The Spanish Gas System - Enagas
75
The Spanish Gas System Report 2020
-
Upload
khangminh22 -
Category
Documents
-
view
2 -
download
0
Transcript of The Spanish Gas System - Enagas
The SpanishGas System
Report 2020
The SpanishGas System
Report 2020
1
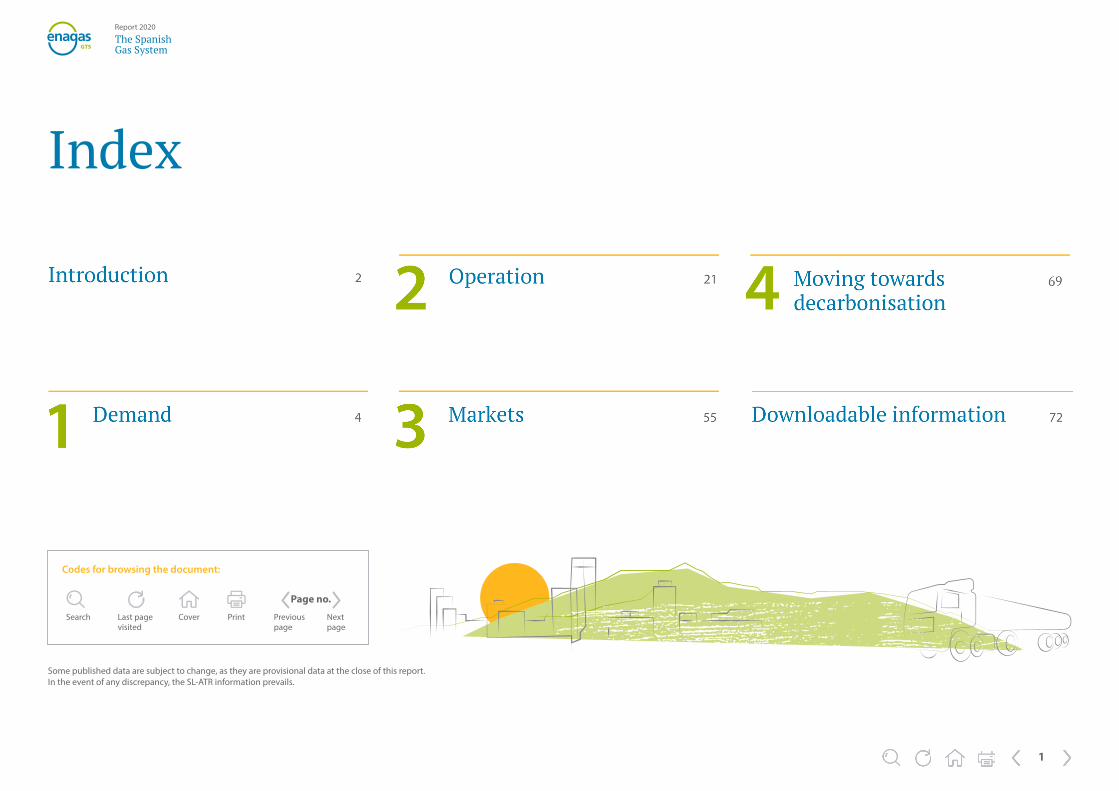
Index
Some published data are subject to change, as they are provisional data at the close of this report.In the event of any discrepancy, the SL-ATR information prevails.
Page no.
Codes for browsing the document:
Search Last pagevisited
Cover Print Previouspage
Nextpage
2
The SpanishGas System
Report 2020
Introduction
Operational excellence in the year of COVID-19During 2020, a year marked by the COVID-19 pandemic, the Spanish Gas System operated normally, guaranteeing the continuity and security of the energy supply. The availability, both commercial and technical, has been 100%, 24 hours a day, every day of the year. The Spanish Gas System as a whole has worked to ensure that, during the exceptional circumstances experienced this year, the operation has been carried out efficiently and flexibly.
Demand reached 360 TWh, an increase of 3.1% vs 2018. Compared to 2019, when demand grew exceptionally (+14%) due to high deliveries of natural gas for electricity generation, total demand stood at around 90.4%, at the end of the year.
In 2020, gas demand was 4% higher than the average for the last ten years and the compound annual rate for the 2015-2020 period was +3%, confirming a sustained growth trend over the last few years.
In a context of the pandemic, gas consumption has proved resilient, with demand more than 5% above the target scenario by the Integrated National Energy and Climate Plan (PNIEC).
Gas consumption has been resilient in a year marked by COVID-19, with demand more than 5% higher than forecast by the PNIEC in its target scenario
In 2020 a new regulation has been successfully implemented that implies another way of understanding access to Gas System capacity: virtual balancing LNG tank
This year has also been marked by the entry into force in April a new regulation, which implies another way of understanding access to the capacity of the Spanish Gas System: the virtual balancing tank, which pools management of the six Spanish regasification plants and virtualises their storage at a single point.
This makes commercial management easier for users and provides greater flexibility and liquidity to the Spanish regasification plant system. This new regulation has been successfully implemented in an exceptional situation caused by the global pandemic of COVID-19, complying with the roadmap established by the CNMC.
In this context, the Gas System faces the challenge of decarbonisation in order to meet climate neutrality targets. Renewable gases, mainly biomethane and hydrogen, will play a key role in the coming years. To this end, without losing sight of the fact that the process must be carried out in the context of a fair and socially sustainable transition, natural gas and its infrastructures will be key: the integration and injection of renewable gases into the Gas System will allow the existing gas infrastructures to be used to the maximum.

3
The SpanishGas System
Report 2020
Introduction
Key figures
360 TWh National gas demand, the second highest since 2012
63% LNG supply
13,341 GWh Volume of tanker trucks loading (+6% vs. 2019)
12,223 GWh Gas extracted (+123% vs. 2019)
89% Average use of contracted capacity in regasification plants
375Auctions every day on short-term products (from 30 September)
184Users adhered to the Balancing Portfolio Framework Contract
208Users adhered to the Access Framework Contract
150 Average number of attendees at the Gas System Monitoring Committee (+20% vs. 2019)
83
750Long-term capacity auctions
14 Countries supplying natural gas to the Spanish Gas System
PVB balancing actions (and 4 TVB/AVB imbalance management actions)
100% Storage capacity contracting (October)
238 Methane tankers unloaded
1 Demand
4
The SpanishGas System
Report 2020
1 Demand Domestic gas demand reached 360 GWh in 2020, 4% higher than the average for the last ten years and the second highest figure since 2012.
1 Demand
5
The SpanishGas System
Report 2020
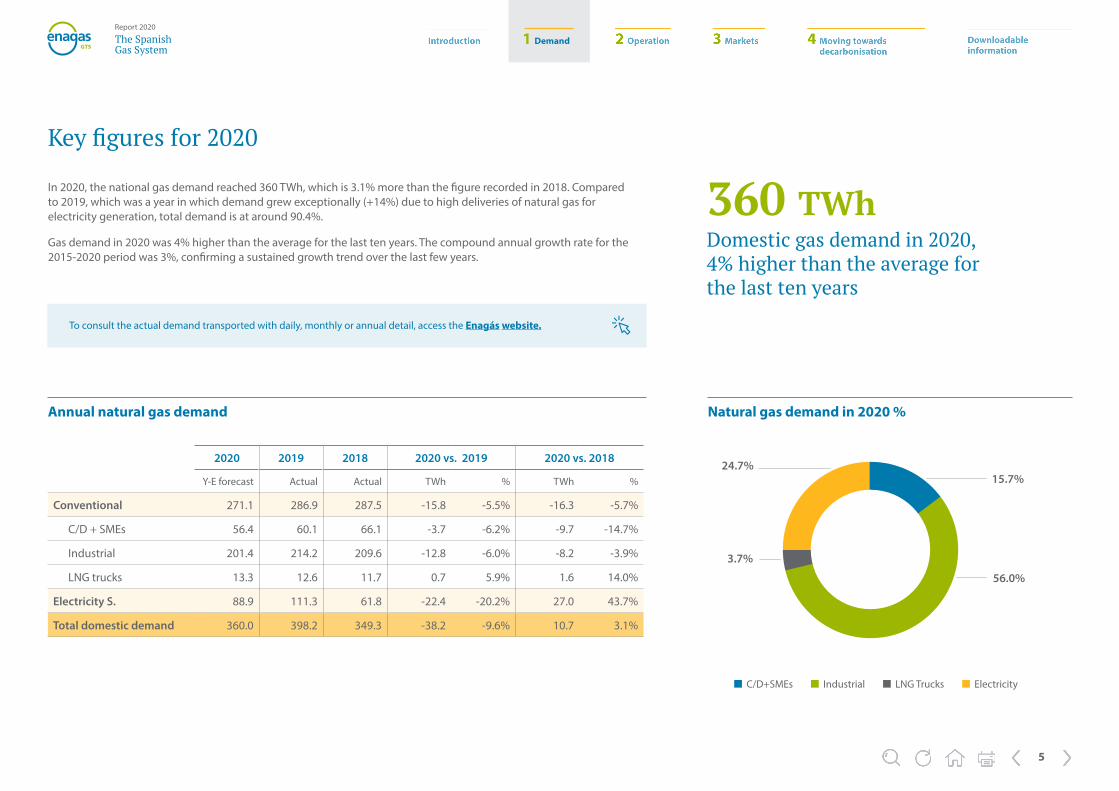
In 2020, the national gas demand reached 360 TWh, which is 3.1% more than the figure recorded in 2018. Compared to 2019, which was a year in which demand grew exceptionally (+14%) due to high deliveries of natural gas for electricity generation, total demand is at around 90.4%.
Gas demand in 2020 was 4% higher than the average for the last ten years. The compound annual growth rate for the 2015-2020 period was 3%, confirming a sustained growth trend over the last few years.
Key figures for 2020
Annual natural gas demand
2020 2019 2018 2020 vs. 2019 2020 vs. 2018
Y-E forecast Actual Actual TWh % TWh %
Conventional 271.1 286.9 287.5 -15.8 -5.5% -16.3 -5.7%
C/D + SMEs 56.4 60.1 66.1 -3.7 -6.2% -9.7 -14.7%
Industrial 201.4 214.2 209.6 -12.8 -6.0% -8.2 -3.9%
LNG trucks 13.3 12.6 11.7 0.7 5.9% 1.6 14.0%
Electricity S. 88.9 111.3 61.8 -22.4 -20.2% 27.0 43.7%
Total domestic demand 360.0 398.2 349.3 -38.2 -9.6% 10.7 3.1%
15.7%
3.7%
24.7%
56.0%
C/D+SMEs Industrial LNG Trucks Electricity
Natural gas demand in 2020 %
360 TWh Domestic gas demand in 2020, 4% higher than the average for the last ten years To consult the actual demand transported with daily, monthly or annual detail, access the Enagás website.
1 Demand
6
The SpanishGas System
Report 2020
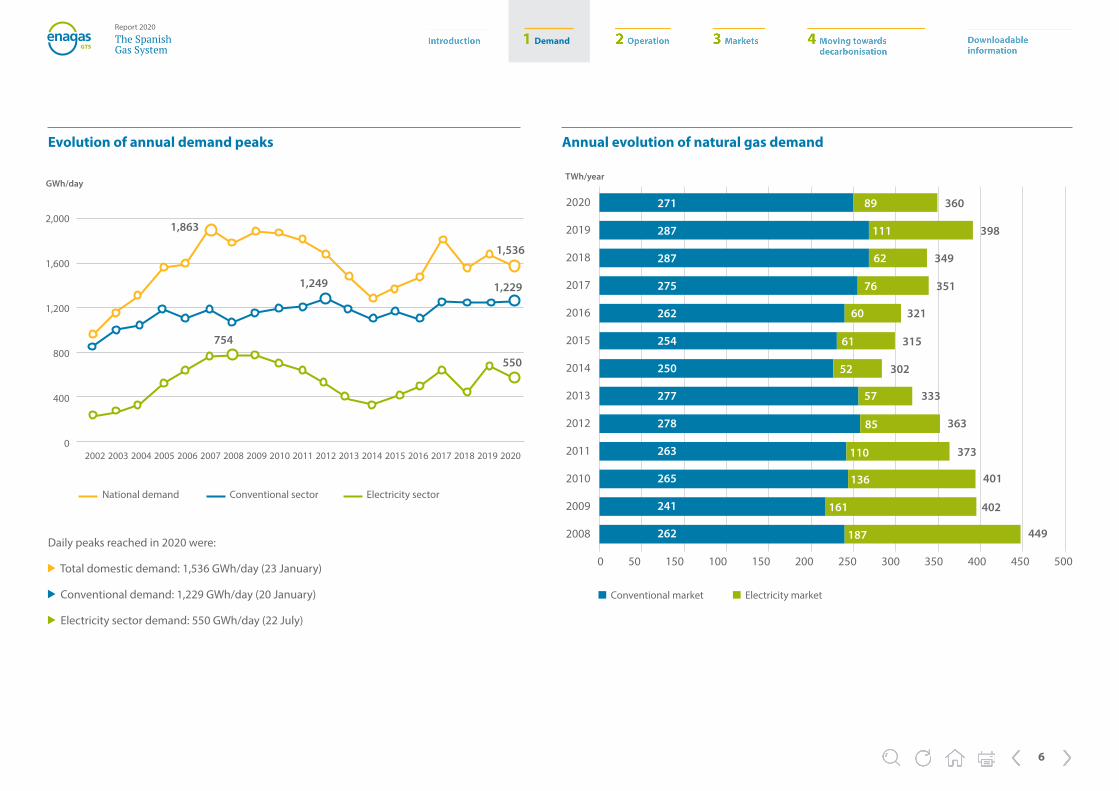
Daily peaks reached in 2020 were:
Total domestic demand: 1,536 GWh/day (23 January)
Conventional demand: 1,229 GWh/day (20 January)
Electricity sector demand: 550 GWh/day (22 July)
2002 2003 2004 2005 2006 2007 2008 2009 2010 2011 2012 2013 2014 2015 2016 2017 2018 2019 2020
National demand Conventional sector Electricity sector
Evolution of annual demand peaks
2,000
1,600
1,200
800
400
0
1,863
1,536
1,229
550
1,249
754
GWh/day
Annual evolution of natural gas demand
0 50 150 100 150 200 250 300 350 400 450 500
2020
2019
2018
2017
2016
2015
2014
2013
2012
2011
2010
2009
2008
271
287
287
275
262
254
250
277
278
263
265
241
262
89
111
62
76
60
61
52
57
85
110
136
161
187
360
398
349
351
321
315
302
333
363
373
401
402
449
TWh/year
Conventional market Electricity market
1 Demand
7
The SpanishGas System
Report 2020
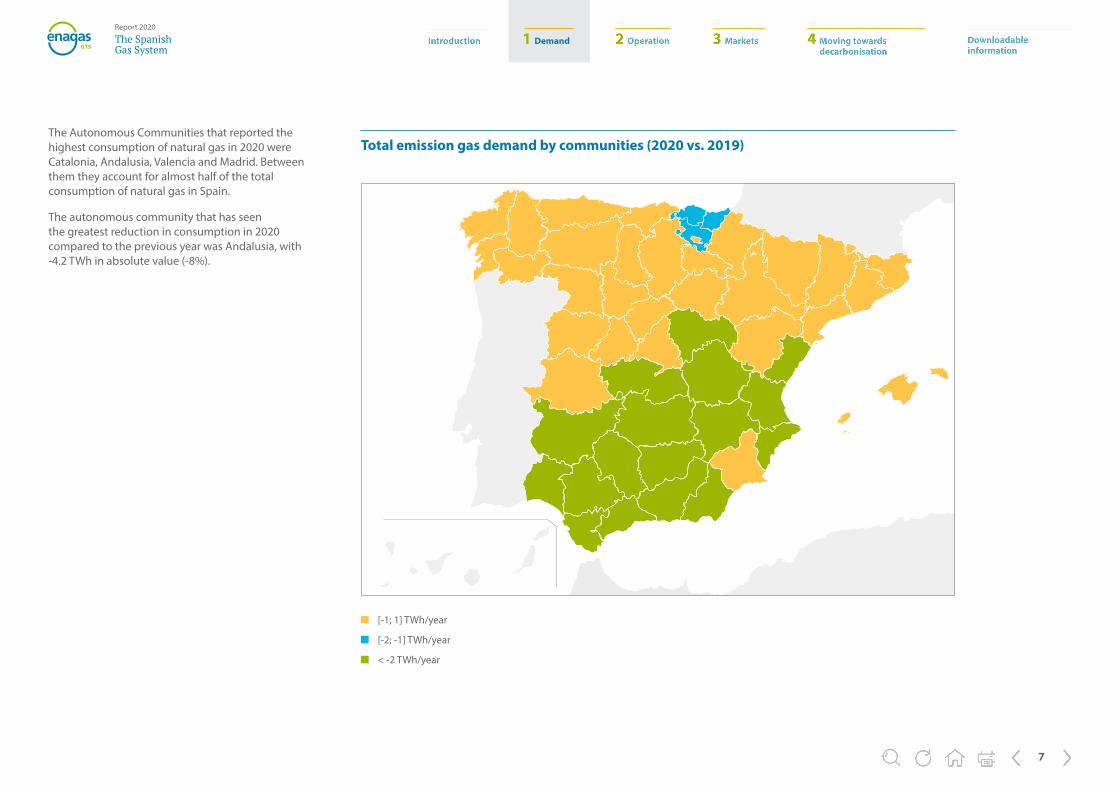
The Autonomous Communities that reported the highest consumption of natural gas in 2020 were Catalonia, Andalusia, Valencia and Madrid. Between them they account for almost half of the total consumption of natural gas in Spain.
The autonomous community that has seen the greatest reduction in consumption in 2020 compared to the previous year was Andalusia, with -4.2 TWh in absolute value (-8%).
[-1; 1] TWh/year
[-2; -1] TWh/year
< -2 TWh/year
Total emission gas demand by communities (2020 vs. 2019)
1 Demand
8
The SpanishGas System
Report 2020
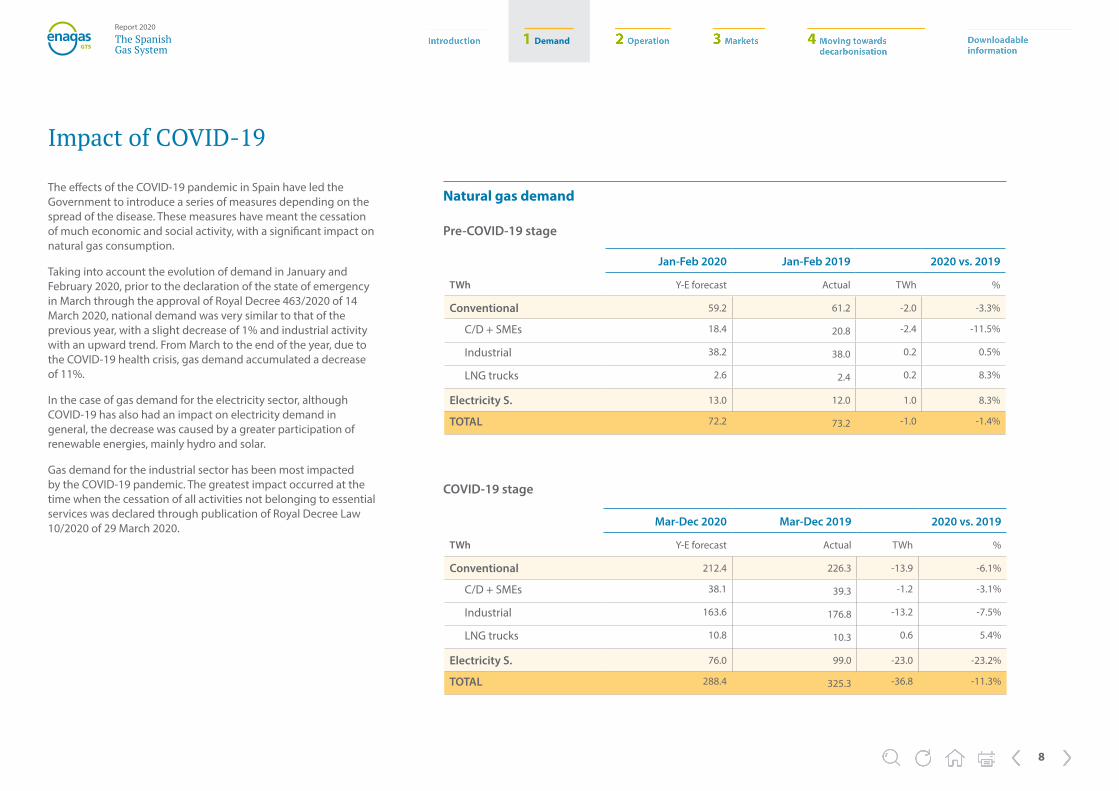
The effects of the COVID-19 pandemic in Spain have led the Government to introduce a series of measures depending on the spread of the disease. These measures have meant the cessation of much economic and social activity, with a significant impact on natural gas consumption.
Taking into account the evolution of demand in January and February 2020, prior to the declaration of the state of emergency in March through the approval of Royal Decree 463/2020 of 14 March 2020, national demand was very similar to that of the previous year, with a slight decrease of 1% and industrial activity with an upward trend. From March to the end of the year, due to the COVID-19 health crisis, gas demand accumulated a decrease of 11%.
In the case of gas demand for the electricity sector, although COVID-19 has also had an impact on electricity demand in general, the decrease was caused by a greater participation of renewable energies, mainly hydro and solar.
Gas demand for the industrial sector has been most impacted by the COVID-19 pandemic. The greatest impact occurred at the time when the cessation of all activities not belonging to essential services was declared through publication of Royal Decree Law 10/2020 of 29 March 2020.
Impact of COVID-19
Natural gas demand
Pre-COVID-19 stage
COVID-19 stage
Jan-Feb 2020 Jan-Feb 2019 2020 vs. 2019
TWh Y-E forecast Actual TWh %
Conventional 59.2 61.2 -2.0 -3.3%
C/D + SMEs 18.4 20.8 -2.4 -11.5%
Industrial 38.2 38.0 0.2 0.5%
LNG trucks 2.6 2.4 0.2 8.3%
Electricity S. 13.0 12.0 1.0 8.3%
TOTAL 72.2 73.2 -1.0 -1.4%
Mar-Dec 2020 Mar-Dec 2019 2020 vs. 2019
TWh Y-E forecast Actual TWh %
Conventional 212.4 226.3 -13.9 -6.1%
C/D + SMEs 38.1 39.3 -1.2 -3.1%
Industrial 163.6 176.8 -13.2 -7.5%
LNG trucks 10.8 10.3 0.6 5.4%
Electricity S. 76.0 99.0 -23.0 -23.2%
TOTAL 288.4 325.3 -36.8 -11.3%

1 Demand
9
The SpanishGas System
Report 2020
Gas demand in industry by stages
Name Period Average working week (GWh) Decrease vs. Stage 1
Stage 1 Pre-COVID-19 01/03 – 15/03 629
Stage 2 Start of the state of emergency (RD 463/2020) 16/03 – 29/03 586 -7%
Stage 3 Essential services (RDL 10/2020) 30/03 – 12/04 476 -24%
Stage 4 End of validity of RDL 10/2020 13/04 – 02/05 497 -21%
Stage 5 De-escalation 03/05 – 21/06 513 -18%
Stage 6.1 New normality 22/06 – 30/08 522 -17%
Stage 6.2 New normality. Post-holiday 31/08 – 30/09 575 -9%
Stage 7 Selective lockdown. Coordinated Public Health Actions (Resolution 30/09/2020) 01/10 – 31/12 632 +0.5%
National demand - Industrial sector
800
700
600
500
400
300
200
100
GWh/d
RD463/2020Start of the state of emergency
+ RDL 10/2020 Essential services
End of validity RDL 10/2020
Start de-escalation in lockdown measures
End of state of emergency
Resolution 30/09/20 Public Health Coordinated actions
STAGE 1 Normality pre-COVID-19
STAGE 2 State of Emergency
STAGE 3 + RDL 10/2020
STAGE 4 State of Emergency
STAGE 5 De-escalation
STAGE 6.1 New normality
STAGE 6.2 New normalityPost-holiday
STAGE 7 Selective lockdown
1-M
ar
7-M
ar
13-M
ar
19-M
ar
25-M
ar
31-M
ar
6-A
pr
12-A
pr
18-A
pr
24-A
pr
30-A
pr
6-M
ay
12-M
ay
18-M
ay
24-M
ay
30-M
ay
5-Ju
n
11-J
un
17-J
un
23-J
un
29-J
un
5-Ju
l
11-J
ul
17-J
ul
23-J
ul
29-J
ul
4-Au
g
10-A
ug
16-A
ug
22-A
ug
28-A
ug
3-Se
pt
15-S
ept
21-S
ept
27-S
ept
3-O
ct
9-O
ct
15-O
ct
21-O
ct
27-O
ct
2-N
ov
8-N
ov
14-N
ov
20-N
ov
26-N
ov
2-D
ec
8-D
ec
14-D
ec
20-D
ec
26-D
ec
Industrial Ave. weekly ind.
To try to analyse the evolution of gas demand in the industrial sector throughout 2020, the annual period has been divided into different stages according to the Government measures taken to try to curb the effects of the pandemic.
1 Demand
10
The SpanishGas System
Report 2020
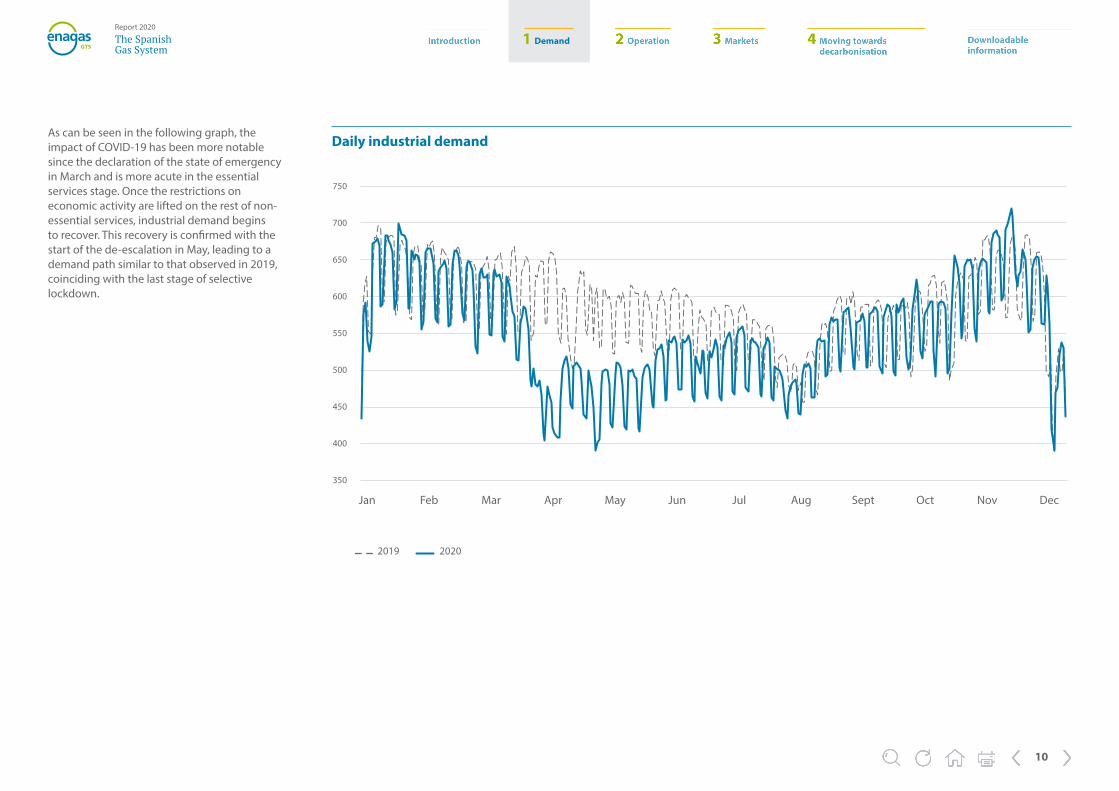
As can be seen in the following graph, the impact of COVID-19 has been more notable since the declaration of the state of emergency in March and is more acute in the essential services stage. Once the restrictions on economic activity are lifted on the rest of non-essential services, industrial demand begins to recover. This recovery is confirmed with the start of the de-escalation in May, leading to a demand path similar to that observed in 2019, coinciding with the last stage of selective lockdown.
Daily industrial demand
Jan Feb Mar Apr May Jun Jul Aug Sept Oct Nov Dec
2019 2020
750
700
650
600
550
500
450
400
350
1 Demand
11
The SpanishGas System
Report 2020
Throughout 2020, the conventional sector recorded 271.2 TWh, -5.5% compared to the previous year.
This decline has been widespread in both the domestic-commercial and SME sector and in the industrial market with figures of -6.2% and -6.0%, respectively, compared to 2019. Adjusted for the effects of labour and temperature, the decline in conventional demand fell from -5.5% to -4.2% compared to the previous year.
Conventional demand
DC/SMEs
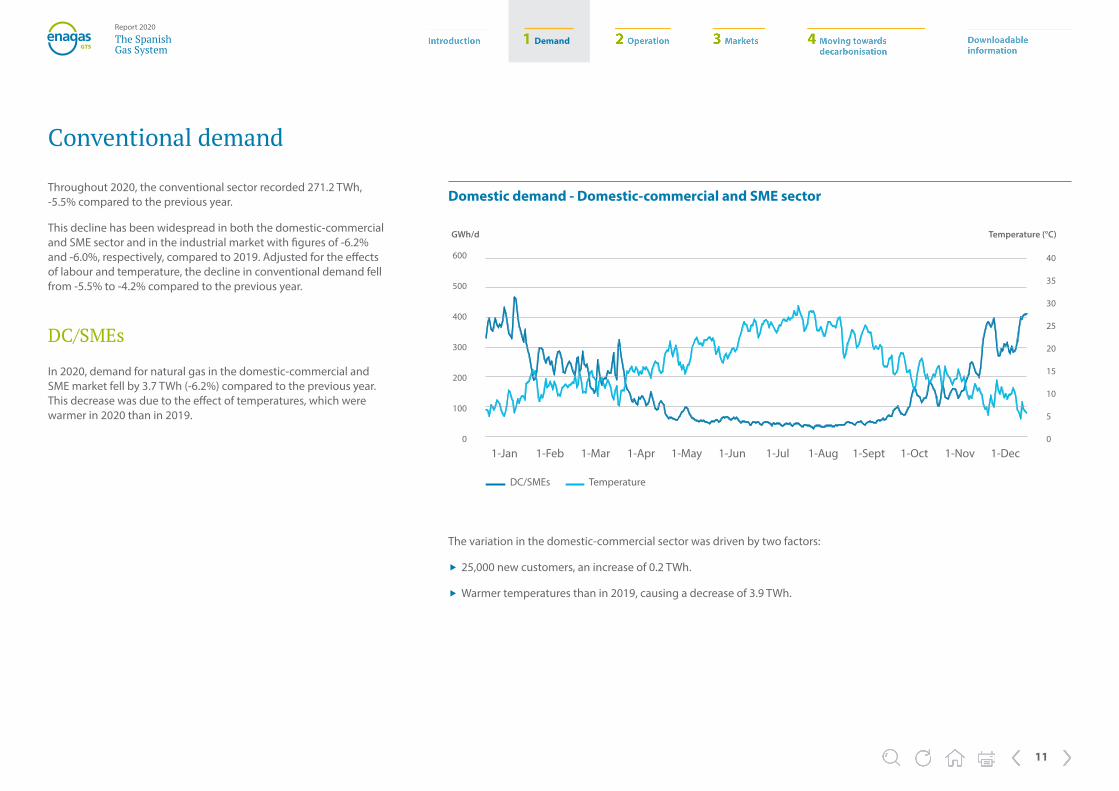
In 2020, demand for natural gas in the domestic-commercial and SME market fell by 3.7 TWh (-6.2%) compared to the previous year. This decrease was due to the effect of temperatures, which were warmer in 2020 than in 2019.
The variation in the domestic-commercial sector was driven by two factors:
� 25,000 new customers, an increase of 0.2 TWh.
� Warmer temperatures than in 2019, causing a decrease of 3.9 TWh.
1-Jan 1-Feb 1-Mar 1-Apr 1-May 1-Jun 1-Jul 1-Aug 1-Sept 1-Oct 1-Nov 1-Dec
600
500
400
300
200
100
0
40
35
30
25
20
15
10
5
0
Domestic demand - Domestic-commercial and SME sector
GWh/d Temperature (°C)
DC/SMEs Temperature
1 Demand
12
The SpanishGas System
Report 2020
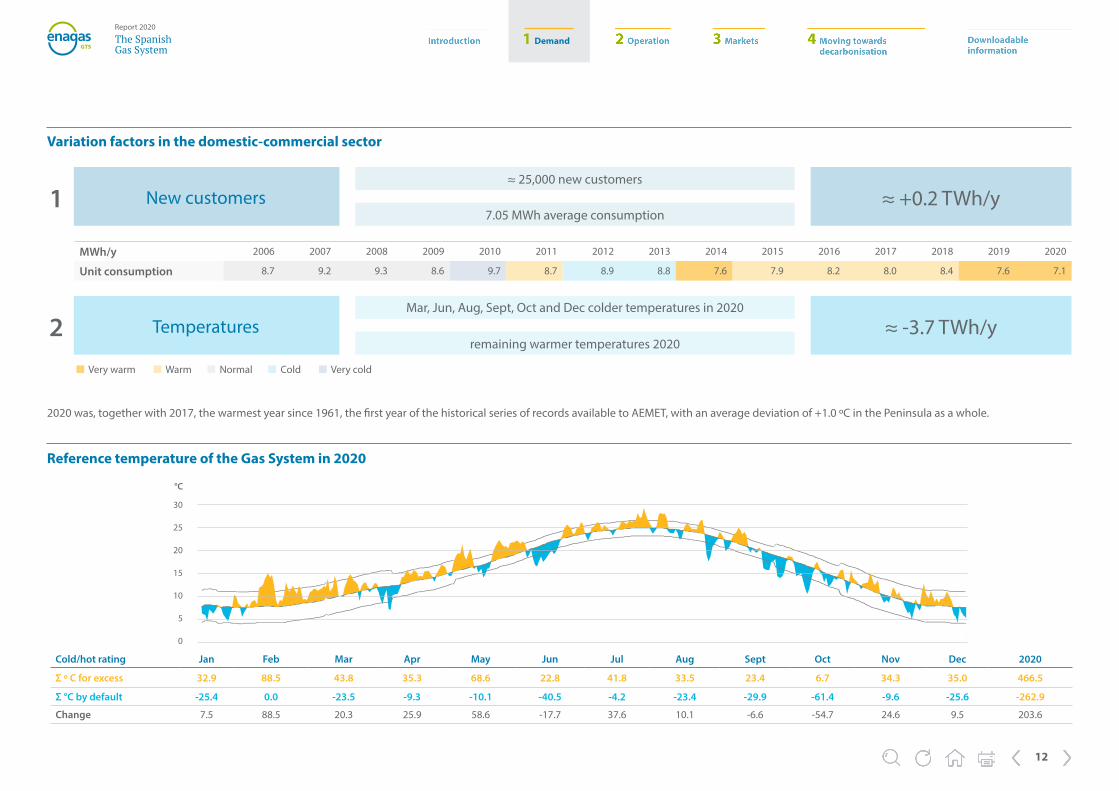
2020 was, together with 2017, the warmest year since 1961, the first year of the historical series of records available to AEMET, with an average deviation of +1.0 ºC in the Peninsula as a whole.
30
25
20
15
10
5
0
°C
Reference temperature of the Gas System in 2020
MWh/y 2006 2007 2008 2009 2010 2011 2012 2013 2014 2015 2016 2017 2018 2019 2020
Unit consumption 8.7 9.2 9.3 8.6 9.7 8.7 8.9 8.8 7.6 7.9 8.2 8.0 8.4 7.6 7.1
≈ 25,000 new customers
≈ +0.2 TWh/y7.05 MWh average consumption
New customers1
Mar, Jun, Aug, Sept, Oct and Dec colder temperatures in 2020
≈ -3.7 TWh/yremaining warmer temperatures 2020
Temperatures2 Very warm Warm Normal Cold Very cold
Cold/hot rating Jan Feb Mar Apr May Jun Jul Aug Sept Oct Nov Dec 2020
Σ º C for excess 32.9 88.5 43.8 35.3 68.6 22.8 41.8 33.5 23.4 6.7 34.3 35.0 466.5
Σ °C by default -25.4 0.0 -23.5 -9.3 -10.1 -40.5 -4.2 -23.4 -29.9 -61.4 -9.6 -25.6 -262.9
Change 7.5 88.5 20.3 25.9 58.6 -17.7 37.6 10.1 -6.6 -54.7 24.6 9.5 203.6
Variation factors in the domestic-commercial sector
1 Demand
13
The SpanishGas System
Report 2020
Industrial demand
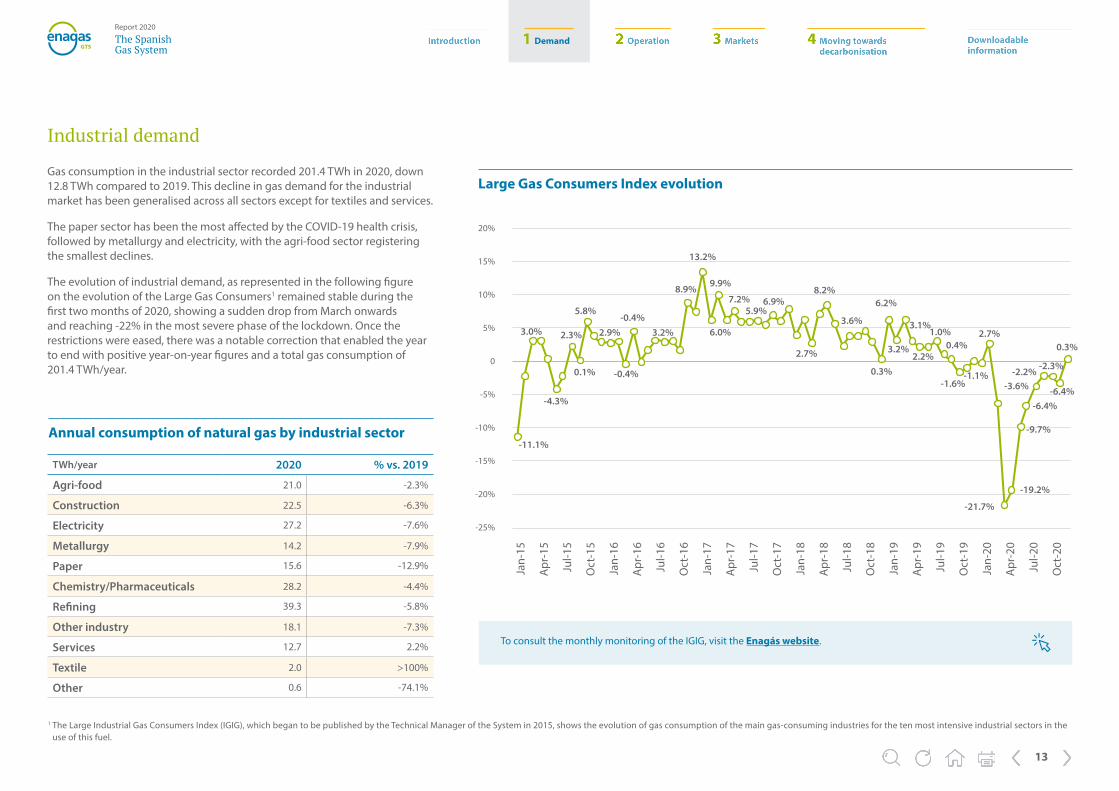
Gas consumption in the industrial sector recorded 201.4 TWh in 2020, down 12.8 TWh compared to 2019. This decline in gas demand for the industrial market has been generalised across all sectors except for textiles and services.
The paper sector has been the most affected by the COVID-19 health crisis, followed by metallurgy and electricity, with the agri-food sector registering the smallest declines.
The evolution of industrial demand, as represented in the following figure on the evolution of the Large Gas Consumers1 remained stable during the first two months of 2020, showing a sudden drop from March onwards and reaching -22% in the most severe phase of the lockdown. Once the restrictions were eased, there was a notable correction that enabled the year to end with positive year-on-year figures and a total gas consumption of 201.4 TWh/year.
Annual consumption of natural gas by industrial sector
1 The Large Industrial Gas Consumers Index (IGIG), which began to be published by the Technical Manager of the System in 2015, shows the evolution of gas consumption of the main gas-consuming industries for the ten most intensive industrial sectors in the use of this fuel.
TWh/year 2020 % vs. 2019
Agri-food 21.0 -2.3%
Construction 22.5 -6.3%
Electricity 27.2 -7.6%
Metallurgy 14.2 -7.9%
Paper 15.6 -12.9%
Chemistry/Pharmaceuticals 28.2 -4.4%
Refining 39.3 -5.8%
Other industry 18.1 -7.3%
Services 12.7 2.2%
Textile 2.0 >100%
Other 0.6 -74.1%
Large Gas Consumers Index evolution
-11.1%
-4.3%
0.1% -0.4%
8.9%
13.2%
9.9%
6.0%
7.2%5.9%
6.9%
2.7%
0.3%
3.2%
3.1%1.0%
0.4%2.7%
-1.6%-1.1%
-21.7%
-19.2%
-9.7%
-6.4%-6.4%
-2.3%
0.3%
-3.6%-2.2%
2.2%
6.2%8.2%
3.6%-0.4%3.2%2.3%
5.8%
2.9%3.0%
20%
15%
10%
5%
0
-5%
-10%
-15%
-20%
-25%Ja
n-15
Jan-
16
Jan-
17
Jan-
18
Jan-
19
Jan-
20
Apr
-15
Apr
-16
Apr
-17
Apr
-18
Apr
-19
Apr
-20
Jul-1
5
Jul-1
6
Jul-1
7
Jul-1
8
Jul-1
9
Jul-2
0
Oct
-15
Oct
-16
Oct
-17
Oct
-18
Oct
-19
Oct
-20
To consult the monthly monitoring of the IGIG, visit the Enagás website.
1 Demand
14
The SpanishGas System
Report 2020
Tanker trucks
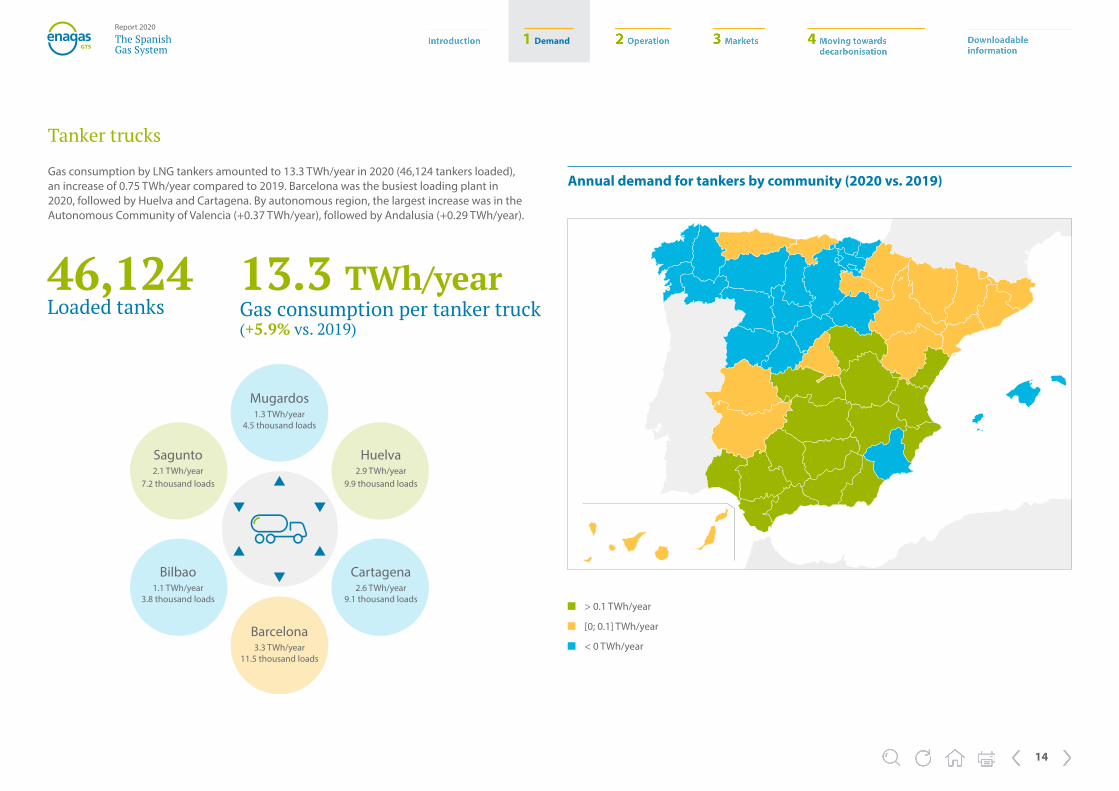
Gas consumption by LNG tankers amounted to 13.3 TWh/year in 2020 (46,124 tankers loaded), an increase of 0.75 TWh/year compared to 2019. Barcelona was the busiest loading plant in 2020, followed by Huelva and Cartagena. By autonomous region, the largest increase was in the Autonomous Community of Valencia (+0.37 TWh/year), followed by Andalusia (+0.29 TWh/year).
13.3 TWh/yearGas consumption per tanker truck (+5.9% vs. 2019)
46,124 Loaded tanks
Barcelona3.3 TWh/year
11.5 thousand loads
Huelva2.9 TWh/year
9.9 thousand loads
Sagunto2.1 TWh/year
7.2 thousand loads
Cartagena2.6 TWh/year
9.1 thousand loads
Bilbao1.1 TWh/year
3.8 thousand loads
Mugardos1.3 TWh/year
4.5 thousand loads
> 0.1 TWh/year
[0; 0.1] TWh/year
< 0 TWh/year
Annual demand for tankers by community (2020 vs. 2019)
1 Demand
15
The SpanishGas System
Report 2020
Tanker trucks destinations
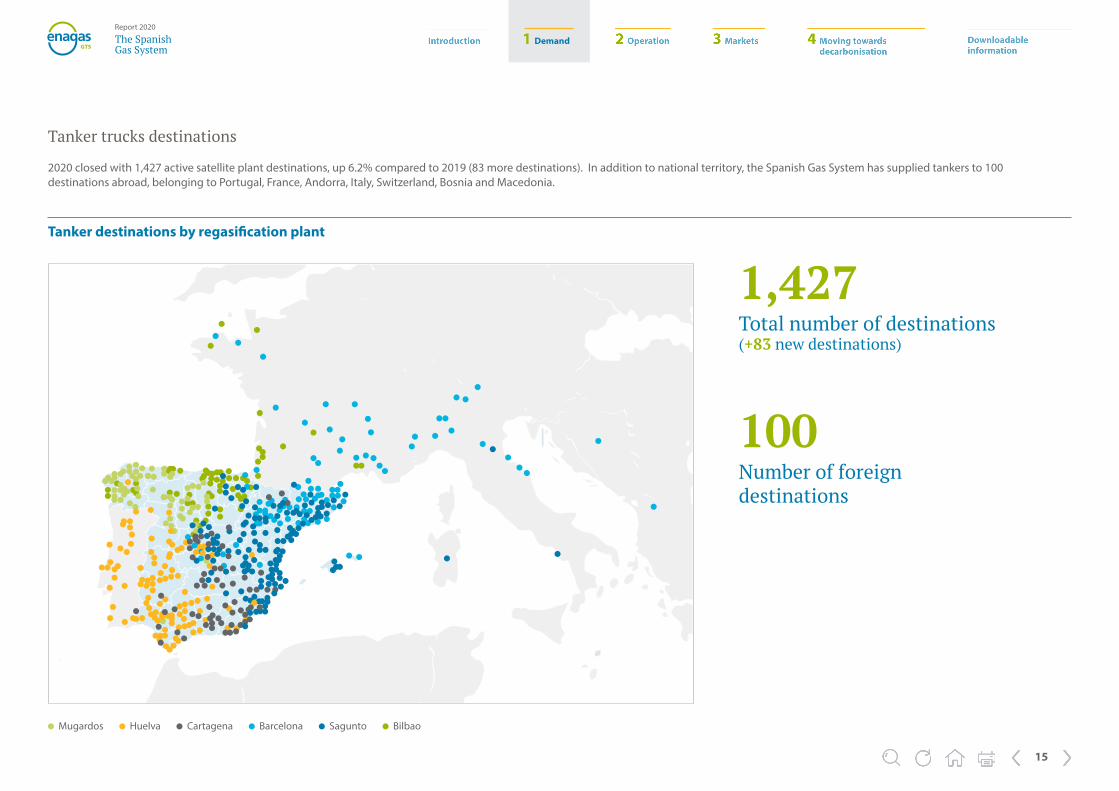
2020 closed with 1,427 active satellite plant destinations, up 6.2% compared to 2019 (83 more destinations). In addition to national territory, the Spanish Gas System has supplied tankers to 100 destinations abroad, belonging to Portugal, France, Andorra, Italy, Switzerland, Bosnia and Macedonia.
Mugardos Huelva Cartagena Barcelona Sagunto Bilbao
1,427 Total number of destinations (+83 new destinations)
100 Number of foreign destinations
Tanker destinations by regasification plant

1 Demand
16
The SpanishGas System
Report 2020
Gas demand for transportation
1 If the LNG supply is carried out by another vessel, this is a ship-to-ship (STS) operation.2 The truck-to-ship (TTS) process is based on the supply of LNG to the ship from a tanker truck that is placed on the quay where the ship is berthed. 3 When several tankers are involved in the same LNG refuelling operation simultaneously, the process is called multi-truck-to-ship (MTTS).
LNG tanker supply for maritime transportationDemand for natural gas in the transportation sector is up versus the previous year. During 2020, the figure exceeded 3 TWh/year, with approximately three quarters of the total going to land transport and one quarter to maritime transport.
Land transportation
The monitored annual consumption of gas vehicles in Spain has posted an increase of 2% compared to 2019 to reach 2.19 TWh/year. In 2020, the autonomous communities with the highest consumption of natural gas for land transport were the Community of Madrid and Catalonia.
Maritime transportation
Throughout 2020, 0.83 TWh/year have been supplied for maritime transport, of which 0.26 TWh correspond to LNG bunkering carried out in 17 ship-to-ship (STS1) operations from supply barges. The remaining 0.52 TWh/year were supplied by LNG tanker trucks, with 248 tanker offloadings to vessels in truck-to-ship (TTS2) and multi-truck-to-ship (MTTS3) operations.
17 operations
0.57 TWh/year(>100% vs. 2019)
2,005 orders
0.26 TWh/year(>100% vs. 2019)
1 Demand
17
The SpanishGas System
Report 2020
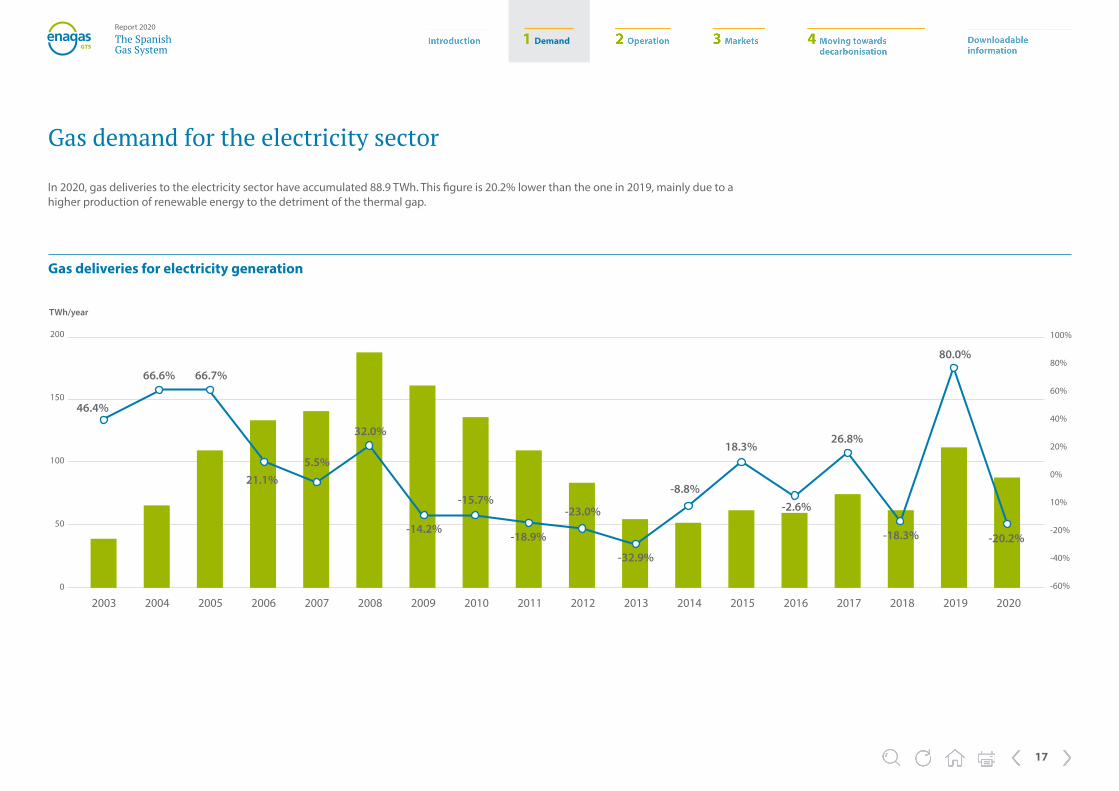
In 2020, gas deliveries to the electricity sector have accumulated 88.9 TWh. This figure is 20.2% lower than the one in 2019, mainly due to a higher production of renewable energy to the detriment of the thermal gap.
Gas demand for the electricity sector
Gas deliveries for electricity generation
200
150
100
50
0
100%
80%
60%
40%
20%
0%
10%
-20%
-40%
-60%
TWh/year
46.4%
66.6% 66.7%
21.1%5.5%
32.0%
-14.2%-18.9%
-32.9%
-8.8%-2.6%
-18.3%
18.3%26.8%
80.0%
-20.2%
-15.7%-23.0%
2009 2010 20142011 2015 201820072006200520042003 2012 2016 20192008 2013 2017 2020
1 Demand
18
The SpanishGas System
Report 2020
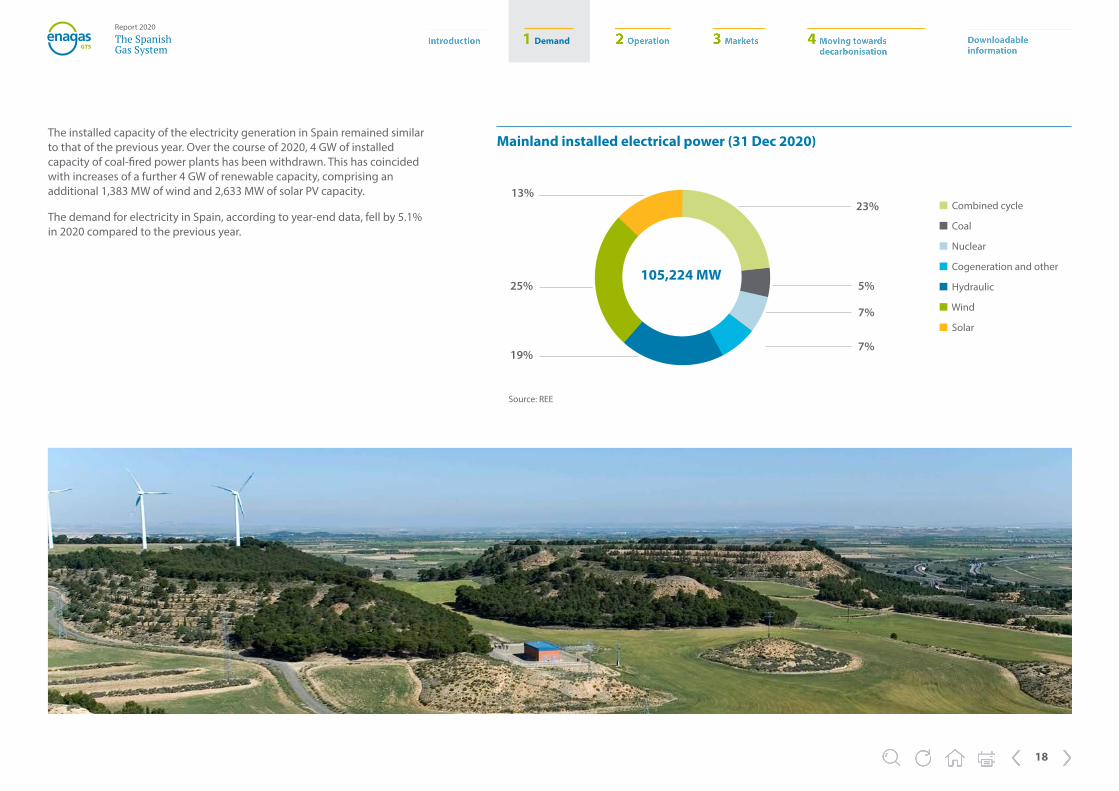
The installed capacity of the electricity generation in Spain remained similar to that of the previous year. Over the course of 2020, 4 GW of installed capacity of coal-fired power plants has been withdrawn. This has coincided with increases of a further 4 GW of renewable capacity, comprising an additional 1,383 MW of wind and 2,633 MW of solar PV capacity.
The demand for electricity in Spain, according to year-end data, fell by 5.1% in 2020 compared to the previous year.
Mainland installed electrical power (31 Dec 2020)
23%
25%
19%
13%
5%
7%
7%
Combined cycle
Coal
Nuclear
Cogeneration and other
Hydraulic
Wind
Solar
105,224 MW
Source: REE

1 Demand
19
The SpanishGas System
Report 2020
Balance of annual electricity
TWh (e) 2019 2020
Electricity demand 249.3 236.5
Wind 53.1 53.8
Hydraulic 26.4 33.3
Solar 14.0 19.4
Other renewables 36.0 33.9
CHP (cogeneration) 29.6 26.9
Other 6.4 7.0
Thermal gap 61.8 43.2
Coal 10.7 4.8
Gas 51.1 38.4
% gas in TG 83% 89%
Nuclear 55.8 55.8
International balances 6.9 3.3
Import Import
21%
21%
4%
23%
11%
6%
14%
23%
16%
2%
14%
23%
14%
8%
2019
2020
The technologies that have provided the greatest coverage of demand have been nuclear, with 23%; closely followed by wind generation, also with a percentage representation of 23%, and combined cycle, with 16%.
The most significant variations with respect to the previous year were as follows:
� The increase in hydro and solar production, which have increased their share by 26.1% and 38.5%, respectively. The two technologies added up to an increase of 12.3 TWh (e), practically coinciding with the 12.7 TWh (e) decrease in combined cycle plants.
� The decline in the contribution of coal, being reduced to less than half of the energy delivered in 2019.
� The reduction of imports in international trade. 2020 closed for the fifth consecutive year with an import balance, albeit with a notable decrease to 3.3 TWh, less than half that of 2019.
Wind
Hydraulic
Solar
Other renewables
Coal
Gas
Nuclear
Source: REE.
1 Demand
20
The SpanishGas System
Report 2020
European comparison of natural gas demand
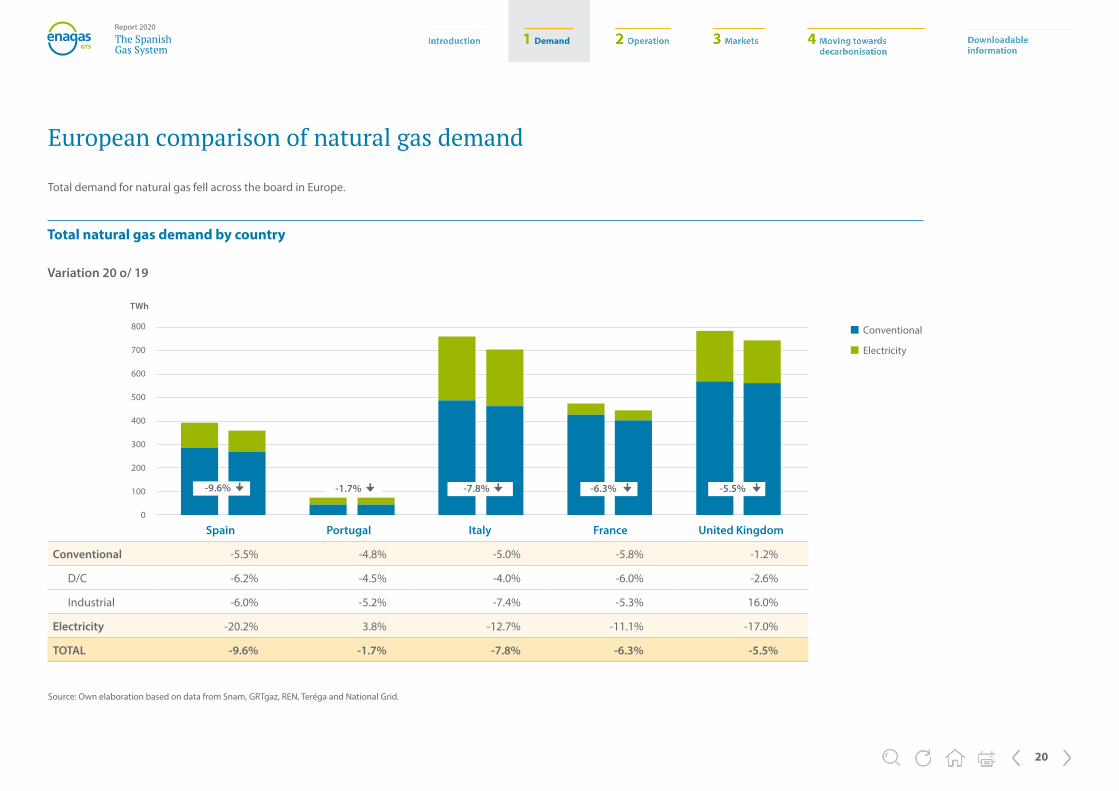
Total demand for natural gas fell across the board in Europe.
Spain Portugal Italy France United Kingdom
Conventional -5.5% -4.8% -5.0% -5.8% -1.2%
D/C -6.2% -4.5% -4.0% -6.0% -2.6%
Industrial -6.0% -5.2% -7.4% -5.3% 16.0%
Electricity -20.2% 3.8% -12.7% -11.1% -17.0%
TOTAL -9.6% -1.7% -7.8% -6.3% -5.5%
Total natural gas demand by country
800
700
600
500
400
300
200
100
0
Conventional
Electricity
TWh
Variation 20 o/ 19
Source: Own elaboration based on data from Snam, GRTgaz, REN, Teréga and National Grid.
-9.6% -7.8% -6.3% -5.5% -1.7%
2 Operation
21
The SpanishGas System
Report 2020
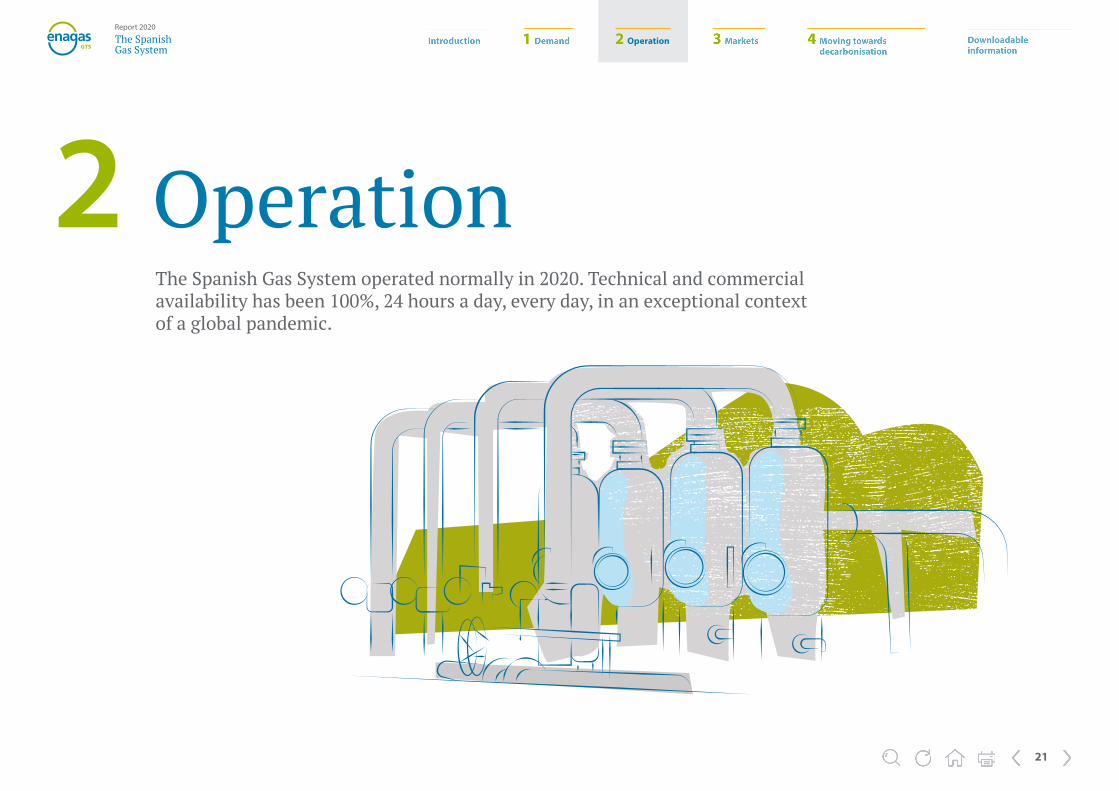
2 Operation The Spanish Gas System operated normally in 2020. Technical and commercial availability has been 100%, 24 hours a day, every day, in an exceptional context of a global pandemic.
2 Operation
22
The SpanishGas System
Report 2020
In 2020, the Technical Manager of the System has continued to guarantee the continuity, quality and security of supply, under the principles of objectivity, transparency and non-discrimination; seeking the correct operation of the System with criteria of effectiveness, efficiency, better customer service and the correct coordination between access points, storage, transmission and distribution.
At 31 December 2020, 184 users were authorised in one of the three balancing areas (PVB, TVB or AVB) and 208 users had signed up to the Framework Contract for Access to the Spanish Gas System facilities.
Following the allocation of capacity in the Spanish system over a 15-year horizon, the long-term use of the gas system has been assured.
On the other hand, in 2020, a total of 238 LNG unloadings were carried out at the Spanish regasification terminals as a whole.
Operating Notes
Seven Operating Notes have been published during 2020, in the following order:
� Reduction of winter reserve obligation 2019-2020 (14/02/2020).
� Low temperature warning (30/03/2020).
� Tanker trucks loading management (09/10/2020).
� Tanker trucks loading management-shutdown (16/10/2020).
� Transitional rule for tanker truck capacity allocation from 04/11/2020 (30/10/2020).
� Low temperature warning (23/12/2020).
� Exceptional Operation Situation Level 0 - Cold Wave (31/12/2020)
The Spanish Gas System operated normally in 2020 thanks to the COVID-19 contingency plan implemented by Enagás in early March. Availability, both commercial and technical, has been 100%, 24 hours a day, every day, always guaranteeing supply to all consumers.
Continuity, quality and security of supply
Between 17 June and 17 September 2020, the balancing portfolio framework contract was adapted to the new model established in the Resolution of 9 June 2020, of the National Commission of Markets and Competition, which approves the procedure for habilitation and cancellation of the balancing portfolio of Gas System users in the virtual balancing LNG tank, the virtual balancing point and the virtual balancing storage and the Balancing Portfolio Framework Contract. A total of 159 users took part in this process and signed up to the new framework contract.
Between 24 April and 24 July 2020, the Framework Contract for Access was adapted to the new model established in the Resolution of 15 April 2020, of the National Commission of Markets and Competition, approving the framework contract for access to Gas System facilities. A total of 178 users participated in this process and signed up to the new framework contract.
At 31 December 2020:
� 208 users have formalised their adhesion to the Framework Agreement for access to the Spanish Gas System Facilities.
� 184 users have signed up to the Balancing Portfolio Framework Contract. Of these, 182 have the Balancing portfolio in PVB, 145 have the Balancing portfolio in TVB and 142 have the Balancing portfolio in AVB.
� 136 companies have been authorised in the Framework Contract for Access to the Spanish Gas System Facilities and in the three Balancing Portfolios (PVB, TVB and AVB).
� 11 Balancing Portfolio groupings were in place.
The SL-ATR logistics system had more than 1,300 active users in 2020.
Authorisation and access to the Gas System
Information on how to be authorised in the System to operate in gas facilities and in the PVB, TVB and AVB balancing areas can be consulted on the following Enagás website.
2 Operation
23
The SpanishGas System
Report 2020
Capacity allocation
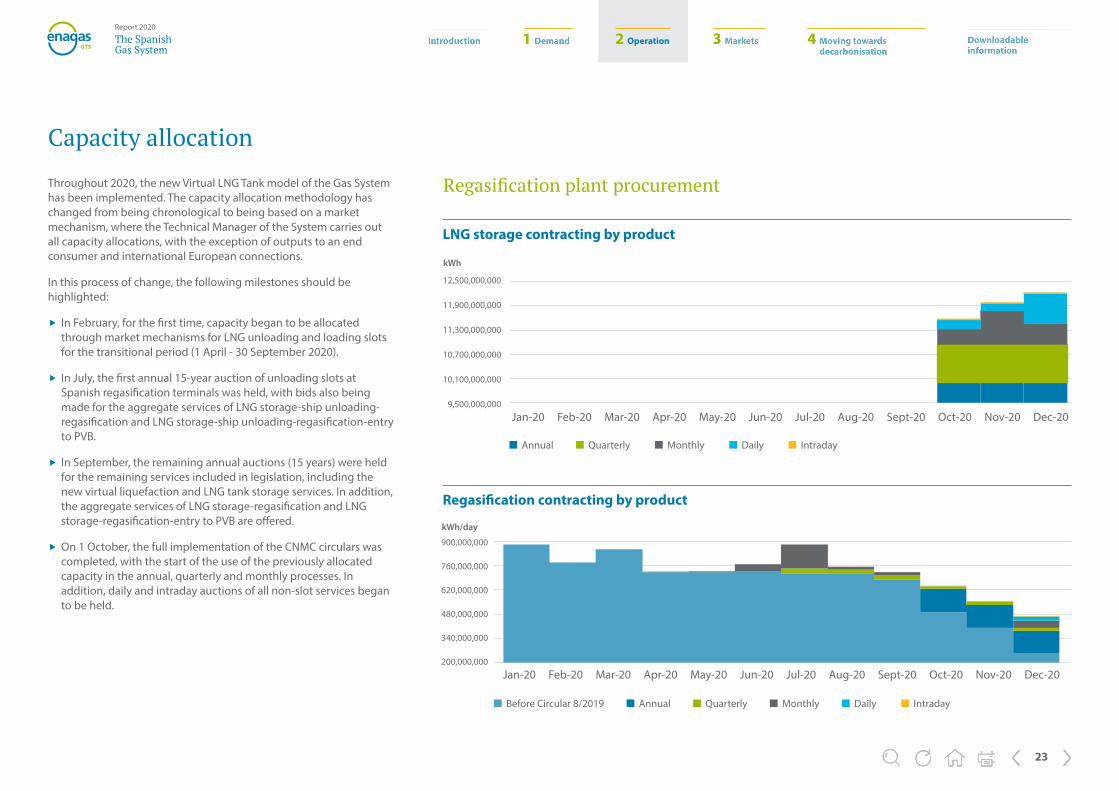
Throughout 2020, the new Virtual LNG Tank model of the Gas System has been implemented. The capacity allocation methodology has changed from being chronological to being based on a market mechanism, where the Technical Manager of the System carries out all capacity allocations, with the exception of outputs to an end consumer and international European connections.
In this process of change, the following milestones should be highlighted:
� In February, for the first time, capacity began to be allocated through market mechanisms for LNG unloading and loading slots for the transitional period (1 April - 30 September 2020).
� In July, the first annual 15-year auction of unloading slots at Spanish regasification terminals was held, with bids also being made for the aggregate services of LNG storage-ship unloading-regasification and LNG storage-ship unloading-regasification-entry to PVB.
� In September, the remaining annual auctions (15 years) were held for the remaining services included in legislation, including the new virtual liquefaction and LNG tank storage services. In addition, the aggregate services of LNG storage-regasification and LNG storage-regasification-entry to PVB are offered.
� On 1 October, the full implementation of the CNMC circulars was completed, with the start of the use of the previously allocated capacity in the annual, quarterly and monthly processes. In addition, daily and intraday auctions of all non-slot services began to be held.
Annual Quarterly Monthly Daily Intraday
LNG storage contracting by product
12,500,000,000
11,900,000,000
11,300,000,000
10,700,000,000
10,100,000,000
9,500,000,000
Regasification contracting by product
Before Circular 8/2019 Annual Quarterly Monthly Daily Intraday
900,000,000
760,000,000
620,000,000
480,000,000
340,000,000
200,000,000
Regasification plant procurement
Jan-20 Feb-20 Mar-20 Apr-20 May-20 Jun-20 Jul-20 Aug-20 Sept-20 Oct-20 Nov-20 Dec-20
kWh
kWh/day
Jan-20 Feb-20 Mar-20 Apr-20 May-20 Jun-20 Jul-20 Aug-20 Sept-20 Oct-20 Nov-20 Dec-20
2 Operation
24
The SpanishGas System
Report 2020
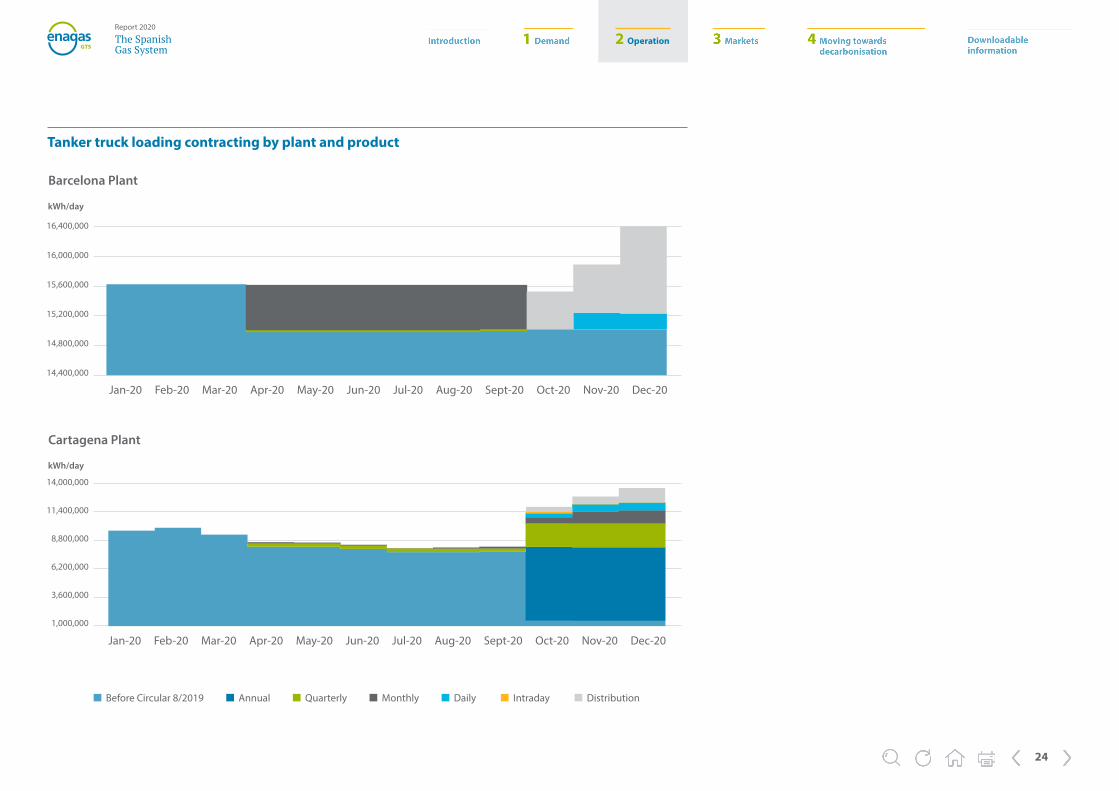
Tanker truck loading contracting by plant and product
Barcelona Plant
Cartagena Plant
Before Circular 8/2019 Annual Quarterly Monthly Daily Intraday Distribution
14,000,000
11,400,000
8,800,000
6,200,000
3,600,000
1,000,000
16,400,000
16,000,000
15,600,000
15,200,000
14,800,000
14,400,000
Jan-20 Feb-20 Mar-20 Apr-20 May-20 Jun-20 Jul-20 Aug-20 Sept-20 Oct-20 Nov-20 Dec-20
Jan-20 Feb-20 Mar-20 Apr-20 May-20 Jun-20 Jul-20 Aug-20 Sept-20 Oct-20 Nov-20 Dec-20
kWh/day
kWh/day
2 Operation
25
The SpanishGas System
Report 2020
Bilbao Plant
5,500,000
5,300,000
5,100,000
4,900,000
4,700,000
4,500,000
Huelva Plant
14,000,000
12,000,000
10,000,000
8,000,000
6,000,000
4,000,000
Jan-20 Feb-20 Mar-20 Apr-20 May-20 Jun-20 Jul-20 Aug-20 Sept-20 Oct-20 Nov-20 Dec-20
Jan-20 Feb-20 Mar-20 Apr-20 May-20 Jun-20 Jul-20 Aug-20 Sept-20 Oct-20 Nov-20 Dec-20
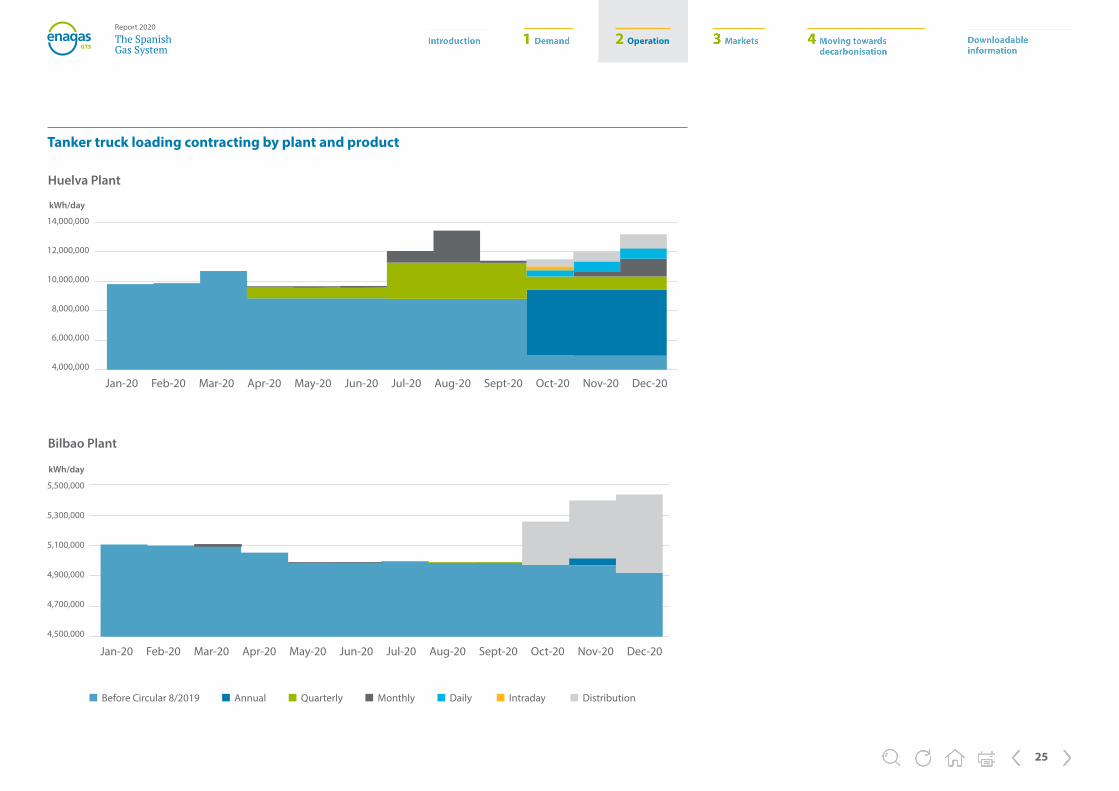
Tanker truck loading contracting by plant and product
kWh/day
kWh/day
Before Circular 8/2019 Annual Quarterly Monthly Daily Intraday Distribution

2 Operation
26
The SpanishGas System
Report 2020
Mugardos Plant
Sagunto Plant
10,500,000
9,500,000
8,500,000
7,500,000
6,500,000
5,500,000
4,500,000
3,500,000
2,500,000
10,500,000
8,900,000
7,300,000
5,700,000
4,100,000
2,500,000
Jan-20 Feb-20 Mar-20 Apr-20 May-20 Jun-20 Jul-20 Aug-20 Sept-20 Oct-20 Nov-20 Dec-20
Jan-20 Feb-20 Mar-20 Apr-20 May-20 Jun-20 Jul-20 Aug-20 Sept-20 Oct-20 Nov-20 Dec-20
Tanker truck loading contracting by plant and product
kWh/day
kWh/day
Before Circular 8/2019 Annual Quarterly Monthly Daily Intraday Distribution
2 Operation
27
The SpanishGas System
Report 2020
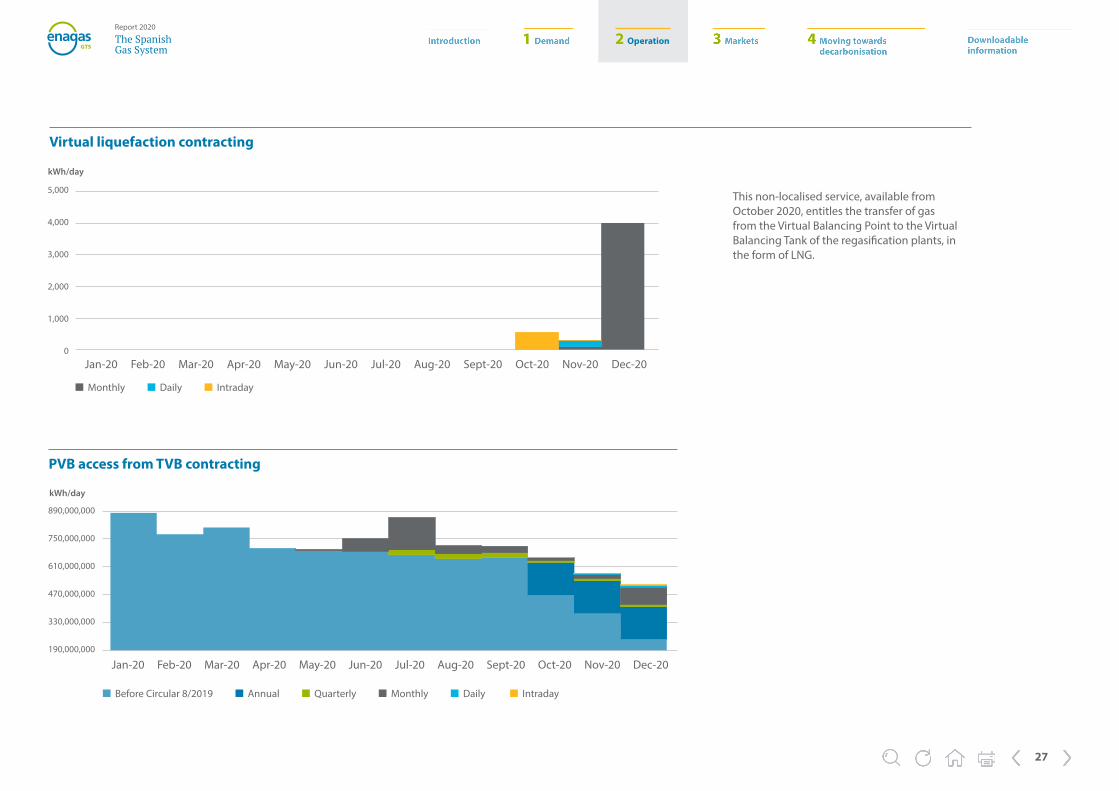
Virtual liquefaction contracting
5,000
4,000
3,000
2,000
1,000
0
Monthly Daily Intraday
PVB access from TVB contracting
This non-localised service, available from October 2020, entitles the transfer of gas from the Virtual Balancing Point to the Virtual Balancing Tank of the regasification plants, in the form of LNG.
Before Circular 8/2019 Annual Quarterly Monthly Daily Intraday
890,000,000
750,000,000
610,000,000
470,000,000
330,000,000
190,000,000
Jan-20 Feb-20 Mar-20 Apr-20 May-20 Jun-20 Jul-20 Aug-20 Sept-20 Oct-20 Nov-20 Dec-20
Jan-20 Feb-20 Mar-20 Apr-20 May-20 Jun-20 Jul-20 Aug-20 Sept-20 Oct-20 Nov-20 Dec-20
kWh/day
kWh/day
2 Operation
28
The SpanishGas System
Report 2020
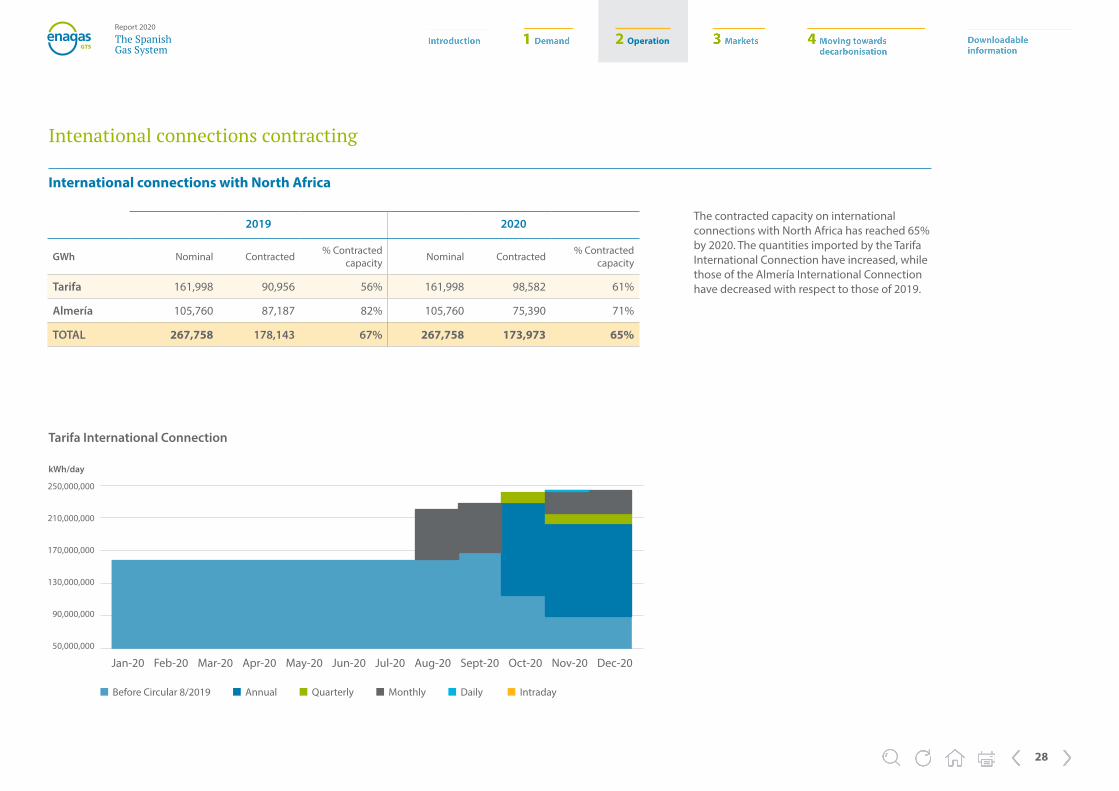
Intenational connections contracting
2019 2020
GWh Nominal Contracted % Contracted capacity Nominal Contracted % Contracted
capacity
Tarifa 161,998 90,956 56% 161,998 98,582 61%
Almería 105,760 87,187 82% 105,760 75,390 71%
TOTAL 267,758 178,143 67% 267,758 173,973 65%
The contracted capacity on international connections with North Africa has reached 65% by 2020. The quantities imported by the Tarifa International Connection have increased, while those of the Almería International Connection have decreased with respect to those of 2019.
International connections with North Africa
Tarifa International Connection
250,000,000
210,000,000
170,000,000
130,000,000
90,000,000
50,000,000
Jan-20 Feb-20 Mar-20 Apr-20 May-20 Jun-20 Jul-20 Aug-20 Sept-20 Oct-20 Nov-20 Dec-20
Before Circular 8/2019 Annual Quarterly Monthly Daily Intraday
kWh/day
2 Operation
29
The SpanishGas System
Report 2020
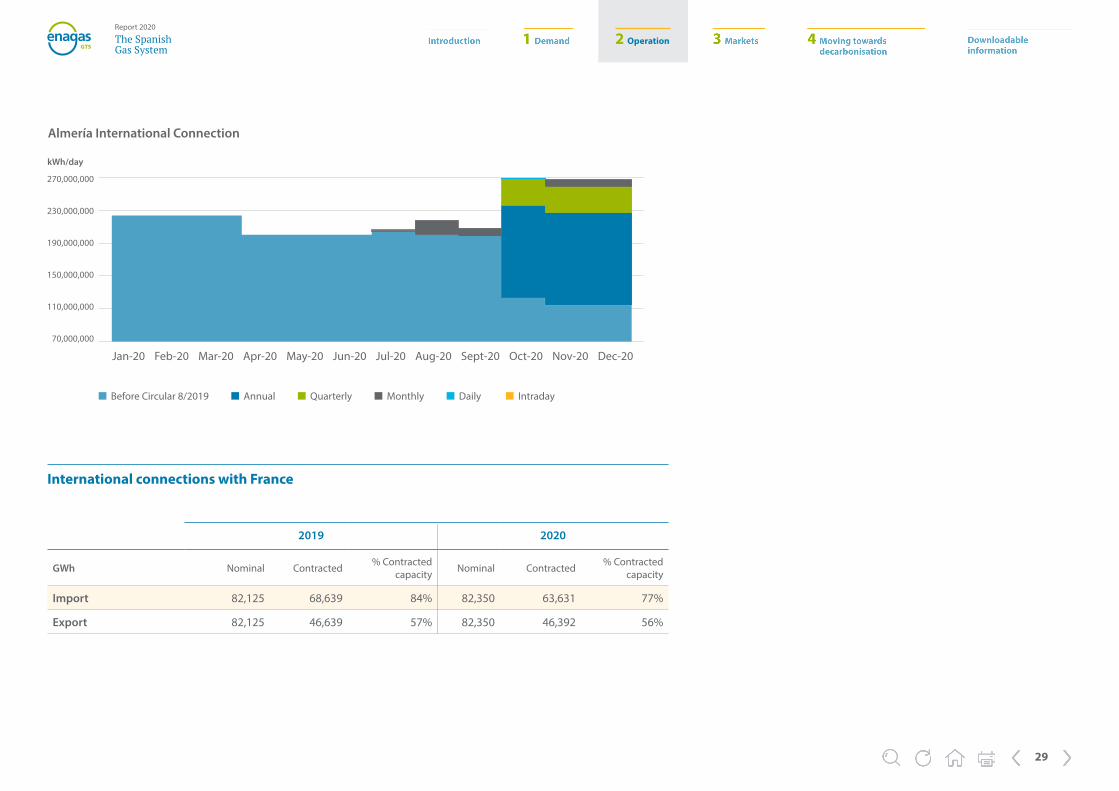
Almería International Connection
270,000,000
230,000,000
190,000,000
150,000,000
110,000,000
70,000,000
Before Circular 8/2019 Annual Quarterly Monthly Daily Intraday
International connections with France
Jan-20 Feb-20 Mar-20 Apr-20 May-20 Jun-20 Jul-20 Aug-20 Sept-20 Oct-20 Nov-20 Dec-20
2019 2020
GWh Nominal Contracted % Contracted capacity Nominal Contracted % Contracted
capacity
Import 82,125 68,639 84% 82,350 63,631 77%
Export 82,125 46,639 57% 82,350 46,392 56%
kWh/day
2 Operation
30
The SpanishGas System
Report 2020
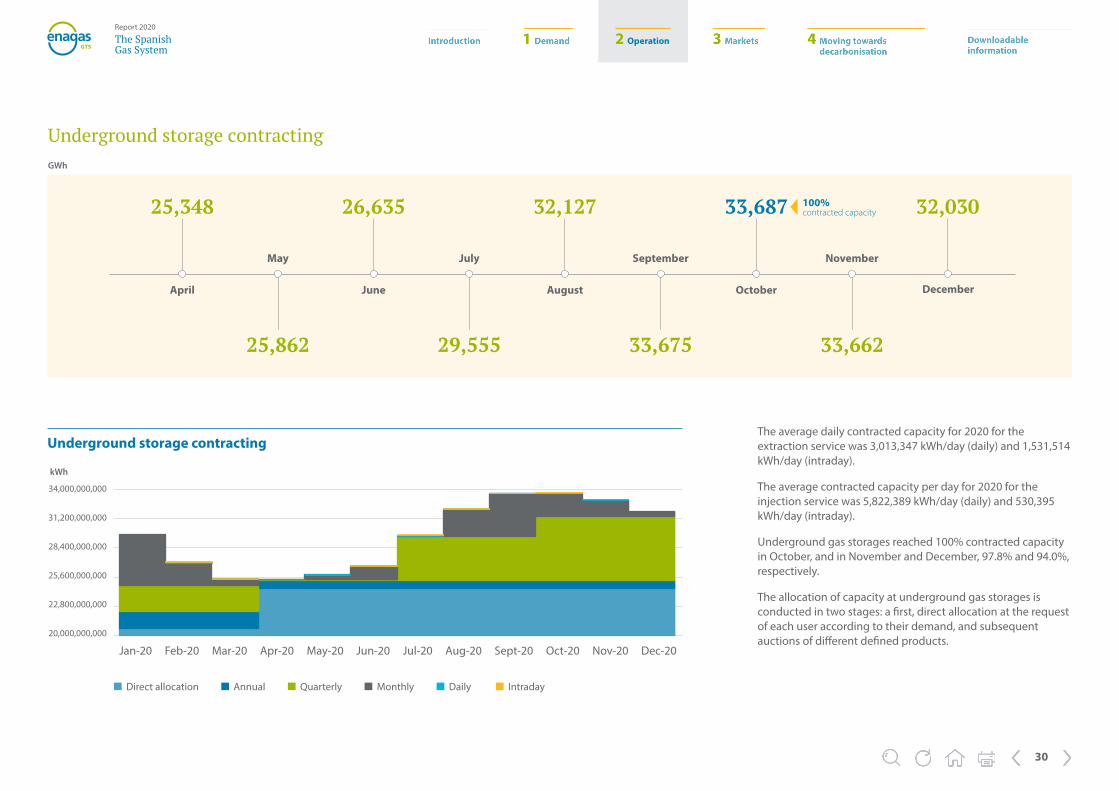
Underground storage contracting
34,000,000,000
31,200,000,000
28,400,000,000
25,600,000,000
22,800,000,000
20,000,000,000
Direct allocation Annual Quarterly Monthly Daily Intraday
32,03025,348
April
26,635
June
32,127
August
33,687
October
25,862
May
29,555
July
33,675
September
33,662
November
The average daily contracted capacity for 2020 for the extraction service was 3,013,347 kWh/day (daily) and 1,531,514 kWh/day (intraday).
The average contracted capacity per day for 2020 for the injection service was 5,822,389 kWh/day (daily) and 530,395 kWh/day (intraday).
Underground gas storages reached 100% contracted capacity in October, and in November and December, 97.8% and 94.0%, respectively.
The allocation of capacity at underground gas storages is conducted in two stages: a first, direct allocation at the request of each user according to their demand, and subsequent auctions of different defined products.
Jan-20 Feb-20 Mar-20 Apr-20 May-20 Jun-20 Jul-20 Aug-20 Sept-20 Oct-20 Nov-20 Dec-20
GWh
Underground storage contracting
kWh
December
100% contracted capacity
2 Operation
31
The SpanishGas System
Report 2020
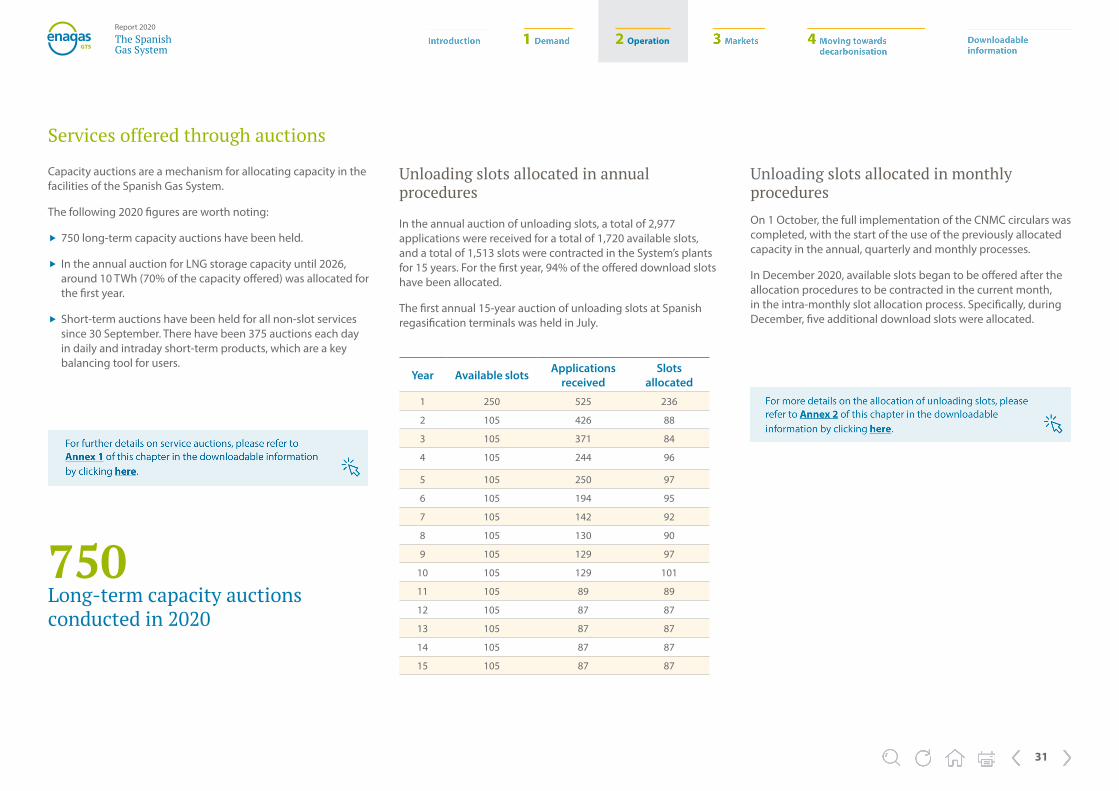
Services offered through auctions
Capacity auctions are a mechanism for allocating capacity in the facilities of the Spanish Gas System.
The following 2020 figures are worth noting:
� 750 long-term capacity auctions have been held.
� In the annual auction for LNG storage capacity until 2026, around 10 TWh (70% of the capacity offered) was allocated for the first year.
� Short-term auctions have been held for all non-slot services since 30 September. There have been 375 auctions each day in daily and intraday short-term products, which are a key balancing tool for users.
Unloading slots allocated in annual procedures
In the annual auction of unloading slots, a total of 2,977 applications were received for a total of 1,720 available slots, and a total of 1,513 slots were contracted in the System’s plants for 15 years. For the first year, 94% of the offered download slots have been allocated.
The first annual 15-year auction of unloading slots at Spanish regasification terminals was held in July.
Unloading slots allocated in monthly procedures
On 1 October, the full implementation of the CNMC circulars was completed, with the start of the use of the previously allocated capacity in the annual, quarterly and monthly processes.
In December 2020, available slots began to be offered after the allocation procedures to be contracted in the current month, in the intra-monthly slot allocation process. Specifically, during December, five additional download slots were allocated.
Year Available slots Applications received
Slots allocated
1 250 525 236
2 105 426 88
3 105 371 84
4 105 244 96
5 105 250 97
6 105 194 95
7 105 142 92
8 105 130 90
9 105 129 97
10 105 129 101
11 105 89 89
12 105 87 87
13 105 87 87
14 105 87 87
15 105 87 87
750 Long-term capacity auctions conducted in 2020

2 Operation
32
The SpanishGas System
Report 2020
The Spanish Gas System establishes a system of guarantees for users to meet their obligations to pay service contract toll invoices and imbalance surcharges in accordance with the provisions of the CNMC.
The calculation and management of guarantees in contracting and imbalance activities are carried out by the Technical Manager of the System and are notified to the affected user and to the Guarantees Manager.
Guarantees management process
The main regulatory references governing the operation of guarantees in the Spanish Gas System are the Guarantee Management Regulations and CNMC Circulars 8/2019, 2/2020 and 6/2020.
The Technical Manager of the System manages all guarantees related to imbalances in the different balancing areas and those related to all capacity contracting processes, both those carried out on the capacity request and contracting platform managed by the Technical Manager of the System and on the PRISMA platform.
In relation to guarantees for the contracting of capacity, prior to formalisation of contracts, users are required to have sufficient guarantees to meet the payment of the tolls for the same.
On the other hand, the management of guarantees for customers connected to distribution networks is carried out on a quarterly basis, due to the fact that the contracting processes in distribution networks are carried out on the distributors’ platforms. The aim of this process is to retain an amount of guarantees equivalent to last year’s operations in terms of contracted capacity and average consumption. However, the Technical Manager of the System carries out detailed work with distributors to try to guarantee as much as possible the payment of the tolls of the PVB exit service contracts to a consumer connected to a distribution network.
Guarantees in the Gas System
GTS integrated collateral management operation diagram
Management of economic amounts withheld at trading platforms and central counterparties
Management of requests for the
return of guarantees
Guarantees for imbalances
Guarantees for capacity contracting
Minimisation of economic
risk

2 Operation
33
The SpanishGas System
Report 2020
Risk management
One of the novelties established in Circular 2/2020 is related to economic risk management for imbalances.
In accordance with this circular, the risk level of all users with a balancing portfolio is quantified on a daily basis after the last renomination cycle has been completed.
This calculation takes into account the economic value of the pre-balancing, which includes the current gas day's transactions and the current and next gas day’s transfers and purchases, as well as all unbilled imbalancing surcharges and issued imbalancing surcharge invoices pending collection or payment. In other words, it is a question of having the creditor or debtor position of each user in relation to the payment obligations with respect to the imbalances, significantly reducing the risk of non-payment of imbalance surcharge invoices.
Summation procedure for the calculation of the daily calculated risk level
Rd RTVBd
Prebalancing TVB Negative unbilled surcharges in PVB, AVB and TVB
Imbalancing tariff of TVB purchase
Positive unbilled surcharges in PVB, AVB and TVB
Daily toll for liquefaction service
Invoices not paid by the user in debtor positions
Invoices not collected by the user credit positions
Minimum guarantees €100,000
Minimum value €0
RPVBd
Prebalancing PVB
PVB purchase imbalancing tariff
Minimum value €0
=
x
RAVBd
Prebalancing AVB
Imbalancing tariff of AVB purchase
Daily tolls for PVB exit and
injecting services
Minimum value €0
=
x
+
=
x
+
=
-
+
-
= + + + ∑𝒏
CDjj=1
2 Operation
34
The SpanishGas System
Report 2020
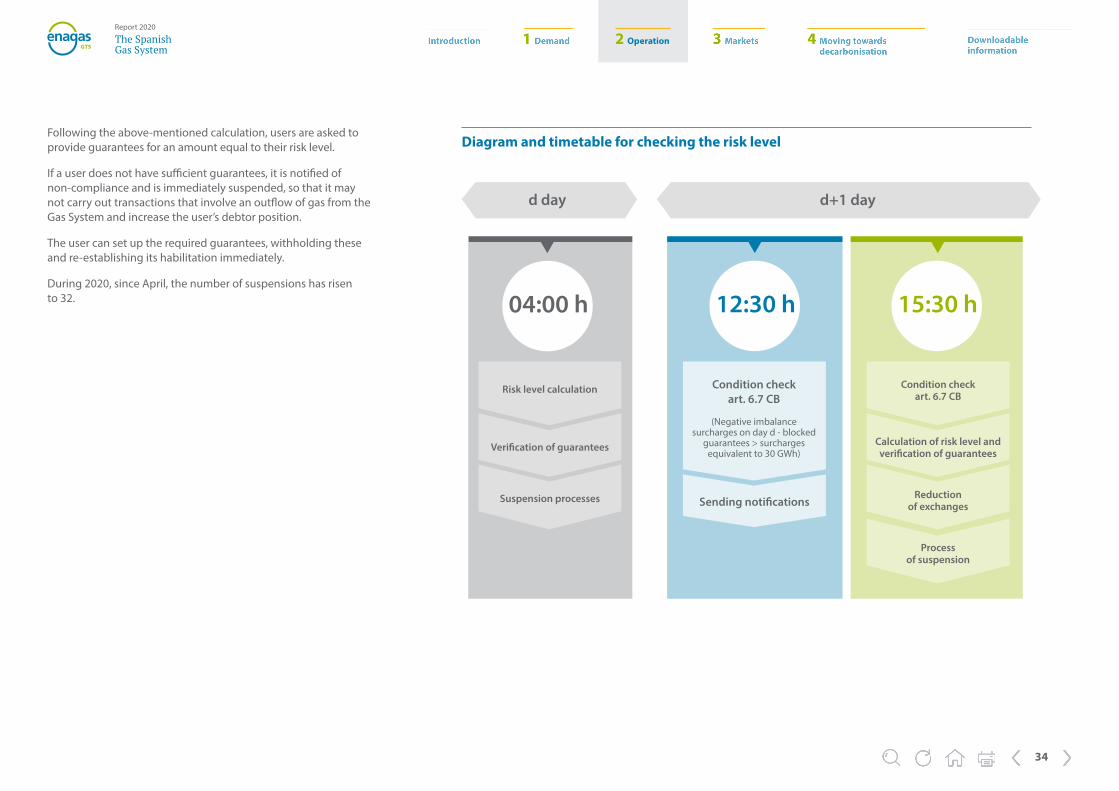
Following the above-mentioned calculation, users are asked to provide guarantees for an amount equal to their risk level.
If a user does not have sufficient guarantees, it is notified of non-compliance and is immediately suspended, so that it may not carry out transactions that involve an outflow of gas from the Gas System and increase the user’s debtor position.
The user can set up the required guarantees, withholding these and re-establishing its habilitation immediately.
During 2020, since April, the number of suspensions has risen to 32.
Diagram and timetable for checking the risk level
04:00 h
Risk level calculation
Verification of guarantees
Suspension processes
12:30 h
Condition check art. 6.7 CB
(Negative imbalance surcharges on day d - blocked
guarantees > surcharges equivalent to 30 GWh)
Sending notifications
15:30 h
d day d+1 day
Condition check art. 6.7 CB
Calculation of risk level and verification of guarantees
Reduction of exchanges
Process of suspension

2 Operation
35
The SpanishGas System
Report 2020
1997 2002 20091998 2003 2010 20141999 2004 2011 2015 20182000 20072005 2012 2016 20192001 20082006 2013 2017 2020
100%
75%
50%
25%
0%
Supplies evolution
49% 44%42%50% 56% 59% 63% 64% 65% 69% 68% 72% 74% 76%
66%60%
40%54% 56% 58%58%
53%43% 37%
57%
46% 44% 42%42% 47%57% 63%
43%
51% 56%58%50%
44% 41% 37% 36% 35% 31% 32% 28% 26% 24%34%
In 2020, natural gas supplies reached 365,569 GWh.
For the second time in seven years, supplies in the form of liquefied natural gas (LNG) have exceeded those of natural gas (NG). The entry of LNG has accounted for 63% of the gas supply for the Spanish Gas System. In 2020, LNG was received from 13 different sources, mostly from the USA, Nigeria, Russia and Qatar.
LNG offloaded in 2020 has registered an increase of 6% over 2019. Two terminals, Cartagena and Mugardos, have experienced an increase in the number of unloadings, while the rest have decreased in unloaded volume.
NG and LNG supplies
Input to the Spanish Gas System
Inflows in the form of NG amounted to 136,834 GWh, 23% less than the previous year.
LNG supply, meanwhile, reached 228,735 GWh. The plants in which the greatest growth in gas unloaded was recorded were those of Cartagena and Mugardos.
In the form of LNG In the form of NG
Input March 2011 MEDGAZ
2 Operation
36
The SpanishGas System
Report 2020
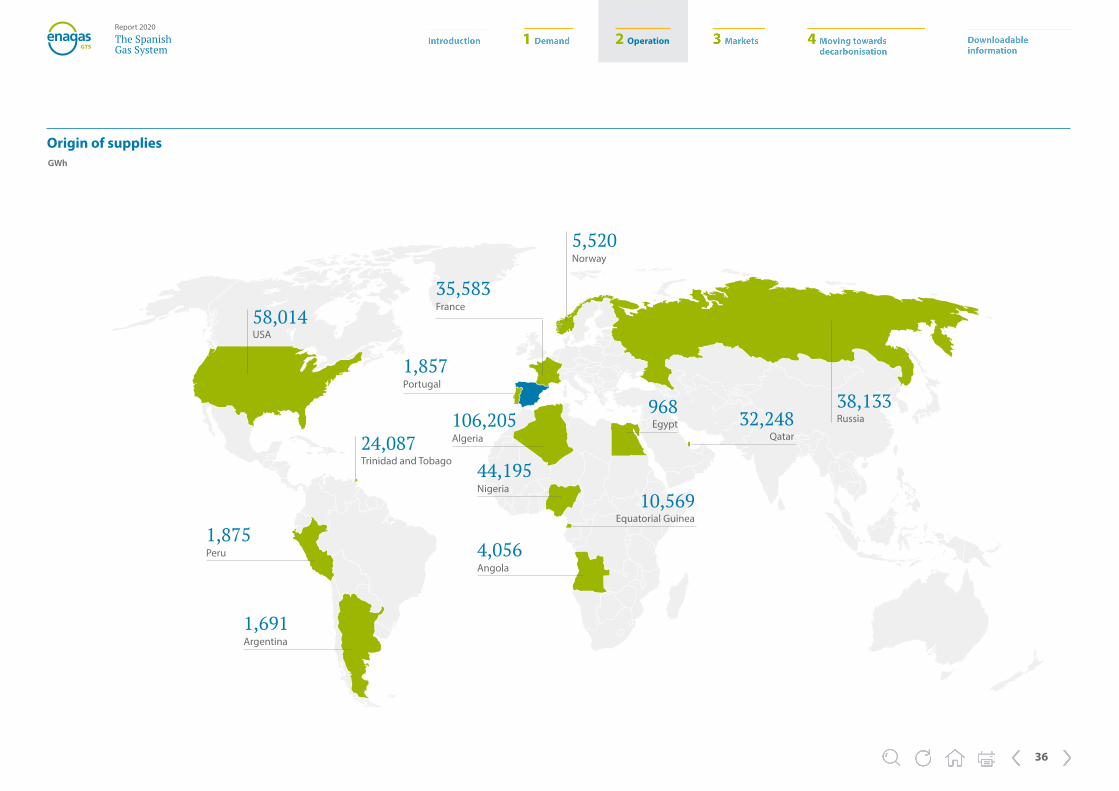
Origin of suppliesGWh
106,205Algeria
35,583France
5,520Norway
1,875Peru
1,691Argentina
44,195Nigeria
4,056Angola
968Egypt 32,248
Qatar
10,569Equatorial Guinea
24,087Trinidad and Tobago
38,133Russia
58,014USA
1,857Portugal

2 Operation
37
The SpanishGas System
Report 2020
Percentage of diversification of procurement
In the supply portfolio, Algeria continued to be the traditional supplier to the Spanish Gas System, accounting for practically 29% of supplies in 2020, followed by the USA, with 16%.
14 Countries that have supplied natural gas to the System in 2020
40%
30%
20%
10%
0%
2019 2020
32.99%
1.51%1.76%
6.59%7.49%
0.51%1.19%
8.82%11.66%
12.09%11.43%
29.05%
0.73%1.11%
11.73%
0.51%0.46%
0.00%0.25%
15.87%
11.00%
0.46%
9.73%
0.26%
10.43%8.49%
0.23%2.89%
0.16%0.35%0.00%
0.00% 0.00%0.00%
0.00%0.00%
0.23%
0.00%
Algeria Nigeria Qatar Peru T&T Norway Angola USA Belgium Portugal National Egypt France Argentina Netherlands Russia Dominican Republic
Cameroon Guinea
2 Operation
38
The SpanishGas System
Report 2020
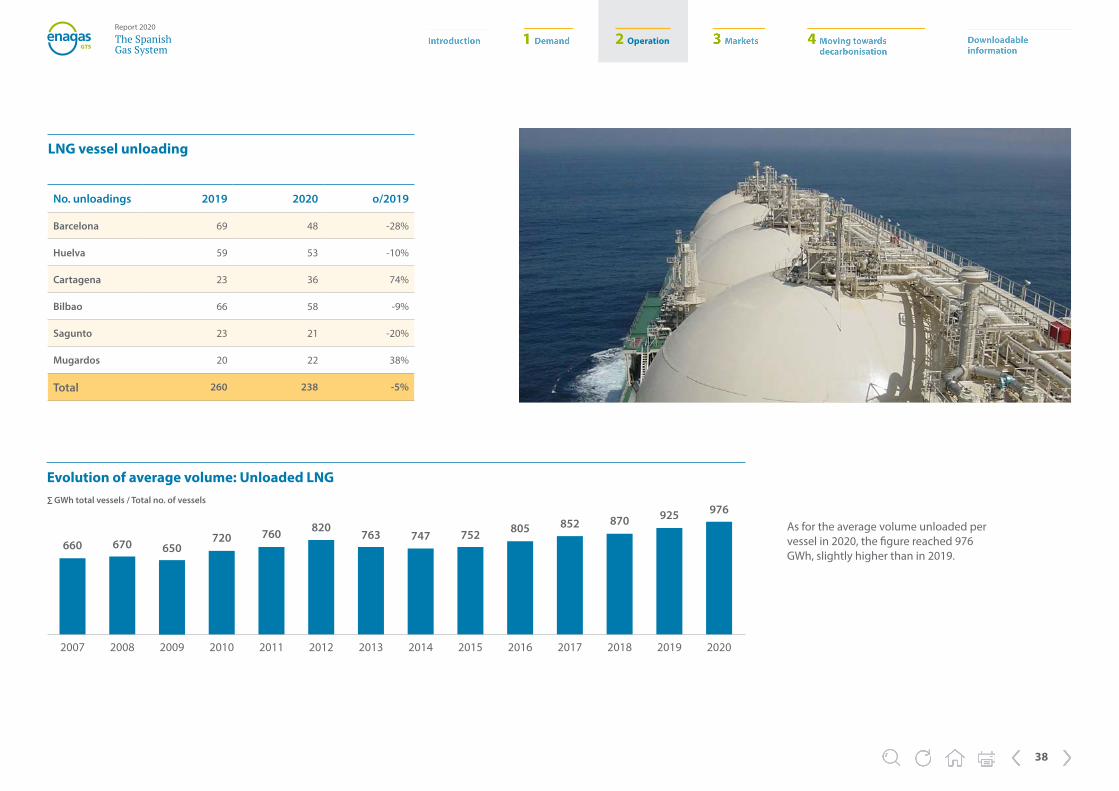
LNG vessel unloading
No. unloadings 2019 2020 o/2019
Barcelona 69 48 -28%
Huelva 59 53 -10%
Cartagena 23 36 74%
Bilbao 66 58 -9%
Sagunto 23 21 -20%
Mugardos 20 22 38%
Total 260 238 -5%
Evolution of average volume: Unloaded LNG
2007
660
2008
670
2009
650
2010
720
2011
760
2012
820
2013
763
2014
747
2015
752
2016
805
2017
852
2018
870
2019
925
2020
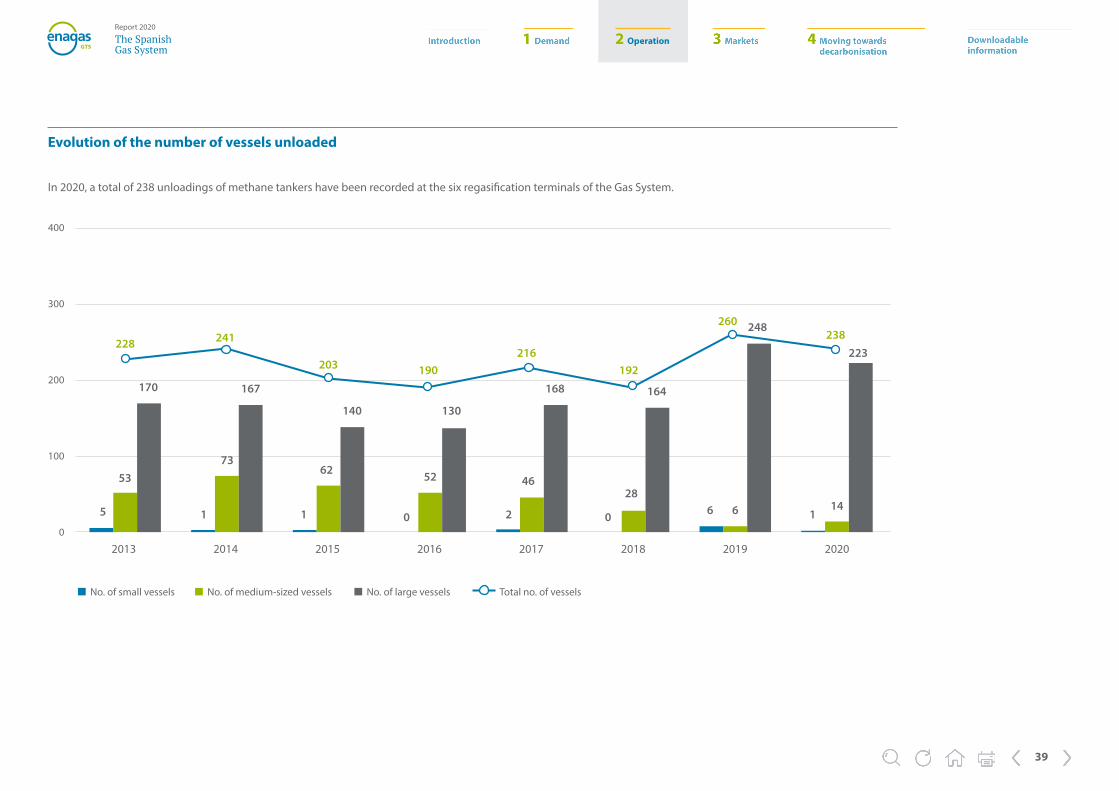
976As for the average volume unloaded per vessel in 2020, the figure reached 976 GWh, slightly higher than in 2019.
∑ GWh total vessels / Total no. of vessels
2 Operation
39
The SpanishGas System
Report 2020
Evolution of the number of vessels unloaded
400
300
200
100
0
No. of small vessels No. of medium-sized vessels No. of large vessels Total no. of vessels
In 2020, a total of 238 unloadings of methane tankers have been recorded at the six regasification terminals of the Gas System.
2014 2015 20182016 20192013 2017 2020
260
7362 52 46
28146 65 1 11 0 2 0
53
170 167 168 164
248
223238
192216
190203
241228
140 130
2 Operation
40
The SpanishGas System
Report 2020
Unloading by origins and regasification plants
No. of unloadings in 2020
TOTAL
Average size
unloaded (GWh)
Barcelona 2 4 - 9 2 - 18 4 - 2 3 - 1 3 48 957
Huelva 3 21 - 19 3 1 2 1 - 1 1 - - 1 53 945
Cartagena 2 6 - 16 - - 5 3 1 - 1 1 - 1 36 995
Bilbao - 6 - 11 1 1 - 13 1 1 20 - - 4 58 1,014
Sagunto 2 8 - 4 - - 5 1 - - 1 - - - 21 956
Mugardos - 2 - 3 - - - 6 - - 10 - - 1 22 983
TOTAL 9 47 - 62 6 2 30 28 2 4 36 1 1 10 238 976
Average size unloaded (GWh)
658 932 - 967 920 938 1,128 894 902 1,014 1,088 968 843 961 976
Alg
eria
Nig
eria
Belg
ium
USA
Nor
way
Peru
Qat
ar
T&T
Fran
ce
Ang
ola
Russ
ia
Egyp
t
Arg
entin
a
Gui
nea
Gas movements at NG connections
2019 2020
GWh Balance Inputs Outputs Balance Inputs Outputs
IC North African 126,264 126,264 - 100,644 100,644 -
VIP Pyrenees 44,707 49,196 4,489 28,080 33,767 5,687
VIP Iberia -5,324 1,929 7,254 -4,460 1,857 6,317
National 1,455 1,455 - 616 616 -
Total 167,101 178,844 11,743 124,880 136,884 12,004
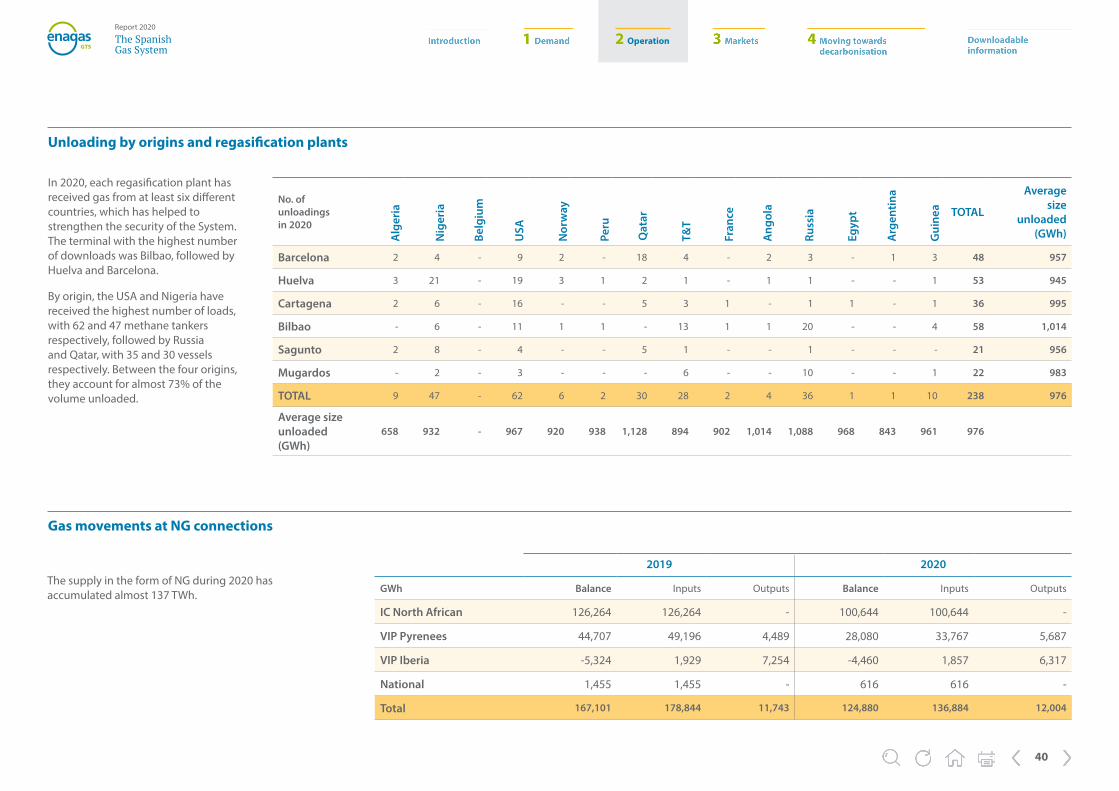
In 2020, each regasification plant has received gas from at least six different countries, which has helped to strengthen the security of the System. The terminal with the highest number of downloads was Bilbao, followed by Huelva and Barcelona.
By origin, the USA and Nigeria have received the highest number of loads, with 62 and 47 methane tankers respectively, followed by Russia and Qatar, with 35 and 30 vessels respectively. Between the four origins, they account for almost 73% of the volume unloaded.
The supply in the form of NG during 2020 has accumulated almost 137 TWh.
2 Operation
41
The SpanishGas System
Report 2020
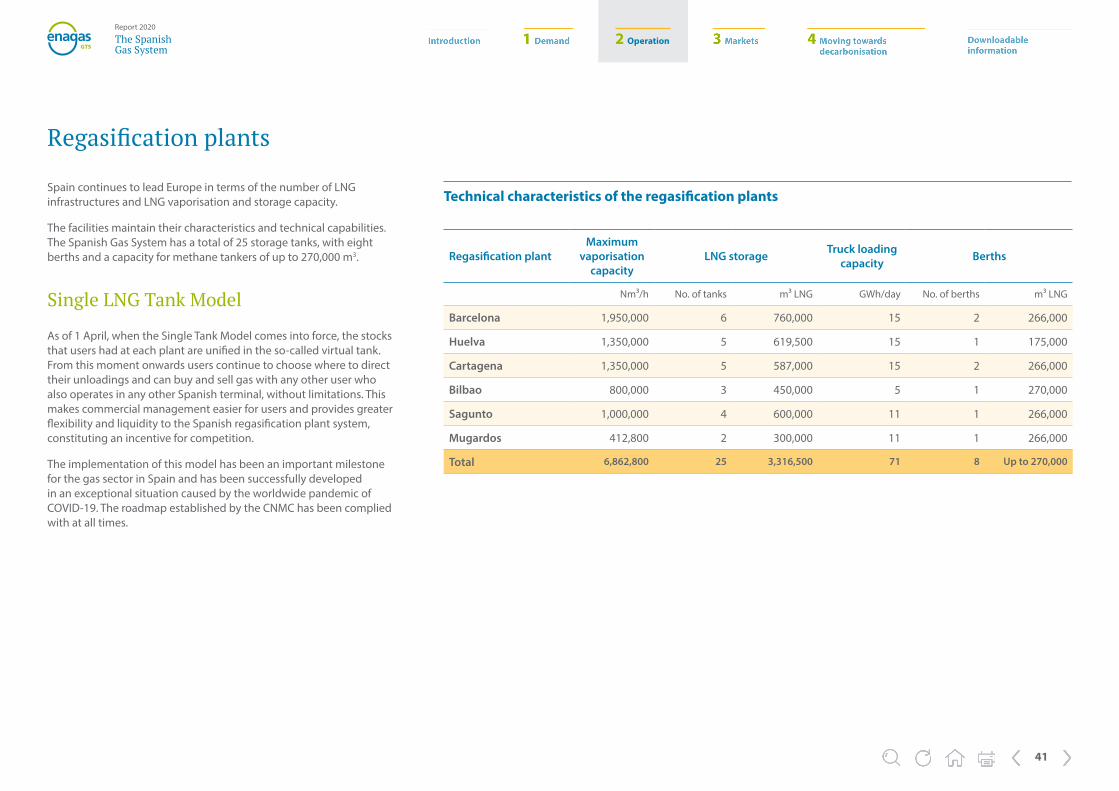
Spain continues to lead Europe in terms of the number of LNG infrastructures and LNG vaporisation and storage capacity.
The facilities maintain their characteristics and technical capabilities. The Spanish Gas System has a total of 25 storage tanks, with eight berths and a capacity for methane tankers of up to 270,000 m3.
Single LNG Tank Model
As of 1 April, when the Single Tank Model comes into force, the stocks that users had at each plant are unified in the so-called virtual tank. From this moment onwards users continue to choose where to direct their unloadings and can buy and sell gas with any other user who also operates in any other Spanish terminal, without limitations. This makes commercial management easier for users and provides greater flexibility and liquidity to the Spanish regasification plant system, constituting an incentive for competition.
The implementation of this model has been an important milestone for the gas sector in Spain and has been successfully developed in an exceptional situation caused by the worldwide pandemic of COVID-19. The roadmap established by the CNMC has been complied with at all times.
Regasification plants
Technical characteristics of the regasification plants
Regasification plantMaximum
vaporisation capacity
LNG storage Truck loading capacity Berths
Nm³/h No. of tanks m³ LNG GWh/day No. of berths m³ LNG
Barcelona 1,950,000 6 760,000 15 2 266,000
Huelva 1,350,000 5 619,500 15 1 175,000
Cartagena 1,350,000 5 587,000 15 2 266,000
Bilbao 800,000 3 450,000 5 1 270,000
Sagunto 1,000,000 4 600,000 11 1 266,000
Mugardos 412,800 2 300,000 11 1 266,000
Total 6,862,800 25 3,316,500 71 8 Up to 270,000
2 Operation
42
The SpanishGas System
Report 2020
Regasification evolution between 2019 and 2020
Regasification evolution
84.4%
Barcelona Huelva Cartagena Bilbao Sagunto Mugardos
70,000
60,000
50,000
40,000
30,000
20,000
10,000
0 -26.9%-10.8%
60.3%
-16.5%-7.8%
Tank truck loading evolution
Barcelona Huelva Cartagena Bilbao Sagunto Mugardos
3,500
3,000
2,500
2,000
1,500
1,000
500
0
2019 2020 Δ o/2019
3.0% 0.3%
59.3%
-2.8%-5.3%2.1%
Production at regasification plants
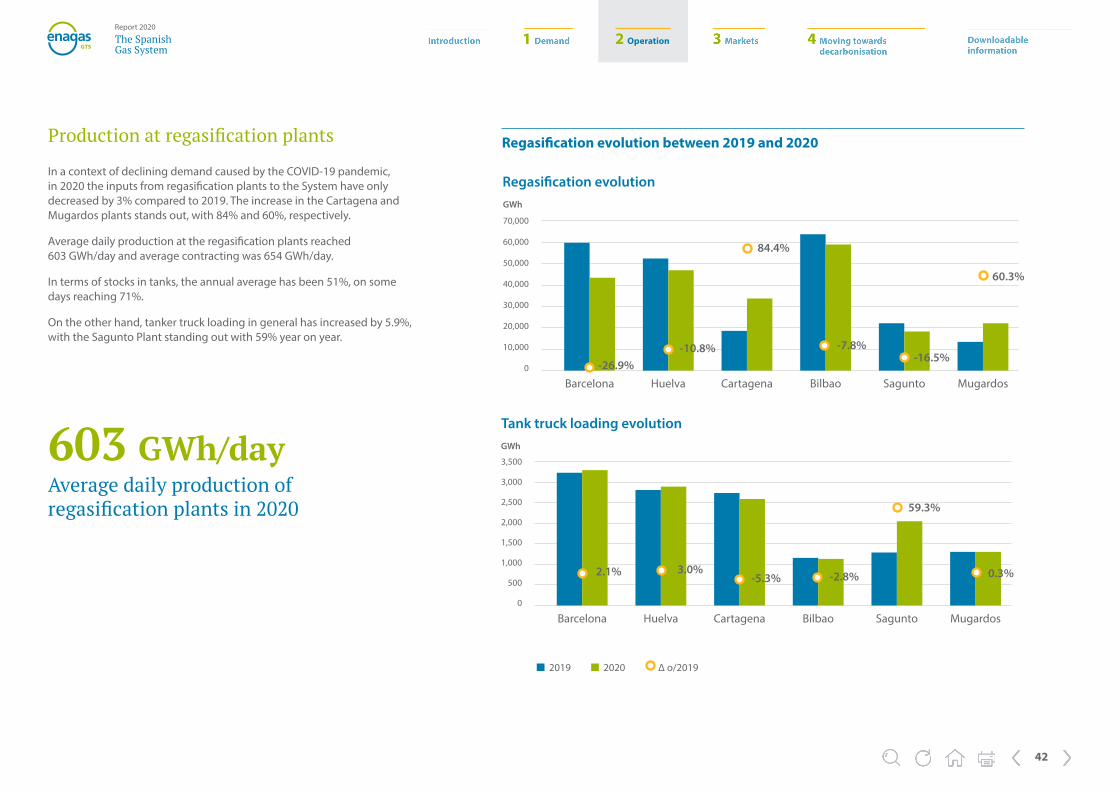
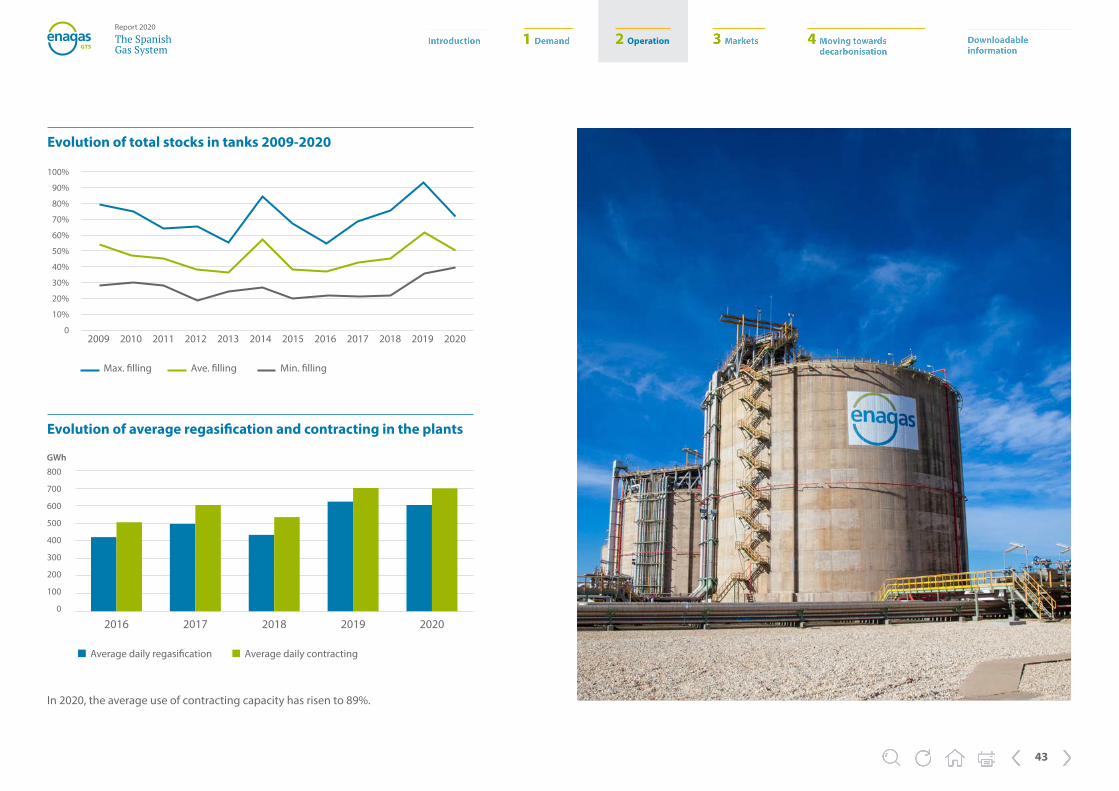
In a context of declining demand caused by the COVID-19 pandemic, in 2020 the inputs from regasification plants to the System have only decreased by 3% compared to 2019. The increase in the Cartagena and Mugardos plants stands out, with 84% and 60%, respectively.
Average daily production at the regasification plants reached 603 GWh/day and average contracting was 654 GWh/day.
In terms of stocks in tanks, the annual average has been 51%, on some days reaching 71%.
On the other hand, tanker truck loading in general has increased by 5.9%, with the Sagunto Plant standing out with 59% year on year.
GWh
GWh603 GWh/dayAverage daily production of regasification plants in 2020
2 Operation
43
The SpanishGas System
Report 2020
Evolution of total stocks in tanks 2009-2020
2009 2010 20142011 2015 20182012 2016 20192013 2017 2020
Evolution of average regasification and contracting in the plants
2016 2017 2018 2019 2020
800
700
600
500
400
300
200
100
0
100%
90%
80%
70%
60%
50%
40%
30%
20%
10%
0
Average daily regasification Average daily contracting
Max. filling Ave. filling Min. filling
In 2020, the average use of contracting capacity has risen to 89%.
GWh
2 Operation
44
The SpanishGas System
Report 2020
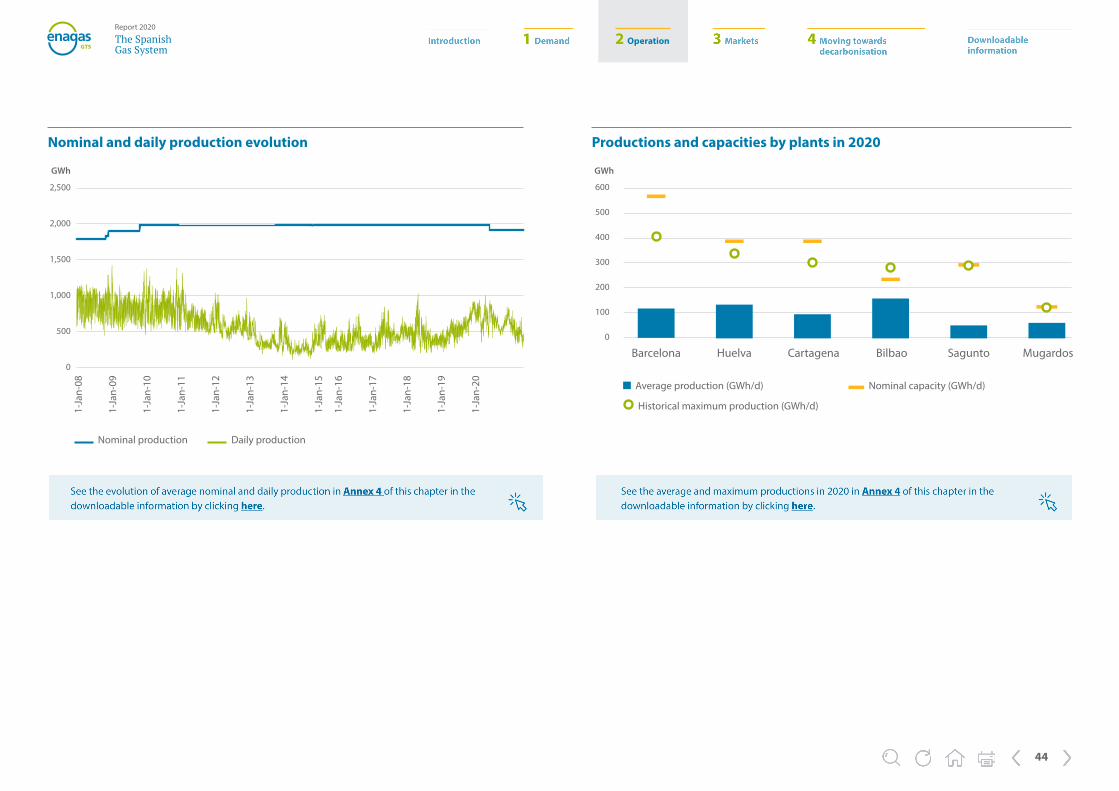
Productions and capacities by plants in 2020
600
500
400
300
200
100
0
Average production (GWh/d)
Historical maximum production (GWh/d)
Nominal capacity (GWh/d)
Barcelona Huelva Cartagena Bilbao Sagunto Mugardos
1-Ja
n-08
1-Ja
n-09
1-Ja
n-10
1-Ja
n-11
1-Ja
n-12
1-Ja
n-13
1-Ja
n-14
1-Ja
n-15
1-Ja
n-16
1-Ja
n-17
1-Ja
n-18
1-Ja
n-19
1-Ja
n-20
2,500
2,000
1,500
1,000
500
0
Nominal production Daily production
Nominal and daily production evolution
GWh GWh
2 Operation
45
The SpanishGas System
Report 2020
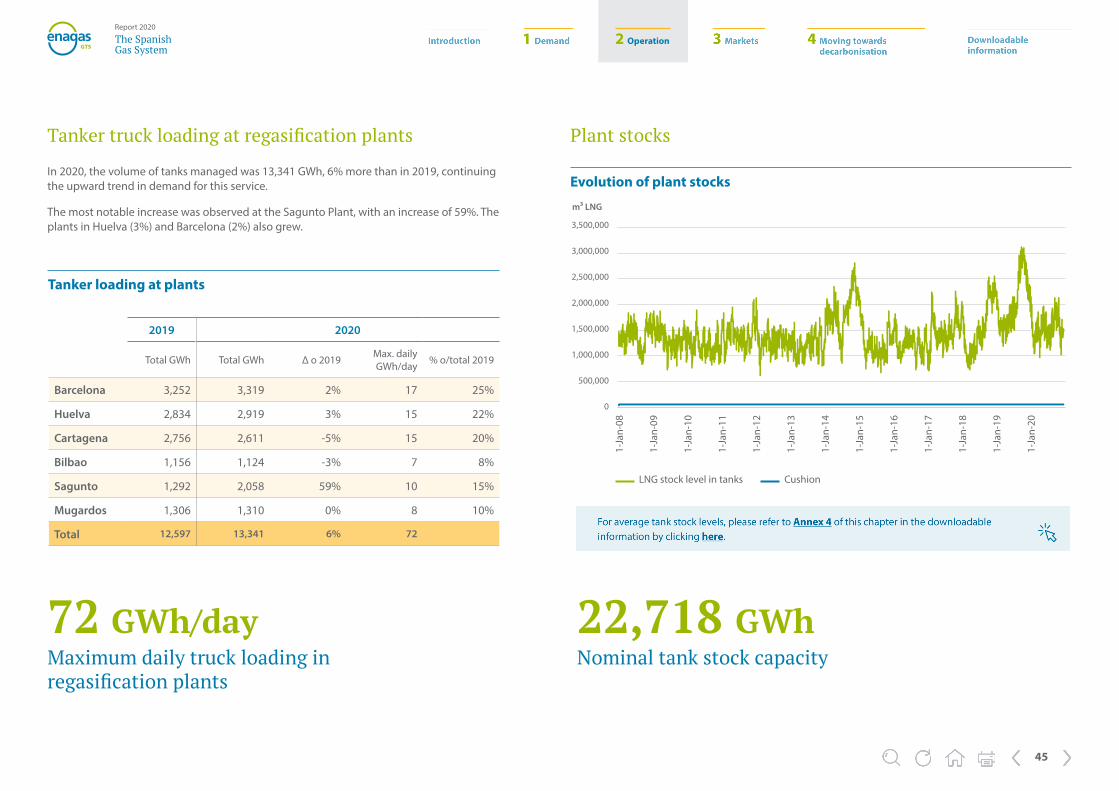
Tanker loading at plants
2019 2020
Total GWh Total GWh Δ o 2019 Max. daily GWh/day % o/total 2019
Barcelona 3,252 3,319 2% 17 25%
Huelva 2,834 2,919 3% 15 22%
Cartagena 2,756 2,611 -5% 15 20%
Bilbao 1,156 1,124 -3% 7 8%
Sagunto 1,292 2,058 59% 10 15%
Mugardos 1,306 1,310 0% 8 10%
Total 12,597 13,341 6% 72
Tanker truck loading at regasification plants
In 2020, the volume of tanks managed was 13,341 GWh, 6% more than in 2019, continuing the upward trend in demand for this service.
The most notable increase was observed at the Sagunto Plant, with an increase of 59%. The plants in Huelva (3%) and Barcelona (2%) also grew.
72 GWh/dayMaximum daily truck loading in regasification plants
Plant stocks
Evolution of plant stocks
1-Ja
n-08
1-Ja
n-09
1-Ja
n-10
1-Ja
n-11
1-Ja
n-12
1-Ja
n-13
1-Ja
n-14
1-Ja
n-15
1-Ja
n-16
1-Ja
n-17
1-Ja
n-18
1-Ja
n-19
1-Ja
n-20
3,500,000
3,000,000
2,500,000
2,000,000
1,500,000
1,000,000
500,000
0
LNG stock level in tanks Cushion
22,718 GWhNominal tank stock capacity
m³ LNG
2 Operation
46
The SpanishGas System
Report 2020
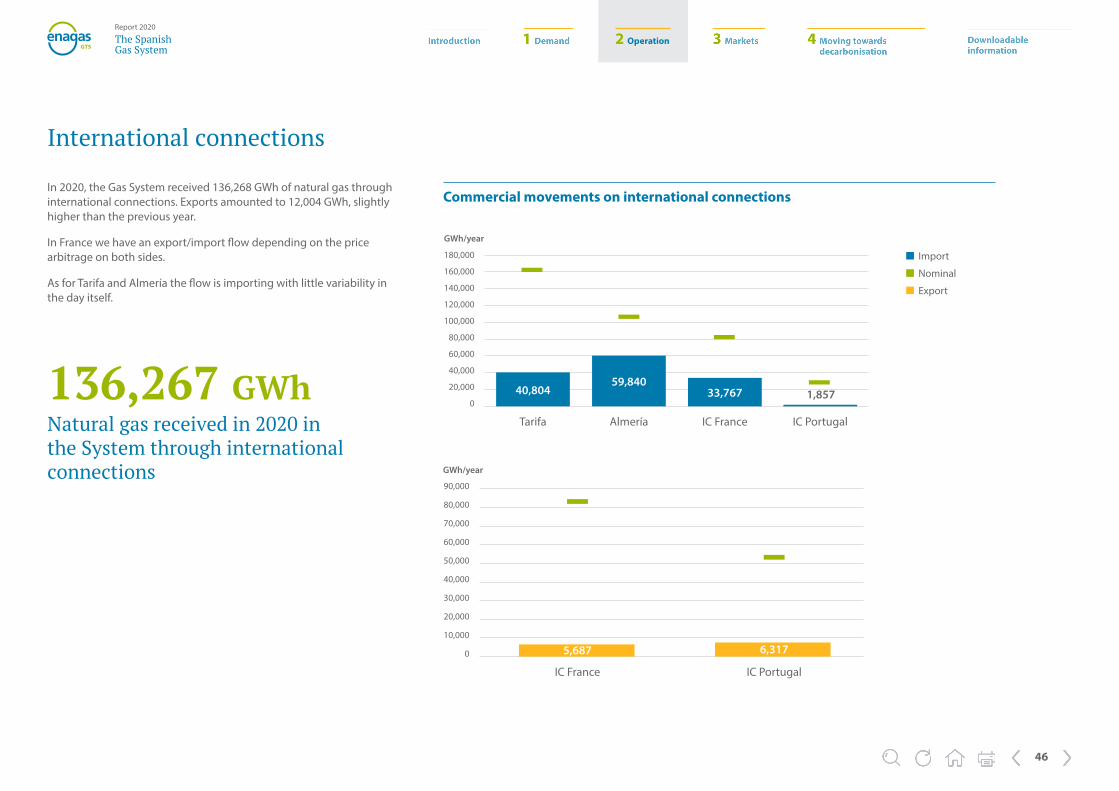
In 2020, the Gas System received 136,268 GWh of natural gas through international connections. Exports amounted to 12,004 GWh, slightly higher than the previous year.
In France we have an export/import flow depending on the price arbitrage on both sides.
As for Tarifa and Almería the flow is importing with little variability in the day itself.
International connections
136,267 GWh Natural gas received in 2020 in the System through international connections
Commercial movements on international connections
180,000
160,000
140,000
120,000
100,000
80,000
60,000
40,000
20,000
0
Tarifa Almería IC France IC Portugal
1,85733,76740,80459,840
Import
Nominal
Export
GWh/year
90,000
80,000
70,000
60,000
50,000
40,000
30,000
20,000
10,000
0
IC France IC Portugal
5,687 6,317
GWh/year
2 Operation
47
The SpanishGas System
Report 2020
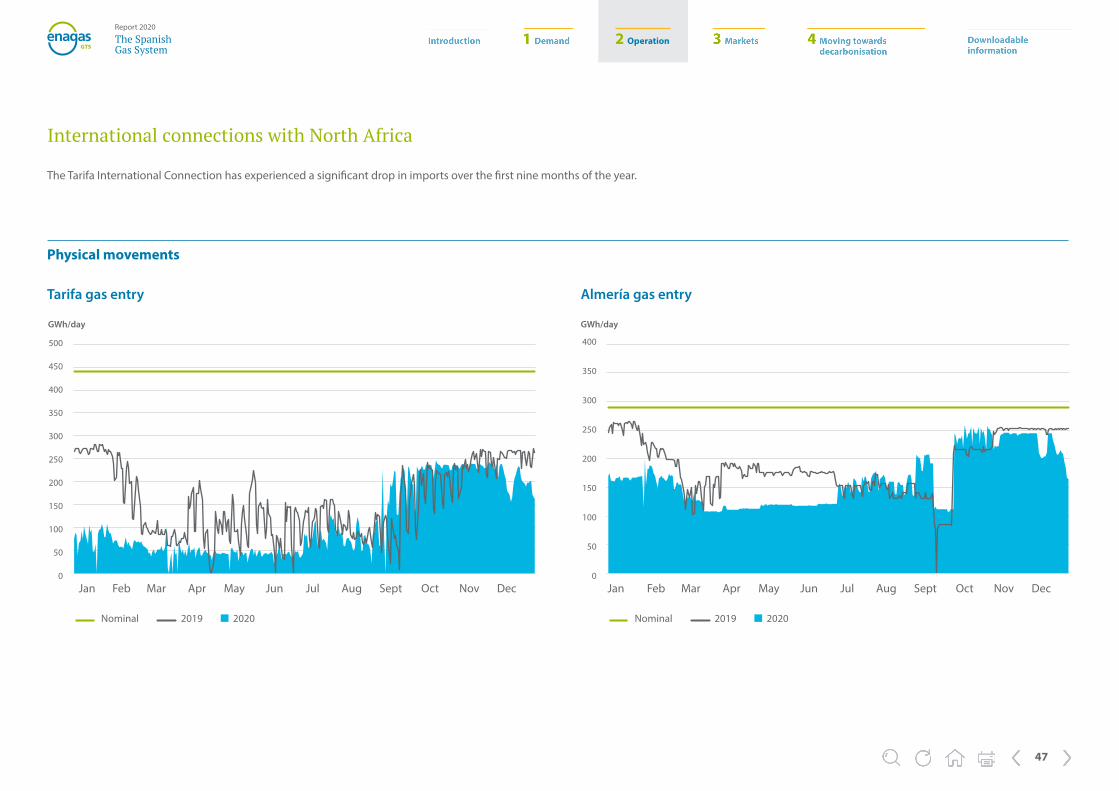
International connections with North Africa
Tarifa gas entry Almería gas entry
500
450
400
350
300
250
200
150
100
50
0
400
350
300
250
200
150
100
50
0Jan JanFeb FebMar MarApr AprMay MayJun JunJul JulAug AugSept SeptOct OctNov NovDec Dec
Nominal 2019 2020 Nominal 2019 2020
Physical movements
GWh/day GWh/day
The Tarifa International Connection has experienced a significant drop in imports over the first nine months of the year.
2 Operation
48
The SpanishGas System
Report 2020
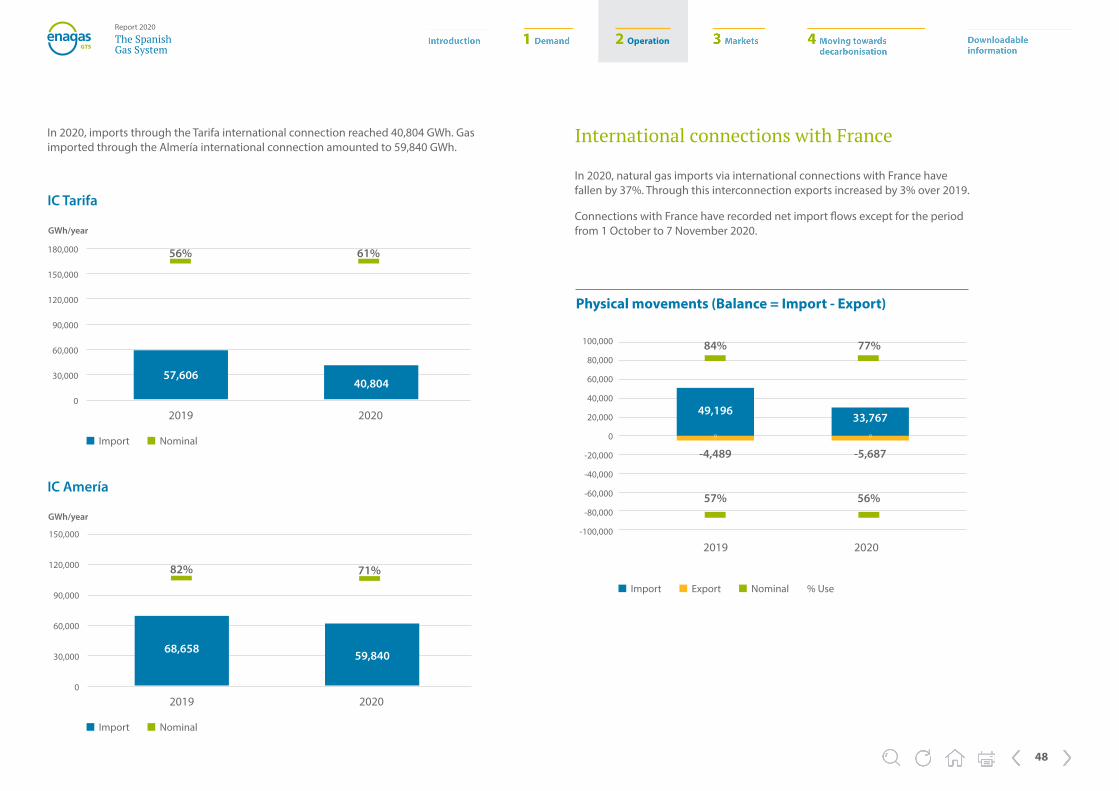
In 2020, imports through the Tarifa international connection reached 40,804 GWh. Gas imported through the Almería international connection amounted to 59,840 GWh.
IC Tarifa
Import Nominal
180,000
150,000
120,000
90,000
60,000
30,000
0
20202019
40,80457,606
GWh/year
IC Amería
Import Nominal
150,000
120,000
90,000
60,000
30,000
0
20202019
59,84068,658
GWh/year
International connections with France
Physical movements (Balance = Import - Export)
Import Export Nominal % Use
100,000
80,000
60,000
40,000
20,000
0
-20,000
-40,000
-60,000
-80,000
-100,000
20202019
49,196
57%
-4,489 -5,687
84% 77%
56%
33,767
In 2020, natural gas imports via international connections with France have fallen by 37%. Through this interconnection exports increased by 3% over 2019.
Connections with France have recorded net import flows except for the period from 1 October to 7 November 2020.
71%82%
61%56%
2 Operation
49
The SpanishGas System
Report 2020
Commercial movements
Import Export Nominal % Use
100,000
80,000
60,000
40,000
20,000
0
-20,000
-40,000
-60,000
-80,000
-100,000
20202019
69%
-7,254 -6,317
9.0% 11%
67%
1,8571,933
International connections with Portugal
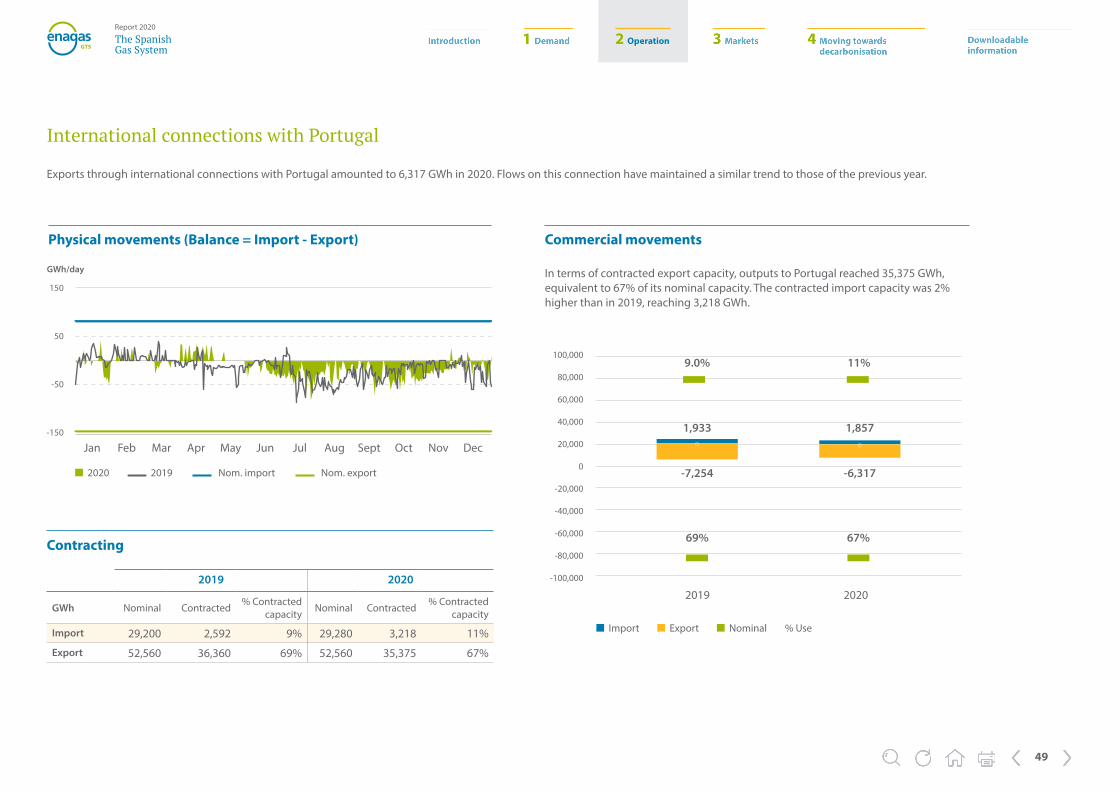
Exports through international connections with Portugal amounted to 6,317 GWh in 2020. Flows on this connection have maintained a similar trend to those of the previous year.
Physical movements (Balance = Import - Export)
In terms of contracted export capacity, outputs to Portugal reached 35,375 GWh, equivalent to 67% of its nominal capacity. The contracted import capacity was 2% higher than in 2019, reaching 3,218 GWh.
Contracting
150
50
-50
-150
Jan Feb Mar Apr May Jun Jul Aug Sept Oct Nov Dec
2020 2019 Nom. import Nom. export
GWh/day
2019 2020
GWh Nominal Contracted % Contracted capacity Nominal Contracted % Contracted
capacity
Import 29,200 2,592 9% 29,280 3,218 11%
Export 52,560 36,360 69% 52,560 35,375 67%
2 Operation
50
The SpanishGas System
Report 2020
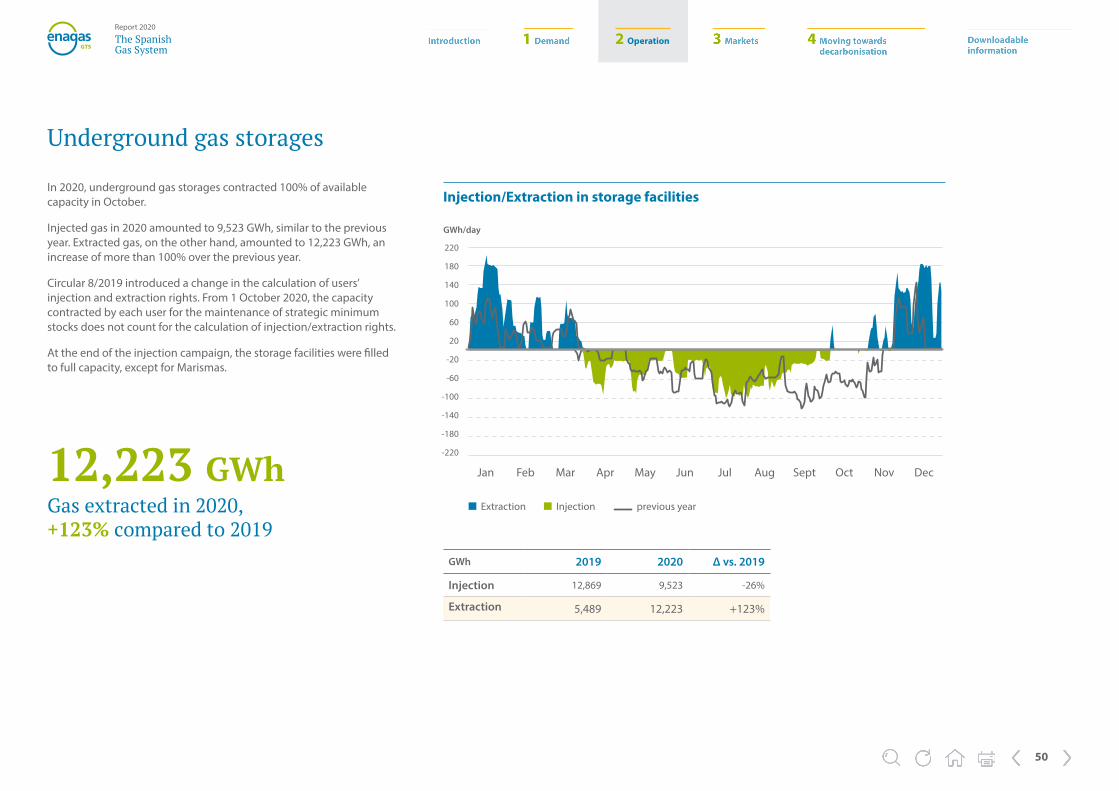
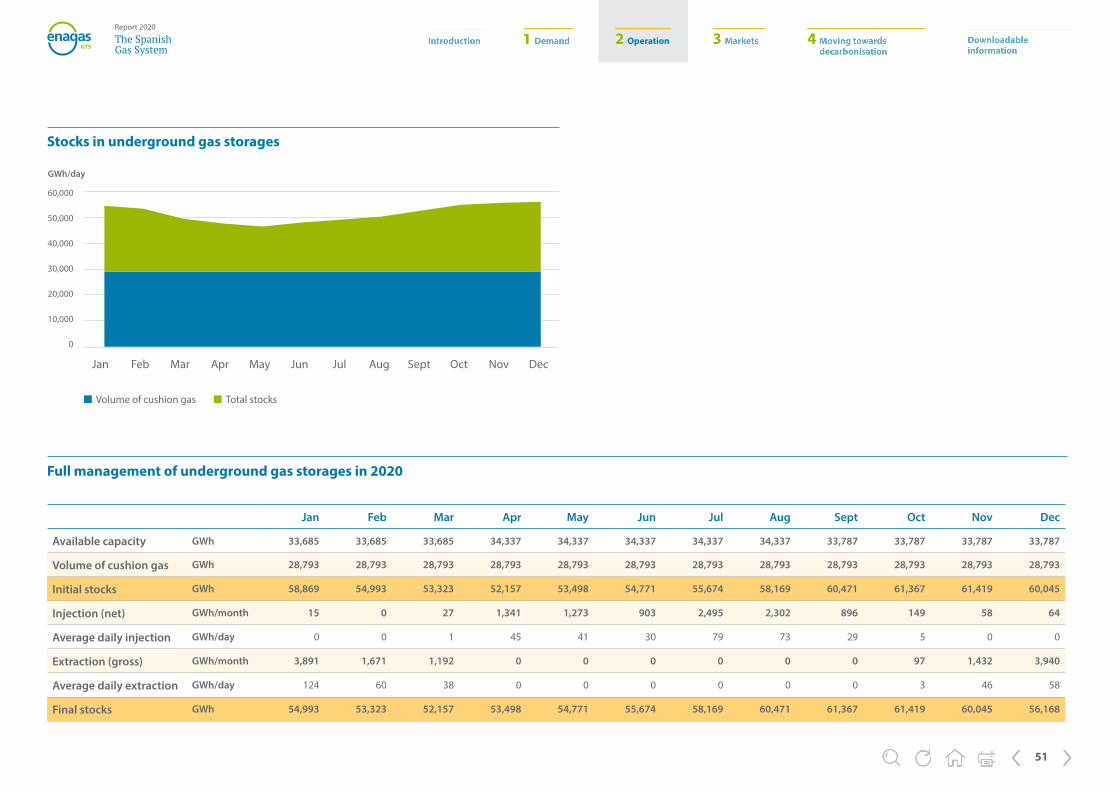
In 2020, underground gas storages contracted 100% of available capacity in October.
Injected gas in 2020 amounted to 9,523 GWh, similar to the previous year. Extracted gas, on the other hand, amounted to 12,223 GWh, an increase of more than 100% over the previous year.
Circular 8/2019 introduced a change in the calculation of users’ injection and extraction rights. From 1 October 2020, the capacity contracted by each user for the maintenance of strategic minimum stocks does not count for the calculation of injection/extraction rights.
At the end of the injection campaign, the storage facilities were filled to full capacity, except for Marismas.
Underground gas storages
12,223 GWh Gas extracted in 2020, +123% compared to 2019
Injection/Extraction in storage facilities
GWh 2019 2020 Δ vs. 2019
Injection 12,869 9,523 -26%
Extraction 5,489 12,223 +123%
220
180
140
100
60
20
-20
-60
-100
-140
-180
-220
Jan Feb Mar Apr May Jun Jul Aug Sept Oct Nov Dec
Extraction Injection previous year
GWh/day
2 Operation
51
The SpanishGas System
Report 2020
60,000
50,000
40,000
30,000
20,000
10,000
0
Jan Feb Mar Apr May Jun Jul Aug Sept Oct Nov Dec
Stocks in underground gas storages
Volume of cushion gas Total stocks
GWh/day
Full management of underground gas storages in 2020
Jan Feb Mar Apr May Jun Jul Aug Sept Oct Nov Dec
Available capacity GWh 33,685 33,685 33,685 34,337 34,337 34,337 34,337 34,337 33,787 33,787 33,787 33,787
Volume of cushion gas GWh 28,793 28,793 28,793 28,793 28,793 28,793 28,793 28,793 28,793 28,793 28,793 28,793
Initial stocks GWh 58,869 54,993 53,323 52,157 53,498 54,771 55,674 58,169 60,471 61,367 61,419 60,045
Injection (net) GWh/month 15 0 27 1,341 1,273 903 2,495 2,302 896 149 58 64
Average daily injection GWh/day 0 0 1 45 41 30 79 73 29 5 0 0
Extraction (gross) GWh/month 3,891 1,671 1,192 0 0 0 0 0 0 97 1,432 3,940
Average daily extraction GWh/day 124 60 38 0 0 0 0 0 0 3 46 58
Final stocks GWh 54,993 53,323 52,157 53,498 54,771 55,674 58,169 60,471 61,367 61,419 60,045 56,168
2 Operation
52
The SpanishGas System
Report 2020
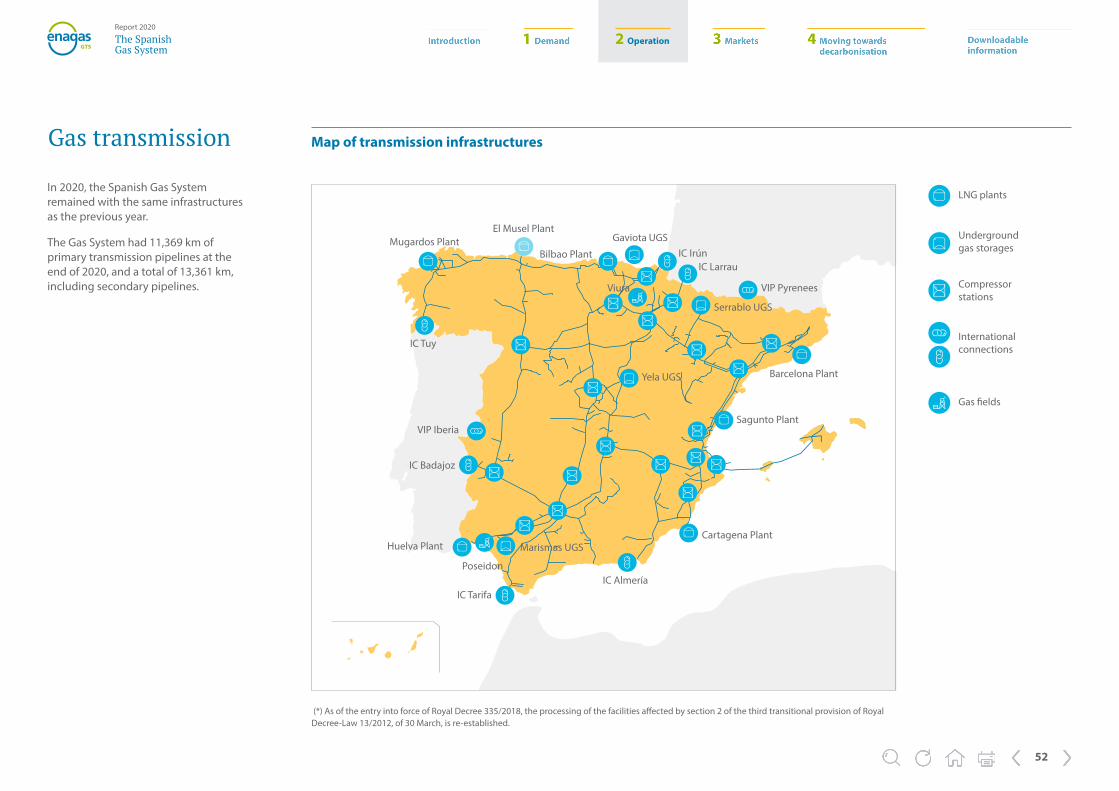
In 2020, the Spanish Gas System remained with the same infrastructures as the previous year.
The Gas System had 11,369 km of primary transmission pipelines at the end of 2020, and a total of 13,361 km, including secondary pipelines.
Gas transmission
(*) As of the entry into force of Royal Decree 335/2018, the processing of the facilities affected by section 2 of the third transitional provision of Royal Decree-Law 13/2012, of 30 March, is re-established.
Map of transmission infrastructures
Mugardos PlantEl Musel Plant
Gaviota UGSIC IrúnBilbao Plant
IC Larrau
Serrablo UGS
VIP Pyrenees
Yela UGS
Viura
Barcelona Plant
Sagunto Plant
Cartagena Plant
IC AlmeríaIC Tarifa
Marismas UGS
Poseidon
Huelva Plant
IC Badajoz
VIP Iberia
IC Tuy
LNG plants
Underground gas storages
Compressor stations
International connections
Gas fields
2 Operation
53
The SpanishGas System
Report 2020
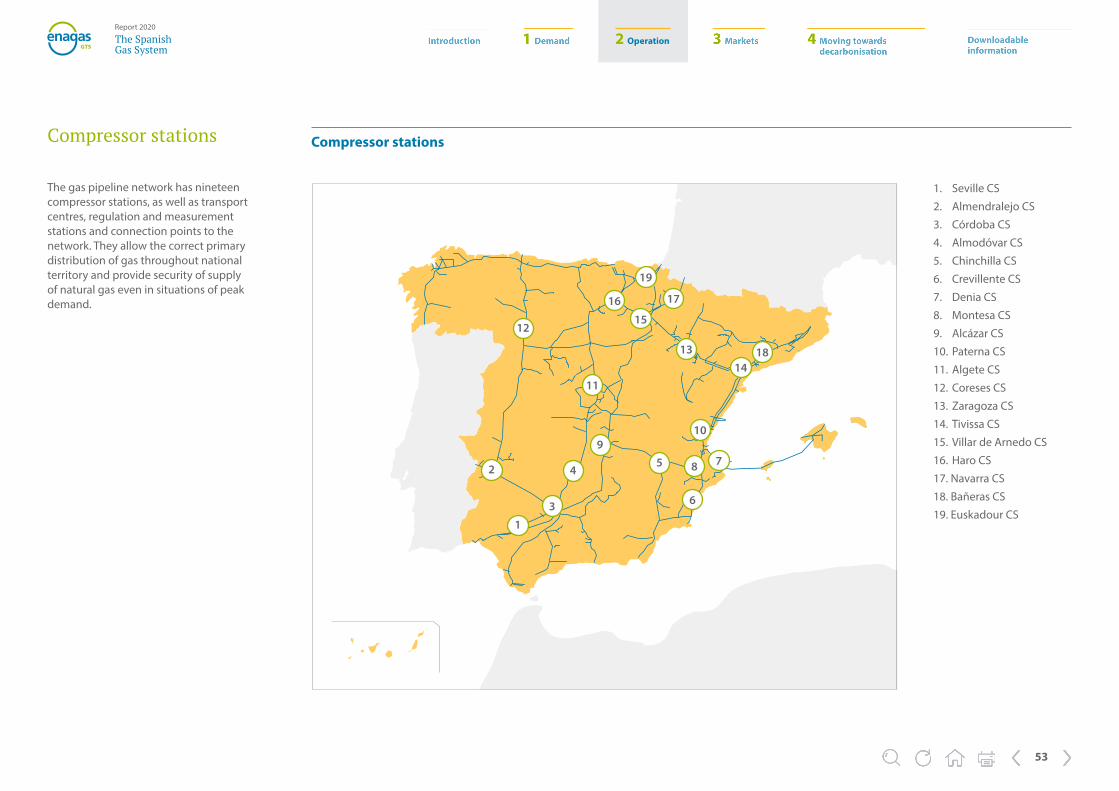
The gas pipeline network has nineteen compressor stations, as well as transport centres, regulation and measurement stations and connection points to the network. They allow the correct primary distribution of gas throughout national territory and provide security of supply of natural gas even in situations of peak demand.
Compressor stations
2
12
1
3
4
9
11
16
19
17
15
1314
10
78
6
18
5
Compressor stations
1. Seville CS
2. Almendralejo CS
3. Córdoba CS
4. Almodóvar CS
5. Chinchilla CS
6. Crevillente CS
7. Denia CS
8. Montesa CS
9. Alcázar CS
10. Paterna CS
11. Algete CS
12. Coreses CS
13. Zaragoza CS
14. Tivissa CS
15. Villar de Arnedo CS
16. Haro CS
17. Navarra CS
18. Bañeras CS
19. Euskadour CS
2 Operation
54
The SpanishGas System
Report 2020
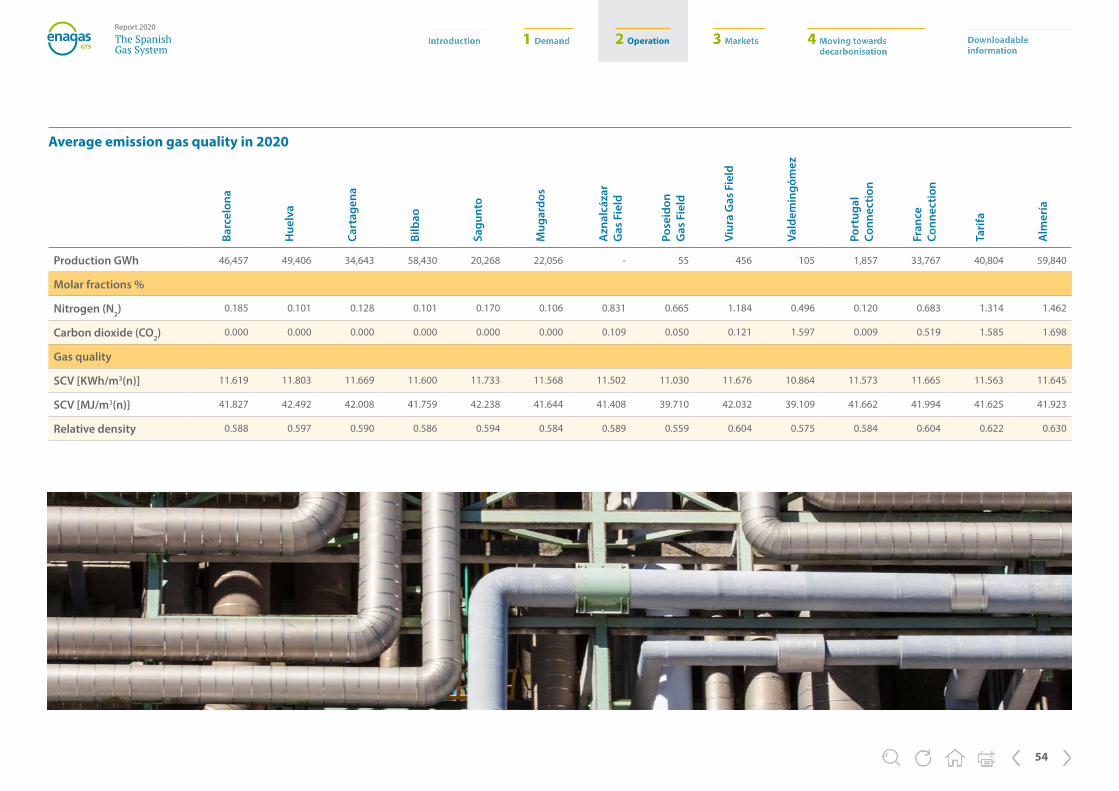
Production GWh 46,457 49,406 34,643 58,430 20,268 22,056 - 55 456 105 1,857 33,767 40,804 59,840
Molar fractions %
Nitrogen (N2) 0.185 0.101 0.128 0.101 0.170 0.106 0.831 0.665 1.184 0.496 0.120 0.683 1.314 1.462
Carbon dioxide (CO2) 0.000 0.000 0.000 0.000 0.000 0.000 0.109 0.050 0.121 1.597 0.009 0.519 1.585 1.698
Gas quality
SCV [KWh/m3(n)] 11.619 11.803 11.669 11.600 11.733 11.568 11.502 11.030 11.676 10.864 11.573 11.665 11.563 11.645
SCV [MJ/m3(n)] 41.827 42.492 42.008 41.759 42.238 41.644 41.408 39.710 42.032 39.109 41.662 41.994 41.625 41.923
Relative density 0.588 0.597 0.590 0.586 0.594 0.584 0.589 0.559 0.604 0.575 0.584 0.604 0.622 0.630
Average emission gas quality in 2020
Barc
elon
a
Hue
lva
Cart
agen
a
Bilb
ao
Sagu
nto
Mug
ardo
s
Vald
emin
góm
ez
Port
ugal
Co
nnec
tion
Fran
ce
Conn
ectio
n
Tari
fa
Alm
ería
Azn
alcá
zar
Gas
Fie
ld
Pose
idon
G
as F
ield
Viur
a G
as F
ield
3 Markets
55
The SpanishGas System
Report 2020
2020 was marked by the COVID-19 pandemic and by the entry into force of the access and balancing circulars, which provide users with new products that make the System more flexible and secure.
3 Markets
3 Markets
56
The SpanishGas System
Report 2020
The world energy landscape has been marked by the evolution of the COVID-19 pandemic, which has caused global effects. Energy, an essential basis for the development of countries, has been affected from production to consumption.
The different population lockdowns carried out by each country have affected the demand for energy materials, causing very significant price variations during the year and giving rise to historical events, such as negative prices in oil futures or oil tankers stopped at sea used as storage.
After the spring months, the energy markets, at the same pace as the stock markets, have been recovering with variations parallel to the pandemic evolution and even surpassing year-on-year prices.
Europe
Europe is characterised by the fact that it is a fundamentally receiving basin, both for gas and oil. Consumption and demand in this part of the world have a strong influence on prices.
Northern Europe is mainly supplied with gas from the North Sea and Russia, in addition to LNG tankers that come principally from the United States. Southern Europe, on the other hand, is highly dependent on natural gas from North Africa. Although origins have diversified in recent years with greater use of LNG, restrictions in North Africa at certain times of the year continue to affect prices.
Market evolution
In November 2020, it is worth noting that pipeline exports from Norway to continental Europe and the United Kingdom peaked at 9.07 bcm. Supplies were up 8% versus September and October and 2% on a year-on-year basis, with flows close to maximum capacity at some points during the month. However, Norway has experienced several episodes of strikes in 2020. The closure of the Nyhammna facility for two days due to a strike led to a decrease in exports by about 50 Mm3/d.
This one-off occurrence of strikes in the North Sea led to lower supplies to Europe and higher prices in this area.
On the other hand, natural gas production at Europe’s largest gas field, Groningen in the Netherlands, fell 45% year-on-year in November due to measures to progressively reduce production at the field. Production at Zuidwest, Loppersum, Central-Oost, Eemskanaal and Bierum gas fields amounted to 599 Mm3. This was a 45% decrease from the 1.09 bcm extracted in November 2019.
These situations put pressure on prices in the northern European hubs, with the result that Spain became, during October and November, a net exporter to France.
Elsewhere, looking towards Russia, its Yamal LNG liquefaction plant regained market leadership for shipments to Europe during November, amid a marginal recovery in demand for this product and taking the lead for the first time in almost two years. Yamal’s production trains accounted for almost a third of imports to European hubs, reducing in the process the resurgent US exports to the region, thus entering into perfect competition with American gas.
Looking more specifically at prices, the bullish rally of the last three months of the year in UK natural gas spot prices came to a halt in November, as the second wave of coronavirus outbreaks caused the country to close international borders for a second time. This caused demand to fall short of October’s forecast levels and not exceed 2019 demand.
With regard to TTF prices in the Netherlands, these were reduced at the year-end, as demand was similarly limited by the progress of the pandemic in these areas, although the various weather forecasts kept price levels very volatile.
On the other hand, the relationship that prices have with climatic events is also relevant. The following graph summarises the price variation of the main trading hubs in Europe. Of particular note were the cold snaps at the end of December 2020, which triggered several episodes of price volatility in early 2021, at the time of writing.

3 Markets
57
The SpanishGas System
Report 2020
Prices in the main European hubs
Source: Own elaboration based on PEGAS, MAREX SPECTRON, GME and MIBGAS.
24.0
22.0
20.0
18.0
16.0
14.0
12.0
10.0
8.0
6.0
4.0
2.0
0Oct-20 Nov-20Sept-20Aug-20Jul-20Jun-20May-20Apr-20Mar-20Feb-20Jan-20 Dec-20
TTF (DA) NBP (DA) PSV (DA) PEG (DA) PVB (DA)
Euros

3 Markets
58
The SpanishGas System
Report 2020
Natural gas is related to other raw materials, either because they are substitute energy materials or because they are derivatives.
In the case of oil, there are still contractual relations for gas contracts pegged to Brent prices. Therefore, what may happen in terms of oil prices is strongly related to natural gas.
On the other hand, until now, coal was consumed in the coal-fired power plants that fed the more than 9,000 MW of installed capacity in Spain, so its prices were very representative for the formation of electricity prices and in the struggle for the hegemony of the thermal gap.
Competing prices
Coal-API2
Jan Feb Mar Apr May Jun Jul Aug Sept Oct Nov Dec
74
70
66
62
58
54
50
46
42
38
34
$/t
35
33
31
29
27
25
23
21
19
17
15
€/t
CO2 (EAU)
Jan Feb Mar Apr May Jun Jul Aug Sept Oct Nov Dec
73
67
61
55
49
43
37
31
25
19
$/Bbl
Brent
Jan Feb Mar Apr May Jun Jul Aug Sept Oct Nov Dec
Sources: Own elaboration based on Refinitiv.
At present, following the closure of coal mining in our country and the announcement of the dismantling of almost the entire coal system, the thermal gap is filled by combined cycles, and is a necessary energy to maintain the variability of wind power production. Although in Spain the weight of coal is a benchmark, it is not so at world level. Therefore, knowing the evolution of its price is always an input to take into account.
Lastly, the price of CO2 frames everything related to industry and electricity production plants and is an extremely important variable in the competition of energy markets. The onset of the pandemic in Europe, the lockdowns and the shutdown of
industrial activity caused the CO2 market to plummet, which has been recovering after the return to a new normality. It is worth noting the sharp rise of CO2 in the last quarter of 2020, following the announcement from Brussels of a new regulatory framework and suspension of the auctions scheduled for February 2021, which has triggered an increase in the purchase of rights.

3 Markets
59
The SpanishGas System
Report 2020
Negotiations on all platforms have also been affected by the evolution of the COVID-19 pandemic. Rises and falls in trading and different volumes have marked the profile of the discontinuity in the volume traded.
While in 2019 we highlighted as important milestones the start of trading in MIBGAS Derivatives of LNG products in plants, the entry of the new Trading Platform and its corresponding Central Counterparty ECC Lux, in 2020 we could highlight the start of trading of products with delivery in TVB and underground gas storages. This interest of platforms in the market, both gas and LNG, derives from the implementation of CNMC Circulars 8/2019 and 2/2020 and the ease of LNG trading that occurs in a single tank management model.
Trading platforms and central counterparties
Volumes traded on trading platforms with PVB delivery
3,605
2,825 2,6682,371 2,362
2,668 2,7123,085 3,210
4,854
4,002
5,417
607569414355102105
514171
443627396
9 15
1,180
MIBGAS MIBGAS Derivatives EEX
6,000
5,500
5,000
4,500
4,000
3,500
3,000
2,500
2,000
1,500
1,000
500
0
Jan Feb Mar Apr May Jun Jul Aug Sept Oct Nov Dec
Trading in the PVB
Trading platforms
In terms of trading on the platforms with delivery in the PVB, the amount traded on MIBGAS stands out, reaching 39,779 GWh, as well as the total amount traded on MIBGAS Derivatives, which amounted to 5,483 GWh. It is worth highlighting the return to EEX trading at the end of the year, ending 2020 with a trading volume of 24 GWh.
Source: Own elaboration based on MIBGAS, MIBGAS Derivatives and EEX.
MWh

3 Markets
60
The SpanishGas System
Report 2020
Central Counterparty Entities
With regard to the volumes registered in the central counterparties and reported to the Technical Manager of the System, it is worth noting the increase in volume despite the uncertainty of the impact of the coronavirus, which was detected after the inauguration of trading in the single tank from April 2020, as shown in the following graph. The total volume recorded was 25,796 GWh.
OMI Clear BME Clearing ECC Lux
2,600
2,400
2,200
2,000
1,800
1,400
1,200
1,000
800
600
400
200
0
Jan Feb Mar Apr May Jun Jul Aug Sept Oct Nov Dec
1,076
1,360
1,119
2,059
767 810
1,481
326
923203
1,345
1,826
1,144
379
818899
195
7166
59
1,715
1,134
1,563
658
0.2
618
1,114
2,468
Volumes recorded in Central Counterparties with delivery in PVB
Source: Own elaboration based on OMICLEAR, BME Clearing and ECC Lux.
MWh
454
3 Markets
61
The SpanishGas System
Report 2020
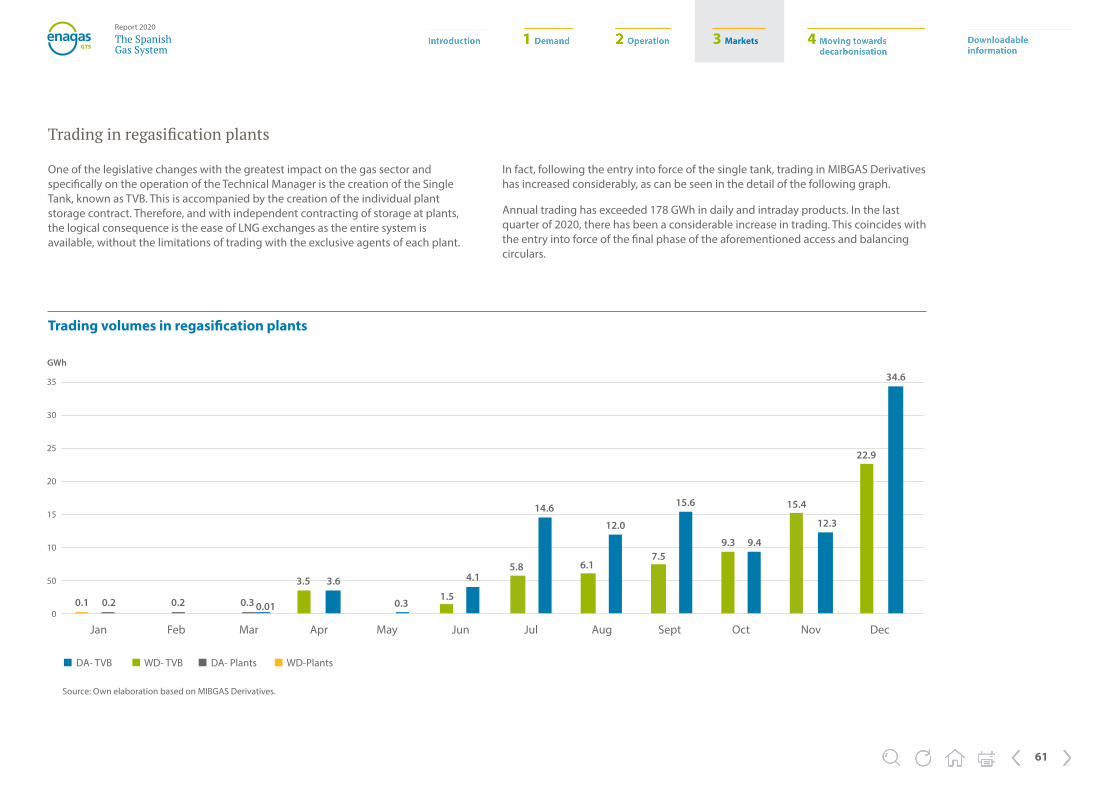
Trading in regasification plants
One of the legislative changes with the greatest impact on the gas sector and specifically on the operation of the Technical Manager is the creation of the Single Tank, known as TVB. This is accompanied by the creation of the individual plant storage contract. Therefore, and with independent contracting of storage at plants, the logical consequence is the ease of LNG exchanges as the entire system is available, without the limitations of trading with the exclusive agents of each plant.
In fact, following the entry into force of the single tank, trading in MIBGAS Derivatives has increased considerably, as can be seen in the detail of the following graph.
Annual trading has exceeded 178 GWh in daily and intraday products. In the last quarter of 2020, there has been a considerable increase in trading. This coincides with the entry into force of the final phase of the aforementioned access and balancing circulars.
DA- TVB WD- TVB DA- Plants WD-Plants
35
30
25
20
15
10
50
0
Jan Feb Mar Apr May Jun Jul Aug Sept Oct Nov Dec
0.1 0.2 0.2 0.3 0.31.5
4.15.8 6.1
7.5
15.6
9.3 9.4
15.4
12.3
22.9
34.6
12.0
14.6
3.5 3.6
0.01
GWh
Trading volumes in regasification plants
Source: Own elaboration based on MIBGAS Derivatives.
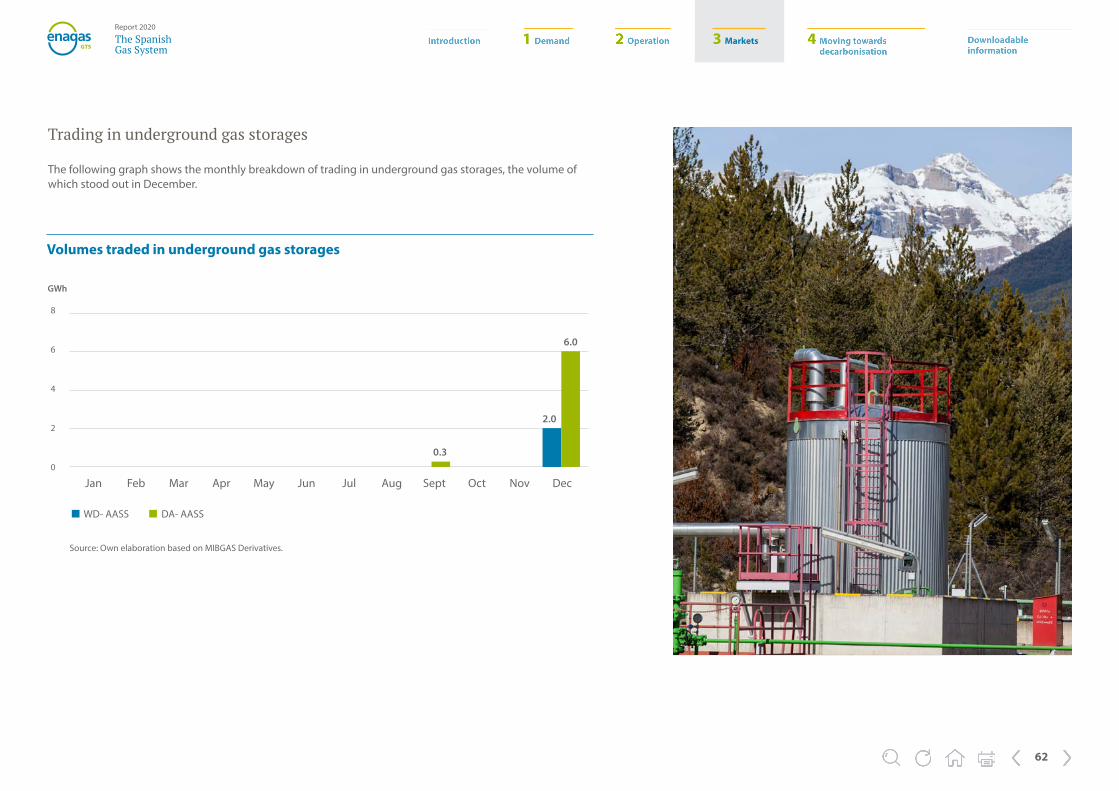
3 Markets
62
The SpanishGas System
Report 2020
Trading in underground gas storages
The following graph shows the monthly breakdown of trading in underground gas storages, the volume of which stood out in December.
Volumes traded in underground gas storages
WD- AASS DA- AASS
Jan Feb Mar Apr May Jun Jul Aug Sept Oct Nov Dec
8
6
4
2
0
GWh
Source: Own elaboration based on MIBGAS Derivatives.
0.3
2.0
6.0
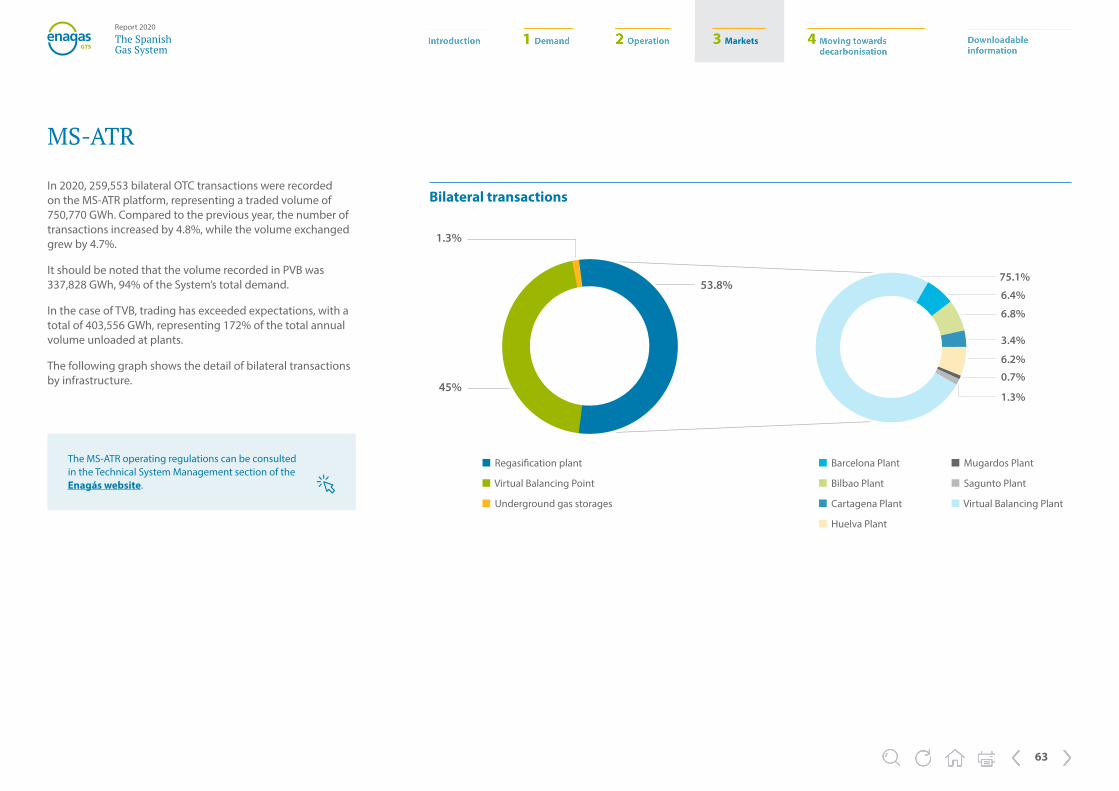
3 Markets
63
The SpanishGas System
Report 2020
53.8%
1.3%
45%
Bilateral transactions
Regasification plant
Virtual Balancing Point
Underground gas storages
Barcelona Plant
Bilbao Plant
Cartagena Plant
Huelva Plant
Mugardos Plant
Sagunto Plant
Virtual Balancing Plant
6.4%
6.8%
3.4%
6.2%
0.7%
1.3%
75.1%
MS-ATR
In 2020, 259,553 bilateral OTC transactions were recorded on the MS-ATR platform, representing a traded volume of 750,770 GWh. Compared to the previous year, the number of transactions increased by 4.8%, while the volume exchanged grew by 4.7%.
It should be noted that the volume recorded in PVB was 337,828 GWh, 94% of the System’s total demand.
In the case of TVB, trading has exceeded expectations, with a total of 403,556 GWh, representing 172% of the total annual volume unloaded at plants.
The following graph shows the detail of bilateral transactions by infrastructure.
The MS-ATR operating regulations can be consulted in the Technical System Management section of the Enagás website.
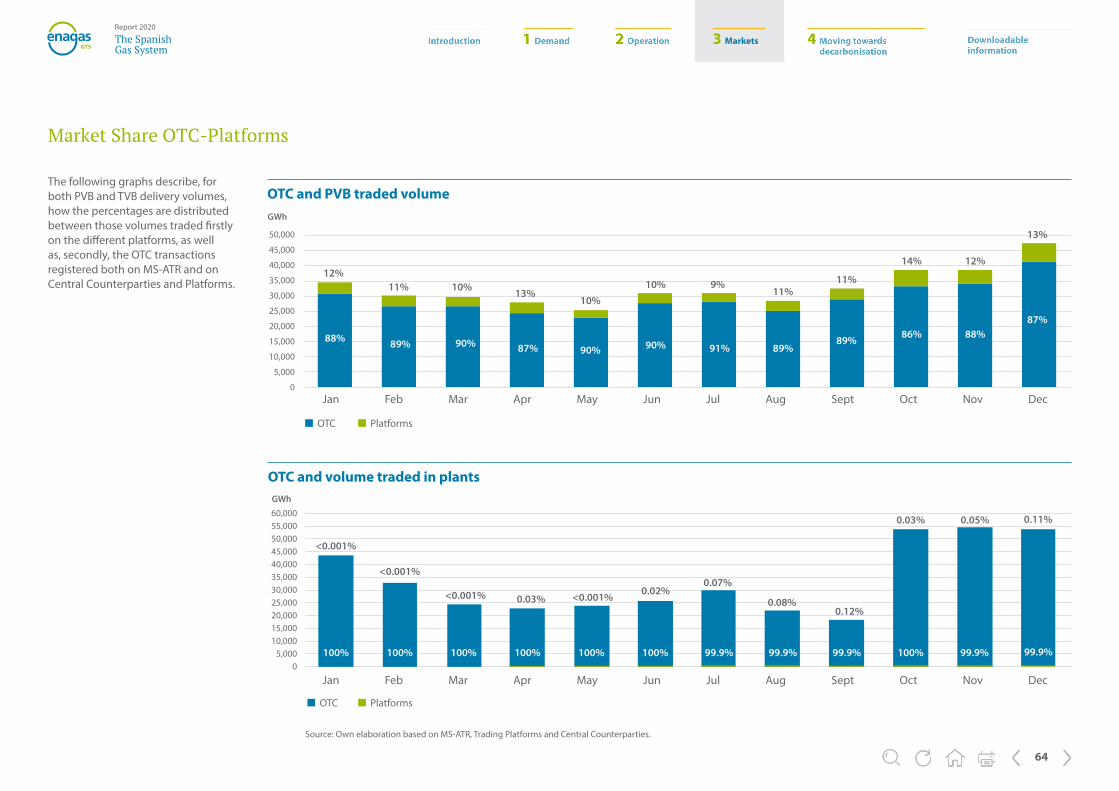
3 Markets
64
The SpanishGas System
Report 2020
Market Share OTC-Platforms
OTC Platforms
50,000
45,000
40,000
35,000
30,000
25,000
20,000
15,000
10,000
5,000
0
GWh
12%11% 10%
10%10% 9%
11%11%
14% 12%
13%
87%88%86%89%
89%91%90%90%87%90%89%88%
13%
OTC and PVB traded volume
OTC and volume traded in plants
60,00055,00050,00045,00040,00035,00030,00025,00020,00015,00010,000
5,0000
<0.001% 0.03% <0.001%0.02%
0.07%
0.08%
99.9% 99.9%
0.12%
99.9%
0.03%
100%
0.05%
99.9%
0.11%
99.9%100% 100% 100%100% 100% 100%
OTC Platforms
Source: Own elaboration based on MS-ATR, Trading Platforms and Central Counterparties.
Jan Feb Mar Apr May Jun Jul Aug Sept Oct Nov Dec
Jan Feb Mar Apr May Jun Jul Aug Sept Oct Nov Dec
GWh
The following graphs describe, for both PVB and TVB delivery volumes, how the percentages are distributed between those volumes traded firstly on the different platforms, as well as, secondly, the OTC transactions registered both on MS-ATR and on Central Counterparties and Platforms.
<0.001%
<0.001%

3 Markets
65
The SpanishGas System
Report 2020
Law 8/2015 also recognised the Technical Manager of the System (GTS) as a participant in the Organised Gas Market.
The GTS went to the market in the cases provided for by the legislation in force.
As established in the Balancing Circular (Circular 2/2020 of 9 January), the GTS is responsible for maintaining the transmission network of the Gas System within normal operating limits. To do this, it may perform so-called balancing actions.
In addition, according to Order IET/2736/2015, of 17 December, which establishes the tolls and fees associated with third-party access to gas facilities and the remuneration of regulated activities for 2016, the operating gas paid for by the System must be acquired by the Technical Manager of the System on the Organised Gas Market.
The participation of the GTS in the Market is necessary to achieve a secure Gas System and an efficient, advanced and competent operation.
Balancing actions in PVBThe Resolution of 28 September 2016, from the Directorate General for Energy Policy and Mines, which approves the detail protocol PD-18 “Technical parameters that determine the normal operation of the transmission grid and the performance of balancing actions at the Virtual Balancing Point by the Technical Manager of the System, defines the values and methodology for calculating the parameters of the transmission grid necessary to identify the operating status of the grid, to manage the operational balance of the grid and to perform balancing actions at the Virtual Balancing Point.
Through the performance of the balancing actions, the first of which was carried out on 6 October 2016, the GTS has performed its role of supervision, management and control of the transmission grid in a transparent, efficient and continuous way.
In 2020, 83 balancing actions were taken, 51 concerning purchases and 32 concerning sales for a total volume of 2,412.557 GWh.
The 51 purchase actions have led to acquisition of 1,652.631 GWh, at an average price of €14.79/MWh. The maximum price was €23.83/MWh (10 December 2020) and the minimum price was €7.26/MWh (31 March 2020).
The 32 sales actions have registered a volume delivered of 759.926 GWh, at an average price of €9.46/MWh. The maximum sale price (16 December 2020) was €20.50/MWh and the minimum was €4.93/MWh (15 July 2020).
Considering the foregoing data for 2020, the intervention of the GTS has been necessary 23% of the total days of the year.
The following figure summarises in monthly detail the number and amounts purchased or sold by the GTS as balancing actions.
The role of the GTS
In order to carry out balancing actions, the operating status of the transmission network is analysed using the Volume of Available Gas as an indicator, which can be consulted on the Enagás website.
Information on the volumes, prices and economic results of the GTS balancing actions can be consulted on the Enagás website.
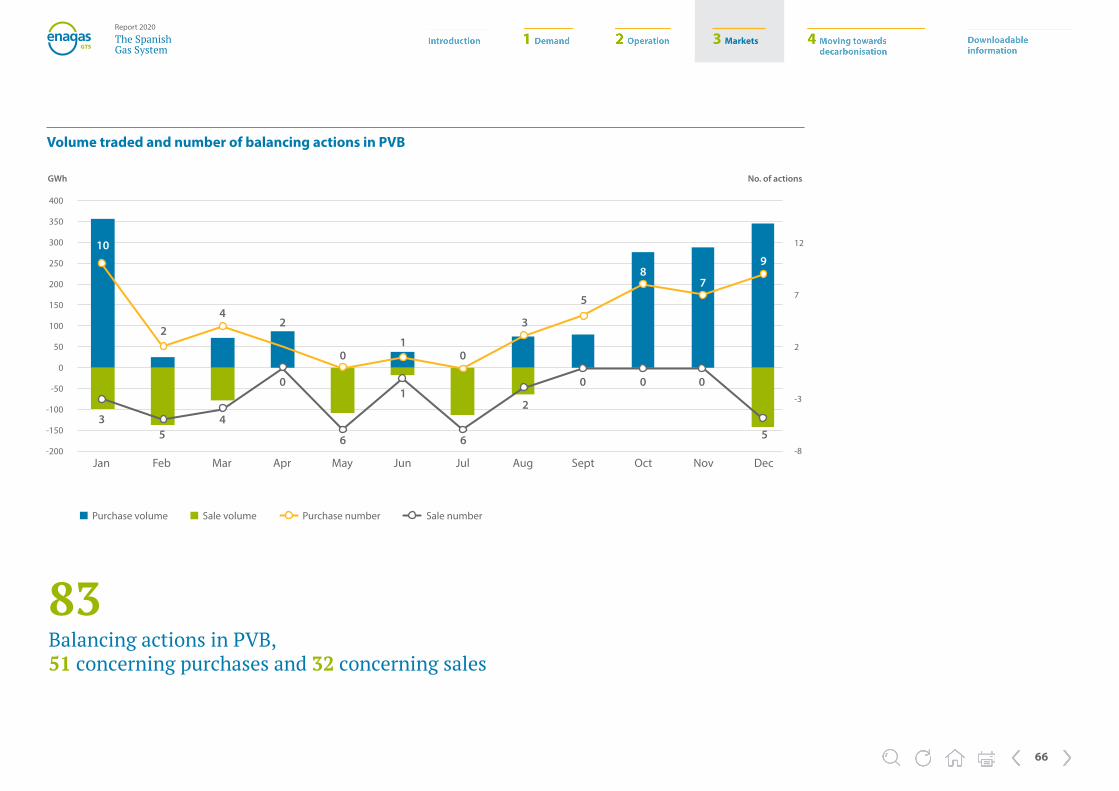
3 Markets
66
The SpanishGas System
Report 2020
Volume traded and number of balancing actions in PVB
Purchase volume Sale volume Purchase number Sale number
!"
Jan Feb Mar Apr May Jun Jul Aug Sept Oct Nov Dec
400
350
300
250
200
150
100
50
0
-50
-100
-150
-200
9
78
5
5 56 6
3
3
2
2
4
4
2
10
00
0 0 0 0
1
1
GWh
12
7
2
-3
-8
No. of actions
83Balancing actions in PVB, 51 concerning purchases and 32 concerning sales
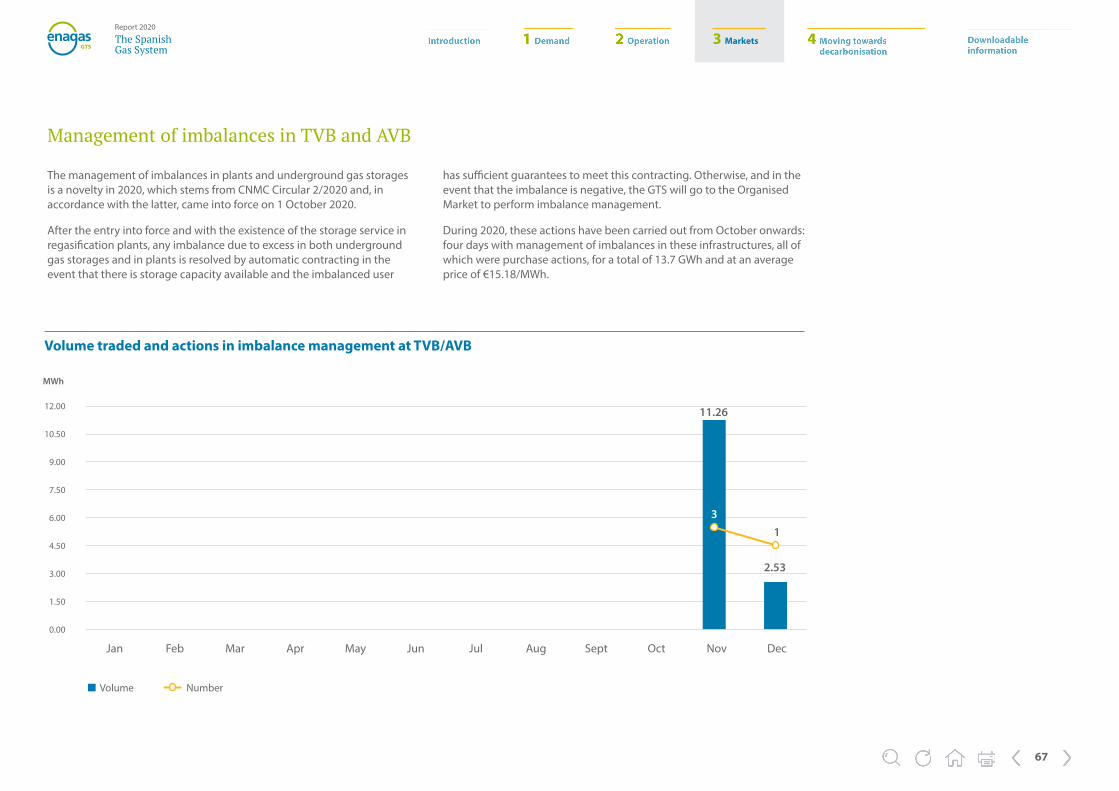
3 Markets
67
The SpanishGas System
Report 2020
Management of imbalances in TVB and AVB
The management of imbalances in plants and underground gas storages is a novelty in 2020, which stems from CNMC Circular 2/2020 and, in accordance with the latter, came into force on 1 October 2020.
After the entry into force and with the existence of the storage service in regasification plants, any imbalance due to excess in both underground gas storages and in plants is resolved by automatic contracting in the event that there is storage capacity available and the imbalanced user
has sufficient guarantees to meet this contracting. Otherwise, and in the event that the imbalance is negative, the GTS will go to the Organised Market to perform imbalance management.
During 2020, these actions have been carried out from October onwards: four days with management of imbalances in these infrastructures, all of which were purchase actions, for a total of 13.7 GWh and at an average price of €15.18/MWh.
Volume traded and actions in imbalance management at TVB/AVB
Jan Feb Mar Apr May Jun Jul Aug Sept Oct Nov Dec
12.00
10.50
9.00
7.50
6.00
4.50
3.00
1.50
0.00
2.53
Volume Number
MWh
11.26
13
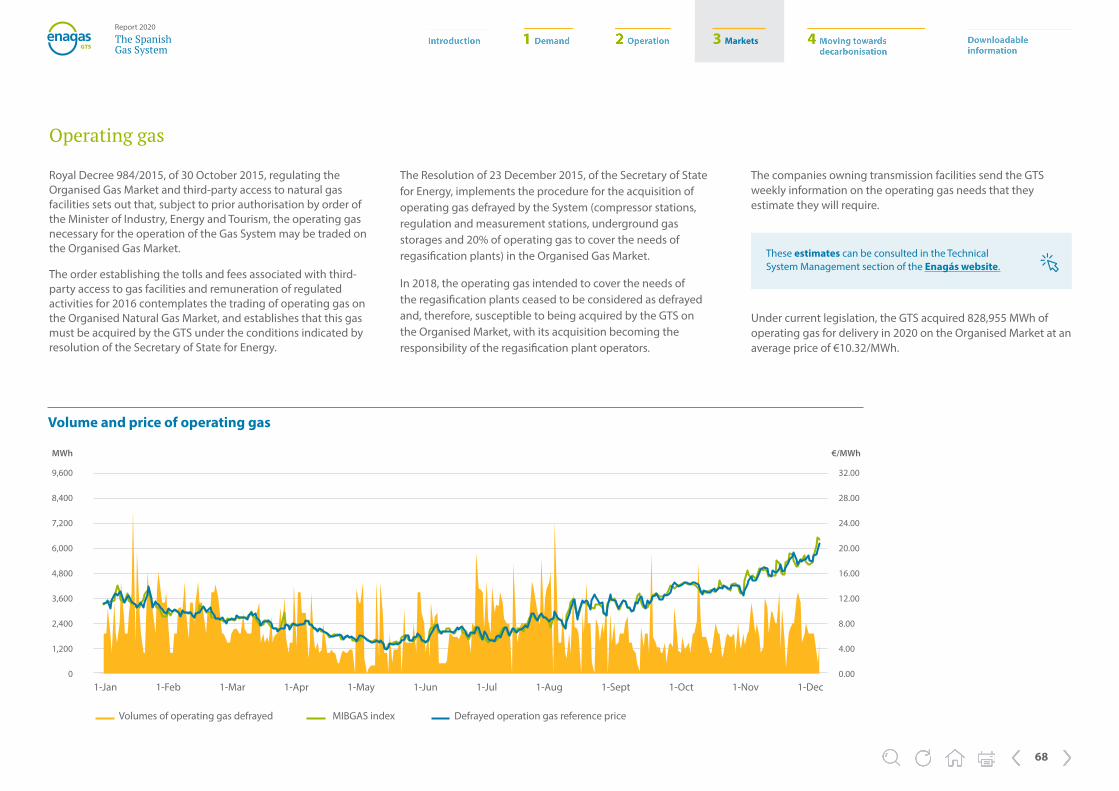
3 Markets
68
The SpanishGas System
Report 2020
Operating gas
Royal Decree 984/2015, of 30 October 2015, regulating the Organised Gas Market and third-party access to natural gas facilities sets out that, subject to prior authorisation by order of the Minister of Industry, Energy and Tourism, the operating gas necessary for the operation of the Gas System may be traded on the Organised Gas Market.
The order establishing the tolls and fees associated with third-party access to gas facilities and remuneration of regulated activities for 2016 contemplates the trading of operating gas on the Organised Natural Gas Market, and establishes that this gas must be acquired by the GTS under the conditions indicated by resolution of the Secretary of State for Energy.
The Resolution of 23 December 2015, of the Secretary of State for Energy, implements the procedure for the acquisition of operating gas defrayed by the System (compressor stations, regulation and measurement stations, underground gas storages and 20% of operating gas to cover the needs of regasification plants) in the Organised Gas Market.
In 2018, the operating gas intended to cover the needs of the regasification plants ceased to be considered as defrayed and, therefore, susceptible to being acquired by the GTS on the Organised Market, with its acquisition becoming the responsibility of the regasification plant operators.
The companies owning transmission facilities send the GTS weekly information on the operating gas needs that they estimate they will require.
Under current legislation, the GTS acquired 828,955 MWh of operating gas for delivery in 2020 on the Organised Market at an average price of €10.32/MWh.
Volume and price of operating gas
9,600
8,400
7,200
6,000
4,800
3,600
2,400
1,200
0
Volumes of operating gas defrayed MIBGAS index Defrayed operation gas reference price
MWh
1-Jan 1-Feb 1-Mar 1-Apr 1-May 1-Jun 1-Jul 1-Aug 1-Sept 1-Oct 1-Nov 1-Dec
32.00
28.00
24.00
20.00
16.00
12.00
8.00
4.00
0.00
€/MWh
These estimates can be consulted in the Technical System Management section of the Enagás website.

4 Moving towards decarbonisation
69
The SpanishGas System
Report 2020
4 Moving towards decarbonisation The gas sector is key to the energy transition and is already taking its first steps towards a fully decarbonised Gas System.

4 Moving towards decarbonisation
70
The SpanishGas System
Report 2020
The energy sector is currently undergoing sweeping changes aimed at transforming the current energy model, with generation sources predominantly of fossil origin, towards a new model based on renewable generation sources, both electrical and non-electrical or renewable gases.
This paradigm shift in the energy model is supported by all the agreements and regulations established both at a global level (United Nations conferences on climate change), at a European level (Green Deal and European Directives) and at a national level (National Integrated Energy and Climate Plan 2030 and Draft Bill on Energy Transition). The main objective is decarbonisation of the energy mix, aiming for Spain to be a climate-neutral country by 2050 at the latest.
During 2020, CO2 emissions from the electricity generation mix have been reduced by 28% compared to 2019, according to REE data. Combined cycle plants have been the third technology in terms of contribution to this mix, accounting for 16% of the mainland electricity generation in 2020.
The gas sector is no stranger to the process of decarbonisation and energy transition, and the first steps are already beginning to be taken towards a fully decarbonised Gas System. Renewable gases, mainly biomethane and hydrogen, will play a key role in the coming decades.
On the one hand, the development of biogas from agricultural, livestock, urban solid waste and wastewater treatment, and its subsequent upgrading to biomethane and injection into the gas network, will play a very important role in the decarbonisation of the energy and gas system. This role has been recognised by the Ministry for Ecological Transition and the Demographic Challenge (MITERD) in the previous public consultation of the Biogas Roadmap, which attributes this fuel with high capacity to integrate the circular economy in the generation of renewable energy and its subsequent use in the different economic sectors, mainly in transport, electricity generation or heat and power systems, displacing the use of raw materials of fossil origin with renewable raw materials.
On the other hand, the development of green hydrogen from renewable sources will be a key energy vector for the decarbonisation of the economy, as stated in the Hydrogen Roadmap approved by MITERD in October 2020.
The Hydrogen Roadmap already sets targets for renewable hydrogen penetration, including the installation of at least 4 GW of electrolyser capacity by 2030. To ensure progress in this installation, it is estimated that by 2024 a total value of installed power of electrolysers of between 300 and 600 MW could be achieved.
Energy transition and decarbonisation
Combined cycle plants have been the third technology in terms of contribution to the electricity generation mix in 2020, which has reduced its CO2 emissions by 28% (vs. 2019)
4 Moving towards decarbonisation
71
The SpanishGas System
Report 2020
As regards industry, the Hydrogen Roadmap foresees a minimum contribution of renewable hydrogen of 25% of the total hydrogen consumed in 2030 in all hydrogen consuming industries, which would represent a consumption of approximately 4 TWh/year.
In relation to transport sector, the Hydrogen Roadmap includes targets for at least 150-200 renewable hydrogen fuel cell buses by 2030, a vehicle fleet of at least 5,000-7,500 light and heavy duty hydrogen fuel cell vehicles for cargo transport by 2030 and a network of at least 100-150 publicly accessible hydrogen plants by 2030.
The gas sector has all the key pieces to make a decisive contribution to the energy transition process
To sum up, in the coming years the gas sector will undergo profound changes aimed at the development of renewable gases, which will require significant efforts by all agents in the sector, but it has all the key elements to make a decisive contribution to the process of decarbonisation and energy transition.
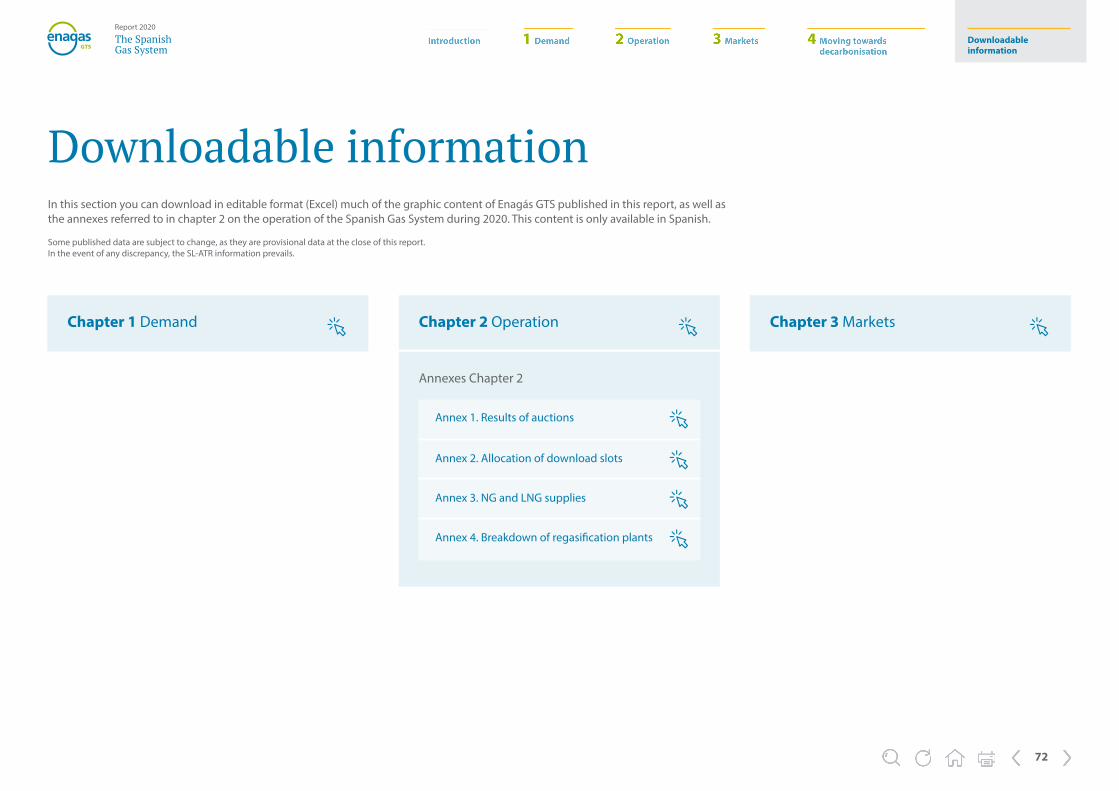
Downloadable information
72
The SpanishGas System
Report 2020
Annex 1. Results of auctions
Annex 2. Allocation of download slots
Annex 3. NG and LNG supplies
Annex 4. Breakdown of regasification plants
Downloadable information
Chapter 1 Demand
In this section you can download in editable format (Excel) much of the graphic content of Enagás GTS published in this report, as well as the annexes referred to in chapter 2 on the operation of the Spanish Gas System during 2020. This content is only available in Spanish.
Some published data are subject to change, as they are provisional data at the close of this report.In the event of any discrepancy, the SL-ATR information prevails.
Chapter 2 Operation Chapter 3 Markets
Annexes Chapter 2

The SpanishGas System
Report 2020
73
Editing:Enagás Communication and Public Affairs Office
Technical coordination:Enagás System Technical Management Department
Design and typesetting:Baética, Graphic communication agency
Paseo de los Olmos, 19 • 28005 Madrid(+34) 91 709 92 [email protected] • www.enagas.es
Follow us on: