The Solent Future Transport Zone Research Programme
45
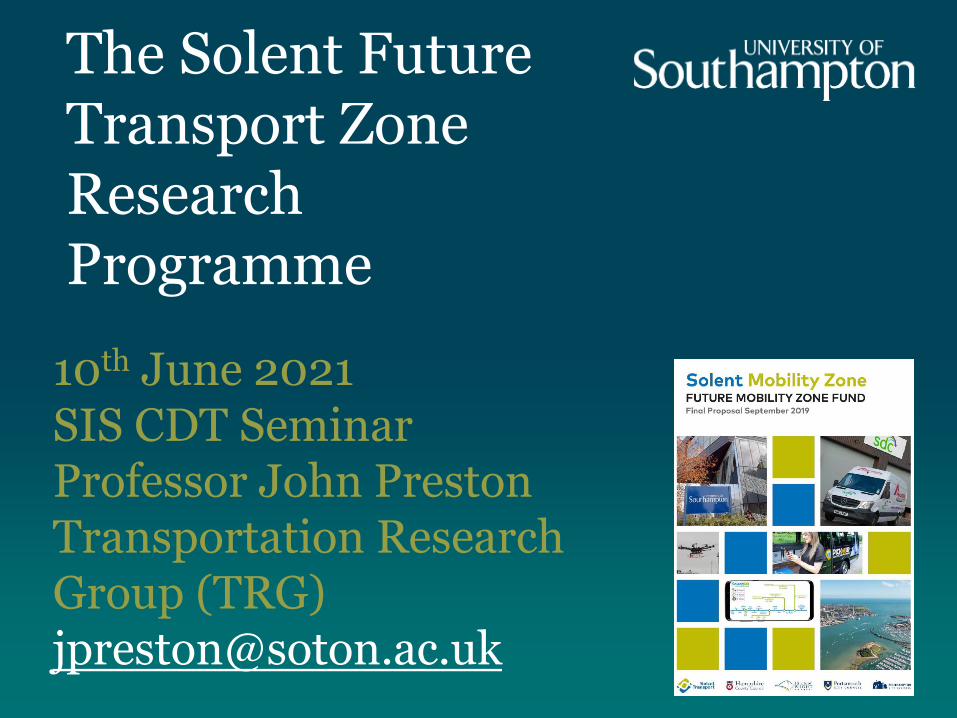
The Solent Future Transport Zone Research Programme 10 th June 2021 SIS CDT Seminar Professor John Preston Transportation Research Group (TRG) [email protected]
-
Upload
khangminh22 -
Category
Documents
-
view
4 -
download
0
Transcript of The Solent Future Transport Zone Research Programme
The Solent Future Transport Zone Research Programme
10th June 2021SIS CDT SeminarProfessor John PrestonTransportation Research Group (TRG)[email protected]
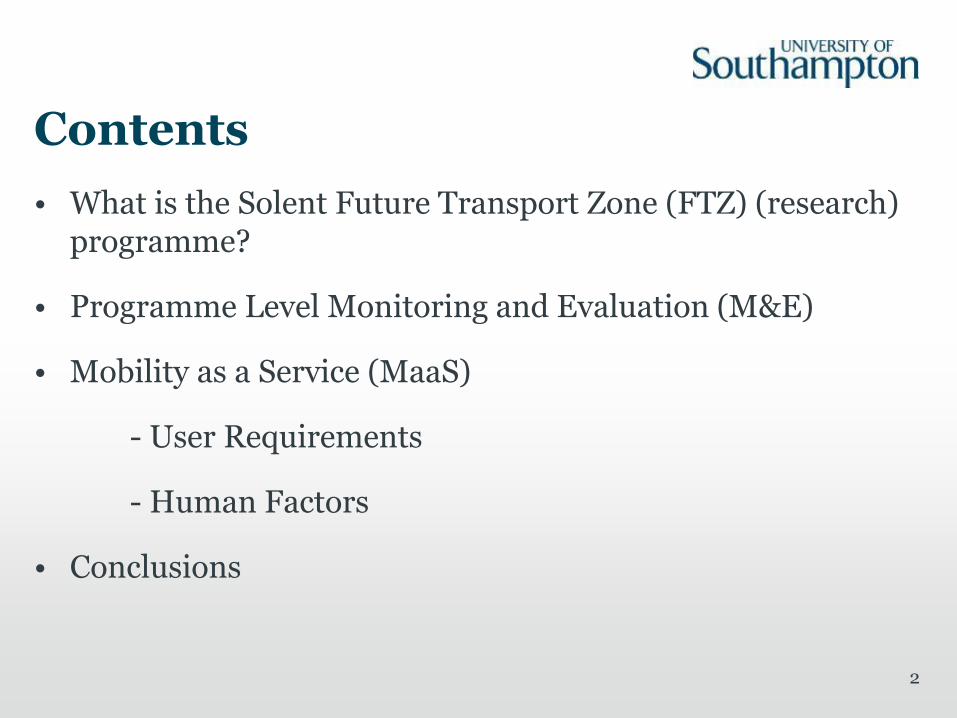
Contents
• What is the Solent Future Transport Zone (FTZ) (research) programme?
• Programme Level Monitoring and Evaluation (M&E)
• Mobility as a Service (MaaS)
- User Requirements
- Human Factors
• Conclusions
2
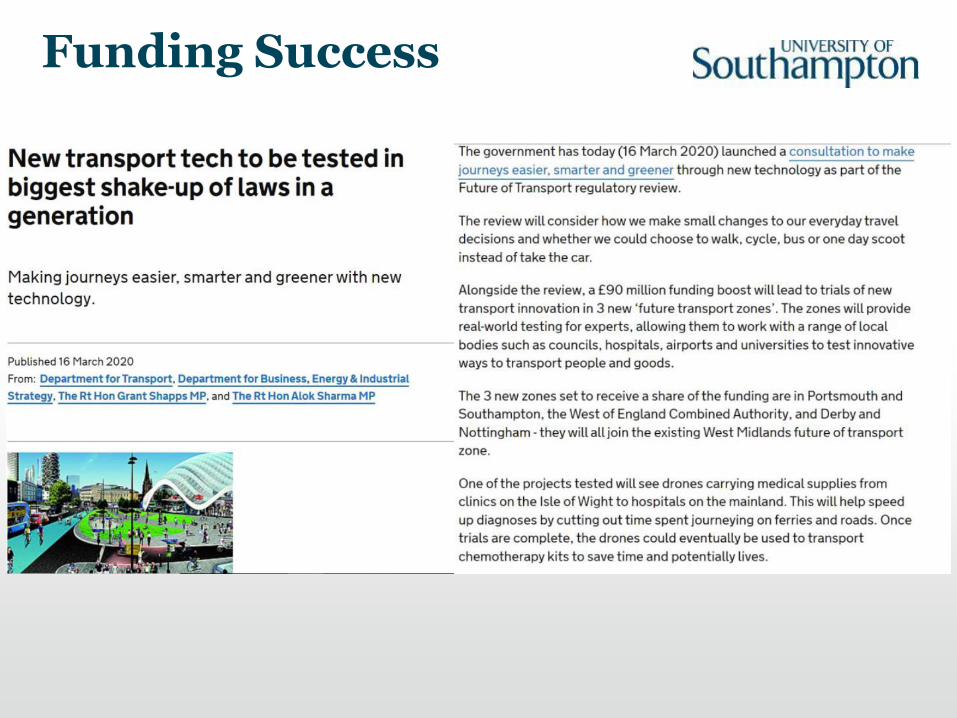
Funding Success
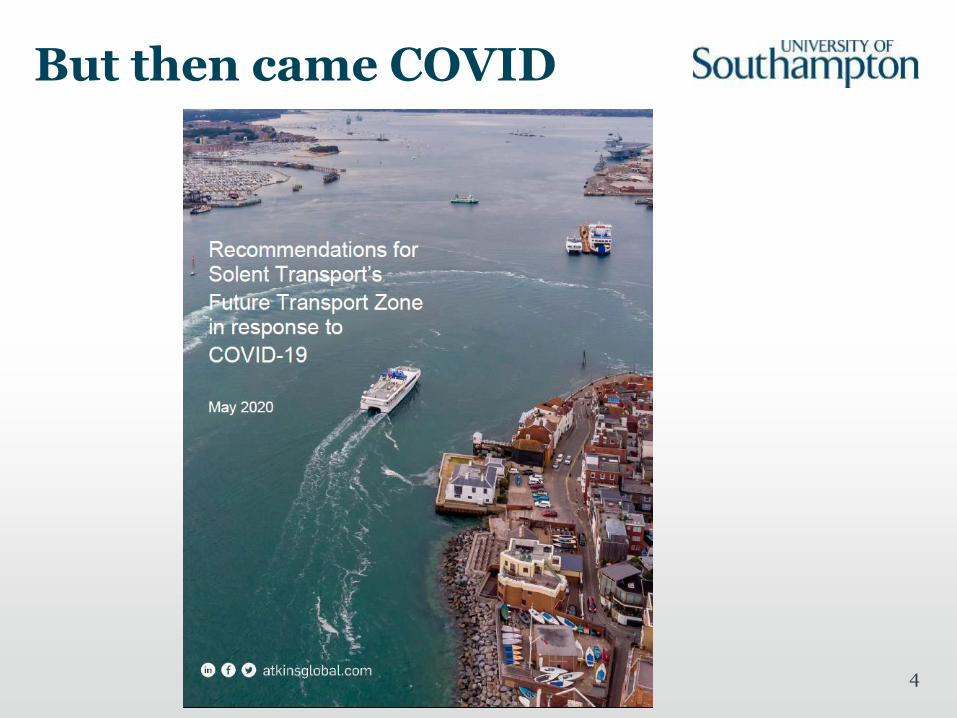
But then came COVID
4
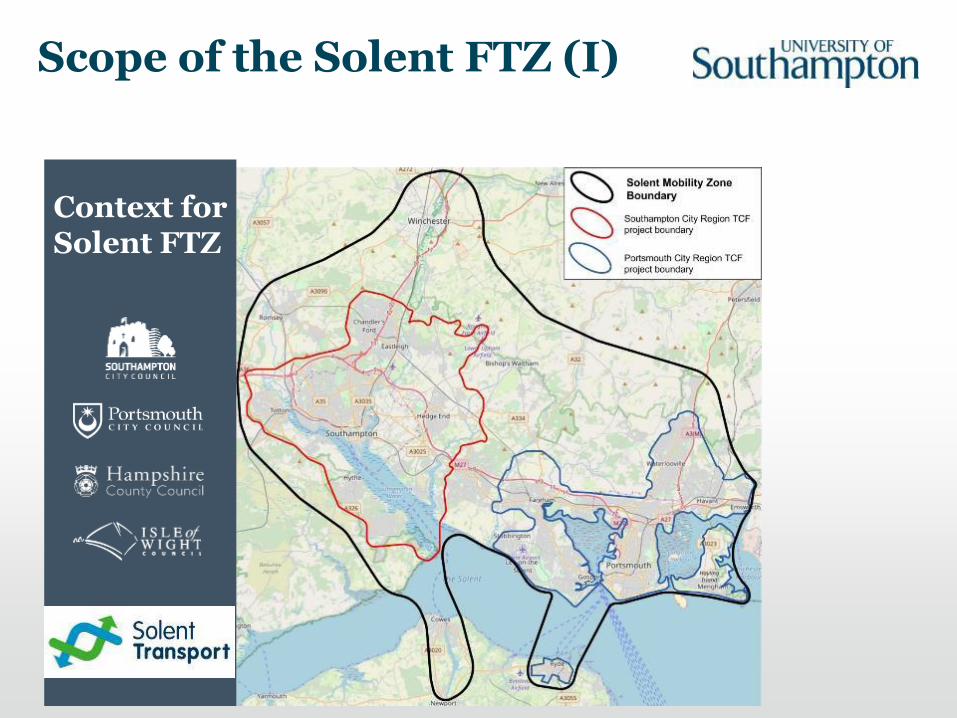
Scope of the Solent FTZ (I)
Text here
Text here
Context for Solent FTZ
6
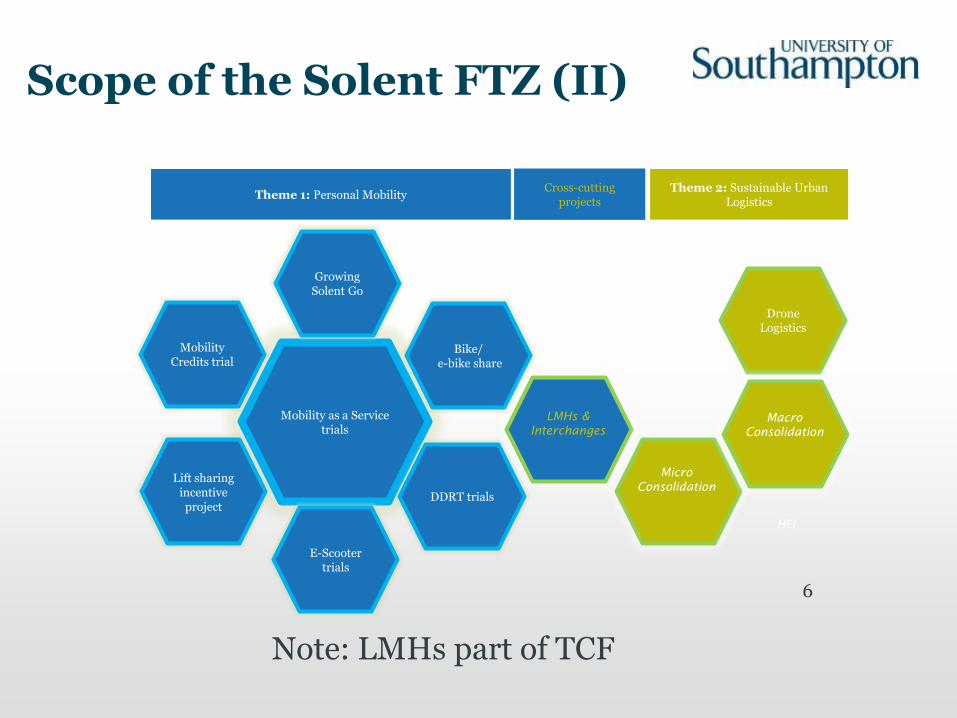
Scope of the Solent FTZ (II)
Mobility as a Service trials
DDRT trials
Mobility Credits trial
Growing Solent Go
Lift sharing incentive project
Bike/e-bike share
Drone Logistics
Theme 1: Personal MobilityTheme 2: Sustainable Urban
LogisticsCross-cutting
projects
LMHs &
Interchanges
Micro
Consolidation
Macro
Consolidation
HEI
E-Scooter trials
Note: LMHs part of TCF
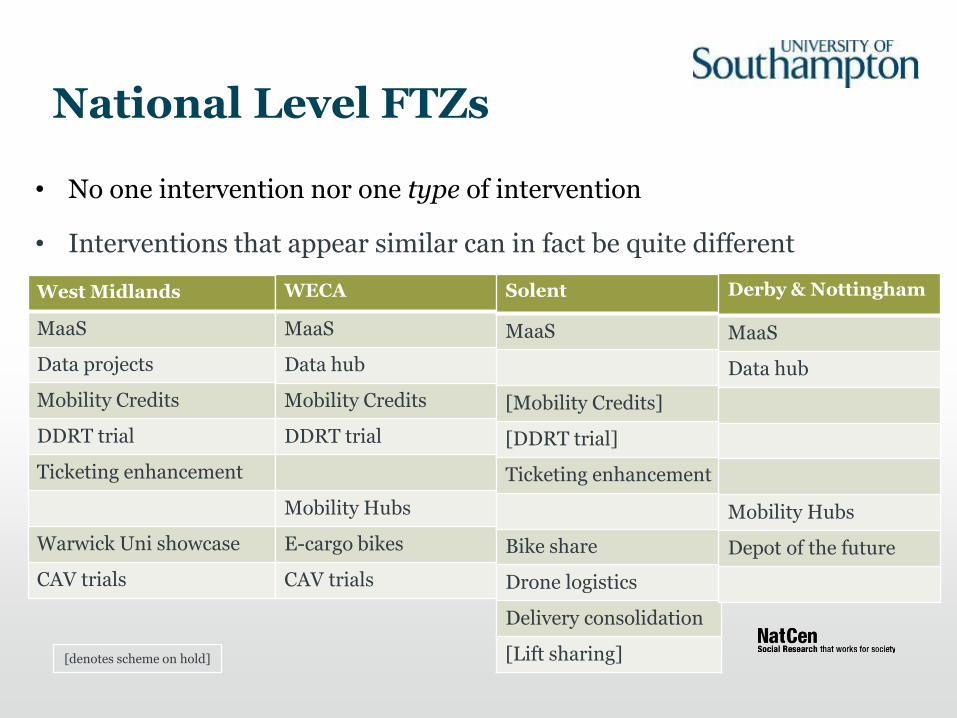
National Level FTZs
• No one intervention nor one type of intervention
• Interventions that appear similar can in fact be quite different
West Midlands
MaaS
Data projects
Mobility Credits
DDRT trial
Ticketing enhancement
Warwick Uni showcase
CAV trials
WECA
MaaS
Data hub
Mobility Credits
DDRT trial
Mobility Hubs
E-cargo bikes
CAV trials
Solent
MaaS
[Mobility Credits]
[DDRT trial]
Ticketing enhancement
Bike share
Drone logistics
Delivery consolidation
[Lift sharing]
Derby & Nottingham
MaaS
Data hub
Mobility Hubs
Depot of the future
[denotes scheme on hold]
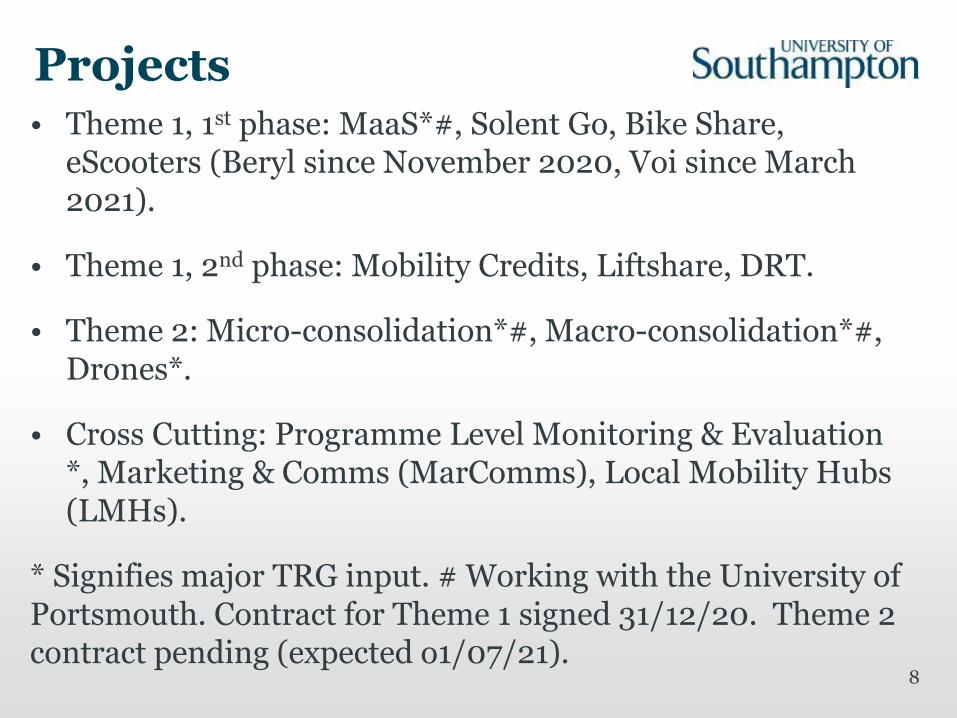
Projects• Theme 1, 1st phase: MaaS*#, Solent Go, Bike Share,
eScooters (Beryl since November 2020, Voi since March 2021).
• Theme 1, 2nd phase: Mobility Credits, Liftshare, DRT.
• Theme 2: Micro-consolidation*#, Macro-consolidation*#, Drones*.
• Cross Cutting: Programme Level Monitoring & Evaluation *, Marketing & Comms (MarComms), Local Mobility Hubs (LMHs).
* Signifies major TRG input. # Working with the University of Portsmouth. Contract for Theme 1 signed 31/12/20. Theme 2 contract pending (expected o1/07/21).
8
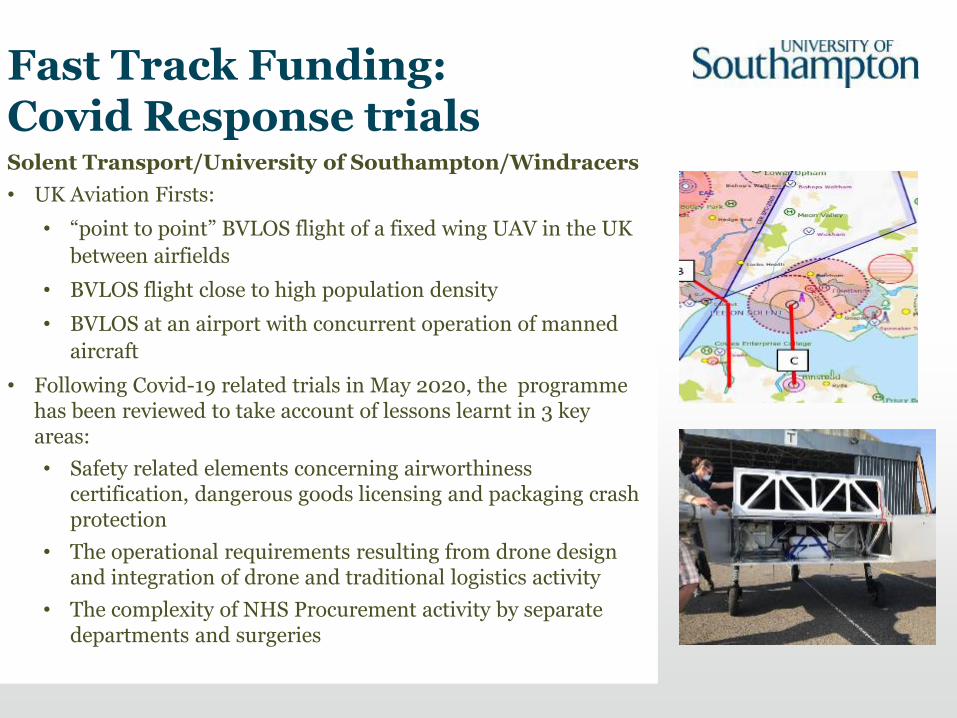
Fast Track Funding:Covid Response trials Solent Transport/University of Southampton/Windracers
• UK Aviation Firsts:
• “point to point” BVLOS flight of a fixed wing UAV in the UK
between airfields
• BVLOS flight close to high population density
• BVLOS at an airport with concurrent operation of manned
aircraft
• Following Covid-19 related trials in May 2020, the programme has been reviewed to take account of lessons learnt in 3 key areas:
• Safety related elements concerning airworthiness certification, dangerous goods licensing and packaging crash protection
• The operational requirements resulting from drone design and integration of drone and traditional logistics activity
• The complexity of NHS Procurement activity by separate departments and surgeries
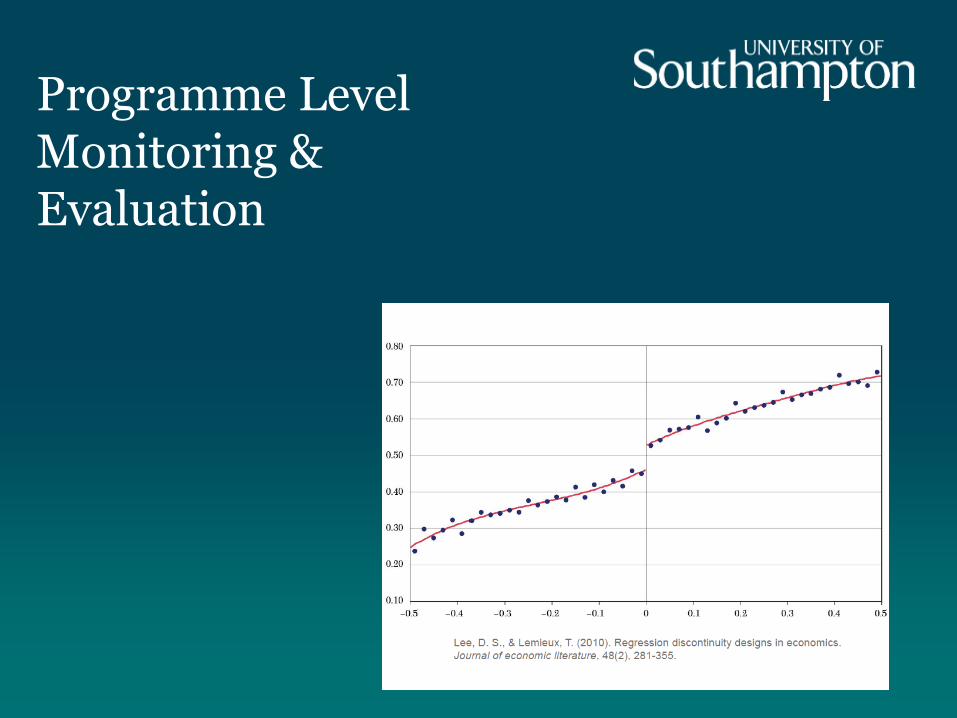
Programme Level Monitoring & Evaluation
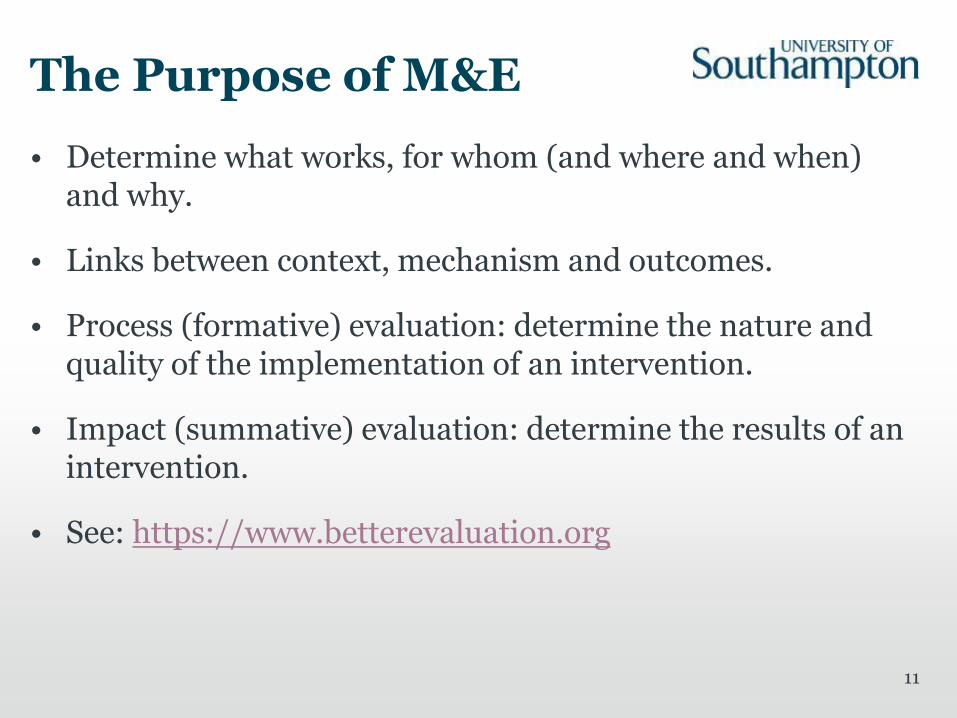
The Purpose of M&E
• Determine what works, for whom (and where and when) and why.
• Links between context, mechanism and outcomes.
• Process (formative) evaluation: determine the nature and quality of the implementation of an intervention.
• Impact (summative) evaluation: determine the results of an intervention.
• See: https://www.betterevaluation.org
11
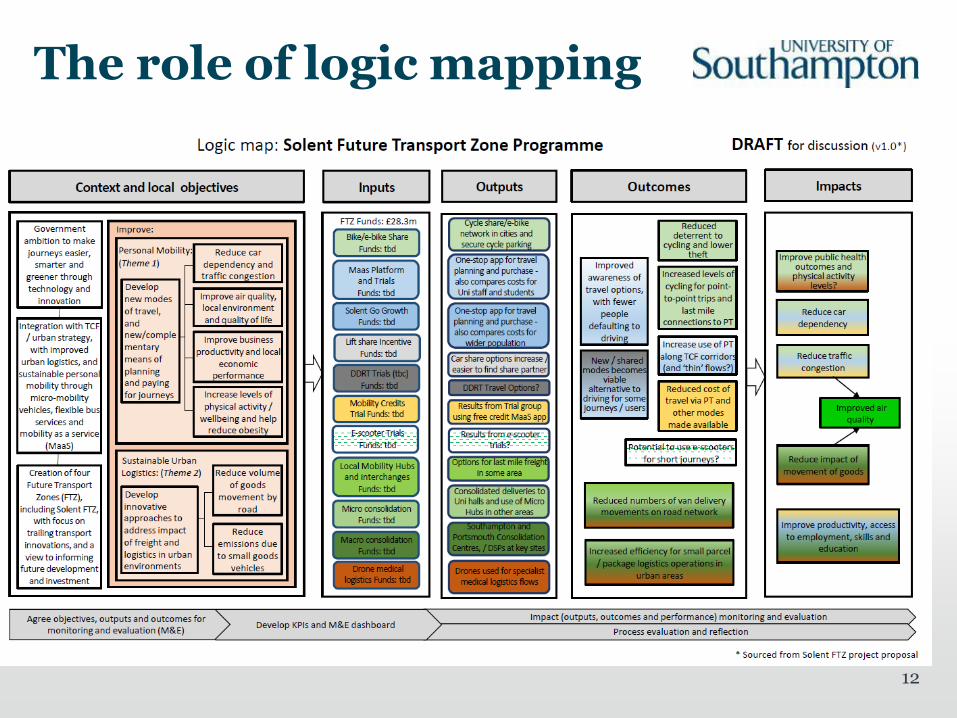
The role of logic mapping
12
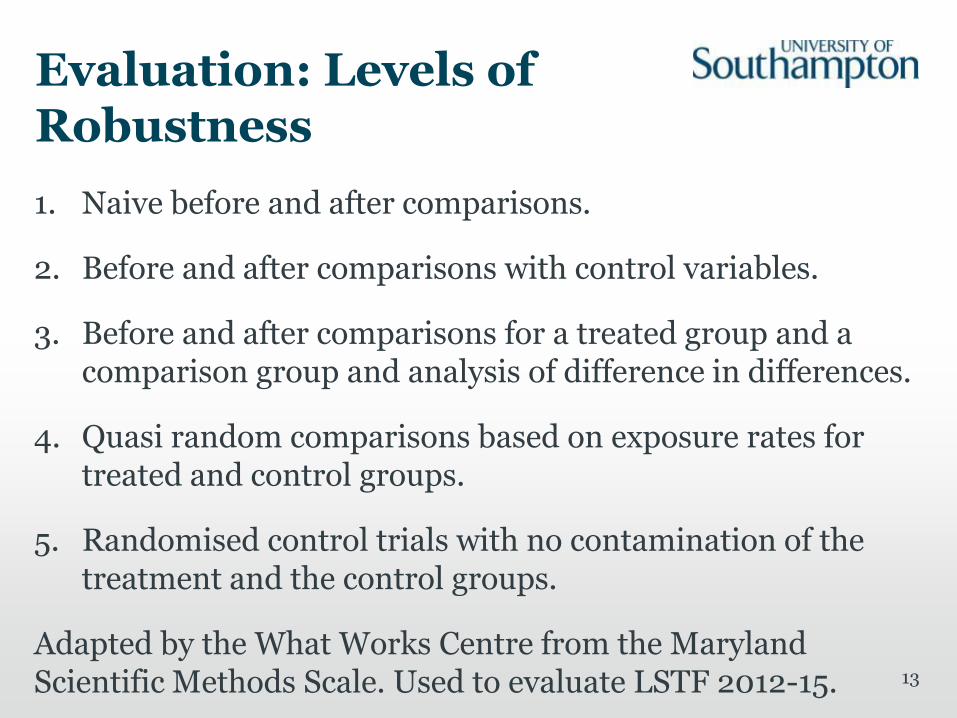
Evaluation: Levels of Robustness
1. Naive before and after comparisons.
2. Before and after comparisons with control variables.
3. Before and after comparisons for a treated group and a comparison group and analysis of difference in differences.
4. Quasi random comparisons based on exposure rates for treated and control groups.
5. Randomised control trials with no contamination of the treatment and the control groups.
Adapted by the What Works Centre from the Maryland Scientific Methods Scale. Used to evaluate LSTF 2012-15. 13
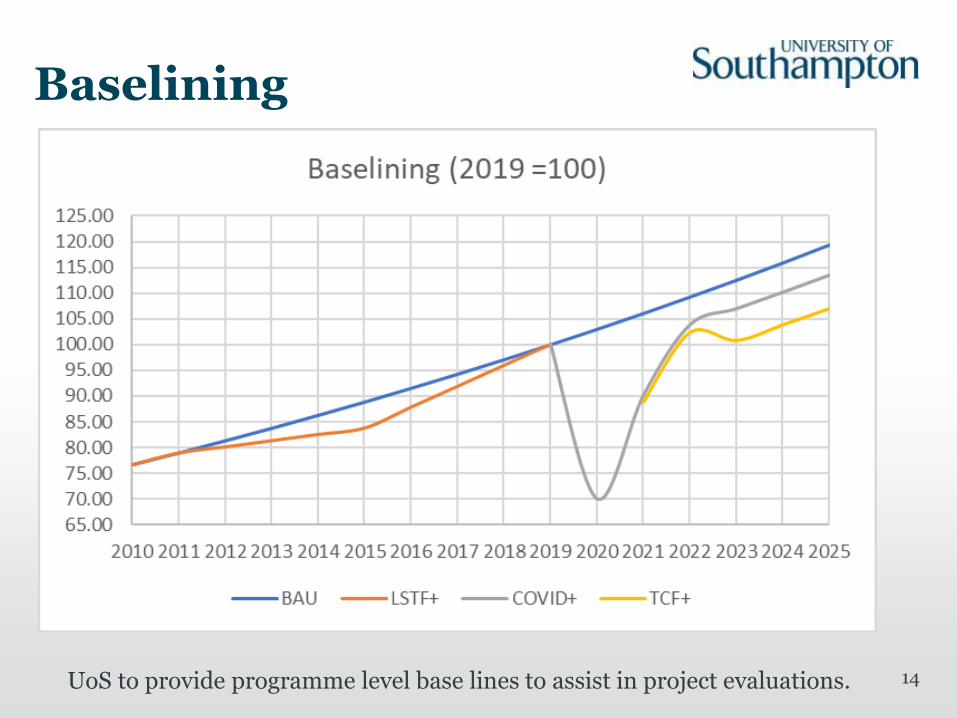
Baselining
14UoS to provide programme level base lines to assist in project evaluations.
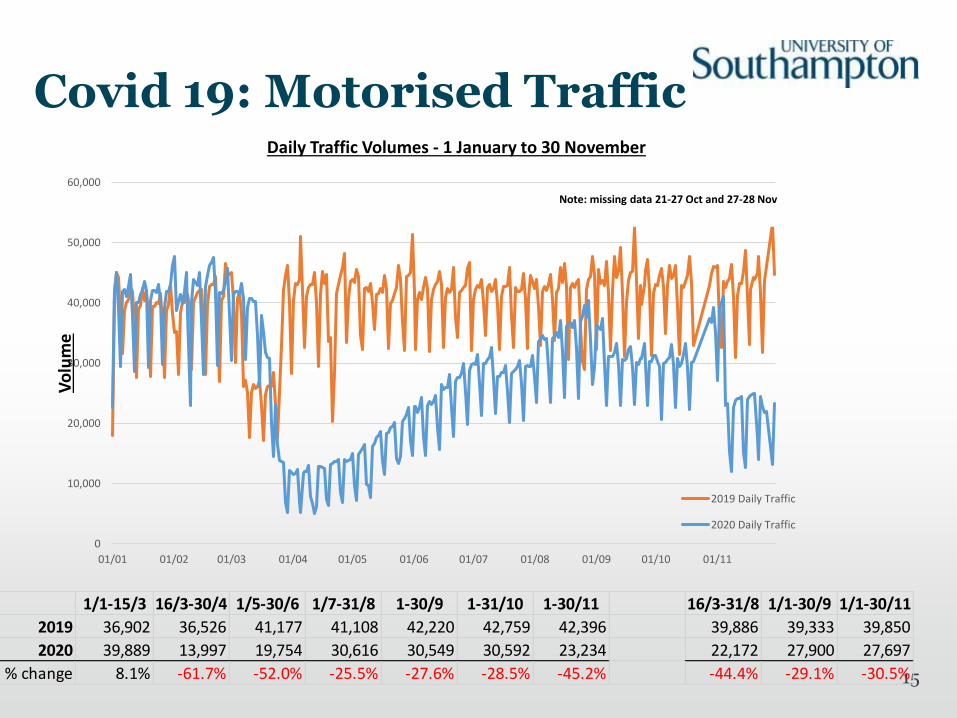
Covid 19: Motorised Traffic
15
0
10,000
20,000
30,000
40,000
50,000
60,000
01/01 01/02 01/03 01/04 01/05 01/06 01/07 01/08 01/09 01/10 01/11
Vo
lum
e
Daily Traffic Volumes - 1 January to 30 November
2019 Daily Traffic
2020 Daily Traffic
Note: missing data 21-27 Oct and 27-28 Nov
1/1-15/3 16/3-30/4 1/5-30/6 1/7-31/8 1-30/9 1-31/10 1-30/11 16/3-31/8 1/1-30/9 1/1-30/11
2019 36,902 36,526 41,177 41,108 42,220 42,759 42,396 39,886 39,333 39,850
2020 39,889 13,997 19,754 30,616 30,549 30,592 23,234 22,172 27,900 27,697
% change 8.1% -61.7% -52.0% -25.5% -27.6% -28.5% -45.2% -44.4% -29.1% -30.5%
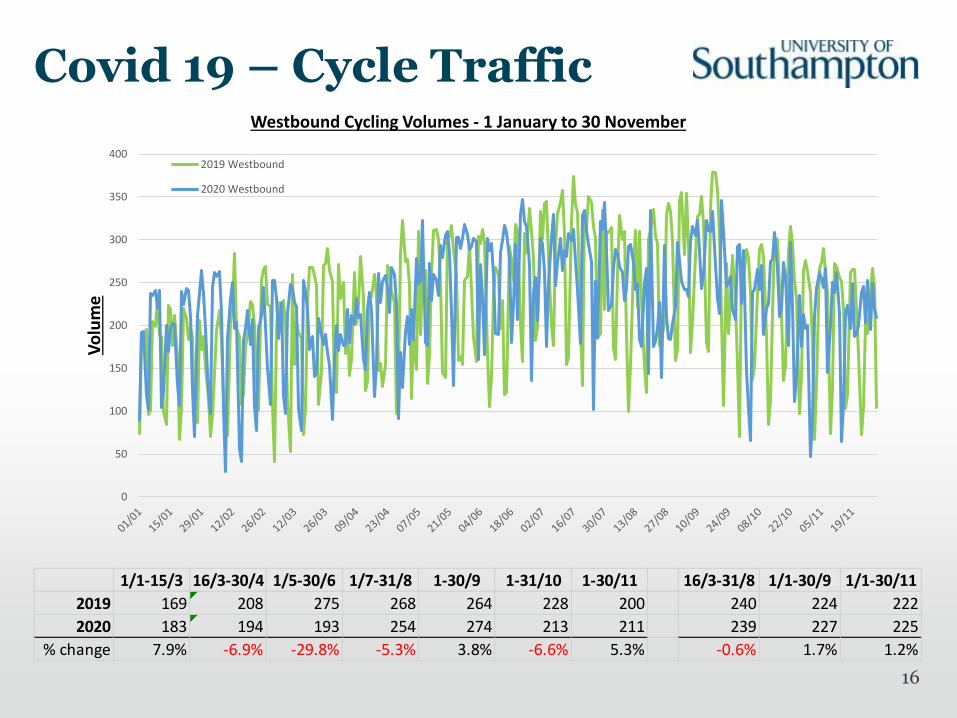
Covid 19 – Cycle Traffic
16
0
50
100
150
200
250
300
350
400
Vo
lum
e
Westbound Cycling Volumes - 1 January to 30 November
2019 Westbound
2020 Westbound
1/1-15/3 16/3-30/4 1/5-30/6 1/7-31/8 1-30/9 1-31/10 1-30/11 16/3-31/8 1/1-30/9 1/1-30/11
2019 169 208 275 268 264 228 200 240 224 222
2020 183 194 193 254 274 213 211 239 227 225
% change 7.9% -6.9% -29.8% -5.3% 3.8% -6.6% 5.3% -0.6% 1.7% 1.2%
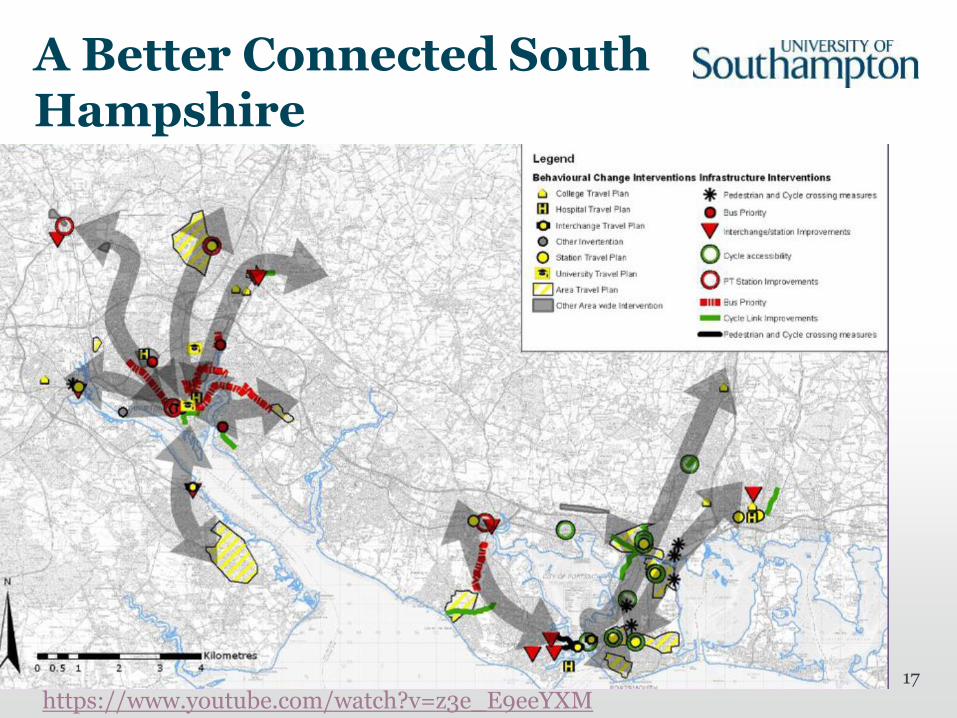
A Better Connected South Hampshire
17
https://www.youtube.com/watch?v=z3e_E9eeYXM
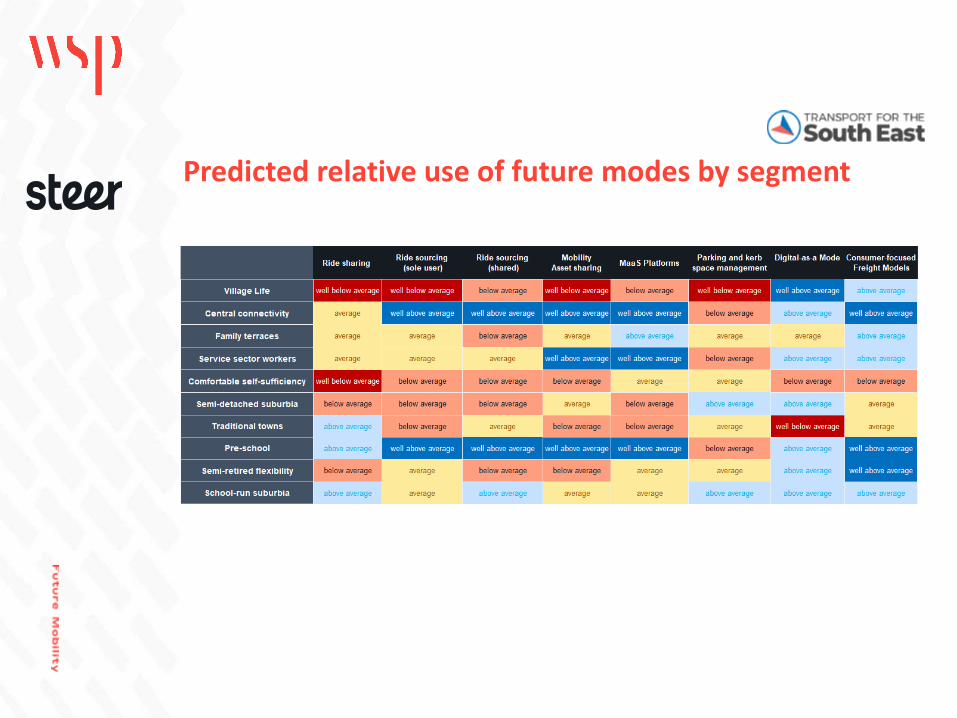
Predicted relative use of future modes by segment
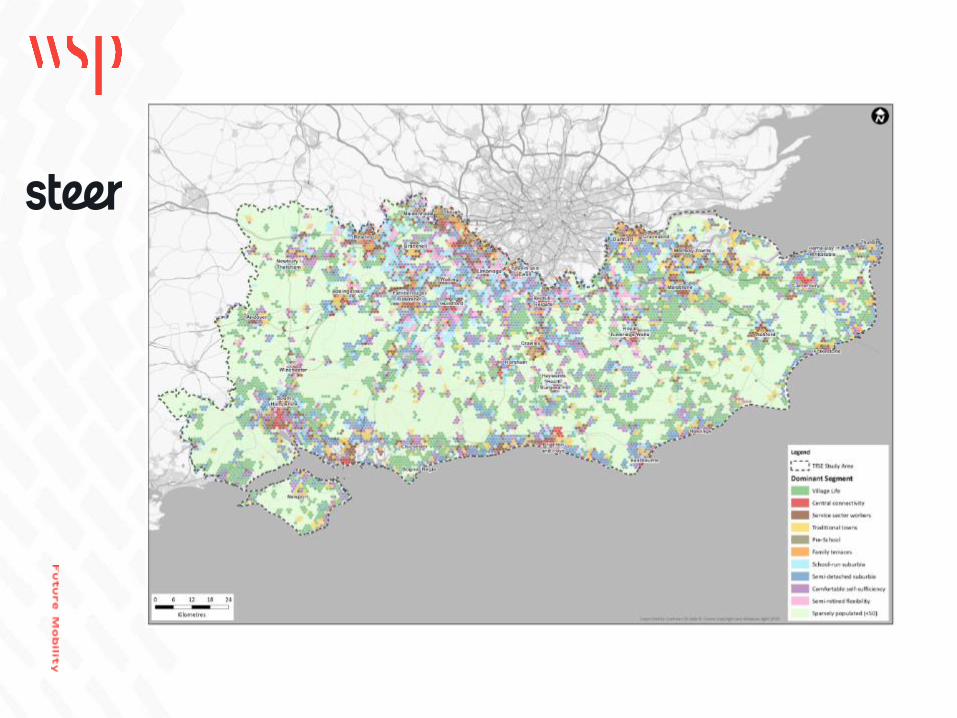
Pen Portraits
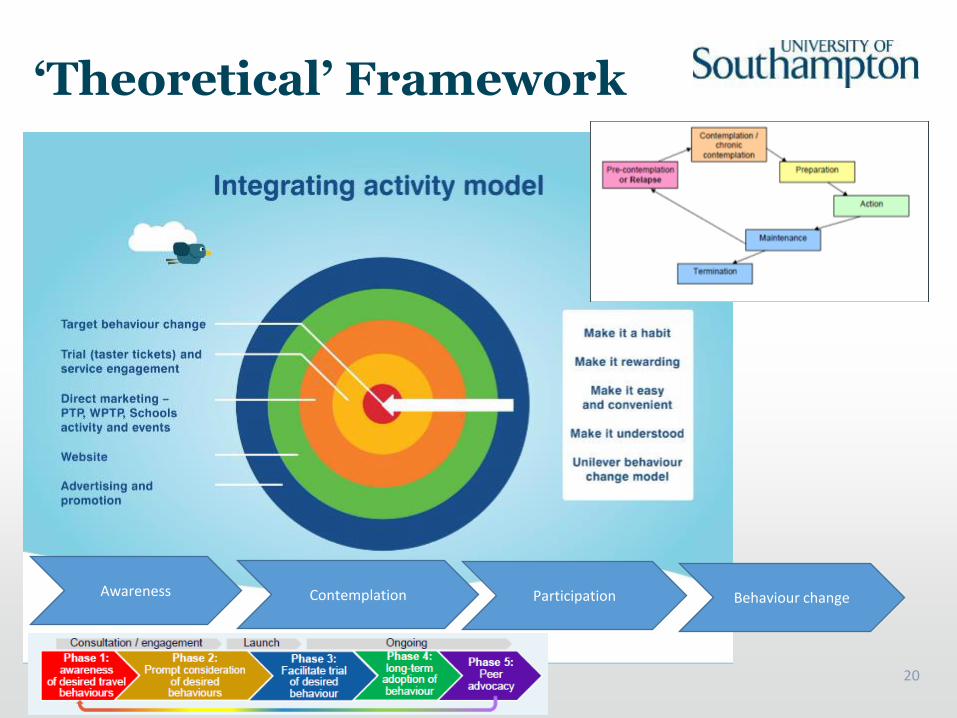
‘Theoretical’ Framework
20
Awareness Contemplation Participation Behaviour change
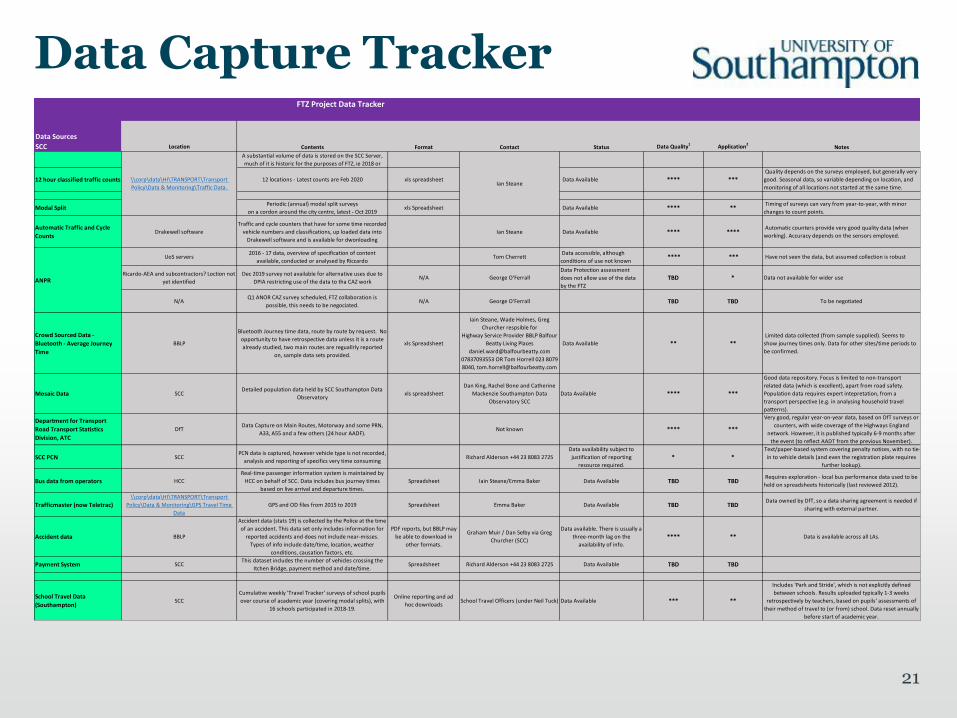
Data Capture Tracker
Data Sources
SCC Location Contents Format Contact Status Data Quality1 Application2Notes
A substantial volume of data is stored on the SCC Server,
much of it is historic for the purposes of FTZ, ie 2018 or
12 hour classified traffic counts 12 locations - Latest counts are Feb 2020 xls spreadsheet Data Available **** ***
Quality depends on the surveys employed, but generally very
good. Seasonal data, so variable depending on location, and
monitoring of all locations not started at the same time.
Modal SplitPeriodic (annual) modal split surveys
on a cordon around the city centre, latest - Oct 2019xls Spreadsheet Data Available **** **
Timing of surveys can vary from year-to-year, with minor
changes to count points.
Automatic Traffic and Cycle
CountsDrakewell software
Traffic and cycle counters that have for some time recorded
vehicle numbers and classifications, up loaded data into
Drakewell software and is available for dwonloading
Ian Steane Data Available **** **** Automatic counters provide very good quality data (when
working). Accuracy depends on the sensors employed.
UoS servers2016 - 17 data, overview of specification of content
available, conducted or analysed by RiccardoTom Cherrett
Data accessible, although
conditions of use not known **** *** Have not seen the data, but assumed collection is robust
Ricardo-AEA and subcontractors? Loction not
yet identified
Dec 2019 survey not available for alternative uses due to
DPIA restricting use of the data to tha CAZ workN/A George O'Ferrall
Data Protection assessment
does not allow use of the data
by the FTZ
TBD * Data not available for wider use
N/AQ1 ANOR CAZ survey scheduled, FTZ collaboration is
possible, this needs to be negociated.N/A George O'Ferrall TBD TBD To be negotiated
Crowd Sourced Data -
Bluetooth - Average Journey
Time
BBLP
Bluetooth Journey time data, route by route by request. No
opportunity to have retrospective data unless it is a route
already studied, two main routes are reguallrly reported
on, sample data sets provided.
xls Spreadsheet
Iain Steane, Wade Holmes, Greg
Churcher respsible for
Highway Service Provider BBLP Balfour
Beatty Living Places
07837093553 OR Tom Horrell 023 8079
8040, [email protected]
Data Available ** **
Limited data collected (from sample supplied). Seems to
show journey times only. Data for other sites/time periods to
be confirmed.
Mosaic Data SCCDetailed population data held by SCC Southampton Data
Observatoryxls spreadsheet
Dan King, Rachel Bone and Catherine
Mackenzie Southampton Data
Observatory SCC
Data Available **** ***
Good data repository. Focus is limited to non-transport
related data (which is excellent), apart from road safety.
Population data requires expert intepretation, from a
transport perspective (e.g. in analysing household travel
patterns).
Department for Transport
Road Transport Statistics
Division, ATC
DfTData Capture on Main Routes, Motorway and some PRN,
A33, A55 and a few others (24 hour AADF).Not known **** ***
Very good, regular year-on-year data, based on DfT surveys or
counters, with wide coverage of the Highways England
network. However, it is published typically 6-9 months after
the event (to reflect AADT from the previous November).
SCC PCN SCCPCN data is captured, however vehicle type is not recorded,
analysis and reporting of specifics very time consumingRichard Alderson +44 23 8083 2725
Data availability subject to
justification of reporting
resource required.
* *
Text/paper-based system covering penalty notices, with no tie-
in to vehicle details (and even the registration plate requires
further lookup).
Bus data from operators HCC
Real-time passenger information system is maintained by
HCC on behalf of SCC. Data includes bus journey times
based on live arrival and departure times.
Spreadsheet Iain Steane/Emma Baker Data Available TBD TBD Requires exploration - local bus performance data used to be
held on spreadsheets historically (last reviewed 2012).
Trafficmaster (now Teletrac)
\\corp\data\HI\TRANSPORT\Transport
Policy\Data & Monitoring\GPS Travel Time
Data
GPS and OD files from 2015 to 2019 Spreadsheet Emma Baker Data Available TBD TBDData owned by DfT, so a data sharing agreement is needed if
sharing with external partner.
Accident data BBLP
Accident data (stats 19) is collected by the Police at the time
of an accident. This data set only includes information for
reported accidents and does not include near-misses.
Types of info include date/time, location, weather
conditions, causation factors, etc.
PDF reports, but BBLP may
be able to download in
other formats.
Graham Muir / Dan Selby via Greg
Churcher (SCC)
Data available. There is usually a
three-month lag on the
availability of info.
**** ** Data is available across all LAs.
Payment System SCCThis dataset includes the number of vehicles crossing the
Itchen Bridge, payment method and date/time. Spreadsheet Richard Alderson +44 23 8083 2725 Data Available TBD TBD
School Travel Data
(Southampton)SCC
Cumulative weekly 'Travel Tracker' surveys of school pupils
over course of academic year (covering modal splits), with
16 schools participated in 2018-19.
Online reporting and ad
hoc downloadsSchool Travel Officers (under Neil Tuck) Data Available *** **
Includes 'Park and Stride', which is not explicitly defined
between schools. Results uploaded typically 1-3 weeks
retrospectively by teachers, based on pupils' assessments of
their method of travel to (or from) school. Data reset annually
before start of academic year.
\\corp\data\HI\TRANSPORT\Transport
Policy\Data & Monitoring\Traffic Data. Ian Steane
ANPR
FTZ Project Data Tracker
21
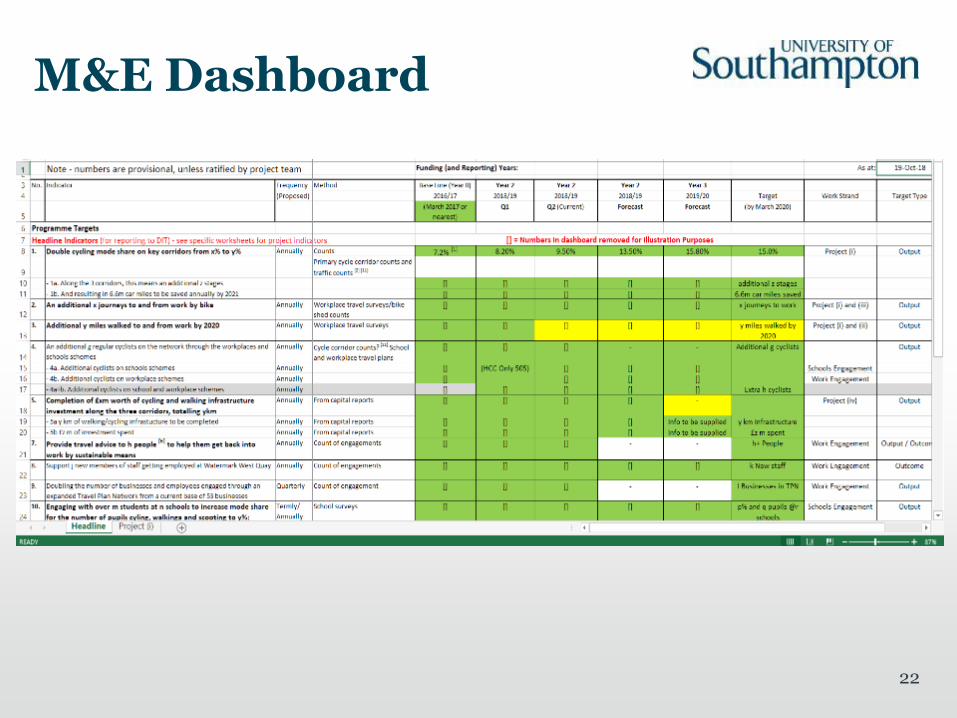
M&E Dashboard
22
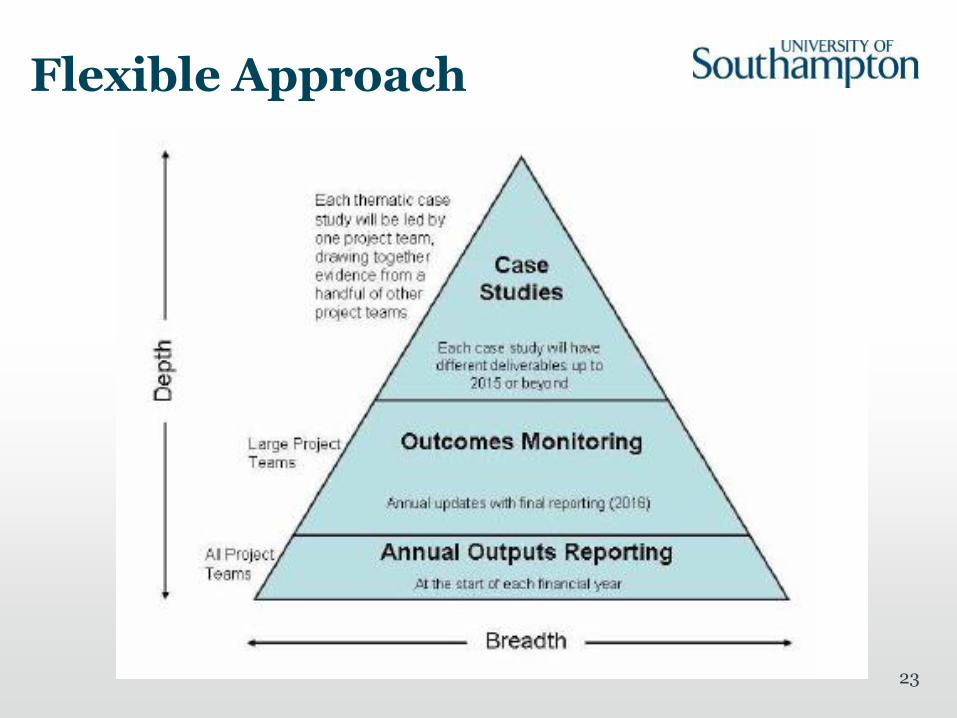
Flexible Approach
23
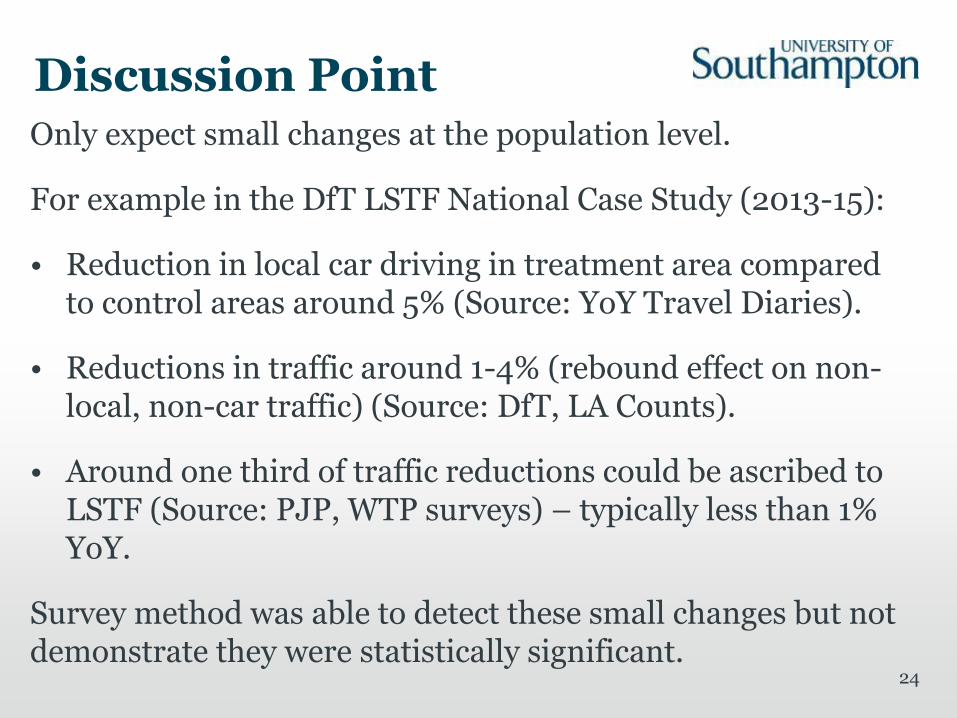
Discussion PointOnly expect small changes at the population level.
For example in the DfT LSTF National Case Study (2013-15):
• Reduction in local car driving in treatment area compared to control areas around 5% (Source: YoY Travel Diaries).
• Reductions in traffic around 1-4% (rebound effect on non-local, non-car traffic) (Source: DfT, LA Counts).
• Around one third of traffic reductions could be ascribed to LSTF (Source: PJP, WTP surveys) – typically less than 1% YoY.
Survey method was able to detect these small changes but not demonstrate they were statistically significant.
24
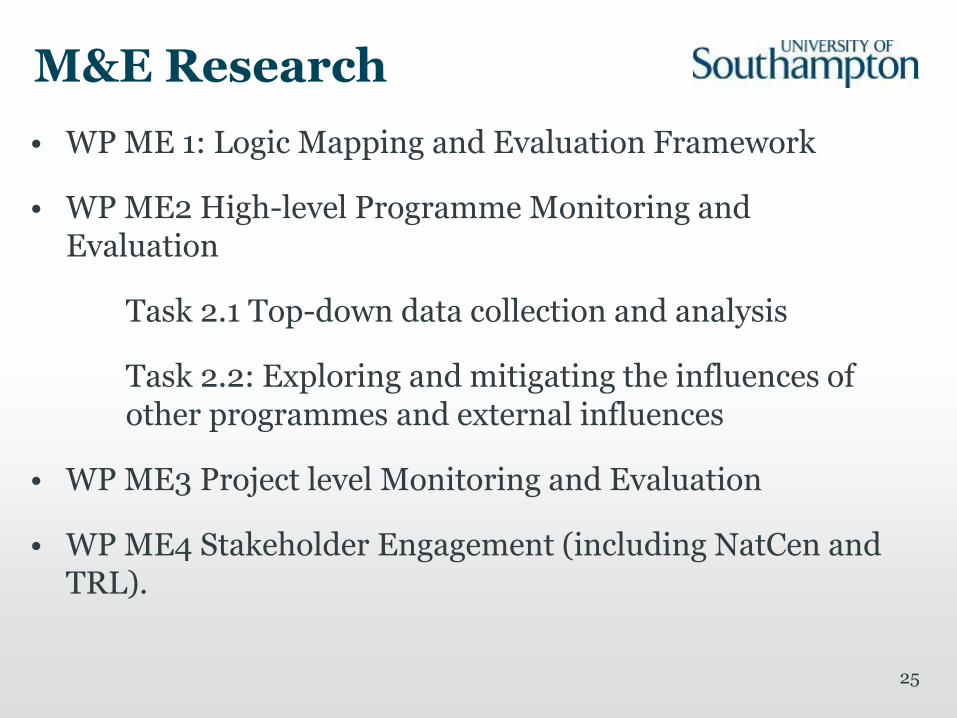
M&E Research
• WP ME 1: Logic Mapping and Evaluation Framework
• WP ME2 High-level Programme Monitoring and Evaluation
Task 2.1 Top-down data collection and analysis
Task 2.2: Exploring and mitigating the influences of other programmes and external influences
• WP ME3 Project level Monitoring and Evaluation
• WP ME4 Stakeholder Engagement (including NatCen and TRL).
25
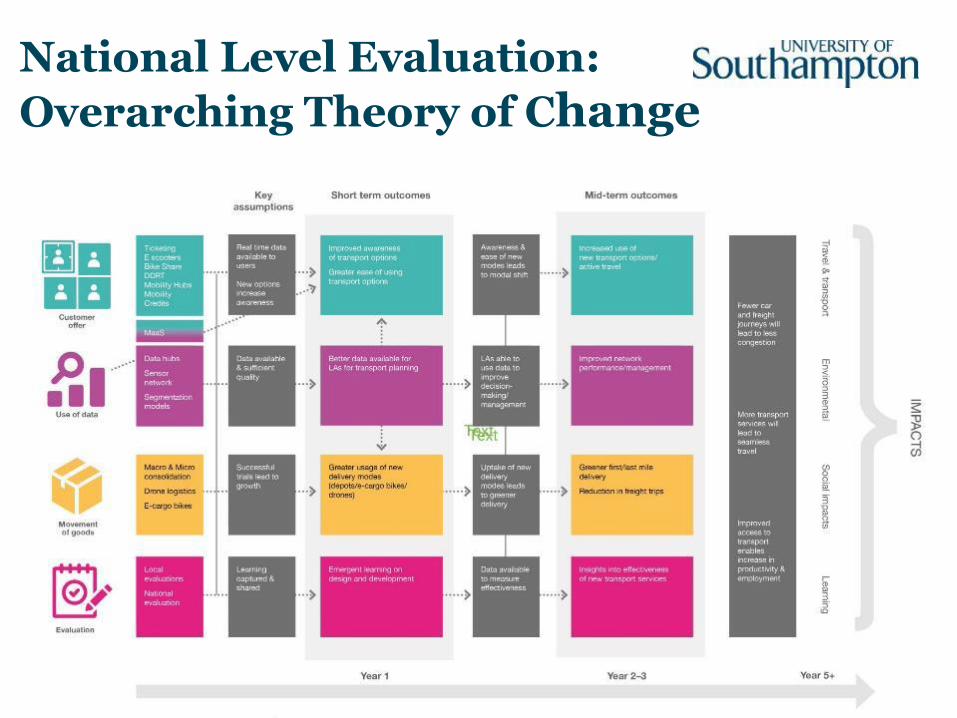
National Level Evaluation:
Overarching Theory of Change
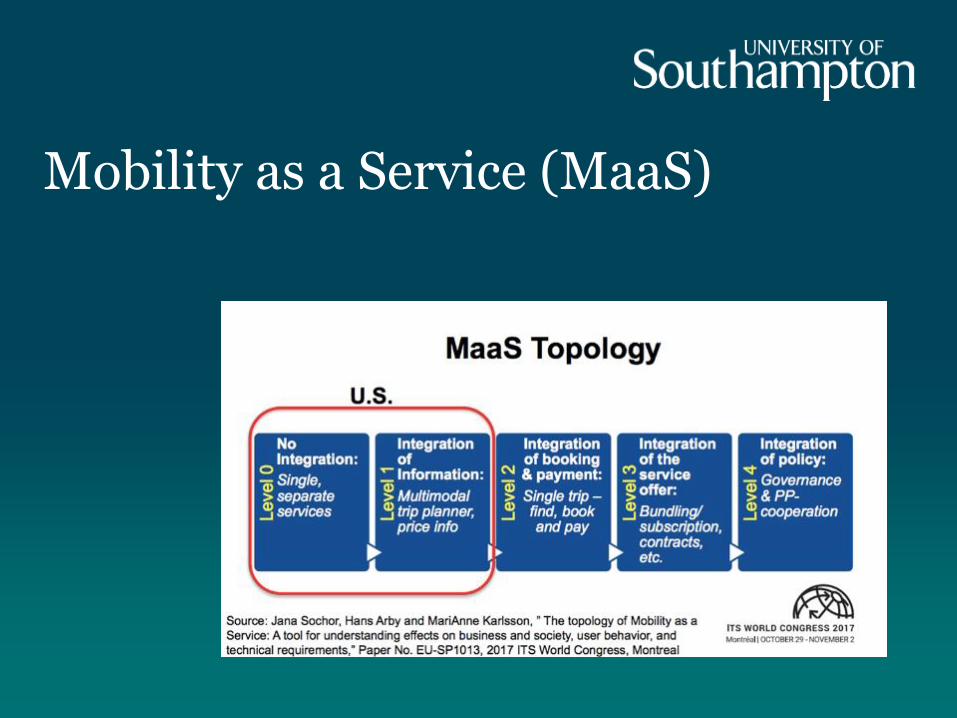
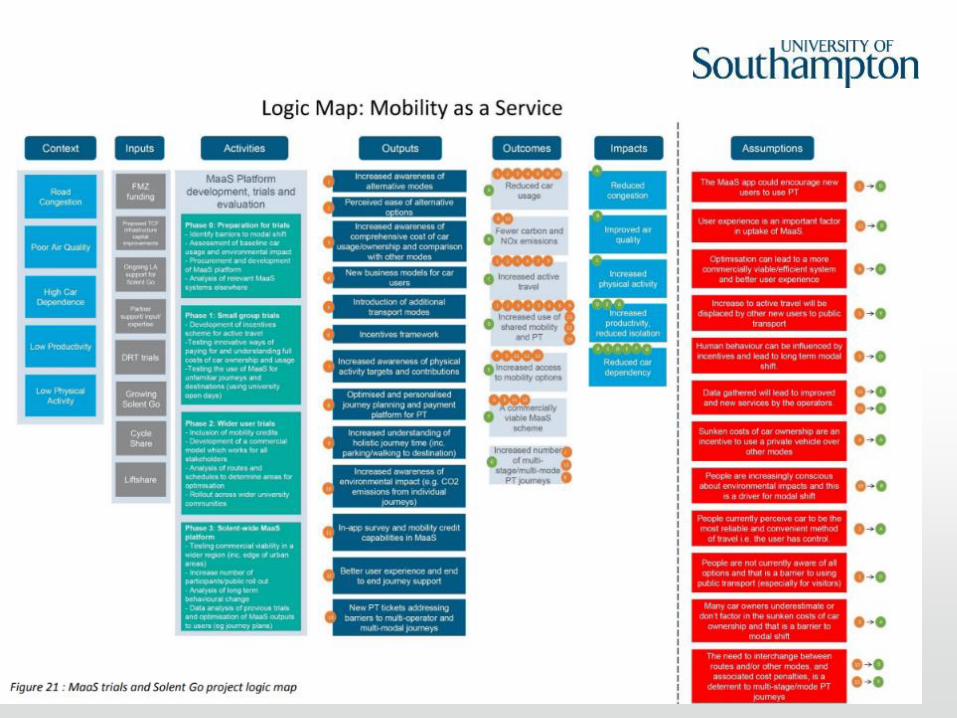
Mobility as a Service (MaaS)
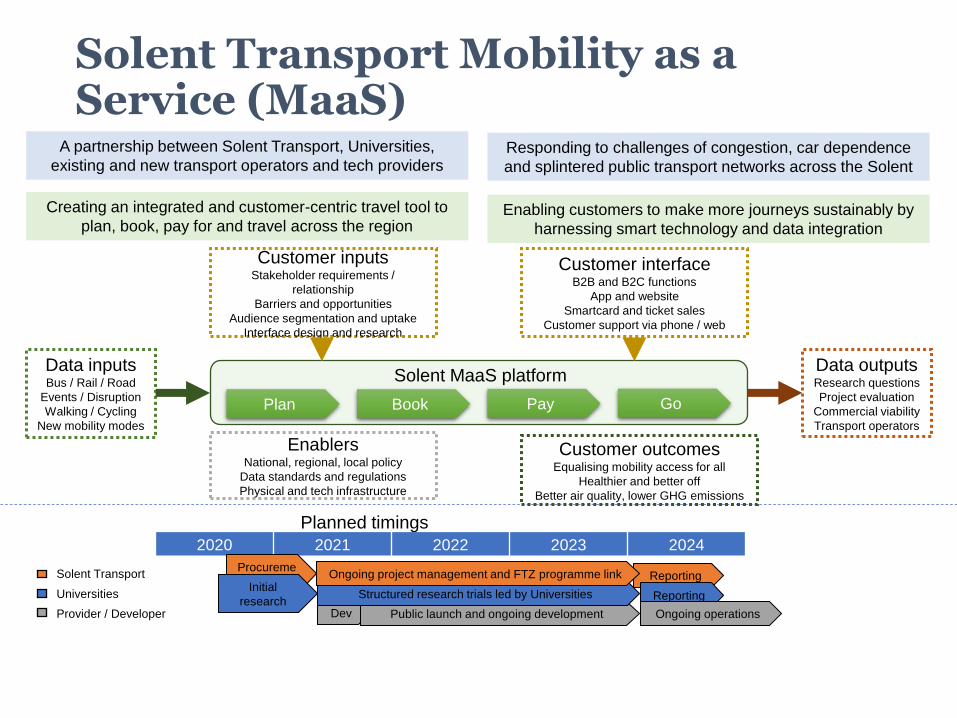
Solent Transport Mobility as a Service (MaaS)
2020 2021 2022 2023 2024
Procureme
nt
Dev Public launch and ongoing development
Initial
researchStructured research trials led by Universities
Reporting
Planned timings
A partnership between Solent Transport, Universities,
existing and new transport operators and tech providersResponding to challenges of congestion, car dependence
and splintered public transport networks across the Solent
Creating an integrated and customer-centric travel tool to
plan, book, pay for and travel across the regionEnabling customers to make more journeys sustainably by
harnessing smart technology and data integration
Data inputsBus / Rail / Road
Events / Disruption
Walking / Cycling
New mobility modes
Plan Book Pay Go
Solent MaaS platformData outputsResearch questions
Project evaluation
Commercial viability
Transport operators
Customer inputsStakeholder requirements /
relationship
Barriers and opportunities
Audience segmentation and uptake
Interface design and research
Customer interfaceB2B and B2C functions
App and website
Smartcard and ticket sales
Customer support via phone / web
Solent Transport Ongoing project management and FTZ programme link
ReportingUniversities
Provider / Developer Ongoing operations
EnablersNational, regional, local policy
Data standards and regulations
Physical and tech infrastructure
Customer outcomesEqualising mobility access for all
Healthier and better off
Better air quality, lower GHG emissions
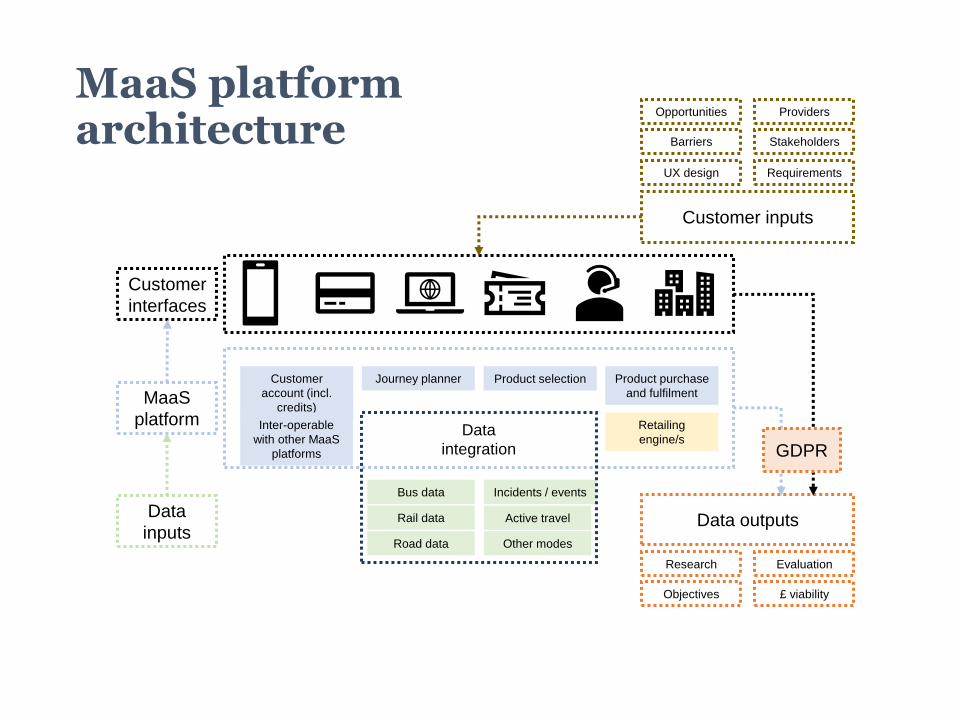
MaaS platform architecture
Data
integration
Bus data
Rail data
Road data
Journey planner Product selection Product purchase
and fulfilment
Retailing
engine/s
Incidents / events
Other modes
Active travel
MaaS
platform
Customer
interfaces
Customer
account (incl.
credits)
Data
inputsData outputs
Inter-operable
with other MaaS
platforms GDPR
Customer inputs
UX design
Barriers
Opportunities
Requirements
Stakeholders
Providers
Objectives
Research
£ viability
Evaluation
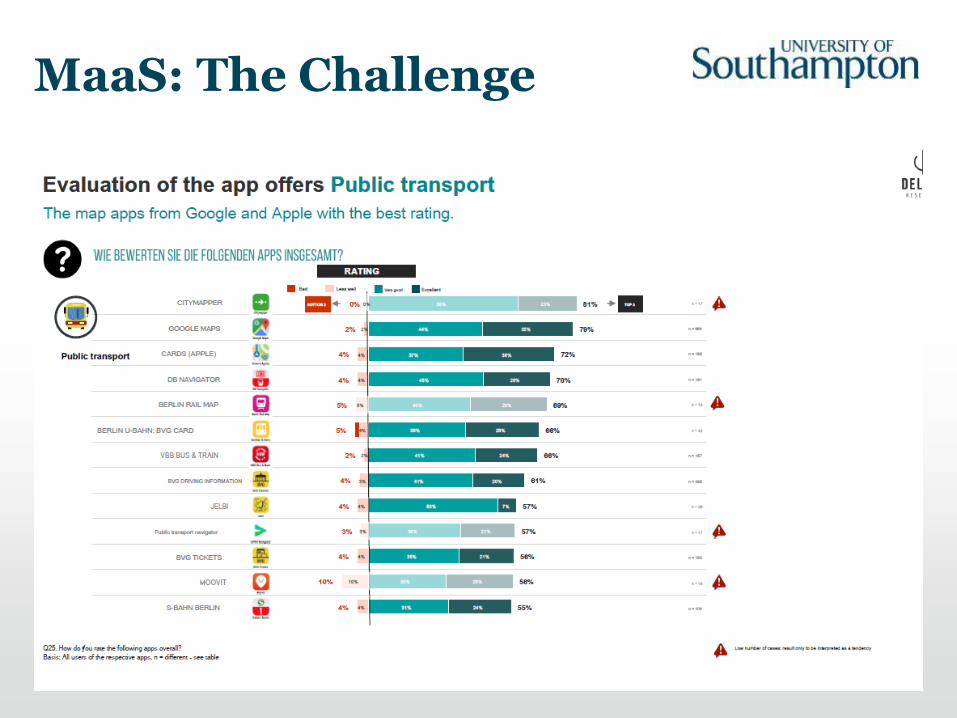
MaaS: The Challenge
31
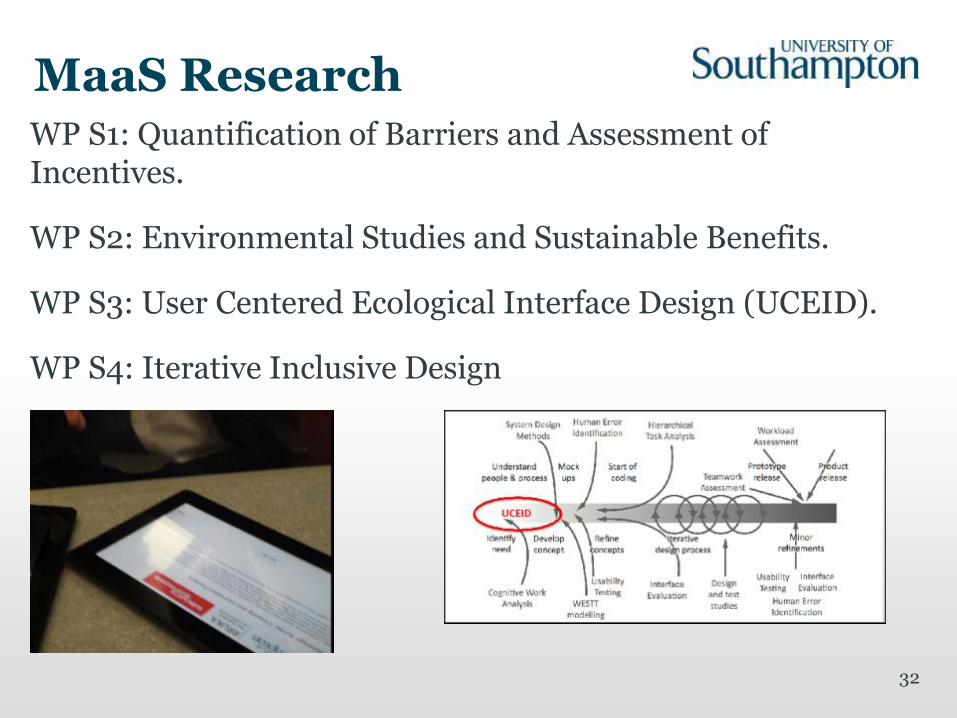
MaaS ResearchWP S1: Quantification of Barriers and Assessment of Incentives.
WP S2: Environmental Studies and Sustainable Benefits.
WP S3: User Centered Ecological Interface Design (UCEID).
WP S4: Iterative Inclusive Design
32
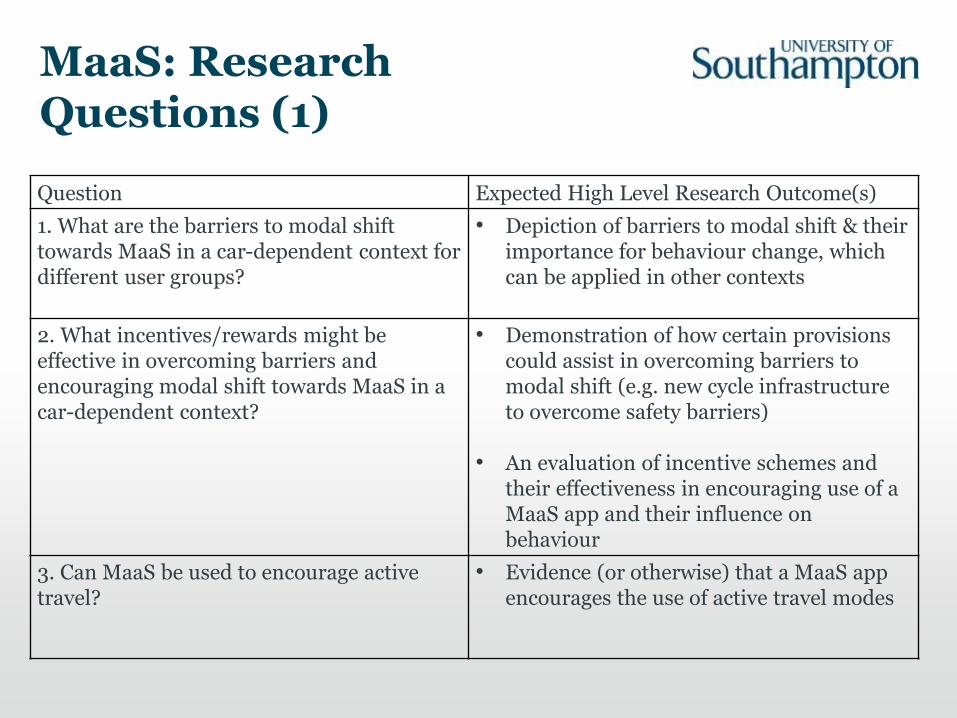
MaaS: Research Questions (1)
Question Expected High Level Research Outcome(s)
1. What are the barriers to modal shift towards MaaS in a car-dependent context for different user groups?
• Depiction of barriers to modal shift & their importance for behaviour change, which can be applied in other contexts
2. What incentives/rewards might be effective in overcoming barriers and encouraging modal shift towards MaaS in a car-dependent context?
• Demonstration of how certain provisions could assist in overcoming barriers to modal shift (e.g. new cycle infrastructure to overcome safety barriers)
• An evaluation of incentive schemes and their effectiveness in encouraging use of a MaaS app and their influence on behaviour
3. Can MaaS be used to encourage active travel?
• Evidence (or otherwise) that a MaaS app encourages the use of active travel modes
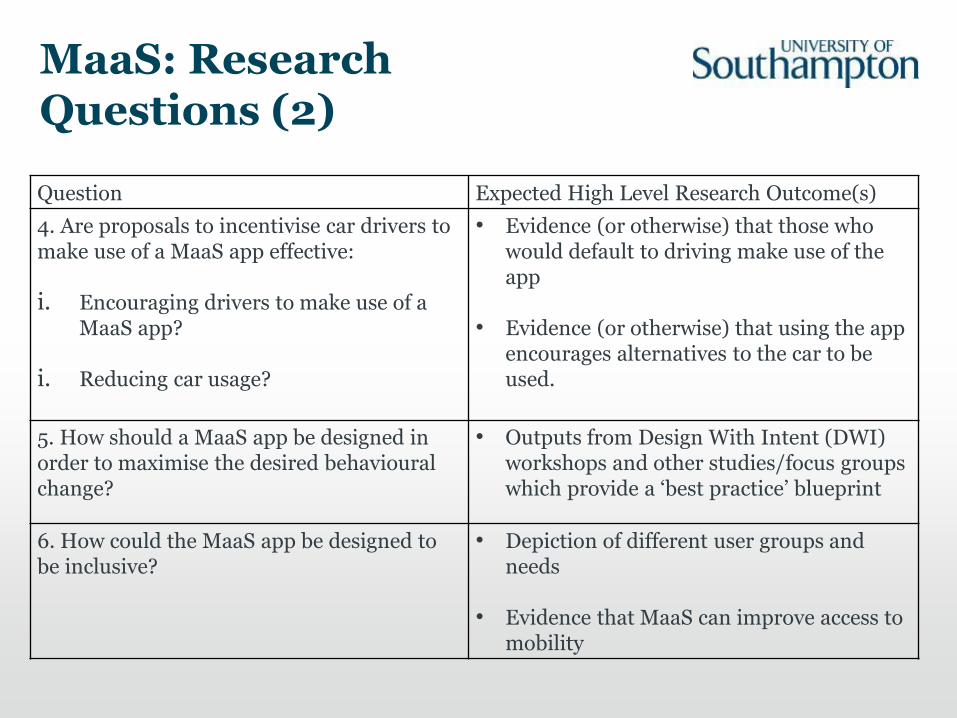
MaaS: Research Questions (2)
Question Expected High Level Research Outcome(s)
4. Are proposals to incentivise car drivers to make use of a MaaS app effective:
i. Encouraging drivers to make use of a MaaS app?
i. Reducing car usage?
• Evidence (or otherwise) that those who would default to driving make use of the app
• Evidence (or otherwise) that using the app encourages alternatives to the car to be used.
5. How should a MaaS app be designed in order to maximise the desired behavioural change?
• Outputs from Design With Intent (DWI) workshops and other studies/focus groups which provide a ‘best practice’ blueprint
6. How could the MaaS app be designed to be inclusive?
• Depiction of different user groups and needs
• Evidence that MaaS can improve access to mobility
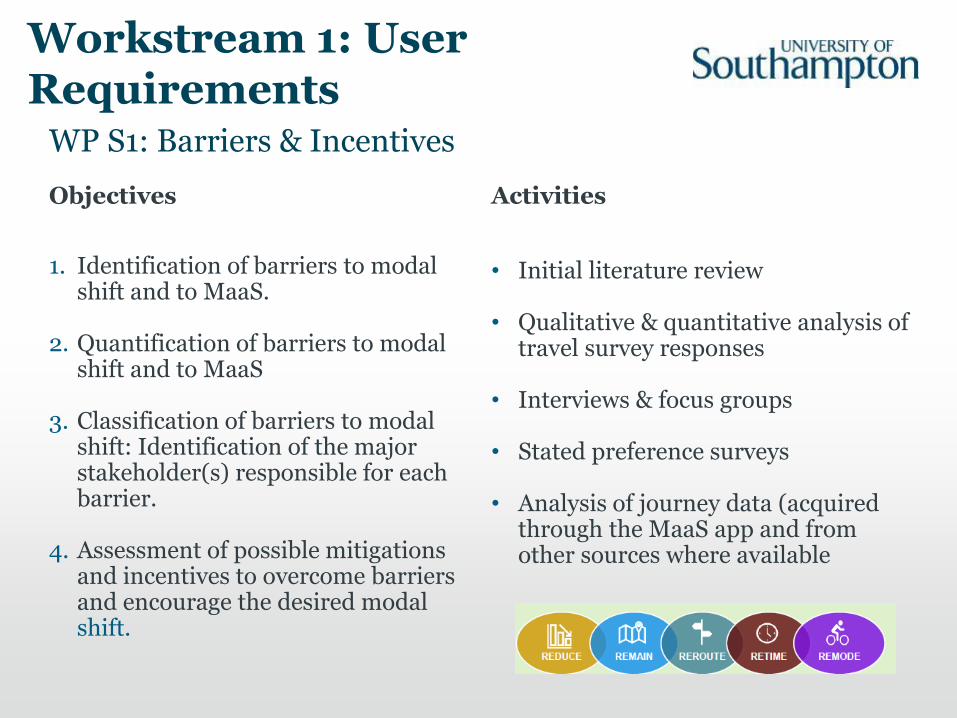
Workstream 1: User Requirements
Objectives
1. Identification of barriers to modal shift and to MaaS.
2. Quantification of barriers to modal shift and to MaaS
3. Classification of barriers to modal shift: Identification of the major stakeholder(s) responsible for each barrier.
4. Assessment of possible mitigations and incentives to overcome barriers and encourage the desired modalshift.
Activities
• Initial literature review
• Qualitative & quantitative analysis of travel survey responses
• Interviews & focus groups
• Stated preference surveys
• Analysis of journey data (acquired through the MaaS app and from other sources where available
WP S1: Barriers & Incentives
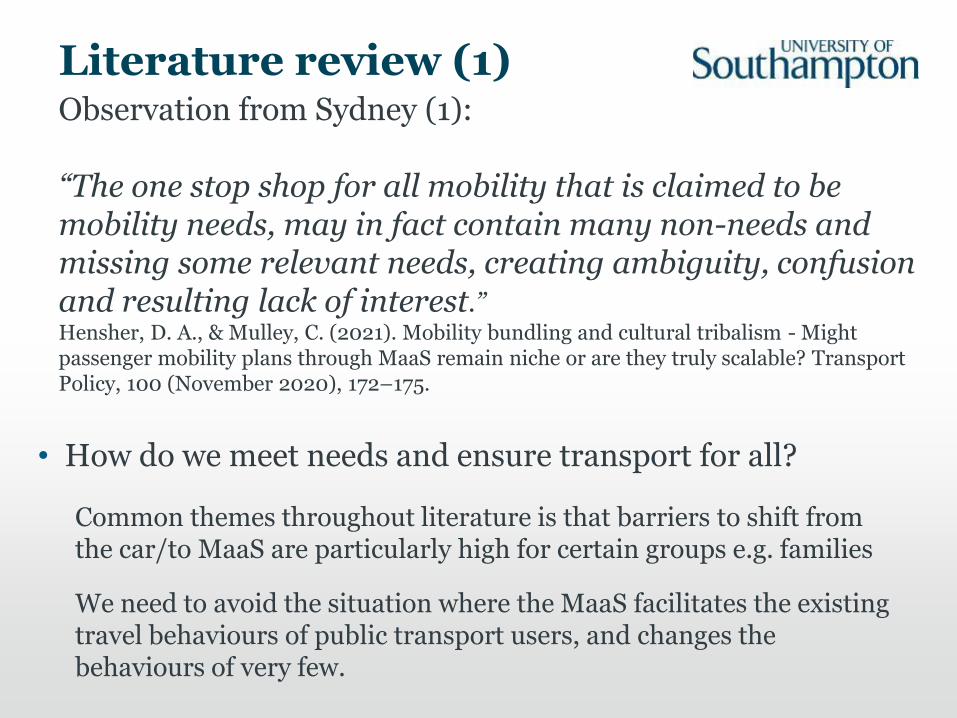
Literature review (1)
• How do we meet needs and ensure transport for all?
Common themes throughout literature is that barriers to shift from the car/to MaaS are particularly high for certain groups e.g. families
We need to avoid the situation where the MaaS facilitates the existing travel behaviours of public transport users, and changes the behaviours of very few.
Observation from Sydney (1):
“The one stop shop for all mobility that is claimed to be mobility needs, may in fact contain many non-needs and missing some relevant needs, creating ambiguity, confusion and resulting lack of interest.”Hensher, D. A., & Mulley, C. (2021). Mobility bundling and cultural tribalism - Might passenger mobility plans through MaaS remain niche or are they truly scalable? Transport Policy, 100 (November 2020), 172–175.
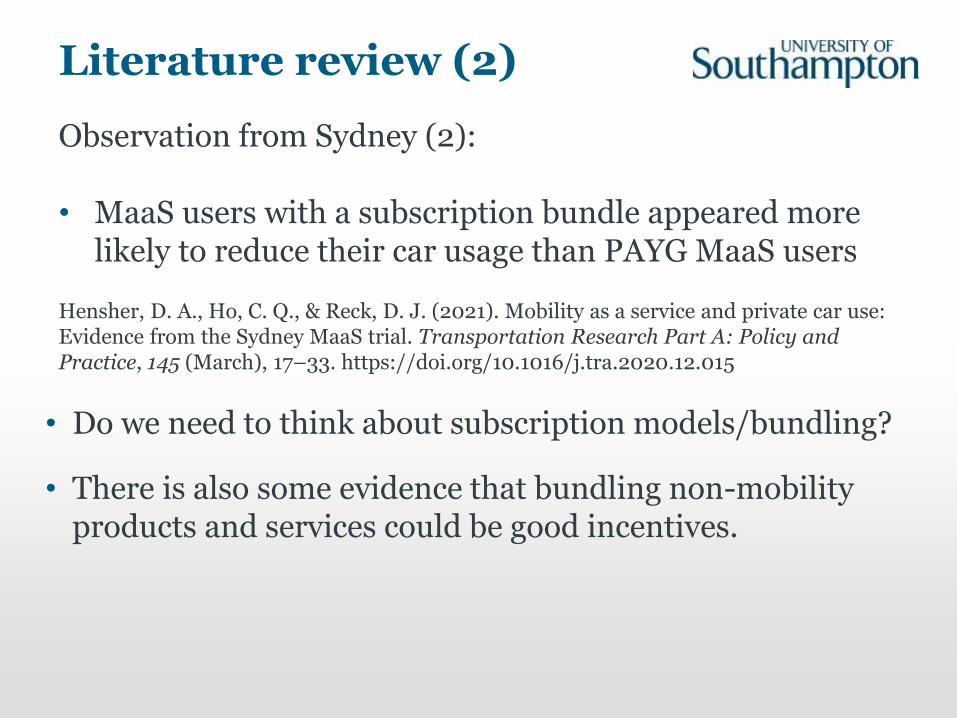
Literature review (2)
• Do we need to think about subscription models/bundling?
• There is also some evidence that bundling non-mobility products and services could be good incentives.
Observation from Sydney (2):
• MaaS users with a subscription bundle appeared more likely to reduce their car usage than PAYG MaaS users
Hensher, D. A., Ho, C. Q., & Reck, D. J. (2021). Mobility as a service and private car use: Evidence from the Sydney MaaS trial. Transportation Research Part A: Policy and Practice, 145 (March), 17–33. https://doi.org/10.1016/j.tra.2020.12.015
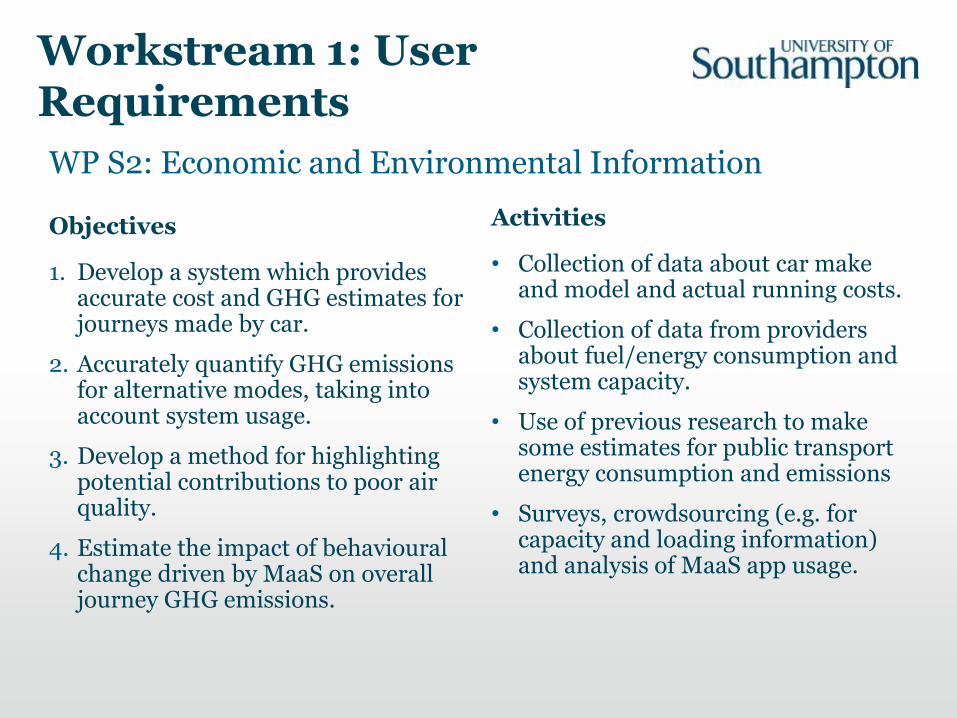
Workstream 1: User Requirements
Objectives
1. Develop a system which provides accurate cost and GHG estimates for journeys made by car.
2. Accurately quantify GHG emissions for alternative modes, taking into account system usage.
3. Develop a method for highlighting potential contributions to poor air quality.
4. Estimate the impact of behavioural change driven by MaaS on overall journey GHG emissions.
Activities
• Collection of data about car make and model and actual running costs.
• Collection of data from providers about fuel/energy consumption and system capacity.
• Use of previous research to make some estimates for public transport energy consumption and emissions
• Surveys, crowdsourcing (e.g. for capacity and loading information) and analysis of MaaS app usage.
WP S2: Economic and Environmental Information
39
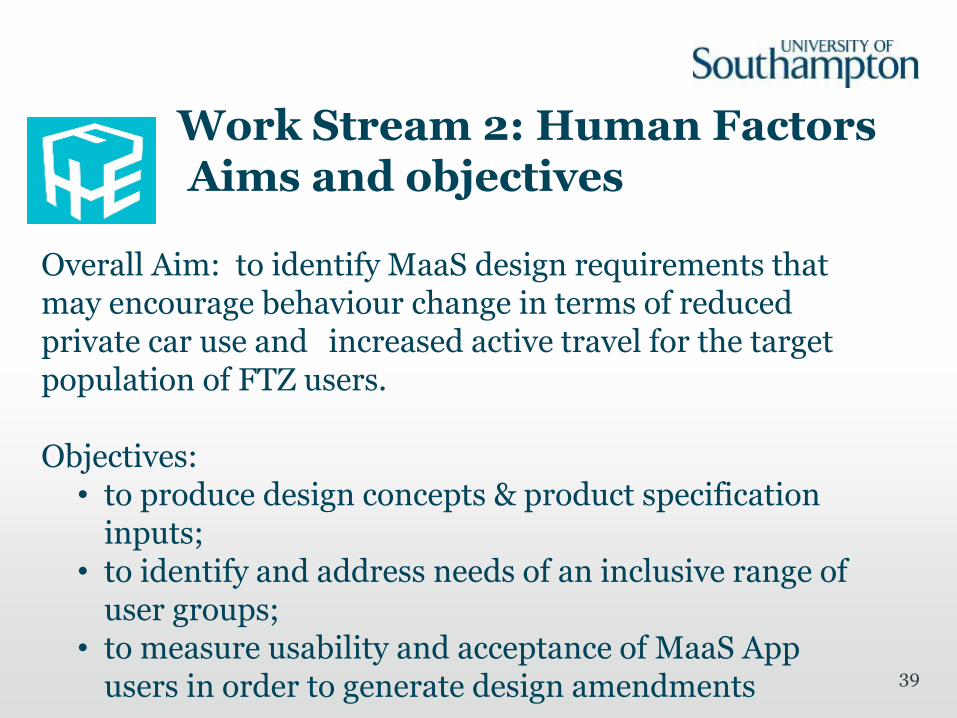
Work Stream 2: Human FactorsAims and objectives
Overall Aim: to identify MaaS design requirements that may encourage behaviour change in terms of reduced private car use and increased active travel for the target population of FTZ users.
Objectives: • to produce design concepts & product specification
inputs; • to identify and address needs of an inclusive range of
user groups; • to measure usability and acceptance of MaaS App
users in order to generate design amendments
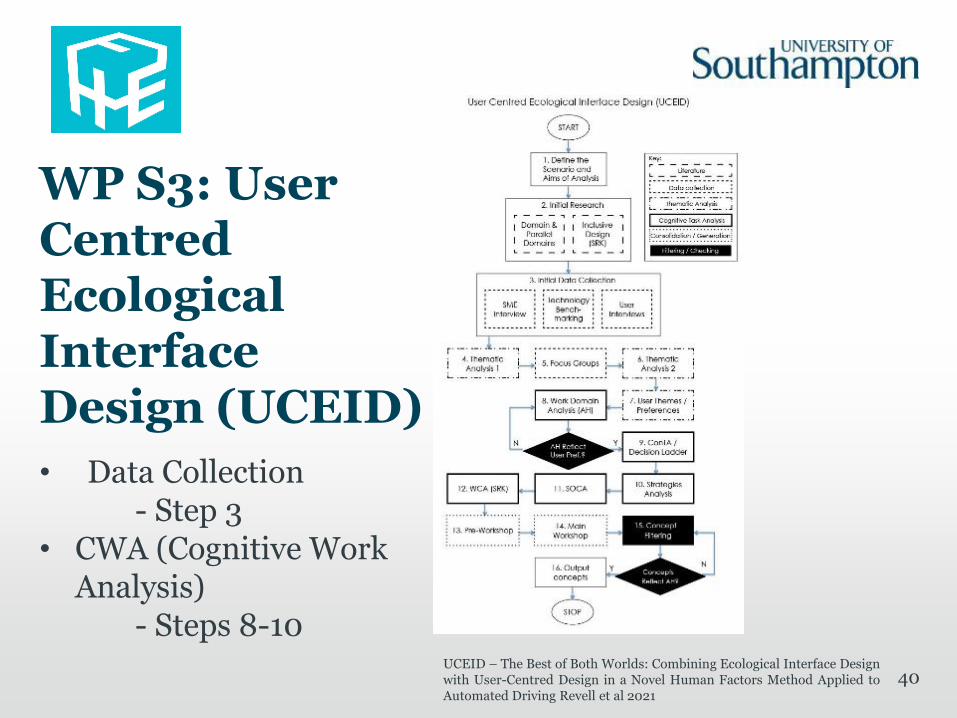
WP S3: User CentredEcological Interface Design (UCEID)
40UCEID – The Best of Both Worlds: Combining Ecological Interface Designwith User-Centred Design in a Novel Human Factors Method Applied toAutomated Driving Revell et al 2021
• Data Collection- Step 3
• CWA (Cognitive Work Analysis)
- Steps 8-10
41
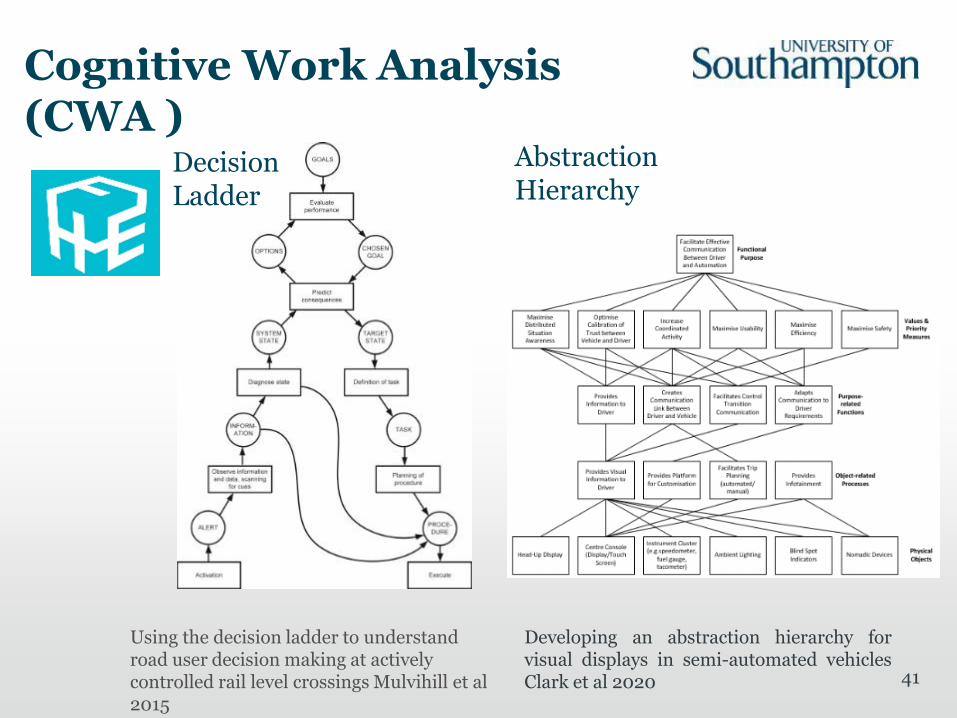
Cognitive Work Analysis (CWA )
Decision Ladder
Abstraction Hierarchy
Using the decision ladder to understand road user decision making at actively controlled rail level crossings Mulvihill et al 2015
Developing an abstraction hierarchy forvisual displays in semi-automated vehiclesClark et al 2020

42
DwI (Design with Intent)
Design with Intent (designwithintent.co.uk) Lockdon 2015
43
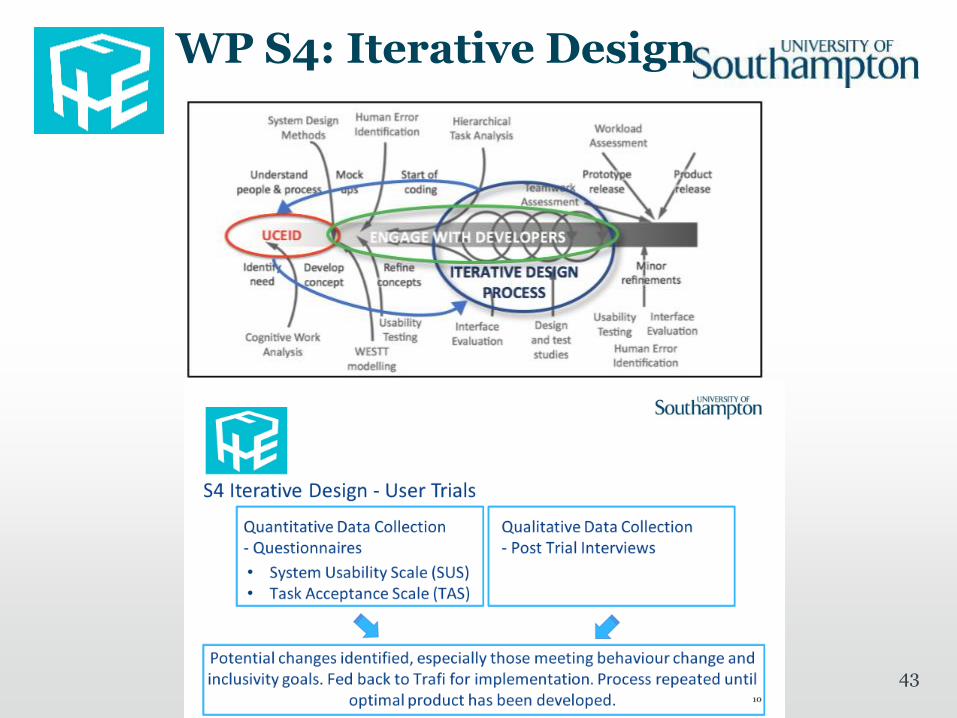
WP S4: Iterative Design
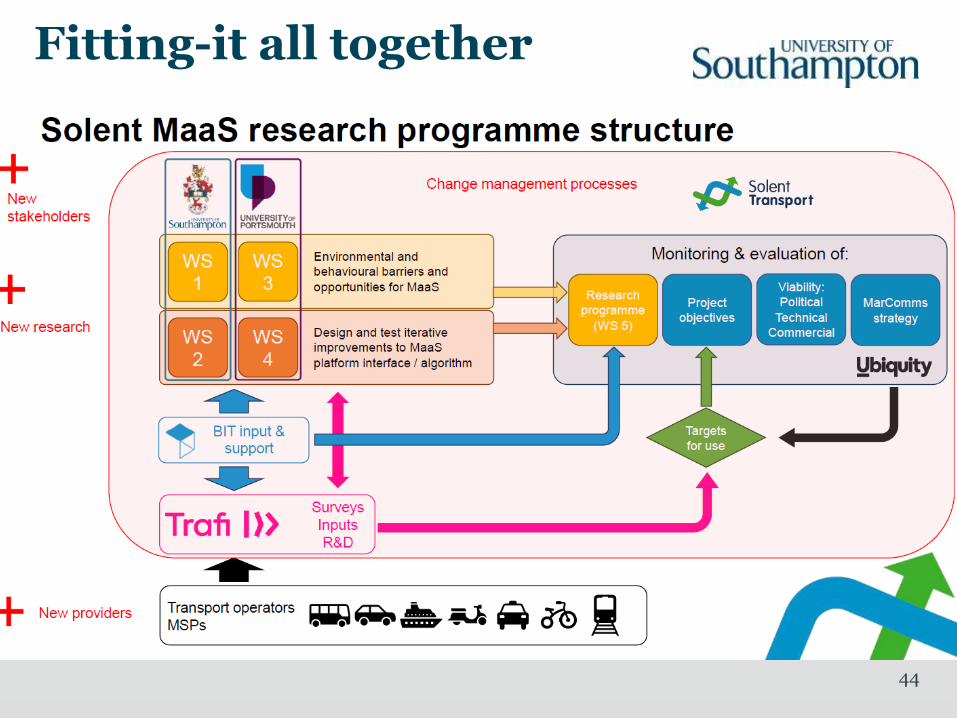
Fitting-it all together
44
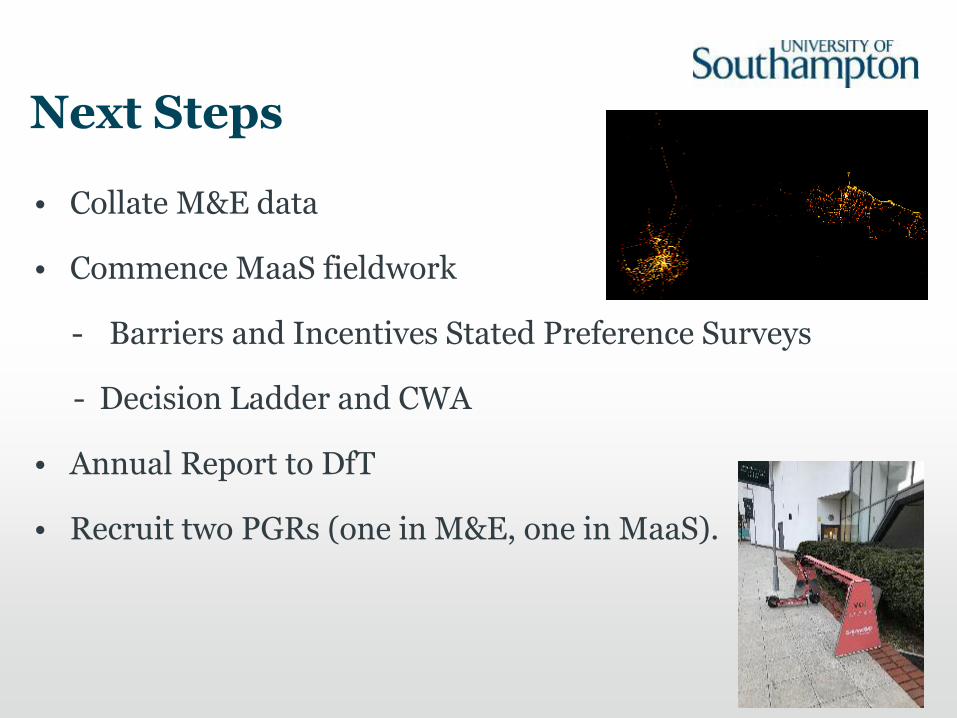
Next Steps
• Collate M&E data
• Commence MaaS fieldwork
- Barriers and Incentives Stated Preference Surveys
- Decision Ladder and CWA
• Annual Report to DfT
• Recruit two PGRs (one in M&E, one in MaaS).
45