The sequence and analysis of duplication rich human chromosome 16
17
The sequence and analysis of duplication-rich human chromosome 16 Joel Martin 1 , Cliff Han 2 , Laurie A. Gordon 1 , Astrid Terry 1 , Shyam Prabhakar 4 , Xinwei She 5 , Gary Xie 1,2 , Uffe Hellsten 1 , Yee Man Chan 6 , Michael Altherr 1,2 , Olivier Couronne 4 , Andrea Aerts 1 , Eva Bajorek 6 , Stacey Black 6 , Heather Blumer 2 , Elbert Branscomb 1,3 , Nancy C. Brown 2 , William J. Bruno 2 , Judith M. Buckingham 2 , David F. Callen 2 , Connie S. Campbell 2 , Mary L. Campbell 2 , Evelyn W. Campbell 2 , Chenier Caoile 6 , Jean F. Challacombe 2 , Leslie A. Chasteen 2 , Olga Chertkov 2 , Han C. Chi 2 , Mari Christensen 3 , Lynn M. Clark 2 , Judith D. Cohn 2 , Mirian Denys 6 , John C. Detter 1 , Mark Dickson 6 , Mira Dimitrijevic-Bussod 2 , Julio Escobar 6 , Joseph J. Fawcett 2 , Dave Flowers 6 , Dea Fotopulos 6 , Tijana Glavina 1 , Maria Gomez 6 , Eidelyn Gonzales 6 , David Goodstein 1 , Lynne A. Goodwin 2 , Deborah L. Grady 2 , Igor Grigoriev 1 , Matthew Groza 3 , Nancy Hammon 1 , Trevor Hawkins 1 , Lauren Haydu 6 , Carl E. Hildebrand 2 , Wayne Huang 1 , Sanjay Israni 1 , Jamie Jett 1 , Phillip B. Jewett 2 , Kristen Kadner 1 , Heather Kimball 1 , Arthur Kobayashi 1,3 , Marie-Claude Krawczyk 2 , Tina Leyba 2 , Jonathan L. Longmire 2 , Frederick Lopez 6 , Yunian Lou 1 , Steve Lowry 1 , Thom Ludeman 2 , Chitra F. Manohar 3 , Graham A. Mark 2 , Kimberly L. McMurray 2 , Linda J. Meincke 2 , Jenna Morgan 1 , Robert K. Moyzis 2 , Mark O. Mundt 2 , A. Christine Munk 2 , Richard D. Nandkeshwar 3 , Sam Pitluck 1 , Martin Pollard 1 , Paul Predki 1 , Beverly Parson-Quintana 2 , Lucia Ramirez 6 , Sam Rash 1 , James Retterer 6 , Darryl O. Ricke 2 , Donna L. Robinson 2 , Alex Rodriguez 6 , Asaf Salamov 1 , Elizabeth H. Saunders 2 , Duncan Scott 1 , Timothy Shough 2 , Raymond L. Stallings 2 , Malinda Stalvey 2 , Robert D. Sutherland 2 , Roxanne Tapia 2 , Judith G. Tesmer 2 , Nina Thayer 1,2 , Linda S. Thompson 2 , Hope Tice 1 , David C. Torney 2 , Mary Tran-Gyamfi 1 , Ming Tsai 6 , Levy E. Ulanovsky 2 , Anna Ustaszewska 1 , Nu Vo 6 , P. Scott White 2 , Albert L. Williams 2 , Patricia L. Wills 2 , Jung-Rung Wu 2 , Kevin Wu 6 , Joan Yang 6 , Pieter DeJong 7 , David Bruce 2 , Norman A. Doggett 2 , Larry Deaven 2 , Jeremy Schmutz 6 , Jane Grimwood 6 , Paul Richardson 1 , Daniel S. Rokhsar 1 , Evan E. Eichler 5 , Paul Gilna 2 , Susan M. Lucas 1 , Richard M. Myers 6 , Edward M. Rubin 1,4 & Len A. Pennacchio 1,4 1 DOE Joint Genome Institute, 2800 Mitchell Avenue, Walnut Creek, California 94598, USA 2 Los Alamos National Laboratory, Los Alamos, New Mexico 87545, USA 3 Lawrence Livermore National Laboratory, 7000 East Avenue, Livermore, California 94550, USA 4 Lawrence Berkeley National Laboratory, One Cyclotron Road, Berkeley, California 94720, USA 5 Department of Genome Sciences, University of Washington, Seattle, Washington 98195, USA 6 Stanford Human Genome Center, Department of Genetics, Stanford University School of Medicine, 975 California Avenue, Palo Alto, California 94304, USA 7 Children’s Hospital Oakland, Oakland, California 94609, USA ........................................................................................................................................................................................................................... Human chromosome 16 features one of the highest levels of segmentally duplicated sequence among the human autosomes. We report here the 78,884,754 base pairs of finished chromosome 16 sequence, representing over 99.9% of its euchromatin. Manual annotation revealed 880 protein-coding genes confirmed by 1,670 aligned transcripts, 19 transfer RNA genes, 341 pseudogenes and three RNA pseudogenes. These genes include metallothionein, cadherin and iroquois gene families, as well as the disease genes for polycystic kidney disease and acute myelomonocytic leukaemia. Several large-scale structural polymorphisms spanning hundreds of kilobase pairs were identified and result in gene content differences among humans. Whereas the segmental duplications of chromosome 16 are enriched in the relatively gene-poor pericentromere of the p arm, some are involved in recent gene duplication and conversion events that are likely to have had an impact on the evolution of primates and human disease susceptibility. The US Department of Energy (DOE) initiated the mapping and sequencing of human chromosome 16 in 1988 to contribute to the generation of a reference human genome sequence to be used in assessing the effects of radiation and for the study of human biology. This particular chromosome was in part targeted for sequencing because of the localization of the DNA repair gene ERCC4 to the p arm of chromosome 16 (ref. 1), the availability of a unique flow- sorted chromosome-specific cosmid library 2 , and access to a mouse–human hybrid cell panel enabling the localization of clones to discrete cytogenetic intervals 3 . Further interest in human chromosome 16 stemmed from the clustering of metallothionein genes on this chromosome, which participate in heavy metal transport and detoxification, coinciding with important biological interests of the DOE 4,5 . Here we describe the finished human chromosome 16 sequence, which provides a reference for the further exploration of genomic sequence alterations and their relationship to human biology. Mapping and sequencing To provide the foundation for sequencing human chromosome 16, we constructed a physical map based on previous sequence-tagged site (STS) content maps 6–8 with a minimal final tiling path of 716 clones, which include 618 bacterial artificial chromosomes (BACs), 79 cosmids, seven fosmids, five phage-derived artificial chromo- somes (PACs), three yeast artificial chromosome (YAC) subclones, two P1 phages, two phage vectors and five genomic polymerase chain reaction (PCR) fragments. The final sequence contains four gaps, with two in each of the chromosome arms. One of the gaps is found in the highly duplicated pericentromeric region in the p arm, while two of the remaining non-pericentromeric gaps are resistant to stable cloning with conventional vectors, and efforts are ongoing to close the estimated ,25 kilobases (kb) of missing sequence using alternative vectors 9 . The final gap is found near the telomere of the q arm in a region of subtelomeric repeats distal to the last identifiable cosmid subclone (AC137934) of a 16q telomere half-YAC as previously described 10 . The high degree of segmental duplication of chromosome 16, coupled with the multiple haplotypes represented in the numerous clone libraries comprising the tiling path, hindered efforts to construct a valid clone-based representation of this chromosome. To resolve this issue, we adopted a strategy of high depth clone coverage from a library constructed from a single individual 11 . This enabled the determination of both of the diploid haplotypes across the segmentally duplicated intervals. Overall, these efforts resulted articles NATURE | VOL 432 | 23/30 DECEMBER 2004 | www.nature.com/nature 988 ©2004 Nature Publishing Group
-
Upload
independent -
Category
Documents
-
view
3 -
download
0
Transcript of The sequence and analysis of duplication rich human chromosome 16
The sequence and analysis ofduplication-rich human chromosome 16Joel Martin1, Cliff Han2, Laurie A. Gordon1, Astrid Terry1, Shyam Prabhakar4, Xinwei She5, Gary Xie1,2, Uffe Hellsten1, Yee Man Chan6,Michael Altherr1,2, Olivier Couronne4, Andrea Aerts1, Eva Bajorek6, Stacey Black6, Heather Blumer2, Elbert Branscomb1,3, Nancy C. Brown2,William J. Bruno2, Judith M. Buckingham2, David F. Callen2, Connie S. Campbell2, Mary L. Campbell2, Evelyn W. Campbell2, Chenier Caoile6,Jean F. Challacombe2, Leslie A. Chasteen2, Olga Chertkov2, Han C. Chi2, Mari Christensen3, Lynn M. Clark2, Judith D. Cohn2, Mirian Denys6,John C. Detter1, Mark Dickson6, Mira Dimitrijevic-Bussod2, Julio Escobar6, Joseph J. Fawcett2, Dave Flowers6, Dea Fotopulos6,Tijana Glavina1, Maria Gomez6, Eidelyn Gonzales6, David Goodstein1, Lynne A. Goodwin2, Deborah L. Grady2, Igor Grigoriev1, Matthew Groza3,Nancy Hammon1, Trevor Hawkins1, Lauren Haydu6, Carl E. Hildebrand2, Wayne Huang1, Sanjay Israni1, Jamie Jett1, Phillip B. Jewett2,Kristen Kadner1, Heather Kimball1, Arthur Kobayashi1,3, Marie-Claude Krawczyk2, Tina Leyba2, Jonathan L. Longmire2, Frederick Lopez6,Yunian Lou1, Steve Lowry1, Thom Ludeman2, Chitra F. Manohar3, Graham A. Mark2, Kimberly L. McMurray2, Linda J. Meincke2,Jenna Morgan1, Robert K. Moyzis2, Mark O. Mundt2, A. Christine Munk2, Richard D. Nandkeshwar3, Sam Pitluck1, Martin Pollard1,Paul Predki1, Beverly Parson-Quintana2, Lucia Ramirez6, SamRash1, James Retterer6, Darryl O. Ricke2, Donna L. Robinson2, Alex Rodriguez6,Asaf Salamov1, Elizabeth H. Saunders2, Duncan Scott1, Timothy Shough2, Raymond L. Stallings2, Malinda Stalvey2, Robert D. Sutherland2,Roxanne Tapia2, Judith G. Tesmer2, Nina Thayer1,2, Linda S. Thompson2, Hope Tice1, David C. Torney2, Mary Tran-Gyamfi1, Ming Tsai6,Levy E. Ulanovsky2, Anna Ustaszewska1, Nu Vo6, P. Scott White2, Albert L. Williams2, Patricia L. Wills2, Jung-Rung Wu2, Kevin Wu6,Joan Yang6, Pieter DeJong7, David Bruce2, Norman A. Doggett2, Larry Deaven2, Jeremy Schmutz6, Jane Grimwood6, Paul Richardson1,Daniel S. Rokhsar1, Evan E. Eichler5, Paul Gilna2, Susan M. Lucas1, Richard M. Myers6, Edward M. Rubin1,4 & Len A. Pennacchio1,4
1DOE Joint Genome Institute, 2800 Mitchell Avenue, Walnut Creek, California 94598, USA2Los Alamos National Laboratory, Los Alamos, New Mexico 87545, USA3Lawrence Livermore National Laboratory, 7000 East Avenue, Livermore, California 94550, USA4Lawrence Berkeley National Laboratory, One Cyclotron Road, Berkeley, California 94720, USA5Department of Genome Sciences, University of Washington, Seattle, Washington 98195, USA6Stanford Human Genome Center, Department of Genetics, Stanford University School of Medicine, 975 California Avenue, Palo Alto, California 94304, USA7Children’s Hospital Oakland, Oakland, California 94609, USA
...........................................................................................................................................................................................................................
Human chromosome 16 features one of the highest levels of segmentally duplicated sequence among the human autosomes. Wereport here the 78,884,754 base pairs of finished chromosome 16 sequence, representing over 99.9% of its euchromatin. Manualannotation revealed 880 protein-coding genes confirmed by 1,670 aligned transcripts, 19 transfer RNA genes, 341 pseudogenesand three RNA pseudogenes. These genes include metallothionein, cadherin and iroquois gene families, as well as the diseasegenes for polycystic kidney disease and acute myelomonocytic leukaemia. Several large-scale structural polymorphismsspanning hundreds of kilobase pairs were identified and result in gene content differences among humans. Whereas thesegmental duplications of chromosome 16 are enriched in the relatively gene-poor pericentromere of the p arm, some are involvedin recent gene duplication and conversion events that are likely to have had an impact on the evolution of primates and humandisease susceptibility.
The US Department of Energy (DOE) initiated the mapping andsequencing of human chromosome 16 in 1988 to contribute to thegeneration of a reference human genome sequence to be used inassessing the effects of radiation and for the study of human biology.This particular chromosome was in part targeted for sequencingbecause of the localization of the DNA repair gene ERCC4 to the parm of chromosome 16 (ref. 1), the availability of a unique flow-sorted chromosome-specific cosmid library2, and access to amouse–human hybrid cell panel enabling the localization of clonesto discrete cytogenetic intervals3. Further interest in humanchromosome 16 stemmed from the clustering of metallothioneingenes on this chromosome, which participate in heavy metaltransport and detoxification, coinciding with important biologicalinterests of the DOE4,5. Here we describe the finished humanchromosome 16 sequence, which provides a reference for thefurther exploration of genomic sequence alterations and theirrelationship to human biology.
Mapping and sequencingTo provide the foundation for sequencing human chromosome 16,we constructed a physical map based on previous sequence-taggedsite (STS) content maps6–8 with a minimal final tiling path of 716
clones, which include 618 bacterial artificial chromosomes (BACs),79 cosmids, seven fosmids, five phage-derived artificial chromo-somes (PACs), three yeast artificial chromosome (YAC) subclones,two P1 phages, two phage vectors and five genomic polymerasechain reaction (PCR) fragments. The final sequence contains fourgaps, with two in each of the chromosome arms. One of the gaps isfound in the highly duplicated pericentromeric region in the p arm,while two of the remaining non-pericentromeric gaps are resistantto stable cloning with conventional vectors, and efforts are ongoingto close the estimated,25 kilobases (kb) of missing sequence usingalternative vectors9. The final gap is found near the telomere of the qarm in a region of subtelomeric repeats distal to the last identifiablecosmid subclone (AC137934) of a 16q telomere half-YAC aspreviously described10.
The high degree of segmental duplication of chromosome 16,coupled with the multiple haplotypes represented in the numerousclone libraries comprising the tiling path, hindered efforts toconstruct a valid clone-based representation of this chromosome.To resolve this issue, we adopted a strategy of high depth clonecoverage from a library constructed from a single individual11. Thisenabled the determination of both of the diploid haplotypes acrossthe segmentally duplicated intervals. Overall, these efforts resulted
articles
NATURE |VOL 432 | 23/30 DECEMBER 2004 | www.nature.com/nature988 © 2004 Nature Publishing Group
in the generation of 78,884,754 base pairs (bp) of finished euchro-matic sequence with an estimated accuracy12 exceeding 99.9% andcovering in excess of 99.9% of its euchromatin. Including thecentromere and its adjacent heterochromatic portion of the qarm, sized together at 9.8 megabases (Mb) (see Methods), thetotal size of the chromosome is estimated at 88.7Mb.
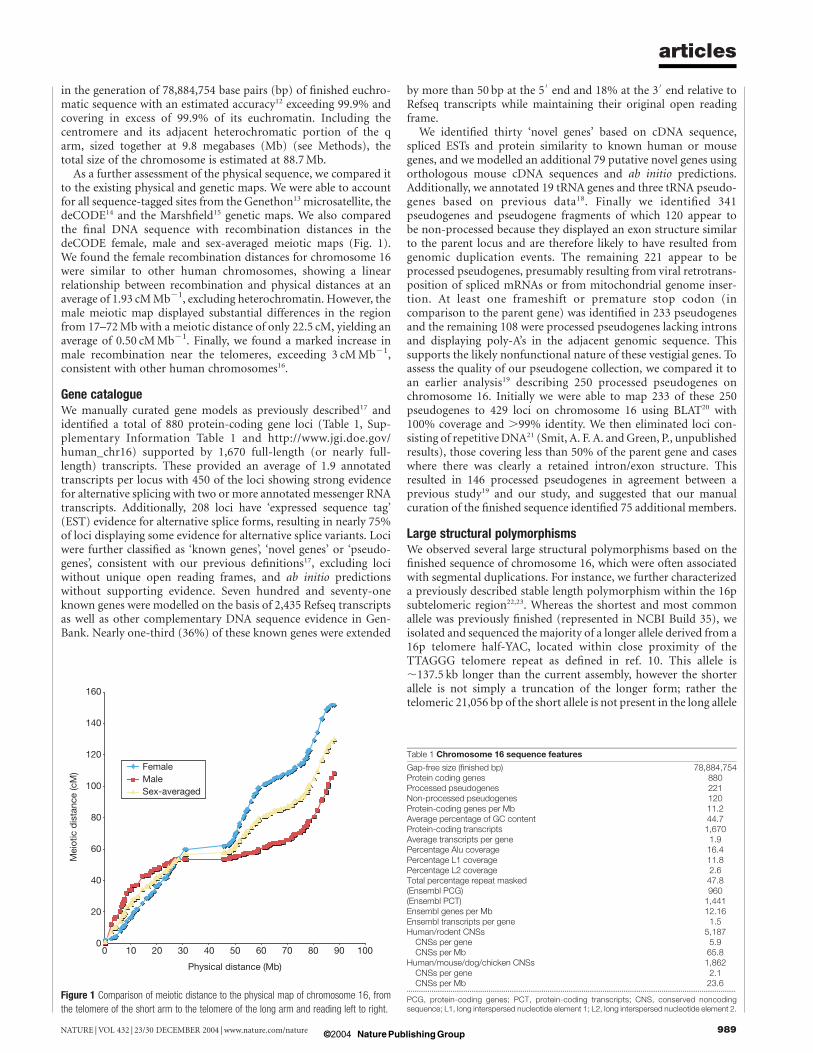
As a further assessment of the physical sequence, we compared itto the existing physical and genetic maps. We were able to accountfor all sequence-tagged sites from the Genethon13 microsatellite, thedeCODE14 and the Marshfield15 genetic maps. We also comparedthe final DNA sequence with recombination distances in thedeCODE female, male and sex-averaged meiotic maps (Fig. 1).We found the female recombination distances for chromosome 16were similar to other human chromosomes, showing a linearrelationship between recombination and physical distances at anaverage of 1.93 cMMb21, excluding heterochromatin. However, themale meiotic map displayed substantial differences in the regionfrom 17–72Mb with a meiotic distance of only 22.5 cM, yielding anaverage of 0.50 cMMb21. Finally, we found a marked increase inmale recombination near the telomeres, exceeding 3 cMMb21,consistent with other human chromosomes16.
Gene catalogueWe manually curated gene models as previously described17 andidentified a total of 880 protein-coding gene loci (Table 1, Sup-plementary Information Table 1 and http://www.jgi.doe.gov/human_chr16) supported by 1,670 full-length (or nearly full-length) transcripts. These provided an average of 1.9 annotatedtranscripts per locus with 450 of the loci showing strong evidencefor alternative splicing with two or more annotated messenger RNAtranscripts. Additionally, 208 loci have ‘expressed sequence tag’(EST) evidence for alternative splice forms, resulting in nearly 75%of loci displaying some evidence for alternative splice variants. Lociwere further classified as ‘known genes’, ‘novel genes’ or ‘pseudo-genes’, consistent with our previous definitions17, excluding lociwithout unique open reading frames, and ab initio predictionswithout supporting evidence. Seven hundred and seventy-oneknown genes were modelled on the basis of 2,435 Refseq transcriptsas well as other complementary DNA sequence evidence in Gen-Bank. Nearly one-third (36%) of these known genes were extended
by more than 50 bp at the 50end and 18% at the 3
0end relative to
Refseq transcripts while maintaining their original open readingframe.We identified thirty ‘novel genes’ based on cDNA sequence,
spliced ESTs and protein similarity to known human or mousegenes, and we modelled an additional 79 putative novel genes usingorthologous mouse cDNA sequences and ab initio predictions.Additionally, we annotated 19 tRNA genes and three tRNA pseudo-genes based on previous data18. Finally we identified 341pseudogenes and pseudogene fragments of which 120 appear tobe non-processed because they displayed an exon structure similarto the parent locus and are therefore likely to have resulted fromgenomic duplication events. The remaining 221 appear to beprocessed pseudogenes, presumably resulting from viral retrotrans-position of spliced mRNAs or from mitochondrial genome inser-tion. At least one frameshift or premature stop codon (incomparison to the parent gene) was identified in 233 pseudogenesand the remaining 108 were processed pseudogenes lacking intronsand displaying poly-A’s in the adjacent genomic sequence. Thissupports the likely nonfunctional nature of these vestigial genes. Toassess the quality of our pseudogene collection, we compared it toan earlier analysis19 describing 250 processed pseudogenes onchromosome 16. Initially we were able to map 233 of these 250pseudogenes to 429 loci on chromosome 16 using BLAT20 with100% coverage and .99% identity. We then eliminated loci con-sisting of repetitiveDNA21 (Smit, A. F. A. andGreen, P., unpublishedresults), those covering less than 50% of the parent gene and caseswhere there was clearly a retained intron/exon structure. Thisresulted in 146 processed pseudogenes in agreement between aprevious study19 and our study, and suggested that our manualcuration of the finished sequence identified 75 additional members.
Large structural polymorphismsWe observed several large structural polymorphisms based on thefinished sequence of chromosome 16, which were often associatedwith segmental duplications. For instance, we further characterizeda previously described stable length polymorphism within the 16psubtelomeric region22,23. Whereas the shortest and most commonallele was previously finished (represented in NCBI Build 35), weisolated and sequenced the majority of a longer allele derived from a16p telomere half-YAC, located within close proximity of theTTAGGG telomere repeat as defined in ref. 10. This allele is,137.5 kb longer than the current assembly, however the shorterallele is not simply a truncation of the longer form; rather thetelomeric 21,056 bp of the short allele is not present in the long allele
Figure 1 Comparison of meiotic distance to the physical map of chromosome 16, from
the telomere of the short arm to the telomere of the long arm and reading left to right.
Table 1 Chromosome 16 sequence features
Gap-free size (finished bp) 78,884,754Protein coding genes 880Processed pseudogenes 221Non-processed pseudogenes 120Protein-coding genes per Mb 11.2Average percentage of GC content 44.7Protein-coding transcripts 1,670Average transcripts per gene 1.9Percentage Alu coverage 16.4Percentage L1 coverage 11.8Percentage L2 coverage 2.6Total percentage repeat masked 47.8(Ensembl PCG) 960(Ensembl PCT) 1,441Ensembl genes per Mb 12.16Ensembl transcripts per gene 1.5Human/rodent CNSs 5,187CNSs per gene 5.9CNSs per Mb 65.8
Human/mouse/dog/chicken CNSs 1,862CNSs per gene 2.1CNSs per Mb 23.6
.............................................................................................................................................................................
PCG, protein-coding genes; PCT, protein-coding transcripts; CNS, conserved noncodingsequence; L1, long interspersed nucleotide element 1; L2, long interspersed nucleotide element 2.
articles
NATURE |VOL 432 | 23/30 DECEMBER 2004 | www.nature.com/nature 989© 2004 Nature Publishing Group
and the telomeric 158,607 bp of the long allele is not shared with theshort allele. Both of these unique regions contain genes with theshort allele containing a putative gene(s) represented by cDNAsMGC:75272 and MGC:52000 and with the long allele containinggenes encoding hypothetical protein XP_375548 (similar to septin),hypothetical protein XP_379920 (similar to capicua) and beta-tubulin 4Q (AAL32434).We also identified one of the most extensively duplicated regions
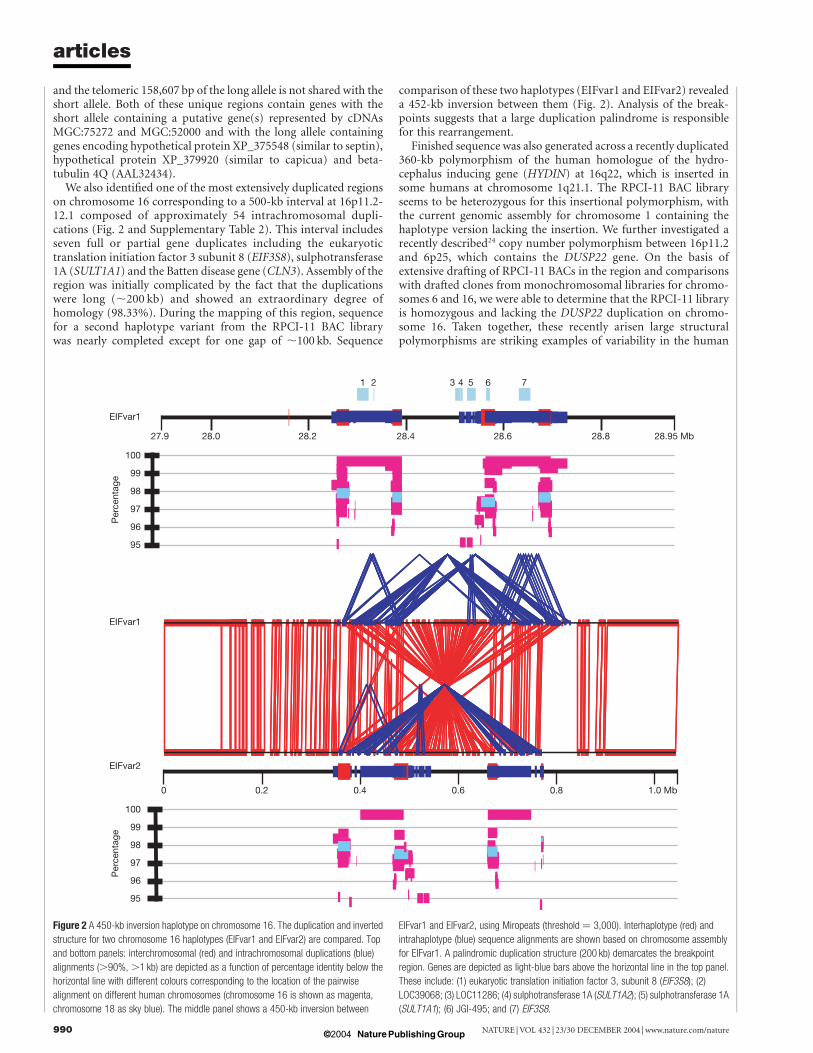
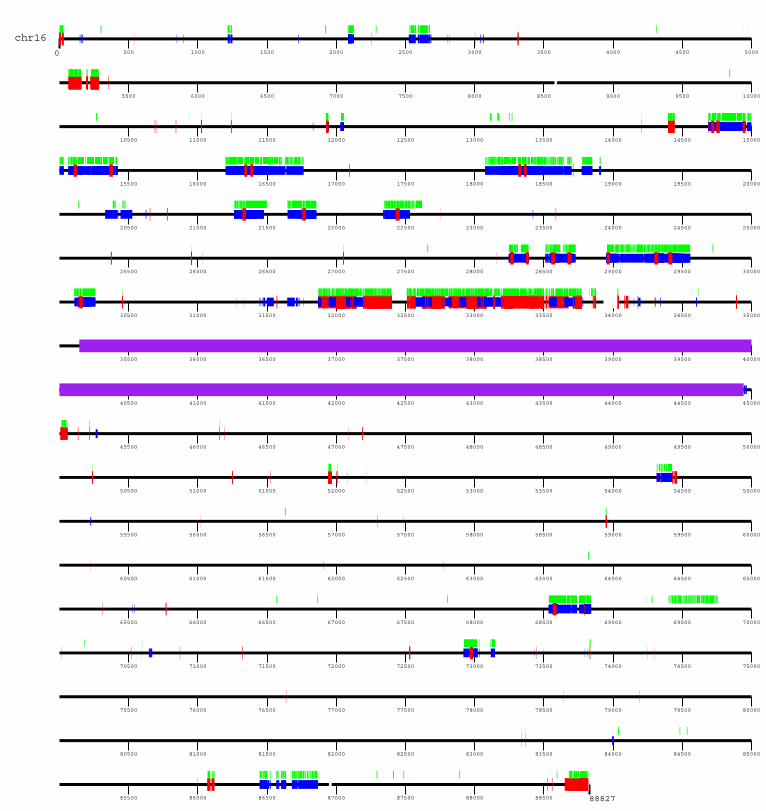
on chromosome 16 corresponding to a 500-kb interval at 16p11.2-12.1 composed of approximately 54 intrachromosomal dupli-cations (Fig. 2 and Supplementary Table 2). This interval includesseven full or partial gene duplicates including the eukaryotictranslation initiation factor 3 subunit 8 (EIF3S8), sulphotransferase1A (SULT1A1) and the Batten disease gene (CLN3). Assembly of theregion was initially complicated by the fact that the duplicationswere long (,200 kb) and showed an extraordinary degree ofhomology (98.33%). During the mapping of this region, sequencefor a second haplotype variant from the RPCI-11 BAC librarywas nearly completed except for one gap of ,100 kb. Sequence
comparison of these two haplotypes (EIFvar1 and EIFvar2) revealeda 452-kb inversion between them (Fig. 2). Analysis of the break-points suggests that a large duplication palindrome is responsiblefor this rearrangement.
Finished sequence was also generated across a recently duplicated360-kb polymorphism of the human homologue of the hydro-cephalus inducing gene (HYDIN) at 16q22, which is inserted insome humans at chromosome 1q21.1. The RPCI-11 BAC libraryseems to be heterozygous for this insertional polymorphism, withthe current genomic assembly for chromosome 1 containing thehaplotype version lacking the insertion. We further investigated arecently described24 copy number polymorphism between 16p11.2and 6p25, which contains the DUSP22 gene. On the basis ofextensive drafting of RPCI-11 BACs in the region and comparisonswith drafted clones from monochromosomal libraries for chromo-somes 6 and 16, we were able to determine that the RPCI-11 libraryis homozygous and lacking the DUSP22 duplication on chromo-some 16. Taken together, these recently arisen large structuralpolymorphisms are striking examples of variability in the human
Figure 2 A 450-kb inversion haplotype on chromosome 16. The duplication and inverted
structure for two chromosome 16 haplotypes (EIFvar1 and EIFvar2) are compared. Top
and bottom panels: interchromosomal (red) and intrachromosomal duplications (blue)
alignments (.90%, .1 kb) are depicted as a function of percentage identity below the
horizontal line with different colours corresponding to the location of the pairwise
alignment on different human chromosomes (chromosome 16 is shown as magenta,
chromosome 18 as sky blue). The middle panel shows a 450-kb inversion between
EIFvar1 and EIFvar2, using Miropeats (threshold ¼ 3,000). Interhaplotype (red) and
intrahaplotype (blue) sequence alignments are shown based on chromosome assembly
for EIFvar1. A palindromic duplication structure (200 kb) demarcates the breakpoint
region. Genes are depicted as light-blue bars above the horizontal line in the top panel.
These include: (1) eukaryotic translation initiation factor 3, subunit 8 (EIF3S8); (2)
LOC39068; (3) LOC11286; (4) sulphotransferase 1A (SULT1A2); (5) sulphotransferase 1A
(SULT1A1); (6) JGI-495; and (7) EIF3S8.
articles
NATURE |VOL 432 | 23/30 DECEMBER 2004 | www.nature.com/nature990 © 2004 Nature Publishing Group
genome and support a potential mechanism that contributes tophenotypic or disease susceptibility differences among humans. Itis worth noting that 91 genes on chromosome 16 are locatedwithin segmental duplications, any of which could be unstableand challenge researchers studying phenotypes linked to these gene-containing regions. These observations are particularly relevant onthe basis of recent findings24,25 of abundant copy number poly-morphisms within the genomes of normal individuals, whichinclude those described here.
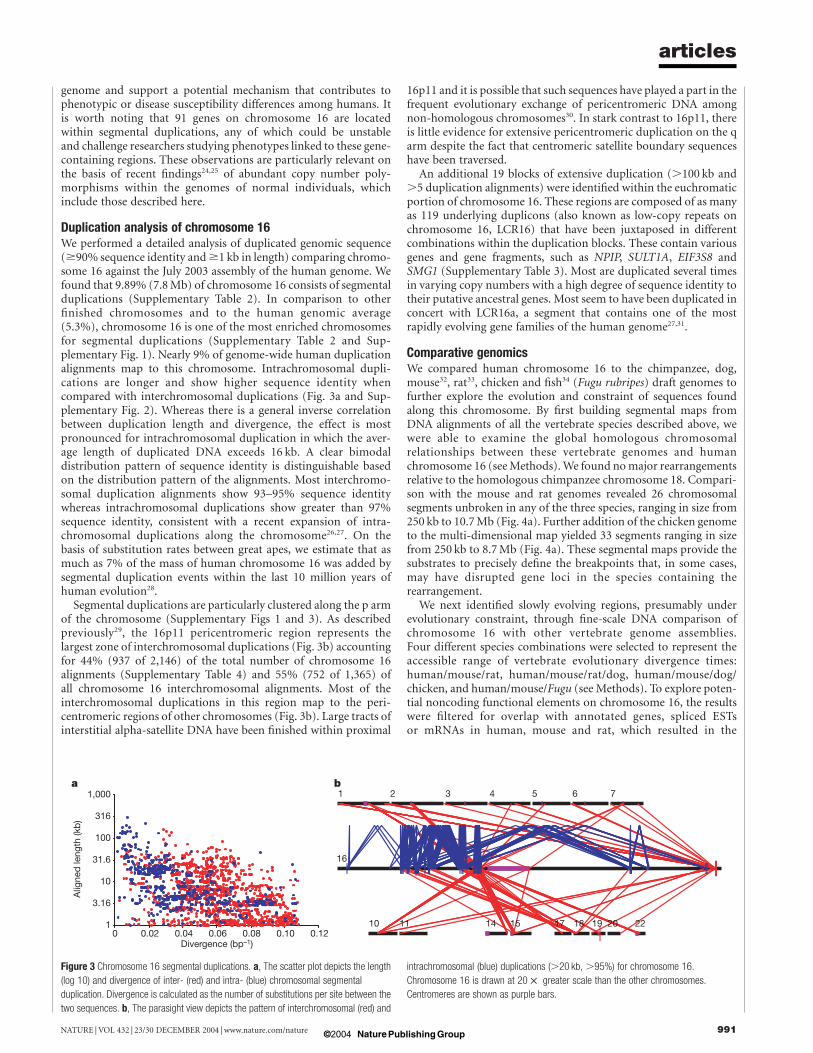
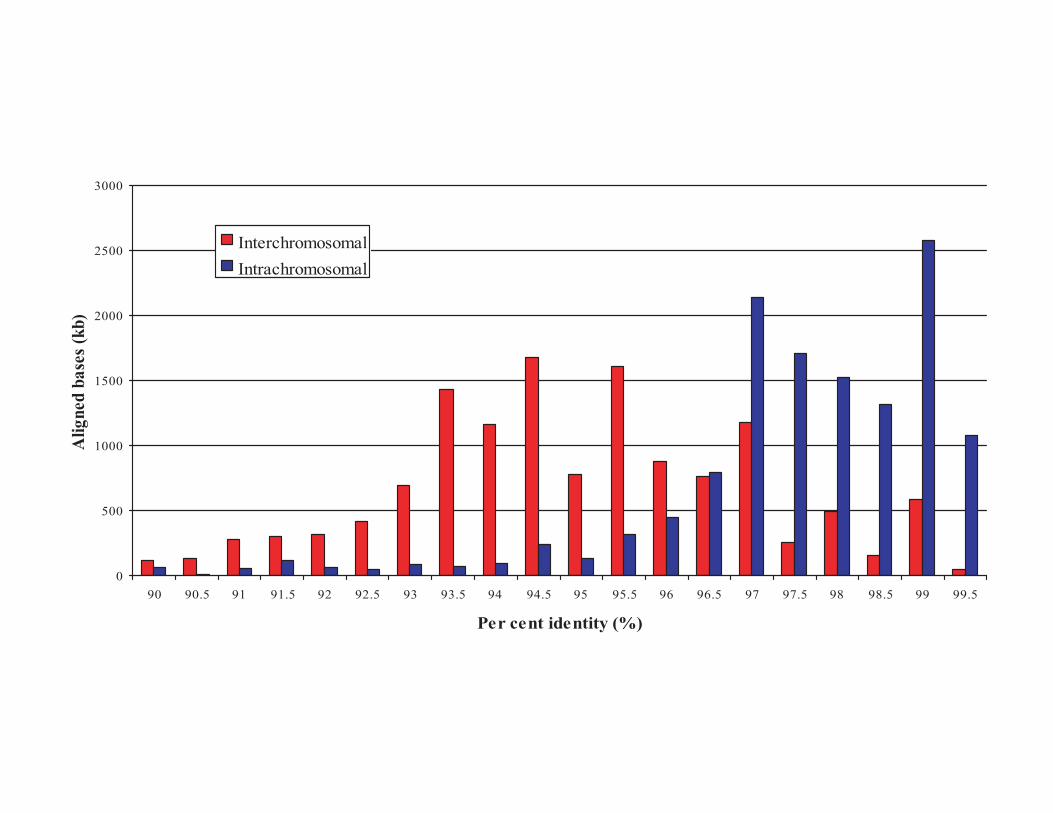
Duplication analysis of chromosome 16We performed a detailed analysis of duplicated genomic sequence($90% sequence identity and$1 kb in length) comparing chromo-some 16 against the July 2003 assembly of the human genome. Wefound that 9.89% (7.8Mb) of chromosome 16 consists of segmentalduplications (Supplementary Table 2). In comparison to otherfinished chromosomes and to the human genomic average(5.3%), chromosome 16 is one of the most enriched chromosomesfor segmental duplications (Supplementary Table 2 and Sup-plementary Fig. 1). Nearly 9% of genome-wide human duplicationalignments map to this chromosome. Intrachromosomal dupli-cations are longer and show higher sequence identity whencompared with interchromosomal duplications (Fig. 3a and Sup-plementary Fig. 2). Whereas there is a general inverse correlationbetween duplication length and divergence, the effect is mostpronounced for intrachromosomal duplication in which the aver-age length of duplicated DNA exceeds 16 kb. A clear bimodaldistribution pattern of sequence identity is distinguishable basedon the distribution pattern of the alignments. Most interchromo-somal duplication alignments show 93–95% sequence identitywhereas intrachromosomal duplications show greater than 97%sequence identity, consistent with a recent expansion of intra-chromosomal duplications along the chromosome26,27. On thebasis of substitution rates between great apes, we estimate that asmuch as 7% of the mass of human chromosome 16 was added bysegmental duplication events within the last 10 million years ofhuman evolution28.
Segmental duplications are particularly clustered along the p armof the chromosome (Supplementary Figs 1 and 3). As describedpreviously29, the 16p11 pericentromeric region represents thelargest zone of interchromosomal duplications (Fig. 3b) accountingfor 44% (937 of 2,146) of the total number of chromosome 16alignments (Supplementary Table 4) and 55% (752 of 1,365) ofall chromosome 16 interchromosomal alignments. Most of theinterchromosomal duplications in this region map to the peri-centromeric regions of other chromosomes (Fig. 3b). Large tracts ofinterstitial alpha-satellite DNA have been finished within proximal
16p11 and it is possible that such sequences have played a part in thefrequent evolutionary exchange of pericentromeric DNA amongnon-homologous chromosomes30. In stark contrast to 16p11, thereis little evidence for extensive pericentromeric duplication on the qarm despite the fact that centromeric satellite boundary sequenceshave been traversed.An additional 19 blocks of extensive duplication (.100 kb and
.5 duplication alignments) were identified within the euchromaticportion of chromosome 16. These regions are composed of as manyas 119 underlying duplicons (also known as low-copy repeats onchromosome 16, LCR16) that have been juxtaposed in differentcombinations within the duplication blocks. These contain variousgenes and gene fragments, such as NPIP, SULT1A, EIF3S8 andSMG1 (Supplementary Table 3). Most are duplicated several timesin varying copy numbers with a high degree of sequence identity totheir putative ancestral genes. Most seem to have been duplicated inconcert with LCR16a, a segment that contains one of the mostrapidly evolving gene families of the human genome27,31.
Comparative genomicsWe compared human chromosome 16 to the chimpanzee, dog,mouse32, rat33, chicken and fish34 (Fugu rubripes) draft genomes tofurther explore the evolution and constraint of sequences foundalong this chromosome. By first building segmental maps fromDNA alignments of all the vertebrate species described above, wewere able to examine the global homologous chromosomalrelationships between these vertebrate genomes and humanchromosome 16 (seeMethods).We found nomajor rearrangementsrelative to the homologous chimpanzee chromosome 18. Compari-son with the mouse and rat genomes revealed 26 chromosomalsegments unbroken in any of the three species, ranging in size from250 kb to 10.7Mb (Fig. 4a). Further addition of the chicken genometo the multi-dimensional map yielded 33 segments ranging in sizefrom 250 kb to 8.7Mb (Fig. 4a). These segmental maps provide thesubstrates to precisely define the breakpoints that, in some cases,may have disrupted gene loci in the species containing therearrangement.We next identified slowly evolving regions, presumably under
evolutionary constraint, through fine-scale DNA comparison ofchromosome 16 with other vertebrate genome assemblies.Four different species combinations were selected to represent theaccessible range of vertebrate evolutionary divergence times:human/mouse/rat, human/mouse/rat/dog, human/mouse/dog/chicken, and human/mouse/Fugu (see Methods). To explore poten-tial noncoding functional elements on chromosome 16, the resultswere filtered for overlap with annotated genes, spliced ESTsor mRNAs in human, mouse and rat, which resulted in the
Figure 3 Chromosome 16 segmental duplications. a, The scatter plot depicts the length
(log 10) and divergence of inter- (red) and intra- (blue) chromosomal segmental
duplication. Divergence is calculated as the number of substitutions per site between the
two sequences. b, The parasight view depicts the pattern of interchromosomal (red) and
intrachromosomal (blue) duplications (.20 kb, .95%) for chromosome 16.
Chromosome 16 is drawn at 20 £ greater scale than the other chromosomes.
Centromeres are shown as purple bars.
articles
NATURE |VOL 432 | 23/30 DECEMBER 2004 | www.nature.com/nature 991© 2004 Nature Publishing Group
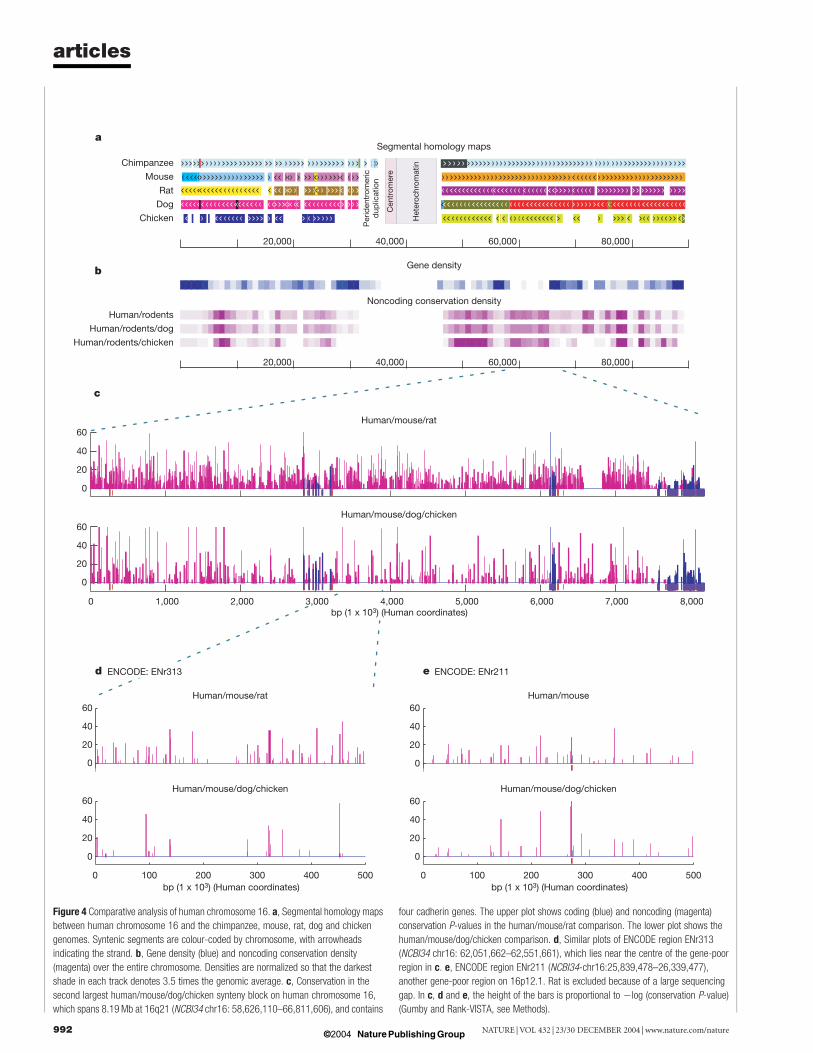
Figure 4 Comparative analysis of human chromosome 16. a, Segmental homology maps
between human chromosome 16 and the chimpanzee, mouse, rat, dog and chicken
genomes. Syntenic segments are colour-coded by chromosome, with arrowheads
indicating the strand. b, Gene density (blue) and noncoding conservation density
(magenta) over the entire chromosome. Densities are normalized so that the darkest
shade in each track denotes 3.5 times the genomic average. c, Conservation in the
second largest human/mouse/dog/chicken synteny block on human chromosome 16,
which spans 8.19Mb at 16q21 (NCBI34 chr16: 58,626,110–66,811,606), and contains
four cadherin genes. The upper plot shows coding (blue) and noncoding (magenta)
conservation P-values in the human/mouse/rat comparison. The lower plot shows the
human/mouse/dog/chicken comparison. d, Similar plots of ENCODE region ENr313
(NCBI34 chr16: 62,051,662–62,551,661), which lies near the centre of the gene-poor
region in c. e, ENCODE region ENr211 (NCBI34-chr16:25,839,478–26,339,477),
another gene-poor region on 16p12.1. Rat is excluded because of a large sequencing
gap. In c, d and e, the height of the bars is proportional to 2log (conservation P-value)
(Gumby and Rank-VISTA, see Methods).
articles
NATURE |VOL 432 | 23/30 DECEMBER 2004 | www.nature.com/nature992 © 2004 Nature Publishing Group
identification of 5,187 discrete conserved noncoding regionsbetween human/mouse/rat, 6,159 between human/mouse/rat/dog,1,862 between human/mouse/dog/chicken, and 191 betweenhuman/mouse/Fugu (Fig. 4b and Supplementary Table 1). Com-pared with genome-wide averages, the densities of human/mouse/rat and human/mouse/dog/chicken elements were only slightlyhigher for human chromosome 16 (Supplementary Table 1). Incontrast, human/mouse/Fugu elements are present at ,2.4 timesthe genome-wide density, indicating that although chromosome 16as a whole has had ‘normal’ levels of noncoding constraint since themammal/bird split, it has conserved more ancient functions to asurprising degree. Functional studies on these conserved elementsare warranted to assess their possible biological activity in the,98% of the human genome that is noncoding.
We further explored an 8.7-Mb region at 16q12, on the basis ofextreme features of evolutionary conservation. This region was firstidentified as the largest unbroken synteny segment between human/mouse/dog/chicken on chromosome 16 and contains 59% (112 of191) of the human/mouse/Fugu noncoding elements. Theseelements are entirely clustered in a gene-poor 5-Mb subregion,which contains at least six developmental transcription factors,including SALL1 and three iroquois genes (IRX3, IRX5 and IRX6).This clustering is an example of the general bias of human–fishconserved sequences towards developmental genes35. Interestingly,at least nine of these human/mouse/Fugu elements have significantsequence similarity to counterparts in the paralogous IRX genecluster on chromosome 5, which is similarly located in a ‘forest’ ofhuman–fish conservation36. In vivo mouse transgenic data indicatethat a significant percentage of these IRX conserved noncodingsequences behave as gene enhancers (Pennacchio, L. A., unpub-lished observation), suggesting that in addition to the well describedconservation of the protein-encoding portions of genomic dupli-cations, evolutionary constraint is also observable in adjacent generegulatory sequences following genomic duplication events. Thissynteny block is an outlier even in terms of more recent noncodingconservation, with 917 (105 per Mb) human/mouse/rat and 590(67.5 per Mb) human/mouse/dog/chicken elements.
The second longest chromosome 16 synteny block in human/mouse/dog/chicken neighbours the highly conserved SALL1-IRXsegment and is similar in length (8.19Mb) (Fig. 4c). Once again thisregion is gene poor, with its telomeric 7.6Mb containing only threeannotated genes, all members of the cadherin family: CDH8,CDH11 and CDH5. Within the full 8.19-Mb interval, we identified968 (118 per Mb) human/mouse/rat conserved noncodingsequences. This is twice the genome-wide density, as was the casein the SALL1-IRX region. However, in stark contrast to the neigh-bouring SALL1-IRX region, this synteny block has no noncodingconservation between human/mouse/Fugu, suggesting that its non-coding functions, though just as constrained among mammals, aremore diverged in distant species.
As a special category of constrained DNA, we also searched forultra-conserved noncoding sequences, recently defined by thestringent criterion of at least 200 bp in length and 100% identitybetween the human, mouse and rat genomes37. Of the 482 ultra-conserved elements found in the entire human genome, 15 (3.1%)were found on chromosome 16, with 11 having some evidence ofbeing transcribed and processed into mature mRNAs. The above-mentioned bias towards developmental genes has also been noted37
for ultra-conserved human/rodent elements. Indeed, 9 of the 15ultra-conserved elements found on chromosome 16 lie in the sameSALL1-IRX synteny block that contains the mammal/fish conserva-tion cluster. This contrasts with the similarly sized cadherin syntenyblock that contains no human–fish noncoding conservation andonly one ultra-conserved element.
Finally, three regions on chromosome 16 have been selected bythe National Human Genome Research Institute as part of theEncyclopaedia of DNA Elements (ENCODE) project, an effort
aimed at rigorously analysing 1% of the human genome sequence38
(http://www.genome.gov/10005107). These three ENCODE regionsinclude the well-studied alpha-globin-containing interval(ENm008) and two randomly chosen regions (ENr211 on16p12.1 and ENr313 on 16q21). Interestingly, ENr313 is locatedwithin the large cadherin gene desert described above and iscompletely devoid of genes (Fig. 4d). Nonetheless, it harbours thesame high density of human/mouse/rat and human/mouse/dog/chicken conserved noncoding elements as the rest of the cadherinsynteny block, suggesting the presence of numerous unassignedfunctional sequences within this region. Ongoing studiesby ENCODE will better define the overlap of functionality andcomparative sequence data such as that presented here.
DiscussionThe primary sequence of human chromosome 16, as well as thehuman genome as a whole, now provides a key foundation forongoing efforts such as ENCODE to deeply annotate all types ofinformation encoded in our genome. This represents an enormouslong-term challenge because genomic signatures embedded withinthe sequence of DNA perform a vast number of different operationsacross the trillions of cells within our bodies. These features rangefrom relatively easily identified genes, to sequences involved in generegulation—which use a plethora of signals to determine when andwhere a given gene is expressed and under what conditions—toprobably even more complicated features such as higher-orderchromosome structure and DNA involvement in replication andrepair. It is inspiring to reminisce that it was only 50 years ago thatwe had our first glimpse into the structure of DNA, which providedthe foundation for generating the nearly entire human euchromaticsequence. The next 50 years will probably also bring similarlyimpressive gains and enable us to precisely relate our primarygenomic sequence to functional genomic signatures and theirrelationship to human biology. A
MethodsSizing of heterochromatic gapsTo estimate the size of the alpha satellite bands (16p11.1-16q11.1) encompassing thecentromere and the satellite II heterochromatin in band 16q11.2, we used contour-clamped homogeneous electric field (CHEF) pulsed-field gel electrophoresis at variouspulse times to resolve macrorestriction fragments between 100 kb and .7,000 kb. DNAfrom CY18 (a mouse–human hybrid containing a single human chromosome 16) wasdigested with several different rare cutting restriction enzymes and separated on CHEFgels. Hybridization to blots of these gels with 16-1 (16-specific alpha satellite) and pHuR195 (16-specific satellite II) probes revealed a single band of alpha satellite (in threedifferent enzyme digests) that did not overlap with any satellite II bands (data not shown).The smallest of these bands was an 1,800-kb Xho I fragment, which provided an upper sizelimit for the alpha satellite array, encompassing the centromere on chromosome 16. SalIfragmented the satellite II heterochromatin into well resolved large restriction fragmentswithout cutting within the alpha satellite array. The sum of the SalI satellite II fragmentswas estimated at ,7,800 kb providing a upper size limit of the 16q11.2 satellite IIheterochromatin at nominally 8Mb. Together these account for 9.8Mb of unsequencedheterochromatin encompassing cytogenetic bands 16p11.1-16q11.2, although it is likelythat we did sequence partially into the boundaries of these regions in the adjacent tiling setclones.
Segmental duplication analysisWe used a BLAST-based detection scheme39 to identify all pairwise similaritiesrepresenting duplicated regions ($1 kb and$90% identity) within the finished sequenceof chromosome 16 and compared it with all other chromosomes in the NCBI genomeassembly (build 34). A total of 2,146 pairwise alignments representing 26.12Mb of alignedbasepairs and 7.8Mb of non-redundant duplicated bases were analysed on chromosome16. The program Parasight (http://humanparalogy.gene.cwru.edu/parasight/) was used togenerate images of pairwise alignments. Divergence of duplication, the number ofsubstitutions per site between the two sequences, were calculated using Kimura’s two-parameter method, which corrects for multiple events and transversion/transitionmutational biases40. Analysis of haplotype structural variation was performed using theprogramMiropeats (threshold ¼ 3,000)41. Gene content of each 1% duplicated regions of90–100% identity was analysed using a non-redundant/non-overlapping set of knowngenes. A gene feature (exon) was considered duplicated if.50 bp of the feature overlappedduplication. Thus, exons less than 50 bp were lost in this analysis.
articles
NATURE |VOL 432 | 23/30 DECEMBER 2004 | www.nature.com/nature 993© 2004 Nature Publishing Group
Pseudogene identificationPseudogenes were defined as gene models built by homology to known human genes inwhich the alignment between themodel and the homologue shows at least one stop codonor frameshift. We identified homologies42 of human IPI (International Protein Index;http://www.ebi.ac.uk/IPI/IPIhelp.html) proteins on repeat-masked21 (Smit, A. F. A andGreen, P., unpublished results) genomic chromosome 16 sequence. For each suchfragment of genomic sequence we built gene models using the GeneWise43 program.Overlapping models were then clustered and the top-scoring model was analysed for thepresence of premature stop codons and frameshifts. Remaining models were thenmanually checked to confirm their pseudogene status.
Comparative analysisMulti-species segmental homology maps were computed using PARAGON (v2.2;Couronne, unpublished work), which is based on BLASTZ44 pairwise alignments of allgenomes to human. After filtering out segments shorter than 250 kb in humans,MLAGAN45 alignments of homologous blocks were scanned for evolutionarily conservedregions using Gumby (v1.5; Prabhakar, unpublished work). These were visualized usingRank-VISTA (Prabhakar, unpublished work). Gumby goes through the following three-step process to identify statistically significant conservation in the input global alignment:(1) first, noncoding regions in the alignment are used to estimate the local neutralmutation rates46 between all pairs of aligned sequences. The rates are used to derive a log-likelihood scoring scheme for slow versus neutral evolution47, in which the slow rate is setat half the neutral rate; (2) each alignment position is then assigned a conservation scoreusing a phylogenetically weighted sum-of-pairs scheme; (3) finally, a dynamicprogramming step scans the alignment for high-scoring segments (conserved regions) ofany length. Conserved regions detected in this manner are assigned P-values using thesame statistical formalism48 as the BLAST algorithm42. Whereas BLAST assigns P-valuesrelative to random permutations of the query and target sequences, Gumby P-values relateto random permutations of the columns in the input alignment. Here, all the results weregenerated using a Gumby P-value threshold of 0.01 and a baseline human sequence lengthof 100 kb. Conserved noncoding regions were defined as conserved segments that overlapannotated exons, spliced ESTs or mRNAs from human, mouse or rat over no more than25%of their length. At a Gumby P-value threshold of 0.01, 2.2% of the ungapped positionsin the human genome were assigned to human/mouse/rat conserved noncoding segments.
Received 9 September; accepted 15 November 2004; doi:10.1038/nature03187.
1. Siciliano, M. J. Chromosomal assignment of human genes coding for DNA repair functions. Isozymes
Curr. Top. Biol. Med. Res. 15, 217–223 (1987).
2. Deaven, L. L. et al. Construction of human chromosome-specific DNA libraries from flow-sorted
chromosomes. Cold Spring Harb. Symp. Quant. Biol. 51, 159–167 (1986).
3. Callen, D. F. et al. High-resolution cytogenetic-based physical map of human chromosome 16.
Genomics 13, 1178–1185 (1992).
4. Hildebrand, C. E. & Enger, M. D. Regulation of Cd2þ/Zn2þ-stimulated metallothionein synthesis
during induction, deinduction, and superinduction. Biochemistry 19, 5850–5857 (1980).
5. Stallings, R. L., Munk, A. C., Longmire, J. L., Hildebrand, C. E. & Crawford, B. D. Assignment of genes
encoding metallothioneins I and II to Chinese hamster chromosome 3: evidence for the role of
chromosome rearrangement in gene amplification. Mol. Cell. Biol. 4, 2932–2936 (1984).
6. Han, C. S. et al. Construction of a BAC contig map of chromosome 16q by two-dimensional overgo
hybridization. Genome Res. 10, 714–721 (2000).
7. Doggett, N. A. et al. An integrated physical map of human chromosome 16. Nature 377, 335–365
(1995).
8. Cao, Y. et al. A 12-Mb complete coverage BAC contig map in human chromosome 16p13.1-p11.2.
Genome Res. 9, 763–774 (1999).
9. Kouprina, N. et al. Construction of human chromosome 16- and 5-specific circular YAC/BAC
libraries by in vivo recombination in yeast (TAR cloning). Genomics 53, 21–28 (1998).
10. Riethman, H. C. et al. Integration of telomere sequences with the draft human genome sequence.
Nature 409, 948–951 (2001).
11. Osoegawa, K. et al. A bacterial artificial chromosome library for sequencing the complete human
genome. Genome Res. 11, 483–496 (2001).
12. Schmutz, J. et al. Quality assessment of the human genome sequence. Nature 429, 365–368 (2004).
13. Dib, C. et al. A comprehensive genetic map of the human genome based on 5,264 microsatellites.
Nature 380, 152–154 (1996).
14. Kong, A. et al. A high-resolution recombination map of the human genome. Nature Genet. 31,
241–247 (2002).
15. Broman, K. W., Murray, J. C., Sheffield, V. C., White, R. L. & Weber, J. L. Comprehensive human
genetic maps: individual and sex-specific variation in recombination.Am. J. Hum. Genet. 63, 861–869
(1998).
16. Yu, A. et al. Comparison of human genetic and sequence-based physical maps. Nature 409, 951–953
(2001).
17. Grimwood, J. et al. The DNA sequence and biology of human chromosome 19. Nature 428, 529–535
(2004).
18. Lowe, T. M. & Eddy, S. R. tRNAscan-SE: a program for improved detection of transfer RNA genes in
genomic sequence. Nucleic Acids Res. 25, 955–964 (1997).
19. Zhang, Z., Harrison, P. M., Liu, Y. & Gerstein, M. Millions of years of evolution preserved: a
comprehensive catalog of the processed pseudogenes in the human genome. Genome Res. 13,
2541–2558 (2003).
20. Kent, W. J. BLAT–the BLAST-like alignment tool. Genome Res. 12, 656–664 (2002).
21. Jurka, J. Repbase update: a database and an electronic journal of repetitive elements. Trends Genet. 16,
418–420 (2000).
22. Flint, J. et al. The relationship between chromosome structure and function at a human telomeric
region. Nature Genet. 15, 252–257 (1997).
23. Wilkie, A. O. et al. Stable length polymorphism of up to 260 kb at the tip of the short arm of human
chromosome 16. Cell 64, 595–606 (1991).
24. Sebat, J. et al. Large-scale copy number polymorphism in the human genome. Science 305, 525–528
(2004).
25. Iafrate, A. J. et al.Detection of large-scale variation in the human genome.Nature Genet. 36, 949–951
(2004).
26. Loftus, B. et al. Genome duplications and other features in 12Mbp of DNA sequence from human
chromosome 16p and 16q. Genomics 60, 295–308 (1999).
27. Johnson, M. E. et al. Positive selection of a gene family during the emergence of humans and African
apes. Nature 413, 514–519 (2001).
28. Chen, F. C. & Li, W. H. Genomic divergences between humans and other hominoids and the effective
population size of the common ancestor of humans and chimpanzees.Am. J. Hum. Genet. 68, 444–456
(2001).
29. She, X. et al.The structure and evolution of centromeric transition regions within the human genome.
Nature 430, 857–864 (2004).
30. Guy, J. et al. Genomic sequence and transcriptional profile of the boundary between pericentromeric
satellites and genes on human chromosome arm 10p. Genome Res. 13, 159–172 (2003).
31. Eichler, E. E. et al. Divergent origins and concerted expansion of two segmental duplications on
chromosome 16. J. Hered. 92, 462–468 (2001).
32. Waterston, R. H. et al. Initial sequencing and comparative analysis of the mouse genome.Nature 420,
520–562 (2002).
33. Gibbs, R. A. et al. Genome sequence of the Brown Norway rat yields insights into mammalian
evolution. Nature 428, 493–521 (2004).
34. Aparicio, S. et al. Whole-genome shotgun assembly and analysis of the genome of Fugu rubripes.
Science 297, 1301–1310 (2002).
35. Boffelli, D., Nobrega, M. A. & Rubin, E. M. Comparative genomics at the vertebrate extremes.Nature
Rev. Genet. 5, 456–465 (2004).
36. Schmutz, J. et al. The DNA sequence and comparative analysis of human chromosome 5.Nature 431,
268–274 (2004).
37. Bejerano, G. et al. Ultraconserved elements in the human genome. Science 304, 1321–1325 (2004).
38. The ENCODE (ENCyclopedia Of DNA Elements) Project. Science 306, 636–640 (2004).
39. Bailey, J. A., Yavor, A. M., Massa, H. F., Trask, B. J. & Eichler, E. E. Segmental duplications:
organization and impact within the current human genome project assembly. Genome Res. 11,
1005–1017 (2001).
40. Kimura, M. A simple method for estimating evolutionary rates of base substitutions through
comparative studies of nucleotide sequences. J. Mol. Evol. 16, 111–120 (1980).
41. Parsons, J. D. Miropeats: graphical DNA sequence comparisons. Comput. Appl. Biosci. 11, 615–619
(1995).
42. Altschul, S. F. et al. Gapped BLAST and PSI-BLAST: a new generation of protein database search
programs. Nucleic Acids Res. 25, 3389–3402 (1997).
43. Birney, E., Clamp, M. & Durbin, R. GeneWise and Genomewise. Genome Res. 14, 988–995 (2004).
44. Schwartz, S. et al. Human-mouse alignments with BLASTZ. Genome Res. 13, 103–107 (2003).
45. Brudno, M. et al. LAGAN and Multi-LAGAN: efficient tools for large-scale multiple alignment of
genomic DNA. Genome Res. 13, 721–731 (2003).
46. Cooper, G. M. et al. Characterization of evolutionary rates and constraints in three mammalian
genomes. Genome Res. 14, 539–548 (2004).
47. Boffelli, D. et al. Phylogenetic shadowing of primate sequences to find functional regions of the
human genome. Science 299, 1391–1394 (2003).
48. Karlin, S. & Dembo, A. Limit distributions of maximal segmental score among Markov-dependent
partial sums. Adv. Appl. Prob. 24, 113–140 (1992).
Supplementary Information accompanies the paper on www.nature.com/nature.
Acknowledgements We thank the International Chimpanzee Sequencing Consortium for pre-
publication access to and permission to analyse the relevant portions of the chimpanzee genomic
sequence; the Broad Institute for pre-publication access to the dog genome assembly; and the
Washington University Genome Sequencing Center for pre-publication access to the chicken
genomic assembly. We also thank D. Gordon of the University of Washington for his assistance in
developing and customizing finishing tools, and T. Furey and G. Schuler for their efforts towards
assessing the quality and completeness of our assemblies. This work was performed under the
auspices of the US Department of Energy’s Office of Science, Biological and Environmental
Research Program and by the University of California, Lawrence Livermore National Laboratory,
Lawrence Berkeley National Laboratory, Los Alamos National Laboratory, and Stanford
University.
Competing interests statement The authors declare that they have no competing financial
interests.
Correspondence and requests for materials should be addressed to E.M.R. ([email protected]) or
L.A.P. ([email protected]). The sequence described here has been deposited in public
databases with accession number NC_000016.
articles
NATURE |VOL 432 | 23/30 DECEMBER 2004 | www.nature.com/nature994 © 2004 Nature Publishing Group
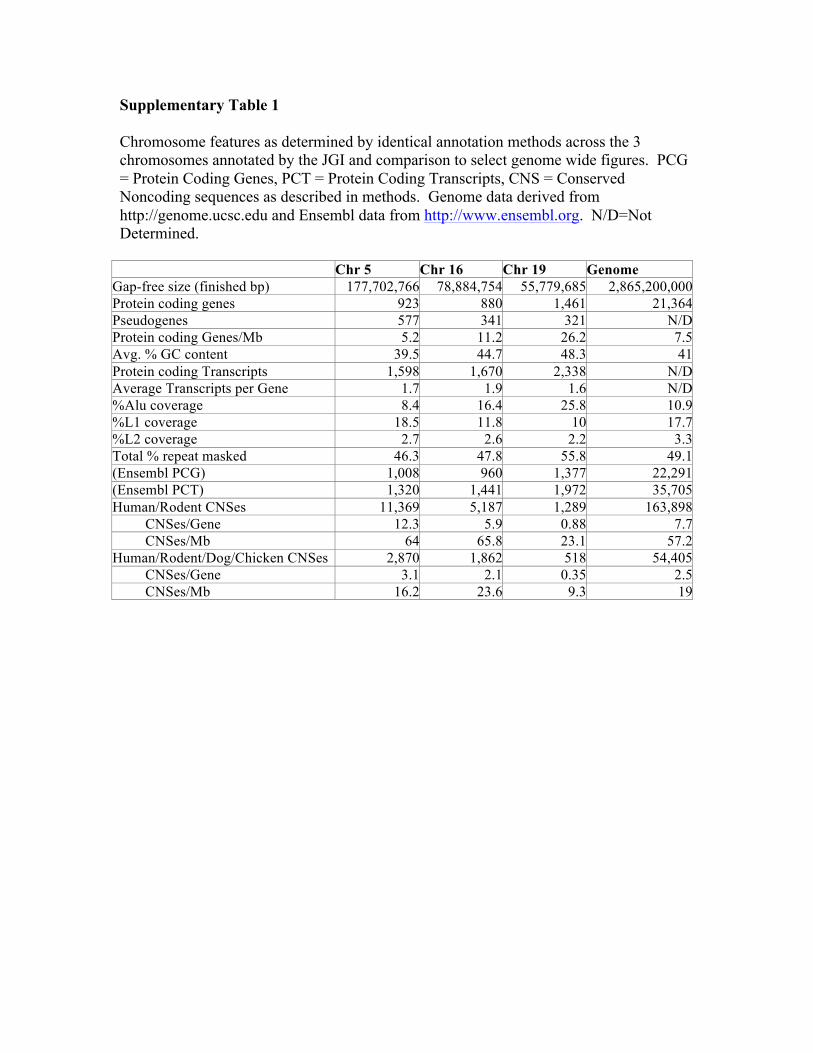
Supplementary Table 1
Chromosome features as determined by identical annotation methods across the 3 chromosomes annotated by the JGI and comparison to select genome wide figures. PCG = Protein Coding Genes, PCT = Protein Coding Transcripts, CNS = Conserved Noncoding sequences as described in methods. Genome data derived from http://genome.ucsc.edu and Ensembl data from http://www.ensembl.org. N/D=Not Determined.
Chr 5 Chr 16 Chr 19 Genome Gap-free size (finished bp) 177,702,766 78,884,754 55,779,685 2,865,200,000 Protein coding genes 923 880 1,461 21,364 Pseudogenes 577 341 321 N/D Protein coding Genes/Mb 5.2 11.2 26.2 7.5 Avg. % GC content 39.5 44.7 48.3 41 Protein coding Transcripts 1,598 1,670 2,338 N/D Average Transcripts per Gene 1.7 1.9 1.6 N/D %Alu coverage 8.4 16.4 25.8 10.9 %L1 coverage 18.5 11.8 10 17.7 %L2 coverage 2.7 2.6 2.2 3.3 Total % repeat masked 46.3 47.8 55.8 49.1 (Ensembl PCG) 1,008 960 1,377 22,291 (Ensembl PCT) 1,320 1,441 1,972 35,705 Human/Rodent CNSes 11,369 5,187 1,289 163,898 CNSes/Gene 12.3 5.9 0.88 7.7 CNSes/Mb 64 65.8 23.1 57.2 Human/Rodent/Dog/Chicken CNSes 2,870 1,862 518 54,405 CNSes/Gene 3.1 2.1 0.35 2.5 CNSes/Mb 16.2 23.6 9.3 19
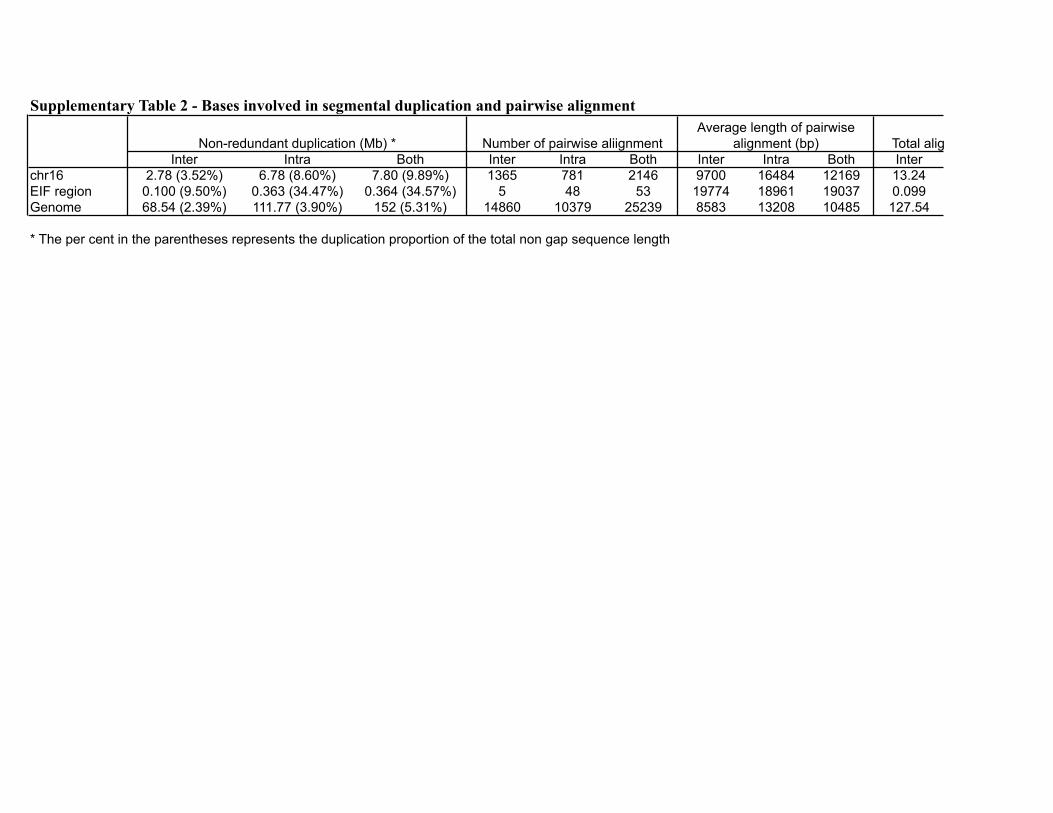
Supplementary Table 2 - Bases involved in segmental duplication and pairwise alignment
Inter Intra Both Inter Intra Both Inter Intra Both Interchr16 2.78 (3.52%) 6.78 (8.60%) 7.80 (9.89%) 1365 781 2146 9700 16484 12169 13.24EIF region 0.100 (9.50%) 0.363 (34.47%) 0.364 (34.57%) 5 48 53 19774 18961 19037 0.099Genome 68.54 (2.39%) 111.77 (3.90%) 152 (5.31%) 14860 10379 25239 8583 13208 10485 127.54
* The per cent in the parentheses represents the duplication proportion of the total non gap sequence length
Total aligined base pairs (Mb)Non-redundant duplication (Mb) * Number of pairwise aliignmentAverage length of pairwise
alignment (bp)
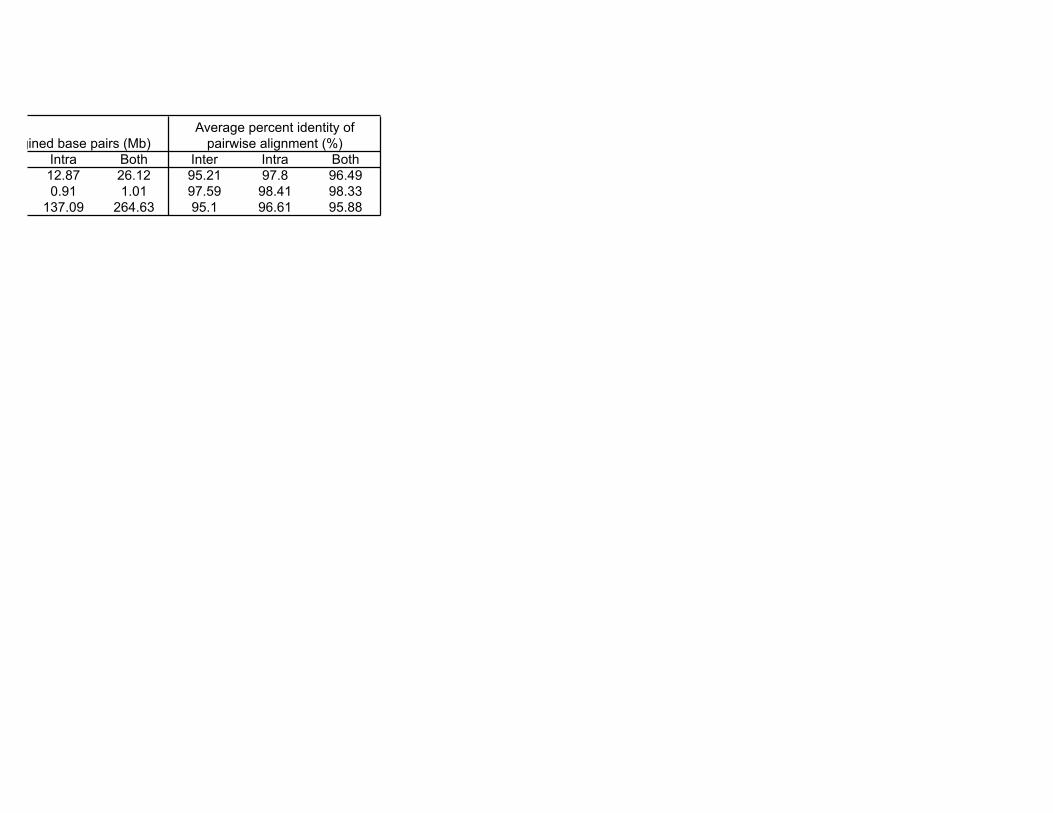
Intra Both Inter Intra Both12.87 26.12 95.21 97.8 96.490.91 1.01 97.59 98.41 98.33
137.09 264.63 95.1 96.61 95.88
* The per cent in the parentheses represents the duplication proportion of the total non gap sequence length
Total aligined base pairs (Mb)Average percent identity of
pairwise alignment (%)
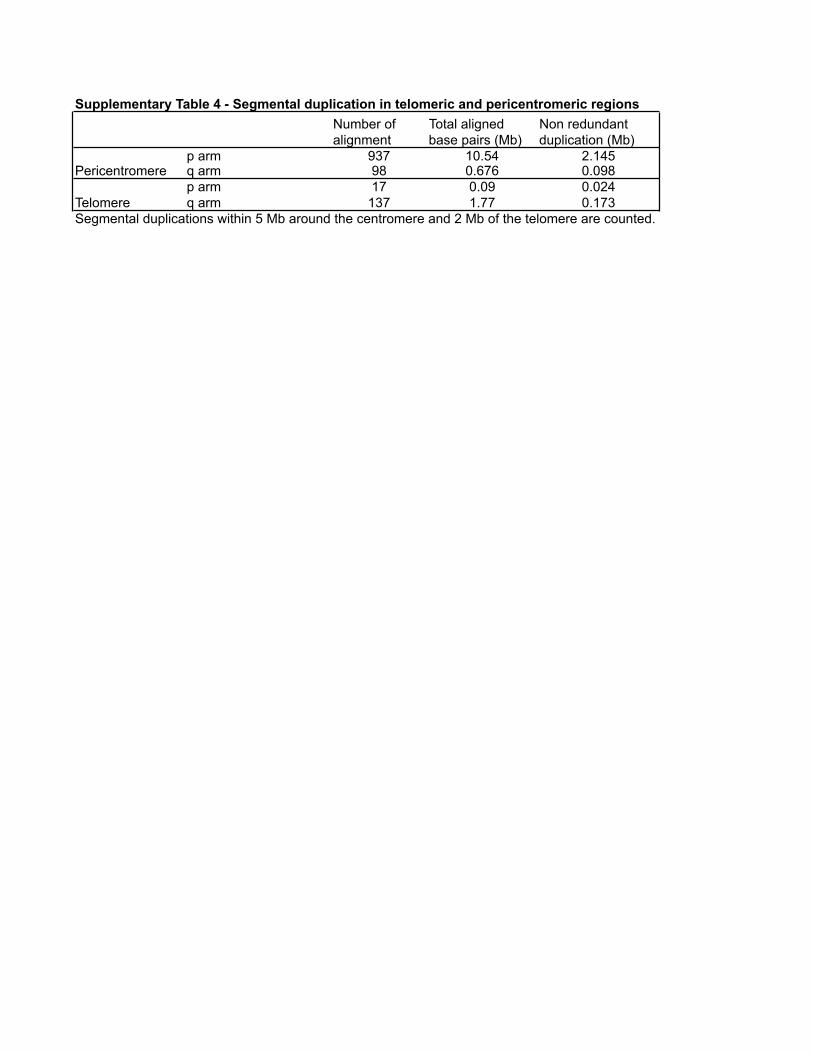
Supplementary Table 4 - Segmental duplication in telomeric and pericentromeric regionsNumber of alignment
Total aligned base pairs (Mb)
Non redundant duplication (Mb)
p arm 937 10.54 2.145q arm 98 0.676 0.098p arm 17 0.09 0.024q arm 137 1.77 0.173
Segmental duplications within 5 Mb around the centromere and 2 Mb of the telomere are counted.
Pericentromere
Telomere
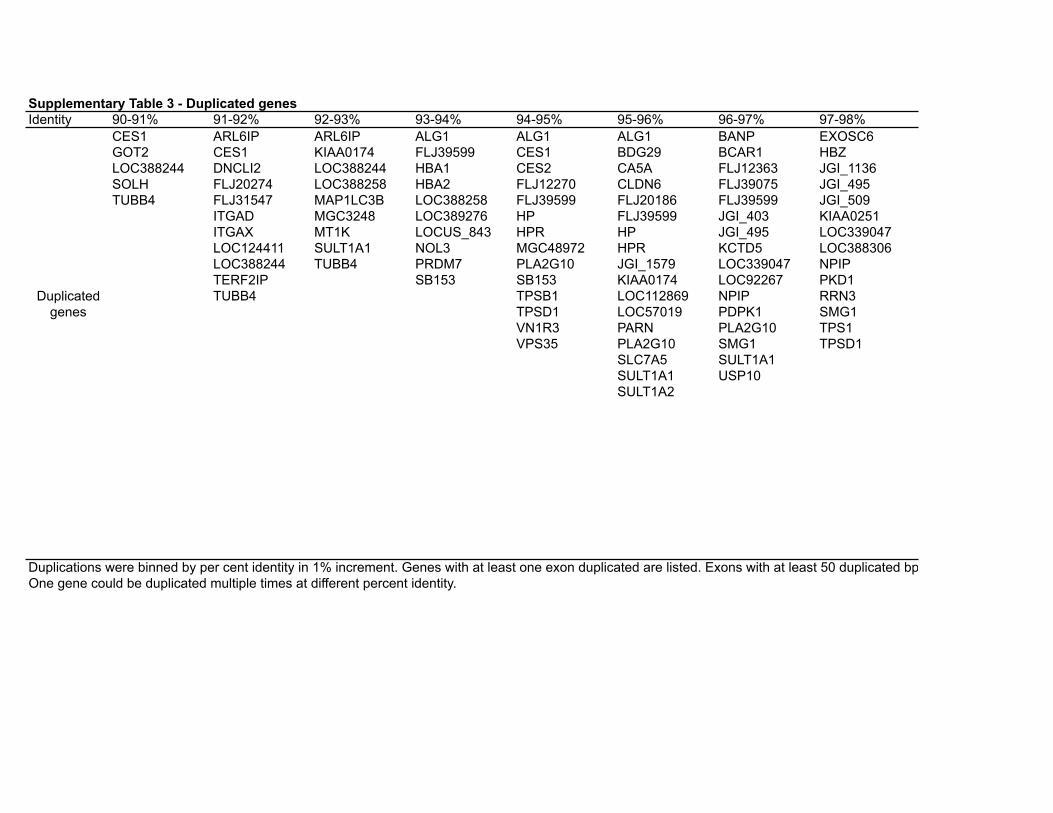
Supplementary Table 3 - Duplicated genesIdentity 90-91% 91-92% 92-93% 93-94% 94-95% 95-96% 96-97% 97-98%
CES1 ARL6IP ARL6IP ALG1 ALG1 ALG1 BANP EXOSC6GOT2 CES1 KIAA0174 FLJ39599 CES1 BDG29 BCAR1 HBZLOC388244 DNCLI2 LOC388244 HBA1 CES2 CA5A FLJ12363 JGI_1136SOLH FLJ20274 LOC388258 HBA2 FLJ12270 CLDN6 FLJ39075 JGI_495TUBB4 FLJ31547 MAP1LC3B LOC388258 FLJ39599 FLJ20186 FLJ39599 JGI_509
ITGAD MGC3248 LOC389276 HP FLJ39599 JGI_403 KIAA0251ITGAX MT1K LOCUS_843 HPR HP JGI_495 LOC339047LOC124411 SULT1A1 NOL3 MGC48972 HPR KCTD5 LOC388306LOC388244 TUBB4 PRDM7 PLA2G10 JGI_1579 LOC339047 NPIPTERF2IP SB153 SB153 KIAA0174 LOC92267 PKD1TUBB4 TPSB1 LOC112869 NPIP RRN3
TPSD1 LOC57019 PDPK1 SMG1VN1R3 PARN PLA2G10 TPS1VPS35 PLA2G10 SMG1 TPSD1
SLC7A5 SULT1A1SULT1A1 USP10SULT1A2
Duplicated genes
aaaaaaaaaaaaaaaaaaaaaaaaaaaaaaaaaaaaaaaaaaaaaaaaaaaaaaaaaaaaaaaaaaaaaaaaaaaaaaaaaaaaaaaaaaaaaaaaaaaaaaaaaaaaaaaaaaaaaaaaaaaaaaaaaaaaaaaaaaaaaaaaaaaaaa Duplications were binned by per cent identity in 1% increment. Genes with at least one exon duplicated are listed. Exons with at least 50 duplicated bp were considered duplicated. One gene could be duplicated multiple times at different percent identity.
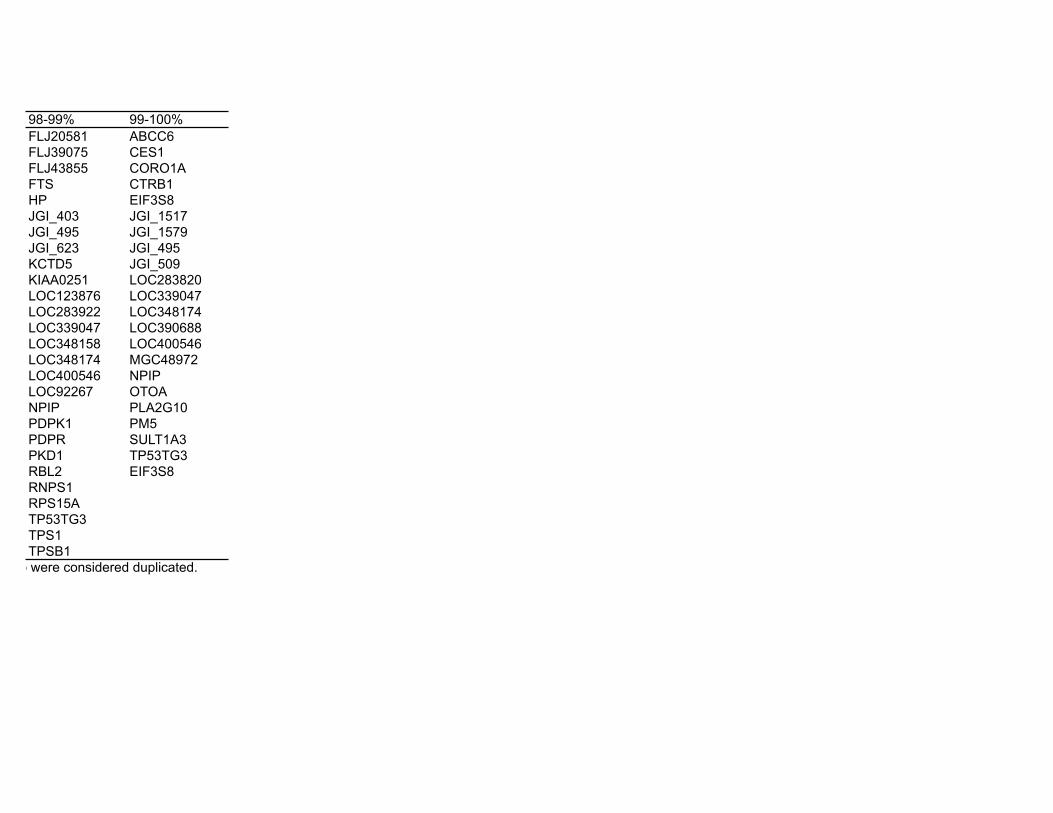
98-99% 99-100%FLJ20581 ABCC6FLJ39075 CES1FLJ43855 CORO1AFTS CTRB1HP EIF3S8JGI_403 JGI_1517JGI_495 JGI_1579JGI_623 JGI_495KCTD5 JGI_509KIAA0251 LOC283820LOC123876 LOC339047LOC283922 LOC348174LOC339047 LOC390688LOC348158 LOC400546LOC348174 MGC48972LOC400546 NPIPLOC92267 OTOANPIP PLA2G10PDPK1 PM5PDPR SULT1A3PKD1 TP53TG3RBL2 EIF3S8RNPS1RPS15ATP53TG3TPS1TPSB1
Duplications were binned by per cent identity in 1% increment. Genes with at least one exon duplicated are listed. Exons with at least 50 duplicated bp were considered duplicated. One gene could be duplicated multiple times at different percent identity.
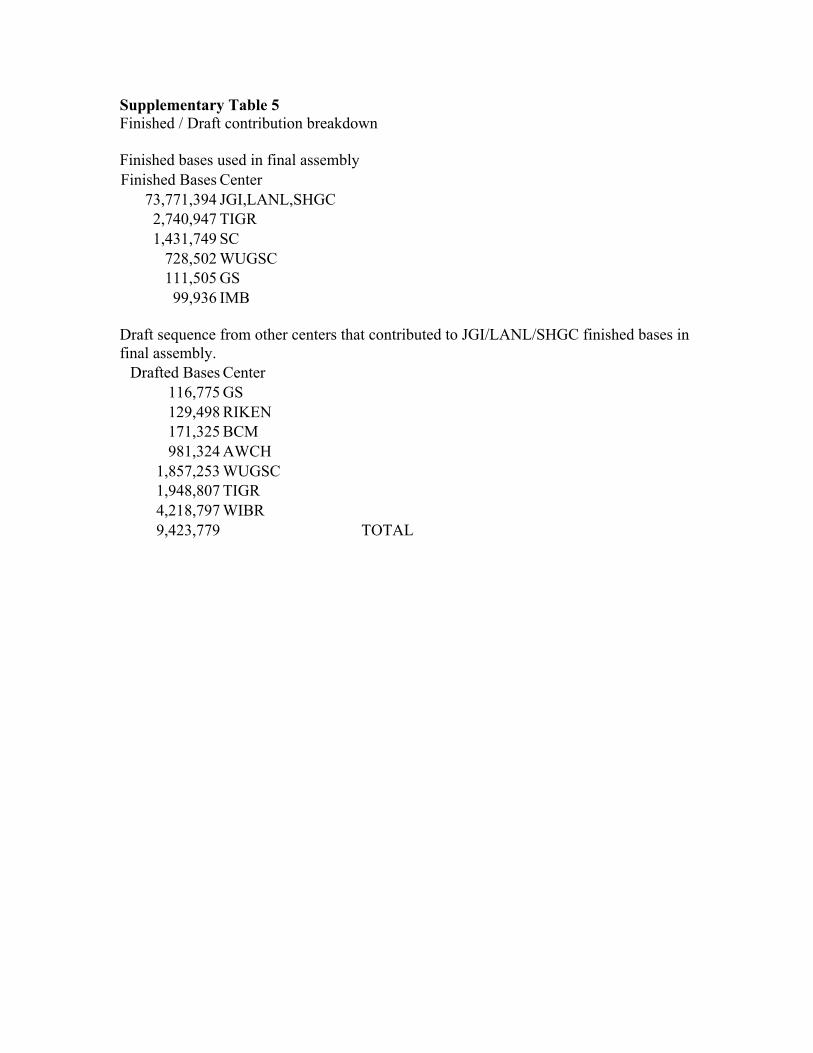
Supplementary Table 5 Finished / Draft contribution breakdown Finished bases used in final assembly Finished Bases Center
73,771,394 JGI,LANL,SHGC 2,740,947 TIGR 1,431,749 SC
728,502 WUGSC 111,505 GS 99,936 IMB
Draft sequence from other centers that contributed to JGI/LANL/SHGC finished bases in final assembly.
Drafted Bases Center 116,775 GS 129,498 RIKEN 171,325 BCM 981,324 AWCH
1,857,253 WUGSC 1,948,807 TIGR 4,218,797 WIBR 9,423,779 TOTAL
0
88827
500 1000 1500 2000 2500 3000 3500 4000 4500 5000
5500 6000 6500 7000 7500 8000 8500 9000 9500 10000
10500 11000 11500 12000 12500 13000 13500 14000 14500 15000
15500 16000 16500 17000 17500 18000 18500 19000 19500 20000
20500 21000 21500 22000 22500 23000 23500 24000 24500 25000
25500 26000 26500 27000 27500 28000 28500 29000 29500 30000
30500 31000 31500 32000 32500 33000 33500 34000 34500 35000
35500 36000 36500 37000 37500 38000 38500 39000 39500 40000
40500 41000 41500 42000 42500 43000 43500 44000 44500 45000
45500 46000 46500 47000 47500 48000 48500 49000 49500 50000
50500 51000 51500 52000 52500 53000 53500 54000 54500 55000
55500 56000 56500 57000 57500 58000 58500 59000 59500 60000
60500 61000 61500 62000 62500 63000 63500 64000 64500 65000
65500 66000 66500 67000 67500 68000 68500 69000 69500 70000
70500 71000 71500 72000 72500 73000 73500 74000 74500 75000
75500 76000 76500 77000 77500 78000 78500 79000 79500 80000
80500 81000 81500 82000 82500 83000 83500 84000 84500 85000
85500 86000 86500 87000 87500 88000 88500
chr16
0
500
1000
1500
2000
2500
3000
90 90.5 91 91.5 92 92.5 93 93.5 94 94.5 95 95.5 96 96.5 97 97.5 98 98.5 99 99.5
Per cent identity (%)
Alig
ned
base
s (kb
)
InterchromosomalIntrachromosomal