The role of semi-natural and abandoned vegetation patches in sustaining lepidopteran diversity in an...
10
Bulletin of Insectology 60 (1): 13-22, 2007 ISSN 1721-8861 The role of semi-natural and abandoned vegetation patches in sustaining lepidopteran diversity in an organic olive orchard Stefano SCALERCIO 1 , Nino IANNOTTA 1 , Pietro BRANDMAYR 2 1 CRA – Istituto Sperimentale per l’Olivicoltura, Rende, Cosenza, Italy 2 Dipartimento di Ecologia, Università della Calabria, Rende, Cosenza, Italy Abstract In an organic farm on the Ionian Coast of Calabria Region, southern Italy, Lepidoptera were monthly surveyed in order to con- tribute to the knowledge of the olive orchard butterflies and moths communities, and investigate the role assumed by patches at different seral stages in sustaining lepidopteran diversity and abundance. The sampling sessions were conducted in four contigu- ous stands representing a gradient of land use running from relatively undisturbed to highly modified vegetation cover. Diversity values, larval feeding preferences, adult dispersal abilities and biogeographical range of species assemblage were analysed to identify the main features of the community. Quantitative and qualitative similarities of species assemblages were computed. 1,371 individuals belonging to 195 species were collected. Although contiguous, species assemblages have attained lower simi- larity values than expected. The highest diversity values were recorded in semi-natural patches. Migrant species were more abun- dant in semi-natural and abandoned patches, and sedentary species were more abundant in olive orchard. The most represented species in the farm were those which are largely distributed through the Palaearctic; the farm also hosts species assemblages hav- ing strong larval feeding preferences for herbaceous plants. Species feeding on trees were very scarce. No significant correspon- dences were found between vegetation cover and distribution of feeding preferences. Although very important for the increase of agricultural landscape species richness, semi-natural and abandoned vegetation patches inhabit few habitat specialists, proving themselves stepping stones and/or corridors only, because of their reduced dimensions that enhance the border effect. Thanks to the favourable microclimate and the low pressure of human activities semi-natural and abandoned vegetation patches inhabit more species than crop areas, but many of these are highly mobile and widespread. The sheltering capacity of biotopes and behavioural features of species are probably the most important factors affecting composition and diversity of communities at the farm scale. Key words: diversity, species assemblage, olive orchard, butterfly, moth, Calabria. Introduction The typical agricultural landscape in Calabria, southern Italy, is composed by several types of cultivation sur- rounded by, or enriched with, hedgerows and patches of semi-natural vegetation. Within agroecosystems, these landscape features are very important for dispersion of invertebrates, acting as corridors or stepping stones, furnishing protection in respect to agricultural practices or microclimatic refuge during periods of environmental stress, and providing alimentary sources (Burel, 1996; Rieux et al., 1999; Dover and Sparks, 2000). Further- more, they enhance biological control by increasing landscape heterogeneity and biodiversity (Marino and Landis, 1996; Altieri, 1999). Traditional farming sys- tems, based mainly on practices like polycultures and crop rotation, and mosaic landscape structures, caused by both hard regional topography and little farm sur- faces, facilitate sustainable agriculture (Paoletti, 1995). In the Calabrian agricultural landscape, many organic farms were established in the recent past. In particular, organic olive orchards are very numerous because of the favourable climate of the region and the ancient history of this cultivation starting in Calabria from the “Magna Graecia” period, twenty-seven centuries ago. Unfortu- nately, the available literature shows a significant lack of information about this agroecosystem. Some attempts were done towards the understanding of the relations between non target insect fauna and pesticides utilised in olive orchards (e.g. Cirio, 1997; Ruano et al., 2004; Iannotta et al., 2006), and some authors described the whole insect community of olive orchards at high taxo- nomic rank (e.g. Belcari and Dagnino, 1995; Brandmayr et al., 1999; Ruiz and Montiel, 2000). Nothing is known about non target lepidopteran species in the olive eco- system. Life history traits of species are very important for identifying main ecological features of species assem- blages and represent the starting point for any further analysis (Scalercio, 2006). In detail, we utilised (i) adult dispersal ability, about which few detailed data are available despite its importance in guiding species dis- tribution of Lepidoptera (e.g. Balletto and Kudrna, 1985 for butterflies; Hausmann, 1990 for moths); (ii) bio- geographical pattern, which provides insight into the ecology of a species (New, 1991); and (iii) larval feed- ing preferences, which are very important in determin- ing spatial and seasonal distribution of Lepidoptera (Shapiro and Shapiro, 1973; Usher and Keiller, 1998; Kitching et al., 2000). In this study we tried to put in evidence the impor- tance of a diversified agricultural landscape in a Medi- terranean region in sustaining lepidopteran diversity. We assumed that lepidopteran species assemblages re- spond to landscape modifications in a plastic way, adapting themselves to environmental conditions by modifying ecological traits of its own species complex, and that the structure of species assemblages changes
Transcript of The role of semi-natural and abandoned vegetation patches in sustaining lepidopteran diversity in an...

Bulletin of Insectology 60 (1): 13-22, 2007ISSN 1721-8861
The role of semi-natural and abandoned vegetationpatches in sustaining lepidopteran diversity
in an organic olive orchardStefano SCALERCIO1, Nino IANNOTTA1, Pietro BRANDMAYR2
1CRA – Istituto Sperimentale per l’Olivicoltura, Rende, Cosenza, Italy2Dipartimento di Ecologia, Università della Calabria, Rende, Cosenza, Italy
Abstract
In an organic farm on the Ionian Coast of Calabria Region, southern Italy, Lepidoptera were monthly surveyed in order to con-tribute to the knowledge of the olive orchard butterflies and moths communities, and investigate the role assumed by patches atdifferent seral stages in sustaining lepidopteran diversity and abundance. The sampling sessions were conducted in four contigu-ous stands representing a gradient of land use running from relatively undisturbed to highly modified vegetation cover. Diversityvalues, larval feeding preferences, adult dispersal abilities and biogeographical range of species assemblage were analysed toidentify the main features of the community. Quantitative and qualitative similarities of species assemblages were computed.1,371 individuals belonging to 195 species were collected. Although contiguous, species assemblages have attained lower simi-larity values than expected. The highest diversity values were recorded in semi-natural patches. Migrant species were more abun-dant in semi-natural and abandoned patches, and sedentary species were more abundant in olive orchard. The most representedspecies in the farm were those which are largely distributed through the Palaearctic; the farm also hosts species assemblages hav-ing strong larval feeding preferences for herbaceous plants. Species feeding on trees were very scarce. No significant correspon-dences were found between vegetation cover and distribution of feeding preferences. Although very important for the increase ofagricultural landscape species richness, semi-natural and abandoned vegetation patches inhabit few habitat specialists, provingthemselves stepping stones and/or corridors only, because of their reduced dimensions that enhance the border effect. Thanks tothe favourable microclimate and the low pressure of human activities semi-natural and abandoned vegetation patches inhabit morespecies than crop areas, but many of these are highly mobile and widespread. The sheltering capacity of biotopes and behaviouralfeatures of species are probably the most important factors affecting composition and diversity of communities at the farm scale.
Key words: diversity, species assemblage, olive orchard, butterfly, moth, Calabria.
Introduction
The typical agricultural landscape in Calabria, southernItaly, is composed by several types of cultivation sur-rounded by, or enriched with, hedgerows and patches ofsemi-natural vegetation. Within agroecosystems, theselandscape features are very important for dispersion ofinvertebrates, acting as corridors or stepping stones,furnishing protection in respect to agricultural practicesor microclimatic refuge during periods of environmentalstress, and providing alimentary sources (Burel, 1996;Rieux et al., 1999; Dover and Sparks, 2000). Further-more, they enhance biological control by increasinglandscape heterogeneity and biodiversity (Marino andLandis, 1996; Altieri, 1999). Traditional farming sys-tems, based mainly on practices like polycultures andcrop rotation, and mosaic landscape structures, causedby both hard regional topography and little farm sur-faces, facilitate sustainable agriculture (Paoletti, 1995).In the Calabrian agricultural landscape, many organicfarms were established in the recent past. In particular,organic olive orchards are very numerous because of thefavourable climate of the region and the ancient historyof this cultivation starting in Calabria from the “MagnaGraecia” period, twenty-seven centuries ago. Unfortu-nately, the available literature shows a significant lackof information about this agroecosystem. Some attemptswere done towards the understanding of the relationsbetween non target insect fauna and pesticides utilised
in olive orchards (e.g. Cirio, 1997; Ruano et al., 2004;Iannotta et al., 2006), and some authors described thewhole insect community of olive orchards at high taxo-nomic rank (e.g. Belcari and Dagnino, 1995; Brandmayret al., 1999; Ruiz and Montiel, 2000). Nothing is knownabout non target lepidopteran species in the olive eco-system.
Life history traits of species are very important foridentifying main ecological features of species assem-blages and represent the starting point for any furtheranalysis (Scalercio, 2006). In detail, we utilised (i) adultdispersal ability, about which few detailed data areavailable despite its importance in guiding species dis-tribution of Lepidoptera (e.g. Balletto and Kudrna, 1985for butterflies; Hausmann, 1990 for moths); (ii) bio-geographical pattern, which provides insight into theecology of a species (New, 1991); and (iii) larval feed-ing preferences, which are very important in determin-ing spatial and seasonal distribution of Lepidoptera(Shapiro and Shapiro, 1973; Usher and Keiller, 1998;Kitching et al., 2000).
In this study we tried to put in evidence the impor-tance of a diversified agricultural landscape in a Medi-terranean region in sustaining lepidopteran diversity.We assumed that lepidopteran species assemblages re-spond to landscape modifications in a plastic way,adapting themselves to environmental conditions bymodifying ecological traits of its own species complex,and that the structure of species assemblages changes

14
with diversity and architectural complexity of the vege-tal cover because Lepidoptera spend their life eatingplants, pollinating plants and staying on and/or under-neath plants. In detail, the aims of the present study areto contribute to the knowledge of the olive orchardagroecosystem by examining butterflies and moths spe-cies assemblages, and to identify the role assumed bypatches at different seral stages in sustaining lepidop-teran diversity and abundance in an organic olive or-chard.
Materials and methods
Study areaWe conducted our study in the Azienda Archeo-
Agrituristica Santa Maria del Mare Vetere, a farm or-ganic from 1993 according to CEE 2092/91, situated inthe municipality of Stalettì, Ionian Coast of Calabria,southern Italy (lat. 38° 45’ 22” N; long. 16° 34’ 4” E.figure 1). The farm has a very irregular topography.Geological substratum is mainly granitic, just few allu-vial coins are present. The climate is typically Mediter-ranean, having a four months long dry and hot season.The maximum average temperature of the warmestmonth (August) is 31.3 °C and the average of minimumtemperatures of the coldest month (January) is 8.2 °C.The landscape is dominated by olive orchards, but manyremnants of wild vegetation are present, mainly in thedeepest valleys and on the steepest slopes. Remnantsrepresent different evolutionary stages of Mediterraneanmaquis, having forests composed by Quercus spp. [Q.ilex L., Q. suber L., Q. virgiliana (Ten.) Ten.] in oldseres and evergreen shrubs (Pistacia lentiscus L., Myr-tus communis L., Cistus spp.) in young seres.
Four contiguous stands were surveyed from May 1998to July 1999. They represent a gradient of land use run-ning from a relatively undisturbed Q. ilex wood (QI), toan olive orchard periodically ploughed and organicallymanaged (OO1). QI is a strip-like wood situated in avalley with occasional water floods, covering a surfaceof 520 m2. An abandoned olive orchard (AB), coveringa surface of 360 m2, burned in 1986 and re-colonised bythe wild vegetation was chosen as intermediate seralstage. Among other parameters, spatial attributes of agiven area play an important role in determining lepi-dopteran diversity (Usher and Keiller, 1998). For thisreason, AB and QI spatial attributes are comparable,while OO1 belongs to the landscape matrix. The shapeof AB and QI were measured by a dimensionless pa-
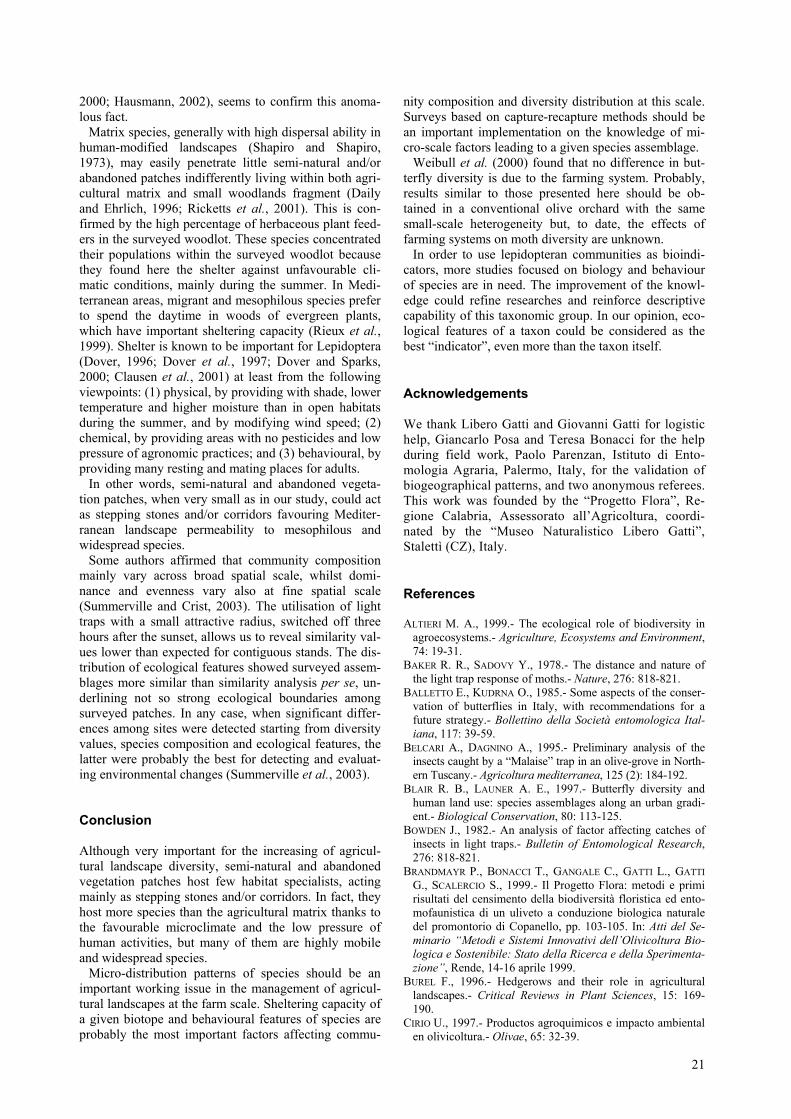
Figure 1. Location of study area. The position of thefour bucket-light traps for moths sampling (blacksquares) and the three areas surveyed for butterfliesmonitoring (white lines) were superimposed to anaerial photograph of the study area.
rameter (R), defined as R = 0.282P/A1/2, where P is theperimeter of the sampled site, A is the area and 0.282 isa factor which ensures that R = 1 for a circular wood. Inorder to test the efficacy of the experimental design, asecond stand within the olive orchard was chosen (OO2)(table 1), where the trap worked in a different way.
Moths samplingMoths were sampled by using bucket traps with 160W
mercury-vapour lamp, powered by a portable electricgenerator. Four traps were used, one within each stand.Traps were turned-on at dusk and turned-off three hourslater, optimising the sampling effort and minimising thecollection of vagrant species. Anyway, it is well knownthat the highest numbers of species and individuals flyduring the first quarter of the night. Before traps open-ing, a quick data collection was carried out around traps
Table 1. Main attributes of sampled sites. The shape of OO1 and OO2 was not measured because they belong to thelandscape matrix. The shape index (R)is defined in the text.
Coverage by(%)Sampled sites Altitude
(m a.s.l.)Shape
(R)
Slopeinclination
(°) trees shrubs grasses bare soilQI 176 2.29 40 90 15 45 10AB 181 2.32 25 5 35 95 5OO1 185 - 5 70 5 5 90OO2 180 - 5 70 5 5 90

15
registering species as singletons. Then, few chloroformdrops were introduced into buckets to anesthetise theindividuals trapped in. Specific determination was car-ried out in the field releasing individuals after counting.Just few specimens were collected and identified bymorphological studies.
Fifteen sampling sessions were monthly carried outfrom May 1998 to July 1999 during standard environ-mental conditions: new moon, no or low wind speed(<1m/s), no rain, temperature near to the mean for thegiven month. Light traps were turned-on simultaneouslyavoiding unexpected differences in the abiotic environ-ment. Summerville and Crist (2003) emphasized sea-sonal effects as an highly confounding factor on diver-sity and species composition. Nevertheless, in order toinclude seasonal effects in species richness data andspecies assemblages composition, the same samplingeffort was carried out through all the seasons.
The traps were put in place with lamps at more or less60 cm above the ground level. The height of the lampshas a direct influence on results by enlarging the trapattractive radius (Baker and Sadovy, 1978).There is nounivocal result about the width of the area successfullysampled by a light trap, spanning from 700 m (Bowden,1982) to 3 m (Baker and Sadovy, 1978) of radius de-pending on the kind of lamp light, the lamp position, theambient light and the species behaviour. However, es-timates based on field evidences reveal as the mostlikely effective a radius not wider than 50 m (Baker andSadovy, 1978; Ricketts et al., 2002). Whatever the at-tractive radius is, our data were reinforced by the si-multaneous light-traps working and by the opportunelyorientation and shading of traps. In order to test locationand shading efficacy, the light-trap located in OO2 wasnot shaded, freely working in all directions. The dis-tance between sampled sites was 15 metres for OO1-ABand for AB-QI, whilst the distance QI-OO2 was 40 me-tres. This sampling design could be affected by pseu-doreplication (Hurlbert, 1984) and by interference be-tween the traps working radius, but these issues werestrongly reduced by the simultaneous traps working andby the very short duration of each sampling.
Butterfly samplingSample sites were monthly surveyed, from March 1998
to November 1998, always on sunny days and between9:30 a.m. and 3:00 p.m. A zigzag line was followed dur-ing systematic walking surveys. Each survey lasted 10minutes in order to limit the ingress of individuals intoour sites during sampling and to minimise the doublecounting. No spot of the sample sites was covered morethan once. A time-constrained method, yet used by otherauthors (e.g.: Blair and Launer, 1997), was here utilisedinstead of the standard butterfly counting method devel-oped by Pollard (1977) because of the small surface ofthe sampled sites. At the beginning of each sampling, thenumerical evaluation of the most mobile and visible spe-cies was carried out. Individuals observed at the siteboundaries were not recorded. Specimens were identifiedin the field and released at the end of sampling. More dif-ficult identifications were performed at the end of sam-pling with the aid of field guides.
Data analysisDiversity was analysed utilising species number (S),
Shannon’s index (H’), here with log2, Fisher’s alpha (α)and Simpson’s index (D). The computing of moth spe-cies recorded out of light traps as singletons could leadto an overestimation of diversity indices, mainly α. Inorder to evaluate the overestimation, indices were cal-culated with and without singletons. Significant differ-ences (P<0.05) among computed H’ values were per-formed by using the Student’s t-test. Running Esti-mateS5 (Colwell, 1997), we verified the sampling ex-haustiveness (1) by building rarefaction curves of ob-served species after 50 randomisations of the sample,and (2) by calculating the total species number of sam-pled sites using ICE, an incidence-based coverage esti-mator of species number (SICE), and ACE, an abun-dance-based coverage estimator of species number(SACE).
Species can be grouped in the following useful catego-ries of dispersal ability: sedentary (SED): bad flyersspreading usually not more than few hundreds metresfrom the adult emergence site; spreader (SPR): speciesspreading usually not more than one or few kilometresfrom the adult emergence site; migratory (MIG): verygood flyers spreading usually very far from the adultemergence site. While SED and MIG groups were com-posed by species with sufficiently known dispersal be-haviour, the SPR group could be composed by specieswith a poorly known dispersal ability. In order to avoidmistakes while grouping species, further studies on theirdispersal behaviour are required.
Biogeographical analysis was performed groupingspecies as follows: range larger than Palaearctic Region(BP1); range = Palaearctic (BP2); range = Euro-Mediterranean (BP3); range = Mediterranean (BP4).Species range was extrapolated from the above men-tioned identification guides.
Larval feeding preferences were assessed assigningspecies to Summerville and Crist’s (2003) feedinggroups: (1) woody plants, trees and shrubs feeders(WP); (2) herb and graminoid feeders (HERB); (3)dead/decaying vegetation feeders (DET); (4)fungi/lichen/moss feeders (FLM); and (5) generalisedfeeders utilising at least two host categories (GEN). The1.96% of individuals and the 6.12% of species have un-known feeding preferences. Although not perfectly cor-rect, these species were in any case included in the group-level analysis determining feeding preferences accordingto the closest, mainly congeneric, species. In fact, in ouropinion their exclusion a priori could be statisticallymore dangerous, because certainly incorrect, than theirinclusion, because probably correct. In any case, the per-centage of species and individuals with unknown ali-mentary behaviour has no statistical significance.
We calculated similarity among stands using (1) thequalitative Sørensen index, Ss = 2c/(a+b), where c is thenumber of species found in both sites, and a and b arethe number of species in sites A and B, respectively, and(2) the quantitative Renkonen index, Sr = Σ pmin (pax,pbx), where pax is the relative abundance of the species xin the site a, pbx is the relative abundance of the samespecies in the site b and pmin is the lowest relative abun-

16
dance value between them. Both Ss and Sr approach 1.0value when species composition is identical betweensites and 0.0 value when two sites have no species incommon. The validity of similarity analysis was alsoexamined by the cluster analysis, unweighted pair-groupmethod using arithmetic average (UPGMA, percentagedifferences) based on the abundance matrix of moth as-semblages, generated by the program STATISTICAKernel release 5.5 (StatSoft, 1999).
All performed correlations were tested with Spearmanrank correlations (Cs) because data were not normallydistributed.
Results
Species assemblages1,371 individuals belonging to 195 species were col-
lected (table 2). 46 species occurred in all sampled sites,while 85 species occurred in only one of it. Speciesnumber is significantly related to abundance (Cs =0.9554, P<0.0001, n = 15), so the same considerationsthat are made below on spatial distribution of diversitycould be made on spatial distribution of abundance. The19 most abundant species were necessary to attain the50% of the sample and compose the head of the farm
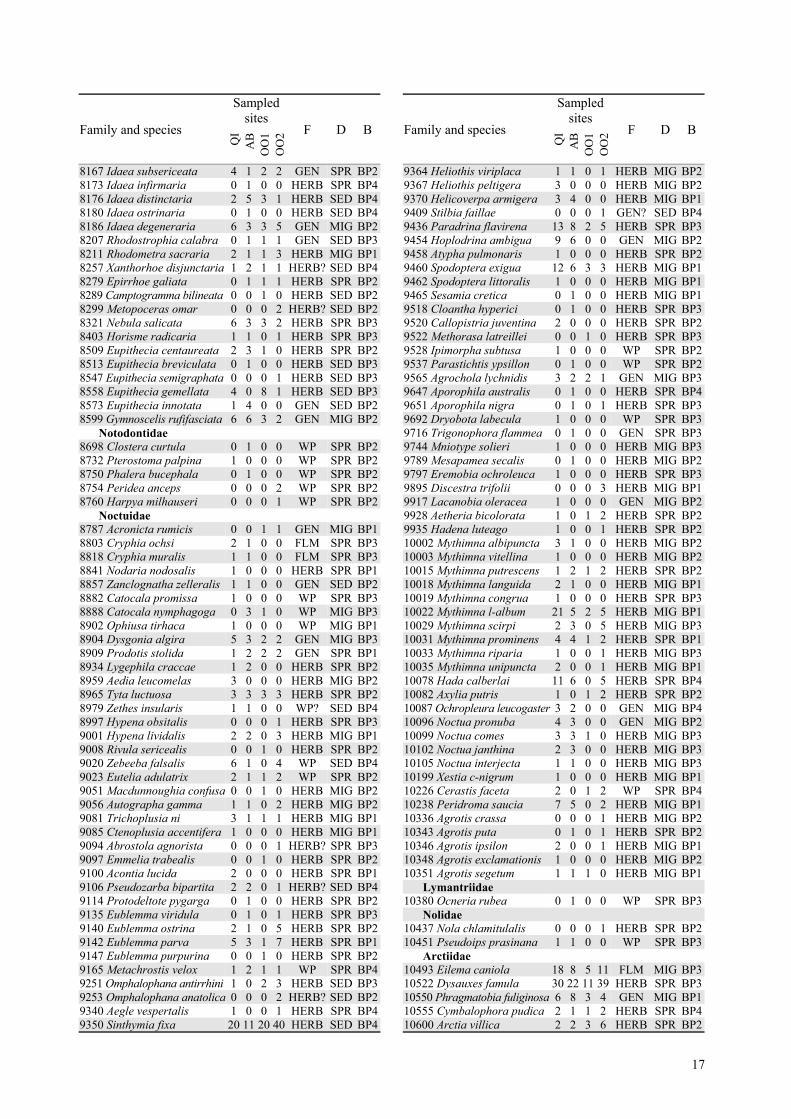
Table 2. List of the abundances (summed over all trap nights and diurnal samples) of all species recorded from the foursampled sites. Species code number and nomenclature follow Karsholt and Razowski (1996). Butterflies were notsampled within OO2. For each species were reported: feeding preferences (F); dispersal ability (D); biogeographicalpattern (B). Feeding preferences marked with ? were determined according to the closest, mainly congeneric, species.
Sampledsites
Family and species
QI
AB
OO
1O
O2 F D B
Sesiidae4019 Tinthia tineiformis 0 0 4 0 HERB SED BP44086 Bembecia uroceriformis 1 0 0 0 HERB SED BP3
Cossidae4156 Parahypopta caestrum 3 1 1 4 WP SED BP34166 Dyspessa ulula 1 0 0 0 HERB SED BP24176 Zeuzera pyrina 0 1 1 1 WP SPR BP1
Lasiocampidae6749 Lasiocampa trifolii 1 1 0 1 GEN SPR BP2
Sphingidae6853 Hyles euphorbiae 0 2 0 0 HERB MIG BP2
Hesperiidae6882 Carcharodus alceae 0 1 1 - HERB SPR BP26925 Thymelicus acteon 1 2 2 - HERB SPR BP36932 Gegenes pumilio 0 4 2 - HERB SPR BP1
Papilionidae6958 Iphiclides podalirius 4 3 0 - WP SPR BP26960 Papilio machaon 2 7 2 - HERB MIG BP2
Pieridae6966 Leptidea sinapis 3 0 0 - HERB SED BP26973 Anthocaris cardamines 2 1 0 - HERB SPR BP26985 Euchloe ausonia 0 2 2 - HERB SPR BP16995 Pieris brassicae 5 10 11 - HERB MIG BP16997 Pieris mannii 1 0 0 - HERB SED BP26998 Pieris rapae 18 19 18 - HERB MIG BP17000 Pieris napi 0 1 0 - HERB SPR BP17005 Pieris edusa 0 2 3 - HERB SPR BP27015 Colias croceus 5 2 3 - HERB MIG BP2
Lycaenidae7034 Lycaena phlaeas 0 1 0 - HERB SPR BP17073 Lampides boeticus 0 2 1 - GEN MIG BP17097 Celastrina argiolus 8 0 0 - WP SED BP17163 Polyommatus icarus 2 13 27 - HERB SPR BP2
Nymphalidae7243 Vanessa atalanta 0 0 3 - HERB MIG BP17245 Vanessa cardui 1 4 3 - HERB MIG BP17270 Melitaea cinxia 0 1 0 - HERB SPR BP27307 Pararge aegeria 1 0 0 - HERB SED BP27309 Lasiommata megera 1 3 13 - HERB SPR BP27334 Coenonympha pamphilus 1 1 2 - HERB SPR BP27341 Pyronia cecilia 5 11 6 - HERB SED BP47350 Maniola jurtina 1 0 0 - HERB SED BP27434 Hipparchia blachieri 0 0 2 - HERB SPR BP4
Sampledsites
Family and species
QI
AB
OO
1O
O2 F D B
7441 Hipparchia statilinus 0 3 3 - HERB SPR BP37145 Aricia agestis 0 0 1 - HERB SPR BP2
Drepanidae7481 Thyatira batis 1 0 0 0 WP SPR BP27504 Watsonalla uncinula 2 2 1 1 WP SPR BP3
Geometridae7583 Rhoptria asperaria 2 0 0 0 WP SPR BP37689 Apochima flabellaria 1 0 0 0 HERB SPR BP17694 Agriopis bajaria 1 0 1 0 WP SPR BP27724 Menophra abruptaria 3 1 1 0 WP SPR BP47725 Menophra japygiaria 1 0 0 0 HERB SPR BP47733 Synopsia sociaria 1 2 1 1 GEN SPR BP27754 Peribatodes rhomboidaria 4 6 0 4 GEN SPR BP27770 Selidosema ambustaria 2 1 1 0 GEN? SED BP47794 Ascotis selenaria 1 0 0 0 GEN SPR BP27837 Campaea honoraria 0 0 0 1 WP SPR BP37850 Gnophos sartata 2 0 0 1 GEN SED BP47916 Siona lineata 0 0 0 1 GEN SED BP27926 Semiaspilates ochrearia 2 1 0 1 HERB SPR BP47933 Dyscia sicanaria 0 0 0 2 HERB? SED BP27966 Pseudoterpna coronillaria 2 1 0 0 GEN SPR BP47984 Chlorissa etruscaria 3 4 1 2 HERB SPR BP27987 Microloxia herbaria 1 0 0 0 HERB SPR BP28017 Cyclophora puppillaria 8 3 1 5 WP MIG BP28023 Cyclophora suppunctaria 0 2 0 0 WP SPR BP38027 Timandra comae 0 0 0 1 HERB SPR BP28048 Scopula submutata 1 0 0 0 HERB SED BP48052 Scopula vigilata 3 1 2 6 HERB SED BP48059 Scopula marginepunctata 5 6 2 3 HERB MIG BP28062 Scopula imitaria 3 4 3 7 GEN MIG BP48073 Scopula minorata 0 0 0 2 HERB MIG BP18092.1 Idaea leipnitzi 1 0 0 0 HERB? SED BP48094 Idea consanguinaria 1 0 0 0 HERB SPR BP48099 Idaea ochrata 0 0 0 2 HERB SED BP28107 Idaea rusticata 1 0 0 0 GEN SPR BP28110 Idaea filicata 27 10 5 20 GEN SPR BP38113 Idaea efflorata 0 1 0 0 HERB? SED BP48115 Idaea attenuaria 0 0 0 1 HERB? SED BP48129 Idaea elongaria 1 2 0 1 HERB SPR BP28131 Idaea obsoletaria 18 6 2 10 HERB SPR BP28155 Idaea seriata 11 5 2 4 DET MIG BP38161 Idaea dimidiata 1 0 0 0 GEN SPR BP1
Continued
17
Sampledsites
Family and species
QI
AB
OO
1O
O2 F D B
8167 Idaea subsericeata 4 1 2 2 GEN SPR BP28173 Idaea infirmaria 0 1 0 0 HERB SPR BP48176 Idaea distinctaria 2 5 3 1 HERB SED BP48180 Idaea ostrinaria 0 1 0 0 HERB SED BP48186 Idaea degeneraria 6 3 3 5 GEN MIG BP28207 Rhodostrophia calabra 0 1 1 1 GEN SED BP38211 Rhodometra sacraria 2 1 1 3 HERB MIG BP18257 Xanthorhoe disjunctaria 1 2 1 1 HERB? SED BP48279 Epirrhoe galiata 0 1 1 1 HERB SPR BP28289 Camptogramma bilineata 0 0 1 0 HERB SED BP28299 Metopoceras omar 0 0 0 2 HERB? SED BP28321 Nebula salicata 6 3 3 2 HERB SPR BP38403 Horisme radicaria 1 1 0 1 HERB SPR BP38509 Eupithecia centaureata 2 3 1 0 HERB SPR BP28513 Eupithecia breviculata 0 1 0 0 HERB SED BP38547 Eupithecia semigraphata 0 0 0 1 HERB SED BP38558 Eupithecia gemellata 4 0 8 1 HERB SED BP38573 Eupithecia innotata 1 4 0 0 GEN SED BP28599 Gymnoscelis rufifasciata 6 6 3 2 GEN MIG BP2
Notodontidae8698 Clostera curtula 0 1 0 0 WP SPR BP28732 Pterostoma palpina 1 0 0 0 WP SPR BP28750 Phalera bucephala 0 1 0 0 WP SPR BP28754 Peridea anceps 0 0 0 2 WP SPR BP28760 Harpya milhauseri 0 0 0 1 WP SPR BP2
Noctuidae8787 Acronicta rumicis 0 0 1 1 GEN MIG BP18803 Cryphia ochsi 2 1 0 0 FLM SPR BP38818 Cryphia muralis 1 1 0 0 FLM SPR BP38841 Nodaria nodosalis 1 0 0 0 HERB SPR BP18857 Zanclognatha zelleralis 1 1 0 0 GEN SED BP28882 Catocala promissa 1 0 0 0 WP SPR BP38888 Catocala nymphagoga 0 3 1 0 WP MIG BP38902 Ophiusa tirhaca 1 0 0 0 WP MIG BP18904 Dysgonia algira 5 3 2 2 GEN MIG BP38909 Prodotis stolida 1 2 2 2 GEN SPR BP18934 Lygephila craccae 1 2 0 0 HERB SPR BP28959 Aedia leucomelas 3 0 0 0 HERB MIG BP28965 Tyta luctuosa 3 3 3 3 HERB SPR BP28979 Zethes insularis 1 1 0 0 WP? SED BP48997 Hypena obsitalis 0 0 0 1 HERB SPR BP39001 Hypena lividalis 2 2 0 3 HERB MIG BP19008 Rivula sericealis 0 0 1 0 HERB SPR BP29020 Zebeeba falsalis 6 1 0 4 WP SED BP49023 Eutelia adulatrix 2 1 1 2 WP SPR BP29051 Macdunnoughia confusa 0 0 1 0 HERB MIG BP29056 Autographa gamma 1 1 0 2 HERB MIG BP29081 Trichoplusia ni 3 1 1 1 HERB MIG BP19085 Ctenoplusia accentifera 1 0 0 0 HERB MIG BP19094 Abrostola agnorista 0 0 0 1 HERB? SPR BP39097 Emmelia trabealis 0 0 1 0 HERB SPR BP29100 Acontia lucida 2 0 0 0 HERB SPR BP19106 Pseudozarba bipartita 2 2 0 1 HERB? SED BP49114 Protodeltote pygarga 0 1 0 0 HERB SPR BP29135 Eublemma viridula 0 1 0 1 HERB SPR BP39140 Eublemma ostrina 2 1 0 5 HERB SPR BP29142 Eublemma parva 5 3 1 7 HERB SPR BP19147 Eublemma purpurina 0 0 1 0 HERB SPR BP29165 Metachrostis velox 1 2 1 1 WP SPR BP49251 Omphalophana antirrhini 1 0 2 3 HERB SED BP39253 Omphalophana anatolica 0 0 0 2 HERB? SED BP29340 Aegle vespertalis 1 0 0 1 HERB SPR BP49350 Sinthymia fixa 20 11 20 40 HERB SED BP4
Sampledsites
Family and species
QI
AB
OO
1O
O2 F D B
9364 Heliothis viriplaca 1 1 0 1 HERB MIG BP29367 Heliothis peltigera 3 0 0 0 HERB MIG BP29370 Helicoverpa armigera 3 4 0 0 HERB MIG BP19409 Stilbia faillae 0 0 0 1 GEN? SED BP49436 Paradrina flavirena 13 8 2 5 HERB SPR BP39454 Hoplodrina ambigua 9 6 0 0 GEN MIG BP29458 Atypha pulmonaris 1 0 0 0 HERB SPR BP29460 Spodoptera exigua 12 6 3 3 HERB MIG BP19462 Spodoptera littoralis 1 0 0 0 HERB MIG BP19465 Sesamia cretica 0 1 0 0 HERB MIG BP19518 Cloantha hyperici 0 1 0 0 HERB SPR BP39520 Callopistria juventina 2 0 0 0 HERB SPR BP29522 Methorasa latreillei 0 0 1 0 HERB SPR BP39528 Ipimorpha subtusa 1 0 0 0 WP SPR BP29537 Parastichtis ypsillon 0 1 0 0 WP SPR BP29565 Agrochola lychnidis 3 2 2 1 GEN MIG BP39647 Aporophila australis 0 1 0 0 HERB SPR BP49651 Aporophila nigra 0 1 0 1 HERB SPR BP39692 Dryobota labecula 1 0 0 0 WP SPR BP39716 Trigonophora flammea 0 1 0 0 GEN SPR BP39744 Mniotype solieri 1 0 0 0 HERB MIG BP39789 Mesapamea secalis 0 1 0 0 HERB MIG BP29797 Eremobia ochroleuca 1 0 0 0 HERB SPR BP39895 Discestra trifolii 0 0 0 3 HERB MIG BP19917 Lacanobia oleracea 1 0 0 0 GEN MIG BP29928 Aetheria bicolorata 1 0 1 2 HERB SPR BP29935 Hadena luteago 1 0 0 1 HERB SPR BP210002 Mythimna albipuncta 3 1 0 0 HERB MIG BP210003 Mythimna vitellina 1 0 0 0 HERB MIG BP210015 Mythimna putrescens 1 2 1 2 HERB SPR BP210018 Mythimna languida 2 1 0 0 HERB MIG BP110019 Mythimna congrua 1 0 0 0 HERB SPR BP310022 Mythimna l-album 21 5 2 5 HERB MIG BP110029 Mythimna scirpi 2 3 0 5 HERB MIG BP310031 Mythimna prominens 4 4 1 2 HERB SPR BP110033 Mythimna riparia 1 0 0 1 HERB MIG BP310035 Mythimna unipuncta 2 0 0 1 HERB MIG BP110078 Hada calberlai 11 6 0 5 HERB SPR BP410082 Axylia putris 1 0 1 2 HERB SPR BP210087 Ochropleura leucogaster 3 2 0 0 GEN MIG BP410096 Noctua pronuba 4 3 0 0 GEN MIG BP210099 Noctua comes 3 3 1 0 HERB MIG BP310102 Noctua janthina 2 3 0 0 HERB MIG BP310105 Noctua interjecta 1 1 0 0 HERB MIG BP310199 Xestia c-nigrum 1 0 0 0 HERB MIG BP110226 Cerastis faceta 2 0 1 2 WP SPR BP410238 Peridroma saucia 7 5 0 2 HERB MIG BP110336 Agrotis crassa 0 0 0 1 HERB MIG BP210343 Agrotis puta 0 1 0 1 HERB SPR BP210346 Agrotis ipsilon 2 0 0 1 HERB MIG BP110348 Agrotis exclamationis 1 0 0 0 HERB MIG BP210351 Agrotis segetum 1 1 1 0 HERB MIG BP1
Lymantriidae10380 Ocneria rubea 0 1 0 0 WP SPR BP3
Nolidae10437 Nola chlamitulalis 0 0 0 1 HERB SPR BP210451 Pseudoips prasinana 1 1 0 0 WP SPR BP3
Arctiidae10493 Eilema caniola 18 8 5 11 FLM MIG BP310522 Dysauxes famula 30 22 11 39 HERB SPR BP310550 Phragmatobia fuliginosa 6 8 3 4 GEN MIG BP110555 Cymbalophora pudica 2 1 1 2 HERB SPR BP410600 Arctia villica 2 2 3 6 HERB SPR BP2
18
species assemblage. Dysauxes famula (7.4% of indi-viduals in the 100% of surveyed sites), and Synthymiafixa (6.6%, 100%) are the most abundant and wide-spread species. The former is polyphagous, very abun-dant in coastal areas of southern Italy, the latter ismonophagous linked by trophic larval relations toPsoralea bituminosa L., an abundant plant in areas withintermediate environmental perturbations. Both speciesare thermophilous, favoured by the climate. 66 specieswere collected as singletons or out of the traps.
Noctuidae (S = 89; N = 508) and Geometridae (S =55; N = 380) are the most species-rich and abundantfamilies among moths, as often worldwide occurs.Geometridae were relatively more abundant within theolive orchard (OO1) and the abandoned vegetationpatch (AB). Butterfly families, instead, are uniformlydistributed in terms of species richness and abundancein the organic olive orchard (OO1) and in the aban-doned and burned olive orchard (AB), showing a dec-rement in the Quercus ilex wood (QI).
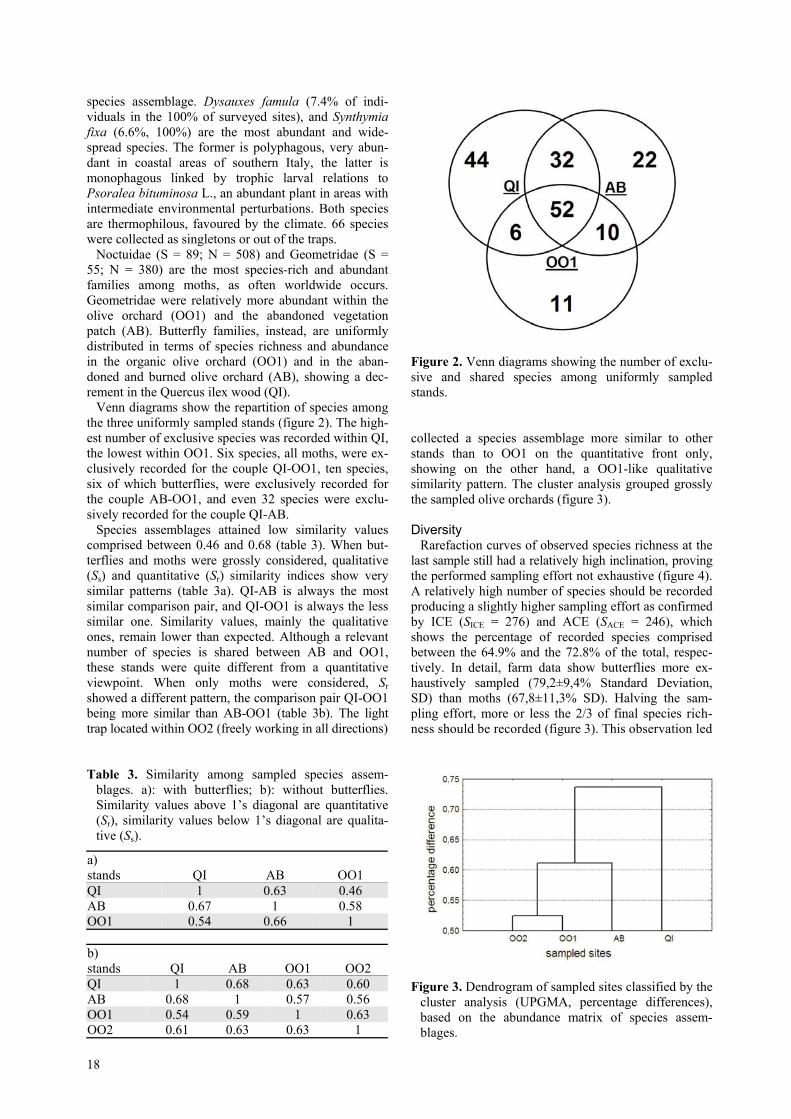
Venn diagrams show the repartition of species amongthe three uniformly sampled stands (figure 2). The high-est number of exclusive species was recorded within QI,the lowest within OO1. Six species, all moths, were ex-clusively recorded for the couple QI-OO1, ten species,six of which butterflies, were exclusively recorded forthe couple AB-OO1, and even 32 species were exclu-sively recorded for the couple QI-AB.
Species assemblages attained low similarity valuescomprised between 0.46 and 0.68 (table 3). When but-terflies and moths were grossly considered, qualitative(Ss) and quantitative (Sr) similarity indices show verysimilar patterns (table 3a). QI-AB is always the mostsimilar comparison pair, and QI-OO1 is always the lesssimilar one. Similarity values, mainly the qualitativeones, remain lower than expected. Although a relevantnumber of species is shared between AB and OO1,these stands were quite different from a quantitativeviewpoint. When only moths were considered, Srshowed a different pattern, the comparison pair QI-OO1being more similar than AB-OO1 (table 3b). The lighttrap located within OO2 (freely working in all directions)
Table 3. Similarity among sampled species assem-blages. a): with butterflies; b): without butterflies.Similarity values above 1’s diagonal are quantitative(Sr), similarity values below 1’s diagonal are qualita-tive (Ss).
a)stands QI AB OO1QI 1 0.63 0.46AB 0.67 1 0.58OO1 0.54 0.66 1
b)stands QI AB OO1 OO2QI 1 0.68 0.63 0.60AB 0.68 1 0.57 0.56OO1 0.54 0.59 1 0.63OO2 0.61 0.63 0.63 1
Figure 2. Venn diagrams showing the number of exclu-sive and shared species among uniformly sampledstands.
collected a species assemblage more similar to otherstands than to OO1 on the quantitative front only,showing on the other hand, a OO1-like qualitativesimilarity pattern. The cluster analysis grouped grosslythe sampled olive orchards (figure 3).
DiversityRarefaction curves of observed species richness at the
last sample still had a relatively high inclination, provingthe performed sampling effort not exhaustive (figure 4).A relatively high number of species should be recordedproducing a slightly higher sampling effort as confirmedby ICE (SICE = 276) and ACE (SACE = 246), whichshows the percentage of recorded species comprisedbetween the 64.9% and the 72.8% of the total, respec-tively. In detail, farm data show butterflies more ex-haustively sampled (79,2±9,4% Standard Deviation,SD) than moths (67,8±11,3% SD). Halving the sam-pling effort, more or less the 2/3 of final species rich-ness should be recorded (figure 3). This observation led
Figure 3. Dendrogram of sampled sites classified by thecluster analysis (UPGMA, percentage differences),based on the abundance matrix of species assem-blages.

19
Figure 4. Rarefaction curves of observed species rich-ness made by running EstimateS (Colwell, 1997).Halving the sampling effort more or less the 2/3 of finalspecies richness should be recorded: the whole Farm(1), 69.7±10.5% Standard Deviation, SD, QI (2),65.1±12.2% SD, AB (3), 67.4±11.3% SD, and OO1 (4),63.4±12.3% SD. Data collected within OO2 were notincluded within the Farm data.
us to affirm that although not exhaustive, our samplingeffort was able to sample the ‘head’ of a given speciesassemblage, missing just species belonging to the ‘tail’of it. After the seventh sample, curves of uniformlysampled sites are quite parallel showing similar trendswhich support the reliability of our data for comparisonanalysis.
The highest species richness was recorded in QI,while the lowest species richness was recorded in OO1(table 4). These stands are representative of the late- andthe early-successional stages respectively. The highestspecies richness of butterflies was attained in AB andOO1, the intermediate- and the early-successional stagerespectively. A very similar pattern was recorded byusing other diversity indexes, H’ showing just a smallincrease in AB, and D showing AB the most diversestand. As sensitive to sample dimension, S and H’ attainthe highest values in the whole farm, while α and D, notso sensitive to sample dimension, are higher in QI than
in the whole farm. OO2’s diversity values were alwayscomprised between OO1’s and AB’s diversity values.Without singletons no diversity pattern changed.
The analysis of significant differences (Student t-test) among computed H’ have shown a highly signifi-cant decrease of diversity (P<0.01) only in OO1 whensingletons are included in the analysis, becomingweaker (P<0.05) when singletons are not included.Butterflies have never shown significant differences ofH’ (table 4).
MobilityMore than an half of species inhabiting the surveyed
farm belongs to the spreader group (table 5), one thirdbelongs to the migrant group, while less than 20% be-longs to the sedentary group. Quantitative data showedan evident increase in migrant species. In fact, at thehead of the farm community, the 57.9% are migrant, the31.6% are spreader and only the 10.5%, i.e. S. fixa andP. cecilia, are sedentary species. Mobility groups wereuniformly ranked within all sampled sites, attaining eve-rywhere SPR the highest percentage and SED the lowestpercentage (table 5). Spreader species were more or lessuniformly distributed among surveyed sites and percent-wise were always represented by fewer individuals thanspecies. MIG species seem to concentrate their popula-tions in less perturbed patches, showing low percentageswithin olive orchards. In QI the highest percentage ofsedentary species was collected, while AB inhabits thelowest percentage of them (table 5). Intermediate SEDspecies percentage were attained by OO1, showing asignificant increase of individuals.
Finally, from a qualitative viewpoint, species assem-blages have shown no significant differences in the dis-tribution of mobility groups, being uniformly distributedalong the successional gradient, but from a quantitativeviewpoint, migrant species were more abundant in semi-natural and abandoned patches, and sedentary specieswere more abundant in olive orchards.
BiogeographyBiogeographical groups proved poorly discriminating,
showing very similar patterns through the farm. Specieslargely distributed in the Palaearctic (BP2) were the
Table 4. Diversity values attained by each sampled butterfly (B) and moth (M) assemblage: species richness (S),Shannon’s index (H’), Fisher’s alpha (α) and Simpson’s index (D) with (+) and without (−) singletons. Butterflieswere not sampled (n.s.) within OO2. Data collected within OO2 were not included within the Farm data.
S H’ α DStands B M B M B M B M+ 17 117 3.31 6.03 7.3 56.5 0.867 0.977QI − 9 64 2.77 5.41 3.2 22.6 0.828 0.969+ 21 95 3.74 6.04 8.5 54.6 0.907 0.981AB − 15 49 3.45 5.31 5.2 19.8 0.894 0.972+ 18 61 3.40 5.32 6.3 41.8 0.872 0.964OO1 − 15 27 3.26 4.33 4.9 11.8 0.864 0.937+ n.s. 87 n.s. 5.45 n.s. 40.9 n.s. 0.955OO2 − n.s. 49 n.s. 4.85 n.s. 17.7 n.s. 0.942+ 29 149 3.91 6.20 8.4 54.1 0.902 0.977Farm − 22 93 3.69 5.52 5.8 28.3 0.896 0.974

20
Table 5. Percentage of species (S) and individuals (N) belonging to mobility (M), biogeographical (B) and larvalfeeding preferences (A) groups within each sampled site. Groups were arranged according to the decreasing per-centage of species belonging to a given groups. Data collected within OO2, not comparable to other because of thelack of butterflies in the sample, were not included within the Farm data.
QI AB OO1 OO2 FarmS N S N S N S N S N
SPR 47.0 42.0 52.6 45.2 51.9 46.5 48.3 49.0 51.9 44.1MIG 35.1 42.8 33.6 42.1 32.9 32.8 29.9 26.2 31.1 40.3MSED 17.9 15.2 13.8 12.7 15.2 20.7 21.8 24.8 16.9 15.6BP2 40.3 28.7 37.1 32.2 38.0 35.3 37.9 26.2 40.1 31.3BP3 21.6 30.8 25.0 26.8 22.8 22.0 25.3 35.4 22.6 27.5BP1 20.1 24.1 19.8 24.9 22.8 23.7 18.4 13.6 20.3 24.2B
BP4 17.9 16.5 18.1 16.1 16.5 19.1 18.4 24.8 16.9 16.9HERB 64.2 62.7 62.9 68.6 67.1 80.5 65.5 68.5 66.6 68.7GEN 17.9 20.0 19.0 19.8 17.7 12.4 19.5 18.5 15.8 18.2WP 14.9 10.5 14.5 7.3 12.7 4.1 12.6 7.9 15.3 8.0
FLM 2.2 4.4 2.6 2.8 1.3 2.1 1.2 3.6 1.7 3.4A
DET 0.7 2.3 0.9 1.4 1.3 0.8 1.2 1.3 0.6 1.7
most represented (table 5), but their abundance de-creased in respect to their richness, mainly in QI.Mediterranean species (BP4) were the less representedand abundant. Among them, just S. fixa (n = 91), P.cecilia (n = 22), Hada calberlai (n = 22) and Scopulaimitaria (n = 17), belong to the head of the farm com-munity. BP4 was well represented in OO1 and OO2,where the highest percentage of individual belonging tothis group was collected.
Larval feeding preferencesThe farm hosts a community with strong larval feed-
ing preferences for herbaceous plants (table 5). Thehead of the farm community includes more or less ex-clusively herb and generalist feeders. The only excep-tions are the FML Eilema caniola (n = 42), the DETIdaea seriata (n = 22), and the WP Cyclophora puppil-laria (n = 17), all these species having an high dispersalability. All sampled stands showed patterns very similarto this, AB and OO1 only loosing woody plant feederswithin the head of their assemblages. The most abun-dant WP feeder was Cyclophora puppillaria, whichranks sixteenth. C. puppillaria, together with Parahy-popta caestrum (n = 9), linked to Asparagus spp., arethe only WP feeders wherever present. Only woodyplant feeders in all stands, and generalist feeders in OO1and OO2, were more abundant as number of speciesthan as individuals. QI had some peculiarities: (1) in-habits a lower percentage of individuals than specieswith herbaceous feeding preferences, and (2) shows thesmallest decrease of the WP feeders abundance. WithinAB intermediate percentage values of feeding groupswere often recorded.
Only the analysis of quantitative data provides differ-ences among surveyed assemblages, because vegetationcover was unable to decisively influence feeding prefer-ences of species. In other words, no significant corre-spondences was found between vegetation cover andfeeding preferences of species.
Discussion
Lepidoptera diversity is known to be affected by land-scape attributes acting in many ways depending on theobservation scale (Dover, 1996; Usher and Keiller,1998; Weibull et al., 2000; Krauss et al., 2003; Sum-merville and Crist, 2003; Summerville et al., 2003). Ourresults demonstrate Lepidoptera distribution patternsdepending at a very small scale (from 10 to 100 metres)and in a very fragmented landscape (with patchessmaller than 1 ha) mainly on architecture and diversityof habitats, both simplified by human activities. Thevegetation cover of semi-natural and abandoned patchesitself is unable to favour specialist species because ofthe small area occupied (Usher and Keiller, 1998). Thehighest species richness found in the small woodlot wasfavoured by its spatial attributes, and may be well ex-plained by species supplementation (Summerville andCrist, 2003), which permits the coexistence of specieswith different ecological needs. In our study butterfliesdiversity peaked at the moderately disturbed site, asstated by Blair and Launer (1997), whilst moths diver-sity is higher where human activities are lower, both at-taining their lowest diversity values at the highly dis-turbed site. Behavioural features of species determinethe different distribution of butterflies, which preferherbaceous environments rich of adult alimentarysources, and moths, which lightly prefer woody habitats(Ricketts et al., 2002). The decrease of similarity shownby stands with very different vegetation architecturemay be due to the different ecology and behaviour ofbutterflies and moths in a relevant part.
High dispersal ability of lepidopteran species isknown to be increased by environmental perturbations(Shapiro and Shapiro, 1973; Usher and Keiller, 1998;Kitching et al., 2000). Available literature is in contrastwith our data which showed this attribute higher in wellpreserved vegetation patches. The distribution ofGeometridae, indicated as good bioindicator because oftheir prevalence in woody habitats and their low disper-sal ability (Usher and Keiller, 1998; Kitching et al.,
21
2000; Hausmann, 2002), seems to confirm this anoma-lous fact.
Matrix species, generally with high dispersal ability inhuman-modified landscapes (Shapiro and Shapiro,1973), may easily penetrate little semi-natural and/orabandoned patches indifferently living within both agri-cultural matrix and small woodlands fragment (Dailyand Ehrlich, 1996; Ricketts et al., 2001). This is con-firmed by the high percentage of herbaceous plant feed-ers in the surveyed woodlot. These species concentratedtheir populations within the surveyed woodlot becausethey found here the shelter against unfavourable cli-matic conditions, mainly during the summer. In Medi-terranean areas, migrant and mesophilous species preferto spend the daytime in woods of evergreen plants,which have important sheltering capacity (Rieux et al.,1999). Shelter is known to be important for Lepidoptera(Dover, 1996; Dover et al., 1997; Dover and Sparks,2000; Clausen et al., 2001) at least from the followingviewpoints: (1) physical, by providing with shade, lowertemperature and higher moisture than in open habitatsduring the summer, and by modifying wind speed; (2)chemical, by providing areas with no pesticides and lowpressure of agronomic practices; and (3) behavioural, byproviding many resting and mating places for adults.
In other words, semi-natural and abandoned vegeta-tion patches, when very small as in our study, could actas stepping stones and/or corridors favouring Mediter-ranean landscape permeability to mesophilous andwidespread species.
Some authors affirmed that community compositionmainly vary across broad spatial scale, whilst domi-nance and evenness vary also at fine spatial scale(Summerville and Crist, 2003). The utilisation of lighttraps with a small attractive radius, switched off threehours after the sunset, allows us to reveal similarity val-ues lower than expected for contiguous stands. The dis-tribution of ecological features showed surveyed assem-blages more similar than similarity analysis per se, un-derlining not so strong ecological boundaries amongsurveyed patches. In any case, when significant differ-ences among sites were detected starting from diversityvalues, species composition and ecological features, thelatter were probably the best for detecting and evaluat-ing environmental changes (Summerville et al., 2003).
Conclusion
Although very important for the increasing of agricul-tural landscape diversity, semi-natural and abandonedvegetation patches host few habitat specialists, actingmainly as stepping stones and/or corridors. In fact, theyhost more species than the agricultural matrix thanks tothe favourable microclimate and the low pressure ofhuman activities, but many of them are highly mobileand widespread species.
Micro-distribution patterns of species should be animportant working issue in the management of agricul-tural landscapes at the farm scale. Sheltering capacity ofa given biotope and behavioural features of species areprobably the most important factors affecting commu-
nity composition and diversity distribution at this scale.Surveys based on capture-recapture methods should bean important implementation on the knowledge of mi-cro-scale factors leading to a given species assemblage.
Weibull et al. (2000) found that no difference in but-terfly diversity is due to the farming system. Probably,results similar to those presented here should be ob-tained in a conventional olive orchard with the samesmall-scale heterogeneity but, to date, the effects offarming systems on moth diversity are unknown.
In order to use lepidopteran communities as bioindi-cators, more studies focused on biology and behaviourof species are in need. The improvement of the knowl-edge could refine researches and reinforce descriptivecapability of this taxonomic group. In our opinion, eco-logical features of a taxon could be considered as thebest “indicator”, even more than the taxon itself.
Acknowledgements
We thank Libero Gatti and Giovanni Gatti for logistichelp, Giancarlo Posa and Teresa Bonacci for the helpduring field work, Paolo Parenzan, Istituto di Ento-mologia Agraria, Palermo, Italy, for the validation ofbiogeographical patterns, and two anonymous referees.This work was founded by the “Progetto Flora”, Re-gione Calabria, Assessorato all’Agricoltura, coordi-nated by the “Museo Naturalistico Libero Gatti”,Stalettì (CZ), Italy.
References
ALTIERI M. A., 1999.- The ecological role of biodiversity inagroecosystems.- Agriculture, Ecosystems and Environment,74: 19-31.
BAKER R. R., SADOVY Y., 1978.- The distance and nature ofthe light trap response of moths.- Nature, 276: 818-821.
BALLETTO E., KUDRNA O., 1985.- Some aspects of the conser-vation of butterflies in Italy, with recommendations for afuture strategy.- Bollettino della Società entomologica Ital-iana, 117: 39-59.
BELCARI A., DAGNINO A., 1995.- Preliminary analysis of theinsects caught by a “Malaise” trap in an olive-grove in North-ern Tuscany.- Agricoltura mediterranea, 125 (2): 184-192.
BLAIR R. B., LAUNER A. E., 1997.- Butterfly diversity andhuman land use: species assemblages along an urban gradi-ent.- Biological Conservation, 80: 113-125.
BOWDEN J., 1982.- An analysis of factor affecting catches ofinsects in light traps.- Bulletin of Entomological Research,276: 818-821.
BRANDMAYR P., BONACCI T., GANGALE C., GATTI L., GATTIG., SCALERCIO S., 1999.- Il Progetto Flora: metodi e primirisultati del censimento della biodiversità floristica ed ento-mofaunistica di un uliveto a conduzione biologica naturaledel promontorio di Copanello, pp. 103-105. In: Atti del Se-minario “Metodi e Sistemi Innovativi dell’Olivicoltura Bio-logica e Sostenibile: Stato della Ricerca e della Sperimenta-zione”, Rende, 14-16 aprile 1999.
BUREL F., 1996.- Hedgerows and their role in agriculturallandscapes.- Critical Reviews in Plant Sciences, 15: 169-190.
CIRIO U., 1997.- Productos agroquimicos e impacto ambientalen olivicoltura.- Olivae, 65: 32-39.

22
CLAUSEN H. D., HOLBECK H. B., REDDERSEN J., 2001.- Factorsinfluencing abundance of butterflies and burnet moths in theuncultivated habitats of an organic farm in Denmark.- Bio-logical Conservation, 98: 167-178.
COLWELL R. K., 1997.- Estimates: statistical estimation of spe-cies richness and shared species from samples. Version 5.-[online] URL: http://viceroy.eeb.uconn.edu/estimates.
DAILY G., EHRLICH P. R., 1996.- Preservation in biodiversityin small rainforest patches: rapid evaluations using butterflytrapping.- Biodiversity and Conservation, 4: 35-55.
DOVER J. W., 1996.- Factors affecting the distribution of saty-rid butterflies on arable land.- Journal of Applied Ecology,33: 723-734.
DOVER J., SPARKS T., 2000.- A review of the ecology of but-terflies in British hedgerows.- Journal of EnvironmentalManagement, 60: 51-63.
DOVER J. W., SPARKS T. H., GREATOREX-DAVIS J. N., 1997.-The importance of shelter for butterflies in open land-scapes.- Journal of Insect Conservation, 1: 89-97.
HAUSMANN A., 1990.- Zur dynamik von Nachtfalter-Artenspektren. Turnover und Dispersionsverhalten alsElemente von Verbreitungsstrategien.- Spixiana, suppl. 16.
HAUSMANN A., 2002.- The Geometrid Moths of Europe. Vol-ume 1.- Apollo Books, Stenstrup, Denmark.
HURLBERT S. H., 1984.- Pseudoreplication and the design ofecological field experiments.- Ecological Monographs, 54(2): 187-211.
IANNOTTA N., BELFIORE T., BRANDMAYR P., NOCE M. E.,SCALERCIO S., 2006.- Impatto sull’ecosistema oliveto di al-cuni fitofarmaci “biologici”.- L’Informatore Agrario, 44:65-68.
KARSHOLT O., RAZOWSKI J., 1996.- The lepidoptera ofEurope. A distributional checklist.: Apollo Books, Stenstrup,Denmark.
KITCHING R. L., ORR A. G., THALIB L., MITCHELL H., HOPKINSM. S., GRAHAM A. W., 2000.- Moth assemblages as indica-tors of environmental quality in remnants of upland Austra-lian rain forest.- Journal of Applied Ecology, 37: 284-297.
KRAUSS J., STEFFAN-DEWENTER I., TSCHARNTKE T., 2003.-How does landscape context contribute to effects of habitatfragmentation on diversity and population density of butter-flies?.- Journal of Biogeography, 30: 889-900.
MARINO P. C., LANDIS D. A., 1996.- Effect of landscapestructure on parasitoid diversity and parasitism in agroeco-systems.- Ecological Applications, 6: 276-284.
NEW T. R., 1991.- Butterfly conservation.- Oxford UniversityPress, Oxford, UK.
PAOLETTI M. G., 1995.- Biodiversity, traditional landscapesand agroecosystem management.- Landscape and UrbanPlanning, 31: 117-128.
POLLARD E., 1977.- A method for assessing changes in theabundance of butterflies.- Biological Conservation, 12: 115-134.
RICKETTS T. H., DAILY G. C., EHRLICH P. R., FAY J. P., 2001.-Countryside biogeography of moths in a fragmented land-scape: biodiversity in native and agricultural habitats.- Con-servation Biology, 15: 378-388.
RICKETTS T. H., DAILY G. C., EHRLICH P. R., 2002.- Doesbutterfly diversity predict moth diversity? Testing a popularindicator taxon at local scales.- Biological Conservation,103: 361-370.
RIEUX R., SIMON S., DEFRANCE H., 1999.- Role of hedgerowsand ground cover management on arthropod populations inpear orchards.- Agriculture, Ecosystems and Environment,73: 119-127.
RUANO F., LOZANO C., GARCIA P., PEÑA A., TINAUT A.,PASCUAL F., CAMPOS M., 2004.- Use of arthropods for theevaluation of the olive-orchard management regimes.- Agri-cultural and Forest Entomology, 6: 111-120.
RUIZ M., MONTIEL A., 2000.- Introducción al conocimiento dela entomofauna del olivar en la provincia de Jaén. Aspectoscualitativos.- Boletín Sanitario de Vegetales y Plagas, 26:129-147.
SCALERCIO S., 2006.- Macrolepidotteri rilevati tramite pit-falltraps: sono utili per le analisi ambientali? (Lepidoptera).-Bollettino della Società entomologica Italiana, 138 (1): 19-43.
SHAPIRO A. M., SHAPIRO A. R., 1973.- The ecological asso-ciations of the butterflies of Staten Islands.- Journal of Re-search on Lepidoptera, 12: 65-128.
STATSOFT, 2000.- STATISTICA Kernel release 5.5, StatSoftItalia, Vigonza.
SUMMERVILLE K. S., BOULWARE M. J., VEECH J. A., CRIST T.O., 2003.- Spatial variation in species diversity and compo-sition of forest Lepidoptera in eastern deciduous forest ofNorth America.- Conservation Biology, 17: 1045-1057.
SUMMERVILLE K. S., CRIST T. O., 2003.- Determinants oflepidopteran community composition and species diversityin eastern deciduous forests: roles of season, eco-region andpatch size.- Oikos, 100: 134-148.
USHER M. B., KEILLER S. W. J., 1998.- The macrolepidopteraof farm woodlands: determinants of diversity and commu-nity structure.- Biodiversity and Conservation, 7: 725-748.
WEIBULL A. C., BENGTSSON J., NOHLGREN E., 2000.- Diver-sity of butterflies in the agricultural landscape: the role offarming system and landscape heterogeneity.- Ecography,23: 743-750.
Authors’ addresses: Stefano SCALERCIO (correspondingauthor, [email protected]), Nino IANNOTTA, CRAIstituto Sperimentale per l’Olivicoltura, c.da Li Rocchi-Vermicelli, I-87036 Rende (CS), Italy; Pietro BRANDMAYR,Dipartimento di Ecologia, Università della Calabria, Via P.Bucci, I-87036 Arcavacata di Rende (CS), Italy.
Received April 7, 2006. Accepted March 22, 2007.