ROLE OF NATTRASSIA SP. IN FRUIT ORCHARD DECLINE ...
258
1 ROLE OF NATTRASSIA SP. IN FRUIT ORCHARD DECLINE AND DETERMINATION OF KEY FACTORS FOR ITS MANAGEMENT FAISAL SOHAIL FATEH 94-arid-224 Department of Plant Pathology Faculty of Crop and Food Sciences Pir Mehr Ali Shah Arid Agriculture University Rawalpindi Pakistan 2018
-
Upload
khangminh22 -
Category
Documents
-
view
0 -
download
0
Transcript of ROLE OF NATTRASSIA SP. IN FRUIT ORCHARD DECLINE ...

1
ROLE OF NATTRASSIA SP. IN FRUIT ORCHARD DECLINE
AND DETERMINATION OF KEY FACTORS FOR ITS
MANAGEMENT
FAISAL SOHAIL FATEH
94-arid-224
Department of Plant Pathology
Faculty of Crop and Food Sciences
Pir Mehr Ali Shah
Arid Agriculture University Rawalpindi
Pakistan
2018

2
ROLE OF NATTRASSIA SP. IN FRUIT ORCHARD DECLINE
AND DETERMINATION OF KEY FACTORS FOR ITS
MANAGEMENT
by
FAISAL SOHAIL FATEH
(94-arid-224)
A thesis submitted in partial fulfillment of
the requirements for the degree of
Doctor of Philosophy
in
Plant Pathology
Department of Plant Pathology
Faculty of Crop and Food Sciences
PirMehr Ali Shah
Arid Agriculture University Rawalpindi
Pakistan
2018

3

4

5

6

7
"In the Name of Allah, the most
Beneficent, the most Merciful"

8
DEDICATION
To
MyAffectionate, Loving Parents
&
My Sweet Family
9
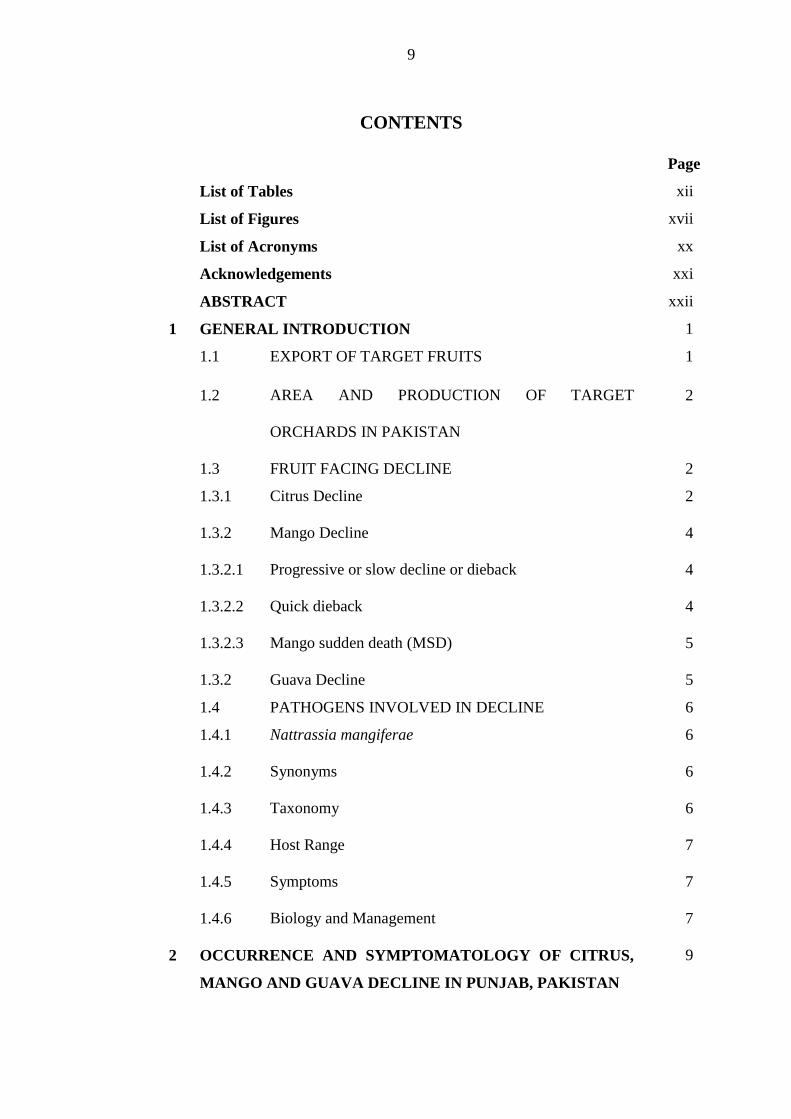
CONTENTS
Page
List of Tables xii
List of Figures xvii
List of Acronyms xx
Acknowledgements xxi
ABSTRACT xxii
1 GENERAL INTRODUCTION 1
1.1 EXPORT OF TARGET FRUITS 1
1.2 AREA AND PRODUCTION OF TARGET
ORCHARDS IN PAKISTAN
2
1.3 FRUIT FACING DECLINE 2
1.3.1 Citrus Decline 2
1.3.2 Mango Decline 4
1.3.2.1 Progressive or slow decline or dieback 4
1.3.2.2 Quick dieback 4
1.3.2.3 Mango sudden death (MSD) 5
1.3.2 Guava Decline 5
1.4 PATHOGENS INVOLVED IN DECLINE 6
1.4.1 Nattrassia mangiferae 6
1.4.2 Synonyms 6
1.4.3 Taxonomy 6
1.4.4 Host Range 7
1.4.5 Symptoms 7
1.4.6 Biology and Management 7
2 OCCURRENCE AND SYMPTOMATOLOGY OF CITRUS,
MANGO AND GUAVA DECLINE IN PUNJAB, PAKISTAN
9

10
2.1 INTRODUCTION 9
2.2 REVIEW OF LITERATURE 12
2.2.1 Decline of Fruit Orchards 12
2.2.1.1 Citrus decline 12
2.2.1.2 Mango decline 14
2.2.1.3 Guava decline 15
2.3 MATERIALS AND METHODS 17
2.3.1 Survey of Target Fruit Orchards for Disease Assessment 17
2.3.1.1 Profile of areas surveyed 18
2.3.1.1.1 Sargodha 18
2.3.1.1.2 Multan 18
2.3.1.1.3 Northern Irrigated Plan (Zone Iva) 19
2.3.2 Disease Incidence 35
2.3.3 Disease Severity 35
2.3.4 Disease Index 35
2.3.5 Symptomatology 36
2.4 RESULTS 36
2.4.1 Disease Assessment 36
2.4.1.1 Citrus decline assessment 36
2.4.1.2 Mango decline assessment 38
2.4.1.3 Guava decline assessment 47
2.4.2 Symptomatology 51
2.5 DISCUSSION 62
3 PREVALENCE OFNATTRASSIASP. FROM CITRUS,
MANGOAND GUAVA ORCHARDS ALONG WITH OTHER
DECLINE CAUSING FUNGI
64
3.1 INTRODUCTION 64
3.2 REVIEW OF LITERATURE 66

11
3.3 MATERIALS AND METHODS 68
3.3.1 Sampling Methodology 68
3.3.2 Isolation and Identification of Pathogens 69
3.3.2.1 Potato dextrose agar medium (PDA) 69
3.3.2.2 Malt extract agar (MEA) 69
3.3.2.3 Stem decoction glucose agar (SDGA) 69
3.3.2.4 Sterilization 70
3.3.2.5 Isolation from infected tissues 70
3.3.3 Microscopy 70
3.3.4 Determination of Fungal Frequency Percantage 71
3.3.5 Purification of Fungal Cultures 71
3.4 RESULTS 71
3.4.1 Plant Parts Wise Fungal Frequency Percentage 71
3.4.1.1 Mycoflora from citrus decline affected trees 71
3.4.1.2 Mycoflora from mango decline affected trees 72
3.4.1.3 Mycoflora from guava decline affected trees 72
3.5 DISCUSSION 93
4 ROLE OFNATTRASSIA MANGIFERAEAND
OTHERDECLINE CAUSING FUNGI IN SYMPTOMS
DEVELOPMENT
97
4.1 INTRODUCTION 97
4.2 REVIEW OF LITERATURE 99
4.3 MATERIALS AND METHODS 101
4.3.1 Pathogenicity Tests 101
4.3.1.1 Flap method 101
4.3.1.2 Root injury method 101

12
4.4 RESULTS 103
4.5 DISCUSSION 111
5 STUDIES ON FACTORS AFFECTING DEVELOPMENT
OFFUNGI WITH SPECIAL REFERENCE TO NATTRASSIA
SP.
114
5.1 INTRODUCTION 114
5.2 REVIEW OF LITERATURE 114
5.3 MATERIALS AND METHODS 117
5.3.1 Effect of Temperature, Light, pH and Culture Media
onFungal Growth
117
5.3.1.1 Effect of culture media 117
5.3.1.2 Effect of temperature 118
5.3.1.3 Effect of light 118
5.3.1.4 Effect of Ph 118
5.4 RESULTS 119
5.4.1 Effect of Culture Media on Radial Mycelial Growth 119
5.4.2 Effect of Temperature on Radial Mycelial Growth 120
5.4.3 Effect of Light on Radial Mycelial Growth 122
5.4.4 Effect of pH on Radial Mycelial Growth 122
5.5 DISCUSSION 129
6 MORPHOLOGICAL VARIABILITY AMONG ISOLATES
OFCOMMONLY FOUND FUNGUS (NATTRASSIA
MANGIFERAE)FROM DECLINE AFFECTED CITRUS,
MANGO AND GUAVA TREES
132
6.1 INTRODUCTION 132
6.2 REVIEW OF LITERATURE 134
6.3 MATERIALS AND METHODS 136
6.3.1 Fungal Isolates 136
6.3.2 Morphological Characterization 136
6.4 RESULTS 136
6.5 DISCUSSION 145
7 FACTORS FAVOURING THE DECLINE DISEASE 147

13
ANDDEVELOPMENT OF STRATEGIES FOR ITS
MANAGEMENT
7.1 INTRODUCTION 147
7.2 REVIEW OF LITERATURE 148
7.3 MATERIALS AND METHODS 150
7.3.1 Surveys for Factor Favoring Decline in Fruit Orchards 150
7.3.2 Statistical Analysis 151
7.4 RESULTS 151
7.5 DISCUSSION 191
8 GENERAL DISCUSSION 198
8.1 ASSESSMENT OF DECLINE IN CITRUS, MANGO
AND GUAVA
198
8.2 COMMON SYMPTOMS OF DECLINE IN CITRUS,
MANGO AND GUAVA
201
8.3 MYCOFLORA ISOLATED FROM DECLINE
AFFECTED TREES
202
8.4
PATHOGENICITY OF THE IMPORTANT DECLINE
CAUSING FUNGI
203
8.5 FACTORS AFFECTING THE GROWTH AND
DEVELOPMENT OF NATTRASSIA SP.
203
8.6 MORPHOLOGICAL CHARACTERISTICS OF
NATTRASSIA SP. FROM CITRUS, MANGO AND
GUAVA
204
SUMMARY 206
LITERATURE CITED 210
14
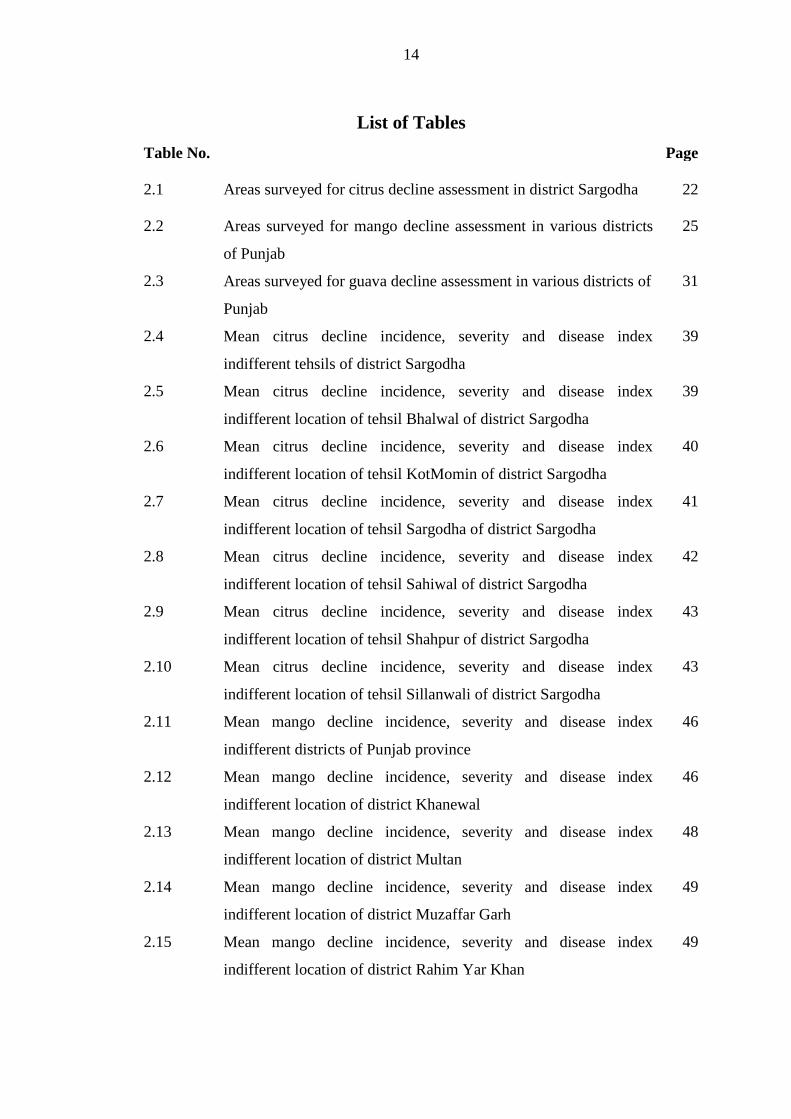
List of Tables
Table No. Page
2.1 Areas surveyed for citrus decline assessment in district Sargodha 22
2.2 Areas surveyed for mango decline assessment in various districts
of Punjab
25
2.3 Areas surveyed for guava decline assessment in various districts of
Punjab
31
2.4 Mean citrus decline incidence, severity and disease index
indifferent tehsils of district Sargodha
39
2.5 Mean citrus decline incidence, severity and disease index
indifferent location of tehsil Bhalwal of district Sargodha
39
2.6 Mean citrus decline incidence, severity and disease index
indifferent location of tehsil KotMomin of district Sargodha
40
2.7 Mean citrus decline incidence, severity and disease index
indifferent location of tehsil Sargodha of district Sargodha
41
2.8 Mean citrus decline incidence, severity and disease index
indifferent location of tehsil Sahiwal of district Sargodha
42
2.9 Mean citrus decline incidence, severity and disease index
indifferent location of tehsil Shahpur of district Sargodha
43
2.10 Mean citrus decline incidence, severity and disease index
indifferent location of tehsil Sillanwali of district Sargodha
43
2.11 Mean mango decline incidence, severity and disease index
indifferent districts of Punjab province
46
2.12 Mean mango decline incidence, severity and disease index
indifferent location of district Khanewal
46
2.13 Mean mango decline incidence, severity and disease index
indifferent location of district Multan
48
2.14 Mean mango decline incidence, severity and disease index
indifferent location of district Muzaffar Garh
49
2.15 Mean mango decline incidence, severity and disease index
indifferent location of district Rahim Yar Khan
49

15
2.16 Mean mango decline incidence, severity and disease index
indifferent location of district Bahawalpur
50
2.17 Mean guava decline incidence, severity and disease index
indifferent districts of Punjab province
53
2.18 Mean guava decline incidence, severity and disease index
indifferent location of district Kasur
53
2.19 Mean guava decline incidence, severity and disease index
indifferent location of district Sheikhupura
54
2.20 Mean guava decline, severity and disease index in
differentlocation of district Nankana Sahib
55
2.21 Decline symptoms development percentages in citrus, mangoand
guava trees
61
4.1 Response of citrus plants against artificial inoculation of N.
mangiferaeandB. theobromaeusing flap method
105
4.2 Response of citrus plants against artificial inoculation of N.
mangiferaeandB. theobromaeusing root injury method
105
4.3 Response of mango plants against artificial inoculation
ofCeratotocystissp.,N. mangiferae,B. theobromaeandFusariumsp.
using flap method
106
4.4 Response of mango plants against artificial inoculation
ofCeratotocystissp.,N. mangiferae,B. theobromaeandFusarium sp.
using root injury method
107
4.5 Pathogenicity of fungi associated with guava decline by usingflap
method inoculation
108
4.6 Pathogenicity of fungi associated with guava decline by usingroot
injury method of inoculation
109
5.1 Effect of culture media on radial mycelial growth of the
fungiisolated from Citrus on PDA medium
121
5.2 Effect of culture media on radial mycelial growth of the
fungiisolated from mango on PDA medium
121
5.3 Effect of temperature on radial mycelial growth of the fungi
isolated from guava on PDA medium
123

16
5.4 Effect of temperature on radial mycelial growth of the fungi
isolated from citrus on PDA medium
123
5.5 Effect of temperature on radial mycelial growth of the
fungiisolated from mango on PDA medium
124
5.6 Effect of temperature on radial mycelial growth of the
fungiisolated from guava on PDA medium
124
5.7 Effect of light on radial mycelial growth of the fungi isolated from
citrus on PDA medium
125
5.8 Effect of light on radial mycelial growth of the fungi isolatedfrom
mango on PDA medium
125
5.9 Effect of light on radial mycelial growth of the fungi isolatedfrom
guava on PDA medium
127
5.10 Effect of pH on radial mycelial growth of the fungi isolated
fromcitrus on PDA medium
127
5.11 Effect of pH on radial mycelial growth of the fungi isolated
frommango on PDA medium
128
5.12 Effect of pH on radial mycelial growth of the fungi isolated
fromguava on PDA medium
128
6.1 Morphological characteristics of N. mangiferae isolates fromcitrus
in tehsil and district Sargodha
138
6.2 Morphological characteristics of N. mangiferae isolates fromcitrus
in tehsil Bhalwal, district Sargodha
139
6.3 Morphological characteristics of N. mangiferae isolates
frommango in district Multan
140
6.4 Morphological characteristics of N. mangiferae isolates
frommango in district Rahimyar Khan
141
6.5 Morphological characteristics of N. mangiferae isolates fromguava
in tehsil Pattoki of district Kasur
142
6.6 Morphological characteristics of N. mangiferae isolates fromguava
in tehsil Sharaqpur of district Sheikhupura
143
7.1 Factor affecting disease index (%) in selected orchards of citrusin
district Sargodha
152

17
7.2 Correlations of factors causing citrus decline disease index (%) 162
7.3 Correlation between citrus tree age groups with disease index(%) 164
7.4 Correlation between citrus tree age groups with disease index(%) 164
7.5 Correlation between mode of irrigation in citrus orchards
withdisease index (%)
165
7.6 Correlation between nutrition in citrus orchards with diseaseindex
(%)
165
7.7 Correlation between pruning in citrus orchards with diseaseindex
(%)
166
7.8 Correlation between ploughing under tree canopy in citrusorchards
with disease index (%)
166
7.9 Correlation between plant protection in citrus orchards withdisease
index (%)
167
7.10 Factors affecting decline disease index in selected orchards
ofmango growing districts in Punjab
168
7.11 Correlations of factors causing mango decline disease index (%) 174
7.12 Correlation between age group in mango orchards with
diseaseindex (%)
176
7.13 Correlation between intercropping in mango orchards withdisease
index (%)
176
7.14 Correlation between irrigation mode in mango orchards
withdisease index (%)
177
7.15 Correlation between ploughing under tree canopy in citrusorchards
with disease index
177
7.16 Correlation between pruning of trees in mango orchards
withdisease index (%)
178
7.17 Correlation between ploughing under tree canopy in
mangoorchards with disease index (%)
178
7.18 Correlation between plant protection in mango orchards
withdisease index (%)
179
7.19 Factors affecting decline disease index in selected orchards
ofguava growing districts in Punjab
181

18
7.20 Correlations of factors causing guava decline disease index (%) 185
7.21 Correlations of factors causing guava decline disease index (%) 187
7.22 Correlation between intercropping in guava orchards withdisease
index (%)
187
7.23 Correlation between irrigation mode in guava orchards withdisease
index (%)
188
7.24 Correlation between nutrition application in guava orchards
withdisease index (%)
188
7.25 Correlation between pruning of trees in guava orchards
withdisease index (%)
189
7.26 Correlation between ploughing under tree canopy in
guavaorchards with disease index (%)
189
7.27 Correlation between plant protection in guava orchards
withdisease index (%)
190

19
List of Figures
Figure No. Page
2.1 Agro-ecological zones 21
2.2 Areas surveyed for citrus decline in district Sargodha, Punjab,
Pakistan
24
2.3 Areas surveyed for mango decline in district Khanewal, Punjab,
Pakistan
27
2.4 Areas surveyed for mango decline in district Multan, Punjab,
Pakistan
28
2.5 Areas surveyed for mango decline in district Muzaffar Garh, Punjab,
Pakistan
29
2.6 Areas surveyed for mango decline in district R. Y. Khan, Punjab,
Pakistan
30
2.7 Areas surveyed for guava decline in district Kasur, Punjab, Pakistan 32
2.8 Areas surveyed for guava decline in district Sheikhupura, Punjab,
Pakistan
33
2.9 Areas surveyed for guava decline in district Nankana Sahib, Punjab,
Pakistan
34
2.10 Twig dieback in citrus 56
2.11 Bark Splitting and gummosis in citrus 56
2.12 Canker development in citrus 57
2.13 Citrus tree mortality 57
2.14 Bark splitting and oozing of thick darkish brown liquid in Mango 58
2.15 Gummosis and stem canker in mango decline affected tree 58
2.16 Mango Sudden Death affected dead tree (MSD) 59
2.17 Bark splitting and gummosis in decline affected guava tree 59
2.18 Tree canker in decline affected guava tree 60
2.19 Decline affected dead guava tree 60
3.1 Plant parts wise fungal frequency percentage from declineaffected
citrus trees at Chak No. 26/NB tehsil Bhalwal, Sargodha
74
3.2 Plant parts wise fungal frequency percentage from declineaffected 75

20
citrus trees at Chak No. 8 NB, tehsil Bhalwal of districtSargodha
3.3 Plant parts wise fungal frequency percentage from declineaffected
citrus trees at Chak No. 10 N/B, tehsil Bhalwal of districtSargodha
76
3.4 Plant Parts wise fungal frequency Percentage from declineaffected
citrus trees at Chak No. 56/NB of tehsil and districtSargodha
77
3.5 Plant parts wise fungal frequency percentage from declineaffected
citrus trees at Chak No. 112/NB of tehsil and districtSargodha
78
3.6 Plant parts wise fungal frequency percentage from declineaffected
citrus trees at Chak No. 27 SB of tehsil and district,Sargodha
79
3.7 Plant parts wise fungal frequency percentage from declineaffected
mango trees in BastiNandla, Multan
80
3.8 Plant Parts wise fungal frequency Percentage from declineaffected
mango trees in ChahNizamWala, Multan
81
3.9 Plant parts wise fungal frequency percentage from declineaffected
mango trees in Basti Band Bosan, Multan
82
3.10 Plant parts wise fungal frequency percentage from declineaffected
mango trees at Chak 22A, tehsil Liaqatpur of districtRahim Yar
Khan
83
3.11 Plant parts wise fungal frequency percentage from declineaffected
mango trees at Chak 2P, tehsil Khanpur of district RahimYar Khan
84
3.12 Plant parts wise fungal frequency percentage from declineaffected
mango trees at MianwaliQureshian, tehsil and districtRahimYar
Khan
85
3.13 Plant parts wise fungal frequency Percentage from declineaffected
guava trees at Sehjowal, tehsil Pattoki of district Kasur
86
3.14 Plant parts wise fungal frequency percentage from declineaffected
guava trees at Faizpur, tehsil Ferozewala of districtSharaqpur
87
3.15 Plant parts wise fungal frequency percentage from declineaffected
guava trees at AddaPulTorian of tehsil and districtNankana Sahib
88
3.16 Culture and macrospores of Fusarium sp. 89
3.17 Culture and conidia of Ceratocystis sp. 90
3.18 Cultural and conidia of Lasiodiplodia theobromae 91

21
3.19 Culture and spores of Nattrassia mangiferae 92
4.1 Flap method of inoculation. 110
4.2 Root injury method of inoculation. 110
6.1 N. mangiferaearthrospores from citrus. 144
6.2 N. mangiferae arthrospores from mango. 144
22
LIST OF ACRONYMS A Absent Av. Average BE Bhalwal East BW Bhalwal West CJA Carrot Juice Agar D.I. Khan DeraIsmial Khan Eds. Editors GOP Government of Pakistan J. Journal MEA Malt Extrat Agar MSDS Mango Sudden Death Syndrome N Total number of plants NARC National Agricultural Research Centre P Present Pak. Pakistan PARC Pakistan Agricultural Research Council PDA Potato Dextrose Agar PI Pattoki R.Y. Kan Rahimyar Khan Sar Sargodha SDGA Stem Decoction Glucose Agar SP Sharqpur
SW Silanwali
ACKNOWLEDGEMENTS

23
I would like to acknowledge my supervisor Prof. Dr. Tariq Mukhtar for his
constant support, patience, sympathetic attitude, inspiring guidance, constructive
criticism, timely advice and enlightened supervision during my research work and
in the accomplishment of this manuscript.
Thanks to my respected teachers Prof. Dr. Muhammad Irfan Ul Haque and Prof.
Dr. Abdul Rauf Chauhdary for their helpful advice,inputs and encouragement
during the course of my research studies and presentation of this manuscript.
I am deeply thankful to Dr. Munawar Raza Kazmi for his support and
brilliant ideas to meet the objectives of my research.
I would specially like to extend my deepest gratitude to my parents, my
beloved wife and my children for their prayers always remain with me.
Appreciation for my friends Dr. Muhammad Zakria, Dr. Atif Jamal, Mr.
Usman Raja, Dr. ShahzadAsad, Dr. Hussain Shah Hayatullah Tareen and my
officers Dr. Iftikhar Ahmad, Dr. Anjum Munir and Dr. Shahid Hameed who
always encouraged me for thecompletion of my Ph. D.
Finally, I would like to express my deepest gratitude to Ms.
ShumailaIqbal, Dr. TahiraYasmin and Dr. IshaqueMastoi who always backed
me up to complete my research in time.
(FAISAL SOHAIL FATEH)
24
ABSTRACT
Decline of citrus mango and guava is a serious threat in Pakistan. This
study was undertaken to know the role of Nattrassia sp. in fruit orchard decline, its
biology and listing down the management strategies. Its role was studies through
recording the disease incidence and severity from citrus, mango and guava
orchards in Punjab from Sargodha, Bhalwal, Multan, Rahimyar Khan, Pattoki,
Sharqpur and Ahmedpur. Disease prevalence was found in all of the above areas of
citrus mango and guava with less or more intensities. The sampling from target tree
crops resulted in almost similar type of mycoflora except Ceratocystis sp. was
isolated from only decline affected mango trees. Other fungi include Nattrassia
mangiferae, Lasiodiplodia theobromae, Botryosphaeria sp., Fusarium sp.,
Cladosporium sp., Aspergillus sp., Penecillium sp. andCurvularia sp. with different
intensities from affected twigs, branches, stem at collar region and roots. However,
the fungus Nattrassia sp. and Lasiodiplodia sp. were the most common fungi.
Pathogenicity was conducted to know the four decline causing fungi including
Nattrassia sp. It was found that Nattrassia sp. alone cannot cause tree mortality but
contributes towards the mortality in combination with other fungi. The fungus
Nattrassia isolated from citrus is morphologically and physiologically different
from isolates of mango and guava. However, there is resemblance in isolates of
mango and guava. Most of the factors that favored the disease include no concept
of pruning; faulty intercropping; flooding of the orchards; application of partially
decomposed farm yard manure; poor nutrition; inadequate plant protection
measures and less interest of the growers. The orchards can be managed by

25
adopting pruning, following recommended plant protection plans, nutrition based
on leaf, soil and water sampling; avoiding plowing under tree canopies; if
necessary to intercrop choose friendly crops. In short the decline of citrus, mango
and guava have almost common, pathogens, common symptoms, common biology
and hence the common management strategies may be adopted to avoid them in
future.

26
Chapter 1
GENERAL INTRODUCTION
Fruit orchards e.g. apple, pear, peach, grapes, citrus, mango and guava around the
world are facing decline. Symptoms of decline vary with the kind of fruit orchards
as well as the nature of causal organisms involved. The causal agents of decline
reported from around the world include fungi, bacteria, nematode, phytoplasma,
viruses and some nutrient deficiencies (Agrios, 2005).
In Pakistan important fruit trees such as citrus, mango, guava etc are facing
decline. Among these fruits, citrus and mango decline have been addressed
strongly as they are important foreign exchange earnings and export items. Mango
is being given attention in all aspects but citrus needs special attention. Due to poor
quality citrus in Pakistan we have been restricted by export markets. According to
Pakistan Horticulture Export Board, 20% of the citrus fruit is gone waste either due
to diseases or post harvest mishandling (Humayun et al., 2005; Khanzada et al.,
2004). Other fruit trees like guava and loquat are also very famous fruit of Pakistan
and are liked by all generations (Misra and Pandey, 2000).
1.1. EXPORT OF TARGET FRUITS
Pakistan is famous for citrus production especially for its kinnow and
oranges. It ranks sixth in the world with 2.3 million tons production. Pakistan
produces 95% of the world's Kinnow. According to an estimate, the country
exported kinnows amounting to Rs. 15 million thousands in year 2012. By the year
2013 the citrus export target per anum was set a 500,000 tones within the next
fiveyears, and expecting an export income of $300 million but due to some
1

27
keyconstraints that needed to be addressed these ambitious targets were not
achieved (Anonymous, 2013).
Mango ranks second after citrus in Pakistan. It is making its way to
the foreign market by its taste and shapes. The main foreign markets include
United Kingdom, France and Germany which consumes 15 % of mangoes
imported by the EU. Imports of Pakistani mango has increased since 2002 by EU
countries up to 50% i.e. 199,000 tons worth 228 million euros in 2006. The reason
for this growth is that mangoes are not grown in Europe. The major export of
mango is done by India, Mexico, Brazil and Peru. Pakistani mango has a
substantial export potential in foreign markets which has not been realized so far.
Mango exports from Pakistan reached up to Rs. 3.27 million in 2012 (Anonymous,
2013).
1.2.AREA AND PRODUCTION OF TARGET FRUIT ORCHARDS
INPAKISTAN
Citrus, mango and guava are grown on an area of 0.193; 0.175 and
0.064million hectares respectively with the production of 2.40; 1.720 and 0.490
million tons respectively (Anonymous, 2016).Citrus orchards vary from less than
10 heactares to 400 hectares (Ashraf et al., 2015), mango orchards range in size
from less than 2 hectares to 200 hectares (Khan, 2010) while guava orchards range
from less than hectare to 96 hectare (Khushk et al., 2009).
1.3. FRUITS FACING DECLINE
1.3.1. Citrus Decline

28
Citrus decline sometimes also referred to as “Citrus Dieback” which is not a
specific disease but is symptomatic expression of many disorders in the plant. The
malady is also termed as „frenching‟ or „chlorosis (Anonymous, 2000).
Citrus species which are being cultivated in Pakistan include grape-
fruit (Citrus paradisi Macfad.), mandarin (Citrus reticulata Blanco), sweet
Orange (Citrus sinensis (L.) Osbeck), bitter Orange (Citrus aurantium L.),
Lime (Citrus aurantifolia (Christm.) Swingle), Rough Lemon (Citrus
jambhiri Lush.) and Kinnow (it is a Hybrid of Citrus nobilis and Citrus deliciosa).
The kinnow is grown largely in citrus orchards of Pakistan but not a single variety
has shown resistance against decline (Anonymous, 2013).
Scientists during 1970s and 1980s reported that relatively large number of
trees were declining and showed dieback in all the citrus areas visited both on
mandarin and on sweet orange trees. Thus it appears that the decline affecting
citrus is not new. Young decline affected citrus trees grow well initially, and then
begin to show symptoms only after three or four years. (Chapot, 1975; Boveet al.,
1983).
Symptoms of decline included overall pale green-yellowish colour of
foliage; mature leaf drop and replacement of normal-sized leaves by small ones; an
upright position of small leaves along shoots; zinc-deficiency symptoms on small
leaves but without green islands on an overall yellow blade; mild leaf mottle on old
leaves; dieback and stunting (Chapot, 1975).
29
Citrus decline is known to be caused by biotic (fungi, nematodes, viruses,
phytoplasma etc.) and abiotic factors (soil, nutritional and rootstock factors).
Similarlysingle variety cultivation has further aggravated disease situation in
existing citrus gowing areas. It has been observed that decline is much more
prevalent in high rainfall receiving areas. Besides the local diseases, diseases of
international importance like citrus tristeza virus (CTV) and citrus greening have
been reported from the existing citrus growing areas and contribute to citrus
decline. (Naqvi, 2004).
1.3.2. Mango Decline
In case of mango, decline has different forms, generally known as
progressive, slow decline or die back; quick die back and sudden death (Fateh et
al., 2006). The details are given as below.
1.3.2.1. Progressive or slow decline or dieback
In progressive decline, twig and branch dieback is seen on mango trees. It
starts from top of the canopy and progresses towards the lower braches.This affect
the normal flush of trees which are supressed as well as cause leaf disoloration.
Due to weak flushes the canopy seems barren and dead twigs are generally high in
number. This kind of situation is mostly prevalent in poorly managed orchards
where proper nutrition, plant protection and irrigation practices are neglected. Such
kind of decline can be easily managed if cultivating orchards according to best
available production technology (Fateh et al., 2009).
1.3.2.2. Quick dieback

30
In this kind of dieback, trees start losing their shape quickly. Suck kind of
dieback is the indication of either deficiency or toxicity of some elements. Leaves
change colour from green to yellow and drop; the moisture does not reach the
higher branches and trees' tops look dead. This kind of drought situation allows the
opportunistic fungi to invade the plants and in response the plants produce gum of
various colors. The appropriate nutrition, irrigation at required timing as well as
foliar sprays of sustemic fungicides help in managing the quick dieback of mango
trees (Kazmi et al., 2007).
1.3.2.3. Mango sudden death (MSD)
This kind of decline is alarming and is a real threat for the mango growers.
The name "sudden death" given to this disease is tree death visible inshortest time
may be in few days or a month. Once the decline causing pathogens infect trees the
internal break down of the tissues is initiated. However, the symptoms remain
masked. As the environment becomes favourable for the rapid growth of pathogen
and trees lose vigor, healthy looking trees show severe symptoms resulting in
sudden mortality. The symptoms include leaf drying, drooping and sometimes
become leathery. The cracks appear on the stem at collar region, bark splits and
trees ooze dark brown gum. Sometimes thick dark brown liquid is released from
the colar region. In the infected trees when bark is removed from the stem, mouse
grey streaks appear which show that pathogens have fully invaded the trees and its
recovery is unlikely (Fateh et al., 2006).
1.3.3. Guava Decline
Guava Decline has been observed in the areas of sub continent in 1935
before partition. However, it was reported in 1947 for the first time (Naqvi, 2004).

31
The symptoms of guava decline include leaf discoloration, twigs necrosis, branch
splitting, drying of branches mostly at one side of the trees and irregular tree
symmetry. On removal of bark, the stem shows canker. Several fungi have been
reported from guava decline like Lasiodiplodia theobromae, Fusarium sp.,
Botryosphaeria sp. Phytophthora sp. etc. (Bukhari, 2009).
1.4.PATHOGENS INVOLVED IN DECLINE
Decline in different forest and fruit trees involve different pathogens e.g.
fungi such as Ceratocystis fimbriata, Armillaria sp., Nattrassia magniferae,
Lasiodiplodia theobromae, Phoma sp., Phomopsis sp., Fusarium sp., Viruses such
as citrus tristeza virus (CTV), Nematodes especially in case of citrus decline
(Tylenchulus semipenetrans) and in mango (Hemicriconemoides, Longidorus sp.),
bacteria such as Pseudomonas sp. and Phytoplasma. Among these pathogens, the
fungus Nattrassia magniferae has been reported from almost all of the forest and
fruit trees facing decline (Fateh et al., 2006; Bukhari, 2009).
1.4.1. Nattrassia magniferae
1.4.1.1. Synonyms
This fungus has different synonyms e.g. Dothiorella mangiferae,
Exosporina fawcettii, Fusicoccum dimidiatum (Penz.), F. eucalypti, Hendersonula
agathidis, H. cypria Nattrass, H. toruloidea Nattrass, Neofusicoccum mangiferae,
Neoscytalidium dimidiatum, Scytalidium dimidiatum, S. lignicola and Torula
dimidiate (Farr et al., 2005).
1.4.1.2. Taxonomy

32
The Nattrassia mangiferae belongs to Phylum Ascomycota; Class
Ascomycetes; Sub ClassDothidiomycetes; FamilyBotryosphaeriacea; Genus
Nattrassia and Species: N. mangiferae(Farr et al., 2005).
1.4.1.3. Host range
In fruit trees mango, guava, citrus, apple, plum, mulberry, fig and walnut
are the hosts. In forest trees the recorded hosts are Arbutus sp., Euclyptus sp.,
Madrone sp.Besides causing different plant diseases, this fungus is equally harmful
to human beings causing skin diseases (Atta and Aref, 2013).
1.4.1.4. Symptoms
The fungus Nattrassia magniferae causes different symptoms in different
trees e.g. dieback, cankers, blossom blight, wilt, necrosis, decline and death. As
mentioned above the symptoms of slow or quick die back can result from infection
by the fungus N. mangiferae. The symptoms are confused with those produced by
other pathogens such as Botryodiplodia theobromae and Botryosphaeria
sp.Brownish streaks appear when the bark is removed from branches and stem as
well.The trees are apparently healthy, with masked symptoms and produce rotten
fruits (Farr et al., 2005).
1.4.1.5. Biology and management
A very few scientists made efforts to study the biology of this potential
pathogen which is involved in many of the decline diseases in fruits and forest
trees. To devise effective strategies for its management,biology of N.
mangiferaewas studied in South Africa. In this regard many chemicals were
applied in preharvest stage of the trees to see their effect on management of pre and
33
post harvest diseases of citrus fruit. Among all thetested fungicides, pre-harvest
applications of copper-oxychloride on monthly basis during fruit set till harvest
significantly managed the disease (Saimaan, 1997).
Keeping in view importance of the fungus associated with decline of fruit trees,
lack of information on its biology and management, the present studies were
designed with the following objectives:
Determination of prevalence of Nattrassia sp. in target orchards (mango, citrus
and guava) of Punjab.
Studies on the biology and epidemiology of Nattrassia sp. causing decline in
fruit orchards and
Determination of factors causing tree decline for the management of Nattrassia
sp.

34
Chapter 2
OCCURRENCE AND SYMPTOMATOLOGY OF CITRUS,
MANGO AND GUAVA DECLINE IN PUNJAB, PAKISTAN
2.1. INTRODUCTION
Pakistan is an agricultural country. The Gross Domestic Product (GDP) of
Pakistan was 20.9 % in 2014-15. Livelihood of 43.5 % of rural population exists in
agriculture.Enhance productivity and less vulnerability are the main objectives of
food security. To increase economic growth and reducing poverty in Pakistan
through agriculture, a policy framework coupled with best socio political climate,
good governance is fundamental. The government of Pakistan is focusing on
horticulture, livestock and fisheries. Along with developed nations efforts have
been made to improve production technologies and linking farmers directly with
markets and industry (Anonymous, 2015).
Horticulture is the main hub of agricultural economy. Approximately12
million tons of fruits, vegetables and spices are produced on yearly basis. Among
the important fruits citrus contributes2,000,000, mangoes 1,000,000, dates63000
and apples 400,000 tons annually. There are few minor fruits which are harvested
round the year in different geographical zones of Pakistan.
Citrus, mango and guava are grown on an area of 190,000,170,000 and
63000 hectares respectively with the productionsof 240,000, 1,720,000and 490,000
tons respectively (Anonymous, 2016).
Citrus is leading the fruits industry in Pakistan and occupies first position.
Pakistan produces approximately 3 to 4 % of the world citrus and the exports are
9

35
limited to only about 0.8 % of harvest. It is a known fact thatup to 95 % of the
world's kinnow is produced in Pakistan. In Punjab 85% area under citrus is in tehsil
Sargodha and Bhalwal. The rest of 15% is shared by Sillanwali, Sahiwal and
Sahpur tehsils. However, Bhalwal is leading in terms of citrus cultivation. Kinnow
is the famous variety in these areas (Sharif and Waqar, 2005).
In Pakistan, citrus has been planted in the new areas but the average
economic life of citrus is still not comparable with other citrus producing countries.
Fifty years is the average economic life of citrus all around the world. However,
the average life of citrus in Pakistan is about 25 years and trees start to decline after
7-10 years of production (Chaudhry, 2003).
Citrus decline in Pakistan has been thought to be found since 1960s from
the Khyber Pakhtoonkhwah province. However, it was reported in 1970 in the form
of dieback and the causes were attributed to deficiency symptoms and drainage
problems in the orchard (Chapot, 1970).
In citrus, particular decline symptoms are wilt and chlorosis of leaves
followed by leaf and fruit drop. Affected branches show die back starting from top
to the lower branches, a healthy tree suddenly wilts, turns yellow and dies rapidly
(Safdar et al., 2010).
Mango decline in Pakistan was reported from the Punjab province in one of
the orchards at Muzaffar Garh in 1995. The symptoms like leaf drooping, bark
splitting, gummosis, stem canker and stem bleeding appeared. This type of decline
was called quick decline. Twig dieback and the branches dieback are also observed
but that might be due to many reasons (Fateh et al., 2006; Naqvi, 2004).
36
The association of pathogenic fungi and role of bark beetle in mango
decline has been studied in Pakistan as well as few other countries where the
disease has become a dilemma. The most common symptoms produced were leaf
drying, discoloration gum oozing, cankers development under the bark and
vascular blockage. The symptoms intensify when Hypocryphalus
mangiferae,commonly known as bark beetle bores in the stem. Some of local
mango varieties of Pakistan like Malda, Langra and Anwar Ratol show a little bit
tolerance to decline.The mycoflora from decline affected treesand the bark beetle
(H. mangiferae) includedLasiodiplodia theobromae, Ceratocystis fimbriata and
Phomopsis sp. (Masood et al., 2011).
Guava decline have been found existing in India since 1935 but it
wasreported for the first time in 1947. Severely decline affected trees show leaf
drooping and discoloration, dead twigs and rotted, discolored stems. The branches
die on one side of the trees initially and later cover the entire canopy. The tree
mortality occurs with complete defoliation and dry wood.
During a survey of guava growing areas in Sheikhupura district of Punjab,
Pakistan maximum disease incidence was recorded in Tehsil Sharaqpur followed
by Pattoki of district Kasur (Safdar et al., 2015).
As orchards in the Punjab province are declining, trees are becoming
debilitated and less productive, therefore, the first step was planned to conduct
surveys in major areas to determine the incidence and prevalence so that proper
management measures might be suggested to the farmers.
The objectives of this study were as under:
37
1) To assess the disease occurence and severity in the orchards of
citrus, guava and mango from some selected locations famous for the
production of the commodity in the province of Punjab.
2) To find out the similarity of symptoms of citrus, mango and guava
decline affected trees.
2.2. REVIEW OF LITERATURE
2.2.1. Decline of Fruit Orchards
Many fruit orchards in Pakistan have prevalence of decline disease
including citrus, mango, guava, loquat and pomegranate. However, special
importance is given to citrus, mango and guava decline being the most important
fruit crops of Pakistan.
2.2.1.1. Citrus decline
Citrus decline is a global problem in citrus growing areas. Mostly the
mature trees become victim of decline. The recovery of an infected tree is quite
difficult. Twig blight of citrus is mostly confined to tree canopies but its symptoms
resemble with other internationally important diseases like greening, CTV and slow
decline (caused by nematode Radophilus citrophilus) in Florida (EPPO/CABI,
1996a, b and c). The decline affected citrus trees show zinc deficiency. The
significance of high levels of zinc is not known but its analysis may be helpful for
diagnosis of decline (Young et al., 1980a and b).
Other than apparent symptoms, there is also change in tree physiology.
Studies have shown that in decline affected citrus trees water conductivity in the
xylem is impaired. The trees failed to intake water and food because the xylem was

38
blocked by light-yellow dark-brown filamentous plugs known as tylosis. The
dieback symptoms appear due to lack of water transport to the canopy (Brlansky et
al., 1985).
Most of the scientists thought that it was citrus tristeza virus which caused
citrus decline and they did research with this vision. A survey was conducted in
citrus growing areas of Khyber Pakhtunkhwah province of Pakistan to assess
various citrus diseases. Most common diseases in citrus orchards and nurseries
included citrus tristeza, citrus variegation, citrus exocortis, citrus cachexia
(xyloprosis) and citrus greening. High incidence of these devastating pathogens has
caused the severe citrus decline, drastic yield and quality losses in citrus fruits in
the region (Arif et al., 2005).
Another school of thought said that phytoplasma and bacteria are involved
in citrus decline. Burney et al. (2007) during a survey of citrus growing areas in
Punjab found that citrus decline was a result of combination of bacteria and
phytoplasma. The leaf sample showed that Xanthomonas compestris is the most
prevalent bacterium with 50% incidence in Jhang, 17.24% in Sahiwal and no
incidence was found in Faisalabad, Toba Tek singh and Kasur. Phytoplasmal
disease incidence was found to be 27.58% in Sahiwal, 15.62% in Toba Tek Singh
while it was not encountered in Jhang.
The fungal involvement in citrus decline was found in Oman as well.
During survey conducted in various citrus growing districts, it was observed that
citrus varieties i.e. acid limes and sweet limes exhibited gummosis at collar region.
The isolation from bark and roots resulted in 19 fungal species. Among these the

39
most common were Lasiodiplodia hormozganensis, L. theobromae and Fusarium
solani. On artificial inoculation of these common fungi, acid lime and sweet lime
seedlings reproduced decline and gummosis symptoms. The nursery studies on
sweet lime showed association of 12 fungal species, which is evidence that
nurseries act as a main source for some citrus pathogens (Al Sadi et al., 2010).
During a survey in Pakistan from citrus growing districts especially
Sargodha and Faisalabad, decline incidence was found higher in Sargodha except
Sillanwali and Kot Momin tehsils. The isolated fungi from decline affected tree
tissue and root samples were Fusarium semitectum, F.solani, Helminthosporium
sp. and Phytophthora sp., with varying frequencies. (Safdar etal., 2010).
Nematologists said that these are nematodes causing citrus decline.
Khanzada et al. (2007) conducted surveys in different districts of Punjab and
collected roots and soil samples from the orchards showing decline symptoms. In
all areas the incidence of Tylenchulus semipenetrans, the cause of slow decline was
the maximum (56%) in variety Feutrell‟s Early followed by 40% in lemon and
orange, 35% in Kinnow and Musambi. The minimum incidence (20%) was
observed in grape fruit. A survey in Punjab showed that the nematode (T.
semipenetrans) population was recorded above economic threshold level in all
citrus growing tehsils of Sargodha districts and this might also contributing towards
citrus decline (Safdar etal., 2010).
2.2.1.2. Mango decline
Mango decline is prevalent in the world especially in Brazil, Oman,
Pakistan and India. A fungus Diplodia theobromae associated with sudden decline

40
of mango for the first time was reported in Oman. During 1999 up to 60% of trees
in parts of the Al Batinah region had died of strange wilt disease. Trees showed
gummosis, wilting, browning of leaves and died in 5-6 months after appearance of
first symptoms. Dead wood was dark brown. It was thought that a bark beetle
(Cryphalus scabrecollis), is responsible for spread of the disease (Al-Adawi et al.,
2002).
The etiology of mango sudden death in Pakistan was first time reported in
Pakistan during 2005. Incidence of the disease was high in mango growing areas of
province Sindh as compared to the Punjab province. The mycoflora isolated
included Botryodiplodia theobromae, Phytophthora sp., and Fusarium sp. In the
mean time a new fungus was reported in Oman during 2006, known as
Ceratocystis fimbriata which attacked mango in combination with L. theobromae.
Later it was reported new species Ceratocystis omanensis (Al- Adawi et al., 2006).
In Pakistan the fungus C. fimbriata for the first time was reported in Sindh
from declining mango trees. It's identification was confirmed by morphological
characteristics of perithecia (brown to black with globose base, necks almost 800-
900 µm long with ostiolar hyphae), ascospores (elliptical 4-8 × 2-5 µm, hat shaped)
conidiophores (hyaline, septate up to 150 µm long and conidia that were
cylindrical, sometimes in chains and truncated at the ends (Fateh et al., 2006).
2.2.1.3. Guava decline
Guava decline is also termed as guava wilt; Rosemary (2001) reported that
in guava decline leaves start wilting from the top of the tree. Sometimes, it is a
rapid decline and sometimes it is a slow decline. There is general wilting of all the

41
leaves. The leaves become yellow or purple and drop. During the initial stages, the
leaves dry out and often remain on the tree. If there are fruit on the tree, fruit
development ceases immediately, and you get mummified fruit on the tree. Guava
wilt disease killed off orchard trees randomly, and at the end, there would be no
orchard left. The original research concentrated on trying to control the disease
with chemicals, but was totally ineffective. There are no chemicals available to
control the disease.
Guava decline is distributed in many countries of the world. Most of the
guava is cultivated in India (where it is known as poor men‟s apple) and Pakistan.
Guava decline in India is considered a soil borne disease associated with
association of several pathogens. Among most common pathogens, Fusarium
oxysporum f. sp. psidii and F. solani were reported. A new potential fungus
Gliocladium roseum was also identified. Heavy losses in guava production in India
have been recorded due to this disease (Misra, 2007).
In South Africa guava decline has been reported to cause by a fungus
identified as Penicillium vermoesenii. Earlier, the fungus has been associated with
blight of ornamental palms in the United States and Belgium. It was later reported
from guava in the above mentioned countries. The Koch's postulates confirmed the
pathogenicity of the fungus in the glasshouse and field conditions by producing
symptoms like wilting, chlorosis and defoliation in nursery seedling as well as
branches of mature trees (Schoeman et al., 2008).
Avelar-Mejia et al. (2003) described the effect of guava tree decline on the
anatomy of branches and roots of guava. Guava tree decline in Calvillo,

42
Aguascalientes and Apozol, Zacatecas, Mexico did not affect the anatomy of the
branches of the tree. The disease was associated with root histological alterations
caused by Meloidogyne sp. infestation. The bark, phloem and vascular cambium
tissues showed hyperplasia and hypertrophy, as well as an increase in polyphenol
content and necrosis. The decline was related with an increase in lignin and
polyphenol content, and with the reduction in root starch. Fungi were observed in
the xylem and cambium of severely affected trees, although the genus and species
were not determined. The partial plugging of xylem vessels was not related with
the decline.
During a survey in one of the guava growing districts of the Punjab
province of Pakistan i.e. Sheikhupura, decline disease incidence was reported as
high as 36% inTehsil Sharaqpur. The isolated fungi included B. theobromae,
Fusarium oxysporum f.sp. psidii, Phytophthora parasitica, F. solani,
Helminthosporium sp. and Curvularia lunata. The pathogenicity of most
dominating fungus (B. theobromae) was confirmed on green house potted guava
plants of 2 years (Safdar et al., 2015).
2.3. MATERIALS AND METHODS
2.3.1.Survey of Fruit Orchards for Disease Assessment
According to world map Pakistan is located between 24o to 37
o latitudes in
north and 61o to 75
o longitudes in east. It is spread over 1600 kilometres from north
to south and from east to west 885 kilometres. The total area of the country is 796,
095 square kilometres. Pakistan has best climate for agriculture ranging from
subtropical to semi-arid. The per anum rainfall ranges from 125 mm (extreme
southern plains) to 900 mm in the mountainous and northern plains. Monsoon

43
season is known for heavy rainfall and receives 70 % of the total rainfall in
generarlly from month of July to September. The remaining 30 % rainfall is in
winter. In plains summers is extreme with maximum temperature more than 40 °C,
while the temperature in winter is a few degrees above the freezing point.
2.3.1.1. Profile of areas surveyed
A brief description of the areas surveyed for incidence and prevalence of decline is
given below.
2.3.1.1.1. Sargodha
Sargodha is known as Pakistan's best citrus-producing area. It is situated
220 kilometers from Islamabad, the capital. Summer season in the district is hot
and temperature may reach to 50 oC (122
oF) while, in winter temperature can be as
low as 2-3 oC. The climate of the district is quite suitable for agriculture;
wheat, rice, and sugarcane are its main field crops. However, Sargodha district is
famous for citrus (Kinnow) production. The district Sargodha comprises of six
tehsils i.e. Sargodha, Bhalwal, Sillanwali, Shahpur, Sahiwal and Kot Momin.
2.3.1.1.2 Multan
Multan is famous for saints and mango. There are many shrines of saints in
the district. Many crops are grown in Multan but the only crop linked with its name
is mango. Flat and alluvial plains are best combination for cultivation of fruit crops.
The canal system running in Multan brings soil from distant places and makes the
land more fertile.
Multan has very harsh climate in summer and the temperature exceeds even
52 oC (126
oF) whereas, in extreme winter, the minimum recorded temperature is

44
approximately −1 oC (30
oF). Average rainfall is about 186 mm. Multan is also
popular for its dust storms.
Basically, Pakistan is divided into ten agro-ecological zones depending
upon climate, land utilization and availability of water (Fig.2.1). Maximum fruits
and other field crops in Pakistan are cultivated in northern irrigated plan (Zone
IVa) among other agro-ecological zones. Following are the characteristics of Zone
IVa.
2.3.1.1.3 Northern irrigated plain (Zone IVa)
Northern Irrigated Plainis mostly characterized as flood plain with semi-
arid to arid climate. The eastern side receives more average per annum rainfall (300
to 500 mm) than southwest (200 to 300 mm). The soils range from sandy, loam-
clay to loam. The canal system in the northern part helps in cultivation of irrigated
crops like wheat, rice, sugar cane and millets. The south is suitable for cotton,
sugar cane, maize, citrus and mangoes (PARC, 1998).
Survey for the current study was planned in such a way that the areas which
were best known for the target host plants must be visited. The survey was
conducted in the citrus, mango and guava orchards for disease estimation as well as
sampling. For citrus the survey was conducted in tehsils of district Sargodha. In
Sargodha district a total of 88 locations with three orchards from each location
were surveyed (Table 2.1). In each orchard randomly 5 out of 40 trees were
observed. Hence a total of 264 citrus orchards were surveyed and a total of 1320
trees were observed for disease estimation and sampling. The orchards were
surveyed using double diagonal method. Randomly five trees from an orchard were
observed for recording the data.

45
For mango, the surveys were conducted in 5 districts of Punjab viz.
Khanewal, Multan, Muzaffar Garh, Rahim Yar Khan and Bahawalpur. In total 50
locations were visited, in each location 3 mango orchards were surveyed and in
each orchard 5 out of 35 trees were observed. A total of 150 mango orchards were
surveyedand 750 mango trees were observed (Table 2.2).For disease assessment in
guava, surveys were done in disttrict Kasur,Sheikhupura and Nankana Sahib. In
total 26 locations and in each locationthree orchards were surveyed. Similarly from
each orchard, 5 trees out of 40 were observed for the disease assessment and
sample collection. Thus a total of 90 orchards and 390 trees wereobserved (Table
2.3).

46
I: Indus Delta
II: Southern Irrigated
III (a & b) Sandy Desert
IV (a & b) Nothern Irrigated Plains
V Barani Lands
VI Wet Mountains
VII Northern Dry Mountains
VIII Western Dry Mountains
IX Dry Western Plateau
X Suleman Piedmont
Fig. 2.1: Agro-ecological zones of Pakistan

47
Table 2.1: Areas surveyed for citrus decline assessment in district Sargodha.
S. No. Tehsils Localities
1 Bhalwal Chak No. 4 SB, 7 ML, 7SB, 7 ASB 8NB, 9
NB, Chak 9 Lokri, 10 NB, 13 NB, 18 NB, 22
NB, 23 NB, 26 NB
2 Sargodha Chak No. 24 SB, 27 SB, 28 SB, 30 NB, 48
NB, 53 SB, 56 NB, 90 NB, 91 NB, 93 SB, 94
BN, 95 NB, 95SB, 101 SB, 112 NB, 115 SB,
and 122 SB.
3 Sillanwanli Chak No. 118 NB, 119 SB, 120SB, 122 SB,
4123 SB, 124 SB, 127 SB, 127 NB,137 SB,
147 NB and 148 NB.
4 Shahpur Malakwal, Wadhi, kot Maghrib, Shahpur
Saddar, Noor Kallu, Kandaan Kalan,
Jhavarian, Hussain Shah, Kudyana, Allahdad
Wala, Chachar Sharf, Chak 128 NB
5 Sahiwal Kot Pehalwan, Biral Sharif, Nawabpur, Vijh,
Nehang, Chohal, Tirkhanwala, Haveli
Majuka, Pindi Wala, Sial Sharif, Sangoraka,
Farooka, Sial Dholka, Muhammad Wala,
Jahane Wala, Dherowal, Chatror and Radhan
48
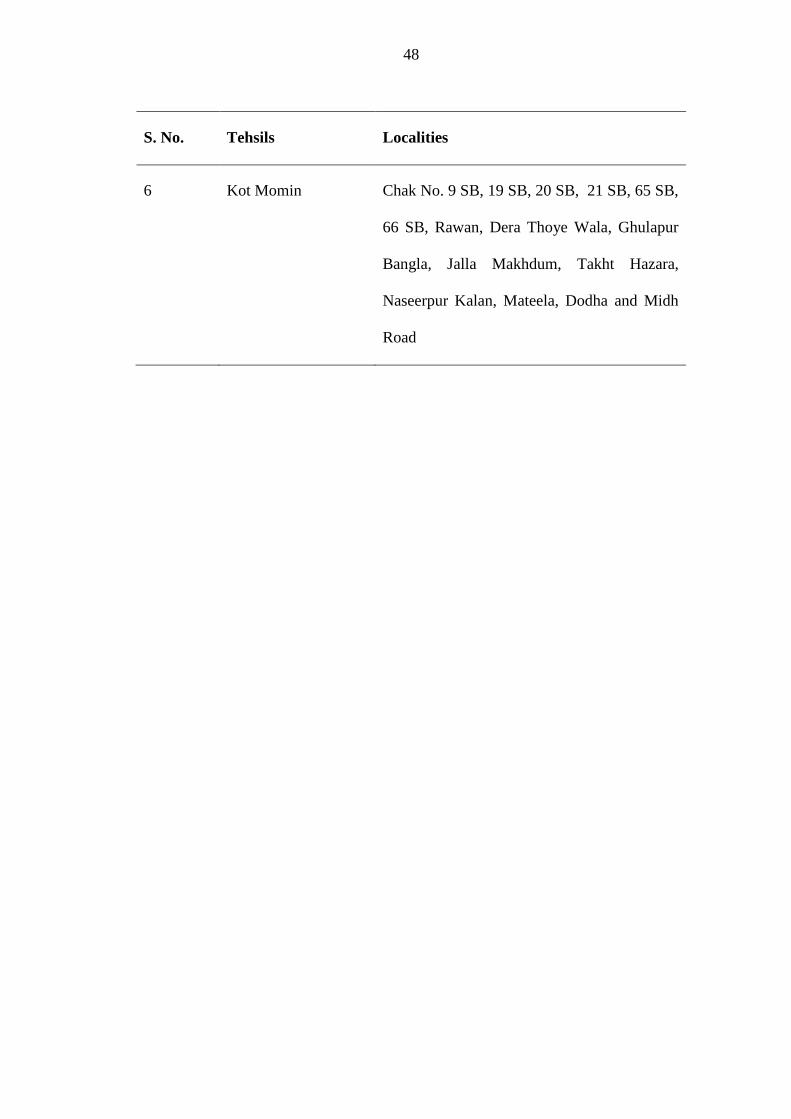
S. No. Tehsils Localities
6 Kot Momin Chak No. 9 SB, 19 SB, 20 SB, 21 SB, 65 SB,
66 SB, Rawan, Dera Thoye Wala, Ghulapur
Bangla, Jalla Makhdum, Takht Hazara,
Naseerpur Kalan, Mateela, Dodha and Midh
Road
49
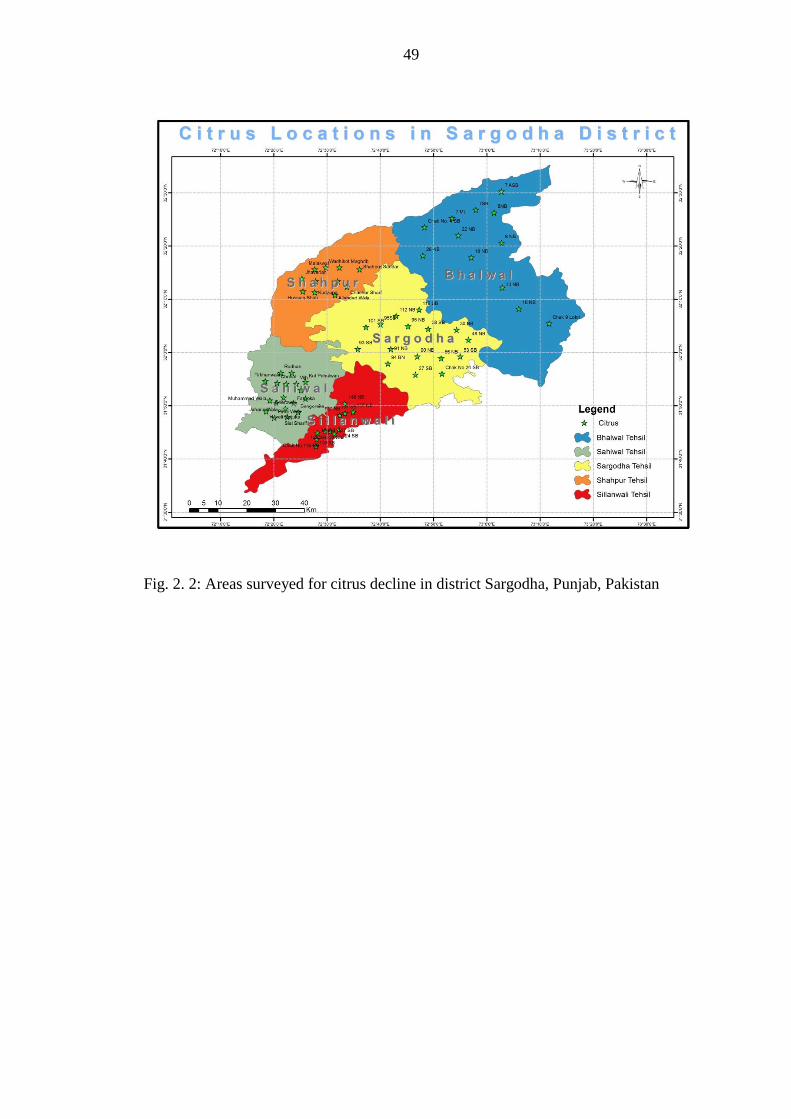
Fig. 2. 2: Areas surveyed for citrus decline in district Sargodha, Punjab, Pakistan
50
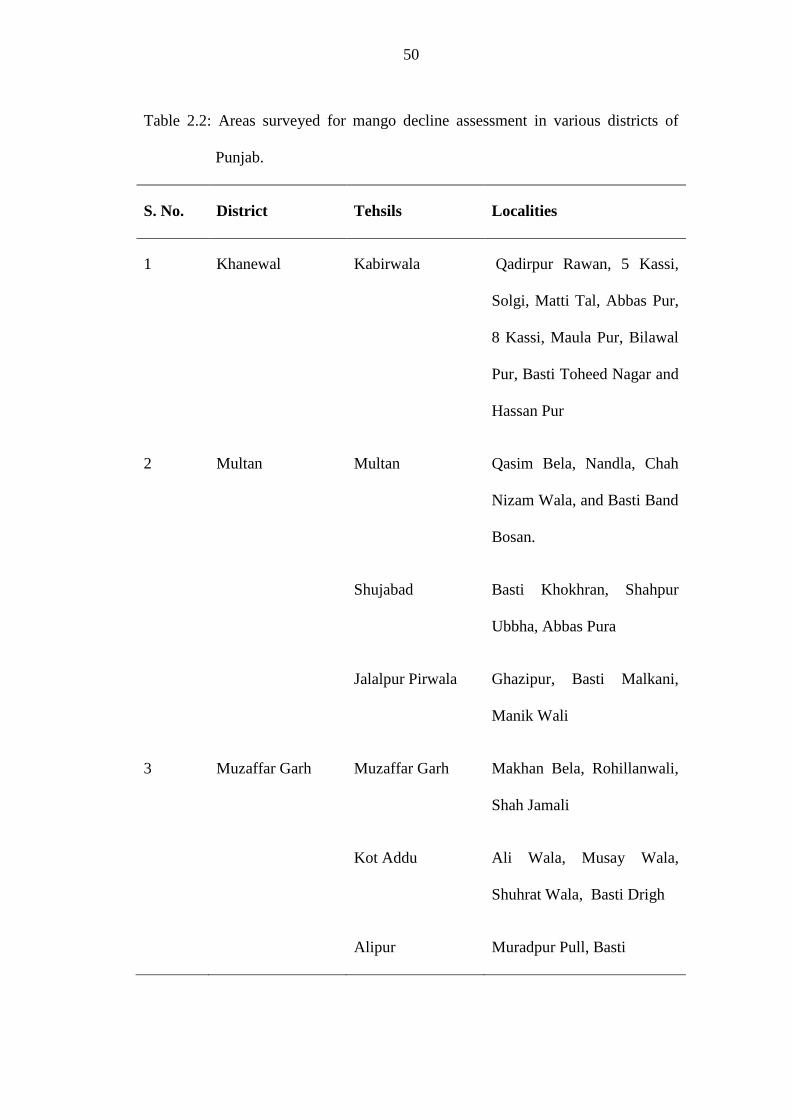
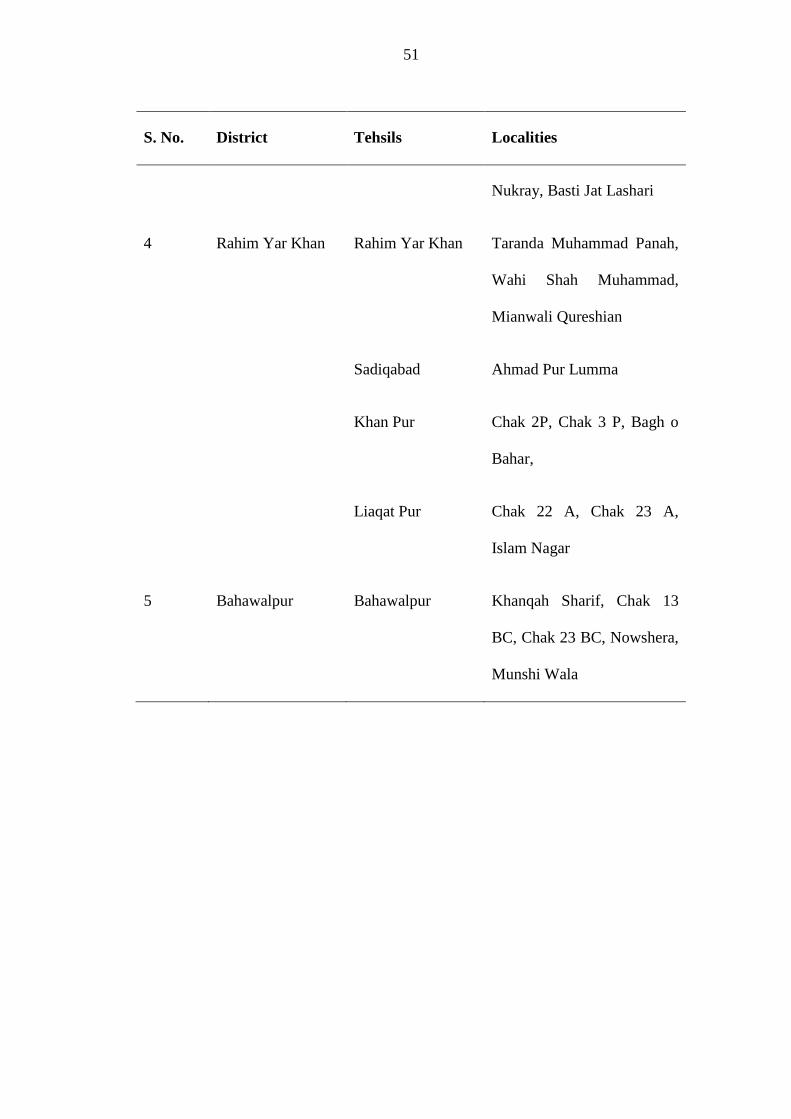
Table 2.2: Areas surveyed for mango decline assessment in various districts of
Punjab.
S. No. District Tehsils Localities
1 Khanewal Kabirwala Qadirpur Rawan, 5 Kassi,
Solgi, Matti Tal, Abbas Pur,
8 Kassi, Maula Pur, Bilawal
Pur, Basti Toheed Nagar and
Hassan Pur
2 Multan Multan Qasim Bela, Nandla, Chah
Nizam Wala, and Basti Band
Bosan.
Shujabad Basti Khokhran, Shahpur
Ubbha, Abbas Pura
Jalalpur Pirwala Ghazipur, Basti Malkani,
Manik Wali
3 Muzaffar Garh Muzaffar Garh Makhan Bela, Rohillanwali,
Shah Jamali
Kot Addu Ali Wala, Musay Wala,
Shuhrat Wala, Basti Drigh
Alipur Muradpur Pull, Basti
51
S. No. District Tehsils Localities
Nukray, Basti Jat Lashari
4 Rahim Yar Khan Rahim Yar Khan Taranda Muhammad Panah,
Wahi Shah Muhammad,
Mianwali Qureshian
Sadiqabad Ahmad Pur Lumma
Khan Pur Chak 2P, Chak 3 P, Bagh o
Bahar,
Liaqat Pur Chak 22 A, Chak 23 A,
Islam Nagar
5 Bahawalpur Bahawalpur Khanqah Sharif, Chak 13
BC, Chak 23 BC, Nowshera,
Munshi Wala

52
Fig. 2. 3: Areas surveyed for mango decline in district Khanewal, Punjab, Pakistan

53
Fig. 2. 4: Areas surveyed for mango decline in district Multan, Punjab, Pakistan

54
Fig. 2. 5: Areas surveyed for mango decline in district Muzaffar Garh, Punjab,
Pakistan

55
Fig. 2. 6: Areas surveyed for mango decline in district R. Y. Khan, Punjab,
Pakistan

56
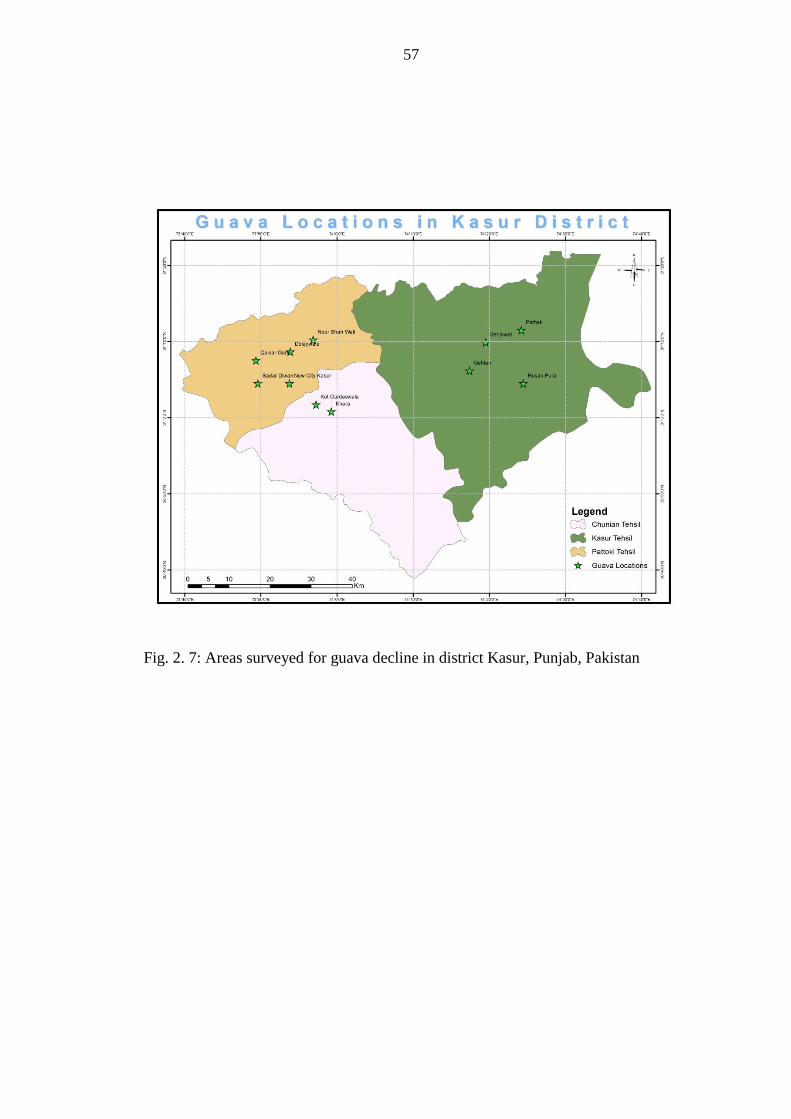
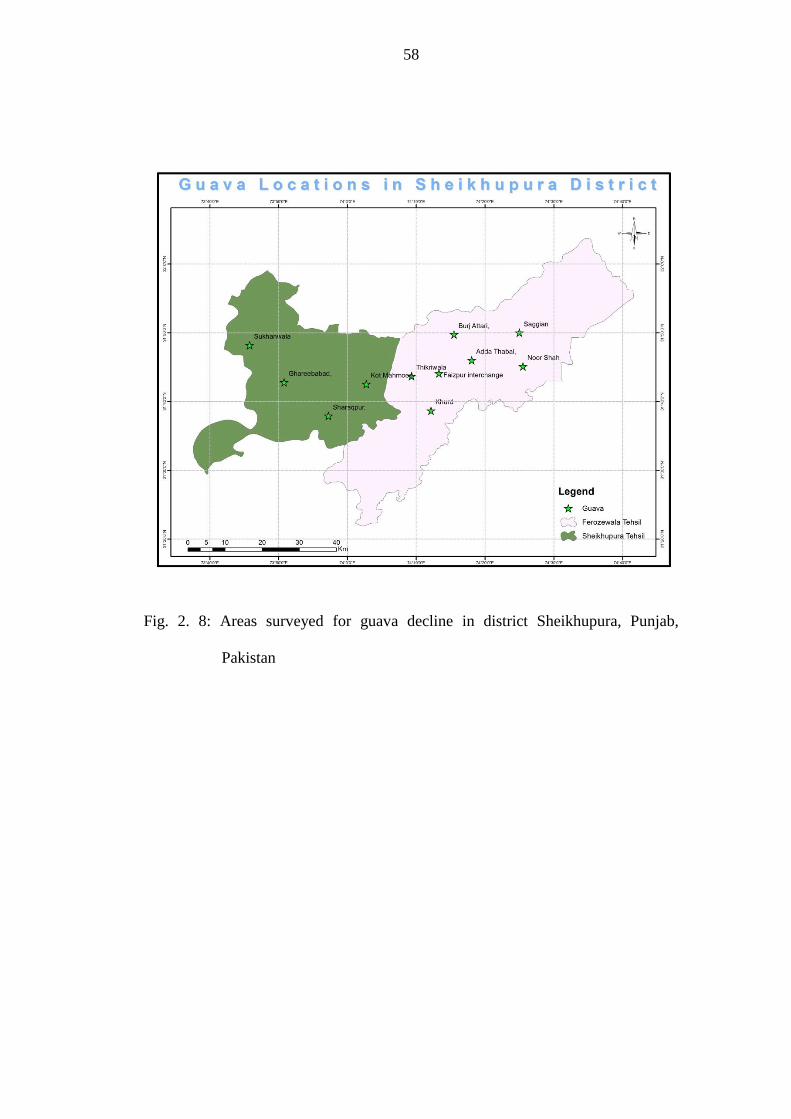
Table 2.3: Areas surveyed for guava decline assessment in various districts of
Punjab.
S. No. District Tehsils Localities
1 Kasur Kasur Qaisar Garh, Dolaywala,
Noor Shah Wali, New City
Kasur, Sadar Diwan
Chuniyan Khara, Kot Gurdas Wala
Pattoki Gehlan Pathak, Rukan Pura,
Sehjowal
3 Sheikhupura Ferozewala Faizpur interchange, Adda
Thabal, Noor Shah, Burj
Attari, Saggian Khurd,
Thikriwala
Sharaqpur Sharaqpur, Ghareebabad,
Sukhanwala, Kot Mahmood
4 Nankana Sahib Nankana Sahib Jalal Nou, Giller Wala,
Magtan Wala, Adda Pul
Torian, Chachkay Gill,
Mirza Pur, Mandi Faziabad
and Mor Khunda
57
Fig. 2. 7: Areas surveyed for guava decline in district Kasur, Punjab, Pakistan
58
Fig. 2. 8: Areas surveyed for guava decline in district Sheikhupura, Punjab,
Pakistan

59
Fig. 2. 9: Areas surveyed for guava decline in district Nankana Sahib, Punjab,
Pakistan

60
Prevalence, incidence and severity data were recorded to calculate the disease
index % age. Others parameters were also recorded which included tree age, tree
height, variety, damage, symptom of the decline or sudden death, irrigation and
fertilizer regimes etc.
2.3.2. Disease Incidence
The incidence of decline in citrus, mango and guava was calculated by the
formula (Rehman et al., 2011 a).
Disease Incidence (%)= Number of declined plants× 100
Total number of plants observed
2.3.3. Disease Severity
Disease Severity of mango, citrus and guava decline was recorded using 0-5
visual rating scale(Kazmi et al., 2005). Where:
0=Healthy Plants; 1=1-10%decline; 2=11-20%; 3=21-30%, 4=31-50% 5=More
than 50%.
2.3.4. Disease Index
Disease Index gives the exact status of the disease combining the disease
incidence and severity (Kazmi et al., 2005).
Disease Index (%) = 0(n1)+1(n2)+2(n3)+3(n4)+4(n5)+5(n6)× 100
N 5
Where
n1: No. of trees in 0 rating
n2: No. of trees in 1 rating
n3: No. of trees in 2 rating

61
n4: No. of trees in 3 rating
n5: No. of trees in 4 rating
n6: No. of trees in 5 rating
N: Total Number of Trees
2.3.5. Symptomatology
Symptoms were carefully observed from each decline affected citrus,
mango and guava trees. For current study, 50 trees each of citrus, mango and guava
were selected and the %age of trees showing decline symptoms such as gummosis,
bark splitting, die back, canker formation, stem bleeding etc was calculated.
2.4. RESULTS
2.4.1. Disease Assessment
As a result of survey for the disease assessment and observation taken, the
disease incidence, severity and disease index was calculated as follows:
2.4.1.1. Citrus decline assessment
Disease incidence, severity and disease index were found to be variable in
district Sargodha. Maximum mean disease incidence was recorded in tehsil
Sargodha (94.06%) followed by tehsil Shahpur (93.33%) and Sahiwal (73.33%),
while it was the minimum in tehsil Sillanwali (35.73%). Similarly, mean disease
severity was the maximum in tehsil Sargodha (1.47) and the minimum (0.64)
wasobserved in Sillanwali. The rest of the tehsils has intermediate disease situation.
Likewise, maximum disease index was observed in tehsil Sargodha (29.41%)
followed by tehsil Shahpur (26.75%) and Bhalwal (23.77%) On the other hand

62
minimum disease index was found in tehsil Sillanwali (10.36%) as shown in table
2.4.
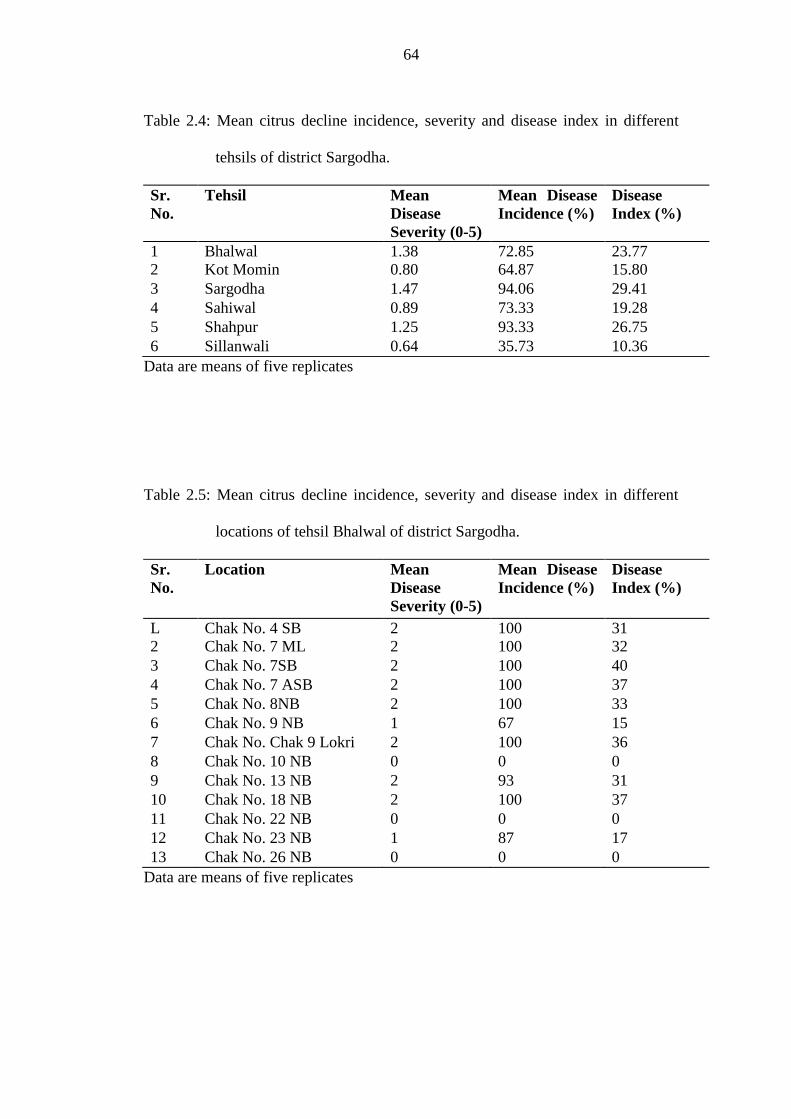
In tehsil Bhalwal of Sargodha almost 54% of the locations had 100%
disease incidence. Similarly, 61.5% locations fell into disease severity rating of "2"
which was the maximum rating observed in any location of tehsil Bhalwal (Table
2.5).
In tehsil Kot Momin 27% of the locations showed 100% disease incidence
while 80% locations had disease severity rating of "1", maximum rating observed
in any location of tehsil Kot Momin. Disease index ranged from 12-28% as shown
in Table 2.6.
In tehsil Sargodha, 71% of the locations observed had 100% disease
incidence and in 47% locations maximum disease severity rating "2" was recorded.
Disease index ranged from 20-40% (Table 2.7). In tehsil Sahiwal, 61% locations
observed had 100% disease incidence; 11% locations showed disease severity
rating "2" (maximum). Disease index ranged from 12-32% as shown in Table 2.8.
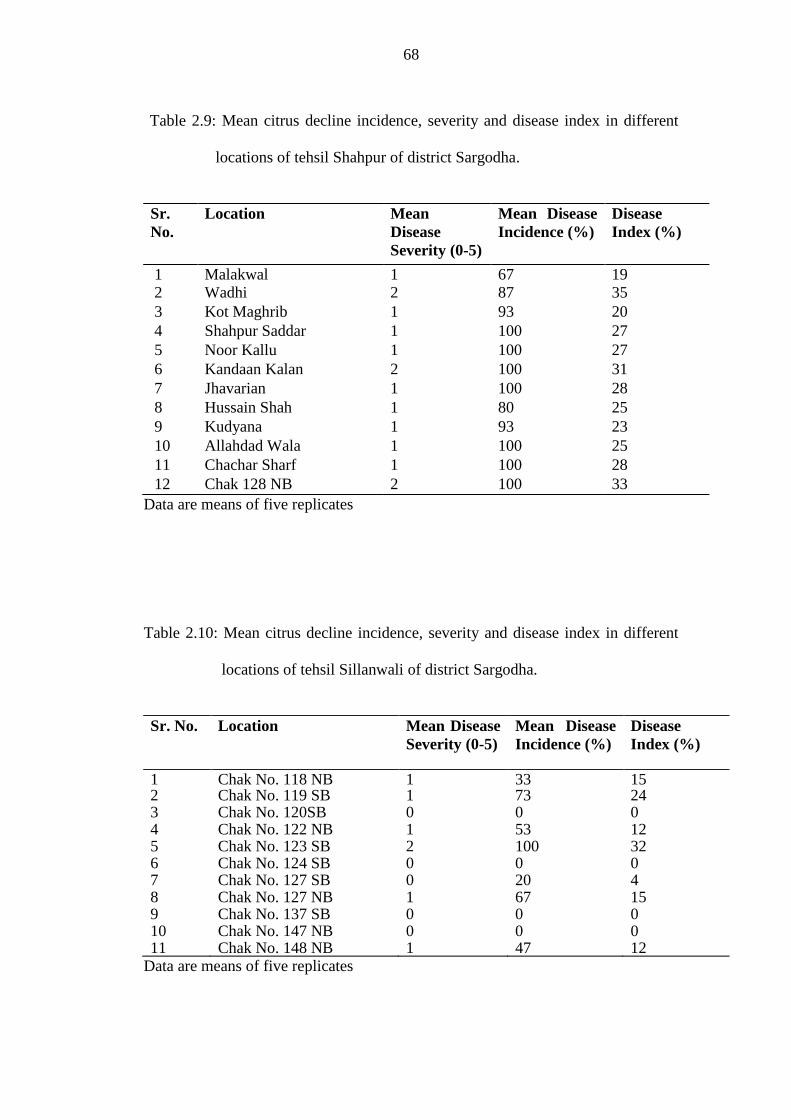
In Shahpur tehsil 58% locations had 100% disease incidence and 25%
locations showed maximum disease severity rating "2" while disease index ranged
from 19-35% (Table 2.9). Similarly, in Sillanwali only one location had 100%
disease incidence maximum disease severity rating was "2". Disease index
however, ranged from 4-32% (Table 2.10)where growers are following integrated
orchard management approach (Fateh et al., 2017).
Generally disease index of more than 15% of any disease at any location or
any host is considered alarming. However, in district Sargodha overall disease
index ranged from minimum 10.36 to maximum 29.41% which is a real panic for
63
the growers as well as entire citrus industry and requires the immediate attention of
the scientists and other stakeholders. There is lack of value chain and supply chain
studies and training of the growers‟ at large scale based on the best available
integrated approaches. Nominal quarantine measures in the country has also
aggravated the disease situation which renders the growers to either change their
crops or they sell their properties to land mafia for housing societies. It is
concluded that the situation of citrus decline is alarming in district Sargodha and
almost every orchard faced the problem. The situation is alarming and warrants
strict control strategies for its management. It is also emphasized that the farming
community be trained in this regard.
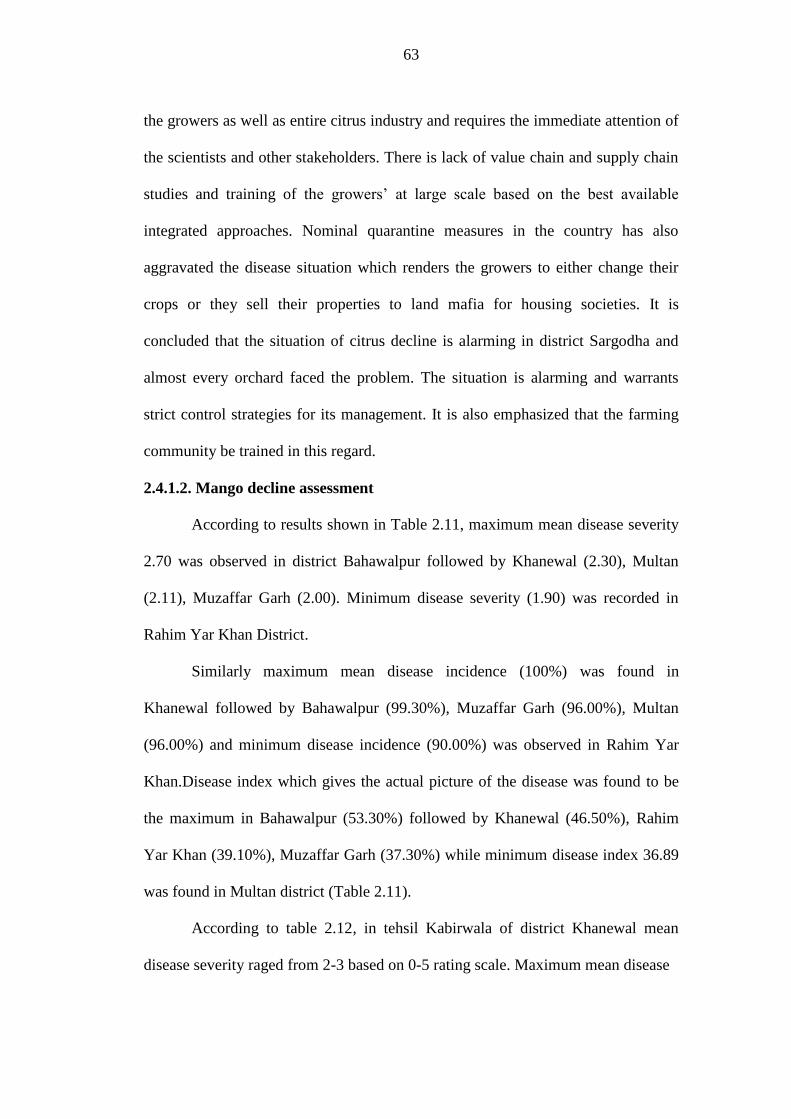
2.4.1.2. Mango decline assessment
According to results shown in Table 2.11, maximum mean disease severity
2.70 was observed in district Bahawalpur followed by Khanewal (2.30), Multan
(2.11), Muzaffar Garh (2.00). Minimum disease severity (1.90) was recorded in
Rahim Yar Khan District.
Similarly maximum mean disease incidence (100%) was found in
Khanewal followed by Bahawalpur (99.30%), Muzaffar Garh (96.00%), Multan
(96.00%) and minimum disease incidence (90.00%) was observed in Rahim Yar
Khan.Disease index which gives the actual picture of the disease was found to be
the maximum in Bahawalpur (53.30%) followed by Khanewal (46.50%), Rahim
Yar Khan (39.10%), Muzaffar Garh (37.30%) while minimum disease index 36.89
was found in Multan district (Table 2.11).
According to table 2.12, in tehsil Kabirwala of district Khanewal mean
disease severity raged from 2-3 based on 0-5 rating scale. Maximum mean disease
64
Table 2.4: Mean citrus decline incidence, severity and disease index in different
tehsils of district Sargodha.
Sr.
No.
Tehsil Mean
Disease
Severity (0-5)
Mean Disease
Incidence (%)
Disease
Index (%)
1 Bhalwal 1.38 72.85 23.77
2 Kot Momin 0.80 64.87 15.80
3 Sargodha 1.47 94.06 29.41
4 Sahiwal 0.89 73.33 19.28
5 Shahpur 1.25 93.33 26.75
6 Sillanwali 0.64 35.73 10.36
Data are means of five replicates
Table 2.5: Mean citrus decline incidence, severity and disease index in different
locations of tehsil Bhalwal of district Sargodha.
Sr.
No.
Location Mean
Disease
Severity (0-5)
Mean Disease
Incidence (%)
Disease
Index (%)
L Chak No. 4 SB 2 100 31
2 Chak No. 7 ML 2 100 32
3 Chak No. 7SB 2 100 40
4 Chak No. 7 ASB 2 100 37
5 Chak No. 8NB 2 100 33
6 Chak No. 9 NB 1 67 15
7 Chak No. Chak 9 Lokri 2 100 36
8 Chak No. 10 NB 0 0 0
9 Chak No. 13 NB 2 93 31
10 Chak No. 18 NB 2 100 37
11 Chak No. 22 NB 0 0 0
12 Chak No. 23 NB 1 87 17
13 Chak No. 26 NB 0 0 0
Data are means of five replicates

65
Table 2.6: Mean citrus decline incidence, severity and disease index in different
locations of tehsil Kot Momin of district Sargodha.
Sr.
No.
Location Mean
Disease
Severity (0-5)
Mean Disease
Incidence (%)
Disease
Index (%)
1 Chak No. 9 SB 0 0 0 2 19 SB 0 0 0
3 20 SB 1 60 12
4 21 SB 1 80 19
5 65 SB 1 73 16
6 66 SB 1 87 23
7 Rawan 0 0 0
8 Dera Thoye Wala 1 100 24
9 Ghulapur Bangla 1 100 29
10 Jalla Makhdum 1 80 16
11 Takht Hazara 1 60 12
12 Naseerpur Kalan 1 73 17
13 Mateela 1 100 25
14 Dodha 1 100 28
15 Midh Road 1 60 16
Data are means of five replicates

66
Table 2.7: Mean citrus decline incidence, severity and disease index in different
locations of tehsil Sargodha of district Sargodha.
Sr.
No.
Location Mean
Disease
Severity (0-5)
Mean Disease
Incidence (%)
Disease
Index (%)
1 Chak No. 24 SB 1 80 20
2 Chak No 27 SB 2 100 37
3 Chak No 28 SB 1 73 20
4 Chak No 30 NB 1 100 27
5 Chak No 48 NB 1 100 29
6 Chak No 53 SB 2 100 31
7 Chak No 56 NB 1 100 27
8 Chak No 90 NB 2 100 32
9 Chak No 91 NB 1 73 24
10 Chak No 93 SB 2 100 40
11 Chak No 94 NB 2 100 37
12 Chak No 95 NB 2 100 33
13 Chak No 95SB 2 100 32
14 Chak No 101 SB 1 73 24
15 Chak No 112 NB 1 100 29
16 Chak No 115 SB 2 100 31
17 Chak No 122 SB 1 100 27
Data are means of five replicates

67
Table 2.8: Mean citrus decline incidence, severity and disease index in different
locations of tehsil Sahiwal of district Sargodha.
Sr.
No.
Location Mean
Disease
Severity (0-5)
Mean Disease
Incidence (%)
Disease
Index (%)
1 Kot Pehalwan 1 100 28
2 Biral Sharif 1 93 25
3 Nawabpur 1 100 24
4 Vijh 1 100 28
5 Nehang 0 0 0
6 Chohal 1 100 23
7 Tirkhanwala 0 0 0
8 Haveli Majuka 2 100 32
9 Pindi Wala 1 100 24
10 Sial Sharif 2 100 31
11 Sangoraka 1 60 12
12 Farooka 1 67 16
13 Sial Dholka 1 100 23
14 Muhammad Wala 1 100 24
15 Jahane Wala 0 0 0
16 Dherowal 1 100 28
17 Chatror 1 100 29
18 Radhan 0 0 0
Data are means of five replicates
68
Table 2.9: Mean citrus decline incidence, severity and disease index in different
locations of tehsil Shahpur of district Sargodha.
Sr.
No.
Location Mean
Disease
Severity (0-5)
Mean Disease
Incidence (%)
Disease
Index (%)
1 Malakwal 1 67 19 2 Wadhi 2 87 35
3 Kot Maghrib 1 93 20
4 Shahpur Saddar 1 100 27
5 Noor Kallu 1 100 27
6 Kandaan Kalan 2 100 31
7 Jhavarian 1 100 28
8 Hussain Shah 1 80 25
9 Kudyana 1 93 23
10 Allahdad Wala 1 100 25
11 Chachar Sharf 1 100 28
12 Chak 128 NB 2 100 33
Data are means of five replicates
Table 2.10: Mean citrus decline incidence, severity and disease index in different
locations of tehsil Sillanwali of district Sargodha.
Sr. No. Location Mean Disease
Severity (0-5)
Mean Disease
Incidence (%)
Disease
Index (%)
1 Chak No. 118 NB 1 33 15 2 Chak No. 119 SB 1 73 24 3 Chak No. 120SB 0 0 0 4 Chak No. 122 NB 1 53 12 5 Chak No. 123 SB 2 100 32 6 Chak No. 124 SB 0 0 0 7 Chak No. 127 SB 0 20 4 8 Chak No. 127 NB 1 67 15 9 Chak No. 137 SB 0 0 0 10 Chak No. 147 NB 0 0 0 11 Chak No. 148 NB 1 47 12
Data are means of five replicates

69
severity "3"was recorded in Matti Tal, Bilawal Pur and Basti Toheed Nagar
followed by disease severity "2" in Qadirpur Rawan, 5 Kassi, Solgi, Abbas Pur, 8
Kassi, Maula Pur and Hassan Pur. Mean disease incidence observed was 100% in
all orchards observed in all locations. However, maximum disease index 65% was
observed in Basti Toheed Nagar followed by 57% in Bilawal Pur, 51% in Matti
Tal, 49% in Maula Pur, 47% in 8 Kassi, 41% in Solgi, 40% in Abbas Pur, 39% in
Qadirpur Rawan and 5 Kassi and minimum 37% in Hassan Pur.
Survey condcuted in 3 tehsils of Multan showed mean disease severity
ranging from 1-3. Maximum mean disease severity "3"was observed in Chah
Nizam Wala (Tehsil & district Multan) and Ghazi Pur (Tehsil Jalalpur Pirwala,
district Multan) followed by disease severity "2" in Nandla, Basti Band Bosan
(Tehsil Multan); Basti Khokhran, Shahpur Ubbha, Abbas Pura (Tehsil Shujabad)
and Manik Wali ( Tehsil Jalal Pur Pirwala). Minimum mean disease severity "1"
was observed in Qasim Bela of Multan. Mean disease incidence was 100% in all
orchards except Qasim Bela and Nandla in tehsil Multan where it was 67%.
Disease index was maximum in 52% in Chah Nizam Wala (Multan) and Ghazipur
(Jalalpur Pirwala) followed by 40% in Shahpur Ubbha and Abbas Pura (Shujabad),
39% in Manik Wali (Jalalpur Pirwala), 33% Bast Band Bosan (Multan), 32% Basti
Khokhran ( Shujabad), 31% Nandla (Multan) and minimum 13% in Qasim Bela of
tehsil Multan (Table 2.13).
In Muzaffar Garh district, 3 tehsils were covered i.e. Muzaffar Garh, Kot
Addu and Ali Pur. Mean disease severity ranged from 1-3. Maximum mean disease
severity "3" was recorded in Basti Drigh of Muzaffar Garh tehsil and Basti Nukray
of Alipur tehsil followed by disease severity "2" in Makhan Bela, Rohillanwali,

70
Shah Jamali (Tehsil Muzaffar Garh), Shuhrat Wala (Kot Addu), Muradpur Pull and
Basti Jat Lashri (Ali Pur). Minimum mean disease severity "1" was observed in Ali
Wala and Musay Wala of tehsil Kot Addu, District Muzaffar Garh. Mean disease
incidence 100% was observed in Rohillanwali, Shah Jamali (Muzaffar Garh); Ali
Wala and Shuhrat Wala, Basti Drigh (Kot Addu) and Murad Pur Pull, Basti Nukray
and Basti Jatt Lashri of tehsil Ali Pur. Maximum disease index (52%) was
calculated in Basti Drigh of Kot Addu tehsil and Basti Nukray of Ali Pur tehsil
followed by 44% in Makhan Bela and Shah Jamali (Muzaffar Garh); 41% Basti Jat
Lashari (Ali Pur), 40% Shuhratt Wala (Kot Addu); 31% Muradpur Pull (Ali Pur);
29% Ali Wala (Kot Addu), 27 % Rohillanwali (Muzaffar Garh) and minimum 13%
Musay walla (Kot Addu) (Table 2.14).
In district Rahim Yar Khan 4 tehsils i.e. Rahim Yar Khan, Sadiqabad, Khan
Pur and Liqat Pur were surveyed. Maximum mean disease severity "3" was
observed in Wahi Shah Muhammad of tehsil Rahim Yar Khan only followed by
disease severity "2" in all locations. Disease incidence was 100% in all
locationssurveyed. However, maximum disease index (52%) was found in Wahi
Shah Muhammad (Rahim Yar Khan) followed by 49% in Chak 23 A (Liaqat Pur);
48% Chak 2P (Khan Pur). and Islam Nagar (Liaqat Pur); minimum 37 % in
Taranda Muhammad Panah & Mianwali Qureshian of tehsil Rahim Yar Khan
(Table 2.15).
Tehsil Bahawalur and Ahmedpur East were surveyed in the district of
Bahawalpur. Mean disease severity ranged from 2-4 based on 0-5 rating scale.
Maximum mean disease severity "4" was recorded in Chak 23 BC of tehsil
Bahawalpur followed by "3" in Khanqah Sharif, Chak 13 BC, Munshi Wala (Baha-

71
Table 2.11: Mean mango decline incidence, severity and disease index in different
districts of Punjab province.
Sr. No. District Mean Disease
Severity
(0-5)
Mean Disease
Incidence (%)
Disease
Index (%)
1 Khanewal 2.30 100 46.50 2 Multan 2.11 92.67 36.89 3 Muzaffar Garh 2.00 96.00 37.30 4 Rahim Yar Khan 1.90 90.00 39.10
5 Bahawalpur 2.70 99.30 53.30 Data are means of fivereplicates
Table 2.12: Mean mango decline incidence, severity and disease index in different
location of district Khanewal.
Sr. No. Tehsil Location Mean Disease
Severity (0-5)
Severity (0-5)
Mean Disease
Incidence (%)
Disease
Index (%)
1 Kabirwala
Qadirpur
Rawan
2 100 39 5 Kassi 2 100 39 Solgi 2 100 41 Matti Tal 3 100 51 Abbas Pur 2 100 40 8 Kassi 2 100 47 Maula Pur 2 100 49 Bilawal Pur 3 100 57 Basti
Toheed
Nagar and
3 100 65 Hassan Pur 2 100 37
Data are means of fivereplicates

72
Walpur) and Mehrab Wala and Basti Johnan (Ahmedpur East). Minimum mean
disease intensity "2" was recorded in Nowshera (Bahawalpur) and Channi Goth,
Muhabbat Pur and Basti Khokhran of tehsil Ahmedpur East. Mean disease
incidence was 100% in all locations except in Khanqah Sharif (Bahawalpur) which
was 93%. Maximum disease index 76% was observed in Chak 23 BC
(Bahawalpur) followed by 61% in Basti Johnan and it was minimum in Channi
Goth as shown in Table 2.16.
2.4.1.3 Guava decline assessment
During the decline assessment in guava, results showed that among three
guava growing districts, the maximum severity was recorded in district
Sheikhupura (0.90) followed by district Kasur (0.78), while, the minimum
severitywas observed in district Nankana Sahib (0.57).
Maximum guava decline incidence was found in district Kasur (62.89%)
followed by Sheikhpura (61.30%) whereas it was minimum in district Nankana
Sahib (56.29%).
However, a maximum disease index of 18% was recorded in district Kasur
followed by Sheikhpura but the minimum disease index of 14% was observed in
district Nankana Sahib (Table 2.17).

73
Table 2.13: Mean mango decline incidence, severity and disease index in different
locations of district Multan.
Sr. No. Tehsil Location Mean Disease
Severity (0-5)
Severity (0-5)
Mean Disease
Incidence (%)
Disease
Index
(%) 1 Multan Qasim Bela 1 67 13
Nandla 2 67 31
Chah
Nizam
Wala
3 100 52
Basti Band
Bosan
2 100 33
2 Shujabad Basti
Khokhran
2 100 32
Shahpur
Ubbha
2 100 40
Abbas Pura 2 100 40
3 Jalalpur
Pirwala
Ghazipur 3 100 52
Manik Wali 2 100 39
Data are means of five replicates

74
Table 2.14: Mean mango decline incidence, severity and disease index in different
locations of district Muzaffar Garh.
Sr. No. Tehsil Location Mean Disease
Severity (0-5)
Severity (0-5)
Mean Disease
Incidence (%)
Disease
Index
(%) 1 Muzaffar
Garh
Makhan
Bela
2 93 44
Rohillanwal
i
2 100 27
Shah Jamali 2 100 44
2 Kot Addu Ali Wala 1 100 29
Musay
Wala
1 67 13
Shuhrat
Wala
2 100 40
Basti Drigh 3 100 52
3 Alipur Muradpur
Pull
2 100 31
Basti
Nukray
3 100 52
Basti Jat
Lashari
2 100 41
Data are means of five replicates
Table 2.15: Mean mango decline incidence, severity and disease index in different
locations of district Rahim Yar Khan.
Sr.
No.
Tehsil Location Mean Disease
Severity (0-5)
Mean
Disease
Incidence
(%)
Disease
Index (%)
1 Rahim Yar
Khan
Taranda
Muhammad
Panah
2 100 32
Wahi Shah
Muhammad
3 100 52
Mianwali
Qureshian
2 100 32
2 Sadiqabad Ahmad Pur
Lumma
2 100 41
3 Khan Pur Chak 2P 2 100 48
Chak 3 P 2 100 44
4 Liaqat Pur Chak 22 A 2 100 45
Chak 23 A 2 100 49
Islam Nagar 2 100 48
Data are means of five replicates

75
Table 2.16: Mean mango decline incidence, severity and disease index in different
locations of district Bahawalpur.
Sr. No. Tehsil Location Mean Disease
Severity (0-5)
Mean
Disease
Incidence
(%)
Disease
Index (%)
1 Bahawalpur Khanqah
Sharif
3 93 53 Chak 13 BC 3 100 52
Chak 23 BC 4 100 76 Nowshera 2 100 49
Munshi
Wala
3 100 57
2 Ahmed Pur
East
Channi
Goth
2 100 32
Mehrab
Wala
3 100 60
Muhabbat
Pur
2 100 48
Basti
Khokhran,
2 100 45
Basti
Johnan
3 100 61
Data are mean of five replicates.
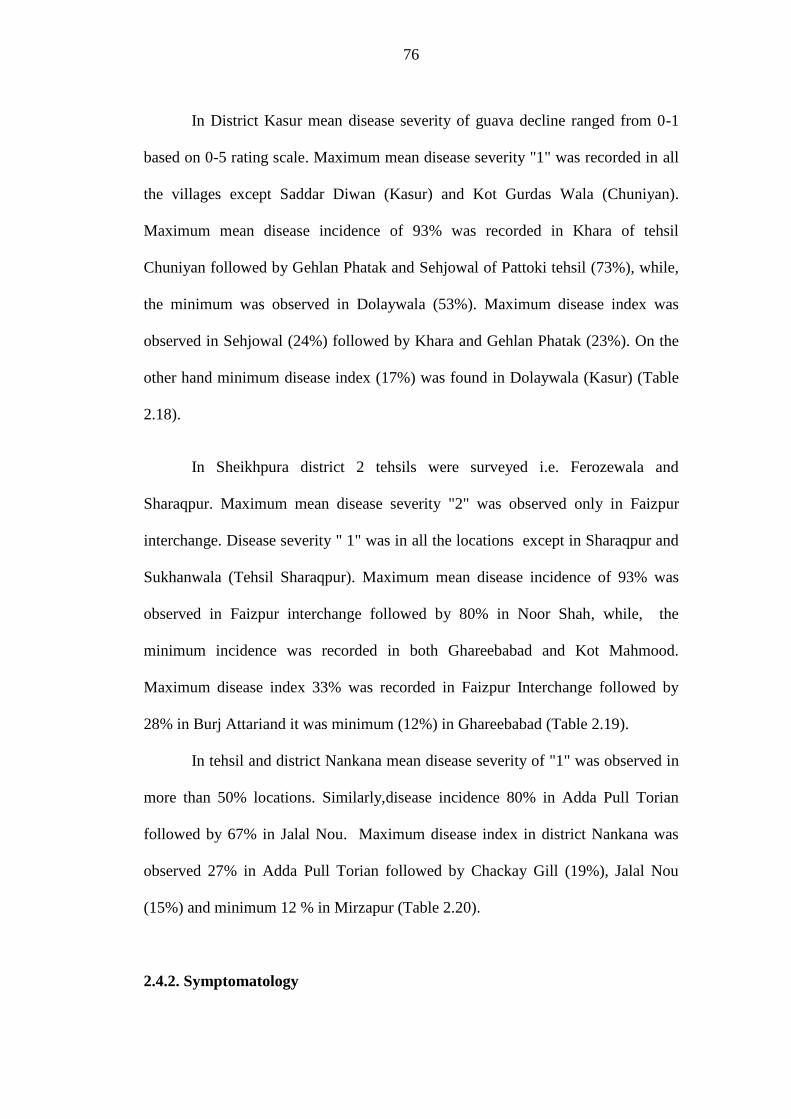
76
In District Kasur mean disease severity of guava decline ranged from 0-1
based on 0-5 rating scale. Maximum mean disease severity "1" was recorded in all
the villages except Saddar Diwan (Kasur) and Kot Gurdas Wala (Chuniyan).
Maximum mean disease incidence of 93% was recorded in Khara of tehsil
Chuniyan followed by Gehlan Phatak and Sehjowal of Pattoki tehsil (73%), while,
the minimum was observed in Dolaywala (53%). Maximum disease index was
observed in Sehjowal (24%) followed by Khara and Gehlan Phatak (23%). On the
other hand minimum disease index (17%) was found in Dolaywala (Kasur) (Table
2.18).
In Sheikhpura district 2 tehsils were surveyed i.e. Ferozewala and
Sharaqpur. Maximum mean disease severity "2" was observed only in Faizpur
interchange. Disease severity " 1" was in all the locations except in Sharaqpur and
Sukhanwala (Tehsil Sharaqpur). Maximum mean disease incidence of 93% was
observed in Faizpur interchange followed by 80% in Noor Shah, while, the
minimum incidence was recorded in both Ghareebabad and Kot Mahmood.
Maximum disease index 33% was recorded in Faizpur Interchange followed by
28% in Burj Attariand it was minimum (12%) in Ghareebabad (Table 2.19).
In tehsil and district Nankana mean disease severity of "1" was observed in
more than 50% locations. Similarly,disease incidence 80% in Adda Pull Torian
followed by 67% in Jalal Nou. Maximum disease index in district Nankana was
observed 27% in Adda Pull Torian followed by Chackay Gill (19%), Jalal Nou
(15%) and minimum 12 % in Mirzapur (Table 2.20).
2.4.2. Symptomatology

77
The symptoms development percentageswere calculated by randomly
selecting 50 trees of each citrus, mango and guava. According to Table 2.21,
recorded data showed that dieback was maximum (42%) in guava followed by 38%
in citrus and minimum (28%) in mango trees. Bark splitting was shown to be
maximum by mango (38%), while, in citrus and guava bark splitting trees were
30% and 16% respectively. Maximum gummosis was recorded in 48%mango trees,
followed by 42% in citrus and minimum 32% in guava. Cankers were observed in
36% citrus trees (maximum), while in mango and guava it was 20% and 10%
respectively. Thirty percent (30%) mango trees showed stem bleeding followed by
28% in citrus and 8% in guava trees. Maximum mortality (8%) was observed in
mango, followed by (4%) guava and 3% citrus trees (Table 4.5). It was noted that
the similar symptoms observed in citrus, mango and guava included twigs dieback
(Fig. 2.10), bark splitting and gummosis (Fig.2.11, 2.14and 2.17), canker
development (Fig. 2.12, 2.2.15 (b) and 2.18. Finally, the mortality of decline
affected trees occur (Fig. 2.13, 2.16 and 2.19).
The results show that all citrus, mango and guava tree showed somewhat
similar symptoms with greater or lesser extent. These symptoms may appear either
due to similar predisposing factors or due to the common pathogens. However,
bark splitting in citrus, mango and guava trees happen differently, this is may be
due to their wood structure, physiology or the varietal character. Moreover, sudden
death is found less in citrus and guava as compared to mango. Dieback symptoms
have been most common among target commodities. Similarly canker development
can also be seen very commonly in all cases. Leaf drooping and drying but
remaining attached to trees was a common symptom in sudden death.
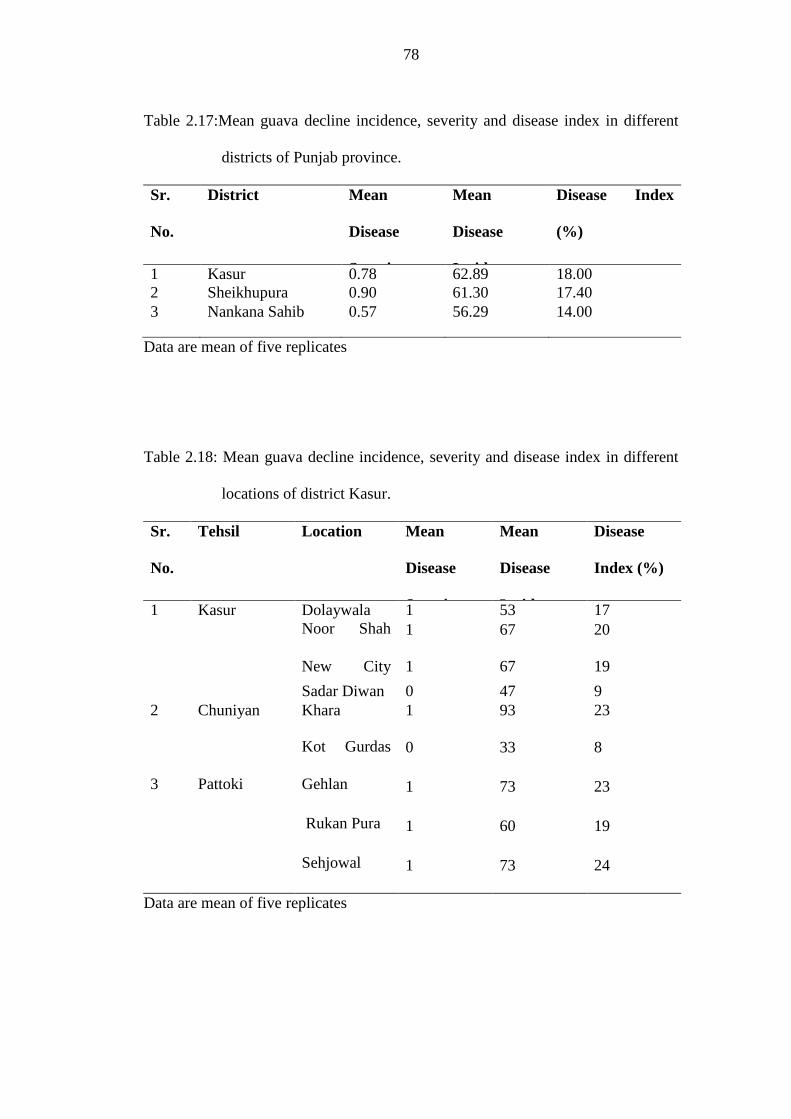
78
Table 2.17:Mean guava decline incidence, severity and disease index in different
districts of Punjab province.
Sr.
No.
District Mean
Disease
Severity
(0-5)
Mean
Disease
Incidence
(%)
Disease Index
(%)
1 Kasur 0.78 62.89 18.00
2 Sheikhupura 0.90 61.30 17.40
3 Nankana Sahib 0.57 56.29 14.00
Data are mean of five replicates
Table 2.18: Mean guava decline incidence, severity and disease index in different
locations of district Kasur.
Sr.
No.
Tehsil Location Mean
Disease
Severity
(0-5)
Severity (0-
5)
Mean
Disease
Incidence
(%)
Disease
Index (%)
1 Kasur
Dolaywala 1 53 17
Noor Shah
Wali
1 67 20
New City
Kasur
1 67 19
Sadar Diwan 0 47 9
2 Chuniyan
Khara 1 93 23
Kot Gurdas
Wala
0 33 8
3 Pattoki
Gehlan
Pathak
1 73 23
Rukan Pura 1 60 19
Sehjowal 1 73 24
Data are mean of five replicates

79
Table 2.19: Mean guava decline incidence, severity and disease index in different
location of district Sheikhupura.
Sr.
No.
Tehsil Location Mean
Disease
Severity
(0-5)
Severity (0-
5)
Mean
Disease
Incidence
(%)
Disease
Index (%)
1 Ferozewala Faizpur
interchange,
2 93 33
Adda Thabal 1 67 16
Noor Shah 1 80 17
Burj Attari 1 67 28
Saggian
Khurd
1 67 19
Thikriwala 1 60 17
2 Sharaqpur Sharaqpur 0 33 8
Ghareebabad 1 53 12
Sukhanwala 0 40 9
Kot
Mahmood
1 53 15
Data are mean of five replicates

80
Table 2.20: Mean guava decline, severity and disease index in different location of
district Nankana Sahib.
Sr.
No.
Tehsil Location Mean
Disease
Severity
(0-5)
Severity (0-
5)
Mean
Disease
Incidence
(%)
Disease
Index (%)
1 Nankana
Sahib
Jalal Nou
1 67 15
Giller Wala 0 47 9
Magtan Wala 0 40 8
Adda Pul
Torian
1 80 27
Chachkay
Gill
1 60 19
Mirza Pur 1 60 12
Mandi
Faziabad
0 40 8
Data are mean of five replicates

81
Fig.2.10: Twig dieback in citrus.
Fig.2.11: Bark Splitting and gummosis in citrus.

82
Fig.2.12: Canker development in citrus.
Fig.2.13:Citrus tree mortality.

83
Fig.2.14: Bark splitting and oozing of thick dark brown liquid in Mango.
Fig. 2.15 (a) Fig. 2.15 (b)
Fig.2.15 (a) and (b): Gummosis and stem canker in mango decline affected tree.

84
Fig.2.16: Mango Sudden death affected dead tree (MSD).
Fig. 2.17: Bark splitting and gummosis in decline affected guava tree.

85
Fig. 2.18: Tree canker in decline affected guava tree.
Fig. 2.19: Decline affected dead guava tree.

86
Table 2.21: Percentage of citrus, mango and guva trees showing various decline
symptoms.
Data are mean of 50 replicates
Orchards Die-
back
Bark
splitting
(% trees)
Gummosis
(% trees)
Canker
formation
(% trees)
Stem
bleeding
(% trees)
Complete
Mortality
(% trees)
Citrus
19/50
(38%)
15/50
(30%)
21/50
(42%)
18/50
(36%)
14/50
(28%)
3/50
(6%)
Mango
14/50
(28%)
19/50
(38%)
24/50
(48%)
10/50
(20%)
15/50
(30%)
4/50
(8%)
Guava
21/50
(42%)
8/50
(16%)
16/50
(32%)
5/50
(10%)
4/50
(8%)
2/50
(4%)

87
2.5. DISCUSSION
The overall results indicate disease havoc in citrus growing areas of
district Sargodha which is due to a number of biotic and abiotic factors. Most of the
scientists thought that it was CTV causing et al., 2009 and Arif et al., 2015). Others
thought that phytoplasma and bacteria are involved in citrus decline (Burney et al.,
2007). Some considered bacteria e.g. Xanthomonas compestris as the cause of
citrus decline. Fungal involvement in citrus decline was studied in Oman, Iran and
Pakistan. A list of fungi has been reported to cause decline symptoms. e.g.
Lasiodiplodia hormozganensis, L. theobromae, Fusarium solani, Phytophthora sp.,
Neoscytalidium dimidiatum and Nattrassia mangiferaebeing the most common
(Safdar etal., 2010).
Among abiotic stresses there are two categories which are related to soil i.e.
salinity, nutrient toxicity/ deficiency, compaction/ hardpan in subsurface and other
is irrigation problem including water logging and water stress (Ali et al., 2014).
The human manipulations regarding orchard management as well as intercropping
are aggravating decline problem in existing citrus growing areas. Most of the
orchards in Sargodha, Bhalwal and Shahpur had old citrus plantations with
intercropping of wheat, berseem and barley. Removal of deadwood and pruning are
not commonly practicedin these orchards which haveresulted in profused branching
of trees. However, better situation was found in terms of orchard management in
Kot Momin and Sillanwali tehsils.
In mango areas, maximum decline disease index of 53.30% was recorded in
district Bahawalpur. During survey the large overlapping trees have been observed
in this district. Most of the areas surveyed had more than 100 years old plantations.
88
The age of trees have been reported to have significant relationship with decline
symptoms (Khaskheli et al., 2011). The growers were not even aware of the
disease but they thought that senescens had been resulting in such symptoms of the
trees. Secondly mango orchards were not given importance by the growers rather
they were taking care of intercropped plants. The large farms were owned by the
absentee landlords who stayed abroad and left orchard management on their
attendants. These attendants strongly believed in traditional mango cultivation and
showed harshness towards the adoption of innovative technologies.
In case of guava, maximum disease index was found in Kasur (18%)
followed by Sheikhupura (17.40%) and minimum 14% in Tehsil Nankana. Kasur
being the nursery industry area is looking for guava trees in high density for sale
rather than better management to earn from the fruit. Most of the trees were not
grown in proper rows, rather overlapping with each other in such a way that all the
operations like sprays, pruning and machine operations were difficult. Improper
cuttings and non treatment of woundsresulted in guva decline. However, proper
guava cultivation has been observed in Sheikhupura with intercropping of wheat
and berseem. Ploughing inside the orchards increased tree infection by making
injuries. Nankana is comparatively low in disease as most of the platations were
with proper planning and better management strategy. The main reason for low
severity in Nankana Sahib District may bedue to a new cultivaing area for guava;
the trees are young and are planted in a systematic way.

89
Chapter 3
PREVALENCE OF NATTRASSIA SP. FROM CITRUS, MANGO
AND GUAVA ORCHARDS ALONG WITH OTHER DECLINE
CAUSING FUNGI
3.1. INTRODUCTION
Tree decline in citrus, mango and guava has been a hot issue in Pakistan
and some of the countries around the globe. Different researchers around the world
have reported different causes of these declining trees. Mostly described terms for
the decline factors are predisposing, inciting and contributing factors (Malik et al.,
2004; Safdar et al., 2010 and Safdar et al., 2015).
Predisposing factors are long term factors that change slowly such as soil,
site and climate. These affect tree's ability to respond to any kind of injury or
disease inducing agents. In case of citrus, mango and guava decline all of these
factors have a key role. The changing climate especially prevailing drought
conditions have tremendously affetced citrus, mango and guava cultivation as well
as other fruit, forest and ornamental trees. Similarly, sites also play important role
as the plantation near the roads or canals are mostly decline affected either because
of hard soil pans, road or canal widening and other human interventions which
cause the root injury of the trees and result in the decline symptoms. Saline and
saturated soils are other predisposing factors which create hindrance in the orchard
management. Salinization of soil and water is an important factor for increased
desertification in arid and semi-arid regions of the world (Szabolcs, 1992). About
6.3 million hectares of arable land in Pakistan is affected to varying degrees of
salinity/sodicity.
64

90
Inciting factors are of short duration and appear in biological or
physiological form. They generally produce dieback symptoms or we can say they
are just starter of the disease. These might be twig dieback causing fungi, insects,
phytoplasma, late spring frost, drought and salt spray (Burney et al., 2007).
The role of contributing factors starts after inciting factors which further
weaken the plants and ultimately moratlity occurs. These include pathogenic fungi,
vectors (in case of decline the bark beetle), canker causing fungi, bacteria, viruses
and phytoplasma etc (Kazmi et al., 2005).
The most important pathogens worked out among other contributing biotic
and abiotic factors causing tree decline are the fungi. Maximum fungi have been
isolated from the roots of decline affected citrus trees. The isolated fungi were
Nattrassia mangiferae, Fusarium sp., Alternaria sp. and Aspergillus sp. from the
area of Sargodha, Bhalwal, Kot Momin, Sillanwali and Toba Tek Singh areas of
the Punjab province (Khan et al., 2012; Ali et al., 2014). Several fungi isolated
from decline affected mango trees include Ceratocystis fimbriata, Lasiodiplodia
theobromae, Fusarium sp., Nattrassia mangiferae, Phomopsis sp. (Kazmi et al.,
2005; Fateh et al., 2006 and Masood et al., 2010). Fungi associated with guava
decline include Fusarium sp., Nattrassia mangiferae, Macrophomina sp.,
Cephalosporium sp., Alternaria sp., Pythium sp., Verticillium sp., Trichthecium sp.
(Mirzae, 2003; Miskita et al., 2005).
It is hypothesized that sometimes these fungi individually or sometimes
with the interaction of more than one fungi result in the appearance of decline
symptoms. These different fungi are found in different profiles or parts of the
decline affected trees. The fungus N. mangiferae have a wide host arrange around

91
the globe and has covered field crops, ornamental, forest and fruit trees. However,
in Pakistan, the fungus was not studied thoroughly on systematic basis. Hence, the
present study was conducted to determine the frequency of Nattrassia
mangiferaealong with other mycoflora associated with decline of citrus, mango and
guava and to find out common mycoflora in different plant parts of the affected
trees so that a common management may be devised for decline of all fruit crops.
3.2. REVIEW OF LITERATURE
Lonsdale (1992) reported that Nattrassia mangiferae was found to be an
important pathogen of mango in South Africa. It was found to be the cause of
blossom blight. Initial symptoms of the disease were sudden wilt followed by rapid
dying and drying out of inflorescences. In the later stages of the disease, side axes
and individual flowers dropped, fruitlets shriveling up and turned black and also
dropped. Other fungi such as Alternaria alternata and Colletotrichum
gloeosporioides did not cause blight, but instead, induced small, dark necrotic spots
(lesions) on the inflorescences.
In North America, eucalyptus dieback for the first time was reported in
1994 caused by the fungus N. magniferae. Dieback symptoms were observed in
branches; rifting between the phloem and the xylem. During summer cankers and
exuding gum were also observed on Eucalyptus camaldulensis Dehnh. trees in
southwestern Arizona. N. mangiferae was the dominant fungus which has been
consistently isolated from the affected branches (Michael, 1994).
In south-eastern Iran, the fungus N. mangiferae was reported from guava
and Ficus religiosa, causing branch die-back. The pathogenicity was confirmed
through Koch's postulates. This pathogen repported for the first time in 2000 in

92
Iran and has been a threat to Irani citrus and guava industry since then (Mirzaee et
al., 2003).
Decline of Pacific Madrone has been a popular disease caused by N.
mangiferae inducing cankers on stem and blight of shoots. Due to attack by N.
mangiferae trees were weakened and opportunistic fungi like Fusicoccum aesculii
nvaded stressed trees. These two pathogens were also reported on declining
Madrone trees in Washington, USA but N. mangiferae was the most prominent and
primary pathogen (Elliott and Robert, 2002).
Further studies on the fungus N. mangiferae causing canker of Pacific
madrone were based on morphological and molecular methods. The asexual spores
confirm the pathogen, however, sequencing of the ITS region of the ribosomal
rDNA of sexual state had linkages with genus Botryosphaeria. The fungus showed
resemblance to Fusicoccum anamorphs, closely related Botryosphaeria species and
has a similar pathology (Elliott and Robert, 2003).
Msikita (2005) isolated the fungus N. mangiferae from cassava causing root
rot in Bénin and West Africa. The pathogenicity was confirmed on different
cultivars of cassava, showing fungal lesions, while control plants remained
symptom free. Other pathogens causing root rot included Macrophomina
phaseolina, Fusarium sp. B. theobromae and Pythium sp.
David et al. (2005) reported that pacific Madrone had been facing decline
for thirty years. It was reported that fungus causing decline has been present in
western North America since 1968. Prior to this research, plant pathologists had
misidentified the causal fungus, which is now known to be N. mangiferae.

93
Jayasinghe and Silva (2007) for the first time reported N. mangiferae
causing foot canker of Hevea seedlings. One of the predisposing factors for the foot
canker was sun-scorch and hence it must be considered in other declining trees as
well where N. mangiferae is isolated.
3.3.MATERIALS AND METHODS
3.3.1. Sampling Methodology
During survey of citrus mango and guava orchards, samples were taken
from the twigs, branches, stem at collar region, bark and the roots of decline
affected trees. The samples were taken from randomly selected villages keeping in
mind the maxiumum orchards present in the areas. For citrus samples were
collected from samples 26 NB, 8NB and 10NB from tehsil Bhalwal of district
Sargodha. Similarly in tehsil and district Sargodha, samples were taken from 56
NB, 112 NB and 27 SB villages.
In mango growing areas the samples for isolation were taken from Nandla,
Chah Nizam Wala and Basti Band Bosan in district Multan while, in district Rahim
Yar Khan samples were taken from villages of Chak 22A (tehsil Liaqatpur), Chak
2P (tehsil Khan Pur) and Mianwali Qureshian.
To know the fungal frequencies in guava decline orchards, the samples
were taken from Sehjowal, tehsil Pattoki of district Kasur, Faizpur (tehsil
Ferozewala of district Sheikhupura) and Adda Pul Torian(tehsil and district
Nankana Sahib).
The samples were used for the isolation, identification and further
pathogenicity studies. The sample pieces were cut with sterilized sharp tool and
kept in paper bags which after proper labeling were placed in the shopping bags to

94
avoid moisture loss.
3.3.2. Isolation and Identification of Pathogens
All the diseased samples of mango, citrus and guava were brought to
Mango Pathological Lab. at National Agricultural Research Centre, Islamabad and
the isolations were made aseptically in the laminar flow chamber placed in
isolation room. All glassware and media were sterilized by autoclaving at 121oC at
15 Psi for 20 min. For the isolation of fungi Potato Dextrose Agar (PDA), Malt
Extract Agar (MEA) and Stem Decoction Glucose Agar (SDGA) media were used.
Recipe of the media used is given below.
3.3.2.1.Potato dextrose agar medium (PDA)
For making Potato Dextrose Agar (PDA) medium a readymade mixture of
the chemical company BDH was used
Potato Dextrose Agar = 39 g
Sterilized Distilled water = to make volume up to 1000 ml
Medium was made homogeneous by heating in a microwave oven for 3
minutes in half filled 1000 ml flasks, air tightened with cotton plug and later
sterilized by autoclaving at 121oC at 15 Psi for 20 minutes.
3.3.2.2.Malt extract agar (MEA)
This medium was prepared by mixing following ingredients:
Malt Extract= 20 g
Agar= 20 g
Distilled water= to make volume up to 1000 ml
3.3.2.3. Stem decoction glucose agar (SDGA)
Citrus/mango/guava stem pieces = 200 g
95
Agar= 20 g
Glucose=20 g
Distilled water= to make volume up to 1000 ml
The respective stem pieces of citrus, mango and guava were boiled in 1000
ml water for 10 min. cooled down and then again boiled so that half of the volume
is left. Concentrated water sieved through muslin cloth in beaker and more water
was added to make the volume up to 1 L before adding other ingredients.
3.3.2.4. Sterilization
The media were sterilized in autoclave at 121oC and 15 PSi. All glassware
including flasks, petriplates and other inoculation equipment was also sterilized in
the autoclave.
3.3.2.5. Isolation from infected tissues
All the infected tissue samples were cut into small pieces and disinfested by
rinsing into 1 % sodium hypochlorite for 1 min. followed by washing thrice with
sterilized distilled water. The washed pieces were dried on filter papers to remove
excessive moisture and aseptically placed in the 90 mm petridishes containing
either PDA or MEA medium. The plates were wrapped with parafilm to avoid
moisture loss and contamination and incubated 25oC ±.
3.3.3. Microscopy
Slides were prepared by taking a minute portion of fungal colony from the
growing margin with the help of inoculating needle and identified by viewing
under the Labomed Florescent Microscope made in USA microscope,using the
magnifications of X100, X200, X400 and X1000. Isolated fungi were identified on
the basis of their colony characteristics, conidial morphology, ascospores, pycnidia,
96
pericthecia etc. The identification was based on key used by Fateh et al., 2010 and
Domsch et al., 1980.
3.3.4. Determination of Fungal Frequency %age
The fungal frequency was determined using the following formula for
tissue inoculation:
Fungal frequency (%) =Number of colonies of a particular fungus × 100
Total no. of colonies of all fungi in 90 mm petridish
3.3.5. Purification of Fungal Cultures
Cultures of individual fungi were purified using single spore technique. The
spores were observed through Olympus stereoscope and were picked with the help
of very thin wire inoculating needle and placed in 90 mm petridish containing
PDA. The pure cultures were preserved in mineral oil for further studies.
3.4. RESULTS
3.4.1. Plant Parts Wise Fungal Frequency %age
The plant parts wise % frequency of different fungi associated with
declining trees is given below.
3.4.1.1. Mycoflora from citrus decline affected trees
Six fungi (Nattrassia mangiferae, Fusarium sp., Botryodiplodia
theobromae, Alternaria sp., and Phytophthora sp.) were isolated from different
parts (twigs, branches, bark, stem at collar region and roots) of affected samples of
citrus trees from randomly selected villages. In Chak No. 26 NB of tehsil Bhalwal
of district SargodhaN. mangiferae was found at maximum frequency (40%) in the
bark of tree followed by 22% in stem at collar region, 7% on branches and only 3%
frequency was observed from the root samples. Fusarium sp. frequency was
maximum (12%) from both branches as well as stem at collar region followed by

97
11% from both twigs and roots. However no Fusarium sp. colony appeared from
bark samples. Botryosphaeria sp. was isolated in maximum frequency (39%) twigs,
27% from branches and minimum of 17% from bark. But it was absent in other
plant parts. Lasiodiplodia theobromae frequency was maximum from branch
samples (34%), from stem at collar region 27 %, from twigs 24%, 12 % from bark
and only 2% from roots. Alternaria was mostly found in twigs(14%), 4% from
branch samples, 12% from bark and of minimum 6% from the roots. However, the
fungus Phytophthora sp. (12%) was only recovered from roots (Fig.3.1). Almost
similar trends were observed from other randomly selected villages i.e. Chak 8 NB,
Chak 10 NB, Chak 56 NB, Chak 112 NB and Chak 27 SB as shown in Fig.3.2, 3.3,
3.4, 3.5 and 3.6 respectively.
3.4.1.2. Mycoflora from mango decline affected trees
From mango decline affected trees, samples were taken from six randomly
selected villages (Basti Nandla, Chah Nizam Wala, and Basti Ban Bosan of district
Multan and Chak 22 A, Chak 2 P and Mianwali Qureshian of district Rahim Yar
Khan). From the infected trees, six fungi were found associated with different plant
parts in varying frequencies. These fungi associted with declining mango trees
were N. mangiferae, Fusarium sp., Ceratocystis fimbriata, Lasiodiplodia
theobromae, Alternaria alternata and Phytophthora species. The plant wise
percentage frequencies of these fungi are given in Fig.3.7, 3.8, 3.9, 3.10, 3.11 and
3.12.
3.4.1.3 Mycoflora from guava decline affectedtrees
Similarly from decline affected guava trees sampling was done in in three
randomly selected locations situated in districts of Kasur, Sheikhpura and Nankana

98
Sahib. Six fungi viz. N. mangiferae, Fusarium sp, Botryosphaeria sp, L.
theobromae, Alternaria alternata and Phytophthora sp. were isolated.
The percentage frequencies of different fungi isolated from different plant
parts of decline affected guava trees from Sehjowal (Tehsil Pattoki of district
Kasur) are given in Fig.3.13. N.mangiferae frequencywas maximum (14%) from
bark samples followed by branches (8%) and minimum7% from twig samples.
Fusarium sp. frequency was maximum from roots (13%)followed by 9 %
(branches) and minimum 5% from stem at collar region. The % frequency of
Botryosphaeria sp. was maximum (16%) from branches followed by 6% from twig
samples. Lasiodiplodia theobromae frequency was maximum (27%) from stem at
collar region followed by branches (15%), twigs (12%) and minimum 3% from
bark samples. Likewise, Alternaria sp. frequency maximum (12%) was found from
all branches, barks and stem at collar region and minimum 11% from root samples.
The fungus Phytophthora sp. was only recovered from roots (4%).
The percentage frequencies of these six fungi from other two selected
locations more or less followed the similar trends and are given in Fig.3.14 and
3.15. The culture and conidia of some of these fungi are given in Fig. 3.16 (a and
b), 3.17 (a and b), 3.18 (a and b) and 3.19 (a and b).
Another important point was that in case of citrus and guava there was not
any record of Ceratocystis sp. which was solely isolated from mango. It does not
mean that it may not be found in citrus or guava but it may be present in some
stage of the same genera. The results conclude that the most common fungus found
in all types of decline is Nattrassia mangiferae.

99
Fig.3.1: Plant parts wise fungal frequency %age from decline affected citrus trees
at Chak No. 26/NB tehsil Bhalwal, Sargodha.
0
5
10
15
20
25
30
35
40
45
Twig
branches
Bark
Stem at collar region
Roots
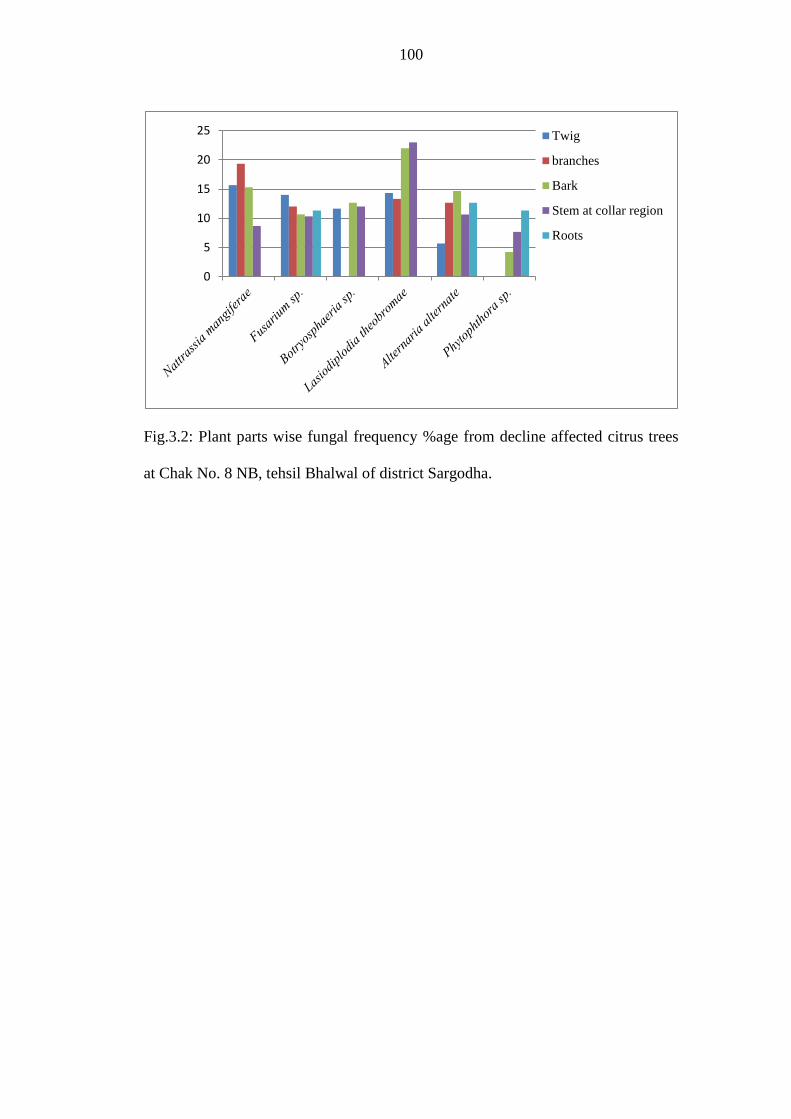
100
Fig.3.2: Plant parts wise fungal frequency %age from decline affected citrus trees
at Chak No. 8 NB, tehsil Bhalwal of district Sargodha.
0
5
10
15
20
25 Twig
branches
Bark
Stem at collar region
Roots

101
Fig.3.3: Plant parts wise fungal frequency %age from decline affected citrus trees
at Chak No. 10 N/B, tehsil Bhalwal of district Sargodha.
05
1015202530354045 Twig
branches
Bark
Stem at collar region
Roots

102
Fig.3.4: Plant Parts wise fungal frequency %age from decline affected citrus trees
at Chak No. 56/NB of tehsil and district Sargodha.
0
5
10
15
20
25
30
35
Twig
branches
Bark
Stem at collar region
Roots

103
Fig. 3.5: Plant parts wise fungal frequency %age from decline affected citrus trees
at Chak No. 112/NB of tehsil and district Sargodha.
0
5
10
15
20
25
30
35
40
45
Twig
branches
Bark
Stem at collar region
Roots

104
Fig.3.6. Plant parts wise fungal frequency %age from decline affected citrus trees
at Chak No. 27 SB of tehsil and district, Sargodha.
0
5
10
15
20
25
30
35Twig
branches
Bark
Stem at collar region
Roots

105
Fig.3.7: Plant parts wise fungal frequency %age from decline affected mango trees
in Basti Nandla, Multan.
0
5
10
15
20
25Twig
branches
Bark
Stem at collar region
Roots

106
Fig.3.8: Plant Parts wise fungal frequency %age from decline affected mango trees
in Chah Nizam Wala, Multan.
0
5
10
15
20
25
30 Twig
branches
Bark
Stem at collar region
Roots

107
Fig.3.9: Plant parts wise fungal frequency %age from decline affected mango trees
in Basti Band Bosan, Multan.
0
5
10
15
20
25 Twig
branches
Bark
Stem at collar region
Roots

108
Fig.3.10:Plant parts wise fungal frequency %age from decline affected mango trees
at Chak 22A, tehsil Liaqatpur of district Rahim Yar Khan.
0
5
10
15
20
25
30Twig
branches
Bark
Stem at collar
regionRoots

109
Fig.3.11: Plant parts wise fungal frequency %age from decline affected mango
trees at Chak 2P, tehsil Khanpur of district Rahim Yar Khan.
0
5
10
15
20
25
30
Twig
branches
Bark
Stem at collar region
Roots

110
Fig.3.12: Plant parts wise fungal frequency %age from decline affected mango
trees at Mianwali Qureshian, tehsil and district Rahim Yar Khan.
0
5
10
15
20
25
30
35 Twig
branches
Bark
Stem at collar region
Roots

111
Fig. 3.13: Plant parts wise fungal frequency %age from decline affected guava
trees at Sehjowal, tehsil Pattoki of district Kasur.
0
5
10
15
20
25
30 Twig
branches
Bark
Stem at collar region
Roots

112
Fig.3.14: Plant parts wise fungal frequency %age from decline affected guava trees
at Faizpur, tehsil Ferozewala of district Sharaqpur.
0
5
10
15
20
25
30
35Twig
branches
Bark
Stem at collar
region

113
Fig.3.15: Plant parts wise fungal frequency %age from decline affected guava trees
at Adda Pul Torian of tehsil and district Nankana Sahib.
0
5
10
15
20
25
30
35
40 Twig
branches
Bark
Stem at collarregion

114
Fig.3.16 (a)
Fig.3.16 (b)
Fig.3.16: (a) and (b) Culture and macrospores of Fusarium sp.

115
Fig.3.17 (a)
Fig.3.17 (b)
Fig.3.17: (a) and (b): Culture and conidia of Ceratocystis sp.

116
Fig.3.18 (a)
Fig.3.18 (b)
Fig.3.18: (a) and (b): Cultural and conidia of Lasiodiplodia theobromae.

117
Fig.3.19 (a)
Fig.3.19 (b)
Fig. 3.19: (a) and (b): Culture and spores of Nattrassia mangiferae.

118
3.5. DISCUSSION
A number of fungi have been isolated from different decline affected trees
and different plant parts. These include Botryodiplodia, Botryosphaeria, Nattrassia
mangiferae, Fusarium, Alternaria, Pythium, Phytophthora and Ceratocystis species
(Fateh et al., 2006; Kazmi et al., 2007; Fateh et al., 2016, 2017). These fungi have
been found infecting the trees singly or in combination (Anwar et al., 2012). It has
been observed that Botryodiplodia, Botryosphaeria and Nattrassia mangiferae
were mostly found in the twigs and branches of all affected trees. They may be the
cause of twig blight and branch die back in the affected trees (Safdar et al., 2015;
Mirzae et al., 2003; Atta and Aref, 2013). Another probable reason for their co-
existance is their common lineage (Crous and Palm, 2004). Nattrassia and
Botryodiplodia were also observed on the bark as well as on the inner side of the
bark where bark splitting occurred. Therefore, they might have an additional role in
bark splitting. Fusarium, Ceratocystis have been found in the vascular tissues of
the plants to stop the nutrients inflow and cause the wilting symptoms. However, it
is impotant to note that Ceratocystis was only found from the vascular tissues of
mango but it was not isolated from citrus and guava (Mirzaee et al., 2003; Miskita
et al., 2005; Fateh et al., 2006 and Masood et al., 2010;).
Maximum frequencies of N. mangiferae and B. theobromae recorded in the
present study agreed with those described by Giha, (1975); Farr et al. (2005) and
Fateh et al.(2016). It seems that infection by these two fungi has reached an
epidemic stage. This is much evident from the host range of these fungi.
Especially, the fungus N. mangiferae caused branch wilt of Banyan trees (Ficus
beneghalensis) Khartoum, Sudan (Giha, 1975); top dying and mortality of Gmelina

119
arborea in India (Harsh and Tiwari, 1992). The fungus had an endemic attack on
Eucalyptus camaldulensis and on citrus trees in Arizona (Sigler et al., 1997);
caused butt rot of Zanthoxylum bungeanum in China (Cao and Wang, 1989). N.
mangiferae invaded number of fruit trees including almond, peach, plum, guava
and forest trees like Eucalyptus sp., Populus sp. and Pinus sp. in Iraq (Al Zarrari et
al., 1979;Shawkat et al., 1979). The continuing victims of the fungus include
lemon trees (gummosis) in Lebanon (Hartmann and Niehaus, 1974) and bananas
(Tip rot) in Jamaica (Meredith, 1963; Jones and Stover, 2000). In USA, the canker
of Pacific madrone (Arbutus menziesii) (Davis and DeVay. 1975 and Far et al.,
2005) and foliar disease of strawberry trees (Arbutus unedo) in Europe
(Tsahouridou and Thanassoulopoulos, 2000) was also reported to be caused by the
fungus. In Africa it attacked cassava and white yam (Msikita et al., 1997) and the
most importantly the fungus has been reported to cause skin and nail diseases and
fungal keratitis in humans (Kindo et al., 2010). Being ubiquitous in distribution, it
is not sparing trees in Pakistan as well.Although the fungus has not been studied
frequently, yet few scientists have reported it on citrus, mango and guava (Fateh et
al., 2010; Anwar et al., 2012; Fateh et al., 2016, 2017)
The high frequencies of N. mangiferae in the tropical fruits such as mango
and guava are also due to the wide range of temperature these fungi can withstand.
For example Namsi et al.(2010) reported that N. mangiferae grew well within the
range of 20 to 40oC. Sehlar et al. (1997) and Mahmood et al. (2002) showed
similar results for the growth of B. theobomae.
Another important reason for high frequencies of these fungi is that in the
sampling area there were large overlapping trees. This affects the frequencies in
120
two ways: firstly, the large trees with overlapping branches are not the well
managed trees i.e. they do not receive proper pruing or protective spray regimes.
Thus the opportunistic fungi found their way through possible wounds due to
ploughing or other such cultural practices and invaded the trees without any danger
to their own survival (Mirzae et al., 2003). Secondly, the large trees are mostly old
age or senescence is itself a contributing factor in tree decline (Khaskheli et al.,
2011; Anwar et al., 2012).
In case of mango, Ceratocystis sp. is unique, as it was not found in both
citrus and guava decline affected orchards even though the sampling parts were
same for all target fruit trees. One reason can be the resistance of these plants
towards this fungus which is yet to be studied or they still did not come in touch
with the fungus and are safe. However, across the globe, the fungus Ceratocystis is
known to cause mango and many forest tree decline as well as decline in field
crops. The fungus for the first time was reported in Pakistan by Fateh et al. (2006)
during sampling in mango orchards of Sindh province. Later, the fungus has been
repeatedly reported by the relevant scientists in mango as well as shisham (Masood
et al., 2010; Safdar et al., 2012; Fatehet al., 2016). Like N. mangiferae and B.
theobromae, Ceratocystis genera also penetrate the plants through wounds and
establish itself in the xylem vessel, it clogs the xylem and the sap is collected in the
small pockets. These pockets later rupture and a thick dark color liquid oozes out
which is the characteristic of Ceratocystis sp. (Fateh et al., 2006;Al-Adawi et
al.,2006). Unlike other fungi, the fungus Ceratocystis likes low temperatures. Its
infection starts in the mid of October to the end of February which are mostly cool
121
months in Pakistan. Hence, its management is possible as October to January is
mostly the dormant period of mangoes in the country.
The present study was very significant to report the similar pathogens in
citrus, mango and guava decline as this will encourage, similar management pattern
for similar fungi in all trees. However, special care will be required in case of
mango in future that the deadly fungus Ceratocystis sp. may not enter other fruit
orchards from mango ones. This also provides a complete profile that which part of
the plant is occupied by which fungi and to devise management accordingly.
122
Chapter 4
ROLE OF NATTRASSIA MANGIFERAE AND OTHER
DECLINE CAUSING FUNGI IN SYMPTOMS DEVELOPMENT
4.1. INTRODUCTION
There are four major fungi, which have been consistently reported to cause
the tree decline in fruit trees, forest and other ornamental plants. These fungi
include Nattrassia mangiferae,Ceratocystis sp., Lasiodiplodia theobromae, and
Fusarium sp. The symptoms produced by the inoculation of these fungi alone or in
combination are dieback, gummosis, bark splitting, canker formation and mortality
of the tree (Kazmi et al., 2007; Fateh et al., 2006).
Different scientists used different methods for the confirmation of
pathogenicity of these fungi associated with decline (Khanzada et al., 2004; Urbez-
Torres et al., 2008; Masood et al., 2010). Some of the scientists used green house
potted plants and others used branches of the mature trees. In green house potted
plants the plugs from fresh cultures were inoculated through flap method, stem
injury method and root injury method. In case of mature trees, branches have been
artificially inoculated through flap methods (Mirzaee et al., 2003).
In Oman, citrus decline study was conducted by artificial inocultion of acid
lime and sweet lime seedlings of age six month to one year. The seedlings were
apparently healthy before inoculation. The procedure was done by making injury at
the base line of the seedlings and insertion of 5 mm mycelial plug in it that has
been taken from 5-6 day-old culture of the fungi grown on potato dextrose agar.
The plugs were wraped by moist cotton to avoid drying of the mycelium or culture.
Seedlings were placed in completely randomized design in a glasshouse under
25oC. The test was replicated 5 times and the symptoms were observed on
97

123
seedlings on weekly basis for 3-4 months for the development of gum, dieback or
death. Re-isolations were made to confirm the association Gof the inoculated fungi
with the observed symptoms. The isolations were done as explained previously
(Al-Sadi et al., 2010).
Similar studies have also been conducted on mango for C. fimbriata and L.
theobromaecausing mango decline. Individual as well as combine inoculation to
healthy mango seedling was done in five replications for each treatment under
completely randomized design (CRD) in a green house. For inoculation 5mm plug
of fungi growing on PDA was placed in slanting cuts under the bark with sterilized
scalpel and then covered with parafilm (Mullen et al., 1991). In case of control,
only agar slant without any fungal growth was used for insertion. The
pathogenicity was confirmed by re isolation of the inoculated fungi (Masood et al.,
2011).
To conduct the pathogenicity for guava decline, detached guava twigs were
used for inoculation of the fungi. A moist chamber was developed by placing a
blotter sheet on a plastic tray (50 × 40 × 7.5 cm). Twigs of 8‒10 cm length and
2‒3 cm thickness were cut from healthy branches, thouroughly washed twice with
distilled water, dried on sterilized blotting paper and re-sterilized with 2% sodium
hypochlorite. Twigs were injured with the help of a cork borer. Fungal disks from
the respective culture were placed in the holes made as well as uninjured sites of
twigs. The uninoculatedtwigs served as control. There were three replications with
five twigs per replication. The twigs in trays were incubated in a growth chamber at
28 ± 2°C. The observations were recorded regularly for symptoms or fungal lesion
development (Shah et al., 2010).

124
The evaluation of symptoms during pathogenicity has been reported in
many different ways. Some of the scientists evaluated by using different rating
scales, while others just described the symptoms produced. However, the
pathogenicity was confirmed after re-isolation of pathogens from artificially
inoculated symptomatic plants.
The aim of present study was to determine the role of Nattrassia sp. in
causing decline along with other fungi. Therefore, the pathogenicity of four
selected fungi was done individually and in combination which have been
associated with decline symptoms directly or indirectly. These fungi included
Nattrassia sp., Fusarium sp., Ceratocystis sp. and Botryodiplodia theobromae.
4.2. REVIEW OF LITERATURE
The fungal involvement in citrus decline was found in Oman. Among these
the most common were Lasiodiplodia hormozganensis, L. theobromae and
Fusarium solani. On artificial inoculation of these common fungi, acid lime and
sweet lime seedlings reproduced decline and gummosis symptoms. The nursery
studies on sweet lime showed association of 12 fungal species, which is an
evidence that nurseries act as a main source for some citrus pathogens (Al Sadi et
al., 2010).
Abbasher et al. (2013) reported that the fungus Nattrassia mangiferae
(Nattrass) is considered to be the pathogen of branch wilt of citrus, one of the most
hazardous diseases that spread in Wad Medani province, Gezira state, Sudan. The
survey for the prevalence of fungi isolated from the branch wilt disease samples in
Wad Medani area revealed that that there were 2 different isolates of N.

125
mangiferae. The 1st one was isolated from ficus (Ficus nitida) and the 2
nd was
isolated from lime (Citrus aurantifolia Swingle.).
A study was conducted to observe the synergistic effect of the fungus
Fusarium semitectum Berk & Rev. and a nematode Tylenchulus semipenetrans
Cobb. was determined singly and in combination on citrus. Maximum reduction in
leaves, root length, shoot length, fresh shoot weight, fresh root weight, stem
diameter and number of feeder roots were observed in the plants having combined
treatment of F. semitectum and T. semipenetrans. Thus, existence of synergistic
relationship between F. semitectum and T. semipenetrans in citrus decline was
confirmed (Safdar et al., 2013).
Masood et al., 2011 conducted a study to identify the association of
pathogenic fungi with mango quick decline tree and the bark beetle. From diseased
tree as well as from H. mangiferae, the most frequently isolated fungi were
Lasiodiplodia theobromae, Ceratocystis fimbriata and Phomopsis sp. The fungi
were re-isolated from artificially inoculated and symptomatic mango plants. After
six months of inoculations, disease symptoms i.e., wilting, oozing and black streaks
were developed which showed significant differences among all treatments.
Similar research was done in Oman as well on mango sudden decline.
Affected mango trees showed wilting that began on one side and later spread to
involve the entire tree. Trees exude amber-coloured gum from the bark of their
trunks or branches and vascular tissues are discoloured. It was found that vascular
wilt pathogen Ceratocystis fimbriata caused decline disease in combination
with Lasiodiplodia theobromae. Isolates of these fungi from affected trees, caused
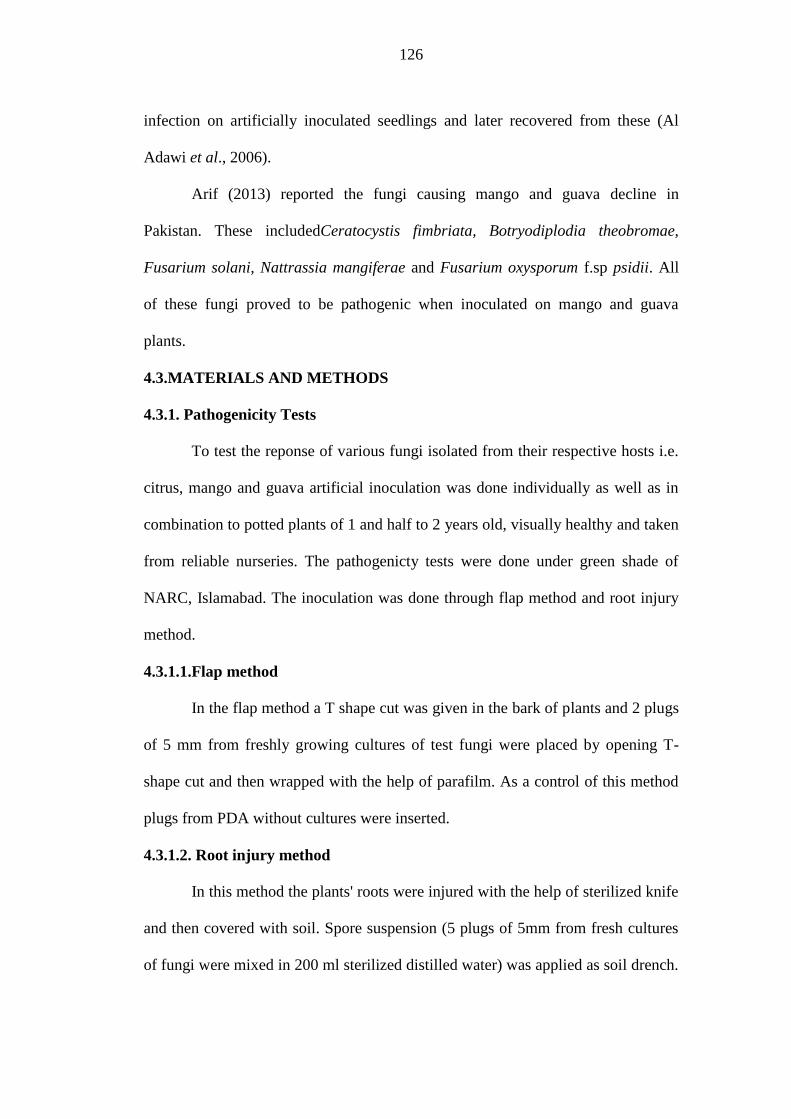
126
infection on artificially inoculated seedlings and later recovered from these (Al
Adawi et al., 2006).
Arif (2013) reported the fungi causing mango and guava decline in
Pakistan. These includedCeratocystis fimbriata, Botryodiplodia theobromae,
Fusarium solani, Nattrassia mangiferae and Fusarium oxysporum f.sp psidii. All
of these fungi proved to be pathogenic when inoculated on mango and guava
plants.
4.3.MATERIALS AND METHODS
4.3.1. Pathogenicity Tests
To test the reponse of various fungi isolated from their respective hosts i.e.
citrus, mango and guava artificial inoculation was done individually as well as in
combination to potted plants of 1 and half to 2 years old, visually healthy and taken
from reliable nurseries. The pathogenicty tests were done under green shade of
NARC, Islamabad. The inoculation was done through flap method and root injury
method.
4.3.1.1.Flap method
In the flap method a T shape cut was given in the bark of plants and 2 plugs
of 5 mm from freshly growing cultures of test fungi were placed by opening T-
shape cut and then wrapped with the help of parafilm. As a control of this method
plugs from PDA without cultures were inserted.
4.3.1.2. Root injury method
In this method the plants' roots were injured with the help of sterilized knife
and then covered with soil. Spore suspension (5 plugs of 5mm from fresh cultures
of fungi were mixed in 200 ml sterilized distilled water) was applied as soil drench.

127
In this method the spore suspension of each fungus was mixed and stirred well
before applying as soil drench.
The treatments for citrus in both flap and root injury methods were as
follows:
T1= N. mangiferae
T2= B. theobromae
T3= Nattrassia + B. theobromae
T4= 5 mm plug from PDA (Control)
The treatments for mango in both flap and root injury methods were as
follows:
T1= Ceratocystis sp.
T2= Nattrassia sp.
T3= Botryodiplodia theobromae
T4= Fusarium sp.
T5= Nattrassia + Ceratocystis
T6= Ceratocystis + B. theobromae
T7= Ceratocystis+ Fusarium
T8= Nattrassia+ B. theobromae
T9= Nattrassia + Fusarium
T10= B. theobromae+ Fusarium
T11= Nattrassia + Ceratocystis + B. Theobromae
T12= Nattrassia + Fusarium + B. Theobromae
T13= Nattrassia + Fusarium + Ceratocystis
T14= B. Theobromae + Fusarium + Ceratocystis

128
T15= Nattrassia + Ceratocystis + B. Theobromae + Fusarium
T16= 5 mm plug from PDA (Control)
The treatments for guava in both flap and root injury methods were as
follows:
T1= N. mangiferae
T2= B. theobromae
T3= Fusarium sp.
T4= Nattrassia + B. theobromae
T5= Nattrassia + Fusarium
T6= Fusarium + B. Theobromae
T7= Nattrassia +B. Theobromae + Fusarium
T8= 5 mm plug from PDA (Control)
Each of the above treatment was tested in triplicate and a range of
symptoms was observed on citrus, mango and guava seedlings over a period of two
months.
4.4.RESULTS
The inoculation results of different fungi by flap method (Fig.4.1) on 1 to 2
years citrus potted plants have been shown in the Table 4.1. The results indicate
that when Nattrassia sp. was inoculated alone (T1), bark splitting, stem canker and
gummosis appeared but the plants survived. On inoculation of Botryodiplodia
theobromae alone (T2), stem canker and gummosis was shown without mortality
of the plants. The combination of Nattrassia sp + Botryodiplodia theobromae (T3)
showed similar symptoms as N. mangiferae alone. The control plants (T4) without
inoculation of any fungi only produced minor gummosis.

129
The inoculation results of different fungi by root injury method (Fig.4.2)
through soil drenching the fungal spore suspension on citrus plants have been
shown in the Table 4.2.
It was observed when Nattrassia sp. was inoculated alone (T1), bark
splitting and gummosis were observed but plants survived. On inoculation of B.
theobromae alone (T2), showed only gummosis. The combination of N.
mangiferae+ B. theobromae (T3) also showed same results as N. mangiferae alone.
The control plants (T4) without inoculation of any fungi only produced gummosis.
Pathogenicity of different fungi on potted mango plants by flap method is
given in Table 4.3. The results indicated that T1, T5, T6, T7, T13, T14 and T15
produced all symptoms of decline i.e. leaf drooping, bark splitting, stem canker,
stem gummosis and the final mortality. In all of these cases Ceratocystis sp. was
either inoculated alone or in combination with other fungi. In case of other
treatments some of the decline symptoms were observed but no mortality was
recorded. However, in case of control plants only stem gummosis was seen that
may be due to the injury done for inoculation.
Mango plants in case of root injury inoculation method almost showed
similar results to that of flap method except, in case of Fusarium sp. inoculated
alone also caused mortality of seedling (Table 4.4).
Guava plants response to different fungal inoculations was same as that of
mango. Plants of T7 in both flap and root injury method showed all decline
symptoms and eventually died. Other treatments similar to mango showed some of
the decline symptoms but no mortility occured.

130
Table 4.1: Response of citrus plants against artificial inoculation of N. mangiferae
and B. theobromae using flap method.
Treatments Decline symptoms in citrus(flap method)
Leaf
drooping
Bark
splitting
Stem
canker
Stem
gummosis
Mortality
T1
N. mangiferae (Nm)
- + + + -
T2
B. theobromae (Bt)
- - + + -
T3
Nm + Bt
- + + + -
T4
Control
- - - + -
+ = Symptoms present ; - = Absent
Table 4.2: Response of citrus plants against artificial inoculation of N. mangiferae
and B. theobromae using root injury method.
Treatments Decline symptoms in citrus(Root injury)
Leaf
drooping
Bark
splitting
Stem
canker
Stem
gummosis
Mortality
T1
N. mangiferae (Nm)
- + - + -
T2
B. theobromae (Bt)
- - - + -
T3
Nm + Bt
- + - + -
T4
Control
+ - - + -
+ = Symptoms present ; - = Absent

131
Table 4.3: Response of mango plants against artificial inoculation of Caratocystis
sp., N. mangiferae, B. theobromae and Fusarium sp. using flap
method.
Treatments Decline symptoms in mango(flap method)
Leaf
drooping
Bark
splitting
Stem
canker
Stem
gummosis
Mortality
T1
Ceratocystis sp.(Cs) + + + + +
T2
N. mangiferae (Nm) - + - + -
T3
B. theobromae (Bt) - + + + -
T4
Fusarium sp. (Fu) + - + + -
T5
Nm + Cs + + + + +
T6
Cs + Bt + + + + +
T7
Cs + Fu + + + + +
T8
Nm + Bt - + + + -
T9
Nm + Fu - + + + -
T10
Bt + Fu - - + + +
T11
Nm + Cs + Bt - - - + -
T12
Nm + Fu + Bt + + + + -
T13
Nm + Fu + Cs + + + + +
T14
Bt + Fu + Cs + + + + +
T15
Nm + Bt + Cs + Fu + + + + +
T16
Control - - - + -
+ = Symptoms present ; - = Absent

132
Table 4.4: Response of mango plants against artificial inoculation of Caratotocystis
sp., N. mangiferae, B. theobromae and Fusarium sp. using root injury
method.
Treatments Decline symptoms in mango(root injury)
Leaf
drooping
Bark
splitting
Stem
canker
Stem
gummosis
Mortality
T1
Ceratocystis sp.(Cs) + + + + +
T2
N. mangiferae (Nm) - - - + -
T3
B. theobromae (Bt) - + - + -
T4
Fusarium sp. (Fu) + + + + +
T5
Nm + Cs + + + + +
T6
Cs + Bt + + + + +
T7
Cs + Fu + + + + +
T8
Nm + Bt - + + + -
T9
Nm + Fu + + + + -
T10
Bt + Fu + + + - +
T11
Nm + Cs + Bt + + + + +
T12
Nm + Fu + Bt - + + + -
T13
Nm + Fu + Cs + + + + +
T14
Bt + Fu + Cs + + + + +
T15
Nm + Bt + Cs + Fu + + + + +
T16
Control - - - + -
+ = Symptoms present ; - = Absent

133
Table 4.5: Pathogenicity of fungi associated with guava decline by using flap
method inoculation.
Treatments Decline symptoms in guava
(Flap method)
Leaf
drooping
Bark
splitting
Stem
canker
Stem
gummosis
Mortality
T1
N. mangiferae (Nm)
- + - + -
T2
B. theobromae (Bt)
- + + + -
T3
Fusarium sp. (Fu)
+ - + + -
T4
Nm + Bt
- + + + -
T5
Nm + Fu
+ + - - -
T6
Fu+ Bt
+ + + + -
T7
Nm + Bt + Fu
+ + + + +
T8
Control
- - - - -
+ = Symptoms present ; - = Absent

134
Table 4.6:Pathogenicity of fungi associated with guava decline by using root injury
method of inoculation.
Treatments Decline symptoms in guava(root injury)
Leaf
drooping
Bark
splitting
Stem
canker
Stem
gummosis
Mortality
T1
N. mangiferae (Nm)
- + - + -
T2
B. theobromae (Bt)
- + - + -
T3
Fusarium sp. (Fu)
+ - - + -
T4
Nm + Bt
- + + + -
T5
Nm + Fu
+ + - + -
T6
Fu+ Bt
+ + + + -
T7
Nm + Bt + Fu
+ + + + +
T8
Control
+ - - + -
+ = Symptoms present ; - = Absent

135
Fig.4.1: Flap method of inoculation.
Fig.4.2: Root injury method of inoculation.

136
The response of plants in all cases showed that Nattrassia alone cannot
cause the mortality of plants. However, in combination with other fungi it can
produce all the symptoms we observe in the decline affected trees of citrus mango
and guava. Moreover, the fungus Ceratocystis sp. has the ability to cause the
mortality of plants which is more common in case of mango.
4.5. DISCUSSION
The present study was done to evaluate the role of N. mangiferae incausing
decline among other popular fungi that has been repeatedly reported from various
declining trees. It was necessary to include those fungi in pathogenicity experiment
as various scientists reported the cause of decline differently, for example
Mahmood et al.(2002) reported that the cause of decline is B. theobromae. Similar
results were shown by Khanzada et al.(2005). However, Fateh et al. (2006); Al
Adawi et al. (2006) and Masood et al. (2010) reported the cause of the disease was
Ceratocystis sp. Similar results were also reported for citrus and guava decline,
where the role of B. theobromae and Fusarium sp. were given more importance
than other fungi (Safdar et al., 2015; Bokhari et al., 2008). There was another
school of thought who has reported that in case of guava decline, there is an
association of Fusarium sp. and Meloidogyne sp. (Gomes et al., 2012).
The similar behavior of N. magiferae and B. theobromae upon individual
inoculation for producing symptoms irrespective of the hosts once again confirms
that they inherit a common lineage as discussed in Chapter 3. It is important to
discuss here that most of these fungi are endophytic. Endophytic fungi live
symbiotically with the majority of plants by entering their cells (Hirsch and Braun,
137
1992) and are utilized as an indirect defence against herbivores. This means that
probably when the fungus is alone within a plant, it plays its symbiotic part, but
when combined with other fungi it becomes aggressive and damages plants. In the
present study, individual fungi except Ceratocystis were not able to produce
mortality at all. However, the combinations of these fungi caused mortality in the
green house potted plants; these results are in agreement with those of Fateh et
al.(2006); Al Adawi et al.,
(2006); Masoodet al. (2010) and Fateh et al. (2016).
Among the two methods used for pathogenicity, root injury was the most
effective for infection development and causing the mortality of plants. This also
confirms the findings that the decline causing fungi and in particular the
Ceratocystis sp. when enter the plants through wounds during cultural practices
such as plowing, hoeing and weeding, invade roots, move to xylem part where they
block the intake of water and nutrient inflow. Thus, cause permanent wilting or
mortality of the tree (Fateh et al., 2006; Al Adawi et al., 2006; Kazmi et al, 2007;
Masood et al., 2010 and Fateh et al., 2016). This also suggests that when some
screening studies are planned especially for varietal resistance against Ceratocystis
sp. or other decline causing fungi, the root injury method should be adopted.
The fungus Fusarium sp. in case of mango has been able to cause mortality
but in only one case when it was inoculated through root injury method. This once
again strengthens the statement that the root injury method of inoculation was the
most effective to cause disease which enabled Fusarium as well to cause mortality.
In case of guava the death caused by Fusarium was already reported by Pandey and
Dwivedi (1985).

138
The fungus N. mangiferae in field conditions enters the plants through
wounds not only from the branches through bark cracks but also through stem and
injured roots. This fungus in the presence of other fungi such as Fusarium sp., B.
theobromae, Ceratocystis sp. plays an equal role for creating a situation where the
plants normal functioning is disturbed in target fruits i.e. mango, citrus and guava
as reported by Safdar et al.(2015) and Fateh et al. (2016).
139
Chapter 5
SOME PHYSIOLOGICAL STUDIES OF FUNGI ASSOCIATED
WITH DECLINE
5.1. INTRODUCTION
Basic knowledge about the pathogen, its survival, spread and other related
aspects are very important for the better management of any disease. Physiological
studies include the study of factors that contribute towards the physiological
development of the fungi. These factors can be different sources of carbon and
nitrogen by using different culture media to observe the best growth on a particular
medium (Walker and White, 2005).
It is a known fact that physiological development offungi is largely affected
by environmental factors such as temperature, light and pH. Most of the time these
studies are the part of epidemiology and are conducted in vitro (Charlie and
Watkinson, 1995).
The factors that influence physiological development of fungi include the
optimum ranges of temperature, light, pH and carbon sources that can either favour
or inhibit the growth of fungi. Therefore, these studies lead to develop the
management strategies for different diseases (Hubbali et al., 2010).
As the effects of these physiological factors have not been studied on
decline inciting fungi in Pakistan. Therefore, the present studies were conducted to
assess the effects of different physiological factors on the growth of the fungi
isolated from citrus, mango and guava with special emphasis on N. mangiferae.
5.2. REVIEW OF LITERATURE
Physiological studies have been done on decline causing fungi on several
114

140
different hosts. For example Lasiodiplodia theobromae, causing decline of
common tea (Camellia sinensis) does not sporulate or poorly sporulates on potato
dextrose agar (PDA). Therefore, a study was planned to determine the effects of
culture media, carbon source, nitrogen source, temperature, pH and light on
mycelial growth and sporulation. Among several carbon sources tested, glucose
and sucrose were found superior for growth. The addition of tea root extract to
potato dextrose agar medium was found to be the most suitable for mycelial growth
and sporulation of L. theobromae. It was found that the fungus grew at
temperatures ranging from 20 to 36 oC, with optimum growth at 28
oC and no
growth was noted at 40 oC. There was no significant effect of different light periods
on growth of L. theobromae, however, light enhanced sporulation. The fungus
grew at pH 3.0-8.0 and optimum growth was observed at pH 6.0. Tea root extract
supplemented potato dextrose agar medium with pH 6.0 was the most suitable for
production of conidia of L. theobromae at 28 oC (Saha et al., 2008).
However, Kausar et al. (2009) reported that Optimum temperature for both
Fusarium solani and Lasiodiplodia theobromae fungi was 25 ºC. They found that
continuous light supported growth more as compared to darkness (for 24 hours)
and 12 hours light plus 12 hours darkness for the growth of fungi. Among two
media tested for both fungi, grew maximum on Poatao Dextrose Agar (PDA)
medium but least grew on the water agar (WA) medium.
According to Alam et al. (2001) Botryodiplodia theobromae grew and
sporulated well at 15-40°C, but optimum between 25-30oC. Among culture media
PDA showed maximum mycelial growth and sporulation. However, no growth was
observed at 10 and 45°C.

141
Similarly,Ceratocystis fimbriata is a decline cauing pomegranate decline,
grew well in all most all pH ranging from 2.0 to 11.0. It indicates that the fungus
can survive in all soil types and locations. Maximum growth has been recorded at a
pH of 7.5 with no significant difference with that on pH 7 and 8. The fungal growth
was inhibited below pH 5.5 and above pH 9.0. Lowest growth was observed at pH
2.0. The maximum growth of the fungus was observed at a temperature of 30oC
and failed to grow at 45oC (Sonyal el al., 2015). However, the best growth from
other hosts has been obtained at 25oC. This shows that the fungus when isolated
from different hosts can behave differently.
Fusarium oxysporum f. sp. psidii and F. solani, cause wilt in guava and are
highly variable pathogens. Physiological studies of the fungi revealed that
maximum mycelial growth was obtained on PDA followed by ME broth as liquid
medium. Maximum sporulation was recorded in oatmeal agar (OMA). The
optimum temperature and pH for growth of Fusarium sp. was 28oC and 5.5
respectively. The isolates had differences in their colony growth, mycelial mass,
macro-conidia, and micro-conidia produced. These variations were characters of
each of the isolates with respect to cultural and physiological characters (Gupta et
al., 2010).
Dring a field study on cashew diseases three fungal generaLasiodiplodia,
Fusarium and Pestalotiafound were cultured on Potato Dextrose Agar medium.
The optimum temperature for the growth of Fusarium was 250C while all the
temperature treatments 20oC, 25
oC and 30
oC were found suitable for the growth of
Lasiodiplodia and Pestalotia. Moreover, alternating 12 hours light and12 hours
darkness was more suitable for the growth of Fusarium than continuous darkness.

142
The growth of both Lasiodiplodia and Pestalotia were not affected by the light
condition.
5.3. MATERIALS AND METHODS
5.3.1.Effect of Temperature, Light, pH and Culture Media on Fungal Growth
The effect of culture media, temperature, light and pH was observed on
mycelial growth of fungi including Nattrassia mangiferae, Ceratocystis sp.,
Botryodiplodia theobromae and Fusarium sp. in 90 mm petridish. The study was
done to have the basic information of suitable temperature, growth medium, pH
and sensitivity to alternate light and dark periods. For this purpose the temperature
ranges used were, 20oC, 22
oC, 25
oC and 28
oC, the pH ranges 5.5, 6.0 and 6.5.
Light and dark periods of 12 hrs respectively and complete 24 hours of continuous
light and continuous dark. The culture media tested were MEA, PDA and SDGAM.
In all cases other than target variable tested all conditions were kept constant. The
radial growth was measured by the ruler from the central point of inoculation at the
back of 90 mm Petri dish containing culture. Four observations were taken from
around and the average was calculated.
5.3.1.1. Effect of culture media.
Four culture media i.e. Potato Dextrose Agar (PDA), Malt Extract Agar
(MEA), Stem Decoction Glucose Agar (SDGA) and Carrot Juice Agar (CJA) were
evaluated to find out the most suitable one for the growth of the fungi. Each culture
medium was prepared in 1 L of water and autoclaved at 121 oC at 15 psi for 20
min. These were cooled to 45 oC and then poured in 90 mm Petri dishes for
solidification. A plug of 5 mm was taken from freshly growing culture of each of
the fungi was taken and inoculated to plates containing above mentioned media.

143
The plates were observed for mycelial growth everyday and on 7th day the final
reading was taken. The experiment was done in triplicate.
5.3.1.2. Effect of temperature
As mentioned above 5 mm culture plugs were taken by sterilized cork borer
from advancing margin of freshly growing target fungal cultures and inoculated on
PDA containing 90 mm petridishes. The incubation was done on PDA at 20oC, 22
oC, 25
oC and 28
oC for 7 days till the final reading was taken for radial mycelial
growth measurement. The experiment was done in triplicate.
5.3.1.3. Effect of light
For the effect of light and darkness on mycelial growth of isolated fungi, 5
mm culture discs were cut with sterilized cork borer from advancing margins of the
colonies of isolated fungi and inoculated on PDA plates separately for seven days.
To create condition of darkness carbon paper was used to wrap the petridishes.
Another set of petridishes of fungal culture was without wrap. All petridishes were
incubated at 25+1oC in triplicates and alternating light and darkness (12 hours light
plus 12 hours darkness) and complete darkness (24 hours) was provided to record
the effects in terms of mycelial growth. The mycelial growth in mm was recorded
on 7th day of inoculation.
5.3.1.4. Effect of pH
Target fungi were inoculated as bove in petridishes containing PDA and
incubated at optimum temperature 25+ 1 oC. The pH of PDA medium was adjusted
5.5, 6.0 and 6.5 with 0.1 N NaOH/HCl with pH meter. Optimum pH was
determined by calculating colony diameter on daily bases till final reading on 7th
day.

144
5.4.RESULTS
5.4.1. Effect of Culture Media
The culture media had significant effects on the growth of decline causing
fungi. Among isolates from citrus, the fungusN. mangiferaeshowed maximum
radial growth on MEA followed by PDA which was not significantly different
from that of MEA. Minimum growth was recorded on SDGA and CJA. Similarly,
there was significant difference in growth of Fusarium sp. on PDA and MEA. The
fungi Botryosphaeria sp. and B. theobromae both showed no significant difference
in growth on PDA and MEA. The growth on SDGA and CJA was significantly less
as compared to PDA and MEA (Table 5.1).
The fungi isolated from declining mango trees had significant differences in
growth on different media.N. mangiferae gave maximum growth on MEA medium
PDA. The growth of the fungus was significantly less on SDGA and CJA media
(Table 5.2).
Unlike N. mangiferae isolated from citrus, which showed no significant
difference in growth on MEA and PDA media, the isolate from mango showed
significant difference in radial mycelial growth on the media. The growth on MEA
was significantly higher than on PDA medium. This shows that isolates of same
fungus from different hosts can behave differently when growth is tested on same
culture media. This is because that fungus can have varying virulence levels on
different hosts (Makun et al., 2010)
The isolates of fungi from guava showed that N. mangiferae has significant
difference in growth on MEA from rest of the culture media giving the maximum

145
(75 mm) radial growth. Similarly, B. theobromae from guava showed significant
difference in growth on PDA and MEA (Table 5.3).
The results in table 5.3 showed that N. mangiferae and Fusarium sp. gave
best growth on PDA and MEA. The fungus Ceratocystis sp. grew well on SDGA
and CJA. The Botrysphaeria sp. and B. theobromae showed variable responses in
growth on different culture media. This also showed that the fungi isolated from
mango and guava had resemblance regarding radial mycelial growth on tested
culture media. However, the fungal isolates from citrus species behaved differently.
5.4.2. Effect of Temperature on Radial Mycelial Growth
The decline causing fungi behaved differently when grown on different
temperatures.
The statistical analysis showed highly significant results regarding the
effect of temperature on radial growth. The growth of Nattrassia mangiferae
increased from 20oC to 25
oC and then declined. Maximum radial growth of all the
fungi was recorded at 25oC, below and above this temperature their growth
declined (Table 5.4).
All the fungi isolated from mango grew to the maximum at a temperature of
25oC except Ceratocystis sp. which showed maximum growth at 22
oC as shown in
Table 5.5.
Similarly, the fungi isolated from guava followed the same growth patterns
at different temperature regimes as shown by the isolates from citrus and mango
(Table 5.6).

146
Table 5.1: Effect of culture media on radial mycelial growth of the fungi isolated
from Citrus.
Fungi Culture Media
(Average growth in mm)
PDA MEA SDGA CJA
Nattrassia mangiferae 80 e 81 e 74 d 67 c
Botryosphaeria sp. 85 e 84 e 71 d 70 cd
Botryodiplodia theobromae 80 e 79 e 75 d 70 cd
Fusarium sp. 65 c 61 a 57 b 58 b
Data are mean of threereplicates
Table 5.2: Effect of culture media on radial mycelial growth of the fungi isolated
from mango.
Fungi
Culture Media
(Average growth in mm)
PDA MEA SDGA CJA
Nattrassia mangiferae 69 ef 75 fg 68 e 65e
Ceratocystis sp. 43 a 51 b 55 c 54 c
Botryodiplodia theobromae 84 ef 72 f 71 f 67 e
Fusarium sp. 70 f 65 e 58 cd 58 cd
Data are mean of threereplicates

147
5.4.3. Effect of Light on Radial Mycelial Growth
Light significantly affected the growth of fungi isolated from different
hosts. It was found that continuous light or continuous dark did not have any
significant effect on the growth of fungi isolated from citrus. However, alternate
light and dark periods were found significant for the growth of fungi as shown in
Table 5.7. Similar findings were reported by Alam et al. (2001) and Sharma et al.
(2005).
The fungi isolated from declining mango trees followed the same pattern as
shown in Table 5.8. B. theobromae and Fusarium sp. had no significant differences
in any case. The results are in line with Rehman et al. (2011).
In case of the fungal isolates from guava the growth of B. theobromae when
kept in continuous dark was the minimum. However, it showed maximum growth
in alternate light and dark (80 mm) followed by continuous light conditions (75
mm). Thus, it did not show the significant difference in growth when placed in
either complete dark or under alternate light and dark hours. From the results it
seemed that the fungus had photophobic behavior. The rest of the fungi has no
clear significant difference in all cases (Table 5.9).
5.4.4. Effect of pH on Radial Mycelial Growth
The pH had significant effect on the growth of Botryosphaeria sp. it
showedmaximum growth at pH 5.5. Similarly,Fusarium sp. had significant
difference in growth at pH 5.5 from other pH ranges. The rest of the fungi have no
clear significant difference (Table 5.10).

148
N. mangiferae isolated from mango showed significant difference in growth
at different pH regimes. At pH 5.5, it gave maximum growth followed by that at
pH 6.0 and 6.5 respectively.
Table 5.3: Effect of culture media on radial mycelial growth of the fungi isolated
from guava.
Fungi
Culture Media
(Average growth in mm)
PDA MEA SDGA CJA
Nattrassia mangiferae 70 def 75 fg 67 de 65 d
Botryosphaeria sp. 75 fg 78 g 54 ab 51 a
Botryodiplodia theobromae 82h 73 f 70 def 68 de
Fusarium sp. 71 def 64 d 57 bc 58 bc
Data are mean of three replicates
Table 5.4: Effect of temperature on radial mycelial growth of the fungi isolated
from citrus on PDA medium.
Fungi Temperature (oC)
(Average growth in mm)
20 22 25 28
Nattrassia mangiferae 80 def 81 def 84 ef 78 cdef
Botryosphaeria sp. 74 cd 78 def 85 f 80 def
Botryodiplodia theobromae 76 cde 80 def 85 f 81 def
Fusarium sp. 43 a 54 b 71 c 68 c
Data are mean of 3 replicates

149
Table 5.5: Effect of temperature on radial mycelial growth of the fungi isolated
from mango on PDA medium.
Fungi Temperature (oC)
(Average growth in mm)
20 22 25 28
Nattrassia mangiferae 68c 75d 83e 80e
Ceratocytis sp. 55b 57b 55b 41a
Botryodiplodia theobromae 67c 72cd 84e 82e
Fusarium sp. 41a 55b 74d 69c
Data are mean of three replicates
Table 5.6: Effect of temperature on radial mycelial growth of the fungi isolated
from guava on PDA medium.
Fungi
Temperature (oC)
(Average growth in mm)
20 22 25 28
Nattrassia mangiferae 64 b 68 bc 81f 75 def
Botryosphaeria sp. 67 bc 70 bcd 79 ef 78 ef
Botryodiplodia theobromae 70 bcd 73 cdf 80 f 75 ef
Fusarium sp. 48 a 53 a 79 ef 65 b
Data are mean of three replicates

150
Table 5.7: Effect of light on radial mycelial growth of the fungi isolated from citrus
on PDA medium
Fungi
Light Conditions
(Average growth in mm)
12 hrs light+
12 hrs dark
Continuous
light
Continuous
dark
Nattrassia mangiferae 80 d 65 ab 68 ab
Botryosphaeria sp. 77 d 69 bc 75 cd
Botryodiplodia theobromae 80 d 75 cd 70 bc
Fusarium sp. 62 a 68 a 65 ab
Data are mean of threereplicates
Table 5.8:Effect of light on radial mycelial growth of the fungi isolated from
mango on PDA medium.
Fungi
Light Conditions
(Average growth in mm)
12 hrs light+
12 hrs dark
Continuous
light
Continuous
dark
Nattrassia mangiferae 76 ef 74 ef 71 e
Ceratocystis sp. 56 cd 48 ab 43 a
Botryodiplodia theobromae 79 f 74 ef 74 ef
Fusarium sp. 59d 55 cd 52 bc
Data are mean of threereplicates

151
While, Ceratocystis sp. and Fusarium sp. showed significant difference in
growth at pH 6.5.Ceratocystis sp. gave maximum growth at pH 6.5 and Fusarium
sp. gave minimum growth at pH 6.5. The fungus B. theobromae followed same
pattern as shown in Table 5.11. The results coincide with those of Lathal et
al.(2012) and Rehman et al. (2011).
The isolates of N. mangiferae, Botryosphaeria sp. and Fusarium sp. from
guava had significant difference in growth at 5.5 pH. All fungi showed maximum
growth at pH 5.5 (69 mm, 65 mm and 62 mm respectively).
The fungus B. theobromae had no clear significant difference in growth in
any case and grew maximum at pH 5.5 (75 mm) followed by 72 mm and 68 mm
respectively at pH 6.0 and 6.5 (Table 5.12).
Results showed that the alternate light and dark conditions have
sigfunginificant effect on growth of N. mangiferae, Botryosphaeria sp., B.
theobromae and Fusarium sp. However, the fungus Ceratocystis sp. has shown
significant growth in contiuous dark condition.
The results regarding pH have shown that all of the fungi like low pH level.
As pH increases the mycelial growth is reduced. The results are somehow similar
in citrus and guava. However, in case of mango, Ceratocystis sp. has ascending
mycelial growth trend. The lowest pH range 5.5 and 6.0 has significantly reduced
growth as compared to pH level 6.5.
Similarities were also found in growth pattern of fungi associated with
Botryosphaeriacae family. This was very astonishing that within the same mango
trees the isolated mycoflora have different choices of environmental conditions,
especially the fungi belong to Botryospaeriace and Ceratocystis sp.

152
Table 5.9: Effect of light on radial mycelial growth of the fungi isolated from
guava on PDA medium.
Fungi
Light Conditions
(Average growth in mm)
12 hrs light+
12 hrs dark
Continuous
light
Continuous
dark
Nattrassia mangiferae 69 abcd 65 abc 63 ab
Botryosphaeria sp. 70 bcd 64 abc 61 a
Botryodiplodia theobromae 80 e 75 de 72 cd
Fusarium sp. 64 abc 61 a 65 abc
Data are mean ofthree replicates
Table 5.10: Effect of pH on radial mycelial growth of the fungi isolated from citrus
on PDA medium.
Fungi
pH of medium
(Average growth in mm)
5.5 6.0 6.5
Nattrassia mangiferae 71 ef 68 def 63 cd
Botryosphaeria sp. 74 f 62 cd 59 bc
Botryodiplodia theobromae 70 ef 66 de 65 cde
Fusarium sp. 59 bc 54 b 47 a
Data are mean of threereplicates

153
Table 5.11: Effect of pH on radial mycelial growth of the fungi isolated from
mango on PDA medium.
Fungi
pH of medium
(Average growth in mm)
5.5 6.0 6.5
Nattrassia mangiferae 79 gh 71ef 68 ef
Ceratocytis sp. 49 a 51a 57 bc
Botryodiplodia theobromae 81h 78gh 74fg
Fusarium sp. 65de 59cd 51ab
Data are mean ofthree replicates
Table 5.12: Effect of pH on radial mycelial growth of the fungi isolated from guava
on PDA medium.
Fungi
pH of medium
(Average growth in mm)
5.5 6.0 6.5
Nattrassia mangiferae 69 bcd 51a 49 a
Botryosphaeria sp. 65 bc 52 a 51a
Botryodiplodia theobromae 75 d 72 cd 68 bcd
Fusarium sp. 62 b 54 a 51a
Data are mean of 3 replicates

154
5.5. DISCUSSION
It is clear from the results that when the growth of fungal isolates from
citrus was tested against various media i.e. PDA, MEA, SDGA and CJA, three
fungi among 4 have shown no significant difference in the growth. These fungi are
Nattrassia mangifera, Botryodiplodia theobromae and Botryosphaeria sp. As
discussed in chapter 3 that these fungi share a common lineage and hence they
showed no significant difference on each of the culture media used for their
growth. However, Fusarium sp. growth was significantly different from the rest of
the fungi in the study. The significantly shown growth may be due to its slow
growing nature already reported in the past (Schroeder et al. 2006; Kang et al.,
2014). The other reason can be its growth response to a selective medium rather
than a range of media (Vanwyk et al., 2006; Kang et al., 2014).
It was astonishing to know that N. mangiferae isolates from mango showed
completely different behaviour in term of growth within stipulated time i.e.
significantly less growth was observed in all of the tested culture media as
compared to its isolates from citrus. It is due to the fact that the growth of N.
mangiferae in mango is hampered by plant defence mechanisms (Elliott and
Edmonds, 2008) and it is reasonably slow growing in nature. However, further
research is needed in this regard. Among other fungi, Ceratocystis sp., showed
significantly slow growth on all of the media tested. The difference was also
observed in its growth on potato dextrose agar (PDA) and malt extract agar (MEA)
but no significant difference was found onstem decoction glucose agar (SDGA)
and carrot juice agar (CJA). Ceratocystis sp. is known for its complexity in growth

155
and very choosy in physiological conditions especially temperature (Fateh et al.,
2010; Rehman et al., 2011; Masood et al., 2011). Secondly, culture media like
SDGA and CJA media were particularly developed for the fungus Ceratocystis sp.
based on the experience of scientists associated with this fungus (Moller and De
Vay, 1968; Barnes et al., 2003). During the study it was observed that on
inoculation of infected tree samples on SDGA and CJA, only the fungus
Ceratocystis sp. was isolated but its growth was observed in bits and patches
spread throughout the 90 mm petridish but once re-culturing was done the normal
growth was observed in the petri plates and this is the new finding of the study.
There was not much difference in growth among the fungal isolates from guava
when compared with mango. This may be due to the fact that guava in Pakistan is
grown with similar climate as mangoes. Sometimes, guava is intercropped with
mango in orchards (Khushk et al., 2009).
Unlike N. mangiferae isolated from citrus which showed no significant
difference in growth on MEA and PDA media, the isolate from mango showed
significant difference in radial mycelial growth on the media. The growth on MEA
was significantly higher than that on PDA medium. This shows that isolates of
same fungus from different hosts can behave differently when growth is tested on
same culture media. This is because that fungus can have varying virulence levels
on different hosts (Makun et al., 2010).
The response of growth of N. mangiferae isolates from citrus was much
interesting. It showed the aggressive growth from 20oC to 25
oC and started
declining after 28oC. The results are in agreement with those of Jamali and
Banihashemi(2010) and Rehman et al.(2011). It followed similar pattern in growth

156
when isolated from mango as well as guava. However, relatively less growth
among the isolates from mango and guava was observed as compared to citrus
isolates. The reason can again be the similar climatic areas occupied by mango and
guava. It is important to note that the fungus Ceratocystis sp. again preferred a low
temperature range as compared to other fungi, in case of mango (Fateh et al., 2006
and Rehman et al., 2011). The results also suggest that fluctuation in temperature
regimes in field condition affect both the growth of trees as well as the growth of
Ceratocystis sp. This fact has been supported by Reynolds(1992).
Mycelial growth was seen more in the isolates of Nattrassia when provided
alternate light and dark periods as compared to continuous light or continuous dark
periods. However, again the isolates from mango and guava did not show
significant differences in any condition of light and dark (Elliott and Edmonds,
2003). Nattrassia isolates from citrus were the least affected by the pH range of 5.5
to 6.5. However, in mango and guava the isolates performed well at pH up to 6.00.
The results are contradictory to the actual climatic conditions especially in the
mango orchards where soil pH is more than 7 andN. mangiferae keeps growing but
the results are in agreement with the findings of Namsi et al. (2010) andEl Atta and
Aref (2013).

157
Chapter 6
MORPHOLOGICAL VARIABILITY AMONG ISOLATES OF
COMMONLY FOUND FUNGUS (NATTRASSIA
MANGIFERAE)FROM DECLINE AFFECTED CITRUS,
MANGO AND GUAVA TREES
6.1. INTRODUCTION
The most common fungi found from decline affected trees are Nattrassia
mangiferae and Botryodiplodiatheobromae. These fungi are found in different
parts of the plants causing different symptoms. However, the same specie might
have some different characteristics when invading different hosts. Mostly these
fungi invade twigs and branches of the trees (Al- Adawi, 2002, Asif et al., 2011).
The fungus N. mangiferae belongs to class Coelomycetes. The fungus is
polymorphic and has two spore stages, the pycnidial and the arthroconidial stage.
Some anamorphs of Botryosphaeria are similar to Nattrassia both in their behavior
on the host plant and morphology. They attack stressed plants especially due to
drought or physical wounding. The fungus can cause canker, branch die back, twig
die back and blossom blight. Mostly these fungi are endophytic and become
aggressive to cause symptoms when the host is under stress conditions (Denman et
al., 2003).
N. mangiferae has been reported to cause a number of diseases in different
host plants including: branch wilt of walnut, citrus, figs,branch canker of
eucalyptus, madrone, acasia and mango, dieback and trunk canker of guava (El-
Atta and Aref, 2013).
The fungus N. mangiferae is basically a wound invading pathogen of forest
and fruit trees and has been reported to be the cause of foot canker of Hevea
132

158
brasiliensis seedlings in Sri Lanka. The cultural characteristics and the morphology
of the reproductive structures such as thallospores, pycnidia, pycnospores of Hevea
isolate from Sri Lanka resembles with the isolate of N. mangiferae obtained from
other hosts in different parts of the world (Jayasinghe et al., 1997).
In the year 2000, in the Jiroft region, South-Eastern Iran, N. mangiferae was
isolated from both Ficus religiosa, which showed branch die-back and elongated
cankers in trunks, and Psidium guajava (guava) trees, which showed branch die-
back. The pathogenicity of the fungus was demonstrated by fulfilling Koch's
postulates. These diseases are a potential threat to the citrus industry and P.
guajava production in the region. This is the first report of N. mangiferae inciting
die-back and trunk cankers on F. religiosaand die-back on P. guajava (Mirazeeet
al., 2003).
A survey of branch wilt disease was conducted in 2008, 2009 and 2010 in
South Kordofan State. The survey was done on different hosts inclunding citrus,
mango and other fruit trees. The tree showed symptoms of dieback, bark cracking
and sloughing off, gum exudates on pockets at the base of infected branches.
N. mangiferae was dominant pathogen in the samples collected from branch
wilt affected trees. Other opportunistic fungi found were such as Penicillium sp.,
Aspergillus niger and Fusarium oxysporum.
Since N. mangferae has been reported from a variety of hosts causing
variety of symptoms, the present study was aimed to see the morphological
variations among different isolates of these fungi based on their location, tree and
plant parts from which they were isolated with a hypothesis that there may be some
morphological variations among the isolates.

159
6.2.REVIEW OF LITERATURE
In Pakistan the fungus C. fimbriata for the first time was reported in Sindh
from declining mango trees. It's identification was confirmed by morphological
characteristics of perithecia (brown to black with globose base, necks almost 800-
900 µm long with ostiolar hyphae), ascospores (elliptical 4-8 × 2-5 µm, hat shaped)
conidiophores (hyaline, septate up to 150 µm long and conidia that were
cylindrical, sometimes in chains and truncated at the ends (Fateh et al., 2006).
Lasiodiplodia theobromaewhich is the anamorph of Botryosphaeria
rhodina is an opportunistic fungus attacking on more than 500 tree species in the
tropics and subtropics. During surveys of different plant diseases in Australia and
Venezuela various isolates were some what different from L. theobromae based
upon morphology and subsequently characterized and ITS and EF1-α nucleotide
sequences. These were described as three new speciesi.e. L. venezuelensis sp.
nov., L. crassispora sp. nov. and L. rubropurpurea sp. nov. Theywere easily
distinguished from each other (Burgess et al., 2006).
Nattrassia mangiferaeanother opportunistic wound invading fungus of
many forest and fruit trees was reported to cause of Hevea brasiliensis foot canker
in Sri Lanka. The morphology of the reproductive structure: thallospores, pycnidia,
pycnospores of Hevea isolate from Sri Lanka resembled with the isolate of N.
mangiferae obtained from other hosts in different parts of the world (Jayasingheet
al., 1997).
Elliott and Edmonds in 2003 identified N. mangiferae, causing a canker
disease of Pacific madrone, using morphological and molecular methods. Only
asexual spores were observed, but sequencing of the ITS region of the ribosomal
160
rDNA places the sexual state in the genus Botryosphaeria. Resembles of the fungus
was found with Fusicoccumwhich is anamorphs of closely related Botryosphaeria
species and had a similar pathology.
Several pecies of Botryosphaeria affect mango trees and fruit. These are
mainly identified on the morphology of the anamorphs, include,Dothiorella
dominicana, D. mangiferae (Natrassia mangiferae), D. aromatica and an
unidentified species, Dothiorella „long‟. The genus name Dothiorella, however, is
acknowledged as a synonym of Diplodia. To achieve isolates representing all four
Dothiorella spp. the anamorphs of known Botryosphaeria sp., were based on
conidial morphology and DNA sequence data. The morphological and molecular
results confirmed that the fungi previously identified from mango as species of
Dothiorella belong to Fusicoccum. This study provided basis for the identification
of Botryosphaeria species from mango, which is important for disease control and
to uphold quarantine regulations (Slippers et al., 2005).
In, Iran, a study was conducted using morphological and molecular
methods to identify the causal agent of black locust treesdecline. The isolates of the
fungus produced arthroconidia, and the fungus identified wasNeofusicoccum
mangiferae.Pathogenicity test under the bark produced similar symptoms as in
natural infection. Species classification was confirmed by analysis of the internal
transcribed spacer (ITS) sequencing. The funus was mostly similar to N.
mangiferae(Nazerianet al., 2015).
A fungus resembling the asexual morphs in the family Botryosphaeriaceae
was isolated from a fallen leaf of an orchid collected in Thailand. After
morphological and phylogenetic analyses it was placed as Neoscytalidium sp.

161
(Huang et al., 2016).
6.3.MATERIALS AND METHODS
6.3.1. Fungal Isolates
To study the morphological characterization, the samples were collected
from decline affected citrus trees from representative orchards of tehsil and district
Sargodha and tehsil Bhalwal of Sargodha. For mango, the orchards of districts
Multan & Rahim Yar Khan and for guava tehsil Pattoki of district Kasur and tehsil
Sharaqpur of Sheikhupura. The areas were selected as representatives, based on
their commodity based popularity as well as number of orchards. The samples were
taken from twigs, branches and stem at collar region. The cultures were purified by
sub culturing and finally 30 isolates were selected out of 300 samples based on
their hosts used in the present study. The methodology for isolation and
identification has already been mentioned in chapter 3.
6.3.2. Morphological Characterization
For morphological characterization, each isolate was maintained on Malt
Extract Agaer (MEA) medium. A 5 mm mycelial plug was taken from fresh
growing culture of the fungi N. mangiferae and B. theobromae and aseptically
placed in the center of petridish (90 mm). After 5 days at 25oC, morphological
characters like colony color and patterns were studied. However, the conidial
characters and measurements were recorded on conidial appearance.
The measurement of conidia, perithecia and other target structure was done
using method reported by Fateh et al., 2006.
6.4.RESULTS

162
The morphological variability of the most common decline causing fungi N.
mangiferae was studied based on hosts i.e. citrus mango and guava, plant parts i.e.
branch and twig and location. The results are shown in the tables 6.1 to 6.6.
The isolates for decline affected citrus trees collected from tehsil and
district Sargodha showedmorphologically similar characteristics irrespective of the
plant part and location. The isolates on malt extract agar medium showed dark grey
mycelial and produced appressed colonies five days after inoculation. However,
there was a slight difference in the measurement of chain of arthrospores which
were somewhat elongated (Fig.6.1), hyaline aseptate, and fusoid becoming 2-3
septate with central cell dark brown (Table 6.1).
In tehsil Bhalwal of Sargodha, isolates had exactly similar characteristics
with one another. They even did not show slight change in the measurement of
arthrospores. They also showed resemblance to the isolates taken from tehsil and
district Sargodha (Table 6.2).
In case of mango, the isolates of N. mangiferae showed major difference in
the mycelial pattern in the 90 mm petri plates. The mycelia started to rise instead of
running in the appressed form. Mycelial color in case of mango after 5 days of
inoculation turned creamy grey which was completely different fromN. mangiferae
isolates taken from decline affected citrus trees. The arthrospores were also not
much elongated continuously and mostly they were round shaped in the chain
(Table 6.3). The isolates from district Rahim Yar Khan were also similar to the
isolates taken from district Multan (Table 6.4).
The isolates taken from decline affected guava trees show more closeness
towards the mango isolates. There has been mixture of elongated and roundish

163
Table 6.1: Morphological characteristics of N. mangiferae isolates from citrus in
tehsil and district Sargodha.
Isolate Tree/
Plant
Part
Mycelial
color
(after 5
days)
Mycelial
pattern
Arthrospores
measurement
(LxW) µm
Description of
arthrospores
SW-6 Citrus/
Branch
Dark grey Appressed 5-12.5x2.5-10 Somewhat elongated
hyaline aseptate,
fusoid becoming 2-3
septate with central
cell dark brown
SW-7 -ditto- -ditto- -do- 5-12.0x2.5-10 -ditto-
SW-8 -ditto- -ditto- -do- 4.5-12.5x2.5-9 -ditto-
SW-9 -ditto- -ditto- -do- 5-12.5x2.5-10 -ditto-
SW-10 -ditto- -ditto- -do- 5-12.0x2.5-9 -ditto-
Sar-6 Citrus/
Twigs
-ditto- -do- 4.5-12.0x3.0-
10
-ditto-
Sar-7 -do- -ditto- -do- 5-12.0x2.5-10 -ditto-
Sar-8 -do- -ditto- -do- 5-12.5x2.5-10 -ditto-
Sar-9 -do- -ditto- -do- 5-12.0x2.5-9 -ditto-
Sar-10 -do- -ditto- -do- 4.5-12.0x3.0-
10
-ditto-
Table 6.2: Morphological characteristics of N. mangiferae isolates from citrus in
tehsil Bhalwal, district Sargodha.
Isolate Tree/
Plant
Part
Mycelial
color
(after 5
days)
Mycelial
pattern
Arthrospores
measurement
(LxW) µm
Description of
arthrospores
BE-10 -ditto- Dark grey Appressed 5-12.0x2.5-10.5 elongated hyaline
aseptate, fusoid
becoming 2-3 septate
with central cell dark
brown
BW-6 Citrus/
Twigs
-ditto- -ditto- 5-12.0x2.5-10 -ditto-
BW-7 -ditto- -ditto- -ditto- 5-12.5x2.5-10 -ditto-
BW-8 -ditto- -ditto- -ditto- 5-12.0x2.5-9 -ditto-
BW-9 -ditto- -ditto- -ditto- 5-12.5x2.5-10 -ditto-
BW-
10
-ditto- -ditto- -ditto- 5-12.0x2.5-10.5 -ditto-

164
Table 6.3: Morphological characteristics of N. mangiferae isolates from mango in
district Multan.
Isolate Tree/
Plant
Part
Mycelial
color
(after 5
days)
Mycelial
pattern
Arthrospores
measurement
(LxW) µm
Description of
arthrospores
BBR-6 Twigs Creamy
grey
Raised 5-12.0x2.5-10 Hyaline aseptate,
fusoid becoming 2-3
septate with central
cell dark brown
BBR-7 -ditto- -ditto- -ditto- 4.9-12.0x2.5-10 -ditto-
BBR-8 -ditto- -ditto- -ditto- 4.5-12.5x2.5-10 -ditto-
MKR-
8
-ditto- -ditto- -ditto- 5-12.0x3.0-10 -ditto-
MKR-
9
Branch -ditto- -ditto- 4.4-12.5x2.5-10 -ditto-
MKR-
10
-ditto- -ditto- -ditto- 5.2-12.0x2.5-10 -ditto-
MSR-
6
-ditto- -ditto- -ditto- 4.5-12.0x2.5-10 -ditto-
MSR-
7
-ditto- -ditto- -ditto- 4.2-12.0x2.5-10 -ditto-
MSR-
8
-ditto- -ditto- -ditto- 4.5-12.5x2.5-10 -ditto-
MSR-
9
-ditto- -ditto- -ditto- 5-12.0x2.5-10 -ditto-
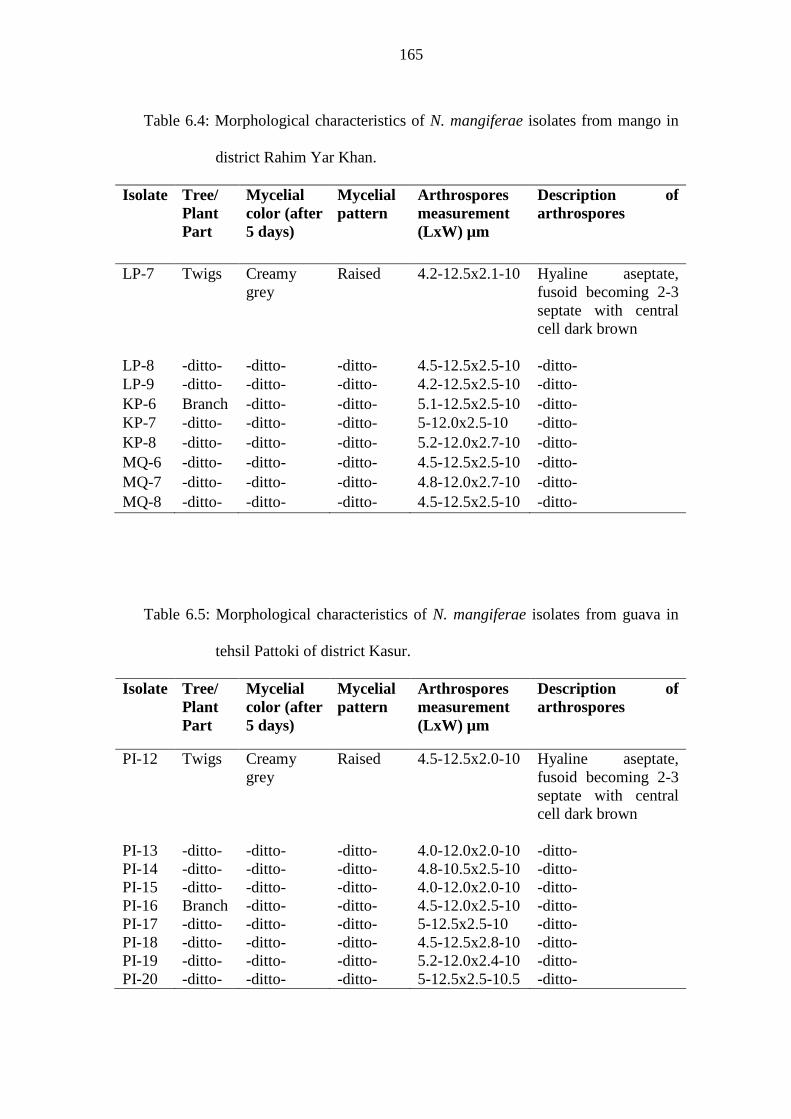
165
Table 6.4: Morphological characteristics of N. mangiferae isolates from mango in
district Rahim Yar Khan.
Isolate Tree/
Plant
Part
Mycelial
color (after
5 days)
Mycelial
pattern
Arthrospores
measurement
(LxW) µm
Description of
arthrospores
LP-7 Twigs Creamy
grey
Raised 4.2-12.5x2.1-10 Hyaline aseptate,
fusoid becoming 2-3
septate with central
cell dark brown
LP-8 -ditto- -ditto- -ditto- 4.5-12.5x2.5-10 -ditto-
LP-9 -ditto- -ditto- -ditto- 4.2-12.5x2.5-10 -ditto-
KP-6 Branch -ditto- -ditto- 5.1-12.5x2.5-10 -ditto-
KP-7 -ditto- -ditto- -ditto- 5-12.0x2.5-10 -ditto-
KP-8 -ditto- -ditto- -ditto- 5.2-12.0x2.7-10 -ditto-
MQ-6 -ditto- -ditto- -ditto- 4.5-12.5x2.5-10 -ditto-
MQ-7 -ditto- -ditto- -ditto- 4.8-12.0x2.7-10 -ditto-
MQ-8 -ditto- -ditto- -ditto- 4.5-12.5x2.5-10 -ditto-
Table 6.5: Morphological characteristics of N. mangiferae isolates from guava in
tehsil Pattoki of district Kasur.
Isolate Tree/
Plant
Part
Mycelial
color (after
5 days)
Mycelial
pattern
Arthrospores
measurement
(LxW) µm
Description of
arthrospores
PI-12 Twigs Creamy
grey
Raised 4.5-12.5x2.0-10 Hyaline aseptate,
fusoid becoming 2-3
septate with central
cell dark brown
PI-13 -ditto- -ditto- -ditto- 4.0-12.0x2.0-10 -ditto-
PI-14 -ditto- -ditto- -ditto- 4.8-10.5x2.5-10 -ditto-
PI-15 -ditto- -ditto- -ditto- 4.0-12.0x2.0-10 -ditto-
PI-16 Branch -ditto- -ditto- 4.5-12.0x2.5-10 -ditto-
PI-17 -ditto- -ditto- -ditto- 5-12.5x2.5-10 -ditto-
PI-18 -ditto- -ditto- -ditto- 4.5-12.5x2.8-10 -ditto-
PI-19 -ditto- -ditto- -ditto- 5.2-12.0x2.4-10 -ditto-
PI-20 -ditto- -ditto- -ditto- 5-12.5x2.5-10.5 -ditto-

166
Table 6.6:Morphological characteristics of N. mangiferae isolates from guava in
tehsil Sharaqpur of district Sheikhupura.
Isolate Tree/
Plant
Part
Mycelial
color (after
5 days)
Mycelial
pattern
Arthrospores
measurement
(LxW) µm
Description of
arthrospores
SP-11 Twigs Creamy
grey
Raised 5-12.5x2.5-10 Hyaline aseptate,
fusoid becoming 2-3
septate with central
cell dark brown
SP-12 -ditto- -ditto- -ditto- 4.5-12.0x2.5-9 -do-
SP-13 -ditto- -ditto- -ditto- 5-12.5x2.5-10 -do-
SP-14 -ditto- -ditto- -ditto- 5-12.5x3.0-10 -do-
SP-15 -ditto- -ditto- -ditto- 5-12.5x2.5-10 -do-
SP-16 Branch -ditto- -ditto- 4.5-12.0x2.5-10 -do-
SP-17 -ditto- -ditto- -ditto- 4.0-12.5x2.5-
10.2
-do-
SP-18 -ditto- -ditto- -ditto- 4.5-12.5x2.5-10 -do-
SP-19 -ditto- -ditto- -ditto- 5-12.0x2.5-10.2 -do-
SP-20 -ditto- -ditto- -ditto- 4.5-12.0x2.5-10 -do-

167
Fig.6.1:N. mangiferae arthrospores from citrus
Fig.6.2:N. mangiferae arthrospores from mango

168
arthrospores (Fig. 6.2). However, there has been no difference in mycelial colours
and pattern when compared with mango isolates.
6.5. DISCUSSION
The morphological characteristics of the fungus described in current study
were in agreement with those reported by Wilson (1949); Calavan and Wallace
(1954); Sutton and Dyko (1989) and El Atta and Nori (2014). The similarity
between isolates of mango and guava shows that there has been a shift of attack of
N. mangiferae either from mango to guava or otherwise. The chances are that these
are the same fungal isolates which attack both trees as both are grown in tropical
climate and as discussed earlier that sometimes guava is intercropped in mango
orchards and hence there has been a transfer of the fungus from mango to guava.
It has been found during the pathogenicity tests that the symptoms produced
by N. mangiferae in both trees were almost similar, which is again a confirmation
of their common origin (Fateh et al., 2016). In case of citrus, the morphology of N.
mangiferae was a little bit different. One of the reasons might be the difference in
climate where citrus is grown and secondly, it can be due to the fact that in citrus
the fungus has been reported to produce branch wilt with cracks in a particular
check pattern, while in mango and guava they either cause branch dieback, branch
canker or twig die back (Mirzae et al., 2002; Saaiman, 1997).
However, the morphology of N. mangiferae isolates from all citrus, mango
and guava had close resemblance with madrone canker isolates in USA. Madrone
isolates of N. mangiferae are characterized as hyaline, aseptate, guttulate conidia
becoming 1- to 3-septate, verisicolored or brown. Conidia had thin-walls, mostly
fusoid but occasionally oblong or clavate with truncate bases. The isolates differed

169
in conidial length, width as well as in arthrospore size. Although there were
statistically significant differences, there does not appear to be a geographical
pattern in spore size or shape. The researchers in US conclude that N. mangiferae
isolated from Pacific madrone belonged in the teleomorph genus Botryosphaeria
and hence, diseases caused by this fungus can be managed using methods
developed for other Botryosphaeria pathogens, such as B. dothidea(Elliott and
Edmonds, 2003).
170
Chapter 7
FACTORS FAVORING THE DECLINE DISEASE AND
DEVELOPMENT OF STRATEGIES FOR ITS MANAGEMENT
7.1. INTRODUCTION
Tree decline have been a universal problem and none of the forest, fruit and
ornamental trees are safe from the disease. Mostly decline in trees has very
complex etiology and is attributed to pathogens, various native organisms, climatic
factors and agricultural or urban pollution. Where particular biotic or abiotic
factors could not be singled out, they have been regarded as predisposing, inciting
or contributing factors in „diseases of complex etiology‟. For example ongoing
monitoring of eucalypt decline during recent droughts in eastern Australia, together
with extensive one-time observations across temperate Australia, provided
opportunities to further examine some hypotheses of decline and dieback that were
largely based on retrospective investigations (Jurskis, 2005). Dieback in intervals
can be distinguished from the process of chronic decline. Repeated dieback was
associated with natural climatic extremes whereas chronic decline was associated
with human management. Decline of forests in nature was associated with
exclusion of fire and grazing, while decline of rural trees was mostly associated
with pastures development (Fensham, 1998). Trees growing low in the landscape
on soils with poor drainage and aeration were especially predisposed to decline. It
appears that chronic abiotic stress causes tree decline when the function of roots is
impaired by changes in soils. Climatic extremes can accelerate severe declines
associated with human management. A variety of pests, „pathogens‟ and parasites
can take advantage of trees that are stressed by environmental changes, especially
eutrophication. Similarities between diebacks and declines in the Atlantic and
147

171
Pacific regions suggest a simple unifying concept of tree decline and dieback
(Karnosky, 2003).
A gradual decline in tree health is a common problem in urban and rural
areas of Pakistan. Decline is not limited to certain specific trees but it is galloping
towards almost all woody vegetation of forest, ornaments and fruits. Trees live
long and over period of years they are invaded by number of insects, diseases and
environmental effects. These trees are called stressed trees and often end up in
decline and mortality (Bigler et al., 2004).
7.2. REVIEW OF LITERATURE
Pakistan has tropical and sub tropical climate in most of the fruit growing
areas. Much information has been generated in general for the perennial crops in
the tropics and sub tropics in the world. Diseases in the tropics may be complicated
by interactions between different pathogens, or between pathogens and insect pests
(Holliday, 1980; Ploetz, 2006; Vandermeer et al., 2010; Anonymous, 2010).
Disease complexes involving a number of fungal pathogens or fungi and
nematodes are common in tropical situations. Interactions between pathogens and
environmental stress may also occur. Crops can become more susceptible to
pathogen infections when weakened by environmental stresses such as drought,
temperature extremes, and exposure to sunlight or wind (Agrios, 2005). Stressed
plants, or plants sustaining damage caused by insects or other pathogens, may also
be susceptible to attack by secondary pathogens or pathogens that infect through
wounds. Nutrient deficiencies may increase the susceptibility of crops to disease. In
tropical perennial crops, poor plant nutrition is likely to be a particularly important
contributing factor to production losses (Palti, 1981). In addition to lower

172
production due to nutrient deficiency, low nutrition may predispose plants to
diseases, increasing losses further. Nutrient deficiency causes the plant to become
weakened and generally more susceptible to infection. Under such conditions,
infection by weakly pathogenic species that would normally cause few problems
may become more serious. The incidence and severity of particular diseases may
also be linked to deficiencies of particular nutrients (Schroth et al., 2000).
Scientists agreed that the insect pests and diseases are not the only cause of
tree decline but the tree age, environmental factors, tree nutrition, soil chemistry
and above all the neglecting right production practices play a crucial role for
decline of the trees. For example citrus decline in Pakistan is a complex or
syndrome. As the phytoplasma, viruses, nematodes and fungi are involved in citrus
decline but at the same time the production practices like tree density in the
orchard, orchard sanitation, orchard irrigation and nutrition etc. are not accurate
(Arif et al. 2005; Burney et al., 2007). All these circumstances invite decline not
only for citrus but also in other forest, ornamental and fruit trees (Bigler et al.,
2006).
Mango decline has been a problem for Pakistan since it was first time
reported in 1995 at Muzaffar Garh. Lot of work has been done on mango decline in
the past few years and the production technology is being altered to manage the
issues (Fateh et al., 2006). Mango decline is a general term and it is used for
different disorders in the mango trees which either slowly or rapidly decline the
mango tree or eventually cause the death of tree
Guava decline is another big threat in Pakistan. As we have already limited
area under cultivation and the stressed condition someday will let vanish this
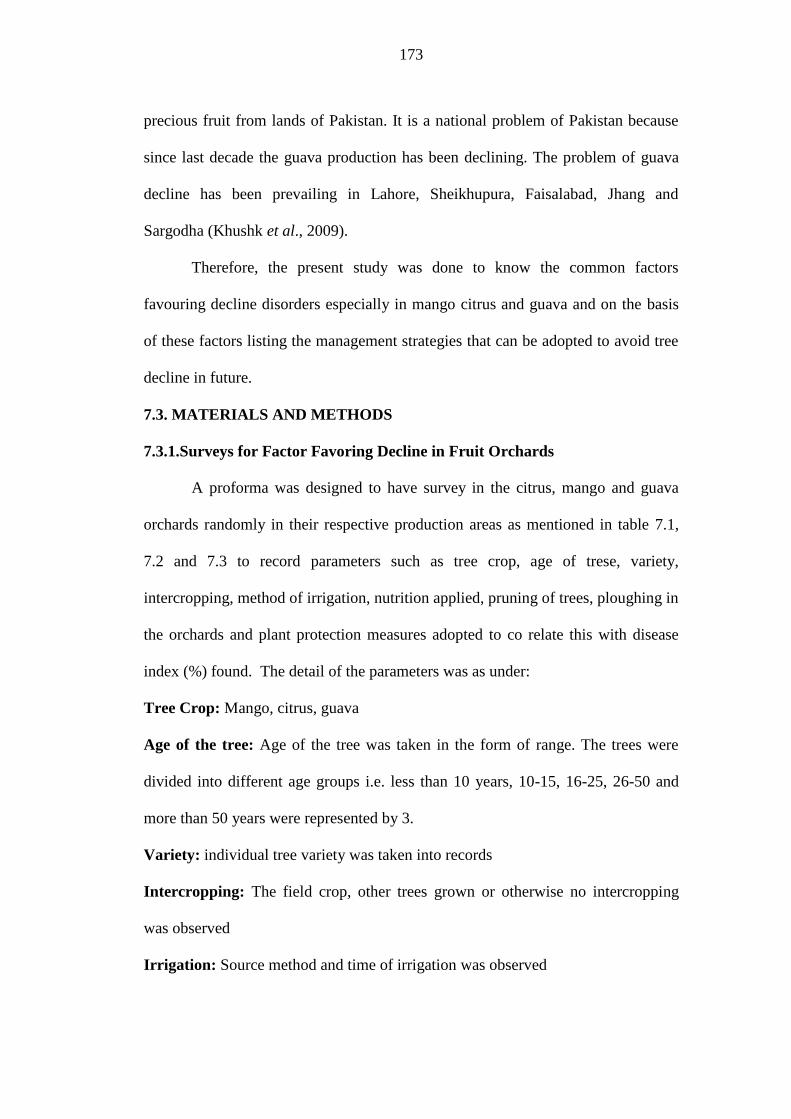
173
precious fruit from lands of Pakistan. It is a national problem of Pakistan because
since last decade the guava production has been declining. The problem of guava
decline has been prevailing in Lahore, Sheikhupura, Faisalabad, Jhang and
Sargodha (Khushk et al., 2009).
Therefore, the present study was done to know the common factors
favouring decline disorders especially in mango citrus and guava and on the basis
of these factors listing the management strategies that can be adopted to avoid tree
decline in future.
7.3. MATERIALS AND METHODS
7.3.1.Surveys for Factor Favoring Decline in Fruit Orchards
A proforma was designed to have survey in the citrus, mango and guava
orchards randomly in their respective production areas as mentioned in table 7.1,
7.2 and 7.3 to record parameters such as tree crop, age of trese, variety,
intercropping, method of irrigation, nutrition applied, pruning of trees, ploughing in
the orchards and plant protection measures adopted to co relate this with disease
index (%) found. The detail of the parameters was as under:
Tree Crop: Mango, citrus, guava
Age of the tree: Age of the tree was taken in the form of range. The trees were
divided into different age groups i.e. less than 10 years, 10-15, 16-25, 26-50 and
more than 50 years were represented by 3.
Variety: individual tree variety was taken into records
Intercropping: The field crop, other trees grown or otherwise no intercropping
was observed
Irrigation: Source method and time of irrigation was observed

174
Nutrition: Kind of nutrients applied or not applied
Ploughing under tree canopy: Ploughing in the orchard especially under tree
canopy was present or absent.
Plant protection measures: If any plant protection measures are adopted?
Disease Incidence in the Orchard and average severity: Incidence of the disease
was recorded as the % age of affected plants in an observed population. While, the
severity was recorded based on the area of infected individual tree.Factors were
correlated with disease index (%).
7.3.2. Statistical Analysis
For the statistical analysis, SPSS software was used wherever needed. First
of all the data was coded in binary form. Such kind of coding is needed where in
data we have "Yes" or "No"entries. The data was imported from excel spread sheet
to SPSS software. Finally the correlation was chosen for the analysis to see effect
of each factor on decline disease index of citrus mango and guava.
7.4.RESULTS
According to table 7.1 survey conducted in 6 tehsils of district
Sargodha for observing the factors that can favor the decline disease in these areas
has shown interesting results. In Tehsil Bhalwal 8citrus orchards out of 13
locations fell in the age group of 16-25 while the rest 5 are in the age group of 10-
15. The sole variety of citrus cultivated in these orchards was "Kinnow". In all
young orchards disease index either was low or zero. This is because the young

175
Table 7.1: Factor affecting disease index (%) in selected orchards of citrus in district Sargodha.
Tehsil Location Age
Group
Variety Intercr
op
(P/A)
Irrigati
on
(T/C),
(HE/
Fl)
Nutriti
on
(P/A)
Prunin
g (P/A)
Plough
ing
under
tree
canopy
(P/A)
Plant
Protecti
on (P/A)
If P
(which)
Disease
Index (%)
Bhalwal
Chak No.
4 SB 16-25 Kinnow P
Canal/F
lood
P
(FYM) A P
P (Lime
paste) 31
Chak No.
7 ML 16-25 Kinnow P
Canal/F
lood
P
(FYM) A P
P (Lime
paste) 32
Chak No.
7SB 16-25 Kinnow P
Canal/F
lood
P
(FYM) A P
P (Lime
paste) 40
Chak No.
7 ASB 16-25 Kinnow P
Canal/F
lood
P
(FYM) A P
P (Lime
paste) 37
Chak No.
8NB 16-25 Kinnow P
Canal/F
lood
P
(FYM) A P
P (Lime
paste) 33
Chak No.
9 NB 10-15 Kinnow A
Canal/F
lood
P
(NPK) P A
P (Lime
paste) 15
Chak No.
Chak 9
Lokri 16-25 Kinnow P
Canal/F
lood
P
(FYM) A P
P (Lime
paste) 36
Chak No.
10 NB 10-15 Kinnow A
Canal/F
lood
P
(NPK) P A
P (Lime
paste)
0

176
Tehsil Location Age
Group
Variety Intercr
op
(P/A)
Irrigati
on
(T/C),
(HE/
Fl)
Nutriti
on
(P/A)
Prunin
g (P/A)
Plough
ing
under
tree
canopy
(P/A)
Plant
Protecti
on (P/A)
If P
(which)
Disease
Index (%)
Chak No.
13 NB 16-25 Kinnow A
Canal/F
lood
P
(FYM) P P
P (Lime
paste) 31
Chak No.
18 NB 16-25 Kinnow P
Canal/F
lood
P
(FYM) A P
P (Lime
paste) 37
Chak No.
22 NB 10-15 Kinnow A
Canal/F
lood
P
*(NPK) P A
P (Lime
paste) 0
Chak No.
23 NB 10-15 Kinnow A
Canal/F
lood
P
(FYM) A P
P (Lime
paste) 17
Chak No.
26 NB 10-15 Kinnow A
Canal/F
lood
P
(NPK) P A
P (Lime
paste) 0
Sargodha Chak No.
24 SB 16-25 Kinnow A
Canal/F
lood
P
(FYM) A P
P (Lime
paste) 20
Chak No
27 SB 16-25 Kinnow P
Canal/F
lood
P
(FYM) A P
P (Lime
paste) 37
Chak No
28 SB 16-25 Kinnow A
Canal/F
lood
P
(FYM) P P
P (Lime
paste) 20
Chak No
30 NB 16-25 Kinnow P
Canal/F
lood
P
(FYM) A P
P (Lime
paste) 27
Chak No
48 NB 16-25 Kinnow P
Canal/F
lood
P
(FYM) A P
P (Lime
paste) 29

177
Tehsil Location Age
Group
Variety Intercr
op
(P/A)
Irrigati
on
(T/C),
(HE/
Fl)
Nutriti
on
(P/A)
Prunin
g (P/A)
Plough
ing
under
tree
canopy
(P/A)
Plant
Protecti
on (P/A)
If P
(which)
Disease
Index (%)
Chak No
53 SB 16-25 Kinnow P
Canal/F
lood
P
(FYM) A P
P (Lime
paste) 31
Chak No
56 NB 16-25 Kinnow P
Canal/F
lood
P
(FYM) A P
P (Lime
paste) 27
Chak No
90 NB 16-25 Kinnow P
Canal/F
lood
P
(FYM) A P
P (Lime
paste) 32
Chak No
91 NB 16-25 Kinnow A
Canal/F
lood
P
(FYM) A P
P (Lime
paste) 24
Chak No
93 SB 16-25 Kinnow P
Canal/F
lood
P
(FYM) A P
P (Lime
paste) 40
Chak No
94 NB 16-25 Kinnow P
Canal/F
lood
P
(FYM) A P
P (Lime
paste) 37
Chak No
95 NB 16-25 Kinnow P
Canal/F
lood
P
(FYM) A P
P (Lime
paste) 33
Chak No
95SB 16-25 Kinnow P
Canal/F
lood
P
(FYM) A P
P (Lime
paste) 32
Chak No
101 SB 16-25 Kinnow A
Canal/F
lood
P
(FYM) P P
P (Lime
paste) 24
Chak No
112 NB 16-25 Kinnow P
Canal/F
lood
P
(FYM) A P
P (Lime
paste) 29
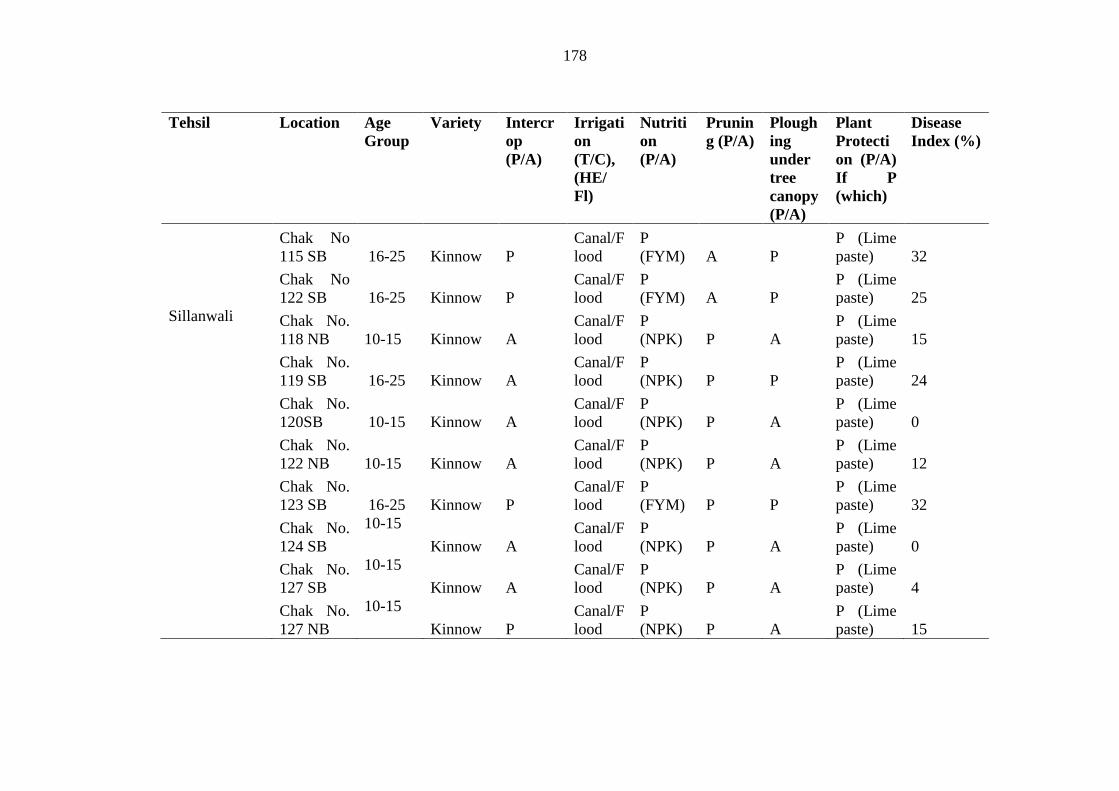
178
Tehsil Location Age
Group
Variety Intercr
op
(P/A)
Irrigati
on
(T/C),
(HE/
Fl)
Nutriti
on
(P/A)
Prunin
g (P/A)
Plough
ing
under
tree
canopy
(P/A)
Plant
Protecti
on (P/A)
If P
(which)
Disease
Index (%)
Chak No
115 SB 16-25 Kinnow P
Canal/F
lood
P
(FYM) A P
P (Lime
paste) 32
Chak No
122 SB 16-25 Kinnow P
Canal/F
lood
P
(FYM) A P
P (Lime
paste) 25
Sillanwali Chak No.
118 NB 10-15 Kinnow A
Canal/F
lood
P
(NPK) P A
P (Lime
paste) 15
Chak No.
119 SB 16-25 Kinnow A
Canal/F
lood
P
(NPK) P P
P (Lime
paste) 24
Chak No.
120SB 10-15 Kinnow A
Canal/F
lood
P
(NPK) P A
P (Lime
paste) 0
Chak No.
122 NB 10-15 Kinnow A
Canal/F
lood
P
(NPK) P A
P (Lime
paste) 12
Chak No.
123 SB 16-25 Kinnow P
Canal/F
lood
P
(FYM) P P
P (Lime
paste) 32
Chak No.
124 SB
10-15
Kinnow A
Canal/F
lood
P
(NPK) P A
P (Lime
paste) 0
Chak No.
127 SB
10-15
Kinnow A
Canal/F
lood
P
(NPK) P A
P (Lime
paste) 4
Chak No.
127 NB
10-15
Kinnow P
Canal/F
lood
P
(NPK) P A
P (Lime
paste) 15

179
Tehsil Location Age
Group
Variety Intercr
op
(P/A)
Irrigati
on
(T/C),
(HE/
Fl)
Nutriti
on
(P/A)
Prunin
g (P/A)
Plough
ing
under
tree
canopy
(P/A)
Plant
Protecti
on (P/A)
If P
(which)
Disease
Index (%)
Chak No.
137 SB
10-15
Kinnow A
Canal/F
lood
P
(NPK) P A
P (Lime
paste) 0
Chak No.
147 NB
10-15
Kinnow A
Canal/F
lood
P
(NPK) P A
P (Lime
paste) 0
Chak No.
148 NB
10-15
Kinnow A
Canal/F
lood
P
(NPK) P A
P (Lime
paste) 12
Shahpur
Malakwal 16-25 Kinnow P
Canal/F
lood
P
(NPK) P A
P (Lime
paste) 19
Wadhi 16-25 Kinnow P
Canal/F
lood
P
(FYM) P P
P (Lime
paste) 35
Kot
Maghrib 16-25 Kinnow P
Canal/F
lood
P
(FYM) P P
P (Lime
paste) 20
Shahpur
Saddar 16-25 Kinnow P
Canal/F
lood
P
(FYM) A P
P (Lime
paste) 27
Noor
Kallu 16-25 Kinnow P
Canal/F
lood
P
(FYM) A P
P (Lime
paste) 27
Kandaan
Kalan 16-25 Kinnow P
Canal/F
lood
P
(FYM) A P
P (Lime
paste) 31
Jhavarian 16-25 Kinnow P
Canal/F
lood
P
(FYM) A P
P (Lime
paste) 28

180
Tehsil Location Age
Group
Variety Intercr
op
(P/A)
Irrigati
on
(T/C),
(HE/
Fl)
Nutriti
on
(P/A)
Prunin
g (P/A)
Plough
ing
under
tree
canopy
(P/A)
Plant
Protecti
on (P/A)
If P
(which)
Disease
Index (%)
Hussain
Shah 16-25 Kinnow P
Canal/F
lood
P
(FYM) P P
P (Lime
paste) 25
Kudyana 16-25 Kinnow P
Canal/F
lood
P
(FYM) P P
P (Lime
paste) 23
Allahdad
Wala 16-25 Kinnow P
Canal/F
lood
P
(FYM) A P
P (Lime
paste) 25
Chachar
Sharf 16-25 Kinnow P
Canal/F
lood
P
(FYM) A P
P (Lime
paste) 28
Chak 128
NB 16-25 Kinnow P
Canal/F
lood
P
(FYM) A P
P (Lime
paste) 33
Sahiwal Kot
Pehalwan 16-25 Kinnow P
Canal/F
lood
P
(FYM) A P
P (Lime
paste) 28
Biral
Sharif 16-25 Kinnow P
Canal/F
lood
P
(FYM) A P
P (Lime
paste) 25
Nawabpur 16-25 Kinnow P
Canal/F
lood
P
(FYM) A P
P (Lime
paste) 24
Vijh 16-25 Kinnow P
Canal/F
lood
P
(FYM) A P
P (Lime
paste) 28
Nehang 10-15 Kinnow A
Canal/F
lood
P
(FYM) P A
P (Lime
paste) 0

181
Tehsil Location Age
Group
Variety Intercr
op
(P/A)
Irrigati
on
(T/C),
(HE/
Fl)
Nutriti
on
(P/A)
Prunin
g (P/A)
Plough
ing
under
tree
canopy
(P/A)
Plant
Protecti
on (P/A)
If P
(which)
Disease
Index (%)
Chohal 16-25 Kinnow P
Canal/F
lood
P
(FYM) A P
P (Lime
paste) 23
Tirkhanwa
la 10-15 Kinnow A
Canal/F
lood
P
(FYM) P A
P (Lime
paste) 0
Haveli
Majuka 16-25 Kinnow P
Canal/F
lood
P
(FYM) A P
P (Lime
paste) 32
Pindi
Wala 16-25 Kinnow P
Canal/F
lood
P
(FYM) A P
P (Lime
paste) 24
Sial Sharif 16-25 Kinnow P
Canal/F
lood
P
(FYM) A P
P (Lime
paste) 31
Sangoraka
10-15
Kinnow P
Canal/F
lood
P
(FYM) P A
P (Lime
paste) 12
Farooka
10-15
Kinnow P
Canal/F
lood
P
(FYM) P A
P (Lime
paste) 16
Sial
Dholka 16-25 Kinnow P
Canal/F
lood
P
(FYM) A P
P (Lime
paste) 23
Muhamma
d Wala 16-25 Kinnow P
Canal/F
lood
P
(FYM) A P
P (Lime
paste) 24
Jahane
Wala 10-15 Kinnow A
Canal/F
lood
P
(NPK) P A
P (Lime
paste) 0
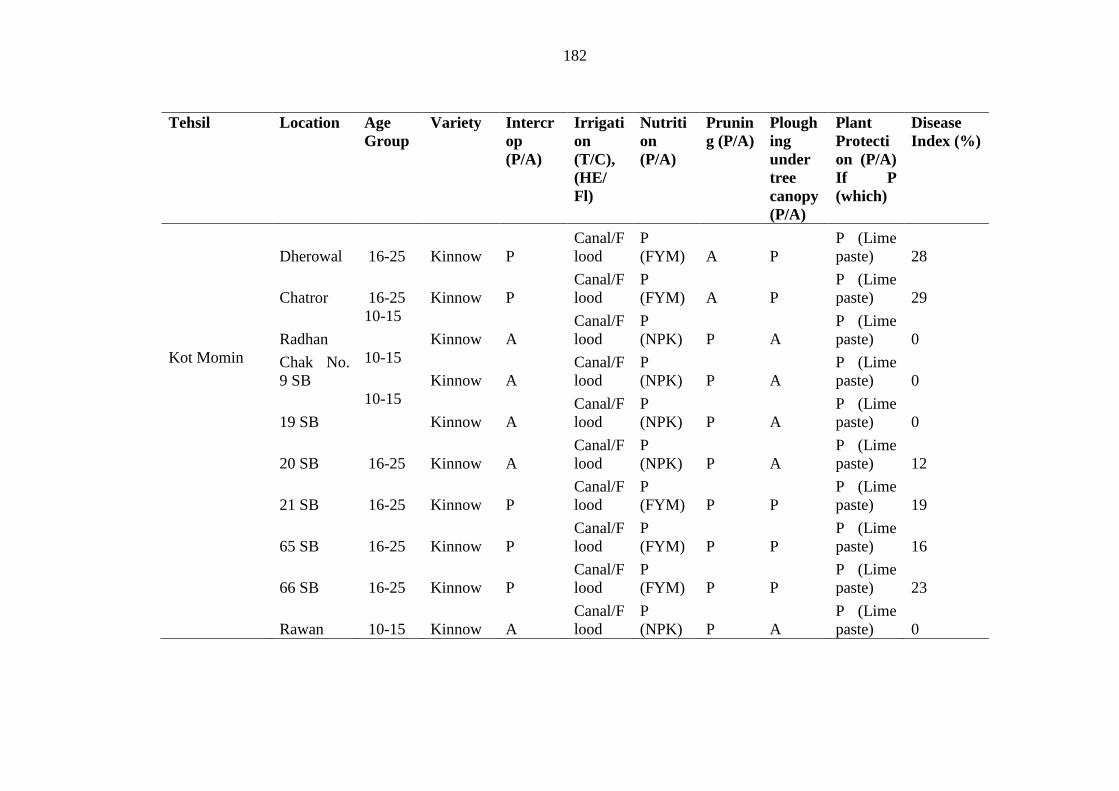
182
Tehsil Location Age
Group
Variety Intercr
op
(P/A)
Irrigati
on
(T/C),
(HE/
Fl)
Nutriti
on
(P/A)
Prunin
g (P/A)
Plough
ing
under
tree
canopy
(P/A)
Plant
Protecti
on (P/A)
If P
(which)
Disease
Index (%)
Dherowal 16-25 Kinnow P
Canal/F
lood
P
(FYM) A P
P (Lime
paste) 28
Chatror 16-25 Kinnow P
Canal/F
lood
P
(FYM) A P
P (Lime
paste) 29
Radhan
10-15
Kinnow A
Canal/F
lood
P
(NPK) P A
P (Lime
paste) 0
Kot Momin Chak No.
9 SB
10-15
Kinnow A
Canal/F
lood
P
(NPK) P A
P (Lime
paste) 0
19 SB
10-15
Kinnow A
Canal/F
lood
P
(NPK) P A
P (Lime
paste) 0
20 SB 16-25 Kinnow A
Canal/F
lood
P
(NPK) P A
P (Lime
paste) 12
21 SB 16-25 Kinnow P
Canal/F
lood
P
(FYM) P P
P (Lime
paste) 19
65 SB 16-25 Kinnow P
Canal/F
lood
P
(FYM) P P
P (Lime
paste) 16
66 SB 16-25 Kinnow P
Canal/F
lood
P
(FYM) P P
P (Lime
paste) 23
Rawan 10-15 Kinnow A
Canal/F
lood
P
(NPK) P A
P (Lime
paste) 0

183
FYM: Farmyard Manure; N: Nitrogen; P: Phosphorus; K: Potassium
Tehsil Location Age
Group
Variety Intercr
op
(P/A)
Irrigati
on
(T/C),
(HE/
Fl)
Nutriti
on
(P/A)
Prunin
g (P/A)
Plough
ing
under
tree
canopy
(P/A)
Plant
Protecti
on (P/A)
If P
(which)
Disease
Index (%)
Dera
Thoye
Wala 16-25 Kinnow P
Canal/F
lood
P
(FYM) A P
P (Lime
paste) 24
Ghulapur
Bangla 16-25 Kinnow P
Canal/F
lood
P
(FYM) A P
P (Lime
paste) 29
Jalla
Makhdum
10-15
Kinnow P
Canal/F
lood
P
(FYM) A P
P (Lime
paste) 16
Takht
Hazara
10-15
Kinnow A
Canal/F
lood
P
(FYM) P A
P (Lime
paste) 12
Naseerpur
Kalan
10-15
Kinnow A
Canal/F
lood
P
(FYM) P P
P (Lime
paste) 17
Mateela 16-25 Kinnow P
Canal/F
lood
P
(FYM) A P
P (Lime
paste) 25
Dodha 16-25 Kinnow P
Canal/F
lood
P
(FYM) A P
P (Lime
paste) 28
Midh
Road 16-25 Kinnow P
Canal/F
lood
P
(FYM) P A
P (Lime
paste) 16

184
orchards 10-15 years group following pruning, fertilizer regimes, without
ploughing under tree canopy and plant protection spray regimes while from
orchards of 16-25 age reciprocal observations were done. Almost similar trend was
seen in other tehsils i.e. Sargodha, Shahpur and Sahiwal. However, best
management of the orchards among all tehsils was observed in tehsil Kot Momin
and Sillanwali. (Table 7.1).
The overall correlation of various factors with the citrus decline
disease index (%) was analysed using SPSS softare. The results are shown in Table
7.2. A perfect correlation was observed regarding age group, intercropping and
nutrition of the orchards with disease index percentage. One to one correlation gave
the accurate picture. The results were significant regarding the correlation between
the age groups and disease index %. It was observed that in young orchards disease
was minimum or nil, while in other higher age groups it was vice versa. Therefore,
at alpha 0.02 a perfect correlation was found using two tailed correlation test
(Table 7.3).
The results are significant when we observe correlation of intercropping
(Table 7.4), nutrition application (Table 7.6), pruning of trees (Table 7.7) and
ploughing under the tree canopy (Table 7.8) at the 0.01 level (2-tailed). The mode
of irrigation (Table 7.5) and plant protection measures adopted (Table 7.9) were
almost constant, hence correlation could not develop.
It is obvious from the results that orchards need care and management to
avoid decline, especially the snescence affects the physiology of trees and they
cannot resist degradation of cells.On the other hand if the growers adopt best
management practices like pruning of the trees for deadwood removal, aeration and

185
Table 7.2:Correlations of factors causing citrus decline disease index (%).
Age Group
Intercrop
(P/A)
Irrigation
(T/C),
(HE/Fl)
Nutrition
(P/A)
Pruning
(P/A)
Ploughing
under tree
canopy
(P/A)
Plant
Protectio
n (P/A) If
P (which)
Disease
Index(%)
Age Group Pearson
Correlation 1 .687
** .
b .687
** .621
** -.835
** .
b .843
**
Sig. (2-
tailed) .000 . .000 .000 .000 . .000
N 86 86 86 86 86 86 86 86
Intercrop (P/A) Pearson
Correlation .687
** 1 .
b .663
** .607
** -.634
** .
b .714
**
Sig. (2-
tailed) .000 . .000 .000 .000 . .000
N 86 86 86 86 86 86 86 86
Irrigation (T/C),
(HE/Fl)
Pearson
Correlation .b .
b .
b .
b .
b .
b .
b .
b
Sig. (2-
tailed) . . . . . . .
N 86 86 86 86 86 86 86 86
Nutrition (P/A) Pearson
Correlation .687
** .663
** .
b 1 .624
** -.805
** .
b .736
**
Sig. (2-
tailed) .000 .000 . .000 .000 . .000
N 86 86 86 86 86 86 86 86
`Pruning (P/A) Pearson
Correlation .621
** .607
** .
b .624
** 1 -.723
** .
b .718
**

186
Age
Group
Intercrop
(P/A)
Irrigatio
n (T/C),
(HE/Fl)
Nutrition
(P/A)
Pruning
(P/A)
Ploughing
under tree
canopy
(P/A)
Sig. (2-
tailed) .000 .000 . .000 .000 . .000
N 86 86 86 86 86 86 86 86
Ploughing under
tree canopy
(P/A)
Pearson
Correlation -.835
** -.634
** .
b -.805
** -.723
** 1 .
b -.849
**
Sig. (2-
tailed) .000 .000 . .000 .000 . .000
N 86 86 86 86 86 86 86 86
Plant Protection
(P/A) If P
(which)
Pearson
Correlation .b .
b .
b .
b .
b .
b .
b .
b
Sig. (2-
tailed) . . . . . . .
N 86 86 86 86 86 86 86 86
Disease
Index(%)
Pearson
Correlation .843
** .714
** .
b .736
** .718
** -.849
** .
b 1
Sig. (2-
tailed) .000 .000 . .000 .000 .000 .
N 86 86 86 86 86 86 86 86
**. Correlation is significant at the 0.01 level (2-tailed).
b. Cannot be computed because at least one of the variables is constant.

187
Table 7.3: Correlation between citrus tree age groups with disease index (%)
Disease
Index (%)
Age Group
Disease Index (%) Pearson Correlation
Sig. (2-tailed)
N
1
86
.843**
0.000
86
Age Group Pearson Correlation
Sig. (2-tailed)
N
0.116
0.000
86
1
86
**. Correlation is significant at the 0.01 level (2-tailed).
Table 7.4:Correlation between intercrop in citrus orchards with disease index
(%)
Disease
Index (%)
Intercrop
(P/A)
Disease Index (%) Pearson Correlation
Sig. (2-tailed)
N
1
86
0.714**
0.000
86
Intercrop (P/A)Pearson Correlation
Sig. (2-tailed)
N
0.714**
0.000
86
1
86
**. Correlation is significant at the 0.01 level (2-tailed).

188
Table 7.5: Correlation between modes of irrigation in citrus orchards with disese
index (%)
Disease Index
(%)
Irrigation
(T/C), (HE/FI)
Disease Index (%) Pearson Correlation
Sig. (2-tailed)
N
1
86
.a
.
86
Irrigation(T/C),(HE/FI) Pearson Correlation
Sig. (2-tailed)
N
.a
.
86
.a
86
a. Cannot be computed because at least one of the variables is constant
Table7.6: Correlation between nutrition in citrus orchards with disese index (%).
Disease Index
(%)
Nutrition
(P/A)
Disease Index (%) Pearson Correlation
Sig. (2-tailed)
N
1
86
0.736**
0.000
86
Nutrition (P/A)
Sig. (2-tailed)
N
0.736**
0.000
86
1
86
a. Cannot be computed because at least one of the variable is constant

189
Table 7.7: Correlation between prunings in citrus orchards with disease index (%).
Disease index
(%)
Pruning
(P/A)
Disease Index (%) Pearson Correlation
Sig. (2-tailed)
N
1
86
0.718**
0.000
86
Pruning (P/ A) Pearson Correlation
Sig. (2-tailed)
N
0.718**
0.000
86
1
86
**. Correlation is significant at the 0.01 level (2-tailed).
Table 7.8: Correlation between ploughing under tree canopy in citrus orchards with
disease index (%).
Disease Index
(%)
Ploughing
under Tree
Canopy (P/A)
Disease Index (%) Pearson Correlation
Sig. (2-tailed)
N
1
86
-0.849**
0.000
86
Plouging under tree canopy (P/A) Pearson
Correlation
Sig. (2-tailed)
N
-0.849**
0.000
86
1
86
**. Correlation is significant at the 0.01 level (2-tailed).

190
Table 7.9: Correlation between plant protection in citrus orchards with disease
index (%).
Disease Index
(%)
Plant
Protection
(P/A)
Disease index (%) Pearson Correlation
Sig. (2-tailed)
N
1
86
.a
.
86
Plant Protection (P/A) Pearson Correlation
Sig. (2-tailed)
N
.a
.
86
.a
86
a. Cannot be computed because at least one of the variables is constant

191
Table 7.10:Factors affecting decline disease index in selected orchards of mango growing districts in Punjab.
District Tehsil Location Age
Group
Variety Interc
rop
(P/A)
Irrigation
(T/C),
(HE/Fl)
Nutrition
(P/A)
Pruning
(P/A)
Ploughing
under tree
canopy
(P/A)
Plant
Protecti
on (P/A)
If P
(which)
Disease
Index
(%)
Khane
wal
Kabir
wala
Qadirpur
Rawan
26-50 Chaunsa P Canal/
Flood
P (FYM) A P A 39
5 Kassi 26-50 Chaunsa P
Canal/
Flood P (FYM) A P A 39
Solgi 26-50 Chaunsa P
Canal/
Flood P (FYM) A P A 41
Matti Tal 26-50 Chaunsa P
Canal/
Flood P (FYM) A P A 51
Abbas
Pur 26-50 Chaunsa P
Canal/
Flood P (FYM) A P A 40
8 Kassi 26-50 Chaunsa P
Canal/
Flood P (FYM) A P A 47
Maula
Pur 26-50 Chaunsa P
Canal/
Flood P (FYM) A P A 49
Bilawal
Pur 26-50 Dosehri P
Canal/
Flood P (FYM) A P A 57
Basti
Toheed
Nagar 26-50 Chaunsa P
Canal/
Flood P (FYM) A P A 65
Hassan
Pur 26-50 Desi P
Canal/
Flood P (FYM) P P P (Imida) 37
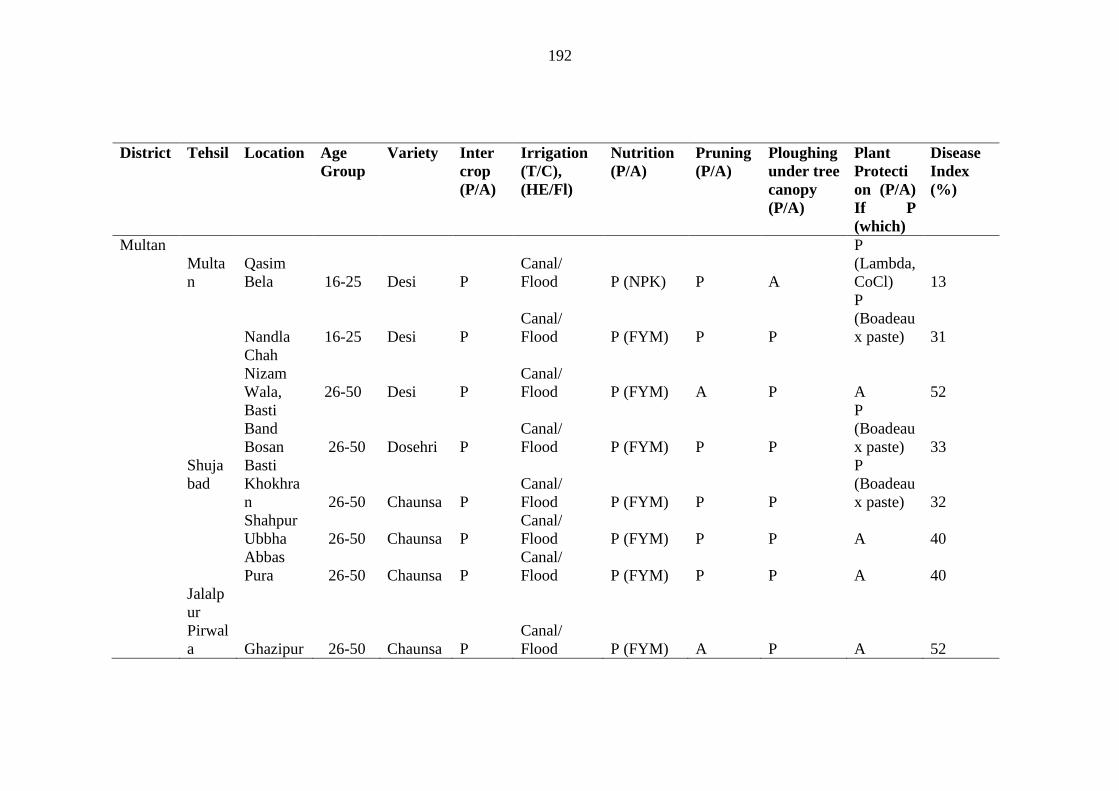
192
District Tehsil Location Age
Group
Variety Inter
crop
(P/A)
Irrigation
(T/C),
(HE/Fl)
Nutrition
(P/A)
Pruning
(P/A)
Ploughing
under tree
canopy
(P/A)
Plant
Protecti
on (P/A)
If P
(which)
Disease
Index
(%)
Multan
Multa
n
Qasim
Bela 16-25 Desi P
Canal/
Flood P (NPK) P A
P
(Lambda,
CoCl) 13
Nandla 16-25 Desi P
Canal/
Flood P (FYM) P P
P
(Boadeau
x paste) 31
Chah
Nizam
Wala, 26-50 Desi P
Canal/
Flood P (FYM) A P A 52
Basti
Band
Bosan 26-50 Dosehri P
Canal/
Flood P (FYM) P P
P
(Boadeau
x paste) 33
Shuja
bad
Basti
Khokhra
n 26-50 Chaunsa P
Canal/
Flood P (FYM) P P
P
(Boadeau
x paste) 32
Shahpur
Ubbha 26-50 Chaunsa P
Canal/
Flood P (FYM) P P A 40
Abbas
Pura 26-50 Chaunsa P
Canal/
Flood P (FYM) P P A 40
Jalalp
ur
Pirwal
a Ghazipur 26-50 Chaunsa P
Canal/
Flood P (FYM) A P A 52

193
District Tehsil Location Age
Group
Variety Interc
rop
(P/A)
Irrigation
(T/C),
(HE/Fl)
Nutrition
(P/A)
Pruning
(P/A)
Ploughing
under tree
canopy
(P/A)
Plant
Protecti
on (P/A)
If P
(which)
Disease
Index
(%)
Manik
Wali 26-50 Desi P
Canal/
Flood P (FYM) P P A 39
Muzaff
ar Garh
Muzaf
far
Garh
Makhan
Bela
26-50 Desi P
Canal/
Flood P (FYM) A P A 44
Rohillan
wali 26-50 Desi P
Canal/
Flood P (NPK) P P P (Imida) 27
Shah
Jamali 26-50 Desi P
Canal/
Flood P (FYM) A P A 44
Kot
Addu
Ali Wala
16-25 Chaunsa P
Canal/
Flood P (FYM) P P A 29
Musay
Wala
16-25
Tota
Pari P
Canal/
Flood P (NPK) P A
P
(Lambda,
CoCl,
Nativo) 13
Shuhrat
Wala 26-50 Desi P
Canal/
Flood P (FYM) A P P 40
Basti
Drigh 26-50 Desi P
Canal/
Flood P (FYM) A P P 52
Alipur Murad
pur Pull
26-50 Chaunsa P
Canal/
Flood P (FYM) P P
P
(Boadeau
x paste) 31
Basti
kray 26-50 Chaunsa P
Canal/Floo
d P (FYM) A P A 52

194
District Tehsil Location Age
Group
Variety Interc
rop
(P/A)
Irrigation
(T/C),
(HE/Fl)
Nutrition
(P/A)
Pruning
(P/A)
Ploughing
under tree
canopy
(P/A)
Plant
Protecti
on (P/A)
If P
(which)
Disease
Index
(%)
Basti Jat
Lashari 26-50 Desi P
Canal/
Flood P (FYM) A P A 41
Rahim
Yar
Khan
Rahim
Yar
Khan
Taranda
Muham
mad
Panah 26-50 Chaunsa P
Canal/
Flood P (FYM) A P A 32
Wahi
Shah
Muham
mad 26-50 Chaunsa P
Canal/
Flood P (FYM) A P A 52
Mianwali
Qureshia
n 26-50 Chaunsa P
Canal
/Flood P (FYM) A P
P
(Boadeau
x paste) 32
Sadiq
abad
Ahmad
Pur
Lumma 26-50 Desi P
Canal/
Flood P (FYM) A P A 41
Khan
Pur
Chak 2P
26-50 Desi P
Canal/
Flood P (FYM) A P A 48
Chak 3 P
26-50 Desi P
Canal/
Flood P (FYM) A P A 44
Liaqat
Pur
Chak 22
A 26-50 Desi P
Canal/
Flood P (FYM) A P A 45
Chak 23
26-50 Desi P
Canal/Floo
d P (FYM) A P A 49

195
District Tehsil Location Age
Group
Variety Interc
rop
(P/A)
Irrigation
(T/C),
(HE/Fl)
Nutrition
(P/A)
Pruning
(P/A)
Ploughing
under tree
canopy
(P/A)
Plant
Protecti
on (P/A)
If P
(which)
Disease
Index
(%)
Islam
Nagar 26-50 Desi P
Canal/
Flood P (FYM) A P A 48
Bahawa
lpur
Baha
walpu
r
Khanqah
Sharif More
than 50 Dosehri P
Canal/
Flood P (FYM) A P A 53
Chak 13
BC
More
than 50 Chaunsa P
Canal/
Flood P (FYM) A P A 52
Chak 23
BC
More
than 50 Chaunsa P
Canal/
Flood P (FYM) A P A 76
Nowsher
a 26-50 Chaunsa P
Canal/
Flood P (FYM) A P A 49
Munshi
Wala 26-50 Chaunsa P
Canal/
Flood P (FYM) A P A 57
Ahme
Pur
East
Channi
Goth
26-50 Chaunsa P
Canal/
Flood P (FYM) P P A 32
Mehrab
Wala, 26-50 Dosehri P
Canal/
Flood P (FYM) A P A 60
Muhabba
t Pur, 26-50 Dosehri P
Canal/
Flood P (FYM) A P A 48
Basti
Khokhra
n, 26-50 Langra P
Canal/
Flood P (FYM) A P A 45
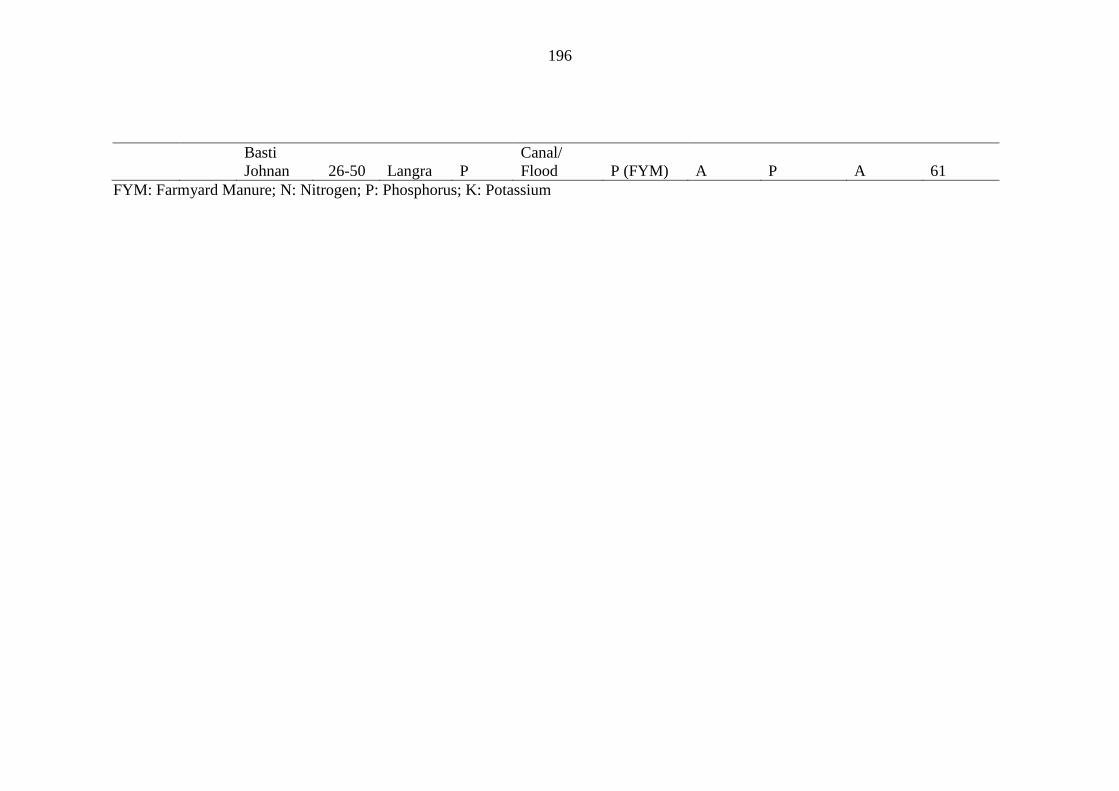
196
Basti
Johnan 26-50 Langra P
Canal/
Flood P (FYM) A P A 61
FYM: Farmyard Manure; N: Nitrogen; P: Phosphorus; K: Potassium

197
reducing height, they can keep trees young and energeting for a long time. This can
also be supplemented by using required nutrition after soil and water testing.
The results also showed that there is potential if we bring change in the
methods of irrigation which is currently flooding, in which most water is wasted. If
the growers adopt high efficiency irrigation such as drip, furrow or sprinkler
irrigation this might reduce decline of trees further. Similarly the crop protection
measures are almost uniform in all tehsils. If the growers start measures after
proper identification of pests and diseases, they can add in health of trees and
orchards.
To study factors favouring mango decline, a survey was done in the district
of Khanewal, Multan, Muzaffar Garh, Rahim Yar Khan and Bahawalpur. In
Kabirwala tehsil of Khanewal almost at all locations mango orchard trees fell into
age group of 26-50 years. At8locations chaunsa variety while in others locations
desi and dosehri variety of mango was cultivated. Intercropping was common in all
locations with wheat and cotton crop. At all of the locations and even the entire
districts observed canal water was used as irrigation through flooding in mango
orchards. All growers used farm yard manure as nutrition in the areas surveyed at
Kabirwala. Pruning was seen only at one location and ploughing under tree canopy
was a common practice. No plant protection measures adopted except in one
location where growers mostly spray Imidacloprid without knowing the need of
chemical. Amost similar situation was found in district Multan except at 2 locations
i.e. Qasim Bela and Nandla where orchards were relatively young and growers
followed good agricultural practices and disease index (%) was found low.

198
Table 7.11:Correlations of factors causing mango decline disease index (%).
Age
Gro
up
Inte
rcro
p
Irri
_m
od
e
Nu
trit
ion
Pru
nin
g
Plo
ugh
ing
un
der
tre
e
can
op
y
Pla
nt
Pro
tect
ion
Dis
ease
Ind
ex (
%)
Age Group Pearson Correlation 1 .a .
a .
a -.089 .030 -.068 .116
Sig. (2-tailed) . . . .548 .837 .644 .433
N 48 48 48 48 48 48 48 48
Intercrop Pearson Correlation .a .
a .
a .
a .
a .
a .
a .
a
Sig. (2-tailed) . . . . . . .
N 48 48 48 48 48 48 48 48
Irri_mode Pearson Correlation .a .
a .
a .
a .
a .
a .
a .
a
Sig. (2-tailed) . . . . . . .
N 48 48 48 48 48 48 48 48
Nutrition Pearson Correlation .a .
a .
a .
a .
a .
a .
a .
a
Sig. (2-tailed) . . . . . . .
N 48 48 48 48 48 48 48 48
Pruning Pearson Correlation -.089 .a .
a .
a 1 -.342
* .633
** -.676
**
Sig. (2-tailed) .548 . . . .017 .000 .000
N 48 48 48 48 48 48 48 48
Ploughing under tree
canopy
Pearson Correlation .030 .a .
a .
a -.342
* 1 -.311
* .542
**
Sig. (2-tailed) .837 . . . .017 .032 .000
N 48 48 48 48 48 48 48 48

199
Age
Gro
up
Inte
r
crop
Irri
_m
od
e
Nu
trit
ion
Pru
nin
g
Plo
ugh
ing
un
der
tre
e
can
op
y
Pla
nt
Pro
tect
ion
Dis
ease
Ind
ex (
%)
Plant Protection Pearson Correlation -.068 .a .
a .
a .633
** -.311
* 1 -.600
**
Sig. (2-tailed) .644 . . . .000 .032 .000
N 48 48 48 48 48 48 48 48
Disease Index (%) Pearson Correlation .116 .a .
a .
a -.676
** .542
** -.600
** 1
Sig. (2-tailed) .433 . . . .000 .000 .000
N 48 48 48 48 48 48 48 48
*. Correlation is significant at the 0.05 level (2-tailed).
**. Correlation is significant at the 0.01 level (2-tailed).
a. Cannot be computed because at least one of the variables is constant.
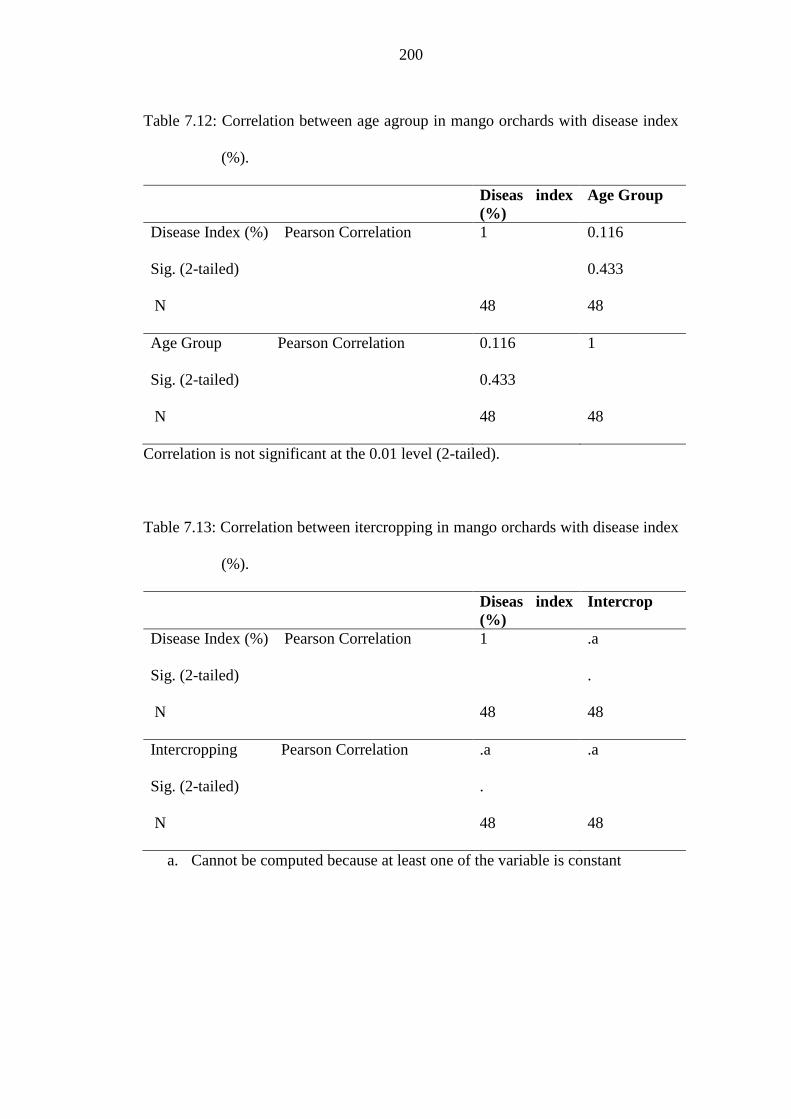
200
Table 7.12: Correlation between age agroup in mango orchards with disease index
(%).
Diseas index
(%)
Age Group
Disease Index (%) Pearson Correlation
Sig. (2-tailed)
N
1
48
0.116
0.433
48
Age Group Pearson Correlation
Sig. (2-tailed)
N
0.116
0.433
48
1
48
Correlation is not significant at the 0.01 level (2-tailed).
Table 7.13: Correlation between itercropping in mango orchards with disease index
(%).
Diseas index
(%)
Intercrop
Disease Index (%) Pearson Correlation
Sig. (2-tailed)
N
1
48
.a
.
48
Intercropping Pearson Correlation
Sig. (2-tailed)
N
.a
.
48
.a
48
a. Cannot be computed because at least one of the variable is constant
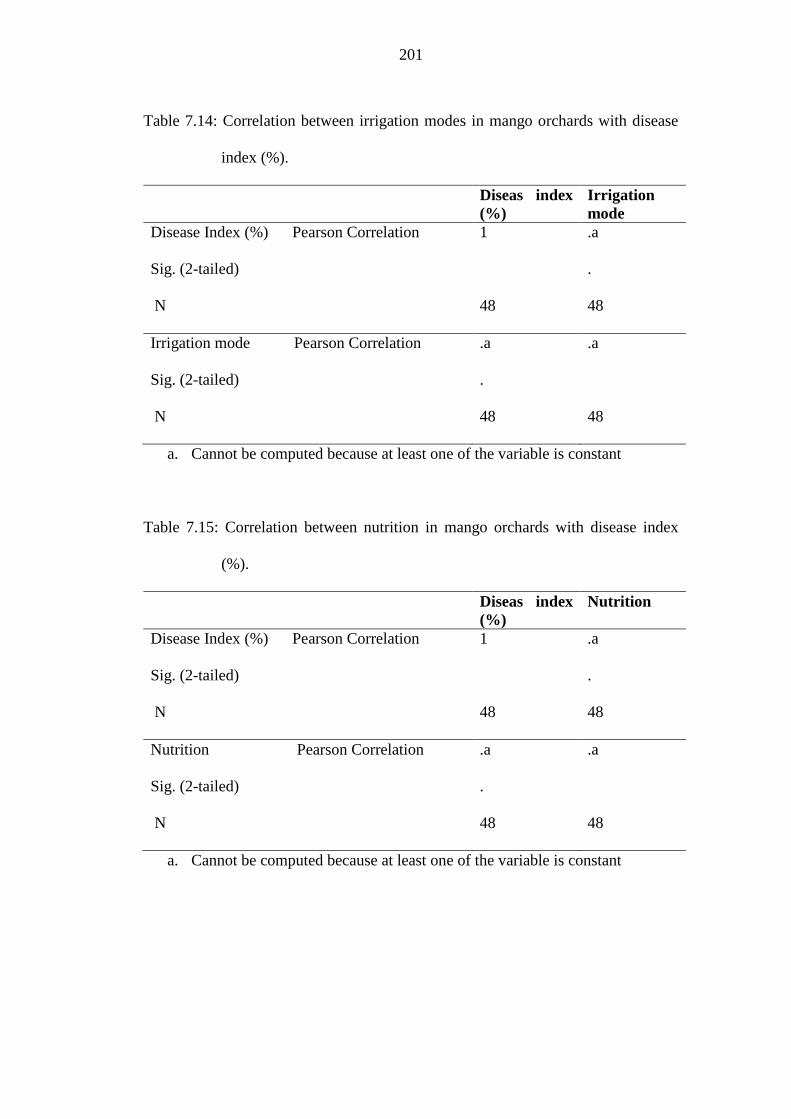
201
Table 7.14: Correlation between irrigation modes in mango orchards with disease
index (%).
Diseas index
(%)
Irrigation
mode
Disease Index (%) Pearson Correlation
Sig. (2-tailed)
N
1
48
.a
.
48
Irrigation mode Pearson Correlation
Sig. (2-tailed)
N
.a
.
48
.a
48
a. Cannot be computed because at least one of the variable is constant
Table 7.15: Correlation between nutrition in mango orchards with disease index
(%).
Diseas index
(%)
Nutrition
Disease Index (%) Pearson Correlation
Sig. (2-tailed)
N
1
48
.a
.
48
Nutrition Pearson Correlation
Sig. (2-tailed)
N
.a
.
48
.a
48
a. Cannot be computed because at least one of the variable is constant
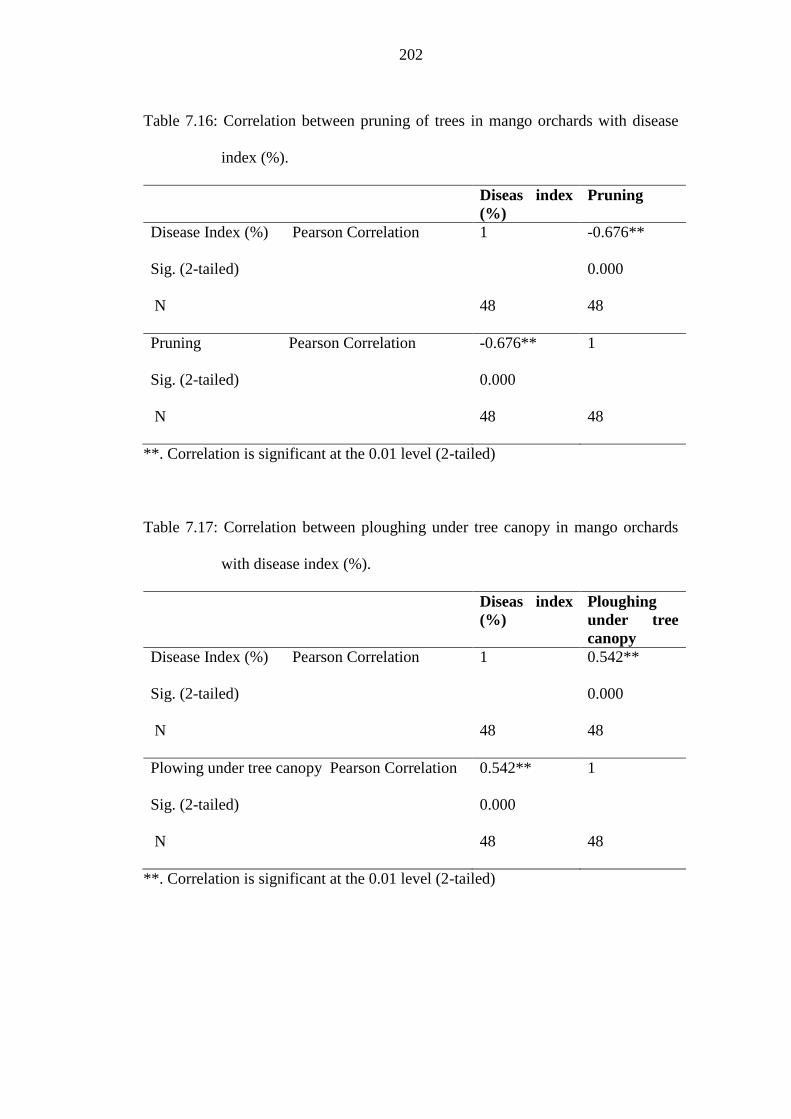
202
Table 7.16: Correlation between pruning of trees in mango orchards with disease
index (%).
Diseas index
(%)
Pruning
Disease Index (%) Pearson Correlation
Sig. (2-tailed)
N
1
48
-0.676**
0.000
48
Pruning Pearson Correlation
Sig. (2-tailed)
N
-0.676**
0.000
48
1
48
**. Correlation is significant at the 0.01 level (2-tailed)
Table 7.17: Correlation between ploughing under tree canopy in mango orchards
with disease index (%).
Diseas index
(%)
Ploughing
under tree
canopy
Disease Index (%) Pearson Correlation
Sig. (2-tailed)
N
1
48
0.542**
0.000
48
Plowing under tree canopy Pearson Correlation
Sig. (2-tailed)
N
0.542**
0.000
48
1
48
**. Correlation is significant at the 0.01 level (2-tailed)

203
Table 7.18: Correlation between pant protection in mango orchards with disease
index (%).
Diseas index
(%)
Plant
Protection
Disease Index (%) Pearson Correlation
Sig. (2-tailed)
N
1
48
-0.600**
0.000
48
Plant Protection Pearson Correlation
Sig. (2-tailed)
N
-0.600**
0.000
48
1
48
**. Correlation is significant at the 0.01 level (2-tailed)

204
Locations surveyed in Muzaffar Garh, Rahim Yar Khan and Bahawalpur
had shown results on same pattern as that of Khanewal and Multan (Table 7.10).
The correlation through statistical analysis showed the significance of various
factors with disease index (%) of mango decline (Table 7.11). The results were
significant against the factors like pruning (Table 7.16), ploughing under the
canopy of mango trees (Table 7.17) and the plant protection measures adopted
(Table 7.18) at the 0.01 level (2-tailed). Other factors like age group had shown no
significance, as tree of all ages were victim of decline. The correlation of
intercropping, irrigation and orchards nutritions was not found due to similarity in
the practices.
According to table 7.19 for guava districts Kasur, Sheikhupura and
Nankana were surveyed. In district Kasur, trees age group of 10-15 and 16-25 with
variety mix of Safeda, Allahabad and Karela. Intercropping of either wheat or
berseem was observed. In all of the orchards irrigation source was canal and
method was flooding. Proper nutrition was followed only at few places. Similar
situations were found in district Sheikhupura and district Nankana.
The statistical correlation showed that the guava decline is significantly
affected by age group, nutrition, pruning, ploughing under tree canopy and plant
protection measures adopted or neglected in the guava orchards. (Table 7.21, 7.23,
7.25. 7.26 and 7.27). However, decline in guava is not as severe as it has been
observed in mango.
The above results indicate that decline diseases can appear in any age group
of the disease but with different disease index % ages. However, it is very clear that
the young orchards are relatively healthy in all commodities and in all locations.

205
Table 7.19:Factors affecting decline disease index in selected orchards of guava growing districts in Punjab.
District Tehsil Location Age
Group
Variety Inte
rcrop
(P/A)
Irrigation
(T/C),
(HE/Fl)
Nutritio
n (P/A)
Prunin
g (P/A)
Plough
ing
under
tree
canopy
(P/A)
Plant
Protectio
n (P/A) If
P (which)
Disease
Index(%
)
Kasur Kasur Qaisar
Garh
16-25 Allahaba
d
P Canal/Flood A A P A 17
Dolaywa
la
10-15 Allahaba
d
P Canal/Flood A A P P (Lime
paste)
20
Noor
Shah
Wali
16-25 Safeda P Canal/Flood A A P A 19
New City
Kasur
10-15 Safeda P Canal/Flood A A P A 9
Sadar
Diwan
10-15 Safeda P Canal/Flood P (FYM) P A P (Lime
paste)
23
Chuniy
an
Khara 16-25 Karela P Canal/Flood A A P A 8
Kot
Gurdas
Wala
10-15 Karela P Canal/Flood P (FYM) A A P
Bordeaux
Paste
23
Pattoki Gehlan
Pathak
16-25 Safeda P Canal/Flood A A P A 19

206
District Tehsil Location Age
Group
Variety Inte
rcrop
(P/A)
Irrigation
(T/C),
(HE/Fl)
Nutritio
n (P/A)
Prunin
g (P/A)
Plough
ing
under
tree
canopy
(P/A)
Plant
Protectio
n (P/A) If
P (which)
Disease
Index(%
)
Rukan
Pura
16-25 Allahaba
d
P Canal/Flood A A P P (Lime
paste)
24
Sehjowal 26-50 Allahaba
d
P Canal/Flood A A P A 33
Sheikhupu
ra
Feroze
wala
Faizpur
interchan
ge,
26-50 Karela P Canal/Flood A A P A 16
Adda
Thabal
10-15 Safeda P Canal/Flood A A A P (Lime
paste)
17
Noor
Shah
10-15 Allahaba
d
P Canal/Flood A A P P (Lime
paste)
28
Burj
Attari
16-25 Allahaba
d
P Canal/Flood A A P A 19
Saggian
Khurd
16-25 Safeda P Canal/Flood A A P P (Lime
paste)
17
Thikriwa
la
16-25 Safeda P Canal/Flood A A P P (Lime
paste)
8
Sharaq
pur
Sharaqpu
r
16-25 Safeda P Canal/Flood P (NPK) A A P
(Bordeaux
paste)
12

207
District Tehsil Location Age
Group
Variety Inte
rcrop
(P/A)
Irrigation
(T/C),
(HE/Fl)
Nutritio
n (P/A)
Prunin
g (P/A)
Plough
ing
under
tree
canopy
(P/A)
Plant
Protectio
n (P/A) If
P (which)
Disease
Index(%
)
Ghareeba
bad
10-15 Karela P Canal/Flood A A P P (Lime
paste)
9
Sukhanw
ala
10-15 Karela P Canal/Flood P (NPK) P A P
(Bordeaux
paste)
15
Kot
Mahmoo
d
10-15 Safeda P Canal/Flood A P P A 15
Nankana
Sahib
Nankan
a Sahib
Jalal
Nou
16-25 Safeda P Canal/Flood A P P A 9
Giller
Wala
10-15 Safeda P Canal/Flood P (FYM) P A P (Lime
paste)
8
Magtan
Wala
10-15 Safeda P Canal/Flood P (NPK) P P P
(Bordeaux
paste)
27
Adda Pul
Torian
10-15 Safeda P Canal/Flood A A P A 19
Chachka
y Gill
10-15 Safeda P Canal/Flood A P P A 12

208
District Tehsil Location Age
Group
Variety Inte
rcrop
(P/A)
Irrigation
(T/C),
(HE/Fl)
Nutritio
n (P/A)
Prunin
g (P/A)
Plough
ing
under
tree
canopy
(P/A)
Plant
Protectio
n (P/A) If
P (which)
Disease
Index(%
)
Mirza
Pur
10-15 Safeda P Canal/Flood A P A A 8
Mandi
Faziabad
10-15 Safeda P Canal/Flood P (NPK) P P P (Lime
paste)
17
FYM: Farmyard Manure; N: Nitrogen; P: Phosphorus; K: Potassium

209
Table 7.20: Correlation of factors causing guava decline with disease index
Age
Gro
up
Inte
rcro
p
Irri
gatt
io
n m
od
e
Nu
trit
ion
Pru
nin
g
Plo
ugh
in
g u
nd
er
tree
can
op
y
Pla
nt
Pro
tect
io n
Dis
ease
Ind
ex
(%)
Age Group Pearson Correlation 1 .a .
a -.332 -.415
* .318 -.383
* .608
**
Sig. (2-tailed) . . .091 .031 .106 .049 .001
N 27 27 27 27 27 27 27 27
Intercrop Pearson Correlation .a .
a .
a .
a .
a .
a .
a .
a
Sig. (2-tailed) . . . . . . .
N 27 27 27 27 27 27 27 27
Irri_mode Pearson Correlation .a .
a .
a .
a .
a .
a .
a .
a
Sig. (2-tailed) . . . . . . .
N 27 27 27 27 27 27 27 27
Nutrition Pearson Correlation -.332 .a .
a 1 .427
* -.677
** .350 -.684
**
Sig. (2-tailed) .091 . . .026 .000 .074 .000
N 27 27 27 27 27 27 27 27
Pruning Pearson Correlation -.415* .
a .
a .427
* 1 -.299 .105 -.562
**
Sig. (2-tailed) .031 . . .026 .130 .603 .002
N 27 27 27 27 27 27 27 27
Ploughing
under tree can.
Pearson Correlation .318 .a .
a -.677
** -.299 1 -.276 .594
**
Sig. (2-tailed) .106 . . .000 .130 . .164 0.001
N 27 27 27 27 27 27 27 27

210
Age
Gro
up
Inte
rcro
p
Irri
gati
on
mod
e
Nu
trit
ion
Pru
nin
g
Plo
ugh
ing
un
der
tre
e
can
op
y
Pla
nt
Pro
tect
ion
Dis
ease
Ind
ex (
%)
Plant Protection Pearson Correlation -.383* .
a .
a .350 .105 -.276 1 -.571
**
Sig. (2-tailed) .049 . . .074 .603 .164 .002
N 27 27 27 27 27 27 27 27
Disease Index
(%)
Pearson Correlation .608**
.a .
a -.684
** -.562
** .594
** -.571
** 1
Sig. (2-tailed) .001 . . .000 .002 .001 .002
N 27 27 27 27 27 27 27 27
*. Correlation is significant at the 0.05 level (2-tailed).
**. Correlation is significant at the 0.01 level (2-tailed).
a. Cannot be computed because at least one of the variables is constant.

Table 7.21: Correlation between age groups in guava orchards with disease index (%).
Diseas index
(%)
Age Group
Disease Index (%) Pearson Correlation
Sig. (2-tailed)
N
1
27
0.608**
0.001
27
Age Group Pearson Correlation
Sig. (2-tailed)
N
-0.608**
0.001
27
1
27
**. Correlation is significant at the 0.01 level (2-tailed)
Table 7.22: Correlation between intercropping of trees in guava orchards with disease
index (%).
Diseas index
(%)
Intercrop
Disease Index (%) Pearson Correlation
Sig. (2-tailed)
N
1
27
.a
.
27
Intercrop Pearson Correlation
Sig. (2-tailed)
N
.a
.
27
1
27
a. Cannot be computed because of the variables is constan

ii
ii
Table 7.23: Correlation between irrigation modes in guava orchards with disease index
(%).
Diseas index
(%)
Irrigation
mode
Disease Index (%) Pearson Correlation
Sig. (2-tailed)
N
1
27
.a
.
27
Irrigation mode Pearson Correlation
Sig. (2-tailed)
N
.a
.
27
.a
27
a. Cannot be computed because of the variables is constan
Table 7.24: Correlation between nutrition applications in guava orchards with disease
index (%).
Diseas index
(%)
Nutrition
Disease Index (%) Pearson Correlation
Sig. (2-tailed)
N
1
27
-0.684**
0.000
27
Nutrition Pearson Correlation
Sig. (2-tailed)
N
-0.684**
0.000
27
1
27
**. Correlation is significant at the 0.01 level (2-tailed)

iii
iii
Table 7.25: Correlation between pruning of trees in guava orchards with disease index
(%).
Diseas index
(%)
Pruning
Disease Index (%) Pearson Correlation
Sig. (2-tailed)
N
1
27
-0.562**
0.002
27
Pruning Pearson Correlation
Sig. (2-tailed)
N
-0.562**
0.002
27
1
27
**. Correlation is significant at the 0.02 level (2-tailed)
Table 7.26: Correlation between ploughing under tree canopy in guava orchards with
disease index (%).
Diseas index
(%)
Ploughing
under tree
canopy
Disease Index (%) Pearson Correlation
Sig. (2-tailed)
N
1
27
0.594**
0.001
27
Age Group Pearson Correlation
Sig. (2-tailed)
N
0.594**
0.001
27
1
27
**. Correlation is significant at the 0.01 level (2-tailed)

iv
iv
Table 7.27: Correlation between plant protection in guava orchards with disease index
(%).
Diseas index
(%)
Plant
Protection
Disease Index (%) Pearson Correlation
Sig. (2-tailed)
N
1
27
0.571**
0.002
27
Plant Protection Pearson Correlation
Sig. (2-tailed)
N
0.571**
0.002
27
1
27
**. Correlation is significant at the 0.02 level (2-tailed)
The senescence in tree has also greatly aggravated the problems.Especially in case of
mango where the age group is either 26-50 years or even more, the disease index has
touched 76% in Bahawalpur. However, in case of citrus and guava as the orchards
were not too old the disease index was not much high.

v
v
7.5. DISCUSSION
A significant correlation was observed in citrus for trees age and disease index.
It means that with an increase in tree age there was a corresponding increase in disease
index.
With increasing age, the efficiency of tree for performing physiological
function lowersi.e. lower photosynthetic rates, decreased growth rates, shifting of
carbon resources to different parts of the plant and reductions in foliar efficiency, leaf
size and gas exchange rates (Kaufmann, 1996; Ryan and Yoder, 1997; Carrer and
Urbinati, 2004; Martínez-Vilalta et al., 2007).Similarly, the larger tree size and the
structural complexity associated with tree aging increase the maintenance respiration
costs and reduce the efficiency of water transport; both tend to reduce growth (Weiner
and Thomas, 2001; Carrer and Urbinati, 2004; Pennisi, 2005).
It has been reported that citrus productivity life span is only ten years, which is
the prime age of production, whereas it is not uncommon for citrus orchards to remain
in production for over 50 years in many other countries.It has also been mentioned that
the average age of citrus tree in Pakistan is about 25 years. Therefore, the significant
correlation between citrus age and disease index in the current study is supported by
the previous findings of Ahmed et al.(2006) and Niaz et al. (2004). It has also been
observed that fruit trees which are invaded by fungi in early age, react more severely
in the advanced stage (Fraser and Singh, 1966).
In Pakistan more than 75% farmers are considered small landholders and even
their holdings are shared. The small landholdings compel the growers for intensive
cropping. Same is the case with citrus orchards like other fruit trees in Pakistan.

vi
vi
Therefore, intercropping of different kinds of fodders, cereals and other trees are a
common practice in the country. Intercropping in the orchards is in a way beneficial
for citrus growers, as it meets the needs of fodder for his livestock, grain for household
use, fuel for his kitchen etc. At the same time the harmful pests and pathogen of
diseases are harboured by these alternate hosts. This happens only when the
intercropping is done with competing plants and unmatching life cycles. Same
happened in trees under current study.
It was observed that rigorous and deep ploughing was done even under the
canopy of trees which resulted in increased tree decline incidence as compared to
orchards without intercropping. Intercropping also disturbs citrus orchards with
unwanted spray and irrigation regimes received by the intercropped plants (Johnson,
2006). However, from rest of the world it has been reported that the intercropping of
leguminous crops in citrus orchards help in the fertility of the orchards. Similarly if
intercropped plants receive nitrogen, phosphorus and potassium fertilizers, indirectly
these are also available to citrus trees as well as encourage the population of friendly
insects. For example Sohail et al.(2013) reported that maizeintercropped plots of each
citrus variety had low infestation of citrus miner and high population of coccinellids
and Chrysoperla carnea when maize was intercropped in citrus orchards between the
tree rows away from tree canopies.
In most of the surveyed orchards in citrus areas, nutrition was being provided
either in the form of farmyard manure or as NPK. However, it was important to know
that only about 18% of the areas surveyed were using the recommended doses of NPK
fertilizers (700:350:700 g of NPK per tree with 4-6 kg FYM). Nutrient management in
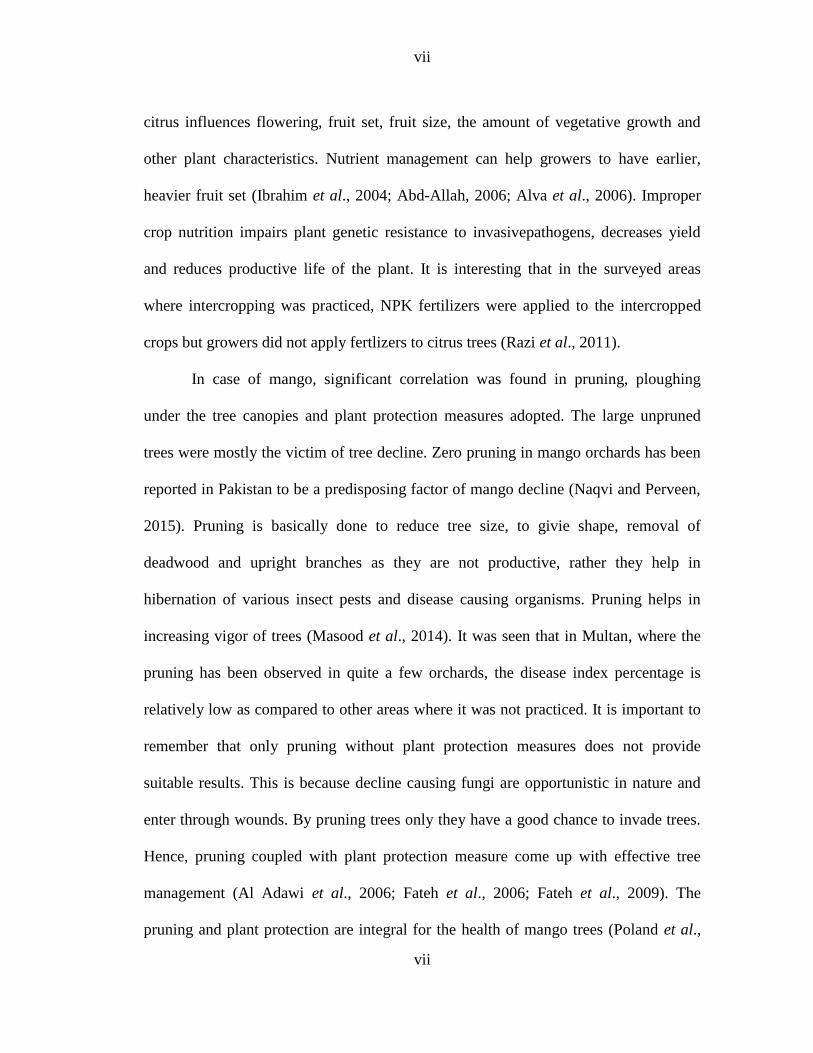
vii
vii
citrus influences flowering, fruit set, fruit size, the amount of vegetative growth and
other plant characteristics. Nutrient management can help growers to have earlier,
heavier fruit set (Ibrahim et al., 2004; Abd-Allah, 2006; Alva et al., 2006). Improper
crop nutrition impairs plant genetic resistance to invasivepathogens, decreases yield
and reduces productive life of the plant. It is interesting that in the surveyed areas
where intercropping was practiced, NPK fertilizers were applied to the intercropped
crops but growers did not apply fertlizers to citrus trees (Razi et al., 2011).
In case of mango, significant correlation was found in pruning, ploughing
under the tree canopies and plant protection measures adopted. The large unpruned
trees were mostly the victim of tree decline. Zero pruning in mango orchards has been
reported in Pakistan to be a predisposing factor of mango decline (Naqvi and Perveen,
2015). Pruning is basically done to reduce tree size, to givie shape, removal of
deadwood and upright branches as they are not productive, rather they help in
hibernation of various insect pests and disease causing organisms. Pruning helps in
increasing vigor of trees (Masood et al., 2014). It was seen that in Multan, where the
pruning has been observed in quite a few orchards, the disease index percentage is
relatively low as compared to other areas where it was not practiced. It is important to
remember that only pruning without plant protection measures does not provide
suitable results. This is because decline causing fungi are opportunistic in nature and
enter through wounds. By pruning trees only they have a good chance to invade trees.
Hence, pruning coupled with plant protection measure come up with effective tree
management (Al Adawi et al., 2006; Fateh et al., 2006; Fateh et al., 2009). The
pruning and plant protection are integral for the health of mango trees (Poland et al.,

viii
viii
2006). Similarly, ploughing under tree canopy which injures roots provides an easy
entry for the opportunistic fungi to invade mango trees and cause mortality. It has been
observed especially, the fungus Ceratocystis fimbriata in mango has entered through
root wounds (Saeed et al., 2007; Masoodet al., 2011).
In guava, a significant correlation was recorded for disease index with age
group, nutrition, pruning, ploughing under tree canopy and plant protection measures.
As it has been discussed in citrus and mango, the age of tree is one of the biggest
factors inviting the decline of trees, same is the case in guava as well (Khushk et al.,
2009). It has been discussed in details earlier in case of mango that how pruning and
plant protection measures are linked. Pruning reduces the disease pressure and
improves the vigor of guava trees (Tomita et al., 2016). The nutrition in guava
orchards is seldom found especially the application of NPK is not adopted. However,
nutrition is given in the form of farmyard manure. However, it has been reported that
one percent increase in these factors results in 0.21 and .016 percent increase in guava
yield (Ishtiaq et al., 2012). The major difference that has been observed in the severity
of decline disease of guava from mango can be the difference in height as well as the
density of leaves and branches. It was observed that guava trees were not as large as
mango trees, having few branches which would allow the aeration and sunlight as
well. However, tree injuries were common which were the entry point of various fungi
as reported by Abbas et al.(2014). It is also worth mentioning to discuss here that
Pakistan is among the water deficient countries and cannot afford flood irrigation for
its orchards or other crops. Secondly, the excessive standing water is lethal in two
ways that it causes suffocation of trees as well as it can act as medium for spread of

ix
ix
diseases from diseased trees to healthy ones. The country has been introduced to high
efficiency irrigation systems and there is dire need to adopt them for conserving
precious water as well as protect plants (Malik et al., 2004; Khushket al., 2009; Mirjat
et al., 2011).
Based on the results of above study, the following short term management
recommendations can be given:
1. Make sure to buy healthy planting material from reliable nurseries.
2. Pruning for having vigorous trees and providing quality fruits.
3. Follow recommendation of plant protection specialists for suitable and safe
spray regimes.
4. Analysis based nutrition for producing quality fruits may be adopted under
the guidance of nutrition specialists.
5. Wounding of the tree may be avoided to check entry of pests and
pathogens.
6. Intercrop with companion crops, such as legumes or with matching life
cycles.
7. Floor management may be encouraged, using local grass species without
disturbing the root zones of trees.
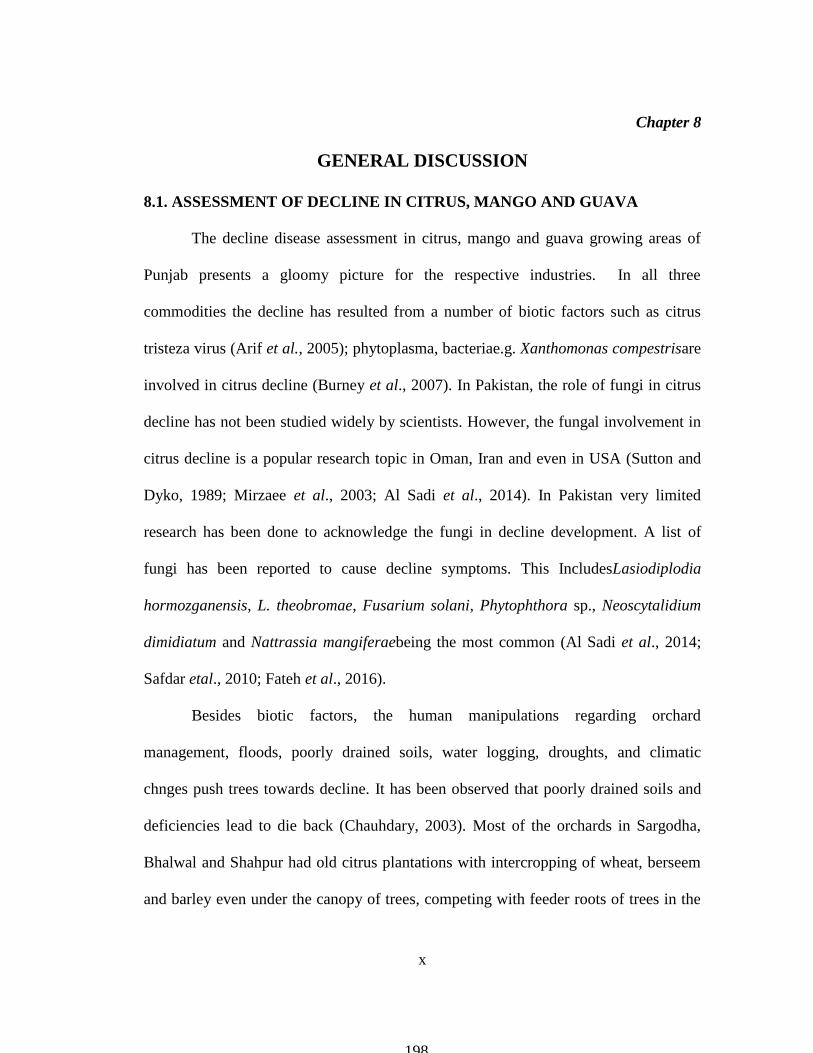
x
x
Chapter 8
GENERAL DISCUSSION
8.1. ASSESSMENT OF DECLINE IN CITRUS, MANGO AND GUAVA
The decline disease assessment in citrus, mango and guava growing areas of
Punjab presents a gloomy picture for the respective industries. In all three
commodities the decline has resulted from a number of biotic factors such as citrus
tristeza virus (Arif et al., 2005); phytoplasma, bacteriae.g. Xanthomonas compestrisare
involved in citrus decline (Burney et al., 2007). In Pakistan, the role of fungi in citrus
decline has not been studied widely by scientists. However, the fungal involvement in
citrus decline is a popular research topic in Oman, Iran and even in USA (Sutton and
Dyko, 1989; Mirzaee et al., 2003; Al Sadi et al., 2014). In Pakistan very limited
research has been done to acknowledge the fungi in decline development. A list of
fungi has been reported to cause decline symptoms. This IncludesLasiodiplodia
hormozganensis, L. theobromae, Fusarium solani, Phytophthora sp., Neoscytalidium
dimidiatum and Nattrassia mangiferaebeing the most common (Al Sadi et al., 2014;
Safdar etal., 2010; Fateh et al., 2016).
Besides biotic factors, the human manipulations regarding orchard
management, floods, poorly drained soils, water logging, droughts, and climatic
chnges push trees towards decline. It has been observed that poorly drained soils and
deficiencies lead to die back (Chauhdary, 2003). Most of the orchards in Sargodha,
Bhalwal and Shahpur had old citrus plantations with intercropping of wheat, berseem
and barley even under the canopy of trees, competing with feeder roots of trees in the
198
xi
xi
root zone.In the surveyed orchards where dead wood removal and pruning was not
commonly practiced theorchards looked like forest(Ali et al., 2004).
The most available nutrition to the citrus trees was farmyard manure which at
many places were dumped fresh in the orchards and caused burning of leaves. This
practice can badly influence the soil pH and soil salinity. Imbalanced nutrition resulted
in deficiency and toxicity of some elements e.g. zinc deficiency in the orchards which
also promoted die back symptoms in trees. Although, it has been reported that citrus
orchards are mostly macronutient deficient (Stenico et al., 2009). Another major issue
is the quality of sub soil water which is unfit for irrigation and played an important
role to destroy the citrus orchards. Canal water is not frequently available and flooding
is done whenever it is available. It means there is no timely irrigation followed in the
orchards.
Generally, more than 15% disease index of any disease at any location or any
commodity is considered alarming. In district Sargodha overall disease index ranged
from minimum 10.36 to maximum 29.41% which requires the immediate attention of
the scientists and other stakeholders to have more research for management of the
system through trainings and education (Fateh et al., 2017).
Among the insect pests, leaf miner, citrus psylla, whitefly and lemon butterfly
were common. The gaps in the orchards were filled with poor quality planting
material. So a complex of soil nutrients, insect pests and improper irrigation was
observed which are all limiting factors for the growth and favorable for the disease
(Khan et al., 2011).

xii
xii
In tehsils like Kot Momin and Sillanwali,the growers were following integrated
orchard management approaches e.g. pruning of trees; plant protection sprays for
insect pest and diseases on proper guidance from plant protection specialists; soil and
water analysis for nutrition; orchard floor management without intercropping and
unnecessary ploughing in the orchards. These good agricultural practices make
Sillanwali and Kot Momin better as compared to other citrus growing tehsils.
Moreover, nutritional study has been conducted in all tehsils of Sargodha and it was
obvious that the above mentioned 2 tehsils were comparatively much better in
nitrogen, potassium and phosphorus contents (Razi et al., 2011). Pruning in most of
the orchards resulted in proper shapes of trees and no brancheswere touching the
ground oroverlapping each other. Ploughing was not being done under the tree
canopies and hence there was no chance of damage to the roots to provide openings to
opportunistic fungi. Pruning of the trees reduces the pests and diseases and improves
the equal flow of nutrients to whole tree making it vigorous to produce more quality
food. It keeps the size of the tree in control and makes easy the field practices, sprays
as well as fruit harvesting without much damage (Van Vuuren and Graca, 1996). In
few orchards an effort was made to paste the lime and Bordeaux paste as well. This
was enough to avoid the opportunistic fungi invading the stems as well as insects
creeping into the bark cracks such as spider mite (Overmeer, 1985).
The localities surveyed in Bhalwal include Chak No. 10 /NB, Chak No. 10/1
were well managed. Moreover, the growers were literate and well aware of the orchard
management. Most of them were posted on the influential posts as well as had links to
the experts in citrus production technology. This may also be due to the international

xiii
xiii
projects running in the area. The trees were well pruned with good shapes having ages
of 10-15years. Many orchards were having the lime pasting and some were sprayed
with suitable pesticides. There was almost an equal ratio of farmers who were
maintaining the orchards themselves as well as those whose orchards were maintained
by the attendants. These orchards were being continuously monitored by the Global
Gap Certification Project of USAid. The experts guided the growers at each stage to
perform different activities at different phenological stages (Anonymous, 2008).
Mango decline is also a problem of all traditional mango growing areas of
Pakistan. The survey to record the occurrence of mango decline was done in
Khanewal, Multan, Muzaffar Garh, Rahim Yar Khan and Bahawalpur distrcits which
are famous for mango production. Maximum disease index of 53.30% was recorded in
district Bahawalpur. During survey the large overlapping trees were observed in this
district. Most of the areas surveyed had more than 100 years old plantations (Fateh et
al., 2016). The growers were not even aware of the disease and they thought that
senescens had resulted in such symptoms of the trees. Secondly, mango orchards are
not given first importance rather the intercropped crops are considered important to the
growers. The large farms are owned by the absent landlords who stay abroad and leave
orchard management on their managers (munshies). These munshies strongly believe
in traditional mango cultivation and show harshness towards the adoption of
innovative technologies (Khushk et al., 1996).
The farmers have lost their interest in the mango orchards and taking more
interest in the housing colonies. The orchards were neglected and animal grazing and
lopping of trees were common. Most of the trees have been uprooted. The existing

xiv
xiv
trees had many wounds. The age of the trees ranged from 26-50 years. The old age
itself a problem for the trees as they are more vulnerable to be attacked by the diseases
(Kazmi et al., 2005; Malik et al., 2005). However, mango tree decline was not limited
to only old age trees but equally found on young trees as well. The trees were large in
size, overlapping with each other giving a complete shade in the orchard and not
allowing any penetration of sunlight. The pruning of the trees was like sin for the
growers (Jiskani, 2002).
Flood irrigation was adopted in the orchards which could easily spread the
disease from infected trees to healthy ones. The water was directly touching the stems
of the trees and leaf drop was much more common. The chemical fungicides which
were not supposed to be for mango were sprayed intentionally on the trees i.e. the
chemicals left over after spraying on cotton and other crops (Iqbal et al.. 2007).
Along the Multan Khanewal and Multan Shujabad Road, many orchards were
pruned and few orchards also showed the lime pasting around tree trunk that showed
that these orchards are not as neglected as the orchards along Band Bosan Road.
Another reason may be that orchard along Shujabad road were in the area of Mango
Research Station Shujabad and had links with the expert. Therefore, the growers were
taking interest in the management of their orchards and decline occurrence in these
orchards was little bit less (Fateh et al., 2016).
Guava decline is another big threat in Pakistan. As we have already limited
area for guava cultivation in Punjab and due to the stressed conditions someday this
precious fruit will vanish from lands of Pakistan. It is a national problem of Pakistan
because since last decade the guava production has been declining. The problem of

xv
xv
guava decline has been prevailing in Lahore, Sheikhupura, Faisalabad, Jhang and
Sargodha (Khushk et al., 2009). Maximum guava decline disease index was observed
in Kasur (18%) followed by Sheikhupura (17%) and minimum of 14% in Tehsil
Nankana. Kasur being the nursery industry area, the nursery growers are interested in
guava in high density for sale rather than in better management to earn from the fruit.
Most of the trees are not grown in proper rows, rather overlapping with each other in
such a way that all the operation like sprays, pruning and machine operations are
difficult. Improper cuttings and non treatment of wounds are giving rise to guava
decline situation. However, proper guava cultivation has been observed in
Sheikhupura but with intercropping of wheat and berseem. Ploughing inside the
orchards is increasing tree infection by making injuries. Nankana is comparatively low
in disease as mostly there are new plantations with proper planning and better
management strategy.
It is concluded that the situation of decline in citrus, mango and guava orchards
is alarming and almost every orchard faced the problem. The situation warrants strict
control strategies for its management. It is also emphasized that the farming
community be trained in this regard to adopt better management strategies.
8.2. COMMON SYMPTOMS OF DECLINE IN CITRUS, MANGO AND
GUAVA
The common symptoms found in the orchards included the bark splitting,
gummosis, leaf drooping and discoloration, twig blight, die back and the eventual tree
mortality. In case of citrus decline, however, there are few additional symptoms like
yellowing, dwarfing or bunching which are attributes of viruses and phytoplasma.

xvi
xvi
Symptoms are always the expression of some disorders of the plants which result from
being invaded by the biotic factors like viruses, fungi, phytoplasma, nematodes etc and
also the result from human manipulations (Safdar et al., 2010). In mango decline the
first symptoms that appear in declining tree is leaf drooping that shows that the
nutrients flow has stopped inside the vascular tissues. Actually the decline causing
fungi enter through the wounded roots or stem and invade the vascular tissues. They
keep growing and form the tylosis in the vascular bundles, thus blocking the flow of
nutrients. Resultantly, the nutrients keep depositing in the air pockets which when
overflow are ruptured the bark and oozing out as thick dark fluid. In most of the
affected trees the stain of overflowing fluid were seen. When the stem of the affected
trees are scraped after peeling of the bark, the dark brown to grey cankers are found
(Kazmi et al., 2005; Fateh et al., 2006; Masood et al., 2010). Similar symptoms have
been observed in guava but the leaf drooping wass not as much apparent as in mango.
However, leaf drying and leaf drooping is found in many trees. The dark stains at the
base of trees are also observed in guava (Rangaswami, 1984).
8.3. MYCOFLORA ISOLATED FROM THE DECLINE AFFECTED TREES
A number of fungi have been isolated from different decline affected trees and
different plant parts. These include Botryodiplodia, Botryosphaeria, Nattrassia
mangiferae,Fusarium, Alternaria, Pythium, Phytophthora and Ceratocystis species.
These fungi have been found infecting the trees singly or in combination. For
exampleBotryodiplodia, Botryosphaeria and Nattrassia mangiferae were mostly found
in the twigs and branches of all affected trees. They may be the cause of twig blight
and branch die back in the affected trees. Nattrassia and Botryodiplodia were also
xvii
xvii
observed on the bark as well as on the inner side of the bark where bark splitting
occurred. Therefore, they might have an additional role in bark splitting.
FusariumandCeratocystis have been found in the vascular tissues of the plants to stop
the nutrients inflow and cause the wilting symptoms (Fateh et al., 2016). However, it
is impotant to note thatCeratocystis was only found from the vascular tissues of mango
but it was not isolated from citrus and guava (Mirzaeeet al., 2003; Miskita et al., 2005;
Fateh et al., 2006;Masood et al., 2010).
8.4. PATHOGENICITY OF THE IMPORTANT DECLINE CAUSING
PATHOGENS
Two different methods were adopted to check the pathogenicity of all the four
commonly occuring fungi individually as well as in combination. These four fungi
were Ceratocystis, Nattrassia, Botryodiplodia and Fusarium sp. Individual fungi
except Ceratocystis was not able to produce mortality at all. However, the
combinations of these fungi caused mortality in the green house potted plants.
Infact,Botryosphaeria species are endophytic in nature and become aggressive only
when they are combined with the virulent fungi. The opportunistic fungi when entered
the plants' system through wound, they start producing decline symptoms in the plants.
Among the two methods, the root injury method was more appropriate as the root
injury frequently produced the symptoms. This can be related to the fact that when
ploughing is done under the tree canopies, the roots are damaged and they provide
opening to the fungi to enter and cause tree decline (Al-Adawi et al., 2006; Urbez-
Torroset al., 2008).

xviii
xviii
8.5. FACTORS AFFECTING THE GROWTH AND DEVELOPMENT OF
NATTRASSIA SP.
In the samples taken from citrus plants, the growth ofNattrassia isolates
was least affected by the temperature range from 20-28oC. However, in case of mango
and guava, the temperature below 25 o
C reduced the growth of the fungi (Alizada et
al., 2000). This may be due to the fact thatN. mangiferae isolates have been adopted to
high temperatures in the tropical areas as compared to subtropical or temperate
regions. Mycelial growth was seen more in the isolates of Nattrassia when provided
alternate light and dark periods as compared to continuous light or continuous dark
periods. However, again the isolates from mango and guava did not show significant
differences in any condition of light and dark (Elliott and Edmonds, 2003). Nattrassia
isolates from citrus were the least affected with the pH range of 5.5 to 6.5. However, in
mango and guava the isolates performed well at pH up to 6.00. The results are
contradictory to the actual climatic conditions especially in the mango orchards where
soil pH is more than 7 but N. mangiferae keeps growing. Among four culture media
used for the growth of N. mangiferae, it only preffered to grow maximum on potato
dextrose agar and malt extract agar media (El Atta and Aref, 2013). Other two media
i.e. carrot juice agar and stem decoction agar media produced less growth of the
fungus. However, it was found that these two media give pure growth of Ceratocystis
which is also a decline causing fungi (Fateh and Kazmi, 2010).
8.6 MORPHOLOGICAL CHARACTERISTICS OF NATTRASSIA SP. FROM
CITRUS, MANGO AND GUAVA
xix
xix
The similarity between isolates of mango and guava shows that there
has been a shift of attack of N. mangiferae either from mango to guava or otherwise.
The chances are that these are the same fungal isolates which attack both trees as both
are grown in tropical climate and as discussed earlier that sometimes guava is
intercropped in mango orchards and hence there has been a transfer from mango to
guava (Sutton and Dyko, 1989; El Atta and Nouri, 2014).
It has been found during the pathogenicity tests that the symptoms produced by
N. mangiferae in both trees were almost similar, which is again a confirmation of their
common origin (Fateh et al., 2016). In case of citrus, the morphology of N. mangiferae
was a little bit different. One of the reasons might be the difference in climate where
citrus is grown and secondly, it can be due to the fact that in citrus the fungus has been
reported to produce branch wilt with cracks in a particular check pattern, while in
mango and guava they either cause branch dieback, branch canker or twig die back
(Mirzae et al., 2002; Saaiman, 1997).
However, the morphology of N. mangiferae isolates from all citrus, mango and
guava had closed resemblance with madrone canker isolates in USA. Madrone isolates
of N. mangiferae are characterized as hyaline, aseptate, guttulate conidia becoming 1-
to 3-septate, verisicolored or brown. Conidia had thin-walls, mostly fusoid but
occasionally oblong or clavate with truncate bases. The isolates differed in conidial
length, width as well as in arthrospore size. Although there were statistically
significant differences, there does not appear to be a geographical pattern in spore size
or shape. The researchers in US conclude that N. mangiferae isolated from Pacific

xx
xx
madrone belonged in the teleomorph genus Botryosphaeria and hence, diseases cause
by this fungus can be managed using methods developed for other Botryosphaeria
pathogens, such as B. dothidea(Elliott and Edmonds, 2003).

xxi
xxi
SUMMARY
In Pakistan important fruit trees such as citrus, mango, guava etc are facing
decline. Among these fruits, citrus and mango decline have been addressed strongly as
they are important foreign exchange earnings and export items. Mango is being given
attention in all aspects but citrus needs special attention. Due to poor quality citrus in
Pakistan we have restricted export markets. According to Pakistan Horticulture Export
Board, 20% of the citrus fruit is gone waste either due to diseases or post harvest
mishandling (Humayun et al., 2005; Khanzada et al., 2004). Other fruit trees like
Guava and Loquat are also very famous fruit of Pakistan and are liked by all
generations.
The common symptoms found in the orchards included the bark splitting
gummosis, leaf drooping and discoloration, twig blight, die back and the eventual tree
mortality.
Decline in different forest and fruit trees involve different pathogens e.g. fungi
such as Ceratocystis fimbriata, Armillaria sp., Nattrassia magniferae, Lasiodiplodia
theobromae, Phoma sp., Phomopsis sp., Fusarium sp., viruses such as Citrus Tristeza
Virus (CTV), nematodes especially in case of citrus decline (Tylenchulus
semipenetrans) and in mango (Hemicriconemoides, Longidorus sp.), bacteria such as
Pseudomonas sp. and phytoplasma. Among these pathogens the fungus Nattrassia
magniferae has been reported from almost all of the forest and fruit trees facing
decline.

xxii
xxii
Citrus decline incidence, severity and disease index were found to be variable
in district Sargodha. Maximum mean disease incidence was recorded in tehsil
Sargodha (94.06%) followed by tehsil Shahpur (93.33%), similarly, mean disease
severity was the maximum in tehsil Sargodha (1.47), Bhalwal (1.38). Maximum
disease index was observed in tehsil Sargodha (29.41%) followed by tehsil Shahpur
(26.75%), Bhalwal (23.77%), Sahiwal (19.28%), and Kot Momin (15.80%). On the
other hand minimum disease index was found in tehsil Sillanwali (10.36%).
In mango maximum mean disease severity 2.70 was observed in district
Bahawalpur followed by Khanewal (2.30). Similarly maximum mean disease
incidence (100% ) was found in Khanewal followed by Bahawalpur (99.30%). Disease
index was found maximum in Bahawalpur (53.30%) followed by Khanewal (46.50%).
Results show that maximum guava decline severity was recorded in district
Sheikhupura (0.90) followed by district Kasur (0.78). Minimum severity was observed
in district Nankana Sahib (0.57). Maximum guava decline incidence was found in
district Kasur (62.89%) followed by Sheikhpura (61.30%) while minimum incidence
was observed in district Nankana Sahib (56.29%). However, regarding disease index
district Kasur and Sheikhpura were not too far (18.00 and 17.40 respectively but
minimum disease index (14% ) was recorded in district Nankana Sahib.
Mycofloral studies showed that in all kind of decline of citrus, mango and
guava mostly common pathogens are involved in producing range of symptoms like,
leaf drooping, bark splitting, twig or branch dieback, stem canker and eventual tree
mortality. Moreover, an important fact found was that mostly N. mangifereae, L.
theobromae and Botryosphaeria sp. were found in case of twig or branch dieback.
206
xxiii
xxiii
However, Fusarium sp. and Ceratocystis sp. were found in the vascular regions.
Two different methods were adopted to check the pathogenicity of
Ceratocystis, Nattrassia, Botryodiplodia and Fusarium sp. Individual fungi except
Ceratocystis was not able to produce mortality at all. However, the combinations of
these fungi led the green house potted plant to mortality. In fact Botryosphaeria
species are endophytic in nature and become aggressive only when they are combined
with the virulent fungi.
During physiological studies it was found that Nattrassia isolates growth was
least affected by the temperature range from 20-28oC. However, in case of mango and
guava, the temperature below 25 o
C reduced the growth of the fungi (Alizada et al.,
2000). This may be the reason that the Nattrassia isolates have been adopted to high
temperature in the tropical areas as compared to subtropical or temperate regions.
Edmonds, 2003).Nattrassia isolates from citrus were least affected with the pH range
of 5.5 to 6.5. However, in mango and guava the isolates have been preferring pH up to
6.00. The results are contradictory to the actual climatic conditions especially in the
mango orchards where soil pH is more than 7. butNattrassia keeps growing. This may
be due to low pH of fluent in the twigs and branches of mango tree which favour the
growth of this fungus. Among four culture media used for the growth of Nattrassia, it
only like to grow maximum on potato dextrose agar (PDA) and malt extract agar
(MEA) media (El Atta and Aref, 2013). Other two media i.e. carrot juice agar and stem
decoction agar media produced less growth of the fungus. However, it was found that
these two media give pure growth of Ceratocystis which is also a decline causing fungi
It can be concluded from all of the above discussion that Nattrassia mangiferae
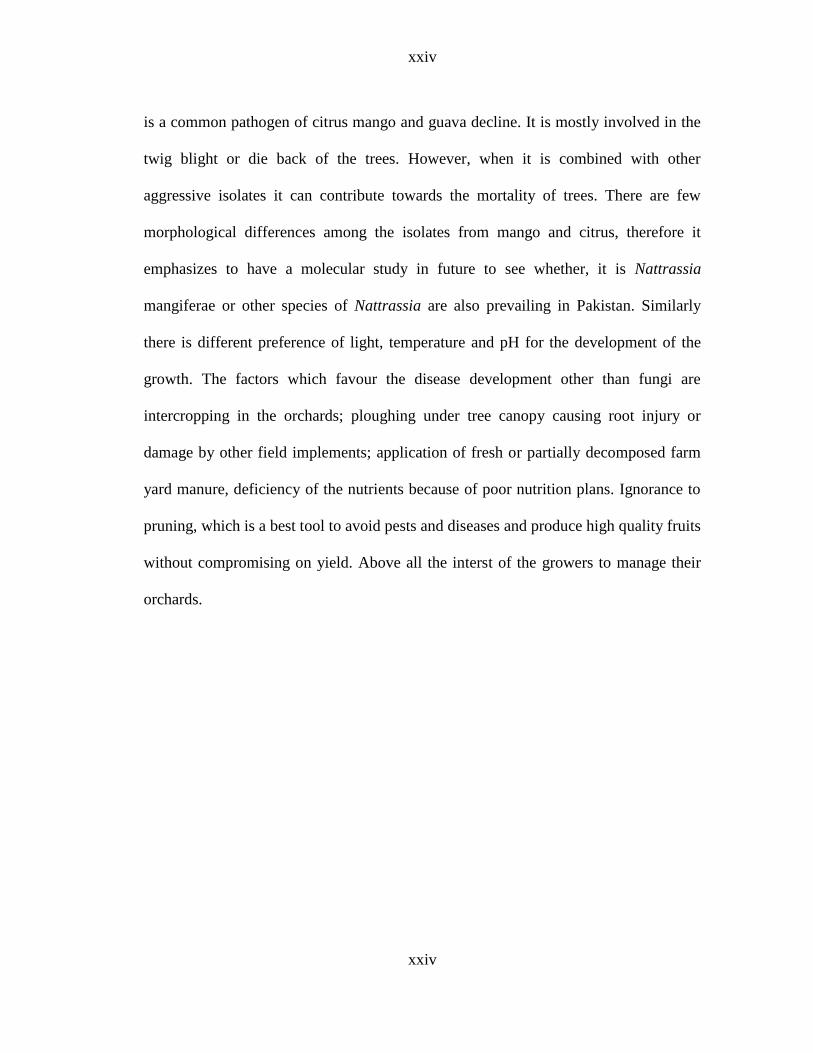
xxiv
xxiv
is a common pathogen of citrus mango and guava decline. It is mostly involved in the
twig blight or die back of the trees. However, when it is combined with other
aggressive isolates it can contribute towards the mortality of trees. There are few
morphological differences among the isolates from mango and citrus, therefore it
emphasizes to have a molecular study in future to see whether, it is Nattrassia
mangiferae or other species of Nattrassia are also prevailing in Pakistan. Similarly
there is different preference of light, temperature and pH for the development of the
growth. The factors which favour the disease development other than fungi are
intercropping in the orchards; ploughing under tree canopy causing root injury or
damage by other field implements; application of fresh or partially decomposed farm
yard manure, deficiency of the nutrients because of poor nutrition plans. Ignorance to
pruning, which is a best tool to avoid pests and diseases and produce high quality fruits
without compromising on yield. Above all the interst of the growers to manage their
orchards.

xxv
xxv
LITERATURE CITED
Abbas, M. M., S. Ahmad and M. A. Javaid. 2014. Effect of NAA on flower and fruit
thinning of guava. Journal of Agricultural Research, 52(1): 111-116.
Abbasher, A., M. M. Husian, M. S. Zaroug, and E. B. Zahran. Prevalence and etiology
of branch wilt disease (Nattrassia mangiferae) on tree species in Wad Medani
Area, Sudan. Journal of Agricultural and Veterinary Sciences, 14(1): 1-10.
Abd-Allah, A.S.E. 2006. Effect of spraying some macro and micro nutrients on fruit
set, yield and fruit quality of Washington Navel orange trees. Journal of Applied
Science Research, 2(11): 1059-1063.
Agrios, G. N. 2005. Plant pathology. Amsterdam: Elsevier Academic Press. UK. 271
pp.
Ahmed, W., M.A. Pervez, M. Amjad, M. Khalid, C.M. Ayyub and M.A. Nawaz. 2006.
Effect of ionic combinations on the growth and yield of Kinnow Mandarin
(Citrus reticulata Blanco). Pakistan Journal of Botany, 38(3): 603-612.
Al Adawi, A. O., M. L. Deadman, A. K. Al Rawahi, A. J. Khan and Y. M. Al Maqbali.
2002. Diplodia theobromae associated with sudden decline of mango in the
Sultanate of Oman. New Disease Reports, 6: 8 pp.
Al Adawi, A. O., M. L. Deadman, A. K. Al Rawahi, A. J. Khan, Y. M. Al Maqbali, A.
A. Al Jahwari, B. A. Al Saadi, I. S. Al Amri and M. Wingfield. 2006. Aetiology
and causal agents of mango sudden decline disease in the Sultanate of Oman.
European Journal of Plant Pathology, 116: 247-254.
210

xxvi
xxvi
Alam, M. S., M. F. Begum, M. A. Sarkar, M. R. Islam and M. S. Alam. 2001. Effect of
temperature light and media on growth, sporulation, and formation of pigments
and pycnidia of Botryodiplodia theobromae Pat. Pakistan Journal of Biological
Sciences, 4(10): 1224-1227.
Ali, S. R., J. Snyder, M. Shehzad and A. U. Khalid. 2014. Associations among fungi,
bacteria, and phytoplasma in trees suffering citrus decline in Punjab. Journal of
Agricultural Technology, 10(5):1343-1352.
Alizadeh, A., A, Heidarian and N. R. Farrokhi. 2000. Citrus branch wilt, decline and
death caused by Nattrassia mangiferae and its other hosts in Khuzestan
province. Iranian Journal of Plant Pathology, 36(1/2): 77-97.
Al Sadi, A.M., F. A. Al Ouweisi, N.K. AlShariani, E. Kaplen, A.O. AlAdawi and M.L.
Deadman. 2010. Histological changes in mango seedlings following infection
with Ceratocystis manginecans, the causal agent of mango decline. Journal of
Phytopathology, 158: 738-743.
Al Sadi, A. M., A. G. Al Ghaithi, N. Al Fahdi and R. Al Yahyai. 2014.
Characterization and pathogenicity of fungal pathogens associated with root
diseases of citrus in Oman. International Journal of Agriculture and Biology,
16(2): 371-376.
Al Sadoon, A. H., M. K. M. Ameen, M. A. Hameed, A. Al-Badran and Z. Ali. 2012.
First report of grapevine dieback caused by Lasiodiplodia theobromae and
Neoscytalidium dimidiatum in Basrah, Southern Iraq. African Journal of
Biotechnology, 11(95):16165-16171.

xxvii
xxvii
Alva, A.K., D.J. Mattos, S. Paramasivam, B. Patil, H. Dou and K.S. Sajwan. 2006.
Potassium management for optimizing citrus production and quality.
International Journal of Fruit Sciences, 6: 3-43.
Alves, A., P. W. Crous, A. Correia, A. J. L.Phillips. 2008. Morphological and
molecular data reveal cryptic speciation in Lasiodiplodia theobromae. Fungal
Diversity, 28:1-13.
Alzarari, A. J., A. A. Attrackchi, A. M. Tarabeib and S. H. Michail. 1979. New hosts
of Hendersonula toruloidea. Pakistan Journal of Scientific and industrial
Research, 22(5): 251.
Anonymous. 2000. Handbook on Citrus Fruits Cultivation and Oil Extraction. Asia
Pacific Business Press Incorporation.P.406-407.
Anonymous. 2008. ASF Pioneers GLOBALGAP Certification in Pakistan.
Agribusiness Support Fund. ASF Quarterly, 1(1): 1 pp.
Anonymous. 2010. On organic coffee farm, complex interactions keep pests under
control. U.S. News and World Report. 1 pp.
Anonymous. 2013. Fruit, vegetables and condiments statistics of Pakistan. Ministry of
Food Security and Research.Government of Pakistan.
Anonymous. 2015. Pakistan Economic Survey. Economic Advisor‟s Wing, Finance
Division, Government of Pakistan, Islamabad.
Anonymous. 2016. Fruit, vegetables and condiments statistics of Pakistan. Ministry of
Food Security and Research.Government of Pakistan.
Anwar, S. A., M. V. McKenry and H. A. Ahmad. 2012. Nematode and Fungal
Communities Associated With Mango Declineof Southern Punjab. Pakistan
xxviii
xxviii
Journal of Zoology, 44(4): 915-922.
Arif, M., A. Ahmed, M. Ibrahim and S. Hassan. 2005. Occurrence and distribution of
virus and virus-like diseases of citrus in North-West Frontier Province of
Pakistan. Pakistan Journal of Botany, 37(2): 407-421.
Arif, A. M. 2013. Soil fungi causing mango and guava decline and their Bio
management. LAP Lambert Academic Publishing, U. S. A. 04 pp.
Ashraf, S., G. A. Khan, S. Ali, M. Iftikhar, M. Luqman and M. Z. Y. Hassan. 2015.
Patterns and limitations of micronutrients application for citrus production in
Sargodha: A challenge for extension education in the Punjab. Journal of
Agricultural Research, 53(1): 145-156
Asif, I., F. S. Fateh, M. R. Kazmi, C. N. Akem, P. Gulbhar and N. H. Labar. 2011.
Trend of mango sudden death syndrome (MSDS) in relation to fungal microflora
and nematodes fauna in Punjab, Pakistan. Pakistan Journalof Nematology, 29(1):
45-51.
Atta, H. A. E. and I. M. Aref. 2013. Pathogenic mortality of Ficus sp. International
Journal of Plant, Animal and Environmental Sciences, 3(1): 204-210
Avelar-Mejía, J. de J., E. Cárdenas-Soriano, D. Téliz-Ortiz and I. Cid-del Prado Vera.
2003. Efecto del declinamiento del guayabo en la anatomía de rama y raíz de
Psidium guajava L. Revista Mexicana de Fitopatología, 21(3): 309-315.
Barnes, I., J. Roux, M. J. Wingfield, K. M. Oldand M. Dudzinski. 2003.Ceratocystis
pirilliformis, a new species from Eucalyptus nitens in Australia. Mycologia, 95:
865-871.

xxix
xxix
Bigler, C., J. Gricar, H. Bugmann and K. Cufar. 2004. Growth patterns as indicators of
Impending tree death in silver fir. Forest Ecology and Management, 199: 183-
190.
Bigler, C., O.U. Braker, H. Bugmann, M. Dobbertin and A. Rigling.2006. Drought as
an inciting mortality factor in Scots pine stands of the Valais, Switzerland.
Ecosystems, 9: 330-343.
Bokhari, A. A., S. T. Sahi, A. M. Khan,R. Ahmad andI. U. Din. 2008. In vivo studies
on the biological and chemical control of guava decline caused by different
soilborne pathogens. Pakistan Journal of Agricultural Sciences, 45:54-56.
Bové, J. M., R. F. Whitcomb and R. E. McCoy. 1983. Culture techniques for
spiroplasma from plants. Methods in mycoplasmology. New York, Academic
Press.p. 225-234.
Brlansky, R. H., R. F. Lee and M. H. Collins. 1985. Structural comparison of xylem
occlusions in the trunks of citrus trees with blight and other decline diseases.
Phytopathology, 75: 145-150.
Bukhari, A. A. 2009. Studies on guava decline and disease management. Ph. D.
Thesis. Department of Plant Pathology.University of Agriculture, Faisalabad.
Burgess, T. I., P. A. Barber, S. Mohali, G. Pegg, W. de Beer and M. J. Wingfield.
2006. Three new Lasiodiplodia sp. from the tropics, recognized based on DNA
sequence comparisons and morphology. Mycologia, 98(3): 423-435.
Burney, K., R. Ali, S. Hameed, A. Munir and H. Rehman. 2007. Association of
bacteria and phytoplasma causing citrus decline in Punjab. International
symposium on prospects of horticultural industry in Pakistan. 170 pp.

xxx
xxx
Calavan, E. C. and J. M. Wallace. 1954. Hendersonula toruloidea Nattrass on citrus in
California. Phytopathology, 44: 635-639.
Cao, Z. M. and X. Wang. 1989. A survey of stem diseases of Zanthoxylum
bungeamum. Forest Pest and Diseases, 1: 47.
Carrer, M. and C. Urbinati. 2004. Age-dependent tree-ring growth responses to climate
in Larix deciduas and Pinus cembra. Ecology, 85: 730-740.
Carlile, M. J. and S. C. Watkinson. 1995. The fungi, Academic Press, London. 251 pp.
Causton, D. R. and J. C. Venus, 1981. The biometry of plant growth. Edward Arnold,
London.
Chapot, H. 1970. Citrus production problems in the Near East and North
Africa.UNDP/FAO Report No. 2810. Rome, FAO.
Chapot, H. 1975. Citrus production problems in the near and middle
East Span, 17(1):17.
Chaudhry, N. A. 2003. Citrus in Sargodha. Pakistan Horticulture.Pakistan Horticulture
Foundation, 2:51-58.
Crous, P. W. and M. E. Palm. Reassessment of the anamorph genera Botryodiplodia,
Dothiorella and Fusicoccum. Sydowia, 52: 167-175.
David, F. F., M. Elliott, A. Y. Rossman and R. L. Edmonds. 2005. Fusicoccum arbuti
sp. nov. causing cankers on Pacific madrone in western North America with
notes on Fusicoccum dimidiatum, the correct name for Scytalidium dimidiatum
and Nattrassia mangiferae. Mycologia, 97(3): 730-741.

xxxi
xxxi
Davis, J. R and J. E. DeVay. 1975. Relationship of Botryosphaeria dothidae and
Hendersonula toruloidea to a canker disease of almond. Phytopathology, 65(2):
114-122.
Denman, S., P. W.Crous, J. Z.Groenewald, B.Slippers, B.Wingfield, and M. J.
Wingfield. 2003. Circumscription of Botryosphaeria species associated with
Proteaceae based on morphology and DNA sequence data. Mycologia, 95: 294-
307.
Domsch, K. H., W. Gams and T. H. Anderson. 1980. Compendium of Soil Fungi. APS
Press.
El Atta, H. A. and I. M. Aref. 2013. Pathogenic mortality of Ficus spp. International
Journal of Plant, Animal and Environmental Sciences, 3(1): 204-210.
El-Atta, H.A. and W. M. Nouri. 1999. Phytotoxicity and antimicrobial activity of the
culture filtrate of Nattrassia mangiferae Nattrass. Univ. KJ Agric. Sci., 7: 130-
138.
Elliott, M. and L. E. Robert.2002. Role of fungal diseases in decline of Pacific
madrone. Northwest Science, 76(4): 293-303.
Elliot, M. and R. L. Edmond. 2003. Systematic study of Nattrassia mangiferae, the
cause of madrone canker. Proceedings of the 51 Western International Forest
Disease Work Conference.p. 59-62.
Elliot, M. and R. L. Edmond. 2008. Injected Treatments for Management of Madrone
Canker. Arboriculture & Urban Forestry, 34(2):110-115.
xxxii
xxxii
EPPO/CABI.1996a. Citrus greening bacterium.Quarantine pests for Europe. In: I.
M.Smith, D. G. McNamara, P. R.Scott and M. Holderness (eds.), CAB
International, Wallingford, UK.3 pp.
EPPO/CABI.1996b. Citrus tristeza closterovirus. Quarantine pests for Europe.
In:I.M.Smith, D. G. McNamara, P. R.Scott & M. Holderness (eds.), CAB
International, Wallingford, UK. 5 pp.
EPPO/CABI. 1996c.Radopholus citrophilus and Radopholus similis. Quarantine pests
for Europe. In: Smith, I. M., D.G. McNamara, P. R Scott and M.
Holderness(eds.), CAB International, Wallingford, UK. 7 pp.
Evans, G. C. 1972. The quantitative analysis of plant growth. Blackwell Scientific
Publications Oxford. 33 pp.
Farr, D. F., M. Elliott, A. Y. Rossman and R. L. Edmonds. 2005. Fusicoccum arbuti
sp. causing cankers on Pacific madrone in Western North America with notes on
Fusicoccum dimidiatum, the correct name for Scytalidium dimidiatum and
Nattrassia mangiferae. Mycologia, 97(3): 730-741.
Fateh, F. S., M. R. Kazmi, I. Ahmad and M. Ashraf. 2006. Ceratocystis fimbriata
isolated from vascular bundles of declining mango trees in sindh, Pakistan.
Pakistan Journal of Botany, 38(2):1257-1259.
Fateh, F. S., M. R. Kazmi and A. Jabeen. 2009. Different forms of mango sudden-
death syndrome. Science Technology and Development, 28: 34-41.
Fateh, F. S. and M. R. Kazmi. 2010. Manual of fungi associated with mango sudden
death syndrome. Pakistan Agricultural Research Council, Islamabad. 20 pp.

xxxiii
xxxiii
Fateh, F. S., M. R Kazmi, A.M. Arif, I. Ahmad and A. Rashid. 2016. Role of different
fungi for development of decline symptoms in citrus, mango and guava. Science
International-Lahore, 28(2): 1263-1267.
Fateh, F. S., T. Mukhtar, M. R. Kazmi, N. A. Abbasi and A. M. Arif. 2017.
Distribution of citrus decline in district Sargodha. Pakistan Journal of
Agricultural Sciences, 54(1): 9-13.
Fensham, R. J. 1998. Mound Spring in Dawson River Valley, Queensland. Vegetation-
environment relations and consequences of proposed impoundments on botanical
values. Pacific Conservation Biology, 4: 42-54.
Fraser, L.R. and D. Singh. 1966. Greening virus, a threat to citrus industry. Indian
Horticulture, 10: 21 -22.
Giha, O. H. 1975. Hendersonula toruloidea associated with a serious wilt disease of
shade trees in Sudan. Plant Disease Reporter, 59: 52-52.
Gomes, V. M., R. M. Souza, G. Midorikawa, R. Miller and A. M. Almeida. 2012.
Guava decline: evidence of nationwide incidencein Brazil. Nematropica, 42:153-
162.
Gupta, V. K., A. K. Misra and R. K. Gaur. 2010. Growth characteristics of Fusarium
sp. causing wilt disease in Psidium guajava L. Plant Protection Research, 50(4):
452-462.
Harsh, N. S. K, and Tiwari, C. K. 1992. Top dying and mortality in provenance trial of
Gemelina arborea. Journal of Tropical Forest, 8(1): 55-61.
Hartmann, G. and F. Nienhaus. 1974. Gummosis agents Phytophthora citrophthora
(Smith & Smith) Leonian and Hendersonula toruloidea Nattrass on Citrus lemon

xxxiv
xxxiv
in Lebanon. Identification and symptomatology. Journal of Plant Diseases and
Protection, 81(5): 269-286.
Hirsch, G.U. and U. Braun.1992. Communities of parasitic microfungi. In: Handbook
of Vegetation Science. Fungi in vegetation science. In:W. Hoff (eds.), Kluwer
Academic, Dordrecht, Netherlands. p.225-250.
Holliday, P. 1980. Fungal diseases of tropical crops. New York: Cambridge University
Press.
Huang, S.K., N. Tangthirasunun, A. J. L. Phillips, D. Q. Dai, D. N. Wanasinghe, T. C.
Wen, A. H. Bahkali, K. D. Hyde and J. C. Kang. 2016. Morphology and
phylogeny of Neoscytalidium orchidacearum sp. nov. (Botryosphaeriaceae).
Mycobiology, 44(2): 79-84.
Hubballi, M., S. Nakkeeran, T. Raguchander, T. Anand and R. Samiyappan. 2010.
Effect of environmental conditions on growth of Alternaria alternata causing
leaf blight of Noni. World Journal of Agricultural Sciences, 6(2): 171-177.
Humayun M. A., S. M Khan, Z. Iqbal, M. T. Malik, A. Saleem and I. U. Haq. 2005.
Histological and control studies on Botryodiplodia theobromae, the cause of
mango decline in the Punjab. Pakistan Journal of Phytopathology, 17(2): 122-
128.
Hunt, R. 1982. Plant growth curves: a functional approach to plant growth analysis.
Edward Arnold, London.
Ibrahim, M., N. Ahmad, S.A. Anwar, T. Majeed and M.I. Asghar. 2004. Micronutrient
effects on citrus-fruit yield growing on calcareous soils.Proceedings of
Symposium on“Plant-Nutrition Management for Horticultural Crops under

xxxv
xxxv
Water-Stress Conditions. In:M. Ibrahim, S.A. Anwar, S. Javed & N. Ahmad
(eds.),Soil Science Society of Pakistan at Agricultural Research Institute Sariab,
Quetta, Pakistan.p. 95-100.
Iqbal, Z., E.E. Valeem, M. Shahbaz, K. Ahmad, Z.I. Khan, M.T. Malik and M. Danish.
2007. Determination of different decline disorders in mango orchards of the
Punjab, Pakistan. Pakistan Journal of Botany, 39: 1313-1318.
Ishtiaq, H., W. Khurshid and K. Iqbal. 2012. Factors responsible for decline in guava
(psidium guajava) yield. Journal of Agricultural Research, 50(1): 130-134.
Jayasinghe, C.K., T.H.P.S. Fernando and U. Priyanka. 1997. Nattrassia mangiferae:
Cultural characteristics and reproductive morphology of the Hevea isolate.
Indian Phytopathology, 50(3): 320-321.
Jayasinghe, C. K. and W. P. K. Silva. 2007. Foot canker and sudden wilt of Hevea
brasiliensis associated with Nattrassia mangiferae. Plant Pathology, 43(5): 938-
940.
Jiskani, M.M. 2002. Dying of mango orchards needs special attention. Pakistan and
Gulf Economist, Karachi.
Jones, D. R. and R. H. Stover. 2000. Fungal diseases of banana fruit, preharvest
diseases. In: Abacá & Enset, D.R. Jones (eds.), CAB International, Wallingford,
UK. p.173-190.
Jurskis, V. 2005.Eucalyptus decline in Australia, and a general concept of tree decline
and dieback. Forest Ecology and Management, (215): 1-20.

xxxvi
xxxvi
Kang, Y., S. H. Lee ad J. Lee. Development of a selective medium for the fungal
pathogen Cylindrocarpon destructans using Radicicol. Plant Pathology Journal,
30(4): 432-436.
Karnosky, D. F, D. R. Zak, K. S. Pregitzer, C. S. Awmack, J. G. Bockheim. 2003.
Tropospheric O3 moderates responses of temperate hardwood forests to elevated
CO2: a synthesis of molecular to ecosystem results from the Aspen FACE
project. Functional Ecology, 17: 289-304.
Kaufmann, M.R. 1996. To live fast or not: growth, vigor, and longevity of old-growth
ponderosa pine and lodgepole pine trees. Tree Physiology, 16: 139-144.
Kausar, P., S. Chohan and R. Parveen. 2009. Physiological studies on Lasiodiplodia
theobromae and Fusarium solani, the cause of Shesham decline. Mycopath,
7(1): 35-38.
Kazmi, M. R., F. S. Fateh, K. Majeed, A. M. Kashkhely, I. Hussain, I. Ahmad and A.
Jabeen. 2005. Incidence and etiology of mango sudden death phenomenon in
Pakistan. Pakistan Journal of Phytopathology, 17(2): 154-158.
Kazmi, M. R., S. I. Farooq, F. S. Fateh, S. Hameed, F. Fahmeed, M. Ashraf and I.
Ahmed. 2007. Identification of phytoplasma from mango trees showing sudden
death phenomenon through molecular techniques. Pakistan Journal of Botany,
39: 2153-2157.
Kempter, G. 2004. Best management practices: Utility pruning of trees. International
Society of Arboriculture. Champaign IL. Miller, R., and W. Sylvester. 1981. An
economic evaluation of the pruning cycle. Journal of Arboriculture, 7:109-112.
xxxvii
xxxvii
Khan, M. A. 2010. Report on Enterprise Based Survey of Horticulture Sector. United
Nations Industrial Development Organization Trade Related Technical
Assistance (TRTA) Programme Pakistan. 27 pp.
Khan, A.S., M. Naseer, A.U. Malik, S.M.A. Basra, M.S. Khalid, S. Khalid, M. Amin,
B.A. Saleem, I.A. Rajwana and M.U. Din. 2011. Location, soil and tree
nutrientstatus influences the quality of „Kinnow‟ mandarin. International Journal
of Agricultural Biology, 13:498-504.
Khan, A. R., N. Javed and R. A. A. Khan. 2012. Fungi associated with citrus decline:
Survey and isolation of fungi associated with declining citrus trees In Sargodha
District, Pakistan. Lambert Academic Publishing.
Khanzada, M. A., A. M. Lodhi and S. Shahzad. 2004. Pathogenicity of Lasiodiplodia
theobromae and Fusarium solani on mango. Pakistan Journal of Botany, 36(1):
181-189.
Khanzada, S. A., A. Munir, K. Burney, S. Hameed and H. Rehman. 2007. Incidence
and distribution of nematodes in citrus orchards of Punjab causing decline.
Proceedings of International Symposium on Prospects of Horticultural Industry
in Pakistan. 170 pp.
Khaskheli, M. I., M. M. Jiskani, M. H. Soomro, M. A. Talpur and G. B. Poussio. 2011.
Prevalence of mango sudden decline/ death syndrome (MSDS) on various
varieties at the orchards of different age in the vicinity of Tando Qaiser,
Hyderabad, Sindh. Pakistan Journal of Agriculture, Agricultural Engineering and
Veterinary Sciences, 27(2): 160-167.

xxxviii
xxxviii
Khushk, A. M. and L. E. D. Smith. 1996. A Preliminary Analysis of the Marketing of
Mango in Sindh Province, Pakistan. The Pakistan Development Review 35:3,
24-255.
Khushk, A.M., A. Memon and M. I. Lashari. 2009. Factors affecting guava production
in Pakistan. Journal of Agricultural Research, 47(2):201-210.
Kindo, A. J., S. Anita and S. Kalpana. 2010. Nattrassia mangiferae causing fungal
keratitis. Indian Journal of Medicinal Microbiology, 28(2): 178-181
Lathal, P., V. Prakasam, E. I. Jonathan, R. Samiyappan and C. Natarajan. 2012. Effect
of culture media and environmental factors on mycelial growth and pycnidial
production of Lasiodiplodia theobromae in physic nut (Jatropha curcas). Journal
of Environmental Biology, 34: 683-687.
Lee, R. F., L. J. Marais, L. W. Timmer and J. H. Graham. 1984. Syringe injection of
water into the trunk: a rapid diagnostic test for citrus blight. Plant Disease, 68:
511-513.
Lonsdale, J. H. 1992. Etiology and control of some mango blossom diseases in
Transvaal.M.Sc. thesis.University of Pretoria.
Mahmood, A. and M.A. Gill. 2002. Quick decline of mango and In vitro response of
fungicides against the disease in Pakistan. International Journal Agricultural
Biology, 4: 39-40.
Makun, H. A., S. T. Anjorin, B. Moronfoye1, F. O. Adejo1, O. A. Afolabi1, G.
Fagbayibo1, B. O. Balogun1 and A. A. Surajudeen. 2010. Fungal and aflatoxin
contamination of some human food commodities in Nigeria. African Journal of
Food Science, 4(4):127-135.

xxxix
xxxix
Malik, M.T., A.A. Dasti and S.M. Khan. 2005. Mango decline disorders prevailing in
Pakistan. Pakistan Journal of Phytopathology, 17: 187-191.
Mandal, A. P., S. Dasgupta and D. Saha. 2008. Influence of culture media and
environmental factors on mycelial growth and sporulation of Lasiodiplodia
theobromae (Pat.) Griffon and Maubl. Journal of Environmental
Biology, 29(3):407-10.
Martínez-Vilalta, J., D. Vanderklein and M. Mencuccini. 2007. Tree height and age-
related decline in growth in Scots pine (Pinus sylvestris L.). Oecologia, 150:529-
544.
Masood, A.,S. Saeed, N. Iqbal, M. T. Malik and M. R. Kazmi.2010.Methodology for
the evaluation of symptoms severity of mango sudden death syndrome in
Pakistan. Pakistan Journal of Botany, 42(2): 1289-1299.
Masood, A., S. Saeed, N. Erbilgin and Y. J. Kwon. 2010 b. Role of stressed mango
host conditions in attraction of and colonization by the mango bark beetle
Hypocryphalus mangiferae Stebbing (Coleoptera: Curculionidae: Scolytinae)
and in the symptom development of quick decline of mango trees in Pakistan.
Entomological Research, 40: 316-327.
Masood, A., S. Saeed, S. F. D. Silveira, C. N. Akem, N. Hussain and M. Farooq. 2011.
Quick decline of mango in Pakistan: Survey and pathogenicity of fungi isolated
from mango tree and bark beetle. Pakistan Journal of Botany, 43(3): 1793-1798.
Masood, A., M. Salman and S. Saeed. 2014. Fungicide injection, an efficient
management technique of mango sudden death disease in Punjab, Pakistan.
Pakistan Journal of Phytopathology, 26(02): 259-263.

xl
xl
Meredith, D. S. 1963. Tip rot of banana fruits in Jamaica. I. Hendersonula toruloidea
on Dwarf Cavendish bananas. Transactions of British Mycological Society, 46:
473-481.
Michael, E. M. 1994. First report of eucalyptus dieback caused by Nattrassia
mangiferae in North America. Plant Disease, 78:432.
Mirjat, M.S., M.M. Jiskani, A.A. Siyal and M.U. Mirjat. 2011. Mango production and
fruit quality under properly managed drip irrigation system. Pakistan Journal of
Agriculture, Agricultural Engineering and Veterinary Sciences, 27(1): 1-12.
Mirzâee, M. R., M. Mohammadi and H. Rahimian.2003. Nattrassia mangiferae, the
cause of die-back and trunk cankers of Ficus religiosa and branch wilt of
Psidium guajava in Iran. Journal of Phytopathology, 150(4-5): 244-247.
Misra, A. K. 2007. Present status of important diseases of guava in India with special
reference to wilt. ISHS Acta Horticulturae, 735: 1.
Misra, A. K. and B. K. Pandey. 2000. Pathogenicity and Symptom Production of wilt
disease of guava by new potent pathogen Glyocladium roseum. Proceedings of
international conference of integrated disease management for sustainable
agriculture. IPS. IARI, New Dehli.p. 749-750.
Moller, W. J. and J. E. Devay. 1968. Carrot as a species-selective medium
for Ceratocystis fimbriata. Phytopathology, 58:123-124.
Msikita, W., J.S. Yaninek, M. Ahounou, H. Baimey and R. Fagbemisi. 1997. First
report of Nattrassia mangiferaeroots and stem rot of cassava in West Africa.
Plant Disease, 81(11): 1332.
Msikita, W., B. Bissang., B. D. James, H. Baimey, H. T. Wilkinson, M. Ahounou

xli
xli
and R. Fagbemissi. 2005. Prevalence and severity of Nattrassia mangiferae root
and stem rot pathogen of cassava in Bénin. Plant Disease, 89: 12-16.
Mullen, J. M., C.H. Gilliam, A.K. Hagan and G. Morgan-Jones. 1991. Canker of
dogwood caused by Lasiodiplodia theobromae, a disease influenced by drought
stress or cultivar selection. Plant Disease, 75: 886-889.
Namsi, A., A. Zouba, M. A. Triki, M. O. B. Mahmoud and M. L. Takrouni. 2010.
Study on Nattrassia mangiferae, the causal agent of apricot tree decline disease
in the oases of South Tunisia: Biology and in vitro evaluation of fungicides. The
African Journal of Plant Sciences and Biotechnology, 4(2): 88-90.
Naqvi, S. A. H and R. Perveen. 2015. Mango quick decline manifestation on various
cultivars at plants of particular age in the vicinity of district Multan. Pakistan
Journal of Phytopathology, 27(01): 31-39.
Naqvi, S. A. M. H. 2004. Diseases of Fruits and Vegetable: Diagnosis & Management.
Kluwer Academic Press. 281 pp.
Nazerian, E., H. R. Naji, H. A. Hamid and M. Moradi. 2015. Phenotypic and
Molecular Characterization of Neofusicoccum mangiferae, the Causal Agent of
Black Locust Decline. Plant Pathology & Microbiology, 6(1): 1-3.
Niaz, A.C., A. Aziz and M.A. Rehman. 2004. Citriculture in other lands. Proceedings
of the 1st International Conference on Citriculture. p.27-35.
Overmeer, W.P.J. 1985.The Phytoseiidae.Alternative prey and other food sources.
Spider mites, their biology, natural enemies and control. In: W. Helle & M. W.
Sabelis (eds.) Vol. 1B Elsevier, Amsterdam, Oxford, New York. p. 131-139.

xlii
xlii
Palti, J. 1981. Cultural practices and infectious crop diseases.Vol. 9. New York:
Springer-Verlag.
Pandey, R. R. and R. S. Dwivedi. 1985.Fusarium oxysporum f. sp. Psidii as a pathogen
causing wilt of guava in Varanasi District India. Phytopathology, 114: 243-248
PARC, 1998. National forage and fodder research programme. Natural Resources
Division, Pakistan Agricultural Research Council, Islamabad.
Pennisi, E. 2005. Tree growth: the sky is not the limit. Science, 23: 1896-1897.
Ploetz, R. C. 2006. Fusarium-Induced diseases of tropical, perennial crops.
Phytopathology, 96(6): 648-52.
Poland, T.M., R.A. Haack, T.R. Petrice, D.L. Miller and L.S. Bauer. 2006. Laboratory
evaluation of the toxicity of systemic insecticides for control of Anoplophora
glabripennis and Plectrodera scalator (Coleoptera: Cerambycidae). Journal of
Economical Entomology, 99: 85-93.
Rangaswami, G. 1984. Diseases of crop plants in India 4th Ed. Rekha printers (PVT)
Ltd., New Delhi.520pp.
Razi, M. F. U. D., I. A. Khan and M. J. Jaskani. Citrus plant nutritional profile in
relation to Huanglongbing prevalence in Pakistan. Pakistan Journal of
Agricultural Sciences, 48: 299-304
Rehman, A., M. Saleem, S. Mehboob and A.A. Bokhari, 2011. Fungi associated with
rhizosphere soil in mango decline orchards and their in vitro control. Pakistan
Journal of Phytopathology, 23: 112-117.
xliii
xliii
Rehman, A., T. Abbas, N. A. Khan and S. M. Saha. 2011. Investigations on mango
sudden death syndrome affected plant parts in district Muzaffar Garh. Pakistan
Journal of Phytopathology, 23(2):125-130.
Reynolds, K. M. (1992). Relations between activity of Dendroctonus rufipennis
(Kirby) on Lutz spruce and blue stain associated with Leptographium abietinum
(Peck) Wingfield. Forest Ecology and Management, 47(1-4): 71-86.
Rosemary, D. P. 2001. Guavas wilt diseases. URL:
http://www.wanatca.org.au/acotanc/Papers/duPreez-2/index.htm.
Ryan, M.G., B. J. Yoder. 1997. Hydraulic limits to tree height and tree growth.
Bioscience, 47: 235-242
Saaiman, W. C. 1997. Biology and Control of Nattrassia mangiferae. Acta
Horticulturae (ISHS), 455: 558-574.
Saeed, S., N. Hussain, R. Attique and A. Masood. 2007. Etiology and management of
sudden death phenomenon in mango. Second Annual Report. Department of
Entomology, University College of Agriculture, Bahuddin Zakariya University
Multan. p. 15-24.
Safdar, A., N. Javed, S. A. Khan, H. U. Khan, A. Rehman, and I. U. Haq. 2010.
Survey and investigation of different citrus growing areas for citrus sudden death
syndrome. Pakistan Journal of Phytopathology, 22(2): 71-78.
Safdar, A., N. Javed, S. A. Khan, H. Safdar, I. U. Haq, H. Abbas and Z. Ullah. 2013.
Synergistic effect of a fungus, Fusarium semitectum, and a nematode,
Tylenchulus semipenetrans, on citrus decline. Pakistan Journal of Zoology,
45(3): 643-651.

xliv
xliv
Safdar, A., S. A. Khan and M. A. Safdar. 2015. Pathogenic association and
management of Botryodiplodia theobromae in guava orchards at Sheikhupura
District, Pakistan. International Journal of Agriculture and Biology, 17(2): 297-
304.
Saha, A., P. Mandal, S. Dasgupta and D. Saha. 2008. Influence of culture media and
environmental factors on mycelial growth and sporulation of Lasiodiplodia
theobromae (Pat.) Griffon and Maubl. Journal of Environmental Biology, 29(3):
407-410.
Salam, A. E., A. E. Abd Allah, E, A. Abu Elgasim and S. K. Mohammed. 2013.
Studies on Branch Wilt Disease (Nattrassia mangiferae Nattrass) of Citrus
Species and other Hosts in Dalanj Locality, Southern Kordofan State. Ph. D.
Theses: Agricultural Studies. Sudan University of Science and Technology.
131pp.
Schoeman, M. H., E. Benade and M. J. Wingfield. 2008. The symptoms and cause of
guava Wilt in South Africa. Journal of Phytopathology, 145(1): 37 - 41.
Schroeder, K. L., P. A. Okubara, J. T. Tambong, C. A. Lévesque and T. C. Paulitz.
2006. Identification andquantification of pathogenic Pythium spp. from soils in
eastern Washington using real-timepolymerase chain reaction. Phytopathology,
96: 637-647.
Schroth, G., U. Krauss, L. Gasparotto, J. A. D. Aguilar, and K. Vohland. 2000.Pests
and Diseases in Agroforestry Systems of the Humid Tropics. Agroforestry
Systems, 50(3): 199-241.

xlv
xlv
Shelar, S.A., D.N. Padule, D.M. Sawant and B.K. Konde. 1997. In vitro evaluation of
fungicides against Botryodiplodia theobromae Pat., the cause of die-back disease
of mango (Mangifera indica L.). Indian Journal Plant Protection, 25: 118-120.
Shah, M.D., K. S. Verma, K. Singh and R. Kaur. 2010. Morphological, pathological
and molecular variability in Botryodiplodia theobromae (Botryosphaeriaceae)
isolates associated with die-back and bark canker of pear trees in Punjab, India.
Genetic and Molecular Research, 9: 1217-1228.
Sharif, M. and W. Akhtar. 2005. Fruit exports prospects in Pakistan. DOC,
www.parc.gov.pk/ data/SSD-Database/.2005.
Sharma R. L., B. P. Singh, M. P. Thakur and S. K. Thapak. 2005. Effect of media,
temperature, pH and light on the growth and sporulation of Fusarium oxysporum
f. sp. lini. Ann. Plant Protection Science, 13: 172-174.
Shawkat, A. L. B., A. M. Tarabeih, A. A. Attrackchi, J. M. Ahmed. 1979. Species of
Populus and Pinus as new hosts of Hendersonula toruloidea Nattrass in Ninevah,
Iraq. Mesopotamia Journal of Agriculture, 14(2): 99-106.
Sigler, L., R. C. Summerbell, L. Poole, M. Wieden,D. A. Sutton, M. G. Rinaldi, M.
Aguirre, G. W. Estes andJ. N. Galgiani. Invasive Nattrassia mangiferae
Infections: Case Report, Literature Review, and Therapeutic and Taxonomic
Appraisal. Journal of Clinic Microbiology, 1997: 433-440.
Slippers, B., G. I. Johnson, P. W. Crous, T. A. Coutinho, B. D. Wingfield and M. J.
Wingfield. 2005. Phylogenetic and morphological re-evaluation of the
Botryosphaeria species causing diseases of Mangifera indica. Mycologia, 97(1):
99-110.

xlvi
xlvi
Sohail, A., M. A. Khan and M. Qasam. 2013. Effect of intercropping of maize in citrus
orchards on citrus leaf miner infestation and population of its natural enemies.
Pakistan Journal of Agricultural Sciences, 50(1): 91-93
Sonyal, S., A. Pappachan, K. B. Palanna, H. S. Mahesha, S. Manjunath, S. Hurakadli
and M. S. Giri. 2015. Survival ability of Ceratocystis fimbriatacausing
pomegranate wilt in different temperature and hydrogen ion concentration (pH).
International Journal of Pure and Applied Bioscience, 3(4): 49-53.
Stenico, M. E. S., F. T. Pacheco, E. R. Pereira-Filho, J. L. Rodrigues, A. N. Souza, A.
Etchegaray, J. E. Gomes and S. M. Tsai. 2009. Nutritional deficiency in citrus
with symptoms of citrus variegated chlorosis disease. Brazilian Journal of
Biology, 69(3):859-64.
Sutton, B. C. and B. J. Dyko. 1989. Revision of Hendersonula. Mycological Research,
93: 466-488
Szabolcs, I. 1992. Salinization of soil and water and its relation to desertification.
Desertification Control Bulletin, 21:32-37.
Tomita, C. K., C. H. Uesugi, L. E. B. Blum, M and A. D. V. Ferreira. 2016. Pruning
time in two production systems in the guava tree bacterial blight control. The
Revista Brasileira de Fruticultura, 38(4): 1-11.
Tsahouridou, P. C. and C.C. Thanassoulopoulos. 2000. First report of Hendersonula
toruloidea as a foliar pathogen of strawberry-tree (Arbutus unedo) in Europe.
Plant Disease, 84: 487.
Úrbez-Torres, J.R., G.M. Leavitt, J.C. Guerrero, J. Guevara, and W. D. Gubler. 2008.
Identification and pathogenicity of Lasiodiplodia theobromae and Diplodia

xlvii
xlvii
seriata, the causal agents of bot canker disease of grapevines in Mexico. Plant
Disease, 92: 519-529.
Vander Merve, J., I. Perfecto, and S. Philpott. 2010. Ecological Complexity and Pest
Control in Organic Coffee Production: Uncovering an Autonomous Ecosystem
Service. Bio Science, 60(7): 527-37.
Van Vuuren, S. P. and J. V. da Graça.1996.Application of transmissible agents from
dwarfed field trees to control tree size of sweet orange. Proceedings International
Society. Citriculture, 2: 711-717.
Van Wyk, M., N. A. Van der Merve, I, Roux, B. D. Wingfield, G. N. Kamgan and M.
J.Wingfield. 2006. Population genetic analyses suggest that theEucalyptus fungal
pathogen Ceratocystis fimbriata has been introducedinto South Africa. South
African Journal of Science, 102:259-263.
Walker, G. M. and N. A. White. 2005. Fungi biology and applications, Wiley,
England. 1 pp.
Weiner, J. and S. C. Thomas. 2001. The nature of tree growth and the age-related
decline in forest productivity. Oikos, 94: 37-376.
Young, R. H., L. G. Albrigo, D. P. H. Tucker and G. Williams. 1980a. Incidence of
citrus blight on Carrizo citrange and some other rootstocks. Proceedings of the
FloridaState Horticultural Society, 93: 14-17.
Young, R. H., H. E. Wutscher andL. G. Albrigo. 1980b. Relationship between water
translocation and zinc accumulation in citrus trees with and without blight.
Journal of the American Society for Horticultural Science, 105: 444-447.

xlviii
xlviii