A Business Case for Integrating a Hazelnut Orchard into an ...
Upload
khangminh22Category
view
2download
0
Unit: Pesos/ha
Year Fixed costs Pruning Weeding Fertilizat
ion Irrigation Flower Induction
Fruit Bagging
Integrated Pest
Manageme
Harvesting Total Cost
1 117,477 5,500 175 1,250 601 125,0032 3,920 180 5,500 350 1,250 811 12,0113 800 180 5,500 462 1,250 2,496 10,6884 800 283 5,500 575 1,875 705 2,155 13,074 300 25,2675 800 283 5,500 688 1,875 888 2,348 15,952 510 28,8446 11,700 385 4,250 100 1,875 1,150 2,843 18,831 925 42,0597 3,920 385 4,250 1,562 1,875 1,412 3,463 21,709 1,450 40,0268 800 447 4,250 2,125 2,500 1,675 5,058 24,857 1,995 43,7079 800 487 4,250 2,688 2,500 1,938 5,110 27,446 2,770 47,98910 400 613 4,250 3,250 2,500 2,200 6,285 30,344 3,565 53,40711 11,300 613 4,000 3,812 2,500 2,462 6,380 34,873 5,340 71,28012 3,520 863 4,000 4,375 2,500 2,725 7,765 37,661 7,135 70,54413 400 863 4,000 4,938 3,125 2,988 7,780 40,540 8,910 73,54414 400 1,050 4,000 5,500 3,125 3,250 9,395 43,418 11,955 82,09315 400 1,050 4,000 6,562 3,125 3,512 9,495 46,296 15,480 89,92016 11,300 1,050 4,000 6,562 3,125 3,512 9,495 46,296 15,480 100,82017 3,520 1,050 4,000 6,562 3,125 3,512 9,495 46,296 15,480 93,04018 400 1,050 4,000 6,562 3,125 3,512 9,495 46,296 15,480 89,92019 400 1,050 4,000 6,562 3,125 3,512 9,495 46,296 15,480 89,92020 400 1,050 4,000 6,562 3,125 3,512 9,495 46,296 15,480 89,920
Total 173,457 12,932 88,750 69,972 48,750 42,465 115,552 590,389 137,735 1,280,002
Table 3.5.5 Production Cost of Mango Orchard per Hectare
X-T17
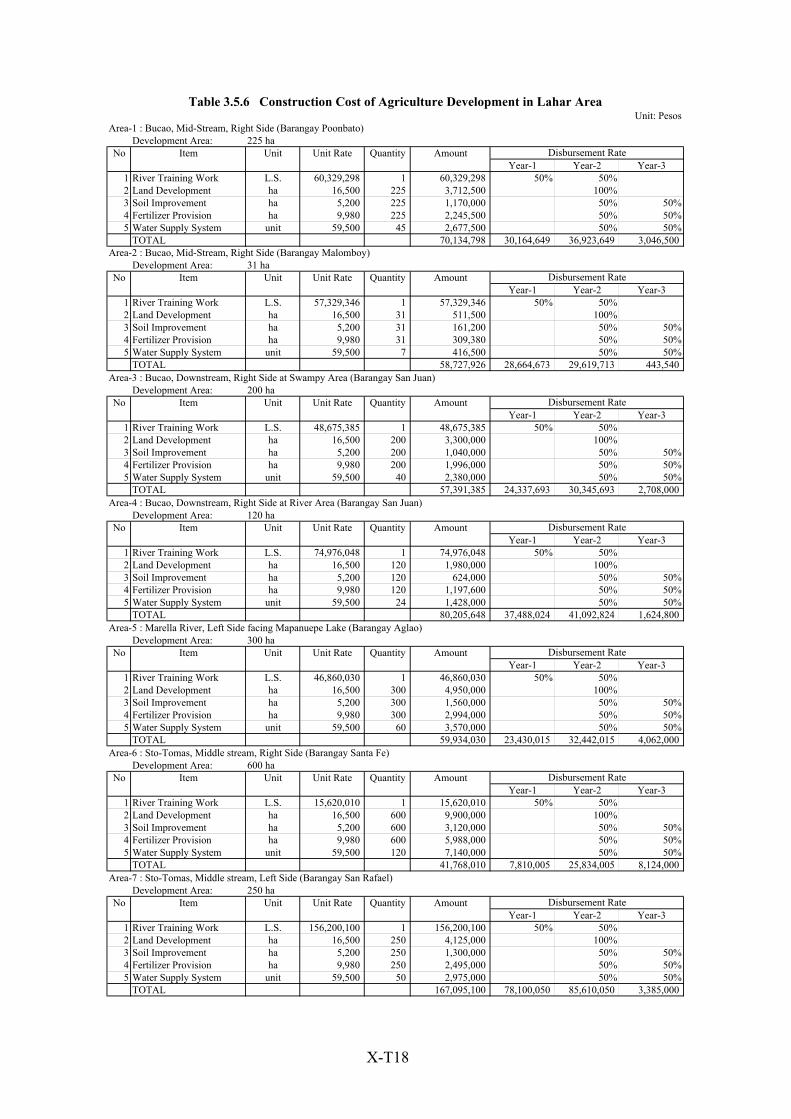
Unit: PesosArea-1 : Bucao, Mid-Stream, Right Side (Barangay Poonbato)
Development Area: 225 haNo Item Unit Unit Rate Quantity Amount
Year-1 Year-2 Year-31 River Training Work L.S. 60,329,298 1 60,329,298 50% 50%2 Land Development ha 16,500 225 3,712,500 100%3 Soil Improvement ha 5,200 225 1,170,000 50% 50%4 Fertilizer Provision ha 9,980 225 2,245,500 50% 50%5 Water Supply System unit 59,500 45 2,677,500 50% 50%
TOTAL 70,134,798 30,164,649 36,923,649 3,046,500Area-2 : Bucao, Mid-Stream, Right Side (Barangay Malomboy)
Development Area: 31 haNo Item Unit Unit Rate Quantity Amount
Year-1 Year-2 Year-31 River Training Work L.S. 57,329,346 1 57,329,346 50% 50%2 Land Development ha 16,500 31 511,500 100%3 Soil Improvement ha 5,200 31 161,200 50% 50%4 Fertilizer Provision ha 9,980 31 309,380 50% 50%5 Water Supply System unit 59,500 7 416,500 50% 50%
TOTAL 58,727,926 28,664,673 29,619,713 443,54077 520 862Area-3 : Bucao, Downstream, Right Side at Swampy Area (Barangay San Juan)Development Area: 200 ha
No Item Unit Unit Rate Quantity AmountYear-1 Year-2 Year-3
1 River Training Work L.S. 48,675,385 1 48,675,385 50% 50%2 Land Development ha 16,500 200 3,300,000 100%3 Soil Improvement ha 5,200 200 1,040,000 50% 50%4 Fertilizer Provision ha 9,980 200 1,996,000 50% 50%5 Water Supply System unit 59,500 40 2,380,000 50% 50%
TOTAL 57,391,385 24,337,693 30,345,693 2,708,00075 756 628Area-4 : Bucao, Downstream, Right Side at River Area (Barangay San Juan)Development Area: 120 ha
No Item Unit Unit Rate Quantity AmountYear-1 Year-2 Year-3
1 River Training Work L.S. 74,976,048 1 74,976,048 50% 50%2 Land Development ha 16,500 120 1,980,000 100%3 Soil Improvement ha 5,200 120 624,000 50% 50%4 Fertilizer Provision ha 9,980 120 1,197,600 50% 50%5 Water Supply System unit 59,500 24 1,428,000 50% 50%
TOTAL 80,205,648 37,488,024 41,092,824 1,624,800105 871 455Area-5 : Marella River, Left Side facing Mapanuepe Lake (Barangay Aglao)Development Area: 300 ha
No Item Unit Unit Rate Quantity AmountYear-1 Year-2 Year-3
1 River Training Work L.S. 46,860,030 1 46,860,030 50% 50%2 Land Development ha 16,500 300 4,950,000 100%3 Soil Improvement ha 5,200 300 1,560,000 50% 50%4 Fertilizer Provision ha 9,980 300 2,994,000 50% 50%5 Water Supply System unit 59,500 60 3,570,000 50% 50%
TOTAL 59,934,030 23,430,015 32,442,015 4,062,00079 112 920Area-6 : Sto-Tomas, Middle stream, Right Side (Barangay Santa Fe)Development Area: 600 ha
No Item Unit Unit Rate Quantity AmountYear-1 Year-2 Year-3
1 River Training Work L.S. 15,620,010 1 15,620,010 50% 50%2 Land Development ha 16,500 600 9,900,000 100%3 Soil Improvement ha 5,200 600 3,120,000 50% 50%4 Fertilizer Provision ha 9,980 600 5,988,000 50% 50%5 Water Supply System unit 59,500 120 7,140,000 50% 50%
TOTAL 41,768,010 7,810,005 25,834,005 8,124,00055 133 773Area-7 : Sto-Tomas, Middle stream, Left Side (Barangay San Rafael)Development Area: 250 ha
No Item Unit Unit Rate Quantity AmountYear-1 Year-2 Year-3
1 River Training Work L.S. 156,200,100 1 156,200,100 50% 50%2 Land Development ha 16,500 250 4,125,000 100%3 Soil Improvement ha 5,200 250 1,300,000 50% 50%4 Fertilizer Provision ha 9,980 250 2,495,000 50% 50%5 Water Supply System unit 59,500 50 2,975,000 50% 50%
TOTAL 167,095,100 78,100,050 85,610,050 3,385,000
Table 3.5.6 Construction Cost of Agriculture Development in Lahar Area
Disbursement Rate
Disbursement Rate
Disbursement Rate
Disbursement Rate
Disbursement Rate
Disbursement Rate
Disbursement Rate
X-T18

Unit: PesosNo. Work Item
(as of 2002) 2002 2003 2004 2005 2006 2007Route-A1 (L=16.0km)
1 Civil Work Road Improvement 64,913,000 12,982,600 32,456,500 19,473,900Bridge 53,434,000 10,686,800 37,403,800 5,343,400Causeway 0 0 0Retaining Wall 0Total of Civil Works 118,347,000 0 23,669,400 69,860,300 24,817,300 0
2 Administration and 35,504,100 14,201,640 7,100,820 7,100,820 7,100,820Engineering Service
3 Phisical Contingency (10%) 15,385,110 1,420,164 3,077,022 7,696,112 3,191,812 0
4 Total (1+2+3) 169,236,210 15,621,804 33,847,242 84,657,232 35,109,932 0
5 Price Escalation 19,921,170 624,872 2,761,935 10,570,641 5,963,722 0(4% per year)
6 Total Cost 189,157,380 16,246,676 36,609,177 95,227,873 41,073,654 0(4+5)
Route-A2 (L=32.0km)1 Civil Work
Road Improvement 131,782,000 26,356,400 65,891,000 39,534,600Bridge 331,348,000 66,269,600 231,943,600 33,134,800Causeway 57,782,000 28,891,000 28,891,000Retaining Wall 0Total of Civil Works 520,912,000 0 92,626,000 326,725,600 101,560,400 0
2 Administration and 156,273,600 62,509,440 31,254,720 31,254,720 31,254,720Engineering Service
3 Phisical Contingency (10%) 67,718,560 6,250,944 12,388,072 35,798,032 13,281,512 0
4 Total (1+2+3) 744,904,160 68,760,384 136,268,792 393,778,352 146,096,632
5 Price Escalation 87,854,452 2,750,415 11,119,533 49,168,740 24,815,764 0(4% per year)
6 Total Cost 832,758,612 71,510,799 147,388,325 442,947,092 170,912,396 0(4+5)
Route-B (L=14.8km)1 Civil Work
Road Improvement 56,086,000 16,825,800 39,260,200Bridge 23,913,000 4,782,600 11,956,500 7,173,900Causeway 6,521,000 3,260,500 3,260,500Retaining Wall 0Total of Civil Works 86,520,000 0 21,608,400 54,477,200 10,434,400 0
2 Administration and 25,956,000 10,382,400 5,191,200 5,191,200 5,191,200Engineering Service
3 Phisical Contingency 11,247,600 1,038,240 2,679,960 5,966,840 1,562,560 0
4 Total (1+2+3) 123,723,600 11,420,640 29,479,560 65,635,240 17,188,160 0
5 Price Escalation 13,977,392 456,826 2,405,532 8,195,479 2,919,556 0(4% per year)
6 Total Cost 137,700,992 11,877,466 31,885,092 73,830,719 20,107,716 0(4+5)
Route-C (L=44.9km)1 Civil Work
Road Improvement 183,043,000 54,912,900 128,130,100Bridge 131,521,000 26,304,200 65,760,500 39,456,300Causeway 14,130,000 7,065,000 7,065,000Retaining Wall 94,565,000Total of Civil Works 423,259,000 0 81,217,100 200,955,600 46,521,300 0
2 Administration and 126,977,700 50,791,080 25,395,540 25,395,540 25,395,540Engineering Service
3 Phisical Contingency 55,023,670 5,079,108 10,661,264 22,635,114 7,191,684 0
4 Total (1+2+3) 605,260,370 55,870,188 117,273,904 248,986,254 79,108,524
5 Price Escalation 56,331,038 2,234,808 9,569,551 31,089,420 13,437,260 0(4% per year)
6 Total Cost 661,591,408 58,104,996 126,843,455 280,075,674 92,545,784 0(4+5)
OVERALL1 Civil Work
Road Improvement 435,824,000 130,747,200 305,076,800Bridge 540,216,000 108,043,200 270,108,000 162,064,800Causeway 78,433,000 39,216,500 39,216,500Retaining Wall 94,565,000Cost for Route-C 1,149,038,000 0 238,790,400 614,401,300 201,281,300 0
2 Total of Civil Works 1,149,038,000 0 238,790,400 614,401,300 201,281,300 0
3 Administration and 344,711,400 137,884,560 68,942,280 68,942,280 68,942,280Engineering Service
4 Phisical Contingency 149,374,940 13,788,456 30,773,268 68,334,358 27,022,358 0
5 Total (1+2+3) 1,643,124,340
5 Price Escalation 178,036,287 6,066,921 27,622,085 93,857,514 50,489,767 0(4% per year)
6 Total Cost 1,821,160,627 157,739,937 366,128,033 845,535,452 347,735,705 0(4+5)
Year
Table 3.5.7 Project Cost of Community Road
X-T19

Table 3.6.1 Project Cost of the Study on Sabo and Flood Control for Western River Basin of Mount Pinatubo (for Full Development Scheme)
(Unit : x 1,000 Peso)
No. Description Constructioncost
Land Acquisition
and
Government Administration
Engineering Service
Price Contingency
Physical Contingency Total
1 Sabo and Flood Control Structure1.1 Bucao river basin 1,034,500 44,878 31,035 165,520 249,529 152,546 1,678,0081.2 Sto. Tomas river basin 1,192,128 37,988 35,764 190,741 324,850 178,147 1,959,618
Sub total (1) 2,226,628 82,866 66,799 356,261 574,379 330,693 3,637,626
2 Non-Structure Measure2.1 Flood /Mudflow Monitoring & Warning Sys 33,559 0 1,007 40,035 0 7,460 82,0612.2 Evacuation center 322,400 0 9,672 51,584 0 38,366 422,022
Sub total (2) 355,959 0 10,679 91,619 0 45,826 504,082
3 Community Based Disaster Prevention and Social Development
3.1 Extension of ongoing community based forest management 576,895 0 17,307 92,303 0 68,651 755,156
3.2 Agricultural development 535,257 0 16,058 85,641 0 63,696 700,6513.3 Community road rehabilitation 1,149,038 0 0 344,711 178,036 149,374 1,821,1593.4 Establishment of the Aeta assistance station 7,260 0 1,075 363 0 6,000 14,698
Sub total (3) 2,268,450 0 34,440 523,018 178,036 287,720 3,291,664
Total 4,851,037 82,866 111,917 970,898 752,415 664,239 7,433,372
Note:1. Land acquisition cost of Item 2 is included in the construction cost.2. Price contingency for Item 2 and Item 3 is not subject to estimate because of uncertain implementation schedule.
X-T
20
The Study on Sabo and Flood Control for Western River Basins of Mount Pinatubo in the Republic of the Philippines
Final Report Supporting Report
Figures

Cuadrado River
Subic
Castillejos
San Marcelino
San Antonio
San Narciso
San Felipe
Cabangan
Botolan
Malumboy
Poonbato
Iba
Maloma
San Rafael
Santa Fe
SUBIC
BAY
SO
UT
H C
HIN
A S
EA
Bucao River
Mapanuepe Lake
Baquilan River
Ca
batuan
Riv
er
Balintaw
ak River
Upper Bucao River
Tanguay Ri ver
Kileng Riv er
Balin Baquero River
AnonangCreek
Gorongoron River
Mar
ella
River
Pamatawan River
Mount Pinatubo
Maloma River
Manila
Luzon
Legend
Pyroclastic fans
Lahar deposits0 5 10 kilometers
N
Sto. Tomas River
Bucao Bridge
National Road No. 7
Bucao Dike
Sto. Tomas Dike
THE GOVERNMENT OF THE PHILIPPINES
THE DEPARTMENT OF PUBLIC WORKS AND HIGHWAYS
The Study on Sabo and Flood Control for
Western River
in the Republic of the Philippines
Basins of Mount Pinatubo
JAPAN INTERNATIONAL COOPERATION AGENCY
Figure 1.1.1
Location of the Works
X-F1

O'
120o
00'E 120o
20'E
15o
00'N
15o
20'N
LEGEND
Municipality in Study Area
Major Highway
River
Catchment
Rainfall Gauge
Iba
Botolan
Cabangan
San Felipe
San Narciso
San Marcelino
San Antonio Castillejos
Subic
Olongapo
Palawig
To Santa Cruz
Baq
uilan R
iver
Mapanuepe
Lake
Subic
Bay
South China Sea
Cubi Point
Location of Selected Rainfall Gauge Stations
for Construction Planning
Figure 1.2.1
Balin Baquero River
0 5km
Scale
10km
N
Mar
ellaRiv
er
Mt. Pinatubo
Bucao River
Sto. Tomas River
Maloma River
THE GOVERNMENT OF THE PHILIPPINES
THE DEPARTMENT OF PUBLIC WORKS AND HIGHWAYS
The Study on Sabo and Flood Control for
Western River Basins of Mount Pinatubo
in the Republic of the Philippines
JAPAN INTERNATIONAL COOPERATION AGENCY
X-F2

Station: Iba
Year JAN FEB MAR APR MAY JUN JUL AUG SEP OCT NOV DEC Total1976 0.0 0.0 13.1 8.6 1,968.5 365.4 414.9 651.2 833.0 41.6 13.4 64.7 4,3741977 29.7 0.0 0.9 11.9 281.2 242.4 945.1 982.7 997.9 18.1 390.3 0.6 3,9011978 0.0 0.7 1.0 2.3 368.1 577.0 609.5 2,296.7 761.4 585.8 4.1 20.0 5,2271979 0.3 2.8 0.0 30.7 660.6 100.1 986.9 1,405.2 162.0 163.1 32.9 6.8 3,5511980 0.0 0.8 18.2 44.9 328.7 204.2 1,214.7 662.1 1,096.7 187.6 284.3 0.0 4,0421981 1.4 2.0 0.0 1.0 107.8 1,003.8 883.9 1,022.9 262.3 265.2 90.7 3.2 3,6441982 0.2 10.4 43.7 19.4 83.6 680.5 1,622.4 793.7 673.3 57.2 67.6 34.8 4,0871983 9.6 5.8 0.0 0.0 5.2 198.4 355.4 916.1 399.8 164.8 65.0 0.0 2,1201984 0.0 0.0 16.7 75.7 195.1 801.8 738.4 1,787.6 135.0 326.5 10.0 20.4 4,1071985 4.6 1.2 94.3 49.6 113.8 1,807.2 270.8 1,020.5 415.2 267.1 55.7 18.8 4,1191986 0.0 4.8 0.0 38.0 470.8 310.9 1,182.6 1,391.8 391.4 160.9 52.0 21.2 4,0241987 2.4 0.0 0.0 1.0 69.3 682.8 660.7 634.8 432.2 46.1 26.6 5.3 2,5611988 6.6 22.6 33.4 53.3 576.6 563.1 814.8 724.2 428.0 619.6 30.8 0.7 3,8741989 - 19.0 49.6 0.0 243.1 358.0 754.0 1,356.8 754.0 160.2 40.0 0.4 -1990 1.8 - 0.0 0.0 229.6 1,019.0 885.2 668.4 556.0 116.0 32.6 0.4 -1991 3.2 3.2 25.6 12.4 57.0 515.8 857.6 1,147.1 1,138.8 211.0 47.4 2.0 4,0211992 0.3 0.0 0.0 69.1 190.8 355.9 1,127.2 1,340.6 618.9 109.4 24.2 2.5 3,8391993 0.1 0.0 1.0 43.4 43.9 281.0 936.4 1,024.3 520.1 533.0 91.6 17.4 3,4921994 19.0 11.4 - 46.0 158.5 487.2 1,461.9 495.3 273.3 108.2 0.0 0.7 -1995 - 0.0 0.0 0.0 245.9 318.6 555.4 811.1 860.7 206.9 68.7 28.7 -
Average 4.4 4.5 15.7 25.4 319.9 543.7 863.9 1,056.7 585.5 217.4 71.4 12.4 3,812
Note: "-" indicates there are missing data
Monthly Average Rainfall in the Study Area
0
200
400
600
800
1,000
1,200
1,400
JAN FEB MAR APR MAY JUN JUL AUG SEP OCT NOV DEC
Month
Mon
thly
Ave
rage
Rai
nfal
l (m
m/m
onth
)
Iba
Dry Season Rainy Season Dry Season
THE GOVERNMENT OF THE PHILIPPINES THE DEPARTMENT OF PUBLIC WORKS AND HIGHWAYS
The Study on Sabo and Flood Control for Western River Basins of Mount Pinatubo in
the Republic of the Philippines JAPAN INTERNATIONAL COOPERATION AGENCY
Figure 1.2.2 Monthly Rainfall in Iba
X-F3

Station: San Marcelino
Year JAN FEB MAR APR MAY JUN JUL AUG SEP OCT NOV DEC Total1976 1.2 0.0 0.0 52.0 1,427.3 518.9 549.8 827.1 595.7 106.7 0.0 74.8 4,1541977 17.7 0.0 97.2 0.0 259.0 89.9 1,039.1 1,102.1 979.3 126.3 539.4 0.0 4,2501978 0.0 0.0 0.0 5.0 368.1 323.2 661.7 2,324.1 487.6 643.0 47.9 240.8 5,1011979 0.2 1.3 0.0 5.5 326.6 266.2 455.2 1,664.4 306.7 - 24.9 36.4 -1980 0.8 0.0 39.0 6.4 287.7 111.6 806.5 426.5 528.0 158.1 187.1 12.2 2,5641981 1.6 0.0 - 56.9 145.6 1,222.5 690.0 1,128.8 360.5 245.7 142.7 13.9 -1982 1.9 1.8 0.0 29.4 95.4 708.1 919.9 897.0 600.7 143.5 32.4 15.7 3,4461983 15.4 6.0 0.0 0.0 0.0 227.1 395.3 834.1 462.1 317.6 2.7 0.0 2,2601984 1.4 0.0 1.2 98.9 200.0 885.1 363.5 934.0 172.3 343.7 19.7 4.8 3,0251985 0.0 0.0 37.8 29.8 54.8 1,321.7 449.5 812.0 441.1 331.9 82.0 0.0 3,5611986 0.0 2.7 0.0 0.0 278.3 329.4 1,041.3 1,364.2 615.7 212.9 137.2 1.1 3,9831987 0.0 0.0 0.0 1.0 57.9 640.5 - 465.7 492.7 154.3 51.2 3.9 -1988 12.8 11.0 0.1 46.0 517.6 554.1 605.8 397.5 238.3 554.3 46.8 0.0 2,9841989 1.5 0.0 74.5 52.6 249.6 258.0 790.0 970.8 738.1 226.8 54.5 0.0 3,4161990 0.0 0.0 0.3 0.0 259.8 1,157.8 672.5 882.7 583.9 85.1 46.2 0.0 3,6881991 0.0 7.7 0.0 24.6 54.5 451.3 624.7 1,393.0 1,242.5 82.2 47.3 0.0 3,9281992 0.0 0.0 0.0 33.0 101.0 279.8 541.0 1,116.6 646.1 161.6 17.4 0.0 2,8971993 0.0 0.0 1.4 2.8 0.4 285.2 834.6 723.1 573.6 670.9 33.6 11.7 3,1371994 24.6 8.6 0.2 40.0 173.3 350.3 779.9 291.0 220.4 61.8 3.8 0.8 1,9551995 0.4 0.6 0.0 0.0 169.2 174.4 229.0 430.9 866.9 259.6 137.4 41.9 2,310
Average 4.0 2.0 13.2 24.2 251.3 507.8 655.2 949.3 557.6 257.2 82.7 22.9 3,333
Note: "-" indicates there are missing data
Monthly Average Rainfall in the Study Area
0
200
400
600
800
1,000
1,200
1,400
JAN FEB MAR APR MAY JUN JUL AUG SEP OCT NOV DEC
Month
Mon
thly
Ave
rage
Rai
nfal
l (m
m/m
onth
)
San Marcelino
Dry Season Rainy Season Dry Season
THE GOVERNMENT OF THE PHILIPPINES THE DEPARTMENT OF PUBLIC WORKS AND HIGHWAYS
The Study on Sabo and Flood Control for Western River Basins of Mount Pinatubo in
the Republic of the Philippines JAPAN INTERNATIONAL COOPERATION AGENCY
Figure 1.2.3 Monthly Rainfall in San Marcelino
X-F4
THE G
OV
ERN
MEN
T OF TH
E PHILIPPIN
ES TH
E DEPA
RTM
ENT O
F PUB
LIC W
OR
KS A
ND
HIG
HW
AY
S
The Study on Sabo and Flood C
ontrol for W
estern River B
asins of Mount Pinatubo
in the Republic of the Philippines
JAPAN IN
TERNATIO
NAL C
OO
PERATION
AGEN
CY
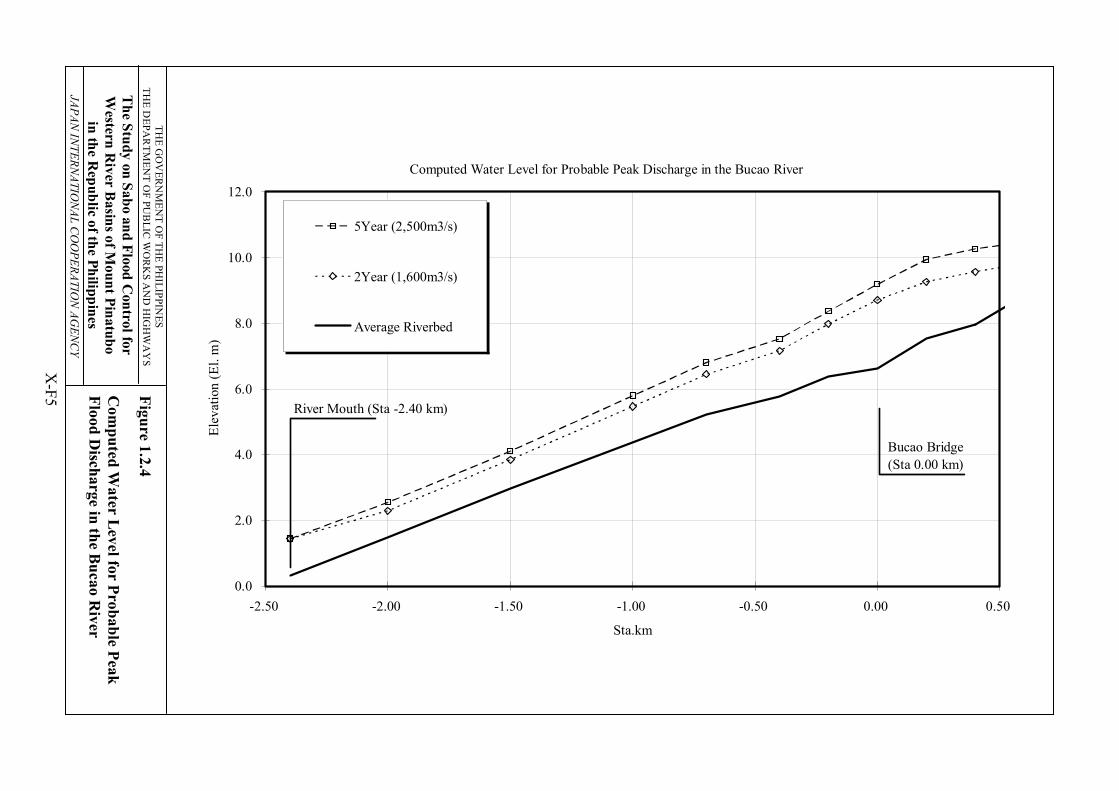
Figure 1.2.4 C
omputed W
ater Level for Probable Peak
Flood Discharge in the B
ucao River
Computed Water Level for Probable Peak Discharge in the Bucao River
0.0
2.0
4.0
6.0
8.0
10.0
12.0
-2.50 -2.00 -1.50 -1.00 -0.50 0.00 0.50
Sta.km
Elev
atio
n (E
l. m
)5Year (2,500m3/s)
2Year (1,600m3/s)
Average Riverbed
River Mouth (Sta -2.40 km)
Bucao Bridge (Sta 0.00 km)
X-F5

THE G
OV
ERN
MEN
T OF TH
E PHILIPPIN
ES TH
E DEPA
RTM
ENT O
F PUB
LIC W
OR
KS A
ND
HIG
HW
AY
S
The Study on Sabo and Flood C
ontrol for W
estern River B
asins of Mount Pinatubo
in the Republic of the Philippines
JAPAN IN
TERNATIO
NAL C
OO
PERATION
AGEN
CY
Figure 1.2.5 Subsoil C
ondition at the Bucao B
ridge
X-F6
Copyright © 2022 FDOKUMEN