WHAT SENSORY CHARACTERISTICS DRIVE PRODUCT QUALITY? AN ASSESSMENT OF INDIVIDUAL DIFFERENCES
Upload
khangminh22Category
view
2download
0
THE ROLE OF INSPECTION IN PRODUCT QUALITY MANAGEMENT DRIVE IN AN
ORGANIZATION: A CASE STUDY OF KIAMOKAMA TEA PROCESSING FACTORY, KISII
COUNTY
EDWARD ONSOTI RATEMO
A RESEARCH PROJECT SUBMITTED IN PARTIAL FULFILLMENT FOR THE REQUIRED
FOR THE AWARD OF A DIPLOMA IN PROCUREMENT, SCHOOL OF BUSINESS AND
ECONOMICS, KISII UNIVERSITY
2017.
i

DECLARATION
I declare that this research is my original work and has not been presented to any academic
institution for examination purposes. All the sources of information have been fully
acknowledged.
Edward Onsoti Ratemo Date: ______________
CB05/10299/15
Sign: _______________________________________
Declaration by the supervisor.
This research has been submitted with my approval as Kisii University supervisor
Nicodemus Karori
Sign: ___________________________ Date:______________
ii

DEDICATION
I dedicate this work to my family and all my classmates.
iii
ACKNOWLEDGEMENT
My indebted appreciations goes to my lecturer Nichodemus Karori for imparting research
techniques that facilitated the study and for in-depth criticism at various.
Also I acknowledge Kisii University for providing smooth atmosphere of learning environment.
iv
ABSTRACT.
My study focused on studying The Role of Inspection in Product Quality Management Drive in
an Organization: A Case Study of Kiamokama Tea Processing Factory, Kisii County. It
purposely focused on the application of quality management generally in all scales of
production i.e. export market and international market in Kiamokama Tea Factory, Kisii County
to determine and extract whether the inspection department as a whole following quality
management ,the intensity of basic requirement of quality management at the levels of all scales
of vendor measure with the perception that if quality management is implemented in its real
approach ,it positively impact on high levels of production, inter-firm relationships, self-quality
control as well as it enables and leads the manufacturer to export across the world market. The
general objective of the study was to note the role of product inspection quality drive in tea
processing firms with particular focus of Kiamokama Tea Factory in Kisii County. The specific
objectives of my study were: To establish if quality management practices can contribute to the
increase export shares of the organization and fetch ready market; To analyze if quality product
management practices can contribute to improved supply chain through strong inter-firm
relationship; To establish if quality management practices contributes to control over product and
process specification through the self continues quality; and To find out if quality controlled
management practices can reduce some extra added costs i.e. repairing and failure costs. My
research was designed in a way that data was collected by both primary and secondary data
collection techniques. A population of 84 buyers comprising the international market buyers and
the local buyers were used for the study. Primary data for this research was collected using a
well-designed and structured questionnaire which was made up of both close ended and open
ended questions. The collected data was presented both graphical and tabulation forms.
v
Table of Contents
DECLARATION..............................................................................................................................I
DEDICATION...............................................................................................................................III
ACKNOWLEDGEMENT.............................................................................................................IV
ABSTRACT....................................................................................................................................V
TABLE OF CONTENTS...............................................................................................................VI
LIST OF TABLES.........................................................................................................................IX
LIST OF FIGURES.......................................................................................................................XI
CHAPTER ONE..............................................................................................................................1
INTRODUCTION...........................................................................................................................1
1.0 Introduction................................................................................................................................1
1.1 Background to the study............................................................................................................2
1.2 Statement of the problem...........................................................................................................3
1.3 Objectives of the study..............................................................................................................4
1.4 The specific objectives of the study......................................................................................4
1.5 Research questions.....................................................................................................................4
1.6 Significance of the study............................................................................................................4
1.7 Scope of the study......................................................................................................................5
vi

1.8 Limitations of the study.............................................................................................................5
1.9 Study Assumptions....................................................................................................................5
1.9.1 Definition of terms..................................................................................................................5
CHAPTER TWO.............................................................................................................................6
LITERATURE REVIEW.................................................................................................................6
2.0 Introduction................................................................................................................................6
2.1 Theoretical Framework..............................................................................................................6
2.1.1 Deming's Theory.....................................................................................................................6
2.1.2 Crosby's Theory......................................................................................................................8
2.1.3 Joseph Juran's Theory.............................................................................................................9
2.1.4 Ishikawa's Theory.................................................................................................................10
2.2 CONCEPTUAL FRAMEWORK............................................................................................11
2.3 Research gap............................................................................................................................12
CHAPTER THREE.......................................................................................................................13
RESEARCH DESIGN AND METHODOLOGY..........................................................................13
3.0 Research Design......................................................................................................................13
3.1 Target population.....................................................................................................................13
3.2 Sampling method and size.......................................................................................................13
3.3 Data collection instrument.......................................................................................................13
vii
3.4 Data collection procedure........................................................................................................13
3.5 Data analysis and presentation.................................................................................................14
3.6 Ethical considerations..............................................................................................................14
CHAPTER FOUR.........................................................................................................................15
DATA ANALYSIS AND DISCUSSIONS OF RESULTS.............................................................15
4.0 INTRODUCTION.................................................................................................................15
CHAPTER FIVE...........................................................................................................................43
SUMMARY OF FINDINGS, CONCLUSIONS AND RECOMMENDATIONS.........................43
5.0 INTRODUCTION...................................................................................................................43
5.1 SUMMARY OF FINDINGS...................................................................................................43
5.1.1 PERSONAL DETAILS........................................................................................................43
5.1.2 QUALITY INSPECTION MANAGEMENT PRACTICES................................................44
5.1.3 EFFECTIVENESS OF QUALITY INSPECTION MANAGEMENT PRACTICES..........44
5.1.4 EFFECT OF QUALITY INSPECTION MANAGEMENT PRACTICES ON
ORGANIZATIONAL PERFORMANCE......................................................................................45
5.1.5 ANALYSIS OF SENIOR STAFF VIEW ON ORGANIZATIONAL PERFORMANCE....45
5.2 CONCLUSIONS.....................................................................................................................46
5.3 RECOMMENDATIONS.........................................................................................................46
REFERENCES..............................................................................................................................48
APPENDIX....................................................................................................................................50
APPENDIX A: QUESTIONAIRE................................................................................................50
viii
LIST OF TABLES
Table 4.1.3: Departments of respondents……………………………………………… 19
Table 4.1.4 length of service of respondents with Kiamokamo Tea Factory……………19
Table 4.2.1: Respondents view of Leadership Commitment to the work………………..20
Table 4.2.2: Employee involvement in quality decisions………………………………21
Table 4.2.3: Effective Communication…………………………………………………22
Table 4.2.4: Team Work………………………………………………………………..22
Table 4.2.5: System for recognition and appreciation of quality efforts………………..23
Table 4.2.6: Respondents view on training & development ……………………………24
Table 4.2.7 Respondents view on self-assessment………………………………………25
Table 4.3.1 is customer satisfaction everybody's business in the organization? ................25
Table 4.3.2 Department which is responsible for product quality in the organization……26
Table 4.3.3: Respondents view on subscription to any quality award system ……………27
Table 4.3.4 Response on training received on the job……………………………………….27
Table 4.3.5: Respondents’ view on whether training received has impacted positively on the
work………………………………………………………………………………………..28
Table 4.3.6 all the resources the respondents need to carry out any improvement on the job are
readily available……………………………………………………………………………..29
4.4.1 Respondents view on reworks done in the departments……………………………….30
Table 4.4.2 Respondents view on the relationship between them and the organization can be
described as satisfactory…………………………………………………………………….31
Table 4.4.3: Respondents view on whether the factory is losing some customers……………32
ix
Table 4.4.5 Respondents view on reasons why the factory is losing some customers………..33
Table 4.4.6: Respondents view on which of these Quality functions will help improve upon
organizational performance…………………………………………………………………34
Table 4.4.7: Respondents view on number of reworks done in a year
……………………………….................................................…………………………….35
Table 4.4.8: Respondents view on the loss rate per annum………………………………..35
Table: 4.5.1 Respondents’ view on customer complaints………………………………….36
Table 4.5.2: Respondents’ view on number of customer complaints received for the past two
years……………………………………………………………………………………….37
Table 4.5.3: Respondents’ view on whether some customers have stopped buying from the
organization
……………………………………………………………………………………………………38
Table 4.5.4: Respondents’ views on the reasons why some customers have stopped buying from
the organization.
……………………………………………………………………………………………………38
Table 4.5.5: Respondents view on whether the organization has lost some major
tenders……….39
Table 4.5.6: Respondents’ reasons why the organization lost some major tenders……………..39
Table 4.5.7: Respondents’ view on the increase in volume of sales for the last two years
compared to those previous
years…………………………………………………………………….…40
Table 3.9.1 Questionnaire…………………………………………………………………….53
x
LIST OF FIGURES
Figure 1: CONCEPTUAL FRAMEWORK...............................................................................................11Figure 2: Age Of Respondents...................................................................................................................16Figure 3:Views of what management could do to improve upon organizational performance. ................41
xi

CHAPTER ONE
INTRODUCTION
1.0 Introduction
Several centuries ago tea was born in China. Few years later it crossed the sea to Japan and then
was spread far and wide. Today tea is grown in several parts around the world. Major tea
producing-regions in the world are just handful countries of the world. These countries are
China, India, Japan, Kenya and Sri Lanka.
In 2003, The world’s annual tea production was 3.21 million tones (FAOSTAT 2003).In 2010 the
world tea production rose to 4.52 million tones with an increase of 5.7% between 2009 and 2010
(Agritrade executive tea, 2013).The production also increased by 3.1% between 2010 and
2011.The largest producer and consumer of black tea in the world is China while Kenya world’s
leading exporter of black tea (Thompsons Gwen 2009).
Smallholders play an important role in tea sub-sector worldwide. In Sri Lanka, there are more
than 400 000 smallholders who account for 76 percent of tea production, Produced in 64 percent
of the area under tea. In Kenya, about 560 000 smallholders account for over 60percent of total
tea production, while in China, which is the world‘s largest tea producing country (particularly
green tea) and Vietnam, smallholders dominate tea production. In Indonesia, smallholders
account 43 percent of the area under tea and 23 percent of production and in India, the world’s
largest producer and consumer of black tea, an estimated 160 000 smallholders account for over
26percent of its production.(Intergovernmental group on tea, Twentieth session,2011)
Growth in smallholders tea production has been significantly evident in the last decade as tea
area under smallholders in China increased by 73 percent from 1.1 million has to almost 2
million ha between 2001 and 2010.During the same period in Kenya the area under smallholders
expended by 34 percent, from 85 511 ha to 115 023h and by 30 percent in Vietnam, from 101
884 ha to 132 000ha.Between 1994 and 2005,tea area under smallholders increased by 48
1
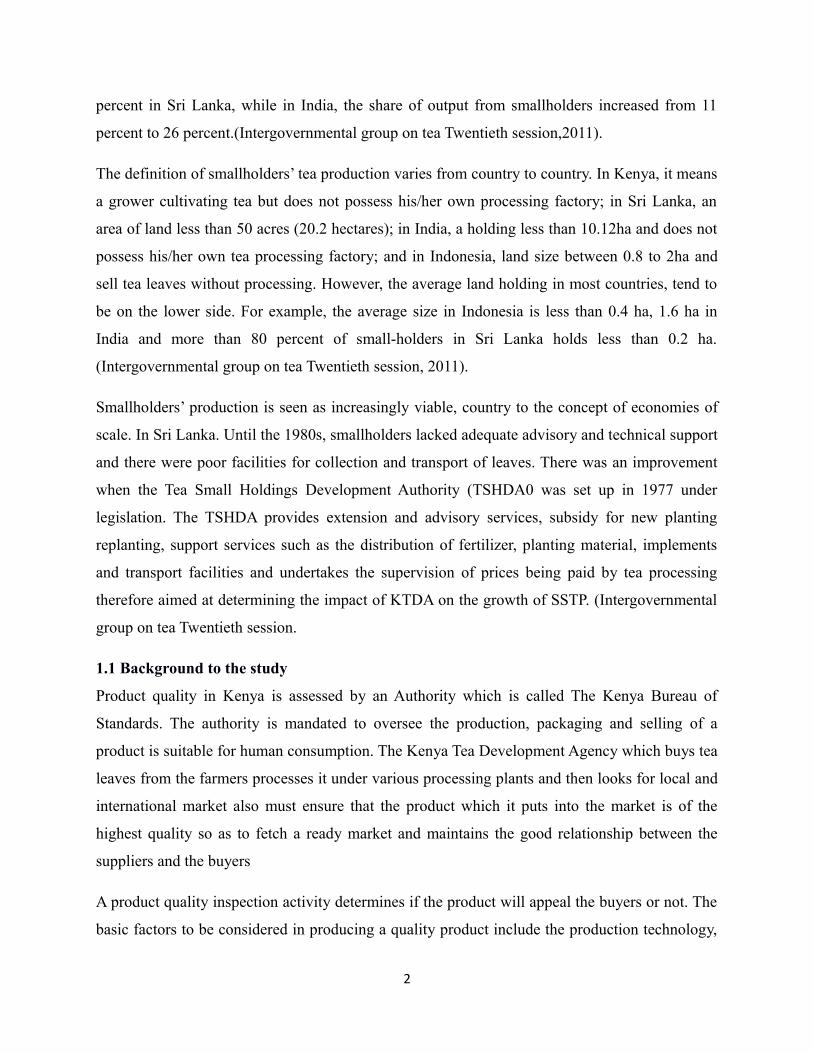
percent in Sri Lanka, while in India, the share of output from smallholders increased from 11
percent to 26 percent.(Intergovernmental group on tea Twentieth session,2011).
The definition of smallholders’ tea production varies from country to country. In Kenya, it means
a grower cultivating tea but does not possess his/her own processing factory; in Sri Lanka, an
area of land less than 50 acres (20.2 hectares); in India, a holding less than 10.12ha and does not
possess his/her own tea processing factory; and in Indonesia, land size between 0.8 to 2ha and
sell tea leaves without processing. However, the average land holding in most countries, tend to
be on the lower side. For example, the average size in Indonesia is less than 0.4 ha, 1.6 ha in
India and more than 80 percent of small-holders in Sri Lanka holds less than 0.2 ha.
(Intergovernmental group on tea Twentieth session, 2011).
Smallholders’ production is seen as increasingly viable, country to the concept of economies of
scale. In Sri Lanka. Until the 1980s, smallholders lacked adequate advisory and technical support
and there were poor facilities for collection and transport of leaves. There was an improvement
when the Tea Small Holdings Development Authority (TSHDA0 was set up in 1977 under
legislation. The TSHDA provides extension and advisory services, subsidy for new planting
replanting, support services such as the distribution of fertilizer, planting material, implements
and transport facilities and undertakes the supervision of prices being paid by tea processing
therefore aimed at determining the impact of KTDA on the growth of SSTP. (Intergovernmental
group on tea Twentieth session.
1.1 Background to the study
Product quality in Kenya is assessed by an Authority which is called The Kenya Bureau of
Standards. The authority is mandated to oversee the production, packaging and selling of a
product is suitable for human consumption. The Kenya Tea Development Agency which buys tea
leaves from the farmers processes it under various processing plants and then looks for local and
international market also must ensure that the product which it puts into the market is of the
highest quality so as to fetch a ready market and maintains the good relationship between the
suppliers and the buyers
A product quality inspection activity determines if the product will appeal the buyers or not. The
basic factors to be considered in producing a quality product include the production technology,
2
well trained and skillful employees, good morals and ethics during the product processing and
also the willingness of ready to work
The employees in any processing plant greatly have the role of ensuring that by all means they
are highly trained and very competent in any of their departments of work. If affirm hires
unskilled laborers, they are likely to encounter many losses as the product produced is not of the
desired quality.
1.2 Statement of the problem
Literature revealed that modern businesses have to come up with sustainable business policies
and frameworks in their operations to attain attractive results moving away from mass
production. (Liyange 2007). The changing business environment has necessitated companies to
change their operation strategies. The Japanese came up with the management that incorporates
continuous improvement in the operations production process and supply chains (Peng et al
2011). They have been able to produce their products with an aim of zero defects, efficiency in
production process, minimal stocks and automation (Pham and Thomas 2008). Studies have
shown that operation management and operational performance are linked (Chaves 2013),
studied the operational management aspect of the internal practices in manufacturing firms
located in Ireland where they established that this has an effect on the operation, elements of
quality, delivery, flexibility and cost. (Feng 2013). In this study of Chinese manufacturing
companies found that internal business activities like the operation management aspect of supply
chain affects business operational performance.
Operations as a combination of tasks performed to create value for a product, operation
management is a company’s role enabling the achievement of a company's goals through
efficient acquisition and use of resources (Bayraktar 2007). Operational management has a direct
impact on both costs and revenues. It is an area that should be given due attention in any
company as it potentially has an effect on profit (Slack 2004). The operational management in an
industry is affected by aspects of uncertainties and competition (Boyle 2006). The systems level
comprises companies’ quality and supply chain management generates this and has to be in line
with the operation strategy as this is a major point in achieving a company’s objective.
3
Quality product production continues to be low despite the Kenya Bureau of Standards efforts to
check on the quality of products produced by a given factory. Therefore, this paper seeks to
highlight the role of product inspection quality drive in an organization. A case study of
Kiamokama Tea Factory in Masaba south sub-county.
1.3 Objectives of the study
The general objective of the study was to note the role of product inspection quality drive in
tea processing firms with particular focus of Kiamokama Tea Factory in Kisii County.
1.4 The specific objectives of the study.i. To establish if quality management practices can contribute to the increase export shares
of the organization and fetch ready market.ii. To analyze if quality product management practices can contribute to improved supply
chain through strong inter-firm relationship.iii. To establish if quality management practices contributes to control over product and
process specification through the self continues quality.iv. To find out if quality controlled management practices can reduce some extra added
costs i.e. repairing and failure costs.
1.5 Research questions
The study was guided by the following research questions
i. Can product quality have any impact on both the local and international market?
ii. Can good product quality reduce some extra added cost to the producer?
iii. If poor products are produced, what will be the relationship between the supplier and the
producer, and the relationship between the buyer and the manufacturer?
1.6 Significance of the study.
The study will help to improve the process of product manufacturing in Kiamokama Tea Factory
in Kisii County and other processing firms in the country Kenya. The findings will help also
other processing firms in the African Continent and other Continents in improving their products
using this knowledge and others done by different people before. The study will also provide a
basis for further research among other future researches.
4
1.7 Scope of the study.
The study mainly dealt with the factors affecting the production quality of tea at Kiamokama Tea
Factory in Kisii County.
1.8 Limitations of the study.
As we mainly consider the skills provided by the workers of the factory, many of them were
unable to show their qualification certificates which made them to get employed at that factory.
The managers also failed to take us through the whole process of processing tea right from the
suppliers to the buyers.
1.9 Study Assumptions.
It was assumed that the findings would help other factories producing tea product and other
related products to produce products that are of high quality so as to suit human consumption and
also get ready local and international markets
1.9.1 Definition of terms.
Processing - transforming something from one state to the next.
Supply chain - the sequence of processes involved in the production and distribution of a
commodity.
Suppliers - people who are willing to put a product into the market at a specific time.
Raw materials - these are unprocessed goods from the supplier.
Management - this is the administration of an organization, whether a business or government
body.
Inter-firm relationship - a broad range of interaction including strategic, joint ventures and
mergers.
Vendors - a person or company offering a product for sale.
5
CHAPTER TWO
LITERATURE REVIEW.
2.0 Introduction
Chapter one briefly explained the research background and also described the research
objectives. This chapter reviews the relevant literature which underpins this research and
describes how this research relates to existing works on quality management and quality
practices, approaches to adoption of quality, models of quality practices, relationship between
quality and performance. In the literature review, the combination of these five major disciplines
provides the theoretical background to the research design for this study. The international and
regional differences and some themes, for example Quality Management, remain popular in Asia,
whilst their popularity has declined in other regions. According to a number of sources
(literature, surveys, and research studies), ISO 9000 and Quality Management practices are two
main approaches used by many companies. Having accepted that there are some irrational
influences on the selection of Quality Management initiatives, the literature in Quality
Management has disagreed with the fixed model and has suggested a rational decision based on
the company’s objectives and situation. Both ISO 9000 and Quality Management theories have
formed an initial background to the Quality Practices selection framework
2.1 Theoretical Framework
In my project, The Role of Inspection in Product Quality Management Drive in an
Organization: A Case Study of Kiamokama Tea Processing Factory, Kisii COUNTY, I sought to
study the various factors affecting product quality in the factory. Some of these factors included:
internal factors; external factors; and ethical factors.
I also reviewed similar research works that are related to my study and have been undertaken
before by different scholars. These theories and studies are as discussed below:
2.1.1 Deming's Theory
Deming's theory of Total Quality Management rests upon fourteen points of management he
identified, the system of profound knowledge, and the Shewart Cycle (Plan-Do-Check-Act). He
is known for his ratio-Quality is equal to the result of work efforts over the total costs. If a
6
company is to focus on costs, the problem is that costs rise while quality deteriorates. Deming's
system of profound knowledge consists of the following four points:
System Appreciation- an understanding of the way that the company's processes and systems
work Variation Knowledge- an understanding of the variation occurring and the causes of the
variation Knowledge Theory- the understanding of what can be known Psychology Knowledge-
the understanding of human nature By being aware of the different types of knowledge
associated with an organization, then quality can be broached as a topic. Quality involves
tweaking processes using knowledge.
The fourteen points of Deming's theory of total quality management are as follows:
Create constancy of purpose
Adopt the new philosophy
Stop dependencies on mass inspections
Don't award business based upon the price
Aim for continuous production and service improvement
Bring in cutting-edge on the job training
Implement cutting-edge methods for leadership
Abolish fear from the company
Deconstruct departmental barriers
Get rid of quantity-based work goals
Get rid of quotas and standards
Support pride of craftsmanship
Ensure everyone is trained and educated
Make sure the top management structure supports the previous thirteen points.
Plan-Do-Check-Act (PDCA) is a cycle created for continuous improvement. In the planning
phase, objectives and actions are outlined. Then, you do your actions and implement the process
improvements. Next, you check to ensure quality against the original. Finally acting requires that
you determine where changes need to occur for continued improvement before returning to the
plan phase.
7
2.1.2 Crosby's Theory
Philip Crosby is another person credited with starting the TQM movement. He made the point,
much like Deming, that if you spend money on quality, it is money that is well spent. Crosby
based on four absolutes of quality management and his own list of fourteen steps to quality
improvement.
Crosby's four absolutes are:
We define quality as adherence to requirements.
Prevention is the best way to ensure quality
Zero Defects (mistakes) is the performance standard for quality
Quality is measured by the price of nonconformity
The fourteen steps to continuous quality improvement, for Crosby, are:
Attain total commitment from management
Form a quality improvement team
Create metrics for each quality improvement activity
Determine cost of quality and show how improvement will contribute to gains
Train supervisors appropriately
Encourage employees to fix defects and keep issues logs
Create a zero-defects committee
Ensure that employees and supervisors understand the steps to quality
Demonstrate your company's commitment by holding a zero defects day
Goals are set on 30, 60,or 90day schedule
Determine root causes of errors, remove them from processes
Create incentives programs for employees
Create a quality council and hold regular meetings
Repeat from step one
8
2.1.3 Joseph Juran's Theory
Joseph Juran is responsible for what has become known as the "Quality Trilogy." The quality
trilogy is made up of quality planning, quality improvement, and quality control. If a quality
improvement project is to be successful, then all quality improvement actions must be carefully
planned out and controlled. Juran believed there were ten steps to quality improvement. These
steps are:
An awareness of the opportunities and needs for improvement must be created
Improvement goals must be determined
Organization is required for reaching the goals
Training needs to be provided
Initialize projects
Monitor progress
Recognize performance
Report on results
Track achievement of improvements
Repeat The EFQM Framework
The European Foundation for Quality Management (EFQM) Model is based upon nine criteria
for quality management. There are five enablers (criteria covering the basis of what a company
does) and four results (criteria covering what a company achieves). The result is a model that
refrains from prescribing any one methodology, but rather recognizes the diversity in quality
management methodologies .The nine criteria as defined by the EFQM Model are:
Focus on Results-pleasing company stakeholders with results achieved by stakeholders is
a primary focus
Focus on Customers-it is vital that a company's quality management leads to customer
satisfaction.
Constancy of Purpose and Consistent, Visionary Leadership
Process and Facts form the Management Focus -Management breaks down everything
into systems, processes and facts for easy monitoring.
9
Training and Involving Employees - Employees should receive professional development
opportunities and be encouraged to remain involved in the company
Continuous Learning -everyone should be provided with opportunities for learning on the
job
Developing Partnerships-It is important to encourage partnerships that add value to the
company's improvement process
Social Responsibility of the Corporation-The Company should always act in a way where
it is responsible towards the environment and society at large.
2.1.4 Ishikawa's Theory
Creator of the last theory, Dr. Kaoru Isikawa is often known for his namesake diagram, but he
also developed a theory of how companies should handle their quality improvement projects.
Ishikawa takes a look at quality from a human standpoint. He points out that there are seven
basic tools for quality improvement.
These tools are:
Pare to Analysis- Pare to analysis helps to identify the big problems in a process.
Cause and Effect Diagrams- Cause and effect diagrams help to get to the root cause of
problems.
Stratification – Stratification analyze show the information that has been collected fits
together.
Check Sheets - Check sheets look at how often a problem occurs.
Histograms - Histograms monitor variation.
Scatter Charts -Scatter charts demonstrate relationships between a varieties of factors.
Process Control Charts- A control chart helps to determine what variations to focus upon.
These are a few of the many different TQM theories, and we haven't even covered Six Sigma
here. When learning about total quality methods, it is important to remember that these are
guidelines. What is important is that you and your company practice consistent steps towards
improving quality in your organization and processes. Use the tools that have been shown to
work and make a commitment. Committed leadership means committed employees.
10

2.2 CONCEPTUAL FRAMEWORK
Figure 1: CONCEPTUAL FRAMEWORK
11
Internal factors
External factors Product quality
Ethical factors

2.3 Research gap
From the above described works, studies and theories that have been conducted before, a lot of
work is still to be done to study The Role of Inspection in Product Quality Management Drive
in An Organization. That is why I undertook this study, taking a case study of Kiamokama Tea
Processing Factory, Kisii County, as a representation of similar factories/industries. I sought to
study the various factors affecting product quality such as internal factors; external factors; and
ethical factors.
12
CHAPTER THREE
RESEARCH DESIGN AND METHODOLOGY.
3.0 Research Design
The study adopted a case study design on the role of inspection in product quality at Kiamokama
Tea Factor .This study design was considered appropriate as it aimed to make an in-depth
analysis with a view to discover more information and relationship among the variables of the
study
3.1 Target population
The population for the study was 49companies out of 84companies of which 30 were from the
international market and 19 from the local market. The target population referred to the entire
group of companies to which a researcher was interested in generalizing the conclusion
(CATILO 2009). Since the study population was small, the target population was equivalent to
the study population.
3.2 Sampling method and size
Due to the fact that the population or the study was relatively small, the study used census or
total enumeration to collect data from the whole population. Complete enumeration consists of
using each and every unit of the population in the study. The study did not use any sampling
technique
3.3 Data collection instrument
Primary data for this research was collected using a well-designed and structured questionnaire
for data collection. A questionnaire is a pro-foma containing a sequence of questions to elicit
information from the interviewee. According to Kotler and Keller (2006), the questionnaire can
be defined as asset of questions presented to respondents. It is commonly used to gather data and
also very flexible because it can be administered in person, by phone or online. Close ended
question constituted the basis of the structured question
13
3.4 Data collection procedure
The researcher assigned one month for the entire data collection exercise. Before the
questionnaires were administered, they were pre-tested on some companies to check whether it
would help achieve the objective of the study. It also showed whether the right responses would
be provided by the respondents. It did help to clarify ambiguities and uncertainties regarding
questions which were asked. After the pre-test the questionnaire were then administered
3.5 Data analysis and presentation
Analysis is a research technique for making replicable and valid references from data to their
context. The researcher searches for structure and pattern regularities in the test and makes
references on the basis of regularities (Krippender, 1990)
Quantitative data analysis statistical packages for social sciences (SPSS VER17) were used to
analyses the data. This means that the analysis was done on the context of data which was
collected.
3.6 Ethical considerations
The researcher informed the research assistants the main purpose of the study and seek their
consent of involvement prior to data collection through them. The respondent’s information and
confidentiality was highly kept and respected. The researcher maintained the scientific integrity
of analyzing the findings objectively without bias and false representation of the research
methodology
14
CHAPTER FOUR
DATA ANALYSIS AND DISCUSSIONS OF RESULTS
4.0 INTRODUCTION
This chapter presents the analysis of the data collected from the field and the
discussion of the results and content analytic approach. Primary data was gathered on
Quality Management practices and its effects on organizational performance at
Kiamokama Tea Factory. The analysis covered personal details, Quality Management
practices, effectiveness of the Quality Management practices, effect of Quality
Management on organizational performance, and Management view on organizational
performance.
4.1 PERSONAL DETAILS
4.1.1 Gender of respondents
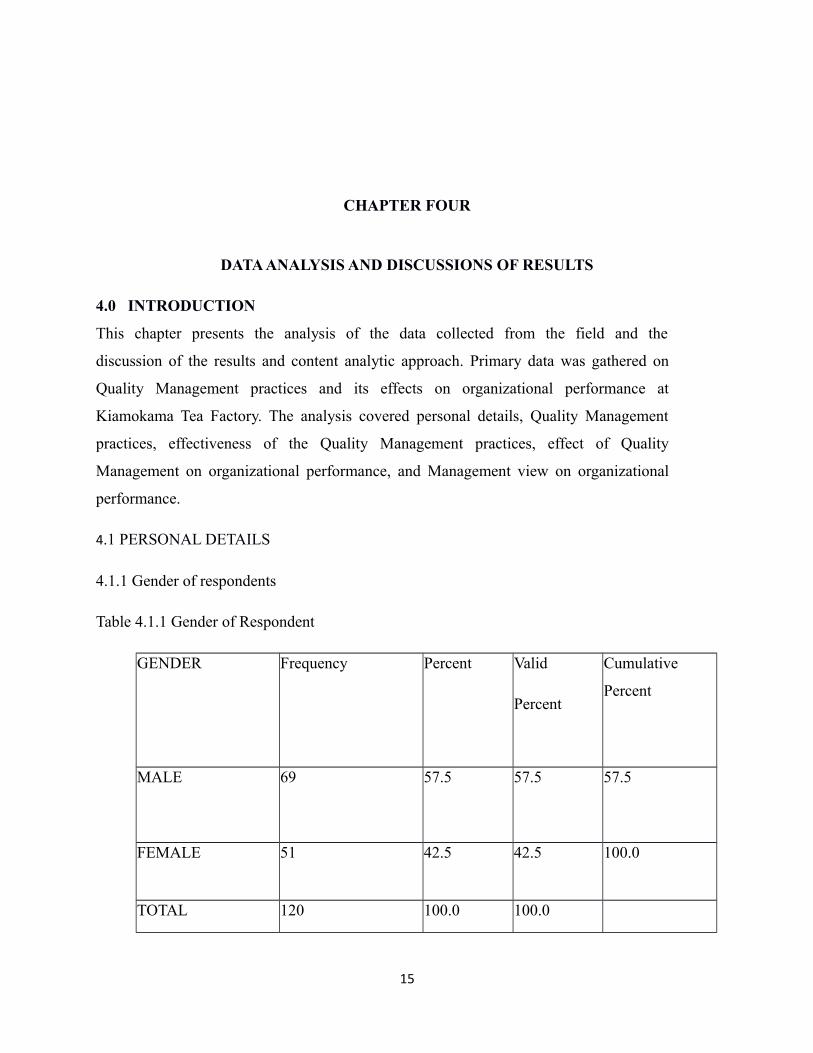
Table 4.1.1 Gender of Respondent
GENDER Frequency Percent Valid
Percent
Cumulative
Percent
MALE 69 57.5 57.5 57.5
FEMALE 51 42.5 42.5 100.0
TOTAL 120 100.0 100.0
15

Table 4.1.1 shows that 69 (57.5 %) of the respondents were males and the remaining
51(42.5%) were females. This indicates that there are more males than females working in
Kiamokama Tea Factory
Figure 2: Age Of Respondents
Fig 2 shows the age distribution of respondents, the indications are that 14 (11.7%) respondents
fell in the age bracket 18- 30. 19 (15.8%) of the respondents fell in the bracket 31-40. That of the
age bracket 41-50 was 34 representing 28.3% and that of 51-60 was 53 representing 44.2%. This
indicate that nearly 44% of the respondents are near the retiring age of 60 which can have effect
on productivity especially when dealing with labor intensive work like manufacturing. Again if
care is not taken it could lead to expensive learning curve when most of these staff nearing their
retiring go suddenly.
16
Age of respondents
4.1.2 Educational background of respondents
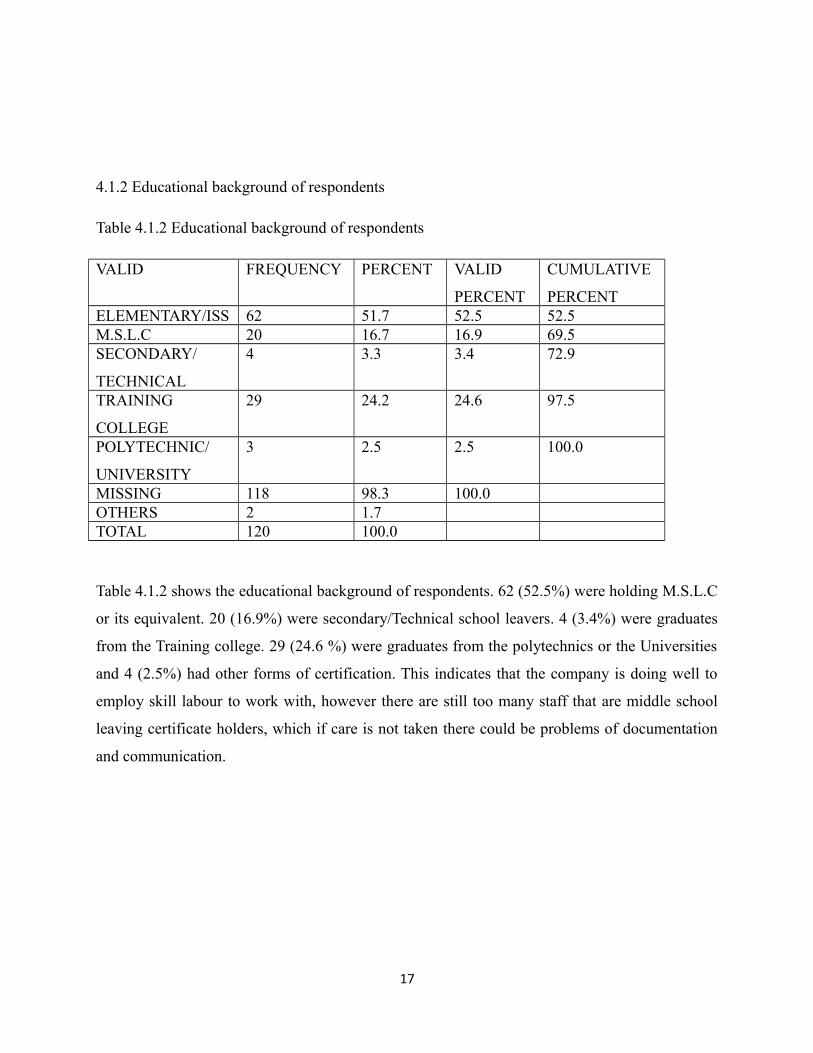
Table 4.1.2 Educational background of respondents
VALID FREQUENCY PERCENT VALID
PERCENT
CUMULATIVE
PERCENTELEMENTARY/ISS 62 51.7 52.5 52.5M.S.L.C 20 16.7 16.9 69.5SECONDARY/
TECHNICAL
4 3.3 3.4 72.9
TRAINING
COLLEGE
29 24.2 24.6 97.5
POLYTECHNIC/
UNIVERSITY
3 2.5 2.5 100.0
MISSING 118 98.3 100.0OTHERS 2 1.7TOTAL 120 100.0
Table 4.1.2 shows the educational background of respondents. 62 (52.5%) were holding M.S.L.C
or its equivalent. 20 (16.9%) were secondary/Technical school leavers. 4 (3.4%) were graduates
from the Training college. 29 (24.6 %) were graduates from the polytechnics or the Universities
and 4 (2.5%) had other forms of certification. This indicates that the company is doing well to
employ skill labour to work with, however there are still too many staff that are middle school
leaving certificate holders, which if care is not taken there could be problems of documentation
and communication.
17
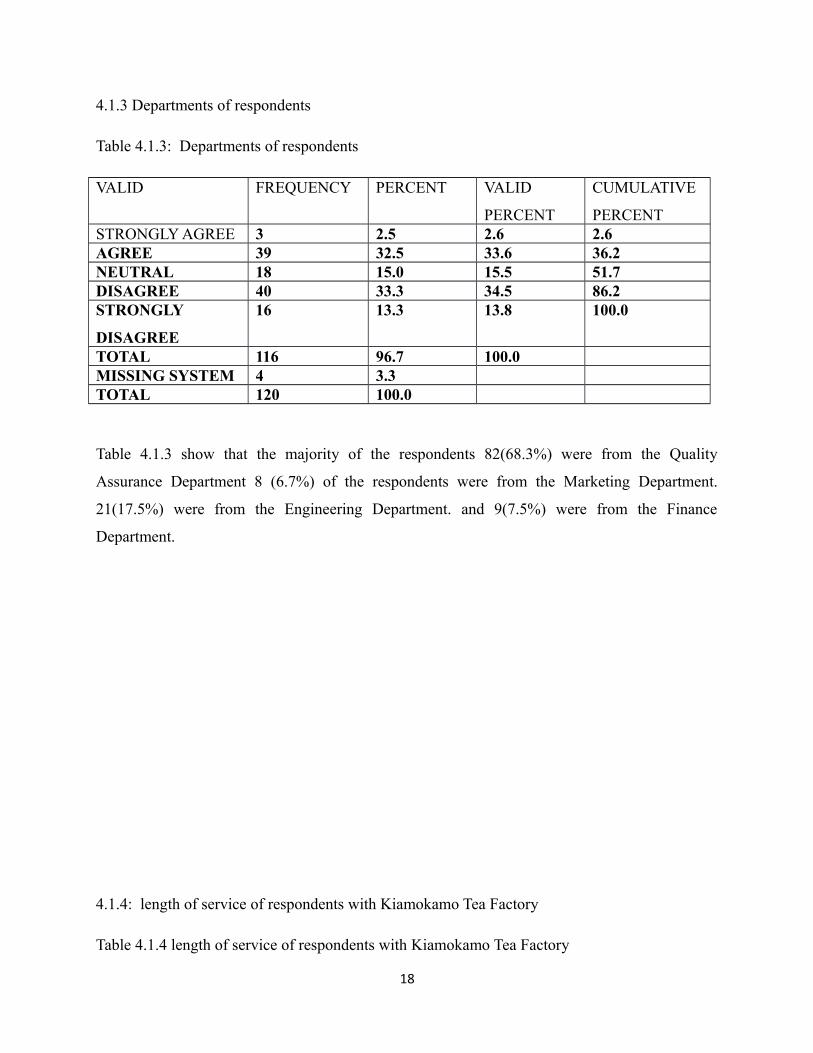
4.1.3 Departments of respondents
Table 4.1.3: Departments of respondents
VALID FREQUENCY PERCENT VALID
PERCENT
CUMULATIVE
PERCENTSTRONGLY AGREE 3 2.5 2.6 2.6AGREE 39 32.5 33.6 36.2NEUTRAL 18 15.0 15.5 51.7DISAGREE 40 33.3 34.5 86.2STRONGLY
DISAGREE
16 13.3 13.8 100.0
TOTAL 116 96.7 100.0MISSING SYSTEM 4 3.3TOTAL 120 100.0
Table 4.1.3 show that the majority of the respondents 82(68.3%) were from the Quality
Assurance Department 8 (6.7%) of the respondents were from the Marketing Department.
21(17.5%) were from the Engineering Department. and 9(7.5%) were from the Finance
Department.
4.1.4: length of service of respondents with Kiamokamo Tea Factory
Table 4.1.4 length of service of respondents with Kiamokamo Tea Factory
18
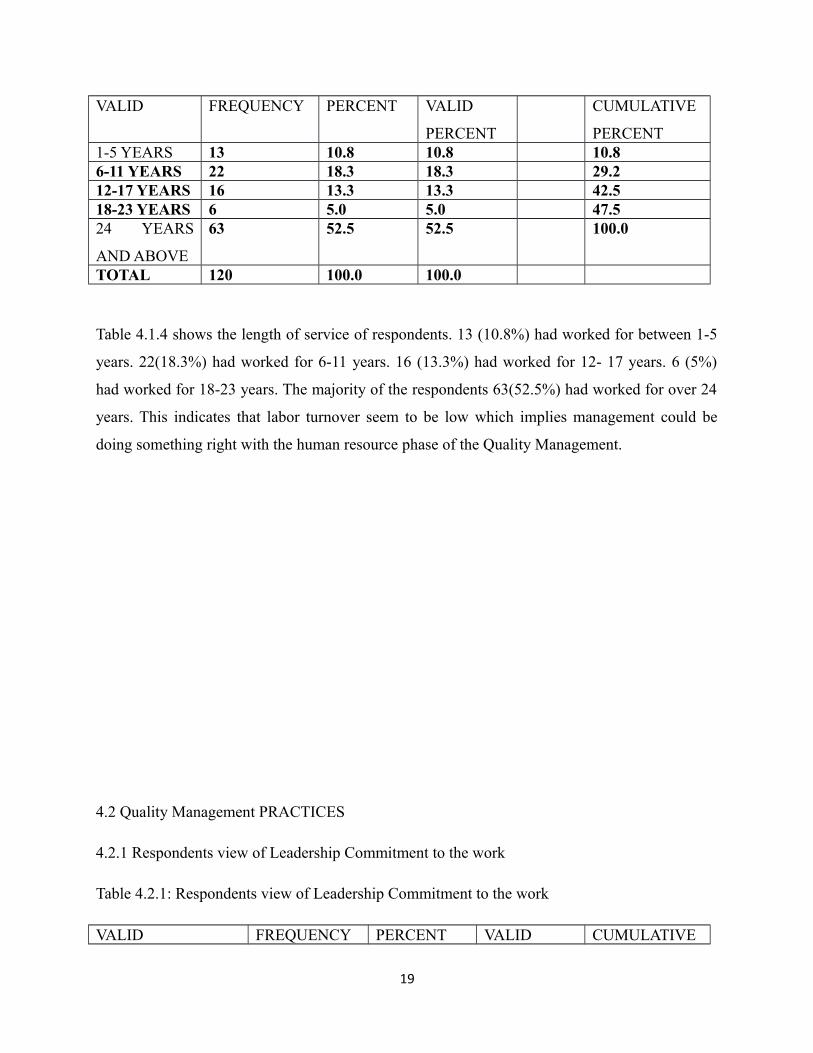
VALID FREQUENCY PERCENT VALID
PERCENT
CUMULATIVE
PERCENT1-5 YEARS 13 10.8 10.8 10.86-11 YEARS 22 18.3 18.3 29.212-17 YEARS 16 13.3 13.3 42.518-23 YEARS 6 5.0 5.0 47.524 YEARS
AND ABOVE
63 52.5 52.5 100.0
TOTAL 120 100.0 100.0
Table 4.1.4 shows the length of service of respondents. 13 (10.8%) had worked for between 1-5
years. 22(18.3%) had worked for 6-11 years. 16 (13.3%) had worked for 12- 17 years. 6 (5%)
had worked for 18-23 years. The majority of the respondents 63(52.5%) had worked for over 24
years. This indicates that labor turnover seem to be low which implies management could be
doing something right with the human resource phase of the Quality Management.
4.2 Quality Management PRACTICES
4.2.1 Respondents view of Leadership Commitment to the work
Table 4.2.1: Respondents view of Leadership Commitment to the work
VALID FREQUENCY PERCENT VALID CUMULATIVE
19
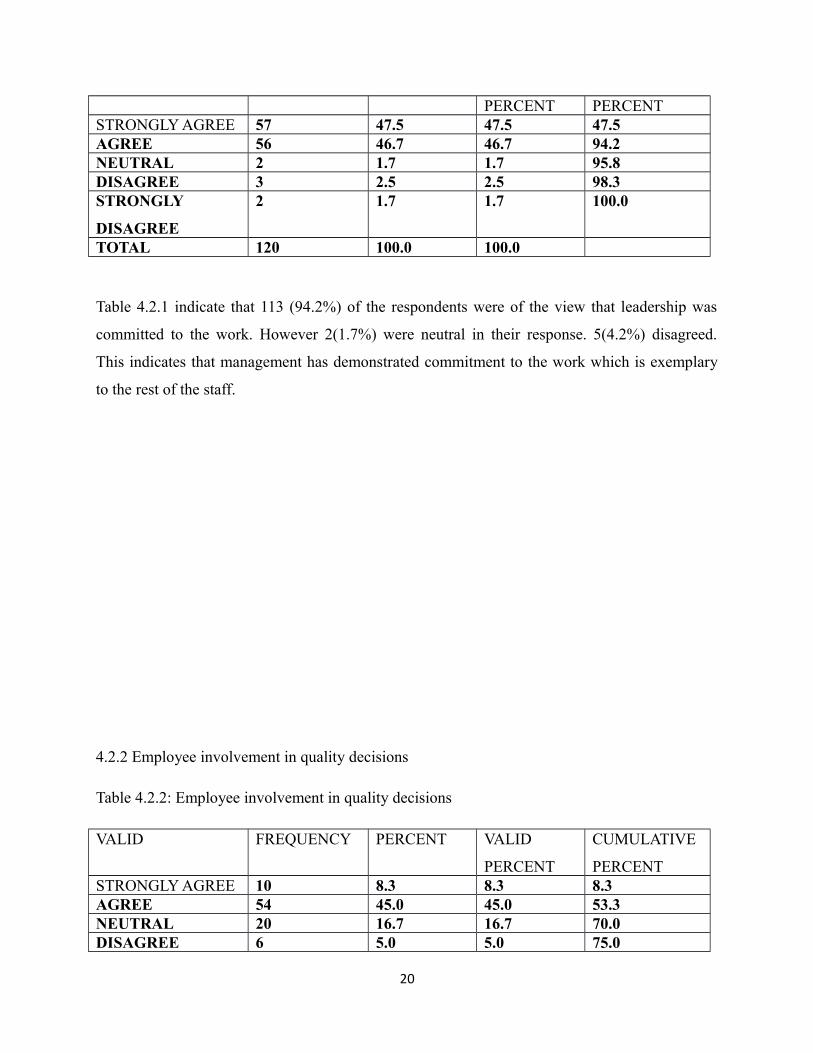
PERCENT PERCENTSTRONGLY AGREE 57 47.5 47.5 47.5AGREE 56 46.7 46.7 94.2NEUTRAL 2 1.7 1.7 95.8DISAGREE 3 2.5 2.5 98.3STRONGLY
DISAGREE
2 1.7 1.7 100.0
TOTAL 120 100.0 100.0
Table 4.2.1 indicate that 113 (94.2%) of the respondents were of the view that leadership was
committed to the work. However 2(1.7%) were neutral in their response. 5(4.2%) disagreed.
This indicates that management has demonstrated commitment to the work which is exemplary
to the rest of the staff.
4.2.2 Employee involvement in quality decisions
Table 4.2.2: Employee involvement in quality decisions
VALID FREQUENCY PERCENT VALID
PERCENT
CUMULATIVE
PERCENTSTRONGLY AGREE 10 8.3 8.3 8.3AGREE 54 45.0 45.0 53.3NEUTRAL 20 16.7 16.7 70.0DISAGREE 6 5.0 5.0 75.0
20
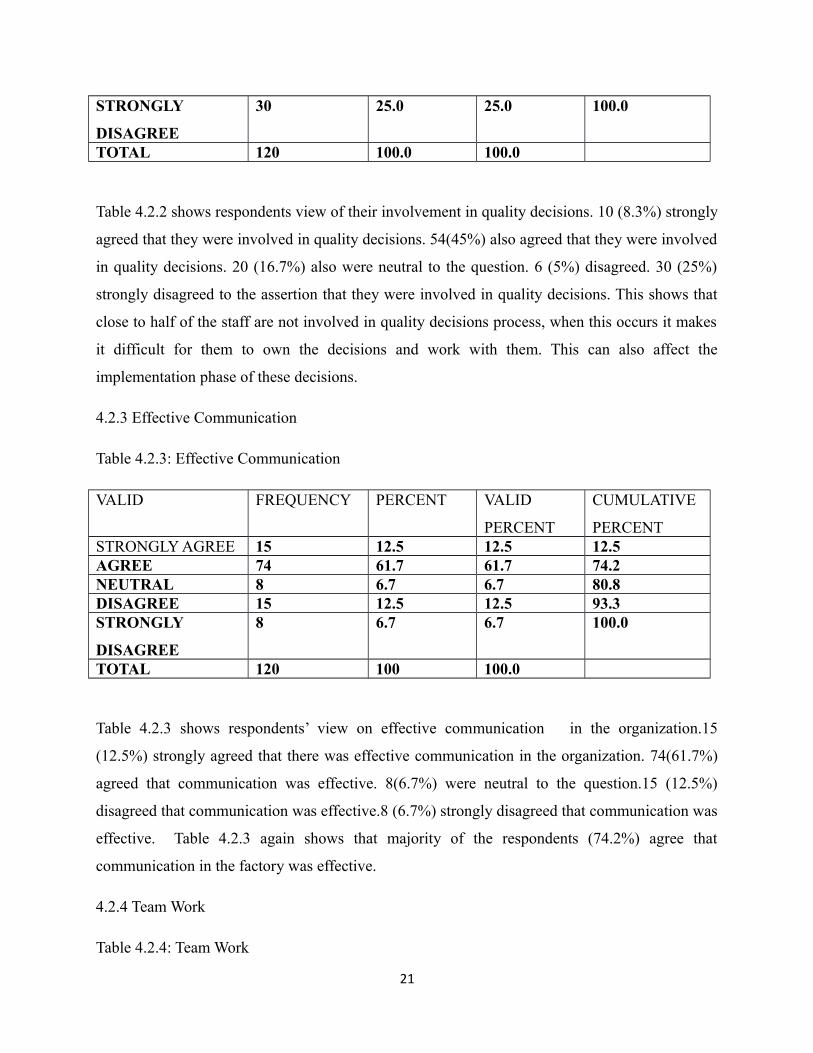
STRONGLY
DISAGREE
30 25.0 25.0 100.0
TOTAL 120 100.0 100.0
Table 4.2.2 shows respondents view of their involvement in quality decisions. 10 (8.3%) strongly
agreed that they were involved in quality decisions. 54(45%) also agreed that they were involved
in quality decisions. 20 (16.7%) also were neutral to the question. 6 (5%) disagreed. 30 (25%)
strongly disagreed to the assertion that they were involved in quality decisions. This shows that
close to half of the staff are not involved in quality decisions process, when this occurs it makes
it difficult for them to own the decisions and work with them. This can also affect the
implementation phase of these decisions.
4.2.3 Effective Communication
Table 4.2.3: Effective Communication
VALID FREQUENCY PERCENT VALID
PERCENT
CUMULATIVE
PERCENTSTRONGLY AGREE 15 12.5 12.5 12.5AGREE 74 61.7 61.7 74.2NEUTRAL 8 6.7 6.7 80.8DISAGREE 15 12.5 12.5 93.3STRONGLY
DISAGREE
8 6.7 6.7 100.0
TOTAL 120 100 100.0
Table 4.2.3 shows respondents’ view on effective communication in the organization.15
(12.5%) strongly agreed that there was effective communication in the organization. 74(61.7%)
agreed that communication was effective. 8(6.7%) were neutral to the question.15 (12.5%)
disagreed that communication was effective.8 (6.7%) strongly disagreed that communication was
effective. Table 4.2.3 again shows that majority of the respondents (74.2%) agree that
communication in the factory was effective.
4.2.4 Team Work
Table 4.2.4: Team Work
21
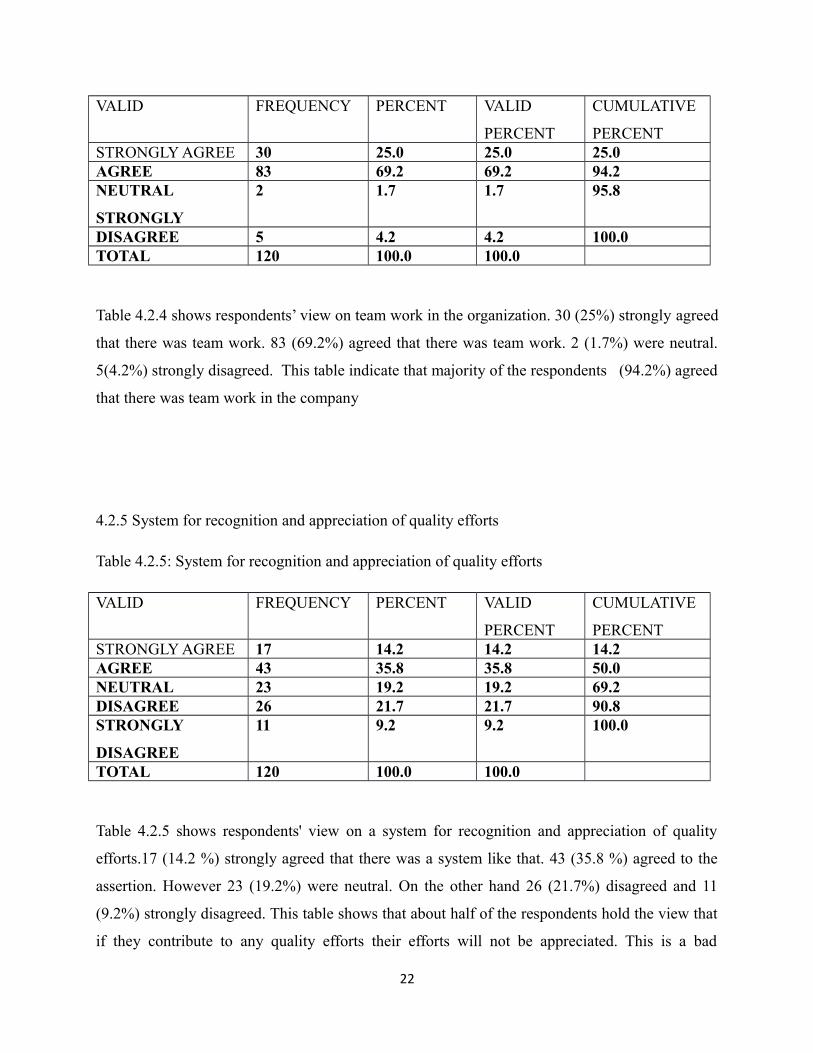
VALID FREQUENCY PERCENT VALID
PERCENT
CUMULATIVE
PERCENTSTRONGLY AGREE 30 25.0 25.0 25.0AGREE 83 69.2 69.2 94.2NEUTRAL
STRONGLY
2 1.7 1.7 95.8
DISAGREE 5 4.2 4.2 100.0TOTAL 120 100.0 100.0
Table 4.2.4 shows respondents’ view on team work in the organization. 30 (25%) strongly agreed
that there was team work. 83 (69.2%) agreed that there was team work. 2 (1.7%) were neutral.
5(4.2%) strongly disagreed. This table indicate that majority of the respondents (94.2%) agreed
that there was team work in the company
4.2.5 System for recognition and appreciation of quality efforts
Table 4.2.5: System for recognition and appreciation of quality efforts
VALID FREQUENCY PERCENT VALID
PERCENT
CUMULATIVE
PERCENTSTRONGLY AGREE 17 14.2 14.2 14.2AGREE 43 35.8 35.8 50.0NEUTRAL 23 19.2 19.2 69.2DISAGREE 26 21.7 21.7 90.8STRONGLY
DISAGREE
11 9.2 9.2 100.0
TOTAL 120 100.0 100.0
Table 4.2.5 shows respondents' view on a system for recognition and appreciation of quality
efforts.17 (14.2 %) strongly agreed that there was a system like that. 43 (35.8 %) agreed to the
assertion. However 23 (19.2%) were neutral. On the other hand 26 (21.7%) disagreed and 11
(9.2%) strongly disagreed. This table shows that about half of the respondents hold the view that
if they contribute to any quality efforts their efforts will not be appreciated. This is a bad
22
development because it will stifle initiative and demoralize staff from coming up with quality
initiative which would have gone a long way to enhance Quality Inspection Management
Practices.
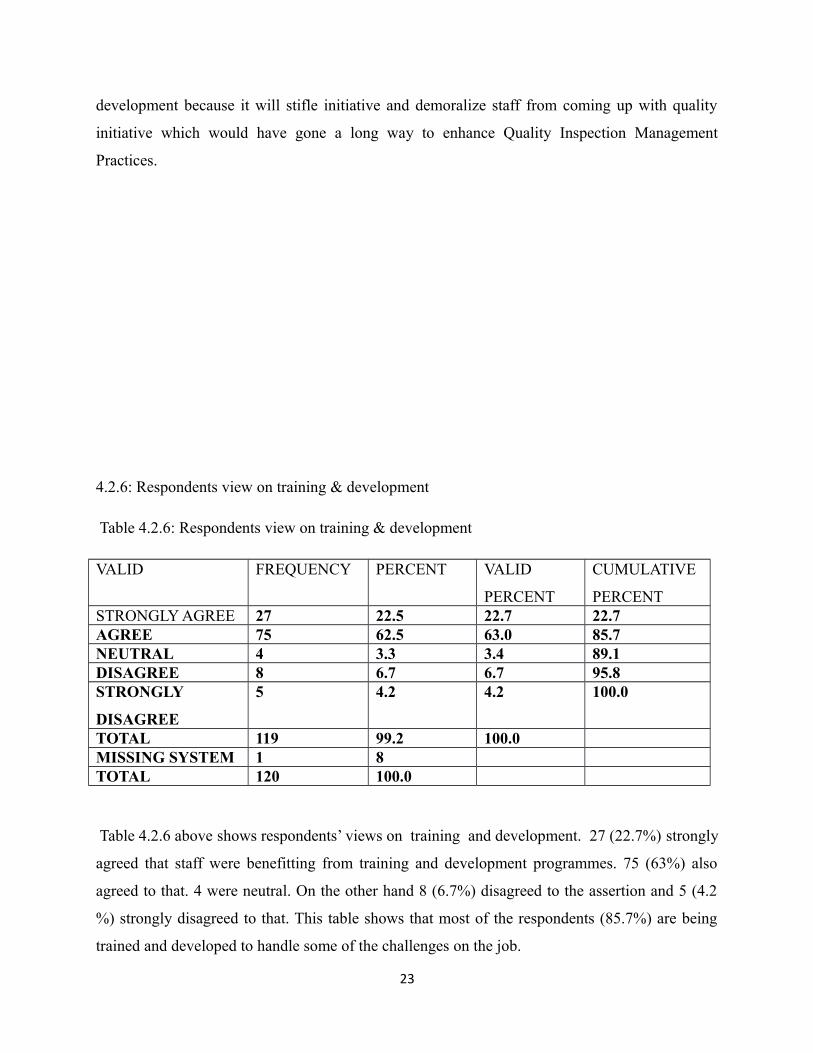
4.2.6: Respondents view on training & development
Table 4.2.6: Respondents view on training & development
VALID FREQUENCY PERCENT VALID
PERCENT
CUMULATIVE
PERCENTSTRONGLY AGREE 27 22.5 22.7 22.7AGREE 75 62.5 63.0 85.7NEUTRAL 4 3.3 3.4 89.1DISAGREE 8 6.7 6.7 95.8STRONGLY
DISAGREE
5 4.2 4.2 100.0
TOTAL 119 99.2 100.0MISSING SYSTEM 1 8TOTAL 120 100.0
Table 4.2.6 above shows respondents’ views on training and development. 27 (22.7%) strongly
agreed that staff were benefitting from training and development programmes. 75 (63%) also
agreed to that. 4 were neutral. On the other hand 8 (6.7%) disagreed to the assertion and 5 (4.2
%) strongly disagreed to that. This table shows that most of the respondents (85.7%) are being
trained and developed to handle some of the challenges on the job.
23
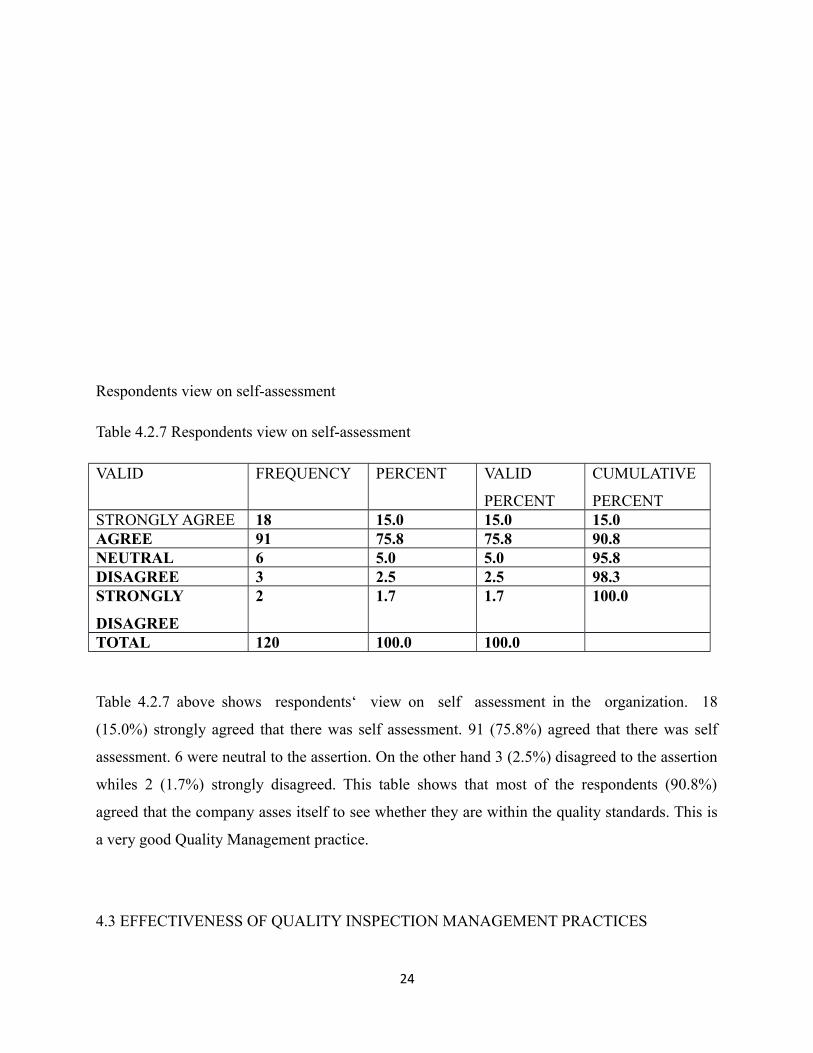
Respondents view on self-assessment
Table 4.2.7 Respondents view on self-assessment
VALID FREQUENCY PERCENT VALID
PERCENT
CUMULATIVE
PERCENTSTRONGLY AGREE 18 15.0 15.0 15.0AGREE 91 75.8 75.8 90.8NEUTRAL 6 5.0 5.0 95.8DISAGREE 3 2.5 2.5 98.3STRONGLY
DISAGREE
2 1.7 1.7 100.0
TOTAL 120 100.0 100.0
Table 4.2.7 above shows respondents‘ view on self assessment in the organization. 18
(15.0%) strongly agreed that there was self assessment. 91 (75.8%) agreed that there was self
assessment. 6 were neutral to the assertion. On the other hand 3 (2.5%) disagreed to the assertion
whiles 2 (1.7%) strongly disagreed. This table shows that most of the respondents (90.8%)
agreed that the company asses itself to see whether they are within the quality standards. This is
a very good Quality Management practice.
4.3 EFFECTIVENESS OF QUALITY INSPECTION MANAGEMENT PRACTICES
24
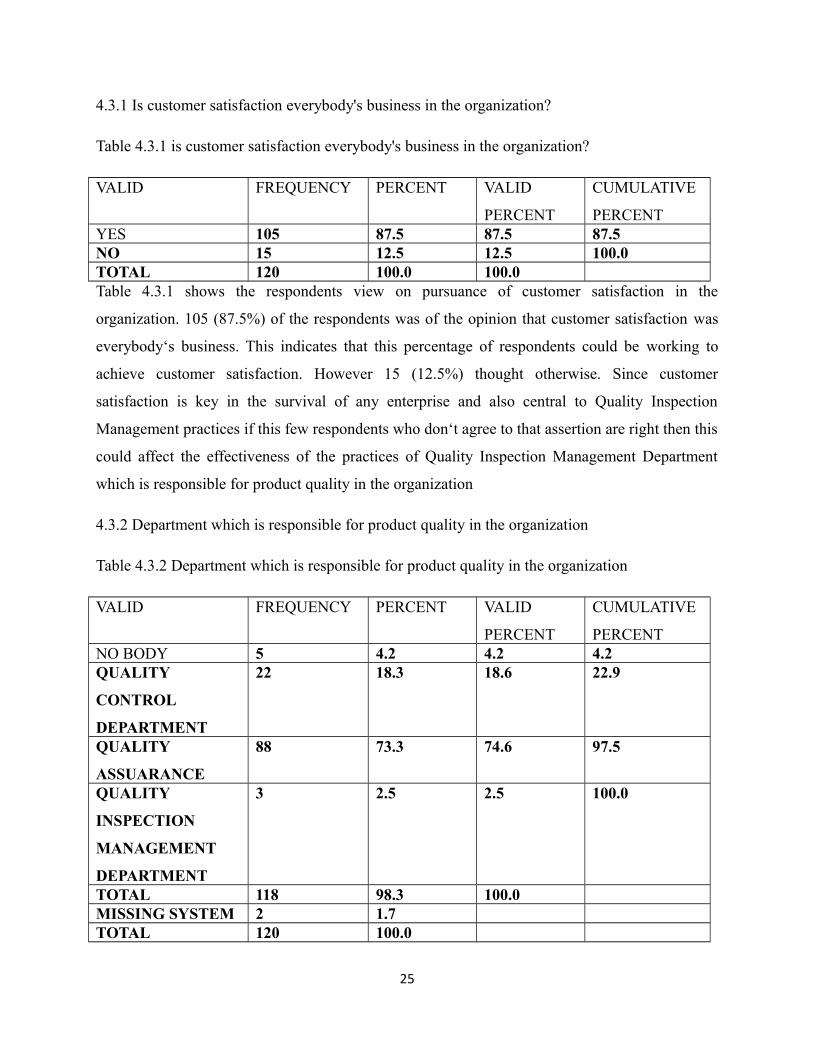
4.3.1 Is customer satisfaction everybody's business in the organization?
Table 4.3.1 is customer satisfaction everybody's business in the organization?
VALID FREQUENCY PERCENT VALID
PERCENT
CUMULATIVE
PERCENTYES 105 87.5 87.5 87.5NO 15 12.5 12.5 100.0TOTAL 120 100.0 100.0Table 4.3.1 shows the respondents view on pursuance of customer satisfaction in the
organization. 105 (87.5%) of the respondents was of the opinion that customer satisfaction was
everybody‘s business. This indicates that this percentage of respondents could be working to
achieve customer satisfaction. However 15 (12.5%) thought otherwise. Since customer
satisfaction is key in the survival of any enterprise and also central to Quality Inspection
Management practices if this few respondents who don‘t agree to that assertion are right then this
could affect the effectiveness of the practices of Quality Inspection Management Department
which is responsible for product quality in the organization
4.3.2 Department which is responsible for product quality in the organization
Table 4.3.2 Department which is responsible for product quality in the organization
VALID FREQUENCY PERCENT VALID
PERCENT
CUMULATIVE
PERCENTNO BODY 5 4.2 4.2 4.2QUALITY
CONTROL
DEPARTMENT
22 18.3 18.6 22.9
QUALITY
ASSUARANCE
88 73.3 74.6 97.5
QUALITY
INSPECTION
MANAGEMENT
DEPARTMENT
3 2.5 2.5 100.0
TOTAL 118 98.3 100.0MISSING SYSTEM 2 1.7TOTAL 120 100.0
25
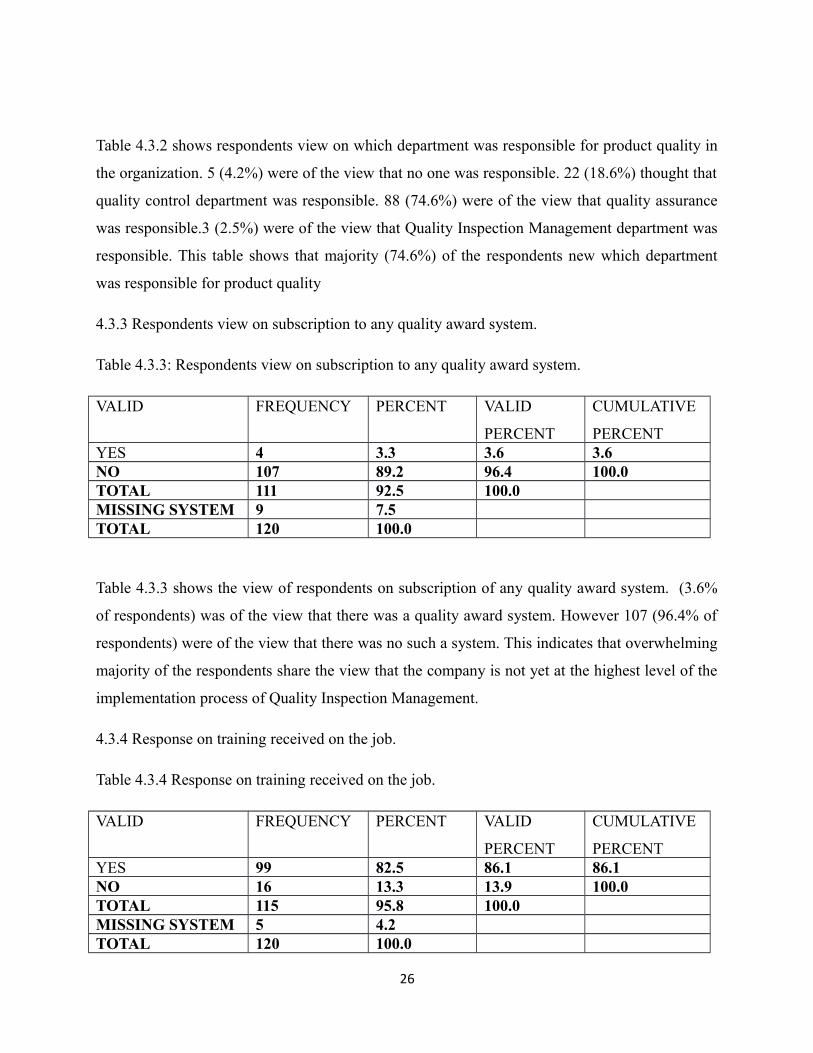
Table 4.3.2 shows respondents view on which department was responsible for product quality in
the organization. 5 (4.2%) were of the view that no one was responsible. 22 (18.6%) thought that
quality control department was responsible. 88 (74.6%) were of the view that quality assurance
was responsible.3 (2.5%) were of the view that Quality Inspection Management department was
responsible. This table shows that majority (74.6%) of the respondents new which department
was responsible for product quality
4.3.3 Respondents view on subscription to any quality award system.
Table 4.3.3: Respondents view on subscription to any quality award system.
VALID FREQUENCY PERCENT VALID
PERCENT
CUMULATIVE
PERCENTYES 4 3.3 3.6 3.6NO 107 89.2 96.4 100.0TOTAL 111 92.5 100.0MISSING SYSTEM 9 7.5TOTAL 120 100.0
Table 4.3.3 shows the view of respondents on subscription of any quality award system. (3.6%
of respondents) was of the view that there was a quality award system. However 107 (96.4% of
respondents) were of the view that there was no such a system. This indicates that overwhelming
majority of the respondents share the view that the company is not yet at the highest level of the
implementation process of Quality Inspection Management.
4.3.4 Response on training received on the job.
Table 4.3.4 Response on training received on the job.
VALID FREQUENCY PERCENT VALID
PERCENT
CUMULATIVE
PERCENTYES 99 82.5 86.1 86.1NO 16 13.3 13.9 100.0TOTAL 115 95.8 100.0MISSING SYSTEM 5 4.2TOTAL 120 100.0
26
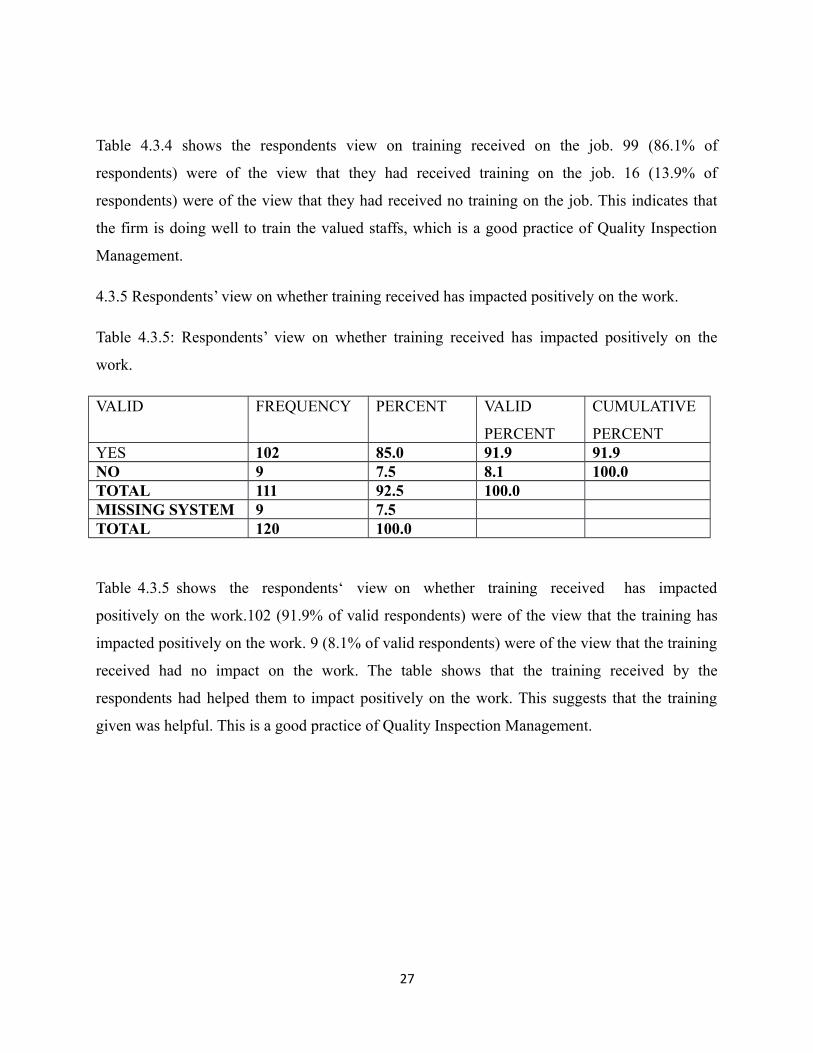
Table 4.3.4 shows the respondents view on training received on the job. 99 (86.1% of
respondents) were of the view that they had received training on the job. 16 (13.9% of
respondents) were of the view that they had received no training on the job. This indicates that
the firm is doing well to train the valued staffs, which is a good practice of Quality Inspection
Management.
4.3.5 Respondents’ view on whether training received has impacted positively on the work.
Table 4.3.5: Respondents’ view on whether training received has impacted positively on the
work.
VALID FREQUENCY PERCENT VALID
PERCENT
CUMULATIVE
PERCENTYES 102 85.0 91.9 91.9NO 9 7.5 8.1 100.0TOTAL 111 92.5 100.0MISSING SYSTEM 9 7.5TOTAL 120 100.0
Table 4.3.5 shows the respondents‘ view on whether training received has impacted
positively on the work.102 (91.9% of valid respondents) were of the view that the training has
impacted positively on the work. 9 (8.1% of valid respondents) were of the view that the training
received had no impact on the work. The table shows that the training received by the
respondents had helped them to impact positively on the work. This suggests that the training
given was helpful. This is a good practice of Quality Inspection Management.
27
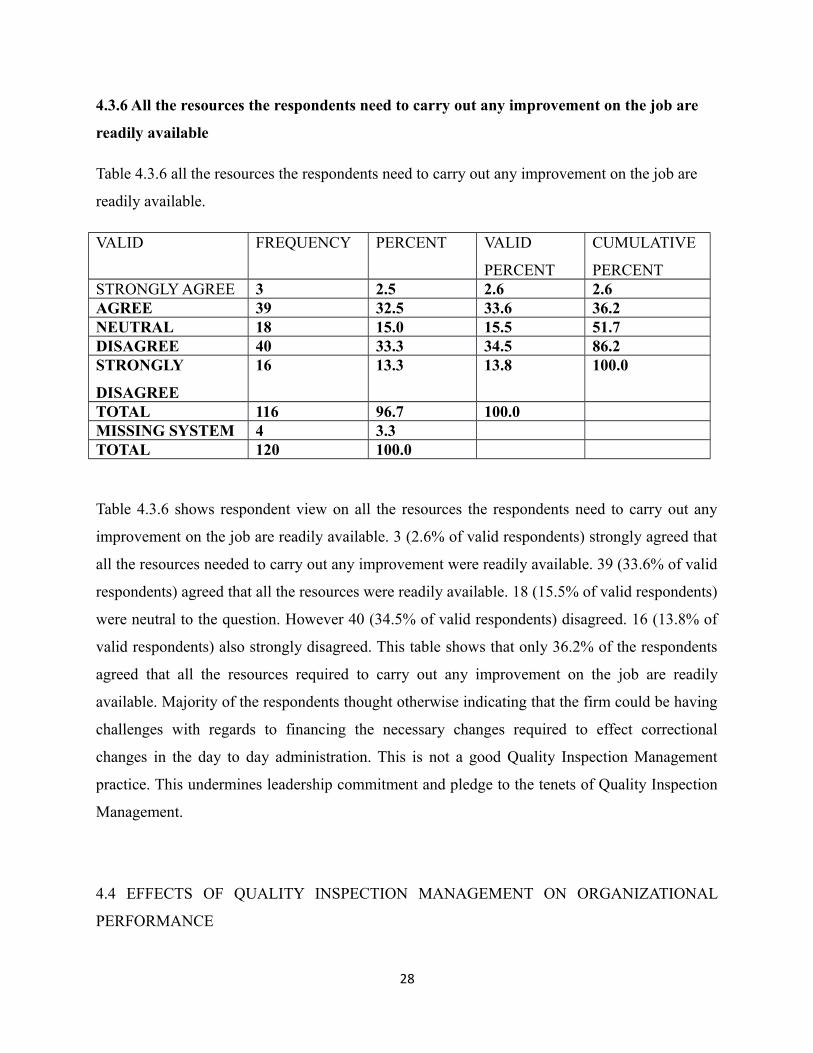
4.3.6 All the resources the respondents need to carry out any improvement on the job are
readily available
Table 4.3.6 all the resources the respondents need to carry out any improvement on the job are
readily available.
VALID FREQUENCY PERCENT VALID
PERCENT
CUMULATIVE
PERCENTSTRONGLY AGREE 3 2.5 2.6 2.6AGREE 39 32.5 33.6 36.2NEUTRAL 18 15.0 15.5 51.7DISAGREE 40 33.3 34.5 86.2STRONGLY
DISAGREE
16 13.3 13.8 100.0
TOTAL 116 96.7 100.0MISSING SYSTEM 4 3.3TOTAL 120 100.0
Table 4.3.6 shows respondent view on all the resources the respondents need to carry out any
improvement on the job are readily available. 3 (2.6% of valid respondents) strongly agreed that
all the resources needed to carry out any improvement were readily available. 39 (33.6% of valid
respondents) agreed that all the resources were readily available. 18 (15.5% of valid respondents)
were neutral to the question. However 40 (34.5% of valid respondents) disagreed. 16 (13.8% of
valid respondents) also strongly disagreed. This table shows that only 36.2% of the respondents
agreed that all the resources required to carry out any improvement on the job are readily
available. Majority of the respondents thought otherwise indicating that the firm could be having
challenges with regards to financing the necessary changes required to effect correctional
changes in the day to day administration. This is not a good Quality Inspection Management
practice. This undermines leadership commitment and pledge to the tenets of Quality Inspection
Management.
4.4 EFFECTS OF QUALITY INSPECTION MANAGEMENT ON ORGANIZATIONAL
PERFORMANCE
28
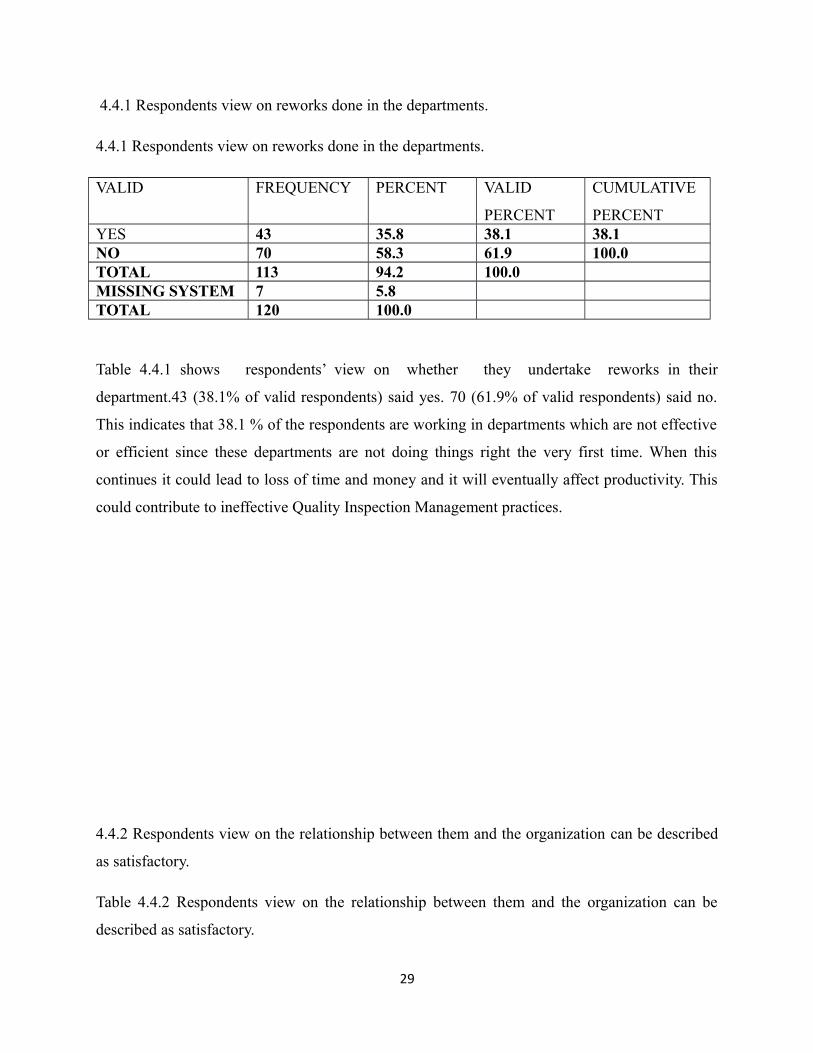
4.4.1 Respondents view on reworks done in the departments.
4.4.1 Respondents view on reworks done in the departments.
VALID FREQUENCY PERCENT VALID
PERCENT
CUMULATIVE
PERCENTYES 43 35.8 38.1 38.1NO 70 58.3 61.9 100.0TOTAL 113 94.2 100.0MISSING SYSTEM 7 5.8TOTAL 120 100.0
Table 4.4.1 shows respondents’ view on whether they undertake reworks in their
department.43 (38.1% of valid respondents) said yes. 70 (61.9% of valid respondents) said no.
This indicates that 38.1 % of the respondents are working in departments which are not effective
or efficient since these departments are not doing things right the very first time. When this
continues it could lead to loss of time and money and it will eventually affect productivity. This
could contribute to ineffective Quality Inspection Management practices.
4.4.2 Respondents view on the relationship between them and the organization can be described
as satisfactory.
Table 4.4.2 Respondents view on the relationship between them and the organization can be
described as satisfactory.
29
VALID FREQUENCY PERCENT VALID
PERCENT
CUMULATIVE
PERCENTSTRONGLY AGREE 9 7.5 7.9 7.9AGREE 78 65.0 68.4 76.3NEUTRAL 12 10.0 10.5 86.8DISAGREE 9 7.5 7.9 94.7STRONGLY
DISAGREE
6 5.0 5.3 100.0
TOTAL 114 95.0 100.0MISSING SYSTEM 6 5.0TOTAL 120 100.0
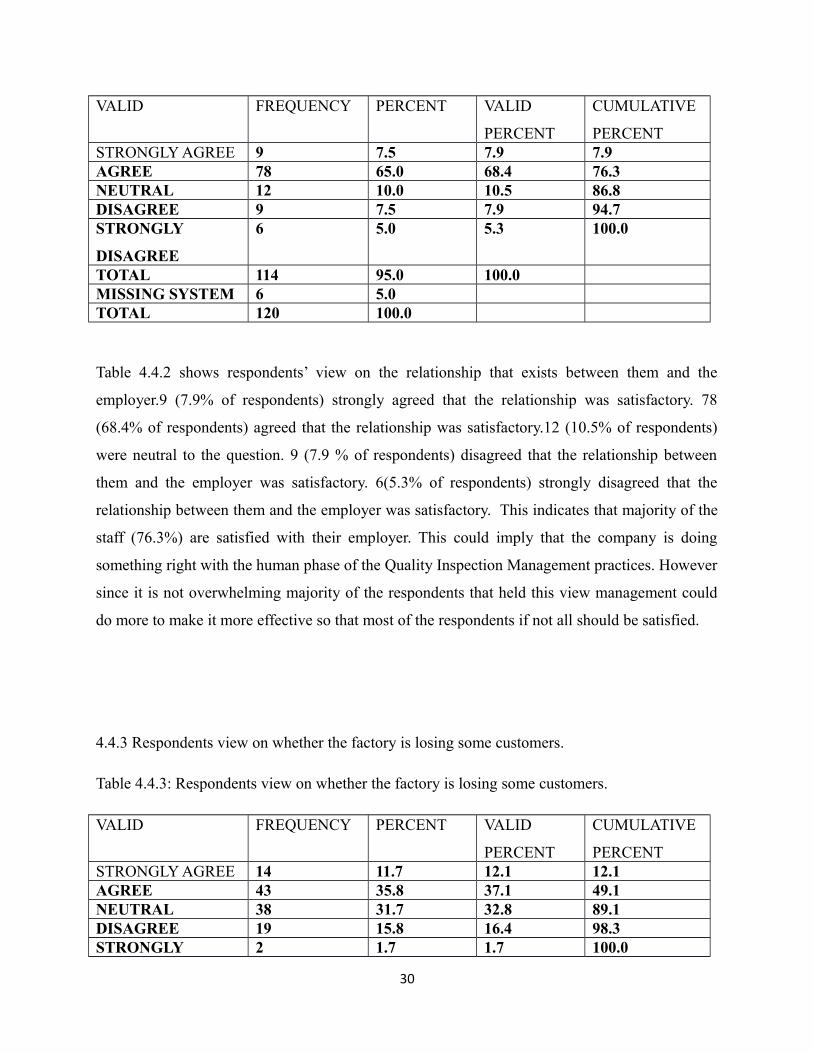
Table 4.4.2 shows respondents’ view on the relationship that exists between them and the
employer.9 (7.9% of respondents) strongly agreed that the relationship was satisfactory. 78
(68.4% of respondents) agreed that the relationship was satisfactory.12 (10.5% of respondents)
were neutral to the question. 9 (7.9 % of respondents) disagreed that the relationship between
them and the employer was satisfactory. 6(5.3% of respondents) strongly disagreed that the
relationship between them and the employer was satisfactory. This indicates that majority of the
staff (76.3%) are satisfied with their employer. This could imply that the company is doing
something right with the human phase of the Quality Inspection Management practices. However
since it is not overwhelming majority of the respondents that held this view management could
do more to make it more effective so that most of the respondents if not all should be satisfied.
4.4.3 Respondents view on whether the factory is losing some customers.
Table 4.4.3: Respondents view on whether the factory is losing some customers.
VALID FREQUENCY PERCENT VALID
PERCENT
CUMULATIVE
PERCENTSTRONGLY AGREE 14 11.7 12.1 12.1AGREE 43 35.8 37.1 49.1NEUTRAL 38 31.7 32.8 89.1DISAGREE 19 15.8 16.4 98.3STRONGLY 2 1.7 1.7 100.0
30
DISAGREETOTAL 116 96.7 100.0MISSING TOTAL 4 3.3TOTAL 120 100.0
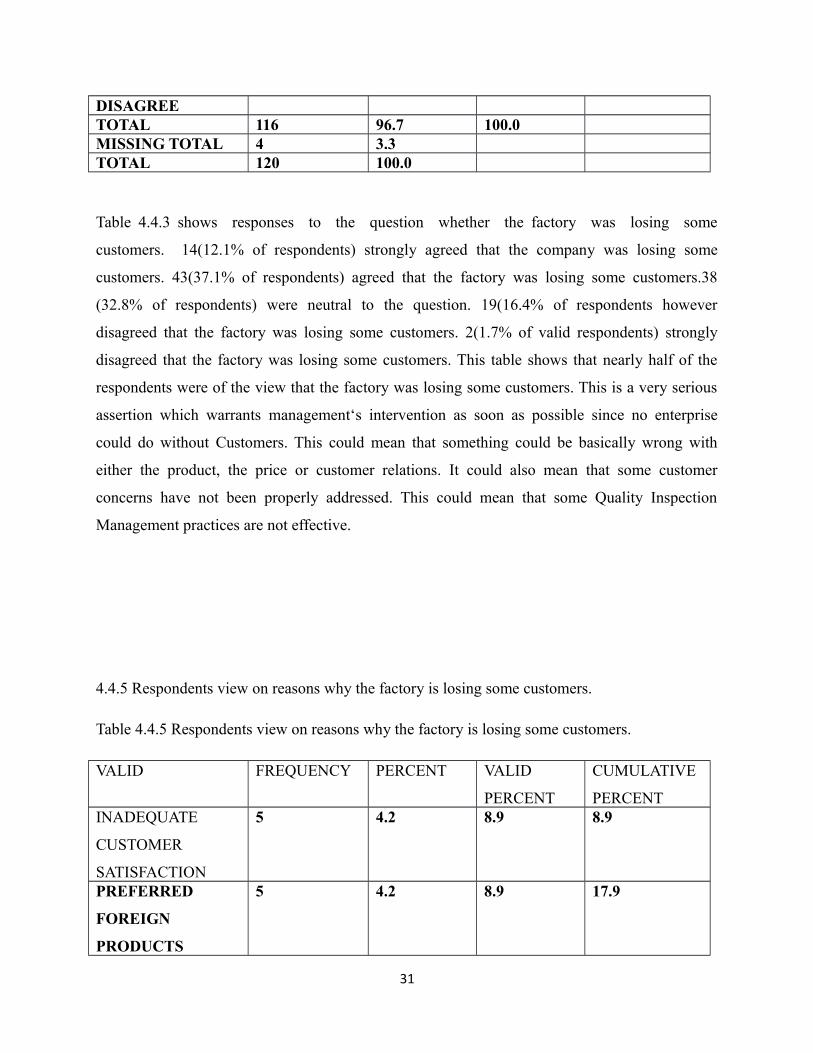
Table 4.4.3 shows responses to the question whether the factory was losing some
customers. 14(12.1% of respondents) strongly agreed that the company was losing some
customers. 43(37.1% of respondents) agreed that the factory was losing some customers.38
(32.8% of respondents) were neutral to the question. 19(16.4% of respondents however
disagreed that the factory was losing some customers. 2(1.7% of valid respondents) strongly
disagreed that the factory was losing some customers. This table shows that nearly half of the
respondents were of the view that the factory was losing some customers. This is a very serious
assertion which warrants management‘s intervention as soon as possible since no enterprise
could do without Customers. This could mean that something could be basically wrong with
either the product, the price or customer relations. It could also mean that some customer
concerns have not been properly addressed. This could mean that some Quality Inspection
Management practices are not effective.
4.4.5 Respondents view on reasons why the factory is losing some customers.
Table 4.4.5 Respondents view on reasons why the factory is losing some customers.
VALID FREQUENCY PERCENT VALID
PERCENT
CUMULATIVE
PERCENTINADEQUATE
CUSTOMER
SATISFACTION
5 4.2 8.9 8.9
PREFERRED
FOREIGN
PRODUCTS
5 4.2 8.9 17.9
31
HIGHER PRICES 19 15.8 33.9 51.8OTHER 27 22.5 48.2 100.0TOTAL 56 46.7 100.0MISSING SYSTEM 64 53.3TOTAL 120 100.0
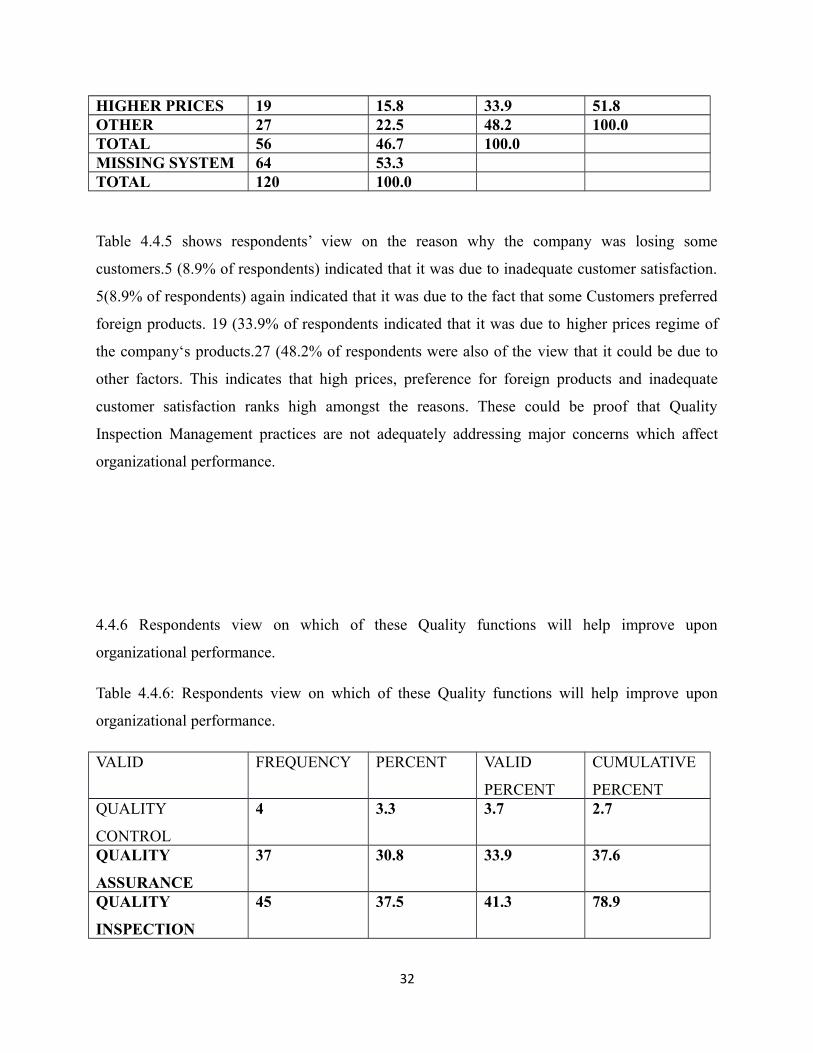
Table 4.4.5 shows respondents’ view on the reason why the company was losing some
customers.5 (8.9% of respondents) indicated that it was due to inadequate customer satisfaction.
5(8.9% of respondents) again indicated that it was due to the fact that some Customers preferred
foreign products. 19 (33.9% of respondents indicated that it was due to higher prices regime of
the company‘s products.27 (48.2% of respondents were also of the view that it could be due to
other factors. This indicates that high prices, preference for foreign products and inadequate
customer satisfaction ranks high amongst the reasons. These could be proof that Quality
Inspection Management practices are not adequately addressing major concerns which affect
organizational performance.
4.4.6 Respondents view on which of these Quality functions will help improve upon
organizational performance.
Table 4.4.6: Respondents view on which of these Quality functions will help improve upon
organizational performance.
VALID FREQUENCY PERCENT VALID
PERCENT
CUMULATIVE
PERCENTQUALITY
CONTROL
4 3.3 3.7 2.7
QUALITY
ASSURANCE
37 30.8 33.9 37.6
QUALITY
INSPECTION
45 37.5 41.3 78.9
32
MANAGEMENTALL OF THE
ABOVE
23 19.2 21.1 100.0
TOTAL 109 90.8 100.0MISSING SYSTEM 11 9.2TOTAL 120 100.0
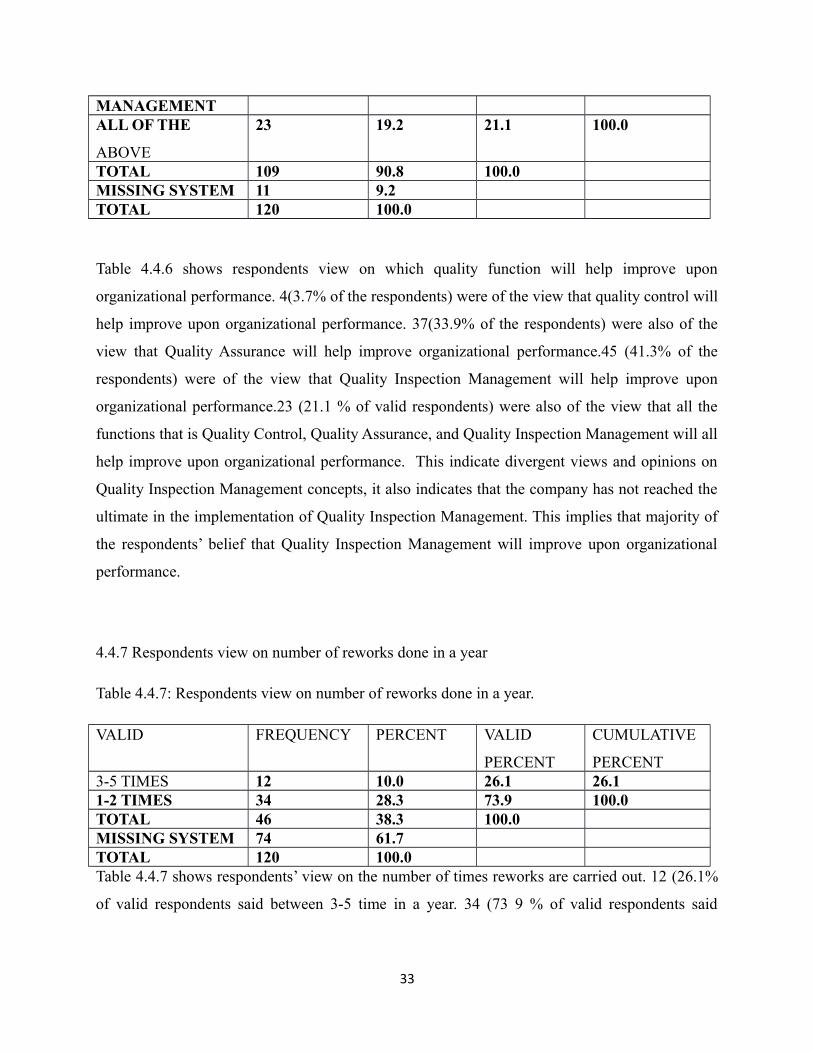
Table 4.4.6 shows respondents view on which quality function will help improve upon
organizational performance. 4(3.7% of the respondents) were of the view that quality control will
help improve upon organizational performance. 37(33.9% of the respondents) were also of the
view that Quality Assurance will help improve organizational performance.45 (41.3% of the
respondents) were of the view that Quality Inspection Management will help improve upon
organizational performance.23 (21.1 % of valid respondents) were also of the view that all the
functions that is Quality Control, Quality Assurance, and Quality Inspection Management will all
help improve upon organizational performance. This indicate divergent views and opinions on
Quality Inspection Management concepts, it also indicates that the company has not reached the
ultimate in the implementation of Quality Inspection Management. This implies that majority of
the respondents’ belief that Quality Inspection Management will improve upon organizational
performance.
4.4.7 Respondents view on number of reworks done in a year
Table 4.4.7: Respondents view on number of reworks done in a year.
VALID FREQUENCY PERCENT VALID
PERCENT
CUMULATIVE
PERCENT3-5 TIMES 12 10.0 26.1 26.11-2 TIMES 34 28.3 73.9 100.0TOTAL 46 38.3 100.0MISSING SYSTEM 74 61.7TOTAL 120 100.0Table 4.4.7 shows respondents’ view on the number of times reworks are carried out. 12 (26.1%
of valid respondents said between 3-5 time in a year. 34 (73 9 % of valid respondents said
33
between 1-2 times in a year. This shows that though reworks are carried out they are not frequent
and for that matter could not affect the organization too much.
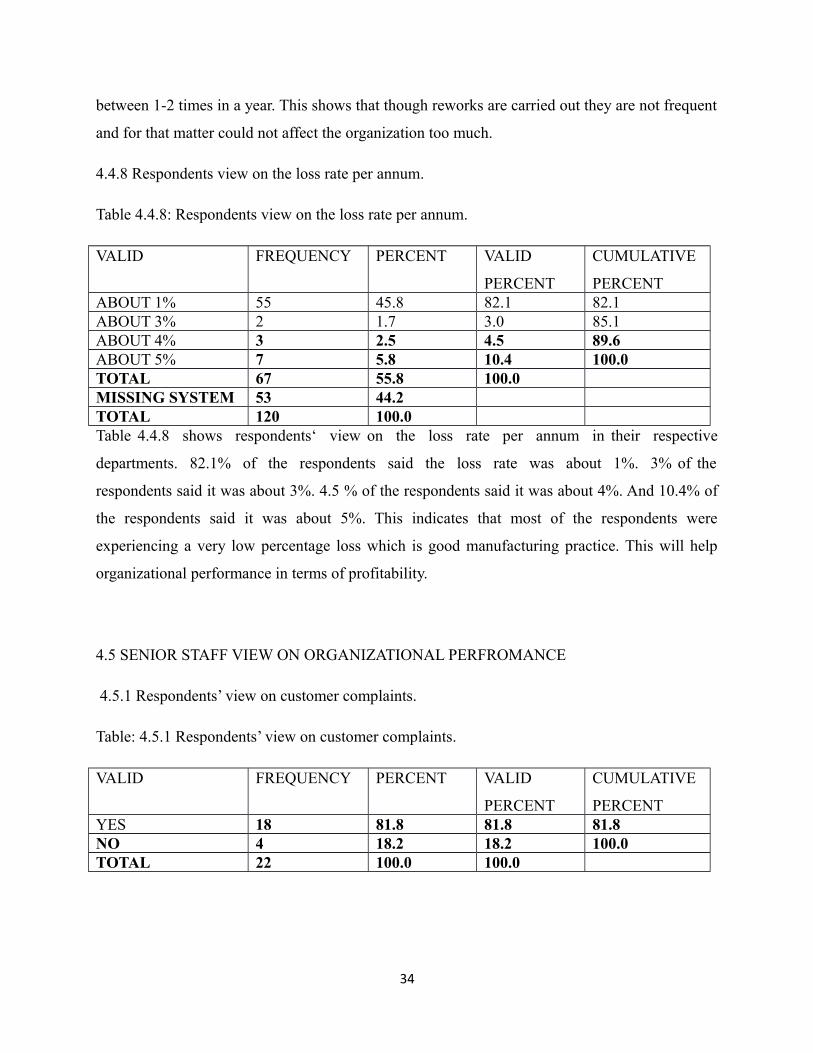
4.4.8 Respondents view on the loss rate per annum.
Table 4.4.8: Respondents view on the loss rate per annum.
VALID FREQUENCY PERCENT VALID
PERCENT
CUMULATIVE
PERCENTABOUT 1% 55 45.8 82.1 82.1ABOUT 3% 2 1.7 3.0 85.1ABOUT 4% 3 2.5 4.5 89.6ABOUT 5% 7 5.8 10.4 100.0TOTAL 67 55.8 100.0MISSING SYSTEM 53 44.2TOTAL 120 100.0Table 4.4.8 shows respondents‘ view on the loss rate per annum in their respective
departments. 82.1% of the respondents said the loss rate was about 1%. 3% of the
respondents said it was about 3%. 4.5 % of the respondents said it was about 4%. And 10.4% of
the respondents said it was about 5%. This indicates that most of the respondents were
experiencing a very low percentage loss which is good manufacturing practice. This will help
organizational performance in terms of profitability.
4.5 SENIOR STAFF VIEW ON ORGANIZATIONAL PERFROMANCE
4.5.1 Respondents’ view on customer complaints.
Table: 4.5.1 Respondents’ view on customer complaints.
VALID FREQUENCY PERCENT VALID
PERCENT
CUMULATIVE
PERCENTYES 18 81.8 81.8 81.8NO 4 18.2 18.2 100.0TOTAL 22 100.0 100.0
34
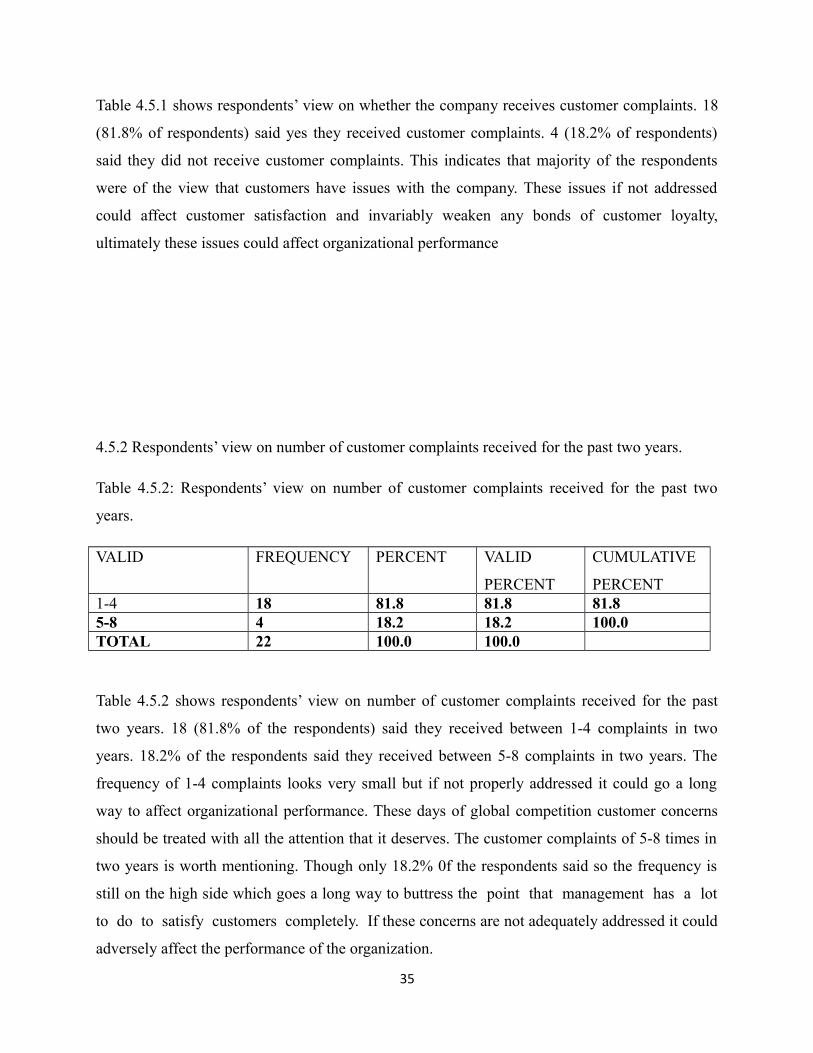
Table 4.5.1 shows respondents’ view on whether the company receives customer complaints. 18
(81.8% of respondents) said yes they received customer complaints. 4 (18.2% of respondents)
said they did not receive customer complaints. This indicates that majority of the respondents
were of the view that customers have issues with the company. These issues if not addressed
could affect customer satisfaction and invariably weaken any bonds of customer loyalty,
ultimately these issues could affect organizational performance
4.5.2 Respondents’ view on number of customer complaints received for the past two years.
Table 4.5.2: Respondents’ view on number of customer complaints received for the past two
years.
VALID FREQUENCY PERCENT VALID
PERCENT
CUMULATIVE
PERCENT1-4 18 81.8 81.8 81.85-8 4 18.2 18.2 100.0TOTAL 22 100.0 100.0
Table 4.5.2 shows respondents’ view on number of customer complaints received for the past
two years. 18 (81.8% of the respondents) said they received between 1-4 complaints in two
years. 18.2% of the respondents said they received between 5-8 complaints in two years. The
frequency of 1-4 complaints looks very small but if not properly addressed it could go a long
way to affect organizational performance. These days of global competition customer concerns
should be treated with all the attention that it deserves. The customer complaints of 5-8 times in
two years is worth mentioning. Though only 18.2% 0f the respondents said so the frequency is
still on the high side which goes a long way to buttress the point that management has a lot
to do to satisfy customers completely. If these concerns are not adequately addressed it could
adversely affect the performance of the organization.
35
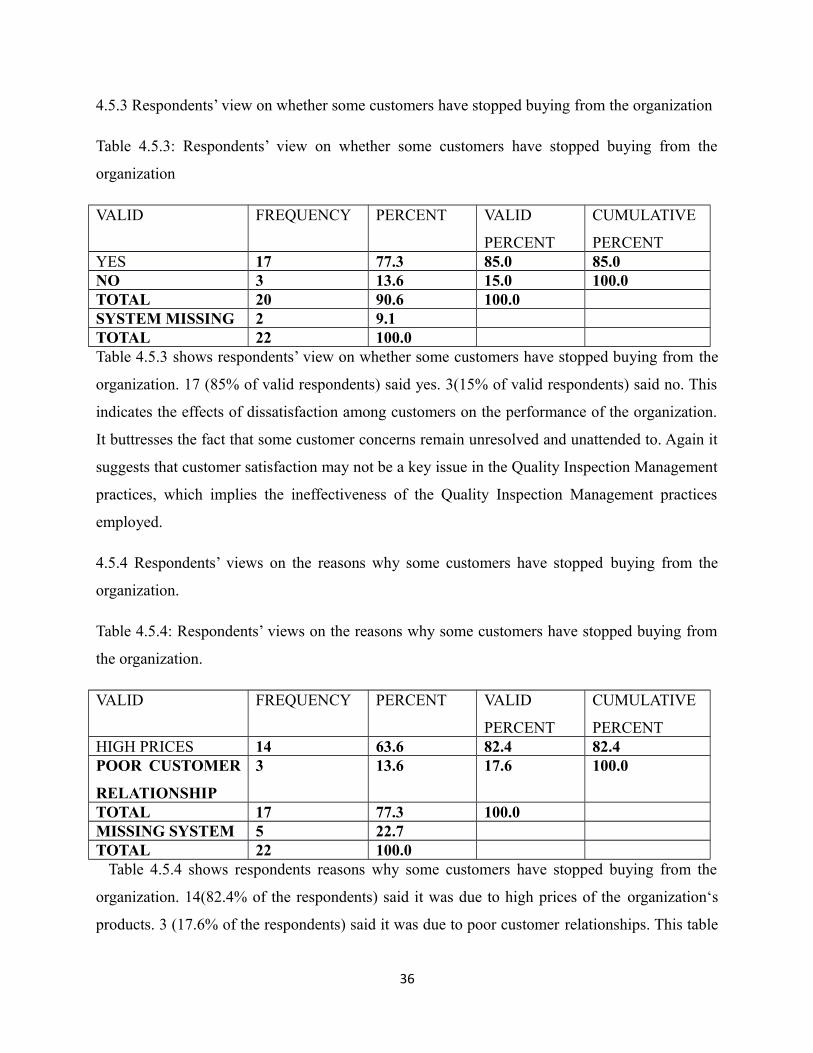
4.5.3 Respondents’ view on whether some customers have stopped buying from the organization
Table 4.5.3: Respondents’ view on whether some customers have stopped buying from the
organization
VALID FREQUENCY PERCENT VALID
PERCENT
CUMULATIVE
PERCENTYES 17 77.3 85.0 85.0NO 3 13.6 15.0 100.0TOTAL 20 90.6 100.0SYSTEM MISSING 2 9.1TOTAL 22 100.0Table 4.5.3 shows respondents’ view on whether some customers have stopped buying from the
organization. 17 (85% of valid respondents) said yes. 3(15% of valid respondents) said no. This
indicates the effects of dissatisfaction among customers on the performance of the organization.
It buttresses the fact that some customer concerns remain unresolved and unattended to. Again it
suggests that customer satisfaction may not be a key issue in the Quality Inspection Management
practices, which implies the ineffectiveness of the Quality Inspection Management practices
employed.
4.5.4 Respondents’ views on the reasons why some customers have stopped buying from the
organization.
Table 4.5.4: Respondents’ views on the reasons why some customers have stopped buying from
the organization.
VALID FREQUENCY PERCENT VALID
PERCENT
CUMULATIVE
PERCENTHIGH PRICES 14 63.6 82.4 82.4POOR CUSTOMER
RELATIONSHIP
3 13.6 17.6 100.0
TOTAL 17 77.3 100.0MISSING SYSTEM 5 22.7TOTAL 22 100.0 Table 4.5.4 shows respondents reasons why some customers have stopped buying from the
organization. 14(82.4% of the respondents) said it was due to high prices of the organization‘s
products. 3 (17.6% of the respondents) said it was due to poor customer relationships. This table
36
indicates that majority of the respondents (82.4%) were of the view that customers have stopped
buying because IIL‘s prices are high. This means that for IIL to prevent this negative
development attempts should made to critically examine the price build up and remove any
bottlenecks that contribute to higher prices of products. This calls for effective Quality
Inspection Management practices where customer concerns like higher prices will become
everybody‘s business and work together to bring these prices down.
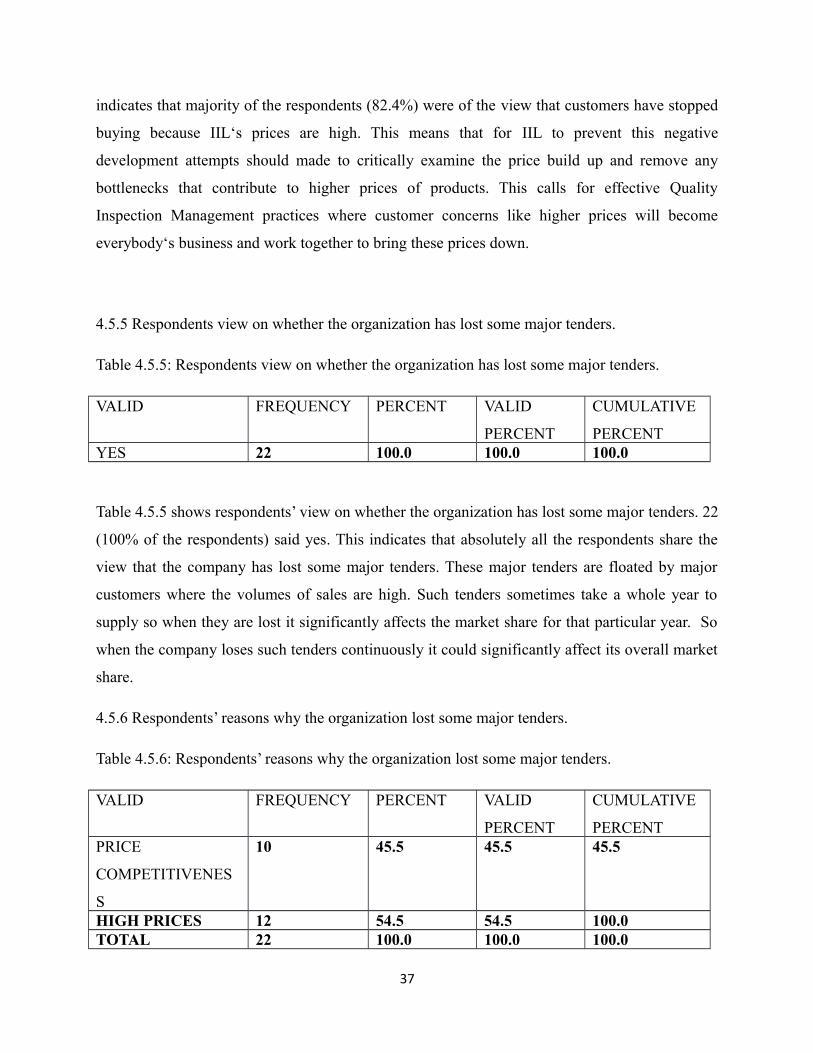
4.5.5 Respondents view on whether the organization has lost some major tenders.
Table 4.5.5: Respondents view on whether the organization has lost some major tenders.
VALID FREQUENCY PERCENT VALID
PERCENT
CUMULATIVE
PERCENTYES 22 100.0 100.0 100.0
Table 4.5.5 shows respondents’ view on whether the organization has lost some major tenders. 22
(100% of the respondents) said yes. This indicates that absolutely all the respondents share the
view that the company has lost some major tenders. These major tenders are floated by major
customers where the volumes of sales are high. Such tenders sometimes take a whole year to
supply so when they are lost it significantly affects the market share for that particular year. So
when the company loses such tenders continuously it could significantly affect its overall market
share.
4.5.6 Respondents’ reasons why the organization lost some major tenders.
Table 4.5.6: Respondents’ reasons why the organization lost some major tenders.
VALID FREQUENCY PERCENT VALID
PERCENT
CUMULATIVE
PERCENTPRICE
COMPETITIVENES
S
10 45.5 45.5 45.5
HIGH PRICES 12 54.5 54.5 100.0TOTAL 22 100.0 100.0 100.0
37
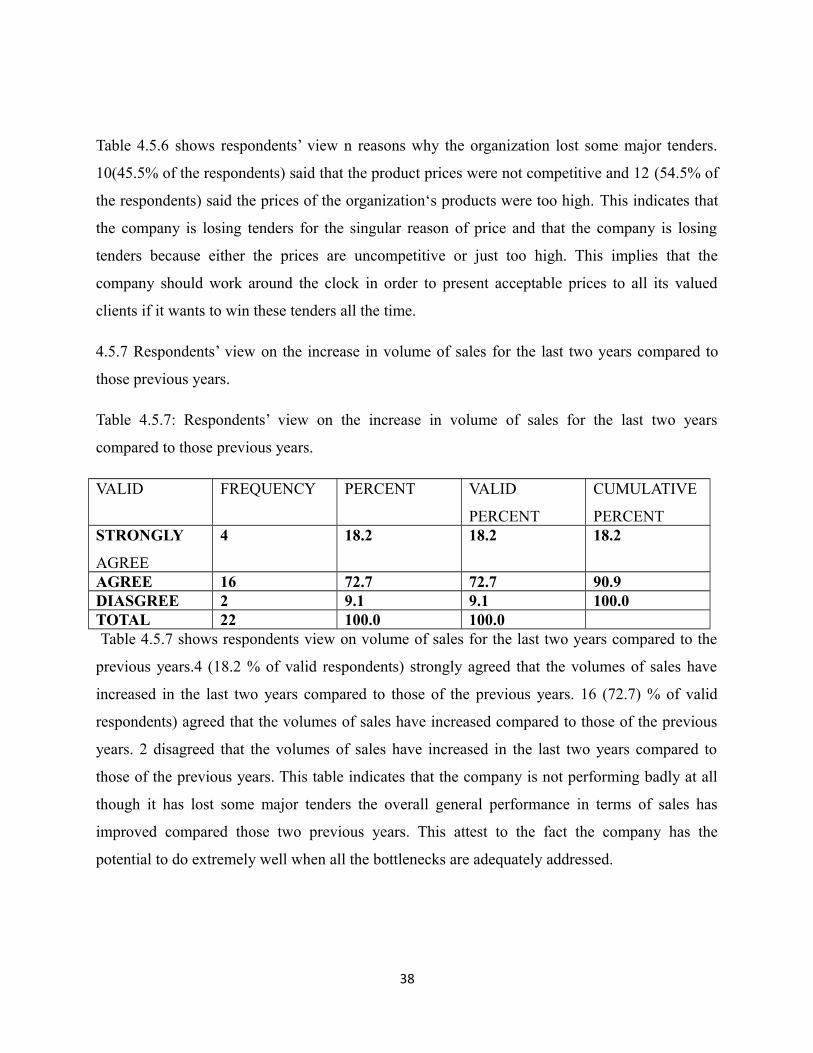
Table 4.5.6 shows respondents’ view n reasons why the organization lost some major tenders.
10(45.5% of the respondents) said that the product prices were not competitive and 12 (54.5% of
the respondents) said the prices of the organization‘s products were too high. This indicates that
the company is losing tenders for the singular reason of price and that the company is losing
tenders because either the prices are uncompetitive or just too high. This implies that the
company should work around the clock in order to present acceptable prices to all its valued
clients if it wants to win these tenders all the time.
4.5.7 Respondents’ view on the increase in volume of sales for the last two years compared to
those previous years.
Table 4.5.7: Respondents’ view on the increase in volume of sales for the last two years
compared to those previous years.
VALID FREQUENCY PERCENT VALID
PERCENT
CUMULATIVE
PERCENTSTRONGLY
AGREE
4 18.2 18.2 18.2
AGREE 16 72.7 72.7 90.9DIASGREE 2 9.1 9.1 100.0TOTAL 22 100.0 100.0 Table 4.5.7 shows respondents view on volume of sales for the last two years compared to the
previous years.4 (18.2 % of valid respondents) strongly agreed that the volumes of sales have
increased in the last two years compared to those of the previous years. 16 (72.7) % of valid
respondents) agreed that the volumes of sales have increased compared to those of the previous
years. 2 disagreed that the volumes of sales have increased in the last two years compared to
those of the previous years. This table indicates that the company is not performing badly at all
though it has lost some major tenders the overall general performance in terms of sales has
improved compared those two previous years. This attest to the fact the company has the
potential to do extremely well when all the bottlenecks are adequately addressed.
38
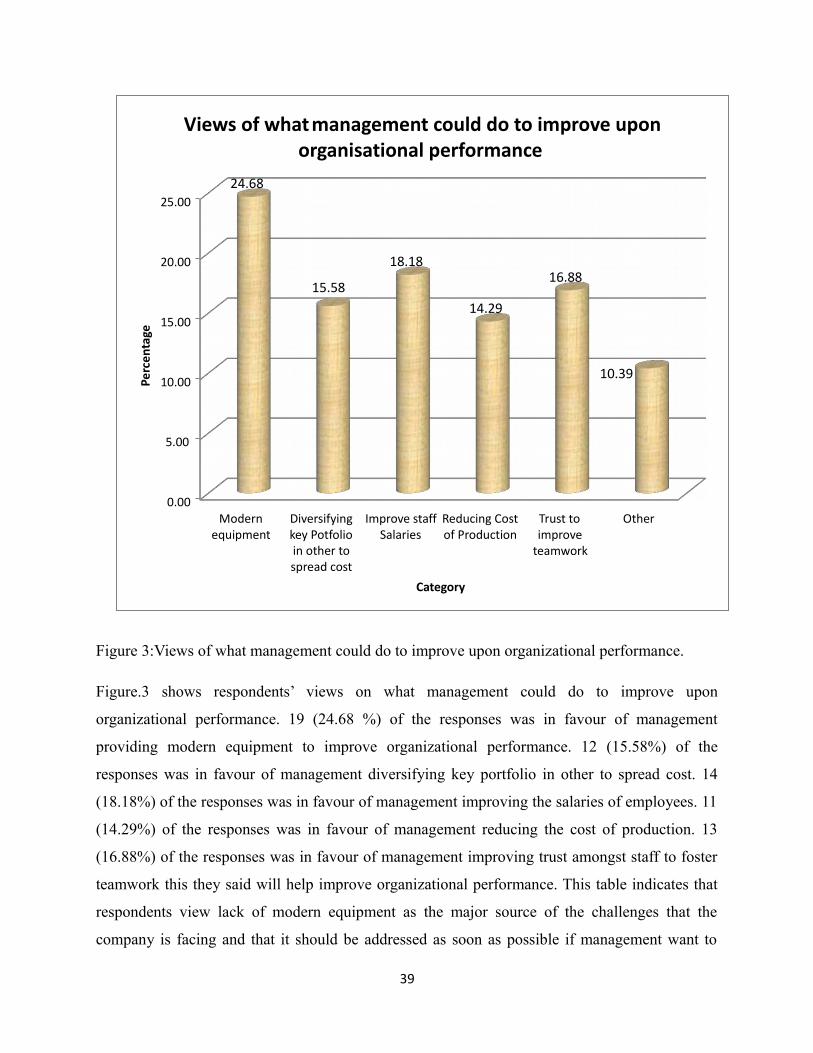
Figure 3:Views of what management could do to improve upon organizational performance.
Figure.3 shows respondents’ views on what management could do to improve upon
organizational performance. 19 (24.68 %) of the responses was in favour of management
providing modern equipment to improve organizational performance. 12 (15.58%) of the
responses was in favour of management diversifying key portfolio in other to spread cost. 14
(18.18%) of the responses was in favour of management improving the salaries of employees. 11
(14.29%) of the responses was in favour of management reducing the cost of production. 13
(16.88%) of the responses was in favour of management improving trust amongst staff to foster
teamwork this they said will help improve organizational performance. This table indicates that
respondents view lack of modern equipment as the major source of the challenges that the
company is facing and that it should be addressed as soon as possible if management want to
39
Perc
e nta
ge
Views of what management could do to improve upon organisational performance
25.00
24.68
20.00
15.00
15.58
18.18
14.29
16.88
10.00 10.39
5.00
0.00 Modern
equipment
Diversifying key Potfolio in other to spread cost
Improve staff
Salaries
Reducing Cost of Production
Trust to improve
teamwork
Other
Category

improve upon organizational performance. The next responses which respondents wish
management to look at are salaries of employees. The respondents were of the view that if the
salaries of employees are improved upon it could ginger them to put in their best which could
lead to improvement in organizational performance. The next issue that respondents want it
addressed by management is lack of trust amongst team members. Respondents are of the
opinion that if management could work to improve upon the level of trust amongst team
members it could improve effectiveness and efficiency these teams which could improve upon
organizational performance. Respondents were also of the view that if management could work
to diversify the portfolio of the company it could help the firm to spread its cost over a lot of
products thereby reducing price of unit item. This indicates the firm is charging its
overhead cost on only few products leading to high prices which featured prominently in the
reasons why the firm was losing customers and tenders. Again respondents indicated that
management should work to reduce the cost associated with production. To them production cost
is high so it should be reduced. If this is done it will invariably reduce the unit price of the
products which will make the firm competitive. The last issue which the respondents stated was
others which I believe the list could be tall and equally of the same weight. Management could
do introspective analysis to find more on these others to address them adequately.
40
CHAPTER FIVE
SUMMARY OF FINDINGS, CONCLUSIONS AND RECOMMENDATIONS
5.0 INTRODUCTION
This chapter summarizes and concludes the entire study. It presents recommendations
and the direction for future research. The purpose of the research was to assess Quality
Inspection Management practices and its effect on organizational performance at
Kiamokamo Tea Factory, in Kisii County. It is noteworthy that some of the
recommendations made can help implement the Quality Inspection Management
practices which could be employed to bring improvement in organizational performance
and other tea processing companies in Kenya. Primary data was collected by the use of
questionnaire from a population of 124 respondents; however 120 of the questionnaire
were retrieved from the respondents and analyzed. The objectives of the study were to
explore the degree of effectiveness of Quality Inspection Management practices in
Kiamokamo Tea Factory, to analyze the extent to which Quality Inspection Management
practices affect organizational performance and to identify the challenges involved in
implementing Quality Inspection Management practices.
5.1 SUMMARY OF FINDINGS
The findings of the study are summarized as follows:
5.1.1 PERSONAL DETAILS.
The analysis showed that there were more males than females working in the factory, about
44.2% of the respondents are nearing the retiring age of 60 this could have some effect on
productivity especially if dealing with labor intensive work like manufacturing. It could also
lead to an expensive learning curve when most of the staff go on retirement around the same
period. 51.7% of the respondents had attained either Elementary, JSS, or M.S.L.C. and 24.6%
41
were graduates from the polytechnics or the universities, this indicates that the company is doing
well to employ skill labor to work with however there are still too many staff that are middle
school leaving certificate holders which if care is not taken could lead to some challenges with
documentation and communication. 52.5% of the respondents had worked with the company for
more than 24 years. This indicates a low labor turnover which implies management could be
doing something right with the human resource aspects of the quality inspection management
practices.
5.1.2 QUALITY INSPECTION MANAGEMENT PRACTICES.
The findings show clearly that quality inspection management practices includes;
leadership commitment to work, employee involvement in quality decisions, effective
communication, team work, system for recognition and appreciation of quality efforts,
training and development and self-assessment. Majority of the respondents agreed that all
the above mentioned Quality Inspection Management practices were being practiced.
Generally it is perceived that majority of the workers agreed that the factory has some
Quality Inspection Management practices in place.
5.1.3 EFFECTIVENESS OF QUALITY INSPECTION MANAGEMENT PRACTICES.
The study explored the degree of effectiveness of Quality Inspection Management
practices. Majority of the respondents agreed that customer satisfaction was every body‘s
business in the organization. Most of the respondents disagreed that the company had
subscribed to any quality award system. This implies Quality Inspection Management is
not being implemented to the highest level. Majority of the respondents said they have
received some training. Nearly all of them agreed that the training and development
received had positively imparted on the job. This is a good practice of Quality Inspection
Management. About half of the respondents indicated that they don‘t receive all the
necessary resources required to carry out any improvement on the
job. This goes a long way to undermine the commitment of leadership to quality. On the whole
the researcher found out that though there were some Quality Inspection Management practices
in the factory these practices were not effectively practiced.
42
5.1.4 EFFECT OF QUALITY INSPECTION MANAGEMENT PRACTICES ON
ORGANIZATIONAL PERFORMANCE
Further the majority of the respondents said they were satisfied with their employer in
terms of the relationship which exists between them. This again emphasises the fact that
management was treating the employees well however since it is not overwhelming
majority of the respondents which shared that view management could do more to make
it effective so that most of the respondents would be satisfied. Nearly half of the
respondents agreed that the company was losing some of its customers and most of these
respondents were of the view that the reason was due to high prices of the company
products. It could also mean that some customer concerns have not been properly
addressed. This could mean that Some Quality Inspection Management practices are not
effective. When this was probed further some respondents were of the view that the
reasons could be due to high prices, preference for foreign products and inadequate
customer satisfaction. These could be proof that the existing Quality Inspection
Management practices are not adequately addressing the major concerns which affect
organizational performance.
5.1.5 ANALYSIS OF SENIOR STAFF VIEW ON ORGANIZATIONAL PERFORMANCE.
On the senior staff views on organizational performance as well as some challenges that
the organization was experiencing, it is clear from the findings that most of the
respondents were of the view that they receive customer complaints however these
complaints were not frequent. Most of them indicated that some customers have stopped
buying from the factory. These respondents concluded that the reasons were due to higher
prices and poor customer relationships. The respondents continued to state that they have
lost major tenders due to uncompetitive prices, however sales have been good compared
to the last two years. They concluded that if management could carry out the following
changes the firm could improve upon its performance:
The need for modern equipment.
Diversification of key portfolio in other to spread cost.
The need to improve salaries of employees.
Reduction of cost of production.
43

Trust amongst staff to improve team work
5.2 CONCLUSIONS
The study sought to assess the Quality Inspection Management practices and its effect on
organizational performance at Kiamokima tea factory in Kisii County. The study
concluded that some Quality Inspection Management practices exist at the factory.
Another conclusion which was drawn from the findings was that the Quality Inspection
Management at the factory was not being implemented to the highest level.
Again management inactions undermine leadership commitment to quality and render
Quality Inspection Management practices ineffective. For example the necessary
resources required to carry out quality improvement were not readily available.
Also majority of the staff were satisfied with working with the factory, however the
company was losing tenders and some customers due to poor customer relationships and
uncompetitive pricing. It was also revealed that some challenges were encountered in the
implementation of Quality Inspection Management notable amongst them were ; lack of
modern equipment, lack of diversification of key portfolio in other to spread the overhead
cost, high cost of production, lack of trust amongst staff to improve team work. In all the
study established the fact that if Quality Inspection Management practices are employed
effectively in Kiamokimo Tea factory, it could improve upon organizational performance.
5.3 RECOMMENDATIONS
In the light of the findings and conclusions, the following recommendations are
hereby proposed: Efforts must be made to implement those Quality Inspection
Management practices which are not being effectively practiced at the factory so as to
help improve on organizational performance. There is the need to employ quality
functional deployment. This will enable quality systems to be built on customer needs
and wants and also exceed customer expectations. When this is done it will help in
addressing the issues of poor customer relations as well as prevent loses of customers as
a result of not meeting customers’ expectations in terms of price. It is recommended
that the company subscribe to a quality award system. For instance it should subscribe to
44
ISO certification which can help them to put in place all the measures as well as practice
Quality Inspection Management to the highest level. This will go a long way to boost
customer confidence all over the world in the products of the company.
Another recommendation is that quality improvement efforts should be appreciated. There
should be systems for recognition and appreciation of quality efforts in order to motivate the staff
to work effectively.
There is the need for the company to purchase modern equipment which would make the
manufacturing process more efficient and also help reduce the cost of production.
Another recommendation is that since production cost is high which contributes to high
pricing of the company’s products there is the need for the company to diversify its key
portfolio in order to spread the overhead cost to reduce the unit cost of products.
Last but not the least there is the need for the company to build trust amongst the staff so as to
improve team work. Team work will enhance productivity and also improve upon employee
involvement which is a key Quality Inspection Management practice employed to improve upon
organizational performance.
45

REFERENCES
Arumugan V, Chang, Hw, Ooi, K, -B and Teh P,-L (2009) self assessment of quality
management practises: a case study analysis.
Abraham ,M., Crawford J. and Fisher T.(1999). Key factors providing effectiveness of cultural
change and improved quality in implementing total quality
management.
Anderson, Ew., Fornell,. C. and Lehman D.R (1994) customer satisfaction market share and
profitability.
Bergman B (1994) Quality from customer needs to customer satisfaction,
London, McGraw-Hill.
Bank J. (1992) The essence of quality management, London
Boaden R.J (1997). What is quality management? Does it matter?
Brown A and Van der wiele T. (1996). Quality management selfassessment in Australia
Crosby(1979) quality management practises in an organization.
Bayraktar(2007) .Evolution of operation management, past, present and future management
research vol 30 (11) 843-871.
Dale B.G, Managing quality 4th edition, Blacwell Publishers Oxford.
EFQM (19960). Self assessment guidelines for companies Brussels, European Foundation for
quality management (EFQM).
Feng T, Li,T, Sun,L, and Wang D (2013). External involvement and operational performance:
chinese management studies.
Ishikawa (1981,1983,1987,1989) .Statistical quality control.
46
Kotler and Keller (2006). Definition of the questionnaire.
KTDA.its role in tea production
PopeJeremy (2000) .Confronting corruption. The elements of national intrrgrity systems.
Transparency international , Berlin Germany.
Rahman H.A, Does professional ethics affect product quality?.quality surveying international
conference. Kuala Lumpur, Malaysia.
Slack N, Lewis and M (2004) The two worlds of operation management and research.
47
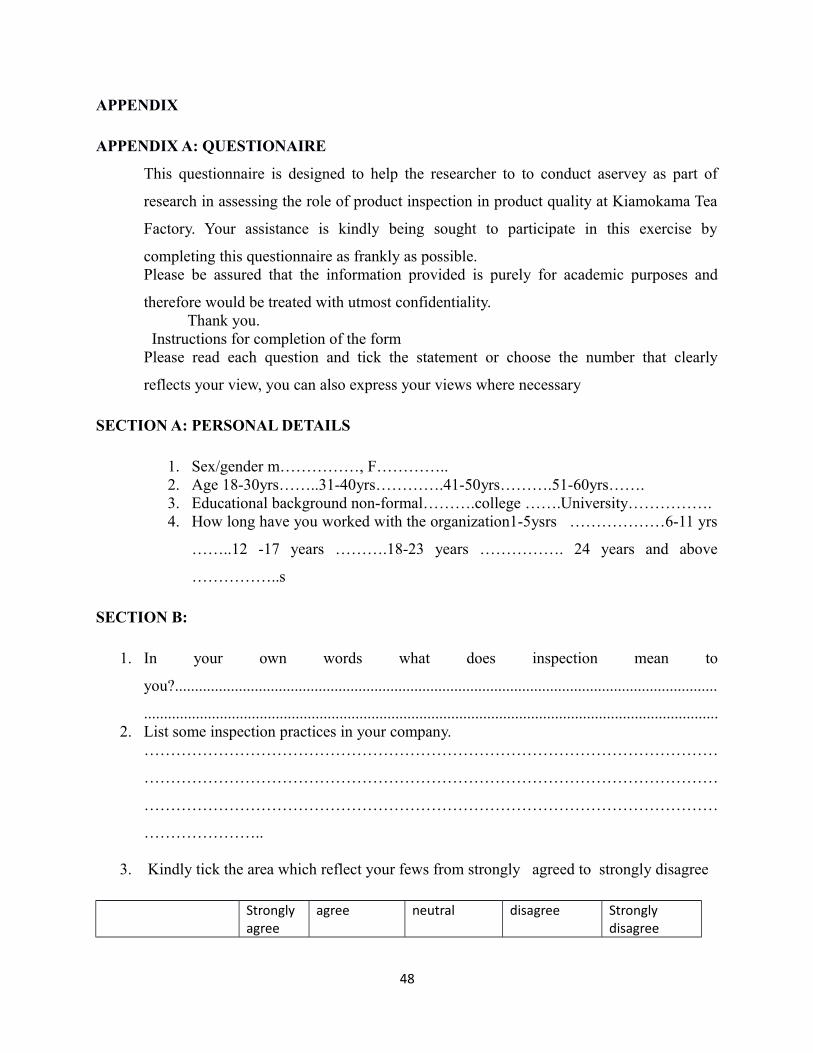
APPENDIX
APPENDIX A: QUESTIONAIRE
This questionnaire is designed to help the researcher to to conduct aservey as part of
research in assessing the role of product inspection in product quality at Kiamokama Tea
Factory. Your assistance is kindly being sought to participate in this exercise by
completing this questionnaire as frankly as possible.Please be assured that the information provided is purely for academic purposes and
therefore would be treated with utmost confidentiality. Thank you. Instructions for completion of the formPlease read each question and tick the statement or choose the number that clearly
reflects your view, you can also express your views where necessary
SECTION A: PERSONAL DETAILS
1. Sex/gender m……………, F…………..2. Age 18-30yrs……..31-40yrs………….41-50yrs……….51-60yrs…….3. Educational background non-formal……….college …….University…………….4. How long have you worked with the organization1-5ysrs ………………6-11 yrs
……..12 -17 years ……….18-23 years ……………. 24 years and above
……………..s
SECTION B:
1. In your own words what does inspection mean to
you?........................................................................................................................................
................................................................................................................................................2. List some inspection practices in your company.
………………………………………………………………………………………………
………………………………………………………………………………………………
………………………………………………………………………………………………
…………………..
3. Kindly tick the area which reflect your fews from strongly agreed to strongly disagree
Strongly agree
agree neutral disagree Strongly disagree
48
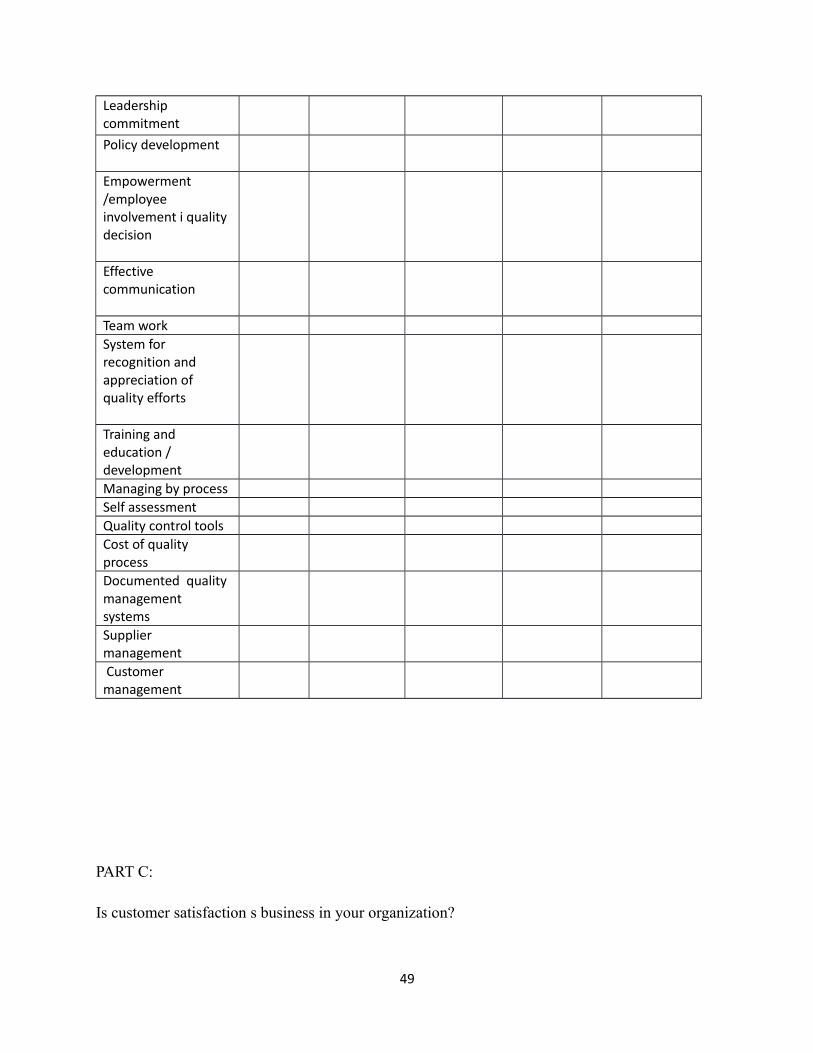
Leadership commitment Policy development
Empowerment /employee involvement i quality decision
Effective communication
Team work System for recognition and appreciation of quality efforts
Training and education / development Managing by processSelf assessment Quality control tools Cost of quality processDocumented quality management systems Supplier management Customer management
PART C:
Is customer satisfaction s business in your organization?
49
Yes ……… no …………………
As the organization subscribe to any quality award s system yes………………
no………………
If yes specify…………………..
Have you had any training on the job your doing yes …………………. No………………
Has the training impacted on the work positively yes …………………..no…………..
PART D:
For staff use only:
Section one only; senior staff few on an organization performance.
1. Do you receive customer complaints? Yes ……….no………….2. If yes how many did you receive in the last two years ………………….3. Have you lost some major tenders? yes………….. no………….4. If yes why? …………………………………………………………..5. In your few what do you think management wil do to improve upon organizational
performance……………………………………………………………………………
…………………………………………………………………………………………
…………………………………………………………………………………………
………………………………………………………………………………………
50
Copyright © 2022 FDOKUMEN