Coffee Markets, Smallholder Credit, and Landscape Change ...
Upload
khangminh22Category
view
2download
0
MODELING METHODOLOGY
JANUARY 2020
The Role of Banks in Illiquid Credit Markets, and the Disruption and Evolution of Credit Portfolio Management Abstract
The combination of new entrants, new technologies and (unintended) consequences of regulatory and accounting rules are driving banks to collect more data and to develop sophisticated tools when designing ever-more robust credit portfolio strategies. These regulations are forcing banks to shift their pricing and market-segment focus, altering the credit risk landscape, drastically affecting value and share price.
A version of this paper first appeared in Credit Risk Measurement and Management: Disruption and Evolution, Amnon Levy, Jing Zhang, eds. Risk Books, 2019.
Authors Amnon Levy Pierre Xu
Acknowledgements We would like to thank our colleagues and Christopher Crossen for their contributions to this paper.
Contact Us Americas +1.212.553.1653 [email protected]
Europe +44.20.7772.5454 [email protected]
Asia (Excluding Japan) +85 2 2916 1121 [email protected]
Japan +81 3 5408 4100 [email protected]

2 JANUARY 2020 HE ROLE OF BANKS IN ILLIQUID CREDIT MARKETS, AND THE DISRUPTION AND EVOLUTION OF CREDIT PORTFOLIO MANAGEMENT
Table of Contents
1. Introduction 3
2. Historical Perspective 4
3. The Evolution and Performance of Credit Portfolio Strategies 7 Applications of modern portfolio theory to banking 7
4. Regulatory Constraints and the Impact of Provisions on Capital Deployment 9
5. The Next Generation of Portfolio Management Tools: Transcending Mean-Variance 11
Conclusions 15
References 16

3 JANUARY 2020 HE ROLE OF BANKS IN ILLIQUID CREDIT MARKETS, AND THE DISRUPTION AND EVOLUTION OF CREDIT PORTFOLIO MANAGEMENT
1. Introduction
Throughout modern history, banks have dominated in extending illiquid credit, originating loans that reside on their books for years or, in some cases, decades. The resulting name and segment concentration poses severe challenges for banks as credit cycles inevitably deteriorate, exposing them to significant risk of losses. With portfolio rebalancing generally managed through new origination, illiquidity can be crippling. Traditionally, credit risk has been managed through relationship banking; the use of stable, long-term relationships as a corporate governance mechanism, particularly when counterparties face performance issues, has long been standard practice (Petersen and Rajan, 1994).
The environment has shifted, however. In this chapter we explore how the combination of new market entrants, new technologies and the (unintended) consequences of regulatory and accounting rules are driving banks to collect more data and to develop sophisticated tools when designing ever-more robust credit portfolio strategies. We also explore how these disruptions have given banks pause to reevaluate their pricing and market-segment focus, in some cases drastically altering the credit landscape.
We begin by looking back at the regulatory rules and their role in banks’ adopting credit portfolio management practices that include measures such as risk-adjusted return on capital (RAROC) and return on risk-adjusted capital (RORAC). We also look at the distinctive properties associated with these strategic measures.
We then assess how these measures perform under various traditional credit portfolio strategies using historical credit market data. Perhaps unsurprisingly, we find that forward-looking (FL) measures, potentially those used in the International Financial Reporting Standard 9 (IFRS 9) and Current Expected Credit Loss (CECL) processes (Levy 2019), and those that account for concentration risk, perform best at steering portfolios away from concentrated credit losses. Next, we explore and test the performance of newer strategies that leverage artificial intelligence (AI). These techniques show promise in further improving performance, and they will clearly affect the evolution of credit portfolio strategies.

4 JANUARY 2020 HE ROLE OF BANKS IN ILLIQUID CREDIT MARKETS, AND THE DISRUPTION AND EVOLUTION OF CREDIT PORTFOLIO MANAGEMENT
2. Historical Perspective
Prior to the roll-out of Basel II in 2008, banks had little incentive to collect and maintain detailed, granular data related to credit portfolios. Basel II required material investment in data systems and quantitative-derived credit portfolio management functions. This change disrupted the longstanding relationship culture, introducing quantitative language into banks’ vernacular (Basel Committee on Banking Supervision, 2006). As part of the compliance process, improved internal ratings-based systems allowed for granularity in rating categories. The efforts required motivated banks to introduce modernized portfolio strategies, based on decision rules that incorporated measures of expected loss and concentration, available as a by-product of the regulatory initiative.
Unfortunately, there were wide-ranging challenges. While ratings systems improved with the granular gradation of credit categories, most credits generally fell into only a handful of categories. These ratings systems also had relatively infrequent review cycles, barring observed and identified deterioration in an asset’s value. To compound the lack of credit differentiation, and in an effort to ensure stability, the internal ratings-based approach introduced measures that allowed (and in some cases required) their design to be Through-the-Cycle (TTC). The intent was for banks to develop slow-moving credit measures, so as not to introduce overly reactive practices that would disrupt lending and potentially impede broader economic stability. The unintended consequence was that banks steered away from using FL techniques, and instead continued to rely upon backward-looking measures.
Despite these shortcomings, banks adopted portfolio strategies that leveraged these new measures as either RAROC (parameterized with, say, TTC default probabilities when describing expected loss and regulatory capital as the risk measure that did not account for name or segment concentration) or RORAC (also parameterized with TTC default probabilities when describing expected loss and economic capital as the risk measure that accounted for concentration, but not in a way that recognized the current state of the credit cycle). Accounting for risk concentrations generated from deteriorated segments was limited, given the slow-moving nature of credit measures. In other words, both RAROC and RORAC, parameterized with TTC measures, incentivized over-concentrated lending in deteriorated segments. This common practice across the banking sector contributed to the observed overextension of credit to segments that ultimately deflated, and inevitably resulted in the banking sector experiencing concentrated losses.
Exclusive reliance on TTC measures changed with the inception of annual stress tests conducted by the U.S. Federal Reserve and the Supervisory Capital Assessment Program (SCAP) in 2009 (these transitioned to the Comprehensive Capital Analysis and Review (CCAR) and Dodd–Frank Act stress test exercises in 2010; see Federal Reserve Board (2019)), designed to assess capital adequacy (Clark and Ryu, 2015). The tests required increasingly comprehensive and granular data systems that transcended the entire organization, and led to models that described balance-sheet dynamics along forward projections. With grave consequences of failure — including limits to dividend policy — senior management found themselves entrenched in the process, adopting vernacular that referenced both TTC and FL measures.
While they were an important catalyst in adopting FL measures, the increased regulatory burdens following the Great Recession and related CCAR compliance overwhelmed and distracted financial institutions. It took years for organizations to manage the requirements and to leverage the data and models for business applications.
Meanwhile, the challenges resulting from the development of Basel 2.5 in 2009 until its initial roll out in 2012, the ever-pending Basel III and, finally, Basel IV, forced institutions to increasingly focus on regulatory compliance.1 Margins fell due to regulatory constraints that limited the affordable, low-cost leverage that banks rely on. Regulatory-constrained organizations (most banks) focused almost entirely on managing to regulatory requirements (Pepe , 2013). We saw a shift in credit portfolio strategies to ones that relied on regulatory capital-driven RAROC models with limited or no consideration for concentration. Almost simultaneously, a number of unrelated agents acted to offset the regulatory focus, accelerating the trend towards increased precision and sophistication in credit portfolio measurement and management.
Initially, in response to the “too-little, too-late” loan loss reserves problem during the Great Recession, accounting standard setters shifted how banks provision against loan loss due to default towards measures based on expected credit losses (ECL). Calculating ECL under IFRS 9 and CECL is a momentous accounting change for banks, with the new standards coming into effect sometime between 2018 and 2021, depending on jurisdiction.2 Firms must base their ECL measurements on reasonable and supportable information, which includes historical, current and forecasted details). While CCAR-compliant institutions were already familiar with the notion of FL credit measures, the ECL requirement forced a cultural shift for institutions in the Asia-Pacific countries and 1 For a useful summary of on the role of multiple regulatory constraints in the Basel III framework, see the “Survey on Challenges Banks Face in Implementing Basel III,” BCBS Working Paper #35, March 2019.
2 Additional changes to impairment models under U.S. GAAP are covered under FASB ASU 2016-13 Topic 326, Measurement of Credit Losses on Financial Instruments, https://www.fasb.org/jsp/FASB/Document_C/DocumentPage?cid=1176168232528&acceptedDisclaimer=true, June 2016.

5 JANUARY 2020 HE ROLE OF BANKS IN ILLIQUID CREDIT MARKETS, AND THE DISRUPTION AND EVOLUTION OF CREDIT PORTFOLIO MANAGEMENT
Europe, the Middle East and Africa, and smaller U.S. organizations. With impairment feeding into earnings and reported in financial statements, the cultural shift will now permeate the whole institution.
This sensitivity of banks’ impairment and earnings to changes in credit quality has intensified through the requirement that ECL calculations are updated to recognize and measure impairments in loans and receivables classified under “amortized cost” or “fair value through other comprehensive income” (under IFRS 9) in each reporting period. This requirement generally covers most banking assets intended to be held until their maturity, and it is a stark departure from incurred loss and relatively infrequent credit review cycles.
We have also seen a shift towards a more granular (in some cases instrument-level) ECL calculation, as recognized by the UK Prudential Regulation Authority (Saporta 2019). Incurred loss is inherently a pooling approach. Under IFRS 9 in particular, staging, and thus impairment, requires a much higher level of granularity. This shift in granularity has been reinforced in Europe by the requirement that institutions ensure all material risks are identified and effectively managed in an FL manner, according to the Internal Capital Adequacy Assessment Process (European Central Bank 2018). Institutions must consider in their forward-looking capital adequacy assessments any risks and any concentrations within and between those risks. Additionally, UK regulators are pushing for institutions to better incorporate risks into ECL models, with less reliance upon model overlays to capture risk and uncertainty (Saporta 2019). The availability of granular, credit-quality outlooks transforms the possible set of analyses and tools banks can leverage for credit portfolio management.
The sensitivity of impairment to changes in credit quality results in a more pronounced manifestation of concentration effects, driving earnings to exhibit a higher level of volatility (Levy et al, 2016). Deterioration in a segment’s credit environment can result in a material swing in impairment, as a concentrated set of instruments are reclassified under IFRS 9 Stage 2, resulting in the “cliff effect”, i.e., the significant increase in loss allowance that represents the difference between the portion that was recognized previously and the lifetime ECLs. Meanwhile, under CECL, impairment is always a lifetime measure, and its variation can be material in comparison to incurred loss. These dynamics have incentivized organizations to consider portfolio models that recognize these sensitivities, so they can better understand the concentration risks in their portfolios. A major concern remains the market’s perception of increased volatility and the resulting impact on equity valuation (Levy et al, 2019). With earnings possibly being the key performance metric, it is understandable that IFRS 9 and CECL measures influence credit portfolio design.
To get a sense of the difference between FL and TTC measures, Figure 1 maps out the average one-year default probability for an overlapping sample of Moody’s rated U.S. firms and firms with a Moody’s EDF™ (Expected Default Frequency) credit measure. While there are a wide range of approaches for measuring a TTC credit measure, the Moody’s rating coupled with the idealized default rate is one of the most common. Similarly, the EDF measure is a commonly used FL measure. The dramatic increase in the average, one-year FL probability of default (PD) in the tech-telecom downturn and Great Recession is not nearly as pronounced under the TTC measure.
Figure 1 Forward-looking versus Through-the-Cycle probabilities of default.
When compared with actual corporate default rates, depicted in Figure 2, it is clear that the FL measures indeed capture the credit environment.

6 JANUARY 2020 HE ROLE OF BANKS IN ILLIQUID CREDIT MARKETS, AND THE DISRUPTION AND EVOLUTION OF CREDIT PORTFOLIO MANAGEMENT
Figure 2 Default Rates — A point of reference.
This trait is particularly relevant within the context of credit portfolio monitoring and management. Figure 3 depicts the average FL measures segmented across financial institutions and non-financial institutions. If we use these FL measures, the portfolio steers aggressively away from non-financial institutions during the tech-telecom downturn and away from financials at the onslaught of the Great Recession, clearly not in the same way that a TTC measure would have the organization move. This finding is something that will be explored more formally in the next section.
Figure 3 Forward-looking measures lend themselves to better decision-making.
The second primary agent that offset the regulatory focus was the proliferation of new tools and techniques that leverage much larger, less-traditional data sets. Banks use these to build increasingly accurate credit models. The entrance of fintech firms into banking was a motivation for banks to leverage less-traditional data sets in order to compete in the market, accelerating their use of granular data and FL models, in particular, as they adopt new technologies to design relevant portfolio strategies. Jacobo and Weinstein (2019) highlight how new market players have effectively entered the illiquid credit market — a market traditionally limited to banks.
In the remainder of this paper, we first assess the performance of traditional credit portfolio strategies. These strategies highlight the incentives and consequences of regulatory and accounting rules faced by banks and the resulting market gaps that may be created for new market entrants. We then explore the performance of the next generation of strategies that leverage AI.

7 JANUARY 2020 HE ROLE OF BANKS IN ILLIQUID CREDIT MARKETS, AND THE DISRUPTION AND EVOLUTION OF CREDIT PORTFOLIO MANAGEMENT
3. The Evolution and Performance of Credit Portfolio Strategies
This section explores the wide-range of factors that drive banks’ incentives when considering credit origination strategies. We begin with the approaches to portfolio management traditionally applied in liquid markets, highlighting refinements needed for them to be applicable to illiquid credit. Our analysis incorporates unique aspects of regulatory constraints and accounting rules that can have material implications for techniques and portfolio performance. We also discuss new tools and techniques that leverage much larger, less-traditional data sets that can be used to design more robust strategies.
Applications of modern portfolio theory to banking Since the introduction of modern portfolio theory, variants of mean–variance optimization strategies have been applied successfully across a wide range of asset markets (Markowitz, 1952). Credit (and illiquid credit in particular) is different. Banks face a plethora of regulatory rules that limit their ability to leverage and accounting rules that require reporting earnings in a way that deviates from fair value, resulting in incentives to design portfolio strategies that are otherwise suboptimal.
Below, we quantify various accounting and regulatory factors that can be incorporated into modern portfolio theory, allowing it to be more applicable within a banking context. In some cases, we reference formalized objective functions and strategic metrics (e.g., risk-based pricing) that align with the measures against which a financial institution’s performance is ultimately judged. We begin by exploring RAROC and RORAC measures and the impact that FL and TTC measures have on performance. We then explore integrating regulatory constraints and economic risks in a unifying pricing framework while considering the implications of provisions.
Regulatory requirements and Basel incentives: TTC measures and concentration
As discussed, Basel II incentivizes organizations to adopt TTC measures, given their need to address Pillar 2 advanced internal ratings-based (A-IRB) approach requirements. Faced with an overwhelming number of binding constraints, organizations have prioritized regulatory metrics such as RAROC over risk-based metrics, such as RORAC in day-to-day operations.3
Our first case study explores the impact of concentration on pricing by comparing RAROC and RORAC strategies, parameterized using TTC and FL measures.
RAROC and RORAC: implications of TTC measures and concentration.
We compare strategies defined by four performance measures.
1. TTC RAROC: expected loss parameterized with TTC PDs.
2. FL RAROC: expected loss parameterized with FL PDs.
3. TTC RORAC: expected loss and earnings-at-risk (EaR) (as a measure of economic capital) parameterized with TTC PDs.
4. FL RORAC: expected loss and EaR (as a measure of economic capital) parameterized with FL PDs.
The starting portfolios (in 2000) under each strategy are identical. In each subsequent period, funds from matured loans, amounts recovered from defaulted loans and interest income are allocated to newly originated loan segments that achieve the highest overall portfolio performance measures. Notional limits are set at 10% of total portfolio to ensure concentration-insensitive strategies (i.e., RAROC) produce realistic concentration levels.
Parts (a) and (b) of Figure 4 depict earnings performance, measured as the realized ratio of return-to-risk, of each strategy for the European sample under an IFRS 9 lens and a U.S. sample under a CECL lens, respectively. Gains and losses are recognized with realized defaults and credit migration affecting provisions that feed into earnings. Provisions are lifetime under CECL, and one year for Stage 1 and lifetime for Stage 2 under IFRS 9. Each sample represents corporate entities in that geographic footprint with a Moody’s rating and an EDF value.
While no measure is perfect, with losses realized across strategies, FL measures that account for concentration perform best on average; FL RORAC measures have the highest earnings-to-risk ratio (Table 1). We observe a material improvement in performance when RAROC is measured using FL measures, as well as the challenges the TTC measure broadly experiences, resulting in over-investment in deteriorated segments.
3 RAROC is defined as (income − expected loss)/regulatory capital. RORAC is defined as (income − expected loss)/economic capital.
8 JANUARY 2020 HE ROLE OF BANKS IN ILLIQUID CREDIT MARKETS, AND THE DISRUPTION AND EVOLUTION OF CREDIT PORTFOLIO MANAGEMENT
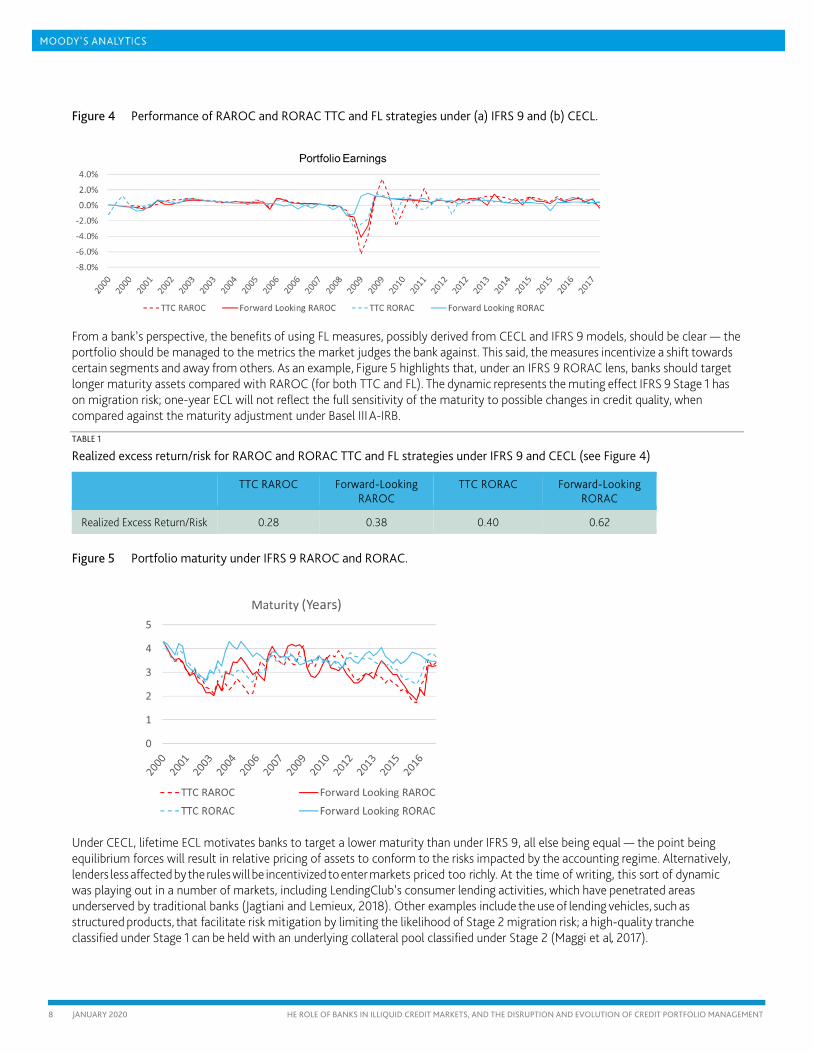
Figure 4 Performance of RAROC and RORAC TTC and FL strategies under (a) IFRS 9 and (b) CECL.
From a bank’s perspective, the benefits of using FL measures, possibly derived from CECL and IFRS 9 models, should be clear — the portfolio should be managed to the metrics the market judges the bank against. This said, the measures incentivize a shift towards certain segments and away from others. As an example, Figure 5 highlights that, under an IFRS 9 RORAC lens, banks should target longer maturity assets compared with RAROC (for both TTC and FL). The dynamic represents the muting effect IFRS 9 Stage 1 has on migration risk; one-year ECL will not reflect the full sensitivity of the maturity to possible changes in credit quality, when compared against the maturity adjustment under Basel III A-IRB.
TABLE 1
Realized excess return/risk for RAROC and RORAC TTC and FL strategies under IFRS 9 and CECL (see Figure 4)
TTC RAROC Forward-Looking RAROC
TTC RORAC Forward-Looking RORAC
Realized Excess Return/Risk 0.28 0.38 0.40 0.62
Figure 5 Portfolio maturity under IFRS 9 RAROC and RORAC.
Under CECL, lifetime ECL motivates banks to target a lower maturity than under IFRS 9, all else being equal — the point being equilibrium forces will result in relative pricing of assets to conform to the risks impacted by the accounting regime. Alternatively, lenders less affected by the rules will be incentivized to enter markets priced too richly. At the time of writing, this sort of dynamic was playing out in a number of markets, including LendingClub’s consumer lending activities, which have penetrated areas underserved by traditional banks (Jagtiani and Lemieux, 2018). Other examples include the use of lending vehicles, such as structured products, that facilitate risk mitigation by limiting the likelihood of Stage 2 migration risk; a high-quality tranche classified under Stage 1 can be held with an underlying collateral pool classified under Stage 2 (Maggi et al, 2017).

9 JANUARY 2020 HE ROLE OF BANKS IN ILLIQUID CREDIT MARKETS, AND THE DISRUPTION AND EVOLUTION OF CREDIT PORTFOLIO MANAGEMENT
4. Regulatory Constraints and the Impact of Provisions on Capital Deployment
Recognizing that FL RORAC measures allow banks to originate loans in a way that better diversifies a portfolio and more effectively uses current information to avoid deteriorating credit, we now explore more formally how constraining regulatory capital ought to enter into pricing.
In a classic risk management setting, credit portfolio risk focuses entirely on economic measures reflecting diversification, concentration and other economic risks. In a constrained regulatory capital environment, it is clear that economic measures (such as economic capital (EC)) alone are insufficient when making credit portfolio management decisions. Levy et al (2012) proposed a unified decision measure that incorporates regulatory capital requirements into the traditional economic framework underpinning economic value added and RORAC-style business decision measures. Since then, a number of advances have been made, including accounting for loss recognition in portfolio optimization. Levy and Xu (2017) introduce a composite capital measure that integrates economic and regulatory capital along with loss accounting, which can be used to optimize formally the risk–return performance of a portfolio while adhering to regulatory requirements. They observe that, barring offsets, provisions serve the same purpose as capital: a reserve against potential future losses. From a decision-metric perspective, loss allowance can be viewed as an additional capital requirement. An increase in loss allowance decreases earnings, which, in turn, reduces available capital. Their model distinguishes between two separate effects that allowance has on setting a target capital level:
1. the impact that allowance has on an institution’s current capital surplus, and 2. the impact allowance has on capital surplus dynamics, and the additional capital surplus needed to limit the likelihood
an organization’s regulatory minimum is violated on future dates.
An additional dynamic recognized in Levy et al (2019) is the effect that provisions have in delaying earnings. This trait is particularly relevant for long-dated assets under IFRS 9 Stage 2 and CECL and high interest rate environments.
Figure 6 Regulatory (Basel III A-IRB), effective and economic capital.
Our next case study explores the impact of incorporating provisions on effective regulatory capital, and the effect provisions have on the time value of earnings.
Provisions and effective capital requirements
Figure 6 compares Basel III A-IRB effective capital and FL economic capital (measured as EaR) for our European sample.
Perhaps unsurprisingly, given the use of TTC measures, the cyclicality of regulatory capital is muted substantially compared with, say, the cyclicality of defaults as depicted in Figure 2. Note that while effective capital under CECL exhibits a higher level of cyclicality, it is by no means as cyclical as FL EC. As highlighted in Levy et al (2019) — and referencing Figure 3, which demonstrates the difference in how FL measures differ across sectors — the impact of using these adjusted FL measures in pricing materially improves the deployment of capital and risk.
We now explore how the time value of provisions might affect pricing under two (relatively extreme) interest rate regimes. Longer-dated assets under CECL or those in, or close to, IFRS 9 Stage 2 are the most affected when interest rates are high. To get a sense of

10 JANUARY 2020 HE ROLE OF BANKS IN ILLIQUID CREDIT MARKETS, AND THE DISRUPTION AND EVOLUTION OF CREDIT PORTFOLIO MANAGEMENT
how effective setting aside large provisions becomes, Figure 7 presents the one-year expected excess return on the x-axis, and the expected excess return adjusted for the time value of provisions on y-axis. Part (a) represents the high interest rate environment in the early 2000s, where the impact could be material, particularly for loans maturing in more than four years. The impact under the 2017 environment shown in part (b) is not as dramatic, but still material. To summaries, we have explored approaches to integrating regulatory requirements and economic risk in pricing, and have demonstrated, using case studies, how provisions enter into pricing through effective capital requirements, as well as through returns and the time value of earnings. As highlighted in these case studies, the effects change the relative pricing of assets and may incentivize new entrants, as well as the marketplace, to develop as equilibrium forces the gaps in the market to be filled.
Figure 7 Impact of the time value on provisions.

11 JANUARY 2020 HE ROLE OF BANKS IN ILLIQUID CREDIT MARKETS, AND THE DISRUPTION AND EVOLUTION OF CREDIT PORTFOLIO MANAGEMENT
5. The Next Generation of Portfolio Management Tools: Transcending Mean-Variance
With the increased data availability, maturity of AI techniques, cloud technology and the entry of fintech players, credit portfolio managers have quickly adopted AI technologies. For example, Dwyer (2017) shows that an AI model using a borrower’s behavioral and financial information to predict PD significantly improves model accuracy compared with a traditional model that leverages only financial statement information. Bacham and Zhao (2017) examine the effectiveness of using various AI methods in credit risk modeling and find that AI methods provide a better fit for the non-linear relationships between explanatory variables and default risk.
Note, the application of AI not only introduces new and potentially better modeling techniques, but also brings about risks and challenges. As Dwyer (2017) points out, a common risk with AI, due to the lack of supporting economic theories, is that the model may predict spurious relationships that tend to break down out-of-sample, resulting in unrealistic asset allocation strategies. To address this issue, it is important to bring certain economic structures into the model. In addition, as highlighted by Babel et al (2019), new elements must be added to AI model validation, such as model interpretability and hyper-parameter tuning. With these risks and challenges associated with AI models in mind, in the next section we explore an application of AI to demonstrate the power these modelling techniques can have in improving portfolio performance.4
The approach identifies optimized loan origination by leveraging borrower and contractual characteristics directly, rather than through the development of intermediate models such as PD, LGD, and correlations, while, under a traditional mean–variance optimization framework, the optimal asset allocation is based on an estimated FL variant of a RAROC measure, which is limited by the accuracy of these models.
Another shortcoming of the mean–variance framework is the general use of a series of single-period optimization exercises. In reality, the objective of portfolio managers is long term, and they should recognize the illiquid nature of credit and the implications for how portfolio composition changes over time. Additionally, by its very nature, the mean–variance framework assumes stakeholders rank order risk based on standard deviation.
In reality, an institution’s risk preferences are much more complex, and often focus on various quantiles of loss (i.e., value-at-risk) or loss during economic downturns.
There are challenges leveraging AI to directly identify optimized origination strategies; significantly, a large amount of data is needed to train the algorithm. While time series of loan-level data representing an organization’s credit footprint can be limited, techniques such as generating synthetic portfolios using bootstrapping methods can alleviate the problem. External benchmark data, such as Moody’s Data Alliance loan-level data, can be used as a complement, allowing for a richer exploratory analysis and performance assessment across a broader set of strategies and markets.5
For ease of exposition, we present a case study that leverages these techniques in constructing a single portfolio, focusing on lifetime performance.
An AI approach to portfolio selection
We begin by creating a large number of synthetic portfolios by allocating funds randomly, keeping track of realized performance over time. We require access to individual loan and borrower characteristics, along with the time of default.
Next, we identify an objective function. In the mean–variance optimization case, we identify a set of instrument weights to minimize ex ante earnings volatility, given a target level of expected earnings. Similarly, the AI algorithm can be designed to identify the optimized portfolio based on the impact of observed characteristics on performance. As with traditional approaches, we must recognize the limitation that optimal weights are based on historically observed characteristics and performance.
We introduce the following AI algorithm:
1. Collect data covering 1,000 large, non-financial, corporate counterparties, spanning 2005–2017.
2. Categorize counterparties into 61 industries. 3. Generate 2,000 synthetic portfolios by randomly allocating $1 billion USD across the 1,000 counterparties in the
4 Although powerful, these modelling techniques come with their own challenges. Proudman (2019) highlights the challenges in adopting technologies due to the lack of data, infrastructure and trust in the models. He also highlights risks due to difficulties in identifying problems caused by incorrect assumptions behind the models.
5 For more details, see https://dataalliance.moodysanalytics.com/.

12 JANUARY 2020 HE ROLE OF BANKS IN ILLIQUID CREDIT MARKETS, AND THE DISRUPTION AND EVOLUTION OF CREDIT PORTFOLIO MANAGEMENT
beginning of 2005. By design, not all counterparties are necessarily assigned a positive amount in a portfolio. For example, in some portfolios, the entire $1 billion USD is allocated to less than 100 counterparties. Which counterparties among the 1,000 receive the allocation is randomly determined. In addition, we assume that there is a fixed origination cost of $1,000 USD associated with each counterparty with a positive allocation.
4. Establish earnings (constituting default loss and interest income).6
5. Calculate the notional, weighted-average financial statement information and contractual characteristics (maturity, coupon rate, etc.) for each portfolio, along with a proxy for portfolio concentration.7
6. Finally, conduct a set of neural network (NN) analyses to identify the ideal combination of characteristics.
Figure 8 Sharpe ratio versus leverage ratio.
We begin by visualizing the relationship between portfolio performance and each characteristic in our NN. Each point in Figure 8 represents average leverage for each portfolio against the portfolio’s annualized earnings Sharpe ratio from 2005−2017. The Sharpe ratio is a concave function of leverage, indicating an “optimal” level of portfolio riskiness, similar to that implied by a typical portfolio’s efficient frontier.
The relationship between the coupon rate and the Sharpe ratio is also non-monotonic. Figure 9 demonstrates the concave relationship between the portfolio’s Sharpe ratio and the coupon rate, peaking at roughly 6%; instruments with higher coupons are also riskier, which offsets the positive impact of larger coupons.
6 In addition, a flat origination expense is associated with the origination of each loan with a positive allocation. 7 The leverage ratio of an instrument is defined as the ratio of equity to total liability of the underlying borrower. The portfolio leverage ratio is defined as the ratio of the notional weighted sum of equity to the notional weighted sum of total liabilities. In practice, a wider set of variables, possibly sub-portfolio or borrower level, would be used.

13 JANUARY 2020 HE ROLE OF BANKS IN ILLIQUID CREDIT MARKETS, AND THE DISRUPTION AND EVOLUTION OF CREDIT PORTFOLIO MANAGEMENT
Figure 9 Sharpe ratio versus coupon rate.
Figure 10 Sharpe ratio versus sector concentration.
Figure 10 highlights the relationship between sector concentration (measured as the percentage of loans with holding greater than 5% of the portfolio total) and the Sharpe ratio. Similar to leverage and coupon information, we find a non-monotonic relationship between the sector concentration and Sharpe ratio. At first glance, this pattern may seem a bit unexpected; as we reduce concentration risk in the portfolio, we generally expect the portfolio risk–return trade-off to improve. However, a more diversified portfolio would also incur higher origination expenses; at some point the marginal benefit of further diversification is offset by lower expenses, decreasing portfolio performance.

14 JANUARY 2020 HE ROLE OF BANKS IN ILLIQUID CREDIT MARKETS, AND THE DISRUPTION AND EVOLUTION OF CREDIT PORTFOLIO MANAGEMENT
To achieve the optimal portfolio, we now explore the multi-characteristic relationship with portfolio performance, given the known confounding effects characteristics have on one another. To capture non-linear relationships, as well as the impact of interactions between different portfolio characteristics on performance, we estimate a two-layer NN model to predict the historical portfolio Sharpe ratio using the portfolio leverage ratio, coupon rate and sector concentration as features. Figure 11 depicts the NN model structure. This particular NN model can be regarded as a non-linear regression that uses portfolio characteristics to predict portfolio performance. Specifically, the features in the input layer are the explanatory variables that describe the portfolio characteristics, while the output layer (portfolio Sharpe ratio) is the dependent variable that describes portfolio performance.
Figure 11 Neural network model structure.
With such an NN model, an institution can explore target portfolios and obtain a view on performance. For example, we can compare five different portfolio strategies:
Strategy 1: portfolio with high leverage ratio, high coupon and high concentration.
Strategy 2: portfolio with medium leverage ratio, medium coupon and medium concentration.
Strategy 3: portfolio with low leverage ratio, low coupon and low concentration.
Strategy 4: portfolio with high leverage ratio, high coupon and medium concentration.
Strategy 5: portfolio with low leverage ratio, low coupon and medium concentration.
To evaluate each of these strategies, we first quantify “high,” “medium,” and “low” according to the 90th, 50th, and 10th percentile points on the corresponding variable’s distribution. For example, we define “high leverage ratio” as the leverage ratio equal to 0.899, equal to the 90th percentile of the leverage ratio distribution of all the portfolios created. We then use the estimated NN model to predict the expected Sharpe ratios of the five portfolios. Table 2 reports our results. In this case, the model predicts that strategy 2 creates the best performance, on average.
If we compare the portfolio performance of each strategy during a downturn economic scenario, we can re-estimate the NN over the crisis period, say from 2008−2010, instead of 2005−2017. In this case, we find that Strategy 5 performs the best.
Our key take-away: we can obtain portfolio performance estimates and manage portfolios without relying overly on intermediate models such as PD and correlation.8 All we require are historical borrower level data, including default time, and a robust AI algorithm.
8 In our example, an LGD model is still necessary, since we only have borrower-level rather than loan-level data. If loan-level data were available, including the collateral level and recovery amount associated with each loan, even an LGD model would not be necessary.

15 JANUARY 2020 HE ROLE OF BANKS IN ILLIQUID CREDIT MARKETS, AND THE DISRUPTION AND EVOLUTION OF CREDIT PORTFOLIO MANAGEMENT
TABLE 2
Predicting portfolio performance
Strategy Leverage Ratio Coupon Rate Concentration Predicted Sharpe Ratio on Average
Predicted Sharpe Ratio During Crisis
1 0.899 0.090 0.705 0.24 0.10 2 0.522 0.050 0.402 0.71 0.34 3 0.144 0.014 0.100 0.47 0.35 4 0.899 0.090 0.402 0.56 0.21 5 0.144 0.014 0.402 0.47 0.36
Conclusions
As lending markets evolve and respond to regulatory and accounting requirements, new technologies and competition are forcing banks to take pause and evaluate their credit portfolio management practices. Banks are increasingly attuned to FL measures, concentration effects and regulatory constraints as they:
» manage portfolios to perform against earnings — being sensitive to provisions under IFRS 9 and CECL — and key performance metrics that the banks are judged against,
» manage volatility and concentration risks in earnings that will manifest in a more pronounced way under CECL and IFRS 9, given the intended sensitivity of provisions to deterioration in the credit environment,
» design credit portfolio measures to manage these risks while adhering to regulatory constraints.
Ironically, FL IFRS 9 and CECL models lend themselves to credit portfolio management when addressing some of the disruptions. Ultimately, the availability of new data and technologies will enable increasingly sophisticated AI approaches in the design of ever more robust strategies.
Undoubtedly, banks will price some market segments to a point where new entrants and markets will form to fill the void. The extent to which this will manifest, and the degree to which these new sources will be a stable source of funding has yet to be seen.

16 JANUARY 2020 HE ROLE OF BANKS IN ILLIQUID CREDIT MARKETS, AND THE DISRUPTION AND EVOLUTION OF CREDIT PORTFOLIO MANAGEMENT
References
Babel, B., K. Buehler, A. Pivonka, B. Richardson and D. Waldron, “Derisking Machine Learning and Artificial Intelligence.” Article, McKinsey & Company, 2019.
Bacham, D., and J. Zhao, “Machine Learning: Challenges, Lessons, and Opportunities in Credit Risk Modeling.” Moody’s Risk Perspectives: Managing Disruption 9, pp. 28–35, 2017.
Basel Committee on Banking Supervision, “International Convergence of Capital Measurement and Capital Standards.” https://www.bis.org/publ/bcbs128.pdf, 2006.
Basel Committee on Banking Supervision, “Survey on Challenges Banks Face in Implementing Basel III.” BCBS Working Paper 35, Bank for International Settlements, Basel, March, 2019.
Clark, T. P., and L. H. Ryu, “CCAR and Stress Testing as Complementary Supervisory Tools.” U.S. Federal Reserve Board, Supervisory Staff Report, 2015.
Dwyer, D., “Combining Information to Better Access the Credit Risk of Small Firms and the Medium-Sized Enterprises.” Moody’s Risk Perspectives: Managing Disruption 9, pp. 44–52, 2017.
European Central Bank, “ECB Guide to the Internal Capital Adequacy Assessment Process (ICAAP).” European Central Bank, Banking Supervision, 2018.
Federal Reserve Board, “Federal Reserve Board Releases Scenarios for 2019 Comprehensive Capital Analysis and Review (CCAR) and Dodd–Frank Act Stress Test Exercises.” Press Release, February 5, 2019.
Financial Accounting Standards Board, “Measurement of Credit Losses on Financial Instruments (Topic 326).” Accounting Standards Update 2016-13, Financial Accounting Standards Board, Norwalk, CT, June 2016.
Jacobo, L. and I. Weinstein, “Homo Ex Machina: Finance Rebooted.” Credit Risk Measurement and Management: Disruption and Evolution, Amnon Levy, Jing Zhang, eds. Risk Books, 2019.
Jagtiani, J., and C. Lemieux, “Do FinTech Lenders Penetrate Areas That Are Underserved by Traditional Banks?” Federal Reserve Bank of Philadelphia Working Paper WP 18-13, 2018.
Levy, A., “Nonbank Players Are Ready for CECL: Are Banks?” American Banker, August 15, 2019.
Levy, A., A. Kaplin, Q. Meng and J. Zhang, “A Unified Decision Measure Incorporating Both Regulatory Capital and Economic Capital.” Moody’s Analytics White Paper, 2012.
Levy, A., X. Liang and P. Xu, “Earnings Volatility, Share Price Performance, and Credit Portfolio Management under CECL and IFRS 9”, Moody’s Analytics White Paper, 2019.
Levy, A., A. Protsyk, P. Xu and J. Zhang, “Managing Earnings Volatility and Uncertainty in the Supply and Demand for Regulatory Capital: The Impact of IFRS 9.” Moody’s Analytics White Paper, 2016.
Levy, A., and P. Xu, “A Composite Capital Allocation Measure Integrating Regulatory and Economic Capital, and the Impact of IFRS 9 and CECL.” Moody’s Analytics White Paper, 2017.
Levy, A., and J. Zhang, Credit Risk Measurement and Management: Disruption and Evolution. Risk Books, 2019.
Maggi, F., A. Natale, T. Pepanides, E. Risso and G. Schröck, “IFRS 9: A Silent Revolution in Banks’ Business Models.” Article, McKinsey & Company, 2017.
Markowitz, H. M., “Portfolio Selection.” Journal of Finance 7(1), pp. 77–91, 1952.
Pepe, G., “Basel 2.5: Potential Benefits and Unintended Consequences” Banca D’Italia Euroistema, 2013.
Petersen, M. A., and R. G. Rajan, “The Benefits of Lending Relationships: Evidence from Small Business Data.” Journal of Finance 49(1), pp. 3–37, 1994.
Proudman, J., “Managing Machines: The Governance of Artificial Intelligence.” Speech given at FCA Conference on Governance in Banking, June 4, 2019.

17 JANUARY 2020 HE ROLE OF BANKS IN ILLIQUID CREDIT MARKETS, AND THE DISRUPTION AND EVOLUTION OF CREDIT PORTFOLIO MANAGEMENT
Saporta, V., “Written Auditor Reporting: Update and Main Thematic Findings.” Letter to Chief Financial Officers of Selected Deposit Takers, Bank of England Prudential Regulation Authority, 2019.
Zhang, J. (ed), The New Impairment Model under IFRS 9 and CECL. Risk Books, 2018.

18 JANUARY 2020 HE ROLE OF BANKS IN ILLIQUID CREDIT MARKETS, AND THE DISRUPTION AND EVOLUTION OF CREDIT PORTFOLIO MANAGEMENT
© 2020 Moody’s Corporation, Moody’s Investors Service, Inc., Moody’s Analytics, Inc. and/or their licensors and affiliates (collectively, “MOODY’S”). All rights reserved.
CREDIT RATINGS ISSUED BY MOODY'S INVESTORS SERVICE, INC. AND ITS RATINGS AFFILIATES (“MIS”) ARE MOODY’S CURRENT OPINIONS OF THE RELATIVE FUTURE CREDIT RISK OF ENTITIES, CREDIT COMMITMENTS, OR DEBT OR DEBT-LIKE SECURITIES, AND CREDIT RATINGS AND RESEARCH PUBLICATIONS PUBLISHED BY MOODY’S (“MOODY’S PUBLICATIONS”) MAY INCLUDE MOODY’S CURRENT OPINIONS OF THE RELATIVE FUTURE CREDIT RISK OF ENTITIES, CREDIT COMMITMENTS, OR DEBT OR DEBT-LIKE SECURITIES. MOODY’S DEFINES CREDIT RISK AS THE RISK THAT AN ENTITY MAY NOT MEET ITS CONTRACTUAL, FINANCIAL OBLIGATIONS AS THEY COME DUE AND ANY ESTIMATED FINANCIAL LOSS IN THE EVENT OF DEFAULT. CREDIT RATINGS DO NOT ADDRESS ANY OTHER RISK, INCLUDING BUT NOT LIMITED TO: LIQUIDITY RISK, MARKET VALUE RISK, OR PRICE VOLATILITY. CREDIT RATINGS AND MOODY’S OPINIONS INCLUDED IN MOODY’S PUBLICATIONS ARE NOT STATEMENTS OF CURRENT OR HISTORICAL FACT. MOODY’S PUBLICATIONS MAY ALSO INCLUDE QUANTITATIVE MODEL-BASED ESTIMATES OF CREDIT RISK AND RELATED OPINIONS OR COMMENTARY PUBLISHED BY MOODY’S ANALYTICS, INC. CREDIT RATINGS AND MOODY’S PUBLICATIONS DO NOT CONSTITUTE OR PROVIDE INVESTMENT OR FINANCIAL ADVICE, AND CREDIT RATINGS AND MOODY’S PUBLICATIONS ARE NOT AND DO NOT PROVIDE RECOMMENDATIONS TO PURCHASE, SELL, OR HOLD PARTICULAR SECURITIES. NEITHER CREDIT RATINGS NOR MOODY’S PUBLICATIONS COMMENT ON THE SUITABILITY OF AN INVESTMENT FOR ANY PARTICULAR INVESTOR. MOODY’S ISSUES ITS CREDIT RATINGS AND PUBLISHES MOODY’S PUBLICATIONS WITH THE EXPECTATION AND UNDERSTANDING THAT EACH INVESTOR WILL, WITH DUE CARE, MAKE ITS OWN STUDY AND EVALUATION OF EACH SECURITY THAT IS UNDER CONSIDERATION FOR PURCHASE, HOLDING, OR SALE.
MOODY’S CREDIT RATINGS AND MOODY’S PUBLICATIONS ARE NOT INTENDED FOR USE BY RETAIL INVESTORS AND IT WOULD BE RECKLESS AND INAPPROPRIATE FOR RETAIL INVESTORS TO USE MOODY’S CREDIT RATINGS OR MOODY’S PUBLICATIONS WHEN MAKING AN INVESTMENT DECISION. IF IN DOUBT YOU SHOULD CONTACT YOUR FINANCIAL OR OTHER PROFESSIONAL ADVISER.
ALL INFORMATION CONTAINED HEREIN IS PROTECTED BY LAW, INCLUDING BUT NOT LIMITED TO, COPYRIGHT LAW, AND NONE OF SUCH INFORMATION MAY BE COPIED OR OTHERWISE REPRODUCED, REPACKAGED, FURTHER TRANSMITTED, TRANSFERRED, DISSEMINATED, REDISTRIBUTED OR RESOLD, OR STORED FOR SUBSEQUENT USE FOR ANY SUCH PURPOSE, IN WHOLE OR IN PART, IN ANY FORM OR MANNER OR BY ANY MEANS WHATSOEVER, BY ANY PERSON WITHOUT MOODY’S PRIOR WRITTEN CONSENT.
All information contained herein is obtained by MOODY’S from sources believed by it to be accurate and reliable. Because of the possibility of human or mechanical error as well as other factors, however, all information contained herein is provided “AS IS” without warranty of any kind. MOODY'S adopts all necessary measures so that the information it uses in assigning a credit rating is of sufficient quality and from sources MOODY'S considers to be reliable including, when appropriate, independent third-party sources. However, MOODY’S is not an auditor and cannot in every instance independently verify or validate information received in the rating process or in preparing the Moody’s Publications.
To the extent permitted by law, MOODY’S and its directors, officers, employees, agents, representatives, licensors and suppliers disclaim liability to any person or entity for any indirect, special, consequential, or incidental losses or damages whatsoever arising from or in connection with the information contained herein or the use of or inability to use any such information, even if MOODY’S or any of its directors, officers, employees, agents, representatives, licensors or suppliers is advised in advance of the possibility of such losses or damages, including but not limited to: (a) any loss of present or prospective profits or (b) any loss or damage arising where the relevant financial instrument is not the subject of a particular credit rating assigned by MOODY’S.
To the extent permitted by law, MOODY’S and its directors, officers, employees, agents, representatives, licensors and suppliers disclaim liability for any direct or compensatory losses or damages caused to any person or entity, including but not limited to by any negligence (but excluding fraud, willful misconduct or any other type of liability that, for the avoidance of doubt, by law cannot be excluded) on the part of, or any contingency within or beyond the control of, MOODY’S or any of its directors, officers, employees, agents, representatives, licensors or suppliers, arising from or in connection with the information contained herein or the use of or inability to use any such information.
NO WARRANTY, EXPRESS OR IMPLIED, AS TO THE ACCURACY, TIMELINESS, COMPLETENESS, MERCHANTABILITY OR FITNESS FOR ANY PARTICULAR PURPOSE OF ANY SUCH RATING OR OTHER OPINION OR INFORMATION IS GIVEN OR MADE BY MOODY’S IN ANY FORM OR MANNER WHATSOEVER.
Moody’s Investors Service, Inc., a wholly-owned credit rating agency subsidiary of Moody’s Corporation (“MCO”), hereby discloses that most issuers of debt securities (including corporate and municipal bonds, debentures, notes and commercial paper) and preferred stock rated by Moody’s Investors Service, Inc. have, prior to assignment of any rating, agreed to pay to Moody’s Investors Service, Inc. for appraisal and rating services rendered by it fees ranging from $1,500 to approximately $2,500,000. MCO and MIS also maintain policies and procedures to address the independence of MIS’s ratings and rating processes. Information regarding certain affiliations that may exist between directors of MCO and rated entities, and between entities who hold ratings from MIS and have also publicly reported to the SEC an ownership interest in MCO of more than 5%, is posted annually at www.moodys.com under the heading “Investor Relations — Corporate Governance — Director and Shareholder Affiliation Policy.”
Additional terms for Australia only: Any publication into Australia of this document is pursuant to the Australian Financial Services License of MOODY’S affiliate, Moody’s Investors Service Pty Limited ABN 61 003 399 657AFSL 336969 and/or Moody’s Analytics Australia Pty Ltd ABN 94 105 136 972 AFSL 383569 (as applicable). This document is intended to be provided only to “wholesale clients” within the meaning of section 761G of the Corporations Act 2001. By continuing to access this document from within Australia, you represent to MOODY’S that you are, or are accessing the document as a representative of, a “wholesale client” and that neither you nor the entity you represent will directly or indirectly disseminate this document or its contents to “retail clients” within the meaning of section 761G of the Corporations Act 2001. MOODY’S credit rating is an opinion as to the creditworthiness of a debt obligation of the issuer, not on the equity securities of the issuer or any form of security that is available to retail investors. It would be reckless and inappropriate for retail investors to use MOODY’S credit ratings or publications when making an investment decision. If in doubt you should contact your financial or other professional adviser.
Additional terms for Japan only: Moody's Japan K.K. (“MJKK”) is a wholly-owned credit rating agency subsidiary of Moody's Group Japan G.K., which is wholly-owned by Moody’s Overseas Holdings Inc., a wholly-owned subsidiary of MCO. Moody’s SF Japan K.K. (“MSFJ”) is a wholly-owned credit rating agency subsidiary of MJKK. MSFJ is not a Nationally Recognized Statistical Rating Organization (“NRSRO”). Therefore, credit ratings assigned by MSFJ are Non-NRSRO Credit Ratings. Non-NRSRO Credit Ratings are assigned by an entity that is not a NRSRO and, consequently, the rated obligation will not qualify for certain types of treatment under U.S. laws. MJKK and MSFJ are credit rating agencies registered with the Japan Financial Services Agency and their registration numbers are FSA Commissioner (Ratings) No. 2 and 3 respectively.
MJKK or MSFJ (as applicable) hereby disclose that most issuers of debt securities (including corporate and municipal bonds, debentures, notes and commercial paper) and preferred stock rated by MJKK or MSFJ (as applicable) have, prior to assignment of any rating, agreed to pay to MJKK or MSFJ (as applicable) for appraisal and rating services rendered by it fees ranging from JPY200,000 to approximately JPY350,000,000.
MJKK and MSFJ also maintain policies and procedures to address Japanese regulatory requirements.
Copyright © 2022 FDOKUMEN