
ASSET PRICING AND SYSTEMATIC LIQUIDITY RISK: AN EMPIRICAL INVESTIGATION OF THE SPANISH STOCK MARKET
Upload
independentCategory
view
1download
0
The Relationship between Liquidity Risk and Credit Risk in Banks
Björn Imbierowiczi | Christian Rauchii
May 2013
Abstract
This paper investigates the relationship between the two major sources of bank default risk: liquidity risk and credit risk. We use a sample of virtually all U.S. commercial banks during the period 1998 to 2010 to analyze the relationship between these two risk sources on the bank institutional-level and how this relationship influences banks’ probabilities of default (PD). Our results show that both risk categories do not have an economically meaningful reciprocal contemporaneous or time-lagged relationship. However, they do influence banks’ probability of default. This effect is twofold: whereas both risks separately increase the PD, the influence of their interaction depends on the overall level of bank risk and can either aggravate or mitigate default risk. These results provide new insights into the understanding of bank risk, as developed by the body of literature on bank stability risk in general and credit and liquidity risk in particular. They also serve as an underpinning for recent regulatory efforts aimed at strengthening banks (joint) risk management of liquidity and credit risks, such as the Basel III and Dodd-Frank frameworks.
JEL Classification: G21, G28, G32, G33
Key Words: Liquidity Risk, Credit Risk, Bank Default Probability
i Björn Imbierowicz, Goethe University Frankfurt, Finance Department, House of Finance, Grueneburgplatz 1, 60323 Frankfurt am Main, Germany, Phone: +49-69-798-33729, Email: [email protected] ii Christian Rauch (corresponding author), Goethe University Frankfurt, Finance Department, House of Finance, Grueneburgplatz 1, 60323 Frankfurt am Main, Germany, Phone +49-69-798-33731, Email: [email protected] Part of the research was conducted while B. Imbierowicz was visiting Stern School of Business at New York University and C. Rauch was visiting Moore School of Business at the University of South Carolina. The authors would like to thank Allen N. Berger, Christa Bouwman, Andreas Hackethal, Michalis Haliassos, Karolin Kirschenmann, Jan-Pieter Krahnen, Lars Norden, Sascha Steffen and participants at the Financial Management Association, Southern Finance Association, International Atlantic Economic Society, and WHU Campus for Finance conferences for valuable comments and suggestions. All remaining errors are our own.

1
What is the relationship between liquidity risk and credit risk in financial institutions? Classic
theories of the microeconomics of banking support the view that liquidity risk and credit risk
are closely linked. Both industrial organization models of banking, such as the Monti-Klein
framework, and the financial intermediation perspective in a Bryant (1980) or Diamond and
Dybig (1983) setting, suggest that a bank’s asset and liability structures are closely connected,
especially with regard to borrower defaults and fund withdrawals. This does not only hold
true for banks’ balance sheet business but also for the lending and funding business conducted
through off-balance sheet items, as shown by e.g. Holmström and Tirole (1998) or Kashyap,
Rajan, and Stein (2002). Building on these models, a body of literature has recently evolved
focusing on the interaction of liquidity risk and credit risk and the implications for bank
stability. Papers such as Goldstein and Pauzner (2005), Wagner (2007), Cai and Thakor
(2008), Gatev, Schuermann and Strahan (2009), Acharya, Shin and Yorulmazer (2010),
Acharya and Viswanathan (2011), Gorton and Metrick (2011), He and Xiong (2012a, b), and
Acharya and Mora (2013) look into the matter from various angles and derive, mostly from a
theoretical perspective, results which show the influence liquidity and credit risk have on each
other and also how this interaction influences bank stability.
Anecdotal evidence from bank failures during the recent financial crisis further supports these
theoretical and empirical results. Perhaps only indicative in nature, official reports of the
FDIC and OCC about the reasons for bank failures (so called “Material Loss Reports”1)
explicitly state that the majority of commercial bank failures during the recent crisis were
partly caused by the joint occurrence of liquidity risks and credit risks. Also, Switzerland-
based money center bank UBS addressed the main causes for its substantial losses and
subsequent financial distress in the wake of the 2007/2008 financial crisis in a 2008 report to
its shareholders2 as follows: “UBS funding framework and related approach to balance sheet
management were significant contributors to the creation of UBS's Subprime exposure” (p.
36). Apparently, the bank did not differentiate between liquid and illiquid assets and the
respective term funding and thereby also disregarded the credit risks of the assets. Albeit this
evidence is only of anecdotal nature, it might be a sign that the joint occurrence of liquidity
and credit risks plays a tremendous role for banks and their stability and that banks do not
account for this joint occurrence in their risk management systems. This assumption is
1 Material Loss Reports are published by the FDIC and OCC whenever a bank default results in a “material loss” to the FDIC insurance fund. On January 1st 2010, the threshold for a “material loss” to the FDIC fund was raised from $25 million to $200 million. The reports contain a detailed analysis of the failed banks’ backgrounds and business models and list the failure reasons. 2 Shareholder Report on UBS’s Write-Downs, UBS AG, Zurich, Switzerland, 04-18-2008, available through http://www.ubs.com/global/en/about_ubs/investor_relations/share_information/shareholderreport.html

2
supported by recent regulatory changes, like the Basel III framework and its Liquidity
Coverage Ratio (LCR) and Net Stable Funding (NSF) Ratio, or the Dodd-Frank Act with its
proposed liquidity stress-tests, which put stronger emphasis on funding and liquidity risks in
conjunction with asset quality risks. Yet, in spite of this alleged importance and the ample
theoretic evidence behind it, no paper has so far analyzed the relation between liquidity risk
and credit risk on a broad range and in its different dimensions across the banking sector. As a
consequence, many important questions regarding this topic remain unanswered: what is the
general relationship between liquidity risks and credit risks in banks? Do liquidity and credit
risk jointly influence banks’ probability of default? If so, do banks manage both risks
together?
We try to answer these questions by empirically analyzing the relationship between liquidity
risk and credit risk in 4,046 non-default and 254 default U.S. commercial banks over the
period 1998:Q1 to 2010:Q3, using a large variety of different subsamples and tests. As
measures for liquidity and credit risk we employ two main variables.3 We develop a liquidity
risk (LR) proxy variable which measures short-term funding risks of banks, as represented by
the relationship of short-term obligations to short-term assets, including off-balance sheet
items as for example unused loan commitments. We thereby account for classic “bank run”
risks. For credit risk (CR) we develop a proxy variable measuring the unexpected loan default
ratio of a bank, as represented by the net loan losses in the current period to the allowances for
these loan losses recorded in the previous period. This variable captures the current riskiness
of a banks’ loan portfolio and the accuracy of a bank’s risk management to anticipate near-
term loan losses.
In the first step of our analysis we analyze the general relationship between liquidity and
credit risk in banks. We are specifically interested in whether or not there is a reciprocal
relationship between the two factors, i.e. whether or not liquidity risk influences credit risk or
vice versa, and if this relationship is positive or negative. Our results show that there is no
reliable relationship between liquidity risk and credit risk in banks. We distinguish between
the different dimensions of liquidity and credit risk using several proxy variables. We also
subdivide banks by size, varying degrees of liquidity and credit risk exposure, economic time
periods, geographical differences, and different interest rate volatility and bank profitability
periods. Furthermore, we incorporate different econometric approaches: a simultaneous
3 We investigate two additional risk measures as robustness checks. These are: the BB measure as developed by Berger and Bouwman (2009) for liquidity risk, and the Z-Score as a measure of overall bank stability, following Roy (1952). A detailed discussion of the measures and the results of their analyses are provided in part 3.1.4 of the paper.

3
equations model controlling for both contemporaneous and lagged influences between
liquidity risk and credit risk, and a panel-VAR model together with a correlation analysis to
separately control for contemporaneous and lagged relationships. Although the results in
some cases show statistical significances, the economic influence is at best marginal.
Given that there is no reliable relationship between the two risk factors across banks, we ask
in the second part of our analysis if liquidity risk and credit risk individually and also jointly
contribute to bank default risk. For this purpose we include our main proxy variables for
liquidity risk and credit risk, as well as the interaction between both risks in a multivariate
logistic regression model to determine their contributions to banks’ probability of default
(PD). Our results show that liquidity risk and credit risk individually both influence banks’
PD. Furthermore, we find that the interaction between the two risk categories has an
additional effect on bank PD. Surprisingly, this effect is different for banks with different
levels of bank PD: the joint occurrence of liquidity and credit risks has a PD-aggravating
effect for banks with a PD of 10-30 percent. In contrast, we find that it is mitigating for banks
with a high PD of 70-90 percent. Apparently, the joint effect of simultaneously high liquidity
and credit risk has a dampening effect on the otherwise PD-aggravating individual effects of
the two risk categories in banks which are close to default. Taken together, our findings
suggest that there is an important relation between liquidity risk and credit risk which affects
the overall probability of bank default.
Our study contributes to the literature by studying the relationship between liquidity and
credit risk and the impact both factors might have on bank stability. In doing so, it builds on
two strands of literature. For liquidity risk, these are the seminal works of Bryant (1980) and
Diamond and Dybvig (1983) which have been extended, refined and applied numerous times
by e.g. Calomiris and Kahn (1991), Diamond and Rajan (2001), and most recently Berger and
Bouwman (2012).4 The credit risk studies we build on are too numerous to be mentioned in
full; the most recent examples include e.g. Illueca, Norden and Udell (2008), Laeven and
Levine (2009), Foos, Norden, and Weber (2010), Houston et al. (2010), and also Rajan and
Winton (1995), Boot (2000), and Berger and Udell (2004) (a very in-depth overview of earlier
studies is provided by e.g. Altman and Saunders, 1998). In all these studies however, liquidity
risk and credit risk have been analyzed thoroughly, but separately. There are only isolated
theoretical papers, as described above, which take both factors into account when modeling
4 Most recent works on liquidity also include Gatev and Strahan (2006), Carletti, Hartmann and Spagnolo (2007), Berger and Bouwman (2009), Nyborg and Östberg (2010), and Freixas, Martin and Skeie (2011). An overview over the existing bank liquidity literature is provided by Tirole (2011).

4
(bank) risk. To the best of our knowledge, no study to date investigates the relationship
between liquidity risk and credit risk empirically on a broad basis across virtually all
commercial banks in a given market, also incorporating bank defaults. Our results thereby
also support recent regulatory efforts to improve banks’ risk management with special regard
to the joint occurrence of liquidity and credit risks.
The remainder of the paper is structured as follows. Section 1 provides the theoretical
background for our analysis. Section 2 describes the data including our proxy variables for
liquidity and credit risk and presents descriptive statistics. Section 3 presents the results and
section 4 concludes.
1 Theoretical Background
1.1 The Reciprocal Relationship between Liquidity Risk and Credit Risk
Over the past 50 to 60 years, a tremendous amount of literature has dealt with banks’ liquidity
and credit risks. Explanations for the way banks work and their major risk and return sources
are given by two major research strands regarding the microeconomics of banking: the classic
financial intermediation theory, most prominently represented by the Bryant (1980) and
Diamond and Dybvig (1983) models and their extensions (such as Qi, 1994, or Diamond,
1997), and also by the industrial organization approach to banking, which features most
prominently in the Monti-Klein model of banking organizations and subsequent related
research. The financial intermediation view models banks as pools of liquidity which provide
both depositors and borrowers with the ready availability of cash, thereby enhancing
economic welfare and internalizing economic liquidity risk. The industrial organization
approach models banks as profit-maximizing price takers in oligopolistic loan and deposit
markets, facing an upward sloping demand for deposits and a downward sloping demand for
loans with respect to increasing interest rates. On the asset side, banks generate returns
through loan interest rates; on the liabilities side, banks face costs through deposit interest
rates.
The models of both strands of literature suggest that, at least in theory, there is a relationship
between liquidity and credit risk. However, research is ambiguous about the question of
whether this relationship is positive or negative. The Monti-Klein framework and its
extensions (e.g. Prisman, Slovin and Sushka, 1986) take borrower defaults and sudden fund

5
withdrawals into account, both assumed to be lowering a bank’s profit. Because equity, other
debt funding and marketable securities are seen as given, banks maximize their profits by
maximizing the spread between deposit and loan rates, given an exogenous main refinancing
rate as well as stochastic borrower defaults and fund withdrawals. As liquidity risk is seen as a
profit-lowering cost, a loan default increases this liquidity risk because of the lowered cash
inflow and depreciations it triggers (following e.g. Dermine, 1986). At least in theory,
liquidity risk and credit risk should thus be positively correlated. This assumption is supported
by the theoretical financial intermediation literature, as modeled by Bryant (1980) as well as
Diamond and Dybvig (1983). Extensions of these models show that risky bank assets together
with uncertainty about the economy’s liquidity needs spark bank runs based on pure panic
(Samartín, 2003; Iyer and Puri, 2012). Based on these models, liquidity and credit risk should
be positively related and contribute jointly to bank instability.
The idea of a positive relationship between liquidity and credit risk is also supported by a very
new body of literature which also focuses on the financial crisis of 2007/2008, such as
Diamond and Rajan (2005), Acharya and Viswanathan (2011), Gorton and Metrick (2011)
and He and Xiong (2012a). Diamond and Rajan’s paper (2005) builds on the model developed
in Diamond and Rajan (2001). Their model is based on the premise that banks obtain money
from unskilled depositors which is used for lending. Problems arise if too many economic
projects funded with loans yield insufficient funds (or even default) and the bank cannot meet
the depositors’ demand. As a consequence of this asset deterioration, more and more
depositors will claim back their money. The bank will thus call in all loans and thereby reduce
aggregate liquidity in the market. The main result is therefore that higher credit risk
accompanies higher liquidity risk through depositor demand. Acharya and Viswanathan’s
(2011) model explains why the building up of leverage in good economic times leads to
severe asset shocks and a drying up of liquidity in bad economic times. The underlying
assumption is that financial firms raise debt which has to be rolled over constantly and which
is used to finance assets. They show that more debt in the banking system yields higher “bank
run” risk: in times of crisis when asset prices deteriorate, banks find it more difficult to roll
over debt, i.e. they have a liquidity problem. He and Xiong (2012a), in building on Diamond
and Dybvig (1983), also focus on debt rollover risk. They state that the debt maturities of
lenders (e.g. investment banks) on short-term debt are spread across time and rolled over to
avoid bank-run risk if all debt contracts expire at the same time. The authors derive an
equilibrium in which each lender will not roll over the debt contract if the fundamental asset
value falls below a certain threshold. The result is a “rat race” in which lenders are more

6
likely to run if the asset values decrease. A different perspective on the relationship between
liquidity and credit risk is provided by Gorton and Metrick (2011). Their empirical analysis
shows how a bank run based on investor panic can happen in modern-day securitized
banking5, as opposed to bank runs in traditional banking. Their evidence suggests that in the
recent financial crisis perceived credit risk in the form of subprime loans caused refinancing
rates and funding haircuts in the interbank market to increase substantially. Although
investors did not know about the actual subprime risks held by banks, the fear for their
investments caused severe liquidity problems for banks as the short-term funding market
dried up because of higher repo rates and haircuts. The paper impressively shows how
perceived credit risk (as opposed to actual credit risk) can lead to liquidity risk in banks.
Based on the assumptions and outcomes of the microeconomic models, their extensions and
the latest papers discussed above, our hypotheses for the relationship between liquidity and
credit risk are:
H1: There is interdependency between liquidity risk and credit risk.
H2: Liquidity risk and credit risk have a positive relationship, i.e. liquidity and
credit risk increase or decrease jointly.
H1 seems uncontested and straightforward based on the presented literature. However, with
regard to H2, we also acknowledge that a very recent and still developing body of literature
suggests the possibility that the relationship between liquidity and credit risk in banks might
be negative, given that certain assumptions and economic features are met. A paper by
Wagner (2007) shows that increased bank asset liquidity leads to heightened bank instability.
The paper argues that although banks benefit from a more liquid asset side in terms of
stability (reducing risk, facilitating the sale of assets in crises), crises become less costly for
banks and they are thus more prone not to prevent these from happening. The paper of Gatev,
Schuermann and Strahan (2009) builds on the model of Kashyap, Rajan and Stein (2002). The
paper shows that transaction deposits are beneficial to a bank’s liquidity risk in times of
heightened credit risk because they help banks to hedge against draw-downs of loan
commitments. Acharya, Shin and Yorulmazer (2010) build on the empirical evidence that the
cash holdings of banks increased steeply during the course of the most recent financial crisis.
The paper develops a model in which liquidity holdings are an ex-ante strategic choice of
5 Securitized banking is defined as bank business in which loans are packaged into special “funds” which are then sold to investors in the form of securities. The financing from these transactions does not stem from retail or corporate deposits but from the interbank repo market.

7
active bank management in order to purchase assets of other banks at fire sale prices in times
of economic distress. The postulated relationship between liquidity and credit risk is therefore
again negative. Cai and Thakor’s work (2008) is centered around bank competition. They find
that with negligible interbank competition, higher credit risk may reduce liquidity risk.
Finally, Acharya and Naqvi (2012) show that in times of heightened macroeconomic stress
(i.e. in a crisis), households and corporate depositors perform a “flight for quality” and deposit
their assets with banks. This leaves banks flush with cash which in turn reduces the “quality”
and their monitoring of new and existing borrowers. The implication is therefore that liquidity
and credit risk do not move in tandem: banks with higher liquidity holdings can load their
loan portfolio with “bad” loans.
The outcome of all of the above-mentioned research is that the relationship between liquidity
and credit risk can hypothetically be either positive or negative, depending on the type of
bank observed, the assumptions regarding the banks’ business model and the economic
conditions the bank operates in. As stated above, we analyze all U.S.-chartered commercial
banks over the period 1998-2010, thereby deliberately excluding thrifts and, more
importantly, money center banks from our sample. We thus analyze small and medium-sized
retail banks during good economic conditions as well as in crisis. The nature of our dataset
and the fact that the banks included are active in the business of retail-oriented lending and
depositing leads us to believe in a positive relationship between liquidity risk and credit risk.
We conjecture that the positive relationship between liquidity and credit risk is strongest in
small retail-oriented banks which perform maturity transformation as their main business
based on bank-internal profit maximization goals induced by yield curve spreads. We will
nevertheless control for all factors mentioned in the (theoretic) literature as the relation
between liquidity risk and credit risk might possibly be different.
1.2 The Influence of Liquidity Risk and Credit Risk on Bank Default Probability
From a theoretical perspective, the relationship between liquidity risks and credit risks
therefore seems to be clearly established. The logical follow-up question then is: how are
banks affected by this relationship in their overall risk structure? To derive a testable
hypothesis for this question, we draw on the literature explaining bank defaults. After all, the
ultimate risk a bank faces is the risk of going out of business. A thorough understanding of
bank risk should therefore focus on bank default reasons. There is a vast body of empirical
literature testing the influence a wide variety of accounting-, market- and general economic
factors have on banks’ PDs. Papers such as Meyer and Pfifer (1970), Martin (1977), Whalen

8
and Thomson (1988), Espahbodi (1991), Thomson (1991, 1992), Cole and Fenn (1995), Cole
and Gunther (1995, 1998), and Kolari, Glennon, Shin and Caputo (2002) show that banks’
default risk is mainly driven by low capitalization, low earnings, over-exposure to certain
categories of loans, and excessive loan defaults. Aubuchon and Wheelock (2010), Ng and
Roychowdhury (2011), Cole and White (2012), Berger and Bouwman (2013), and DeYoung
and Torna (2013) are especially relevant to our work because they focus on bank defaults
during the recent financial crisis. Generally, they find that excessive investment banking
activities, bad macroeconomic conditions in the banks’ immediate vicinity, low equity, and
heavy concentrations in real estate loans substantially increased banks’ PDs during the recent
crisis. Interestingly, all these studies provide clear evidence that credit risk plays a vital part
for the overall stability condition of a bank, but largely ignore liquidity risk. Although some
studies include proxies for liquidity, they mostly focus on the CAMEL-based6 asset-side
liquidity (i.e. the relationship of short-term to long-term assets) or the general funding
liquidity (such as the ratio of short-term to long-term deposits). Maturity transformation risks
are therefore largely ignored, just as the relationship between liquidity risks and credit risks.
Deeper insight into the matter is only provided by two papers. An empirical study of Acharya
and Mora (2013) explains the role of banks as liquidity providers during financial crises. In
doing so, they provide evidence that failed banks during the recent financial crisis suffered
from liquidity shortages just before the actual default. Apparently, distressed banks faced
severe liquidity issues, especially in comparison to healthy banks. They document this by
showing that failed or near-failed banks scramble for (retail) deposits by offering high CD
rates in aggressive marketing campaigns. Indirectly, their results point to the fact that the joint
occurrence of liquidity and credit risk might push banks into default. A more direct channel of
how liquidity and credit risk can jointly cause default is theoretically shown by He and Xiong
(2012b). They analyze the relationship between liquidity and credit risk from a company’s
wholesale funding perspective. The channel they identify which connects liquidity risk to
credit risk and ultimately with default risk is debt rollover risk. The results of the paper show
that investors demand higher illiquidity premia for corporate bonds due to liquidity risk in the
market for corporate bonds. Upon rolling over their companies’ debt in illiquid bond markets
and in order to avoid default, equity holders of the issuing firms must pay for the difference
between the lower liquidity premia in matured bonds and the higher illiquidity premia in
6 CAMEL factors are accounting and governance measures for bank stability, mostly used by US regulatory and supervisory authorities. CAMEL is an acronym for Capital Adequacy, Asset Quality, Management Quality, Earnings, and Liquidity. Included ratios are e.g. the efficiency ratio, return on assets, asset-side liquidity, equity ratios, or management experience.

9
newly issued bonds. As a consequence of having to absorb these losses on behalf of the debt
holders, equity holders might therefore choose to default earlier. An illiquidity shock in
corporate debt markets can therefore lead to higher default rates. Although the presented
model encompasses corporate debt in general, they specifically relate their results to financial
institutions. The findings of He and Xiong (2012b) are especially relevant in light of recent
research showing that companies, especially financial institutions, are prone to very short-
term debt structures (Brunnermeier and Oehmke, 2013), which increase the frequency of debt
rollovers.
Pairing these results with the findings of other bank default studies showing that credit risk
posed a serious threat to bank stability during the recent crisis (such as e.g. Cole and White,
2012), leads us to the following hypothesis:
H3: Liquidity risk and credit risk jointly contribute to bank default probability.
On top of the theoretical and empirical evidence presented above, we believe that anecdotal
evidence on bank failures during the recent crisis might provide further intuitive support for
H3. Table 1 shows that almost half of all 254 commercial bank failures between August 2007
and September 2010 have been caused by the joint occurrence of illiquidity and loan losses.
Although this number is generated using a multiple of different sources, such as FDIC and
OCC Material Loss Reports, newspaper articles etc., we believe that it might be an indication
that the joint occurrence of liquidity and credit risks might have played a role in causing bank
defaults during the recent financial crisis.
[Table 1]
2 Data and Descriptive Statistics
2.1 Data and Sample Selection
For all bank balance sheet, profit & loss account, and off-balance sheet items we use official
FFIEC Call Report data on a quarterly basis, publicly obtainable through the Federal Reserve
Bank of Chicago. Banks in our dataset are solely U.S.-based and -held banks. We deliberately
exclude all U.S.-based and -chartered subsidiaries of foreign bank holding companies, as well
as all thrifts and money center banks to obtain a more homogeneous bank sample in terms of
ownership and governance. All banks are analyzed on the charter bank and not on the bank
10
holding company level.7 The required information on bank ownership and chartering is taken
from the FDIC regulatory database, publicly obtainable through the FDIC website.8 The
balance sheet, profit & loss account, and off-balance sheet items for our subsample of failed
banks are also derived from quarterly Call Report data, as provided by the Federal Reserve
Bank of Chicago. Additional information, such as the date of failure, was obtained through
the FDIC’s failed banks list.9 Note that mergers during our observation period are treated as if
banks had already merged by the beginning of our observation period.10
Further information was collected from three additional datasets. We use the official St. Louis
Federal Reserve “FRED” public database for all macroeconomic data, such as GDP, savings
quota or interest rates. For a regional analysis based on FDIC regions we use FDIC Quarterly
Banking Reports. The reports are published quarterly and contain a large variety of data
regarding the performance of all FDIC-insured banks. Table 2 provides brief descriptions of
the variables used in our analyses. We also make use of Allen N. Berger’s and Christa
Bouwman’s publicly available data set of BB measure values for U.S. commercial banks over
our observation period, downloadable from Christa Bouwman’s personal website. 11 The
composition and calculation of this data set is described in Berger and Bouwman (2009). All
explanatory variables are described in detail in Table 2.
[Table 2]
2.2 Liquidity Risk and Credit Risk Proxy Variables
We use two main variables to measure risk: one measure of liquidity risk, and one of credit
risk. For the purposes of this paper, we call the liquidity proxy variable Liquidity Risk (LR);
for credit risk we observe the Credit Risk (CR) variable. Note that in further robustness
checks we also include the BB measure and the classical Z-score which we discuss in more
detail later on. The description of each variable together with its calculation is provided in
Table 3.
[Table 3]
7 As a robustness check, we repeat all analyses using the BHC-level instead of the institutions-level. The results remain unchanged. 8 http://www2.fdic.gov/IDASP/main.asp 9 http://www.fdic.gov/bank/individual/failed/banklist.html 10 We test our results by also excluding all merged banks from our data set. All findings remain unchanged. 11 http://faculty.weatherhead.case.edu/bouwman/
11
The liquidity risk (LR) variable is calculated by subtracting the volume of all assets which the
bank can quickly and at low cost turn into cash to cover possible short-term withdrawals from
the volume of liabilities which can be withdrawn from the bank on short notice. We also
account for off-balance sheet liquidity risk through e.g. unused loan commitments. The LR
proxy additionally accounts for a bank’s risk exposure to the interbank lending market and
derivative markets. The result of these factors is standardized by total assets. All included
items are displayed in Table 3. The final value of the LR variable can be either positive or
negative. A negative value indicates that a bank has more short-term assets than obligations;
the bank can therefore cover possible short-term withdrawals on the liabilities side through
liquid assets. The lower the ratio the lower the liquidity risk. By contrast, a positive value
indicates that a bank would have to tap sources other than only short-term assets to cover the
withdrawals of (all) short-term liabilities. This implies a very high liquidity risk in cases such
as a bank run. Thus, we use LR to account for classic “bank run” risk, i.e. the risk of not being
able to meet all short-term payment obligations. By observing LR we incorporate the
immediate funding risks a bank might face in case of sudden liquidity withdrawals or asset
deterioration.
We calculate our credit risk (CR) variable by dividing the average net loan losses (loan
charge-offs minus loan recoveries) in the current year by the average loan loss allowance
recorded in the previous year. Note that we do not use quarterly data for its derivation as
banks in most cases adjust the incorporated variables over the year up to the annual balance
sheet date, a pattern also observable in our data. The measure describes a bank’s economic
ability to cover near-term future loan losses. Considering the numerator, it is the same as in
Angbazo (1997) and closely related to Dick (2006) who uses loan write-offs for the
calculation. Normalization with the loan loss allowance in the previous year should result in a
proxy better suited for our analysis. Our measure does not only represent short-term credit
risk, because it can be changed and/or influenced by bank management on a short-term basis,
but also proxies for unexpected loan losses: if the ratio is above 1 the bank can be assumed to
have unanticipated loan losses. Thus, a higher ratio implies higher credit risk. We choose this
variable as our main credit risk proxy because it allows us to capture a bank’s loan risk
management. We are able to observe the accuracy with which loan losses are anticipated and
if a bank faces immediate (asset-) risks due to heavy and unexpected loan losses.12
12 We acknowledge that U.S. bank supervising authorities might use these or similar ratios to measure banks’ liquidity risk and credit risk. It can thus be possible that banks in our dataset merely follow the supervisors’ orders and keep the ratios at the minimum levels required. A possible relationship might therefore not be caused by bank management but by regulators.

12
2.3 Descriptive Statistics
We analyze a dataset of 4,046 non-default U.S. commercial banks over the period from
1998:Q1 until 2010:Q3. We also include 254 default banks in our sample but over the period
2006:Q1 to 2010:Q3. In all analyses which exclude default banks we use the time period
1998:Q1 to 2008:Q4; when we include default banks we use data from 2006:Q1 until
2010:Q3. We have three reasons for this. We exclude the period after 2008:Q4 in our general
analyses because government interventions such as the Troubled Asset Relief Program
(TARP) were introduced at the end of 2008 and could influence results on the relationship
between liquidity risk and credit risk. We only include data after 2008:Q4 to be able to
incorporate a sufficient number of bank defaults in our data sample. Only a very few bank
defaults are observable prior to 2008. Therefore, we extend the observation period in our
analyses acknowledging that government interventions may induce some impact on variables.
The reason to start in 2006:Q1 when including default banks is that we only include the last 8
quarters prior to default of these banks in our analyses to observe mainly default-specific
patterns. The descriptive results are shown in Table 4.
[Table 4]
The table shows the results for non-default banks from 1998:Q1 until 2008:Q4 for the total
sample as well as subdivided into small, medium and large banks. This classification uses the
25th and the 75th percentile of total assets of this sample as the threshold in each year.13 Table
4 also shows the descriptive statistics for default banks from 2006:Q1 until 2010:Q3 and for
non-default banks over the same period for comparison. The results for non-default banks
from 1998:Q1 until 2008:Q4 show an average LR of about 7.3% and an average CR of about
11.1%. This implies ceteris paribus high liquidity risk but low credit risk. The LR values
increase by bank size meaning that bigger banks tend to have a more fragile balance sheet
structure in terms of liquidity risk. The CR values are comparable across all size subsamples.
Non-default banks in our dataset have an average asset size of $1.09 billion whereas the
As target ratios for risk measures are not disclosed by U.S. supervisors we are unable to control for this. However, we do not believe that this poses a problem for the analyses at hand. First, empirical studies show that U.S. banks tend to “do more” than asked for by the regulators, e.g. in terms of capital (as suggested by e.g. Flannery and Rangan, 2008, or Berger et al., 2008). A bank with a stricter risk management will thus also be safer even if the supervisor does not demand it. Second and most importantly, supervisors do not call for a joint management of liquidity risk and credit risk. If all banks strictly observed the minimum supervisory boundaries for liquidity risk and credit risk separately, we would be able to determine whether or not banks additionally managed both risk sources jointly. 13 We also apply other size subsamples in our analyses to check the robustness of our results. First, we exclude all banks which have total assets of less than 1bn. US-$, i.e. very small banks. Second, we split the sample based on the size of deposits using the same size clustering as in the main analysis, to account for size differences in retail-oriented banks which we mostly focus on. Third, we define the bottom 50 percentile of the banks in terms of asset size as “small” banks and run the analysis separately for this group. Regardless of the size definition the results remain unchanged.

13
distribution among banks is strongly skewed. We account for this pattern in the following
analyses and subdivide banks by asset size. Non-default banks in the period 1998:Q1 to
2008:Q4 have a return on assets of 0.724%, a high standard deviation of the return on assets
with 0.400%, a rather small portion of trading assets (0.04%), slightly fewer private than
commercial loans, and about 10% of their total loan portfolio is invested in agricultural and
over 60% in real estate loans. The return on assets, the proportion of trading assets to total
assets, and the ratio of real estate and also commercial loans to total loans increase by bank
size. By contrast, smaller banks grant a larger proportion of agricultural and private loans as a
percentage of their total loan portfolio and are also slightly less efficient. We also observe that
small- and medium-sized banks do not perform any notable off-balance sheet activities.
Comparing non-default banks in 1998:Q1 to 2008:Q4 to the period 2006:Q1 to 2010:Q3 we
observe that LR substantially decreased indicating less liquidity risk in the later period. This is
to a large extent driven by the substantial increase of trading assets which are included in our
LR measure. As trading assets are very liquid and can be disposed of quickly and at low cost,
the strong increase in securities holdings results in a lower LR. In contrast, our CR measure
indicates an increase of credit risk over time from 11.1% to 16.6%.
The comparison between default and non-default banks in the 2006:Q1 to 2010:Q3 period
shows striking differences. Both LR and CR are considerably higher for default banks,
indicating a higher overall liquidity risk and credit risk. This is to be expected and in line with
the discussed literature and our anecdotal findings in Table 1. The remaining variables are
also in line with general expectations. Default banks have a lower capital ratio, a negative
return on assets with a substantially higher standard deviation, are less efficient, and have a
negative loan growth. Furthermore, default banks are smaller and have smaller portions of
private, commercial and agricultural but a much larger portion of real estate loans compared
with non-default banks. Note that no default bank performs off balance sheet activities.
3 Results
3.1 The Relationship between Liquidity Risk and Credit Risk
In this subsection we investigate the direct relationship between liquidity risk and credit risk
in banks using proxy variables for these risks based on bank accounting data. First, we briefly
explain the methodology used in our analyses. This is followed by an analysis of the general

14
relationship between liquidity risk and credit risk. Finally, we examine the relationship
subdividing banks in terms of risk.
3.1.1 Methodology
We first observe the relationship between liquidity and credit risk using our proxy variables
LR and CR. This analysis addresses the problem that the direction of influence is not clear ex
ante. To account for possible reciprocal or lagged relationships between the variables, we
employ a structural equations approach where a system of equations is estimated via
generalized least squares:
, ∑ , ∑ , ,
, ∑ , ∑ , ,
The equations are estimated simultaneously controlling for the possible endogeneity of the
respective independent risk variable in a three stage least squares approach. This allows us to
account for both a contemporaneous and a possible time-lagged effect of the independent
variable to comprehensively observe its influence on the dependent variable. Furthermore, we
are able to address a possible autocorrelation of the dependent variable and also include
lagged values of the latter. The appropriateness of a maximum lag length of 4 quarters is
confirmed employing the Schwert (1989) and the Ng-Perron (2000) criteria. The test for a unit
root of the relevant dependent variable is rejected in a Dickey Fuller GLS test as proposed by
Elliott, Rothenberg, and Stock (1996). In addition, control variables accounting for the bank’s
general health, structure, and interest rate environment are included. These are the log of total
assets, the capital ratio, the return on assets, the standard deviation of the return on assets, the
efficiency ratio, bank loan growth, the ratio of short-term to long-term deposits, the ratio of
trading assets to total assets, the net derivatives exposure, other off-balance sheet items, real
estate to total loans, agricultural to total loans, commercial to total loans, individual to total
loans, the log of GDP in bn. USD, the savings ratio, the federal funds rate, the yield spread,
the quarterly average leverage in the banking industry as well as a time trend and annual time
fixed effects.14 Jointly, these variables have been well established by the body of literature on
bank risk and bank stability, such as e.g. Cole and Gunther (1995, 1998), Acharya and
Viswanathan (2011), Beltratti and Stulz (2012), Cole and White (2012), He and Xiong
14 Note that all control variables are included with their contemporaneous values. We also test the model using lagged values of the control variables. However, doing so only decreases their significance. Note that we also run all regressions excluding net derivatives and unused loan commitments as these are also included in the BB Measure. The results, however, remain unchanged.
(1)

15
(2012b), and Berger and Bouwman (2013) for the accounting-based variables, and Thomson
(1992) and Aubuchon and Wheelock (2010) for the regional macroeconomic variables. In
including the interest rate variables and yield curve spreads we follow Bernanke and Gertler
(1995) and Bernanke, Gertler and Gilchrist (1999). While the included time trend captures a
possible long-term adjustment of a variable due to, for example, a change in the banking
business environment or risk management practices, the time fixed effects account for
features distinct to specific years.
To calculate the total effect of the independent risk variable on the respective dependent risk
variable we sum up the coefficients of the former and divide this by the within-firm standard
deviation of the dependent variable. We are thereby able to investigate the average change in
the number of standard deviations of the dependent variable when the independent variable
changes by one percentage point. Note that it is important to employ the within-firm standard
deviation as values could vary substantially across banks while changing much less within
one bank.
In addition to our simultaneous equations approach we include another robustness check in
terms of methodology: we distinguish between possible contemporaneous and lagged
relationships. As the direction of influence is not clear we also include correlation analyses for
the contemporaneous relationship between liquidity risk and credit risk within a bank. With
regard to a possible lagged relationship we analyze both risks in a panel vector autoregressive
(panel VAR) model which also controls for a possible autocorrelation of variables using the
algorithm provided by Love and Zicchino (2006). Here, we incorporate the same control
variables as in our simultaneous equations approach accounting again for the bank’s general
health, structure, and interest rate environment. Note that for reasons of brevity we only
briefly discuss but do not present the panel VAR results in the following.
3.1.2 The General Relationship between Liquidity and Credit Risk
We first investigate our sample of non-default banks in the period 1998:Q1 to 2008:Q4. We
split this time period into the pre-financial crisis period 1998:Q1 to 2007:Q2 and the financial
crisis period 2007:Q3 to 2008:Q4. This allows us to account for a possible substantial and
nonlinear shock. We also subdivide banks by size.15 In this first part of our analysis we test
the first two hypotheses, as postulated in part I of the paper. We would like to understand the
15 As already mentioned before, we repeat all analyses using further different definitions of bank size. All results remain unchanged regardless of size clustering.

16
overall co-movement of the risk variables to obtain a general view on the relationship
between liquidity risk and credit risk. Furthermore, the results will reveal if the relationship
between liquidity risk and credit risk is indeed positive, and more pronounced in times of
crisis.
[Table 5]
The results are reported in Table 5. For the pre-financial crisis period, the results show some
statistically significant reciprocal relationships between LR and CR. However, even though
the estimation model produces statistically significant coefficients for most of the coefficients
of the variables, two things are of special interest here: first, we do not detect any kind of
striking or prevailing pattern in the direction or strength of the reciprocal influence the
variables have on each other. From a statistical point of view, there are no singular variables
or combinations thereof which might reveal any kind of clear-cut relationship between the
two variables, neither within a certain subsample nor across all banks. Second, we see that the
actual economic impact of the relationship is negligible. The largest overall change in the
number of standard deviations of the dependent variable induced by a one percentage point
change in the independent variable is 0.0471 in absolute value (found in the total pre-financial
crisis sample employing only the contemporaneous variable of LR). The values for the
subsamples and model specifications for which we find the statistically most meaningful
relationship between the variables, such as e.g. the model employing all four lags of the
independent variable (CR) in the small and large bank subsamples, are even smaller with
0.0016 and 0.0049 in absolute values. These values are too small to indicate an economically
meaningful relationship between LR and CR. Furthermore, even the sign of the effect
alternates. These results are supported when we observe the results for the financial crisis
period. Although some coefficients are statistically significant, the economic relevance is
negligible. Also, none of the coefficients in the model specifications testing the influence CR
(as an independent variable) has on LR (as the dependent variable) are statistically
meaningful. On the right hand side of Table 5 we also show the results for the correlation
analysis. The correlation coefficients indicate a negative relationship in the crisis period
which, however, is economically not meaningful. We also investigate a possible lagged
relationship between liquidity risk and credit risk in a panel VAR model. The results are
comparable in the way that no reliable relationship is indicated.
Overall, the results on the general relationship between liquidity risk and credit risk do not
indicate any considerable co-movement. This means that the first part of our empirical

17
analysis cannot confirm any of our postulated hypotheses. Although we already subdivide our
analyses by bank size and the financial crisis period, other (bank) characteristics/situations
might be more important for an identification of a joint liquidity risk and credit risk
management. It might be the case that banks with a high credit risk exposure reduce liquidity
risk or that a low level of credit risk incentivizes managers to assume higher liquidity risks.
We analyze these potential effects in the next subsection in which we additionally subdivide
banks by different types of risk.
3.1.3 The Relationship between Liquidity Risk and Credit Risk by Degree of Bank Risk
In this section we divide the sample according to a bank’s riskiness relative to all banks in our
sample. This means that we investigate the results for high risk and low risk banks separately.
Since we did not find our first and second hypothesis to be confirmed by the results of the
first part of the analysis, we now dig deeper to possibly obtain a different angle of the
relationship between liquidity and credit risk. Why might banks of different riskiness behave
differently in terms of risk? A bank with a high loan charge-off rate has a higher credit risk
than another bank with few charge-offs. Risk officers might be aware of the higher credit risk
and thus keep liquidity risk low, i.e. liquid assets high, so that the total level of bank default
risk does not increase too much. In contrast, risk officers in banks with low credit risk do not
necessarily have to manage both factors jointly because overall risk is limited. A higher level
of liquidity risk might even be desired by bank management to generate higher profits as the
risk of bankruptcy would still be within reason. In contrast to our hypotheses, the arguments
for these banks would actually imply a negative and significant relationship between liquidity
risk and credit risk for high (liquidity or credit) risk banks. The relationship between both
risks in low (liquidity or credit) risk banks should be either significantly positive or
insignificant.
We again subdivide banks by their size and additionally group banks in subsamples by their
(liquidity or credit) risk using the 25th and the 75th percentile in the respective risk category.
We furthermore divide the analysis of these subsamples by economically different risk
periods. Here, we use the pre-financial crisis period 1998:Q1 to 2007:Q2 and the financial
crisis period 2007:Q3 to 2008:Q4. In addition, we incorporate our sample of default banks in
the period 2006:Q1 to 2010:Q3 and again use data in the last 8 quarters prior to their default.
Although this is not a calendar time period it illustrates a time period when bank risk is at its
highest level. To investigate the relationship between liquidity risk and credit risk we use our
structural estimation approach incorporating only the contemporaneous independent risk

18
variable, for brevity, together with the same control variables as in the previous section. In
addition to the coefficient of the contemporaneous other risk variable, we again report the
change in the number of standard deviations of the dependent variable when the independent
risk variable changes by 1 percentage point. We also show the respective value for LR and
CR for each subsample in parentheses. Table 6 presents the results.
[Table 6]
Panel A in Table 6 shows the results for our bank subsamples in the pre-financial crisis period
1998:Q1 to 2007:Q2. The comparison of the values for our measures of CR and LR shows
that banks with higher credit risk have marginally higher liquidity risk (6.65 percent versus
10.42 percent LR across all banks). In contrast, different levels of liquidity risk do not seem to
induce substantial differences in credit risk (10.62 percent versus of 10.71 percent CR across
all banks). These descriptive results are supported in our simultaneous equations regression
models. Some coefficients reveal statistical significances but their economic relevance is
negligible, just as our results in Table 5. The results are similar in our correlation and panel
VAR analyses not shown here for brevity. Note that in line with the descriptive results in
Table 4 larger banks tend to have higher liquidity risk, regardless of the risk category they
belong to.
Panel B in Table 6 shows the results for banks subdivided by their relative riskiness in the
financial crisis period 2007:Q3 to 2008:Q4. Comparing Panels A and B, we observe that
credit risk is at the same level for low credit risk banks (-3.21 percent versus -2.77 percent)
while being substantially higher for high credit risk banks (34.80 percent versus 45.60
percent). We do not find any considerable differences in liquidity risk between both time
periods and liquidity risk categories. In some instances liquidity risk even decreased in the
financial crisis period. However, the coefficients of LR and CR in our simultaneous equations
models in Panel B reveal even fewer statistical significances compared to the pre-financial
crisis period. Again, the values are economically negligible. It is important to bear in mind
that we exclude default banks in Panel A and B. These are compared to our total non-default
bank sample in Panel C.
Panel C in Table 6 shows the results for non-default and for default banks in the time period
2006:Q1 to 2010:Q3. A comparison of the values for LR and CR reveals substantial
differences in each bank size subsample. In all cases, credit risk is much larger for default
banks, and liquidity risk is slightly larger for small and medium sized banks. The coefficients

19
of LR and CR in our simultaneous equations model show some statistical significances for
non-default banks and almost no statistically significant relationship for our sample of default
banks. The only exception is large default banks for which we find statistically significant
coefficients which suggest a negative influence of CR on LR. However, the economic impact
is only marginal, which is why we do not interpret this result as an indication for any kind of
meaningful relationship between the variables. Again, all results are supported in the
correlation and panel VAR analyses not shown.
Overall, the results in this subsection indicate that regardless of the granularity of risk
category, time period and bank size, liquidity risk and credit risk have no economically
meaningful relation. This means that neither our original hypotheses H1 and H2, nor our
alternative explanation for the relationship of liquidity and credit risk in banks with different
degrees of riskiness can be explained by our empirical findings. How can this result be
interpreted? In our view, there are two possible explanations for this phenomenon. First, bank
(risk) managers are aware of the problems a high correlation of the two risks can cause, which
is why they do everything to offset the risks and to keep the correlation low. Or second, bank
(risk) managers do not manage both types of risks jointly but independently of each other,
leading to the lack of co-movement of the variables we witness in our results. We believe the
latter explanation is more likely to apply. The theoretical and anecdotal evidence presented in
the beginning suggests that bank managers seem to have so far neglected the joint risk
management of liquidity risk and credit risk. Also, especially in high-risk banks, an active
management of both risks should reveal a negative co-movement of both. However, our
results do not support this view. Instead, we find no reliable relationship of the proxies for
each type of risk and believe that this is a strong indication for no joint risk management of
liquidity risk and credit risk in banks. In the following subsection we present robustness tests
of our findings which show that the results hold across different specifications of our
analyses.
3.1.4 The Relationship between Liquidity Risk and Credit Risk - Further Robustness
Tests
In addition to our analyses by bank size, time period, and different levels of bank risk we
investigate the result of no meaningful relationship between liquidity risk and credit risk in
further robustness tests not displayed for reasons of brevity.

20
First, we replace our original main variables CR and LR with two proxy variables for liquidity
risk and overall bank stability: the so called “BB measure” and the classic Z-Score, explained
in Table 3. The BB measure was developed by Berger and Bouwan (2009) to represent the
absolute amount of liquidity a bank creates for the economy on both its balance sheet and
through off-balance sheet business. The created liquidity is expressed by an absolute (US
Dollar) number. It is calculated by weighting balance sheet and off-balance sheet items of
banks in accordance with their contribution to a bank’s liquidity creation. An item is
multiplied by a positive factor if it creates liquidity for the economy and multiplied by a
negative factor if it extracts liquidity from the economy. All weighted items are added up to
yield the total amount of created liquidity. A detailed explanation is provided by Berger and
Bouwman (2009). We use these calculated liquidity values (called “CatFat” in Berger and
Bouwman, 2009) normalized by a bank’s total assets as our secondary liquidity measure. The
notion behind this ratio is built on the seminal research of Bryant (1980) and Diamond and
Dybvig (1983), modeling banks as pools of liquidity which provide long-term availability of
cash to borrowers and short-term availability of cash to depositors. To do so, banks must
transform the maturities of deposits when turning them into loans. The more maturity is
transformed, the more liquidity is created for the economy. Hence, a higher amount of
maturity transformation is associated with a higher liquidity risk for the bank since a strongly
maturity-transforming bank will not be able to fully meet an unexpected liquidity demand.
Consequently, a higher value of the BB measure indicates higher liquidity risk. The BB
measure can therefore serve as an indirect measure of liquidity risk.
The Z-score is used as a measure of overall bank risk. Following the literature, we calculate
the Z-Score as the ratio of the sum of the return on assets (RoA) and the capital ratio, divided
by the standard deviation of the return on assets. For the derivation of the standard deviation
of the RoA we use the previous eight quarters of a bank’s RoA. The capital ratio is calculated
as the ratio of total equity to total assets. The Z-score measures the number of standard
deviations a bank’s return on assets has to decrease from its expected value before the bank is
insolvent because equity is depleted (Roy, 1952). Accordingly, a high Z-score indicates low
bank risk. As the regular score is highly skewed we apply the natural logarithm to the Z-score
following Laeven and Levine (2009) and Houston et al. (2010). For purposes of brevity we
will refer to this measure as the Z-score for the remainder of this paper. Furthermore, in some
analyses which incorporate defaulted banks we use an adjusted Z-score, adding a constant of
10 to the ratio before logarithmizing it. The reason is that otherwise negative values for banks
21
prior to default could not be analyzed, reducing the information set only due to
technicalities.16
We use these two measures in a robustness test for our results generated through the
simultaneous equations regression. We re-run the original estimation procedure as discussed
in part 3.1.1 and presented in Table 5, only replacing the main risk proxy variables CR and
LR with the BB measure and the Z-Score. The results are not reported for reasons of brevity.
We see our original results as presented in Table 5 supported. We detect no clear patterns of
reciprocal relationships between variables which are statistically or economically meaningful.
Our original results are therefore supported.
In an additional robustness check we account for the geographical differences in the U.S.
banking landscape by making use of the regional zoning of the Federal Deposits Insurance
Corporation (FDIC). We divide our sample by the FDIC region the bank is located in to
additionally control for bank location. For all regions, we construct subsamples by bank asset
size and (financial crisis) time period. We find the results of our previous analyses confirmed:
although some coefficients for LR and CR are statistically significant in the simultaneous
equations models, they are too small for an economically meaningful relationship between
liquidity risk and credit risk.
We furthermore control for two important factors which could influence bank risk
management: interest rate volatility and a varying level of bank profits. In times of heightened
interest rate volatility, banks might suffer from market-induced interest rate shocks distorting
their “regular” risk management of liquidity risk and credit risk. Although we already include
both the main refinancing rate and the spread between short-term and long-term interest rates
in our simultaneous equations (and panel VAR) regression models, we now additionally
exclude volatile interest rate environments from our observation period. We use the period
from 2003:Q3 to 2004:Q2 for low and stable interest rates and the period 2006:Q3 to 2007:Q2
for a period of high and stable interest rates.17 Furthermore, we account for varying levels of
bank profits. The reason is that banks with different levels of available funds over time might
manage risks differently. We therefore examine only banks with stable earnings as we expect
these to have a more consistent risk management. For this, we exclude all banks with a
standard deviation of the return on assets above the 25th percentile range of each bank size
16 We also repeat all analyses which include the adjusted Z-score with the unadjusted, regular, Z-score. All findings remain robust. 17 The federal funds rate was at 1% from 2003:Q3 to 2004:Q2. In 2006:Q3 and 2006:Q4 it was at 5.2%, and at 5.3% in 2007:Q1 and 2007:Q2.

22
group and the total sample in each of our stable interest rate periods. In addition to the return
on assets we repeat the analysis employing banks’ net income in the same notion. Due to the
rather short time period of one year with non-volatile interest rates we analyze the relationship
between liquidity risk and credit risk only via correlations. In sum, the analysis employs only
time periods in which interest rates have been at different but steady levels and incorporates
banks with stable earnings. All tests support our results of no economically meaningful
relationship between LR and CR with no correlation coefficient being larger than 16% in
absolute value.
Overall, regardless of bank size, (economic) time period, bank risk category, bank location,
possible interest rate and earning/income shocks, and different proxy variables, we do not find
a reliable relationship between liquidity risk and credit risk. These results suggest that there
seems to be no joint management of both risks within banks.
3.2.1 The Impact of Liquidity Risk and Credit Risk on Bank Defaults
To examine the importance of liquidity and credit risk for banks we ask whether and, if so,
how both risks predict default rates. Moreover, do both risks jointly have an impact on banks’
default probability? As stated above, we could not detect any kind of co-movement between
the proxy variables for liquidity risk and credit risk in banks in our analyses. This lack of an
economically meaningful relationship between the two risk types might be an indication of a
lack of joint management of these risks in banks. If this were true, we should find that a joint
(unmanaged) increase in liquidity risk and credit risk contributes strongly to banks’ default
probability, as stated in our hypothesis H3. Next to the results of the joint co-movement of
both variables presented above, we believe there are two main theoretical reasons supporting
this assumption. First, the body of literature on liquidity risk as well as the body of literature
on credit risk as presented in part I of the paper have both established that each risk category
separately has strong implications for banks’ PD. Second, the currently evolving body of
literature analyzing the relationship between liquidity risks and credit risks in financial
institutions, also presented in part I, strongly suggests that the reciprocal relationship between
the two risk categories also has strong implications for overall bank stability. An additional
supportive factor might be the anecdotal evidence presented in Table 1. It suggests that the
joint occurrence of liquidity problems and too high credit risks was among the main default
reasons for banks during the recent financial crisis. From a hypothetical perspective, we
therefore have strong reasons to test whether or not liquidity and credit risks separately but
also jointly have a strong influence on banks’ PD.

23
To test this in an empirical setting, and to obtain a deeper understanding of the inner workings
of liquidity risk and credit risk in banks, we run a multivariate logistic regression model using
a sample of default and non-default banks in the period 2006:Q1 to 2010:Q3. Each regression
uses an indicator variable which is 1 in the quarter prior to default as dependent variable. In
the regressions we control for bank characteristics and include the log of total assets, the
capital ratio, the return on assets, the standard deviation of the return on assets, the efficiency
ratio, bank loan growth, the ratio of trading assets to total assets, the ratio of short-term to
long-term deposits, real estate to total loans, agricultural to total loans, commercial to total
loans and individual to total loans. We furthermore control for macroeconomic influences
using the log of GDP and the savings ratio, and for monetary policy incorporating the interest
rate and the yield curve spread.18 To control for the overall risk in the banking sector we
include the total average leverage in the banking industry. The compilation of these control
variables is based on prior literature analyzing determinants of bank default- and stability risk.
The accounting-based control variables are based on e.g. Cole and Gunther (1995, 1998),
Cole and White (2012), Beltratti and Stulz (2012), He and Xiong (2012b), and Berger and
Bouwman (2013). The macroeconomic variables are based on Aubuchon and Wheelock
(2010) and Thomson (1992), the bank industry-wide risk predictor stems from Acharya and
Viswanathan (2011), including the interest rates and yield curve spreads is based on Bernanke
and Gertler (1995) and Bernanke, Gertler and Gilchrist (1999). Jointly, these variables control
for bank default determinants other than credit and liquidity risk. Table 7 shows the results.
[Table 7]
In interpreting the results, recall that increasing values of both LR and CR indicate higher
liquidity risk and credit risk, respectively. According to Table 7, higher liquidity risk as well
as higher credit risk increases a bank’s PD. This finding is to be expected and in line with the
findings of prior literature. However, next to the separate effects the two risk categories have
on bank PD, we are especially interested in the joint impact of both LR and CR on bank PD.
Table 7 shows that the interaction term between LR and CR is highly significant and negative
at the 1% level. This finding would suggest that there is a joint and negative influence of the
interaction between liquidity risk and credit risk on bank stability. However, one pivotal thing
must be taken into consideration in the interpretation of the coefficient: the body of literature
on the interpretation of interaction terms’ coefficients in logit (i.e. non-linear) regression
18 We use the GDP and savings ratio of the state in which the bank is located in, weighted by the bank’s deposits in each state if it operates in multiple states. As a robustness check, we also use country-level GDP and savings ratios. The results remain unchanged.

24
estimations tells us that the statistical significance of the coefficient as well as its sign cannot
be interpreted in the same way as a coefficient of a linear regression. Instead, the direction of
influence as well as the significance of the interaction term might vary across differing
observations, which is why the coefficient of the interaction term cannot necessarily be
interpreted as statistically significant and negative. We therefore follow Norton, Wang and Ai
(2004) in calculating the cross derivative of the expected value of the dependent variable to
compute the direction and magnitude of the interaction effect. Also, to correctly estimate the
statistical significance of the interaction term, our significance test is based on the estimated
cross-partial derivative instead of the coefficient of the interaction term itself. To better
understand the magnitude and direction of the interaction term’s influence on bank PD, we
present the results of the bank-level estimations as a graph in Figure 1.
[Figure 1]
The upper graph of Figure 1 plots the corrected interaction effect expressed as a change in
percentage points across different levels of predicted bank PDs. The lower graph plots the z-
statistics of the interaction effects across the predicted bank PDs. The graphs reveal two
interesting findings about the influence a joint occurrence of liquidity risks and credit risks
has on banks’ PDs. First, the interaction effect of both risk categories has a statistically
significant influence on bank PD only for certain levels of bank PD. Second, the direction of
influence the interaction effect has on bank PD changes across different levels of bank PD.
The graphs reveal that the joint occurrence of both risk categories has statistically significant
PD-aggravating effects for all banks with an overall PD between about 10 to 30 percent. If the
PD increases beyond this level, the effect is reverting but statistically insignificant. If the PD
levels reach 70 to 90 percent, the effect becomes statistically significant again, but has now a
PD-mitigating influence. How can these results be interpreted? First, it is interesting to note
that banks with varying overall levels of stability risk show different reactions to the
occurrence of liquidity and credit risk. Apparently, banks’ proneness to fail is influenced by
different factors across varying risk levels.
Looking at the first group of banks with PDs between 10 to 30 percent, we believe the PD-
increasing effects are straightforward: it shows that next to the separate risk categories, which
also show up positive in the regression specifications including the interaction term, the
interaction between the two categories additionally amplifies banks’ default risk. The separate
and joint effects of the risks can therefore almost be seen as additive. The second effect for
the group of banks with high PDs between 70 and 90 percent might not be as straightforward.
25
Why would the joint occurrence of liquidity risks and credit risks actually have a mitigating
effect on the PD when the PD is high? We believe that these results might capture a
“gambling for resurrection”-behavior of banks. The existing body of literature on bank
distress has long established that banks facing immediate distress behave differently than
banks in regular economic conditions, especially in terms of risk-taking. Based on Merton
(1977), it can be shown that banks supported by explicit (deposit insurance) or implicit (e.g.
too-big-too-fail) state guarantees considerably increase their risk-taking when facing distress.
The basic idea is straightforward. A bank facing the danger of going out of business has two
options: first, to continue running the failed business model until the point of default is
reached or second, to engage in high-risk business which carries great reward but also great
risks. The risks are negligible because without the high-risk business activity the bank would
very likely face elimination anyway. The only thing saving the bank from failure is an
improbable but potentially very high payoff from the risky business. In simple terms: There is
(almost) only upside for shareholders and management of banks close to default when
engaging in very risky strategies. This behavior is well-documented in the prior literature,
such as Keeley (1990), Corbett and Mitchell (2000), Gropp and Vesala (2001), and Freixas,
Parigi and Rochet (2003). Our results suggest that banks increase their liquidity risks and
credit risks jointly in a last effort to avoid default. In some instances, this gamble is successful
and therefore reduces the risk of failure. This reasoning is supported by the graphs in Figure
1: a successful gambling for resurrection through a joint increase in liquidity risks and credit
risks which mitigates a financially distressed bank’s PD. We believe that it is actually rather
unsurprising that we find this effect for our sample banks during the recent financial crisis. A
large body of literature shows that many failing thrifts engaged in gambling for resurrection
behavior during the savings & loan crisis in the US (Barth, Brumbaugh Jr. and Litan, 1991;
NCFIRRE Report, 1993; Akerlof and Romer, 1993; Pontell, 2005). Pairing these empirical
findings with the theoretic explanations for the reasoning behind gambling for resurrection
should lead us to believe that distressed banks might also have engaged in this behavior
during the recent financial crisis.
Taken together, our results therefore have one major implication: liquidity risks and credit
risks have a strong influence on banks’ default risk. Separately, both risk categories are able
to strongly increase a bank’s PD. Jointly, the effect varies for banks with different levels of
PD. Whereas banks with modest PDs face an additional increase in default risk through the
interaction of liquidity and credit risks, banks with high PD levels are able to benefit from this
interaction effect in terms of default risk. Hence, to fully understand and evaluate what drives

26
banks’ PDs it is not sufficient to analyze liquidity risk and credit risk separately. The
interaction between the two risk categories also has to be taken into strong consideration.
These results are therefore able to confirm our hypothesis H3 stating that liquidity and credit
risk have an impact of bank default risk.
3.2.2 The Impact of Liquidity Risk and Credit Risk on Bank Defaults – Further Robustness Test
To verify our results of section 3.2.1 we use a robustness test, as presented in the Appendix of
this paper. Again, we use the two additional risk measures, the BB measure and the (adjusted)
Z-score, already introduced in section 3.1.4 of the paper as a robustness test for the
simultaneous equations analysis. To test the robustness and validity of our results in section
3.2.1, we re-run the same logit regression model using the corrected calculation of the
interaction terms following Norton, Wang and Ai (2004). We replace the LT and CR
variables with the BB measure and the Z-score. We acknowledge that the Z-score measures
the distance to default and is used here as an explanatory variable for the probability of
default, implying that both are conceptually close.19 In line with general expectations, we find
a negative and statistically highly significant coefficient of the Z-Score in all models. This
means that a bank has a higher PD the closer it is to the default barrier. For the BB measure
we find significant and positive coefficients. Accordingly, banks with higher liquidity creation
also have a higher default probability. This result is intuitively correct, supports our findings
from prior analyses and validates our estimation procedure. Following the notions of Berger
and Bouwman (2009) based on Bryant (1980) and Diamond and Dybvig (1983), a bank
creates liquidity by providing depositors with short-term availability of money and borrowers
with long-term availability of money. By transforming the short-term maturities of deposits
(or, in general, liabilities) into longer-term maturities of assets, banks accept liquidity risks to
generate liquidity for the economy. Hence, a bank which creates more liquidity also has a
higher illiquidity risk which, following our results, contributes to its default risk. The results
of Table A1 support this. The results of the singular variables therefore support the results of
our main analysis. For the interaction term, we again plot the cross-sectional effects and z-
statistics in Figure A1 of the Appendix. It can be seen that the results are as expected: the two
graphs show a mirror image of the graphs using our main risk variables LR and CR due to the
inverted relationship of the (adjusted) Z-score and risk. The results of the robustness test
therefore support our main findings and underpin their main interpretations. 19 As the Z-score is calculated using the return on assets, its standard deviation, and the capital ratio, we exclude these variables in regressions including the Z-score.

27
4 Conclusion
Liquidity risk and credit risk are the two most important factors for bank survival. This study
investigates the relationship between these factors in virtually all commercial banks in the
U.S. over the period 1998:Q1 to 2010:Q3. We show that each risk category has a significant
impact on bank default probability. We also document that the interaction of both risk
categories significantly determines banks’ probability of default, albeit in different fashions.
Whereas the interaction between liquidity risk and credit risk aggravates the PD of banks with
PDs between 10-30 percent, it mitigates the PD-risk of high-risk banks with PDs of 70-90
percent. This calls for a joint management of liquidity risk and credit risk in banks. Using
various combinations of subsets of our sample, proxy variables for liquidity risk and credit
risk, possible macroeconomic and microeconomic shocks, and econometric techniques, we do
not find a reliable relationship between liquidity risk and credit risk in banks.
Our results have several interesting implications. The existing bodies of literature considering
the impact of either liquidity risk or credit risk on bank stability are both very large; however,
surprisingly few studies consider the relationship between both risks. To our knowledge, we
are the first to empirically shed some light on the relationship between liquidity risk and credit
risk in banks from various perspectives and angles. Our results provide several
recommendations for bank (risk) management and bank supervisors. The years 2007/2008
have shown that distrust between banks, to most extents driven by large credit risks in their
portfolios, can cause a freeze of the market for liquidity. Regulators and central banks had to
intervene to prevent the financial system from collapse. However, our results suggest that a
joint management of liquidity risk and credit risk in a bank could reduce uncertainties and
substantially increase bank stability. Our results therefore support and underpin recent
regulatory efforts like the Basel III framework and the Dodd-Frank Act which put stronger
emphasis on the importance of liquidity risk management in conjunction with the asset quality
and credit risk of a bank.

28
References
Acharya, Viral V. and Nada Mora, 2013, A Crisis of Banks as Liquidity Providers, Working Paper. Acharya, Viral V. and Hassan Naqvi, 2012, The Seeds of a Crisis: A Theory of Bank-Liquidity and
Risk-Taking over the Business Cycle, Journal of Financial Economics 106(2), 349-366. Acharya, Viral V. and S. Vish Viswanathan, 2011, Leverage, Moral Hazard, and Liquidity, Journal of
Finance 66(1), 99-138. Acharya, Viral V., Hyun Song Shin and Tanju Yorulmazer, 2010, Crisis Resolution and Bank
Liquidity, Review of Financial Studies 24(6), 2166-2205. Akerlof, George A. and Paul M. Romer, 1993, Looting: The Economic Underworld of Bankruptcy for
Profit, Brookings Papers on Economic Activity 2(1993), 1-73. Altman, Edward I. and Anthony Saunders, 1998, Credit Risk Measurement: Development over the
Last 20 Years, Journal of Banking & Finance 21(11), 1721-1742. Angbazo, Lazarus, 1997, Commercial bank net interest margins, default risk, interest-rate risk, and
off-balance sheet banking, Journal of Banking & Finance 21(1), 55-87. Aubuchon, Craig P. and David C. Wheelock, 2010, The geographic distribution and characteristics of
US bank failures, 2007-2010: Do bank failures still reflect local economic conditions?, Federal Reserve Bank of St. Louis Review 92(05), 395-415.
Barth, James R., R. Dan Brumbaugh Jr. and Robert E. Litan, 1991, Bank Failures are Sinking the FDIC, Challenge 34(2), 4-15.
Beltratti, Andrea and René M. Stulz, 2012, The credit crisis around the globe: why did some banks perform better? Journal of Financial Economics 105(1), 1-17.
Berger, Allen N. and Christa H. S. Bouwman, 2009, Bank Liquidity Creation, Review of Financial Studies 22(9), 3779-3837.
Berger, Allen N. and Christa H. S. Bouwman, 2013, How does capital affect bank performance during financial crises?, Journal of Financial Economics (forthcoming).
Berger, Allen N., Robert DeYoung, Mark J. Flannery, David Lee and Özde Öztekin, 2008, How Do Large Banking Organizations Manage Their Capital Ratios, Journal of Financial Services Research 34(2), 123-149.
Berger, Allen N. and Gregory F. Udell, 2004. The institutional memory hypothesis and the procyclicality of bank lending behavior, Journal of Financial Intermediation 13(4), 458-495.
Bernanke, Ben and Mark Gertler, 1995, Inside the Black Box: the credit channel of monetary policy transmission, The Journal of Economic Perspectives 9(4), 27-48.
Bernanke, Ben, Mark Gertler and Simon Gilchrist, 1999, The Financial Accelerator in a Quantitative Business Cycle Framework, J.B. Taylor and M. Woodford (Eds.), Handbook of Macroeconomics, Amsterdam: North-Holland.
Boot, Arnoud W. A., 2000, Relationship Banking: What Do We Know?, Journal of Financial Intermediation 9(1), 7-25.
Brunnermeier, Markus K. and Martin Oehmke, 2013, The Maturity Rat Race, Journal of Finance 68(2), 483-521.
Bryant, John, 1980, A Model of Reserves, Bank Runs and Deposit Insurance, Journal of Banking & Finance 4(4), 335-344.
Cai, Jian and Anjan V. Thakor, 2008, Liquidity Risk, Credit Risk, and Interbank Competition, Working Paper.
Calomiris, Charles and Charles Kahn, 1991, The Role of Demandable Debt in Structuring Optimal Bank Arrangements, American Economic Review 81(3), 497-513.
Carletti, Elena, Philipp Hartmann and Giancarlo Spagnolo, 2007, Bank Mergers, Competition and Liquidity, The Journal of Money, Credit and Banking 39(5), 1067-1107.
Cole, Rebel A. and George W. Fenn, 1995, The role of commercial real estate investments in the banking crisis of 1985-92, Working Paper.
Cole, Rebel A. and Jeffery W. Gunther, 1995, Separating the timing and likelihood of bank failure, Journal of Banking & Finance 19(6), 1073-1089.
Cole, Rebel A. and Jeffery W. Gunther, 1998, Predicting bank failures: A comparison of on- and off-site monitoring systems, Journal of Financial Services Research 13(2), 103-117.

29
Cole, Rebel A. and Lawrence J. White, 2012, Déjà Vu all over again: The causes of US commercial bank failures this time around, Journal of Financial Services Research 42(1), 5-29.
Corbett, Jenny and Janet Mitchell, 2000, Banking Crises and Bank Rescues: The Effect of Reputation, The Journal of Money, Credit and Banking 32(3), 474-512.
Dermine, Jean, 1986, Deposit Rates, Credit Rates, and Bank Capital: The Klein-Monti Model Revisited, Journal of Banking & Finance 10(1), 99-114.
DeYoung, Robert and Gokhan Torna, 2013, Nontraditional Banking Activities and Bank Failures During the Financial Crisis, Journal of Financial Intermediation (forthcoming).
Diamond, Douglas W., 1997, Liquidity, Banks and Markets, The Journal of Political Economy 105(5), 928-956.
Diamond, Douglas W. and Philip H. Dybvig, 1983, Bank Runs, Deposit Insurance, and Liquidity, The Journal of Political Economy 91(3), 401-419.
Diamond, Douglas W. and Raghuram G. Rajan, 2001, Liquidity risk, liquidity creation, and financial fragility: a theory of banking, The Journal of Political Economy 109(2), 287-327.
Diamond, Douglas W. and Raghuram G. Rajan, 2005, Liquidity Shortages and Banking Crises, Journal of Finance 60(2), 615-647.
Dick, Astrid A., 2006, Nationwide Branching and its Impact on Market Structure, Quality and Bank Performance, Journal of Business 79(2), 567-592.
Elliott, Graham, Thomas J. Rothenberg and James H. Stock, 1996, Efficient Tests for an Autoregressive Unit Root, Econometrica 64(4), 813–836.
Espahbodi, Pouran, 1991, Identification of problem banks and binary choice models, Journal of Banking & Finance 15(1), 53-71.
Flannery, Mark J. and Kasturi P. Rangan, 2008, What Caused the Bank Capital Build-Up of the 1990s?, Review of Finance 12(2), 391-429.
Foos, Daniel, Lars Norden and Martin Weber, 2010, Loan growth and riskiness of banks, Journal of Banking & Finance 34(12), 2929-2940.
Freixas, Xavier, Antoine Martin and David Skeie, 2011, Bank Liquidity, Interbank Markets and Monetary Policy, Review of Financial Studies 24(8), 2656-2692.
Freixas, Xavier, Bruno M. Parigi and Jean-Charles Rochet, 2003, The Lender of Last Resort: A 21st Century Approach, European Central Bank Working Paper Series No. 298.
Gatev, Evan and Philip E. Strahan, 2006, Banks’ Advantage in Hedging Liquidity Risk: Theory and Evidence from the Commercial Paper Market, Journal of Finance 61(2), 867-892.
Gatev, Evan, Til Schuermann and Philip E. Strahan, 2009, Managing Bank Liquidity Risk: How Deposit-Loan Synergies Vary with Market Conditions, Review of Financial Studies 22(3), 995-1020.
Goldstein, Itay and Ady Pauzner, 2005, Demand Deposits Contracts and the Probability of Bank Runs, Journal of Finance 60(3), 1293-1327.
Gorton, Gary and Andrew Metrick, 2011, Securitized Banking and the Run on Repo, Journal of Financial Economics 104(3), 425-451.
Gropp, Reint and Jukka Vesala, 2001, Deposit Insurance and Moral Hazard: Does the Counterfactual Matter? European Central Bank Working Paper.
He, Zhiguo and Wei Xiong, 2012a, Dynamic Debt Runs, Review of Financial Studies 25(6), 1799-1843.
He, Zhiguo and Wei Xiong, 2012b, Rollover Risk and Credit Risk, Journal of Finance 67(2), 391-429. Holmström, Bengt and Jean Tirole, 1998, Private and Public Supply of Liquidity, Journal of Political
Economy 106(1), 1-40. Houston, Joel F., Chen Lin, Ping Lin and Yue Ma, 2010, Creditor rights, information sharing, and
bank risk taking, Journal of Financial Economics 96(3), 485-512. Illueca, Manuel, Lars Norden and Gregory F. Udell, 2008, Liberalization, Corporate Governance, and
Savings Banks, Indiana University Working Paper. Iyer, Rajkamal and Manju Puri, 2012, Understanding Bank Runs: The Importance of Depositor-Bank
Relationships and Networks, American Economic Review 102(4), 1414-1445. Kashyap, Anil K., Raghuram Rajan and Jeremy C. Stein, 2002, Banks as liquidity providers: an
explanation for the coexisting of lending and deposit-taking, Journal of Finance 57(1), 33-73. Keeley, Michael C., 1990, Deposit insurance, risk and market power in banking, American Economic
Review 80(5), 1183-1200.

30
Kolari, James, Dennis Glennon, Hwan Shin, and Michele Caputo, 2002, Predicting large US commercial bank failures, Journal of Economics and Business 54(4), 361-387.
Laeven, Luc and Ross Levine, 2009, Bank governance, regulation and risk taking, Journal of Financial Economics 93(2), 259-275.
Love, Inessa and Lea Zicchino, 2006, Financial Development and Dynamic Investment Behavior: evidence from Panel VAR, The Quarterly Review of Economics and Finance 46(2), 190-210.
Martin, Daniel, 1977, Early warning of bank failure: A logit regression approach, Journal of Banking & Finance 1(3), 249-276.
Merton, Robert C., 1977, An analytic derivation of the cost of deposit insurance and loan guarantees: An application of modern option pricing theory, Journal of Banking & Finance 1(1), 3-11.
Meyer, Paul A. and Howard W. Pfifer, 1970, Prediction of bank failures, Journal of Finance 25(4), 853-868.
National Commission on Financial Institution Reform, Recovery and Enforcement (NCFIRRE), 1993, Origins and Causes of the S&L Debacle: A Blueprint for Reform, Washington, D.C.
Ng, Serena and Pierre Peron, 2000, Lag Length Selection and the Construction of Unit Root Tests with Good Size and Power, Econometrica 69(6), 1519-1554.
Ng, Jeffrey and Sugata Roychowdhury, 2011, Do loan loss reserves behave like capital? Evidence from recent bank failures, Working Paper.
Norton, Edward C., Hua Wang and Chunrong Ai, 2004, Computing interaction effects and standard errors in logit and probit models, The Stata Journal 4(2), 154-167.
Nyborg, Kjell G. and Per Österberg, 2010, Money and Liquidity in Financial Markets, Swiss Finance Institute Research Paper No. 10-25.
Pontell, Henry N., 2005, Control fraud, gambling for resurrection, and moral hazard: Accounting for white-collar crime in the savings and loan crisis, The Journal of Socio-Economics 34(6), 756-770.
Prisman, Eliezer Z., Myron B. Slovin and Marie E. Sushka, 1986, A General Model of the Banking Firm under Conditions of Monopoly, Uncertainty, and Recourse, Journal of Monetary Economics 17(2), 293-304.
Qi, Jianping, 1994, Bank Liquidity and Stability in an Overlapping Generations Model, Review of Financial Studies 7(2), 389-417.
Rajan, Raghuram and Andrew Winton, 1995, Covenants and Collateral as Incentives to Monitor, Journal of Finance 50(4), 1113-1146.
Roy, Andrew D., 1952, Safety First and the Holding of Assets, Econometrica 20(3), 431-449. Samartín, Margarita, 2003, Should bank runs be prevented?, Journal of Banking & Finance 27(5),
977-1000. Schwert, G. William, 1989, Tests for unit roots: A Monte Carlo investigation, Journal of Business and
Economic Statistics 7(2), 147–159. Thomson, James B., 1991, Predicting bank failures in the 1980s, Economic Review Federal Reserve
Bank of Cleveland Q1/1991, 9-20. Thomson, James B., 1992, Modeling the bank regulator’s closure option: A two-step logit regression
approach, Journal of Financial Services Research 6(5), 5-23. Tirole, Jean, 2011, Illiquidity and all its Friends, Journal of Economic Literature 49(2), 287-325. Wagner, Wolf, 2007, The liquidity of bank assets and bank liquidity, Journal of Banking & Finance
31(1), 121-139. Whalen, Gary and James B. Thomson, 1988, Using financial data to identify changes in bank
condition, Economic Review Federal Reserve Bank of Cleveland 24(2), 17-26.

31
Table 1: Bank Defaults in the Financial Crisis Period by Default Reason
The table shows the number of bank defaults in the U.S. included in our sample since the start of the financial crisis in August 2007, until the third quarter of 2010. The default reasons have been predominantly identified using official data on bank default reasons published by bank supervisory and regulatory authorities (FDIC and OCC) in so called “Material Loss Reports”. These reports are published whenever a bank default results in a “material loss” to the FDIC insurance fund. On January 1st 2010, the threshold for a “material loss” to the FDIC fund was raised from $25 million to $200 million. The reports contain a detailed analysis of the failed banks’ backgrounds and business models and list the failure reasons. Those defaults where information on the failure reasons could not be obtained through official sources, the reasons were identified by indicative evidence from newspaper articles or press releases of the banks.
Aug.-Dec. 2007 2008 2009 Jan.-Sep. 2010 Total
Loan Loss only 1 12 51 42 106
Liquidity Loss only - - 1 - 1
Loan and Liquidity Loss - 5 51 61 117
Fraud - 1 2 2 5
Other 1 2 19 3 25
Total 2 20 124 108 254

32
Table 2: Description of Variables
The table contains descriptions of all observed and analyzed balance sheet items and ratios of the paper’s analyses.
Variable Name Unit Description
Ratio Trading Assets/Total
Assets
% Amount of assets held for trading purposes as reported on balance sheet
divided by the amount of total assets as recorded on balance sheet
Ratio Agricultural/Total
Loans
% Amount of agricultural loans as reported on balance sheet divided by the
amount of total loans as reported on balance sheet
Ratio Real Estate/Total
Loans
% Amount of real estate loans as reported on balance sheet divided by the
amount of total loans as reported on balance sheet
Total Assets Thd. USD Total assets as reported on balance sheet
Capital Ratio % Total (Tier 1 and Tier 2-) equity divided by total assets as reported on
balance sheet
Ratio Short-term/Long-
term Deposits
% Amount of short-term deposits (transaction and demand deposits) divided by
the amount of long-term deposits (savings and time deposits) as reported on
balance sheet
Return on Assets % Net income as reported on P&L divided by Total Assets as reported on
balance sheet
Standard Deviation Return
on Assets
% The standard deviation of a bank’s return on assets over the last 8 quarters.
Efficiency Ratio % Operating expenses as reported on P&L divided by total revenues as
reported on P&L.
Loan Growth % Quarterly growth of total loan volume
Net Off-Balance Sheet
Derivative Exposure
Thd. USD Difference of off-balance sheet (OBS) derivatives for which the bank is
beneficiary minus OBS derivatives for which bank is guarantor
Other Net Off-Balance
Sheet Exposure
Thd. USD Total amount of off-balance sheet (OBS) assets minus OBS liabilities other
than derivatives
Crisis Dummy 0/1 Dummy Dummy variable which is 1 in the financial crisis period, i.e. from 2007:Q3
Ratio Short-term/Total % Amount of short-term deposits (transaction and demand deposits) as

33
Deposits reported on balance sheet divided by total deposits
Leverage in the Banking
Industry
% Average quarterly leverage of all U.S. commercial banks.
GDP bn. USD Gross domestic product of the USA
Gross Private Savings bn. USD Gross private savings of all U.S. households
Savings Ratio % Ratio of Gross Private Savings to GDP
Yield Spread % Spread between 1-month U.S. T-Bills and 10-year U.S. Treasuries
Interest Rate % Federal Funds Rate

34
Table 3: Bank Liquidity Risk and Credit Risk Proxy Variables
The table displays descriptions and calculations of the two main proxy variables for bank liquidity risk and credit risk, as well as the additional robustness proxy variable for liquidity risk, the BB measure, and the Z-Score as an overall indicator of bank risk.
Category Proxy Calculation Values Description
Liquidity
Risk
Liquidity Risk
(LR)
DemandDeposits TransactionDeposits BrokeredDeposits
NOWAccounts UnusedLoanCommitments ‐ Cash
Currency&Coin TradingAssets FedFundsPurchased
CommercialPaper SecuritiesavailableforSale NetInter‐Bank
LendingPosition NetInter‐BankAcceptances NetDerivative
Position /TotalAssets
Values above
zero imply
that the bank
is cet. par. not
able to endure
a sudden bank
run.
LR shows to what degree a bank is capable of dealing with sudden and unexpected liquidity
demand (e.g. a bank run). The indicator calculates to what degree a bank can cover this demand
with liquid (readily available) assets. A high value indicates high liquidity risk. It is standardized
by total assets.
Berger-
Bouwman (BB)
measure
CatFat/TotalAssets
High values
indicate a high
level of
liquidity
creation and in
general high
liquidity risk.
The BB measure (as proposed by Berger and Bouwman, 2009) represents a bank’s total liquidity
creation. It shows the total US-Dollar denominated amount of liquidity a bank creates for the
economy. Liquid items held by the bank are therefore labeled illiquid as the bank extracts
liquidity from the economy. The idea is that banks provide depositors with availability of their
deposits and contemporaneously use deposited money to grant loans. The CatFat measure (also
including OBS liquidity creation) is taken from the data publicly provided by the authors. The
measure is standardized by total assets.
Credit
Risk Credit Risk (CR)
Values above
1 indicate
unexpected
losses.
CR is calculated using annual means of quarterly data. Dividing the net loan charge-offs by the
loan loss allowance in the previous year (including the excess allowance on loans and leases) it
indicates to what degree a bank was expecting the current period’s losses in the period before
that.
Bank
Stability Risk Z-Score
.
A lower value
indicates
higher
riskiness.
The Z-Score (as originally proposed by Roy, 1952) is the sum of the return on assets and the ratio
of total equity to total assets divided by the standard deviation of the return on assets. We use the
last 8 quarters for the latter’s derivation in each quarter. It is a bank risk indicator and measures a
bank’s distance to insolvency. Accordingly, it is inversely related to the probability of default. It
is recommendable to use its natural logarithm because of its high skewness (e.g., Laeven and
Levine, 2009).
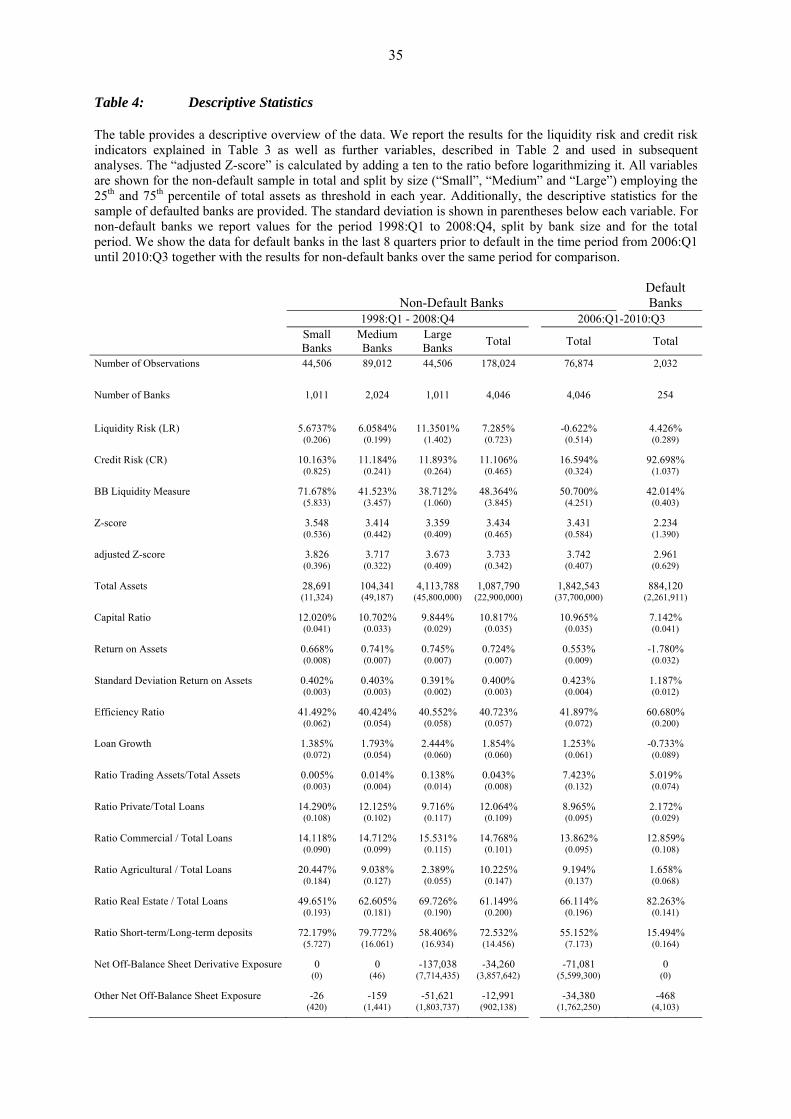
35
Table 4: Descriptive Statistics
The table provides a descriptive overview of the data. We report the results for the liquidity risk and credit risk indicators explained in Table 3 as well as further variables, described in Table 2 and used in subsequent analyses. The “adjusted Z-score” is calculated by adding a ten to the ratio before logarithmizing it. All variables are shown for the non-default sample in total and split by size (“Small”, “Medium” and “Large”) employing the 25th and 75th percentile of total assets as threshold in each year. Additionally, the descriptive statistics for the sample of defaulted banks are provided. The standard deviation is shown in parentheses below each variable. For non-default banks we report values for the period 1998:Q1 to 2008:Q4, split by bank size and for the total period. We show the data for default banks in the last 8 quarters prior to default in the time period from 2006:Q1 until 2010:Q3 together with the results for non-default banks over the same period for comparison.
Non-Default Banks Default Banks
1998:Q1 - 2008:Q4 2006:Q1-2010:Q3
Small Banks
Medium Banks
Large Banks
Total Total Total
Number of Observations 44,506 89,012 44,506 178,024 76,874 2,032
Number of Banks 1,011 2,024 1,011 4,046 4,046 254
Liquidity Risk (LR) 5.6737% 6.0584% 11.3501% 7.285% -0.622% 4.426% (0.206) (0.199) (1.402) (0.723) (0.514) (0.289)
Credit Risk (CR) 10.163% 11.184% 11.893% 11.106% 16.594% 92.698% (0.825) (0.241) (0.264) (0.465) (0.324) (1.037)
BB Liquidity Measure 71.678% 41.523% 38.712% 48.364% 50.700% 42.014% (5.833) (3.457) (1.060) (3.845) (4.251) (0.403)
Z-score 3.548 3.414 3.359 3.434 3.431 2.234 (0.536) (0.442) (0.409) (0.465) (0.584) (1.390)
adjusted Z-score 3.826 3.717 3.673 3.733 3.742 2.961 (0.396) (0.322) (0.409) (0.342) (0.407) (0.629)
Total Assets 28,691 104,341 4,113,788 1,087,790 1,842,543 884,120 (11,324) (49,187) (45,800,000) (22,900,000) (37,700,000) (2,261,911)
Capital Ratio 12.020% 10.702% 9.844% 10.817% 10.965% 7.142% (0.041) (0.033) (0.029) (0.035) (0.035) (0.041)
Return on Assets 0.668% 0.741% 0.745% 0.724% 0.553% -1.780% (0.008) (0.007) (0.007) (0.007) (0.009) (0.032)
Standard Deviation Return on Assets 0.402% 0.403% 0.391% 0.400% 0.423% 1.187% (0.003) (0.003) (0.002) (0.003) (0.004) (0.012)
Efficiency Ratio 41.492% 40.424% 40.552% 40.723% 41.897% 60.680% (0.062) (0.054) (0.058) (0.057) (0.072) (0.200)
Loan Growth 1.385% 1.793% 2.444% 1.854% 1.253% -0.733% (0.072) (0.054) (0.060) (0.060) (0.061) (0.089)
Ratio Trading Assets/Total Assets 0.005% 0.014% 0.138% 0.043% 7.423% 5.019% (0.003) (0.004) (0.014) (0.008) (0.132) (0.074)
Ratio Private/Total Loans 14.290% 12.125% 9.716% 12.064% 8.965% 2.172% (0.108) (0.102) (0.117) (0.109) (0.095) (0.029)
Ratio Commercial / Total Loans 14.118% 14.712% 15.531% 14.768% 13.862% 12.859% (0.090) (0.099) (0.115) (0.101) (0.095) (0.108)
Ratio Agricultural / Total Loans 20.447% 9.038% 2.389% 10.225% 9.194% 1.658% (0.184) (0.127) (0.055) (0.147) (0.137) (0.068)
Ratio Real Estate / Total Loans 49.651% 62.605% 69.726% 61.149% 66.114% 82.263% (0.193) (0.181) (0.190) (0.200) (0.196) (0.141)
Ratio Short-term/Long-term deposits 72.179% 79.772% 58.406% 72.532% 55.152% 15.494% (5.727) (16.061) (16.934) (14.456) (7.173) (0.164)
Net Off-Balance Sheet Derivative Exposure 0 0 -137,038 -34,260 -71,081 0 (0) (46) (7,714,435) (3,857,642) (5,599,300) (0)
Other Net Off-Balance Sheet Exposure -26 -159 -51,621 -12,991 -34,380 -468 (420) (1,441) (1,803,737) (902,138) (1,762,250) (4,103)

36 Table 5: The Relationship between Liquidity Risk and Credit Risk
The table shows results of quarterly data from 1998:Q1 to 2008:Q4, subdivided into a pre-financial crisis period and the financial crisis period starting in 2007:Q3. We report the results of a regression analysis which estimates a system of structural equations (simultaneous equations) via three-stage least squares, separated into the pre-financial crisis and the financial crisis period. Further control variables are (not shown in the table): the first four lags of the dependent variable, the log of total assets, the capital ratio, the return on assets, the standard deviation of the return on assets, the efficiency ratio, bank loan growth, the ratio of short-term to long-term deposits, the ratio of trading assets to total assets, the net derivatives exposure, other off-balance sheet items, real estate to total loans, agricultural to total loans, commercial to total loans, individual to total loans, the log of GDP in bn. USD, the savings ratio, the federal funds rate, the yield spread, the quarterly average leverage in the banking industry, and a time trend. All regressions control for annual time fixed effects. On the right hand side of the table we report the mean of within-firm correlations of variables with significances determined via a Wilcoxon signed rank test. The statistical significance of results is indicated by * = 10%-level, ** = 5%-level and *** = 1%-level. The change in the number of standard deviations is calculated using the total effect on the variable divided by its within-firm standard deviation in percent.
Regression Analysis - Simultaneous Equations Correlation
CR - ALL BANKS Pre-Financial Crisis
Financial
Crisis LR - ALL BANKS
Pre-Financial Crisis
Financial Crisis
Pre-Fin.
Crisis
Financial Crisis
LR (t) 0.0062*** 0.0090 -0.0194 0.0321 0.0080*** CR (t) -0.0026** -0.0009 0.1605 -1.8227* 0.0006 0.0061 -0.0306***
LR (t-1) -0.0028 0.0154 -0.0292 CR (t-1) -0.0014 -0.1404 1.5214* LR (t-2) 0.0095** 0.0170*** CR (t-2) 0.0047*** -0.0336* ∆ St. Dev.s of CR LR (t-3) -0.0128*** CR (t-3) 0.0266** 0.0005 -0.0036
Total Effect 0.0062 0.0062 0.0055 0.0071 0.0080 Total Effect -0.0026 -0.0023 0.0249 -0.3083 0.0006 ∆ St. Dev.s of LR Change in # of within-firm St. Dev.s of CR
0.0471 0.0005 0.0004 0.0005
0.0009 Change in # of within-firm St. Dev.s of LR
-0.0003 -0.0003 0.0030 -0.0366
0.0001 0.0007
-0.0075
CR - SMALL BANKS LR - SMALL BANKS LR (t) 0.0120** -0.2263*** -0.2475** -0.3123 0.0066 CR (t) -0.0022*** -0.0292* -0.0339** -0.1032*** -0.0002 0.0124 0.0008 LR (t-1) 0.2307*** 0.2445*** 0.2915** CR (t-1) 0.0247* 0.0281* 0.0879*** LR (t-2) 0.0069 0.0098 CR (t-2) 0.0009 -0.0042*** ∆ St. Dev.s of CR LR (t-3) 0.0134 CR (t-3) 0.0069*** 0.0007 0.0001
Total Effect 0.0120 0.0044 0.0039 0.0024 0.0066 Total Effect -0.0022 -0.0045 -0.0049 -0.0126 -0.0002 ∆ St. Dev.s of LR Change in # of within-firm St. Dev.s of CR
0.0007 0.0002 0.0002 0.0001
0.0007 Change in # of within-firm St. Dev.s of LR
-0.0003 -0.0006 -0.0006 -0.0016
0.0000 0.0016
0.0002
CR - MEDIUM BANKS LR - MEDIUM BANKS LR (t) 0.0116*** 0.0736 0.0420 -0.0806 0.0142** CR (t) -0.0030*** 0.0210*** 0.0187** 0.0105 -0.0007 0.0143* -0.0246* LR (t-1) -0.0603 -0.0365 0.0591 CR (t-1) -0.0193*** -0.0168** -0.0099 LR (t-2) 0.0071 0.0162 CR (t-2) -0.0008 0.0001 ∆ St. Dev.s of CR LR (t-3) 0.0154 CR (t-3) -0.0020 0.0011 -0.0031
Total Effect 0.0116 0.0133 0.0126 0.0101 0.0142 Total Effect -0.0030 0.0017 0.0011 -0.0013 -0.0007 ∆ St. Dev.s of LR Change in # of within-firm St. Dev.s of CR
0.0009 0.0011 0.0010 0.0008
0.0018 Change in # of within-firm St. Dev.s of LR
-0.0004 0.0002 0.0001 -0.0002
-0.0002 0.0018
-0.0064
CR - LARGE BANKS LR - LARGE BANKS LR (t) -0.0011* 0.0142 -0.0153 0.0337 -0.0063** CR (t) 0.0004 -0.0112 0.0453 0.1251*** -0.0029 -0.0159 -0.0726*** LR (t-1) -0.0149 0.0010 -0.0424* CR (t-1) 0.0083 -0.0644** -0.1212***LR (t-2) 0.0126*** 0.0222*** CR (t-2) 0.0384*** 0.0022 ∆ St. Dev.s of CR LR (t-3) -0.0136*** CR (t-3) 0.0444*** -0.0017 -0.0076
Total Effect -0.0011 -0.0007 -0.0017 -0.0001 -0.0063 Total Effect 0.0004 -0.0029 0.0193 0.0505 -0.0029 ∆ St. Dev.s of LR Change in # of within-firm St. Dev.s of CR
-0.0001 -0.0001 -0.0002 0.0000 -0.0007 Change in # of within-firm St. Dev.s of LR
0.0000 -0.0003 0.0019 0.0049 -0.0007 -0.0015 -0.0180

37
Table 6: The Relationship between Liquidity Risk and Credit Risk by Bank Risk (1/2)
The table shows results of quarterly data employing the variables defined in Tables 2 and 3 with LR and CR as the proxy for liquidity risk and credit risk, respectively. It shows the regression results estimating a system of structural equations (simultaneous equations) via three-stage least squares including further control variables not shown in the table. The “Effect on variable X” shows the regression coefficient of the other relevant contemporaneous variable on variable X in the simultaneous equations regression. All regressions include only one contemporaneous independent variable. The change in the number of standard deviations is calculated using the respective effect on the variable divided by the variable’s within-firm standard deviation in percent. Furthermore, we report the respective values of CR and LR in % in parentheses. Banks are assigned a high (low) level of credit risk if they are in the upper 75th (lower 25th) percentile of CR and a high (low) level of liquidity risk if they are in the upper 75th (lower 25th) percentile of LR, subdivided by the pre-crisis (Panel A) and the crisis (Panel B) period. The bank size is determined using the 25th and the 75th percentile of total assets of all non-default banks in each year. Panel A includes the time period 1998:Q1 to 2007:Q2, Panel B the period from 2007:Q3 to 2008:Q4, and Panel C contains data from 2006:Q1 to 2010:Q3. Panel C incorporates 254 bank defaults where we use quarterly data of the two years prior to default for default banks. The control variables in the regressions not shown in the table are the first four lags of the dependent variable, the log of total assets, the capital ratio, the return on assets, the standard deviation of the return on assets, the efficiency ratio, bank loan growth, the ratio of short-term to long-term deposits, the ratio of trading assets to total assets, the net derivatives exposure, other off-balance sheet items, real estate to total loans, agricultural to total loans, commercial to total loans, individual to total loans, the log of GDP in bn. USD, the savings ratio, the federal funds rate, the yield spread, the quarterly average leverage in the banking industry, and a time trend. All regressions control for annual time fixed effects. The statistical significance of coefficients is indicated by * = 10%-level, ** = 5%-level and *** = 1%-level.
Panel A: Risky Banks in the Pre-Crisis Period (1998:Q1 - 2007:Q2)
Bank Size
Small Medium Large Total
Lower Credit Risk Effect on LR 0.021*** 0.043*** -0.057 0.001
St.Dev.s Change of LR 0.0026 0.0050 -0.0040 0.0002
(CR; LR) (-3.87; 4.51) (-3.07; 4.79) (-2.24; 15.88) (-3.21; 6.65)
Higher Credit Risk Effect on LR -0.003*** -0.002* 0.027** 0.001
St.Dev.s Change of LR -0.0003 -0.0003 0.0025 0.0001
(CR; LR) (41.94; 7.01) (33.66; 5.6) (30.81; 23.03) (34.80; 10.42)
Lower Liquidity Risk Effect on CR 0.046*** 0.009 0.023 0.020**
St.Dev.s Change of CR 0.0030 0.0005 0.0019 0.0013
(CR; LR) (11.97; -20.23) (10.38; -18.73) (9.59; -19.22) (10.62; -19.25)
Higher Liquidity Risk Effect on CR -0.062** 0.028** -0.002*** 0.003***
St.Dev.s Change of CR -0.0036 0.0022 -0.0002 0.0002
(CR; LR) (9.96; 29.06) (10.37; 29.31) (12.43; 58.41) (10.71; 35.75)

38
Table 6: The Relationship between Liquidity Risk and Credit Risk by Bank Risk (2/2)
Panel B: Risky Banks in the Financial Crisis Period (2007:Q3 - 2008:Q4)
Bank Size
Small Medium Large Total
Lower Credit Risk Effect on LR -0.007 -0.004 -0.079 -0.006
St.Dev.s Change of LR -0.0013 -0.0008 -0.0171 -0.0013
(CR; LR) (-3.80; 5.61) (-2.42; 5.26) (-0.86; 2.27) (-2.77; 5.01)
Higher Credit Risk Effect on LR 0.000 -0.005 -0.003 -0.001
St.Dev.s Change of LR -0.0001 -0.0013 -0.0006 -0.0002
(CR; LR) (50.70; 7.47) (41.94; 8.93) (48.47; 19.85) (45.60; 12.23)
Lower Liquidity Risk Effect on CR 0.104** 0.041* -0.040 0.020
St.Dev.s Change of CR 0.0123 0.0054 -0.0048 0.0025
(CR; LR) (10.33; -18.34) (11.73; -17.52) (17.44; -17.05) (12.88; -17.61)
Higher Liquidity Risk Effect on CR 0.002 -0.052** -0.002 0.010***
St.Dev.s Change of CR 0.0002 -0.0064 -0.0002 0.0011
(CR; LR) (9.65; 29.51) (14.14; 29.36) (22.67; 53.22) (14.4; 33.79)
Panel C: Defaulted Banks 2 Years prior to Default (2006:Q1 - 2010:Q3)
Bank Size
Small Medium Large Total
No Default Effect on LR 0.004** 0.004*** -0.009** -0.002*
St.Dev.s Change of LR 0.0003 0.0003 -0.0005 -0.0002
(CR; LR) (11.04; 1.2) (14.73; 1.81) (20.05; 3.92) (15.05; 2.16)
Default Effect on LR -0.003 0.005 -0.030*** -0.008
St.Dev.s Change of LR -0.0002 0.0003 -0.0020 -0.0007
(CR; LR) (115.11; 6.61) (89.93; 5.71) (90.87; 3.01) (92.7; 4.49)
No Default Effect on CR 0.023*** 0.019*** 0.022*** 0.022***
St.Dev.s Change of CR 0.0014 0.0012 0.0012 0.0013
(CR; LR) (11.04; 1.2) (14.73; 1.81) (20.05; 3.92) (15.05; 2.16)
Default Effect on CR 2.098 0.135 0.038 0.016
St.Dev.s Change of CR 0.0277 0.0024 0.0007 0.0003
(CR; LR) (115.11; 6.61) (89.93; 5.71) (90.87; 3.01) (92.7; 4.49)

39
Table 7: The Impact of Liquidity Risk and Credit Risk on Bank Default Probability
The table reports results from logit regressions of bankruptcy indicators on predictor variables. The data are constructed so that the predictor variables are observable at the beginning of the quarter when default occurs. The regressions include data from 2006:Q1 to 2010:Q3. The variables are defined as in Table 2 and 3. The “adjusted Z-score” is calculated by adding a ten to the ratio before logarithmizing it. The statistical significance of results is indicated by * = 10%-level, ** = 5%-level and *** = 1%-level. Standard errors are clustered at the bank level, following e.g. DeYoung and Torna (2013). (1) (2) (3) (4) (5)
CR 1.2017*** 0.6024*** 0.6554*** 0.6801***
LR 4.1499*** 2.7657*** 2.6925*** 2.4843***
CR * LR -0.0723*** -0.0697***
log(Assets) 0.1735 0.0967 0.1050 0.0995 0.1228
Capital Ratio -74.0580*** -141.7423*** -91.8352*** -91.6822*** -90.1090***
Return on Assets (RoA) -17.1258* -66.8141*** -42.9991*** -40.5738*** -39.1823***
Standard Deviation RoA 32.2035* 46.7184*** 33.9768** 33.2391** 31.8779**
Efficiency Ratio -0.0012 -0.0022 -0.0015 -0.0013 -0.0012
Loan Growth -5.7484** -12.3225*** -9.0978*** -8.2982*** -8.1877***
Trading Assets / Total Assets -3.2839** 3.5154* 1.8865 2.1145
Short-term / Long-term Deposits -0.0192*** -0.1193*** -0.0814*** -0.0837*** -0.0770***
Fraction Real Estate Loans 5.3963 9.9493** 6.4597 6.3940 6.2189
Fraction Agricultural Loans 0.3100 6.8923 3.3762 3.2587 3.0966
Fraction Commercial Loans 2.6685 7.9441* 4.4907 4.6170 4.4068
Fraction Individual Loans -6.1024 -71.1602*** -48.2160*** -49.8591*** -45.5226***
log(GDP in bn USD) -1.5484 -8.8776 -5.3738 -7.2389 -6.7385
Savings Ratio 93.7508*** 200.4552*** 141.7323*** 137.5782*** 133.4052***
Interest Rate -6.0950*** -15.2433*** -10.0139*** -12.0115*** -11.2182***
Yield Curve -0.6394** -1.5931*** -1.0854** -1.1996** -1.1475**
Leverage in the Banking Industry 158.2597** 285.8776*** 212.1700*** 203.8396*** 199.1852***
Constant -136.5803 -196.2858 -154.2701 -127.6505 -127.9436
Defaults 205 205 205 205 205
Obs. 75,582 75,639 75,582 75,582 75,582
R-Squared 67.68% 69.83% 70.74% 70.98% 70.91%

40
Figure 1: The Effect of the Interaction between Liquidity Risk and Credit Risk on Bank Default Probability
-.2
-.1
0
.1
.2
Inte
ract
ion
Effe
ct (
perc
ent
age
poin
ts)
0 .2 .4 .6 .8 1Predicted Probability that y = 1
Correct interaction effect
Interaction Effects of CR and LR
-5
0
5
10
z-st
atis
tic
0 .2 .4 .6 .8 1Predicted Probability that y = 1
z-statistics of the Interaction Effects of CR and LR
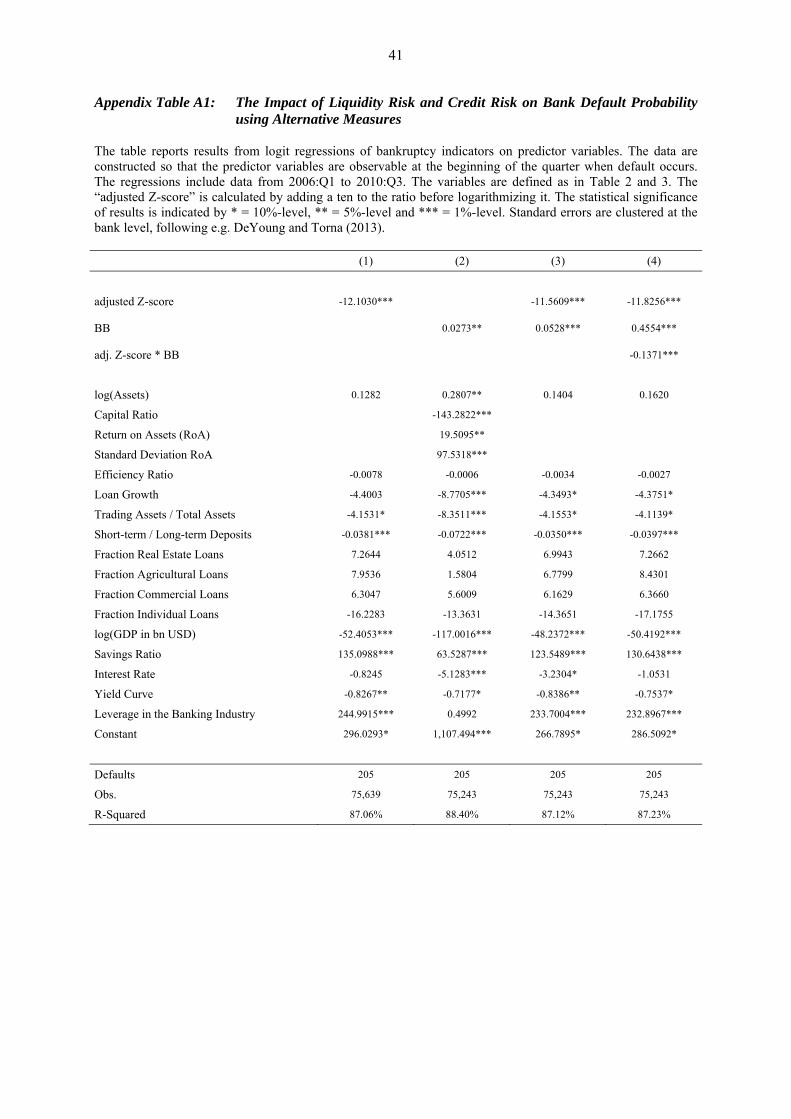
41
Appendix Table A1: The Impact of Liquidity Risk and Credit Risk on Bank Default Probability using Alternative Measures
The table reports results from logit regressions of bankruptcy indicators on predictor variables. The data are constructed so that the predictor variables are observable at the beginning of the quarter when default occurs. The regressions include data from 2006:Q1 to 2010:Q3. The variables are defined as in Table 2 and 3. The “adjusted Z-score” is calculated by adding a ten to the ratio before logarithmizing it. The statistical significance of results is indicated by * = 10%-level, ** = 5%-level and *** = 1%-level. Standard errors are clustered at the bank level, following e.g. DeYoung and Torna (2013). (1) (2) (3) (4)
adjusted Z-score -12.1030*** -11.5609*** -11.8256***
BB 0.0273** 0.0528*** 0.4554***
adj. Z-score * BB -0.1371***
log(Assets) 0.1282 0.2807** 0.1404 0.1620
Capital Ratio -143.2822***
Return on Assets (RoA) 19.5095**
Standard Deviation RoA 97.5318***
Efficiency Ratio -0.0078 -0.0006 -0.0034 -0.0027
Loan Growth -4.4003 -8.7705*** -4.3493* -4.3751*
Trading Assets / Total Assets -4.1531* -8.3511*** -4.1553* -4.1139*
Short-term / Long-term Deposits -0.0381*** -0.0722*** -0.0350*** -0.0397***
Fraction Real Estate Loans 7.2644 4.0512 6.9943 7.2662
Fraction Agricultural Loans 7.9536 1.5804 6.7799 8.4301
Fraction Commercial Loans 6.3047 5.6009 6.1629 6.3660
Fraction Individual Loans -16.2283 -13.3631 -14.3651 -17.1755
log(GDP in bn USD) -52.4053*** -117.0016*** -48.2372*** -50.4192***
Savings Ratio 135.0988*** 63.5287*** 123.5489*** 130.6438***
Interest Rate -0.8245 -5.1283*** -3.2304* -1.0531
Yield Curve -0.8267** -0.7177* -0.8386** -0.7537*
Leverage in the Banking Industry 244.9915*** 0.4992 233.7004*** 232.8967***
Constant 296.0293* 1,107.494*** 266.7895* 286.5092*
Defaults 205 205 205 205
Obs. 75,639 75,243 75,243 75,243
R-Squared 87.06% 88.40% 87.12% 87.23%

42
Appendix Figure A1: The Effect of the Interaction between Liquidity Risk and Credit Risk on Bank Default Probability using Alternative Measures
-.3
-.2
-.1
0
.1
.2
Inte
ract
ion
Effe
ct (
perc
ent
age
poin
ts)
0 .2 .4 .6 .8 1Predicted Probability that y = 1
Correct interaction effect
Interaction Effects of adjusted Z-score and BB
-5
0
5
10
z-st
atis
tic
0 .2 .4 .6 .8 1Predicted Probability that y = 1
z-statistics of the Interaction Effects of adj. Z-score and BB
Copyright © 2022 FDOKUMEN