The risks of transfusion-transmitted infection: direct estimation and mathematical modelling
19
The risks of transfusion-transmitted infection: direct estimation and mathematical modelling Steven H. Kleinman MD Clinical Professor of Pathology University of British Columbia, Vancouver, BC, Canada Michael P. Busch* MD, PhD Vice President Research and Scientific Aairs Blood Centers of the Pacific, San Francisco, CA, USA and Professor of Laboratory Medicine University of California, San Francisco, USA Direct measurement of the risk of transfusion-transmitted infection (TTI) is practical and accurate only if the level of risk is high. Historically, studies that established frozen repositories of transfusion recipient and/or blood donor samples were important in establishing the risk of many TTI agents, including the human immunodeficiency virus (HIV), hepatitis B virus (HBV) and hepatitis C virus (HCV). However, given the current very low risk of TTI, mathematical modelling is necessary to estimate the magnitude of such a risk. For agents for which routine blood donor screening is performed, most of this risk comes from transfusion of units collected in the window period between donor infection and a positive blood screening assay. The incidence/window period model has been used to estimate the magnitude of such risks (of the order of 1 : 100 000 to 1 : 1 000 000) and for predicting the extent of risk reduction that can be expected with implementation of new tests. Direct estimation and mathematical modelling approaches are both important tools for future assessment of potential, new or emerging TTI agents. Key words: transfusion-transmitted infection; HIV; hepatitis. Accurate estimates of the risks of transfusion-transmitted infection (TTI) are important for several reasons: to reassure the public about the safety of transfusion, to provide an informed basis for patients and physicians to decide on allogeneic transfusion versus other therapeutic options, and to enable policy makers to evaluate the expected benefit and costs of proposed interventions to reduce such risk further. 1521–6926/00/04063119 $12.00/00 * c 2000 Harcourt Publishers Ltd. Baillie`re’s Clinical Haematology Vol. 13, No. 4, pp. 631–649, 2000 doi:10.1053/beha.2000.0104, available online at http://www.idealibrary.com on 9 *Address for correspondence: Blood Centers of the Pacific, Irwin Center, 270 Masonic Avenue, San Francisco, CA 94118, USA.
-
Upload
independent -
Category
Documents
-
view
1 -
download
0
Transcript of The risks of transfusion-transmitted infection: direct estimation and mathematical modelling

The risks of transfusion-transmitted infection:direct estimation and mathematical modelling
Steven H. Kleinman MD
Clinical Professor of PathologyUniversity of British Columbia, Vancouver, BC, Canada
Michael P. Busch* MD, PhD
Vice PresidentResearch and Scienti®c A�airsBlood Centers of the Paci®c, San Francisco, CA, USA and
Professor of Laboratory MedicineUniversity of California, San Francisco, USA
Direct measurement of the risk of transfusion-transmitted infection (TTI) is practicaland accurate only if the level of risk is high. Historically, studies that established frozenrepositories of transfusion recipient and/or blood donor samples were important inestablishing the risk of many TTI agents, including the human immunode®ciency virus(HIV), hepatitis B virus (HBV) and hepatitis C virus (HCV). However, given the currentvery low risk of TTI, mathematical modelling is necessary to estimate the magnitude of such arisk. For agents for which routine blood donor screening is performed, most of this risk comesfrom transfusion of units collected in the window period between donor infection and apositive blood screening assay. The incidence/window period model has been used to estimatethe magnitude of such risks (of the order of 1:100 000 to 1:1 000 000) and for predicting theextent of risk reduction that can be expected with implementation of new tests. Directestimation and mathematical modelling approaches are both important tools for futureassessment of potential, new or emerging TTI agents.
Key words: transfusion-transmitted infection; HIV; hepatitis.
Accurate estimates of the risks of transfusion-transmitted infection (TTI) areimportant for several reasons: to reassure the public about the safety of transfusion,to provide an informed basis for patients and physicians to decide on allogeneictransfusion versus other therapeutic options, and to enable policy makers toevaluate the expected bene®t and costs of proposed interventions to reduce suchrisk further.
1521±6926/00/040631�19 $12.00/00 *c 2000 Harcourt Publishers Ltd.
BaillieÁ re's Clinical HaematologyVol. 13, No. 4, pp. 631±649, 2000doi:10.1053/beha.2000.0104, available online at http://www.idealibrary.com on
9
*Address for correspondence: Blood Centers of the Paci®c, Irwin Center, 270 Masonic Avenue, SanFrancisco, CA 94118, USA.
DIRECT MEASUREMENTS OF TRANSFUSION-TRANSMITTEDINFECTION
Case investigation
The most basic method of establishing that a disease is transmitted by transfusion is athorough investigation of post-transfusion clinical case reports. For example, the ®rstevidence that the acquired immunode®ciency syndrome (AIDS) was transmitted bytransfusion was obtained from clinical cases occurring in transfused persons with noknown AIDS risk factors: this led to subsequent investigation of the donors of theunits of blood transfused to these recipients.1 Similar case-reporting methods are usedtoday to determine the risk of transfusion-transmitted malaria, Chagas' disease, andbabesiosis. A variation of clinical case reporting is to investigate whether disease hasdeveloped in recipients when a donor (or his/her physician) reports to the bloodcollection agency that the donor has developed a potentially transfusion-transmissibledisease. This mechanism, termed a look-back investigation, is used to investigate thepossible occurrence of rare or theoretical transfusion outcomes (e.g. the risk oftransmission of Creutzfeldt±Jakob or new variant Creutzfeldt±Jakob disease).2,3
Because clinical case reporting is dependent upon development of disease in arecipient, quantitative estimates based on this approach will almost certainly be under-estimates due to underdiagnosis and under-reporting. Many transfusion-transmittedinfections may not cause symptoms for many years, by which time the recipient mayhave died from underlying causes; or the disease symptoms may not be attributable totransfusion, and hence the association with the original transfusion is often di�cult tosubstantiate.
Recently, some European countries have established active haemovigilance orsurveillance programmes.4,5 While these programmes may have some success indetecting an acute TTI, such as bacterial sepsis, they are subject to the same limitationsas described above for detection of transfusion-transmissible agents with long incuba-tion periods. Furthermore, even in the case of bacterial sepsis, it has been di�cult tostandardize the data required to link potential clinical symptoms with a speci®ctransfusion aetiology.6
Prospective recipient cohort follow-up studies
The most scienti®cally accurate method of directly establishing the risk of transfusion-transmitted infection is a prospective controlled study of transfusion recipients. In thistype of study, recipients are enrolled and blood specimens are obtained prior totransfusion and at periodic intervals post-transfusion. The recipients are monitored forclinical disease and samples tested for biochemical or serological evidence of TTI. Suchstudies are further strengthened when serum samples from recipients and/or donorsare frozen in a repository so that they may be re-evaluated when more sensitive bloodscreening tests become available.
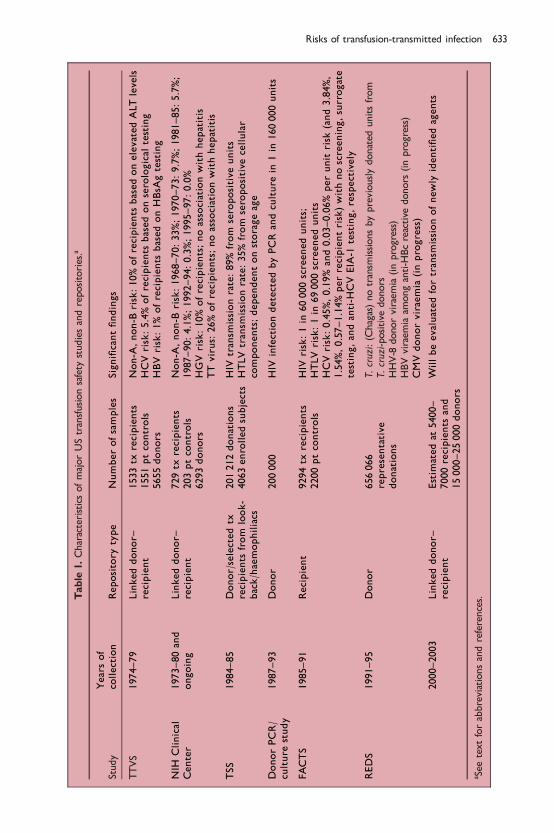
Since the mid-1970s, the National Heart, Lung and Blood Institute (NHLBI) in theUSA has funded several large-scale, prospective transfusion-risk studies that includedthe collection of accompanying repositories of samples.7±11 Characteristics of theserepositories are presented in Table 1. The two earliest repositories (the Transfusion-Transmitted Viruses Study (TTVS) and the ongoing NIH Clinical Center repositories)retained serial samples from transfusion recipients and samples from the donor unitstransfused to these recipients.7,8 These repositories were originally used to measurethe risk of transmitting non A-non B hepatitis. Because the risk was high (5±10% per
632 S. H. Kleinman and M. P. Busch
Table
1.CharacteristicsofmajorUStransfusionsafety
studiesandrepositories.a
Study
Yearsof
collection
Repository
type
Numberofsamples
Signi®cant®ndings
TTVS
1974±79
Linkeddonor±
recipient
1533tx
recipients
1551ptcontrols
5655donors
Non-A
,non-B
risk:10%ofrecipients
basedonelevatedALTlevels
HCVrisk:5.4%ofrecipients
based
onserological
testing
HBV
risk:1%
ofrecipients
based
onHBsA
gtesting
NIH
Clinical
Center
1973±80and
ongoing
Linkeddonor±
recipient
729tx
recipients
203ptcontrols
6293donors
Non-A
,non-B
risk:1968±70:33%;1970±73:9.7%;1981±85:5.7%;
1987±90:4.1%;1992±94:0.3%;1995±97:0.0%
HGVrisk:10%ofrecipients;noassociationwithhepatitis
TTvirus:
26%ofrecipients;noassociationwithhepatitis
TSS
1984±85
Donor/selectedtx
recipients
from
look-
back/haemophiliacs
201212donations
4063enrolledsubjects
HIV
transm
issionrate:89%from
seropositive
units
HTLV
transm
issionrate:35%from
seropositive
cellular
components;dependentonstorageage
DonorPCR/
culture
study
1987±93
Donor
200000
HIV
infectiondetectedbyPCRandculture
in1in
160000units
FACTS
1985±91
Recipient
9294tx
recipients
2200ptcontrols
HIV
risk:1in
60000screenedunits;
HTLV
risk:1in
69000screenedunits
HCVrisk:0.45%,0.19%
and0.03±0.06%perunit
risk
(and3.84%,
1.54%,0.57±1.14%perrecipientrisk)withnoscreening,surrogate
testing,andanti-H
CVEIA-1
testing,respectively
REDS
1991±95
Donor
656066
representative
donations
T.cruzi:(Chagas)notransm
issionsbypreviouslydonated
unitsfrom
T.cruzi-positive
donors
HHV-8
donorviraem
ia(inprogress)
HBVviraem
iaam
onganti-H
Bcreactive
donors
(inprogress)
CMVdonorviraemia
(inprogress)
2000±2003
Linkeddonor±
recipient
Estim
atedat
5400±
7000recipients
and
15000±25000donors
Willbeevaluatedfortransm
issionofnew
lyidenti®edagents
a See
textforabbreviationsandreferences.
Risks of transfusion-transmitted infection 633
recipient in the late 1970s), it was possible to obtain accurate data with a relativelysmall sample size. These repositories have continued to be used many years after theirinitial collection to establish the historical transfusion-transmission risk of hepatitis C(HCV), hepatitis G and TT virus infection.12±15 Proof of such transfusion-transmission isobtained by establishing that a recipient seroconverts post-transfusion, that a donor tothat recipient is positive for the same agent, and that seroconversions in recipients ofpositive donor units occur at a higher rate than in recipients of negative units or non-transfused controls, ruling out a non-transfusion aetiology.
The Frequency of Agents Communicable by Transfusions Study (FACTS) adoptedthe approach of collecting pre- and 6-month post-transfusion samples from a largenumber of recipients and controls, with subsequent selected recall and sampling ofdonors whose units were associated with evidence of recipient seroconversion.9 From1986 to 1992, two cases of infection with human immunode®ciency virus (HIV) weredocumented after transfusion of 120 000 units of blood; seroconverting donors wereidenti®ed in both cases. The risk of HIV was thus estimated at 1 in 60 000 (upper 95%CI: one in 19 000).9 The investigators also retrospectively tested the repository forevidence of HTLV and HCV transmission. HTLV transmission was documented at arate of one in 69 000 units.9 For HCV, the study examined three sequential timeintervals: the interval when there was no screening for non A-non B hepatitis, theinterval when surrogate testing [alanine amino transferase (ALT) and antibody toHepatitis B core antigen (anti-HBc)] was performed, and the interval when anti-HCVtesting [®rst generation enzyme immunoassay (EIA)] was added to surrogate testing.The investigators were able to document a decrease in HCV transmission in the threetime intervals, with per-unit risks determined to be 0.45, 0.19 and 0.03±0.06%respectively.16,17 For this part of the study, the importance of collecting pre-transfusionsamples from recipients was demonstrated by the observation that 50% of the HCV-seropositive transfusion recipients were already HCV-seropositive prior to receivingstudy transfusions.
Donor repository prevalence/transmission studies
An alternative approach to estimating the direct risk involves retention of very largerepositories of donor specimens, followed by testing for TTI agents and selectedrecipient follow-up. In 1984, the Transfusion Safety Study (TSS) collected over 200 000representative blood donor samples which were later tested for HIV and HTLV.10
Testing of the repository led to identi®cation of seropositive donor units; the bloodcomponents made from these units were traced to the hospitals that received themand subsequently to recipients who were studied along with control recipients ofdonor units that tested seronegative. The TSS established the rate of transmission ofHIV and HTLV-1/II from known positive units and identi®ed virological and hostfactors which in¯uence transmission and clinical outcome of infection.18±20
A second study that illustrates the use of donor samples to estimate risk wasconducted in San Francisco in the late 1980s to measure HIV infection in screeneddonors. Viral culture and PCR analyses were used to detect HIV-1 in pooled peripheralblood mononuclear cells (PBMC) derived from 200 000 anti-HIV-negative donationsgiven in the San Francisco Bay Area. Only a single infected seronegative donation wasidenti®ed in 1987. After adjusting for assay sensitivities and the pooled analyses, a riskestimate of 1:160 000 was calculated.21,22
From 1991 to 1995, The Retrovirus Epidemiology Donor Study (REDS) establishedlarge donor repositories of over 600 000 donor samples11, and REDS investigators have
634 S. H. Kleinman and M. P. Busch
used a selective approach for testing these donor specimens. For example, donations inthe repository from donors born in South or Central America were tested forantibody to Trypanosoma cruzi (the causative agent of Chagas' disease) and recipients ofdonations that were found to be positive were then traced and tested for evidence ofseroconversion; no transmissions were found.23 This repository is now being studiedto estimate the prevalence of HHV-8 antibody, CMV DNA and HBV DNA amonganti-HBc-positive donors.
Future repository design and testing issues
As recent events have illustrated, it is necessary to maintain a high degree of vigilanceagainst the possibility that previously unknown or underappreciated infectious agentsmay be transmitted by transfusion. The REDS Allogeneic Donor and RecipientRepository (Radar), a contemporary linked donor±recipient repository scheduled tobegin in 2000, will be a resource that can rapidly be accessed to determine whether anewly discovered agent is likely to be transmitted by transfusion. This repository willbe composed of linked donor±recipient specimens: samples will be retained fromdonors whose units are transfused into enrolled recipients as well as from theserecipients at the time of study enrollment and 6 months post-transfusion. Unlike otherpast repositories, Radar has not been designed with the intent of quantifying trans-fusion risk; rather, its major purpose is to be able to document, with a reasonable levelof certainty (i.e. 95%), whether or not a given agent is transmissible by transfusion.More precisely, the repository has been designed so that if negative test results areobtained in recipients who receive positive donor units, the data will provide a highdegree of statistical con®dence that the transmission rate of a given agent is less than agiven low number (i.e. the transmission rate approaches zero).
Retrospective testing of samples from stored repositories provides estimates of therisk of transmitting infection at a speci®c time in the past when the repositories werebuilt. Although of interest, such historical data may not be directly relevant to deter-mining the current level of risk. Reasons for such discrepancies include the introduc-tion of new donor screening assays or procedures that reduce risk or, conversely, therapid introduction of a new transfusion-transmitted agent into the blood donorpopulation, as occurred with HIV in the early 1980s. On the other hand, testing ofrepository samples o�ers several distinct advantages: testing of a large sample set canbe accomplished relatively rapidly, it is possible to establish whether an agent is newversus newly detectable, and it allows for the identi®cation of recipients who havebeen infected in the past. This last attribute allows for an assessment of the long-termclinical consequences of transfusion-transmitted agents; an example of this is the long-term follow-up of recipients infected with HCV in the 1970s.24
MATHEMATICAL MODELLING OF TRANSFUSION-TRANSMITTEDRISK
Because transfusion-transmitted risks are currently so low in developed countries, it isexceedingly di�cult to measure these risks directly with accuracy. Such measurementrequires very large sample sizes and is extremely expensive: hence, it is unlikely thatmany future prospective studies of transfusion recipients will be conducted. It istherefore necessary to rely on mathematical approaches that evaluate a limited data setand, using reasonable assumptions, model the data to generate an estimate of risk.
Risks of transfusion-transmitted infection 635
Sources of risk
Although each unit of donated blood is tested for evidence ofHIV,HTLV,HBVandHCVinfection, there are four potential reasons why transmission of these viral agents stilloccurs.25 The primary risk is from donations collected during the window period,de®ned as the time during the early stage of infectionwhen the donor is infected with avirus but has negative results in blood donor screening assays.25 A second factor thatcould contribute to the risk of transfusion-transmitted infection is the existence of achronic carrier state in which a clinically asymptomatic donor will persistently testnegative on a screening assay. Although such immunosilent infections have beendocumented for HIV andHCV, current data indicate that these events are rare in blooddonor populations.26,27 Third, a viral agent may have a large enough degree of geneticdiversity so that screening assays fail to identify some infectious donors who harbour aparticular atypical genetic variant. Viral variants such as HIV-1 group O, unusualsubtypes of HCV, or HBsAg mutants occur; however, surveillance data indicate thatthese occur only rarely and are usually detected by current screening assays.28,29 Afourth factor that could contribute to transfusion-transmitted infection is laboratoryerror. It has recently been documented that errors in blood donor laboratory testingscreening occur at low frequency (0.05%; 95% CI: 0±1.5%).30 However, to be signi®cantsuch an error in assay performance would need to occur when testing a seropositiveunit. The contribution of errors to transfusion risk can be calculated by multiplying theerror rate by the prevalence of the positive marker.
Table 2 summarizes risk estimates for HIV, HBV and HCV, according to these fourcomponent risk sources. Window period donations can be seen to contribute thepredominant component to risk. For example, in the case of HIV and HBV infection, atleast 90% of the risk is attributable to donations of window-phase units. For HCV,window-period donations account for 73±88% of the risk, with the remaining 12±27%re¯ecting the contribution of immunosilent HCV infections and test error (due to therelatively high prevalence of HCV).
The incidence/window period model
In the mid 1990s, REDS investigators developed the incidence/window period modelto estimate the per-unit risk for each of the four transfusion-transmissible viruses that
Table 2. Estimated risk of viral infections in the USA per 10 million donations by source of risk prior toHIV-1 p24 antigen and minipool HIV and HCV NAT.
VirusWindow period(days) Viral variants
Chronic antibody-negative carriers Testing error Total
HIV 4 50.6 50.1 0.4 25HCV 80 51 0±20a 11 91±111HBV 63±150b 51c 51d 1±3 66±153HTLV 15 51 51 0.8 16
aRange is due to unknown frequency of such carriers.bRange is due to uncertain estimate of HBV incidence based upon observed HBsAg incidence.cThis number may be higher in Europe or Asia where HBsAg mutants are known to exist.dThis number will be higher in countries that do not perform anti-HBc screening due to the infectivity ofdonors with subdetectable levels of HBsAg.
636 S. H. Kleinman and M. P. Busch
are characterized by a window period prior to detection by blood screeningassays.31±33 This approach estimates risk by measuring the incidence of new infection(seroconversion) in a blood donor population over a speci®c time interval and thenmultiplying this incidence by the average time interval that a seroconvertingdonor would be expected to be capable of transmitting infection (i.e. the length ofthe window period).31,32 Incidence data are obtained from direct observation ofblood donor populations and are measured as the number of newly infected(seroconverting) donors divided by the observed person-years at risk. Incidence iscalculated by using data obtained from donors who gave more than one donationduring the study period.
Determination of the window period requires data from specialized studies ofthe early events following viral infection.34±38 The infectious window period is de®nedas the interval between the time a donor is infectious (by the route of bloodtransfusion) and the time that a particular laboratory test becomes positive. Sincethere may be a lag between the time the donor is exposed to the infectious agent andthe donor's ability to transmit the infection (due to restricted replication in regionallymph nodes or liver), this infectious window period may be shorter than the timefrom exposure to the agent to seroconversion.39,40 Window period data have beenobtained by direct observation in linked donor±recipient transfusion studies for HCV(window period of 82 days for anti-HCV 2.0 testing; range 54±192 days), HBV(window period of 59 days; range 37±87 days), and HTLV (window period of 51 days;range 36±72 days), but not for HIV.34±36 For HIV, the infectious window periodestimate was derived from analysing data from transfusion recipients known to havereceived a unit of blood from a donor who later became HIV-seropositive and wasinitially calculated to be 42 days using HIV antibody assays available in the late 1980s.37
Later studies used samples from high-risk cohorts to compare the performance ofthese older HIV antibody screening assays to that of newer HIV antibody tests; thesestudies produced the current estimate of a 22-day (range 6 to 38 days) infectious(viremic) window period until detection of HIV antibody by currently used donorscreening assays.38 These ®ndings have been con®rmed by a similar analysis conductedusing 394 seroconverting subjects from six cohort studies; this study established anarrower range (16.5 to 28.3 days) for the window period estimate due to its largersample size.41 Furthermore, studies of seroconversion panels obtained from plasmadonors have also supported these initial estimates. Whether a donor is actuallyinfectious for the entire length of the mathematically modelled window period hasnot yet been corroborated by experimental evidence. A recent HIV transfusion-transmission experiment in a chimpanzee model has shown that a negative plasmaHIV RNA PCR result may indicate lack of infectivity in the early theoretical infectiouswindow period.42
For purposes of calculating the risk to recipients of transfused units, an adjustedincidence ratewas calculated by eliminating those seroconverting donors whose poten-tially infectious seronegative unit was removed from distribution prior to transfusion(due to an abnormal result on another laboratory screening assay or by a positiveresponse to con®dential unit exclusion). Furthermore, incident donors with false-posi-tive con®rmatory tests forHIV,HTLVandHBsAgwere eliminated as incident cases. Thecalculated risks, with 95% con®dence intervals (CI), of collecting and transfusing a unitdonated during the window period in the USA from 1991±1993 data was as follows31:
HIV: 1 in 493 000 (95% CI: 202 000 to 2 778 000)HTLV: 1 in 641 000 (95% CI: 256 000 to 2 000 000)
Risks of transfusion-transmitted infection 637
HCV: 1 in 103 000 (95% CI: 28 000 to 288 000)HBV: 1 in 63 000 (95% CI: 31 000 to 147 000)
Due to a limited number of observations for HBV and HTLV and the way in which thewindow period for HIV was theoretically derived, 95% con®dence limits around thewindow period estimates for these agents are wide, resulting in wide con®dence limitsfor the per-unit risk estimate.
The most controversial risk estimate derived from the model is that for HBV. Theestimate of the infectious window period prior to a positive HBsAg result (mean of59 days) is based upon a series of only seven transfusion-transmitted cases.36
Furthermore, the incidence of new HBV infection cannot be accurately measured;because HBsAg is a transient marker, detection of incident HBsAg will underestimatenew HBV infections in blood donors, some of whom may acquire HBV infection andclear HBsAg prior to their next donation. An alternative method, that of measuringanti-HBc seroconversions, will overestimate HBV incidence due to the poor speci®cityof the anti-HBc assay. REDS investigators developed a method for estimating HBVincidence by multiplying incident HBsAg rates by a factor based on the averageinterdonation interval for donors who became HBsAg-positive. This adjustment factor,calculated to be 2.38 in the published REDS dataset, was incorporated into the HBVrisk estimate to generate the 1 in 63 000 point estimate of risk.33 More recently, REDSinvestigators have re-worked the model using a di�erent mathematical derivation toestimate HBV incidence from observed HBsAg incidence and the interdonationinterval for all donors.43 This new method produced a risk estimate that hasoverlapping con®dence intervals with the previously published estimate.
Risk of infection if a positive unit is transfused
For HIV and HCV, the per-unit risk is essentially the same for each type of bloodcomponent transfused (i.e. red blood cells, platelets, fresh frozen plasma (FFP),cryoprecipitate). It is known that recipients who receive a component from HIV- orHCV-seropositive donors have an 80±90% likelihood of acquiring the infection. It isinferred that the risk from a viraemic but seronegative window-period unit is at leastas high. However, units collected during the very early `ramp-up' phase of viraemiamay not contain enough viral particles to comprise an infectious dose.12,18 Althoughsimilar experimental data are not available for HBV, it is likely that the transfusion-transmission rate is similar, given the high rate of transmission of HBV fromneedlestick injury.44 The situation is di�erent for HTLV, where there is no risk oftransmission from acellular components (such as FFP or cryoprecipitate) due to theexclusive cell-associated nature of the virus.45 Furthermore, transmission rates ofHTLV from cellular products obtained from infected donors vary with the length ofstorage of the blood components; while overall transmission rates in the USA are 35%from red cells or platelets, there has been no transmission documented from red cellunits stored greater than 14 days.19
Newer observations pertinent to the incidence/window period model
Do the 1996 published risk estimates still hold true today? Potential reasons whysuch estimates might change include changes in incidence of viral markers,implementation of new tests that shorten the window, or a change in the assumptionsthat have produced the numbers in the model. The incidence rates reported by REDS
638 S. H. Kleinman and M. P. Busch
investigators for donors who had given at least two allogeneic donations in a 3-yearperiod (1991±1993) were 4.0, 1.1, 4.8 and 4.0 per 100 000 person-years for HIV, HTLV,HCV and HBsAg respectively. By comparing the incidence in overlapping 2-yearintervals in the REDS database for each of these four viral agents, it has beenestablished that the incidence for each agent has shown no statistically signi®cantchange from 1991 through 1996.46
Risk in ®rst-time versus repeat donors
The REDS incidence numbers are based upon measured seroconversion in repeatdonors. The model has assumed that the incidence in ®rst-time (or one-time) donors,which is not observable by monitoring seroconversion, is equivalent to that in repeatdonors. Recently, HIV incidence in ®rst-time donors has been measured by using anew approach.47 This method uses a dual HIV antibody testing approach: testing with aconventional anti-HIV enzyme immunoassay (EIA) and further testing of anti-HIVcon®rmed positive samples with a less sensitive (LS) anti-HIV EIA, made by modifyinga conventional viral lysate based EIA in order to lengthen the time to detection of HIVantibody. Because this LS assay requires an additional 129 days (95% CI: 109±149 days)to become positive when compared to conventional HIV EIA and Western blot assays,donors who have been recently infected with HIV will be positive by conventional EIAbut negative by LS EIA. This method of calculating HIV incidence has been validated byshowing that HIV incidence in repeat donors in REDS is equivalent using the dual EIAtesting strategy and the conventional approach of observing HIV seroconversion. Usingthis method, the incidence of HIV infection in ®rst-time donors in REDS was shown tobe approximately twofold greater than in repeat donors.48 When this increased ®rst-time donor incidence is applied to the 22% of donations given by ®rst-time donors, itcan be shown that the observed HIV incidence used in the incidence/window periodmodel is only about 80% of the actual rate. Hence, HIV risk estimates may need to beadjusted to re¯ect an approximately 20% greater per unit risk; however, this revisionto the published point estimate of HIV risk is still within the 95% CI of the originalestimate. It is unknown whether the incidence of other transfusion transmitted viralinfections (HTLV, HCV, HBV) is also increased in ®rst-time donors.
An indirect approach to address the relative risk of ®rst-time versus repeat donors isto compare the frequency of high-risk behaviour among these donor subgroups. In1993, REDS investigators mailed an anonymous-response 53-question optical scanformat questionnaire to 50 162 allogeneic blood donors who successfully donatedblood within the previous 4 to 8 weeks at one of ®ve participating REDS bloodcentres.49 Donors were randomly sampled with the exception of oversampling ofthose younger than 18 and those in minority ethnic and racial groups to compensatefor their lower proportional representation in the donor population. The questionnairecontained items related to sexual history, injection drug use history, other historyrelated to HIV risk, HIV test seeking, and other items. Multi-part questions were usedto determine the time intervals (corresponding to intervals used in blood donorscreening) in which events occurred (ever, since 1977, within the past 12 months, andwithin the past 3 months). Of 50162 donors sampled, 34726 (69.2%) responded and98.1% of the respondents answered all the risk questions. The data were analysed byusing sampling weights to adjust for di�erential sampling and/or response rates amongdi�erent groups. A total of 1.9% of respondents reported at least one behavioural riskthat should have resulted in donor deferral. In 0.4%, this risk occurred in the prior3 months, a time-frame compatible with acute seronegative window period infection.
Risks of transfusion-transmitted infection 639

There was a 1.6-fold higher rate of survey-derived deferrable risk behaviours in ®rst-time donors compared to repeat donors, comparable to the 2.0-fold increase in HIVincident infections discussed above.
An additional issue of interest is whether the frequency of donation in repeatdonors is correlated with their rate of HIV or hepatitis seroconversion; a corollaryquestion is whether there is a threshold number of donations after which serocon-version rates decline and donors are safer with regard to transmission of seronegativewindow period infections. Data from the REDS study appear to show that, amongrepeat donors, the frequency of donations is not correlated with the incidence of newinfection with the common transfusion-transmissible viruses.50
From the viewpoint of recipient safety, these research studies support the commondonor recruitment practice of attempting to collect a greater number of units frompersons who are already repeat donors, but does not support a policy that does notrelease for transfusion blood collected from ®rst-time donors.
Changes in screening tests
Since 1993, several blood screening assays have been revised. Many blood banks haveswitched from HCV EIA 2.0 to EIA version 3.0 screening, resulting in a shortening ofthe 82-day window to 70 days and changing the point estimate for risk from 1 in103 000 to 1 in 120 000, well within the 95% CI of the original estimate.32,51 HTLVscreening is now performed using a combination HTLV-I/HTLV-II assay; this change isnot expected to have any impact on the length of the HTLV window period or on theper-unit risk of HTLV transmission from window period units. These changes shouldnot signi®cantly alter the 1996 published risk estimates for the USA.
In contrast, several other recent testing changes are expected to a�ect risk signi®-cantly.Most recently, tests forHCVRNAonminipools have been added to blood donorscreening programmes in many countries.52 This nucleic acid testing (NAT) will reliablydetect HCV infection early in the antibody negative window period. Data from a largenumber of serial samples collected from HCV seroconverting plasma donors haveestablished that HCVNAT can shorten the 70-day HCV antibody window period by 42to 56 days, which calculates to a 60 to 80% reduction in thewindowperiod.53 These datahave been corroborated by studies of recipientswhodeveloped post-transfusionHCV inthe 1970s; most of these recipients developed HCV viraemia within 2 weeks ofinfection.54 Using these data, it can be estimated that the risk of HCV infection willdecrease to 1 in 250 000 to 1 in 500 000 per unit, assuming that a donor is infectiousduring the entire length of the remaining 2±3weekwindowperiod, and lower still if thedonor does not become infectious for some days following exposure. In addition,minipool HCV NAT should eliminate any risk from chronically infected, antibody-negative donors as well as provide an additional method to interdict any units whichmay have escaped detection due to errors in serological testing. Of note, recent reportsdescribe development of anHCVantigen assay. Although the analytical sensitivityof theearlyHCVantigen tests is relatively poor, the clinical sensitivity (i.e. the ability to detectHCV window phase infections) is estimated at 490%.
For HIV, the HIV-1 p24 antigen test was implemented in the USA in 1996, andminipool HIV-1 NAT is in the process of implementation in the USA and Europe. Therisk of HIV transmission risk was estimated to decrease to 1 in 676 000 units followingthe implementation of HIV-1 p24 antigen testing; however, the p24 antigen yield waslower than predicted (see below).32,55 The potential yield of minipool HIV NAT can becalculated using the following data: a 1 in 493 000 window period risk (ignoring the
640 S. H. Kleinman and M. P. Busch

calculated theoretical bene®t of HIV-1 p24 antigen testing) and a 32 to 41% reductionin risk by minipool HIV NAT (a 7±9 day shortening of the theoretical 22-day antibody-negative window period). The risk of HIV transmission will be decreased to 1 in725 000 to 835 000 donations, assuming that HIV infection can occur during the entiretheoretical early window period.
Table 3 updates the riskestimates in Table 2 to incorporate the expecteddecreases inrisk that are expected tooccurwith implementationofminipoolNAT forHCVandHIV.
Limitations and advantages of the incidence/window period model
The incidence/window period model approach has several limitations. It does not takeinto account whether storage of the infectious unit or recipient host factors willmodify the transmission rate of infection to recipients. The contribution of single-time donors to risk has not been measured for agents other than HIV. The pre-seroconversion window period of infection for each agent has not always been wellestablished. As a result of the very low rates of risk being measured and the need toestimate certain variables, the risk estimates obtained have wide con®dence limits.Risk estimates must be revised when newer more sensitive donor screening orlaboratory testing protocols are adopted. Because estimates may have been obtained inparticular geographical areas, caution must be exercised in generalizing the results toother locations.
The model has been applied by international investigators to estimate the risk oftransfusion-transmitted infections in their countries using locally obtained incidencedata.56,57 Some of these studies have used variations in the methods used to calculateseveral of the variables in the model. Therefore, when comparing risk estimates fromdi�erent studies, the following factors should be assessed to determine whether thestudies are directly comparable:
. Is there an adjustment for incidence in ®rst- or one-time donors?
. Were there changes in screening or con®rmatory test sensitivity during the study?
. Was there an adjustment for false-positive con®rmatory tests?
. Was there an adjustment for non-transfused seronegative units from seroconvertingdonors?
. Was the measured HBsAg incidence taken as the HBV incidence or was an adjust-ment factor calculated?
. Was a relatively short (2±3 years) or a relatively long (43 years) period of observa-tion used to determine incidence rates?
Table 3. Estimated risk of viral infections in the USA per 10 million donations by source of risk afterimplementation of HIV and HCV NAT.
Agent Window period Viral variantsChronic antibody-negative carriers Test error Total
HIV 12±13 50.6 0 0 13±14HCV 16±32 0 0 0 16±32
HIV. The estimate is that minipool NATwill shorten the window period from 7±9 days (33±41%) relativeto that for HIV antibody.HCV. The estimate is that minipool NAT will shorten the window period from 42±56 days (60±80%)relative to that for HCV antibody.
Risks of transfusion-transmitted infection 641
The incidence/window period model has several major advantages over any othermethod of determining transfusion risk for the set of agents to which it can be success-fully applied. It allows for data to be updated and expanded over time, yielding tightercon®dence intervals. Risk estimates can be compared across di�erent geographicalregions that have used the same method. Most importantly, if donor incidence andperson-year data are available, thismodelling approach can be implementedwithout theneed to fund special research projects and estimates of risk for multiple agents can begenerated using the same data set.
Other uses of the incidence/window period model
The incidence/window period model can be used for several purposes other than toestimate per-unit risk; these include generating estimates of the e�ectiveness ofmultiple screening procedures to interdict window period units, predicting the con-sequence of eliminating a test, and predicting the expected yield of adding a test toshorten the window period.
Evaluation of surrogate procedures for decreasing HIV and HCV risk. The incidence/window period model has been used to evaluate the e�ectiveness of the Con®dentialUnit Exclusion (CUE) procedure and of anti-HBc testing in identifying units donated inthe window period of HIV infection. Published REDS data indicate that both of thesetwo approaches had a 6.1% yield (two of 33 HIV seroconverting donors by bothapproaches).32 Assuming that the CUE procedure had not been in place, and re-calculating the REDS incidence data (e.g. two additional units fromHIV seroconverting
HBV
HCV
HIV
Risk per unit
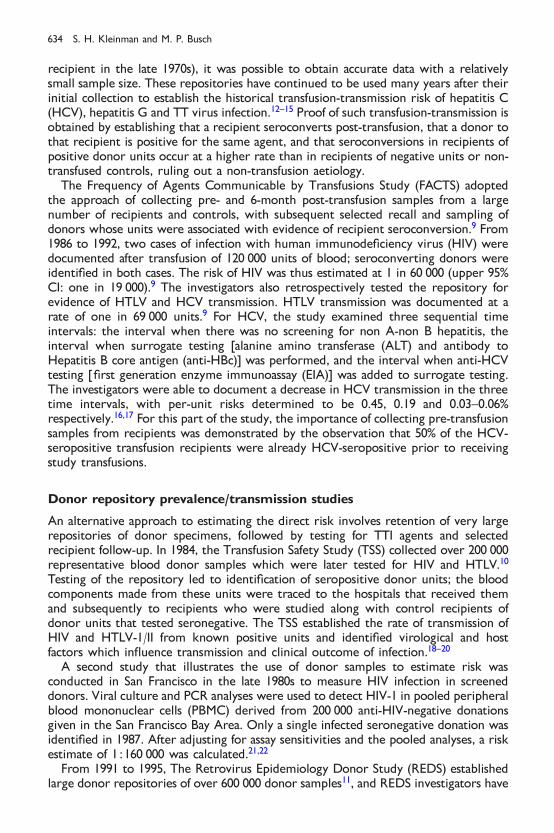
Year1983 1985 1987 1989 1991 1993 1997 19991995
1:60000
1:2500001:7250001/1000000
1/100000
1/10000
1/1000
1/100
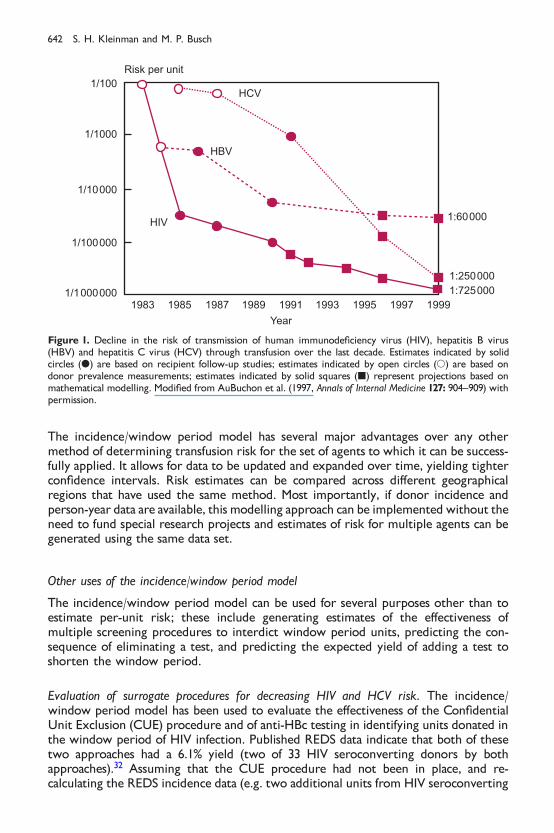
Figure 1. Decline in the risk of transmission of human immunode®ciency virus (HIV), hepatitis B virus(HBV) and hepatitis C virus (HCV) through transfusion over the last decade. Estimates indicated by solidcircles (d) are based on recipient follow-up studies; estimates indicated by open circles (s) are based ondonor prevalence measurements; estimates indicated by solid squares (j) represent projections based onmathematical modelling. Modi®ed from AuBuchon et al. (1997, Annals of Internal Medicine 127: 904±909) withpermission.
642 S. H. Kleinman and M. P. Busch

donors would have been transfused), we calculated an HIV risk of 2.17 per milliondonations (rather than 2.03 per million); this 0.14 per million increase translates totransfusing one additional HIV infectious unit per 7.14 million blood donations if theCUE procedure were not used.
A second study evaluated the performance of anti-HBc testing during the 1987±1990 time-frame when anti-HBc-positive donors were not discouraged from returningto donate; this study found that 17.7% of HIV seroconverters had anti-HBc-positiveresults on their HIV seronegative donation.58 Re-calculating HIV incidence using eitherREDS data (6.1% increase) or the alternative data (17.7% increase) yields an estimatefor increased HIV risk associated with discontinuation of anti-HBc testing ranging fromone additional HIV infectious unit transfused per 2.78 million to 7.14 milliondonations.
REDS data have also been used to quantify the contribution of the dual-level ALTtesting algorithm in use in the era of anti-HCV EIA-2 screening to prevent windowperiod HCV transmission.59 REDS data were used to calculate that eliminating the lowlevel ALT cuto� would increase the risk of window period HCV transmission by 1.3HCV infectious units per million donations (from 9.7 to 11.0 units per milliondonations). The contribution to HCV risk of donors with high-level ALT elevationscould not be calculated directly because all such donors were deferred after theirinitial ALT-elevated donation and therefore could not be evaluated for HCV sero-conversion. An adjustment factor for these donors was calculated based upon theobservation that, in ®rst-time donors, the prevalence of anti-HCV in donors with high-level ALT elevations was 3.4 times more frequent that the anti-HCV prevalence indonors with low-level ALT elevations. Applying this adjustment, it was projected thattotally discontinuing ALT testing would increase HCV risk to 12.5 units per million, anincrease of 2.8 infectious units per million donations. These data were in¯uential in a1995 NIH Consensus Conference panel recommendation that ALT testing of donatedblood should be discontinued.60
Risk reduction by introduction of new tests. In performing risk reduction estimates withregard to the yield of a new assay, it is necessary to know only the shortening ofwindow period provided by the new test. For example, if it were known that a newtest could detect HIV infection 6 days earlier than existing tests (as is the case for theHIV-1 p24 antigen assay), we could make the following calculation. At an HIVincidence rate of 4.01 per 100 000 person-years and with 12 million units collected peryear, the yield of this new assay is calculated as:
�4�0=105py-y� � �year=365 days� � �6 days� � �12 000 000 units=year� � 8 units=year
Prior to implementation of the HIV-1 p24 antigen assay, the above calculation was usedto project the assay's yield (8 units/year or 1 per 1.5 million donations screened) and itse�ect on per unit risk (a 27% decrease to 1 in 676 000).32 Implementation of HIV-1 p24antigen screening has presented the opportunity empirically to validate a projection ofthe incidence/window period model. In almost 4 years of testing, the HIV-1 p24antigen yield has been one per 9 million donations or only 17% of the prediction.55
This yield is below the lower 95% con®dence interval predicted by the incidence/window period model, suggesting that the steady state assumption of the model, i.e.that seroconverting donors will attempt donations at a consistent rate during the pre-seroconversion period, may not apply to the antigenaemic phase of primary HIVinfection. This phase of HIV infection is frequently characterized by clinical or
Risks of transfusion-transmitted infection 643

subclinical illness (the acute HIV syndrome)61, and therefore antigenic donors may self-defer, or may be deferred at an attempted donation due to fevers or a history ofrecent night sweats. Assuming the minipool HIV NAT will result in a 7±9 dayshortening of the theoretical 22 day antibody negative window period, we haveestimated that minipool HIV NAT will detect HIV infectious donors at a rate of 1 in1.2±1.5 million donations in the USA. If, however, donors are also less likely to donatein the NAT-positive, pre-antigenaemic interval, this calculation will overestimate theyield of the test. Preliminary results suggest that the yield is consistent with thesepredictions.
Based upon data indicating thatminipool HCVNATwill result in a 60±80% reductionin thewindowperiod, we have estimated that theminipool HCVNATwill detect HCVinfectious donations at a rate of 1 in 150 000 to 1 in 200 000 donations. Preliminary datafrom the ®rst 6 months of testing in the USA suggest that the actual yield is in the 1 in200 000 to 1 in 300 000 range, which is very close to that predicted by the model.62
Evaluating the signi®cance of transfusion-transmitted infections
Because both HIV and HCV infection take years to develop into clinical disease, theimpact of transfusion transmission of these agents will not be apparent unless thepatient survives for a long period after transfusion. Therefore the transfusion of manyinfected components will never produce any clinical e�ects. Data from look-backstudies have indicated that there is a greater than 50% likelihood that a speci®c bloodcomponent will have been transfused to an individual who will die within 1 year.63
(This should not be misinterpreted to indicate that 50% of blood recipients die within1 year, but rather that large-volume users with poor prognoses receive a highpercentage of transfused blood components.) Nevertheless, long-term follow-upstudies of transfusion recipients have documented the progression to AIDS in asigni®cant number of HIV-infected recipients.64 In the case of HCV, signi®cant liverdisease appears to develop in only a small percentage of recipients at 18±20 yearspost-transfusion.24
Most transfusion recipients who acquire HBV resolve the initial infection anddevelop immunity; in the TTVS only one of 15 HBV seroconverting recipients pro-gressed to a chronic carrier state.34 Moreover, additional evidence makes it unlikelythat the long-term outcome of transfusion-acquired chronic HBV infection is highlysigni®cant. A long-term follow-up study of patients who acquired HBV in adulthoodfrom exposure to contaminated yellow fever vaccine demonstrated lack of serioussequelae and no progression to liver cancer.65 On the other hand, if HBV were trans-mitted to neonates or immunosuppressed patients, signi®cant disease could result.
Most HTLV-infected recipients remain asymptomatic, but a very small percentagedevelop the neurological disease known as HTLV-associated myelopathy after incuba-tion periods as short as 1 to 2 years.66 Long-term follow-up interview data suggest anincreased propensity of HTLV-I and HTLV-II infected transfusion recipients to developrespiratory infection (HTLV-II) and urinary tract infection (HTLV-I and HTLV-II).67
Per-unit versus per-recipient risk
Early studies expressed infection risk on a per-recipient basis, making it di�cult tocompare the risk for patients receiving di�erent numbers of transfusions. Morerecently, it has become standard practice to express the riskof infection on a per-unit orper-blood component basis; i.e. the risk per unit is a given percentage (e.g. 0.001%) or 1
644 S. H. Kleinman and M. P. Busch

in a given number (e.g. 1 in 100 000). This per-unit risk needs to be adjusted for thenumber of units (or more precisely, the number of donor exposures) received by aparticular patient. The mathematically correct way to determine per-patient risk is asfollows, where p represents the probability of infection from a given blood unit and nrepresents the number of units transfused: the probability that a single unit is free ofinfection is �1 ÿ p�; the probability that all n units that the recipient receives would beinfection free is �1 ÿ p�n and therefore, the probability that a recipient would becomeinfected, would be one minus the probability that he would not get infected or 1 ÿ�1 ÿ p�n: Because transfusion risks are small (e.g.51%), this formula simply reduces top � n; therefore, the per-patient risk can be obtained by multiplying the per-unit riskby the number of units transfused.
Estimates of risk from agents for which screening is not routinely performed
The risk of many rare transfusion-transmitted agents cannot be estimated by using theincidence/window period model and therefore may rely more heavily on clinical casereporting or donor±recipient repository prevalence±incidence projection. Never-theless, estimates of risk still rely on many of the principles that are incorporated inthe risk model discussed above: estimating the prevalence of infectious blood donors,estimating the survival of the organism in stored blood components, estimating its rateof transmissibility when an infectious unit is transfused, and determining the suscept-ibility or immunity of the transfused recipient population. Once screening is intro-duced the same sources of residual risk alluded to above become relevant, as does anunderstanding of incidence and window period dynamics.
Transfusion-transmitted infection risk in perspective
In the early 1990s, Dodd concluded that when the data for all transfusion transmittedagents are taken into account, it is reasonable to suggest that about three in 10 000blood recipients contract serious or fatal transfusion transmitted disease.68 Hecontrasted this with results of a study of hospitalized patients in which 60 of 10 000patients died of accidental or preventable causes other than their underlying disease, arisk that is 20-fold higher than that from blood transfusion.69 In 1997, the US Govern-ment Accounting O�ce (GAO) issued a report that compared the infectious and non-infectious risks of blood transfusion with other medical and non-medical risks.70 Theseauthors deliberately selected the highest estimates for transfusion risks consistent withcurrent scienti®c knowledge. Their worst-case scenario analysis showed that the riskof chronic disease or death from transfusion-transmitted infections was substantiallylower than the risk of dying from a direct result of surgery, the risk that a hospital staywill result in death or chronic disability, the risk of su�ering an injury from hospitaldrug therapy, and the risk of developing an infection of unknown cause in theintensive care unit. Furthermore, the annual risk of dying from transfusion to theaverage person without an anticipated surgical operation was shown to be comparableto that of dying from electrocution or drowning. Despite these relatively low risks ofTTIs, the political and public focus on transfusion safety remains acute. E�orts to bringrisk estimates and public perception into balance must be a key objective over the nextseveral years.
Risks of transfusion-transmitted infection 645
CONCLUSIONS
In this era of very low transfusion-transmitted infection risk, mathematical modelling isnecessary to estimate the magnitude of such risks. Direct determinations of risk areeither not possible or prohibitively expensive. Our experience with the incidence/window period model indicates that the model is capable of accurately predicting theapproximate level of transfusion-transmitted risk for those agents to which it applies aswell as predicting risk reductions that can be expected with implementation of newtests. It is important to verify the predictions of mathematical models by continuing toconduct surveillance activities for transfusion-transmitted infection; conversely, policymakers should not be surprised when occasional transmissions are documented aspredicted from the models. Accurate risk estimates are available and should be used bytransfusion safety policy makers in their decision making process.71
Acknowledgement
The work described in this chapter was supported in part by the Retrovirus EpidemiologyDonor Study (REDS) under the United States National Institutes of Health contractNO1-HB-47114.
REFERENCES
1. Centers for Disease Control. Possible transfusion-associated acquired immune de®ciency syndrome(AIDS) ± California. MMWR 1982; 31: 652±654.
2. Dodd RY & Sullivan MT. Creutzfeld±Jakob disease and transfusion safety: tilting at icebergs? [editorial]Transfusion 1997; 38: 221±223.
3. Will RG & Kimberlin RH. Creutzfeld±Jakob disease and the risk from blood or blood products. VoxSanguinis 1998; 75: 178±180.
4. Debeir J, Noel L, Aullen JP et al. The French Haemovigilance system. Vox Sanguinis 1999; 77: 77±81.5. Williamson LM. Systems contributing to the assurance of transfusion safety in the United Kingdom. Vox
Sanguinis 1999; 77: 82±87.6. Mitchell KT & Brecher ME. Approaches to the detection of bacterial contamination in cellular blood
products. Transfusion Medicine Reviews 1999; 13: 132±144.7. Aach RD, Szmuness W, Mosley JWet al. Serum alanine aminotransferase of donors in relation to the risk
of non-A, non-B hepatitis in recipients. The transfusion-transmitted viruses study.New England Journal ofMedicine 1981; 304: 989±994.
8. Alter JH, Purcell RH, Holland PV et al. Donor transaminase and recipient hepatitis. Impact on bloodtransfusion services. Journal of the American Medical Association 1981; 246: 630±634.
9. Nelson KE, Donahue HG, MunÄ oz A et al. Transmission of retroviruses from seronegative donors bytransfusion during cardiac surgery. A multicenter study of HIV-1 and HTLV-I/II infections. Annals ofInternal Medicine 1992; 117: 554±559.
10. Kleinman SH, Niland JC, Azen SP et al and the Transfusion Safety Study Group. Prevalence of antibodiesto human immunode®ciency virus type 1 among blood donors prior to screening: the Transfusion SafetyStudy/NHLBI donor repository. Transfusion 1989; 29: 572±580.
11. Zuck TF, Thomson RA, Schreiber GB et al for the REDS Study Group. The Retrovirus EpidemiologyDonor Study (REDS): rationale and methods. Transfusion 1995; 35: 944±951.
12. Alter HJ, Purcell RH, Shih JW et al. Detection of antibody to hepatitis C virus in prospectively followedtransfusion recipients with acute and chronic non-A, non-B hepatitis. New England Journal of Medicine1989; 321: 1494±1500.
13. Aach RD, Stevens CE, Hollinger FB et al. Hepatitis C virus infection in post-transfusion hepatitis ± ananalysis with ®rst- and second-generation assays. New England Journal of Medicine 1991; 325: 1325±1329.
14. Alter JH, Nakatsuji Y, Melpolder J et al. The incidence of transfusion-associated hepatitis G virusinfection and its relation to liver disease [see comments]. New England Journal of Medicine 1997; 336:747±754.
646 S. H. Kleinman and M. P. Busch
15. Matsumoto A, Yeo AET, Shih JWK et al. Transfusion-associated TT virus infection and its relationship toliver disease. Hepatology 1999; 30: 283±288.
*16. Donahue JG, Munoz A, Ness PM et al. The declining risk of post-transfusion hepatitis C virus infection.New England Journal of Medicine 1992; 327: 369±373.
17. Nelson KE, Donahue JG & Stambolis V. Post-transfusion hepatitis C virus infection [letter]. New EnglandJournal of Medicine 1992; 327: 1601±1602.
18. Donegan E, Stuart M, Niland JC et al and the Transfusion Safety Study Group. Infection with humanimmunode®ciency virus type 1 (HIV-1) among recipients of antibody-positive blood donations. Annals ofInternal Medicine 1990; 113: 733±739.
*19. Donegan E, Lee H, Operskalski EA et al and the Transfusion Safety Study Group. Transfusion trans-mission of retroviruses: human T-lymphotropic viruses types I and II compared with human immuno-de®ciency virus type 1. Transfusion 1994; 34: 478±483.
20. Busch MP, Operskalski EA, Mosley JW et al for the Transfusion Safety Study Group. Factors in¯uencingHIV-1 transmission by blood transfusion. Journal of Infectious Diseases 1996; 174: 26±33.
21. Busch MP, Eble BE, Khayam-Bashi H et al. Evaluation of screened blood donations for human immuno-de®ciency virus type 1 by culture and DNA ampli®cation of pooled cells. New England Journal of Medicine1991; 325: 1±5.
22. Vyas GN, Rawal BD & Busch MP. The risk of HIV transmission by screened blood [comments onLackritz]. Transfusion 1996; 36: 992±993.
23. Williams AE, Leiby DA, Sullivan MT et al. Seroprevalence of T. cruzi infection among US blood donorsborn in Chagas endemic countries [abstract]. XXIII International Meeting of Basic Research in ChagasDisease. 4±8 November. Caxambu, Brazil, 1996.
24. See� LB, Buskell-Bales Z,Wright EC et al. Long termmortality after transfusion-associated non-A, non-Bhepatitis. New England Journal of Medicine 1992; 327: 1906±1911.
*25. Busch MP, Stramer SL & Kleinman SH. Evolving applications of nucleic acid ampli®cation assays forprevention of virus transmission by blood components and derivatives. In Garraty G (ed.) Applications ofMolecular Biology in Blood Transfusion, pp 123±176. Bethesda, MD: American Association of Blood Banks,1997.
26. Centers for Disease Control and Prevention. Persistent lack of detectable HIV-1 antibody in a personwith HIV infection ± Utah, 1995. MMWR 1996; 45: 181±185.
27. Alter MJ, Margolis HS, Krawczynski K et al. The natural history of community-acquired hepatitis C inthe United States. New England Journal of Medicine 1992; 327: 1899±1905.
28. Loussert-Ajaka I, Ly TD, Chaix M et al. HIV-1/HIV-2 seronegativity in HIV-1 subtype O infected patients.Lancet 1994; 343: 1393±1394.
29. Jongerius JM, Wester M, Cuypers HTM et al. New hepatitis B virus mutant form in a blood donor that isundetectable in several hepatitis B surface antigen screening assays. Transfusion 1998; 38: 56±59.
30. Busch MP, Watanabe KK, Smith JW et al for the Retrovirus Epidemiology Donor Study. False-negativetesting errors in routine viral marker screening of blood donors. Transfusion 2000; 40: 585±589.
*31. Schreiber GB, Busch MP, Kleinman SH & Korelitz JJ. The risk of transfusion-transmitted viral infections.New England Journal of Medicine 1996; 334: 1685±1690.
*32. Kleinman SH, Busch MP, Korelitz JJ & Schreiber GB. The incidence/window period model and its use toassess the risk of transfusion-transmitted HIV and HCV infection. Transfusion Medicine Reviews 1997; 11:155±172.
*33. Korelitz JJ, Busch MP, Kleinman SH et al. A method for estimating hepatitis B virus incidence rates involunteer blood donors. Transfusion 1997; 37: 634±640.
34. Manns A, Wilks RJ, Murphy EL et al. A prospective study of transmission by transfusion of HTLV-I andrisk factors associated with seroconversion. International Journal of Cancer 1992; 35: 91±97.
35. Lelie PN, Cuypers HTM, Reesinck HW et al. Patterns of serological markers in transfusion-transmittedhepatitis C infection using second generation HCV assays. Journal of Medical Virology 1992; 37: 203±209.
36. Mimms LT, Mosley JW, Hollinger FB et al. E�ect of concurrent acute infection with hepatitis C virus onacute hepatitis B virus infection. British Medical Journal 1993; 307: 1095±1097.
37. Petersen LR, Satten GA, Dodd R et al and the HIV Seroconversion Study Group. Duration of time fromonset of HIV-1 infectiousness to development of detectable antibody. Transfusion 1994; 34: 283±289.
*38. Busch MP, Lee LLL, Satten GA et al. Time course of detection of viral and serological markers precedingHIV-1 seroconversion; implications for blood and tissue donor screening. Transfusion 1995; 35: 91±97.
39. Niu MT, Stein DS & Schnittman SM. Primary human immunode®ciency virus type 1 infection: review ofpathogenesis and early treatment intervention in humans and animal retrovirus infections. Journal ofInfectious Diseases 1993; 168: 1490±1501.
40. Busch MP & Satten GA. Time course of viremia and antibody seroconversion following primary HIVinfection: implications for management of exposed health care workers. American Journal of Medicine1997; 102 (supplement 5B): 117±124.
Risks of transfusion-transmitted infection 647

41. Busch MP, Herman SA, Henrard DR et al. Time course and kinetics of HIV viremia during primaryinfection [abstract 38], p 60. 3rd Conference on Retroviruses and Opportunistic Infections, WashingtonDC, January, 1996.
42. Murphy KK, Henrard DR, Eichberg JW et al. Rede®ning the HIV-infectious window period in thechimpanzee model: evidence to suggest that viral nucleic acid testing can prevent blood-bornetransmission. Transfusion 1999; 39: 688±693.
43. Wright DJ, Glynn SA, Busch MP et al. A proposed new method to estimate hepatitis B incidence ratesbased on HbsAg marker [abstract S847-040F]. Transfusion 1999; 39 (supplement): 106s.
44. Masuko K, Mitsui T, Iwano K et al. Factors in¯uencing postexposure immunoprophylaxis of hepatitis Bvirus infection with hepatitis B immune globulin. High deoxyribonucleic acid polymerase activity in theinocula of unsuccessful cases. Gastroenterology 1982; 82: 502.
45. Okochi K, Satao H & Hinuma Y. A retrospective study on transmission of adult T cell leukemia virus byblood transfusion: seroconversion in recipients. Vox Sanguinis 1984; 46: 245.
46. Glynn S, Kleinman S, Schreiber GB et al. Trends in incidence and prevalence of major transfusion-transmissible viral infections in United States blood donors, 1991 to 1996. Journal of the American MedicalAssociation 2000; (in press).
*47. Janssen R, Satten GA, Stramer SL et al. New testing strategy to detect early HIV-1 infection for use inincidence estimates and for clinical and prevention purposes. Journal of the American Medical Association1998; 280: 42±48.
48. Busch MP, Rawal BD, Watenabe K et al. HIV incidence in ®rst time vs. repeat blood donors [abstractS300]. Transfusion 1998; 38 (supplement): 80s.
49. Williams AE, Thomson RA, Schreiber GB et al. Estimates of infectious disease risk factors in US blooddonors. Journal of the American Medical Association 1997; 277: 967±972.
50. Schreiber GB, Glynn SA, Busch MP et al. Do frequent donors have lower seroconversion rates? [abstractS521]. Transfusion 1999; 39 (supplement): 114s.
51. Barrera JM, Francis B, Ercilla G et al. Improved detection of anti-HCV in post-transfusion hepatitis by athird generation ELISA. Vox Sanguinis 1995; 68: 15±18.
52. Flanagan P & Barbara J. PCR testing of plasma pools: from concept to reality. Transfusion Medicine Reviews1999; 13: 164±176.
53. Stramer SL, Porter RA, Brodsky JP et al. Sensitivity of HIV and HCV RNA detection by pooled genomeampli®cation testing [abstract S259]. Transfusion 1998; 38 (supplement): 70s.
54. Busch MP, Rawal BD, Feiberg EW et al. Dynamics of HCV viremia and seroconversion in transfusionacquired HCV infections [abstract S265]. Transfusion 1998; 38 (supplement): 72s.
55. Stramer SL, Porter RA, Brodsky JP et al. Replacement of HIV-1 p24 antigen screening with HIV-1 RNAnucleic acid testing (NAT) for whole blood donations [abstract P8-020C]. Transfusion 1999; 39(supplement): 2s.
56. Gluck D, Kubanek B, Maurer C & Petersen N. Seroconversion of HIV, HCV, and HBV in blood donorsin 1996 ± risk of virus transmission by blood products in Germany. Infusionstherapie Transfusionmed 1998;25: 82±84.
*57. Courouce AM & Pillonel J. Transfusion-transmitted viral infection. New England Journal of Medicine 1996;335: 1609±1610.
58. Busch MP, Dodd RY, Lackritz EM et al. Value and cost-e�ectiveness of screening blood donors forantibody to hepatitis B core antigen as a way of detecting window-phase human immunode®ciency type1 infections. Transfusion 1997; 37: 1003±1011.
59. Busch MP, Korelitz JJ, Kleinman SH et al. Declining value of alanine aminotransferase in screening ofblood donors to prevent posttransfusion hepatitis B and C virus infection. Transfusion 1995; 35: 903±910.
60. Infectious disease testing for blood transfusions. NIH Consensus Statement 9±11 January; 13, 1±27, 1995.61. Kinloch S, Perrin L & Hirschel B. The risk of HIV transmission by screened blood [letter]. New England
Journal of Medicine 1996; 334: 992.62. Stramer SL, Waldman KJ, Brodsky JP et al. Investigational screening of whole blood donations for HIV-1
and HCV by nucleic acid testing (NAT) [abstract S381-030F]. Transfusion 1999; 39 (supplement): 84s.63. Goldman M, Juodvalkis S, Gill P & Spurll G. Hepatitis C lookback. Transfusion Medicine Reviews 1998; 12:
84±93.64. Operskalski EA, Stram DO, Lee H et al., and the Transfusion Safety Study Group. Human immuno-
de®ciency virus type 1 infection: relationship of risk group and age to rate of progression to AIDS. Journalof Infectious Diseases 1995; 172: 648±655.
65. See� LB, Beebe GW, Hoofnagle JH et al. A serologic follow-up of the 1942 epidemic of post-vaccinationhepatitis in the United States Army. New England Journal of Medicine 1991; 316: 965±970.
66. Murphy EL, Fridey J, Smith JW et al. HTLV-associated myelopathy in a cohort of HTLV-I and HTLV-II-infected blood donors. The REDS investigators. Neurology 1997; 48: 315±320.
648 S. H. Kleinman and M. P. Busch

67. Murphy EL, Glynn SA, Fridey J et al for the Retrovirus Epidemiology Donor Study. Increased incidenceof infectious diseases during prospective follow-up of human T-lymphotropic virus type II- and I-infectedblood donors. Archives of Internal Medicine 1999; 159: 1485±1491.
*68. Dodd RY. The risk of transfusion-transmitted infection. New England Journal of Medicine 1992; 327:419±420.
69. Leape LL, Brennan TA, Laird N et al. The nature of adverse events in hospitalized patients ± results ofthe Harvard Medical Practice Study II. New England Journal of Medicine 1991; 324: 377±384.
70. United States General Accounting O�ce. Blood Supply: transfusion-associated risks. GAO/PEMD-77-2,Washington DC, 1997.
71. Kleinman S. Transfusion safety decisions in the 1990s: reactions to the past. In Smit Sibinga C & Alter H(eds) Risk Management in Blood Transfusion: the Virtue of Reality, pp 81±94. Amsterdam: Kluwer AcademicPublishers, 1999.
72. AuBuchon JP, Birkmeyer JD & Busch MP. Safety of the blood supply in the United States: opportunitiesand controversies. Annals of Internal Medicine 1997; 127: 904±909.
Risks of transfusion-transmitted infection 649