The Relationship Between Companies Growth and Labour Productivity in Portuguese SMEs: A Dynamic...
20
P.M. Nunes, Z. Serrasqueiro, A. Nunes, L. Mendes ISSN 1648 - 4460 Guest Editorial TRANSFORMATIONS IN BUSINESS & ECONOMICS, Vol. 12, No 3 (30), 2013 20 Nunes, P.M., Serrasqueiro, Z., Nunes, A., Mendes, L. (2013), “The Relationship between Growth of Companies and Labour Productivity in Portuguese SMEs: A Dynamic Panel Data Approach”, Transformations in Business & Economics, Vol. 12, No 3 (30), pp.20-39. THE RELATIONSHIP BETWEEN GROWTH OF COMPANIES AND LABOUR PRODUCTIVITY IN PORTUGUESE SMES: A DYNAMIC PANEL DATA APPROACH 1 Paulo Macas Nunes Department of Management and Economics University of Beira Interior Polo IV, Estrada do Sineiro Covilhã, 6200 – 209 Portugal Tel.: +351275319600 Fax: +351275319601 E-mail: [email protected] 2 Zelia Serrasqueiro Department of Management and Economics University of Beira Interior Polo IV, Estrada do Sineiro Covilhã, 6200 – 209 Portugal Tel.: +351275319600 Fax: +351275319601 E-mail: [email protected] 3 Antonio Nunes Department of Management and Economics University of Beira Interior Polo IV, Estrada do Sineiro Covilhã, 6200 – 209 Portugal Tel.: +351275319600 Fax: +351275319601 E-mail: [email protected] 4 Luis Mendes Department of Management and Economics University of Beira Interior Polo IV, Estrada do Sineiro Covilhã, 6200 – 209 Portugal Tel.: +351275319600 Fax: +351275319601 E-mail: [email protected] 1 Paulo Macas Nunes, PhD in Economics, Assistant Professor at the Department of Management and Economics of Beira Interior University and Researcher in CEFAGE Research Center at Évora University. Prof. Paulo Macas Nunes is graduate of Economics in 1995 at Évora University; also received Master in Economics in 1999 at Beira Interior University and Economics PhD in 2002 at Beira Interior University. 2 Zelia Serrasqueiro, PhD in Management, Assistant Professor at the Department of Management and Economics to Beira Interior University and Researcher in CEFAGE Research Center at Évora University. Profª Zelia Serrasqueiro is graduate in Management in 1988 at Superior Institute of Economics and Management, Lisbon; Postgraduate in European Doctoral Programme in Small Business and Entrepreneurship, 1995-1996, Spain/Sweden and Management PhD in 2001 at Beira Interior University. 3 Antonio Nunes, PhD in Management, Assistant Professor at the Department of Management and Economics of Beira Interior University and Researcher at NECE Research Center of Beira Interior University. Prof. Antonio Nunes is graduate in Management in 1993 at Catholic University at Viseu; and received PhD in Management at Beira Interior University in 2007. ---------TRANSFORMATIONS IN -------- BUSINESS & ECONOMICS © Vilnius University, 2002-2013 © Brno University of Technology, 2002-2013 © University of Latvia, 2002-2013
Transcript of The Relationship Between Companies Growth and Labour Productivity in Portuguese SMEs: A Dynamic...

P.M. Nunes, Z. Serrasqueiro,
A. Nunes, L. Mendes
ISSN 1648 - 4460
Guest Editorial
TRANSFORMATIONS IN BUSINESS & ECONOMICS, Vol. 12, No 3 (30), 2013
20
Nunes, P.M., Serrasqueiro, Z., Nunes, A., Mendes, L. (2013), “The
Relationship between Growth of Companies and Labour Productivity in
Portuguese SMEs: A Dynamic Panel Data Approach”, Transformations
in Business & Economics, Vol. 12, No 3 (30), pp.20-39.
THE RELATIONSHIP BETWEEN GROWTH OF COMPANIES
AND LABOUR PRODUCTIVITY IN PORTUGUESE SMES: A
DYNAMIC PANEL DATA APPROACH 1Paulo Macas Nunes
Department of Management and
Economics
University of Beira Interior
Polo IV, Estrada do Sineiro Covilhã,
6200 – 209
Portugal
Tel.: +351275319600
Fax: +351275319601
E-mail: [email protected]
2Zelia Serrasqueiro
Department of Management and
Economics
University of Beira Interior
Polo IV, Estrada do Sineiro
Covilhã, 6200 – 209
Portugal
Tel.: +351275319600
Fax: +351275319601
E-mail: [email protected]
3Antonio Nunes
Department of Management and
Economics
University of Beira Interior
Polo IV, Estrada do Sineiro
Covilhã, 6200 – 209
Portugal
Tel.: +351275319600
Fax: +351275319601
E-mail: [email protected] 4
Luis Mendes Department of Management and
Economics
University of Beira Interior
Polo IV, Estrada do Sineiro Covilhã,
6200 – 209
Portugal
Tel.: +351275319600
Fax: +351275319601
E-mail: [email protected]
1Paulo Macas Nunes, PhD in Economics, Assistant Professor at
the Department of Management and Economics of Beira Interior
University and Researcher in CEFAGE Research Center at
Évora University. Prof. Paulo Macas Nunes is graduate of
Economics in 1995 at Évora University; also received Master in
Economics in 1999 at Beira Interior University and Economics
PhD in 2002 at Beira Interior University.
2Zelia Serrasqueiro, PhD in Management, Assistant Professor
at the Department of Management and Economics to Beira
Interior University and Researcher in CEFAGE Research Center
at Évora University. Profª Zelia Serrasqueiro is graduate in
Management in 1988 at Superior Institute of Economics and
Management, Lisbon; Postgraduate in European Doctoral
Programme in Small Business and Entrepreneurship, 1995-1996,
Spain/Sweden and Management PhD in 2001 at Beira Interior
University.
3Antonio Nunes, PhD in Management, Assistant Professor at
the Department of Management and Economics of Beira Interior
University and Researcher at NECE Research Center of Beira
Interior University. Prof. Antonio Nunes is graduate in
Management in 1993 at Catholic University at Viseu; and
received PhD in Management at Beira Interior University in
2007.
---------TRANSFORMATIONS IN --------
BUSINESS & ECONOMICS
© Vilnius University, 2002-2013
© Brno University of Technology, 2002-2013 © University of Latvia, 2002-2013

P.M. Nunes, Z. Serrasqueiro,
A. Nunes, L. Mendes
ISSN 1648 - 4460
Guest Editorial
TRANSFORMATIONS IN BUSINESS & ECONOMICS, Vol. 12, No 3 (30), 2013
21
4Luis Mendes, PhD in Management, Assistant Professor at the
Department of Management and Economics at Beira Interior
University and Researcher at NECE Research Center of Beira
Interior University. Prof. Luis Mendes is graduate in
Management in 1991 at Beira Interior University; received
Master in Management at Beira Interior University in 1996 and
acquired PhD in Management at Beira Interior University in
2005.
Received: April, 2009
1st Revision: January, 2010
2nd
Revision: September, 2011
Accepted: March, 2012
ABSTRACT. In this study, applying various dynamic panel
estimators and considering three measures of company growth, we
find that there is a positive relationship between growth and labour
productivity in small and medium-sized Portuguese companies.
Based on the results obtained, we can conclude that labour
productivity is persistent over time and Portuguese small and
medium-sized companies with higher levels of debt and liquidity and
lower levels of tangible assets have greater labour productivity
values. The results suggest greater relevance of motivation, efficiency
and giving employees responsibility, when faced with the possible
breakdown of informal labour relationships as a consequence of
increased company growth.
KEYWORDS: companies growth, dynamic panel data, labor
productivity, SME.
JEL classification: C13, G32, J24.
Introduction
The study of Greiner (1972) indicates that the relationship between growth and
productivity companies can be positive or negative, depending on the effect they can have on
growth business organization. On the one hand, the motivation of employees can be a
determining factor for the growth of SMEs would result in increased labour productivity. On
the other hand, the possibility of breaking the informal relationships that exist especially in
smaller firms, may contribute to the growth of SMEs, with the consequent breakdown of
informal relationships among workers, contributing to the decrease in their productivity levels
(Greiner, 1972).
The major formality in labour relationships, as a consequence to greater size,
contributes negatively to labour productivity (Rollag, 2001). According Rollag (2001) is
necessary owners/managers motivate the employees in order to avoid that larger size do not
contribute to reduction of labour productivity, as a consequence to greater formality of labour
relationships.
Labour factor are a greater relevance in SMEs context (Heskel, 1999). In Portugal,
SMEs are represented 99.5% of total companies, contributed to greater employment and to
economic growth (Instituto Nacional de Estatística, 2004). The empirical studies about growth
influence on company performance do not consider the labour productivity as measure of
company performance. For example, the studies by Adams, Buckle (2003) and Goddard et al.
(2005) consider financial profitability, measured by the ratio between operational results and
total assets, as a measure of company performance. Considering that growth and labour

P.M. Nunes, Z. Serrasqueiro,
A. Nunes, L. Mendes
ISSN 1648 - 4460
Guest Editorial
TRANSFORMATIONS IN BUSINESS & ECONOMICS, Vol. 12, No 3 (30), 2013
22
productivity are particular relevance in SMEs context, this paper aims to fill this gap in the
empirical literature, analyzing the influence of growth in labour productivity. For this
purpose, we use a sample of 51 SMEs, and to estimate the results we use the GMM system
(1998) and LSDVC (2005) dynamic estimators. Dependent variable is labour productivity,
measured by the ratio between gross value added and number of employees. To measure
growth we consider three variables, generally used in the literature, i.e.:
1) assets growth;
2) sales growth;
3) employees growth.
Initially we only test the relationship between growth and labour productivity, the
principal aims of this study, using three measures of growth to test the robustness of the
relationship between growth and labour productivity, i.e. checking if that relationship is
independent of the growth measurement used. In order to test the robustness of the
relationship between growth and labour productivity previously estimated, and enriching the
analysis of paper, we consider other possible independent variables of labour productivity.
The remaining independent variables considered in the paper are:
1) labour productivity in the previous period;
2) debt;
3) liquidity;
4) assets tangibility;
5) ownership control by foreigners.
After the present introduction this study is organised as follows,: in section 2 we
present a review of the literature, highlighting the relationship between growth and labour
productivity in SMEs, and we establish the hypotheses for investigation; in section 3 we
introduce the database used in this study and the methodology; in section 4 we display the
results obtained; in section 5 we discuss the results obtained, checking validity of the
investigation hypotheses previously set out in section 2; and finally, in section 6 we offer the
main conclusions of this study.
1. Review of the Literature and Research Hypotheses
This section begins with a review of literature and proceeds to present the hypotheses
for investigation, concerning the relationship between labour productivity and its possible
explanatory variables, highlighting the relationship between company growth and labour
productivity in SMEs.
1.1 Growth
Various authors (Low, MacMillan, 1988; Storey, 1994; Baum et al., 2001) conclude
that the business success is a consequence of company growth.
The higher levels of vertical integration and diversifying activities and higher
diversifying of the product as a consequence of high rates of company growth (Delmar et al.,
2003). On this subject, Rogers (2004) conclude that the greater performance is consequence
the possibility of higher investments in innovation, consequence of greater size of companies.
As from certain level of scale, the marginal increase in performance of companies is
becoming smaller as the size increases (Russeeuw, 1997). In this respect, concludes Yoon
P.M. Nunes, Z. Serrasqueiro,
A. Nunes, L. Mendes
ISSN 1648 - 4460
Guest Editorial
TRANSFORMATIONS IN BUSINESS & ECONOMICS, Vol. 12, No 3 (30), 2013
23
(2004) that considerable increases in growth may result in the decreased performance of the
companies, if this growth contributes to firm size exceeds its optimal size.
On the one hand, managers and owners expect additional economic gains as a
consequence of companies growth. On the other hand, the greater growth can lead to
uncertainty, consequence to the possibility of control ownership by outsider owners, which
may lead to decrease labour productivity (Davidsson, 1989; Delmar et al., 2003; Wiklund et
al., 2003).
Wiklund et al. (2003) conclude that the labour informal relations are particularly
relevant in the context of smaller firms. According to the authors, the growth increase may
become unviable this informal labour relationships, and such contribute to the reduction in
labour productivity. In this context, Rogers (2004) concluded that the greater rigidity of
labour relations in the context of larger companies may contribute to reduction of labour
productivity; therefore, not necessarily growth contributes to the increase of labour
productivity. Also according to Rogers (2004) the smallest organizational rigidity that
characterizes smaller companies can contribute to this type of companies are more efficiently
enjoy good investment opportunities, associated with innovation process, contributing to
increased labour productivity.
According to Greiner (1972) the effects of growth on labour productivity may be
positive or negative. If growth is associated with an increased motivation of employees due to
the expectation of higher future earnings, and informal relationships between employees is not
substantially affected, then growth can contribute into increased labour productivity. If growth
contributes into a less efficient control of the action of employees by owners/managers, and
also a relevant breaking of informal labour relationships, then growth may contribute to lower
labour productivity.
The conclusions of Greiner (1972) are corroborated by Rollag (2001). The author
refers that when SMEs growth is substantial, resulting in significant organizational changes,
the owners/managers of SMEs should motivate and assign responsibilities to employees,
contributing to such that there are no decline in labour productivity.
The empirical evidence about the growth influence on performance in SMEs context,
although considering operational results as measure of performance, indicates a positive, or a
not statistically, relationship between growth and performance. Chandler, Jensen (1992),
Wiklund (1999), Mendelson (2000) and Cowling (2004), obtain a positive relationship
between growth and performance. Already, Roper (1999) and Markman, Gartner (2002), find
a not statistically relationship between growth and performance.
Considering the theoretical arguments in favour of the positive relationship between
growth and performance as relevant, and most of the existing empirical evidence which
mostly indicates the existence of a positive relationship between growth and performance in
SMEs, although not considering labour productivity as a measure of performance, the
following hypothesis has been established:
H1: There is a positive relationship between growth and labour productivity in SMEs.
1.2 Other Variables
Relationship between Labour Productivity in previous and current periods. Dilling –
Hansen (2005) defines that SMEs have less continuity of performance between previous and
current periods, in comparison with continuity of performance in large companies. According
to the author, company scale is crucial to successfully cope with possible alterations in the

P.M. Nunes, Z. Serrasqueiro,
A. Nunes, L. Mendes
ISSN 1648 - 4460
Guest Editorial
TRANSFORMATIONS IN BUSINESS & ECONOMICS, Vol. 12, No 3 (30), 2013
24
economic and competitive environment. The greater ability of large companies to cope with
those changes, compared to the ability of small companies, means greater continuity of
performance.
Nevertheless, Hawawini et al. (2003) and Schumacher, Boland (2005) claim that
continuity of company performance relates to the fact of companies trying to find a level of
performance that is adapted to specific characteristics of each individual company and of the
market it belongs to. The authors conclude that size and the sector companies belong to will
not be particularly relevant aspects in explaining different levels of performance.
Results about the study of continuity of performance have completely neglected labour
productivity, considering profitability of a company as a measure of performance. Fu et al.
(2002) find continuity of performance in a sample of small Thai companies. Goddard et al.
(2005), although not specifically speaking about SMEs, also find continuity of performance in
a sample of Belgian, French, Italian, Spanish and British firms. Finally, Gschwandtner (2005)
finds continuity of performance in firms in the United States.
Although the theoretical arguments and empirical evidence do not specifically relate to
labour productivity as a measure of performance, the following hypothesis has been
formulated:
H2: There is persistence of labour productivity in SMEs.
Debt. Jensen (1986), Berger et al. (1995), Wells et al. (1995) and Adams (1996) argue
that greater level of company debt contributes to increased efficiency in allocating resources.
According to the authors, a higher level of debt originates a reduction in available funds,
because of the obligation to pay off the debt and respective financial costs, forcing managers
to allocate resources more efficiently.
Jensen (1986) concludes that a higher level of company debt can contribute to increase
in labour productivity. According to the author, increased use of debt augments the possibility
of company bankruptcy. Realizing this, managers will be more efficient in monitoring
employees, as in case of bankruptcy they stand to lose more than owners. In this respect
Geroski et al. (2005) claims that increased debt means greater financial discipline, this being
an incentive for increased productivity.
Greiner (1972) argues that when SMEs face financial restrictions, there tends to be
more employee collaboration and commitment, and that greater collaboration and
commitment contributes to increased labour productivity.
While not specifically about SMEs, the studies by Schiantarelli, Sembenelli (1997), of
British and Italian companies, and by Smith et al. (2004) of Danish companies, show a
positive relationship between debt and labour productivity, although this relationship is not
very significant in the latter study.
On the basis of theoretical arguments and empirical results, the following hypothesis
has been formulated:
H3: There is a positive relationship between debt and labour productivity in SMEs.
Liquidity. SMEs being more subject to a greater level of business risk, compared to
large companies, demonstrate that a greater level of liquidity can be quite relevant in meeting
short-term commitments.
Although it does not only refer to SMEs, empirical results show a positive relationship
between liquidity and productivity. Firstly, considering the total productivity of production
factors as a measure of performance, Geroski et al. (2005), for British companies, obtain a
positive relationship between company liquidity and productivity. Secondly, Schiantarelli,
Sembenelli (1997), for British and Italian companies, and Smith et al. (2004), for Danish

P.M. Nunes, Z. Serrasqueiro,
A. Nunes, L. Mendes
ISSN 1648 - 4460
Guest Editorial
TRANSFORMATIONS IN BUSINESS & ECONOMICS, Vol. 12, No 3 (30), 2013
25
companies, considering specifically labour productivity as a measure of performance, also
obtain a positive relationship between liquidity and productivity.
Considering the empirical evidence, although not specifically regarding SMEs, the
following hypothesis has been formulated:
H4: There is a positive relationship between liquidity and labour productivity in
SMEs.
Asset Structure. Company asset structure is a relevant variable in explaining
performance values. Relying on the conclusions of Nucci et al. (2005), companies with a
higher percentage of intangible assets are the ones most prone to innovating activities. The
authors claim that expenses on innovation can be fundamental for improving company
performance values.
Cressy, Olofsson (1996) argue that SMEs normally have lower levels of fixed assets,
compared to the level of fixed assets of large companies.
Although it does not relate to SMEs only, Schiantarelli, Sembenelli (1997) for British
and Italian firms and Smith et al. (2004) for Danish firms, considering labour productivity as
a measure of performance, obtain a negative relationship between the level of tangible assets
and productivity.
When considering the total productivity of production factors, as a measure of
company performance, the results are various. Nucci et al. (2005) obtain a positive
relationship between the level of intangible assets and total productivity of production factors,
considering a sample of Italian firms. However, Geroski et al. (2005), considering a sample of
British firms, obtain a statistically insignificant relationship between innovation activities,
measuring innovation activities by the number of patents, and total productivity of production
factors.
Considering the theoretical arguments set out above and empirical evidence of the
relationship between the level of tangible assets and labour productivity, the following
hypothesis has been formulated:
H5: There is a negative relationship between the level of tangible assets and labour
productivity in SMEs.
Ownership of Capital. Various authors consider foreign investment in companies to be
relevant, as a means to encourage growth and increase efficiency in the allocation of
resources. In this respect, Berger et al. (1992) define that firms with a significant percentage
of foreign capital tend to invest more efficiently since they are more able to diversify
investments and have more experience in obtaining high levels of performance. According to
Goedhuys et al. (2006) firms with foreign ownership can establish linkages that stimulate the
transfer of production or organisational capabilities and generate higher levels of productivity.
Not concentrating on SMEs only, and considering profitability as a measure of
performance, empirical results show a positive relationship between control and performance
of foreign ownership, as, for example, in the studies by Berger et al. (1992) regarding
companies in the United States, Joseph, Hewins (1997) considering companies in the United
Kingdom, and Adams, Buckle (2003) for companies in Bermuda.
Based on theoretical arguments and empirical results, although not relying on SMEs
only, and considering profitability rather than labour productivity as a measure of
performance, the following hypothesis has been formulated:
H6: There is a positive relationship between control of foreign ownership and labour
productivity in SMEs.
P.M. Nunes, Z. Serrasqueiro,
A. Nunes, L. Mendes
ISSN 1648 - 4460
Guest Editorial
TRANSFORMATIONS IN BUSINESS & ECONOMICS, Vol. 12, No 3 (30), 2013
26
2. Database and Methodology
2.1 Database
In this study we use the database from the Exame Journal, a Portuguese branch of Dun
& Bradstreet Consultants, concerning the 500 best Portuguese companies. The companies
making up the database are initially selected annually considering volume of sales. After an
initial selection, companies are selected according to a set of criteria, including growth of
sales, growth of net results, sales profitability determined by current results, gross added value
per sales, solvency and other economic and financial indicators.
The time period of the study covers the years between 1999 and 2003, due to the
absence of information of previous years regarding capital and asset structure of companies.
Given the need to use dynamic estimators to test the robustness of results and analyse the
influence of the dynamism of explanatory variables on SMEs labour productivity, a uniform
panel has been chosen.
Consideration of a non-uniform panel could make it impossible for certain companies
that were not present in every year to analyse inter-temporal effects. As Arellano, Bond
(1991) claim, for the total number of companies in a given sample to be considered under the
econometric analysis and second-order autocorrelation tests, which are essential to validate
the robustness of results, their presence in the database is necessary over a determined number
of consecutive years, otherwise those companies would be eliminated from the econometric
analysis, so we could be interpreting data for a certain number of companies and that number
would necessarily be lower as a consequence of the possibility of not all being present over a
determined number of consecutive years.
At a first stage the companies that belong to the database made up of the 500 best
companies selected by the Exame Review have been chosen. So we obtain a panel made up of
162 companies, which are firms remaining on the database of the 500 best firms in the Exame
Review carried out annually in the period between 1999 and 2003.
At a second stage small and medium-sized companies from the 162 companies
initially selected have been chosen. For this selection we consider the criteria established by
the European Commission in 1996: 1) assets should not above 27 million Euros; 2) volume of
sales or business should not exceed 40 million Euros; and finally 3) there cannot be more than
250 employees. After combining these three criteria we select 51 SMEs that are on the
database for the whole period under analysis. The total number of observations is 255.
The main aim of this study is to analyse the impact of growth of SMEs on labour
productivity. For this objective to be achieved, we use three measures of growth usually
presented in the literature: 1) asset growth; 2) sales growth; and 3) increase in number of
employees. Therefore, we can find out if the relationship between growth and labour
productivity is dependent or not on the measure of growth used.
In this study, we also use control variables in order: 1) to analyse the robustness of the
results obtained previously concerning the relationship between growth and labour
productivity, seeing if there are no significant changes in the magnitude and significance of
the estimated parameters; 2) to enhance the analysis by introducing other variables that could
explain labour productivity.

P.M. Nunes, Z. Serrasqueiro,
A. Nunes, L. Mendes
ISSN 1648 - 4460
Guest Editorial
TRANSFORMATIONS IN BUSINESS & ECONOMICS, Vol. 12, No 3 (30), 2013
27
Table 1. Measurement of variables
Variables Measurement
Dependent variables
Labour Productivity ( tiPROL ,. ) Ratio between VAG and Number of Employees
Independent variables
Company Growth1( tiGRO ,1 ) Growth of Total Assets
Company Growth2 ( tiGRO ,2 ) Growth of Sales
Company Growth3 ( tiGRO ,3 ) Growth of Number of Employees
Debt ( tiLEV , ) Ratio between Total Liabilities and Total Assets
Liquidity ( tiLIQ , ) Ratio between Current Assets and Short-Term Liabilities
Asset Structure ( tiTANG , ) Ratio between Fixed Assets and Total Assets
Shareholder Control ( tiOWN , ) Dummy Variable that assumes the value of 1 if shareholder
control belongs to foreigners and value 0 otherwise
Source: Table created by authors.
We consider possible explanatory variables for labour productivity, as well as three
measures of growth and labour productivity used for the previous period. Hence, these all
refer to 1) size; 2) level of debt; 3) liquidity; 4) asset structure; and 5) ownership control.
Used variables and corresponding measurement are presented in Table 1.
2.2 Methodology
In this study, not only the impact of growth of the firm and other variables on the
labour productivity of Portuguese SMEs is considered; it is also expected to find out if that
labour productivity persists over time.
For the aim to be achieved, the most suitable methodology relates to dynamic panel
estimators, rather than using static panel models which could lead to bias of the estimated
parameters.
Firstly, considering three previously mentioned measures of growth we present the
relationship between SMEs growth and labour productivity. Then we add previously
considered remaining variables as having a possible influence on labour productivity.
Therefore, we have:
Model I
titittititi eudGROPROLPROL ,,,11,0, *.. ; (1)
Model II
titittiti
tititititi
eudOWNTANG
LIQLEVGROPROLPROL
,,,5,4
,3,2,11,0, *..
, (2)
in which: tiPROL ,. is labour productivity of the current period; 1,. tiPROL is labour
productivity of the previous period; tiGRO ,* is company growth during the current
period; tiLEV , is debt of the current period; tiLIQ , is liquidity of the current period; tiTANG , is
asset structure of the current period; tiOWN , is a dummy variable measuring ownership
control of the current period; td are the dummy variables measuring the effects of possible

P.M. Nunes, Z. Serrasqueiro,
A. Nunes, L. Mendes
ISSN 1648 - 4460
Guest Editorial
TRANSFORMATIONS IN BUSINESS & ECONOMICS, Vol. 12, No 3 (30), 2013
28
macroeconomic changes on labour productivity; tiu , are non-observable individual effects;
and tie , is the random error which is assumed to have normal distribution.
If we estimated equations (1) and (2) using static panel models, admitting or not
correlation between non-observable individual effects and the determinants of labour
productivity, given the correlation existing between tiu , and 1,. tiPRODL and between tie , and
1,. tiPRODL , we would obtain biased and inconsistent estimates of the estimated parameters,
since correlation of non-observable individual effects and the error in labour productivity of
the previous period can lead to bias of the estimated parameters.
For one thing, the use of dynamic estimators, given the use of the dependent and
independent variable lags as instruments, allows us to eliminate companies‟ unobservable
individual effects, eliminating in this way the correlation existing between tiu , and
1,. tiPRODL . For another, use of lagged dependent and independent variables also allows for
the creation of orthogonal conditions, eliminating the correlation between tie , and
1,. tiPRODL .
According to Arellano, Bond (1991), the use of dynamic estimators, given the use of
lagged explanatory variables as instruments, has the added advantage of controlling possible
endogeneity between explanatory variables in comparison with static panel models.
Arellano, Bond (1991) proposes equations (1) and (2) to be considered taking the first-
difference estimator, and using the lagged dependent and independent variables in levels as
instruments. This estimator became known as GMM (1991).
Nevertheless, in cases where we find continuity of the dependent variable with high
correlation between the dependent variable of the current and previous periods, and the
number of cross-sections is not very high; according to Blundell, Bond (1998) the GMM
(1991) estimator may not be very efficient. Considering a system of stepped variables and
first-differences Blundell, Bond (1998) proposes a new estimator. The dynamic estimator
proposed by Blundell, Bond (1998), became known as GMM system (1998).
With the aim to test validity of the restrictions in the case of the GMM (1991) dynamic
estimator the Sargan test is used, , and, in the case of the GMM system (1998) dynamic
estimator, considering one and two stages when using the GMM system (1998) dynamic
estimator, the Hansen test is applied.
In this study, we test for the existence of the first-order and the second-order
autocorrelation. The null hypothesis is non-existence of autocorrelation, against the alternative
hypothesis of existence of autocorrelation. In the case of rejecting the null hypothesis of non-
existence of the second-order autocorrelation, we conclude that the results of the dynamic
estimators cannot be considered valid.
Taking advantage of recent developments concerning dynamic estimators, we
introduce the LSDVC (Least Square Dummy Variable Corrected) dynamic estimator,
proposed by Bruno (2005). Bruno (2005) defines that in cases where the number of
observations is not very high, use of the GMM (1991) and dynamic estimators of the GMM
system (1998), given the high number of instruments generated when compared to the number
of observations, can lead to biased estimates of the parameters. Because of a rather low
number of observations in this study, we present the results of the LSDVC (2005) estimator,
so as to test the robustness of the results obtained using the GMM (1991) and dynamic
estimators of the GMM system (1998).

P.M. Nunes, Z. Serrasqueiro,
A. Nunes, L. Mendes
ISSN 1648 - 4460
Guest Editorial
TRANSFORMATIONS IN BUSINESS & ECONOMICS, Vol. 12, No 3 (30), 2013
29
3. Results
3.1 Descriptive Statistics
Results concerning descriptive statistics of the variables used in this study are
presented in Table 2.
Table 2. Descriptive Statistics
.VAR .OBSER MEAN ..DS .MIN .MAX
itPRODL.
255 60.838 68.657 1.6521 324.69
itGRO1
255 0.6390 0.9807 -0.6227 2.3199
itGRO2
255 0.8669 1.7220 -0.5863 2.1516
itGRO3
255 0.1471 0.1851 -1.5339 1.4263
itLEV
255 0.5482 0.2127 0.0848 1.0743
itLIQ
255 1.7619 1.3331 0.2846 11.646
itTANG
255 0.3887 0.2410 0.0062 0.9004
itOWN
255 0.2941 0.4565 0 1
Source: Table created by authors.
Observing the results of the descriptive statistics, we see that labour productivity
shows some volatility, since standard deviation of the variable is above average, the
difference between the minimum and maximum value being pronounced. Three measures of
company growth, i.e. 1) asset growth; 2) sales growth; and 3) increase in number of
employees, also show some volatility, since standard deviations are also above the respective
average, and there is also a pronounced difference between minimum and maximum values.
Concerning the control variables used in this study, we can conclude that they do not show
high volatility, since standard deviations are under the respective average, with the exception
of the variable measuring ownership control, the volatility in this specific case resulting from
the fact it is a binary variable.
3.2 Results of the Dynamic Panel Estimators
Initially, we present the results considering only the relationship between the various
measures of growth and labour productivity. Afterwards, we present the results of the
relationship between the various measures of growth and labour productivity but adding
control variables.
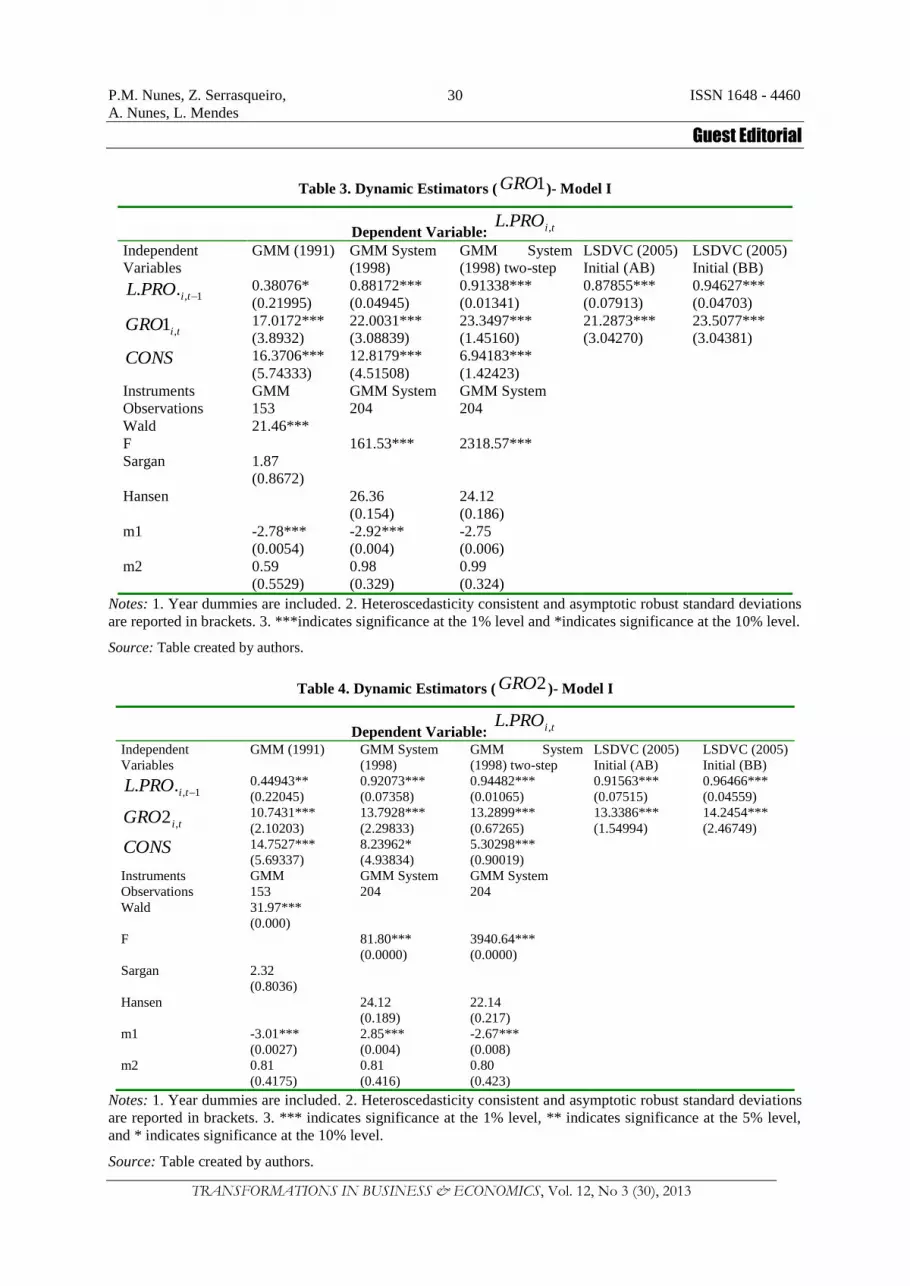
Results of Model I: In the Table 3, Table 4, Table 5 we present the results of the
relationship between the various measures of growth and labour productivity used in this
study.
P.M. Nunes, Z. Serrasqueiro,
A. Nunes, L. Mendes
ISSN 1648 - 4460
Guest Editorial
TRANSFORMATIONS IN BUSINESS & ECONOMICS, Vol. 12, No 3 (30), 2013
30
Table 3. Dynamic Estimators ( 1GRO )- Model I
Dependent Variable: tiPROL ,.
Independent
Variables
GMM (1991) GMM System
(1998)
GMM System
(1998) two-step
LSDVC (2005)
Initial (AB)
LSDVC (2005)
Initial (BB)
1,.. tiPROL
0.38076*
(0.21995)
0.88172***
(0.04945)
0.91338***
(0.01341)
0.87855***
(0.07913)
0.94627***
(0.04703)
tiGRO ,1
17.0172***
(3.8932)
22.0031***
(3.08839)
23.3497***
(1.45160)
21.2873***
(3.04270)
23.5077***
(3.04381)
CONS 16.3706***
(5.74333)
12.8179***
(4.51508)
6.94183***
(1.42423)
Instruments GMM GMM System GMM System
Observations 153 204 204
Wald 21.46***
F 161.53*** 2318.57***
Sargan 1.87
(0.8672)
Hansen 26.36
(0.154)
24.12
(0.186)
m1 -2.78***
(0.0054)
-2.92***
(0.004)
-2.75
(0.006)
m2 0.59
(0.5529)
0.98
(0.329)
0.99
(0.324)
Notes: 1. Year dummies are included. 2. Heteroscedasticity consistent and asymptotic robust standard deviations
are reported in brackets. 3. ***indicates significance at the 1% level and *indicates significance at the 10% level.
Source: Table created by authors.
Table 4. Dynamic Estimators ( 2GRO )- Model I
Dependent Variable: tiPROL ,.
Independent
Variables
GMM (1991) GMM System
(1998)
GMM System
(1998) two-step
LSDVC (2005)
Initial (AB)
LSDVC (2005)
Initial (BB)
1,.. tiPROL
0.44943**
(0.22045)
0.92073***
(0.07358)
0.94482***
(0.01065)
0.91563***
(0.07515)
0.96466***
(0.04559)
tiGRO ,2
10.7431***
(2.10203)
13.7928***
(2.29833)
13.2899***
(0.67265)
13.3386***
(1.54994)
14.2454***
(2.46749)
CONS 14.7527***
(5.69337)
8.23962*
(4.93834)
5.30298***
(0.90019)
Instruments GMM GMM System GMM System
Observations 153 204 204
Wald 31.97***
(0.000)
F 81.80***
(0.0000)
3940.64***
(0.0000)
Sargan 2.32
(0.8036)
Hansen 24.12
(0.189)
22.14
(0.217)
m1 -3.01***
(0.0027)
2.85***
(0.004)
-2.67***
(0.008)
m2 0.81
(0.4175)
0.81
(0.416)
0.80
(0.423)
Notes: 1. Year dummies are included. 2. Heteroscedasticity consistent and asymptotic robust standard deviations
are reported in brackets. 3. *** indicates significance at the 1% level, ** indicates significance at the 5% level,
and * indicates significance at the 10% level.
Source: Table created by authors.

P.M. Nunes, Z. Serrasqueiro,
A. Nunes, L. Mendes
ISSN 1648 - 4460
Guest Editorial
TRANSFORMATIONS IN BUSINESS & ECONOMICS, Vol. 12, No 3 (30), 2013
31
Table 5. Dynamic Estimators ( 3GRO )- Model I
Dependent Variable: tiPROL ,.
Independent
Variables
GMM (1991) GMM System
(1998)
GMM System
(1998) two-step
LSDVC (2005)
Initial (AB)
LSDVC (2005)
Initial (BB)
1,.. tiPROL
-0.01600
(0.171683)
0.78042***
(0.05209)
0.80612***
(0.02844)
0.71427***
(0.08969)
0.68344***
(0.05276)
tiGRO ,3
61.0374***
(17.6889)
59.9377***
(18.0530)
55.04599***
(3.23411)
64.2099***
(13.3473)
63.4171***
(6.5482)
CONS 23.8239***
(4.92143)
30.1421***
(4.17869)
23.2466***
(2.69375)
Instruments GMM GMM System GMM System
Observations 153 204 204
Wald 13.50***
(0.0000)
F 117.02***
(0.0000)
1545.25***
(0.0000)
Sargan 2.12
(0.829)
Hansen 11.41
(0.478)
10.79
(0.508)
m1 -0.89
(0.3755)
-6.61***
(0.000)
-3.31***
(0.001)
m2 -0.76
(0.4474)
1.14
(0.256)
1.42
(0.156)
Notes: 1. Year dummies are included. 2. Heteroscedasticity consistent and asymptotic robust standard deviations
are reported in brackets. 3. *** indicates significance at the 1% level.
Source: Table created by authors.
Observing the results of the Sargan, Hansen tests, in all estimations, we can conclude
that we cannot reject the null hypotheses suggesting that the restrictions, generated by use of
the instruments, are valid.
The results of the second-order autocorrelation tests, in all estimations, indicate that
we cannot reject the null hypotheses of absence of the second-order autocorrelation.
Therefore, considering the results of the Sargan, Hansen tests, as well as the results of
the second-order autocorrelation tests, we can conclude that application of the GMM (1991)
and dynamic estimators of the GMM system (1998) in one stage, and dynamic estimator of
the GMM system (1998) in two stages, lead us to results which can be interpreted due to their
validity.
The results obtained from application of the LSDVC (2005) dynamic estimator
corroborate those obtained using the GMM (1991) and dynamic estimators of the GMM
system (1998) in one stage and dynamic estimator of the GMM system (1998) in two stages.
The exception concerns use of the GMM (1991) dynamic estimator, where: the relationship
between labour productivity of the previous period and labour productivity of the current
period is not statistically significant, when we consider the increase in the number of
employees; it relates to 10% statistical significance with reference to asset growth; and it is
statistically significant at 5% significance when considering growth of sales. As Blundell and
Bond (1998) claim, these results are obtained possibly due to the high persistence of the
dependent variable. Calculating the correlation coefficient between labour productivity of the
previous period and labour productivity of the current period, we obtain a value of 0.7614.
Given a rather low number of periods and high continuity of the dependent variable, there will
be some bias of the estimated parameter that measures the relationship between labour
productivity in the previous and current periods. We should note that when we apply the

P.M. Nunes, Z. Serrasqueiro,
A. Nunes, L. Mendes
ISSN 1648 - 4460
Guest Editorial
TRANSFORMATIONS IN BUSINESS & ECONOMICS, Vol. 12, No 3 (30), 2013
32
LSDVC (2005) dynamic estimator, correcting the results of the GMM (1991) dynamic
estimator, the estimated parameters are close to those obtained using the GMM system (1998)
dynamic estimator in terms of their magnitude and statistical significance.
Results of Model II: The results obtained by adding the remaining variables used in
this study are presented in the Table 6, Table 7, Table 8.
Table 6. Dynamic Estimators ( 1GRO )- Model II
Dependent Variable: tiPROL ,.
Independent
Variables
GMM (1991) GMM System
(1998)
GMM System
(1998) two-step
LSDVC (2005)
Initial (AB)
LSDVC (2005)
Initial (BB)
1,. tiPROL
0.28828
(0.23694)
0.762957***
(0.08961)
0.773025***
(0.02853)
0.70296***
(0.10613)
0.806490***
(0.05874)
tiGRO ,1
9.04937
(7.0034)
20.1385***
(4.32813)
19.77607***
(1.46905)
17.1964***
(3.61371)
19.9254***
(3.36841)
tiLEV ,
76.0486**
(35.3360)
68.4952***
(26.2602)
57.81226***
(9.09566)
73.5474***
(27.3370)
74.2307***
(28.3192)
tiLIQ ,
13.3757***
(4.69600)
12.72468***
(3.47423)
11.77648***
(1.00931)
10.90971***
(2.73149)
11.3649***
(2.84815)
tiTANG ,
-63.1658**
(27.4201)
-45.06161***
(16.9532)
-48.60614***
(2.63414)
-69.1731***
(20.0801)
-65.1397***
(20.6686)
tiOWN ,
0.55906
(46.2889)
27.86838**
(12.9075)
26.31384***
(1.75692)
-20.6098
(40.7654)
-29.1968
(36.2639)
CONS 6.399066
(6.48842)
-31.12415
(73.2621)
-34.8948***
(8.02839)
Instruments GMM GMM System GMM System
Observations 153 204
Wald 45.21***
(0.000)
F 43.04***
(0.0000)
9711.52***
(0.0000)
Sargan 6.86
(0.2309)
Hansen 43.06
(0.195)
45.65
(0.362)
m1 -2.07***
(0.0381)
-2.35***
(0.019)
-2.65***
(0.008)
m2 0.98
(0.3263)
0.78
(0.434)
0.86
(0.392)
Notes: 1. Year dummies are included. 2. Heteroscedasticity consistent and asymptotic robust standard deviations
are reported in brackets. 3. *** indicates significance at the 1% level and ** indicates significance at the 5%
level.
Source: Table created by authors.
Table 7. Dynamic Estimators ( 2GRO )- Model II
Dependent Variable: tiPROL ,.
Independent
Variables
GMM (1991) GMM System
(1998)
GMM System
(1998) two-step
LSDVC (2005)
Initial (AB)
LSDVC (2005)
Initial (BB)
1,. tiPROL
0.37107
(0.25585)
0.837827***
(0.08447)
0.83735***
(0.017471)
0.775057***
(0.103465)
0.86765***
(0.05426)
tiGRO ,2
8.65362**
(3.83997)
11.43532***
(2.067711)
11.17506***
(0.53936)
11.1372***
(1.86060)
12.73269***
(1.62768)
tiLEV ,
51.6114
(36.3203)
68.7486***
(25.45934)
58.5056***
(6.96507)
44.87401***
(5.42712)
40.5478***
(5.28140)
tiLIQ ,
12.5443***
(4.32624)
11.18309***
(3.42168)
10.1369***
(0.71705)
9.4969***
(2.6446)
9.58718***
(2.72096)
tiTANG ,
-25.6672
(35.1045)
-31.4981*
(16.2993)
-25.8560***
(1.80798)
-38.2953***
(6.49718)
29.2145***
(6.7702)

P.M. Nunes, Z. Serrasqueiro,
A. Nunes, L. Mendes
ISSN 1648 - 4460
Guest Editorial
TRANSFORMATIONS IN BUSINESS & ECONOMICS, Vol. 12, No 3 (30), 2013
33
Table 7 (continue). Dynamic Estimators ( 2GRO )- Model II
tiOWN ,
-4.36447
(45.8451)
35.46338**
(14.5177)
31.5336***
(3.08801)
-26.14081
(38.0017)
-30.70765
(34.1878)
CONS 10.7221*
(6.35594)
-3.12867
(63.8652)
-17.3216**
(7.44756)
Instruments GMM GMM System GMM System
Observations 153 204 204
Wald 45.99***
(0.000)
F 52.59***
(0.000)
31403.58***
(0.000)
Sargan 5.28
(0.3824)
Hansen 41.95
(0.228)
45.28
(0.377)
m1 -2.31**
(0.0211)
-5.56***
(0.0000)
-2.68***
(0.007)
m2 1.31
(0.l903)
0.88
(0.379)
0.76
(0.450)
Notes: 1. Year dummies are included. 2. Heteroscedasticity consistent and asymptotic robust standard deviations
are reported in brackets. 3. *** indicates significance at the 1% level, ** indicates significance at the 5% level,
and * indicates significance at the 10% level.
Source: Table created by authors.
Table 8. Dynamic Estimators ( 3GRO )- Model II
Dependent Variable: tiPROL ,.
Independent Variables
GMM (1991) GMM System (1998)
GMM System (1998) two-step
LSDVC (2005) Initial (AB)
LSDVC (2005) Initial (BB)
1,. tiPROL
0.021108 (0.16025)
0.652039*** (0.057117)
0.704197*** (0.03197)
0.554022*** (0.07646)
0.585418*** (0.01929)
tiGRO ,3
63.6494***
(17.4110)
48.14799***
(17.74955)
53.42798***
(15.0127)
58.73597***
(14.0879)
60.9915***
(10.41217)
tiLEV ,
68.2734** (31.4134)
58.7948*** (22.8129)
56.71297*** (20.8179)
68.4166*** (17.9184)
62.47912*** (17.7179)
tiLIQ ,
2.96182 (4.15747)
5.53997* (3.02199)
6.23149*** (1.04179)
4.13054*** (0.82417)
4.46806*** (0.42682)
tiTANG ,
-45.6833***
(14.0101)
-40.1401***
(13.0648)
-42.4298***
(10.7989)
-40.6607***
(5.45944)
-36.4971***
(6.719872)
tiOWN ,
31.4007 (39.3254)
22.2282* (12.2017)
27.42971** (11.4712)
26.0863 (38.3677)
17.19223 (41.41278)
CONS 7.70505 (6.13636)
-168.019*** (50.8379)
-185.693*** (6.96749)
Instruments GMM GMM System GMM System
Observations 153 204 204 Wald 65.85***
(0.000)
F 62.14*** (0.000)
5357.75*** (0.000)
Sargan 4.13 (0.519)
Hansen 48.38
(0.118)
45.44
(0.256)
m1 -0.85
(0.3971)
-2.98***
(0.003)
-2.78***
(0.005)
m2 0.56
(0.5733)
1.30
(0.193)
1.31
(0.192)
Notes: 1. Year dummies are included. 2. Heteroscedasticity consistent and asymptotic robust standard deviations
are reported in brackets. 3. *** indicates significance at the 1% level, ** indicates significance at the 5% level,
and * indicates significance at the 10% level.
Source: Table created by authors.

P.M. Nunes, Z. Serrasqueiro,
A. Nunes, L. Mendes
ISSN 1648 - 4460
Guest Editorial
TRANSFORMATIONS IN BUSINESS & ECONOMICS, Vol. 12, No 3 (30), 2013
34
The results of the Sargan, Hansen tests, in all estimations carried out, when
introducing the remaining variables that could influence labour productivity, allow us to come
to a conclusion, as before, that we can reject the null hypotheses that the restrictions generated
by the instruments are valid.
The second-order autocorrelation tests, in all estimations carried out, allow us to
conclude that we cannot reject the null hypotheses regarding absence of the second-order
autocorrelation.
The results of the Sargan, Hansen and the second-order autocorrelation tests, when
adding the remaining variables over and above the measures of growth, allow us to argue that
the results of the GMM (1991) and GMM system (1998) dynamic estimators in one stage and
the GMM system (1998) dynamic estimator in two stages can be considered valid and can
therefore be interpreted.
It should be noted that inclusion of control variables did not mean a substantial change
in the previously estimated results, concerning magnitude and statistical significance of the
estimated parameters that measure the relationship between the various measures of growth
and labour productivity.
Based on the results obtained from models I and II, we can draw the following
conclusions: 1) we find a positive and statistically significant relationship between growth and
labour productivity in Portuguese SMEs; 2) we find a positive and statistically significant
relationship between labour productivity of the previous period and labour productivity of the
current period in Portuguese SMEs; 3) we find a positive and statistically significant
relationship between the level of debt and labour productivity in Portuguese SMEs; 4) we find
a positive and statistically significant relationship between the level of liquidity and labour
productivity in Portuguese SMEs; 5) we find a negative and statistically significant
relationship between asset tangibility and labour productivity in Portuguese SMEs; and 6) we
do not find a statistically significant relationship between the dummy variable that measures
control of foreign ownership, and labour productivity in Portuguese SMEs.
4. Discussion of the Results
The empirical evidence, considering three measure of growth, indicates a positive
relationship between growth and labour productivity in Portuguese SMEs context. This result
to validate the hypothesis H1.
This result obtained in Portuguese SMEs context are according the conclusions of
Delmar et al. (2003) and Rogers (2004) that growth to contribute, respectively, to gains
resulting to diversification of activities and product, and to high investment in innovation
activities.
The relationship obtained in Portuguese SMEs context do not corroborate the
conclusions of Davidsson (1989), Delmar et al. (2003) and Wiklund et al. (2003), that high
growth may cause higher uncertainty, can contribute to less labour productivity.
The conclusions of Wiklund et al. (2003) and Rogers (2004) are uncorroborated by the
empirical evidence obtained in Portuguese SMEs context. Effectively, more possible formal
relationships between employees, i.e. the breaking of that most informal employees relations
are accustomed in smaller companies, result of the high growth, do not contribute do less
labour productivity. On the contrary, the greater motivation resulting of the high growth
seems to assume particular relevance in Portuguese SMEs context, overcoming the possible

P.M. Nunes, Z. Serrasqueiro,
A. Nunes, L. Mendes
ISSN 1648 - 4460
Guest Editorial
TRANSFORMATIONS IN BUSINESS & ECONOMICS, Vol. 12, No 3 (30), 2013
35
negative effects of growth resulting of high employee‟s formality relationships, contributed to
high labour productivity.
Empirical evidence of this study allows us to come to a conclusion that there is
continuity of labour productivity in Portuguese SMEs, since we find a positive and significant
relationship between labour productivity of the previous and current periods, and so we can
validate hypothesis H2 of this study.
The results obtained allow us to conclude that labour productivity in Portuguese SMEs
is not haphazard, but rather assumes a continuous process. The values for labour productivity
persistence are quite significant, clearly above 0.5 in most estimations, with the exception of
the results obtained using the GMM (1991) estimator. Obtained persistency values indicate
that labour productivity in Portuguese SMEs remains relatively constant over time.
Empirical evidence of high persistency of labour productivity in Portuguese SMEs
does not corroborate the arguments of Dilling – Hansen (2005) that significant persistence of
performance is essentially a characteristic of large companies. It corroborates rather the
arguments of Hawawini et al. (2003) and Schumacher and Boland (2005) that persistence of
performance is not significantly influenced by size.
A positive relationship between the level of debt and labour productivity in Portuguese
SMEs allows us to accept hypothesis H3 of this study as valid.
A positive relationship between the level of debt and labour productivity in Portuguese
SMEs allows us to corroborate the arguments of Jensen (1986) and Geroski (2005), that
recourse to debt can contribute to increased employee efficiency, since they realize a greater
possibility of bankruptcy and consequently the greater need for rigour, greater employee
collaboration and commitment, permitting increased productivity and corroborating the
arguments of Greiner (1972).
The result of the relationship between the level of debt of Portuguese SMEs and labour
productivity confirms the results obtained by Schiantarelli, Sembenelli (1997) and Smith et al.
(2004), although these studies do not concern specifically SMEs.
A positive relationship between the liquidity of Portuguese SMEs and labour
productivity allows us to accept hypothesis H4 of this study as valid.
The liquidity of Portuguese SMEs assumes relevance in increased labour productivity,
corroborating the arguments of Deloof (2003) and Faggiolo, Luzzi (2006) that greater
liquidity allows SMEs to cope with possible changes in their environment, take advantage of
good business opportunities, consequently permitting increased performance.
The relationship obtained in this study between the liquidity of Portuguese SMEs and
labour productivity supports the results obtained by Schiantarelli, Sembenelli (1997) and
Smith et al. (2004), although the authors‟ studies do not specifically deal with SMEs.
A negative correlation between the asset tangibility of Portuguese SMEs and labour
productivity allows us to validate hypothesis H5 of this study.
The obtained result allows us to conclude that the possibility of a higher level of
intangible assets can lead to Portuguese SMEs reaching better rates of performance, namely
concerning labour productivity, given the greater tendency towards innovating activities,
compared with companies with a higher level of tangible assets, corroborating the conclusions
of Nucci et al. (2005).
A negative relationship between the level of tangible assets of Portuguese SMEs and
labour productivity follows the results of Schiantarelli, Sembenelli (1997) and Smith et al.
(2004), although these studies do not deal specifically with SMEs.

P.M. Nunes, Z. Serrasqueiro,
A. Nunes, L. Mendes
ISSN 1648 - 4460
Guest Editorial
TRANSFORMATIONS IN BUSINESS & ECONOMICS, Vol. 12, No 3 (30), 2013
36
A statistically insignificant relationship between the dummy variable measuring
control of foreign ownership of Portuguese SMEs and labour productivity does not allow us to
validate hypothesis H6 of this study.
Foreign ownership control of Portuguese SMEs does not mean increased labour
productivity. Firstly, the obtained result does not confirm the arguments of Berger et al.
(1992) and Joseph, Hewins (1997) that control of foreign ownership allows a greater
possibility of diversification of activities and product and for obtaining lower levels of risk,
contributing to improved performance. Secondly, it does not corroborate the arguments of
Markusen, Venables (1999) and Becchetti, Trovato (2002) that foreign ownership control of
SMEs can make new growth dynamics and greater export capacity possible, these aspects
meaning improved performance.
The result obtained in this study, concerning the absence of a relationship between
foreign ownership control of SMEs and labour productivity relates to the result Goedhuys et
al. (2006).
Conclusions
Considering three measures of growth: 1) asset growth, 2) sales growth, and 3)
employees growth, and using GMM system (1998) and LSDVC (2005) dynamic estimators,
in this paper we tested the relationship between growth and labour productivity in SMEs
context. The empirical evidence indicates the positive, and statistically significant,
relationship between growth and labour productivity.
The positive influence of growth on labour productivity of SMEs is indicative that
positive effects of growth, namely the greatest expertise and motivation of employees, as well
as efficiency gains as a result of larger scale of firms, is more relevant than the negative
effects of breakdown of informal relationships between owners/managers and employees.
We also consider other possible explanatory variables of labour productivity of SMEs,
i.e. 1) labour productivity in previous period; 2) debt; 3) liquidity; 4) assets tangibility; and 5)
ownership control by foreigners. The results indicate that debt and liquidity positively
influence labour productivity of SMEs, while the assets tangibility influences negatively
labour productivity of SMEs. In addition, the labour productivity is persistent, i.e. labour
productivity of the previous period positively affects labour productivity in the current period.
Finally, the ownership control by foreigners has no influence on the labour productivity of
SMEs.
The persistence of labour productivity is indicative that higher levels of labour
productivity not occur occasionally, but are the result of continuity over time. In addition, the
positive influence of debt and of the liquidity on labour productivity is indicative that, on one
hand, the debt contributes to greater discipline and cooperation among employees and, on the
other hand, the liquidity contribute to reducing the “stress" in the management of financial
resources allowing enjoy good investment opportunities. The negative influence of assets
tangibility on labour productivity of SMEs reveals that the lower propensity of innovative
activities of SMEs, consequence of greater assets tangibility, contributes to lower levels of
labour productivity. Finally, the ownership control by foreigners does not contribute to
increased labour productivity of SMEs, so we cannot conclude that the possibility of greater
diversification of activities result of operation in other markets does not contribute to the
increase in labour productivity of SMEs.

P.M. Nunes, Z. Serrasqueiro,
A. Nunes, L. Mendes
ISSN 1648 - 4460
Guest Editorial
TRANSFORMATIONS IN BUSINESS & ECONOMICS, Vol. 12, No 3 (30), 2013
37
Given the great importance of SMEs in the Portuguese economy context, empirical
evidence support the suggestions for policy makers, as well as suggestions for
owners/managers of SMEs. For policy makers: 1) given the relevance of debt to increased the
labour productivity of SMEs, and considering the particular difficulties of SMEs in accessing
debt, we suggest the creation of special credit lines to support SMEs to reveals good
investment projects but difficulties in access to debt in favourable terms; and 2) we suggest
financial support for SMEs with greater propensity innovative, since the greater innovation
propensity contribute to higher level of labour productivity of SMEs. For owners/managers of
SMEs: 1) we suggest seek to increased their levels of liquidity by increasing the payment
terms of its debt, so that it would result in an increase labour productivity; and 2) we suggest
for owners/managers of SMEs with higher assets tangibility seek to monitor the employees
action, so that the lower innovative propensity of this type of SMEs does not result in a
decrease in labour productivity.
References
Adams, M. (1996), “Investment Earnings and the Characteristics of Life Insurance Firms: New Zealand
Evidence”, Australian Journal of Management, Vol. 21, No 1, pp.41-55.
Adams, M., Buckle, M. (2003), “The Determinants of Corporate Financial Performance in the Bermuda
Insurance Market”, Applied Financial Economics, Vol. 13, No 2, pp.133-143.
Arellano, M., Bond, S. (1991), “Some Tests of Specification for Panel Data: Monte Carlo Evidence and
Application to Employment Equations”, Review of Economic Studies, Vol. 58, No 2, pp.277-297.
Baum, J., Locke, E., Smith, K. (2001), “A Multidimensional Model of Venture Growth”, Academy of
Management Journal, Vol. 44, No 2, pp.292-303.
Becchetti, L., Trovato, G. (2002), “The Determinants of Growth for Small and Medium Sized Firms”, Small
Business Economics, Vol. 19, No 4, pp.291-306.
Berger, A., Cummins, J., Tennyson, S. (1992), “Reinsurance and the Liability Crisis”, Journal of Risk and
Uncertainty, Vol. 5, No 3, pp.253-272.
Berger, A., Herring, R., Szego, G. (1995), “The Role of Capital in Financial Institutions”, Journal of Banking
and Finance, Vol. 19, No 3-4, pp.393-430.
Blundell, M., Bond, S. (1998), “Initial Conditions and Moment Restrictions in Dynamic Panel Data Models”,
Journal of Econometrics, Vol. 87, No 1, pp.115-143.
Bruno, G. (2005), “Approximating the Bias of LSDV Estimator for Dynamic Unbalanced Panel Data Models”,
Economic Letters, Vol. 87, No 3, pp.361-366.
Chandler, G., Jensen, E. (1992), “The Founder‟s Self-Assessed Competence and Venture Performance”, Journal
of Business Venturing, Vol. 7, No 3, pp.223-236.
Cowling, M. (2004), “The Growth-Profit Nexus”, Small Business Economics, Vol. 22, No 1, pp.1-9.
Cressy, R., Olofsson, C. (1996), “The Financial Conditions for Swedish SMEs: Survey and Research Agenda”,
Small Business Economics, Vol. 9, No 2, pp.179-194.
Davidsson, P. (1989), “Entrepreneurship-and After? A Study of Growth Willingness in Small Firms”, Journal of
Business Venturing, Vol. 4, No 3, pp.211-226.
Delmar, F., Davidsson, P., Gartner, W. (2003), “Arriving at the High-Growth Firm”, Journal of Business
Venturing, Vol. 18, No 2, pp.189-216.
Deloof, M. (2003), “Does Working Capital Management Affect Profitability of Belgian Firms”, Journal of
Business Finance and Accounting, Vol. 30, No 3-4, pp.573-588.
Dilling-Hansen, M. (2005), “Small Firms Performance and Ownership Structure”, Working Paper of the School
of Economics and Management, University of Aarhus, Denmark.
Fagiolo, G., Luzzi, A. (2006), “Do Liquidity Constrains Matter in Explaining Firm Size and Growth? Some
Evidence from the Italian Manufacturing Industry”, Industrial and Corporate Change, Vol. 15, No 4,
pp.1-39.
Fu, T., Ke, M., Huang, Y. (2002), “Capital Growth, Financing Source and Profitability of Small Businesses:
Evidance from Taiwan Small Enterprises”, Small Business Economics, Vol. 18, No 4, pp.257-267.

P.M. Nunes, Z. Serrasqueiro,
A. Nunes, L. Mendes
ISSN 1648 - 4460
Guest Editorial
TRANSFORMATIONS IN BUSINESS & ECONOMICS, Vol. 12, No 3 (30), 2013
38
Geroski, P., Kretschmer, T., Walters, C. (2005), “Corporate Productivity Growth: Leaders and Laggards”,
available at, www.lse.ac.uk/collections/IIM/pdf/Geroski_Kretschmer_Walters_Growth.pdf, referred on
15/14/2009.
Goddard, J., Tavakoli, M., Wilson, J. (2005), “Determinants of Profitability in European Manufacturing and
Services: Evidence From a Dynamic Panel Data”, Applied Financial Economics, Vol. 15, Issue 18,
pp.1269-1282.
Goedhuys, M., Janz, N., Mohnen, P. (2006), “What Drives Productivity in Tanzanian Manufacturing Firms:
Technology or Institutions?”, Working Paper United Nations University, Maastricht Economic and Social
Research and Training Centre on Innovation and Technology, UNU-MERIT Working Paper Series, No
037.
Greiner, L. (1972), “Evolutions and Revolutions as Organizations Grow”, Harvard Business Review, Vol. 50, No
4, pp.37-46.
Gschwandtner, A. (2005), “Profit Persistence in the „Very‟ Long Run: Evidence from Survivors and Exiters”,
Applied Economics, Vol. 37, No 7, pp.793-806.
Hawawini, G., Subramanian, V., Verdin, P. (2003), “Is Performance Driven by Industry or Firm-Specific
Factors? A New Look at the Evidence”, Strategic Management Journal, Vol. 24, No 1, pp.1-16.
Heskel, J. (1999), “Small Firms, Contracting-Out, Computers and Wage Inequality: Evidence from UK
Manufacturing”, Economica, Vol. 66, No 261, pp.1-21.
INE – Instituto Nacional de Estatística (2004), Lisboa, Portugal, available at, http:/www.ine.pt, referred on
25/05/2009, [INE – National Institute of Statistics, in Portuguese].
Jensen, M. (1986), “Agency Costs of Free Cash Flow, Corporate Finance and Takeover”, American Economic
Review: Papers and Proceedings, Vol. 76, No 2, pp.323-329.
Joseph, M., Hewins, R. (1997), “The Motives for Corporate Hedging among UK Multinationals”, International
Journal of Finance and Economics, Vol. 2, No 2, pp.151-171.
Low, M., MacMillan, I. (1988), “Entrepreneurship: Past Research and Future Challenges”, Journal of
Management, Vol. 14, No 2, pp.139-161.
Markman, G., Gartner, W. (2002), “Is Extraordinary Growth Profitable? A study of Inc. 500 High Growth
Companies”, Entrepreneurship Theory and Practice, Vol. 27, No 1, pp.65-75.
Mendelson, H. (2000), “Organizational Architechture and Successin the Information Technology Industry”,
Management Science, Vol. 46, No 4, pp.513-529.
Nucci, F., Pozzolo, A., Schivardi, F. (2005), “Is Firm‟s Productivity Related to its Financial Structure? Evidence
From Microeconomic Data”, Working Paper, Banca d’Italia, Research Department.
Markusen, J., Venables, A. (1999), “Foreign Direct Investment as a Catalyst for Industrial Development”,
European Economic Review, Vol. 43, No 2, pp.335-356.
Rogers, M. (2004), “Networks, Firm Size and Innovation”, Small Business Economics, Vol. 22, No 2, pp.141-
153.
Rollag, K. (2001), “How Fust Growth Promotes Rapid Socialization in Entrepreneurial Firms”, in: W.D.
Bygrave, E. Autio, C.G. Brush, P. Davidsson, P.G. Green, P.D. Reyonlds, H.J. Sapienza (eds.), Frontiers
of Entrepreneurship Research, Wellesley, M.A., Babson College.
Roper, S. (1999), “Modelling Small Business Growth and Profitability”, Small Business Economics, Vol. 13, No
3, pp.235-252.
Russeeuw, P. (1997), “Estimating the Determinants of Financial Performance of Very Small Service Firms”,
Conference Proceedings of USASBE-United States Association for Small Business and Entrepreneurship,
San Francisco, California.
Schiantarelli, F., Sembenelli, A. (1997), “The Maturity Structure of Debt, Policy”, Research Working Paper
1699, The world Bank Policy Research Department Finance and Private Sector Development Division.
Schumacher, S., Boland, M. (2005), “The Persistence of Profitability among Firms in the Food Economy”,
American Journal of Agriculture Economics, Vol. 87, No 1, pp.103-107.
Smith, V., Harsenm, M., Eriksson, T., Madsen, E. (2004), “R&D Productivity in Danish Firms: Some Empirical
Evidence”, Applied Economics, Vol. 36, No 16, pp.1797-1806.
Storey, D. (1994), Understanding the Small Business Sector, London, Routledge.
Wells, B., Cox, L., Garver, K. (1995), “Free Cash Flow in the Life Insurance Industry”, The Journal of Risk and
Insurance, Vol. 62, No 1, pp.50-66.
Wiklund, J. (1999), “The Sustainability of the Entrepreneurial Orientation – Performance Relationship”,
Entrepreneurship Theory & Practice, Vol. 24, No 1, pp.37-48.

P.M. Nunes, Z. Serrasqueiro,
A. Nunes, L. Mendes
ISSN 1648 - 4460
Guest Editorial
TRANSFORMATIONS IN BUSINESS & ECONOMICS, Vol. 12, No 3 (30), 2013
39
Wiklund, J., Davidson, P., Delmar, F. (2003), “Expected Consequences of Growth and Their Effect on Growth
Willingness in Different Samples of Small Firms”, Entrepreneurship Theory & Practice, Vol. 27, No 3,
pp.247-269.
Yoon, S. (2004), “A Note on the Market Structure and Performance in Korean Manufacturing Industries”,
Journal of Policy Modelling, Vol. 26, No 6, pp.733-746.
ĮMONĖS AUGIMO IR DARBO NAŠUMO RYŠYS PORTUGALIJOS MVĮ: DINAMINIS DUOMENŲ
METODAS
Paulo Maçãs Nunes, Zélia Serrasqueiro, António Nunes, Luis Mendes
SANTRAUKA
Šiame straipsnyje, taikant įvairius dinaminės skalės statistinius įvertinimus ir atsižvelgiant į tris kompanijos
plėtros rodiklius, įsitikinama, kad egzistuoja teigiamas santykis tarp augimo ir darbo našumo mažose ir vidutinėse
Portugalijos įmonėse. Remiantis gautais rezultatais, prieinama prie išvados, kad darbo našumas išlieka pastovus,
bėgant laikui, ir vidutinės įmonės, kurių įsiskolinimo ir likvidumo lygis aukštesnis, o materialaus turto – mažesnis,
pasižymi didesniu darbo našumu. Rezultatai rodo, kad motyvacija, našumas ir didesnės atsakomybės darbuotojams
suteikimas tampa vis svarbesni, kuomet dėl didėjančio įmonės augimo susiduriama su galimu neformalių darbo
santykių nutrūkimu.
REIKŠMINIAI ŽODŽIAI: įmonės augimas, dinaminės skalės duomenys, darbo našumas, MVĮ (Mažos ir Vidutinės
Įmonės).