Digital platform innovation in European SMEs
73
Digital platform innovation in European SMEs An analysis of SME Instrument Business Proposals and Case Studies Authors: Chiara Eleonora De Marco, Alberto Di Minin, Cristina Marullo and Daniel Nepelski Editors: Nestor Duch-Brown, Bertin Martens and Vincent van Roy 2019 EUR 29690 EN
-
Upload
khangminh22 -
Category
Documents
-
view
3 -
download
0
Transcript of Digital platform innovation in European SMEs

Digital platform innovation in European SMEs
An analysis of SME
Instrument Business
Proposals and Case
Studies
Authors: Chiara Eleonora De Marco,
Alberto Di Minin, Cristina Marullo and
Daniel Nepelski
Editors: Nestor Duch-Brown, Bertin
Martens and Vincent van Roy
2019
EUR 29690 EN

This publication is a Technical report by the Joint Research Centre (JRC), the European Commission’s science
and knowledge service. It aims to provide evidence-based scientific support to the European policymaking
process. The scientific output expressed does not imply a policy position of the European Commission. Neither
the European Commission nor any person acting on behalf of the Commission is responsible for the use that
might be made of this publication.
EU Science Hub
https://ec.europa.eu/jrc
JRC115240
EUR 29690 EN
PDF ISBN 978-92-76-00776-0 ISSN 1831-9424 doi:10.2760/57240
Luxembourg: Publications Office of the European Union, 2019
© European Union, 2019
The reuse policy of the European Commission is implemented by Commission Decision 2011/833/EU of 12
December 2011 on the reuse of Commission documents (OJ L 330, 14.12.2011, p. 39). Reuse is authorised,
provided the source of the document is acknowledged and its original meaning or message is not distorted. The
European Commission shall not be liable for any consequence stemming from the reuse. For any use or
reproduction of photos or other material that is not owned by the EU, permission must be sought directly from
the copyright holders.
All content © European Union, 2019
How to cite this report: De Marco, C., Di Minin, A., Marullo, C., and Nepelski, D. (2019). Digital platform
innovation in European SMEs. An analysis of SME Instrument Business Proposals and Case Studies. Publications
Office of the European Union, Luxembourg, EUR 29690 EN, ISBN 978-92-76-00776-0, doi:10.2760/57240,
JRC115240.
Abstract
The study explores how European SMEs applying to the SME Instrument (SMEi) funding scheme under Horizon 2020 innovate
use the digital platform business model. The study demonstrates a widespread awareness of the digital platform concept as a
tool to be applied to gain momentum and growth, taking advantage of the digital affordances. The main challenges to scale-up
include how to manage external communities and orchestrate them in order to build innovation ecosystems; how to find a profitable business model; and secure funding for growth. Firms located in peripheral regions face additional difficulties in
finding complementary resources.

i
Contents
Acknowledgements ................................................................................................ 3
Foreground ........................................................................................................... 4
Executive Summary ............................................................................................... 5
1 Introduction ...................................................................................................... 7
1.1 The role of digital platforms as an innovation model ......................................... 7
1.2 Defining digital platform innovations and digital business models ....................... 7
1.3 Scope of the study ....................................................................................... 9
1.4 Methodology ............................................................................................... 9
2 Digital platform SMEs in Europe: economic profiles of SMEi applicants and beneficiaries
10
2.1 Geography, demographics and industries of operation .................................... 10
2.2 R&D and innovation activities ...................................................................... 17
3 Profiling digital platform SMEs in Europe ............................................................. 24
3.1 Cluster 1: Data Services and Market Analysis for Digital Business .................... 28
3.2 Cluster 2: Health and Biomedical ................................................................. 29
3.3 Cluster 3: Energy and Manufacturing ........................................................... 31
3.4 Cluster 4: Mobile, Apps and IoT ................................................................... 32
3.5 Cluster 5: Data Security, Cloud, Cyber Security ............................................. 34
3.6 Cluster 6: Marketing, Advertising/Other Services for Digital Platforms .............. 36
3.7 Cluster 7: Online Content Platforms ............................................................. 37
3.8 Cluster 8: Transport, Smart Cities, Urban ..................................................... 39
4 Evidence from case studies: characteristics and business models of digital platform SMEs ................................................................................................................. 41
4.1 Overview of the selected digital platform SMEs .............................................. 41
4.2 The nature and business model of digital platform SMEs ................................. 43
4.2.1 The nature of digital platform SMEs ...................................................... 44
4.2.2 Business models of digital platform SMEs .............................................. 44
4.3 Case-studies' take-aways ........................................................................... 45
4.3.1 King of App: A platform for platforms ................................................... 47
4.3.2 GoOpti: Disrupting the transportation services ...................................... 48
4.3.3 SocialDiabetes: Bringing communities together ..................................... 49
4.3.4 Mazemap: Navigating indoor ............................................................... 49
4.3.5 Sensefinity: IoT for the Masses ............................................................ 50
4.3.6 Cybernetica: Secure digital democracy ................................................. 50
4.3.7 Cynny: Capitalising on emotions .......................................................... 51
4.3.8 Shotl & Drivania: Serial entrepreneurship ............................................. 52
4.3.9 Mosaicoon: Scaling-up is not enough .................................................... 53

ii
5 Innovation and business strategies of European digital platform SMEs .................... 55
6 Conclusions .................................................................................................... 58
7 Annex: Methodology ........................................................................................ 60
7.1.1 Selection of digital platform SMEs ........................................................ 60
7.1.2 Quantitative analysis .......................................................................... 63
7.1.3 Cases analysis ................................................................................... 64
References ......................................................................................................... 66
List of figures ...................................................................................................... 68
List of tables ....................................................................................................... 69

3
Acknowledgements
This study is the result of a team effort that involved the Innovation Management
Research Group at the Institute of Management of Scuola Superiore Sant’Anna, Pisa (IT).
We acknowledge the support and feedback received from our colleagues and their
specific contributions on the following:
Antonio Crupi, Postdoctoral Fellow: Cluster analysis (Section 3)
Giulio Ferrigno, Postdoctoral Fellow: Cluster analysis and Interview support (Section 3)
Irene Martelli, Postdoctoral Fellow: dataset construction and cluster analysis (Sections
2-3)
Matteo Tranchero, PhD Student at Haas School of Business, UC Berkeley: descriptive
analysis of quantitative section of the study (Section 2)
Shahab Zhare, PhD Students at the Institute of Management, Scuola Superiore
Sant’Anna: interviews case study analysis support (Section 4)
Authors
De Marco, Chiara Eleonora, [email protected]
Postdoctoral Fellow, Haas School of Business, Garwood Centre for Corporate Innovation,
UC Berkeley, CA-US
Research Fellow, Institute of Management, Scuola Superiore Sant’Anna, Pisa (IT)
Di Minin, Alberto, [email protected]
Associate Professor, Institute of Management, Scuola Superiore Sant’Anna, Pisa (IT)
Marullo, Cristina, [email protected]
Assistant Professor, Institute of Management, Scuola Superiore Sant’Anna, Pisa (IT)
Daniel Nepelski, EC JRC, Seville (ES)
Editors
Bertin Martens, Nestor Duch-Brown and Vincent van Roy, EC JRC Seville (ES)

4
Foreground
Digitisation has transformed the character of business activities as for both the business
opportunities and the practices to pursue them. The current report provides an analysis
on how European SMEs are seizing the opportunities unfolded by the digital economy. In
particular, it formulates an idea of how new and original business and innovation
strategies are emerging from European SMEs operating through digital platforms. It
investigates the characteristics of SMEs developing platform innovations and the
potential mediation role of these innovations across different market segments and
sectors. The research explores the business strategy adopted by the digital company,
focusing on: business model design and development; networking and collaboration
activity; internationalization; appropriation strategy; characteristics of innovation
processes; R&D organization and management. In exploring the platform innovation, and
based on the definitions and taxonomies proposed, the study particularly focuses on the
following aspects:
The function and structure of the diverse “digital platforms” in which the SMEs
operate; and the definition of “platform” that they adopt;
The degree of “disruption” of the platform innovation;
The potential network effects connected to the platform scale-up;
The role of data analytics, reductions in transaction and information costs in
multi-sided markets resulting from the platform innovation.

5
Executive Summary
This study analyses the patterns of digital platform innovation among SMEs applying to
the SME Instrument (SMEi) funding scheme under the Horizon 2020 Framework
Programme. It aims at understanding how the smallest players of the European economy
translate digital affordances into business models and capture value in the digital
economy.
Two elements were considered in defining “digital platforms/digital markets”: a) the
nature of digital platform innovations, i.e. the company’s product/technology, the
characteristics of the innovation processes, nature of networking, and collaboration
activities; and b) the accompanying business model design and development, i.e. the
choice of how to generate revenues . On these bases, and employing both quantitative
and qualitative research methodologies, the following research questions are addressed:
What is the landscape of European SMEs developing Digital Platform innovations?
How is value created? Who captures this value? Who owns or controls the
platform? What are the potential network effects connected to platform success?
How does the platform innovation disrupt extant business models?
In the first instance, a quantitative, descriptive analysis was conducted on the activities
and financial profiles of European SMEs developing digital platform innovations. The
sample consisted of 2,320 active SMEs that, participated in the SMEi between January
2014 and March 2017, the innovative funding scheme introduced by the eighth European
Framework Programme Horizon 2020.
This analysis offered insights on the scenario of the European digital platform SMEs and
their main characteristics. The main points are included below:
The highest concentration of SMEs showing evidence of digital platform innovation
in SMEi proposals can be found in Italy, Spain, and the United Kingdom. This
distribution reflects the structure of the entire population of applicants and
beneficiaries of the SMEi. Consistently with the high level of development of digital
entrepreneurship ecosystems in the Nordic countries (Autio et al., 2018) the most
interesting exception is Finland where large percentage submitted a proposal
concerned digital platforms innovation.
SMEs operating through digital platforms are mainly new-born ventures classifying
as start-ups: 41% ages 5 years old or less, and 21% ages less than 3 years old. A
very small percentage (2.7%) of participants is over 30 years old, and almost one
third of the sample (32%) is over 10 years old.
SMEs operating in the service sectors are the most active in digital platform
innovations and represent more than 90% of the sample. Digital platform SMEs
operating in the manufacturing sector are mostly concentrated in Eastern Europe
and in Italy.
The majority of the SMEs in the services sectors operate in High-Tech Knowledge-
Intensive service categories, including scientific R&D, computer programming,
media and telecommunication, and information services.
SMEs operate in eight sectoral clusters: i) Data services and market analysis for
digital business; ii) Health and Biomedical; iii) Energy and Manufacturing; iv)
Mobile, Apps, and IoT; v) Data security, Cloud, and Cybersecurity; vi) Marketing,
Advertising/Other services for digital platforms; vii) Online content platforms; viii)
Transport, Smart Cities, Urban. The categorisation in each cluster was not
exclusive, meaning that each SME could fall in more than one cluster. The Data
service and market analysis for digital business cluster was the most inclusive
one. Health and Biomedical, Energy and Manufacturing, and Mobile apps and IoT
clusters showed also a high level of SME activity.

6
The descriptive quantitative analysis was complemented by a qualitative analysis of the
business models and strategies deployed by European SMEs to catch the opportunities
offered by the digital platform economy. The insights can be summarised as follows:
Disintermediation/transformation of traditional industries. Different
aspects of the digital platform innovations may enable mechanisms of
disintermediation, transformation, or even disruption of existing industries.
External community engagement is a key managerial task to shape networks
of users, contributors, and complementary businesses, whose presence on the
platform motivates other members to join.
Orchestrating communities to build innovation ecosystems. Digital platform
SMEs often orchestrate networks of external communities across different
industries and implement business models presenting elements of both platform
and sharing economies.
Managing frictions. The core business of digital platform SMEs is to align the
interests of different communities converging onto the platform.
Easy to start-up difficult to scale-up. Barriers to start-up the businesses are
very low, while barriers to scale them up are high.
Digital platforms are laboratories where multiple business models are tested
at the same time.
Multiple funding sources to support growth. The scale-up phase represents
an important aspect of the validation phase of platform business models and
different types of funding with different objectives are relevant both in the start-
up and in the scale-up phase.
Previous experience matters. The previous background of entrepreneurs is a
powerful source of inspiration, since it allows for identifying or discovering
opportunities in the pre-start-up phase.
Geographical scale-up. Market fragmentation still hampers the development of
new businesses through digital platforms in the EU.
Digital platforms in peripheral areas. The scale-up phase of digital platforms
may be adversely affected by an SME's location. The public funding is especially
relevant for SMEs established in peripheral areas with weak innovation and
entrepreneurial ecosystems.
The SMEi opens new business opportunities. The SMEi helps SMEs to
experiment and seek new growth opportunities. It is stimulating the diversification
and the expansion activities.

7
1 Introduction
This study explores the current landscape of European SMEs having applied to the SME
Instrument (SMEi) funding scheme under the Horizon 2020 (H2020) program. It looks at
SMEs whose proposals involve the development of digital platforms. The scope of the
study was to shed light on how these companies are facing the evolution of the digital
platform economy.
1.1 The role of digital platforms as an innovation model
The advent and spreading of ICTs and their progressive socialisation and application to
productive environments are the leverage of the modern industrial revolution. Even
though the digital era emerged decades ago with the Internet and the IT-based
transformation of services, vast improvements in data processing, transfer and access
are pushing for a new techno-economic paradigm: the “Platform Economy” or “Digital
Platform Economy”.
Digitalisation and the cloud are the infrastructures on which new types of economic
activities and organisational models operate, i.e. platform-based markets and
business/commercial/institutional ecosystems. Digital platforms are the essence of this
innovative reorganisation of the economy: they represent the hinges and the facilitators
of the action and development of software, hardware, operations, and networks.
Platforms provide a set of shared techniques, technologies, and interfaces to a broad set
of users, contributors (e.g. third-party app developers) and complementary businesses
that, when sufficiently rich, result in the formation of an ecosystem (Kenney and
Zysman, 2016). Scholars represented this ecosystem as organised on four layers that
globally interact with and build on each other: i) equipment manufacturing; ii) network
operators; iii) platform, contents, and applications; iv) users and consumers (Fransman,
2014; Nepelski, 2019). In the virtue of the global projection of the digital ecosystem and
the interconnectedness of said levels, the platforms require a transformation of corporate
strategies and at the same time pose a wide range of policy challenges (Zysman and
Kenney, 2018), redefining the traditional boundaries and practices of business, changing
the way value is generated and captured in the digital economy (European Commission,
2014).
Platform economies are characterised by modularity: many platforms operating in niche
markets remain such in most of the cases, while others grow, specialise further and
develop, even taking over other niche businesses, until they manage to become platform
themselves. Expanding and facilitating entrepreneurship, digital platforms play a major
role in fostering and creating new opportunities for bottom-up innovation (Kenney and
Zysman, 2015). As far as supply is concerned, digital platforms promote new forms of
entrepreneurship and innovation, enabling individuals to fully take advantage of
technological opportunities and fulfil their own ambitions or reach alternative goals. This
leads to the rise of the so-called new generation of “micro-entrepreneurship” conducted
by individuals previously limited to and left on the margins of traditional business
activities (Sundarajan, 2014), as well as to the establishment of a new category of
professionals known as “digital entrepreneurs”: “those persons who seek to generate
value, through the creation or expansion of economic activity, by identifying and
exploiting new ICT or ICT-enabled products, processes, and corresponding markets
(Bogdanowicz, 2015, p. 15). In terms of demand, users and customers can gain a range
of advantages by using the platforms and, depending on the functions of the specific
platform, they usually show very different motivations for using them, from economic or
environmental factors to transparency and social objectives (Schor, 2016).
1.2 Defining digital platform innovations and digital business models
For the purpose of this study, two types of elements were considered to be relevant to
the definition of “digital platforms/digital markets”: a) the nature of digital platform

8
innovations, i.e. the company’s product/technology, characteristics of the innovation
processes, nature of networking, and collaboration activities; and b) the accompanying
business model design and development, i.e. the choice of how to generate
revenues from that platform - “who sells to whom” - the development of the
appropriation strategy.
Specifically, and in order to sense the nature of digital platform innovations and the
scope of their market impact, we considered different categories of platforms (Kenney
and Zysman, 2016:65):
I. Platforms for platforms – this category includes foundational platforms
facilitating the construction of the tools on which other platforms are built. Some
examples are the Internet itself, Operating System platforms (e.g. iOS or Android), and
Cloud services platforms (e.g. Amazon web);
II. Platforms that make available digital tools and help with the creation of other
platforms/marketplaces – this category includes platforms acting as repositories of digital
tools (e.g. sales support, human resources, accounting, insurance, and open source
software platforms). These platform innovations create value by cutting transaction costs
(such as search efforts or customer lock-in) and reduce disintermediation by traditional
actors, drastically lowering prices for software, tools, and other foundation blocks for
small companies. Examples are Wonolo for staffing services and Git Hub for open source
software;
III. Platforms mediating work – this category includes platforms mediating work in
different ways: from platforms transforming the work of previously independent
professionals (e.g. LinkedIn) to platforms enabling companies to crowdsource work that
requires human judgment (e.g. Amazon Mechanical Turk) and websites creating virtual
markets for labour exchange (e.g. Upwork);
IV. Retail platforms – this category includes the most widespread online platforms:
digital marketplaces that initiated the concept of platform economy (e.g. Amazon, eBay,
Etsy);
V. Service-providing platforms –this category includes platforms recognised as
having the most disruptive power. Service-providing platform are displacing traditional
service companies (e.g. Airbnb or Lyft), or financial institutions (e.g. crowdsourcing
platforms such as Kickstarter or VC platforms such as Angel List).
With regard to the investigation of the business model design and development, we
took into account the three categories of platform business models proposed by
Boudreau and Lakhani (2009). These categories are identified on the bases of the degree
of control of the platform (who typically oversees technology development, income
streams, and the end-customer relationship) or, conversely, the autonomy enjoyed by
the economic agents involved (external communities of innovators and users):
I. Integrator platform business models – in this type of business model the
company incorporates innovations brought in from the outside and sells the final product
to customers. This model involves a high degree of control since the platform is wedged
between the external innovators and the customers. For example, Apple’s App Store is
placed between iPhone software developers (external innovators) and customers, the
platform directly monitors the app development (technical specifications) and directly
sells them to customers.
II. Product platform business models – in this type of business model companies
have less control over the technology since external innovators build on top of the
existing technology and then directly sell to customers (being able to set prices and to
retain IPR over their technical developments). An example is Intel Inside’s strategy for
microprocessors: the company provides the technology and the rules for its use, while
the licensees innovate on that platform and sell the applications to customers.
9
III. Two-sided (or multi-sided) platform business models - in this type of
business model external innovators and customers can transact directly with one another
as long as they affiliate with the platform’s owner. In such cases, the platforms act as a
“catalyst” (Evans, 2016), facilitating the transactions and interactions between the
different categories of economic agents (external innovators and customers). Although
the external innovators might not interact with the platform owner during the design and
development of new products, the owner can still demand some degree of control over
the ecosystem, for example by setting rules and regulations as a condition for their
affiliation (Bodreau and Hagiu, 2009).
1.3 Scope of the study
The background described in the previous section highlights the necessity to understand
how and to what extent digital platforms are diverse in function and structure, in order to
shape a suitable regulatory and policy framework. Moreover, although rich and relevant
literature on platform economics is gradually flourishing (Martens, 2016), no real theory
on the impact of the diverse types of platforms on the overall economy has been yet
developed (Kenney and Zysman, 2015; 2016).
The scope of this study was to shed light on the process of adaptation of a relevant
sample of European SMEs and their innovative responses to the evolution of the digital
platform economy. The study investigated how new and original business strategies
are emerging among European SMEs having applied to the SMEi funding
program and operating through digital platforms and markets. The study analyses
the characteristics of European SMEs developing platform innovations and the potential
mediation role of this innovation across different markets and segments.
As a result, the following research questions are addressed, employing both quantitative
and qualitative research methodologies:
(1) What is the landscape of European SMEs developing Digital Platform innovations?
(2) How is value created? Who captures this value? Who owns or controls the
platform? What are the potential network effects connected to platform success? How
does the platform innovation disrupt extant business models?
1.4 Methodology1
For the purpose of this study, we used a sample of SMEs that applied to the SMEi. From
the 33,056 proposals submitted to the SMEi from January 2014 to March 2017, we
selected SMEs whose projects reported clear evidence of digital platform innovation. The
final sample consisted of 2,320 firms. These companies were analysed with respect to
their size, financial performance and patenting activity. For the purpose of the cases
analysis, 9 firms were analysed in-depth.
1 For full the methodology description, see Annex II.

10
2 Digital platform SMEs in Europe: economic profiles of SMEi applicants and beneficiaries
2.1 Geography, demographics and industries of operation
Starting with the geographical distribution of the SMEs in the sample, Figure 1 shows
that SMEi applicants reporting evidence of digital platforms (hereafter: digital platform
SMEs) tend to be concentrated in a rather small number of countries.
Applicants coming from the three most represented countries (Italy, Spain, and the
United Kingdom) amount to almost half of the total. Italy ranks first among the Member
States with 442 applicants, counting for a fifth of all the digital platform SMEs taken into
consideration. Besides Italy, other countries with a large number of applicants are Spain
(306) and the United Kingdom (250), followed at some distance by Germany and France
with 162 and 133 firms, respectively. Countries from Eastern and Northern Europe
amount to a smaller part of the total number of applicants, with only Finland having more
than one hundred digital platform SMEs applying to the SMEi.
The geographical concentration is not surprising. This finding matches the distribution of
the total number of applicants, as documented by Di Minin et al (2016). For instance, Di
Minin et al. (2016) report that, from its launch to mid-2016, the SME Instrument
received 5,336 proposals from Italian SMEs and 4,124 bids from Spanish firms, which
again shared the podium with SMEs from UK.
The overall ranking of countries with more applicants on digital platforms closely
resembles the one of the total of applicants. The most interesting exception is Finland
which, despite not having a large number of SMEs applying to the SMEi (ranking 9th
among Member States), has a quite large number of firms submitting proposals related
to platforms (5% of the total, thus ranking 6th). This aligns with the country’s precedent
of industrial specialisation, encompassing traditional strength in ICT (exemplified by
Nokia’s early leadership in telecommunications).
Finally, we observe that the small and medium enterprises applying to the SMEi are
rather well established, with an average age of 9.66 years (Table 1).
Figure 1. Geographical distribution of digital platform SMEs applying to SMEi.
Note: 2302 firms that submitted a proposal to the SMEi between January 2014 to March 2017.

11
Table 1. Distribution of digital platform SMEs by country and age.
Country Number of SMEs Age (mean) Age (St. Dev.)
Albania . . .
Austria 32 7.25 5
Belgium 33 9.7 8.46
Bosnia and Herzegovina . . .
Bulgaria 23 10.78 8.01
Croatia 16 10.25 7.77
Cyprus . . .
Czech Republic 16 8.06 8.1
Denmark 50 8.1 7.07
Estonia 29 8.31 6.39
Finland 111 8.05 7.57
France 133 11.44 10.66
Germany 162 6.85 6.06
Hungary 88 11.03 6,79
Iceland . . .
Ireland 52 6.92 7.03
Italy 442 11.83 10,04
Latvia 15 7.67 6.73
Lithuania 15 7.33 4.55
Luxembourg . . .
Macedonia (FYROM) . . .
Malta 5 12 6.28
Netherlands 76 8.75 7.86
Norway 34 8.15 4.72
Poland 58 8.72 5.62
Portugal 62 8.24 6
Romania 26 6.96 5.64
Serbia 5 16.4 8.99
Slovakia 28 10.82 6.43
Slovenia 60 14.23 9.45
Spain 306 10.53 7.68
Sweden 56 8.39 7.24
Turkey 6 11 6.69
Ukraine . . .
United Kingdom 250 7.63 7.46
Total 2,201 9.66 8.25 (1) Statistics for countries reporting fewer than 5 observations are not displayed. The total is based on the
number of SMEs for which demographic data is available.

12
On one side, SMEs from Romania, Ireland and Germany have a particularly low mean
age, probably reflecting a better recovery of entrepreneurial activity in the aftermath of
the economic crisis spread in 2008. On the opposite side, SMEs from Serbia, Slovenia
and Malta, age distribution is much higher than the average.
In addition, we observe particularly high values of the standard deviation calculated on
the SMEs’ age in the overall sample (8.25), and even higher values among SMEs from
Italy, Belgium, France, Serbia, and Slovenia. As a dispersion measure, the magnitude of
standard deviation reflects a large heterogeneity among SMEi applicants in terms of age.
To this point, a closer look at the distribution of the full sample according to age classes
(Figure 2) reveals further facts. In spite of the fact that 41% of SMEs in the sample are
start-ups (5 years old or less), and that 21% of the new ventures are still in the early
stages of development (from 1 to 3 years old), a considerable amount of SMEs score in
the upper age classes (32% is over 10 years old and 2.7% is over 30 years, including
some companies which are more than 60 years old).
Figure 2. Distribution of digital platform SMEs by age groups.
Figure 3 and Table 2 respectively report the distribution of digital platform SMEs in the
sample by size classes and show some statistics on company size at country level.
Almost 60% of the SMEs in the sample consist of micro-enterprises (0-9 employees)
among which more than 15% has 0 or 1 employees2. The remaining 40% is equally
distributed across size classes.
The aggregate statistics reported in Table 3 shows a large discrepancy between the
overall mean value, amounting to 19 employees, and the median value, which is a much
smaller size of only 7 workers, a second important piece of evidence of the high degree
of heterogeneity within the pool of SMEi applicants. Although the difference may appear
quite small in absolute terms, in relative terms it means that some applicants are several
times larger than the median competitor.
(2) Data available from the Amadeus – Bureau van Dijk Database specifically refer to companies’ employees.
As such, the measure of company size used in this report excludes self-employed persons (i.e. the sole or joint owner of the enterprises) unless they are also in paid employment (in that case, they are considered as employees).

13
Figure 3. Distribution of digital platform SMEs by size groups.
At the country level, the United Kingdom stands out both for the mean and median
values of firms’ size (34 employees and 7 employees respectively), more than double of
the values observed in the overall sample. Other countries with a high mean size include
Lithuania, Serbia, France, and Bulgaria. However, their median firm size is very close to
the global median, which hints to the presence of few larger SMEs that consistently raise
the mean value for the entire country.
In Figure 4, the relative position of countries with respect to the mean size and age of
digital platform SMEs is reported. Most of the countries in the sample are in the fourth
quadrant, which means they have average lower age and size with respect to the overall
sample.
What should be noted here is the peculiar case of Romania. Firms established in this
country show the lowest average age and size values in the European Union, due to a
very high incidence of young sole-employee companies.
Relevant exceptions are Italy, Slovakia, and Slovenia: these countries position within the
third quadrant, meaning that SMEs established in these member states present higher
age but lower mean size.

14
Table 2. Distribution of digital platform SMEs by country and number of employees.
Country Number of
SMEs
Number of employees
(mean)
Number of employees (Standard
Deviation)
Number of employees
(median)
Albania . . . .
Austria 20 16 31 5
Belgium 18 22 61 6
Bosnia Herzegovina . . . .
Bulgaria 23 31 67 7
Croatia 16 23 33 7
Cyprus . . . .
Czech Republic 10 11 14 5
Denmark 30 12 13 5
Estonia 23 15 25 8
Finland 70 28 52 9
France 55 32 42 12
Germany 146 18 40 4
Hungary 71 21 27 11
Iceland . . . .
Ireland 34 7 6 5
Italy 362 18 33 7
Latvia 15 16 26 5
Lithuania 15 44 67 6
Luxembourg . . . .
Macedonia (FYROM) . . . .
Malta . . . .
Netherlands 49 16 34 6
Norway 33 8 8 6
Poland 15 11 13 5
Portugal 57 15 19 5
Romania 26 5 10 1
Serbia 5 36 72 4
Slovakia 23 8 11 3
Slovenia 57 16 20 7
Spain 283 21 35 8
Sweden 54 15 31 5
Turkey . . . .
Ukraine . . . .
United Kingdom 22 34 42 18
Total 1,538 19 35 7 (1) Statistics for countries reporting fewer than 5 observations are not displayed. The total is based on the
number of SMEs for which financial and employment data is available.

15
Figure 4. Plot of European countries according to average age and size of digital platform SMEs.
The size of the bubble represents the number (%) of digital platform SMEs in each country. (1) Statistics for countries reporting fewer than 5 observations are not displayed.
Shifting the attention to the distribution of firms across industries, Table 3 shows that,
unsurprisingly, the large majority of SMEi applicants in the digital platform domain
operate in the service sectors (89.8%). Very few SMEs are classified under the residual
category of “other industries”, with the partial exception of Poland.
Although this distribution appears to be particularly stable across countries, it is worth
noticing that the weight of manufacturing sector among SMEi applicants is higher in
Serbia, Croatia, Czech Republic, and Italy (more than 15%) and that in those countries
we had already observed a higher average age/dispersion. On the contrary, other
countries with solid manufacturing traditions like Germany and Sweden have very few
applicants coming from the manufacturing sector.
From this preliminary data, we can conclude that the SMEs operating in the service
sectors are more active in digital platform innovation and that this pattern holds across
Europe. Evidence from the following section(s) will provide new arguments supporting
these considerations.

16
Table 3. Distribution of digital platform SMEs by country and industry.
Country Number of
SMEs manufacturing
% services
%
other industries
%
Albania . . . .
Austria 32 6.3% 93.8% 0.0%
Belgium 33 6.1% 93.9% 0.0%
Bosnia and Herzegovina . . . .
Bulgaria 24 8.3% 91.7% 0.0%
Croatia 16 18.8% 81.3% 0.0%
Cyprus . . . .
Czech Republic 16 18.8% 81.3% 0.0%
Denmark 49 8.2% 91.8% 0.0%
Estonia 29 6.9% 93.1% 0.0%
Finland 111 8.1% 91.0% 0.9%
France 133 11.3% 86.5% 2.3%
Germany 162 4.9% 94.4% 0.6%
Hungary 88 2.3% 97.7% 0.0%
Iceland . . . .
Ireland 50 4.0% 96.0% 0.0%
Italy 442 15.6% 82.6% 1.8%
Latvia 15 13.3% 86.7% 0.0%
Lithuania 15 13.3% 86.7% 0.0%
Luxembourg . . . .
Macedonia (FYROM) . . . .
Malta . . . .
Netherlands 76 0.0% 98.7% 1.3%
Norway 34 5.9% 94.1% 0.0%
Poland 58 10.3% 82.8% 6.9%
Portugal 62 4.8% 93.5% 1.6%
Romania 26 7.7% 92.3% 0.0%
Serbia 5 20.0% 80.0% 0.0%
Slovakia 28 3.6% 92.9% 3.6%
Slovenia 60 11.7% 88.3% 0.0%
Spain 306 7.2% 90.8% 2.0%
Sweden 56 5.4% 94.6% 0.0%
Turkey 6 0.0% 100.0% 0.0%
Ukraine . . . .
United Kingdom 242 8.3% 90.9% 0.8%
Total 2189 8.9% 89.8% 1.3% (1) Statistics for countries reporting fewer than 5 observations are not displayed. The total is based on the
number of SMEs for which financial and employment data is available.

17
2.2 R&D and innovation activities
In this section, we investigate the R&D and innovation activities of our sample SMEs
applying to the SMEi within the domain of digital platforms. We provide evidence of
companies’ technological intensity from two complementary perspectives:
at the industry-level, we provide evidence of the technological content of
companies’ activities according to the High-tech Classification of Manufacturing
Industries and to the definition of Knowledge Intensive Services (KIS), both based
on NACE Rev.2 2-digit level, (EUROSTAT 2017a; 2017b).
at the company-level, we compile statistics on the R&D intensity and patenting
activities of firms in the sample, based on data retrieved from the Amadeus –
Bureau Van Dijk database.
First, 91% of SMEs in the total sample operate in the services sector, and 1,134 firms out
of 2,161 (half of the companies in our sample) are classified as High-Tech Knowledge
Intensive Services (Figure 5). This category includes scientific research and development,
computer programming, media and telecommunications services, and information service
activities.
Figure 5. Distribution of digital platform SMEs by industry.
Besides High-Tech Knowledge Intensive Services, representing over 52% of firms (Figure
6), the second, most common category of SMEs in the sample is that of knowledge-
intensive market services (408 companies out of 2,161). Ranging from architectural and
engineering businesses (technical testing and analysis) to advertising and market
research, management and consulting, legal and accounting, professional and S&T
activities, to air and water transport, market KIS represents 19% of the digital platform
companies in the sample.

18
Figure 6. Distribution of digital platform SMEs based on technological content
High-tech Classification of Manufacturing Industries - Definition of Knowledge-Intensive Services.
The distribution of firms in the manufacturing sector appears more balanced. Most of the
SMEs operate in high-tech (3.2%) and medium/high-tech industries (2.3%), but the
weight of these companies on the total sample is just over 5% (118 firms over 2,161).
To provide a comprehensive view of the distribution of technology-intensive firms across
European countries, we computed a Specialisation Index (SI) for each country, by
normalising the share of SMEs operating in high-tech manufacturing and knowledge
intensive services with the correspondent share in the total sample. Being 1 the
European average specialisation in high-tech and knowledge intensive industries, the
value of the Specialisation Index for each country indicates a higher (>1), equal (=1) or
lower specialisation (<1) with respect to the European average value.
Figure 7 displays the map of countries’ specialisation indexes based on the technological
content of digital platform companies’ activities. From this perspective, three groups of
countries emerge. A first group shows very little variation of the SI around one (which
indicates a relative specialisation equal to the European average); the group includes,
among the others, Norway, Sweden, Denmark, Finland Italy, Spain and the UK. A higher
concentration of SMEs operating in high-technology manufacturing and service industries
(SI>1) is observed in Germany and in some of the leading new member countries,
where, coherently with a favourable scale-up context (Autio et al., 2018) we observe a
small but relevant nucleus of young high-tech manufacturing companies.

19
Figure 7. Countries’ specialisation index (SI) based on technological content.
(High-tech Manufacturing Industries – High Tech Knowledge-Intensive Services)
A third group of countries, composed, among the others, by Ireland, France, Belgium and
the Netherlands show lower concentrations of high technology manufacturing/knowledge
intensive services firms operating through digital platforms with respect to the European
average (SI=0.5).
In all these countries, SMEi proposals concerning digital platform innovations mainly
originate from SMEs operating in the cultural industries3.
(3) More in detail, such companies operate in the category of “Other knowledge intensive services” which
includes Publishing activities, Education, Creative, arts and entertainment activities, Sports activities and amusement and recreation activities.

20
Table 4. Average R&D intensity of digital platform SMEs by country.
Country Number of
SMEs
R&D intensity %
(mean)
R&D intensity
% (St. Dev.)
Albania . . .
Austria 29 3.1 6.8
Belgium 33 25.4 29.8
Bosnia and Herzegovina . . .
Bulgaria 24 5.0 14.9
Croatia 16 29.4 40.0
Cyprus . . .
Czech Republic 10 28.4 37.3
Denmark 43 34.8 34.0
Estonia 26 30.5 37.6
Finland 98 45.6 32.6
France 133 21.6 25.0
Germany 70 12.9 23.9
Hungary 84 21.2 28.3
Iceland . . .
Ireland 36 18.9 31.0
Italy 442 17.8 23.0
Latvia 14 19.4 27.9
Lithuania . . .
Luxembourg . . .
Macedonia (FYROM) . . .
Malta 5 29.5 41.5
Netherlands 60 10.5 26.1
Norway 34 24.7 29.2
Poland 49 23.0 34.5
Portugal 57 21.2 29.7
Romania 26 7.2 16.7
Serbia 5 0.0 0.0
Slovakia 28 11.8 24.7
Slovenia 60 8.5 15.6
Spain 306 23.5 24.8
Sweden 49 37.6 33.3
Turkey . . .
Ukraine . . .
United Kingdom 198 16.1 29.8
Total 1,949 20.7 27.9 (1) Statistics for countries reporting fewer than 5 observations are not displayed. The total is based on the
number of SMEs for which financial and employment data is available.

21
Shifting to company-level analysis, we first computed a measure of R&D Intensity based
on financial data retrieved from the Amadeus Bureau van Dijk Database, as the
percentage share of intangible fixed assets over total assets. It needs to be noted that
this measure of R&D intensity is based on capital structure rather than on R&D
expenditures. This limits direct comparison between the two measures.
Table 4 reports the average values of R&D intensity of SMEs in the sample for each
country. It reveals that our dataset covers enterprises with a relatively high ratio of
intangible assets over fixed assets, averaging at 20.7% overall.
Such finding is in line with the sectorial overview provided above, which finds a
predominance of knowledge-intensive firms. Scandinavian countries are by far the most
knowledge-intensive, with Finnish firms having an average 45.6% of intangible assets.
However, these countries also show a high standard deviation for this measure, hinting
to uneven distributions with both “R&D champions” and firms with low levels of intangible
assets.
On the other hand of the spectrum, we find Austria, Bulgaria, Romania, and Slovenia,
whose SMEs have on average very low intangible assets. In addition, they also appear to
be quite homogeneous as shown by their low standard deviations. Among the largest EU
economies, only German firms have on average a proportion of intangible fixed assets
that is lower than the global mean.
Finally, we explore more in detail the stock of knowledge-related assets by focussing on
patents (Table 5). Patent data constitute one of the most used and available empirical
proxies for studying innovation activities (Jaffe et al. 1993; Jaffe and de Rassenfosse,
2017).
Nevertheless, patents suffer from many well-known drawbacks that make them an
imprecise proxy for innovation. Not only are patents inherently less suited to protect a
certain type of inventions relative to other mechanisms (Teece, 1986), but they are also
often used for strategic goals that differ from protecting true novelties (Cohen et al.,
2000). Furthermore, the distribution of patent applications is highly skewed in terms of
company size, a finding that is particularly evident for international patent filings (Blind
et al, 2006). Keeping this caveat in mind, we consider the stock of patent granted to
each SME as reported in Amadeus.
Starting with a bird’s eye view, the Amadeus database reports a stock of 1,926 patents
granted to the 2,203 SMEs in the period of analysis (i.e. slightly less than 1 patent each).
Considering the distribution of the stock of patents, we see that Italy accounts for the
lion’s share (32.2%) followed by the United Kingdom (21.3%) while, despite the high
number of applicants, Spain and Germany account for very small shares.
Turning to patenting intensity, measured through the normalised values of per-capita
indicators, the UK (1.8), Italy (1.6), France (1.5) and Finland (1.4) Sweden (1.3) belong
to a restricted group of countries with very high levels of patenting activities.

22
Table 5. Distribution of patents granted to digital platform SMEs by country
Country Number
of SMEs Number of patents
Patenting Intensity
(normalised values)
Albania . . .
Austria 32 19 0.7
Belgium 33 8 0.3
Bosnia and Herzegovina . . .
Bulgaria 24 1 0.1
Croatia 16 1 0.1
Cyprus . . .
Czech Republic 16 0 0.0
Denmark 50 26 0.6
Estonia 29 9 0.3
Finland 111 132 1.4
France 133 172 1.5
Germany 162 113 0.8
Hungary 88 38 0.5
Iceland . . .
Ireland 52 13 0.3
Italy 442 621 1.6
Latvia 15 0 0.0
Lithuania 15 3 0.2
Luxembourg . . .
Macedonia (FYROM) . . .
Malta 5 0 0.0
Netherlands 76 30 0.5
Norway 34 17 0.6
Poland 58 8 0.2
Portugal 62 60 1.1
Romania 26 7 0.3
Serbia 5 0 0.0
Slovakia 28 9 0.4
Slovenia 60 45 0.9
Spain 306 116 0.4
Sweden 56 62 1.3
Turkey 6 5 0.9
Ukraine . . .
United Kingdom 250 411 1.8
Total 2,203 1,926 1.0 (1) Statistics for countries reporting fewer than 5 observations are not displayed. The total is based on the
number of SMEs for which patent data is available.

23
Figure 8 shows that this group of countries have markedly higher levels of patenting
intensity than the European average (PI>1) while, consistently with the large inter-
country heterogeneity observed above, the PI values of the observed SMEs in all the
remaining EU countries are markedly lower than the European average (PI<1).
Figure 8. Patenting Intensity (PI) of digital platform SMEs by country.

24
3 Profiling digital platform SMEs in Europe
The process applied to identify digital platform SMEs’ profiles among SMEi digital
platform applications started from the collection of proposal abstracts. The aim was to
identify natural groups among the total number of applications in order to then conduct
an analysis on individual groups. Given that we are dealing with textual data, we apply a
topic modelling analysis, which is the counterpart of the cluster analysis for numeric
data. Latent Dirichlet Allocation (LDA) is a popular algorithm for implementing topic-
modelling procedures (for a more detailed description, see Blei, Ng & Jordan, 2003). In
our context, each proposal abstract is treated as a mixture of topics, and a combination
of words characterizes each topic. LDA allows to simultaneously estimate both the
mixtures: defining the mixture of words associated with each topic, while also finding the
mixture of topics that describe each proposal abstract. The final output of the algorithm
is the classification of each proposal into one or more than one topic according to the
words used in the abstract. According to LDA specifications, the number of topics (k) is a
fixed parameter that needs to be defined before running the algorithm. To ensure
interpretability and robustness of the results, we implemented the LDA procedures for
several values of k, from k=15 to k=5. For each value of k, we examined the resulting
topics through the list of relevant words characterising each one. The final value of k is 8,
determined as the maximum number of topics that allows a distinct interpretation of
each group, hence minimising topic overlapping. The list of the 8 clusters resulting from
the analysis and the relevant keywords per each cluster is reported in Table 6.
Table 6. Clusters definition.
CLUSTER
NUMBER CLUSTER NAME
RELEVANT TERMS (TOPICS)
CHARACTERIZING THE CLUSTERS
1 Data Services and Market Analysis for Digital Business
Market; Business; Data; Platform; Software; Service; Management; Model
2 Health and Biomedical Health; Medical; Patients; Care; Healthcare; Clinical; Data; System; Device; Treatment;
Monitoring
3 Energy and Manufacturing Energy; System; Production; Water; Control; Monitoring; Data; Cost; Quality
4 Mobile, Apps and IoT Mobile; Devices; User; Smart; App; IOT;
Internet; System; Video; Software; Cloud
5 Data Security, Cloud, and Cyber
Security
Data; Security; System; Mobile; Service; Users; Privacy; Information; Protection; Cloud; Storage; Cyber; Payment; Identity
6 Marketing, Advertising/Other
Services for Digital Platforms
Online; Marketing; Customers; Advertising;
Retailers; Products; Mobile; Data
7 Online Content Platforms
Content; Learning; Social; Media; Platform;
Education; Users; Music; Video; Online; Students; Games
8 Transport, Smart cities, Urban Transport; Public; Cities; Services; Local; Mobile; Car; Citizens; Travel; Platform; Tourism; City
Figure 9 shows the occurrence of the topics singled out with the clustering method in the
full sample and within each sector. Most of the SMEs made a proposal concerning “Data

25
services and market analysis for digital business”. The second-most addressed topic was
Health and Biomedical, followed by Energy and Manufacturing and Mobile, Apps, and IoT.
Less frequent are Data Security, Cloud Cyber Security and Online Content Platform,
Transport Smart city, Urban, and Market services for digital platforms (i.e. marketing,
advertising, other services).
Figure 9. Distribution of digital platform SMEs according to topic clusters.
The distribution of topics across the sectors in which the SMEs operate does not show
any distinctive pattern with respect to the full sample (see Table 7). In every sector,
almost 30% of SMEs made a proposal concerning “Data services and market analysis for
digital business”, 14% involving Health and Biomedical, and 10% concerning Energy and
Manufacturing or Mobile, Apps and IoT, and so on.
Proposals relative to Online Content Platforms and Data Security, Cloud, and Cyber
Security are much more frequent among firms operating in the services sectors-
especially those operating as high-tech knowledge-intensive services - while proposals
coming from manufacturing firms tend to cluster around Energy and Manufacturing,
Health and Biomedical, and Mobile, Apps and IoT.
Among these, high tech and medium-high-tech manufacturing businesses have a higher
incidence of digital platform proposals related to Health and Biomedical and Energy and
Manufacturing, while low and medium-low technology firms developed proposals related
to Mobile, Apps and IoT topics.
Such evidence suggests that SMEi proposals concerning the development of digital
platform innovations build, at least to a certain extent, on the firms’ in-house R&D
capacity. Also, it is worth noticing that, from a geographical perspective, bigger
economies are more representative of the different topics while this is not the case of
smaller countries, whose applicants tend to cluster around fewer topics. This may
suggest that the SMEi project can have a multi-market impact. If true, the SMEi could
offer SMEs the opportunity to diversify their portfolio of competencies by starting new
ventures and explore new areas of activity.
Table 8 displays the distribution of project proposals across the clusters, showing the
degree of overlap among different topics. As previously discussed, (see section 4.1)
including a proposal in one cluster does not exclude the possibility of being included in
another cluster. Such overlaps between generic technological capabilities, e.g. data
services, and particular sector of activities, e.g. health, hints on versatility of digital
technologies.

26
Table 7. Distribution of digital platform SMEs based on technological activity and topic clusters.
Dat
a Se
rvic
es
and
Mar
ket
An
alys
is f
or
Dig
ital
Bu
sin
ess
He
alth
an
d B
iom
ed
ical
Ene
rgy
and
Man
ufa
ctu
rin
g
Mo
bile
, Ap
ps
and
Io
T
Dat
a Se
curi
ty, C
lou
d, C
ybe
r Se
curi
ty
Mar
keti
ng,
Ad
vert
isin
g/O
the
r
Serv
ice
s fo
r D
igit
al P
latf
orm
s
On
line
Co
nte
nt
Pla
tfo
rms
Tran
spo
rt, S
mar
t ci
tie
s, U
rban
Total
MANUFACTURING 28.4% 14.9% 16.7% 15.0% 7.7% 5.4% 6.4% 5.5% 100%
High and Medium-high tech 28.2% 15.9% 15.9% 17.1% 6.3% 4.1% 5.8% 6.7% 100%
Low and Medium-low tech 28.8% 13.2% 17.9% 11.7% 10.1% 7.4% 7.4% 3.5% 100%
SERVICES 29.8% 13.8% 10.2% 10.1% 9.5% 8.2% 9.2% 9.3% 100%
High tech knowledge intensive services 30.0% 13.2% 9.6% 10.2% 10.1% 9.0% 8.9% 8.9% 100%
Other services 29.6% 14.4% 10.9% 10.0% 8.7% 7.1% 9.6% 9.7% 100%
Total 29.7% 13.9% 10.8% 10.6% 9.3% 7.9% 9.0% 8.9% 100%

27
Table 8. Overlaps between clusters
Dat
a Se
rvic
es
and
Mar
ket
An
alys
is f
or
Dig
ita
l
Bu
sin
ess
He
alth
an
d B
iom
ed
ical
Ene
rgy
and
Man
ufa
ctu
rin
g
Mo
bile
, Ap
ps
and
Io
T
Dat
a Se
curi
ty, C
lou
d, C
ybe
r
Secu
rity
Mar
keti
ng,
Ad
vert
isin
g/O
the
r Se
rvic
es
for
Dig
ital
Pla
tfo
rms
On
line
Co
nte
nt
Pla
tfo
rms
Tran
spo
rt, S
mar
t ci
tie
s,
Urb
an
Data Services and Market Analysis for Digital Business 2133 1051 825 802 717 603 686 676
Health and Biomedical 1051 995 324 390 355 282 289 320
Energy and Manufacturing 825 324 773 290 214 181 155 218
Mobile, Apps and IoT 802 390 290 758 245 199 240 240
Data Security, Cloud, Cyber Security 717 355 214 245 669 192 239 218
Marketing, Advertising/Other Services for Digital Platforms 603 282 181 199 192 567 151 178
Online Content Platforms 686 289 155 240 239 151 643 181
Transport, Smart cities, Urban 676 320 218 240 218 178 181 640

28
3.1 Cluster 1: Data Services and Market Analysis for Digital
Business
Keywords: Market; Business; Data; Platform; Software; Service; Management; Model
The Data Services and Market Analysis for Digital Business cluster is the most inclusive
one. It groups the largest part of the proposals submitted, which focus on data
services, market analysis, and digital platforms. These projects generally aim to
improve technologies in daily life activities, urban solutions, medical applications, the
Internet of Things (IoT), and Cyber Security. As the following sections show, these topics
are also developed in a wide plethora of technical applications in different fields.
Essentially, Cluster 1 proposals promote the creation of digital platforms to collect and
process data, making them available to end users. On the one hand, these
implementations aim to increase public services efficiency and encourage
responsible behaviour. Conversely, they aim to facilitate people’s life, connect people
and things (IoT) or help users in sharing content.
Main characteristics of SMEs falling within Cluster 1 are the application of digital
technologies that monetise and build on data, software and cloud-based platforms
in order to speed up the delivery of product and services to the market. These companies
transform raw information to trigger knowledge diffusion and improve contents and
activities’ management. The main goals of firms included in Cluster 1 are generally to
create sources for planning, management, protection, promotion, valuation and
monetisation of innovative solutions.
Cluster 1 SMEs leverage their activities on wide ecosystems of partners, with which
they establish technological and service collaborations to secure the highest level of
integration and interoperability of their products and services on digital marketplaces.
In conclusion, the cluster analysis shows that organising and using data on a large scale
play a vital part of innovation implementation. Data often collected and shared on
platforms, is considered crucial for a huge variety of applications from the most
traditional sectors (e.g. agriculture, food, etc.) to most innovative ones, such as the use
of Artificial Intelligence (AI) for data processing and marketing analysis, or cyber and
data security.
SMEs’ profiles
Cluster 1 on “Data Services and Market Analysis for Digital Business” includes almost the
totality of digital SMEs (2,290 out of 2,320), out of which only 115 resulted to be non-
active. As previously discussed, including a proposal in one cluster, does not exclude the
possibility of being included in another cluster. Therefore, it is interesting to notice the
distribution of proposal across the clusters. Being the widest and more general one,
just 39 active and 2 non-active companies fell solely in the “Data Services and Market
Analysis for Digital Business” cluster, while all the other firms presented a proposal
included in more than one cluster. The most noticeable overlap is between Cluster 1 and
Cluster 2 on “Health and Biomedical”, with 1,051 proposals included in Cluster 1 also
falling into Cluster 2, followed by Cluster 3 on “Energy and Manufacturing” and Cluster 4
on “Mobile, Apps and IoT”, respectively 825 and 802 shared proposals (Table 8). 811
SMEs out of 2,175 submitted more than one proposal (between 2 and 6) that always fell
into Cluster 1.
Cluster 1 company age averages 10 years (only slightly higher than the 9.7 years
average of the total sample of digital SMEs); their size coincides with the mean of the
total sample (19 employees) and, typically, they own one patent (total sample average
0.87), see Figure 11.
Reflecting the distribution of the total sample of digital SMEs, 91% of Cluster-1 SMEs
operates in the Service sector while only 9% deal in Manufacturing, with Knowledge-

29
Intensive High-tech being the majority of services SMEs (57%) and High-Tech only about
one third (36%) of total manufacturing firms in Cluster 1 (Figure 10).
Figure 10. Characteristics of firms in Cluster 1. (avg. age, size, and no of patents)
Figure 11. Distribution of firms in Cluster 1 by industry and technological content.
3.2 Cluster 2: Health and Biomedical
Keywords: Health; Medical; Patients; Care; Healthcare; Clinical; Data; System; Device;
Treatment; Monitoring
Three interesting insights emerge from the analysis of the proposals grouped in cluster 2.
First, the cluster analysis shows that some proposals aim to develop digital solutions to
assist people in making responsible and informed use of medications. These
projects allow, for instance, helping the general public to increase their knowledge of
healthcare, supporting them in an “intelligent” use and purchase of medicines, or
developing wireless stethoscopes that integrate devices and online platforms (intelligent
brain) through the collection of data and the comparison with standard values that help
detecting potential pathologies.
Second, the cluster analysis shows that some other projects focus on the development
and implementation of hardware and software for people’s needs. Some examples
are the Braille digital printers that reduce the costs of copies and improve the quality of
life of communities, educational institutes, and individual users.
Finally, the cluster also includes proposals focussing on public health. One of the
examples of the topics is, for example, the wastewater networks management. Since
governments only have partial information of their underground (waste) water
infrastructure, some proposals suggest 3D technology to be used to connect dedicated
platforms allowing operators to monitor the status of the water infrastructures in real
time.
SMEs’ profiles
10
9.66
Age Cluster 1
Age Total sample
19
19
Size Cluster 1
Size Total
sample1
0.87
Avg Number of
patents Cluster 1
Avg Number of
patents Total
sample
9%
91%
Manufacturing
Services36%
57%
% High-tech (over total
manufacturing)
% Knowledge-intensive
high-tech services (over
total services)
30
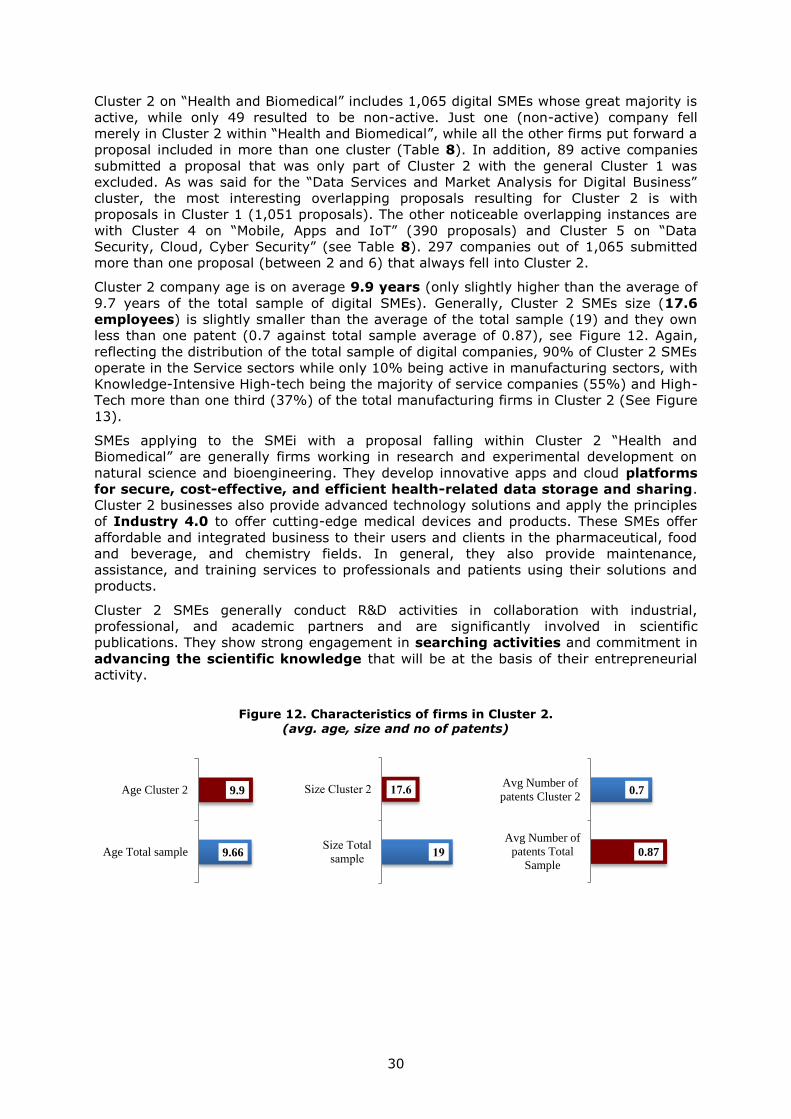
Cluster 2 on “Health and Biomedical” includes 1,065 digital SMEs whose great majority is
active, while only 49 resulted to be non-active. Just one (non-active) company fell
merely in Cluster 2 within “Health and Biomedical”, while all the other firms put forward a
proposal included in more than one cluster (Table 8). In addition, 89 active companies
submitted a proposal that was only part of Cluster 2 with the general Cluster 1 was
excluded. As was said for the “Data Services and Market Analysis for Digital Business”
cluster, the most interesting overlapping proposals resulting for Cluster 2 is with
proposals in Cluster 1 (1,051 proposals). The other noticeable overlapping instances are
with Cluster 4 on “Mobile, Apps and IoT” (390 proposals) and Cluster 5 on “Data
Security, Cloud, Cyber Security” (see Table 8). 297 companies out of 1,065 submitted
more than one proposal (between 2 and 6) that always fell into Cluster 2.
Cluster 2 company age is on average 9.9 years (only slightly higher than the average of
9.7 years of the total sample of digital SMEs). Generally, Cluster 2 SMEs size (17.6
employees) is slightly smaller than the average of the total sample (19) and they own
less than one patent (0.7 against total sample average of 0.87), see Figure 12. Again,
reflecting the distribution of the total sample of digital companies, 90% of Cluster 2 SMEs
operate in the Service sectors while only 10% being active in manufacturing sectors, with
Knowledge-Intensive High-tech being the majority of service companies (55%) and High-
Tech more than one third (37%) of the total manufacturing firms in Cluster 2 (See Figure
13).
SMEs applying to the SMEi with a proposal falling within Cluster 2 “Health and
Biomedical” are generally firms working in research and experimental development on
natural science and bioengineering. They develop innovative apps and cloud platforms
for secure, cost-effective, and efficient health-related data storage and sharing.
Cluster 2 businesses also provide advanced technology solutions and apply the principles
of Industry 4.0 to offer cutting-edge medical devices and products. These SMEs offer
affordable and integrated business to their users and clients in the pharmaceutical, food
and beverage, and chemistry fields. In general, they also provide maintenance,
assistance, and training services to professionals and patients using their solutions and
products.
Cluster 2 SMEs generally conduct R&D activities in collaboration with industrial,
professional, and academic partners and are significantly involved in scientific
publications. They show strong engagement in searching activities and commitment in
advancing the scientific knowledge that will be at the basis of their entrepreneurial
activity.
Figure 12. Characteristics of firms in Cluster 2. (avg. age, size and no of patents)
9.9
9.66
Age Cluster 2
Age Total sample
17.6
19
Size Cluster 2
Size Total
sample0.87
0.7
Avg Number of
patents Total
Sample
Avg Number of
patents Cluster 2

31
Figure 13. Distribution of firms in Cluster 2 by industry and technological content.
3.3 Cluster 3: Energy and Manufacturing
Keywords: Energy; System; Production; Water; Control; Monitoring; Data; Cost; Quality
Two insights emerge from the analysis of the proposal grouped in Cluster 3. First, the
cluster analysis shows that some proposals seek to reduce energy costs and control
water waste. On the one hand, these projects allow for, for instance, improved building
energy performance, helping users to save on energy bills and reduce CO2 emissions.
They also promote the use of mobile charging stations that employ clean energy,
including rooftop photovoltaic installations, as well as wind power, or combined heat and
power plants. On the other hand, some other projects focus on the water management
sector. These projects develop, for example, online platforms that aim to support
farmers’ by providing tools for monitoring water consumption and giving management
advice that contributes to costs saving and water reduction.
Second, the cluster analysis shows that some projects centre on proposals related to
manufacturing and retail sale of consumers’ goods. For example, some projects
provide platforms dedicated to the “influencers” that widely populate social networks.
These platforms aim to facilitate the distribution of products and to monitor their
marketing performances on social networks.
SMEs’ profiles
Cluster 3 on “Energy and Manufacturing” includes 838 digital SMEs of which only 39
resulted to be non-active. Just one active company fell only in Cluster 3, while all the
others presented a proposal that applied to more than one cluster (Table 8).
Furthermore, 122 active companies submitted a proposal falling only in Cluster 3,
excluding the general Cluster 1. As above, the most noticeable overlapping proposal
resulting for Cluster 3 is with proposals for Cluster 1 (825 applications). The other
noticeable overlapping is between Cluster 3 proposals and Cluster 2 (324) and Cluster 4
on “Mobile, Apps and IoT” (290 proposals) (see Figure 14). Finally, 40 companies out of
838 submitted more than one proposal (between 2 and 4) falling into Cluster 3.
Clusters 3 SMEs age for this cluster is 10.7 years, higher than the 9.7 years average of
the total sample of digital SMEs, and these companies are the largest in terms of size,
with an approximate number of 20.8 employees (total sample average is 19 employees).
Firms included in Cluster 3 also own more patents, with an average of 1.6 compared
with the total sample average of 0.87.
Again, reflecting on the distribution of the total sample of digital SMEs, 86% of Cluster 3
SMEs operate in the Service sectors while only 14% are active in the manufacturing
sector, with the majority of service companies being Knowledge-Intensive High-Tech
(54%) and only about one third High-Tech (29%) out of the total manufacturing firms in
Cluster 3 (See Figure 15).
10%
90%
Manufacturing
Services
37%
55%
% High-tech (over total
manufacturing)
% Knowledge-intensive
high-tech services (over total
services)

32
SMEs in the “Energy and Manufacturing” cluster apply a ‘green philosophy’ to offer
functional and technically-advanced machines and products to the national and
international markets. The objective of these companies is generally to use accurately-
selected raw materials and apply innovative technology to deliver the best quality in an
efficient, reliable and sustainable manner. Cluster 3 SMEs usually operate in traditional
sectors of manufacturing but deploy business strategies that diversify their portfolio in
order to get to different market segments and add value to their business. Indeed, these
SMEs are getting value from data organised and made available for their users and
customers on digital cloud platforms. Cluster 3 SMEs offer integrated hardware and
software solutions that combine cost-effective monitoring and control, analysis,
alert, and reporting activities.
These SMEs engage in a variety of collaborations with a diversified type of partners
with complementary assets throughout the value chain in which they are active.
By working on promising technologies that exploit the power of data and their application
across several sectors, these SMEs gain external recognition in terms of not only
awards and prizes for their products and solutions, but also in terms of funding (both
public and private) thus supporting further development of their business.
Figure 14. Characteristics of firms in Cluster 3. (avg. age, size and no of patents)
Figure 15. Distribution of firms in Cluster 3 by industry and technological content.
3.4 Cluster 4: Mobile, Apps and IoT
Keywords: Mobile; Devices; User; Smart; App; IoT; Internet; System; Video; Software;
Cloud
Proposals in Cluster 4 deal with the idea of incrementing services for daily life purposes,
on apps and mobile devices. The fields concerned are the navigations systems in urban
areas, digital transmissions through the cloud of TV and radio services, or 3D model
digitalisation.
Two different insights emerge from the analysis of the proposal grouped in the cluster.
First, the cluster analysis shows that some proposals aim to improve the massive use of
10.7
9.66
Age Cluster 3
Age Total
sample
20.8
19
Size Cluster 3
Size Total
sample0.87
1.6
Avg Number of
patents Total
sample
Avg Number of
patents Cluster 3
14%
86%
Manufacturing
Services
29%
54%
% High-tech (over total
manufacturing)
% Knowledge-intensive
high-tech services (over
total services)

33
the Internet of Things technology. For instance, these projects point to the creation of
platforms that connect mobiles with tools used in the daily life. Others, instead, aim
to create networks for data collection, monitoring, decision-making, and process
optimisation.
Second, some proposals deal with innovation for smarter access to public goods
and services. These projects, for instance, aim to preserve cultural heritage by using
digitisation techniques that offer digital 3D modelling experiences for a most realistic and
reliable way of preserving precious artefacts. Other SMEs want to launch inventions that
apply 3D modelling to history, art, and biology for the practical use in science, education
and industry. Finally, the proposals also create platforms for inner-city drivers (shared-
mobility) to access underused private garages from one-click apps unlocking private
parking spaces to public users with no need to change infrastructures.
SMEs’ profiles
Cluster 4 on “Mobile, Apps and IoT” includes 815 digital SMEs only 40 of which appeared
to be non-active. No active company fell only within Cluster 4, while all the other firms
presented a proposal were included in more than one cluster (Table 8). 42 active
companies submitted a proposal that applied only to Cluster 4, excluding the general
Cluster 1. Again, the higher overlapping is with Cluster 1 (802 proposals). The other
noticeable overlapping is with Cluster 2 (390) and Cluster 3 on “Energy and
Manufacturing” (290 proposals). Just 11 companies out of 815 submitted more than one
proposal (between 2 and 3) that always fell into Cluster 4.
On average, Clusters 4 SMEs size (19.4) is almost equal to the average of the total
sample (19 employees) and they own 1.2 patents (against a total sample average of
0.87), see Figure 16. These SMEs are also slightly older, with their age averaging at
10.4 years.
87% of Cluster 4 SMEs operates in service sectors while only 13% is active in
manufacturing sectors. Cluster 4 is consistent with the general sample in terms of
Knowledge Intensive High-tech in the services sector (58%), but the percentage of
High-Tech SMEs in the manufacturing sector accounts almost for half of the sample
(46%) (See Figure 17).
As suggested by the label itself, firms in Cluster 4 are digital SMEs which operate in the
IoT domain. Such companies mostly operate in the IT sector to develop software and
open source platforms that aim at new product development, reduced technical
complexities and time to market, enhanced user experience, and improved project
management through cloud-based platforms, mobile application, and smart devices.
Cluster 4 SMEs develop their activities collaborating with partners on the integration of
their product and services in clients’ businesses and heavily involve their users in the
innovation processes in order to guarantee high-quality user experience. They employ
revenues share and license models in their strategies.
Cluster 4 seems to have the highest concentration of spin-offs from universities and
research centres, with strong scientific bases and high-knowledge intensity. They
receive public funding support, generally from their national and/or local government
that allows them to continuously develop their business in order to be sustainable and
competitive on the market with constantly updated products and services.

34
Figure 16. Characteristics of firms in Cluster 4.
(average age, size and nr of patents)
Figure 17. Distribution of firms in Cluster 4 by industry and technological content
3.5 Cluster 5: Data Security, Cloud, Cyber Security
Keywords: Data; Security; System; Mobile; Service; Users; Privacy; Information;
Protection; Cloud; Storage; Cyber; Payment; Identity
The core of the proposals grouped in Cluster 5 points to the importance of data security
and cybersecurity. More specifically, some proposals aim to increase the security by
complex preparedness, rapid detection and fast response. The most relevant tools used
are advanced machine learning and unique algorithms that allow for the detection
of advanced threats and behavioural abnormalities.
Cybersecurity is tightly linked to data security. Over the last years, the percentage of
cyber-attacks has grown exponentially. Consequently, some projects aim to secure
people’s and companies’ assets by providing an increased level of protection for digital
transaction systems against cyber-attacks. On the one hand, these projects focus on
improving the detection and protection capabilities of cyber-operators against threats,
frauds, and incidents. On the other hand, many projects rather adopt specialised
devices to record the pulse and digital sensor data from industrial machines, sub-
sectors, and facilities enabling continuous and complete monitoring of the off-site
electrical grid. Protecting the power grid is a sensitive matter, especially for industries
involved in strategic sectors such as electric or nuclear power plants, water supply and
wastewater systems, communications, and so on. Industrial automation and control
systems are considered vital for such industries.
SMEs’ profiles
Cluster 5 on “Data Security, Cloud, and Cyber Security” includes 731 digital SMEs of
which 48 resulted to be non-active. No active company fell only in Cluster 5, while all the
other firms presented a proposal included in more than one cluster (Table 8). 50 active
companies submitted a proposal included only in Cluster 5, excluding the general Cluster
1. Besides the overlapping of proposals from Cluster 5 and Cluster 1 (717 proposals), the
only noticeable overlapping is between Cluster 5 and Cluster 2 proposals on “Health and
Biomedical (355) (see Figure 18). Just 15 companies out of 815 submitted more than
one proposal (between 2 and 4) that fell into Cluster 5.
10.4
9.66
Age Cluster 4
Age Total sample
19.4
19
Size Cluster 4
Size Total
sample0.87
1.2
Avg Number of
patents Total
sample
Avg Number of
patents Cluster 4
13%
87%
Manufacturing
Services
46%
58%
% High-tech (over total
manufacturing)
% Knowledge-intensive
high-tech services (over
total services)

35
Cluster 5 company age is on average 8.8 years (lower than the 9.7 years average of the
total sample of digital SMEs). Clusters 5 SMEs size (18.1) is slightly smaller than the
average of the total sample (19 employees), and the average patent owned by Cluster 5
SMEs is lower than in the total sample (0.6 against 0.87), see Figure 18.
Reflecting on the distribution of the total sample of digital SMEs, 92% of Cluster 5 SMEs
operate in the Service sectors while only 8% is active in the manufacturing sector, with
the Knowledge-Intensive High-tech being the majority of service companies (61%) and
High-Tech only about one third (31%) of total manufacturing firms in Cluster 5 (see
Figure 19).
SMEs in Cluster 5 generally develop online platforms for marketing and e-commerce.
They develop software applications suited to the needs of end customers and provide
installation, integration, and maintenance services. Cluster 5 firms operate on several
activities, building their competitive advantage on the principles of Industry 4.0 and big
data.
To combine their products and solutions with other products, Cluster 5 SMEs work in
partnership with system integrators, solutions providers, and digital and marketing
companies. Partnerships generally aim to improve customer experience and develop
affordable solutions. For these reasons, users and customers are involved in design
and development activities.
Cluster 5 SMEs receive many awards for e-commerce activities and services provided.
They also benefit from their founding investors (both public and private) to support their
business with seed funding and grants.
Figure 18. Characteristics of firms in Cluster 5 (average age, size, and nr of patents)
Figure 19. Distribution of firms in Cluster 5 by industry and technological content
8.8
9.66
Age Cluster 5
Age Total
sample
18.1
19
Size Cluster 5
Size Total
sample0.87
0.6
Avg Number of
patents Total
sample
Avg Number of
patents Cluster 5
8%
92%
Manufacturing
Services
31%
61%
% High-tech (over
total manufacturing)
% Knowledge-
intensive high-tech
services (over total
services)

36
3.6 Cluster 6: Marketing, Advertising/Other Services for Digital
Platforms
Keywords: Online; Marketing; Customers; Advertising; Retailers; Products; Mobile; Data
A major insight emerging from the analysis of the proposals grouped in Cluster 6 is that
these mainly point to the development of platforms for different fields.
First, a substantial part of the proposals develops platforms in connection with marketing
activities. For instance, SMEs offer solutions dedicated to online retail and advertising
of product and services by applying free licenses and empowering multiple services for
professionals, SMEs, and corporations.
Second, another part of proposals is dedicated to the innovative mobility field. For
example, these proposals point to the creation and the implementation of open sources
platforms, such as car and bike sharing, to make the sector even more heterogeneous
and to provide renting users with more affordable vehicles while only paying a fee for the
effective time used.
Finally, other proposals aim to improve the use of platforms in the area of public good
in which users can participate to socially and environmentally virtuous actions
creating a high-growth business around the commercial opportunities. For example,
every time they recycle packaging, batteries or electronic devices, donate shoes and
clothes, use public transport, keep utility bills low or learn through quizzes, they gain
access to measurable, rewarding, and sharable accomplishment.
SMEs’ profiles
Cluster 6 on “Marketing, Advertising/Other Services for Digital Platform” includes 611
digital SMEs out of which 53 resulted to be non-active. Just one active company fell only
in Cluster 6, while all the other firms presented proposals included in more than one
cluster (Table 8). 53 active companies submitted a proposal that was included only in
Cluster 6, excluding the general Cluster 1. Almost all the proposals in Cluster 6 are also
included in Cluster 1 (603 out of 611) and the most relevant overlapping for Cluster 1 is
with proposals from Cluster 2 on “Health and Biomedical (282) (see Figure 20). A mere
21 companies out of 815 submitted more than one proposal (between 2 and 5) that fell
into Cluster 6.
Cluster 6 company age is about 10 years (almost equal to the 9.7 years average of the
total sample of digital SMEs). SMEs in this cluster are slightly larger (averaging 20
employees against the total sample mean of 19 employees), each one typically owning
one patent (Figure 20).
Confirming the distribution of the total sample of digital SMEs, 94% of Cluster 6 SMEs
operate in the service sectors while only 6% is active in the manufacturing sectors, with
the Knowledge-Intensive High-tech being the majority of service companies (63%) and
High-Tech exactly one third (33%) of total manufacturing firms in Cluster 6 (See Figure
21).
Cluster 6 SMEs generally develop their own software and systems that combine
information technologies and cloud computing to conduct activities in marketing and
advertising, communication channels-enabling and device manufacturing.
Cluster 6 firms work on transparent, secure, and efficient multi-sided platform to
perform business transactions and provide services that ensure customers data security
and high-level of solution usability. They usually protect their technologies through
formal and informal tools of appropriation (IPR) and receive efficiency and high-
performance certifications.
These SMEs gain funding from the public sector and from private investors to develop
their business. Cluster 6 firms collaborate with industrial partners for system
development and integration, and with universities on joint research projects.

37
Figure 20. Characteristics of firms in Cluster 6
(avg. age, size and no of patents)
Figure 21. Distribution of firms in Cluster 6 by industry and technological content
3.7 Cluster 7: Online Content Platforms
Keywords: Content; Learning; Social; Media; Platform; Education; Users; Music; Video;
Online; Students; Games
Two different insights emerge from the analysis of the proposal grouped in Cluster 7.
First, the cluster analysis shows that a substantial part of proposals aims to improve
platforms in which users can share contents, physical objects, or even ideas. These
platforms may also allow users to easily publish and sell digital content on physical
media.
Second, the cluster analysis also shows that some other projects focus their attention on
proposals linked to Augmented Reality (AR). AR is applied to a vast array of fields.
Some proposals aim to create platforms that allow for augmented reality contents and
games for educational purposes on mobile devices.
The sectors of activity include smartphone gaming and online sharing contents such as
music and media.
SMEs’ profiles
Cluster 7 on “Online Content Platform” includes 692 digital SMEs, with only 36 resulted to
be non-active. No active company fell only in Cluster 7, while all the other firms
presented a proposal that was included in more than one cluster (Table 8). 86 active
companies submitted a proposal included only in Cluster 7, excluding the general Cluster
1. Understandably, the most noticeable overlapping proposals resulting for Cluster 7 is
with proposals in Cluster 1: almost all the proposals falling within the “Online Content
Platforms” (686 out of 692) were also included in the general Cluster 1 on “Data Services
and Market Analysis for Digital Business”. The only other noticeable overlapping is
between Cluster 7 and Cluster 2 on “Health and Biomedical (289) (see Figure 22). Just
10
9.66
Age Cluster 6
Age Total sample
20
19
Size Cluster 6
Size Total
sample0.87
1
Avg Number of
patents Total
Sample
Avg Number of
patents Cluster 6
6%
94%
Manufacturing
Services
33%
63%
% High-tech (over
total manufacturing)
% Knowledge-
intensive high-tech
services (over total
services)

38
21 companies out of 692 submitted more than one proposal (between 2 and 4) that fell
into Cluster 7.
Cluster 7 company age is on average 9.3 years (almost equal to the 9.7 years mean of
the total sample of digital SMEs). Clusters 7 SMEs are the smallest in size (17.4) if
compared with the total sample average (19 employees), and these companies generally
own fewer patents than the total sample (0.5 against the 8.7), (see Figure 22).
Again, reflecting on the distribution of the total sample of digital SMEs, 93% of Cluster 7
SMEs operates in the Service sectors while only 7% is active in Manufacturing sectors,
with the Knowledge-Intensive High-Tech being the majority of services companies (55%)
and High-Tech more than one third (37%) of total manufacturing firms in Cluster 7
(See ).
SMEs in Cluster 7 usually develop proprietary platforms taking advantage from the
potential impact of the digital revolution for business. They exploit the rationales of
gamification by working on app development and tailor-made services for their users
and customers. SMEs engage in developing an open learning environment involving
all the interested stakeholders: learners, educators, content providers, and application
developers, thereby generating an educational ecosystem.
Cluster 7 firms use the latest technologies, virtual and AR to provide outsourced
services to clients. They offer innovative digital services with educational and learning
content on complex platforms equipped with personalised programs. These SMEs
constantly develop and update their product and services and often innovate their
business models in order to stay competitive on the market adjusting their pricing
strategy. They can have many partnerships, which usually take the form of close-knit
relationships with their clients.
Figure 22. Characteristics of firms in Cluster 7 (avg. age, size and no of patents)
Figure 23. Distribution of firms in Cluster 7 by industry and technological content
9.3
9.66
Age Cluster
7
Age Total
sample
17.4
19
Size Cluster 7
Size Total
sample0.87
0.5
Avg Number of
patents Total
sample
Avg Number of
patents Cluster 7
7%
93%
Manufacturing
Services
37%
55%
% High-tech (over
total manufacturing)
% Knowledge-
intensive high-tech
services (over total
services)
39
3.8 Cluster 8: Transport, Smart Cities, Urban
Keywords: Transport; Public; Cities; Services; Local; Mobile; Car; Citizens; Travel;
Platform; Tourism; City
The largest part of the proposals in Cluster 8 deals with topics concerning urban needs,
tourism increment, public transportations and smart cities.
The cluster analysis shows that a significant part of proposals aims to meet the travellers’
needs. They develop, for example, platforms that meet travellers’ business needs.
Sometimes business travellers feel frustrated by the time waste at the airports,
especially in connecting flights. Millions of people transit in airports on a daily basis but
their time is often wasted and their stay can be improved, making better returns on
investment for business travelling. The goal of these innovative platforms is to allow
business travellers to improving the planning of their flights by making better use of their
time to meet existing or new potential partners.
Other proposals aim to improve the public transportation field. The public
transportations field counts more than 1 million vehicles, producing 25% of all CO2
emissions, consuming 30% of all available fossil energy and being the cause for more
than 1.200.000 casualties, every year. Consequently, some proposals suggest the use of
platforms for promoting best practices also in commercial road transportations, collecting
data, sharing information and promoting a new driving behaviour.
The cluster analysis also shows that some projects focus their attention on proposals
related to cities’ cultural heritage. Some projects suggest the use of innovation to
preserve the cultural heritage by using digitisation and 3D models’ techniques in order to
create realistic 3D models capturing reality in a very precise way.
SMEs’ profiles
Cluster 8 on “Transport, Smart Cities, and Urban” includes 683 digital SMEs, of which
only 30 resulted to be non-active. No active company fell only within Cluster 8, while all
the other firms presented a proposal falling under more than one cluster (Table 8). 42
active companies submitted a proposal that was included only in Cluster 8, excluding the
general Cluster 1. Almost the totality of proposals falling within the “Transport, Smart
Cities, Urban” cluster (676 out of 683) was also included in the general Cluster 1 on
“Data Services and Market Analysis for Digital Business”. The only other noticeable
overlapping is between Cluster 8 and Cluster 2 on “Health and Biomedical (320). Just 12
companies out of 683 submitted more than one proposal (between 2 and 4) always
falling within Cluster 8.
Cluster 8 company age is on average 9.2 years (almost equal to the 9.7 years average of
the total sample of digital SMEs). Across all the other Clusters, SMEs included in
“Transports, Smart Cities, Urban” Cluster are the smallest in terms of number of
employees (15.8 employees, against a total sample average of 19). These SMEs own
fewer patents if compared with other Clusters SMEs, with an average of 0.5 patents
against a total sample average of 0.87 (Figure 24).
94% of SMEs in this cluster operate in the Service sectors while only 6% is active in
Manufacturing sectors, with the Knowledge-Intensive High-tech being the majority of
services companies (55%) and High-Tech about one third (35%) of the total
manufacturing firms in Cluster 8 (See Figure 25).
SMEs in Cluster 8 develop applications, software and platforms in the transport and
smart city environment to enable the smart revolution at the urban level, building on
innovative technologies for logistics, security, and traffic management. These SMEs
generally develop platforms to make it easier to access and use their products and
services and introduce functionally-advanced solutions on the market. SMEs in Cluster 8
derive their competitive advantage from offering quick, cheap, and easy solutions to their
customers. Cluster 8 SMEs pursue the goal of producing impact for companies by
triggering individual behavioural changes and enabling informed business

40
decision-making. They work with their customers to develop additional features of their
product and services, meeting users’ requirements and needs. They generate revenues
through licences and support fee models on their platforms.
Figure 24. Characteristics of firms in Cluster 8. (avg. age, size, and no of patents)
Figure 25. Distribution of firms in Cluster 8 by industry and technological content.
9.2
9.66
Age Cluster 8
Age Total
sample
15.8
19
Size Cluster 8
Size Total
sample0.87
0.5
Avg Number of
patents Total
sample
Avg Number of
patents Cluster 8
6%
94%
Manufacturing
Services
35%
55%
% High-tech (over
total manufacturing)
% Knowledge-
intensive high-tech
services (over total
services)

41
4 Evidence from case studies: characteristics and business
models of digital platform SMEs
The qualitative analysis was based on 9 case studies of SMEs operating through different
types of digital platforms and types of business models.
Using a story-telling approach, in-depth case studies of each of the 9 SMEs were
conducted (Eisenhardt, 1989; Eisenhardt and Graebner, 2007). The objective was to
identify the challenges that digital SMEs face in capitalising on the opportunities offered
by digital affordances. Every case was chosen for the potentially relevant information it
might add to the research framework.
The information collected through case studies was complemented through desk
research. This way, a comprehensive picture on a set of the analysed firms was created.
It offers rich insights into the following aspects of the analysed digital platform SMEs:
The nature of digital platform SMEs and their business models,
Company’s structure, offering and value proposition,
Financial performance and employment figures4.
4.1 Overview of the selected digital platform SMEs
As shown in Table 9, the SMEs taken into consideration for the case-study analysis are
young SMEs. They are on average less than 7 years old, with the oldest being 21 and the
youngest 5 years old. All of them are small companies, employing between 4 and 41
employees, except for one firm with a head count of 85 employees. They are established
across six different European Member States and represent the different European socio-
economic and geographical areas: Northern Europe (Norway); Eastern Europe (Slovenia
and Estonia); Mediterranean Europe (Spain, Italy, and Portugal). Moreover, this
geographical distribution also reflects countries with different levels of innovativeness
according to the EC classification: Innovation Leaders (Norway), Strong Innovators
(Slovenia); Moderate Innovators (Estonia, Italy, Portugal, Spain,) (European
Commission, 2017).
4 Source: Bureau Van Dijk Amadeus database.

42
Table 9. Basic data on digital platform SMEs in the sample.
Company name
Country of origin
Year of incorporation
Trade description Number of employees
Operating Revenue -Turnover (USD)
King of App S.L. ES 2013 Online mobile application developing Software-as-a-Service (SaaS) provider
30 4,943 (2015)
Cynny S.p.A. IT 2013 Software platform manufacturer; Social
Cloud services; Hardware manufacturing; Computer programming
services
15 1,402,505 (2017)
GoOpti D.O.O. SLO 2008 Online airport transfer
booking service
41 6,110,813
(2017)
Shotl S.L. ES 2006 Computer consultancy activities
20 N/A
Mosaicoon
S.p.A.
IT 2009 Video community
marketplace operator; Marketing consultancy services; Video production services
85 4,144,878
(2016)
Mazemap A.S. NO 2013 Digital services based on geographical position
and map, including
individual navigation
21 1,255,000 (2017)
Sensefinity L.D.A.
PT 2013 Solutions, hardware, software, protocols and services for the
interconnection of computer equipment and systems
9 290,000 (2016)
Socialdiabetes S.L.
ES 2012 Computer applications for technological devices
15 38,000 (2016)
Cybernetica A.S.
EE 1997 Computer Systems Design and Related Services
4 11,639,620 (2017)
The main selection criterion of digital platform SMEs for case study analysis was to cover
all the clusters of digital platforms identified among the digital proposals submitted to the
SME Instrument (see Section 3). As discusses in Section 3, Cluster Data Services/Market
Analysis for Digital Business is the most inclusive one. Allowing for overlapping between
different clusters, shows the possible application of generic technological capabilities, e.g.
data services, within particular sector of activities, e.g. health.
Table 10 shows the distribution of the SMEs across the clusters. All 9 digital platform
SMEs that were selected for in-depth analysis fit into Data Services/Market Analysis for

43
Digital Business cluster. A closer look reveals that they are active in distinct sectors of
activities, e.g. healthcare (Socialdiabetes) or transportation and smart cities (GoOpti,
Shotl, Mazemap). The presence of such combinations hints on versatility of digital
technologies.
Table 10. Distribution of selected SMEs across the clusters.
Company name Data
Servic
es/
Market
An
aly
sis
fo
r D
igit
al
Bu
sin
ess
Healt
h /
Bio
med
ical
En
erg
y /
Man
uf.
Mo
bile,
Ap
ps a
nd
IO
T
Data
Secu
rit
y,
clo
ud
,
cyb
ers
ecu
rit
y
Marketi
ng
,
Ad
vert
isin
g/o
ther
serv
ices f
or d
igit
al
pla
tfo
rm
s
On
lin
e c
on
ten
t
pla
tfo
rm
s
Tran
sp
ort
, S
mart
cit
ies,
Urb
an
King of App S.L. ✓
✓
✓
Cynny S.p.A. ✓ ✓
✓
✓
✓
GoOpti D.O.O. ✓
✓
✓
Shotl S.L. ✓
✓
✓
Mosaicoon S.p.A. ✓
✓
✓
Mazemap A.S. ✓
✓
Sensefinity L.D.A. ✓
✓ ✓
✓
Socialdiabetes S.L. ✓ ✓
Cybernetica A.S. ✓
✓
✓ ✓
4.2 The nature and business model of digital platform SMEs
The aim of this study was to explore innovation and value creation patterns of European
digital platform SMEs. In order to address these questions, two elements digital
platforms are considered: 1) the nature of the digital platform; 2) the business model
applied to create and capture value from this platform (see Section 1.2). The 9 digital
platform SMEs analysed were classified according to these two dimensions. Table 11
shows the nature of their platform and the business model they operate. Subsequent
sections present a detailed analysis of the selected SMEs according to these criteria.

44
Table 11. Nature of Platforms and Platform Business Models of the analysed SMEs.
4.2.1 The nature of digital platform SMEs
According to Table 11, the analysed digital platform SMEs mainly developed Service
Providing Platform. Except for King of App and Mosaicoon, 7 out of the 9 SMEs had
developed platform technologies that, according to the literature, could have high
disruption effects on the traditional services companies in the market of transportation,
healthcare counselling, advertising, and software as service. Out of the companies
developing Service Providing Platforms, only Cynny showed the ambition of further
developing its platform to target different markets, potentially becoming a Platform
Mediating Work offering its technology for the recognition of micro-facial expression to
the development of tailored learning experience.
Concerning the other two companies, King of App developed a Platform for Platform
technology, offering a space where all the tools to build other platforms and apps can be
found in the same place and with different templates available. Mosaicoon is the only
company in the sample that throughout its life applied changes in the nature of its
platform. The company changed its business model many times and evolved from a
Service Providing Platform to a Digital Tool for Platforms and Market Place. The initial
technology developed by Mosaicoon was a platform for the distribution on the web of
advertising contents created by the company itself. Later, it started involving content
creators and dedicated its technology platform to integrate these contents into other
websites.
4.2.2 Business models of digital platform SMEs
Four SMEs in our sample developed an Integrator Platform Business Model, two
companies developed a Product Platform Business Model, and 3 developed a Two-Sided
Platform Business Model (See Table 11).
Integrator Platforms Business Model: Cynny; Mazemap; Sensefinity; Mosaicoon.
The SMEs engaged in developing this business model aims at integrating external
innovations or products on top of their platform technology, but closely monitoring the
activities of external contributors to innovation and/or customers. They provide a
technological standard that platform users have to use if they want to benefit from the
platform offerings. This is particularly clear in the case of Cynny. The brands involved in
Cynny’s platform are the content sources for advertising videos distributed to viewers;
however, Cynny does not leave the brands any space in the use of viewers’ data or its
protected technology, which is only applied to the contents provided by the brands.
Mosaicoon is another example of a company that has been testing different business
models, always in connection with technological evolution. Its last step was to pass from
an Integrator to a Two-Sided Platform business model, in order to alleviate the work
Platform Business Models
Integrator
Platform
Product
Platform
Two-Sided
Platform
Natu
re o
f P
latf
orm
s Platform for Platform
King of App King of App
Digital Tools for Platform and
Market Places
Mosaicoon
Mosaicoon
Platform Mediating Work
Cynny
Retail Platform
Service
Providing
Platform
Mosaicoon
Cynny
Mazemap Sensefinity
Cybernetica
Drivania/Shotl
GoOpti
Shotl
Socialdiabetes

45
conducted in-house of controlling contents creation and/or creating the contents itself,
and on which creators could just develop the advertising contents desired by client
brands. However, the company closed few months after launching the two-sided
platform.
Product Platform Business Model: King of App; Cybernetica. King of App offers to
developers the possibility of selling their contents and template for app building directly
to the users (clients), and only covering a small mark-up to gain revenues from the
mediation. However, King of App is now investing the funds received from the European
Commission in the SME Instrument competition to develop a new business model and
scale its platform. The project involves the creation of an academy for users on how to
use the King of Apps technology in the development of new templates for apps. This way,
the company aims at setting a new standard in app technology development. It is
expected that this would increase the user retention level and allow it to experiment with
a new Product Platform-based business model.
Two-Sided Platform Business Model: GoOpti, Shotl, Socialdiabetes. Most of the
SMEs operating a Two-Sided Platform business model have not introduced major changes
to their business models during their lifetime. Shotl together with its parent company
Drivania went through several business model evolutions. Despite remaining (just as
Shotl) a Service Providing Platform, Drivania started operating under a sort of franchising
business model, centred on customer service and ride offers. Subsequently, it evolved
towards developing a technology platform for chauffeur services bookings and related
driver ID- and criminal record-checking. In this scenario, the technology platform
became the core of the company and customer service is only the added value of
Drivania. As far as Shotl is concerned, it was conceived as a multi-sided platform in
which several stakeholders would have been involved (i.e. Government and local
institutions, private vehicle fleet companies, users). However, the company rapidly
understood that the Spanish business environment was not the right one to start a
business involving all the stakeholders from the beginning, and it went back to pursuing
a Two-Sided Platform as a starting point to sustainably scale its business model and
activities.
4.3 Case-studies' take-aways
Moreover, we conducted a cross-case analysis to observe the drivers and the obstacles
posed by the types of business models identified by the literature, highlighting patterns
of emerging digital platform business models across the sample. The results of the
within-case analysis are summarised in Table 12 and detailed findings are reported in
subsequent sections.

46
Table 12. Findings from the within-case analysis.
King of App S.L.:
A platform for
platforms
Value creation: shifted from B2C to B2B market through the disintermediation of traditional actors.
Value Capturing: two-sided digital platform wedged between two sides of the market
Scale-up: API integration with other platforms and engagement of additional communities of developers
Strategies to enter as an ecosystem: leveraging on indirect network effects
GoOpti D.O.O.:
Disrupting the transportation services
Shift from a traditional business to a digital marketplace
Dynamic pricing algorithm underpinning the online activities of the platform to mediate between different market segments
Business model evolution for value capturing
SocialDiabetes:
Bringing
communities together
Increasing competition pushed value traditional value capture mechanisms
VC and Public funding are complementary funding methods and provide different types of support to digital platforms, depending on the stage of development.
Facing resources constraints for further technology development
Mazemap:
Navigating indoor
Access to complementary assets has enormous importance for the market-entry
Market expansion in Europe is hampered by cultural and bureaucratical differences.
Lack of “soft” complementary assets, managerial skills and tools needed to scale up
Sensefinity:
IoT for the
Masses
Previous work experience can be an enabler to create value
Growth and scale up can be amplified through another form of revenue stream.
Cybernetica:
Secure digital democracy
The niche of cybersecurity is crowded, and constant progress must be made, advancing technology and disintermediating R&D
To scale up, exploration of other markets is required but it implies higher
costs
Cynny S.p.A.:
Capitalising on emotions
Entrepreneurial expertise and technical background of the entrepreneur gained investors trust.
Balancing Technology Push and Business Pull Approaches in different phases
of innovation (from ideation to commercialization).
Scaling the platform requires business model evolution: the company went from B2C to B2B, becoming an integrator platform.
Crowdfunding is a valuable funding tool. It complements investors and public funding. The European VC is not suitable to the digital platform needs.

47
Shotl/Drivania:
Serial entrepreneurship
Outbound Open Innovation Strategy: establishment of CaminaLab, a
corporate venture builder that allows diversifying its business through a spin-off activity
One Platform, Multiple Business Models Evolution, from a service platform to a technology company and tech-incubator, purely focused on technology
Appropriation strategies: internal development, from outsourcing to in-house development through collaboration-learning -hiring
Group’s ventures are self-funded with reinvestment of profit coming from the business. Shotl is the first one that involved VC, which was fund to accelerate timing in a start-up
Mosaicoon:
Scaling-up is not enough
Drivers:
- role of the founder as pivotal in the company
- Appropriation strategy is crucial for gaining investors’ interest,
enhance company’s value and protect the technology in complex markets
- Business models need to be tested and constantly adapted
Barriers:
- Generalist VC can be inappropriate for the specific needs of digital platforms
- Peripheral location jeopardise development and growth because impedes testing and lack complementary assets
- Lack of clear business model: creating value is not enough when value capturing mechanisms lack
Case study results were reported through a “takeaway” table for each company based on
the following dimensions:
Role of the entrepreneur/founder
Funding
Appropriation strategies
Platform development
Business model evolution
Details on the profiles of the analysed digital platform SMEs and key takeaways from the
case studies are reported below.
4.3.1 King of App: A platform for platforms
King of App is a textbook case of digital platform innovation providing digital tools to
support the creation of other platforms, a phenomenon becoming increasingly common in
the web environment (Kenney and Zysman, 2015; 2016). As a start-up, it developed and
launched the first Open Source Mobile Content Management System (CMS) as an online
tool to create mobile applications for iOS and Android allowing developers, designers, and
even users with little coding experience to build mobile apps faster and more
economically than in the traditional advertising market.
Case takeaways:

48
Value creation: The platform creates value in the marketing, advertising, and
design industries resulting in a dramatic lowering of the price and the time to develop
mobile applications for small companies. The platform disintermediates traditional
actors shifting the focus from the B2C segment to a new B2B market where
developers can build, programme and share modules. In this perspective, this type of
platform has reduced the transaction costs (e.g. search efforts, customer lock-in) of
the mobile app market and has an integrator platform business model.
Value capture mechanisms: King of App as a two-sided digital platform wedged
between two sides of the market. On one side, it provides the developers’ community
(external innovators developing their own items using the free platform features) with
additional paid services, such as professional technical support, training, form filling.
On the other side, it maintains an online store allowing firms to create their own
projects and build communities.
Scaling up: to increase its market impact, King of App is also developing its business
through API integration with other platforms, facilitating the connection with the tools
on which other platforms are built. The company is now engaging the developers’
community to scale up and prove itself in the market.
Strategies to build an ecosystem: To engage the developers’ community the
company is actually leveraging on indirect network effects through an academy
programme (online training) aiming at shifting customers from the user side to the
developer's side of the platform. Marketing activities and business development
processes are resource-intensive: the company’s growth rests on public funds.
4.3.2 GoOpti: Disrupting the transportation services
GoOpti is a case of digital platform innovation intending to transform service industries
(Kenney and Zysman, 2015). The nature of GoOpti digital platform innovation is
recognised in the literature as one with a most disruptive power. Coherently with
Christensen’s theory of disruptive innovation (Christensen and Rosenbloom, 1995;
Christensen, 1997), service-providing platform innovations initially target small market
segments (which are typically unattractive for traditional services companies) and,
through the development of a different value proposition (based on new functionalities
typically offered at a lower price) are able to move upmarket delivering the performance
that mainstream customers require. The GoOpti platform targets a market segment of
demand-responsive transportation (shared and private transfers) to displace the
traditional public and private transportation and the use of a personal car.
Case takeaways:
A shift from a traditional business to a digital marketplace for shared
transfer. The ecosystem created by the platform allowed developing a new value
proposition based on convenience and affordability of long-distance shuttle services,
as two performance dimensions meeting the low-end travel needs in this segment.
The dynamic pricing algorithm underpinning the online activities of the platform
allows to mediate between different market segments:
On the demand side, the platform combines passengers with similar travel
time limitations on the same vehicle and allows to set up the lowest price
possible (demand aggregator).
On the supply side, the platform supports contractual relationships with local
franchisees (i.e. transportation companies) in the different countries in which
it operates. The platform supports suppliers also with risk management,
routing, and payment transaction services.
The nature of the digital platform innovation also supports multiple business models,
allowing setting up different value capture mechanisms. GoOpti grew through an
evolution in the business model. From that of a typical transportation company

49
owning the vehicles and allowing other transportation companies to join towards a
franchising business model allowing multiple transportation companies to sustain
expansion in local markets, to the “pure” digital business model of a multi-sided
platform in some cities, which proved to be extremely challenging and resources
intensive.
4.3.3 SocialDiabetes: Bringing communities together
Socialdiabetes is a digital health platform making available to anyone an online tool to
facilitate diabetes management. It provides an infrastructure enabling the interactions
between the patients and the doctors giving everyone the necessary knowledge to be
empowered and take control of their diabetes. The two-sided platform acts as an
intermediary between the community of patients and the doctors coordinating
communication more efficiently than bilateral relationships and therefore minimising
transaction costs (search costs and communication costs).
Case takeaways:
This case contains both the features of the digital economy and those of the
sharing economy (Kenney and Zysman, 2015). Being disconnected from any
industry, the platform was born to grant to the community of patients free access
to the tool. The increasing competition among health apps pushed the platform
owners to appropriate the value created by building the community of patients
through traditional value capture mechanisms (freemium version).
Finance: VC and SMEi are seen as complementary tools, since different types of
funding provide different types of support to digital platforms, depending on the
stage of development. In the pre-start-up phase, VCs in the field of digital
healthcare require the development of patents and clinical trials and fund set up
costs and internal technology development. The relationship with the EU
commission is fundamental in the stage of market entry, enabling organic growth
(e.g. it allowed the development of the business model and the recruitment of a
team)
Barriers: resources constraints for further technology development. The company
still depends on its own funding for internal R&D activities.
4.3.4 Mazemap: Navigating indoor
MazeMap is an exemplar of the service-providing platform that disrupts the service sector
by providing new values to a small segment of the market. They provide services for
indoor maps, designed for large building complexes and mainly public organisations, such
as universities, hospitals, conference venues, shopping malls, offices, and airports. Their
services revolve around indoor positioning and navigation using enterprise wireless
networking. They are backed by a Norwegian VC and in some occasions they have made
the platform accessible to their customers and innovators, therefore moving from a
product platform business model to multi-sided platform business model (Boudreau &
Lakhani, 2009).
Case takeaways:
The Mazemap case implies that access to complementary assets (e.g. university
networking, academic knowledge, relationship with the investors) for a (serial)
entrepreneur has an enormous importance for the market-entry. Thomas Jolle, the
founder, has been an adjunct assistant professor while finding Mazemap and claims
that accessing the ecosystem resources had a big impact and helped him with the
new venture.
The Mazemap founder believes that for expanding their market within Europe, the
cultural and bureaucratical differences for each country are barriers to their efforts. In

50
addition, they lack the “soft” complementary assets (i.e. non-technology related
aspects) for scaling their market.
Mazemap case demonstrates that start-ups lack some essential managerial skills and
tools, which drives communication problems affecting their ability of accessing
resources and funding from different investors. Indeed, start-ups often invest huge
amount of money to prepare the applications for public funds with no guarantees of
success.
4.3.5 Sensefinity: IoT for the Masses
Sensefinity's offer consists of a stack solution from the hardware to a secured cloud with
an API, to tailor-made mobile and web applications. In addition, they created a sensor
device for size, temperature, and humidity to transmit the location of the item. They
claim to connect all the goods and to enable businesses to succeed their IoT
transformation for companies. Their offer is modular and is a complete chain of the
solution and that is why their customer audiences can be varied independent of their
company’s size. However, their cloud offering is merely provided to increase the
performance of their customers and is not considered a platform to use with other
platforms (Kenney & Zysman, 2016) but to help with the creation of other platforms.
The company follows a product platform business model (Boudreau & Lakhani, 2009) by
providing a complete and modular solution from hardware to software, hardware-as-
service, integrated into clients’ clouds and applications, such as Salesforce. They also
provide tailor-made solutions to connect goods, enable businesses to succeed in their IoT
transformation and bring them added value.
Case takeaways:
Among the firms that we studied, the case of Sensefinity clearly shows that previous
work experience can be an enabler to create value through a venture that covers
some unserved market that the entrepreneur spotted during a different
entrepreneurial activity. Previous experience is a source of inspiration for people that
wish to become entrepreneurs. Thanks to low costs necessary for entering into this
sector, it is easy to test the value proposition. Then the entrepreneurs apply and
adjust the business model through their test results.
Sensefinity is an example of digital platform firms, which is seeking to leverage on
other alternative revenue streams once having sufficient data received from their
customers. In other words, the growth of this digital platform can be amplified
through another form of revenue stream.
As a prevailing concern for the start-ups within our studied firms, Sensefinity is also
searching for ways to scale up their business.
4.3.6 Cybernetica: Secure digital democracy
Cybernetica is a platform to provide digital tools and support the creation of other
platforms (Kenney & Zysman, 2016). They are a key player in several e-Government
projects and radio communication solutions for Maritime Authorities. For example,
Cybernetica worked to develop the electronic voting system used by the Estonian
Electoral Commission. Their activities involve research and development in information
security. In other words, they are an R&D intensive ICT company that researches,
develops and manufactures software solutions, maritime surveillance and radio
communications systems as well as investigating and applying theoretical and practical
security solutions.
The company follows a product platform business model (Boudreau & Lakhani, 2009) and
they have ongoing collaborations with top universities from Europe, and institutions from
the USA and Japan.

51
They enhance the use of data for data-driven decision-making. Cybernetica developed a
technology that collects and share customer/citizen information without compromising
privacy and provides a distributed, Web-services based inter-organisational data
exchange framework.
Case takeaways:
The niche of cybersecurity is crowded, and constant progress must be made. The
founder of Cybernetica believes that due to the constantly evolving industry,
cybersecurity needs to get updated with the progress of technology and a strong
disintermediated R&D is required.
In order to scale up, they should expand to other markets. This is, however, resource
intensive. So, Cybernetica also finds it hard to expand internationally and, thus, it is
mainly focusing on the Estonian market.
4.3.7 Cynny: Capitalising on emotions
Cynny S.p.A. works on the interaction between machines and humans. It is at the centre
of a group of four companies, namely Cynny Inc., established in 2012 in California
(100% stake); in 2013 the group also acquired a 2% stake of a hardware engineering
company, Ambedded Technologies Co. Ltd, based in Taiwan, and in November 2015 it
established Cynny Space S.r.l. in Florence (Italy, with a 72% stake). Cynny group
currently employs a well-experienced team of more than 35 individuals including 3 CDA
experts and 24 engineers within the technology team, out of which 17 work full time to
develop special algorithms of artificial intelligence. In 2017 it had a turnover of €1.4M.
The company has filed 7 patents and obtained 3 so far.
Cynny has been developing its MorphCast® technology starting from the passion of its
Founder and CEO. The MorphCast® is based on blockchain technology and AI and runs
on the M-roll platform and servers. It allows the fruition of online stored pictures on
users’ mobile phones in the form of a video clip that adapts to the viewers’ micro-facial
expressions: the video contents change according to the emotional reactions of the
viewer. After trying to develop its own MorphCast® app, Cynny understood that the best
way to spread this technology was through the integration of its MorphCast® into
existing platforms and apps to enable the MorphCast® player working as an advertising
spot for partners’ platforms.
The company is still conducting R&D activities and, hiring a new CFO, it is also exploring
further business opportunities to expand its activity. It is already designing new potential
applications for its MorphCast® in the online content management (i.e. e-learning and
parental control systems). In doing so, Cynny is pursuing EU funding to support its
continuous R&D activities and business model innovation. The company believes strongly
in the EU programs and policy for innovation, especially the ones supporting the digital
market in which it operates. According to the CEO, the EU already started to ease the
path of EU SMEs simplifying the bureaucracy for accessing capital (e.g. the regulation of
crowdfunding), the ones related to equity and savings transparency. Simplify EU
regulation is the most important action that the EU could deploy because it would push
Member States (such as Italy) that might result slower than the others in catching up
with innovative legislation and tools.
Case takeaways:
The company benefits from the strong entrepreneurial expertise and technical
background of its founder and CEO, Stefano Bargagni. Not only is he a businessman
but also an inventor gaining the trust of investors thanks to his reputation and
previous business experience.

52
Balancing Technology Push and Business Pull Approaches: innovation comes
from inventing in isolation but, at one point or another, it is necessary to relate to the
market and listening to the customer is a must.
At the beginning of the venture, Cynny developed a purely technological approach
that was then shaped by a market strategy based on the needs and market
expertise of potential customers.
Scaling the platform requires business model evolution. Cynny is evolving its
business model from B2C to B2B, becoming an integrator platform. The company
wants to integrate its technology with partners’ platforms and in order to do that, it is
connecting the dots of the entire advertising value chain and orchestrating the
interests of involved stakeholders.
Financing: Cynny raises its capital among more than 600 stakeholders and
investors. This makes Cynny a public company, subjects to all the rules and
obligation of listed companies. Investors’ trust is gained thanks to strong corporate
governance and the experience of the founder, but also a high-level managerial and
technical team, and large R&D investments (80% of the capital).
The strategic choice of excluding VC as a source of funding relates to Bargagni’s
previous experiences and entrepreneurial attitude: he wanted to write a success
story in the Italian business scenario and linking its company to VC was not what
he envisaged. Moreover, the European VC market would not be adequate for
Cynny, both in terms of amount of funding usually offered and timing of business
development.
Relying only on public money (as the SME Instrument) is wrong because it is not
a reliable source of funding: the competition can be high, and success not always
guaranteed
Cynny had 4 successful crowdfunding campaigns. The company believes in
crowdfunding as a modern and democratic innovation tool that involves the
people in building the future of their Country and eliminates intermediaries in the
businesses’ fundraising.
4.3.8 Shotl & Drivania: Serial entrepreneurship
Shotl On-demand Shuttles is a mobility platform that matches multiple passengers
headed in the same direction as a moving vehicle. Shotl is the last venture resulting from
a long entrepreneurial experience and it is part of a family business centred on
CaminaLab, a corporate venture builder that allows the mother company (Drivania) to
de-risk business diversification and spin-off establishment. Through CaminaLab, the
family launched three venture projects Dzpatcher, FourRide, and Shotl. The case
focussed on Drivania and Shotl.
The mother company is Drivania: lift services for high-end customers, not on-demand,
pre-arranged, booked it in advance on a platform, checking the ID of the drivers,
chauffeur service. And then Shotl is on-demand, is a real-time, to manage transportation
for the local authorities, like a bus-service but more intelligent. It is a secure service,
available in 927 cities worldwide, with criminal record and background checks available in
the US.
The goal of Shotl is to improve the transport system by reducing private vehicles on the
road by 50% in the next 10 years, and enhance and encourage access to public
transportation (bus, train, underground) that provides ride solutions based on collective
ridership system.
The group managed by the Martret brothers (including Drivania, CaminaLab, Shotl,
Dzpatcher and FourRide) has been running for more than 15 years now, and faced all the
challenges of capital shortage and loss of trust from the markets, due to the economic
and financial crisis in 2009 that particularly affected Spain. Nonetheless, it currently

53
includes 45 employees and is hiring more. Out of the current 45 employees, one third
works in technology R&D, while the rest works in customer service and administration
activities.
Case takeaways:
Family Business and Serial entrepreneurs: Outbound Open Innovation Strategy.
Shotl is the last venture experience by the Martret brothers. They first established
Drivania. Then realised that developing the ideas stemming from that business was
costly and risky. Therefore, they established CaminaLab, a corporate venture builder
that allows diversifying its business through a spin-off activity. Drivania pursues new
businesses and markets through its spinoff and does not bear the risks and costs of
these entrepreneurial journeys.
One Platform, Multiple Business Models Evolution: The Martret brothers evolved
their entrepreneurial activity going from a service platform to a technology company
and tech-incubator, purely focused on technology.
Drivania evolved from a service company, cantered around the customer service,
to a technology company in which customer service is an added value.
Two-sided Platform BM: Drivania then implemented a sort of franchising BM for its
ride services worldwide, which offered to the company flexibility and reliability.
Shotl was conceived with a multi-sided platform business model to allow the
platform for hosting multiple transportation service companies. Due to capital
lack, the multi-sided platform business model revealed to be not sustainable for
go-to market strategies.
Two-sided platform Business model: Shotl went back to the Two-sided model to
achieve business sustainability.
Appropriation strategies: Drivania and Shotl develop everything internally, from
outsourcing to in-house development through collaboration-learning -hiring.
Everything is internally developed and proprietary. Both Shotl and Drivania worked
with external technology developers, outsourcing software development. The
collaboration worked poorly when the partners were located in the US and not in
Spain. Therefore the brothers started working with a local company of developers and
ended up hiring many of them.
Finance: Drivania and all the other ventures are self-funded with reinvestment of
profit coming from the business. Shotl is the first venture experience of the Martret
family involving VC funds. Working with VC is a totally new game: the company went
from dealing with customers and employees only, to include a new actor that implies
a cultural change in the organisation. Entrepreneurs need to talk to VC as investors
and not as entrepreneurs, but then go back to the company as an investor in order
not to lose the business focus. Working with VC is awkward for people like the
Martrets, who are used to work for themselves and not for someone else, but it is
good because with start-ups everything is about learning and going out of one’s
comfort zone. Moreover, VC accelerates timing in a start-up, and the Martret are
considering the possibility of looking for VC funding even for the other ventures in
order to speed up their development.
4.3.9 Mosaicoon: Scaling-up is not enough
Mosaicoon was a service providing platform – Content management solution provider. It
offered a video content platform incorporating high-quality, original video projects which
can be readily procured and customised for customer brand campaigns.
Mosaicoon’s integrated tracking tool aimed at verifying the performance of the content
and enabled brands to pay only for guaranteed views, thanks to its unique pricing
model—CVPplus.

54
Established in 2009, Mosaicoon closed in mid-2018. Its last available data reports (2016)
reports €3,932,150 of operating revenues; and 85 employees. At that moment,
Mosaicoon was managing a marketplace to buy and sell original video projects easily and
swiftly.
On the platform, creators could express their talent and easily monetise their original
videos without an initial brief from a client. Brands got thousands of high-quality creative
videos with 85% reduction in production time. Videos could be directly distributed on
social media channels with an integrated tracking tool.
The initial idea was a display of videos on the Internet but this was not working because
it was impossible to scale in terms of the number of users and contents and compete
with other content platforms such as Facebook or YouTube. The second phase of the idea
development was the integration of the contents within other players’ websites on which
Mosaicoon was making its contents available to users. In doing so, the number of users
increased but it was still impossible to mix content and advertising without a server. The
third and last phase of Mosaicoon’s activity was the creation of a real advertising
platform. The company grew through offering contents and distributing these contents.
Mosaicoon Ambidexterity: the company started working on the internal production of
content as a side business while still selecting the contents from ‘creative outsourcing’.
Next step would have been to make the creation of the content the core business of
Mosaicoon, but the company failed before being able to accomplish this part of the plan
and it is now in liquidation.
Company’s Drivers
Exemplar business platform case: platforms integrator of services and tools. On
Mosaicoon platform creatives develop advertising video projects for brand customers.
Ugo Parodi, entrepreneur and founder of Mosaicoon, was the soul of the business:
with his skill of transposing graphics arts passion on the digital world, he could gain
interests and trust of the investors.
Appropriation strategy can be crucial for gaining investors’ interest, enhance
company’s value and protect the technology in complex markets.
Business models need to be tested and constantly adapted to the market strategy
needed.
Company’s Challenges
Mosaicoon struggled in dealing with Italian VC, which are the generalist and not
experts in the media/advertising/digital world in which the company was operating.
The case of Mosaicoon suggests that the platforms in the periphery struggle to
develop and grow. This is due to the fact that the value propositions need to be
tested and in order to do so, this requires finance and skills and complementary
assets.
Mosaicoon didn’t manage to get competitive on many aspects: its prices were too
high, scaling up the platform and the business was hard and the content on the
platform lacked customisation.
Mosaicoon lacked a clear business model. It was hard to find the right market balance
within the platform: creating value through the technology is not enough, what is
hard is to capture value.
When Mosaicoon tested the business model of a two-sided platform, starting from an
integrator platform business model and it immediately faced the challenge of achieving
the required number of users and creators involved in the platform marketplace. The
company closed few months after the launch of the two-sided platform.

55
5 Innovation and business strategies of European digital
platform SMEs
The digital sector offers several examples of technological platforms (Gawer and
Cusumano, 2002; Kenney and Zysman, 2015; 2016).
Platforms provide a set of shared techniques, technologies and interfaces to a broad set
of users, contributors (e.g. individual innovators, third-party app developers) and
complementary businesses. Within this network, digital platforms play a core,
orchestrating role that results in the formation of an “innovation ecosystem” (Adner and
Kapoor, 2010). In this study, we analysed the characteristics of European SMEs
developing platform innovations and the potential mediation role of this innovation across
different markets and segments, to shed light on the adaptation processes of European
SMEs and their innovative responses to the evolving digital platform economy.
Despite the cases under analysis featured different circumstances, they presented some
recursive elements that let to identifying the following common features of SMEs digital
platform business.
In this section we present the results of the cross-case analysis, offering an overview of
how new and original business strategies are emerging among European SMEs
applying to the SMEi and catching the opportunities of digital platforms/digital
markets.
1. Disintermediation/transformation of traditional industries. Digital businesses
create value through the disintermediation or the transformation of entire
industries, in the cases with higher disruptive.
a. Digital platforms disintermediate traditional industries wedging
themselves between different sides of the market and supporting interactions
among different and converging communities (e.g. producers, consumers,
users). From a technology perspective, the digital platform provides a central
infrastructure on which participants co-create and exchange value based on
the content/goods/services created on the platform. From a market
perspective, the platform is more efficient than bilateral relationships in
facilitating coordination among multiple actors. Pricing models supported by
digital platforms are often able to dramatically reduce the transaction costs of
existing markets, crowding out traditional channels. As platforms supplying
digital tools and contents, King of App and Mosaicoon are instances of
digital platforms that disintermediate traditional advertising service, lowering
the efforts, the price, and time to develop mobile applications and advertising
videos for small companies and individuals.
b. Platforms intending to transform service industries (Kenney and Zysman,
2015) are recognised in the literature as the potentially most disruptive ones.
This perspective is connected to two dimensions: entrepreneurial and
technological. From an entrepreneurial perspective, platforms serve small
market niches that are typically unattractive for traditional services
companies. In these niches, platforms offer value through services with better
price/performance ratio, target small and demand-responsive market
segments. From a technological perspective, the algorithms underpinning
platforms’ online activities are able to mediate between different and
previously unconnected market segments, allowing to move upmarket and
potentially displace traditional actors. The dynamic pricing algorithm
developed by GoOpti represents an example of key technology allowing
developing a new value proposition in the segment of shared transfers
between big airports and remote towns. Similarly, the dynamic routing
algorithm underpinning Shotl on-demand shuttle rides allowed the
development of a new value proposition intended to transform the public and
private urban transportation system.

56
Our cases show that different aspects of the digital platform innovations may
enable mechanisms of disintermediation, transformation or even disruption of
existing industries. The growth opportunities for digital platforms are higher when
the power of enabling technology supporting market convergence and
coordinating communities’ interaction is higher and triggers network effects.
Moreover, our cases demonstrate that SMEs are more successful in capturing
value when they build on a proprietary technology.
2. External community engagement is a key managerial task to shape networks of
users, contributors, and complementary businesses, whose presence on the platform
motivates other members to join. Most of the SMEs included in this study evolved
their business model towards two- or multi-sided platforms that act as “catalyst”
(Evans, 2003) building thriving innovation ecosystems of different economic agents.
In some cases (i.e. King of Apps, Social Diabetes and Cybernetica), different
communities may have different incentives to join the platform, whose main function
is to align participants’ interests and thrive network effects.
3. Orchestrating communities to build innovation ecosystems. Digital platforms
often orchestrate networks of external communities across different industries and
implement business models presenting elements of both platform and sharing
economies. These business models are typical of large companies acting as “platform
leaders” (Gawer, 2014). The SMEs in our sample implementing this type of business
models (Social Diabetes, Mazemap and Shotl) strongly benefit from being
connected to innovation ecosystems that provide them with complementary assets
fundamental for the development of the business.
4. Managing frictions. The core business of digital platform companies is to align the
interests of different communities converging on the platform. While value creation
and experimentation are supported by the development of infrastructures based on
digital technologies, value capture mechanisms require the trigger of direct and
indirect network effects. Our cases applied different mechanisms of focussing on
customer retention (King of Apps) or friction creation (Cynny, Mosaicoon) even
before developing and experimenting on specific business models.
5. Easy to start-up difficult to scale-up. SMEs in our sample faced very low barriers
to start-up their businesses, but high barriers to scale them up. In other words, while
identifying entrepreneurial opportunities was easy, they later incurred in significant
hurdles to generate revenue streams to support growth. The start-up/scale-up gap
represents a recurring topic in studies on European entrepreneurship (Nepelski et al.,
2016; Rossetti et al., 2018; Autio et al., 2018); nonetheless, it needs to be redefined
in the specific context of digital platforms. The technological infrastructures of digital
platforms act as plug-and-play business models supporting the experimentation of
multiple value propositions in the start-up phase. The demonstration of these
business models’ logic can be simple and straightforward, but their testing implies
difficulties related to the resources and time required by the scaling-up activities.
SMEs in our sample show that resources constraints are mainly related to business
development and marketing activities, lack of specific funding opportunities and, in
some cases, to geographical constraints limiting internationalisation opportunities.
6. Digital platforms are laboratories where multiple business models are tested at
the same time. In most of our cases, SMEs developed digital platform innovations
that allow a) experimenting on different and often alternative business models to
engage with different communities; b) letting the business model evolve according to
the most appropriate value capture mechanism. As laboratories, digital platforms
lower the costs of business model experimentations: in some cases, e.g.
Sensefinity, experimentation can be a source of funding when it allows leveraging
on alternative sources of revenue streams. However, choosing a business model that
validates and enacts a growth strategy is a crucial managerial challenge where most
barriers to growth emerge. Shotl mobility platform is a spin-off from the parent

57
company Drivania which, in order to lower the risks of business diversification,
established a venture accelerator through which it spins out new companies with new
business models conducting business model experimentation.
7. Multiple funding sources to support growth. The scale-up phase represents an
important aspect of the validation phase of platform business models. The case of
Sensefinity shows that platform business models succeed when they generate
different and complementary revenue streams. In other cases, the interviewees
stressed the relevance of SMEi funding opportunities in supporting the validation of
the business model(s) developed in the “lab” phase. However, different types of
funding with different objectives are relevant in the start-up phase and in the scale-
up phase. Our cases provided clear evidence of the fact that private money (VC) and
public money act as complementary resources for digital platform businesses,
respectively at technological and market levels. Companies also highlighted the need
for expertise in combining different forms of funding and “speak the language of
different money providers” (Mazemap, King of Apps).
8. Previous experience matters. As most of our cases showed, past experiences of
the entrepreneur are powerful sources of inspiration, since they enable the
recognition or discovery of opportunities in the pre-start-up phase. Experience is
fundamental when new ideas are tested; knowledge from past experience also helps
to focus on the development of effective value propositions in digital markets, as the
cases of Sensefinity, King of Apps, Mazemap, and Cynny show.
9. Geographical scale-up. Geography remains another barrier affecting the
development of new businesses through digital platforms in Europe. As some cases
showed (Mazemap, GoOpti, Cybernetica), cultural, logistic, and administrative
distances persist across diversified national contexts, making it difficult to propose,
extend, and validate a value proposition beyond the original target market. Such
limitations raise actual difficulties and increase the costs of the scale-up phase when
growth strategies are based on internationalisation across national contexts.
10. Digital platforms in peripheral areas. Some of the analysed cases suggest that
the scale-up phase of digital platforms may be adversely affected by being located in
a peripheral area. This generally happens in traditional industries. As the Mosaicoon
and Shotl cases show, specific barriers to the development of digital
entrepreneurship arise when the company’s headquarters are in geographical areas
that are peripheral to the core of the innovation system. Testing a value proposition
and constantly adapting it to the scaling-up strategy require specific funding
opportunities, skills, and availability of complementary assets. Peripheral markets
could have great ideas but it is hard to develop them when there is no physical
proximity to a fervent environment guaranteeing easy access to the necessary
resources and assets.

58
6 Conclusions
This study analysed the European digital platform SMEs applying to the SME Instrument.
The collected evidence allows to draw some conclusions concerning the innovation
patterns and characteristics of such companies, the role of the SME Instrument in
promoting digitally-enabled business models among the smallest firms and the directions
for future research on the ways in which digital affordances are translated into economic
benefits.
Digital platform innovation in European SMEs
The study shows that European SMEs are actively pursuing platform innovation through a
number of diversified ways. They are present in many sectors including both services and
manufacturing and exhibit various levels of R&D intensity. Digital platform SMEs operate
in the knowledge-intensive service industries. Only a small number of firms operate in
the manufacturing sectors. Their main areas of activity include Health and Biomedical,
Energy and Manufacturing, Mobile apps and IoT.
Digital platform SMEs attempt to transform traditional industries through
disintermediation or disruption. Frequently, they connect and engage external
communities and orchestrate them in order to build innovation ecosystems. These
networks need to be managed whenever frictions between different communities arise.
The study confirms that entry barriers for digital platforms are rather low and that the
main challenge is to scale-up activities. Digital platform businesses mainly appeared to
be start-ups. 41% of the analysed SMEs are less than 5 years old. Being less than 3
years old, 21% are still in early stage of development. Throughout their lifetime, digital
platforms SMEs are laboratories that allow experimenting and validating several business
models. In addition to experiment with the best strategies and business models to access
the digital market; they are also trying to find and test the best ways to scale-up digital
platform businesses.
The development of digital platforms can be hampered by limited access to assets,
resources, and markets. The fragmentation of the European market additionally
increases the difficulty to scale up. Moreover, these SMEs can also be affected by being
located in peripheral areas with undeveloped innovation and entrepreneurial ecosystems.
Previous experience of the entrepreneurs can be a source of inspiration for venture
activities or business model to be tested on the platforms. It is also a key success factor
for scaling-up.
The role of SME Instrument in fostering digital platform innovation
The sample investigated was selected from the population of SMEs participating in the
European SME Instrument (SMEi), an innovative funding scheme introduced by Horizon
2020, the 8th Framework Programme for Research and Innovation. The SMEi targets the
most innovative European SMEs, with high ambitions of growth and internationalisation,
pursuing high-risk innovations with the potential of disrupting the European and global
markets.
The study shows that the wide majority of SMEs that applied to the SMEi are using the
received the funds for further growth. The SMEi encourages established innovative SMEs
to experiment with new business models to explore new business opportunities. These
attempts are built on existing capabilities. Therefore, the SMEi provides SMEs with the
possibility to diversify their portfolio and to look for new opportunities in distinct business
lines and markets.
Firms located in peripheral areas face a number of disadvantages, compared to their
peers in technology hot-spots with strong innovation and entrepreneurial ecosystems.
Public interventions in peripheral areas can help innovative SMEs not only providing
funds, but also exposing them to the international ecosystem and building reputation
necessary to seek capital for growth.

59
Implications for future research
The SMEi is a relatively new funding scheme to promote innovation among SMEs. The
target group of the SMEi represents a relevant sample of innovative and entrepreneurial
firms in Europe. Most of the beneficiaries of the SMEi are still in the early stages of
entrepreneurial development. Further research could be developed through longitudinal
studies focusing on companies which are ready in the process of scaling-up.
Consistently with previous studies (see, e.g. Autio et al., 2018) the results show that it is
easy to start up as a digital firm, but difficult to scale up. In this context, digital platforms
act as infrastructures which hold up the experimentation of multiple types of business
models, supporting different growth strategies. Further research could concentrate on the
dynamics of digital ecosystems and on the nature and types of resources allowing digital
platform companies to connect and develop growth strategies based on collaboration and
diversification.
Finally, and consistently with research on nascent entrepreneurship performed on similar
samples (Marullo et al., 2018), this study confirms that the nature and the characteristics
of entrepreneurs’ previous experience represent relevant human capital resources. It is
particularly relevant for the shift between the stand-up and scale-up stages. In this
perspective, future research on the nature and perspectives of European
entrepreneurship should “enter the lab” and engage scientists and engineers in the
stand-up stage (i.e. the process of self-selection of individuals into entrepreneurship) and
analyse in-depth the characteristics of entrepreneurial orientation and the dynamics of
opportunity recognition, discovery and creation.

60
7 Annex: Methodology
7.1.1 Selection of digital platform SMEs
For the purpose of this study, we used a sample of SMEs selected among the SMEs that
applied to the SME Instrument funding scheme under the Horizon 2020 framework
programme. These companies took part to a public competition for public funding
targeting the “European Innovation Champions”, i.e. SMEs with high ambition of growth
and internationalisation, proposing innovative entrepreneurial projects. For these
reasons, we considered the SME Instrument applicants as an interesting and relevant
group from which the sample of the study could be selected, in order to include in the
analysis new entrepreneurial initiatives as well as a relevant sample of innovative
European SMEs.
From the 33,056 proposals submitted to the SMEi from January 2014 to March 2017,
we selected SMEs whose projects reported clear evidence of digital platform innovation.
A thorough assessment of the proposal abstracts was carried out with the view of
selecting the sub-population of SMEi proposals with content pertaining digital markets
and digital platforms. To this end, we followed an iterative approach.
In the first instance, we screened the proposal abstracts including the word “digital” and
other relevant keywords appearing in the most common descriptions of “digital
economy”. Out of the population of the 33,056 proposals submitted, we obtained a
sample of 3,358 (Table 13).
Secondly, we ran a text analysis of these 3,358 proposals abstracts using the NVivo
software, to obtain a dendogram showing the 500 most cited expressions associated with
the word “digital”. Using the first 100 expressions, we ran a second non-automated
screening of the population of proposals submitted, selecting the ones which included the
new keywords and did not include the word digital. Excluding duplicates, we obtained
1,926 additional valid results and achieved a sample of 5,284 proposals (Table 14).

61
Table 13. Sample selection: preliminary check and step 1.
PRELIMINARY CHECK
Query String Results
1 Include "digital" 2,609
2 Include "digital" AND "platform" 1,239
3 Include "digital" AND "market" 2,073
4 Include "digital market" 137
5 include "digital platform" 122
STEP 1
Include Results Duplicated Total
1 digital 2,609 0 2,609
2 real time monitoring 45 5 2,649
3 sharing economy 90 29 2,710
4 market place 136 36 2,810
5 content creation 32 14 2,828
6 user generat* 33 9 2,852
7 communit* of user* 52 10 2,894
8 digital AND communit* 247 247 2,894
9 collaborative work 20 5 2,909
10 collaborative environment 16 3 2,922
11 exchange platform 30 14 2,938
12 ecosystem AND platform 357 99 3,196
13 web platform 211 60 3,347
14 crowd funding 19 8 3,358

62
Table 14. Sample selection: step 2.
STEP 2
Include "15-57" AND don’t include "Digital" Results Duplicated Total
15 business analytics 14 0 3,372
16 business intelligence tool 23 1 3,394
17 Business intelligence software 4 3 3,395
18 data-driven automation 0 0 3,395
19 data-driven online 1 1 3,395
20 data mining technologies 0 0 3,395
21 data anal* 528 35 3,888
22 data science solution 1 0 3,889
23 data processing solution 0 0 3,889
24 highly automatised solution 1 1 3,889
25 Bluetooth technology 11 1 3,899
26 RFID technology 26 1 3,924
27 blockchain technology 8 0 3,932
28 big data technology 8 4 3,936
29 time control system 0 0 3,936
30 intelligent system 57 4 3,989
31 automation system 70 5 4,054
32 artificial intelligence system 12 1 4,065
33 service management processes 0 0 4,065
34 service management systems 0 0 4,065
35 new complex service 0 0 4,065
36 information management system 12 1 4,076
37 real time information 42 7 4,111
38 mobile app 728 111 4,728
39 mobile application 393 393 4,728
40 mobile device app 4 1 4,731
41 management of artificial intelligence 0 0 4,731
42 integrated information management 0 0 4,731
43 software system 87 10 4,808
44 business intelligence software 4 4 4,808
45 software as a service 184 42 4,950
46 digitised content 1 0 4,951
47 content management system 26 9 4,968
48 virtual content 4 0 4,972
49 web app 158 36 5,094
50 web application 142 142 5,094
51 smart analysis 6 0 5,100
52 smart analytics 3 2 5,101
53 cloud computing 167 41 5,227
54 cloud technology 20 8 5,239
55 disruptive hybrid cloud 0 0 5,239
56 multiplatform application 4 0 5,243
57 smartphone application 56 15 5,284

63
7.1.2 Quantitative analysis
For the purpose of quantitative analysis, we drew on an original database matching the
information from the SMEi and the financial details of the applicant companies5. Among
the 5,284 project proposals included in the sample, 1,412 proposals were rejected
due to an unsuccessful matching procedure6 of the names of applicant companies. Out of
the remaining 3,872 proposals submitted from an identifiable applicant company, 1,537
identifiers were duplicates (that is, firms presenting more than one proposal in either of
the two phases of the SMEi). For the resulting sample of 2,335 SMEs reporting evidence
of “digital platform” activities, financial data were extracted on 15 December 2017. Out
of these, financial data were not found for 13 companies at the time of the extraction and
2 additional companies were dropped from the sample due to inconsistencies with the
official definition of SMEs (number of employees >250)7
As a result, the final output of the matching procedure consisted of 2,320 firms (Figure
26).
Figure 26. Output of the matching procedure.
Prior to analysing their characteristics, we explored the activity status of the companies
in the sample, as reported in the legal information provided by Amadeus – Bureau van
Dijk (Table 1). The overwhelming majority (95%) of the firms populating our sample was
active, with only a minor portion being dormant or under insolvency proceedings.
Interestingly, out of 117 inactive firms, almost half (54%) had dissolved, while 8 had
declared bankruptcy and 23 were under liquidation.
(5) Financial data were retrieved from the Amadeus – Bureau van Dijk Database. (6) Amadeus does not include data for Israel, which is one of the participants to the Horizon 2020 Program
despite being outside the European Union. Moreover, we experienced some particular difficulties in matching the names of Turkish firms, given that their transliteration to the Latin alphabet contained in Amadeus rarely matches with the name contained in the proposals.
(7) EU Commission Recommendation 2003/361.

64
Table 15. Analysis of companies’ status.
Status n %
Active 2,167 93.4%
Active (default of payment) 5 0.2%
Active (dormant) 13 0.6%
Active (insolvency proceedings) 15 0.6%
Active (reorganisation) 2 0.1%
Active (rescue plan) 1 0.0%
Active (total) 2,203 95.0%
Bankruptcy 18 0.8%
Dissolved 54 2.3%
Dissolved (bankruptcy) 5 0.2%
Dissolved (demerger) 1 0.0%
Dissolved (liquidation) 2 0.1%
Dissolved (merger or take-over) 7 0.3%
In liquidation 23 1.0%
Status unknown 7 0.3%
Other statuses (total) 117 5.0%
TOTAL 2,320 100.0%
7.1.3 Cases analysis
For the purpose of the cases analysis only SMEi awardees were selected. Drawing on the
initial sample of 5,284 SMEs, we identified 307 proposals that had received the SMEi
award, 922 that were awarded the Seal of Excellence (i.e. evaluated as above the
threshold but below the available budget), and 4,055 proposals that were evaluated
below threshold. After discarding duplicates (i.e. SMEs that submitted a proposal to the
SMEi more than once), we obtained 297 awarded SMEs. Using the companies’ legal
name, we matched the records with the Amadeus database to collect the SMEs’ contact
harmonised data. Due to unsuccessful matching, we dropped 108 SMEs. The final
selected sample included 209 SMEI awardees. This final sample was used as source of
selection for the case studies to be developed for this project (Figure 27).

65
Figure 27. Sample selection for cases analysis.
The 9 European digital SMEs included in the research whose results are summarised in
this report were selected from a list of 42 candidate European digital SMEs, identified
from the sample of 209 companies.
In order to capture the variety of our sample and enhance the robustness of our findings,
42 SMEs were identified and contacted from the sample of 209 companies following a
multidimensional approach that considered the different markets of operation, country of
origin, type of platform, and platform business model. This selection criterion aimed at
guaranteeing a full representation of the heterogeneity in dimensions among European
Member States, industries and firms. The 42 SMEs initially identified were contacted
through email and phone calls providing an overview of the research and its goal and
collect preliminary consent to the participation in the study. After a second email contact,
only 5 companies agreed to take part in the research. In order to reach the target of 9
case studies, in September 2018, 29 additional SMEs were further contacted and 4 of
them accepted to participate in the study. This produced a sample of 9 SMEs that were
analysed in-depth.

66
References
Adner, R., & Kapoor, R. 2010. Value creation in innovation ecosystems: How the
structure of technological interdependence affects firm performance in new technology
generations. Strategic Management Journal, 31(3), 306-333.
Autio, E., Szerb, L., Komlósi, E. and Tiszberger, M. 2018. The European Index of Digital
Entrepreneurship Systems. EUR 29309 EN, Publications Office of the European Union,
Luxembourg, 2018, ISBN 978-92-79-91303-7, doi: 10.2760/39256, JRC112439
Blei, David M., Andrew Y. Ng, and Michael I. Jordan 2003. Latent dirichlet allocation.
Journal of machine Learning research 3: 993-1022.
Blind, K., J. Edler, R. Frietsch and U. Schmoch 2006. Motives to patent: Empirical
evidence from Germany. Research Policy, 35: 655-672.
Bogdanowicz, M. 2015. Digital entrepreneurship barriers and drivers: The need for a
specific measurement framework, JRC Technical Report - EUR 27679 EN. Brussels, doi:
10.2791/3112.
Boudreau, K. and Hagiu, A. 2009. Platform rules: multi-sided platforms as regulators. In
Gawer, A (eds) Platforms, Markets and Innovation, Edward Elgar Pub.:163-189
Boudreau, K.J. and Lakhani, K. 2009. How to manage outside innovation. MIT Sloan
Management Review 50(4):69-76
Christensen, C. M., & Rosenbloom, R. S. 1995. Explaining the attacker's advantage:
Technological paradigms, organizational dynamics, and the value network. Research
policy, 24(2):233-257.
Christensen, C. 1997. The innovator’s dilemma. Harvard Business School Press,
Cambridge, Mass.
Cohen, W. M., R. R. Nelson, and J. P. Walsh 2000. Protecting their intellectual assets:
Appropriability conditions and why US manufacturing firms patent (or not). National
Bureau of Economic Research.
Di Minin, A., De Marco, C.E. & Karaulova, M,. 2016. Sme Instrument- So Far So Good?
Expectations, Reality and Lessons to Learn. BRIE Working Paper
Eisenhardt, K. M. 1989. Building Theories from Case Study Research., Academy of
Management Review 14(4):532–550. doi: 10.5465/AMR.1989.4308385.
Eisenhardt, K. M. & Graebner, M. E. 2007. Theory Building From Cases: Opportunities
And Challenges. Academy of Management Journal 50(1): 25–32. doi: Article.
European Commission (2014) Working Paper : Digital Economy - Facts & Figures. Expert
Group on the Taxation of Digital Economy, Brussels. TAXUD D1/JT - Digit/008/2014
European Commission (2017) European Innovation Scoreboard. Brussels. Available at:
https://www.rvo.nl/sites/default/files/2017/06/European_Innovation_Scoreboard_2017.p
df.
EUROSTAT (2017a): “High tech classification of manufacturing industries”. Available at
http://ec.europa.eu/eurostat/statistics-explained/index.php/Glossary:High-
tech_classification_of_manufacturing_industries (Last update: 22 March 2017)
EUROSTAT (2017b) “Glossary: Knowledge intensive Services (KIS)”. Available at
http://ec.europa.eu/eurostat/statistics-explained/index.php/Glossary:Knowledge-
intensive_services_(KIS) (Last update: 20 September 2016).
Evans, D.S. (2003). Some empirical aspects of multi-sided platform industries. Review of
Network Economics 2 (3).
Fransman, M. (2014) Models of Innovation in Global ICT Firms: The Emerging Global
Innovation Ecosystems. Joint Research Centre, JRC Science for Policy Report. EUR

67
26774 EN. doi:10.2791/10679
Gawer, A., & Cusumano, M. A. (2002). Platform leadership: How Intel, Microsoft, and
Cisco drive industry innovation. Boston, MA: Harvard Business School Press.
Gawer, A. (2014). Bridging differing perspectives on technological platforms: Toward an
integrative framework. Research Policy 43(7): 1239-1249
Jaffe, A. B., Trajtenberg, M., & Henderson, R. (1993). Geographic localization of
knowledge spillovers as evidenced by patent citations. The Quarterly journal of
Economics 108(3): 577-598.
Jaffe, A. and G. de Rassenfosse (2017) Patent citation data in social science research:
Overview and best practices. Journal of the Association for Information Science and
Technology 68: 1360-1374.
Kenney, M. and Zysman, J. (2015) Choosing a Future in Platform Economy: The
Implications and Consequences of Digital Platforms, Kauffman Foundation New
Entrepreneurial Growth Conference. Amelia Island Florida. doi:
10.1017/CBO9781107415324.004.
Kenney, M. and Zysman, J. (2016) The rise of the platform economy. Issues in Science
and Technology. 32(2):61–69. doi: 10.17226/21913.
Martens, B (2016) An Economic Policy Perspective on Online Platforms. Institute for
Prospective Technological Studies Digital Economy Working Paper 2016/05, JRC101501.
Marullo C., Casprini E., Di Minin A. & Piccaluga A. (2018) Ready for Take‐off: How Open
Innovation influences startup success. Creativity and Innovation Management 27(4):
476-488
Nepelski, D., Piroli, G. & De Prato, G. (2016) European start-up hotspots: Analysis of
Venture Capital financing in Europe. Joint Research Centre, JRC Science for Policy
Reports EUR 28021 EN. doi:10.2791/39207
Nepelski, D. (2019). How to Facilitate Digital Innovation in Europe. Intereconomics,
54(1): 47-52.
Rossetti, F., Nepelski, D. and Cardona, M. (2018) The Startup Europe Ecosystem.
Analysis of the Startup Europe projects and of their beneficiaries, Joint Research Centre,
JRC Science for Policy Report, EUR 29134 EN, doi:10.2760/78946, JRC110945.
Schor, J. (2016). Debating the Sharing Economy. Journal of Self-Governance and
Management Economics 1(3): 7–22.
Sundararajan, A. (2014). Peer-to-peer businesses and the sharing (collaborative)
economy: Overview, economic effects and regulatory issues. Written testimony for the
hearing titled The Power of Connection: Peer to Peer Businesses.
Teece, D. J. (1986): Profiting from technological innovation: Implications for integration,
collaboration, licensing and public policy. Research Policy 15: 285-305.
Zysman, J. and Kenney, M. (2018) ‘The Next Phase in the Digital Revolution’,
Communications of the ACM, 61(2):54–63. doi: 10.1145/3173550.

68
List of figures
Figure 1. Geographical distribution of digital platform SMEs applying to SMEi. ..............10
Figure 2. Distribution of digital platform SMEs by age groups. ....................................12
Figure 3. Distribution of digital platform SMEs by size groups. ....................................13
Figure 4. Plot of European countries according to average age and size of digital platform
SMEs. .................................................................................................................15
Figure 5. Distribution of digital platform SMEs by industry. ........................................17
Figure 6. Distribution of digital platform SMEs based on technological content ..............18
Figure 7. Countries’ specialisation index (SI) based on technological content. ..............19
Figure 8. Patenting Intensity (PI) of digital platform SMEs by country. ........................23
Figure 9. Distribution of digital platform SMEs according to topic clusters. ...................25
Figure 10. Characteristics of firms in Cluster 1. (avg. age, size, and no of patents) .......29
Figure 11. Distribution of firms in Cluster 1 by industry and technological content. .......29
Figure 12. Characteristics of firms in Cluster 2. (avg. age, size and no of patents) ........30
Figure 13. Distribution of firms in Cluster 2 by industry and technological content. .......31
Figure 14. Characteristics of firms in Cluster 3. (avg. age, size and no of patents) ........32
Figure 15. Distribution of firms in Cluster 3 by industry and technological content. .......32
Figure 16. Characteristics of firms in Cluster 4. (average age, size and nr of patents) ...34
Figure 17. Distribution of firms in Cluster 4 by industry and technological content ........34
Figure 18. Characteristics of firms in Cluster 5 (average age, size, and nr of patents) ...35
Figure 19. Distribution of firms in Cluster 5 by industry and technological content ........35
Figure 20. Characteristics of firms in Cluster 6 (avg. age, size and no of patents) .........37
Figure 21. Distribution of firms in Cluster 6 by industry and technological content ........37
Figure 22. Characteristics of firms in Cluster 7 (avg. age, size and no of patents) .........38
Figure 23. Distribution of firms in Cluster 7 by industry and technological content ........38
Figure 24. Characteristics of firms in Cluster 8. (avg. age, size, and no of patents) .......40
Figure 25. Distribution of firms in Cluster 8 by industry and technological content. .......40
Figure 26. Output of the matching procedure. ..........................................................63
Figure 27. Sample selection for cases analysis. ........................................................65

69
List of tables
Table 1. Distribution of digital platform SMEs by country and age. ..............................11
Table 2. Distribution of digital platform SMEs by country and number of employees. .....14
Table 3. Distribution of digital platform SMEs by country and industry. ........................16
Table 4. Average R&D intensity of digital platform SMEs by country. ...........................20
Table 5. Distribution of patents granted to digital platform SMEs by country ................22
Table 6. Clusters definition. ...................................................................................24
Table 7. Distribution of digital platform SMEs based on technological activity and topic
clusters. ..............................................................................................................26
Table 8. Overlaps between clusters .........................................................................27
Table 9. Basic data on digital platform SMEs in the sample. .......................................42
Table 10. Distribution of selected SMEs across the clusters. .......................................43
Table 11. Nature of Platforms and Platform Business Models of the analysed SMEs. ......44
Table 12. Findings from the within-case analysis. .....................................................46
Table 13. Sample selection: preliminary check and step 1. ........................................61
Table 14. Sample selection: step 2. ........................................................................62
Table 15. Analysis of companies’ status. ..................................................................64

GETTING IN TOUCH WITH THE EU
In person
All over the European Union there are hundreds of Europe Direct information centres. You can find the address of the centre nearest you at: https://europa.eu/european-union/contact_en
On the phone or by email
Europe Direct is a service that answers your questions about the European Union. You can contact this service:
- by freephone: 00 800 6 7 8 9 10 11 (certain operators may charge for these calls),
- at the following standard number: +32 22999696, or
- by electronic mail via: https://europa.eu/european-union/contact_en
FINDING INFORMATION ABOUT THE EU
Online
Information about the European Union in all the official languages of the EU is available on the Europa website at: https://europa.eu/european-union/index_en
EU publications You can download or order free and priced EU publications from EU Bookshop at:
https://publications.europa.eu/en/publications. Multiple copies of free publications may be obtained by
contacting Europe Direct or your local information centre (see https://europa.eu/european-
union/contact_en).

KJ-N
A-2
9690-E
N-N
doi:10.2760/57240
ISBN 978-92-76-00776-0