
External Validation of Two Established Clinical Risk Scores ...
Upload
khangminh22Category
view
1download
0
Linköping Studies in Science and Technology, Thesis No. 1704
Growth in established SMEs Exploring the innovative and ambitious firm
Anders Uddenberg
2015
Department of Management and Engineering Linköping University, SE-581 83 Linköping

i
© Anders Uddenberg, 2015
Linköping Studies in Science and Technology,
Thesis No. 1704
ISBN: 978-91-7519-139-3
ISSN: 0280-7971
Printed by: LiU-Tryck, Linköping
Distributed by:
Linköping University
Department of Management and Engineering
SE-581 83 Linköping, Sweden
Tel: +46 13 281000, fax: +46 13 281873

ii
Abstract The growth of firms is a complex but relevant subject for different stakeholders, such as owners,
who want returns on their investment, and society, where firms are vessels for jobs and job
creation. Despite the vast amount of research conducted on firm growth and factors associated
with firm growth, there is no coherent body of knowledge, and the average firm is not growing.
This research focuses on growth in established small and medium-sized enterprises (SMEs),
i.e. firms that have passed the startup phase and have established themselves on the market. The
purpose is to investigate the characteristics of high-growth established SMEs with special focus
on the entrepreneur’s growth ambitions and the role of innovation activities for firm growth.
The data was collected from 88 established SMEs in which interviews were conducted with
CEOs, owners, managers, and employees. A questionnaire was used which included questions
regarding factors previously linked to firm growth such as resources, market factors,
organizational factors, innovation, and attitude toward firm growth.
The results show that growth ambitions have a limited impact on firm growth, and that growth
ambitions alone are not a good predictor of firm growth. When high-growth firms were
compared to the average established SME, there was no difference in the level the managers of
the firms were seeking growth. Neither lack of growth, nor high growth, can be explained by
the managers’ perception of the firm’s possibility to grow. Furthermore, there is no evidence
that the difference in growth rates is attributed to different levels of growth opportunities.
Instead, this research shows that what distinguishes high-growth firms from the average, non-
growing firms are factors associated with innovation, the market, and customer knowledge. The
high-growth firms were found to be significantly better at identifying and delivering on unfilled
demands. However, no evidence suggests that the high-growth firms had exclusive access to
new technology they could leverage as a means to grow faster, and both groups believed there
to be plenty of market opportunities and possibilities to create growing niches.
If the difference between high growth and no growth in established SMEs is associated with
external factors related to innovation, market and customers, it is interesting that when growth
ambitions increase, so does the internal focus on organizational structures and systems.
Ambitious entrepreneurs who seek firm growth should therefore not lose sight of external
factors, and strive to quickly deal with increased internal complexity that accompanies firm
growth.

iii
Sammanfattning Tillväxt i företag är ett komplext forskningsområde, ofta utan enkla svar och ibland med
motstridiga resultat. Samtidigt är tillväxt relevant både för företagets ägare som strävar efter
avkastning, och för samhället då växande företag skapar sysselsättning. Trots omfattande
forskning är kunskapen om tillväxt fortfarande spretig, och ett genomsnittligt företag växer inte.
Denna studie fokuserar på tillväxt i etablerade små och medelstora företag (SMF), d.v.s. företag
som har passerat uppstartsfasen och lyckats etablera sig på marknaden. Syftet med studien är
att undersöka vad som utmärker snabbväxande etablerade företag med ett speciellt fokus på
entreprenörens tillväxtambitioner och innovationers påverkar på tillväxt.
Det empiriska underlaget består av intervjuer genomförda i 88 etablerade SMF där de
tillfrågade har varit VD, ägare, mellanchefer, och anställda. De intervjuade har besvarat frågor
knutna till tillväxt, såsom resurser, marknad, organisation, innovation, och attityden till tillväxt.
Studien visar att tillväxtambitioner har en begränsad påverkan på tillväxt. Det är därmed
problematiskt att använda tillväxtambitioner för att förklara tillväxt i SMF. När snabbväxande
företag jämfördes mot genomsnittliga SMF var det ingen skillnad i hur dessa två grupper
strävade efter tillväxt. Varken utebliven tillväxt, eller snabb tillväxt, kan alltså förklaras av
företagsledarnas syn på företagets möjligheter att växa eller mängden tillväxtmöjligheter.
Istället visar denna studie att det som särskiljer snabbväxande etablerade SMF från
genomsnittliga, icke växande, företag är faktorer knutna till innovation, marknad, och
företagens kunskap om sina kunder. De snabbast växande företagen var betydligt bättre på att
identifiera nya krav och utnyttja den efterfråga som fanns. Noterbart är att de snabbväxande
företagen inte hade exklusiv tillgång till ny teknik som de kunde utnyttja för att växa, utan de
båda grupperna var jämförbara avseende denna. Båda grupperna ansåg också att det fanns gott
om möjligheter på marknaden och att det gick att skapa växande nischer.
Om skillnaden mellan tillväxt och icke tillväxt i etablerade företag till stor del kan förklaras av
externa faktorer relaterade till innovation, marknad och kunder är det intressant att konstatera
att företagen med högst tillväxtambitioner istället fokuserar internt på strukturer och system.
Ambitiösa entreprenörer som söker tillväxt bör prioritera externa faktorer och sträva efter att
snabbast möjligt hantera den ökade komplexiteten som tillväxt för med sig.

iv
Table of Contents
1. Characteristics of high growth ............................................................................................ 1
1.1. Purpose ........................................................................................................................ 3
1.2. Focusing on the high-growth SMEs ............................................................................ 3
1.3. Innovation and high growth ......................................................................................... 4
1.4. Attitudes toward firm growth ...................................................................................... 5
2. Frame of reference .............................................................................................................. 7
2.1. High-growth firms – the big picture ............................................................................ 7
2.1.1. The importance of firm growth ............................................................................ 8
2.1.2. Firm growth and chance ....................................................................................... 9
2.1.3. Growth rate distribution and growth persistence ............................................... 11
2.1.4. High-growth firms .............................................................................................. 12
2.1.5. Growth antecedents, determinants, and firm characteristics .............................. 14
2.1.6. Factors associated with firm growth .................................................................. 18
2.1.7. Advantages and disadvantages of firm growth .................................................. 23
2.2. The ambitious entrepreneur – to grow or not to grow ............................................... 25
2.2.1. Definition of the Ambitious Entrepreneur ......................................................... 27
2.2.2. Motivation and ambition .................................................................................... 27
2.2.3. Theory of Planned Behavior .............................................................................. 28
2.2.4. Growth ambition: motives and preferences ....................................................... 29
2.2.5. Growth ambitions and SME growth ................................................................... 31
2.3. Innovation and growth ............................................................................................... 31
2.3.1. Innovation and firm growth ................................................................................ 33
2.3.2. Innovation in SMEs ............................................................................................ 34
2.4. Toward a tentative model for firm growth ................................................................ 35
2.4.1. Gazelles and innovation ..................................................................................... 35
2.4.2. Gazelles and ambition ........................................................................................ 36
3. Research methodology ...................................................................................................... 38

v
3.1. About the research ..................................................................................................... 38
3.2. The research process .................................................................................................. 38
3.3. Details on the project ................................................................................................. 40
3.3.1. Selecting suitable firms ...................................................................................... 40
3.3.2. Effects of selected firms ..................................................................................... 41
3.3.3. Data collection .................................................................................................... 42
3.4. Research design ......................................................................................................... 44
3.4.1. Research type ..................................................................................................... 44
3.4.2. Both qualitative and quantitative data ................................................................ 46
3.4.3. Deductive approach ............................................................................................ 47
3.5. Operationalization – how it was done ....................................................................... 47
3.5.1. Definition of an established SME ...................................................................... 47
3.5.2. Definition of growth ........................................................................................... 48
3.5.3. Measuring growth .............................................................................................. 51
3.5.4. Selecting cases to include in the sample ............................................................ 53
3.5.5. Gazelles and average firms ................................................................................ 54
3.5.6. Measuring abstract concepts .............................................................................. 54
3.5.7. Principal component factor analysis .................................................................. 55
3.5.8. Computing factor scores ..................................................................................... 57
3.5.9. Computing high Growth Ambitions and high Innovation ................................. 58
3.6. Data analysis strategy ................................................................................................ 58
3.6.1. Research Question 1 and analysis ...................................................................... 58
3.6.2. Research Question 2 and analysis ...................................................................... 61
3.6.3. Research Question 3 and analysis ...................................................................... 62
3.6.4. Data processing .................................................................................................. 62
3.7. Reliability and validity of the study .......................................................................... 66
3.7.1. Selection bias and sample characteristics ........................................................... 66
3.7.2. Using a pre-existing framework ......................................................................... 67
3.7.3. Measuring abstract concepts .............................................................................. 68
3.7.4. Combination of information from present and past ........................................... 69
3.7.5. High-growth firms and outliers .......................................................................... 69
4. Findings and analysis ........................................................................................................ 70

vi
4.1. Industry distribution of the sample ............................................................................ 71
4.2. Principal component factor analysis .......................................................................... 74
4.3. Characteristics of gazelles (RQ1) .............................................................................. 76
4.4. Role of innovation (RQ2) .......................................................................................... 79
4.4.1. High levels of innovation and firm growth (RQ2:1) .......................................... 79
4.4.2. Characteristics of innovative and established SMEs (RQ2:2) ........................... 81
4.5. Role of growth ambitions (RQ3) ............................................................................... 82
4.5.1. High levels of growth ambitions and firm growth (RQ3:1) ............................... 82
4.5.2. Characteristics of ambitious firms (RQ3:2) ....................................................... 85
5. Concluding discussion ...................................................................................................... 86
5.1. Differences between gazelles and the average established SME (RQ1) ................... 87
5.1.1. Intentions and opportunities do not explain differences in growth rates ........... 87
5.1.2. Gazelles are more innovative ............................................................................. 88
5.1.3. The role of resources, market, and organizational structures and routines for firm
growth 89
5.2. The role of innovation in established SMEs (RQ2) .................................................. 90
5.2.1. More gazelles among the most innovative firms ............................................... 91
5.2.2. Strong focus on securing a positive cash flow ................................................... 91
5.2.3. Small organizational differences ........................................................................ 92
5.3. Characteristics of established SMEs with high growth ambitions (RQ3) ................. 92
5.3.1. No direct link between growth ambitions and firm growth ............................... 93
5.3.2. Ambitious established SMEs are not younger and smaller ................................ 94
5.3.3. Increased focus on internal processes ................................................................ 94
5.4. Concluding remarks and implications of this study .................................................. 95
5.5. Suggestions for further research ................................................................................ 96
Works Cited .............................................................................................................................. 98
6. Appendix ......................................................................................................................... 108
6.1. Number of employees and firm sizes, in Sweden ................................................... 108
6.2. Elimination of outliers ............................................................................................. 108
6.3. Research Question 1 ................................................................................................ 110

vii
6.3.1. Group of high growth – GT8-12 ...................................................................... 110
6.3.2. Group of high growth – GT9-12 ...................................................................... 113
6.3.3. Group of high growth – GE8-12 ...................................................................... 117
6.3.4. Group of high growth – GE9-12 ...................................................................... 121
6.4. Research Question 2 ................................................................................................ 125
6.4.1. Descriptive statistics of firms with high and low Innovation ........................... 125
6.4.2. Descriptive statistics, absolute growth: high and low Innovation .................... 126
6.4.3. Mann-Whitney U Test of absolute numbers – High vs. Low Innovation ........ 126
6.4.4. Group statistics and results from T-test: High vs. Low Innovation ................. 129
6.5. Research Question 3 ................................................................................................ 132
6.5.1. Descriptive statistics of firms with high and low Growth Ambitions .............. 132
6.5.2. Descriptive statistics, absolute growth: high and low Growth Ambitions ....... 132
6.5.3. Mann-Whitney U Test of absolute numbers – High vs. Low Growth Ambitions
133
6.5.4. Group statistics and results from T-test: High vs. Low Growth Ambitions .... 135

viii
List of tables Table 1: Overview of areas of investigation and question areas .............................................. 42
Table 2: Definition of an SME within the European Union (European Commission, 2014) .. 47
Table 3: Selected growth measures .......................................................................................... 49
Table 4: The dependent growth variables and their code names ............................................. 53
Table 5: Number of firms in the sample with financial data .................................................... 54
Table 6: Aggregated data in absolute numbers: Turnover (EUR) and the number of employees
.................................................................................................................................................. 70
Table 7: Aggregated data in relative numbers: Turnover (EUR) and the number of employees
.................................................................................................................................................. 71
Table 8: Principal component factor analysis on innovation variables .................................... 74
Table 9: Pearson's correlation coefficients of innovation variables ......................................... 75
Table 10: Principal component factor analysis on Growth Ambitions variables ..................... 75
Table 11: Pearson's correlation coefficients of Growth Ambitions variables .......................... 76
Table 12: Summary table of Independent Samples T-test between GT8-12, GT9-12, GE8-12,
GE9-12 and factors: resources, market, organizational ........................................................... 77
Table 13: Group statistics for T-Test between bottom and top on Innovation and LOG firm
growth ....................................................................................................................................... 80
Table 14: Independent Samples T-Test for Innovation and LOG growth measures................ 80
Table 15: Mann-Whitney Test for Innovation and absolute firm growth ................................ 81
Table 16: Group statistics for T-Test between bottom and top on Growth Ambitions and LOG
firm growth ............................................................................................................................... 83
Table 17: Independent Samples T-Test for Growth Ambitions and LOG growth measures ... 84
Table 18: Top 3 descending Z-Scores for GT8-12................................................................. 109
Table 19: Top 3 descending Z-Scores for GT9-12................................................................. 109
Table 20: Top 3 descending Z-Scores for GE8-12................................................................. 109
Table 21: Top 3 descending Z-Scores for GE9-12................................................................. 110
Table 22: Group statistics for T-Test between gazelles and average firms on GT8-12 ......... 110
Table 23: Independent Samples T-Test for GT8-12 and factors: resources, market,
organizational ......................................................................................................................... 112
Table 24: Group statistics for T-Test between gazelles and average firms on GT9-12 ......... 113
Table 25: Independent Samples T-Test for GT9-12 and factors: resources, market,
organizational ......................................................................................................................... 116

ix
Table 26: Group statistics for T-Test between gazelles and average firms on GE8-12 ......... 117
Table 27: Independent Samples T-Test for GE8-12 and factors: resources, market,
organizational ......................................................................................................................... 120
Table 28: Group statistics for T-Test between gazelles and average firms on GE9-12 ......... 121
Table 29: Independent Samples T-Test for GE9-12 and factors: resources, market,
organizational ......................................................................................................................... 124
Table 30: Descriptive statistics of firms with high and low Innovation ................................ 125
Table 31: Absolute growth: descriptive statistics of firms with high and low Innovation .... 126
Table 32: Group statistics for Mann-Whitney Test between bottom and top on Innovation and
absolute firm growth .............................................................................................................. 128
Table 33: Group statistics for T-Test between bottom and top on Innovation ...................... 129
Table 34: Independent Samples T-Test for Innovation and factors: resources, market,
organizational ......................................................................................................................... 130
Table 35: Descriptive statistics of firms with high and low Growth Ambitions .................... 132
Table 36: Absolute growth for bottom and top 30 on Growth Ambitions for the years 2008-
2012 and 2009-2012 ............................................................................................................... 132
Table 37: Group statistics for Mann-Whitney Test between bottom and top on Growth
Ambitions and absolute firm growth ...................................................................................... 134
Table 38: Mann-Whitney Test for Growth Ambitions and absolute firm growth ................. 135
Table 39: Group statistics for T-Test between bottom and top on Growth Ambitions .......... 135
Table 40: Independent Samples T-Test for Growth Ambitions and factors: resources, market,
organizational ......................................................................................................................... 137
x
List of figures Figure 1: Gazelle rate measured by turnover growth, 2010 or latest available year (OECD, 2013)
.................................................................................................................................................. 14
Figure 2: Gazelle rate measured by employment growth (OECD, 2013) ................................ 14
Figure 3: High-level view of the stages from growth aspirations to realized growth (Covin &
Slevin, 1997) ............................................................................................................................ 15
Figure 4: Firm continuum and sources of finance (Berger & Udell, 1998, p.623) .................. 20
Figure 5: Tentative model for firm growth .............................................................................. 37
Figure 6: Research process ....................................................................................................... 39
Figure 7: Sequential design. Adapted from Creswell (2009) ................................................... 47
Figure 8: Relative growth using turnover, 2008-2012 ............................................................. 63
Figure 9: Relative growth using turnover, 2009-2012 ............................................................. 63
Figure 10: Relative growth using number of employees, 2008-2012 ...................................... 63
Figure 11: Relative growth using number of employees, 2009-2012 ...................................... 63
Figure 12: Q-Q Plot for GT8-12 .............................................................................................. 65
Figure 13: Q-Q Plot for GT9-12 .............................................................................................. 65
Figure 14: Q-Q Plot for GE8-12 .............................................................................................. 65
Figure 15: Q-Q Plot for GE9-12 .............................................................................................. 65
Figure 16: Q-Q Plot for LogGT8-12 ........................................................................................ 66
Figure 17: Q-Q Plot for LogGT9-12 ........................................................................................ 66
Figure 18: Q-Q Plot for LogGE8-12 ........................................................................................ 66
Figure 19: Q-Q Plot for LogGE9-12 ........................................................................................ 66
Figure 20: Percentage of firms per industry: in sample and SMEs in Sweden ........................ 72
Figure 21: Relative growth per industry using turnover .......................................................... 73
Figure 22: Relative growth per industry using the number of employees ............................... 73
Figure 23: Employees and number of firms per firm size in Sweden (SCB, 2015) ............... 108
Figure 24: Bottom 30 Innovation - Histogram of Abs GT8-12 ............................................. 127
Figure 25: Top 30 Innovation - Histogram of Abs GT8-12 ................................................... 127
Figure 26: Bottom 30 Innovation - Histogram of Abs GT9-12 ............................................. 127
Figure 27: Top 30 Innovation - Histogram of Abs GT9-12 ................................................... 127
Figure 28: Bottom 30 Innovation - Histogram of Abs GE8-12 ............................................. 128
Figure 29: Top 30 Innovation - Histogram of Abs GE8-12 ................................................... 128
Figure 30: Bottom 30 Innovation - Histogram of Abs GE9-12 ............................................. 128

xi
Figure 31: Top 30 Innovation - Histogram of Abs GE9-12 ................................................... 128
Figure 32: Bottom 30 Growth Ambitions - Histogram of Abs GT8-12 ................................. 133
Figure 33: Top 30 Growth Ambitions - Histogram of Abs GT8-12 ...................................... 133
Figure 34: Bottom 30 Growth Ambitions - Histogram of Abs GT9-12 ................................. 133
Figure 35: Top 30 Growth Ambitions - Histogram of Abs GT9-12 ...................................... 133
Figure 36: Bottom 30 Growth Ambitions - Histogram of Abs GE8-12 ................................. 134
Figure 37: Top 30 Growth Ambitions - Histogram of Abs GE8-12 ...................................... 134
Figure 38: Bottom 30 Growth Ambitions - Histogram of Abs GE9-12 ................................. 134
Figure 39: Top 30 Growth Ambitions - Histogram of Abs GE9-12 ...................................... 134

xii
Definitions
High-growth firms and Gazelles are used interchangeably throughout this thesis.
Moderator is a factor that affects the direction and/or strength of the relationship between an
independent variable and a dependent variable (i.e. firm growth).
Mediator is a factor that explains how the relationship between two variables occurs, meaning
that if you remove the mediator the relationship disappears.
Ambitious firm is a term that broadly indicates if the managers and employees have outspoken
and clear ambitions to seek and realize growth. Ambitious does not relate to the firm itself, but
should be associated with the people working and governing the firm.


1
1. Characteristics of high growth
Some firms grow faster than others. Some firm managers state that they want to grow, while
others state they do not. Further, some firms know what customers want and are able to satisfy
their needs, while others cannot. The growth of a firm is a relevant subject for different
stakeholders, such as owners who want returns on their investment, or society when new jobs
are created. The knowledge of firm growth is expanding, while the number of researched factors
associated with firm growth is ever increasing; still, the average firm is not growing (Coad,
2009). Achieving firm growth has similarities to baking: there are a lot of different recipes and
many different ingredients that could be used, and more of every ingredient usually does not
render the best result. The problem is to understand which ingredients should be used, as well
as when and how they should be used. Likewise, owners and managers of firms are facing the
same problem as they too need to understand which factors that are related to growth and how
they affect the firm.
Looking at the big picture, generally 99% of a nation’s total number of firms is comprised of
Small and Medium-sized Enterprises (SMEs), and they employ around half of the workforce.
If the underlying factors are better understood as well as how they affect the outcome of the
individual firm, it is possible for more SME owners and managers to make decisions that will
put their firms on a track for growth. With better understanding, it will also be possible to design
better support systems that can help, guide, and steer firms in the direction toward growth.
A large body of papers, books, and reports has been published by researchers over the years,
highlighting different aspects of firm growth. In the field of SME growth there a great body of
knowledge and know-how, but based on their literature review, Davidsson et al. (2005) argue
that no coherent body of knowledge exists. Two other recent literature reviews, Dobs &
Hamilton (2006) and Storey & Greene (2010), share this view. They too draw the conclusion
that no unifying theory exists, and that new theoretical and empirical findings are necessary.
This becomes evident when researchers put growth in SMEs as the dependent variable, and fail
to reach a high explanatory power (Wiklund, 1998). In their review of 36 growth studies, Storey
& Greene (2010) conclude that most studies are generally not able to explain more than 10

2
percent of the variation behind firm growth, which supports the findings put forward by Coad
(2007).
If all SMEs is a superset, established SMEs is a significant subset where firm growth can have
a positive impact on the economy. While growth in large firms and the success of new ventures
have attracted a lot of attention, growth in established SMEs has attracted less attention. These
are more mature SMEs that: have passed the startup phase and have a longer track record vis-
à-vis startups and younger SMEs; have developed offerings; have found their customers; and
have an existing customer base. In many cases their growth has stagnated (Coad, 2009) and
they are stuck, unable to reinvent themselves.
Many factors have been identified as prerequisites for firm growth. Two such factors are
financing and what impact the availability of resources have on firms that are growing or
aspiring to grow. Wiklund & Shepherd (2003) found a positive correlation between the amount
of resources available and firm growth; others (e.g. Gundry & Welsch 2001, and Storey &
Greene, 2010) have put forward similar findings. Besides financing being a possible constraint
or opportunity, the market, the segment, or the niche that the firm is serving have also been
linked to firm growth. Examples of dimensions are whether or not the market is growing, how
fierce the competition is (Dobbs & Hamilton, 2006), and if the firm is aggressively and actively
selling to customers (Gundry & Welsch, 2001). Internal factors determine the outcome of firm
growth as well; organizational structures and systems have been found to play a crucial role.
Organizational structures and systems have been found to play a crucial role. For example, the
use of goals as a means to guide and control the organization have been positively linked to
firm growth (Wiklund, 1998; Baum, Locke, & Smith, 2001; Locke & Latham, 2002). Decision-
making structure as well as internal flexibility and control are other dimensions associated with
organizational structures and systems that seem to highly affect the firm’s growth (Gilbert,
McDougall, & Audretsch, 2006; McPherson & Holt, 2007).
Innovation and its relation to firm growth, in the context of SMEs, is a factor that renders
ambiguous research results. While innovative firms have brought forward important
commodities such as airplanes, automobiles, telecommunications, and refrigerators (Fagerberg,
2003), there is still more to learn about the level of innovativeness and its relationship to firm
growth. In 2005, executives answering McKinsey’s Global Survey of Business Executives put
forward innovation as the most important factor their firm needed to achieve growth, while
SMEs have reported that investment into product innovation is the most popular strategy for

3
firm growth (Coad & Rao, 2008). Still, for SMEs the empirical results are ambiguous on the
effect of innovation on firm growth (Coad, 2009; Storey & Greene, 2010; Audretsch, Coad, &
Segarra, 2014). The relationship between innovation and firm growth is not always
straightforward: studies have found a significant and positive impact (Coad, 2009), no
significant impact at all (Demirel & Mazzucato, 2012), and even a significant and negative
impact (Coad & Rao, 2008) on firm growth. Demirel & Mazzucato (2012) concluded that the
market does not always reward the most innovative firm, and that the effect of innovation on
firm growth is contingent upon characteristics of the firm. The inconclusiveness of the results
can be interpreted as it is necessary to further study the innovative firm to find characteristics
that can explain why some innovative firms grow while others do not.
One characteristic that could help explain the different results is the growth ambitions of the
entrepreneurs. Growth intentions have been put forward as a prerequisite for firm growth, but
realized firm growth requires other factors be in place (Stam, o.a., 2012). Stenholm (2011)
found that innovative behavior negatively moderates the effect of expectation on realized
growth. Furthermore, Hermans et al. (2012) concluded in their review that high levels of
innovative orientation did not coincide with growth ambitions. By studying growth ambitions
of the entrepreneurs and the relationship to other factors, such as innovation and the possible
indirect impact on firm growth, it is possible to expand our knowledge of growth in established
SMEs.
1.1. Purpose The purpose of this thesis is to investigate the characteristics of high-growth, established SMEs
with special focus on the entrepreneur’s growth ambitions and the role of innovation activities
for firm growth.
1.2. Focusing on the high-growth SMEs The term gazelle firm has been given to firms that during a certain period show high consecutive
growth. Many have studied the link between gazelles and factors like firm age and firm size.
One common result is that younger and smaller firms grow faster (see e.g. Smallbone and North
1995, Kangasharju 2000, Rutherford et al. 2001), but gazelles have also been found among
more mature firms (Grundström, Sjöström, Uddenberg, & Öhrwall Rönnbäck, 2012). In most
nations, only 2-5% of all firms are growing fast, regardless of industry (Storey & Greene, 2010).
With some 99% of all firms SMEs, a learning opportunity is presented by targeting these
gazelles specifically. However, there are some challenges associated with studying SMEs. The

4
low explanatory power produced by earlier studies is due to several reasons. First, SMEs are a
heterogeneous group, as stated by e.g. Delmar (2006) and Storey (1994), which can make it
more difficult to find common underlying factors across large samples. Second, firm growth
can be measured in many ways as well as calculated differently, which makes the comparability
between studies more challenging (Davidsson & Wiklund, 2006; Coad & Hölzl, 2010). Third,
as argued by Storey & Greene (2010), the focus in many studies is narrow, where researchers
are partial in what they examine (e.g. examine either “pre”, “at”, or “post” start-up factors).
Fourth, as the average firm is not growing and since high growth is fairly rare, the impact these
few firms have on aggregated results can be difficult to distinguish. To overcome some of these
challenges the focus of this thesis is on gazelles specifically; by comparing them to the average
firm, it is possible to gain knowledge regarding what they do differently that can explain their
high growth. Studying gazelles in the broad context of the abovementioned factors, the aim this
thesis is to add knowledge to the field of high-growth firms, and at the same time emphasize
the comparability to other studies by including several growth measures. This yields the first
research question:
RQ1: What are the differences between gazelles and the average established SMEs
regarding innovation, growth ambition, resources, and market and organizational factors?
1.3. Innovation and high growth There has been substantial attention on innovation, but the relationship with high growth in
SMEs is still not definitive. In their review, Hoffman et al. (1998) did not find any connection
between firm growth and innovation, but Freel (2000), among others (e.g. North and Smallbone
2000, Littunen and Tohmo 2003), found that innovative firms are heavily represented among
the firms that grow their turnover fast (i.e. high-growth firms). A decade later, Coad and Rao
(2008) found no general relationship between firm growth and innovation, but did find an
exception when it comes to innovation and fast-growing firms. There are a couple of possible
reasons behind this ambiguity. First, there are many different ways to measure the level of
innovativeness of a firm. Second, the impact of innovations on the firm’s performance (e.g.
growth) can be difficult to determine. Firms can achieve high innovation scores without being
able to find success in the market, and therefore lack significant growth (Åstebro, 2003). There
might be several other factors that can act as mediators or moderators (such as resources, the
market, or the organization) to the realized effect of innovation on firm growth.

5
The different results and ambiguity call for more research into the relationship between firm
growth and innovation. Furthermore, it is equally important to study the context of innovative
firms to understand when innovation can lead to firm growth. Finally, innovation is often
studied in the context of new ventures/startups or in large enterprises. Startups are often based
on a new idea; the challenge is to find the necessary resources and develop the idea into an
offering that can be offered to customers on a sometimes new market. In large firms, innovation
can be measured through the number of patents or the amount of resources dedicated to an R&D
department. In the case of SMEs, this is often not the case as patents are too expensive, or an
idea may not be patentable, and there is usually no dedicated R&D department. Many SMEs
have passed the startup phase and their future growth is contingent on more than developing
the initial idea. These established SMEs have often been around for several years, have
developed offerings, existing customers, and reached a certain level of size and complexity.
The role of innovation in these firms lacks research, and no coherent body of knowledge exists.
This yields the second research question:
RQ2: What is the role of innovation in established SMEs and its relation to realized firm
growth?
1.4. Attitudes toward firm growth In all firms, the top management team (TMT) plays an important role and in many ways affects
the outcome of the firm. It shapes the future of the firm by deciding upon goals, strategies,
operations, investments and so forth. The same is true for SMEs (Delmar & Wiklund, 2008),
but one key difference between SMEs and bigger firms is that in SMEs the number of leading
figures is usually smaller. It is not uncommon that the founder is still active in the firm and
holds several key positions such as CEO and/or Chairman of the Board. This is fully
understandable, as the amount of resources that SMEs possesses is often scarce. If one or a few
leading figures hold so many influential positions, a natural question is: how do their motivation
and ambitions regarding firm growth affect the performance and growth of the firm?
In the literature the term entrepreneur is often associated with leading figures of a firm: e.g.
owners or CEOs. Over the years several definitions of entrepreneurship have been purposed
(Stam et al. 2012). Knight (1921) argued that an entrepreneur is someone who undertakes
uncertain investments and bears all of the associated risks. Leibenstein (1968) looked at an
entrepreneur as someone who finds and exploits arbitrages in markets. He claims that one of
the unique characteristic of an entrepreneur is gap-filling, i.e. finding and exploiting market

6
imperfections, and “input-completing”, i.e. being able to find all the necessary resources to
produce a marketable product. This would suggest that entrepreneurs are to some degree
responsible for facilitating the exploitation of market opportunities. If so, and given the fact that
entrepreneurs have a position within the firm that gives them power and possibilities to steer
and thus affect the outcome of the venture, it is logical to reason that their growth ambitions are
important. Some entrepreneurs have higher ambitions than others, and several researchers have
viewed these ambitions as an important antecedent of firm growth (Hermans et al. 2012). Stam
et al. (2012) define an ambitious entrepreneur as “someone who engages in the entrepreneurial
process with the aim to create as much value as possible”. This definition builds on the
behavioral interpretation of entrepreneurship, where entrepreneurship is “a process by which
opportunities to create future goods and services are discovered, evaluated, and exploited”
(Stam et al. 2012). Some studies have found that growth intention is positively associated with
firm growth, but others suggest that the relationship might not be direct (Wiklund & Shepherd,
2003). Following the same logic, Storey and Greene (2010) argue, besides suggesting that
growth intentions should be researched in the context of high-growth firms, that “there may be
little value in examining the entrepreneur’s growth intentions unless a range of other factors
are taken into account” (s. 234). The reason, they argue, is that intentions might be a necessary
condition for firm growth but that it in itself is not enough.
By acknowledging the impact an entrepreneur has on a firm and its outcome, research targeting
the ambitious entrepreneur has been presented (Stam et al. 2012), but less research has been
conducted on the established ambitious SME and its relationship to high growth. By studying
the characteristics of ambitious firms it might be possible to understand how higher growth
ambitions can lead to realized firm growth. Hermans et al. (2012) concluded in their review of
studies regarding ambitious entrepreneurs that multiple levels of analysis are required when
exploring ambitious entrepreneurship. They suggest including both personal variables as well
as contextual variables, such as external factors, internal factors and organizational factors. This
yields the third and last research question:
RQ3: What is the role of growth ambitions in established SMEs and their relation to
realized firm growth?

7
2. Frame of reference
With the basis on a broad analytical framework, the emphasis in Chapter 2 is on firm growth
in general; what innovation is and how it is related to growth in SMEs; and what ambitions are
in the context of SMEs and their role in firm growth. Finally, the framework is presented in
more detail.
2.1. High-growth firms – the big picture To understand what the differences are between high-growth firms and the average not-growing
firm, it is essential to understand the dynamics and nature of firm growth: what it is, which
firms are growing, how growth affects the firm, and what factors are associated with firm
growth.
Growth in SMEs is not a new area of interest to researchers. A large body of papers, books, and
reports has been published over the years highlighting different aspects of firm growth.
However, in their literature reviews both Wiklund (1998) and later Davidsson et al. (2005)
argued that there is no coherent body of knowledge, and that researchers generally fail to reach
a high explanatory power when putting firm growth as the dependent variable. One possible
reason for this might be that SMEs are a heterogeneous group, as stated by Delmar (2006).
According to the definitions of an SME, any business, within all types of markets and whatever
age, is defined in the European Union as a SME if the firm has between 10 and 250 employees,
has a turnover less than € 50 m, and a balance sheet smaller than € 43 m. Firms with fewer than
10 employees are classified as micro-firms, although this large group of companies is often
included in the SME definition. In this thesis, micro-firms are excluded when referring to
SMEs. The vast diversity among SMEs as a group of firms makes it challenging to find
underlying factors that are generally valid for the entire sample. As many new or small firms
with high-growth aspirations will eventually become SMEs, it is important that the knowledge
of what it means to be a high-growth SME is sufficient so that firms do not become stuck and
unable to grow further. Another factor that might have a role in the difficulty in reaching high
explanatory power is the fact that firm growth can be measured in a great many ways, as well
as calculated differently. This chapter will highlight some of the different aspects regarding
firm growth such as factors associated with firm growth, the growth rate distribution among

8
firms, how growth might affect an SME, and what the benefits of high growth are, as well as
possible drawbacks.
2.1.1. The importance of firm growth
From the perspective of an individual SME, Storey & Greene (2010) conclude from their review
of the growth literature that there are four stylized facts about business growth:
1. Businesses that grow – even at a modest level – are more likely to survive.
2. Fast-growth businesses are highly unusual. Typically, they make up no more than 5
percent of any business population
3. Growth is ‘spotty’. Just because a business has grown in one period it is no guarantee
that it will grow at the same rate in a second period
4. Smaller and younger businesses tend to grow more quickly than larger businesses
Linking these conclusions to a more overall discussion of wealth and prosperity of a nation,
growth in SMEs plays an important role both for the individual firm, as the firm is more likely
to survive, and to a nation, as a growing firm can employ more people. At the same time, only
a handful of the firms in a nation manage to grow fast, or maintain growth over a longer period
of time. Storey & Greene (2010) suggest that up to five percent manage to grow fast, while
others argue that this number can be as low as two percent (Sims & O'Regan, 2006). Birch
(1981), who studied firms in the US, claims that the firms that are fairly young and growing
fast are the biggest source of new jobs and can create up to around 80 percent of all new jobs.
This has since been challenged.
Davis, Haltiwanger, and Schuh (1996) examined job creation in manufacturing firms between
1972 and 1988. They found that smaller firms may have higher gross rates of job creation, but
that they also have a lower net rate of job creation. This would suggest that smaller firms are
quicker to employ new people, but that they are also quicker to cut down on the workforce,
which makes the net effect (measured over one year) lower than that of larger firms. Put into
other words, their findings suggest that small firms may create more jobs short-term (gross),
but job security is higher in larger firms. Henrekson and Johansson (2010) performed meta-
analysis on 20 studies that examined the effects of job creation in high-growth SMEs. Their
conclusions were that a few rapidly-growing firms created a disproportionately large share of
all new net jobs compared to non-high-growth firms. A noteworthy finding by Henreksson and
Johansson (2010) was that the effects of gazelles on overall job creation were more modest in
Swedish studies. One possible explanation for this is that Sweden had negative GDP growth

9
during three years (1991-1993), which could have influenced the results. Storey (1994) also
showed that only 4 percent of the firms that are founded today will provide 50 percent of
employment in the surviving firms after 10 years.
Several authors have suggested that high-growth is a temporary state rather than a continuous
process. Storey & Greene (2010) argue that growth is spotty, or as Birch (1981) says, pulsating
in its nature. Birch (1981) goes as far as to say that “periods of expansion are the best predictors
of future decline” (s. 8). However, he also concludes that so-called stable firms, that are not as
affected by the things happening around them, are even more likely to fail in the end (Birch D.
L., 1981). Daunfeldt & Halvarsson (2012) conclude in their study that “Firms with the greatest
job losses in one period were most likely to be found to become high-growth firms in the next
period”. These findings both support the abovementioned facts of Storey & Greene (2010),
especially facts 1 through 3. It would seem that growth of a business is no easy task, especially
long-lasting growth. However, the evidence also points to the fact that even though growth,
especially fast growth, is unusual, spotty or pulsating, it would be desirable both for the owner
who has less risk of failure and to the nation that experiences the benefits of new jobs.
2.1.2. Firm growth and chance
The statement saying growth in firms is independent of its size requires special attention. It was
first purposed by Gibrat in 1931 (Sutton, 1997). In his book he presented what he called The
Law of Proportional Effect (also called Gibrat’s Law), which means that the expected growth
rate of a firm is independent of its size at the beginning of the period. This would suggest that
the growth of firms is a stochastic process, rather than a deterministic process where no
randomness is involved.
It is possible to model this using the following logic. Denote the size of a firm at time t by 𝑥𝑡
and let the random variable 𝜀𝑡 denote the proportionate rate of growth between period (t-1) and
period t, so that
𝑥𝑡 − 𝑥𝑡−1 = 𝜀𝑡𝑥𝑡−1 (1)
which can be expressed
𝑥𝑡 = (1 + 𝜀𝑡)𝑥𝑡−1 = 𝑥0(1 + 𝜀1)(1 + 𝜀2) . . . (1 + 𝜀𝑡) (2)

10
If we choose t as a small, i.e. short period of time, then we can regard 𝜀𝑡 as being small, which
would justify the approximation of log(1 + 𝜀𝑡) ≈ 𝜀𝑡 (since log(1) = 0). Taking logs we
obtain
log 𝑥𝑡 ≈ log(𝑥0) + 𝜀0 + 𝜀1 + 𝜀2 + ⋯ + 𝜀𝑡 = log(𝑥0) + ∑ 𝜀𝑠
𝑡
𝑠=1
(3)
As t becomes large, the term log(𝑥0) becomes insignificant and what is remaining is
log(𝑥𝑡) ≈ ∑ 𝜀𝑠
𝑡
𝑠=1
(4)
This means, as argued by (Coad, 2009), that a firm’s size at time t is the sum of all historic
idiosyncratic multiplicative growth shocks. This would imply that chance or luck play an
important role when it comes to firm growth, and that strategy is not that important.
Gibrat’s Law has been tested rigorously throughout the years, but the results are to some degree
ambiguous. Sutton (1997) showed that different results can be obtained depending on the
interpretation of the law. According to Sutton (1997) there are three different versions,
depending on which firms to include in the sample. One interpretation is that firms that exited
(e.g. via bankruptcy) n years into the period should be included but with proportional growth
rate (𝜀𝑡+𝑛) to -1, while another interpretation is that the law proposes that proportional rate of
growth is conditional on survival and independent of firm size.
The third interpretation is if the law held only above some minimal size of firm. Using these
three interpretations he found that the law holds for the third interpretation but not for the first
two, where he rejected the hypothesis in seven of ten samples using the first interpretation and
four of ten samples using the second interpretation. His finding that the law can be rejected
when studying smaller firms has been verified by others. Lotti et al. (2003) found in their review
of studies on Gibrat’s Law among manufacturing firms that smaller and younger firms are more
likely to grow faster than older and larger businesses. Audretsch et al. (2004) further emphasize

11
this as they found, by using the third interpretation, that Gibrat’s Law was accepted for only
three out of ten studies on manufacturing industries.
However, while looking at some service industries they could not find any differences in the
growth rate between smaller and larger firms, as they could accept Gibrat’s Law in 11 out of
15 cases (Audretsch, Klomp, & Santarelli, 2004). In a study on high-growth firms during two
time periods, 1992-1996 and 1996-2001, the conclusion was that only one factor acted as a
determinant of firm growth, and that high-growth in period one did not guarantee high growth
in period two. The average sales growth in the first period was 36% but only 8% in the second
time period, providing evidence that growth rates and firm size are independent (Parker, Storey,
& Witteloostuijn, 2010). However, when looking at the big picture and by performing meta-
analysis on the studies on Gibrat’s Law, it does appear to be broadly valid for the big population
of firms, but with the exception of smaller and younger firms (Storey & Greene, 2010).
If the conclusion is that smaller and younger firms grow faster, this would be indicative of them
doing something differently when compared to their competitors, or that the used measurement
favors small firms. The argumentation behind the latter is that it might be easier to double the
size of the firm if the firm has a turnover of e.g. 2€ rather than 20€, or goes from 10 to 20
employees instead of 100 to 200 employees.
If answers to the research questions are to be found, Gibrat’s Law must first be rejected. To
study the relationships between firm growth, ambitions and innovation – and find
characteristics of growing firms – it implies that firm growth is not the result of random growth
shocks over which the firm has no influence. It is possible that the law, depending on the
interpretation, is broadly valid for the big population of all firms as a consequence of growth
being observed as stochastic. However, it can be argued that the underlying process is still
deterministic, as the firm’s management acts and makes decisions.
2.1.3. Growth rate distribution and growth persistence
As mentioned before, the average growth rate of firms is close to zero. One popular possible
explanation is that firm growth is observed as a stochastic process, as stated by Gibrat’s Law.
The low average firm growth rate, and the fact that firm growth might be a random stochastic
process, would also explain the low amount of variability accounted for (R-squared values)
when researchers put firm growth as the dependent variable in regression models (Coad &
Hölzl, 2010). Furthermore, Coad and Hölzl (2010) argue that growth has little persistence over
time and varies for each individual firm.

12
As shown by both Storey & Greene (2010) and Coad (2009), the growth rate distribution of
SMEs has a clear tent shape around 0%. The distribution has a close fit to the Laplace
distribution (Coad, 2009), which can be described as two exponential distributions spliced
together.
There has been some research into the growth rate persistence of gazelles and high-growth
firms. Parker et al. (2010) conducted a study in the UK where they looked at 100 high-growth
firms and their turnover growth between 1992 and 2001. High-growth firms were defined as
firms that increased their annual turnover by at least 30% per year over a 4-year period. The
average growth rate per year of the gazelles between 1992 and 1996 was 36%. Of these firms,
the ones who survived showed a growth rate of only 8% between 1996 and 2001. They
concluded that gazelles have a hard time sustaining this type of “frenzied” growth, and that this
type of high growth is fragile. Others have found similar results. Coad (2009) argued that if
small firms showed rapid growth one year, they were most likely not able to do the same the
next.
Daunfeldt and Halvarsson (2012) investigated growth persistence among high-growth firms in
their article “Are high-growth firms one-hit wonders?” Using the number of employees rather
than turnover they found that the firms that experienced high growth in one period were more
likely to have suffered job losses in a previous period, and that high-growth firms were unlikely
to grow at the same pace over the coming period. This means that the firms with the highest
loss of jobs in one period were more likely to become high-growth firms in the coming period.
Even if the high-growth firm was unable to repeat the same growth rate, it was more likely to
experience a moderate growth rate (Daunfeldt & Halvarsson, 2012). In another recent study
based on gazelles in Denmark, results pointed to the fact that gazelles are not able to sustain
their rapid growth, and in fact are later outperformed by the more slow-growing firms (Gjerløv-
Juel & Guenther, 2012).
These findings suggest that the statement that growth is “spotty” made by e.g. Birch (1981) and
Storey & Greene (2010) holds true, and it can be argued that high growth is a process of radical
change in the firm, rather than a process of gradual growth (Coad & Hölzl, 2010).
2.1.4. High-growth firms
Unsurprisingly, there are always a number of firms that manage to expand their business from
one point in time to another, whether it is an expansion of the number of employees or an
expansion of their turnover numbers. A number of firms even manage to show consecutive

13
growth over a number of years, but far fewer manage to grow by more than 30% each year.
These are usually called the abovementioned term gazelles. The term gazelle was coined by
Birch when he studied firms that contributed disproportionately to new job creation (Henrekson
& Johansson, 2010). One unresolved issue when studying high-growth firms is that there is no
general agreement on the definition of gazelles. Birch’s definition of a gazelle was “A business
establishment which has achieved a minimum of 20% turnover growth each year over the
interval, starting from a base-year revenue of at least $100,000” (Birch, Haggerty, & Parsons,
1995; Henrekson & Johansson, 2010). While some use the threshold of 20% turnover growth,
they do not include a base-year revenue (St-Jean, Julien, & Audet, 2008). Others have simply
used a cut-off point to define gazelles. Parker et al. (2010) labelled the 9.8% of all firms in their
sample which had grown more than 30% each year as the “Ten Percenters”, while Hölzl (2009)
uses both 5% and 10% as cut-off points. Recently, the OECD put forward a definition of
gazelles which stated that gazelles are firms that show a 20% growth in employees over a three-
year period, have at least 10 employees at the beginning of the period, and are younger than 5
years old (Ahmad, 2006). Consequently, the literature is quite disparate.
The lack of a unanimous definition makes it troublesome for researchers to compare results.
Even on occasions when a definition is stated there is ambiguity, as some researchers use the
average growth for the selected time period, while others use a more strict “each year” principle.
The difference is that by using the former it is possible to label a firm as a gazelle if it e.g.
expanded its business enormously in the first year, but perhaps not above the purposed
minimum growth rate for each year (e.g. 20%). When using the size at the beginning and end
of the time period, the average growth rate might be above the desired level, but there might be
years in-between where the firm shows no growth. A stricter way of finding gazelles is by
looking at the growth rate from year to year during the time period to find those that that show
“true” consecutive growth above the desired level.
A publication from The Organisation for Economic Co-operation and Development (OECD)
(2009) reported that the number of gazelles in OECD countries was lower than 1% when
measured using the number of employees, and between 0.5% and 2% when using turnover (see
Figures 1 and 2 below). Noteworthy is that the OECD (2009; 2013) reports that gazelles are
usually more common in the service sector (wholesale and retail trade; hotels and restaurants;
transport, storage and communications; financial intermediation; real estate, renting and
business activities) compared to manufacturing (mining and quarrying; manufacturing;
electricity, gas and water).

14
Figure 1: Gazelle rate measured by turnover growth, 2010 or latest available year (OECD, 2013)
Figure 2: Gazelle rate measured by employment growth (OECD, 2013)
It is evident from the figures above that the number of gazelles, as defined by the OECD (2006),
varies across different countries, especially when the number of employees is used as a measure.
Also interesting is that the difference between manufacturing and services seems to be bigger
when the measure is employment.
2.1.5. Growth antecedents, determinants, and firm characteristics
In an attempt to explain the determinants of firm growth, Covin and Slevin (1997) put forward
a growth model which builds on a model by Sexton and Bowman-Upton (1991) that explains
some of the fundamental issues, limitations, and requirements to achieve firm growth, as seen
in Figure 3 below:
0,0
0,2
0,4
0,6
0,8
1,0
1,2
1,4
1,6
1,8
2,0
Man
ufac
turin
g
Ser
vice
s
Man
ufac
turin
g
Ser
vice
s
Man
ufac
turin
g
Ser
vice
s
Man
ufac
turin
g
Ser
vice
s
Man
ufac
turin
g
Ser
vice
s
Man
ufac
turin
g
Ser
vice
s
Man
ufac
turin
g
Ser
vice
s
Man
ufac
turin
g
Ser
vice
s
Man
ufac
turin
g
Ser
vice
s
Man
ufac
turin
g
Ser
vice
s
Italy Luxembourg(2007,2010)
Sweden (2007,2008) Slovenia (2009) Hungary Romania Estonia (2006,2009) Canada (2009) Portugal Czech Republic(2007,2010)
2010 2006
0,0
0,2
0,4
0,6
0,8
1,0
1,2
Man
ufac
turin
g
Ser
vice
s
Man
ufac
turin
g
Ser
vice
s
Man
ufac
turin
g
Ser
vice
s
Man
ufac
turin
g
Ser
vice
s
Man
ufac
turin
g
Ser
vice
s
Man
ufac
turin
g
Ser
vice
s
Man
ufac
turin
g
Ser
vice
s
Man
ufac
turin
g
Ser
vice
s
Man
ufac
turin
g
Ser
vice
s
Man
ufac
turin
g
Ser
vice
s
Man
ufac
turin
g
Ser
vice
s
Man
ufac
turin
g
Ser
vice
s
Man
ufac
turin
g
Ser
vice
s
Man
ufac
turin
g
Ser
vice
s
Man
ufac
turin
g
Ser
vice
s
Man
ufac
turin
g
Ser
vice
s
United States Spain Italy New Zealand(2007,2010)
Sweden(2007)
Luxembourg(2007,2010)
Slovenia(2009)
Hungary Romania Portugal Israel Canada(2009)
France Estonia (2006,2009)
CzechRepublic
(2006,2010)
Brazil (2009)
2010 2006
3.3

15
Figure 3: High-level view of the stages from growth aspirations to realized growth (Covin & Slevin, 1997)
This model describes a high-level view of the stages from “Growth aspirations” to realized
growth, expressed as “Growth in sales”, and finally the necessary transitions needed to cope
with the complexity that accompanies growth. In this structural model, the factor “Growth
aspirations” describes the entrepreneur’s desire to grow his/her firm. Every other box or step
depicts how these aspirations are transformed into and realized as growth in turnover. Sexton
and Bowman-Upton (1991) argue that firm growth depends on various marketing and
management-related factors. In the model above, the marketing factors are named “Market
constraints/limitations” and contain factors like size of the market niche, the expected duration
of the market window of opportunity, and the product life cycle stage of the firm’s
product/product line.
The management-related factors include the entrepreneur’s growth aspirations, ability to
manage growth, ability to identify market opportunities, and his/her ability to exploit these. In
the model above, all “ability”-related factors, going from “Growth aspirations” to “Growth in
sales”, are subsumed under the label “Entrepreneurial capability”. Using these factors, they
argue that an upper limit on realized firm growth exists and will be determined by different
market constraints. The size of the market niche will be a theoretical upper limit to the turnover
volume, but the actual turnover is constrained by factors like the amount of time the firm has to
Growth
aspirations
Market constraints /
limitations
Entrepreneurial
capability
Organizational
resources
Growth in
sales
Organizational
complexity
Environmental
complexity
Managerial
complexity
Organizational change
aspirations
Managerial
capability
Transitions
Organizational
profitability
Desire for
growth
Growth
enablers Growth Complexity
Desire for
change
Change
enablers Transitions Firm
performance

16
serve the niche (called opportunity window), as well as by the rate of turnover in the niche,
which is determined by a product’s position in the product life cycle. Further, the realized
turnover volume will also be determined by the entrepreneur’s growth desire. If the desired
growth level is higher than the theoretical upper limit of the niche, the desired growth will not
be realized. On the other hand, if the desired growth level is below the upper limit of the niche,
Sexton and Bowman-Upton (1991) argue that realized growth levels will be a function of the
entrepreneur’s ability to manage growth. Subsequent growth should then be realized if the
entrepreneur can identify and exploit new opportunities, which in this model fall under
“Entrepreneurial capability”. Covin and Slevin (1997) suggest another moderator of firm
growth, namely “Organizational resources”. This includes employees, financial resources,
intellectual and other intangible assets, plant and equipment, technological capabilities,
organizational systems, and core competencies. These resources and their size determine the
ability of the organization to support growth.
The steps after realized turnover growth (“Growth in sales”) concern complexity. In this model,
“Managerial complexity” is defined by Covin and Slevin (1997) as “an indicator of the
challenge faced by managers as a function of the number, variety, and interrelationships among
tasks required to effectively and efficiently administer the operations of a firm” (s. 106). This
managerial complexity is depicted in the model above as “Organizational complexity” and
“Environmental complexity”. As the firm grows the managerial complexity increases, and it is
possible that e.g. previously appropriate behavioral patterns and organizational systems are no
longer sufficient. The key, as argued by Covin and Slevin (1997), is to be able to identify and
resolve these shortcomings. In the model above, “Managerial capability” includes the set of
skills required to make the transition into new modes of operations and more appropriate
organizational systems.
The difference between managerial capability and entrepreneurial capability is that the latter
refers to the ability to create growth, while the former concerns the ability to build the
organization strong internally so that behavioral patterns and systems are appropriate and
support the current state of the firm. In other words, managerial complexity reflects the different
challenges (defined above), while managerial capability represents the organization’s ability to
meet these challenges. The number of transitions or changes accomplished is a function of the
desire for change (“Organizational change aspirations”) and the “Managerial capability”.
Successful adaptation of patterns and systems will more likely be captured in the performance
of the firm, measured as “Organizational profitability” in this model (e.g. return on assets or

17
profit-to-sales ratio (Covin & Slevin, 1997)). Profitability will directly affect the resources
available to the firm to use in subsequent growth cycles (Covin & Slevin, 1997).
This reasoning is in line with that of others, who argue that growth is not a continuous process
but rather a temporary state (Birch, 1981; Storey & Greene, 2010). It is also in line with Coad
(2009), who states that a firm’s future growth depends on its organizational slack (i.e.
resources), and that additional resources can bring changes to the organization as its different
parts are interdependent.
Others have found similar results when studying the determinants of firm growth. Storey (1994)
studied SMEs in the United Kingdom and found that three main factors influence the growth
of the firm. These are the resources of the entrepreneur, the firm itself, and the strategic choices
taken by the entrepreneur. In short, the resources that affected firm growth were motivation and
education. Smaller and younger firms grew faster. Among the strategic factors were: if the
entrepreneur was willing to share ownership, his/her ability to identify niches, and the ability
to introduce new products. Storey (1994) and Covin and Slevin (1997) argue that important
constraints to firm growth are finance, labor market and market demands.
The abovementioned increasing complexity as the firm grows is at the heart of the conclusion
made in a study that focused on the long-term success of gazelles (Gjerløv-Juel & Guenther,
2012). The study focused on the approximately 15,000 small businesses that started in Denmark
between 1995 and 2001. The conclusion is that the firms that experienced an initial period of
high growth were unable to sustain the same growth rate in the following years. Even worse,
the initial period of high growth has a long-term effect on performance vis-à-vis firms with a
more moderate initial growth rate. The reason, they argue, is that the gazelles never have the
opportunity to transition into more solid and efficient organizational routines. The rationale, as
they measured growth in employees, is that a higher inflow and outflow of employees causes
new organizational forms that are disruptive to the performance of the firm.
As mentioned before, growth is usually spotty (Birch, 1981; Storey & Greene, 2010). Coad
(2009) offers a possible explanation to this phenomenon using the “resourced-based view”,
which can be linked to the abovementioned discussion regarding increased complexity and
growth. He starts off with the fact that these firms are heterogeneous, and that the explanation
behind different firms’ growth can be explained by a multitude of factors, but that it is still
possible to generalize across the entire sample. To do this, he uses the resource-based view to
argue that a firm is composed of discrete, complementary resources, as purposed by Penrose

18
(1959). A firm must then have organizational slack to accommodate this growth. By this he
means that at any given time a firm’s resources will not be fully used, and that managers are
seeking to use the resources more efficiently so that they are used as close to full utilization as
possible. Should they be underutilized, the firm can then use these slack resources to grow; on
the other hand, if they are fully utilized, the firm needs additional resources to grow. As different
parts of the organization, and resources, are interdependent, the effect of adding another
resource to the firm will most likely spread across the organization and can bring extra
workload. If the resources are already utilized to the fullest, the addition of another resource
can bring extra workload that might send ripples of change across the entire organization and
potentially enable or hinder subsequent growth. As Coad (2009) writes, “small changes can be
decisive if they occur on the edge of chaos” (2009, p. 32).
Taken together, the process from growth aspirations to realized growth, and consequently the
increase in complexity, highlight some important aspects. To find differences between gazelles
and the average firm it is important to study the actions of these firms, rather than the factors
firms are unable to influence, such as firm age or firm size. Under the assumption that firm
growth is a deterministic process, there are bound to be differences between a gazelle and the
average firm that explain their growth rates. Viewing firm growth as a process with enablers
and challenges associated with increased complexity, it is understandable that it takes both time
and skill to secure the enablers and to handle the challenges of increased complexity. This can
explain why growth is spotty and not a linear process. Through targeting the gazelles and by
comparing them with the average firm it is possible to find differences in how the two groups
of firms navigate and deal with the growth process. By focusing on factors associated with firm
growth, the knowledge of established gazelles will be expanded.
2.1.6. Factors associated with firm growth
Numerous factors associated with firm growth have been proposed. One of the more difficult
tasks researchers are facing is to find which factors are associated with firm growth, and argue
why and how the factors are affecting the firm and its growth processes. Below are three
categories listed containing factors commonly associated with firm growth. These are
influenced by Covin & Slevin (1997) and recent literature reviews on firm growth (Dobbs &
Hamilton, 2006; Coad, 2009; Storey & Greene, 2010; Davidsson, Achtenhagen, & Naldi,
2010). The categories are: resources; market factors (external); and organizational structures
and systems (internal).

19
2.1.6.1. Resources
One of the most frequently researched and discussed factors when it comes to firm growth is
resources. For the SME, these resources can be either financial, like cash-flow or assets, or
employees or intellectual assets, or capabilities and core competencies (Covin & Slevin, 1997;
St-Jean, Julien, & Audet, 2008). These factors can be important as growth enablers, as
illustrated in Figure 3.
Resources can also act as constraints; Beck and Demirguc-Kunt (2006), for example, argue that
lack of finance can reduce SME growth by as much as 10 percent. Regarding finance, Storey
& Greene (2010) put it straightforward: “Finance is a crucial lubricant for small businesses.
Without Finance – the life blood of a business – it is difficult to see how a business can start,
grow or survive.” (s. 312).
This lack of finance can be especially tough for growing firms, as they are often cash-starved
and have extraordinary resource needs as a result of the expansion (Hambrick & Crozier, 1985).
Access to finance is somewhat different when comparing micro-firms, SMEs, and large firms.
Below is a diagram created by Berger and Udell (1998) where it is evident that SMEs tend to
rely more heavily on trade credit, loans and private placements – whereas large businesses,
which have known risk and a track record, can rely more on public finance and commercial
papers.

20
Figure 4: Firm continuum and sources of finance (Berger & Udell, 1998, p.623)
To secure resources, whether it is trade credit, venture capital, loans or similar, is something
necessary to achieve firm growth, but resources alone are not enough. According to Wiklund
and Shepherd (2003), resources are necessary but firm growth is contingent upon growth
aspirations. The link between finance and ambition has been studied by others. In a study of
some 800 entrepreneurs it was concluded that ambitious entrepreneurs in fast-growing firms
were better at utilizing a wider range of financing resources (Gundry & Welsch, 2001).
Business size
Business age
Information
Very small businesses,
possibly with no track
record
Small businesses,
possibly with high
growth potential but
often with limited track
Medium-sized
business. Some track
record. Collateral
available if necessary
Large business of
known risk and
track record
Initial insider
Angel finance Venture capital Public capital
Trade credit
Commercial paper
Short-Term Financial Institution
Intermediate-Term Financial Institution
Medium-Term Notes
Mezzanine Fund
Financing
Private placements
Public debt

21
However, not all resources are financial or even tangible. Other types of resources can also be
vital for the success of firms with growth ambitions. They can be factors related to the
workforce, such as having employees with the necessary skills, or factors related to the TMT
and having adequate time to identify and seize opportunities (Chandler & Baucus, 1996). Storey
(1994) argues that in good times, i.e. when firms are growing, issues related to the workforce
are usually an important constraint, as opposed to finance constraints during recessionary times.
Among the characteristics and behaviors of successful rapid-growth firms is the ability to find
and employ people with the skills necessary to implement and maintain growth strategies
(Barringer, Jones, & Neubaum, 2005). This view is shared by Pena (2002), who concluded that
the human capital, such as experience and motivation, is positively associated with firm growth,
while firm capital elements, such as the ability to adapt to changes, are linked with growth.
2.1.6.2. Market factors
The idea that factors associated with the market or markets where the firm is acting can have a
profound impact on the performance is no surprise. However, there is no consensus regarding
under which conditions a firm is most likely to succeed. Firm growth is not isolated to firms in
new markets or niche markets alone. There are studies that have found that younger and smaller
firms grow faster than older and bigger firms (Kangasharju, 2000), but there are also studies
that have found high-growth firms among more mature firms (Rutherford, McMullen, &
Oswald, 2001), while others have found that smaller firms in mature markets exhibit lower
growth rates as they do not have the same level of opportunity (Daunfeldt & Elert, 2011).
Firm growth in a more mature market should not be underestimated if success can be associated
with economies of scale or having a reputation, which can take time to establish (Dobbs &
Hamilton, 2006). The characteristics of the market itself are a factor of importance and research
has found that periods of high demand, sometimes as a result of industry or market maturity,
can greatly increase the number of growth opportunities (O'Gorman, 2001). However,
Smallbone et al. (1995) found that firms are rarely simply pulled along by market trends, such
as increased demand, but that active strategies were necessary to achieve firm growth.
Furthermore, they found that one of the clearest differences between high-growth and low-
growth firms was associated with the level of activity regarding product and market
development, i.e. developing new products and services, developing new markets, finding new
customers, managing product portfolios, and making their offerings more competitive. This
reasoning is in line with that of Storey (1994), who found a high frequency with which fast-

22
growing firms built upon an already existing product base by identifying new markets for
existing products.
Related to this is the ability to perform market scanning, which is an ability that has been linked
to ambitious high-growth firms, together with market-expanding activities such as adding new
products and expanding promotion or advertising (Gundry & Welsch, 2001).
2.1.6.3. Organizational structures and systems
Various internal processes and structures have been studied to help understand the growing
firm. From a high-level view, this can be depicted as in Figure 3: High-level view of the stages
from growth aspirations to realized growth (on page 15 above), where “as the firm grows” the
organizational complexity increases as a result of adding new employees, products, acquiring
new customers, etc.
When the organizational complexity increases, so does the managerial complexity. For the
TMT, the challenge is to make sure that the internal structures and systems work in such a way
that they facilitate and use the available resources to match the challenges. For many SMEs,
one of the biggest challenges is to create and maintain structures and systems that are lean
enough, and cost-effective, so that positive cash flow is secured. High-growth-oriented
entrepreneurs, i.e. ambitious entrepreneurs, have been found to have more structured
organizations with more disciplined management (Gundry & Welsch, 2001).
Furthermore, research showed that in low-growth firms it was more common to find no
structure at all, and that employees performed “hat tricks” (Hambrick & Crozier, 1985) in
carrying out a wide variety of tasks with little coordination between them, which is something
that is ineffective in growing firms (Gundry & Welsch, 2001). Instead, high-growth firms are
more likely to use teams, which would make the firm more flexible and faster to respond to
external changes, as this would permit information sharing and delegation of tasks (Gilmore &
Kazanjian, 1989).
To sustain the growth it is necessary that the firm can adapt its internal structure so it can
accommodate the growth (Gilbert, McDougall, & Audretsch, 2006); this means that as the firm
goes through stages of development, commercialization, growth, and stability, the decision-
making must be more decentralized.

23
Framed differently, as the firm grows, new organizational problems are created that need to be
resolved (Fomburn & Wally, 1989), and if the firm is to survive and continue to grow, the firm
needs to be transformed into another configuration (Wiklund, 1998).
Often related to structures and control are the use of goals. Locke & Latham (2006) summarized
goal-setting theory prudently:
Goals are related to affect in that goals set the primary standard for self-
satisfaction with performance. High, or hard, goals are motivating because they
require one to attain more in order to be satisfied than do low, or easy, goals.
Feelings of success in the workplace occur to the extent that people see that they
are able to grow and meet job challenges by pursuing and attaining goals that are
important and meaningful. (p. 265)
They argue that as long as someone is dedicated to the goal, does not have other conflicting
goals, and has the resources and possibility to attain the goal, there is a relationship between
task difficulty and task performance. This means that difficult goals lead to a higher level of
task performance than vague, abstract, and easy goals (Locke & Latham, 2002). When goal-
setting theory is used to understand firm growth, studies show that if the firm is committed to
growth, it is also more likely to achieve rapid growth (Gundry & Welsch, 2001; Barringer,
Jones, & Neubaum, 2005; Dobbs & Hamilton, 2006). Deciding to grow the firm can be an
important strategic decision (Gilbert, McDougall, & Audretsch, 2006), but it is likewise
important that entrepreneurs communicate their vision and growth goals to their employees,
and that they have belief in themselves to realize the intended future (Baum & Locke, 2004).
2.1.7. Advantages and disadvantages of firm growth
It has been illustrated above that growth, and especially high growth, is not something easily
accomplished as only a few percent of all firms in any nation’s population manage to grow. The
effects of growth on an organization are important to highlight so they can be studied and
interpreted.
From the eyes of an employee working in a growing organization might be seen an increase in
the chance of a promotion, since new positions are created to facilitate the increased complexity.
Following firm growth are also higher salaries and prestige (Whetten, 1987), which many
employees see as advantageous (Troske, 1999; Coad, 2009). In a study of Japanese firms, Aoki
(1990) suggested that some employees were willing to forgo current earnings in exchange for

24
future benefits made possible by promotion in an expanding hierarchy. Higher working morale
has been linked to firm growth. Bronars and Deere (1993) researched the link between
unionization in a firm and firm growth. A union can to some extent change or affect the behavior
of a firm, and unionization can therefore be advantageous to the workers. They found that
growing firms are less susceptible to unionization because of their ability to maintain higher
wages and greater job security, which increased the morale of the workers. As indicated above,
as the firm grows the complexity increases, and it is likely that a growing firm breaks away
from its routines (Coad, 2009), thus creating a more stimulating environment, which can explain
the conclusion “work is more fun in a growing company” (Roberts, 2004, p. 243).
The lack of growth can result in an uninspiring environment that can reduce managerial
efficiency (Coad, 2009). As a result, it is easier to obtain commitment to organizational
priorities and goals when the firm grows (Whetten, 1987). It is possible that firms seek growth;
or rather, that managers seek growth, because increased size is associated with increases in
compensation, power, prestige, and bonuses. However, growth of a firm can also be beneficial
as it can lower production costs if an expansion leads to economies of scale or economies of
scope (more products or services) (Coad, 2009). Growth can also enable the firm to expand into
other segments or markets, and thus successfully deter entry from other firms, as theorized by
Dixit (1980). In this case, growth would be advantageous as it fends off competition that might
otherwise affect the firm and its future growth possibilities.
Firm growth is not only associated with benefits and advantages. A disadvantage of firm
growth, commonly put forward, is that as the firm grows the entrepreneur might feel that he/she
is losing control (Coad, 2009). Also, as the firm grows and the number of employees increases,
and when new processes are added, the manager usually feels less informed, which adds to the
feeling of not having the same level of control as before (Wiliamsson, 1967). Other
disadvantages of firm growth are that the firm becomes larger, and therefore will not remain
adaptable and responsive to changes; initiatives are replaced by routines; and the layers of
bureaucracy are enhanced. Furthermore, as the firm grows it is also possible that shared
attitudes and a cooperative environment are replaced by an environment where employees focus
more on personal goals (Coad, 2009).
Figure 3 shows that when the firm grows, organizational complexity increases, and as a result,
so does managerial complexity. A larger organization gives rise to new challenges that
managers need to be able to address. Churchill and Lewis (1983) list eight such key

25
management concerns or potential problem areas during the growth process, the first four of
which are associated with the organization, and the last four which are related to the
entrepreneur:
Financial resources (e.g. cash)
Personnel resources (i.e. the number and quality of the people in the organization)
System resources (defined in terms of the degree of sophistication of information and
planning and control systems)
Business resources (e.g. customer relations, market share, supplier relations, manufacturing
and distribution processes, technology, and reputation)
Personal and business goals
“Operational abilities” related to, for example, marketing and production
“Managerial abilities” related to, for example, delegate responsibility and manage the
activities of others
“Strategic abilities” related to forward thinking and matching opportunities with initiatives
and resources over time.
Not all managers or entrepreneurs seek to handle and tackle these kinds of challenges, or find
themselves inadequate to handle them, and therefore associate firm growth with something
negative.
2.2. The ambitious entrepreneur – to grow or not to grow Firm growth is associated with, among other things, complexity, and often the need to
successfully manage organizational changes. This requires decisions to be made regarding
strategy, customers, employees, and so on, and for risks to be evaluated. The transition from a
smaller to a larger firm is not something that all entrepreneurs aim for (Smallbone, Leigh, &
North, 1995).
In all firms, the leading figures play an important role and in many ways affect the performance
of the firm. Often managers attach positive utility to firm growth because a bigger firm is
associated with compensation, power, prestige, and bonuses (Coad, 2009). They shape the
future of the firm by deciding upon e.g. goals, strategies, operations, and investments. The same
is true for SMEs (Delmar & Wiklund, 2008), but one key difference between SMEs and bigger
firms is that in SMEs, the number of leading figures is usually smaller. It is not uncommon that
the founder is still active in the firm and holds several key positions such as CEO and/or

26
Chairman of the Board. In the literature the term entrepreneur is often associated with these
leading figures.
Over the years, several definitions of entrepreneurship have been proposed (Stam et al., 2012).
Knight (1921) argued that an entrepreneur is someone who undertakes uncertain investments
and bears all of the associated risks. He distinguishes between the employee and the
entrepreneur, saying that the latter has a higher degree of confidence to act on their opinions
and to “venture”. He continues: “This fact is responsible for the most fundamental change of
all in the form of organization, the system under which the confident and venturesome "assume
the risk" or "insure" the doubtful and timid by guaranteeing to the latter a specified income in
return for an assignment of the actual results” (s. 269).
Leibenstein (1968) looked at an entrepreneur as someone who finds and exploits arbitrages in
markets. He claims that the unique characteristics of an entrepreneur are gap-filling. i.e. finding
and exploiting market imperfections, and “input-completing”, i.e. being able to find all the
necessary resources to produce a marketable product. Further, exploiting arbitrages can be
accomplished by connecting different markets in a novel way; combining resources to produce
new products or services; and creating a new organizational form by arranging and deploying
organizational resources in a novel structure (Amit, Glosten, & Muller, 1993). Low and
MacMillan (1988) also argued that an entrepreneur plays the role of an arbitrageur by
identifying market imperfections, and by doing so being able to anticipate opportunities. They
also (1988, p. 142) defined entrepreneurship as “purposeful activity to initiate, maintain, and
develop a profit-oriented business”. Others have also put emphasis on the creation of new
businesses, such as Cole (1968), who simply defined entrepreneurship as “new venture
creation”. More recently, Shane and Venkataraman (2000, p. 218) defined entrepreneurship as
a process by which “opportunities to create future goods and services are discovered, evaluated,
and exploited”. According to Stam et al. (2012), two broad interpretations of entrepreneurship
are dominant in the current literature. The first interpretation is an occupational one, i.e. that
some people choose to be self-employed rather than working for someone else. The second
interpretation is closely related to the definition from Shane and Venkataraman (2000), and is
more associated with behavior. This interpretation refers to the changes made by different actors
to develop e.g. the organization or the economic situation of the firm. This can be done by
identifying, evaluating and pursuing opportunities such as bringing new products or services to
market, or by finding new organizing methods.

27
2.2.1. Definition of the Ambitious Entrepreneur
Some entrepreneurs have higher ambitions than others regarding development of the firm, and
several researchers have viewed these ambitions as an important antecedent of firm growth
(Delmar & Wiklund, 2008; Hermans et al., 2012). Stam et al. (2012) define an ambitious
entrepreneur as someone who engages in the entrepreneurial process with the aim to create as
much value as possible. This definition builds on the behavioral interpretation of
entrepreneurship, where entrepreneurship is a process by which opportunities to create future
goods and services are discovered, evaluated, and exploited (Stam et al., 2012, p. 37). When
entrepreneurs are pursuing opportunities, entrepreneurial ambition will, according to Shane et
al. (2003), affect and influence the degree to which the entrepreneurs seek to create something
significant and important. Furthermore, high goals usually follow high motivation, and several
researchers have found that high goals lead to better performance (e.g. Wiklund 1998, Locke
and Latham 2002).
It is important to distinguish between different levels of value ambition. One entrepreneur may
have a value ambition to create enough value to be a self-sufficient entrepreneur, while another
may have a value ambition level that goes far beyond self-sufficiency (Stam et al., 2012). With
Research Question 3, this study aims to study the firms in which there are ambitious
entrepreneurs who, to some extent, already realized this higher level of value ambition, i.e.
already realized high growth. The aim is not to find antecedents to high growth ambitions, but
rather to find characteristics of established SMEs with already high growth ambitions.
2.2.2. Motivation and ambition
Ambition refers to “what” is to be done, whereas motivation refers to “why” it should be done.
Motivation is what drives a person, entrepreneur, or organization to realize his/her ambition.
Motivation can be called the accelerator that can increase the intensity and speed with which
an entrepreneur can reach his/her ambition or goal. In the research on ambitious entrepreneurs,
ambition and motivation are sometimes used interchangeably, and often without being defined.
As Stam et al. (2012) puts it: “… various theories of motivation are discussed in the context of
entrepreneurship, as “ambition” implies an explicit reference to motivation. That is, ambitious
entrepreneurs are different from their non-ambitious counterparts precisely because they are
differently motivated” (s. 94). It is not the intention that this research will find or explain the
differences in motivation among ambitious entrepreneurs, i.e. explain what factors contribute
to higher ambitions. Rather, as stated earlier, the purpose of this study is to explain the
differences that can be attributed to having high growth ambitions.

28
2.2.3. Theory of Planned Behavior
Much of the literature on ambitious entrepreneurs concerns the theory of planned behavior, first
purposed by Ajzen (1991). The idea behind this theory is that “intentions to perform behaviors
of different kinds can be predicted with high accuracy from attitudes toward the behavior,
subjective norms, and perceived behavioral control; and these intentions, together with
perceptions of behavioral control, account for considerable variance in actual behavior”
(Ajzen, 1991, p. 179). This means in the context of entrepreneurs with growth-seeking behavior
that realized firm growth can be explained by intentions regarding growth (Hermans et al.,
2012). Furthermore, in this theory, intentions have a central role: “Intentions are assumed to
capture the motivational factors that influence a behavior; they are indications of how hard
people are willing to try, of how much of an effort they are planning to exert in order to perform
the behavior. As a general rule, the stronger the intention to engage in a behavior, the more
likely should be its performance” (Ajzen, 1991, p. 181). This means that the beliefs a person
holds regarding performing a certain behavior can explain that person's behavioral intentions.
Stam et al. (2012) categorize these beliefs into three different types of beliefs: behavioral beliefs
(attitudes); normative beliefs (norms); and control beliefs. In the context of entrepreneurship,
behavioral beliefs are the perceived advantages or disadvantages related to the behavior; for
entrepreneurs, for example, it is the advantages or disadvantages towards growing the firm.
Normative beliefs concern the expected approval or disapproval of the environment from for
example friends and colleagues – which is the perceived social norm which will then affect the
entrepreneur’s behavioral intentions. Control beliefs refer to the perception the entrepreneur
has of being able or capable to perform the behavior (perceived behavior control), in this case
firm growth.
Attitude, norms, and perceived behavioral control explain the intention, while intention and
perceived behavioral control predict the behavior. This means that perceived behavioral control
play a central role in this theory and in the interpretation of behavior. In fact, the addition of
perceived behavioral control in this model is what makes it differ from the theory of reason
action. Research conducted prior to Ajzen’s development of the theory of planned action
suggested that “people’s behavior is strongly influenced by their confidence in their ability to
perform it (i.e. by perceived behavioral control)” (Ajzen, 1991, p. 184) Furthermore, Ajzen
(1991) argues that actual behavioral control is both important and self-evident, since the
resources and opportunities that are available ought to have an impact on the likelihood of
achieving a certain behavior, but that actual control differs from perceived control as it does not

29
include motivational factors but rather factors like time, skills, money, cooperation of others
and so on.
Often the theory of planned behavior is used in research on new firm creation, rather than used
to explain ambitious entrepreneurship (Kreuger, Reilly, & Carsrud, 2000). But as Hermans et
al. (2012) argue, this theory is especially well-suited to study ambitious entrepreneurship rather
than entrepreneurship in general, as growing a firm is a more committed act than establishing
a new firm. Establishing a firm can be done out of necessity and without clear intentions. Also,
there are hardly any new growing firms where the entrepreneur does not have growth intentions
(ibid).
As a step to explain firm growth by using the Theory of Planned Behavior, it would be correct
to assume that a link between the growth intentions of the TMT, its perception of behavioral
control and actual firm growth exists. This theory suggests that if the TMT in established SMEs
has intentions to grow the firm, as well as a perception of behavioral control, it would lead to
growth behavior (i.e. firm growth).
2.2.4. Growth ambition: motives and preferences
Using the theory of planned behavior, it is possible to understand how growth intentions can
translate into growth behavioral actions. However, it is also important to distinguish between
different types of entrepreneurs, where some have high growth intentions while others start and
run their firm without a growth intention. From Section 2.2 it is clear that some entrepreneurs
seek to be self-sufficient while others have a value ambition level that is far higher than only
self-sufficiency. This would suggest that there are various drivers of entrepreneurial intention
and behavior. To understand these drivers and the differences among entrepreneurs and their
intention toward growth, it is possible to study both entrepreneurial motives and the ambition
of the entrepreneur. The growth ambition of an entrepreneur can be defined as the desire to
grow the firm, regardless of measure, and the entrepreneur’s willingness to strive for this to
happen (Stam et al., 2012). In his study of career choices of entrepreneurs, Cassar (2007)
studied their growth preferences and subsequent growth achieved. He included several reasons
for becoming an entrepreneur, namely self-realization (to challenge myself; to fulfill a personal
vision; to grow and learn as a person; to lead and motivate others; power to influence an
organization), financial success (earn a larger personal income; financial security; build great
wealth, high income; build a business that the children can inherit), roles (to continue a family
tradition; to follow the example of a person I admire; to be respected by my friends), innovation

30
(innovative, forefront of technology; to develop an idea for a product), recognition (achieve
something, get recognition; gain a higher position for myself), and independence (get greater
flexibility for personal life; free to adapt my approach to work). Growth preference was
operationalized as two measures: preference for unconstrained growth and high risk-return
preferences. The first measure describes the level of control an entrepreneur desires to have and
how willing he/she is to lower this control to grow the business. The latter measure describes
the preference between getting high returns and reducing the risk of failure. By using these
measures and dividing the sample of nascent entrepreneurs into different groups he found that
the entrepreneurs who preferred unconstrained growth, rather than growth at a manageable
level, assigned more importance to all of the abovementioned reasons. The same result was
found using the second measure, where one group was entrepreneurs with low risk preference
and the other was entrepreneurs with high risk preference. The most important reasons found
were independence (in line with Shane et al. 2003) and financial success, regardless of measure.
Later, by conducting phone interviews with those in the sample who actually took the step and
became an entrepreneur, Cassar (2007) found similar results when comparing preferences and
choices to intended growth (turnover and employees). Financial success was positively and
significantly associated with both types of growth preference as well as intended turnover and
intended number of employees. However, when looking at actual entrepreneurs, instead of
nascent entrepreneurs, the importance of independence is negatively associated with higher
growth intentions and preferences. One interpretation of this is that independence might be a
driver for starting a firm and becoming an entrepreneur, while it might also be an explanation
for why some entrepreneurs do not want to grow their firm, i.e. they want to remain independent
and have a high degree of control. Lastly, Cassar (2007) looked at actual turnover, number of
employees, growth intention, and preferences. Financial success was positively related to
turnover and employment, and self-realization was positively associated with turnover;
importance of independence, however, was negatively associated with employment. All this
suggests that there are different drivers behind intentions and behaviors and that these drivers,
such as high or low risk and degree of control, can affect actual firm growth.
If ambitions to grow the firm vary over time as a result of changed priorities it would be difficult
to link growth ambitions to realized firm growth. The stability of growth ambitions over time
has been researched, and the results presented by Delmar and Wikund (2008) are interesting.
They build on the theory of planned behavior and recognize that the growth of a firm is a process
that happens over time, rather than spontaneously. This would indicate that if growth ambitions
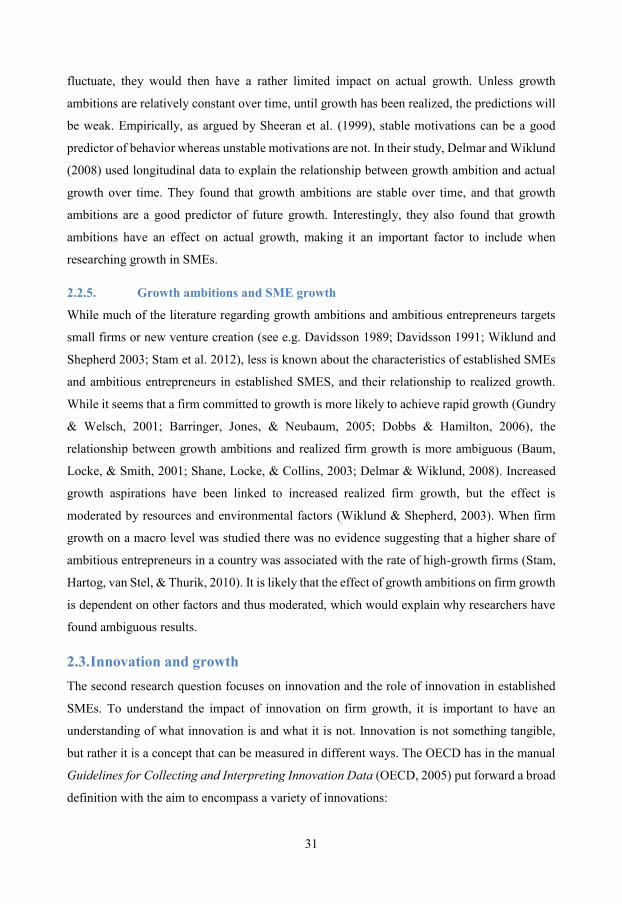
31
fluctuate, they would then have a rather limited impact on actual growth. Unless growth
ambitions are relatively constant over time, until growth has been realized, the predictions will
be weak. Empirically, as argued by Sheeran et al. (1999), stable motivations can be a good
predictor of behavior whereas unstable motivations are not. In their study, Delmar and Wiklund
(2008) used longitudinal data to explain the relationship between growth ambition and actual
growth over time. They found that growth ambitions are stable over time, and that growth
ambitions are a good predictor of future growth. Interestingly, they also found that growth
ambitions have an effect on actual growth, making it an important factor to include when
researching growth in SMEs.
2.2.5. Growth ambitions and SME growth
While much of the literature regarding growth ambitions and ambitious entrepreneurs targets
small firms or new venture creation (see e.g. Davidsson 1989; Davidsson 1991; Wiklund and
Shepherd 2003; Stam et al. 2012), less is known about the characteristics of established SMEs
and ambitious entrepreneurs in established SMES, and their relationship to realized growth.
While it seems that a firm committed to growth is more likely to achieve rapid growth (Gundry
& Welsch, 2001; Barringer, Jones, & Neubaum, 2005; Dobbs & Hamilton, 2006), the
relationship between growth ambitions and realized firm growth is more ambiguous (Baum,
Locke, & Smith, 2001; Shane, Locke, & Collins, 2003; Delmar & Wiklund, 2008). Increased
growth aspirations have been linked to increased realized firm growth, but the effect is
moderated by resources and environmental factors (Wiklund & Shepherd, 2003). When firm
growth on a macro level was studied there was no evidence suggesting that a higher share of
ambitious entrepreneurs in a country was associated with the rate of high-growth firms (Stam,
Hartog, van Stel, & Thurik, 2010). It is likely that the effect of growth ambitions on firm growth
is dependent on other factors and thus moderated, which would explain why researchers have
found ambiguous results.
2.3. Innovation and growth The second research question focuses on innovation and the role of innovation in established
SMEs. To understand the impact of innovation on firm growth, it is important to have an
understanding of what innovation is and what it is not. Innovation is not something tangible,
but rather it is a concept that can be measured in different ways. The OECD has in the manual
Guidelines for Collecting and Interpreting Innovation Data (OECD, 2005) put forward a broad
definition with the aim to encompass a variety of innovations:

32
“An innovation is the implementation of a new or significantly improved
product (good or service), or process, a new marketing method, or a new
organizational method in business practices, workplace organisation or
external relations” (OECD, 2005, p. 46).
They also state that a minimum requirement for an innovation is that the product, process,
marketing method or organizational method must be new or significantly improved for the
business (OECD, 2005).
One key feature about the innovation, that sets it apart from an invention, is that it must be
implemented into the business, i.e. introduced to the market. Whereas an invention is the first
occurrence of an idea, innovation is the first commercialization of the idea (Fagerberg, 2003).
To take an invention to market and to transform the invention into an innovation usually
requires a combination of knowledge, skills, capabilities, and resources (Fagerberg, 2003). This
would indicate that innovation requires time and a multitude of actions. Therefore, innovation
can be viewed as a continuous process rather than discrete occurrence. Kline and Rosenberg
(Kline & Rosenberg, 1986) write:
“It is a serious mistake to treat an innovation as if it were a well-defined,
homogenous thing that could be identified as entering the economy at a
precise date – or becoming available at a precise point in time. (…) The fact
is that most important innovations go through drastic changes in their
lifetimes – changes that may, and often do, totally transform their economic
significance. The subsequent improvements in an invention after its first
introduction may be vastly more important, economically, than the initial
availability of the invention in its original form” (s. 283).
The goal and rationale for putting effort into innovation-related activities are to enhance the
performance of the firm. This could mean an increasing demand or reduced costs. A new
product could be a source of market advantage vis-à-vis competitors, or even open up a
completely new market, rendering prior competition invalid. To be able to achieve any of these
advantages over competitors through innovation a firm could, according to the OECD, carry
out either product, process, market or organizational innovations. A product innovation can be
the introduction of a new good or service to the market where the characteristics or the intended
use is significantly improved, which can be related to changes in the material, components, or
similar characteristics that enhance performance. A process innovation is the implementation

33
of a new or improved product or delivery method. Examples of this can be changes to the
techniques used in production or changes to the equipment or software used during the
production. Market innovations are implementations of new marketing methods, which can be
related to e.g. product design, packaging, product placement, promotion, or pricing. If the
marketing method used is significantly different from previous marketing methods used by the
firm, it could be classified as a marketing innovation. Finally, organizational innovations are
the implementation of significantly changed organizational methods in the firm’s business
practices, workplace organization or external relations (OECD, 2005).
2.3.1. Innovation and firm growth
The process of innovation is one area that has been included in several studies on firm
performance and growth (Freel & Robson, 2004; OECD, 2005; Dobbs & Hamilton, 2006;
Storey & Greene, 2010). The results are not unanimous, and the effect of innovation on
performance and growth is still under debate. The impact of innovation on firm growth might
not be direct but rather moderated or mediated by other factors, and is therefore more difficult
to understand and interpret. A firm can be classified as innovative, but may still not be a high
growth firm. Åstebro (2003) found in his research, which included 1091 Canadian inventions
between 1976 and 1993, that 93% of these never reached the market, and that only 40% of these
had positive returns. This would suggest that being innovative, however important it might be,
is probably not the only thing that separates successful firms from less successful. Storey and
Greene (2010) argue that while the link between innovation and large firm performance is to a
greater extent confirmed, the result is far more mixed when it comes to SMEs (Storey & Greene,
2010). Furthermore, amongst firms that are growing their turnover fast, innovative businesses
are heavily represented (Audretsch, Coad, & Segarra, 2014); there are also studies, however,
that find no connection between innovativeness and firm growth (Storey & Greene, 2010). This
ambiguity is also supported by Coad and Roa (2008), who were not able to find any general
relationship between innovation and growth in SMEs in high-tech sectors. However, they did
find an exception and a link between high-growth firms and innovation. These results indicate
that the road to firm growth via innovation is tricky and difficult. The outcome of the innovative
firm is dependent upon other factors, and not contingent on innovation alone. Still, innovation
is at the top when it comes to strategies for firm growth (Coad & Rao, 2008) which emphasize
the importance to understand when and how innovation is likely to be a successful strategy. To
answer the second research question and to better understand the role of innovation in
established SMEs it is important to study successful innovative established SMEs.

34
2.3.2. Innovation in SMEs
Kline and Rosenberg (1986) pointed out in their influential paper that innovation has no obvious
shape or form, and that there is no generally agreed way to measure the importance or impact
of an innovation. However, Storey & Greene (2010, p. 80) list three common measures of
innovation researchers and practitioners use:
1. Input measures such as research and development (R&D) expenditures or the number
of R&D workers employed
2. Intermediate output measures such as number of patents
3. Direct measures of innovation output such as surveying businesses about the innovative
activity
For SMEs, all of the abovementioned measures have their innate problems. Measuring
expenditures or the number of R&D workers might not correlate with the actual output
(Audretsch, 2002), which is what eventually shall generate firm growth. Also, in SMEs there is
usually no R&D department with dedicated R&D workers; instead, the innovation activities are
more likely to be spread out across their design, production, and turnover departments for
example (Santarelli & Sterlacchini, 1990). Another widely-used measure is the number of
patents a firm holds. This might be a reasonable measure of innovation in larger firms or firms
in certain industries. Arundel and Kabla (1998) found that larger businesses were much more
likely to patent, and that patents were most common in sectors like pharmaceuticals, chemicals,
machinery, and precision instruments. Another disadvantage of using patents as a measure of
innovation is that firms in some industries do not patent their inventions (e.g. food and tobacco,
petroleum refining, and basic metals) (Arundel & Kabla, 1998). Storey & Greene (2010) argue
that the average cost of €32,000 for a Europe-wide patent (10 years) is too much for most SMEs.
These two abovementioned measures are often in the innovation literature associated with
technology (Frankelius, 2009), which makes the definition of innovation somewhat narrow.
Lastly, measuring innovation based on different activities gives the researcher the possibility to
use a wider interpretation of innovation (e.g. asking about strategies, management techniques
and organizational structures) which can be of use for interpretation and understanding of the
situation. The downside of these measures is that they are subjective, and Storey & Greene
(2010) argue that innovators often remember their successes while non-innovators are less
likely to answer such questions. The last method of measuring innovation is in line with the
definition put forward by the OECD (2005) and Frankelius (2009). With these definitions of

35
innovation it is possible to study different areas in a firm, rather than factors like the size or the
expenditure of the R&D department or the number of patents.
It is evident that defining and measuring innovation in established SMEs is a challenge. If the
impact of innovation on SMEs has mixed results on firm growth, and managers still emphasize
the need for innovation, it is important to further study factors associated with innovation that
can determine the level of growth.
2.4. Toward a tentative model for firm growth By studying gazelles in the context of established SMEs and using the previously identified
growth factors of resources, market, and organizational factors, it is possible to expand the
knowledge of what the differences are between gazelles and average firms. Including
innovation as another factor, and by studying the innovative established firm in the same
context of resources, market, and organizational factors, it is possible to add to the
understanding of why some innovative firms grow while others do not. Finally, by studying the
impact of growth ambitions on firm growth, and what the characteristics are of established
SMEs with high growth ambitions, it is possible to expand the perspective of firm growth and
the role of growth ambitions.
2.4.1. Gazelles and innovation
The results from previous research are not clear, and there is still no consensus on the definitive
relationship between firm growth in established SMEs and innovation. More research is needed
to understand why some innovative firms grow while others do not. As mentioned above,
previous research suggests that being innovative can be a step toward realizing firm growth,
but being successful on the market and achieving firm growth are contingent upon other factors
as well. Innovation should most likely be viewed as one of several antecedents to firm growth,
and should therefore be studied in the broader context of firm growth. To understand the
difference between firms with different levels of innovativeness the relationship with firm
growth characteristics must be studied. This yields two detailed research questions derived from
the second research question.
Detailed research question: RQ2:1: Does a high level of innovation have a positive impact
on firm growth in established SMEs?

36
Detailed research question: RQ2:2: What are the differences between innovative established
SMEs vis-à-vis established SMEs that are less innovative, regarding resources, market, and
organizational factors?
2.4.2. Gazelles and ambition
Wiklund and Shepherd (2003) studied managers’ growth aspirations and the level of growth
achieved. They hypothesized and found that managers with higher aspirations for growth also
achieved higher levels of growth, but both their aspirations and realized growth are enhanced
by more human capital (such as education and experience), access to financial capital and
dynamism in the environment. In their discussion they argue that a firm is unlikely to grow
unless the manager has a propensity for growth. Furthermore, if the firm is to grow, the manager
must also have the ability to manage a growing organization, spot new opportunities, and secure
the necessary resources, and the environment must offer suitable growth opportunities. As
mentioned before, there are findings that suggest that growth ambitions are stable over time and
that they are a good predictor for firm growth. This would verify that the theory of planned
action also holds true for the entrepreneur and his/her intention of growing the firm. However,
whether or not there exists a direct relationship between growth ambitions and firm growth
(Baum, Locke, & Smith, 2001; Shane, Locke, & Collins, 2003; Delmar & Wiklund, 2008) is
not clear. When studying gazelles, St-Jean et al. (2008) concluded that the connection between
motivation and firm growth is not direct, and that motivation is necessary but not a sufficient
condition. The ambiguity about the relationship between growth ambition and realized firm
growth calls for more research. The theory of planned behavior suggests that firms led by
ambitious entrepreneurs are more likely to achieve higher growth. To help answer the third
research question, it is imperative to study the effect of growth ambition on realized firm
growth, and what characterizes firms with high growth ambitions – vis-à-vis firms with low
growth ambitions. This leads to two detailed research questions that are linked to the third
research question.
Detailed research question: RQ3:1: Do established SMEs with high growth ambitions
achieve more growth?
Detailed research question: RQ3:2: What are the differences between established SMEs with
high growth ambitions vis-à-vis established SMEs with low growth ambitions, regarding
resources, market, and organizational factors?

37
Below is a tentative model for firm growth that illustrates the concepts and the different research
questions.
Figure 5: Tentative model for firm growth
Context
Resources
Market
Organization Growth ambitions
Firm growth
Innovation
RQ1
RQ2:2
RQ3:2

38
3. Research methodology
This chapter gives a description of the selected research design. It highlights the decisions
made, discusses why and how they were made, and examines the implications these decisions
had on the research.
3.1. About the research The starting point of this research has a clear connection between the success of SMEs and the
recovery after the economic downturn that hit globally in 2009. A report by Tapper (2010)
indicated that the firms in Östergötland did not recover as fast as other firms in different parts
of Sweden. In 2011, the Regional Council therefore initiated a program, in which Linköping
University and the author of this thesis participated, to stimulate growth and to learn from those
who had either gone through the downturn, or successfully recovered from it. It was determined,
by the project members, consisting of researchers from Linköping University and business
advisors of Almi Östergötland, that a pre-defined and frequently-used broad analytical
framework should be used to identify how growth-oriented the firms in Östergötland were and
how well prepared they were for growth. The selected model is owned by Ahrens & Partners,
and has been continuously developed for more than two decades (Ahrens Rapid Growth, 2015).
While the model is mainly based on practical findings, the underlying structure comes from
research findings. The rationale for selecting this model was to compare a targeted SME against
a typical high-growth firm, based on a multitude of factors. The model includes factors and
questions from 12 different areas, which makes it a useful tool for collecting data spanning for
example the environmental, firm and individual levels.
3.2. The research process This research was initiated during the spring of 2011, when the joint project between Linköping
University and Almi Östergötland was initiated. Until autumn 201391 firms were interviewed
using the selected model. Data from all interviews were compiled into a database from which
relevant information to answer the research questions was drawn. The following framework
depicts the research process (see Figure 6: Research process below).
The author of this thesis was a member of the joint project from its start in 2011, where
participation included both workshops and discussions, but also interviewing owners, CEOs,

39
TMTs, and employees using the questions associated with the model. The opportunity to use
the data gathered throughout the project was accompanied by the challenge to find research
questions, which could be answered by using the broad set of answers the firms had provided.
The author’s participation and conducting interviews, combined with an in-depth literature
study on the subject of high growth in SMEs, yielded insights for formulating the purpose,
research questions and design of the study. After the research purpose and research questions
were formulated, effort was put into operationalization to bridge and link the selected
theoretical perspectives on high growth in SMEs with the collected data. Quantitative methods
where chosen as they best matched the available data and could aid in answering the research
questions. The analysis included comparative analysis to find characteristics of different
subgroups of the complete sample, as well as different analyses to investigate the relationships
put forward in the research questions. Conclusions were formed and detailed, which can be seen
as the contribution from this thesis to theory regarding established SMEs, innovation, and
growth ambitions. Also practical contribution as implications and recommendations were
formulated. Finally, the outcome was reflected on and linked to the research purpose as well as
suggested topics for future research.
Figure 6: Research process
Researcher
Literature
study
Research
approach
Operatio-
nalization
Project: data gathering
Analysis &
Interpretation
Conclusions &
Recommendations
Input

40
3.3. Details on the project A total of six researchers from the Department of Management and Engineering at Linköping
University were involved in the project. One professor, three associate professors, one junior
lecturer, and the author of this thesis formed one half of the project team. Note that the professor
did not take part in the data collection (described below) but instead had the role of external
auditor (Creswell, 2009).
The other half of the team consisted of five business advisors from ALMI Östergötland. ALMI
is the Swedish state-owned organization for financing and business development based on an
industrial policy that promotes economic growth.
From April 2011 until December 2013 the project team had regular meetings once every fifth
week to discuss the current status, what had happened since the last meeting, and potential
problems, as well as to share experiences and the development of the program.
3.3.1. Selecting suitable firms
A pre-study was initiated to find firms that were more likely to grow and create jobs and
therefore be eligible for step one. From Swedish official financial statistics1, a list of all SMEs
in Östergötland was exported. This list included some 1140 firms with 10 or more employees
and their financial data from 2006-2009/2010. It was important that the firms had more than 10
employees to avoid the inclusion of startups and increase the chance of including established
SMEs. Next, it was hypothesized that it would be more likely to find firms that have a positive
attitude towards growth among the firms that had grown consecutively during 2006-2009. Upon
further inspection it was decided that established firms were more likely to be found among
firms with more than 25 employees.
As a result, the original list of 1140 firms was updated with a priority (1-3) associated with each
firm. Firms with priority 1 were slightly larger (preferably >25 employees) firms that had grown
two or more consecutive years. Priority 2 was given to firms with around 25 employees that
had made a successful turnaround (i.e. had two years of consecutive growth). Priority 3 was
associated with firms that had shown negative growth numbers two or more years. Firms with
priority 1 were selected as most important for the project and were targeted with information,
and the managing director was sent an invitation to participate. This classification was only
1 Access by the database services Bonnier Affärsdata and Retreiver Business, licensed to Linköping University Library and UC, licensed to Almi

41
seen as guidance on how to find firms with growth potential and growth ambitions. Since both
the team members from Linköping University and ALMI have many connections with SMEs
in Östergötland on a daily basis, information and knowledge about already known firms were
also taken into account. A few firms that had priority 2 or 3 were flagged as interested if a team
member had information that would suggest that the firm had growth ambitions and potential
to grow. This information could be that there were new owners of the firm, or a new CEO had
been recruited, or that the firm had recently acquired a new large customer.
To make sure that a certain firm had growth potential and an ambition to grow, a second
screening was conducted. This time, one to two project members visited each firm that had
accepted the invitation and interviewed the management following a nine-question
questionnaire that had been agreed upon by the project members. These interviews took
approximately one to three hours, and the goal was to better understand the firm’s area of
operation: how they perceived their ability to grow, their customers and their demands, as well
as the market they were in.
This information was brought back to the rest of the project team. During one of the recurring
project meetings the interviewers described the firm, and after a discussion it was decided
whether the firm was eligible to participate in the project.
It is important to note that although the focus was on including firms with priority 1, other firms
were included as some of the priority 1 firms were too busy and did not have time to participate.
Therefore, the final sample includes firms with all types of priority. Overall, this method for
finding suitable firms is similar to strategic sampling (Yin, 2009).
3.3.2. Effects of selected firms
The firms included in the sample were all established, i.e. they already had a customer base, a
proven business model and had successfully made the transition from a micro business into a
small or medium-sized firm. This likely reduced the risk of including firms whose growth was
a result of them finding the right customer for the first time. Instead, the included firms already
had a customer base, which therefore increased the chance of explaining part of the growth by
means of other factors, rather than finding the first customers. Furthermore, by including only
SMEs and excluding micro firms, the firms had already reached a higher level of complexity
(see Growth antecedents, determinants, and firm characteristics on page 14 above).

42
3.3.3. Data collection
The included firms were suited to answer the research questions, as they were verified as having
high growth ambitions and were growing. Their ambition was important as they were willing
to take time off their schedules and answer our questions thoroughly. As the sample not only
included high-growth firms with high growth ambitions but also firms that had high growth
ambitions but had not yet realized high growth, it was possible to answer the third research
question.
At the start of the project the Ahrens Rapid Growth method for case data collection was
evaluated and selected as suitable. It fulfilled the following requirements:
1. The possibility to collect data for a large number of cases. The goal was 100 in-depth
cases during 3 years.
2. A standardized model that could be used by several persons simultaneously.
3. A model that could be used by business professionals without experience in higher
academia.
4. The broad range of question areas included covering many business growth aspects.
5. Permit evaluation of a firm's progress in terms of rapid growth at the end of the project.
3.3.3.1. Model description
The model and questionnaire developed by Ahrens Rapid Growth aims to benchmark a “typical
fast-growing firm” using a variety of characteristics. To do so, the model is divided into four
different areas (Ahrens Rapid Growth, 2015), as shown in Table 1.
Table 1: Overview of areas of investigation and question areas
Area Question areas (question number) Number of
questions
(1) Growth platform Owner’s growth orientation (10-12)
Financing for growth (20-24)
Potential market growth (30-35)
3
5
6
(2) Growth strategy Market position (40-42)
Focus of the offering (50-56)
Marketing and turnover force (60-67)
3
7
8
(3) Organization and
control
International selling capacity (70-75)
Dynamic efficiency (80-83)
6
4

43
Area Question areas (question number) Number of
questions
Management control (90-93)
Organization (100-105)
4
6
(4) Management Management for growth (110-116)
Management capabilities (120-129)
7
10
Total number of questions 69
Each area is divided into different question areas, as seen in Table 1, which are then
operationalized into carefully framed questions. In total there are 69 open-ended interview
questions. Some questions had sub-questions, giving a total of 114 assessments per interview.
Each question is graded on a scale of 1 (low) through 6 (high), where a high score is interpreted
as a high similarity between the targeted firm and a typical fast-growing firm (i.e. they share
this particular characteristic). To help grade the answers the model and questionnaire provided
guidance for each kind of answer.
3.3.3.2. Data collection process
The data was collected from April 2011 to August 2013. At each firm the team conducted on
average 5-8 interviews, but sometimes up to 12 depending on the size of the top management
team. The following people were interviewed at each firm (number of interviews):
The CEO, or Managing Director (1)
The top management team (approximately 3-9)
Employees not part of the management team (1-2)
The employees that were not part of the management team were usually interviewed as a group,
but occasionally there were two groups of 2-4 people, depending on their availability. The CEO
was selected as he/she is in a governing position and to a great extent shapes the future of the
firm. The top management team was interviewed as it was seen as highly important for
operations and has deep knowledge about different parts of the firm, and also because the top
management team usually acts as a strategic support to the CEO. Employees without a
management position were selected as it was believed that they would give another perspective
on the current situation of the firm, the future of the firm, and the management.

44
Each interview took between 75 minutes and 3 hours, depending on who was being interviewed.
Interviews with employees without a management position and thus less information were
quicker than the interviews with CEOs or interviews with employees in top management teams.
No fixed teams were used to collect data, and different setups of team members were used to
make sure that the use of the questionnaire would stay the same. To further enhance this, there
was an emphasis on a mix of team members, both from Linköping University and ALMI,
collecting the data.
When all the interviews at the firm were completed, the team had a meeting where they
compared scores, both between interviewees at the same interviews as well as between different
interviews. A score was settled upon for each question and for all interviews using a method
called expert evaluation (Shane, Locke, & Collins, 2003). The scores were put into Excel where
a matrix of questions, interviews, and scores could be compiled. This matrix was used to
calculate, on the firm level, an average score for each question.
3.4. Research design
3.4.1. Research type
The first research question, which is explanatory in nature, regards high growth in established
SMEs. It is possible that the relationship between growth ambition, innovation and firm growth
is not direct as suggested by e.g. Wiklund & Shepherd (2003) but rather moderated or mediated
by other factors. By finding characteristics of successful high-growth firms, and comparing
these to the characteristics of ambitious firms and innovative firms, it might be possible to see
similarities. In addition, by studying high-growth firms, and by studying and linking growth
ambitions and innovation to firm growth, it is possible to develop a deeper understanding of the
relationship between firm growth, innovation, and growth ambitions. It is possible to find e.g.
moderators or mediators of innovation and growth ambitions on firm growth, and thereby to
expand the knowledge. With the purpose of trying to understand why firm growth occurs in
some cases and not in others, the first research question is explanatory (Valerie & Lois, 2012).
The second research question targets the area of innovation, which is a heavily researched area.
Growth ambitions and innovation have primarily been researched in the context of large
enterprises or small startups. Innovation is difficult to measure (Storey & Greene, 2010), but in
large enterprises it is possible to measure innovation through e.g. the number of patents or by
calculating research expenditures. Since patents are expensive and SMEs often do not have an
R&D department, using any of these two as measures of innovation is usually not possible in

45
the context of SMEs. The innovation aspect for small startups is often studied, since one big
challenge these firms have is to find their position on the market, as they often originate from
an innovative idea. Established SMEs that have successfully transitioned from a micro startup
into a small or medium-sized firm have found their position and developed one or several
concepts into offerings. As growing from a micro startup into an established SME is
accompanied with increased organizational complexity and increased managerial complexity
(Sexton & Bowman-Upton, 1991), growth rates level off. The challenge for an established SME
wishing to grow thus shifts from managing current offerings to reinventing and innovating
within an already existing organization. Research into this has been difficult and findings often
contradict other findings (Coad & Rao, 2008; Coad, 2009; Demirel & Mazzucato, 2012), which
calls for more research and new ways to tackle this phenomenon. Research Question 2 aims to
explain the role of innovation in established SMEs and the relationship to growth ambitions and
firm growth. From this perspective, the second research question is explanatory in nature
(Valerie & Lois, 2012).
Finally, in the third and last research question, RQ3, the aim is to expand on the knowledge
regarding ambitious entrepreneurs. While the groundwork associated with the motivation of
entrepreneurs has been laid out and theorized (see e.g. Davidsson 1989; Davidsson 1991,
Wiklund 1998, and Stam et al. 2012), we still have more to learn about the effect of ambitions
on the established firm and its performance, and what characterizes the firm in which there are
people with high growth ambitions. While much of the previous research has targeted either
large firms or startups, this research aims to investigate the role of ambition in firms that have
transitioned from a micro firm into an established SME. By using prior knowledge in the
context of established SMEs, the first research question is exploratory in its nature (Yin, 2009).
While the groundwork regarding innovation and growth ambitions has been laid out, the second
and third research questions are a combination of both descriptive and explanatory research.
For each of these research questions, detailed research questions have been formulated. Two
detailed research questions focus on finding characteristics of innovative firms and firms with
high growth ambitions. By doing so, the intention is to add information to the fields of
innovation and growth ambitions from the perspective of established SMEs. This is an attempt
to explore and explain the workings of established SMEs, and these detailed research questions
are therefore descriptive (Valerie & Lois, 2012).

46
By using the characteristics, the two detailed research questions investigating the relationship
between firm growth, innovation and growth ambitions respectively are explanatory as the aim
is to investigate cause and effect.
3.4.2. Both qualitative and quantitative data
The aim of this research is to enhance the understanding of high-growth firms, growth
ambitions, the role of innovation and their respective relationship with firm performance.
Following the purpose of this thesis are research questions. Then, after the frame of reference,
detailed research questions are formulated. The research questions are to some extent quite
common as they focus on SMEs in general. To draw conclusions about SMEs overall a
quantitative study using a representative sample drawn from the whole population is the best
alternative, as a census study involving the entire population is not feasible. As the main
concepts are high growth, innovation, and growth ambitions, the sample needs to include firms
with different growth rates, different levels of innovativeness, and different levels of growth
ambitions. It also needs to be large enough to find general characteristics. To facilitate the need
for a large enough sample, a database containing firms’ answers to a qualitative questionnaire
was used. Normally, quantitative survey-based data collection would be used to collect
information on a large number of factors, as this is both time and cost effective. However,
quantitative survey-based data usually captures a snapshot of the firm, while interviews using
a qualitative questionnaire are able to capture richer images of the researched firms. In this
sense, the first step used during the project was a qualitative case study (Yin, 2009), where
“how” and “why” questions in complex settings were asked and answered. By later using expert
valuation it is possible to use the answers to give a score for each question and each firm (Shane,
Locke, & Collins, 2003). This method enables standard statistical analytical methods to be used
in this research.
Starting with a qualitative approach has several advantages. Both innovation and growth
ambitions are difficult concepts to measure. To develop a deeper understanding of each firm,
its history, and operations a multiple case study can best help in answering “how” and “why”
questions regarding these concepts. As the number of cases is large it enables quantitative
analyses of the sample, which makes it possible to find general similarities and differences.
Therefore, a mix of qualitative and quantitative research methodology was applied sequentially
for this study. Figure 7 illustrates this sequential design. This design is similar to the sequential
exploratory strategy suggested by Creswell (2009), but is different in the aspect that in the
interpretation of the analysis, the qualitative data is not used.

47
Figure 7: Sequential design. Adapted from Creswell (2009)
3.4.3. Deductive approach
Since the research starts with a solid frame of reference from which detailed research questions
have been formulated, and proceeds to answer these using empirical data within the context of
established SMEs, the approach is classified as deductive (Bryman & Bell, 2003; Wilson,
2010).
3.5. Operationalization – how it was done Below is a description of how firm growth was computed, how the abstract concept of ambition
and innovations was constructed, and finally what analysis was needed to answer the research
questions.
3.5.1. Definition of an established SME
Small and medium-sized enterprises (SMEs) represent a large part of all firms in most
economies. In Europe, as much as 99.8% of all firms in each country would be considered a
SME (Eurostat, 2014). The definition of an SME however is not unanimous. For this research,
the definition put forward by the European Union (European Commission , 2003) is used, where
the criteria, shown in Table 2, must be met to classify a firm as an SME:
Table 2: Definition of an SME within the European Union (European Commission, 2014)
Firm category Employees, and Turnover or Balance sheet total
Small 10 ≤ x < 50 ≤ € 10 m ≤ € 10 m
Medium 50 ≤ x < 250 ≤ € 50 m ≤ € 43 m
Throughout this thesis, references to firms that are classified as SMEs will be in accordance
with the definition from the European Union.
Qualitative
Data
collection
Qualitative
Data
analysis
Quantitative
Data
collection
Quantitative
Data
analysis
Interpretation
of analysis
Qualitative to quantitative design

48
How to define an established SME is more difficult to specify, as there are no standards to
follow. In this research a combination of several characteristics have been used that - when put
together - describe an established firm. If a firm is to be regarded as established, it: 1) needs to
have an existing customer base, should not be searching for its first customers and must have
one or several offerings; 2) needs to have been operational for preferably 5 years; 3) should
have formed formal processes and created routines; and 4) preferably reached at least 20
employees or more. These characteristics have been viewed as guidelines and a means to avoid
including startups without the level of complexity of a firm that has existed for several years.
3.5.2. Definition of growth
Throughout the numerous research studies on firm growth there are a vast number of measures
used to define firm growth. Janssen (2009) concluded that common variables used to measure
firm growth are based on e.g. employees, profit, and turnover, or what Storey & Greene (2010)
call financial ratios, e.g. assets, added value, and return on investment (ROI). This
heterogeneity can be a hindrance for developing a more coherent theoretical body (Delmar,
2006). Nevertheless, there are two growth measures that tend to be used more frequently,
namely employees and turnover (see e.g. Davidsson et al. 2005, Gilberg et al. 2006, Dobbs &
Hamilton 2006, Storey & Greene 2010). Delmar (2006) found that these were the preferred
measures with 29.1 percent and 30.9 percent respectively in the reviewed studies. One reason
for this, as argued by Coad and Hölzl (2010), is that data related to these two measures are often
easy to obtain by researchers and are therefore included in studies. Another argument is that
these two measures are seen as non-controversial from both researchers and their respondents
(Delmar, 2006). Davidsson & Wiklund (2006) argue that the growth process is likely to be
driven by an increased demand, which renders higher turnover for the firm. As a response to
increased turnover, the firm would need to acquire additional resources such as employees or
machinery. That growth would first occur in some other dimension, before turnover is unlikely
(Davidsson & Wiklund, 2006). Storey (1994) pointed to a strong correlation between growth
in turnover and growth in employees, but others (Davidsson, Achtenhagen, & Naldi, 2005) have
argued that some firms rely heavily on outsourcing, and if included in the sample, will nullify
such a correlation.
Table 3 lists the two growth measures used in this thesis, and their respective advantages and
disadvantages.

49
Table 3: Selected growth measures
Growth
measure
Advantage Disadvantage
Employees Easily obtainable
The measures do not require deflation and
can therefore be used in multi-industry
and cross-country studies (Coad & Hölzl,
2010)
Is less volatile than e.g. turnover as
managers tend to wait until the demand
for their products or services has
stabilized before hiring more people
(Janssen, 2009)
Robust to the manipulation of reported
turnover and profits (Coad & Hölzl, 2010)
Usually important to policy makers as
they see SMEs as a source of new jobs
(Storey & Greene, 2010; Delmar, 2006)
Possible for firms to increase
turnover without showing
any increase in the number of
employees (Janssen, 2009)
Davidsson & Wiklund
(2006) note the possibility of
replacing employees with
capital investments in a
process of rationalization
Firms may outsource
employment (Storey &
Greene, 2010)
The number of employees
might not increase, even if
the output is increased as a
result of higher productivity
(Janssen, 2009)
Employment levels vis-à-vis
balance sheet size can be
different between industries
(Storey & Greene, 2010)
Business owners do not see
this as a growth measure or
their primary goal (Wiklund,
1998; Davidsson,
Achtenhagen, & Naldi, 2005;
Davidsson & Wiklund, 2006)
Turnover Easily obtainable Might overstate the size of
the firm as turnover might

50
Growth
measure
Advantage Disadvantage
Possibly the best measure to mirror the
short-term and long-term changes in a
firm (Coad & Hölzl, 2010)
Theoretically, turnover growth is
chronologically the first form of growth
and precedes employment growth
(Janssen, 2009)
Among business owners, turnover growth
appears to be the preferred measure of
success (Janssen, 2009)
also reflect input prices
(Coad & Hölzl, 2010)
Delmar (2006), as well as Davidsson & Wiklund (2006), concludes that the variety among
growth measures makes comparison between studies difficult, and to make it easier, researchers
should present several models with growth calculated differently. By presenting several models,
and not selecting the growth measure that gives the highest explained variance and significant
variables, research into firm growth can evolve if accumulated findings are easy to compare
(Delmar, 2006).
As did Janssen (2009), the author of this thesis will here link firm growth to either turnover or
employees, as he believes growth in turnover is the most relevant measure for managers and
owners of SMEs, whereas employees are the most relevant measure from a societal point of
view. Furthermore, data regarding turnover and the number of employees is easily obtainable
from a third-party source, which reduces the risk of bias. An important reason to study firm
growth expressed in both turnover and the number of employees is that the outcome of an
innovation can make an organization or process more effective, which might reduce the number
of employees, while the turnover might increase. These two measures complement each other,
are important to different stakeholders, and might reduce the risk of drawing incorrect
conclusions. Furthermore, they are not subjective and can therefore be used when comparing
firms. Finally, they are the two most popular measures of firm growth, which makes it possible
to compare conclusions to older studies.

51
3.5.3. Measuring growth
There are a few different ways to calculate growth. Most common is to use a relative growth
rate (growth in percentage), e.g. turnover or the number of employees. The formula to calculate
the relative growth rate of a firm is:
𝐺𝑟𝑜𝑤𝑡ℎ𝑡 = 𝑆𝑡 − 𝑆𝑡−𝑛
𝑆𝑡−𝑛
= 𝑆𝑡
𝑆𝑡−𝑛−
𝑆𝑡−𝑛
𝑆𝑡−𝑛
= 𝑆𝑡
𝑆𝑡−𝑛− 1
(5)
where 𝑆𝑡 is the size of the firm at time t, and 𝑆𝑡−𝑛 was the size of the firm n time units prior to
time t. Sometimes, but not always, researchers are calculating the logs of the firm’s growth rate.
Taking logs of the dependent variable can reduce the risk of heteroscedasticity (Coad & Hölzl,
2010) when comparing growth rates of firms, i.e. that different subgroups in the sample have
different variance. Another advantage of logs is that it corrects for possible skewness and
renders a higher fit when doing regression analysis (Delmar, 2006).
log(𝐺𝑟𝑜𝑤𝑡ℎ𝑡) = log (𝑆𝑡
𝑆𝑡−𝑛− 1)
= log (𝑆𝑡 − 𝑆𝑡−𝑛
𝑆𝑡−𝑛)
= log(𝑆𝑡 − 𝑆𝑡−𝑛) − log (𝑆𝑡−𝑛)
(6)
When a firm is growing fast and its size at 𝑆𝑡−𝑛 is close to zero, the relative growth rate can be
so large that it is difficult to compare to firms that did not have a size close to zero at time t-n.
This is evident when comparing new small firms, which have grown quickly, with larger, often
older, firms. To correct for this, and to be able to compare different relative growth rates,

52
researchers and policy makers sometimes use absolute growth, i.e. the absolute increase in e.g.
the number of employees (Coad, 2009). Davidsson & Wiklund (2006) argue that it is important
for researchers to clearly state how they have calculated firm growth. They also suggest that it
is important to present both relative and absolute numbers to avoid “erroneous conclusions
about the ‘effect’ of initial size and explanatory variables that are correlated with size” (2006,
p. 59). Both Shepherd & Wiklund (2009) and Almus (2002) conclude that different results can
be achieved whether researchers focus on relative or absolute growth. In a study of 55 published
growth articles, Delmar (2006) found that the most frequently used growth measure was relative
(50.9%) followed by absolute (29.1%).
Another way of calculating growth is to combine both the relative job growth and the
employment growth in absolute numbers. Birch (1987) created the “Birch index”, which can
be presented as:
𝑣 = (𝐸𝑡 − 𝐸𝑡−𝑛)(𝐸𝑡
𝐸𝑡−𝑛) (7)
where 𝐸𝑡 is the number of employees at time t, and 𝐸𝑡−𝑛 was the number of employees, n time
units prior to time t. By using a combination of both relative growth and absolute growth, the
impact of firm size on the growth indicator is reduced seeing as measuring employment growth
in absolute numbers is biased towards larger firms, whereas relative employment growth is
biased towards smaller firms (Delmar, 2006; Coad & Hölzl, 2010). The drawback of the Birch
index is that it is harder to understand what the value represents and how to interpret it.
As mentioned before (see 3.5.2 Definition of growth above), the view in this thesis is that the
two most important measures for firm growth are turnover and the number of employees. To
make comparison to other studies possible, and to minimize the risk of drawing erroneous
conclusions, growth will be calculated in this thesis using both relative and absolute numbers.
If relative growth is by far the most frequently used growth measure, the diversity is larger
when concerning the number of years to include. According to the same study, Delmar (2006)
reasoned that different time periods will yield different results. Based on this argument, this
study will present results where two different time periods are used: 2008-2012 and 2009-2012.
Finally, logs have been calculated to reduce the risk of different subgroups in the sample having

53
different variance (Coad & Hölzl, 2010). With this in mind, eight different dependent variables
were computed for each firm. In Table 4, these variables are listed and explained.
Table 4: The dependent growth variables and their code names
Variable Time period Code name
Relative growth using turnover 2008-2012 GT8-12
Relative growth using turnover 2009-2012 GT9-12
Relative growth using the number of
employees
2008-2012 GE8-12
Relative growth using the number of
employees
2009-2012 GE9-12
LOGS of relative growth using turnover 2008-2012 LogGT8-12
LOGS of relative growth using turnover 2009-2012 LogGT9-12
LOGS of growth using the number of
employees
2008-2012 LogGE8-12
LOGS of growth using the number of
employees
2009-2012 LogGE9-12
3.5.4. Selecting cases to include in the sample
Financial data for the years 2008-2012 was exported from Retriever. A handful of firms had a
parent firm or several subsidiaries, where each subsidiary represented different regions in
Sweden. These firms were handled manually and their financial data was aggregated upwards
to illustrate one firm. This was a necessary step to take to be able to follow the growth process
over several years as new subsidiaries were created. Of the 91 firms included in the project,
only 88 were included in this study. To be included the firms needed to fulfill the criteria of an
SME in 2008, 2009, or 2012. The rationale is that a more strict selection, i.e. fulfilling the
criteria of an SME in both 2008 and 2012 and in 2009 and 2012, would discriminate firms that
successfully grew from micro to SMEs or grew from SMEs to large enterprises. Either way,
growing into or growing out of still includes a time period of being an SME, which was deemed
as a qualifier. Of these 88 firms, only 86 had a closing of account for 2012. The reason for this
is that two firms did not survive 2012 but were still operational when they entered the project
in 2011. One firm was registered in November 2008, two firms were registered in 2009, and
another three were registered in 2010. Because of this, there were no closing of accounts for
the years 2008 and 2009 resulting in the numbers n=84 and n=81 for 2009 and 2008,

54
respectively (see Table 5). Because of the lack of financial data, it is not possible to calculate
the growth rate for the selected time periods (2008-2012 and 2009-2012), which is why these
firms were excluded in the analyses regarding growth rate.
Table 5: Number of firms in the sample with financial data
Year 2012 2009 2008
Turnover 86 84 81
Number of
employees
86 84 81
All of the selected firms were classified as established. Data from the initial interview, financial
data, and survey data were used to determine whether a firm was established.
3.5.5. Gazelles and average firms
In their meta-analysis of gazelles, Henrekson and Johansson (2010) concluded that no general
agreement on a definition for gazelles exists. As there is no consensus on either what measure
(turnover or employment) or the length of the time period that should be used, the author of this
thesis followed Parker et al. (2010) and used a cut-off point to define a gazelle. The 30 firms
with the highest values on firm growth (on each respective growth measure) were considered a
gazelle. As the process used to draw the sample favored firms with high growth (see 3.3.1
Selecting suitable firms), the 30 firms with the lowest values on firm growth constituted a group
labeled “average firms”. The firms included in this group were checked to have growth rates
close to zero, and thus could be considered as average (Coad, 2009). The average growth rates
for these firms is also close to zero (see Appendix 6.3). The number 30 was selected so that the
sizes of the groups are large enough to compare using common statistical tools.
The rationale behind not selecting any of the proposed definitions from e.g. Birch et al. (1995)
or OECD (2006) is that the sample size is not large enough to comply with these more strict
definitions.
3.5.6. Measuring abstract concepts
Both growth ambitions and innovation are concepts that need to be operationalized. As
innovation measured by the number of patents or by the amount of expenditures on R&D are
difficult to use in the context of established SMES (see 1.3 Innovation and high growth), a

55
construct representing innovation was created. The measure Growth Ambitions has also been
operationalized as one single construct representing the ambitions to grow the firm.
Innovation and growth ambitions are both abstract concepts. These concepts are crucial to
define and measure to answer the research questions. A reliable way of expressing and
measuring these abstract, or latent, concepts was to use Principal Component Analysis (PCA).
The factor analysis helps reduce the data as well as develop and test the validity and reliability
of the extracted constructs representing the abstract concepts.
3.5.7. Principal component factor analysis
When doing principal component factor analysis to create a measure, validity is crucial (Flynn,
Sakikibara, Schroeder, Bates, & Flynn, 1990). It is important that the measure actually measures
the abstract concepts Innovation and Growth Ambitions. Furthermore, it is also important to
make sure that these measures do not measure anything else, and to ensure this, content validity
is important. In this research, content validity is the judgement of the extent to which the scales
truly measure the abstract concepts innovation and growth ambitions, based on the content of
the items used to create the measures. As suggested by Flynn et al. (1990) the content should
be based on literature searches and expert opinions. As evident below, all items included in the
constructs representing innovation and growth ambitions are linked to literature and prior
research. To ensure construct validity, i.e. whether a measure is an appropriate operational
definition of an abstract construct, factor analysis will be used.
For each analysis an eigenvalue greater than one was used to determine the number of
components to extract, as suggested by Jae-On (1978). To find evidence for construct validity,
both convergent validity and discriminant validity were checked. To ensure convergent validity,
the factor loadings for each variable were checked to meet the criteria of 0.5 or higher
(Johannessen, Olsen, & Lumpkin, 2001). To ensure discriminant validity, no variable could
load above 0.3 on any other component (Meyer & Collier, 2001). To ensure scale
unidimensionality, it was verified that the first component explained at least 40% of the
variance in the items (Meyer & Collier, 2001). To test the reliability, and more specifically
internal consistency, meaning the inter-correlation between variables, Cronbach’s alpha was
calculated. According to Nunnally (1978) the minimum accepted value is 0.70, but he also
argues that this value depends on the situation. For a new measure values above 0.60 (Flynn,
Sakikibara, Schroeder, Bates, & Flynn, 1990) can be acceptable, but where important decisions

56
about the fate of individuals are made on the basis of test scores, reliability should be 0.90-0.95
or better (Nunnally, 1978). As the measures here are new, values above 0.70 are acceptable.
3.5.7.1. Innovation construct
To evaluate the innovation aspect, six of the questions were labelled as innovation factors,
drawing on the definition of innovation by OCED (2005) and Frankelius (2009). To find the
principal component, henceforth called Innovation, a factor analysis of the following six
variables was performed:
Are there any strong customer demands or problems that are not met today, and are
customers willing to try new untested products or solutions? (Question 30)
Is the industry mainly conservative or is it possible to succeed by delivering new offerings
that are not similar to those already existing? (Question 31)
Does the firm possess and can use new technology or new processes which can be
significantly beneficial to customers? (Question 32)
Does the firm offer its customers radically new solutions (e.g. based on new technology),
something completely unexpected, and that may be of great value for the customers?
(Question 40)
Does the firm lie ahead of its competitors with these radically new solutions? (Question 41)
Is the firm introducing new solutions first, and is it perceived as a trendsetter in the market?
(Question 60)
Questions 30, 32, 40 and 41 are to create sustainable competitive advantage (Barney, 1991)
valued by the customer. The second question and the last question are to create something new
– to break new ground – that does not capitalize on existing solutions. Also, questions 30, 31,
and 32 reflect the knowledge perception of the firm’s customers and the market, while questions
40, 41, and 60 reflect how the firm is serving the market and fulfilling customer needs.
3.5.7.2. Growth Ambitions construct
Three questions were labelled as factors associated with ambitions toward firm growth. A factor
analysis was performed to find the principal component to represent Growth Ambitions. The
three questions were:
Do the entrepreneur have a long-term rather than short-term-oriented perspective, and
does he/she invests in the firm for the future? (Question 10)

57
To what extent do the owners and managers have the same ambition regarding the future
of the firm? (Question 11)
To what extent do the entrepreneur wishes to make the firm grow and to what extent does
he/she thinks it is possible? (Question 12)
These three questions were selected as they measure both aspirations and actions. Whereas the
second question involves the entrepreneur’s growth aspirations, the first one was selected as a
measure for the actions performed to increase the firm’s opportunity to realize growth, as
argued by Wiklund and Shepherd (2003). The second question also acts as a control question
regarding the homogeneity of the future plans and strategies among the owners and managers
of the firm. The wording of the third question also covers the differences between an
entrepreneur who has all the right motivations to grow to that of an entrepreneur who has all
the right motivations to grow and has discovered and valued opportunities (Shane, Locke, &
Collins, 2003). The last question also captures the two important aspects in the theory of
planned behaviour, namely intentions and perception of behavioural control (Ajzen, 1991). By
combining these two aspects it should be possible to partly explain the variance of firm growth.
The third question is also meant to encompass the actual behavioural control which respondents
take into account when answering. Factors associated with actual control are e.g. the amount of
resources, time, and skills (Ajzen, 1991). If the entrepreneur has actual control and has the
intention to grow the firm, he or she should succeed.
3.5.8. Computing factor scores
Once the factors representing innovation and growth ambitions were identified and clearly
interpretable, factor scores for them were saved. These were created by using, in SPSS 22, the
standard method of extracting the factor score, namely regression. This method, created by
Thurstone (1934), uses a least squares regression approach to predict factor scores. With this
method, the factor scores are the dependent variables in the regression equation, while
independent variables in the regression equation are the standardized observed values of the
items in the estimated factors. The least squared regression is a multivariate procedure, which
means that it takes into consideration not only the item loadings and the score for each item in
the factor, but also the correlation between different factors (if more than one is extracted),
correlation between factors and observed variables, and the correlation between observed
variables. Using the regression method to predict factor scores, each factor score is
standardized, i.e. has a mean of zero. Since principal components are used, the standard
deviation of the factor scores will be 1 (DiStefano, Zhu, & Mîndrilã, 2009).

58
3.5.9. Computing high Growth Ambitions and high Innovation
To be able to answer RQ2 and RQ3 a definition on “high” is necessary. In the same way as
high-growth firms, i.e. gazelles, are defined by using a cut-off point (see 3.5.5 Gazelles) – so
are high innovation and high growth ambitions. Ranking the sample from highest to lowest on
the factor scores from Innovation and Growth Ambition, the 30 firms having the highest factor
scores are here considered to have either high growth ambitions or high innovation,
respectively. Consequently, the 30 firms with the lowest factor scores are considered to have
low growth ambitions or low innovation. By defining high (and low) using this method the
average firm is not targeted. Instead, focus is on the extremes, as suggested by e.g. Coad and
Rao (2008).
3.6. Data analysis strategy
3.6.1. Research Question 1 and analysis
The first research question - “What are the differences between gazelles and the average firm
regarding innovation, growth ambitions, resources, and market and organizational factors?” -
is regarding the differences between established SMEs that have managed to realize gazelle-
like growth and the average firm. The sample was split, using the method presented in Section
3.5.9, Computing high Growth Ambitions and high Innovation, resulting in the two groups,
gazelles and the average non-growing firms. These two groups were compared with regard to
the factors identified in Section 2.1.6, Factors associated with firm growth on page 18, using
the Independent Samples T-test. Also, the differences associated with the items building up the
constructs, Growth Ambitions and Innovation, will be presented.
3.6.1.1. Resources
As mentioned in Section 2.1.6.1 , financial resources are often a source of limitation to firm
growth. Figure 4 on page 20 shows that SMEs in particular are dependent on trade credit,
venture capital, and loans to secure necessary cash flow. The following questions have been
identified to address the resource situation in each firm:
Question 20: To grow, are external actors, such as banks or private equity firms, willing
to supply resources if it becomes necessary?
With this question, the purpose was to develop a better understanding of if the firm can gain
access to resources if it needs to, as a means to enable growth. This question shows whether the

59
firm has connections with external financial actors, and if these actors are willing to make
resources available to the firm.
Question 21: To what extent are the firm’s profits enough to finance future growth?
If the firm is profitable and has sufficient margins, it is more likely to be self-sustained and able
to manage possible future investments on its own.
Question 22: To what extent is the firm focusing on securing a positive cash flow?
As scarce resources can affect the firm’s possibility to grow, knowledge on how to balance cost
and revenue is important (Hambrick & Crozier, 1985; Beck & Demirguc-Kunt, 2006; Storey &
Greene, 2010). Being able to e.g. calculate costs and revenues in projects, and to perform future
cash flow projections and follow-ups, can reduce the risk of having a shortage of resources or
a negative cash flow.
Question 23: To what extent is the firm using other means of financing, such as
customers or suppliers?
This question concerns the firm’s ability to use a wider range of financial resources, such as
customers and suppliers, as indirect sources of financing (Gundry & Welsch, 2001). This
question primarily regards how the firm is setting and negotiating its payment terms. Ideally,
the firm wants to pay its suppliers as late as possible and have its customers pay as soon as
possible.
Question 24: To what extent is the firm cost-aware, and trying to reduce fixed costs?
This question concerns the firm’s focus on trying to reduce or eliminate unnecessary costs.
Also, as a means to stay as flexible as possible, it addresses if the firm has tried to shift fixed
costs into more easily scalable variable costs.
3.6.1.2. Market factors
The market factors highlighted in Section 2.1.6.2 regard the firm’s ability to identify
opportunities, develop products and markets, find new customers, and make offerings more
competitive. The following questions have been identified as addressing these factors.
Question 30: Do any strong customer demands or problems exist that are not met, and
are customers willing to try new untested products or solutions?

60
This question regards the firm’s ability to create a competitive advantage (Barney, 1991) by
offering something valued by the firm’s customer.
Question 31: Is the industry mainly conservative or is it possible to succeed by
delivering new offerings that are not similar to those that already exist?
Question 32: Does the firm possess and can it use new technology or new processes
which can be significantly beneficial to customers?
Question 34: To what extent is it possible to create growth opportunities in profitable
niches of the market?
The three questions above reflect the firm’s knowledge perception of its customers and the
market. The market and its characteristics have been found to directly affect firm growth, both
positively and negatively (Wiklund, Patzelt, & Shepherd, 2009). Firms on a market that is
constantly changing grow, generally, slower than firms in a more stable market. However, in
markets under constant change there are plenty of opportunities, so firms should grow faster if
they have an orientation for pursuing new opportunities, as suggested by Wiklund et al. (2009).
Question 40: Does the firm offer its customers radically new solutions (e.g. based on
new technology), something completely unexpected, and that may be of great value for
the customer?
Question 41: Does the firm lie ahead of its competitors with these radically new
solutions?
Question 60: Is the firm introducing new solutions first, and is it perceived as a
trendsetter in the market?
The three questions above reflects how the firm is serving the market and fulfilling customer
needs. Flexibility and being able to respond to changing needs have been previously linked to
growth in small firms, while others have suggested that smaller firms also need to anticipate
changes in the market, and not only respond to changes (Dobbs & Hamilton, 2006).
Question 64: Vis-á-vis competitors, how much effort does the firm put into sales
activities?
Finally, this question reflects to what extent the firm is active in offering its products or services
to customers and potential customers.

61
3.6.1.3. Organizational structures and systems
The factors highlighted in Section 2.1.6.3 regard the firm’s ability to have lean and cost-
effective structures and systems; be flexible and faster to respond to external changes; and be
able to spread information within the organization and delegate tasks. It also concerns if the
decision making is decentralized and if the firm uses growth goals.
Question 80: To what extent does the firm focus on making processes, routines, and
structures more efficient and flexible?
Question 81: To what extent does the firm have flexible processes, structures, and
routines that provide good governance?
The two questions above regard the firm’s ability to deal with increased complexity as the firm
grows (Covin & Slevin, 1997).
Question 93: To what extent does the firm have distinctive and outspoken goals for the
next 6 months?
Question 112: To what extent are the firm’s leaders emphasizing a decentralized
decision-making structure?
Question 116: To what extent is the firm conducting follow-ups on goals and plans?
Questions 93 and 116 reflect the firm’s ability to set and use goals as a means to motivate
employees, spread information and share a vision (Locke & Latham, 2006), while question 112
refers to the TMT’s ability to decentralize decision making as the firm grows (Gilbert,
McDougall, & Audretsch, 2006).
3.6.2. Research Question 2 and analysis
The second research question - “What is the role of innovation in established SMEs and its
relation to realized firm growth?” - concern the relationship between firm growth and
innovation, and also what characterizes innovative firms. The method and principles mentioned
under Section 3.7.3 will be used to create and evaluate the innovation construct. To help answer
this research question, two detailed research questions were formulated (RQ2:1 and RQ2:2).
To answer RQ2:1 a T-Test was used to compare two groups with different levels of innovation
(high and low) and their respective average growth rates. To answer RQ2:2, and to find
characteristics of innovative firms, the group with high factor scores on the Innovation construct
was compared to the group with low factor scores. The factors used in RQ1 were used in RQ2:2,

62
and the differences between the two groups were tested using the T-Test to conclude if they are
significant.
3.6.3. Research Question 3 and analysis
The third research question - “What is the role of growth ambitions in established SMEs and
their relation to realized firm growth?” - regards the concept of growth ambitions in established
SMEs and their relation to firm growth. The method and principles mentioned under Section
3.5.6 will be used to create and evaluate the Growth Ambitions construct. RQ3 was broken
down into two detailed research questions: RQ3:1 and RQ3:2. To answer RQ3:1, the
differences in growth rates between the group with high growth ambitions and the group with
low growth ambitions were tested using the T-Test.
Again, to find what characterizes established SMEs with high growth ambitions the group
containing firms with high growth ambitions was compared to the group containing firms with
low growth ambitions. Similarly, a T-Test was used to test if the differences between the groups
were significant.
3.6.4. Data processing
To be able to test the differences mentioned above, a sufficient method was used for each
dependent variable, as listed in Table 4. It would be preferable to use relative growth rather
than the corresponding log value, since the latter loses interpretability. However, some evidence
suggests that firm growth rates are not normally distributed (Coad, 2009), which is an
assumption when using the T-Test. Instead, the distribution looks similar to the Laplace
distribution (Bottazzi, Dosi, Lippi, Pammolli, & Riccaboni, 2001).
By looking at the four different variables representing relative growth rate in Figure 8-11, it is
evident that the distribution is highly skewed with some extreme values.

63
Figure 8: Relative growth using turnover, 2008-2012
Figure 9: Relative growth using turnover, 2009-2012
Figure 10: Relative growth using number of employees, 2008-2012
Figure 11: Relative growth using number of employees, 2009-2012
Both the Kolmogorov-Smirnov test and Shapiro-Wilk test for normality suggest that the
abovementioned distributions are not normally distributed; hence, it is not possible to test the

64
differences using the standard T-Test. Also visible above are some extreme values, or outliers,
which need attention.
Generally speaking, dealing with outliers is difficult. If nothing is done about outliers, the final
results may neither describe the bulk of the data nor the outliers. Regarding the data collected
for this study there is a potential risk of outliers due to the initial size of the firms. The reason
behind small initial sizes can be attributed to the firms not being an SME, or that there are
special circumstances that needed to be addressed and evaluated. These cases were identified
and removed. See Appendix 6.2, Elimination of outliers, for a detailed explanation on the
removal of outliers.
Throughout the analysis all tests were performed with the outliers excluded. However, to avoid
drawing erroneous conclusions, the same tests were then performed with the outliers included,
and the results are presented here with possible differences highlighted.
Still, when the outliers were removed the four different variables did not pass the Kolmogorov-
Smirnov test (p<0.001 for all variables) for normality, nor the Shapiro-Wilk test (p<0.01 for all
variables) for normality. Also, the corresponding QQ plots, shown in Figure 12-15, give
evidence to the fact that the variables do not have a normal distribution.

65
Figure 12: Q-Q Plot for GT8-12
Figure 13: Q-Q Plot for GT9-12
Figure 14: Q-Q Plot for GE8-12
Figure 15: Q-Q Plot for GE9-12
To overcome this problem, logs for each variable were calculated to transform to normality. To
compute logs and account for negative values, a translation of the data was conducted prior to
transformation. A shift in values was conducted where, for each variable, the min value, plus
one, was added to the growth. This can be expressed as
min(𝑔𝑟𝑜𝑤𝑡ℎ + 𝑎) = 1 (8)
and to calculate the value of the constant a, the following equation was used for each variable
𝑎 = 1 − min (𝑔𝑟𝑜𝑤𝑡ℎ) (9)
This would ensure that all values were positive and that the lowest value was 1, hence yielding
log(1)=0. Post-transformation, Z-scores were calculated again to remove any new outliers. By
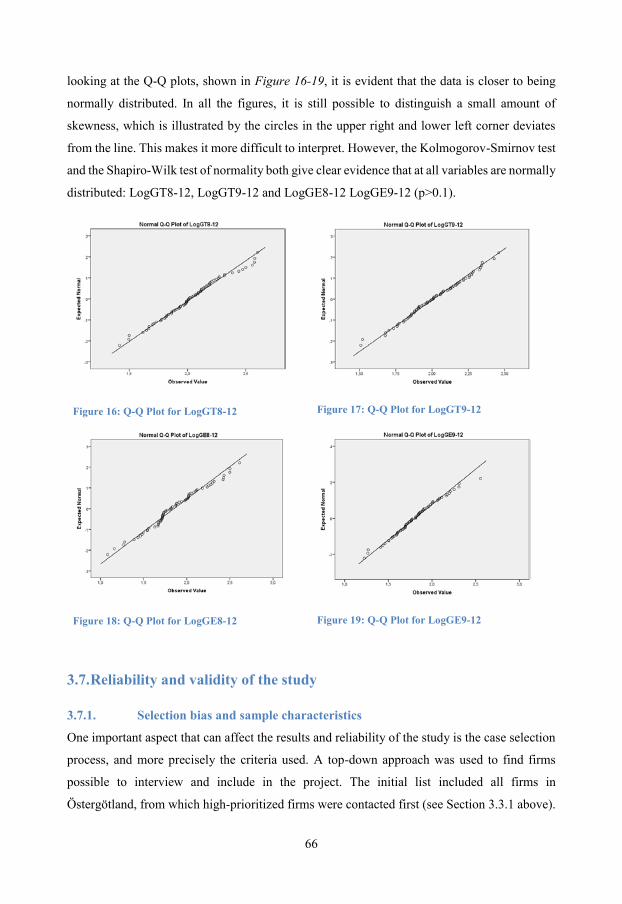
66
looking at the Q-Q plots, shown in Figure 16-19, it is evident that the data is closer to being
normally distributed. In all the figures, it is still possible to distinguish a small amount of
skewness, which is illustrated by the circles in the upper right and lower left corner deviates
from the line. This makes it more difficult to interpret. However, the Kolmogorov-Smirnov test
and the Shapiro-Wilk test of normality both give clear evidence that at all variables are normally
distributed: LogGT8-12, LogGT9-12 and LogGE8-12 LogGE9-12 (p>0.1).
Figure 16: Q-Q Plot for LogGT8-12
Figure 17: Q-Q Plot for LogGT9-12
Figure 18: Q-Q Plot for LogGE8-12
Figure 19: Q-Q Plot for LogGE9-12
3.7. Reliability and validity of the study
3.7.1. Selection bias and sample characteristics
One important aspect that can affect the results and reliability of the study is the case selection
process, and more precisely the criteria used. A top-down approach was used to find firms
possible to interview and include in the project. The initial list included all firms in
Östergötland, from which high-prioritized firms were contacted first (see Section 3.3.1 above).

67
The firms on this list were compared to a list of all firms in Sweden to determine if there were
any significant differences between the two groups regarding the values of a multitude of
financial measurements exported from Retriever. Since no such differences could be established
it was determined that the firms in Östergötland were a subset of the entire population of firms.
This was a vital step to ensure that the conclusions from this research are generalizable.
When comparing high-growth firms with average-growth firms, or when growth is the
dependent variable, it is possible that the variance is not enough to show significant difference.
This is a result of the selection bias introduced as most of the firms included in the project were
already successful, and that average firms with low growth were to some extent intentionally
avoided. However, since the correlation between the constructs and firm growth is expected to
be positive and strong there should still be a difference between the high-growth firms and
average-growing firms. It is important to study the growth rates of both groups when
formulating conclusions and interpreting the results.
There is a possibility that the respondents would give different answers depending on their
position within the firm; owners, for example, have one perspective while managers without
ownership have another. Shane et al. (2003) compared the risk-taking between owners and
managers and found that they do not differ. Wiklund (1998) concluded that it would be unwise
to conclude that motivation plays a different role for owner managers than managers in general
in determining the performance of SMEs. Since the strategy was to interview both CEOs and
different managers it increased the chance to obtain the opinions of both owners and managers.
Even if the abovementioned findings, i.e. that no differences exist, are not true for all
circumstances, the sampling strategy would minimize the impact of the possible differences of
opinions.
3.7.2. Using a pre-existing framework
Another highly important aspect is the selected framework within the project. This was deemed
fit for project-specific purposes, but for this research 21 out of 69 questions were used. The
rationale was that although the framework as a whole has no documented connection with the
research, but still it is possible to use some questions which the author of this thesis has linked
to prior research. By using the answers to these questions in combination with a robust method
for conducting analyses as the author has done, it is possible to ensure both high validity and
high reliability (Creswell, 2009).

68
As the questions were taken from the framework, reliability is a potential issue. A few of the
questions were open-ended and the respondent was often asked to give examples that could
help the interviewer understand. To ensure the reliability, each team always operated in a
minimum of pairs, and each interviewer compared their answers with the other team members
before, together, agreeing upon a final score for each question. To ensure reliability between all
project members, several meetings were conducted to calibrate how the final scores should be
set. In addition, as the project members teamed up differently for all the cases, it was also
possible to spread information and experience across the team, which contributed to a uniform
interpretation of the answers as well. By going from interviews, with some open-ended
questions, to a score on a scale via a calibrated tool, reliability was ensured. The potential
negative side of this method is that the final score represents the interviewing team’s
interpretation of the underlying aspect of each question, rather than the exact question as it is
formulated.
This research was done at the firm level, and here the firm is an entity. The interviews however
were conducted with people at different levels within the firm (i.e. CEO, managers, and
employees). For each question, answers from all interviews conducted within a firm were used
to calculate a mean value. This means that some variance was lost. If one interview yielded a
score of 1 and another interview yielded a score of 6, the mean would be set to 3.5. This is
troublesome for several reasons. First, a score of 3 does not represent the opinion of anyone in
the firm. Second, when this is done for all the firms, the variance in each question is lowered.
Thus, the chance of finding significant differences between firms is reduced. The
abovementioned a score of 3 is interpreted in this research as the representation of the firm, and
not any group of people. The advantage is that by conducting several interviews with each firm
instead of only one interview with e.g. the CEO, the final score is also a representation of what
several people said. This means that more information has been used to set the final score.
3.7.3. Measuring abstract concepts
There is a risk that the compounded measures Innovation and Growth Ambitions do not capture
the abstract concepts they are intended to capture. If this is the case, they would yield results
that deviate from prior research, or results that would ultimately yield incorrect conclusions. It
is always difficult to create new measures or constructs. However, to ensure both validity and
reliability, the items included were all linked to previous research and values; e.g., loadings and
Cronbach’s alphas were all set to values that have previously been accepted. As the items
included in the two constructs have not been tested prior to this research, i.e. they were not

69
taken from previously tested and validated constructs, they are also investigated separately.
When grouped together and used to measure an abstract concept, some information is lost. It is
therefore important to see what the individual questions can explain in the context of firm
growth.
3.7.4. Combination of information from present and past
It is always troublesome when questions asked at the present are mixed with information from
the past, such as financial data. When asked, it is inevitable that the respondent is affected by
the current settings of the firm. It is not always possible to recall actions and situations that
happened several years ago with total accuracy. Therefore, the answers given are assumed to
be true for the extended time period used here (2008-2012). As the method used to collect
answers was face-to-face interviews with several individuals at each firm, a much more
complete picture was established prior to jointly deciding upon a final score for each question.
For each questions it was possible for the interviewers to ask follow up questions which gave
more information about the firm and its operations. Many times the respondents were asked to
give examples which gave the interviewer information not only about the present but also about
the past. By doing so, the gap between the answers and scores and the financial data was
reduced.
3.7.5. High-growth firms and outliers
Focusing on gazelles, i.e. the firms that grow much faster than the average firm, is accompanied
by some challenges. It is possible that some of the firms included can be outliers and thus not
represent a “normal” high-growth firm. An outlier is represented by a data point that is so far
from normal that, if included, can cause skewness of the sample and move the sample mean
away from the true mean of the entire population. To reduce the risk of including outliers that
could affect the analysis and the interpretation of the results, a thorough elimination process
was conducted (see Section 3.6.4, Data processing, on page 62 above).

70
4. Findings and analysis
First a description of the sample is provided. On average, the age of the firms is 16.80
(SD=11.90) years while the median age is 13.00 years. Basic data on the firms is provided in
Table 6.
Table 6: Aggregated data in absolute numbers: Turnover (EUR) and the number of employees
Year 2012 2011 2010 2009 2008
Turnover (MSEK) n=86 n=87 n=86 n=84 n=86
Average 71.53 70.90 60.86 51.30 53.15
Median 46.78 46.60 37.39 34.72 32.73
Number of employees
(N)
Average 44.60 41.90 35.29 32.68 32.36
Median 29.00 24.00 23.00 21.00 21.00
Overall, and on average, the firms in the sample showed an increase in both turnover and the
number of employees during the periods 2008-2012 and 2009-2012. On average, the firms
increased their turnover by more than 1.8 M€ and have close to 12 more employees. Looking
at the distribution of SMEs in Sweden (see Figure 23 in Appendix 6.1), there are almost 10
times as many firms having 10-49 employees than there are SMEs having 50+ employees.
Approximately 75% of the firms included in the sample have 10-49 employees, which indicates
that the sample is somewhat skewed towards bigger SMEs. This is a consequence of the
sampling method used (see Section 3.3.1 Selecting suitable firms) favoring growing SMEs.
In Table 7, the relative growth rates for each time period are presented. The data used here have
been subject to the elimination of outliers (see Section 6.2). It is clear that the average relative
turnover growth was approximately 61% and 67% for the two time periods. The equivalent
number of the relative employee growth is lower, at 47% and 56% respectively.

71
Table 7: Aggregated data in relative numbers: Turnover (EUR) and the number of employees
Time period 2009-2012 2008-2012
Turnover n=81 n=77
Mean/Median 61% / 42% 67% / 45%
SD 81% 85%
Number of employees n=81 n=78
Mean/Median 47% / 33% 56% / 30%
SD 71% 78%
4.1. Industry distribution of the sample The sample contained firms from a broad range of industries. The number of industries and the
names of the industries follow the Swedish Standard Industrial Classification (SCB, 2013). A
total of 11 industries are not represented by firms in the sample. These 11 are industries with
fairly few firms in them, and when looking at the distribution of all Swedish firms, these 11
industries account for less than 16% of all firms (SCB, 2015), as seen in Figure 20. The
distribution of firms in the sample is similar to the aggregated industry distribution, which is
shown in the figure as dotted bars.

72
Figure 20: Percentage of firms per industry: in sample and SMEs in Sweden
By looking in more detail at the different industries and firms in the sample (see Figure 21 and
Figure 22), it can be noted that it is possible for firms to show significant growth, both regarding
turnover and number of employees, in all industries except for real estate. The average growth
rate for the firms in the sample, categorized by industry, is presented in Figure 21 and Figure
22.
0% 5% 10% 15% 20% 25% 30% 35% 40%
Accommodation and food service activities
Activities of extraterritorial organisations and…
Activities of households as employers;…
Administrative and support service activities
Agriculture, forestry and fishing
Arts, entertainment and recreation
Construction
Education
Electricity, gas, steam and air conditioning…
Financial and insurance activities
Human health and social work activities
Information and communication
Manufacturing
Mining and quarrying
Other service activities
Professional, scientific and technical activities
Public administration and defence;…
Real estate activities
Transportation and storage
Water supply; sewerage, waste management…
Wholesale and retail trade; repair of motor…
Percentage of firms per industry
SMEs in Sweden Sample

73
Figure 21: Relative growth per industry using turnover
Figure 22: Relative growth per industry using the number of employees
When looking at the growth rates per industry it is important to remember that the number of
firms in each industry is small.

74
4.2. Principal component factor analysis The results from the principal component factor analysis for the Innovation component are
presented in Table 8 and for Growth Ambitions in Table 9. The tables display the component
loadings, communalities as well as descriptive statistics. The principal component factor
analysis of the six innovation variables confirmed the unidimensionality of the component as
all variables loaded strongly in the factor, and the Cronbach’s alpha, representing the reliability
analysis performed, confirmed that the variables can be regarded as strong indicators of an
overall construct of innovation, and that internal consistency exists. There is evidence of
construct validity as each variable loaded above 0.5 (convergent validation) (Johannessen,
Olsen, & Lumpkin, 2001), and that no variable also loaded above 0.3 in any other component
(discriminant validity) (Meyer & Collier, 2001). Taken together, the result indicates that the
variables linked to the theoretical frame of reference shows a promising direction for measuring
innovation.
Table 8: Principal component factor analysis on innovation variables
Question Mean SD Components Communalities N
No 30 3.499 1.285 0.802 0.644 88
No 31 3.558 1.317 0.683 0.467 88
No 32 3.034 1.294 0.595 0.354 88
No 40 3.916 1.015 0.795 0.632 88
No 41 3.634 1.081 0.774 0.588 88
No 60 3.527 1.199 0.808 0.653 88
Eigenvalue 3.348
% Variance 55.807
Cronbach’s Alpha 0.833
Note: Pairwise missing value treatment
In Table 9, the Pearson’s correlation matrix for all the variables in the Innovation construct is
depicted. All but one bivariate correlation is significant at the 0.01 level (0.06 instead). The
correlation coefficients clearly show that the relationships are positive and overall strong,
reaching values up to and above 0.7.

75
Table 9: Pearson's correlation coefficients of innovation variables
No 30 No 31 No 32 No 40 No 41 No 60
No 30 1
No 31 .464** 1
No 32 .480** .324** 1
No 40 .520** .381** .295** 1
No 41 .532** .451** .186† .732** 1
No 60 .565** .480** .510** .554** .481** 1
Note: N=88.
**. Correlation is significant at the 0.01 level (2-tailed).
*. Correlation is significant at the 0.05 level (2-tailed).
†. Correlation is significant at the 0.10 level (2-tailed).
The results from the principal component factor analysis for the Growth Ambitions component
are presented in Table 10. Regarding the principal component factor analysis of the three
growth ambition variables, the same conclusion as above can be drawn, i.e. that the variables
represent a good measure of a firm’s Growth Ambitions. However, it is important to note that
the Cronbach’s alpha is just below 0.7, which is acceptable if the measure is new (see Section
3.5.7).
Table 10: Principal component factor analysis on Growth Ambitions variables
Question Mean SD Components Communalities N
No 10 4.751 0.870 0.755 0.601 88
No 11 4.387 1.133 0.759 0.577 88
No 12 4.293 1.072 0.808 0.652 88
Eigenvalue 1.829
% Variance 60,982
Cronbach’s Alpha 0.673
Note: Pairwise missing value treatment
The corresponding Pearson’s correlation matrix is displayed in Table 11. It is evident that all
correlations are significant at the 0.01 level and that the correlations coefficients have values
above 0.4, which would suggest a moderate strength of the relationship. The somewhat lower

76
value of the correlation coefficient would explain the Cronbach’s Alpha value of 0.673 in Table
10.
Table 11: Pearson's correlation coefficients of Growth Ambitions variables
No 10 No 11 No 12
No 10 1
No 11 .370** 1
No 12 .448** .425** 1
Note: N=88.
**. Correlation is significant at the 0.01 level (2-tailed).
*. Correlation is significant at the 0.05 level (2-tailed).
†. Correlation is significant at the 0.10 level (2-tailed).
As outlined previously in Section 3.5.6 factor scores were saved for each factor. Both factors
pass the Kolmogorov-Smirnov test, Growth Ambition factor: p>0.05, Innovation factor: p>0.1,
and Shapiro-Wilk test for normality, Growth Ambition factor: p>0.05, Innovation factor: p>0.1.
Also, the Q-Q plots confirm that these compounded measures are indeed normally distributed.
4.3. Characteristics of gazelles (RQ1) In Figure 5 on page 37, a tentative model was put forward, linking together Growth Ambitions
and Innovation with Firm Growth. To find characteristics of high-growth firms, the factors
mentioned in Section 2.1.6, Factors associated with firm growth, are included in the tests, as
well as the individual items building up the different constructs depicted in the tentative model.
The test results, detailed in Appendix 6.3, Research Question 1, are summarized in Table 12.

77
Table 12: Summary table of Independent Samples T-test between GT8-12, GT9-12, GE8-12, GE9-12 and factors: resources, market, organizational
Significant difference between gazelles and the average established SMEs
Variable GT8-12 GT9-12 GE8-12
GE9-12
GT8-12 ** N/A N/A N/A GT9-12 N/A ** N/A N/A GE8-12 N/A N/A ** N/A GE9-12 N/A N/A N/A **
LogGT8-12 ** N/A N/A N/A LogGT9-12 N/A ** N/A N/A LogGE8-12 N/A N/A ** N/A LogGE9-12 N/A N/A N/A **
Long-term commitment and invests in the firm (10)
- - - -
Owners and managers have the same ambitions (11)
- - - -
Possible, and want, to grow the firm (12) - - - - External actors willing to supply resources
(20) - - - -
Profits enough to finance future growth (21) - - - - Focus on securing positive cash flow (22) * - - *
Using other means of financing (23) - - - † Is cost-aware (24) - - - †
Aware of unmet customer demands (30) ** * ** * Industry is conservative and not ready for
new solutions (31) ** † ** **
Firm has advantages with technology or new processes (32)
- - - -
Possible to create niches (34) - - - - Firm offers radically new solutions (40) - - - -
Firm lies ahead of competitors in delivering new solutions (41)
** - ** -
First to introduce new solutions (60) ** ** * * Effort put into sales activities vis-à-vis
competitors (64) * - * †
Making processes, routines and structures more efficient and flexible (80)
- - - -
Have flexible processes, routines and structures (81)
- * ** **
Have distinctive goals for the next six months (93)
- - - †
Managers emphasizing a decentralized decision-making structure (112)
- - - -

78
Significant difference between gazelles and the average established SMEs
Variable GT8-12 GT9-12 GE8-12
GE9-12
Follow-up on goals and plans (116) - - - - Age * † † -
Turnover 2008 (MSEK) ** - ** ** Turnover 2009 (MSEK) ** * * ** Turnover 2012 (MSEK) - - - -
Number of employees 2008 ** † ** ** Number of employees 2009 * - * * Number of employees 2012 - - - -
**. Significant at the 0.01 level (2-tailed).
*. Significant at the 0.05 level (2-tailed).
†. Significant at the 0.10 level (2-tailed).
Overall, the T-Test shows that there is a significant difference in the growth rates between the
high-growth firms and the average firm. While the average firm did not grow at all, just as
reported by Coad (2009), the high-growth firms did grow some 176% and 141% during 2008-
2012 and 2009-2012 respectively, and the growth rates on the number of employees were 105%
and 129% for the two time periods respectively.
Table 12 reveals that there is a significant difference between the two groups regarding only a
few of the tested variables. Noteworthy is that there were no significant differences regarding
either the questions associated with growth ambitions or the questions associated with
resources. However, significant differences were found between the groups on all four growth
measures on several questions regarding market and innovation. High-growth firms reported
that they act on markets with less conservatism, and where it is possible to succeed by delivering
new offerings. They are also characterized by better knowledge of unmet customer demands,
and perceiving that they are first to introduce new solutions. However, when questioned about
the introduction of radically new solutions to the market, the high growers perceived that they
were faster than their competitors to introduce radically new solutions. Even so, both groups
reported that they were equally good at introducing radically new solutions, and that it was
possible to create niches. Lastly, there were significant differences in three of four growth
measures regarding the effort put into sales activities (Gundry & Welsch, 2001). The high-
growth firms put more effort into sales activities than the average firm, as described by Gundry
& Welsch (2001). Noteworthy is that the average score is only approximately three on a six-

79
point scale, which indicates that even the high growers did not perceive themselves having
extraordinary efforts vis-à-vis their competitors.
Of the questions associated with organizational structures and systems, only one showed
significant differences between the two groups. “To what extent does the firm have flexible
processes, structures, and routines?” indicated, for three out of four growth measures, that the
average-growing firms reported having more flexible processes, structures, and routines, the
difference being as big as 0.5-0.8 in favor of the average firms. This contradicts the findings
reported by Covin & Slevin (1997) and would indicate that average-growing firms perceive
themselves as having a better ability to deal with increased complexity as the firm grows.
Finally, there was a significant difference on the firms’ age. The high-growth firms were on
average some 5-6 years younger. The fastest-growing firms were on average approximately 15
years old (SD approximately 12 years), while the average firms were some 20 years old (SD
approximately 12 years). Regarding sizes, the high-growth firms had lower turnover and a
fewer number of employees in 2008 and 2009, but in 2012 they had outgrown the average firm
and had a larger turnover and a larger number of employees.
4.4. Role of innovation (RQ2) To answer the second research question: “What is the role of innovation in established SMEs
and the relation to realized firm growth?” - two detailed research questions were formulated.
4.4.1. High levels of innovation and firm growth (RQ2:1)
The first detailed research question targeted the impact innovation has on firm growth in
established SMEs. It derives from the ambiguity that in some cases innovation is associated
with firm growth, while in other cases no such relationship can be distinguished. To test the
relationship between firm growth and innovation, the sample was divided according to the
description in Section 3.5.9, Computing high Growth Ambitions and high Innovation. Table 30
in Section 6.4.1 of the appendix Research Question 2 on page 125 shows the two groups and
descriptive statistics. From the table it is evident that the top 30 firms in Innovation have a
higher average growth rate on all four growth measures. The standard deviation for both groups
and all growth measures is fairly large, which would indicate that some overlap is present.
Generally, the top 30 firms on Innovation had a smaller initial size in 2008 and 2009, but were
also smaller in 2012. This is true for both turnover and the number of employees. Also, the most
innovative firms were on average seven years younger than the least innovative firms. However,

80
no correlation could be found between the level of innovation and the size of the firm. A
significant negative correlation between innovation and age was found.
To determine if the differences in firm growth are significant, Table 13 and Table 14 show the
group statistics and the T-test result of the independent samples, respectively.
Table 13: Group statistics for T-Test between bottom and top on Innovation and LOG firm growth
Group of Innovation N Mean SD LogGT8-12 Bottom 30 Innovation 25 1.86 0.26
Top 30 Innovation 26 2.17 0.23 LogGT9-12 Bottom 30 Innovation 26 1.91 0.20
Top 30 Innovation 26 2.12 0.23 LogGE8-12 Bottom 30 Innovation 25 1.65 0.38
Top 30 Innovation 27 1.98 0.30 LogGE9-12 Bottom 30 Innovation 26 1.65 0.30
Top 30 Innovation 27 1.88 0.27
Table 14: Independent Samples T-Test for Innovation and LOG growth measures
T df Sig. (2-tailed)
95% Confidence Interval of the Difference
Lower Upper LogGT8-12 -4.489 49 0.000 -.44 -.17 LogGT9-12 -3.425 50 0.001 -.32 -.08 LogGE8-12 -3.458 50 0.001 -.51 -.14 LogGE9-12 -2.845 51 0.006 -.38 -.07
Table 14 shows that there was a significant difference in the values of LogGT8-12 for the
bottom 30 in Innovation (M=1.86, SD=0.26) and the top 30 in Innovation (M=2.17, SD=0.23);
t(49)=-4.489, p=0.000. For the other three growth measures, the differences between the two
groups were all significant at the 0.01 level.
Note that Table 30 in the appendix revealed big differences between the two groups regarding
growth rates, size and age. The top 30 firms in Innovation had a relative growth rate almost 2-
3 times that of the bottom 30 firms on Innovation. In the same table it is evident that the initial
sizes in 2008 and 2009 were smaller for the top 30 firms. While the bottom 30 firms had an
initial size of approximately 70 MSEK in 2008 and around 60 MSEK in 2009, the top 30 firms
had an average initial size of approximately 40 MSEK. In 2012 the bottom 30 firms had almost
the exact same average size as they did in 2008, while the top 30 firms grew from 37 MSEK in

81
2008 to 62 MSEK in 2012. The same pattern can be noted when comparing the number of
employees between the two groups and across the years. The bottom 30 firms had fewer
employees on average in 2009 compared to 2008, but in 2012 the number of employees was
close to the average number they had in 2008. The top 30 firms did slightly increase their
average number of employees between 2008 and 2009, and in 2012 had some 9.5 more
employees compared to 2008.
These differences are also visible in Table 31, where the absolute number for the different
growth measures and different time periods are presented. The sum of new employees is rather
big when comparing the two groups. For the first time period, the bottom 30 firms employed
some 31 people while the top 30 firms almost employed 250. The second time period reveals
that the bottom 30 firms did better and employed approximately 100 people, while the top 30
firms employed more than twice that number. Testing the significance of these differences in
absolute numbers can give room for another interpretation of the relationship between
Innovation and firm growth, as discussed in Section 3.5.3, Measuring growth. The Mann-
Whitney U Test was used as the variables containing the absolute growth neither passed the
Kolmogorov-Smirnov test nor the Shapiro-Wilks test for normality. The shapes of the different
distributions and the group statistics for the test are detailed in Section 6.4.3 of the appendix,
Research Question 2. Table 15 contains the test statistics for the Mann-Whitney U Test. From
the table it is evident that the differences between the two groups are significant for the first
time period, on both turnover and the number of employees, but not for the second time period.
Table 15: Mann-Whitney Test for Innovation and absolute firm growth
Abs GT8-12 Abs GT9-12 Abs GE8-12 Abs GE9-12
Mann-Whitney U
147.0 279.0 205.5 262.0
Z -3.211 -1.080 -2.428 -1.393 Asymp. Sig. (2-tailed)
.001 .280 .015 .164
4.4.2. Characteristics of innovative and established SMEs (RQ2:2)
The second research question aims at finding the differences between highly innovative and
established SMEs vis-à-vis less innovative firms regarding the factors associated with
resources, market, and organization.

82
The differences and results from the T-Test are detailed in Appendix 6.4.4, Group statistics and
results from T-test: High vs. Low Innovation. First, by looking at the group statistics it is evident
that the differences between the two groups are big on several of the factors. Regarding
resources there are no significant differences between the two groups, and both have the
profitability needed to finance future growth. Related to this is the focus on securing a positive
cash flow. There were no significant differences between the groups, and the high values
indicate that both groups find this equally important. At a lower score, but still equal, is the
perception of being cost-aware. The only two significant differences found were that the most
innovative firms 1) more frequently used other means of financing (e.g. suppliers and
customers), and 2) believed to a greater extent that external actors are more willing to supply
resources if necessary.
Regarding the market factors, all differences were significant and the highly innovative firm
has higher values compared to the group with fewer innovative firms. Aside from being better
and faster in developing new solutions and bringing them to market, the highly innovative firms
also believed to a greater extent that the market is ready for new solutions. Furthermore, they
also believed that there are opportunities to create niches. Finally, they were more active and
put more effort into sales activities.
Only two factors show a significant difference between the two groups regarding the
organizational factors. The more innovative firms put more emphasis on making processes,
routines and structures more efficient and flexible (p<0.1). The less innovative firms reported
that they have more flexible processes, routines and structures vis-à-vis the more innovative
firms. However, this difference is small and not significant. The final significant difference is
concerns how the firms follow up on goals and plans. Both groups reported that they have
distinctive goals, but that they do not use them extensively. However, the most innovative firms
are slightly better at following up on the goals and plans.
4.5. Role of growth ambitions (RQ3) From the third research question - “What is the role of growth ambitions in established SMEs
and the relation to realized firm growth?” - two detailed research questions were formulated.
4.5.1. High levels of growth ambitions and firm growth (RQ3:1)
The aim of this detailed research question was to investigate if established SMEs with high
growth ambitions achieve more growth. Earlier studies have found that growth ambitions are
stable over time, and thus can be regarded as a good predictor for firm growth (see Section

83
2.1.4, High-growth firms). However, there is also ambiguity about the relationship between
growth ambitions and realized firm growth. While some (Baum, Locke, & Smith, 2001; Shane,
Locke, & Collins, 2003; Delmar & Wiklund, 2008) argue that the relationship between growth
ambitions and firm growth is direct, others have found that this is not always the case (St-Jean,
Julien, & Audet, 2008). To investigate the relationship between growth ambitions and firm
growth in established SMEs, the sample was divided using the factor scores on Growth
Ambitions as detailed in Section 3.5.9, Computing high Growth Ambitions and high Innovation.
Table 35 in the appendix shows the two groups and descriptive statistics. From this table it is
evident that no clear and distinctive differences between the two groups can be easily identified.
Regarding Growth Ambitions and firm growth, the two groups show similar values on firm
growth using turnover. For GT8-12 and GT9-12 there is only a two percent difference in favor
of the more ambitious firms. Looking at firm growth as measured by relative growth using the
number of employees, the differences are more significant and reversed, i.e. the less ambitious
firms have grown more. The firms with the lowest values on Growth Ambitions have managed
to grow almost 66% (SD=81.72%) on average with regards to the number of employees
between 2008 and 2012. This is almost an additional 26% compared to the firms with the
highest values on Growth Ambitions on average. Looking at the time period 2009-2012, the
firms with the lowest values on Growth Ambitions showed growth of more than 48%
(SD=49.41%), which is almost 15% more than the firms with the highest Growth Ambitions.
To conclude, if these differences are a result of chance or if the differences are significant, Table
16 and Table 17 show the group statistics and the result of the T-Test, respectively.
Table 16: Group statistics for T-Test between bottom and top on Growth Ambitions and LOG firm growth
N Mean SD
LogGT8-12 Bottom 30 Growth Ambitions 28 2.02 0.24 Top 30 Growth Ambitions 24 2.01 0.27
LogGT9-12 Bottom 30 Growth Ambitions 29 1.98 0.23 Top 30 Growth Ambitions 24 1.98 0.27
LogGE8-12 Bottom 30 Growth Ambitions 27 1.91 0.32 Top 30 Growth Ambitions 25 1.74 0.37
LogGE9-12 Bottom 30 Growth Ambitions 29 1.82 0.29 Top 30 Growth Ambitions 24 1.77 0.24
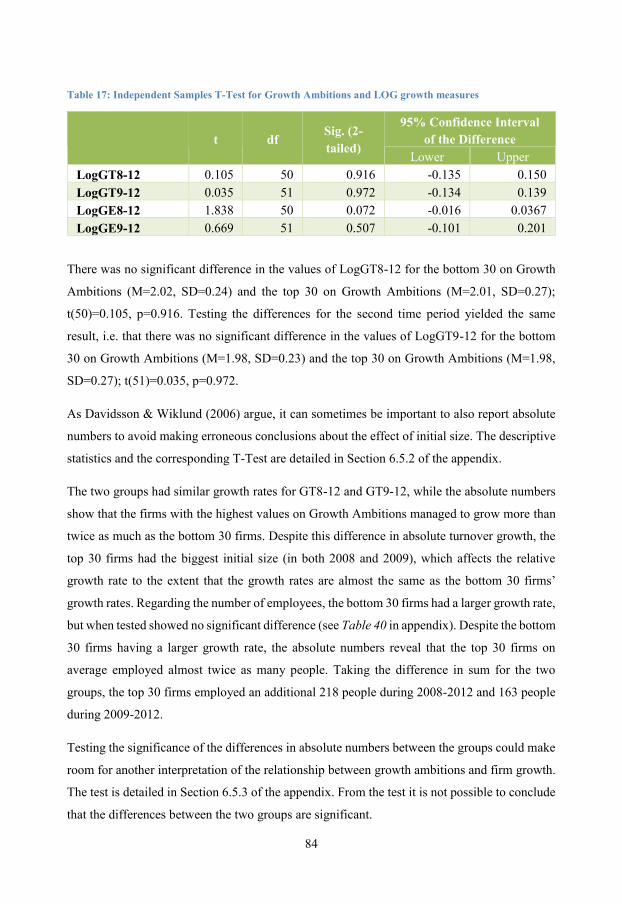
84
Table 17: Independent Samples T-Test for Growth Ambitions and LOG growth measures
t df
Sig. (2-tailed)
95% Confidence Interval of the Difference
Lower Upper LogGT8-12 0.105 50 0.916 -0.135 0.150 LogGT9-12 0.035 51 0.972 -0.134 0.139 LogGE8-12 1.838 50 0.072 -0.016 0.0367 LogGE9-12 0.669 51 0.507 -0.101 0.201
There was no significant difference in the values of LogGT8-12 for the bottom 30 on Growth
Ambitions (M=2.02, SD=0.24) and the top 30 on Growth Ambitions (M=2.01, SD=0.27);
t(50)=0.105, p=0.916. Testing the differences for the second time period yielded the same
result, i.e. that there was no significant difference in the values of LogGT9-12 for the bottom
30 on Growth Ambitions (M=1.98, SD=0.23) and the top 30 on Growth Ambitions (M=1.98,
SD=0.27); t(51)=0.035, p=0.972.
As Davidsson & Wiklund (2006) argue, it can sometimes be important to also report absolute
numbers to avoid making erroneous conclusions about the effect of initial size. The descriptive
statistics and the corresponding T-Test are detailed in Section 6.5.2 of the appendix.
The two groups had similar growth rates for GT8-12 and GT9-12, while the absolute numbers
show that the firms with the highest values on Growth Ambitions managed to grow more than
twice as much as the bottom 30 firms. Despite this difference in absolute turnover growth, the
top 30 firms had the biggest initial size (in both 2008 and 2009), which affects the relative
growth rate to the extent that the growth rates are almost the same as the bottom 30 firms’
growth rates. Regarding the number of employees, the bottom 30 firms had a larger growth rate,
but when tested showed no significant difference (see Table 40 in appendix). Despite the bottom
30 firms having a larger growth rate, the absolute numbers reveal that the top 30 firms on
average employed almost twice as many people. Taking the difference in sum for the two
groups, the top 30 firms employed an additional 218 people during 2008-2012 and 163 people
during 2009-2012.
Testing the significance of the differences in absolute numbers between the groups could make
room for another interpretation of the relationship between growth ambitions and firm growth.
The test is detailed in Section 6.5.3 of the appendix. From the test it is not possible to conclude
that the differences between the two groups are significant.

85
4.5.2. Characteristics of ambitious firms (RQ3:2)
To investigate the characteristics of firms with high growth ambitions, differences between
highly ambitious firms and less ambitious firms were tested. The descriptive statistics and the
results from the T-Test are detailed in Section 6.5.4 of the appendix, Group statistics and results
from T-test: High vs. Low Growth Ambitions. Overall, the differences between the groups were
not large and only a few differences were significant. Furthermore, neither the differences in
market factors nor the differences associated with resources were significant. These results
contradict the findings that ambitious firms to a greater extent utilize a wider range of financing
resources (Gundry & Welsch, 2001). All factors but one associated with organizational
processes, structures and routines were significant at the 0.05 level. For all these significant
factors the firms with the highest growth ambitions reported higher scores. This means that
firms with high growth ambitions perceive themselves to, vis-à-vis firms with lower growth
ambitions, to have more flexible and efficient processes, routines and structures; to use
distinctive goals to a higher extent, and to be better at doing follow-ups on them. Finally, they
also put more emphasis on the need to decentralize decisions. As mentioned in the detailed
research question (RQ3:1) above, the growth rates were almost similar between the groups for
turnover, number of employees and over both time periods. While the firms with the highest
growth ambitions had higher turnover and more employees in 2008 and 2009, the differences
persisted over time as the growth rates are similar. Consequently, the more ambitious firms had
more turnover and more employees in 2012. However, these differences were not statistically
significant.

86
5. Concluding discussion
The purpose of this thesis is to investigate the characteristics of high-growth established SMEs
with special focus on the entrepreneur’s growth ambitions and the role of innovation activities
for firm growth. Understanding and explaining the workings behind high growth in established
SMEs is no easy task, but all new knowledge and information added is valuable. If correctly
used by owners and managers of firms, as well as by policy makers, it can have a positive effect
on the individual firm as well as on the prosperity of nations. This of course implies that the
performance and possible growth of a firm is something that can be affected by actions taken
inside the firm by employees, or outside the firm by policy makers. As discussed in Section
2.1.2, Firm growth and chance, it seems as if Gibrat’s Law is broadly valid for the big
population of firms, with the exception of smaller and younger firms. On the positive side,
Gibrat’s Law tries to explain the relationship between firm growth and size, which if it holds
true, would be important for policy makers, for example, when they are to decide where efforts
would yield, at least statistically, the best result. The negative side of Gibrat’s Law is that it is
a simplification of something complex. The firm as an entity is complex and its performance,
as shown above, is affected by a great many factors which are not always easily interpreted.
Associated with Gibrat’s Law are also the implications of how different growth measures affect
the outcome. Relative growth measures run the risk of favoring the firms with a smaller initial
size (Davidsson & Wiklund, 2006). This can be an explanation as to why small and young firms
are put forward as an exception to the rule. Age and size will logically be associated, and
therefore it is more likely to find smaller firms among those that are young.
As the author of this thesis rejects Gibrat’s Law on the basis that firm growth is a process that
does not only include randomness but also conscious decisions, there are a lot of potential
factors that could have an impact on firm growth, as suggested by researchers. Several of these
have been discussed above. Two factors were more thoroughly investigated in this thesis,
namely innovation and growth ambitions. These two factors have been associated with firm
growth and the relationship between each of them and firm growth has been investigated, as
highlighted in the tentative model for firm growth in Section 2.4, Toward a tentative model for
firm growth. Additionally, the factors highlighted in Section 2.1.6, Factors associated with firm

87
growth, have been explored and their relationship with growth ambitions and innovation has
been investigated.
5.1. Differences between gazelles and the average established SME (RQ1) The first research question focuses on the differences between gazelles and average established
SMEs regarding innovation, growth ambition, resources, market, and organizational factors.
Therefore, the sample was divided as to distinguish the gazelles from the average established
SME. The relationships between firm growth and the constructs, Innovation and Growth
Ambitions, were investigated separately in RQ2 and RQ3. To find additional characteristics of
gazelles, the individual items building up each construct as well as the factors identified in
Section 2.1.6, Factors associated with firm growth, were investigated separately to answer
RQ1. The analyses showed that there were significant differences between the two groups
regarding several of the factors, but primarily factors associated with market and innovation.
5.1.1. Intentions and opportunities do not explain differences in growth rates
The individual items used to create the measure Growth Ambitions did not yield any significant
differences between gazelles and the average growing SMEs. These findings are interesting
when studied in the context of established SMEs. While there was a significant difference
between the two groups regarding their average age, the firms in both groups have been
operational for one or two decades. The absence of a difference in the owners’ and managers’
ambitions regarding the future can most likely be explained by the fact that the owners and
managers have had time to find common ground during these years. Both groups strongly
emphasized that they wished for their firms to grow, and that they thought it was possible.
Consequently, no evidence points to the fact that the difference in growth between the gazelles
and the average firms is attributed to the gazelles having plenty of growth opportunities, while
the average firms believed themselves to have few growth opportunities. Furthermore, as both
groups had similar ambitions for the future, a long-term commitment and willingness to reinvest
profits in the firm, nothing suggests that the difference in growth rates can be explained by the
high-growth firms having TMT’s with higher levels of growth ambitions.
If owners and managers in both groups: 1) wish for their firm to grow, and 2) believe it to be
possible to grow their firm and that they have the opportunities to do so, and 3) have managerial
teams with the same intentions and ambitions for the future, neither lack of growth nor high
growth can be explained by the managers’ perception of their firm’s possibility to grow. Rather,
it suggests that the combination of intentions to grow the firm and perception of behavioral

88
control in the context of established SMEs is in itself ill-suited to explain the difference in
growth rates. This finding contradicts previous findings by e.g. Hermans et al. (2012).
Noteworthy is the lack of a difference in the question regarding the extent the entrepreneurs
wish to make the firm grow, and to what extent he/she thinks it is possible. This question
encompasses both the intentions to grow the firm and the perception of behavioral control,
which is theorized to account for much of the variance in actual firm growth (see Section 2.2.3,
Innovation and growth). If this were true for the established SME, there would have been a
significant difference between the gazelles and the average firms. This non-difference further
suggests that it is problematic to use the Theory of Planned Behavior to understand and explain
firm growth in established SMEs. However, as discussed in Section 2.2.5, Growth ambitions
and SME growth, there is an ambiguity regarding the effect of growth ambition on realized
growth. The effect is likely not direct and possibly moderated or mediated by other factors, as
concluded by Wiklund and Shepherd (2003). This study confirms this conclusion, but in the
context of established SMEs. Furthermore, within the scope of this study was to compare the
high-growth firms with the average firms, rather than with the low-growth firms. It is possible
that growth ambitions are better suited to explain the difference between the two groups of
established SMEs having the highest and the lowest growth rates.
5.1.2. Gazelles are more innovative
The analysis revealed a clear pattern regarding the individual items building the Innovation
construct (see Section 4.4.2, Characteristics of innovative and established SMEs (RQ2:2)).
Gazelles put more emphasis on delivering new solutions to the market prior to their competitors.
They also believe to have a better understanding of their customers’ demands and problems.
The gazelles perceived themselves to a greater extent to know what customer demands are not
yet fulfilled. Linked to this is their heightened perception that the customers are also willing to
accept new offerings. One possibility is that the gazelles are more likely to act on markets that
are not conservative, and where it is less of a struggle to introduce new ideas and concepts.
Another, perhaps more likely explanation is that the high-growth firms value their customers’
input, and are thus more keen to engage in a dialog and listen to their demands. By doing so,
they can develop more innovative and suitable offerings. The gazelles were perceived to a
higher degree to be trendsetters, as there was support for the gazelles being ahead of their
competitors when they had radically new solutions ready to introduce on the market. However,
no findings here suggest that gazelles had an advantage in new and better technology that they
could leverage as a means to grow faster than the average firms. Taking all this together, it

89
shows that part of the gazelles’ growth can be explained by the gazelles having identified
unfilled demands, managing to craft a suitable offering, and successfully delivering this to the
market.
5.1.3. The role of resources, market, and organizational structures and routines for
firm growth
Interestingly, there was no difference in the perception regarding the dynamics in the markets
between gazelles and average firms; both of them viewed the market as filled with growth
potential and opportunities. The two groups also believed it to be possible to identify and create
niches that would be both profitable and growing. This suggests that entrepreneurs are present
in both groups, which is a prerequisite for firm growth (Shane & Venkataraman, 2000; Stam et
al., 2012). It is therefore unlikely that the difference in growth rates is attributed to a difference
in market opportunities. This further emphasizes the fact that growth is a process in which
owners, managers, and employees make conscious decisions which determine the outcome of
the firm. Generally, the gazelles reported a modest score regarding the use of goals and plans.
They did not have distinctive and outspoken short-term goals that were known throughout the
firms. Consequently, they did not put much emphasis on following up on the goals. The average
firms, however, put more emphasis on setting goals and performing follow-ups, but the
difference in the latter was not significant when tested. The average firms were initially (in
2008 and 2009) bigger and reported having processes, routines and structures that provided
good governance, and were more flexible. It is possible that the bigger firms have thus had more
resources (such as time and money) to incorporate goal-setting and follow-ups into the firms’
processes, i.e. making the use of goals more formal. As none of the organizational factors
showed a significant difference in favor of gazelles, there is nothing to support the findings of
e.g. Gundry and Welsch (2001) that gazelle-like growth in established SMEs would be a result
of more structured organizations with a more disciplined management.
Overall, there was no significant difference between the two groups regarding the questions
associated with resources. Failing to distinguish a difference could for some factors partly be
explained by the equivalence in sizes (in 2012). The gazelles were smaller in 2008 and 2009,
and over the years they grew faster than the average firm, becoming equivalents in terms of size
in 2012. Consequently, the analyses revealed no difference between the groups regarding size
in 2012 (turnover or number of employees). Of the factors associated with cash flow the firms
in both groups reported that their profits are enough to finance future growth, and that they put
effort into securing a positive cash flow. Both these factors are associated with securing

90
operating cash flow through e.g. trade credits (see Section 2.1.6.1, Resources). The two factors
are both highly relevant and can be linked to survivability. Failure to have a positive cash flow
can lead to insecurity, growth volatility, or bankruptcy (Storey & Greene, 2010). The absence
of a clear difference between average firms and gazelles could be attributed to the selection bias
mentioned in Section 3.7, Reliability and validity of the study, namely that the included firms
were skewed towards already prosperous and growing firms. Another explanation could also
be that both the gazelles and the average firms included here have some 15-20 years of
experience, and that they know how important cash flow is and are making this a priority. From
this comparison it is not possible to argue that gazelles put more emphasis on cash flow than
firms with an average growth rate. It is interesting and important to highlight the non-difference
regarding profits. Since the firms in both groups were of equal size in 2012 and operated in
various markets, there is no evidence that suggests that the gazelles are more likely to be in
more profitable niches. Furthermore, and overall, it is not possible to link unrealized growth
among the average firms, despite them having equal opportunities, due to a lack of resources
e.g. originating from low profitability due to market constraints.
5.2. The role of innovation in established SMEs (RQ2) The second research question focused on the role of innovation in established SMEs and its
relation to realized firm growth. While some researchers have found a connection between firm
growth and innovation (se e.g. Freel 2000, North and Smallbone 2000, Littunen and Tohmo
2003), others could not find a general relationship (Hoffman et al., 1998; Coad & Rao, 2008).
The road from innovation to realized firm growth is tricky and difficult but still: innovation is
at the top when it comes to strategies for firm growth (Coad & Rao, 2008). To expand the
knowledge of innovation in established SMEs and to better understand the relationship with
firm growth, characteristics of innovative firms were analyzed and compared to characteristics
of less innovative firms. Finally, the relationship between innovation and firm growth was
analyzed.
As there is no generally agreed upon method to measure innovation in SMEs (Kline &
Rosenberg, 1986; Storey & Greene, 2010), a construct was created and tested (see Section 4.2,
Principal component factor analysis) to measure the level of innovation in established SMEs
and to facilitate the analyses. The analysis of the Innovation construct concluded that there is
evidence of internal consistency among the included variables, as well as construct validity and
discriminant validity. Taken together, there is strong evidence to conclude that the created
measure is robust, has high reliability and validity, and indeed measures innovation.
91
5.2.1. More gazelles among the most innovative firms
The analysis showed that there were big differences in growth rates between the most
innovative established SMEs and the least innovative established SMEs. The most innovative
firms had between two and three times higher growth rates (some 60-110%), regardless of
growth measure and time period. While there were big differences in absolute growth numbers,
only the difference during the first time period was significant. Taken together, there is strong
evidence to suggest that more innovative established SMEs are more likely to be high-growth
firms.
The most innovative firms share many characteristics with gazelles. The analysis revealed that
several of the characteristics that separate the gazelles from the average firms also separate the
most innovative firms from the least innovative firms. Most notably are the factors associated
with knowledge regarding customer needs and being able to quickly introduce, sometimes
radical, new solutions. However, the most innovative firms, as well as the gazelles, believed
that they put effort on sales activities on a par with their competitors. Interestingly, while the
most innovative firms and the gazelles believed they put similar effort into sales as did their
competitors, the least innovative firms and the average firms believed themselves to put less
effort into sales activities than their competitors. Taken together, these findings indicate that
both innovative firms and gazelles have more of an external focus, i.e. have better knowledge
about their customers’ needs. Nothing suggests that it is necessary for firms to put more effort
into sales activities than their competitors to be able to achieve gazelle-like growth. Instead, the
analysis showed that a combination of sales activities on par with competitors’ effort and being
innovative can result in gazelle-like growth rates.
5.2.2. Strong focus on securing a positive cash flow
From the analyses it is not possible to conclude that the most innovative firms act differently
compared to the least innovative firms regarding resources. The only difference between the
two groups is that the most innovative firms, to a greater extent, use other means of securing
financial resources, e.g. sharing costs of development with customers. This finding is not
surprising, as the most innovative firms have more of an external focus and are more willing to
try to fulfill unmet customer needs and therefore seek other sources of financing. Regarding
resources, while the two groups had very different growth rates, nothing suggests that the least
innovative firms are cash-starved and consequently have not been able to grow as a result of
scarce resources (Beck & Demirguc-Kunt, 2006). Likewise, nothing suggests that the most
innovative firms, of which many are growing very fast, believe themselves to lack resources as

92
a result of having extraordinary resource needs due to expansion, as suggested by Hambrick &
Crozier (1985). Instead the most innovative firms, as well as the least innovative firms, believe
that their profits are just enough to finance future growth, and that it is crucial to secure a
positive cash flow. It is possible that the non-differences between the two groups are a result of
accumulated experience the owners and managers of the firms have gathered over more than a
decade. Consequently, the established SMEs, innovative or not, understand the necessity of
resources, and that resources alone are not enough to explain the difference in growth rates.
5.2.3. Small organizational differences
While the least innovative firms remained the same size from 2008-2012, and the most
innovative firms almost doubled their sizes, very small differences regarding organizational
factors could be found. Covin and Slevin (1997) suggest that with firm growth comes increased
organizational complexity and increased managerial complexity (see Section 2.1.5, Growth
antecedents, determinants, and firm characteristics). The analyses showed that there was no
difference in the level of efficiency and flexibility regarding the groups’ processes, routines and
structures. This indicates that if the level of expansion the most innovative firms achieved
brought with it increased complexity, the owners and managers managed to handle it. The
difference between the groups regarding the level of effort put into developing more efficient
and flexible processes, routines and structures provides further evidence to the fact that the most
innovative firms successfully managed to adapt to accommodate the growth (Gilbert,
McDougall, & Audretsch, 2006). It is likely that there is a connection between the level of
innovativeness in a firm and how willing the firm is to transform and change internally. Firms
that have better knowledge about unmet needs should also be more likely to see benefits to
internal changes as a means to deliver solutions that the customers want.
5.3. Characteristics of established SMEs with high growth ambitions (RQ3) The third research question focused on the role of growth ambitions in established SMEs and
their relation to realized firm growth. There are previous findings that suggest that intentions to
grow the firm play an important role, and that higher growth ambitions are an antecedent of
firm growth (Hermans et al., 2012). While much of the literature on ambitious entrepreneurs
targets small firms, less is known about the impact of growth ambitions on firm growth in
established SMEs. To expand the knowledge in this area, the focus here is to investigate the
impact of growth ambitions on firm growth by studying the relationship between ambitions and
realized firm growth, and by studying a range of factors of the ambitious firms - as suggested
by Storey and Greene (2010).

93
5.3.1. No direct link between growth ambitions and firm growth
Overall, this study could not find evidence of a direct relationship between growth ambitions
and firm growth. Formulated in a different way: there is no evidence suggesting that having
higher growth ambitions would be a good predictor of firm growth. By testing the relationship
between growth ambitions and firm growth, using both relative and absolute growth during two
time periods and both turnover and the number of employees showed any significant
differences. The firms with the highest growth ambitions did not show significantly higher
growth. This finding is in line with previous research done by e.g. St-Jean et al. (2008), but
contradicts other findings (Shane, Locke, & Collins, 2003; Baum & Locke, 2004; Delmar &
Wiklund, 2008). It is difficult to explain this ambiguity, but one explanation can reside with the
measurement of growth ambitions. In this research, a combination of three different items was
used to distill the essence of growth ambitions into one single measurement. While e.g. Wiklund
& Shepherd (2003) among others measure growth ambitions by querying managers about
desirable future sizes of the firm, this research focuses more on the managers’ perceived growth
ambitions (i.e. desire to grow), and his/her actions to fulfill these growth ambitions.
Furthermore, while previous research primarily targets the managers of firms, the method used
here includes managers, the CEO, and employees in the firm which, taken together, can affect
the interpretation of the firms’ growth ambitions. Having included employees and asked their
opinion will reduce the risk of having managers and the CEO give too little of a positive picture.
Comparing the abovementioned results with the results from the analyses associated with RQ1
show a unified picture, namely that it is not possible to directly link growth ambitions and firm
growth, neither when using a construct as in RQ3, nor when each item used to create the Growth
Ambitions construct as analyzed and interpreted in RQ1. Taken together, these results indicate
that growth ambitions, as measured here, is not a good predictor of firm growth.
One explanation why firms with the higher Growth Ambitions do not have significantly higher
growth rates could be related to market dynamics. The size of the market niche will be a
theoretical upper limit to the turnover volume but the actual turnover is constrained by factors
like the amount of external focus (as concluded in RQ1 and RQ2), as well as by the rate of
turnover in the niche. If the niche is new and the product’s position is early in the product life
cycle, the turnover is usually lower and therefore acts as a constraint (Covin & Slevin, 1997).
Sexton and Bowman-Upton (1991) argue that if the desired growth level is below the upper
limit of the niche, realized growth levels will be a function of the owners’ and managers’ ability
to manage growth. Consequently, the non-difference in growth rates between the groups

94
investigated here could be a result of firms operating under various constraints, which could in
turn have affected their growth rates.
5.3.2. Ambitious established SMEs are not younger and smaller
When studying firm size it is evident that the firms with the highest growth ambitions are bigger,
both when measured by turnover and the number of employees. Previous research has
concluded that, generally, smaller and younger firms grow faster (see Section 2.1.5, Growth
antecedents, determinants, and firm characteristics and Section 2.1.6.2, Market factors). If
growth ambitions were to be a good identifier of high growth then the firms in the group
containing the most ambitious firms would be smaller and grow more. Instead, the results here
indicate that the growth rate between the two is are similar while, contradictory to the expected
results, the most ambitious firms are bigger than the least ambitious firms. The situation is
similar when comparing firm age. There is only a small difference in the number of years
between the two groups. These findings suggest that previous findings regarding age, size and
growth ambitions are not valid for established SMEs.
5.3.3. Increased focus on internal processes
To further extract characteristics of ambitious firms, factors associated with resources, markets,
and organizational structures were investigated. No factors associated with resources or market
showed a significant difference. According to Gundry and Welsch (2001), ambitious
entrepreneurs use a wider range of financing sources. The findings here do not support this
conclusion. However, Gundry and Welsch (2001) focused on smaller firms while this study
targeted established SMEs. Both the most ambitious firms and the least ambitious firms in this
study had high scores regarding if their profits are enough to finance future growth. It is possible
that the non-difference in the use of other means of financing is partially explained by the
adequate profitability.
The only things discriminating the most ambitious firms were factors associated with
organizational processes, routines and structures. They believed themselves to have more
flexible and efficient organization and they put emphasis on making the processes, routines and
structures more flexible and efficient. At the same time, the most ambitious firms thought it
was more important to use distinctive goals and perform follow-ups. Finally, the managers
favored a decentralized decision-making structure to ensure the organization remains flexible
(Gilbert, McDougall, & Audretsch, 2006). The lack of differences regarding resources and
market, combined with the abovementioned organizational characteristics, suggest that as the

95
level of growth ambitions increases so does the perceived necessity to focus on organizational
development. The findings from RQ1 and RQ2 suggest that high growth is accompanied by an
external focus rather than high growth ambitions. Overall, the findings here could not support
the assumption that there is a positive relationship between growth ambitions and firm growth.
Instead, the analyses showed that the most ambitious firms had growth rates similar to those of
the least ambitious firms. While the most ambitious firms are on average bigger, the difference
in not significant. Still, it is possible, as suggested by Covin & Slevin (1997), that these firms
have reached such a level of organizational and managerial complexity that the managers feel
that they need to put more emphasis on internal processes to be able to facilitate future growth.
5.4. Concluding remarks and implications of this study Studying established SMEs and the gazelles in comparison to the average firms is not very
common. This research shows that there are some noteworthy differences between the high-
growth firms and the average firms regarding resources, internal factors and external factors.
The established SMEs studied here have been operational for more than a decade and this has
given the owners and managers a lot of experience, which could explain some of the similarities
found when different groups were compared. Overall, the most significant differences between
gazelles and average firms are concentrated around innovation and market factors, rather than
differences associated with growth ambitions, resources, and organizational factors.
Finding a balance between the internal and the external focus is an important task for the
managers who wished to see their firm grow. The evidence here suggests that the level of
external focus, the amount of time the firms are devoting to getting to know their customers
and the amount of time they put into serving their niche are what have the most effect on firm
growth. Reconfiguring the organization and making processes, structures and routines flexible
and efficient is important, but managers need to remember that this is not what primarily drives
growth, yet sometimes is an important step to facilitate future growth. Therefore, it is important
that managers be aware of the needed transitions and ensure that they are undertaken as quickly
as possible so the firm do not get stuck. It is necessary to deal with new problems or increased
complexity, but it is likely that growth will decline if the focus shifts too much towards internal
issues for a prolonged period of time. Finding the balance between the internal and external
focus is no easy task. Managers need to remember that no growth can be achieved, regardless
of a well-structured, flexible and efficient organization, if the market is not aware of, or has no
need for, the firms’ offerings. It is therefore surprising that the most ambitious firms did not put

96
more focus on selling activities, have better knowledge of unmet demands and try to find new
ways to fulfill them vis-à-vis the least ambitious firms.
While it might be important to devote more time and resources to organizational development
as the firm grows and the complexity increases, it is not likely that these changes will be
antecedents of future firm growth. Instead, the evidence here suggests that it is an external focus
and a higher knowledge of customer needs that enables firm growth. To make the organization
flexible and efficient might be a necessary step to deal with increased complexity and new
problems, but it is important that managers of the established SME are able to remain
knowledgeable about customer needs.
On the basis of the conclusions reached in this research, policy makers and others who are
creating support systems around established SMEs should seek to support innovative behaviour
and actions that put firms closer to their customers.
5.5. Suggestions for further research On the basis of the findings in this research a number of research areas have been identified. If
these are investigated further, we would better understand growth in the established SME, or
more specifically
Find and analyse common transitions or reconfigurations growing established SMEs have to
overcome.
The data presented in this research shows that very few established SMEs manage to grow
beyond 49 employees. While more than 3% of all firms have 10-49 employees, about 0.3%
have 50-99 and less than 0.3% have 100+ employees (see Figure 23). This would suggest that
there is increased complexity or new problems associated with firm growth that very few SMEs
successfully overcome. These aspects of growth in established SMEs need to be further
investigated, namely
Under what conditions do high growth ambitions lead to high growth, i.e. what are the steps
from growth ambitions to firm growth?
Having high growth ambitions does not necessarily mean that firm growth is guaranteed. Others
have pointed out that managers need to have the ability to manage a growing organization, spot
new opportunities and secure the necessary resources to capitalize on the opportunities
(Wiklund & Shepherd, 2003). It was not possible to link growth ambitions with firm growth in

97
this research, and it is therefore important to also focus on actions originating from having high
growth ambitions to better understand how growth ambitions can translate into firm growth.

98
Works Cited
Ahmad, N. (2006). A Proposed Framework for Business Demographic Statistics. Organisation
for Economic Co-operation and Development.
Ahrens Rapid Growth. (2015, 01 10). Retrieved from http://ahrens.se/
Ajzen, I. (1991). The Theory of Planned Behavior. Organizational Behavior and Human
Decision Process, 179-211.
Almus, M. (2002). What characterizes a fast-growing firm? Applied Economics, 34(12), 1497-
1508.
Amit, R., Glosten, L., & Muller, E. (1993). Challenges to Theory Development in
Entrepreneurship Research. Journal of Management Studies, 30(5), 815-834.
Aoki, M. (1990). Toward and Economic Model of the Japanese Firm. Journal of Economic
Literature, 1-27.
Arundel, A., & Kabla, I. (1998). What percentage of innovations are patented? empirical
estimates for European firms. Research Policy, 27(2), 127-141.
Audretsch, D. B. (2002). Entrepreneurship: A Survey of the Literature. Brussels: Enterprise
Directorate-General European Commission.
Audretsch, D. B., Coad, A., & Segarra, A. (2014). Firm growth and innovation. Small Business
Economics, 743–749.
Audretsch, D., Klomp, L., & Santarelli, E. (2004). Gibrat's Law: Are the Services Different?
Review of Industrial Organization, 24(3), 301-324.
Barney, J. (1991). Firm resources and sustained competitive advantage. Journal of
Management, 17(1), 99-120.
Barringer, B. R., Jones, F. F., & Neubaum, D. O. (2005). A quantitative content analysis of the
characteristics of rapid-growth firms and their founders. Journal of Business Venturing,
20, 663-687.

99
Baum, J. R., Locke, E. A., & Smith, K. G. (2001). A Multidimensional Model of Venture
Growth. The Academy of Management Journal, 44(2), 292-303.
Baum, R. J., & Locke, E. A. (2004). The relationship of entrepreneurial traits, skill, and
motivation to subsequent venture growth. Journal of Applied Psychology, 89(4), 587-
598.
Beck, T., & Demirguc-Kunt, A. (2006). Small and medium-size enterprises: Access to finance
as a growth constraint. Journal of Banking & Finance, 30(11), 2931-2943.
Berger, A. N., & Udell, G. F. (1998). The economics of small business Finance: The roles of
private equity and debt markets in the financial growth cycle. Journal of Banking &
Finance, 22(6), 613-673.
Birch, D. (1987). Job Creation in America: How Our Smallest Companies Put the Most People
to Work. New York: Free Press.
Birch, D. L. (1981). Who creates jobs? The Public Interest 65, 65, 3-14.
Birch, D. L., Haggerty, A., & Parsons, W. (1995). Who's creating jobs? Boston: Cognetics Inc.
Bottazzi, G., Dosi, G., Lippi, M., Pammolli, F., & Riccaboni, M. (2001). Innovation and
corporate growth in the evolution of the drug industry. International Journal of
Industrial Organization, 19(7), 1161-1187.
Bronars, S. G., & Deere, D. R. (1993). Union Organizing Activity, Firm Growth, and the
Business Cycle. The American Economic Review, 203-220.
Bryman, A., & Bell, E. (2003). Business research methods. Oxford University Press.
Cassar, G. (2007). Money, money, money? A longitudinal investigation of entrepreneur career
reasons, growth preferences and achieved growth. Entrepreneurship and Regional
Development, 19(1), 89-107.
Chandler, G. N., & Baucus, D. A. (1996). Gauging performance in emerging businesses:
Longitudinal evidence and growth pattern analysis. Frontiers of Entrepreneurship
Research, 491-504.
Churchill, N. C., & Lewis, V. L. (1983). The five stages of small business growth. Harvard
Business Review, 61(3), 30-50.

100
Coad, A. (2007). Firm Growth: A Survey. CES Working Paper 24.
Coad, A. (2009). The Growth of Firms - A Survey of Theories and Empirical Evidence.
Coad, A., & Hölzl, W. (2010, Feb). Firm growth: empirical analysis. Papers on economics and
evolution, 2010-02.
Coad, A., & Rao, R. (2008). Innovation and firm growth in high-tech sectors: A quantile
regression approach. Research Policy, 37(4), 633-648.
Cole, A. H. (1968). Meso-Economics: A contribution from Entrepreneurial History.
Explorations in Entrepneurial History, 6(1), 30-33.
Covin, J. G., & Slevin, D. P. (1997). High Growth Transitions: Theoretical Perspectives and
Suggested Directions. In D. L. Sexton, & R. W. Smilor, Entrepreneurship 2000 (pp. 99-
126). Chicago, Illinois: Upstart Publishing Company.
Creswell, J. W. (2009). Research design: Qualitative, quantitative, and mixed methods
approaches. Sage.
Daunfeldt, S.-O., & Elert, N. (2011). When is Gibrat’s law a law? Small Business Economics,
133-147.
Daunfeldt, S.-O., & Halvarsson, D. (2012). Are high-growth firms one-hit wonders? Evidence
from Sweden. HUI Working Papers 73, p. HUI Working Papers.
Davidsson, P. (1989). Entrepreneurship - and after? A study of growth willingness in small
firms. Journal of Business Venturing, 4(3), 211-226.
Davidsson, P. (1991). Continued Entrepreneurship: Ability, Need, and Opportunity as
Determinants of Small Firm Growth. Journal of Business Venturing, 6(6), 405-429.
Davidsson, P., & Wiklund, J. (2006). Conceptual and empirical challenges in the study of firm
growth. In P. Davidsson, F. Delmar, & J. Wiklund, Entrepreneurship and the Growth
of Firms (pp. 39-61). Edward Elgar Publishing.
Davidsson, P., Achtenhagen, L., & Naldi, L. (2005). Research on Small Firm Growth: A
Review. In Proceedings European Institute of Small Business, 61.
101
Davidsson, P., Achtenhagen, L., & Naldi, L. (2010). Small Firm Growth. Foundations and
Trends in Entrepreneurship, 69-166.
Davis, S. J., Haltiwanger, J., & Schuh, S. (1996). Small business and job creation: dissecting
the myth and reassessing the facts. Small Business Economics, 8(4), 297-315.
Delmar, F. (2006). Measuring growth: methodological conciderations and empirical results. In
P. Davidsson, F. Delmar, & J. Wiklund, Entrepreneurship and the Growth of Firms (pp.
62-84). Edward Elgar Publishing.
Delmar, F., & Wiklund, J. (2008). The Effect of Small Business Managers' Growth Motivation
on Firm Growth: A Longitudinal Study. Entrepreneurship Theory and Practice, 32(3),
437-457.
Demirel, P., & Mazzucato, M. (2012). Innovation and Firm Growth; Is R&D Worth It? Industry
and Innovation, 19(1), 45-62.
DiStefano, C., Zhu, M., & Mîndrilã, D. (2009). Understanding and Using Factor Scores:
Considerations for the Applied Researcher. Practical Assessment, Research &
Evaluation, 14(20).
Dixit, A. (1980). The Role of Investment in Entry-Deterrence. The Economic Journal, 95-106.
Dobbs, M., & Hamilton, R. (2006). Small business growth: recent evidence and new directions.
International Journal of Entrepreneurial Behaviour & Research, 13(5), 296-322.
European Comission. (2014, 12 17). What is an SME? Retrieved from European Comission:
http://ec.europa.eu/enterprise/policies/sme/facts-figures-analysis/sme-definition/
European Commission . (2003). EU recommendation 2003/361. Official Journal of the
European Union.
European Commission. (2014, 12 17). What is an SME? Retrieved from European Comission:
http://ec.europa.eu/enterprise/policies/sme/facts-figures-analysis/sme-definition/
Eurostat. (2014, 12 17). Retrieved from Eurostat: http://ec.europa.eu/eurostat/web/structural-
business-statistics/entrepreneurship/business-demography
Fagerberg, J. (2003). Innovation: A Guide to the Literature. (U. o. Oslo, Ed.) Working Papers
on Innovation Studies 20031012.

102
Flynn, B. B., Sakikibara, S., Schroeder, R. G., Bates, K. A., & Flynn, E. J. (1990). Empirical
Research Methods in Operations Management. Journal of Operations Management,
9(2), 250-284.
Fomburn, C. J., & Wally, S. (1989). Structuring Small Firms for Rapid Growth. Journal of
Business Venturing, 4(2), 107-122.
Frankelius, P. (2009). Questioning two myths in innovation literature. Journal of High
Technology Management Research, 20(1), 40-51.
Freel, M. S. (2000). Do Small Innovating Firms Outperform Non-Innovators? Small Business
Economics, 14(3), 195–210.
Freel, M. S., & Robson, P. J. (2004). Small Firm Innovation, Growth and Performance.
International Small Business Journal, 22(6), 561–575.
Gilbert, B. A., McDougall, P. P., & Audretsch, D. B. (2006). New Venture Growth: A Review
and Extension. Journal of Management, 32(6), 926-950.
Gilmore, T. N., & Kazanjian, R. K. (1989). Clarifying Decision Making in High-Growth
Ventures: The Use of Responsibility Charting. Journal of Business Venturing, 4(1), 69-
83.
Gjerløv-Juel, P., & Guenther, C. (2012). Heroes today - but what about tomorrow? Gazelles
and their long-term performance. Presented at the Annual Meeting of the Academy of
Management. Boston, USA.
Grundström, C., Sjöström, R., Uddenberg, A., & Öhrwall Rönnbäck, A. (2012, June). Fast-
growing SMEs and the role of innovation. International Journal of Innovation
Management, 16(3).
Gundry, L. K., & Welsch, H. P. (2001). The Ambitious Entrepreneur: High Growth Strategies
of Women-Owned Enterprises. Journal of Business Venturing, 16(5), 453-470.
Hambrick, D. C., & Crozier, L. M. (1985). Stumblers and Stars in the Management of Rapid
Growth. Journal of Business Venturing, 1(1), 31-45.
Henrekson, M., & Johansson, D. (2010). Gazelles as job creators: a survey and interpretation
of the evidence. Small Business Econ, 35(2), 227-244.

103
Hermans, J., Vanderstraeten, J., Dejardin, M., Ramdani, D., Stam, E., & van Witteloostuijn, A.
(2012). Ambitious entrepreneurship: Antecedents and consequences.
Hoffman, K., Parejo, M., Bessant, J., & Perren, L. (1998). Small firms, R&D, technology and
innovation in the UK: a literature review. Technovation, 18(1), 39–55.
Hölzl, W. (2009). Is the R&D behaviour of fast-growing SMEs different? Evidence from CIS
III data for 16 countries. Small Business Economics, 33(1), 59-75.
Jae-On, K. (1978). Factor analysis: Statistical methods and practical issues (Vol. 14).
Janssen, F. (2009). The Conceptualisation of Growth: Are Employment and Turnover
Interchangeable Criteria? The Journal of Entrepreneurship, 18(1), 21–45.
Johannessen, J.-A., Olsen, B., & Lumpkin, G. (2001). Innovation as newness: what is new, how
new, and new to whom? European Journal of Innovation Management, 4(1), 20-31.
Kangasharju, A. (2000). Growth of the Smallest: Determinants of Small Firm Growth During
Strong Macroeconomic Fluctuations. International Small Business Journal, 19(1).
Kline, S. J., & Rosenberg, N. (1986). An Overview of Innovation. In R. Landau, & N.
Rosenberg, The Positive Sum Strategy: Harnessing Technology for Economic Growth
(pp. 275-304). Washington D.C.: National Academy Press.
Knight, F. (1921). Risk, Uncertainty and Profit. Boston, MA.
Kreuger, N. F., Reilly, M. D., & Carsrud, A. L. (2000). Competing models of Entrepreneurial
Intentions. Journal of Business Venturing, 15(5), 411-432.
Leibenstein, H. (1968). Entrepreneurship and Development. The American Economic Review,
72-83.
Littunen, H., & Tohmo, T. (2003). The High Growth in New Metal-Based Manufacturing and
Business Service Firms in Finland. Small Business Economics, 21(2), 187–200.
Locke, E. A., & Latham, G. P. (2002). Building a Practically Useful Theory of Goal Setting
and Task Motivation: A 35-Year Odyssey. American Psychologist, 57(9), 705-717.
Locke, E. A., & Latham, G. P. (2006). New Directions in Goal-Setting Theory. Current
Directions in Psychological Science, 15(5), 265-268.
104
Lotti, F., Santarelli, E., & Vivarelli, M. (2003). Does Gibrat’s Law hold among young, small
firms? Journal of Evolutionary Economics, 13(3), 213-235.
Low, M. B., & MacMillan, I. C. (1988). Entrepreneurship: Past research and future challenges.
Journal of Management, 14(2), 139-161.
McPherson, A., & Holt, R. (2007). Knowledge, learning and small firm growth: A systematic
review of the evidence. Research Policy, 36(2), 172-192.
Meyer, S. M., & Collier, D. A. (2001). An empirical test of the causal relationships in the
Baldrige Health Care Pilot Criteria. Journal of Operations Management, 19(4), 403-
425.
North, D., & Smallbone, D. (2000). The Innovativeness and Growth of Rural SMEs During the
1990s. Regional Studies, 34(2), 145-157.
Nunnally, J. (1978). Psychometric Theory. New York: McGraw-Hill.
OECD. (2005). Guidelines for Collecting and Interpreting Innovation Data. Paris: OECD
Publishing.
OECD. (2009). Measuring Entrepreneurship A Collection of Indicators. Paris: OECD Statistics
Directorate.
OECD. (2013). Gazelle rate. In OECD, Entrepreneurship at a Glance 2013. OECD Publishing.
doi:http://dx.doi.org/10.1787/entrepreneur_aag-2013-19-en
O'Gorman, C. (2001). The sustainability of growht in small- and medium-sized enterprises.
International Journal of Entrepreneurial Behaviour & Research, 7(2), 60-75.
Parker, S. C., Storey, D. J., & Witteloostuijn, A. v. (2010). What happens to gazelles? The
importance of dynamic management strategy. Small Business Economics, 35(2), 203-
226.
Pena, I. (2002). Intellectual capital and business start-up success. Journal of Intellectual
Capital, 3(2), 180-198.
Penrose, E. (1959). The theory of the growth of the firm. Oxford: Blackwell.

105
Roberts, J. (2004). The Modern Firm: Organizational Design for Performance and Growth.
Oxford, UK: Oxform University Press.
Rutherford, M. W., McMullen, P., & Oswald, S. (2001). Examining the issue of size and the
small business: A self organizing map approach. Journal of Business & Economic
Studies, 7(1).
Santarelli, E., & Sterlacchini, A. (1990). Innovation, Formal vs. Informal R&D, and Firm Size:
Some Evidence from Italian Manufacturing Firms. Small Business Economics, 2(3),
223-228.
SCB. (2013). SNI 2007. doi:http://www.sni2007.scb.se/snipdf.asp
SCB. (2015, 01 04). Retrieved 11 06, 2012, from SCB Företagsregister:
http://www.scb.se/Pages/List____259330.aspx
Sexton, D. L., & Bowman-Upton, N. B. (1991). Entrepreneurship: Creativity and Growth. New
York: Macmillan.
Shane, S., & Venkataraman, S. (2000). The promise of entrepreneurship as a field of research.
Academy of Management Review, 25(1), 217-226.
Shane, S., Locke, E. A., & Collins, C. J. (2003). Entreprenurial motivation. Human Resource
Management Review, 13(2), 257-279.
Sheeran, P., Orbell, S., & Trafimow, D. (1999). Does the Temporal Stability of Behavioral
Intentions Moderate Intention-Behavior and Past Behavior-Future Behavior Relations?
Personality and Social Psychology Bulletin, 25(6), pp. 724-734.
Shepherd, D., & Wiklund, J. (2009). Are We Comparing Apples With Apples or Apples With
Oranges? Appropriateness of Knowledge Accumulation Across Growth Studies.
Entrepreneurship Theory and Practive, 33(1), 105-123.
Sims, M. A., & O'Regan, N. (2006). In search of gazelles using a research DNA model.
Technovation, 26(8), 943-954.
Smallbone, D., Leigh, R., & North, D. (1995). The characteristics and strategies of high growth
SMEs. International Journal of Entrepreneurial Behaviour & Research, 1(3), 44-62.

106
Stam, E., Bosma, N., van Witteloostuijn, A., de Jong, J., Bogaert, S., Edwards, N., & Jaspers,
F. (2012). Ambitious entrepreneurship: A review of the state of the art. StudieReeks 23.
Stam, E., Hartog, C., van Stel, A., & Thurik, R. (2010). Ambitious entrepreneurship, high-
growth firms and macroeconomic growth. In M. Minniti, The Dynamics of
Entrepreneurship: Evidence from Global Entrepreneurship. Oxford University Press.
Stenholm, P. (2011). Innovative Behavior as a Moderator of Growth Intentions. Journal of
Small Business Management, 49(2), 233-251.
St-Jean, E., Julien, P.-A., & Audet, J. (2008). Factors associated with growth changes in
"Gazelles". Journal of Enterprising Culture, 16(2), 161-188.
Storey, D. (1994). Understanding The Small Business Sector.
Storey, D. J., & Greene, F. J. (2010). Small Business and Entrepreneurship. Pearson Education
Limited.
Sutton, J. (1997). Gibrat's Legacy. Journal of Economic Litterature, 40-59.
Tapper, H. (2010). Östergötlands ekonomiska utveckling 1990-2007. Linköping:
Regionförbundet Östsam.
Thurstone, L. L. (1934). The Vectors of Mind. Psychological Review, 41(1), 1-32.
Troske, K. R. (1999). Evidence on the employer size-wage premium from worker-
establishment matched data. The Review of Economics and Statistics, 81(1), 15-26.
Valerie, S. M., & Lois, R. A. (2012). Conducting Online Surveys. SAGE Publications.
Whetten, D. A. (1987). Organizational growth and decline processes. Annual review of
sociology, 335-358.
Wiklund, J. (1998). Small Firm Growth and Performance - Entrepreneurship and Beyond.
Jönköping: Jönköping International Business School.
Wiklund, J., & Shepherd, D. (2003). Aspiring for, and Achieving Growth: The Moderating Role
of Resources and Opportunities. Journal of Management Studies, 40(8), 1919-1941.
Wiklund, J., Patzelt, H., & Shepherd, D. A. (2009). Building an integrative model of small
business growth. Small Business Economics, 32, 351-374.

107
Wiliamsson, O. E. (1967). Hierarchical control and optimum firm size. Journal of Political
Economy, 123-138.
Wilson, J. (2010). Essentials of Business Research - A Guide to Doing Your Research Project.
Sage.
Yin, R. K. (2009). Case Study Research: Design and Methods.
Åstebro, T. (2003). The Return to Independent Invention: Evidence of Unrealistic Optimism,
Risk Seeking or Skewness Loving? The Economic Journal, 113(484), 226-239.

108
6. Appendix
6.1. Number of employees and firm sizes, in Sweden Figure 23 shows the number of employees per firm size class (as reported by SCB, 2015).
Figure 23: Employees and number of firms per firm size in Sweden (SCB, 2015)
6.2. Elimination of outliers Special cases were identified when looking for outliers regarding relative growth, using
turnover for the time period 2008-2012 (see Figure 8). The most extreme firm (number 19)
showed some 3500% growth. This particular firm had 15 employees in 2008, and fulfilled that
criterion for an SME, but it only had 0.04 M€ in turnover. The explanation is that the firm was
focused on the development of its single product, and did not conduct any market expanding
activities until the years after 2008. To handle the cash flow requirements of having 15
employees and a virtually non-existent turnover, the firm relied on investments made by the
owners
To determine if this would be defined as an outlier, and consequently would be removed from
the sample, a Z-Score was calculated for each observation. Table 18 shows the three firms with
the highest Z-Scores. It reveals that the only growth rate yielding an absolute Z-Score larger
0%
5%
10%
15%
20%
25%
0%
2%
4%
6%
8%
10%
12%
14%
16%
18%
1-9 10-49 50-99 100-500
Employees and number of firms per firm size in Sweden
% of total employees
% of total firms

109
than 3 was the abovementioned firm. This being an unusual case, it was excluded from the
analyses including GT8-12.
Table 18: Top 3 descending Z-Scores for GT8-12
Firm Growth rate Descending Z-Scores
Number 19 3530% 8.50
Number 23 806% 1.71
Number 52 343% 0.56
For the time period 2009-2012 one firm was identified as a possible outlier, as seen in Figure
9: Relative growth using turnover, 2009-2012. This firm displayed a relative growth rate
(turnover) of 3200%. Table 19 lists the three highest Z-Scores for GT9-12. Only observation
Number 89 had an absolute Z-Score above three, and was removed from the sample.
Table 19: Top 3 descending Z-Scores for GT9-12
Firm Growth rate Descending Z-Scores
Number 89 3212% 8.82
Number 23 470% 1.05
Number 19 347% 0.70
For the growth rate using number of employees in the time period 2008-2012, the situation was
similar. One firm, Number 23, was identified to have over an 1100% increase in the number of
employees as shown in Figure 10. From 2008 to 2012 the firm managed to employ some 67
employees, going from 6 in 2008 to 73 in 2012. Table 20 indicates that this was the only firm
in the sample with an absolute Z-Score above 3.
Table 20: Top 3 descending Z-Scores for GE8-12
Firm Growth rate Descending Z-Scores
Number 23 1117% 7.44
Number 48 375% 2.18
Number 52 281% 1.52
Finally, in Figure 11, it is evident that one firm showed an unusually high growth rate. This
firm, number 89, was founded late in 2008 and had only 1 employee in 2009. In 2012 it had 23
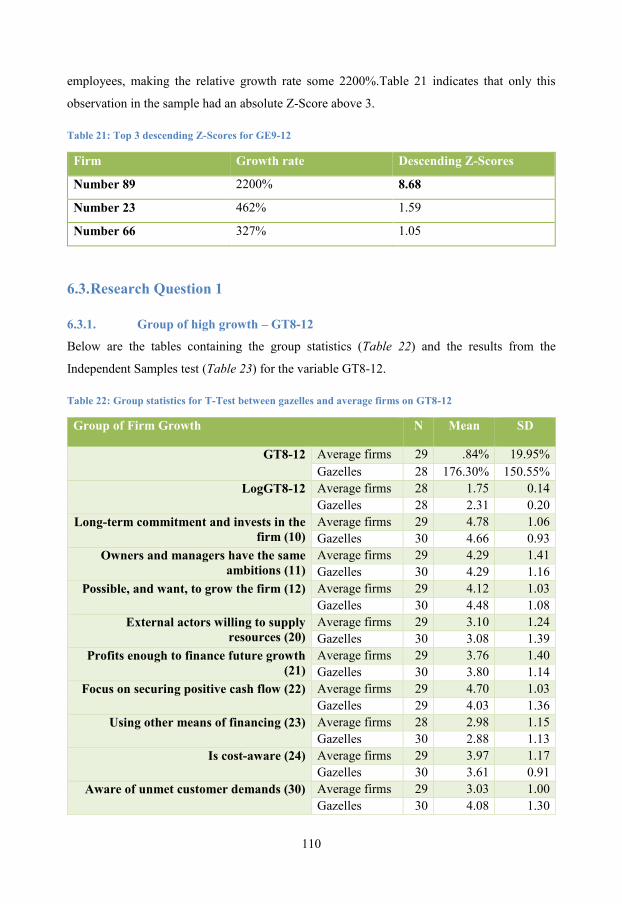
110
employees, making the relative growth rate some 2200%.Table 21 indicates that only this
observation in the sample had an absolute Z-Score above 3.
Table 21: Top 3 descending Z-Scores for GE9-12
Firm Growth rate Descending Z-Scores
Number 89 2200% 8.68
Number 23 462% 1.59
Number 66 327% 1.05
6.3. Research Question 1
6.3.1. Group of high growth – GT8-12
Below are the tables containing the group statistics (Table 22) and the results from the
Independent Samples test (Table 23) for the variable GT8-12.
Table 22: Group statistics for T-Test between gazelles and average firms on GT8-12
Group of Firm Growth N Mean SD
GT8-12 Average firms 29 .84% 19.95% Gazelles 28 176.30% 150.55%
LogGT8-12 Average firms 28 1.75 0.14 Gazelles 28 2.31 0.20
Long-term commitment and invests in the firm (10)
Average firms 29 4.78 1.06 Gazelles 30 4.66 0.93
Owners and managers have the same ambitions (11)
Average firms 29 4.29 1.41 Gazelles 30 4.29 1.16
Possible, and want, to grow the firm (12) Average firms 29 4.12 1.03 Gazelles 30 4.48 1.08
External actors willing to supply resources (20)
Average firms 29 3.10 1.24 Gazelles 30 3.08 1.39
Profits enough to finance future growth (21)
Average firms 29 3.76 1.40 Gazelles 30 3.80 1.14
Focus on securing positive cash flow (22) Average firms 29 4.70 1.03 Gazelles 29 4.03 1.36
Using other means of financing (23) Average firms 28 2.98 1.15 Gazelles 30 2.88 1.13
Is cost-aware (24) Average firms 29 3.97 1.17 Gazelles 30 3.61 0.91
Aware of unmet customer demands (30) Average firms 29 3.03 1.00 Gazelles 30 4.08 1.30

111
Group of Firm Growth N Mean SD
Is the industry conservative and not ready for new solutions (31)
Average firms 29 2.99 1.42 Gazelles 30 4.13 1.01
Firm has advantages with technology or new processes (32)
Average firms 29 2.78 1.10 Gazelles 30 3.27 1.39
Possible to create niches (34) Average firms 29 3.81 0.98 Gazelles 30 4.03 0.90
Firm offers radically new solutions (40) Average firms 29 3.88 0.95 Gazelles 30 4.16 0.95
Firm lies ahead of competitors in delivering new solutions (41)
Average firms 29 3.40 1.02 Gazelles 30 4.14 0.96
First to introduce new solutions (60) Average firms 29 3.03 1.15 Gazelles 30 4.09 0.91
Effort put into sales activities vis-à-vis competitors (64)
Average firms 29 2.47 1.07 Gazelles 30 3.13 1.26
Making processes, routines and structures more efficient and flexible (80)
Average firms 29 3.96 1.17 Gazelles 30 3.90 1.23
Have efficient and flexible processes, routines and structures (81)
Average firms 29 3.88 0.96 Gazelles 30 3.54 1.07
Have distinctive goals for the next six months (93)
Average firms 29 3.43 1.24 Gazelles 30 3.05 0.93
Managers emphasizing a decentralized decision-making structure (112)
Average firms 29 4.08 0.81 Gazelles 30 4.28 0.89
Follow-ups on goals and plans (116) Average firms 29 3.52 1.42 Gazelles 30 3.08 1.30
Age Average firms 29 22.69 12.53 Gazelles 30 14.97 11.83
Turnover 2008 (MSEK) Average firms 29 80.62 93.07 Gazelles 30 23.35 14.73
Turnover 2009 (MSEK) Average firms 29 66.90 69.87 Gazelles 30 31.72 24.21
Turnover 2012 (MSEK) Average firms 29 76.41 85.08 Gazelles 30 61.50 49.55
Number of employees 2008 Average firms 29 43.76 39.37 Gazelles 30 21.20 18.02
Number of employees 2009 Average firms 29 40.59 34.39 Gazelles 30 25.50 26.16
Number of employees 2012 Average firms 29 42.00 32.45 Gazelles 30 50.47 60.64

112
Table 23: Independent Samples T-Test for GT8-12 and factors: resources, market, organizational
t df Sig.
(2-
tailed)
95% Confidence
Interval of the
Difference
Lower Upper
GT8-12 -6.12 27.92 0.00 -234.24% -116.68%
LogGT8-12 -12.04 54.00 0.00 -0.66 -0.47
Long-term commitment and invests
in the firm (10)
0.44 57.00 0.66 -0.40 0.63
Owners and managers have the same
(11) ambitions
0.00 57.00 1.00 -0.67 0.67
Possible, and want, to grow the firm
(12)
-1.29 57.00 0.20 -0.91 0.20
External actors willing to supply
resources (20)
0.07 57.00 0.95 -0.66 0.71
Profits enough to finance future
growth (21)
-0.14 57.00 0.89 -0.71 0.62
Focus on securing positive cash flow
(22)
2.10 52.18 0.04 0.03 1.30
Using other means of financing (23) 0.32 56.00 0.75 -0.50 0.70
Is cost-aware (24) 1.32 57.00 0.19 -0.19 0.91
Aware of unmet customer demands
(30)
-3.45 57.00 0.00 -1.65 -0.44
Is the industry conservative and not
ready for new solutions (31)
-3.54 50.30 0.00 -1.78 -0.49
Firm has advantages with technology
or new processes (32)
-1.51 57.00 0.14 -1.15 0.16
Possible to create niches (34) -0.91 57.00 0.37 -0.71 0.27
Firm offers radically new solutions
(40)
-1.13 57.00 0.27 -0.77 0.22
Firm lies ahead of competitors in
delivering new solutions (41)
-2.90 57.00 0.01 -1.26 -0.23
First to introduce new solutions (60) -3.94 57.00 0.00 -1.59 -0.52

113
t df Sig.
(2-
tailed)
95% Confidence
Interval of the
Difference
Lower Upper
Effort put into sales activities vis-à-
vis competitors (64)
-2.16 57.00 0.03 -1.27 -0.05
Making processes, routines and
structures more efficient and flexible
(80)
0.19 57.00 0.85 -0.57 0.69
Have efficient and flexible processes,
routines and structures (81)
1.28 57.00 0.21 -0.19 0.87
Have distinctive goals for the next six
months (93)
1.31 57.00 0.20 -0.20 0.95
Managers emphasizing a
decentralized decision-making
structure (112)
-0.90 57.00 0.37 -0.64 0.25
Follow-ups on goals and plans (116) 1.26 57.00 0.21 -0.26 1.15
Age 2.44 57.00 0.02 1.37 14.07
Turnover 2008 (MSEK) 3.27 29.36 0.00 21.51 93.02
Turnover 2009 (MSEK) 2.57 34.43 0.01 73.36 63.03
Turnover 2012 (MSEK) 0.83 57.00 0.41 -21.24 51.06
Number of employees 2009 2.81 38.95 0.01 6.34 38.77
Number of employees 2009 1.90 57.00 0.06 -0.81 30.98
Number of employees 2012 -0.67 57.00 0.51 -33.95 17.02
6.3.2. Group of high growth – GT9-12
Below are the tables containing the group statistics (Table 24) and the results from the
Independent Samples test (Table 25) for the variable GT9-12.
Table 24: Group statistics for T-Test between gazelles and average firms on GT9-12
Group of Firm Growth N Mean SD
GT9-12 Average firms 30 -.32% 21.18%
Gazelles 28 140.70% 87.75%

114
Group of Firm Growth N Mean SD
LogGT9-12 Average firms 28 1.74 0.15
Gazelles 28 2.26 0.15
Long-term commitment and invests in the
firm (10)
Average firms 30 4.74 0.77
Gazelles 30 4.65 1.11
Owners and managers have the same
ambitions (11)
Average firms 30 4.24 1.32
Gazelles 30 4.46 1.06
Possible, and want, to grow the firm (12) Average firms 30 4.31 1.07
Gazelles 30 4.19 1.09
External actors willing to supply resources
(20)
Average firms 30 2.90 1.07
Gazelles 30 2.99 1.44
Profits enough to finance future growth
(21)
Average firms 30 3.66 1.35
Gazelles 30 4.05 1.16
Focus on securing positive cash flow (22) Average firms 30 4.63 1.03
Gazelles 29 4.28 1.23
Using other means of financing (23) Average firms 29 3.27 1.22
Gazelles 30 2.88 1.25
Is cost-aware (24) Average firms 30 3.92 1.16
Gazelles 30 3.54 0.92
Aware of unmet customer demands (30) Average firms 30 3.18 1.16
Gazelles 30 3.93 1.22
Is the industry conservative and not ready
for new solutions (31)
Average firms 30 3.29 1.40
Gazelles 30 3.94 1.19
Firm has advantages with technology or
new processes (32)
Average firms 30 2.91 1.04
Gazelles 30 3.21 1.35
Possible to create niches (34) Average firms 30 3.95 0.85
Gazelles 30 4.02 0.95
Firm offers radically new solutions (40) Average firms 30 4.05 1.07
Gazelles 30 4.01 0.85
Firm lies ahead of competitors in
delivering new solutions (41)
Average firms 30 3.54 1.17
Gazelles 30 3.81 0.85
First to introduce new solutions (60) Average firms 30 3.13 1.15

115
Group of Firm Growth N Mean SD
Gazelles 30 3.91 1.07
Effort put into sales activities vis-à-vis
competitors (64)
Average firms 30 2.56 1.02
Gazelles 30 3.02 1.26
Making processes, routines and structures
more efficient and flexible (80)
Average firms 30 4.20 1.11
Gazelles 30 3.95 1.07
Have efficient and flexible processes,
routines and structures (81)
Average firms 30 4.07 1.00
Gazelles 30 3.53 1.02
Have distinctive goals for the next six
months (93)
Average firms 30 3.37 1.32
Gazelles 30 3.19 1.00
Managers emphasizing a decentralized
decision-making structure (112)
Average firms 30 4.20 0.90
Gazelles 30 4.29 0.76
Follow-ups on goals and plans (116) Average firms 30 3.50 1.53
Gazelles 30 3.08 1.26
Age Average firms 30 21.27 12.68
Gazelles 30 15.17 12.52
Turnover 2008 (MSEK) Average firms 28 54.58 51.99
Gazelles 29 40.53 66.64
Turnover 2009 (MSEK) Average firms 30 58.44 48.86
Gazelles 30 33.13 34.93
Turnover 2012 (MSEK) Average firms 30 55.85 40.98
Gazelles 30 72.99 66.83
Number of employees 2008 Average firms 28 37.07 30.43
Gazelles 29 25.45 20.21
Number of employees 2009 Average firms 30 35.93 27.64
Gazelles 30 26.67 26.49
Number of employees 2012 Average firms 30 37.13 24.90
Gazelles 30 52.87 59.64
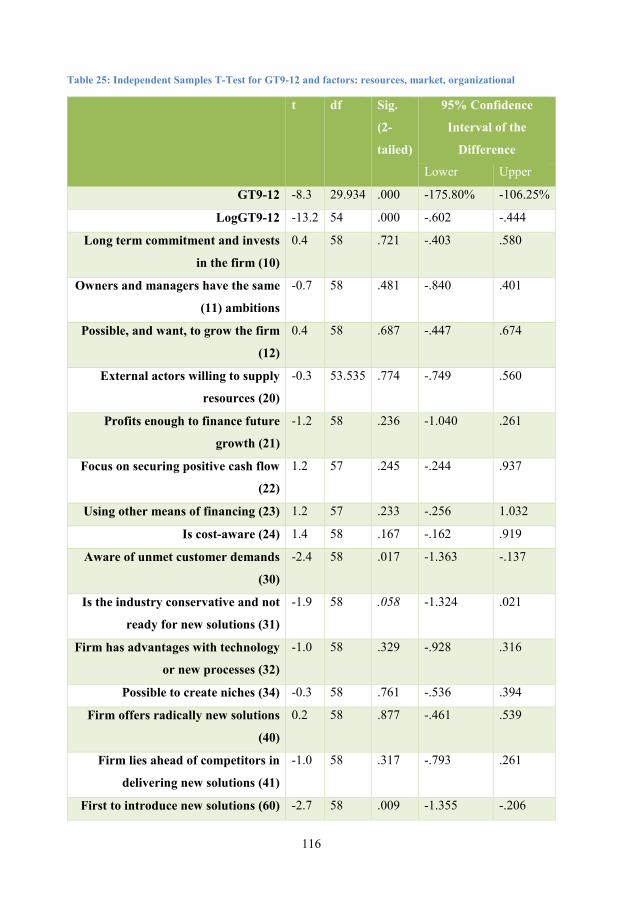
116
Table 25: Independent Samples T-Test for GT9-12 and factors: resources, market, organizational
t df Sig.
(2-
tailed)
95% Confidence
Interval of the
Difference
Lower Upper
GT9-12 -8.3 29.934 .000 -175.80% -106.25%
LogGT9-12 -13.2 54 .000 -.602 -.444
Long term commitment and invests
in the firm (10)
0.4 58 .721 -.403 .580
Owners and managers have the same
(11) ambitions
-0.7 58 .481 -.840 .401
Possible, and want, to grow the firm
(12)
0.4 58 .687 -.447 .674
External actors willing to supply
resources (20)
-0.3 53.535 .774 -.749 .560
Profits enough to finance future
growth (21)
-1.2 58 .236 -1.040 .261
Focus on securing positive cash flow
(22)
1.2 57 .245 -.244 .937
Using other means of financing (23) 1.2 57 .233 -.256 1.032
Is cost-aware (24) 1.4 58 .167 -.162 .919
Aware of unmet customer demands
(30)
-2.4 58 .017 -1.363 -.137
Is the industry conservative and not
ready for new solutions (31)
-1.9 58 .058 -1.324 .021
Firm has advantages with technology
or new processes (32)
-1.0 58 .329 -.928 .316
Possible to create niches (34) -0.3 58 .761 -.536 .394
Firm offers radically new solutions
(40)
0.2 58 .877 -.461 .539
Firm lies ahead of competitors in
delivering new solutions (41)
-1.0 58 .317 -.793 .261
First to introduce new solutions (60) -2.7 58 .009 -1.355 -.206

117
t df Sig.
(2-
tailed)
95% Confidence
Interval of the
Difference
Lower Upper
Effort put into sales activities vis-à-
vis competitors (64)
-1.6 58 .125 -1.053 .132
Making processes, routines and
structures more efficient and flexible
(80)
0.9 58 .388 -.319 .809
Have efficient and flexible processes,
routines and structures (81)
2.1 58 .043 .018 1.066
Have distinctive goals for the next six
months (93)
0.6 58 .555 -.426 .786
Managers emphasizing a
decentralized decision-making
structure (112)
-0.4 58 .687 -.519 .344
Follow-ups on goals and plans (116) 1.1 58 .255 -.308 1.139
Age 1.9 58 .066 -.413 12.613
Turnover 2008 (MSEK) 0.9 55 .380 -17.763 45.846
Turnover 2009 (MSEK) 2.3 58 .025 .336 47.263
Turnover 2012 (MSEK) -1.2 48.108 .237 -45.908 1.164
Number of employees 2008 1.7 55 .094 -2.042 25.288
Number of employees 2009 1.3 58 .190 -4.723 23.256
Number of employees 2012 -1.3 58 .188 -39.354 7.887
6.3.3. Group of high growth – GE8-12
Below are the tables containing the group statistics (Table 26) and the results from the
Independent Samples test (Table 27) for the variable GE8-12.
Table 26: Group statistics for T-Test between gazelles and average firms on GE8-12
Group of Firm Growth N Mean SD
GE8-12 Average firms 29 -.48% 15.89%
Gazelles 29 129.23% 84.73%

118
Group of Firm Growth N Mean SD
LogGE8-12 Average firms 28 1.49 0.26
Gazelles 29 2.17 0.20
Long term commitment and invests in the
firm (10)
Average firms 30 4.50 1.19
Gazelles 30 4.66 0.76
Owners and managers have the same
ambitions (11)
Average firms 30 4.33 1.25
Gazelles 30 4.28 1.11
Possible, and want, to grow the firm (12) Average firms 30 4.02 1.17
Gazelles 30 4.22 1.01
External actors willing to supply resources
(20)
Average firms 30 2.82 1.14
Gazelles 30 3.07 1.20
Profits enough to finance future growth
(21)
Average firms 30 3.80 1.38
Gazelles 30 4.01 1.06
Focus on securing positive cash flow (22) Average firms 29 4.59 1.08
Gazelles 30 4.39 1.20
Using other means of financing (23) Average firms 29 3.10 1.20
Gazelles 30 2.95 1.36
Is cost-aware (24) Average firms 30 3.95 1.31
Gazelles 30 3.53 0.94
Aware of unmet customer demands (30) Average firms 30 3.08 1.19
Gazelles 30 3.94 1.22
Is the industry conservative and not ready
for new solutions (31)
Average firms 30 2.99 1.34
Gazelles 30 4.34 0.99
Firm has advantages with technology or
new processes (32)
Average firms 30 2.96 1.22
Gazelles 30 3.24 1.44
Possible to create niches (34) Average firms 30 3.92 0.97
Gazelles 30 4.08 0.82
Firm offers radically new solutions (40) Average firms 30 3.68 1.10
Gazelles 30 4.07 0.88
Firm lies ahead of competitors in
delivering new solutions (41)
Average firms 30 3.21 1.20
Gazelles 30 4.05 0.93
First to introduce new solutions (60) Average firms 30 3.05 1.20

119
Group of Firm Growth N Mean SD
Gazelles 30 3.80 1.08
Effort put into sales activities vis-à-vis
competitors (64)
Average firms 30 2.45 1.03
Gazelles 30 3.06 1.28
Making processes, routines and structures
more efficient and flexible (80)
Average firms 30 4.04 0.98
Gazelles 30 3.92 1.14
Have efficient and flexible processes,
routines and structures (81)
Average firms 30 4.22 0.95
Gazelles 30 3.47 0.97
Have distinctive goals for the next six
months (93)
Average firms 30 3.22 1.08
Gazelles 30 3.05 1.09
Managers emphasizing a decentralized
decision-making structure (112)
Average firms 30 3.94 0.77
Gazelles 30 4.22 1.00
Follow-ups on goals and plans (116) Average firms 30 3.14 1.48
Gazelles 30 2.98 1.20
Age Average firms 30 20.07 11.85
Gazelles 30 14.67 10.39
Turnover 2008 (MSEK) Average firms 30 81.41 90.35
Gazelles 30 26.19 19.65
Turnover 2009 (MSEK) Average firms 30 69.23 70.43
Gazelles 30 34.27 25.94
Turnover 2012 (MSEK) Average firms 30 87.04 88.20
Gazelles 30 61.38 53.33
Number of employees 2008 Average firms 30 48.87 45.00
Gazelles 30 19.40 17.28
Number of employees 2009 Average firms 30 45.17 40.64
Gazelles 30 24.83 25.85
Number of employees 2012 Average firms 30 46.57 42.44
Gazelles 30 50.30 60.29

120
Table 27: Independent Samples T-Test for GE8-12 and factors: resources, market, organizational
t df Sig.
(2-
taile
d)
95% Confidence
Interval of the
Difference
Lower Upper
GE8-12 -8.10 29.97 .000 -162.40% -97.02%
LogGE8-12 -11.16 55 .000 -.80 -.55
Long term commitment and invests in
the firm (10)
-0.60 58 .553 -.67 .36
Owners and managers have the same
(11) ambitions
0.16 58 .870 -.56 .66
Possible, and want, to grow the firm (12) -0.69 58 .493 -.76 .37
External actors willing to supply
resources (20)
-0.83 58 .411 -.85 .35
Profits enough to finance future growth
(21)
-0.66 58 .514 -.85 .43
Focus on securing positive cash flow (22) 0.67 57 .503 -.39 .79
Using other means of financing (23) 0.47 57 .642 -.51 .83
Is cost-aware (24) 1.40 58 .165 -.18 1.00
Aware of unmet customer demands (30) -2.77 58 .008 -1.48 -.24
Is the industry conservative and not
ready for new solutions (31)
-4.43 53.22 .000 -1.96 -.74
Firm has advantages with technology or
new processes (32)
-0.81 58 .421 -.97 .41
Possible to create niches (34) -0.71 58 .480 -.63 .30
Firm offers radically new solutions (40) -1.52 58 .133 -.90 .12
Firm lies ahead of competitors in
delivering new solutions (41)
-3.02 58 .004 -1.39 -.28
First to introduce new solutions (60) -2.57 58 .013 -1.34 -.17
Effort put into sales activities vis-à-vis
competitors (64)
-2.06 58 .044 -1.22 -.02

121
t df Sig.
(2-
taile
d)
95% Confidence
Interval of the
Difference
Lower Upper
Making processes, routines and
structures more efficient and flexible
(80)
0.44 58 .664 -.43 .67
Have efficient and flexible processes,
routines and structures (81)
3.03 58 .004 .26 1.25
Have distinctive goals for the next six
months (93)
0.61 58 .545 -.39 .73
Managers emphasizing a decentralized
decision-making structure (112)
-1.23 58 .223 -.74 .18
Follow-ups on goals and plans (116) 0.44 58 .663 -.54 .85
Age 1.88 58 .066 -.36 11.16
Turnover 2008 (MSEK) 3.27 31.74 .003 20.82 89.62
Turnover 2009 (MSEK) 2.55 36.73 .015 71.89 62.73
Turnover 2012 (MSEK) 1.36 58 .178 -12.01 63.33
Number of employees 2008 3.35 37.37 .002 11.64 47.29
Number of employees 2009 2.31 58 .024 2.73 37.94
Number of employees 2012 -0.28 58 .783 -30.68 23.21
6.3.4. Group of high growth – GE9-12
Below are the tables containing the group statistics (Table 28) and the results from the
Independent Samples test (Table 29) for the variable GE9-12.
Table 28: Group statistics for T-Test between gazelles and average firms on GE9-12
Group of Firm Growth N Mean Std.
Deviation
GE9-12 Average firms 29 1.79% 12.87%
Gazelles 29 105.62% 89.95%
LogGE9-12 Average firms 28 1.51 0.18

122
Group of Firm Growth N Mean Std.
Deviation
Gazelles 29 2.08 0.20
Long term commitment and invests in
the firm (10)
Average firms 30 4.69 1.07
Gazelles 30 4.71 0.74
Owners and managers have the same
ambitions (11)
Average firms 30 4.43 1.08
Gazelles 30 4.40 1.08
Possible, and want, to grow the firm (12) Average firms 30 4.14 1.12
Gazelles 30 4.32 1.04
External actors willing to supply
resources (20)
Average firms 30 2.93 1.18
Gazelles 30 2.93 1.34
Profits enough to finance future growth
(21)
Average firms 30 3.65 1.29
Gazelles 30 3.96 1.17
Focus on securing positive cash flow (22) Average firms 29 4.73 1.10
Gazelles 30 4.04 1.24
Using other means of financing (23) Average firms 29 3.23 1.21
Gazelles 30 2.70 1.11
Is cost-aware (24) Average firms 30 3.99 1.36
Gazelles 30 3.41 0.87
Aware of unmet customer demands (30) Average firms 30 3.13 1.17
Gazelles 30 3.87 1.17
Is the industry conservative and not
ready for new solutions (31)
Average firms 30 3.25 1.42
Gazelles 30 4.14 1.10
Firm has advantages with technology or
new processes (32)
Average firms 30 3.02 1.19
Gazelles 30 3.30 1.37
Possible to create niches (34) Average firms 30 3.98 1.03
Gazelles 30 3.97 0.91
Firm offers radically new solutions (40) Average firms 30 3.83 1.13
Gazelles 30 3.88 0.77
Firm lies ahead of competitors in
delivering new solutions (41)
Average firms 30 3.38 1.22
Gazelles 30 3.80 0.89
First to introduce new solutions (60) Average firms 30 3.16 1.28
Gazelles 30 3.86 1.07
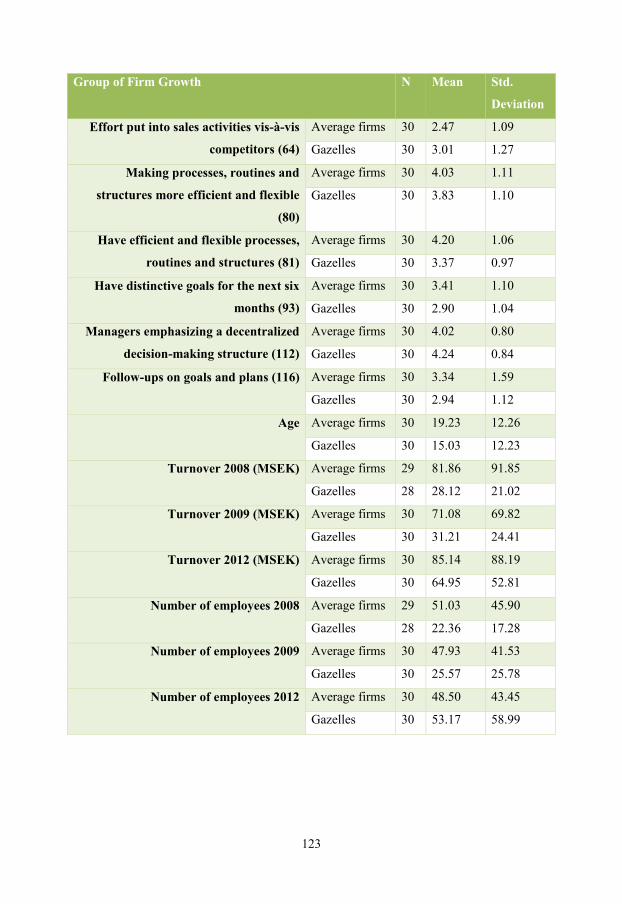
123
Group of Firm Growth N Mean Std.
Deviation
Effort put into sales activities vis-à-vis
competitors (64)
Average firms 30 2.47 1.09
Gazelles 30 3.01 1.27
Making processes, routines and
structures more efficient and flexible
(80)
Average firms 30 4.03 1.11
Gazelles 30 3.83 1.10
Have efficient and flexible processes,
routines and structures (81)
Average firms 30 4.20 1.06
Gazelles 30 3.37 0.97
Have distinctive goals for the next six
months (93)
Average firms 30 3.41 1.10
Gazelles 30 2.90 1.04
Managers emphasizing a decentralized
decision-making structure (112)
Average firms 30 4.02 0.80
Gazelles 30 4.24 0.84
Follow-ups on goals and plans (116) Average firms 30 3.34 1.59
Gazelles 30 2.94 1.12
Age Average firms 30 19.23 12.26
Gazelles 30 15.03 12.23
Turnover 2008 (MSEK) Average firms 29 81.86 91.85
Gazelles 28 28.12 21.02
Turnover 2009 (MSEK) Average firms 30 71.08 69.82
Gazelles 30 31.21 24.41
Turnover 2012 (MSEK) Average firms 30 85.14 88.19
Gazelles 30 64.95 52.81
Number of employees 2008 Average firms 29 51.03 45.90
Gazelles 28 22.36 17.28
Number of employees 2009 Average firms 30 47.93 41.53
Gazelles 30 25.57 25.78
Number of employees 2012 Average firms 30 48.50 43.45
Gazelles 30 53.17 58.99

124
Table 29: Independent Samples T-Test for GE9-12 and factors: resources, market, organizational
t df Sig. (2-
tailed)
95% Confidence Interval of the
Difference Lower Upper
GE9-12 -6.15 29.15 .000 -138.34% -69.33%
LogGE9-12 -11.36 55 .000 -0.67 -0.47
Long term commitment and invests in
the firm (10)
-0.09 58 .932 -0.50 0.45
Owners and managers have the same
(11) ambitions
0.13 58 .901 -0.52 0.59
Possible, and want, to grow the firm
(12)
-0.62 58 .539 -0.73 0.39
External actors willing to supply
resources (20)
0.01 58 .996 -0.65 0.65
Profits enough to finance future growth
(21)
-1.00 58 .322 -0.95 0.32
Focus on securing positive cash flow
(22)
2.26 57 .028 0.08 1.30
Using other means of financing (23) 1.76 57 .084 -0.07 1.14
Is cost-aware (24) 1.98 49.36 .053 -0.01 1.18
Aware of unmet customer demands
(30)
-2.46 58 .017 -1.35 -0.14
Is the industry conservative and not
ready for new solutions (31)
-2.70 54.63 .009 -1.54 -0.23
Firm has advantages with technology
or new processes (32)
-0.86 58 .392 -0.95 0.38
Possible to create niches (34) 0.04 58 .971 -0.49 0.51
Firm offers radically new solutions (40) -0.23 51.11 .816 -0.56 0.44
Firm lies ahead of competitors in
delivering new solutions (41)
-1.55 58 .127 -0.98 0.13
First to introduce new solutions (60) -2.28 58 .026 -1.30 -0.09

125
t df Sig. (2-
tailed)
95% Confidence Interval of the
Difference Lower Upper
Effort put into sales activities vis-à-vis
competitors (64)
-1.76 58 .083 -1.15 0.07
Making processes, routines and
structures more efficient and flexible
(80)
0.72 58 .476 -0.37 0.77
Have efficient and flexible processes,
routines and structures (81)
3.16 58 .002 0.30 1.35
Have distinctive goals for the next six
months (93)
1.84 58 .070 -0.04 1.06
Managers emphasizing a decentralized
decision-making structure (112)
-1.03 58 .306 -0.64 0.21
Follow-ups on goals and plans (116) 1.13 52.21 .262 -0.31 1.12
Age 1.33 58 .189 -2.13 10.53
Turnover 2008 (MSEK) 3.07 31.02 .004 18026.27 89460.22
Turnover 2009 (MSEK) 2.95 35.99 .006 12480.25 67253.89
Turnover 2012 (MSEK) 1.08 47.43 .287 -17555.43 57935.23
Number of employees 2008 3.14 36.02 .003 10.17 47.19
Number of employees 2009 2.51 48.46 .016 4.43 40.30
Number of employees 2012 -0.35 58 .728 -31.44 22.11
6.4. Research Question 2
6.4.1. Descriptive statistics of firms with high and low Innovation Table 30: Descriptive statistics of firms with high and low Innovation
Innovation
Bottom 30 Top 30
Variable Mean SD N Mean SD N
GT8-12 (%) 28.21 69.30 26 111.74 90.40 26
GT9-12 (%) 35.92 39.36 26 89.94 86.19 27
GE8-12 (%) 28.92 79.04 26 83.81 82.83 27

126
Innovation
GE9-12 (%) 24.19 41.87 26 59.90 68.84 27
Turnover 2008 (MSEK) 72.11 84.24 27 37.37 56.98 28
Turnover 2009 (MSEK) 58.85 57.75 27 40.61 51.84 29
Turnover 2012 (MSEK) 72.18 62.77 29 62.52 71.71 29
Number of employees 2008 37.48 29.40 27 25.36 34.69 28
Number of employees 2009 35.59 24.40 27 26.34 33.25 29
Number of employees 2012 39.93 19.46 29 38.55 41.61 29
Firm age in years 19.93 12.64 30 12.57 8.46 30
6.4.2. Descriptive statistics, absolute growth: high and low Innovation
Below are the tables that show the differences in absolute numbers for GT8-12, GT9-12, GE8-
12, and GE9-12.
Table 31: Absolute growth: descriptive statistics of firms with high and low Innovation
Bottom 30 Innovation Top 30 Innovation
Mean SD Sum N Mean SD Sum N
Absolute GT8-12 (MSEK) 3.09 24.19 - 25 24.36 18.20 - 25
Absolute GT9-12 (MSEK) 14.03 28.27 - 26 19.92 27.34 - 26
Absolute GE8-12 (MSEK) 1.19 13.81 31 26 9.58 10.34 249 26
Absolute GE9-12 (MSEK) 3.73 9.20 97 26 8.62 9.37 224 26
6.4.3. Mann-Whitney U Test of absolute numbers – High vs. Low Innovation
Below are the shapes of the different distributions. As it is not possible to test with absolute
certainty that they have the same shape, the test will be conducted comparing mean ranks
instead of medians.

127
Innovation: bottom 30 Innovation: top 30
Figure 24: Bottom 30 Innovation - Histogram of Abs GT8-12
Figure 25: Top 30 Innovation - Histogram of Abs GT8-12
Figure 26: Bottom 30 Innovation - Histogram of Abs GT9-12
Figure 27: Top 30 Innovation - Histogram of Abs GT9-12

128
Innovation: bottom 30 Innovation: top 30
Figure 28: Bottom 30 Innovation - Histogram of Abs GE8-12
Figure 29: Top 30 Innovation - Histogram of Abs GE8-12
Figure 30: Bottom 30 Innovation - Histogram of Abs GE9-12
Figure 31: Top 30 Innovation - Histogram of Abs GE9-12
Below is the ranks table produced by the Mann-Whitney U Test for the different variables tests.
It is evident that the mean ranks for the top 30 firms on innovation are higher for all growth
measures.
Table 32: Group statistics for Mann-Whitney Test between bottom and top on Innovation and absolute firm growth
Variable Group N Mean Rank Abs GT8-12 Bottom 30 Innovation 25 18.88
Top 30 Innovation 25 32.12 Abs GT9-12 Bottom 30 Innovation 26 24.23
Top 30 Innovation 26 28.77 Abs GE8-12 Bottom 30 Innovation 26 21.40
Top 30 Innovation 26 31.60

129
Variable Group N Mean Rank Abs GE9-12 Bottom 30 Innovation 26 23.58
Top 30 Innovation 26 29.42
6.4.4. Group statistics and results from T-test: High vs. Low Innovation Table 33: Group statistics for T-Test between bottom and top on Innovation
Variable Group of Innovation N Mean SD External actors willing to supply
resources (20) Bottom 30 Innovation 30 2.77 1.10 Top 30 Innovation 30 3.36 1.24
Profits enough to finance future growth (21)
Bottom 30 Innovation 30 3.77 1.31 Top 30 Innovation 30 3.83 1.17
Focus on securing positive cash flow (22) Bottom 30 Innovation 30 4.22 1.14 Top 30 Innovation 30 4.50 1.12
Using other means of financing (23) Bottom 30 Innovation 29 2.62 .93 Top 30 Innovation 30 3.37 1.20
Is cost-aware (24) Bottom 30 Innovation 30 3.52 1.15 Top 30 Innovation 30 3.79 .83
Aware of unmet customer demands (30) Bottom 30 Innovation 30 2.42 .75 Top 30 Innovation 30 4.69 .80
Is the industry conservative and not ready for new solutions (31)
Bottom 30 Innovation 30 2.45 .99 Top 30 Innovation 30 4.50 .67
Firm has advantages with technology or new processes (32)
Bottom 30 Innovation 30 2.50 1.01 Top 30 Innovation 30 4.12 1.09
Possible to create niches (34) Bottom 30 Innovation 30 3.32 .84 Top 30 Innovation 30 4.39 .80
Firm offers radically new solutions (40) Bottom 30 Innovation 30 3.06 .70 Top 30 Innovation 30 4.70 .77
Firm lies ahead of competitors in delivering new solutions (41)
Bottom 30 Innovation 30 2.63 .73 Top 30 Innovation 30 4.51 .79
First to introduce new solutions (60) Bottom 30 Innovation 30 2.55 .79 Top 30 Innovation 30 4.75 .70
Effort put into sales activities vis-à-vis competitors (64)
Bottom 30 Innovation 30 2.34 1.11 Top 30 Innovation 30 3.10 1.19
Making processes. routines and structures more efficient and flexible (80)
Bottom 30 Innovation 30 3.48 1.11 Top 30 Innovation 30 4.01 1.16
Have efficient and flexible processes, routines and structures (81)
Bottom 30 Innovation 30 3.79 1.00 Top 30 Innovation 30 3.61 1.16
Have distinctive goals for the next six months (93)
Bottom 30 Innovation 30 3.18 1.05 Top 30 Innovation 30 3.11 .95
Managers emphasizing a decentralized decision-making structure (112)
Bottom 30 Innovation 30 4.09 .78 Top 30 Innovation 30 4.32 .78
Follow-ups on goals and plans (116) Bottom 30 Innovation 30 2.80 1.39 Top 30 Innovation 30 3.44 1.20

130
Variable Group of Innovation N Mean SD Age Bottom 30 Innovation 30 19.93 12.64
Top 30 Innovation 30 12.57 8.46 Turnover 2008 Bottom 30 Innovation 27 72.11 84.24
Top 30 Innovation 28 37.37 56.98 Turnover 2009 Bottom 30 Innovation 27 58.85 57.75
Top 30 Innovation 29 40.61 51.84 Turnover 2012 Bottom 30 Innovation 29 72.18 62.76
Top 30 Innovation 29 62.51 71.71 Number of employees 2008 Bottom 30 Innovation 27 37.48 29.40
Top 30 Innovation 28 25.36 34.69 Number of employees 2009 Bottom 30 Innovation 27 35.59 24.40
Top 30 Innovation 29 26.34 33.25 Number of employees 2012 Bottom 30 Innovation 29 39.93 19.46
Top 30 Innovation 29 38.55 41.61 LogGT8-12 Bottom 30 Innovation 25 1.86 .26
Top 30 Innovation 26 2.17 .23 LogGT9-12 Bottom 30 Innovation 26 1.91 .20
Top 30 Innovation 26 2.12 .23 LogGE8-12 Bottom 30 Innovation 25 1.65 .38
Top 30 Innovation 27 1.98 .30 LogGE9-12 Bottom 30 Innovation 26 1.65 .30
Top 30 Innovation 27 1.88 .27
Table 34: Independent Samples T-Test for Innovation and factors: resources, market, organizational
t df Sig. (2-
tailed)
95% Confidence Interval of the
Difference Lower Upper
External actors willing to supply resources (20)
-1.964 58 .054 -1.20 .01
Profits enough to finance future growth (21)
-.192 58 .848 -.70 .58
Focus on securing positive cash flow (22) -.960 58 .341 -.87 .30
Using other means of financing (23) -2.658 57 .010 -1.30 -.18
Is cost-aware (24) -1.029 58 .308 -.79 .25
Aware of unmet customer demands (30) -11.396 58 .000 -2.67 -1.87
Is the industry conservative and not ready for new solutions (31)
-9.376 51.120 .000 -2.49 -1.61
Firm has advantages with technology or new processes (32)
-5.972 58 .000 -2.16 -1.08

131
t df Sig. (2-
tailed)
95% Confidence Interval of the
Difference Lower Upper
Possible to create niches (34) -5.028 58 .000 -1.49 -.64
Firm offers radically new solutions (40) -8.534 58 .000 -2.01 -1.25
Firm lies ahead of competitors in delivering new solutions (41)
-9.533 58 .000 -2.27 -1.48
First to introduce new solutions (60) -11.380 58 .000 -2.58 -1.81
Effort put into sales activities vis-à-vis competitors (64)
-2.550 58 .013 -1.35 -.16
Making processes. routines and structures more efficient and flexible
(80)
-1.797 58 .078 -1.11 .06
Have efficient and flexible processes. routines and structures (81)
.656 58 .514 -.38 .74
Have distinctive goals for the next six months (93)
.265 58 .792 -.45 .59
Managers emphasizing a decentralized decision-making structure (112)
-1.132 58 .262 -.63 .18
Follow-ups on goals and plans (116) -1.892 58 .064 -1.30 .04
Age 2.65 50.63 .011 1.79 12.94
Turnover 2008 1.80 53.00 .078 -4.03 73.51
Turnover 2009 1.25 54.00 .218 -11.12 47.60
Turnover 2012 .55 56.00 .587 -25.79 45.11
Number of employees 2008 1.40 53.00 .169 -5.30 29.54
Number of employees 2009 1.18 54.00 .243 -6.47 24.97
Number of employees 2012 .16 56.00 .872 -15.71 18.47
LogGT8-12 -4.49 49.00 .000 -.44 -.17
LogGT9-12 -3.43 50.00 .001 -.32 -.08
LogGE8-12 -3.46 50.00 .001 -.51 -.14
LogGE9-12 -2.85 51.00 .006 -.38 -.07

132
6.5. Research Question 3
6.5.1. Descriptive statistics of firms with high and low Growth Ambitions Table 35: Descriptive statistics of firms with high and low Growth Ambitions
Growth Ambitions
Bottom 30 Top 30
Variable Mean SD N Mean SD N
GT8-12 (%) 64.93 71.41 28 66.04 99.66 25
GT9-12 (%) 53.37 50.85 29 54.12 68.33 25
GE8-12 (%) 66.04 81.72 28 40.42 71.04 25
GE9-12 (%) 48.64 49.41 29 33.97 41.31 25
Turnover 2008 (MSEK) 48.40 56.09 28 67.38 71.07 26
Turnover 2009 (MSEK) 49.43 54.92 29 64.30 60.03 27
Turnover 2012 (MSEK) 64.74 49.94 30 90.56 89.20 29
Number of employees 2008 29.25 29.16 28 40.27 44.95 26
Number of employees 2009 28.86 24.55 29 40.70 44.66 27
Number of employees 2012 37.23 20.78 30 54.48 63.04 29
Firm age in years 18.33 11.97 30 19.60 14.24 30
6.5.2. Descriptive statistics, absolute growth: high and low Growth Ambitions Table 36: Absolute growth for bottom and top 30 on Growth Ambitions for the years 2008-2012 and 2009-2012
Bottom 30 Growth
Ambitions
Top 30 Growth Ambitions
Mean SD Sum N Mean SD Sum N
Absolute GT8-12 (MSEK) 14.50 22.55 - 28 32.09 49.95 - 25
Absolute GT9-12 (MSEK) 13.46 21.16 - 29 33.51 43.76 - 26
Absolute GE8-12 (MSEK) 7.54 14.93 211 28 17.16 43.46 429 25
Absolute GE9-12 (MSEK) 7.93 11.13 230 29 15.72 34.62 393 26

133
6.5.3. Mann-Whitney U Test of absolute numbers – High vs. Low Growth
Ambitions
As the variables Absolute GXX-12 and LOG Absolute GXX-12 all fail to pass the Kolmogorov-
Smirnov test and Shapiro-Wilk test for normality, even after translation and transformation, it
is not possible to use the independent samples t-test. Instead, the fallback is the Mann-Whitney
U Test (also called the Mann–Whitney–Wilcoxon), which is the nonparametric alternative to
the independent t-test. Below are the shapes of the different distributions. As it is not possible
to determine with certainty that the different distributions have the same shapes, the test will be
conducted comparing mean ranks, instead of comparing medians.
Growth Ambitions: bottom 30 Growth Ambitions: top 30
Figure 32: Bottom 30 Growth Ambitions - Histogram of Abs GT8-12
Figure 33: Top 30 Growth Ambitions - Histogram of Abs GT8-12
Figure 34: Bottom 30 Growth Ambitions - Histogram of Abs GT9-12
Figure 35: Top 30 Growth Ambitions - Histogram of Abs GT9-12

134
Growth Ambitions: bottom 30 Growth Ambitions: top 30
Figure 36: Bottom 30 Growth Ambitions - Histogram of Abs GE8-12
Figure 37: Top 30 Growth Ambitions - Histogram of Abs GE8-12
Figure 38: Bottom 30 Growth Ambitions - Histogram of Abs GE9-12
Figure 39: Top 30 Growth Ambitions - Histogram of Abs GE9-12
Below is the ranks table produced by the Mann-Whitney U test for the different variables tested.
It is evident that for firm growth computed by using turnover, the top 30 firms have a mean
rank slightly higher than the bottom 30. For the variables computed using the number of
employees the difference is reversed.
Table 37: Group statistics for Mann-Whitney Test between bottom and top on Growth Ambitions and absolute firm growth
Variable Group N Mean Rank
Abs GT8-12 Bottom 30 28 25.75
Top 30 23 26.30

135
Variable Group N Mean Rank
Abs GT9-12 Bottom 30 29 25.97
Top 30 23 27.17
Abs GE8-12 Bottom 30 28 29.02
Top 30 23 22.33
Abs GE9-12 Bottom 30 29 29.26
Top 30 23 23.02
The table below contains the test statistics for the Mann-Whitney U Test.
Table 38: Mann-Whitney Test for Growth Ambitions and absolute firm growth
Abs GT8-12 Abs GT9-12 Abs GE8-12 Abs GE9-12
Mann-Whitney U 315.0 318.0 237.5 253.5
Z -0.133 -0.286 -1.603 -1.477
Asymp. Sig. (2-tailed) 0.895 0.755 0.109 0.140
6.5.4. Group statistics and results from T-test: High vs. Low Growth Ambitions Table 39: Group statistics for T-Test between bottom and top on Growth Ambitions
Variable Group of Growth Ambitions N Mean SD External actors willing to supply
resources (20) Bottom 30 Growth Ambitions 30 3.03 1.10 Top 30 Growth Ambitions 30 3.35 1.27
Profits enough to finance future growth (21)
Bottom 30 Growth Ambitions 30 3.72 1.46 Top 30 Growth Ambitions 30 4.09 1.36
Focus on securing positive cash flow (22)
Bottom 30 Growth Ambitions 30 4.26 1.46 Top 30 Growth Ambitions 30 4.46 0.90
Using other means of financing (23) Bottom 30 Growth Ambitions 30 2.72 1.11 Top 30 Growth Ambitions 29 3.27 1.20
Is cost-aware (24) Bottom 30 Growth Ambitions 30 3.51 1.23 Top 30 Growth Ambitions 30 3.89 0.89
Aware of unmet customer demands (30)
Bottom 30 Growth Ambitions 30 3.36 1.31 Top 30 Growth Ambitions 30 3.52 1.28
Is the industry conservative and not ready for new solutions (31)
Bottom 30 Growth Ambitions 30 3.58 1.27 Top 30 Growth Ambitions 30 3.41 1.47
Firm has advantages with technology or new processes (32)
Bottom 30 Growth Ambitions 30 2.68 1.34 Top 30 Growth Ambitions 30 3.19 1.10
Possible to create niches (34) Bottom 30 Growth Ambitions 30 3.79 0.87 Top 30 Growth Ambitions 30 3.83 1.02
Firm offers radically new solutions (40)
Bottom 30 Growth Ambitions 30 3.84 0.94 Top 30 Growth Ambitions 30 4.01 1.19

136
Variable Group of Growth Ambitions N Mean SD Firm lies ahead of competitors in
delivering new solutions (41) Bottom 30 Growth Ambitions 30 3.58 1.03 Top 30 Growth Ambitions 30 3.64 1.17
First to introduce new solutions (60) Bottom 30 Growth Ambitions 30 3.42 1.10 Top 30 Growth Ambitions 30 3.79 1.24
Effort put into sales activities vis-à-vis competitors (64)
Bottom 30 Growth Ambitions 30 2.66 1.23 Top 30 Growth Ambitions 30 3.06 1.31
Making processes. routines and structures more efficient and flexible
(80)
Bottom 30 Growth Ambitions 30 3.60 1.08 Top 30 Growth Ambitions 30 3.99 1.16
Have efficient and flexible processes, routines and structures (81)
Bottom 30 Growth Ambitions 30 3.40 0.94 Top 30 Growth Ambitions 30 3.95 1.04
Have distinctive goals for the next six months (93)
Bottom 30 Growth Ambitions 30 2.88 1.04 Top 30 Growth Ambitions 30 3.50 1.06
Managers emphasizing a decentralized decision-making structure (112)
Bottom 30 Growth Ambitions 30 3.80 0.86 Top 30 Growth Ambitions 30 4.21 0.76
Follow-ups on goals and plans (116) Bottom 30 Growth Ambitions 30 2.66 1.07 Top 30 Growth Ambitions 30 3.40 1.36
Age Bottom 30 Growth Ambitions 30 18.33 11.97 Top 30 Growth Ambitions 30 19.60 14.24
Turnover 2008 (MSEK) Bottom 30 Growth Ambitions 28 48.40 56.09 Top 30 Growth Ambitions 26 67.38 71.07
Turnover 2009 (MSEK) Bottom 30 Growth Ambitions 29 49.43 54.92 Top 30 Growth Ambitions 27 64.30 60.03
Turnover 2012 (MSEK) Bottom 30 Growth Ambitions 30 64.74 49.94 Top 30 Growth Ambitions 29 90.56 89.20
Number of employees 2008 Bottom 30 Growth Ambitions 28 29.25 29.16 Top 30 Growth Ambitions 26 40.27 44.95
Number of employees 2009 Bottom 30 Growth Ambitions 29 28.86 24.55 Top 30 Growth Ambitions 27 40.70 44.66
Number of employees 2012 Bottom 30 Growth Ambitions 30 37.23 20.78 Top 30 Growth Ambitions 29 54.48 63.04
LogGT8-12 Bottom 30 Growth Ambitions 28 2.02 .24
Top 30 Growth Ambitions 24 2.01 .27
LogGT9-12 Bottom 30 Growth Ambitions 29 1.98 .23
Top 30 Growth Ambitions 24 1.98 .27
LogGE8-12 Bottom 30 Growth Ambitions 27 1.91 .32

137
Variable Group of Growth Ambitions N Mean SD Top 30 Growth Ambitions 25 1.74 .37
LogGE9-12 Bottom 30 Growth Ambitions 29 1.82 .29
Top 30 Growth Ambitions 24 1.77 .24
Table 40: Independent Samples T-Test for Growth Ambitions and factors: resources, market, organizational
t df Sig. (2-
tailed)
95% Confidence Interval of the
Difference Lower Upper
External actors willing to supply resources (20)
-1.053 58 .297 -.93 .29
Profits enough to finance future growth (21)
-1.041 58 .302 -1.11 .35
Focus on securing positive cash flow (22) -.659 58 .512 -.83 .42 Using other means of financing (23) -1.861 57 .068 -1.16 .04
Is cost-aware (24) -1.375 52.917 .175 -.94 .17 Aware of unmet customer demands (30) -.472 58 .638 -.83 .51
Is the industry conservative and not ready for new solutions (31)
.480 58 .633 -.54 .88
Firm has advantages with technology or new processes (32)
-1.630 58 .109 -1.15 .12
Possible to create niches (34) -.153 58 .879 -.53 .45 Firm offers radically new solutions (40) -.591 58 .557 -.72 .39
Firm lies ahead of competitors in delivering new solutions (41)
-.215 58 .830 -.63 .51
First to introduce new solutions (60) -1.226 58 .225 -.98 .23 Effort put into sales activities vis-à-vis
competitors (64) -1.233 58 .222 -1.06 .25
Making processes. routines and structures more efficient and flexible
(80)
-1.360 58 .179 -.97 .19
Have efficient and flexible processes. routines and structures (81)
-2.166 58 .034 -1.07 -.04
Have distinctive goals for the next six months (93)
-2.301 58 .025 -1.17 -.08
Managers emphasizing a decentralized decision-making structure (112)
-1.949 58 .056 -.83 .01
Follow-ups on goals and plans (116) -2.355 54.965 .022 -1.37 -.11

138
t df Sig. (2-
tailed)
95% Confidence Interval of the
Difference Lower Upper
Age -.373 58 .711 -8.07 5.53 Turnover 2008 (MSEK) -1.093 52 .279 -53.80 15.85 Turnover 2009 (MSEK) -.968 54 .337 -45.67 15.93 Turnover 2012 (MSEK) -1.365 43.666 .179 -63.93 12.30
Number of employees 2008 -1.076 52 .287 -31.56 9.52 Number of employees 2009 -1.217 39.760 .231 -31.51 7.82 Number of employees 2012 -1.402 33.830 .170 -42.26 7.76
LogGT8-12 .11 50.00 .916 -.14 .15
LogGT9-12 .04 51.00 .972 -.13 .14
LogGE8-12 1.84 50.00 .072 -.02 .37
LogGE9-12 .67 51.00 .507 -.10 .20
Copyright © 2022 FDOKUMEN