The Racial Saving Gap Enigma: Unraveling the Role of Institutions
43
IZA DP No. 3545 The Racial Saving Gap Enigma: Unraveling the Role of Institutions Willie Belton Ruth Uwaifo Oyelere DISCUSSION PAPER SERIES Forschungsinstitut zur Zukunft der Arbeit Institute for the Study of Labor June 2008
Transcript of The Racial Saving Gap Enigma: Unraveling the Role of Institutions

IZA DP No. 3545
The Racial Saving Gap Enigma:Unraveling the Role of Institutions
Willie BeltonRuth Uwaifo Oyelere
DI
SC
US
SI
ON
PA
PE
R S
ER
IE
S
Forschungsinstitutzur Zukunft der ArbeitInstitute for the Studyof Labor
June 2008

The Racial Saving Gap Enigma:
Unraveling the Role of Institutions
Willie Belton Georgia Institute of Technology
Ruth Uwaifo Oyelere Georgia Institute of Technology
and IZA
Discussion Paper No. 3545 June 2008
IZA
P.O. Box 7240 53072 Bonn
Germany
Phone: +49-228-3894-0 Fax: +49-228-3894-180
E-mail: [email protected]
Any opinions expressed here are those of the author(s) and not those of IZA. Research published in this series may include views on policy, but the institute itself takes no institutional policy positions. The Institute for the Study of Labor (IZA) in Bonn is a local and virtual international research center and a place of communication between science, politics and business. IZA is an independent nonprofit organization supported by Deutsche Post World Net. The center is associated with the University of Bonn and offers a stimulating research environment through its international network, workshops and conferences, data service, project support, research visits and doctoral program. IZA engages in (i) original and internationally competitive research in all fields of labor economics, (ii) development of policy concepts, and (iii) dissemination of research results and concepts to the interested public. IZA Discussion Papers often represent preliminary work and are circulated to encourage discussion. Citation of such a paper should account for its provisional character. A revised version may be available directly from the author.

IZA Discussion Paper No. 3545 June 2008
ABSTRACT
The Racial Saving Gap Enigma: Unraveling the Role of Institutions
It has been well documented in the literature that ethnicity matters significantly in the determination of savings. In particular, African-American savings lag far behind savings for other ethnic groups. Similarly, the literature also provides evidence of the long-lived nature of institutions and the link between institutions and culture. In this paper, we provide an explanation for the savings gap that still exists between African-Americans and White Americans even after accounting for appropriate factors that can lead to savings differentials. We initially provide evidence that the savings gap exists and persist after including several control variables in a regression analysis. We then provide evidence that the persistent gap can not be attributed solely to racial discrimination but can be explained by the response of culture to institutional scaffolding erected many years earlier. Using a novel within race decomposition we provide evidence that past institutions transmitted through culture can help to explain this persistent saving disparity. JEL Classification: D14, D31, J15, J11, J71 Keywords: savings gap, institutions, race, culture Corresponding author: Ruth Uwaifo Oyelere School of Economics Georgia Institute of Technology 781 Marietta Street Atlanta, GA 30318 USA E-mail: [email protected]
1 Introduction and Background
North and Thomas (1973) define institutions as the formal and informal rules that govern human,
social, economic, and political interactions. They suggest that the rise of the western world occurred
because of the adoption of economic institutions which fostered economic growth through granting
and protecting property rights of individuals. More recently, Acemoglu, Johnson and Robinson
(2001, 2002) found ways to empirically test the impact of colonial institutions on the growth and
development of the modern industrialize world. They find that not only do institution matter for the
initial development and creation of economic growth but have long-lived impacts on down stream
outcomes in terms of social, economic, and political well being of societies. More specifically, they
find that institutional difference across colonial powers help to statistically explain differences in
economic growth across former European colonies four-hundred years later.
If institutions have the long-lived lasting impact suggested by Acemoglu, Johnson and Robinson,
then it should be possible to examine the impact of historical institutions on modern social, political,
and economic outcomes in modern U.S. society. The American Slavery of the 1500s to 1800s and
modern social, economic and political outcomes in the African-American community, provide a
unique opportunity to examine the impact of institutions on downstream outcomes in a particular
community.
Our research examines the issue of saving in the African-American community relative that of the
majority community. Current research (see Altonji and Doraszelski (2002) and Gittleman and Wolff,
2000) suggest that after controlling for income, education and all other control variables that impact
saving, research continues to find that saving is significantly less among African-Americans relative to
Caucasian-Americans. This is a matter of concern for policy-makers and the future of the African-
American community as increased saving could lead to increased investment in homeownership,
education, and healthcare, which all tend to enhance the quality of life in the African-American
community.
To provide evidence of the impact of past institutions on current savings behavior of African-
Americans, we make use of data from the March Current Population Survey (CPS) derived from
2

Integrated Public Use Micro-data Series (IPUMS). First, we outline a simple model of how institu-
tions through their impact on culture can have intergenerational impacts on savings behavior. Based
on this simple model we develop testable hypotheses as to the impact of institutions on African-
American saving. In particular, we hypothesize that the institutional impact of the American en-
slavement of Africans created an intergenerational non-saving culture within the African-American
community i.e., African-Americans with similarly based African ancestry save less than compara-
ble Africans and/or African-American who were not exposed to American slavery. Using a simple
personal saving function similar to the Mincer earnings function, we first provide evidence of the ex-
istence of the, well documented, savings gap between African-American and Whites. Subsequently,
we decompose the racial variables into several categories differentiating African-Americans (Blacks)
who were exposed to American slavery indirectly through their enslaved ancestry, from those with
parents whose ancestry, in all likelihood, escaped the direct impact of American enslavement. This
novel decomposition allows us to examine the impact of past institutions on present outcomes.
Employing both the Tobit and OLS regression models and using White Americans with U.S. born
parents (WAUBP) as the reference group, we examine the relative savings behavior between Whites
with American born parents and other racial groups. To prevent problems of omitted variable bias
and provide consistent estimates we control for possible factors that could impact savings and/or
wealth accumulation.1 We generally find support for the hypotheses derived from our simple model,
however, our inability to observe accumulated wealth for all subgroups makes it impossible to find
substantial evidence in support of all model results. Based on our estimations, we find that there
is a substantial savings gap of (28%) between comparable WAUBP and African-Americans with
US born parents (AAUBP). In contrast, this negative gap is missing when we consider comparable
Blacks whose predecessors did not pass through American slavery. This result raises questions as to
difference in the saving behavior of Blacks with parents born in the United States relative to Blacks
with foreign born parents. Could there be an intrinsic difference in the behavior of the two groups
which is unrelated to the enslavement experience of African-American Blacks or does the institu-
tional experience of African-American Blacks who passed through the culture altering institution
1Some of the controls used are marital status , family size, region, employment status and gender.
3

of slavery, impact the saving behavior of their descendants two hundred years later? We address
this issue by first decomposing the White American race variable, as we do with African-American
Blacks. We find no difference in savings among comparable White American subgroups i.e., White
American with White American born parents save no differently than White American who are de-
scendants of recent immigrants. This finding provides sharp contrast to the similar decomposition
for Blacks as savings for AAUBP is 80% less than comparable Blacks whose ancestors did not pass
through American slavery. Second, we show that the savings difference between AAUBP and other
groups cannot be driven by differences in inheritance. Given that we control for other potential
factors that can lead to differences in savings across individuals and groups, our result suggest that
the savings gap is not characteristics of all Blacks. In addition, our results provide evidence that the
racial savings gap is linked in part to the impact of past institutions transmitted through culture.
Following the introduction the second section of this paper provides a short review of the liter-
ature related to wealth accumulation and race. In section 3 we highlight the data used and provide
arguments for the choice of savings proxies. Section 4 provides a simple model that develops a
relationship between institutions, culture and wealth accumulation. In section 5 we describe the
econometric approach and in a step by step format, outline the identification strategy, provide econo-
metric results and also offer robustness checks of key results. The final section contains a discussion
of inferences, recommendations, and conclusion.
2 Literature Review
The literature has clearly documented the disparity in savings/wealth accumulation between African-
Americans and Whites. However, the literature is much less clear as to why this disparity exist and
has persisted over time2. Recent research suggests that the cause of the disparity can not be traced
to a single specific dynamic but is a function of a number of social, economic, behavioral and in-
stitutional factors that impact the African-American community. More specifically, the literature
appears to focus on racial differences in consumption, education and knowledge, economic discrimi-
2Previous studies have investigated the sources of the Black/White wealth gap, including Blau & Graham (1990),Smith (1995), Avery & Rendall (1997), Menchik & Jianakoplos (1997) and Altonji and Doraszelski (2002). Thesepapers provide further insight but fail to fully explain the wealth accumulation gap.
4

nation, inheritance patterns, family size and make-up and broadly defined institutional experiences.
Charles, Hurst, and Roussanov (2007) argue that African-American and Hispanics tend to devote
a larger share of their expenditure bundle to visible goods than do comparable Whites. They ruled
out differences in preference functions across race and conclude that social status seeking models in
which conspicuous consumption is used to reflect a household’s economic position accounts for the
larger share of African-American and Hispanic expenditures on visible goods. Chiteji and Stafford
(1999) using PSID data, show that parental exposure of their children to financial options in the
market place significantly increase the likelihood that their children will hold transaction accounts
and stocks. Keister (2000) concludes that providing opportunities for low-income low-wealth house-
holds to invest in long-term sound financial assets and reducing barriers to education would go
along way in reducing the level of wealth inequality. Kofi and Hurst (2002) argue that homeown-
ership provides the foundation for wealth accumulation; however, after controlling credit proxies
and demographics, Black mortgage applicants are 73% more likely to be rejected than White ap-
plicants. This difference in treatment accounts for a significant portion of the difference between
Black and White homeownership and could shed light on the Black/White differences in wealth
accumulation. Menchik and Jianakplos (1997) using the National Longitudinal Survey of mature
men (NLS76) show that racial differences in the receipt of financial inheritance help to explain why
the average difference in wealth accumulation between black and white household is larger than the
average difference in income. After controlling for other factors that contribute to racial differences
in wealth they show that financial inheritance may account for 10% to 20% of the average difference
in black-white household wealth. Smith and Ward (1980) using panel data show that children are
found to depress savings for young families but tend to increase savings for marriages of duration
greater than five years. The decline in savings occurs because child birth acts to reduce female
labor force participation and in effect reduce household income. Keister (2000) using the National
Longitudinal Survey of youth 1979 cohort (NLS-Y79) finds that family size and family disruption in
childhood are negatively associated with wealth accumulation, portfolio behavior and wealth mobil-
ity in adulthood. Further, Keisters (2000) finds support for the resource dilution argument which
5

states that as family size increase in terms of siblings, finite resources are spread more thinly across
siblings i.e., each child benefits less from family material resources. The resource dilution literature
finds that increased number of siblings has a negative impact on educational attainment. Given the
positive relationship between educational outcomes and wealth accumulation, increased family size
may be negatively related to wealth accumulation and savings. Beverly and Sherraden (1999) is
the only available work which considers the savings impact of institutions. They argue that institu-
tional variables such as access to institutionalized savings mechanisms, targeted financial education,
attractive saving incentives and processes which facilitate savings are the reasons that the poor do
not save. More specifically, the literature is void of any research on the impact of institutions on
savings/wealth accumulation behavior across race.
North (1973) and (2005) defines institutions as the formal and informal rules which govern so-
cietal interactions. These rules represent the institutional scaffolding on which communities move
through time and provide context for understanding the basic legal, political, economic and social
paths of societal outcomes. When formal rules and processes are reinforced over time through re-
alization of predicted outcomes, they tend to become a part of the societal fiber leading to more
entrenched informal methodologies that impact culture. Culture tends to be long-lived as per-
spectives and perceptions of established outcomes become self-reinforcing and are passed from one
generation to the next through word of mouth and/or perceived fundamental truism. North (1990)
suggests that the establishment of a particular institution is generally focused on obtaining a specific
outcome, but in many cases, have unintended consequences that can lead to path dependence with
down-stream effects that could impact the long-term likelihood of societal success. North (1973) re-
veals that countries of 14th to 18th century Europe, had divergent economic paths because England
through the success of it’s parliament adopted institutions which were pro-growth and development
whereas the monarch of Spain adopted a more centralized pro-tax approach to governing. These
differences led to divergent growth paths as England became the most dominant world power during
the 18th century while Spain’s wealth and world-wide influence dissipated. Acemoglu, Johnson, and
Robinson (2001) and (2002) using North’s definition of institutions, have examined empirically the
6

impact of institutions on downstream outcomes in terms of economic growth across nation states.
They show that the establishment of colonial institution of the 14th century help to explain divergent
growth paths of former European colonies during the 1980s and 1990s. This research shows that not
only do institutions matter but their impacts are long-lived. If colonial institutions implanted during
the 14th century have been shown to impact the growth of former colonies some 300 to 400 years
later, then examining the institutional history of African-Americans may provide insights as to why
African-Americans given their income, education, and other demographics, tend to save less and/or
consume more visible goods at a much higher rate than their White counterpart. The American
slavery of the late 1500 through 1800s established enslaved Africans as property of their slave own-
ers. Given this fact, slaves could not legally own property or establish independent residence. These
facts leads one to believe that for African slaves, formal barriers existed preventing them from what
Sowell (1981) termed a “future orientation.” Sowell (1981) argues that this characteristic appears to
lead to a belief and behavior pattern that “sacrifices present comfort and enjoyment while preparing
for future success.” More formally, the fact that African-American enslavement lasted for almost
300 years, and given long-lived nature of the impact of institutions through cultural adaptation
and modification, could African-American exposure to American enslavement help to explain the
low saving and/or high visible goods consumption behavior found in the modern African-American
community?
3 Data
3.1 General Description of Datasets
To provide evidence of the indirect impact of institutions on African-American saving, we make use
of the March Current Population Survey (CPS) which is micro-data that provides information about
individual persons and households. The CPS is a monthly U.S. household survey conducted jointly
by the U.S. Census Bureau and the Bureau of Labor Statistics. We derive multi-stage stratified
samples of the CPS from IPUMS. The IPUMS-CPS data is available for 46 years (1962-2007). The
nature of our identification strategy requires that we use data from 1994-2002. We select this period
7

because of the existence of certain important variables which, in many cases, were not surveyed until
1994. For example, parents’ birth place is used as a control variable in our analysis but was not
available in the CPS before 1994. Similarly, post 2002 the coding for race changed significantly as
the variable that captures race was broken down into several subcategories making it more difficult
to easily identify groups of interest. Specifically prior to 2003, the number of race categories ranged
from 3 (white, negro, and other) to 5 (white, black, American Indian/Eskimo/Aleut, Asian or Pacific
Islander, and other). The three category breakdown of race was thought to be too simplistic and
was abandoned in 1988 for the more empirically useful five category breakdown. Beginning in 2003,
respondents could report more than one race, and the number of codes rose to 21 making it more
difficult to compare data prior to 2003 with data post 2003 with respect to race. Individuals who
classed themselves as Black previously could now identify themselves as biracial and similarly others
who identified themselves as White prior to this change could also claim multi-racial. One of the
advantages of using the CPS via IPUMS is it make cross-time comparisons using the March CPS
data more feasible as variables in IPUMS-CPS are coded identically or “harmonized” for 1962 to
2007.
3.2 Measuring Saving
Savings can be measured using different proxy variables. For most people, a significant portion of
accumulated wealth is in the form of savings accounts, certificates of deposit, money market funds,
bonds, treasury notes, IRAs, and other investments which pay interest.3 In this paper we focus
on these types of wealth accumulation and call it savings in a broad sense.4 We measure savings
using interest income for two reasons: First, the only data set that contains good estimates on actual
savings and other interest bearing investments is the Survey of Consumer Finances (SCF). However,
we cannot use this data set because it does not contain important race category variables needed
for identifying the impact of historical institutions. For example, the SCF collects data on race but
does not identify citizenship characteristic needed in our analysis. Further, it’s publicly available
3Note all these types of saving/ wealth accumulation have one thing in common, they pay interest.4For the rest of the paper, when we mention savings, we are referring to the part of wealth highlighted above.
8

data does not provide detailed racial categories. Second, though interest income simply indicates
how much pre-tax income the respondent received from interest producing accounts, it is strongly
correlated with actual saving.5 Given this correlation, interest income can be viewed as a reliable
proxy for savings.6
As robustness checks, section 6 provides a companion analysis where capital gains and income
from dividends are used as alternate proxies for saving. Dividend income is a much more narrow
definition of wealth accumulation and is define in IPUMS as the amount of pre-taxed income that
respondents received from stocks and mutual funds during the previous calendar year. Capital gain
represents the numerical pre-tax increase or decrease in the value of a capital asset that accrues
to an individual or tax-filing unit over the course of the previous calendar year. Capital gains also
includes profits from the sale of certain assets, this includes stocks and other investments, such
as investment property. This variable is not actually found through direct survey questioning of
respondents but comes from the Census Bureau’s tax model. For more information about the model
that generates values for individual or household capital gains, see the current population reports,
series P60-18RD produced by US census bureau.
3.3 Descriptive Statistics
Table 1 provides an over view of the data sample used in this research. The sample includes 1,296,606
records where 84.04% of respondent selected race as White, 10.4% as Black, 1.41% as American
Indian, Aleut or Eskimo, 3.63% as Asians of Pacific Islanders and 0.43% classify themselves as
Other. Table 2 provides a summary of mean household income and measures of wealth holding for
5The interest income variable we use captures how much pre-tax income (if any) the respondent received frominterest on saving accounts, certificates of deposit, money market funds, bonds, treasury notes, IRAs, and/or otherinvestments which paid interest (Source IPUMS). Hence, one can easily imagine a scenario where there is perfectcorrelation between this proxy and the actual size of savings from these sources.
6If we assume as is true in most cases that interest income is a percentage of the actual saving, using interestincome as a proxy for savings presents two interesting econometric challenges: First, most coefficient in the regressionwill be much smaller relative to their size if saving is measured directly. Secondly the standard errors are larger usingthe actual savings versus the interest income. These problems are not of significant concern since t statistics willremain approximately the same. The interpretation of the coefficients will be different to the extent that our resultswould refer to variation in interest income rather than savings. We deal with the problem of substantial difference incoefficients by using log of interest income. In this scenario, estimates on the independent variables using log interestincome and log savings should not be statistically different.
9

Table 1: Breakdown of Data by Race
Variable Observations
Black US born 127,617 9.77
White US born 998,205 76.40Black Naturalized 3,374 0.26White Naturalized 31,427 2.41
Black Foreign 6,163 0.47White Foreign 68,386 5.23
American Indian/Aleut/Eskimo 18,368 1.41Asian or Pacific Islander 47,487 3.63
Other (single) race 5,579 0.43
both Blacks and Whites across citizenship status. These measures are adjusted for inflation using
the GDP deflator with a base year of 2000. White U.S. born citizen and White naturalized citizen
tend to receive significantly more interest income, capital gains, and dividend income than do U.S.
born Blacks, naturalize Blacks, Black foreigners and White foreigners. This is not unexpected given
that income for Whites is on average 30% higher than average income for Blacks. However, the
interest income, income from dividends, and income from capital gains for Whites is on average four
times that of Blacks. This result reaffirms the finding of Menchik and Jianakoplos (1997) which
revealed that the White/Black average difference in household income is significantly smaller than
the average White/Black wealth difference.
4 Theoretical Framework: A Simple Model on the Role of Past
Institutions
Initially, we assume that all economic agents are endowed with a propensity to save θi. The propen-
sity to save is a function of culture (C), institutions (I), and other factors (X). We assume culture
is passed from one generation to the next through the family unit and following North (1990), we
assume that culture responds to formal and informal rules of societal behavior i.e., culture is a
function of institutions, [C=f(I)]. Since savings is a function of culture, the propensity to save θi is
passed on from one generation to the next via (C). We assume that in absence of any institutional
10

Table 2: Summary Statistics Race
Variable Interest income Capital Gain Dividend HH income
Black US born 247.42 429.15 101.49 32851s.e (2333.92) (3698.26) (1450.16) (24118.01)N 85837 85873 85873 114027
White US born 975.85 1123.54 494.92 44924.83s.e (4618.93) (7706.07) (3213.83) (25418.82)N 754346 754346 754346 869566
Black Naturalized 382.03 960.26 136.28 41495s.e (2864.95) (6476.48) (1158.39) (25328.88)N 3302 3302 3302 3025
White Naturalized 1066.02 1267.53 468.97 40503.76s.e (4946.27) (8654.41) (3326.58) (25444.01)N 30722 30722 30722 27498
Black Foreign 122.55 408.68 44.58 34779s.e (1212.33) (3730) (942.83) (23362.33)N 5557 5557 5557 5787
White Foreign 239.18 512.04 97.95 34473s.e (2283.51) (5146.58) (1335.09) (22967.3)N 61470 5146.53 61470 64353
impacts, economic agents in each country are forward looking, and are endowed with a culture of
saving (CS) for the future. If we consider only the savings aspect of culture, then institutional
incentives can drive agents to become savers i.e C=CS or non-savers C=NS. We also assume that
there is a disincentive to save τ that arises in wealthy countries where social programs exist to
provided assistance to agents who fail to provide for their long-terms existence. We also assume
that richer developed countries and/or developed countries with better market for credit, insurance
and retirement, have higher τ . We denote the effect of this disincentive to save as a reduction in
CS, hence, for an individuals in a developed country C = CS − τ . However, in developing countries
because of the existence of missing markets (like credit, insurance, retirement plans) this disincentive
is very small or nonexistent. For example no social security or pension plans exist for many people
in developing countries. Therefore, saving money in a bank or accumulating wealth over time is the
only way to prepare for retirement, i.e, we assume that for developing countries τ = 0. We also
11

assume τ = 0 for individuals in a developed country if C = NS. This assumption is reasonable since
C = NS provides the lower bound/extreme case of a nonsaving culture, hence, (S − τ) is always
strictly greater than NS implying NS − (CS − τ) < 0).
Given the assumptions above, let us consider the impact of slavery on African-American society.
Since the American slavery of the 1500 through the 1800s defined African slaves as property with
no legal right to accumulate wealth, a legal institutional barrier to save existed for African slaves.
Following North (1990), formal rules impact culture creating downstream outcomes that are self-
perpetuating long after the formal rule have been removed.
Assume initially that θA is an average African’s propensity to save prior to enslavement. Slavery
represents a negative institutional shock that impacts a proportion α of Africans. Hence slavery
divided Africans into two groups; African (A) who were not enslaved and Africans (AS) who were
enslaved. The enslaved Africans were forcefully moved to a wealthy country. From above we
know that θi = F (CS, I,X) hence for a given level of X and I at time t= period post slavery,
θAS = F (C = NS, I,X) < θA = F (C = CS, I,X). Implying that slavery through the impact of
legal institutions on culture, over time, removed a culture of savings, and replaced it with a culture
of non-saving.
If culture (C) is not passed on generationally, and we consider savings behavior across time and
generations, then African-Americans (AA) who are descendants of group AS (enslaved Africans)
from the recent past, should exhibit savings behavior similar to that of White Americans (WA)
with similar levels of X and I i.e., θAA = F (C = CS − τ, I,X) = θWA = F (C = CS − τ, I,X).7.
However, in our model we assume culture is passed down through generations, therefore, θAA =
F (C = NS, I,X) < θWA = F (C = CS− τ, I,X) for a given level of I and X. Also, in comparison to
African (A) with the same I and X, θAA = F (C = NS, I,X) < θA = F (C = S, I,X). Hence, culture
(C) can be partitioned into three groups: C1 = NS none saving culture, C2 = CS saving culture,
and a saving culture impacted by the disincentive arising from living in a rich country C3 = C2 − τ
where C2 > C3 > C1.
Based on the simple assumptions above, we formulate a simple economic model examining savings
7Recall we assume a τ > 0 in developed countries if C 6= NS
12
behavior in the U.S., at the micro level. We define the savings stock of individual j as Ωj. For
individual j, Ωj = G(θj ·ω,Z,D) where ω is equal to wage. This function implies that an individuals
savings stock is a function of the propensity to save multiplied by ω, a matrix of independent
variables impacting savings behavior, Z, and a factor of discrimination D.8 The variable D, takes on
a value of zero for Whites and a negative value for Non-Whites. Given Ωj is a function of θj and
θj = F (C, I,X) then, Ωj = G(F (C, I,X) · ω,Z,D).
Application of Model to the U.S. Labor Market Case
We apply the economic model described above to the U.S. labor market and develop testable hy-
potheses. The U.S. labor market consist of both foreigners and citizens. We define the group of
Blacks that live in the U.S. and have C=CS as not exposed Blacks (NEB) while we refer to Blacks
that live in the U.S. but have C=NS as group AA. For a given level of X, Z, and I, where the
intersection of X and Z is an empty set X a Z = ∅, consider U.S. labor market outcomes. We
assume that individuals who immigrate to the U.S. from developing country (LDC), maintain τ = 0
because of their prior LDC experience.9 These immigrants indoctrinate their American children
with a similar view through cultural exchange i.e., for their children τ = 0. Since U.S born children,
to immigrant parents, do not experience the missing markets in LDC, we assume that they do not
indoctrinate their own child in this regards, i.e grandchildren of immigrants acquire the disincentive
to save.
We also assume that individuals who immigrate to the U.S. from other developed country (DC)
have a lower or equal disincentive to save relative to U.S. citizens who have a τ > 0 [τDC 6 τUS].
Hence, τUS provides the upper bound in terms of saving disincentives.10 Similar to immigrants
from LDC, we assume that those from developed countries (DC) pass, on through culture, to their
children, the τ acquired from their homeland. However, their grandchildren acquire the τUS . Given
8Past research like Martin and Hill (2000) provide evidence consistent with the presence of statistical racial dis-crimination in the auto-credit market. Such discrimination can affect savings and we assume that Ω is a negativefunction of D.
9As mentioned earlier, poor developing countries do not have social programs to help economic agent who fail toprovide for their elderly years.
10It is reasonable to make U.S. the upper bound because She is among the wealthiest countries in the world and weassumed earlier that wealthier DC have higher τ .
13

these assumptions, if C=CS, all individuals with US born parents share the same τUS, however,
individuals with foreign born parents share their parents τ which is 0 for LDCs and greater than
0 for DCs. The only group of U.S citizens, whose parents are U.S. born but do not have τUS are
those who have a τ = 0 because C = NS.
Given our basic economic model above, we make predictions regarding savings in the U.S. la-
bor market and in the empirical part of this paper, we attempt to find evidence for these predictions.
Prediction I: Given that Ω = G(F (C, I,X) · ω,Z,D)
and CAA = NS < CWA = CS − τ
Since an increase in C leads to an increase in Ω
then ΩAA < ΩWA and ΩAA − ΩWA < 0.
Implying that for a given level of X, Z, D and I, savings stock of African Americans will be less than
White Americans.
Prediction II: As Ω = G(F (C, I,X) · ω,Z,D)
and CFW = CS − τ ≤ CWA = CS − τ , where FW is foreign White.
Then ΩWA 6 ΩFW
Implying that for a given level of X, Z, and I, savings of WA would be less than or equal to that of
FW. White WA saving stock would be less if the FW are from a developing country11. However the
same result could hold for Whites from developed countries if FW are from a developed country with
lower τ . Conversely if τ is similar for both countries then WA and FW from developed countries
should have similar savings behavior all other things being equal.
Prediction III: As Ω = G(F (C, I,X) · ω,Z,D)
given D > 0 for NEB and D = 0 for WA
if τ = 0 for NB then CWA = CS − τ < CNEB = CS,
11We assumed that developing countries have τ = 0
14

and ΩNEB T ΩWA.
Implying that for a given level of X, Z, and I, the stock of savings of NEB relative to WA will depend
on the impact of discrimination, D, on the value of NEB savings relative to the impact, τ , on WA.
If D and τ take on the same value, then there should be little difference in the savings across the
two groups ceteris paribus.
Prediction IV: Given that Ω = G(F (C, I,X) · ω,Z,D)
and DAA = DNEB where D > 0
as CAA = NS < CNEB = CS
then ΩAA < ΩNEB
Implying that for a given level of X, Z, D and I, the savings stock of African-Americans will be
less than that of NEB. Note, African-American were exposed to slavery and develop a non-saving
culture accounting for lower savings stock relative to immigrant Africans and their descendants who
were exposed to slavery. However, both groups are exposed to similar discrimination patterns that
would not account for the significant difference in savings across the two groups. This hypothesis
is the basis of our identification strategy in providing evidence as to the impact of past institutions
on savings of African-Americans. Figure one is an illustration of this. If slavery had no impact that
is transmitted through culture, then ΩAA = ΩNEB ceteris paribus.
5 Econometric Model and Results
Significant empirical evidence already exists which reveal a savings gap between Black and White
Americans. Blau and Graham (1990) note that after controlling for demographic factors and income
differences, three fourths of the saving/wealth gap between Blacks and Whites still remained unex-
plained. Initially, we provide evidence of this gap using a savings econometric model based on the
assumptions of our theoretical framework i.e., the stock of savings is a function of a set of variables
Ωj = f(θi · (ω), Z,D).12 Equation 1, our basic econometric model is a linear characterization of the
function above.
12A similar model is used by Chiteji and Stafford(1999) for wealth accumulation.
15
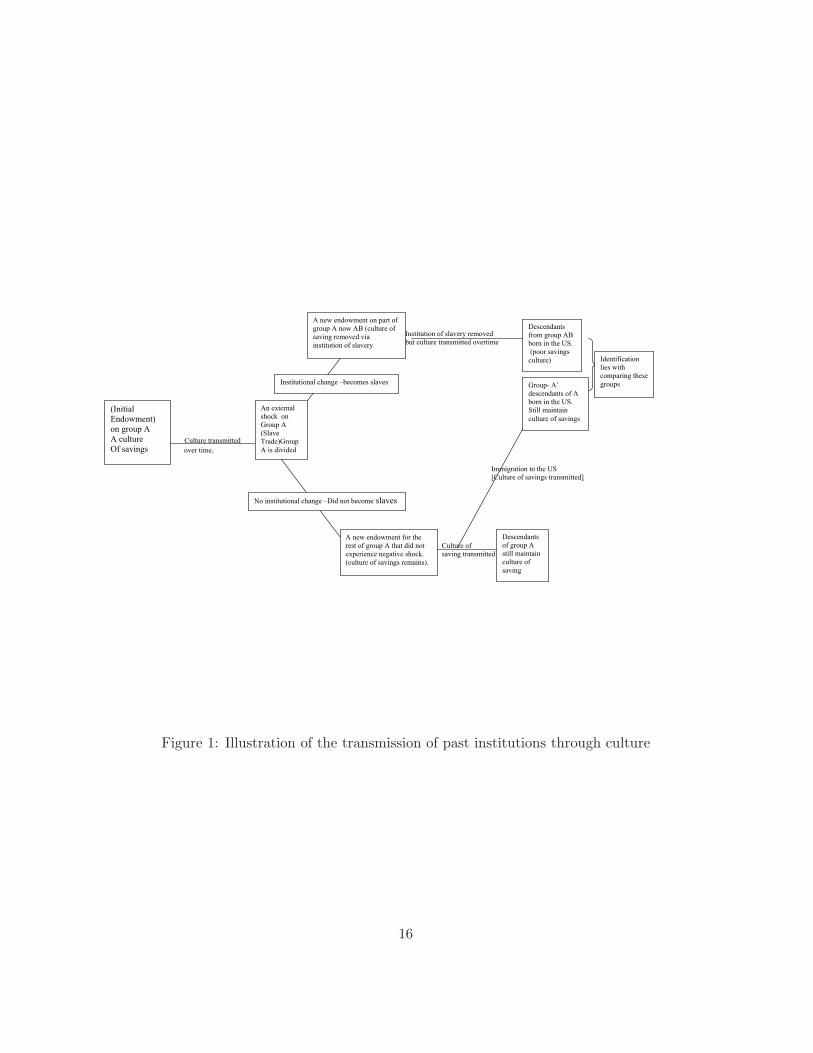
Institution of slavery removed
but culture transmitted overtime
Culture transmitted
over time.
Immigration to the US
[Culture of savings transmitted]
Culture of
saving transmitted
An external
shock on
Group A
(Slave
Trade)Group
A is divided
A new endowment on part of
group A now AB (culture of
saving removed via
institution of slavery
Institutional change –becomes slaves
No institutional change –Did not become slaves
A new endowment for the
rest of group A that did not
experience negative shock.
(culture of savings remains).
Descendants
from group AB
born in the US.
(poor savings
culture)
Descendants
of group A
still maintain
culture of
saving
Group- A’
descendants of A
born in the US.
Still maintain
culture of savings
Identification
lies with
comparing these
groups
(Initial
Endowment)
on group A
A culture
Of savings
Figure 1: Illustration of the transmission of past institutions through culture
16

Ω = α + γX + δF + βR + θW + ǫ (1)
In equation (1) we use interest income as a proxy for, Ω (stock of savings), α the constant term,
X is a matrix of variables affecting savings, F is a matrix of relevant dummy variables including
year but excluding race related variables, R is a matrix of race related dummy variables, W is wage
and is deflated and ǫ is the error term. Initially, we estimate this model using OLS and control for
potential heteroskedasticity. Note in section 6, we address the potential problems of OLS when data
is censored by using a Tobit model. Table 3 provides the results from OLS estimation of equation
(1), where the racial dummy variables are Asian, American Indian and Eskimo, Black and Other.13
In this regression Whites are the baseline for comparison. The variables in matrix F are dummies
for marital status, year fixed effects, and employment status. The matrix X contains schooling, age,
sex, number of children, and age squared. In the regression summarized in column (1) of Table 3,
we include the log of wages as an independent variable because of the critical role of wages in the
saving, investment, and ultimate wealth accumulation decisions. There is however, two potential
problems with this variable: First wages may not be independent of the savings, decisions. Wages
affect savings and savings could impact future wage decisions.14 Second, by including wages we
restrict the dataset to those who worked in the previous calendar year and exclude those who did
not, potentially creating a selection bias.15 Excluding wages from the model may deal with some of
the potential biases highlighted, however, this exclusion could reduce the explanatory power of the
model or create other biases (omitted variable bias). Hence, we present results with and without
the wage variable throughout the paper. We also include personal weights when estimating all the
regressions because the CPS uses a complex stratified sampling scheme, and weight must be used
to produce unbiased results.
13We do not interpret any result for the racial group, Other, as this category does not provide any clear information.Since the CPS allows the selection of Other by any surveyed person, this category contains any number people fromvarious racial group who choose not to identify their race.
14Meaning that including wages as a regressor can create a simultaneity bias.15Assigning zero wages for these individuals who are not working and including them in the analysis may not solve
this problem but can creates other specification and estimation problems. For example some of those with zero wagesare retired and live on pension while others are unemployed and live on government /welfare support.
17

Results of Table 3 confirms previous evidence noted in the literature and is consistent with our
first prediction (Prediction 1). After controlling for standard variables that could impact savings,
we find a substantial difference in savings for Whites and Blacks. The results of Table 3 suggest
that Blacks, with similar levels of education, age, and number of children generally save 36% less
than comparable Whites. This result is similar to the findings of Ariel Capital Management LLC
and Charles Schwab Corp which in their examination of investing habits of African-Americans who
earn more than $50,000 per year, find that African-Americans have far less money invested in
retirement accounts than do Whites. The median amount invested for Blacks is $59,000, whereas
White median investment is $93,000 representing a 36% difference across race. Results in Table
3 reveal that when we do not control for wages, the savings gap increases to about 43%. All the
variables in the saving equation of Table 3 have the expected signs and given that the estimated
equation produces results similar to those found in the saving/wealth accumulation literature, the
question still remains as to why the difference in saving behavior across race remain after including
traditional accepted control variables. We hypothesize that these differences may be attributed to
the impact of past institutions transferred through culture on saving behavior of African-Americans
over time. In the sections below, we examine the potential impact of past institution on the savings
of African-Americans in detail.
5.1 Searching For the Impact of Institutions
5.1.1 Do Foreign Black and U.S. Black save similarly?
Consistent with previous literature, we find a gap between White and Blacks saving behavior using
equation 1. We know, however, that not all Blacks are American citizens, therefore we partition
the sample into two groups, Blacks who are American and Foreign Blacks (FB). In a similar fashion
we partition Whites into those who are American and those who are Foreigners (FW). Could the
partitioning of our sample by race and place of birth, provide more information on the impact of
institutions on culture and ultimate saving behavior patterns of Blacks and Whites over time? FB
are newcomers to the U.S. so its most unlikely that they are descendants of American slaves and
could potentially have acquired the nonsaving culture described in our model. Therefore, if our
18

model is consistent, we should observe differential saving behavior between U.S. Black and FB.
Specifically, FB should save more than American Black all things being equal. In addition, if racial
discrimination has a strong negative effect on saving, and the disincentive to save brought on by
living in a wealth country has a smaller effect, FB should save less than WA or FW but still more
than American Blacks. However, if exposure to American slavery is immaterial then savings for FB
and American Blacks should be similar but less than FW or WA, all other thing being equal. To
examine these issues we estimate equation 2 where Ri are dummy variables: R1 ∼FB, R2 ∼ FW,
R3 ∼ U.S Black, R4 ∼American Indian, R5 ∼ Asian and R6 ∼ Other. The baseline comparison
group is WA.
Ω = α + γX + δF +6∑
i
biRi + θW + ǫ (2)
Table 4 columns (1) and (2) provides estimation results of equations 2. Contrary to our initial
prediction, we find that FW savings is 22% less than WA. The result for American Blacks relative
to FB also appears to be counter to our prediction as the coefficient for American Blacks is larger
than the coefficient for FB though not statistically different. At first glance, the result seems to
indicate Blacks whether Foreign or American save much less than Whites. This contradictory result
is not of particular concern since the dataset that we are using only captures part of Foreign Blacks’
saving. According the World Bank 2007 report, the U.S. ranks first in remittances with a lion share
of World Wide remittances of ($42.2 billion). Developing countries including those in Africa and the
Caribbean represent a significant portion of recipients of these remittances as developing countries
received 75% of all remittances worldwide.16 We note that countries within Africa, where most
Black immigrants originate, though a small number of immigrants relative to other parts of the
world, received remittance of $10.8 billion. This finding on remittance suggests that comparisons
between coefficients associated with FB, U.S. Blacks and WA cannot provide reliable comparisons of
relative savings across the groups. Moreover, there are other variables that we do not observe that
could differentiate these two groups and bias our estimates. Take for example language skills and
16For more information on the data set from these numbers are calculated see http ://go.worldbank.org/NN93K4Q420
19

legal restrictions placed on noncitizen in term of opportunities that could increase or decrease the
probability of saving. It is however of significance to note, that though we only observe a portion
of savings for FB, the econometric model result reveals no statistical difference in the saving stock
between this group and U.S. Black. Finally, finding that FB save less than any group of Whites
does not raise concern. As the theory suggest, lower savings for this group could indicate significant
racial discrimination in the market place and a low disincentive to save for Whites.
5.1.2 Are we Analyzing Whites the Right way?
Examining savings for FW relative to WA provides similar challenges to comparing FB to U.S.
Blacks in that savings for FW are not completely observed in the U.S. The results in Table 4
columns (1) and (2) reveal that FW savings is 23% less than U.S. Whites. Similar to the results for
FB, this difference may reflect savings and/or remittance back to the country of origin. An alternate
argument for this gap is that FW are from countries that are more wealthy than the U.S and would
save less because wealthier DC posses a higher disincentive to save. Since the U.S. GDP per capita
remains one of the highest in the world this argument is unlikely. The world ranking of the U.S.
in term of wealth, provided the underpinning for the models assumption that the U.S. provides the
upper bound for the saving disincentive. Hence, if FW saved only in the U.S., we should observe
savings for FW equal or greater than White American. We do not observe this result in columns
(1) and (2) of Table 4, suggesting that FW on average save outside the U.S. and similar to FB, do
not make a good comparison group.
Note that, unlike FB who are generally from developing countries, FW are from both developed
(FWDC) and developing countries (FWLDC). Given this difference in the makeup of FW, is it
possible that FWDC save more in the US and remit less than their counterparts from LDC? This
may be true because the level of development and institutional arrangement across DC are more
similar than across DC and LDC countries. Hence, FWDC are more likely to save a larger share in
the U.S. than FWLDC. Therefore savings shares in the U.S. for FB and FWLDC may be similar
but different from FWDC. We estimate equation (3) to test for this difference, dividing FW into
FWLDC and FWDC.
20

Ω = α + γX + δD +
7∑
i
biRi + θW + ǫ (3)
In equation (3) R1 ∼FB, R2 ∼ Black US citizen, R3 ∼ American Indian, R4 ∼Asian, R5 ∼Other,
R6 ∼FWLDC and R7 ∼ FWDC. Table 4 columns (3) and (4) reveal that FWDC and U.S. Whites
tend to save in a similar fashion while FWLDC do not. A direct implication of this result is that
FWDC save more in the U.S. than their counterparts from developing countries.17 This result
is consistent with the World Bank 2007 remittance data, which notes that high income OECD
remittances receipt are less than 1/3 of developing countries’ receipt. Similar savings for FWDC
and WA noted in Table 4 is compatible with our theory’s prediction (prediction 2). A possible
interpretation of this result is that FWDC save in the U.S. and share similar disincentives to save
as U.S. Whites.18 Columns (3) and (4) of Table 4 provide evidence that FWLDC saving is 36% less
than U.S. Whites but tend to save similarly to FB. The simple explanation is that they both save
in their country of origin and we only observe a portion of their savings in the U.S.
We find evidence to support the hypothesis that U.S. Blacks save differently than do WA and
FWDC. These preliminary results reveal little about the impact of institutions on African-American
saving. However, this analysis has provided evidence, that foreigners do not make good comparison
groups for U.S. Blacks or Whites given our inability to completely observe savings behavior for
foreigners.
5.2 Could the answers lie in those who are Naturalized?
To investigate the role of institutions in explaining the savings gap, we need to identify two groups
with similar characteristics who face similar challenges in the U.S. labor market. The only difference
between these groups should be that one group’s predecessors experienced American slavery and
the other did not. Hence, one group is exposed to the savings culture created by American slavery
through cultural heritage while the other is not. The first possible alternative is to sub-divide our
17Another more unlikely scenario is that FWDC save equally at home and abroad but save so much more thaneveryone else leading to similar savings for this group and U.S Whites. Though this scenario is consistent with ourhypothesis, there is no anecdotal evidence consistent with this possibility.
18It is possible that in reality that U.S whites actually save less than FWDC and we only observe similar savingsbecause we do not view a part of FWDC savings. This possibility is consistent with Prediction 2: ΩWA 6 ΩF W .
21

sample of Blacks into two groups those who are U.S. born African-American and those who were
born elsewhere and have become naturalized citizens19. Using this decomposition and employing
OLS, we estimate equation (4) and as with all previous regressions, the robust standard errors are
derived. Though Naturalized American Blacks (NAB) and American born Blacks shared the same
African origin, there is a high probability that NAB predecessors were not American slaves. Hence,
NAB have a high probability of not being exposed to the cultural impact of American slavery. Given
that both groups are American citizens, and are likely to face similar challenges in the labor market,
including discrimination, NAB may provide a reasonable comparison group.
Ω = α + γX + δF +
9∑
i
biRi + θW + ǫ (4)
In equation (4) R1 ∼ FB, R2 ∼FWLDC, R3 ∼ FWDC, R4 ∼Black U.S. born, R5 ∼ Naturalized
American Whites (NAW), R6 ∼NAB, R7 ∼American Indian, R8 ∼Asian and R9 ∼Other.
Table 5 provides a summary of the results of the savings regression where the decompositions
of Blacks and Whites into naturalized citizens verses U.S. born citizens are added to the model.
The results reveal no saving differences among NAW, FWDC, and U.S. born Whites. This result is
not unexpected, however, the results for NAB is unexpected as a comparison of coefficients reveal
that relative to the U.S. born Whites, there is no significant difference in the savings gap of NAB
and U.S. born Blacks as both groups tend to save about 38-39% less than U.S born Whites. If our
model is correct, all else held constant, NAB should save in a fashion similar to U.S. born Whites
and greater than U.S. born Blacks who were impacted culturally.20 This result, though inconsistent
with our model is explainable but raises a few questions: First, do naturalized citizens represent the
best comparison group for the purpose at hand? Second, do we observe complete savings behavior
of naturalized citizen? The answer to the first question is not independent of conditions imposed
by the second. While there is a high probability that NAB are not descendants of American slaves
19We also do similar decomposition for U.S Whites. We refer to this group as Naturalized American Whites (NAW).20We expected if the model is correct that NAB would save more than black U.S. born and either less or more
than White Americans depending on the size of the disincentive to save for Whites and the discrimination factorexperienced by NAB. We assume that NAB have a τ = 0 implying that Blacks are from developing countries. Whilenot all Blacks are from developing countries most are so it is safe to make this assumption.
22

and hence, should not exhibit the cultural impact describe in our model, NAB are general from
developing countries. As most NAB become U.S. citizen post 30 years of age, they tend to maintain
a financial presence in both the U.S. and their country of origin21. In effect, the data does not
capture a complete picture of the saving behavior of naturalized citizens. Since citizenship is not an
instantaneous process, in most cases the uncertainty associated with obtaining citizenship creates
a significant incentive for citizenship seekers to preserve ties in the country of origin enhancing the
probability that U.S. financial data may not reflect the complete savings picture.22
5.3 Identifying the Impact of Culture
Given the identification problems with NAB relative to U.S. born Blacks, to obtain a decomposition
that could shed light on the impact of institutions on savings behavior of African-American Blacks,
we must identify two groups within the African-American community, who have a high probability
of saving in the U.S. but one of the two groups has been impacted by American slavery through
the cultural heritage.23 Using the notion that culture is long-lived and passed to future generation,
we decompose the U.S born sample in a novel way, by parental origin. Parent origin implies that
we partition the sample into those whose parents were foreign born and those whose parents are
U.S. born. Specifically, we partition U.S. born Blacks into those whose parents are U.S. born and
have likely been impacted by American Slavery via the cultural channel, and parents of the second
group are identified as foreign born, either FB or NAB, and are much less likely to be descendants
of American slaves. Implicit in this identification strategy is the North-Acemoglu, Johnson, and
Robinson notion that institutions influence culture and culture is long-lived, impacting downstream
behavior and outcomes long after institutions have been changed or discarded. If the institution
21Under certain strict conditions, some naturalized may be the comparison group we want. The subgroup ofnaturalized Blacks who could be a good comparison group category are those who grew up in the U.S. and becamenaturalized U.S. citizen at a very early age and began saving in the U.S. Unfortunately, the dataset does not provideinformation on when individuals became naturalized citizen.
22Note that after getting a permanent resident status, which can take up to 5 years post school, individual have towait an average of five years to become citizens.
23If American Slavery institutions reduced or removed the culture of savings, then when we compare these twosimilar groups, we should find a significant difference in savings all other conditions being equal. Similarly, holding allother factors fixed, we expect AAFBP to save more or less than Whites. If we find that AAFBP save more (dummycoefficient of group positive and significant), then the impact of discrimination D is less than the disincentive to saveτ . If we note the opposite, the inference is simply the reverse and if both are equal then both effects cancel each other.
23

of American slavery has impacted downstream saving behavior of African-Americans in the North-
Acemoglu, Johnson, and Robinson sense, then we should find differential savings behavior when
comparing the behavior of African-Americans with U.S. born parents (AAUBP) to African-American
with foreign born parents (AAFBP).
For completeness and further evidence of our thesis we define other groups apart from NAB and
FB. There are many Africa-Americans with just one foreign born parent: African-American with
Foreign Born Mothers (AAFBM) and African American with Foreign Born Fathers(AAFBF).24
AAFBP are the only valid comparison group for AAUBP because AAFBM and AAFBF are more
likely to have been exposed to the savings impact of American slavery from their American born
parent. It is important to mention that these individuals may not exhibit this negative savings
culture if they lived with the parent who was foreign born or if the foreign born parent had more
bargaining power in the household, with respect to cultural transfer/resource allocation. Since we
have no information in this regard, we are less concerned about results for AAFBM and AAFBF.
Moreover, our theoretical model does not inform a forecast of the impact of such a cultural mix on
savings behavior.
We estimate equation (5) which captures the decompositions discussed above.
Ω = α + γX + δF +
15∑
i
biRi + θW + ǫ (5)
In equation 5 R1 ∼ AAFBM ,R2 ∼ AAFBF, R3 is our variable of interest-AAFBP, R4 ∼
AAUBP, R5 ∼ WAFBP, R6 ∼ WAFBM ,R7 ∼ WAFBF, R8 ∼ FB, R9 ∼ FWLDC, R10 ∼ FWDC,
R11 ∼ NAW R12 ∼ NAB, R13 ∼ American Indian, R14 ∼ Asian and R15 ∼ Other. Note in this
analysis the baseline for comparison is White American with US born parents (WAUBP).
The results of the OLS analysis using racial decompositions discussed above are found in Table
6. We find that there is no statistical difference in the savings behavior of AAUBP, AAFBM,
AAFBF, FB and NAB. Given that we do not observe full savings for FB and NAB we ignore these
24We also decompose White Americans in a similar way for consistency sake and also as a further prove to thevalidity of our identification strategy and results. White American with Foreign Born Parents (WAFBP), WhiteAmerican with Foreign born Mothers (WAFBM) and White American with Foreign Born Fathers (WAFBF).
24

two categories. However, the results point to a similar savings gap for AAUBP, AAFBM, AAFBF
in comparison to WAUBP. In contrast we find that AAFBP actually save more than the baseline
group, WAUBP and about 80% more than other African-Americans (AAUBP, AAFBM, AAFBF).
The higher savings of AAFBP than other African-American is consistent with the fourth prediction
of our model. The higher savings of AAFBP relative to WAUBP is consistent with the model’s third
prediction and suggests that though the negative effect of discrimination (D) occurs, the negative
effect of τ may be larger. Through the regression analysis, we attempt to control for other factors
that lead to differential savings behavior across groups. If we are able to successfully do this, then
the AAFBP and AAUBP we compare should be identical but for the cultural impact on one group.
In this case, by comparing estimated dummy coefficients for AAFBP and AAUBP, we find support
for the thesis that the impact of the institution of slavery is long-lived and can help explain the
savings gap between White American and African Americans.
6 Robustness Checks
Could statistical regularities identified by this research be random artifacts of the data arising from
poor model specification i.e., a failure to control for possible variables that could impact savings?
Below we show that after adding other control variables suggested in the literature, as well as
changing the modeling strategy all statistical results remain in tact. In addition to control variables
already in the model, we add other variables including those identifying the region of the country
where survey participant live and whether or not an individual works for government. Some have
argued that many Blacks work for government because of the certainty associated with the receipt
of a government retirement, reducing the need to save for retirement. We also include dummies for
an individual’s birth cohort and a dummy for homeownership. In section 5 we mention the potential
problem we might face using OLS given the censored nature of the dataset. In the CPS, actual income
related observations above certain upper threshold are not revealed. Therefore, we only observe a
fixed upper limit for observations on interest income and wages above the threshold. In addition, all
income related variables are nonnegative. These two restrictions, create a cluster at both the top and
25

bottom of the distribution for income variables in the data. In reality, it is possible for an individual
to have negative savings as a person could have a positive balance on a credit card along with savings
of zero. We do not observe negative savings in our data set, hence, the data is left censored at zero.
Using OLS in the face of censored data could lead to biased estimates providing unreliable results.
To provide a robustness check and to manage the potential censored data problem, we re-estimate
our econometric models using a Tobit modeling strategy. Table 7 columns (1) and (2) provides OLS
estimation results of equation (5) including the additional controls highlighted earlier. Columns (3)
and (4) provide Tobit results for equation (5) with similar controls as the OLS regression. The
Tobit results confirms earlier OLS findings which suggest that institutions and culture may help to
explain the savings gap between Blacks and Whites. The Tobit estimates are general higher than
OLS results for most variables, however, variables that are statistical significant remain the same
across modeling strategies. Though there are no statistical significant changes in estimates for most
variables, there are a few interesting changes in the size of the coefficients that should be noted.
First, the gap in savings between WAUBP and African-American with one or two U.S. born parents
(AAUBP, AAFBM, AAFBF) has decreased implying that including additional control variables may
have been useful in obtaining better results. We note also that coefficients associated with AAFBM,
AAFBF, AAUBP, and FB are, as in the OLS results, all statistically similar in size. Once again
AAFBP tend to save more than WAUBP and save more than AAUBP. More specifically, results
suggest that, all other things being equal, AAFBP savings is 87% higher than AAUBP. A potential
argument can be made that there maybe something unique about the savings behavior of Americans
with foreign born parents that is unrelated to our argument surrounding institutions and culture.
If this argument is valid then WAFBP should save more than WAUBP. Table 7 provides evidence
to the contrary, when we include wages in the model, we find that WAFBP save less than WAUBP.
However, if we exclude wages from the model there is no significant difference in savings across the
two groups. This result for Whites contrasted with AAFBP saving more than AAUBP, suggests
that the savings gap, between AAUBP and AAFBP, is not linked to being an American with foreign
born parents.
26

In earlier results, before including additional control variables, we found no significant difference
in the saving of Asian relative to U.S. born White. This result is contrary to anecdotal evidence
that points to Asians saving more than other racial groups in the U.S. However, after including
additional controls variables we find that Asians savings is (7%) higher than WAUBP. This result is
consistent across OLS and Tobit modeling strategies and with the findings derived from micro-and
macroeconomic analysis suggesting higher savings in some Asian countries. (See Kraay (2000) for
the Chinese case).
Upon examination of results in Table 7, it is possible to argue that the difference in the size of the
coefficient associated with WAUBP and AAFBP appears implausible high relative to the difference
in WAUBP and the Asian coefficient. Interestingly, there is no statistically significant difference
between the coefficients on Asian and AAFBP though there values seem to be quite different (0.068
and 0.598 using OLS and 0.07 and 0.61 using the Tobit model ). More careful examination of both
OLS and Tobit results reveal that the standard errors and the confidence intervals associated with
the AAFBP dummy are large relative to those associated with the Asian variable. The results of the
model suggest that both Asians and AAFBP save more than WAUBP but both groups save similarly.
We note that the Asian result is consistent with our stylized model suggesting that immigrants from
developing countries may save more than other groups because they lack the disincentive to save
that is found in more wealthy countries.25
The results of this research appear robust, however, one could argue, as with most research, that
the results are a function of omitting an important variable from our model. One such variable is
innate ability and/or training. Much of the immigration research suggests that high ability and/or
well trained individuals are more likely to migrate. Since ability and education are correlated, the
inclusion of education as a control variable in our model helps address the high ability/training
argument. Controlling for education in our model allows comparison of individuals with similar
education levels and given the correlation between education and ability, we implicitly address the
ability argument. Furthermore, there is little evidence which suggest that all immigrants are of high
25It could be that Asian American with US born parents save similarly to WAUBP and our findings are driven byAsians with foreign born parents. This is an interesting possibility but is beyond the scope of this paper.
27

ability as many immigrants especially from developing countries come to the U.S. as refugees of war
seeking asylum or through family reunification. If the immigrant high ability argument is true then
we should observe the same increased savings behavior for WAFBP in comparison to WAUBP. Our
results in Table 7 provides no evidence to this effect, WAFBP save similarly as WAUBP.
Our identification of the impact of the institution of American slavery on culture is based on
the premise that there is no reason apart from the institutional shock transmitted through culture
as to why AAUBP and AAFBP should save differently if WAUBP and WAFBP save similarly all
other conditions held constant. However, a potential argument is that though this result reflects
the indirect impact of the institution of American slavery on savings, the channel is not culture
but inheritance. That is AAUBP have less savings not because they do not save similar to com-
parison groups, but rather have less inherited wealth. Less inheritance can be linked, in part to
their ancestors enslavement with no capacity to acquire wealth. This argument implicitly assumes
that AAFBP have significant inheritance similar to WAUBP. A rationale for this argument could be
that AAFBP are more likely to be from high skilled families and hence receive larger inheritance.
Although we do not discount the potential importance of inheritance in creating and perpetuating
a savings gap, this argument does not explain our results. Menchik and Jianakplos (1997) show
that after controlling for other factors that contribute to racial differences in wealth, financial inher-
itance may account for only 10% to 20% of the average difference in Black-White household wealth.
Implying that there is still a large unexplained portion of this gap which we attempt to address in
this paper. In addition, Altonji and Doraszelski (2002) results suggests that little of the difference
between Whites and Blacks in the effect of income on wealth is due to differences in inter vivos
transfers and inheritances. Moreover, there is no evidence that AAFBP have high inheritance since
most black immigrants come from developing countries with poorly defined property rights, low
income, corrupt governments and high levels of poverty. Even if we argue that the more educated
migrate, we cannot argue that those who are wealthy immigrate, in fact, in most African countries
it is the struggling educated middle class and not the wealthy ruling class who immigrate.26 Hence,
26As Uwaifo (2007) noted, return to education is really low in some African countries and might explain the braindrain from many African countries.
28

assuming that AAFBP have significant inheritance similar to WAUBP and differ from AAUBP has
no bases. Given that AAFBP parents generally immigrate from developing countries, it is more
plausible to assume that AAUBP and AAFPB have similar inheritance or that AAFBP have less.
The issue of inheritance would not exist if our dataset allowed us to control for inheritance but it does
not. Nevertheless, a unique way to test whether these results are driven by inheritance or culture
is to compare savings for AAUBP, AAFBP, AAFBM and AAFBF, all other thing being equal. If
inheritance and not culture explains our results, then savings of AAFBM, AAFBF, AAFBP, should
be similar. In contrast, savings of AAUBP should be less than these three groups. The rationale is
that all African-Americans who have an immigrant parent received inheritance while AAUBP were
less likely to receive inheritance resulting in a lower saving stock. However, if our results are linked
to culture, then AAUBP, AAFBP and AAFBF should have similar saving behaviors because each
of these group have at least one parent who was culturally impacted. Table 6 provides evidence
for culture versus inheritance, we find that their is no savings gap among AAUBP, AAFBF and
AAFBM but these groups save less than AAFBP.27
A final robustness check, we examine alternative measures of stock of saving; dividend income
and income from capital gains. Dividend income measures only income from stocks and mutual
fund which along with capital gains represents only a small portion of the wealth accumulation
portfolio for many individuals. Given the small coverage of savings provided by dividend income
and capital gains and the fact that most survey participants had zero capital gains, our unique
race decomposition could be more noisy and results subject to selectivity bias.28 Despite these
limitations, it is interesting to see if results change drastically when employing less inclusive proxies
for savings. Table 8 provides both OLS and Tobit results. Focusing on the Tobit results in column
(5), we find that the signs associated with most of the race dummy coefficients are similar to earlier
results but interestingly, most coefficients are non-significant. There appears to be no differences in
saving from dividend income when comparing AAUBP and WAUBP.29We do however, see a large
27The similarity of the saving gap for AAUBP, AAFBM, AAFBF is also confirmed using the Tobit model andadditional controls in Table 7 although the AAFBF coefficient is only significant at levels lower than 95%.
28Individuals select into owning mutual fund and stocks.29It is possible that comparable WAUBP and AAUBP who select into owning mutual funds and stocks are receiving
similar income from their investment in stock and mutual funds but the issue might be that many comparable AAUBP
29

difference in wealth from dividend income when we compare AAFBP to WAUBP. In fact, when using
dividend income as a savings proxy, AAFBP performs significantly better than all other sub-groups.
When using capital gains as the savings proxy, we find that AAUBP have lower savings from
capital gains than WAUBP. However, there is no statistical difference between the wealth from
capital gains for AAFBP, WAUBP, and WAFBP. This result is consistent with our stylized model
where we hypothesized that the savings stock for AAFBP could be less, greater, or equal to the
saving of WAUBP, depending on the size of the discrimination factor and the disincentive to save
from living in a rich country.30 The capital gains savings proxy provides an interesting check of
our results even though there are many limitations to using this variable. Capital gains represent
profit or loss resulting from the sale or the increase in value of a capital asset as classified by federal
income tax legislation. Further, we must keep in mind that this variable does not come from direct
questioning of survey participants, but was constructed by Census Bureau’s tax model. Despite
the limitation of this variable, it is encouraging that we observe similar trends using capital gain
as interest income. The findings from Table 8 reveal that the gap between AAUBP and other
comparable groups is real. Second, here as in Table 7, though comparable WAFBP and WAUSP
are identical in their capital gain and dividend, AAFBP and AAUBP are not and the relevant
question is why? Our answer is that given the otherwise identical nature of these groups but for an
institutional shock to one groups ancestors, there is only one explanatory factor, the negative effect
of American slavery on a culture of savings that is enduring.
7 Conclusion and Recommendations
Our stylized model provides a few testable results. First, savings of African Americans who are
descendants of slaves should be less than comparable US born White Americans given the saving
altering culture of slavery. We find evidence of this result in all tables highlighted earlier. Our
second prediction states that the savings of White US citizens should be less than or equal to White
foreigners in the U.S. The savings of White Americans is less if compared to White foreigners from
might not be selecting into this form of investment at all.30We notice some of the other sub-groups like FWLDC and FWDC have higher capital gain. We do not have any
particular explantation for this result and this finding could simply be as a result of the narrow proxy for saving used.
30

a developing country or to those from a developed country with a lower disincentive to save. We
are unable to find concrete evidence supporting this hypothesis in our data set as most foreigners
are saving elsewhere especially those from developing countries. Large scale remittances provide
clear evidence of this behavior. If we focus solely on White foreigners from developed countries,
it is possible to argue that this group is more likely to save in the U.S. Our results suggest that
immigrants from DCs remit less and keep more of their stock of savings in the U.S. while there
counterparts from developing countries remit more to their home country keeping less in America.
Since we find no saving gap between comparable foreign Whites from developed countries and White
Americans, this result provides suggestive evidence of a similar disincentive to save in the U.S. and
other developed countries.
Our third prediction suggests, other things being equal, saving of Blacks not exposed to the
cultural impact of American slavery, should be equal to White Americans if the dollar effect of
discrimination is equal to the dollar effect of the disincentive to save resulting from living in a rich
country. If the effect of discrimination is profound, we should find Whites have higher savings than
unexposed Blacks, ceteris paribus. Similarly, if the dollar effect of the disincentive to save is greater
than the dollar effect of discrimination, saving of unexposed Blacks should be higher than that of
comparable American Whites. We find evidence for this prediction if we focus on a part of this
group who are most likely saving in the U.S. because they were born here, AAFBP. As AAFBP
save more than White Americans, our result suggest that the negative effect of discrimination on
savings might be less than the disincentive to save effect.
The fourth result from our stylized model leads to our identification strategy which suggests that
the negative institutional shock of American slavery, through its impact on culture, altered the saving
behavior of the descendants of slaves. Hence, African-Americans who are descendants of African who
were taken as slaves should save less than comparable African-Americans, who are not descendants
from slaves, ceteris paribus. AAFBP are the valid comparison group because it is unlikely there
is any historical/intrinsic difference between AAFBP and AAUBP but for the institutional shock
affecting AAUBP. Using Tobit and OLS modeling strategies, we find evidence that support our
31

hypothesis. We provide supporting evidence for our identification of the impact of past institutions
on savings by decomposing White Americans in an identical fashion as African-Americans (WAFBP
WAUBP), noting no difference in savings patterns between these groups.
In summary, Table 7 captures our preferred specification and results from the Tobit model.
Our results suggest that the saving gap widely documented and unexplained in the literature does
not apply to all Blacks, in particular, AAFBP. When considering African-Americans whose recent
ancestors were not exposed directly or indirectly to the culture derived from the slavery experience,
we do not observe a saving gap. Given that African-Americans who were directly and/or indirectly
exposed to American slavery and AAFBP who were likely not exposed share the same ethnic heritage
and face similar labor market challenges, the only difference between comparable members of these
groups is exposure to American slavery. Our research suggest that the difference in saving behavior
across these two groups may be attributed to the culture altering institution of slavery.
Why are these results important? If the notion that slavery created a non-saving culture among
African-Americans, and has been transmitted over time through the African American community,
then there is need for intervention to attenuate or remove this negative culture from this group.
If we think about slavery as a negative shock that has enduring impacts then there is need for
a countering positive shock to the African-American community. Although our main goal is to
create awareness of the impact of past institutions on economic decisions today, we hope this results
creates a dialogue on how to change this culture. Specifically, programs aimed at incentivizing this
community to save would help but awareness through the education process as early as possible is
key and may lead slowly lead to a cultural change.
32

References
[1] Acemoglu, D., S. Johnson and J.A. Robinson (2001) The Colonial Origins of Comparative
Development: An Empirical Investigation. American Economic Review 91(5): 1369-1401.
[2] Acemoglu, D., S. Johnson and J.A. Robinson (2002) Reversal of Fortune: Geography and
Institutions in the Making of the Modern World Income Distribution, Quarterly Journal of
Economics 117(4): 1231-1294.
[3] Avery, R., and M. Rendall(1997) The contribution of inheritances to black.white wealth dis-
parities in the United States,. Board of Governors of the Federal Reserve System, working
paper.
[4] Joseph G. Altonji and Ulrich Doraszelski (2002) The Role of Permanent Income and Demo-
graphics in Black/White Differences in Wealth Economic growth center Yale University Center
discussion paper NO. 850.
[5] Beverly, S.G., and M. Sherraden.(1999) Institutional Determinants of Saving: Implications for
Low- Income Households and Public Policy. Journal of Socio-Economics 28: 457–73.
[6] Blau, F., and J. Graham (1990) Black.White differences in wealth and asset composition,.
Quarterly Journal of Economics, Vol. 105, No. 2, pp. 321.339.
[7] Charles, Kerwin Kofi, Erik Hurst, Nikolai Roussanov (2007)Conspicuous Consumption and
Race NBER Working Paper No. 13392.
[8] Charles Yuji Horioka and Junmin Wan (2007) The Determinants of Household Saving in China:
A Dynamic Panel Analysis of Provincial Data Journal of Money, Credit and Banking, , vol. 39,
issue 8, pages 2077-2096
[9] Chiteji and Stafford (1999). Portfolio Choices of Parents and Their Children as Young Adults:
Asset Accumulation by African-American Families. AEA Papers and Proceedings, May.
Findings and Challenges October 17, 2002; Revised, April 13, 2005
33

[10] Gittleman, Maury and Wolff, Edward N(2000), Racial Wealth Disparities: Is the Gap Closing?
Levy Economics Institute Working Paper No. 311.
[11] Keister (2000) Family Structure, Race, and Wealth Ownership: A Longitudinal Exploration
of Wealth Accumulation Processes (July 2000). Levy Economics Institute Working Paper No.
304. Available at SSRN: http://ssrn.com/abstract=240274 or DOI: 10.2139/ssrn.240274
[12] Kofi Kerwin Charles and Hurst Erik (2002) The Transition to Home Ownership and the Black-
White Wealth Gap. The Review of Economics and Statistics, Vol. 84, No. 2, pp. 281-297.
[13] Kofi Kerwin Charles, Hurst Erik Nikolai Roussanov (2007)Conspicuous Consumption and Race
NBER Working Paper No. 13392.
[14] Kraay (2000) Household Saving in China, The World Bank Economic Review, September 2000;
14, 3.
[15] Menchik, Paul L & Jianakoplos, Nancy Ammon (1997)Economic Inquiry, Volume XXXV, Num-
ber 2, April
[16] Martin, Robert E., and R. Carter Hill (2000) , Loan Performance and Race, Economic Inquiry
38(1), January 2000, Pp. 136-50.
[17] North, Douglass C. and Robert Paul Thomas (1973), The Rise of the Western World: A New
Economic History. New York: Cambridge University
[18] North, Douglass C. (2005) Understanding the Process of Economic ChangePrinceton, N.J.:
Princeton University Press, 2005. xi + 187 pp
[19] North, Douglass C. (1990) Institutions, Institutional Change, and Economic Performance. New
York: Cambridge University Press Press, 1973. viii + 171 pp.
[20] Douglass C. North, Where have we been and where are we going? in Ben-Ner and Putterman,
1998 (reference above) chapter 19.
34

[21] Smith, J. and M. Ward. (1980) Asset accumulation and family size. Demography 17(3):243-260.
[22] Smith, J., (1995)Smith, J., 1995, .Racial and ethnic differences in wealth in the Health and
Retirement Study,. Journal of Human Resources, Vol. 30, Supplement, pp. S158.S183.
[23] Sowell, Thomas(1981) Ethnic America (New York: Basic Books, 1981).
[24] Sowell, T. (1991). Cultural Diversity: A World View. American Enterprise, 2 (3), p. 44-55.
[25] Sowell, T. (1994). Race and Culture: A World View. New York: Harper Collins, Basic Books.
[26] Squires, Gregory D. and Sally O’Connor (1998). 1998. Fringe Banking in Milwaukee: The Rise
of Check Cashing Businesses and the Emergence of a Two-Tiered Banking System,. Urban
Affairs Review 34(1): 126-163.
[27] Uwaifo, Ruth (2007)Africa’s Education Enigma? The Nigerian Story. IZA WP3097
[28] World Bank (2008) Migration & Remittances Factbook 2008. World Bank Publication.
[29] World Bank (2007) Remittance Trends 2007. World Bank Publication. November 2007
March 2008report
35
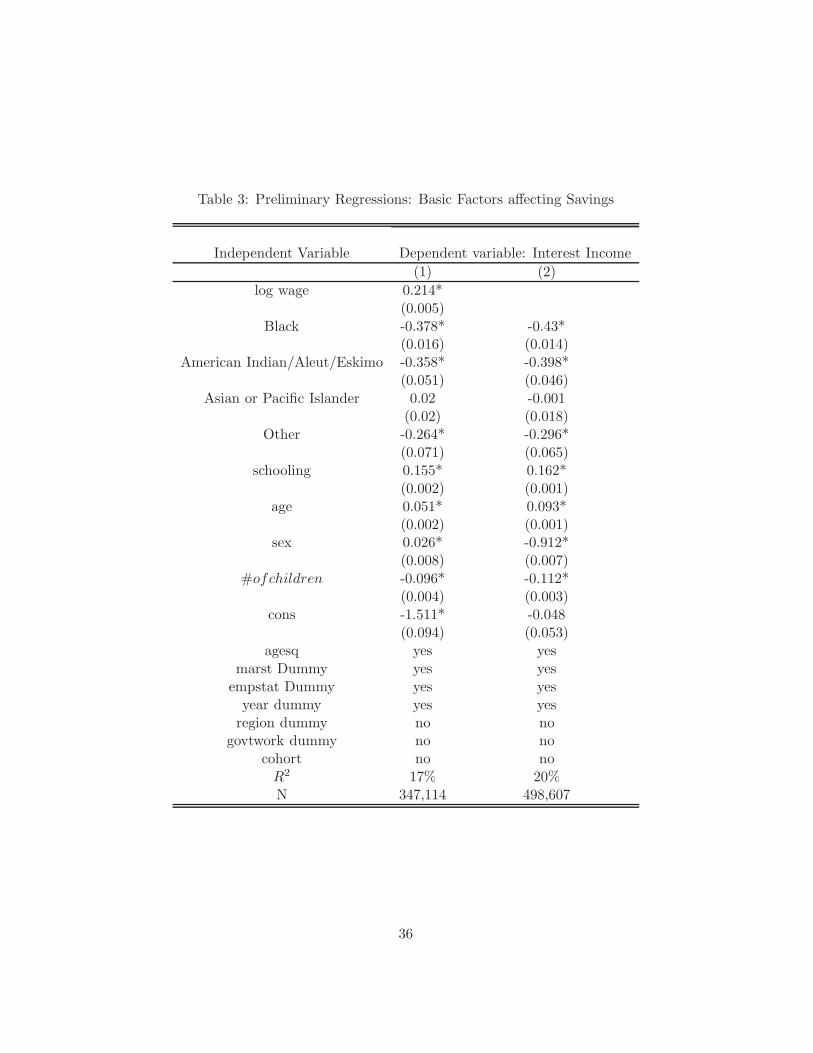
Table 3: Preliminary Regressions: Basic Factors affecting Savings
Independent Variable Dependent variable: Interest Income
(1) (2)
log wage 0.214*(0.005)
Black -0.378* -0.43*(0.016) (0.014)
American Indian/Aleut/Eskimo -0.358* -0.398*(0.051) (0.046)
Asian or Pacific Islander 0.02 -0.001(0.02) (0.018)
Other -0.264* -0.296*(0.071) (0.065)
schooling 0.155* 0.162*(0.002) (0.001)
age 0.051* 0.093*(0.002) (0.001)
sex 0.026* -0.912*(0.008) (0.007)
#ofchildren -0.096* -0.112*(0.004) (0.003)
cons -1.511* -0.048(0.094) (0.053)
agesq yes yesmarst Dummy yes yes
empstat Dummy yes yesyear dummy yes yes
region dummy no nogovtwork dummy no no
cohort no noR2 17% 20%N 347,114 498,607
36

Table 4: Preliminary Regressions: Does being Foreign or from a Developing country Matter
Variable: Dependent Variable: Interest income(1) (2) (3) (4)
log wage 0.214* 0.214*(0.005) (0.005)
Foreign Black -0.421* -0.493* -0.422* -0.494*(0.067) (0.061) (0.067) (0.061)
Foreign White -0.223* -0.244*(0.022) (0.0198)
U.S. Black -0.383* -0.435* -0.384* -0.435*(0.016) (0.014) (0.016) (0.015)
American Indian/Aleut/Eskimo -0.367* -0.405* -0.367* -0.406*(0.051) (0.046) (0.051) (0.046)
Asian 0.014 -0.008 0.014 -0.008(0.02) (0.018) (0.019) (0.018)
Other -0.272* -0.305* -0.274* -0.307*(0.071) (0.065) (0.071) (0.065)
educ99 0.154* 0.161* 0.153* 0.161*(0.002) (0.001) (0.002) (0.001)
age 0.051* 0.092* 0.051* 0.093*(0.002) (0.001) (0.002) (0.001)
sex 0.025* -0.092* 0.023* -0.093*(0.008) (0.007) (0.008) (0.007)
no. child -0.095* -0.111* -0.094* -0.109*(0.004) (0.003) (0.004) (0.003)
cons -1.495* -0.037 -1.48* -0.026(0.094) (0.053) (0.094) (0.053)
Foreign white LDC -0.3603* -0.398*(0.026) (0.023)
Foreign White DC 0.074 0.06(0.042) (0.036)
age sq yes yes yes yesregion no no no no
govtwork no no no nocohort no no no no
R2 18% 20% 18% 20%N 347114 347114 498607 498607
Dummies for Marital status, year of data and employment status are included.
37

Table 5: Preliminary Regressions: Adding the Naturalized
Variable: DependentInterest Income (1) (2)
Dependent Variable: Interest Incomelog wage 0.214*
(0.005)Foreign Black -0.421* -0.494*
(0.067) (0.061)Foreign White LDC -0.36* -0.398*
(0.026) (0.023)Foreign White DC 0.074 0.0603
(0.418) (0.036)Black U.S. Born -0.383* -0.435*
(0.017) (0.015)Naturalized American White 0.018 0.012
(0.023) (0.019)Naturalized American Black -0.393* -0.434*
(0.065) (0.061)American Indian/Aleut/Eskimo -0.366* -0.406*
(0.051) (0.046)Asian 0.015 0.008
0.12 0.018Other -0.274* -0.306*
(0.071) (0.065)educ99 0.153* 0.161*
(0.002) (0.001)age 0.051* 0.093*
(0.002) (0.001)sex 0.024* -0.093*
(0.008) (0.007)no of children -0.094* -0.11*
(0.004) (0.003)cons -1.48* -0.026
(0.094) (0.053)agesq yes yesyear yes yes
region no nogovtwork no nocohort no no
R2 18% 20%N 347114 498607
Dummy variables include marital status, employment status, year fixed effects.38

Table 6: Main Regression: Identifying the Impact of Culture
Dependent Variable: Interest Income (1) (2)
log wage 0.214*0.005
AA with foreign born Mother (AAFBM) -0.448* -0.433*0.181 0.163
AA with foreign born Father (AAFBF) -0.354* -0.330.177 0.177
AA with foreign born parents (AAFBP) 0.65* 0.6*(0.28) (0.262)
AA with US born parents (AAUBP) -0.385* -0.436*(0.017) (0.015)
WA with foreign born parents (WAFBP) -0.032 -0.093*(0.04) (0.031)
WA with foreign born mother(WAFBM) -0.005 0.044*(0.024) (0.021)
WA with foreign born father (WAFBF) 0.051* 0.082*(0.024) (0.019)
Foreign Black (FB) -0.42* -0.489*(0.065) (0.061)
Foreign White (FWLDC) -0.358* -0.393*(0.026) (0.023)
Foreign White DC (FWDC) 0.076 0.065(0.042) (0.036)
Naturalized American White (NAW) 0.019 0.018(0.023) (0.019)
Naturalized American Black (NAB) -0.391* -0.429*(0.065) (0.061)
American Indian/Aleut/Eskimo (AAE) -0.364* -0.401*(0.051) (0.046)
Asian 0.016 -0.003(0.019) (0.018)
Other -0.272* -0.302*(0.071) (0.065)
education 0.153* 0.161*(0.001) (0.001)
sex 0.024* -0.093*(0.008) (0.007)
constant -1.483* -0.032(0.094) (0.053)
Controls: Marital Status, age square, Employment status, year dummy, children, age
39

Table 7: Main Regressions with more Control Variables(OLS VS TOBIT)
Variables OLS Tobit(1) (2) (3) (4)
Dependent Variable: Interest Income
log wage 0.237* 0.239*(0.005) (0.005)
AAUBP -0.278* -0.332* -0.278* -0.331*(0.017) (0.015) (0.017) (0.016)
Foreign Black -0.248* -0.295* -0.244* -0.292*(0.067) (0.061) (0.068) (0.062)
AAFBP 0.599* 0.541* 0.609* 0.549*(0.279) (0.26) (0.286) (0.265)
A/A/E -0.26* -0.304* -0.27* -0.316*(0.051) (0.046) (0.051) (0.047)
Asian 0.068* 0.059* 0.07* 0.062*(0.02) (0.018) (0.02) (0.018)
Other -0.143* -0.167* -0.158* -0.184*(0.071) (0.064) (0.073) (0.066)
Naturalized White 0.022 0.03 0.021 0.03(0.023) (0.019) (0.023) (0.019)
Naturalized Black -0.353* -0.373* -0.353* -0.371*(0.064) (0.06) (0.065) (0.081)
Foreign White LDC -0.186* -0.212* -0.193* -0.219*(0.026) (0.024) (0.027) (0.024)
Foreign White DC 0.127* 0.128* 0.13* 0.132*(0.042) (0.036) (0.042) (0.036)
WAFBP 0.004 -0.064* 0.004 -0.065*(0.04) (0.031) (0.04) (0.031)
education 0.164* 0.174* 0.165* 0.176*(0.002) (0.001) (0.002) (0.001)
sex 0.063* -0.067* 0.064* -0.067*(0.008) (0.007) (0.008) (0.007)
WAFBM -0.005 0.047* -0.004 0.048*(0.025) (0.021) (0.0248) (0.021)
WAFBF 0.043 0.072* 0.041 0.072*(0.024) (0.019) (0.024) (0.019)
AAFBM -0.352* -0.328* -0.357* -0.328*(0.178) (0.16) (0.183) (0.164)
AAFBF -0.294 -0.276 -0.302 -0.283(0.179) (0.177) (0.183) (0.18)
Controls: Marital Status, age, age square, region dummy, own a home, year dummy, Employmentstatus, government worker, cohort dummy, age squared, own home, number of children,
40

Table 8: Main Regressions (OLS VS TOBIT) :Robustness Checks
Variable: OLS TobitDep. Var.: Div. Inc. Dep. Var: Capital Gain Dep Var: Dividend Inc. Dep. Var.: Capital Gain
(1) (2) (3) (4) (5) (6) (7) (8)log wage 0.133* 0.532* 0.134* 0.532*
(0.008) (0.008) (0.008) (0.008)AAUBP -0.047 -0.066 -0.1* -0.131* -0.047 -0.67 -0.1* -0.131*
(0.038) (0.035) (0.013) (0.015) (0.039) (0.035) (0.011) (0.015)FB -0.07 -0.178 -0.058 -0.18* -0.066 -0.174 -0.058 0.18*
(0.161) (0.152) (0.051) (0.063) (0.161) (0.152) (0.051) (0.063)AAFBP 1.54* 1.307* 0.116 0.288 1.538* 1.304* 0.116 0.288
(0.57) (0.5) (0.2) (0.249) (0.57) (0.499) (0.2) (0.249)A/A/E 0.09 0.033 -0.088* -0.134* 0.087 0.03 -0.088* -0.134*
(0.103) (0.089) (0.037) (0.043) (0.104) (0.09) (0.037) (0.043)Asian 0.019 0.028 -0.002 0.014 0.02 0.03 -0.002 -0.14
(0.039) (0.034) (0.019) (0.022) (0.039) (0.034) (0.019) (0.022)Other 0.117 0.089 0.006 0.015 0.125 0.095 0.006 0.015
(0.219) (0.196) (0.081) (0.094) (0.223) (0.199) (0.081) (0.094)NAW 0.038 0.063 -0.019 0.024 0.037 0.063 -0.018 0.024
(0.045) (0.034) (0.022) (0.023) (0.045) (0.035) (0.022) (0.023)NAB -0.197 -0.199 -0.166* -0.194* -0.198 -0.2 -0.166* -0.194*
(0.153) (0.141) (0.056) (0.057) (0.157) (0.144) (0.056) (0.056)FWLDC 0.23* 0.189* 0.062* 0.007 0.23* 0.189* 0.062* 0.007
(0.083) (0.071) (0.022) (0.026) (0.084) (0.072) (0.022) (0.026)FWDC 0.005 0.03 0.122* 0.16* 0.007 0.032 0.122* 0.16*
(0.077) (0.067) (0.036) (0.043) (0.077) (0.067) (0.036) (0.043)WAFBP -0.134 -0.093 0.029 -0.037 -0.136 -0.094 0.029 -0.037
(0.072) (0.054) (0.039) (0.037) (0.072) (0.054) (0.039) (0.037)education 0.119* 0.13* 0.067* 0.134* 0.12* 0.131* 0.067* 0.134*
0.003 0.003 0.002 0.002 0.003 0.003 0.002 0.00235.46 50.76 36.91 85.74 35.41 50.66 36.93 85.78
WAFBM 0.072 0.065 0.042 0.061* 0.072 0.065 0.042 0.061*(0.046) (0.037) (0.025) (0.025) (0.046) (0.037) (0.025) (0.025)
WAFBF 0.084* 0.074* -0.031 0.001 0.085* 0.074* -0.031 0.001(0.041) (0.032) (0.022) (0.022) (0.041) (0.032) (0.022) (0.022)
AAFBM -0.356 -0.302 0.049 -0.051 -0.353 -0.3 0.049 -0.051(0.328) (0.311) (0.123) (0.168) (0.327) (0.31) (0.126) (0.168)
AAFBF -0.732 -0.652 -0.159 -0.2 -0.728 -0.648 -0.159 -0.2(0.419) (0.345) (0.142) (0.148) (0.419) (0.345) (0.142) (0.148)
R2 8% 11% 54% 37% 2% 2.5% 25% 14%N 110,648 157,539 53,685 70,790 110,648 157,539 53,685 70,790
Controls: Marital Status, age, age square, region dummy, own a home, year dummy, Employment status,government worker, cohort dummy, age squared, own home, number of children,sex
41