Unraveling the Underlying Heavy Metal Detoxification ... - MDPI
Upload
khangminh22Category
view
1download
0

Unraveling the genetics of Botrytis cinerea resistance in
Gerbera hybrida
Yiqian Fu

Thesis committee Promotor Prof. dr ir R.G.F. Visser Professor of Plant Breeding Wageningen University & Research Co-promoter Dr P.F.P. Arens Researcher, Wageningen Plant Breeding Wageningen University & Research Dr ir J.M. van Tuyl Senior Scientist, Wageningen Plant Breeding Wageningen University & Research Other members Prof. dr ir E.J. Woltering, Wageningen Food & Biobased Research Dr J.A.L. van Kan, Wageningen University Prof. dr ir G.H. Immink, Wageningen University Dr ir N. de Vetten, Dekker Chrysanten B. V., Hensbroek This research was conducted under the auspices of the graduate school Experimental Plant Sciences.

Unraveling the genetics of Botrytis cinerea resistance in
Gerbera hybrida
Yiqian Fu
Thesis
Submitted in fulfilment of the requirements for the doctor degree
at Wageningen University
by the authority of the Rector Magnificus
Prof. dr A.P.J. Mol
in the presence of the
Thesis Committee appointed by the Academic Board
to be defended in public
on Monday 19 June 2017
at 11 a.m. in the Aula

Yiqian Fu Unraveling the genetics of Botrytis cinerea resistance in Gerbera hybrida 160 pages PhD thesis, Wageningen University, Wageningen, NL (2017) With references, with summary in English ISBN: 978-94-6343-181-1 DOI: 10.18174/413048

5
Content
Chapter 1 General introduction 9
Chapter 2 Transcriptome analysis of Gerbera hybrida including in
silico confirmation of defense genes found 23
Chapter 3 Genetic mapping and QTL analysis of Botrytis resistance in
Gerbera hybrida 47
Chapter 4 The use of a candidate gene approach to arrive at Botrytis
resistance in Gerbera hybrida 69
Chapter 5 Two candidate genes, ghPG1 and ghsit, contribute to
Botrytis resistance in Gerbera hybrida 105
Chapter 6 General discussion 125 References 137
Summary 149
Acknowledgments 153
Curriculum Vitae 157
Education Statement of EPS 158

6

7
This thesis is dedicated
to my dearest grandmothers, Yanzhen Kang and Sumei Zhu, who grew the Magnolia, Rosa, Rhododendron, Camellia, Osmanthus in my heart.

8

9
Chapter 1 General introduction
Chapter 1 General introduction
10
1
The genus Gerbera that currently includes about 42 accepted species (Flann 2009) belongs to the Compositae (Asteraceae) family in the tribe of Mutisieae. Most species in this genus are distributed in Africa and Asia (Hansen 1985; Tseng 1996). The generic name Gerbera was established in 1737 after the German medical doctor Traugott Gerber (Hansen 1985), and is well-known to people since the commercial gerbera hybrid has been consistently ranked among the top 5 of most used cut flowers worldwide (Hansen 1999; Tourjee et al. 1994). In 2014, a total number of 1,890 million gerbera stems were sold at the Dutch Flower Auctions (FloraHolland 2015) and the annual quantity of gerbera sold in the USA domestically in 2015 was about 106 million stems based on the statistics of 15 states (USDA 2016).
Origin of Gerbera hybrida
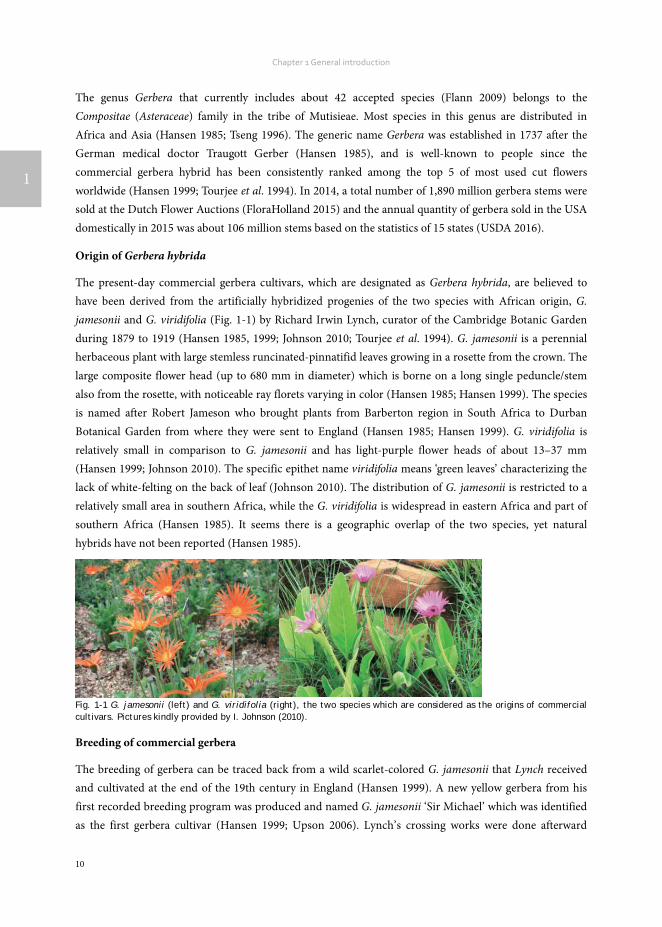
The present-day commercial gerbera cultivars, which are designated as Gerbera hybrida, are believed to have been derived from the artificially hybridized progenies of the two species with African origin, G. jamesonii and G. viridifolia (Fig. 1-1) by Richard Irwin Lynch, curator of the Cambridge Botanic Garden during 1879 to 1919 (Hansen 1985, 1999; Johnson 2010; Tourjee et al. 1994). G. jamesonii is a perennial herbaceous plant with large stemless runcinated-pinnatifid leaves growing in a rosette from the crown. The large composite flower head (up to 680 mm in diameter) which is borne on a long single peduncle/stem also from the rosette, with noticeable ray florets varying in color (Hansen 1985; Hansen 1999). The species is named after Robert Jameson who brought plants from Barberton region in South Africa to Durban Botanical Garden from where they were sent to England (Hansen 1985; Hansen 1999). G. viridifolia is relatively small in comparison to G. jamesonii and has light-purple flower heads of about 13–37 mm (Hansen 1999; Johnson 2010). The specific epithet name viridifolia means ‘green leaves’ characterizing the lack of white-felting on the back of leaf (Johnson 2010). The distribution of G. jamesonii is restricted to a relatively small area in southern Africa, while the G. viridifolia is widespread in eastern Africa and part of southern Africa (Hansen 1985). It seems there is a geographic overlap of the two species, yet natural hybrids have not been reported (Hansen 1985).
Fig. 1-1 G. jamesonii (left) and G. viridifolia (right), the two species which are considered as the origins of commercial cultivars. Pictures kindly provided by I. Johnson (2010).
Breeding of commercial gerbera
The breeding of gerbera can be traced back from a wild scarlet-colored G. jamesonii that Lynch received and cultivated at the end of the 19th century in England (Hansen 1999). A new yellow gerbera from his first recorded breeding program was produced and named G. jamesonii ‘Sir Michael’ which was identified as the first gerbera cultivar (Hansen 1999; Upson 2006). Lynch’s crossing works were done afterward

Unraveling the genetics of Botrytis cinerea resistance in Gerbera hybrida
11
1
between these G. jamesonii individuals and also with G. viridifolia, which was introduced to England earlier. Interspecific hybridization of the two species could generate completely fertile offspring with new color combinations and hybrids were found more easily to grow (Hansen 1999).
However, the specimen of G. viridifolia used for the first hybridization experiments perished and the hybridizations later on were mainly performed by backcrossing with G. jamesonii or crossings among the hybrid offspring (Hansen 1999; Tourjee et al. 1994; Upson 2006). Although G. viridifolia was involved in the commercial gerbera more or less, G. jamesonii is therefore considered as the primary contributor (Hansen 1999). It might be the reason G. hybrida was often referred to as G. jamesonii, even in scientific publications nowadays (Baas et al. 1995; Bhatia et al. 2011; Caballero et al. 2009; Gantait et al. 2011; Minerdi et al. 2008; Nhut et al. 2007). Seeds from the pioneering work of Lynch were distributed to different places and breeders (Hansen 1999; Tourjee et al. 1994). After getting the hybrid plants and seeds from Lynch’s stock, a gardener named Adnet in France made 2,700 crosses and created a fourth-generation population with about 25,000 seedlings, which varied in color (Tourjee et al. 1994). Breeding was subsequently done in Italy, Belgium, and the Netherlands by crossing the wild gerbera directly from South Africa with the processed materials probably also obtained from Lynch directly or indirectly (Hansen 1999; Tourjee et al. 1994). Meanwhile, growers in Europe and US also made efforts for the gerbera hybrids to become adapted to and survive in new climates, for instance by acquiring cold hardiness, by using horticultural techniques (Tourjee et al. 1994).
Gerbera was identified as a commercial crop in the US around 1930 and there were already commercial gerbera growers in the Netherlands in 1951 (Tourjee et al. 1994). Breeding gerbera as a commercial crop faced new challenges. A breeding project was started in 1963 at IVT (former Institute for Horticultural Plant Breeding, Wageningen), aiming to introduce resistance against o the soil-borne fungus Phytophthora cryptogea into the commercial gerbera when plant production switched to glasshouses (Sparnaaij and Lamers 1971; Sparnaaij et al. 1975). Gerbera cut flowers with high quality, like longer vase life, were also preferred by customers. Gerbera vase life was counted from the first one or two circles of disc florets showing pollen to when stem folded or petals wilted (de Jong and Garretsen 1985). Van Meeteren (1978a, b, 1979a, b, 1980) researched quite intensively the relations between water content and gerbera flower quality after cutting. Besides the physiological and pathogenic reasons, the shortened vase life could be explained by genetic variance as well and selecting parents with strong stem could reduce the problem (de Jong 1978; de Jong 1986; de Jong and Garretsen 1985). A gerbera Davis Population was produced from random mating in the 1970s and was initially created to increase the yield (Drennan et al. 1980; Harding et al. 1981b). Plants in each generation with the highest yield were chosen as the parents of the next generation. Harding et al. (1981b) found that the averaged broad-sense heritability of gerbera yield was 42% and concluded that most genetic variance was additive and selectable. Except the yield, vase life and consumer preference were also used as selection indices for parents for each generation (Drennan et al. 1980; Harding et al. 1981a; Harding et al. 1981b; Harding et al. 1985; Harding et al. 1987).
Using classical breeding methods, breeding for improvement of some specific traits in gerbera, like disease resistance, is not easy. Gerbera breeders are confronted with several restrictions of these artificial hybrids: it is an outcrossing crop with high degree of genetic variability and thus highly heterozygote for most

Chapter 1 General introduction
12
1
characteristics for which there is an interest; high self-incompatibility with noticeable inbreeding depression etc. (Barigozzi and Quagliotti 1979). To overcome some of these barriers, Jenkin carried out a recurrent selection program for gerbera in 1940 to eliminate lethal and sub-lethal genes to prevent inbreeding depression and reduced survival and fertility in offspring; and by doing this he found that the fertility (seed production) of certain genotypes increased after only one generation (Schiva 1979). Since inbreeding depression makes F1 hybrid development difficult, Hondelman suggested making a sib crossing to render the crop more homogenous (Harding et al. 1981b).
With the early success of tissue culture in gerbera by using rhizome (Leffring 1971), midrib (Pierik and Segers 1973), capitulum (Pierik et al. 1975; Pierik et al. 1973) and shoot tip (Murashige et al. 1974) as explants, several alternative breeding methods combined with this in vitro technique have been applied to improve gerbera. Jain et al. (1998) reviewed several technologies, which could be used to produce genetic variability in breeding options for gerbera improvement:
- mutagenesis to induce mutations on flower morphology or color by X-ray or gamma ray irradiation and chemical (EMS) mutagens (Laneri et al. 1989; Walther and Sauer 1986); - production of haploids by in vitro culture of unfertilized ovules or anthers (Ahmim and Vieth 1986; Cappadocia et al. 1988; Cappadocia and Vieth 1990; Gidrol et al. 1984; Preil W et al. 1977; Sitbon 1981); - production of doubled haploid homozygous lines or tetraploids from chromosome doubling using colchicine; (Miyoshi and Asakura 1996; Tosca et al. 1995; Gantait et al. 2011; Honkanen et al. 1990); - somaclonal variation developed from in vitro propagated material (Buiatti and Gimelli 1993; Vitti 1996); - genetic transformation to modify certain traits, like flower color and flower pattern (Elomaa et al. 1996; Elomaa et al. 1993; Helariutta et al. 1993; Yu et al. 1999).
Till now, gerbera breeders are active in this floricultural crop to achieve improved characteristics of interests to satisfy customers, like new flower colors, variation in morphology and size, vase life extension and improved resistance to diseases (Barigozzi and Quagliotti 1979; Jain et al. 1998). Those methods mentioned above could still provide valuable contributions for gerbera development (Jain et al. 1998). Breeding companies in general invest on average about 15% of their turnover in R&D per year (Plantum 2014) and also want their varieties to get protection. More than 4800 gerbera varieties have been applied for Plant Breeder’s Right according to the plant variety database of the International Union for the Protection of New Varieties of Plant (UPOV) with applications from amongst The Netherlands, Germany, Denmark, Brazil, France, Israel, Italy, Japan and United States (UPOV 2016).
Propagation of commercial gerbera
Most commercial used cut flower gerberas and some garden and pot flower gerbera are primarily vegetatively propagated from tissue culture (Hamrick 2005). Gerbera can be easily multiplied by a division of rhizomes with buds and attached roots, yet less than 10-12 progeny plants might be produced in this way for each mature plant per year and cut pieces are easily infected (Rogers and Tjia 1990). Therefore, for

Unraveling the genetics of Botrytis cinerea resistance in Gerbera hybrida
13
1
large-scale commercial gerbera production, tissue culture is widely used to result in uniform, vigorous and pathogen-free plantlets (Kanwar and Kumar 2008; Rogers and Tjia 1990).
Gerbera cultivars can also be produced by sexual propagation (Kanwar and Kumar 2008). Several ornamental (gerbera specific) breeding companies developed female and male parental inbred lines to produce F1 hybrid seeds for potted and garden used gerbera because of economic and phytopathogenic reasons (Hamrick 2005; Reimann-Philipp 1983). More importantly, the F1 hybrid seeds possess so-called ‘hybrid vigor’, uniformity and high yield, and it could be used against illegal reproduction since the hybrids segregate and produce variable offspring (Horn 2002; Reimann-Philipp 1983). Sakata, PanAmerican Seeds and Florist have released their own series/lines (http://www.durora.com/; http://www. panamseed.com/revolution.aspx ; http://www.floristholland.nl/en/products/flori_line_pot_plants).
Ornamental diversity of gerbera
Owing to the continuous activities of commercial and hobbyists gerbera breeders, there are thousands of gerbera varieties with a wide range of variation. The flower of gerbera in fact is a composite of small florets forming an inflorescence. The most attractive part of the inflorescences is the surrounding 'petals' of a gerbera flower that are actually individual strap-shaped florets and called 'ray florets'. The central part, the 'heart', consists of so called 'disc florets'. Between these two types of florets, some gerbera inflorescences also possess 'trans florets' (Fig. 1-2).
According to the inflorescence structure, commercial gerbera can be simply classified by presence or absence of trans florets, size and cycle of trans florets, as single, semi-double and double types. Further classification is by ray floret shape such as spider type (Fig. 1-3). The color of corolla (ray florets and trans florets) in a single flower can be quite diverse and vary from simplex white, cream, yellow, orange, salmon, pink, lilac, purple or red, with contrasting color combinations of ray and trans florets or with bicolor in ray florets only. The disc florets can be either black or green, with slightly different shades.
ray florets •
trans florets •
disc florets •
Fig. 1-2 The three different types of florets in the gerbera inflorescence (shown is the cultivar named Soap® from Schreurs B.V., http://www.schreurs.nl).

Chapter 1 General introduction
14
1
Fig. 1-3 From left to right, there are single flower type gerbera cultivar (Harumi® from Schreurs B.V.), semi-double flower type (Café® from Schreurs B.V.), double type (Tattoo® from Florist B.V., http://www.floristholland.nl) and spider type (Stryker® from Florist B.V.).
Based on the flower/capitulum size, commercial gerbera used for cut flowers can mainly be divided into two types: standard gerbera with flower size around 10-14 cm (Fig. 1-4) and mini gerbera (germini) with a size around 6-9 cm (Fig. 1-5). The stem length for both two types of gerbera can reach to 60-70 cm with a vase life of around 2-3 weeks. Pot gerbera (Fig. 1-6) for indoor or outdoor use, usually have the same flower pattern of cut flower gerbera however with relatively shorter stem and smaller flower size.
Fig. 1-4 Different standard gerbera cultivars from Florist B.V. and Schreurs B.V.. The commercial names of cultivars are White Jewel, Alliance, Alma, Volia, Spotlight, Hollywood, La Vida; Edelweiss, Barista, Damask, Benidorm, Palestra, Oilila, Kaiser. Bar, 1 cm.
Fig. 1-5 Different mini gerbera (Germini) cultivars from Florist B.V. and Schreurs B.V.. Cultivars are Noxx, Jimmies, Honky tonk, Bolero BonBon, Shayna, Babydoll, yell, Verdana; Frozen, Babyface, Bride, Sylvie, Mamamia, Garfield, Nacho, Purple Wonder, Smoothie, Cassis. Bar, 1 cm.
Fig. 1-6. Different pot gerbera cultivars Sweet Memories®, Sophie®, Sunny®, Eyecatcher Purple BC, Dark Fireball BC, Orange from Florist B.V..

Unraveling the genetics of Botrytis cinerea resistance in Gerbera hybrida
15
1
Model for Compositae family with regards to molecular studies
Gerbera is attractive not only to consumers for their diverse colors but also for biochemical, developmental and genetic research (Teeri et al. 2006). Gerbera is a member of the Compositae that exclusively form capitula and show a large variation in flower shapes. Studies of floral development and secondary metabolites synthesis in gerbera as a model plant could be representative of a large number of plants species since the Compositae are the largest family of the flowering plants with a number of economically important crops, like sunflower, lettuce, chrysanthemum and gerbera itself (Teeri et al. 2006).
The diversity of inflorescence patterns and colors in gerbera are evidence for the beauty of gerbera. The inflorescence of gerbera is composed of hundreds of small flowers that are differentiated into ray and disc florets (sometimes also trans florets, see the previous section). These small flowers are morphologically different (Fig. 1-7). The stamens of gerbera flowers are aborted in ray florets and trans florets, yet the stamens and pistils in disc florets are completely developed (Teeri et al. 2006). A series of flower traits were investigated and analyzed in gerbera morphologically (Drennan et al. 1986; Harding et al. 1990; Huang and Harding 1998; Huang et al. 1990). By looking for the homologous genes from the ABC(E) model found in Arabidopsis or snapdragon, several homologous genes were identified in gerbera and genetic transformation with these genes resulted in a phenotypic change in flower type (Broholm et al. 2010; Ruokolainen et al. 2010, 2011; Teeri et al. 2006). However, floral development in gerberas is much more complicated because of multiple homologous genes with subfunctionalization (Teeri et al. 2006).
Moreover, wide ranges of gerbera flower colors already exist in wild gerbera species and varied colors can also be present on a single capitulum or even on single ray florets. The color of the capitulum of gerbera can also be divided into three distinct parts according to morphology based on the color of disc florets, ray florets and/or trans florets. Disc color, which comes from pappus bristles, could be simplified distinguished as black or green (Barigozzi and Quagliotti 1979), although varying colors as black-purple, brown-black, or green-yellow, light-yellow also exist. Kloos et al. (2005) indicated the segregation of disc color is according to Mendel’s law and showed that it is determined by a dominant gene named Dc.
However, the color of ray florets (including trans florets) seems a much more complex trait. Ray floret color can be simply grouped into several categories, like white, cream, yellow, orange, pink, lilac, purple, red or bi-color (indicates the presence of two colors in a single ray floret or two different colors of ray and
Fig. 1-7 Three different types of florets in gerbera inflorescence. The pigmented ligulate ray and trans florets (left and middle) are female. The disc florets (right) are completely developed with both stamens and carpels. Stamens (arrow) fuse post genitally and cover the carpels in disc flowers. Bar, 1 cm. Reprinted from Teeri et al. (2006), with the permission from the John Wiley & Sons.

Chapter 1 General introduction
16
1
trans florets) for marketing purposes. In reality, there is no clear boundary for the shades of the color, and it is observed like a quantitative trait with continuous variables (Tourjee et al. 1995a, b). Flavonoids and carotenoids together determine the color of gerbera (Tyrach and Horn 1997). Pigmented flavonoids include anthocyanins, flavones and flavonols (Tyrach and Horn 1997). A series of genes/enzymes in the secondary metabolite synthesis, such as the general phenylpropanoids, flavonoids, anthocyanins, carotenoid biosynthesis pathway and transcription factors, like BHLH- and MYB-type TF, were confirmed contributing to the understanding of pigmentation in the gerbera flower (Ainasoja 2008; Bashandy et al. 2015; Deng et al. 2014; Elomaa et al. 1996; Elomaa et al. 1993; Helariutta et al. 1993; Teeri et al. 2006).
Molecular genetic resources for gerbera development
At the NCBI database, about 60,000 nucleotide sequences related to gerbera have been published in the recent 20 years. The increasing amounts of sequencing data that have been made available in gerbera provide genetic resources for research in gerbera as a model plant or for improvement of itself as a floriculture crop. Quite a lot of researches on flower development and flower color synthesis mentioned before were based on the EST data submitted by the Gerbera Laboratory at University of Helsinki (http://blogs.helsinki.fi/gerberalab/). In the last 25 years, each year around 40 new gerbera cultivars from the Netherlands alone and around 120 from other countries were put forward for Plant Breeder’s Rights application (UPOV 2016). Many new cultivars are with little morphological differences and that makes DUS testing (examining new cultivars for compliance with the Distinctness, Uniformity and Stability requirements) difficult. Some researches were done by using molecular markers which were developed from the NCBI database to study genetic diversity/variation and evaluate the genetic fidelity of certain gerbera cultivars (Da Mata et al. 2009; Minerva et al. 2012; Rezende et al. 2009; Bhatia et al. 2011; Bhatia et al. 2009; Gong and Deng 2012). These results could be applied in cultivar identification, potential collection undoubling and detection of possible infringements.
Genetic resources in gerbera could also help gerbera improvement in breeding by enabling indirect selection for traits. In field and vegetable crops, marker assisted selection/breeding is not a new story, while the use of molecular markers in ornamental crops is still lagging far behind (Arens et al. 2012; Smulders et al. 2012). Only a small amount of SSR and RGA (resistance gene analog) markers have been developed in gerbera (Gong and Deng 2010 2012; Song et al. 2012). The lag-behind situation in ornamentals is partly because some ornamental traits, like flower color, flower pattern, flower size or flower scent, themselves are perfect morphological markers and indeed widely used in breeding for a long time and selection programs. However, nowadays, new cultivars, in which disease resistance and novel ornamental traits are integrated, are demanded by growers and consumers. Disease resistance is often controlled by multiple genes and/or is strongly influenced by the environment. Selection on phenotype instead of genotype is therefore difficult. Thus, developing genetic tools will assist the breeding of gerbera for these traits.
Gerbera gray mold
Gerbera is mainly used for cut flower production with plants that are grown commercially in greenhouses for year round production. However, during cultivation in the greenhouse, especially in winter, the

Unraveling the genetics of Botrytis cinerea resistance in Gerbera hybrida
17
1
heating easily results in high humidity and in condensation on plant surfaces, which form ideal conditions for Botrytis cinerea conidial germination causing gerbera gray mold (Salinas et al. 1989). After cutting, gerbera is generally transported either in closed cardboard boxes or in plastic containers filled with water. In both transport systems, high relative humidity and condensation are unavoidable. Therefore, during every stage of gerbera flower production and transport botrytis infection can occur and form a considerable threat to the commercial gerbera flower production chain.
Problem of gerbera gray mold
Botrytis cinerea is an airborne plant pathogen, and spores could be detected everywhere in gerbera growing greenhouses using a selective medium (Kerssies 1990, 1993a). Botrytis spores can be spread by air currents, water droplets and/or irrigation systems (Cole et al. 1996). They can remain dormant on the plant surfaces for a long time. B. cinerea lesion numbers on gerbera flowers counted under the microscope after cutting were observed with a seasonal pattern: few lesions in spring and early summer, many lesions at other times of the year (Kerssies 1993b). This was mainly related to the effects of relative humidity (Kerssies and Frinking 1996). Once the humidity reaches to 90% or higher, Botrytis spores will germinate and invasion will start at any temperature either in pre-harvest or post-harvest stage (Eden et al. 1996).
To control gray mold, keeping good greenhouse sanitation, removing faded or blighted flowers, and using air circulation to reduce high humidity levels are required (Dreistadt 2001; Elad et al. 2016b). Chemical control, by applying fungicides, is also a common method to control Botrytis, although it increases the risk of fungicide resistance in Botrytis, of damaging flowers and of chemical residues on the flowers (Dean et al. 2012; Kerssies 1993b; Salinas and Verhoeff 1995; van Kan et al. 1997). Particularly in the post-harvest stage, it is difficult to avoid Botrytis infections (Kerssies 1993b), when gerbera stems are cut from the plant and experience senescence.
The Dutch Flower Auction Association (VBN) practice a zero tolerance on gerbera affected by Botrytis, and all gerbera flowers with detectable Botrytis infections will be rejected and destroyed (VBN 2009). In 2002, a total number of 759 million gerbera stems were sold at the Dutch Flower Auction. However, 0.26 % of the stems were found to be infected by Botrytis causing at least 200,000 euro economic losses. It has to be stated here that this is just the visible Botrytis infection found during quality inspection at the Auction (Vrind 2005). Based on the vase life test of FloraHolland during the period 2000-2003, vase life of Botrytis-infected gerbera was dropped from 10.2 to 6.8 days. Quality losses due to gerbera gray mold might affect the seller (a breeder’s reputation), the grower (reduction in profits) (Bastiaan-Net et al. 2007) and the consumer (dissatisfied with short vase life, flower reputation) (Dean et al. 2012). Breeding for a Botrytis resistance gerbera will benefit breeding companies, growers and consumers.
Wide host range of Botrytis cinerea and disease cycle
Botrytis-induced infections in gerbera manifest itself by brown stripes and spots on ray florets (Fig. 1-8 Left), by rotting inside of disc florets (Fig. 1-8 Right) and/or also by overgrowing gray fungus hyphae on anthers and unripe disc florets. B. cinerea, the cause of gerbera gray mold, is a typical necrotrophic fungal pathogen. This notorious fungus causes devastating diseases and considerable quality/quantity losses in a

Chapter 1 General introduction
18
1
wide range of plant species. Widely cited literature from Jarvis (1977) estimated that B. cinerea could infect over 200 plant species. However, up to now, the species B. cinerea is reported to attack at least 586 genera including far more than thousand plant species (Elad et al. 2016a). From the host list of B. cinerea, commonly used ornamental plants, such as, Alstoemeria, Anemone, Antirrhinum, Aquilegia, Aster, Begonia, Bellis, Calendula, Callistephus, Camellia, Canna, Chrysanthemum, Cymbidium, Dahlia, Delphinium, Dendrobium, Dianthus, Echinacea, Eschscholzia, Freesia, Gladiolus, Helianthus, Hemerocallis, Hibiscus, Hosta, Hyacinthus, Hydrangea, Hymenocallis, Impatiens, Iris, Jasminum, Lavandula, Malus, Narcissus, Paeonia, Papaver, Phalaenopsis, Phlox, Primula, Ranunculus, Rhododendron, Rosa, Syringa, Tagetes, Viola, Zinnia and also Gerbera are all covered. Like for Gerbera, the symptoms of disease caused by B. cinerea on different ornamental plants are visible as necrotic spots on leaves or petals, as gray mold rot on leaves or bulbs, blossom blight, stem canker and damping off (Elad et al. 2016a and Fig. 1-9.).
Fig. 1-8. Symptoms of Botrytis cinerea infection on ray florets and (on the bottom of) disc florets of gerbera inflorescence. The brown (necrotic) spots could be seen on ray florets (left, the arrow shown). Inside rot of disc florets could be observed after cutting (right, the arrow shown).
B. cinerea overwinters either as sclerotia or mycelia in/on plant debris and in soil and the growth of the pathogen can be activated by favorable weather conditions. Germinated infectious spores mainly target senescent or damaged tissue (Fig. 1-9). When Botrytis lands on the surface of host plants, it secretes enzymes to degrade host plant cell walls and induce cell death. Alternatively, spores might also remain quiescent for a while waiting for suitable conditions for development (van Kan 2006; Williamson et al. 2007). Botrytis is considered an opportunistic invader (Corbaz 1978; Prins et al. 2000), and decomposing plant biomass for its own use (van Kan 2006). With lesion expansion, the surface of infected plants forms visible gray molds of conidiophores and conidia which are the infection source for the next round of disease (Agrios 2005).

Unraveling the genetics of Botrytis cinerea resistance in Gerbera hybrida
19
1
Fig. 1-9. Disease cycle of gray mold disease. Reprinted from Plant Pathology, Agrios (2005), with the permission from the Elsevier.
Genetic basis of resistance to Botrytis cinerea
Botrytis cinerea, and some other necrotrophic pathogens, with a broad range of host plants are considered to possess versatile tools to acquire a successful infection. B. cinerea takes advantage of these tools to invade host plants, and then to degrade plant cells as the carbon source for their own growth (van Kan 2006). Although B. cinerea is considered to carry such subtle mechanisms, host plants also developed corresponding strategies to cope with the invasion from this necrotrophic pathogen. A total number of 621 Arabidopsis genes were induced upon B. cinerea inoculation and the expression of these genes increased at least twofold (AbuQamar et al. 2006). A series of plant hormones, ethylene, salicylic acid, jasmonic acid and abscisic acid, are found to influence tomato resistance to B. cinerea (Diaz et al. 2002) and partial resistance against B. cinerea in wild tomato stem and leaf was described (ten Have et al. 2007).
The genetic basis for resistance to B. cinerea in Arabidopsis and tomato is regarded as polygenic, which needing the involvement of multiple loci to confer a reduction in disease instead of complete resistance (St.Clair 2010). Furthermore, the developmental process and outbreak of B. cinerea infection is greatly affected by environment. Compared with the effect of environment, the effect of the allelic difference from any individual gene on phenotypic variation is small. The genetic basis of Arabidopsis, tomato and other crops as well as the response of gerbera to B. cinerea all indicate the genetic basis of gerbera resistance to B. cinerea would also be quantitative.
Breeding for resistance to Botrytis cinerea
Sax (1923) first presented in common bean the genetic linkage between the polymorphism of seed color pattern, which can be used as a visible marker, with a quantitative trait (seed weight). It provided a possible solution for identifying individual polygenes of quantitative traits and treating these complex traits like Mendelian traits. The location in the chromosomal region of the causal gene(s) is defined as

Chapter 1 General introduction
20
1
quantitative trait loci (QTLs) (Collard et al. 2005; Mackay et al. 2009; St.Clair 2010). Allelic differences in genes underlying the QTL affect the quantitative trait variation. Although the idea of QTL mapping was known since the 1920s, limited morphological and isozyme markers were available which restricted the application of QTL mapping (Tanksley 1993). With the introduction of abundant DNA markers, the pioneering work from Lander and Botstein (1989) and Paterson et al. (1988) inspired researchers to use this tool to study the molecular quantitative genetics and resolve complex traits into single genetic components (Paterson 1997).
Mapping quantitative resistance loci (QRLs) is an effective tool to identify the genes that account for QDR (Quantitative Disease Resistance; St.Clair 2010). DNA markers tightly linked to QTLs/QRLs can predict a direct linkage of phenotype and genotype. The process of using DNA markers for tracking and selection of traits of interesting in breeding is called marker-assisted selection (MAS). DNA markers with a clear Mendelian segregation can be applied as the visible indicators in breeding programs for quantitative traits, such as improved crop disease resistance. MAS for single or multiple QRLs have been deployed for QDR in some important crops for disease reduction after years of efforts. A major QRL (Fhb1) for fusarium head blight resistance in wheat was identified and using flanking markers, near-isogenic lines (NILs) for validation were developed and the lines with the Fhb1 allele were found to have a significant reduction of FHB disease (Pumphrey et al. 2007). In common bean, recombinant inbred lines (RILs) selected with two major-QTLs resistance alleles for white mold were less diseased than those with susceptible alleles (Ender et al. 2008).
In crops with well-annotated genomes, candidate genes underlying QTL regions would be easily located and the quantitative trait nucleotides, the causal molecular variants in or outside of the coding region of the causal gene, could also be identified by targeted-sequencing. Using the specific polymorphisms in the causal gene for MAS is more precise than using the flanking random DNA markers at some distance because of the complete linkage between target gene allele with the marker (Andersen and Lubberstedt 2003). For crops without genome information, candidate genes could also be predicted by prior knowledge from model species. Identification of the causal gene(s) for MAS breeding will produce selection gain and minimize linkage drag (St.Clair 2010).
Outline of this thesis
In this chapter (Chapter 1), I introduced the origin of commercial gerbera hybrids; the breeding and propagation methods used in gerbera and reviewed some researches of inflorescence development and floral color development performed in gerbera. As an important floricultural crop, gerbera is easy infected by gray mold during transportation, which causes significant losses. The aim of this research was to unravel the genetics of Botrytis resistance in Gerbera and develop genetic tools for gerbera breeding against this serious disease.
In Chapter 2, the leaf and flower bud transcriptomes of the four parents of two populations segregating for botrytis resistance were sequenced using Illumina paired-end sequencing and consensus contig sequences were generated. Reads from the four parents were mapped to the consensus contig sequences to identify genotype and population specific SNPs. After annotation, gerbera transcripts associated with possible

Unraveling the genetics of Botrytis cinerea resistance in Gerbera hybrida
21
1
processes of disease resistance, Botrytis resistance in particular, were in silico demonstrated. In Chapter 3, genotype and population specific SNP markers were selected for KASP genotyping in the two segregating populations. Four parental linkage maps were constructed using the SNP markers and the maps were integrated per population as well as over both populations to derive at a consensus map. Botrytis disease severity was evaluated by whole inflorescence, bottom (of disc florets) and ray floret tests on the parents and progenies of the two populations. QTLs were identified on the parental maps of the two populations using these three different tests. Chapter 4 describes a candidate gene approach to narrow down QTL regions. By screening recently published literature, several candidate genes related to Botrytis resistance were identified and used to find corresponding homologs in gerbera. These candidate gene homologs were mapped on the previously constructed gerbera linkage maps to check for co-localization with the found QTLs. The allelic diversity and gene expression of promising candidate genes were analyzed. In Chapter 5, two candidate genes which were mapped in a QTL region for ray floret were characterized using virus induced gene silencing (VIGS) and inoculated with Botrytis spores to evaluate the function of candidate genes. The General discussion in Chapter 6, summarizes the results from the above experimental chapters and discusses them in view of literature. Some propositions to the use of molecular markers and genetic tools to increase the resistance of gerbera to botrytis are made.
Acknowledgments
I also would like to express my appreciation to Hans V. Hansen for the original paper of A story of the cultivated Gerbera and Isabel Johnson for providing the pictures of Gerbera jamesonii and G. viridifolia.
Statement
Wageningen UR does not promote the sales or use of the gerbera cultivars which were described in this chapter.


23
Chapter 2 Transcriptome analysis of Gerbera hybrida including in
silico confirmation of defense genes found
Yiqian Fu, G. Danny Esselink, Richard G.F. Visser, Jaap M. van Tuyl, Paul Arens*
Wageningen UR Plant Breeding, Wageningen, the Netherlands
* Corresponding author: Paul Arens, Wageningen UR Plant Breeding, Droevendaalsesteeg 1, Wageningen,
6708 PB, the Netherlands
This chapter has been published in Frontier in Plant Science (2016) 7: 247.

Chapter 2
24
2
Abstract
For the ornamental crop Gerbera hybrida, breeding at the moment is done using conventional methods. As this has drawbacks in breeding speed and efficiency, especially for complex traits like disease resistance, we set out to develop genomic resources. The leaf and flower bud transcriptomes of four parents, used to generate two gerbera populations, were sequenced using Illumina paired-end sequencing. In total, 36,770 contigs with an average length of 1397 bp were generated and these have been the starting point for SNP identification and annotation. The consensus contig sequences were used to map reads of individual parents, to identify genotype specific SNPs, and to assess the presence of common SNPs between genotypes.
Comparison with the non-redundant protein database (nr) showed that 29,146 contigs gave BLAST hits. Of sequences with blast results, 73.3% obtained a clear gene ontology (GO) annotation. EST contigs coding for enzymes were found in Kyoto Encyclopedia of Genes and Genomes maps (KEGG). Through these annotated data and KEGG molecular interaction network, transcripts associated with the phenylpropanoid metabolism, other secondary metabolite biosynthesis pathways, phytohormone biosynthesis and signal transduction were analyzed in more detail. Identifying genes involved in these processes could provide genetic and genomic resources for studying the mechanism of disease resistance in gerbera.
Keywords
EST, candidate gene, annotation, disease pathway, gerbera gray mold

Transcriptome analysis of Gerbera hybrida: including in silico confirmation of defense genes found
25
2
Introduction
Gerbera hybrida (2n = 2x = 50) is one of the most important ornamental plants and belongs to the Compositae family. Cultivated gerbera, which probably originates from a crossing of two wild species from Africa (G. jamesonii and G. viridifolia; Hansen 1999), is highly heterozygous. Commercial gerbera cultivars are mainly produced in greenhouses for year round cut flower production (Moyer and Peres 2008; Simpson 2009) and ranked fifth in the cut flower sale at the Dutch flower auctions 2014 (https://www.floraholland.com/media/3949227/Kengetallen-2014-Engels.pdf). Gerbera became a model plant to study flower development in composed (Compositae) flowers (Teeri et al. 2006). Furthermore, the high variation in flower color and patterning of ray and disc florets as well as the high levels of secondary metabolites derived from connected pathways make it a putative model crop for biosynthetic research (Teeri et al. 2006). Given the importance of gerbera in floriculture and breeding as well as its potential for fundamental research on flower developmental and regulation of secondary metabolites, there is a demand for genomic resources.
In general, the use of molecular markers in breeding for ornamental crops has been lagging behind other agricultural and horticultural crops (Arens et al. 2012; Smulders et al. 2012). This is partly due to some breeding traits for ornamentals like flower color that are themselves easily visible markers. Also, it is more complicated to develop molecular markers for ornamental crops since they are highly heterozygous with a complex genetic background (Debener 2009). In gerbera, there are only a small amount of SSR and RGA (resistance gene analog) markers (Gong and Deng 2010, 2012; Seo et al. 2012) available for genetic studies in this species.
With the rapid progress in high-throughput next-generation sequencing (NGS) technologies, new possibilities for creating genomic resources and identifying (SNP) markers have become feasible. Transcriptome RNA sequencing (RNA-seq) provides significant advantages for ornamental crops where genomic resources are still scarce and high levels of heterozygosity are expected. Because gerbera has a relatively large genome size, sequencing transcripts as a genome complexity reduction not only reduces cost and time significantly, but also contributes to establishment of resources by the focus on genes. Furthermore, in species with a very high diversity, many SNPs may not be useable markers because of flanking SNPs. Targeting genic regions which have a lower expected SNP diversity may reduce this and result in more widely applicable markers. At present only two studies have contributed to genomic resources building in gerbera. Using Sanger sequencing, an ESTs database with nearly 17,000 cDNA sequences was already constructed for mining genes involved in gerbera floral development (Laitinen et al. 2005). A transcriptome of the gerbera ray floret sequenced by NGS sequencing was constructed to predict genes involved in gibberellin metabolism and signal transduction (Kuang et al. 2013). Although these transcriptome analyzes have been reported in gerbera, these studies were not focussed on finding SNP markers and focussed strictly on flowers.
SNPs that can be discovered from expressed sequence tags (ESTs) NGS-sequencing are valuable resources for genetic research and accepted as markers for MAS in ornamentals (Koning-Boucoiran et al. 2015; Shahin et al. 2012). RNA-Seq can generate numerous transcripts with sufficient read-depth to guarantee
Chapter 2
26
2
high quality SNP identification (Kim et al. 2014). Development of SNP markers for the highly heterozygous ornamentals is very feasible and 200 - 1000 SNP markers will be sufficient to construct a genetic map for QTL mapping (Smulders et al. 2012).
In this study, we aim for the identification of SNP markers from the transcriptomes of four gerbera genotypes based on leaf and flower tissues using NGS sequencing. Through alignment of reads from four genotypes with consensus contigs constructed by de novo assembly, we expect to identify SNPs within and between cultivars and detect reliable SNPs markers that can be used for mapping and other genetic studies. Transcriptomes are analyzed by gene annotation and predicted candidate genes that relate to disease resistance pathways, and to gerbera gray mold in particular, will be shown as examples. Gerbera gray mold is a main problem in gerbera production in greenhouses which is caused by Botrytis cinerea. As a necrotrophic pathogen, a series of plant secondary metabolites from the phenylpropanoid and flavonoid biosynthesis pathway are considered to be involved in plant defense responses (Dixon 2001; Dixon et al. 2002). Phytohormone jasmonate (JA) and ethylene (ET) also play a role in plant defense against B. cinerea (Thomma et al. 2001). Identifying the gene sequences involved in these pathways will help us to study their gene function in gerbera upon Botrytis infestation. SNPs found will provide genetic tools for gerbera breeding that may help in efficient gerbera improvement.
Material and Methods
Plant materials, RNA isolation and cDNA library construction
Three Mini Gerbera breeding lines (‘SP1’, ‘SP2’, ‘FP1’) and a garden gerbera breeding line (‘FP2’) that are also the parents of two gerbera populations were used for cDNA sequencing. The selected 4 parental genotypes show different symptoms on Botrytis susceptibility and the two populations of these parents showed the largest variation on Botrytis susceptibility among 20 populations tested. Young leaves and floral buds of the four parents were collected and stored at -80°C upon RNA isolation.
Total RNA of the leaves and floral buds for the four parents was isolated according to the standard TRIZol reagent protocol (Life Technologies, USA) followed by purification using the RNeasy isolation Kit (Qiagen, Germany). Total RNA of leaves and floral buds was mixed in equal amounts and sent to GATC Biotech (Germany) for sequence library preparation.
Sequencing, assembly and SNP detection
The cDNA libraries of all four genotypes were sequenced using 2 × 100 bp paired-end sequencing on an Illumina HiSeq platform (Illumina, USA). Reads were pre-processed using ConDeTri (Content Dependent Read Trimmer) (Smeds and Künstner 2011) with default settings to trim adapter sequences from the 3' and 5' ends from reads and to filter reads with low quality. To improve the quality of assemblies, FLASH (Fast Length Adjustment of Short reads) (Magoč and Salzberg 2011) was used with default settings to merge overlapping read pairs. For de novo assembly, transcripts of four parents were constructed separately by Trinity (Grabherr et al. 2011) from the merged, single-end and paired-end reads.

Transcriptome analysis of Gerbera hybrida: including in silico confirmation of defense genes found
27
2
Construction of a reference transcriptome was performed in a stepwise procedure. In short, transcriptome of SP1 was assembled de novo and redundancy was removed by reassembling the transcriptome using CAP3 (Huang and Madan 1999) with default setting and an identity (-p) of 95%. Next, the transcripts of SP2 were added to the CAP3 contigs and singlets of SP1 and assembled again with the same settings. In a similar way the transcripts of FP1 and FP2 were added and contigs were reassembled. The final consensus contig sequences were used as a reference transcriptome for SNP detection.
For SNP detection the raw reads were pre-processed using Prinseq-lite (vs. 0.20.3) which included the trimming of nucleotides having a phred score lower than 25, the trimming of poly A/T tails, the removal of duplicate reads, of low complexity reads (DUST approach), of reads shorter than 50 bp and of reads with more than one ambiguous nucleotide. The remaining reads of each genotype where aligned to the reference transcriptome using Bowtie2 (--very-sensitive setting) and filtered for mapping quality (>2) using SAMtools (Li et al. 2009). The resulting .sam files were merged and used for SNP calling using QualitySNPng (Nijveen et al. 2013) with default settings. Retrieved SNP regions were blasted (BLASTn, e-value: 1E-30) to the contigs derived from the EST sequences as a control for possible paralog presence.
GO annotation, enzyme code annotation and KEGG annotation
To predict function, assembled unigene contigs were annotated. Gene ontology (GO) annotation in Blast2GO (Conesa et al. 2005) consisted of three steps: blasting, mapping and annotation. The assembled contigs were compared by BLASTX against the NCBI non-redundant protein database (nr) using Blast2GO V.3.0. The expectation value (E-value) threshold was set at 1E-3 for reporting matches and the number of retrieved hits at 20 (default value). After blasting, Gene Ontology (GO) terms associated to the hits were mapped. When a BLAST result is successfully mapped to one or several GO terms, GO annotations were assigned.
Enzyme code (EC) annotation was available only for contig sequences with GO annotations with EC numbers. Additionally, the KEGG mapping was done to display enzymatic functions in the context of the metabolic pathways in which they participate.
Results
Sequencing and SNP detection
The transcriptome reads of four genotypes were obtained using Illumina 2 × 100 bp paired-end sequencing. For genotype ‘SP1’, sequencing the cDNA library resulted in a total of 114,519,206 raw paired end reads. After trimming and removing reads with low quality 80,182,250 (70%) paired end reads remained. Merging connected paired-end reads using FLASH software resulted in 46,043,245 single reads and 5,931,379 paired end reads for de novo assembly. The de novo assembly for ‘SP1’ resulted into 113,970 transcripts longer than 200 bp. Results of sequencing assembly data for all four genotypes are shown in Table 2-1. All raw data has been donated to the SRA (Short Read Archive) and can be found under accession numbers PRJEB12127.

Chapter 2
28
2
Table 2-1 Summary of the sequence assembly data
Parents # bases # paired end reads
Pre-processing De novo assembly CAP3 Assembly
# paired end reads after trimming
# paired end reads after merging
# single end reads after merging
# transcripts (>200 bp)
# contigs
# singlets
SP1 11,566,439,806 114,519,206 80,182,250 5,931,379 46,043,245 113,970
36,770 144,356 SP2 11,885,597,584 117,679,184 82,276,886 6,964,989 46,331,282 119,675
FP1 14,435,581,146 142,926,546 99,901,704 9,400,798 55,225,869 130,234
FP2 9,416,840,444 93,236,044 73,156,762 6,104,039 38,065,122 73,634
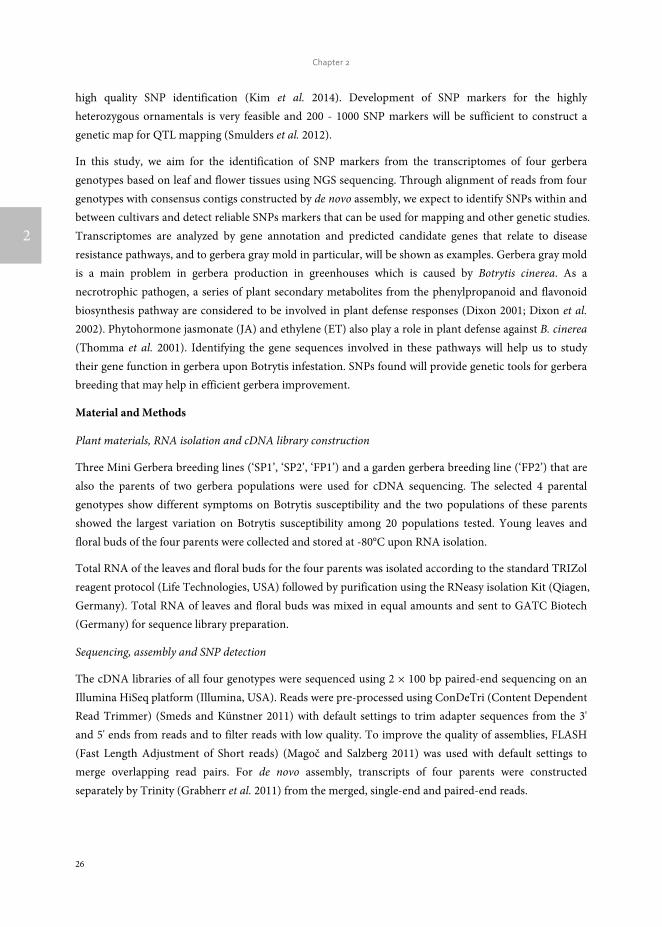
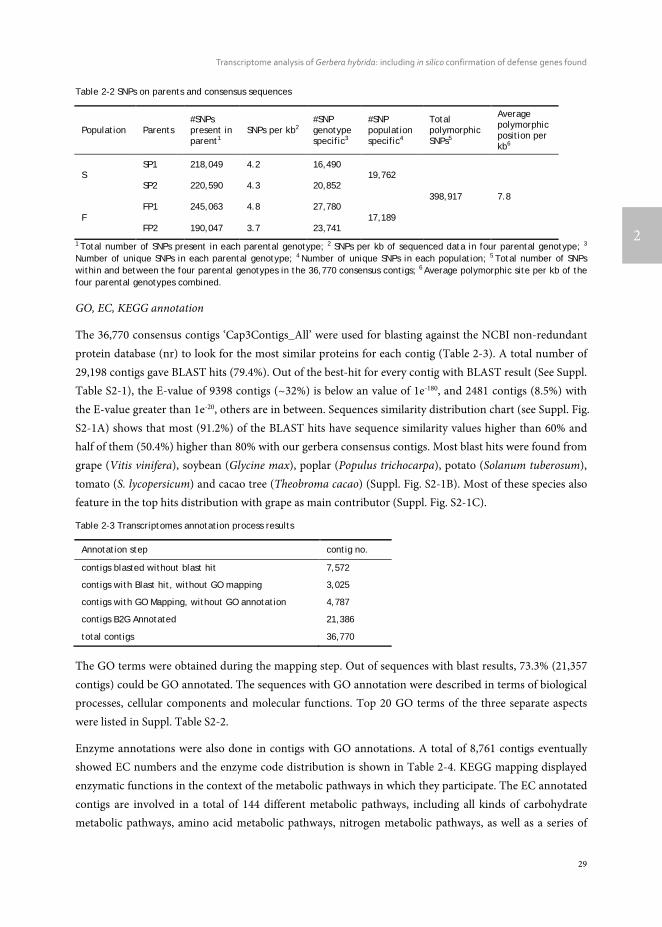
Transcripts of parent ‘SP1’ were first used to construct a reference transcriptome after which transcripts of the other genotypes were one by one added to reach an overall consensus assembly (Fig. 2-1). The final consensus transcriptome yielded 36,770 consensus contigs and 144,356 singletons. The average length of consensus contigs was 1397 bp, and the N50 was equal to 1889 bp (The minimum length of 201 bp, median length of 1130 bp and maximum length of 15746 bp). This consensus transcriptome (named ‘Cap3Contigs_All’) was the starting point for SNP identification and annotation. All paired-end and single-end reads of the four genotypes were mapped to the 36,770 ‘Cap3Contigs_All’ consensus contigs for SNP detection. In total 398,917 SNPs polymorphic within or between the four genotypes were detected (Table 2-2). Genetic diversity of the consensus sequences on average is 7.8 SNPs per kb. The average SNP density within the four genotypes varied from 3.7 - 4.8 SNPs per kb of sequence. They all harbour quite a lot parent specific SNPs and population specific SNPs polymorphic in only that specific parent or population (Table 2-2).
Fig. 2-1 Workflow of transcriptome sequencing for four parents. i, leaves and floral buds of the four gerbera genotypes used to isolate RNA; ii, mixed cDNA libraries of four genotypes sequenced on an Illumina platform; iii, raw reads used for pro-processing to trim adapter sequences and to filter reads with low quality; iv, transcripts of SP1 assembled as first step towards reference transcriptome construction; v, transcripts of other genotypes mapped to reference to yield consensus contigs named ‘Cap3Contigs_All’ for SNP detection and annotation.
ii: Illumina sequencing of cDNA libraries
Raw readsTTCAAGCTGCTTTCCGGCAAAGATGAGGCGTTGTTGATCCGGAGGAATGCCTTCCTTGTCTTGAATCTTGGCCTTGACGTTGTCAATGGTATCGGAGCTCTCGACCTCCAACGTAATCGTCTTGCCAGTTAGGGTTTTGACGAAAATCTGCATCCCACCACGCAGACGGAGAACAAGATGAAGAGTCGATTCCTTCTGGATGTTGTAGTCCGCTAGGGTTCTTCCGTCTTCCAACTGCTTCCCGGCGAAAATCAGCCTCTGTTGATCAGGAGGAATACCTTCCTTGTCCTGAATCTTAGCTTTAACATGATCAATGGTGTCCGAGCTTTCCACCTC。。。。。。。。。。。。。。。。。。。。。。。。。。
iii: Pre-processing
iv: de novo referencetranscriptome assembly
SP1 SP2 FP1 FP2
CGACGCCTTCCGATCTGGGGTGAAAATCAAAACAATGTGCACCAGTATGTGCTTCAAGAAGACAACAAAAGGCTTTTGGTAACATTCAAACATAGCAAACTCCAAAGCCAAAAAACATTTGAGTGAAAATAAACGTTACAATTAGATGAAAACAGCTATATAATTGTCGTCACCTTGCACCCCTATGGCCGTAATGAAATGTTTTTTTACATTCACAATAACAAGTAGAATAATTTGAAGGATGAAAATTATCGCCTCAAAAAGAATATTTTATAGAATGCCTAGAGGGTAACTAAACTCAACTACTATGCTAAAACTGAAGTAGAACTATATCAT。。。。。。。。。。。。。。。。。。。。。。。。。。
GATCCTATTATAAACACATGCAATGGTTTCTATTGTGACGCTTTCACCCCAAACAAGCCGTACAAACCCACAATTTGGACCGAGGCTTGGAGCGGATGGTTCACGGAATTTGGTGGCCCAACCCATGAGAGACCCATTCAAGATTTGGCATTTGCCGTGGCCCGATTCATACAAAAGGGTGGATCATTCTTCAACTACTACATGTACCATGGAGGCACGAACTTTGGCCGCTCTTCTGGAGGCCCATTCATCACTACTAGTTACGACTATGACGCTCCTCTTGATGAATATGGTTTGACCAGACAACCGAAATACGGCCATTTGAGGGAGCTTCAT。。。。。。。。。。。。。。。。。。。。。。。。。。
TTTTTTTTGAAACACGTAATAATCCCCTCACTTTCCGTTGAGACAATTCTCCTCGATATTTATACACACAAAACCCTTCTCCTTTCTCCTCTCTAGATTCAAAGGCGACGGCGGCGGCGGAGTGATATACCAGCGGCGGAGATGGATCCAGATGCGGTGGCGAAGGCGTTCGTGGAGCACTACTACTCAACATTCGATACGAATCGATCCGGCTTGGCTAATCTGTACCAGGACACTTCGATGTTGACGTTTGAAGGCCAAAAGATACAGGGATCTGCGAACATCGTAGCGAAGTTGACGACGCTCCCTTTCCAACAGTGCAAGCACAGCATCACC。。。。。。。。。。。。。。。。。。。。。。。。。。
Reference transcriptome
i: Total RNA of leaves and floral buds
v: consensus contigs‘Cap3Contigs_All’
Transcripts
Transcriptome analysis of Gerbera hybrida: including in silico confirmation of defense genes found
29
2
Table 2-2 SNPs on parents and consensus sequences
Population Parents #SNPs present in parent1
SNPs per kb2 #SNP genotype specific3
#SNP population specific4
Total polymorphic SNPs5
Average polymorphic position per kb6
S SP1 218,049 4.2 16,490
19,762
398,917 7.8 SP2 220,590 4.3 20,852
F FP1 245,063 4.8 27,780
17,189 FP2 190,047 3.7 23,741
1 Total number of SNPs present in each parental genotype; 2 SNPs per kb of sequenced data in four parental genotype; 3
Number of unique SNPs in each parental genotype; 4 Number of unique SNPs in each population; 5 Total number of SNPs within and between the four parental genotypes in the 36,770 consensus contigs; 6 Average polymorphic site per kb of the four parental genotypes combined.
GO, EC, KEGG annotation
The 36,770 consensus contigs ‘Cap3Contigs_All’ were used for blasting against the NCBI non-redundant protein database (nr) to look for the most similar proteins for each contig (Table 2-3). A total number of 29,198 contigs gave BLAST hits (79.4%). Out of the best-hit for every contig with BLAST result (See Suppl. Table S2-1), the E-value of 9398 contigs (~32%) is below an value of 1e-180, and 2481 contigs (8.5%) with the E-value greater than 1e-20, others are in between. Sequences similarity distribution chart (see Suppl. Fig. S2-1A) shows that most (91.2%) of the BLAST hits have sequence similarity values higher than 60% and half of them (50.4%) higher than 80% with our gerbera consensus contigs. Most blast hits were found from grape (Vitis vinifera), soybean (Glycine max), poplar (Populus trichocarpa), potato (Solanum tuberosum), tomato (S. lycopersicum) and cacao tree (Theobroma cacao) (Suppl. Fig. S2-1B). Most of these species also feature in the top hits distribution with grape as main contributor (Suppl. Fig. S2-1C).
Table 2-3 Transcriptomes annotation process results
Annotation step contig no.
contigs blasted without blast hit 7,572
contigs with Blast hit, without GO mapping 3,025
contigs with GO Mapping, without GO annotation 4,787
contigs B2G Annotated 21,386
total contigs 36,770
The GO terms were obtained during the mapping step. Out of sequences with blast results, 73.3% (21,357 contigs) could be GO annotated. The sequences with GO annotation were described in terms of biological processes, cellular components and molecular functions. Top 20 GO terms of the three separate aspects were listed in Suppl. Table S2-2.
Enzyme annotations were also done in contigs with GO annotations. A total of 8,761 contigs eventually showed EC numbers and the enzyme code distribution is shown in Table 2-4. KEGG mapping displayed enzymatic functions in the context of the metabolic pathways in which they participate. The EC annotated contigs are involved in a total of 144 different metabolic pathways, including all kinds of carbohydrate metabolic pathways, amino acid metabolic pathways, nitrogen metabolic pathways, as well as a series of

Chapter 2
30
2
secondary metabolic biosynthesis pathways. The top 30 pathways in overall sequence coverage and the details of all 144 pathways with contig identity and enzyme code can be found in Suppl. Table S2-3 and Suppl. Table S2-4, respectively.
Table 2-4 Gerbera transcripts enzyme code distribution
EC Classes #Contigs
1.- Oxidoreductases 1,769
2.- Transferases 3,404
3.- Hydrolases 2,403
4.- Lyases 421
5.- Isomerases 281
6.- Ligases 483
Transcripts related to phenylpropanoid biosynthesis and flavonoid biosynthesis pathway
Based on the EC annotated sequences, enzymes involved in phenylpropanoid and flavonoid biosynthesis pathway that are considered to be involved in flower color and disease resistance were retrieved and highlighted in different colors in the pathway-maps from KEGG (see Suppl. Fig. S2-2 and Suppl. Fig. S2-3). There are 137 contigs that translate to 14 enzymes in the phenylpropanoid biosynthesis pathway. Eleven enzymes represented by 71 contigs were found for the flavonoid biosynthesis pathway. These two pathway-maps loaded from KEGG (see Suppl. Fig. S2-2 and Suppl. Fig. S2-3) included all possible enzymes and metabolites in a broad perspective, but we can see clearly from the simplified phenylpropanoid and flavonoid biosynthetic pathway (Fig. 2-2) that the key enzymes in the pathways are well represented. The three key regulatory enzymes in the phenylpropanoid biosynthesis are phenylalanine ammonia lyase (PAL, EC:4.3.1.24), cinnamate-4-hydroxylase (C4H, EC:1.14.13.11), 4-coumarate-CoA ligase (4CL, EC:6.2.1.12), which were represented by 11, 2 and 12 homologous contigs respectively. The sequence similarities of the best-hit for these 25 contigs are above 90% and 17 of the best-hits come from other species within the Compositae like, Helianthus tuberosus, Lactuca sativa, Artemisia sieberi, Cynara cardunculus, etc indication that these pathways are well conserved within the family. After the formation of p-coumaroyl-CoA, the next step is into the central flavonoid pathway. Chalcone synthase (CHS, EC:2.3.1.74) and chalcone isomerase (chalcone-flavanone isomerase, CHI, EC:5.5.1.6.) are the first two enzymes in the flavonoid pathway leading to subsequent metabolite synthesis. Eight out of the 10 contigs which are predicted as CHS gene are highly identical to the gerbera CHS genes in public databases (Z38096.1, Z38097.2, Z38098.1, AM906210.1, AM906211.1, X91339.1) with a very low (or zero) E-value and similarity close to 100%. No contig were found specific for stilbene synthase (STS, EC:2.3.1.95) which is the key enzyme for stilbene synthesis. Enzymes in this pathway and the number of contigs homologous to these enzymes are show in Fig. 2-2.

Transcriptome analysis of Gerbera hybrida: including in silico confirmation of defense genes found
31
2
Transcripts related to phytohormone biosynthesis and signalling
The initial precursor for ethylene synthesis is the amino acid methionine. The three key regulatory enzymes in the pathway are S-adenosyl-l-methionine synthase (SAMS, EC:2.5.1.6), ACC synthase (ACS, EC:4.4.1.14) and ACC oxidase (AOC, EC:1.14.17.4). Our gerbera EST database contains multiple contigs encoding these three enzymes (see Fig. 2-3). Jasmonate biosynthesis start from linolenic acid. Lipoxygenase (LOX, EC:1.13.11.12), allene oxide synthase (AOS, EC:4.2.1.92), allene oxide cyclase (AOC, EC:5.3.99.6) and 12-oxo-phytodienoic acid reductase (OPDR, EC:1.3.1.42) participant in the synthesis. Numbers of contigs encoding these enzymes are show in Fig. 2-4. We also found the multiple contigs connected with these two plant hormone signalling pathway which were shown in Fig. 2-5, although some of them still remained without coverage.
Fig. 2-3 Distribution of Gerbera transcripts in the ethylene biosynthetic pathway (Wang et al. 2002). Each enzyme name is followed with the number of contigs homologous to the gene family encoding this enzyme between brackets. SAMS, S-adenosyl methionine synthase; ACS, 1-aminocyclopropane-1-carboxylic acid (ACC) synthase; ACO, ACC oxidase.
Fig. 2-2 Distribution of Gerbera transcripts in the simplified phenylpropanoid and flavonoid biosynthesis pathway (Ainasoja 2008; Ali et al. 2011; Boubakri et al. 2013; Dixon et al. 2002; Ferreyra et al. 2012). The processes in the box indicate the general phenylpropanoid pathway and the rest is flavonoid pathway. Each enzyme name is followed with the number of contigs homologous to the gene family encoding this enzyme between brackets. PAL, phenylalanine ammonia-lyase; C4H, cinnamate-4-hydroxylase; 4CL, 4-coumarate-CoA ligase; CHS, chalcone synthase; STS, stilbenes synthase; CCR, cinnamoyl-CoA reductase; CHI, chalcone isomerase/chalcone-flavanone isomerase; F3H, flavanone 3-hydroxylase; F3’H, flavonoid 3'-hydroxylase; FLS, flavonol synthase.

Chapter 2
32
2
Discussion
In this study, we developed transcriptomes (based on leaf and flower tissues) of gerbera using RNA sequencing in four gerbera genotypes. After de novo assembly, we generated 36,770 consensus contigs with an average length of 1397 bp and a N50 length of 1889 bp. Average length and N50 length are markedly larger than a transcriptome of flower development (845 bp and 1321 bp respectively; Kuang et al. 2013). This is likely because four gerbera genotypes were used instead of one which increases chances for higher read coverage and wider sequence overlap.
SNPs present within genotypes and between genotypes were detected from the alignment of reads of all parents with the consensus contigs. In all those consensus contigs with a total length of 51,360,054 bp, 398,917 polymorphic loci (SNPs present either in parent or between parents) were identified with an average SNP density of 7.8 SNPs per 1kb whereas within genotype SNP density ranged from 3.7 - 4.8 SNPs per 1 kb. These numbers are comparable to for instance rose 4 - 6 SNP/kb (Koning-Boucoiran et al. 2015)
Fig. 2-4 Distribution of Gerbera transcripts in the Jasmonic acid biosynthetic pathway (Howe 2001; Wasternack 2007). Each enzyme name is followed with the number of contigs homologous to the gene family encoding this enzyme between brackets. LOX, lipoxygenase; AOS, allene oxide synthase; AOC, allene oxide cyclase; OPDR, 12-oxo-phytodienoic acid reductase; JAR1, JA amino acid conjugate synthase; JA-Ile, jasmonate-isoleucine.
Fig. 2-5 Simplified signaling ethylene and jasmonic acid signal transduction during Botrytis infection (Wang et al. 2002; Katsir et al. 2008a). Each enzyme name is followed with the number of contigs homologous to the gene family encoding this enzyme between brackets. ET, ethylene; CTR1, constitutive triple response 1; EIN2, ethylene insensitive 2; EIN3, Ethylene insensitive 3; ERF; ethylene response factor; JA, jasmonate; JA-Ile, jasmonate-isoleucine; SCF, Skp/Cullin/F-box; COI1, coronatine-insensitive 1; JAZ, jasmonate ZIM domain; bHLH TFs, basic-helix-loop-helix transcription factors; PDF1.2, plant defensin 1.2.

Transcriptome analysis of Gerbera hybrida: including in silico confirmation of defense genes found
33
2
and sunflower 6.1 SNP/kb (Bachlava et al. 2012). In eleven safflower (Carthamus tinctorius) individuals exons and introns sequences of 7 genes showed a SNP density of 10.5 SNP/kb (Chapman and Burke 2007) whereas SNP densities varied from 2.6 to 26.9 SNP/kb in ten intron regions from eight safflower accessions (Chapman et al. 2007). The frequency of polymorphisms in safflower seems higher than that in overall consensus gene sequences of gerbera but this could be biased because of the small set of genes studied in safflower. Furthermore, polymorphism rates in intron are higher than in exons since introns are under less strict selection pressure (Tamura et al. 2013).
The highest numbers of homologs were found with Vitis vinifera (grapevine). Interestingly, grapevine is a crop that also is known for its high number of secondary metabolites and its interaction with B. cinerea. Many studies have been performed on this crop-pathogen from multiple aspects (Bézier et al. 2002; Coutos-Thevenot et al. 2001; Deytieux-Belleau et al. 2009; Goetz et al. 1999; Hain et al. 1993; Jeandet et al. 1991; Poinssot et al. 2003; Timperio et al. 2012; Trotel-Aziz et al. 2006) that could be instructive for the interaction of the pathogen with gerbera as well.
There is general recognition that various natural secondary metabolites play an important role in plant defense (Dixon 2001; Dixon et al. 2002; Howlett 2006; van Baarlen et al. 2007). Plants combating the necrotrophic pathogen Botrytis especially utilize this tool (Glazebrook 2005; Oliver and Ipcho 2004). The precursors for these compounds, which are involved in physical and chemical barriers, such as lignin and phytoalexins, are derived from the phenylpropanoid pathway. Enzymes involved in the biosynthesis of the general phenylpropanoid pathway have been well studied (see Dixon et al. 2002). For instance, enzyme activities increased lignification in wheat upon B. cinerea infection (Maule and Ride 1976, 1983). In our study, we identified homologs for the three key genes (PAL, C4H and 4CL) in the core of the phenylpropanoid pathway in gerbera, and found multiple transcripts encoding the three enzymes. For 17 out of the 25 best-hits homologs come from Compositae species.
The flavonoid pathway is closely linked with the phenylpropanoid pathway and the precursor is a phenylpropanoid-derived compound. Flavonoid biosynthesis will yield in different flower color pigments (Winkel-Shirley 2001) but may also produce a range of plant defense compounds (Treutter 2005). For instance, chalcone synthase (CHS) belongs to the type III polyketide synthase (PKS) superfamily (Abe and Morita 2010; Austin and Noel 2003) and is the key enzyme towards the flavonoid biosynthesis. Members in the type III PKS superfamily, including stilbene synthases (STS) and 2-pyrone synthase (2-PS) in gerbera, share high amino acid similarities and are highly correlated with Botrytis resistance. Grapevine synthesizes stilbenes upon Botrytis infection (Goetz et al. 1999; Jeandet et al. 1991). Tobacco transformed with a stilbene synthase gene from grapevine showed increased resistance to B. cinerea (Hain et al. 1993). The 2-pyrone synthase (2-PS) codes for polyketide synthase which synthesizes a putative precursor for two phytoalexins in gerbera. Knocking out this gene resulted in increased susceptibility to B. cinerea (Koskela et al. 2011). Deng et al. (2014) confirmed that CHS enzymes in gerbera are encoded by a family of three genes. We found at least 10 transcripts annotated to the chalcone and stilbene synthase family protein. Eight of them showed high similarity at nucleotide level with gerbera CHS or CHS-like genes in public databases, whereas the other two showed only low amino acid similarity (40%) to known gerbera sequences. The latter two give the best hits to chalcone and stilbene synthases from T. cacao

Chapter 2
34
2
(XP_007041944.1, 90%) and a putative chalcone synthase from Artemisia annua (ACY74337.1, 93%). Based on the phylogenetic tree of the amino acid sequences of chalcone- and stilbene-like synthases (Suppl. Fig. S2-4 and Suppl. Table S2-5), these two transcripts (GhCHS1 and GhCHS2 in Suppl. Fig. S2-4) belong to a clearly separate group of putative chalcone and stilbene synthases.
In this study, we also exampled the possibilities of the presented transcriptome on plant hormone ethylene and jasmonate biosynthesis and signaling networks that are considered to play an important role in plant resistance in general and Botrytis in specific. For instance, ethylene production plays an important role in plant resistance against B. cinerea (Broekaert et al. 2006). The rate-limiting step of ethylene synthesis is the conversion of SAMe to ACC by ACC synthase (ACS; Kende 1993). A multigene family codes for ACC synthase in plants. Nine contigs were found in our data related with ACS genes. Similarly, the Arabidopsis and tomato genomes contain nine ACS genes (Harpaz-Saad et al. 2012). Two knockout mutants of type I ACS isoforms in Arabidopsis, acs2 and acs6, reduced B. cinerea-induced ethylene biosynthesis (Han et al. 2010). ACS-silenced apple fruit was more susceptible to B. cinerea than untransformed apple (Akagi et al. 2011). The activity of lipoxygenase (LOX), a key JA biosynthetic enzyme, is also highly related to Botrytis resistance (Azami-Sardooei et al. 2010).
Our gerbera EST database contained multiple transcripts encoding key enzymes in ethylene and jasmonate synthesis pathways. An efficient defense response to Botrytis also need genes in signaling transduction pathways, such as EIN2 in ethylene signaling (Thomma et al. 1999), COI1 and JAZ in jasmonate signaling (Cerrudo et al. 2012). COI1 protein was shown to mediate JAZ degradation to release its bound downstream TFs (e.g. MYC2) for defense gene expression (Katsir et al. 2008b, Kazan and Manners 2013). Jasmonoyl–isoleucine (JA-Ile), which is the only bioactive jasmonates derivative by a JA conjugate synthase (JAR1) confirmed so far, directly promotes their interaction (Katsir et al. 2008a; Wasternack 2007). In Arabidopsis, the coi1 and other mutations that block functional JA signaling, showed increased susceptibility to Botrytis and decreased induction of the plant antimicrobial metabolite camalexin after infection (Rowe et al. 2010). Some of these components in the signal transduction pathway still remained without coverage which may be related to the RNA-seq source that is from unchallenged material as the main focus was building generic genomic resources and SNP detection.
Through analysis of the large gerbera EST database that was generated from next-generation sequencing, we identified a series of SNP markers for further linkage mapping and also identified transcripts that might be involved in interesting pathways for both fundamental as well as applied studies as was exampled for Botrytis resistance. We expect these genes can provide genetic resources for studying the mechanism of disease resistance and developing markers for gerbera breeding in the future.
Acknowledgments
We are thankful for the support from the Foundation Technological Top Institute Green Genetics (3CFL030RP) and from gerbera breeding companies Florist Holland BV and Schreurs Holland BV.
Transcriptome analysis of Gerbera hybrida: including in silico confirmation of defense genes found
35
2
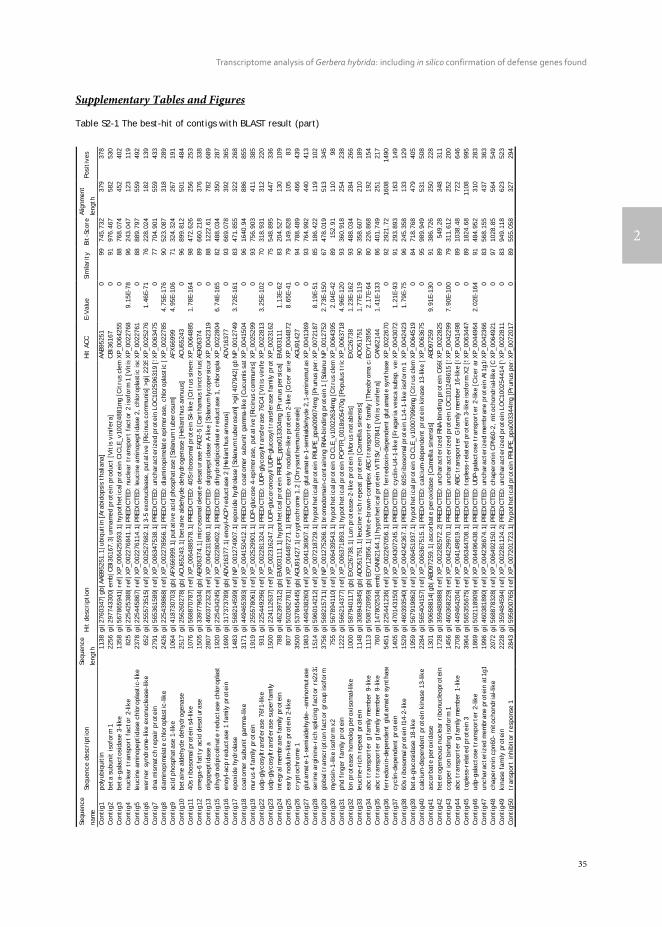
Supplementary Tables and Figures
Table S2-1 The best-hit of contigs with BLAST result (part)
Sequ
ence
nam
eSe
quen
ce d
escr
ipti
onSe
quen
ce
leng
thH
it d
escr
ipti
onH
it A
CC
E-V
alue
Sim
ilari
tyBi
t-Sc
ore
Alig
nmen
t
leng
thPo
siti
ves
Con
tig1
poly
ubiq
uiti
n11
38gi
|276
0347
|gb|
AAB9
5251
.1|u
biqu
itin
[Ar
abid
opsi
s th
alia
na]
AAB9
5251
099
745.
732
379
378
Con
tig2
beta
sub
unit
isof
orm
122
56gi
|297
7433
00|e
mb|
CBI
3616
7.3|
unna
med
pro
tein
pro
duct
[V
itis
vin
ifer
a]C
BI36
167
091
976.
467
582
530
Con
tig3
beta
-gal
acto
sida
se 3
-like
1358
gi|5
6786
5941
|ref
|XP_
0064
2559
3.1|
hypo
thet
ical
pro
tein
CIC
LE_v
1002
4881
mg
[Cit
rus
clem
e
X
P_00
6425
590
8876
8.07
445
240
2C
onti
g4nu
clea
r tr
ansp
ort
fact
or 2
-like
825
gi|2
2542
5388
|ref
|XP_
0022
7684
1.1|
PRED
ICTE
D:
nucl
ear
tran
spor
t fa
ctor
2 is
ofor
m 1
[V
itis
X
P_00
2276
849.
15E-
7896
243.
047
123
119
Con
tig5
leuc
ine
amin
opep
tida
se c
hlor
opla
stic
-like
2378
gi|2
2544
5867
|ref
|XP_
0022
7611
4.1|
PRED
ICTE
D:
leuc
ine
amin
opep
tida
se 2
, ch
loro
plas
tic
iso
X
P_00
2276
110
8888
9.79
755
949
2C
onti
g6w
erne
r sy
ndro
me-
like
exon
ucle
ase-
like
652
gi|2
5557
3515
|ref
|XP_
0025
2768
2.1|
3-5
exon
ucle
ase,
put
ativ
e [R
icin
us c
omm
unis
] >g
i|22
35
XP_
0025
2768
1.46
E-71
7622
8.02
418
213
9C
onti
g7dn
a m
ism
atch
rep
air
prot
ein
2791
gi|5
6536
1589
|ref
|XP_
0063
4753
8.1|
PRED
ICTE
D:
unch
arac
teri
zed
prot
ein
LOC
1025
9631
9 [S
X
P_00
6347
530
7770
4.90
155
943
3C
onti
g8di
amin
opim
elat
e ch
loro
plas
tic-
like
2426
gi|2
2543
9868
|ref
|XP_
0022
7856
6.1|
PRED
ICTE
D:
diam
inop
imel
ate
epim
eras
e, c
hlor
opla
stic
[
XP_
0022
7856
4.75
E-17
690
523.
087
318
289
Con
tig9
acid
pho
spha
tase
1-li
ke10
64gi
|418
7307
03|g
b|AF
X66
999.
1|pu
tati
ve a
cid
phos
phat
ase
[Sol
anum
tub
eros
um]
AFX
6699
94.
95E-
106
7132
4.32
426
719
1C
onti
g10
beta
ine
alde
hyde
deh
ydro
gena
se25
17gi
|256
2602
78|g
b|AC
U65
243.
1|be
tain
e al
dehy
de d
ehyd
roge
nase
[H
elia
nthu
s an
nuus
]AC
U65
243
096
899.
812
501
484
Con
tig1
140
s ri
boso
mal
pro
tein
s4-
like
1076
gi|5
6887
0787
|ref
|XP_
0064
8857
8.1|
PRED
ICTE
D:
40S
ribo
som
al p
rote
in S
4-lik
e [C
itru
s si
nens
XP_
0064
8857
1.78
E-16
498
472.
626
256
253
Con
tig1
2om
ega-
6 fa
tty
acid
des
atur
ase
1505
gi|3
3977
9634
|gb|
AEK0
6374
.1|m
icro
som
al o
leat
e de
satu
rase
FAD
2-5
[Car
tham
us t
inct
oriu
s]
AEK0
6374
089
660.
218
376
338
Con
tig1
3ol
igop
epti
dase
a28
07gi
|460
3723
23|r
ef|X
P_00
4231
980.
1|PR
EDIC
TED
: ol
igop
epti
dase
A-li
ke [
Sola
num
lyco
pers
icum
XP_
0042
3198
088
1222
.61
782
689
Con
tig1
5di
hydr
odip
icol
inat
e re
duct
ase
chlo
ropl
ast
1920
gi|2
2543
4245
|ref
|XP_
0022
8040
2.1|
PRED
ICTE
D:
dihy
drod
ipic
olin
ate
redu
ctas
e 1,
chl
orop
las
XP_
0022
8040
6.74
E-16
582
488.
034
350
287
Con
tig1
6en
oyl-a
cp r
educ
tase
1 f
amily
pro
tein
1690
gi|3
1737
3789
|gb|
ADV
1637
7.1|
enoy
l-AC
P re
duct
ase
2 [H
elia
nthu
s an
nuus
]AD
V16
377
093
669.
078
392
365
Con
tig1
7ep
oxid
e hy
drol
ase
1483
gi|5
6821
4599
|ref
|NP_
0012
7490
7.1|
epox
ide
hydr
olas
e [S
olan
um t
uber
osum
] >g
i|40
7942
|gb
NP_
0012
7490
3.72
E-16
183
471.
855
322
268
Con
tig1
8co
atom
er s
ubun
it g
amm
a-lik
e31
71gi
|449
4653
93|r
ef|X
P_00
4150
412.
1|PR
EDIC
TED
: co
atom
er s
ubun
it g
amm
a-lik
e [C
ucum
is s
at
XP_
0041
5041
096
1640
.94
886
855
Con
tig1
9m
urus
4 f
amily
pro
tein
1919
gi|2
5557
8061
|ref
|XP_
0025
2990
1.1|
UD
P-gl
ucos
e 4-
epim
eras
e, p
utat
ive
[Ric
inus
com
mun
is]
X
P_00
2529
900
9375
6.90
341
138
5C
onti
g22
udp-
glyc
osyl
tran
sfer
ase
76f1
-like
931
gi|2
2544
9296
|ref
|XP_
0022
8132
4.1|
PRED
ICTE
D:
UD
P-gl
ycos
yltr
ansf
eras
e 76
C4
[Vit
is v
inif
erX
P_00
2281
323.
25E-
102
7031
8.93
131
222
0C
onti
g23
udp-
glyc
osyl
tran
sfer
ase
supe
rfam
ily15
00gi
|224
1126
37|r
ef|X
P_00
2316
247.
1|U
DP-
gluc
oron
osyl
/UD
P-gl
ucos
yl t
rans
fera
se f
amily
pro
t
XP_
0023
1624
075
548.
895
447
336
Con
tig2
4in
tegr
al m
embr
ane
fam
ily p
rote
in78
8gi
|462
3973
12|g
b|EM
J031
11.1
|hyp
othe
tica
l pro
tein
PRU
PE_p
pa01
3304
mg
[Pru
nus
pers
ica]
EMJ0
3111
1.13
E-62
8320
4.52
713
010
9C
onti
g25
earl
y no
dulin
-like
pro
tein
2-li
ke80
7gi
|502
0827
81|r
ef|X
P_00
4487
271.
1|PR
EDIC
TED
: ea
rly
nodu
lin-li
ke p
rote
in 2
-like
[C
icer
ari
etX
P_00
4487
278.
65E-
4179
149.
828
105
83C
onti
g26
cryp
toch
rom
e 1
3500
gi|5
3784
5445
|gb|
AGU
9142
7.1|
cryp
toch
rom
e 1.
2 [C
hrys
anth
emum
bor
eale
]AG
U91
427
094
788.
489
466
439
Con
tig2
7gl
utam
ate-
1-se
mia
ldeh
yde-
-am
inom
utas
e19
83gi
|449
4382
60|r
ef|X
P_00
4136
907.
1|PR
EDIC
TED
: gl
utam
ate-
1-se
mia
ldeh
yde
2,1-
amin
omut
as
X
P_00
4136
900
9376
4.99
244
041
3C
onti
g28
seri
ne a
rgin
ine-
rich
spl
icin
g fa
ctor
rs2
z32
1514
gi|5
9601
4212
|ref
|XP_
0072
1872
9.1|
hypo
thet
ical
pro
tein
PRU
PE_p
pa00
9074
mg
[Pru
nus
pers
XP_
0072
1872
8.19
E-51
8518
6.42
211
910
2C
onti
g29
glob
al t
rans
crip
tion
fac
tor
grou
p is
ofor
m
3756
gi|5
6821
5711
|ref
|NP_
0012
7526
6.1|
brom
odom
ain-
cont
aini
ng R
NA-
bind
ing
prot
ein
1 [S
olan
um
N
P_00
1275
262.
73E-
150
6747
8.01
951
334
5C
onti
g30
myo
sin-
1-lik
e is
ofor
m x
275
5gi
|567
8941
10|r
ef|X
P_00
6439
543.
1|hy
poth
etic
al p
rote
in C
ICLE
_v10
0226
34m
g [C
itru
s cl
eme
XP_
0064
3954
2.04
E-42
8915
2.91
110
98C
onti
g31
phd
fing
er f
amily
pro
tein
1222
gi|5
6621
4377
|ref
|XP_
0063
7189
3.1|
hypo
thet
ical
pro
tein
PO
PTR_
0018
s054
70g
[Pop
ulus
tri
c
X
P_00
6371
894.
96E-
120
9336
0.91
825
423
8C
onti
g32
lon
prot
ease
hom
olog
per
oxis
omal
-like
1000
gi|5
8794
0117
|gb|
EXC
2673
8.1|
Lon
prot
ease
-2-li
ke p
rote
in [
Mor
us n
otab
ilis]
EXC
2673
81.
23E-
162
9348
8.03
428
426
6C
onti
g33
leuc
ine-
rich
rep
eat
prot
ein
1148
gi|3
0894
3845
|gb|
ADO
5175
1.1|
leuc
ine
rich
rep
eat
prot
ein
[Cam
ellia
sin
ensi
s]AD
O51
751
1.77
E-11
990
358.
607
210
189
Con
tig3
4ab
c tr
ansp
orte
r g
fam
ily m
embe
r 9-
like
1113
gi|5
0872
0959
|gb|
EOY
1285
6.1|
Whi
te-b
row
n-co
mpl
ex A
BC t
rans
port
er f
amily
[Th
eobr
oma
caEO
Y12
856
2.17
E-64
8022
6.86
819
215
4C
onti
g35
abc
tran
spor
ter
g fa
mily
mem
ber
9-lik
e76
0gi
|147
8025
34|e
mb|
CAN
6214
4.1|
hypo
thet
ical
pro
tein
VIT
ISV
_007
841
[Vit
is v
inif
era]
CAN
6214
41.
41E-
133
8640
1.74
925
121
7C
onti
g36
ferr
edox
in-d
epen
dent
glu
tam
ate
synt
hase
54
51gi
|225
4412
36|r
ef|X
P_00
2267
056.
1|PR
EDIC
TED
: fe
rred
oxin
-dep
ende
nt g
luta
mat
e sy
ntha
se
X
P_00
2267
050
9229
21.7
216
0814
90C
onti
g37
cycl
in-d
epen
dent
pro
tein
1405
gi|4
7014
3150
|ref
|XP_
0043
0724
5.1|
PRED
ICTE
D:
cycl
in-U
4-1-
like
[Fra
gari
a ve
sca
subs
p. v
esX
P_00
4307
241.
21E-
9391
293.
893
163
149
Con
tig3
860
s ri
boso
mal
pro
tein
l14-
2-lik
e15
29gi
|460
3935
40|r
ef|X
P_00
4242
367.
1|PR
EDIC
TED
: 60
S ri
boso
mal
pro
tein
L14
-1-li
ke is
ofor
m 1
XP_
0042
4236
1.79
E-75
9624
5.35
813
312
9C
onti
g39
beta
-glu
cosi
dase
18-
like
1959
gi|5
6791
9862
|ref
|XP_
0064
5193
7.1|
hypo
thet
ical
pro
tein
CIC
LE_v
1000
7996
mg
[Cit
rus
clem
e
X
P_00
6451
930
8471
8.76
847
940
5C
onti
g40
calc
ium
-dep
ende
nt p
rote
in k
inas
e 13
-like
2284
gi|5
6540
4157
|ref
|XP_
0063
6751
5.1|
PRED
ICTE
D:
calc
ium
-dep
ende
nt p
rote
in k
inas
e 13
-like
[
XP_
0063
6751
095
989.
949
531
508
Con
tig4
1as
corb
ate
pero
xida
se13
01gi
|906
5881
4|gb
|ABD
9725
9.1|
asco
rbat
e pe
roxi
dase
[C
amel
lia s
inen
sis]
ABD
9725
99.
91E-
130
9138
6.72
625
022
8C
onti
g42
hete
roge
neou
s nu
clea
r ri
bonu
cleo
prot
ein
1728
gi|3
5948
0888
|ref
|XP_
0022
8257
2.2|
PRED
ICTE
D:
unch
arac
teri
zed
RNA-
bind
ing
prot
ein
C66
0
X
P_00
2282
570
8954
9.28
348
311
Con
tig4
3co
pper
ion
bind
ing
isof
orm
114
56gi
|460
3682
29|r
ef|X
P_00
4229
970.
1|PR
EDIC
TED
: un
char
acte
rize
d pr
otei
n LO
C10
1248
615
[S
XP_
0042
2997
7.90
E-10
079
311.
612
252
200
Con
tig4
4ab
c tr
ansp
orte
r g
fam
ily m
embe
r 1-
like
2708
gi|4
4946
4204
|ref
|XP_
0041
4981
9.1|
PRED
ICTE
D:
ABC
tra
nspo
rter
G f
amily
mem
ber
16-li
ke [
C
XP_
0041
4981
089
1038
.48
722
646
Con
tig4
5to
ples
s-re
late
d pr
otei
n 3
3964
gi|5
6535
5675
|ref
|XP_
0063
4470
8.1|
PRED
ICTE
D:
topl
ess-
rela
ted
prot
ein
3-lik
e is
ofor
m X
2 [S
X
P_00
6344
700
8918
24.6
811
0899
5C
onti
g46
udp-
gala
ctos
e tr
ansp
orte
r 2-
like
1869
gi|5
0211
8909
|ref
|XP_
0044
9643
8.1|
PRED
ICTE
D:
UD
P-ga
lact
ose
tran
spor
ter
2-lik
e [C
icer
arX
P_00
4496
432.
02E-
164
9148
4.95
231
028
3C
onti
g47
unch
arac
teri
zed
mem
bran
e pr
otei
n at
1g1
1996
gi|4
6038
1890
|ref
|XP_
0042
3667
4.1|
PRED
ICTE
D:
unch
arac
teri
zed
mem
bran
e pr
otei
n At
1g16
XP_
0042
3667
083
568.
155
437
363
Con
tig4
8ch
aper
onin
cpn
60-
mit
ocho
ndri
al-li
ke20
72gi
|568
8783
28|r
ef|X
P_00
6492
150.
1|PR
EDIC
TED
: ch
aper
onin
CPN
60-2
, m
itoc
hond
rial
-like
[C
i
XP_
0064
9215
097
1028
.85
564
549
Con
tig4
9ki
nase
fam
ily p
rote
in22
28gi
|359
4845
94|r
ef|X
P_00
2281
124.
2|PR
EDIC
TED
: un
char
acte
rize
d pr
otei
n LO
C10
0254
414
[V
XP_
0022
8112
083
949.
118
623
523
Con
tig5
0tr
ansp
ort
inhi
bito
r re
spon
se 1
2843
gi|5
9580
0765
|ref
|XP_
0072
0172
3.1|
hypo
thet
ical
pro
tein
PRU
PE_p
pa00
3344
mg
[Pru
nus
pers
XP_
0072
0172
089
555.
058
327
294

Chapter 2
36
2
Table S2-1 (continued)
The best-hit of all contigs with BLAST result can be found in the link: http://journal.frontiersin.org/file/downloadfile/167778_supplementary-materials_tables_1_xlsx/octet-stream/Table%201.XLSX/1/167778
Sequ
ence
nam
eSe
quen
ce d
escr
ipti
onSe
quen
ce
leng
thH
it d
escr
ipti
onH
it A
CC
E-V
alue
Sim
ilari
tyBi
t-Sc
ore
Alig
nmen
t
leng
thPo
siti
ves
Con
tig5
1ud
p-d-
gluc
ose
dehy
drog
enas
e18
61gi
|460
3751
58|r
ef|X
P_00
4233
374.
1|PR
EDIC
TED
: U
DP-
gluc
ose
6-de
hydr
ogen
ase-
like
isof
orm
X
P_00
4233
370
9079
5.42
348
243
4C
onti
g52
prob
able
glu
tath
ione
per
oxid
ase
8-lik
e96
1gi
|391
3794
|sp|
O23
970.
1|G
PX1_
HEL
ANRe
cNam
e: F
ull=
Glu
tath
ione
per
oxid
ase
1 >g
i|23
2645
3
O
2397
07.
60E-
9795
295.
049
165
157
Con
tig5
3gd
p-m
anno
se-d
epen
dent
alp
ha-m
anno
sylt
r20
67gi
|356
4961
70|r
ef|X
P_00
3516
943.
1|PR
EDIC
TED
: un
char
acte
rize
d pr
otei
n LO
C10
0780
899
[G
XP_
0035
1694
083
754.
977
508
422
Con
tig5
4pr
obab
le lr
r re
cept
or-li
ke s
erin
e th
reon
ine
2642
gi|5
6618
0602
|ref
|XP_
0063
8068
7.1|
hypo
thet
ical
pro
tein
PO
PTR_
0007
s105
00g
[Pop
ulus
tri
c
X
P_00
6380
680
7383
5.09
974
854
7C
onti
g55
seri
ne t
hreo
nine
pro
tein
pho
spha
tase
2a
5
19
26gi
|462
4112
73|g
b|EM
J163
22.1
|hyp
othe
tica
l pro
tein
PRU
PE_p
pa00
4338
mg
[Pru
nus
pers
ica]
EMJ1
6322
094
721.
465
455
429
Con
tig5
6se
rine
thr
eoni
ne p
rote
in p
hosp
hata
se 2
a 5
1420
gi|5
7151
4969
|ref
|XP_
0065
9718
5.1|
PRED
ICTE
D:
seri
ne/t
hreo
nine
pro
tein
pho
spha
tase
2A
5
X
P_00
6597
180
9371
7.61
342
439
6C
onti
g57
prob
able
pho
spha
tidy
linos
itol
4-k
inas
e ty
p
11
87gi
|460
3866
63|r
ef|X
P_00
4239
016.
1|PR
EDIC
TED
: pr
obab
le p
hosp
hati
dylin
osit
ol 4
-kin
ase
type
XP_
0042
390
3.78
E-52
8919
4.51
212
110
8C
onti
g58
seri
ne t
hreo
nine
-pro
tein
kin
ase
afc2
-like
i
2579
gi|2
5554
0473
|ref
|XP_
0025
1130
1.1|
afc,
put
ativ
e [R
icin
us c
omm
unis
] >g
i|22
3550
416|
gb|E
E
X
P_00
2511
300
9662
9.40
232
031
0C
onti
g59
syst
em p
rote
in c
537
gi|5
6538
5211
|ref
|XP_
0063
5850
7.1|
PRED
ICTE
D:
unch
arac
teri
zed
prot
ein
LOC
1026
0096
2 [S
X
P_00
6358
502.
57E-
1974
88.5
817
8765
Con
tig6
060
s ri
boso
mal
pro
tein
l27-
like
818
gi|2
2546
2170
|ref
|XP_
0022
6747
8.1|
PRED
ICTE
D:
60S
ribo
som
al p
rote
in L
27 [
Vit
is v
inif
era]
XP_
0022
6747
2.81
E-73
9623
1.87
613
513
0C
onti
g61
wd-
40 r
epea
t-co
ntai
ning
pro
tein
msi
4-lik
e17
92gi
|357
4497
89|r
ef|X
P_00
3595
171.
1|N
ucle
osom
e/ch
rom
atin
ass
embl
y fa
ctor
gro
up [
Med
icag
XP_
0035
9517
087
707.
212
441
388
Con
tig6
2m
yb f
amily
tra
nscr
ipti
on f
acto
r fa
mily
pro
3107
gi|4
6241
6773
|gb|
EMJ2
1510
.1|h
ypot
heti
cal p
rote
in P
RUPE
_ppa
0001
26m
g [P
runu
s pe
rsic
a]EM
J215
100
6760
9.75
770
447
7C
onti
g63
prob
able
lrr
rece
ptor
-like
ser
ine
thre
onin
e
97
4gi
|567
8863
76|r
ef|X
P_00
6435
710.
1|hy
poth
etic
al p
rote
in C
ICLE
_v10
0332
93m
g [C
itru
s cl
eme
XP_
0064
357
6.36
E-68
7023
9.19
523
416
4C
onti
g64
cycl
oart
enol
syn
thas
e26
57gi
|484
8478
96|g
b|AG
K624
47.1
|cyc
loar
teno
l syn
thas
e [P
anax
qui
nque
foliu
s]AG
K624
470
9213
75.5
375
770
0C
onti
g65
prol
ifer
atio
n-as
soci
ated
pro
tein
2g4
-like
2483
gi|4
6240
0945
|gb|
EMJ0
6502
.1|h
ypot
heti
cal p
rote
in P
RUPE
_ppa
0067
78m
g [P
runu
s pe
rsic
a] >
EM
J065
020
9565
6.36
639
037
1C
onti
g66
unch
arac
teri
zed
loc1
0120
2927
4034
gi|2
2545
0585
|ref
|XP_
0022
8210
9.1|
PRED
ICTE
D:
unch
arac
teri
zed
prot
ein
LOC
1002
6484
6 [V
X
P_00
2282
100
7595
1.04
484
663
6C
onti
g67
glut
athi
one
s-tr
ansf
eras
e t1
-like
1146
gi|2
5553
7437
|ref
|XP_
0025
0978
5.1|
glut
athi
one-
s-tr
ansf
eras
e th
eta,
gst
, pu
tati
ve [
Rici
nus
X
P_00
2509
781.
39E-
110
7633
5.88
250
192
Con
tig6
8se
rine
thr
eoni
ne-p
rote
in k
inas
e at
5g01
0221
96gi
|565
3933
17|r
ef|X
P_00
6362
327.
1|PR
EDIC
TED
: se
rine
/thr
eoni
ne-p
rote
in k
inas
e At
5g01
02
X
P_00
6362
320
9369
6.04
137
935
6C
onti
g69
acon
itat
e hy
drat
ase
mit
ocho
ndri
al-li
ke10
36gi
|565
4022
39|r
ef|X
P_00
6366
590.
1|PR
EDIC
TED
: ac
onit
ate
hydr
atas
e 2,
mit
ocho
ndri
al-li
ke
X
P_00
6366
593.
70E-
133
9441
5.61
621
820
6C
onti
g70
duf2
46 d
omai
n-co
ntai
ning
pro
tein
at1
g049
2937
gi|5
8790
0812
|gb|
EXB8
9105
.1|h
ypot
heti
cal p
rote
in L
484_
0166
65 [
Mor
us n
otab
ilis]
EXB8
9105
093
869.
381
486
454
Con
tig7
1ep
oxid
e hy
drol
ase
1290
gi|5
6821
4641
|ref
|NP_
0012
7541
7.1|
epox
ide
hydr
olas
e [S
olan
um t
uber
osum
] >g
i|40
7944
|gb
NP_
0012
7541
1.46
E-76
8625
2.67
716
114
0C
onti
g72
PRED
ICTE
D:
unch
arac
teri
zed
prot
ein
LOC
1897
gi|3
5948
0951
|ref
|XP_
0022
6484
2.2|
PRED
ICTE
D:
unch
arac
teri
zed
prot
ein
LOC
1002
4329
5 is
X
P_00
2264
840
8770
2.97
543
638
0C
onti
g73
sum
o-ac
tiva
ting
enz
yme
subu
nit
1a-li
ke13
91gi
|225
4563
43|r
ef|X
P_00
2283
880.
1|PR
EDIC
TED
: SU
MO
-act
ivat
ing
enzy
me
subu
nit
1B [
Vit
is
XP_
0022
8388
087
532.
332
323
284
Con
tig7
4ci
nnam
oyl-
redu
ctas
e 1-
like
1246
gi|2
2543
4488
|ref
|XP_
0022
7519
5.1|
PRED
ICTE
D:
dihy
drof
lavo
nol-4
-red
ucta
se [
Vit
is v
inif
era
XP_
0022
7519
091
526.
168
327
298
Con
tig7
5ca
lciu
m-d
epen
dent
pho
spho
trie
ster
ase
su
1191
gi|5
6536
4957
|ref
|XP_
0063
4918
4.1|
PRED
ICTE
D:
unch
arac
teri
zed
prot
ein
LOC
1025
9895
3 [S
X
P_00
6349
183.
66E-
123
7737
1.31
831
924
6C
onti
g76
unch
arac
teri
zed
part
ial
2937
gi|4
4947
4556
|ref
|XP_
0041
5421
3.1|
PRED
ICTE
D:
unch
arac
teri
zed
prot
ein
LOC
1012
0780
0, p
XP_
0041
5421
2.00
E-79
9427
0.78
114
013
2C
onti
g77
kina
se f
amily
pro
tein
3618
gi|2
5556
8924
|ref
|XP_
0025
2543
2.1|
case
in k
inas
e, p
utat
ive
[Ric
inus
com
mun
is]
>gi|
2235
35
XP_
0025
2543
093
1257
.28
708
660
Con
tig7
8pl
eiot
ropi
c dr
ug r
esis
tanc
e pr
otei
n 1-
like
3662
gi|7
5326
590|
sp|Q
76C
U2.
1|PD
R1_T
OBA
CRe
cNam
e: F
ull=
Plei
otro
pic
drug
res
ista
nce
prot
ein
Q
76C
U2
086
1819
.67
1182
1024
Con
tig7
9pl
eiot
ropi
c dr
ug r
esis
tanc
e pr
otei
n 1-
like
2381
gi|4
6038
8418
|ref
|XP_
0042
3986
4.1|
PRED
ICTE
D:
plei
otro
pic
drug
res
ista
nce
prot
ein
1-lik
e [
X
P_00
4239
860
8892
7.93
259
552
8C
onti
g80
splic
ing
fact
or 1
-like
pro
tein
2956
gi|2
2546
1650
|ref
|XP_
0022
8311
5.1|
PRED
ICTE
D:
unch
arac
teri
zed
prot
ein
LOC
1002
6753
9 [V
X
P_00
2283
110
7384
5.88
477
957
3C
onti
g81
clat
hrin
inte
ract
or e
psin
220
94gi
|255
5838
60|r
ef|X
P_00
2532
681.
1|Ep
sin-
2, p
utat
ive
[Ric
inus
com
mun
is]
>gi|
2235
2759
4|gb
XP_
0025
3268
5.52
E-15
463
481.
159
337
8C
onti
g82
prot
ein
exec
uter
chl
orop
last
ic-li
ke51
92gi
|225
4640
89|r
ef|X
P_00
2271
011.
1|PR
EDIC
TED
: pr
otei
n EX
ECU
TER
1, c
hlor
opla
stic
[V
itis
vi
XP_
0022
710
072
721.
079
697
506
Con
tig8
3un
char
acte
rize
d m
embr
ane
prot
ein
ymr1
510
22gi
|565
3487
85|r
ef|X
P_00
6341
383.
1|PR
EDIC
TED
: un
char
acte
rize
d pr
otei
n LO
C10
2606
368
[S
XP_
0063
4138
6.99
E-14
085
420.
239
261
224
Con
tig8
4pr
otei
n be
m46
-like
1364
gi|5
9057
5522
|ref
|XP_
0070
1271
0.1|
Alph
a/be
ta-H
ydro
lase
s su
perf
amily
pro
tein
isof
orm
2 [
T
XP_
0070
127
091
550.
436
314
286
Con
tig8
6-f
ruct
an:
-fru
ctan
1-f
ruct
osyl
tran
sfer
ase
2560
gi|3
7840
7622
|gb|
AFB8
3199
.1|f
ruct
an-f
ruct
an 1
-fru
ctos
yltr
ansf
eras
e [C
icho
rium
inty
bus]
AFB8
3199
085
969.
148
612
522
Con
tig8
7gl
utam
ate
bind
ing
prot
ein
1174
gi|4
7010
8658
|ref
|XP_
0042
9062
9.1|
PRED
ICTE
D:
BI1-
like
prot
ein-
like
[Fra
gari
a ve
sca
subs
p XP_
0042
9062
7.31
E-10
287
313.
538
240
211
Con
tig8
8ga
ta t
rans
crip
tion
fac
tor
24-li
ke15
86gi
|255
5728
74|r
ef|X
P_00
2527
369.
1|G
ATA
tran
scri
ptio
n fa
ctor
, pu
tati
ve [
Rici
nus
com
mun
is]
XP_
0025
2736
6.59
E-10
581
329.
331
218
177
Con
tig8
9tr
ansc
ript
ion
elon
gati
on f
acto
r sp
t6-li
ke44
13gi
|297
7417
09|e
mb|
CBI
3284
1.3|
unna
med
pro
tein
pro
duct
[V
itis
vin
ifer
a]C
BI32
841
083
1895
.94
1366
1134
Con
tig9
0hi
gh m
obili
ty g
roup
pro
tein
813
gi|2
9784
9910
|ref
|XP_
0028
9283
6.1|
hypo
thet
ical
pro
tein
ARA
LYD
RAFT
_888
880
[Ara
bido
psis
X
P_00
2892
831.
49E-
5067
176.
022
184
124
Con
tig9
1m
ethy
l- -b
indi
ng d
omai
n-co
ntai
ning
pro
tei
30
53gi
|571
4986
85|r
ef|X
P_00
6594
288.
1|PR
EDIC
TED
: m
ethy
l-CpG
-bin
ding
dom
ain-
cont
aini
ng p
ro
XP_
0065
9428
2.47
E-13
263
452.
595
544
344
Con
tig9
2an
apha
se-p
rom
otin
g co
mpl
ex s
ubun
it 1
-lik
7841
gi|5
0872
5846
|gb|
EOY
1774
3.1|
E3 u
biqu
itin
liga
se is
ofor
m 1
[Th
eobr
oma
caca
o]EO
Y17
743
083
2254
.17
1605
1347
Con
tig9
3pr
obab
le in
acti
ve le
ucin
e-ri
ch r
epea
t re
ce
2990
gi|2
2545
6272
|ref
|XP_
0022
7969
7.1|
PRED
ICTE
D:
prob
able
inac
tive
leuc
ine-
rich
rep
eat
rece
X
P_00
2279
690
7172
8.39
876
254
3C
onti
g94
prot
ein
nsp-
inte
ract
ing
kina
se 1
-like
3304
gi|5
6618
3369
|ref
|XP_
0023
1140
8.2|
hypo
thet
ical
pro
tein
PO
PTR_
0008
s109
70g
[Pop
ulus
tri
c
X
P_00
2311
400
9075
9.59
943
039
1C
onti
g95
seri
ne t
hreo
nine
-pro
tein
kin
ase
edr1
-like
3166
gi|5
0208
2392
|ref
|XP_
0044
8715
2.1|
PRED
ICTE
D:
seri
ne/t
hreo
nine
-pro
tein
kin
ase
EDR1
-like
XP_
0044
8715
071
890.
567
816
581
Con
tig9
6fla
vono
id 3
-m
onoo
xyge
nase
-like
1965
gi|5
6537
8114
|ref
|XP_
0063
5550
7.1|
PRED
ICTE
D:
cyto
chro
me
P450
93A
1-lik
e [S
olan
um t
uber
XP_
0063
5550
083
716.
457
499
418

Transcriptome analysis of Gerbera hybrida: including in silico confirmation of defense genes found
37
2
Table S2-2 Transcriptomes annotation process results
GO-id GO-term Score
Biological Process
GO:0006950 response to stress 3186 9.10%
GO:0006464 cellular protein modification process 2824 8.07%
GO:0005975 carbohydrate metabolic process 2442 6.98%
GO:0006520 cellular amino acid metabolic process 2185 6.24%
GO:0006629 lipid metabolic process 1849 5.28%
GO:0007165 signal transduction 1757 5.02%
GO:0006259 DNA metabolic process 1114 3.18%
GO:0055085 transmembrane transport 1075 3.07%
GO:0006091 generation of precursor metabolites and energy 933 2.67%
GO:0051186 cofactor metabolic process 874 2.50%
GO:0040007 growth 867 2.48%
GO:0030154 cell differentiation 842 2.41%
GO:0071554 cell wall organization or biogenesis 836 2.39%
GO:0006412 translation 794 2.27%
GO:0006461 protein complex assembly 777 2.22%
GO:0034655 nucleobase-containing compound catabolic process 763 2.18%
GO:0016192 vesicle-mediated transport 753 2.15%
GO:0051276 chromosome organization 746 2.13%
GO:0006605 protein targeting 733 2.09%
GO:0006790 sulfur compound metabolic process 726 2.07%
Molecular Function
GO:0043167 ion binding 6190 28.54%
GO:0016301 kinase activity 2121 9.78%
GO:0016491 oxidoreductase activity 2114 9.75%
GO:0003677 DNA binding 1267 5.84%
GO:0022857 transmembrane transporter activity 1192 5.50%
GO:0016887 ATPase activity 758 3.49%
GO:0016757 transferase activity, transferring glycosyl groups 729 3.36%
GO:0008233 peptidase activity 608 2.80%
GO:0001071 nucleic acid binding transcription factor activity 487 2.25%
GO:0016829 lyase activity 467 2.15%
GO:0016791 phosphatase activity 459 2.12%
GO:0016798 hydrolase activity, acting on glycosyl bonds 456 2.10%
GO:0003735 structural constituent of ribosome 417 1.92%
GO:0016746 transferase activity, transferring acyl groups 387 1.78%
GO:0016874 ligase activity 377 1.74%
GO:0004871 signal transducer activity 338 1.56%

Chapter 2
38
2
Table S2-2 (continued)
GO-id GO-term Score
GO:0008168 methyltransferase activity 321 1.48%
GO:0016853 isomerase activity 315 1.45%
GO:0016779 nucleotidyltransferase activity 270 1.24%
GO:0008092 cytoskeletal protein binding 266 1.23%
GO:0004386 helicase activity 258 1.19%
Cellular component
GO:0009536 plastid 3314 17.29%
GO:0043234 protein complex 2986 15.58%
GO:0005886 plasma membrane 2769 14.45%
GO:0005739 mitochondrion 1839 9.59%
GO:0005829 cytosol 1831 9.55%
GO:0005794 Golgi apparatus 1064 5.55%
GO:0005773 vacuole 950 4.96%
GO:0005840 ribosome 740 3.86%
GO:0005783 endoplasmic reticulum 679 3.54%
GO:0005618 cell wall 630 3.29%
GO:0009579 thylakoid 565 2.95%
GO:0005730 nucleolus 517 2.70%
GO:0005768 endosome 342 1.78%
GO:0016023 cytoplasmic membrane-bounded vesicle 303 1.58%
GO:0005777 peroxisome 230 1.20%
GO:0005654 nucleoplasm 212 1.11%
GO:0005635 nuclear envelope 85 0.44%
GO:0000228 nuclear chromosome 64 0.33%
GO:0000229 cytoplasmic chromosome 22 0.11%
GO:0005815 microtubule organizing center 18 0.09%
GO:0044421 extracellular region part 7.8 0.04%

Transcriptome analysis of Gerbera hybrida: including in silico confirmation of defense genes found
39
2
Table S2-3 Annotated contigs involved in top 30 metabolic pathway
Pathway #Seqs in Pathway #Enzyme
Biosynthesis of antibiotics 668 175
Starch and sucrose metabolism 478 40
Purine metabolism 435 52
T cell receptor signaling pathway 198 2
Glycolysis / Gluconeogenesis 196 25
Amino sugar and nucleotide sugar metabolism 195 42
Phenylalanine metabolism 182 22
Pyrimidine metabolism 171 28
Glycerophospholipid metabolism 168 29
Glycerolipid metabolism 151 21
Galactose metabolism 146 19
Pyruvate metabolism 146 26
Drug metabolism - other enzymes 137 14
Phenylpropanoid biosynthesis 137 14
Oxidative phosphorylation 135 17
Phosphatidylinositol signaling system 135 7
Pentose and glucuronate interconversions 133 16
Carbon fixation in photosynthetic organisms 126 21
Arginine and proline metabolism 121 34
Aminobenzoate degradation 119 34
Cysteine and methionine metabolism 119 11
Glycine, serine and threonine metabolism 117 32
Pentose phosphate pathway 113 18
Methane metabolism 106 19
Carbon fixation pathways in prokaryotes 104 18
Glyoxylate and dicarboxylate metabolism 104 27
Citrate cycle (TCA cycle) 101 16
Inositol phosphate metabolism 95 22
Thiamine metabolism 94 8
Ascorbate and aldarate metabolism 93 14

Chapter 2
40
2
Table S2-4 Details of contigs involved in secondary metabolic biosynthesis pathways (part)
Details of all contigs involved in secondary metabolic biosynthesis pathways can be found in the link: http://journal.frontiersin.org/file/downloadfile/167778_supplementary-materials_tables_4_xlsx/octet-stream/Table%204.XLSX/1/167778
Path
way
#Seq
s in
Path
way
Enzy
me
Ezym
e ID
#Seq
s of
Enzy
me
Seqs
invo
lved
Path
way
IDSt
eroi
d ho
rmon
e bi
osyn
thes
is43
O-m
ethy
ltra
nsfe
rase
ec:2
.1.1
.62
Cont
ig27
880,
Con
tig2
7881
map
0014
0St
eroi
d ho
rmon
e bi
osyn
thes
is43
5bet
a-re
duct
ase
ec:1
.3.1
.32
Cont
ig23
923,
Con
tig2
5515
map
0014
0St
eroi
d ho
rmon
e bi
osyn
thes
is43
dehy
drog
enas
eec
:1.1
.1.1
491
Cont
ig15
861
map
0014
0St
eroi
d ho
rmon
e bi
osyn
thes
is43
dehy
drog
enas
eec
:1.1
.1.1
459
Cont
ig46
58,
Cont
ig65
32,
Cont
ig68
65,
Cont
ig11
024,
Con
tig2
0432
, Co
ntig
2392
3, C
onti
g255
15,
Cont
ig34
03
map
0014
0St
eroi
d ho
rmon
e bi
osyn
thes
is43
17-d
ehyd
roge
nase
ec:1
.1.1
.62
5Co
ntig
4866
, Co
ntig
5424
, Co
ntig
1309
9, C
onti
g230
08,
Cont
ig24
044
map
0014
0St
eroi
d ho
rmon
e bi
osyn
thes
is43
20be
ta)-
hydr
oxys
tero
id d
ehyd
roec
:1.1
.1.5
31
Cont
ig19
083
map
0014
0St
eroi
d ho
rmon
e bi
osyn
thes
is43
1-na
phth
ol g
lucu
rony
ltra
nsfe
rase
c:2.
4.1.
174
Cont
ig26
07,
Cont
ig12
837,
Con
tig1
2925
, Co
ntig
1508
0m
ap00
140
Ster
oid
horm
one
bios
ynth
esis
43m
onoo
xyge
nase
ec:1
.14.
14.1
19Co
ntig
388,
Con
tig2
578,
Con
tig1
0619
, Co
ntig
1243
1, C
onti
g126
22,
Cont
ig12
776,
Con
tig1
3139
, Co
ntig
1347
m
ap00
140
Ster
oid
horm
one
bios
ynth
esis
43su
lfotr
ansf
eras
eec
:2.8
.2.4
1Co
ntig
6053
map
0014
0St
eroi
d ho
rmon
e bi
osyn
thes
is43
4-de
hydr
ogen
ase
(NAD
P+)
ec:1
.3.1
.22
1Co
ntig
1123
2m
ap00
140
Capr
olac
tam
deg
rada
tion
26hy
drat
ase
ec:4
.2.1
.17
23Co
ntig
440,
Con
tig2
746,
Con
tig2
936,
Con
tig2
953,
Con
tig5
767,
Con
tig1
2793
, Co
ntig
1279
4, C
onti
g128
79,
C
m
ap00
930
Capr
olac
tam
deg
rada
tion
26de
hydr
ogen
ase
(NAD
P+)
ec:1
.1.1
.22
Cont
ig15
55,
Cont
ig84
57m
ap00
930
Capr
olac
tam
deg
rada
tion
26de
hydr
ogen
ase
ec:1
.1.1
.35
11Co
ntig
2746
, Co
ntig
2936
, Co
ntig
1279
3, C
onti
g127
94,
Cont
ig16
800,
Con
tig1
8154
, Co
ntig
2025
2, C
onti
g272
m
ap00
930
Thia
min
e m
etab
olis
m94
diph
osph
okin
ase
ec:2
.7.6
.22
Cont
ig48
51,
Cont
ig48
52m
ap00
730
Thia
min
e m
etab
olis
m94
kina
seec
:2.7
.4.7
2Co
ntig
5840
, Co
ntig
2135
6m
ap00
730
Thia
min
e m
etab
olis
m94
synt
hase
ec:2
.2.1
.76
Cont
ig56
02,
Cont
ig56
70,
Cont
ig12
428,
Con
tig1
3581
, Co
ntig
1968
2, C
onti
g214
52m
ap00
730
Thia
min
e m
etab
olis
m94
diph
osph
oryl
ase
ec:2
.5.1
.34
Cont
ig57
71,
Cont
ig58
40,
Cont
ig21
356,
Con
tig2
6429
map
0073
0Th
iam
ine
met
abol
ism
94de
sulfu
rase
ec:2
.8.1
.74
Cont
ig17
54,
Cont
ig52
36,
Cont
ig52
37,
Cont
ig73
44m
ap00
730
Thia
min
e m
etab
olis
m94
phos
phat
ase
ec:3
.6.1
.15
77Co
ntig
561,
Con
tig7
53,
Cont
ig12
86,
Cont
ig27
94,
Cont
ig38
13,
Cont
ig42
15,
Cont
ig50
08,
Cont
ig51
73,
Cont
map
0073
0Th
iam
ine
met
abol
ism
94ki
nase
ec:2
.7.1
.50
1Co
ntig
2859
0m
ap00
730
Thia
min
e m
etab
olis
m94
kina
seec
:2.7
.1.4
92
Cont
ig58
40,
Cont
ig21
356
map
0073
0G
lyco
sam
inog
lyca
n bi
osyn
thes
is -
45xy
losy
ltra
nsfe
rase
ec:2
.4.2
.26
10Co
ntig
2083
, Co
ntig
4968
, Co
ntig
6078
, Co
ntig
6880
, Co
ntig
1370
8, C
onti
g182
68,
Cont
ig30
171,
Con
tig3
0739
map
0053
4G
lyco
sam
inog
lyca
n bi
osyn
thes
is -
453-
beta
-glu
curo
nosy
ltra
nsfe
rase
ec:2
.4.1
.135
4Co
ntig
1534
, Co
ntig
3130
, Co
ntig
5531
, Co
ntig
6654
map
0053
4G
lyco
sam
inog
lyca
n bi
osyn
thes
is -
453-
beta
-gal
acto
sylt
rans
fera
seec
:2.4
.1.1
3414
Cont
ig25
17,
Cont
ig10
476,
Con
tig1
1031
, Co
ntig
1115
9, C
onti
g111
68,
Cont
ig19
551,
Con
tig2
1765
, Co
ntig
21
m
ap00
534
Gly
cosa
min
ogly
can
bios
ynth
esis
-
45
4-al
pha-
N-a
cety
lglu
cosa
min
yltr
aec
:2.4
.1.2
2410
Cont
ig25
88,
Cont
ig58
50,
Cont
ig93
95,
Cont
ig11
371,
Con
tig1
8981
, Co
ntig
2005
5, C
onti
g234
11,
Cont
ig24
73
m
ap00
534
Gly
cosa
min
ogly
can
bios
ynth
esis
-
45
4-al
pha-
N-a
cety
lglu
cosa
min
yltr
aec
:2.4
.1.2
237
Cont
ig38
17,
Cont
ig58
69,
Cont
ig15
150,
Con
tig2
1360
, Co
ntig
2713
6, C
onti
g271
37,
Cont
ig31
401
map
0053
4G
lyco
sam
inog
lyca
n bi
osyn
thes
is -
28
xylo
sylt
rans
fera
seec
:2.4
.2.2
610
Cont
ig20
83,
Cont
ig49
68,
Cont
ig60
78,
Cont
ig68
80,
Cont
ig13
708,
Con
tig1
8268
, Co
ntig
3017
1, C
onti
g307
39
m
ap00
532
Gly
cosa
min
ogly
can
bios
ynth
esis
-
283-
beta
-glu
curo
nosy
ltra
nsfe
rase
ec:2
.4.1
.135
4Co
ntig
1534
, Co
ntig
3130
, Co
ntig
5531
, Co
ntig
6654
map
0053
2G
lyco
sam
inog
lyca
n bi
osyn
thes
is -
28
3-be
ta-g
alac
tosy
ltra
nsfe
rase
ec:2
.4.1
.134
14Co
ntig
2517
, Co
ntig
1047
6, C
onti
g110
31,
Cont
ig11
159,
Con
tig1
1168
, Co
ntig
1955
1, C
onti
g217
65,
Cont
ig21
map
0053
2G
lyco
sam
inog
lyca
n de
grad
atio
n32
hexo
sam
inid
ase
ec:3
.2.1
.52
3Co
ntig
2028
7, C
onti
g301
10,
Cont
ig34
002
map
0053
1G
lyco
sam
inog
lyca
n de
grad
atio
n32
alph
a-ac
etyl
gluc
osam
inid
ase
ec:3
.2.1
.50
3Co
ntig
1563
6, C
onti
g245
56,
Cont
ig24
557
map
0053
1G
lyco
sam
inog
lyca
n de
grad
atio
n32
beta
-glu
curo
nide
glu
curo
nohy
d
ec:3
.2.1
.31
1Co
ntig
2934
8m
ap00
531
Gly
cosa
min
ogly
can
degr
adat
ion
32la
ctas
e (a
mbi
guou
s)ec
:3.2
.1.2
325
Cont
ig3,
Con
tig1
178,
Con
tig1
432,
Con
tig2
272,
Con
tig2
450,
Con
tig6
386,
Con
tig6
617,
Con
tig7
180,
Con
tig
map
0053
1

Transcriptome analysis of Gerbera hybrida: including in silico confirmation of defense genes found
41
2
Table S2-5 Chalcone and stilbene synthase protein sequences obtained from NCBI for phylogenetic analyzes
Species accession no. abbreviation note
Antirrhinum majus BAE80511.1 AmCHS
Arabidopsis halleri subsp. gemmifera AAZ23684.1 AhCHS
A. thaliana NP_196897.1 AtCHS
A. thaliana AAZ23705.1 AtPKSB
Arachis hypogaea P20178.1 AhSS
Artemisia annua ACY74337.1 AaCHS3
Betula pendula CAA71904.1 BpCHS
Bromheadia finlaysoniana AAB62876.1 BfCHS
Callistephus chinensis CAA91930.1 CcCHS
Chrysanthemum x morifolium ABF69124.1 CmCHS
Chrysosplenium americanum AAB54075.1 CaCHS
Dahlia pinnata BAJ14768.1 DpCHS1
Gerbera hybrida CAA86219.2 Gh2PS
G. hybrida CAA86218.1 GhCHS1
G. hybrida CAA86220.1 GhCHS3
G. hybrida CAP20328.1 GhCHS4
Glycine max P24826.1 GmCHS1
G. soja KHN32314.1 GsCHS
Helianthus annuus Ha_DY911847 Ha_DY911847 1
H. annuus Ha_DY921724 Ha_DY921724 1
H. annuus Ha_DY922225 Ha_DY922225 1
H. annuus Ha_GE514800 Ha_GE514800 1
H. annuus Ha_TC39714 Ha_TC39714 1
H. annuus Ha_TC40680 Ha_TC40680 1
H. annuus ALL34489.1 HaCHS2 1
Ipomoea perperea AAB02620.1 IpCHSA
I. perperea AAC49030.1 IpCHSB
I. perperea AAC49031.1 IpCHSC
I. perperea ABW69675.1 IpCHSD
I. perperea BAA87337.1 IpCHSE
I. perperea AAB41103.1 IpCHSF-1
Juglans nigra x Juglans regia CAA64452.1 JCHS
Lactuca sativa Ls_DY962354 Ls_DY962354 1
L. sativa Ls_DY970700 Ls_DY970700 1
L. sativa Ls_TC16147 Ls_TC16147 1
L. sativa Ls_TC27150 Ls_TC27150 1
L. sativa AAP03003.1 LsCHS 1

Chapter 2
42
2
Table S2-5 (continued)
Species accession no. abbreviation note
Medicago sativa AAA02823.1 MsCHS1
M. sativa AAA02824.1 MsCHS2
M. sativa AAA02825.1 MsCHS4
M. sativa AAA02826.1 MsCHS8
M. sativa AAA02827.1 MsCHS9
M. sativa CAA48226.1 MsCHSI
M. truncatula XP_013456566.1 MtCHS
Morus notabilis XP_010088676.1 MnCHS9
Oryza sativa BAA19186.2 OsCHS
Perilla frutescens BAA19656.1 PfCHS
Petunia hybrida CAA32731.1 PhCHSA
P. hybrida CAA32732.1 PhCHSB
P. hybrida CAA32733 PhCHSD
P. hybrida CAA32734 PhCHSF
P. hybrida CAA32735 PhCHSG
P. hybrida CAA32737 PhCHSJ
Pinus strobus O65872.1 PsCHS
P. strobus CAA06077.1 PsSS
P. sylvestris P30079.1 PsCHS2
P. sylvestris CAA43166.1 PsSS2
Populus trichocarpa XP_006379273.1 PtCHS
Raphanus sativus AAB87072.1 RsCHS
Scutellaria baicalensis BAA23373.1 SbCHS
Solanum tuberosum AAB67734.1 StCHS1a
Theobroma cacao XM_007041882.1 TcCHS
Vitis riparia AAF00586.1 VrSS
V. vinifera BAA31259.1 VvCHS
V. vinifera AAB72091.1 VvCHS2
V. vinifera CAA54221.1 VvSS
V. vinifera NP_001267939.1 VvSS1
1 sequences of sunflower (Helianthus annuus) and lettice (Lactuca sativa) are retrieved from the TGI databases (ftp://occams.dfci.harvard.edu/pub/bio/tgi/data/) using the key word 'chalcone synthase'.

Transcriptome analysis of Gerbera hybrida: including in silico confirmation of defense genes found
43
2
Fig. S2-1 Charts of Sequences Similarity Distribution (A), (Blast hit) Species Distribution (B) and Top-hits Species Distribution (C).

Chapter 2
44
2
Fig. S2-2 Details of enzymes involved in phenylpropanoid biosynthesis pathway (from KEGG, Kyoto Encyclopedia of Genes and Genomes). Annotated enzymes are highlighted in different colors.

Transcriptome analysis of Gerbera hybrida: including in silico confirmation of defense genes found
45
2
Fig. S2-3 Details of enzymes involved in flavonoid biosynthesis pathway (from KEGG). Annotated enzymes are highlighted in different colors.

Chapter 2
46
2
Fig. S2-4 Phylogenetic tree of chalcone and stilbene synthase family protein from different species. The tree generated with MEGA 6.0 using the Maximum-likelihood after sequence alignment. The numbers indicate bootstrap probabilities. NCBI accession numbers of the chalcone and stilbene synthase family protein sequences used in the tree are given in suppl.Table S2-5.
MsCHS8 MsCHS4
MsCHSI MsCHS2
MsCHS9 MsCHS1
GmCHS1 PsCHS
PsCHS2 JCHS
VvCHS VvCHS2 CaCHS
AtCHS LsCHS
RsCHS BpCHS
DpCHS1 Ha TC39714
GhCHS4 PhCHSA
IpCHSD PhCHSJ
PhCHSD PhCHSG
PhCHSF OsCHS
StCHS1a PfCHS
SbCHS IpCHSF-1 IpCHSE
BfCHS Ha TC40680
GhCHS3 GhCHS1
Ls TC27150 HaCHS2
CcCHS CmCHS
VvSS VrSS
VvSS1 Gh2PS
Ls DY970700 Ha DY921724
Ha GE514800 Ha DY911847 Ha DY922225
AhSS PsSS
PsSS2 PhCHSB
IpCHSB lpCHSA
IpCHSC AmCHS
GhCHS1280 AaCHS3
MtCHS GsCHS
AhCHS AtPKSB
TcCHS PtCHS
MnCHS9 GhCHS28458
Ls TC16147 Ls DY962354 100
98
100
71
69 10
69
15
89
21 100
88
100
99
99
100
99
93
76
50 32
52
74
94
58
95
100
12
98
63 90
92
0
30
2
28
69
1 4
23
23 1
27
3
28
5
28
17
17
15
14
6
4
7
0
1
2
0
0
0.1

Chapter 3 Genetic mapping and QTL analysis of Botrytis
resistance in Gerbera hybrida
Yiqian Fu1, Alex van Silfhout1, Arwa Shahin1, Ronny Egberts2, Martin Beers3, Ans van der Velde3, Adrie
van Houten2, Jaap M. van Tuyl1, Richard G.F. Visser1, Paul Arens1,*
1Wageningen UR Plant Breeding, Wageningen University & Research, PO Box 386, 6700AJ, Wageningen,
The Netherlands
2Schreurs Holland B.V., Hoofdweg 81, 1424PD, De Kwakel, The Netherlands
3Florist Holland B.V., Dwarsweg 15, 1424PL, De Kwakel, The Netherlands
*Corresponding author, e-mail address: [email protected]; telephone: +31317481589; fax number:
+31317418094
This chapter has been published in Molecular Breeding (2017) 37: 13.
Chapter 3
48
3
Abstract
Gerbera hybrida is an economically important cut flower. In the production and transportation of gerbera with unavoidable periods of high relative humidity, gray mold occurs and results in losses in quality and quantity of flowers. Considering the limitations of chemical use in greenhouses and the impossibility to use these chemicals in auction or after sale, breeding for resistant gerbera cultivars is considered as the best practical approach. In this study, we developed two segregating F1 populations (called S and F). Four parental linkage maps were constructed using common and parental specific SNP markers developed from EST sequencing. Parental genetic maps, contained 30, 29, 27 and 28 linkage groups and a consensus map covering 24 of the 25 expected chromosomes could be constructed. After evaluation of Botrytis disease severity using three different tests, whole inflorescence, bottom (of disc florets) and ray floret. QTL mapping was performed using the four individual parental maps. A total of 20 QTLs (including one identical QTL locus for whole inflorescence and bottom test) were identified in the parental maps two populations. The number of QTLs found and the explained variance of most QTLs detected reflects the complex mechanism of Botrytis disease response.
Keywords
gerbera gray mold, SNP, linkage group, QTL mapping

Genetic mapping and QTL analysis of Botrytis resistance in Gerbera hybrida
49
3
Introduction
Gerbera hybrida belongs to the Compositae family and is known for its abundant flower colors, capitula sizes and shapes. As one of the most economical important ornamental plants, gerbera is mainly used as cut flower, and ranked fifth in cut flower sales on Dutch flower auctions in 2014 (https://www.floraholland.com/media/3949227/Kengetallen-2014-Engels.pdf). The cultivated commercial gerberas are highly heterozygous almost complete obligatory outcrossing diploid (2n = 50) plants and probably originated from crossings between two wild species, G. jamesonii and G. viridifolia, from Africa (Hansen 1999).
Gerbera as a cut flower is mainly grown in greenhouses for year-round production. However, during gerbera cultivation especially in winter and during the process of post-harvest transportation, the high relative humidity is ideal for gray mold infestation. Gerbera gray mold is caused by the necrotrophic fungus Botrytis cinerea, a notorious fungal pathogen with a wide range of plant host species (Elad et al. 2016a). B. cinerea infection leads to direct damage on gerbera. Necrotic lesions (spotting) in early infection occurs on flower buds and ray florets, and these symptoms are strengthened when flowers are packed in boxes, in which a high relative humidity develops during cold storage and transport (Bastiaan-Net et al. 2007; Kerssies 1993a; Kerssies 1993b; Salinas and Verhoeff 1995). Control of gerbera gray mold in greenhouses frequently relies on spraying chemicals (Prins et al. 2000), but using chemicals may cause environmental issues and increase resistance to fungicides (Leroux 2007) whereas the use of some compounds has been restricted and banned in a number of countries. Moreover, quality loss due to gerbera gray mold occurring in post-harvest (in auction or after sale) transport is hard to avoid by chemical treatments, affecting both the buyer (reduction in profits) and the seller (a breeder’s reputation) (Bastiaan-Net et al. 2007). Thus, breeding for Botrytis resistant varieties is needed to reduce current and future problems due to this devastating pathogen in gerbera.
A number of studies on Arabidopsis indicated that the positive responses regulated by JA/ET (jasmonic acid/ethylene) signalling (Glazebrook 2005; Thomma et al. 1998; Thomma et al. 1999) and production of camalexin (Kliebenstein et al. 2005; van Baarlen et al. 2007; Williamson et al. 2007) enhance a plant’s resistance to B. cinerea. Similarly, in Brassica rapa, glucosinolate defensive metabolite accumulation coincided with B. cinerea QTLs (Zhang et al. 2016a). Catecheol from onion scales inhibited B. cinerea growth in vitro (Clark and Lorbeer 1975). However, none of these metabolites in different species can confer full resistance. Plant resistance to Botrytis is considered conditioned by multiple genes with partial effects and likely requires the contribution of multiple loci to reduce disease severity (Mengiste et al. 2003) and to obtain acceptable levels of resistance under standard conditions. This kind of complex resistance is polygenic and can be referred to as quantitative disease resistance (St.Clair 2010). DNA markers tightly linked to quantitative resistance loci can be used for marker-assisted selection (MAS) and desirable QTLs can be then subsequently introgressed into commercial cultivars.
Up to now, QTL analysis for Botrytis resistance has been primarily assayed in Arabidopsis and tomato. Denby et al. (2004) identified 12 small- to medium-effect QTL governing Botrytis susceptibility as to lesion size in Arabidopsis using 104 individuals from a Ler × Col-0 recombinant inbred population and
Chapter 3
50
3
several interesting candidate genes were found co-located in the QTL regions of the genome. Rowe and Kliebenstein (2008) found that several separate QTLs influenced lesion size and camalexin accumulation on Arabidopsis leaves using a larger RILs population with 411 individuals. They suggested that the plant defense against B. cinerea is mainly quantitative and genetically complex. Finkers et al. (2007b) calculated disease incidence and lesion growth rate in tomato populations, and detected three QTLs that explained 12%, 15% and 7% of the total phenotypic variation. They also analyzed two QTLs in BC2S1 progeny and found additive effects for progeny with homozygous resistance QTL alleles present.
No gerbera genetic maps are published to date. In this study, we developed two F1 populations segregating for Botrytis resistance in order to obtain the first genetic maps for this highly heterozygous ornamental crop. Through next generation sequencing of the transcriptomes of the parental genotypes (Chapter 2; Fu et al. 2016), SNP markers have been developed. These SNP markers have been used for linkage map construction and QTL mapping of Botrytis resistance in gerbera.
Materials and methods
Mapping populations
Two gerbera segregating F1 populations from heterozygous parents were used in this study. The two mapping populations were derived from four parental genotypes with different resistance levels against B. cinerea infection and the selected (unrelated) two populations showed the largest variation among 20 F1 populations (4 half sibs of crosses with a line with known Botrytis infection problems) which were tested for Botrytis susceptibility on 50 individuals. Population Schreurs (hereafter referred to as population S), containing 276 offspring, was obtained from a cross between the gerbera genotypes, SP1 and SP2. Population Florist (here after referred to as population F) was produced by a cross between FP1 and FP2. Population F consisted of 270 progeny. All individuals from both populations were used for linkage mapping, disease tests and QTL analysis.
Phenotypic measurements
The head-like inflorescence of gerbera is composed of different flower types, the marginal ray florets, the central disc florets and the intermediate trans florets. Botrytis infected lesion symptoms vary in these gerbera florets: spotting on ray florets and rotting on disc florets. To assess Botrytis resistance levels on different gerbera inflorescences of all F1 progeny and four parents in the two populations, phenotypic data was collected using three tests based on visual inspection of Botrytis infestation: on whole inflorescence (further referred to as whole inflorescence or WI test), on the bottom of disc florets in the capitulum (further referred to as bottom test) and on ray florets (further referred to as ray floret or RF test), respectively.
B. cinerea (strain B05.10 obtained from Dr. J. van Kan, Laboratory of Phytopathology, Wageningen University) was grown for 1 week on potato dextrose agar (PDA) medium after which conidia were transferred onto fresh PDA medium and grown until sporulation (about one week). A spore suspension of 1×10⁷ conidial spores per ml in sterile distilled water was prepared as stock suspension. For the Botrytis disease test on whole inflorescence and bottom, the spore suspension was diluted to a concentration of

Genetic mapping and QTL analysis of Botrytis resistance in Gerbera hybrida
51
3
1×10⁵/ml with water and sprayed on the inflorescence with a fine plant sprayer. After inoculation, inflorescences were incubated for five days in a climate cell at 20°C and a R.H. of 90%. Because ripe flowers (anthesis of the first whorl of disk floret) are not available from single plants in abundance testing was done over a period of 10 consecutive weeks (8-10 inflorescences tested on average). Inflorescence testing was done simultaneously for whole inflorescence and bottom test on the same inflorescence. First, whole inflorescences were visually evaluated to score, after which, the bottom of the capitulum was cut (horizontal cross section) to check (score) fungal growth inside the capitulum for the bottom test. The response to Botrytis infection on whole inflorescence and bottom were scored ranging from 0 (no symptom) to 5 (completely rotten).
For the ray floret test, inoculation was performed by pipetting 2 μl of spore suspension that was diluted to a concentration of 3×10⁵/ml in potato dextrose (to guarantee 100% spore germination), on the upper surface of single marginal ray floret. Twenty ray florets were incubated for 48 hours at nearly 100% relative humidity. After 48h, the disease score was assessed as follow: 0 = no visible symptoms, 1 = infection limited in inoculation droplet size, 2 = lesion extended twice to forth times the droplet size, 3 = large lesion area but still smaller than ½ of the ray floret, 4= lesion area larger than ½ of the ray floret, and 5 = complete necrosis.
SNP selection and genotyping
EST database establishment and SNP detection have been performed as described in Chapter 2 and Fu et al. (2016). SNPs were identified as specific SNPs (only polymorphic in one set of crossing parents, i.e. a single population) and common SNPs (polymorphic in both populations). The origin of SNP markers is indicated in the name. For example, marker WGC10601_843_S1F2 means that this marker is developed from contig10601 of the gerbera EST dataset (Chapter 2; Fu et al. 2016). The number after the first underscore is the SNP position in the contig. At the end of each markers’ name the source of polymorphism is indicated by population (and parent). If it is a specific SNP, it will be followed only with either S or F (S after the second underscore means polymorphic in both S population parents and S1 means only polymorphic in SP1, et cetera). Common SNPs are indicated with both an S and F in the name. In this case, S1F2 means this marker is a common marker which is polymorphic in parents S1 and F2 and can be found under an identical name in both maps.
Genotyping of selected reliable SNP markers in parents and all individuals of the two populations were performed by KBioscience (current name LGC genomics) using KASP technology. The genotyping data were visualized in SNPviewer (LGC genomics) to check the segregation type in each population, and SNP markers with segregation type 1:1 and 1:2:1 were included for genetic mapping. SNP markers segregating in a non-Mendelian inheritance pattern were analyzed by hypothesizing one or more null-allele present. After checking the goodness of fit to possible segregation types, these markers were rescored and included.
Genetic linkage map construction
The genotyping data of two gerbera populations were coded following the population type CP (cross pollinating) in JoinMap® 4.1 (van Ooijen 2006). After created maternal and paternal population nodes,
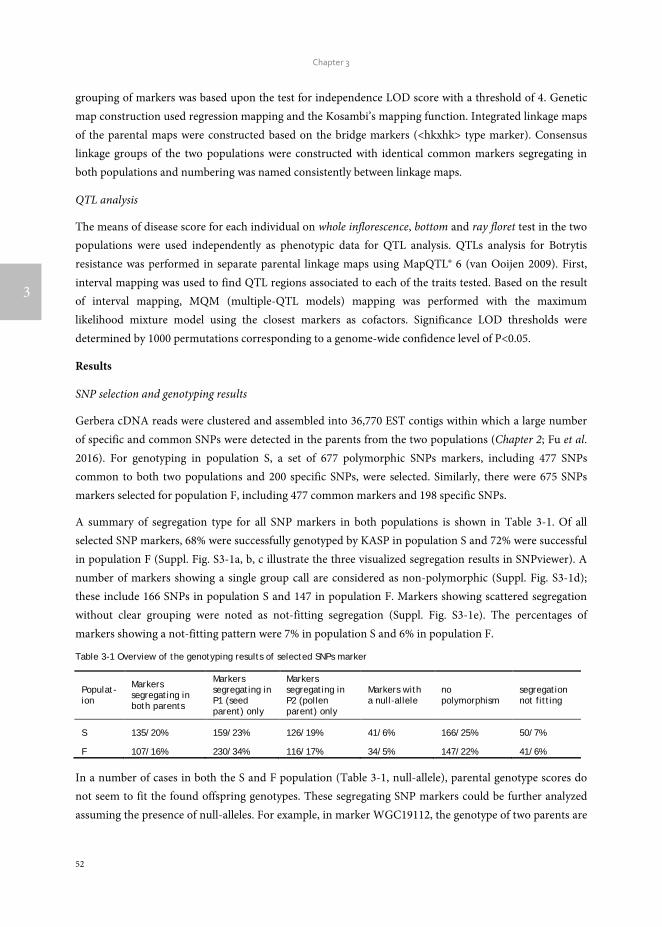
Chapter 3
52
3
grouping of markers was based upon the test for independence LOD score with a threshold of 4. Genetic map construction used regression mapping and the Kosambi’s mapping function. Integrated linkage maps of the parental maps were constructed based on the bridge markers (<hkxhk> type marker). Consensus linkage groups of the two populations were constructed with identical common markers segregating in both populations and numbering was named consistently between linkage maps.
QTL analysis
The means of disease score for each individual on whole inflorescence, bottom and ray floret test in the two populations were used independently as phenotypic data for QTL analysis. QTLs analysis for Botrytis resistance was performed in separate parental linkage maps using MapQTL® 6 (van Ooijen 2009). First, interval mapping was used to find QTL regions associated to each of the traits tested. Based on the result of interval mapping, MQM (multiple-QTL models) mapping was performed with the maximum likelihood mixture model using the closest markers as cofactors. Significance LOD thresholds were determined by 1000 permutations corresponding to a genome-wide confidence level of P<0.05.
Results
SNP selection and genotyping results
Gerbera cDNA reads were clustered and assembled into 36,770 EST contigs within which a large number of specific and common SNPs were detected in the parents from the two populations (Chapter 2; Fu et al. 2016). For genotyping in population S, a set of 677 polymorphic SNPs markers, including 477 SNPs common to both two populations and 200 specific SNPs, were selected. Similarly, there were 675 SNPs markers selected for population F, including 477 common markers and 198 specific SNPs.
A summary of segregation type for all SNP markers in both populations is shown in Table 3-1. Of all selected SNP markers, 68% were successfully genotyped by KASP in population S and 72% were successful in population F (Suppl. Fig. S3-1a, b, c illustrate the three visualized segregation results in SNPviewer). A number of markers showing a single group call are considered as non-polymorphic (Suppl. Fig. S3-1d); these include 166 SNPs in population S and 147 in population F. Markers showing scattered segregation without clear grouping were noted as not-fitting segregation (Suppl. Fig. S3-1e). The percentages of markers showing a not-fitting pattern were 7% in population S and 6% in population F.
Table 3-1 Overview of the genotyping results of selected SNPs marker
Populat-ion
Markers segregating in both parents
Markers segregating in P1 (seed parent) only
Markers segregating in P2 (pollen parent) only
Markers with a null-allele
no polymorphism
segregation not fitting
S 135/20% 159/23% 126/19% 41/6% 166/25% 50/7%
F 107/16% 230/34% 116/17% 34/5% 147/22% 41/6%
In a number of cases in both the S and F population (Table 3-1, null-allele), parental genotype scores do not seem to fit the found offspring genotypes. These segregating SNP markers could be further analyzed assuming the presence of null-alleles. For example, in marker WGC19112, the genotype of two parents are

Genetic mapping and QTL analysis of Botrytis resistance in Gerbera hybrida
53
3
A:G (P1) and G:G (P2) respectively, and the expected segregation in progeny should be [A:G]:[G:G] = 1:1, but the visualized genotyping result in SNPviewer (Suppl. Fig. S3-1f) showed three genotype cluster plots [A:A]:[A:G]:[G:G] ≈ 1:1:2 (74:69:133). The possible explanation is the presence of a null-allele in P2 (G:Ø), and the actual progeny segregation is [A:G]:[A:Ø]:[G:G]:[G:Ø] ≈ 1:1:1:1, because the genotyping technology cannot distinguish the genotype G:G and G:Ø (they are in the same cluster), also the P2 genotype G:Ø is recognized as G:G.
To use the marker information, we rescored these markers, like WGC19112, with the consideration that both parents are heterozygous. However information content differed between parents for such a marker. P1 is heterozygous and WGC19112 is used as fully informative <lmxll> marker (a). Both A:G and A:Ø offspring clusters are rescored as ‘lm’ and G:G (in fact containing [G:G] and [G:Ø]) as ‘ll’. P2 is also heterozygous and WGC19112 is here regarded as <nnxnp> marker (b). However, only offspring within groups A:A and A:G are informative for this parent (group A:A scored as ‘nn’ and group A:G as ‘np’), the mixed group G:G (containing [G:G] and [G:Ø]) is discarded. To distinguish the two ways of scoring, we added a letter ‘a’ or ‘b’ in the end of the marker. Markers in which null-alleles were demonstrated with an ‘a’ and ‘b’ in the end were mapped at almost the same position on the integrated maps, but in eight markers sufficient linkage was only found in linkage groups of the most informative parent and not in the other parent.
Linkage map construction
Both maternal and paternal maps of the two populations were constructed, as well as integrated maps per population and a consensus map of the two populations. There were 30, 29, 27 and 28 linkage groups constructed in SP1, SP2, FP1 and FP2, respectively (Suppl. Table S3-1). Total marker number ranged from 259 in parent FP2 to 350 in parent FP1. The observed parental map lengths varied from 1103 cM to 1498 cM and the average marker distance varied from 3.50 cM to 4.41 cM per parental map (Suppl. Table S3-1).
Parental linkage maps could be aligned via the presence of bridge markers (<hkxhk> type markers) that are segregating from both parents (Suppl. Table S3-2). Based on the position of the bridge markers, markers order on parental maps showed good consistency, but distance between markers on parental linkage maps varied as can be expected. For instance, on maternal linkage group FP1_08, the distance of between marker WGC9125 and WGC18021 is 7.6 cM, while the distance on the paternal linkage group (FP2_08) is 12.9 cM (Suppl. Fig. S3-2a). By using these bridge markers, the two parental linkage maps could be combined into one integrated linkage map with the same linkage group number code (see Suppl. Fig. S3-2a).
Similarly, with the help of common markers, identical parental linkage maps of both crosses could be also be identified and aligned. For instance, there are around 35 markers in linkage group SP1_01, of which some markers are also found in two linkage groups in parents of the F population (i.e. common markers) indicating that these linkage groups are homologs of SP1_01. So these fragments are named as FP1_01.1, FP1_01.2 and FP2_01.1, FP2_01.2. Same situation happens on SP1_03, SP2_03, SP1_12, SP2_12 etc. (Suppl. Table S3-1). Few maternal and paternal linkage groups (e.g. SP1_21, SP2_23 and FP1_17, FP1_24, FP2_16, FP2_20) could not be aligned to a linkage group of another parent because just a single bridge

Chapter 3
54
3
marker was present or there was a lack of informative common markers (Suppl. Table S3-1 and Suppl. Table S3-2).
These parental linkage maps, with in total 285 common markers present, can be integrated into a consensus map (see Suppl. Fig. S3-2b). In total 24 consensus linkage groups were merged (Fig. 3-1 Suppl. Table S3-3). As is described in Suppl. Table S3-3, the consensus linkage map of 687 SNPs covered 1601 cM. The marker density on the consensus map varied from 1.32 cM on LG09 to 5.16 cM on LG17, with an average density 2.57 cM. There were 14 gaps larger than 15 cM observed in the consensus linkage map.
Fig. 3-1 Consensus linkage map of two gerbera populations.
WGC22294_267_S2a-1.2WGC22294_267_S2b0.0WGC35295_167_S4.5WGC17546_204_F28.2WGC8621_386_S18.7WGC36295_149_SF29.3WGC3920_511_S2F19.6WGC28002_228_SF1b13.2WGC16961_586_S1F113.8WGC3324_261_SF114.0WGC28002_228_SF1a15.9WGC30639_405_F1b18.2WGC27835_141_S2F118.7WGC30639_405_F1a19.3WGC7366_112_Fb25.4WGC33749_426_F2b26.1WGC7366_112_Fa29.1WGC33108_447_F131.4WGC33749_426_F2a31.5WGC25286_478_S2F135.7WGC9062_263_S2Fa36.0WGC224_115_SF1b40.6WGC8203_378_S2b41.6WGC8203_378_S2a41.7WGC17612_204_F1a42.7WGC3957_170_SF44.1WGC27987_180_S44.7WGC27470_200_S1F144.9WGC224_115_SF1a45.0WGC9062_263_S2F47.0WGC224_115_SF148.9WGC27738_319_S1F151.1WGC9062_263_S2Fb53.7WGC8436_166_S2b64.4WGC8870_374_F2a64.9WGC17612_204_F1b65.8WGC9954_900_F270.1WGC10214_71_S2F170.2WGC18050_562_SF171.9WGC5230_1586_S2F272.6WGC8140_84_S274.5WGC16204_523_S2F1b75.4WGC9128_148_S1F1WGC20788_411_S1F1WGC3029_209_S1F1
75.9
WGC19258_230_SF176.6WGC16204_523_S2F1a77.3WGC9384_476_S1F177.4WGC16204_523_S2F1WGC30999_868_S1F177.7
WGC2920_160_S_F179.2WGC17781_676_SF179.7WGC36485_147_S2F81.2WGC16787_905_S2F182.0WGC21895_782_S1F184.3WGC3411_200_S1F285.3WGC18375_600_S86.0WGC16835_1142_F286.4WGC2851_117_S2F288.5WGC8870_374_F2b90.0WGC7767_115_Fa90.4WGC5263_310_S190.6WGC7767_115_Fb91.2WGC27086_382_S2F191.4WGC8436_166_S2a92.6WGC10531_163_S1F2WGC34062_300_F294.7
WGC33025_223_F2bWGC33025_223_F296.7
WGC7745_871_S297.2WGC19616_554_S1F298.9WGC4503_278_S1F1102.0WGC8430_469_S1F1103.5WGC32669_336_SF1104.8WGC20122_505_S2111.3WGC10226_238_Fb112.0WGC729_629_S2113.5WGC2655_394_S2114.2WGC10226_238_Fa127.0WGC36541_224_SF1136.9WGC19529_158_SF1137.0
LG01
WGC11464_359_S1F-1.7WGC6199_1191_S2F20.0WGC8508_520_S214.9WGC18942_274_S1F1b21.1WGC18942_274_S1F122.3WGC18942_274_S1F1a23.8WGC34976_88_S25.3WGC19660_424_S2F2b28.6WGC19660_424_S2F2a29.3WGC27443_327_SF1aWGC27443_327_SF1b30.6
WGC4477_1171_SF130.9WGC34745_323_S2F31.0WGC3004_110_SF131.2WGC3930_242_SF131.3WGC32105_310_S1F131.9WGC25570_844_S32.1WGC27443_327_SF132.6WGC12651_1823_F232.7WGC2374_598_F234.4WGC8272_136_S1F138.2WGC7983_971_SF39.5WGC3086_90_F239.8WGC31308_165_S1F140.1WGC34999_109_F241.2WGC2177_311_SF43.0WGC1770_76_S246.0WGC15789_100_S1F156.4WGC8799_438_S1F157.4WGC18743_246_F169.3WGC11243_647_S2F1a69.6WGC7795_318_F1WGC7795_318_F1a70.4
WGC11243_647_S2F1b70.9WGC3921_139_F171.2WGC11243_647_S2F172.1WGC23656_151_S1F173.4WGC23656_151_S1F1a73.5WGC23656_151_S1F1b74.7WGC22185_434_S2F1a78.9WGC31982_135_S1F80.2WGC22185_434_S2F1b82.3WGC34768_65_S1F184.7WGC18262_147_S185.6WGC19477_230_SF189.6WGC34711_134_F2b98.1WGC27925_98_S1F199.6WGC34475_396_SF1b99.8WGC34711_134_F2a101.6WGC34475_396_SF1a105.3WGC7419_63_S1F1WGC17757_237_S2F1105.6
WGC34475_396_SF1105.8
LG02
WGC31732_337_SF20.0WGC9509_428_SF20.4WGC17021_2481_S1F20.5WGC22289_336_F20.7WGC4022_134_S15.7WGC10385_486_S1F27.0WGC3283_124_F15.8WGC16203_309_S1F18.6WGC23435_245_F1b32.1WGC19704_238_S1F140.6WGC18569_197_S147.3WGC27578_1176_S148.0WGC27091_180_F148.5WGC7294_1023_S148.7WGC11409_325_SF249.7WGC22443_342_S1F251.4WGC6073_123_S2a55.1WGC6821_571_S1F256.2WGC1546_255_S56.7WGC18950_162_S2F1WGC12914_1020_S56.8
WGC8380_543_S1F256.9WGC7722_846_S1WGC11924_433_S1WGC12078_2206_S1
57.1
WGC19080_240_S1F1WGC20720_497_S1F257.2
WGC5979_360_S1F257.3WGC14842_414_Sb57.6WGC14842_414_Sa57.7WGC4082_303_S258.1WGC2825_374_S258.2WGC8867_154_S1F258.4WGC2630_188_S258.6WGC17399_462_S258.8WGC3917_184_S1F261.6WGC27213_976_F262.8WGC849_141_F64.7WGC8825_292_S1FWGC6073_123_S2b66.2
WGC3317_107_F167.2WGC20799_220_S1F174.6WGC8442_332_S179.2WGC5809_222_F180.3WGC26837_145_S98.6
LG03
WGC19498_261_S1F10.0WGC3574_475_SF0.9WGC20870_99_S1F111.4WGC21560_189_S1F39.0WGC21560_189_S1Fa40.2WGC18155_189_S45.4WGC3228_98_S1F146.8WGC2952_358_S1F47.5WGC19682_206_S2F150.4WGC16724_245_F1aWGC16724_245_F155.0
WGC31490_172_S2F256.7WGC36033_534_S1F157.2WGC18837_429_S2b62.3WGC18837_429_S2a62.4WGC3131_106_F162.5WGC8153_138_F1WGC27713_180_S2F2WGC18966_197_S2
62.7
WGC2732_157_F162.8WGC6488_560_S263.1WGC8372_105_S2F163.2WGC23235_142_F1WGC16085_544_S2F263.3
WGC19120_131_S2F163.9WGC9403_546_S1F169.6WGC9403_546_S1F1a70.0WGC25129_300_S2b70.6WGC25129_300_S2a70.8WGC35912_221_SF171.6WGC18737_810_S76.1WGC34449_558_SWGC3259_328_S76.5
WGC19166_306_S1F177.6WGC9403_546_S1F1b89.4WGC25081_216_S95.3WGC30016_79_SF2aWGC2621_159_S2108.2
WGC30016_79_SF2b114.7WGC15966_1511_S2F2118.0
LG04
WGC3000_320_S1F20.0WGC9162_972_S2F15.1WGC22343_292_SFa5.3WGC25114_277_SF5.5WGC4138_154_SF6.1WGC31215_552_S6.5WGC11108_178_S6.9WGC4253_92_S17.0WGC9217_845_S7.1WGC26242_226_SF17.8WGC32274_134_S1F18.1WGC3739_149_SF18.6WGC36258_87_SF29.0WGC15978_170_S1F2WGC8241_315_S1F29.2
WGC7914_341_S1F29.3WGC16097_667_S210.7WGC23177_167_S2F211.2WGC18843_595_F211.9WGC3331_685_S2F114.4WGC2550_64_S118.0WGC22343_292_SFb18.7WGC2966_218_S1WGC19130_393_S1F139.1
WGC20711_63_S2F2a44.4WGC20711_63_S2F2b44.7WGC20711_63_S2F245.4WGC10346_175_F1b45.9WGC36739_222_S46.4WGC17061_401_SF48.1WGC20132_1389_S48.2WGC8642_167_SF148.3WGC10346_175_F1a48.8WGC35157_467_F152.7WGC2728_71_S254.6
LG05
WGC10668_254_F1-3.0WGC20939_125_F-1.9WGC35726_297_SF-0.4WGC23551_82_S1F1a-0.2WGC20712_458_S10.0WGC23551_82_S1F1bWGC19070_644_S1F10.7
WGC3476_117_S1F1.3WGC12089_1094_S1.6WGC2836_126_S1F12.2WGC4230_4177_S22.6WGC8424_460_S1F23.7WGC9138_166_Sa7.3WGC9138_166_Sb9.7WGC18669_1670_S1F113.0WGC18669_1670_S1F1a13.6WGC19165_389_Sa15.7WGC18953_619_Sb15.8WGC19126_744_S2F1a17.5WGC18669_1670_S1F1b19.4WGC19165_389_Sb20.0WGC19126_744_S2F1bWGC22066_625_S220.6
WGC9148_195_SF121.8WGC8990_750_S2F123.7WGC36013_366_S1F129.1WGC4264_216_S134.5WGC19218_398_S1F139.8WGC33549_80_Fa47.9WGC9143_379_SF255.0WGC3505_351_S1F158.5WGC10529_113_S2F164.0WGC36650_474_S1F165.6
LG06
WGC4457_98_F10.0WGC8755_477_S2F1WGC8572_1297_S2F12.0
WGC30433_466_SWGC11692_278_SWGC27999_351_SWGC27416_552_S1
2.9
WGC18560_159_SWGC18688_200_SF3.0
WGC16507_1013_SF14.7WGC27467_540_F7.1WGC16500_442_S11.3WGC17793_888_S1F211.4WGC22130_81_SF212.2WGC20332_347_S2F1b13.3WGC10243_386_S2F1b13.4WGC10243_386_S2F114.3WGC22982_111_S1F114.7WGC20332_347_S2F116.4WGC20819_209_S1F116.6WGC20819_209_S1F1a16.7WGC1222_283_S117.9WGC18461_658_S1F118.2WGC20819_209_S1F1b18.3WGC10243_386_S2F1a24.6WGC1593_239_S1_F27.3WGC20332_347_S2F1a27.7WGC32454_351_F232.8WGC27817_207_F135.5WGC17798_117_S2F136.0WGC4224_271_F142.4
LG07
WGC36511_668_F2a0.0WGC18021_112_F1.5WGC4377_303_F11.6WGC36511_668_F2b2.1WGC19189_350_S1F12.4WGC11384_140_S4.3WGC2824_142_S25.4WGC9125_295_S2F12.3WGC3691_83_F215.8WGC10836_652_S24.2WGC25040_299_S25.1WGC3420_455_S2F228.3WGC13559_78_S129.5WGC28656_114_F230.1WGC14447_485_S1F135.2WGC4445_2405_F136.7WGC33495_350_S2F145.8WGC11462_766_S2F46.7WGC17809_355_S2F248.0WGC18936_108_F250.0WGC10588_275_F51.9WGC8552_779_S2F152.2WGC215_178_S52.5WGC6332_460_SWGC2778_462_S_F252.7
WGC2359_302_S1F254.0WGC14531_563_S1F55.7WGC8919_239_S1F155.9WGC4515_103_S1F156.8WGC18014_131_S1F57.7WGC2545_101_S1F159.6
LG08
WGC27639_103_F10.0WGC35370_146_S2F10.2WGC22285_206_S2F1b0.7WGC18994_594_S2F0.9WGC27915_91_S2F11.5WGC22285_206_S2F11.7WGC17528_144_F12.4WGC18652_365_F12.7WGC27903_379_S2F1b5.0WGC23609_194_S1Fa7.6WGC8602_452_S1F111.2WGC23609_194_S1F11.9WGC22180_153_S1F112.1WGC544_486_S1WGC18636_75_S112.4
WGC23609_194_S1Fb13.5WGC8438_219_S1WGC15824_424_S1WGC14515_553_S1
15.7
WGC8266_708_S115.8WGC22285_206_S2F1a17.4WGC25181_443_S219.4WGC35893_105_S2F124.5WGC17958_767_S2F134.0WGC33445_346_S1F236.1WGC33264_70_SF138.3WGC28102_213_S2F139.1WGC3469_267_F143.7WGC18158_119_F1bWGC18158_119_F143.9
WGC18158_119_F1a48.1WGC7649_321_S1F56.9WGC27903_379_S2F168.7WGC18273_134_S1F186.3
LG09
WGC8179_185_S10.0WGC7288_193_S1F3.4WGC31496_55_Sb6.3WGC17455_653_F16.5WGC28414_421_S2F2b8.2WGC31496_55_Sa8.6WGC28414_421_S2F2a10.2WGC4521_2140_S1F1b10.4WGC10920_210_F211.7WGC4521_2140_S1F1a14.9WGC4521_2140_S1F118.7WGC23649_136_S2F123.2WGC8772_188_S28.2WGC19637_457_S2F128.4WGC26459_452_S28.7WGC25934_157_S1F29.0WGC19198_155_S29.1WGC7561_567_F31.8WGC3850_171_F2b37.4WGC3850_171_F2a37.6WGC31071_211_S2F139.0WGC33931_214_S1F49.8WGC19686_485_S150.5WGC19194_294_S1F1b50.9WGC19194_294_S1F1a52.7WGC4540_277_S1F153.9WGC19194_294_S1F155.1WGC8977_163_SF155.7WGC26791_2667_F157.7WGC7173_301_S160.9WGC10448_287_S1F164.2WGC8524_1158_S1F169.0WGC11457_257_S2F2aWGC11457_257_S2F271.8
LG10
WGC3956_115_S1F10.0WGC19516_214_S2F18.5WGC18833_209_S2F19.5WGC12799_1155_S210.1WGC34157_246_S2F15.7WGC4278_180_SF118.9WGC28196_243_S1F19.8WGC25268_184_S23.4WGC27484_676_S25.1WGC27626_149_S1F26.9WGC4052_220_S29.3WGC20636_152_F1a30.2WGC34440_142_S2F32.6WGC8726_266_S2F34.7WGC20615_61_S2F1b40.9WGC20615_61_S2F143.4WGC20615_61_S2F1a43.5WGC33030_228_S44.2WGC18733_346_S2F49.4WGC4185_170_F1b50.3WGC26323_2583_F50.4WGC24450_2028_F2WGC34514_77_F2WGC27131_1189_F2WGC7654_417_S1F1b
50.5
WGC7654_417_S1F153.4WGC20336_2175_S1F1WGC1044_660_S153.9
WGC7654_417_S1F1a54.8WGC4185_170_F1a56.3
LG11

Genetic mapping and QTL analysis of Botrytis resistance in Gerbera hybrida
55
3
Fig. 3-1 (continued)
Phenotypic traits evaluation for Botrytis resistance
Phenotypic data of resistance to B. cinerea were assessed in three tests (whole inflorescence, bottom and ray floret). Histograms of disease testing resulting from these three traits in the mapping population S and F population indicating transgressive segregation are shown in Fig. 3-2. The mean of the phenotyping data in population S for whole inflorescence, bottom and ray floret were 2.42±0.55, 2.96±0.63 and 2.98±0.79. Means in population F were 3.64±0.40, 3.80±0.40 and 3.14±0.80, respectively. Based on the skewedness
WGC18656_631_S2F1b0.0WGC8201_354_S2F1b0.1WGC14466_1718_F2WGC36438_790_S1F21.4
WGC8201_354_S2F1a4.5WGC18656_631_S2F1a4.7WGC6178_123_S2F15.4WGC18030_324_S2F5.6WGC8201_354_S2F15.8WGC18656_631_S2F15.9WGC27945_490_S2F16.0WGC17525_192_SF6.8WGC18765_397_S1F19.5WGC27726_205_S2F19.9WGC26751_388_S2F1a10.7WGC3269_135_SF210.9WGC26730_306_S2F111.5WGC26751_388_S2F1bWGC26751_388_S2F111.8
WGC19515_468_SF1b14.0WGC19515_468_SF114.8WGC19515_468_SF1a14.9WGC35820_247_F15.2WGC9243_208_S1F118.8WGC3872_221_S1b19.0WGC9121_215_S1F220.8WGC771_772_S1F221.5WGC34091_249_S1F224.7WGC3872_221_S1a26.2WGC19432_94_S1F127.2WGC4376_224_S1F228.5WGC34695_116_F2WGC4217_100_S2F149.2
WGC8837_493_S2F152.7WGC23067_1870_F54.9WGC24795_328_SF156.1WGC3758_76_S56.8WGC33479_427_S1F57.1WGC25045_123_SF259.0WGC27464_56_SF59.5WGC9301_544_S1F2b60.2WGC9301_544_S1F2a61.4WGC9301_544_S1F262.0WGC10305_190_F66.3WGC20619_638_S1F169.0WGC16523_281_F1b69.6WGC4149_407_S1F271.5WGC693_624_F1WGC4460_246_F1WGC16523_281_F1a
72.1
WGC2762_139_F173.8
LG12
WGC992_371_S1b0.0WGC17690_285_F0.1WGC3995_275_S2WGC18819_128_S2F1a2.5
WGC4448_294_S2F1WGC5574_460_S2F14.0
WGC27846_452_S2F14.6WGC27250_261_S1F2WGC18819_128_S2F1b4.8
WGC3633_123_S1F16.7WGC18819_128_S2F18.1WGC36165_169_S8.4WGC992_371_S1a9.3WGC20749_354_S11.0WGC34662_205_F12.0WGC9308_396_SF112.5WGC34409_322_F214.3WGC3108_124_SF114.5WGC22133_489_S219.9WGC11627_252_S2F232.4WGC18668_127_F1b46.0WGC18668_127_F1a51.6WGC19078_418_S1F156.8
LG13
WGC34723_249_F2bWGC34723_249_F20.0
WGC17177_1793_S1F13.6WGC3507_143_F4.8WGC4358_306_S26.4WGC3801_506_S8.5WGC22208_450_S10.6WGC2726_213_S212.2WGC4489_77_S114.1WGC7302_742_S1F214.4WGC4355_157_S2F127.2WGC18204_532_F245.4WGC6974_151_S2F248.6WGC17277_213_S1F152.0WGC18548_202_S1F253.8WGC36346_215_S55.0WGC11531_363_S2F156.9WGC9176_170_SF157.1WGC17320_229_S2F258.4WGC2015_590_S258.6WGC10429_697_S2F259.1WGC19617_114_F59.2WGC17277_213_S1F1b59.7WGC31019_90_F260.4
LG14
WGC36216_955_F10.0WGC1697_224_S1Fa3.6WGC2765_64_S2F16.1WGC1697_224_S1F9.2WGC1697_224_S1Fb9.4WGC10483_460_S2F1WGC7520_3774_S1F29.5
WGC17470_602_S2F19.6WGC3829_232_S2F110.4WGC4126_149_F112.7WGC36235_369_S1F113.1WGC7077_610_S217.2WGC17031_251_F118.2WGC8896_566_S2F119.8WGC2031_690_S220.6WGC18371_139_S2F20.8WGC17566_197_S2F121.6WGC8267_240_SF25.7WGC19903_508_S1F28.0WGC29477_280_S1F128.8WGC19318_99_S1F36.7WGC24960_103_S37.3WGC828_408_S2F39.3
LG15
WGC33889_542_F10.0WGC27929_106_S1F18.7WGC18670_73_S10.1WGC32763_122_S11.5WGC35898_122_S1F123.8WGC5981_286_F127.0WGC2467_64_F127.4WGC8881_859_SF128.9WGC27191_117_S1F129.6WGC4013_122_F131.7WGC20787_532_S2F132.8WGC4372_144_S1F35.4WGC59_150_S1F236.7WGC2644_234_S138.7WGC7433_150_S2F1a39.0WGC19289_1003_F240.1WGC8743_118_S1F1bWGC27592_275_S2F242.9
WGC8743_118_S1F144.7WGC18800_256_S1F145.2WGC19040_355_F2bWGC19040_355_F247.3
WGC8743_118_S1F1a47.4WGC19782_600_SF247.9WGC6074_441_S2F56.8WGC35264_283_S2F160.5WGC8954_249_S2F60.7WGC34991_187_S2F164.8WGC5549_561_S271.0WGC17619_188_S275.6WGC7433_150_S2F180.2WGC9144_292_S281.3WGC12786_448_S89.7
LG18
WGC17038_450_F0.0
WGC2951_238_S212.8WGC25353_140_S15.7WGC34570_147_S2F21.7WGC34116_168_F26.0WGC17332_1876_S1F26.2WGC19112_269_SFa32.2WGC4251_260_Sa33.3WGC19112_269_SFb34.3WGC4251_260_Sb34.8WGC24446_221_S1F245.0WGC4399_409_S46.4WGC33922_118_SF246.6WGC34858_1542_SF148.5WGC7762_411_F49.7
WGC4953_374_S164.5
WGC4184_237_S1F10.0WGC17156_213_SWGC23478_142_S0.6
WGC22105_263_S2F121.9WGC35140_136_SF223.5WGC23294_171_F24.1WGC9032_170_S2F1b24.6WGC10514_254_S1F131.4WGC11600_139_S1F1WGC11600_139_S1F1a34.2
WGC19704_238_S1F135.2WGC9032_170_S2F1a40.7WGC9032_170_S2F144.1WGC3283_124_F0.0WGC16203_309_S1F0.9
WGC23435_245_F1a7.0
WGC7960_564_SF10.0WGC3581_160_S2F11.9WGC8244_216_S2F23.2WGC18664_326_S2F224.2WGC11305_1255_S234.2WGC2056_191_F37.1WGC19048_294_SF138.4WGC9226_226_F239.4WGC3424_72_S2F142.6WGC6799_173_F144.5WGC8809_433_S2F1a46.1WGC8809_433_S2F1b50.0WGC19322_269_S2F151.9WGC4151_332_S2F52.2WGC19051_337_FWGC35409_177_F52.4
WGC9202_285_FWGC7759_664_F52.5
WGC20761_143_S2F253.0WGC19322_269_S2F1a53.5WGC19322_269_S2F1b53.7
LG21LG19 LG20
WGC35300_107_Fb0.0WGC9248_106_S1F10.6WGC35300_107_Fa3.3WGC36410_271_S2FWGC7516_117_F4.4
WGC10594_147_F9.2WGC35564_129_S2F1b13.3WGC35564_129_S2F1a15.3WGC35185_192_F119.0WGC35394_173_SF1a24.9WGC35394_173_SF1b25.7
WGC19367_526_S1F252.3WGC19545_281_S1F55.4WGC19647_399_F255.6WGC18960_284_S1F158.5
WGC35394_173_SF10.0
WGC35564_129_S2F112.4
WGC6064_871_S2b25.6WGC36410_271_S2Fb26.3WGC846_114_S26.4
LG22
WGC22447_285_Fb0.0WGC7127_127_S1F24.8WGC1067_494_S15.3WGC15405_1293_S1F5.9WGC22447_285_F7.8WGC1084_721_F7.9WGC27629_93_S18.8WGC1824_721_S1F127.4WGC407_4995_S1F127.6WGC16170_118_F129.6WGC19020_660_S129.8WGC3454_459_F1b30.1WGC3745_120_S130.2WGC21545_548_S1F131.1WGC3454_459_F1a32.0
WGC22355_237_S1F160.1WGC34390_211_F61.3WGC8574_435_S1F61.5WGC7513_582_S1F61.7WGC8047_200_F162.4WGC14274_384_F163.0
WGC27795_176_F90.0WGC35400_175_F10.0WGC3581_160_S2F10.6WGC18015_419_F1WGC18469_69_F1WGC3459_96_F1WGC14461_576_S2F1
0.8
LG23 LG24
WGC8948_569_F20.0WGC10651_1126_F21.2WGC18601_620_S2F25.1
WGC8121_498_S1F10.0
WGC2476_271_S15.6
WGC9103_440_F116.6
WGC18703_968_S1F122.1
WGC7576_107_S1F136.8WGC15379_306_S254.5WGC16319_821_S1F255.6WGC3979_333_S56.9WGC8562_422_S59.2WGC7599_395_S2WGC889_106_S2WGC8760_289_S2F1WGC17081_316_S2F1WGC1691_115_SF1WGC17520_293_S2F1WGC34318_203_S2F1
61.1
WGC25048_458_S2F161.5
LG16
WGC3939_240_S2F20.0
WGC11593_467_F26.5
WGC4966_1108_F20.6
WGC5962_1153_F41.2WGC15914_515_F242.3WGC6386_762_F243.3WGC8417_313_F244.5WGC3585_238_F245.3WGC6768_187_F246.5
LG17
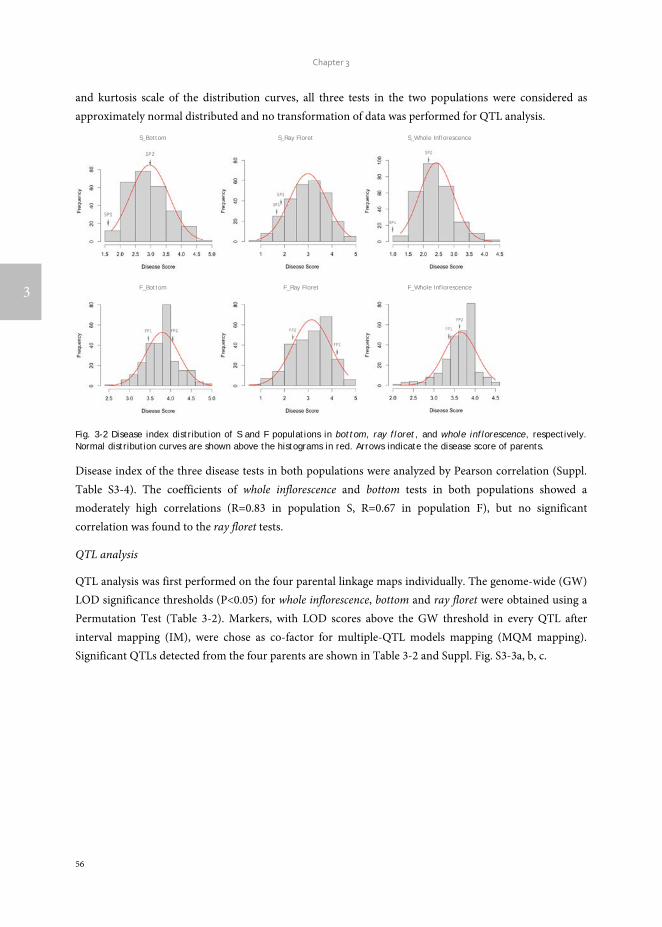
Chapter 3
56
3
and kurtosis scale of the distribution curves, all three tests in the two populations were considered as approximately normal distributed and no transformation of data was performed for QTL analysis.
Fig. 3-2 Disease index distribution of S and F populations in bottom, ray floret, and whole inflorescence, respectively. Normal distribution curves are shown above the histograms in red. Arrows indicate the disease score of parents.
Disease index of the three disease tests in both populations were analyzed by Pearson correlation (Suppl. Table S3-4). The coefficients of whole inflorescence and bottom tests in both populations showed a moderately high correlations (R=0.83 in population S, R=0.67 in population F), but no significant correlation was found to the ray floret tests.
QTL analysis
QTL analysis was first performed on the four parental linkage maps individually. The genome-wide (GW) LOD significance thresholds (P<0.05) for whole inflorescence, bottom and ray floret were obtained using a Permutation Test (Table 3-2). Markers, with LOD scores above the GW threshold in every QTL after interval mapping (IM), were chose as co-factor for multiple-QTL models mapping (MQM mapping). Significant QTLs detected from the four parents are shown in Table 3-2 and Suppl. Fig. S3-3a, b, c.
S_Bottom S_Ray Floret S_Whole Inflorescence
F_Bottom F_Ray Floret F_Whole Inflorescence

Genetic mapping and QTL analysis of Botrytis resistance in Gerbera hybrida
57
3
Table 3-2 QTLs found for bottom, ray floret, and whole inflorescence test in the parental maps of both populations
QTL Parents Flanking Markers LG
MQM
LOD % expl
(GW)
RBQB1 SP1 WGC11243_647_S2F1a 2 4.4 (4.0) 6.3
RBQB2 SP1 WGC2476_271_S1 16 4.6 (4.0) 6.6
RBQB3 SP2 WGC18733_346_S2F 11 4.6 (4.1) 7.6
RBQB4 FP1 WGC16204_523_S2F1 1 6.8 (4.0) 10.3
RBQB5 FP1 WGC28102_213_S2F1 9 4.5 (4.0) 7.5
RBQB6 FP2 WGC18158_119_F1b 9 4.8 (3.9) 8
RBQRF1 SP2 WGC17798_117_S2F1 7 5.3 (4.0) 8.9
RBQRF2 FP1 WGC22343_292_SFa 5 6.5 (4.1) 8.6
RBQRF3 FP1 WGC35370_146_S2F1 9 4.8 (4.1) 6.2
RBQRF4 FP1 WGC828_408_S2F 15 6.1 (4.1) 8
RBQRF5 FP1 WGC35264_283_S2F1 18 5.9 (4.1) 7.6
RBQRF6 FP2 WGC7520_3774_S1F2 15 4.9 (4.0) 7
RBQRF7 FP2 WGC6074_441_S2F 18 4.0 (4.0) 5.7
RBQRF8 FP2 WGC9226_226_F2 21 4.75 (4.0) 8.0
RBQWI1 SP1 WGC1044_660_S1, WGC33030_228_S 11 4.8 (4.0) 7.3
RBQWI2 SP1 WGC407_4995_S1F1 23 5.3 (4.0) 8.2
RBQWI3 SP2 WGC18733_346_S2F 11 5.2 (4.1) 8.6
RBQWI4 FP1 WGC1084_721_F 23 6.8 (4.1) 11.1
RBQWI5 FP2 WGC5962_1153_F 17 5.6 (4.0) 8.3
RBQWI6 FP2 WGC22447_285_Fb 23 7.6 (4.0) 11.4
Note: Name of QTLs are RBQ (as Resistance Botrytis QTL) followed by the initials of disease tests used: B=Bottom; RF=Ray Floret; WI=Whole Inflorescence test. LG indicates linkage group and the LG number in the two populations ; Null-alleles are marked with a letter 'a' or 'b' in the end; GW indicates genome wide significant threshold level P<0.05; %Expl. is the percentage of total variance explained by the QTL.
In S population, 7 significant QTLs for Botrytis resistance were detected by MQM mapping, and 13 QTLs in F population. The difference in numbers of QTLs found between the two populations is defined by the number of QTLs associated with Botrytis resistance in ray floret. There is only one ray floret QTL found in S population but 7 in F population (Table 3-2). Phenotypic variance explained by single QTLs ranged between 5.7 and 11.4%, with three QTL (RBQB4, RBQWI4 and RBQWI6) higher than 10%. Three QTLs, RBQWI2, RBQWI4 and RBQWI6 from SP1, FP1 and FP2 respectively, were found on LG23 at similar positions in the consensus map (see Suppl. Fig. S3-4) indicating this may be a single QTL locus. Interestingly, a QTL for whole inflorescence and bottom (RBQB3 and RBQWI3) shared an identical position with marker WGC18733_346_S2F on LG11 of population S.

Chapter 3
58
3
Several QTLs were detected on both parental linkage groups separately and showed overlapping positions on the integrated linkage group, like RBQWI1 from SP1 and RBQWI3 from SP2 on LG11; RBQB5 from FP1 and RBQB6 from FP2 on LG 9. In these cases, alleles from both parents contributed to the resistance in progeny. We identified the favorable and unfavorable alleles from the parents of these QTLs.. Progeny can then be divided into four groups: progeny with the presence of two favorable alleles (+/+), with one favor allele from one of the parents (+/- or -/+) and no favorable allele present (-/-). The mean disease score of each progeny group for each QTLs are shown in Table 3-3. The mean disease scores of individuals with two favorable alleles (+/+) were all significantly lower than for individuals with no favorable allele present (-/-) and also show advantage over individuals with one favorable allele only.
Table 3-3 Difference between the mean score of individuals with presence of two, one or no favorable allele from the parents
Bottom Ray Floret Whole Inflorescence
QTLs RBQB5+RBQB6 RBQRF4+RBQRF6 RBQRF5+RBQRF7 RBQWI1+RBQWI3 RBQWI4+RBQWI6
Flanking Markers
WGC28102_213_S2F1 WGC828_408_S2F WGC35264_283_S2F1 WGC33030_228_S WGC1084_721_F
WGC18158_119_F1b WGC7520_3774_S1F2 WGC6074_441_S2F WGC18733_346_S2F WGC22447_285_Fb
Genotype1 Mean±S.E. Mean±S.E. Mean±S.E. Mean±S.E. Mean±S.E.
+/+ 3.621±0.044a2 2.840±0.099a 2.732±0.126a 2.244±0.060a 3.436±0.057a
+/- 3.847±0.041bc 3.328±0.090b 3.152±0.071b 2.440±0.067b 3.631±0.043b
-/+ 3.764±0.058b 3.299±0.096b 3.152±0.071b 2.316±0.057ab 3.739±0.050bc
-/- 3.938±0.052c 3.414±0.121b 3.430±0.115b 2.635±0.074c 3.776±0.041c
1, +/+ represent individuals with presence of two favorable alleles from both parents; +/- represent individuals carrying one favorable from P1 and one unfavorable allele from P2; -/+ represent individuals carrying one unfavorable allele from P1 and favorable from P2; -/- represent individuals with presence of the two unfavorable alleles from both parents. 2, mean of each groups with letter a, b and c shows significant difference (P < 0.05)
Discussion
Genetic linkage mapping and integration
In this study, we constructed the first gerbera genetic linkage maps from two F1 populations using newly generated SNP markers. Genetic linkage maps construction for cultivated ornamental crops often use F1 populations (Debener and Mattiesch 1999; Han et al. 2002; Rajapakse et al. 2001; Shahin et al. 2011; Zhang et al. 2010). Because many ornamental plants, including gerbera, are outcrossing species with complex genetic background and high heterozygosity that cannot be easily selfed due to serious inbreeding depression effects.
Four parental genetic linkage maps were constructed by using SNPs markers from EST data (Chapter 2; Fu et al. 2016). Most selected SNP markers showed a Mendelian segregation in the populations. For some loci, the allele segregation and allele ratios indicated the presence of null-alleles. Three flanking markers of a QTL contained null alleles. These markers with null-alleles probably come from mutations in the marker region which in the RNAseq data analysis of Fu et al. (2016) may have led to assembly of these sequences in alternative contigs and thus stayed unnoticed during SNP identification. We scored markers with null

Genetic mapping and QTL analysis of Botrytis resistance in Gerbera hybrida
59
3
alleles for each parent separately in order to use the marker data as much as possible and found these two-way scored markers are mapped on almost the same positions in the integrated map and the consensus map. The fact that the four alleles of these markers are all different reflects the complex genetic background of gerbera.
Based on the location of bridge (<hkxhk> type) markers on maternal and paternal linkage maps, we found the markers order on parental maps shows good consistency, but distance between markers on parental linkage maps varies. This is caused by independent meiotic events occurring in the two heterozygous parents and the different frequency of recombination determines the location of markers in each parent (Gebhardt 2007). This also explains the difference in linkage group length between parents of a cross. Markers common to both populations could be used to merge maps between the two populations and to arrive at a consensus map which was helpful for comparisons between the two populations in QTL mapping. From the integrated and consensus maps, we notice that some parental chromosomes appeared as separate (fragmented) linkage groups in one genotype whereas they were in one LG in another genotype (eg FP1_01.1 and FP1_01.2 vs SP1_01). Fragmentation also occurs in integrated maps of single populations. Generally, this occurs more often in the F population (9 out of 20 integrated LGs) than the S population (6 out of 21 integrated LGs). This might be due to a lower number of markers in FP2. Given the offspring numbers in both populations a theoretical minimum marker distance of 0.4 cM is possible. So by introducing more markers, map quality may be further improved.
For gerbera, we expected 25 linkage groups (2n=50). However, a total of 24 consensus linkage groups could be established. There are no additional linkage groups left in any of the four parental maps which could be assigned to LG25. This could be related to the size of this particular chromosome and the number of markers used in our study. Introducing higher numbers of markers might result in retrieving LG25. Also a lack of polymorphism between alleles of this chromosome could cause the inability to find this linkage group.
Gerbera gray mold phenotyping
Gerbera gray mold occurs mainly on gerbera capitulum in the production and post-harvest process. Different symptoms in infected gerbera cultivars were found, either necrotic spots on ray and trans florets or rot on disc florets. The mechanism underlying plant resistance against B. cinerea is not well understood, but it is generally accepted that plant resistance to this necrotrophic pathogen is quantitative and polygenic (Poland et al. 2009; Rowe and Kliebenstein 2008; St.Clair 2010). In a structured mapping population, quantified disease indexes after inoculation can be used to analyze plant responses to this pathogen and perform QTL mapping. However, there is no standard bioassay approach for evaluating plant resistance to B. cinerea available.
Previous studies on Arabidopsis and tomato (AbuQamar et al. 2006; Denby et al. 2004; Ferrari et al. 2007; Finkers et al. 2008; Finkers et al. 2007b; Hu et al. 2013; Rowe and Kliebenstein 2008; ten Have et al. 2007; Zhang 2013) are mainly based on infection assays using drop-inoculation or spray-inoculation with conidia suspension on leaves or stems, then measuring the lesion expansion rate, lesion size or camalexin accumulation. In gerbera, leaf and stem infections are of little importance and mainly flower infections

Chapter 3
60
3
lead to losses. To thoroughly assess the disease severity on gerbera flowers, we developed spray-inoculation tests on whole inflorescences (whole inflorescence and bottom), as well as a droplet-inoculation test for single ray florets. The tests were devised as simple tests in which a large number of flowers and ray florets could be tested in a relatively short period of time to avoid season influences during the testing period.
As a necrotrophic pathogen, Botrytis relies primarily on its abilities to kill host plant cell and subsequently decompose the plant tissue and consume it for its own growth (van Kan 2006). The fungus can use different infection paths in the complex organs that capitulum are and from experiments with cultivar panels, different responses between cultivars were observed and these led to the three different tests used. Among the three tests, there is a high correlation in both populations between the infection data of whole inflorescence and bottom disease symptoms. Apparently, the mechanism of defense within the chosen parents of the two crosses is more similar with regards to these two traits compared to the wider set of cultivars used in the development of the tests. The test on ray florets is clearly different from the other two tests. Therefore, for the ray floret test versus whole inflorescence and bottom, it can be envisaged that different genes are involved in resistance to Botrytis. Similarly, ten Have et al. (2007) also observed that resistance to Botrytis on tomato leaves and stems were distinct from each other.
QTLs mapping and analysis
QTLs detected varied between the two populations and also between the three tests. The reason for lower number of QTLs found in S population for ray floret resistance might be the small difference in ray floret disease score between the two parents of this population. The two F population parents, by contrast, showed a large difference in disease score for ray floret. Three QTL regions for whole inflorescence test, which were detected on different parental maps separately, co-localised on linkage group 23 for both populations. Although the QTL region still spans 20 cM on the consensus map between the most significant loci, the flanking bridge markers indicated possible overlapping of parental linkage groups and the existence of favorable alleles.
A relative high correlation between bottom and whole inflorescence was found in both populations, yet there is only one identical locus in both populations showing a significant QTL in both tests. More common QTLs for whole inflorescence and bottom might be expected given the correlation between the two tests. Apparently not all QTLs underlying the high correlation of the two tests can be detected which could be due to a lack of resolving power to detect minor QTLs for both disease indexes at the same time in a population. Environmental variance between test weeks may influence both tests in a similar way, however numbers of repetitions per week were too low to be able to study this.
In this study, several QTL with minor-effect for Botrytis resistance on gerbera inflorescences were detected. The results showed that, similar to Botrytis resistance in other plants, defense against B. cinerea on gerbera is quantitative and genetically complex, with probably the involvement of different infection mechanisms (Denby et al. 2004; Finkers et al. 2007a; Rowe and Kliebenstein 2008). QTLs found in our study may seem minor-effect QTLs, which are more difficult to use in breeding programs than major-effect QTLs or single resistance genes. However, several QTLs detected from separate parental linkage groups were found in
Genetic mapping and QTL analysis of Botrytis resistance in Gerbera hybrida
61
3
overlapping locations on the integrated map and we assume that these correlative QTLs are probably from a common gene with positive and negative alleles which can be defined as quantitative trait alleles (QTAs, Schäfer-Pregl et al. 1998). With the present of two positive QTAs, gerbera resistance to Botrytis increased significantly.
For two reasons we think there is potential for introgression of favorable QTL alleles in breeding to increase resistance to Botrytis in gerbera; a) phenotyping Botrytis disease is difficult and the large environmental component in testing has an downsizing effect on the total explained variance found in QTLs i.e. contributions of QTLs to genetic variance explained will be higher, b) compared to the disease tests (conditions chosen to avoid effects of incidence), the disease pressure in commercial greenhouses will be much lower and environmental conditions are less favorable for Botrytis infection (Finkers et al. 2007b). Under such conditions the effect of the QTLs may be much stronger.
This mapping study provides the first genetic map of gerbera and by using SNP markers derived from EST sequences (Chapter 2; Fu et al. 2016) a generally useable framework is provided which can be used for other studies as well and provides a first step in unraveling the complexity of the genetic background of resistance to botrytis in gerbera.
Acknowledgments
We are thankful for the support from the Foundation Technological Top Institute Green Genetics (3CFL030RP) and Jan van Kan for providing us with the Botrytis strain and useful advice in the start-up phase of disease testing.

Chapter 3
62
3
Supplementary Tables and Figures
Table S3-1 Overview of parental genetic linkage maps
SP1 Markers no. Length
(cM) SP2 Markers no. Length
(cM) FP1 Markers no. Length
(cM) FP2 Markers no. Length
(cM) LG01* SP1_01 35 126.07 SP2_01.1 12 45.96 FP1_01.1 26 130.58 FP2_01.1 15 88.04
SP2_01.2 22 112.34 FP1_01.2 11 45.11 FP2_01.2 9 37.91 LG02 SP1_02 26 102.53 SP2_02 20 108.2 FP1_02 30 95.65 FP2_02.1 4 11.9
FP2_02.2 10 37.05 LG03 SP1_03.1 25 50.58 SP2_03.1 10 23.41 FP1_03.1 6 46.41 FP2_03 18 89.63
SP1_03.2 5 7.74 SP2_03.2 3 - FP1_03.2 3 6.95 LG04
SP1_04 18 107.72 SP2_04.1 19 65.21 FP1_04 19 80.33 FP2_04.1 2 3.2 SP2_04.2 3 5.83 FP2_04.2 2 3.08 FP2_04.3 6 40.36 FP2_04.4 5 53.58
LG05 SP1_05 23 42.07 SP2_05 20 61.36 FP1_05 12 64.66 FP2_05.1 12 45.8 FP2_05.2 3 0.78
LG06 SP1_06 19 62.53 SP2_06 12 22.95 FP1_06 18 77.31 FP2_06 3 5.55 LG07 SP1_07 19 24.74 SP2_07 17 34.17 FP1_07 15 53.08 FP2_07 11 35.27 LG08 SP1_08 15 59.67 SP2_08 13 61.37 FP1_08 18 53.03 FP2_08 18 60.05 LG09 SP1_09.1 14 29.47 SP2_09 10 56.58 FP1_09 17 92.44 FP2_09 7 30.94
SP1_09.2 2 18.29 LG10 SP1_10 17 81.09 SP2_10 7 26.05 FP1_10.1 9 29.45 FP2_10 12 43.82
FP1_10.2 9 33.05 LG11 SP1_11 11 39.28 SP2_11 12 47.78 FP1_11 16 57.19 FP2_11 13 26.8 LG12 SP1_12.1 10 14.94 SP2_12.1 13 13.13 FP1_12 26 50.92 FP2_12 26 83
SP1_12.2 8 15.78 SP2_12.2 6 8.79 LG13 SP1_13 8 9.87 SP2_13 13 51.7 FP1_13 9 51.6 FP2_13 7 48.91 LG14 SP1_14.1 5 10.97 SP2_14 12 52.11 FP1_14.1 4 3.87 FP2_14 10 66.21
SP1_14.2 5 8.3 FP1_14.2 3 22.15 LG15 SP1_15.1 5 19.53 SP2_15 14 43.39 FP1_15 17 54.54 FP2_15 6 39.75
SP1_15.2 3 9.69 LG16 SP1_16 7 54.2 SP2_16 12 7.3 FP1_16 10 63.41 FP2_16 - - LG17 SP1_17 2 10.06 SP2_17.1 2 32.48 FP1_17 - - FP2_17 9 46.45
SP2_17.2 3 - LG18 SP1_18 10 31 SP2_18.1 8 57.07 FP1_18 17 98.34 FP2_18 14 95.26
SP2_18.2 3 0.82 LG19 SP1_19 9 46.05 SP2_19 5 24.56 FP1_19 6 73.13 FP2_19 5 19.55 LG20 SP1_20 7 37.26 SP2_20 4 23.02 FP1_20 8 49.71 FP2_20 - - LG21 SP1_21 - - SP2_21 11 55.46 FP1_21.1 10 18.24 FP2_21 13 45.72
FP1_21.2 6 0.84 LG22
SP1_22.1 2 0.67 SP2_22 5 26.42 FP1_22 11 62.62 FP2_22 10 53.36 SP1_22.2 2 12.59 SP1_22.3 2 2.3
LG23 SP1_23 12 61.14 SP2_23 - - FP1_23 14 83.36 FP2_23 6 24.74 LG24 SP1_24 3 56.34 SP2_24 2 36.15 FP1_24 - - FP2_24 3 5.06 LG25 SP1_25 - - SP2_25 - - FP1_25 - - FP2_25 - - Total 329 1152.5 293 1103.6 350 1498 259 1141.8 Total number of LGs 30 29 27 28
Map density (average cM/marker) 3.5 3.77 4.28 4.41
Number of unlinked/ungro-uped markers 6 4 5 15
*. LG is Linkage Group.

Genetic mapping and QTL analysis of Botrytis resistance in Gerbera hybrida
63
3
Table S3-2 Overview of integrated map of the populations
S_LG Markers no. Length (cM) F_LG Markers no. Length (cM)
LG01* S_LG01 53 102.3 F_LG01.1 40 154.9
F_LG01.2 11 45.1
F_LG01.3 8 37.9
LG02 S_LG02 34 106.8 F_LG02.1 32 91.9
F_LG02.2 7 37.4
LG03 S_LG03.1 27 50.5 F_LG03.1 18 89.5
S_LG03.2 5 7.5 F_LG03.2 4 33.8
LG04
S_LG04 33 49.1 F_LG04.1 18 80.3
F_LG04.2 5 53.6
F_LG04.3 3 40.2
LG05
S_LG05 30 54.0 F_LG05.1 12 45.5
F_LG05.2 8 65.2
F_LG05.3 3 0.8
LG06 S_LG06 28 64.5 F_LG06 18 77.3
LG07 S_LG07 20 37.6 F_LG07 21 50.3
LG08 S_LG08 21 63.1 F_LG08 24 61.3
LG09 S_LG09 20 59.8 F_LG09 22 92.0
LG10 S_LG10 19 80.9 F_LG10.1 15 42.2
F_LG10.2 9 29.5
LG11 S_LG11 19 46.9 F_LG11 21 50.7
LG12 S_LG12.1 19 17.3 F_LG12 42 78.7
S_LG12.2 10 20.8
LG13 S_LG13 16 52.9 F_LG13 11 69.4
LG14
S_LG14 17 55.3 F_LG14.1 10 66.2
F_LG14.2 3 3.9
F_LG14.3 2 22.9
LG15 S_LG15 14 43.1 F_LG15 19 60.4
LG16 S_LG16.1 11 7.3 F_LG16 (10) -
S_LG16.2 5 54.5
LG17 S_LG17 (6) - F_LG17 (9) -
LG18 S_LG18.1 10 30.2 F_LG18 23 46.5
S_LG18.2 8 57.1
LG19 S_LG19.1 9 46.0 F_LG19 8 39.6
S_LG19.2 4 24.9
LG20 S_LG20 8 36.8 F_LG20 (8) -
LG21 S_LG21 (11) - F_LG21.1 10 46.5
F_LG21.2 7 59.0
LG22
S_LG22.1 5 24.4 F_LG22 15 18.3
S_LG22.2 2 2.2 S_LG22.3 2 2.3
LG23 S_LG23 (12) - F_LG23.1 17 84.3
F_LG23.2 6 0.8
LG24 S_LG24 3 56.3 F_LG24 (3) -
LG25 S_LG25 - - F_LG25 - -
*. LG is Linkage Group.

Chapter 3
64
3
Table S3-3 Overview of the genetic consensus map of gerbera based on the integrated maps of both populations
Linkage Group (LG) Length (cM) Markers no. Density Gaps
(>15cM)
LG01 134.44 78 1.72 0
LG02 108.38 48 2.26 0
LG03 97.35 45 2.16 1
LG04 117.93 38 3.1 1
LG05 58.52 34 1.72 1
LG06 68.48 32 2.14 0
LG07 42.88 28 1.53 0
LG08 59.58 31 1.92 0
LG09 40.96 31 1.32 0
LG10 74.78 32 2.34 0
LG11 59.33 28 2.12 0
LG12 73.11 46 1.59 1
LG13 57.97 22 2.64 0
LG14 59.68 25 2.39 1
LG15 42.83 22 1.95 0
LG16 61.54 17 3.62 1
LG17 46.45 9 5.16 1
LG18 90.4 31 2.92 0
LG19 60.53 16 3.78 2
LG20 41 12 3.42 1
LG21 53.44 20 2.67 1
LG22 56.6 17 3.33 1
LG23 90 22 4.09 2
LG24 5.06 3 1.69 0
Average 1601.24 687 2.57
Table S3-4 The correlation of disease indexes in both populations
Population S S_B S_WI S_RF Population F F_B F_WI F_RF
S_B Pearson Correlation 1 0.83** 0.11 F_B Pearson
Correlation 1 0.67** -0.01
Sig. (2-tailed) 0 0.09 Sig. (2-tailed) 0 0.93
S_WI Pearson Correlation 0.83** 1 0.08 F_WI Pearson
Correlation 0.67** 1 0.05
Sig. (2-tailed) 0 0.18 Sig. (2-tailed) 0 0.46
S_RF Pearson Correlation 0.11 0.08 1 F_RF Pearson
Correlation -0.01 0.05 1
Sig. (2-tailed) 0.09 0.18 Sig. (2-tailed) 0.93 0.46

Genetic mapping and QTL analysis of Botrytis resistance in Gerbera hybrida
65
3
Table S3-5 The board-sense heritability of the three disease tests from two populations
H2 Whole
inflorescence Bottom Ray Floret
S population 28.24%* 32.60% 38.76%
F population 38.83% 46.41% 48.70% *one-way ANOVA (analysis of variance) test by SPSS (version 21) was used to measure the between group variation and the within group variation. Between group variation (variation among individuals within a population) is considered as genetic, and within group variation (variation between clones of offspring) is due to the environmental factors. The board-sense heritability (H2) = between group variation/total variation×100%
Fig. S3-1. Examples of different segregation types for SNP markers visualized by SNPviewer. a: the parental genotypes are T:A indicating a <hkxhk> marker, and the progeny genotypes are T:T (n=66), T:A (n=140) and A:A (n=69) segregating in the ratio 1:2:1. b: the first parent genotype is A:G, and the second is are G:G indicating a <lmxll> marker. The progeny genotypes are A:G (n=135) and G:G (n=141) segregating in the ratio 1:1. c: the first parent genotype is C:C, and the second is are T:C indicating a <nnxnp> marker. The progeny genotypes are C:C (n=133) and T:C (n=134) segregating in the ratio 1:1. d: not polymorphic marker. Two parents and all progeny are in the same A:A cluster without segregation. e: not-fitting segregation. The parental genotypes are G:A, and the progeny should be segregating in 1:2:1 ratio but in fact they are scattered and no clear clusters can be defined. f: non-Mendelian segregating marker with putative null-allele. Parents seem to be A:G and G:G, whereas progeny show clusters A:A, A:G and G:G with 74, 69 and 133 individuals respectively indicating that the true genotype of parent P2 is likely G: Ø.

Chapter 3
66
3
Fig. S3-2. a: Parental and integrated map of LG08 from F population. Identical markers are linked. The anchor markers (<hkxhk> type loci) are highlighted in red. b: Integrated and consensus map (in the middle) of LG08 of the two populations. Bridge (common) markers of S and F population are indicated in red.
Fig. S3-3 The location of all QTLs. a: QTLs locations in parental linkage maps for bottom test. b: QTLs locations in parental linkage maps for ray florets test. c: QTLs locations in parental linkage maps for whole inflorescence test. Red bars represent the LOD 95% confidence intervals for QTL peaks and red markers represent the QTL peak location.
WGC2545_101_S1F10.0WGC8919_239_S1F13.4WGC18014_131_S1FWGC4515_103_S1F15.2
WGC14531_563_S1F5.8WGC8552_779_S2F19.0WGC10588_275_F9.8WGC4445_2405_F114.2WGC14447_485_S1F115.1WGC33495_350_S2F118.2WGC17809_355_S2F219.2WGC11462_766_S2F19.9
WGC9125_295_S2F41.4
WGC18021_112_F49.0WGC4377_303_F149.2WGC36511_668_F2a50.5WGC19189_350_S1F153.0
FP1_08
WGC2545_101_S1F10.0WGC8919_239_S1F13.5WGC18014_131_S1F5.5WGC4515_103_S1F16.0WGC14531_563_S1F6.6WGC8552_779_S2F18.3WGC10588_275_F8.7WGC2359_302_S1F210.4WGC2778_462_S_F211.5WGC18936_108_F213.6WGC4445_2405_F113.9WGC14447_485_S1F114.7WGC33495_350_S2F117.8WGC17809_355_S2F218.3WGC11462_766_S2F19.4
WGC28656_114_F233.0WGC3420_455_S2F234.8
WGC3691_83_F246.7WGC9125_295_S2F48.5
WGC18021_112_F57.4WGC4377_303_F157.5WGC36511_668_F2a58.7WGC19189_350_S1F161.3WGC36511_668_F2b62.3
F_LG08
WGC18014_131_S1F0.0WGC4515_103_S1F10.8WGC14531_563_S1F1.6WGC10588_275_F3.1WGC8552_779_S2F13.4WGC2359_302_S1F25.1WGC2778_462_S_F26.2WGC18936_108_F28.2WGC17809_355_S2F212.2WGC11462_766_S2F13.8
WGC28656_114_F227.8WGC3420_455_S2F229.6
WGC3691_83_F241.9WGC9125_295_S2F42.9
WGC18021_112_F55.8WGC4377_303_F156.1WGC36511_668_F2b60.1
FP2_08
WGC2545_101_S1F10.0WGC8919_239_S1F1WGC14531_563_S1F1.6
WGC4515_103_S1F11.9WGC18014_131_S1F2.2WGC33495_350_S2F12.7WGC11462_766_S2F3.5WGC2359_302_S1F24.1WGC6332_460_SWGC8552_779_S2F16.3
WGC2778_462_S_F26.5WGC215_178_S6.6WGC17809_355_S2F26.9WGC14447_485_S1F125.4WGC13559_78_S130.4WGC25040_299_S33.8WGC10836_652_S34.7
WGC9125_295_S2F53.5
WGC2824_142_S260.1WGC11384_140_S61.2WGC19189_350_S1F163.1
S_LG08
WGC2545_101_S1F10.0WGC18014_131_S1F1.9WGC4515_103_S1F12.8WGC8919_239_S1F13.7WGC14531_563_S1F3.9WGC2359_302_S1F25.6WGC2778_462_S_F2WGC6332_460_S6.9
WGC215_178_S7.1WGC8552_779_S2F17.4WGC10588_275_F7.7WGC18936_108_F29.6WGC17809_355_S2F211.6WGC11462_766_S2F12.9WGC33495_350_S2F113.8WGC4445_2405_F123.0WGC14447_485_S1F124.4WGC28656_114_F229.5WGC13559_78_S130.1WGC3420_455_S2F231.3WGC25040_299_S34.5WGC10836_652_S35.4WGC3691_83_F243.8WGC9125_295_S2F47.3WGC2824_142_S254.2WGC11384_140_S55.4WGC19189_350_S1F157.2WGC36511_668_F2b57.5WGC4377_303_F158.0WGC18021_112_F58.1WGC36511_668_F2a59.6
LG08
WGC2545_101_S1F10.0WGC8919_239_S1F13.8WGC18014_131_S1F5.6WGC4515_103_S1F16.1WGC14531_563_S1F6.7WGC8552_779_S2F18.5WGC10588_275_F9.0WGC2359_302_S1F29.7WGC2778_462_S_F210.7WGC18936_108_F212.8WGC33495_350_S2F114.3WGC17809_355_S2F215.2WGC11462_766_S2F16.2WGC14447_485_S1F123.0WGC4445_2405_F124.0WGC28656_114_F232.0WGC3420_455_S2F233.7
WGC3691_83_F245.6WGC9125_295_S2F47.5
WGC18021_112_F56.4WGC4377_303_F156.5WGC36511_668_F2a57.7WGC19189_350_S1F160.3WGC36511_668_F2b61.3
F_LG08
a b
WGC34475_396_SF1aWGC7419_63_S1F10.0
WGC17757_237_S2F10.1WGC27925_98_S1F15.7WGC18262_147_S118.0WGC34768_65_S1F119.5WGC31982_135_S1F23.1WGC22185_434_S2F1a24.3WGC23656_151_S1F1a29.2WGC11243_647_S2F1a33.4WGC15789_100_S1F145.2WGC8799_438_S1F145.9WGC8272_136_S1F162.1WGC31308_165_S1F162.4WGC7983_971_SF64.3WGC2177_311_SF64.7WGC34745_323_S2FWGC25570_844_SWGC4477_1171_SF1
67.8
WGC32105_310_S1F168.0WGC27443_327_SF1WGC3004_110_SF1WGC3930_242_SF1
68.3
WGC34976_88_S75.6WGC18942_274_S1F1a76.9WGC11464_359_S1F102.5
RBQB1
SP1_02
WGC16319_821_S1F20.0WGC8562_422_S2.0WGC3979_333_S2.9
WGC7576_107_S1F117.9
WGC18703_968_S1F131.6
WGC2476_271_S148.5WGC8121_498_S1F154.2
RBQB2
SP1_16
WGC18733_346_S2F0.0WGC20615_61_S2F1b11.7WGC8726_266_S2F18.7WGC34440_142_S2F20.8WGC4052_220_S23.3WGC27484_676_S28.0WGC25268_184_S33.4WGC4278_180_SF137.6WGC34157_246_S2F40.8WGC12799_1155_S245.8WGC18833_209_S2F146.1WGC19516_214_S2F147.8
RBQB3
SP2_11
WGC19529_158_SF10.0WGC36541_224_SF10.3WGC10226_238_Fa11.1WGC32669_336_SF135.6WGC8430_469_S1F136.8WGC4503_278_S1F138.9WGC27086_382_S2F153.2WGC7767_115_Fa54.6WGC21895_782_S1F159.6WGC16787_905_S2F162.6WGC36485_147_S2F63.6WGC2920_160_S_F165.2WGC20788_411_S1F1WGC9128_148_S1F1WGC3029_209_S1F1
69.1
WGC19258_230_SF169.8WGC30999_868_S1F1WGC9384_476_S1F1WGC16204_523_S2F1
71.4
WGC10214_71_S2F175.7WGC18050_562_SF177.3WGC8870_374_F2a81.9
WGC33108_447_F1118.0WGC9062_263_S2Fa122.5WGC17612_204_F1a129.1WGC3957_170_SF130.6
RBQB4
FP1_01
WGC17528_144_F10.0WGC22285_206_S2F1WGC27915_91_S2F10.6
WGC18994_594_S2F1.9WGC18652_365_F12.1WGC35370_146_S2F1WGC27639_103_F13.4
WGC23609_194_S1Fa8.2WGC8602_452_S1F110.9WGC35893_105_S2F128.3WGC17958_767_S2F140.3WGC33264_70_SF144.2WGC28102_213_S2F145.3WGC3469_267_F149.7WGC18158_119_F1a54.2
WGC27903_379_S2F174.8
WGC18273_134_S1F192.4
RBQB5
FP1_09
WGC23609_194_S1Fb0.0WGC7649_321_S1F6.1
WGC18158_119_F1WGC18158_119_F1b18.9
WGC33264_70_SF125.9WGC33445_346_S1F226.3WGC35893_105_S2F130.9
RBQB6
FP2_09
a

Genetic mapping and QTL analysis of Botrytis resistance in Gerbera hybrida
67
3
Fig. S3-3 (continued)
WGC27999_351_SWGC30433_466_SWGC11692_278_SWGC27416_552_S1WGC18688_200_SF
0.0
WGC18560_159_S0.1WGC8572_1297_S2F1WGC8755_477_S2F10.2
WGC16507_1013_SF10.6WGC17793_888_S1F28.1WGC22130_81_SF2WGC16500_442_S8.3
WGC10243_386_S2F111.2WGC20332_347_S2F113.2WGC17798_117_S2F134.2
RBQRF1
SP2_07
WGC32274_134_S1F10.0WGC3739_149_SF10.8WGC26242_226_SF11.9WGC4138_154_SF3.3WGC22343_292_SFa7.1
WGC19130_393_S1F150.2
WGC35157_467_F159.9WGC17061_401_SF62.4WGC8642_167_SF164.4WGC10346_175_F1a65.5
RBQRF2
FP1_05
WGC17528_144_F10.0WGC22285_206_S2F1WGC27915_91_S2F10.6
WGC18994_594_S2F1.9WGC18652_365_F12.1WGC35370_146_S2F1WGC27639_103_F13.4
WGC23609_194_S1Fa8.2WGC8602_452_S1F110.9
WGC35893_105_S2F128.3
WGC17958_767_S2F140.3WGC33264_70_SF144.2WGC28102_213_S2F145.3WGC3469_267_F149.7WGC18158_119_F1a54.2
WGC27903_379_S2F174.8
WGC18273_134_S1F192.4
RBQRF3
FP1_09
WGC8267_240_SF0.0WGC19903_508_S1F4.1WGC29477_280_S1F14.5WGC19318_99_S1F10.4
WGC828_408_S2F24.4WGC36216_955_F133.4WGC1697_224_S1Fa37.8WGC2765_64_S2F142.6WGC17470_602_S2F1WGC10483_460_S2F144.3
WGC3829_232_S2F145.3WGC36235_369_S1F146.8WGC4126_149_F147.3WGC17566_197_S2F151.7WGC17031_251_F152.8WGC8896_566_S2F153.3WGC18371_139_S2F54.5
RBQRF4
FP1_15
WGC7433_150_S2F1a0.0
WGC8954_249_S2F19.2
WGC34991_187_S2F125.9WGC35264_283_S2F130.7WGC6074_441_S2F31.4
WGC18800_256_S1F143.2WGC8743_118_S1F1a44.3WGC4372_144_S1F58.6WGC20787_532_S2F159.9WGC4013_122_F160.9WGC27191_117_S1F163.0WGC8881_859_SF163.8WGC2467_64_F165.3WGC5981_286_F165.6WGC35898_122_S1F168.2
WGC27929_106_S1F191.5
WGC33889_542_F198.3
RBQRF5
FP1_18
WGC19903_508_S1F0.0WGC29477_280_S1F10.1WGC19318_99_S1F4.8
WGC7520_3774_S1F221.1WGC1697_224_S1Fb21.3
WGC828_408_S2F39.7
RBQRF6
FP2_15
WGC35478_496_F20.0
WGC4372_144_S1F39.2WGC19289_1003_F243.0WGC8743_118_S1F1b45.9WGC27592_275_S2F246.2WGC18800_256_S1F147.0WGC19040_355_F2WGC19040_355_F2b50.2
WGC19782_600_SF250.8WGC6074_441_S2F56.9WGC35264_283_S2F160.4WGC8954_249_S2F68.7
WGC7433_150_S2F1b83.6
WGC18057_1139_F295.3
RBQRF7
FP2_18
WGC8244_216_S2F20.0
WGC18664_326_S2F219.4WGC2056_191_F30.9WGC9226_226_F232.1WGC3424_72_S2F134.7WGC8809_433_S2F1b39.4WGC4151_332_S2FWGC35409_177_FWGC19051_337_F
45.1
WGC7759_664_FWGC9202_285_F45.2
WGC19322_269_S2F1b45.6WGC20761_143_S2F245.7
RBQRF8
FP2_21
b
WGC7654_417_S1F10.0WGC20336_2175_S1F1WGC1044_660_S10.7
WGC33030_228_S10.1WGC20615_61_S2F1a10.9
WGC27484_676_S25.2WGC4052_220_S27.1WGC27626_149_S1F29.1WGC25268_184_S33.2WGC4278_180_SF135.5WGC28196_243_S1F39.3
RBQW
I1SP1_11
WGC7127_127_S1F20.0WGC15405_1293_S1F0.4WGC1067_494_S11.1
WGC27629_93_S15.9
WGC21545_548_S1F125.5WGC3745_120_S126.6WGC19020_660_S127.1WGC1824_721_S1F1WGC407_4995_S1F129.4
WGC22355_237_S1F159.3WGC8574_435_S1FWGC7513_582_S1F61.1
RBQW
I2
SP1_23
WGC18733_346_S2F0.0
WGC20615_61_S2F1b11.7
WGC8726_266_S2F18.7WGC34440_142_S2F20.8WGC4052_220_S23.3WGC27484_676_S28.0
WGC25268_184_S33.4WGC4278_180_SF137.6WGC34157_246_S2F40.8WGC12799_1155_S245.8WGC18833_209_S2F146.1WGC19516_214_S2F147.8
RBQW
I3
SP2_11
WGC15405_1293_S1F0.0WGC22447_285_Fa0.3WGC1084_721_F1.2
WGC3454_459_F1a19.1WGC21545_548_S1F120.2WGC16170_118_F121.8WGC1824_721_S1F123.1WGC407_4995_S1F123.8
WGC27795_176_F52.5
WGC14274_384_F180.9WGC8047_200_F181.5WGC34390_211_F82.6WGC8574_435_S1F82.9WGC22355_237_S1F183.4
RBQW
I4
FP1_23
WGC3939_240_S2F20.0
WGC11593_467_F26.5
WGC4966_1108_F20.6
WGC5962_1153_F41.2WGC15914_515_F242.3WGC6386_762_F243.3WGC8417_313_F244.5WGC3585_238_F245.3WGC6768_187_F246.5
RBQW
I5
FP2_17
WGC7127_127_S1F20.0WGC15405_1293_S1F1.6WGC1084_721_F2.5WGC22447_285_Fb4.9
WGC1824_721_S1F113.5
WGC3454_459_F1b24.7
RBQW
I6
FP2_23
c

Chapter 3
68
3
Fig. S3-4 The location of QTLs (RBQWI2, RBQWI4 and RBQWI6) on parental linkage maps. The bars in red color show the position of the QTL for whole inflorescence in three different parental linkage maps and **, ****, ****** indicated significant at P=0.05, 0.005, 0.0005 of Kruskal–Wallis test. The highest marker QTL is in red marker and common markers are underlined.
WGC7127_127_S1F20.0WGC15405_1293_S1F0.4WGC1067_494_S11.1
WGC27629_93_S15.9
WGC21545_548_S1F1 ****25.5WGC3745_120_S1 ****26.6WGC19020_660_S1 ****27.1WGC1824_721_S1F1 ******WGC407_4995_S1F1 ******29.4
WGC22355_237_S1F1 *59.3WGC8574_435_S1FWGC7513_582_S1F61.1
RBQW
I2
SP1_23
WGC15405_1293_S1F0.0WGC22447_285_Fa ********0.3WGC1084_721_F1.2
WGC3454_459_F1a ****19.1WGC21545_548_S1F1 *****20.2WGC16170_118_F1 ****21.8WGC1824_721_S1F123.1WGC407_4995_S1F1 ****23.8
WGC27795_176_F52.5
WGC14274_384_F180.9WGC8047_200_F181.5WGC34390_211_F82.6WGC8574_435_S1F82.9WGC22355_237_S1F183.4
RBQW
I4
FP1_23
WGC7127_127_S1F2 **0.0WGC15405_1293_S1F1.6WGC1084_721_F2.5WGC22447_285_Fb4.9
WGC1824_721_S1F113.5
WGC3454_459_F1b24.7
RBQW
I5
FP2_23

Chapter 4 The use of a candidate gene approach to arrive at
Botrytis resistance in Gerbera hybrida
Yiqian Fu, Wen Fang, Jaap M. van Tuyl, Richard G.F. Visser, Paul Arens*
Plant Breeding, Wageningen University & Research, PO Box 386, 6700AJ, Wageningen, The
Netherlands
*Corresponding author, e-mail address: [email protected]; telephone: +31317481589; fax
number: +31317418094
This chapter has been published partly in Acta Horticulturae 1087, 461-466.

Chapter 4
70
4
Abstract
Candidate genes (CG) described in the literature that were found to affect Botrytis resistance were mapped on gerbera linkage maps using a rapid, low-cost and high-throughput platform for SNP genotyping. With this method we could use high-resolution melting analysis to screen and map potential functional genes in a highly heterozygous ornamental plant species without genome information. In total, 29 candidate genes were mapped on previously constructed linkage maps in which several QTLs for botrytis resistance have been found. Four CGs were mapped in the previous identified QTLs intervals and three co-localized with QTLs. The analysis of allelic diversity on CGs which are involved in phenotypic variation demonstrated the heterozygosity of gerbera. Involved CGs were up-regulated after Botrytis inoculation. The candidate gene approach in this study is a useful tool to identify possible causal genes and can make a contribution to gerbera improvement and also for understanding the molecular mechanisms of Botrytis resistance in gerbera.
Keywords
QTLs, gerbera gray mold, MAS, allele
The use of a candidate gene approach to arrive at Botrytis resistance in Gerbera hybrida
71
4
Introduction
Gerbera is an economically important ornamental plant which is mainly used as cut flower. In pre-harvest and post-harvest processes, high relative humidity regularly occurs often leading to gray mold infections which cause major losses in gerbera production. Gerbera gray mold may be suppressed by cultural management and fungicide application during production in greenhouses, yet prevention and control of this disease in transportation or after sales is difficult since fungicide cannot be applied in the post-harvest process. Moreover, flowers are subjected to the active process of senescence once harvested and thus vulnerable to pathogen attack. Infected gerbera will be thrown away or have a shortened vase life. Breeding companies will receive complaints from growers when cultivars are very susceptible and customers may buy other cut flowers as a substitute when experience with vase-life is disappointing. Therefore, breeding gerberas that are resistant to gerbera gray mold should be an important goal of all breeding companies.
Traditionally, breeding in gerbera is conducted using F1 crossing and selection on generations after generations in several breeding programs. Although this traditional method is considered time and labour consuming, it is still widely in use for ornamental plant breeding since lots of horticultural characteristics of ornamental plants, like flower color, flower pattern and shape, as well as agronomical traits as multiplication rate and flower production are segregating due to the high variation in parental genotypes and can be easily selected as it are partly visible traits (color, pattern, shape) and partly easily quantifiable traits (multiplication, production). However, selection for genetic complex quantitative traits, which are often also influenced by environment and present themselves in continuous distributions (Paterson et al. 1988), is very difficult using only visual selection schemes. Thus, more and more molecular DNA markers have been exploited for trait selection due to their abundance and independence of environmental influences (Collard et al. 2005). DNA markers which are linked to a trait of interest enable marker assisted selection (MAS) in breeding and MAS has been widely accepted as a potential tool for crop improvement.
Resistance to B. cinerea, the cause of gerbera gray mold, is a quantitative trait which means that the resistance requires contributions of multiple loci to reduce disease severity (Mengiste et al. 2003; Poland et al. 2009). QTL mapping of quantitative resistance to Botrytis in Arabidopsis and tomato has revealed numerous small-effect QTLs affecting the disease (Finkers et al. 2008; Finkers et al. 2007a; Finkers et al. 2007b; Rowe and Kliebenstein 2008; ten Have et al. 2007). Similarly, also in gerbera (Chapter 3; Fu et al. 2017), we detected 20 QTLs and explained variance of most detected QTLs were below 10%. The results reflected the complex response of plants to Botrytis infection.
Selection using several small-effect QTLs in breeding programs might limit the efficiency of MAS. Genetic linkage between random DNA markers and a QTL allele with the trait of interest, especially when the QTL region is wide, leaves the possibility that linkage can be broken by recombination (Andersen and Lübberstedt 2003). Furthermore, in cross-pollinating highly diverse ornamental species, QTL alleles are likely more random associated with marker alleles in the germplasm (Kumar et al. 2000). The observed marker alleles which were detected in a created single F1 outbred population might not be directly applied to predict the association with the allele of a QTL in another population for practical breeding programs

Chapter 4
72
4
(Liu et al. 2011; Williams 1997). Thus, developing an alternative strategy to increase selection efficiency in gerbera breeding is required.
For ornamental crops, with increasing EST sequence data availability the use of a candidate gene (CG) approach was recently recommended (Arens et al. 2012; Collard et al. 2005; Debener 2009; Pflieger et al. 2001; Smulders et al. 2011). A CG approach is based on the hypothesis that homologs of known functional genes from other species could control similar traits of interest in the focus species (Collard et al. 2005; Pflieger et al. 2001). Through co-localization of CGs with QTLs, promising genes underlying the QTLs could be quickly pinpointed (Decroocq et al. 2005; Gardner et al. 2016; Kawamura et al. 2011; Norelli et al. 2009; Pflieger et al. 2001) and used for understanding molecular mechanisms of interested traits (Smulders et al. 2011). Developing molecular markers which are derived directly from polymorphic loci in functional candidate genes themselves will be in complete linkage with the causal genes (Andersen and Lübberstedt 2003) and would be more efficient than using random DNA markers in marker-assisted selection.
To develop candidate gene markers, understanding the resistance mechanism for this necrotrophic pathogen is essential. The infection process of B. cinerea is widely studied and usually described by the following stages: penetration of the host epidermal cell surface, primary lesion formation, lesion expansion/tissue maceration and sporulation (Choquer et al. 2007; Jarvis 1962; van Kan 2006). During the infection, a series of genes are involved in plant disease resistance against the necrotrophic pathogen. The first category of genes are those involved in cell wall biosynthesis or affecting cell wall composition. For a host plant, the cell wall is the first barrier to pathogen invasion. As a necrotrophic pathogen, B. cinerea can secrete an arsenal of enzymes to decompose plant cell wall polysaccharides in order to facilitate penetration (Zhang 2013). The pathogen prefers to colonize plant species whose cell walls are rich in pectin while plants with low pectin contents are considered poor hosts for Botrytis (van Kan 2006).
The second category of genes is those involved in regulation of signaling pathways. To modulate induced defense responses, plants have developed a complex system of signals to activate defense response. Functional deficient plants in the JA (coi1, jar1, and iop1), ET (ein2, ein3) and SA (nahG) signal transduction pathways have an altered Botrytis interaction in Arabidopsis (AbuQamar et al. 2006). A large number of regulatory genes encoding JA, ET and SA response transcription factors, e.g. R2R3MYB, WRKY33, MYC and ORA59, also influence the resistance to Botrytis (Lorenzo et al. 2004; Mengiste et al. 2003; Pre et al. 2008; Zheng et al. 2006). An abscisic acid deficient mutant of tomato sitiens (sit) has increased resistance to B. cinerea (Asselbergh et al. 2007; Audenaert et al. 2002) and indicated that ABA is also involved in Botrytis resistance.
Meanwhile, to resist against microbial attack and detoxify the low-molecular-weight phytotoxic compounds produced by B. cinerea, plants can produce a remarkably diverse array of secondary metabolites and the genes involved in the often complex pathways of plant natural product biosynthesis (Dixon 2001) form a third category of genes. Inoculating multiple camalexin-deficient Arabidopsis mutants with several B. cinerea isolates confirmed that camalexin plays a major role in resistance (Kliebenstein et al. 2005). B. cinerea lesion outgrowth has been shown to be inhibited by accumulation of camalexin in Arabidopsis (Rowe and Kliebenstein 2008). Asteraceae are renowned for their ability to

The use of a candidate gene approach to arrive at Botrytis resistance in Gerbera hybrida
73
4
produce a wide range of unique secondary metabolites including: monoterpenes, diterpenes, triterpenes, polyacetylenes, flavonoids, phenolic acids, coumarins and pyrrolizidine alkaloids (Calabria et al. 2009). Enzymes or regulatory genes involved in those phenylpropanoid compound synthesis pathways can affect the synthesis of antimicrobial plant natural products that are considered potential weapons against botrytis.
In this study, we have developed SNP markers targeted on candidate genes which may affect plant resistance to Botrytis and mapped them using two gerbera populations that were previously used to perform Botrytis resistance QTL mapping. The use of a candidate gene approach in gerbera aims to turn markers which are linked with QTLs to markers in potential CGs and eventually leading to the possibility for selection of functional gene alleles. In this research, we obtain a preliminary understanding of the allele diversity in gerbera through the allele distinction from several CGs and provide a number of loci that may be further studied for resistance to botrytis in gerbera under glasshouse production situations.
Materials and Methods
Mapping populations and Botrytis disease test
The plant materials used were two gerbera populations already used for QTL mapping previously (Chapter 3; Fu et al. 2017). In short, population Schreurs (abbreviated as S, with 276 progeny) and Florist (abbreviated as F, with 270 progeny) were produced by crosses between heterozygous hybrids with different resistance levels for B. cinerea susceptibility. Phenotypic data available for these two F1 progenies were based on three tests, whole inflorescence, bottom (of disc floret) and ray floret respectively with scores ranging from 0 (no symptom) to 5 (very serious) as described by Fu et al. (2017) and in Chapter 3.
Genome DNA extraction
Young leaf material from all progeny of the two populations and four parents was sampled by leaf punches. After dehydrating with silica gel at room temperature over 48 hours, three 6mm leaf discs per sample were grounded to powder using a TissueLyser II (Qiagen). Genomic DNA was isolated following the DNA isolation protocol of Fulton et al. (1995) with some adaptations. In short: 750μl of fresh-prepared microprep buffer with RNAse 100μg/ml was added to 2ml-eppendorf tubes with ground leaf disc powder and after mixing this was incubated at 60°C for at least 60 min. After that, 800μl chloroform:isoamyl (24:1) was added and mixed well. tubes were centrifuged at 13,000 rpm for 5 min and 500μl of the upper aqueous phase was pipetted into a new Eppendorf tube to which an equal volume cold isopropanol was added. Mix by inverting tubes repeatedly until DNA precipitates and centrifuge tubes at 13,000 rpm for 5 min. Wash the DNA pellet with 500μl 70% ethanol twice and dry DNA pellet by leaving tube upside down on paper towel for approximately 1h. Re-suspend DNA pellet in TE-4. DNA quality and quantity of all samples were checked on 1% TBE agarose gel and also by Nanodrop.
Candidate gene identification and marker development
Candidate genes from Arabidopsis or other crops that are considered involved in Botrytis resistance were selected based on published literature and sequences were obtained from NCBI. A Gerbera EST database

Chapter 4
74
4
containing 36,770 assembled contigs which were used for detecting SNPs for linkage mapping in the two described populations was available from Chapter 2 and Fu et al. (2016). Candidate genes from literature were run against this gerbera ESTs database using tBLASTn in the blast-2.2.28+ program (ftp://ftp.ncbi.nih.gov/blast/executables/blast+/).
From the alignments between the candidate genes and contigs from the gerbera EST database, the contig with the highest similarity and sequence homology was selected (minimum threshold E-value < 1e-15, bits-score > 50 and identity > 30%). SNP identification was performed as described in Chapter 2 and Fu et al. (2016) using QualitySNPng (Nijveen et al. 2013). To avoid SNP markers in exon/intron boundaries, Open Reading Frames (ORFs) were identified in the selected best-hit sequences using the ORF data of the query genes from literature.
To readily group the offspring, we mainly focused on SNPs heterozygous in just one parent. Primers were selected to generate fragments between 80 to 120bp using Primer3 online (Koressaar and Remm. 2007; Untergasser et al. 2012). Intron spanning primers were avoided if possible.
Genotyping using HRM analysis
Primers were first tested on the four parents and randomly selected four offspring to filter out the primers with no amplification or multiple bands on gel. PCR reactions were conducted using a DNA Engine Thermal Cycler PCR machine (Bio-RAD, USA). The 10-μl reaction mixtures used for Lightscanner PCR reaction included: 2μl genomic DNA (5ng/μl), 1μl forward and reverse primer mix (10μM), 0.4μl dNTP mix (5mM), 0.1μl Phire Hot Start II DNA Polymerase (5U), 2μl 5× Phire Reaction Buffer (containing 7.5 mM MgCl2), 1μl LCGreen Plus + and 3.5μl Milli-Q water. PCR reaction mixes were overlaid with 10μl of mineral oil in 96-well plates covered with sealing film. PCR was initiated at 98°C for 30s, then 40 cycles of 5s at 98°C, 5s at 60°C and 10s at 72°C, and one hold of 60s at 72°C, 30s at 94°C, 30s at 25°C, stored (hold) at 10°C at last.
After PCR reaction, PCR products from each genotype were screened by analysing melting curve in the LightScanner (Idaho Technology) to check SNP marker polymorphisms. Samples with initial fluorescence signals below 800 were discarded. Raw melting data were normalized to have the same start and end fluorescence baseline and shift curve using the default setting. Only when the melting curve of the two parents and selected individual could be clearly distinguished, the marker will be used for whole population genotyping.
Statistical analysis and candidate genes mapping
Offspring could be separated based on the shapes of the melting curves due to the allelic variation of the amplified CGs fragment. The segregation ratios were tested by χ² (1:1) statistics. The mean of disease scores (from bottom, ray floret, and whole inflorescence test) between the two allelic groups were tested for significance (P<0.05) by t-test using SPSS software (Version 21). Mapping was performed using JoinMap®4 (van Ooijen 2006). Candidate gene map positions were mapped using the linkage maps that were previously constructed for Botrytis resistance QTL mapping (Chapter 3; Fu et al. 2017). Similarly, QTL

The use of a candidate gene approach to arrive at Botrytis resistance in Gerbera hybrida
75
4
analyzes using the candidate gene markers added to the maps were repeated as described earlier (Chapter 3; Fu et al. 2017).
Allele identification of candidate genes
For promising candidate genes, which are co-located with previous detected QTLs and showing statistical difference in Botrytis scores between groups, allelic diversity was assessed among the four parents. To assess haplotype information for CGs in the parents, the existing transcriptome data (Chapter 2; Fu et al. 2016) were supplemented by Sanger sequencing to obtain longer and if possible full length gene sequence information. Primers for amplifying candidate gene fragments for Sanger sequencing were designed by Primer3 online. Fragments were amplified from genomic DNA. PCR conditions were 95°C for 30s, then 35 cycles of 30s at 95°C, 30s at annealing temperature (annealing temperature based on Tm of primer pair) and 1min at 72°C, followed by 10min at 72°C.
PCR products showing single bands and expected sizes were purified using the QIAquick PCR Purification Kit (Qiagen). Purified PCR products were checked on 1% agarose gels again to guarantee the quality and cloned into the pGEM®-T Easy Vector System I following the recommended instruction (Promega). Transformation of recombinant vector into E. coli DH5α™ competent cells (Invitrogen) was performed by 45 second heat-shock in a water bath at 42°C and chilling on ice for 5 min. To cells 1ml LB broth was added after which cell were incubated for 1h at 37°C. Of each transformation culture, 100uL were plated onto LB plates containing ampicillin (100 mg/mL) with 100µL IPTG (100mM) and 20µL X-Gal (50 mg/mL) on the surface. Plates were incubated overnight at 37°C and seven white single colonies (and one blue colony on each plate as control) were selected for colony PCR to quickly screen for recombinant clones based on fragment size. Confirmed white colonies were cultured overnight at 37°C with shaking in LB liquid medium including ampicillin (100 mg/mL). Plasmid DNA was isolated by QIAprep® Spin Miniprep Kit (Qiagen) for Sanger sequencing.
B. cinerea inoculation
B. cinerea (strain B05.10 provided by Dr. Jan van Kan, Wageningen University & Research) was grown for one week at 25°C in the dark on potato dextrose agar (PDA) medium after which conidia were transferred onto fresh PDA medium and grown until mycelia covered the whole Petri dish surface and sporulation started. Spores were collected by pouring 5 ml of 0.1% Tween 80 solution on each plate detaching all aerial mycelium and conidiophores from the agar by a glass rod. The spore suspension was filtered through three thin layers of cheesecloth and other 5 ml 0.1% Tween 80 solution was added to rinse the surface of the agar and remove any remaining spores. Spore concentration was calculated by Fuchs-Rosenthal Counting Chamber (0.2mm depth).
A concentration of 1×10⁷/ml spore suspension was prepared as stock and diluted with 3% potato dextrose to a working solution 5×10⁵/ml. Ray floret s from the four gerbera parents were sampled when the first circle of disk florets shows pollen development (stage 9 according to Helariutta et al. 1993 and Laitinen et al. 2007). The candidate genes expression analysis was only performed on ray florets due to the limited availability of flowers. To induce Botrytis defense-related gene expression ray florets were placed in plastic

Chapter 4
76
4
containers with wet filter paper, three 2µl-droplets spore suspension (one droplet for FP2 due to its relative small ray floret size) were inoculated on the upper face of each single ray floret after which containers were put in plastic bags to maintain a high humidity at room temperature. Inoculated ray florets were collected at different time points (0 hpi, 6 hpi, 12 hpi, 24 hpi also 36 hpi, 48 hpi, 72 hpi at initial experimental setup) whereas mock samples were taken at 24hpi only. Single ray florets (for FP2 three ray florets) were put in an Eppendorf tube with two metal balls frozen in liquid nitrogen and stored at -80 0C upon further gene expression analysis.
Candidate gene expression analysis on ray florets
For RNA isolation, infected ray florets were grinded to powder using a TissueLyser II (Qiagen) and RNA was extracted using Trizol (Life Technologies) according to the manufacturer’s protocol with modification (chloroform washing twice). After RNA extraction, the quality and quantity of RNA samples were checked on 1% agarose gel and by NanoDrop. After DNase treatment, 1µg RNA was used for cDNA synthesis according to the iScript™ cDNA Synthesis Kit (Bio-Rad). For Real time quantitative PCR, 10µl reaction mix was used, containing 2µl cDNA template (~50ng/µl), 5µl 2x iQ™ SYBR® Green supermix (Bio-Rad), 0.3µl forward and reverse primers (10µM) and 2.7μl Milli-Q water. Optimized RT-qPCR was initiated at 95°C for 3min, followed by 40 cycles of 15s at 95°C, 1min at 60°C, and one hold of 10s at 95°C, 5s at 65°C and increased to 95°C by 0.5°C for generating a final melting curve. The reference gene (GAPDH) was used in quantitative real time PCR (qRT-PCR) using the primer sequences as described by Deng et al. (2014). Recommended fragment size for SYBR green qRT-PCR is around 100bp, thus the primers for candidate genes expression analysis were the same used for LightScanner HRM analysis. Reference and candidate genes were always run together on the same 96-well plates with three biological replicates and three technical replicates.
Relative quantification method (Livak and Schmittgen 2001) was used to analyze data from real-time quantities PCR. The change in expression of candidate (target) gene was normalized to reference gene expression relative to reference group (sample at time point 0 in this experiment) and presented as fold change. The equation of this method is fold change = 2-ΔΔCT, where ΔΔCT=(CT,Target- CT,GAPDH)Time_X-(CT,Target- CT,GAPDH)Time_00.
Results
Selection of candidate genes and homologues of gerbera
A list of 71 genes was identified from literature as potential candidate genes for Botrytis resistance in gerbera (Suppl. Table S4-1). All these candidate genes are belonging to genes affecting cell wall composition, signal transduction or secondary metabolism. Most of the candidate genes with confirmed involvement in Botrytis resistance were derived from the well-studied model plant Arabidopsis, and also from two major host crops for Botrytis, grapevine and tomato. Some of the genes from the phenylpropanoid and flavonoid biosynthetic pathway from the Asteraceae family, like sunflower, Artemisia and gerbera itself, are also included in the CGs list as they are important for flavonoid phytoalexin accumulation during Botrytis infection.

The use of a candidate gene approach to arrive at Botrytis resistance in Gerbera hybrida
77
4
The corresponding homologous sequences of gerbera for all potential CGs sequences were searched in the Gerbera ESTs database (Chapter 2; Fu et al. 2016). At least one hit could be found for all CGs in the Gerbera ESTs, the contigs with the highest hit score, lowest e-value and highest identity percentage were identified as the homologous CG sequence (Suppl. Table S4-1). Over half of the identified homologs (42/71) were with an e-value < 1E-180 and the identities of most of the contigs (64/71) are above 50%. Frames showing the longest ORF were used for re-BLAST analysis. Identified gerbera CG homologs re-BLAST (blastp) against the NCBI database, showed best hits to coding sequences with even higher hit scores and identical annotations to the original query CG (Suppl. Table S4-1). In general, almost full length gerbera ORFs were identified based on the coding regions of other species.
Choice of primers for HRM
Primers were designed to flank a targeted SNP in the CG ORF region with expected PCR products sizes of 80-150 bp and only primers amplifying single band amplicons were chosen for further analysis (Suppl. Table S4-2). Parents as well as a number of randomly selected offspring were scanned on the Lightscanner to check the polymorphism by analysing the melting curve.
The four possible outcomes of HRM output in primer polymorphism detection in parental samples are illustrated in Fig. 4-1. In Fig. 4-1a (contig12863/ghPER21 gene); the PCR product size of CGs fragment was exactly as expected and the two parents as well as selected offspring can be clearly grouped via the HRM showing the presence of a single SNP marker. The PCR product size of ghPgD (contig28711, Fig. 4-1b) was as expected but the two parental and selected offspring melting curves overlaid indicating the absence of polymorphism. For contig28693/ghLOX gene (Fig. 4-1c), a single band was visible on the gel yet the size was higher than expected and the melting curve showed a swing line which indicated the presence of more than one SNP in this amplicon. In Fig. 4-1d (contig29198/ghDELLA gene), multiple bands (and also potential multiple polymorphic loci) existed that will not result in a clear grouping result for HRM scanning analysis. Only primer pairs resulting in clear grouping as is the situation in Fig. 4-1a were used for further HRM analysis.
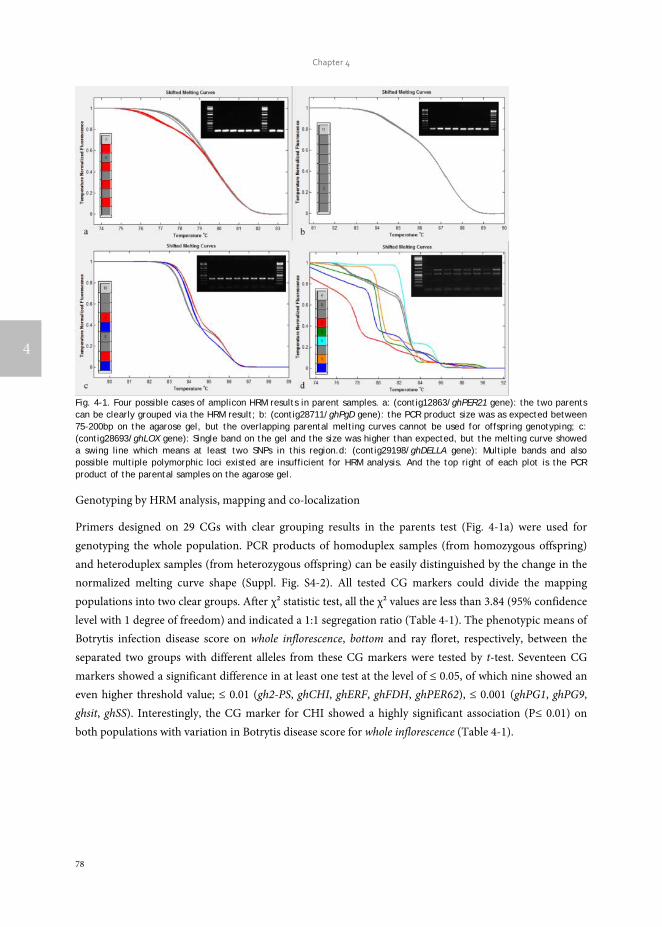
Chapter 4
78
4
Fig. 4-1. Four possible cases of amplicon HRM results in parent samples. a: (contig12863/ghPER21 gene): the two parents can be clearly grouped via the HRM result; b: (contig28711/ghPgD gene): the PCR product size was as expected between 75-200bp on the agarose gel, but the overlapping parental melting curves cannot be used for offspring genotyping; c: (contig28693/ghLOX gene): Single band on the gel and the size was higher than expected, but the melting curve showed a swing line which means at least two SNPs in this region.d: (contig29198/ghDELLA gene): Multiple bands and also possible multiple polymorphic loci existed are insufficient for HRM analysis. And the top right of each plot is the PCR product of the parental samples on the agarose gel.
Genotyping by HRM analysis, mapping and co-localization
Primers designed on 29 CGs with clear grouping results in the parents test (Fig. 4-1a) were used for genotyping the whole population. PCR products of homoduplex samples (from homozygous offspring) and heteroduplex samples (from heterozygous offspring) can be easily distinguished by the change in the normalized melting curve shape (Suppl. Fig. S4-2). All tested CG markers could divide the mapping populations into two clear groups. After χ² statistic test, all the χ² values are less than 3.84 (95% confidence level with 1 degree of freedom) and indicated a 1:1 segregation ratio (Table 4-1). The phenotypic means of Botrytis infection disease score on whole inflorescence, bottom and ray floret, respectively, between the separated two groups with different alleles from these CG markers were tested by t-test. Seventeen CG markers showed a significant difference in at least one test at the level of ≤ 0.05, of which nine showed an even higher threshold value; ≤ 0.01 (gh2-PS, ghCHI, ghERF, ghFDH, ghPER62), ≤ 0.001 (ghPG1, ghPG9, ghsit, ghSS). Interestingly, the CG marker for CHI showed a highly significant association (P≤ 0.01) on both populations with variation in Botrytis disease score for whole inflorescence (Table 4-1).

The use of a candidate gene approach to arrive at Botrytis resistance in Gerbera hybrida
79
4
Table 4-1 Overview of mapped candidate genes, χ² test and t-test results
Candidate gene hit CGs marker χ²(1:1) mapped
on
t-test of the two genotypic groups on
Bottom Ray Floret
Whole inflorescence
gh2-PS contig11873 2_PS_11873_814 0.73 FP1_23 0.0052 0.7792 0.0528
ghACS contig17688 ACS_17688_842 2.09 SP2_24 0.5025 0.2891 0.7043
ghAS contig1926 AS_1926_I2 0.39 SP1_08 0.4974 0.6818 0.4380
ghCHI contig22447 CHI_22447_421 0.08 FP2_23 0.1338 0.9597 0.0043
ghCHI contig22447 CHI_22447_421 0.49 SP1_23 0.0506 0.3098 0.0090
ghCHS1 contig29143 CHS_29143_1582 0.04 SP1_17 0.0723 0.9820 0.0389
ghcutin contig4918 cutin_4918_3081 3.06 SP2_02 0.0141 0.3986 0.2436
ghDND contig29068 DND_29068_911 2.10 FP2_04 0.4132 0.7622 0.4412
ghDND contig29068 DND_29068_911 0.62 SP2_04 0.2133 0.2612 0.0611
ghELP2 contig2398 ELP2_2398_1249 0.02 SP1_06 0.0174 0.3721 0.2071
ghERF contig11093 ERF_11093_229 0.93 FP2_09 0.0075 0.2194 0.0583
ghET contig14926 ET_14926_1910 0.00 FP1_16 0.3624 0.6401 0.2525
ghFDH contig12215 FDH_12215_1158 0.00 SP1_02 0.0041 0.9751 0.0491
ghGSL5 contig30332 GSL5_30332_2672 2.79 FP1_20 0.4063 0.7067 0.2516
ghLOX contig13375 LOX_13375_1313 0.10 SP1_12 0.1136 0.0120 0.0258
ghMPP3 contig15525 MPP3_15525_1055 0.82 SP2_01 0.7767 0.2504 0.7008
ghMYB contig11297 MYB_11297_481 0.17 FP2_22 0.1389 0.6366 0.4696
ghP450 contig25584 P450_25584_2562 2.43 SP2_02 0.4991 0.0699 0.7834
ghPER21 contig12863 PER21_12863_774 3.28 FP2_05 0.9363 0.6885 0.2686
ghPER21 contig12863 PER21_12863_774 0.26 SP2_05 0.8169 0.0114 0.6455
ghPER62 contig31925 PER62_31925_540 1.71 FP2_18 0.9971 0.0016 0.4303
ghPG1 contig15001 PG1_15001_1052 0.81 FP2_21 0.6880 0.0002 0.7800
ghPG1 contig15001 PG1_15001_1052 0.00 SP1_21 0.2836 0.6503 0.1400
ghPG2 contig1158 PG2_1158_857 0.08 FP2_18 0.1045 0.0214 0.5778
ghPG7 contig35500 PG7_35500_1285 0.07 SP1_06 0.2745 0.4141 0.8631
ghPG9 contig25150 PG9_25150_888 2.32 SP2_02 0.0003 0.7148 0.0236
ghPG10 contig11147 PG10_11147_3429 0.01 FP2_06 0.3194 0.1243 0.4550
ghPG10 contig11147 PG10_11147_5246 0.04 SP1_06 0.0473 0.2727 0.2633
ghPGIP1 contig17627 PGIP1_17627_1064 0.33 SP2_22 0.3155 0.3981 0.0322
ghPGIP2 contig20957 PGIP2_20957_910 0.13 FP2_08 0.8248 0.9677 0.7393
ghRD21 contig20206 RD21_20206_4286 0.47 FP1_10 0.9234 0.4332 0.6737
ghRD21 contig20206 RD21_20206_I2 0.04 SP1_10 0.0679 0.2106 0.1072
ghsit contig19807 sit_19807_6510 1.76 FP1_05 0.6503 0.0003 0.2911
ghsit contig19807 sit_19807_I2 0.08 FP1_05 0.2024 0.0017 0.3657
ghsit contig19807 sit_19807_6510 1.60 SP1_05 0.0134 0.0967 0.0835
ghSR1 contig1903 SR1_1903_2688 0.16 FP1_11 0.1517 0.2194 0.5784
ghSS contig5198 SS_5198_1668 0.80 FP2_16 0.9438 0.8962 0.6704
ghSS contig5198 SS_5198_1668 0.10 SP1_16 0.0009 0.3052 0.0119
* CG markers are named as: gene name _hit contig no._SNP position in the contig.

Chapter 4
80
4
All 29 candidate genes could be mapped to at least one of the linkage maps (Table 4-1), and seven candidate genes (ghCHI, ghDND, ghPER21, ghPG1, ghPG10, ghsit, and ghSS) could be mapped to linkage maps of both populations. Three CGs (ghsit, ghPG1 and ghCHI) mapped in previously detected QTLs regions (RBQRF2, RBQRF8 and RBQWI6; Suppl. Fig. S4-3a, b, c). CGs ghPG9 and ghcutin were mapped on the paternal linkage map SP2_02 close to markers WGC23656_151_S1F1 and WGC11243_647_S2F1. On maternal linkage map (SP1_01), QTL RBQB1 was located between these two markers (Suppl. Fig. S4-3d). Two CGs (ghPER62 and ghSS) co-localized with QTLs, RBQRF7, RBQB2 (Table 4-2 and Suppl. Fig. S4-3f, g).
Table 4-2 CGs mapped and co-localized in QTLs regions
CGs CGs marker Mapped inside QTL region Maps near to QTL region
ghCHI CHI_22447_421 RBQWI4/RBQWI6
ghPG1 PG1_15001_1052 RBQRF8
ghsit sit_19807_6510 RBQRF2
ghPG9 PG9_25150_888 RBQB1/RBQB8
ghcutin cutin_4918_3081
RBQB1 (2.6 cM)
ghPER62 PER62_31925_540
RBQRF7 (4.9 cM)
ghSS SS_5198_1668 RBQB2 (4.98 cM)
With the newly mapped CGs, we have conducted QTL mapping again (Suppl. Table S4-3). Compared with the previous QTL analysis (Chapter 3; Fu et al. 2017), a number of small differences were detected. Two new QTLs were detected, RBQB7 from SP1_06 ( LOD = 5.33) with the two CGs (ghPG7 and ghPG10) mapped (Suppl. Fig. S4-3e); and RBQB8 in SP2_02 was just above the GW threshold (LOD = 4.0) with the newly added CG marker (PG9_25150_888) from ghPG9, and it could be correlated with the previous QTL RBQB1 which was detected on the maternal map (SP1_02) at a similar position (Suppl. Fig. S4-3d); CG marker (PG1_15001_1052) from ghPG1 was mapped on linkage group FP2_21 in a 13 cM marker interval and re-analyzes of the QTL lead to a shift of the location of the maximum LOD score around 10cM to this locus. Variance explained by this QTL (RBQRF8) increased from 8.0% to 10.7%. Adding CG marker (from CG ghPER62) showed that the LOD score of the previous detected QTL RBQRF7 (4.09) was just a fraction below the GW threshold (4.1).
Allelic diversity of candidate gene
Using a single SNP marker, alleles having a positive contribution on the QTLs could only be identified from the parent in which the marker is polymorphic. Allelic diversity was assessed for the four parents of candidate genes showing significance below the 0.01 threshold level in the t-test between mean disease score of whole inflorescence, bottom and/or ray floret of the two allelic groups. As a diploid heterozygous crop, at most 8 haplotypes/alleles per gene can be expected in these four parents. In Fig. 4-2 (and see also Suppl. Fig. S4-4), specific haplotypes for each gene in each parent are represented by only indicating SNP positions. Allelic diversity ranged from at least 3 haplotypes (ghSS and ghERF) in the CGs loci of the four parents to at most 7 haplotypes (ghPG9). In all analyzed CGs, unique haplotype(s) which were not shared with other parents existed. Each of the parents had an unique haplotype combination at each CG locus. In three CGs (ghFDH, ghPER62, ghPG9), the unique haplotype contributed to the resistance effect. Two

The use of a candidate gene approach to arrive at Botrytis resistance in Gerbera hybrida
81
4
alleles from all ten analyzed CGs loci from parent FP1 are heterozygous, SP1 has nine heterozygous loci (except ghcutin) and FP2 eight heterozygous loci (except ghsit and ghcutin), while in SP2, only four loci contained two distinctive alleles in the CGs loci (ghERF, ghPER62, ghcutin, ghPG9).
on ORF 240 249 261 262 300 303 312 339 354 376 384 401 485 494 496 528
SP1 A A A C G T G T G A G A C A G C
G C G A T G A C A G A G T T A A
SP2 A A A C G T G T G A G A C A G C
G C G A T G A C A G A G T T A A
FP1 G C G A T G A C A G A G T T A A
A A A C G T G T G A G A C A G A
FP2 A A A C G T G T G A G A C A G C +
G C G A T G A C A G A G T T A A
Fig. 4-2 The alignment of alleles of ghERF (ethylene-responsive transcription factor, from contig11093). SNPs in the ORF of the gene are shown and 528 is the SNP used for the HRM.
More than half of the SNPs were present in the third base of the codon. Overall, 57% of the SNPs were synonymous SNPs whereas the other 43% were non-synonymous SNPs (nsSNP). Two alleles from ghERF, ghPER62, ghSS, and three alleles from ghcutin, ghPG9 encoded the same protein (Suppl. Fig. S4-4). Interestingly, a 36bp insertion–deletion (InDel) was found in the first intron of ghsit (Suppl. Fig. S4-4g), while a 1-bp InDel in the second exon region was found for an ghCHI allele which would lead to an early stop codon (also Suppl. Fig. S4-4f).
Expression of candidate genes
Expression levels of seven candidate genes which showed association with Botrytis disease score variation were analyzed on ray florets. In the initial experimental setup, inoculated ray florets were sampled for expression analysis at 0 hpi, 6 hpi, 12 hpi, 24 hpi, 36 hpi, 48 hpi and 72 hpi. Spores of Botrytis already germinated on ray florets 6 hpi (Suppl. Fig. S4-5). The initial stages of Botrytis infection resulted in necrotic lesions which were clearly visible on ray florets and then lesions expanded quickly from the initial necrotic lesions to the whole ray floret (Suppl. Fig. S4-5). Expression of gerbera house-keeping gene at later stages of infection (36 h, 48 h and 72 h after inoculation) was already absent because florets had become necrotic. So final expression analyzes were performed on ray florets at 0, 6, 12 and 24 hrs after inoculation, with a control sample with mock inoculation sampled after 24 hrs.
The expression levels of candidate genes are shown in Table 4-3, all seven CGs were expressed in SP1 and FP2. Expression of ghCHS1 and ghPER62 was not detected in SP2 and no expression of ghCHI, ghPG1 and ghPER62 was found in FP1. The expression pattern of studied CGs showed variation at different time points but with significant up-regulation after Botrytis infection. In general, gene expression levels reached their peak at 12h or 24 h after Botrytis inoculation. All CGs expression levels from the resistant parent FP2 (except ghPER21) were reached with a significant increase before or at 12hpi. There was no significant difference in gene expression between start time point 0h and 24h mock except for CG ghPER21 in SP2 and FP2. The expression of ghPER21 increased even without Botrytis inoculation.

Chapter 4
82
4
Table 4-3 The expression levels of CGs on ray florets of gerbera
CGs Parents 00hpi 06hpi 12hpi 24hpi 24hpi_mock
ghCHI
SP1 0.97±0.26c 0.75±0.31bc 2.39±0.78a 1.48±0.34b 1.04±0.25bc
SP2 1.3±0.59b 2.61±1.75b 2.59±1.28b 4.69±2.33a 1.38±0.63b
FP1 - - - - -
FP2 1.54±1.3b 1.68±1.13b 11.89±6.3a 1.49±0.83b 0.89±0.4b
ghCHS1
SP1 1.08±0.39b 1.6±0.35b 4.55±1.41a 3.77±2.51a 0.56±0.07b
SP2 - - - - -
FP1 1.08±0.47b 1.05±0.32b 20.07±4.38a - 1.49±0.89b
FP2 1.07±0.42b 0.46±0.17c 4.26±0.73a 0.89±0.17b 0.8±0.25bc
ghLOX
SP1 1.02±0.27c 1.25±0.11bc 2.15±0.17b 11.14±2.14a 0.48±0.1c
SP2 1.07±0.45b 1.23±0.26b 1.92±0.4b 7.72±6.94a 0.65±0.14b
FP1 1±0.11c 4.83±1.35b 15.38±3.55a - -
FP2 1.05±0.41c 2.45±0.32b 7.2±2.39a 1.38±0.65c 0.47±0.21c
ghPER21
SP1 1.03±0.26b 1.86±1.27a 1.26±0.13ab 0.82±0.58b 1.53±0.42ab
SP2 1.06±0.38c 0.32±0.19d 0.39±0.22d 5.01±0.82a 3.95±0.75b
FP1 1.12±0.6bc 0.75±0.23c 3.36±2.14a - 1.93±0.63b
FP2 1.24±0.85bc 1.04±0.79c 1.85±1.43bc 13.44±7.96a 5.2±3.41b
ghPER62
SP1 1.15±0.59b 1.25±1.13b 1.59±0.71b 25.49±12.72a 0.24±0.06b
SP2 - - - - -
FP1 - - - - -
FP2 1.82±2.15b 2.24±1.66b 20.59±15.26a 2.3±1.99b 0.58±0.34b
ghsit
SP1 0.97±0.22b 0.73±0.21b 1.32±0.36b 2.8±1.64a 0.52±0.04b
SP2 1.15±0.68c 2.17±0.85b 1.88±0.57bc 4.03±1.68a 0.97±0.23c
FP1 1.02±0.24b 2.51±0.32b 9.64±4.12a - 1.42±0.2b
FP2 1.02±0.22c 4.92±2.06b 17.44±5.63a 2.46±1.14c 0.93±0.22c
ghPG1
SP1 1.63±0.5c 3.98±2.1b 13.85±0.95a 4.3±0.22b 1.96±0.78bc
SP2 1.12±0.49b 1.92±1.41b 2.19±2.31b 5.6±2.69a 3.16±3.22b
FP1 - - - - -
FP2 1.24±0.51c 4.61±4.23b 6.24±7.56a 3.12±1.61b 1.31±0.52c
Note: The expression levels of different timepoints were performed by pairwise comparisons, and the letters a, b, c, etc indicate the LSD test performance (P<0.05).
Discussion
Candidate gene genotyping by HRM
In this study, we selected putative candidate genes involved in plant resistance against Botrytis from literature and screened our gerbera ESTs database (Chapter 2; Fu et al. 2016) for homologous genes. After alignment of the homologous gene sequences found among the parents and selection of suitable SNP markers, CGs were mapped on the genetic maps of two populations used for QTL mapping previously (Chapter 3; Fu et al. 2017).

The use of a candidate gene approach to arrive at Botrytis resistance in Gerbera hybrida
83
4
For good HRM results several criteria need to be satisfied in order to generate amplicons with just single SNPs producing easy to distinguish single-base differences on the melting curve. In such cases, all homozygotes melt in a single transition and heterozygotes produce a deviating melting curve arising from the integrated melting curves of two homoduplexes and two heteroduplexes (Gundry et al. 2003; Reed and Wittwer 2004). First, PCR conditions must be optimized and primers checked to amplify a single PCR fragment, as non-specific bands can significantly reduce HRM performance (Lehmensiek et al. 2008). For 14 candidate gene primers (12 in both populations and 2 in one population) multiple bands after amplification have been found. It might be mainly because these genes, such as DELLA and CHS, belong to gene families with homologues genes existing in the genome. In such cases the melting curve represents a combination of individual melting curves of homologous genes which cannot be used for genotyping.
Another criterion is the amplicon size. Product size should be below 300 bp and preferably much smaller to keep a high sensitivity and specificity to detect the possible heterozygotes by HRM without error (Reed and Wittwer 2004). De Koeyer et al. (2010) suggested that produced amplicons within the size range from 50 to 400 bp are suitable for HRM analyzes in potato. However, when product length increases, the difference between homozygote and heterozygote curves will become smaller making SNP calling more difficult (Reed and Wittwer 2004). Moreover, gerbera is a highly heterozygous ornamental crop and if the target sequence is larger the potential for inclusion of other unexpected SNPs is increasing. Amplicons with several SNPs always result in a complex situation with several melting curves for analysis that do not render clear groups. Except only the CG marker (CHI_22447_421) from ghCHI, multiple SNPs all located in one fragment of the parental allele and the amplified allelic sequence variation were separated by HRM analysis. According to our previous study (Chapter 2; Fu et al. 2016), the average number of polymorphic SNP sites within each of the four parental ESTs varied from 3.7 to 4.8 SNPs per kb. That means there is at least one SNP in every 200~250 bp in each parental genotype. Thus, we produced small fragments to avoid additional SNPs. Furthermore, our primer design was based on cDNA sequence, if longer size PCR amplicons are selected without having information on gene structure, there will be a higher chance that amplicons span an intron region where more SNPs exist. Most primers were designed taking into account intron exon structure from the homologous gene coding sequence aiming to flank a single SNP as detected in the Gerbera EST database. We also successfully mapped three CGs which primers (AS_1926_I2, sit_19807_I2, RD21_20206_I2) were designed flanking a ~100bp-size intron region that was known to contain a SNP from whole genome Sanger sequencing. Sometimes, amplicons with two nearby SNPs can be distinguished in groups, but in most cases this leads to unclear grouping.
Mapping of candidate genes and the co-localization with QTLs
In total, we designed 89 primer pairs for 71 CGs, and 29 CGs with a clear 1:1 segregation in the offspring were mapped in at least one population. The percentage of genes successful mapped is 41%, yet other primers dropped out mainly because of additional SNPs and multiple bands. Additional SNPs from included intron regions can only be excluded if more genomic information from the focal or other species is obtained to avoid designing primers spanning an intron region. Primers yielding multiple bands due to the gene belonging to a gene family might focus on the 5’- or 3’- ends of the gene, since these regions might be more specific. Through the recently developed amplicon sequencing in combination with NGS

Chapter 4
84
4
sequencing (e.g. Ion AmpliSeq™) problems with additional SNPs and gene family membership may be overcome without the relative high costs for conventional sequencing.
Out of the 29 mapped CGs, several genes are from the same gene family, for example, ghCHS1 (chalcone synthase gene), ghSS (stilbene synthase gene), gh2-PS (2-pyrone synthase gene); ghPER21 (peroxidase gene) and ghPER62; and several polygalacturonase genes (ghPG1, ghPG2, ghPG7, ghPG9, ghPG10). Those genes were mapped on different linkage groups, except PG7 and PG10 which were mapped at the same linkage group close to each other (1cM apart).
Using the candidate gene approach for identifying Botrytis resistance genes in gerbera is effective. Several mapped candidate gene alleles are showing significantly difference in resistance performance of whole inflorescence, bottom and ray floret in the two populations, and several CGs were found mapped in a QTL region or co-localized with the identified QTLs. Few CGs showed allelic variation that gave a high significance level (P<0.01) in the t-test, but couldn’t be detected as a QTL. The underestimated QTLs might be the environmental conditions which could influence the power of detecting QTLs or interaction of alleles from different genes and parental alleles.
Possible mechanisms for Botrytis resistance in gerbera
Several candidate genes with statistical associations with the whole inflorescence, bottom and ray floret tests might be involved in Botrytis resistance under multiple mechanisms. Plant cuticle and cell wall are constituted as the first protective barriers to defense Botrytis invasion (Curvers et al. 2010). The function of the cuticle against Botrytis has been studied showing that genes involved in cuticle synthesis have a strong effect on botrytis susceptibility (Chassot et al. 2007; Bessire et al.2007). Lignin is crucial for structural integrity of the cell wall and peroxidase is a key enzyme in biosynthesis of lignin (Boerjan et al. 2003). Botrytis resistance might be associated with increases in peroxidase activity (Lurie et al. 1997). B. cinerea secretes polygalacturonases (PGs) to decompose plant cell walls (Ferrari et al. 2003) and there are at least 6 genes in Botrytis encoding PGs (van Kan 2006). However, fungal PGs can be inhibited by plant polygalacturonase-inhibiting proteins (PGIPs) whereas these proteins may not inhibit a plant’s own endo-PGs. Blanco-Ulate et al. (2014) suggested that B. cinerea might be able to manipulate plants to produce endo-PGs in order to degrade plant cell walls as they will not be inhibited by PGIP. From our studies, two of the gerbera endo-PGs (ghPG1 and ghPG9) were found associated with Botrytis resistance on gerbera ray floret and bottom test respectively showing high statistical significance in the disease tests. After QTL mapping, the two candidate loci were detected as QTLs and explained 10.7% and 6.1% of the phenotypic variation. However, no statistical association was found between the two ghPGIP genes with phenotypic variation or detected QTL yet. We assume B. cinerea might indeed be manipulating endo-PGs in gerbera plants to take the advantage of this in the infection process.
Plant hormones are considered to play an essential role in defense against Botrytis, especially the ET and JA pathways. The ethylene responsive transcription factor (ERF) family encode proteins in disease resistance regulation pathways (Gutterson and Reuber 2004) and their binding target sequence is the GCC box which is found in several promoters of pathogen related and ET- or JA-induced genes. Overexpression of ERF1 in Arabidopsis is sufficient to enhance tolerance to B. cinerea (Berrocal-Lobo et al.

The use of a candidate gene approach to arrive at Botrytis resistance in Gerbera hybrida
85
4
2002). Also in our study, the ghERF is related to the phenotypic variation in the bottom test (P = 0.0075) and could be a promising candidate locus. ABA signalling is also believed to play an important role to B. cinerea resistance from the studies on the interaction between ABA-deficient tomato mutant sitiens and B. cinerea (Asselbergh et al. 2007; Curvers et al. 2010). ABA signalling regulated the cuticle and pectin composition which affect Botrytis resistance. The last step of ABA biosynthesis (ABA-aldehyde oxidation) in sitiens is blocked and leads to accumulation of trans-ABA instead of ABA (Rock et al. 1991) and sitiens is identified as a member of the ABA-aldehyde oxidase genes. The difference of sitiens wild type allele (sit+) and mutant allele (sit) in tomato is in the deletion of intron 1 and division of exon 2 (Harrison et al. 2011). Furthermore, considering that gerbera gray mold infection mainly happens in post-harvest when plant are experiencing senescence whereas ABA level is strongly related to senescence, it is likely that the reduced ABA level contributes to Botrytis resistance in gerbera. In our study, the two groups sorted by gerbera sit homologous gene allelic variation showed significant difference in the ray floret test (at p<0.001 level) and mapped in the QTL interval of RBQRF2. Interestedly, like the tomato sit allele, we also found a 36 bp InDel in intron 1 of the four gerbera parental sit alleles as well as quite a lot of these similar alleles in other gerbera genotypes (date not shown). Different structures in the first intron have been identified to have an effect on human genes (Bornstein et al. 1987) or having a promoter-like function in maize (Salgueiro et al. 2000). Therefore, we assume the polymorphic sequence in the intron 1 may affect the gene function, but this needs further confirmation.
Phenylpropanoid compounds are natural secondary products which are derived from the general phenylpropanoid pathway and the consecutive flavonoid pathway. These derivatives, like anthocyanins, are known for the origin of flower pigmentation (Winkel-Shirley 2001) but other derivates like isoflavonoid phytoalexins are active in plant defense (Dixon et al. 2002). Enzymes in the phenylpropanoid/flavonoid pathway have been well studied (Ainasoja 2008; Deng et al. 2014; Elomaa et al. 1993; Helariutta et al. 1995) in some crops and include phenylalanine ammonia-lyase (PAL), chalcone synthase (CHS), chalcone isomerase (CHI), dihydroflavonol reductase (DFR), flavanone 3-hydroxylase (F3H) on the main phenylpropanoid pathway, and 2-pyrone synthase (2-PS) and stilbene synthase (SS) on the branch for flavonoid production. Several of these metabolites were confirmed to be involved in Botrytis resistance (Dixon et al. 2002; Koskela et al. 2011; Laquitaine et al. 2006) or their expression was enhanced by Botrytis infestation (Blanco-Ulate et al. 2015). Tomato with increased anthocyanin accumulation lead to an extended shelf life and is less susceptible to B. cinerea (Bassolino et al. 2013). Our study confirms that for a number of genes they might play a similar role in botrytis defense in gerbera.
The variation of inflorescence colors in commercial gerbera cultivars is a result of the interaction of carotenoid and flavonoid pigments which are all under genetic control (Tyrach and Horn 1997). In gerbera, several CHS have been confirmed to be involved with flavonoid and anthocyanin synthesis (Ainasoja 2008; Deng et al. 2014; Elomaa et al. 1993; Helariutta et al. 1995). In our study, CG marker SS_5198_1668, the homologous sequence of stilbene synthase from grapevine, is found to be co-localized with the bottom test QTL RBQB2. Alignment of the ORF region of this contig5198 with the GCHS4 (AM906210.1), a gerbera chalcone synthase gene showed that the two sequences are identical. Deng et al. (2014) found that GCHS4 is highly expressed in carpels. The bottom test is in accordance with ‘heart rot’,

Chapter 4
86
4
which is describing the disc florets infection by Botrytis. Interestingly, the disk florets color of SP1 which contributes to the QTL is black, while the other three parents have green/yellowish disk florets. Therefore, we assume that differences in disc floret color might be connected with the ‘heart rot’ in gerbera and is probably related to the expression of the ghSS gene.
Another key enzyme in flavonoid biosynthesis pathway, chalcone isomerase (CHI) catalyzes chalcones into their corresponding flavonones (Mehdy and Lamb 1987) and is considered the rate-limiting enzyme of flavonoid biosynthesis during tomato fruit development (Muir et al. 2001). A China aster (Callistephus chinensis) mutant with two recessive alleles deficient in chalcone isomerase activity caused an accumulation of chalcone and a completely blocked anthocyanin synthesis, but in wild-type plants, no chalcone was detected and high isomerase activity increased the amounts of downstream products, like flavones, flavonols, and anthocyanins (Kuhn et al. 1978). Besides the differences caused by genetic variation, chalcone isomerase is regulated by several biotic and abiotic stresses and CHI expression was strongly induced during Colletotrichum lindemuthianum (a fungal bean pathogen) infection (Mehdy and Lamb 1987). The polymorphisms of ghCHI in the two gerbera populations are associated with whole inflorescence test and the ghCHI gene might be the causal gene underlying the QTLs which were identified in the F population (RBQWI4, RBQWI6). After the Botrytis inoculation, ghCHI expression in SP1, SP2 and FP2 increased but no ghCHI expression was detected in FP1. Yellow-pigmented carnation, cyclamen and antirrhinum were all identified as due to the absence or reduction of CHI activity (Forkmann and Dangelmayr 1980; Ono et al. 2006; Takamura et al. 1995). Considering that parent FP1 is yellow colored, it might also have lost its CHI activity. Interestingly, we found a SNP deletion in the two ghCHI alleles of FP1. The loss-of-function allele might decrease the accumulation of flavonoid secondary metabolites which contribute to Botrytis resistance in gerbera.
Allelic variation and expression of the candidate genes
Candidate genes allelic diversity was conducted mainly on genes co-localized with detected QTLs and statistically correlated with phenotypic variation. The sequence polymorphisms of these selected CGs offer a glimpse of the heterozygosity of gerbera. Although only two species are considered to be involved in the origin of modern gerbera cultivars with a possible bottleneck at the moment of hybridisation (Hansen 1999), genetic diversity is rather high in gerbera germplasm. The SNP density in the specific genes involved in Botrytis resistance varies from 5.7 to 27.2 SNPs/kb which is higher than the average SNP density identified within the four parental overall ESTs (from 3.7 ~ 4.8 SNPs/kb) (Chapter 2; Fu et al. 2016); or in eleven safflower (Carthamus tinctorius) individuals in which SNP density is 10.5 SNP/kb in the exons and introns of 7 genes (Chapman and Burke 2007). We mainly looked at the SNPs in exon regions and more variation would be expected if the upstream and downstream region of the gene (e.g. 3'-UTR, 5'-UTR) and also intron sequences are all taken into consideration.
Multiple alleles existed at the candidate loci of the (four) parental genotypes and all genotypes are unique. Acquaah (2012) implied that for the improvement of cross-pollinated species breeding has to focus on increasing the frequency of favorable alleles. QTL analysis from bi-parental populations of gerbera in our previous study (Chapter 3; Fu et al. 2017) only indicates the favorable segregating alleles present in our

The use of a candidate gene approach to arrive at Botrytis resistance in Gerbera hybrida
87
4
populations. Considering the heterozygous and heterogeneous in each genotype, it could be a practicable start to screen possible alleles focusing on these CGs in a broader gene pool and linking these to botrytis resistance.
The upregulation of expression levels of the CGs upon Botrytis infection, given the function of these genes in other species, is a clear implication that these CGs are related with Botrytis resistance in gerbera. Tracking the Botrytis infection process on gerbera ray florets of parents till 72 hpi, we found all the ray florets were infected eventually while the speed of disease development varied. Few candidate gene expressions were not detected in SP2 and FP1 and that might be because of the genetic variation resulting in no expression or other genes playing a role in these two genotypes. All the studied CGs expressed in FP2 and the highest level of gene expression were at or before 12 hpi which was in line with this genotype FP2 having a relative high resistance to Botrytis in ray florets. A quick response of disease-related genes reaching the highest expression level as early as possible seems important to resist the attack of Botrytis.
The candidate gene approach as used in this study in gerbera, for which crop no genome sequence is available, can efficiently pinpoint a number of potential causal genes. Whereas using QTL regions in outcrossing crops possess practical problems in the implementation for MAS, finding causal genes involved in a trait would be a major step and can also help in understanding the molecular interactions between Botrytis and gerbera.
Acknowledgments
We are thankful for the support from the Foundation Technological Top Institute Green Genetics (3CFL030RP).

Chapter 4
88
4
Supplementary Tables and Figures
Table S4-1 The information of candidate genes for Botrytis resistance and blasted homologues in gerbera
Des
crip
tion
Scor
e
(Bit
)
Que
ry
cove
rE-
valu
eId
enti
ties
Acce
ssio
n
2-PS
2-py
rone
syn
thas
eC
AA86
219.
2G
erbe
ra h
ybri
da40
2co
ntig
1187
381
70
99%
402
2-py
rone
syn
thas
e, 2
-PS,
817
100%
099
%P4
8391
.2
AC
SAC
C s
ynth
ase
AEE8
2992
.1A
rabi
dops
is t
hali
ana
495
cont
ig17
688
658
068
%48
1pu
tati
ve A
CC
syn
thas
e 1
85
599
%0
84%
AAP1
4019
.1
AF
plan
t de
fens
inN
P_19
9255
.1A
rabi
dops
is t
hali
ana
80co
ntig
2900
056
.62.
00E-
1052
%18
3D
NA/
RNA
helic
ase,
ATP
-de
34
298
%2.
00E-
107
90%
KVI0
4017
.1
AIR
12au
xin-
indu
ced
in r
oot
cult
ures
p
NP_
5663
06.3
Ara
bido
psis
tha
lian
a27
3co
ntig
1278
169
1.00
E-47
53%
387
PRED
ICTE
D:
cyto
chro
me
54
494
%0
68%
XP_
0110
8963
1.1
AO
Sal
lene
oxi
de s
ynth
ase
AED
9484
2.1
Ara
bido
psis
tha
lian
a51
8co
ntig
2875
360
20
62%
479
alle
ne o
xide
syn
thas
e [A
rt
746
97%
076
%AD
Z240
00.1
AS
anth
rani
late
syn
thas
e co
mpo
ne
AED
9091
6.1
Ara
bido
psis
tha
lian
a62
4co
ntig
1926
806
071
%59
7an
thra
nila
te s
ynth
ase
alp
10
2297
%0
85%
OIT
0682
9.1
BIK1
Botr
ytis
-ind
uced
kin
ase
NP_
1814
96.1
Ara
bido
psis
tha
lian
a39
5co
ntig
1433
749
61.
00E-
170
66%
402
prot
ein
kina
se a
pk1b
, ch
l
66
010
0%0
80%
OIT
0116
1.1
BOS
puta
tive
tra
nscr
ipti
on f
acto
r MN
P_18
7301
.1A
rabi
dops
is t
hali
ana
323
cont
ig35
6226
71.
00E-
8556
%30
8PR
EDIC
TED
: tr
ansc
ript
ion
39
697
%5.
00E-
136
66%
XP_
0110
2794
4.1
bre1
botr
ytis
-res
ista
nt 1
NP_
1820
22.2
Ara
bido
psis
tha
lian
a87
8co
ntig
1562
182
10
52%
878
PRED
ICTE
D:
E3 u
biqu
itin
-
1177
99%
067
%X
P_01
0661
359.
1
cel1
endo
-1,4
-bet
a-gl
ucan
ase
NP_
0012
3486
2.1
Sola
num
lyc
oper
sicu
m48
9co
ntig
1354
178
20
83%
501
Endo
gluc
anas
e 8
[Mor
us n
828
93%
085
%X
P_01
0101
981.
1
cel2
endo
-1,4
-bet
a-gl
ucan
ase
NP_
0012
3486
7.1
Sola
num
lyc
oper
sicu
m50
1co
ntig
5926
650
068
%50
5en
dogl
ucan
ase
[Nic
otia
na 70
098
%0
67%
OIT
3321
1.1
CH
IC
halc
one-
flavo
none
isom
eras
eQ
4266
3.1
Cal
list
ephu
s ch
inen
sis
237
cont
ig49
2359
70
75%
222
Cha
lcon
e is
omer
ase
[Sau
s
369
99%
6.00
E-12
878
%Q
8LKP
9.1
CH
IC
halc
one
isom
eras
eN
P_00
1234
421.
1So
lanu
m l
ycop
ersi
cum
262
cont
ig22
447
270
1.00
E-57
64%
220
chal
cone
isom
eras
e [C
am
249
87%
2.00
E-80
65%
AHB3
2112
.1
CH
S3ch
alco
ne s
ynth
ase
CAA
8621
8.1
Ger
bera
hyb
rida
398
cont
ig13
3272
90
89%
402
Cha
lcon
e sy
ntha
se 3
[G
er
832
100%
099
%P4
8392
.1
CH
S1ch
alco
ne s
ynth
ase
CAA
8621
8.1
Ger
bera
hyb
rida
398
cont
ig29
143
517
010
0%25
9C
halc
one
synt
hase
1 [
Ger
53
110
0%0
100%
P483
90.1
cuti
ncu
tin
bios
ynth
esis
; lo
ng-c
hain
a
N
P_17
5368
.2A
rabi
dops
is t
hali
ana
665
cont
ig49
1893
60
68%
660
long
cha
in a
cyl-c
oa s
ynth
11
1099
%0
79%
OIT
0731
2.1
DEL
LAD
ELLA
pro
tein
RG
AAE
C05
469.
1A
rabi
dops
is t
hali
ana
587
cont
ig29
198
687
064
%56
2D
ELLA
1 [
Lact
uca
sati
va]1
014
99%
090
%BA
G71
200.
1
DN
Dcy
clic
nuc
leot
ide-
gate
d io
n ch
a
NP_
1970
45.1
Ara
bido
psis
tha
lian
a72
6co
ntig
2906
895
20
74%
699
cycl
ic n
ucle
otid
e ga
ted
io
1250
97%
090
%AI
T397
58.1
EDR3
dyna
min
-rel
ated
pro
tein
1E
NP_
5670
94.1
Ara
bido
psis
tha
lian
a62
3co
ntig
2401
310
130
80%
644
dyna
min
-rel
ated
pro
tein
10
9599
%0
83%
OIT
3924
7.1
EIN
2et
hyle
ne s
igna
l tra
nsdu
ctio
n co
NP_
1959
48.1
Ara
bido
psis
tha
lian
a12
94co
ntig
2555
793
20
45%
1184
ethy
lene
sig
nalin
g pr
otei
n
1171
97%
050
%N
P_00
1234
518.
1
ELP2
elon
gato
r su
buni
t 2
NP_
1753
77.2
Ara
bido
psis
tha
lian
a83
8co
ntig
2398
1092
065
%83
5el
onga
tor
com
plex
pro
tei
12
6699
%0
72%
OIS
9728
0.1
ERF
ethy
lene
-res
pons
ive
tran
scri
pt
AED
9548
7.1
Ara
bido
psis
tha
lian
a24
3co
ntig
1843
017
68.
00E-
5355
%22
9AP
2/ER
F do
mai
n-co
ntai
ni
370
99%
3.00
E-12
879
%KV
H91
971.
1
ERF
ethy
lene
-res
pons
ive
tran
scri
pt
AEE7
6738
.1A
rabi
dops
is t
hali
ana
218
cont
ig11
093
186
2.00
E-57
57%
196
AP2-
ERF
tran
scri
ptio
n fa
c
24
194
%1.
00E-
7870
%AF
A360
63.1
ETet
hyle
ne-i
nsen
siti
ve p
rote
inAA
R086
78.1
Petu
nia
x hy
brid
a13
10co
ntig
1492
677
70
46%
865
Ethy
lene
-ins
ensi
tive
2 [
Cy
12
5598
%0
71%
KVH
9391
7.1
EXLA
2ex
pans
in-li
ke A
2N
P_19
5553
.1A
rabi
dops
is t
hali
ana
265
cont
ig14
980
313
2.00
E-10
567
%26
0PR
EDIC
TED
: ex
pans
in-li
ke
404
95%
6.00
E-14
174
%X
P_00
2534
094.
1
EXP1
expa
nsin
1 p
rote
inAA
Q12
264.
1So
lanu
m l
ycop
ersi
cum
261
cont
ig12
313
423
2.00
E-14
680
%28
4PR
EDIC
TED
: ex
pans
in-A
4
456
91%
5.00
E-16
184
%X
P_00
8384
848.
1
FDH
fidd
lehe
ad p
rote
in;
3-ke
toac
yl-
AAF7
3973
.1A
rabi
dops
is t
hali
ana
550
cont
ig12
215
878
076
%55
4hy
poth
etic
al p
rote
in C
crd
1059
100%
092
%KV
H88
528.
1
GD
SLG
DSL
-like
Lip
ase/
Acyl
hydr
olas
e
NP_
1947
43.1
Ara
bido
psis
tha
lian
a34
8co
ntig
1179
526
53.
00E-
8345
%36
0Li
pase
, G
DSL
[C
ynar
a ca
r
47
998
%6.
00E-
167
65%
KVI0
0927
.1
GLK
1tr
ansc
ript
ion
acti
vato
r G
olde
n2
NP_
5654
76.1
Ara
bido
psis
tha
lian
a42
0co
ntig
1514
523
73.
00E-
7146
%41
1tr
ansc
ript
ion
acti
vato
r g
429
100%
5.00
E-14
558
%O
IT00
132.
1
GSL
5 ca
llose
syn
thas
e 12
NP_
1922
64.1
Ara
bido
psis
tha
lian
a17
80co
ntig
3033
225
650
70%
1756
callo
se s
ynth
ase
12 [
Nic
o
2806
99%
075
%O
IT39
115.
1
GST
1gl
utat
hion
e S-
tran
sfer
ase
AEE2
7498
.1A
rabi
dops
is t
hali
ana
208
cont
ig17
531
149
9.00
E-44
53%
160
Glu
tath
ione
S-t
rans
fera
se
53
510
0%2.
00E-
6968
%KV
I124
66.1
LOX
lipox
ygen
ase
2AG
O03
786.
1Ta
nace
tum
cin
erar
iifol
i899
cont
ig28
693
1318
072
%90
1Li
pase
/lip
ooxy
gena
se,
PL
25
7510
0%0
78%
KVH
9090
0.1
LOX
lipox
ygen
ase
AGO
0378
5.1
Tana
cetu
m c
iner
ariif
oli9
07co
ntig
1337
514
840
82%
920
lipox
ygen
ase
1 [T
anac
etu
15
5010
0%0
82%
AGO
0378
5.1
LOX
lipox
ygen
ase
2AA
A327
49.1
Ara
bido
psis
tha
lian
a89
6co
ntig
4808
1011
059
%82
9Li
pase
/lip
ooxy
gena
se,
PL
13
6910
0%0
78%
KVI0
0262
.1
MKP
2M
AP k
inas
e ph
osph
ate
2N
P_85
0522
.1A
rabi
dops
is t
hali
ana
167
cont
ig42
718
14.
00E-
5559
%17
9D
ual s
peci
fici
ty p
hosp
hat
306
92%
1.00
E-10
488
%KV
H88
866.
1
MYB
46tr
ansc
ript
ion
fact
or M
YB4
6AE
D91
824.
1A
rabi
dops
is t
hali
ana
280
cont
ig11
297
211
2.00
E-63
90%
330
MY
B tr
ansc
ript
iona
l fac
to
332
100%
5.00
E-11
054
%BA
R455
70.1
OPR
12-o
xoph
ytod
ieno
ate
redu
ctas
AEE3
5875
.1A
rabi
dops
is t
hali
ana
372
cont
ig19
660
80
79%
378
PRED
ICTE
D:
puta
tive
12-
o
65
195
%0
84%
XP_
0172
3779
4.1
ORF
siz
e
in c
onti
g
BLAS
T ba
ckC
andi
date
gene
Func
tion
Acce
ssio
nfr
omam
ino
acid
shi
tSc
ore
(Bit
)E-
valu
eId
enti
ties

The use of a candidate gene approach to arrive at Botrytis resistance in Gerbera hybrida
89
4
Table S4-1 (continued)
Des
crip
tion
Scor
e
(Bit
)
Que
ry
cove
rE-
valu
eId
enti
ties
Acce
ssio
n
OPR
312
-Oxo
phyt
odie
noat
e re
duct
as
N
P_00
1233
873.
1So
lanu
m l
ycop
ersi
cum
396
cont
ig12
803
639
076
%39
4ar
tem
isin
ic a
ldeh
yde
redu
720
99%
087
%BA
U61
367.
1
P450
cyto
chro
me
P450
red
ucta
seAF
O64
618.
1A
rtem
isia
ann
ua70
4co
ntig
1511
711
170
85%
709
cyto
chro
me
P450
red
ucta
1243
100%
086
%AF
O64
618.
1
P450
cyto
chro
me
P450
mon
o-ox
ygen
ADO
1618
2.1
Art
emis
ia a
nnua
515
cont
ig80
9167
40
67%
378
cyto
chro
me
P450
mon
o-o
512
98%
1.00
E-17
767
%AD
O16
182.
1
PAD
auxi
n si
gnal
ing
F-bo
x 2
NP_
5668
00.1
Ara
bido
psis
tha
lian
a57
5co
ntig
1228
268
50
59%
574
PRED
ICTE
D:
prot
ein
TRAN
98
199
%0
81%
XP_
0110
8249
6.1
PAL
cyto
chro
me
P450
red
ucta
seAF
O64
618.
1A
rtem
isia
ann
ua70
4co
ntig
2558
411
220
83%
711
cyto
chro
me
P450
red
ucta
1225
100%
083
%AF
O64
618.
1
PAL
phen
ylal
anin
e am
mon
ia-ly
ase
1N
P_18
1241
.1A
rabi
dops
is t
hali
ana
725
cont
ig10
623
1135
085
%61
9ph
enyl
alan
ine
amm
onia
-lya
1205
99%
093
%AA
L552
42.1
PDF1
.2et
hyle
ne-
and
jasm
onat
e-re
spo
N
P_19
9255
Ara
bido
psis
tha
lian
a80
cont
ig13
068
56.2
8.00
E-11
52%
123
defe
nsin
[H
elia
nthu
s an
nu14
390
%4.
00E-
4274
%AA
M27
914.
1
PER2
1Pe
roxi
dase
21
Q42
580
Ara
bido
psis
tha
lian
a32
7co
ntig
1286
344
91.
00E-
153
66%
324
PRED
ICTE
D:
pero
xida
se 2
503
99%
1.00
E-17
772
%X
P_00
7027
286.
1
PER6
2Pe
roxi
dase
62
Q9F
KA4
Ara
bido
psis
tha
lian
a31
9co
ntig
3192
532
11.
00E-
106
51%
315
PRED
ICTE
D:
pero
xida
se 2
472
95%
9.00
E-16
674
%X
P_01
2078
787.
1
PFT1
poly
mer
ase
II t
rans
crip
tion
sub
N
P_17
3925
.3A
rabi
dops
is t
hali
ana
836
cont
ig12
433
714
059
%76
8Ph
ytoc
hrom
e an
d flo
wer
in
948
89%
071
%EO
Y02
123.
1
PG1
poly
gala
ctur
onas
e 2
NP_
0011
8536
1.1
Ara
bido
psis
tha
lian
a62
6co
ntig
1500
164
20
58%
622
poly
gala
ctur
onas
e 1
beta
812
99%
065
%O
IT26
928.
1
PG10
poly
gala
ctur
onas
e 1
AEE3
3681
.1A
rabi
dops
is t
hali
ana
624
cont
ig11
147
704
063
%63
1po
lyga
lact
uron
ase-
1 no
n-
87
296
%0
68%
OIS
9602
1.1
PG2
poly
gala
ctur
onas
eBA
A894
76.1
Sali
x gi
lgia
na39
3co
ntig
1158
380
4.00
E-12
649
%41
0Po
lyga
lact
uron
ase
[The
ob
429
96%
5.00
E-14
653
%EO
X93
416.
1
PG7
poly
gala
ctur
onas
eN
P_00
1234
256.
1So
lanu
m l
ycop
ersi
cum
452
cont
ig35
500
375
5.00
E-12
450
%45
0PR
EDIC
TED
: pr
obab
le p
oly
67
810
0%0
69%
XP_
0120
8541
2.1
PG9
poly
gala
ctur
onas
e 3
XP_
0028
8466
8.1
Ara
bido
psis
lyr
ata
subs
39
1co
ntig
2515
032
32.
00E-
106
50%
347
PRED
ICTE
D:
exop
olyg
alac
372
93%
1.00
E-12
458
%X
P_01
1003
515.
1
PgD
defe
nsin
AAR8
4643
.1Pi
cea
glau
ca83
cont
ig28
711
56.2
5.00
E-11
53%
63D
efen
sin-
like
prot
ein
[Gly
10
310
0%9.
00E-
2876
%KH
N06
998.
1
PGIP
1po
lyga
lact
uron
ase-
inhi
biti
ng p
r
AIF2
7225
.0H
elia
nthu
s an
nuus
325
cont
ig17
627
500
9.00
E-17
680
%32
9po
lyga
lact
uron
ase-
inhi
bit
536
96%
080
%AI
F272
24.1
PGIP
2po
lyga
lact
uron
ase-
inhi
biti
ng p
r
AIF2
7225
.1H
elia
nthu
s an
nuus
330
cont
ig20
957
440
2.00
E-14
670
%32
9po
lyga
lact
uron
ase-
inhi
bit
521
99%
078
%AI
F272
27.1
PLDβ1
phos
phol
ipas
e D
bet
a 1
NP_
5659
63.2
Ara
bido
psis
tha
lian
a10
83co
ntig
1432
713
440
79%
1091
phos
phol
ipas
e d
beta
1 [
N
1408
99%
065
%O
IT39
456.
1
PLP2
phos
phol
ipas
e A
2A
NP_
1802
24.1
Ara
bido
psis
tha
lian
a40
7co
ntig
6394
575
069
%44
4Ph
osph
olip
ase
A 2A
, II
A,PL
617
90%
074
%EO
Y14
528.
1
PME3
pect
in m
ethy
lest
eras
e 3
NP_
1880
48.1
Ara
bido
psis
tha
lian
a59
2co
ntig
2840
077
20
72%
585
pect
ines
tera
sepe
ctin
este
941
100%
075
%O
IT26
967.
1
RAP
ethy
lene
-res
pons
ive
tran
scri
pt
NP_
8505
82.1
Ara
bido
psis
tha
lian
a37
5co
ntig
2559
821
47.
00E-
6446
%33
2AP
2/ER
F do
mai
n-co
ntai
nin
51
910
0%0
75%
KVI0
5829
.1
RD21
cyst
eine
pro
tein
ase
NP_
5644
97.1
Ara
bido
psis
tha
lian
a46
2co
ntig
2020
660
70
69%
455
cyst
eine
pro
teas
e-1
[Hel
i
757
99%
079
%BA
C75
923.
1
rwa2
Redu
ced
wal
l ace
tyla
tion
2N
P_00
1078
116.
1A
rabi
dops
is t
hali
ana
568
cont
ig29
675
843
074
%54
5PR
EDIC
TED
: pr
otei
n RE
DU
92
910
0%0
80%
XP_
0042
2902
3.1
siti
ens
/sit
ABA-
defi
cien
t m
utan
t/AB
A al
deh
AD
R313
54.1
Sola
num
lyc
oper
sicu
m13
61co
ntig
1980
717
270
67%
1341
Lact
uca
sati
va a
ldeh
yde
o
2033
99%
075
%BA
E720
98.1
SR1
calm
odul
in-b
indi
ng t
rans
crip
tio
NP_
8500
23.1
Ara
bido
psis
tha
lian
a10
32co
ntig
1903
962
051
%10
80PR
EDIC
TED
: ca
lmod
ulin
-bi
14
2799
%0
66%
XP_
0106
4522
3.1
SSst
ilben
e sy
ntha
se 1
NP_
0012
6793
9.1
Viti
s vi
nife
ra39
2co
ntig
5198
597
075
%38
9ch
alco
ne s
ynth
ase
[Ger
be
80
110
0%0
99%
CAP
2032
8.1
SSI2
acyl
-[ac
yl-c
arri
er-p
rote
in]
desa
NP_
1818
99.1
Ara
bido
psis
tha
lian
a40
1co
ntig
1187
866
10
87%
426
stea
royl
-acy
l-car
rier
pro
t
790
92%
094
%AB
F666
38.1
STP1
3su
gar
tran
spor
t pr
otei
ns 1
3N
P_19
8006
.1A
rabi
dops
is t
hali
ana
526
cont
ig68
2481
30
85%
519
PRED
ICTE
D:
suga
r tr
ansp
914
98%
086
%X
P_01
1090
738.
1
TAG
L1
TAG
L1 t
rans
crip
tion
fac
tor
AAM
3310
1.2
Sola
num
lyc
oper
sicu
m26
9co
ntig
3000
528
14.
00E-
9266
%24
7M
ADS-
box
prot
ein,
GAG
A1
505
100%
097
%C
AA08
800.
1
WRK
Y33
WRK
Y t
rans
crip
tion
fac
tor
33AA
M34
736.
1A
rabi
dops
is t
hali
ana
512
cont
ig16
847
347
2.00
E-11
156
%49
8W
RKY
33 [
Chr
ysan
them
um
75
110
0%0
76%
AJF1
1718
.1
ZFzi
nc f
inge
r C
CC
H d
omai
n-co
nta
AE
C09
788.
1A
rabi
dops
is t
hali
ana
597
cont
ig30
219
529
4.00
E-18
052
%61
0Zi
nc f
inge
r fa
mily
pro
tein
671
99%
053
%EO
Y17
761.
1
ZFzi
nc io
n bi
ndin
g pr
otei
nN
P_56
5200
Ara
bido
psis
tha
lian
a35
8co
ntig
1325
172
5.00
E-49
44%
331
Zinc
fin
ger,
RIN
G-t
ype
[C
478
100%
8.00
E-16
879
%KV
I102
34.1
ZFzi
nc f
inge
r pr
otei
nAE
E308
70.1
Ara
bido
psis
tha
lian
a27
7co
ntig
3068
317
22.
00E-
5150
%23
8C
ys2/
His
2-ty
pe z
inc
fing
e
31
510
0%5.
00E-
106
66%
AFF5
7513
.1
ORF
siz
e
in c
onti
g
BLAS
T ba
ckhi
tSc
ore
(Bit
)E-
valu
eC
andi
date
gene
Func
tion
Acce
ssio
nfr
omam
ino
acid
sId
enti
ties

Chapter 4
90
4
Table S4-2 Primers list for candidate genes amplicon HRM analysis in parents and qRT-PCR analysis
CGs markers PrimerHRM results in parents
noteS F
2-PS_11873_814_F GGCCTGAACCCACAATGAGTb a *
2-PS_11873_814_R GGACCCAATGAGAACCACCTTACS_17688_842_F ACCCTTTGGGCACTTTTCTT
a aACS_17688_842_R CGCAAATGAGGTGGATGTTTAF_29000_1070_F CCGAGAAGTTGGCTCAAGAC
d dAF_29000_1070_R TTTCTCGGCTTCGACTTTGTAIR12_1278_1722_F ATCTAACCTCCCTTTCGCCC
d dAIR12_1278_1722_R GGAATTCCGGCGAAACATGAAOS_28753_1931_F CTGATCTCCGACGCCAAT
c cAOS_28753_1931_R TCCCCAATACAATCAAATGGAAOS_28753_2837_F GTCGCTTGGAACTGTGGAAT
b dAOS_28753_2837_R CCTCCTCTTCTTCATGCTCAAAS_1926_1135_F TCTGCACATTGTTTTTCATCA
a aAS_1926_1135_R CAGGAGAGGGAAGACACCAAAS_1926_I2_F CCAGGTTTAAAGGCTTCCAGT
a bAS_1926_I2_R AGCTCCAATAACACTGTACCGBOS_3562_1071_F TGCATACATTATTGGATTAGGAAGA
b bBOS_3562_1071_R TCACAAATTAGAACATGTATCTCACAAbre1_15621_850_F GCTTCTGAACTTGATCCGAACA
c cbre1_15621_850_R AGAGGAAGATTCAACAGGGCAcel2_5926_809_F ATTCTCCGGGAACTGAGGTG
c ccel2_5926_809_R AAGCTTTCTCGAGTACTTTGAATCCCHI_22447_421_F GACGGTGAAAATGGTGATTGT
a aCHI_22447_421_R TTGTGAGGTGGTCGTGTTTTCHI_22447_175_F GAAACGATAACCGGAAATGC
**CHI_22447_175_R CCGTCGCTTAGCTTAACCAGCHI_4923_1704_F CCATAACTGCCGGAGTGAAC
b bCHI_4923_1704_R GAGGTATCTAACTTTTCCTGTTCTCCCHS_1332_1045_F ACCGGTGGTGGTCTTTCC
d dCHS_1332_1045_R TGGTAATATGTCCAGCGCCTCHS_29143_1582_F GGAATCAAGGTGGGTGTCAT
a b **CHS_29143_1582_R CTCGCGGAGAACAATAAAGGcutin_11795_2336_F GGACTTGAGGAGCACCATCC
a acutin_11795_2336_R TGGGTTTCGATATTAAGGTTTTGcutin_11795_2266_F CCCATCGGGAAAGTCAATC
c ccutin_11795_2266_R TTACTGAGGCAAAAGCCAATcutin_11795_2066_F AACAAGGGACTTGAGGAGCA
d bcutin_11795_2066_R GGTTTCGATATTAAGGTTTTGATTTcutin_4918_2779_F GTGACATGTTGCACCGTTCT
d dcutin_4918_2779_R TGAAACATCCACCACAACTTTCcutin_4918_3081_F GTGGCGAAATTTGCCTGAG
a acutin_4918_3081_R TCACGCTTGTGATACCCAGAcutin_6590_1039_F GCTGTTCAAGCTGTTGCAGT
b acutin_6590_1039_R TACTCTGAGCCCAGCAATCADELLA_29198_2133_F TTATTTGCAGGAAGTGGGTTG
d dDELLA_29198_2133_R TGCAACAAAACCCCTGTATTCDELLA_29198_2293_F ACAGGGGTTTTGTTGCAGAG
d dDELLA_29198_2293_R TGCAACAACTTCACCTTCTCTTDND_29068_911_F GGTCGGTTCCACACATGTAA
a aDND_29068_911_R TCGAGCCAGGAGGGTATTTAELP2_2398_1249_F ATTCAGTCGAGTGGCAACCA
a aELP2_2398_1249_R GCTTTCGGGTTGATAACACGGGERF_11093_229_F CAAATAGTCACTACCCAAATCCTC
a aERF_11093_229_R GAGAAGGAGGCTAAGTTGGAAAERF_18430_480_F GCCGGACACCTCTGTAATGT
b cERF_18430_480_R TGAGATTTCAAGCGGAATCGET_14926_1910_F CCGATATCTCCGGGCTTT
c aET_14926_1910_R CTGGACTGGGAAGACTGACCEXLA2_14980_495_F GGCCGGAACCCTACTTGT
d dEXLA2_14980_495_R AAGCCCTAATTATCTTGCCATCAFDH_12215_1158_F GCCGGTTCCATCACTTTCTC
a aFDH_12215_1158_R AACACCAAAACCAGCACCGGSL5_30332_2672_F CGAGTGTCACGAAGCTCATT
c aGSL5_30332_2672_R AACCGACGATCTTAGGAGTTCGST1_17531_312_F TTATCAGATCCGTCCCCTTG
c bGST1_17531_312_R ATTCGAATCAAGGGCGATTA

The use of a candidate gene approach to arrive at Botrytis resistance in Gerbera hybrida
91
4
Table S4-2 (continued)
CGs markers PrimerHRM results in parents
noteS F
LOX_13375_1313_F GATGGCTTCCCAGATCAAGAa a **
LOX_13375_1313_R TCCTGACCCGAGTCAAAGACLOX_13375_3067_F TTGCAAGGGAAATGAACAGG
a cLOX_13375_3067_R GGAGCAATCACCGTCACTAALOX_28693_4515_F TGGTCTCCGTCAATGGATCT
c cLOX_28693_4515_R GGCGATGAAAATCCTTACCCMMP3_15525_1055_F ACCGTACAACACCTGAATGC
a aMMP3_15525_1055_R GGAGTACGGAAAGTCGAGCTMYB_11297_481_F GGCAACAGGTGGTCTCAAAT
b aMYB_11297_481_R CCAGAAGTTCTTGATTTCGTTATCTOPR_196_1138_F AGGCTTTGGGTCTATACAT
d dOPR_196_1138_R TTTTCATCCTCGGTTCOPR_196_514_F CCAGGTATATGGACAAAAGAACAA
c aOPR_196_514_R CGTGAACCGCATCTACAATGOPR3_12803_809_F CGGTGGCTTTCTCATCACTG
c cOPR3_12803_809_R TCCAAGCCTCGACTTGTTCTP450_15117_2118_F TTCCATGCTGCGAAATCAT
a aP450_15117_2118_R AAAACGCCTTGTTCCTGTTGP450_8091_1686_F TGGGCCGTAGGATTTAGAGA
b cP450_8091_1686_R TTGCACCAGATCAACAAATCAPAD_12282_675_F ATGAAAGGCGACGAAGCTCT
a aPAD_12282_675_R GAACCACAAGCCCCAGACTAPAD_12282_1133_F TGAAGTGAGCCTAGAACAAATGG
a bPAD_12282_1133_R CCTATCAGGGTTCTGGGATGPAL_10623_2338_F GATCGAATCACCTCAATTTGC
a bPAL_10623_2338_R CCAAAACAAGACCGTTACGCPAL_25584_2562_F GTCTGCTTTGATTGCCTTGG
a aPAL_25584_2562_R AGCAGGAGATGCGAGGAATPAL_28938_2050_F CCTGAAAATTCCCACCGTGA
a aPAL_28938_2050_R GGCTAGGTCCGCTTATCGAGGPER21_12863_774_F GCGAGATACAACTGAATTACTACTCA
a a **PER21_12863_774_R AACGATTTCTTCGGCATTTGPER62_31925_540_F ACGGACCAAATGCTGAGAAA
c a **PER62_31925_540_R CTTCGCTTTTGCATTCTCTACTPFT1_12433_1433_F TGCCGTCAAATCAGAGTCCT
c cPFT1_12433_1433_R TTTACAGTAGCGGGAGGAATGPG1_15001_1052_F GTGGGGTTTTCTGGCTACG
a a **PG1_15001_1052_R AGTATCATTCGCGCCGTTACPG10_11147_5246_F GTCGGATCGGTTGAAGACAT
a bPG10_11147_5246_R CGTTTGTGTTGTCGGTTGTCPG10_11147_2266_F GCCGGAAACTCAGAAGACC
a bPG10_11147_2266_R ACGAGGGTTTCGGTAGATCAPG10_11147_3429_F GCAGGGACCAGACGTTCAC
b aPG10_11147_3429_R GTTTCCCTTTTTGCCGTAGCPG2_1158_857_F TTGACCAGAAGGGCAATATTCT
b aPG2_1158_857_R AATGCATTTCGAAGACATCGTPG3_10267_1039_F CAATAGGGTTCCTTGAATTTCG
b cPG3_10267_1039_R ACTACACCGGCCAAGCTTCTPG3_10267_143_F AATTTTTGCCCGTGAATGTT
b bPG3_10267_143_R TTAGTGGCCAATTTGTGCATPG4_21627_1257_F TCAAACAAGGCATGTTCAAA
d dPG4_21627_1257_R TGAAGTTCCCTTAATCTTCACGAPG5_8410_454_F TGGTTTGCCGTTGTTTCTTA
c cPG5_8410_454_R CAAAAACTCAAACCGCAATGPG6_17218_1141_F ATGGTGTCCGCATCAAAACT
b cPG6_17218_1141_R GGTTCGTCACATTCTGCATCPG6_17218_605_F GACCGTGTTGACAACCTCCT
b cPG6_17218_605_R GCAGGAATTTTTCCACCAAAPG7_35500_1285_F ACAAAGGCTGGACGGTAAAA
a cPG7_35500_1285_R TCTGCAGACGGTTGAACTAAPG8_10107_508_F TGAGGCCGAAGTACCTTTGA
c bPG8_10107_508_R GCCCTTTCCAGAAATGTGACPG9_25150_888_F CAGAGGAACTTCAGGGACGA
a cPG9_25150_888_R TCAAGTCCACTTCAGAAATCTCCPgD_28711_481_F TTTGGTGCAGAAACAACGAC
c cPgD_28711_481_R AAGACTGAAGGCTTTCAAGGTG
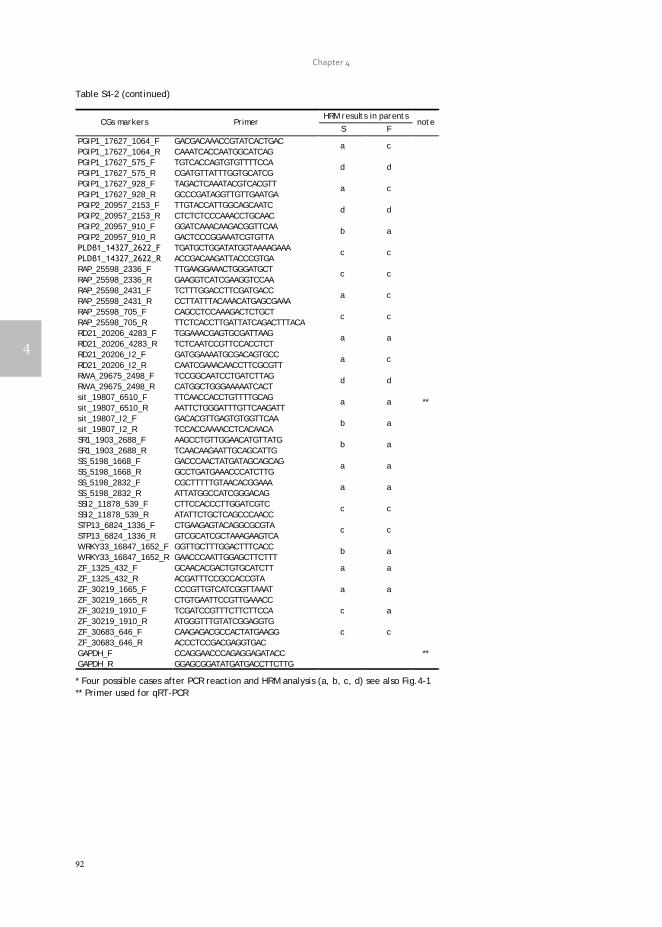
Chapter 4
92
4
Table S4-2 (continued)
* Four possible cases after PCR reaction and HRM analysis (a, b, c, d) see also Fig.4-1 ** Primer used for qRT-PCR
S FPGIP1_17627_1064_F GACGACAAACCGTATCACTGACPGIP1_17627_1064_R CAAATCACCAATGGCATCAGPGIP1_17627_575_F TGTCACCAGTGTGTTTTCCAPGIP1_17627_575_R CGATGTTATTTGGTGCATCGPGIP1_17627_928_F TAGACTCAAATACGTCACGTTPGIP1_17627_928_R GCCCGATAGGTTGTTGAATGAPGIP2_20957_2153_F TTGTACCATTGGCAGCAATCPGIP2_20957_2153_R CTCTCTCCCAAACCTGCAACPGIP2_20957_910_F GGATCAAACAAGACGGTTCAAPGIP2_20957_910_R GACTCCCGGAAATCGTGTTAPLDβ1_14327_2622_F TGATGCTGGATATGGTAAAAGAAAPLDβ1_14327_2622_R ACCGACAAGATTACCCGTGARAP_25598_2336_F TTGAAGGAAACTGGGATGCTRAP_25598_2336_R GAAGGTCATCGAAGGTCCAARAP_25598_2431_F TCTTTGGACCTTCGATGACCRAP_25598_2431_R CCTTATTTACAAACATGAGCGAAARAP_25598_705_F CAGCCTCCAAAGACTCTGCTRAP_25598_705_R TTCTCACCTTGATTATCAGACTTTACARD21_20206_4283_F TGGAAACGAGTGCGATTAAGRD21_20206_4283_R TCTCAATCCGTTCCACCTCTRD21_20206_I2_F GATGGAAAATGCGACAGTGCCRD21_20206_I2_R CAATCGAAACAACCTTCGCGTTRWA_29675_2498_F TCCGGCAATCCTGATCTTAGRWA_29675_2498_R CATGGCTGGGAAAAATCACTsit_19807_6510_F TTCAACCACCTGTTTTGCAGsit_19807_6510_R AATTCTGGGATTTGTTCAAGATTsit_19807_I2_F GACACGTTGAGTGTGGTTCAAsit_19807_I2_R TCCACCAAAACCTCACAACASR1_1903_2688_F AAGCCTGTTGGAACATGTTATGSR1_1903_2688_R TCAACAAGAATTGCAGCATTGSS_5198_1668_F GACCCAACTATGATAGCAGCAGSS_5198_1668_R GCCTGATGAAACCCATCTTGSS_5198_2832_F CGCTTTTTGTAACACGGAAASS_5198_2832_R ATTATGGCCATCGGGACAGSSI2_11878_539_F CTTCCACCCTTGGATCGTCSSI2_11878_539_R ATATTCTGCTCAGCCCAACCSTP13_6824_1336_F CTGAAGAGTACAGGCGCGTASTP13_6824_1336_R GTCGCATCGCTAAAGAAGTCAWRKY33_16847_1652_F GGTTGCTTTGGACTTTCACCWRKY33_16847_1652_R GAACCCAATTGGAGCTTCTTTZF_1325_432_F GCAACACGACTGTGCATCTT a aZF_1325_432_R ACGATTTCCGCCACCGTAZF_30219_1665_F CCCGTTGTCATCGGTTAAAT a aZF_30219_1665_R CTGTGAATTCCGTTGAAACCZF_30219_1910_F TCGATCCGTTTCTTCTTCCA c aZF_30219_1910_R ATGGGTTTGTATCGGAGGTGZF_30683_646_F CAAGAGACGCCACTATGAAGG c cZF_30683_646_R ACCCTCCGACGAGGTGACGAPDH_F CCAGGAACCCAGAGGAGATACC **GAPDH_R GGAGCGGATATGATGACCTTCTTG
CGs markers PrimerHRM results in parents
note
a c
d d
a c
d d
c c
a c
b a
c c
a c
d d
c c
a a
b a
a a
a a **
b a
c c
b a
a a
c c

The use of a candidate gene approach to arrive at Botrytis resistance in Gerbera hybrida
93
4
Table S4-3 QTLs found for bottom, whole inflorescence,and ray florets test in the parental genetic maps of two populations (after adding the new CG markers)
QTL Flanking Markers Linkage Group
MQM
LOD (GW) % Expl.
RBQB1 WGC11243_647_S2F1a SP1_02 5.19 (4.2) 7.3
RBQB2 WGC2476_271_S1 SP1_16 4.48 (4.2) 6.3
RBQB3 WGC18733_346_S2F SP2_11 5.25 (4.0) 8.6
RBQB4 WGC16204_523_S2F1 FP1_01 6.87 (4.2) 10.4
RBQB5 WGC28102_213_S2F1 FP1_09 5.28 (4.2) 7.8
RBQB6 WGC18158_119_F1b FP2_09 4.74 (4.1) 7.9
RBQRF1 WGC17798_117_S2F1 SP2_07 5.21 (4.0) 8.7
RBQRF2 WGC22343_292_SFa, sit_19807_6510 FP1_05 6.81 (4.1) 8.9
RBQRF3 WGC35370_146_S2F1 FP1_09 5.27 (4.1) 6.8
RBQRF4 WGC828_408_S2F FP1_15 6.83 (4.1) 8.9
RBQRF5 WGC35264_283_S2F1, WGC6074_441_S2F FP1_18 5.5 (4.1) 7.1
RBQRF6 WGC7520_3774_S1F2, WGC828_408_S2F FP2_15 4.31 (4.1) 6.5
RBQRF7 WGC6074_441_S2F FP2_18 4.09 (4.1) 5.9
RBQRF8 PG1_15001_1052 FP2_21 6.42 (4.1) 10.7
RBQWI1 WGC33030_228_S SP1_11 4.74 (4.0) 7.2
RBQWI2 WGC1824_721_S1F1 SP1_23 5.46 (4.0) 8.4
RBQWI3 WGC18733_346_S2F SP2_11 5.25 (4.0) 8.6
RBQWI4 WGC22447_285_Fa FP1_23 6.96 (4.2) 11.4
RBQWI5 WGC5962_1153_F FP2_17 5.34 (4.1) 8
RBQWI6 WGC1084_721_F FP2_23 7.25 (4.1) 11
RBQB7* WGC19218_398_S1F1 SP1_06 5.33 (4.2) 7.6
RBQB8* PG9_25150_888 SP2_02 4.0 (4.0) 6.1
Note: Name of QTLs are RBQ (as Resistance Botrytis QTL) followed by the initials of disease tests used: B=Bottom; RF=Ray Floret; WI=Whole inflorescence test. LG indicates linkage group and the LG number in the two populations ; Null-alleles are marked with a letter 'a' or 'b' in the end; GW indicates genome wide significant threshold level P<0.05; %Expl. is the percentage of total variance explained by the QTL. QTLs with * indication are the two new QTLs.

Chapter 4
94
4 Fig. S4-1. Visualized output from QualitySNPng which is presented SNP in contig17688 of the parental reads. Arrow indicates the SNP at the position 842 for marker design and table on the left bottom shows the SNPs calls on different parental reads.
Fig. S4-2 HRM results of contig1926 (the homologue hit of anthranilate synthase/AS gene in Arabidopsis) on part offspring of the Schreurs population. Grey curve group represents homozygous alleles; red curve group represents heterozygous alleles. Note: H11 and H12 on the 96-well plate represent Parent 1 and Parent 2 (of population S), and the others represent individuals in the population. All individuals are in three plates. He. Heterozygote. Ho. Homozygote

The use of a candidate gene approach to arrive at Botrytis resistance in Gerbera hybrida
95
4
a b
c
WGC10346_175_F1a0.0WGC8642_167_SF11.1WGC17061_401_SF3.2WGC35157_467_F15.6
WGC19130_393_S1F115.3
sit_19807_651057.0WGC22343_292_SF59.6WGC4138_154_SF62.7WGC26242_226_SF164.2WGC3739_149_SF165.1WGC32274_134_S1F165.7
RBQRF2
0 2 4 6 8
FP1_05
WGC20761_143_S2F20.0WGC19322_269_S2F1b0.2WGC9202_285_FWGC7759_664_F0.5
WGC19051_337_FWGC35409_177_FWGC4151_332_S2F
0.6
WGC8809_433_S2F1b6.6WGC3424_72_S2F111.1WGC9226_226_F213.7WGC2056_191_F14.7
PG1_15001_105222.9
WGC18664_326_S2F227.8
WGC8244_216_S2F247.3
RBQRF8
0 5
FP2_21
WGC7127_127_S1F20.0WGC15405_1293_S1F1.2WGC1084_721_F2.3
CHI_22447_4215.8WGC22447_285_Fb6.5
WGC1824_721_S1F114.5
WGC3454_459_F1b26.9
RBQW
I60 5
FP2_23
WGC15405_1293_S1F0.0WGC22447_285_Fa0.3WGC1084_721_F1.2
WGC3454_459_F1a19.1WGC21545_548_S1F120.2WGC16170_118_F121.8WGC1824_721_S1F123.1WGC407_4995_S1F123.8
WGC27795_176_F46.9
2_PS_1187359.3
WGC14274_384_F176.0WGC8047_200_F176.6WGC34390_211_F77.8WGC8574_435_S1F78.1WGC22355_237_S1F178.6
RBQW
I40 5
FP1_23

Chapter 4
96
4
d
e
WGC17757_237_S2F10.0
WGC34475_396_SF1b8.2
WGC18262_147_S122.2WGC22185_434_S2F1b25.7WGC23656_151_S1F1b29.2PG9_25150_88830.4WGC11243_647_S2F1b37.9cutin_4918_308140.5
WGC1770_76_S263.0WGC2177_311_SF69.6WGC7983_971_SF70.4WGC34745_323_S2FWGC25570_844_S74.3
WGC4477_1171_SF174.4WGC32105_310_S1F174.5WGC27443_327_SF1WGC3004_110_SF174.8
WGC3930_242_SF174.9P450_25584_256277.8WGC34976_88_S88.2WGC18942_274_S1F1b90.2WGC8508_520_S296.4
WGC6199_1191_S2F2116.0
SP2_02
WGC34475_396_SF1aWGC7419_63_S1F10.0
WGC17757_237_S2F10.1WGC27925_98_S1F15.7WGC18262_147_S118.0WGC34768_65_S1F119.5WGC31982_135_S1F23.1WGC22185_434_S2F1a24.3WGC23656_151_S1F1a29.2WGC11243_647_S2F1a33.4WGC15789_100_S1F145.2WGC8799_438_S1F145.9FDH_12215_115859.9WGC8272_136_S1F162.4WGC31308_165_S1F162.6WGC7983_971_SF64.4WGC2177_311_SF64.9WGC34745_323_S2FWGC25570_844_SWGC4477_1171_SF1
67.9
WGC32105_310_S1F168.1WGC27443_327_SF168.4WGC3004_110_SF1WGC3930_242_SF168.5
WGC34976_88_S75.8WGC18942_274_S1F1a77.0
WGC11464_359_S1F102.7
RBQB1
0 5
SP1_02
WGC20712_458_S10.0WGC12089_1094_S0.4WGC23551_82_S1F1a0.5WGC19070_644_S1F10.8WGC35726_297_SF1.2WGC3476_117_S1F1.6WGC2836_126_S1F12.8WGC8424_460_S1F23.6WGC9138_166_Sa6.9WGC18669_1670_S1F1a12.6WGC19126_744_S2F1a14.0WGC19165_389_Sa14.5WGC9148_195_SF117.6ELP2_2398_124921.1WGC36013_366_S1F125.0WGC4264_216_S132.1WGC19218_398_S1F137.6
PG10_11147_524650.3PG7_35500_128551.7WGC9143_379_SF254.7WGC3505_351_S1F157.9
WGC36650_474_S1F165.2
RBQB7
0 5
SP1_06

The use of a candidate gene approach to arrive at Botrytis resistance in Gerbera hybrida
97
4
f g Fig. S4-3 Mapped CGs and QTL analysis after added CGs. a, the mapped ghsiton FP2_05 in the region of QTL RBQRF2, explained the 6.81% variance. b, the mapped ghPG1 on FP2_21 in the region of QTL RBQRF8, explained the 10.7% variance. c The QTLs RBQWI4 and RBQWI6 in the maternal and paternal LG23 of F populationsd. The marker WGC22447_285_Fa is a KASP marker from contig22447 and CHI_22447_421 is a marker for HRM. d, ghPG9 and ghcutin mapped on the SP2_02 around WGC23656_151_S1F1 and WGC11243_647_S2F1 and a QTLs is between the markers on SP1_02. e, new QTL RBQB7 from SP1_06 ( LOD = 5.33) with the two CGs (ghPG7 and ghPG10) mapped; f, the mapped ghSS on SP1_16 near the region of QTL RBQB2. g, the mapped ghPER62 on FP2_18 near the region of QTL RBQRF7.
WGC16319_821_S1F20.0WGC8562_422_S2.1WGC3979_333_S2.9
WGC7576_107_S1F117.9
WGC18703_968_S1F131.7
WGC2476_271_S148.5
SS_5198_166853.5WGC8121_498_S1F155.6
RBQB2
0
SP1_16
WGC35478_496_F20.0
WGC4372_144_S1F39.3WGC19289_1003_F243.0WGC8743_118_S1F1b46.1WGC27592_275_S2F246.2WGC18800_256_S1F146.9WGC19040_355_F2bWGC19040_355_F250.3
WGC19782_600_SF250.7PER62_31925_54052.3WGC6074_441_S2F57.2WGC35264_283_S2F161.0WGC8954_249_S2F68.9PG2_1158_85779.7
WGC7433_150_S2F1b88.7
WGC18057_1139_F2100.9
RBQP7
FP2_18

Chapter 4
98
4

The use of a candidate gene approach to arrive at Botrytis resistance in Gerbera hybrida
99
4

Chapter 4
100
4

The use of a candidate gene approach to arrive at Botrytis resistance in Gerbera hybrida
101
4
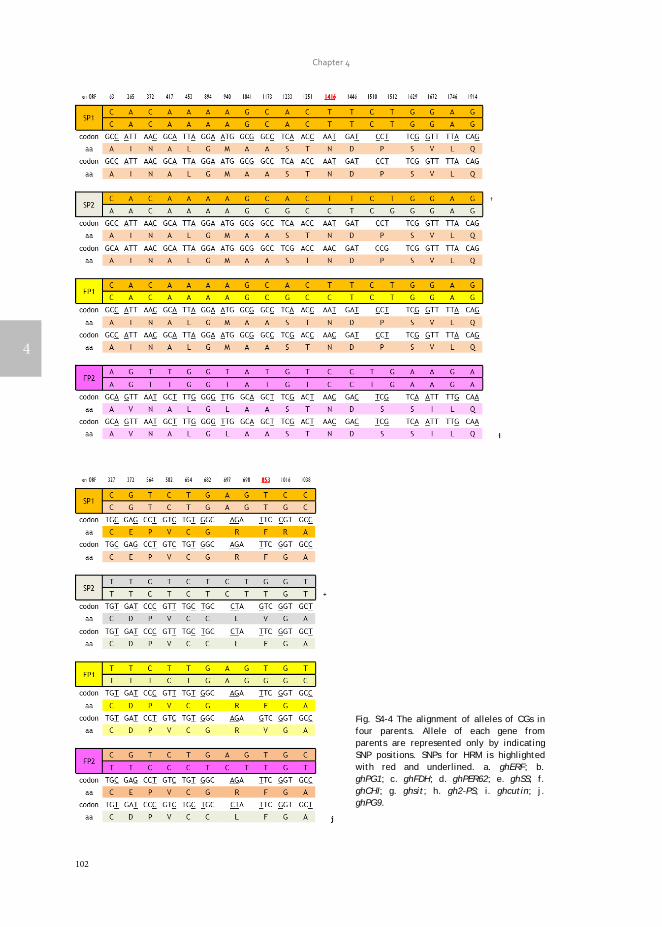
Chapter 4
102
4
Fig. S4-4 The alignment of alleles of CGs in four parents. Allele of each gene from parents are represented only by indicating SNP positions. SNPs for HRM is highlighted with red and underlined. a. ghERF; b. ghPG1; c. ghFDH; d. ghPER62; e. ghSS; f. ghCHI; g. ghsit; h. gh2-PS; i. ghcutin; j. ghPG9.

The use of a candidate gene approach to arrive at Botrytis resistance in Gerbera hybrida
103
4
Fig. S4-5 Progress of disease in Botrytis-inoculated gerbera SP2 ray florets after trypan blue staining at 0, 6, 12, 24hpi; 24 hpi mock, 36, 48 and 72hpi hpi (from left to right, from top to bottom). At the 6hpi, the Spore of Botrytis is germinated and hyphal growth on ray florets. In 36, 48, 72 hpi, background can be seen in the microscope that ray florets are necrotic brown. Trypan blue staining was according to the protocol by Chung (2006).

Chapter 4
104

105
Chapter 5 Two candidate genes, ghPG1 and ghsit, contribute to
Botrytis resistance in Gerbera hybrida
Yiqian Fu1, Yin Song2, Jaap van Tuyl1, Richard GF Visser1, Paul Arens1,*
1Plant Breeding, Wageningen University & Research, PO Box 386, 6700AJ, Wageningen, The Netherlands
2Laboratory of Phytopathology, Wageningen University, Droevendaalsesteeg 1, 6708PB Wageningen, The
Netherlands
*Corresponding author, e-mail address: [email protected]; telephone: +31317481589; fax number:
+31317418094

Chapter 5
106
5
Abstract
Botrytis cinerea can cause direct damage during the whole process of gerbera production. Two candidate genes PG1 (polygalacturonase gene) and sit (sitiens, ABA-aldehyde oxidase gene) for resistance against Botrytis that were previously mapped in QTL regions for the ray floret disease resistance test in gerbera were studied. Tobacco rattle virus (TRV)-based virus-induced gene silencing (VIGS) was used to characterize gene function in relation to Botrytis resistance in gerbera. Single candidate gene constructs and a two-gene-combined construct were developed and tested. Results showed that after 24h of Botrytis in vitro inoculation on the ray florets, a significantly delayed spread of lesions was observed on VIGS candidate gene silenced ray florets compared to controls. One gerbera genotype with two genes co-suppression had even smaller lesions, on ray florets than single gene silenced plants, although difference was not significant. Through this study, we conclude that gene silencing each of these two genes, results in decreased Botrytis invasion in gerbera and that these genes probably are among the determining genes leading to the variation of Botrytis resistance in gerbera QTLs.
Keywords
Gerbera gray mold; virus-induced gene silencing; TRV; VIGS

Two candidate genes, ghPG1 and ghsit, contribute to Botrytis resistance in Gerbera hybrida
107
5
Introduction
Gerbera gray mold is a serious disease that occurs in the whole production process including the post-harvest life of gerbera and is caused by the necrotrophic pathogen Botrytis cinerea. Gerbera, especially cut flower cultivars, are vulnerable to Botrytis attack owing to the occurrence of high humidity during transport as well as that inflorescences are suffering from the active process of senescence once harvested. The Dutch Flower Auction Association (VBN) practice zero tolerance on gerbera affected by Botrytis, and all gerbera flowers with detectable Botrytis infection will be rejected and destroyed. Quality losses due to gerbera gray mold might affect the entire supply chain of gerbera from upstream (breeders) to downstream (consumers) (Bastiaan-Net et al. 2007; Dean et al. 2012).
Botrytis resistant or less susceptible gerbera cultivars are highly desirable for gerbera breeding companies due to the limitations for the usage of fungicides, particularly, in post-harvest. Several QTLs linked with Botrytis resistance were found from two mapping populations in a previous study (Chapter 3; Fu et al. 2017). The detected QTLs contributed minor effects on phenotypic variance similarly to other QTL mapping studies in Arabidopsis and tomato (Davis et al. 2009; Denby et al. 2004; Finkers et al. 2008; Finkers et al. 2007a; Finkers et al. 2007b; Rowe and Kliebenstein 2008). As in many QTL studies, the found QTL regions in Fu et al. (2017; Chapter 3) cover relative large genetic distances with high probability for recombination between QTL flanking markers. These circumstances might all reduce the reliability and usefulness of the markers. Moreover, gerbera, like many other ornamental plants, has a heterozygous background and a lack of adequate genetic information. Instead of going through the process of high-resolution fine mapping and identify tightly-linked markers for marker-assisted selection, we developed a candidate gene approach searching for possible causal genes. Four candidate genes were mapped co-localizing in previously identified QTL regions and three candidate genes were found near the QTLs. Upregulated expression of these candidate genes indicated that these genes were activated during Botrytis infection in gerbera (Chapter 4).
As co-localization is the first indication for putative candidate genes to be involved in resistance to Botrytis, gene function of these candidate genes needs to be further explored. There are several methods to characterize gene function. One of the methods is based on phenotypic screening of mutants (Koornneef et al. 1980) however such resources are not available for gerbera. Overexpression of genes can also be utilized to study gene function. Several genes, GMYB10 (Elomaa et al. 2003), GhCYC2 (Broholm et al. 2008), GSQUA2 (Ruokolainen et al. 2010) and Gh-SOC1 (Ruokolainen et al. 2011), were transformed to gerbera to identify gene functions in flower secondary metabolism (color) and floral development, which are important traits for this ornamental crop. Thus, overexpressed genes showed a phenotypic change which provided evidence for the genes' involvement in a trait. Similarly, downregulating a gene by genetic modification can also provide evidence for the functional effect of genes. For instance, downregulation of 2-pyrone synthase (2-PS) which is involved in the synthesis of the precursors of the polyketide-derived antifungal compounds present in gerbera plants resulted in increased susceptible to Botrytis (Eckermann et al. 1998; Koskela et al. 2011).

Chapter 5
108
5
However, these transformation technologies for gene function analysis are often very genotype depending and considered time-consuming. Virus-induced gene silencing (VIGS) is a post-transcriptional gene silencing (PTGS) that is considered as one of the mechanisms for plant defense against virus invasion (Jiang et al. 2011). During virus replication in plants, double-stranded RNAs (dsRNAs) are produced. Plant cells recognize these dsRNAs as foreign invaders, and an enzyme named Dicer degrades the dsRNA into small interfering oligonucleotides (siRNA). The siRNA duplexes are composed of two 21~25 nucleotide (nt) RNA (MacDiarmid 2005) and bind to an RNA-induced silencing complex (RISC). The specific RISC cleaves viral transcripts with identical or highly similar sequences (Jiang et al. 2011). This plant defense strategy has been developed and adapted as a widely used tool to analyze the functional effect of gene silencing on plant phenotype (Jiang et al. 2011; Senthil-Kumar and Mysore 2014). A specific plant gene fragment inserted into a virus vector is multiplied in plants by viral replication. PTGS is induced by recognizing these plant transcripts as foreign invaders, so siRNA’s are generated and these target the paticular plant gene resulting in gene silencing.
Advantages of VIGS over other gene knockdown methods are: i) VIGS vectors can be easily constructed and applied in a broad host range; ii) VIGS phenotypes can be quickly observed in a relatively short period; and iii) VIGS (by inserting a fragment from a conserved region) can be used to downregulate all members of a gene family (Jiang et al. 2011; Senthil-Kumar and Mysore 2014). Disadvantages may be: i) incomplete loss of gene expression, ii) occurrence of off-target gene silencing, iii) occurrence of a mild viral infection phenotype, iv) a variable silencing efficiency (Senthil-Kumar and Mysore 2014). Despite these limitations for VIGS applications, VIGS systems have been successfully applied in a large number of ornamental plants like, TRV-based VIGS on Petunia hybrida (Chen et al. 2004; Chen et al. 2005; Reid et al. 2009), Rosa hybrida (Ma et al. 2008), Eschscholzia californica (Wege et al. 2007), Gerbera hybrida (Deng et al. 2014; Deng et al. 2012), Papaver somniferum (Hileman et al. 2005; Wijekoon and Facchini 2012), Aquilegla vulgaris (Gould and Kramer 2007; Kramer et al. 2007), Gladiolus grandifloras (Singh et al. 2013); cucumber mosaic virus (CMV)-based VIGS on Antirrhinum majus (Kim et al. 2011); cymbidium mosaic virus (CymMV)-based VIGS on Phalaenopsis (Hsieh et al. 2013; Liao et al. 2004; Lu et al. 2007). And the system is considered an attractive approach for gene characterisation in ornamentals, particularly those not amenable to tissue culture or genetic transformation.
Two gerbera candidate genes named ghPG1 and ghsitiens (shortened as ghsit), homologs of tomato polygalacturonase gene and ABA-aldehyde oxidase gene, were mapped in Botrytis resistance QTL regions detected from the ray floret test in gerbera (Chapter 3; Fu et al. 2017). Tomato polygalacturonase is responsible for pectin degradation during fruit ripening (Sitrit and Bennett 1998) and could be used by Botrytis for induction of plant susceptibility (Blanco-Ulate et al. 2014). The tomato sit mutant which is deficient in aldehyde oxidase for ABA biosynthesis (Taylor et al. 1988) was found to contribute to resistance against B. cinerea (Asselbergh et al. 2007). To investigate whether these two candidate genes ghPG1 and ghsit contributed to Botrytis resistance in gerbera, we adopted a tobacco rattle virus (TRV)-based gene silencing system to study the function of the two genes.

Two candidate genes, ghPG1 and ghsit, contribute to Botrytis resistance in Gerbera hybrida
109
5
Materials and Methods
Plant material
Gerbera plants (genotypes SP1, SP2, FP1) were obtained from the Gerbera breeding companies Florist B.V. and Schreurs B.V. and grown in greenhouse chambers (Unifarm, Wageningen UR, the Netherlands) under 16h light/8h night photoperiods with 21°C/19°C day/night temperature in relative humidity of ~75%, and 100 W·m-2 supplemental light when light intensity dropped below 150 W·m-2.
Amplification and isolation of target genes
Candidate gene sequences ghPG1 and ghsit were identified from the gerbera EST database (Chapter 2; Fu et al. 2016). Similarly, sequences of reporter genes, two chalcone synthase genes (ghCHS1 and ghCHS4) and one phytoene desaturase gene (ghPDS), which were used as the positive controls were retrieved from the database as well (Suppl. Fig. S5-1). CHS is responsible for flavonoids biosynthesis, and silencing one member (ghCHS1) of CHS family has resulted in partly color loss in gerbera inflorescence (Deng et al. 2012; Deng et al. 2014). Silencing PDS would produce a typical photobleaching in the green leaves, and in gerbera, photobleaching could be found in scapes (flower stems) or bracts (Deng et al. 2014). Gene-specific primers to generate a 300~700bp fragment were designed on Primer3 online. The attB1 and attB2 sequences were added, respectively, to the forward and reverse primers for amplification (listed in Suppl. Table S5-1 and Suppl. Fig. S5-1). To check whether they could hit any other continuous identical or reverse complementary sequence that may result in triggering off-target gene silencing (Xu et al. 2006), the expected fragments of target genes were divided into 20bp sequences and used as query to blast against our gerbera EST database (Chapter 2; Fu et al. 2016).
The fragments of the candidate genes (ghPG1, ghsit) and three reporter genes (ghPDS, ghCHS1, ghCHS4) for VIGS were amplified from gerbera DNA by using Phusion DNA polymerase (Thermo Scientific). PCR reaction mixture (25μl) included: 2μl DNA (20ng/μl), 5μl 5× Phusion HF Buffer, 1μl dNTP's (5mM), 1.25μl of forward and reverse primer each (10μM), 0.25μl Phusion DNA Polymerase and 14.25μl Milli-Q water. PCR was initiated at 98°C for 1min, then 35 cycles of 10s at 98°C, 30s at 62°C and 30s at 72°C, and a final extension step of 7min at 72°C. To ensure that the PCR products were specifically amplified with expected size, PCR-specific products were checked on 1% agarose gel and were excised from gel and purified by using the QIAquick Gel Extraction Kit (Qiagen).
To co-suppress two candidate genes (ghPG1+ghsit), a construct was constructed consisting of the two gene fragments. Fragments of the first gene (A; ghPG1) were amplified using forward primers of A gene sequence added with attB1 sequence in 5’ end (as forward primer, AF in Suppl. Table S5-1) and reverse primers A added with forward primer of the other gene (B, ghsit) sequence in 3’ end (as reverse primer, BF+AR); fragments of B gene were amplified using forward primer of B gene with reverse primers A in 5’ end (AR+BF) and reverse primers B with attB2 sequence in 3’ end (BR). The two fragments were amplified separately and purified by cutting from the gel. The 25μl-reaction mixture for overlap extension PCR was 2μl fragment A, 2μl fragment B (equal masses), 5μl 5× Phusion HF Buffer, 1μl dNTP's mix (5mM), 0.25μl Phusion DNA Polymerase and 14.75μl Milli-Q water (without primers). The overlap

Chapter 5
110
5
extension PCR was initiated at 98°C for 1min, then 12 cycles of 10s at 98°C, 30s at 62°C and 30s at 72°C, and one hold of 7min at 72°C. From this PCR, a 4μl reaction mixture was used as the template for a 50-μl PCR reaction (components were doubled and procedure for PCR were the same as the previous reaction). Two gene fragment constructs with expected size were excised from gel and purified by QIAquick Gel Extraction Kit and checked on 1% agarose gel.
VIGS vectors construction
The Gateway-compatible Tobacco rattle virus (TRV) two-component Agrobacterium mediated expression system was used for gene silencing as previously described (Liu et al. 2002). DNA fragments of reporter genes and candidate genes were individually cloned into pDONR207 which contains a gene for gentamycin resistance by using the Gateway® BP Clonase® II Enzyme Mix following the manufacturer’s recommendation (Invitrogen) to generate entry vectors (Fig. 5-1). Entry vectors with the presence of CG fragments insertion can be grown on selection media with 25mg gentamicin and were verified by DNA sequencing using primers attL1 and attL2 listed in Suppl. Table S5-1. Entry vectors pDONR207 carrying the reporter genes and candidate genes fragments were cloned into the destination vector pTRV2 by using Gateway® LR Clonase® II Enzyme Mix (Invitrogen) to generate constructs TRV2::ghPDS, TRV2::ghCHS1, TRV2::ghCHS4, TRV2::ghPG1, TRV2::ghsit and TRV2::ghPG1+ghsit. A negative control TRV2 construct (TRV2::ghGUS) carrying a 648bp GUS fragment was also used and described by Song and Thomma (2016). The resulting TRV2 constructs were confirmed by DNA sequencing (using TRV2 seq listed in Suppl. Table S5-1).
All TRV1 and TRV2 (TRV2::GOI) (GOI, Gene Of Interest, either single gene or two-gene combination) constructs were transformed to Agrobacterium tumefaciens strain GV3101 by electroporation. Transformed agrobacteria were inoculated on LB agar media supplemented with 25mg rifampicin (rif) + 25mg gentamicin (genta) + 50mg kanamycin (kana). Three single colonies for each construct were picked and cultured in the LB liquid media with rif25, genta25 and kana50, and inoculated in an incubator at 28°C, 200rpm overnight. Constructs were confirmed by normal PCR procedure by using 2µl agro-bacterial suspension as the template and the gene-specific primers (the primers for target gene fragments amplification), only with extending the time of initialization step to 10 minutes. One confirmed colony of each target gene construct was used for agro-infiltration.

Two candidate genes, ghPG1 and ghsit, contribute to Botrytis resistance in Gerbera hybrida
111
5
Fig. 5-1 The Gateway-compatible Tobacco rattle Virus (TRV)-based virus induced gene silencing (VIGS) system. a. TRV-based VIGS vector construction. Target gene fragments (gene of interest, GOI) are amplified with gene-specific primers added with attB1 and attB2 sites. Gene fragments are cloned into pDONR207 to create entry clone by BP reaction. Entry clone pDONR207 with target gene fragment is cloned into TRV2 to generate pTRV2::GO. B1 and B2, attB1 and attB2 sites; P1 and P2, attP1 and attP2 sites; L1 and L2, attL1 and attL2 sites; R1 and R2, attR1 and attR2 sites; ccdB, cell killing gene; CmR, chloramphenicol-resistance gene. b. TRV-based VIGS vector systems. LB and RB, left and right borders of T-DNA; 2 × 35S, duplicated CaMV 35S promoter; RdRp, RNA-dependent RNA polymerase; MP, movement protein; 16K, 16 kDa cysteine-rich protein; Rz, self-cleaving ribozyme; NOSt; nopaline synthase terminator; CP, coat protein; R1 and R2, attR1 and attR2 sites.
Agrobacterium infiltration on gerbera scape
A. tumefaciens carrying TRV1 and confirmed TRV2 constructs were incubated separately in LB liquid medium containing the same antibiotics grown overnight at 28°C shaking with 200rpm. Subsequently, a new culture was made by adding 100µl TRV1 or TRV2::GOI to a 50ml blue cap centrifuge tube with 20ml YEB (every 1000ml containing 5g beef extract, 5g bacteriological peptone, 5g sucrose, 1g yeast extract and 2ml 1M MgSO4) + 2µl 200mM acetosyringone + 20ul 50mg/ml kana + 200ul 1M MES. These cultures were grown at least 15 hours in 28°C shaker (200rpm) after which the O.D. value was measured. Cells were pelleted by 10min centrifugation at 3000 rpm. Pellets were resuspended with fresh MMA (every 1000ml MMA containing 20g sucrose, 5g MS salt without vitamins, 1.95g MES and 1ml 200mM acetosyringone; pH = 5.6) to adjust to an OD of 2. Equal volumes of agrobacteria carrying pTRV1 and each modified pTRV2 derivatives were mixed making the final OD of 1.0. After incubation at 28°C with 200rpm shaking for 1 hour, cultures in MMA were ready for agro-infiltration.
2xCaMV35S pro RdRp MP 16K Rz NOSt
2xCaMV35S pro CP R
2 ccdB Rz NOStR1CmR
630bp
274bp
294bp
428bp
TRV2::GUS
TRV2::ghPDS
TRV2::ghPG1
TRV2::ghsit
TRV2::ghPG1+ghsit
pTRV1
pTRV2
294bp428bp
313bp
282bp
TRV2::ghCHS1
TRV2::ghCHS4
LB
LB
RB
RB
a
b

Chapter 5
112
5
As in the procedure described by Deng et al. (2012) for gene silencing in gerbera inflorescences, the agro-infiltrates with 1:1 mixtures of TRV1 and TRV2::GOI constructs were applied to scapes. When the scape was about 5cm in length (used in this study), the flower stem close to the flower bud was scratched by a metal nail file to remove the outside cell layer for around 1cm length and less than 1/3 of the outer perimeter of the stem. Agrobacterium-soaked cotton was covered on the scratched area bound loosely with a tape for agro-infiltration. Gerbera genotypes SP1, SP2, FP1 that previous were used as parents to construct two crossing populations (Chapter 3; Fu et al. 2017) were used for infiltration. Two independent experiments were carried out. Nine inflorescences for each single candidate gene silencing in genotypes SP2 and FP1 were infiltrated with TRV1 + TRV2::ghPG1 or TRV1 + TRV2::ghsit. For ghPG1 and ghsit co-suppression, 13~16 inflorescences were used for each parent (SP1, SP2 and FP1). Five inflorescences for each genotype were infiltrated with the negative control TRV1 + TRV2::GUS; and three to six inflorescences for each reporter gene (TRV1 + TRV2::ghPDS; TRV1 + TRV2::ghCHS1; TRV1 + TRV2:: ghCHS4) as positive control were treated simultaneously as indicated.
Expression analysis and disease test
To test the Botrytis infection on TRV-treated gerbera plants, flowers were harvested at around 2 to 3 weeks post Agrobacterium infiltration when the first and second whorls of disc florets were fully developed, which is generally accepted as the time for harvesting. Ray florets (in the sector right above the scar due to the scratching) from each inflorescence were collected for Botrytis inoculation and for total RNA isolation (i.e. flash frozen in liquid nitrogen (LN) then stored at -80 °C).
To analyze the efficiency of candidate gene silencing, LN-frozen single ray floret was ground and total RNA was isolated using Trizol reagent (Invitrogen) and cDNA was synthesized according to the iScript™ cDNA Synthesis Kit (Bio-Rad) for Real time quantitative PCR (described in Chapter 4 in detail). Relative quantification (Livak and Schmittgen 2001) was used to analyze data from the real-time quantities PCR. Target gene and reference gene (GAPDH) were amplified using the cDNA of TRV2::GUS plants and TRV2::GOI plants. The change in expression of the target gene in silenced plants was normalized to the reference gene (GAPDH) relative to control plants (as 1, TRV2::GUS plant in this experiment) and represented as fold change. The method is called 2-ΔΔCT method, where ΔΔCT = (CT, Target - CT, GAPDH) TRV2::GOI - (CT, Target - CT, GAPDH) TRV2::GUS. Three ray florets from different silenced inflorescences and three technical replications for each treatment was performed.
For Botrytis resistance testing, single fresh ray florets were inoculated with a 2µl-droplet of B. cinerea (strain B05.10) spore suspension with a concentration of 5×10⁵/ml. Ray florets were put on wet filter paper in plastic containers and containers were put in plastic bags to maintain a high humidity at room temperature (described in Chapter 4 in detail). From individual inflorescence, for each treatment 5-6 ray florets were collected for the inoculation. The inoculation droplets resulted in a spreading lesion on the ray florets and lesion sizes of inoculated ray florets were obtained after 24 hours post infection from images using ImageJ. Data from different gene silenced treatments were analyzed by one-way ANOVA in SPSS (Version 21).
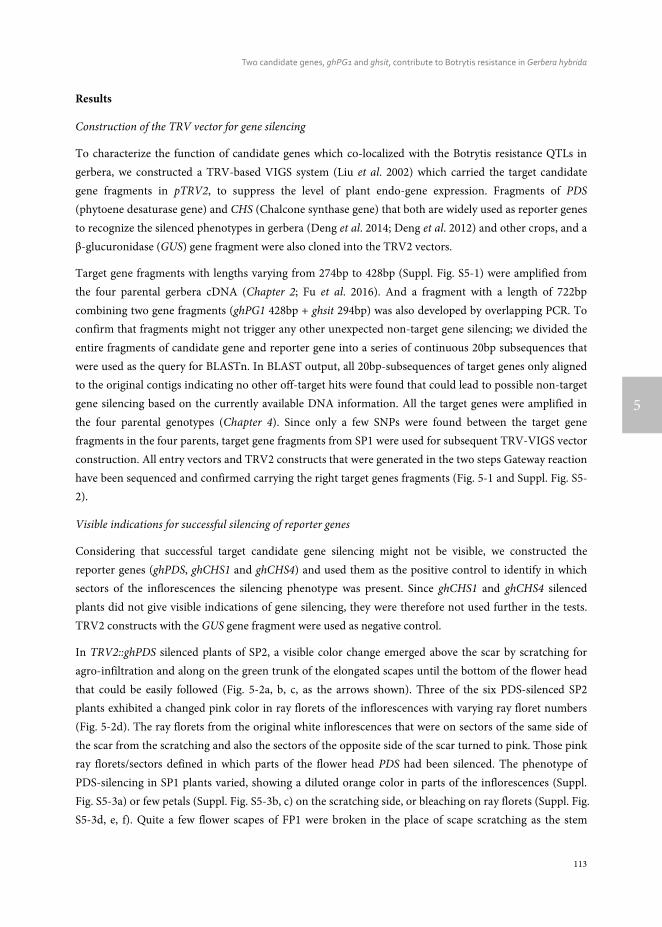
Two candidate genes, ghPG1 and ghsit, contribute to Botrytis resistance in Gerbera hybrida
113
5
Results
Construction of the TRV vector for gene silencing
To characterize the function of candidate genes which co-localized with the Botrytis resistance QTLs in gerbera, we constructed a TRV-based VIGS system (Liu et al. 2002) which carried the target candidate gene fragments in pTRV2, to suppress the level of plant endo-gene expression. Fragments of PDS (phytoene desaturase gene) and CHS (Chalcone synthase gene) that both are widely used as reporter genes to recognize the silenced phenotypes in gerbera (Deng et al. 2014; Deng et al. 2012) and other crops, and a β-glucuronidase (GUS) gene fragment were also cloned into the TRV2 vectors.
Target gene fragments with lengths varying from 274bp to 428bp (Suppl. Fig. S5-1) were amplified from the four parental gerbera cDNA (Chapter 2; Fu et al. 2016). And a fragment with a length of 722bp combining two gene fragments (ghPG1 428bp + ghsit 294bp) was also developed by overlapping PCR. To confirm that fragments might not trigger any other unexpected non-target gene silencing; we divided the entire fragments of candidate gene and reporter gene into a series of continuous 20bp subsequences that were used as the query for BLASTn. In BLAST output, all 20bp-subsequences of target genes only aligned to the original contigs indicating no other off-target hits were found that could lead to possible non-target gene silencing based on the currently available DNA information. All the target genes were amplified in the four parental genotypes (Chapter 4). Since only a few SNPs were found between the target gene fragments in the four parents, target gene fragments from SP1 were used for subsequent TRV-VIGS vector construction. All entry vectors and TRV2 constructs that were generated in the two steps Gateway reaction have been sequenced and confirmed carrying the right target genes fragments (Fig. 5-1 and Suppl. Fig. S5-2).
Visible indications for successful silencing of reporter genes
Considering that successful target candidate gene silencing might not be visible, we constructed the reporter genes (ghPDS, ghCHS1 and ghCHS4) and used them as the positive control to identify in which sectors of the inflorescences the silencing phenotype was present. Since ghCHS1 and ghCHS4 silenced plants did not give visible indications of gene silencing, they were therefore not used further in the tests. TRV2 constructs with the GUS gene fragment were used as negative control.
In TRV2::ghPDS silenced plants of SP2, a visible color change emerged above the scar by scratching for agro-infiltration and along on the green trunk of the elongated scapes until the bottom of the flower head that could be easily followed (Fig. 5-2a, b, c, as the arrows shown). Three of the six PDS-silenced SP2 plants exhibited a changed pink color in ray florets of the inflorescences with varying ray floret numbers (Fig. 5-2d). The ray florets from the original white inflorescences that were on sectors of the same side of the scar from the scratching and also the sectors of the opposite side of the scar turned to pink. Those pink ray florets/sectors defined in which parts of the flower head PDS had been silenced. The phenotype of PDS-silencing in SP1 plants varied, showing a diluted orange color in parts of the inflorescences (Suppl. Fig. S5-3a) or few petals (Suppl. Fig. S5-3b, c) on the scratching side, or bleaching on ray florets (Suppl. Fig. S5-3d, e, f). Quite a few flower scapes of FP1 were broken in the place of scape scratching as the stem

Chapter 5
114
5
extended (Suppl. Fig. S5-4a, b) and few even fell off, before the flower blossoming. Out of the scape without stem breaking after flowering, no detectable phenotype was found in the reporter gene silenced inflorescences indicating that gene silencing in FP1 was likely ineffective.
Fig. 5-2 The phenotypes of SP2 plants after agro-infiltration with TRV2::ghPDS constructs. The crosses in (a) and (b) represent the position of scratching and the scar still remain with scape extension. The arrows on (a), (b), (c) track the potential transmission of the virus, from the scar left till the bottom of the flower head. Three gerbera flowers in (d) indicate the color changed sectors in the whole gerbera inflorescences and the number of pink ray florets is varied.
Gene expression in silenced ray florets
To quantify the suppression of the candidate and reporter gene expression after VIGS, we used a relative quantification method to determine the efficiency of silencing. The relative expression of target gene in negative control TRV2::GUS plants using the formula were set as 1. The change in expression of target genes was normalized to the reference gene (ghGAPDH) relative to TRV2::GUS silenced plant and represented as fold change.
The expression levels of PDS gene after normalization in TRV2::ghPDS plants showed a significant decrease (P<0.05) to PDS expression in control TRV2::GUS plants of SP1 and SP2 (Fig. 5-3a). There was a decrease in PDS-silenced FP2 of PDS without a statistically significant difference. The expression of PG1 and sit were analyzed in the two-gene-silenced SP1 plant, and both genes were successfully silenced, albeit to a different extent (Fig. 5-3b). Significant silencing of PG1 expression was only in SP2 TRV2::ghPG1 plants, but not in TRV::ghPG1+ghsit plants. While the relative sit expression in SP2 TRV2::ghsit plants and TRV2::ghPG1+ghsit plants decreased significantly (Fig. 5-3c). The expression levels of neither PG1 nor sit were found decreased statistical significantly on any gene silenced treatment in FP1 (Fig. 5-3d).
a b c d
× ×

Two candidate genes, ghPG1 and ghsit, contribute to Botrytis resistance in Gerbera hybrida
115
5
Fig. 5-3. Relative gene expression level of reporter gene PDS and candidate genes in silenced plants using 2-ΔΔCT method (Livak and Schmittgen 2001). The change in expression of target gene in silenced plant which was normalized to reference gene (GAPDH) relative to control plant (as 1, TRV2::GUS plant in this experiment) and represent as fold change. The aster indicated the significant difference compared with the related gene expression on control TRV2::GUS plants (P<0.05). a, relative PDS expression on three parental TRV2::ghPDS silenced plants. b, relative PG1 and sit expression on SP1 TRV2::GUS silenced plants and TRV2::ghPG1+ghsit silenced plants;c, relative PG1 expression on SP2 TRV2::GUS silenced plants, TRV2::ghPG1 silenced plants and TRV2::ghPG1+ghsit silenced plants; relative sit expression on SP2 TRV2::GUS silenced plants, TRV2::ghsit silenced plants and TRV2::ghPG1+ghsit silenced plants; d, relative PG1 expression on FP1 TRV2::GUS silenced plants, TRV2::ghPG1 silenced plants and TRV2::ghPG1+ghsit silenced plants; relative sit expression on FP2 TRV2::GUS plants, TRV2::ghsit silenced plants and TRV2::ghPG1+ghsit silenced plants.
Disease test on candidate gene silenced ray florets
To test Botrytis resistance on ray florets after VIGS, single ray florets were collected for Botrytis inoculation. According to the results from the indicator gene, we collected 5-6 ray florets in the sectors just right above the scratching scar being around or less than 1/4 of the total ray florets (Suppl. Fig. S5-5a). After 24 h post inoculation, lesion sizes of each ray floret from target gene silenced plants and GUS gene silencing treatment can be observed using ImageJ. Lesion regions were identified and lesion size difference was analyzed with one-way ANOVA test (Suppl. Fig. S5-5b). The number of ray florets sampled from each parent and each silencing treatment for disease test was shown in Suppl. Table S5-2.
Compared with the mean lesion size of control treatment (TRV2::GUS), the mean lesion size on ray florets from TRV2::GOI silenced plants showed a decrease on the three genotypes used (Fig. 5-4a, b, c). Due to the material limitations, SP1 was only used for two genes (TRV2::ghPG1+ghsit) co-suppression. The lesion size of TRV2::ghPG1+ghsit co-silenced plants were reduced by 80% compared to TRV2::GUS silenced plants. The same amount (81%) reduction was also observed in SP2 with TRV2::ghPG1+ghsit co-silenced (Suppl. Fig. S5-6). There were significant differences (P<0.05) between TRV2::ghPG1+ghsit and TRV2::ghsit silenced plants compared to TRV2::GUS silenced SP2 plants, while no significant difference between TRV2::PG1+sit co-silenced plants compared to TRV2::PG1 silenced plants was found. Although the lesion size of FP1 ray florets came with less reduction and more variation than other parents, it seems a bigger lesion reduction in FP1 came from the TRV2::PG1 silenced plants. Significant differences could be
0
0.5
1
1.5
2
2.5
d
0.0
0.3
0.6
0.9
1.2
1.5
1.8
**
*
c
0
0.3
0.6
0.9
1.2
1.5
1.8
TRV2::GUS TRV2::ghPG1+ghsit TRV2::GUS TRV2::ghPG1+ghsit
*
*
0.0
0.3
0.6
0.9
1.2
1.5
1.8
TRV2::GUS TRV2::ghPDS TRV2::GUS TRV2::ghPDS TRV2::GUS TRV2::ghPDS
*
*
SP1PDS
SP2PDS
FP1PDS
SP1PG1
SP1sit
SP2PG1
SP2sit
FP1PG1
FP1sit
Rela
tive
exp
ress
ion
Rela
tive
expr
essi
on
Rela
tive
exp
ress
ion
Rela
tive
exp
ress
ion
a b

Chapter 5
116
5
observed in the mean of lesion size between the four treatments of FP1, yet in each treatment, large variations existed.
Discussion
The use of VIGS to study gene function in inflorescences
In this study, we adopted the TRV-based induced gene silencing system that was previously described for gerbera (Deng et al. 2014; Deng et al. 2012) to inspect the function of two candidate genes related to Botrytis resistance. Deng et al. (2012) developed different methods for agro-infiltration on gerbera, syringe infiltration and vacuum infiltration on newly developed leaves, and inoculating of the Agrobacteria on the surface of scapes after mechanical wounding. The latter was developed especially for studying the gene function in floral tissues, and two chalcone synthesis genes were successfully silenced using this method by the authors themselves (Deng et al. 2014). Similarly, direct injection of the Agrobacteria suspension was employed into the stalk of the raceme (floral bud) of Phalaenopsis for silencing genes related to floral morphological features (Lu et al. 2007), although they found leaf injection is more easily (Hsieh et al. 2013). Agro-injection was also applied through the peduncle that is attached to a tomato fruit to study the function of genes related fruit developing and ripening (Fu et al. 2005; Orzaez et al. 2009; Fantini and Giuliano (2016). Since these genes expressed in the later plant developmental stages, gene suppression can be utilized in the reproductive parts of a plant directly, e.g. the flowers and fruits, instead of young leaves. Deng et al. (2012) indicated that the best time for agro-infiltration was gerbera seedling at the stage when the leaf shape starts to turn from round to lobed. However, it will take at least three months from this stage to a mature gerbera that could be able to flower (information from Florist Holland B.V. and Schreurs Holland B.V.). Considering the time (from 5 cm scape to flowering only need 3-4 weeks) and ease of operation (high pressure exists in gerbera scapes that make injection by syringe difficult), we chose the agro-infiltration method using mechanical wounding on scapes.
a b
c
aaab
b
aa
ab
b
cb
Fig. 5-4 The lesion size (cm2) of Botrytis inoculation at 24hpi on different ray florets of parental silenced plants. a, SP1; b, SP2; c, FP1. Different letters indicate significant difference (P<0.05). Every single ray florets for ImageJ measurement was coded with a number, and ray florets with number such as 49, 55, 73, 74 etc were indicated the outliers of box-plots.

Two candidate genes, ghPG1 and ghsit, contribute to Botrytis resistance in Gerbera hybrida
117
5
Variations in responses exist for TRV-based VIGS infiltration among gerbera cultivars. Deng et al. (2012) described that responses could be with a typical virus induced silencing phenotype (photobleaching), without photo-bleached symptoms or with severe virus infection symptoms. The three genotypes we used for this study didn’t show severe virus infection symptoms indicating that these genotypes might be tolerant for the side effect that TRV-VIGS could deliver. We observed a visible color changing phenotype in the reporter gene ghPDS silenced plants. The silenced phenotypes on the inflorescences were detected as described in Deng et al. (2014), on the side of the scape where it was wounded for agro-infiltration. The PDS-silenced plants in SP2 even showed a recognizable clue not only on the inflorescences but also on the scape by coloration which apparently tracks the virus movement. It also indicates the virus transmits mainly by means of the vascular system. Wege et al. (2007) also found patterns of photo-bleaching mainly occurred along the vascular system in California poppy, and there was a separated boundary of photobleached and unsilenced (green) tissues parallel to the vascular bundle. With these indications, we only sampled the ray florets above the scar in candidate gene(s) silenced plants to observe lesion size after Botrytis inoculation.
The TRV-based VIGS can be successfully performed at least in two gerbera parents (SP1 and SP2), since the phenotypes of the PDS reporter gene silenced in these plants can be readily recognized and a significant decrease in gene expression confirmed this. We sampled the ray florets from the inflorescence on the same side above the scar and inoculated the Botrytis on the silenced plant ray florets and detected reduced lesion sizes comparing with the control treatment. However, in FP1, we didn't notice a visible color change on the reporter gene silenced plants nor a significant decrease in gene expression, as was detected for SP1 and SP2. There was a large variation in FP1 between target gene silenced plants and control plants in lesion size reduction in ray florets after Botrytis infection. It indicated that the target genes might not be silenced in most FP1 inflorescences. We found quite a few inflorescence stems that were broken on the wounded place from the stem scratching. Apparently, FP1 is more sensitive to stem wounding. When stems are stretching, the difference in growth speed between the scratched side and the unscratched side of the stem as well as the gradually increased weight of flower head may lead to problems for stem integrity. Gerbera needs a straight-stand and firm stem to support the relative large flower head. Stem bending occurs in gerbera and was found correlated with low stem lignin levels (Perik et al. 2014). Actually, the stem in FP1 is harder than others (Y. Fu pers. observation) and high lignin content could be expected in this cultivar. The unbalanced growth of the two sides might be the reason for FP1 inflorescence stems to break after stem injury. The result might be that the virus cannot transmit upward, and that finally results in low efficiency and success of VIGS in FP1.
The possible involvement of PDS for gerbera flower coloration
We studied the VIGS system on flower inflorescences to characterize the previously identified candidate gene function. Since targeted candidate gene silencing would not be expected to give any direct visual phenotype, several reporter gene constructs were tested to track the timing and location of silencing. We expected to see recognizable phenotypes that occur in the absence of the reporter gene product in the stems and/or leaves or inflorescences to guide to the exact timing and extent of silencing. PDS encodes an enzyme in the carotenoid biosynthesis pathway and carotenoids protect chlorophyll from photo-bleaching.

Chapter 5
118
5
PDS gene-silenced plants demonstrate a photo-bleached phenotype and as such TRV2::PDS VIGS constructs are widely used as the reporter gene for tobacco, petunia and other crops (Deng et al. 2012; Jiang et al. 2011; Senthil-Kumar and Mysore 2014). CHS is part of the flavonoid biosynthesis pathway contributing to the flower color. Silencing phCHS in the purple Petunia resulted in white corollas (Chen et al. 2004). In gerbera, there are three members (ghCHS1, ghCHS3, ghCHS4) in CHS gene family, and two of them (ghCHS1, ghCHS4) are highly expressed in gerbera ray florets (Helariutta et al. 1995; Deng et al. 2014). Only ghCHS1 seems to be contributing to flavonoid biosynthesis in ray florets. Silencing ghCHS1 in two gerbera cultivars containing different kinds of anthocyanin pigmentation (one pelargonidin and one cyanidin) resulted in a visible color loss, from orange or purple to milky white in partial sectors of gerbera inflorescences (Deng et al. 2014). The ghCHS4 was successfully silenced in two gerbera cultivars with a deceased gene expression and flavonoids content as described in Deng et al. (2014), whereas no visible color change on ray florets of the two was observed.
In our experiments, no obvious phenotype on either ghCHS1 or ghCHS4 silenced plants of the three parental genotypes was observed. The possible reason might come from the color of the three genotypes themselves which are different from the two gerbera genotypes used by Deng et al. (2014). The white and yellow colored parents (SP2 and FP1) might not contain any anthocyanin and the orange of the parent (SP1) is probably due to carotenoids content. The SP1, PDS silenced plants produced the photo-bleached phenotype in the orange ray florets, yet not in green parts of the plants. Carotenoids contribute to the orange-red colors in flowers (Tanaka et al. 2008) and the gene PDS is responsible for synthesizing carotenoids. It seems highly likely that the reduction of flower pigment on SP1 was originating from the reduced expression of phytoene desaturase (PDS) and a likely subsequent reduction of carotenoids. To our surprise, silencing the of PDS in the white parent SP2 leads to the pink color of ray florets and also on the scape. In Chrysanthemum, a carotenoid cleavage dioxygenase gene (cmCCD4a) that could degrade carotenoid to a colorless compound was found to contribute to white color and suspension the expression of cmCCD4a produced a yellow-colored Chrysanthemum flower (Ohmiya et al. 2006). Deng et al. (2012) found the expression of 2-PS gene was downregulated to a very low level in PDS-silenced gerbera. 2-PS gene (previously named as ghCHS2) belongs to CHS superfamily of type III polyketide synthase and catalyzes gerbera specific secondary metabolites gerberin and parasorboside (Eckermann et al. 1998; Koskela et al. 2011). Therefore, we assume that the PDS gene for carotenoid biosynthesis somehow is involved in gerbera coloration, and that the balance between the carotenoids and flavonoids determine the final presented color of gerbera.
The function of candidate genes for Botrytis cinerea resistance
In our previous studies, we developed Botrytis disease tests on whole inflorescence, bottom and ray floret and found several QTLs for these tests and candidate genes related to these QTLs individually. Two of those candidate genes, ghPG1 and ghsit, which were mapped in QTL regions from the ray floret test were further characterized in this study. The two candidate genes are the homologs of the genes responsible for Botrytis infection in tomato. Polygalacturonases (PGs) are cell-wall-degrading enzymes and participate in tomato ripening (Cantu et al. 2009). PGs, among one of the tomato ripening-associated genes, have been found to facilitate Botrytis susceptibility (Cantu et al. 2009). The ABA-deficient sitiens mutant in tomato is

Two candidate genes, ghPG1 and ghsit, contribute to Botrytis resistance in Gerbera hybrida
119
5
impaired in the last step of ABA biosynthesis (Taylor et al. 1988; Rock et al. 1991). The sitiens mutant with reduced ABA level is more resistant to Botrytis than wild type tomato plants that have higher amounts of ABA (Audenaert et al. 2002). The sit mutant also accumulates H2O2 and changes cell walls timely and efficiently to resistance Botrytis infection (Asselbergh et al. 2007).
The normal function of these two genes might be beneficial to Botrytis infection, while when the gene expressions are suppressed, Botrytis might fail to take advantage of the genes for infection. Plant genes/alleles that facilitate pathogen infection are defined as susceptibility (S) genes/alleles and an exclusive S-gene list is given by van Schie and Takken (2014). These two genes are part of that list. In tomato, simultaneous suppression of two ‘S-genes’, PG (polygalacturonase) and EXP1 (expansin), lead to a reduced susceptibility to B. cinerea (Candu et al.2008). Similarly, silencing two signaling components EDS1 and SGT1 by VIGS enhanced resistance to B. cinerea in Nicotiana benthamiana (Oirdi and Bouarab 2007). Silencing S-genes can limit the ability of the pathogen for infection and that was performed in this study. A remarkable reduction of lesion size was found in these S-gene silenced gerbera ray florets and resulted from slowing the spreading of Botrytis on ray florets 24hpi. Denby et al (2004) considered that the variations in lesion size of Arabidopsis ecotypes for Botrytis infection were caused by either time prior to lesion initiation or the lesion's growth rate. Suppression of these two genes might postpone the lesion initiation and presented a delayed invasion at 24hpi on the ray florets.
Genes contributing to fruit ripening are considered to induce B. cinerea susceptibility in tomato since the two processes: fruit ripening and successfully B. cinerea infection require the expression of cell-wall-degrading enzymes (Cantu et al. 2008). B. cinerea is probably hitchhiking with the process of fruit ripening to penetrate the plant cell. Gerbera inflorescences after cutting inevitably experience senescence. Loss of membrane integrity is an early stage of plant senescence (Fan et al.1997). ABA and ethylene participate in the regulation of plant senescence and promote this process. Thus, reducing the amount of ABA will prevent senescence. It is easy to understand that both of the two candidate genes are related with senescence and that senescent cell walls support Botrytis infection. The two genes interacted with Botrytis in a somehow similar way which might be the reason that no further decrease of the lesion size on SP2 for the two gene silenced constructs was found compared with TRV2::ghsit alone.
Based on the visible indications from TRV2::PDS gene silenced plants of SP2, there may only be a small part, of the ray florets on the flower inflorescence be silenced. We also constructed TRV2 vectors carrying the candidate gene ghCHI that mapped in a botrytis resistance QTLs from whole flower test. However, when we sprayed the Botrytis spore on the whole flower, no visible difference was found (data not shown). The phenotypes after Botrytis infection may be difficult to detect as whole inflorescences are sprayed for the botrytis test, but only a small part of the ray petals are silenced based on the reporter gene. To explore the function of candidate genes that were found on the whole inflorescence or bottom test, a stable transformation may be needed for confirming the role in botrytis resistance.
This study confirmed that the two candidate genes probably are among the determining genes leading to the variation of Botrytis resistance in gerbera. After 24h of Botrytis in vitro inoculation on the ray florets, a significantly delayed spread of lesions was observed on candidate gene silenced ray florets compared to

Chapter 5
120
5
controls. As a crop without genome sequence, using a candidate gene approach could be an efficient method to pinpoint possible causal genes. VIGS here provided a rapid way to study the relationship between gene expression and susceptibility to Botrytis. Using markers developed from the causal genes themselves could make marker-assisted selection more accurate and can avoid the risk of loss of linkage due to recombination when using more distant markers. Further research will have to show the value of the combined effects of the best alleles for the two genes ghsit and ghPG1 in gerbera with respect to botrytis incidence and resistance under normal greenhouse and postharvest conditions.

Two candidate genes, ghPG1 and ghsit, contribute to Botrytis resistance in Gerbera hybrida
121
5
Supplementary Tables and Figures
Table S5-1 Primers used in this study
Primer name Oligonucleotide sequence (5'-3') note
ghPDS_B1_274_F ggggacaagtttgtacaaaaaagcaggctAGTAAAGTTTGCGATTGGGCT attB1 is underlined
ghPDS_B2_274_R ggggaccactttgtacaagaaagctgggtAAGTCTCTCAGGTGGGTTGC attB2 is underlined
ghCHS1_B1_313_F ggggacaagtttgtacaaaaaagcaggctAATTGCGTCTATCAAGCGGA
ghCHS1_B2_313_R ggggaccactttgtacaagaaagctgggtAGGTGGTGCAGAAGATGAGG
ghCHS4_B1_282_F ggggacaagtttgtacaaaaaagcaggctTGCAGTTACTTTTCGTGGGC
ghCHS4_B2_282_R ggggaccactttgtacaagaaagctgggtTGAAAGGCCTCTACCAAGCT
ghPG1_B1_294_F ggggacaagtttgtacaaaaaagcaggctAAAGCCTCCCCACTTCTACC AF
ghPG1_B2_294_R ggggaccactttgtacaagaaagctgggtGCCGCTGTATCTAGCAAACC
ghsit_B1_428_F ggggacaagtttgtacaaaaaagcaggctCTGTCGCTGCACTGGTTATC
ghsit_B2_428_R ggggaccactttgtacaagaaagctgggtCAGCTGCTCCAACTTCGATC BR
ghPG1+ghsit_BF+AR GGTAGAAGTGGGGAGGCTTTCAGCTGCTCCAACTTCGATC BF+AR
ghPG1+ghsit_AR+BF GATCGAAGTTGGAGCAGCTGAAAGCCTCCCCACTTCTACC AR+BF
attL1 TCGCGTTAACGCTAGCATGGATCTC sequencing
attL2 ACATCAGAGATTTTGAGACACGGGC sequencing
TRV2 GTTTTTATGTTCAGGCG sequencing
ghPDS_qPCR_F GTGGCCAAGTCAGGCTAAAT qRT-PCR
ghPDS_qPCR_R ACATAAGCATCGCCTTTGAT qRT-PCR
ghPG1_qPCR_F GTGGGGTTTTCTGGCTACG qRT-PCR
ghPG1_qPCR_R AGTATCATTCGCGCCGTTAC qRT-PCR
ghsit_qPCR_F TTCAACCACCTGTTTTGCAG qRT-PCR
ghsit_qPCR_R AATTCTGGGATTTGTTCAAGATT qRT-PCR
ghGAPDH_qPCR_F CCAGGAACCCAGAGGAGATACC qRT-PCR
ghGAPDH_qPCR_R GGAGCGGATATGATGACCTTCTTG qRT-PCR
Table S5-2 The number of ray florets used for Botrytis disease test.
Treatments
TRV2::GUS TRV2::ghPG1 TRV2::ghsit TRV2::ghPG1+ghsit
pare
nts SP1 27 (5)* - - 52 (10)
SP2 22 (5) 21 (4) 20 (4) 84 (14)
FP1 32 (5) 34 (6) 34 (6) 57 (10)
* the number of ray florets collected for disease test; the number in brackets are indicating from how many inflorescences the ray florets were collected.

Chapter 5
122
5
Fig. S5-1 The inserted target gene fragment sequences into the TRV2 vector. Underlined sequences are indicating primers sites.
>ghPDS; 274bp AGTAAAGTTTGCGATTGGGCTCTTGCCAGCAATGTTAGGTGGACAGGCTTATGTTGAGGCTCAAGATGGTTTGAGTGTTCAAGACTGGATGAGAAAGCAAGGCATACCAGATCGGGTTACTACTGAGGTGTTTATTGCCATGTCAAAGGCGTTAAACTTCATAAATCCAGATGAACTTTCTATGCAATGTATTCTCATTGCTTTGAACAGGTTTCTTCAGGAGAAGCACGGTTCAAAGATGGCATTTTTAGATGGCAACCCACCTGAGAGACTT >ghCHS1; 313bp AATTGCGTCTATCAAGCGGATTATCCCGATTACTATTTTCGGATCACCAAGAGTGAACACATGGTGGATCTCAAAGAGAAATTCAAGCGCATGTGTGACAAGTCGATGATAAGGAAACGTTACATGCACATCACAGAGGAGTATCTTAAACAAAACCCTAACATGTGCGCATACATGGCGCCGTCGCTCGACGTCCGGCAAGACCTGGTCGTCGTCGAAGTCCCAAAGCTCGGCAAAGAAGCCGCCATGAAAGCCATCAAAGAATGGGGACACCCCAAATCCAAGATCACCCACCTCATCTTCTGCACCACCT >ghCHS4; 282bp TGCAGTTACTTTTCGTGGGCCTGATGAAACCCATCTTGATAGCCTTGTGGGCCAAGCATTGTTTGGTGACGGGGCTGCTGCTATCATAGTTGGGTCCGACCCGTTGTTGGGCCAAGAAAAGCCTCTTTTTGAGATGGTTTATGCGGCCCAAACCATTCTCCCTGATAGCGAGGGGGCGATTGATGGGCATCTTCGTGAGGTCGGGCTTACCTTTCATCTTCTTAAGGATGTTCCTGGGCTTATATCAAAACACATCGATAAGAGCTTGGTAGAGGCCTTTCA >ghsit; 428bp CTGTCGCTGCACTGGTTATCGACCCATTGCTGACGTCTGTAAAAGTTTCGCTGCTGACGTGGATATTGAGGATTTGGGGCTTAATTCTTTCTGGAAAAAGGGCGAAAATGAAGACCCGGATGAAAAAATTCATAAACTACCCTTTTATGATTCGAAACAGATATGTACTTATCCAGAGTTCTTGAAAAAAGAATATCAGAAATATGAGAAAACATCTTGGTATAGTCCGGTTTCTATAAAAGATCTTCAGAGCTTACTGGAATCAAGTTCAGCTGAAAATGGGGTGACTGCAAAGTTAACTGTTGGTAACACAGGCATAGGTTATTATAAGGAAAATCAGCATTATGATAAGTACATTGATCTTAGGTTTATCCCTGATCTCTCTATAATTAAGAAAGATGACTCTAAGATCGAAGTTGGAGCAGCTG >ghPG1; 294bp AAAGCCTCCCCACTTCTACCCCTGGAGTTCACTTTATTTACCAAACTAGCCTCCACCCACTCTCTTTCTTCTCACCTCTCCTCCTTCTGCGCCACCGCCAACTTATTCTGCTTTTCCGACACCGGCACCACAGCCGGCGGCCAGTCAAATCCAAGCAAAGACTCAAACTTCGCCGTCTACGACGGCAAACGATTCACCAACTACGGCGCCGGCCGCATTTCCGGCGGAGACACGTTCAAGAACTACTCGGAAAACACCAACTTTGCCGTTAGTGGGTTTGCTAGATACAGCGGC >GUS; 648bp CACTTACAGGCGATTAAAGAGCTGATAGCGCGTGACAAAAACCACCCAAGCGTGGTGATGTGGAGTATTGCCAACGAACCGGATACCCGTCCGCAAGTGCACGGGAATATTTCGCCACTGGCGGAAGCAACGCGTAAACTCGACCCGACGCGTCCGATCACCTGCGTCAATGTAATGTTCTGCGACGCTCACACCGATACCATCAGCGATCTCTTTGATGTGCTGTGCCTGAACCGTTATTACGGATGGTATGTCCAAAGCGGCGATTTGGAAACGGCAGAGAAGGTACTGGAAAAAGAACTTCTGGCCTGGCAGGAGAAACTGCATCAGCCGATTATCATCACCGAATACGGCGTGGATACGTTAGCCGGGCTGCACTCAATGTACACCGACATGTGGAGTGAAGAGTATCAGTGTGCATGGCTGGATATGTATCACCGCGTCTTTGATCGCGTCAGCGCCGTCGTCGGTGAACAGGTATGGAATTTCGCCGATTTTGCGACCTCGCAAGGCATATTGCGCGTTGGCGGTAACAAGAAAGGGATCTTCACTCGCGACCGCAAACCGAAGTCGGCGGCTTTTCTGCTGCAAAAACGCTGGACTGGCATGAACTTCGGTGAAAAACCGCAGCAGGGAGGCAAACAATGA
ghPDS ghCHS1 ghCHS4
ghsit ghPG1 ghPG1+ghsit
1500
500400300200
75
Fig. S5-2 The fragment size of target genes transformed to Agrobacterium tumefaciens. Agro-bacterial suspension with TRV2::GOI constructs were used as a template for PCR and the primers were the same as the primers for amplifying target genes.

Two candidate genes, ghPG1 and ghsit, contribute to Botrytis resistance in Gerbera hybrida
123
5
Fig. S5-3. The variation for PDS silencing in SP1 inflorescences. a, the phenotype of PDS-silencing in SP1 plants showed a diluted orange color in parts of the inflorescences; b and c, one or two ray florets with a diluted orange color; d, e and f, bleaching on ray florets.
Fig. S5-4. The stem break happened on FP1. As stem extension and the increased flower head of gerbera, the flower stem of FP1 were broken at the site of scratching for agro-infiltration.
Fig. S5-5. The ray florets sampled for Botrytis inoculation (a) and the area circled for measuring the lesion size, the lesion size of the petals from top to bottom are 0.0024cm2, 0.0068cm2
and 0.0105cm2.

Chapter 5
124
5
Fig. S5-6. Ray florets from SP2 (white cultivar) and FP1 (yellow cultivar) inoculated with Botrytis at 24hpi (part). Controls were TRV2::GUS silenced plants and the other treatments were indicated. For each row, the first five ray florets were sampled from one plant and the following 5 (or 6) were the sample from another plant. The bottom three ray florets were inoculated with MQ.

Chapter 6 General discussion

Chapter 6 General discussion
126
6
Gerbera gray mold, caused by Botrytis cinerea, is a serious and unpredictable problem that can happen in all steps of gerbera cut flower production and post-harvest life. Breeding gerbera with improved Botrytis resistance is one of the most important objectives gerbera breeders would like to achieve. Plant resistance to B. cinerea is considered a quantitative disease resistance (QDR) which is under polygenic control, and is highly affected by the environment. Classical breeding is based on a selection of desired phenotypes and has been used for improving many traits in ornamentals. However, for QDR improvement by classical breeding may turn out to be much more difficult and time-consuming. The lack of ‘real’ Botrytis resistant gerbera and the difficulty to test resistance form obstacles for obtaining better performing varieties. Hence, classical breeding that employs only breeding based on phenotypes for Botrytis resistance in gerbera might be inefficient.
The main aim of this thesis was to make the first step to unravel the genetics of Botrytis cinerea resistance in Gerbera hybrida. The entire research took a top-down strategy. The study went from the generation of four parental transcriptome data sets, development of SNP markers (Chapter 2), construction of genetic maps and mapping of QTLs to identify the potential locations for Botrytis resistance (Chapter 3). This was combined with candidate gene searching in other crops, querying and mapping homologous genes (Chapter 4) and characterizing the candidate genes, which co-localized with QTLs (Chapter 5). The whole process not only helped us to unravel the genetics of Botrytis resistance in gerbera and develop genetic tools for gerbera improvement, but also could serve as guidance for developing genetic resources for other ornamental plants that start from scratch. In this chapter, the general discussion, I would like to discuss the findings of this thesis in view of results yielded from recently published studies.
Development of genomic and genetic resources for ornamental crops
The transition from phenotype-based breeding to genotype-based breeding requires a large amount of sequencing information and genetic resources. With these sequencing data, molecular markers can be developed for establishing the relationship between phenotypic variation and sequence polymorphisms. Once the connection of genotype and phenotype is established, molecular markers will assist phenotype-based classical selection. In general, the application of marker-assisted selection (MAS) for ornamental crops has been lagging behind other agricultural and horticultural crops (Arens et al. 2012; Smulders et al. 2012). It results partly from the fact that some very important breeding goals for ornamentals, like flower color or pattern, are easy to select for as the morphological trait. Moreover, the floriculture has traditionally been an industry with many small companies and hundreds of different species (and cultivars). The costs and time needed for the development of molecular markers for every specific ornamental crop limits the use of MAS. In addition, most ornamental crops are highly heterozygous with a complex genetic background which makes that, although markers might be available, it generally is much more difficult to apply them broader (Debener 2009). Most ornamental crops have a relatively large genome size. According to the RBG Kew Plant DNA C-value database (Bennett and Leitch 2002), the amount of DNA in the unreplicated haploid nuclear genome (known as the 1C-value) for widely used cut flowers, like Rosa (average) is 0.74 picograms (pg); Gerbera hybrida is 2.56 pg; Phalaenopsis (average) is 3.67 pg and Chrysanthemum (average) is 8.71 pg. Many ornamentals are polyploids as well, such as most

Unraveling the genetics of Botrytis cinerea resistance in Gerbera hybrida
127
6
roses, lily, carnation, freesia, gladiolus, alstroemeria and chrysanthemum. It results from evolution, selection and hybridization (either intraspecific or interspecific) during the hundreds and sometimes thousand years of domestication. It is not difficult to imagine that a great number of duplicated sequences probably exist in the genomes of ornamentals.
It could be the best time to start MAS in ornamental crops with the introduction of next generation sequencing and high-throughput genotyping. Development of transcriptome data based molecular marker discovery might be an economical option and can achieve many valuable genetic resources, which could be employed for gene identification. In Chapter 2, we generated a consensus contig with a total length of 51,360,054 bp. Based on the 1C-value, the whole genome size of G. hybrida is estimated to be about 5007 Mb (1 pg ≈ 9.78 × 10⁸ bp), and our transcriptome data thus would represent 1% of the whole genome. Although only a small percentage of sequence data, they are regarded as the best representative of the genome to understand gene activity. Hence, targeting on genic regions can decrease the complexity of large genomes and reduce the redundancy of sequencing repeat regions. Also, the genic regions are expected to have lower polymorphism rates and this makes the development of markers more accessible and results in more widely applicable markers.
Start from generation of transcriptome data
With the rapid progress of high-throughput next-generation sequencing technologies (NGS, e.g. Illumina Sequencing), quite a lot of ornamental genomic resources were generated from transcriptomes in recent years such as from Rosa (Dubois et al. 2012; Gao et al. 2016; Kim et al. 2012; Koning-Boucoiran et al. 2015; Yan et al. 2015; Zhang et al. 2016b); Chrysanthemum (Hong et al. 2015; Song et al. 2016a; Song et al. 2016b; Xu et al. 2013); Lilium (Shahin et al. 2012; Zhu et al. 2016); Tulipa (Shahin et al. 2012; Moreno/Leeggangers 2016); Paeonia (Li et al. 2015b; Wu et al. 2014; Zhang et al. 2015; Zhou et al. 2013) and Gerbera (Fu et al. 2016; Kuang et al. 2013; Laitinen et al. 2008; Laitinen et al. 2005; Laitinen et al. 2007; Li et al. 2015). Each transcript from expressed sequence tags (ESTs) sequencing represents a specific gene and can be annotated to provide a general awareness of the potential gene function into different categories, molecular function, biological process and cellular component. Producing these transcriptome data always comes with several particular targets in these studies, such as predicting certain candidate genes involved in the hormonal regulation pathway; related to flower color variation; activated under different biotic/abiotic stress; expressed during developmental stages; or for molecular marker development (Chapter 2, 3 & 4).
In Chapter 2, we generated a genetic resource by preparing cDNA libraries of all four gerbera parental genotypes and performed sequencing on an Illumina HiSeq platform. A total number of 36,770 consensus contigs with an average length of 1397 bp were produced and used for gene annotation. Around 29,198 (80%) of the consensus contigs showed BLAST hits based on sequence similarities and approximately 55% of the contigs have strong similarities (smaller than 1e-100) that could provide a direct association with potential genes/proteins/functions. These data are comparable with those reported by Laitinen et al. (2005) where 58.5% of the 8098 Unigenes remained ‘unknown’ and Kuang et al. (2013) where 44% of the Unigenes is smaller than 1e-100. The better outcome of our results is most probably due to the fact that

Chapter 6 General discussion
128
6
more and more plant sequence data have become available very recently which would help to get an updated BLAST hit. Another reason in our favor could be that we sequenced cDNA from both leaves and flower buds, and assembled four parental genotypes to produce the final consensus contigs (UniGene).
Although our transcriptome/RNA-sequences were obtained from unchallenged/untreated materials by gerbera gray mold, we still could recognize almost all the genes of the phenylpropanoid and flavonoid biosynthesis pathway that could produce plant secondary metabolites responsible for plant defense responses (Dixon 2001; Dixon et al. 2002). Also, we found the genes related to the biosynthesis and regulation of the phytohormone jasmonate (JA) and ethylene (ET) which also play a role in plant defense against B. cinerea (Thomma et al. 2001) (Chapter 2). Additionally, these transcriptome data provided us all gene sequence information we needed for SNP marker development (Chapter 2 & 3) and, candidate genes identification (Chapter 4). Furthermore, the EST data provided housekeeping gene sequences for RT-qPCR normalization and indicator genes for gene silencing experiments (Chapter 4 & 5). By annotating the transcriptome to KEGG (Kyoto Encyclopedia of Genes and Genomes) data, we generated a rough impression of what genes/transcripts are active in which pathway. We believe once a gene function is identified in other pioneer/model crops, transcriptome data could immediately provide a valuable resource for retrieving homologous genes in gerbera and provide an insight to explore gene function.
Towards the genetic dissection of complex traits
SNP marker development
Transcriptome data can also generate numerous transcripts with sufficient read-depth to guarantee high quality single nucleotide polymorphisms (SNP) identification (Shahin et al. 2012; Kim et al. 2014). Since each transcript represents an expressed gene, SNPs are derived from the coding region of a gene and directly exhibit DNA polymorphism in the genes. Development of SNP markers for the highly heterozygous ornamentals is very feasible and 200–1000 SNP markers will be sufficient to construct a genetic map for QTL mapping (Smulders et al. 2012). SNPs are valuable resources for genetic research and widely accepted as markers for genetic linkage map construction or as newly added markers for existing linkage maps as shown in recent years for ornamentals like rose (Bourke et al. 2017; Vukosavljev et al. 2016), lily (Shahin et al. 2011), tulip (Tang et al. 2015) and gerbera (Fu et al. 2017). The applications of SNP markers in these studies were done with the aim to produce a high density linkage map, increase the marker density on existing linkage maps or integrate different linkage maps.
Markers developed from SNPs have a benefit from their abundant numbers, especially in the case of the highly heterozygous ornamental crops. In Chapter 2, we achieved in total 398,917 polymorphic loci (SNPs existing either in two alleles of a parent or between parents) from all consensus contigs in the process of SNP detection. SNPs derived from transcriptome sequencing data for marker development were assessed according to several criteria such as high-quality sequences, at least two reads, no other SNPs present on flanking sequence of 50 bp on both sides, etc. Selected reliable SNPs were genotyped by Kompetitive Allele Specific PCR (KASP) on the two entire populations. However, because of the high heterozygosity of gerbera, some SNPs showed unexpected segregation patterns that were identified as SNP markers with null-alleles. Quite a few SNP markers (about 5-6% in both gerbera populations) were identified as

Unraveling the genetics of Botrytis cinerea resistance in Gerbera hybrida
129
6
containing null-alleles. However, most of these markers could be rescored and mapped (Chapter 3). Null-alleles were also noticed in other ornamental plants, such as lily (Shahin et al. 2011), rose (Vukosavljev et al. 2012) and tulip (Tang et al. 2015). In Chapter 4, some primers designed for candidate gene amplification and high resolution melting (HRM) analyzes failed to distinguish the allelic variation in populations due to a similar reason. From the melting curves it became evident that they apparently were generated from amplicons containing multiple SNPs. Actually, we adopted the criteria for SNP selection for linkage group construction (Chapter 3), and tried to target single SNPs for HRM without flanking SNPs, yet unexpected SNPs could still pop up. One possible reason is that the default setting for computational SNPs detection always required a minimal number of high quality reads. Low quality reads are removed, but this might also filter out some rare SNPs or SNPs in less well covered flanking regions. Filtering with a low-threshold setting for SNPs detection might be beneficial.
SNP markers we used for linkage group construction and QTL mapping (Chapter 3) and candidate gene mapping (Chapter 4) are bi-allelic and not multi-allelic, and they can only represent two possible alleles. When looking at the parents from the populations, we noticed in many cases more than two alleles are present (Chapter 4). It might minimize the transition of the QTL analyzes results from our working populations to other genotypes. Thus, in Chapter 4, we sequenced the full length of several candidate genes that co-localized with the detected QTL regions, and identified multiple alleles. We expected that the candidate gene allelic information combined with the QTL analysis could be applied to a greater extent to different gerbera genotypes as the initial screening for a genome-wide association study (GWAS).
Genetic linkage groups of Gerbera hybrida
In Chapter 3, successfully genotyped SNPs markers were used for genetic linkage map construction. As a cross pollinated plant, four gerbera maternal and paternal genetic maps containing 30, 29, 27 and 28 linkage groups were constructed simultaneously for subsequent studies. G. hybrida is characterized as a diploid with a chromosome number of 2n = 50 (Cappadocia and Vieth 1990; Ahmim and Vieth 1986; Reynoird et al. 1993; Bennett and Leitch 1997; Marie and Brown 1993; Sitbon 1981). All parental linkage groups constructed could be integrated into a consensus genetic map covering 24 of the 25 expected chromosomes, only linkage group (LG) no. 25 could not be assigned. This could be due to the chromosome size of this particular LG and also to the total number of markers used in our study. Most of the chromosomes of G. hybrida contained markers, but we still probably need to add more markers to also identify the missing linkage group.
Teeri et al. (2006) indicated that G. hybrida carries 50 chromosomes or chromosomal fragments from different Gerbera species as a functional diploid. It results from the origin of the commercial gerbera (Chapter 1). However, plants in the family of the Compositae are believed to have an ancestral chromosome base number of x = 9. On the meta-tree of Compositae which is used for understanding the systematics, evolution, and biogeography of this family (Funk et al. 2009a; Funk et al. 2005; Funk et al. 2009b), the tribe Mutisieae (Gerbera belongs to) and its close tribes/clades (Barnadesieae, Stifftia, etc.) are listed as the Basal Grade (Ortiz et al. 2009). Plants in these branches are hypothesized as paleopolyploid with the derived base number x2 = 27 from basal number x = 9 (Semple and Watanabe 2009).

Chapter 6 General discussion
130
6
Chromosome counts reported for genera in Mutisieae varied from 8, 9, 10, 11, to 25, 26, 27 and 36, and it indicates that polyploidy and dysploidy have occurred multiple times in this tribe (Semple and Watanabe 2009). We assume Gerbera might be an ancient hexaploid but lost 4 chromosomes that finally make the G. hybrida nowadays as the functional diploid we know. In Chapter 5, several genes from the same gene family were mapped in different parental linkage groups. These duplicated genes existed in the gerbera genome and are probably derived from polyploidization events.
Phenotyping for Botrytis resistance
Botrytis disease severity in gerbera was evaluated using three different tests, whole inflorescence, bottom (of disc florets) and ray floret. According to these phenotypic data from the two populations, we estimated the broad-sense heritability (H2) of Botrytis resistance for these three tests in S population as 28.24%, 32.6% and 38.76%, respectively, while H2 in F population for the three tests is 38.83%, 46.41% and 48.70%. After calculating the broad-sense heritability, we could notice that a great part of phenotypic variation after B. cinerea infection is caused by environmental factors. Selection of individuals only based on phenotype after Botrytis infection would be insufficient and biased.
Although these are two independent populations constructed by two breeding companies and grown in different environments, H2 of all tests in F population are higher than in S population. There might be more genetic variation in F population since it is a cross between a cut flower genotype and a garden used gerbera with wild characteristics, while S population is produced by two gerbera genotypes with similar qualities as cut flower. The H2 of ray floret tests on the two populations are all higher than the other two tests. It might be because we added the potato dextrose broth (PDB) for ray floret test which ensured a higher germination rate of Botrytis spores. The germination of Botrytis spores is indicating the start of a successful infection that could also be included in the environmental variation/non-genetic factors in the formula of H2. Since ray floret test always had a higher H2, we think the ray floret test is a more repeatable test and we also used ray floret test in Chapter 4 & 5 (also considering the amount of material available and required and relative ease of VIGS and disease testing). The candidate genes (shown with statistical significance) related to ray floret (test) is different from the other two tests (Chapter 4). It might also be because of the added PDB for the Botrytis spore germination, or because different parts of the gerbera inflorescence might have different mechanisms to response to Botrytis infection. Van Kan (2006) indicated that Botrytis needs to decompose host biomass for its own use as the energy, and plants with high pectin content would be beneficial for Botrytis infection. Since in the ray floret test energy could be obtained from the PDB, other genetic variation in gerbera would be more important in the response to Botrytis.
QTL mapping for Botrytis resistance
The big difference between our study and most of the researches at analyzing ornamental transcriptome data is that we were not concentrating on evaluating differential gene expression patterns under different conditions, but aimed to develop SNP markers based on these EST data to construct linkage groups and for QTL mapping. When plants are under different conditions, stresses or developmental stages, or with a different origin, a large number of genes/transcripts might be activated and revealed with a differential

Unraveling the genetics of Botrytis cinerea resistance in Gerbera hybrida
131
6
expression level. So which genes would be the switch for these downstream genes and finally lead to the phenotypic variation in each individual? For a disease resistance study with a necrotrophic pathogen and resistance controlled by multiple QTLs such a question is not likely to be addressed by differential expression studies.
With the advent of various and abundant molecular markers (e.g., SNP markers used in Chapter 3), construction of genetic maps and QTLs mapping has become easy to perform. Via development of two F1 segregating populations and SNPs markers, four parental genetic maps were constructed separately for QTL mapping (Chapter 3). QTL mapping was performed with these phenotypic data and a total of 20 QTLs (including one identical QTL for whole inflorescence and bottom tests) were identified in the four parental linkage maps. Markers that are identified as tightly linked with genes or QTLs of interest could transfer, track and select the favorable allele(s) in breeding for genetic improvement (St. Clair 2010). Individuals not containing the desired marker alleles could be dismissed or disposed of, as a preliminary screening to save space and time for breeding companies. Collard et al. (2005) listed the advantages of MAS, like saving time, ignoring the environmental variation, choosing wanted genotypes at an earlier stage, pyramiding multiple genes, preventing linkage drag, selecting traits with low heritability etc. There is no scientific report on MAS application in crop improvement for Botrytis resistance yet, and QTL analysis on Botrytis resistance or susceptibility has been performed only in a limited number of crops like tomato (Davis et al. 2009; Finkers et al. 2008; Finkers et al. 2007a; Finkers et al. 2007b), chickpea (Anuradha et al. 2011), Brassica rapa (Zhang et al. 2016a) and gerbera (Chapter3; Fu et al. 2017). MAS has been used to increase the favorable QTL alleles for other traits, such as stripe rust in barley, common bacterial blight in common bean, Fusarium head blight in wheat, which were reviewed by St.Clair (2010) and build up our confidence on the application of MAS for improving Botrytis resistance in gerbera.
Finding markers for candidate genes related to a complex trait
Studies from pioneer plants on Botrytis resistance
Identification of the causal gene(s) related to Botrytis resistance can benefit greatly from the basic researches on interactions between Arabidopsis and Botrytis. A successful infection of B. cinerea comprises several steps, penetrating the host cell wall, killing the host cell and decomposing the host biomass as well as the involvement of sensing and signaling (van Kan 2006). A series of genes in the host Arabidopsis were defined by using existing Arabidopsis mutants and series of transgenic techniques (Denby et al. 2004; Ferrari et al. 2007; Ferrari et al. 2003; Govrin and Levine 2000; Kliebenstein et al. 2005; Lionetti et al. 2007; Mengiste et al. 2003; Thomma et al. 1999; Veronese et al. 2006). The variable resistance/susceptibility to B. cinerea in Arabidopsis is influenced by multiple loci which were detected at the gene level (Denby et al. 2004; Rowe and Kliebenstein 2008). These massive studies provide a primary understanding of Botrytis resistance and source for candidate genes for gerbera or other crops.
The plant defense mechanism against necrotrophic pathogens is considered to be different from defense against biotrophic pathogens which would promote a hypersensitive response (HR) to prevent an infection (Glazebrook 2005). HR is a form of cell death and might not be effective to defend against a necrotrophic pathogen, because the death of the host cells facilitates the infection of B. cinerea. Moreover,

Chapter 6 General discussion
132
6
B. cinerea itself carries weapons to kill the host cell (van Kan 2006). This was exemplified on an Arabidopsis HR-deficient mutant dnd1 in which it was found that the growth of B. cinerea on leaves was suppressed (Govrin and Levine 2000). The production of camalexin, a secondary metabolite phytoalexin, is also involved in Arabidopsis/Botrytis interactions, despite showing variation in different Botrytis isolates and Arabidopsis genotypes (Kliebenstein et al. 2005). There are also two QTL analysis studies on Botrytis resistance/susceptibility for Arabidopsis to discover the complex genetic basis of this quantitative disease resistance (Denby et al. 2004; Rowe and Kliebenstein 2008). Denby et al. (2004) identified 12 QTLs in an RIL (recombinant inbred line) population using two Botrytis isolates. While comparing the region of Botrytis susceptibility QTL on the physical map with the genomic location of certain genes related to Botrytis infection, four previously identified genes (BOS1, EIN2, JAR1 and PGIP1/2) were found to be co-localized with the detected three QTLs. Rowe and Kliebenstein (2008) also located candidate genes in the QTL regions and found overlaps with the QTLs from Denby et al. (2004).
Pinpointing candidate genes in ornamentals
As a model plant, Arabidopsis has a completed genome sequence with detailed gene information. The corresponding position between a QTL region and possible candidate genes are readily available. In some plants with a genome sequence, narrowing down the QTL region by fine mapping could also contribute to the efficiency of MAS. This is because the linkage between the flanking markers of a QTL and the causal gene allele can be broken by recombination (Andersen and Lubberstedt 2003; Poczai et al. 2013). Narrowing down the QTL region and even better to be able to develop polymorphic markers based on the causal gene(s) underlying a QTL can increase the effective use of MAS in breeding. Thus, identifying the causal gene in QTL regions and development of markers targeted from candidate gene is an alternative promising approach.
To identify a potential functional gene and develop functional gene targeted markers on plants without prior knowledge of the whole genome, for example, ornamentals can be based on a candidate gene (CG) approach. The CG approach is based on the hypothesis that analogs of known functional genes from other species could control traits of interest in the focal species (Collard et al. 2005; Pflieger et al. 2001). For ornamentals, in which ESTs have been produced and are available these could be used for candidate gene homolog identification. CG homologs can either be used for studying the genetic basis of particular traits or for marker development. Markers that are developed from polymorphic sites in a functional gene are defined as functional markers (FMs) (Andersen and Lübberstedt 2003). Probably due to the limited functional genetic resources, Poczai et al. (2013) found about 90% of the previous studies which were involved with molecular markers used arbitrarily amplified DNA markers, and only a small part of the studies was adopted with gene-targeted markers or functional markers. FMs are in complete linkage with the favorable allele (Andersen and Lübberstedt 2003), so FMs are of much higher predictive value on phenotypic trait variation than random DNA markers. With increased research on model plants and genetic resources available in ornamental plants, the use of functional gene targeted markers will be increasing in all plant species irrespective of the status of their genome sequence availability. For instance in rose (Rosa hybrida) several genes, controlling ornamental characteristics and disease resistance etc., have been mapped (Byrne 2009; Foucher et al. 2008). Twenty-five homologs of Arabidopsis genes in the

Unraveling the genetics of Botrytis cinerea resistance in Gerbera hybrida
133
6
gibberellin (GA) pathway that potentially controls recurrent blooming trait in rose were mapped (Remay et al. 2009). Spiller et al. (2011) constructed an integrated rose genetic map from four individual maps via several bridge SSR and gene-targeted markers, and the position of CGs and previous detected QTLs were recognized. The co-localization of several candidate genes with QTLs was also shown in recent studies (Kawamura et al. 2015; Moghaddam et al. 2012; Otagaki et al. 2015; Roman et al. 2015). Recently Bourke et al. (2017) showed a high-density SNP genetic map of rose that synteny with Fragaria vesca is very high and the genome sequence of this species could be used to find functional gene positions in rose as well. This information indicates that the CG approach is valuable for molecular breeding approaches in ornamental crops.
The effectiveness of the candidate gene strategy
With the idea of the candidate gene strategy, we also developed markers from candidate genes that are related to Botrytis resistance (Chapter 4). The homologs of candidate Botrytis resistance genes from other crops, like a lot of genes from Arabidopsis, but also from tomato and grape, two major hosts of B. cinerea, were confirmed in gerbera based on protein similarities. Unlike the CG markers in rose that are SSR markers, the SNPs we used directly originated from the gerbera ESTs contigs (Chapter 2). Twenty-nine candidate genes, out of 71 CGs could be successfully genotyped by HRM and were mapped on the parental linkage maps (Chapter 3) of which seven candidate genes could be mapped on both populations. Using the same phenotyping data for QTLs detection (Chapter 3), we found different genetic groups which were separated by allelic variation of 17 candidate genes (markers) and showed a significant difference (P<0.05) on the disease score from either the whole inflorescence, bottom (of disc florets) or ray floret tests. Apparently, candidate genes are worth to give more attention, especially with the indication of statistically significant difference or when they are located in the vicinity of the QTLs detected. These promising candidate genes could be categorized into various types and some of them were included in Chapter 2. Looking at the bottom test, genes from secondary metabolite biosynthesis pathways (stilbene synthase, polyketide synthase), phytohormone biosynthesis (ABA aldehyde oxidase) and signal transduction (elongator subunits 2), cuticle biogenesis (long-chain acyl-CoA synthetase, 3-ketoacyl-CoA synthase) and plant cell wall-degrading enzyme (polygalacturonase) are associated. For whole inflorescence and ray floret tests, fewer gene categories were involved. Secondary metabolites are expected to play an important role in the defense against necrotrophs, but no gene was found in the secondary metabolite biosynthesis pathways with a significant difference on ray floret test in any population. I assume it probably results from the different inoculation method we used for the ray floret test or also could be due to the different defense mechanisms for different parts of gerbera inflorescences.
Statistical analysis of the candidate gene allelic variation on these disease scores in our study (Chapter 4) is like the single-marker analysis (Collard et al. 2005). A single marker separates a (mapping) population and the disease score mean of two or more groups can be conducted by t-test or ANOVA. Markers are assumed to be linked with traits of interest or QTLs when one group is significantly better/different than/from the other group. The single-marker analysis could be performed without the genetic maps, although linkage maps were already constructed by then, and also QTLs (without CGs marker) have been analyzed (Chapter 3). After redoing QTLs analysis with new CGs mapped on the parental maps, we found

Chapter 6 General discussion
134
6
that some candidate genes which showed a statistical difference by t-test were not detected as the QTLs or co-localized with QTLs region. MQM mapping (also known as the composite interval mapping) we used for QTLs detection is considered to have more statistical power, because it could estimate the possible recombination between markers and QTLs, and calculate multiple QTLs etc. (Collard et al. 2005; Zeng 1994). Therefore, interval mapping (composite or simple) is widely accepted by researchers as the methodology for QTL mapping. Rebai et al. (1995) proposed that interval mapping gives more powerful results when markers are sparse or with increasing intervals, otherwise, the single marker analysis would also be powerful enough. The candidate gene analysis is indeed the single-marker analysis, whereas the marker is developed from the motif of a candidate gene sequence itself, recombination to be happening in that gene itself would be rare. Thus, I very much believe that these candidate genes are promising to use.
Like the QTL analysis in Chapter 3 where QTLs were detected from both parents, favorable alleles of candidate genes were also mapped on both parents (Chapter 4). Apparently, Botrytis resistance could be contributed by these candidate genes with additive genetic effects, and pyramiding more possible genes could be positive for gerbera improvement. The significant difference of CGs and the co-localization of QTLs with CGs indicates that these candidate genes could be involved in resistance to Botrytis and provide a more precise possibility to use MAS in gerbera breeding in the future.
The characterization of candidate genes mapped in the QTLs region
With the ongoing researches in model plants and pioneer plants and the increasing availability of EST data from ornamentals, finding a homolog for a specific gene that was previously identified in a model plant to start with might not be difficult anymore. The challenge is finding whether the gene functionally contributes to the phenotypic variation. A co-localization of putative candidate genes with QTLs provides favorable evidence that these candidate genes might indeed be responsible for the difference in resistance between genotypes. Gene function characterization is complementary to our initial QTL and CG studies (Chapter 2 & 3 & 4). There are several methods to study gene function. We followed a tobacco rattle virus (TRV) based gene silencing system, that was already previously described for gerbera (Deng et al. 2014; Deng et al. 2012), to inspect the function of two candidate genes thought to be involved in Botrytis resistance (Chapter 5). These two CGs are the homologs of the genes responsible for Botrytis infection in tomato and were mapped in the QTL region related to Botrytis resistance in gerbera ray floret test. Since the expression of these two genes was beneficial to Botrytis infection in tomato, Van Schie and Takken (2014) included them in the list of susceptibility (S) genes/alleles.
B. cinerea is notorious as an opportunistic fungus (Corbaz 1978; Prins et al. 2000). The best time for Botrytis to attack host plants is when plants are at their most vulnerable, like tomato in the process of fruit ripening or gerbera inflorescences experiencing senescence after cutting. Moreover, the expression of cell-wall-degrading enzymes is needed for tomato fruit ripening (Cantu et al. 2008) and the expression of these genes probably is used by B. cinerea for a successful infection. In the ABA-deficient tomato mutant sitiens, accumulation of H2O2 was observed earlier and defense-related transcript expression was higher than in wild type plants (Asselbergh et al. 2007). The two candidate genes (ghPG1 and ghsit) mapped in the QTLs region are related to Botrytis infection and seem to function as susceptibility genes. Silencing the two

Unraveling the genetics of Botrytis cinerea resistance in Gerbera hybrida
135
6
genes in gerbera by VIGS, we found a smaller lesion size indicating a possible higher resistance to Botrytis for gerbera ray florets. Denby et al (2004) considered that the variation on lesion size of Arabidopsis ecotypes was due to either time prior to lesion initiation or the lesion's growth rate. The function of PGs is originally for the plants’ own biological processes, but the genes might also promote the penetration of Botrytis, thus knocking down these genes may have postponed the lesion formation in gerbera ray florets. The accumulation of ABA transfers gerbera plants in a more senescing state, leaving them vulnerable to Botrytis. Therefore, silencing ABA will increase resistance.
Obviously, other candidate genes not yet analyzed or not co-localized with QTLs we found in our two populations might also contribute to the resistance of Botrytis, and probably function in other genotypes or take effect in different situations. Antimicrobial secondary metabolites like, camalexin found in Arabidopsis, stilbenes from grape and gerberin from gerbera, can detoxify a variety of phytotoxic metabolites produced by Botrytis (van Baarlen et al. 2007; Koskela et al. 2011). Gene(s) that influence the accumulation of these phytoalexins or the amount of phytoalexins could slow down the speed of Botrytis growth or be able to inhibit the Botrytis growth. In gerbera, I would expect the only CG ghCHI (chalcone isomerase) which was mapped in both populations with a statistical difference and also detected as the QTL would be especially interesting and could be used as a marker directly. Since we already know that the resistance to Botrytis is a quantitative disease resistance, selecting more candidate gene (markers) could be additive to the effect of resistance to Botrytis in Gerbera.
Concluding remarks and future perspectives
In this study, we sequenced the cDNAs of four gerbera genotypes which were used as the parents for two segregating populations in assessing Botrytis resistance. Transcriptome data were annotated and we especially focused on the potential function and biological process of transcripts related with Botrytis resistance. SNPs were detected in each transcript and selected for as SNPs markers that are employed for genotyping in two segregating populations and construction of the first gerbera genetic maps. We also performed QTL analysis on the two populations and subsequently added candidate genes markers. Two candidate genes which were co-localized with QTLs were confirmed explicitly and suggest that the candidate gene approach is effective to pinpoint potential gene(s) for developing functional gene markers or transgene applications for ornamental improvement. The whole study provides a complete procedure to develop the genetic resources for carrying out MAS in a non-model crop and unravel a complex quantitative trait step by step from the beginning. To deploy an effective MAS program for gerbera might need more validation in a wide-scale gerbera genetic breeding pool to determine a best-practice strategy to select genotypes with a variety of quality characteristics. A follow-up of this research can be initiated immediately by the SNPs detected in every candidate gene co-located with Botrytis resistance QTLs, and the two candidate genes that have been functionally identified in this study.


Unraveling the genetics of Botrytis cinerea resistance in Gerbera hybrida
137
References Abe, I. and H. Morita (2010). "Structure and function of the chalcone synthase superfamily of plant type III polyketide
synthases." Natural Product Reports 27(6): 809-838. AbuQamar, S., X. Chen, R. Dhawan, B. Bluhm, J. Salmeron, S. Lam, R. A. Dietrich and T. Mengiste (2006). "Expression
profiling and mutant analysis reveals complex regulatory networks involved in Arabidopsis response to Botrytis infection." The Plant Journal 48(1): 28-44.
Acquaah, G. (2012). Breeding Cross-Pollinated Species. Principles of Plant Genetics and Breeding, John Wiley & Sons, Ltd: 337-354.
Agrios, G. N. (2005). Chapter 11 - Plant disease caused by fungi. Plant Pathology (Fifth Edition). San Diego, Academic Press: 385-614.
Ahmim, M. and J. Vieth (1986). "Production de plantes haploides de Gerbera jamesonii par culture in vitro d'ovules." Canadian Journal of Botany-Revue Canadienne De Botanique 64(10): 2355-2357.
Ainasoja, M. (2008). Secondary metabolites in Gerbera hybrida [PhD Thesis], University of Helsinki. Akagi, A., A. M. Dandekar and H. U. Stotz (2011). "Resistance of Malus domestica Fruit to Botrytis cinerea Depends on
Endogenous Ethylene Biosynthesis." Phytopathology 101(11): 1311-1321. Ali, M. B., S. Howard, S. Chen, Y. Wang, O. Yu, L. G. Kovacs and W. Qiu (2011). "Berry skin development in Norton
grape: distinct patterns of transcriptional regulation and flavonoid biosynthesis." BMC plant biology 11(1): 7. Andersen, J. R. and T. Lübberstedt (2003). "Functional markers in plants." Trends in Plant Science 8(11): 554-560. Anuradha, C., P. M. Gaur, S. Pande, K. K. Gali, M. Ganesh, J. Kumar and R. K. Varshney (2011). "Mapping QTL for
resistance to botrytis grey mould in chickpea." Euphytica 182(1): 1-9. Arens, P., P. Bijman, N. Tang, A. Shahin and J. M. van Tuyl (2012). Mapping of disease resistance in ornamentals: A long
haul. Acta Horticulturae, International Society for Horticultural Science (ISHS), Leuven, Belgium. Asselbergh, B., K. Curvers, S. C. Franca, K. Audenaert, M. Vuylsteke, F. Van Breusegem and M. Hofte (2007). "Resistance
to Botrytis cinerea in sitiens, an abscisic acid-deficient tomato mutant, involves timely production of hydrogen peroxide and cell wall modifications in the epidermis." Plant Physiology 144(4): 1863-1877.
Audenaert, K., G. B. De Meyer and M. M. Höfte (2002). "Abscisic acid determines basal susceptibility of tomato toBotrytis cinerea and suppresses salicylic acid-dependent signaling mechanisms." Plant Physiology 128(2): 491-501.
Austin, M. B. and A. J. P. Noel (2003). "The chalcone synthase superfamily of type III polyketide synthases." Natural Product Reports 20(1): 79-110.
Azami-Sardooei, Z., S. C. França, D. De Vleesschauwer and M. Höfte (2010). "Riboflavin induces resistance against Botrytis cinerea in bean, but not in tomato, by priming for a hydrogen peroxide-fueled resistance response." Physiological and Molecular Plant Pathology 75(1-2): 23-29.
Baas, R., H. M. C. Nijssen, T. J. M. Vandenberg and M. G. Warmenhoven (1995). "Yield and Quality of Carnation (Dianthus-Caryophyllus L) and Gerbera (Gerbera-Jamesonii L) in a Closed Nutrient System as Affected by Sodium-Chloride." Scientia Horticulturae 61(3-4): 273-284.
Bachlava, E., C. A. Taylor, S. Tang, J. E. Bowers, J. R. Mandel, J. M. Burke and S. J. Knapp (2012). "SNP Discovery and Development of a High-Density Genotyping Array for Sunflower." PLoS ONE 7(1): e29814.
Barigozzi, C. and L. Quagliotti (1979). Current research on breeding gerbera. Eucarpia Meeting Genetics and Breeding of Carnation and Gerbera.
Bashandy, H., M. Pietiainen, E. Carvalho, K. J. Lim, P. Elomaa, S. Martens and T. H. Teeri (2015). "Anthocyanin biosynthesis in gerbera cultivar 'Estelle' and its acyanic sport 'Ivory'." Planta 242(3): 601-611.
Bassolino, L., Y. Zhang, H.-j. Schoonbeek, C. Kiferle, P. Perata and C. C. Martin (2013). "Accumulation of anthocyanins in tomato skin extends shelf life." New Phytologist 200(3): 650-655.
Bastiaan-Net, S., P. Balk, C. Roelofsen, M. van Wordragen and J. Mes (2007). Developing marker genes for the prediction of Botrytis cinerea infection on flower petal of Rosa hybrida. 14th International Botrytis Symposium. Cape Town, South Africa, AFRICAN SUN MeDIA Pty (Ltd.).
Bennett, M. and I. Leitch. (2012). "Plant DNA C-values database (release 6.0, Dec. 2012)." Retrieved Jan. 17th, 2017, from http://www.kew.org/cvalues/.
Bennett, M. D. and I. J. Leitch (1997). "Nuclear DNA amounts in angiosperms - 583 new estimates." Annals of Botany 80(2): 169-196.
Berrocal-Lobo, M., A. Molina and R. Solano (2002). "Constitutive expression of ETHYLENE-RESPONSE-FACTOR1 in Arabidopsis confers resistance to several necrotrophic fungi." Plant Journal 29(1): 23-32.

References
138
Bessire, M., C. Chassot, A. C. Jacquat, M. Humphry, S. Borel, J. M. C. Petetot, J. P. Metraux and C. Nawrath (2007). "A permeable cuticle in Arabidopsis leads to a strong resistance to Botrytis cinerea." Embo Journal 26(8): 2158-2168.
Bézier, A., B. Lambert and F. Baillieul (2002). "Study of Defense-related Gene Expression in Grapevine Leaves and Berries Infected with Botrytis cinerea." European Journal of Plant Pathology 108(2): 111-120.
Bhatia, R., K. P. Singh, T. Jhang and T. R. Sharma (2009). "Assessment of clonal fidelity of micropropagated gerbera plants by ISSR markers." Scientia Horticulturae 119(2): 208-211.
Bhatia, R., K. P. Singh, T. R. Sharma and T. Jhang (2011). "Evaluation of the genetic fidelity of in vitro-propagated gerbera (Gerbera jamesonii Bolus) using DNA-based markers." Plant Cell Tissue and Organ Culture 104(1): 131-135.
Blanco-Ulate, B., K. C. H. Amrine, T. S. Collins, R. M. Rivero, A. R. Vicente, A. Morales-Cruz, C. L. Doyle, Z. R. Ye, G. Allen, H. Heymann, S. E. Ebeler and D. Cantu (2015). "Developmental and Metabolic Plasticity of White-Skinned Grape Berries in Response to Botrytis cinerea during Noble Rot." Plant Physiology 169(4): 2422-2443.
Blanco-Ulate, B., A. Morales-Cruz, K. C. H. Amrine, J. M. Labavitch, A. L. T. Powell and D. Cantu (2014). "Genome-wide transcriptional profiling of Botrytis cinerea genes targeting plant cell walls during infections of different hosts." Frontiers in Plant Science 5(435).
Boerjan, W., J. Ralph and M. Baucher (2003). "Lignin biosynthesis." Annual Review of Plant Biology 54: 519-546. Bornstein, P., J. McKay, J. K. Morishima, S. Devarayalu and R. E. Gelinas (1987). "Regulatory elements in the first intron
contribute to transcriptional control of the human alpha 1 (I) collagen gene." Proceedings of the National Academy of Sciences 84(24): 8869-8873.
Boubakri, H., A. Poutaraud, M. A. Wahab, C. Clayeux, R. Baltenweck-Guyot, D. Steyer, C. Marcic, A. Mliki and I. Soustre-Gacougnolle (2013). "Thiamine modulates metabolism of the phenylpropanoid pathway leading to enhanced resistance to Plasmopara viticola in grapevine." BMC Plant Biology 13.
Bourke, P. M., P. Arens, R. E. Voorrips, G. D. Esselink, C. F. Koning‐Boucoiran, W. P. van‘t Westende, T. Santos Leonardo, P. Wissink, C. Zheng and G. van Geest (2017). "Partial preferential chromosome pairing is genotype dependent in tetraploid rose." The Plant Journal.
Broekaert, W. F., S. L. Delaure, M. F. C. De Bolle and B. P. A. Cammue (2006). The role of ethylene in host-pathoven interactions. Annual Review of Phytopathology. 44: 393-416.
Broholm, S. K., E. Pollanen, S. Ruokolainen, S. Tahtiharju, M. Kotilainen, V. A. Albert, P. Elomaa and T. H. Teeri (2010). "Functional characterization of B class MADS-box transcription factors in Gerbera hybrida." Journal of Experimental Botany 61(1): 75-85.
Broholm, S. K., S. Tahtiharju, R. A. E. Laitinen, V. A. Albert, T. H. Teeri and P. Elomaa (2008). "A TCP domain transcription factor controls flower type specification along the radial axis of the Gerbera (Asteraceae) inflorescence." Proceedings of the National Academy of Sciences of the United States of America 105(26): 9117-9122.
Buiatti, M. and F. Gimelli (1993). Somaclonal variation in ornamentals. Proceedings of the 17th symposium of EUCARPIA, Section Ornamentals, Creating genetic variation in ornamentals, Sanremo, Italy, Istituto Sperimentale per la Floricoltura.
Byrne, D. H. (2009). Rose Structural Genomics. Genetics and Genomics of Rosaceae. K. M. Folta and S. E. Gardiner. New York, NY, Springer New York: 353-379.
Caballero, R., P. Pajuelo, J. Ordovas, E. Carmona and A. Delgado (2009). "Evaluation and correction of nutrient availability to Gerbera jamesonii H. Bolus in various compost-based growing media." Scientia Horticulturae 122(2): 244-250.
Calabria, L. M., V. P. Emerenciano, M. T. Scotti and T. J. Mabry (2009). "Secondary Chemistry of Compositae." Systematics, evolution, and biogeography of Compositae.
Cantu, D., B. Blanco-Ulate, L. Yang, J. M. Labavitch, A. B. Bennett and A. L. T. Powell (2009). "Ripening-Regulated Susceptibility of Tomato Fruit to Botrytis cinerea Requires NOR But Not RIN or Ethylene." Plant Physiology 150(3): 1434-1449.
Cappadocia, M., L. Chrétien and G. Laublin (1988). "Production of haploids in Gerbera jamesonii via ovule culture: influence of fall versus spring sampling on callus formation and shoot regeneration." Canadian Journal of Botany 66(6): 1107-1110.
Cappadocia, M. and J. Vieth (1990). Gerbera jamesonii H. Bolus ex Hook: In Vitro Production of Haploids. Haploids in Crop Improvement I. Y. P. S. Bajaj. Berlin, Heidelberg, Springer Berlin Heidelberg: 417-427.
Cerrudo, I., M. M. Keller, M. D. Cargnel, P. V. Demkura, M. de Wit, M. S. Patitucci, R. Pierik, C. M. J. Pieterse and C. L. Ballare (2012). "Low Red/Far-Red Ratios Reduce Arabidopsis Resistance to Botrytis cinerea and Jasmonate

Unraveling the genetics of Botrytis cinerea resistance in Gerbera hybrida
139
Responses via a COI1-JAZ10-Dependent, Salicylic Acid-Independent Mechanism." Plant Physiology 158(4): 2042-2052.
Chapman, M. A. and J. M. Burke (2007). "DNA sequence diversity and the origin of cultivated safflower (Carthamus tinctorius L.; Asteraceae)." BMC Plant Biology 7(1): 60.
Chapman, M. A., J. Chang, D. Weisman, R. V. Kesseli and J. M. Burke (2007). "Universal markers for comparative mapping and phylogenetic analysis in the Asteraceae (Compositae)." Theoretical and Applied Genetics 115(6): 747-755.
Chen, J. C., C. Z. Jiang, T. E. Gookin, D. A. Hunter, D. G. Clark and M. S. Reid (2004). "Chalcone synthase as a reporter in virus-induced gene silencing studies of flower senescence." Plant Molecular Biology 55(4): 521-530.
Chen, J. C., F. Johnson, D. G. Clark, T. Gookin and M. S. Reid (2005). Potential Application of Virus-Induced Gene Silencing (VIGS) in Flower Senescence Studies. Acta Horticulturae, International Society for Horticultural Science (ISHS), Leuven, Belgium.
Choquer, M., E. Fournier, C. Kunz, C. Levis, J. M. Pradier, A. Simon and M. Viaud (2007). "Botrytis cinerea virulence factors: new insights into a necrotrophic and polyphageous pathogen." Fems Microbiology Letters 277(1): 1-10.
Chung, C.-L. (2006). "Trypan Blue Staining." Retrieved Nov. 20, 2014, from https://blogs.cornell.edu/maizedisease/files/2016/08/TrypanBlue-and-AnilineBlue-Staining-on896c.doc.
Clark, C. A. and J. W. Lorbeer (1975). "The Role of Phenols in Botrytis Brown Stain of Onion." Phytopathology 65(3): 338-341.
Cole, L., F. Dewey and C. Hawes (1996). "Infection mechanisms of Botrytis species: pre-penetration and pre-infection processes of dry and wet conidia." Mycological Research 100(3): 277-286.
Collard, B. C. Y., M. Z. Z. Jahufer, J. B. Brouwer and E. C. K. Pang (2005). "An introduction to markers, quantitative trait loci (QTL) mapping and marker-assisted selection for crop improvement: The basic concepts." Euphytica 142(1-2): 169-196.
Conesa, A., S. Götz, J. M. García-Gómez, J. Terol, M. Talón and M. Robles (2005). "Blast2GO: a universal tool for annotation, visualization and analysis in functional genomics research." Bioinformatics 21(18): 3674-3676.
Corbaz, R. (1978). "Opportunistic fungi in the atmosphere." Dermatologica 159(Suppl 1): 56-59. Coutos-Thevenot, P., B. Poinssot, A. Bonomelli, H. Yean, C. Breda, D. Buffard, R. Esnault, R. Hain and M. Boulay
(2001). "In vitro tolerance to Botrytis cinerea of grapevine 41B rootstock in transgenic plants expressing the stilbene synthase Vst1 gene under the control of a pathogen-inducible PR 10 promoter." Journal of Experimental Botany 52(358): 901-910.
Curvers, K., H. Seifi, G. Mouille, R. de Rycke, B. Asselbergh, A. Van Hecke, D. Vanderschaeghe, H. Hofte, N. Callewaert, F. Van Breusegem and M. Hofte (2010). "Abscisic Acid Deficiency Causes Changes in Cuticle Permeability and Pectin Composition That Influence Tomato Resistance to Botrytis cinerea." Plant Physiology 154(2): 847-860.
Da Mata, T. L., M. I. Segeren, A. S. Fonseca and C. A. Colombo (2009). "Genetic divergence among gerbera accessions evaluated by RAPD." Scientia Horticulturae 121(1): 92-96.
Davis, J., D. Z. Yu, W. Evans, T. Gokirmak, R. T. Chetelat and H. U. Stotz (2009). "Mapping of loci from Solanum lycopersicoides conferring resistance or susceptibility to Botrytis cinerea in tomato." Theoretical and Applied Genetics 119(2): 305-314.
de Jong, J. (1978). "Dry storage and subsequent recovery of cut gerbera flowers as an aid in selection for longevity." Scientia Horticulturae 9(4): 389-397.
de Jong, J. (1986). "Breeding for keeping quality in Gerbera." Acta Hort 181: 353-357. de Jong, J. and F. Garretsen (1985). "Genetic analysis of cut flower longevity in Gerbera." Euphytica 34(3): 779-784. De Koeyer, D., K. Douglass, A. Murphy, S. Whitney, L. Nolan, Y. Song and W. De Jong (2009). "Application of high-
resolution DNA melting for genotyping and variant scanning of diploid and autotetraploid potato." Molecular Breeding 25(1): 67.
Dean, R., J. A. L. Van Kan, Z. A. Pretorius, K. E. Hammond-Kosack, A. Di Pietro, P. D. Spanu, J. J. Rudd, M. Dickman, R. Kahmann, J. Ellis and G. D. Foster (2012). "The Top 10 fungal pathogens in molecular plant pathology." Molecular Plant Pathology 13(4): 414-430.
Debener, T. (2009). Current strategies and future prospects of resistance breeding in ornamentals. Acta Horticulturae, International Society for Horticultural Science (ISHS), Leuven, Belgium.
Debener, T. and L. Mattiesch (1999). "Construction of a genetic linkage map for roses using RAPD and AFLP markers." Theoretical and Applied Genetics 99(5): 891-899.
Decroocq, V., M. Foulongne, P. Lambert, O. Le Gall, C. Mantin, T. Pascal, V. Schurdi-Levraud and J. Kervella (2005). "Analogues of virus resistance genes map to QTLs for resistance to sharka disease in Prunus davidiana." Molecular Genetics and Genomics 272(6): 680-689.

References
140
Denby, K. J., P. Kumar and D. J. Kliebenstein (2004). "Identification of Botrytis cinerea susceptibility loci in Arabidopsis thaliana." Plant Journal 38(3): 473-486.
Deng, X. B., H. Bashandy, M. Ainasoja, J. Kontturi, M. Pietiainen, R. A. E. Laitinen, V. A. Albert, J. P. T. Valkonen, P. Elomaa and T. H. Teeri (2014). "Functional diversification of duplicated chalcone synthase genes in anthocyanin biosynthesis of Gerbera hybrida." New Phytologist 201(4): 1469-1483.
Deng, X. B., P. Elomaa, C. X. Nguyen, T. Hytonen, J. P. T. Valkonen and T. H. Teeri (2012). "Virus-induced gene silencing for Asteraceae-a reverse genetics approach for functional genomics in Gerbera hybrida." Plant Biotechnology Journal 10(8): 970-978.
Dı ́az, J., A. ten Have and J. A. van Kan (2002). "The role of ethylene and wound signaling in resistance of tomato to Botrytis cinerea." Plant Physiology 129(3): 1341-1351.
Dixon, R. A. (2001). "Natural products and plant disease resistance." Nature 411(6839): 843-847. Dixon, R. A., L. Achnine, P. Kota, C. J. Liu, M. S. S. Reddy and L. J. Wang (2002). "The phenylpropanoid pathway and
plant defence - a genomics perspective." Molecular Plant Pathology 3(5): 371-390. Dreistadt, S. H. (2001). Integrated pest management for floriculture and nurseries, UCANR Publications. Drennan, D., J. Harding and T. G. Byrne (1986). "Heritability of Inflorescence and Floret Traits in Gerbera." Euphytica
35(1): 319-330. Drennan, D. L., R. W. Hodgson and J. Harding (1980). "Methods for Selecting Flower Quality Based on Consumer
Evaluation." Euphytica 29(3): 641-651. Dubois, A., S. Carrere, O. Raymond, B. Pouvreau, L. Cottret, A. Roccia, J.-P. Onesto, S. Sakr, R. Atanassova and S.
Baudino (2012). "Transcriptome database resource and gene expression atlas for the rose." BMC genomics 13(1): 638.
Eckermann, S., G. Schroder, J. Schmidt, D. Strack, R. A. Edrada, Y. Helariutta, P. Elomaa, M. Kotilainen, I. Kilpelainen, P. Proksch, T. H. Teeri and J. Schroder (1998). "New pathway to polyketides in plants." Nature 396(6709): 387-390.
Eden, M., R. Hill, R. Beresford and A. Stewart (1996). "The influence of inoculum concentration, relative humidity, and temperature on infection of greenhouse tomatoes by Botrytis cinerea." Plant Pathology 45(4): 795-806.
Elad, Y., I. Pertot, A. M. Cotes Prado and A. Stewart (2016a). Plant Hosts of Botrytis spp. Botrytis – the Fungus, the Pathogen and its Management in Agricultural Systems. S. Fillinger and Y. Elad. Cham, Springer International Publishing: 413-486.
Elad, Y., M. Vivier and S. Fillinger (2016b). Botrytis, the Good, the Bad and the Ugly. Botrytis–the Fungus, the Pathogen and its Management in Agricultural Systems, Springer: 1-15.
Elomaa, P., Y. Helariutta, M. Kotilainen and T. H. Teeri (1996). "Transformation of antisense constructs of the chalcone synthase gene superfamily into Gerbera hybrida: Differential effect on the expression of family members." Molecular Breeding 2(1): 41-50.
Elomaa, P., J. Honkanen, R. Puska, P. Seppanen, Y. Helariutta, M. Mehto, M. Kotilainen, L. Nevalainen and T. H. Teeri (1993). "Agrobacterium-Mediated Transfer of Antisense Chalcone Synthase cDNA to Gerbera-Hybrida Inhibits Flower Pigmentation." Bio-Technology 11(4): 508-511.
Elomaa, P., A. Uimari, M. Mehto, V. A. Albert, R. A. E. Laitinen and T. H. Teeri (2003). "Activation of anthocyanin biosynthesis in Gerbera hybrida (Asteraceae) suggests conserved protein-protein and protein-promoter interactions between the anciently diverged monocots and eudicots." Plant Physiology 133(4): 1831-1842.
Ender, M., K. Terpstra and J. D. Kelly (2008). "Marker-assisted selection for white mold resistance in common bean." Molecular Breeding 21(2): 149-157.
Fan, L., S. Q. Zheng and X. M. Wang (1997). "Antisense suppression of phospholipase D alpha retards abscisic acid- and ethylene-promoted senescence of postharvest Arabidopsis leaves." Plant Cell 9(12): 2183-2196.
Fantini, E. and G. Giuliano (2016). Virus-Induced Gene Silencing as a Tool to Study Tomato Fruit Biochemistry. Plant Signal Transduction: Methods and Protocols. J. R. Botella and M. A. Botella. New York, NY, Springer New York: 65-78.
Ferrari, S., R. Galletti, C. Denoux, G. De Lorenzo, F. M. Ausubel and J. Dewdney (2007). "Resistance to Botrytis cinerea induced in Arabidopsis by elicitors is independent of salicylic acid, ethylene, or jasmonate signaling but requires PHYTOALEXIN DEFICIENT3." Plant Physiology 144(1): 367-379.
Ferrari, S., J. M. Plotnikova, G. De Lorenzo and F. M. Ausubel (2003). "Arabidopsis local resistance to Botrytis cinerea involves salicylic acid and camalexin and requires EDS4 and PAD2, but not SID2, EDS5 or PAD4." Plant Journal 35(2): 193-205.
Ferreyra, M. L. F., S. P. Rius and P. Casati (2012). "Flavonoids: biosynthesis, biological functions, and biotechnological applications." Frontiers in Plant Science 3: 222.

Unraveling the genetics of Botrytis cinerea resistance in Gerbera hybrida
141
Finkers, R., Y. L. Bai, P. van den Berg, R. van Berloo, F. Meijer-Dekens, A. ten Have, J. van Kan, P. Lindhout and A. W. van Heusden (2008). "Quantitative resistance to Botrytis cinerea from Solanum neorickii." Euphytica 159(1-2): 83-92.
Finkers, R., P. van den Berg, R. van Berloo, A. ten Have, A. W. van Heusden, J. A. L. van Kan and P. Lindhout (2007a). "Three QTLs for Botrytis cinerea resistance in tomato." Theoretical and Applied Genetics 114(4): 585-593.
Finkers, R., A. W. van Heusden, F. Meijer-Dekens, J. A. L. van Kan, P. Maris and P. Lindhout (2007b). "The construction of a Solanum habrochaites LYC4 introgression line population and the identification of QTLs for resistance to Botrytis cinerea." Theoretical and Applied Genetics 114(6): 1071-1080.
Flann, C. (2009). "Global Compositae checklist." Retrieved Mar. 9th, 2016, from http://compositae.landcareresearch.co.nz/.
FloraHolland. (2015). "FloraHolland Facts & figures 2014." Retrieved Nov. 11th, 2015, from https://www.floraholland.com/media/3949227/Kengetallen-2014-Engels.pdf.
Forkmann, G. and B. Dangelmayr (1980). "Genetic-Control of Chalcone Isomerase Activity in Flowers of Dianthus-Caryophyllus." Biochemical Genetics 18(5-6): 519-527.
Foucher, F., M. Chevalier, C. Corre, V. Soufflet-Freslon, F. Legeai and L. H. S. Oyant (2008). "New resources for studying the rose flowering process." Genome 51(10): 827-837.
Fu, D. Q., B. Z. Zhu, H. L. Zhu, W. B. Jiang and Y. B. Luo (2005). "Virus-induced gene silencing in tomato fruit." Plant Journal 43(2): 299-308.
Fu, Y., G. D. Esselink, R. G. F. Visser, J. M. Van Tuyl and P. Arens (2016). "Transcriptome analysis of Gerbera hybrid: including in silico confirmation of defence genes found." Frontiers in Plant Science 7(247).
Fu, Y., A. van Silfhout, A. Shahin, R. Egberts, M. Beers, A. van der Velde, A. van Houten, J. M. van Tuyl, R. G. F. Visser and P. Arens (2017). "Genetic mapping and QTL analysis of Botrytis resistance in Gerbera hybrida." Molecular Breeding 37(2): 13.
Fu, Y., J. van Tuyl, R. Visser and P. Arens (2015). The Use of a Candidate Gene Approach to Arrive at Botrytis Resistance in Gerbera. XXV International EUCARPIA Symposium Section Ornamentals: Crossing Borders 1087.
Fulton, T. M., J. Chunwongse and S. D. Tanksley (1995). "Microprep protocol for extraction of DNA from tomato and other herbaceous plants." Plant Molecular Biology Reporter 13(3): 207-209.
Funk, V., A. Anderberg, B. Baldwin, R. Bayer, M. Bonifacino, I. Breitwieser, L. Brouillet, R. Carbajal, R. Chan and A. Coutinho (2009a). Compositae metatrees: the next generation. Systematics, evolution and biogeography of the Compositae. V. A. Funk, A. Susanna, T. F. Stuessy and R. J. Bayer. Vienna, International Association for Plant Taxonomy: 747-777.
Funk, V. A., R. J. Ba, R. Chan, L. Watson, B. Gemeinholzer, E. Schilling, J. L. Panero, B. G. Baldwin, G.-J. NURIA and A. Susanna (2005). Everywhere but Antarctica: Using a supertree to understand the diversity and distribution of the Compositae. Plant Diversity and Complexity Patterns: Local, Regional and Global Dimensions, Copenhagen, Denmark,, Kgl. Danske Videnskabernes Selskab.
Funk, V. A., A. Susanna, T. F. Stuessy and H. Robinson (2009b). Classification of compositae. Systematics, evolution, and biogeography of Compositae. V. A. Funk, A. Susanna, T. F. Stuessy and R. J. Bayer. Vienna, International Association for Plant Taxonomy: 171-192.
Gantait, S., N. Mandal, S. Bhattacharyya and P. K. Das (2011). "Induction and identification of tetraploids using in vitro colchicine treatment of Gerbera jamesonii Bolus cv. Sciella." Plant Cell Tissue and Organ Culture 106(3): 485-493.
Gao, Y., C. Liu, X. Li, H. Xu, Y. Liang, N. Ma, Z. Fei, J. Gao, C.-Z. Jiang and C. Ma (2016). "Transcriptome Profiling of Petal Abscission Zone and Functional Analysis of an Aux/IAA Family Gene RhIAA16 Involved in Petal Shedding in Rose." Frontiers in Plant Science 7(1375).
Gardner, A. M., A. F. Brown and J. A. Juvik (2016). "QTL analysis for the identification of candidate genes controlling phenolic compound accumulation in broccoli (Brassica oleracea L. var. italica)." Molecular Breeding 36(6).
Gebhardt, C. (2007). Molecular Markers, Maps and Population Genetics. Potato Biology and Biotechnology. Amsterdam, Elsevier Science B.V.: 77-89.
Gidrol, X., J. Meynet and M. Sibi (1984). "Haploid plants from in vitro culture of unfertilized ovules in Gerbera jamesonii." Zeitschrift fuer Pflanzenzuechtung 93: 78-85.
Glazebrook, J. (2005). "Contrasting mechanisms of defense against biotrophic and necrotrophic pathogens." Annual Review of Phytopathology 43: 205-227.
Goetz, G., A. Fkyerat, N. Métais, M. Kunz, R. Tabacchi, R. Pezet and V. Pont (1999). "Resistance factors to grey mould in grape berries: identification of some phenolics inhibitors of Botrytis cinerea stilbene oxidase." Phytochemistry 52(5): 759-767.
Gong, L. and Z. Deng (2010). "EST-SSR markers for gerbera (Gerbera hybrida)." Molecular Breeding 26(1): 125-132.

References
142
Gong, L. and Z. Deng (2012). "Selection and application of SSR markers for variety discrimination, genetic similarity and relation analysis in gerbera (Gerbera hybrida)." Scientia Horticulturae 138(0): 120-127.
Gould, B. and E. M. Kramer (2007). "Virus-induced gene silencing as a tool for functional analyses in the emerging model plant Aquilegia (columbine, Ranunculaceae)." Plant Methods 3.
Govrin, E. M. and A. Levine (2000). "The hypersensitive response facilitates plant infection by the necrotrophic pathogen Botrytis cinerea." Current Biology 10(13): 751-757.
Grabherr, M. G., B. J. Haas, M. Yassour, J. Z. Levin, D. A. Thompson, I. Amit, X. Adiconis, L. Fan, R. Raychowdhury, Q. Zeng, Z. Chen, E. Mauceli, N. Hacohen, A. Gnirke, N. Rhind, F. di Palma, B. W. Birren, C. Nusbaum, K. Lindblad-Toh, N. Friedman and A. Regev (2011). "Full-length transcriptome assembly from RNA-Seq data without a reference genome." Nature biotechnology 29(7): 644-652.
Gundry, C. N., J. G. Vandersteen, G. H. Reed, R. J. Pryor, J. Chen and C. T. Wittwer (2003). "Amplicon melting analysis with labeled primers: A closed-tube method for differentiating homozygotes and heterozygotes." Clinical Chemistry 49(3): 396-406.
Gutterson, N. and T. L. Reuber (2004). "Regulation of disease resistance pathways by AP2/ERF transcription factors." Current Opinion in Plant Biology 7(4): 465-471.
Hain, R., H. J. Reif, E. Krause, R. Langebartels, H. Kindl, B. Vornam, W. Wiese, E. Schmelzer, P. H. Schreier, R. H. Stocker and K. Stenzel (1993). "Disease resistance results from foreign phytoalexin expression in a novel plant." Nature 361(6408): 153-156.
Hamrick, D. (2005). Ornamental Bedding Plant Industry and Plug Production. Flower Seeds: Biology and Technology. M. B. McDonald and F. Y. Kwong, CABI Pub.
Han, L., G.-J. Li, K.-Y. Yang, G. Mao, R. Wang, Y. Liu and S. Zhang (2010). "Mitogen-activated protein kinase 3 and 6 regulate Botrytis cinerea-induced ethylene production in Arabidopsis." The Plant Journal 64(1): 114-127.
Han, T.-H., H. van Eck, M. de Jeu and E. Jacobsen (2002). "The construction of a linkage map of Alstroemeria aurea by AFLP markers." Euphytica 128(2): 153-164.
Hansen, H. V. (1985). A taxonomic revision of the genus Gerbera (Compositae, Mutisieae) sections Gerbera, Parva, Piloselloides (in Africa), and Lasiopus. Copenhagen, Council for Nordic Publications in Botany.
Hansen, H. V. (1999). "A story of the cultivated Gerbera." New Plantsman 6: 85–95. Harding, J., T. Byrne and D. Drennan (1987). the use of a selection index to improve gerbera cut-flowers. Acta
Horticulturae, International Society for Horticultural Science (ISHS), Leuven, Belgium. Harding, J., T. Byrne and R. L. Nelson (1981a). "Heritability of Cut-Flower Vase Longevity in Gerbera." Euphytica 30(3):
653-657. Harding, J., T. G. Byrne and R. L. Nelson (1981b). "Estimation of Heritability and Response to Selection for Cut-Flower
Yield in Gerbera." Euphytica 30(2): 313-322. Harding, J., D. Drennan and T. G. Byrne (1985). "Components of Genetic-Variation for Cut-Flower Yield in the Davis
Population of Gerbera." Euphytica 34(3): 759-767. Harding, J., H. Huang, T. Byrne and N. Huang (1990). "Quantitative-Analysis of Correlations among Flower Traits in
Gerbera-Hybrida Compositae .1. Genetic and Environmental Correlations." Theoretical and Applied Genetics 80(4): 552-558.
Harpaz-Saad, S., G. M. Yoon, A. K. Mattoo and J. J. Kieber (2012). The Formation of ACC and Competition Between Polyamines and Ethylene for SAM. Annual Plant Reviews Volume 44, Wiley-Blackwell. 44: 53-81.
Harrison, E., A. Burbidge, J. P. Okyere, A. J. Thompson and I. B. Taylor (2011). "Identification of the tomato ABA-deficient mutant sitiens as a member of the ABA-aldehyde oxidase gene family using genetic and genomic analysis." Plant Growth Regulation 64(3): 301-309.
Helariutta, Y., P. Elomaa, M. Kotilainen, R. J. Griesbach, J. Schroder and T. H. Teeri (1995). "Chalcone Synthase-Like Genes Active during Corolla Development Are Differentially Expressed and Encode Enzymes with Different Catalytic Properties in Gerbera-Hybrida (Asteraceae)." Plant Molecular Biology 28(1): 47-60.
Helariutta, Y., P. Elomaa, M. Kotilainen, P. Seppanen and T. H. Teeri (1993). "Cloning of cDNA Coding for Dihydroflavonol-4-Reductase (Dfr) and Characterization of Dfr Expression in the Corollas of Gerbera-Hybrida Var Regina (Compositae)." Plant Molecular Biology 22(2): 183-193.
Hileman, L. C., S. Drea, G. de Martino, A. Litt and V. F. Irish (2005). "Virus-induced gene silencing is an effective tool for assaying gene function in the basal eudicot species Papaver somniferum (opium poppy)." Plant Journal 44(2): 334-341.
Hong, Y., X. Tang, H. Huang, Y. Zhang and S. Dai (2015). "Transcriptomic analyses reveal species-specific light-induced anthocyanin biosynthesis in chrysanthemum." BMC genomics 16(1): 202.
Honkanen, J., A. Aapola, P. Seppaenen, T. Toermaelae, K. Oy, J. de Wit, H. Esendam, L. Stravers and B. Terra Nigra (1990). "Production of doubled haploid Gerbera clones." In Vitro Culture, XXIII IHC 300: 341-346.

Unraveling the genetics of Botrytis cinerea resistance in Gerbera hybrida
143
Horn, W. (2002). Breeding Methods and Breeding Research. Breeding For Ornamentals: Classical and Molecular Approaches. A. Vainstein. Dordrecht, Springer Netherlands: 47-83.
Howe, G. A. (2001). "Cyclopentenone signals for plant defense: Remodeling the jasmonic acid response." Proceedings of the National Academy of Sciences 98(22): 12317-12319.
Howlett, B. J. (2006). "Secondary metabolite toxins and nutrition of plant pathogenic fungi." Current Opinion in Plant Biology 9(4): 371-375.
Hsieh, M. H., H. C. Lu, Z. J. Pan, H. H. Yeh, S. S. Wang, W. H. Chen and H. H. Chen (2013a). "Optimizing virus-induced gene silencing efficiency with Cymbidium mosaic virus in Phalaenopsis flower." Plant Science 201: 25-41.
Hsieh, M. H., Z. J. Pan, P. H. Lai, H. C. Lu, H. H. Yeh, C. C. Hsu, W. L. Wu, M. C. Chung, S. S. Wang, W. H. Chen and H. H. Chen (2013b). "Virus-induced gene silencing unravels multiple transcription factors involved in floral growth and development in Phalaenopsis orchids." Journal of Experimental Botany 64(12): 3869-3884.
Hu, P., W. Zhou, Z. W. Cheng, M. Fan, L. Wang and D. X. Xie (2013). "JAV1 Controls Jasmonate-Regulated Plant Defense." Molecular Cell 50(4): 504-515.
Huang, H. and J. Harding (1998). "Quantitative analysis of correlations among flower traits in Gerbera hybrida, Compositae. III. Genetic variability and structure of principal component traits." Theoretical and Applied Genetics 97(1-2): 316-322.
Huang, H., J. Harding, T. Byrne and N. Huang (1990). "Quantitative-Analysis of Correlations among Flower Traits in Gerbera-Hybrida, Compositae .2. Direct and Mean Correlated Response to Selection." Theoretical and Applied Genetics 80(4): 559-563.
Huang, X. and A. Madan (1999). "CAP3: A DNA sequence assembly program." Genome research 9(9): 868-877. Ingham, J. L. (1972). "Phytoalexins and Other Natural-Products as Factors in Plant Disease Resistance." Botanical
Review 38(3): 343-424. Jain, S. M., D. Vitti, M. Tucci, A. Grassotti, E. Rugini and F. Saccardo (1998). "Biotechnology and mutagenesis in gerbera
improvement." Advances in Horticultural Science 12(1): 47-53. Jarvis, W. R. (1962). "The infection of strawberry and raspberry fruits by Botrytis cinerea Fr." Annals of Applied Biology
50(3): 569-575. Jarvis, W. R. (1977). Botryotinia and Botrytis species: taxonomy, physiology, and pathogenicity. Jeandet, P., R. Bessis and B. Gautheron (1991). "The Production of Resveratrol (3,5,4'-Trihydroxystilbene) by Grape
Berries in Different Developmental Stages." American Journal of Enology and Viticulture 42(1): 41-46. Jiang, C.-Z., J.-C. Chen and M. Reid (2011). Virus-Induced Gene Silencing in Ornamental Plants. RNAi and Plant Gene
Function Analysis: Methods and Protocols. H. Kodama and A. Komamine. Totowa, NJ, Humana Press: 81-96. Johnson, I. (2010). "The genus Gerbera in summer-rainfall South Africa." PlantLife 39 & 40. Katsir, L., H. S. Chung, A. J. Koo and G. A. Howe (2008a). "Jasmonate signaling: a conserved mechanism of hormone
sensing." Curr Opin Plant Biol 11(4): 428-435. Katsir, L., A. L. Schilmiller, P. E. Staswick, S. Y. He and G. A. Howe (2008b). "COI1 is a critical component of a receptor
for jasmonate and the bacterial virulence factor coronatine." Proceedings of the National Academy of Sciences of the United States of America 105(19): 7100-7105.
Kawamura, K., L. Hibrand-Saint Oyant, T. Thouroude, J. Jeauffre and F. Foucher (2015). "Inheritance of garden rose architecture and its association with flowering behaviour." Tree Genetics & Genomes 11(2).
Kawamura, K., L. H. S. Oyant, L. Crespel, T. Thouroude, D. Lalanne and F. Foucher (2011). "Quantitative trait loci for flowering time and inflorescence architecture in rose." Theoretical and Applied Genetics 122(4): 661-675.
Kende, H. (1993). "Ethylene Biosynthesis." Annual Review of Plant Physiology and Plant Molecular Biology 44(1): 283-307.
Kerssies, A. (1990). "A selective medium for Botrytis cinerea to be used in a spore-trap." Netherlands Journal of Plant Pathology 96(4): 247-250.
Kerssies, A. (1993a). "Horizontal and Vertical-Distribution of Airborne Conidia of Botrytis-Cinerea in a Gerbera Crop Grown under Glass." Netherlands Journal of Plant Pathology 99(5-6): 303-311.
Kerssies, A. (1993b). "Influence of Environmental-Conditions on Dispersal of Botrytis-Cinerea Conidia and on Postharvest Infection of Gerbera Flowers Grown under Glass." Plant Pathology 42(5): 754-762.
Kerssies, A. and H. D. Frinking (1996). "Relations between glasshouse climate and dry weight of petals, epicuticular wax, cuticle, pre-harvest flowering period and susceptibility to Botrytis cinerea of gerbera and rose flowers." European Journal of Plant Pathology 102(3): 257-263.
Kim, B. M., J. Inaba and C. Masuta (2011). "Virus induced gene silencing in Antirrhinum majus using the Cucumber mosaic virus vector: Functional analysis of the AINTEGUMENTA (Am-ANT) gene of A. majus." Horticulture Environment and Biotechnology 52(2): 176-182.

References
144
Kim, J.-E., S.-K. Oh, J.-H. Lee, B.-M. Lee and S.-H. Jo (2014). "Genome-Wide SNP Calling Using Next Generation Sequencing Data in Tomato." Molecules and Cells 37(1): 36-42.
Kim, J., J. H. Park, C. J. Lim, J. Y. Lim, J.-Y. Ryu, B.-W. Lee, J.-P. Choi, W. B. Kim, H. Y. Lee and Y. Choi (2012). "Small RNA and transcriptome deep sequencing proffers insight into floral gene regulation in Rosa cultivars." BMC genomics 13(1): 657.
Kim, S., R. Jones, K. S. Yoo and L. M. Pike (2004). "Gold color in onions (Allium cepa): a natural mutation of the chalcone isomerase gene resulting in a premature stop codon." Molecular Genetics and Genomics 272(4): 411-419.
Kliebenstein, D. J., H. C. Rowe and K. J. Denby (2005). "Secondary metabolites influence Arabidopsis/Botrytis interactions: variation in host production and pathogen sensitivity." Plant Journal 44(1): 25-36.
Kloos, W. E., C. G. George and L. K. Sorge (2005). "Dark disk color in the flower of Gerbera hybrida is determined by a dominant gene, dc." Hortscience 40(7): 1992-1994.
Koning-Boucoiran, C. F. S., G. D. Esselink, M. Vukosavljev, W. P. C. van 't Westende, V. W. Gitonga, F. A. Krens, R. E. Voorrips, W. E. van de Weg, D. Schulz, T. Debener, C. Maliepaard, P. Arens and M. J. M. Smulders (2015). "Using RNA-Seq to assemble a rose transcriptome with more than 13,000 full-length expressed genes and to develop the WagRhSNP 68k Axiom SNP array for rose (Rosa L.)." Frontiers in Plant Science 6(249).
Koornneef, M., E. Rolff and C. J. P. Spruit (1980). "Genetic-Control of Light-Inhibited Hypocotyl Elongation in Arabidopsis-Thaliana (L) Heynh." Zeitschrift Fur Pflanzenphysiologie 100(2): 147-160.
Koskela, S., P. P. Söderholm, M. Ainasoja, T. Wennberg, K. D. Klika, V. V. Ovcharenko, I. Kylänlahti, T. Auerma, J. Yli-Kauhaluoma and K. Pihlaja (2011). "Polyketide derivatives active against Botrytis cinerea in Gerbera hybrida." Planta 233(1): 37-48.
Kramer, E. M., L. Holappa, B. Gould, M. A. Jaramillo, D. Setnikov and P. M. Santiago (2007). "Elaboration of B gene function to include the identity of novel floral organs in the lower eudicot Aquilegia." Plant Cell 19(3): 750-766.
Kuang, Q., L. Li, J. Peng, S. Sun and X. Wang (2013). "Transcriptome analysis of Gerbera hybrida ray florets: putative genes associated with gibberellin metabolism and signal transduction." PloS one 8(3): e57715.
Kuhn, B., G. Forkmann and W. Seyffert (1978). "Genetic control of chalcone-flavanone isomerase activity in Callistephus chinensis." Planta 138(3): 199-203.
Kumar, S., S. D. Carson and D. J. Garrick (2000). "Detecting linkage between a fully informative marker locus and a trait locus in outbred populations using analysis of variance." Forest Genetics 7(1): 47-56.
Laitinen, R. A. E., M. Ainasoja, S. K. Broholm, T. H. Teeri and P. Elomaa (2008). "Identification of target genes for a MYB-type anthocyanin regulator in Gerbera hybrida." Journal of Experimental Botany 59(13): 3691-3703.
Laitinen, R. A. E., J. Immanen, P. Auvinen, S. Rudd, E. Alatalo, L. Paulin, M. Ainasoja, M. Kotilainen, S. Koskela, T. H. Teeri and P. Elomaa (2005). "Analysis of the floral transcriptome uncovers new regulators of organ determination and gene families related to flower organ differentiation in Gerbera hybrida (Asteraceae)." Genome Research 15(4): 475-486.
Laitinen, R. A. E., E. Pollanen, T. H. Teeri, P. Elomaa and M. Kotilainen (2007). "Transcriptional analysis of petal organogenesis in Gerbera hybrida." Planta 226(2): 347-360.
Lander, E. S. and D. Botstein (1989). "Mapping Mendelian Factors Underlying Quantitative Traits Using RFLP Linkage Maps." Genetics 121(1): 185-199.
Laneri, U., R. Franconi and P. Altavista (1989). Somatic mutagenesis of Gerbera jamesonii hybr.: irradiation and in vitro culture. I International Symposium on In Vitro Culture and Horticultural Breeding 280.
Laquitaine, L., E. Gomes, J. Francois, C. Marchive, S. Pascal, S. Hamdi, R. Atanassova, S. Delrot and P. Coutos-Thevenot (2006). "Molecular basis of ergosterol-induced protection of grape against Botrytis cinerea: Induction of type I LTP promoter activity, WRKY, and stilbene synthase gene expression." Molecular Plant-Microbe Interactions 19(10): 1103-1112.
Leffring, L. (1971). "Vegetatieve vermeerdering van Gerbera." Vakblad Bloemisterij 26(20): 9. Lehmensiek, A., M. W. Sutherland and R. B. McNamara (2008). "The use of high resolution melting (HRM) to map
single nucleotide polymorphism markers linked to a covered smut resistance gene in barley." Theoretical and Applied Genetics 117(5): 721-728.
Leroux, P. (2007). Chemical Control of Botrytis and its Resistance to Chemical Fungicides. Botrytis: Biology, Pathology and Control. Y. Elad, B. Williamson, P. Tudzynski, N. Delen and P. Leroux, Springer Netherlands: 195-222.
Li, H., B. Handsaker, A. Wysoker, T. Fennell, J. Ruan, N. Homer, G. Marth, G. Abecasis and R. Durbin (2009). "The sequence alignment/map format and SAMtools." Bioinformatics 25(16): 2078-2079.

Unraveling the genetics of Botrytis cinerea resistance in Gerbera hybrida
145
Li, L., W. Zhang, L. Zhang, N. Li, J. Peng, Y. Wang, C. Zhong, Y. Yang, S. Sun and S. Liang (2015a). "Transcriptomic insights into antagonistic effects of gibberellin and abscisic acid on petal growth in Gerbera hybrida." Frontiers in plant science 6: 168.
Li, S.-S., L.-S. Wang, Q.-Y. Shu, J. Wu, L.-G. Chen, S. Shao and D.-D. Yin (2015b). "Fatty acid composition of developing tree peony (Paeonia section Moutan DC.) seeds and transcriptome analysis during seed development." BMC genomics 16(1): 208.
Liao, L. J., I. C. Pan, Y. L. Chan, Y. H. Hsu, W. H. Chen and M. T. Chan (2004). "Transgene silencing in Phalaenopsis expressing the coat protein of Cymbidium Mosaic Virus is a manifestation of RNA-mediated resistance." Molecular Breeding 13(3): 229-242.
Lionetti, V., A. Raiola, L. Camardella, A. Giovane, N. Obel, M. Pauly, F. Favaron, F. Cervone and D. Bellincampi (2007). "Overexpression of pectin methylesterase inhibitors in Arabidopsis restricts fungal infection by Botrytis cinerea." Plant Physiology 143(4): 1871-1880.
Liu, T., C. Tong, J. Luo, J. Wu, B. Zhang, Y. Cui, Y. Li, Y. Zeng and R. Wu (2011). Haplotype Analysis of Complex Traits in Outcrossing Tree Species. Genetics, Genomics and Breeding of Poplar. C. P. Joshi, S. P. DiFazio and C. Kole, Science Publishers: 62-84.
Liu, Y. L., M. Schiff and S. P. Dinesh-Kumar (2002). "Virus-induced gene silencing in tomato." Plant Journal 31(6): 777-786.
Livak, K. J. and T. D. Schmittgen (2001). "Analysis of relative gene expression data using real-time quantitative PCR and the 2(T)(-Delta Delta C) method." Methods 25(4): 402-408.
Lorenzo, O., J. M. Chico, J. J. Sánchez-Serrano and R. Solano (2004). "JASMONATE-INSENSITIVE1 Encodes a MYC Transcription Factor Essential to Discriminate between Different Jasmonate-Regulated Defense Responses in Arabidopsis." The Plant Cell 16(7): 1938-1950.
Lu, H. C., H. H. Chen, W. C. Tsai, W. H. Chen, H. J. Su, D. C. N. Chang and H. H. Yeh (2007). "Strategies for functional validation of genes involved in reproductive stages of orchids." Plant Physiology 143(2): 558-569.
Lurie, S., E. Fallik, A. Handros and R. Shapira (1997). "The possible involvement of peroxidase in resistance to Botrytis cinerea in heat treated tomato fruit." Physiological and Molecular Plant Pathology 50(3): 141-149.
Ma, N., J. Q. Xue, Y. H. Li, X. J. Liu, F. W. Dai, W. S. Jia, Y. B. Luo and J. P. Gao (2008). "Rh-PIP2;1, a rose aquaporin gene, is involved in ethylene-regulated petal expansion." Plant Physiology 148(2): 894-907.
MacDiarmid, R. (2005). "RNA silencing in productive virus infections." Annual Review of Phytopathology 43: 523-544. Mackay, T. F. C., E. A. Stone and J. F. Ayroles (2009). "The genetics of quantitative traits: challenges and prospects."
Nature Reviews Genetics 10(8): 565-577. Magoč, T. and S. L. Salzberg (2011). "FLASH: Fast Length Adjustment of Short Reads to Improve Genome Assemblies."
Bioinformatics 27(21): 2957-2963. Marie, D. and S. C. Brown (1993). "A Cytometric Exercise in Plant DNA Histograms, with 2c-Values for 70 Species."
Biology of the Cell 78(1-2): 41-51. Maule, A. J. and J. P. Ride (1976). "Ammonia-lyase and O-methyl transferase activities related to lignification in wheat
leaves infected with botrytis." Phytochemistry 15(11): 1661-1664. Maule, A. J. and J. P. Ride (1983). "Cinnamate 4-hydroxylase and hydroxycinnamate: CoA ligase in wheat leaves infected
with Botrytis cinerea." Phytochemistry 22(5): 1113-1116. Mehdy, M. C. and C. J. Lamb (1987). "Chalcone isomerase cDNA cloning and mRNA induction by fungal elicitor,
wounding and infection." EMBO J 6(6): 1527-1533. Mengiste, T., X. Chen, J. Salmeron and R. Dietrich (2003). "The BOTRYTIS SUSCEPTIBLE1 gene encodes an
R2R3MYB transcription factor protein that is required for biotic and abiotic stress responses in Arabidopsis." Plant Cell 15(11): 2551-2565.
Minerdi, D., M. Moretti, Y. Li, L. Gaggero, A. Garibaldi and M. L. Gullino (2008). "Conventional PCR and real time quantitative PCR detection of Phytophthora cryptogea on Gerbera jamesonii." European Journal of Plant Pathology 122(2): 227-237.
Minerva, G., K. Surinder and T. Manisha (2012). "In Vitro Propagation and Assessment of Plant Genetic Fidelity by RAPD and SSR Markers in Gerbera (Gerbera jamesonii)." Research Journal of Biotechnology 7(4): 53-57.
Miyoshi, K. and N. Asakura (1996). "Callus induction, regeneration of haploid plants and chromosome doubling in ovule cultures of pot gerbera (Gerbera jamesonii)." Plant Cell Reports 16(1): 1-5.
Moghaddam, H. H., L. Leus, J. De Riek, J. Van Huylenbroeck and E. Van Bockstaele (2012). "Construction of a genetic linkage map with SSR, AFLP and morphological markers to locate QTLs controlling pathotype-specific powdery mildew resistance in diploid roses." Euphytica 184(3): 413-427.
Moyer, C. and N. A. Peres (2008). Evaluation of biofungicides for control of powdery mildew of gerbera daisy. Proceedings of the Florida State Horticultural Society (FSHS).

References
146
Muir, S. R., G. J. Collins, S. Robinson, S. Hughes, A. Bovy, C. H. R. De Vos, A. J. van Tunen and M. E. Verhoeyen (2001). "Overexpression of petunia chalcone isomerase in tomato results in fruit containing increased levels of flavonols." Nature Biotechnology 19(5): 470-474.
Murashige, T., M. Serpa and J. B. Jones (1974). "Clonal multiplication of Gerbera through tissue culture." Hort. Sci 9: 175-180.
Nhut, D. T., T. T. T. An, N. T. D. Huong, N. T. Don, N. T. Hai, N. Q. Thien and N. H. Vu (2007). "Effect of genotype, explant size, position, and culture medium on shoot generation of Gerbera jamesonii by receptacle transverse thin cell layer culture." Scientia Horticulturae 111(2): 146-151.
Nijveen, H., M. van Kaauwen, D. G. Esselink, B. Hoegen and B. Vosman (2013). "QualitySNPng: a user-friendly SNP detection and visualization tool." Nucleic acids research 41(W1): W587-W590.
Norelli, J. L., D. A. Lalli, C. L. Bassett, M. E. Wisniewski, S. E. Gardiner, J. M. Celton, D. R. Bowatte, C. M. Carlisle, M. Malnoy, H. S. Aldwinckle, R. E. Farrell Jr, A. M. Baldo, M. B. Horner and V. G. M. Bus (2009). Using Functional Genomics to Identify Molecular Markers for Fire Blight Resistance (Erwinia amylovora) in Apple (Malus). Acta Horticulturae, International Society for Horticultural Science (ISHS), Leuven, Belgium.
Ohmiya, A., S. Kishimoto, R. Aida, S. Yoshioka and K. Sumitomo (2006). "Carotenoid cleavage dioxygenase (CmCCD4a) contributes to white color formation in chrysanthemum petals." Plant Physiology 142(3): 1193-1201.
Oirdi, M. E. and K. Bouarab (2007). "Plant signalling components EDS1 and SGT1 enhance disease caused by the necrotrophic pathogen Botrytis cinerea." New Phytol 175(1): 131-139.
Oliver, R. P. and S. V. S. Ipcho (2004). "Arabidopsis pathology breathes new life into the necrotrophs-vs.-biotrophs classification of fungal pathogens." Molecular Plant Pathology 5(4): 347-352.
Ono, E., M. Fukuchi-Mizutani, N. Nakamura, Y. Fukui, K. Yonekura-Sakakibara, M. Yamaguchi, T. Nakayama, T. Tanaka, T. Kusumi and Y. Tanaka (2006). "Yellow flowers generated by expression of the aurone biosynthetic pathway." Proceedings of the National Academy of Sciences of the United States of America 103(29): 11075-11080.
Ortiz, S., J. M. Bonifacino, J. V. Crisci, V. A. Funk, H. V. Hansen, D. N. Hind, L. Katinas, N. Roque, G. Sancho and A. Susanna (2009). "The basal grade of Compositae: Mutisieae (sensu Cabrera) and Carduoideae." Systematics, evolution, and biogeography of Compositae. Vienna: IAPT: 193-213.
Orzaez, D., A. Medina, S. Torre, J. P. Fernández-Moreno, J. L. Rambla, A. Fernández-del-Carmen, E. Butelli, C. Martin and A. Granell (2009). "A visual reporter system for virus-induced gene silencing in tomato fruit based on anthocyanin accumulation." Plant physiology 150(3): 1122-1134.
Otagaki, S., Y. Ogawa, L. H. S. Oyant, F. Foucher, K. Kawamura, T. Horibe and S. Matsumoto (2015). "Genotype of FLOWERING LOCUS T homologue contributes to flowering time differences in wild and cultivated roses." Plant Biology 17(4): 808-815.
Paterson, A. (1997). Molecular dissection of complex traits. Boca Raton, Florida, CRC Press. Paterson, A. H., E. S. Lander, J. D. Hewitt, S. Peterson, S. E. Lincoln and S. D. Tanksley (1988). "Resolution of
Quantitative Traits into Mendelian Factors by Using a Complete Linkage Map of Restriction Fragment Length Polymorphisms." Nature 335(6192): 721-726.
Perik, R. R. J., D. Razé, A. Ferrante and W. G. van Doorn (2014). "Stem bending in cut Gerbera jamesonii flowers: Effects of a pulse treatment with sucrose and calcium ions." Postharvest Biology and Technology 98: 7-13.
Pflieger, S., V. Lefebvre and M. Causse (2001). "The candidate gene approach in plant genetics: a review." Molecular Breeding 7(4): 275-291.
Pflieger, S., A. Palloix, C. Caranta, A. Blattes and V. Lefebvre (2001). "Defense response genes co-localize with quantitative disease resistance loci in pepper." Theoretical and Applied Genetics 103(6-7): 920-929.
Pierik, R., J. Jansen, A. Maasdam and C. Binnendijk (1975). "Optimalization of Gerbera plantlet production from excised capitulum explants." Scientia Horticulturae 3(4): 351-357.
Pierik, R., H. Steegmans and J. Marelis (1973). "Gerbera plantlets from in vitro cultivated capitulum explants." Scientia Horticulturae 1(1): 117-119.
Pierik, R. L. M. and T. A. Segers (1973). "In-Vitro Culture of Midrib Explants of Gerbera - Adventitious Root Formation and Callus Induction." Zeitschrift Fur Pflanzenphysiologie 69(3): 204-212.
Plantum. (2014). "The economic value - sector of plant reproductive materials." Retrieved Nov. 11th, 2016, from https://www.plantum.nl/Content/Files/file/Standpunten/Factsheet%20Sector%20-%20economic%20value.pdf.
Poczai, P., I. Varga, M. Laos, A. Cseh, N. Bell, J. P. T. Valkonen and J. Hyvonen (2013). "Advances in plant gene-targeted and functional markers: a review." Plant Methods 9.

Unraveling the genetics of Botrytis cinerea resistance in Gerbera hybrida
147
Poinssot, B., E. Vandelle, M. Bentéjac, M. Adrian, C. Levis, Y. Brygoo, J. Garin, F. Sicilia, P. Coutos-Thévenot and A. Pugin (2003). "The Endopolygalacturonase 1 from Botrytis cinerea Activates Grapevine Defense Reactions Unrelated to Its Enzymatic Activity." Molecular Plant-Microbe Interactions 16(6): 553-564.
Poland, J. A., P. J. Balint-Kurti, R. J. Wisser, R. C. Pratt and R. J. Nelson (2009). "Shades of gray: the world of quantitative disease resistance." Trends in Plant Science 14(1): 21-29.
Pré, M., M. Atallah, A. Champion, M. De Vos, C. M. Pieterse and J. Memelink (2008). "The AP2/ERF domain transcription factor ORA59 integrates jasmonic acid and ethylene signals in plant defense." Plant physiology 147(3): 1347-1357.
Preil W, Huhnke W, Engelhardt M and H. M (1977). "Haploide bei Gerbera jamesonii aus in vitro Kulturen von Blütenköpfchen." Zeitschrift fuer Pflanzenzuechtung 79: 167 -171.
Prins, T. W., P. Tudzynski, A. von Tiedemann, B. Tudzynski, A. Ten Have, M. E. Hansen, K. Tenberge and J. A. van Kan (2000). Infection strategies of Botrytis cinerea and related necrotrophic pathogens. Fungal pathology, Springer: 33-64.
Prins, T. W., L. Wagemakers and J. A. L. van Kan (2000). "Structure and expression in planta of Botrytis cinerea ubiquitin genes." European Journal of Plant Pathology 106(7): 693-698.
Pumphrey, M. O., R. Bernardo and J. A. Anderson (2007). "Validating the Fhb1 QTL for fusarium head blight resistance in near-isogenic wheat lines developed from breeding populations." Crop Science 47(1): 200-206.
Rajapakse, S., D. H. Byrne, L. Zhang, N. Anderson, K. Arumuganathan and R. E. Ballard (2001). "Two genetic linkage maps of tetraploid roses." Theoretical and Applied Genetics 103(4): 575-583.
Rebai, A., B. Goffinet and B. Mangin (1995). "Comparing Power of Different Methods for QTL Detection." Biometrics 51(1): 87-99.
Reed, G. H. and C. T. Wittwer (2004). "Sensitivity and specificity of single-nucleotide polymorphism scanning by high-resolution melting analysis." Clinical Chemistry 50(10): 1748-1754.
Reid, M., J.-C. Chen and C.-Z. Jiang (2009). Virus-Induced Gene Silencing for Functional Characterization of Genes in Petunia. Petunia: Evolutionary, Developmental and Physiological Genetics. T. Gerats and J. Strommer. New York, NY, Springer New York: 381-394.
Reimann-Philipp, R. (1983). Heterosis in Ornamentals. Heterosis: Reappraisal of Theory and Practice. R. Frankel. Berlin, Heidelberg, Springer Berlin Heidelberg: 234-259.
Remay, A., D. Lalanne, T. Thouroude, F. Le Couviour, L. Hibrand-Saint Oyant and F. Foucher (2009). "A survey of flowering genes reveals the role of gibberellins in floral control in rose." Theoretical and Applied Genetics 119(5): 767-781.
Reynoird, J.-P., D. Chriqui, M. Noin, S. Brown and D. Marie (1993). "Plant regeneration fromin vitro leaf culture of several Gerbera species." Plant cell, tissue and organ culture 33(2): 203-210.
Rezende, R. K. S., L. V. Paiva, R. Paiva, A. Chalfun, P. P. Torga and T. E. Masetto (2009). "Genetic divergence among cultivars of gerbera using RAPD markers." Ciencia Rural 39(8): 2435-2440.
Rock, C. D., T. G. Heath, D. A. Gage and J. A. D. Zeevaart (1991). "Abscisic Alcohol Is an Intermediate in Abscisic-Acid Biosynthesis in a Shunt Pathway from Abscisic Aldehyde." Plant Physiology 97(2): 670-676.
Rogers, M. N. and B. O. Tjia (1990). Gerbera production for cut flowers and pot plants. Portland, Timber Press. Roman, H., M. Rapicault, A. S. Miclot, M. Larenaudie, K. Kawamura, T. Thouroude, A. Chastellier, A. Lemarquand, F.
Dupuis, F. Foucher, S. Loustau and L. Hibrand-St Oyant (2015). "Genetic analysis of the flowering date and number of petals in rose." Tree Genetics & Genomes 11(4).
Rooke, L., D. Byrne and S. Salgueiro (2000). "Marker gene expression driven by the maize ubiquitin promoter in transgenic wheat." Annals of Applied Biology 136(2): 167-172.
Rowe, H. C. and D. J. Kliebenstein (2008). "Complex Genetics Control Natural Variation in Arabidopsis thaliana Resistance to Botrytis cinerea." Genetics 180(4): 2237-2250.
Rowe, H. C., J. W. Walley, J. Corwin, E. K. F. Chan, K. Dehesh and D. J. Kliebenstein (2010). "Deficiencies in Jasmonate-Mediated Plant Defense Reveal Quantitative Variation in Botrytis cinerea Pathogenesis." PLoS Pathogens 6(4): e1000861.
Ruokolainen, S., Y. P. Ng, V. A. Albert, P. Elomaa and T. H. Teeri (2010). "Large scale interaction analysis predicts that the Gerbera hybrida floral E function is provided both by general and specialized proteins." Bmc Plant Biology 10.
Ruokolainen, S., Y. P. Ng, V. A. Albert, P. Elomaa and T. H. Teeri (2011). "Over-expression of the Gerbera hybrida At-SOC1-like1 gene Gh-SOC1 leads to floral organ identity deterioration." Annals of Botany 107(9): 1491-1499.
Ruokolainen, S., Y. P. Ng, S. K. Broholm, V. A. Albert, P. Elomaa and T. H. Teeri (2010). "Characterization of SQUAMOSA-like genes in Gerbera hybrida, including one involved in reproductive transition." BMC Plant Biology 10.

References
148
Salinas, J., D. C. M. Glandorf, F. D. Picavet and K. Verhoeff (1989). "Effects of Temperature, Relative-Humidity and Age of Conidia on the Incidence of Spotting on Gerbera Flowers Caused by Botrytis-Cinerea." Netherlands Journal of Plant Pathology 95(1): 51-64.
Salinas, J. and K. Verhoeff (1995). "Microscopical studies of the infection of gerbara flowers byBotrytis cinerea." European Journal of Plant Pathology 101(4): 377-386.
Sax, K. (1923). "The Association of Size Differences with Seed-Coat Pattern and Pigmentation in PHASEOLUS VULGARIS." Genetics 8(6): 552-560.
Schäfer-Pregl, R., E. Ritter, L. Concilio, J. Hesselbach, L. Lovatti, B. Walkemeier, H. Thelen, F. Salamini and C. Gebhardt (1998). "Analysis of quantitative trait loci (QTLs) and quantitative trait alleles (QTAs) for potato tuber yield and starch content." Theoretical and Applied Genetics 97(5): 834-846.
Schiva, T. (1979). Results in recurrent selection on Gerbera. Eucarpia Meeting Genetics and Breeding of Carnation and Gerbera.
Semple, J. C. and K. Watanabe (2009). "A review of chromosome numbers in Asteraceae with hypotheses on chromosomal base number evolution." Systematics, evolution and biogeography of Compositae. IAPT, Vienna: 61-72.
Senthil-Kumar, M. and K. S. Mysore (2014). "Tobacco rattle virus-based virus-induced gene silencing in Nicotiana benthamiana." Nature Protocols 9(7): 1549-1562.
Seo, K.-I., G.-A. Lee, S.-K. Park, M.-S. Yoon, K.-H. Ma, J.-R. Lee, Y.-M. Choi, Y.-j. Jung and M.-C. Lee (2012). "Genome shotgun sequencing and development of microsatellite markers for gerbera (Gerbera hybrida H.) by 454 GS-FLX." African Journal of Biotechnology 11(29): 7388-7396.
Shahin, A., P. Arens, A. W. van Heusden, G. van der Linden, M. van Kaauwen, N. Khan, H. J. Schouten, W. E. van de Weg, R. G. F. Visser and J. M. van Tuyl (2011). "Genetic mapping in Lilium: mapping of major genes and quantitative trait loci for several ornamental traits and disease resistances." Plant Breeding 130(3): 372-382.
Shahin, A., T. van Gurp, S. A. Peters, R. G. Visser, J. M. van Tuyl and P. Arens (2012). "SNP markers retrieval for a non-model species: a practical approach." BMC Research Notes 5(1): 79.
Shahin, A., M. van Kaauwen, D. Esselink, J. W. Bargsten, J. M. van Tuyl, R. G. Visser and P. Arens (2012). "Generation and analysis of expressed sequence tags in the extreme large genomes Lilium and Tulipa." BMC Genomics 13(1): 640.
Simpson, B. B. (2009). Economic importance of Compositae. Systematics, evolution, and biogeography of Compositae. V. A. Funk, A. Susanna, T. F. Stuessy and R. J. Bayer. Vienna, International Association for Plant Taxonomy.
Singh, A., P. Kumar, C. Z. Jiang and M. S. Reid (2013). "TRV Based Virus Induced Gene Silencing in Gladiolus (Gladiolus grandiflorus L.), A Monocotyledonous Ornamental Plant." Vegetos 26: 170-174.
Sitbon, M. (1981). "Production of haploid Gerbera jamesonii plants by in vitro culture of unfertilized ovules." Agronomie 1(9): 807-812.
Sitrit, Y. and A. B. Bennett (1998). "Regulation of tomato fruit polygalacturonase mRNA accumulation by ethylene: A re-examination." Plant Physiology 116(3): 1145-1150.
Smeds, L. and A. Künstner (2011). "ConDeTri - A Content Dependent Read Trimmer for Illumina Data." PLoS ONE 6(10): e26314.
Smulders, M. J. M., M. Vukosavljev, A. Shahin, W. E. van de Weg and P. Arens (2012). High throughput marker development and application in horticultural crops. Acta Horticulturae, International Society for Horticultural Science (ISHS), Leuven, Belgium.
Song, A., T. Gao, P. Li, S. Chen, Z. Guan, D. Wu, J. Xin, Q. Fan, K. Zhao and F. Chen (2016a). "Transcriptome-wide identification and expression profiling of the DOF transcription factor gene family in Chrysanthemum morifolium." Frontiers in plant science 7.
Song, A., T. Gao, D. Wu, J. Xin, S. Chen, Z. Guan, H. Wang, L. Jin and F. Chen (2016b). "Transcriptome-wide identification and expression analysis of chrysanthemum SBP-like transcription factors." Plant Physiology and Biochemistry 102: 10-16.
Song, X., Z. Deng, L. Gong, J. Hu and Q. Ma (2012). "Cloning and characterization of resistance gene candidate sequences and molecular marker development in gerbera (Gerbera hybrida)." Scientia Horticulturae 145: 68-75.
Song, Y. and B. P. Thomma (2016). "Host-induced gene silencing compromises Verticillium wilt in tomato and Arabidopsis." Mol Plant Pathol.
Sparnaaij, L. and D. Lamers (1971). "Gerbera breeding at the Institute for Horticultural Plant Breeding, Wageningen, the Netherlands." Proc. Eucarpia Meet. on Ornamentals: 15-17.
Sparnaaij, L. D., F. Garretsen and W. Bekker (1975). "Additive inheritance of resistance to Phytophthora cryptogea Pethybridge & Lafferty in Gerbera jamesoniiBolus." Euphytica 24(2): 551-556.

Unraveling the genetics of Botrytis cinerea resistance in Gerbera hybrida
149
Spiller, M., M. Linde, L. Hibrand-Saint Oyant, C. J. Tsai, D. H. Byrne, M. J. M. Smulders, F. Foucher and T. Debener (2011). "Towards a unified genetic map for diploid roses." Theoretical and Applied Genetics 122(3): 489-500.
St.Clair, D. A. (2010). "Quantitative Disease Resistance and Quantitative Resistance Loci in Breeding." Annual Review of Phytopathology 48(1): 247-268.
Takamura, T., T. Tomihama and I. Miyajima (1995). "Inheritance of Yellow-Flowered Characteristic and Yellow Pigments in Diploid Cyclamen (Cyclamen-Persicum Mill) Cultivars." Scientia Horticulturae 64(1-2): 55-63.
Tamura, K.-I., J.-I. Yonemaru and T. Yamada (2013). Insertion-Deletion Marker Targeting for Intron Polymorphisms. Diagnostics in Plant Breeding. T. Lübberstedt and R. K. Varshney, Springer: 211-228.
Tanaka, Y., N. Sasaki and A. Ohmiya (2008). "Biosynthesis of plant pigments: anthocyanins, betalains and carotenoids." Plant J 54(4): 733-749.
Tang, N., T. van der Lee, A. Shahin, M. Holdinga, P. Bijman, M. Caser, R. G. F. Visser, J. M. van Tuyl and P. Arens (2015). "Genetic mapping of resistance to Fusarium oxysporum f. sp. tulipae in tulip." Molecular Breeding 35(5): 122.
Tanksley, S. D. (1993). "Mapping Polygenes." Annual Review of Genetics 27: 205-233. Taylor, I. B., R. S. T. Linforth, R. J. Al-Naieb, W. R. Bowman and B. A. Marples (1988). "The wilty tomato mutants flacca
and sitiens are impaired in the oxidation of ABA-aldehyde to ABA." Plant, Cell & Environment 11(8): 739-745. Teeri, T. H., P. Elomaa, M. Kotilainen and V. A. Albert (2006). "Mining plant diversity: Gerbera as a model system for
plant developmental and biosynthetic research." BioEssays 28(7): 756-767. ten Have, A., R. Berloo, P. Lindhout and J. L. van Kan (2007). "Partial stem and leaf resistance against the fungal
pathogen Botrytis cinerea in wild relatives of tomato." 117(2): 153-166. Thomma, B. P. H. J., K. Eggermont, I. A. M. A. Penninckx, B. Mauch-Mani, R. Vogelsang, B. P. A. Cammue and W. F.
Broekaert (1998). "Separate jasmonate-dependent and salicylate-dependent defense-response pathways in Arabidopsis are essential for resistance to distinct microbial pathogens." Proceedings of the National Academy of Sciences of the United States of America 95(25): 15107-15111.
Thomma, B. P. H. J., K. Eggermont, K. F. M. J. Tierens and W. F. Broekaert (1999). "Requirement of functional ethylene-insensitive 2 gene for efficient resistance of Arabidopsis to infection by Botrytis cinerea." Plant Physiology 121(4): 1093-1101.
Thomma, B. P. H. J., I. A. M. A. Penninckx, B. P. A. Cammue and W. F. Broekaert (2001). "The complexity of disease signaling in Arabidopsis." Current Opinion in Immunology 13(1): 63-68.
Timperio, A. M., A. D’Alessandro, M. Fagioni, P. Magro and L. Zolla (2012). "Production of the phytoalexins trans-resveratrol and delta-viniferin in two economy-relevant grape cultivars upon infection with Botrytis cinerea in field conditions." Plant Physiology and Biochemistry 50(0): 65-71.
Tosca, A., R. Pandolfi, S. Citterio, A. Fasoli and S. Sgorbati (1995). "Determination by flow cytometry of the chromosome doubling capacity of colchicine and oryzalin in gynogenetic haploids of gerbera." Plant Cell Reports 14(7): 455-458.
Tourjee, K. R., J. Harding and T. G. Byrne (1994). "Early development of Gerbera as a floricultural crop." HortTechnology 4(1): 34-40.
Tourjee, K. R., J. Harding and T. G. Byrne (1995a). "Complex Segregation Analysis of Gerbera Flower Color." Heredity 74: 303-310.
Tourjee, K. R., J. Harding and T. G. Byrne (1995b). "Interpretation of a Selection Plateau through Complex Segregation Analysis - Euclidean Distance Index Selection for Flower Color in the Davis Population of Gerbera." Heredity 75: 290-296.
Treutter, D. (2005). "Significance of Flavonoids in Plant Resistance and Enhancement of Their Biosynthesis." Plant Biology 7(6): 581-591.
Trotel-Aziz, P., M. Couderchet, G. Vernet and A. Aziz (2006). "Chitosan Stimulates Defense Reactions in Grapevine Leaves and Inhibits Development of Botrytis Cinerea." European Journal of Plant Pathology 114(4): 405-413.
Tseng, Y.-C. (1996). Compositae - Mutisieae. Flora Reipublicae Popularis Sinicae (The Chinese edition of Flora of China). Beijing, Science Press. 79: 73-96.
Tyrach, A. and W. Horn (1997). "Inheritance of flower colour and flavonoid pigments in Gerbera." Plant Breeding 116(4): 377-381.
UPOV. (2016). "PLUTO: Plant Variety Database." Retrieved Nov. 11th, 2016, from http://www.upov.int/pluto/en/. Upson, T. (2006). "Cantab Plants." Curtis's Botanical Magazine 23(1): 91-102. USDA. (2016). "Floriculture Crops 2015 Summary." Retrieved Nov. 15th 2016, from
http://usda.mannlib.cornell.edu/usda/current/FlorCrop/FlorCrop-04-26-2016.pdf. van Baarlen, P., L. Legendre and J. A. L. van Kan (2007). Plant Defence Compounds Against Botrytis Infection. Botrytis:
Biology, Pathology and Control. Y. Elad, B. Williamson, P. Tudzynski and N. Delen, Springer Netherlands: 143-161.

References
150
van Kan, J. A. L. (2006). "Licensed to kill: the lifestyle of a necrotrophic plant pathogen." Trends in Plant Science 11(5): 247-253.
van Kan, J. A. L., J. W. van't Klooster, C. A. M. Wagemakers, D. C. T. Dees and C. J. B. van der Vlugt Bergmans (1997). "Cutinase A of Botrytis cinerea is expressed, but not essential, during penetration of gerbera and tomato." Molecular Plant-Microbe Interactions 10(1): 30-38.
van Meeteren, U. (1978a). "Water Relations and Keeping-Quality of Cut Gerbera Flowers. I. Cause of Stem Break." Scientia Horticulturae 8(1): 65-74.
van Meeteren, U. (1978b). "Water Relations and Keeping-Quality of Cut Gerbera Flowers. II. Water-Balance of Aging Flowers." Scientia Horticulturae 9(2): 189-197.
van Meeteren, U. (1979a). "Water Relations and Keeping-Quality of Cut Gerbera Flowers. III. Water-Content, Permeability and Dry-Weight of Aging Petals." Scientia Horticulturae 10(3): 261-269.
van Meeteren, U. (1979b). "Water Relations and Keeping-Quality of Cut Gerbera Flowers. IV. Internal Water Relations of Aging Petal-Tissue." Scientia Horticulturae 11(1): 83-93.
van Meeteren, U. (1980). "Water Relations and Keeping-Quality of Cut Gerbera Flowers. VI. Role of Pressure Potential." Scientia Horticulturae 12(3): 283-292.
van Ooijen, J. W. (2006). "JoinMap ® 4, Software for the calculation of genetic linkage maps in experimental populations." van Ooijen, J. W. (2009). "MapQTL ® 6, Software for the mapping of quantitative trait loci in experimental populations of
diploid species." van Schie, C. C. N. and F. L. W. Takken (2014). "Susceptibility Genes 101: How to Be a Good Host." Annual Review of
Phytopathology, Vol 52 52: 551-+. VBN (2009). Product Specification Gerbera. Veronese, P., H. Nakagami, B. Bluhm, S. AbuQamar, X. Chen, J. Salmeron, R. A. Dietrich, H. Hirt and T. Mengiste
(2006). "The membrane-anchored BOTRYTIS-INDUCED KINASE1 plays distinct roles in Arabidopsis resistance to necrotrophic and biotrophic pathogens." Plant Cell 18(1): 257-273.
Vitti, D. (1996). Induzione di variabilità genetica in Gerbera jamesonii hybrid (H. Bolus) mediante rigenerazione e mutazione in vitro. PhD, University of Tuscia, .
Vrind, T. A. (2005). The Botrytis Problem in Figures. Acta Horticulturae, International Society for Horticultural Science (ISHS), Leuven, Belgium.
Vukosavljev, M., P. Arens, R. E. Voorrips, W. P. C. van 't Westende, G. D. Esselink, P. M. Bourke, P. Cox, W. E. van de Weg, R. G. F. Visser, C. Maliepaard and M. J. M. Smulders (2016). "High-density SNP-based genetic maps for the parents of an outcrossed and a selfed tetraploid garden rose cross, inferred from admixed progeny using the 68k rose SNP array." Horticulture Research 3.
Walther, F. and A. Sauer (1986). Analysis of radiosensitivity: A basic requirement for in vitro somatic mutagenesis II. Gerbera jamesonii. Nuclear techniques and in vitro culture for plant improvement, Vienna, Austria.
Wang, K. L. C., H. Li and J. R. Ecker (2002). "Ethylene biosynthesis and signaling networks." The Plant Cell 14(suppl 1): S131-S151.
Wege, S., A. Scholz, S. Gleissberg and A. Becker (2007). "Highly efficient virus-induced gene silencing (VIGS) in california poppy (Eschscholzia californica): An evaluation of VIGS as a strategy to obtain functional data from non-model plants." Annals of Botany 100(3): 641-649.
Wijekoon, C. P. and P. J. Facchini (2012). "Systematic knockdown of morphine pathway enzymes in opium poppy using virus-induced gene silencing." Plant Journal 69(6): 1052-1063.
Williams, C. (1997). "QTL mapping in outbred pedigrees." Molecular dissection of complex traits. Edited by A. Paterson. CRC Press, Boca Raton, Fla: 81-94.
Williamson, B., B. Tudzynsk, P. Tudzynski and J. A. L. van Kan (2007). "Botrytis cinerea: the cause of grey mould disease." Molecular Plant Pathology 8(5): 561-580.
Winkel-Shirley, B. (2001). "Flavonoid biosynthesis. A colorful model for genetics, biochemistry, cell biology, and biotechnology." Plant physiology 126(2): 485-493.
Wu, J., C. Cai, F. Cheng, H. Cui and H. Zhou (2014). "Characterisation and development of EST-SSR markers in tree peony using transcriptome sequences." Molecular breeding 34(4): 1853-1866.
Xu, P., Y. J. Zhang, L. Kang, M. J. Roossinck and K. S. Mysore (2006). "Computational estimation and experimental verification of off-target silencing during posttranscriptional gene silencing in plants." Plant Physiology 142(2): 429-440.
Xu, Y., S. Gao, Y. Yang, M. Huang, L. Cheng, Q. Wei, Z. Fei, J. Gao and B. Hong (2013). "Transcriptome sequencing and whole genome expression profiling of chrysanthemum under dehydration stress." BMC genomics 14(1): 662.
Yan, X., X. Zhang, M. Lu, Y. He and H. An (2015). "De novo sequencing analysis of the Rosa roxburghii fruit transcriptome reveals putative ascorbate biosynthetic genes and EST-SSR markers." Gene 561(1): 54-62.

Unraveling the genetics of Botrytis cinerea resistance in Gerbera hybrida
151
Yu, D., M. Kotilainen, E. Pöllänen, M. Mehto, P. Elomaa, Y. Helariutta, V. A. Albert and T. H. Teeri (1999). "Organ identity genes and modified patterns of flower development in Gerbera hybrida (Asteraceae)." The Plant Journal 17(1): 51-62.
Zeng, Z. B. (1994). "Precision Mapping of Quantitative Trait Loci." Genetics 136(4): 1457-1468. Zhang, F., S. M. Chen, F. D. Chen, W. M. Fang and F. T. Li (2010). "A preliminary genetic linkage map of
chrysanthemum (Chrysanthemum morifolium) cultivars using RAPD, ISSR and AFLP markers." Scientia Horticulturae 125(3): 422-428.
Zhang, L. S. and J. A. L. Van Kan (2013). "Botrytis cinerea mutants deficient in D-galacturonic acid catabolism have a perturbed virulence on Nicotiana benthamiana and Arabidopsis, but not on tomato." Molecular Plant Pathology 14(1): 19-29.
Zhang, W., S. T. Kwon, F. Chen and D. J. Kliebenstein (2016a). "Isolate Dependency of Brassica rapa Resistance QTLs to Botrytis cinerea." Frontiers in Plant Science 7.
Zhang, X. Y., J. Z. Zhang, W. W. Zhang, T. Yang, Y. Xiong and D. D. Che (2016b). "Transcriptome sequencing and de novo analysis of Rosa multiflora under cold stress." Acta Physiologiae Plantarum 38(7).
Zhang, Y., Y. Cheng, H. Ya, S. Xu and J. Han (2015). "Transcriptome sequencing of purple petal spot region in tree peony reveals differentially expressed anthocyanin structural genes." Frontiers in Plant Science 6(964).
Zheng, Z. Y., S. Abu Qamar, Z. X. Chen and T. Mengiste (2006). "Arabidopsis WRKY33 transcription factor is required for resistance to necrotrophic fungal pathogens." Plant Journal 48(4): 592-605.
Zhou, H., F.-Y. Cheng, R. Wang, Y. Zhong and C. He (2013). "Transcriptome comparison reveals key candidate genes responsible for the unusual reblooming trait in tree peonies." PloS one 8(11): e79996.
Zhu, X., M. Chai, Y. Li, M. Sun, J. Zhang, G. Sun, C. Jiang and L. Shi (2016). "Global Transcriptome Profiling Analysis of Inhibitory Effects of Paclobutrazol on Leaf Growth in Lily (Lilium Longiflorum-Asiatic Hybrid)." Frontiers in Plant Science 7(491)


Unraveling the genetics of Botrytis cinerea resistance in Gerbera hybrida
153
Summary
Gerbera hybrida is one of the top five cut flowers. It is well-known to people for its variation in flower color
and patterning. Gerbera breeding at the moment is done using conventional methods which are based on a
phenotypic selection. This has drawbacks in breeding speed and efficiency, especially for complex traits
like disease resistance. Gerbera gray mold, promoted by high humidity during the production in
greenhouses or by an accumulation of condensate during transportation, is a considerable threat to the
gerbera production. Gerbera gray mold is caused by Botrytis cinerea and plant resistance to B. cinerea is
considered to be a polygenic trait that needs the contribution of multiple loci, and on top of that is highly
affected by the environment. Conventional breeding might be inefficient for improving Botrytis resistance
in gerbera.
Given the importance of gerbera in floriculture and breeding as well as its potential to be a model species
to study flower development in composed (Compositae) flowers, there is a demand for genomic resources.
To develop genomic resources, the transcriptomes of four parents of two gerbera populations were
sequenced using Illumina paired-end sequencing. In total, 36,770 consensus contigs with an average length
of 1397 bp were generated. SNPs within and between the four genotypes were detected on the consensus
contigs. These contigs were also the starting point for transcriptome annotation. A series of genes from the
phenylpropanoid and flavonoid biosynthesis pathway were identified since they are involved in the
production of plant secondary metabolites responsible for plant defense responses. In addition, key genes
in the biosynthesis and regulation of phytohormone which likewise play a role in plant defense against B.
cinerea were identified. Transcriptome data provides a resource for genetic dissection and an insight to
explore gene functions for this ornamental crop.
To identify the QTL regions leading to the phenotypic variation in Botrytis resistance, and establishing a
relationship between marker genotype and phenotypic variation for marker assisted selection (MAS),
genetic linkage maps were constructed with SNP markers in the two F1 segregating populations. SNPs
markers were developed from the transcriptome data of the four parents and were genotyped in the
populations. Botrytis disease severity in gerbera was evaluated using three different tests, whole
inflorescence, bottom (of disc florets) and ray floret. QTL mapping was performed using the four individual
parental maps. A total of 20 QTLs (including one identical QTL locus for whole inflorescence and bottom
test) were identified in the parental maps of the two populations. The number of QTLs found and the
explained variance of most QTLs detected reflects the complex mechanism of Botrytis disease response.
Narrowing down the QTL region and identifying the causal gene(s) underlying a QTL could maximize the
effective use of MAS in breeding. To develop functional gene-targeted markers on plants without genome
sequence like for gerbera, a candidate gene (CG) approach was developed. Homologs of known functional
genes involved in Botrytis resistance from other species were obtained in gerbera and SNP markers
identified and mapped. Twenty-nine candidate genes were mapped and seven candidate genes could be

Summary
154
mapped on both populations. QTL detection for Botrytis resistance and candidate gene mapping was
accomplished in the same two populations and using the same phenotyping data as before. Several
candidate genes showed a significant difference between allelic groups in the disease score from the whole
inflorescence, bottom (of disc florets) and ray floret tests independently and seven candidate genes were
located in the vicinity of the QTLs detected. The co-localization of QTLs with CGs gives an indication that
these candidate genes could probably be involved in resistance to Botrytis and provide a more precise
possibility to use MAS in gerbera breeding in the future.
A tobacco rattle virus (TRV) based gene silencing system which was previously described in gerbera was
used to inspect the function of two candidate genes. The two CGs are the homologs of the genes
responsible for Botrytis resistance in tomato and both mapped in QTL regions related to Botrytis
resistance in gerbera ray floret test. Silencing the two genes by VIGS, showed smaller lesion sizes upon
Botrytis infection on gerbera ray florets compared with the controls. The variation in lesion size is
considered to be caused by either different interval of time before lesion initiation or to the lesion's growth
rate. The expression of candidate gene PGs, for plants’ own biological process, would promote the
penetration of Botrytis and knock down the gene might postpone the lesion formation; and lesser
accumulation of ABA will prevent gerbera to enter into senescence and makes them more resilient to
Botrytis.
The entire research went from the generation of four parental transcriptome data sets to development of
SNP markers (Chapter 2), construction of genetic maps and to mapping QTLs for Botrytis resistance
(Chapter 3). This was further on combined with candidate gene searching in other crops, querying and
mapping homologous genes (Chapter 4) and characterizing the candidate genes which co-localized with
QTLs (Chapter 5). The whole process not only helped us to unravel the genetics of Botrytis resistance in
gerbera and develop genetic tools for gerbera improvement, but also could serve as guidance for
developing marker-assisted selection for other ornamental plants from the beginning.

Unraveling the genetics of Botrytis cinerea resistance in Gerbera hybrida
155
Acknowledgments I came to the Netherlands without a clear idea of the genetic map and QTLs mapping. But at some point of
my PhD, I realized when I was like 11 years old, I stood on a desk in front of a map of the world on the
wall. My father helped me to memorize the knowledge I learned from the course of geography, and even
ask me to point out where is the country Mauritius. My father specialized in cartography, and he probably
knows more about the importance of a map and how to find a location on a map. I think that is why the
second day when he visited me in the Netherlands, after a glance at the Google map, he cycled to Ede from
Wageningen alone in this totally unfamiliar place. I really appreciate my father who let me form a right
worldview starting from the map of the world and keep curious about the world.
First I would like to thank Dr. Jaap van Tuyl gave me the opportunity to come to the flowering
Netherlands and continue the studies on ornamentals. Dear Jaap, I really admired your profound
knowledge and enthusiasm on ornamentals and bulbs. Thanks for all your guidance and contributions on
my experiments and thesis. Dr. Paul Arens, thank you told me the importance of genetic maps and
encourage me to be an independent researcher! Dear Paul, thank you for allowing me to come to your
office without an appointment in advance. I am reallllly appreciate your constructive suggestions, precise
comments, considerable effort and time for my every progress, every rehearsal of presentation and after the
presentation, every experimental design and every word of my papers and thesis chapters, in the past four
and half years. Prof. Dr. Richard Visser, thanks for the extensive discussion especially during my second
and third year of PhD, and your time on my thesis in the last journey of my PhD. Dear Richard, thanks for
your encouragement when I felt insecurity and reminder when I was over-optimistic.
Thanks Marleen Cobben as my external supervisor, but more like my big sister. Dear Marleen, I really love
to talk with you and share my life with you and thank you for guiding me for the life planning. Thanks
Awra Shahin for your always valuable suggestions in the experiments and discussion, and your smile from
the daily life. Thanks funny Alex van Silfhout making the life much easier. I am happy to belong to two
research groups under Frans Krens and Rene Smulders. Thanks to all the colleagues from these two
groups for the work discussion. Thanks Rene for the specific suggestion for my presentation and Herman
van Eck for the worthwhile discussion. Thank you Wendy van’t Westende, for guiding me at the very
beginning of my lab-life and helping me to do experiments effectively. Thank you Danny Esslink for your
assistance on dealing with the bioinformatic data. Thanks Linda Kodde, Jan Schaart, Gert van Arkel,
Christel Denneboom, Danny schipper, Marjon Arens, Gereard Bijsterbosch, Johan Bucher, Patrick
Hendrickx, Dianka Dees, and Bernadette van Kronenburg etc. for your kindness helps when I was
working in the lab. Thanks Annelies Loonen and Michela Appiano for the guidance on VIGS. Thanks
Dirk Jan Huigen and Doret Wouters for the arrangement of greenhouse in Unifarm. Thanks Harm
Wiegersma from Unifarm for taking care of the gerbera plants. Thanks Herma Koehorst-van Putten for
the yoga course and concerns.

Acknowledgments
156
Thanks Martin Beer, Ronny Egberts and other people from Florist BV and Schreurs BV for the
cooperation on the project and helps on sampling and all Gerbera things. Thanks Meng Chen, Wen Fang,
Kevin Windels, Hani Wijaya, Joyce van Assen, and Eline Jansen, who worked with me on the experiments.
Thanks secretaries of plant breeding, Nicole Trefflich, Letty Dijker, Janneke van Deursen and Danielle van
der Wee for handling some tedious documents of mine. I would like to thank all the colleagues in Plant
Breeding!! I did not talk to most of you yet, but when I met you every time in the department, your smile,
hello, hoi, hi, good morning, bye, nice weekend, doi, goedemorgen make me very delighted.
I stay in the office E2.176 for almost five years, and I met my nice officemates Clarie Kamei, Peter Vos,
Ahmed Abd-El-Haliem, Jarst van Belle, and Zhe Yan. Thank you for sharing the funny jokes and stories
with me. I do not know why I sneezed a lot in the office, but I received a lot of bless you from you guys.
Thanks to the helps from the PhD students in Plant Breeding, Nur Fatihah, Ashikin Kemat, Atiyeh
Kashaninia, Geert van Geest, Coralina Aguilera Galvez, Peter Ding, Charlie (Changlin) Chen, Peter
Bourke, Ernest Aliche (xueba), Marcela Viquez-Zamora, Dalia Carvalho, Mas Muniroh, Sri Sunarti,
Naser Askari, Mehdi massoumi, Cynara Romero, etc.
I am happy to meet many Chinese friends who make my life so much fun here in Wageningen. I will
always remember the stories between you and me. Thank you all: Dong Xiao/栋哥, Yin Song/学霸, Xi
Chen/嘻嘻 & Weicong Qi/维聪, Kaile Sun/大表姐, Zhao Zhang/钊哥, Yue Lu/玥姐, Xiaomei Yang/杨二
爷, Feng Zhu/峰峰朱 & Guojing Tian/大靓靓, Chunzhi Zhang/春春, Mengli Xi/席老师, Xiaoxue Sun/小
雪, Xueping Chen/陈老师, Xiao Lin/四少, Lisha Zhang/丽莎师姐, Xu Cheng/师父, Junyi Xu/小君君,
Lujie Chen/璐洁, Lijing Liu/小婧婧, Jiao Mei/美娇, Yuehan Dou/豆豆, Yifan Zhang/帆爷, Dongli Gao/冬
冬, Fengjiao Bu/阿娇, Xiaohua Du/杜老师, Lianwei Qu/屈老师, Lujun Zhang/章老师, Yajun Wang/亚军
师兄 & Wen Cui/崔文, Peirong Li/佩荣, Huayi Li/华一, Xuexue Shen/雪雪, Haiyan Xiao/海燕, Jinbin
Wu/斌斌, Jinling Li/金岭, Zhichun Yan/小鲜肉, Tao Zhao/涛哥, Yan Wang/王燕, Yu Du/杜宇, Juan Du/
杜鹃, Mengjing Sun/梦婧 & Wei Du/杜伟, Chunxun Song/春旭 & Wei Qin/伟哥, Ningwen Zhang/凝文
师姐 & Ke Lin/林柯师兄, Mengyang Liu/梦洋, Nan Tang/唐楠, Xuan Xu/许萱, Jia Ning/Jessie, Hao Hu/
胡昊别, Yongran Ji/老季, Juncai Chen/才哥, Guozhi Bi/毕姥爷, Yuanyuan Zhang/媛园, Fang Gou/苟芳,
Yongfu Tang/永富 & Jiacui Chen/家翠, Hucheng Li/虎臣, Haiyan Ma/海燕, Guiling Ren/贵玲, etc. etc.
Thanks all my dearest friends in China, especially Nan Wang/多多, Jie Yu/小于子, Jin Liu/金姐, Minna
Zeng/敏子, Le Li/乐姐, Feng Xiao/牛奶, Dan Tan/旦姐, etc. we used to spend a lot of time together,
although I am now far away from you, you still encourage me and care about me a lot.
I am happy to born in a supportive family and thanks to my parents never hesitated to say how proud you
are of me. Moreover, thanks to my other half Tonggao, thanks for your sacrifices and tolerating my
sometimes childish behavior!!
Yiqian Fu 18th, May, 2017

Unraveling the genetics of Botrytis cinerea resistance in Gerbera hybrida
157
Curriculum Vitae
Yiqian Fu was born on July 8, 1987 in Huarong, Hunan province,
China. In 2009, she accomplished her bachelor degree at the
Horticulture in ornamentals module at Shandong Agricultural
University, and her BSc thesis was Characteristic physiological
features of hyperhydric Chrysanthemum ‘Jinba’. At the same year, she
started her master study at the Landscape Plant and Ornamental
Horticulture at Beijing Forestry University and after a three-year
master education program, she completed the MSc thesis entitled In
vitro conservation of wild lily. In September 2012, she applied the
fellowship from China Scholarship Council to continue the study on the ornamental plant. This thesis
presents the outcomes of her four and half year PhD research on Unraveling the genetics of Botrytis cinerea
resistance in Gerbera hybrida.
The following is a list of her publications in refereed journals:
Fu, Y., van Tuyl, J., Visser, R., Arens, P., 2015. The Use of a Candidate Gene Approach to Arrive at Botrytis
Resistance in Gerbera, XXV International EUCARPIA Symposium Section Ornamentals: Crossing Borders
1087, pp. 461-466.
Fu, Y., Esselink, G.D., Visser, R.G.F., Van Tuyl, J.M., Arens, P., 2016. Transcriptome analysis of Gerbera
hybrid: including in silico confirmation of defense genes found. Frontiers in Plant Science 7:247.
Fu, Y., van Silfhout, A., Shahin, A., Egberts, R., Beers, M., van der Velde, A., van Houten, A., van Tuyl, J.M.,
Visser, R.G.F., Arens, P., 2017. Genetic mapping and QTL analysis of Botrytis resistance in Gerbera hybrida.
Mol Breeding 37, 13.

158
CONTINUED ON NEXT PAGE
Education Statement of the Graduate School
Experimental Plant Sciences
Issued to: Yiqian FuDate: 19 June 2017Group: Laboratory of Plant BreedingUniversity: Wageningen University & Research
1) Start-up phase date
► First presentation of your project
Title: QTLs mapping for Botrytis resistance in Gerbera hybrida 15 Apr 2013
► Writing or rewriting a project proposal
► Writing a review or book chapter
► MSc courses
► Laboratory use of isotopes
Subtotal Start-up Phase 1.5 credits*
2) Scientific Exposure date
► EPS PhD student days
EPS PhD student day, Amsterdam, NL 30 Nov 2012
EPS PhD student day, Leiden, NL 29 Nov 2013
EPS PhD student day 'Get2Gether', Soest, NL 29-30 Jan 2015
EPS PhD student day 'Get2Gether', Soest, NL 28-29 Jan 2016
► EPS theme symposia
EPS Theme 2 symposia: Interactions bewteen Plants and Biotic Agents, Utrecht, NL 24 Jan 2013
EPS Theme 2 symposia: Interactions bewteen Plants and Biotic Agents and the Willie Commelin Scholten Day, Amsterdam, NL 25 Feb 2014
EPS Theme 4 symposia: Genome Biology, Wageningen, NL 03 Dec 2014
EPS Theme 2 symposia: Interactions bewteen Plants and Biotic Agents and the Willie Commelin Scholten Day, Utrecht, NL 20 Feb 2015
EPS Theme 2 symposia: Interactions bewteen Plants and Biotic Agents and the Willie Commelin Scholten Day, Leiden, NL 22 Jan 2016
EPS Theme 4 symposia: Genome Biology, Wageningen, NL 16 Dec 2016
► Lunteren days and other National Platforms
Annual meeting 'Experimental Plant Sciences', Lunteren, NL 22-23 Apr 2013
Annual meeting 'Experimental Plant Sciences', Lunteren, NL 13-14 Apr 2015
Annual meeting 'Experimental Plant Sciences', Lunteren, NL 11-12 Apr 2016
► Seminars (series), workshops and symposia
Plant Sciences Seminar by Guusje Bonnema and Arnaud Bovy 'The role of Plant Breeding in improving quality of crop plants' 11 Jun 2013
Seminar by Kuang Hanhui 'Using the Nicotiana-TMV system to study resistance gene evolution and plant genome stability' 11 Sep 2013
Seminar by Teemu Teeri 'Deep RNA sequencing and flavonoid metabolons in Gerbera hybrida' in UVA 12 Sep 2013
Seminar by Salvadore Ceccarelli 'The efficiency of plant breeding' 16 Sep 2013
Plant Sciences Seminar by Robert Hall 'Metabolomics in the lab: a myriad of applications' and Nicole van Dam 'Metabolomics in the wild: Assessing the functional diversity of plant chemical defences in non-model systems'
08 Oct 2013
Mini-symposium: How to Write a World-class Paper 17 Oct 2013
CALN 2013 Annual Meeting 'Innovative Horticultural Industry and Food Safety in the Netherlands: past-present-future' 09 Nov 2013
Seminar by Li Jiayang 'Understanding the molecular mechanisms underlying rice tillering' 15 Nov 2013
Seminar by Dani Zamir 'Geno-Pheno in plant breeding' 10 Feb 2014
Seminar by Jeff Endelman 'Genome-wide Marker-assisted Selection' 25 Jun 2014
Seminar by Emma Huang 'Genetic analysis in MAGIC: advantages and challenges' 25 Jun 2014
WEES Seminar by Joy Bergelson ‘Maintaining an ancient balanced polymorphism for resistance amidst diffuse interactions’ 26 Sep 2014
Plant Breeding Research Day 2014 30 Sep 2014
Plant Sciences Seminar on Bioinformatics by Dick de Ridder and Paul Kersey 07 Nov 2014
Extra Plant Sciences Seminar by Claude Fauquet 'The application of plant biotechnology for preventing diseases' 04 Dec 2014
Seminar by Chih-Hang Wu ‘Helper NLR proteins of the NRC family in solanaceous plants’ 05 Mar 2015
Seminar by Sonia Osorio 'The uncovering of new transcription factors involved in ripening and post-harvest life of tomato and strawberry fruits' 15 Apr 2015
Plant Sciences Seminar on "Into the Battle between Plants and Viruses, but what about EVEs?" by Richard Kormelink 12 May 2015
Seminar by Christine Hackett 'Linkage analysis and QTL mapping in autotetraploid potato using SNP dosage data' 07 Sep 2015
QTL mapping within the Genstat environment: an overview of the QTL mapping library 08 Sep 2015
Plant Breeding Research Day 2015 29 Sep 2015
Seminar by Xiaowu Wang 'Subgenome Parallel Selection Drives Diversification and Convergent Morphotype Evolution in Brassica crops' 21 Oct 2015
Seminar on 'Genomics in plant and animal breeding and conservation: Strategies for success in plants, birds, and livestock' 04 Nov 2015
Seminar by Rossana Henriques 'And yet they oscillate: functional analysis of circadian long non-coding RNAs' 16 Nov 2016
Seminar by Jane Parker 'Plant intracellular immunity: evolutionary and molecular underpinnings' 21 Jan 2016
Workshops JoinMap® 4.1 : Introduction to mapping & Trouble shooting 19 May 2016
Workshops Sino Dutch Vegetable Breeding Sector Innovation 22 Sep 2016
Lectures by Edze Westra and Jennifer Doudna: 'Rewriting our genes?' 30 Sep 2016
1st Symposium 'WURomics: Technology-Driven Innovation for Plant Breeding' 15 Dec 2016

159
► Seminar plus
► International symposia and congressesSymposium 'Roses, what in it for us' on Floriade, Venlo, NL 26 Sep 2012
Conference Next Generation Plant Breeding, Ede, NL 12-14 Nov 2012
3rd International Symposium on the genus Lilium, Zhangzhou, China 31 Apr- 03 May 2014
6th European Plant Science Retreat for PhD Students, Amsterdam, NL 01-04 Jul 2014
Symposium 'All-inclusive Breeding: Integrating high-throughtput science', Wageningen, NL 16 Oct 2014
XXV Eucarpia Symposium on Ornamentals, Melle, Belgium 28 Jun-02 Jul 2015
► PresentationsTalk: XXV Eucarpia Symposium on Ornamentals, Melle, Belgium 28 Jun-02 Jul 2015
Poster: 6th European Plant Science Retreat for PhD Students, Amsterdam, NL 01-04 Jul 2014
► IAB interview
► ExcursionsPhD Trip: Rijk Zwaan excursion 27 Sep 2013
PhD Company visit: Genetwister and In2 Care 19 Sep 2014
PhD Company visit: Enza Zaden 12 Jun 2015
PhD Company visit: TomatoWorld 14 Oct 2016
Subtotal Scientific Exposure 18.3 credits*
3) In-Depth Studies date
► EPS courses or other PhD coursesMixed model based genetic analysis in GenStat: from QTLs mapping and assosiation mapping to genetic prediction 02-04 Sep 2013An Introduction to Mass Spectrometry-based Plant Metabolomics 09-13 Dec 2013Genome Assembly 28-29 Apr 2015Introduction to R for statistical analysis 18-19 May 2015
► Journal clubParticipant of literature discussion group at Plant Breeding 2012-2016
► Individual research training
Subtotal In-Depth Studies 6.6 credits*
4) Personal development date
► Skill training coursesPractical English Oct 2012-Feb 2013
Scientific Writing Nov 2014-Jan 2015
Presentation Skills 10, 17, 24 Oct 2014
Efficient Writing Strategies Sep-Oct 2015
Interpersonal Communication for PhD candidates 19-20 Nov 2015
Career assessment 2016
► Organisation of PhD students day, course or conference
► Membership of Board, Committee or PhD council
Subtotal Personal Development 6.9 credits*
TOTAL NUMBER OF CREDIT POINTS* 33.3
Herewith the Graduate School declares that the PhD candidate has complied with the educational requirements set by the Educational Committee of EPS which comprises of a minimum total of 30 ECTS credits
* A credit represents a normative study load of 28 hours of study.

The research was conducted at Plant Breeding, Wageningen University & Research, and was made possible by a financal grant from the Foundation Technological Top Institute Green Genetics (3CFL030RP). Financial support from Wageningen University for printing this thesis is gratefully acknowledged. Yiqian Fu is sponsored by CSC Fellowship.
Cover Design: Yiqian Fu
Layout: Yiqian Fu
Printed by: GVO drukkers & vormgevers, Ede (NL) | gvo.nl
Gerbera Alma from Florist B.V. was used for the cover design and word cloud on the back cover was made by wordart.com.
Copyright © 2022 FDOKUMEN