Unraveling the role of salt-sensitivity genes in obesity ... - PLOS
21
RESEARCH ARTICLE Unraveling the role of salt-sensitivity genes in obesity with integrated network biology and co-expression analysis Jamal Sabir M. Sabir 1,2 , Abdelfatteh El Omri 1,2 , Babajan Banaganapalli 3,4 , Nada Aljuaid 2 , Abdulkader M. Shaikh Omar 5 , Abdulmalik Altaf 6 , Nahid H. Hajrah 1,2 , Houda Zrelli 1,2 , Leila Arfaoui 7 , Ramu Elango 3,4 , Mona G. Alharbi 5 , Alawiah M. Alhebshi 5 , Robert K. Jansen 1,8 , Noor A. Shaik 3,4 , Muhummadh KhanID 1,2 * 1 Center of Excellence in Bionanoscience Research, King Abdulaziz University, Jeddah, Saudi Arabia, 2 Genomics and Biotechnology Section and Research Group, Department of Biological Sciences, Faculty of Science, King Abdulaziz University, Jeddah, Saudi Arabia, 3 Department of Genetic Medicine, Faculty of Medicine, King Abdulaziz University, Jeddah, Saudi Arabia, 4 Princess Al-Jawhara Center of Excellence in Research of Hereditary Disorders, King Abdulaziz University, Jeddah, Saudi Arabia, 5 Biology, Department of Biological Sciences, Faculty of Science, King Abdulaziz University, Jeddah, Saudi Arabia, 6 Department of Surgery, Faculty of Medicine, King Abdulaziz University, Jeddah, Saudi Arabia, 7 Clinical Nutrition Department, Faculty of Applied Medical Sciences, King Abdulaziz University, Jeddah, Saudi Arabia, 8 Department of Integrative Biology, University of Texas at Austin, Austin, TX, United States of America * [email protected] Abstract Obesity is a multifactorial disease caused by complex interactions between genes and die- tary factors. Salt-rich diet is related to the development and progression of several chronic diseases including obesity. However, the molecular basis of how salt sensitivity genes (SSG) contribute to adiposity in obesity patients remains unexplored. In this study, we used the microarray expression data of visceral adipose tissue samples and constructed a com- plex protein-interaction network of salt sensitivity genes and their co-expressed genes to trace the molecular pathways connected to obesity. The Salt Sensitivity Protein Interaction Network (SS PIN ) of 2691 differentially expressed genes and their 15474 interactions has shown that adipose tissues are enriched with the expression of 23 SSGs, 16 hubs and 84 bottlenecks (p = 2.52 x 10⁻¹⁶) involved in diverse molecular pathways connected to adipos- ity. Fifteen of these 23 SSGs along with 8 other SSGs showed a co-expression with enriched obesity-related genes (r � 0.8). These SSGs and their co-expression partners are involved in diverse metabolic pathways including adipogenesis, adipocytokine signaling pathway, renin-angiotensin system, etc. This study concludes that SSGs could act as molecular signatures for tracing the basis of adipogenesis among obese patients. Integrated network centered methods may accelerate the identification of new molecular targets from the complex obesity genomics data. Introduction Obesity, an excessive body fat accumulation in individuals acts as a major risk factor for the development of diverse chronic diseases like impaired insulin metabolism, glycemic PLOS ONE | https://doi.org/10.1371/journal.pone.0228400 February 6, 2020 1 / 21 a1111111111 a1111111111 a1111111111 a1111111111 a1111111111 OPEN ACCESS Citation: Sabir JSM, El Omri A, Banaganapalli B, Aljuaid N, Omar AMS, Altaf A, et al. (2020) Unraveling the role of salt-sensitivity genes in obesity with integrated network biology and co- expression analysis. PLoS ONE 15(2): e0228400. https://doi.org/10.1371/journal.pone.0228400 Editor: Narasimha Reddy Parine, King Saud University, SAUDI ARABIA Received: November 18, 2019 Accepted: January 14, 2020 Published: February 6, 2020 Peer Review History: PLOS recognizes the benefits of transparency in the peer review process; therefore, we enable the publication of all of the content of peer review and author responses alongside final, published articles. The editorial history of this article is available here: https://doi.org/10.1371/journal.pone.0228400 Copyright: © 2020 Sabir et al. This is an open access article distributed under the terms of the Creative Commons Attribution License, which permits unrestricted use, distribution, and reproduction in any medium, provided the original author and source are credited. Data Availability Statement: All relevant data are within the paper and its Supporting Information files.
-
Upload
khangminh22 -
Category
Documents
-
view
0 -
download
0
Transcript of Unraveling the role of salt-sensitivity genes in obesity ... - PLOS

RESEARCH ARTICLE
Unraveling the role of salt-sensitivity genes in
obesity with integrated network biology and
co-expression analysis
Jamal Sabir M. Sabir1,2, Abdelfatteh El Omri1,2, Babajan Banaganapalli3,4, Nada Aljuaid2,
Abdulkader M. Shaikh Omar5, Abdulmalik Altaf6, Nahid H. Hajrah1,2, Houda Zrelli1,2,
Leila Arfaoui7, Ramu Elango3,4, Mona G. Alharbi5, Alawiah M. Alhebshi5, Robert
K. Jansen1,8, Noor A. Shaik3,4, Muhummadh KhanID1,2*
1 Center of Excellence in Bionanoscience Research, King Abdulaziz University, Jeddah, Saudi Arabia,
2 Genomics and Biotechnology Section and Research Group, Department of Biological Sciences, Faculty of
Science, King Abdulaziz University, Jeddah, Saudi Arabia, 3 Department of Genetic Medicine, Faculty of
Medicine, King Abdulaziz University, Jeddah, Saudi Arabia, 4 Princess Al-Jawhara Center of Excellence in
Research of Hereditary Disorders, King Abdulaziz University, Jeddah, Saudi Arabia, 5 Biology, Department
of Biological Sciences, Faculty of Science, King Abdulaziz University, Jeddah, Saudi Arabia, 6 Department of
Surgery, Faculty of Medicine, King Abdulaziz University, Jeddah, Saudi Arabia, 7 Clinical Nutrition
Department, Faculty of Applied Medical Sciences, King Abdulaziz University, Jeddah, Saudi Arabia,
8 Department of Integrative Biology, University of Texas at Austin, Austin, TX, United States of America
Abstract
Obesity is a multifactorial disease caused by complex interactions between genes and die-
tary factors. Salt-rich diet is related to the development and progression of several chronic
diseases including obesity. However, the molecular basis of how salt sensitivity genes
(SSG) contribute to adiposity in obesity patients remains unexplored. In this study, we used
the microarray expression data of visceral adipose tissue samples and constructed a com-
plex protein-interaction network of salt sensitivity genes and their co-expressed genes to
trace the molecular pathways connected to obesity. The Salt Sensitivity Protein Interaction
Network (SSPIN) of 2691 differentially expressed genes and their 15474 interactions has
shown that adipose tissues are enriched with the expression of 23 SSGs, 16 hubs and 84
bottlenecks (p = 2.52 x 10⁻¹⁶) involved in diverse molecular pathways connected to adipos-
ity. Fifteen of these 23 SSGs along with 8 other SSGs showed a co-expression with
enriched obesity-related genes (r� 0.8). These SSGs and their co-expression partners are
involved in diverse metabolic pathways including adipogenesis, adipocytokine signaling
pathway, renin-angiotensin system, etc. This study concludes that SSGs could act as
molecular signatures for tracing the basis of adipogenesis among obese patients. Integrated
network centered methods may accelerate the identification of new molecular targets from
the complex obesity genomics data.
Introduction
Obesity, an excessive body fat accumulation in individuals acts as a major risk factor for the
development of diverse chronic diseases like impaired insulin metabolism, glycemic
PLOS ONE | https://doi.org/10.1371/journal.pone.0228400 February 6, 2020 1 / 21
a1111111111
a1111111111
a1111111111
a1111111111
a1111111111
OPEN ACCESS
Citation: Sabir JSM, El Omri A, Banaganapalli B,
Aljuaid N, Omar AMS, Altaf A, et al. (2020)
Unraveling the role of salt-sensitivity genes in
obesity with integrated network biology and co-
expression analysis. PLoS ONE 15(2): e0228400.
https://doi.org/10.1371/journal.pone.0228400
Editor: Narasimha Reddy Parine, King Saud
University, SAUDI ARABIA
Received: November 18, 2019
Accepted: January 14, 2020
Published: February 6, 2020
Peer Review History: PLOS recognizes the
benefits of transparency in the peer review
process; therefore, we enable the publication of
all of the content of peer review and author
responses alongside final, published articles. The
editorial history of this article is available here:
https://doi.org/10.1371/journal.pone.0228400
Copyright: © 2020 Sabir et al. This is an open
access article distributed under the terms of the
Creative Commons Attribution License, which
permits unrestricted use, distribution, and
reproduction in any medium, provided the original
author and source are credited.
Data Availability Statement: All relevant data are
within the paper and its Supporting Information
files.

abnormalities, hypertension and cardiovascular diseases in future. Obesity, owing to its com-
plex multifactorial disease nature is not only challenging the molecular scientists to decode its
molecular basis but also the clinicians who are involved in treating, preventing and disease
management. Approximately 30% of the world population is either overweight or obese [1]. So
far, the specific molecular and cellular mechanisms through which environmental factors
increase the risk of developing obesity in genetically susceptible individuals still remains to be
a mystery. The chronic low inflammation in different tissues is one of the characteristic fea-
tures of obesity [2]. Particularly, chronic inflammatory reactions which takes place in adipose
tissues contribute to the obesity associated insulin insensitivity. Adipose tissue plays an impor-
tant role in the development of metabolic diseases due to dysregulated discharge of adipocyto-
kines from adipocytes in visceral fat of obese individuals. This will subsequently induce insulin
resistance condition in muscles and liver. The faulty insulin sensitivity of adipose tissues, con-
nects the obesity with other chronic diseases like diabetes, hyperlipidemia, arthritis, hyperten-
sion, cardiovascular disease, ischemic stroke, hyperglycemia and different types of cancer [3]
[4].
The importance of excess salt intake in the pathogenesis of metabolic diseases is widely rec-
ognized. Salt sensitivity is a physiological trait, in which the changes in salt intake parallel the
changes in blood pressure [5]. The gene expression status of salt sensitivity genes (SSGs) in adi-
pose tissues is not yet well explored. In the present study, we focused on SSGs expressed in adi-
pose tissues to figure their influential role in the pathogenesis of obesity. We considered genes
from renin-angiotensin system pathway which maintains the homeostasis of salt and body flu-
ids, and regulate the blood pressure [6]. In addition, expression of renin-angiotensin system in
adipose tissue is involved in the regulation of triglyceride accumulation, adipocyte formation,
glucose metabolism, lipolysis, and the initiation of the adverse metabolic consequences of obe-
sity [7], [8]. Therefore, in order to identify the candidate genes from SSGs and their molecular
signature networks connected to the pathogenesis of obesity, the gene expression datasets col-
lected from visceral adipose tissues were analyzed by knowledge based systemic investigations
and statistical methods. We used different statistical parameters like graph theory to pick up
biomarkers from the gene expression data. We also used gene-gene correlation, which relies
on the fact that disease candidate genes showing a similar expression pattern are more likely to
interact with one another for their biological functioning[9]. Our network biology integrated
investigation will offer novel association with potential biological comprehensions and sup-
ports future translational assessment on SSGs and obesity.
Materials and methods
Gene expression dataset
The microarray generated gene expression dataset with the reference ID of GSE88837 was col-
lected from GEO (Gene Expression Omnibus) database [10]. This gene expression data is gen-
erated on Affymetrix microarray platform using the total RNA extracted from human visceral
adipose tissue of 16 overweight woman adolescent samples (BMI > 25) and 14 lean adolescent
women (BMI< 25). Complete information about the individuals and testing methods, can be
found in S1 Table.
Normalization of gene expression data
Gene expression data analysis of the samples were implemented by means of R packages [11]
[12]. For the standardization and noise reduction in the probe data, CEL files were incorpo-
rated into R package, Affy, and the unprocessed signal intensity values of each gene expression
probe sets were standardized with help of a statistical algorithm called as RMA (Robust
Studying salt-sensitive genes in obesity with integrated network biology and co-expression analysis
PLOS ONE | https://doi.org/10.1371/journal.pone.0228400 February 6, 2020 2 / 21
Funding: This project was funded by the Deanship
of Scientific Research (DSR), King Abdulaziz
University, Jeddah, KSA, under grant no. HiCi-63-
130-35. The authors are thankful to DSR for the
technical and the financial support.
Competing interests: The authors have declared
that no competing interests exist.
Abbreviations: BC, Betweenness Centrality; BIND,
Biomolecular Interaction Network Database;
BioGRID, Biological General Repository for
Interaction Datasets; DC, Degree Centrality; DEGs,
differentially expressed genes; DIP, Database of
Interacting Proteins; FDR, False Discovery Rate;
GWAS, Genome-wide association studies; HPRD,
Human Protein Reference Database; MINT, The
Molecular Interaction database; PCC, Pearson’s
correlation algorithm; PPIM, Protein Interaction
Map; RMA, Robust Multiarray Average; SSG, Salt
sensitivity genes; SSPIN, Salt Sensitivity Protein
Interaction Network.

Multiarray Average). This RMA algorithm performs the normalization of raw intensity data
by generating a matrix of gene expression data whose background is corrected and log2 con-
version, and then quantile normalization was performed [12]. The standardized samples were
then quantitatively categorized as normal (control) and obese (disease) sets. The statistical dif-
ference between differentially expressed genes (DEGs) was computed using unpaired t-test
measure among healthy and obese samples [13]. For examine the statistical differences in
DEGs, the false discovery rate of Benjamini and Hochberg with a p value of 0.05 was con-
ducted[14].
Building network of proteinprotein interaction
Bisogenet, a cytoscape plugin, was used to derive associations between the DEGs obtained
from the profiles of expression. Bisogenet finds significant gene interactions from high-perfor-
mance experiments and deposited literature data in DIP (Database of Interacting Proteins),
BIND (Biomolecular Interaction Network Database), BioGRID (Biological General Repository
for Interaction Datasets), MINT (The Molecular Interaction database), HPRD (Human Pro-
tein Reference Database), and IntAct databases [13, 15–19].
Construction of subnetwork
The complex interactome Protein Interaction Network (PIN) was rescaled to a significant sub-
network of Salt Sensitivity Protein Interaction Network (SSPIN) by following admitted notions
in the network biology. From the Protein Interaction Network, we extracted genes that belong
to (a) hubs based on degree centrality (DC), (b) betweenness centrality (BC) based bottlenecks
(c) salt sensitivity genes. The PIN created from Bisogenet was optimized and imported to
Cytoscape 3.2.1 in order to represent and measure the different parameters like DC and BC
connected to network centrality of each individual protein in the biological network [20]. The
Network Analyzer [21] Cytoscape plugin was deployed to monitor the network’s local and
global centrality parameters [14, 22–24].
Selection of hub proteins
DC of a gene is the number of partners that are connected to that specific gene. Genes which
shows higher DC in any given biological network will possess many interacting partners[25].
In PIN, genes having higher DC corresponds to essential genes. For identifying the hubs, we
followed the hub classification approach, which was previously described by Rakshit et al.,
[26]. The cut-off scores used for DC, while selecting the hub protein is described as:
Hubs ¼ AvgðDCÞ þ ½2� SDðDCÞ� ðFormula 1Þ
where Avg is the average DC of significantly expressed genes in the PIN and SD denotes the
standard deviation values [26].
Identification of bottlenecks
The higher DC is in correspondence to biologically essential genes, but DC is unable to quan-
tify significance of any gene in a network [27]. Based on the theory of the protein’s local prop-
erty, DC does not assess the global value of the protein in the network. There could be several
other key indicators that show the importance of a protein in the network based on its global
significance. A global BC measure was therefore implemented to determine the characteristics
of any query gene at the entire interactome level [28]. BC is measured by applying following
Studying salt-sensitive genes in obesity with integrated network biology and co-expression analysis
PLOS ONE | https://doi.org/10.1371/journal.pone.0228400 February 6, 2020 3 / 21

formula:
BC nð Þ ¼P
s6¼n6¼tsstðnÞsst
� �
ðFormula 2Þ
where ‘s’ and ‘t’ are the network nodes, other than ‘n’ and σst(n) is the number of shortest paths
from s to t that ‘n’ lies upon [29]. The significantly expressed genes falling in top 25% are
regarded under bottleneck category using the node betweenness distribution.
Salt sensitivity genes
The genes involved in the pathway of renin angiotensin aldosterone system were collected as
they serve as chief component in the regulation of salt and water balance of the body [30]. We
also collected salt sensitivity genes from a detailed literature survey [31] [5] [32] [33]. In total,
we obtained 47 SSG as represented in S2 Table.
Mapping of weighted gene-gene correlations
The map detailing gene-gene correlations was created on the basis of the algorithm known as
the Pearson correlation across the entire gene set in the SSPIN. The “r” value indicating the cor-
relation between gene pairs in the expression data was generated with help of Pearson’s corre-
lation coefficient (PCC) method. The formula used for calculating PCC for gene pairs is
described in below given Formula 3.
PCC rð Þ ¼
Pni¼1ðxi � xÞðyi � yÞ
ffiffiffiffiffiffiffiffiffiffiffiffiffiffiffiffiffiffiffiffiffiffiffiffiffiffiffiffiPn
i¼1ðxi � xÞ
2
q ffiffiffiffiffiffiffiffiffiffiffiffiffiffiffiffiffiffiffiffiffiffiffiffiffiffiffiffiPni¼1ðyi � yÞ
2q ðFormula 3Þ
where x and y indicates average of the expression values of two genes in the samples,
respectively.
Functional enrichment analysis
Functional enrichment analysis validates the physiological importance of the genes involved in
a biological process and helps to reveal unintended gene activity. ToppGene Suite was
employed to perform functional enrichment of the filtered genes [34].
Results
Microarray gene expression profile analysis
We obtained 2691 significant genes from the analysis of raw gene expression signals using
RMA with statistical significance of p value� 0.05. The intensity values of genes in the expres-
sion profiles, before and after normalization, are depicted as box plots which represents stan-
dardized form of representing the data distribution in Fig 1.
Constructed Protein Interaction Network
Overall 2691 differentially expressed genes generated from the microarray expression profile were
inputted in Bisogenet, a plugin in Cytoscape, to create PIN by extracting all potential connectivity
between the genes. The created PIN comprised of outliers like replicated edges and self-loops. The
PIN is transformed to a stable network by eliminating self-loops and replicated edges which is
then used to calculate the standardized graph centrality parameters for each single gene. The
plugin created a complex PIN, covered of 2691 nodes and 15474 edges with edge-node ratio of
Studying salt-sensitive genes in obesity with integrated network biology and co-expression analysis
PLOS ONE | https://doi.org/10.1371/journal.pone.0228400 February 6, 2020 4 / 21

5.75 on an average. Next, the plugin NetworkAnalyzer, calculated the degree centrality between-
ness centrality parameters of the network which are considered as local and global graph parame-
ters respectively [21]. Table 1 provides a description of the top 10 significant genes dependent on
the highest degree centrality along with general parameters of centrality.
Salt Sensitivity Protein Interaction Network (SSPIN)
PIN genes have been grouped into hubs and bottlenecks based on criteria of graph centrality
to establish a large network of protein interactions. The cut-off limit for hubs and bottlenecks
Fig 1. Pre and post-normalization of microarray gene expression data. Samples are represented on horizontal axis and the gene expression values on vertical
axis.
https://doi.org/10.1371/journal.pone.0228400.g001
Studying salt-sensitive genes in obesity with integrated network biology and co-expression analysis
PLOS ONE | https://doi.org/10.1371/journal.pone.0228400 February 6, 2020 5 / 21

was defined in the methods section on the basis of Formulas 1 & 2. The degree of the hubs ran-
ged from 86 to 882 nodes which makes an average connectivity of 208 edges per node. We
obtained 40 hubs, 502 bottlenecks and 47 SSGs. 15 of 47 SSGs were also found to act as bottle-
neck in the interactome (Table 2). Hubs, bottlenecks and SSGs were together consisted of 574
genes with 5356 interactions. For the ease of exploration genes in hubs, bottlenecks and SSGs
were grouped as HBS. The interaction among these 574 genes in HBS were mapped from PIN
to create new network of Salt Sensitivity Protein Interaction Network.
Functional enrichment analysis
We used the ToppGene computational annotation system to determine the functional and bio-
logical importance of the genes. The genes of HBS have been enriched by 2192 biological
Table 1. List of 10 significant genes obtained from network analysis based on graph theory.
Gene Name BC# DC$
PHF8 PHD Finger Protein 8 0.260 882
EGR1 Early Growth Response 1 0.091 504
JUND Jund Proto-Oncogene, Ap-1 Transcription Factor Subunit 0.089 462
FOS Fos Proto-Oncogene, Ap-1 Transcription Factor Subunit 0.076 438
CHD2 Chromodomain Helicase Dna Binding Protein 2 0.051 371
APP Amyloid Beta Precursor Protein 0.070 366
IRF1 Interferon Regulatory Factor 1 0.036 306
STAT3 Signal Transducer And Activator Of Transcription 3 0.049 295
TEAD4 TEA Domain Transcription Factor 4 0.042 292
RELA RELA Proto-Oncogene, Nf-Kb Subunit 0.039 278
#BC = Betweenness Centrality$DC = Degree Centrality
https://doi.org/10.1371/journal.pone.0228400.t001
Table 2. The salt sensitivity genes overlapping with bottleneck genes.
Symbol Name BC# DC$
ADD1 Adducin 1 0.001 17
ADRB2 Adrenoceptor beta 2 0.00305 62
AGT Angiotensinogen 0.00105 16
AGTR1 Angiotensin II receptor type 1 0.00097 9
ATP6AP2 ATPase H+ transporting accessory protein 2 0.00102 20
CYP11B2 Cytochrome P450 family 11 subfamily B member 2 0.00084 4
GNAI2 G protein subunit alpha i2 0.00283 31
GNB3 G protein subunit beta 3 0.00041 10
MME Membrane metalloendopeptidase 0.00047 22
NEDD4L Neural precursor cell expressed, developmentally down-regulated 4-like, E3 ubiquitin protein ligase 0.00216 46
PRCP Prolylcarboxypeptidase 0.00052 9
PREP Prolyl endopeptidase 0.00048 11
SCNN1A Sodium channel epithelial 1 alpha subunit 0.00043 12
SGK1 Serum/glucocorticoid regulated kinase 1 0.00149 32
WNK1 WNK lysine deficient protein kinase 1 0.00096 33
#BC = Betweenness Centrality$DC = Degree Centrality
https://doi.org/10.1371/journal.pone.0228400.t002
Studying salt-sensitive genes in obesity with integrated network biology and co-expression analysis
PLOS ONE | https://doi.org/10.1371/journal.pone.0228400 February 6, 2020 6 / 21

processes (BP), 210 molecular functions (MF), 246 cellular components (CC), 642 pathways
and 1669 diseases. Analysis of enrichment accounted for about 125 obesity genes. The obesity
related genes consisted of 23 SSGs, 16 hubs and 84 bottleneck genes. Approximately 50% of
the SSGs were observed to be involved in obesity via functional enrichment analysis (Table 3).
These genes were also involved in pathways associated with obesity like regulation of lipolysisin adipocytes, adipogenesis, adipocytokine signaling pathway, renin-angiotensin system, signal-ing by leptin, toll-like receptor pathway, PI3K-Akt signaling pathway, ras signaling pathway,cytokine signaling in immune system insulin pathway, glucocorticoid receptor regulatory networkand NF-kappa B signaling pathway (Table 4). The detailed list of genes involved in these path-
ways are given in the S3 Table.
The enriched genes were also involved in obesity related diseases like Diabetes Mellitus,
Hypertensive disease, Asthma, Autoimmune Diseases, Diabetes Mellitus (Insulin-Dependent),
Congestive heart failure, Cardiovascular Diseases, Coronary Artery Disease, Heart failure,
Coronary heart disease, Coronary Arteriosclerosis, Depressive disorder, Hyperglycemia, Meta-
bolic Syndrome X, Essential Hypertension, Ischemic stroke, Hyperlipidemia. Obesity is one of
leading cause of aforesaid diseases. The interaction map of genes to the diseases is depicted in
the Fig 2.
Co-expression analysis
The expression pattern similarity between 574 HBS genes was established and ranked based
on Pearson’s correlation algorithm (Fig 3) for array of control and disease samples. For control
and disease samples (Formula 3), the algorithm created PCC for 328329 pair of genes from 574
genes. Gene pairs were screened in this approach based on established concepts such as i) gene
expression level with high positive correlation. ii) Genes with similar patterns of speech are
more likely to interact. In obesity studies, gene pairs with value r = 0.8 are chosen from the cor-
relation map as higher r score indicates a greater relationship. Corresponding gene pairs were
extracted from normal correlation map to identify the variation in the co-expression from obe-
sity to normal sample. Totally, 226 genes are observed to co-express with obesity related genes
with 1126 interactions in obesity condition (Fig 4). There were 88 obesity related genes and 23
SSGs in the set which were co-expressed in samples of obese adipose tissue. We focused on the
23 SSGs that are found to have co-expressed with obesity related genes.
By performing co-expression analysis, we obtained 23 co-expressed SSGs with obesity
related genes. Eight among the 23 co-expressed genes were not previously reported for the
Table 3. The genes involved in obesity categorized as hubs, bottlenecks and salt sensitivity genes.
Category Genes P-value
Salt sensitivity
genes
ACE, ACE2, ADD1, ADRB2, AGT, AGTR1, AGTR2, ANPEP, ATP6AP2, CMA1,
CYP17A1, GNB3, GRK4, KLK1, LNPEP, MAS1, MME, NEDD4L, PRCP, PRKG1,
REN, SGK1, TH
2.52 x
10−16
Hubs EGR1, JUND, FOS, APP, STAT3, JUN, STAT1, ATF3, SIRT7, FOXM1, TBL1XR1,
BAG3, HSPB1, CEBPD, HNRNPA1, VCAM1
2.52 x
10−16
Bottlenecks CALM1, PCNA, JUNB, CRK, SHC1, GAPDH, WWOX, ITCH, HSPA1A, CRY2,
NFKB1, MLH1, PKM, HSPD1, PTPN11, MAP1LC3B, TUFM, APC, SNRNP200,
CDK5, CALR, HLA-C, GTF2I, PRKAR1A, BCL2L1, TNF, IGF1R, ZFP36, NR4A1,
TANK, SOD2, KRT18, JAK3, SMARCA2, NUP62, PRKCZ, DNMT1, ATG5,
DNAJB1, STAT5B, LEPR, VDR, PIK3CA, PPIA, FOXO3, MYD88, CAST, DDAH2,
VEGFA, SOCS3, PINK1, COL1A1, THBS1, ACAT2, THRA, SNAP29, VTI1B, PER1,
TPI1, RGS2, BMPR1A, NPHP1, FTL, GTF2H1, APOE, CYCS, ABCA1, CSK,
TIMM44, GNAQ, C3, POLDIP2, SLU7, ST13, COL4A1, LAMA1, SDC2, IGF1,
BGN, CFH, ADM, WASF1, HGF, C1QTNF6
2.52 x
10−16
https://doi.org/10.1371/journal.pone.0228400.t003
Studying salt-sensitive genes in obesity with integrated network biology and co-expression analysis
PLOS ONE | https://doi.org/10.1371/journal.pone.0228400 February 6, 2020 7 / 21

disease obesity via functional enrichment analysis. The list of co-expressed SSGs are depicted in
the Table 5. We developed an interaction map of unreported SSGs with obesity related genes (Fig
5) by taking their co-relation score as weight (Table 6). We extracted the edge weight of gene
pairs in both obese and normal sample to identify the distinct variations across set of two condi-
tions. This attempt was performed because of the fact that differentially co-expressed genes partic-
ipate in numerous biological processes resulting in adverse or complementary effects.
It is very clear from the plot that majority of the co-expressed genes in the obese conditions
are not co-expressed in normal conditions. Considering them as a disease subnetwork, we cal-
culated the local topological parameters based on graph theory. Among 8 unreported SSGs,
the highly connected genes with obesity related genes is ENPEP followed by WNK1. These
two genes were having 21 and 20 direct connectivity to the obesity related gene in the co-
expressed state. The SSGs, THOP1, CLCNKB, SCNN1G and THOP1 were having poor con-
nectivity in the disease subnetwork. Notably, CYP3A5 and CTSA formed two separate net-
works with connectivity 6 and 3 respectively to obesity related gene. The interactions of the
unreported SSGs with obesity related genes was separated and depicted in the Fig 6. We have
narrowed down unreported SSGs to 5 prioritized genes (ENPEP, WNK1, CYP3A5, SLC24A3
and CTSA) based on their co-expression and topological parameters.
Table 4. The enriched pathways that are closely associated with obesity or obesity related diseases.
Pathway P-value Source Gene’s Count
Adipocytokine signaling pathway 1.86E-02 KEGG 7
Adipogenesis 5.56E-03 Wikipathways 12
Cellular responses to stress 7.36E-06 REACTOME 39
Chemokine signaling pathway 4.22E-04 KEGG2 18
Cytokine Signaling in Immune system 9.58E-08 REACTOME 62
Glucocorticoid receptor regulatory network 1.45E-07 PID 16
Hemostasis 7.39E-04 REACTOME 43
Insulin signaling pathway 6.39E-05 PID1 9
Interferon Signaling 2.18E-06 REACTOME 24
MAPK signaling pathway 6.88E-04 KEGG 22
Mineralocorticoid biosynthesis 4.78E-03 BIOCYC 2
NF-KB signaling pathway 1.12E-03 BioCarta 5
NOD-like receptor signaling pathway 5.32E-04 KEGG 17
PI3K-Akt signaling pathway 8.92E-06 KEGG 32
Ras signaling pathway 3.61E-04 KEGG 21
Regulation of lipolysis in adipocytes 1.16E-03 KEGG 8
Renin secretion 2.61E-04 KEGG 10
Renin-angiotensin system 3.25E-30 KEGG 22
Signaling by Leptin 8.10E-03 REACTOME 19
Signaling by Rho GTPases 2.63E-03 REACTOME 30
Sodium/Calcium exchangers 7.92E-03 Reactome 3
Sphingolipid signaling pathway 2.94E-03 KEGG 12
TNF signaling pathway 1.46E-06 KEGG 17
Toll-like receptor pathway 2.23E-03 BioCarta 6
Type I diabetes mellitus 2.61E-02 KEGG 5
Type II diabetes mellitus 8.93E-03 KEGG 6
1PID = pathway interaction database2KEGG = Kyoto Encyclopedia of Genes and Genomes
https://doi.org/10.1371/journal.pone.0228400.t004
Studying salt-sensitive genes in obesity with integrated network biology and co-expression analysis
PLOS ONE | https://doi.org/10.1371/journal.pone.0228400 February 6, 2020 8 / 21

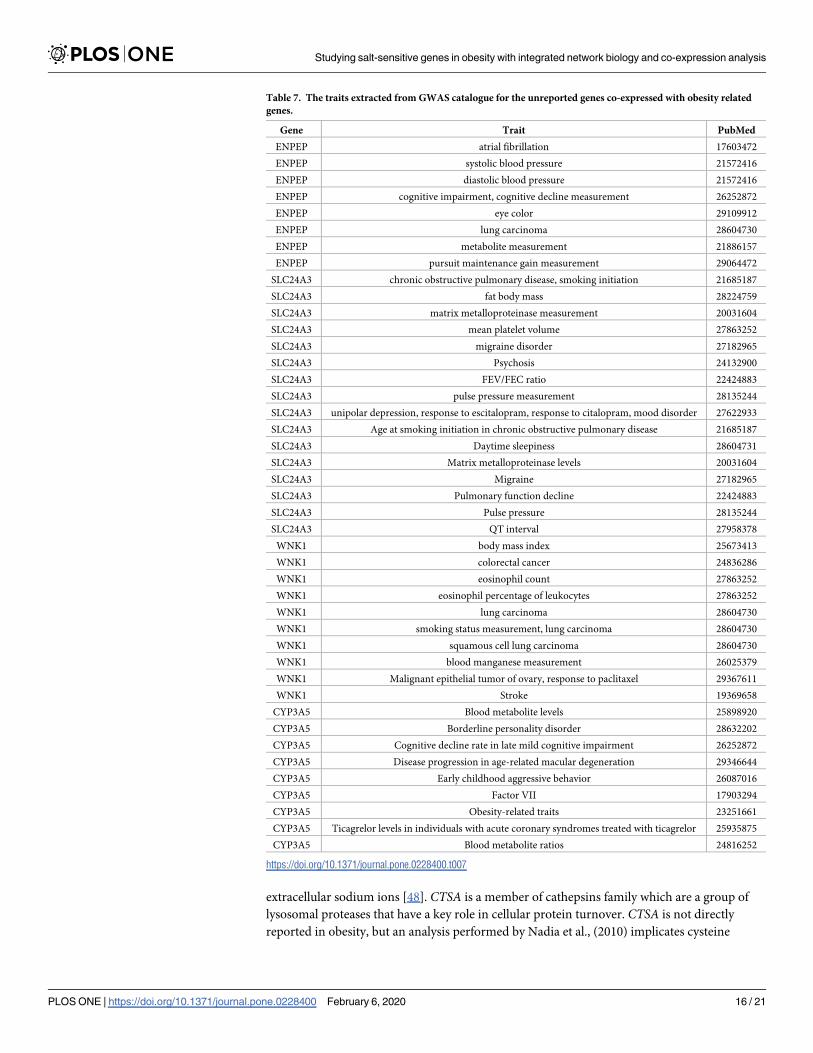
An attempt was made to associate novel genes found in this study to the genome wide asso-
ciation studies on many disease traits from around the world in the GWAS catalog (Mac-
Arthur et al., 2016). We extracted the reported traits of these co-expressed genes from GWAS
catalog to identify their association to obesity (Table 7). Many of these traits were related to
obesity or its associated traits in cardiovascular or metabolic diseases.
Discussion
Traditional gene profiling approaches are based on detecting individual targeted genes show-
ing variations in the experimental group versus the control one. However, mere identification
of differentially expressed genes cannot always help in understanding biological pathways
Fig 2. The interaction map of disease to genes. The red nodes represents salt sensitivity genes, pink and green nodes represents hubs and bottlenecks respectively.
https://doi.org/10.1371/journal.pone.0228400.g002
Studying salt-sensitive genes in obesity with integrated network biology and co-expression analysis
PLOS ONE | https://doi.org/10.1371/journal.pone.0228400 February 6, 2020 9 / 21

(metabolism, transcription, and gene interactions, among others) regulations involved in the
disease pathogenesis [35]. This is especially true in case of multifaceted or complex disorders
like obesity, which do not progress because of instabilities in a single gene, but due to the
changes in several pathways comprising of various biological networks [14]. In the current
study, we investigated the concepts of gene regulatory networks in order to profile the signifi-
cant variations of salt-sensitive genes involved in obesity.
Local parameter DC and global parameter BC were used to dissect the complex interac-
tome. DC of a gene is the number of partners that are connected to that specific gene. Protein
Interaction Network (PIN) are mathematical representations of physical and/or functional
interaction between nodes, where nodes are the genes and the edges represent the connection
between them, which may be binding possibility, metabolic interaction or regulatory crosstalks
[36]. In our built PIN, significant alterations were observed in the expression level of h selected
genes in our experimental settings. Initially, a complex network of significant genes from adi-
pose tissue was constructed which was further decomposed to a Salt Sensitivity Protein Inter-
action Network based on hubs and bottlenecks. Hubs are considered as key features in
networks, because they project critical intersections, which gets disturbs the networks when-
ever they are removed [37]. In the constructed interactome PIN, highly essential genes show
high degree of connectivity. Several publications strongly suggested that diseased genes have
higher connectivity and cross-talks when compared to non-diseased ones which are support-
ing hubs impact in the network [38]. We obtained 40 hubs with an average connectivity of 208
edges. The enrichment analysis revealed that 16 hub genes were involved in obesity and 13
hubs were involved in Type 2 Diabetes, closely related to obesity. Thus, the identification of
hub molecules in the PIN is of substantial interest to get better insights of the disease patho-
genesis. On other hand, functionally relevant vertices (nodes) in the network were detected
Fig 3. Representation of gene-gene correlation plot. The correlation plots illustrate substantial variations in gene expression among the gene pairs in the control (lean)
and obese samples. A). Gene-gene correlation of lean samples (control), B). Gene-gene correlation of obese samples (disease)
https://doi.org/10.1371/journal.pone.0228400.g003
Studying salt-sensitive genes in obesity with integrated network biology and co-expression analysis
PLOS ONE | https://doi.org/10.1371/journal.pone.0228400 February 6, 2020 10 / 21

using betweenness centrality (BC). In fact, This approach helped to sort-out vertices linking
dense networks, rather than nodes located inside the dense cluster[28]. Functional enrichment
analysis represented 84 bottleneck genes in obesity.
The unintended interactions of the genes may lead to deregulated functions. Hence, to bet-
ter understand the gene function in cellular context, we need to understand how genes are
interconnected together within several biological processes and molecular signaling pathways.
In fact this type of structural and functional bio interactome can be created by evaluating the
Fig 4. The plot of genes co-expressed with obesity related genes. The obese condition where yellow nodes represents obesity related genes.
https://doi.org/10.1371/journal.pone.0228400.g004
Studying salt-sensitive genes in obesity with integrated network biology and co-expression analysis
PLOS ONE | https://doi.org/10.1371/journal.pone.0228400 February 6, 2020 11 / 21

functional features of the genes. Therefore, carrying out gene enrichment analysis is a vital
part in exploring the high-throughput data extracted from different biological observations
and experiments. This methodology helps to discover the non-predefined interaction between
functional genes that significantly regulate different biological. Gene ontology analysis
depicted the involvement of 125 genes in obesity and 24 genes among them were SSGs con-
tributing to 50 percentage of total SSGs. These findings signifies the critical role of SSGs in the
role of obesity. To explore more on salt related genes co-expression analysis of obesity related
genes in adipose tissue was carried out. By performing co-expression analysis, we obtained 23
co-expressed SSGs with obesity related genes. Eight among the 23 co-expressed genes were not
previously reported for the disease obesity via gene ontology analysis. Gene co-correlation can
be explained by the fact that genes showing similar regulation/ expression patterns are fre-
quently interconnected together than with arbitrary genes [9]. Interaction map of the unre-
ported SSGs with obesity related genes showed stronger interactions in disease state. It is very
clear from the plot (Fig 5) that majority of the co-expressed genes in the obese conditions are
not co-expressed in normal conditions. The novel obesity associated SSG and their interac-
tions supports the view that the differentially co-expressed genes are likely to get involved in
numerous molecular processes resulting in adverse or balancing effects [39].
The established theory in network biology is that disease related genes existing in close
physical proximity are most likely to cause diseases with similar molecular basis. In addition,
in a network of disease genes, the non-disease genes are identified to have a higher tendency to
interact with other disease genes [40]. Considering the theory, we looked into disease and
pathway related to the prioritized gene from unreported SSGs.WNK1 and ENPEP act as cen-
tral hub in the network with high number co-expressed partners. In the functional enrichment
Table 5. List of co-expressed salt sensitive genes with their identity in obesity.
Gene Name Role in obesity
ACE2 Angiotensin I Converting Enzyme 2 Reported
ADD1 Adducin 1 Reported
ADRB2 Adrenoceptor Beta 2 Reported
AGT Angiotensinogen Reported
AGTR1 Angiotensin Ii Receptor Type 1 Reported
ANPEP Alanyl Aminopeptidase, Membrane Reported
ATP6AP2 Atpase H+ Transporting Accessory Protein 2 Reported
CYP17A1 Cytochrome P450 Family 17 Subfamily A Member 1 Reported
GNB3 G Protein Subunit Beta 3 Reported
LNPEP Leucyl And Cystinyl Aminopeptidase Reported
MAS1 Mas1 Proto-Oncogene, G Protein-Coupled Receptor Reported
MME Membrane Metalloendopeptidase Reported
NEDD4L Neural Precursor Cell Expressed, Developmentally Down-Regulated 4-Like, E3 Ubiquitin Protein Ligase Reported
PRKG1 Protein Kinase Cgmp-Dependent 1 Reported
SGK1 Serum/Glucocorticoid Regulated Kinase 1 Reported
CLCNKB Chloride Voltage-Gated Channel Kb Unreported
CTSA Cathepsin A Unreported
CYP3A5 Cytochrome P450 Family 3 Subfamily A Member 5 Unreported
ENPEP Glutamyl Aminopeptidase Unreported
SCNN1G Sodium Channel Epithelial 1 Gamma Subunit Unreported
SLC24A3 Solute Carrier Family 24 Member 3 Unreported
THOP1 Thimet Oligopeptidase 1 Unreported
WNK1 Wnk Lysine Deficient Protein Kinase 1 Unreported
https://doi.org/10.1371/journal.pone.0228400.t005
Studying salt-sensitive genes in obesity with integrated network biology and co-expression analysis
PLOS ONE | https://doi.org/10.1371/journal.pone.0228400 February 6, 2020 12 / 21

data, the geneWNK1 is reported in diseases like Diabetes Mellitus, Cardiovascular Diseases,
Metabolic Syndrome X, Hyperglycemia and heart failure. These enriched diseases also show
close relationship with obesity. Recent report by Ding et al., [41] in mouse model suggests
WNK1 as a novel signaling molecule involved in development of obesity. It suggests lack of
Akt3 in adipocytes rises the WNK1 protein level which in turn activates SGK1 and stimulates
adipogenesis through phosphorylation and inhibition of FOXO1 transcription factor, subse-
quently, activating the transcription of PPARg in adipocytes. Increased adipocyte results in
high fat accumulation and ultimately to obesity. Thus,WNK1, can act as one of the potential
biomarker or targets for controlling obesity. Additionally, at pathway level,WNK1 is known to
be a potent regulator of Na+ and Cl- ions transport, and consequently the blood pressure.
Ewout et al, (2011) describes about the role of WNKs in salt metabolism via regulating sodium,
chlorine, potassium and blood pressure [42]. WNKs are involved in crucial molecular path-
ways via connecting hormones such as angiotensin II and aldosterone to sodium and potas-
sium transport.WNK1 is significantly involved in homeostasis and several biological processes
regulations including and not limited to cell survival, proliferation and signaling fates. WNK1
activates sodium channel epithelial (ENaC) gene subunits SCNN1A, SCNN1B, and SCNN1D.
It is also known as an activator of SGK1. In fact, by inhibiting WNK4 activity through kinase
phosphorylation, WNK1 controls Na+ and Cl- ions transport. Moreover, WNK1 plays a switch
role-like (activation/inhibition) of the Na-K-Cl cotransporters (NKCC) respectively [43].
ENPEP is a member of the M1 family of endopeptidases. It is plays a role in the catabolic
pathway of the renin angiotensin system which in turn is involved in regulation of blood pres-
sure [44]. The gene is observed in Hypertensive disease which are closely associated with obe-
sity. Currently, inhibition of ENPEP activity is one of procedure used to treat hypertension
Fig 5. The plot depicts the correlation score of gene pairs in obese and control conditions. The color scale (-1 to +1) represents the correlation value. Higher the
value higher is the correlation. (A) Represents gene-gene correlation in normal samples and (B) represents their corresponding correlation in obese condition. Pink
nodes depict novel genes that are co-expressed with obesity related genes in obese condition and Yellow nodes represent obesity related genes.
https://doi.org/10.1371/journal.pone.0228400.g005
Studying salt-sensitive genes in obesity with integrated network biology and co-expression analysis
PLOS ONE | https://doi.org/10.1371/journal.pone.0228400 February 6, 2020 13 / 21

Table 6. Interactions of unreported salt sensitive genes in obese and normal condition with their corresponding
co-relation score as weights.
Gene-1 Gene-2 Obese1 Normal2
WNK1 CALM1 0.9439 0.5472
ENPEP C1QBP 0.9417 -0.2225
ENPEP PCNA 0.9240 -0.2255
ENPEP MBNL1 0.9156 0.5669
WNK1 CEP104 0.9145 0.2931
ENPEP XRCC5 0.9110 -0.1939
CYP3A5 HIST1H2BD 0.9040 0.2237
CYP3A5 C3 0.9015 0.6306
CLCNKB MAS1 0.9001 0.4543
ENPEP CAST 0.8897 0.3039
CYP3A5 CFH 0.8787 0.5056
CYP3A5 KRT18 0.8696 0.1807
ENPEP SNX1 0.8659 0.3880
SLC24A3 RTN4 0.8625 0.7491
ENPEP MID2 0.8569 0.3283
ENPEP GNAQ 0.8480 0.5793
WNK1 SPTBN1 0.8469 0.3412
SLC24A3 LNPEP 0.8434 0.6549
WNK1 OPTN 0.8420 0.3940
ENPEP MAP1LC3B 0.8410 0.4832
WNK1 ST13 0.8377 0.4385
WNK1 LIN7C 0.8362 0.2726
WNK1 DLG1 0.8352 0.3487
ENPEP PPP2CB 0.8341 0.2886
WNK1 BCL2L2 0.8338 0.7179
ENPEP AGFG1 0.8333 0.2477
SLC24A3 ADM 0.8324 0.5586
ENPEP MLH1 0.8309 0.2835
WNK1 RNF11 0.8297 0.3692
CTSA POLDIP2 0.8285 0.1705
CTSA DERL1 0.8279 0.1225
ENPEP YAP1 0.8258 0.1928
WNK1 SMAD7 0.8237 0.2519
ENPEP KCMF1 0.8225 -0.0395
WNK1 YWHAG 0.8217 0.5680
SCNN1G GNB3 0.8216 0.5586
ENPEP PRKAR1A 0.8215 0.7386
CYP3A5 PRKCZ 0.8213 0.1144
ENPEP RDH11 0.8198 -0.0770
WNK1 COL4A1 0.8191 0.3485
CTSA DHX30 0.8171 0.2648
WNK1 EBF1 0.8168 0.3779
ENPEP ATG5 0.8151 0.2386
ENPEP AGTR1 0.8149 0.4997
ENPEP EPS15 0.8134 0.5767
WNK1 AGTR1 0.8124 0.4890
(Continued)
Studying salt-sensitive genes in obesity with integrated network biology and co-expression analysis
PLOS ONE | https://doi.org/10.1371/journal.pone.0228400 February 6, 2020 14 / 21

condition. Hypertension is a growing problem affecting 40% percent of adults due to the grow-
ing prevalence of obesity and diabetes in many parts of the world [45]. In addition, DNA
methylation study in human adipose tissue reveals ENPEP as one of the differentially methyl-
ated genes associated with obesity and related traits [46]. ENPEP is found to be a candidate
gene associated with obesity and hypertension traits in GWAS (Genome Wide Association
study) studies. ENPEP is highly correlated with obesity related genes and also correlated with
the diseases that may be comorbidity conditions of obesity. Therefore, our work provides
strong evidence for ENPEP to be a novel gene that contributing to obesity.
CYP3A5 plays a role in the metabolism of many drugs and other metbolites, such as ste-
roids. CYP3A5 is also involved in the oxidative metabolism of xenobiotics, as well as calcium
channel blocking drugs and immunosuppressive drugs. CYP3A5 is a member of the cyto-
chrome P450 superfamily of enzymes. These proteins are monooxygenases catalyzing reac-
tions in metabolism of drugs, cholesterol, steroids and other lipids. The main functions
associated with CYP3A5 are monooxygenase activity, iron ion binding, lipid metabolism and
oxidoreductase activity [47].
Potassium-dependent sodium/calcium exchanger (SLC24A3) plays an important role in
intracellular calcium homeostasis. It facilitates exchange of intracellular Ca++ and K+ ions for
Table 6. (Continued)
Gene-1 Gene-2 Obese1 Normal2
WNK1 MBNL1 0.8123 0.5277
WNK1 RTN4 0.8121 0.4261
ENPEP PDIA6 0.8111 -0.2465
CYP3A5 CHEK2 0.8098 0.0108
WNK1 PPP2CB 0.8077 0.4375
WNK1 SCARB2 0.8059 0.1818
THOP1 CSK 0.8058 0.3290
WNK1 MID2 0.8047 0.3940
ENPEP TANK 0.8027 0.3945
WNK1 GTF2I 0.8001 0.1125
1obese = correlation score in obese sample2normal = correlation score in normal sample
https://doi.org/10.1371/journal.pone.0228400.t006
Fig 6. The partners of prioritized unreported salt sensitive genes (ENPEP, WNK1, CYP3A5, SLC24A3 and CTSA) which are co-expressed with obesity related
genes in obese condition.
https://doi.org/10.1371/journal.pone.0228400.g006
Studying salt-sensitive genes in obesity with integrated network biology and co-expression analysis
PLOS ONE | https://doi.org/10.1371/journal.pone.0228400 February 6, 2020 15 / 21
extracellular sodium ions [48]. CTSA is a member of cathepsins family which are a group of
lysosomal proteases that have a key role in cellular protein turnover. CTSA is not directly
reported in obesity, but an analysis performed by Nadia et al., (2010) implicates cysteine
Table 7. The traits extracted from GWAS catalogue for the unreported genes co-expressed with obesity related
genes.
Gene Trait PubMed
ENPEP atrial fibrillation 17603472
ENPEP systolic blood pressure 21572416
ENPEP diastolic blood pressure 21572416
ENPEP cognitive impairment, cognitive decline measurement 26252872
ENPEP eye color 29109912
ENPEP lung carcinoma 28604730
ENPEP metabolite measurement 21886157
ENPEP pursuit maintenance gain measurement 29064472
SLC24A3 chronic obstructive pulmonary disease, smoking initiation 21685187
SLC24A3 fat body mass 28224759
SLC24A3 matrix metalloproteinase measurement 20031604
SLC24A3 mean platelet volume 27863252
SLC24A3 migraine disorder 27182965
SLC24A3 Psychosis 24132900
SLC24A3 FEV/FEC ratio 22424883
SLC24A3 pulse pressure measurement 28135244
SLC24A3 unipolar depression, response to escitalopram, response to citalopram, mood disorder 27622933
SLC24A3 Age at smoking initiation in chronic obstructive pulmonary disease 21685187
SLC24A3 Daytime sleepiness 28604731
SLC24A3 Matrix metalloproteinase levels 20031604
SLC24A3 Migraine 27182965
SLC24A3 Pulmonary function decline 22424883
SLC24A3 Pulse pressure 28135244
SLC24A3 QT interval 27958378
WNK1 body mass index 25673413
WNK1 colorectal cancer 24836286
WNK1 eosinophil count 27863252
WNK1 eosinophil percentage of leukocytes 27863252
WNK1 lung carcinoma 28604730
WNK1 smoking status measurement, lung carcinoma 28604730
WNK1 squamous cell lung carcinoma 28604730
WNK1 blood manganese measurement 26025379
WNK1 Malignant epithelial tumor of ovary, response to paclitaxel 29367611
WNK1 Stroke 19369658
CYP3A5 Blood metabolite levels 25898920
CYP3A5 Borderline personality disorder 28632202
CYP3A5 Cognitive decline rate in late mild cognitive impairment 26252872
CYP3A5 Disease progression in age-related macular degeneration 29346644
CYP3A5 Early childhood aggressive behavior 26087016
CYP3A5 Factor VII 17903294
CYP3A5 Obesity-related traits 23251661
CYP3A5 Ticagrelor levels in individuals with acute coronary syndromes treated with ticagrelor 25935875
CYP3A5 Blood metabolite ratios 24816252
https://doi.org/10.1371/journal.pone.0228400.t007
Studying salt-sensitive genes in obesity with integrated network biology and co-expression analysis
PLOS ONE | https://doi.org/10.1371/journal.pone.0228400 February 6, 2020 16 / 21

proteases cathepsins S, L, and K in complications of obesity [49]. Similarly, a study conducted
by Araujo et al., (2018) reports CTSB, a member in Cathepsin family, controls autophagy in
adipocytes. In obese individuals, the expression of this gene increases which in turn regulates
inflammatory markers [50]. In our analysis CTSA is co-expressed with obesity related genes
suggesting a critical role in the pathway of obesity since the members of Cathespin family plays
import role in obesity. The major functions associated with CTSA are glycosphingolipid
metabolism, protein transport and enzyme activating activity.
In GWAS analysis, the genes CYP3A5, SLC24A3 and CTSA are observed in obesity related
diseases like Hypertensive disease, Asthma, Coronary Artery Disease, Essential Hypertension,
Hypertensive disease and Heart failure. We found the gene CYP3A5 is reported as one of loci
associated with obesity related traits in GWAS studies [51]. It is also associated with Factor VII
and blood metabolite levels. Recent study by Takahashi et al., [52] reports the relationship of
factor VII and obesity. The results propose Factor VII is an adipokine, enhanced by TNF-α or
isoproterenol, which plays crucial role in the pathogenesis of obesity. SLC24A3 andWNK1 are
mapped to traits like fat body mass and body mass index which are closely associated with obe-
sity. This analysis of integrating GWAS studies also substantiates the possible association of
novel genes identified through this study to obesity related traits and comorbidity symptoms
and diseases.
We acknowledge that our strategy has some technical constraints. First, since experimen-
tally derived protein interactions were retrieved using Bisogenet plugin. This plugin employs
multiple databases of protein-protein interactions hence any interaction which has not been
updated in those databases may not have been included in our study. In addition to this the
insufficiency of data pertaining to certain genes in the Gene Ontology (GO) should also be
considered. In order to overcome these limitations, we tried to include protein interaction
based on co-expression. Overall, our research analysis has presented the effectiveness of link-
ing genetic expression with their functional relationship in identification of obesity candidate
genes. In order to demonstrate the involvement of the novel candidate genes mentioned in
this study further experimental validation is required.
Conclusions
This work systematically outlines an integrated bioinformatics pipeline for figuring out the
most indispensable key signatures from the interactome Salt Sensitivity Protein Interaction
Network (SSPIN). The findings with biological relevance depict 50% of the SSGs have experi-
mental evidences for their role in the pathogenesis of obesity. A detailed parametric down-
stream analysis based on biological insights, illustrated 5 candidate genes that can act as
potential biomarker or target for obesity. To authenticate our results, we illustrate the possible
role of ENPEP and WNK1 which appeared in the top prioritized list. Overall, our research
analysis has presented the effectiveness of linking genetic expression with their functional rela-
tionship in identification of obesity candidate genes.
Supporting information
S1 Table. The list of samples and their characteristics used in the research analysis.
(PDF)
S2 Table. The list of Salt Sensitive Genes analyzed in the present study.
(PDF)
S3 Table. Go Annotation of Obesity Salt-Sensitivity Genes.
(XLSX)
Studying salt-sensitive genes in obesity with integrated network biology and co-expression analysis
PLOS ONE | https://doi.org/10.1371/journal.pone.0228400 February 6, 2020 17 / 21

Acknowledgments
This project was funded by the Deanship of Scientific Research (DSR) at King Abdulaziz Uni-
versity, under grant no. HiCi-63-130-35. The authors are thankful to DSR for the technical
and the financial support.
Author Contributions
Conceptualization: Jamal Sabir M. Sabir, Abdelfatteh El Omri, Abdulkader M. Shaikh Omar,
Robert K. Jansen, Muhummadh Khan.
Data curation: Babajan Banaganapalli, Noor A. Shaik.
Formal analysis: Babajan Banaganapalli, Nada Aljuaid, Nahid H. Hajrah, Noor A. Shaik.
Funding acquisition: Jamal Sabir M. Sabir, Abdulkader M. Shaikh Omar.
Investigation: Abdelfatteh El Omri, Babajan Banaganapalli, Abdulkader M. Shaikh Omar,
Noor A. Shaik, Muhummadh Khan.
Methodology: Abdelfatteh El Omri, Babajan Banaganapalli, Nada Aljuaid, Abdulmalik Altaf,
Nahid H. Hajrah, Houda Zrelli, Mona G. Alharbi, Alawiah M. Alhebshi, Noor A. Shaik.
Project administration: Jamal Sabir M. Sabir, Abdelfatteh El Omri, Muhummadh Khan.
Resources: Abdelfatteh El Omri, Nada Aljuaid, Nahid H. Hajrah, Leila Arfaoui, Mona G.
Alharbi, Alawiah M. Alhebshi.
Software: Babajan Banaganapalli, Leila Arfaoui, Mona G. Alharbi, Muhummadh Khan.
Supervision: Jamal Sabir M. Sabir, Abdelfatteh El Omri, Abdulkader M. Shaikh Omar, Houda
Zrelli, Robert K. Jansen, Noor A. Shaik.
Validation: Nada Aljuaid, Abdulmalik Altaf, Mona G. Alharbi, Alawiah M. Alhebshi.
Visualization: Babajan Banaganapalli, Abdulmalik Altaf, Mona G. Alharbi, Noor A. Shaik.
Writing – original draft: Houda Zrelli, Ramu Elango, Muhummadh Khan.
Writing – review & editing: Houda Zrelli, Ramu Elango, Robert K. Jansen, Noor A. Shaik,
Muhummadh Khan.
References
1. Jousheghany F, Phelps J, Crook T, Hakkak R. Relationship between level of HbA1C and breast cancer.
BBA Clin. 2016; 6:45–8. Epub 2016/12/14. https://doi.org/10.1016/j.bbacli.2016.04.005 PMID:
27957429; PubMed Central PMCID: PMC5144103.
2. Tanti JF, Ceppo F, Jager J, Berthou F. Implication of inflammatory signaling pathways in obesity-
induced insulin resistance. Front Endocrinol (Lausanne). 2012; 3:181. Epub 2013/01/15. https://doi.org/
10.3389/fendo.2012.00181 PMID: 23316186; PubMed Central PMCID: PMC3539134.
3. Gabrielli AP, Manzardo AM, Butler MG. Exploring genetic susceptibility to obesity through genome func-
tional pathway analysis. Obesity (Silver Spring). 2017; 25(6):1136–43. Epub 2017/05/06. https://doi.
org/10.1002/oby.21847 PMID: 28474384; PubMed Central PMCID: PMC5444946.
4. Iyer A, Fairlie DP, Prins JB, Hammock BD, Brown L. Inflammatory lipid mediators in adipocyte function
and obesity. Nat Rev Endocrinol. 2010; 6(2):71–82. Epub 2010/01/26. https://doi.org/10.1038/nrendo.
2009.264 PMID: 20098448.
5. Mishra S, Ingole S, Jain R. Salt sensitivity and its implication in clinical practice. Indian Heart J. 2018; 70
(4):556–64. Epub 2018/09/02. https://doi.org/10.1016/j.ihj.2017.10.006 PMID: 30170653; PubMed
Central PMCID: PMC6116721.
6. Rassler B. The Renin-Angiotensin System in the Development of Salt-Sensitive Hypertension in Animal
Models and Humans. Pharmaceuticals (Basel). 2010; 3(4):940–60. Epub 2010/03/29. https://doi.org/
10.3390/ph3040940 PMID: 27713283; PubMed Central PMCID: PMC4034015.
Studying salt-sensitive genes in obesity with integrated network biology and co-expression analysis
PLOS ONE | https://doi.org/10.1371/journal.pone.0228400 February 6, 2020 18 / 21

7. Dunner N, Quezada C, Berndt FA, Canovas J, Rojas CV. Angiotensin II signaling in human preadipose
cells: participation of ERK1,2-dependent modulation of Akt. PLoS One. 2013; 8(10):e75440. Epub
2013/10/08. https://doi.org/10.1371/journal.pone.0075440 PMID: 24098385; PubMed Central PMCID:
PMC3788799.
8. Bader S, Kuhner S, Gavin AC. Interaction networks for systems biology. FEBS Lett. 2008; 582
(8):1220–4. Epub 2008/02/20. https://doi.org/10.1016/j.febslet.2008.02.015 PMID: 18282471.
9. Grigoriev A. A relationship between gene expression and protein interactions on the proteome scale:
analysis of the bacteriophage T7 and the yeast Saccharomyces cerevisiae. Nucleic Acids Res. 2001;
29(17):3513–9. Epub 2001/08/28. https://doi.org/10.1093/nar/29.17.3513 PMID: 11522820; PubMed
Central PMCID: PMC55876.
10. Clough E, Barrett T. The Gene Expression Omnibus Database. Methods Mol Biol. 2016; 1418:93–110.
Epub 2016/03/24. https://doi.org/10.1007/978-1-4939-3578-9_5 PMID: 27008011; PubMed Central
PMCID: PMC4944384.
11. Carvalho BS, Irizarry RA. A framework for oligonucleotide microarray preprocessing. Bioinformatics.
2010; 26(19):2363–7. Epub 2010/08/07. https://doi.org/10.1093/bioinformatics/btq431 PMID:
20688976; PubMed Central PMCID: PMC2944196.
12. Ritchie ME, Phipson B, Wu D, Hu Y, Law CW, Shi W, et al. limma powers differential expression analy-
ses for RNA-sequencing and microarray studies. Nucleic Acids Res. 2015; 43(7):e47. Epub 2015/01/
22. https://doi.org/10.1093/nar/gkv007 PMID: 25605792; PubMed Central PMCID: PMC4402510.
13. Brown L. The Conditional Level of Student’s $t$ Test. Ann Math Statist. 1967; 38(4):1068–71. https://
doi.org/10.1214/aoms/1177698776
14. Sabir JSM, El Omri A, Shaik NA, Banaganapalli B, Al-Shaeri MA, Alkenani NA, et al. Identification of
key regulatory genes connected to NF-kappaB family of proteins in visceral adipose tissues using gene
expression and weighted protein interaction network. PLoS One. 2019; 14(4):e0214337. Epub 2019/04/
24. https://doi.org/10.1371/journal.pone.0214337 PMID: 31013288; PubMed Central PMCID:
PMC6478283.
15. Oughtred R, Stark C, Breitkreutz BJ, Rust J, Boucher L, Chang C, et al. The BioGRID interaction data-
base: 2019 update. Nucleic Acids Res. 2019; 47(D1):D529–D41. Epub 2018/11/27. https://doi.org/10.
1093/nar/gky1079 PMID: 30476227; PubMed Central PMCID: PMC6324058.
16. Salwinski L, Miller CS, Smith AJ, Pettit FK, Bowie JU, Eisenberg D. The Database of Interacting Pro-
teins: 2004 update. Nucleic Acids Res. 2004; 32(Database issue):D449–51. Epub 2003/12/19. https://
doi.org/10.1093/nar/gkh086 PMID: 14681454; PubMed Central PMCID: PMC308820.
17. Peri S, Navarro JD, Amanchy R, Kristiansen TZ, Jonnalagadda CK, Surendranath V, et al. Develop-
ment of human protein reference database as an initial platform for approaching systems biology in
humans. Genome Res. 2003; 13(10):2363–71. Epub 2003/10/04. https://doi.org/10.1101/gr.1680803
PMID: 14525934; PubMed Central PMCID: PMC403728.
18. Rohart F, Eslami A, Matigian N, Bougeard S, Le Cao KA. MINT: a multivariate integrative method to
identify reproducible molecular signatures across independent experiments and platforms. BMC Bioin-
formatics. 2017; 18(1):128. Epub 2017/03/01. https://doi.org/10.1186/s12859-017-1553-8 PMID:
28241739; PubMed Central PMCID: PMC5327533.
19. Kerrien S, Alam-Faruque Y, Aranda B, Bancarz I, Bridge A, Derow C, et al. IntAct—open source
resource for molecular interaction data. Nucleic Acids Res. 2007; 35(Database issue):D561–5. Epub
2006/12/06. https://doi.org/10.1093/nar/gkl958 PMID: 17145710; PubMed Central PMCID:
PMC1751531.
20. Shannon P, Markiel A, Ozier O, Baliga NS, Wang JT, Ramage D, et al. Cytoscape: a software environ-
ment for integrated models of biomolecular interaction networks. Genome Res. 2003; 13(11):2498–
504. Epub 2003/11/05. https://doi.org/10.1101/gr.1239303 PMID: 14597658; PubMed Central PMCID:
PMC403769.
21. Assenov Y, Ramirez F, Schelhorn SE, Lengauer T, Albrecht M. Computing topological parameters of
biological networks. Bioinformatics. 2008; 24(2):282–4. Epub 2007/11/17. https://doi.org/10.1093/
bioinformatics/btm554 PMID: 18006545.
22. Shaik NA, Banaganapalli B. Computational Molecular Phenotypic Analysis of PTPN22 (W620R), IL6R
(D358A), and TYK2 (P1104A) Gene Mutations of Rheumatoid Arthritis. Front Genet. 2019; 10:168.
Epub 2019/03/23. https://doi.org/10.3389/fgene.2019.00168 PMID: 30899276; PubMed Central
PMCID: PMC6416176.
23. Shaik NA, Al-Kreathy HM, Ajabnoor GM, Verma PK, Banaganapalli B. Molecular designing, virtual
screening and docking study of novel curcumin analogue as mutation (S769L and K846R) selective
inhibitor for EGFR. Saudi J Biol Sci. 2019; 26(3):439–48. Epub 2019/03/23. https://doi.org/10.1016/j.
sjbs.2018.05.026 PMID: 30899155; PubMed Central PMCID: PMC6408711.
Studying salt-sensitive genes in obesity with integrated network biology and co-expression analysis
PLOS ONE | https://doi.org/10.1371/journal.pone.0228400 February 6, 2020 19 / 21

24. Shaik NA, Awan ZA, Verma PK, Elango R, Banaganapalli B. Protein phenotype diagnosis of autosomal
dominant calmodulin mutations causing irregular heart rhythms. J Cell Biochem. 2018; 119(10):8233–
48. Epub 2018/06/23. https://doi.org/10.1002/jcb.26834 PMID: 29932249.
25. George G, Valiya Parambath S, Lokappa SB, Varkey J. Construction of Parkinson’s disease marker-
based weighted protein-protein interaction network for prioritization of co-expressed genes. Gene.
2019; 697:67–77. Epub 2019/02/19. https://doi.org/10.1016/j.gene.2019.02.026 PMID: 30776463.
26. Rakshit H, Rathi N, Roy D. Construction and analysis of the protein-protein interaction networks based on
gene expression profiles of Parkinson’s disease. PLoS One. 2014; 9(8):e103047. Epub 2014/08/30.
https://doi.org/10.1371/journal.pone.0103047 PMID: 25170921; PubMed Central PMCID: PMC4149362.
27. Lahiri C, Pawar S, Sabarinathan R, Ashraf MI, Chand Y, Chakravortty D. Interactome analyses of Sal-
monella pathogenicity islands reveal SicA indispensable for virulence. J Theor Biol. 2014; 363:188–97.
Epub 2014/08/17. https://doi.org/10.1016/j.jtbi.2014.08.013 PMID: 25128737.
28. Yoon J, Blumer A, Lee K. An algorithm for modularity analysis of directed and weighted biological net-
works based on edge-betweenness centrality. Bioinformatics. 2006; 22(24):3106–8. Epub 2006/10/25.
https://doi.org/10.1093/bioinformatics/btl533 PMID: 17060356.
29. Freeman LC. A Set of Measures of Centrality Based on Betweenness. Sociometry. 1977; 40(1):35–41.
https://doi.org/10.2307/3033543
30. Schweda F. Salt feedback on the renin-angiotensin-aldosterone system. Pflugers Arch. 2015; 467
(3):565–76. Epub 2014/12/17. https://doi.org/10.1007/s00424-014-1668-y PMID: 25502115.
31. Sanada H, Jones JE, Jose PA. Genetics of salt-sensitive hypertension. Curr Hypertens Rep. 2011; 13
(1):55–66. Epub 2010/11/09. https://doi.org/10.1007/s11906-010-0167-6 PMID: 21058046; PubMed
Central PMCID: PMC4019234.
32. Freitas SRS. Molecular Genetics of Salt-Sensitivity and Hypertension: Role of Renal Epithelial Sodium
Channel Genes. Am J Hypertens. 2018; 31(2):172–4. Epub 2017/10/19. https://doi.org/10.1093/ajh/
hpx184 PMID: 29045522.
33. Citterio L, Simonini M, Zagato L, Salvi E, Delli Carpini S, Lanzani C, et al. Genes involved in vasocon-
striction and vasodilation system affect salt-sensitive hypertension. PLoS One. 2011; 6(5):e19620.
Epub 2011/05/17. https://doi.org/10.1371/journal.pone.0019620 PMID: 21573014; PubMed Central
PMCID: PMC3090407.
34. Chen J, Bardes EE, Aronow BJ, Jegga AG. ToppGene Suite for gene list enrichment analysis and can-
didate gene prioritization. Nucleic Acids Res. 2009; 37(Web Server issue):W305–11. Epub 2009/05/26.
https://doi.org/10.1093/nar/gkp427 PMID: 19465376; PubMed Central PMCID: PMC2703978.
35. Ghazalpour A, Doss S, Sheth SS, Ingram-Drake LA, Schadt EE, Lusis AJ, et al. Genomic analysis of
metabolic pathway gene expression in mice. Genome Biol. 2005; 6(7):R59. Epub 2005/07/07. https://
doi.org/10.1186/gb-2005-6-7-r59 PMID: 15998448; PubMed Central PMCID: PMC1175990.
36. Albert R. Scale-free networks in cell biology. J Cell Sci. 2005; 118(Pt 21):4947–57. Epub 2005/10/29.
https://doi.org/10.1242/jcs.02714 PMID: 16254242.
37. Khosravi P, Gazestani VH, Asgari Y, Law B, Sadeghi M, Goliaei B. Network-based approach reveals Y
chromosome influences prostate cancer susceptibility. Comput Biol Med. 2014; 54:24–31. Epub 2014/
09/10. https://doi.org/10.1016/j.compbiomed.2014.08.020 PMID: 25199846.
38. Csermely P, Korcsmaros T, Kiss HJ, London G, Nussinov R. Structure and dynamics of molecular net-
works: a novel paradigm of drug discovery: a comprehensive review. Pharmacol Ther. 2013; 138
(3):333–408. Epub 2013/02/07. https://doi.org/10.1016/j.pharmthera.2013.01.016 PMID: 23384594;
PubMed Central PMCID: PMC3647006.
39. Hsu CL, Juan HF, Huang HC. Functional Analysis and Characterization of Differential Coexpression
Networks. Sci Rep. 2015; 5:13295. Epub 2015/08/19. https://doi.org/10.1038/srep13295 PMID:
26282208; PubMed Central PMCID: PMC4539605.
40. Chavali S, Barrenas F, Kanduri K, Benson M. Network properties of human disease genes with pleiotro-
pic effects. BMC Syst Biol. 2010; 4:78. Epub 2010/06/08. https://doi.org/10.1186/1752-0509-4-78
PMID: 20525321; PubMed Central PMCID: PMC2892460.
41. Ding L, Zhang L, Biswas S, Schugar RC, Brown JM, Byzova T, et al. Akt3 inhibits adipogenesis and pro-
tects from diet-induced obesity via WNK1/SGK1 signaling. JCI Insight. 2017; 2(22). Epub 2017/12/05.
https://doi.org/10.1172/jci.insight.95687 PMID: 29202451; PubMed Central PMCID: PMC5752373.
42. Hoorn EJ, Nelson JH, McCormick JA, Ellison DH. The WNK kinase network regulating sodium, potas-
sium, and blood pressure. J Am Soc Nephrol. 2011; 22(4):605–14. Epub 2011/03/26. https://doi.org/10.
1681/ASN.2010080827 PMID: 21436285; PubMed Central PMCID: PMC4496838.
43. Hadchouel J, Delaloy C, Jeunemaitre X. [WNK1 and WNK4, new players in salt and water homeosta-
sis]. Med Sci (Paris). 2005; 21(1):55–60. Epub 2005/01/11. https://doi.org/10.1051/medsci/200521155
PMID: 15639021.
Studying salt-sensitive genes in obesity with integrated network biology and co-expression analysis
PLOS ONE | https://doi.org/10.1371/journal.pone.0228400 February 6, 2020 20 / 21

44. Holmes RS, Spradling-Reeves KD, Cox LA. Mammalian Glutamyl Aminopeptidase Genes (ENPEP)
and Proteins: Comparative Studies of a Major Contributor to Arterial Hypertension. J Data Mining Geno-
mics Proteomics. 2017; 8(2). Epub 2017/01/01. https://doi.org/10.4172/2153-0602.1000211 PMID:
29900035; PubMed Central PMCID: PMC5995572.
45. Gao J, Marc Y, Iturrioz X, Leroux V, Balavoine F, Llorens-Cortes C. A new strategy for treating hyper-
tension by blocking the activity of the brain renin-angiotensin system with aminopeptidase A inhibitors.
Clin Sci (Lond). 2014; 127(3):135–48. Epub 2014/04/05. https://doi.org/10.1042/CS20130396 PMID:
24697296.
46. Benton MC, Johnstone A, Eccles D, Harmon B, Hayes MT, Lea RA, et al. An analysis of DNA methyla-
tion in human adipose tissue reveals differential modification of obesity genes before and after gastric
bypass and weight loss. Genome Biol. 2015; 16:8. Epub 2015/02/05. https://doi.org/10.1186/s13059-
014-0569-x PMID: 25651499; PubMed Central PMCID: PMC4301800.
47. Eap CB, Crettol S, Rougier JS, Schlapfer J, Sintra Grilo L, Deglon JJ, et al. Stereoselective block of
hERG channel by (S)-methadone and QT interval prolongation in CYP2B6 slow metabolizers. Clin
Pharmacol Ther. 2007; 81(5):719–28. Epub 2007/03/03. https://doi.org/10.1038/sj.clpt.6100120 PMID:
17329992.
48. Kraev A, Quednau BD, Leach S, Li XF, Dong H, Winkfein R, et al. Molecular cloning of a third member
of the potassium-dependent sodium-calcium exchanger gene family, NCKX3. J Biol Chem. 2001; 276
(25):23161–72. Epub 2001/04/11. https://doi.org/10.1074/jbc.M102314200 PMID: 11294880.
49. Naour N, Rouault C, Fellahi S, Lavoie ME, Poitou C, Keophiphath M, et al. Cathepsins in human obe-
sity: changes in energy balance predominantly affect cathepsin s in adipose tissue and in circulation. J
Clin Endocrinol Metab. 2010; 95(4):1861–8. Epub 2010/02/19. https://doi.org/10.1210/jc.2009-1894
PMID: 20164293.
50. Araujo TF, Cordeiro AV, Vasconcelos DAA, Vitzel KF, Silva VRR. The role of cathepsin B in autophagy
during obesity: A systematic review. Life Sci. 2018; 209:274–81. Epub 2018/08/15. https://doi.org/10.
1016/j.lfs.2018.08.024 PMID: 30107168.
51. MacArthur J, Bowler E, Cerezo M, Gil L, Hall P, Hastings E, et al. The new NHGRI-EBI Catalog of pub-
lished genome-wide association studies (GWAS Catalog). Nucleic Acids Res. 2017; 45(D1):D896–
D901. Epub 2016/12/03. https://doi.org/10.1093/nar/gkw1133 PMID: 27899670; PubMed Central
PMCID: PMC5210590.
52. Takahashi N, Yoshizaki T, Hiranaka N, Kumano O, Suzuki T, Akanuma M, et al. The production of coag-
ulation factor VII by adipocytes is enhanced by tumor necrosis factor-alpha or isoproterenol. Int J Obes
(Lond). 2015; 39(5):747–54. Epub 2014/12/17. https://doi.org/10.1038/ijo.2014.208 PMID: 25504041.
Studying salt-sensitive genes in obesity with integrated network biology and co-expression analysis
PLOS ONE | https://doi.org/10.1371/journal.pone.0228400 February 6, 2020 21 / 21