The Putative Drp1 Inhibitor mdivi-1 Is a Reversible ... - Cell Press
30
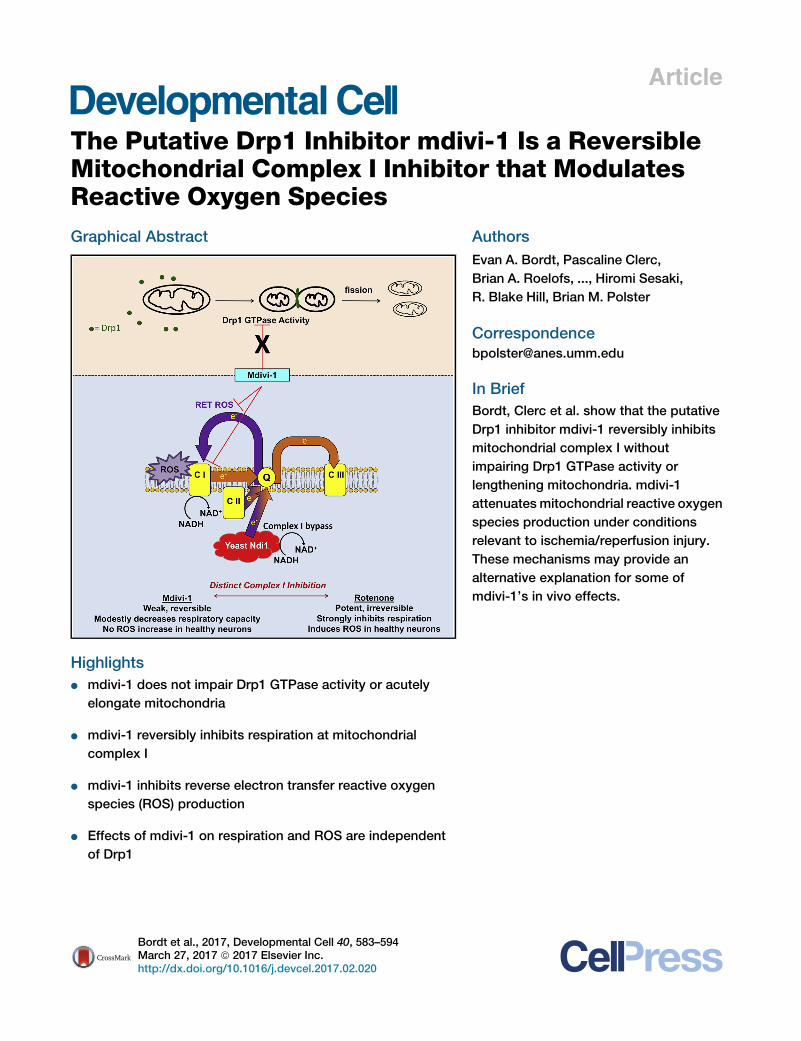
Article The Putative Drp1 Inhibitor mdivi-1 Is a Reversible Mitochondrial Complex I Inhibitor that Modulates Reactive Oxygen Species Graphical Abstract Highlights d mdivi-1 does not impair Drp1 GTPase activity or acutely elongate mitochondria d mdivi-1 reversibly inhibits respiration at mitochondrial complex I d mdivi-1 inhibits reverse electron transfer reactive oxygen species (ROS) production d Effects of mdivi-1 on respiration and ROS are independent of Drp1 Authors Evan A. Bordt, Pascaline Clerc, Brian A. Roelofs, ..., Hiromi Sesaki, R. Blake Hill, Brian M. Polster Correspondence [email protected] In Brief Bordt, Clerc et al. show that the putative Drp1 inhibitor mdivi-1 reversibly inhibits mitochondrial complex I without impairing Drp1 GTPase activity or lengthening mitochondria. mdivi-1 attenuates mitochondrial reactive oxygen species production under conditions relevant to ischemia/reperfusion injury. These mechanisms may provide an alternative explanation for some of mdivi-1’s in vivo effects. Bordt et al., 2017, Developmental Cell 40, 583–594 March 27, 2017 ª 2017 Elsevier Inc. http://dx.doi.org/10.1016/j.devcel.2017.02.020
-
Upload
khangminh22 -
Category
Documents
-
view
0 -
download
0
Transcript of The Putative Drp1 Inhibitor mdivi-1 Is a Reversible ... - Cell Press
Article
The Putative Drp1 Inhibitor mdivi-1 Is a Reversible
Mitochondrial Complex I Inhibitor that ModulatesReactive Oxygen SpeciesGraphical Abstract
Highlights
d mdivi-1 does not impair Drp1 GTPase activity or acutely
elongate mitochondria
d mdivi-1 reversibly inhibits respiration at mitochondrial
complex I
d mdivi-1 inhibits reverse electron transfer reactive oxygen
species (ROS) production
d Effects of mdivi-1 on respiration and ROS are independent
of Drp1
Bordt et al., 2017, Developmental Cell 40, 583–594March 27, 2017 ª 2017 Elsevier Inc.http://dx.doi.org/10.1016/j.devcel.2017.02.020
Authors
Evan A. Bordt, Pascaline Clerc,
Brian A. Roelofs, ..., Hiromi Sesaki,
R. Blake Hill, Brian M. Polster
In Brief
Bordt, Clerc et al. show that the putative
Drp1 inhibitor mdivi-1 reversibly inhibits
mitochondrial complex I without
impairing Drp1 GTPase activity or
lengthening mitochondria. mdivi-1
attenuates mitochondrial reactive oxygen
species production under conditions
relevant to ischemia/reperfusion injury.
These mechanisms may provide an
alternative explanation for some of
mdivi-1’s in vivo effects.
Developmental Cell
Article
The Putative Drp1 Inhibitor mdivi-1Is a Reversible Mitochondrial Complex I Inhibitorthat Modulates Reactive Oxygen SpeciesEvan A. Bordt,1,13 Pascaline Clerc,1,13 Brian A. Roelofs,1 Andrew J. Saladino,2,5 Laszlo Tretter,6 Vera Adam-Vizi,6
Edward Cherok,3 Ahmed Khalil,7,8 Nagendra Yadava,7,8,9 Shealinna X. Ge,1 T. Chase Francis,4 Nolan W. Kennedy,10
Lora K. Picton,11 Tanya Kumar,1 Sruti Uppuluri,1 Alexandrea M. Miller,1 Kie Itoh,12 Mariusz Karbowski,3 Hiromi Sesaki,12
R. Blake Hill,10 and Brian M. Polster1,14,*1Department of Anesthesiology, The Shock, Trauma and Anesthesiology Research (STAR) Center2Department of Pathology3Center for Biomedical Engineering and Technology4Department of Anatomy and NeurobiologyUniversity of Maryland School of Medicine, Baltimore, MD 21201, USA5Pathology and Laboratory Medicine Service, Department of Veterans Affairs Medical Center, Baltimore, MD 21201, USA6MTA-SE Laboratory for Neurobiochemistry, Department of Medical Biochemistry, Semmelweis University, Budapest 1094, Hungary7Pioneer Valley Life Sciences Institute8Baystate Medical Center
Springfield, MA 01109, USA9Department of Biology, University of Massachusetts, Amherst, MA 01003, USA10Department of Biochemistry, Medical College of Wisconsin, Milwaukee, WI 53226, USA11Department of Biology12Department of Cell Biology
Johns Hopkins University School of Medicine, Baltimore, MD 21205, USA13Co-first author14Lead Contact
*Correspondence: [email protected]
http://dx.doi.org/10.1016/j.devcel.2017.02.020
SUMMARY
Mitochondrial fission mediated by the GTPasedynamin-related protein 1 (Drp1) is an attractivedrug target in numerous maladies that rangefrom heart disease to neurodegenerative disor-ders. The compound mdivi-1 is widely reported toinhibit Drp1-dependent fission, elongate mitochon-dria, and mitigate brain injury. Here, we show thatmdivi-1 reversibly inhibits mitochondrial complexI-dependent O2 consumption and reverse electrontransfer-mediated reactive oxygen species (ROS)production at concentrations (e.g., 50 mM) used totarget mitochondrial fission. Respiratory inhibitionis rescued by bypassing complex I using yeastNADH dehydrogenase Ndi1. Unexpectedly, respira-tory impairment by mdivi-1 occurs without mito-chondrial elongation, is not mimicked by Drp1 dele-tion, and is observed in Drp1-deficient fibroblasts.In addition, mdivi-1 poorly inhibits recombinantDrp1 GTPase activity (Ki > 1.2 mM). Overall, theseresults suggest that mdivi-1 is not a specific Drp1inhibitor. The ability of mdivi-1 to reversibly inhibitcomplex I and modify mitochondrial ROS produc-tion may contribute to effects observed in diseasemodels.
Develop
INTRODUCTION
Mitochondrial fission-fusion events occur physiologically and
are involved in the segregation and elimination of damagedmito-
chondrial elements by autophagy (Twig et al., 2008). Basal dyna-
min-related protein 1 (Drp1)-dependent mitochondrial fission is
required for mitochondrial trafficking to synapses, mitochondrial
quality control, and brain development (Ishihara et al., 2009;
Wakabayashi et al., 2009; Kageyama et al., 2014). However,
mitochondrial fragmentation also occurs simultaneously with
cytochrome c release during programmed cell death (Frank
et al., 2001). The fission guanosine triphosphatase (GTPase)
Drp1 promotes Bax-dependent cytochrome c redistribution
frommitochondria to the cytoplasm (Frank et al., 2001), an event
which initiates activation of caspase protease executioners.
Therefore, Drp1 is a drug target in numerous degenerative
diseases that involve aberrant mitochondrial fission and/or dis-
rupted membrane integrity.
mdivi-1 is a quinazolinone derivative identified as a mitochon-
drial fission inhibitor in a chemical library screen for compounds
that influencemitochondrial morphology in yeast (Cassidy-Stone
et al., 2008). mdivi-1 impaired the GTPase activity of Dnm1, the
yeast homolog of the mammalian fission factor Drp1 (Cassidy-
Stone et al., 2008). However, mdivi-1 failed to inhibit the GTPase
activity of recombinant human Drp1 in the same study. Human
Drp1 was less active than its yeast homolog and incapable of
self-assembly, leading to speculation that the human protein
was folded incorrectly. Nevertheless, mdivi-1 caused elongation
mental Cell 40, 583–594, March 27, 2017 ª 2017 Elsevier Inc. 583
ofmammalianmitochondria inCOScellswithin an hour (Cassidy-
Stone et al., 2008) and lengthened mitochondria in several addi-
tional studies (Rosdah et al., 2016). Consequently, mdivi-1 is
widely considered to be a small-molecule inhibitor of mitochon-
drial fission that specifically targets Drp1.
mdivi-1 crosses the blood-brain barrier and is protective in
several preclinical disease animal models that include heart
and brain ischemia-reperfusion injury (Grohm et al., 2012; Ong
et al., 2010), traumatic brain injury (Wu et al., 2016), and Parkin-
son’s disease (Rappold et al., 2014). mdivi-1 also blocks pro-
apoptotic Bax-dependent cytochrome c release from isolated
mitochondria (Cassidy-Stone et al., 2008) and attenuates neural
cell death in vitro and in vivo (Grohm et al., 2012), consistent with
the possibility that Drp1 is a bona fide therapeutic drug target.
However, because Drp1 is an essential regulator of mitochon-
drial fission under normal conditions, it is important to determine
whether its inhibition by mdivi-1 affects cellular bioenergetics
over the short or long term, and if so, whether the effects of
mdivi-1 are directly due to blocking Drp1 activity.
Here, we set out to test the hypothesis that pharmacological
inhibition of Drp1 by mdivi-1 leads to impaired mitochondrial
bioenergetics. We predicted that mdivi-1 would rapidly elongate
mitochondria and cause Drp1-dependent changes in mito-
chondrial respiration. Unexpectedly, mdivi-1 treatment failed
to lengthen mitochondria in neurons, wild-type (WT) or Drp1
knockout (KO) immortalized mouse embryonic fibroblasts
(MEFs), or COS-7 cells. mdivi-1 also poorly antagonized recom-
binant human Drp1 GTPase activity. However, mdivi-1 rapidly
and reversibly inhibited electron transport chain (ETC) complex
I-dependent O2 consumption by cells in a Drp1-independent
fashion. In addition, mdivi-1 attenuated complex I-dependent
reverse electron transfer (RET)-mediated reactive oxygen spe-
cies (ROS) production by brain mitochondria oxidizing succi-
nate. Collectively, these results establish mitochondrial complex
I as a previously unknown target of mdivi-1 action and suggest a
re-evaluation of prior studies attributing the effects of mdivi-1
exclusively to inhibition of Drp1.
RESULTS
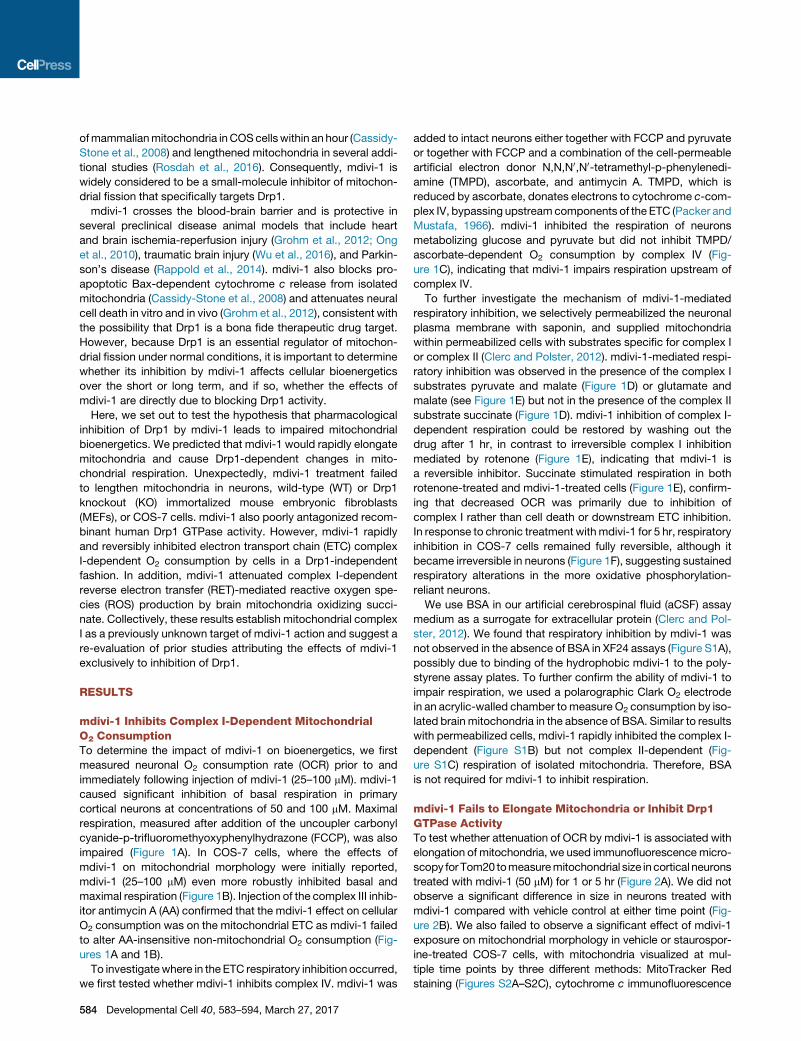
mdivi-1 Inhibits Complex I-Dependent MitochondrialO2 ConsumptionTo determine the impact of mdivi-1 on bioenergetics, we first
measured neuronal O2 consumption rate (OCR) prior to and
immediately following injection of mdivi-1 (25–100 mM). mdivi-1
caused significant inhibition of basal respiration in primary
cortical neurons at concentrations of 50 and 100 mM. Maximal
respiration, measured after addition of the uncoupler carbonyl
cyanide-p-trifluoromethyoxyphenylhydrazone (FCCP), was also
impaired (Figure 1A). In COS-7 cells, where the effects of
mdivi-1 on mitochondrial morphology were initially reported,
mdivi-1 (25–100 mM) even more robustly inhibited basal and
maximal respiration (Figure 1B). Injection of the complex III inhib-
itor antimycin A (AA) confirmed that the mdivi-1 effect on cellular
O2 consumption was on the mitochondrial ETC as mdivi-1 failed
to alter AA-insensitive non-mitochondrial O2 consumption (Fig-
ures 1A and 1B).
To investigatewhere in the ETC respiratory inhibition occurred,
we first tested whether mdivi-1 inhibits complex IV. mdivi-1 was
584 Developmental Cell 40, 583–594, March 27, 2017
added to intact neurons either together with FCCP and pyruvate
or together with FCCP and a combination of the cell-permeable
artificial electron donor N,N,N0,N0-tetramethyl-p-phenylenedi-
amine (TMPD), ascorbate, and antimycin A. TMPD, which is
reduced by ascorbate, donates electrons to cytochrome c-com-
plex IV, bypassing upstreamcomponents of the ETC (Packer and
Mustafa, 1966). mdivi-1 inhibited the respiration of neurons
metabolizing glucose and pyruvate but did not inhibit TMPD/
ascorbate-dependent O2 consumption by complex IV (Fig-
ure 1C), indicating that mdivi-1 impairs respiration upstream of
complex IV.
To further investigate the mechanism of mdivi-1-mediated
respiratory inhibition, we selectively permeabilized the neuronal
plasma membrane with saponin, and supplied mitochondria
within permeabilized cells with substrates specific for complex I
or complex II (Clerc and Polster, 2012). mdivi-1-mediated respi-
ratory inhibition was observed in the presence of the complex I
substrates pyruvate and malate (Figure 1D) or glutamate and
malate (see Figure 1E) but not in the presence of the complex II
substrate succinate (Figure 1D). mdivi-1 inhibition of complex I-
dependent respiration could be restored by washing out the
drug after 1 hr, in contrast to irreversible complex I inhibition
mediated by rotenone (Figure 1E), indicating that mdivi-1 is
a reversible inhibitor. Succinate stimulated respiration in both
rotenone-treated and mdivi-1-treated cells (Figure 1E), confirm-
ing that decreased OCR was primarily due to inhibition of
complex I rather than cell death or downstream ETC inhibition.
In response to chronic treatment withmdivi-1 for 5 hr, respiratory
inhibition in COS-7 cells remained fully reversible, although it
became irreversible in neurons (Figure 1F), suggesting sustained
respiratory alterations in the more oxidative phosphorylation-
reliant neurons.
We use BSA in our artificial cerebrospinal fluid (aCSF) assay
medium as a surrogate for extracellular protein (Clerc and Pol-
ster, 2012). We found that respiratory inhibition by mdivi-1 was
not observed in the absence of BSA in XF24 assays (Figure S1A),
possibly due to binding of the hydrophobic mdivi-1 to the poly-
styrene assay plates. To further confirm the ability of mdivi-1 to
impair respiration, we used a polarographic Clark O2 electrode
in an acrylic-walled chamber to measure O2 consumption by iso-
lated brain mitochondria in the absence of BSA. Similar to results
with permeabilized cells, mdivi-1 rapidly inhibited the complex I-
dependent (Figure S1B) but not complex II-dependent (Fig-
ure S1C) respiration of isolated mitochondria. Therefore, BSA
is not required for mdivi-1 to inhibit respiration.
mdivi-1 Fails to Elongate Mitochondria or Inhibit Drp1GTPase ActivityTo test whether attenuation of OCR by mdivi-1 is associated with
elongation of mitochondria, we used immunofluorescencemicro-
scopy for Tom20 tomeasuremitochondrial size incortical neurons
treated with mdivi-1 (50 mM) for 1 or 5 hr (Figure 2A). We did not
observe a significant difference in size in neurons treated with
mdivi-1 compared with vehicle control at either time point (Fig-
ure 2B). We also failed to observe a significant effect of mdivi-1
exposure on mitochondrial morphology in vehicle or staurospor-
ine-treated COS-7 cells, with mitochondria visualized at mul-
tiple time points by three different methods: MitoTracker Red
staining (Figures S2A–S2C), cytochrome c immunofluorescence

Figure 1. mdivi-1 Reversibly Inhibits Basal and Maximal Respiration at Complex I
(A and B) OCR traces for (A) neurons or (B) COS-7 cells receiving mdivi-1 or DMSO vehicle (CTRL), FCCP (3 mM for neurons, 2 mM for COS-7) plus pyruvate (Pyr,
10 mM), and antimycin A (AA, 1 mM). Traces are mean ± SD from three wells and are representative of four independent experiments (2–3 wells each).
(C) FCCP together with pyruvate or together with TMPD (0.4 mM) plus ascorbate (0.4 mM) were injected along with mdivi-1 (100 mM) or CTRL while measuring
OCR. The complex IV inhibitor azide (5 mM) was then injected.
(D) Neurons were permeabilized by saponin (sap, 25 mg/mL), and OCR was stimulated by 1 mMADP in the presence of pyruvate and malate (P/M, 5 mM each) or
succinate (S, 5 mM) in the presence of rotenone (R, 0.5 mM). mdivi-1 (50 mM) or vehicle control was then injected.
(E) Neurons were treated with rotenone or mdivi-1 (50 mM) for 1 hr prior to OCRmeasurements. Rotenone or mdivi-1 was then either left on for the duration of the
assay (‘‘present’’), or washed out and replaced with drug-free aCSF (‘‘washout’’). Following permeabilization by sap and addition of ADP with glutamate and
malate (G/M, 5 mM each), 5 mM succinate was added.
(F) Neurons or COS-7 cells were treated with DMSO or mdivi-1 (50 mM) for 1 or 5 hr. The drug was then washed out and maximal OCR was determined. Data are
means ± SD, n = 3. *p < 0.05 compared with control.
See also Figure S1.
Developmental Cell 40, 583–594, March 27, 2017 585
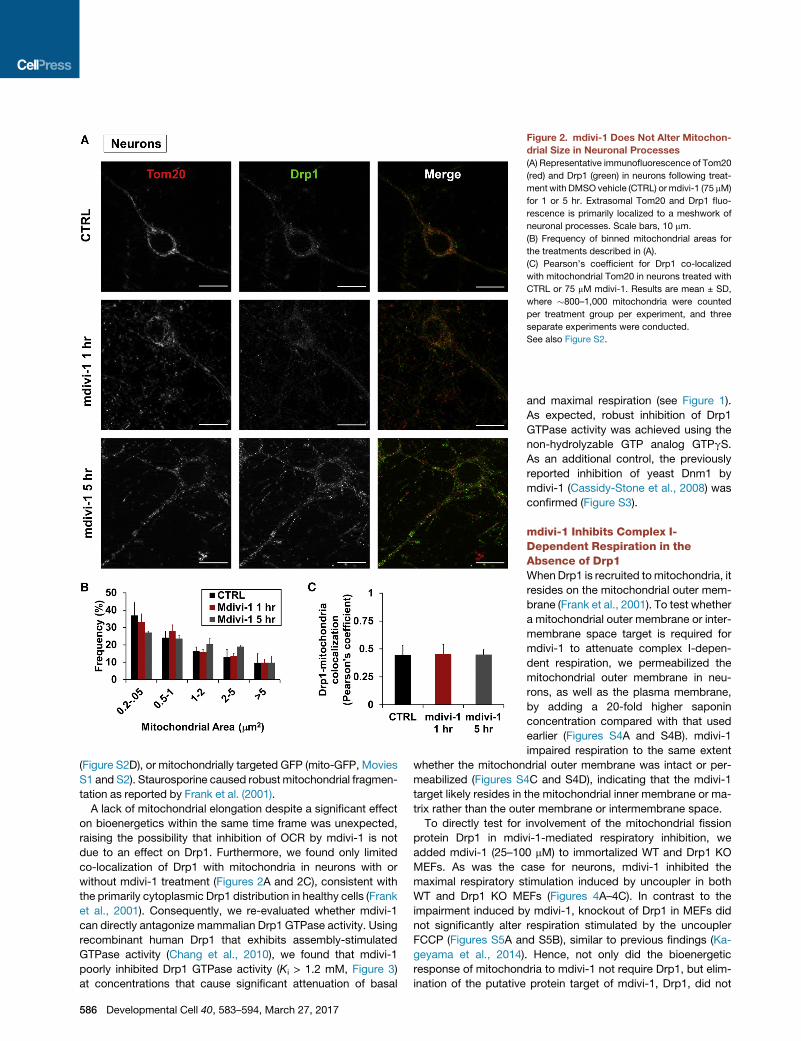
Figure 2. mdivi-1 Does Not Alter Mitochon-
drial Size in Neuronal Processes
(A) Representative immunofluorescence of Tom20
(red) and Drp1 (green) in neurons following treat-
ment with DMSO vehicle (CTRL) or mdivi-1 (75 mM)
for 1 or 5 hr. Extrasomal Tom20 and Drp1 fluo-
rescence is primarily localized to a meshwork of
neuronal processes. Scale bars, 10 mm.
(B) Frequency of binned mitochondrial areas for
the treatments described in (A).
(C) Pearson’s coefficient for Drp1 co-localized
with mitochondrial Tom20 in neurons treated with
CTRL or 75 mM mdivi-1. Results are mean ± SD,
where �800–1,000 mitochondria were counted
per treatment group per experiment, and three
separate experiments were conducted.
See also Figure S2.
(Figure S2D), or mitochondrially targeted GFP (mito-GFP, Movies
S1 and S2). Staurosporine caused robust mitochondrial fragmen-
tation as reported by Frank et al. (2001).
A lack of mitochondrial elongation despite a significant effect
on bioenergetics within the same time frame was unexpected,
raising the possibility that inhibition of OCR by mdivi-1 is not
due to an effect on Drp1. Furthermore, we found only limited
co-localization of Drp1 with mitochondria in neurons with or
without mdivi-1 treatment (Figures 2A and 2C), consistent with
the primarily cytoplasmic Drp1 distribution in healthy cells (Frank
et al., 2001). Consequently, we re-evaluated whether mdivi-1
can directly antagonize mammalian Drp1 GTPase activity. Using
recombinant human Drp1 that exhibits assembly-stimulated
GTPase activity (Chang et al., 2010), we found that mdivi-1
poorly inhibited Drp1 GTPase activity (Ki > 1.2 mM, Figure 3)
at concentrations that cause significant attenuation of basal
586 Developmental Cell 40, 583–594, March 27, 2017
and maximal respiration (see Figure 1).
As expected, robust inhibition of Drp1
GTPase activity was achieved using the
non-hydrolyzable GTP analog GTPgS.
As an additional control, the previously
reported inhibition of yeast Dnm1 by
mdivi-1 (Cassidy-Stone et al., 2008) was
confirmed (Figure S3).
mdivi-1 Inhibits Complex I-Dependent Respiration in theAbsence of Drp1WhenDrp1 is recruited tomitochondria, it
resides on the mitochondrial outer mem-
brane (Frank et al., 2001). To test whether
a mitochondrial outer membrane or inter-
membrane space target is required for
mdivi-1 to attenuate complex I-depen-
dent respiration, we permeabilized the
mitochondrial outer membrane in neu-
rons, as well as the plasma membrane,
by adding a 20-fold higher saponin
concentration compared with that used
earlier (Figures S4A and S4B). mdivi-1
impaired respiration to the same extent
whether the mitochondrial outer membrane was intact or per-
meabilized (Figures S4C and S4D), indicating that the mdivi-1
target likely resides in the mitochondrial inner membrane or ma-
trix rather than the outer membrane or intermembrane space.
To directly test for involvement of the mitochondrial fission
protein Drp1 in mdivi-1-mediated respiratory inhibition, we
added mdivi-1 (25–100 mM) to immortalized WT and Drp1 KO
MEFs. As was the case for neurons, mdivi-1 inhibited the
maximal respiratory stimulation induced by uncoupler in both
WT and Drp1 KO MEFs (Figures 4A–4C). In contrast to the
impairment induced by mdivi-1, knockout of Drp1 in MEFs did
not significantly alter respiration stimulated by the uncoupler
FCCP (Figures S5A and S5B), similar to previous findings (Ka-
geyama et al., 2014). Hence, not only did the bioenergetic
response of mitochondria to mdivi-1 not require Drp1, but elim-
ination of the putative protein target of mdivi-1, Drp1, did not
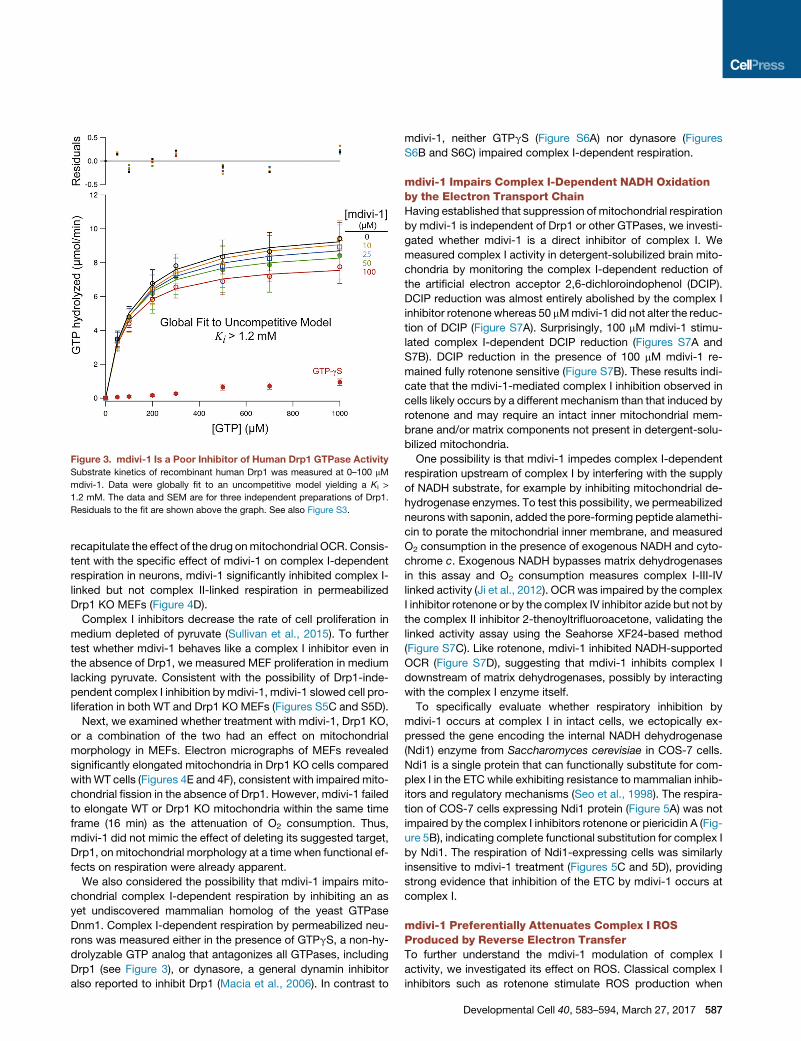
Figure 3. mdivi-1 Is a Poor Inhibitor of Human Drp1 GTPase Activity
Substrate kinetics of recombinant human Drp1 was measured at 0–100 mM
mdivi-1. Data were globally fit to an uncompetitive model yielding a Ki >
1.2 mM. The data and SEM are for three independent preparations of Drp1.
Residuals to the fit are shown above the graph. See also Figure S3.
recapitulate the effect of the drug onmitochondrial OCR. Consis-
tent with the specific effect of mdivi-1 on complex I-dependent
respiration in neurons, mdivi-1 significantly inhibited complex I-
linked but not complex II-linked respiration in permeabilized
Drp1 KO MEFs (Figure 4D).
Complex I inhibitors decrease the rate of cell proliferation in
medium depleted of pyruvate (Sullivan et al., 2015). To further
test whether mdivi-1 behaves like a complex I inhibitor even in
the absence of Drp1, we measured MEF proliferation in medium
lacking pyruvate. Consistent with the possibility of Drp1-inde-
pendent complex I inhibition bymdivi-1, mdivi-1 slowed cell pro-
liferation in both WT and Drp1 KO MEFs (Figures S5C and S5D).
Next, we examined whether treatment with mdivi-1, Drp1 KO,
or a combination of the two had an effect on mitochondrial
morphology in MEFs. Electron micrographs of MEFs revealed
significantly elongated mitochondria in Drp1 KO cells compared
with WT cells (Figures 4E and 4F), consistent with impaired mito-
chondrial fission in the absence of Drp1. However, mdivi-1 failed
to elongate WT or Drp1 KO mitochondria within the same time
frame (16 min) as the attenuation of O2 consumption. Thus,
mdivi-1 did not mimic the effect of deleting its suggested target,
Drp1, on mitochondrial morphology at a time when functional ef-
fects on respiration were already apparent.
We also considered the possibility that mdivi-1 impairs mito-
chondrial complex I-dependent respiration by inhibiting an as
yet undiscovered mammalian homolog of the yeast GTPase
Dnm1. Complex I-dependent respiration by permeabilized neu-
rons was measured either in the presence of GTPgS, a non-hy-
drolyzable GTP analog that antagonizes all GTPases, including
Drp1 (see Figure 3), or dynasore, a general dynamin inhibitor
also reported to inhibit Drp1 (Macia et al., 2006). In contrast to
mdivi-1, neither GTPgS (Figure S6A) nor dynasore (Figures
S6B and S6C) impaired complex I-dependent respiration.
mdivi-1 Impairs Complex I-Dependent NADH Oxidationby the Electron Transport ChainHaving established that suppression of mitochondrial respiration
by mdivi-1 is independent of Drp1 or other GTPases, we investi-
gated whether mdivi-1 is a direct inhibitor of complex I. We
measured complex I activity in detergent-solubilized brain mito-
chondria by monitoring the complex I-dependent reduction of
the artificial electron acceptor 2,6-dichloroindophenol (DCIP).
DCIP reduction was almost entirely abolished by the complex I
inhibitor rotenone whereas 50 mMmdivi-1 did not alter the reduc-
tion of DCIP (Figure S7A). Surprisingly, 100 mM mdivi-1 stimu-
lated complex I-dependent DCIP reduction (Figures S7A and
S7B). DCIP reduction in the presence of 100 mM mdivi-1 re-
mained fully rotenone sensitive (Figure S7B). These results indi-
cate that the mdivi-1-mediated complex I inhibition observed in
cells likely occurs by a different mechanism than that induced by
rotenone and may require an intact inner mitochondrial mem-
brane and/or matrix components not present in detergent-solu-
bilized mitochondria.
One possibility is that mdivi-1 impedes complex I-dependent
respiration upstream of complex I by interfering with the supply
of NADH substrate, for example by inhibiting mitochondrial de-
hydrogenase enzymes. To test this possibility, we permeabilized
neurons with saponin, added the pore-forming peptide alamethi-
cin to porate the mitochondrial inner membrane, and measured
O2 consumption in the presence of exogenous NADH and cyto-
chrome c. Exogenous NADH bypasses matrix dehydrogenases
in this assay and O2 consumption measures complex I-III-IV
linked activity (Ji et al., 2012). OCRwas impaired by the complex
I inhibitor rotenone or by the complex IV inhibitor azide but not by
the complex II inhibitor 2-thenoyltrifluoroacetone, validating the
linked activity assay using the Seahorse XF24-based method
(Figure S7C). Like rotenone, mdivi-1 inhibited NADH-supported
OCR (Figure S7D), suggesting that mdivi-1 inhibits complex I
downstream of matrix dehydrogenases, possibly by interacting
with the complex I enzyme itself.
To specifically evaluate whether respiratory inhibition by
mdivi-1 occurs at complex I in intact cells, we ectopically ex-
pressed the gene encoding the internal NADH dehydrogenase
(Ndi1) enzyme from Saccharomyces cerevisiae in COS-7 cells.
Ndi1 is a single protein that can functionally substitute for com-
plex I in the ETC while exhibiting resistance to mammalian inhib-
itors and regulatory mechanisms (Seo et al., 1998). The respira-
tion of COS-7 cells expressing Ndi1 protein (Figure 5A) was not
impaired by the complex I inhibitors rotenone or piericidin A (Fig-
ure 5B), indicating complete functional substitution for complex I
by Ndi1. The respiration of Ndi1-expressing cells was similarly
insensitive to mdivi-1 treatment (Figures 5C and 5D), providing
strong evidence that inhibition of the ETC by mdivi-1 occurs at
complex I.
mdivi-1 Preferentially Attenuates Complex I ROSProduced by Reverse Electron TransferTo further understand the mdivi-1 modulation of complex I
activity, we investigated its effect on ROS. Classical complex I
inhibitors such as rotenone stimulate ROS production when
Developmental Cell 40, 583–594, March 27, 2017 587
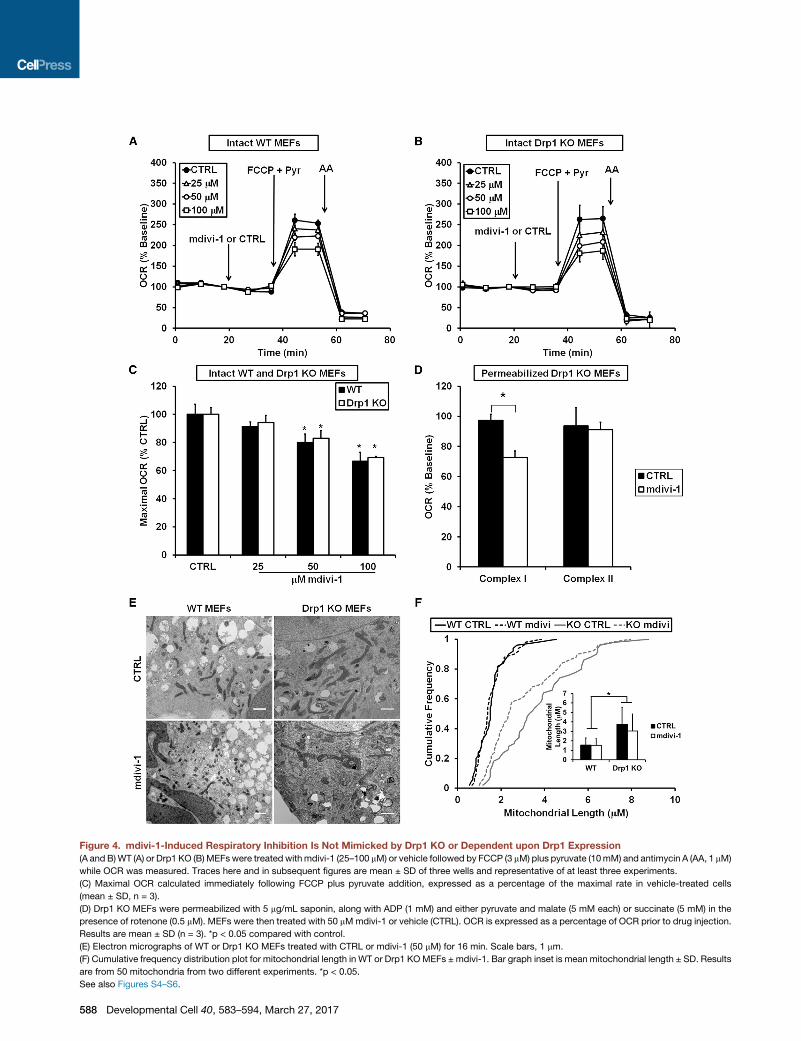
Figure 4. mdivi-1-Induced Respiratory Inhibition Is Not Mimicked by Drp1 KO or Dependent upon Drp1 Expression
(A and B)WT (A) or Drp1 KO (B)MEFswere treated withmdivi-1 (25–100 mM) or vehicle followed by FCCP (3 mM) plus pyruvate (10mM) and antimycin A (AA, 1 mM)
while OCR was measured. Traces here and in subsequent figures are mean ± SD of three wells and representative of at least three experiments.
(C) Maximal OCR calculated immediately following FCCP plus pyruvate addition, expressed as a percentage of the maximal rate in vehicle-treated cells
(mean ± SD, n = 3).
(D) Drp1 KO MEFs were permeabilized with 5 mg/mL saponin, along with ADP (1 mM) and either pyruvate and malate (5 mM each) or succinate (5 mM) in the
presence of rotenone (0.5 mM). MEFs were then treated with 50 mMmdivi-1 or vehicle (CTRL). OCR is expressed as a percentage of OCR prior to drug injection.
Results are mean ± SD (n = 3). *p < 0.05 compared with control.
(E) Electron micrographs of WT or Drp1 KO MEFs treated with CTRL or mdivi-1 (50 mM) for 16 min. Scale bars, 1 mm.
(F) Cumulative frequency distribution plot for mitochondrial length in WT or Drp1 KOMEFs ± mdivi-1. Bar graph inset is mean mitochondrial length ± SD. Results
are from 50 mitochondria from two different experiments. *p < 0.05.
See also Figures S4–S6.
588 Developmental Cell 40, 583–594, March 27, 2017

Figure 5. Yeast Ndi1 NADH Dehydrogenase Prevents Respiratory Inhibition by mdivi-1
(A) Ndi1 and b-actin protein levels in COS-7 cells (COS) transfected with the NDI1 gene and selected for NDI1 expression compared with parental COS.
(B) COS or NDI1-transfected COS (Ndi1) were treated with vehicle (CTRL), rotenone (1 mM), or piericidin A (100 nM), followed by FCCP (2 mM) plus pyruvate
(10 mM) and then antimycin A (1 mM) while OCR was measured.
(C) OCR traces for Ndi1-COS-7 or parental COS-7 cells treated with DMSO or mdivi-1, followed by the drugs in (B). Traces in (B) and (C) are mean ± SD of three
wells and representative of three experiments.
(D) Bar graph showing quantification of traces in (C). Data are means ± SD, n = 4. *p < 0.05 compared with control.
See also Figure S7.
mitochondria oxidize complex I-linked substrates (Chinta et al.,
2009; Yadava and Nicholls, 2007). As expected, complete inhibi-
tion of complex I by rotenone led to an increase in ROS-depen-
dent oxidation of the fluorescent dye dihydroethidium (DHE) in
both neurons and MEFs (Figure 6). The effect of piericidin A on
neurons was indistinguishable from that of rotenone (Figure 6B).
Interestingly, partial inhibition of respiration by 50 mM mdivi-1
was insufficient to elevate ROS levels in neurons (Figures 6A
and 6B), but increasedROS levels inWT andDrp1 KOMEFs (Fig-
ures 6C–6E).
Similar to findings with intact neurons, mdivi-1 failed to stimu-
late ROS emission from isolated brain mitochondria oxidizing
complex I substrates in the absence of ADP (Figures 7A and
7B). ADP significantly reduced the rate of ROS emission in
both the absence and presence of mdivi-1, consistent with
the oxidized shift in NADH/NAD+ ratio that accompanies phos-
phorylating respiration (Starkov and Fiskum, 2003). However,
ROS emission following ADP addition was significantly higher
when mdivi-1 was present. Notably, the mdivi-1 augmentation
of ROS release during phosphorylating respiration was several-
fold lower than that observedwhen rotenonewas added (Figures
7A and 7B).
Whenwell-coupledbrainmitochondria oxidize succinate rather
than complex I-linked substrates, ROS are produced from the
quinone-binding (Q) siteof complex I (Andreyevetal., 2005).Rote-
none and similar complex I inhibitors attenuate this so-called RET
ROSproduction (Tretter et al., 2007;Chinta et al., 2009). Like rote-
none, mdivi-1 caused a significant and dose-dependent attenua-
tion of RET-mediated ROS production (Figures 7C and 7D). Sub-
sequent addition of ADP to slightly decrease the electrochemical
proton gradient by stimulating proton flux through the ATP syn-
thase largely abolished ROS emission by brain mitochondria
Developmental Cell 40, 583–594, March 27, 2017 589
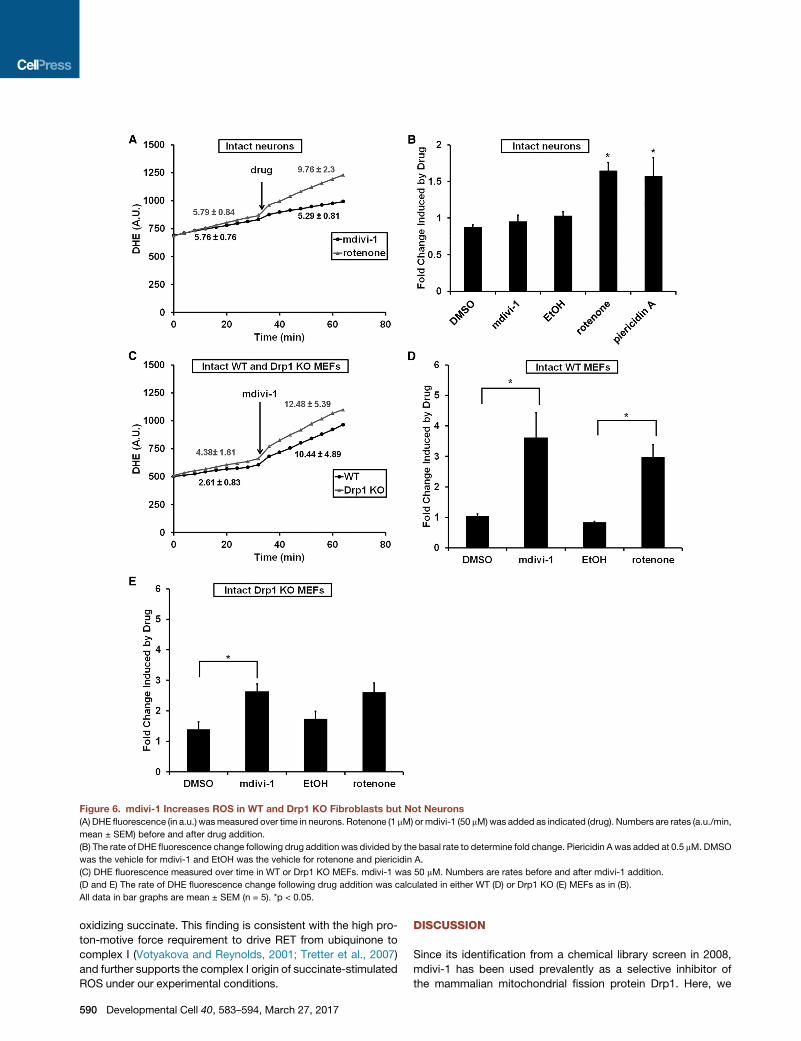
Figure 6. mdivi-1 Increases ROS in WT and Drp1 KO Fibroblasts but Not Neurons
(A) DHE fluorescence (in a.u.) wasmeasured over time in neurons. Rotenone (1 mM) ormdivi-1 (50 mM)was added as indicated (drug). Numbers are rates (a.u./min,
mean ± SEM) before and after drug addition.
(B) The rate of DHE fluorescence change following drug addition was divided by the basal rate to determine fold change. Piericidin A was added at 0.5 mM. DMSO
was the vehicle for mdivi-1 and EtOH was the vehicle for rotenone and piericidin A.
(C) DHE fluorescence measured over time in WT or Drp1 KO MEFs. mdivi-1 was 50 mM. Numbers are rates before and after mdivi-1 addition.
(D and E) The rate of DHE fluorescence change following drug addition was calculated in either WT (D) or Drp1 KO (E) MEFs as in (B).
All data in bar graphs are mean ± SEM (n = 5). *p < 0.05.
oxidizing succinate. This finding is consistent with the high pro-
ton-motive force requirement to drive RET from ubiquinone to
complex I (Votyakova and Reynolds, 2001; Tretter et al., 2007)
and further supports the complex I origin of succinate-stimulated
ROS under our experimental conditions.
590 Developmental Cell 40, 583–594, March 27, 2017
DISCUSSION
Since its identification from a chemical library screen in 2008,
mdivi-1 has been used prevalently as a selective inhibitor of
the mammalian mitochondrial fission protein Drp1. Here, we
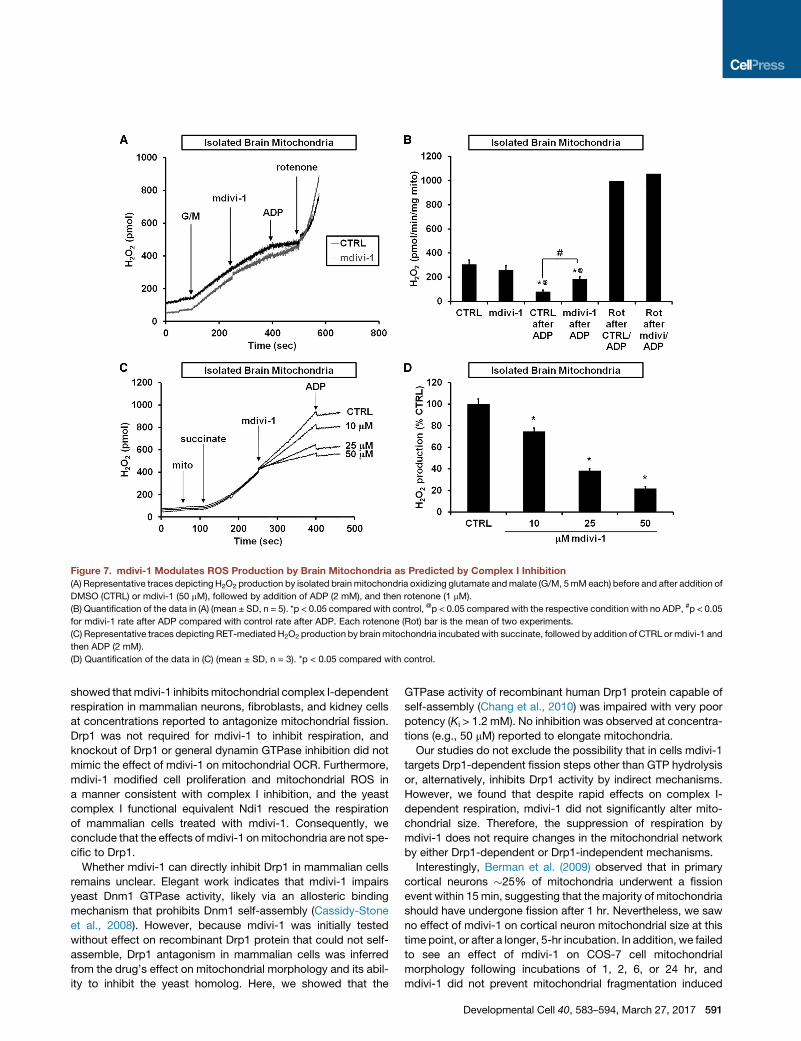
Figure 7. mdivi-1 Modulates ROS Production by Brain Mitochondria as Predicted by Complex I Inhibition
(A) Representative traces depicting H2O2 production by isolated brainmitochondria oxidizing glutamate andmalate (G/M, 5mMeach) before and after addition of
DMSO (CTRL) or mdivi-1 (50 mM), followed by addition of ADP (2 mM), and then rotenone (1 mM).
(B) Quantification of the data in (A) (mean ± SD, n = 5). *p < 0.05 compared with control, @p < 0.05 compared with the respective condition with no ADP, #p < 0.05
for mdivi-1 rate after ADP compared with control rate after ADP. Each rotenone (Rot) bar is the mean of two experiments.
(C) Representative traces depicting RET-mediated H2O2 production by brainmitochondria incubated with succinate, followed by addition of CTRL or mdivi-1 and
then ADP (2 mM).
(D) Quantification of the data in (C) (mean ± SD, n = 3). *p < 0.05 compared with control.
showed thatmdivi-1 inhibits mitochondrial complex I-dependent
respiration in mammalian neurons, fibroblasts, and kidney cells
at concentrations reported to antagonize mitochondrial fission.
Drp1 was not required for mdivi-1 to inhibit respiration, and
knockout of Drp1 or general dynamin GTPase inhibition did not
mimic the effect of mdivi-1 on mitochondrial OCR. Furthermore,
mdivi-1 modified cell proliferation and mitochondrial ROS in
a manner consistent with complex I inhibition, and the yeast
complex I functional equivalent Ndi1 rescued the respiration
of mammalian cells treated with mdivi-1. Consequently, we
conclude that the effects of mdivi-1 onmitochondria are not spe-
cific to Drp1.
Whether mdivi-1 can directly inhibit Drp1 in mammalian cells
remains unclear. Elegant work indicates that mdivi-1 impairs
yeast Dnm1 GTPase activity, likely via an allosteric binding
mechanism that prohibits Dnm1 self-assembly (Cassidy-Stone
et al., 2008). However, because mdivi-1 was initially tested
without effect on recombinant Drp1 protein that could not self-
assemble, Drp1 antagonism in mammalian cells was inferred
from the drug’s effect on mitochondrial morphology and its abil-
ity to inhibit the yeast homolog. Here, we showed that the
GTPase activity of recombinant human Drp1 protein capable of
self-assembly (Chang et al., 2010) was impaired with very poor
potency (Ki > 1.2 mM). No inhibition was observed at concentra-
tions (e.g., 50 mM) reported to elongate mitochondria.
Our studies do not exclude the possibility that in cells mdivi-1
targets Drp1-dependent fission steps other than GTP hydrolysis
or, alternatively, inhibits Drp1 activity by indirect mechanisms.
However, we found that despite rapid effects on complex I-
dependent respiration, mdivi-1 did not significantly alter mito-
chondrial size. Therefore, the suppression of respiration by
mdivi-1 does not require changes in the mitochondrial network
by either Drp1-dependent or Drp1-independent mechanisms.
Interestingly, Berman et al. (2009) observed that in primary
cortical neurons �25% of mitochondria underwent a fission
event within 15 min, suggesting that the majority of mitochondria
should have undergone fission after 1 hr. Nevertheless, we saw
no effect of mdivi-1 on cortical neuron mitochondrial size at this
time point, or after a longer, 5-hr incubation. In addition, we failed
to see an effect of mdivi-1 on COS-7 cell mitochondrial
morphology following incubations of 1, 2, 6, or 24 hr, and
mdivi-1 did not prevent mitochondrial fragmentation induced
Developmental Cell 40, 583–594, March 27, 2017 591

by staurosporine. We measured mitochondrial morphology in
cells using multiple methods, including those used in prior
studies with mdivi-1: TOM20 or cytochrome c immunofluores-
cence, Mito-GFP fluorescence, MitoTracker Red staining, and
electron microscopy. A subtle difference in experimental condi-
tions compared with published studies may have prevented us
from seeing an effect of mdivi-1 on mitochondrial morphology.
Since the initial description of the anti-mitochondrial fission ef-
fect of mdivi-1, the evidence that mdivi-1 inhibits mammalian
Drp1 is correlative; i.e., data showing that mdivi-1 affects mito-
chondrial size in the same manner as Drp1 small interfering
RNA or K38A dominant-negative Drp1 (Rosdah et al., 2016). To
our knowledge, there are no convincing demonstrations that
mdivi-1 directly inhibits Drp1. One study showed a minor
�25% decrease in cellular GTPase activity ascribed to Drp1
following a 24-hr treatment with 50 mM mdivi-1 (Manczak and
Reddy, 2015). Notably, mitochondrial fusion proteins Mfn1,
Mfn2, and Opa1 were all significantly upregulated at this time
point, suggesting that mdivi-1 may elongate mitochondria in
some cells by Drp1-independent mechanisms.
Themajor finding of our study is the identification of mdivi-1 as
a reversible inhibitor of complex I. Unexpectedly, mdivi-1 stimu-
lated rather than inhibited complex I-catalyzed electron transfer
to an artificial electron donor in detergent-solubilized mitochon-
dria, suggesting that the integrity of the lipid bilayer and/or other
mitochondrial components influence how mdivi-1 interacts with
complex I. Nevertheless, mdivi-1 acts as a complex I inhibitor in
cells since it impaired respiration, which was rescued by Ndi1
expression, and it triggered ROS accumulation in MEFs.
The well-characterized complex I inhibitor rotenone causes
parkinsonian neurodegeneration in rodents (Sherer et al., 2003).
In contrast, mdivi-1 has little to no reported in vivo toxicity and
is instead neuroprotective in several animal models, including
mouse models of Parkinson’s disease (Rappold et al., 2014).
The toxicity of rotenone was linked to the induction of oxidative
stress (Sherer et al., 2003). We found that mdivi-1 is a weak com-
plex I inhibitor compared with rotenone, and 50 mM mdivi-1
generated almost no ROS from isolated brain mitochondria in
either the absence or presence of ADP, compared with >4-fold
stimulation by a saturating concentration of rotenone (Figure 7B).
Strikingly, mdivi-1 failed to elevate ROS in intact neurons, which
may partly explain its lack of in vivo brain toxicity. Importantly, in
contrast to chronicmdivi-1 treatment (Rappold et al., 2014), con-
ditional knockout of Drp1 in dopaminergic neurons caused
degeneration associated with axonal mitochondria loss (Berthet
et al., 2014). The absence of dopaminergic neurodegeneration
following several days of mdivi-1 administration suggests that
mdivi-1 is not a potent antagonist of Drp1 in vivo.
We further investigated the ability of mdivi-1 to modulate com-
plex I-dependent ROS production by measuring ROS released
bybrainmitochondria incubatedwith succinate. Succinate accu-
mulates during ischemia and is oxidized rapidly during reperfu-
sion, producing ROS by RET that contribute to injury (Chouchani
et al., 2014; Brand et al., 2016). RET ROS is also thought to play a
role in Alzheimer’s disease (Zhang et al., 2015) and life span
(Lambert et al., 2007; Scialo et al., 2016). We found that mdivi-1
dose-dependently inhibits ROS produced by RET. Whereas
mdivi-1 barely elevated ROS by brain mitochondria oxidizing
complex I substrates in the presence of ADP, mdivi-1 was effec-
592 Developmental Cell 40, 583–594, March 27, 2017
tive as a RET inhibitor, with �80% ROS inhibition at 50 mM
mdivi-1. Interestingly, 25 mMmdivi-1 had no effect on respiratory
capacity in cortical neurons yet still inhibited succinate-driven
ROS production by �60%. Notably, multiple reports indicate
that mdivi-1 mitigates oxidative stress in animals and suggest
that this effect is due to Drp1 inhibition (Liu et al., 2015; Sharp
et al., 2015). However, conditional knockout of Drp1 in the cere-
bellum led to increased rather than decreased oxidative stress
(Kageyama et al., 2012). Because Drp1 ablation alters oxidative
stress in vivo, it is problematic to useKOmice to evaluate the abil-
ity of mdivi-1 to alter ROS in the absence of Drp1.
Overall, our results raise the possibility that mdivi-1 is a rela-
tively unusual complex I inhibitor that is not only weak and
reversible but also has the ability to attenuate pathological
ROS production at the complex I Q site, with limited impact on
ROS in healthy neurons. Interestingly, metformin, a drug widely
prescribed for the treatment of type 2 diabetes, partially inhibits
complex I (El-Mir et al., 2000) and RET ROS (Batandier et al.,
2006), but, in contrast to mdivi-1, is reported to exacerbate
toxicity in a mouse model of Parkinson’s disease (Ismaiel et al.,
2016). The translational potential of mdivi-1 is supported by the
success of metformin in humans while its potentially different
mode of action may increase its utility in some disorders. Never-
theless, it is important to note that because the structure of
mdivi-1 contains a thiophenol, it likely has multiple cellular tar-
gets, and additional experiments will be needed to demonstrate
the specificity of its effects.
Drugs that prevent mitochondrial dysfunction are highly
sought. Because we find that mdivi-1 influences multiple as-
pects of mitochondrial function—respiration and ROS—even in
the absence of Drp1, it has limited utility in studies aiming to
demonstrate a specific role for Drp1-dependent fission in biolog-
ical processes. However, its ability to target several aspects
of mitochondrial dysfunction, particularly succinate-driven RET
ROS and cytochrome c release (Cassidy-Stone et al., 2008),
make it an attractive therapeutic drug candidate for numerous
diseases.
STAR+METHODS
Detailed methods are provided in the online version of this paper
and include the following:
d KEY RESOURCES TABLE
d CONTACT FOR REAGENT AND RESOURCE SHARING
d EXPERIMENTAL MODEL AND SUBJECT DETAILS
B Rat Primary Cortical Neurons
B Cell Line Culture and Transfection
d METHOD DETAILS
B XF24 Microplate-based Respirometry
B Oxygen Consumption by Isolated Mitochondria
B Immunofluorescence and Mitochondrial Size
B Analysis of Mitochondrial Morphology
B Live Cell Time-Lapse Imaging
B Purification of Recombinant Drp1 and Dnm1
B GTPase Activity Assay
B Cell Proliferation Assay
B Electron Microscopy
B Complex I Activity Assay

B Ndi1-expressing Construct
B Immunoblotting
B Measurement of Intracellular ROS
B H2O2 Detection Using Amplex UltraRed
d QUANTIFICATION AND STATISTICAL ANALYSIS
SUPPLEMENTAL INFORMATION
Supplemental Information includes seven figures and two movies and can
be found with this article online at http://dx.doi.org/10.1016/j.devcel.2017.
02.020.
AUTHOR CONTRIBUTIONS
E.A.B., P.C., B.A.R., E.C., S.X.G., T.C.F., T.K., S.U., A.M.M., and M.K. per-
formed and/or designed and analyzed bioenergetics and imaging experi-
ments. E.A.B., L.T., and V.A.-V. conducted ROS measurements. A.J.S. de-
signed the electron microscopy study. H.S. provided Drp1 knockout MEFs
and conceptual advice. K.I. cloned NDI1 into the pEGPF-N1 vector. A.K.
and N.Y. helped design the linked complex I-III-IV activity assay. N.W.K.,
L.K.P., and R.B.H. conducted and analyzed GTPase assays. E.A.B., P.C.,
R.B.H., and B.M.P. designed the study and wrote the manuscript.
ACKNOWLEDGMENTS
The authors thank Ru-ching Hsia, PhD, of the University of Maryland Dental
School Core Imaging Facility for her assistance in collecting the electronmicro-
scopic images. They also thankTakaoYagi (TheScrippsResearch Institute,San
Diego, CA) for the generous gift of the Ndi1 antibody. This research was sup-
ported by NINDS grants R01NS064978, R01NS085165, and R21NS096538
(B.M.P.), by NICHD grant P01HD016596, by NIGMS grants R01GM089853
(H.S.) and R01GM067180 (R.B.H.), OTKA (NK 81983, V.A.-V.), the Hungarian
Academy of Sciences MTA TKI 02001 (V.A.-V.), and the Hungarian Brain
Research Program grant KTIA_13_NAP-A-III/6 (V.A.-V.).
Received: April 20, 2016
Revised: January 19, 2017
Accepted: February 24, 2017
Published: March 27, 2017
REFERENCES
Andreyev, A.Y., Kushnareva, Y.E., and Starkov, A.A. (2005). Mitochondrial
metabolism of reactive oxygen species. Biochemistry (Mosc) 70, 200–214.
Batandier, C., Guigas, B., Detaille, D., El-Mir, M.Y., Fontaine, E., Rigoulet, M.,
and Leverve, X.M. (2006). The ROS production induced by a reverse-electron
flux at respiratory-chain complex 1 is hampered by metformin. J. Bioenerg.
Biomembr. 38, 33–42.
Berman, S.B., Chen, Y.B., Qi, B., McCaffery, J.M., Rucker, E.B., III, Goebbels,
S., Nave, K.A., Arnold, B.A., Jonas, E.A., Pineda, F.J., and Hardwick, J.M.
(2009). Bcl-x L increases mitochondrial fission, fusion, and biomass in neu-
rons. J. Cell Biol. 184, 707–719.
Berthet, A., Margolis, E.B., Zhang, J., Hsieh, I., Zhang, J., Hnasko, T.S.,
Ahmad, J., Edwards, R.H., Sesaki, H., Huang, E.J., and Nakamura, K.
(2014). Loss of mitochondrial fission depletes axonal mitochondria in midbrain
dopamine neurons. J. Neurosci. 34, 14304–14317.
Brand, M.D., Goncalves, R.L., Orr, A.L., Vargas, L., Gerencser, A.A., Borch,
J.M., Wang, Y.T., Melov, S., Turk, C.N., Matzen, J.T., et al. (2016).
Suppressors of superoxide-H2O2 production at site IQ of mitochondrial com-
plex I protect against stem cell hyperplasia and ischemia-reperfusion injury.
Cell Metab. 24, 582–592.
Cahill, T.J., Leo, V., Kelly, M., Stockenhuber, A., Kennedy, N.W., Bao, L.,
Cereghetti, G., Harper, A.R., Czibik, G., Lao, C., et al. (2015). Resistance of dy-
namin-related protein 1 oligomers to disassembly impairsmitophagy, resulting
inmyocardial inflammation and heart failure. J. Biol. Chem. 290, 25907–25919.
Cassidy-Stone, A., Chipuk, J.E., Ingerman, E., Song, C., Yoo, C., Kuwana, T.,
Kurth, M.J., Shaw, J.T., Hinshaw, J.E., Green, D.R., and Nunnari, J. (2008).
Chemical inhibition of the mitochondrial division dynamin reveals its role in
bax/bak-dependent mitochondrial outer membrane permeabilization. Dev.
Cell 14, 193–204.
Chang, C.R., Manlandro, C.M., Arnoult, D., Stadler, J., Posey, A.E., Hill, R.B.,
and Blackstone, C. (2010). A lethal de novo mutation in the middle domain of
the dynamin-related GTPase Drp1 impairs higher order assembly and mito-
chondrial division. J. Biol. Chem. 285, 32494–32503.
Chinta, S.J., Rane, A., Yadava, N., Andersen, J.K., Nicholls, D.G., and Polster,
B.M. (2009). Reactive oxygen species regulation by AIF- and complex I-
depleted brain mitochondria. Free Radic. Biol. Med. 46, 939–947.
Chouchani, E.T., Pell, V.R., Gaude, E., Aksentijevic, D., Sundier, S.Y., Robb,
E.L., Logan, A., Nadtochiy, S.M., Ord, E.N., Smith, A.C., et al. (2014).
Ischaemic accumulation of succinate controls reperfusion injury through mito-
chondrial ROS. Nature 515, 431–435.
Clerc, P., and Polster, B.M. (2012). Investigation of mitochondrial dysfunction
by sequential microplate-based respiration measurements from intact and
permeabilized neurons. PLoS. One 7, e34465.
El-Mir, M.Y., Nogueira, V., Fontaine, E., Averet, N., Rigoulet, M., and Leverve,
X. (2000). Dimethylbiguanide inhibits cell respiration via an indirect effect tar-
geted on the respiratory chain complex I. J. Biol. Chem. 275, 223–228.
Frank, S., Gaume, B., Bergmann-Leitner, E.S., Leitner, W.W., Robert, E.G.,
Catez, F., Smith, C.L., and Youle, R.J. (2001). The role of dynamin-related pro-
tein 1, a mediator of mitochondrial fission, in apoptosis. Dev. Cell 1, 515–525.
Grohm, J., Kim, S.W., Mamrak, U., Tobaben, S., Cassidy-Stone, A., Nunnari,
J., Plesnila, N., and Culmsee, C. (2012). Inhibition of Drp1 provides neuropro-
tection in vitro and in vivo. Cell Death Differ. 19, 1446–1458.
Ingerman, E., and Nunnari, J. (2005). A continuous, regenerative coupled
GTPase assay for dynamin-related proteins. Methods Enzymol. 404, 611–619.
Ishihara, N., Nomura, M., Jofuku, A., Kato, H., Suzuki, S.O., Masuda, K., Otera,
H., Nakanishi, Y., Nonaka, I., Goto, Y., et al. (2009). Mitochondrial fission factor
Drp1 is essential for embryonic development and synapse formation in mice.
Nat. Cell Biol. 11, 958–966.
Ismaiel, A.A., Espinosa-Oliva, A.M., Santiago, M., Garcia-Quintanilla, A., Oliva-
Martin, M.J., Herrera, A.J., Venero, J.L., and de Pablos, R.M. (2016).
Metformin, besides exhibiting strong in vivo anti-inflammatory properties, in-
creases MPTP-induced damage to the nigrostriatal dopaminergic system.
Toxicol. Appl. Pharmacol. 298, 19–30.
Ji, F., Sharpley, M.S., Derbeneva, O., Alves, L.S., Qian, P., Wang, Y., Chalkia,
D., Lvova, M., Xu, J., Yao, W., et al. (2012). Mitochondrial DNA variant associ-
ated with Leber hereditary optic neuropathy and high-altitude Tibetans. Proc.
Natl. Acad. Sci. USA 109, 7391–7396.
Kageyama, Y., Zhang, Z., Roda, R., Fukaya, M., Wakabayashi, J.,
Wakabayashi, N., Kensler, T.W., Reddy, P.H., Iijima, M., and Sesaki, H.
(2012). Mitochondrial division ensures the survival of postmitotic neurons by
suppressing oxidative damage. J. Cell Biol. 197, 535–551.
Kageyama, Y., Hoshijima, M., Seo, K., Bedja, D., Sysa-Shah, P., Andrabi, S.A.,
Chen,W., Hoke, A., Dawson, V.L., Dawson, T.M., et al. (2014). Parkin-indepen-
dent mitophagy requires Drp1 and maintains the integrity of mammalian heart
and brain. EMBO J. 33, 2798–2813.
Koppenol-Raab, M., Harwig, M.C., Posey, A.E., Egner, J.M., MacKenzie, K.R.,
and Hill, R.B. (2016). A targeted mutation identified through pKa measure-
ments indicates a postrecruitment role for Fis1 in yeast mitochondrial fission.
J. Biol. Chem. 291, 20329–20344.
Kristian, T., and Fiskum, G. (2004). A fluorescence-based technique for
screening compounds that protect against damage to brain mitochondria.
Brain Res. Brain Res. Protoc. 13, 176–182.
Lambert, A.J., Boysen, H.M., Buckingham, J.A., Yang, T., Podlutsky, A.,
Austad, S.N., Kunz, T.H., Buffenstein, R., and Brand, M.D. (2007). Low rates
of hydrogen peroxide production by isolated heart mitochondria associate
with long maximum lifespan in vertebrate homeotherms. Aging Cell 6,
607–618.
Developmental Cell 40, 583–594, March 27, 2017 593
Liu, J.M., Yi, Z., Liu, S.Z., Chang, J.H., Dang, X.B., Li, Q.Y., and Zhang, Y.L.
(2015). The mitochondrial division inhibitor mdivi-1 attenuates spinal cord
ischemia-reperfusion injury both in vitro and in vivo: involvement of BK chan-
nels. Brain Res. 1619, 155–165.
Ma, D., Taneja, T.K., Hagen, B.M., Kim, B.Y., Ortega, B., Lederer, W.J., and
Welling, P.A. (2011). Golgi export of the Kir2.1 channel is driven by a trafficking
signal located within its tertiary structure. Cell 145, 1102–1115.
Macia, E., Ehrlich, M., Massol, R., Boucrot, E., Brunner, C., and Kirchhausen,
T. (2006). Dynasore, a cell-permeable inhibitor of dynamin. Dev. Cell 10,
839–850.
Manczak, M., and Reddy, P.H. (2015). Mitochondrial division inhibitor 1
protects against mutant huntingtin-induced abnormal mitochondrial dy-
namics and neuronal damage in Huntington’s disease. Hum. Mol. Genet. 24,
7308–7325.
McDowell, E.M., and Trump, B.F. (1976). Histologic fixatives suitable for diag-
nostic light and electron microscopy. Arch. Pathol. Lab. Med. 100, 405–414.
Mitchell, D.A., Marshall, T.K., and Deschenes, R.J. (1993). Vectors for the
inducible overexpression of glutathione S-transferase fusion proteins in yeast.
Yeast 9, 715–722.
Ong, S.B., Subrayan, S., Lim, S.Y., Yellon, D.M., Davidson, S.M., and
Hausenloy, D.J. (2010). Inhibiting mitochondrial fission protects the heart
against ischemia/reperfusion injury. Circulation 121, 2012–2022.
Packer, L., and Mustafa, M.G. (1966). Pathways of electron flow established
by tetramethylphenylenediamine in mitochondria and ascites tumor cells.
Biochim. Biophys. Acta 113, 1–12.
Rappold, P.M., Cui, M., Grima, J.C., Fan, R.Z., de Mesy-Bentley, K.L., Chen,
L., Zhuang, X., Bowers, W.J., and Tieu, K. (2014). Drp1 inhibition attenuates
neurotoxicity and dopamine release deficits in vivo. Nat. Commun. 5, 5244.
Rosdah, A.A., Holien, K., Delbridge, L.M., Dusting, G.J., and Lim, S.Y. (2016).
Mitochondrial fission - a drug target for cytoprotection or cytodestruction?
Pharmacol. Res. Perspect. 4, e00235.
Schiestl, R.H., and Gietz, R.D. (1989). High efficiency transformation of intact
yeast cells using single stranded nucleic acids as a carrier. Curr. Genet. 16,
339–346.
Scialo, F., Sriram, A., Fernandez-Ayala, D., Gubina, N., Lohmus, M., Nelson,
G., Logan, A., Cooper, H.M., Navas, P., Enriquez, J.A., et al. (2016).
Mitochondrial ROS produced via reverse electron transport extend animal life-
span. Cell Metab. 23, 725–734.
Seo, B.B., Kitajima-Ihara, T., Chan, E.K., Scheffler, I.E., Matsuno-Yagi, A., and
Yagi, T. (1998). Molecular remedy of complex I defects: rotenone-insensitive
internal NADH-quinone oxidoreductase of Saccharomyces cerevisiae mito-
chondria restores the NADH oxidase activity of complex I-deficient mamma-
lian cells. Proc. Natl. Acad. Sci. USA 95, 9167–9171.
Shang, C., Hazbun, T.R., Cheeseman, I.M., Aranda, J., Fields, S., Drubin, D.G.,
and Barnes, G. (2003). Kinetochore protein interactions and their regulation by
the Aurora kinase Ipl1p. Mol. Biol. Cell 14, 3342–3355.
Sharma, L.K., Fang, H., Liu, J., Vartak, R., Deng, J., and Bai, Y. (2011).
Mitochondrial respiratory complex I dysfunction promotes tumorigenesis
through ROS alteration and AKT activation. Hum. Mol. Genet. 20, 4605–4616.
Sharp, W.W., Beiser, D.G., Fang, Y.H., Han, M., Piao, L., Varughese, J., and
Archer, S.L. (2015). Inhibition of the mitochondrial fission protein dynamin-
related protein 1 improves survival in a murine cardiac arrest model. Crit.
Care Med. 43, e38–e47.
594 Developmental Cell 40, 583–594, March 27, 2017
Sherer, T.B., Betarbet, R., Testa, C.M., Seo, B.B., Richardson, J.R., Kim, J.H.,
Miller, G.W., Yagi, T., Matsuno-Yagi, A., and Greenamyre, J.T. (2003).
Mechanism of toxicity in rotenone models of Parkinson’s disease. J. Neurosci.
23, 10756–10764.
Sims, N.R. (1990). Rapid isolation of metabolically active mitochondria from
rat brain and subregions using Percoll density gradient centrifugation.
J. Neurochem. 55, 698–707.
Starkov, A.A., and Fiskum, G. (2003). Regulation of brain mitochondrial H2O2
production by membrane potential and NAD(P)H redox state. J. Neurochem.
86, 1101–1107.
Sullivan, L.B., Gui, D.Y., Hosios, A.M., Bush, L.N., Freinkman, E., and Vander
Heiden, M.G. (2015). Supporting aspartate biosynthesis is an essential func-
tion of respiration in proliferating cells. Cell 162, 552–563.
Tretter, L., Mayer-Takacs, D., and Adam-Vizi, V. (2007). The effect of bovine
serum albumin on the membrane potential and reactive oxygen species gen-
eration in succinate-supported isolated brain mitochondria. Neurochem. Int.
50, 139–147.
Twig, G., Elorza, A., Molina, A.J., Mohamed, H., Wikstrom, J.D., Walzer, G.,
Stiles, L., Haigh, S.E., Katz, S., Las, G., et al. (2008). Fission and selective
fusion govern mitochondrial segregation and elimination by autophagy.
EMBO J. 27, 433–446.
Votyakova, T.V., and Reynolds, I.J. (2001). DeltaPsi(m)-Dependent and -inde-
pendent production of reactive oxygen species by rat brain mitochondria.
J. Neurochem. 79, 266–277.
Wakabayashi, J., Zhang, Z., Wakabayashi, N., Tamura, Y., Fukaya, M.,
Kensler, T.W., Iijima, M., and Sesaki, H. (2009). The dynamin-related
GTPase Drp1 is required for embryonic and brain development in mice.
J. Cell Biol. 186, 805–816.
Wells, R.C., Picton, L.K., Williams, S.C., Tan, F.J., and Hill, R.B. (2007). Direct
binding of the dynamin-like GTPase, Dnm1, tomitochondrial dynamics protein
Fis1 is negatively regulated by the Fis1 N-terminal arm. J. Biol. Chem. 282,
33769–33775.
Wu, Q., Xia, S.X., Li, Q.Q., Gao, Y., Shen, X., Ma, L., Zhang, M.Y., Wang, T., Li,
Y.S., Wang, Z.F., et al. (2016). Mitochondrial division inhibitor 1 (Mdivi-1) offers
neuroprotection through diminishing cell death and improving functional
outcome in amousemodel of traumatic brain injury. Brain Res. 1630, 134–143.
Xu, S., Cherok, E., Das, S., Li, S., Roelofs, B.A., Ge, S.X., Polster, B.M., Boyman,
L., Lederer, W.J., Wang, C., and Karbowski, M. (2016). Mitochondrial E3
ubiquitin ligase MARCH5 controls mitochondrial fission and cell sensitivity to
stress-induced apoptosis through regulation of MiD49 protein. Mol. Biol. Cell
27, 349–359.
Yadava, N., and Nicholls, D.G. (2007). Spare respiratory capacity rather than
oxidative stress regulates glutamate excitotoxicity after partial respiratory inhi-
bition of mitochondrial complex I with rotenone. J. Neurosci. 27, 7310–7317.
Yakovlev, A.G., Ota, K., Wang, G., Movsesyan, V., Bao, W.L., Yoshihara, K.,
and Faden, A.I. (2001). Differential expression of apoptotic protease-activating
factor-1 and caspase-3 genes and susceptibility to apoptosis during brain
development and after traumatic brain injury. J. Neurosci. 21, 7439–7446.
Zhang, L., Zhang, S., Maezawa, I., Trushin, S., Minhas, P., Pinto, M., Jin, L.W.,
Prasain, K., Nguyen, T.D., Yamazaki, Y., et al. (2015). Modulation of mitochon-
drial complex I activity averts cognitive decline in multiple animal models of
familial Alzheimer’s disease. EBioMedicine 2, 294–305.
STAR+METHODS
KEY RESOURCES TABLE
REAGENT or RESOURCE SOURCE IDENTIFIER
Antibodies
Anti-mouse Dynamin Like Protein-1 (Clone 8) BD Biosciences Cat# 611113; RRID: AB_398424
Anti-rabbit Tom20 (FL-145) Santa Cruz Biotechnology Cat# sc-11415; RRID: AB_2207533
Anti-mouse cytochrome c (Clone BH2.B4) BD Biosciences Cat# 556432; RRID: AB_396416
Anti-rabbit Ndi1 Seo et al., 1998 N/A
Anti-mouse beta-actin (Clone AC-74) SigmaAldrich A5316; RRID: AB_476743
Goat anti-rabbit IgG (H+L) Secondary Antibody, HRP ThermoFisher Scientific Cat# 65-6120; RRID: AB_2533967
Goat anti-mouse IgG (H+L) Secondary Antibody, HRP ThermoFisher Scientific Cat# 62-6520; RRID: AB_2533947
Goat anti-rabbit IgG (H+L) Highly Cross-Adsorbed
Secondary Antibody, Alexa Fluor 594
ThermoFisher Scientific Cat# A11037; RRID: AB_2534095
Goat anti-mouse IgG (H+L) High Cross-Adsorbed
Secondary Antibody, Alexa Fluor 488
ThermoFisher Scientific Cat# A11029; RRID: AB_2534088
Bacterial and Virus Strains
Escherichia coli BL21 (DE3) New England BioLabs Cat # C2527I
Biological Samples
Primary Rat Cortical Neurons This paper N/A
Chemicals, Peptides, and Recombinant Proteins
Mdivi-1 Sigma-Aldrich Cat# M0199
Mdivi-1 Enzo Life Sciences Cat# BML-CM127
Tris-Glycine SDS Sample Buffer (2x) ThermoFisher Scientific Cat# LC2672
Protease Inhibitor Cocktail Set III, Animal-Free EMD Millipore Cat# 535140
Recombinant human Drp1 Cahill et al., 2015 N/A
Purified Saccharomyces cerevisiae Dnm1 This paper N/A
Dihydroethidium ThermoFisher Scientific Cat# D11347
Amplex UltraRed Reagent ThermoFisher Scientific Cat# A36006
MitoTracker Red CMXRos ThermoFisher Scientific Cat# M7512
Lipofectamine 2000 Transfection Reagent ThermoFisher Scientific Cat# 11668027
Hoechst 33342, Trihydrochloride, Trihydrate ThermoFisher Scientific H3570
Percoll Sigma-Aldrich Cat# P1644
HEPES Sigma-Aldrich Cat# H0887
K2HPO4 Sigma-Aldrich Cat# P9791
MgCl2 Sigma-Aldrich Cat# M1028
EGTA Sigma-Aldrich Cat# E4378
2,6-Dichlorophenol-indophenol sodium salt dihydrate EMD Millipore Cat# 1030280005
Bovine Serum Albumin Sigma-Aldrich A7030
Carbonyl cyanide 4-(trifluoromethoxy) phenylhydrazone Sigma-Aldrich Cat# C2920
Antimycin A Sigma-Aldrich Cat# A8674
Sodium Azide Sigma-Aldrich Cat# S8032
(+)-Sodium L-ascorbate Sigma-Aldrich Cat# A4034
N,N,N’,N’-Tetramethyl-p-phenylenediamine Sigma-Aldrich Cat# T7394
Saponin from quillaja bark Sigma-Aldrich Cat# S7900
Adenosine 5’-diphosphate monopotassium salt dihydrate Sigma-Aldrich Cat# A5285
Sodium pyruvate Sigma-Aldrich Cat# P2256
L-Glutamic acid monosodium salt hydrate Sigma-Aldrich Cat# G1626
L-(-)-Malic acid Sigma-Aldrich Cat# M6413
(Continued on next page)
Developmental Cell 40, 583–594.e1–e6, March 27, 2017 e1
Continued
REAGENT or RESOURCE SOURCE IDENTIFIER
Rotenone Sigma-Aldrich Cat# R8875
Piericidin A Enzo Life Sciences Cat# ALX-380-235
Succinic acid disodium salt Sigma-Aldrich Cat# 224731
Oligomycin EMD Millipore Cat# 495455
D-(+)-Glucose Sigma-Aldrich Cat# G7528
Dowex 50WX8 hydrogen form Sigma-Aldrich Cat# 217492
Pierce 16% Formaldehyde (w/v), Methanol-free ThermoFisher Scientific Cat# 28908
Pierce 20X PBS Tween 20 Buffer ThermoFisher Scientific Cat# 28352
Iscove’s Modified Dulbecco’s Medium ThermoFisher Scientific Cat# 12440053
Primocin InvivoGen Cat# ant-pm-1
Penicillin:Streptomycin Solutions Gemini Bio-Products Cat# 400-109
Ni2+ Sepharose High Performance beads GE Healthcare Cat# 17-5268-01
Isopropyl 1-thio-b-D-galactopyranoside Sigma-Aldrich Cat# I5502
Neurobasal ThermoFisher Scientific Cat# 21103049
Gem21 NeuroPlex Serum-Free Supplement Gemini Bio-Products Cat# 400-160
Deoxyribonuclease I Sigma-Aldrich Cat# DN25
Fetal Bovine Serum, Heat Inactivated Sigma-Aldrich Cat# F4135
Cytosine beta-d-arabinofuranoside Sigma-Aldrich Cat# C1768
Glutamax (100x) Gibco Cat#14190-144
Experimental Models: Cell Lines
Wild Type Mouse Embryonic Fibroblast Kageyama et al., 2014 N/A
Drp1 Knockout Mouse Embryonic Fibroblast Kageyama et al., 2014 N/A
COS-7 Ma et al., 2011 N/A
Experimental Models: Organisms/Strains
Protease deficient Saccharomyces cerevisiae strain
DDY1810 (MATa, leu2D,trp1D, ura3-52, prb1-1122,
pep4-3, pre1-451)
Shang et al., 2003 N/A
Recombinant DNA
S. cerevisiae Dnm1 in pEGKT with an N-terminal
Maltose Binding Protein fusion tag
Koppenol-Raab et al., 2016) N/A
pEGFP-N1 expression vector Clontech Cat# 6085-1
pSMPUW-Puro Base Plasmid Cell BioLabs Cat# VPK-212
Human Drp1 (isoform 1) in pET29b which contains
a C-terminal His6 tag
EMD Millipore Cat# 69872-3
Other
Novex WedgeWell 4-20% Tris-Glycine Mini Gels ThermoFisher Scientific XP04202BOX
CONTACT FOR REAGENT AND RESOURCE SHARING
Further information and requests for resources and reagents should be directed to and will be fulfilled by the Lead Contact,
Brian M. Polster ([email protected]).
EXPERIMENTAL MODEL AND SUBJECT DETAILS
Rat Primary Cortical NeuronsAll procedures were in accordance with the NIH Guide for the Care and Use of Laboratory Animals and were approved by the Uni-
versity of Maryland Institutional Animal Care and Use Committee. Embryonic day 18 rat cortices were used to prepare primary
cortical neurons according to established procedures (Yakovlev et al., 2001). Male and female rat cortices were mixed together
for this study. Cortices were isolated, placed in Hank’s Balanced Salt Solution (HBSS), and meninges were removed. The cortices
were then gently mixed by passing through a 5ml pipette. Tissue wasminced and dissociated with 1800 U/ml trypsin (Sigma-Aldrich,
St. Louis, MO) at 37�C for 15 minutes. DNase I (200 U/ml, Sigma-Aldrich) was then added to the suspension and mixed by gentle
e2 Developmental Cell 40, 583–594.e1–e6, March 27, 2017
inversion. This tissue mixture was centrifuged at 1,000 x g for 10 minutes, suspended in 2 ml of Neurobasal medium (Thermo Fisher,
Waltham, MA) that included 10% fetal bovine serum (Sigma-Aldrich), 1x Gem21 (Gemini Bio-Products, Broderick, CA), 1x Glutamax
(Thermo Fisher), and 100 IU/ml penicillin with 100 mg/ml streptomycin (Gemini Bio-Products), and then filtered through a 40 mm filter.
Cells were seeded at a density of 0.8 x 10⁵ cells/well (0.32 cm2) in V7 microplates (Agilent Technologies, Santa Clara, CA) and main-
tained in a humidified atmosphere of 95% air/5%CO2 at 37�C. Glial proliferation was inhibited by addition of cytosine arabinofurano-
side (5 mM) after 4 days in vitro (DIV). Neurons were used for experiments at DIV 10-14.
Cell Line Culture and TransfectionWT and Drp1 KO MEFs (Wakabayashi et al., 2009) that were spontaneously immortalized by serial passage (Kageyama et al., 2012)
were cultured in Iscove’s Modified Dulbecco’s Medium supplemented with 10%FBS and 100 mg/ml primocin (InvivoGen, San Diego,
CA). WT and Drp1 KO cell lines were authenticated by western blot for Drp1. COS-7 cells were cultured in Dulbecco’s Modified Eagle
Medium (DMEM) supplemented with 10% FBS, penicillin (100 IU/ml), and streptomycin (100 mg/ml). COS-7 cells were transfected
with the NDI1-puromycin construct (see below for description) using Lipofectamine 2000 (Thermo Fisher). At 24 hr post-transfection,
cells were treated with 3 mg/ml puromycin for 4 days to select for transfected cells. Ndi1 expression was confirmed by immunoblot.
METHOD DETAILS
XF24 Microplate-based RespirometryO2 consumption measurements from intact and permeabilized cells were performed using an XF24 Extracellular Flux Analyzer (Agi-
lent Technologies) (Clerc and Polster, 2012). Artificial cerebrospinal fluid (aCSF) assay medium consisted of 120 mM NaCl, 3.5 mM
KCl, 1.3 mM CaCl2, 0.4 mM KH2PO4, 1 mM MgCl2, 5 mM 4-(2-hydroxyethyl)-1-piperazineethanesulfonic acid (HEPES), 15 mM
glucose, and 4 mg/ml fatty acid free bovine serum albumin (BSA), pH 7.4. Cells were incubated in an aCSF volume of 0.675 ml in
a CO2-free incubator at 37�C for one hour prior to assays to allow temperature and pH equilibration. Cells were then loaded into
the instrument and further equilibrated for 15min by three 3minmix, 2min wait cycles prior tomeasurements. Compounds of interest
prepared in assay medium (75 ml) were pre-loaded into reagent delivery chambers a, b, c, and d at 10X, 11X, 12X, and 13X the final
working concentration, respectively. Saponin and pyruvate were prepared fresh from powder for each individual experiment. The
molecular identity of mdivi-1 from two different commercial sources (Sigma-Aldrich, St. Louis, MO and Enzo Life Sciences, Farm-
ingdale, NY) was verified by the NMR andMass Spectrometry facilities at the Medical College of Wisconsin (Milwaukee, WI). O2 con-
sumption rate (OCR) measurements were made and drugs were injected sequentially as described in figure legends. For permeabi-
lized cell assays, saponin (25 mg/ml unless otherwise indicated) was co-injected with 3.6 mM K2HPO4, 1 mM ADP, 5 mM EGTA, and
the indicatedmitochondrial substrate(s) to initiate permeabilization and ADP-stimulated respiration in aCSF assaymedium. Note that
saponin should be titrated for every individual lot obtained as the optimal concentration of saponin depends on source and purity.
Substrate combinations for complex I-linked respiration consisted of 5 mM pyruvate plus 5 mM malate or 5 mM glutamate plus
5 mM malate. Succinate (5 mM) in combination with rotenone (0.5 mM) was used to assay complex II-dependent respiration. The
ATP synthase inhibitor oligomycin (0.3 mg/ml) was used to measure OCR in the absence of oxidative phosphorylation, the protono-
phore carbonyl cyanide 4-(trifluoromethoxy) phenylhydrazone (FCCP, 2-3 mM)was added tomeasure uncoupled respiration, and the
complex III inhibitor antimycin A (1 mM) was used to inhibit O2 consumption by the mitochondrial electron transport chain.
Oxygen Consumption by Isolated MitochondriaSprague-Dawley rat non-synaptosomal forebrain mitochondria were isolated and purified on a Percoll� gradient (Sims, 1990; Kris-
tian and Fiskum, 2004). Following decapitation, the olfactory bulb and cerebellumwere removed and the rest of the brain was placed
in ice-coldmitochondrial isolation buffer (75mMmannitol, 225mM sucrose, 1mMEGTA, 5mMHEPES, pH 7.4) at 4�C. All tissue was
mincedwith scissors inmitochondrial isolation buffer, and homogenized by handwith 10 up and down strokes. This homogenate was
then centrifuged for 3 minutes at 1,330 x g at 4�C. Following supernatant removal, the pellet was resuspended in mitochondrial isola-
tion buffer and again centrifuged at 1,330 x g at 4�C. Supernatant was then centrifuged at 4�C for 10minutes at 21,200 x g. The resul-
tant pellet was resuspended in 15% Percoll (100% Percoll stock consisted of 225 mM sucrose, 1 mM EGTA, 75 mMmannitol, 5 mM
HEPES at pH 7.4; 100%Percoll stockwas diluted withmitochondrial isolation buffer to obtain final concentrations). This 15%Percoll/
tissue solution was layered into a two-step discontinuous gradient of 1.5 ml of 40% Percoll and 3.7 ml of 24% Percoll. This gradient
was centrifuged at 4�C for 8 minutes at 30,700 x g. The mitochondrial fraction, which was at the interface of the bottom two layers,
was taken and diluted 1:4 in mitochondrial isolation buffer, after which it was centrifuged at 4�C for 10 minutes at 16,700 x g. The
resultant pellet was resuspended in 0.5 ml of 10 mg/ml BSA (made up in mitochondrial isolation buffer) and diluted 1:10 in mitochon-
drial isolation buffer. This mixture was centrifuged at 4�C for 10 minutes at 6,900 x g. The final mitochondrial pellet was then resus-
pended in 100 ml of mitochondrial isolation buffer lacking EGTA. Oxygen consumption was measured polarographically with a Clark-
type oxygen electrode (Hansatech Instruments, obtained through PP Systems, Amesbury, MA) (Chinta et al., 2009). Mitochondria
(0.5 mg/ml) were added to medium containing 125 mM KCl, 20 mM HEPES, 2 mM K2HPO4, pH 7.0 at 37�C. Complex I-dependent
oxygen consumption wasmeasured in the presence of glutamate andmalate (5 mM each) andMgCl2 (1 mM). Complex II-dependent
oxygen consumption was measured in the presence of succinate (5 mM), the complex I inhibitor rotenone (2 mM), and MgCl2 (1 mM).
State 3 (phosphorylating) respiration was initiated by addition of ADP (1 mM).
Developmental Cell 40, 583–594.e1–e6, March 27, 2017 e3

Immunofluorescence and Mitochondrial SizePrimary cortical neurons were treated with mdivi-1 (75 mM) or vehicle for 60 min, after which they were fixed for 20 minutes in pre-
warmed 4% formaldehyde, diluted 1:4 in PBS from stock (Thermo Fisher). Cells were then washed 3x with PBS, and permeabilized
with 0.15%Trixton-X-100 in PBS for 20minutes. Following 2xwashing with PBS, cells were blockedwith 7.5%BSA in PBS for 45mi-
nutes. Cells were then immunostained with primary antibody in 7.5% BSA for 90 minutes. Primary antibodies used were anti-Tom20
(FL-145, Santa Cruz Biotechnology, Dallas, TX, 1:2,000) and anti-Drp1 (Clone 8/DLP1, BD Transduction Laboratories, San Jose, CA,
1:500). Following 2x washing with PBS, secondary antibodies were incubated for 60 minutes in 7.5% BSA. Secondary antibodies
used were anti-rabbit IgG Alexa Fluor 594 (ThermoFisher Scientific, 1:250) and anti-mouse IgG Alexa Fluor 488 (ThermoFisher Sci-
entific, 1:250). Cells were then washed 2x with PBS and left in PBS. At least eight random images for each condition were captured
with a Zeiss ApoTome- and AxioCamMRmRev.3 camera-equipped AxioObserver Z1 invertedmicroscopewith a 100x/1.4 Plan-Apo-
chromat objective lens. Tom20 imageswere converted to 32-bit grayscale format using ImageJ software, inverted, and analyzedwith
the same threshold settings in each experiment. Mitochondria were selected and analyzed for area in neuronal processes by a
blinded observer using the particle analysis function. Quantification of mitochondrial size specifically in neuronal processes allowed
for unambiguous identification of individual mitochondria. The restriction of mitochondrial width by the width of the neuronal pro-
cesses was an additional advantage that enabled the use of mitochondrial area as a reasonable measure of mitochondrial length.
Mitochondria were then binned for analysis of the neuronal mitochondrial population.
Analysis of Mitochondrial MorphologyCOS-7 cells were grown in 2-well chamber slides (model 1 German borosilicate; Lab-Tek, Thermo Fisher). Cells were treated with
mdivi-1 (50 mM), staurosporine (1 mM), or mdivi-1 plus staurosporine in phenol red-free cell culture medium (‘‘DMEM’’) or aCSF for
a total of 2 hours. Some cells were treated with mdivi-1 (50 mM) or DMSO vehicle in DMEM for 24 hours. MitoTracker Red CMXRos
(20 nM) was added 30minutes prior to imaging to label mitochondria for analysis of morphology. Alternatively, cells were treated with
mdivi-1 (50 mM) or DMSO vehicle for 1 or 6 hours, fixed, and immunostained for cytochrome c for morphology analysis. Immunostain-
ing and analysis were performed as described above; primary antibody for cytochrome cwas mouse monoclonal anti-cytochrome c
(Clone 6H2.B4, BD Biosciences, San Jose, CA, 1:500). Images were acquired with a Zeiss AxioObserver Z1 fluorescence micro-
scope, equipped with a 100X/1.45 a-Plan-FLUAR objective lens (Zeiss MicroImaging, Thornwood, NJ). Mitochondrial morphologies
in cells were scored using blinded cell counting. Cells were divided into three categories based on mitochondrial morphology:
‘‘Normal’’, ‘‘Fragmented,’’ and ‘‘Elongated’’ (Xu et al., 2016). The data represent at least 50 cell counts per condition.
Live Cell Time-Lapse ImagingCells were grown in 2-well chambered coverslides and transfected with 0.375 mg of mitochondrial matrix-localized green fluorescent
protein (mito-GFP) construct using Lipofectamine 2000 (Thermo Fisher). Cells with mito-GFP labelled mitochondria were imaged at
�24hr post transfection in imaging medium containing phenol red-free DMEM, supplemented with 10% heat-inactivated FBS, 2 mM
GlutaMAX, 1 mM sodium pyruvate, non-essential amino acids, 100 U/ml penicillin, 100 mg/ml streptomycin, and 25 mM HEPES
(pH 7.4). Vehicle (DMSO)- or mdivi-1-treated cells were imaged for 65 minutes at room temperature. Sixty-five minutes was selected
because mdivi-1 was reported to elongate mitochondria in COS cells within 60 minutes (Cassidy-Stone et al., 2008). The image
acquisition interval was set at 5 minutes, producing a total of 13 images per experiment. Each image consisted of 6 z-sections taken
with an interval of 0.5 mm. Images were acquired using a Nikon TI-E inverted microscope, equipped with CFI60 Plan Apochromat
Lambda 100X Oil Immersion Objective Lens (N.A. 1.45), Perfect Focus module, monochrome Zyla sCMOS 5.5 Megapixel camera,
and NIS-Elements imaging software. After acquisition, maximum intensity projections were obtained using NIS-Elements software.
Image cropping and global adjustments to brightness and contrast and time lapse movie formatting were performed using ImageJ
software (National Institutes of Health, Bethesda, MD).
Purification of Recombinant Drp1 and Dnm1Human Drp1 (isoform 1) was expressed and purified as a His-tagged fusion construct as previously described (Cahill et al., 2015).
Specifically, plasmid encoding Drp1 isoform 1 was transformed into Escherichia coli BL21 (DE3). Protein expression was induced
with 0.5 mM isopropyl 1-thio-b-D-galactopyranoside for 12-16 hours and then affinity chromatography using Ni2+ Sepharose High
Performance beads (GE Healthcare, Pittsburgh, PA) was employed to isolate His6-tagged Drp1. Following washing, resin-bound
Drp1 was eluted with buffer containing 20 mM HEPES, pH 7.4, 400 mM NaCl, 5 mM MgCl2, and 500 mM imidazole. Fractions con-
taining Drp1 were then pooled, dialyzed overnight at 4�C into buffer containing 20 mM HEPES, pH 7.4, 5 mM MgCl2, and 500 mM
NaCl, and then concentrated. Purified protein was frozen in 0.5 ml aliquots using a dry ice and ethanol bath. Frozen aliquots were
stored at -80�C. No loss of activity compared to fresh protein was observed if frozen aliquots were used within 12 hours of thawing.
Yeast Dnm1 was expressed and purified as a maltose binding protein (MBP) fusion construct as previously described (Koppenol-
Raab et al., 2016). Briefly, MBP-Dnm1 was cloned into a modified pEG(KT) backbone by homologous recombination in yeast. The
glutathione S-transferase (GST) open reading frame present in pEG(KT) (Mitchell et al., 1993) was removed by digesting the vector
with SacI followed by gel purification of the pEG(KT) backbone lacking GST. The full-lengthMBP-Dnm1 open reading framewas PCR
amplified using pMalc2xDnm1 (Wells et al., 2007) as a template and with homology to pEG(KT) at the 5’ and 3’ ends. TheMBP-Dnm1
e4 Developmental Cell 40, 583–594.e1–e6, March 27, 2017
PCR fragment and SacI-digested pEG(KT) were transformed into SEY6210 yeast using the LiAc method (Schiestl et al., 1989). Circu-
larized plasmids were recovered by plasmid rescue, and successful recombination of MBP-Dnm1 into the pEG(KT) backbone was
verified by sequencing.
Protease-deficient DDY1810 cells (MATa, leu2D,trp1D, ura3-52, prb1-1122, pep4-3, pre1-451) (Shang et al., 2003) were trans-
formed with the pEGKT-MBPDnm1 plasmid using the LiAc method (Schiestl et al., 1989). For large scale purification, plasmid-con-
taining cells were grown in 50 ml synthetic complete media lacking uracil and with 2% glucose for 36-48 hrs at 30�C, shaking at
200 rpm until reaching OD 600 of 2. Cultures were then back-diluted (25 ml into 1 l) into synthetic complete medium lacking uracil
and leucine, with 2% raffinose and 2x tryptophan. Cells were grown (�24h) at 26�C, shaking at 250 rpm, and expression was induced
by the addition of 10 g yeast extract, 20 g Bacto-tryptone and 100 ml 20% w/v galactose. Cells were grown overnight at 26�C with
shaking. Harvested cells were then washed in sterile water, resuspended to 80 ml in sterile water with AEBSF (0.1 mM final) and
10 ml-aliquotted into conical tubes. The cells were stored at -80�C. Four aliquots at a time were thawed on ice, and buffer A
(50mM sodium phosphate pH 7.4, 500mM NaCl, 2mM DTT and 5mM MgCl2) was added to an 80 ml total volume. One tablet of
EDTA-free protease inhibitors (Roche Applied Science) and PMSF (2 mM final) were added. Cells were lysed by 5-6 passes on an
Emulsiflex C3 Homogenizer (Avestin, Ottawa, CA) at 21,000 psi. DNase was added at 1 mg/ml, and the lysates were assessed by
microscopy for lysis. The lysate was then clarified by centrifugation for 45 min at 15,000 rpm. The resulting soluble MBP-Dnm1
was then purified as described (Wells et al., 2007). TEV protease was added to pooled fractions from the elution at 2:1 molar ratio
(TEV:MBP-Dnm1) for 24 hours at 4�C to cleave the N-terminal MBP tag. Cleaved Dnm1 was then run on a SE-75 sizing column
(GE Healthcare, Pittsburgh PA). Sample purity was assessed by Coomassie-stained SDS-Page gel and found to be at least
90% pure.
GTPase Activity AssayDrp1 activity was measured in the absence and presence of mdivi-1 using a continuous, coupled GTPase assay (Ingerman and Nun-
nari, 2005). GTPase activity was determined in a 96-well format using 150ml of GTPase reaction buffer (25mMHEPES, 25mMPIPES,
7.5mM KCl, 5mM MgCl2, 1mM phosphoenolpyruvate, 20 units/ml pyruvate kinase/lactate dehydrogenase, 600mM NADH, pH 7.0),
whichwas placed into a 96-well Corning Costar flat, clear bottomplate (Sigma-Aldrich). The oxidation of NADHwasmeasured at A340
for 40minutes at 25�Cusing aMolecular Devices (Sunnyvale, CA) Flexstation 3Multi-Detection Reader with Integrated Fluid Transfer.
Reactions were run using 5 mM Drp1, 150 mM NaCl, and 5% DMSO at indicated GTP and mdivi-1 concentrations. GTPase assays
were started by the addition of GTP to the desired concentration. Global analysis of the data was fit using Igor Pro to the following
equation that models uncompetitive inhibition: Vo = (Vmax*[GTP])/(KM+(1+(I/Ki))*[GTP]). Data from three independent preparations of
enzyme are reported with standard errors of the mean and are representative of similar observations conducted with multiple prep-
arations at different concentrations of Drp1.
Purified Dnm1 from yeast (10 mM) was incubated for 30 min on ice with 1 mM GTP and mdivi-1 at the indicated concentrations.
Samples (160 ml) were placed in 96-well plates, and the reactions were started by addition of 40 ml of a 5x master mix, including
125 mM HEPES pH 7.0, 125 mM PIPES pH 7.0, 5 mM MgCl2, 37.5 mM KCl, 5 mM phosphoenolpyruvate, 100U/ml pyruvate ki-
nase/lactate dehydrogenase, and 1.5 mM NADH. Reactions (150 ml) were transferred with a multichannel pipette to a new plate,
and absorbance at 340 nm was recorded for 40 min at 30 sec intervals on a Spectra Pro X. Absorbance was plotted vs. time, and
the linear portions of the plot fit to a line. The slope (DA340/sec) was converted to activity in nmol/min with the following equation:
activity = (DA340/sec * 60 sec/min) * (0.001 l) * (19 nmol/mol) / (6220M-1cm-1) / (0.41 cm). A buffer control for eachGTP concentration
was done and the background rate subtracted from the activity.
Cell Proliferation AssayWTorDrp1 KOmouse embryonic fibroblasts were plated in DMEMcell culturemediumwithout pyruvate on 6-well plates and allowed
24 hours to attach and recover, after which they were treated with vehicle (DMSO) or mdivi-1 (25 or 50 mM). At 0, 24, or 48 hours
following treatment, cells were fixed with 4% formaldehyde and stained with 1 mg/ml Hoechst 33342 (Thermo Fisher). Images
were taken at 20X using an EVOS FL Auto (Thermo Fisher) fluorescence microscope, with an excitation filter of 357/44 nm and an
emission filter of 447/60 nm. At least 5 images were acquired per treatment group per experiment, with at least 3 experiments per-
formed. The number of Hoechst-stained cells was quantified at each time point and expressed as a percentage of cells present at
0 hours.
Electron MicroscopyDrp 1 WT and KO cells were plated on 10 mm diameter glass coverslips at 2 x 10⁴ cells/coverslip and cultured for 24 hours. Cells
were then treated with mdivi-1 (50 mM) or DMSO vehicle control for 16 min and fixed in Trump’s Fixative (McDowell and Trump,
1976), post-fixed in 1% osmium tetroxide, dehydrated in graded alcohols, enbloc stained with uranyl acetate, embedded in epoxy
resin, sectioned (50-100 nm) on an ultramicrotome, stained with lead acetate and examined in a Tecnai G12 electron microscope.
Mitochondrial profile lengths were measured using a Calculated Industries Scale Master Pro Digital Plan measuring device.
Complex I Activity AssayMdivi-1 intrinsic fluorescence interferes with Complex I assays that are based on NADH autofluorescence. Therefore, Complex I ac-
tivity was measured using 2,6-dichloroindophenol (DCIP) as a terminal electron acceptor. Decylubiquinone reduced by Complex I
Developmental Cell 40, 583–594.e1–e6, March 27, 2017 e5
delivers electrons to DCIP which is followed spectrophotometrically at 600 nm. An incubation volume of 1 ml containing 25 mM po-
tassium phosphate (pH 7.8), 3.5 g/l BSA, 120 mMDCIP, 140 mMdecylubiquinone, 1 mMantimycin A, and 0.4mMNADHwas used. Rat
brain mitochondria (50 mg) were pre-incubated at 37�C in 1 ml of assay buffer without NADH. After 3 min, 0.4 mM NADH was added
and absorbance at 600 nm was measured. Drug was added at 4 min and then 4 min of additional measurements were made.
Ndi1-expressing ConstructYeast genomic DNA was extracted from wild type Saccharomyces cerevisiae (strain FY833) using Yeast DNA Extraction Kit (Thermo
Scientific) according to the manufacturer’s instructions. The NDI1 gene was PCR-amplified from yeast genomic DNA using two
primers 5’ AAAGAATTCGCCACCATGCTATCGAAGAATTTGTATAG 3’ and 5’ AAAGGTACCGTTAATCCTTTAAAAAAGTCTC 3’. After
digestion with EcoRI and KpnI, PCR products were ligated into the pEGFP-N1 expression vector (Clontech, Mountain View, CA) and
confirmed by DNA sequencing. NDI1 was sub-cloned from pEGFP-N1 vector into a pSMPUW base plasmid with a puromycin resis-
tance gene (Cell BioLabs, San Diego, CA) by the University of Maryland, Baltimore Recombinant Virus Core.
ImmunoblottingNDI1-transfected or parental COS-7 cells were lysed by sonication in sodium dodecyl sulfate and protease inhibitor cocktail (Milli-
pore, Billerica, MA). SDS-PAGE and immunodetection for Ndi1 (1:1000, graciously provided by Takao Yagi (The Scripps Research
Institute, La Jolla, CA)) and b-actin (1:5000; Sigma-Aldrich) were performed as described (Sharma et al., 2011). In detail, 30 mg of
protein were loaded on NovexWedgeWell 4-20% Tris-Glycine Mini Gels (Thermo Fisher), and run at 200V for 45 minutes, after which
they were transferred to PVDFmembranes. Blots were then washed 3x 10minutes in PBS, following by blocking in 5%BSA in PBS-T
(20x stock from ThermoFisher was diluted 1:20 in H2O). Primary antibodies were then incubated in 5% BSA in PBS-T overnight at
4�C. The next morning, blots were washed 3x 10 minutes in PBS-T, following by incubation with secondary antibodies at
1:10,000 dilution for 1 hour in 5% BSA in PBS-T. Finally, blots were washed 3x 10 minutes in PBS-T, after which they were placed
in PBS. Proteins were visualized using SuperSignal West Pico Chemiluminescent Substrate (Thermo Fisher) and imaged with a
ChemiDoc MP system (Bio-Rad, Hercules, CA).
Measurement of Intracellular ROSRat cortical neurons (2 x 10⁵/well, DIV10-14) or MEFs (variable densities to achieve �70% confluence at the time of imaging) were
plated on borosilicate 4-well chamber slides. On the day of imaging, DHE (Thermo Fisher) was diluted to 2 mM in aCSF, and then
incubated with Dowex cation exchange beads (Sigma-Aldrich) for 30 min to remove oxidized DHE products. Post-bead incubation,
DHEwas diluted in aCSF to a final concentration of 5 mM forMEFs and of 1 mM for neurons. Cells were incubated at 37oC for 1 hour to
allowDHE uptake and then imaged at 20X using an EVOS FLAuto fluorescencemicroscope, with an excitation filter of 531/40 nmand
an emission filter of 593/40 nm. Images were acquired at 4 min intervals and fluorescence intensity over time was analyzed in blinded
fashion using ImageJ software.
H2O2 Detection Using Amplex UltraRedGuinea pig brain mitochondria were isolated on a discontinuous Percoll gradient as described for oxygen consumption measure-
ments. Mitochondria (0.1 mg/ml) were added to medium containing 125 mM KCl, 20 mM HEPES, 2 mM K2HPO4, 1 mM MgCl2,
0.1 mM EGTA, 0.025% fatty acid-free BSA, 1 mM Amplex UltraRed, and 2.5 U/ml horseradish peroxidase, pH 7.0 at 37�C. Dyewas excited at 550 nm, and emission was measured at 585 nm using a fluorescence spectrophotometer (Tretter et al., 2007). Traces
were calibrated in pmol H2O2 for each experiment using known concentrations of freshly prepared H2O2.
QUANTIFICATION AND STATISTICAL ANALYSIS
Statistical parameters, including the exact value of n, dispersion and precision measures (mean ± SD or mean ± SE), and statistical
significance are reported in the Figures and Figure Legends. Statistical analyses were performed using SigmaPlot 12.0 (Systat Soft-
ware, Inc., San Jose, CA). OCR and electron microscopy length measurements comparing treatments and genotype (Figures 4C and
4F, respectively) were evaluated by two-way analysis of variance (ANOVA) with Tukey’s post-hoc analysis, while all other measure-
ments were analyzed by one-way ANOVA with Tukey’s post-hoc analysis. p < 0.05 was considered to be statistically significant.
e6 Developmental Cell 40, 583–594.e1–e6, March 27, 2017
Developmental Cell, Volume 40
Supplemental Information
The Putative Drp1 Inhibitor mdivi-1
Is a Reversible Mitochondrial Complex I Inhibitor
that Modulates Reactive Oxygen Species
Evan A. Bordt, Pascaline Clerc, Brian A. Roelofs, Andrew J. Saladino, László Tretter, VeraAdam-Vizi, Edward Cherok, Ahmed Khalil, Nagendra Yadava, Shealinna X. Ge, T. ChaseFrancis, Nolan W. Kennedy, Lora K. Picton, Tanya Kumar, Sruti Uppuluri, AlexandreaM. Miller, Kie Itoh, Mariusz Karbowski, Hiromi Sesaki, R. Blake Hill, and Brian M. Polster

INVENTORY OF SUPPLEMENTAL INFORMATION
Supplemental Figures
Figure S1. Bovine serum albumin allows mdivi-1 to inhibit neuronal respiration in XF24 assay
plates but is not required for respiratory inhibition by mdivi-1, related to Figure 1.
Figure S2. Mdivi-1 fails to influence COS-7 mitochondrial morphology in the absence or
presence of staurosporine, related to Figure 2.
Figure S3. Yeast Dnm1 GTPase activity assay, related to Figure 3.
Figure S4. A mitochondrial outer membrane target is not required for mdivi-1 to inhibit
respiration, related to Figure 4.
Figure S5. Drp1 KO does not alter FCCP-stimulated respiration or the effect of mdivi-1 on cell
proliferation, related to Figure 4.
Figure S6. General GTPase or dynamin inhibition does not impair Complex I-dependent
neuronal respiration, related to Figure 4.
Figure S7. Mdivi-1 inhibits Complex I-III-IV linked activity, but not the ability of Complex I to
reduce an artificial electron acceptor, related to Figure 5.
Supplemental Movies
Movie S1. Mitochondrial structure over time in vehicle-treated COS-7 cells, related to Figure 2.
Movie S2. Mitochondrial structure over time in mdivi-1-treated COS-7 cells, related to Figure
2.
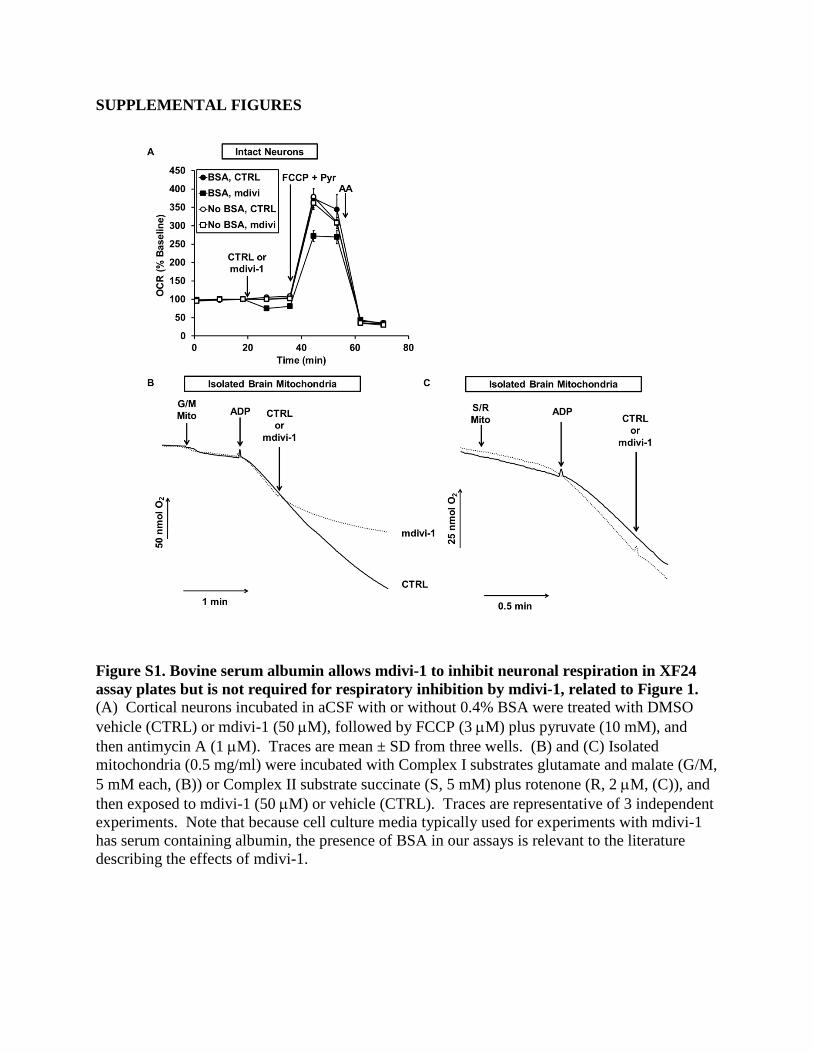
SUPPLEMENTAL FIGURES
Figure S1. Bovine serum albumin allows mdivi-1 to inhibit neuronal respiration in XF24 assay plates but is not required for respiratory inhibition by mdivi-1, related to Figure 1. (A) Cortical neurons incubated in aCSF with or without 0.4% BSA were treated with DMSO vehicle (CTRL) or mdivi-1 (50 µM), followed by FCCP (3 µM) plus pyruvate (10 mM), and then antimycin A (1 µM). Traces are mean ± SD from three wells. (B) and (C) Isolated mitochondria (0.5 mg/ml) were incubated with Complex I substrates glutamate and malate (G/M, 5 mM each, (B)) or Complex II substrate succinate (S, 5 mM) plus rotenone (R, 2 µM, (C)), and then exposed to mdivi-1 (50 µM) or vehicle (CTRL). Traces are representative of 3 independent experiments. Note that because cell culture media typically used for experiments with mdivi-1 has serum containing albumin, the presence of BSA in our assays is relevant to the literature describing the effects of mdivi-1.

Figure S2. Mdivi-1 fails to influence COS-7 mitochondrial morphology in the absence or presence of staurosporine, related to Figure 2. (A) Representative images of COS-7 cells loaded with Mitotracker Red CMXRos (20 nM), and treated with either DMSO vehicle (CTRL), mdivi-1 (50 µM), staurosporine (STS, 1 µM), or STS plus mdivi-1 for 2 hours in aCSF respiration media. (B) and (C) Blinded quantification of mitochondrial morphology in Mitotracker Red-labeled COS-7 cells treated with vehicle (CTRL), mdivi-1 (50 µM), STS (1 µM), or the two drugs combined for the indicated times in aCSF medium (B) or phenol red-free cell culture medium (DMEM) (C). Experiments were performed

in aCSF that contained 0.4% BSA, in addition to in the more standard cell culture medium, because our respiration measurements suggest that mdivi-1 can access mitochondria under those conditions. (D) Blinded quantification of mitochondrial morphology in cytochrome c-stained COS-7 cells treated with vehicle (CTRL) or mdivi-1 (50 µM) in DMEM for either 1 or 6 hours. Percentages in (B-D) are based on a total of ≥50 cells per treatment from three independently plated coverslips.
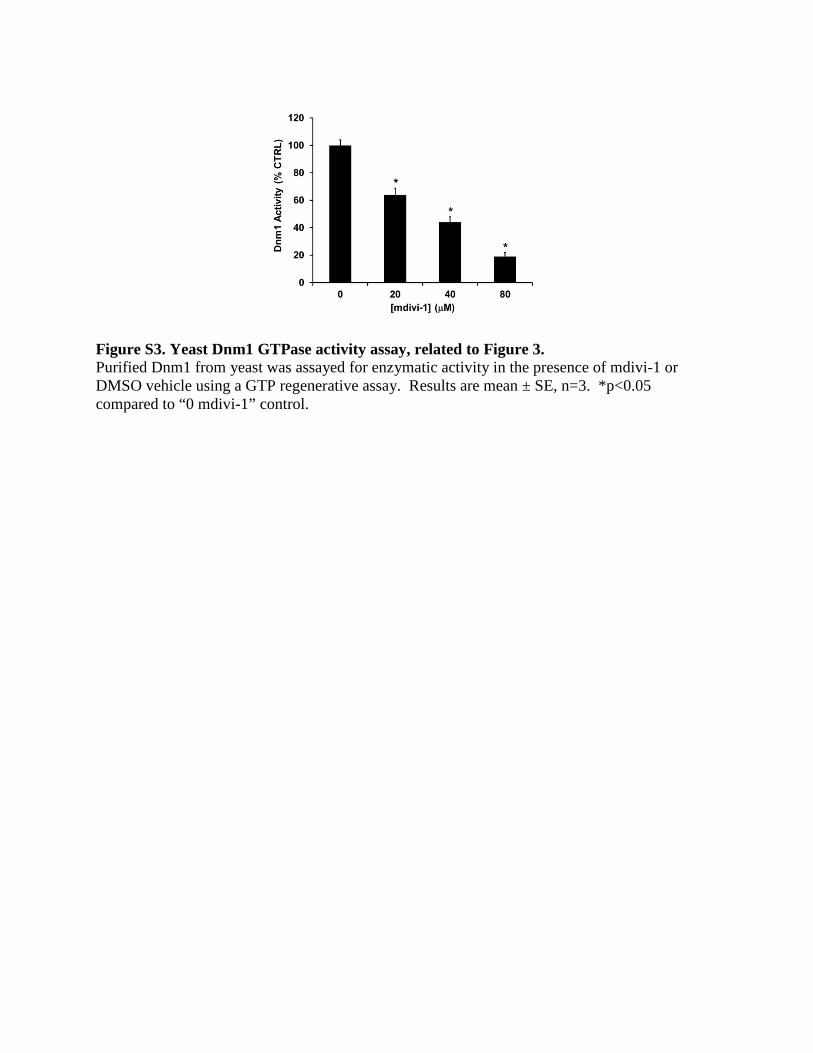
Figure S3. Yeast Dnm1 GTPase activity assay, related to Figure 3. Purified Dnm1 from yeast was assayed for enzymatic activity in the presence of mdivi-1 or DMSO vehicle using a GTP regenerative assay. Results are mean ± SE, n=3. *p<0.05 compared to “0 mdivi-1” control.
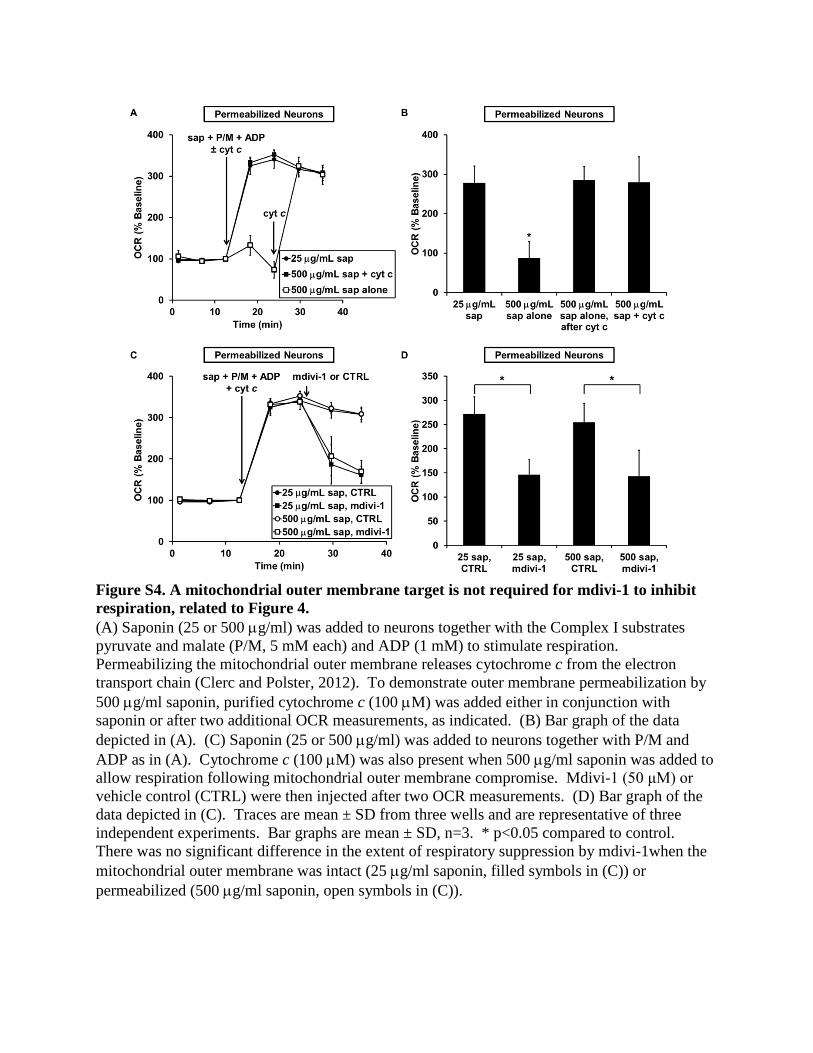
Figure S4. A mitochondrial outer membrane target is not required for mdivi-1 to inhibit respiration, related to Figure 4. (A) Saponin (25 or 500 µg/ml) was added to neurons together with the Complex I substrates pyruvate and malate (P/M, 5 mM each) and ADP (1 mM) to stimulate respiration. Permeabilizing the mitochondrial outer membrane releases cytochrome c from the electron transport chain (Clerc and Polster, 2012). To demonstrate outer membrane permeabilization by 500 µg/ml saponin, purified cytochrome c (100 µM) was added either in conjunction with saponin or after two additional OCR measurements, as indicated. (B) Bar graph of the data depicted in (A). (C) Saponin (25 or 500 µg/ml) was added to neurons together with P/M and ADP as in (A). Cytochrome c (100 µM) was also present when 500 µg/ml saponin was added to allow respiration following mitochondrial outer membrane compromise. Mdivi-1 (50 μM) or vehicle control (CTRL) were then injected after two OCR measurements. (D) Bar graph of the data depicted in (C). Traces are mean ± SD from three wells and are representative of three independent experiments. Bar graphs are mean ± SD, n=3. * p<0.05 compared to control. There was no significant difference in the extent of respiratory suppression by mdivi-1when the mitochondrial outer membrane was intact (25 µg/ml saponin, filled symbols in (C)) or permeabilized (500 µg/ml saponin, open symbols in (C)).
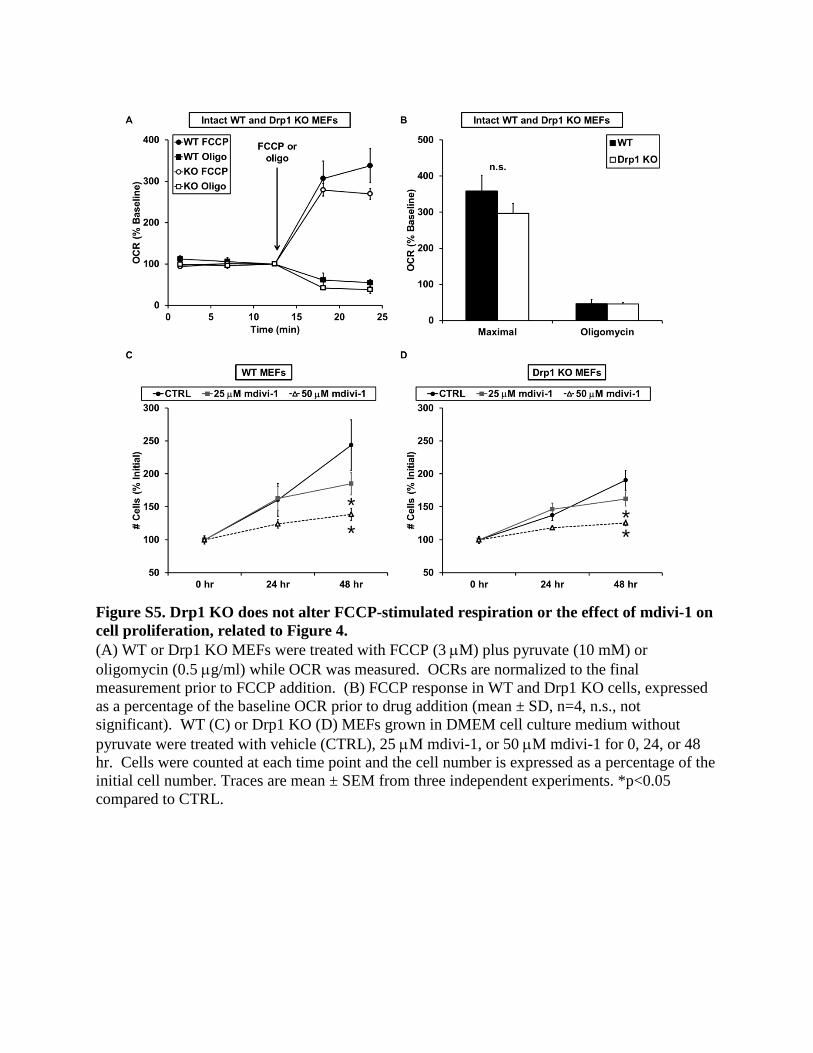
Figure S5. Drp1 KO does not alter FCCP-stimulated respiration or the effect of mdivi-1 on cell proliferation, related to Figure 4. (A) WT or Drp1 KO MEFs were treated with FCCP (3 µM) plus pyruvate (10 mM) or oligomycin (0.5 µg/ml) while OCR was measured. OCRs are normalized to the final measurement prior to FCCP addition. (B) FCCP response in WT and Drp1 KO cells, expressed as a percentage of the baseline OCR prior to drug addition (mean ± SD, n=4, n.s., not significant). WT (C) or Drp1 KO (D) MEFs grown in DMEM cell culture medium without pyruvate were treated with vehicle (CTRL), 25 µM mdivi-1, or 50 µM mdivi-1 for 0, 24, or 48 hr. Cells were counted at each time point and the cell number is expressed as a percentage of the initial cell number. Traces are mean ± SEM from three independent experiments. *p<0.05 compared to CTRL.
* *
* *

Figure S6. General GTPase or dynamin inhibition does not impair Complex I-dependent neuronal respiration, related to Figure 4. Saponin (sap), pyruvate plus malate (P/M), and ADP were injected as in Figure 1D while neuronal respiration was monitored. At the second arrow, neurons were treated with GTP-γ-S (0.5 mM, A) or dynasore (50 µM, B), and the response was compared to that of mdivi-1 (50 µM) or DMSO vehicle (CTRL) injection. (C) Respiration of intact neurons was measured, followed by injection of FCCP (3 μM) plus pyruvate (10 mM) to stimulate maximal respiration (first arrow), and then CTRL, mdivi-1, or dynasore (second arrow). Numbers in figure legend are mdivi-1 (mdivi) or dynasore (dyn) concentration in µM. Traces are mean ± SD from three wells and are representative of three independent experiments.

Figure S7. Mdivi-1 inhibits Complex I-III-IV linked activity, but not the ability of Complex I to reduce an artificial electron acceptor, related to Figure 5. (A) Complex I activity was quantified by DCIP reduction in brain mitochondria exposed to mdivi-1 (50 or 100μM), rotenone (4µM), or vehicle. (B) Representative trace of data quantified in A. (C) Neuronal OCR was measured in the presence of saponin (25 µg/ml), alamethicin (40 µg/ml), NADH (0.5 mM), and cytochrome c (100 µM). Rotenone (1 µM), sodium azide (5 mM) or TTFA (10 µM) were present when indicated. Note that negative OCR following azide treatment is due to inaccuracy at the detection limit of the instrument. (D) OCR was measured as in (C) and mdivi-1 or rotenone was present when indicated. Data in (A), (C), and (D) are mean ± SE, n=3. * p<0.05 compared to control.
SUPPLEMENTAL MOVIES
Movie S1. Mitochondrial structure over time in vehicle-treated COS-7 cells, related to Figure 2. Mito-GFP-transfected COS-7 cells incubated in phenol red-free DMEM culture medium were imaged for 65 minutes (5 minutes per frame) following DMSO addition. Movie S2. Mitochondrial structure over time in mdivi-1-treated COS-7 cells, related to Figure 2. Mito-GFP-transfected COS-7 cells incubated in phenol red-free DMEM culture medium were imaged for 65 minutes (5 minutes per frame) following mdivi-1 (50 µM) addition.