THE PRIMARY APPLICATION OF THE HYDROCYCLONE ...
76
THE PRIMARY APPLICATION OF THE HYDROCYCLONE FOR THE SEPARATION OF BIOLOGICAL SOLIDS FROM DISPERSED BACTERIAL SYSTEMS By KENT E. PATTERSON It I Bachelor of Science Oklahoma State University Stillwater, Oklahoma Submitted to the Faculty of the Graduate College of the Oklahoma State University in partial fulfillment of the requirements for the degree of MASTER OF SCIENCE May 1971
-
Upload
khangminh22 -
Category
Documents
-
view
2 -
download
0
Transcript of THE PRIMARY APPLICATION OF THE HYDROCYCLONE ...
THE PRIMARY APPLICATION OF THE HYDROCYCLONE
FOR THE SEPARATION OF BIOLOGICAL SOLIDS
FROM DISPERSED BACTERIAL SYSTEMS
By
KENT E. PATTERSON It I
Bachelor of Science
Oklahoma State University
Stillwater, Oklahoma
Submitted to the Faculty of the Graduate College of the Oklahoma State University
in partial fulfillment of the requirements for the degree of MASTER OF SCIENCE
May 1971
I
The- SIS 1q 71 p j/(3p Ctr;:1 . ::J...,
• ... I) ) •
t ' - '
····-..... ,, .. , . ... ,,
THE PRIMARY APPLICATION OF THE HYDROCYCLb~
FOR THE SEPARATION OF BIOLOGICAL SOLIDS -~ / FROM DISPERSED BACTERIAL SYSTEMS
Thesis Approved:
.~n·r&C~ 'fr, LI. 11~.1
; ;
ACKNOWLEDGMENTS
The author would like to take this opportunity to express his
sincere appreciation to the many people who had such a large part in
making this course of study possible.
To Dr. D. F. Kincannon for his continuous faith and encouragement
throughout the research and preparation for this thesis.
To Dr. R. N. DeVries and Dro W. G. Tiederman for their valuable
suggestions during the course of study and their careful evaluation of
this manuscript.
To Mrs. Robert Morrison for accurately typing this manuscript and
to Mr. Peter F. Johnson for drawing the figures within.
To my parents for their support and encouragement throughout my
studies.
Most important, to my wife Gini who not only helped with the
preparation of this manuscr·ipt, but also made many sacrifices without
uttering a discouraging word throughout.
Lastly, to the Federal Water Pollution Control Administration
which made this work posstble through the bioengineering training grant
lTl-WP-238-01.
.;.; .;

TABLE OF CONTENTS
Chapter
I. INTRODUCTION . . II. LITERATURE RESEARCH . 0 • • Ill 0 .•
A. General o o o II o o • o o o o o ~ Cl o o Cl
B. Factors Affecting Sludge Formation .•.. C. Separation Techniques ....•...
III. THEORETICAL CONSIDERATIONS ... 0 0 • • It Cl
A. General ...... . B. Hydrocyclone Dynamics
IV. MATERIALS AND METHODS .....
A. Experimental Apparatus . B. Synthetic Waste . . . . .. . C. The Bacterial System ....... . D. Experimental Procedures E. Analytical Procedures ..•.
V. RESULTS
A. General ..... B. Hydrocyclone #1 C, Hydrocyclone #2 ....... . D. Hydrocyclone #3
VI. DISCUSSION
VI I. CONCLUSIONS
VIII. SUGGESTIONS FOR FUTURE STUDY
SELECTED BIBLIOGRAPHY
APPENDIX . . . . . . .
; \I
. .
Ill • 0 • 0
Page
1
5
5 6 7
14
14 17
26
26 33 34 34 37
39
39 39 46· 54
57
61
62
63
67
LIST OF FIGURES
Figure
1. Typical Hydrocyclone Configurations .
2. Classical Hydrocyclone Configuration
3. General Flow Patterns in a Hydrocyclone .
4. (A) Tangential Velocity versus Radius, (B) Vertical Velocity versus Radius, (C) Radial Velocity versus Radius ...
5. Parameters Affecting Separation Efficiency of
. "· . Page
3
15
16
21
the Hydrocyclone . . . . 23
6. Hydrocyc 1 one #1 ·:' . . , . 27
7. Hydrocyclones #2 anq #3 . 28
8. Hydrocyclone System Config:urati011 3~
9. Flow Rate versus Pressure Drop for Hydrocyclone #1 40
10. Results, Hydrocyclone ~1 with J:ontamination Trap 41
lL Results, Hyt'.lroc;;yclone #1, (A), (B), and (C) with Cont~mination Trap, (D) without Contamination Trap, Ou = 0 • • . , • 43
12. Filter Efficiency versus Runs ....... , , 45
13. Results, Hydrocyclone #1 without Contamination Trap, (A) Ou = 0, {B) Ou = 3.4% O, (C) Ou = 4.6% O, (D) Ou= 5.1% 0 . , , •. o , •• e o • o • • e • • • • • o 47
14. Pump Curve for Design of Hydrocyclone #2
15. Results, Hydrocyclone #2, Ou = 0 ..
16. Results, Hydrocyclone #2, (A) Ou= 10,1% Q,J· (B) Ou = 7.6% O, (C) Ou = 5.4% O, (D) Ou = 4.2% 0 .... , ........ .
\I
48
50
51

Figure
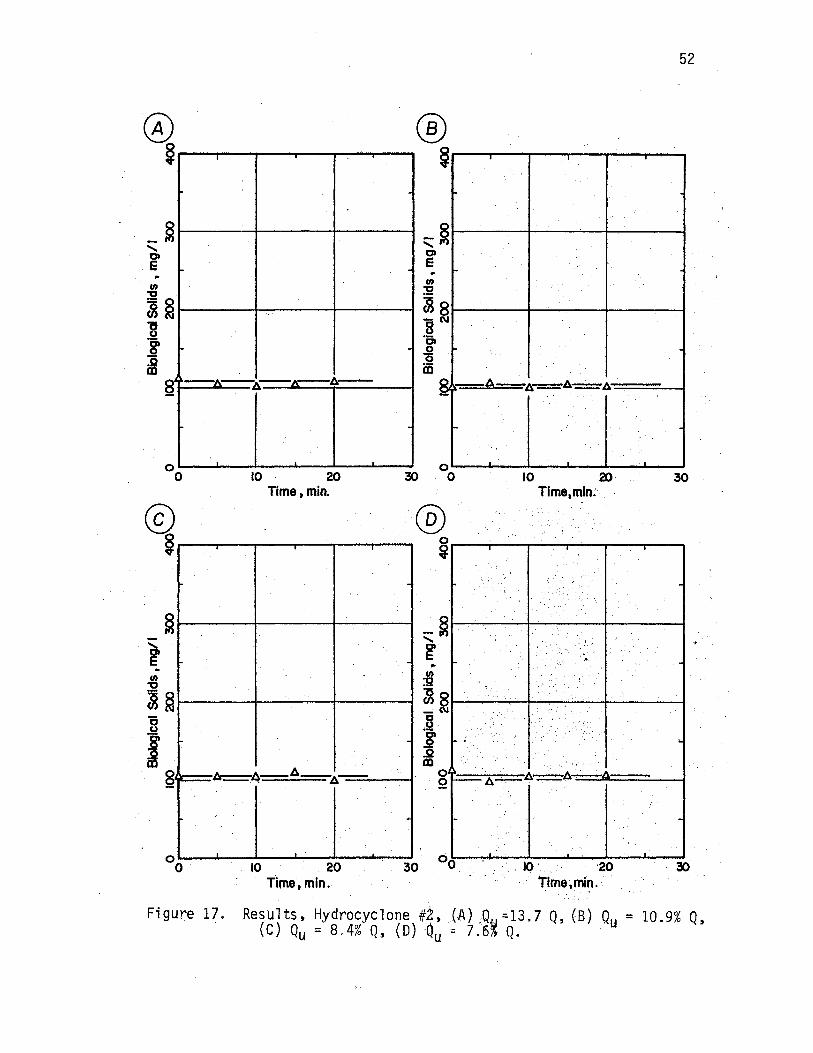
17. Results, Hydrocyclone #2, (A) Qu = 13.7% Q, (B) Qu = 10.9% Q, {C) Qu = 8.4% Q, (D) Qu = 7.6% Q ............. .
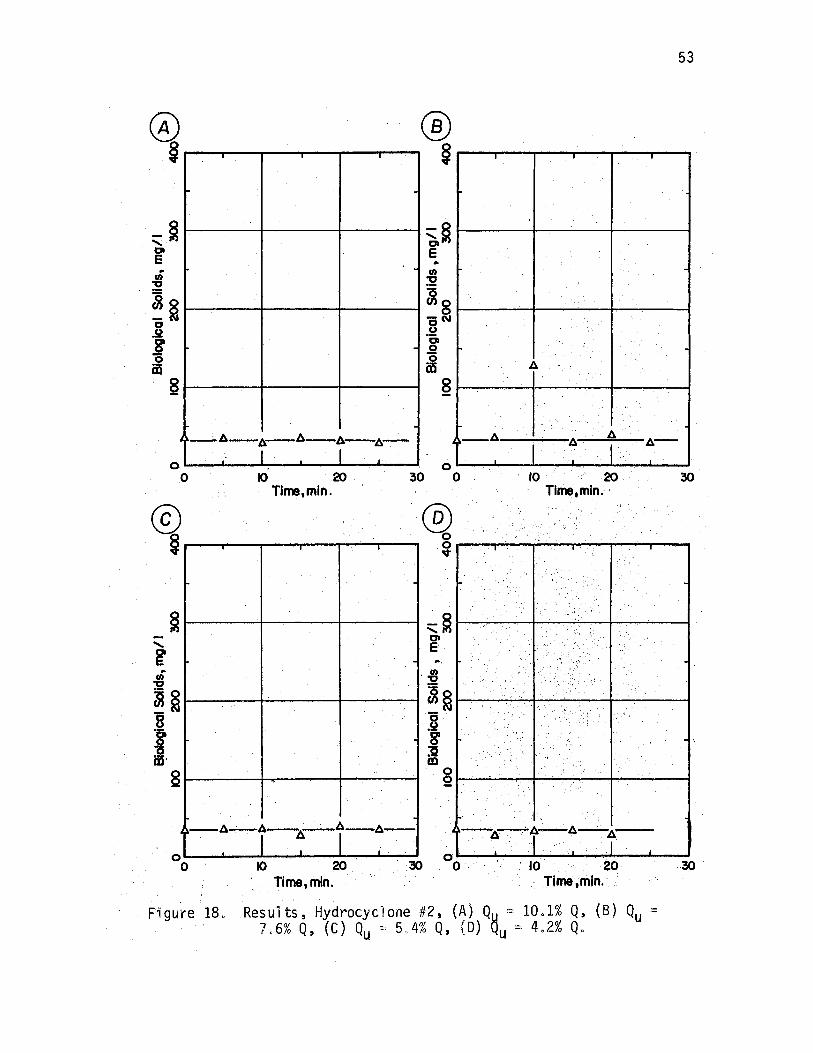
18. Results, Hydrocyclone #2, (A) Qu = 10.1% Q, (B) Qu = 7.6% Q, (C) Qu = 5.4% Q, (D) Qu = 4.2 % Q .......•..
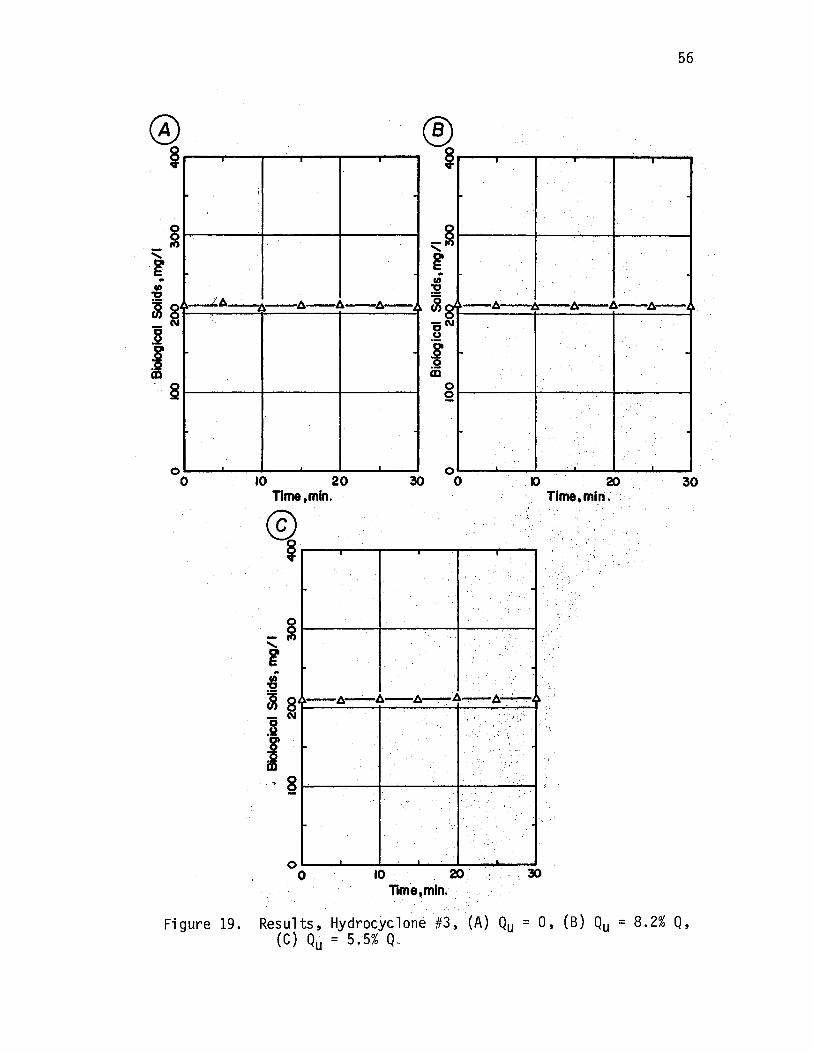
19. Results, Hydrocyclone #3, (A) Qu = 0, (B) Qu = 8.2% Q, (C) Qu = 5.5% Q ..
Page
52
53
56
CHAPTER I
INTRODUCTION
As the world 1 s population continues to increase placing more
stress upon the environment, more efficient use of our natural
resources, including our disappearing fresh water supply, will be
required, To insure that maximum benefits are derived from these
natural resources, more specifically the disappearing fresh water
supply, more stringent standards will necessarily be placed upon
effluents being discharged into these water supplies. To meet these
requirements more efficient and more economical waste treatment systems
must be developed, Our· present methods of treating wastes will in
most cases be unable to produce effluents of the required quality or
will be able to do so only at a great costo
One major problem confronting the sanitary engineer is solid
liquid separation, This process is usually included in both water
treatment {drinking water) and wastewater treatmenL In the water
treatment process flocculated turbidity is separated from clear water.
In the wastewater treatment process both primary and secondary separa
tion are often required,
The activated sludge process is a commonly used secondary treat
ment process which generally produces high quality effluents when
properly operated, P·ipes (1) has stated that the primary factor
controlling the performance of the activated sludge process is the
2
separation of the sludge solids from the effluent in the secondary
sedimentation processo Nearly all secondary treatment configurations
include a solid-liquid separation device. Many such separation tech
niques have been tried with varying degrees of success. Some of these
techniques include centrifugation, flotation, the addition of poly
electrolytes, microscreening, diatomaceous earth filtration, chemical
clarification (lime or alum), fiber filtration, vacuum filtration,
electrodialysis, countercurrent extraction, and gravity sedimentation
with many variations. Gravity sedimentation has been utilized far more
than any of the other processes in biological treatment configurations,
not necessarily because it is more efficient than the others, but
because it requires less maintenance and is more economical to operate.
If a useable solid-liquid separation device is to be developed for
incorporation into the secondary treatment configuration, it must com
pete primarily with gravity sedimentation.
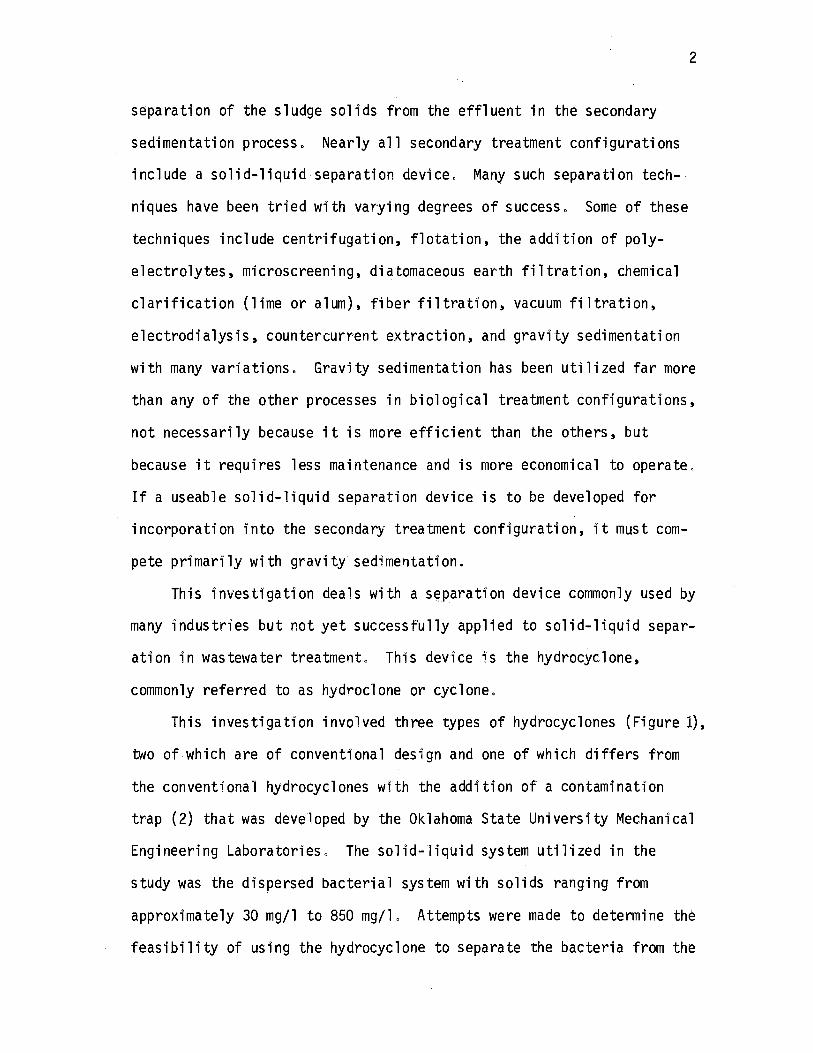
This investigation deals with a separation device commonly used by
many industries but not yet successfully applied to solid-liquid separ
ation in wastewater treatment. This dev'ice is the hydrocyclone,
commonly referred to as hydroclone or cyclone.
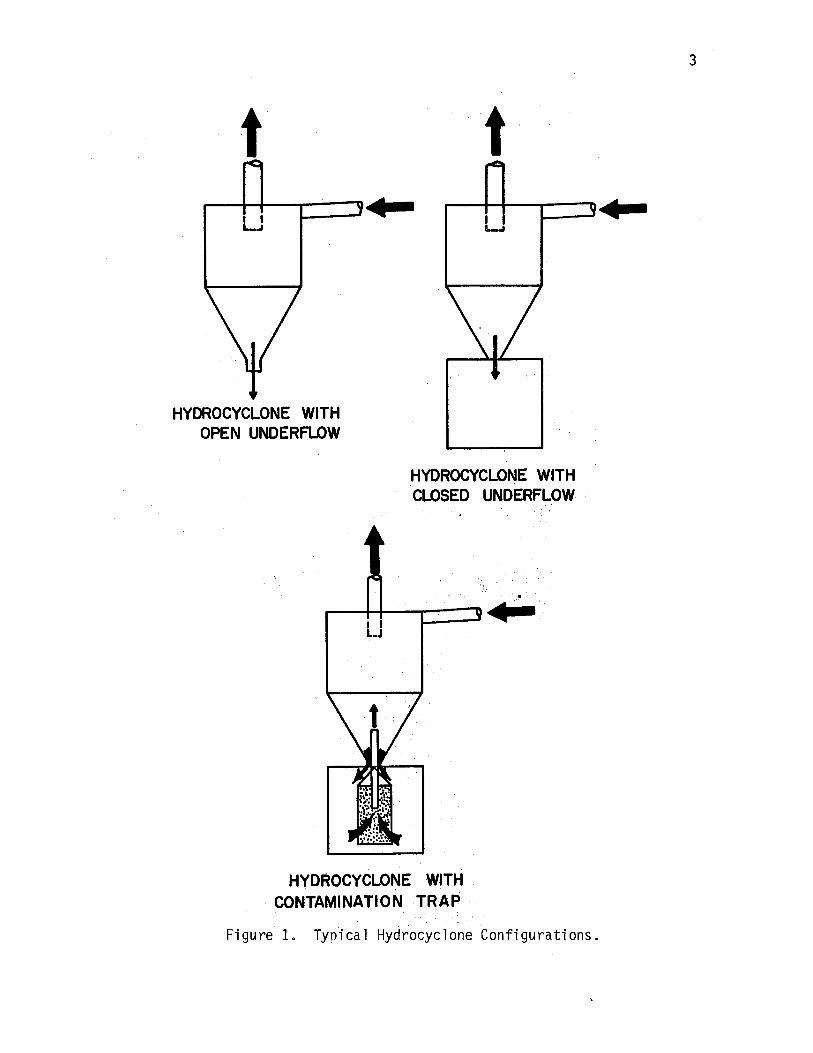
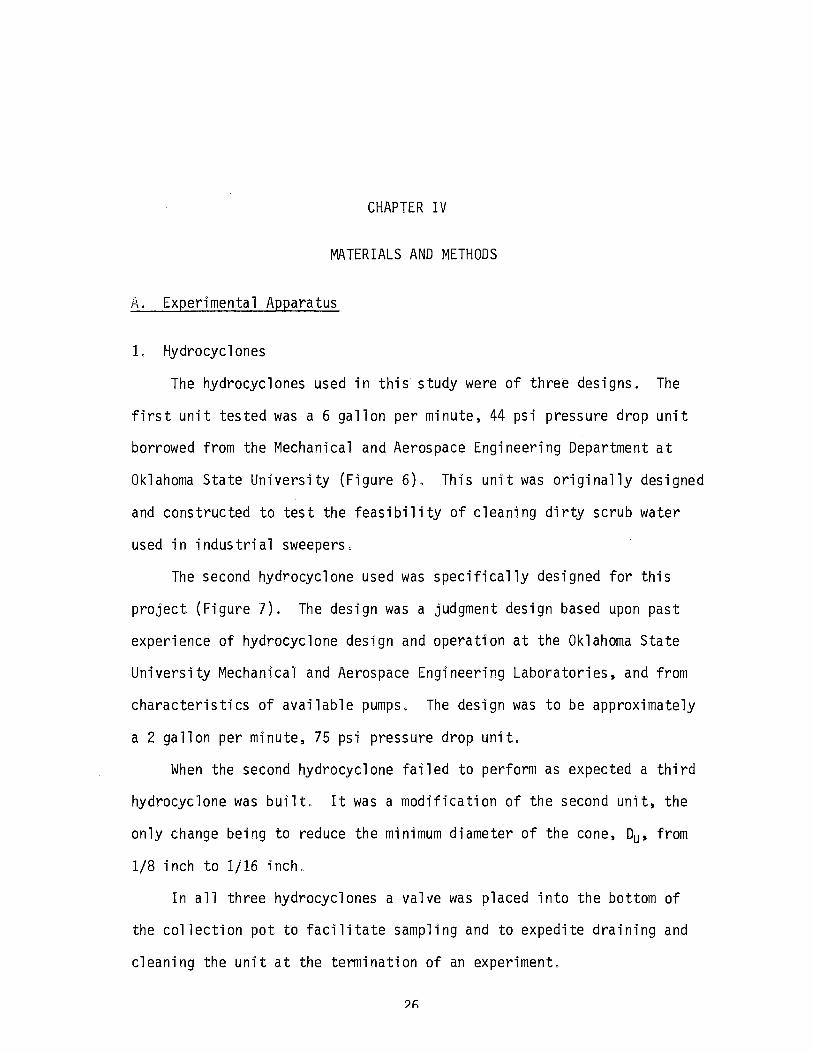
This investigation involved three types of hydrocyclones (Figure 1),
two of which are of conventional design and one of which differs from
the conventional hydrocycl ones w·i th the addition of a contamination
trap (2) that was developed by the Oklahoma State University Mechanical
Engineering Laboratories. The solid-liquid system utilized in the
study was the dispersed bacterial system with solids ranging from
approximately 30 mg/l to 850 mg/l. Attempts were made to determine the
feasibility of using the hydrocyclone to separate the bacteria from the
t --+-+-----.-~--a 4
I I L....1
HYDROCYCLONE WITH OPEN UNDERFLOW
I I L.J
t I L...I
HYOROCYCLONE WITH CLOSED UNDERFLOW ·
' .
HYDROCYCLONE WITH CONTAMINATION TRAP
Figure 1. Typical Hydrocyclone Configurations.
3
•
4
liquid medium (tap water) in this system. Hydrocyclone parameters were
varied in an attempt to indicate direction for design of more efficient.
systems.
The goal of this study was simply to determine the feasibility of
utilizing the hydrocyclone to separate the solids from a dispersed
bacterial system. No attempt was made to derive design equations,
either theoretically or empirically.
CHAPTER II
LITERA.TURE RESEARCH
A. Genera 1
A great deal of work has been done to develop solid-liquid
separation techniques, much of which has resulted in industrial appli
cation. The application of these techniques to the separation of
biological solids 'in wastewater treatment has attained varying degrees
of success.
One major problem encountered in the activated sludge process,
seldom found in most industrial applications, is the variable separa
tion characteristics of the material to be separated. Not only are the
separation characteristics of the activated sludge variable, but unpre
dictably so. This fact alone eliminates many of the separation tech
niques commonly utilized industrially.
The mere fact that there are so many process variables in most
waste treatment systems (hydraulic loading, organic loading, tempera
ture, pH, etc.) causes the physical properties, therefore, the separa
tion characteristics of the bacteria, to varyo Much work has been done
to determine what effects these process variables have on sludge fonna
tion, the separation characteristics of the sludge formed, and what
steps can be taken to improve these characteristics (1), (3), (4), (5),
(6), (7), (8), (10), (11). Dick (12) has stated that the size and cost
6
of treatment faci'J-ities are often controlled by settling characteristics
of the sludge.
Bo Factors Affecting Sludge Formation
Pipes (1) has done a considerable amount of work to simply define
some of the factors affecting sludge formation, and to determine what
effect these factors have on s Judge fonnationo He makes an attempt to
describe the various sludge types commonly encountered in the activated
sludge process which separate poorly. He also attempts to define the
process properties which cause the sludge to separate poorly, and
corrective measures to be taken which might improve the sludge condi
tion o
P·ipes and Jones (13) and Richards and Sawyer (14) have related
poor settling characteristt~s of sludge to specific microbial popula
tions which develop in the system, The activated sludge process is
dependent upon the bacterial populations which develop within it to
utilize soluble organic material from the waste stream., The nature of
this process allows heterogeneous populations to develop with frequent
predominance changes occurring. Often a particular species or group of
bacter·ia will predominate which has poor settling characteristics.
These predominance changes often occur due to changes in process var
iables such as temperature, pH, hydraulic loading, organic loading, etco
Reed and Murphy ( 11) have studied the effect of temperature on
settling of activated sludge, They developed an equation for zone
settling velocity of activated sludge based on experimental datao They
found the influence of tempel"a tu re on settling velocity to decrease as
the concentration increased" They did, however, conclude that the
7
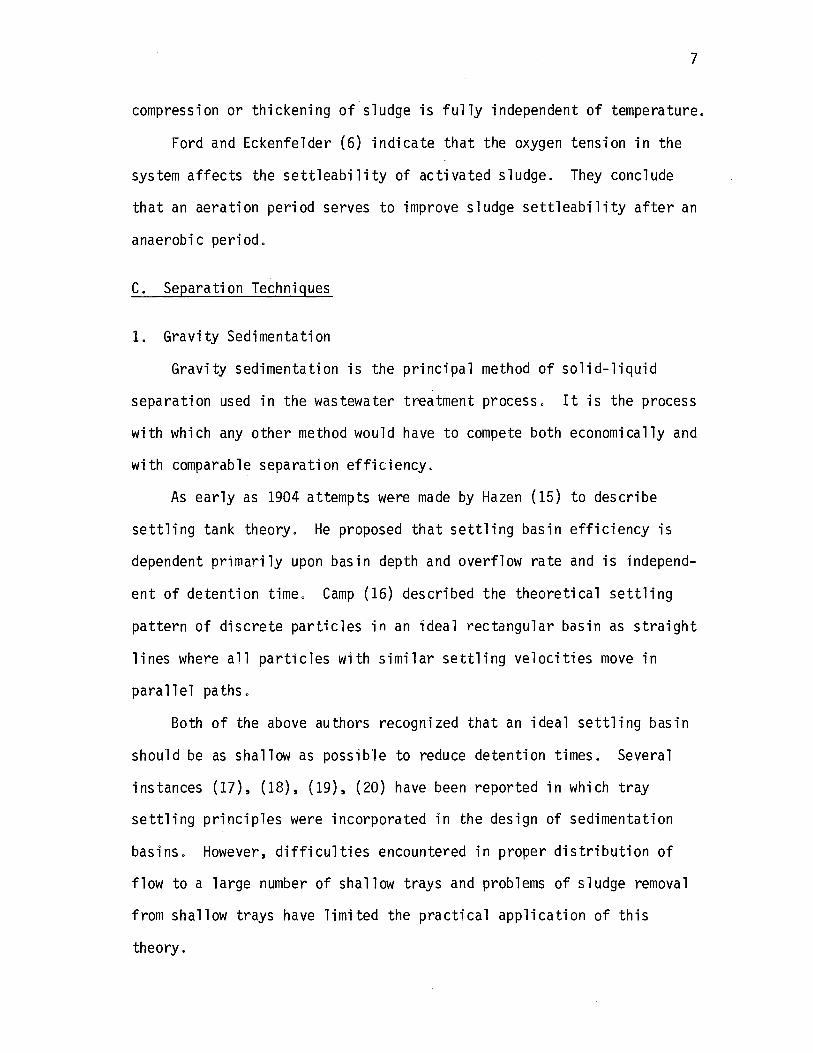
compression or thickening of sludge is fully independent of temperature.
Ford and Eckenfelder (6) indicate that the oxygen tension in the
system affects the settleability of activated sludge. They conclude
that an aeration period serves to improve sludge settleability after an
anaerobic period.
C. Separation Techniques
1. Gravity Sedimentation
Gravity sedimentation is the principal method of solid-liquid
separation used in the wastewater treatment process. It is the process
with which any other method would have to compete both economically and
with comparable separation efficiency.
As early as 1904 attempts were made by Hazen (15) to describe
settling tank theory. He proposed that settling ba.s in efficiency is
dependent primarily upon basin depth and overflow rate and is independ
ent of detention time. Camp (16) described the theoretical settling
pattern of discrete particles in an ideal rectangular basin as straight
lines where all particles with similar settling velocities move in
parallel paths.
Both of the above authors recognized that an ideal settling basin
should be as shallow as poss·ib'le to reduce detention times. Several
instances (17), (18), (19), (20) have been reported in which tray
settling principles were incorporated in the design of sedimentation
basins. However, difficulties encountered in proper distribution of
flow to a large number of shallow trays and problems of sludge removal
from shallow trays have limited the practical application of this
theory.
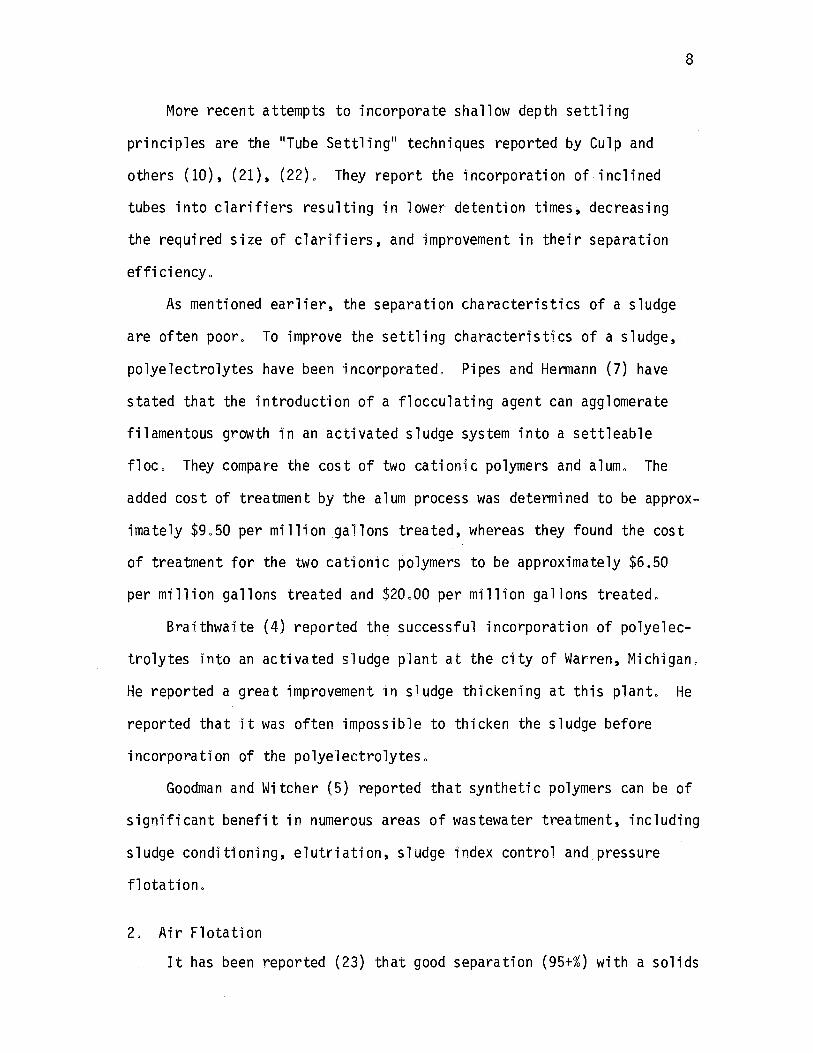
More recent attempts to incorporate shallow depth settling
principles are the 11 Tube Settling 11 techniques reported by Culp and
others (10), (21), (22). They report the incorporation of inclined
tubes into clarifiers resulting in lower detention times, decreasing
the required size of clarifiers, and improvement in their separation
efficiency.
As mentioned earlier, the separation characteristics of a sludge
are often poor. To improve the settling characteristics of a sludge,
polyelectrolytes have been incorporated. Pipes and Hermann (7) have
stated that the introduct'ion of a flocculating agent can agglomerate
filamentous growth in an activated sludge system into a settleable
8
floe. They compare the cost of two cationic polymers and alum, The
added cost of treatment by the alum process was determined to be approx
; mate ly $9. 50 per mil 1 ion ga 11 ans treated, whereas they found the cost
of treatment for the two cationic polymers to be approximately $6.50
per mi 11 ion ga 11 ans treated and $20, 00 per mi 11 ion ga 11 ans treated,
Braithwaite (4) reported the successful incorporation of polyelec
trolytes into an activated sludge p'lant at the city of Warren, Michigan.
He reported a great improvement in sludge thickening at this plant. He
reported that it was often impossible to thicken the sludge before
incorporation of the polyelectrolytes,
Goodman and Witcher (5) reported that synthetic polymers can be of
significant benefit in numerous areas of wastewater treatment, including
sludge conditioning, elutriation, sludge index control and pressure
flotation.
2. Air Flotation
It has been reported (23) that good separation (95+%) with a solids
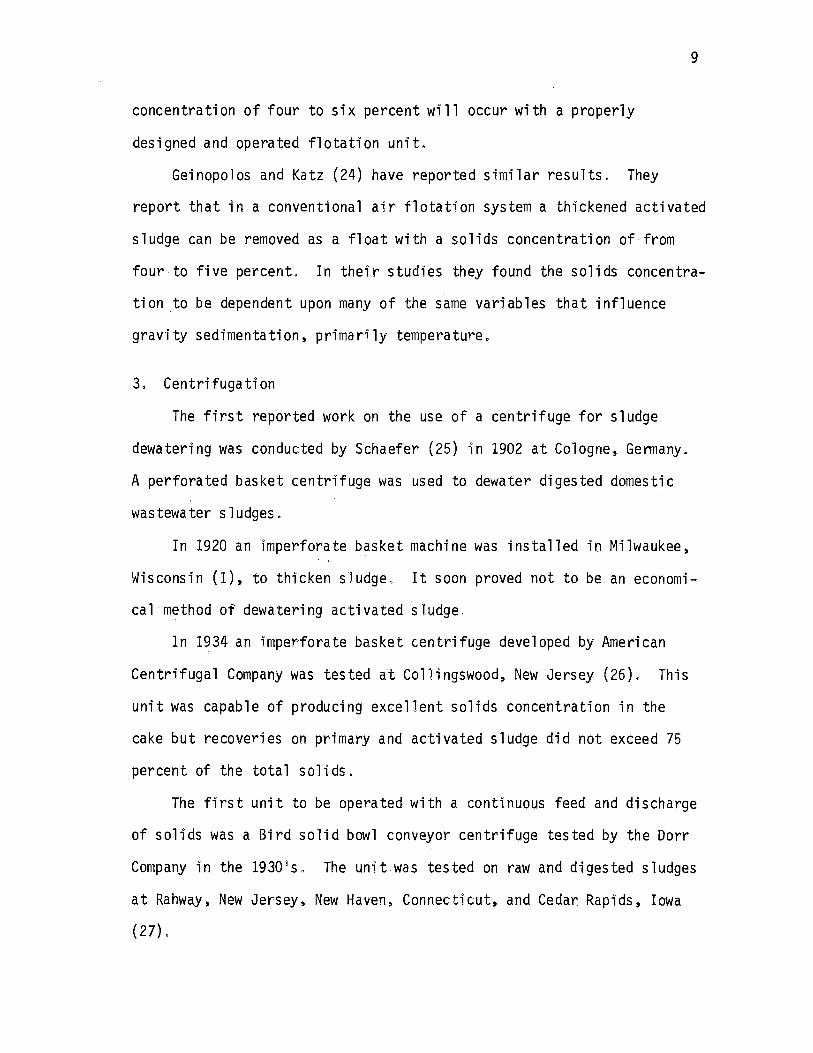
concentration of four to six percent will occur with a properly
designed and operated flotation unit.
9
Geinopolos and Katz (24) have reported similar results. They
report that in a conventional air flotation system a thickened activated
sludge can be removed as a float with a solids concentration of from
four-to five percent. In their studies they found the solids concentra
tion to be dependent upon many of the same variables that influence
gravity sedimentation, primarily temperature.
3. Centrifugation
The first reported work on the use of a centrifuge for sludge
dewatering was conducted by Schaefer (25) in 1902 at Cologne, Germany.
A perforated basket centrifuge was used to dewater digested domestic
wastewater sludges.
In 1920 an imperforate basket machine was installed in Milwaukee,
Wisconsin (1), to thicken sludge. It soon proved not to be an economi
cal method of dewatering activated sludge.
In 1934 an imperforate basket centrifuge developed by American
Centrifugal Company was tested at Collingswood, New Jersey (26). This
unit was capable of producing excellent solids concentration in the
cake but recoveries on primary and activated sludge did not exceed 75
percent of the total solids.
The first unit to be operated with a continuous feed and discharge
of solids was a Bird solid bowl conveyor centrifuge tested by the Dorr
Company in the 1930 1 s. The unit wa.s tested on raw and digested sludges
at Rahway, New Jersey, New Haven, Connecticut, and Cedar Rapids, Iowa
(27).
10
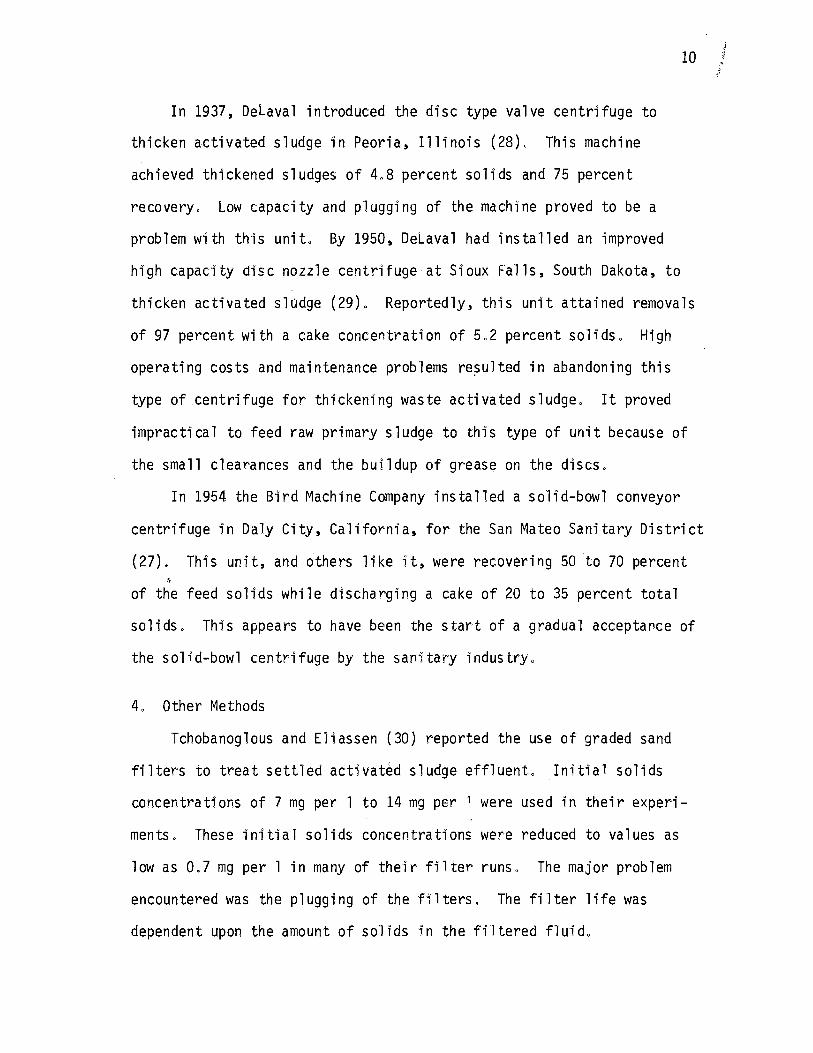
In 1937, Delaval introduced the disc type valve centrifuge to
thicken activated sludge in Peoria, Illinois (28). This machine
achieved thickened sludges of 4,8 percent so'lids and 75 percent
recovery. Low capacity and plugging of the machine proved to be a
problem with th·is unite By 1950, Delaval had installed an improved
high capacity disc nozzle centrifuge at Sioux Falls, South Dakota, to
thicken activated sludge (29). Reportedly, this unit attained removals
of 97 percent with a cake concentration of 5a2 percent so1idso High
operating costs and maintenance problems re~ulted in abandoning this
type of centrifuge for thickening waste activated sludge. It proved
impractical to feed raw primary sludge to this type of unit because of
the small clearances and the buildup of grease on the discs.
In 1954 the Bird Machine Company installed a solid-bowl conveyor
centrifuge in Daly City, California, for the San Mateo Sanitary District
(27). This unit, and others like it, were recovering 50 to 70 percent
of the feed solids while discharging a cake of 20 to 35 percent total
solids. This appears to have been the start of a gradual acceptance of
the solid-bowl centrifuge by the sanitary industry.
4a Other Methods
Tchobanoglous and Eliassen (30) reported the use of graded sand
filters to treat settled activated sludge effluent. Initial solids
concentrations of 7 mg per 1 to 14 mg per 1 were used in their experi-
ments. These initia'1 solids concentrations were reduced to values as
low as 0.7 mg per 1 in many of their filter runs. The major problem
encountered was the plugging of the filters. The filter life was
dependent upon the amount of solids in the filtered fluid.
11
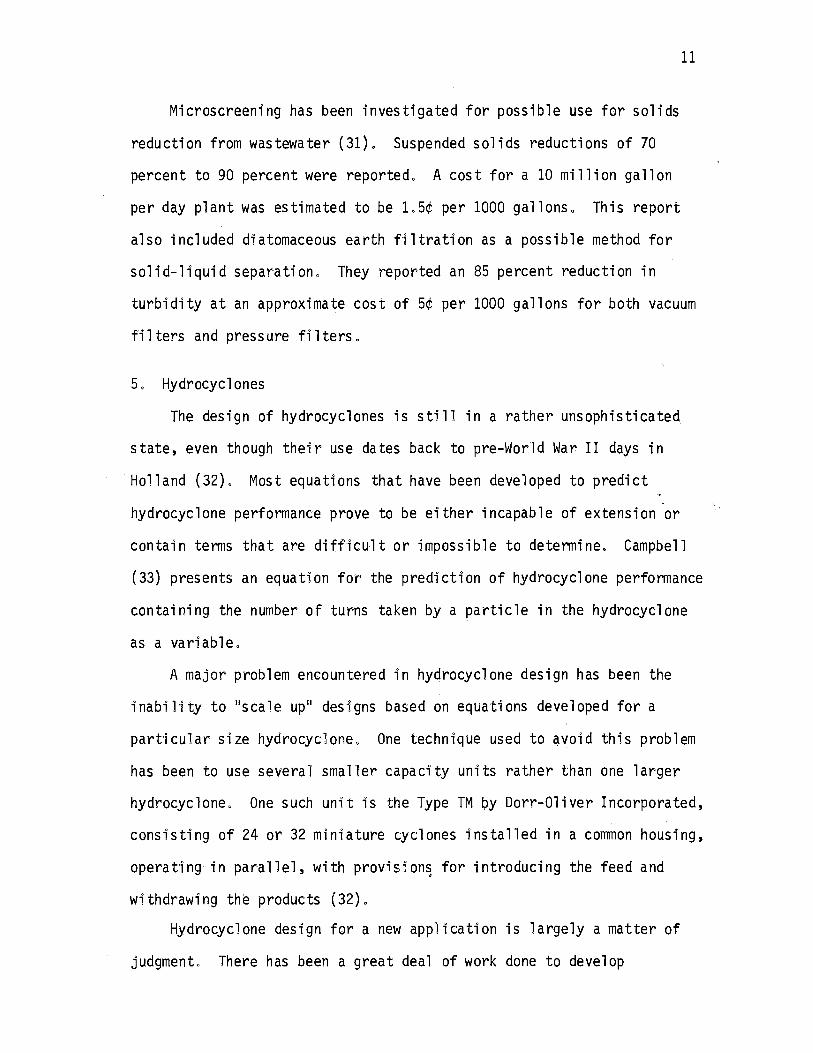
Microscreening has been investigated for possible use for solids
reduction from wastewater (31). Suspended solids reductions of 70
percent to 90 percent were reported, A cost for a 10 million gallon
per day plant was estimated to be l,5¢ per 1000 gallons, This report
also included diatomaceous earth filtration as a possible method for
solid-liquid separation, They reported an 85 percent reduction in
turbidity at an approximate cost of 5¢ per 1000 gallons for both vacuum
filters and pressure filters.
5, Hydrocyclones
The design of hydrocyclones is still in a rather unsophisticated
state, even though their use dates back to pre-World War II days in
Holland (32), Most equations that have been developed to predict
hydrocyclone performance prove to be either incapable of extension or
contain terms that are difficult or impossible to determine. Campbell
(33) presents an equation for the prediction of hydrocyclone performance
containing the number of turns taken by a particle in the hydrocyclone
as a variable,
A major problem encountered in hydrocyclone design has been the
inability to 11 scale up 11 designs based on equations developed for a
particular size hydrocyclone, One technique used to ~void this problem
has been to use several smaller capacity units rather than one larger
hydrocyclone, One such unit is the Type TM ~Y Dorr-Oliver Incorporated,
consisting of 24 or 32 miniature cyclones installed in a common housing,
operating in parallel, with provision~ for introducing the feed and
withdrawing the products (32),
Hydrocyclone design for a new application is largely a matter of
judgment, There has been a great deal of work done to develop
hydrocycl one, theory to a state that wil 1 a 11 ow re 1 i ab le the ore ti ca 1 ,_
design of uni ts based on treatment requirements and input parameters.
This will be discussed in the next chapter.
Hydrocyclones have been used for many industrial purposes.
12
Bergman and others (34} report the use of three inch cyclones to recover
bari te from Gulf Coast muds in o'il we 11 dril 1 i ng operations. · They
reported that a single cyclone could readily concentrate as much as 50
tons per day. To achieve more capacity, he recommended the opera ti on
of cyclones in parallel.
Lummus and Scott (35} reported the use of an 8 inch cyclone to
separate the sand cuttings from drilling fluids in oil well drilling
operations. They reported recla·iming.82 to 98 percent of the lost
circulation materials from drilling fluids having a density range of
8.5 to 10~5 pounds per gallon.
Haas and others ( 36} discussed a hydrocyclone developed to remove
precipitated fission and corrosion products from uranyl sulfate solu
tions in aqueous homogeneous nuclear reactions. Tests were performed
on 0.16 inch, 0.25 inch, 0.4 inch and 0.5 inch diameter hydrocyclones.
They found they could attain acceptable separation of particles approxi-
mately 1 micron in diameter.
Some of the industrial applications of the hydrocyclone reported
in the literature but not d·fscussed in detail (37), (38} are listed as
follows·:
1. Classifiers in closed circuit g.r'indi-ng as trr: c:ement mills.;cyanidati on mills, flotation plant regrind circuits, and ironore circuits.
2. Desliming grpund ore prior to flotation, tabling and other concentration processes in which the slime fraction is detrimental.

3. Removing undesirable minus 200-mesh fines from glass sand, recovering and classifying sand to be used for construction, classifying bentonite and pumice slurries at 10 microns, and degritting clay slurries, slaked lime, and whiting.
13
4. The manufacture of-evaporated salto Used to classify sodium chloride slurry at about 200-mesh, the overflow fraction being returned to the evaporator for further crystal growth.
5. Pulp and paper industry cyclones are used for removal of undesirable coarse and heavy particles from dilute pulps.
6. Impurities in the food industry products are removed from starch by ~roups of 15-mm diameter cyclones.
7. In coal preparation, cyclones are used to make possible a closed water circuit. The wash water which fonnerly contaminated streams is now treated by cyclones to recover the fine coal and the cyclone overflow is clean enough for reuse as wash water.
8. Recovery of,solids from water used to scrub flue gas.
9. Cleaning of wash water used in wet screening.
10. Used to separate minerals, i.e., coal from shale due to differences in specific gravity.
11. Removal of fine particles from green liquor in the recaus ti ci zing steps of sulfate kraft mills.
12. Separation of starch from gluten.
CHAPTER II I
THEORETICAL CONSIDERATIONS
A. General
A hydrocyclone is a vertical separator whose dispersion medium is
a liquid. Its separation characteristics are due to the high particle
settling velocities which result from forces that occasionally reach a
value of several thousand times the force due to gravityo
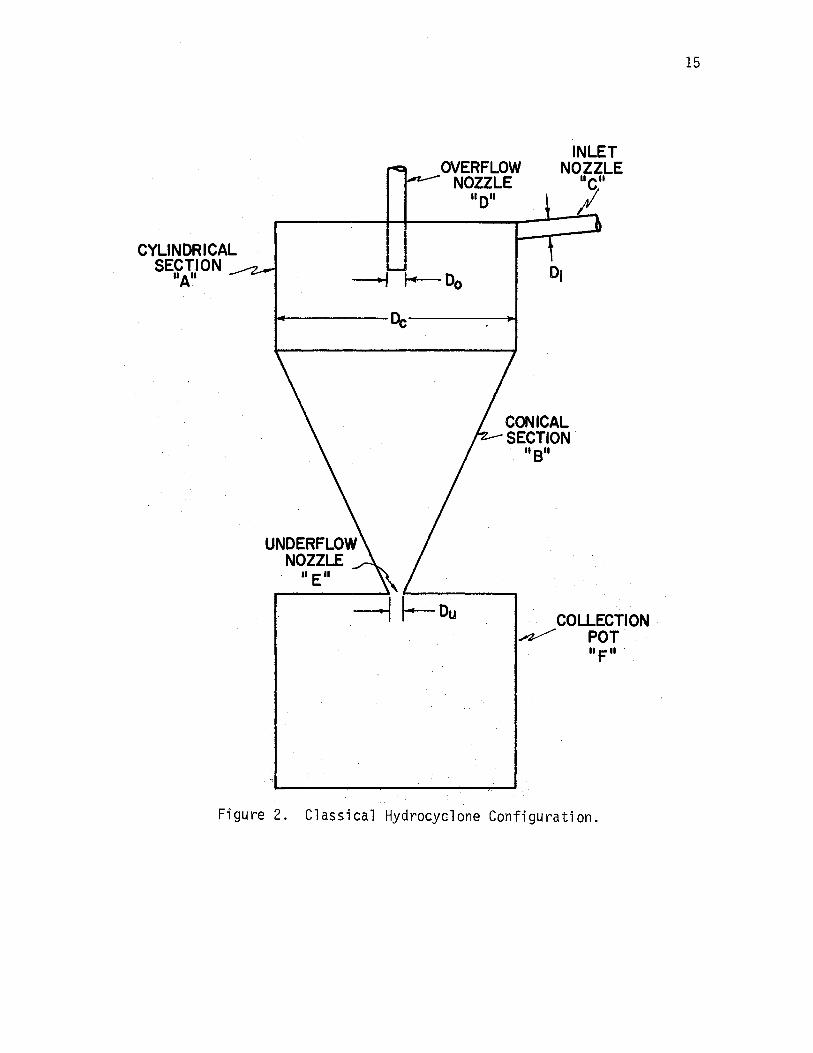
The hydrocyclone shown in Figure 2 is a classical configuration.
It consists of a cylindrical section (A) mounted above a truncated
cone (B). The inlet nozzle (C) enters the cylindrical section (A)
tangentially at the topo The overflow nozzle (D), commonly known as
the vortex finder, extends partially into the top center of the cylin
drical section (A). An opening at the apex of the truncated cone
serves as the underflow nozzle (E). Shown at the apex of the cone is
the collection pot (F). The purpose of the collection pot (F) is to
collect the particles that are discharged from the underflow nozzle
(E). The collection pot may or may not be included in particular
hydrocyclone configurations, this being the distinction between open
and closed underflow units.
Figure 3 illustrates the general flow patterns resulting in par
ticle separation found within the hydrocyclone. The fluid enters the
hydrocyclone tangentially through the inlet nozzle. The high velocity
at which the fluid enters tangential to the cylindrical section creates
1 II
CYLINDRICAL SECTION
11A11 J
OVERFLOW NOZZLE
II Dll
--I ~Do
&.-----De-----
' II B"
II E II
INLET NOZZLE
"c" i!_
COLLECTION ~ POT
II F II
Figure 2. Classical Hydrocyclone Configuration.
15

Cylindrical Section
z..-
Decontaminated fluid exits here
Outlet 2-.._
(
',",.;: '. ! '' ., .. ,:,. . i,';"', •'f~· ~ . '• ; ~
,, ... o I • I w ,•: \ I
....... ··'· -~ •• .: •. "'! •'.·· '. ··. •' · ..
'1: I ., ''. • • •,t: :"' , •'"'4 / f-, "" I I ' •• II \ .: I I·•''
I .. '~'11 I• I 1l.,, o I I:. •, 11\\ ... ,• .... ' ~ . , ' . . ... . . ,.. . . ', ... ·. ', ....... ,,. If~ lo••.:• I It o • ~ • o 1\,f''to \
''",:'I• ' • I lo o I I Io t1 ! ~· ... ;...c; I•".>··; •. ::-~·- ..... I 1'1 ·.1t:\; ..
• ~ ' '. , • I •• • I I • :. '· I .•• • •. - '"' .....
••, •!': :~ ,°:.' ',~: ', : 1 ! 1 •' ', 1 1 •Ir 1 4. ,: I•:·.·,:::• I,'
-~ _-'l'"' _____ ·~···
Contaminated fluid enters here
Particles move to outside due, to centrifugal ·force
Collection. Chamber
-5'
Figure 3. General Flow Patterns in a Hydrocyclone.
16
17
a spiral pattern of high centrifugal force. This high centrifugal
force causes particles of sufficient size and gravity to be moved out-
wardly toward the cyclone walls and be discharged spirally through the
apex of the cone, However, most of the fluid moves radially inward
generating a forced vortex finally being discharged through the over
flow nozzle, It has been estimated that only 3 to 10% of the fluid
passing through the hydrocyclone actually enters the collection pot,
where, ideally all of the particles to be separated enter and remain
( 36)' ( 39).
B, Hydrocyclone Dynamics
l, Separation Efficiency
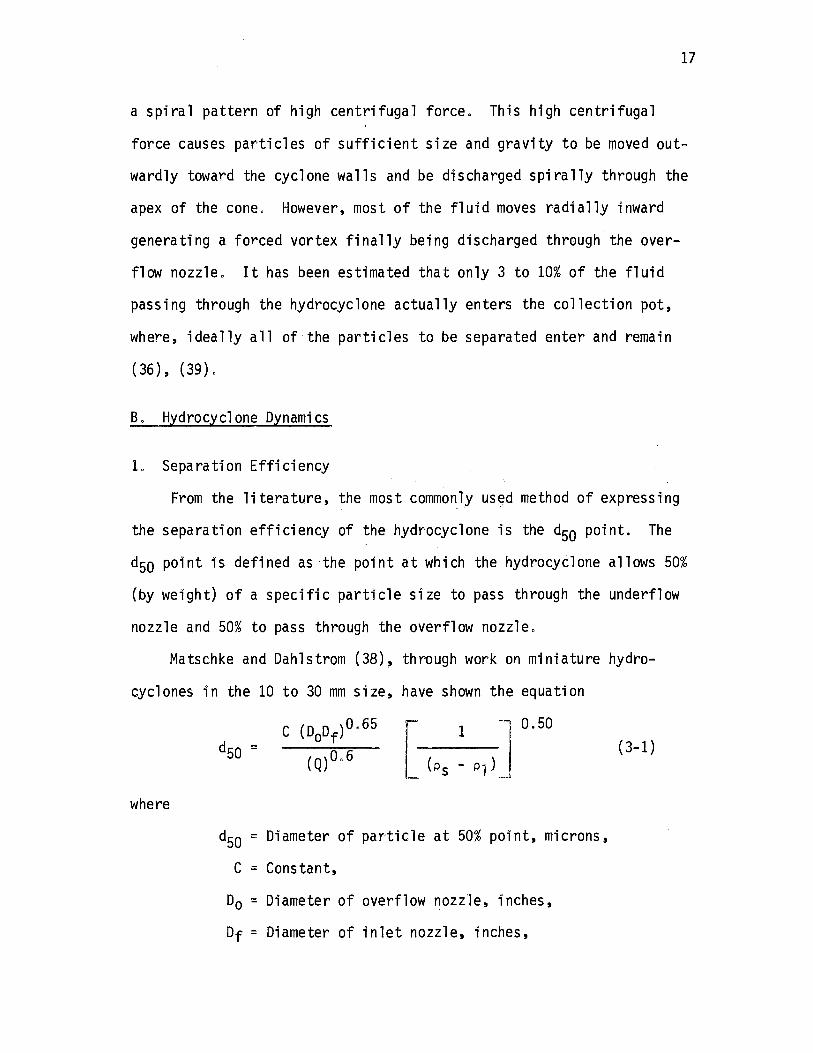
From the literature, the most commonly used method of expressing
the separation efficiency of the hydrocyclone is the d50 point. The
d50 point is defined as the point at which the hydrocyclone allows 50%
(by weight) of a specific particle size to pass through the underflow
nozzle and 50% to pass through the overflow nozzle,
Matschke and Dahlstrom (38), through work on miniature hydro-
cyclones in the 10 to 30 mm s·1ze, have shown the equation
where
C (DoDf)0.65
(Q)0,6
-, 0. 50
d50 = Diameter of particle at 50% point, microns,
C = Constant,
D0 = Diameter of overflow nozzle, inches,
Df = Diameter of inlet nozzle, inches,
(3-1)
18
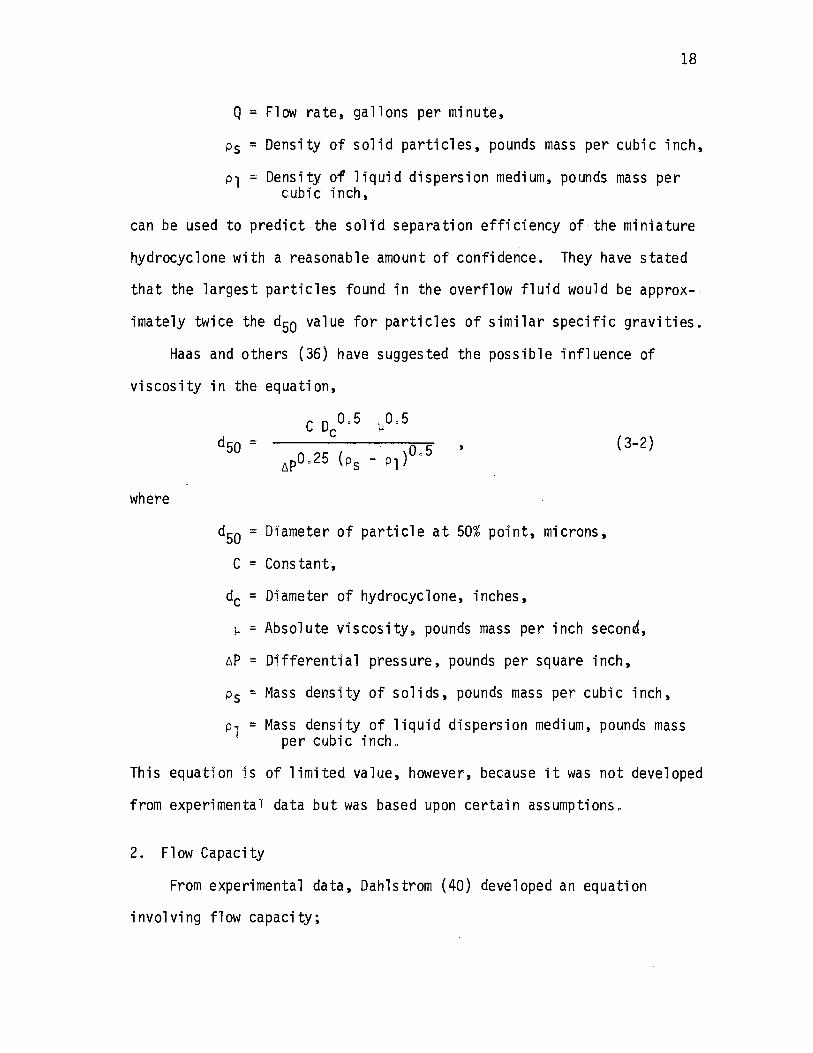
Q = Flow rate, gallons per minute,
Ps ·-Density of solid particles, pounds mass per cubic inch,
Pl - Density of' liquid dispersion medium, pounds mass per cubic inch,
can be used to predict the solid separation efficiency of the miniature
hydrocyclone with a reasonable amount of confidence. They have stated
that the largest particles found in the overflow fluid would be approx
imately twice the d50 value for particles of similar specific gravities.
Haas and others (36) have suggested the possible influence of
viscosity in the equation,
where
C D 0.5 ].10,5
d5o c
(3-2) = ( ' )0" 5 L'.IP0.25 Ps - Pl
d50 - Diameter of particle at 50% point, microns,
c -· Constant,
de = Diameter of hydrocyclone, inches,
µ=Absolute viscosity, pounds mass per inch second,
~p = Differential pressure, pounds per square inch,
Ps ~Mass density of solids, pounds mass per cubic inch,
pl =Mass density of liquid dispersion medium, pounds mass per cubic inch.
This equation is of limited value, however, because it was not developed
from experimental data but was based upon certain assumptions.
2. Flow Capacity
From experimental data, Dahlstrom (40) developed an equation
involving flow capacity;

19
Q (3-3)
where
Q = Total flow rate, cubic inches per second,
L'IP '"' Differential pressure, pounds per square inch,
k ,_ Constant for flow capacity correlation,
Do = Diameter of overflow nozzle, inches,
of = Diameter of inlet nozzle, incheso
The expression Q is called the capacity ratio. It simply
states flow capacity is a function of the square root of energy loss.
This term should remain constant for any particular constant dimension
hydrocycl one o
Haas and others (36) developed a similar equation for miniature
hydrocyclones smaller than one incho This equation,
g = k D LB (3-4) (L'IP)Oo44
c
where
Q ;;: Total flow rate, cubic inches per second,
L'IP = Differential pressure, pounds per square inch,
k = Constant for flow capacity correlation,
De = Hydrocyclone diameter, inches,
is of limited usefulness due to the fact so few hydrocyclone parameters
are included making actual prediction of hydrocyclone performance rather
unreliableo
(41)
where
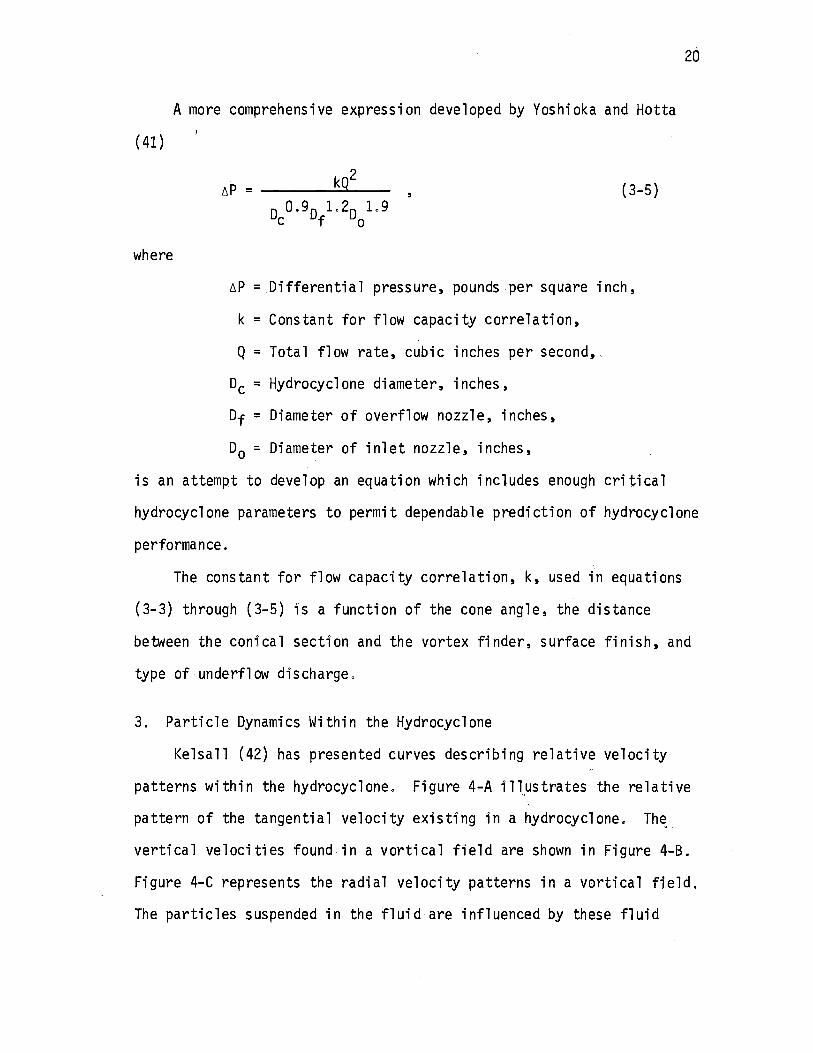
A more comprehensive expression developed by Yoshioka and Hotta
l'IP = ____ kQ_2 __ (3-5) D 0.90 L20 L9 c f 0
l'IP =Differential pressure, pounds per square inch,
k =Constant for flow capacity correlation,
Q = Total flow rate, cubic inches per second,
De = Hydrocyclone diameter, inches,
Of = Diameter of overflow nozzle, inches,
00 = Diameter of inlet nozzle, inches,
26
is an attempt to develop an equation which includes enough critical
hydrocyclone parameters to permit dependable prediction of hydrocyclone
performance.
The constant for flow capacity correlation, k, used in equations
(3-3) through (3-5) is a function of the cone angle, the distance
between the conical section and the vortex finder, surface finish, and
type of underflow discharge,
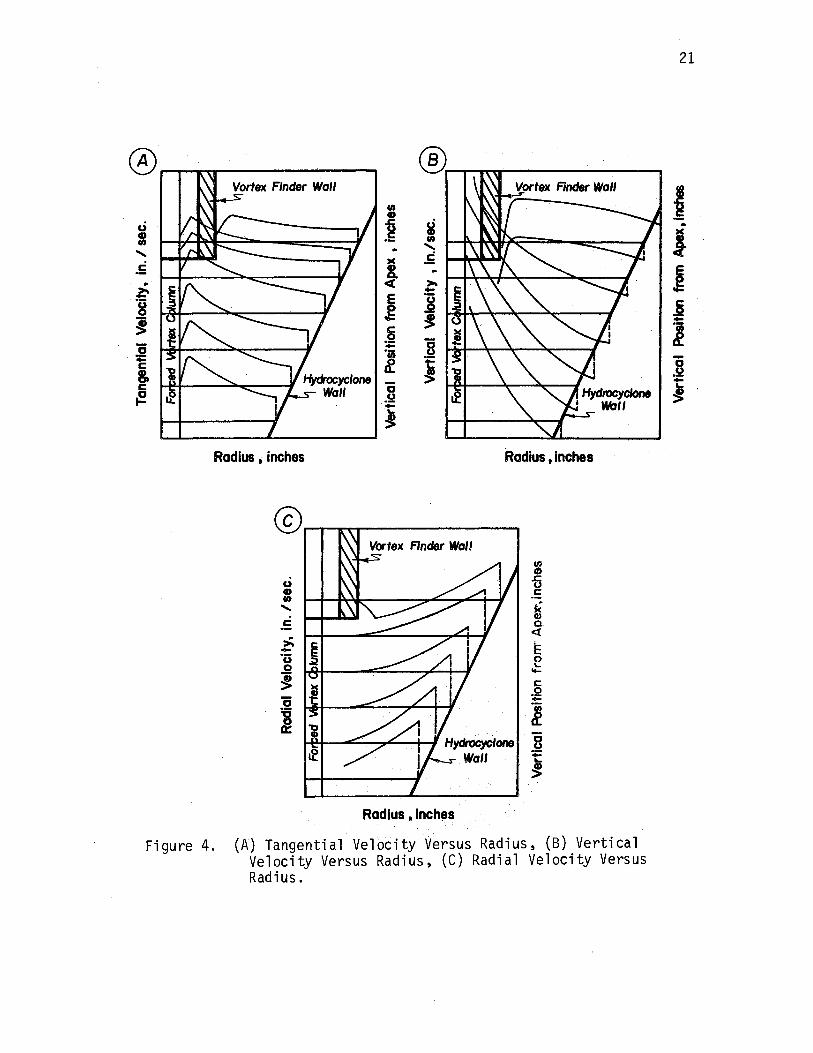
3. Particle Dynamics Within the Hydrocyclone
Kelsall (42) has presented curves describing relative velocity
patterns within the hydrocyclone. Figure 4-A ill..ustrates the relative
pattern of the tangential velocity existing in a hydrocyclone. Th~
vertical velocities found in a vortical field are shown in Figure 4-B.
Figure 4-C represents the radial velocity patterns in a vortical field.
The particles suspended in the fluid are influenced by these fluid
u : ...... .5 i 8 ~ "6 :;:: c & c {!.
Radius , inches
®
u CD en
...... c ..
>-.. "() 0
~ "6 =a Ii
®. en CD
~ &i en ......
>< c 8. ct >--E ~ .g
~ -~ - B ·u; e. i 0 .2 ·-... -j
Radius , inches
~ .c 0 c:
k Q) 0.
<(
i: 0 \.. -c: 0
i 8 +: .... ~
Radius , inches
Figure 4. (A) Tangential Velocity Versus Radius, (B) Vertical Velocity Versus Radius, (C) Radial Velocity Versus Radius.
21
I .. l i j
l 0 .!:! -~
velocities. These velocity patterns subject the suspended particles
to three forces:
22
1. Centrifugal force--an inertia force related to the tangential velocity of the particles,
2, Radial Stokes force--caused by the radia'lly moving fluid dragging the particles,
3o Axial Stokes force--caused by the axially moving fluid dragging the particles.
It is the vector sum of these three forces at any given time that
determines the particle movement within the hydrocycloneo
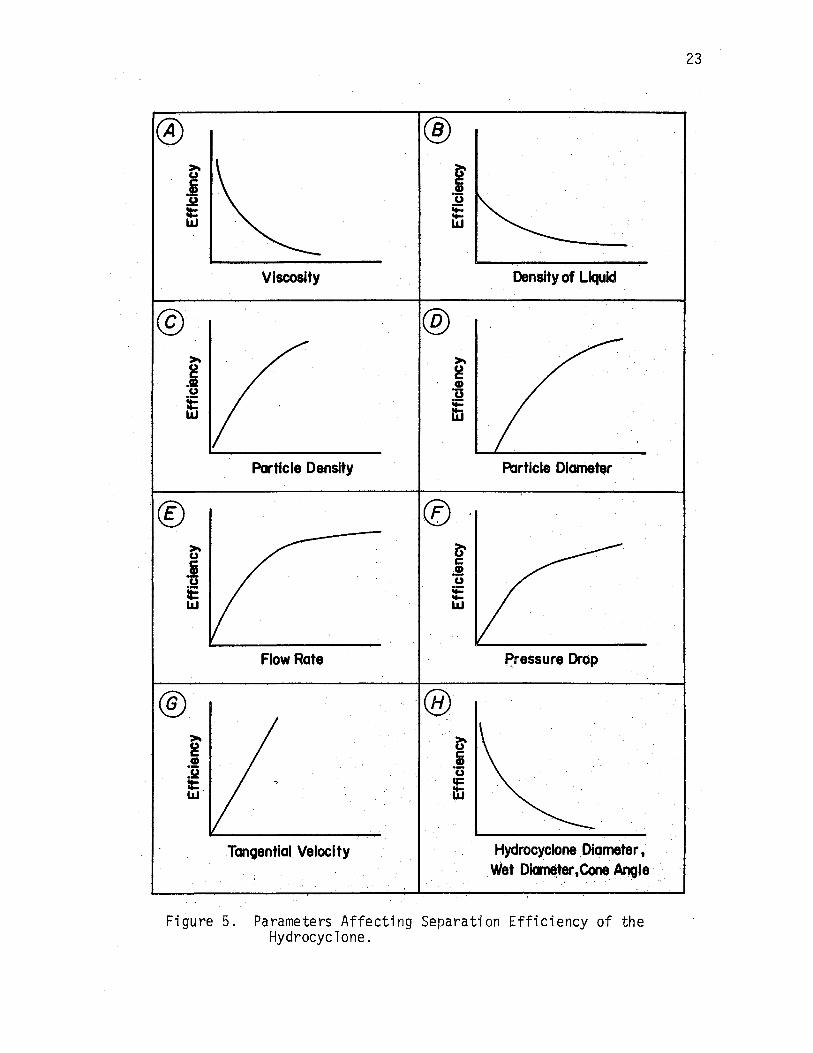
4. Factors Affecting Separation Efficiency
The basic factors affecting the separation efficiency are the
fluid properties, the particle properties, flow parameters, and hydro
cyclone parameterso Kelsall (43) has described the effect of each of
these factors, Figure 5 generally describes these factors 'in relation
to the separation efficiencieso
50 The Collection Pot
Haas and others (36) have reported that the settling of particles
in a collection pot could improve the efficiency of the hydrocyclone.
The particles that are discharged from the underflow nozzle are moved
to the walls of the collection pot, due to the centrifugal forces on
the particles, and downward along the walls, An equal volume of fluid
returns through the overflow nozzle by means of the vortex patho
One problem that arises in the use of the collection pot is that
the poor settling characteristics of some particles might allow them to
be returned to the overflow nozzle, One attempt to correct this problem
has been the addition of a contamination trap, developed by the School
Viscosity
@ >-g .II u iE LaJ
Particle Density
® >-u .I u !E LaJ
Flow Rate
®
Tangential Velocity
@
.f
@
®
.!:! ::: LaJ
>-g ..92 u q:: iti
~ c .!! u q:: -LaJ
Density of Liquid
Particle Diamet.,-
Pressure Drop ,,
Hydrocyclone Diameter, Wet D~ter,Cone Angle
Figure 5. Parameters Affecting Separation Efficiency of the Hydrocyclone.
23
24
of Mechanical and Aerospace Engineering at Oklahoma State University
(2), to the system to 11 trap 11 the particles that are difficult to
settle. This contamination trap does not function as a full flow fil
ter because as mentioned earlier only about 3 to 10% of the fluid
actually enters the collection pot and is acted upon by the trap. The
majority of the sa·1 ids are acted on by the contamination trap because
ideally they have been concentrated in the collection pot by centrifu
gal forces.
6. General Design Considerations
Matschke and Dahlstrom (38) have given a summary of geometric
guides for design. They are as fa i ·1 ows:
and
1. Cyclone included angle should be kept as low as possible (10 to 20 degrees).
2. The bottom of the vortex finder should be 6 inches or one cyclone diameter, whichever is less, from the transition point between the coni ca 1 sec ti on and cyl i ndri ca 1 sec ti ans.
3. The vortex finder should extend just below the bottom of the inlet no.zz'le to the cyclone.
4. The inlet angle should allow the entering fluid to descend at least one inlet nozzle diameter in the first revolution.
5. Inlet, overflow, or vortex finder dimensions are detennined with respect to cyclone diameter accord'ing to the following equations:
' (3-6)
( 3-7)
where
Df = Diameter of inlet nozzle, inches,
D0 = Diameter of overflow nozzle, inches,
Dc = Diameter of hydrocyclone, incheso
6. Distance between the top of the inlet port and cyclone top should be kept at a minimum to minimize secondary flows that result in an overall decrease in efficiencyo
25
CHAPTER IV
MATERIALS AND METHODS
A. Experimental Apparatus
1. Hydrocyclones
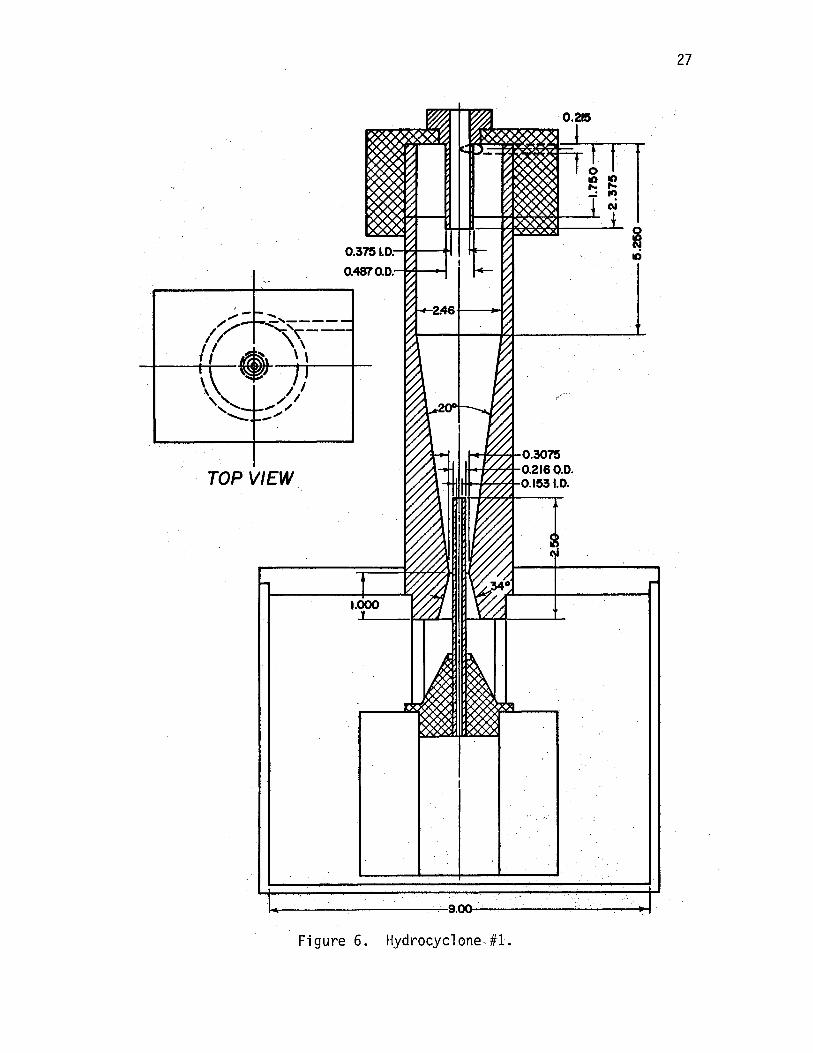
The hydrocyclones used in this study were of three designs. The
first unit tested was a 6 gallon per minute, 44 psi pressure drop unit
borrowed from the Mechanical and Aerospace Engineering Department at
Oklahoma State University (Figure 6). This unit was originally designed
and constructed to test the feasibility of cleaning dirty scrub water
used in industrial sweepers,
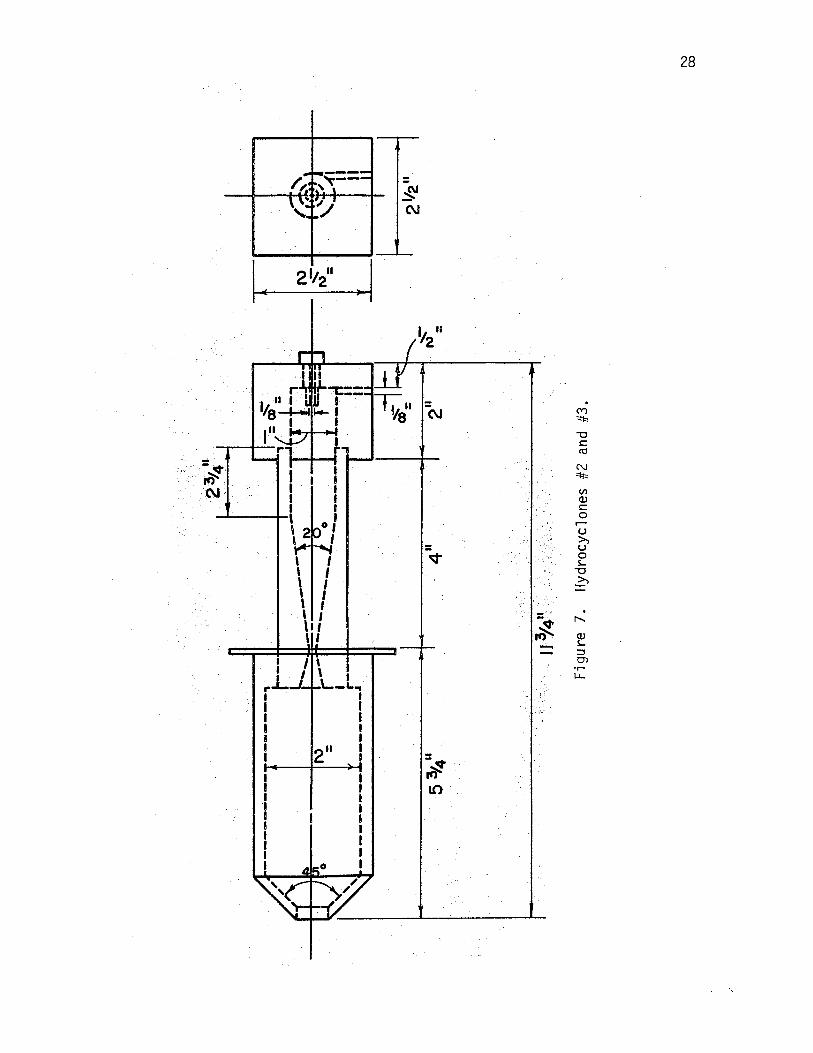
The second hydrocyclone used was specifically designed for this
project (Figure 7). The design was a judgment design based upon past
experience of hydrocyclone design and operation at the Oklahoma State
University Mechanical and Aerospace Engineering Laboratories, and from
characteristics of available pumps, The design was to be approximately
a 2 gallon per minute, 75 psi pressure drop unit.
When the second hydrocyclone failed to perform as expected a third
hydrocyclone was built, It was a modification of the second unit, the
only change being to reduce the minimum diameter of the cone, Du, from
1/8 inch to 1/16 inch.
In all three hydrocyclones a valve was placed into the bottom of
the collection pot to facilitate sampling and to expedite draining and
cleaning the unit at the termination of an experiment.
TOP VIEW
1.000 t
Figure 6. Hydrocyclone.#l:.
27
0.21!5
I
,.L I I I I I I
I I
I I
I I I
I I . I
I o/
I
l I ' I \ I
' I \ I \I I \ I
I\ L L- ..
I I I I I
211 I
.... ·,. ...
·,
28
. M ~
"'C c:: ltS
N ~
VI QJ c:: 0 ,..... u ~ 0 s..
"'C >, :c
. r--..
f ::3 O'l .,....
LL.
,_
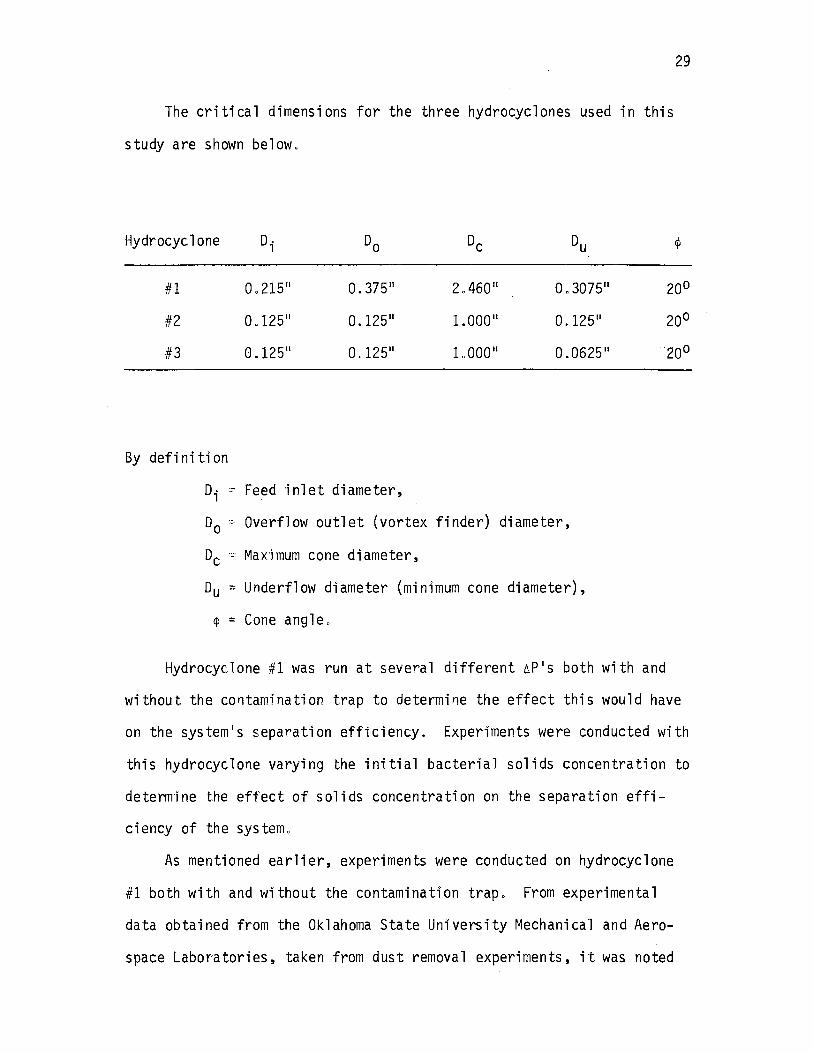
The critical dimensions for the three hydrocyclones used in this
study are shown below"
Hydrocyclone D. ,
#1
#2
#3
0.215 11
0.125 11
0.375 11
0.125 11
2.460 11 0. 3075 11
1.000 11
L000 11 0.0625 11
By defi ni ti on
D; : Feed inlet diameter,
00 ·:; Overflow outlet (vortex finder) diameter,
De - Maximum cone diameter,
Du ,, Underflow diameter (minimum cone diameter),
t - Cone angle"
29
Hydrocyclone #1 was run at several different lP 1 s both with and
without the co11tamination trap to determine the effect this would have
on the sys tern 1 s separation efficiency. Experiments were conducted with
this hydrocyclone varying the initial bacterial solids concentration to
determine the effect of solids concentration on the separation effi-
ciency of the system.
As mentioned earlier, experiments were conducted on hydrocyclone
#1 both with and without the contamination trapo From experimental
data obtained from the Oklahoma State University Mechanical and Aero-
space Laboratories, taken from dust removal experiments, it was noted

30
that separation efficiencies approaching those obtained with the
contamination trap could be obtained without the contamination trap if
the collection pot were drained at a rate of 3 to 10% of the flow rate
through the hydrocyclone,
Based on this information, experiments were conducted on hydro
cyclone #1 without the contamination trap, draining the collection pot
at various flow rates,
Hydrocyclones #2 and #3 were designed for use without a contamina
tion trap and for continuous collection pot drainage, Experiments were
conducted with hydrocyc1ones #2 and #3 at various ~P's, initial bacter-.
ial concentrations, and collection pot drainage rates,
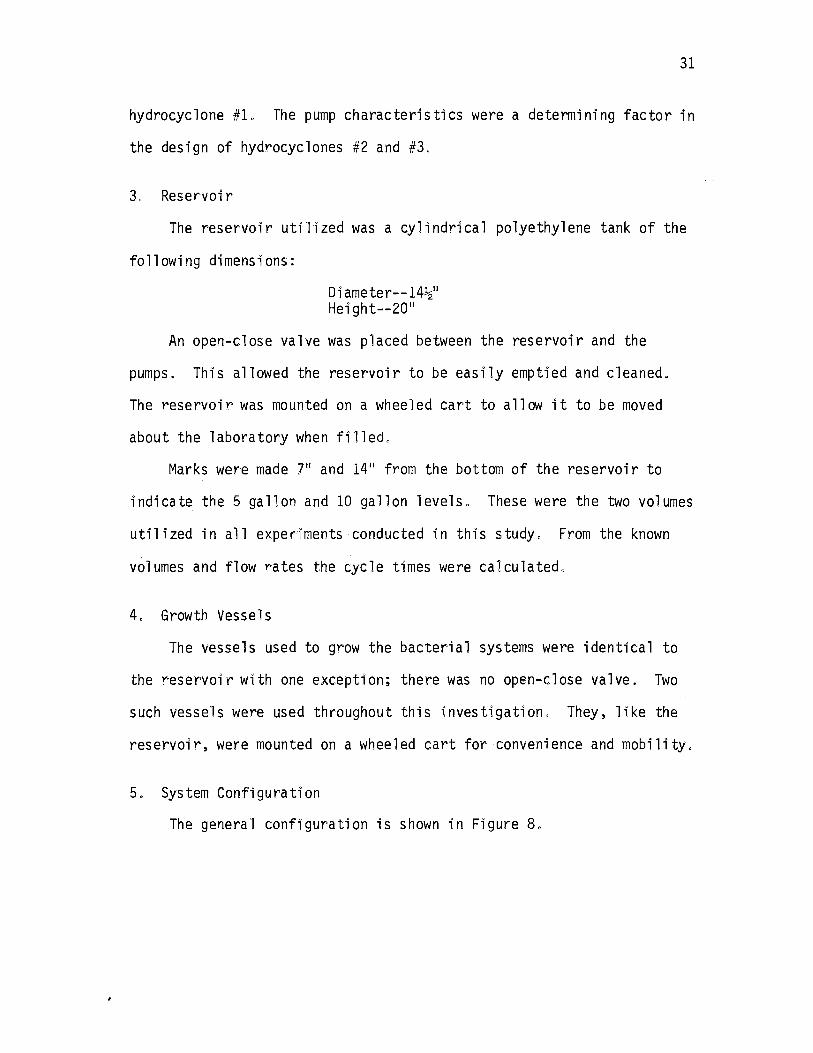
2, Pumps
The pumps used were of two types: 1. Centrifugal pump, 2. Roller
pump. The centrifugal pump was driven by a ~ horsepower, 110 volt a.c.
motor. The roller pump was driven by a 1 horsepower, 110-220 ~olt a.c,
motor. These pumps were placed in series, the centrifug_al pump fi.rs.t~
followed by the roller pump, followed by a valve. This configuration
allowed maximum flexibility and control of the pressure drop and flow
rate through the system,
From this configuration the pumps could be operated separately or
together, depending upon the pressure drop and fl ow rate requirements,
with further control being offered by the valve located between the
pumps and the hydrocyclone. This configuration allowed the pressure
drop and the flow rate to be varied from zero to the maximum for the
system.
The pumps and the configuration described above were selected to
meet the design pressure drop and flow rate requirements of
31
hydrocyclone #1, The pump characteristics were a determining factor in
the design of hydrocyclones #2 and #3.
3, Reservoir
The reservoir utiJ·ized was a cylindrical polyethylene tank of the
following dimensions:
Di ameter--141211
Height--20 11
An open-close valve was placed between the reservoir and the
pumps. This allowed the reservoir to be easily emptied and cleaned.
The reservoir was mounted on a wheeled cart to allow it to be moved
about the laboratory when filled,
Marks were made 711 and 1411 from the bottom of the reservoir to
i ndi ca te the 5 ga 11 on and 10 ga 11 on l eve 1 s" These were the two vo 1 umes
utilized in all experiments conducted in this study, From the known
volumes and flow rates the cycle times were calculated"
4. Growth Vessels
The vessels used to grow the bacterial systems were identical to
the reservoir with one exception; there was no open-c 1 ose va 1 ve. Two
such vessels were used throughout this investigation, They, like the
reservoir, were mounted on a wheeled cart for convenience and mobility,
5, System Configuration
The general configuration is shown in Figure 8,
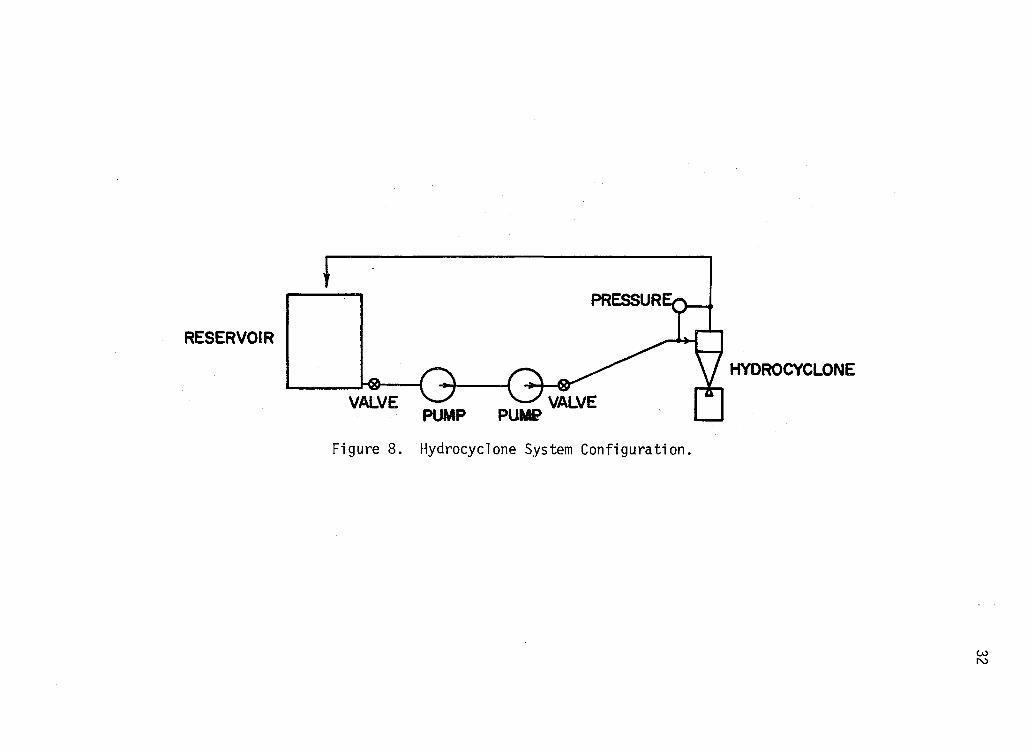
RESERVOIR
Figure 8. Hydrocyclone System Configuration.
HYDROCYCLONE
w N
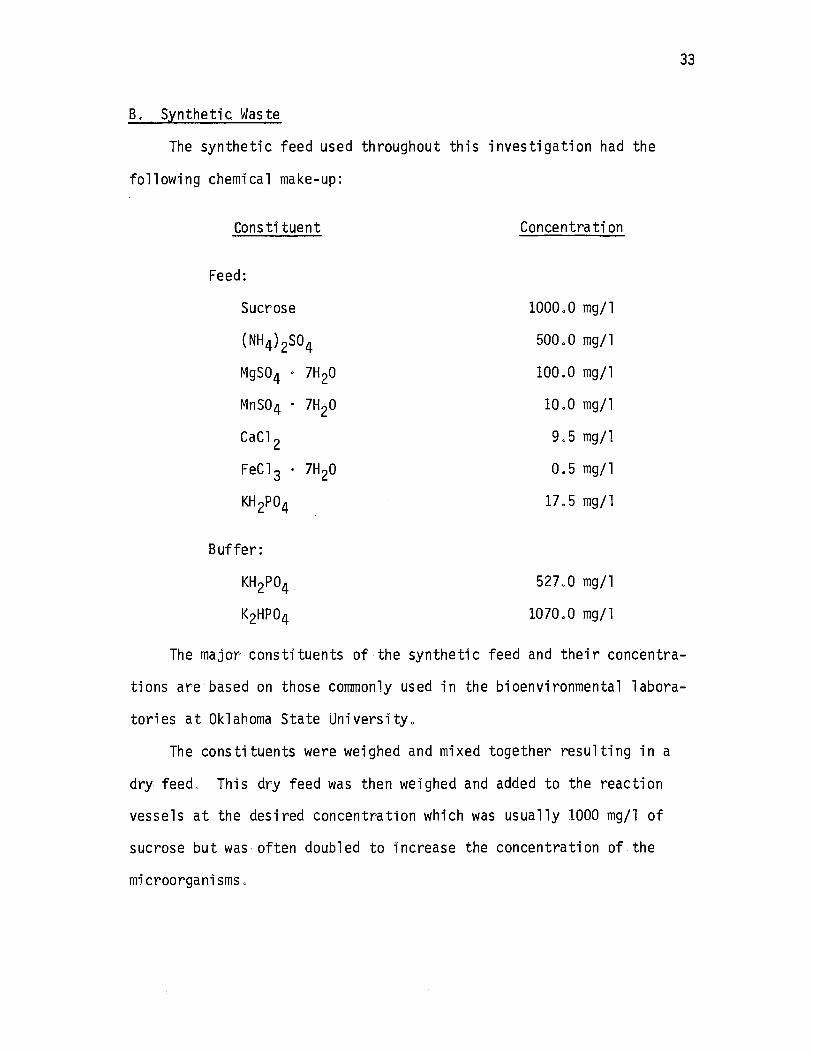
B .. Synthetic Waste
The synthetic feed used throughout this investigation had the
following chemical make-up:
Constituent
Feed:
Sucrose
(NH4} 2so4
MgS04 ° 7H2o
MnS04 · 7H20
CaC1 2
FeC1 3 · 7H20
KH 2Po4
Buffer:
KH2Po4 .
K2HP04
Concentration
1000.0 mg/l
500.0 mg/l
100.0 mg/l
lOoO mg/l
9.5 mg/1
0.5 mg/l
17.5 mg/l
527.0 mg/l
1070.0 mg/l
33
The major constituents of the synthetic feed and their concentra
tions are based on those commonly used in the bioenvironmental labora
tories at Oklahoma State Universityo
The constituents were weighed and mixed together resulting in a
dry feed. This dry feed was then weighed and added to the reaction
vessels at the desired concentration which was usually 1000 mg/l of
sucrose but was often doubled to increase the concentration of the
microorganisms.
34
C. The Bacterial System
The bacterial systems used in this investigation were heterogenous
dispersed systems varying in solids concentration from 30 mg/l to
850 mg/l. The systems were grown in the growth vessels described
previously. The initial 11 seed 11 was taken from an abandoned project in
the Oklahoma State University bioenvironmental engineering laboratories.
All following systems were seeded with 1000 ml of the supernatent from
the system preceding it. The desired growth usually occurred within 1
to 2 days, depending upon the required concentration. Aeration was
provided by compressed air.
After each experiment the bacterial systems were disposed of,
saving 1000 ml for seeding the next system, to insure that flocculation
would not occur as it often does in 11 old 11 bacterial,systems.
D. Experimental Procedures
1. Preparatory Procedures
A considerable amount of data had to be obtained on the physical
system in each configuration that was to be investigated before data
from experiments on bacterial systems could be obtained and reduced.
Curves were obtained for each configuration to be investigated
describing pressure drop across the hydrocyclone vs flow rate. The
technique used to obtain these curves involved determining the time
required to fill a 10 gallon container at a given pressure drop across
the hydrocyclone. The pressure drop was then varied by opening or
closing the valve located between the pumps and the hydrocyclone. The
time required to fill the 10 gallon container, at the new pressure drop,
was then determined. This process was repeated until enough values
were obtained to plot a graph of ~P vs flow rate. Thus the flow rate
could be obtained simply by reading ~P from the pressure gauge and
converting to flow rate from the graph.
From a knowledge of the flow rate and the volume of fluid in the
system, the time required for one cycle through the system could be
computed where
Cycle time (minutes) = Volume (gals.)
35
Also needed for the design of hydrocyclones #2 and #3 were pump
curves without the hydrocyclones in the system. These were obtained in
nearly the same manner as the curves described above. The only differ
ence is the absence of the hydrocyclone in the system. From these
pressure vs flow rate curves the design flow rate and pressure drop
were selected for hydrocyclones #2 and #3 within the capabilities of the
pumps.·
One to two days prior to an experiment, depending upon the desired
bacterial concentration, a growth vessel was prepared (seeded and fed)
as described earlier.
When the biological solids approached the desired concentration
experiments involving separation of these solids by passage through
the hydrocyclone were begun.
2. Hydrocyclone Experiment
The experimental procedures for all hydrocyclone configurations
investigated were basically the same.
36
The bacterial systems of the desired biological solids concentra
tion were transferred to the reservoir. The reservoir was always filled
to either the 5 or 10 gallon mark. These volumes were chosen according
to the flow rate selected for each particular experimento At the lower
flow rates the 5 gallon volume was generally used to decrease the cycle
time, thereby shortening the time required to complete the experiment.
The 5 gallon volume was most often used with hydrocyclones #2 and #3
since their flow rates were always below 2 gallons per minute, whereas
the 10 gallon volume was utilized with hydrocyclone #1 which had flow
rates between 5 and 6 gallons per minute for all experiments.
After filling the reservoir to the desired level samples were
drawn to determine the initial biological solids concentration. Also
an Imhoff Cone was utilized to insure that the system was truly dis
persed and that no gravity settling would occur.
After initial biological solids samples were drawn the pumps were
started, 6P was set to the desired value (by opening or closing the
valve between the pumps and the hydrocyclone), and the timer was
startedo Samples were periodically taken from the reservoir mixed
liquor for biological solids determination and the time of sampling
recorded. The experiments were continued until enough data had been
obtained to describe the separation characteristics of the particular
hydrocyclone configuration being investigated.
Upon termination of each experiment, approximately 1000 ml of the
mixed liquor was taken from the reservoir to seed the growth vessel.
The remainder of the supernatent in the reservoir was then discardedo
Experiments were conducted on hydrocyclone #1, both with the
contamination trap and without the contamination trap draining the
collection pot at various flow rates.
37
After each experiment with hydrocyclone #1 with the contamination
trap, the trap (0,4 µ paper filter) was removed and cleaned by washing
in hot water.
All experiments with hydrocyclones #2 and #3 were conducted as
described above. Investigations were made at various drainage rates
of the collection potD
E. Analytical Procedures
1. Flow Rate
All flow rates were determined by timing the flow into a known
volume with a stop watch. This was repeated several times to improve
accuracy.
2. Biological Solids
The concentration of biological solids in the reservoir was
determined by filtering a known volume through a 0.45 µ Millipore Filter
as described in Standard Methods (44).
Also, the optical density of the mixed liquor was employed to
determine the course of growth in each growth vessel and to determine
the concentration of biological solids in the reservoir as a check on
the filtration method, It also gave a quick indication as to the
progress of an experiment. Percent transmittance was measured and con
verted to optical density in accordance with the equation
where
OD = Optical Density,
T = % Transmittance.
A Bausch and Lomb spectrophotometer was used.
38
From data obtained in each experiment, optical density vs biologi
cal solids concentration (as determined by filtration) was plotted.
From these graphs, biological solids concentration could be determined
by knowing the optical density of the mixed liquor. Graphs plotted from
data obtained in these experiments all appeared to be linear indicating
that the concentration of biological solids in the mixed liquor was
directly proportional to the optical density for the concentrations
investigated.
CHAPTER V
EXPERIMENTAL RESULTS
A. General
The results of this investigation are shown in Figures 9 through
19. The experimental results for hydrocyclone #1 are found in Figures
9 through 13. The data obtained from hydrocyclone #2 are found in
Figures 14 through 18. Figure 13 displays the results from experiments
with hydrocyclone #3.
B. Hydrocyclone #1
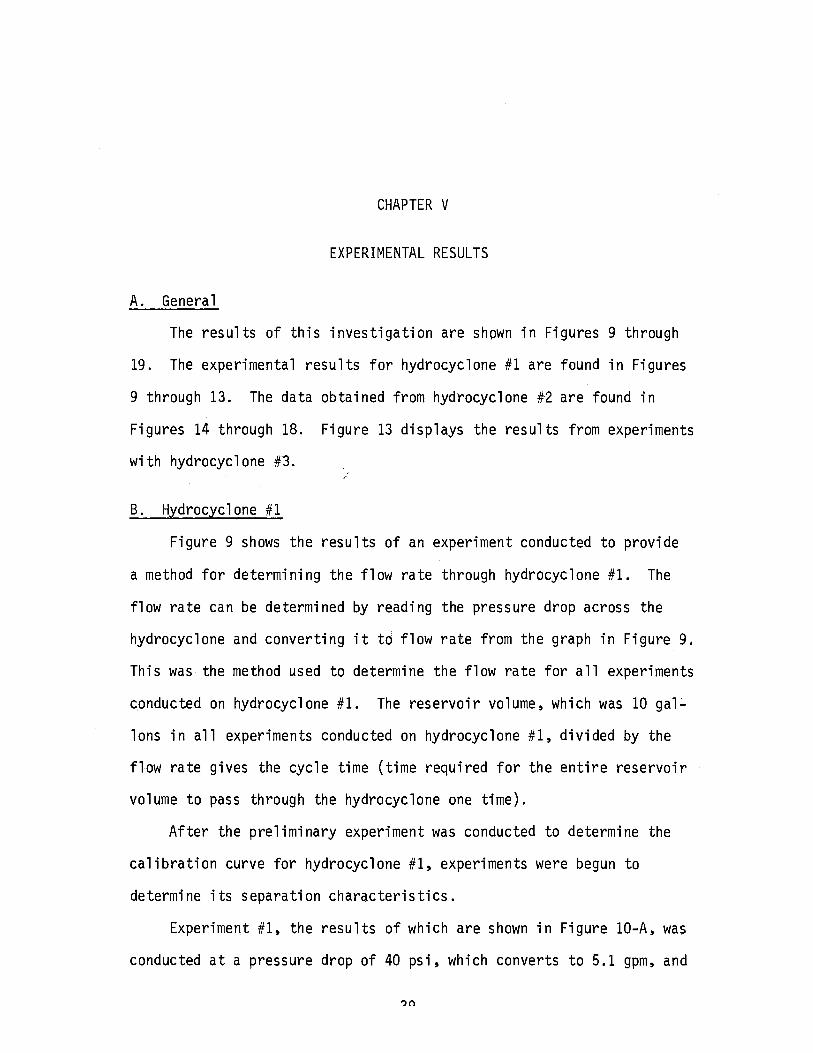
Figure 9 shows the results of an experiment conducted to provide
a method for determining the flow rate through hydrocyclone #1. The
flow rate can be determined by reading the pressure drop across the
hydrocyclone and converting it td flow rate from the graph in Figure 9.
This was the method used to determine the flow rate for all experiments
c.onducted on hydrocyclone #1. The reservoir volume, which was 10 gal
lons in all experiments conducted on hydrocyclone #1, divided by the
flow rate gives the cycle time (time required for the entire reservoir
volume to pass through the hydrocyclone one time).
After the preliminary experiment was conducted to determine the
calibration curve for hydrocyclone #1, experiments were begun to
determine its separation characteristics.
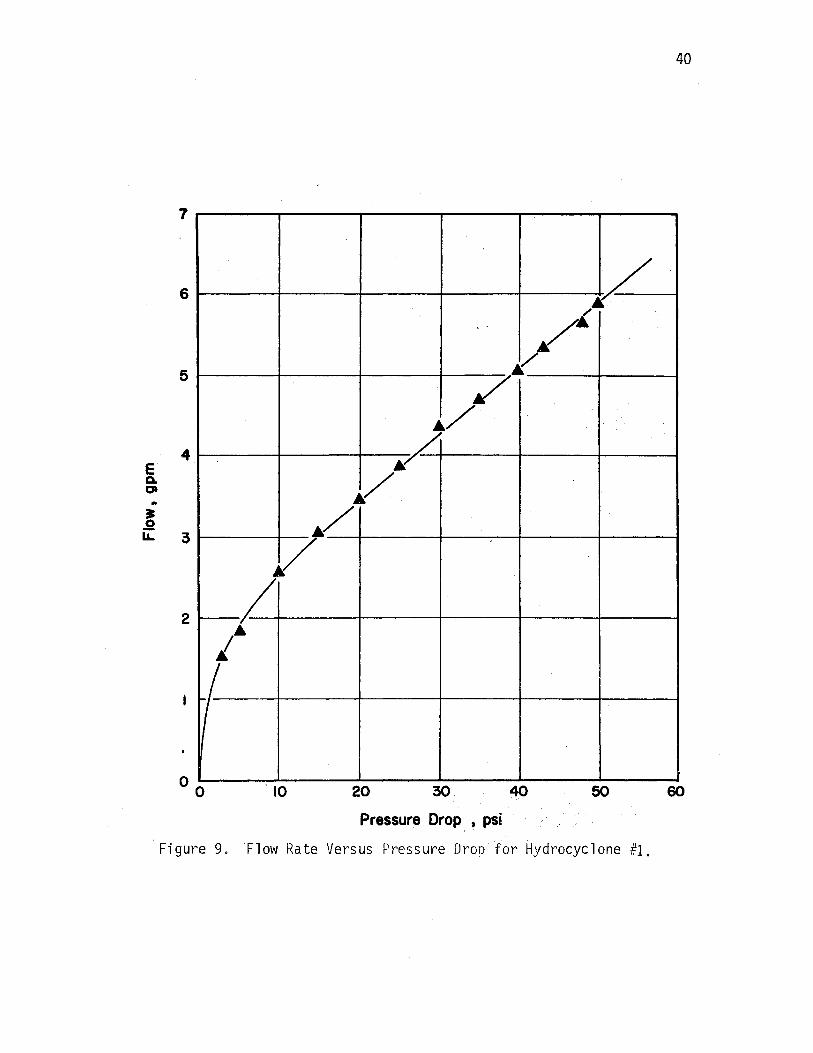
Experiment #1, the results of which are shown in Figure 10-A, was
conducted at a pressure drop of 40 psi, which converts to 5.1 gpm, and
.. ~ 0
7
6
5
4
iL 3
2
I-
00
40
~ / /A
~
7 /
.,/ A
/ /
7 L
1• ~
10 20 30 40 50 60
Pressure Drop , psi
Figure 9. Flow Rate Versus Pressure Droo for Hydrocyclone #I.
.. en
"O
j~
~~A ~~ " u ~ ~A--·c.
0 0 iD
0 0
'
\ -\
A\
20 40 Posses
-.
~'A.j
~ A~ A
~ ~o 40 80
Posses
41
,,
~ A\t
'A ~
\A 60
\ ~o 20 40 60
Posses
® ~--~..--~..-----.--~.--~....----, CD
A
I()
\ N CD
...... c> E .. (/) "O
~~ A ,.._ A 'A
0 ~ t
i:D I() N ,...
A
Passes
Figure 10. Results, Hydrocyclone #1 with Contamination Trap.
42
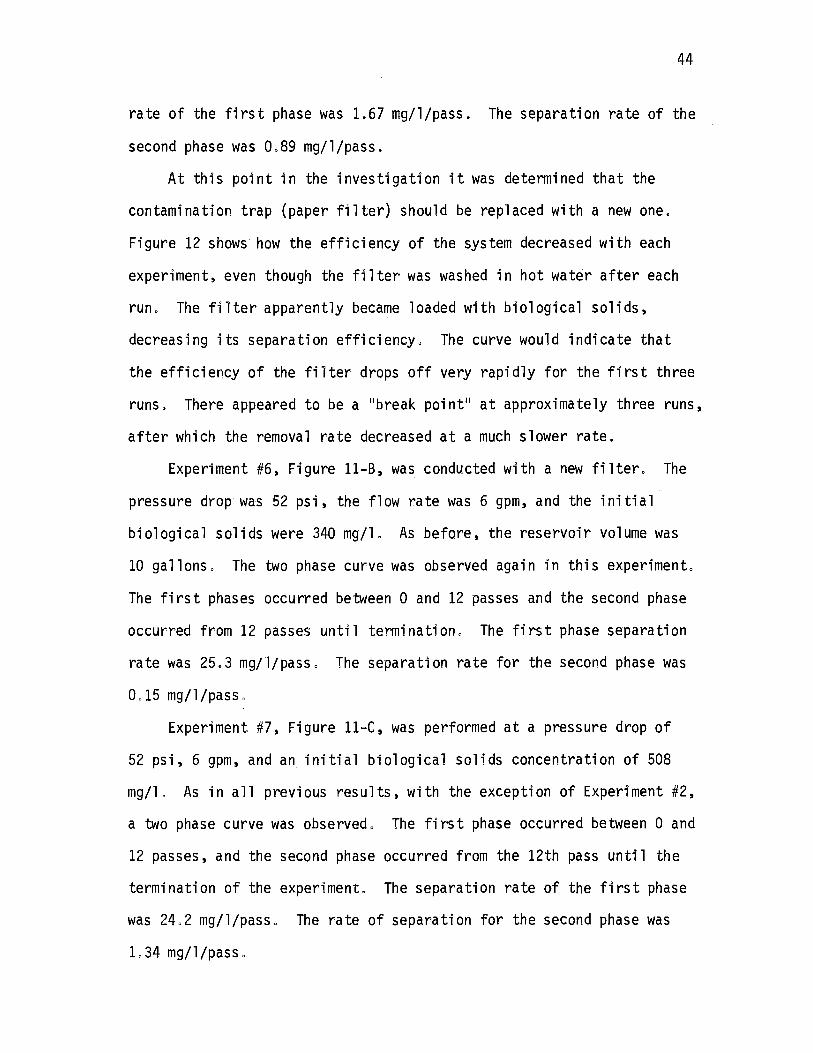
an initial biological solids concentration of 560 mg/l. The removal
curve obtained appears to be a two phase curve; the first phase, from
0 to 14 passes, having a separation rate of approximately 10,45 mg/l/
pass, and the second phase, from 14 passes until termination, having a
separation rate of approximately 1.75 mg/l/pass,
Experiment #2, Figure 10-B, was conducted at a pressure drop of
45 psi which converts to 5.45 gpm, and an initial biological solids
concentration of 480 mg/l, The separation rate in this experiment was
approximately 4,56 mg/l/pass,
Experiment #3, Figure 10-C, was conducted at a pressure drop of
46 psi, which was a flow rate of 5,55 gpm, and an initial biological
solids concentration of 212 mg/l, As in Experiment #1 the separation
curve is a two phase curve, the first phase occurring from 0 until 20
passes and the second phase occurring from 20 passes until termination,
The separation rate of the first phase was 3.45 mg/l/pass.
Experiment #4, Figure 10-D, was conducted at a pressure drop of
48 psi which was a flow rate of 5,7 gpm, and an initial biological
solids concentration of 860 mg/1, Again a two phase separation curve
was obtained, The first phase, from 0 to approximately 20 passes, had
a separation rate of 3.45 mg/l/pass, The second phase, from 20 passes
until termination, had a separation rate of 2,48 mg/l/pass.
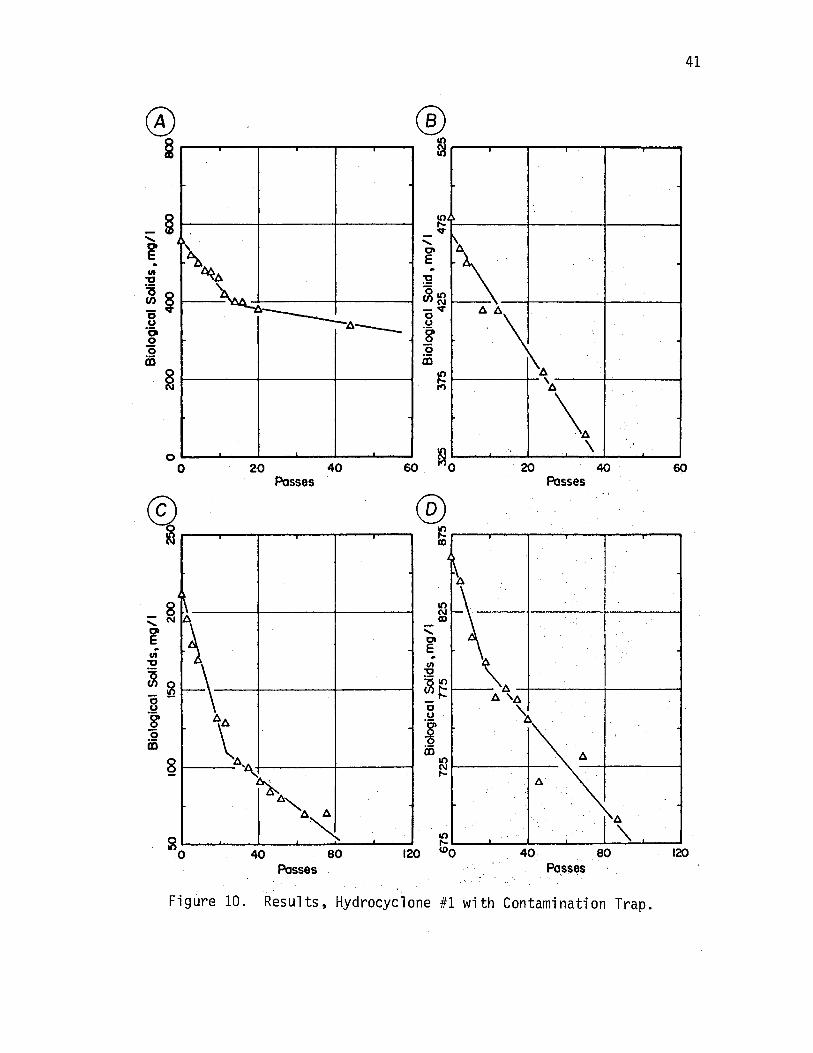
A pressure drop of 48 psi, therefore a flow rate of 5.70 gpm, and
an initial biological solids concentration of 452 mg/l were utilized
for Experiment #5, Figure 11-A. As before, a two phase curve was
obtained, the first phase occurring between 0 and 50 passes and the
second phase occurring from 50 passes until termination, The separation

43
® ~-----....-.--
•;\
--\ ., ~ ~
' t., n"-~~ .. l:i.
c
80 120 °o 40 .. 80 120 Passes Passes , :.,
© ® §--------T""---~~ .~----------------
; .
.. en .. :2
~ ~
l UI
---~---+-----1 ~ e l:i.4~·. ~~ . . 'l:i,-
.~ ·. : ... f . · .. < :. m \
~ ~ \..; .· . . ,. . •·
m~~·-'-~-1-----~~----i
·.··~ · ~o.____., __ 40~-...____..eo _ _..__ ...... 120 ° o · ·. 20 .. 40 60
Passes · .P,asse$
Figure 11. Results, Hydrocyclone #1, (A), (B), and (c)with Contamination Trap, Qu = 0, {D) without Contamination Trap, Qu = O.
44
rate of the first phase was 1.67 mg/l/pass. The separation rate of the
second phase was 0,89 mg/l/pass.
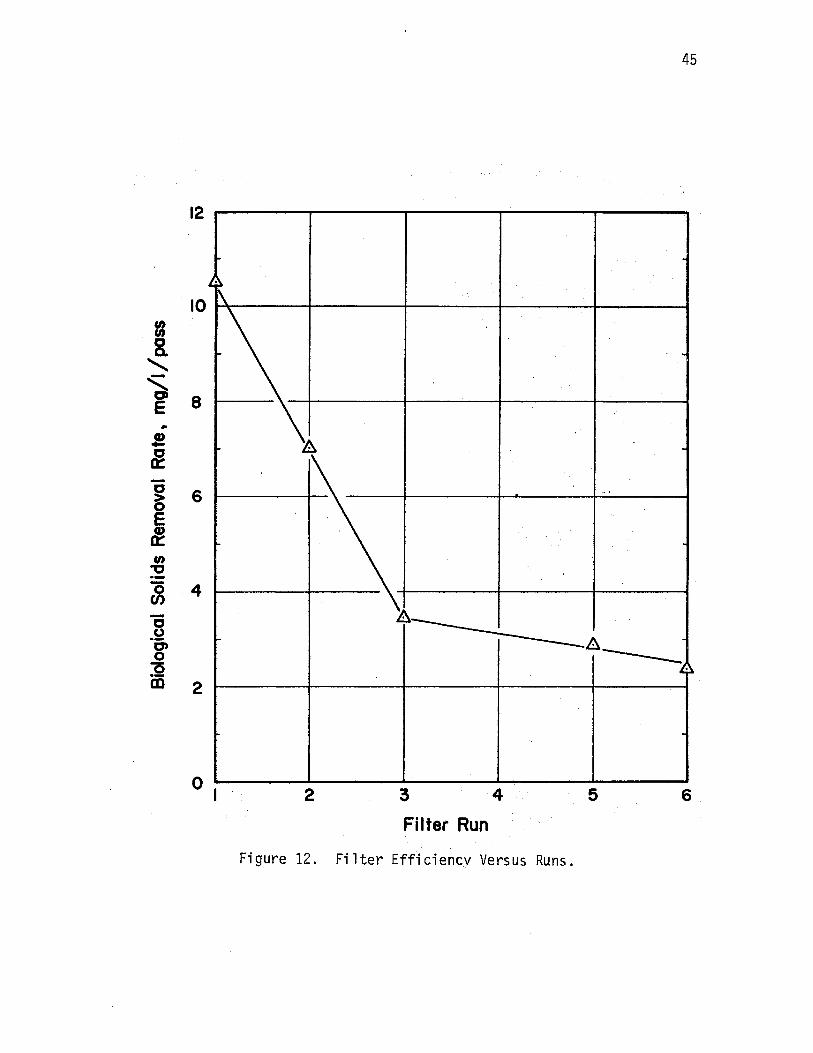
At this point in the investigation it was determined that the
contamination trap (paper filter) should be replaced with a new one.
Figure 12 shows how the efficiency of the system decreased with each
experiment, even though the filter was washed in hot water after each
run, The filter apparently became loaded with biological solids,
decreasing its separation efficiency, The curve would indicate that
the efficiency of the filter drops off very rapidly for the first three
runs. There appeared to be a 11 break poi nt 11 at approximately three runs,
after which the removal rate decreased at a much slower rate.
Experiment #6, Figure 11-B, was conducted with a new filter, The
pressure drop was 52 psi, the flow rate was 6 gpm, and the initial
biological solids were 340 mg/1. As before, the reservoir volume was
10 gallons, The two phase curve was observed again in this experiment,
The first phases occurred between 0 and 12 passes and the second phase
occurred from 12 passes until termination, The first phase separation
rate was 25.3 mg/l/pass, The separation rate for the second phase was
0,15 mg/l/pass,
Experiment #7, Figure 11-C, was performed at a pressure drop of
52 psi, 6 gpm, and an initial biological solids concentration of 508
mg/l. As in all previous results, with the exception of Experiment #2,
a two phase curve was observed, The first phase occurred between 0 and
12 passes, and the second phase occurred from the 12th pass until the
termination of the experiment. The separation rate of the first phase
was 24,2 mg/l/pass, The rate of separation for the second phase was
L34 mg/l/pass,
45
12
.. . .j·~
10 ~
gr 8. .... .
..........
' Ct 8 E .. .! ~
~
g 6 0
··'
E tl. U)
"t:J
~ 4
-c 8 -~ Ct 0 l?
8 ----,H m 2
o, 2 3 4 5 6
Filter Run
Figure 12. Filter Efficiency Versus Runs.
46
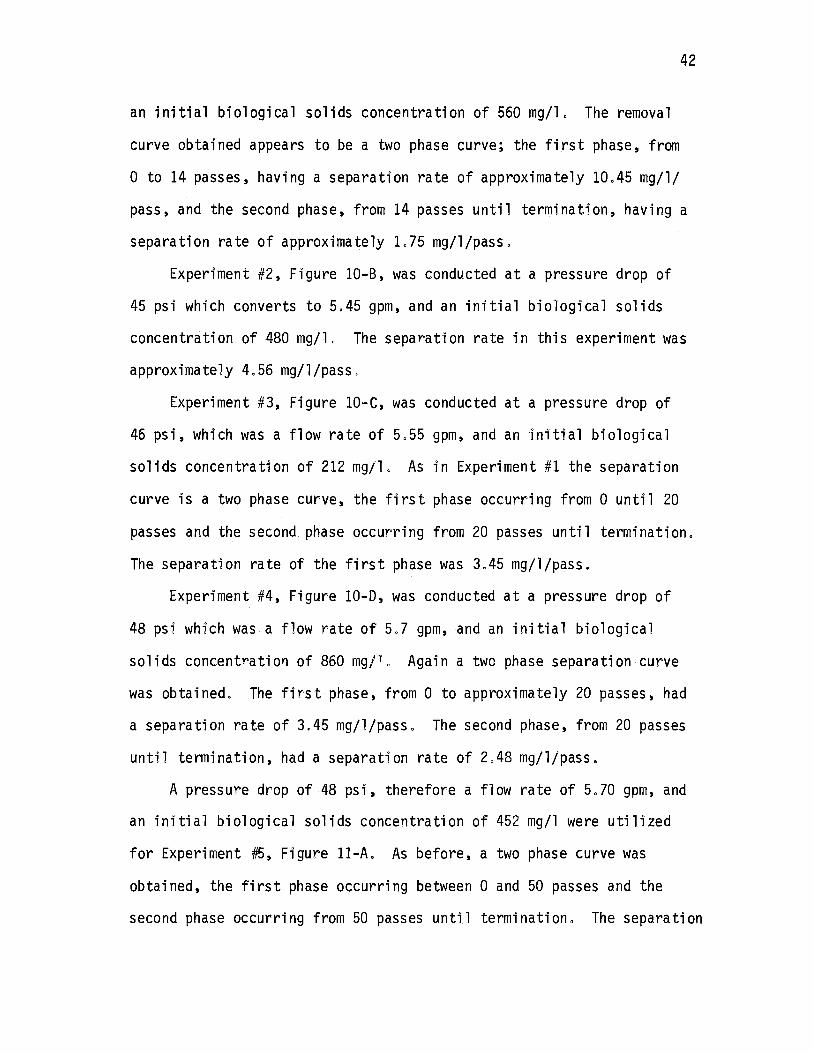
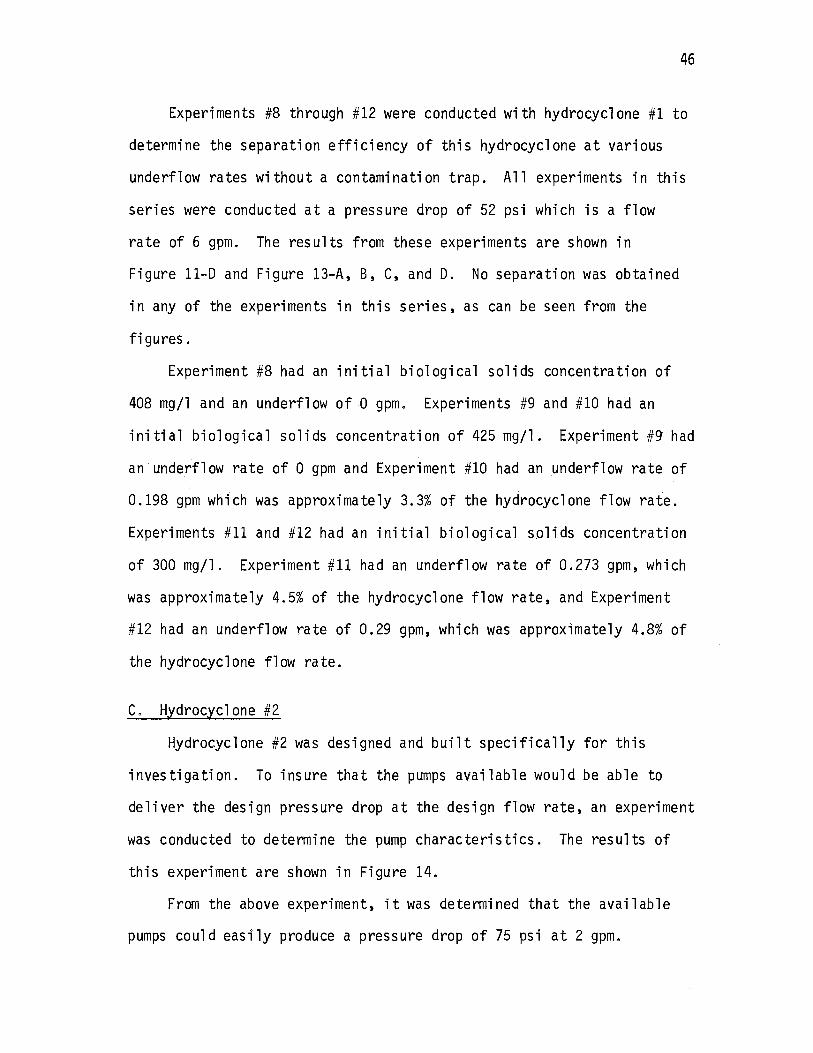
Experiments #8 through #12 were conducted with hydrocyclone #1 to
determine the separation efficiency of this hydrocyclone at various
underflow rates without a contamination trap. All experiments in this
series were conducted at a pressure drop of 52 psi which is a flow
rate of 6 gpm. The results from these experiments are shown in
Figure 11-D and Figure 13-A, B, C, and D. No separation was obtained
in any of the experiments in this series, as can be seen from the
figures.
Experiment #8 had an initial biological solids concentration of
408 mg/l and an underflow of 0 gpm. Experiments #9 and #10 had an
initial biological solids concentration of 425 mg/l. Experiment #9 had
an underflow rate of 0 gpm and Experiment #10 had an underflow rate of
0.198 gpm wh1ch was approximately 3.3% of the hydrocyclone flow rate.
Experiments #11 and #12 had an initial biological solids concentration
of 300 mg/l. Experiment #11 had an underflow rate of 0.273 gpm, which
was approximately 4.5% of the hydrocyclone flow rate, and Experiment
#12 had an underflow rate of 0.29 gpm, which was approximately 4.8% of
the hydrocyclone flow rate.
C. Hydrocyclone #2
Hydrocyclone #2 was designed and built specifically for this
investigation. To insure that the pumps available would be able to
deliver the design pressure drop at the design flow rate, an experiment
was conducted to determine the pump characteristics. The results of
this experiment are shown in Figure 14.
From the above experiment, it was determined that the available
pumps could easily produce a pressure drop of 75 psi at 2 gpm.
-
0 0
~
A A
~~-A:
0 0
.
Figure 13.
47
·®
.:..-A A-~
.
I
IO 20 Passes
.
A 6 30.-A-~~
.,
§ r----w---.--.--w-----.-, --...
,~~------1----~~--1 0 e .. -8 · -A-A__;.b. A is;--A-b._ ~ ~ .. oe~-----------+---------'"-+-----------1 .2 0 0 0 iii 2......,._ ___ __
· ...
10 20 30 Tlme,mln ... · ···
@ § ..---.-___ _,_,_......,...._____
·. . :.,·
§ ___ ...,........... ________ __ ...... r ..
i ' .fl A
~ e ..-----.,.--;--------1 -~--A-··· ....... ·--.~-·. -· --. -. ·'4--:-- "
CD ~ i----- --+----------: -· . .,-+-------------1
.. ,.· .
10 20
.O _____ _,_ _____ ..._ _______ _.
30 0 10 ·. '• 20·. · Time,mm. Tlnie,mln.
Results, Hydrocyclone #1 Without Contamination Trap, (A) Qu = 0, (B) Qu = 3,4% Q, (C) Qu = 4.6% Q, (D) Qu = 5.1% Q.
4.6
j~ ......
~ 4.0
3.5
3.0
E. 2.5 g; .. ~· LI.. 2.0
1.5
1.0
0.5
. 0.0 60
"' ~ .. "\
~ ~
·~ ··~
65 75 Pressure, psi
80
.. '
·~ . A
·. -,
"
85
Figure 14. Pump Curve for Design of Hydrocyclone #2.
48
-
••
90
49
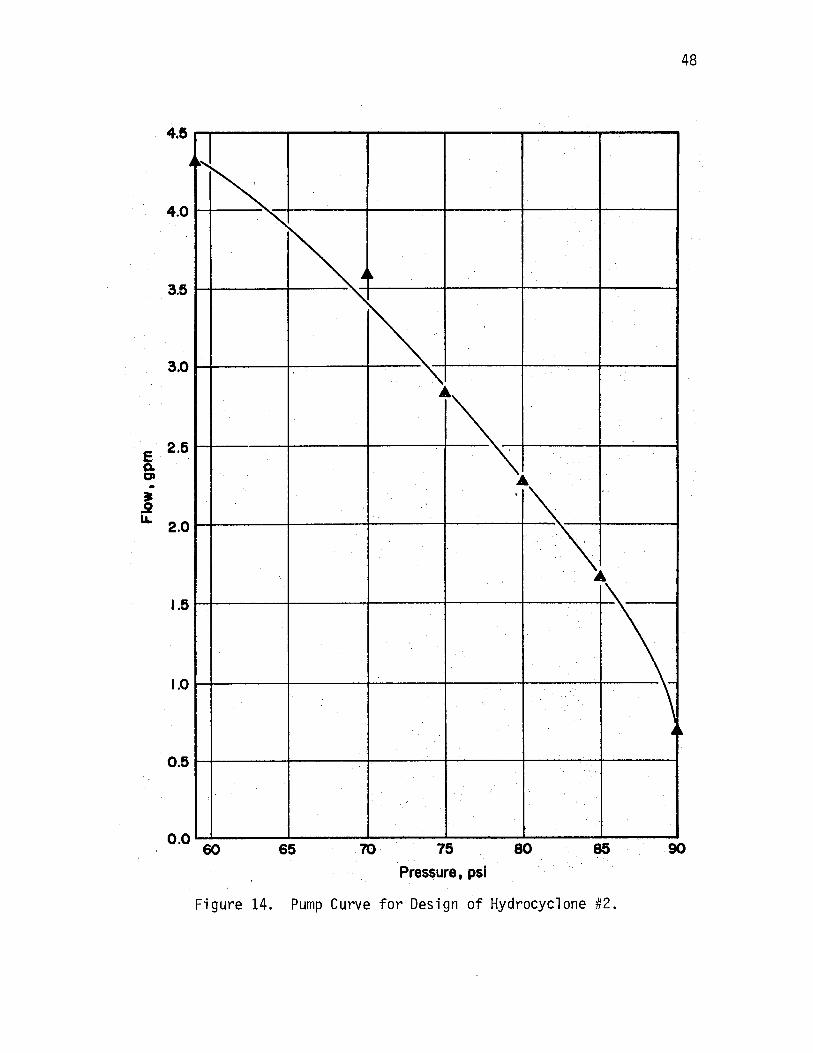
Therefore, hydrocyclone #2 was designed to operate at this pressure
drop and flow rate. However, the hydrocyclone was unable to produce a
flow rate of 2 gpm at 75 psi pressure drop. In fact, a flow rate of
only 1.34 gpm was produced at a pressure drop of 90 psi, which was the
maximum output of the available pumps. A possible explanation for this
apparent deficiency in flow rate at the design pressure drop could be
due to the oscillation that occurred in the pressure gauge, making
accurate pressure readings difficult. Any attempts to reproduce exper
iments in this investigation should be based on flow rate.
Sixteen experiments were conducted to determine the separation
characteristics of hydrocyclone #2. The results of these experiments
are shown in Figures 15 through 18. All of the experiments, with the
exception of Experiment #4 {Figure 15-D) were conducted at a pressure
drop of 80 psi and a flow rate of 1.31 gpm {as obtained by determining
the time required to fill a known volume). E~periment #4 was conducted
at a pressure drop of 90 psi which produced a flow rate of 1.34 gpm.
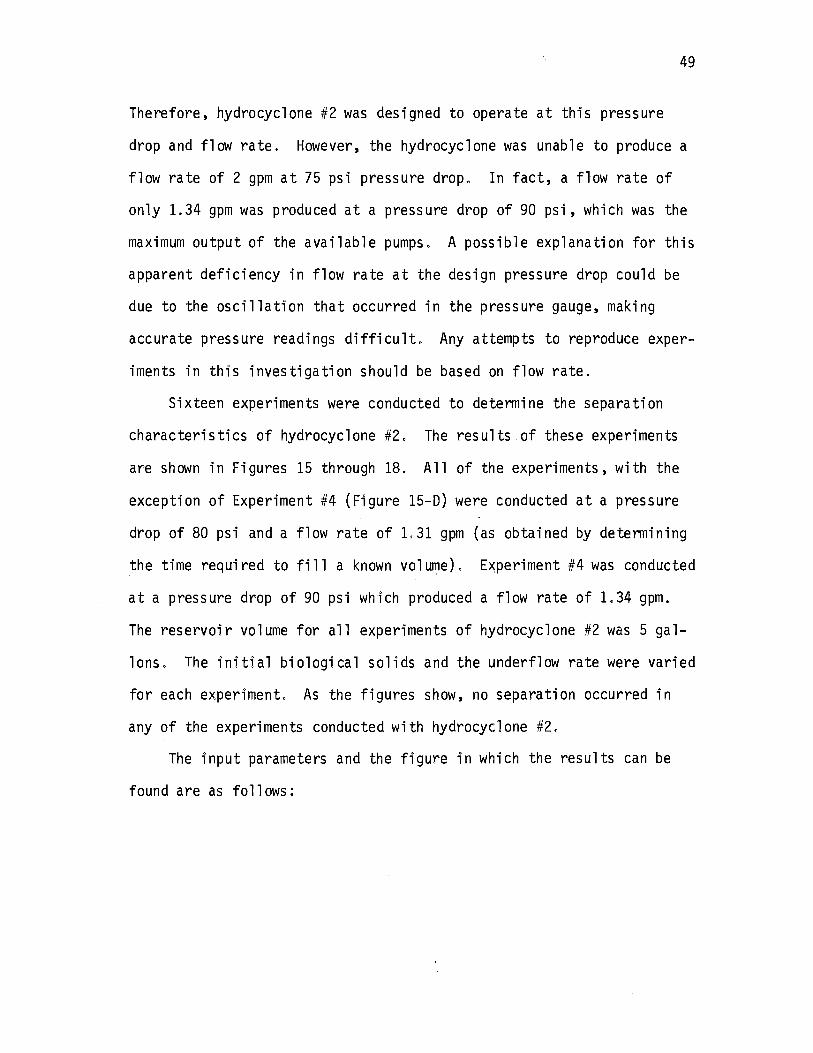
The reservoir volume for all experiments of hydrocyclone #2 was 5 gal
lons. The initial biological solids and the underflow rate were varied
for each experiment. As the figures show, no separation occurred in
any of the experiments conducted with hydrocyclone #2.
The input parameters and the figure in which the results can be
found are as follows:
50
® . . § ..---..,..--,.----.-~...--..,..---.
~t.-A-JJ.-b 6--
.
00 IO 20 30 °o IO 20 Timt,rnin. . TllM,rnin.
© e I I
@ ~,---....__,..____,..__,_ ____ __,
-A-A_.__A,--
O"-_.. _____ ...__....~-·--- o----"'~-------------0 10 20 30 0 IO 20
Tlme,min. Timt,nin.'
Figure 15. Results, Hydrocyclone #2, Qu = O.
.. Cl) 'O
~ 8 - N 0 .Y H .2 m
'
0 -A-t,;--A
0 0
I . IO 20
Tlme,mln.
I I '~·--~--A-Jl--l>:
-..... ~ i ~ 8 (/) N "6
I 8 .
A
- ~ i----+.---4--'---I
..... ~ .. Cl)
~
~~1----~----'--i---'-----I 8 ~ 0 iii
8 1------i-----1-------1
10 20. Time, min .... , ·
® ~ .
. --A-tj.__;_A--~--
- ~ l---4-----'----'--'--'--'----'
..... g .. Ill
::2 ~81----------'--i------J-_;_.;,...______,j -"' 8 ·si :-§ m
0 21----~----1--------1
o....-. __ ..._ ____ __,,_ _ _._ _ _._ __ ~
51
10 20 30 0 .10 .. ·.·20 30· . Tlme,mln. Tlme,mln.
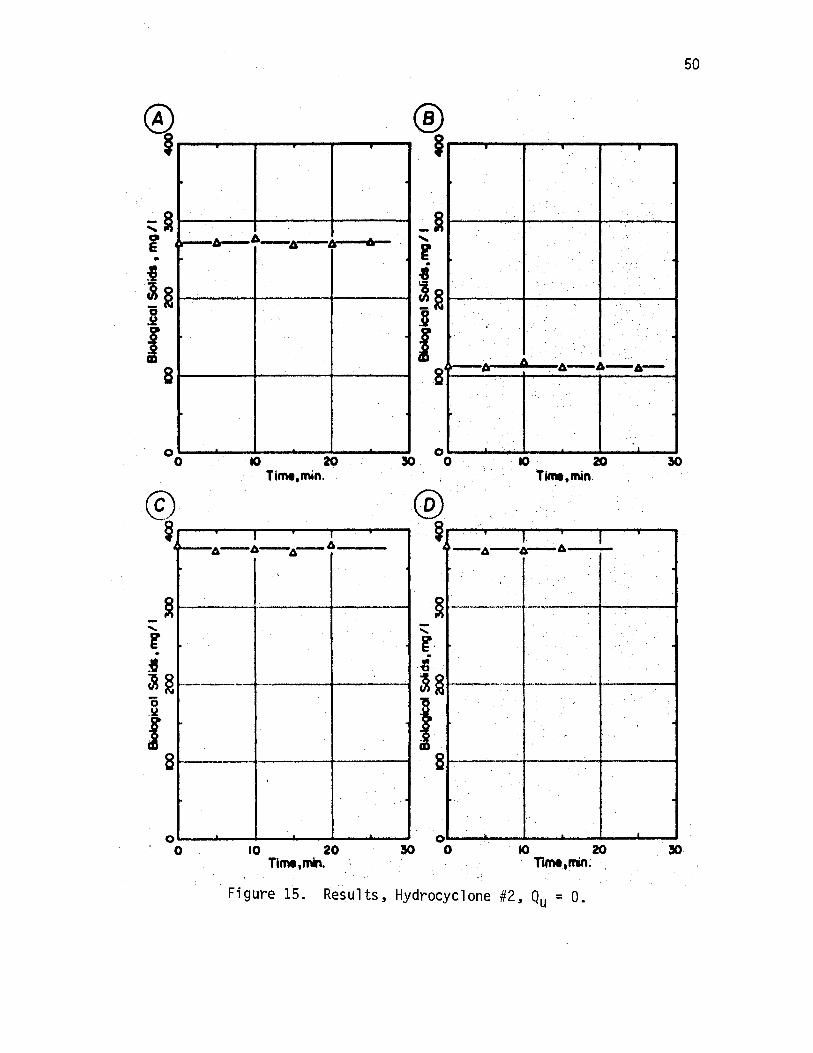
Figure 16. Results, Hydrocyclone #2, (A) Qu = 10.1% Q, (B) Qu = 7. 6% Q, ( C) Qu - 5. 4% Q, ( C) = 4. 2% Q.
I .
-~ ..... ~ .. ,_
,_
«ll>-L1.:--A---x--A-
00 10 20 Time, min.
i~A .:4-A-'b._
0 0 10 20
Thne, min.
I
-
-
..... C> E
~
8 N
8
0
52
'
~-A-A:_A_A . . .
...
30 0 10 20 30
-
-
Tlme,mln:
- ~t--------t--~----1 ..... ~ .. . fl)
ll .. i.
~ ~i---r---i---,.-----1r------t -~ f m
0 2
. ·.· -A_;;_A-· -A-.-. . -. - .. -------1
IO· 20 .. ao ilme1min. ·
Figure 17. Results, Hydrocyclone #Z, (A) ,Q-u"°l3.7 Q, tB) Ou= 10.9% Q> (C) Ou= 8,4% Q> (D) Ou~ 7.6~ Q.
53
® §-----
-~ ..... '~ i------+---+------1 Cl
0 e
4~___,..;..A-~-A-A--~-
0 0
I I IO 20
Tlme,mln.
'
E .. fl)
:E
~8~----.----.-4-~----.-1-----.----.-l 8"' ·c;, 0
~ A
·~1-----1-------1----~
-A~--~.A-··__.A.....__A___,
o.____. __ -a.---'-'-...---i...--'---~ 30 0 10 20 30
Tlme,mln;,
® ® ~------.._,........,._,_____________ ~------------------------
~------~-~,~~---.--4-----~~~ - Cl
' E ~ 0 ·-S
~~ ~~~---"-------~f--------1
I 1 m· ~
8 ~~-----~"'-'-"-~-----l
-A~A-A~A-A-. ·- -.-.-4-·.•-· A-··· -·.··A-·· .. _ .. _: A-·.· -
o'----i.-----'---1.----J..---i...--~ 0 IO 20.·
0 ...................... __ ....... _..,___....._ __ .____,
0 . . . . . .· 10 . ·, 20 30 .· Time,mln. · Time1min. ·
Figure 18" Re;ul~s, Hydrocyc~one. ~2, (~) O~ =_10.1: O, (B) Ou= 1 "6% O, (C) Ou~ 5.4% O, tD) ~u - 4.2% O.
54
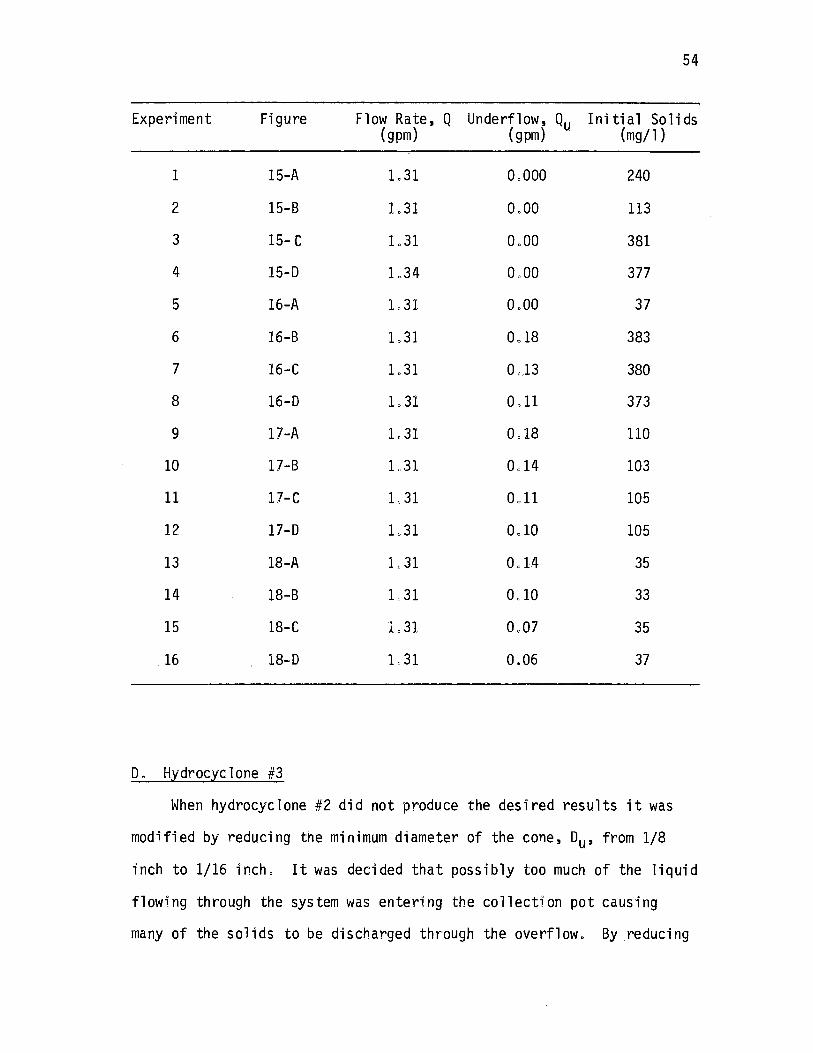
Experiment Figure Flow Rate, Q Underflow, Qu In i ti al So 1 ids (gpm) (gpm) (mg/ 1)
1 15-A L31 0,000 240
2 15-B L31 0,00 113
3 15- c 1.31 0.00 381
4 15-D L34 0,00 377
5 16-A L31 0.00 37
6 16-B L31 Ool8 383
7 16-C L31 0,13 380
8 16-D L31 0, 11 373
9 17-A L31 0, 18 110
10 17-B L31 0,14 103
11 17-C L31 Oo 11 105
12 17-D 1.31 Oo 10 105
13 18-A L31 0, 14 35
14 18-B L31 0,10 33
15 18-C L31 0,07 35
. 16 18-D L31 0.06 37
D, Hydrocyclone #3
When hydrocyclone #2 did not produce the desired results it was
modified by reducing the minimum diameter of the cone, Du, from 1/8
inch to 1/16 inch. It was decided that possibly too much of the liquid
flowing through the system was entering the collection pot causing
many of the solids to be discharged through the overflow. By reducing
the minimum diameter of the cone the amount of fluid entering the
co 11 ec ti on pot was reduced. There were no other modi fi ca ti ans made 0
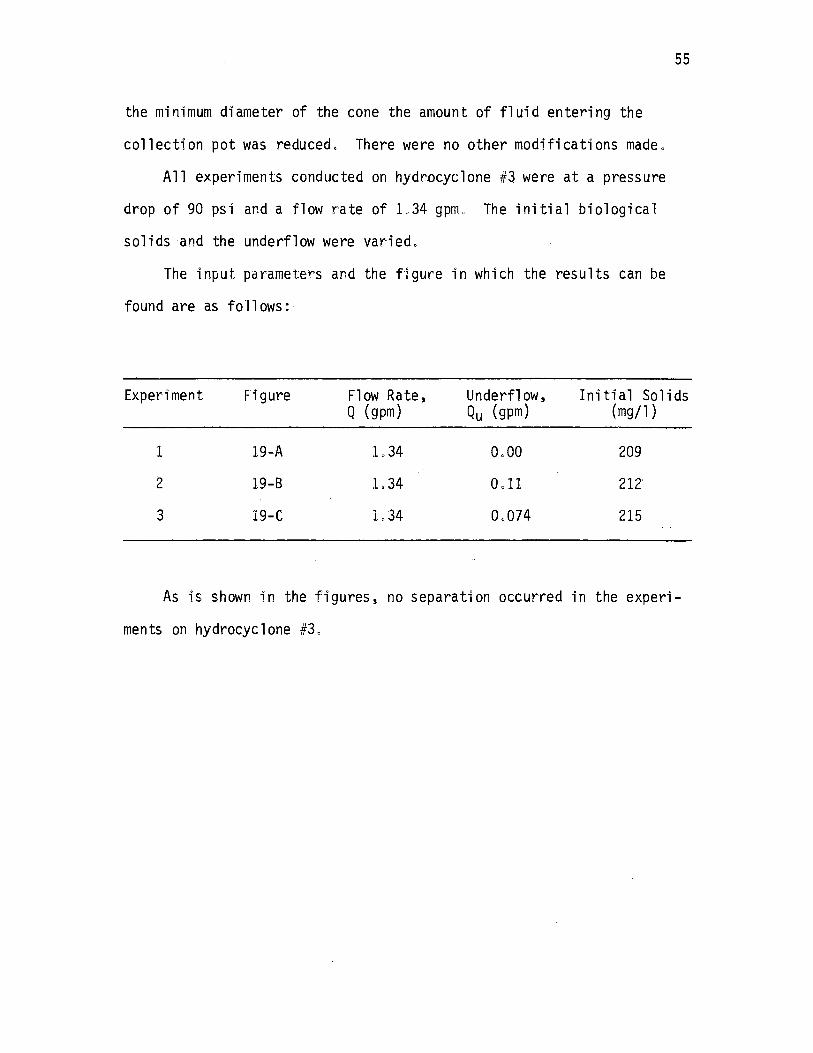
All experiments conducted on hydrocyclone #3 were at a pressure
drop of 90 psi and a flow rate of L34 gpm, The initial biological
solids and the underflow were varied.
The input parameters and the figure in which the results can be
found are as follows:
55
Experiment Figure Fl ow Rate, Q ( gpm)
Underflow, Ou (gpm)
Initial Solids (mg/l)
1
2
3
19-A
19-B
19-C
L34
1. 34
L34
209
212
215
As is shown in the figures, no separation occurred in the experi-
ments on hydrocyclone #3.
56
'~t--~~-t-~~-+-~~~
~ .. en :2
, .---.:'.A-~--A-A-6--, • ~ -A-A--A--A-i:Ja-. -N
0 0
.
Figure 19.
.~ - f
m 0 gi-------t--------+-"'"-----1
I
o--__,_,...__.. _________ __
10 20 30 0 IO 20 30 Tlme,mln. Time.min.' .
- ~-----1---.....-..... ff .. :G . . ~ 8 -A~A---:-A...--A~A~ - N .
. 8 i . ~ ~-,.--~-------~-.,........-'-I
o.____. _ _...._.._,......._ ___ ~----o. 10 ... 20 .·· 30
11me,mln ... ·. ·
Results, Hydrocyclone #3, (A) Qu = 0, (B) Qu = 8.2% Q, (C) Qu = 5.5% Q,

CHAPTER VI
DISCUSSION
The purpose of this investigation was to determirre the feasibility
of utilizing the hydrqcyclone for separating the biological solids from
a dispersed b~cteria1 systemo The results obtained in these experi
ments indicate that the hydrocyclone, in the configurations investi
gated, has limited application in this areao
. The only hydrocyclone configuration in which any separation
occurred was hydrocyclone #1 with the contamination trap. Hydrocyclones
#2 and #3 were unable to separate the biological solids from the mixed
liquor in any of the experiments conducted.
Based upon these results, it was considered that possibly the only
separation occurring in hydrocyclone #1 was that due to the mixed liquor
being filtered by the contamination trapo Based on calculations made
by Tiederman (39), the amount of fluid entering the collection pot in
hydrocyclone #1 was approximately 2% of the hydrocyclone flow rate, Q.
Assuming this to be true, a separation efficiency for the contamination
trap of 93o5% in Experiment #1, to an efficiency of 50% in Experiment 5
occurred. This drop in efficiency with each experiment seems to be
feasible and Figure 12 tends to strengthen this idea,
Experiments #6 and #7, however, produced results which tend to
show some separation by the hydrocyclone other than that removed by the
contamination trapo Again, if 2% of the flow is assumed to have been

58
acted upon by the contamination trap, 6.8 mg/l/pass would have been the
separation rate for Experiment #6, as compared to the observed rate of
25.3 mg/l/pass, and a separation rate of 10.6 mg/l/pass would have
occurred in Experiment #7, as compared with the observed rate of 24.2
mg/l/pass.
One possible explanation for this increased efficiency in Experi
ments #6 and #7 might be that the added pressure drop, therefore an
increase in flow rate, increased the inlet momentum of the hydrocyclone
to a high enough value to allow separation of the biological solids
from the mixed liquor in these two experiments.
Another possibility lies in the fact that the first contamination
trap used, Experiments #1 through #5, was 11 seasoned11 by operating the
hydrocyclone with a solution of clay suspended in water for a short
time. The second trap, Experiments #5 and #6, was not 11 seasoned 11 in
this manner. The first contamination trap (the 11 seasoned 11 trap) could
possibly have been loaded with clay particles to its capacity causing
it to be ineffective in the first series of experiments.
Two phase separation curves were observed in all experiments
conducted with hydrocyclone #1 with the contamination trap, with the
exception of-Experiment #2. In all cases where this was observed, the
first phase was observed to have a more rapid separation rate than the
second. The only explanation that could be given for this two phase
separation was that the biological solids built up to a finite level on
the contamination trap at which point much of the efficiency of the
trap was lost. With this hypothesis in mind, the separation rates of
the first five experiments were multiplied by the number of passes
occurring to the break point which was then multiplied by 37085 l
59
(reservoir volume, 10 gallons) giving the weight of biological solids
that had been separated by the first phaseo The valves were all very
near 4000 mg, The two phase separation curves observed in Experiments
#6 and #7 could also be explained by this hypothesiso Assuming 2% of
the total hydrocycl one fl ow was acted upon by the contamination trap
in both of these experiments, a.nd a trap efficiency of 100%, the same
type of calculations as above yield nearly the same results, approxi
mately 4000 mg of solids removed by the filter in the first phase.
This characteristic of the contamination trap would indicate that
there are likely to be several problems in the development of a useable
hydrocyclone system. A contamination trap that must be cleaned after
short periods of operation will be of limited use in an actual full
scale unit. Several possibilities do exist, however, that could feasi
bly overcome these problems.
One such solution might be to have two or more uni ts so that one
could carry the load while the other was being cleaned.
Another possibility might be to develop a continuous bleed system
where the solids buildup could be continuously bled from the contamina
tion trap.
In all of the experiments conducted without the contamination trap
the results were the same; no separation occurred. Experiments of this
nature were conducted with all three hydrocyclones at various underflow
rates,
One possible explanation for the inability of the hydrocyclones in
this configuration to separate the biological solids might be that
insufficient flow rate occurred in the hydrocyclones to provide the
necessary inlet momentum. Hydrocyclones #2 and #3 were to operate at a
60
pressure drop of 75 psi and 2 ga11ons per minute. They failed to
produce this flow rate at a pressure drop of even 90 psio At 90 psi
the flow rate in both hydrocyclones #2 and #3 was 1.34 gpmo The pumps
used in this investigation were unable to deliver a greater flow rate
or pressure drop, therefore hydrocycl ones #2 and #3 were never operated
at their design flow rate of 2 gallons per minute.
CHAPTER VII
CONCLUSIONS
The results of this investigation support the following
conclusions:
(1) At the pressure drops and flow rates investigated a contamina~
tion trap was necessary for separation of the biological solids from a
dispersed bacterial system.
(2) The contamination tra14_has a finite holding capacity, after
which the separation efficiency of the system is greatly decreased.
(3) Befo·re any separation wi 11 occur due to the effect of the
hydrocyclone, very high inlet momentums must be obtained. In order ·to
generate sufficient inlet mQmentum, the system must be operated at high
pressure drops and fl ow rates.
C1
CHAPTER VIII
SUGGESTIONS FOR FUTURE STUDY
From the results of this investigation, the following suggestions
are made for future study on the utilization of the hydrocyclone for
separation of biological solids from a dispersed bacterial system:
(1) The design and construction of hydrocyclones that operate at
pressure drops in excess of 100 psic
(2) Methods for continuously bleeding the biological solids from
the contamination trap, and development of contamination traps that
lend themselves to continuous bleeding.
(3) Study power requirements for typical hydrocyclone configura
tions.
(4) Deve'lop design equations for the prediction of hydrocyclone
performance on dispersed biological systems.
(1)
(2)
(3)
(4)
(5)
(6)
( 7)
( 8)
(9)
( 10)
( 11)
SELECTED BIBLIOGRAPHY
Pipes, Wesley 0., 11 Types of Activated Sludge which Separate Poorly, 11 Jour. Water Pollution Control Federation, 41, 5, 714- 724 ( 1969) . . -
Maciula, L. Andrew, and Reed, Robert E., Stillwater, Oklahoma, Assignors to Oklahoma State University, Stillwater, Oklahoma, Patent 3,529,724.
Walker, and Dougherty, 11 Use of Polyelectrolyte Coagulants to Enhance Settling Characteristics of Activated Sludge. 11 Engineering Bulletin of Purdue University, 715 (May 4, 5, and 6, 1965) , -
Braithwaite, L., 11 Polymers as Aids to the Pressure Flotation of Wastes Activated Sludge. 11 Water and Sewage Works, 545-547 (December, 1964).
Goodman, Brian L., and Witcher, Preston_C., 11 Polymer-Aided Sludge Elutriation and Filtration, 11 Jour. Water Pollution Control Federation, 37, 12, 1643-1656 (1965).
Ford! Davis L, and Eckenfelder, Wesley W,, 11 Effect of Process Variables of Sludge Floe Formation}' Jour. Water Pollution Control Federation, 39, 11, 1850 (1967 . , -
Singer, Philip C., Pipes, Wesley O., and Hermann; Edward R., 11 Flocculation of Bulked Activated Sludge with Polyelectrolytes.11 Jour, Water Pollution C-ontrol Federation, 40, 2 Part 2, Rl {1968). -
Tenny, Echelberger, Coffey, and McAloon, 11 Chemical Conditioning of Biological Sludges for Vacuum Filtration. 11 Jour. Water Pollution Control Federation, 42, Rl (1970).
Sirnon, E. R°' and Lee, D" 11 Sludge Density Control with Sonar. 11 Jour, Water Pollution Control Federation, 42, 298 (1970).
Culp, Gordon L., Hsiung, Kou-ying, and Conley, Walter R.", 11 Tube Clarification Process. 11 Jour. San. Engr. Div., ASCE, ~' SA5, 829-847 (1968).
Reed, Sherwood C., and Murphy, R. Sage, 11 Low Temperature Activated Sludge Settling. 11 Jour. San. Engr. Div., ASCE, 96, SA4, 747-763 (1969). -
(12) Dick, Richard L, 11 Role of Activated Sludge in Final Settling Tankso 11 Jour. San. Engr. Div., ASCE, 96, SA2, 423-436 (1970). - - - -
64
(13) Pipes, Wesley 0., and Jones, P.H., 11 Decomposition of Organic Wastes by Sphaerotilus. 11 Biotechnology and Bioengineering, 87 (1963L
(14) Richards, E., and Sawyer, G. C., 11 Further Experiments with Activated Sludge. 11 Jour. Society of Chemical Industries, i!_, 61 (1922).
(15) Hazen, A., 11 0n Sedimentation. 11 Transactions American Society of Civil Engineers, 53, 45 (1904).
(16) Camp, L R"' 11 Sedimentation and the Design of Settling Tanks. 11
Transactions American Society of Civil Engineers, 111, 895 (1946). -
(17) Eliassen, R., Discussion, Transactions American Society of Civil Eng'ineers, 111, 947 (1946L
(18) Camp, T. R., Discussion, TrQ.n.sactions American Society of Civil Engineers, 111, 952 (1946).
(19) Schmitt, E. A., and Voight, 0. D., 11 Two Story FlocculationSedimentation Basin for the Washington Aqueduct. 11 Jour. American Water Works Association, i!_, 837 (1949). --
(20) Dresser, H. G., 11 Trays Nearly T'riple Settling Tank Capacity. 11
Engineering News Record, 147, 32 (November 29, 1951).
(21) Hansen, S. P .. , Cu"lp, G. L., and Stukenberg, J. R., 11 Practical Application of Idealized Sedimentation Theory in Wastewater Treatment. 11 Jour. Water Pollution Control Federation, 41, 8, Part 1, 1421-1444 ( 1969). -
(22) Culp, G. L, and Hsiung, K., 11 Tube Clarification Process Operating Experiences. 11 Jour. San. Engr. Div., ASCE, 95, SA5, 829-847 ( 1969) 0 -
(23) , 11 Analysis of Flotation Thickening of Waste Activated Sludge, 11 Water and Sewage Works, 111, 1, 68-69 (1965).
(24) Geinopolos, A., and Katz, W. J., 11 A Study of a Rotating Cylinder Sludge Collector in D·issolved-Air Flotation Process. 11 Jour. Water Pollution Control Federation, 36, 1, 712-721 (196-zi:y:-
(25) Keefer, Co E., and Krotz, H., 11 Experiments on Dewatering Sewage with a Centrifuge. 11 Jour. Water Pollution Control Federation, 1_, 1, 120 (1929 .
(26) Pecker, J. S., 11 Centrifugals. 11 Jour. Water Pollution Control Federation, Q., 11, 991 (1936 .
(27) Albertson, 0. E., and Guidi, E. E., 11 Centrifugation of Waste Sludge. 11 Jour. Water Pollution Control Federation, 41, 4, 607-628 (1969) 0 -
65
(28) Kraus, LS., and Longby, J. R., "Concentrating Activated Sludge with a Continuous Feed Centrifuge. 11 Jour. Water Pollution Control Federation, _!l, 1, 9 (1939)"
(29) Bradney, L., and Bragstad, R. L, "Concentration of Activated Sludge by Centrifuge." Jour. Water Pollution Control Federation,'!]_, 4, 404 (1955).
(30) Tchobanogfous, G., and Eliassen, R., "Filtration of Treated Sewage Effluent. 11 Jour. San. Engr. Div,, ASCE, 96, SA2, 243-265 ( 1970). '
(31) , 11 Water Pollution Control Research Series Advanced Waste Treatment Research, Summary Report Advanced Waste Treatment. 11
U. S. Dept. of the Interior FWPCA, Publication WP-20AWTR-19, 9-27 (July, 1964 - July, 1967).
'.
(32) Tangel, O. F,, and Brison, R. J., 11 Wet Cyclones. 11 Chemical Engineerin~, .§_£, 2, 234-238 (1955).
(33) Campbell, John M., 11 Centrifugal Mist Extractors. 11 The Oil and Gas Journal, 54, 101-102 (March 26, 1956),
(34)
(35)
( 36)
( 37)
(38)
(39)
Bergman, W. E., Engle, S. J., Marwill, S. J., Porter, E. W., 11liquid Cyclone Cuts Cost of Treating Drilling Fluids. 11
The Oil and Gas Journal, 54, 9, 114-116 (October 15, 1956).
Lummus, J. L,, and Scott, P. P., Jr., 11 Cyclones Score 77 to 100 Per CenL 11 The Oil and Gas Journal, 55, 106-110 (February 25, 1957) 0 -
Haas, P.A., Nurmi, E. 0., Whatley, M. E., and Engle, J. R., 11 Midget Hydrocyclones Remove Micron Particles. 11 Chemical Engineering Progress, _§1, 4, 203-207 (1957).
Tangel, 0. F" Brison, R. J., 11 Wet Cyclones. 11 Chemical Engineer.i.!
(40)
(41)
(42)
(43)
(44)
Dahlstrom, D, A., 11 Cyclone Operating Factors and Capacities on Coal and Refuse Slurries. 11 Transactions of the American Institute of Mining Engineers, 184, 331-344 (1949).
Yoshioka, N., and Hatta, A., Chemical Engineering (Japan), 632-640 ( 1955).
Kelsall, D. F., 11 A Study of the Motion of Solid Particles in a Hydraulic Cyclone. 11 Transactions Institution of Cheniical Engineers, (London), 30, 87-108 (1952).
Kelsall, D. F., 11 A Further Study of the Hydraulic Cyclone. 11
Chemical Engineering Science, _g_, 254-272 (1953).
66
, Standard Methods for the Examination of Water and Waste__ w_a..,....ter, 12th Ed., APHA, New York, (1965).

APPENDIX
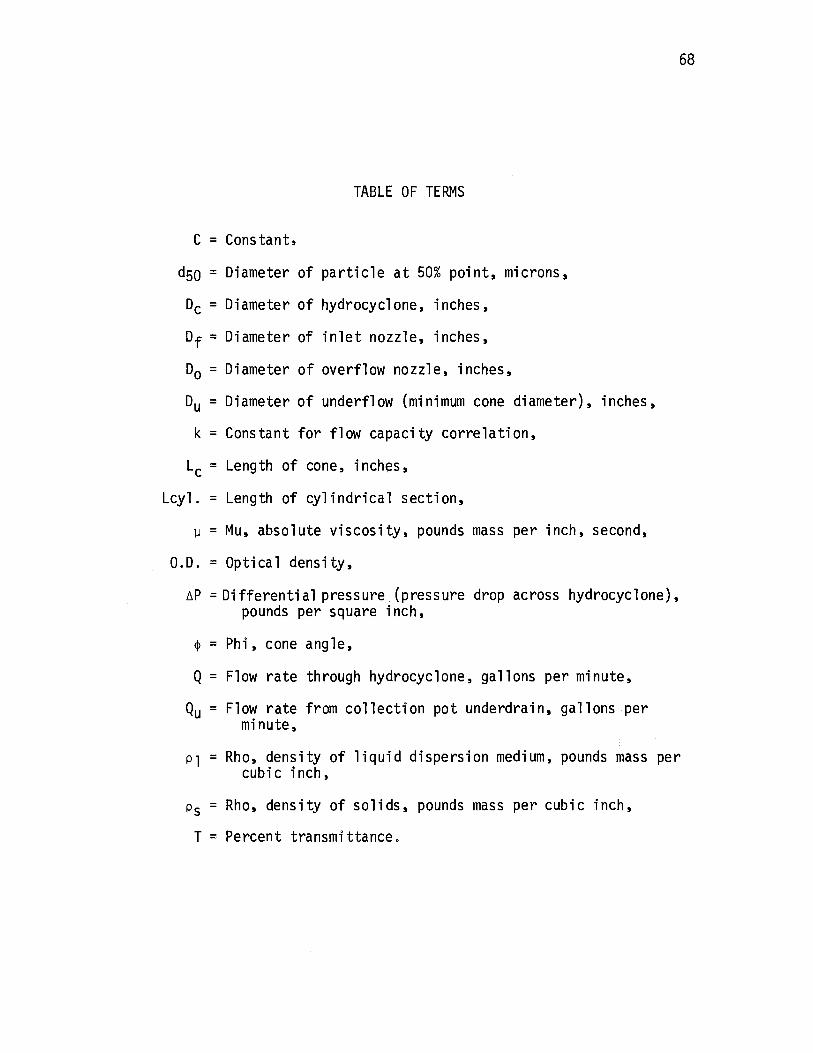
TABLE OF TERMS
C = Constant,
dso = Diameter of particle at 50% point, microns,
De = Diameter of hydrocyclone, inches,
Df = Diameter of inlet nozzle, inches,
D0 = Diameter of overflow nozzle, inches,
Du= Diameter of underflow (minimum cone diameter), inches,
k = Constant for flow capacity correlation,
Le = Length of cone, inch~s,
Lcyl. =Length of cylindrical section,
µ = Mu, absolute viscosity, pounds mass per inch, second,
O.D. = Optical density,
~p =Differential pressure (pressure drop across hydrocyclone), pounds per square inch,
~ = Phi, cone angle,
Q = Flow rate through hydrocyclone, gallons per minute,
Qu = Flow rate from collection pot underdrain, gallons per minute,
68
Pl = Rho, density of liquid dispersion medium, pounds mass per cubic inch,
Ps = Rho, density of solids, pounds mass per cubic inch,
T = Percent transmittance.
VITA
Kent Edward Patterson
Candidate for the Degree of
Master of Science
Thesis: THE PRIMARY APPLICATION OF THE HYDROCYCLONE FOR THE SEPARATION OF BIOLOGICAL SOLIDS FROM DISPERSED BACTERIAL SYSTEMS
Major Field: Bioenvironmental Engineering
Biographical:
Personal Data: Born January 29, 1947, in Anthony, Kansas, the~ of Wendell and Betty Patterson. r·.·
/
Education: Graduated from Anthony Rural High School, Anthony Kansas, in 1965; received the Degree of Bachelor of Science in Civil Engineering from Oklahoma State University, Stillwater, Oklahoma, in May 1969; received the Master of Science Degree from Oklahoma State University, Stillwater, Oklahoma, in May 1971.
Professional Experience: Civil Engineer with the U. S. Army Corps of Engineers, Tulsa District, May 1969 - September 1969; Undergraduate Research Assistant, Oklahoma State University, October 1967 - May 1968 and August 1968 - May 1969.
Membership in Professional Societies: American Society of Civil Engineers, American Water Works Association, Water Pollution Control Federation, Chi Epsil~n"