THE PRESTIGE DISASTER AND THE PROPOSAL FOR A EUROPEAN FUND FOR THE COMPENSATION OF OIL POLLUTION...
305
ISSN 2066-575X www.seap.usv.ro/annals Revistă cotată CNCSIS, categoria B+ / Indexată în baze de date internaţionale THE ANNALS OF THE "ŞTEFAN CEL MARE" UNIVERSITY OF SUCEAVA. FASCICLE OF THE FACULTY OF ECONOMICS AND PUBLIC ADMINISTRATION VOLUME 11, NO. 2(14), 2011 Editura Universităţii Ştefan cel Mare din Suceava
-
Upload
independent -
Category
Documents
-
view
0 -
download
0
Transcript of THE PRESTIGE DISASTER AND THE PROPOSAL FOR A EUROPEAN FUND FOR THE COMPENSATION OF OIL POLLUTION...
ISSN 2066-575X www.seap.usv.ro/annals
Revistă cotată
CNCSIS, categoria B+ /
Indexată în baze de date
internaţionale
THE ANNALS OF THE "ŞTEFAN CEL MARE"
UNIVERSITY OF SUCEAVA. FASCICLE OF THE FACULTY OF
ECONOMICS AND PUBLIC ADMINISTRATION
VOLUME 11, NO. 2(14), 2011
Editura Universităţii Ştefan cel Mare din Suceava
The Annals of The "Ştefan cel Mare" University of Suceava. Fascicle of The Faculty of Economics and Public Administration Vol. 11, No. 2(14), 2011
2
EDITORIAL BOARD:
Editor‐in‐chief: Carmen NĂSTASE General editorial secretary: Adrian Liviu SCUTARIU Editors: Elena HLACIUC, Carmen CHAŞOVSCHI, Mariana LUPAN, Ovidiu Florin HURJUI SCIENTIFIC COMMITTEE:
Angela ALBU, „Ştefan cel Mare” University of Suceava, Romania Paolo ANDREI, University of Studies in Parma, Italy Stefano AZZALI, University of Studies in Parma, Italiy George P. BABU, University of Southern Mississippi, USA Christian BAUMGARTNER, International Friends of Nature, Austria Grigore BELOSTECINIC, ASEM, Chi şinău, Republic of Moldova Ionel BOSTAN, „Alexandru Ioan Cuza” University of Iaşi, Romania Aurel BURCIU, „Ştefan cel Mare” University of Suceava, Romania Gheorghe CÂRSTEA, Academy of Economic Studies, Bucharest , Romania Slobodan CEROVIC, Singidunum University, Belgrade, Serbia Simion CERTAN, State University of Chişinău, Republic of Moldova Carmen CHAŞOVSCHI, „Ştefan cel Mare” University of Suceava, Romania Liliana ELMAZI, Tirana University, Albania Cristian Valentin HAPENCIUC, „Ştefan cel Mare” University of Suceava, Romania Elena HLACIUC, „Ştefan cel Mare” University of Suceava, Romania Elena IFTIME, „Ştefan cel Mare” University of Suceava, Romania Marian JALENCU, State University of Chişinău, Republic of Moldova Miika KAJANUS, Savonia University of Applied Sciences, Iisalmi, Finland Alunica MORARIU, „Ştefan cel Mare” University of Suceava, Romania Maria MUREŞAN, Academy of Economic Studies, Bucuresti, Romania Carmen NĂSTASE, „Ştefan cel Mare” University of Suceava, Roman ia Alexandru NEDELEA, „Ştefan cel Mare” University of Suceava, Romania Ion PÂRȚACHI, ASEM, Chişinău, Republic of Moldova Rusalim PETRIŞ, „Ştefan cel Mare” University of Suceava, Romania Abraham PIZAM, University of Central Florida, Orlando, Florida Ion POHOAȚĂ, „Alexandru Ioan Cuza” University of Iaşi, Romania Gabriela PRELIPCEAN, „Ştefan cel Mare” University of Suceava, Romania Gheorghe SANDU, „Ştefan cel Mare” University of Suceava, Romania Petru SANDU, Elizabethtown College, Pennsylvania, USA Doru TILIUȚE, „Ştefan cel Mare” University of Suceava, Romania Viorel ȚURCANU, ASEM, Chişinău, Republic of Moldova Diego VARELA PEDREIRA, University of A Coruna, Spain Răzvan VIORESCU, „Ştefan cel Mare” University of Suceava, Romania Text review: Adrian Liviu SCUTARIU. Cover design: Adrian Liviu SCUTARIU Contact: Faculty of Economics and Public Administration „Ştefan cel Mare” University of Suceava Str. Universităţii nr. 13, Corp H, Camera H108 720229 SUCEAVA, ROMANIA Phone: (+40) 230 216147 ext. 294 E-mail: [email protected] Journal web site: www.seap.usv.ro/annals Faculty web site: www.seap.usv.ro University web site: www.usv.ro
Întreaga răspundere asupra conţinutului articolelor publicate revine autorilor. The entire responsability for the content of the published articles rests with the authors.
The Annals of The "Ştefan cel Mare" University of Suceava. Fascicle of The Faculty of Economics and Public Administration Vol. 11, No. 2(14), 2011
3
CONTENT
SECTION 1. ECONOMY, TRADE, SERVICES ................................................................... 6 DOES EU MEMBERSHIP AFFECT THE SOCIAL AND LABOUR INCLUSION OF FOREIGN PRISONERS IN SPAIN? AN ANALYSIS OF SELF-PERCEPTIONS AND ATTITUDES TOWARDS LEARNING ..........................................................................................7
Isabel NOVO-CORTI María RAMIL María BARREIRO-GEN
SUSTAINABLE DEVELOPMENT IN BUCOVINA REGION – ANALYSIS OF TOURISTIC POTENTIAL IN SUCEAVA BASIN.............................................................................................16
PhD. Student Constantin COCERHAN Professor PhD. Carmen NĂSTASE
ONLINE EDUCATION - AN IMPORTANT ISSUE FOR THE LABOR MARKET..............25 Assoc. Prof. PhD. Diana-Mihaela POCIOVĂLIŞTEANU PhD. Lecturer Liana BADEA
THE PRESTIGE DISASTER AND THE PROPOSAL FOR A EUROPEAN FUND FOR THE COMPENSATION OF OIL POLLUTION DAMAGE: A MISSED OPPORTUNITY FOR THE EUROPEAN UNION? ...........................................................................................................32
Javier PRADO-DOMÍNGUEZ Diego VARELA
QUALITATIVE OBSERVATION APPLIED IN PROMOTIONAL STRATEGY DESIGN .40 Associate Professor Adriana MANOLICĂ Teaching assistant, PhD. Claudia BOBÂLCĂ Teaching assistant, PhD. Oana CIOBANU
IS THERE A STABLE RELATIONSHIP BETWEEN REAL INTEREST RATES AND HOUSING PRICES? EVIDENCE FROM SEVERAL EURO AREA COUNTRIES ..............46
José Manuel SÁNCHEZ SANTOS José Pablo ABEAL VÁZQUEZ
CHARACTERISTICS OF THE ILLEGAL DRUG MARKETS IN EUROPEAN UNION ....56 Scientific Researcher PhD. Irina CAUNIC Professor PhD. Gabriela PRELIPCEAN
STRATEGIES FOR ACHIEVING COMPETITIVE ADVANTAGE .......................................63 Assistant Professor Jusuf ZEKIRI Associate Professor Ph.D. Alexandru NEDELEA
TEA PRODUCTION, CONSUMPTION AND EXPORTS IN GLOBAL AND BANGLADESHI PERSPECTIVE.................................................................................................74
Tasnuba NASIR Mohammad SHAMSUDDOHA
COMBINING COMPANIES – A SOLUTION FOR OVERCOMING THE ECONOMIC CRISIS EFFECTS ...........................................................................................................................81
Lecturer Ph.D. Nicoleta Cristina MATEI THE EVOLUTION OF THE CUSTOMS UNION.......................................................................86
Lecturer PhD. Marius BOIŢĂ Professor PhD. Dorina ARDELEAN Professor PhD. Cristian HAIDUC
THE ROLE OF COMMERCIAL BANKS FROM ROMANIA IN THE ATTRACTION OF STRUCTURAL FUNDS..................................................................................................................91
PhD. Corina BERICA
The Annals of The "Ştefan cel Mare" University of Suceava. Fascicle of The Faculty of Economics and Public Administration Vol. 11, No. 2(14), 2011
4
MEASURING ECONOMIC GLOBALIZATION – FACTS AND FIGURES..........................99 Ph. D. Student Marius C. APOSTOAIE
PHARE CROSSBORDER GRANTS AND CHANGES IN THE CROSSBORDER ECONOMY. STUDY CASE – ROMANIAN-UKRAINIAN BORDER ...................................110
PhD. Student Marcela SLUSARCIUC THE INCOME INEQUALITY IN THE EASTERN EUROPEAN COUNTRIES: A COMPARATIVE STUDY FOR THE PERIOD 1990-2010.......................................................119
PhD. Student Cristina Gabriela SUSANU HOW CAN WE ANTICIPATE CRISES? ..................................................................................128
Ph.D. student Elena Bianca VIERU
SECTION 2. MANAGEMENT AND BUSINESS ADMINISTRATION ............................. 135 SUSTAINABLE DEVELOPMENT POLICIES IMPACT ON FOREIGN DIRECT INVESTMENT...............................................................................................................................136
Associate Professor PhD. Costică MIHAI HUMAN RESOURCES MANAGEMENT MATURITY MODEL..........................................143
Associate Professor PhD. Carmen CHAŞOVSCHI EMPLOYABILITY MANAGEMENT: IS HIGHER EDUCATION IN CRISIS? .................149
Assistant Professor Nikhil Chandra SHIL Alok Kumar PRAMANIK
SOME FEATURES OF POSTWAR BUSINESS CYCLES ......................................................166 Assistant PhD. Student. Mihaela IFRIM
THE ROLE OF EMOTIONAL INTELLIGENCE IN TRANSFORMATIONAL LEADERSHIP AND REAL ESTATE MARKET IN POST-COMMUNIST MARKETS.....173
Teaching Assistant PhD. Student Sorin ANAGNOSTE Teaching Assistant PhD. Student Costin DAMAŞARU
SECTION 3. ACCOUNTING ‐ FINANCES ..................................................................... 180 DIFFERENTIAL FINANCIAL REPORTING FOR MICRO-ENTITIES: ADVANTAGES AND LIMITS .................................................................................................................................181
Professor PhD. Ramona NEAG ASSESSING THE IMPACT OF XBRL IN RAPORTATIONS ISSUED BY CREDIT INSTITUTIONS.............................................................................................................................188
Lecturer Ph.D. Mariana VLAD Ph.D. Student Ioana COLBU PhD. Student Alexandra Narcisa CIOBAN
QUALITY THROUGH EDUCATION IN AUDITING.............................................................194 Lecturer Ph.D. Ionela-Corina CHERSAN Lecturer Ph.D. Maria BERHECI (căs. GROSU)
THE ASSETS OF THE COMPANY – A THEORETICAL AND PRACTICAL APROACH RELATING PARTICULARLY TO INTELLECTUAL CAPITAL ........................................201
Assistant PhD. Student Irina MIHAI PhD. Student Alexandra-Daniela SOCEA Assistant PhD. Student Marius CIUBOTARIU
THE TREASURY OPERATING MECHANISM IN ROMANIA............................................208 Nicoleta IONESCU (EFTENE) Gabriela MIHAI (ANDREESCU)
The Annals of The "Ştefan cel Mare" University of Suceava. Fascicle of The Faculty of Economics and Public Administration Vol. 11, No. 2(14), 2011
5
IMPLICATIONS OF FISCAL CONSOLIDATION IN EU ON THE BACKGROUND OF PROMOTING SUSTAINABLE ECONOMIC GROWTH.......................................................214
PhD. Candidate Elena TOMA PhD. candidate Marius FRUNZĂ
CONVERGENCE PROCESS- PRECONDITION FOR ENSURING FINANCIAL AND MONETARY STABILITY IN EURO AREA.............................................................................225
PhD. Student Anca Elena NUCU OCKHAM’S RAZOR IN THE ANALYSIS OF INTANGIBLE CAPITAL? .........................233
PhD. student Cristina Ionela FĂDUR PhD. student Daniela CIOTINĂ
THE ROLE OF MUTUAL FUNDS IN U.S. ECONOMY .........................................................239 PhD. Student Delia-Elena DIACONAŞU
ANALYSIS OF THE ECONOMICAL-FINANCIAL BUSINESS OF THE CONTRIBUTORS – SUPPORT OF THE TAX EVASION FIGHT .........................................................................245
PhD. Student George Dorin DEDU
SECTION 4. STATISTICS, DATA PROCESSING (INFORMATICS) & MATHEMATICS... 251 STATISTICAL WAVES OF THE BUDGETARY FINANCING OF EDUCATION AND SCIENE IN UKRAINE .................................................................................................................252
Associate Professor Ph.D. Olesia TOTSKA EDGES DETECTION METHODS BASED ON FILTERING FOLLOWED BY APPLICATION OF DIFFERENTIAL OPERATORS FOR FINGERPRINT .......................258
Ph.D. Student Cătălin LUPU SECTION 5. LAW AND PUBLIC ADMINISTRATION ................................................... 265 MODELS OF THE IMPLEMENTATION IN ROMANIAN CIVIL SERVICE AT THE LOCAL LEVEL.............................................................................................................................266
Assoc. Prof. PhD. Dorina ŢICU THE LEGAL EUROPEAN CUSTOMS REGIME ....................................................................274
Lecturer PhD. Dumitrita FLOREA (IONESCU) Lecturer PhD. Parascheva NISIOI
LAW FROM AUGUST 14, 1938 BETWEEN TRADITION AND INNOVATION, NECESSITY AND OPPORTUNITY...........................................................................................281
Lecturer PhD. Student Marilena-Oana NEDELEA AUTONOMY AND DECENTRALIZATION - CURRENT PRIORITIES IN THE LOCAL PUBLIC ADMINISTRATION MANAGEMENT......................................................................288
University Assistant Ph.D. Candidate Petronela ZAHARIA LEGAL SYSTEM OF PUBLIC LIMITED LIABILITY COMPANIES .................................293
University Assistant Ph.D. Candidate Eugenia Gabriela LEUCIUC
INSTRUCȚIUNI UTILE PENTRU AUTORI / AUTHOR GUIDELINES ............................. 303
The Annals of The "Ştefan cel Mare" University of Suceava. Fascicle of The Faculty of Economics and Public Administration Vol. 11, No. 2(14), 2011
6
SECTION 1
ECONOMY, TRADE, SERVICES
The Annals of The "Ştefan cel Mare" University of Suceava. Fascicle of The Faculty of Economics and Public Administration Vol. 11, No. 2(14), 2011
DOES EU MEMBERSHIP AFFECT THE SOCIAL AND LABOUR INCLUSION OF FOREIGN PRISONERS IN SPAIN? AN ANALYSIS OF SELF-PERCEPTIONS AND
ATTITUDES TOWARDS LEARNING
Isabel NOVO-CORTI University of A Coruña, Faculty of Economics and Business, Campus de Elviña, 15071 A Coruña, Spain
[email protected] María RAMIL
University de A Coruña, Faculty of Economics and Business, Campus de Elviña, 15071 A Coruña, Spain [email protected]
María BARREIRO-GEN University de A Coruña, Faculty of Economics and Business, Campus de Elviña, 15071 A Coruña, Spain
Abstract: Movements of people linked to the processes of globalization lead to the formation of foreign cultural and
ethnical groups, which may generate risk of exclusion. When these people have committed crimes, and have been punished for them, this risk is increased. In this paper we analyze the case of foreign prisoners in the Northwest region of Spain. We rely on qualitative and quantitative research conducted in prisons. By means of statistical analysis of equality-of-means t-test, we found greater difficulties for the inclusion of foreign prisoners, as well as significant differences in self-perceptions of this group in relation to Spaniards, especially in the groups of non-EU foreigners. These differences are particularly apparent in matters relating to the education processes and employment training conducted within prisons. Taking into account these differences would allow designing specific education and training policies to promote the social integration and employment of the foreign-born inmate population, minimizing thus the risk of exclusion.
Keywords: social exclusion, prisoners, foreign, comparison of means JEL Classification: J00 INTRODUCTION The sustainability of any social structure necessarily involves the inclusion of each and
every one of its members. A society with ghettos or groups without their own space will hardly achieve those levels of development needed for its survival over time (Wiliamson & Pickett, 2008).
Globalization is characterized by the high speed and increasing size of international relations and exchanges. People's mobility is thus growing, and societies become much more pluralistic, with the growing presence of cultural and ethnic minority groups. If societies are not flexible and tolerant enough, situations where the is a risk of exclusion will soon arise (Sen, 2000).
When these minority groups, for whatever reason, are, in addition, part of another minority group (disabled, elderly, homosexuals, drug addicts, criminals, etc.), the risk of exclusion increases and therefore, society can see its own structure and sustainability threatened.
The process of multiple risk of exclusion faced by foreign prisoners is shown in Figure no. 1, which states that migration is linked to globalization, which creates social groups, which for the only fact of being composed by foreigners, gives them different cultural characteristics (sometimes also ethnic), linked to the emergence of the risk of exclusion, which increases the risk of marginalization and/or crime, thus reinforcing the group qualitative differences and increasing the differential characteristics, entering a into a vicious circle. This allows the accumulation of reasons that lead to the risk of multiple exclusion, entering into a feedback mechanism in which the exclusion processes are reinforced and augmented. That is, exclusion causes crime, which in turn leads to exclusion, and so on.
The Annals of The "Ştefan cel Mare" University of Suceava. Fascicle of The Faculty of Economics and Public Administration Vol. 11, No. 2(14), 2011
8
THEORETICAL BACKGROUND Inclusion is therefore a goal for all societies pursuing the survival of their own
organizational and operational schemes, i.e. whose goal is sustainable social development. But inclusion cannot be achieved without a strong knowledge of each and every groups that should be included. Thus, the consideration of all the social groups is essential in a developed society. The fight against social exclusion in general, and multiple exclusion in particular, becomes a prime target (Silver, 1995). In fact, this concern is reflected in world declarations, such as the Millennium Development Goals (UN, 2000), or the European Agenda 2020, that sets the achievement of sustainable and inclusive growth as one of its objectives (COM, 2010).
Sometimes, situations of exclusion lead to crime, which in turn leads to exclusion (Herrero, 2003), so that the wheel of multiple exclusion begin to roll.
In this paper we present a study based on the convicted population in the northwest region of Spain (region NUTS at level 2), in order to know their home country peculiarities, and then be able to know if nationality really affects the opportunities for inclusion. If so, it would be possible to carry out some actions to reverse the situation of multiple exclusion of this group. For that reason, we made a survey among prisoners in the prisons of Galicia to evaluate possible differences in attitudes linked to nationality that could affect future opportunities for convicts.
In order to to perform the analysis, we developed a questionnaire that we distributed among the convict population of Galician prisons. This survey reflects the opinions and perceptions of inmates. We are aware that prisoners may belong to organized criminal gangs internationally, as part of a superstructure, and escape, to some extent, to the exclusion processes discussed here. However, their individual assessments on the prison system would remain valid. Similarly, we see that the group of foreign inmates as a heterogeneous group, which should be subject to further analysis.
The importance of taking into account the views and perceptions of the group of foreign prisoners relies on the high risk of social exclusion they face. But we must also bear in mind that they are a significant part of the prison population. According to the Ministry of Home Affairs (Government of Spain), 35 percent of inmates in Spanish prisons are foreigners (Ministry of Home Affairs, 2009). Therefore, the proportion of non-nationals is high, and represents over a third of the prison population. In recent years, in absolute terms, there was an increasing trend in the number of foreign prisoners, although it decreased in 2011. However, since the total convicted population has also declined, foreigners account for a similar share of the population as in the previous year.
With respect to the country of origin, the largest foreign inmate population come from South America, followed by North Africa. Foreign prisoners from the European Union amounted, in 2009, to 18.9% of the foreign prison population in Spain, according to the Ministry of Home Affairs. The number of Romanian prisoners in Spanish jails was 2169, accounting for 8% of all the foreigners in prison. Thus, Romania is at the top of EU, followed by Portugal, with 557 inmates (2.1% of total foreigners).
In this paper, we investigate how foreign prisoners, particularly, the ones that comes from the European Union, perceive their future outlook, and if their perceptions and attitudes differ (or not) from those of Spanish prisoners.
METODOLOGY The work is divided into two parts: in the first one, we analyzed the different areas pointed
out for Subirats i Humet, Carmona and Brugué Gomà Torruella (2005) as the essential pillars of social inclusion, namely labour and economy, education and training, and famili and society..Our aim is to study the nature and magnitude of the differences between the possibilities of inclusion for Spanish and foreign prisoners.
Subsequently, we carried out a fieldwork focused on the study of the prisoners perceptions on these pillars (Family and Society, Education and Labor), depending on their nationality, and also
The Annals of The "Ştefan cel Mare" University of Suceava. Fascicle of The Faculty of Economics and Public Administration Vol. 11, No. 2(14), 2011
9
related to their language and their belonging or not to the European Union. In order to do this, we used a statistical analysis for comparison of means, analyzing the values of the "Student t" in order to find statistically significant differences in the responses. The questionnaire was based on a set of questions that we asked to inmate population so that they expressed how much they agree or disagree with specific statements, according to a Likert scale, where the value 1 corresponds to strongly disagree and 5 is complete agreement. We performed a pretest to 50 inmates, after that, we proceeded to the purification of the questionnaire, eliminating redundant questions and wrong understanding. The final test was translated into Arabic, with support from the Official School of Languages in A Coruña, due to the presence of prisoners of Arabic origin, with whom the research team had some communication problems.
Family and Social Area: In this regard, we found that public visibility is a major factor, essential for inclusion. In
Spain there is a high level of the condemned "without papers", we mean that they are not in legal status. Illegal residence of foreigners in the country of destination makes the problems of exclusion grow and multiply, worsening the situation considerably. That is the main reason to analyze the foreign prison population separately from that of European Union countries, which enjoy the status of EU citizens, and do not have this problem. However, they still have their own language and cultural differences, such as those from Central and Eastern Europe. This is a differential issue that may generate groups at risk of exclusion.
On the other hand, having support from family or friends is essential to achieve a normal life after leaving prison. In the case of foreigners, they often have their family abroad and, in many cases, the family does not know that they are in prison, so they must face alone this difficult situation. Foreigners face limitations on family reunification and they are expelled from the country as a preferential sanction (foreigners are given the option not to pay the whole of their term in prison if they accept to leave the country and commit not to return for a number of years), making it more difficult to leave the prison and quickly begin a normal life (Ribas et al, 2005). Furthermore, the social networks of the inmate are often the only way they have, for example, to get a job, being one of the most important mechanisms for achieving social inclusion. If they lack these networks, the adaptation process is complicated, so they need the help of an intermediary, such as an association (Ribas et al, 2005).
Economic and Labor sphere: Leaving prison with a lawful source of income, such as a job or a pension, is decisive for
non-recidivism. Those prisoners who have good prospects in the labor market reoffend less, while those who do not, among which are almost always foreigners, relapse more easily, especially if they have drug problems (Entford, 2009 ).
Education and Training sphere: Having previous training and undertaking training courses in prison are a definite plus for
inmates to find a job after they leave prison. Education is therefore a precondition to make reintegration easier (Smerotkina, 2010). An attempt, for example, to make the prison environment more relaxed and facilitate education is the implementation of the "modules of respect", which promote the activity of prisoners and good manners (Cantero, 2010). Despite these efforts, we must take into account the high percentage of illiteracy in prison. Often, even if inmates can read and write, they have considerable difficulties, because they lack reading and writing habits (Bhatti, 2009). Among foreigners, an important part do not speak Spanish well. For this reason, we have dedicated a special section to the differentiation of the foreign prison population between Spanish-speakers and the rest.
Consequently, the potential inclusion of foreign prisoners is lower overall than that of national prisoners, even those that enjoy European citizenship. After considering these spheres, we decided to conduct a questionnaire for the inmates to further examine these aspects of prisoners’ life
The Annals of The "Ştefan cel Mare" University of Suceava. Fascicle of The Faculty of Economics and Public Administration Vol. 11, No. 2(14), 2011
10
and see the aspects that can be targeted in order to get out of the situation of social exclusion they face.
EMPIRICAL ANALYSIS The study has been carried out in the region of Galicia, located in the Northwest of Spain.
There are five prisons in Galicia: Teixeira, Bonxe, Monterroso, Pereiro de Aguiar and A Lama. There are also two Social Integration Centres (CIS), with third grade prison population (semi-freedom).
One of the main difficulties in the implementation of this work has been the access to the prison population. Entry into prisons has required nominal permits for each of the members of the research team from the Ministry of Interior of the Government of Spain (Penitentiary Institutions).
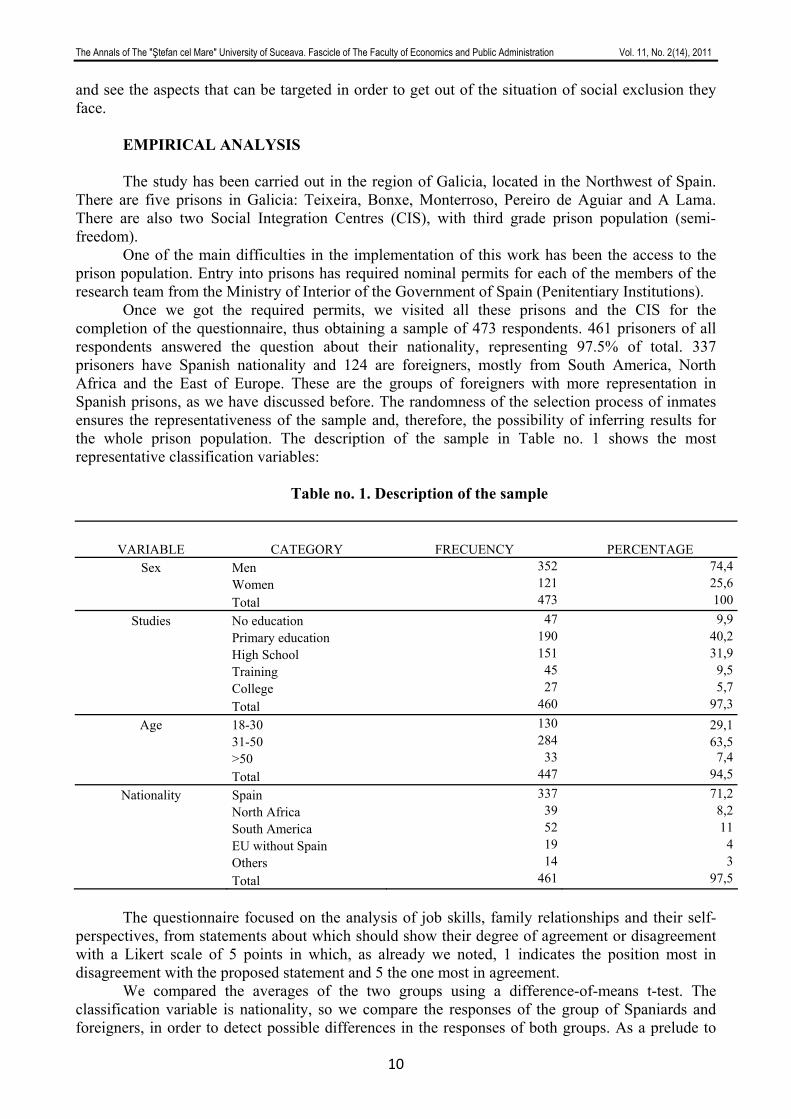
Once we got the required permits, we visited all these prisons and the CIS for the completion of the questionnaire, thus obtaining a sample of 473 respondents. 461 prisoners of all respondents answered the question about their nationality, representing 97.5% of total. 337 prisoners have Spanish nationality and 124 are foreigners, mostly from South America, North Africa and the East of Europe. These are the groups of foreigners with more representation in Spanish prisons, as we have discussed before. The randomness of the selection process of inmates ensures the representativeness of the sample and, therefore, the possibility of inferring results for the whole prison population. The description of the sample in Table no. 1 shows the most representative classification variables:
Table no. 1. Description of the sample
VARIABLE CATEGORY FRECUENCY PERCENTAGE Sex Men 352 74,4
Women 121 25,6 Total 473 100
Studies No education 47 9,9 Primary education 190 40,2 High School 151 31,9 Training 45 9,5 College 27 5,7 Total 460 97,3
Age 18-30 130 29,1 31-50 284 63,5 >50 33 7,4 Total 447 94,5
Nationality Spain 337 71,2 North Africa 39 8,2 South America 52 11 EU without Spain 19 4 Others 14 3 Total 461 97,5
The questionnaire focused on the analysis of job skills, family relationships and their self-
perspectives, from statements about which should show their degree of agreement or disagreement with a Likert scale of 5 points in which, as already we noted, 1 indicates the position most in disagreement with the proposed statement and 5 the one most in agreement.
We compared the averages of the two groups using a difference-of-means t-test. The classification variable is nationality, so we compare the responses of the group of Spaniards and foreigners, in order to detect possible differences in the responses of both groups. As a prelude to
The Annals of The "Ştefan cel Mare" University of Suceava. Fascicle of The Faculty of Economics and Public Administration Vol. 11, No. 2(14), 2011
11
the t-test, we conducted Levene's test, which indicates whether it is possible to assume equal variances or if they are different.
We have analyzed the responses grouped into the fields we have commented previously: Family and Social sphere: We found significant differences in certain questions. The foreign prison population has a
more positive perception than the Spanish because they think that will be received better in their environment when they leave prison. However, foreign prisoners often have their families abroad. Their family supports them, but they must rebuild their lives by themselves.
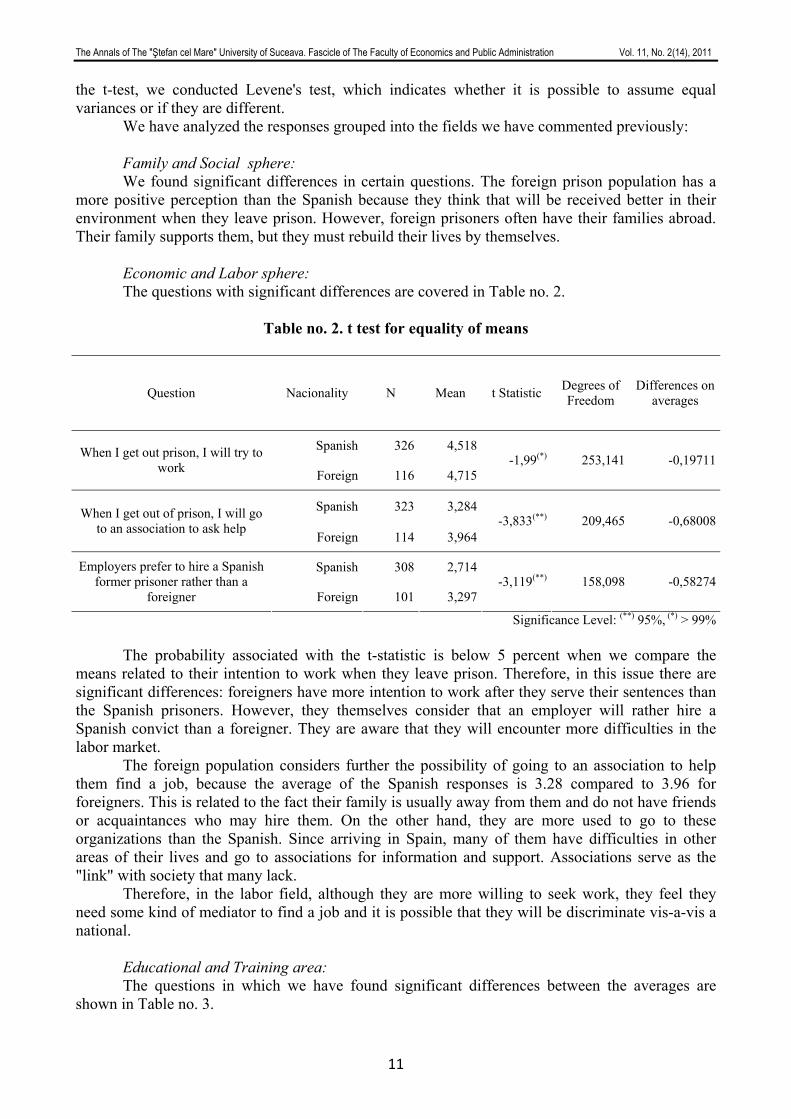
Economic and Labor sphere: The questions with significant differences are covered in Table no. 2.
Table no. 2. t test for equality of means
Question Nacionality N Mean t Statistic Degrees of Freedom
Differences on averages
Spanish 326 4,518When I get out prison, I will try to work Foreign 116 4,715
-1,99(*) 253,141 -0,19711
Spanish 323 3,284When I get out of prison, I will go to an association to ask help Foreign 114 3,964
-3,833(**) 209,465 -0,68008
Spanish 308 2,714Employers prefer to hire a Spanish former prisoner rather than a
foreigner Foreign 101 3,297-3,119(**) 158,098 -0,58274
Significance Level: (**) 95%, (*) > 99% The probability associated with the t-statistic is below 5 percent when we compare the
means related to their intention to work when they leave prison. Therefore, in this issue there are significant differences: foreigners have more intention to work after they serve their sentences than the Spanish prisoners. However, they themselves consider that an employer will rather hire a Spanish convict than a foreigner. They are aware that they will encounter more difficulties in the labor market.
The foreign population considers further the possibility of going to an association to help them find a job, because the average of the Spanish responses is 3.28 compared to 3.96 for foreigners. This is related to the fact their family is usually away from them and do not have friends or acquaintances who may hire them. On the other hand, they are more used to go to these organizations than the Spanish. Since arriving in Spain, many of them have difficulties in other areas of their lives and go to associations for information and support. Associations serve as the "link" with society that many lack.
Therefore, in the labor field, although they are more willing to seek work, they feel they need some kind of mediator to find a job and it is possible that they will be discriminate vis-a-vis a national.
Educational and Training area: The questions in which we have found significant differences between the averages are
shown in Table no. 3.

The Annals of The "Ştefan cel Mare" University of Suceava. Fascicle of The Faculty of Economics and Public Administration Vol. 11, No. 2(14), 2011
12
Table no. 3. t test for equality of means
Question Nationality N Mean t Statistic Degrees of Freedom
Differences on averages
Spanish 319 2,589Courses and professions that I have learned in prison will
help me find a job Foreign 108 3,25-3,643(**) 425 -0,66066
Spanish 322 1,729Courses in prison are sufficient Foreign 110 2,345
-3,786(**) 156,352 -0,61564
Spanish 316 1,744Institutions promote enough programs for inmates Foreign 107 2,327
-3,475(**) 153,577 -0,58343
Significance Level: (**) > 99%
The foreign prison population has a higher educational level than the national average, although it should be noted that the courses of studies are not always equivalent. Also, foreigners know, in general, more languages than Spaniards. Their interest in languages is explained, often, by the need to communicate in the host country and in prison, where in many cases they can not communicate with others in the language of their home country.
When inmates are asked about the usefulness of what they have learned in prison at the time they go free, we get an average of 2.59 points in the case of the Spanish and 3.25 in the foreign; about their opinion on the existence of sufficient training in prison, the means are of 1.73 points compared to 2.35 and as to whether they consider that institutions promote sufficient support programs, the average values obtained are of 1.74 points in the national group of prisoners against 2.33 for foreigners.
In all three cases, the average response of the Spanish prisoners and foreigners differs significantly, as indicated by the low probability associated with the t-statistic, far below the reference value 0.05. Foreigners have a more positive opinion of these three aspects. They value more positively the programs and courses held in prison. It is possible that foreigners are more eager to learn than national prisoners, but it is possible to accept the help offered by the institutions further than domestic ones, because they have fewer resources to rely on.
The greater effectiveness of actions taken in the educational field was verified. However, in order to clarify this result, we divided the foreign prison population into three groups: from South America, North Africa and the European Union without Spain. Then, we did the same comparison of means, three times, first comparing the group of South American with the other foreigners, second to the North Africans with other foreigners. Thirdly, we compared the EU's collective without Spain with other foreign prison population. Despite the differences, according to this analysis, are not significant, the average of Africans responses is the highest. This group may not only be influenced by the factor of foreignness. The level of studies which this group has is lower than the level of other foreigners. The mean difference in this respect is shown significantly at a 98% level. Moreover, inmates who come from the European Union show in these questions a lower average compared to other foreigners. This group has also a higher education level.
In order to determine the influence of factors such as language or belonging to any EU Member State, we proceeded to a new analysis for the comparison of means.
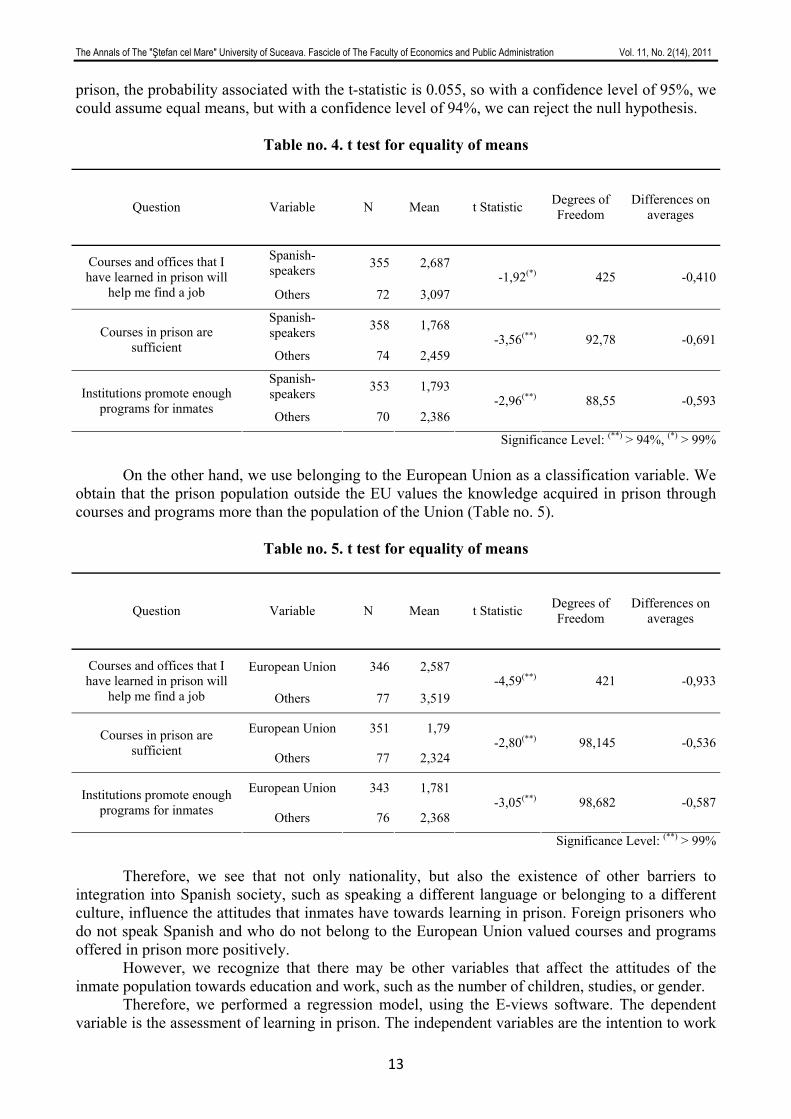
First, we split the sample into Spanish speakers and other inmates. We have obtained very similar results to those discussed above (Table no. 4). The non-Spanish speakers valued more positively the courses and programs offered in prison. With respect to the knowledge acquired in
The Annals of The "Ştefan cel Mare" University of Suceava. Fascicle of The Faculty of Economics and Public Administration Vol. 11, No. 2(14), 2011
13
prison, the probability associated with the t-statistic is 0.055, so with a confidence level of 95%, we could assume equal means, but with a confidence level of 94%, we can reject the null hypothesis.
Table no. 4. t test for equality of means
Question Variable N Mean t Statistic Degrees of Freedom
Differences on averages
Spanish-speakers 355 2,687Courses and offices that I
have learned in prison will help me find a job Others 72 3,097
-1,92(*) 425 -0,410
Spanish-speakers 358 1,768Courses in prison are
sufficient Others 74 2,459-3,56(**) 92,78 -0,691
Spanish-speakers 353 1,793Institutions promote enough
programs for inmates Others 70 2,386-2,96(**) 88,55 -0,593
Significance Level: (**) > 94%, (*) > 99% On the other hand, we use belonging to the European Union as a classification variable. We
obtain that the prison population outside the EU values the knowledge acquired in prison through courses and programs more than the population of the Union (Table no. 5).
Table no. 5. t test for equality of means
Question Variable N Mean t Statistic Degrees of Freedom
Differences on averages
European Union 346 2,587Courses and offices that I have learned in prison will
help me find a job Others 77 3,519-4,59(**) 421 -0,933
European Union 351 1,79Courses in prison are sufficient Others 77 2,324
-2,80(**) 98,145 -0,536
European Union 343 1,781Institutions promote enough programs for inmates Others 76 2,368
-3,05(**) 98,682 -0,587
Significance Level: (**) > 99%
Therefore, we see that not only nationality, but also the existence of other barriers to integration into Spanish society, such as speaking a different language or belonging to a different culture, influence the attitudes that inmates have towards learning in prison. Foreign prisoners who do not speak Spanish and who do not belong to the European Union valued courses and programs offered in prison more positively.
However, we recognize that there may be other variables that affect the attitudes of the inmate population towards education and work, such as the number of children, studies, or gender.
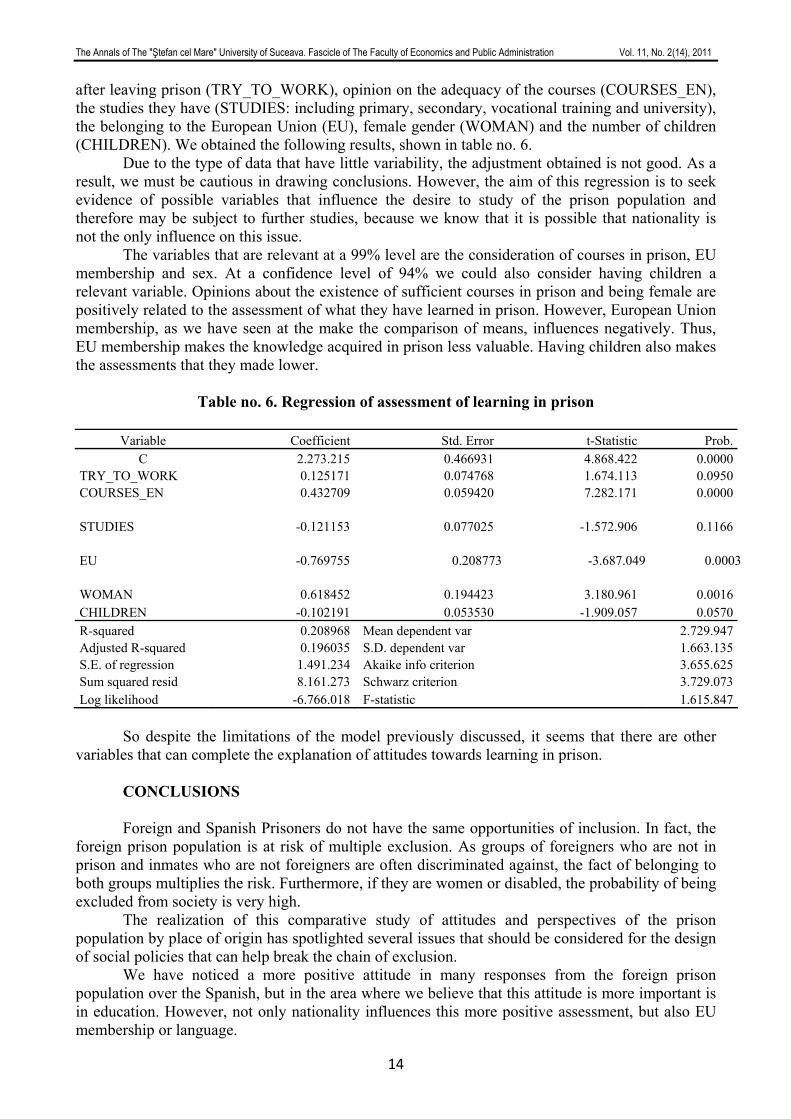
Therefore, we performed a regression model, using the E-views software. The dependent variable is the assessment of learning in prison. The independent variables are the intention to work
The Annals of The "Ştefan cel Mare" University of Suceava. Fascicle of The Faculty of Economics and Public Administration Vol. 11, No. 2(14), 2011
14
after leaving prison (TRY_TO_WORK), opinion on the adequacy of the courses (COURSES_EN), the studies they have (STUDIES: including primary, secondary, vocational training and university), the belonging to the European Union (EU), female gender (WOMAN) and the number of children (CHILDREN). We obtained the following results, shown in table no. 6.
Due to the type of data that have little variability, the adjustment obtained is not good. As a result, we must be cautious in drawing conclusions. However, the aim of this regression is to seek evidence of possible variables that influence the desire to study of the prison population and therefore may be subject to further studies, because we know that it is possible that nationality is not the only influence on this issue.
The variables that are relevant at a 99% level are the consideration of courses in prison, EU membership and sex. At a confidence level of 94% we could also consider having children a relevant variable. Opinions about the existence of sufficient courses in prison and being female are positively related to the assessment of what they have learned in prison. However, European Union membership, as we have seen at the make the comparison of means, influences negatively. Thus, EU membership makes the knowledge acquired in prison less valuable. Having children also makes the assessments that they made lower.
Table no. 6. Regression of assessment of learning in prison Variable Coefficient Std. Error t-Statistic Prob.
C 2.273.215 0.466931 4.868.422 0.0000TRY_TO_WORK 0.125171 0.074768 1.674.113 0.0950COURSES_EN 0.432709 0.059420 7.282.171 0.0000
STUDIES -0.121153 0.077025 -1.572.906 0.1166
EU -0.769755 0.208773 -3.687.049 0.0003
WOMAN 0.618452 0.194423 3.180.961 0.0016CHILDREN -0.102191 0.053530 -1.909.057 0.0570R-squared 0.208968 Mean dependent var 2.729.947Adjusted R-squared 0.196035 S.D. dependent var 1.663.135S.E. of regression 1.491.234 Akaike info criterion 3.655.625Sum squared resid 8.161.273 Schwarz criterion 3.729.073Log likelihood -6.766.018 F-statistic 1.615.847
So despite the limitations of the model previously discussed, it seems that there are other
variables that can complete the explanation of attitudes towards learning in prison.
CONCLUSIONS Foreign and Spanish Prisoners do not have the same opportunities of inclusion. In fact, the
foreign prison population is at risk of multiple exclusion. As groups of foreigners who are not in prison and inmates who are not foreigners are often discriminated against, the fact of belonging to both groups multiplies the risk. Furthermore, if they are women or disabled, the probability of being excluded from society is very high.
The realization of this comparative study of attitudes and perspectives of the prison population by place of origin has spotlighted several issues that should be considered for the design of social policies that can help break the chain of exclusion.
We have noticed a more positive attitude in many responses from the foreign prison population over the Spanish, but in the area where we believe that this attitude is more important is in education. However, not only nationality influences this more positive assessment, but also EU membership or language.
The Annals of The "Ştefan cel Mare" University of Suceava. Fascicle of The Faculty of Economics and Public Administration Vol. 11, No. 2(14), 2011
15
So foreign inmates value the learning they do in prison, as well as programs and courses that are offered in a prison environment, more positively,. Therefore, we believe that certain training courses adapted to the needs of this group would provide additional mechanisms to rebuild their lives, and could be one of the key elements to achieve reintegration. However, in the case of foreigners outside the EU the development of these programs may not be an effective mechanism for labor integration, since within the group of foreigners in prison are those who give a lower valuation of these activities, probably motivated by the higher education level or the possibility of obtaining inclusion in other ways.
Also, we leave the analysis of the influence of other variables such as sex or the number of children on the assessment of education in prison open to possible further detailed investigation.
ACKNOWLEDGMENTS
This work has been done with the financial support from the Ministry of Education, Government of Spain, the General Secretary of Penitentiary Institutions under the Ministry of Home Affairs (Government of Spain), the General Secretary for Equality (Government of the Xunta de Galicia) and the assistance of the Official School of Languages of A Coruña (Galicia).
REFERENCES
1. Bhatti, G. (2010), Learning behind bars: Education in Prisons, Teaching and Teacher Education 26, 31-36
2. Cantero, F. (2010), The pedalogical action in jails. Possibilities and limits, Revista española de psicología 68 (245), 49-64.
3. COM. (2010), Comunicación de la Comisión: Europa 2020: Una estrategia para un crecimiento inteligente, sostenible e integrador 2020, Bruselas 3.3.2010
4. Entorf, H. (2009), Crime and the labour market: Evidence from a survey of inmates, Jahrbucher Fur Nationalokonomie Und Statistik 229(2-3), 254-269.
5. Ministry of Home Affairs. (2009) Anuario estadístico del Ministerio del Interior 2009, Chapter 4. Consulted in: http://www.institucionpenitenciaria.es/web/portal/documentos/publicaciones.html
6. United Nations. (2000), Declaración del Milenio, Asamblea General 13.09.2000 7. Ribas, N; Almeda, E y Bodelón, E. (2005), Rastreando lo invisible: Mujeres extranjeras
en las cárceles Anthropos. 8. Sen, A. (2000), Social exclusion: concept, application and scrutiny, Asian Development
Bank. 9. Silver, H. (1995), Reconceptualizing Social Disadvantage: Three Paradigms of Social
Exclusion. En Rodgers,G. Gore, G Y Figueiredo, J. (Ed.) Social Exclusion: Rhetoric, Reality, Responses. Geneva: International Institute for Labour Studies
10. Smerotkina, K. (2010), Education as a Prerequisite for Inclusion of Prisioners in the Society, Society, Integration, Education 453-460.
11. Subirats i Humet, J, Gomà Carmona, R. y Brugué Torruella, J. (2005) Riesgos de exclusión social en las Comunidades Autónomas, Documentos de Trabajo. Bilbao: Fundación BBVA e Institut d’Estudis Autonòmics, Generalitat de Catalunya.
12. Wiliamson, R., Pickett, K. (2008) Desigualdad: un análisis de la infelicidad colectiva, Turner.
The Annals of The "Ştefan cel Mare" University of Suceava. Fascicle of The Faculty of Economics and Public Administration Vol. 11, No. 2(14), 2011
16
SUSTAINABLE DEVELOPMENT IN BUCOVINA REGION – ANALYSIS OF TOURISTIC POTENTIAL IN SUCEAVA BASIN
PhD. Student Constantin COCERHAN
„Simion Mehedinţi” Doctoral School Bucharest University Bucureşti, Faculty of Geography
[email protected] Professor PhD. Carmen NĂSTASE
"Ştefan cel Mare" University of Suceava, Romania Faculty of Economics and Public Administration
[email protected] Abstract: Tourism has always been an economic pillar of European countries, in addition to building understanding and
enlightening travellers. New considerations, sustainability, environment and socio-economics are calling for a new pardigm of how tourism operates. This article present the touristic potential of Suceava Basin, the infrastucture and how tourism can be considered as a fundamental opportunity for social and economic development in North East Region – Bucovina. The research investigated innovative strategies, solutions and recommandations to improve infractucture and supporting services for tourism, overcoming many barriers.
Keywords: Bucovina Region, innovative strategies, touristic infractucture, touristic potential, sustainability
JEL Classification: A12, O18
1. INTRODUCTION 1.1. Motivation of the theme selection, scope and purpose of research
World tourism has acquired in the second half of the XXth century, a bigger importance,
which was illustrated mainly by the continued growth in the number of tourists and revenue collected. National tourism, constitutes in the perspective of the present approach, a real chance to relaunch the economic growth and sustainable development of market economy in Romania.
The goal of the research was to create a synthesis work to present, in a realistic picture, the overall characteristics of the infrastructure and tourist facilities in the area studied and to evaluate possibilities to improve the infrastructure in terms of sustainable tourism development of the area.
The aims pursued were: - Identification, analysis and description of existing infrastructure elements in the area
studied; - The achievement of some synthesis cartographic representation; - Assessing the adequacy of infrastructure of communications routes to the current
requirements of tourism; - Advancing proposals for infrastructure development / tourism base from the perspective of
the growing importance of this sector in all economic activities of the area and from the European integration and sustainable development.
1.2. The scientific fundamentation, methods and research procedures used
The methods and procedures mainly used in our research have been the observation, the analysis (functional - to highlight the role of some elements in the overall, statistical which has focused particularly reporting series of data and formulating hypotheses, cartographic conducting spatial mapping of elements, diagnostic reflecting the features of the current situation, prognostic on the possible developments, synthesis, comparative method (comparing the elements, phenomena of the same kind to capture the similarities and differences between them in order to reflect the logical links), computerized data.
The Annals of The "Ştefan cel Mare" University of Suceava. Fascicle of The Faculty of Economics and Public Administration Vol. 11, No. 2(14), 2011
17
Personal contribution to this paper is to process and summarize data obtained from sources or from direct observation in the field and drawing a picture of the topic studied, realization of some thematic synthetic maps: Suceava Basin –The infrastructure of the ways of communications, Suceava Basin - Accommodation capacity, computerized data processing, advancing proposals to improve tourism resources.
2. THE ANALYSIS OF THE TURISTIC POTENTIAL IN THE SUCEAVA BASIN
2.1. The infrastructure of the communication ways
Suceava Basin is located in the north of the country, is included in the touristic province of Carpatho- Pericarpatica, being included in touristic region Bukovina and overlaps Suceava complex tourism area, touristic region known worldwide, which has a base and a tourism potential varied and complex. Regarding the accessibility of the area, it is in a plateau region, with favorable conditions to develop communication networks.
For this area, the most important road artery is European road E 85 which crosses the county from north to south, in Suceava and liaises with Ukraine in Chernovtsy and the capital, Bucharest. To this is added E576 highway from Suceava to Gura Humorului - Câmpulung Moldovenesc – Vatra Dornei.
Suceava is the main railway junction of the area, and most important railway bus is bus 5: Bucharest - Suceava - Vicsani and on to Moscow, thus having an international character. From this emerges bus line that provides contact Transcarpathian northwest, namely Suceava - Câmpulung Moldovenesc – Vatra Dornei, to Timisoara, Oradea, Baia Mare - Satu Mare.
The entire area from north of Moldova benefits from the presence of the International Airport "Stefan cel Mare" Salcea located in the city, 12 km from the city of Suceava.
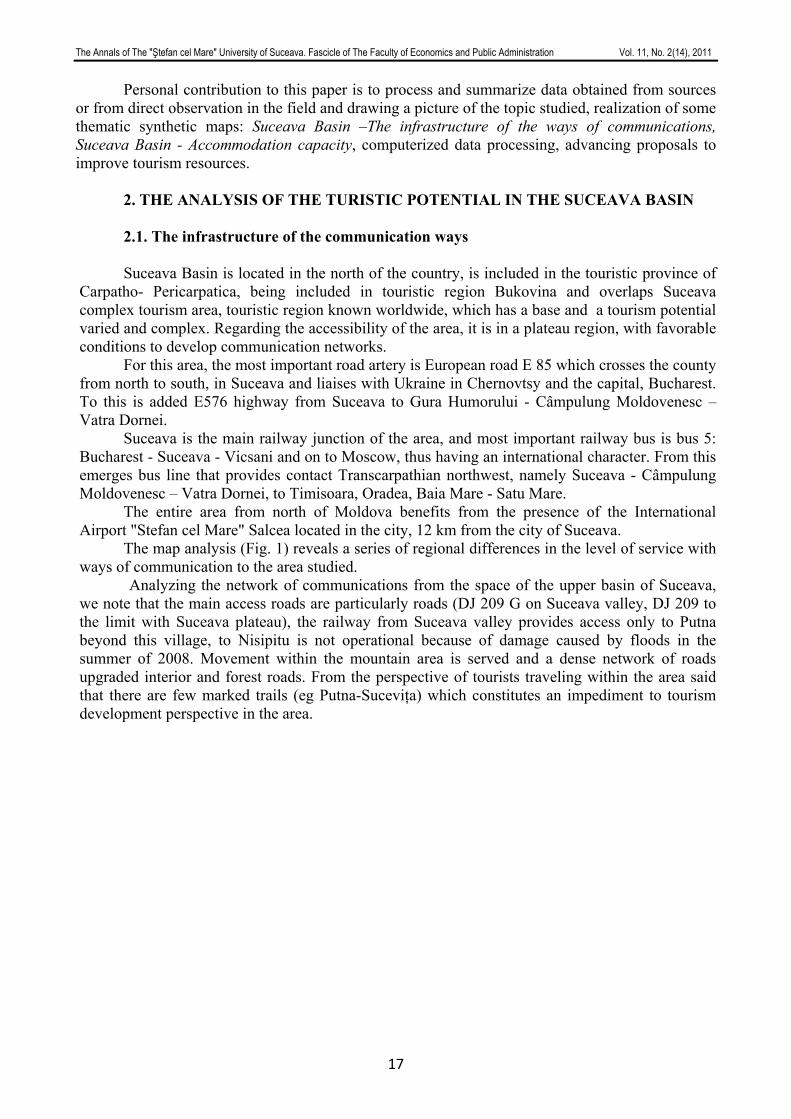
The map analysis (Fig. 1) reveals a series of regional differences in the level of service with ways of communication to the area studied.
Analyzing the network of communications from the space of the upper basin of Suceava, we note that the main access roads are particularly roads (DJ 209 G on Suceava valley, DJ 209 to the limit with Suceava plateau), the railway from Suceava valley provides access only to Putna beyond this village, to Nisipitu is not operational because of damage caused by floods in the summer of 2008. Movement within the mountain area is served and a dense network of roads upgraded interior and forest roads. From the perspective of tourists traveling within the area said that there are few marked trails (eg Putna-Suceviţa) which constitutes an impediment to tourism development perspective in the area.
The Annals of The "Ştefan cel Mare" University of Suceava. Fascicle of The Faculty of Economics and Public Administration Vol. 11, No. 2(14), 2011
18
Figure no. 1. Suceava Basin – The infrastructure of the communication ways
(Author Constantin Cocerhan) Distances to the main tourist centers nearby (Radauti, Sucevita, Solca) and turistic
objectives, often exceed 50 km, many sights being relatively isolated. Contact area mountain – plateau is favored by a high accessibility of the area given by the
proximity to the plateau area, area served by a dense network of communication routes, and the one of Siret corridor and Suceava valley, old axes of movement road and rail. Access to tourist centers (Sucevita, Solca, Cacica) is facilitated by the proximity of the location of the county, city of Suceava, which is the most important railway and road of the county with a polarizing role of economic activities in the area.
Looking at the area level of service with the means of communication, we can appreciate that in Suceava Basin there is a network road which provides an easy movement between centers and attractions in the area (209 G on Suceava valley, DJ 209 to limit with the Suceava Plateau, completed inside by DN 17A which crosses Obcina Mare by Ciumârna Step and by DJ that joins Suceviţa with Gura Humorului) and an inner dense network of roads between counties, upgraded that connects settlements to each other (eg Rădăuţi - Volovat – Arbore; Radauti - Badeuti - Iaslovăţ - Arbore – Solca; Pătrăuţi - Todiresti - Solonet with deviation to Comanesti and Botosana - Cacica).
The area is poorly served inside by rails, Suceava – Cacica being the only railway section from the area, affected by flooding, being restored in July, 2011.
Inside the mountain area the marginal access network is completed by several marked mountain trails (Suceviţa - Putna; Suceviţa - Poiana Marului - Humor Monastery, Ciumârna Scoruşeţ Peak – Bobeica Peak; Solca - Humor Monastery) which facilitates the movement and allow, some extent, tourists to discover the beauty of the landscape from the region.
The Annals of The "Ştefan cel Mare" University of Suceava. Fascicle of The Faculty of Economics and Public Administration Vol. 11, No. 2(14), 2011
19
Distances between major tourist centers (Radauti, Suceviţa, Gura Humorului, Solca) and attractions are included frequently between 10-50 km.
For Suceava area and its surroundings, the most important road artery is European road E 85 which crosses the county from north to south, in Suceava and liaises with Ukraine in Chernovtsy and the capital, Bucharest. This is compounded by the national road E 576 from Suceava to Gura Humor - Câmpulung Moldovenesc – Vatra Dornei. An important role have and other county or municipal roads that are linking tourist objectives: Suceava - Pascani by Bosanci-Udeşti-Dolhasca, Suceava - Dorohoi by Adancata, Suceava - Radauti and Suceava - Dragomirna.
Railway circulation is done in the area on the route Suceava - Milisauti - Dornesti - Radauti, but lately decreased a lot the frequency of using of this type of transport, road transport being preferred, more quickly and conveniently, which is well served by private entrepreneurs.
Among the analyzed sub areas we can appreciate that the latter is characterized by the dense network of communication routes, the movement of people realizing easy and efficient. In conclusion, we appreciate that road densities decrease from the middle and lower basin area to the one of contact with the mountain, the most poorly served in this regard remains the upper basin of Suceava, although there are operational railways in this area, their importance in movement of people and tourists has decreased greatly over the past decade, their functions being taken over by road transport.
2.2. Tourist accommodation structures
Bucovina region, in which limits falls Suceava basin, is a touristic area with national and
international recognition. Tourism potential which is available, accessibility in the area were used locally in recent years by increasing the number of tourist reception and overall development of tourism infrastructure.
In the area we have identified the presence of the following types of tourist accommodation structures: structures with accommodation (hotels, motels, villas, camps, campgrounds, boarding houses, farmhouses, rented rooms in family homes), structures with functions of catering (inside structures belonging to companies and accommodation), recreational structures with functions (clubs, swimming pools, small football fields, tennis, winter sports equipment) and structures with functions of transport (buses, rental cars).
The situation of the existing accommodation capacity from the area was summarized in Table no. 1, shown below.
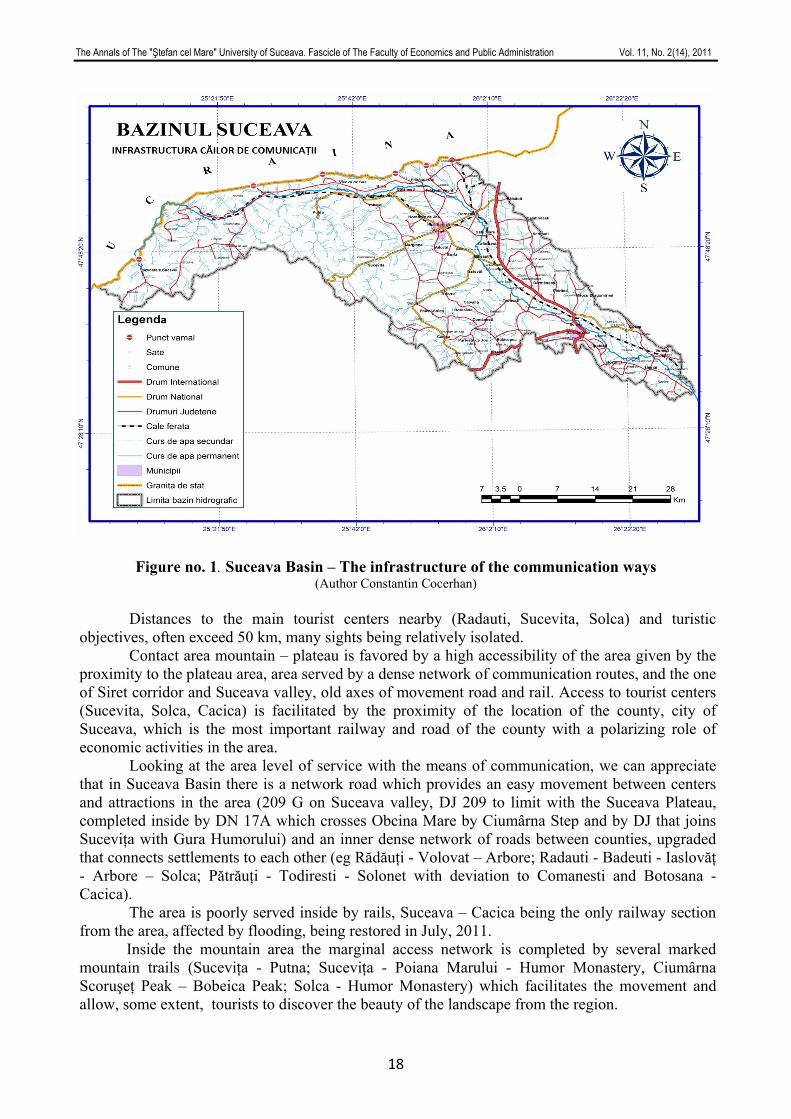
Table no. 1. Suceava Basin - Capacity of accommodation existing in touristic establishments in 2009
Official statistics Internet offer No. Locality No. of
existent structures
Existent accommodation capacity
(places –bed)
Working accommodatio
n capacity(place
s - days)
No. of existing
structures
Existent accommodatio
n capacity (places –bed)
1. Brodina 3 25 1159 - - 2. Cacica - - - 7 136 3. Ilișești - - - 3 60 4. Marginea - - - 1 20 5. Putna 4 60 16770 11 80 5. Solca - - - 5 196 6. Suceava 17 1182 436083 - - 7. Rădăuți 9 455 146069 - - 8. Sucevița 30 550 82804 31 640 9. Total area 63 2272 682885 - - 10. Total county 235 7554 2.176.422 - -
Source of official data: Touristic breviary of Suceava county, 2010; Internet unofficial data– sites (www.cazarebucovinaagroturism.eo; www.cazarelanoi.ro; www.infopensiuni.ro; )
The Annals of The "Ştefan cel Mare" University of Suceava. Fascicle of The Faculty of Economics and Public Administration Vol. 11, No. 2(14), 2011
20
Reporting the existing accommodation capacity in the analyzed area to the total of the
county shows that 26.8% of accommodation structures in the county is concentrated in the area studied, 30.07% of the capacity of accommodation (bed spaces) and 31.37 % of operational accommodation capacity (seats-days).
Analyzing the distribution of accommodation capacity on the two parts of the Suceava basin - mountain and plateau - we stated that the middle and lower basin has a capacity of significant relative to the mountain, all indicators analyzed, holds 44.06% respectively the number of structures, 74% of the capacity of existing accommodation (bed spaces) and 87.39% of operational accommodation capacity (seats-days).
Data obtained from consulting official sources were filled in the table with a series of data corresponding to touristic offer published for April of 2010 on the internet.
As can be seen, these data reflect the fact that in reality, the accommodation capacity is higher than reflected by the data in official statistics.
The differences between the two possible sources of information have the first question non-coverage in official statistics the localities with less than three structures of accommodation. Other probable causes are: non-inclusion of some farmhouses in the permanent tourist circuit, registration of more rooms in Easter touristic offers to attract more tourists, commissioning of new pensions etc.
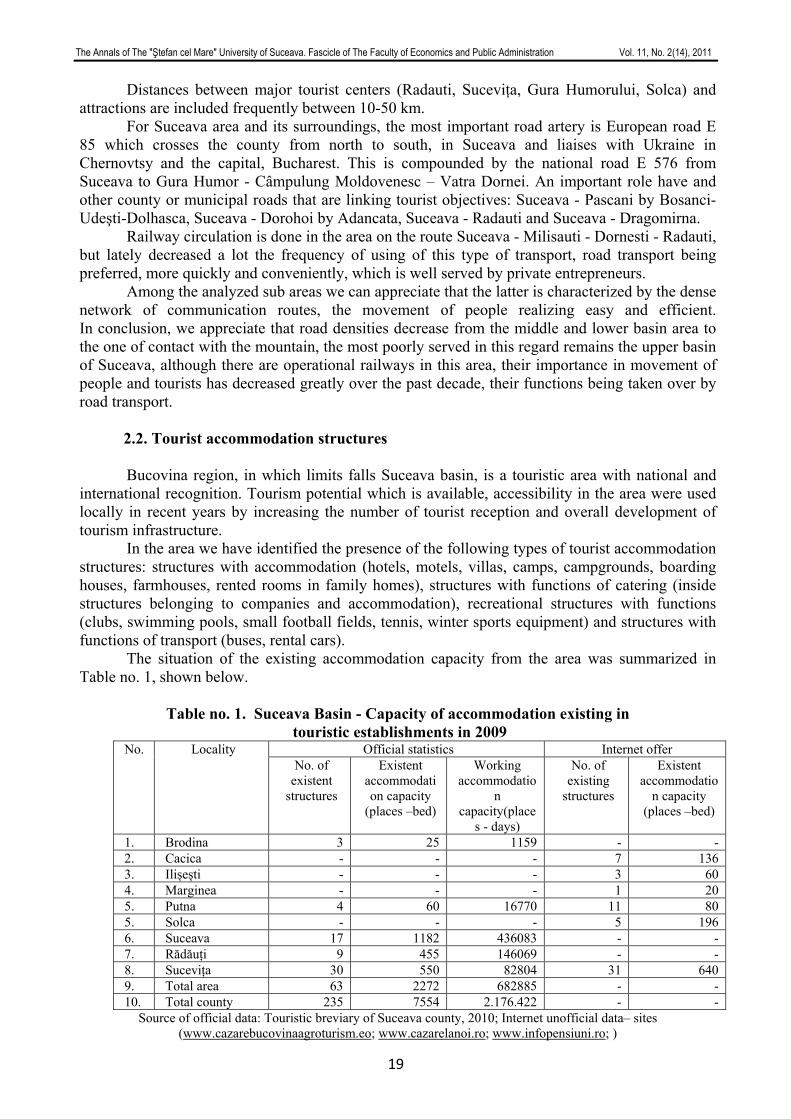
On the map in Fig. 2 is shown the territorial distribution of tourist accommodation structures of Suceava Basin.
Analyzing the accommodation capacity estimated as number of structures we see large disparities between analyzed subunits of the Suceava basin. In the upper basin of Suceava, the accommodation capacity is reduced, being concentrated in Putna town in mountain-plateau contact area with the highest accommodation capacity falls Suceviţa city, which owns the largest number of structures in the basin of Suceava, followed by Cacica and Solca, and in the middle and lower basin is dominated by the city of Suceava, followed by city Radauti.
In terms of accommodation capacity in operation, with the greatest capacity is part of the middle and lower basin which is dominated by the city of Suceava, followed by mountain-plateau contact area where Suceviţa city includes the largest capacity. In the upper basin of Suceava official statistics include only data for Putna area, accommodation capacity in operation is very small compared to that of the other two areas analyzed.
In the typology of tourist accommodation structures with functions stands the predominance in the plateau area of the basin of the hotel type structures and the sub-mountainous and mountainous of agro-touristic guesthouses, service quality is appreciated in most cases with 2-3 flowers for hostels and 2-3 stars for hotels and restaurants, with only 4 units classified with 4 stars across the area (1 in Suceava, 1 in Radauti and 2 in Suceviţa).
Campings satisfy partially the requests of the automobilist tourism; is remarkable in this respect Ilişeşti camping, Dragomirna camping and Burac camping, near Dragomirna Monastery, offering tourists the possibility of camping in a very picturesque area.
The Annals of The "Ştefan cel Mare" University of Suceava. Fascicle of The Faculty of Economics and Public Administration Vol. 11, No. 2(14), 2011
21
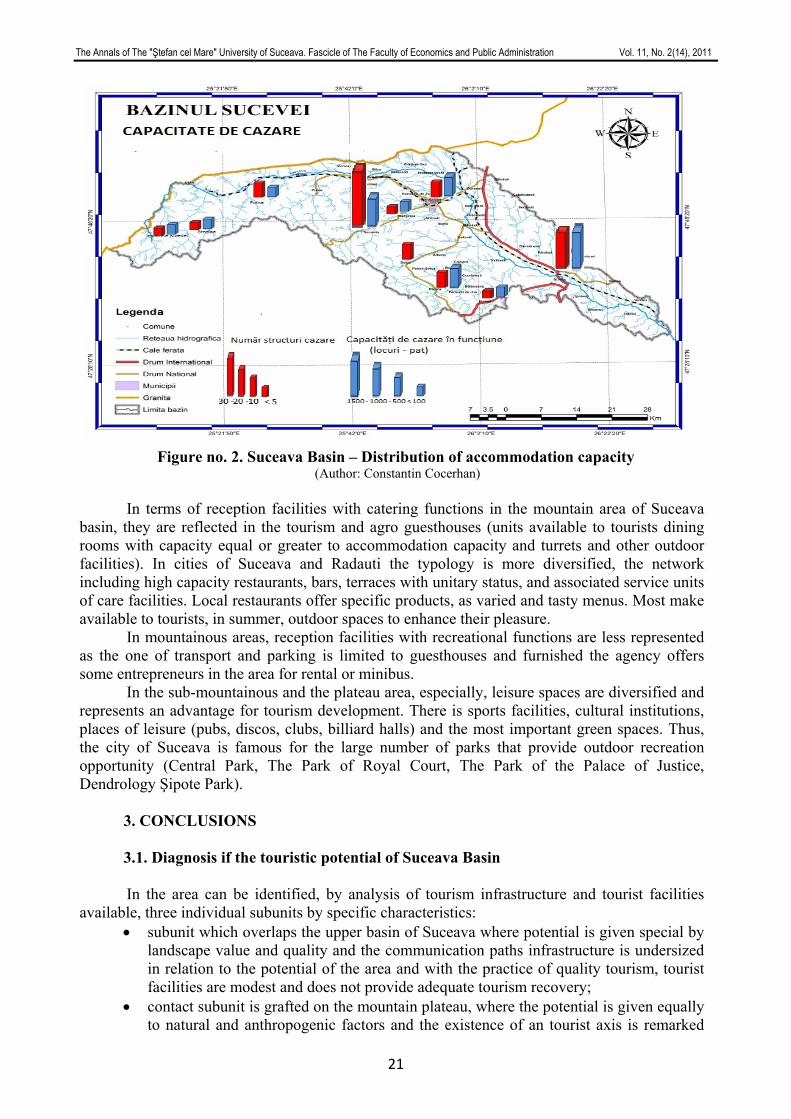
Figure no. 2. Suceava Basin – Distribution of accommodation capacity (Author: Constantin Cocerhan)
In terms of reception facilities with catering functions in the mountain area of Suceava
basin, they are reflected in the tourism and agro guesthouses (units available to tourists dining rooms with capacity equal or greater to accommodation capacity and turrets and other outdoor facilities). In cities of Suceava and Radauti the typology is more diversified, the network including high capacity restaurants, bars, terraces with unitary status, and associated service units of care facilities. Local restaurants offer specific products, as varied and tasty menus. Most make available to tourists, in summer, outdoor spaces to enhance their pleasure.
In mountainous areas, reception facilities with recreational functions are less represented as the one of transport and parking is limited to guesthouses and furnished the agency offers some entrepreneurs in the area for rental or minibus.
In the sub-mountainous and the plateau area, especially, leisure spaces are diversified and represents an advantage for tourism development. There is sports facilities, cultural institutions, places of leisure (pubs, discos, clubs, billiard halls) and the most important green spaces. Thus, the city of Suceava is famous for the large number of parks that provide outdoor recreation opportunity (Central Park, The Park of Royal Court, The Park of the Palace of Justice, Dendrology Şipote Park).
3. CONCLUSIONS
3.1. Diagnosis if the touristic potential of Suceava Basin
In the area can be identified, by analysis of tourism infrastructure and tourist facilities available, three individual subunits by specific characteristics:
• subunit which overlaps the upper basin of Suceava where potential is given special by landscape value and quality and the communication paths infrastructure is undersized in relation to the potential of the area and with the practice of quality tourism, tourist facilities are modest and does not provide adequate tourism recovery;
• contact subunit is grafted on the mountain plateau, where the potential is given equally to natural and anthropogenic factors and the existence of an tourist axis is remarked
The Annals of The "Ştefan cel Mare" University of Suceava. Fascicle of The Faculty of Economics and Public Administration Vol. 11, No. 2(14), 2011
22
with touristic resorts located in contact depressions with the mountain valleys (Suceviţa - Solca - Cacica ), where the infrastructure of communications channels has a higher density, where there are adequate tourist facilities that can meet various requirements, the image potential and resources of the area but not sufficiently exploited and promoted;
• the subunit which is grafted on the mountain-plateau contact in which touristic potential is given equally to natural and anthropogenic factors and is remarked the existence of an axis with tourist resorts located in contact with the mountain valleys (Suceviţa - Solca - Cacica) where communications infrastructure routes have a higher density, where there are adequate tourist facilities that can meet various requirements, the image potential and resources of the area but not sufficiently exploited and promoted;
• subunit which overlaps the plateau area of the Suceava basin, which has human touristic resources of international value, where the infrastructure requirements are approaching to practice a civilized tourism, with tourist facilities which can meet various requirements under the complex when they would be effectively promoted and that are valued in a relatively high measure, especially in tourist centers as polarizing activity zone (Suceava and Radauti).
3.2 Sustainable tourism in Suceava Basin
In sustainable development perspective, tourism potential of the Suceava Basin can be a valuable resource and a planning and recovery to a similar level to other tourist regions in the world can ensure sustainable development of the region for the benefit of current and future generations.
Valence elements for the practice of sustainable tourism in the area are to maintain a large natural background, there is a distinct ethno-folkloric background, objectives of exceptional cultural-historical, hospitality people, with specific cuisine Bucovina, the existence of higher schools profile of tourism in the area, availability of people for practicing tourism. Currently, in the Suceava area and in Bucovina is practiced a conventional tourism, tourist offer being focused on visiting religious monuments and fund capitalization traditions and customs of Bucovina region, addressing in particular the adult population.
From the perspective of sustainable development this area should be seen as an area where you can develop many forms of tourism: ecological, rural, cultural, spa, entertainment, religious. Although some forms are already present, the recovery of the tourism potential is not satisfactory or brings important environmental damage.
In the situation of Suceava Basin for inclusion in sustainable development and reducing human pressure on the environment is required:
• protection and conservation of world heritage from the area (churches with mural paintings from Suceviţa, Arbore, Pătrăuţi);
• protection and conservation of cultural heritage in urban areas; • establishment of a tourist information center in the city Radauti; • Increase tourism in the region's tourism offer; • modernization of tourist infrastructure in mountain areas (Brodina Valley); • developing and promoting improved specificity tourist area; • increasing the professionalism of those involved in tourism activities; • ensuring quality of tourism services for visitors to provide valuable experience; • ensuring continuity of natural resources and culture of host communities; • ensuring a balance between the needs of the tourism industry and the need to preserve
the environment; • promotion of ecological tourism.
The Annals of The "Ştefan cel Mare" University of Suceava. Fascicle of The Faculty of Economics and Public Administration Vol. 11, No. 2(14), 2011
23
• accessing European funds for modernization funding of tourism activities and technical and material base for tourism.
AKNOLEDGEMENT This work was supported by the project "Post-Doctoral Studies in Economics: training
program for elite researchers - SPODE" co-funded from the European Social Fund through the Development of Human Resources Operaţional Programme 2007-2013, contract no. POSDRU/89/1.5/S/61755.)”
BIBLIOGRAPHY
1. Băltăreţu, Andreea (2007), Ecoturism și dezvoltare durabilă, Edit. PRO Universitaria, București
2. Barbu, N.; Ionesi, L. (1987), Obcinile Bucovinei, Ghid turistic, colecția Munții noștri, Edit. Sport-Turism, București
3. Bibirigea, I.,R., Managementul integrării turismului românesc în Uniunea Europeană,autoreferat teza de doctorat, www.cnaa.md
4. Ielenicz, M., Comănescu, Laura (2006), România potențial turistic, Edit. Universitară, București.
5. Bahre Heike, Chasovschi Carmen, Năstase Carmen (2009), The Profile of the Tourism Information Center Officer in Romania, Amfiteatru Economic Journal, ISSN 1582-9146, Vol 11, no. 25/2009, pages 51-61, February
6. Hrenciuc, D. (2010), Patrimoniu 2010-Buletin de informare, lucrare editată de Direcția pentru Cultură, Culte și Patrimoniu Cultural Național Suceava, Edit. Terra Design, Suceava.
7. Năstase, Carmen, (2007), Dezvoltare durabilă și turism durabil, Revista de turism, nr. 3, Universitatea ”Ștefan cel Mare”, Suceava.
8. Pompei Cocean, Gh. Vlăsceanu, Bebe Negoescu, (2005), Geografia generală a turismului, Editura Meteor Press, București
9. Răduianu, I.D., (2009), Resursele de apă din bazinul hidrografic al râului Suceava și valorificarea lor, rezumatul tezei de doctorat,
10. Scutariu Adrian Liviu, Năstase Carmen (2010), Comparative evolution of tourism in the Nord Eastern Region of Romania, Subcarpathia of Poland and Central Slovakia, Bulletin of University of Agricultural Sciences and Veterinary Medicine Cluj Napoca. Horticulture, Volume 67, No. 2, pp. 229 – 237
11. Velcea, Valeria, Savu, A., (1982), Geografia Carpaților și Subcarpaților Românești, Edit.. Didactică și pedagogică București.
12. Direcția Județeană de Statistică Suceava – Breviarul turistic al județului Suceava, ediția 2007.
13. Direcția Județeană de Statistică Suceava – Breviarul turistic al județului Suceava, ediția 2010.
14. www.alpinnetorg.ro –Puncte de acces în Obcinile Bucovinei, accessed 12.04.2010. 15. www.carpatiorg.ro – Trasee în Obcinile Bucovinei, accessed 12.04.2010, 16.06.2010. 16. www.cazarebucovinaagroturism.eo – pensions data, accessed 12.04.2011 . 17. www.cazarelanoi.ro- pensions data, accessed 12.04.2010. 18. www.comune.ro – localities data Suceava county, accessed 17.05.2010 19. www.hartainfoturism.ro – pensions data, accessed 17.05.2010 20. www.harta-suceava.ro – Touristic map of the Suceava county, accessed 17.05.2010 21. www.infopensiuni.ro – pensions data, accessed 12.04.2011. 22. www.lasuceava.ro – pensions data, accessed 7.05.2010

The Annals of The "Ştefan cel Mare" University of Suceava. Fascicle of The Faculty of Economics and Public Administration Vol. 11, No. 2(14), 2011
24
23. www.pensiuni-vile.ro - pensions data, accessed 12.04.2010 24. www.romaniaturistica.ro – Info ski, accessed 20.06.2010 25. www.travelworld.ro – Human settlements map from Obcinile Bucovinei, accessed
7.05.2010 26. www.turism365.ro – date pensiuni, accessed 7.05.2010 27. www.vileonline.ro – date pensiuni, accessed 15.04.2010
The Annals of The "Ştefan cel Mare" University of Suceava. Fascicle of The Faculty of Economics and Public Administration Vol. 11, No. 2(14), 2011
25
ONLINE EDUCATION - AN IMPORTANT ISSUE FOR THE LABOR MARKET
Assoc. Prof. PhD. Diana-Mihaela POCIOVĂLIŞTEANU “Constantin Brâncuşi” University of Targu Jiu, West University of Timişoara, Romania
[email protected] PhD. Lecturer Liana BADEA
Academy of Economic Studies, Bucharest, Romania [email protected]
Abstract: Crises come and a crisis go and during any period of insecurity there is invariably an outcry for “change”,
change to the law, the rules, the system, our behaviour etc. It is then, during the crisis when people start asking questions about the causes, the effects and the remedies for the crisis. They usually blame others for what happens to them and start observing what it is obvious – the factors that change the world. Nowadays, population face a number of significant new trends in the global environment. These shifts are affecting not only the shape and mode of operation but also the purpose of higher education systems. Some of these trends represent sources of opportunities; others constitute potential threats. Among the most critical dimensions of change are the growing role of knowledge, the information and communication revolution, the emergence of a worldwide labour market, and global socio-political changes. Increasing the level of education is became a priority for individuals and society. Starting from such aspects, this paper aims to emphasize the fact that a high level of education obtained in the classical way or online, increases the chance of adapting to labour market demands and it contributes to increasing the quality of life.
Keywords: online education, higher education, labour market, employment
JEL Classification: I20, I25
INTRODUCTION
In the context of a globalised society, one may observe that knowledge accumulation has become one of the major factors in economic development and is increasingly at the core of a country’s competitive advantage, which is itself determined by the ability to innovate in a continuous manner. Starting from this, it is easy to understand that countries are struggling to adapt their higher education systems to meet the challenges brought about by rapid societal change over recent years. Thus, new types of higher institutions and new forms of competition are appearing, inducing traditional institutions to change their modes of operation and delivery and take advantage of opportunities offered by the new information and communication technologies.
As the majority of individuals know, in the present, as in the past, one of the factors that made a huge difference between the stages of developments of countries was the educational system. It was also one of those factors that assured the functionality of the labour market. This is why, in our era confronted with many changes, the rapid adaption of the educational system to the markets evolution become very important.
Employment is, in any society, including in developed countries, a balance which is essential for macroeconomic and socio-political stability. It is a complex dynamic process of major interest to all economic and social partners for the present and future of society, with varying implications: economic, psychosocial, educational, cultural, political. Increasing the employment of the workforce and reducing the phenomenon of unemployment are now key economic policy objectives of all countries, made possible by establishing equilibrium between supply and demand for skilled labor market.
In accordance with the objectives of Europe 2020, the European Strategy on Employment aims to create more and better jobs throughout the European Union. The European Strategy encourages measures to ensure the achievement by 2020 of three major objectives:
75% of people aged between 20 and 64 to be active on the labor market reducing school dropout to less than 10% and increasing to at least 40% the proportion of
higher education graduates among the population aged 30-34;
The Annals of The "Ştefan cel Mare" University of Suceava. Fascicle of The Faculty of Economics and Public Administration Vol. 11, No. 2(14), 2011
26
reduction by at least 20 million the number of people who suffer or may suffer from poverty and social exclusion. The Europe 2020 strategy for smart, sustainable and inclusive growth rightly recognises the
key role education and higher education must play if the ambitions for Europe in a fast-changing global reality are to be realised. It is obviuos that the labour markets increasingly require more graduates with the knowledge and competences provided by higher education; countries will have to invest substantially in their higher education systems to ensure that this demand is met. However, as we all know, while demands are increasing, public funding is diminishing and the new tehnologies require important funds.
As James D. Wolfensohn said in 2000: „It is impossible to have a complete education system without an appropriate and strong higher education system... I am not for a moment suggesting that primary education and secondary education are not at the very essence of development... [but that is] not enough. You have to have centers of excellence and learning and training if you are going to advance the issue of poverty and development in developing countries... the key... is higher education, not just on the technological side, but to create people with enough wisdom to be able to use it.”
In order to realise that objective, one must first understand what the trends in this area are and how they affect the general mentality. The paper is going to emphasize the importance of the online education in our days and the fact that it became one of the trusted forms of education.
ONLINE EDUCATION Nowadays we can see that quality higher education and training is crucial for economies that
want to move up the value chain beyond simple production processes and products. In particular, today’s globalizing economy requires countries to nurture pools of well-educated workers who are able to adapt rapidly to their changing environment and the evolving needs of the production system. Today’s world asks to well train people which are able to give practical solutions for economic problems. And we ask ourselves: is the educational system ready to provide such a thing? Is it enough to teach students how to memorize a bunch of theories? Is it enough to tell them which are the economic variables and how they evolve? Is it enough to stay to the classical forms of education? Do we have to adapt the educational system to the global trends?
Thus is why it is particularly important to examine how research can energize and re-engage the brain and the voice of online classes in achieving a more effective strategic positioning in the context of the modern university.
The Internet has changed the way people get informed, interact, communicate and learn in the 21st century. Distribution of information and knowledge is nowadays carried out more and more via the Internet. The growing demands for highly skilled and educated labour force claim for changing traditional teaching and learning processes. One way of changes is related with an integration of various kinds of computer-based learning systems as supplements to conventional teaching methods, as it is said that nowadays there are three major new challenges which bear heavily on the role and functions of higher education: economic globalization; the increasing importance of knowledge as a driver of growth, and the information and communication revolution (Salmi, 2001).
Historically, the rush of online education may be located in the decade 1990-2000, a period characterised by a boom in the ICT and the invention and evolution of the Web. This not only led to the foundation of many Open Universities around the world (Doukas and Andreatos, 2007), but also pushed many traditional universities to offer distance learning courses. It is estimated that, as far as continuing education in higher education institutions is concerned, distance learning will grow at least ten times faster than on-campus learning over the years to come (Burns, 2006). Thus is why many universities around the world started to use means of online education in order to adopt their management strategies to the evolution of the humankind.
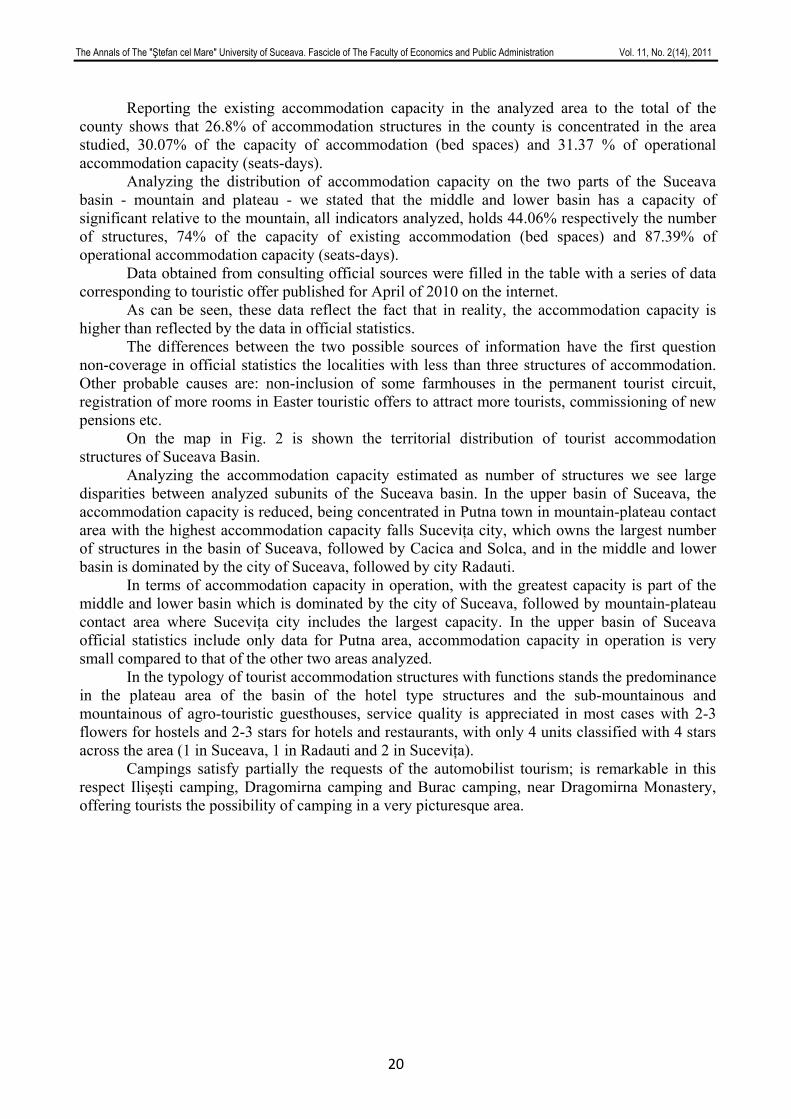
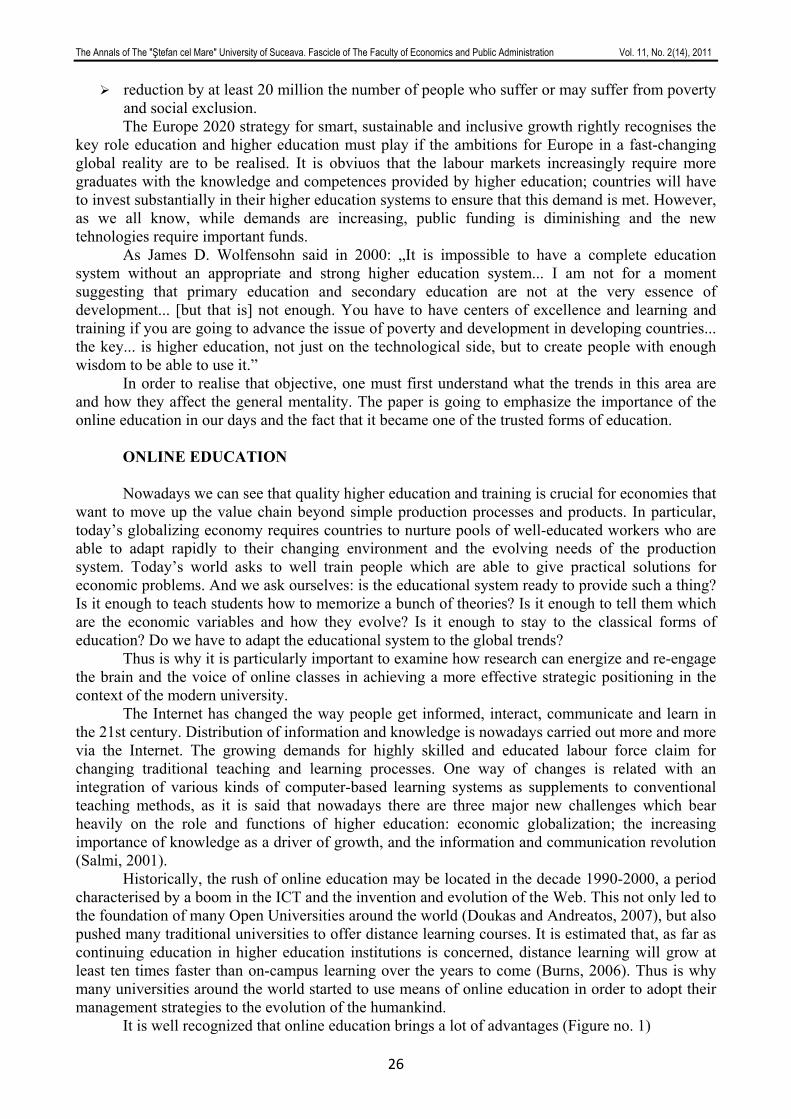
It is well recognized that online education brings a lot of advantages (Figure no. 1)
The Annals of The "Ştefan cel Mare" University of Suceava. Fascicle of The Faculty of Economics and Public Administration Vol. 11, No. 2(14), 2011
27
Figure no. 1. Advantages of online education
Most of these advantages have an important impact on various aspects of human behaviour
which affects the quality of life. The flexibility of online education offers opportunities for a series of racially, ethnical or age discriminated people such as persons with disabilities, housewives, people with minority ethnical origins. Also, this kind of flexibility might be an advantage in lifelong learning allowing both work and study at the same time. As previously shown, online learning tends to create intimate community of learners which might have a significant impact on the quality of interaction between different people. Moreover, online learning facilitates the rapid creation and operation of think tanks enlarging considerably the pool of expert specialized ideas in different fields.
Online education brings also disadvantages. In scientific fields like engineering, for example, the need for practical training remains an important issue. Computer simulations alone cannot replace all forms of applied training. In many science and technology-oriented programs, hands-on activities in laboratories and workshops remain an indispensable constituent of effective learning.
There are some controversies related to the quality of online education. Studies focused on academic achievement have shown mixed reviews, but some researchers point out that online
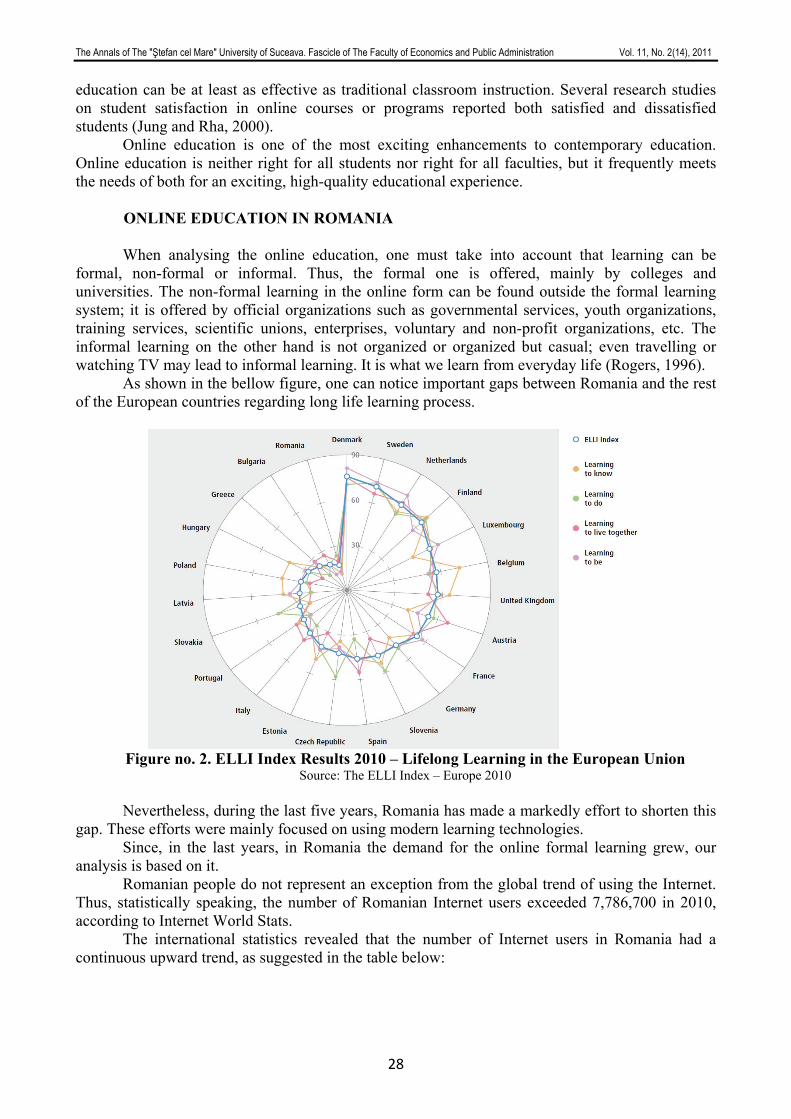
The Annals of The "Ştefan cel Mare" University of Suceava. Fascicle of The Faculty of Economics and Public Administration Vol. 11, No. 2(14), 2011
28
education can be at least as effective as traditional classroom instruction. Several research studies on student satisfaction in online courses or programs reported both satisfied and dissatisfied students (Jung and Rha, 2000).
Online education is one of the most exciting enhancements to contemporary education. Online education is neither right for all students nor right for all faculties, but it frequently meets the needs of both for an exciting, high-quality educational experience.
ONLINE EDUCATION IN ROMANIA When analysing the online education, one must take into account that learning can be
formal, non-formal or informal. Thus, the formal one is offered, mainly by colleges and universities. The non-formal learning in the online form can be found outside the formal learning system; it is offered by official organizations such as governmental services, youth organizations, training services, scientific unions, enterprises, voluntary and non-profit organizations, etc. The informal learning on the other hand is not organized or organized but casual; even travelling or watching TV may lead to informal learning. It is what we learn from everyday life (Rogers, 1996).
As shown in the bellow figure, one can notice important gaps between Romania and the rest of the European countries regarding long life learning process.
Figure no. 2. ELLI Index Results 2010 – Lifelong Learning in the European Union
Source: The ELLI Index – Europe 2010
Nevertheless, during the last five years, Romania has made a markedly effort to shorten this gap. These efforts were mainly focused on using modern learning technologies.
Since, in the last years, in Romania the demand for the online formal learning grew, our analysis is based on it.
Romanian people do not represent an exception from the global trend of using the Internet. Thus, statistically speaking, the number of Romanian Internet users exceeded 7,786,700 in 2010, according to Internet World Stats.
The international statistics revealed that the number of Internet users in Romania had a continuous upward trend, as suggested in the table below:
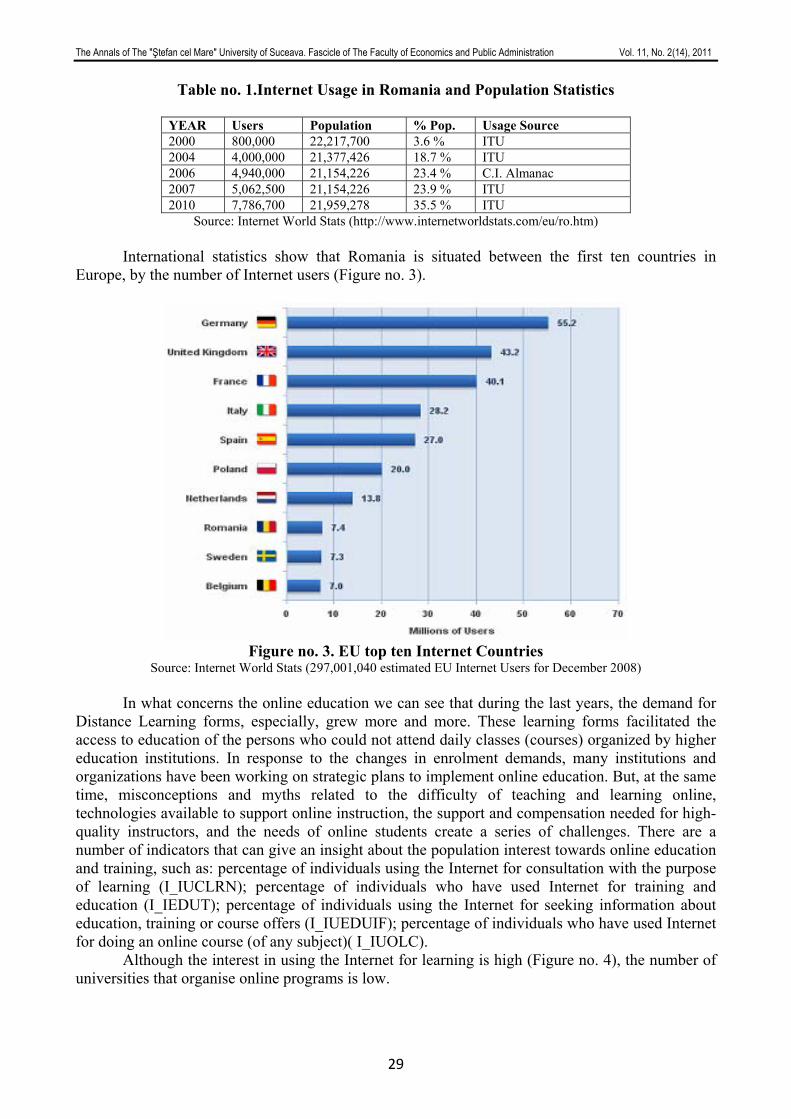
The Annals of The "Ştefan cel Mare" University of Suceava. Fascicle of The Faculty of Economics and Public Administration Vol. 11, No. 2(14), 2011
29
Table no. 1.Internet Usage in Romania and Population Statistics
YEAR Users Population % Pop. Usage Source 2000 800,000 22,217,700 3.6 % ITU 2004 4,000,000 21,377,426 18.7 % ITU 2006 4,940,000 21,154,226 23.4 % C.I. Almanac 2007 5,062,500 21,154,226 23.9 % ITU 2010 7,786,700 21,959,278 35.5 % ITU
Source: Internet World Stats (http://www.internetworldstats.com/eu/ro.htm)
International statistics show that Romania is situated between the first ten countries in Europe, by the number of Internet users (Figure no. 3).
Figure no. 3. EU top ten Internet Countries
Source: Internet World Stats (297,001,040 estimated EU Internet Users for December 2008)
In what concerns the online education we can see that during the last years, the demand for Distance Learning forms, especially, grew more and more. These learning forms facilitated the access to education of the persons who could not attend daily classes (courses) organized by higher education institutions. In response to the changes in enrolment demands, many institutions and organizations have been working on strategic plans to implement online education. But, at the same time, misconceptions and myths related to the difficulty of teaching and learning online, technologies available to support online instruction, the support and compensation needed for high-quality instructors, and the needs of online students create a series of challenges. There are a number of indicators that can give an insight about the population interest towards online education and training, such as: percentage of individuals using the Internet for consultation with the purpose of learning (I_IUCLRN); percentage of individuals who have used Internet for training and education (I_IEDUT); percentage of individuals using the Internet for seeking information about education, training or course offers (I_IUEDUIF); percentage of individuals who have used Internet for doing an online course (of any subject)( I_IUOLC).
Although the interest in using the Internet for learning is high (Figure no. 4), the number of universities that organise online programs is low.
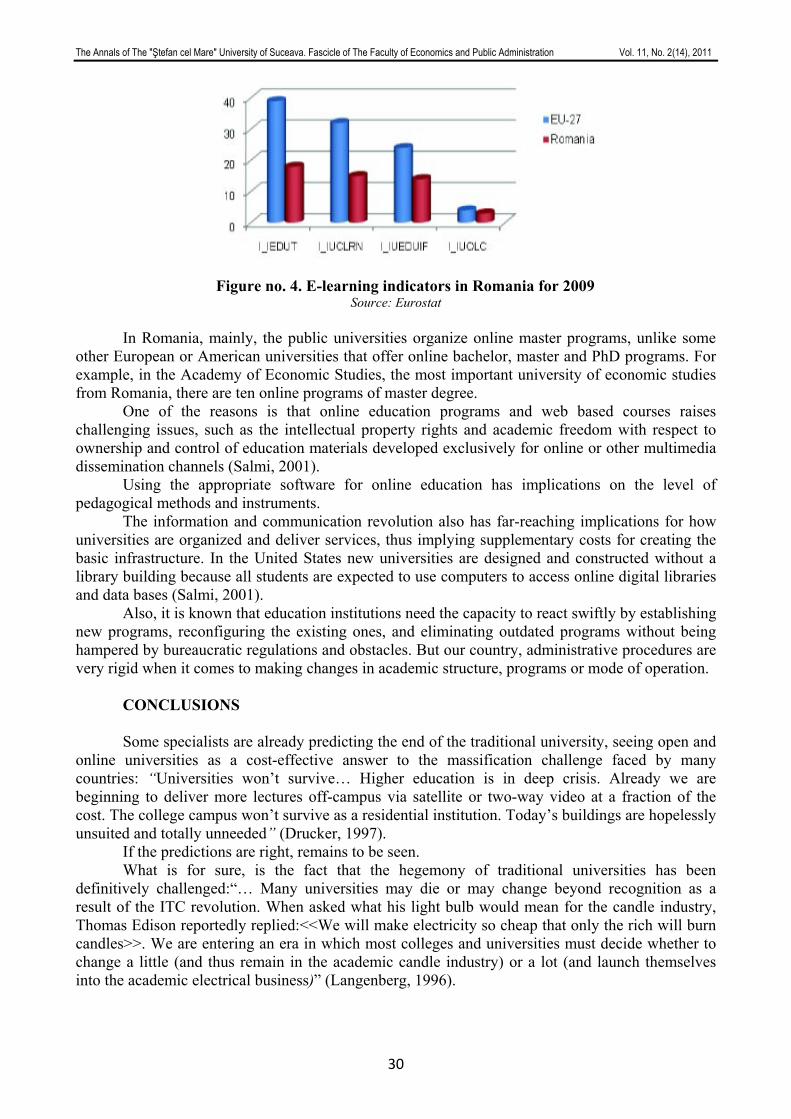
The Annals of The "Ştefan cel Mare" University of Suceava. Fascicle of The Faculty of Economics and Public Administration Vol. 11, No. 2(14), 2011
30
Figure no. 4. E-learning indicators in Romania for 2009 Source: Eurostat
In Romania, mainly, the public universities organize online master programs, unlike some
other European or American universities that offer online bachelor, master and PhD programs. For example, in the Academy of Economic Studies, the most important university of economic studies from Romania, there are ten online programs of master degree.
One of the reasons is that online education programs and web based courses raises challenging issues, such as the intellectual property rights and academic freedom with respect to ownership and control of education materials developed exclusively for online or other multimedia dissemination channels (Salmi, 2001).
Using the appropriate software for online education has implications on the level of pedagogical methods and instruments.
The information and communication revolution also has far-reaching implications for how universities are organized and deliver services, thus implying supplementary costs for creating the basic infrastructure. In the United States new universities are designed and constructed without a library building because all students are expected to use computers to access online digital libraries and data bases (Salmi, 2001).
Also, it is known that education institutions need the capacity to react swiftly by establishing new programs, reconfiguring the existing ones, and eliminating outdated programs without being hampered by bureaucratic regulations and obstacles. But our country, administrative procedures are very rigid when it comes to making changes in academic structure, programs or mode of operation.
CONCLUSIONS
Some specialists are already predicting the end of the traditional university, seeing open and
online universities as a cost-effective answer to the massification challenge faced by many countries: “Universities won’t survive… Higher education is in deep crisis. Already we are beginning to deliver more lectures off-campus via satellite or two-way video at a fraction of the cost. The college campus won’t survive as a residential institution. Today’s buildings are hopelessly unsuited and totally unneeded” (Drucker, 1997).
If the predictions are right, remains to be seen. What is for sure, is the fact that the hegemony of traditional universities has been
definitively challenged:“… Many universities may die or may change beyond recognition as a result of the ITC revolution. When asked what his light bulb would mean for the candle industry, Thomas Edison reportedly replied:<<We will make electricity so cheap that only the rich will burn candles>>. We are entering an era in which most colleges and universities must decide whether to change a little (and thus remain in the academic candle industry) or a lot (and launch themselves into the academic electrical business)” (Langenberg, 1996).
The Annals of The "Ştefan cel Mare" University of Suceava. Fascicle of The Faculty of Economics and Public Administration Vol. 11, No. 2(14), 2011
31
Starting from the actual situation in Romanian education system, it is obvious that we are facing with a “perfect e-storm,” linking pedagogy, technology, and learner needs. The growing demand for online learning leads to opportunities for innovation in the educational system.
In Romania the first steps were taken through implementing e-Learning projects and defining the barriers that stand in the way of an information society for everyone. In the Romanian educational system – rather conservative – changes occur gradually and it takes a long time until the innovations (especially quite radical, such as those generated by the introduction of ICT) are assimilated.
We recommend to the public and private universities to explore, implement, and extend online education programs and partnership activities and continue to build-out the use of technology implementations that increase the quality of online courses, improve their ability to scale to larger populations, and improve the breadth of coverage of courses.
Acknowledgements This work was cofinanced from the European Social Fund through Sectoral Operational
Programme Human Resources Development 2007-2013, project number POSDRU/89/1.5/S/59184 „Performance and excellence in postdoctoral research in Romanian economics science domain”
REFERENCES
1. Burns, E. (2006), Continuing Education drives Distance-Learning enrolment, Available online at: www.clickz.com/stats/sectors/education/article.php/3605321
2. Doukas, N. and Andreatos, A. (2007), Advancing Electronic Assessment, International Journal of Computers, Communications & Control, Vol. II, No. 1, pp. 56-65
3. Drucker, P. (1997), Still the youngest mind, Forbes, 10 March 1997 4. Jung, I. and Rha, I. (2000), Effectiveness and Cost-Effectiveness of Online Education: A
Review of the Literature, Educational Technology, Vol. 40, No. 4, 2000, pp. 57–60 5. Langenberg, D. (1996), Power plants or candle factories, in science, quoted in J. Dator
(1998), “The Futures of universities: ivied halls, virtual malls, or theme parks?”, Futures, Vol. 30, No. 1, p. 619, June.
6. Pociovălişteanu D.-M., Şerban-Oprescu G.L., Badea L. (2011), The impact of online education on the quality of life in Romania, Proceedings. International Scientific Conference PRogress, INnovation, DEmocracy HORIZON 2025. 2nd edition, Academica Brancusi House Publishing, pp. 581-586, www.utgjiu.ro/orizont2025/index.html
7. Rogers, A. (1996), Teaching Adults, Open University Press 8. Salmi, J. (2001), Tertiary Education in the 21st Century: Challenges and Opportunities,
Higher Education Management, Vol. 13, No. 2, pp. 104-125 9. ***, The ELLI Index – Europe 2010
The Annals of The "Ştefan cel Mare" University of Suceava. Fascicle of The Faculty of Economics and Public Administration Vol. 11, No. 2(14), 2011
32
THE PRESTIGE DISASTER AND THE PROPOSAL FOR A EUROPEAN FUND FOR THE COMPENSATION OF OIL POLLUTION DAMAGE: A MISSED OPPORTUNITY FOR
THE EUROPEAN UNION?
Javier PRADO-DOMÍNGUEZ [email protected] Diego VARELA [email protected]
Department of Applied Economics, University of A Coruña, Spain
Abstract: In this paper we analyze the proposal for the creation of a European fund for the compensation of oil pollution
damage. We argue that experience from the accident of the Prestige tanker off the Spanish coast in 2002 made it clear that existing international liability and compensation mechanisms were insufficient. The disaster added momentum to the proposal for the creation of an intermediate tier between the national and the international regimes. However, the proposal was dropped in 2004. In this paper we analyze the causes of the proposal demise and whether a similar opportunity is likely to arise in the future.
Keywords: European Union; maritime transport; pollution; oil; IOPC Fund; COPE Fund. JEL Classification: F51; H87; L98; R42; Q52.
INTRODUCTION On 19 November 2002, the Prestige tanker, registered in Bahamas, split in two and sank 260
km away from the Spanish port of Vigo. The oil spill was estimated at 25 thousand tons. The oil spilled travelled with the streams for a long time, covering a long distance. The oil polluted the Western coast of Galicia and, to a lesser extent, some coastal areas of Portugal and, eventually, the North of Spain and France. The spill caused important damages and required important cleaning operations at sea and on the coast in the three countries concerned, being Spain the most affected (González Laxe and Martín Palmero, 2009).
The great public opinion and media repercussion of the disaster and the subsequent judicial cases, some of which were not yet resolved several years later, highlight the need to analyze the principles of the financing of damages or negative externalities of maritime pollution. In this paper we will argue that due to the transnational nature of oil spills, compensation mechanisms can be better dealt with by supranational organizations such as the European Union than by individual member states. We also argue that existing international compensation mechanisms are insufficient. In order to estimate the financial expenses generated by the Prestige disaster, we will use information from the International Oil Pollution Compensation Funds (IOPC Funds).
We will also argue that the Prestige disaster created a window of opportunity to develop such compensation mechanisms at EU level (see Kingdon, 1995). Indeed, there is evidence that financial mechanisms have historically developed as a result of similar environmental disasters, and oil spills have been a paradigm of this trend. Thus, it was not until the accident of the Torrey Canyon oil tanker off the French coast in 1967, and having regard to the insufficiency of existing rules, that the international maritime community took the first steps towards uniform international rules on financial compensation.
The rest of this paper is divided in three sections. In section two, we will analyze the existing international compensation mechanisms at the time of the Prestige disaster and argue that they were insufficient. In section three, we will argue that the prestige disaster created a window of opportunity for the development of financial compensation mechanisms. In section four, we will analyze the actual reaction of the European Union to the Prestige disaster and its attempts to develop a European compensation fund for oil pollution damage. In the last section we will conclude by analyzing the outcome of the reform and the reasons for its failure.
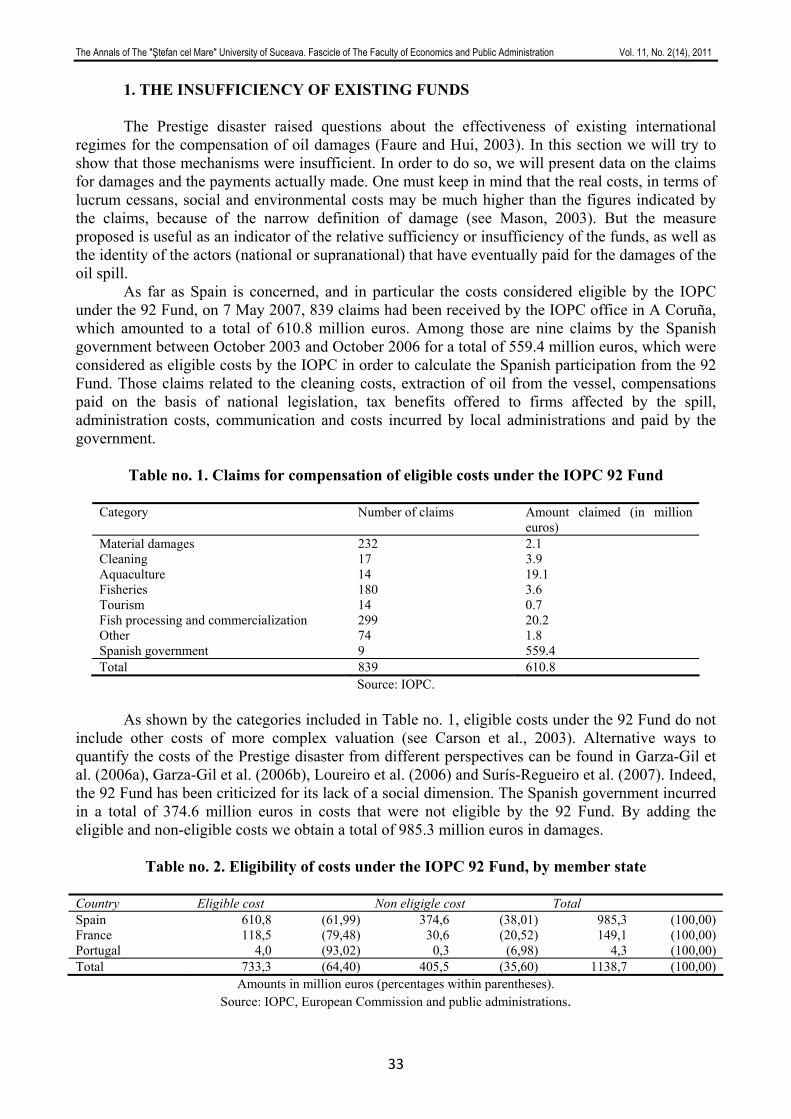
The Annals of The "Ştefan cel Mare" University of Suceava. Fascicle of The Faculty of Economics and Public Administration Vol. 11, No. 2(14), 2011
33
1. THE INSUFFICIENCY OF EXISTING FUNDS
The Prestige disaster raised questions about the effectiveness of existing international regimes for the compensation of oil damages (Faure and Hui, 2003). In this section we will try to show that those mechanisms were insufficient. In order to do so, we will present data on the claims for damages and the payments actually made. One must keep in mind that the real costs, in terms of lucrum cessans, social and environmental costs may be much higher than the figures indicated by the claims, because of the narrow definition of damage (see Mason, 2003). But the measure proposed is useful as an indicator of the relative sufficiency or insufficiency of the funds, as well as the identity of the actors (national or supranational) that have eventually paid for the damages of the oil spill.
As far as Spain is concerned, and in particular the costs considered eligible by the IOPC under the 92 Fund, on 7 May 2007, 839 claims had been received by the IOPC office in A Coruña, which amounted to a total of 610.8 million euros. Among those are nine claims by the Spanish government between October 2003 and October 2006 for a total of 559.4 million euros, which were considered as eligible costs by the IOPC in order to calculate the Spanish participation from the 92 Fund. Those claims related to the cleaning costs, extraction of oil from the vessel, compensations paid on the basis of national legislation, tax benefits offered to firms affected by the spill, administration costs, communication and costs incurred by local administrations and paid by the government.
Table no. 1. Claims for compensation of eligible costs under the IOPC 92 Fund
Category Number of claims Amount claimed (in million
euros) Material damages 232 2.1 Cleaning 17 3.9 Aquaculture 14 19.1 Fisheries 180 3.6 Tourism 14 0.7 Fish processing and commercialization 299 20.2 Other 74 1.8 Spanish government 9 559.4 Total 839 610.8
Source: IOPC.
As shown by the categories included in Table no. 1, eligible costs under the 92 Fund do not include other costs of more complex valuation (see Carson et al., 2003). Alternative ways to quantify the costs of the Prestige disaster from different perspectives can be found in Garza-Gil et al. (2006a), Garza-Gil et al. (2006b), Loureiro et al. (2006) and Surís-Regueiro et al. (2007). Indeed, the 92 Fund has been criticized for its lack of a social dimension. The Spanish government incurred in a total of 374.6 million euros in costs that were not eligible by the 92 Fund. By adding the eligible and non-eligible costs we obtain a total of 985.3 million euros in damages.
Table no. 2. Eligibility of costs under the IOPC 92 Fund, by member state Country Eligible cost Non eligigle cost Total Spain 610,8 (61,99) 374,6 (38,01) 985,3 (100,00) France 118,5 (79,48) 30,6 (20,52) 149,1 (100,00) Portugal 4,0 (93,02) 0,3 (6,98) 4,3 (100,00) Total 733,3 (64,40) 405,5 (35,60) 1138,7 (100,00)
Amounts in million euros (percentages within parentheses). Source: IOPC, European Commission and public administrations.
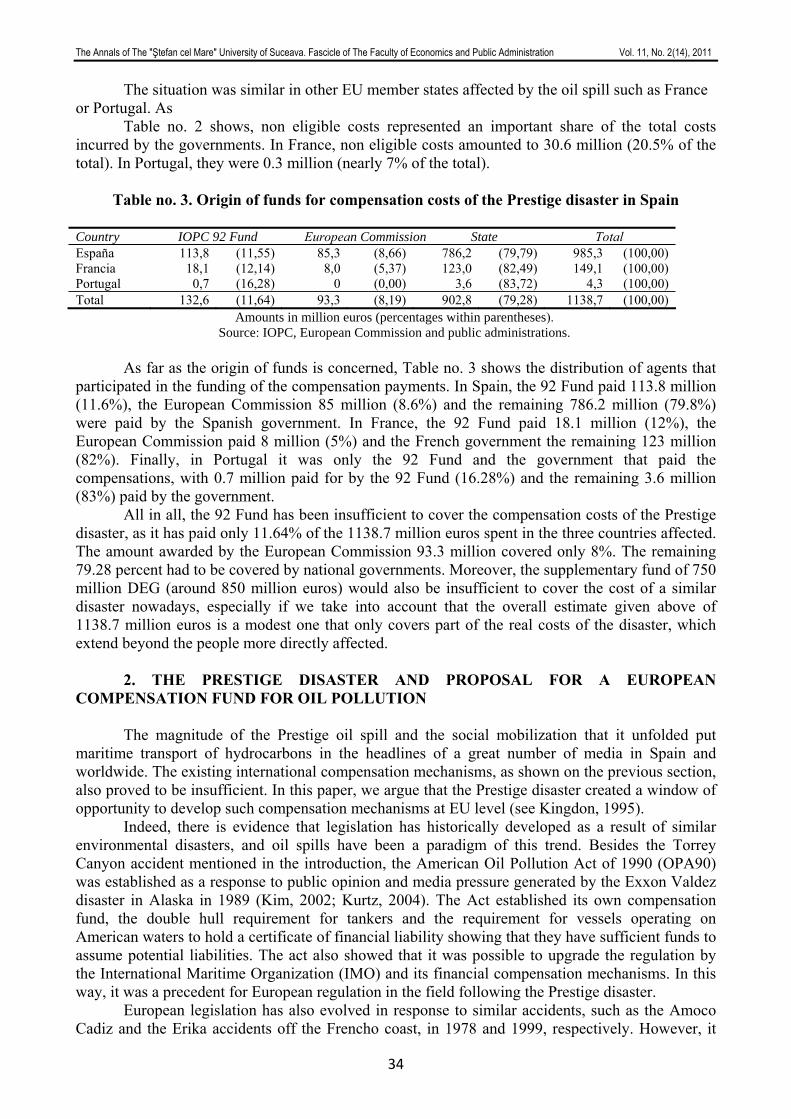
The Annals of The "Ştefan cel Mare" University of Suceava. Fascicle of The Faculty of Economics and Public Administration Vol. 11, No. 2(14), 2011
34
The situation was similar in other EU member states affected by the oil spill such as France or Portugal. As
Table no. 2 shows, non eligible costs represented an important share of the total costs incurred by the governments. In France, non eligible costs amounted to 30.6 million (20.5% of the total). In Portugal, they were 0.3 million (nearly 7% of the total).
Table no. 3. Origin of funds for compensation costs of the Prestige disaster in Spain
Country IOPC 92 Fund European Commission State Total España 113,8 (11,55) 85,3 (8,66) 786,2 (79,79) 985,3 (100,00) Francia 18,1 (12,14) 8,0 (5,37) 123,0 (82,49) 149,1 (100,00) Portugal 0,7 (16,28) 0 (0,00) 3,6 (83,72) 4,3 (100,00) Total 132,6 (11,64) 93,3 (8,19) 902,8 (79,28) 1138,7 (100,00)
Amounts in million euros (percentages within parentheses). Source: IOPC, European Commission and public administrations.
As far as the origin of funds is concerned, Table no. 3 shows the distribution of agents that
participated in the funding of the compensation payments. In Spain, the 92 Fund paid 113.8 million (11.6%), the European Commission 85 million (8.6%) and the remaining 786.2 million (79.8%) were paid by the Spanish government. In France, the 92 Fund paid 18.1 million (12%), the European Commission paid 8 million (5%) and the French government the remaining 123 million (82%). Finally, in Portugal it was only the 92 Fund and the government that paid the compensations, with 0.7 million paid for by the 92 Fund (16.28%) and the remaining 3.6 million (83%) paid by the government.
All in all, the 92 Fund has been insufficient to cover the compensation costs of the Prestige disaster, as it has paid only 11.64% of the 1138.7 million euros spent in the three countries affected. The amount awarded by the European Commission 93.3 million covered only 8%. The remaining 79.28 percent had to be covered by national governments. Moreover, the supplementary fund of 750 million DEG (around 850 million euros) would also be insufficient to cover the cost of a similar disaster nowadays, especially if we take into account that the overall estimate given above of 1138.7 million euros is a modest one that only covers part of the real costs of the disaster, which extend beyond the people more directly affected. 2. THE PRESTIGE DISASTER AND PROPOSAL FOR A EUROPEAN COMPENSATION FUND FOR OIL POLLUTION
The magnitude of the Prestige oil spill and the social mobilization that it unfolded put maritime transport of hydrocarbons in the headlines of a great number of media in Spain and worldwide. The existing international compensation mechanisms, as shown on the previous section, also proved to be insufficient. In this paper, we argue that the Prestige disaster created a window of opportunity to develop such compensation mechanisms at EU level (see Kingdon, 1995).
Indeed, there is evidence that legislation has historically developed as a result of similar environmental disasters, and oil spills have been a paradigm of this trend. Besides the Torrey Canyon accident mentioned in the introduction, the American Oil Pollution Act of 1990 (OPA90) was established as a response to public opinion and media pressure generated by the Exxon Valdez disaster in Alaska in 1989 (Kim, 2002; Kurtz, 2004). The Act established its own compensation fund, the double hull requirement for tankers and the requirement for vessels operating on American waters to hold a certificate of financial liability showing that they have sufficient funds to assume potential liabilities. The act also showed that it was possible to upgrade the regulation by the International Maritime Organization (IMO) and its financial compensation mechanisms. In this way, it was a precedent for European regulation in the field following the Prestige disaster.
European legislation has also evolved in response to similar accidents, such as the Amoco Cadiz and the Erika accidents off the Frencho coast, in 1978 and 1999, respectively. However, it
The Annals of The "Ştefan cel Mare" University of Suceava. Fascicle of The Faculty of Economics and Public Administration Vol. 11, No. 2(14), 2011
35
has never developed legislation of its own in the line of the American Oil Pollution Act. Instead, it has relied on international conventions (Faure and Wang, 2004).
The Prestige disaster added to the pressure for more stringent regulation at EU level, which had already become apparent with the Erika accident off the coast of France in 1999. Zero-risk is not an option in the field of maritime transport, but it was clear the there was room to improve the existing prevention and compensation mechanisms. EU institutions such as the European Commission or the European Parliament were aware of this pressure, so the issue re-emerged with force on their agendas immediately after the Prestige disaster.
One of the most important initiatives in this direction aimed at the establishment of a fund for the compensation of oil pollution damage in European waters and related measures, the so-called COPE Fund. The measure was contained in a European Commission proposal for a Regulation of 6 December 2000, under the codecisión procedure. The proposal was part of the second set of Community measures on maritime safety following the sinking of the oil tanker Erika (the first set of measures was adopted by the Commission on 21 March 2000). In this section we will present the main events in the life of this proposal based on data from the European Parliament’s Legislative Observatory (OEIL).
2.1. Original Commission proposal The Commission's proposal aimed to complement the existing international two-tier regime
on liability and compensation for oil pollution damage by tankers by creating a European supplementary fund, the COPE Fund, to compensate victims of oil spills in European waters. The COPE Fund would only compensate victims whose claims have been considered justified, but who have nevertheless been unable to obtain full compensation under the international regime, owing to insufficient compensation limits. The current ceiling is EUR 200 million. Compensation from the COPE Fund would thus be based on the same principles and rules as the current international fund system, but subject to a ceiling which was deemed to be sufficient for any foreseeable disaster, i.e. EUR 1 000 million. The COPE Fund could also be used to speed up the payment of full compensation of victims.
The COPE Fund was to be financed by European oil receivers. Any person in a Member State who received more than 150 000 tonnes of crude oil and/or heavy fuel oil per year would have to pay its contribution to the COPE Fund, in a proportion which corresponded to the amounts of oil received.
The COPE Fund would only be activated once an accident that exceeded, or threatened to exceed, the maximum limit provided by the IOPC Fund had occurred in EU waters. The proposed regulation, in addition to the provisions on liability, included an article introducing financial penalties for grossly negligent behaviour by any person involved in the transport of oil by sea. This penalty would be imposed by Member States outside the scope of liability and compensation and would thus not be affected by any limitation of liability.
2.2. Council opinion
On 20 December 2000, under French Presidency and at the end of a wide-ranging discussion, the Council took note of the Commission's submission of its "second ERIKA package" and of delegations' comments on it.
At the end of its discussions on maritime safety, the Council emphasised the need to properly implement and enforce Port State Control obligations and the need to harmonise such controls at a high level in the Community. It welcomed the prospect of being able to ban sub-standard ships from Community ports as from the entry into force of the necessary legal instrument. It also called on Member States to pursue their joint cooperation efforts with a view to increasing the quality and availability of information on maritime traffic by submitting appropriate proposals to the IMO and by setting up a regional information system between their processing centres in order to make as effective as possible the procedures for maritime traffic surveillance and for the prevention of risks to shipping and the environment. The Council also invited the Commission to
The Annals of The "Ştefan cel Mare" University of Suceava. Fascicle of The Faculty of Economics and Public Administration Vol. 11, No. 2(14), 2011
36
draw up regularly an inventory of the international and Community provisions of maritime social legislation applied by Member States. The relative importance of these issues seems to indicate that the creation of a COPE Fund was not a priority for a majority of member state governments. Finally, and most importantly, the Council underlined the need to ensure a proper and, as far as possible, global regime for liability and compensation in cases of pollution damage resulting from contamination by petroleum products or other noxious and hazardous substances transported by ship. This was an early indication that the Council was not determined to the creation of an intermediate tier of regulation of liability and compensation for oil damage at European level, preferring instead that these issues remained at the level of international conventions.
2.3. European Parliament opinion
On 29 May 2001, the committee responsible in the European Parliament adopted the report by Alain ESCLOPE (EDD, F) broadly approving the proposal subject to a number of amendments (codecision procedure, 1st reading). While it welcomed the proposal in principle, the committee wanted to make the rules stricter. For example, it felt that all operators involved in the transport of oil - and not only oil receivers as the Commission had proposed - should be required to make financial contributions. In particular, it believed that ship owners, who bore primary responsibility for the condition of their vessels, should also be made liable. To this end, it specified that every ship sailing in European territorial waters or marine economic interest zones should be able to prove that it held a financial guarantee or else pay a heavy financial penalty.
On 14 June 2001, the European Parliament endorsed the report and adopted a number of amendments to tighten the legislation. Despite strong resistance by Commissioner Loyola de PALACIO, MEPs voted for the regulation to cover bunker oil and hazardous and noxious substances, as the Bunker Convention 2001 and the Hazardous and Noxious Substances Convention 1996 had not been ratified or implemented. In addition, Parliament wanted the COPE Fund to provide for advance provisional payments within six months because victims were often left in difficult circumstances whilst waiting for the first payments to come through. Moreover, not only oil receivers but all operators involved in the transport of oil, including ship owners, should contribute to the compensation fund, according to the House.
2.4. Modified Commission proposal
On 12 June 2002, the Commission agreed to a number of amendments which would either clarify the text or the scope of the regulation or otherwise constitute editorial improvements. Similarly, it accepted several amendments that would provide useful additions to the text. These concerned the clarification of the nature and activities of the COPE fund, its link to the IOPC Fund, the facility to provide advance payment and the preparation of a progress report on the developments in maritime liability and compensation at the international level.
The Commission did however not accept the amendments seeking to extend the scope of the COPE Fund to cover other forms of pollution than oil pollution by tankers. While the improvement in itself of the compensation regime for pollution damage caused by hazardous and noxious substances was an objective which was supported, the Commission considered that the regulation under consideration was inappropriate to serve that function. The purpose of the COPE Fund was to place an additional compensation layer on the existing international compensation regime, and in this way to ensure compensation for expensive accidents in EU waters. It complemented and built upon the international regime by creating a third layer which was closely linked to the two existing ones (CLC and IOPC Fund). The Commission did, however, agree that there is a need to put in place a regime ensuring proper compensation for marine pollution caused by other substances than oil as soon as possible.
The Commission did not agree to the amendments aiming at introducing an obligation for ship owners to pay at part of the compensation. These amendments raised problems of international law. The existing international legal regime (the CLC convention) did not allow additional compensation claims to be placed on the ship owner. While the Commission agreed with the longer
The Annals of The "Ştefan cel Mare" University of Suceava. Fascicle of The Faculty of Economics and Public Administration Vol. 11, No. 2(14), 2011
37
term aim that owners should make a more substantial contribution in the payment, in particular if the accident was due to their gross negligence, requiring ship owners to participate in the compensation of damage would be in conflict with the international rules as they stood at the moment. The Commission proposed to address this issue at the revision of the international system. In order to make ship owners more responsible and subject to penalties in case of negligence, the Commission's proposal included a financial penalty to be placed on any party which has caused or contributed to the accident by gross negligence.
The Commission also rejected the amendment aiming at extending compensation of environmental damage and the one proposing to limit the period of collection of the funds to the COPE Fund from one year to six months.
2.5. Council conclusions
On 9 December 2004, following an exchange of views on civil liability and compensation for victims in the event of oil pollution at sea, the Presidency reiterated its former conclusions on maritime safety, most particularly those adopted in the aftermath of the Prestige accident both by the TTE Council and the European Council.
It also stressed, in the interest of victims, the need to ensure appropriate compensation for damage caused by oil pollution from ships by actively working to ensure that effective financial responsibility is exercised on the part of those involved in transportation of oil by sea, and the need for appropriate revision of the relevant provisions of the 1992 Civil Liability (CLC) and 1992 International Oil Pollution Compensation Fund (IOPCF) Conventions. It also welcomed the ongoing talks on burden sharing and encourages industry to pursue these in the interest of all. Finally, the Council urged all Member States to ratify the IOPCF Supplementary Fund Protocol of May 2003, if they had not yet done so and to seek a common EU approach ahead of the forthcoming intersessional IOPCF Working Group meeting in February 2005.
3. A MISSED OPPORTUNITY FOR THE EU?
In this paper we have analyzed the international regime for oil pollution liability and compensation, and we have come to the conclusion that the system is improvable. As the figures in section two have shown, international liability and compensation amounts are blatantly insufficient. The experience from the Prestige disaster shows us that, because of the isufficiency of the system, it is national governments that end up paying for the damages, which is in contrast with the polluter-pays principle.
At the time of the Prestige disaster, the EU was already working on a set of measures related to oil pollution, the so-called Erika packages. Those packages included the creation of a European fund for compensation for oil pollution damage by tankers. The Prestige disaster made it apparent that there was a need for a firm commitment, inexistent until that time, by member state to apply the Erika packages urgently and without exhausting the previously specified deadlines.
Two years after the Prestige disaster, the initiative lost momentum and the efforts were redirected towards the expansion of the existing international liability and compensation regime. Thus, the EU gave up its ambition to create an intermediate tear or regulation between the international and the member state level in the lines of the American Oil Pollution Act.
Amongst the factors that contributed to the failure of the proposal were the direct influence and indirect political pressure of important lobbies and sectoral interest groups, which succeeded in weakening the most important and innovative elements of the proposal for a COPE fund. As far as the maritime sector is concerned, of special relevance were a number of ship operator groups such as INTERTANKO and BIMCO, and oil companies with an interest in the shipment and terminalling of crude oil, such as OCIMF. These groups were particularly critical of the initiatives, which they qualified as disproportionate, impulsive and out of touch with the reality of the sector.
Another factor that may have influenced the demise of the proposal for the creation of a European fund is the end of tenure of Spanish politicial Loyola de Palacio as vice-president of the
The Annals of The "Ştefan cel Mare" University of Suceava. Fascicle of The Faculty of Economics and Public Administration Vol. 11, No. 2(14), 2011
38
European Commission in charge for transport. She was one of the main supporters of the proposals immediately after the Erika disaster in 1999, and she was proved right then the Prestige sank off the Galician coast three years later, in 2002.
But the main reason for the failure of the proposals was the lack of support in the Council of the EU, which was evident from its first opinion on the proposals on 20 December 2000. The interest of European commissioner Loyola de Palacio and the added momentum from the Prestige disaster were not enough to change this. The main reason is that the creation of a European fund financed from contributions by recipients of oil has a heavy redistributive component, from EU oil consumers to the member states potentially affected by accidents. The result of this is that although there will be a small number of member states in favour of the fund, headed by France and Spain, there will also be a majority of member states that are reluctant to pay the bill of a proposal from which they have little to gain. The requirement from an oversized majority of votes in the Council (over 70%) makes things even more difficult.
Given the fact that the benefits will be concentrated in a few member states, whereas the costs will be more thinly spread, the only way for the proposal to succeed would be to include it in a broader package deal. Horse trading or logrolling though package deals are a known way of ugrading the European interest beyond the lowest common denominator of the member state governments (see Moravcsik, 1991; Lodge, 1998; Crombez, 2000). But the Erika II package was not broad enough, as it was too focused on maritime safety to be able to gather the support needed for the proposal to succeed.
A missed opportunity for such a package was the enlargement of the EU in 2004 and 2007. Such enlargement also means that the gathering of the necessary majority for similar measures will be even more difficult in the future, not only because of the increase in the number of member states, but also because the center of gravity of the Union moves eastward and away from the coast. The new members are less interested about ocean pollution.
The upgrade of the international and compensation mechanisms, particularly the expansion of the IOPC fund, will also make it more difficult for similar proposals to succeed in the future. The reason is that it shifts the status quo closer to the member state preferences, thereby reducing the margin of manoeuvre of the agenda setter, be it the European Commission or the Council Presidency. The Erika and Prestige disasters created a window of opportunity for the creation of a European compensation fund, and it is possible that a similar catastrophe will put the issue back on the agenda. But the options for success are likely to be fewer next time.
REFERENCES
1. Carson, Richard T., Robert C. Mitchell, Michael Hanemann, Raymond J. Kopp, Stanley Presser and Paul A. Ruud (2003), Contingent valuation and lost passive use: damages from the Exxon Valdez oil spill, Environmental and Resource Economics 25(3): 257-86.
2. Crombez, Christophe (2000), Spatial models of logrolling in the European Union, European Journal of Political Economy 16(4): 707-38.
3. Faure, Michael and Hui Wang (2004), Liability for oil pollution-the EU approach, Environmental Liability 12: 55-67.
4. Faure, Michael and Wang Hui (2003), The International Regimes for the Compensation of Oil-Pollution Damage: Are they Effective?, Review of European Community and International Environmental Law 12(3): 242-53.
5. Garza-Gil, M. D., Albino Prada-Blanco and M. X. Vázquez-Rodríguez (2006a), Estimating the short-term economic damages from the Prestige oil spill in the Galician fisheries and tourism, Ecological Economics 58(4): 842-9.
The Annals of The "Ştefan cel Mare" University of Suceava. Fascicle of The Faculty of Economics and Public Administration Vol. 11, No. 2(14), 2011
39
6. Garza-Gil, M. D., Juan C. Surís-Regueiro and Manuel M. Varela-Lafuente (2006b), Assessment of economic damages from the Prestige oil spill, Marine Policy 30(5): 544-51.
7. González Laxe, Fernando and Federico Martín Palmero (2009), Evaluación económica de las catrástofes marítimas. A Coruña: Netbiblo.
8. Kim, Inho (2002), Ten years after the enactment of the Oil Pollution Act of 1990: a success or a failure, Marine Policy 26(3): 197-207.
9. Kingdon, John W. (1995) Agendas, alternatives and public policies. New York: Longman.
10. Kurtz, R. S. (2004), Coastal Oil Pollution: Spills, Crisis, and Policy Change, Review of Policy Research 21(2): 201-19.
11. Lodge, Juliet (1998), Negotiations in the European Union: The 1996 Intergovernmental Conference, International Negotiation 3(3): 481-505.
12. Loureiro, M. L., A. Ribas, E. Lopez and E. Ojea (2006), Estimated costs and admissible claims linked to the Prestige oil spill, Ecological Economics 59(1): 48-63.
13. Mason, Michael (2003), Civil liability for oil pollution damage: examining the evolving scope for environmental compensation in the international regime, Marine Policy 27(1): 1-12.
14. Moravcsik, Andrew (1991), Negotiating the Single European Act: National interests and conventional statecraft in the European Community, International Organization 45(1): 19-56.
15. Surís-Regueiro, Juan C., M. D. Garza-Gil and Manuel M. Varela-Lafuente (2007), The Prestige oil spill and its economic impact on the Galician fishing sector, Disasters 31(2): 201-15.
The Annals of The "Ştefan cel Mare" University of Suceava. Fascicle of The Faculty of Economics and Public Administration Vol. 11, No. 2(14), 2011
40
QUALITATIVE OBSERVATION APPLIED IN PROMOTIONAL STRATEGY DESIGN
Associate Professor Adriana MANOLICĂ University Alexandru Ioan Cuza of Iasi, Romania
[email protected] Teaching assistant, PhD. Claudia BOBÂLCĂ
University Alexandru Ioan Cuza of Iasi, Romania [email protected]
Teaching assistant, PhD. Oana CIOBANU University Alexandru Ioan Cuza of Iasi, Romania
Abstract: Observational research gained more importance in the speciality literature lately, as the method allows
researchers to understand better the purpose of information in people’s life. Many researchers that tested modern data collection techniques returned to observational concept, using it on a large scale as a basic method in influences evaluations on buying decision process.
The research team had to realise a qualitative research pattern to be used in the business environment. The chosen example was arbitrary. The starting point was not real needs and problems of any company.
The purpose of this research is to found the promotional strategy for a furniture cleaning product. The qualitative study’s objectives are: (1) understanding the manner that people clean the furniture in their
apartments; (2) identifying motivations for choosing certain furniture cleaning products; (3) identifying the ambient elements associated to furniture cleaning activities.
The research method is the unstructured, undisguised, direct observation, followed by an interview. Conclusion synthesize the typical elements to be included in the advertising message, following the manner people
are cleaning their furniture. Some of these elements refer to: main character is a married woman, 20-30 years old, cleaning the living room furniture; the furniture is decorated; there is an opened TV in the room on a musical channel. The text elements should include expressions such as: “I usually spend 2-3 hours to clean the house on Saturdays”, “My daughter also helps me cleaning around the house”.
Keywords: Qualitative observation, promotional strategy, advertising elements, cleaning furniture products,
participation observation, interview JEL Classification: M31
INTRODUCTION
Comparing to all the other research methods, observation seems to be the simplest one. Even so, many researchers that had tested modern collecting data techniques have started to reuse the old concept of observation on a large scale as a basis method in influences evaluation of consumers’ buying decisions (Fannin, 1988).
Observation is a complex research method as it usually dictates researcher to play a number of roles and use a number of techniques, including the own senses, in order to collect data. One more aspect would be that, leaving aside the involvement level in the studied group, the researcher needs to always remember his/her part in order to remain detached in collecting and analyzing relevant data for the investigated problem. There are two important factors that need special attention: 1 – obtaining group attending access; 2 – leaving the field. Other specific challenges involve professional ethical issues and results validity and trust.
Gorman and Clayton define observation as being represented by those studies involving systematic recording, using senses, of the characteristics and transformations of the studied object (2005, p. 40). Becket and Geer define participation observation as a hidden or obvious activity in which the researcher participates in the daily life of the observed people observing, listening certain aspects, questioning them within a period of time (1970, p. 133).
As a scientific method, observation consists in a systematic recording, using senses, characteristics and transformations of the studied object.
Observation involves recording human behaviour patterns, objects and events of a systematic manner, in order to obtain information about the concerned phenomena. The most
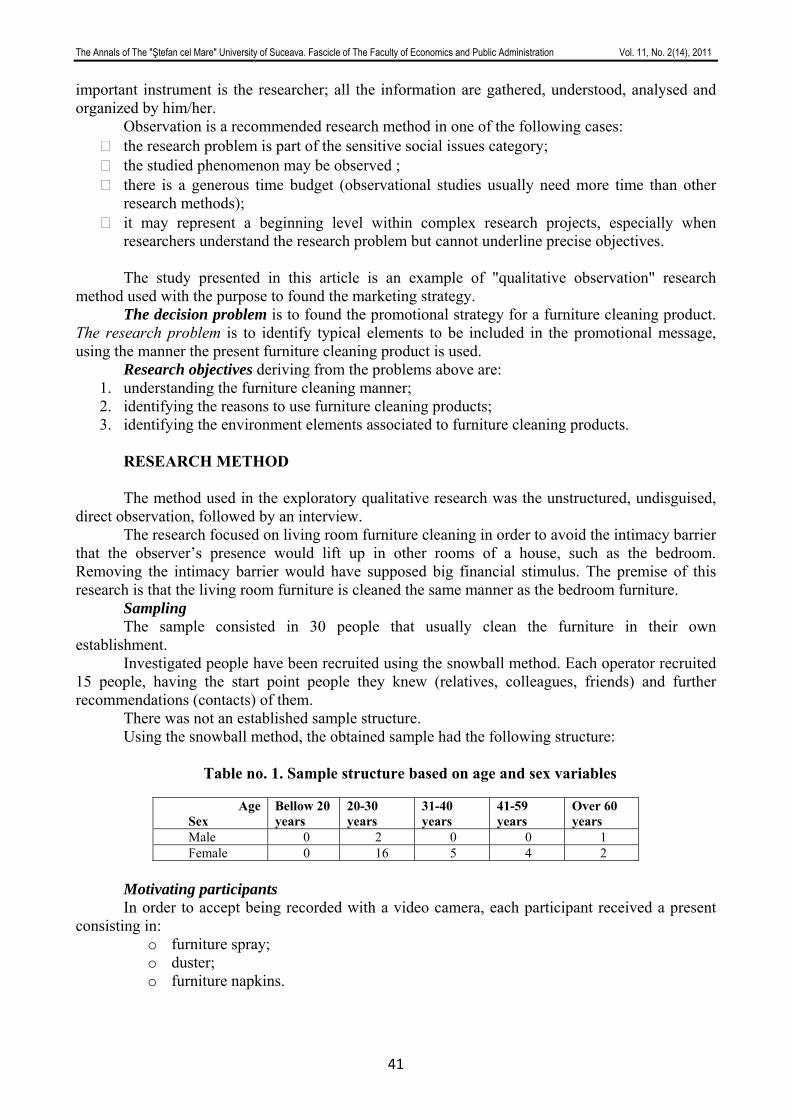
The Annals of The "Ştefan cel Mare" University of Suceava. Fascicle of The Faculty of Economics and Public Administration Vol. 11, No. 2(14), 2011
41
important instrument is the researcher; all the information are gathered, understood, analysed and organized by him/her.
Observation is a recommended research method in one of the following cases: the research problem is part of the sensitive social issues category; the studied phenomenon may be observed ; there is a generous time budget (observational studies usually need more time than other
research methods); it may represent a beginning level within complex research projects, especially when
researchers understand the research problem but cannot underline precise objectives. The study presented in this article is an example of "qualitative observation" research
method used with the purpose to found the marketing strategy. The decision problem is to found the promotional strategy for a furniture cleaning product.
The research problem is to identify typical elements to be included in the promotional message, using the manner the present furniture cleaning product is used.
Research objectives deriving from the problems above are: 1. understanding the furniture cleaning manner; 2. identifying the reasons to use furniture cleaning products; 3. identifying the environment elements associated to furniture cleaning products.
RESEARCH METHOD
The method used in the exploratory qualitative research was the unstructured, undisguised,
direct observation, followed by an interview. The research focused on living room furniture cleaning in order to avoid the intimacy barrier
that the observer’s presence would lift up in other rooms of a house, such as the bedroom. Removing the intimacy barrier would have supposed big financial stimulus. The premise of this research is that the living room furniture is cleaned the same manner as the bedroom furniture.
Sampling The sample consisted in 30 people that usually clean the furniture in their own
establishment. Investigated people have been recruited using the snowball method. Each operator recruited
15 people, having the start point people they knew (relatives, colleagues, friends) and further recommendations (contacts) of them.
There was not an established sample structure. Using the snowball method, the obtained sample had the following structure:
Table no. 1. Sample structure based on age and sex variables
Age
Sex Bellow 20 years
20-30 years
31-40 years
41-59 years
Over 60 years
Male 0 2 0 0 1 Female 0 16 5 4 2
Motivating participants In order to accept being recorded with a video camera, each participant received a present
consisting in: o furniture spray; o duster; o furniture napkins.
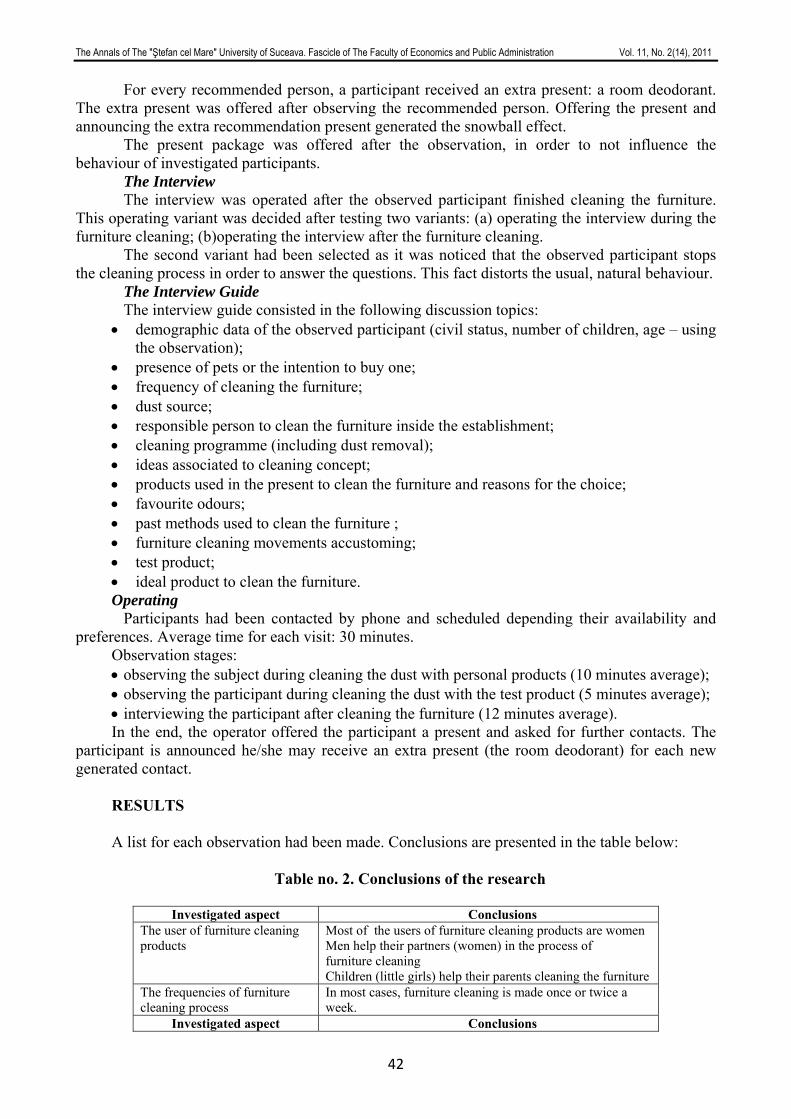
The Annals of The "Ştefan cel Mare" University of Suceava. Fascicle of The Faculty of Economics and Public Administration Vol. 11, No. 2(14), 2011
42
For every recommended person, a participant received an extra present: a room deodorant. The extra present was offered after observing the recommended person. Offering the present and announcing the extra recommendation present generated the snowball effect.
The present package was offered after the observation, in order to not influence the behaviour of investigated participants.
The Interview The interview was operated after the observed participant finished cleaning the furniture.
This operating variant was decided after testing two variants: (a) operating the interview during the furniture cleaning; (b)operating the interview after the furniture cleaning.
The second variant had been selected as it was noticed that the observed participant stops the cleaning process in order to answer the questions. This fact distorts the usual, natural behaviour.
The Interview Guide The interview guide consisted in the following discussion topics:
• demographic data of the observed participant (civil status, number of children, age – using the observation);
• presence of pets or the intention to buy one; • frequency of cleaning the furniture; • dust source; • responsible person to clean the furniture inside the establishment; • cleaning programme (including dust removal); • ideas associated to cleaning concept; • products used in the present to clean the furniture and reasons for the choice; • favourite odours; • past methods used to clean the furniture ; • furniture cleaning movements accustoming; • test product; • ideal product to clean the furniture. Operating
Participants had been contacted by phone and scheduled depending their availability and preferences. Average time for each visit: 30 minutes.
Observation stages: • observing the subject during cleaning the dust with personal products (10 minutes average); • observing the participant during cleaning the dust with the test product (5 minutes average); • interviewing the participant after cleaning the furniture (12 minutes average). In the end, the operator offered the participant a present and asked for further contacts. The
participant is announced he/she may receive an extra present (the room deodorant) for each new generated contact.
RESULTS
A list for each observation had been made. Conclusions are presented in the table below:
Table no. 2. Conclusions of the research
Investigated aspect Conclusions
The user of furniture cleaning products
Most of the users of furniture cleaning products are women Men help their partners (women) in the process of furniture cleaning Children (little girls) help their parents cleaning the furniture
The frequencies of furniture cleaning process
In most cases, furniture cleaning is made once or twice a week.
Investigated aspect Conclusions
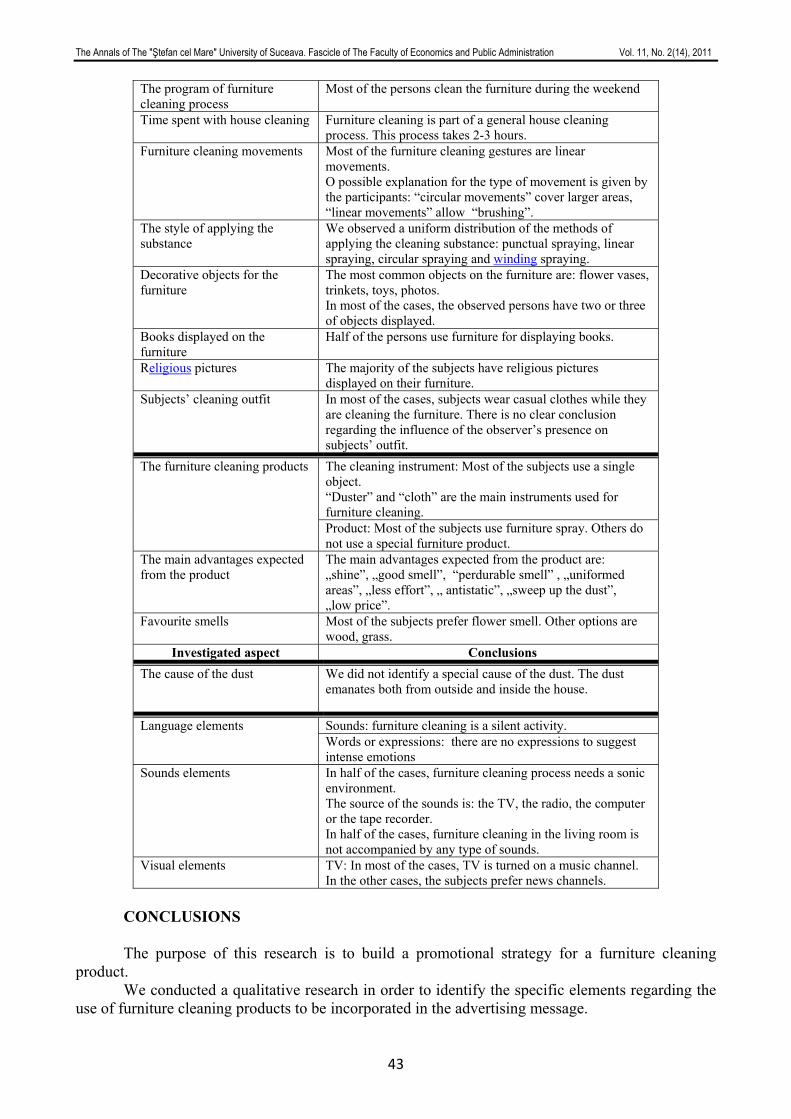
The Annals of The "Ştefan cel Mare" University of Suceava. Fascicle of The Faculty of Economics and Public Administration Vol. 11, No. 2(14), 2011
43
The program of furniture cleaning process
Most of the persons clean the furniture during the weekend
Time spent with house cleaning Furniture cleaning is part of a general house cleaning process. This process takes 2-3 hours.
Furniture cleaning movements
Most of the furniture cleaning gestures are linear movements. O possible explanation for the type of movement is given by the participants: “circular movements” cover larger areas, “linear movements” allow “brushing”.
The style of applying the substance
We observed a uniform distribution of the methods of applying the cleaning substance: punctual spraying, linear spraying, circular spraying and winding spraying.
Decorative objects for the furniture
The most common objects on the furniture are: flower vases, trinkets, toys, photos. In most of the cases, the observed persons have two or three of objects displayed.
Books displayed on the furniture
Half of the persons use furniture for displaying books.
Religious pictures The majority of the subjects have religious pictures displayed on their furniture.
Subjects’ cleaning outfit
In most of the cases, subjects wear casual clothes while they are cleaning the furniture. There is no clear conclusion regarding the influence of the observer’s presence on subjects’ outfit. The cleaning instrument: Most of the subjects use a single object. “Duster” and “cloth” are the main instruments used for furniture cleaning.
The furniture cleaning products
Product: Most of the subjects use furniture spray. Others do not use a special furniture product.
The main advantages expected from the product
The main advantages expected from the product are: „shine”, „good smell”, “perdurable smell” , „uniformed areas”, „less effort”, „ antistatic”, „sweep up the dust”, „low price”.
Favourite smells Most of the subjects prefer flower smell. Other options are wood, grass.
Investigated aspect Conclusions The cause of the dust We did not identify a special cause of the dust. The dust
emanates both from outside and inside the house. Sounds: furniture cleaning is a silent activity. Language elements
Words or expressions: there are no expressions to suggest intense emotions
Sounds elements In half of the cases, furniture cleaning process needs a sonic environment. The source of the sounds is: the TV, the radio, the computer or the tape recorder. In half of the cases, furniture cleaning in the living room is not accompanied by any type of sounds.
Visual elements TV: In most of the cases, TV is turned on a music channel. In the other cases, the subjects prefer news channels.
CONCLUSIONS
The purpose of this research is to build a promotional strategy for a furniture cleaning
product. We conducted a qualitative research in order to identify the specific elements regarding the
use of furniture cleaning products to be incorporated in the advertising message.

The Annals of The "Ştefan cel Mare" University of Suceava. Fascicle of The Faculty of Economics and Public Administration Vol. 11, No. 2(14), 2011
44
The exploratory research only represents the first step of the study and it generates the information used to generate the hypothesis to be tested in quantitative research. Our research presents just the exploratory phase.
The advertising message includes the following elements: • The main character is a woman, with the age of 20-30 years, married, wearing casual
clothes (jeans and a t-shirt); • The usual context of the cleaning process is the living room, classic furniture, opened
window, objects like vacuum or pug; • The usual decorative products on the furniture are: trinkets, toys, books and religious
pictures; • The TV is turned on a music channel; • Most of the furniture cleaning gestures are linear movements (up/down, left/right) but also
circular movements (for larger surfaces). The content of the advertising message will include the following elements: • The cleaning day (usually on Saturday: “on Saturday I usually clean the house for 2-3
hours”); • The woman is usually helped by her daughter(s): “my daughter also helps me to clean the
house”. The results show that most of the users of the furniture cleaning products are women. The
men and the female children (less than 21 years) just help the woman (the mother). In most of the cases, the furniture is cleaned once or twice a week. Saturday is the preferred
day for this activity. Furniture cleaning is a part of general house cleaning process. House cleaning takes mostly
2-3 hours. Most of the furniture cleaning gestures are linear movements (up/down, left/right). The
subjects could not offer a clear explanation for their cleaning movements. O possible explanation for the type of movement is that: “circular movements” cover larger surfaces, “linear movements” allow “brushing”.
There is a uniform distribution of the methods of applying the cleaning substance: punctual spraying, linear spraying, circular spraying and winding spraying. We did not identify a pattern for the style of applying the cleaning substance.
The usual decorative products on the furniture are: trinkets, toys, flower vases, photos. The trinkets are usually white. Half of subjects have books displayed on the furniture shelves. Most of the persons have religious pictures on the furniture.
The cleaning outfit is a casual one (jeans and t-shirts). Most of the subjects use a main product (active substance sprayed on the furniture) and an
auxiliary product (rag, dust cloth, duster, wet wipes). The most used main product is the furniture spray. The most common auxiliary products are
dusters and dust clothes. The main advantages expected from the dusting products are:
• „shine”, • „good smell”, • “perdurable smell , • „uniformed areas”, • „less effort”, • „ antistatic”, • „sweep up the dust”, • „low price”.
The preferred smell for these products is floral scent. Other options are: wood, grass and fruits flavours. The TV, the computer or the radio are usually used for the sound surrounding.
The Annals of The "Ştefan cel Mare" University of Suceava. Fascicle of The Faculty of Economics and Public Administration Vol. 11, No. 2(14), 2011
45
LIMITATION OF THE STUDY AND FUTURE RESEARCH DIRECTIONS
The purpose of the research is an educational one and uses a product chosen by our research team.
The selection of the subjects was not based on a selecting questionnaire. Researcher participation and subjects’ recording might influence the usual behaviour of the subjects (the outfit, language, sounds). The observation was reduced only on living room furniture and we assumed that the rest of the furniture is cleaned in the same manner.
The present research can be developed by the following future directions: (a) Correlations between demographic / psychographic subjects features and the objects displayed on the furniture; (b) Correlations between the toys on the furniture and the presence of young people in the family (less than 25 years); (c) Identifying the advantages the subjects desire from a new furniture cleaning product; (d) Investigating the characteristics of the ideal piece of furniture; (e) Observation of the subjects’ cleaning behaviour on different groups of consumers, in order to identify specific behavioural elements.
REFERENCES
1. Adler, P. A., & Adler, R (1987). Membership roles infield research: Vol. 6. Qualitative research methods. Newbury Park, CA: Sage Publications
2. Adler, P. A., & Adler, P. (1994). Observational techniques. In N. K. Denzin & Y S. Lincoln (Eds.), Handbook of qualitative research (pp. 377-392). Thousand Oaks, CA: Sage Publications.
3. Baker, L. (2006). Observation: a complex research method. (Ethnological methods), Library Trends: p.171(19).
4. Becker, H. S., & Geer, B. (1970). Participant observation and interviewing: A comparison. In W.J. Filstead (Ed.), Qualitative methodology: Firsthand involvement with the social world (pp. 133-142). Chicago: Markham.
5. Biernacki, P., & Waldorf, D. (1981). Snowball sampling: Problems and techniques of chain referral sampling. Sociological Methods & Research, 10(2), 141-163.
6. Caldwel, K. and Atwal, A. (2005), Non-participant observation: using video tapes to collect data in nursing research, Nurse Researcher 13.2 (Dec 2005): p.42(13)
7. Chatman, E. A. (1992). The information world of retired women. Westport, CT: Greenwood Press.
8. Fannin, R. (1988), Seeing is believing: ethnology, the study through observation of different cultures' behavior, is netting profitable insights for worldly marketers, Marketing & Media Decisions 23.n2 (Feb 1988): p.p51(3).
9. Gold, R. L. (1958). Roles in sociological field observations. Social Forces, 36(3), 217-223.
10. Gorman, G. E., & Clayton, P. (2005). Qualitative research for the information professional (2nd ed.). London: Facet.
11. Johnson, R. B. (1997). Examining the validity structure of qualitative research. Education, 118(2), 282-292.
12. Pearsall, M. (1970). Participant observation as rote and method in behavioral research. In W.J. Filstead (Ed.), Qualitative methodology: Firsthand involvement with the social world (pp. 340-352). Chicago: Markham.
13. Polit, D. F., & Hungler, B. P. (1987). Nursing research: Principles and methods (3rd ed.). Philadelphia: J. B. Lippincott.
14. Powell, R. R., & Connaway, L. S. (2004). Basic research methods for librarians (4th ed.) Westport, CT: Libraries Unlimited
15. Spradley, J. P. (1980). Participant observation. New York: Holt, Rinehart and Winston.
The Annals of The "Ştefan cel Mare" University of Suceava. Fascicle of The Faculty of Economics and Public Administration Vol. 11, No. 2(14), 2011
46
IS THERE A STABLE RELATIONSHIP BETWEEN REAL INTEREST RATES AND
HOUSING PRICES? EVIDENCE FROM SEVERAL EURO AREA COUNTRIES
José Manuel SÁNCHEZ SANTOS Department of Applied Economics, University of A Coruña, Spain
[email protected] José Pablo ABEAL VÁZQUEZ
Department of Applied Economics, University of A Coruña, Spain [email protected]
Abstract: This paper analyzes the relationship between real interest rates and housing prices in three European Union
countries (France, Spain and the Netherlands) between 1999 and 2010. The main objective is to test whether there is a stable long-run relationship between both variables, as well as whether there are differences across countries. In order to do so, I use different real interest rates (short-term and long-term) and different housing price indices (nominal and real), and apply cointegration techniques and propose an error correction model, following the two-stage methodology suggested by Engle and Granger, in order to examine the different dynamics in the short and the long term. The main conclusion is that the relationship between real interest rates and housing prices is weak, although there are differences across countries. This has some implications for the single monetary policy conducted by the European Central Bank.
Keywords: Housing price, monetary policy, interest rate, monetary union, cointegration, error correction model
JEL Classification: C50, E42, E52
1. INTRODUCTION This article examines the influence of real interest rates on housing prices in three of the
countries that are part of the European Economic and Monetary Union (EMU), namely France, Spain and the Netherlands. The basic objective is to analyze the evolution of both variables from 1999 to 2010 and see if it is possible to verify the existence of a long-term stable relationship between them. The housing market is of central concern to monetary policy makers because of its important role in the economy, for two main reasons. On the one hand, the influence of changes in real interest rates on economic activity depends largely on the relationship real interest rates and the price of housing. On the other hand, to the extent that this relationship varies across EMU countries, it will also contribute to explain the current asymmetries in the transmission of the single monetary policy. The interest rate channel is the conventional channel through which monetary policy affects real economic activity. The rationale behind this channel is that when the central bank modifies interest rates, due the existence of certain price rigidities in the economy, it can also influence the long-term real interest rate, which is the relevant variable for the spending decisions of economic agents.
The analysis of the relationship between real interest rates and housing prices is of particular importance for the European Central Bank monetary policy for a number of reasons. First, there is a controversy about the role played by the evolution of real interest rates in the formation of a bubble in the housing market in certain countries. Second, it provides additional evidence to assess whether it is appropriate to include the price of certain assets in the central bank's objective function. Finally, it sheds some light on potential sources of asymmetric effects derived from the adoption of a single monetary policy within the Euro area. Thus, we want to investigate the potential relevance of monitoring both variables for the monetary policy of the European Central Bank. The issue is very significant from the perspective of Euro area stability as for the definition of the monetary policy objectives.
In general, the existence in the EU of important differences in patterns of ownership, financing systems and transaction costs of housing has deep implications for the transmission
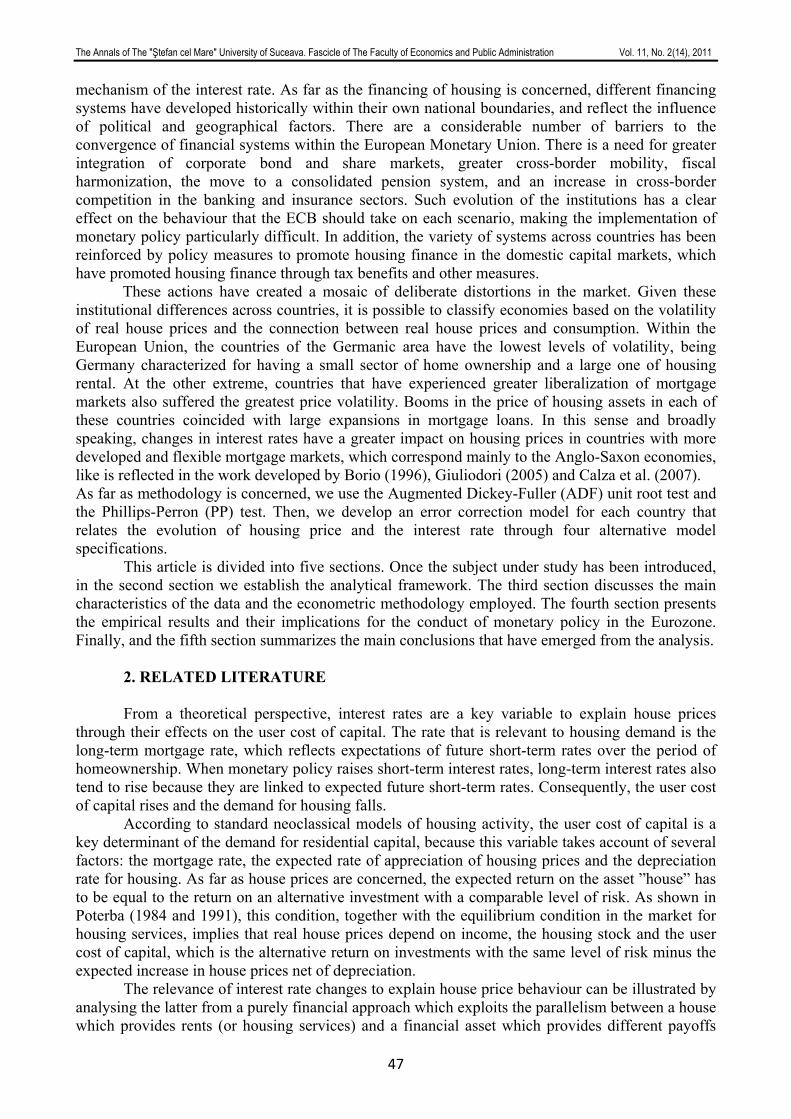
The Annals of The "Ştefan cel Mare" University of Suceava. Fascicle of The Faculty of Economics and Public Administration Vol. 11, No. 2(14), 2011
47
mechanism of the interest rate. As far as the financing of housing is concerned, different financing systems have developed historically within their own national boundaries, and reflect the influence of political and geographical factors. There are a considerable number of barriers to the convergence of financial systems within the European Monetary Union. There is a need for greater integration of corporate bond and share markets, greater cross-border mobility, fiscal harmonization, the move to a consolidated pension system, and an increase in cross-border competition in the banking and insurance sectors. Such evolution of the institutions has a clear effect on the behaviour that the ECB should take on each scenario, making the implementation of monetary policy particularly difficult. In addition, the variety of systems across countries has been reinforced by policy measures to promote housing finance in the domestic capital markets, which have promoted housing finance through tax benefits and other measures.
These actions have created a mosaic of deliberate distortions in the market. Given these institutional differences across countries, it is possible to classify economies based on the volatility of real house prices and the connection between real house prices and consumption. Within the European Union, the countries of the Germanic area have the lowest levels of volatility, being Germany characterized for having a small sector of home ownership and a large one of housing rental. At the other extreme, countries that have experienced greater liberalization of mortgage markets also suffered the greatest price volatility. Booms in the price of housing assets in each of these countries coincided with large expansions in mortgage loans. In this sense and broadly speaking, changes in interest rates have a greater impact on housing prices in countries with more developed and flexible mortgage markets, which correspond mainly to the Anglo-Saxon economies, like is reflected in the work developed by Borio (1996), Giuliodori (2005) and Calza et al. (2007). As far as methodology is concerned, we use the Augmented Dickey-Fuller (ADF) unit root test and the Phillips-Perron (PP) test. Then, we develop an error correction model for each country that relates the evolution of housing price and the interest rate through four alternative model specifications.
This article is divided into five sections. Once the subject under study has been introduced, in the second section we establish the analytical framework. The third section discusses the main characteristics of the data and the econometric methodology employed. The fourth section presents the empirical results and their implications for the conduct of monetary policy in the Eurozone. Finally, and the fifth section summarizes the main conclusions that have emerged from the analysis.
2. RELATED LITERATURE From a theoretical perspective, interest rates are a key variable to explain house prices
through their effects on the user cost of capital. The rate that is relevant to housing demand is the long-term mortgage rate, which reflects expectations of future short-term rates over the period of homeownership. When monetary policy raises short-term interest rates, long-term interest rates also tend to rise because they are linked to expected future short-term rates. Consequently, the user cost of capital rises and the demand for housing falls.
According to standard neoclassical models of housing activity, the user cost of capital is a key determinant of the demand for residential capital, because this variable takes account of several factors: the mortgage rate, the expected rate of appreciation of housing prices and the depreciation rate for housing. As far as house prices are concerned, the expected return on the asset ”house” has to be equal to the return on an alternative investment with a comparable level of risk. As shown in Poterba (1984 and 1991), this condition, together with the equilibrium condition in the market for housing services, implies that real house prices depend on income, the housing stock and the user cost of capital, which is the alternative return on investments with the same level of risk minus the expected increase in house prices net of depreciation.
The relevance of interest rate changes to explain house price behaviour can be illustrated by analysing the latter from a purely financial approach which exploits the parallelism between a house which provides rents (or housing services) and a financial asset which provides different payoffs
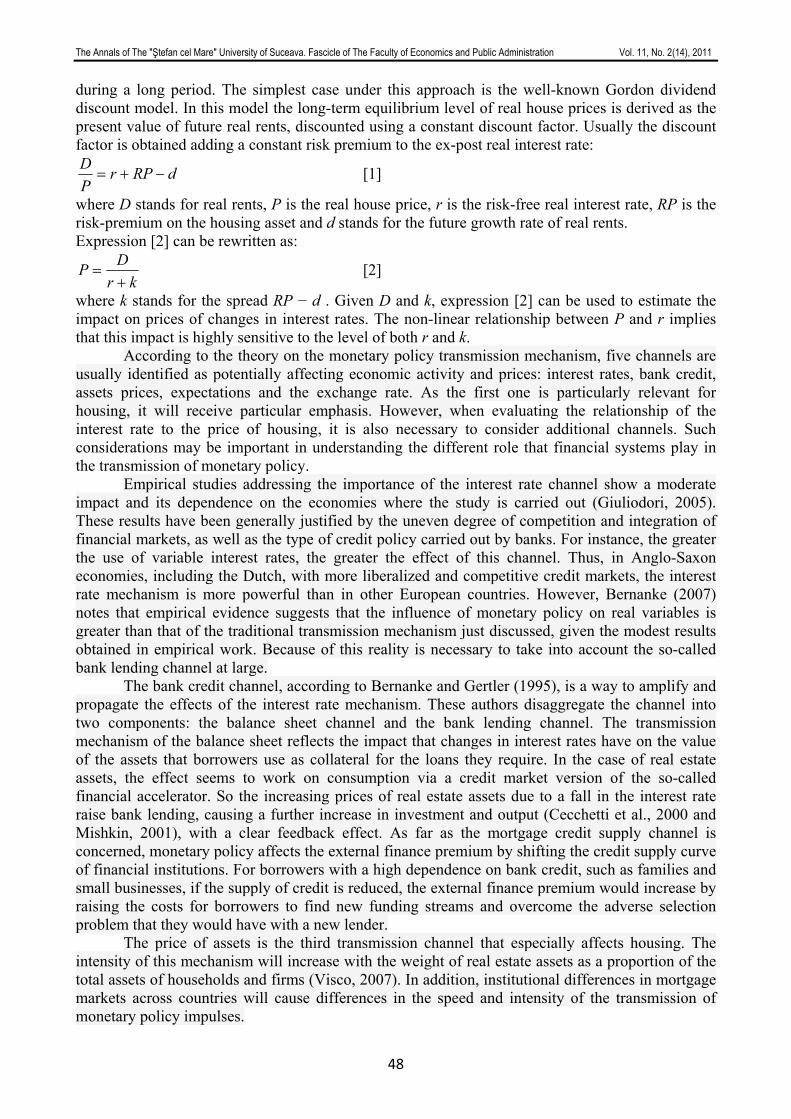
The Annals of The "Ştefan cel Mare" University of Suceava. Fascicle of The Faculty of Economics and Public Administration Vol. 11, No. 2(14), 2011
48
during a long period. The simplest case under this approach is the well-known Gordon dividend discount model. In this model the long-term equilibrium level of real house prices is derived as the present value of future real rents, discounted using a constant discount factor. Usually the discount factor is obtained adding a constant risk premium to the ex-post real interest rate:
dRPrPD
−+= [1]
where D stands for real rents, P is the real house price, r is the risk-free real interest rate, RP is the risk-premium on the housing asset and d stands for the future growth rate of real rents. Expression [2] can be rewritten as:
krDP+
= [2]
where k stands for the spread RP − d . Given D and k, expression [2] can be used to estimate the impact on prices of changes in interest rates. The non-linear relationship between P and r implies that this impact is highly sensitive to the level of both r and k.
According to the theory on the monetary policy transmission mechanism, five channels are usually identified as potentially affecting economic activity and prices: interest rates, bank credit, assets prices, expectations and the exchange rate. As the first one is particularly relevant for housing, it will receive particular emphasis. However, when evaluating the relationship of the interest rate to the price of housing, it is also necessary to consider additional channels. Such considerations may be important in understanding the different role that financial systems play in the transmission of monetary policy.
Empirical studies addressing the importance of the interest rate channel show a moderate impact and its dependence on the economies where the study is carried out (Giuliodori, 2005). These results have been generally justified by the uneven degree of competition and integration of financial markets, as well as the type of credit policy carried out by banks. For instance, the greater the use of variable interest rates, the greater the effect of this channel. Thus, in Anglo-Saxon economies, including the Dutch, with more liberalized and competitive credit markets, the interest rate mechanism is more powerful than in other European countries. However, Bernanke (2007) notes that empirical evidence suggests that the influence of monetary policy on real variables is greater than that of the traditional transmission mechanism just discussed, given the modest results obtained in empirical work. Because of this reality is necessary to take into account the so-called bank lending channel at large.
The bank credit channel, according to Bernanke and Gertler (1995), is a way to amplify and propagate the effects of the interest rate mechanism. These authors disaggregate the channel into two components: the balance sheet channel and the bank lending channel. The transmission mechanism of the balance sheet reflects the impact that changes in interest rates have on the value of the assets that borrowers use as collateral for the loans they require. In the case of real estate assets, the effect seems to work on consumption via a credit market version of the so-called financial accelerator. So the increasing prices of real estate assets due to a fall in the interest rate raise bank lending, causing a further increase in investment and output (Cecchetti et al., 2000 and Mishkin, 2001), with a clear feedback effect. As far as the mortgage credit supply channel is concerned, monetary policy affects the external finance premium by shifting the credit supply curve of financial institutions. For borrowers with a high dependence on bank credit, such as families and small businesses, if the supply of credit is reduced, the external finance premium would increase by raising the costs for borrowers to find new funding streams and overcome the adverse selection problem that they would have with a new lender.
The price of assets is the third transmission channel that especially affects housing. The intensity of this mechanism will increase with the weight of real estate assets as a proportion of the total assets of households and firms (Visco, 2007). In addition, institutional differences in mortgage markets across countries will cause differences in the speed and intensity of the transmission of monetary policy impulses.
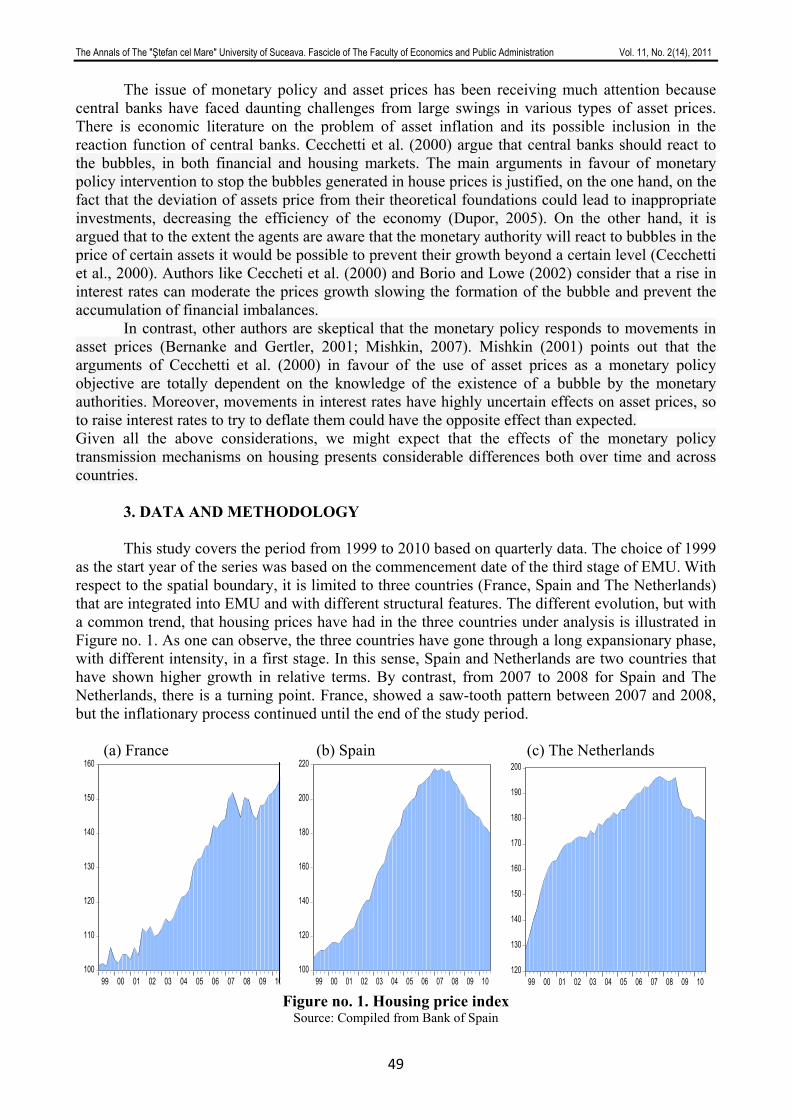
The Annals of The "Ştefan cel Mare" University of Suceava. Fascicle of The Faculty of Economics and Public Administration Vol. 11, No. 2(14), 2011
49
100
110
120
130
140
150
160
99 00 01 02 03 04 05 06 07 08 09 10120
130
140
150
160
170
180
190
200
99 00 01 02 03 04 05 06 07 08 09 10100
120
140
160
180
200
220
99 00 01 02 03 04 05 06 07 08 09 10
The issue of monetary policy and asset prices has been receiving much attention because central banks have faced daunting challenges from large swings in various types of asset prices. There is economic literature on the problem of asset inflation and its possible inclusion in the reaction function of central banks. Cecchetti et al. (2000) argue that central banks should react to the bubbles, in both financial and housing markets. The main arguments in favour of monetary policy intervention to stop the bubbles generated in house prices is justified, on the one hand, on the fact that the deviation of assets price from their theoretical foundations could lead to inappropriate investments, decreasing the efficiency of the economy (Dupor, 2005). On the other hand, it is argued that to the extent the agents are aware that the monetary authority will react to bubbles in the price of certain assets it would be possible to prevent their growth beyond a certain level (Cecchetti et al., 2000). Authors like Ceccheti et al. (2000) and Borio and Lowe (2002) consider that a rise in interest rates can moderate the prices growth slowing the formation of the bubble and prevent the accumulation of financial imbalances.
In contrast, other authors are skeptical that the monetary policy responds to movements in asset prices (Bernanke and Gertler, 2001; Mishkin, 2007). Mishkin (2001) points out that the arguments of Cecchetti et al. (2000) in favour of the use of asset prices as a monetary policy objective are totally dependent on the knowledge of the existence of a bubble by the monetary authorities. Moreover, movements in interest rates have highly uncertain effects on asset prices, so to raise interest rates to try to deflate them could have the opposite effect than expected. Given all the above considerations, we might expect that the effects of the monetary policy transmission mechanisms on housing presents considerable differences both over time and across countries.
3. DATA AND METHODOLOGY
This study covers the period from 1999 to 2010 based on quarterly data. The choice of 1999 as the start year of the series was based on the commencement date of the third stage of EMU. With respect to the spatial boundary, it is limited to three countries (France, Spain and The Netherlands) that are integrated into EMU and with different structural features. The different evolution, but with a common trend, that housing prices have had in the three countries under analysis is illustrated in Figure no. 1. As one can observe, the three countries have gone through a long expansionary phase, with different intensity, in a first stage. In this sense, Spain and Netherlands are two countries that have shown higher growth in relative terms. By contrast, from 2007 to 2008 for Spain and The Netherlands, there is a turning point. France, showed a saw-tooth pattern between 2007 and 2008, but the inflationary process continued until the end of the study period. (a) France (b) Spain (c) The Netherlands
Figure no. 1. Housing price index Source: Compiled from Bank of Spain
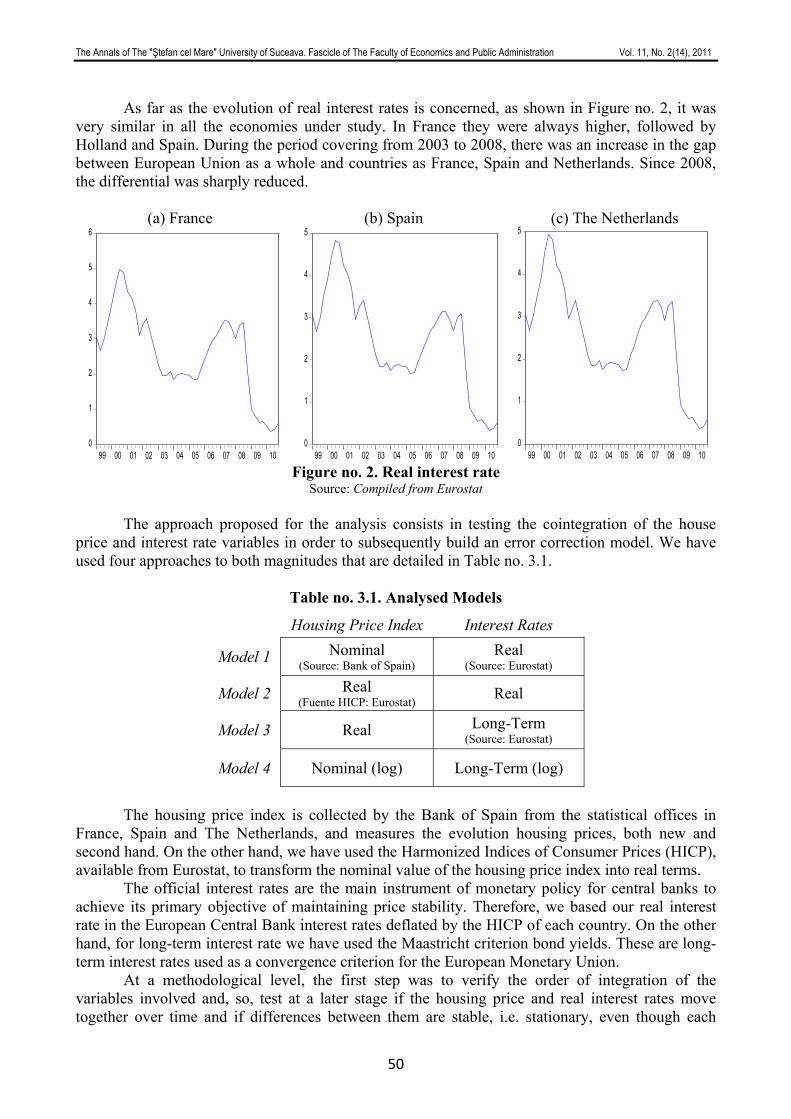
The Annals of The "Ştefan cel Mare" University of Suceava. Fascicle of The Faculty of Economics and Public Administration Vol. 11, No. 2(14), 2011
50
0
1
2
3
4
5
99 00 01 02 03 04 05 06 07 08 09 100
1
2
3
4
5
6
99 00 01 02 03 04 05 06 07 08 09 100
1
2
3
4
5
99 00 01 02 03 04 05 06 07 08 09 10
As far as the evolution of real interest rates is concerned, as shown in Figure no. 2, it was
very similar in all the economies under study. In France they were always higher, followed by Holland and Spain. During the period covering from 2003 to 2008, there was an increase in the gap between European Union as a whole and countries as France, Spain and Netherlands. Since 2008, the differential was sharply reduced.
(a) France (b) Spain (c) The Netherlands
Figure no. 2. Real interest rate Source: Compiled from Eurostat
The approach proposed for the analysis consists in testing the cointegration of the house
price and interest rate variables in order to subsequently build an error correction model. We have used four approaches to both magnitudes that are detailed in Table no. 3.1.
Table no. 3.1. Analysed Models
Housing Price Index Interest Rates
Model 1 Nominal (Source: Bank of Spain)
Real (Source: Eurostat)
Model 2 Real (Fuente HICP: Eurostat) Real
Model 3 Real Long-Term (Source: Eurostat)
Model 4 Nominal (log) Long-Term (log)
The housing price index is collected by the Bank of Spain from the statistical offices in
France, Spain and The Netherlands, and measures the evolution housing prices, both new and second hand. On the other hand, we have used the Harmonized Indices of Consumer Prices (HICP), available from Eurostat, to transform the nominal value of the housing price index into real terms.
The official interest rates are the main instrument of monetary policy for central banks to achieve its primary objective of maintaining price stability. Therefore, we based our real interest rate in the European Central Bank interest rates deflated by the HICP of each country. On the other hand, for long-term interest rate we have used the Maastricht criterion bond yields. These are long-term interest rates used as a convergence criterion for the European Monetary Union.
At a methodological level, the first step was to verify the order of integration of the variables involved and, so, test at a later stage if the housing price and real interest rates move together over time and if differences between them are stable, i.e. stationary, even though each
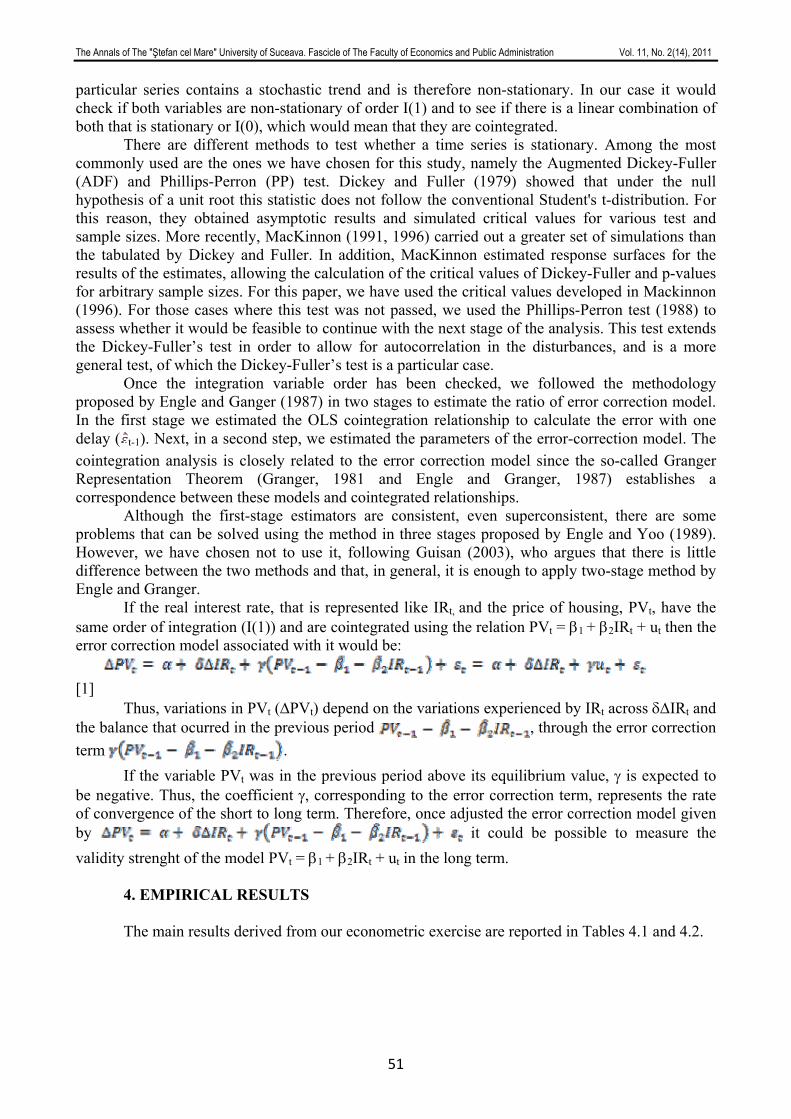
The Annals of The "Ştefan cel Mare" University of Suceava. Fascicle of The Faculty of Economics and Public Administration Vol. 11, No. 2(14), 2011
51
particular series contains a stochastic trend and is therefore non-stationary. In our case it would check if both variables are non-stationary of order I(1) and to see if there is a linear combination of both that is stationary or I(0), which would mean that they are cointegrated.
There are different methods to test whether a time series is stationary. Among the most commonly used are the ones we have chosen for this study, namely the Augmented Dickey-Fuller (ADF) and Phillips-Perron (PP) test. Dickey and Fuller (1979) showed that under the null hypothesis of a unit root this statistic does not follow the conventional Student's t-distribution. For this reason, they obtained asymptotic results and simulated critical values for various test and sample sizes. More recently, MacKinnon (1991, 1996) carried out a greater set of simulations than the tabulated by Dickey and Fuller. In addition, MacKinnon estimated response surfaces for the results of the estimates, allowing the calculation of the critical values of Dickey-Fuller and p-values for arbitrary sample sizes. For this paper, we have used the critical values developed in Mackinnon (1996). For those cases where this test was not passed, we used the Phillips-Perron test (1988) to assess whether it would be feasible to continue with the next stage of the analysis. This test extends the Dickey-Fuller’s test in order to allow for autocorrelation in the disturbances, and is a more general test, of which the Dickey-Fuller’s test is a particular case.
Once the integration variable order has been checked, we followed the methodology proposed by Engle and Ganger (1987) in two stages to estimate the ratio of error correction model. In the first stage we estimated the OLS cointegration relationship to calculate the error with one delay ( t-1). Next, in a second step, we estimated the parameters of the error-correction model. The cointegration analysis is closely related to the error correction model since the so-called Granger Representation Theorem (Granger, 1981 and Engle and Granger, 1987) establishes a correspondence between these models and cointegrated relationships. Although the first-stage estimators are consistent, even superconsistent, there are some problems that can be solved using the method in three stages proposed by Engle and Yoo (1989). However, we have chosen not to use it, following Guisan (2003), who argues that there is little difference between the two methods and that, in general, it is enough to apply two-stage method by Engle and Granger.
If the real interest rate, that is represented like IRt, and the price of housing, PVt, have the same order of integration (I(1)) and are cointegrated using the relation PVt = β1 + β2IRt + ut then the error correction model associated with it would be: [1]
Thus, variations in PVt (ΔPVt) depend on the variations experienced by IRt across δΔIRt and the balance that ocurred in the previous period , through the error correction term .
If the variable PVt was in the previous period above its equilibrium value, γ is expected to be negative. Thus, the coefficient γ, corresponding to the error correction term, represents the rate of convergence of the short to long term. Therefore, once adjusted the error correction model given by it could be possible to measure the validity strenght of the model PVt = β1 + β2IRt + ut in the long term.
4. EMPIRICAL RESULTS The main results derived from our econometric exercise are reported in Tables 4.1 and 4.2.
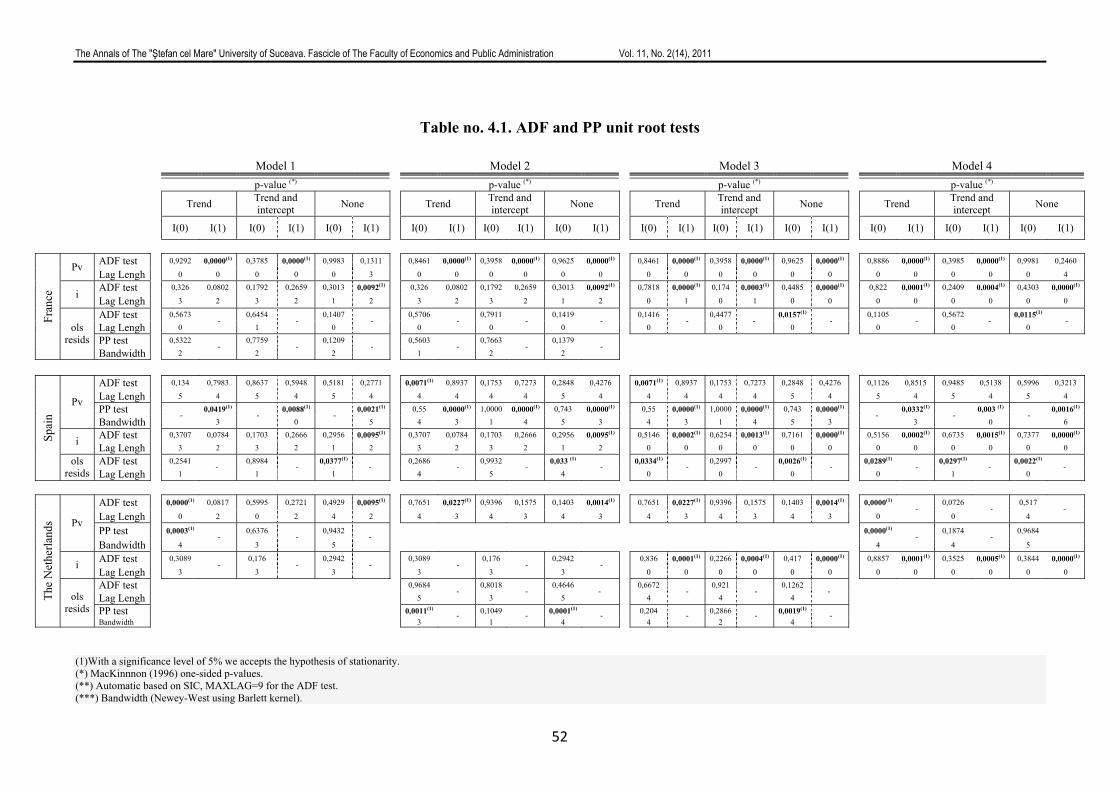
The Annals of The "Ştefan cel Mare" University of Suceava. Fascicle of The Faculty of Economics and Public Administration Vol. 11, No. 2(14), 2011
52
Table no. 4.1. ADF and PP unit root tests
(1)With a significance level of 5% we accepts the hypothesis of stationarity. (*) MacKinnnon (1996) one-sided p-values. (**) Automatic based on SIC, MAXLAG=9 for the ADF test. (***) Bandwidth (Newey-West using Barlett kernel).
Model 1 Model 2 Model 3 Model 4
p-value (*) p-value (*) p-value (*) p-value (*)
Trend Trend and
intercept None Trend Trend and intercept None Trend Trend and
intercept None Trend Trend and intercept None
I(0) I(1) I(0) I(1) I(0) I(1) I(0) I(1) I(0) I(1) I(0) I(1) I(0) I(1) I(0) I(1) I(0) I(1) I(0) I(1) I(0) I(1) I(0) I(1)
ADF test 0,9292 0,0000(1) 0,3785 0,0000(1) 0,9983 0,1311 0,8461 0,0000(1) 0,3958 0,0000(1) 0,9625 0,0000(1) 0,8461 0,0000(1) 0,3958 0,0000(1) 0,9625 0,0000(1) 0,8886 0,0000(1) 0,3985 0,0000(1) 0,9981 0,2460 Pv
Lag Lengh 0 0 0 0 0 3 0 0 0 0 0 0 0 0 0 0 0 0 0 0 0 0 0 4
ADF test 0,326 0,0802 0,1792 0,2659 0,3013 0,0092(1) 0,326 0,0802 0,1792 0,2659 0,3013 0,0092(1) 0,7818 0,0000(1) 0,174 0,0003(1) 0,4485 0,0000(1) 0,822 0,0001(1) 0,2409 0,0004(1) 0,4303 0,0000(1) i Lag Lengh 3 2 3 2 1 2 3 2 3 2 1 2 0 1 0 1 0 0 0 0 0 0 0 0
ADF test 0,5673 0,6454 0,1407 0,5706 0,7911 0,1419 0,1416 0,4477 0,0157(1) 0,1105 0,5672 0,0115(1)
Lag Lengh 0 -
1 -
0 -
0 -
0 -
0 -
0 -
0 -
0 -
0 -
0 -
0 -
PP test 0,5322 0,7759 0,1209 0,5603 0,7663 0,1379
Fran
ce
ols resids
Bandwidth 2 -
2 -
2 -
1 -
2 -
2 -
ADF test 0,134 0,7983 0,8637 0,5948 0,5181 0,2771 0,0071(1) 0,8937 0,1753 0,7273 0,2848 0,4276 0,0071(1) 0,8937 0,1753 0,7273 0,2848 0,4276 0,1126 0,8515 0,9485 0,5138 0,5996 0,3213
Lag Lengh 5 4 5 4 5 4 4 4 4 4 5 4 4 4 4 4 5 4 5 4 5 4 5 4
PP test 0,0419(1) 0,0088(1) 0,0021(1) 0,55 0,0000(1) 1,0000 0,0000(1) 0,743 0,0000(1) 0,55 0,0000(1) 1,0000 0,0000(1) 0,743 0,0000(1) 0,0332(1) 0,003 (1) 0,0016(1) Pv
Bandwidth -
3 -
0 -
5 4 3 1 4 5 3 4 3 1 4 5 3 -
3 -
0 -
6
ADF test 0,3707 0,0784 0,1703 0,2666 0,2956 0,0095(1) 0,3707 0,0784 0,1703 0,2666 0,2956 0,0095(1) 0,5146 0,0002(1) 0,6254 0,0013(1) 0,7161 0,0000(1) 0,5156 0,0002(1) 0,6735 0,0015(1) 0,7377 0,0000(1) i Lag Lengh 3 2 3 2 1 2 3 2 3 2 1 2 0 0 0 0 0 0 0 0 0 0 0 0
ADF test 0,2541 0,8984 0,0377(1) 0,2686 0,9932 0,033 (1) 0,0334(1) 0,2997 0,0026(1) 0,0289(1) 0,0297(1) 0,0022(1)
Spai
n
ols resids Lag Lengh 1
- 1
- 1
- 4
- 5
- 4
- 0
- 0
- 0
- 0
- 1
- 0
-
ADF test 0,0000(1) 0,0817 0,5995 0,2721 0,4929 0,0095(1) 0,7651 0,0227(1) 0,9396 0,1575 0,1403 0,0014(1) 0,7651 0,0227(1) 0,9396 0,1575 0,1403 0,0014(1) 0,0000(1) 0,0726 0,517
Lag Lengh 0 2 0 2 4 2 4 3 4 3 4 3 4 3 4 3 4 3 0 -
0 -
4 -
PP test 0,0003(1) 0,6376 0,9432 0,0000(1) 0,1874 0,9684 Pv
Bandwidth 4 -
3 -
5 -
4 -
4 -
5
ADF test 0,3089 0,176 0,2942 0,3089 0,176 0,2942 0,836 0,0001(1) 0,2266 0,0004(1) 0,417 0,0000(1) 0,8857 0,0001(1) 0,3525 0,0005(1) 0,3844 0,0000(1) i Lag Lengh 3
- 3
- 3
- 3
- 3
- 3
- 0 0 0 0 0 0 0 0 0 0 0 0
ADF test 0,9684 0,8018 0,4646 0,6672 0,921 0,1262
Lag Lengh 5 -
3 -
5 -
4 -
4 -
4 -
PP test 0,0011(1) 0,1049 0,0001(1) 0,204 0,2866 0,0019(1)
The
Net
herla
nds
ols resids
Bandwidth 3 -
1 -
4 -
4 -
2 -
4 -
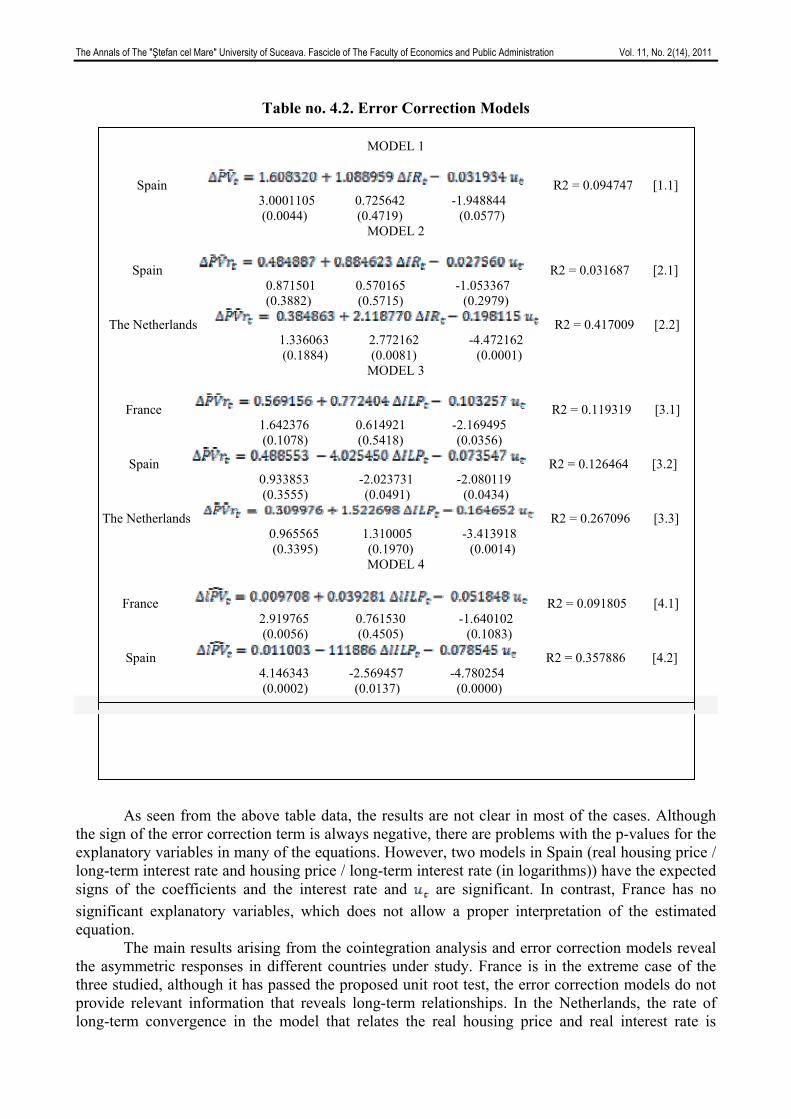
The Annals of The "Ştefan cel Mare" University of Suceava. Fascicle of The Faculty of Economics and Public Administration Vol. 11, No. 2(14), 2011
Table no. 4.2. Error Correction Models
MODEL 1
Spain R2 = 0.094747 [1.1] 3.0001105 0.725642 -1.948844 (0.0044) (0.4719) (0.0577)
MODEL 2
Spain R2 = 0.031687 [2.1] 0.871501 0.570165 -1.053367 (0.3882) (0.5715) (0.2979)
The Netherlands R2 = 0.417009 [2.2] 1.336063 2.772162 -4.472162 (0.1884) (0.0081) (0.0001)
MODEL 3
France R2 = 0.119319 [3.1] 1.642376 0.614921 -2.169495 (0.1078) (0.5418) (0.0356)
Spain R2 = 0.126464 [3.2] 0.933853 -2.023731 -2.080119 (0.3555) (0.0491) (0.0434)
The Netherlands R2 = 0.267096 [3.3] 0.965565 1.310005 -3.413918 (0.3395) (0.1970) (0.0014)
MODEL 4
France R2 = 0.091805 [4.1] 2.919765 0.761530 -1.640102 (0.0056) (0.4505) (0.1083)
Spain R2 = 0.357886 [4.2] 4.146343 -2.569457 -4.780254 (0.0002) (0.0137) (0.0000)
As seen from the above table data, the results are not clear in most of the cases. Although
the sign of the error correction term is always negative, there are problems with the p-values for the explanatory variables in many of the equations. However, two models in Spain (real housing price / long-term interest rate and housing price / long-term interest rate (in logarithms)) have the expected signs of the coefficients and the interest rate and are significant. In contrast, France has no significant explanatory variables, which does not allow a proper interpretation of the estimated equation.
The main results arising from the cointegration analysis and error correction models reveal the asymmetric responses in different countries under study. France is in the extreme case of the three studied, although it has passed the proposed unit root test, the error correction models do not provide relevant information that reveals long-term relationships. In the Netherlands, the rate of long-term convergence in the model that relates the real housing price and real interest rate is
The Annals of The "Ştefan cel Mare" University of Suceava. Fascicle of The Faculty of Economics and Public Administration Vol. 11, No. 2(14), 2011
54
comparatively the highest of all the results found. For its part, in Spain both variables are cointegrated in all the models analyzed, although those that use the long-term interest rate and logarithms got the best results.
This mixed evidence reinforces the idea that there is no single housing market, but geographically segmented markets. This segmentation is determined by different factors: institutional, cultural, demographic, regulations (urban planning, taxation, etc.). It is also important to note that the financial systems of countries that are part of the EMU are not fully integrated. In particular, financial markets and banks do not play a neutral role in the transmission of monetary impulses. Hence, the heterogeneity of financial systems and their regulations, constitutes one of the factors contributing to accentuate the asymmetries in the transmission of monetary policy effects on the housing prices.
5. CONCLUSIONS
The empirical evidence that emerges from our analysis allows to conclude that Spain is the country where there is a greater relationship between interest rates and housing prices along the proposed models. These results are consistent with those of Restoy et al. (2006) according to which the available empirical evidence supports the view that the interest rate is a key variable to explain recent house price developments in Spain.
Our results also suggest that the ECB has limited ability to directly influence the price of assets through interest rate and, by extension, to control the creation of speculative bubbles in housing markets. Although the transmission of changes in interest rates for monetary policy to real interest rates of the different EMU countries was comparable, the final impact on real economic activity can be very heterogeneous. One of the reasons that might explain this heterogeneity is differences across countries in the relationship between real interest rates and housing prices. From this point of view, our analysis provides a piece of evidence suggesting the existence of differences in monetary policy transmission across countries in the euro area.
Regarding the implications for the ECB, the implementation of the single monetary policy is hampered not only by the difficulties to control real interest rates, but also by the added difficulty of controlling its effect on the markets for certain types of assets, since the link between interest rates and asset prices in general, and housing prices in particular, is uncertain. This would be a technical reason that would help explain why central banks should not react to the formation of bubbles in asset markets.
REFERENCES 1. Ayuso, J., Blanco, R. and Restoy, F. (2006): Housing prices and real interest rates in Spain,
Bank of Spain, Occasional Papers, n. 0608. 2. Bank of Spain (statistics): http://www.bde.es. 3. Bernanke, B. (2007); The financial accelerator and the credit channel, speech at The Credit
of Monetary Policy in the Twenty-first Century Conference, Federal Reserve Bank of Atlanta, Atlanta, Giorgia, june.
4. Bernanke, B.S., and Gertler, M. (1995): Inside the Black Box: the credit channel of monetary policy transmission, Journal of Economic Perspectives 9, pp. 27-48.
5. Bernanke, B.S., and Gertler, M. (2001): Should Central Banks respond to movements in asset prices? American Economic Review, 91, pp. 253-57.
6. Borio, C. (1996): Credit characteristics and the monetary policy transmission in fourteen industrial countries: Facts, conjectures and some econometric evidence, en Alders, K. et al. (Eds.) Monetary Policy in a converging Europe, Dordrecht/Boston/London: Kluwer Academic Publishers, pp. 77-115.
The Annals of The "Ştefan cel Mare" University of Suceava. Fascicle of The Faculty of Economics and Public Administration Vol. 11, No. 2(14), 2011
55
7. Borio, C. and Lowe, P.L. (2002): Asset prices, financial and monetary stability: Exploring the nexus, Bank of International Settlements Working Paper 114.
8. Calza, A., Monacelli, T. and Stracca, L. (2007): Mortgage, markets, colateral constraints and Money policy: do institutional factors matter?, CEPR Discussion Paper Series nº 6231.
9. Cecchetti, S., Genberg, H., Lipsky, and S. Wadhawani (2000): Asset prices and Central Bank Policy, Geneve Report on the World Economy 2.
10. Dickey, D.A. and Fuller, W.A. (1979): Distribution of the estimators for autoregressive time series with a unit root, Journal of the American Statistical Association, 74, 427-431.
11. Dupor, B. (2005): Stabilizing non-fundamental asset price movements under discretion and limited information, Journal of Monetary Economics, 52, pp. 727-47.
12. Engle, R.F. and Granger, C.W.J. (1987): Co-integration and error correction: representation, estimation and testing, Econometrica, 55, pp. 251-76.
13. Engle, R. and Yoo, S. (1989): A survey of Co-Integration UCLA, at San Diego. 14. Eurostat (statistics), http://www.eurostat.eu. 15. Frankel, J.A. (2009): Don´t target asset prices; monitor them. The International Economy,
Fall. 16. Giuliodori, M. (2005): The role of house prices in the monetary transmission mechanism
across European coutries, Scottish Journal of Political Economy 52, nº 4, pp. 519-543. 17. Granger, C.W.J. (1981): Some properties of time series data and their use in econometric
model specification. Journal of Econometrics, 16, pp. 121-130. 18. Guisán, M.C (2003): Causality test, interdependence and model selection: A comparative
analysis of OECD countries. Working paper series Economic Development, nº 63, Euro-American Association of Economic Development Studies.
19. Ludwig, A. and Slok, T. (2002): The impact of changes in stock prices and house prices on consumption in the OECD countries, IMF Working Paper 02/1.
20. MacKinnon, James G. (1991): Critical values for cointegration tests Chapter 13 in R.F. Engle and C.W.J. Granger (eds), Long-run Economic Relationships: Readings in Cointegrations, Oxford: Oxford University Press.
21. MacKinnon, James G. (1996): Numerical distribution functions for unit root and cointegration test Journal of Applied Econometrics, 11, pp. 601-618.
22. Mishkin, F.S. (2001): The transmission mechanism and the role of asset prices in monetary policy, NBER Working Paper 8617.
23. Mishkin, F.S. (2007): Housing and the monetary policy transmission mechanism, NBER Working Paper Series nº 13518.
24. Poterba, J. (1991), “House price dynamics: the role of tax policy and demography”, Brookings Papers on Economic Activity, 2, pp. 143-203
25. Visco, I. (2007): Financial deepening and the monetary policy transmission mechanism, Bank of Italy, speech at the IV joint high-level eurosystem – Bank of Russia Seminar, Moscow, 10-12, October 2007.
The Annals of The "Ştefan cel Mare" University of Suceava. Fascicle of The Faculty of Economics and Public Administration Vol. 11, No. 2(14), 2011
56
CHARACTERISTICS OF THE ILLEGAL DRUG MARKETS IN EUROPEAN UNION
Scientific Researcher PhD. Irina CAUNIC „Al. I. Cuza” University of Iasi, Romania
[email protected] Professor PhD. Gabriela PRELIPCEAN
Stefan cel Mare University of Suceava, Romania [email protected]
Abstract:
Considering the illegal markets in the European Union member states, the valences of drug trafficking get more and more worrisome, both of the proliferation level, and the size of the financial transactions, the European markets being the most profitable in terms of heroin and cocaine consumption. The article focuses on the analysis of the theoretical aspects concerning the EU illegal drug markets, for identifying and understanding their peculiarities. In this context, we will emphasize the characteristics and dynamics of these markets, their national and european economic mechanisms, the profits made by organized crime networks and also, the impact of these activities on the formal economy.
Keywords: illegal markets, drug trafficking, profit, cocaine, heroin, synthetic drugs.
JEL Classification: E 26
INTRODUCTION
Among the illegal activities controlled by organized crime networks operating in the European Union, trafficking in drugs gains increasingly worrisome valences, due to the level of proliferation, and the size of financial transactions, the available data [1] (Council of Europe, 2005) placing the European markets among the most profitable in terms of drugs consumption. With a variety of European Union drug production and entry points, there is a large-scale intra-European Union trafficking of all types of drugs. In maximizing their profits, most organized crime networks no longer limit their activities to one type of drug which is reflected in the increasing number of ‘poly-drug’ seizures and the alarming rise in ‘poly-drug’ consumption [2] (Europol, 2006).
Despite the scale of illicit drug flow, little is known about the dynamics of these underground markets, their national and european economic mechanisms or about the way in which these markets respond to changes in supply and demand.
COCAINE PRODUCTION AND CONSUMPTION IN EUROPE
The European Union member states and the four countries of the European Free Trade
Association (EFTA) represent after North America, the second cocaine largest market, with a consumption of 124 tones in 2008 [3] (UNODC , 2009 A). In the European Union, the largest cocaine market is the United Kingdom, with a million users in 2007/2008, followed by Spain, Italy, Germany and France [4] (UNODC, 2010 A).
Between 1998-2006, the European cocaine market has doubled its volume and along with the increasing demand for this drug, indicated by the prevalence among the general population, could be seen a decreasing of cocaine price, trend that preserved both for wholesale and retail transactions. In this context, the retail prices for this drug, in Euro, declined on average, from € 143 per gram, in 1990 to € 91 per gram, in 2000 and € 70 per gram, in 2008 [5] (UNODC, 2010 A). Lately, the cocaine use has emerged on the European illegal markets, in some countries been preferred over the amphetamines and MDMA [6] (INCB, 2011), trend reflected in the dynamics of the cocaine retail prices.
In 2008, the typical retail price of cocaine ranged between € 50 and € 70 for a gram, in countries reporting data. Lower prices were reported in Poland and Turkey, and higher prices, in the Czech Republic, Italy, Latvia and Sweden. With an exception, all countries with sufficient data for
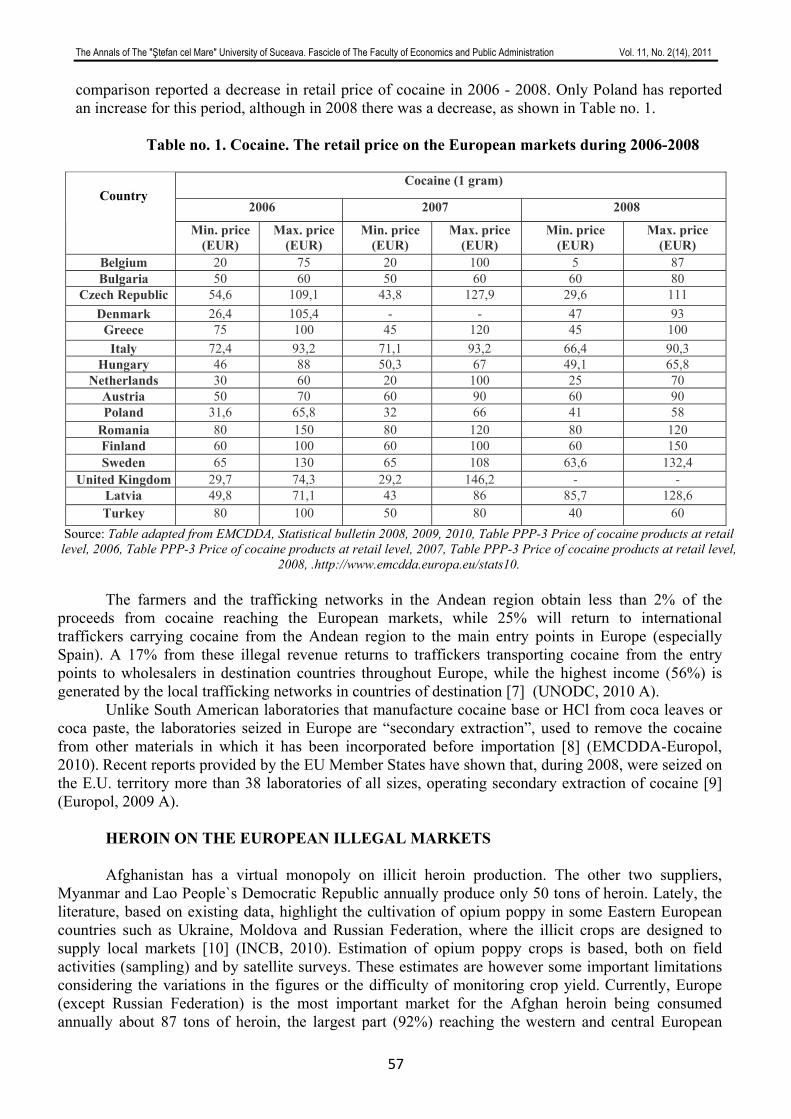
The Annals of The "Ştefan cel Mare" University of Suceava. Fascicle of The Faculty of Economics and Public Administration Vol. 11, No. 2(14), 2011
57
comparison reported a decrease in retail price of cocaine in 2006 - 2008. Only Poland has reported an increase for this period, although in 2008 there was a decrease, as shown in Table no. 1.
Table no. 1. Cocaine. The retail price on the European markets during 2006-2008
Cocaine (1 gram)
2006 2007 2008 Country
Min. price
(EUR) Max. price
(EUR) Min. price
(EUR) Max. price
(EUR) Min. price
(EUR) Max. price
(EUR) Belgium 20 75 20 100 5 87 Bulgaria 50 60 50 60 60 80
Czech Republic 54,6 109,1 43,8 127,9 29,6 111 Denmark 26,4 105,4 - - 47 93
Greece 75 100 45 120 45 100 Italy 72,4 93,2 71,1 93,2 66,4 90,3
Hungary 46 88 50,3 67 49,1 65,8 Netherlands 30 60 20 100 25 70
Austria 50 70 60 90 60 90 Poland 31,6 65,8 32 66 41 58
Romania 80 150 80 120 80 120 Finland 60 100 60 100 60 150 Sweden 65 130 65 108 63,6 132,4
United Kingdom 29,7 74,3 29,2 146,2 - - Latvia 49,8 71,1 43 86 85,7 128,6 Turkey 80 100 50 80 40 60
Source: Table adapted from EMCDDA, Statistical bulletin 2008, 2009, 2010, Table PPP-3 Price of cocaine products at retail level, 2006, Table PPP-3 Price of cocaine products at retail level, 2007, Table PPP-3 Price of cocaine products at retail level,
2008, .http://www.emcdda.europa.eu/stats10. The farmers and the trafficking networks in the Andean region obtain less than 2% of the
proceeds from cocaine reaching the European markets, while 25% will return to international traffickers carrying cocaine from the Andean region to the main entry points in Europe (especially Spain). A 17% from these illegal revenue returns to traffickers transporting cocaine from the entry points to wholesalers in destination countries throughout Europe, while the highest income (56%) is generated by the local trafficking networks in countries of destination [7] (UNODC, 2010 A).
Unlike South American laboratories that manufacture cocaine base or HCl from coca leaves or coca paste, the laboratories seized in Europe are “secondary extraction”, used to remove the cocaine from other materials in which it has been incorporated before importation [8] (EMCDDA-Europol, 2010). Recent reports provided by the EU Member States have shown that, during 2008, were seized on the E.U. territory more than 38 laboratories of all sizes, operating secondary extraction of cocaine [9] (Europol, 2009 A).
HEROIN ON THE EUROPEAN ILLEGAL MARKETS
Afghanistan has a virtual monopoly on illicit heroin production. The other two suppliers,
Myanmar and Lao People`s Democratic Republic annually produce only 50 tons of heroin. Lately, the literature, based on existing data, highlight the cultivation of opium poppy in some Eastern European countries such as Ukraine, Moldova and Russian Federation, where the illicit crops are designed to supply local markets [10] (INCB, 2010). Estimation of opium poppy crops is based, both on field activities (sampling) and by satellite surveys. These estimates are however some important limitations considering the variations in the figures or the difficulty of monitoring crop yield. Currently, Europe (except Russian Federation) is the most important market for the Afghan heroin being consumed annually about 87 tons of heroin, the largest part (92%) reaching the western and central European
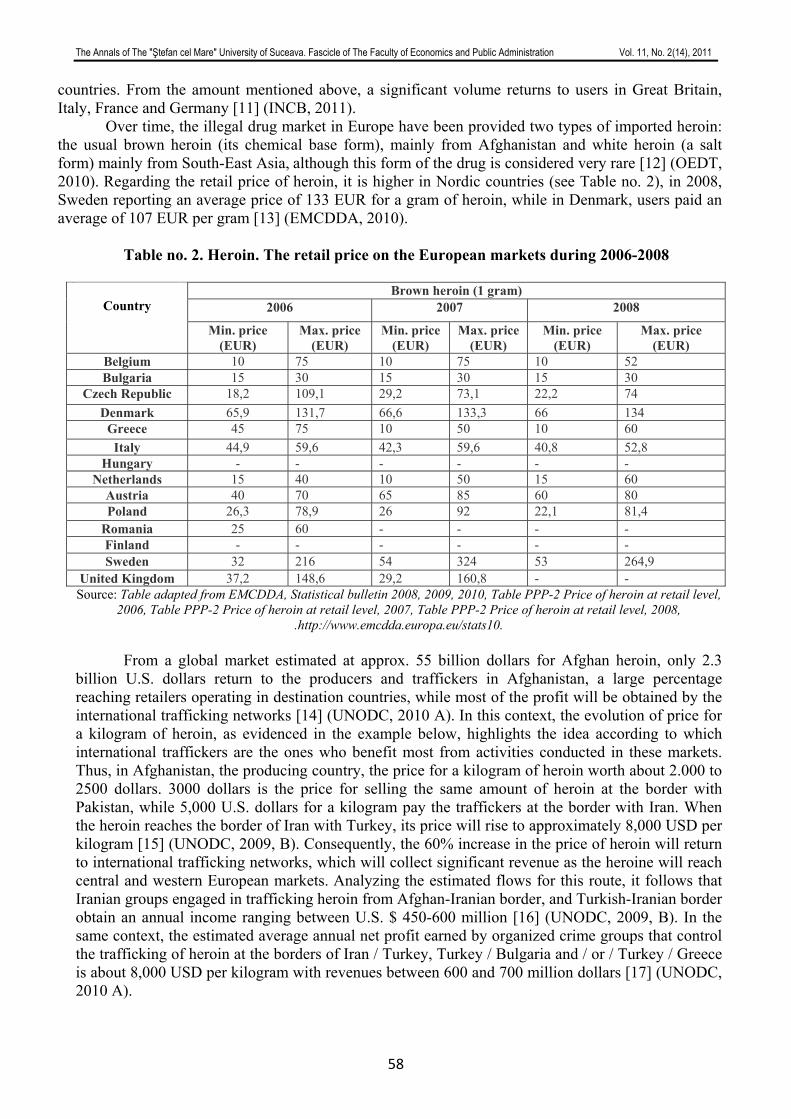
The Annals of The "Ştefan cel Mare" University of Suceava. Fascicle of The Faculty of Economics and Public Administration Vol. 11, No. 2(14), 2011
58
countries. From the amount mentioned above, a significant volume returns to users in Great Britain, Italy, France and Germany [11] (INCB, 2011). Over time, the illegal drug market in Europe have been provided two types of imported heroin: the usual brown heroin (its chemical base form), mainly from Afghanistan and white heroin (a salt form) mainly from South-East Asia, although this form of the drug is considered very rare [12] (OEDT, 2010). Regarding the retail price of heroin, it is higher in Nordic countries (see Table no. 2), in 2008, Sweden reporting an average price of 133 EUR for a gram of heroin, while in Denmark, users paid an average of 107 EUR per gram [13] (EMCDDA, 2010).
Table no. 2. Heroin. The retail price on the European markets during 2006-2008
Brown heroin (1 gram)
2006 2007 2008
Country
Min. price (EUR)
Max. price (EUR)
Min. price (EUR)
Max. price (EUR)
Min. price (EUR)
Max. price (EUR)
Belgium 10 75 10 75 10 52 Bulgaria 15 30 15 30 15 30
Czech Republic 18,2 109,1 29,2 73,1 22,2 74 Denmark 65,9 131,7 66,6 133,3 66 134
Greece 45 75 10 50 10 60 Italy 44,9 59,6 42,3 59,6 40,8 52,8
Hungary - - - - - - Netherlands 15 40 10 50 15 60
Austria 40 70 65 85 60 80 Poland 26,3 78,9 26 92 22,1 81,4
Romania 25 60 - - - - Finland - - - - - - Sweden 32 216 54 324 53 264,9
United Kingdom 37,2 148,6 29,2 160,8 - - Source: Table adapted from EMCDDA, Statistical bulletin 2008, 2009, 2010, Table PPP-2 Price of heroin at retail level,
2006, Table PPP-2 Price of heroin at retail level, 2007, Table PPP-2 Price of heroin at retail level, 2008, .http://www.emcdda.europa.eu/stats10.
From a global market estimated at approx. 55 billion dollars for Afghan heroin, only 2.3 billion U.S. dollars return to the producers and traffickers in Afghanistan, a large percentage reaching retailers operating in destination countries, while most of the profit will be obtained by the international trafficking networks [14] (UNODC, 2010 A). In this context, the evolution of price for a kilogram of heroin, as evidenced in the example below, highlights the idea according to which international traffickers are the ones who benefit most from activities conducted in these markets. Thus, in Afghanistan, the producing country, the price for a kilogram of heroin worth about 2.000 to 2500 dollars. 3000 dollars is the price for selling the same amount of heroin at the border with Pakistan, while 5,000 U.S. dollars for a kilogram pay the traffickers at the border with Iran. When the heroin reaches the border of Iran with Turkey, its price will rise to approximately 8,000 USD per kilogram [15] (UNODC, 2009, B). Consequently, the 60% increase in the price of heroin will return to international trafficking networks, which will collect significant revenue as the heroine will reach central and western European markets. Analyzing the estimated flows for this route, it follows that Iranian groups engaged in trafficking heroin from Afghan-Iranian border, and Turkish-Iranian border obtain an annual income ranging between U.S. $ 450-600 million [16] (UNODC, 2009, B). In the same context, the estimated average annual net profit earned by organized crime groups that control the trafficking of heroin at the borders of Iran / Turkey, Turkey / Bulgaria and / or / Turkey / Greece is about 8,000 USD per kilogram with revenues between 600 and 700 million dollars [17] (UNODC, 2010 A).
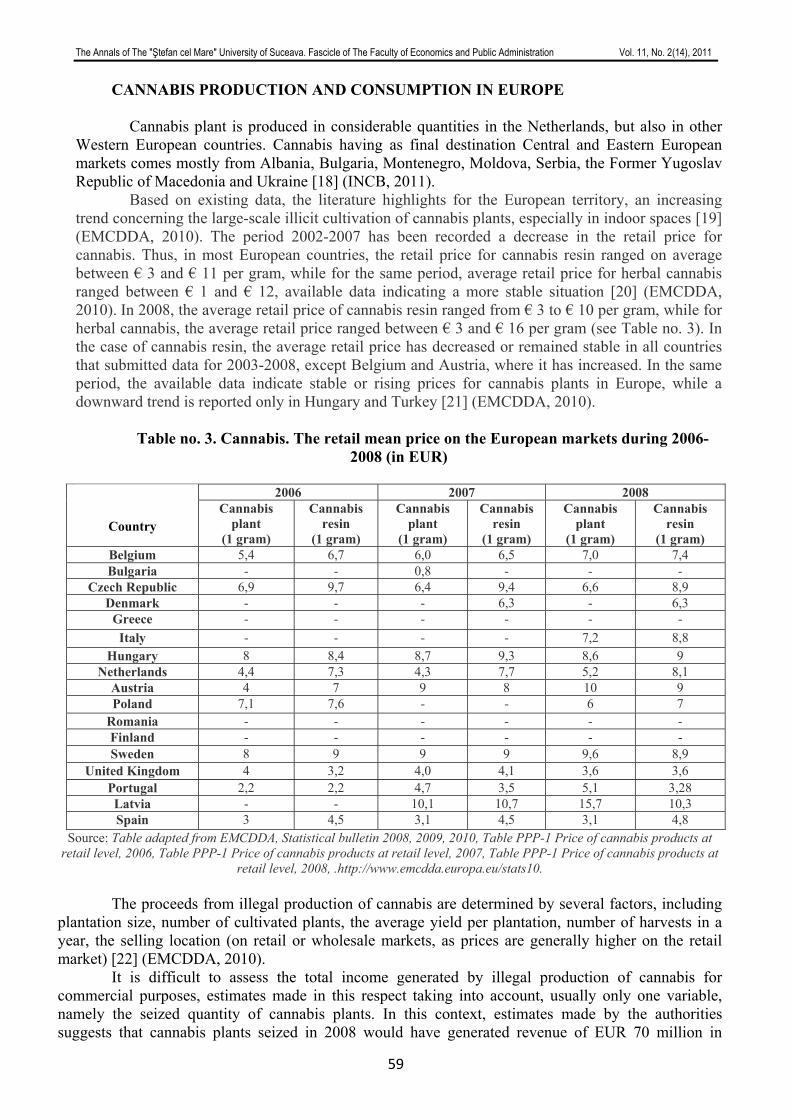
The Annals of The "Ştefan cel Mare" University of Suceava. Fascicle of The Faculty of Economics and Public Administration Vol. 11, No. 2(14), 2011
59
CANNABIS PRODUCTION AND CONSUMPTION IN EUROPE Cannabis plant is produced in considerable quantities in the Netherlands, but also in other
Western European countries. Cannabis having as final destination Central and Eastern European markets comes mostly from Albania, Bulgaria, Montenegro, Moldova, Serbia, the Former Yugoslav Republic of Macedonia and Ukraine [18] (INCB, 2011).
Based on existing data, the literature highlights for the European territory, an increasing trend concerning the large-scale illicit cultivation of cannabis plants, especially in indoor spaces [19] (EMCDDA, 2010). The period 2002-2007 has been recorded a decrease in the retail price for cannabis. Thus, in most European countries, the retail price for cannabis resin ranged on average between € 3 and € 11 per gram, while for the same period, average retail price for herbal cannabis ranged between € 1 and € 12, available data indicating a more stable situation [20] (EMCDDA, 2010). In 2008, the average retail price of cannabis resin ranged from € 3 to € 10 per gram, while for herbal cannabis, the average retail price ranged between € 3 and € 16 per gram (see Table no. 3). In the case of cannabis resin, the average retail price has decreased or remained stable in all countries that submitted data for 2003-2008, except Belgium and Austria, where it has increased. In the same period, the available data indicate stable or rising prices for cannabis plants in Europe, while a downward trend is reported only in Hungary and Turkey [21] (EMCDDA, 2010).
Table no. 3. Cannabis. The retail mean price on the European markets during 2006-
2008 (in EUR)
2006 2007 2008
Country Cannabis
plant (1 gram)
Cannabis resin
(1 gram)
Cannabis plant
(1 gram)
Cannabis resin
(1 gram)
Cannabis plant
(1 gram)
Cannabis resin
(1 gram) Belgium 5,4 6,7 6,0 6,5 7,0 7,4 Bulgaria - - 0,8 - - -
Czech Republic 6,9 9,7 6,4 9,4 6,6 8,9 Denmark - - - 6,3 - 6,3
Greece - - - - - - Italy - - - - 7,2 8,8
Hungary 8 8,4 8,7 9,3 8,6 9 Netherlands 4,4 7,3 4,3 7,7 5,2 8,1
Austria 4 7 9 8 10 9 Poland 7,1 7,6 - - 6 7
Romania - - - - - - Finland - - - - - - Sweden 8 9 9 9 9,6 8,9
United Kingdom 4 3,2 4,0 4,1 3,6 3,6 Portugal 2,2 2,2 4,7 3,5 5,1 3,28 Latvia - - 10,1 10,7 15,7 10,3 Spain 3 4,5 3,1 4,5 3,1 4,8
Source: Table adapted from EMCDDA, Statistical bulletin 2008, 2009, 2010, Table PPP-1 Price of cannabis products at retail level, 2006, Table PPP-1 Price of cannabis products at retail level, 2007, Table PPP-1 Price of cannabis products at
retail level, 2008, .http://www.emcdda.europa.eu/stats10.
The proceeds from illegal production of cannabis are determined by several factors, including plantation size, number of cultivated plants, the average yield per plantation, number of harvests in a year, the selling location (on retail or wholesale markets, as prices are generally higher on the retail market) [22] (EMCDDA, 2010).
It is difficult to assess the total income generated by illegal production of cannabis for commercial purposes, estimates made in this respect taking into account, usually only one variable, namely the seized quantity of cannabis plants. In this context, estimates made by the authorities suggests that cannabis plants seized in 2008 would have generated revenue of EUR 70 million in
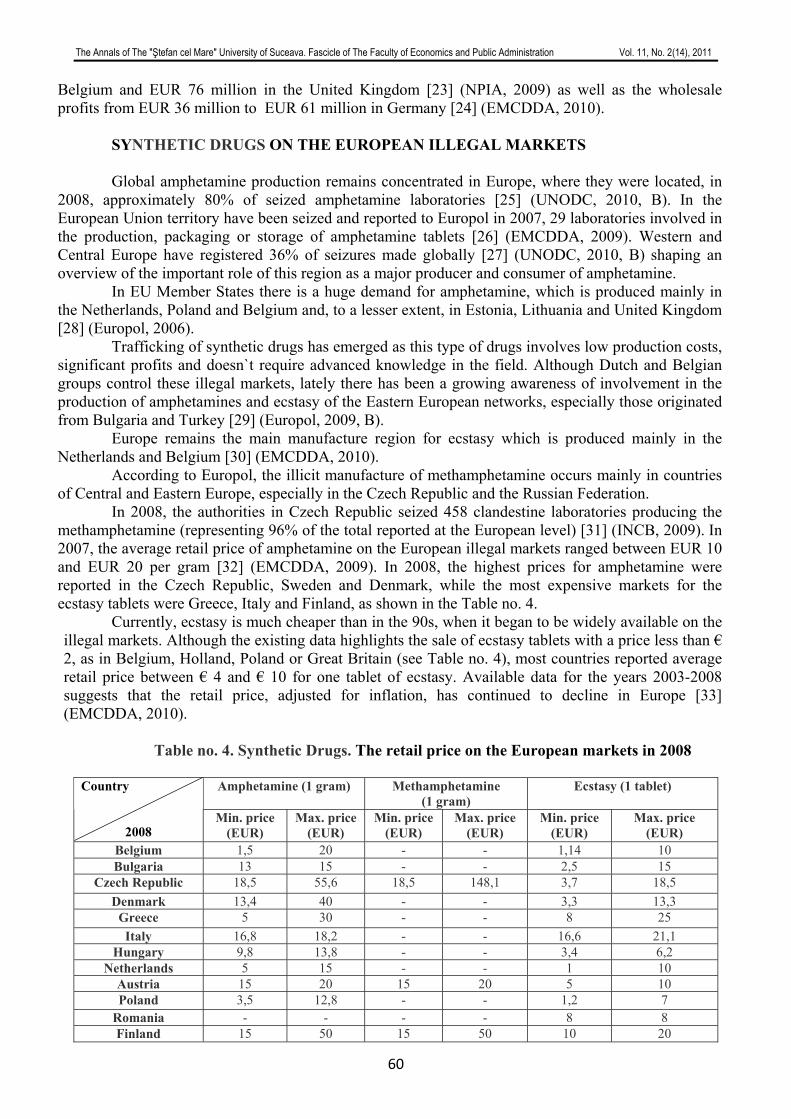
The Annals of The "Ştefan cel Mare" University of Suceava. Fascicle of The Faculty of Economics and Public Administration Vol. 11, No. 2(14), 2011
60
Belgium and EUR 76 million in the United Kingdom [23] (NPIA, 2009) as well as the wholesale profits from EUR 36 million to EUR 61 million in Germany [24] (EMCDDA, 2010).
SYNTHETIC DRUGS ON THE EUROPEAN ILLEGAL MARKETS
Global amphetamine production remains concentrated in Europe, where they were located, in
2008, approximately 80% of seized amphetamine laboratories [25] (UNODC, 2010, B). In the European Union territory have been seized and reported to Europol in 2007, 29 laboratories involved in the production, packaging or storage of amphetamine tablets [26] (EMCDDA, 2009). Western and Central Europe have registered 36% of seizures made globally [27] (UNODC, 2010, B) shaping an overview of the important role of this region as a major producer and consumer of amphetamine.
In EU Member States there is a huge demand for amphetamine, which is produced mainly in the Netherlands, Poland and Belgium and, to a lesser extent, in Estonia, Lithuania and United Kingdom [28] (Europol, 2006).
Trafficking of synthetic drugs has emerged as this type of drugs involves low production costs, significant profits and doesn`t require advanced knowledge in the field. Although Dutch and Belgian groups control these illegal markets, lately there has been a growing awareness of involvement in the production of amphetamines and ecstasy of the Eastern European networks, especially those originated from Bulgaria and Turkey [29] (Europol, 2009, B).
Europe remains the main manufacture region for ecstasy which is produced mainly in the Netherlands and Belgium [30] (EMCDDA, 2010).
According to Europol, the illicit manufacture of methamphetamine occurs mainly in countries of Central and Eastern Europe, especially in the Czech Republic and the Russian Federation.
In 2008, the authorities in Czech Republic seized 458 clandestine laboratories producing the methamphetamine (representing 96% of the total reported at the European level) [31] (INCB, 2009). In 2007, the average retail price of amphetamine on the European illegal markets ranged between EUR 10 and EUR 20 per gram [32] (EMCDDA, 2009). In 2008, the highest prices for amphetamine were reported in the Czech Republic, Sweden and Denmark, while the most expensive markets for the ecstasy tablets were Greece, Italy and Finland, as shown in the Table no. 4.
Currently, ecstasy is much cheaper than in the 90s, when it began to be widely available on the illegal markets. Although the existing data highlights the sale of ecstasy tablets with a price less than € 2, as in Belgium, Holland, Poland or Great Britain (see Table no. 4), most countries reported average retail price between € 4 and € 10 for one tablet of ecstasy. Available data for the years 2003-2008 suggests that the retail price, adjusted for inflation, has continued to decline in Europe [33] (EMCDDA, 2010).
Table no. 4. Synthetic Drugs. The retail price on the European markets in 2008
Amphetamine (1 gram) Methamphetamine
(1 gram) Ecstasy (1 tablet) Country
2008 Min. price
(EUR) Max. price
(EUR) Min. price
(EUR) Max. price
(EUR) Min. price
(EUR) Max. price
(EUR) Belgium 1,5 20 - - 1,14 10 Bulgaria 13 15 - - 2,5 15
Czech Republic 18,5 55,6 18,5 148,1 3,7 18,5 Denmark 13,4 40 - - 3,3 13,3
Greece 5 30 - - 8 25 Italy 16,8 18,2 - - 16,6 21,1
Hungary 9,8 13,8 - - 3,4 6,2 Netherlands 5 15 - - 1 10
Austria 15 20 15 20 5 10 Poland 3,5 12,8 - - 1,2 7
Romania - - - - 8 8 Finland 15 50 15 50 10 20
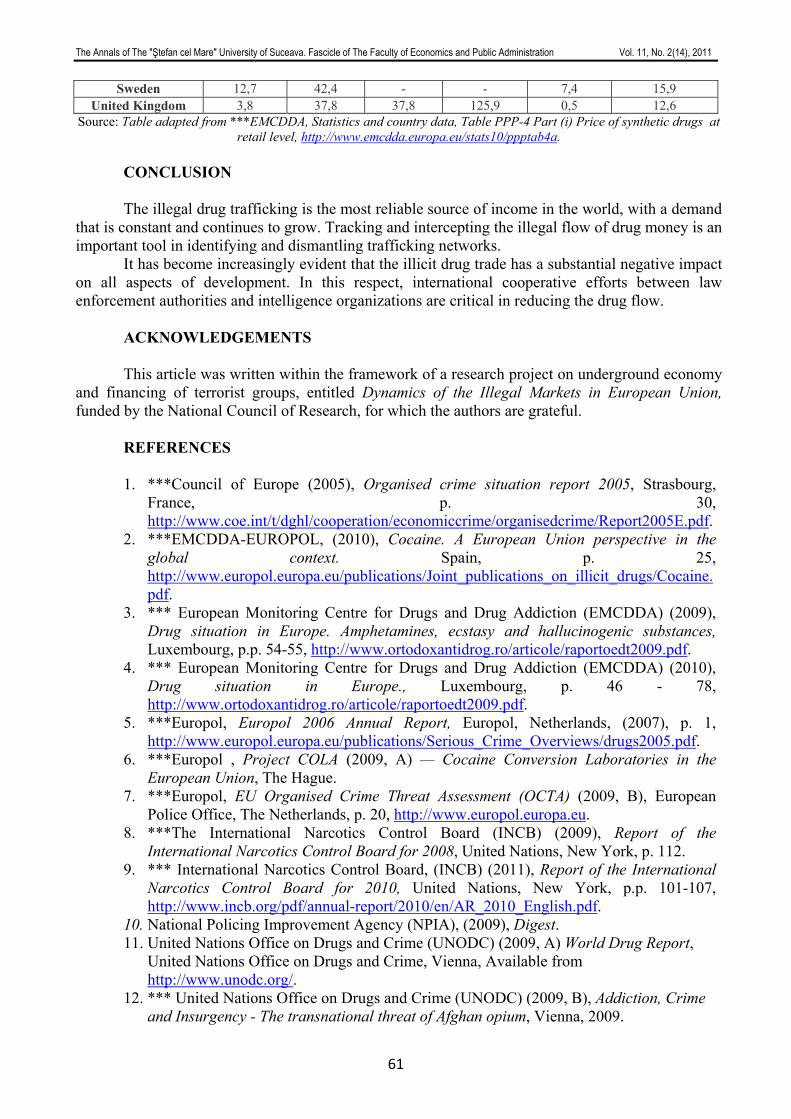
The Annals of The "Ştefan cel Mare" University of Suceava. Fascicle of The Faculty of Economics and Public Administration Vol. 11, No. 2(14), 2011
61
Sweden 12,7 42,4 - - 7,4 15,9 United Kingdom 3,8 37,8 37,8 125,9 0,5 12,6
Source: Table adapted from ***EMCDDA, Statistics and country data, Table PPP-4 Part (i) Price of synthetic drugs at retail level, http://www.emcdda.europa.eu/stats10/ppptab4a.
CONCLUSION The illegal drug trafficking is the most reliable source of income in the world, with a demand
that is constant and continues to grow. Tracking and intercepting the illegal flow of drug money is an important tool in identifying and dismantling trafficking networks.
It has become increasingly evident that the illicit drug trade has a substantial negative impact on all aspects of development. In this respect, international cooperative efforts between law enforcement authorities and intelligence organizations are critical in reducing the drug flow.
ACKNOWLEDGEMENTS This article was written within the framework of a research project on underground economy
and financing of terrorist groups, entitled Dynamics of the Illegal Markets in European Union, funded by the National Council of Research, for which the authors are grateful.
REFERENCES 1. ***Council of Europe (2005), Organised crime situation report 2005, Strasbourg,
France, p. 30, http://www.coe.int/t/dghl/cooperation/economiccrime/organisedcrime/Report2005E.pdf.
2. ***EMCDDA-EUROPOL, (2010), Cocaine. A European Union perspective in the global context. Spain, p. 25, http://www.europol.europa.eu/publications/Joint_publications_on_illicit_drugs/Cocaine.pdf.
3. *** European Monitoring Centre for Drugs and Drug Addiction (EMCDDA) (2009), Drug situation in Europe. Amphetamines, ecstasy and hallucinogenic substances, Luxembourg, p.p. 54-55, http://www.ortodoxantidrog.ro/articole/raportoedt2009.pdf.
4. *** European Monitoring Centre for Drugs and Drug Addiction (EMCDDA) (2010), Drug situation in Europe., Luxembourg, p. 46 - 78, http://www.ortodoxantidrog.ro/articole/raportoedt2009.pdf.
5. ***Europol, Europol 2006 Annual Report, Europol, Netherlands, (2007), p. 1, http://www.europol.europa.eu/publications/Serious_Crime_Overviews/drugs2005.pdf.
6. ***Europol , Project COLA (2009, A) — Cocaine Conversion Laboratories in the European Union, The Hague.
7. ***Europol, EU Organised Crime Threat Assessment (OCTA) (2009, B), European Police Office, The Netherlands, p. 20, http://www.europol.europa.eu.
8. ***The International Narcotics Control Board (INCB) (2009), Report of the International Narcotics Control Board for 2008, United Nations, New York, p. 112.
9. *** International Narcotics Control Board, (INCB) (2011), Report of the International Narcotics Control Board for 2010, United Nations, New York, p.p. 101-107, http://www.incb.org/pdf/annual-report/2010/en/AR_2010_English.pdf.
10. National Policing Improvement Agency (NPIA), (2009), Digest. 11. United Nations Office on Drugs and Crime (UNODC) (2009, A) World Drug Report,
United Nations Office on Drugs and Crime, Vienna, Available from http://www.unodc.org/.
12. *** United Nations Office on Drugs and Crime (UNODC) (2009, B), Addiction, Crime and Insurgency - The transnational threat of Afghan opium, Vienna, 2009.

The Annals of The "Ştefan cel Mare" University of Suceava. Fascicle of The Faculty of Economics and Public Administration Vol. 11, No. 2(14), 2011
62
13. *** United Nations Office on Drugs and Crime (UNODC) (2010, A), The globalization of crime. A transnational organized crime threat assessment, Viena, 2010, p.p. 96-122.
14. *** United Nations Office on Drugs and Crime (UNODC) (2010, B), World drug report 2010, Viena, 2010.
The Annals of The "Ştefan cel Mare" University of Suceava. Fascicle of The Faculty of Economics and Public Administration Vol. 11, No. 2(14), 2011
63
STRATEGIES FOR ACHIEVING COMPETITIVE ADVANTAGE
Assistant Professor Jusuf ZEKIRI South East European University, Business and Economics Faculty, Tetovo, Macedonia
[email protected] Associate Professor Ph.D. Alexandru NEDELEA Stefan cel Mare University of Suceava, Romania
Abstract: This paper is organized in three parts. A brief overview of the importance of strategies within companies, as
well as literature review is presented along with traditional approaches on strategies for achieving competitive advantage, and new approaches for gaining a competitive advantage.
The main objective of the paper is to outline and discuss the relevant issues and challenges from a theoretical viewpoint related with the possible strategy formulation of companies in order to achieve a competitive advantage in a market. Therefore, the primary objectives of this study consist on the theoretical frames of strategies for achieving the competitive advantage, and considering the ways of implementing them in companies worldwide. This paper concentrates on secondary sources of research regarding the approaches on strategies for achieving competitive advantage. According to the previous literature, scholars present some traditional approaches for gaining a competitive advantage. The new approaches are also presented that inevitably will play a crucial role in the future while formulating strategies for gaining a competitive advantage. Therefore, in order to understand the determinants for strategy setting, secondary information will be collected, and the data will be compared and analyzed. Finally, the research propositions will be submitted.
Key words: competitive advantage, generic strategies, industry structure.
JEL Classification: M10, M21, M31
1. INTRODUCTION Business strategy is all about competitive advantage. Businesses need strategies in order to
ensure that resources are allocated in the most effective way. Many studies of strategies and a lot literature have been carried out that outline the importance of strategies in managing the businesses successfully.
The word “strategy” is maybe one of the most used words in business and in everyday life. In the business world there are many preparatory strategies for almost every potential activity, starting from strategies for managing the employees and to the strategies for knowledge management. In the first sight, we get the perception that a strategy is something simple which deals with the use of resources for realizing the before hand planned objectives. But in practice, strategies differ in the time aspect, and its formulation and implementation cannot be perfect. There are also frequent conflicts between long term objectives and the actual needs, especially within the organization that operate in countries in transition, like Macedonia.
When a firm sustains profits that exceed the average for its industry, the firm is said to possess a competitive advantage over its rivals. The goal of much of business strategy is to achieve a sustainable competitive advantage. According to Porter (1987), a firm can gain competitive advantage if it is able to create value for its buyers. If a firm wishes to pursue the strategy of cost leadership, it has to be the low cost producer. A firm may gain cost advantage through economics of scale, proprietary technology, cheap raw material, etc. The strategy of differentiation involves offering a different product, a different delivery system, or using a different marketing approach. And it is up to the management of the company to decide which factors it wants to emphasize in order to gain competitive advantage (Porter, 1987).
According to Henry Mintzberg, business strategies could follow one of three modes: planning, entrepreneurial, and adaptive mode. He argues that the right choice depends on contingency variables such as the size and age of the organization and the power of key decision
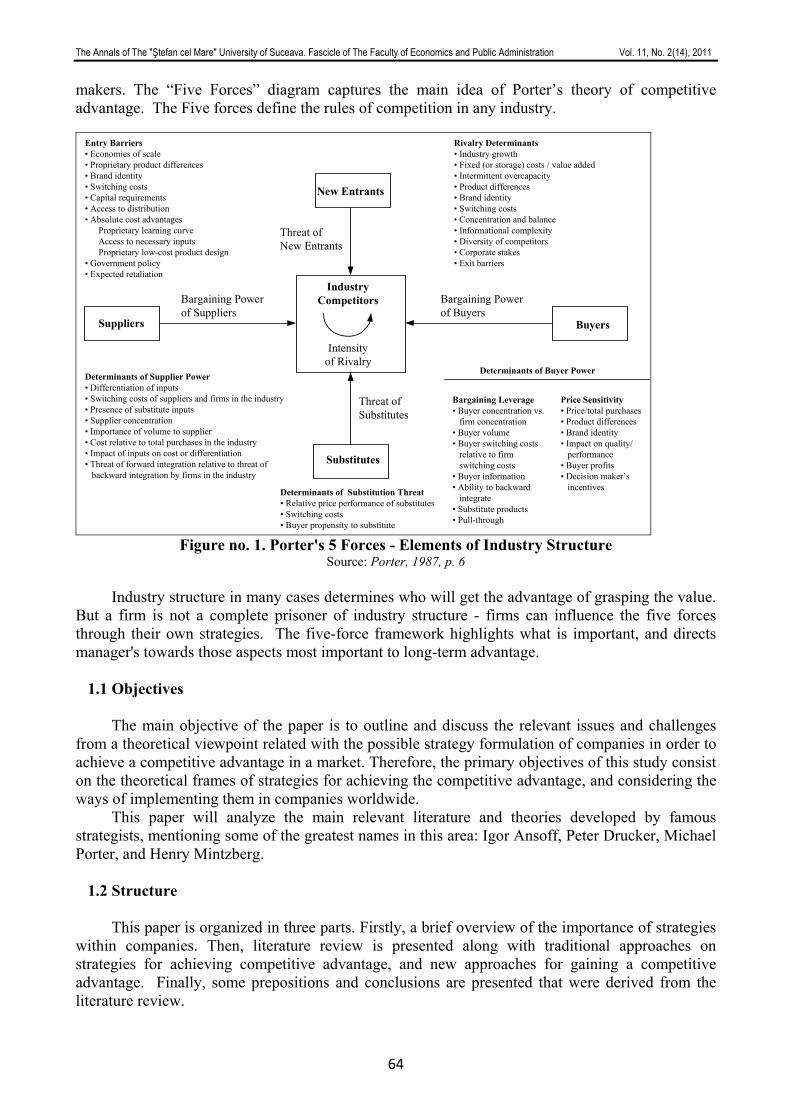
The Annals of The "Ştefan cel Mare" University of Suceava. Fascicle of The Faculty of Economics and Public Administration Vol. 11, No. 2(14), 2011
64
makers. The “Five Forces” diagram captures the main idea of Porter’s theory of competitive advantage. The Five forces define the rules of competition in any industry.
New Entrants
BuyersSuppliers
Substitutes
IndustryCompetitors
Intensityof Rivalry
Threat ofSubstitutes
Threat ofNew Entrants
Bargaining Powerof Suppliers
Bargaining Powerof Buyers
Determinants of Buyer Power
Bargaining Leverage• Buyer concentration vs. firm concentration• Buyer volume• Buyer switching costs relative to firm switching costs• Buyer information• Ability to backward integrate• Substitute products• Pull-through
Price Sensitivity• Price/total purchases• Product differences• Brand identity• Impact on quality/ performance• Buyer profits• Decision maker’s incentivesDeterminants of Substitution Threat
• Relative price performance of substitutes• Switching costs• Buyer propensity to substitute
Rivalry Determinants• Industry growth• Fixed (or storage) costs / value added• Intermittent overcapacity• Product differences• Brand identity• Switching costs• Concentration and balance• Informational complexity• Diversity of competitors• Corporate stakes• Exit barriers
Entry Barriers• Economies of scale• Proprietary product differences• Brand identity• Switching costs• Capital requirements• Access to distribution• Absolute cost advantages Proprietary learning curve Access to necessary inputs Proprietary low-cost product design• Government policy• Expected retaliation
Determinants of Supplier Power• Differentiation of inputs• Switching costs of suppliers and firms in the industry• Presence of substitute inputs• Supplier concentration• Importance of volume to supplier• Cost relative to total purchases in the industry• Impact of inputs on cost or differentiation• Threat of forward integration relative to threat of backward integration by firms in the industry
Figure no. 1. Porter's 5 Forces - Elements of Industry Structure
Source: Porter, 1987, p. 6
Industry structure in many cases determines who will get the advantage of grasping the value. But a firm is not a complete prisoner of industry structure - firms can influence the five forces through their own strategies. The five-force framework highlights what is important, and directs manager's towards those aspects most important to long-term advantage.
1.1 Objectives
The main objective of the paper is to outline and discuss the relevant issues and challenges from a theoretical viewpoint related with the possible strategy formulation of companies in order to achieve a competitive advantage in a market. Therefore, the primary objectives of this study consist on the theoretical frames of strategies for achieving the competitive advantage, and considering the ways of implementing them in companies worldwide.
This paper will analyze the main relevant literature and theories developed by famous strategists, mentioning some of the greatest names in this area: Igor Ansoff, Peter Drucker, Michael Porter, and Henry Mintzberg.
1.2 Structure
This paper is organized in three parts. Firstly, a brief overview of the importance of strategies within companies. Then, literature review is presented along with traditional approaches on strategies for achieving competitive advantage, and new approaches for gaining a competitive advantage. Finally, some prepositions and conclusions are presented that were derived from the literature review.
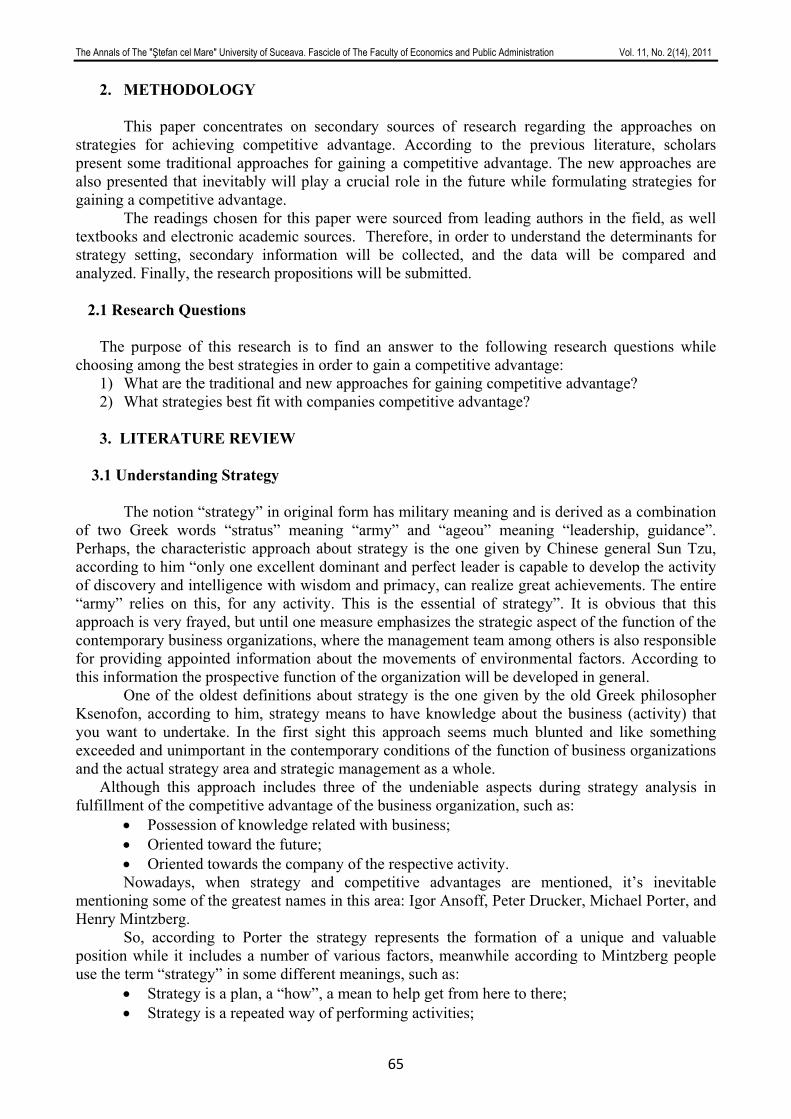
The Annals of The "Ştefan cel Mare" University of Suceava. Fascicle of The Faculty of Economics and Public Administration Vol. 11, No. 2(14), 2011
65
2. METHODOLOGY
This paper concentrates on secondary sources of research regarding the approaches on strategies for achieving competitive advantage. According to the previous literature, scholars present some traditional approaches for gaining a competitive advantage. The new approaches are also presented that inevitably will play a crucial role in the future while formulating strategies for gaining a competitive advantage.
The readings chosen for this paper were sourced from leading authors in the field, as well textbooks and electronic academic sources. Therefore, in order to understand the determinants for strategy setting, secondary information will be collected, and the data will be compared and analyzed. Finally, the research propositions will be submitted.
2.1 Research Questions
The purpose of this research is to find an answer to the following research questions while choosing among the best strategies in order to gain a competitive advantage:
1) What are the traditional and new approaches for gaining competitive advantage? 2) What strategies best fit with companies competitive advantage?
3. LITERATURE REVIEW
3.1 Understanding Strategy
The notion “strategy” in original form has military meaning and is derived as a combination
of two Greek words “stratus” meaning “army” and “ageou” meaning “leadership, guidance”. Perhaps, the characteristic approach about strategy is the one given by Chinese general Sun Tzu, according to him “only one excellent dominant and perfect leader is capable to develop the activity of discovery and intelligence with wisdom and primacy, can realize great achievements. The entire “army” relies on this, for any activity. This is the essential of strategy”. It is obvious that this approach is very frayed, but until one measure emphasizes the strategic aspect of the function of the contemporary business organizations, where the management team among others is also responsible for providing appointed information about the movements of environmental factors. According to this information the prospective function of the organization will be developed in general.
One of the oldest definitions about strategy is the one given by the old Greek philosopher Ksenofon, according to him, strategy means to have knowledge about the business (activity) that you want to undertake. In the first sight this approach seems much blunted and like something exceeded and unimportant in the contemporary conditions of the function of business organizations and the actual strategy area and strategic management as a whole.
Although this approach includes three of the undeniable aspects during strategy analysis in fulfillment of the competitive advantage of the business organization, such as:
• Possession of knowledge related with business; • Oriented toward the future; • Oriented towards the company of the respective activity. Nowadays, when strategy and competitive advantages are mentioned, it’s inevitable
mentioning some of the greatest names in this area: Igor Ansoff, Peter Drucker, Michael Porter, and Henry Mintzberg.
So, according to Porter the strategy represents the formation of a unique and valuable position while it includes a number of various factors, meanwhile according to Mintzberg people use the term “strategy” in some different meanings, such as:
• Strategy is a plan, a “how”, a mean to help get from here to there; • Strategy is a repeated way of performing activities;
The Annals of The "Ştefan cel Mare" University of Suceava. Fascicle of The Faculty of Economics and Public Administration Vol. 11, No. 2(14), 2011
66
• Strategy is a position, actually a reflection of the decisions taken for offering a specified product or service in the respective markets;
• Strategy is a perspective, actually vision and management. The strategy represents the management and long term engagement of the company which
creates advantages in the flexible environment between sources and appointed competences by fulfillment of shareholders demands (Johnson et al., 2005, p. 9).
The corporate strategies in order to be successful at work must be based on some main premises, such as:
• Competition appears in the level of Business Strategy Units. The diverted companies do not compete as integrity but the Business Strategy Units compete with each other. If the strategy does not pay the necessary importance to the success of different units, then the success is almost impossible;
• The diversion causes higher costs and different limits for the Business Strategy Units. The units are obliged to argument their decisions to the high management, they must dedicate the time necessary to synchronize their system with the other systems in the company and they must always act accordingly to company rules. These costs may be reduced, but not entirely eliminated;
• Shareholders can diverse themselves. They can diverse their share portfolios while determining for those shares that suit their preferences and their predispositions to endure a specified level of risk. (Porter, 1987, p.3)
3.2 Traditional approaches on strategies for achieving competitive advantage. When traditional approaches on strategies for achieving competitive advantage are mentioned, it
is refereed to two main approaches such as: 1) The Porter Matrix and 2) The Ansoff Matrix
3. 3 The Porter Matrix of strategy for achieving competitive advantage
One of the most referred approaches upon the strategies for achieving competitive advantage is the one given by Michael Porter who talks about generic strategies which appear in the next matrix (figure no. 2).
Figure no. 2. Porter’s Generic Strategies Source: Porter: 1987, p. 12
The purpose of the strategy for managing costs is for the organization to have lower costs
than his competitor. So, in this strategy with great importance is the work efficiency. In fact the
The Annals of The "Ştefan cel Mare" University of Suceava. Fascicle of The Faculty of Economics and Public Administration Vol. 11, No. 2(14), 2011
67
company tends by producing bigger amounts of a standardized product to use the advantages of the level economy and the experience curve. Usually the company tries to give the product some essential characteristics so that it is suitable to a higher number of potential consumers. For this strategy to be successful the company has to have a non stop research for a way to lower costs in every aspect of its function. This strategy is successful when the business company has a bigger participation in the market and in the cases when it has easy and secure access in the respective sources. This strategy is very attractive for companies, which is obvious if we take into consideration the fact that the low costs offer the company better opportunities to make profit and to be very resistant in case it enters in a war of prices with a competitor. The companies that usually practice this strategy produce products with a low level of diversification knowing that low prices will attract potential consumers.
Finding the way of how to produce with lower costs may be the most important question for the company managers. Some of the ways to lower producing costs are the investments, actually the implementation of new producing technologies, product design in the way that it enables producing with lower costs, reducing costs for distributing products, finding cheaper inputs etc.
We think we should distinguish the strategy of managing costs and managing prices even though both of them are very close to each other. In fact, cost leading strategy is based on the products that are intended to be produced with lower costs compared to competitors. If a business company decides to use this priority in order to set lower prices to its products compared to the competitors, then we will deal with a price leading strategy. On the other hand, beside lower costs, the company may sell its products with the same price as it is offered by the competitors, trying in this way to create greater difference between incomes and expenses in favor of cash. Several extreme cases wherein companies decide to sell a product with lower price compared to competitors, despite the fact that the obtained income does not cover product costs, should be taken into account.
Except many advantages of this strategy, it also has many disadvantages as well. A major disadvantage of the cot leading strategy is pointed out by Hill, Jones, 1992, p.149:
• Competitors may lower their product costs by using cheaper labor force. This is not strange, if the difference of salaries in various countries is taken into account. Thus, salaries in USA are six times higher compared to those of Mexico or South Korea;
• Copying or imitating competitors; • The risk of customers changing their taste, while a business company is focused on
lowering the prices. The purpose of the differentiation strategy is to create a product or a service, which will
differ from the products or services that are provided by the competitors. So, we are talking about a strategy which is focused on product differentiation. This strategy can be attained in different ways. For example Procter & Gamble always point out that its products are made of natural ingredients, whereas Sony always claims the high quality of its TV sets. We should not leave aside the psychological factors as well. For example one who wears a Rolex makes an impression of a wealthy person with a good taste and who pays attention to the quality. On the other hand, there are many companies that run their business successfully by pointing out the need for security, respectively by using the fear that people experience by the physical insecurity. Therefore, we can say that there are unlimited possibilities for product differentiation.
A company that wants to implement this strategy should first of all have research and development skills, close relations with distributors, creative staff, high image and marketing skills, etc. This strategy implies the invention of a unique product, which will be accepted by a group of customers, who will be willing to pay even high prices for it.
Generally, the differentiation strategy can be applied in several ways: by providing better products and services, by providing better after sale services, as well as by a better image of the company. Therefore, the differentiation between fashion design companies like Channel or Ralph Lauren is made by their well known image; Ritz claims the high quality of its services, whereas Toyota always points out the high quality of its vehicles.
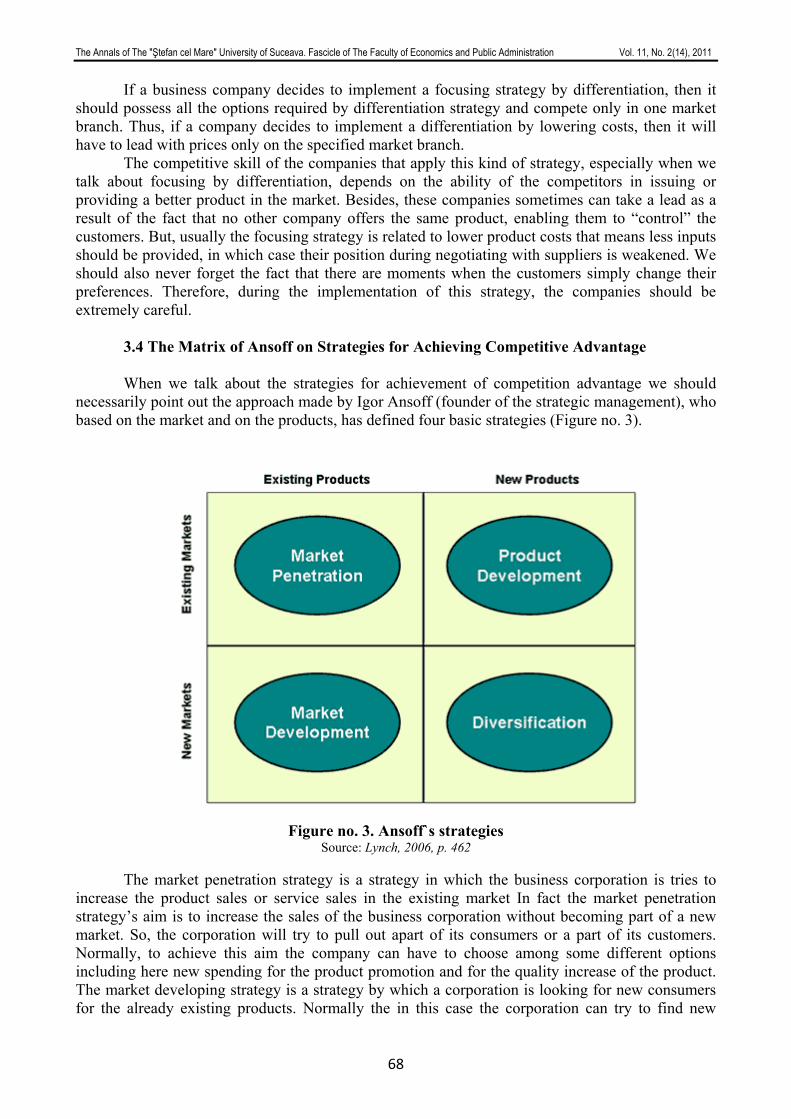
The Annals of The "Ştefan cel Mare" University of Suceava. Fascicle of The Faculty of Economics and Public Administration Vol. 11, No. 2(14), 2011
68
If a business company decides to implement a focusing strategy by differentiation, then it should possess all the options required by differentiation strategy and compete only in one market branch. Thus, if a company decides to implement a differentiation by lowering costs, then it will have to lead with prices only on the specified market branch.
The competitive skill of the companies that apply this kind of strategy, especially when we talk about focusing by differentiation, depends on the ability of the competitors in issuing or providing a better product in the market. Besides, these companies sometimes can take a lead as a result of the fact that no other company offers the same product, enabling them to “control” the customers. But, usually the focusing strategy is related to lower product costs that means less inputs should be provided, in which case their position during negotiating with suppliers is weakened. We should also never forget the fact that there are moments when the customers simply change their preferences. Therefore, during the implementation of this strategy, the companies should be extremely careful.
3.4 The Matrix of Ansoff on Strategies for Achieving Competitive Advantage
When we talk about the strategies for achievement of competition advantage we should necessarily point out the approach made by Igor Ansoff (founder of the strategic management), who based on the market and on the products, has defined four basic strategies (Figure no. 3).
Figure no. 3. Ansoff`s strategies
Source: Lynch, 2006, p. 462
The market penetration strategy is a strategy in which the business corporation is tries to increase the product sales or service sales in the existing market In fact the market penetration strategy’s aim is to increase the sales of the business corporation without becoming part of a new market. So, the corporation will try to pull out apart of its consumers or a part of its customers. Normally, to achieve this aim the company can have to choose among some different options including here new spending for the product promotion and for the quality increase of the product. The market developing strategy is a strategy by which a corporation is looking for new consumers for the already existing products. Normally the in this case the corporation can try to find new
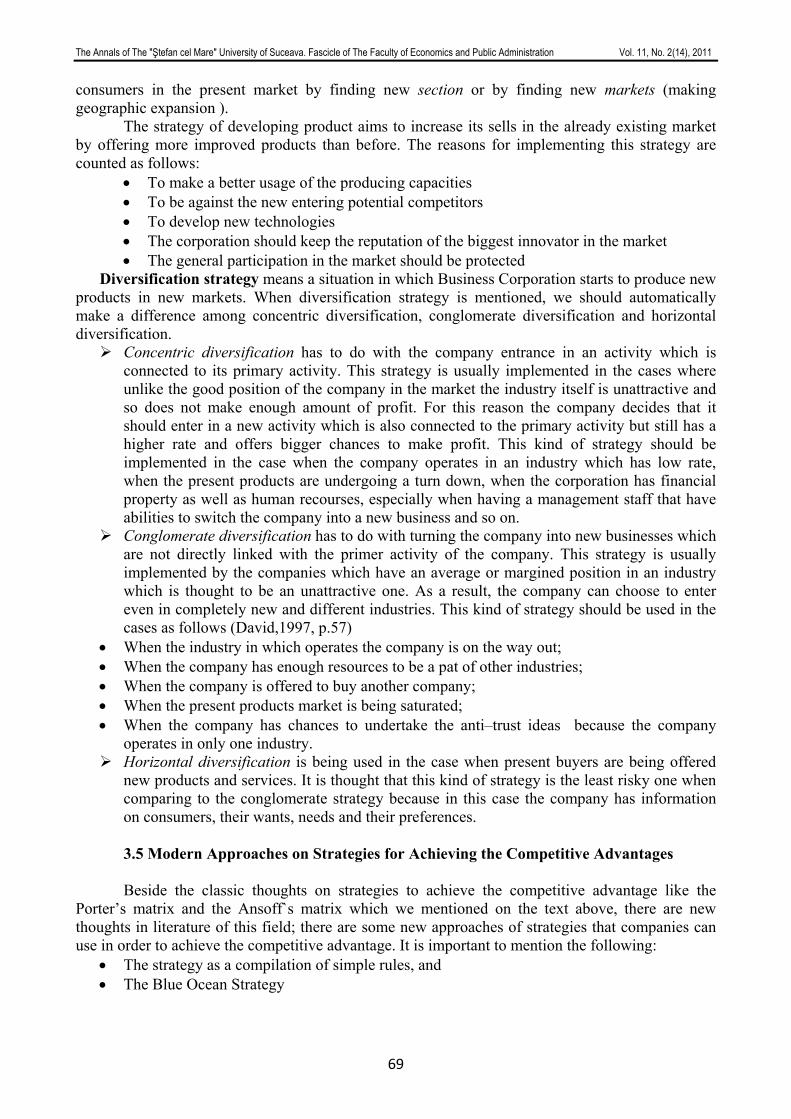
The Annals of The "Ştefan cel Mare" University of Suceava. Fascicle of The Faculty of Economics and Public Administration Vol. 11, No. 2(14), 2011
69
consumers in the present market by finding new section or by finding new markets (making geographic expansion ).
The strategy of developing product aims to increase its sells in the already existing market by offering more improved products than before. The reasons for implementing this strategy are counted as follows:
• To make a better usage of the producing capacities • To be against the new entering potential competitors • To develop new technologies • The corporation should keep the reputation of the biggest innovator in the market • The general participation in the market should be protected
Diversification strategy means a situation in which Business Corporation starts to produce new products in new markets. When diversification strategy is mentioned, we should automatically make a difference among concentric diversification, conglomerate diversification and horizontal diversification.
Concentric diversification has to do with the company entrance in an activity which is connected to its primary activity. This strategy is usually implemented in the cases where unlike the good position of the company in the market the industry itself is unattractive and so does not make enough amount of profit. For this reason the company decides that it should enter in a new activity which is also connected to the primary activity but still has a higher rate and offers bigger chances to make profit. This kind of strategy should be implemented in the case when the company operates in an industry which has low rate, when the present products are undergoing a turn down, when the corporation has financial property as well as human recourses, especially when having a management staff that have abilities to switch the company into a new business and so on.
Conglomerate diversification has to do with turning the company into new businesses which are not directly linked with the primer activity of the company. This strategy is usually implemented by the companies which have an average or margined position in an industry which is thought to be an unattractive one. As a result, the company can choose to enter even in completely new and different industries. This kind of strategy should be used in the cases as follows (David,1997, p.57)
• When the industry in which operates the company is on the way out; • When the company has enough resources to be a pat of other industries; • When the company is offered to buy another company; • When the present products market is being saturated; • When the company has chances to undertake the anti–trust ideas because the company
operates in only one industry. Horizontal diversification is being used in the case when present buyers are being offered
new products and services. It is thought that this kind of strategy is the least risky one when comparing to the conglomerate strategy because in this case the company has information on consumers, their wants, needs and their preferences.
3.5 Modern Approaches on Strategies for Achieving the Competitive Advantages Beside the classic thoughts on strategies to achieve the competitive advantage like the
Porter’s matrix and the Ansoff`s matrix which we mentioned on the text above, there are new thoughts in literature of this field; there are some new approaches of strategies that companies can use in order to achieve the competitive advantage. It is important to mention the following:
• The strategy as a compilation of simple rules, and • The Blue Ocean Strategy
The Annals of The "Ştefan cel Mare" University of Suceava. Fascicle of The Faculty of Economics and Public Administration Vol. 11, No. 2(14), 2011
70
3.6 The Strategy as a compilation of simple rules. “The Strategy as a compilation of simple rules” is a more modern approach to the strategies
focused on achieving competitive advantage. In reality this approach has evolved as a need to explain the success of organizations as Yahoo.com or AOL in absence of a traditional approach to explain the strategies and strategic management in all. The essence of this strategy is to grasp and use the opportunities given at the moment to the business organizations while moving in a flexible way from one opportunity to another and always focusing on the basis of the actual movements and potential future changes of the external market factors. In this case managers concentrate on some simple rules which they follow very carefully while they are managing the company.
Like the other strategies “The Strategy as a compilation of simple rules” seeks to find a basis for differentiation of businesses. This differentiation doesn’t come from activities that are closely related neither from basic competence, as in the case of traditional strategies. On the contrary it comes from focusing on important processes and the evolution of simple rules that make those processes. When from a similar process evolves a practice that results in achieving economy of scales and scope, as a result a competitive advantage may appear as in the case of Microsoft and Intel. This advantage usually last for a short period. From this prospective maybe the most important approach is the impossibility to define the duration of the competitive advantage. For this reason managers try to generate large incomes for the actual moment because the next competitive advantage may disappear.
Table no. 1. The Strategy as a Compilation of Simple Rules
Type Aim Example
The“WHY” rules The main aspects of process development are emphasized, especially the answer on the question “What makes our proceses unique?”
The Akamai rules for the process of consumer service: Staff needs to be fro technical experts, questions should ne answered immediately, whereas the RD staff should fluctuate from one task to another .
Limitation rules This helps managers what opportunities to follow and what not.
The eraly Cisco rule for acquisition Acquired companies have no right of having more than 75 workers and at least 75% of them should be engineers.
Priority rules This enables managers to rank the accepted oppotunities
The Intel rule for allocation producing capacities: the allocation is based on the gross margin of the product.
Rules concerning with time management
This enables to syncronize mangers the new opportunities and other functioning parts of the company.
The rule for new product “Nortele”: the project team should determine the date whne the product will be delivered to the consumer and the product itself should not last more tha 18 months.
Rules from getting out of business
This helps mannagers to determine when to withdraw from the start up
At Oticon if any key member decides to withdraw from the project and to be engaged in other projects then the actul project is closed.
Source: Eisenhardt, Sull, 2002, p. 104
3.7 The Blue Ocean Strategy Although the term “Blue Ocean” is new, its existence is very old. It has been and will
remain a characteristic of business life. If we see the world a century ago and ask ourselves how much of modern industries at that time had been unknown? We will notice that many industries that are our everyday life like cars, song recording, aviation, petrochemical, health protection and management consulting at that time they have been unknown or in the beginning of its development. Now, if we analyze the business world thirty years ago. You will see that a hole constellation of multibillion businesses like common funds, cellular phones, production of the energy from natural gas, biotechnology, fast delivery packages, minivans, snowboards, cafes and videos either had been very rare or had not existed at all. Now try to imagine how the world will appear after twenty or fifty years and ask you how many industries that are unknown, then they
The Annals of The "Ştefan cel Mare" University of Suceava. Fascicle of The Faculty of Economics and Public Administration Vol. 11, No. 2(14), 2011
71
would be everyday life reality. If the saying holds that History predicts the future than it’s very clear that the number of such industries would be very large. (Kim, Mauborgne, 2005, p. 5)
One of the main aspects of this approach is overcoming the competition. In fact, the organization insists that it pursues its development path without any importance on the steps the competitors take. This concept is known as the Innovation of value and comes as a result of tendencies.
This strategy is based on six main principles divided in two groups, where in the first group formulating strategies take place like: reconstruction of market confines, look at the big picture and do not focus too much in numbers, look beyond the existing demand, look after the functioning of strategic process. Whereas in the second group principles take place which are related with the implementation of strategies like: exceed the main organization problems, convert self implementation in a strategy. This strategy is based on 4 main actions like: create, increase, decrease and eliminate.
Figure no. 4. The frame of the four main actions
Source: Kim , Mauborgne, 2005
The strategy of Blue Ocean in many issues differentiates from traditional approach and strategies of business organizations. Thus, they look like two linked integrities which need to confront each other and in the end of this confrontation there needs to be only one winner which will gain more consumers, and there would be one loser which will lose its consumers and at the same time it will be one step closer to bankruptcy. This issue is also shown in (table no. 2).
Table no. 2. The difference between two strategic approaches
Type Competition under the traditional concept
Competition under the ‘blue ocean’ concept
Industry
Focuses on rivals within the industry
It also analysis companies which operate within other industries
Strategic group Focuses on the competitive position within the strategic group
It also analysis other strategic groups within the industry
Consumer group
Focuses to offer the best services to consumer groups
defines the group of consumers in the industrial frame work(within industry)
Product or services supplied (offered)
Focus on maximizing the value of products or services within the industry
Analysis the bids of other complementary products and services
DECREASE Which factors need to be decreased under the industrial standard?
INCREASE Which factors need to be increased above the industrial standard?
ELIMINATE Which of the actual industrial factors need to be eliminated?
CREATE Which new factors need to be created in the current industry?
Curve of the value

The Annals of The "Ştefan cel Mare" University of Suceava. Fascicle of The Faculty of Economics and Public Administration Vol. 11, No. 2(14), 2011
72
Source: Kim, Mauborgne, 2005, p.79
The strategy of ‘Blue Ocean’ as an approach is very new, and is a little known in strategic management literatures, however, in practice it has followed and reached the development of business activities for a long time. That is why we express the conviction that in future this strategic approach will be one of the most used strategies in the literature of strategic management.
4. SUBMISSION OF RESEARCH PREPOSITIONS
According to previous scholars’ research and literature review we can see that strategy formulation plays and it is an influential factor in gaining a competitive advantage for companies (Igor Ansoff, Peter Drucker, Michael Porter, and Henry Mintzberg). In regard to this, propositions are submitted as follows: Proposition 1: The more value a company creates the more competitive it will be. The crucial question in determining profitability is how much value firms can create for their buyers, and how much of this value will be captured or competed away. Industry structure determines who will capture the value. But a firm is not a complete prisoner of industry structure - firms can influence the five forces through their own strategies (Porter, 1987). Proposition 2: The more a firm is optimally positioned, the more it can generate return and profit. A firm positions itself by leveraging its strengths. According to Michael Porter a firm's strengths can position into one of two headings: cost advantage or differentiation. Proposition 3: The more the firm is a focus strategy, the more it enjoys customer loyalty. Proposition 4: If the high risk is compensated by the chance of a high rate of return, companies’ diversification may be a reasonable choice. Proposition 5: The more the firm is related to specific customers, the more the firm will use the product development strategy. Proposition 6: The more a firm differentiates its strategies, the higher its competitive advantage will be. Proposition 7: The more a firm innovates and the more it follows its path, the more competitive in the long run it will be.
5. CONCLUSION
The successful creation of a strategy is critical to company’s future, because strategies must be designed to generate sustainable competitive advantages in order to have market share. Porter argues that careful analysis of the competitive arena can be done with the help of his five forces model which will help companies to select the competitive strategy that will allow them to achieve a competitive advantage in the potential market.
Competitive strategy of the firm is the roadmap that shows the way to gaining sustainable competitive advantage by the firm. Thus, competitive advantage depicts a company’s competencies and its capability to survive against the factors prevailing in the firm’s external environment. Therefore, gaining competitive advantage entails a set of specialized skills, assets, and capabilities for the organization.
Competitive advantage is an important concept because it defines the ‘uniqueness’ of an organization vis-à-vis its competitors. The strategy by which the sustainable competitive advantage is gained is known as business level strategy of the organization. The internal resources and
Functional–emotional orientation
Focuses on changing the price for the current functional-emotional group
Examines the opportunities for changing the functional – emotional group
Time Tends to adopt changes in the external factors after they are exposed
Participates in creating changes in the external environment
The Annals of The "Ştefan cel Mare" University of Suceava. Fascicle of The Faculty of Economics and Public Administration Vol. 11, No. 2(14), 2011
73
capabilities of the organization that are a source of competitive advantage over rival firms are collectively known as the core competency of the organization.
REFERENCES
1. Porter, Michael (1987). From Competitive Advantage to Corporate Strategy. Harvard Business Review May-June (3): 43–59
2. Johnson G, Scoles. K, Whittington W (2005), Exploring Corporate Strategy: Text and Cases, Prentice Hall-Financial Times, Essex.
3. Eisenhardt K.M, Sull D.N (2002), Strategy as simple rules, Harvard Business Review on Advances in Strategy, A Harvard Business Review Paperback.
4. Hill Ch, Jones G (1992), Strategic Management: An Integrated Approach, Houghton Millin Company, Dallas
5. Lynch R (2006), Corporate Strategy, Prentice Hall-Financial Times, Essex. 6. David F (1997), Concepts of Strategic Management, Prentice Hall, New Jersey. 7. Kim Ch. W, Mauborgne R (2005), Blue Ocean Strategy: How to Create Uncontested
Market Space and Make the Competition Irrelevant, Harvard Business School Press, Massachusetts.
The Annals of The "Ştefan cel Mare" University of Suceava. Fascicle of The Faculty of Economics and Public Administration Vol. 11, No. 2(14), 2011
74
TEA PRODUCTION, CONSUMPTION AND EXPORTS IN GLOBAL AND BANGLADESHI PERSPECTIVE
Tasnuba NASIR
Lecturer, Faculty of Business Administration (FBA), University of Science and Technology Chittagong (USTC), Bangladesh
[email protected] Mohammad SHAMSUDDOHA
Department of Marketing Studies and International Marketing University of Chittagong, Bangladesh
Abstract: Bangladesh Tea Industry established in 1840 when a pioneer tea garden was inaugurate on the slopes of the
hills of Chittagong, where the Chittagong Club in Bangladesh now stands. The first commercial tea garden was established in 1857 in Mulnichera, Sylhet. During the India-Pakistan partition in 1947, Bangladesh (then called East Pakistan) owned 103 tea estates, covering 26,734 hectares of tea plantation with annual production of 18.36 Million kg with a yield of about 639 kgs per ha. Home consumption was around 13.64 Million kg until 1955. Then after, home consumption went up rapidly, and Government imposed 3% mandatory extension of tea area per annum in 1961. Ten years later in 1970, tea area was extended to 42,658 hectares, and production was increased to 31.38 Million kg. During the liberation war in 1971, tea industry suffered colossal damages, which resulted in poor management, high unemployment, insufficient inputs, dilapidated factory machinery, inadequate maintenance, etc. leading to lower yield and poor quality of tea. Besides that, world tea production has been showing an annual increment of 3% while in Bangladesh, the production has increased by 1.84 % and contributes 1.37 in export in the word tea trade and earns near about 1775 million Taka (Taka 69 = USD 1.00) every year. The study aims to picturize the scenario of Bangladesh tea in the context of world tea, export and import and consumption of tea products in different countries of the world.
Keywords: Tea, Tea Global Scenario, Bangladesh JEL Classification: :K12
INTRODUCTION Tea is one of the most important non-alcoholic beverage drinks in the world and has been
gaining further popularity as an important ‘health drink’ in view of its purported medicinal value. It is served as a morning drink for nearly 2/3 of the world population daily. The Bangladesh tea industry is one of the major sources of income for the national exporters. At present, this industry is facing a multitude of problems. Lack of capital and modern machinery, lower market value of tea in comparison to increasing production cost, lower yield per hectare are forcing back to the tea entrepreneurs. Besides that, increasing domestic need and lack of modern techniques for measuring quality of tea constitute some of the main problems as well. There is also the lack of perennial water source for irrigation during dry season or during prolonged drought. In addition, some tea gardens owners are not using Government prescription for improvement. Malnutrition among the children of the labour line, security problems of the executives, deteriorating the law and order situation of the tea estates (log stealing, political or outsider influence on their internal arrangements, illegal occupation of land by the outsiders), lack of medical facilities for labour and lack of infrastructure (road, network, etc.) are some of the other constraints. For successful tea culture, the above problems being faced by both the manufacturing and the marketing sector need to be addressed immediately. In Bangladesh, there is thus dire need to focus attention on improvements in the manufacturing sector covering quality of tea, its productivity, cost of production as well as the marketing system (Islam, 2005). The government tried to revive the sector in the early 1980s by privatizing and rehabilitating two tea estates, which had been nationalized in the 1970s; restructuring the Tea Board; privatizing the six state tea factories; and revamping public research on tea. These policy initiatives have had some success, but much remains to be done to fully revitalize the tea sector. Infrastructure is still inadequate. The tax system is too complex, with too many taxes
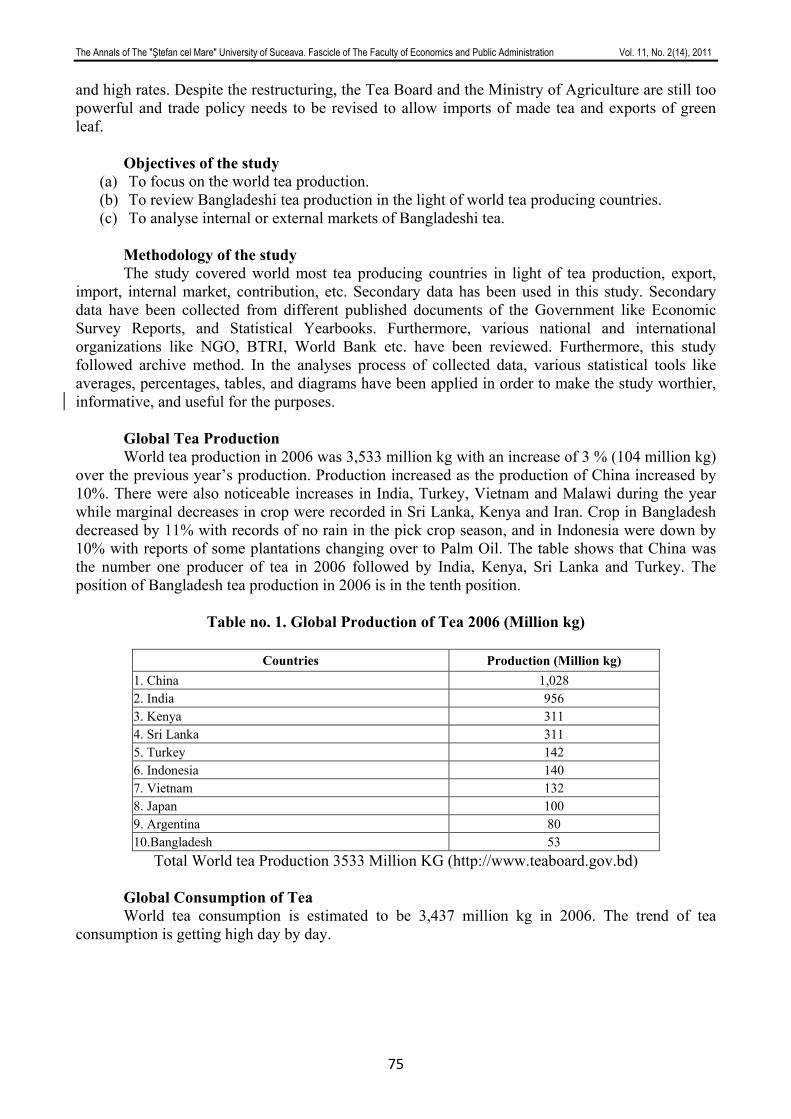
The Annals of The "Ştefan cel Mare" University of Suceava. Fascicle of The Faculty of Economics and Public Administration Vol. 11, No. 2(14), 2011
75
and high rates. Despite the restructuring, the Tea Board and the Ministry of Agriculture are still too powerful and trade policy needs to be revised to allow imports of made tea and exports of green leaf.
Objectives of the study (a) To focus on the world tea production. (b) To review Bangladeshi tea production in the light of world tea producing countries. (c) To analyse internal or external markets of Bangladeshi tea.
Methodology of the study The study covered world most tea producing countries in light of tea production, export,
import, internal market, contribution, etc. Secondary data has been used in this study. Secondary data have been collected from different published documents of the Government like Economic Survey Reports, and Statistical Yearbooks. Furthermore, various national and international organizations like NGO, BTRI, World Bank etc. have been reviewed. Furthermore, this study followed archive method. In the analyses process of collected data, various statistical tools like averages, percentages, tables, and diagrams have been applied in order to make the study worthier, informative, and useful for the purposes.
Global Tea Production World tea production in 2006 was 3,533 million kg with an increase of 3 % (104 million kg)
over the previous year’s production. Production increased as the production of China increased by 10%. There were also noticeable increases in India, Turkey, Vietnam and Malawi during the year while marginal decreases in crop were recorded in Sri Lanka, Kenya and Iran. Crop in Bangladesh decreased by 11% with records of no rain in the pick crop season, and in Indonesia were down by 10% with reports of some plantations changing over to Palm Oil. The table shows that China was the number one producer of tea in 2006 followed by India, Kenya, Sri Lanka and Turkey. The position of Bangladesh tea production in 2006 is in the tenth position.
Table no. 1. Global Production of Tea 2006 (Million kg)
Countries Production (Million kg)
1. China 1,028 2. India 956 3. Kenya 311 4. Sri Lanka 311 5. Turkey 142 6. Indonesia 140 7. Vietnam 132 8. Japan 100 9. Argentina 80 10.Bangladesh 53
Total World tea Production 3533 Million KG (http://www.teaboard.gov.bd)
Global Consumption of Tea World tea consumption is estimated to be 3,437 million kg in 2006. The trend of tea
consumption is getting high day by day.
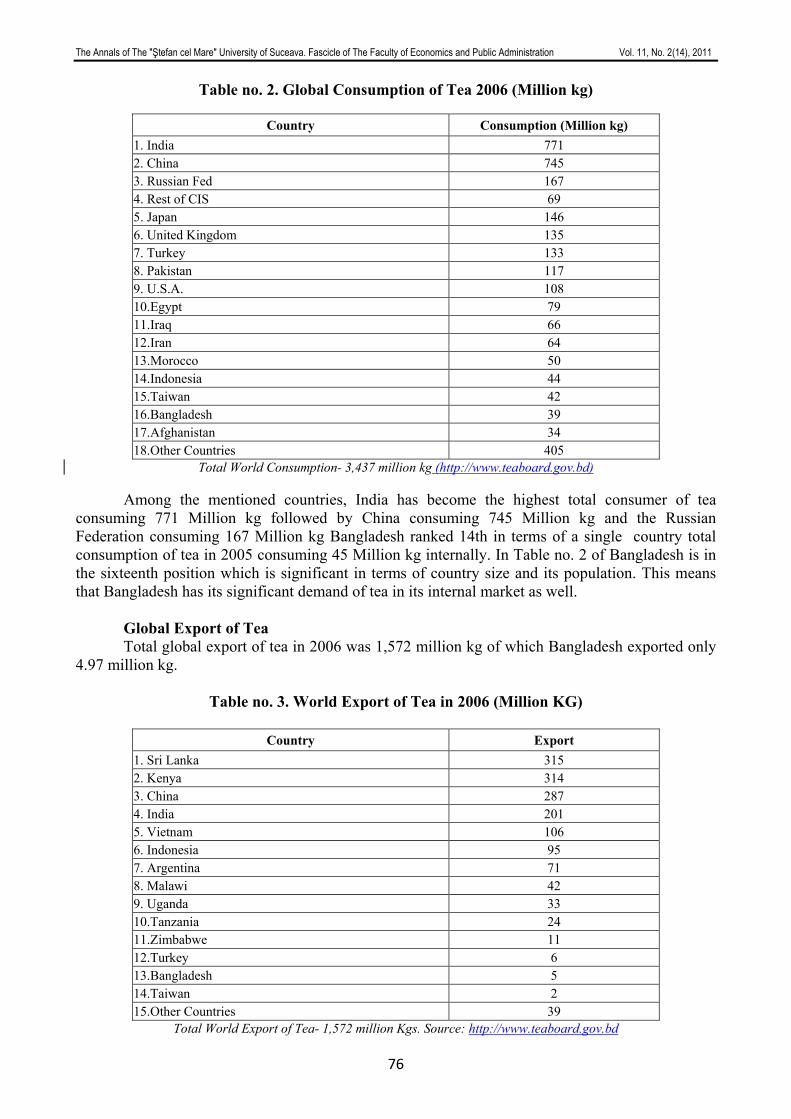
The Annals of The "Ştefan cel Mare" University of Suceava. Fascicle of The Faculty of Economics and Public Administration Vol. 11, No. 2(14), 2011
76
Table no. 2. Global Consumption of Tea 2006 (Million kg)
Country Consumption (Million kg) 1. India 771 2. China 745 3. Russian Fed 167 4. Rest of CIS 69 5. Japan 146 6. United Kingdom 135 7. Turkey 133 8. Pakistan 117 9. U.S.A. 108 10.Egypt 79 11.Iraq 66 12.Iran 64 13.Morocco 50 14.Indonesia 44 15.Taiwan 42 16.Bangladesh 39 17.Afghanistan 34 18.Other Countries 405
Total World Consumption- 3,437 million kg (http://www.teaboard.gov.bd)
Among the mentioned countries, India has become the highest total consumer of tea consuming 771 Million kg followed by China consuming 745 Million kg and the Russian Federation consuming 167 Million kg Bangladesh ranked 14th in terms of a single country total consumption of tea in 2005 consuming 45 Million kg internally. In Table no. 2 of Bangladesh is in the sixteenth position which is significant in terms of country size and its population. This means that Bangladesh has its significant demand of tea in its internal market as well.
Global Export of Tea Total global export of tea in 2006 was 1,572 million kg of which Bangladesh exported only
4.97 million kg.
Table no. 3. World Export of Tea in 2006 (Million KG)
Country Export 1. Sri Lanka 315 2. Kenya 314 3. China 287 4. India 201 5. Vietnam 106 6. Indonesia 95 7. Argentina 71 8. Malawi 42 9. Uganda 33 10.Tanzania 24 11.Zimbabwe 11 12.Turkey 6 13.Bangladesh 5 14.Taiwan 2 15.Other Countries 39
Total World Export of Tea- 1,572 million Kgs. Source: http://www.teaboard.gov.bd

The Annals of The "Ştefan cel Mare" University of Suceava. Fascicle of The Faculty of Economics and Public Administration Vol. 11, No. 2(14), 2011
77
India, Sri Lanka, Vietnam and Argentina ended the year with higher exports while exports
from Indonesia, Kenya and Bangladesh dropped. Export from Bangladesh declined about 88% from 9.01 M.kg in 2005 to 4.79 M.kg. in 2006 mainly due to the increase of internal demand that increased the local auction prices. Interestingly, Sri Lanka ranked first as its internal consumption is increased significant volume rather than Kenya, China, India, Vietnam.
Production of Tea Approximately, twenty five countries are producing significant amounts of tea in the world
tea market.
Table no. 4. Productivity of Tea (kg/ha) Country Kenya India Japan Turkey Sri Lanka Bangladesh China Indonesia Argentina
Productivity 1,934 1,743 1,745 1,494 1,450 1,102 627 1,006 1,538
Source: Islam, 2005, ITC
Bangladesh Perspective of Tea Bangladesh Tea Research Institute (BTRI) has produced interesting information regarding
tea production in Bangladesh at different stage since 1947. It shows that great success came to this industry in 1970. Thereafter, Bangladesh failed to achieve its targeted figure due to bureaucracy, policy, financing and marketing problems, failed to adapt the new technology etc.
Table no. 5. Tea production in Bangladesh at different periods
Year Total Area ( ha) Increased/
Decreased Total Production ‘000 Kg
Increased/ Decreased
Yield Kg/ha
1947 30353 - 18884 - 62 - 1957 31287 + 934 25549 + 6665 817 + 195 1970 42688 + 11401 31381 + 5832 735 – 82 1980 43732 + 1044 40038 + 8657 916 + 181 1992 47781 + 4049 48930 + 8892 1040 + 124 2000 48735 +954 55834 + 6894 1145 + 105
Source: BTRI [5]; * Difference from previous total denoted by (+) or (-) sign. ** calculated on the basis of production/total tea area/ha
Table no. 6. Tea Area and Yield since 1947
Year No. of Tea Estates
Area Under Tea (ha)
Pluckable Area (ha)
Production (In Million kg)
Yield (kg/ha)
1947 103 28,734 28,734 18.36 639 1960 127 31,418 30,744 19.01 618 1970 153 42,685 39,308 31.38 798 1980 153 43,528 43,201 40.04 927 1990 158 47,385 44,759 46.16 1,031 2000 160 50,470 46,344 53.15 1,147 2005 163 52,317 45,366 60.14 1,326 2006 163 52,407 45,505 53.41 1,174
Source: http://www.teaboard.gov.bd
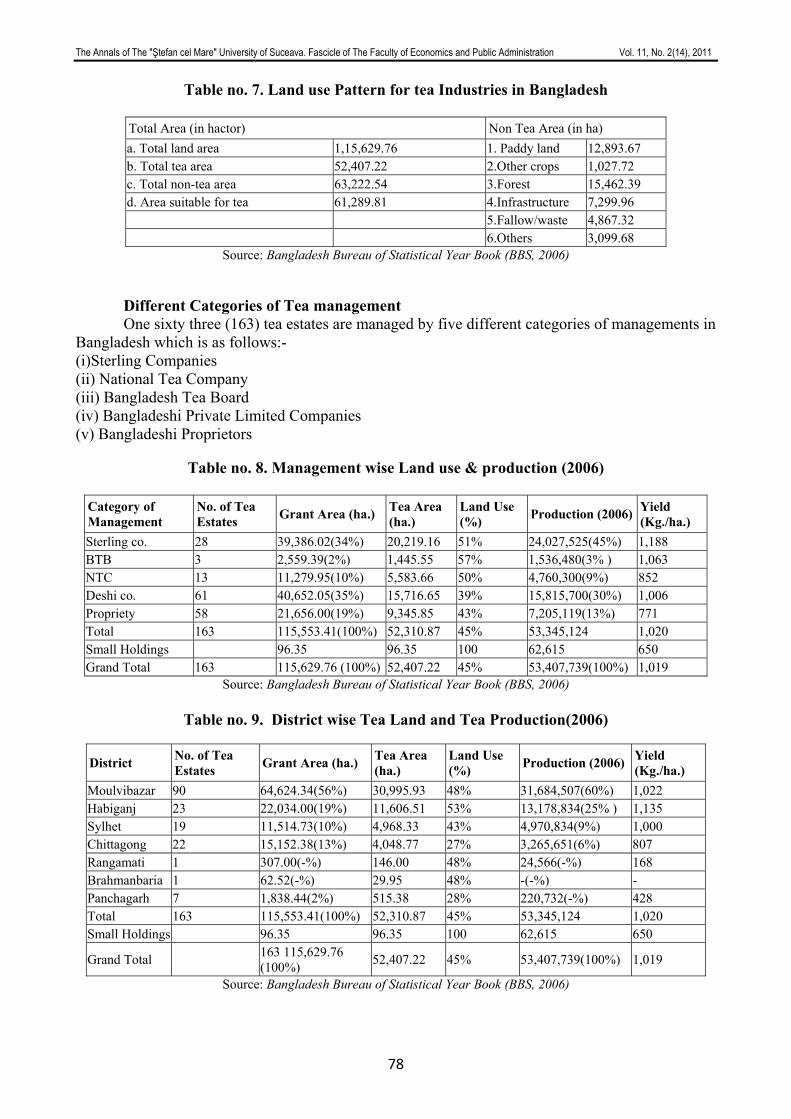
The Annals of The "Ştefan cel Mare" University of Suceava. Fascicle of The Faculty of Economics and Public Administration Vol. 11, No. 2(14), 2011
78
Table no. 7. Land use Pattern for tea Industries in Bangladesh
Total Area (in hactor) Non Tea Area (in ha) a. Total land area 1,15,629.76 1. Paddy land 12,893.67 b. Total tea area 52,407.22 2.Other crops 1,027.72 c. Total non-tea area 63,222.54 3.Forest 15,462.39 d. Area suitable for tea 61,289.81 4.Infrastructure 7,299.96 5.Fallow/waste 4,867.32 6.Others 3,099.68
Source: Bangladesh Bureau of Statistical Year Book (BBS, 2006)
Different Categories of Tea management One sixty three (163) tea estates are managed by five different categories of managements in
Bangladesh which is as follows:- (i)Sterling Companies (ii) National Tea Company (iii) Bangladesh Tea Board (iv) Bangladeshi Private Limited Companies (v) Bangladeshi Proprietors
Table no. 8. Management wise Land use & production (2006)
Category of Management
No. of Tea Estates Grant Area (ha.) Tea Area
(ha.) Land Use (%) Production (2006) Yield
(Kg./ha.) Sterling co. 28 39,386.02(34%) 20,219.16 51% 24,027,525(45%) 1,188 BTB 3 2,559.39(2%) 1,445.55 57% 1,536,480(3% ) 1,063 NTC 13 11,279.95(10%) 5,583.66 50% 4,760,300(9%) 852 Deshi co. 61 40,652.05(35%) 15,716.65 39% 15,815,700(30%) 1,006 Propriety 58 21,656.00(19%) 9,345.85 43% 7,205,119(13%) 771 Total 163 115,553.41(100%) 52,310.87 45% 53,345,124 1,020 Small Holdings 96.35 96.35 100 62,615 650 Grand Total 163 115,629.76 (100%) 52,407.22 45% 53,407,739(100%) 1,019
Source: Bangladesh Bureau of Statistical Year Book (BBS, 2006)
Table no. 9. District wise Tea Land and Tea Production(2006)
District No. of Tea Estates Grant Area (ha.) Tea Area
(ha.) Land Use (%) Production (2006) Yield
(Kg./ha.) Moulvibazar 90 64,624.34(56%) 30,995.93 48% 31,684,507(60%) 1,022 Habiganj 23 22,034.00(19%) 11,606.51 53% 13,178,834(25% ) 1,135 Sylhet 19 11,514.73(10%) 4,968.33 43% 4,970,834(9%) 1,000 Chittagong 22 15,152.38(13%) 4,048.77 27% 3,265,651(6%) 807 Rangamati 1 307.00(-%) 146.00 48% 24,566(-%) 168 Brahmanbaria 1 62.52(-%) 29.95 48% -(-%) - Panchagarh 7 1,838.44(2%) 515.38 28% 220,732(-%) 428 Total 163 115,553.41(100%) 52,310.87 45% 53,345,124 1,020 Small Holdings 96.35 96.35 100 62,615 650
Grand Total 163 115,629.76 (100%) 52,407.22 45% 53,407,739(100%) 1,019
Source: Bangladesh Bureau of Statistical Year Book (BBS, 2006)
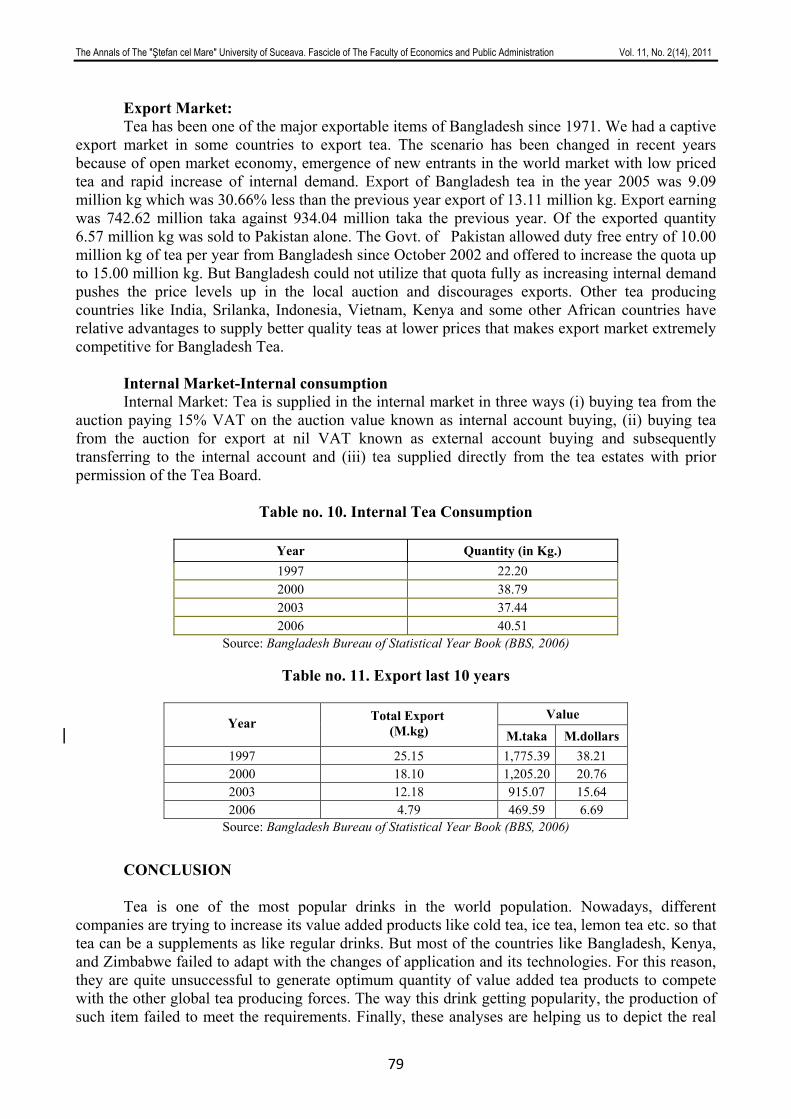
The Annals of The "Ştefan cel Mare" University of Suceava. Fascicle of The Faculty of Economics and Public Administration Vol. 11, No. 2(14), 2011
79
Export Market: Tea has been one of the major exportable items of Bangladesh since 1971. We had a captive
export market in some countries to export tea. The scenario has been changed in recent years because of open market economy, emergence of new entrants in the world market with low priced tea and rapid increase of internal demand. Export of Bangladesh tea in the year 2005 was 9.09 million kg which was 30.66% less than the previous year export of 13.11 million kg. Export earning was 742.62 million taka against 934.04 million taka the previous year. Of the exported quantity 6.57 million kg was sold to Pakistan alone. The Govt. of Pakistan allowed duty free entry of 10.00 million kg of tea per year from Bangladesh since October 2002 and offered to increase the quota up to 15.00 million kg. But Bangladesh could not utilize that quota fully as increasing internal demand pushes the price levels up in the local auction and discourages exports. Other tea producing countries like India, Srilanka, Indonesia, Vietnam, Kenya and some other African countries have relative advantages to supply better quality teas at lower prices that makes export market extremely competitive for Bangladesh Tea.
Internal Market-Internal consumption Internal Market: Tea is supplied in the internal market in three ways (i) buying tea from the
auction paying 15% VAT on the auction value known as internal account buying, (ii) buying tea from the auction for export at nil VAT known as external account buying and subsequently transferring to the internal account and (iii) tea supplied directly from the tea estates with prior permission of the Tea Board.
Table no. 10. Internal Tea Consumption
Year Quantity (in Kg.) 1997 22.20 2000 38.79 2003 37.44 2006 40.51
Source: Bangladesh Bureau of Statistical Year Book (BBS, 2006)
Table no. 11. Export last 10 years
Value Year Total Export
(M.kg) M.taka M.dollars 1997 25.15 1,775.39 38.21 2000 18.10 1,205.20 20.76 2003 12.18 915.07 15.64 2006 4.79 469.59 6.69
Source: Bangladesh Bureau of Statistical Year Book (BBS, 2006)
CONCLUSION Tea is one of the most popular drinks in the world population. Nowadays, different
companies are trying to increase its value added products like cold tea, ice tea, lemon tea etc. so that tea can be a supplements as like regular drinks. But most of the countries like Bangladesh, Kenya, and Zimbabwe failed to adapt with the changes of application and its technologies. For this reason, they are quite unsuccessful to generate optimum quantity of value added tea products to compete with the other global tea producing forces. The way this drink getting popularity, the production of such item failed to meet the requirements. Finally, these analyses are helping us to depict the real
The Annals of The "Ştefan cel Mare" University of Suceava. Fascicle of The Faculty of Economics and Public Administration Vol. 11, No. 2(14), 2011
80
pictures of world tea demands, productions, exports and imports. At last, there are so many issues relating to world tea industry needs to get attention by the appropriate researcher to dig out the problems for the ultimate solutions. Future research can be done on market expansions, changes of demands, pattern of modern consumptions, value added products etc.
REFERENCES
1. Bangladesh bureau of statistics. Ministry of planning, government of People’s Republic
of Bangladesh, pp.81 & 327. Dhaka, Bangladesh. 2. BBS. 2008. Statistical year book of Bangladesh. 3. BTRI. 2003. Biennial report. Bangladesh tea research institute, government of people’s
republic of Bangladesh, pp. 94-98, Srimangal, Moulvibazar, Bangladesh. 4. http://www.teaboard.gov.bd/index.php?option=historyteaarea. 5. Islam G M R et. Al, 2005, Present status and future needs of tea industry in
Bangladesh, Pakistan acad. Sci. 42(4):305-314.2005 6. ITC. 2001. International tea committee report 2001. 7. Khisa, p. And Iqbal, i. 2001. Tea manufacturing in Bangladesh: problems and
prospects. Proceedings of the international conference on “mechanical engineering”, 26-28 December 2001, department of mechanical engineering, Bangladesh university of science and technology, Dhaka.
8. Mondal, T.K., Bhattacharya, A. And Ahuja,P. S., 2002. Induction of synchronous secondary embryogenesis of tea (camellia sinensis). J. Plant physiol. 158:945–951.
The Annals of The "Ştefan cel Mare" University of Suceava. Fascicle of The Faculty of Economics and Public Administration Vol. 11, No. 2(14), 2011
81
COMBINING COMPANIES – A SOLUTION FOR OVERCOMING THE ECONOMIC
CRISIS EFFECTS
Lecturer Ph.D. Nicoleta Cristina MATEI The International and Domestic Business Relations, Finance and Banking
the Romanian-American University, Bucharest, Romania [email protected]
Abstract: The aim of this paper is to present the concept of combining businesses as a possible solution for companies to
overcome the effects of the economic crisis. Combining companies is approached from the point of view of accountancy, therefore presenting the accounting method, the modality of identifying of the acquirer, the evaluation and allotment of the costs of the operation.
Keywords: combining companies, acquisition cost, acquisition method, trading fund
JEL Classification: M41
INTRODUCTION
Economic entities perform their activities in a dynamic environment due to: the sharpening of the economic, educational and technical-scientific competitiveness; the expansion and increase of communication opportunities and media; the multiplying and diversifying of consumer needs; the promotion of certain requirements and new quality criteria for goods and services; the spectacular profusion of technical and technological innovations; the reevaluation of the man-nature relationship and the start of wide programs aiming at ensuring the ecological balance; the alteration of forms of organization and management; the limitation of classical resources of raw materials and energy; the deepening of economic and technical-scientific cooperation (Tiron Tudor A., 2005).
Under such economic circumstances, companies are compelled to focus their efforts on self-protection activities, survival, adaptation to the fluctuations of the market and conjunctural as well as, not least, development modifications. At the same time, in order to reduce the possible risks related to business it is necessary to ensure a control of provisioning, marketing and, possibly, to anihilate competition, all these determining the reorganization of companies.
The reorganization operations that enable a company to maintain control over another or to develop are mergers and acquisitions, in short, the combining of companies can offer this facility.
COMPANY COMBINING – REASONS AND BENEFITS The need to survive, to adapt to the circumstances of the market, to obtain competitional
margin compells companies to act so as to benefit from control over other companies with a view to reach the objectives pursued.
Company combining enables companies to: • control the entire production cycle:
- upstream – suppliers, thus ensuring the regularity of provisioning, and a steady level of cost and quality;
- downstream – customers, thus being able to eliminate rival products and exploit new outlets;
• eliminate rival companies, which will offer a consolidated position on the market by the merger of distribution networks and combination of the production techniques with a view to reduce unitary costs;
• the diversification of activity fields and maximization of the profit.
The Annals of The "Ştefan cel Mare" University of Suceava. Fascicle of The Faculty of Economics and Public Administration Vol. 11, No. 2(14), 2011
82
The obtaining of competitional margin urges companies to develop either internally by means of acquiring new assets, financed from the profit non-distributed to shareholders or associates and from external resources, or externally by taking over the control of a company that already owns the equipment necessary with a view to use them.
A combination of companies represents the grouping in one reporting entity of other entities or companies, with lucrative purpose and separately. In most cases, the result of the combination is that one of the companies, the acquirer, obtains control over net assets and the exploitation of another company, the one acquired, in exchange for the transfer of assets, debt assuming and issuing of shares and other securities of the company (Ristea M.,2004).
Control represents the power to govern the financial and company exploitation strategies, with a view to obtain benefits from the activity undertaken.
Company combination may imply: • the acquisition of all assets and debts of an entity; • the acquisition of assets, debts and privileges regarding the activities of an entity; • the setting up of a new legal entity that will take over the assets, debts and business of the
grouped entities. Company combining can be achieved:
• by means of mergers, by fusion or absorbtion; • by means of setting up company groups through maintaining exclusive control
The group of companies is a system made up of the parent company and its subsidiaries, each having their own legal status, but having only one decision center (the parent company).
The parent company is a company that has one or more subsidiaries. A subsidiary is a company under the control of another company (called parent company). Exclusive control implies that the parent company would hold, directly or indirectly, by
means of its subsidiaries, more than 50% of the voting power. Company combining can take effect as a result of the issuance of instruments of capital,
cash transfer, cash or other assets convertible, or a combination of these. The transaction can take place between the entities participant to the combination or an entity and the shareholders of another entity (Ristea M., 2004).
THE EVALUATION AND ALLOTMENT OF THE COMPANY COMBINING COST
All company combinations are considered, with accountant purposes, acquisitions and are
accounted for by applying the acquisition method. The application of the acquisition method implies following the steps below:
a) identifying the acquirer; b) evaluating the cost of the company combination; c) alloting of the costs of the company combination to the acquired assets, contingent
debtors and assumed debts.
a) Identifying the Acquirer The acquirer is represented by the entity that obtains the control over the other entities
participant to the company combination. Therefore, in most cases, a company that is combining obtains more than half the voting power of the other company, is the acquirer. Under exceptional circumstances, the buyer does not possess half of the voting power, but the acquirer will be the party that obtains the power if it:
• owns more than half of the voting power of the other company by virtue of an agreement with the other investors (for example, fiduciary vote conventions or other contract terms);
• has control over the financial and exploitation policies of the other company, according to a statute or contract;
The Annals of The "Ştefan cel Mare" University of Suceava. Fascicle of The Faculty of Economics and Public Administration Vol. 11, No. 2(14), 2011
83
• can assign and revoke the majority of the Board or other counterpart leading body of the other company;
• exercises the majority of the votes in the meetings of the Board or other leading body. Other aspects that can attest the acquirer in a company combination:
• the just value - the entity of the just value significantly larger than the just value of the other combining entity, is considered to be the buyer;
• the combination takes effect by an exchange of voting rights with cash - the entity that pays in cash is the acquirer;
• the management of a company is able to dominate the selection of the leading team of a combined entity – the dominant entity will be considered to be the acquirer.
b) The Evaluation of the Company Combining Costs The company combining cost or the acquisition cost is the aggregate amount of the just
values of the assets yielded, the debts incurred and the capital instruments issued by the buyer in exchange of the control over the entity acquired.
The assets yielded and the debts assumed by the buyer are evaluated at their just value. The just value is the value in exchange of which an asset could be exchanged or a debt paid
in the framework of a transaction held under objective circumstances between willing and conscientious parties.
If the transaction is remunerated by the issuance of shares, these are evaluated at the market value on the date of the exchange.
Acording to the reviewed version of the IFRS 3 ”Companies Combinations”, costs that are directly attributable to the acquisition affect the profit and loss account and represent expenses of the period. Costs directly attributable to the acquisition refer to costs of the fees of the accountants, legal counsellors, evaluators and other consultants participant to the operation. At the same time, general administrative costs, the ones pertaining to the acquisition department, the costs of the issuance of securities used as exchange instruments represent expenses of the period.
Example At the beginning of the financial exercise N, company A acquires company B. The
transaction is remunerated by the issuance of 1.000 shares A at the price of 20 m.u. and the amount of 10.000 m.u. paid to the shareholders of the acquired company. The expenses for the fees of the legal counsellors and evaluators participant to the operations amount to 5.000 m.u. The acquisition department of company A generated expenses amounting to the total value of 2.000 m.u. in the month when the acquisition took place and it used 20% of its time in order to do the operation. Acquisition cost = number of shares issues × issuance price + cash payment = = 1.000 × 20 + 10.000 = 30.000 m.u.
The other expenses, including the fees of the legal counsellors and evaluators, the expenses of the acquisition department are expenses of the period and do not affect the acquisition cost.
In some cases, contract terms stipulate a supplementary counterprestation depending on certain subsequent events related to the performance of the acquired entity and the market value of the securities issued in exchange for obtaining control. The value of the supplementary counterprestation affects the cost of the acquisition upon combination date if it is probable to be supported and if it can be credibly evaluated. If subsequent events do not take place or if the value of the counterpreatation has to be modified, the acquisition cost will be adjusted.
Example In the month of March of the financial exercise N, company A acquires 70% of the capital
of company B, for the price of 500.000 m.u., following to pay a supplementary counterprestation of 100.000 m.u, if the profit of the acquired company surpasses 5.000 m.u. in the first year after the
The Annals of The "Ştefan cel Mare" University of Suceava. Fascicle of The Faculty of Economics and Public Administration Vol. 11, No. 2(14), 2011
84
acquisition date. During the financial exercises previous to the closing of the operation, company B has recorded anual profits of around 4.000 m.u. and 6.000 m.u.
Taking into account the annual results obtained by company B previous to the acquisition date, it is probable that that event, exceeding of the profit after the first year, of 5.000 m.u., may take place and consequently, the counterprestation is contingent and is included in the acquisition cost.
If, after the first year, the profit of company B is smaller than 5.000 m.u., the acquisition cost will be decreased accordingly, together with, implicitly, the trading fund resulted after the combination.
c) The allotment of the cost of the company combination to the acquired assets, debtors, and contingent debts assumed Upon acquisition date, the buying company will allot the cost of the company combination
onto the just value of the assets, the debtors and the identifiable contingent debt. There will be exempted from the rule of just value evaluation the assets that are to be resold and that will be recorded at their just value minus the selling costs according to IFRS 5.
Assets, debts and contingent debts of the acquired company are acknowledged, upon acquisition date, by the buying company if they fulfill the following conditions:
• in the case of the assets, other than intangible ones, it is probable for all the subsequent economic benefits to go to the buyer and their just value to be reliably evaluated;
• in the case of intangibles, debts and contingent debts– it has to be possible for the the just value to be reliably evaluated. If the cost of the combination exceeds the just value of the acquired net assets, the surplus is
considered to be a trading fund.
CONCLUSIONS Combing businesses can be a solution for companies with a view to overcome the economic
crisis effects. From the accountancy’s point of view, company combinations are considered as acquisitions and they imply the identification of the buyer, the evaluation of the acquisition cost and its allotment onto assets and debts acquired while taking over the business.
The acquisition cost, according to IFRS 3, is represented by the just value of the asets yielded, of the debts assumend and capital instruments issued for the taking over of another company, to which one can add the value of the supplementary counterprestation as provisioned by the contract.
With respect to the allotment of the acquisition cost, this will be attributed to the net asset (assets minus debts) acquired as well as any possible debts. If, as a result of the act of attributing, there appears a surplus, it will be acknowledged as trading fund in the accounting of the acquirer.
REFERENCES
1. Barry J. Epstein, Eva K. Jermakowicz (2007), The Interpretation and Application of International Accounting and Financial Reporting Standards, BMT Publishing House
2. Dumbravă P. (2004), Patrimony Modifications, Presa Universitară Clujeană Publishing House, Cluj-Napoca
3. Feleagă N., Feleagă L. (2007), Consolidated Accountancy. An International and European Approach, The Economică Publishing House, Bucharest
4. Gîrbina M., Bunea Şt. (2008), Syntheses, Case Studies and Grid Tests Regarding the Application of IAS (revised) – IFRS, CECCAR Publishing House, Bucharest
5. Horga V. (2007), Advanced Accounting, Bibliotheca Publishing House, Iaşi

The Annals of The "Ştefan cel Mare" University of Suceava. Fascicle of The Faculty of Economics and Public Administration Vol. 11, No. 2(14), 2011
85
6. Ristea M. (2004), Dumitru C.G., Advanced Accounting, Second Edition, revised and added, Universitară Publishing House, Bucharest
7. Tiron Tudor A. (2005), Company Combinations. Mergers and Acquisitions, Accent Publishing House, Cluj-Napoca
The Annals of The "Ştefan cel Mare" University of Suceava. Fascicle of The Faculty of Economics and Public Administration Vol. 11, No. 2(14), 2011
86
THE EVOLUTION OF THE CUSTOMS UNION
Lecturer PhD. Marius BOIŢĂ Vasile Goldiş Western University of Arad, Romania
[email protected] Professor PhD. Dorina ARDELEAN
Vasile Goldiş Western University of Arad, Romania [email protected]
Professor PhD. Cristian HAIDUC Vasile Goldiş Western University of Arad, Romania
Abstract: Today, the custom is confronted with an environment in a very fast change: in full evolution models of
production and consumption, enhanced international commercial exchanges, global threats as terrorism, organized crime, clime change and new dangers, such as commerce with dangerous products.
In this context, the customs authorities from the E.U. play an essential role: their mission is to assure, at any given time, the equilibrium between the protection of the society and the facilitation of commerce through controlling the chain of supply, both at the external at the external border, and within the E.U. The customs services have information’s concerning the important merchandise circulation in or exported in the E.U. and it applies sophisticated methods and systems for the control of all types of merchandises.
In order to allow the custom to continue fulfilling its role in this exigent environment, it was launched an ambitious reform.
Key words: custom, competitiveness, facilitating, control, protection JEL Classification: A10 INTRODUCTION The customs union of the European Union (E.U), which celebrated 40 years at the first of
July 2008, represents one of the fundaments of the European Community. Since its creation, the customs union it extended both quantitative, from 6 to 27 members, and qualitative, becoming a sole market. This contributes to the prosperity of Europe, through facilitating the commerce, both within the Union, but with third countries as well.
The Commission, with the member states, realized a deep evaluation of the customs role, and the obtained results were the object of same high level discussion with the customs administration of the member’s states. It was reached an agreement in what it concerns the necessity of improving the work methods and of consolidating the global coordination.
CONTENT
Today, the custom is confronted with an environment in a very fast change: in full evolution
models of production and consumption, enhanced international commercial exchanges, global threats as terrorism, organized crime, clime change and new dangers, such as commerce with dangerous products.
In this context, the customs authorities from the E.U. play an essential role: their mission is to assure, at any given time, the equilibrium between the protection of the society and the facilitation of commerce through controlling the chain of supply, both at the external at the external border, and within the E.U. The customs services have information’s concerning the important merchandise circulation in or exported in the E.U. and it applies sophisticated methods and systems for the control of all types of merchandises. The volume of the merchandise that comes across the European Union borders is enormous.
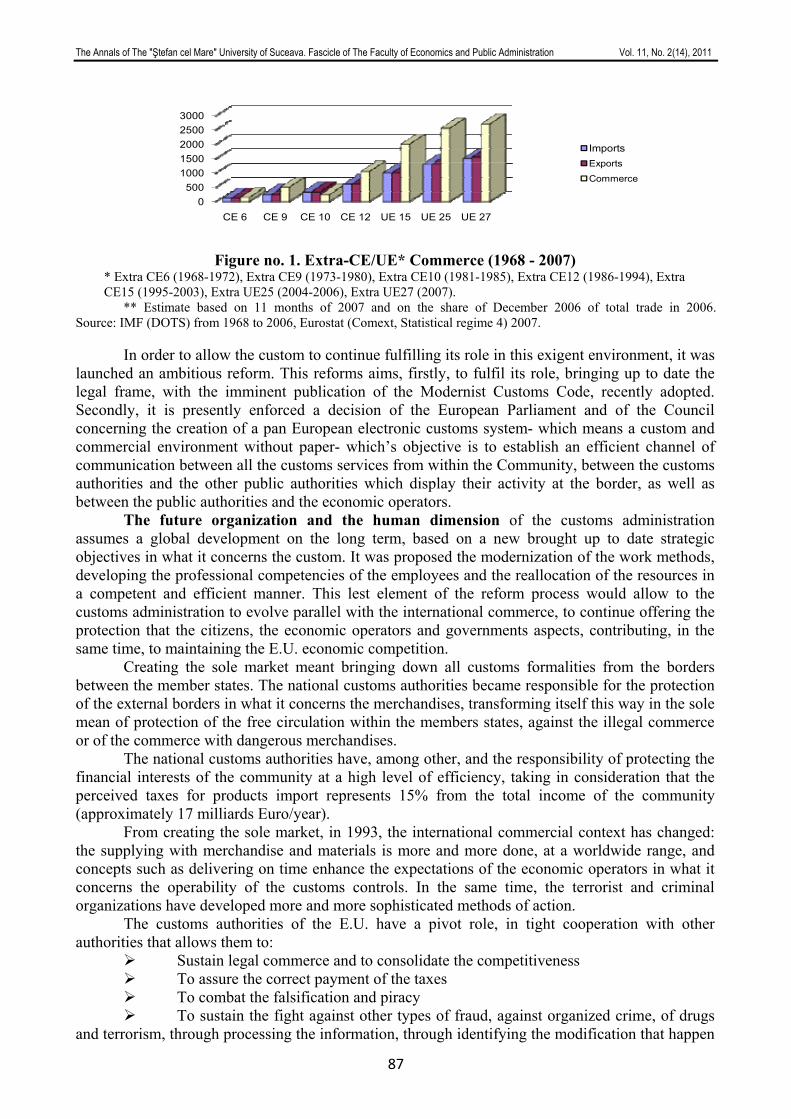
The Annals of The "Ştefan cel Mare" University of Suceava. Fascicle of The Faculty of Economics and Public Administration Vol. 11, No. 2(14), 2011
87
Figure no. 1. Extra-CE/UE* Commerce (1968 - 2007) * Extra CE6 (1968-1972), Extra CE9 (1973-1980), Extra CE10 (1981-1985), Extra CE12 (1986-1994), Extra CE15 (1995-2003), Extra UE25 (2004-2006), Extra UE27 (2007).
** Estimate based on 11 months of 2007 and on the share of December 2006 of total trade in 2006. Source: IMF (DOTS) from 1968 to 2006, Eurostat (Comext, Statistical regime 4) 2007.
In order to allow the custom to continue fulfilling its role in this exigent environment, it was
launched an ambitious reform. This reforms aims, firstly, to fulfil its role, bringing up to date the legal frame, with the imminent publication of the Modernist Customs Code, recently adopted. Secondly, it is presently enforced a decision of the European Parliament and of the Council concerning the creation of a pan European electronic customs system- which means a custom and commercial environment without paper- which’s objective is to establish an efficient channel of communication between all the customs services from within the Community, between the customs authorities and the other public authorities which display their activity at the border, as well as between the public authorities and the economic operators.
The future organization and the human dimension of the customs administration assumes a global development on the long term, based on a new brought up to date strategic objectives in what it concerns the custom. It was proposed the modernization of the work methods, developing the professional competencies of the employees and the reallocation of the resources in a competent and efficient manner. This lest element of the reform process would allow to the customs administration to evolve parallel with the international commerce, to continue offering the protection that the citizens, the economic operators and governments aspects, contributing, in the same time, to maintaining the E.U. economic competition.
Creating the sole market meant bringing down all customs formalities from the borders between the member states. The national customs authorities became responsible for the protection of the external borders in what it concerns the merchandises, transforming itself this way in the sole mean of protection of the free circulation within the members states, against the illegal commerce or of the commerce with dangerous merchandises.
The national customs authorities have, among other, and the responsibility of protecting the financial interests of the community at a high level of efficiency, taking in consideration that the perceived taxes for products import represents 15% from the total income of the community (approximately 17 milliards Euro/year).
From creating the sole market, in 1993, the international commercial context has changed: the supplying with merchandise and materials is more and more done, at a worldwide range, and concepts such as delivering on time enhance the expectations of the economic operators in what it concerns the operability of the customs controls. In the same time, the terrorist and criminal organizations have developed more and more sophisticated methods of action.
The customs authorities of the E.U. have a pivot role, in tight cooperation with other authorities that allows them to:
Sustain legal commerce and to consolidate the competitiveness To assure the correct payment of the taxes To combat the falsification and piracy To sustain the fight against other types of fraud, against organized crime, of drugs
and terrorism, through processing the information, through identifying the modification that happen
0500
10001500200025003000
CE 6 CE 9 CE 10 CE 12 UE 15 UE 25 UE 27
ImportsExports
Commerce
The Annals of The "Ştefan cel Mare" University of Suceava. Fascicle of The Faculty of Economics and Public Administration Vol. 11, No. 2(14), 2011
88
in the structure of the commercial exchange and through realizing some risk analyses to identify the fraudulent, terrorist or criminal activities
To implement the measurements of commercial policy (for example the preferential commercial agreements, contingents and antidumping measurements)
To protect the surrounding environment and the citizens against the dangerous merchandises of any kind.
Presently confronting an exigent environment in fast evolution, the customs authorities must be able to continue assuring high class services to the citizens and to the commercial societies from within the E.U.
Modernization and simplification of the legal and technological customs frame, started a few years ago, through, the adoption in 2005, of a major modification of the Communitarian Customs Code which gave to the customs authorities from the E.U. the power to implement some of the most advanced security measurements in the world, creating in the same time, an environment that won’t disturb the legal commerce
Once, completely put in application, the Modernized Customs Code will assure the necessary simplification for both the customs control and the commercial exchange to function better, faster and cheaper.
The decision to create an environment based upon informatics is already a big step ahead in the direction of interconnecting the informatics and of communication systems. Answering to the needs of modern logistics, an electronic pan European customs will allow the growth of the commercial operators competitiveness that display their activity in Europe, it will reduce the conforming costs with the customs regulations and it will enhance the safety at the E.U. borders.
The proposal to modify the dispositions of administrative reciprocal assistance in the customs area will lead to a rationalization and enhancement of the present informatics systems and to the enhancement of fight capacity against fraud in the customs sector.
These are judicial and technological important advances that will offer to the customs service’s adequate instruments for the near future and on medium term as well.
It is necessary though to be seen beyond these aspects and to be defined a strategic frame for the modernization of the work methods of the customs services and, as a consequence, to be allocated adequate resources in a coordinated manner.
The main objective is to maintain the key position of the custom as a key, modern and efficient partner of commerce, capable to protect the fiscal, of safety and security interests of the Community, in collaboration with other governmental agencies and that have the necessary instruments to respond in crises situation and to be able to face the new exigencies in the area of public policies. For this purpose, the customs services of the E.U. must have common strategic objectives:
Protection: To protect society and the financial interests of the Community through: 1. assuring the correct and efficient collecting of taxes; 2. applying some efficient measurements to stop the illegal, the ones under restriction or the
forbidden merchandise circulation; 3. developing some efficient methods to evaluate the risks, that will contribute to the fight
against terrorism and of the criminal activities, including drug traffic and of the counterfeit and piracy merchandise;
4. preventing, identifying and, in a national frame, judicial inquiring and prosecution of frauds and abuses in the domain of the customs legislation;
5. using the reciprocal administrative assistance to assure the correct application of the legislation in the customs and agricultural domain.
Competitiveness: To sustain the competitiveness of the European companies through:
1. modernizing the environment and the work methods (for example through adopting some systemic methods, through the continues harmonization of the work methods, etc.);
2. applying a free of paper customs environment (electronic customs) and
The Annals of The "Ştefan cel Mare" University of Suceava. Fascicle of The Faculty of Economics and Public Administration Vol. 11, No. 2(14), 2011
89
3. adopting a proactive attitude in what it concerns the standards, through recognizing the international standards, such as the ones promoted by The Worldwide Customs Organization, there where is the case, and through developing new European standards that may serve as a model throughout the world.
Facilitating: To facilitate legal commerce through: 1. developing and enhancing the control systems to reduce the interference in the
merchandise circulation, as well as the administrative weight to the necessary minimum in order to achieve other public policies objectives, such as security norms and through
2. assuring some facilities for the economic operators in order to reduce the conformity costs.
Control: To control and administrate the supplying chains used for the international circulation of the merchandises through:
1. the enhancement, consolidation and efficiency of the customs controls in the most adequate place (at the border or within) for the supplying chains;
2. applying, correctly and coherent, the communitarian and national legislation in what it concerns the control and circulation of merchandises;
3. making more efficient and the systematization of the exchange information concerning the risks;
4. examining the possibilities to exchange information with the major players in order to establish a control and administration system of the supplying chain;
Cooperation: To maintain, develop and amplify the cooperation of quality between the customs authorities of the member states, between these ones, other governmental agencies as well as between the customs authorities and the business community through:
1. deepening the existent customs cooperation; 2. coordinating the actions meant to protect the financial interests of the Community; 3. assuming the role of leader in developing the mechanisms that would allow a
coordination a bit fluid with other agencies that display theirs activity at the border (services with sole interface);
4. enhancing the cooperation and consulting mechanisms with the business environment; 5. consolidating the international cooperation or of the reciprocal administrative assistance
in the customs domain, through the proper agreements and through the extension of the participation to international forums, with the abilities to adopt legislation or international decisions (such as embargoes, agreements in the domain of environment, agreements about the rights of intellectual propriety, etc).
In order to achieve this strategic objectives, it must be develop a new approach for continues adaptation and enhancement of the common methods of work from the customs domain. Only continues development and strategic investments in abilities, competencies and resources may maintain the efficiency and efficacy of the customs services. The strategy offers a structured broach, which will allow the realization of these changes in a synchronized and harmonious way for all the 27 member states.
In order to achieve these objectives, the political support from the member states is of vital importance.
CONCLUSIONS Based upon the experience accumulated from applying the decision concerning the
electronic customs, through which is established a multiannual strategic plan as a base for all the involved parties (the Commission, the member states and the economic operators), in order to plan the resources for each of it, it is proposed that developing of a similar strategy in order to guarantee the coordinated and uniform application of the common strategic objectives mentioned before.

The Annals of The "Ştefan cel Mare" University of Suceava. Fascicle of The Faculty of Economics and Public Administration Vol. 11, No. 2(14), 2011
90
BIBLIOGRAPHY:
1. Boiţă Marius, Impactul Politicilor Vamale asupra economiei Româneşti la produsele agroalimentare în perioada de pre şi post aderare la Uniunea Europeană, Editura Gutenberg Univers, Arad, 2009
2. Silaşi G., Rollet P., Trandafir N., Economia Uniunii Europene: O poveste de succes?, Ed. De Vest, Timişoara, 2005
3. Silaşi G., Stan G., Dăianu D., Pantea A., Teoria Integrării, Note, Studii, Comentarii, Conspecte, Ed. Universităţii de Vest, Timişoara, 2008
4. ***www.eur.eu., Perspectiva financiară a Uniunii Europene, perioada 2007 – 2013
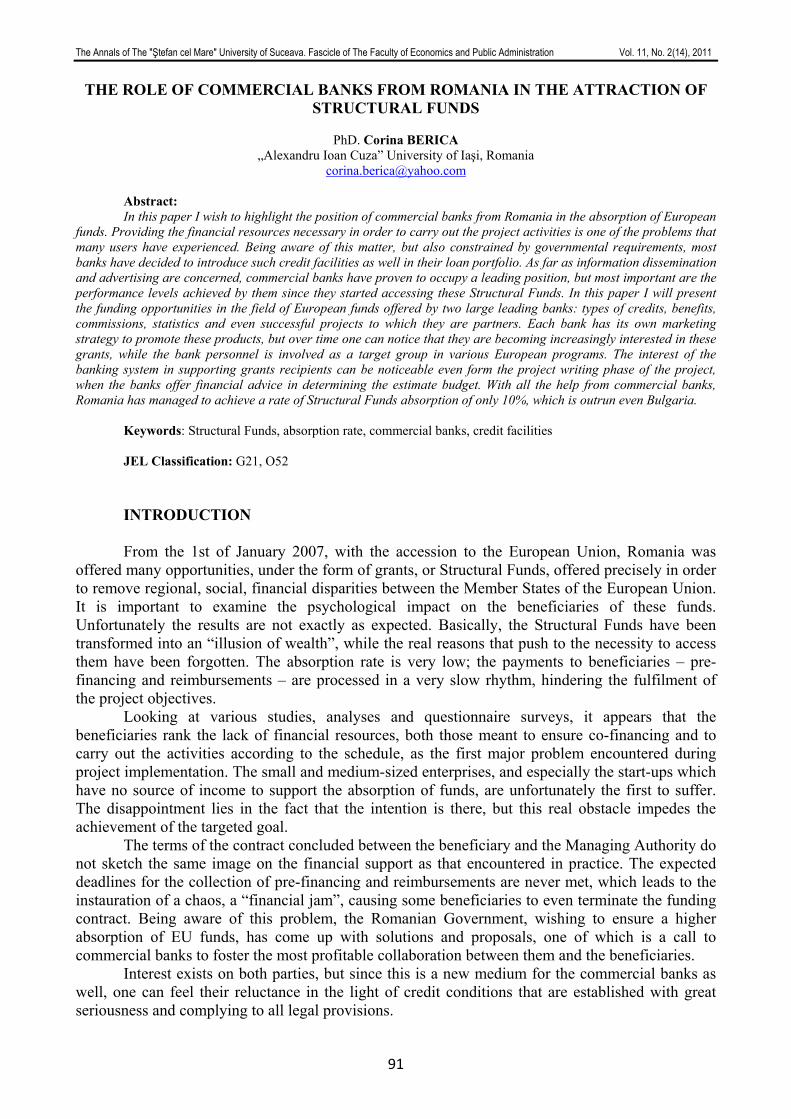
The Annals of The "Ştefan cel Mare" University of Suceava. Fascicle of The Faculty of Economics and Public Administration Vol. 11, No. 2(14), 2011
91
THE ROLE OF COMMERCIAL BANKS FROM ROMANIA IN THE ATTRACTION OF STRUCTURAL FUNDS
PhD. Corina BERICA
„Alexandru Ioan Cuza” University of Iaşi, Romania [email protected]
Abstract: In this paper I wish to highlight the position of commercial banks from Romania in the absorption of European
funds. Providing the financial resources necessary in order to carry out the project activities is one of the problems that many users have experienced. Being aware of this matter, but also constrained by governmental requirements, most banks have decided to introduce such credit facilities as well in their loan portfolio. As far as information dissemination and advertising are concerned, commercial banks have proven to occupy a leading position, but most important are the performance levels achieved by them since they started accessing these Structural Funds. In this paper I will present the funding opportunities in the field of European funds offered by two large leading banks: types of credits, benefits, commissions, statistics and even successful projects to which they are partners. Each bank has its own marketing strategy to promote these products, but over time one can notice that they are becoming increasingly interested in these grants, while the bank personnel is involved as a target group in various European programs. The interest of the banking system in supporting grants recipients can be noticeable even form the project writing phase of the project, when the banks offer financial advice in determining the estimate budget. With all the help from commercial banks, Romania has managed to achieve a rate of Structural Funds absorption of only 10%, which is outrun even Bulgaria.
Keywords: Structural Funds, absorption rate, commercial banks, credit facilities JEL Classification: G21, O52
INTRODUCTION From the 1st of January 2007, with the accession to the European Union, Romania was
offered many opportunities, under the form of grants, or Structural Funds, offered precisely in order to remove regional, social, financial disparities between the Member States of the European Union. It is important to examine the psychological impact on the beneficiaries of these funds. Unfortunately the results are not exactly as expected. Basically, the Structural Funds have been transformed into an “illusion of wealth”, while the real reasons that push to the necessity to access them have been forgotten. The absorption rate is very low; the payments to beneficiaries – pre-financing and reimbursements – are processed in a very slow rhythm, hindering the fulfilment of the project objectives.
Looking at various studies, analyses and questionnaire surveys, it appears that the beneficiaries rank the lack of financial resources, both those meant to ensure co-financing and to carry out the activities according to the schedule, as the first major problem encountered during project implementation. The small and medium-sized enterprises, and especially the start-ups which have no source of income to support the absorption of funds, are unfortunately the first to suffer. The disappointment lies in the fact that the intention is there, but this real obstacle impedes the achievement of the targeted goal.
The terms of the contract concluded between the beneficiary and the Managing Authority do not sketch the same image on the financial support as that encountered in practice. The expected deadlines for the collection of pre-financing and reimbursements are never met, which leads to the instauration of a chaos, a “financial jam”, causing some beneficiaries to even terminate the funding contract. Being aware of this problem, the Romanian Government, wishing to ensure a higher absorption of EU funds, has come up with solutions and proposals, one of which is a call to commercial banks to foster the most profitable collaboration between them and the beneficiaries.
Interest exists on both parties, but since this is a new medium for the commercial banks as well, one can feel their reluctance in the light of credit conditions that are established with great seriousness and complying to all legal provisions.
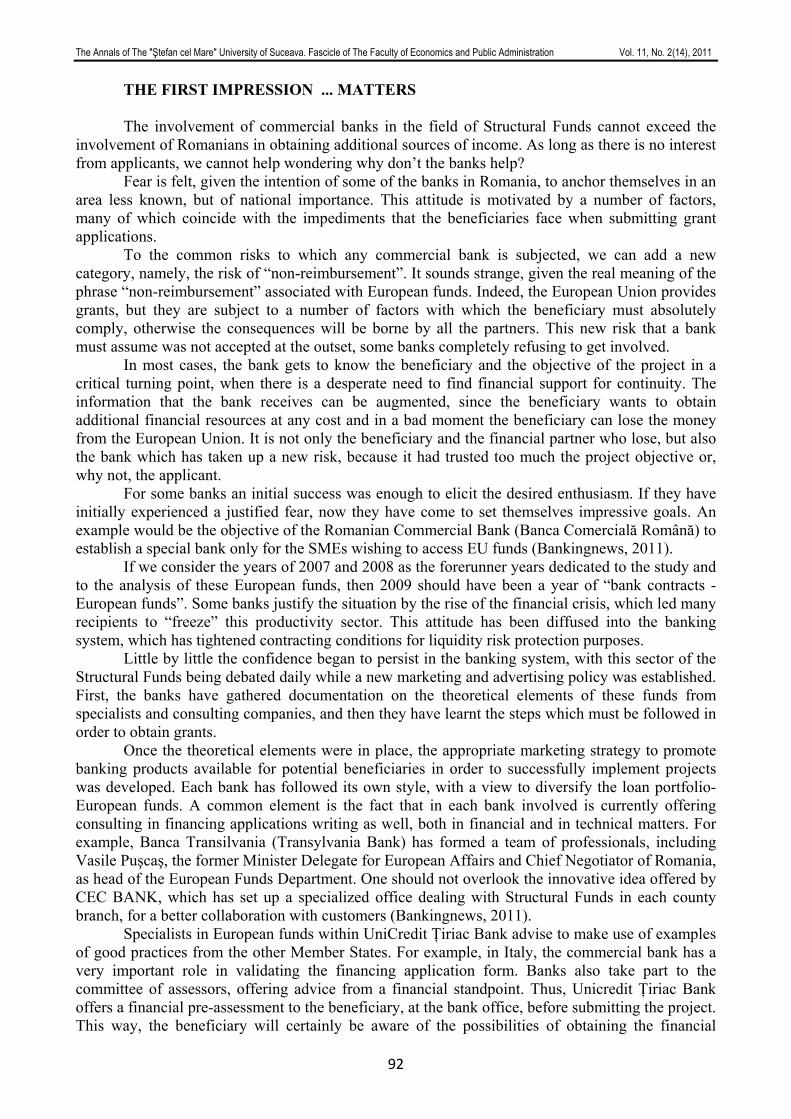
The Annals of The "Ştefan cel Mare" University of Suceava. Fascicle of The Faculty of Economics and Public Administration Vol. 11, No. 2(14), 2011
92
THE FIRST IMPRESSION ... MATTERS The involvement of commercial banks in the field of Structural Funds cannot exceed the
involvement of Romanians in obtaining additional sources of income. As long as there is no interest from applicants, we cannot help wondering why don’t the banks help?
Fear is felt, given the intention of some of the banks in Romania, to anchor themselves in an area less known, but of national importance. This attitude is motivated by a number of factors, many of which coincide with the impediments that the beneficiaries face when submitting grant applications.
To the common risks to which any commercial bank is subjected, we can add a new category, namely, the risk of “non-reimbursement”. It sounds strange, given the real meaning of the phrase “non-reimbursement” associated with European funds. Indeed, the European Union provides grants, but they are subject to a number of factors with which the beneficiary must absolutely comply, otherwise the consequences will be borne by all the partners. This new risk that a bank must assume was not accepted at the outset, some banks completely refusing to get involved.
In most cases, the bank gets to know the beneficiary and the objective of the project in a critical turning point, when there is a desperate need to find financial support for continuity. The information that the bank receives can be augmented, since the beneficiary wants to obtain additional financial resources at any cost and in a bad moment the beneficiary can lose the money from the European Union. It is not only the beneficiary and the financial partner who lose, but also the bank which has taken up a new risk, because it had trusted too much the project objective or, why not, the applicant.
For some banks an initial success was enough to elicit the desired enthusiasm. If they have initially experienced a justified fear, now they have come to set themselves impressive goals. An example would be the objective of the Romanian Commercial Bank (Banca Comercială Română) to establish a special bank only for the SMEs wishing to access EU funds (Bankingnews, 2011).
If we consider the years of 2007 and 2008 as the forerunner years dedicated to the study and to the analysis of these European funds, then 2009 should have been a year of “bank contracts - European funds”. Some banks justify the situation by the rise of the financial crisis, which led many recipients to “freeze” this productivity sector. This attitude has been diffused into the banking system, which has tightened contracting conditions for liquidity risk protection purposes.
Little by little the confidence began to persist in the banking system, with this sector of the Structural Funds being debated daily while a new marketing and advertising policy was established. First, the banks have gathered documentation on the theoretical elements of these funds from specialists and consulting companies, and then they have learnt the steps which must be followed in order to obtain grants.
Once the theoretical elements were in place, the appropriate marketing strategy to promote banking products available for potential beneficiaries in order to successfully implement projects was developed. Each bank has followed its own style, with a view to diversify the loan portfolio-European funds. A common element is the fact that in each bank involved is currently offering consulting in financing applications writing as well, both in financial and in technical matters. For example, Banca Transilvania (Transylvania Bank) has formed a team of professionals, including Vasile Puşcaş, the former Minister Delegate for European Affairs and Chief Negotiator of Romania, as head of the European Funds Department. One should not overlook the innovative idea offered by CEC BANK, which has set up a specialized office dealing with Structural Funds in each county branch, for a better collaboration with customers (Bankingnews, 2011).
Specialists in European funds within UniCredit Ţiriac Bank advise to make use of examples of good practices from the other Member States. For example, in Italy, the commercial bank has a very important role in validating the financing application form. Banks also take part to the committee of assessors, offering advice from a financial standpoint. Thus, Unicredit Ţiriac Bank offers a financial pre-assessment to the beneficiary, at the bank office, before submitting the project. This way, the beneficiary will certainly be aware of the possibilities of obtaining the financial
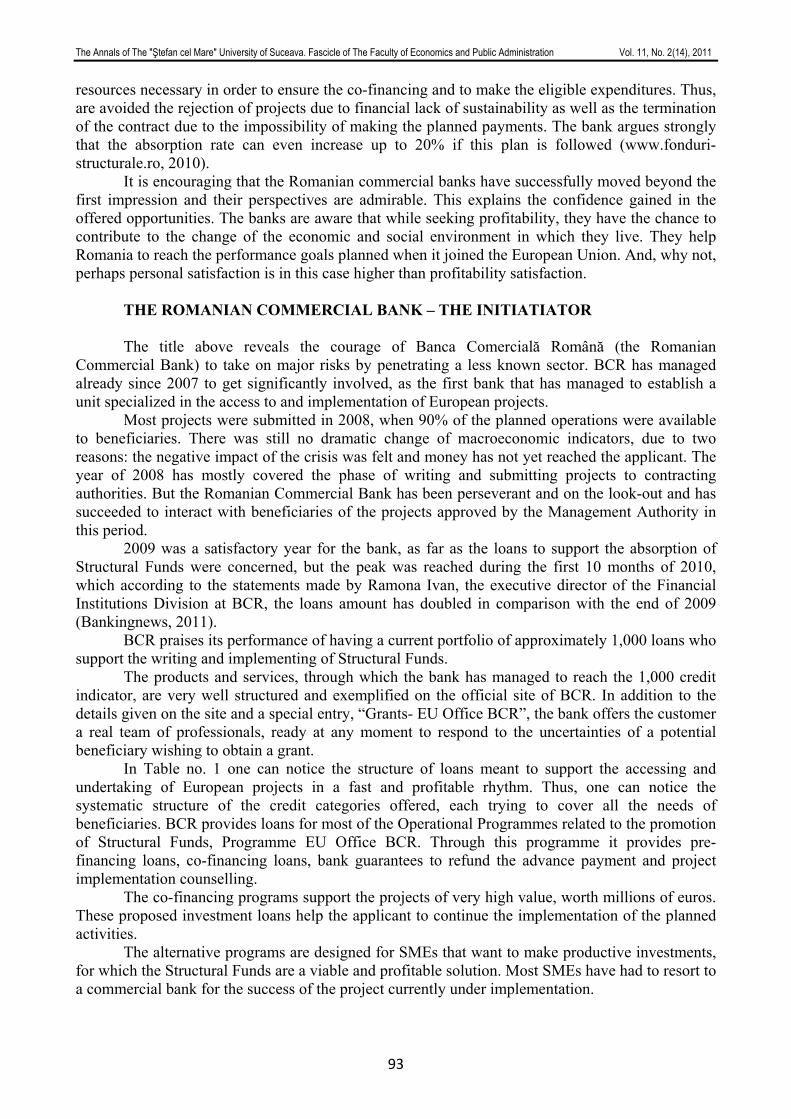
The Annals of The "Ştefan cel Mare" University of Suceava. Fascicle of The Faculty of Economics and Public Administration Vol. 11, No. 2(14), 2011
93
resources necessary in order to ensure the co-financing and to make the eligible expenditures. Thus, are avoided the rejection of projects due to financial lack of sustainability as well as the termination of the contract due to the impossibility of making the planned payments. The bank argues strongly that the absorption rate can even increase up to 20% if this plan is followed (www.fonduri-structurale.ro, 2010).
It is encouraging that the Romanian commercial banks have successfully moved beyond the first impression and their perspectives are admirable. This explains the confidence gained in the offered opportunities. The banks are aware that while seeking profitability, they have the chance to contribute to the change of the economic and social environment in which they live. They help Romania to reach the performance goals planned when it joined the European Union. And, why not, perhaps personal satisfaction is in this case higher than profitability satisfaction.
THE ROMANIAN COMMERCIAL BANK – THE INITIATIATOR The title above reveals the courage of Banca Comercială Română (the Romanian
Commercial Bank) to take on major risks by penetrating a less known sector. BCR has managed already since 2007 to get significantly involved, as the first bank that has managed to establish a unit specialized in the access to and implementation of European projects.
Most projects were submitted in 2008, when 90% of the planned operations were available to beneficiaries. There was still no dramatic change of macroeconomic indicators, due to two reasons: the negative impact of the crisis was felt and money has not yet reached the applicant. The year of 2008 has mostly covered the phase of writing and submitting projects to contracting authorities. But the Romanian Commercial Bank has been perseverant and on the look-out and has succeeded to interact with beneficiaries of the projects approved by the Management Authority in this period.
2009 was a satisfactory year for the bank, as far as the loans to support the absorption of Structural Funds were concerned, but the peak was reached during the first 10 months of 2010, which according to the statements made by Ramona Ivan, the executive director of the Financial Institutions Division at BCR, the loans amount has doubled in comparison with the end of 2009 (Bankingnews, 2011).
BCR praises its performance of having a current portfolio of approximately 1,000 loans who support the writing and implementing of Structural Funds.
The products and services, through which the bank has managed to reach the 1,000 credit indicator, are very well structured and exemplified on the official site of BCR. In addition to the details given on the site and a special entry, “Grants- EU Office BCR”, the bank offers the customer a real team of professionals, ready at any moment to respond to the uncertainties of a potential beneficiary wishing to obtain a grant.
In Table no. 1 one can notice the structure of loans meant to support the accessing and undertaking of European projects in a fast and profitable rhythm. Thus, one can notice the systematic structure of the credit categories offered, each trying to cover all the needs of beneficiaries. BCR provides loans for most of the Operational Programmes related to the promotion of Structural Funds, Programme EU Office BCR. Through this programme it provides pre-financing loans, co-financing loans, bank guarantees to refund the advance payment and project implementation counselling.
The co-financing programs support the projects of very high value, worth millions of euros. These proposed investment loans help the applicant to continue the implementation of the planned activities.
The alternative programs are designed for SMEs that want to make productive investments, for which the Structural Funds are a viable and profitable solution. Most SMEs have had to resort to a commercial bank for the success of the project currently under implementation.
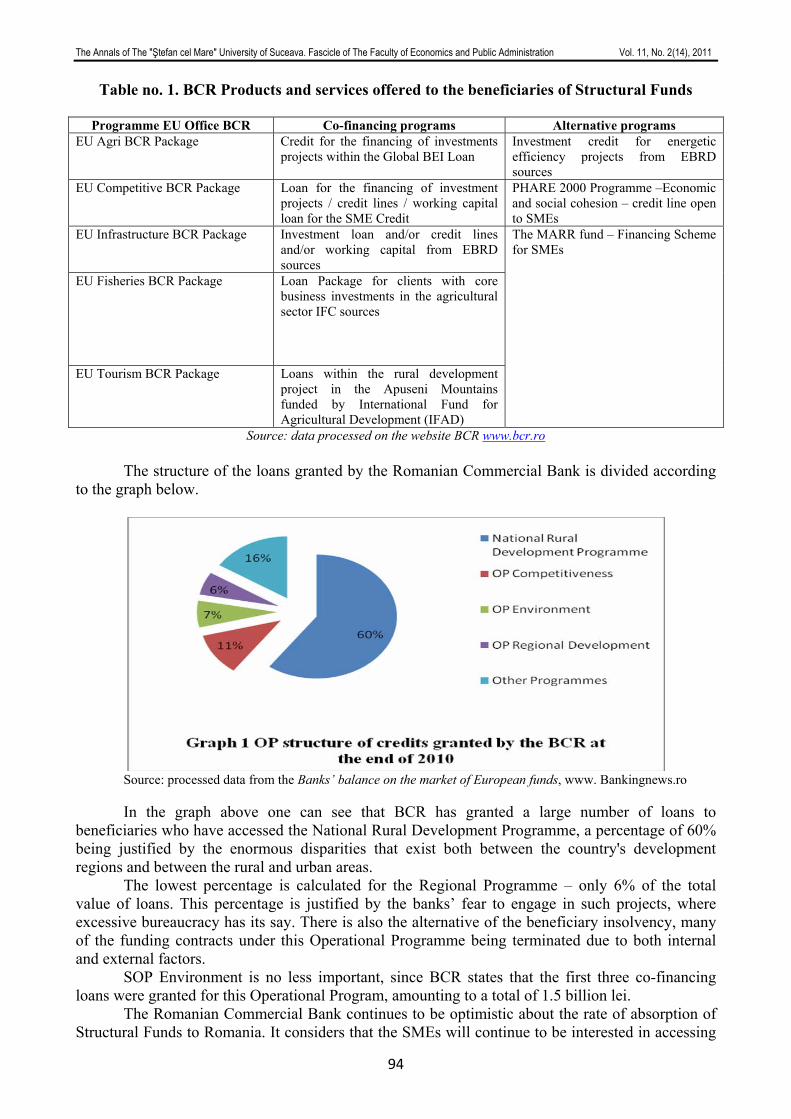
The Annals of The "Ştefan cel Mare" University of Suceava. Fascicle of The Faculty of Economics and Public Administration Vol. 11, No. 2(14), 2011
94
Table no. 1. BCR Products and services offered to the beneficiaries of Structural Funds
Programme EU Office BCR Co-financing programs Alternative programs EU Agri BCR Package Credit for the financing of investments
projects within the Global BEI Loan Investment credit for energetic efficiency projects from EBRD sources
EU Competitive BCR Package Loan for the financing of investment projects / credit lines / working capital loan for the SME Credit
PHARE 2000 Programme –Economic and social cohesion – credit line open to SMEs
EU Infrastructure BCR Package Investment loan and/or credit lines and/or working capital from EBRD sources
EU Fisheries BCR Package Loan Package for clients with core business investments in the agricultural sector IFC sources
EU Tourism BCR Package Loans within the rural development project in the Apuseni Mountains funded by International Fund for Agricultural Development (IFAD)
The MARR fund – Financing Scheme for SMEs
Source: data processed on the website BCR www.bcr.ro The structure of the loans granted by the Romanian Commercial Bank is divided according to the graph below.
Source: processed data from the Banks’ balance on the market of European funds, www. Bankingnews.ro
In the graph above one can see that BCR has granted a large number of loans to beneficiaries who have accessed the National Rural Development Programme, a percentage of 60% being justified by the enormous disparities that exist both between the country's development regions and between the rural and urban areas.
The lowest percentage is calculated for the Regional Programme – only 6% of the total value of loans. This percentage is justified by the banks’ fear to engage in such projects, where excessive bureaucracy has its say. There is also the alternative of the beneficiary insolvency, many of the funding contracts under this Operational Programme being terminated due to both internal and external factors.
SOP Environment is no less important, since BCR states that the first three co-financing loans were granted for this Operational Program, amounting to a total of 1.5 billion lei.
The Romanian Commercial Bank continues to be optimistic about the rate of absorption of Structural Funds to Romania. It considers that the SMEs will continue to be interested in accessing
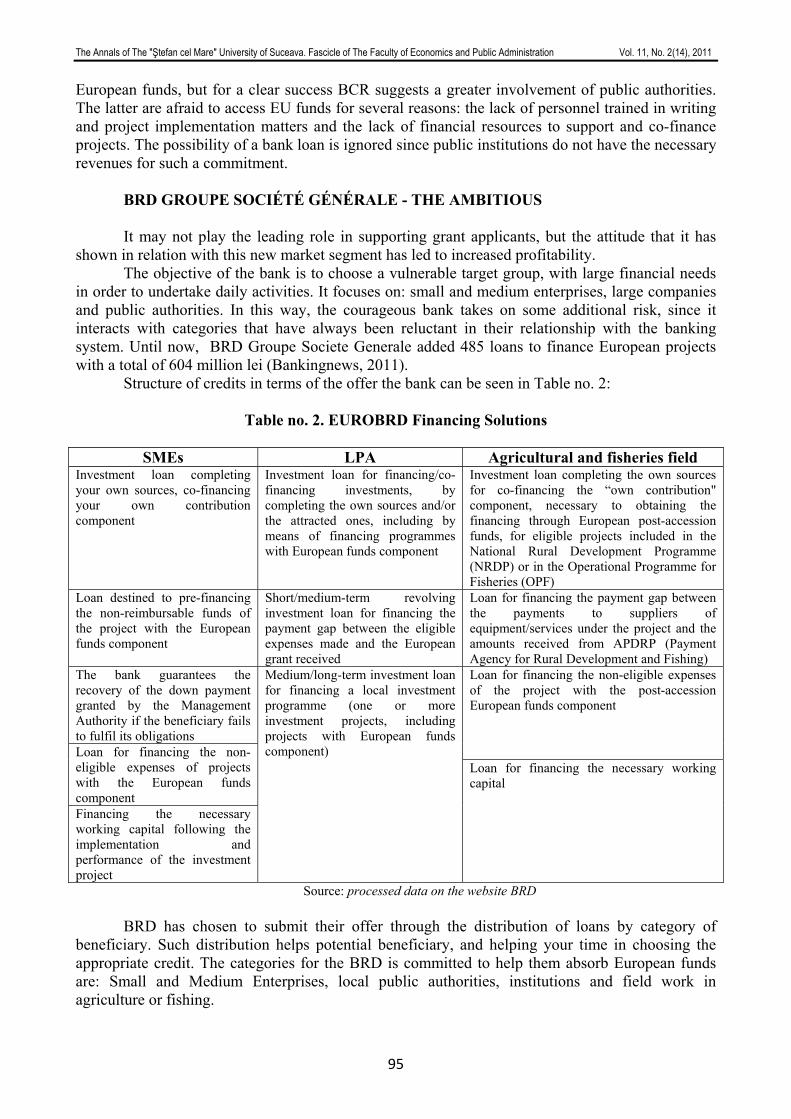
The Annals of The "Ştefan cel Mare" University of Suceava. Fascicle of The Faculty of Economics and Public Administration Vol. 11, No. 2(14), 2011
95
European funds, but for a clear success BCR suggests a greater involvement of public authorities. The latter are afraid to access EU funds for several reasons: the lack of personnel trained in writing and project implementation matters and the lack of financial resources to support and co-finance projects. The possibility of a bank loan is ignored since public institutions do not have the necessary revenues for such a commitment. BRD GROUPE SOCIÉTÉ GÉNÉRALE - THE AMBITIOUS It may not play the leading role in supporting grant applicants, but the attitude that it has shown in relation with this new market segment has led to increased profitability.
The objective of the bank is to choose a vulnerable target group, with large financial needs in order to undertake daily activities. It focuses on: small and medium enterprises, large companies and public authorities. In this way, the courageous bank takes on some additional risk, since it interacts with categories that have always been reluctant in their relationship with the banking system. Until now, BRD Groupe Societe Generale added 485 loans to finance European projects with a total of 604 million lei (Bankingnews, 2011).
Structure of credits in terms of the offer the bank can be seen in Table no. 2:
Table no. 2. EUROBRD Financing Solutions
SMEs LPA Agricultural and fisheries field Investment loan completing your own sources, co-financing your own contribution component
Investment loan for financing/co-financing investments, by completing the own sources and/or the attracted ones, including by means of financing programmes with European funds component
Investment loan completing the own sources for co-financing the “own contribution" component, necessary to obtaining the financing through European post-accession funds, for eligible projects included in the National Rural Development Programme (NRDP) or in the Operational Programme for Fisheries (OPF)
Loan destined to pre-financing the non-reimbursable funds of the project with the European funds component
Short/medium-term revolving investment loan for financing the payment gap between the eligible expenses made and the European grant received
Loan for financing the payment gap between the payments to suppliers of equipment/services under the project and the amounts received from APDRP (Payment Agency for Rural Development and Fishing)
The bank guarantees the recovery of the down payment granted by the Management Authority if the beneficiary fails to fulfil its obligations
Loan for financing the non-eligible expenses of the project with the post-accession European funds component
Loan for financing the non-eligible expenses of projects with the European funds component Financing the necessary working capital following the implementation and performance of the investment project
Medium/long-term investment loan for financing a local investment programme (one or more investment projects, including projects with European funds component)
Loan for financing the necessary working capital
Source: processed data on the website BRD BRD has chosen to submit their offer through the distribution of loans by category of
beneficiary. Such distribution helps potential beneficiary, and helping your time in choosing the appropriate credit. The categories for the BRD is committed to help them absorb European funds are: Small and Medium Enterprises, local public authorities, institutions and field work in agriculture or fishing.
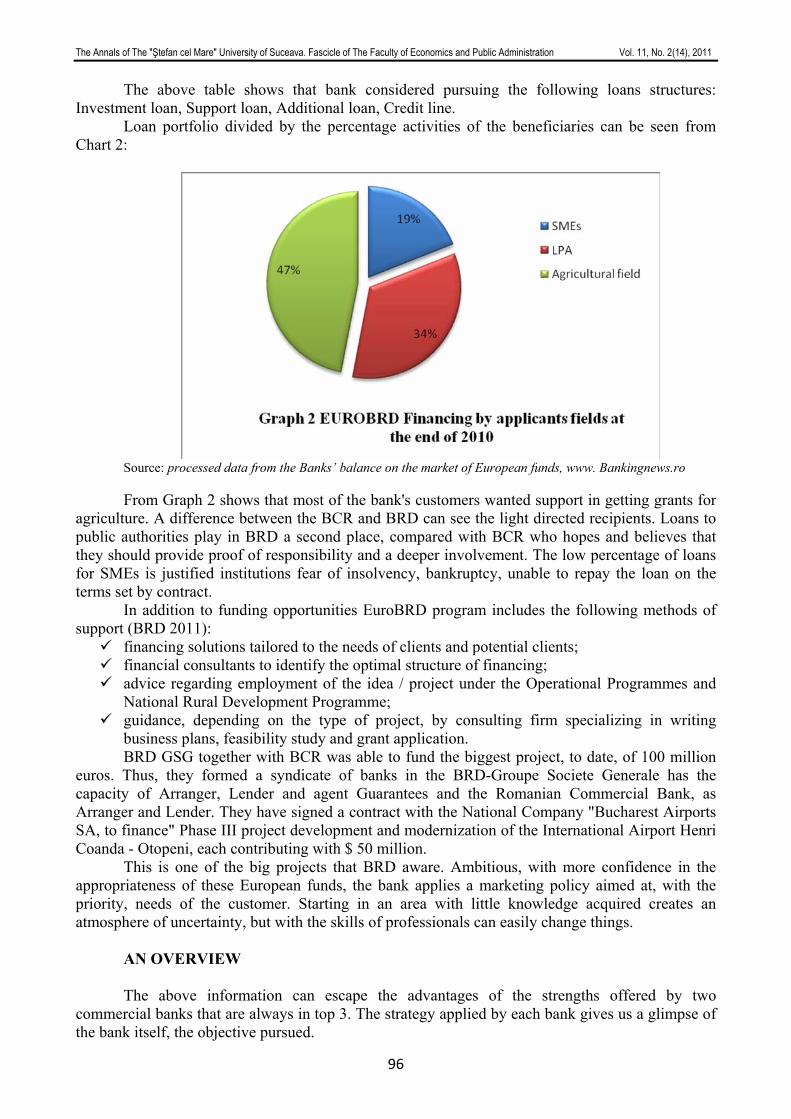
The Annals of The "Ştefan cel Mare" University of Suceava. Fascicle of The Faculty of Economics and Public Administration Vol. 11, No. 2(14), 2011
96
The above table shows that bank considered pursuing the following loans structures: Investment loan, Support loan, Additional loan, Credit line.
Loan portfolio divided by the percentage activities of the beneficiaries can be seen from Chart 2:
Source: processed data from the Banks’ balance on the market of European funds, www. Bankingnews.ro
From Graph 2 shows that most of the bank's customers wanted support in getting grants for agriculture. A difference between the BCR and BRD can see the light directed recipients. Loans to public authorities play in BRD a second place, compared with BCR who hopes and believes that they should provide proof of responsibility and a deeper involvement. The low percentage of loans for SMEs is justified institutions fear of insolvency, bankruptcy, unable to repay the loan on the terms set by contract. In addition to funding opportunities EuroBRD program includes the following methods of support (BRD 2011):
financing solutions tailored to the needs of clients and potential clients; financial consultants to identify the optimal structure of financing; advice regarding employment of the idea / project under the Operational Programmes and
National Rural Development Programme; guidance, depending on the type of project, by consulting firm specializing in writing
business plans, feasibility study and grant application. BRD GSG together with BCR was able to fund the biggest project, to date, of 100 million
euros. Thus, they formed a syndicate of banks in the BRD-Groupe Societe Generale has the capacity of Arranger, Lender and agent Guarantees and the Romanian Commercial Bank, as Arranger and Lender. They have signed a contract with the National Company "Bucharest Airports SA, to finance" Phase III project development and modernization of the International Airport Henri Coanda - Otopeni, each contributing with $ 50 million.
This is one of the big projects that BRD aware. Ambitious, with more confidence in the appropriateness of these European funds, the bank applies a marketing policy aimed at, with the priority, needs of the customer. Starting in an area with little knowledge acquired creates an atmosphere of uncertainty, but with the skills of professionals can easily change things.
AN OVERVIEW The above information can escape the advantages of the strengths offered by two
commercial banks that are always in top 3. The strategy applied by each bank gives us a glimpse of the bank itself, the objective pursued.
The Annals of The "Ştefan cel Mare" University of Suceava. Fascicle of The Faculty of Economics and Public Administration Vol. 11, No. 2(14), 2011
97
In addition to BCR and BRD GSG, the Romanian banking system there are other banks that have had the courage to embark on the path of the Structural Funds. Each has adopted a style, a strategy that will lead to customer satisfaction and increase profitability of the bank.
Most appropriate term for Transilvania Bank-BT offered by a number of critics, analysts, is "aggressive". BT wanted, at all costs, to provide loans to attract grants, thereby engaging the best professionals staff as desired team. This attitude is strongly felt since 2010, when he created the "Platform of solutions for beneficiaries of grants from the European Union, for responsibility promptly to customer requests. Among the performance indicators highlight BT touched by granting loans for attract over 100 European funds worth 350 million lei. Areas of activity for which BT has agreed to offer their support are: agriculture, food, metal, medicine and pharmaceutical production, IT and tourism. In 2010, BT has focused, in particular, for finance agricultural plantations, farm animals, rural doctors (Bankingnews, 2011).
UniCredit Tiriac Bank is optimistic the bank, which believes that in the next two years Romania will reach a peak absorption of Structural Funds, if both recipients and supervisors and implementation of ideas proposed projects approved by the bank. They believe that the customer before submitting a project for obtaining a grant must consult with a banking specialist for the project will receive all necessary information in an efficient manner. Bank boasts of 120 credits completed with beneficiaries, amounting to 350 million lei. Of these, at a rate of 55% was awarded through the National Programme for Rural Development Operational Programme for Fisheries. The Sectoral Operational Programme Increase of Economic Competitiveness, UniCredit Tiriac Bank concluded a loan eligible highest, over 50 million lei (Bankingnews, 2011).
Promoter of agriculture, CEC Bank, the credit performance achieved by the 5042 European projects with a value of 1.28 billion lei. After June 1, 2010 the bank registered the biggest successes motivated, moreover, by establishing "European Funding Office" in each district branches. The National Rural Development Programme were set up projects worth about 350 million lei, many in the year 2010, it constituted a clear strategy by the bank. Interest in this bank, compared with the rest, relates to the provision at the end of 2010, most loans for financing projectson the Regional Operational Programme Human Resources Development Operational Programme. Bank did not ignore the SMEs, large enterprises, giving them loans to obtain funds and the Sectoral Operational Programme Increase of Economic Competitiveness (Bankingnews, 2011).
Involvement of Romanian commercial banks continue to be active, full of innovative ideas to support writing and implementation grant funds. Each has followed the objectives required in an original, but all the same purpose: helping to increase the rate of absorption of the Structural Funds. Certainly there are other interests pursued by each bank, which he will never testify but we can guess. It is obvious that the transformation of Romania into an environment of growth, with high national and international investment banks will benefit. These are the indirect effects generated by high growth of EU funding.
CONCLUSIONS By structuring this article we tried to emphasize the role of commercial banks in Romania in
order to obtain grant funding once promised to join the European Union. They are commended for the courage to anchor in a road unknown and the seriousness and responsibility for providing financial advice and banking.
Before creating a portfolio of loans designed just for this category of beneficiaries, the experts have learned from consulting firms, the competent authorities, the stages through which must pass the beneficiary of a successful project. Good listener knew to listen to customers desires by giving them answers to all the uncertainties presented by them. They are given an advisory from the time of writing the grant application until the end of the implementation of the project approved and financed.
After you have passed the stage of project approval, is the most important is financially supported by the commercial banks, if they choose for this source. This additional financial
The Annals of The "Ştefan cel Mare" University of Suceava. Fascicle of The Faculty of Economics and Public Administration Vol. 11, No. 2(14), 2011
98
resources necessary for the recipient to carry out their activities exactly as they were originally planned.
I learned from examples of best practices offered by two of the largest banks in Romania, BCR and BRD GSG. I 'stole' the secrets of other commercial banks involved in this area of great national interest.
If success is to call a European project performed by a commercial bank, one should not avoid this possibility. Indeed, most people have treated only the negative part of the Romanian banking system, must affirm that in our case, the Structural Funds must go beyond all pride and consider it "a necessary evil. " Mark Twain's genius phrase "A banker is a fellow who lends you his umbrella when the sun is shining, but wants it back the minute it begins to rain"can be transformed into the current situation thus: "A banker is a fellow who his lends you the before it begins to rain umbrella, until the sun is shining. "
ACKNOWLEDGEMENTS "This work was supported by the European Social Fund in Romania, under the
responsibility of the Managing Authority for the Sectorial Operational Programme for Human Resources Development 2007-2013 [grant POSDRU/CPP 107/DMI 1.5/S/78342]".
REFERENCES
1. www.bancatransilvania.ro, Section of Structural Funds, 2011; 2. www.bankingnews.ro, Banks’ balance on the market of European Funds, 2011; 3. www.bcr.ro, Non-reimbursable EU Office BCR Funds Section, 2011; 4. www.brd.ro, European Funds Post-Accession Section, 2011; 5. www.cec.ro, European Funds Section, 2011. 6. www.fonduri-structurale.ro, Archive 2009, 2010 and 2011; 7. www.unicredit-tiriac.ro, European Funds and Efficient Financial Solutions Section, 2011.
The Annals of The "Ştefan cel Mare" University of Suceava. Fascicle of The Faculty of Economics and Public Administration Vol. 11, No. 2(14), 2011
99
MEASURING ECONOMIC GLOBALIZATION – FACTS AND FIGURES
Ph.D. Student Marius C. APOSTOAIE University „Alexandru Ioan Cuza” of Iaşi, Romania
Abstract: Globalization is a very dynamic and complex phenomenon. It exerts a big influence at local, national and
regional level through the interconnections between countries, institutions, people, etc. that result in important changes of economic, environmental, political, social and cultural nature. Although globalization is a multidimensional phenomenon, one cannot deny that some of its most visible aspects are of economic nature. The need to measure economic globalization is now of central concern both for academic circles as for the business environment, the mass, specialized mass media and policy makers. Although it is almost impossible to capture such a complex phenomenon in a single representative figure, this paper attempts to place a theoretical debate on more solid scientific basis (in terms of economic globalization indices).
In the first part of the paper, we present a brief literature review focusing on some of the different interpretations and beliefs regarding the concept of economic globalization (with reference to the economic literature to date) in order to facilitate future empirical approaches of its impact on national economies. In the second part of the paper, we highlight the extent of the process of economic globalization and the impact on the global economy (and on the Romanian economy), using three indicators quite new in literature: the KOF index of globalization, the globalization index proposed by A.T. Kearney/Foreign Policy and the CSGR Globalization Index. Also we have included in the paper other two important globalization indices – the M-GI and WMRC Index – paying attention to the economic dimension.
Keywords: economic globalization, the multidimensional globalization index, the index of economic globalization
JEL Classification: F15, F36, E02, C00
INTRODUCTION
During its evolution, mankind has passed through many stages of development, each stage involving specific socio-economic needs. Beginning with the early forms of a closed society, where individual needs were met by their own resources, over time, communities began to interact and subsequently, as a result of the process of exchange and specialization, some regions have come to dependent on others. Therefore what we are witnessing today is known for many as “the global community” in which each country is interlinked with the rest of the world forming a single organism. The phenomenon that makes all of this possible is, according to economic literature, labeled as globalization.
Although theoreticians and practitioners alike have not reached a common place regarding the definition of globalization, there is nonetheless a consensus about the fact that it is a reality, perhaps an irreversible and unpredictable one, yet inexorable. They have agreed also that it affects the entire world in many different ways. This cause and effect relationship as regards to globalization has been the subject of many theoretical debates, namely discussions without solid empirical evidence, thus leaving the correlation between globalization and its effects without an appropriate indicator. Designing such an indicator expressed in well-known measurement units or associated to a statistical index (accepted by academic circles as well as by practitioners), that measures the effects of globalization upon the economic, social, political and cultural environment might prove to be very useful in: developing and implementing economic policies, adopting strategic decisions, and also other types of economic and social analysis.
With regard to this specific issue (measuring globalization and in particular, economic globalization) this paper intends to go further than a simple listing of different variables that are being used in describing the extent to which an economy is globalized. Such a list could include, among many others: the ratio of imports to GDP for every country, the size and value of multinational and transnational companies' activities, the evolution of satellite communication, environmental issues or matters concerning national security and world peace.

The Annals of The "Ştefan cel Mare" University of Suceava. Fascicle of The Faculty of Economics and Public Administration Vol. 11, No. 2(14), 2011
100
The purpose of this paper is to highlight, within a theoretical framework provided by the economic literature to date, the characteristic of a particular set of indicators used by theoreticians as well as by practitioners to analyze and assess the extent of the process of economic globalization. This paper is just one in a series of papers centered on an analysis that evaluates the effects of financial crises (as a residual product of the phenomenon of economic globalization) on monetary policy instruments used by central banks worldwide to ensure financial and price stability.
SOME CONSIDERATIONS ON THE ECONOMIC DIMENSION OF GLOBALIZATION
Although the concept of “globalization” is often used, finding expression today in all the world's major languages, it is nevertheless a term without a clear delimitation, deprived of a precise and universally accepted definition. Paradoxically, in a knowledge society, as the society in which we live today, we don't know an exact definition of what globalization actually is that is widely recognized and accepted in all the fields where its effects are felt (political, legal, economic, sociological etc.). The meanings of globalization therefore tend to enrich rather than to reduce. In addition, we can cite Ulrich (2003: 37), who considers globalization as “the most widely used - and misused - keyword in disputes of recent as well as coming years; but [...] also one of the most rarely defined, the most nebulous and misunderstood, as well as the most politically effective”.
The paper rests upon the following hypothesis: globalization comprises a multitude of complex processes that are very dynamic; among these processes there is one that implies the strengthening and expansion of relationships between national economies. Therefore, the economic dimension represents a key factor supporting globalization in all its other dimensions.
Many authors consider economic globalization as the main pillar, the foundation of globalization upon which all the other components are built on and developed. Problems that are of great concern do not regard only the causes and consequences of economic globalization but also the content and essence of the process. Although many authors have engaged in this activity, the views expressed prove to be somewhat contradictory, without reaching a consensus.
Like the whole itself, the component “economic globalization” knows many interpretations and definitions developed by theorists as well as by practitioners.
Some authors have gathered in a single paper the different interpretations that the concept of economic globalization knows. In Table no. 1 we present schematically such a synthesis:
Table no. 1. Interpretations of the concept of „economic globalization”
BARNET Richard, CAVANAGH John (1994)
a new era of global competition, which, like a bulldozer, removes everything from its path
DAHRENDORF Ralf (1995)
free movement of capital, where business agents everywhere are able to deposit and invest their money where they wish and are able to do so; a redefined world in which we are all interdependent in a global market;
CABLE Vincent (1995) a trade regime where the tendency towards integration and the pressure of competitiveness has given rise to mega markets;
BLANK Stephen (1994) geopolitics, product of the triumph of neoliberalism, capable of externalizing the national policies at global scale;
BAIROCH Paul (1996) a larger significance of the export sector within national economies; RODRIK Dani (1997) the end of the keynesian economy and its international market strategies; as a new form
(some say phase) of economic development, in which the role of the state must be redefined; Source: Postelnicu and Postelnicu, 2000: 60-61
Furthermore, leading researchers within international organizations express different views
regarding the content of economic globalization. Specialists from the International Monetary Fond (1997) define economic globalization as “a historical process, result of innovation and technological progress”. It refers especially to “the growing economic interdependence of countries worldwide
The Annals of The "Ştefan cel Mare" University of Suceava. Fascicle of The Faculty of Economics and Public Administration Vol. 11, No. 2(14), 2011
101
through increasing volume and variety of cross-border transactions in goods and services, freer international capital flows, and more rapid and widespread diffusion of technology”. According to World Bank specialists (WB), globalization is defined as “freedom and ability of individuals and firms to initiate voluntary economic transactions with residents of other countries”. European Commission (1997: 45) refers to economic globalization as the process by which markets and production in different countries become increasingly interdependent due to the dynamics of trade in goods and services and capital and technology flows.
From our point of view, the economic dimension of globalization is, without doubt, of a very great importance. It represents a powerful motor for the other components of globalization which come on second place, i.e. components like culture, environment, society and politics. Nonetheless, when describing economic globalization one mustn’t reduce its meaning to just the rapid integration of economies worldwide.
OPINIONS EXPRESSED AS REGARDS TO MEASURING GLOBALIZATION Attempts to devise indicators that could yield empirical insight into the extent and effects of
(economic) globalization are relatively recent. Among them, numerous international organizations have initiated various projects aimed at developing indicators and methodologies to measure economic globalization. Such institutions are: the World Bank (WB), International Monetary Fund (IMF), Bank of International Settlements (BIS), United Nations Conference on Trade and Development (UNCTAD), United Nations (UN), Organisation for Economic Cooperation and Development (OECD) and Eurostat. Unfortunately, apart from certain elements on which researchers and institutions tend to agree, we cannot relate to a widely accepted data base, mainly because they are missing or are profoundly heterogeneous, although measures are taken for their harmonization.
From this point forward, the paper pursues two related issues: - on one hand, the article highlights some alternative approaches and statistical data used by
well known international organizations to assess the extent and intensity of a countries’ integration into the global system, focusing on the economic component;
- and, on the other hand, the paper highlights the most important synthetic indices devised to analyze and measure the globalization of national economies, emphasizing some comparisons between countries (for which data was available) including the case of Romania.
THE INVOLVEMENT OF INTERNATIONAL ORGANIZATIONS IN MEASURING
ECONOMIC GLOBALIZATION The Organisation for Economic Cooperation and Development (OECD) has put together a
special group of experts to analyze the process of globalization in all its dimensions – economic, technological, commercial and financial – and to develop a manual (Handbook) with internationally comparable indicators. Thus, their work has led to the “Handbook on Economic Globalisation Indicators”, an outcome in line with the existing methodological standards of United Nations (UN), European Commission (EC), and other international bodies. Researchers at the OECD founded the Handbook upon data bases and methodological work already published by other international institutions, such as: the “IMF Balance of Payments Manual” (or MBP5), the “OECD Benchmark Definition of FDI” (3rd edition, 1996 ), the “Manual on Statistics of International Trade in Services” (2002) and other manuals that cover information regarding R&D and technology balance of payments, like the “Frascati Manual” (OECD, 2002) and the “Technological Balance of Payments Manual” (OECD, 1990). The final results were:
- The OECD Handbook on Economic Globalisation Indicators for 2005 – this manual assesses: capital movements and foreign direct investment, the economic activity of multinational firms, the internationalization of technology and international trade;
The Annals of The "Ştefan cel Mare" University of Suceava. Fascicle of The Faculty of Economics and Public Administration Vol. 11, No. 2(14), 2011
102
- The OECD Handbook on Economic Globalisation Indicators for 2010 – this edition of the manual provides a wider variety of indicators that includes, among those from the first edition, some indices linked to the financial crisis, portfolio investments, environmental aspects and the emergence of global value chains.
The peculiarity of these manuals, genuine methodological works, consist in the fact that after identifying a set of relevant indicators that collectively provide insight information into the process of economic globalization, the same indicators are than broken down into their component variables, a technique called “reverse engineering”. Up until these manuals, for measuring the magnitude and intensity of economic globalization, researchers used economic variables with reference to (Bari, 2005: 72): exports and imports, the level of investment, levels of the external-debt and credit, involvement in regional and global financial markets, the dependency on foreign technologies in various industrial sectors, etc.
The World Bank (Eurostat, 2007: 6) publishes the annual World Development Indicators (WDI) that includes more than 900 indicators of globalization organized in six sections: World View, People, Environment, Economy, States and Markets, and Global Links. As regard to economic globalization the World Bank assesses a country's integration with the world economy on the basis of indicators like: indicators of the international commodity exchange, private capital flows and foreign direct investment flows. The economic indicators developed by the World Bank measure, in absolute or relative values, the production and trade level, aggregate demand and macroeconomic performances.
United Nations Conference on Trade and Development (UNCTAD) is an international body dealing, among others, with trade issues, investment and economic development problems and assists developing countries to integrate beneficially into the global economy. Special attention is given also to the phenomenon of (economic) globalization, given the fact that a new programme has been launched “Globalization and Development”.
Among last UNCTAD publications our attention is focused upon the „Trade and Development Report, 2010; Employment, globalization and development”. Using succinct explanations and key data laid down in easy-to-read tables and charts, the report surveys major developments over the past 40 years in the world economy in the context of globalization (with focus on economic globalization). According to the report this is more than just a actualization of last issues. The 2010 publication is aimed at the process of economic globalization with various analytical studies and explanations regarding new economic trends (UNCTAD, 2010).
International Monetary Fund (IMF) is another important international organization which uses various indices to illustrate how globalized are the goods, capital and people: trade (goods and services) as a percentage of global GDP has increased from 42.1% in 1980 to 62.1% in 2007; Foreign Direct Investment (FDI) to global GDP increased from 6.5% in 1980 to 31.8% in 2006; the level of international money demand (especially bank loans) as percentage of world GDP rose from around 10% in 1980 to 48% in 2006; the number of persons working abroad increased from 78 million people (2.4% of the world’s population) in 1965 to 191 million people (about 3% of the world’s population) in 2005 (IMF, 2008: 2).
The recently created website by the Inter-Agency Group on Economic and Financial Statistics (Principal Global Indicators), also known as IAG, provides internationally comparable data for the Group G-20. The information obtained is used to facilitate the monitoring of economic and financial developments for these economies. The website was launched in response to the global economic and financial crisis and is hosted by the IMF. Under the umbrella of IAG collaborate the following institutions: BIS, ECB, Eurostat, IMF (as Chair), OECD, UN, and WB (Inter-Agency Group on Economic and Financial Statistics, 2010).
THE USE OF INDICATORS TO MEASURE ECONOMIC GLOBALIZATION The need to measure economic globalization is now of central concern both for academic
circles as for the business environment, the mass, the specialized mass media and policy makers.
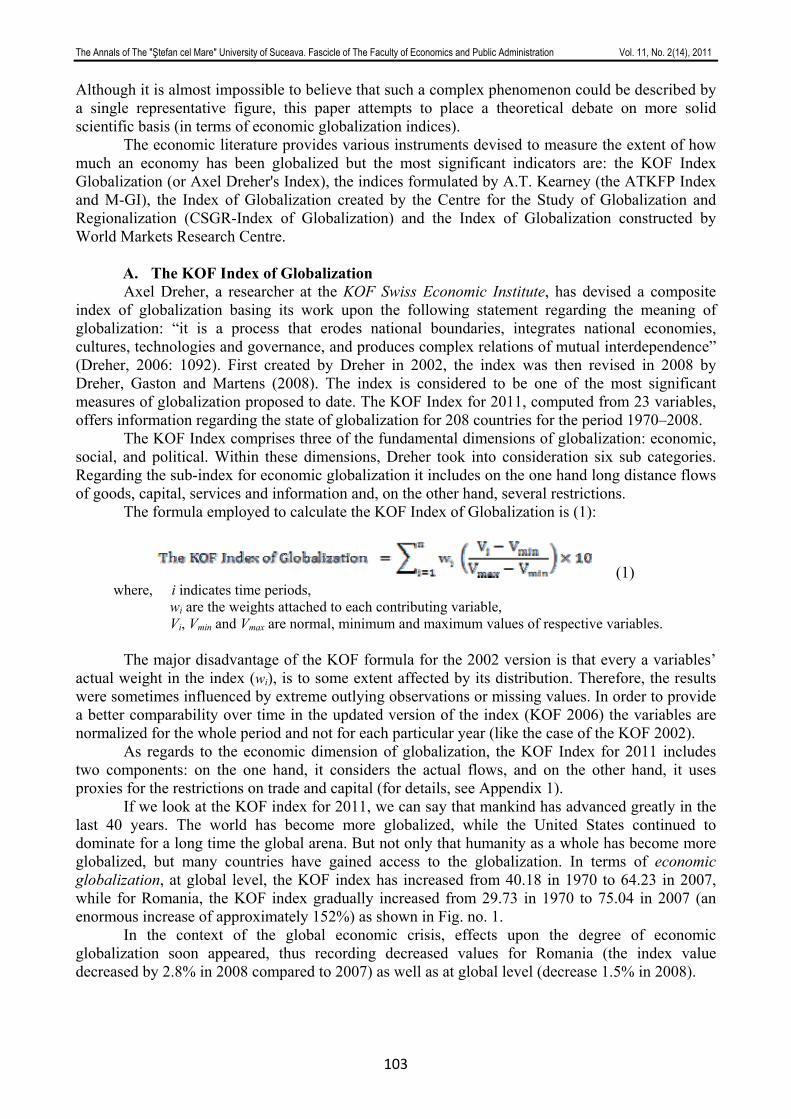
The Annals of The "Ştefan cel Mare" University of Suceava. Fascicle of The Faculty of Economics and Public Administration Vol. 11, No. 2(14), 2011
103
Although it is almost impossible to believe that such a complex phenomenon could be described by a single representative figure, this paper attempts to place a theoretical debate on more solid scientific basis (in terms of economic globalization indices).
The economic literature provides various instruments devised to measure the extent of how much an economy has been globalized but the most significant indicators are: the KOF Index Globalization (or Axel Dreher's Index), the indices formulated by A.T. Kearney (the ATKFP Index and M-GI), the Index of Globalization created by the Centre for the Study of Globalization and Regionalization (CSGR-Index of Globalization) and the Index of Globalization constructed by World Markets Research Centre.
A. The KOF Index of Globalization Axel Dreher, a researcher at the KOF Swiss Economic Institute, has devised a composite
index of globalization basing its work upon the following statement regarding the meaning of globalization: “it is a process that erodes national boundaries, integrates national economies, cultures, technologies and governance, and produces complex relations of mutual interdependence” (Dreher, 2006: 1092). First created by Dreher in 2002, the index was then revised in 2008 by Dreher, Gaston and Martens (2008). The index is considered to be one of the most significant measures of globalization proposed to date. The KOF Index for 2011, computed from 23 variables, offers information regarding the state of globalization for 208 countries for the period 1970–2008.
The KOF Index comprises three of the fundamental dimensions of globalization: economic, social, and political. Within these dimensions, Dreher took into consideration six sub categories. Regarding the sub-index for economic globalization it includes on the one hand long distance flows of goods, capital, services and information and, on the other hand, several restrictions.
The formula employed to calculate the KOF Index of Globalization is (1):
(1) where, i indicates time periods,
wi are the weights attached to each contributing variable, Vi, Vmin and Vmax are normal, minimum and maximum values of respective variables.
The major disadvantage of the KOF formula for the 2002 version is that every a variables’
actual weight in the index (wi), is to some extent affected by its distribution. Therefore, the results were sometimes influenced by extreme outlying observations or missing values. In order to provide a better comparability over time in the updated version of the index (KOF 2006) the variables are normalized for the whole period and not for each particular year (like the case of the KOF 2002).
As regards to the economic dimension of globalization, the KOF Index for 2011 includes two components: on the one hand, it considers the actual flows, and on the other hand, it uses proxies for the restrictions on trade and capital (for details, see Appendix 1).
If we look at the KOF index for 2011, we can say that mankind has advanced greatly in the last 40 years. The world has become more globalized, while the United States continued to dominate for a long time the global arena. But not only that humanity as a whole has become more globalized, but many countries have gained access to the globalization. In terms of economic globalization, at global level, the KOF index has increased from 40.18 in 1970 to 64.23 in 2007, while for Romania, the KOF index gradually increased from 29.73 in 1970 to 75.04 in 2007 (an enormous increase of approximately 152%) as shown in Fig. no. 1.
In the context of the global economic crisis, effects upon the degree of economic globalization soon appeared, thus recording decreased values for Romania (the index value decreased by 2.8% in 2008 compared to 2007) as well as at global level (decrease 1.5% in 2008).
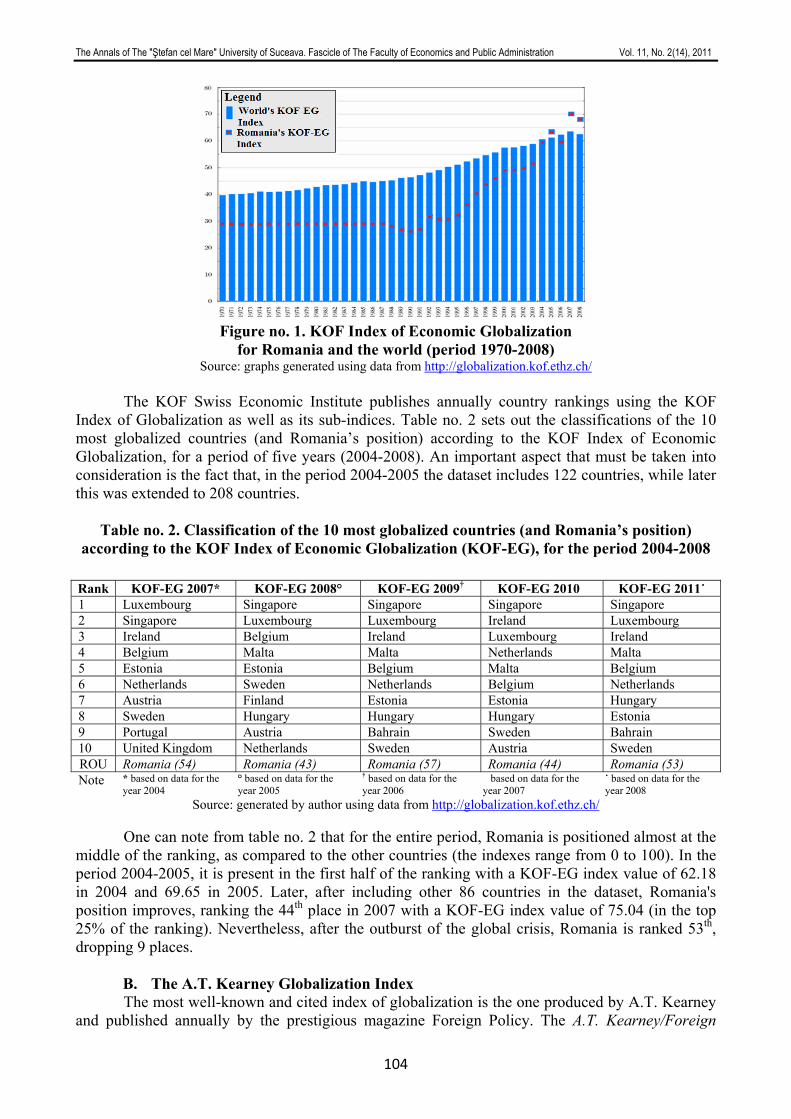
The Annals of The "Ştefan cel Mare" University of Suceava. Fascicle of The Faculty of Economics and Public Administration Vol. 11, No. 2(14), 2011
104
Figure no. 1. KOF Index of Economic Globalization
for Romania and the world (period 1970-2008) Source: graphs generated using data from http://globalization.kof.ethz.ch/
The KOF Swiss Economic Institute publishes annually country rankings using the KOF
Index of Globalization as well as its sub-indices. Table no. 2 sets out the classifications of the 10 most globalized countries (and Romania’s position) according to the KOF Index of Economic Globalization, for a period of five years (2004-2008). An important aspect that must be taken into consideration is the fact that, in the period 2004-2005 the dataset includes 122 countries, while later this was extended to 208 countries.
Table no. 2. Classification of the 10 most globalized countries (and Romania’s position)
according to the KOF Index of Economic Globalization (KOF-EG), for the period 2004-2008
Rank KOF-EG 2007* KOF-EG 2008° KOF-EG 2009† KOF-EG 2010� KOF-EG 2011˙ 1 Luxembourg Singapore Singapore Singapore Singapore 2 Singapore Luxembourg Luxembourg Ireland Luxembourg 3 Ireland Belgium Ireland Luxembourg Ireland 4 Belgium Malta Malta Netherlands Malta 5 Estonia Estonia Belgium Malta Belgium 6 Netherlands Sweden Netherlands Belgium Netherlands 7 Austria Finland Estonia Estonia Hungary 8 Sweden Hungary Hungary Hungary Estonia 9 Portugal Austria Bahrain Sweden Bahrain 10 United Kingdom Netherlands Sweden Austria Sweden ROU Romania (54) Romania (43) Romania (57) Romania (44) Romania (53) Note * based on data for the
year 2004 ° based on data for the year 2005
† based on data for the year 2006
� based on data for the year 2007
˙ based on data for the year 2008
Source: generated by author using data from http://globalization.kof.ethz.ch/ One can note from table no. 2 that for the entire period, Romania is positioned almost at the
middle of the ranking, as compared to the other countries (the indexes range from 0 to 100). In the period 2004-2005, it is present in the first half of the ranking with a KOF-EG index value of 62.18 in 2004 and 69.65 in 2005. Later, after including other 86 countries in the dataset, Romania's position improves, ranking the 44th place in 2007 with a KOF-EG index value of 75.04 (in the top 25% of the ranking). Nevertheless, after the outburst of the global crisis, Romania is ranked 53th, dropping 9 places.
B. The A.T. Kearney Globalization Index The most well-known and cited index of globalization is the one produced by A.T. Kearney
and published annually by the prestigious magazine Foreign Policy. The A.T. Kearney/Foreign
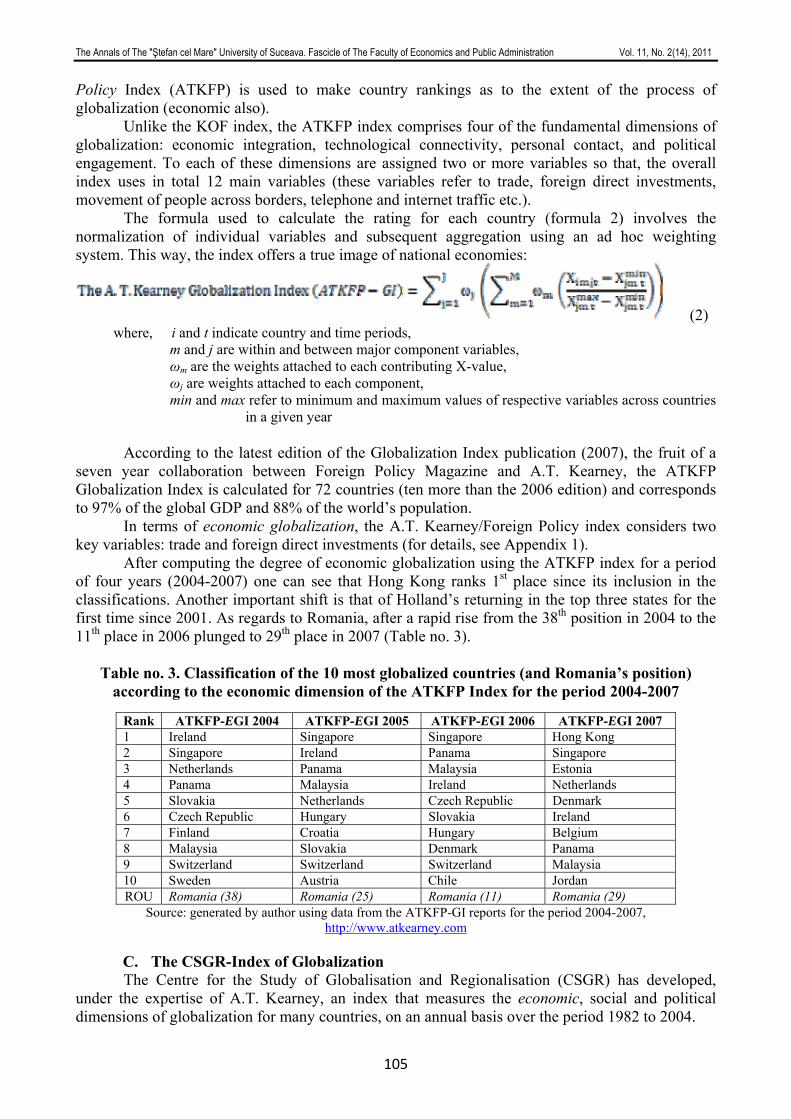
The Annals of The "Ştefan cel Mare" University of Suceava. Fascicle of The Faculty of Economics and Public Administration Vol. 11, No. 2(14), 2011
105
Policy Index (ATKFP) is used to make country rankings as to the extent of the process of globalization (economic also).
Unlike the KOF index, the ATKFP index comprises four of the fundamental dimensions of globalization: economic integration, technological connectivity, personal contact, and political engagement. To each of these dimensions are assigned two or more variables so that, the overall index uses in total 12 main variables (these variables refer to trade, foreign direct investments, movement of people across borders, telephone and internet traffic etc.).
The formula used to calculate the rating for each country (formula 2) involves the normalization of individual variables and subsequent aggregation using an ad hoc weighting system. This way, the index offers a true image of national economies:
(2) where, i and t indicate country and time periods,
m and j are within and between major component variables, ωm are the weights attached to each contributing X-value, ωj are weights attached to each component, min and max refer to minimum and maximum values of respective variables across countries
in a given year According to the latest edition of the Globalization Index publication (2007), the fruit of a
seven year collaboration between Foreign Policy Magazine and A.T. Kearney, the ATKFP Globalization Index is calculated for 72 countries (ten more than the 2006 edition) and corresponds to 97% of the global GDP and 88% of the world’s population.
In terms of economic globalization, the A.T. Kearney/Foreign Policy index considers two key variables: trade and foreign direct investments (for details, see Appendix 1).
After computing the degree of economic globalization using the ATKFP index for a period of four years (2004-2007) one can see that Hong Kong ranks 1st place since its inclusion in the classifications. Another important shift is that of Holland’s returning in the top three states for the first time since 2001. As regards to Romania, after a rapid rise from the 38th position in 2004 to the 11th place in 2006 plunged to 29th place in 2007 (Table no. 3).
Table no. 3. Classification of the 10 most globalized countries (and Romania’s position)
according to the economic dimension of the ATKFP Index for the period 2004-2007
Rank ATKFP-EGI 2004 ATKFP-EGI 2005 ATKFP-EGI 2006 ATKFP-EGI 2007 1 Ireland Singapore Singapore Hong Kong 2 Singapore Ireland Panama Singapore 3 Netherlands Panama Malaysia Estonia 4 Panama Malaysia Ireland Netherlands 5 Slovakia Netherlands Czech Republic Denmark 6 Czech Republic Hungary Slovakia Ireland 7 Finland Croatia Hungary Belgium 8 Malaysia Slovakia Denmark Panama 9 Switzerland Switzerland Switzerland Malaysia 10 Sweden Austria Chile Jordan ROU Romania (38) Romania (25) Romania (11) Romania (29)
Source: generated by author using data from the ATKFP-GI reports for the period 2004-2007, http://www.atkearney.com
C. The CSGR-Index of Globalization The Centre for the Study of Globalisation and Regionalisation (CSGR) has developed,
under the expertise of A.T. Kearney, an index that measures the economic, social and political dimensions of globalization for many countries, on an annual basis over the period 1982 to 2004.

The Annals of The "Ştefan cel Mare" University of Suceava. Fascicle of The Faculty of Economics and Public Administration Vol. 11, No. 2(14), 2011
106
The CSGR-Index of Globalization combines three sub-indices and is computed following a five steps process (Lockwood, Redoano, 2005).
Regarding the economic dimension of globalization, the CSGR Globalization Index employs the following components: trade, foreign direct investments, portfolio investments, and income (for details, see Appendix 1).
Figure no. 2. The CSGR Index of Economic Globalization
for Romania and the world (period 1993-2004) Source: graphs generated using data from de http://www2.warwick.ac.uk/fac/soc/csgr/index/
As we can see in Fig. no. 2, the value of the economic dimension of the CSGR Index of
Globalization (CSGR-EG) has increased during the analyzed period, both for Romania as well as for the entire world. Unlike the KOF Index where we can see an uptrend in the period 1998-1999, the CSGR Index registers a downtrend, this because of the different composition of the indices.
D. The Modified Globalization Index (MGI) A complex phenomenon, that encompasses several components that together have a greater
effect than the sum of their parts, must be assessed as a whole. Globalization is an example of such complex phenomenon. This is the premise from which Martens and Zywietz (2006) started their work and proposed a composite index to measure globalization.
Although indices such as the ones we have analyzed – ATKFP Globalization Index and CSGR Globalization Index – can provide valuable information, they present nevertheless a significant weak point: as regard to the economic dimension of globalization, both indices are focused only on a very specific point of view, namely the neoliberal one (Martens and Zywietz, 2006: 333). This restrictive point of view stems from the narrow definitions of globalization that both indices use (for example, globalization is seen as the “ever closer knitting together of a one-world economy”) (Randolph, 2001: 5).
The Modified Globalization Index or the „MGI” or „The Maastricht Globalisation Index” (Dreher and others, 2008: 29) created by Martens and Zywietz (in a four step process) is considered to be a composite index that provides a comprehensive picture of globalization. The index is considered to be valuable because of the conditions that it fulfills: relevance, robustness, transparency and it adds value (it is not redundant).
The MGI Index is based upon the ATKFP-GI index, but is improved both conceptually and operationally and uses data for 117 countries, from a variety of resources and data bases. Unlike the ATKFP-GI index, the two researchers included in their index two new variables: “environment” and “trade in conventional arms”. In regards to the similarity of the MGI Index with the KOF Index, there are many resemblances but there are also methodological differences. For example, while the MGI Index explicitly includes the environmental component, the KOF Index excludes it from the formula because it is considered the result of the other components.
The Annals of The "Ştefan cel Mare" University of Suceava. Fascicle of The Faculty of Economics and Public Administration Vol. 11, No. 2(14), 2011
107
In terms of economic globalization, the MGI index considers the following sub/indices (for details, see Appendix 1): global trade (the sum of imports and exports of goods and services as a share of GDP) and global finance (with FDI and gross private capital flows).
E. The Globalization Index developed by the World Markets Research Centre The World Markets Research Centre (WMRC) is company with headquarters in London and
provides information regarding the business environment (of 185 countries) for directors of multinational corporations, financial institutions and governments worldwide. Researchers at WMRC have developed in 2001 the “G-Index”. Unfortunately, since then, the database has been updated. However, it has a notable feature for which it was heavily criticized: although the index claims to measure globalization as a whole, it is in fact focused almost exclusively (90%) on the economic dimension of the phenomenon (only 5% of the index is based on telephone traffic and the remaining 5% on Internet traffic).
In an attempt to measure the depth and magnitude of a country's economic links with the world, the WMRC analysts reduce the world economy to the two categories of “old economy” and “new economy” (Randolph, 2001). The a priori weights of the “G-Index” lean heavily towards trade and exports, so that the components “international trade” and “service exports” make up 70% of the overall index weight. These features are not to be at all neglected, because they raise the ranks of small trading nations that have huge (transit) trade volumes with respect to their internal economy.
CONCLUSIONS The lack of a consensus regarding the existence of clear anchors, which can describe the
phenomenon of globalization, is due not to the fact that nobody has ever defined globalization, but because there are too many definitions in the economic literature. Given these circumstances, can we be more successful in finding a better measurement of the phenomenon of globalization than the attempt to define it? Can we capture it in a single representative figure?
Although economists and statisticians alike do not agree upon a definition of globalization, they agree however on the level of difficulty of the process of measuring it. Because it is such a complex and multidimensional phenomenon, it is almost impossible to extract only the effects of the economic dimension of globalization (we could accidentally overlook the effects of the correlation between this component and the others).
Despite all, attempts to measure globalization as a whole, or just the economic dimension, are made and this paper focuses upon some of these attempts: on one hand, the article highlights some alternative approaches and statistical data used by well known international organizations to assess the extent and intensity of a countries’ integration into the global system, focusing on the economic component; and, on the other hand, the paper highlights the most important synthetic indices devised to analyze and measure the globalization of national economies, emphasizing some comparisons between countries (for which data was available) including the case of Romania.
Thereby, the paper succeeds in providing a comprehensive picture of the extent of the process of economic globalization and the impact on the global economy (and on the Romanian economy) using three indicators quite new in the economic literature: the KOF Globalization Index, the globalization index proposed by A.T. Kearney/Foreign Policy (a starting point for the works of other indices in Andersen and Herbertsson (2003) or Lockwood (2003)) and the CSGR Globalization Index. Also we have included in the paper other two important globalization indices – the M-GI and WMRC Index – paying attention to the economic dimension.
We will continue our research by looking for new ways of measuring economic globalization that will asses, among other things, the process of “forced takeover” of an economy of a country by foreign capital and the degree of expansion of capital abroad. To achieve this, we will use the findings in this paper as a start point (and moreover we will analyze the strengths and weaknesses of the indices already studied).
The Annals of The "Ştefan cel Mare" University of Suceava. Fascicle of The Faculty of Economics and Public Administration Vol. 11, No. 2(14), 2011
108
ACKNOWLEDGMENTS This work was partially supported by the European Social Fund in Romania, under the
responsibility of the Managing Authority for the Sectorial Operational Programme for Human Resources Development 2007-2013 [grant POSDRU/88/1.5/S/47646].
REFERENCES
1. Andersen, T., Herbertsson, T. T. (2003), Measuring Globalization, Discussion Paper, no. 817. Bonn, Institute for the Study of Labor.
2. Bairoch, P. (1996), Globalization Myths and Realities: One Century of External Trade and Foreign Investment, in Boyer, R., Drahe, D. (eds.), States Against Markets. The Limits of Globalization, London: Routledge.
3. Bari, I. (2005), Globalizarea economiei, Bucureşti: Editura Economică. 4. Barnet, R.J., Cavanagh J. (1994), Global Dreams: Imperial Corporations and the New
World Order, New York: Simon and Schuster Publishing House. 5. Blank, S. (1994), The United States on the Eve of the 21st Century, Global Business
Policy Council, no. 71. 6. Cable, V. (1995), The Diminished Nation State. A Study in the Loss of Economic Power,
Daedalus, vol. 124, no. 2, pp. 23-54. 7. Dahrendorf, R. (1995), A Precarious Balance: Economic Opportunity, Civil Society and
Political Liberty, The Responsive Community. 8. Dreher, A. (2006), Does Globalization Affect Growth? Evidence from a new Index of
Globalization, Applied Economics, no. 38, vol. 10, pp. 1091-1110. 9. Dreher, A., Gaston, N., Martens, P. (2008), Measuring globalisation: gauging its
consequences, New York: Springer. 10. Lockwood, B. (2003), How Robust is the Foreign Policy/Kearney Index of
Globalization? Working Paper, 7901, University of Warwick, Centre for the Study of Globalization and Regionalisation.
11. Lockwood, B., Redoano, M. (2005), The CSGR Globalisation Index: an Introductory Guide, Working Paper, Centre for the Study of Globalisation and Regionalisation, no. 155/04.
12. Martens, P., Zywietz, D. (2006), Rethinking Globalization: A Modified Globalization Index, Journal of International Development, no. 18, pp. 331–350.
13. Postelnicu, G., Postelnicu, C. (2000), Globalizarea economiei, Bucureşti: Editura Economică.
14. Randolph, J. (2001), G-Index: ‘globalisation measured, World Markets Research Centre.
15. Rodrik, D. (1997), Sense and Nonsense in the Globalization Debate, Foreign Policy, no. 107.
16. Ulrich, B. (2003), Ce este globalizarea? Erori ale globalismului – răspunsuri la globalizare, Bucureşti: Editura Trei,.
17. *** „World Economic Outlook” (may 1997), Fondul Monetar Internaţional. 18. *** „Second European Report on S&T Indicators” (1997), Comisia Europeană,
Brussels. 19. *** „Focus on: Measuring globalisation” (2007), Selected Readings, Eurostat, p. 6,
disponibil la http://epp.eurostat.ec.europa.eu/cache/ITY_PUBLIC/LN-SR122007/EN/LN-SR122007-EN.PDF
20. *** „Trade and Development Report, 2010; Employment, globalization and development” (2008), United Nations Publication, UNCTAD, New York and Geneva, disponibil la adresa
The Annals of The "Ştefan cel Mare" University of Suceava. Fascicle of The Faculty of Economics and Public Administration Vol. 11, No. 2(14), 2011
109
http://www.unctad.org/Templates/webflyer.asp?docid=13740&intItemID=2093&lang=1.
21. *** „Globalization: A Brief Overview” (2008), International Monetary Fund Issues Brief, IMF Staff, no. 2.
22. *** „Principal Global Indicators” (2010), Inter-Agency Group on Economic and Financial Statistics, disponibil la adresa http://www.principalglobalindicators.org/default.aspx.
23. *** „World Development Indicators (WDI)” (2010), Banca Mondială, disponibil la adresa http://data.worldbank.org/data-catalog/world-development-indicators/wdi-2010.
24. ∗∗∗ http://www.oecd.org/home/0,2987,en_2649_201185_1_1_1_1_1,00.html
APPENDIX 1 Components of the KOF, ATKFP, CSGR, M-GI and WMRC Globalization Indices – the economic dimension
Index Components / Variables Definition (methodology)
Actual Flows Trade Exports and Imports of Goods and Services, % of GDP Foreign Direct Investment Flows FDI Inflows and Outflows, % of GDP Foreign Direct Investment Stocks Stocks of FDI, % of GDP Portfolio Investments Inflows and Outflows of Portfolio Investments, % of
GDP Income Payments to Foreign Nationals
Total sum of Income Payments to Foreign Nationals, % of GDP
Restrictions Hidden Import Barriers - Mean Tariff Rate - Taxes on International Trade Total sum of Taxes on International Trade, % of GDP
The KOF 2011 Globalization Index
Restricţionări ale contului de capital - Trade Exports and Imports of Goods and Services, % of GDP The ATKFP 2008
Globalization Index Foreign Direct Investment FDI Inflows and Outflows, % of GDP Trade Exports and Imports of Goods and Services, % of GDP Foreign Direct Investment FDI Inflows and Outflows, % of GDP Portfolio Investments Inflows and Outflows of Portfolio Investments, % of
GDP The CSGR 2011 Globalization Index
Income Employee compensation paid to non-resident workers plus employee compensation paid to resident workers working abroad, % of GDP
Global Trade (Trade) Exports and Imports of Goods and Services, % of GDP Global Finance Foreign Direct Investment Stocks of FDI, % of GDP
The Maastricht 2011 Globalization Index
Capital Gross Private Capital Flows, % of GDP New Economy 3 variables The WMRC
Globalization Index Old Economy 3 variables
The Annals of The "Ştefan cel Mare" University of Suceava. Fascicle of The Faculty of Economics and Public Administration Vol. 11, No. 2(14), 2011
110
PHARE CROSSBORDER GRANTS AND CHANGES IN THE CROSSBORDER ECONOMY
STUDY CASE – ROMANIAN-UKRAINIAN BORDER
PhD. Student Marcela SLUSARCIUC “Stefan cel Mare” University of Suceava, Romania Faculty of Economics and Public Administration
Abstract: This paper intends to go through the main issues about the role of the Phare Crossborder funds in the
development of the economy in the border area. The specific approach is linked to the Neighbourhood Programme Romania-Ukraine. The paper starts with the European view about the external borders aims, describes the framework of the Neighbourhood Programme focused on the aspects with relevance on economical improvement of the border areas and presents few financial marks. There are reviewed the most important lessons learned during the implementation of the programme and there are listed some of the results that marked an economical change and could have long term economical impact.
The paper concludes the main ingredients needed for a future cooperation in terms of crossborder economical projects between two different countries, at the external border of the European Union.
Keywords: crossborder, cooperation, grant, border economy JEL Classification: H81, R11 INTRODUCTION In 2003, the Commission proposes that “the European Union should aim to develop a zone of
prosperity and a friendly neighbourhood … with whom the European Union enjoys close, peaceful and cooperative relations.”[1] The Wider Europe Communication first outlined the European neighbourhood policy for shaping the future EU relations with its neighbours. As one element of this policy, the Commission sought to establish, as of 2007, a new neighbourhood instrument, the European Neighbourhood Partnership Instrument (ENPI), which finances cross-border cooperation measures on both sides of the external border of the enlarged EU and focuses “on ensuring the smooth functioning and secure management of the future Eastern and Mediterranean borders, promoting sustainable economic and social development of the border regions and pursuing regional and trans-national co-operation".[2] Following this approach, on 1 July 2003 the Commission adopted the Communication "Paving the way for a New Neighbourhood Instrument" (NNI) which introduced the concept of Neighbourhood Programmes. The NNI Communication highlighted the main objectives of such an instrument and proposed a two-phase approach in establishing it. The First Phase (2004-2006) was aimed at the more coordinated use of the various existing instruments (Interreg, Phare CBC, Tacis, Cards, Meda). Neighbourhood Programmes permited a single application process, including a single call for proposals covering both sides of the border, and will have a joint selection process for projects. The Second Phase (as of 2007) would imply a fully-fledged Neighbourhood Instrument. This would completely integrate the use of internal and external European Union funding to ensure an integrated approach to crossborder and interregional cooperation.
In establishing and elaborating the scope and focus of the Romanian-Ukrainian crossborder cooperation in this document, the aims and objectives of the Neighbourhood Programme concept have been taken into consideration. The main objectives of the Neighbourhood Programme concept, as stated in the Communication “Paving the way for a new Neighbourhood Instrument”[3], are to promote sustainable economic and social development in the border areas, to work together to address common challenges, in fields such as environment, public health, and the prevention of and fight against organised crime, to ensure efficient and secure borders, and to promote local, “people-to-people” type actions.
The Annals of The "Ştefan cel Mare" University of Suceava. Fascicle of The Faculty of Economics and Public Administration Vol. 11, No. 2(14), 2011
111
An expansion of the EU including Romania created a new situation for the relation between Romania and the Ukraine. The EU was faced with the challenge of finding a balance between its internal security versus its openness. Within this framework the new neighborhood instrument (ENPI) aims at addressing the challenges and opportunities arising from the proximity of in this case Romania, Ukraine and Republic of Moldavia, such as economic development of the border areas, environmental problems and people-to-people contacts. Until this instrument was in place, the Neighbourhood Programme fostered crossborder cooperation in bordering regions with the use of Phare and TACIS funds.
ECONOMICAL BACKGROUND OF THE AREA WHEN THE FIRST
PROGRAMME STARTED Economic links between Romanian and Ukrainian border regions were rather weak at the
beginning of the Neighbourhood Programme (NP). Although the share of export and import to each other was higher in the eligible border area in comparison with the national data, it was still insignificant. The same applied for the direct investments. The level of economic development in the border regions of both countries was rather low, with the GDP/per capita lower than the national figure. The Ukrainian Odesska oblast was the only exception, with GDP per capita higher than the national Ukrainian GDP per capita. A possible solution to accelerate the local economic development in the eligible area was considered to be in the development of SME sector in the region, in response to downsizing or closing down obsolete industries and to the required structural economic reforms in general. But the NP didn’t fund directly SMEs and the intervention on this spot was only through projects run by local administration or economical NGO’s or the SME’s benefit was by the usage of the infrastructure subject of the projects. Analyses furthermore showed that the eligible area had a big potential for tourism, which could gain significantly from closer cooperation of the two countries.
The economies of the Romanian and Ukrainian border regions had different structure. The economic structure of the Romanian eligible area was dominated by the agricultural sector. Also forestry had a considerable contribution through high wood volume and by the large afforested areas (in Suceava 456,579 ha). Due to the lack of investment programmes and poor technology in the wood industry and in furniture manufacturing large amounts of raw materials (instead of finished products) were exported (timber and cut wood), which has lead to an unreasonable exploitation of the forest fund and a degradation of the environment. Industrial activities included food-processing, wood processing, textile, machine building, naval construction, furniture, electric equipment and mining. The Ukrainian border area was more diverse in terms of economic specialization. A considerable share of regional value-added of Ukrainian border regions was formed by services. Transportation and tourism services made the largest contribution to the value-added in the services sector. Transport has been the key to the development especially of Odesska oblast. Agriculture and industry were also a priority, but the lack of own raw materials impeded industrial development. Odesska and Ivano-Frankivska were characterized by developed industry and Odesska oblast industry was specialized in chemicals and food. Electricity and fuel made the biggest contribution to the industrial output of Ivano-Frankivska oblast. Agricultural production was playing an important role in the economy of other oblasts in the eligible area as well, but the low level of organisation of the and the insignificant influence of small scale private/family farming enterprises hinder the introduction of new technologies, which makes the economy sensitive to weather conditions and competition in agricultural markets.
The majority of (SME) companies in the Romanian border area were active in trade, followed by the service and industry sector. The number of SMEs per 1000 inhabitants in the Romanian crossborder area was lower than the number of 17.5 (in the EU this is 50). Although also the number of SMEs in the Ukrainian eligible border area was below the Ukrainian average, these enterprises produced double the country average for Zakarpatska, Ivano-Frankivska and Chernivetska oblasts and 1.2 times the average Ukrainian level in Odesska oblast. The highest share
The Annals of The "Ştefan cel Mare" University of Suceava. Fascicle of The Faculty of Economics and Public Administration Vol. 11, No. 2(14), 2011
112
of small enterprises was engaged in trade, following by industry. The development of the SME sector in both countries was hindered by a lack of entrepreneurial skills, a lack of information about accessing medium-long term credit for investment opportunities, and in some cases lack of support of local authorities, with high and double taxation and lots of administrative barriers.
The opportunities resulting from Romania’s and Ukraine’s endowment of tourism had positive side effects and fostered the start of an autonomous growth process of SMEs in the crossborder area. Recreational possibilities, the cultural and historical heritage and rural areas free from pollutions presented opportunities for tourism development in the eligible area. Moreover, the development of cross-border cooperation in this area (e.g. the development of tourist packages, which include visits to both countries), could contribute to an expanding tourist services market and to increase economic and social gains for both countries. Although the border regions of both countries do have tourism potential, its development was hindered by undeveloped tourist facilities - the acces to public utilities in rural areas was limited, especially in the Ukraine, the lack of integrated information system, which could allow traditional tourist routs to both countries, the lack of border cross-points, underdeveloped transport infrastructure, a lack of well-trained specialists in the tourist sector.
OPPORTUNITIES AND OBJECTIVES Starting point to state the general objective has been an analysis focused on key factors
uniting border regions of Ukraine and Romania. The analysis on uniting factors showed that a number of key socio-economic fields are important and with a high crossborder value. These were considered as local development opportunities on which a clear-cut crossborder strategy of the Neighbourhood Programme was based:
- The opportunity of expanding rural tourism in regions particularly rich and competitively advantaged for long-term development in this sector, provided that biological equilibrium will be protected in the short and long term.
- The development of existing human resources operating or to be operating in competitive sectors.
- The opportunity of supporting growth of an interesting SME backbone specialized in economic sectors and having good cooperation scope for local development with an integrated perspective.
- The opportunity of preserving and promoting common historical heritage and natural treasures of extremely high value at regional, national and international levels.
The General Objective of the programme was to improve cross border integration between boundary regions while posing good bases for sustainable economic development. The opportunities for crossborder cooperation in the eligible regions was converted in 4 intermediate/specific objectives, which were steps to acquire the general objective:
- Strengthening existing common assets to ignite a new integrated cycle of sustainable development;
- Supporting a new cycle of sustainable development with key infrastructures; - Develop cross-border cooperation to resurface the common socio-cultural heritage linked
to the local history and environment; - Operationally strengthen crossborder cooperation. The first priority was to promote local socio-economic development and included measures
aimed at boosting key local sectors showing either competitive advantage in the global market or demand growth potential, or both and accommodate economic growth with relevant labor market actions.
The tourism sector, especially rural, mountain, cultural, religious and environmentalist, showed both competitive advantage and high growth potential for all eligible. The measure 1.1, about expanding and strengthening tourism, aimed at expanding and qualifying the existing local supply of tourism services, thereby boosting local economies. The main objectives were focused on
The Annals of The "Ştefan cel Mare" University of Suceava. Fascicle of The Faculty of Economics and Public Administration Vol. 11, No. 2(14), 2011
113
expanding and qualifying the offer of tourism sector with a cross-border perspective and ensuring a sustainable development of the tourism sector on both sides of the border. Financed activities included joint marketing (generic and niche marketing, like for religious tourism, mountaineering, speleological activities etc.), tourism management training, joint booking network development, forest hiking path rehabilitation and education programs for sustainable tourism development.
The measure 1.2 about crossborder economic cooperation was central to ensure the entire success of Priority 1 actions. The focus of this priority was on training and advisory activities for SMEs with a clearly identified crossborder character. Typical projects demanded by local actors during JPD workshops included strengthening business centers, data collection and dissemination, consulting, etc. These were intended as institution building capacity actions and are supposed support actions that go beyond simple physical small-infrastructure construction. Projects targeted at sectors with a good crossborder integration perspective (for instance: food processing, art and craft, agriculture, fishing, wood processing, etc.) were considered of highest priority. Human resources development was here intended as a fundamental tool to ensure a steady upgrade of specific professional and general skills alike, provided they are consistent with the underlying strategy of the program and of Priority 1 in particular. The measure aimed at developing existing HR and manpower for key local activities having a good cross-border integration scope. Hence, development of professional skills in SME management, trade and cross-border integrating sectors (for instance: food processing, art and craft, agriculture, fishing, wood processing, etc.) were considered principal. Joint institution capacity building projects across the borders and joint training in both professional and secondary education are also possible components of this measure that has as objectives to boost the cross-border economic development process and to upgrade Human Resources.
Financed actions included creation or upgrade business and trade centers, financial consulting training, organising Fairs, socio-economic data base development and servicing, market studies for regional products, crossbborder industrial cluster formation, joint regional marketing and advertising campaigns, general and professional training and business management training.
The second priority, about developing cross border integrated infrastructure systems, includes measures aimed at addressing issues in crossborder infrastructure. Even if this priority is not directly financing the economic sector it is assumed that any kind of infrastructure investement leads to an economic development.
Cross-border transport and border infrastructure are crucial now too for the support of the whole development process of crossborder regions. Efficient border management is essential for joint prosperity and security. Facilitating trade and passage, while securing borders against smuggling, trafficking, organized crime (including terrorist threats) and illegal immigration (including transit migration), had and still has a crucial importance. Regional and crossborder co-operation can assist in facing these challenges, in line with actions to be taken at national level.
The measure 2.1, focused on developing cross-border transport and border infrastructure was designed also to construct/improve small-scale border infrastructure. The main objectives of this measure were to contribute to stronger border institutions that are well positioned to meet the challenges facing border management, to upgrade the HR skills so that Customs staff trained to cope with the above mentioned border issues and to construct/improve border infrastructure.
Activities that were financed were such as joint institution capacity building projects, training programmes to allow personnel to cope with smuggling, trafficking, organized crime (including terrorist threats) and illegal immigration (including transit migration), project preparation support (transport market data collection, transport analysis and planning documents, a study on future trends in transport etc.) including feasibility studies, complementary actions to other programs involved in border infrastructure development and management (for instance customs management projects) and small scale transport infrastructures.
To ensure sustainable development, crossborder environmental management infrastructure requires development. In particular the environmental monitoring system in various sectors (water, air, waste) were developed or upgraded. Other types of environmental protection infrastructure such
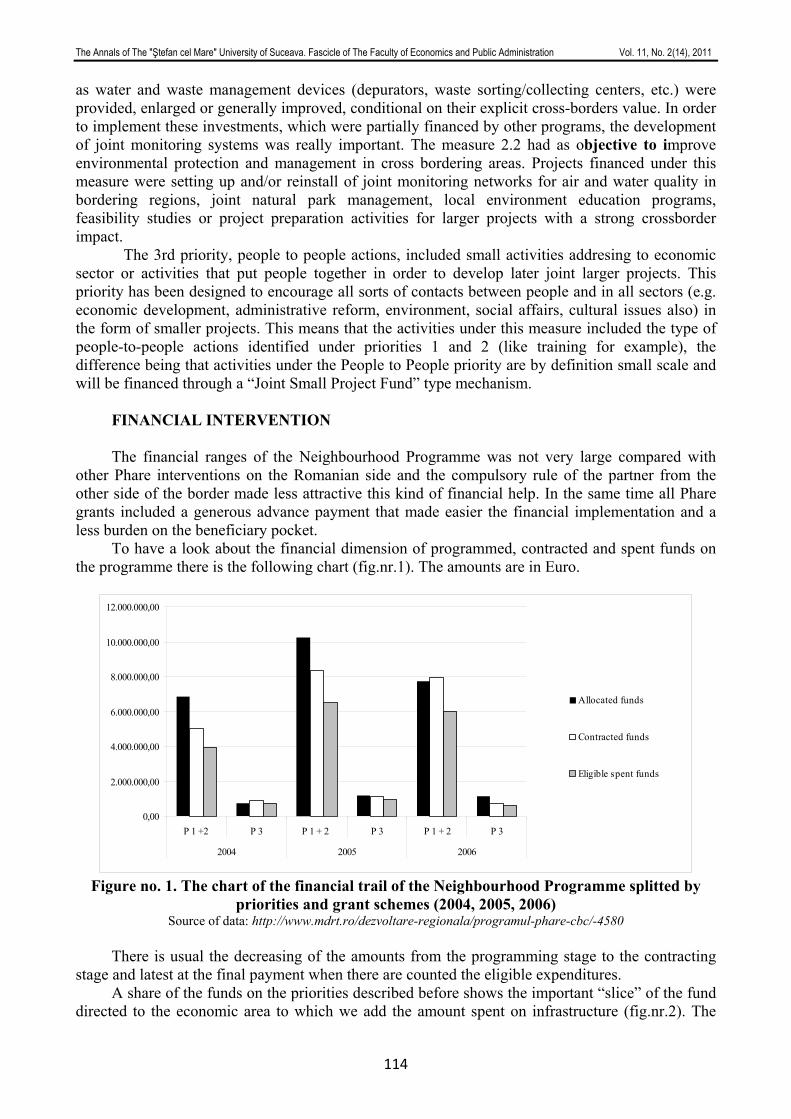
The Annals of The "Ştefan cel Mare" University of Suceava. Fascicle of The Faculty of Economics and Public Administration Vol. 11, No. 2(14), 2011
114
as water and waste management devices (depurators, waste sorting/collecting centers, etc.) were provided, enlarged or generally improved, conditional on their explicit cross-borders value. In order to implement these investments, which were partially financed by other programs, the development of joint monitoring systems was really important. The measure 2.2 had as objective to improve environmental protection and management in cross bordering areas. Projects financed under this measure were setting up and/or reinstall of joint monitoring networks for air and water quality in bordering regions, joint natural park management, local environment education programs, feasibility studies or project preparation activities for larger projects with a strong crossborder impact.
The 3rd priority, people to people actions, included small activities addresing to economic sector or activities that put people together in order to develop later joint larger projects. This priority has been designed to encourage all sorts of contacts between people and in all sectors (e.g. economic development, administrative reform, environment, social affairs, cultural issues also) in the form of smaller projects. This means that the activities under this measure included the type of people-to-people actions identified under priorities 1 and 2 (like training for example), the difference being that activities under the People to People priority are by definition small scale and will be financed through a “Joint Small Project Fund” type mechanism.
FINANCIAL INTERVENTION The financial ranges of the Neighbourhood Programme was not very large compared with
other Phare interventions on the Romanian side and the compulsory rule of the partner from the other side of the border made less attractive this kind of financial help. In the same time all Phare grants included a generous advance payment that made easier the financial implementation and a less burden on the beneficiary pocket.
To have a look about the financial dimension of programmed, contracted and spent funds on the programme there is the following chart (fig.nr.1). The amounts are in Euro.
0,00
2.000.000,00
4.000.000,00
6.000.000,00
8.000.000,00
10.000.000,00
12.000.000,00
P 1 +2 P 3 P 1 + 2 P 3 P 1 + 2 P 3
2004 2005 2006
Allocated funds
Contracted funds
Eligible spent funds
Figure no. 1. The chart of the financial trail of the Neighbourhood Programme splitted by
priorities and grant schemes (2004, 2005, 2006) Source of data: http://www.mdrt.ro/dezvoltare-regionala/programul-phare-cbc/-4580
There is usual the decreasing of the amounts from the programming stage to the contracting
stage and latest at the final payment when there are counted the eligible expenditures. A share of the funds on the priorities described before shows the important “slice” of the fund
directed to the economic area to which we add the amount spent on infrastructure (fig.nr.2). The
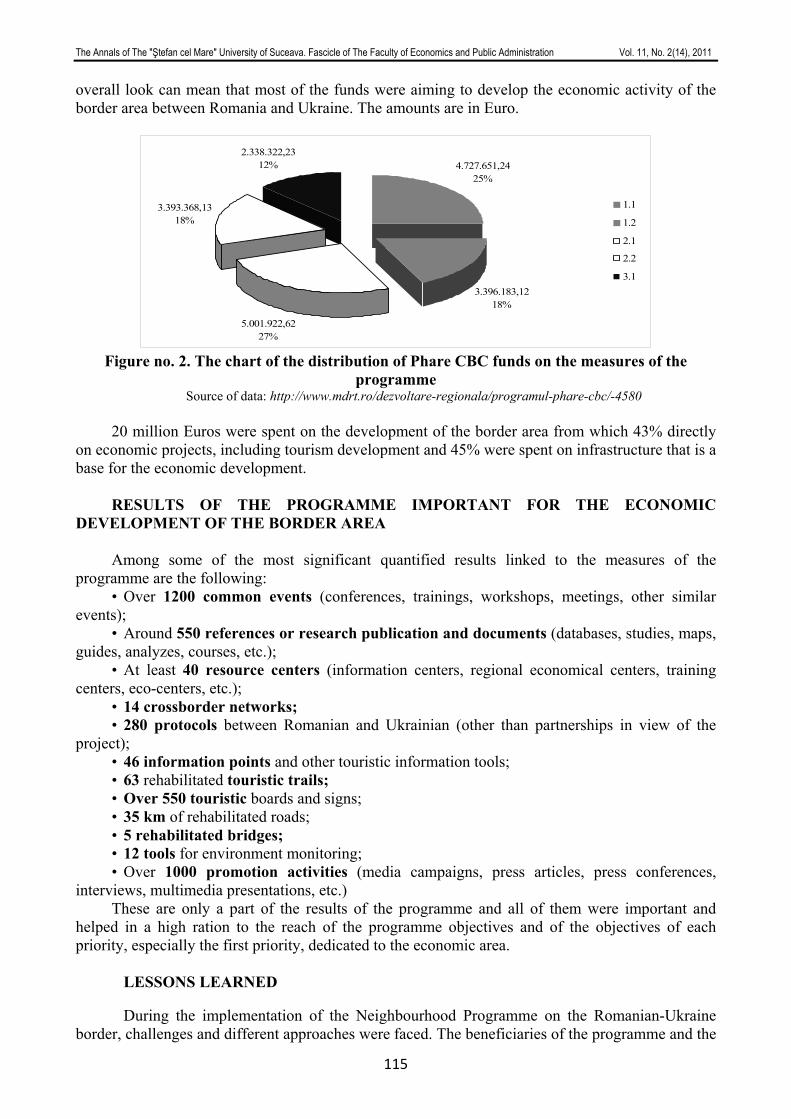
The Annals of The "Ştefan cel Mare" University of Suceava. Fascicle of The Faculty of Economics and Public Administration Vol. 11, No. 2(14), 2011
115
overall look can mean that most of the funds were aiming to develop the economic activity of the border area between Romania and Ukraine. The amounts are in Euro.
4.727.651,2425%
3.396.183,1218%
5.001.922,6227%
3.393.368,1318%
2.338.322,2312%
1.1
1.2
2.1
2.2
3.1
Figure no. 2. The chart of the distribution of Phare CBC funds on the measures of the
programme Source of data: http://www.mdrt.ro/dezvoltare-regionala/programul-phare-cbc/-4580
20 million Euros were spent on the development of the border area from which 43% directly
on economic projects, including tourism development and 45% were spent on infrastructure that is a base for the economic development.
RESULTS OF THE PROGRAMME IMPORTANT FOR THE ECONOMIC
DEVELOPMENT OF THE BORDER AREA Among some of the most significant quantified results linked to the measures of the
programme are the following: • Over 1200 common events (conferences, trainings, workshops, meetings, other similar
events); • Around 550 references or research publication and documents (databases, studies, maps,
guides, analyzes, courses, etc.); • At least 40 resource centers (information centers, regional economical centers, training
centers, eco-centers, etc.); • 14 crossborder networks; • 280 protocols between Romanian and Ukrainian (other than partnerships in view of the
project); • 46 information points and other touristic information tools; • 63 rehabilitated touristic trails; • Over 550 touristic boards and signs; • 35 km of rehabilitated roads; • 5 rehabilitated bridges; • 12 tools for environment monitoring; • Over 1000 promotion activities (media campaigns, press articles, press conferences,
interviews, multimedia presentations, etc.) These are only a part of the results of the programme and all of them were important and
helped in a high ration to the reach of the programme objectives and of the objectives of each priority, especially the first priority, dedicated to the economic area.
LESSONS LEARNED
During the implementation of the Neighbourhood Programme on the Romanian-Ukraine border, challenges and different approaches were faced. The beneficiaries of the programme and the
The Annals of The "Ştefan cel Mare" University of Suceava. Fascicle of The Faculty of Economics and Public Administration Vol. 11, No. 2(14), 2011
116
staff included in the implementation of the programme learned some important lessons to be taken further in the new programme. Following there are presented the most important ones:
- A beneficiary who doesn’t properly consider its financial and operational capacity before submitting an application or more will certainly encounter difficulties, especially when implementing more than one project, as the team members will be overloaded and also due to budgetary constraints on providing co-financing.
- A basic condition for successful implementation of a project is knowledge and understanding of the grant contract provisions.
- Obtaining all the necessary information / clarification of all issues concerning a proper elaboration of the application, including budget preparing, during the call for proposals period, especially through the specialized helpdesk and through participation at specific events of information and training is a must.
- It is very important to follow all the instructions mentioned in the guidelines for grant applicants for completing the application.
- Correction of the planning errors is recommended as soon as possible (in the first quarter of project implementation).
- A greater attention in selection of partners, associates and project team, in order to ensure their availability, high involvement and professionalism, is recommended.
- Participation in Partnership events organized by the Joint Technical Secretariat can bring a proper partner.
- Participation in working sessions and sending questions to the Joint Technical Secretariat in order to clarify implementation issues can help preventing/ solving problems that can occur during performance of the contracts.
- It is important to properly justify the crossborder nature of the proposed action (Ukrainian partner involvement in project activities, participation in all phases of development, ending with the final report, etc.)
- Any deviation, modification or replacement of the criteria and / or outcomes linked with the selection of the target group can put on discussion the entire project and the grant award.
- If there are difficulties on understanding the terminology, it is advisable to call the helpdesk or to require specialized support (an action to reach all potential applicants).
- Establishing milestones concerning the implementation process offers good perspective on progress in performance of the project contributes to assessing of fulfillment of assigned responsibilities within the team, supports management decisions.
- Maximum attention is to be given to procurement process. Secondary procurement should be initiated preferably during the first quarter of implementation.
- Developing documentation, underlying the preparation of the specifications for complex procurement of works are time consuming, therefore they must be rigorous planned and final responsibility should be entrusted to specialists.
- Planning specific activities for the effective project implementation can be an important ingredient to the success of the project. Especially in cases of complex projects with many activities, meetings, studies, etc. it is recommended to keep a calendar concerning what has been done every month, since the first day of implementation, develop and reevaluate, on a regular base, an implementation plan.
- During implementation, obstacles in communicating with various partners, especially with the Ukrainians partners, were identified quite often. This can seriously affect target group participation in activities, thus leading to cancellation of grant contracts. It is necessary to establish clear conditions for involvement of partners in projects and try to make them as interested as possible in developing proposed activities.
- Timely approval of the budget for public institutions, in order to avoid problems related to co-financing, is crucial.
The Annals of The "Ştefan cel Mare" University of Suceava. Fascicle of The Faculty of Economics and Public Administration Vol. 11, No. 2(14), 2011
117
- A project is implemented / monitored by a team. A successful project implementation depends also on how the team members are able to work together and coordinate their efforts for the accomplishment of the project goals.
- During implementation of the action, the focus should be on preventive measures, rather than post – implementation ones.
- Each project is unique and needs specific solutions for various problems occurring during implementation.
- A call for proposal should be based on a solid information and promotion campaign consisting of a variety of instruments, whereby all potential beneficiaries are being reached. Otherwise the call for proposals moreover offers opportunities to the most active and well-connected potential beneficiaries, not necessarily the most needy ones. During the programme implementation a group of constant beneficiaries that applied for each call for proposals and a group of “new-comers” that experienced for the first time a crossborder project were identified.
- The involvement of the Romanian and Ukrainian authorities in the process of Programme implementation is very important; they should keep in touch with each other and work together, on a formal and especially also informal basis. A joint effort (joint programming, a single joint call for proposals, joint projects, joint committees), requires first and foremost a shared vision on co-operation, mutual institutional understanding and good personal relations.
CROSSBORDER IMPACT
The crossborder impact is very important and relevant for the economic development of the
border area, mainly by the projects developed on economic and infrastructure field and by the long term relationships that usually lead to economic exchanges.
During the performance of the programme 80 Romanian partners and 95 Ukrainian partners were involved in the projects developed. 178 partnership statements by Ukraininian partners were signed in order to implement the projects, meaning that some organizations/institutions were involved in more than one project as a partner. 280 partnership or agreements between Romanian and Ukrainian organizations during the projects implementation or for following activities were also concluded.
The benefits of these partnerships in the framework of the crossborder cooperation inside the Neighbourhood Programme Romania-Ukraine could be synthesized as following:
- Working together in the projects was a welcomed exercise and a reach source for future, more complex projects;
- The partners from both sides of the border faced common challenges and issues that challenged the projects. These made them more prepared for the new programmes with new framework and higher requirements;
- The intercultural experience in which the partners from both sides of the border were involved helped them to find the common roots and traditions and the differences aroused in time in the two different countries;
- The partnership was a safe area for sharing and transfer knowledge, know-how, tools and methods about project management or the area of the project.
CONCLUSIONS
The 142 successfully implemented project, covering different areas required by the
Neighbourhood Programme by their activities helped to: - expand and qualify the offer of tourism sector with a cross-border perspective; - ensure a sustainable development of the tourism sector on both sides of the border: - boost the cross-border economic development process;
The Annals of The "Ştefan cel Mare" University of Suceava. Fascicle of The Faculty of Economics and Public Administration Vol. 11, No. 2(14), 2011
118
- upgrade Human Resources field, - construct/improve border infrastructure; - improve environmental protection and management in cross bordering areas. From the point of view of the objectives contained in the Neighbourhood Programme we
can conclude that the projects with their results helped to make economical changes in the border area, mostly on the Romanian part of the eligible area.
Even if the Neighbourhood Programme Romania-Ukraine was built on the joint principle, during the implementation was difficult to organize joint call sessions. Most of the projects were developed on the Romanian territory but with the respect of the involvement of the Ukrainian partner as mentioned in the chapter about the crossborder impact. This will be a starting point for the development of the projects under the new programme but it is not sure that it will be enough to smoothly run the programme because of many differences between the two countries: language, legislation, administrative structures, economic development.
Working in partnership is difficult generally even when we speak about the same country partners and the principles that conduct businesses are the mostly the same when it is about projects.
All these lead to the conclusion that in the guidance of the wish of an economically developement of a crossborder area at the external borders of the European Union there is need of good cooperation, patience, good organization, good understanding of partnership principles and of the other partner values and intentions. Without the mentioned, any undertaking of „developing a zone of prosperity and a friendly neighbourhood” as the „Wider Europe..” Communication proposes, is doomed to failure at a high cost.
ENDNOTES
[1] Communication from the Commission to the Council and the European Parliament, Wider Europe— Neighbourhood: A New Framework for Relations with our Eastern and Southern Neighbours, , Brussels, 11.3.2003 [2]Idem. [3] Communication from the Commission to the Council and the European Parliament, "Paving the way for a New Neighbourhood Instrument", Brussels, 01.7.2003
REFERENCES
1. Communication from the Commission to the Council and the European Parliament, Wider Europe - Neighbourhood: A New Framework for Relations with our Eastern and Southern Neighbours, Brussels, 11.3.2003
2. Communication from the Commission to the Council and the European Parliament, "Paving the way for a New Neighbourhood Instrument", Brussels, 01.7.2003
3. Neighbourhood Programme Romania-Ukraine 2004-2006, Joint Programming Document, version October 2006
4. http://www.mdrl.ro/index.php?p=183 5. http://www.mdrt.ro/dezvoltare-regionala/programul-phare-cbc/-4580
“ACKNOWLEDGMENT
This paper has been financially supported within the project entitled „Doctorate: an Attractive Research
Career”, contract number POSDRU/107/1.5/S/77946, co-financed by European Social Fund through Sectoral Operational Programme for Human Resources Development 2007-2013. Investing in people!”
The Annals of The "Ştefan cel Mare" University of Suceava. Fascicle of The Faculty of Economics and Public Administration Vol. 11, No. 2(14), 2011
119
THE INCOME INEQUALITY IN THE EASTERN EUROPEAN COUNTRIES: A COMPARATIVE STUDY FOR THE PERIOD 1990-2010
PhD. Student Cristina Gabriela SUSANU
Alexandru Ioan Cuza University of Iasi, Romania [email protected]
Abstract: This paper realizes a comparative study among Eastern European countries regarding their ways of economic
growth characterized by a higher or lower increase of inequality in their income distribution. The market liberalization from the early 1990s in the former communist countries have resulted in new distributions of income and wealth, the new structural sources of poverty and inequality being often more extreme. The paper will focus on the factors that contributed to the rising social inequality in ten post communist countries, from 1990 to 2010, emphasizing on four main macroeconomic performance indicators, the annual economic growth rate, income distribution as Gini coefficient, Human Development Index, and gross fixed capital formation rate for showing the level of investments.
We will conclude at the end of the paper that in the last twenty years, between the former communist countries from Eastern Europe, the gaps in distribution between the high and low income groups tend to enlarge, especially since all of them are developing countries. Although none of the countries from this region exceeds the critical upper level of 40% on the Gini scale coefficient, together with a continuous degradation of the human development index in the last two decades, the evolution of these countries is at least questionable.
Keywords: income inequality, poverty, Eastern Europe, globalization, transition, economic liberalization. JEL Classification: I3, O11, O15, P3, R11. INTRODUCTION The present paper aims to realize a comparative study among the Eastern European
countries and to determinate the income distribution and economic inequality’s evolution in the last two decades, once with the economic liberalization of the former communist countries.
Although there is any poverty or income inequality’s tendency analyzed until now which can be solely, and probably not even largely, attributable to the consequences of globalization without a rigorous analysis of the phenomenon, it has to be admitted at least that globalization, in its practical application so far, may have had at least some adverse effects on poverty and income distribution. These concerns are some of which have generated worldwide debates and a strong anti-globalization movement, being thus a research matter with multiple nuances and solutions.
The relationship between globalization and poverty is examined in several studies. Cornia and Court (2001) found that an increased income inequality will affect the growth and poverty reduction objectives. The result of Agenor (2005) suggest that a globalization applied not to the entire national economy will further deteriorate the living standards, and Ravallion (2006) believes that reducing income inequality through the opportunities of an developing country is the most essential element for maximizing the potential of globalization to eradicate poverty. Also, several specific issues regarding globalization have been published in time by Oxford Development Studies, Journal of World-System Research, Journal of African Economies or by the World Bank Economy Review, which, for example, contains a study on income distribution among the world countries (Atkinson and Brandolini, 2010), the recent comparative perspective of Galbraith on economic and political change and inequality (Galbraith, 2010), or some relatively older but original studies, like „Who is Not Poor? Dreaming of a World Truly Free of Poverty” (Pritchett, 2006) and „Elite Perceptions of Poverty and Inequality” (Reis, Moore and Books, 2006).
Further, we will realize a comparative study for ten countries considered to be part of Eastern Europe, focusing on four macroeconomic indicators: the economic growth, income inequality level in the form of Gini index, Human Development Index and the levels of investment for each country. In the end we intend to present the economic evolution of the ten eastern
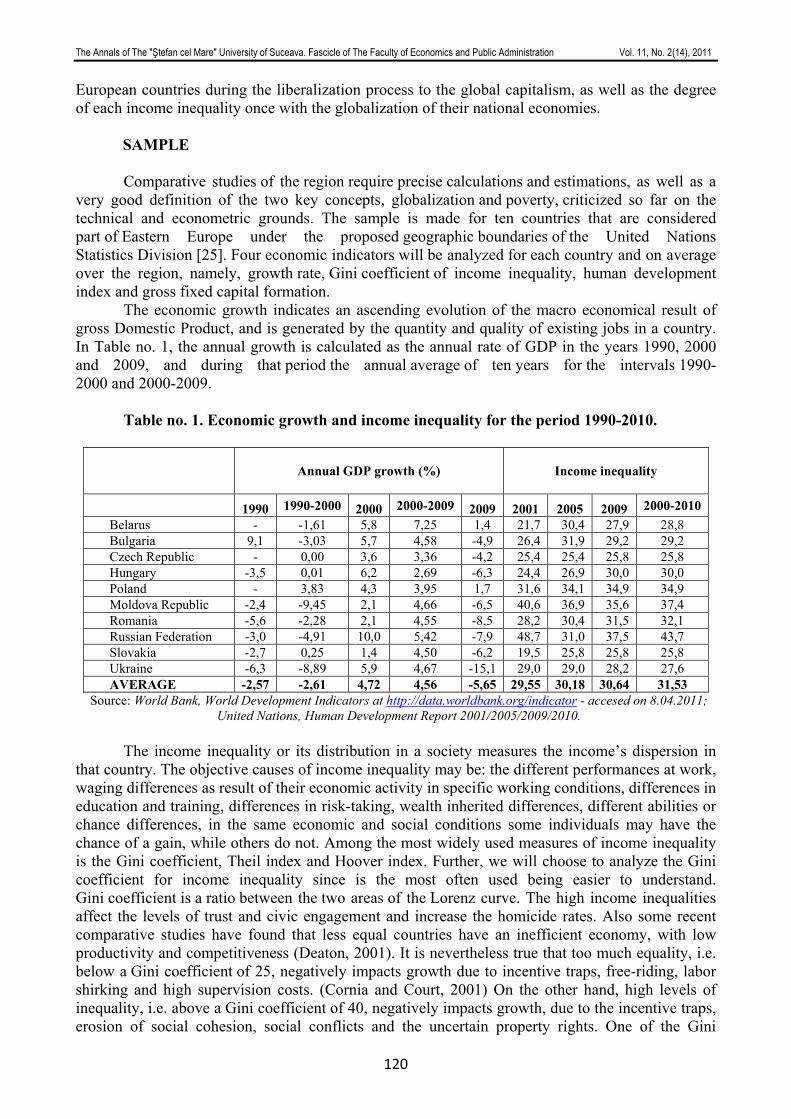
The Annals of The "Ştefan cel Mare" University of Suceava. Fascicle of The Faculty of Economics and Public Administration Vol. 11, No. 2(14), 2011
120
European countries during the liberalization process to the global capitalism, as well as the degree of each income inequality once with the globalization of their national economies.
SAMPLE Comparative studies of the region require precise calculations and estimations, as well as a
very good definition of the two key concepts, globalization and poverty, criticized so far on the technical and econometric grounds. The sample is made for ten countries that are considered part of Eastern Europe under the proposed geographic boundaries of the United Nations Statistics Division [25]. Four economic indicators will be analyzed for each country and on average over the region, namely, growth rate, Gini coefficient of income inequality, human development index and gross fixed capital formation.
The economic growth indicates an ascending evolution of the macro economical result of gross Domestic Product, and is generated by the quantity and quality of existing jobs in a country. In Table no. 1, the annual growth is calculated as the annual rate of GDP in the years 1990, 2000 and 2009, and during that period the annual average of ten years for the intervals 1990-2000 and 2000-2009.
Table no. 1. Economic growth and income inequality for the period 1990-2010.
Annual GDP growth (%)
Income inequality
1990 1990-2000 2000 2000-2009 2009 2001 2005 2009 2000-2010 Belarus - -1,61 5,8 7,25 1,4 21,7 30,4 27,9 28,8 Bulgaria 9,1 -3,03 5,7 4,58 -4,9 26,4 31,9 29,2 29,2 Czech Republic - 0,00 3,6 3,36 -4,2 25,4 25,4 25,8 25,8 Hungary -3,5 0,01 6,2 2,69 -6,3 24,4 26,9 30,0 30,0 Poland - 3,83 4,3 3,95 1,7 31,6 34,1 34,9 34,9 Moldova Republic -2,4 -9,45 2,1 4,66 -6,5 40,6 36,9 35,6 37,4 Romania -5,6 -2,28 2,1 4,55 -8,5 28,2 30,4 31,5 32,1 Russian Federation -3,0 -4,91 10,0 5,42 -7,9 48,7 31,0 37,5 43,7 Slovakia -2,7 0,25 1,4 4,50 -6,2 19,5 25,8 25,8 25,8 Ukraine -6,3 -8,89 5,9 4,67 -15,1 29,0 29,0 28,2 27,6 AVERAGE -2,57 -2,61 4,72 4,56 -5,65 29,55 30,18 30,64 31,53
Source: World Bank, World Development Indicators at http://data.worldbank.org/indicator - accesed on 8.04.2011; United Nations, Human Development Report 2001/2005/2009/2010.
The income inequality or its distribution in a society measures the income’s dispersion in
that country. The objective causes of income inequality may be: the different performances at work, waging differences as result of their economic activity in specific working conditions, differences in education and training, differences in risk-taking, wealth inherited differences, different abilities or chance differences, in the same economic and social conditions some individuals may have the chance of a gain, while others do not. Among the most widely used measures of income inequality is the Gini coefficient, Theil index and Hoover index. Further, we will choose to analyze the Gini coefficient for income inequality since is the most often used being easier to understand. Gini coefficient is a ratio between the two areas of the Lorenz curve. The high income inequalities affect the levels of trust and civic engagement and increase the homicide rates. Also some recent comparative studies have found that less equal countries have an inefficient economy, with low productivity and competitiveness (Deaton, 2001). It is nevertheless true that too much equality, i.e. below a Gini coefficient of 25, negatively impacts growth due to incentive traps, free-riding, labor shirking and high supervision costs. (Cornia and Court, 2001) On the other hand, high levels of inequality, i.e. above a Gini coefficient of 40, negatively impacts growth, due to the incentive traps, erosion of social cohesion, social conflicts and the uncertain property rights. One of the Gini
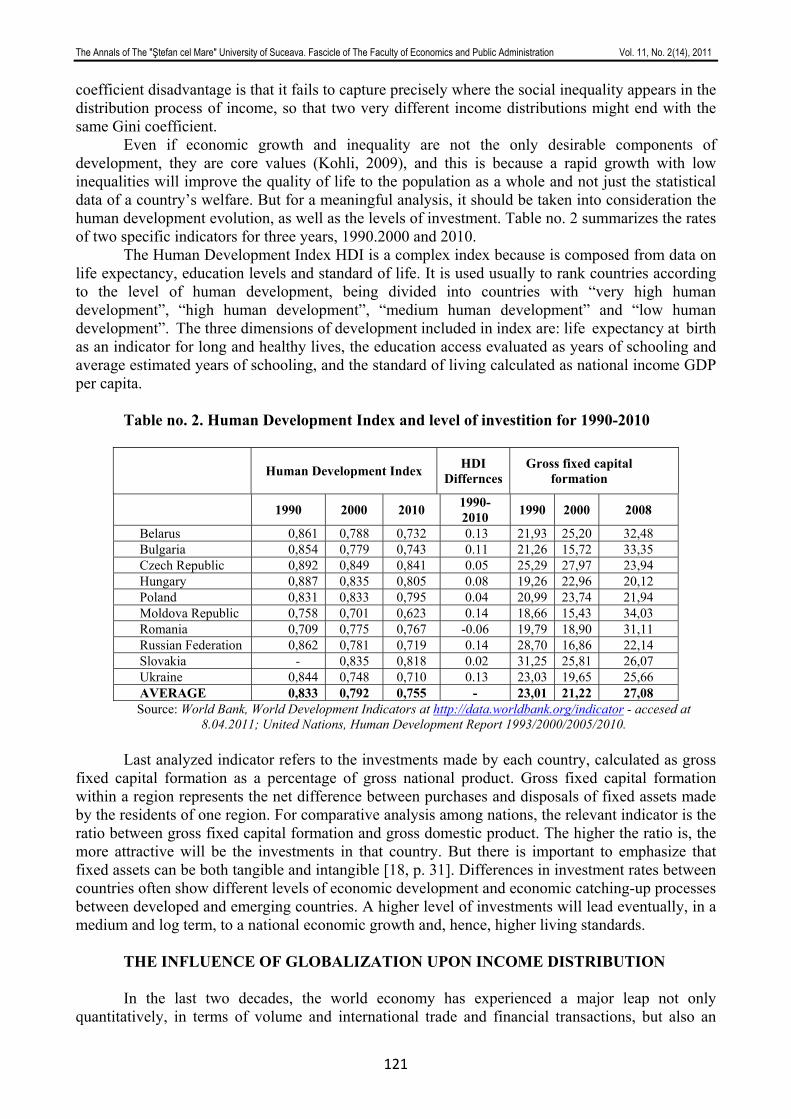
The Annals of The "Ştefan cel Mare" University of Suceava. Fascicle of The Faculty of Economics and Public Administration Vol. 11, No. 2(14), 2011
121
coefficient disadvantage is that it fails to capture precisely where the social inequality appears in the distribution process of income, so that two very different income distributions might end with the same Gini coefficient.
Even if economic growth and inequality are not the only desirable components of development, they are core values (Kohli, 2009), and this is because a rapid growth with low inequalities will improve the quality of life to the population as a whole and not just the statistical data of a country’s welfare. But for a meaningful analysis, it should be taken into consideration the human development evolution, as well as the levels of investment. Table no. 2 summarizes the rates of two specific indicators for three years, 1990.2000 and 2010.
The Human Development Index HDI is a complex index because is composed from data on life expectancy, education levels and standard of life. It is used usually to rank countries according to the level of human development, being divided into countries with “very high human development”, “high human development”, “medium human development” and “low human development”. The three dimensions of development included in index are: life expectancy at birth as an indicator for long and healthy lives, the education access evaluated as years of schooling and average estimated years of schooling, and the standard of living calculated as national income GDP per capita.
Table no. 2. Human Development Index and level of investition for 1990-2010
Human Development Index
HDI Differnces
Gross fixed capital formation
1990 2000 2010 1990-2010 1990 2000 2008
Belarus 0,861 0,788 0,732 0.13 21,93 25,20 32,48 Bulgaria 0,854 0,779 0,743 0.11 21,26 15,72 33,35 Czech Republic 0,892 0,849 0,841 0.05 25,29 27,97 23,94 Hungary 0,887 0,835 0,805 0.08 19,26 22,96 20,12 Poland 0,831 0,833 0,795 0.04 20,99 23,74 21,94 Moldova Republic 0,758 0,701 0,623 0.14 18,66 15,43 34,03 Romania 0,709 0,775 0,767 -0.06 19,79 18,90 31,11 Russian Federation 0,862 0,781 0,719 0.14 28,70 16,86 22,14 Slovakia - 0,835 0,818 0.02 31,25 25,81 26,07 Ukraine 0,844 0,748 0,710 0.13 23,03 19,65 25,66 AVERAGE 0,833 0,792 0,755 - 23,01 21,22 27,08 Source: World Bank, World Development Indicators at http://data.worldbank.org/indicator - accesed at
8.04.2011; United Nations, Human Development Report 1993/2000/2005/2010. Last analyzed indicator refers to the investments made by each country, calculated as gross
fixed capital formation as a percentage of gross national product. Gross fixed capital formation within a region represents the net difference between purchases and disposals of fixed assets made by the residents of one region. For comparative analysis among nations, the relevant indicator is the ratio between gross fixed capital formation and gross domestic product. The higher the ratio is, the more attractive will be the investments in that country. But there is important to emphasize that fixed assets can be both tangible and intangible [18, p. 31]. Differences in investment rates between countries often show different levels of economic development and economic catching-up processes between developed and emerging countries. A higher level of investments will lead eventually, in a medium and log term, to a national economic growth and, hence, higher living standards.
THE INFLUENCE OF GLOBALIZATION UPON INCOME DISTRIBUTION In the last two decades, the world economy has experienced a major leap not only
quantitatively, in terms of volume and international trade and financial transactions, but also an
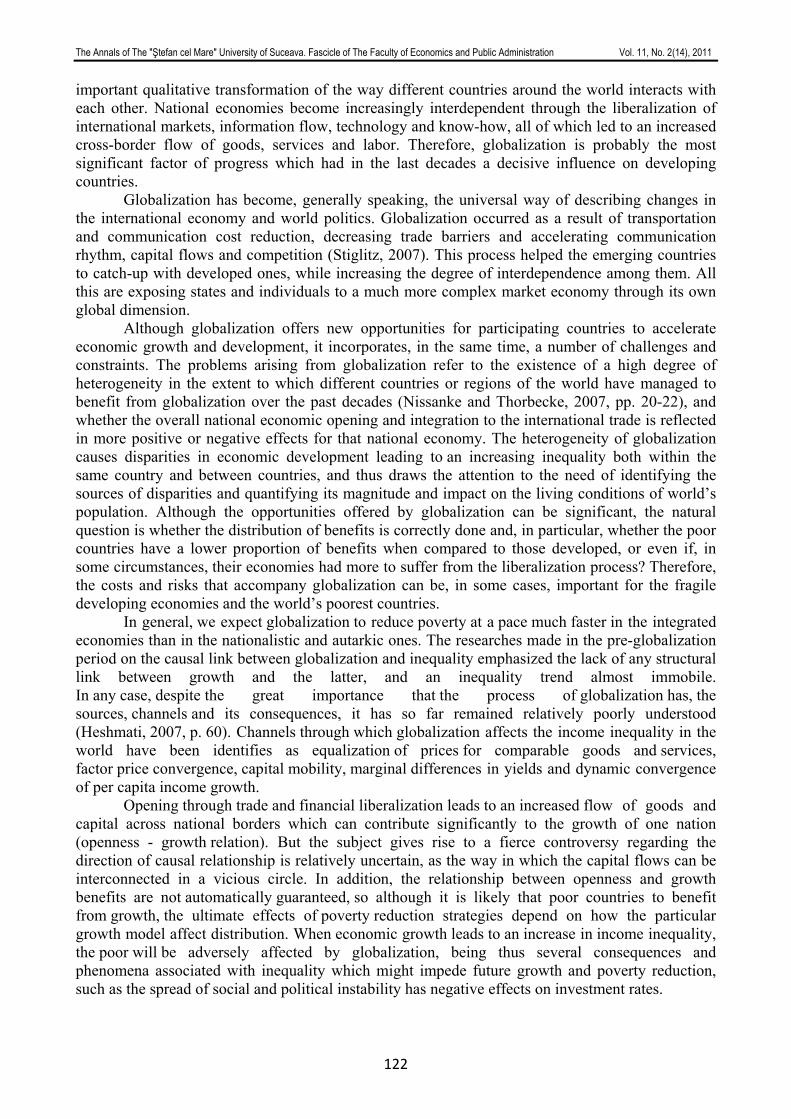
The Annals of The "Ştefan cel Mare" University of Suceava. Fascicle of The Faculty of Economics and Public Administration Vol. 11, No. 2(14), 2011
122
important qualitative transformation of the way different countries around the world interacts with each other. National economies become increasingly interdependent through the liberalization of international markets, information flow, technology and know-how, all of which led to an increased cross-border flow of goods, services and labor. Therefore, globalization is probably the most significant factor of progress which had in the last decades a decisive influence on developing countries.
Globalization has become, generally speaking, the universal way of describing changes in the international economy and world politics. Globalization occurred as a result of transportation and communication cost reduction, decreasing trade barriers and accelerating communication rhythm, capital flows and competition (Stiglitz, 2007). This process helped the emerging countries to catch-up with developed ones, while increasing the degree of interdependence among them. All this are exposing states and individuals to a much more complex market economy through its own global dimension.
Although globalization offers new opportunities for participating countries to accelerate economic growth and development, it incorporates, in the same time, a number of challenges and constraints. The problems arising from globalization refer to the existence of a high degree of heterogeneity in the extent to which different countries or regions of the world have managed to benefit from globalization over the past decades (Nissanke and Thorbecke, 2007, pp. 20-22), and whether the overall national economic opening and integration to the international trade is reflected in more positive or negative effects for that national economy. The heterogeneity of globalization causes disparities in economic development leading to an increasing inequality both within the same country and between countries, and thus draws the attention to the need of identifying the sources of disparities and quantifying its magnitude and impact on the living conditions of world’s population. Although the opportunities offered by globalization can be significant, the natural question is whether the distribution of benefits is correctly done and, in particular, whether the poor countries have a lower proportion of benefits when compared to those developed, or even if, in some circumstances, their economies had more to suffer from the liberalization process? Therefore, the costs and risks that accompany globalization can be, in some cases, important for the fragile developing economies and the world’s poorest countries.
In general, we expect globalization to reduce poverty at a pace much faster in the integrated economies than in the nationalistic and autarkic ones. The researches made in the pre-globalization period on the causal link between globalization and inequality emphasized the lack of any structural link between growth and the latter, and an inequality trend almost immobile. In any case, despite the great importance that the process of globalization has, the sources, channels and its consequences, it has so far remained relatively poorly understood (Heshmati, 2007, p. 60). Channels through which globalization affects the income inequality in the world have been identifies as equalization of prices for comparable goods and services, factor price convergence, capital mobility, marginal differences in yields and dynamic convergence of per capita income growth.
Opening through trade and financial liberalization leads to an increased flow of goods and capital across national borders which can contribute significantly to the growth of one nation (openness - growth relation). But the subject gives rise to a fierce controversy regarding the direction of causal relationship is relatively uncertain, as the way in which the capital flows can be interconnected in a vicious circle. In addition, the relationship between openness and growth benefits are not automatically guaranteed, so although it is likely that poor countries to benefit from growth, the ultimate effects of poverty reduction strategies depend on how the particular growth model affect distribution. When economic growth leads to an increase in income inequality, the poor will be adversely affected by globalization, being thus several consequences and phenomena associated with inequality which might impede future growth and poverty reduction, such as the spread of social and political instability has negative effects on investment rates.
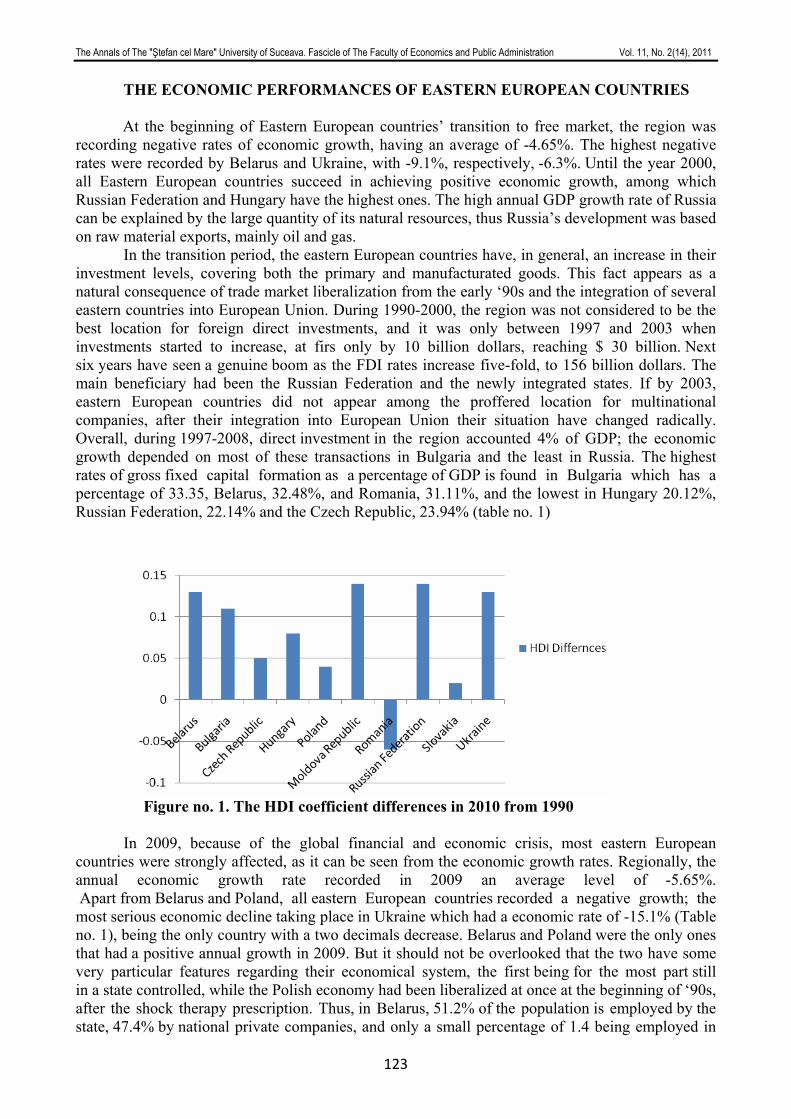
The Annals of The "Ştefan cel Mare" University of Suceava. Fascicle of The Faculty of Economics and Public Administration Vol. 11, No. 2(14), 2011
123
THE ECONOMIC PERFORMANCES OF EASTERN EUROPEAN COUNTRIES At the beginning of Eastern European countries’ transition to free market, the region was
recording negative rates of economic growth, having an average of -4.65%. The highest negative rates were recorded by Belarus and Ukraine, with -9.1%, respectively, -6.3%. Until the year 2000, all Eastern European countries succeed in achieving positive economic growth, among which Russian Federation and Hungary have the highest ones. The high annual GDP growth rate of Russia can be explained by the large quantity of its natural resources, thus Russia’s development was based on raw material exports, mainly oil and gas.
In the transition period, the eastern European countries have, in general, an increase in their investment levels, covering both the primary and manufacturated goods. This fact appears as a natural consequence of trade market liberalization from the early ‘90s and the integration of several eastern countries into European Union. During 1990-2000, the region was not considered to be the best location for foreign direct investments, and it was only between 1997 and 2003 when investments started to increase, at firs only by 10 billion dollars, reaching $ 30 billion. Next six years have seen a genuine boom as the FDI rates increase five-fold, to 156 billion dollars. The main beneficiary had been the Russian Federation and the newly integrated states. If by 2003, eastern European countries did not appear among the proffered location for multinational companies, after their integration into European Union their situation have changed radically. Overall, during 1997-2008, direct investment in the region accounted 4% of GDP; the economic growth depended on most of these transactions in Bulgaria and the least in Russia. The highest rates of gross fixed capital formation as a percentage of GDP is found in Bulgaria which has a percentage of 33.35, Belarus, 32.48%, and Romania, 31.11%, and the lowest in Hungary 20.12%, Russian Federation, 22.14% and the Czech Republic, 23.94% (table no. 1)
Figure no. 1. The HDI coefficient differences in 2010 from 1990 In 2009, because of the global financial and economic crisis, most eastern European
countries were strongly affected, as it can be seen from the economic growth rates. Regionally, the annual economic growth rate recorded in 2009 an average level of -5.65%. Apart from Belarus and Poland, all eastern European countries recorded a negative growth; the most serious economic decline taking place in Ukraine which had a economic rate of -15.1% (Table no. 1), being the only country with a two decimals decrease. Belarus and Poland were the only ones that had a positive annual growth in 2009. But it should not be overlooked that the two have some very particular features regarding their economical system, the first being for the most part still in a state controlled, while the Polish economy had been liberalized at once at the beginning of ‘90s, after the shock therapy prescription. Thus, in Belarus, 51.2% of the population is employed by the state, 47.4% by national private companies, and only a small percentage of 1.4 being employed in
The Annals of The "Ştefan cel Mare" University of Suceava. Fascicle of The Faculty of Economics and Public Administration Vol. 11, No. 2(14), 2011
124
foreign companies. Therefore, it is not surprising that Belarus was not affected by the global crises as the rest of eastern European liberalized economies exposed to external risks.
Interesting to note is also that despite the economic growth and increasing foreign investments, human development index decreased continuously in the last two decades in all eastern European countries, except Romania and Poland. The negative trend cannot be attributed to some cyclical events such as the world economic crisis from 2008 since the trend is maintaining throughout the twenty years of transition. Also, it cannot be associated solely with the transition process as has been observed in other developing regions, only Eastern Europe has experienced depreciations of its HDI coefficient (Susanu, 2011). Among the most significant declines in living standards are in Moldova republic and the Russian Federation where the index felt from 0.758 to 0.623, respectively, from 0.862 to 0.719 (table no. 2), and among the lowest in Romania and Poland where the index changes from 0.709 to 0.767, respectively, from 0.831 to 0.795 (for Slovakia, the difference is calculated between the coefficient in 2000 and 2009). The fact that Romania had an increase in its HDI indicator should not be interpreted as having the highest standard of living in the region because at the beginning of transition, Romania registered a HDI coefficient of only 0.709 [19], the smallest in the entire region. Its increase of the last two decades made Romania the fifth of the ten analyzed countries, after the Czech Republic, Slovakia, Hungary and Poland, and ahead of Bulgaria, Belarus, Russia, Ukraine and Moldova.
THE INCOME INEQUALITY EVOLUTION By the late 1990s, few eastern European countries in transition had made strides in regard of
the deep economic restructuring needed for development, and for some of them the structural tension was lightened by the substantial inflows of external capital. The lack of deep restructuring maintained a high degree of tension in the system and stressed the rent seeking culture (Dăianu, 2000). The conversion from communism to capitalism in Eastern Europe followed a process of privatization, in many cases based on widespread pillage, illegal seizures of public resources and precipitous fall in domestic living standards and production during the first half of the 1990’s (Petras, 2009). Poverty and inequality disempower people and open them to discrimination in many aspects of life and to additional violations of their rights.
During the past decade, the income inequality rates had an oscillating trend. Income inequality, as can be seen in table. 1, recorded a relatively small increases compared to 1990, but most of them still remain with coefficients over 30%, but not exceeding the critical upper level of 40% on a scale of 1 to 100. The highest coefficient of the indicator is made by Russia, Moldova and Poland, with a percentage of 37.5, 35.6 and 34.9, while the lowest are in the Czech Republic and Slovakia, both with a rate of 25.8%. Among the main causes of deterioration of living standards and the rise of income inequality is declining productivity, hyperinflation, rising unemployment and ineffective policies of macroeconomic stabilization.
The Annals of The "Ştefan cel Mare" University of Suceava. Fascicle of The Faculty of Economics and Public Administration Vol. 11, No. 2(14), 2011
125
Figure no. 2. Income inequality level during 2000-2010.
In most Eastern European states liberalization was achieved almost overnight as in Poland
and Czechoslovakia, and shortly afterwards, prices with the exception for those of utilities and real estate were left to be formed by the markets’ forces, and foreign trade monopolies were eliminated boosting thus both exports and imports (Lavigne, 2000). But problems arose from the process of the structural changing with the privatization of state-owned enterprises and of the banking sector. Eastern European countries began the transition with some of the lowest levels of inequality in the world. During the transition however the inequality increased steadily in all of the economies from the region [24]. Gaps between rich and poor are widening in many countries—in the Russian Federation the Gini coefficient rose from 0.24 to 0.48 between 1987–88 and 1993–95. It is tempting to attribute increasing inequality to reforms and liberalization, but this is only one perspective. While inequality has increased almost everywhere, the more advanced reforms show much equal rather than unequal outcomes compared with less advanced reformers. And this difference cannot be solely explained by different conditions across the countries at the start of transition (Susanu, 2011). A World Bank study from 2000 shows that positive developments largely explain the rise in inequality in Eastern Europe: rising returns to education, decompressing wages, and emerging returns to risk taking and entrepreneurship. These forces are welcome despite the increase in inequality because they signal that the market is now rewarding skills and effort, as in the more mature market economies.
Simai believes that without major changes in economic and social policies, the inequality and human capital erosion will continue in most Eastern European countries (Simai, 2006). For such changes to take place, Simai argues that a change in the government power structure is imminent, and in spite of the current uncertain and problematic way to progress, a new middle class is needed. Transition has eroded employment guarantees and ended extensive state employment. Before the fall of the Berlin Wall, 9 of 10 people in socialist countries were employed by the state, compared with 2 of 10 in Organisation for Economic Cooperation and Development economies [23]. While the privileged elite often attained higher material well-being, the measured differences in income were narrow. We conclude therefore that, overall, in Eastern Europe the gaps in health between highland low-income groups tend to be large, especially since all of the countries in the region are developing. It is not less true that a slightly high income inequality in emerging countries can also signal that the market is now rewarding skills and effort, as in the more mature market economies, income inequalities being just a natural effect of liberalization.
The Annals of The "Ştefan cel Mare" University of Suceava. Fascicle of The Faculty of Economics and Public Administration Vol. 11, No. 2(14), 2011
126
CONCLUSIONS The market liberalization from the ’80s and globalization, in general, are subjects that are
always raising a series of questions about their effectiveness, fairness and ethics. Globalization, through the market liberalization and economic privatization, managed to facilitate the development of several post-communist countries and their integration into international economic organizations, like many eastern European countries which entered into NATO and European Union, the Latin Americans which associated as Mercosur and ALADI or the Southeast Asian countries which formed organizations such as ASEAN or APEC. Although globalization has enormous potential to accelerate economic growth and development through integration into the global economy, technology transfer and knowledge dissemination, the impact of globalization on poverty reduction was uneven, and in some cases, even marginal.
In Eastern Europe, the transition process had a more negative trend with results such as increasing income inequality, de-industrialization, de-modernization and spread of poverty. The evolution of the capitalist economic system in this region remains dominated by a few financial-industrial groups with strong political influence focused on raw material exploitation and small and medium sector. Income inequality in Eastern Europe had a relatively low increased during the last two decades, but the human development index recorded a continuous degradation of the living standards from the region. The questions that arose from this are related to the direction of causal relationship between liberalization and economic growth, or the effect of income inequality in developing countries.
In conclusion, we believe that the economic globalization process has many economic and financial levers to accelerate growth in developing regions of the world, and if they will be used efficiently and morally, globalization is likely in the next decade to succeed in reducing the extreme poverty, which according to World Bank refers to individuals who live on less than $ 1 per day. And the degree at which globalization will succeed in reducing poverty will be determined by the way in which the next economical growth will be or not accompanied by increasing income inequality.
BIBLIOGRAPHY
1. Agenor, Pierre Richard, Does Globalization Hurt the Poor?, Unpublished manuscript, World Bank, Washington, DC., 2005;
2. Atkinson, A.B., and A. Brandolini. On Analyzing the World Distribution of Income. World Bank Economy Review (2010) 24 (1): 1-37.
3. Cornia, G.A., and J. Court. Inequality, Growth and Poverty in the Era of Liberalization and Globalization. Helsinki: UNU World Institute for Development Economics Research, 2007.
4. Dăianu, Daniel, Încotro se îndreaptă ţările postcomuniste?, Polirom, Iaşi, 2000; 5. Deaton, A. Health, inequality and economic development. Princeton: Research Program in
Development Studies, 2001. 6. Galbraith, J.K.. Inequality and economic and political change: a comparative perspective.
Cambridge Journal of Regions, Economy and Society (2010). 7. Heshmati, Almas. The Relationship between Income Inequality, Poverty and
Globalization, pp. 59-93, în Nissanke, Machiko, Thorbecke, Eric, The Impact of Globalization on the World’s Poor. New York: Palgrave Macmillan, 2007.
8. Kohli, A., Nationalist Versus Dependent Capitalist Development: Alternate Pathways of Asia and Latin America in a Globalized World. Springer Science + Business Media 44 (July 2009): 386-410.
9. Lavigne, M., The Economics of the transition Process: What Have We Learned?” M E Sharpe, Problems of Post-Communism 47, no. 4 (July/August 2000): 16-23.
The Annals of The "Ştefan cel Mare" University of Suceava. Fascicle of The Faculty of Economics and Public Administration Vol. 11, No. 2(14), 2011
127
10. Nissanke, Machiko, Thorbecke, Eric, The Impact of Globalization on the World’s Poor. New York: Palgrave Macmillan, 2007.
11. Petras, J., Worldwide Depression: Regional Impacts of the Global Crisis. Global Research, no. 5 (April 2009).
12. Pritchett, L., Who is Not Poor? Dreaming of a World Truly Free of Poverty. World Bank Research Observer (Spring 2006) 21 (1): 1-23.
13. Ravallion, M., A Comparative Perspective on Poverty Reduction in Brazil, China, and India. World Bank Research Observer (2006).
14. Reis, E.P., M. Moore and Z. Books, Elite Perceptions of Poverty and Inequality. Community Development Journal (April 2006) 41 (2): 260-262.
15. Simai, M., Poverty and Inequality in Eastern Europe and the CIS Transition Economies. DESA Working Paper, No. 17, 2006, la http://www.un.org/esa/desa/papers/2006/wp17_2006.pdf - accesat 15.04.2010;
16. Stiglitz, Joseph, Making Globalization Work, Penguin Group, London, 2007; 17. Susanu, C.G.. The Capitalist Development Pathway of Eastern Europe: A Comparative
Study between Eastern Europe, Southeast Asia and Latin America. Romanian Economic Journal (2011), 14(39): 175-201.
18. Voinea, Liviu, coord., Manual de evaluare a competitvităţii regionale, Grupul de Economie Aplicată, 2007.
19. HDR 1993. „Human Development Report 1993”. New York: United Nations Development Programme: 2010.
20. HDR 2000. „Human Development Report 2000”. New York: United Nations Development Programme.
21. HDR 2002. „Human Development Report 2002”. New York: United Nations Development Programme.
22. HDR 2005. „Human Development Report 2005”. New York: United Nations Development Programme.
23. HDR 2010. „Human Development Report 2010”. New York: United Nations Development Programme.
24. The World Bank. World Development Indicators la http://data.worldbank.org/indicator - accesat la 10.04.2011.
25. United Nations Statistics Division. Geographical region and composition. United Nations: 2010 la http://unstats.un.org/unsd/methods/m49/m49regin.htm - accesat la 5.04.2011.
The Annals of The "Ştefan cel Mare" University of Suceava. Fascicle of The Faculty of Economics and Public Administration Vol. 11, No. 2(14), 2011
128
HOW CAN WE ANTICIPATE CRISES?
Ph.D. Student Elena Bianca VIERU University Alexandru Ioan Cuza of Iași, Romania
Abstract: Every crisis should teach us a valuable lesson. However, it seems that we learn almost nothing since they still
occur from time to time strongly affecting the world economies. The basic question from where we started our research and to which we tried to answer as clearly as possible is the following: How can we anticipate future crises before they begin to make their presence felt on the global economic scene? The answer is both simple and handy, as the most consistent and relevant explanations in this regard come from the Austrian School of economics. We refer, in particular, to the theory of business cycle. Analyzing this problem, we discovered multiple causes, or better said clues that might help us anticipate and recognize the onset time of economic recessions. We will focus on two of them, considered to be the most important ones. The first clue is closely linked to an expansionary monetary policy that led to a deterioration of credit and to inflation. The second sign that we will be argued in this paper, a sign in close connection with the first clue, is due to the application of protectionist measures or, in other words, the second cause was actually the state’s interventionism.
Keywords: Austrian School, business cycle, crisis, expansion, interventionism JEL Classification: B 13, B 25, B 53, E 32, E 40, E 51, G 21 INTRODUCTION We all have been affected over time by the economic crises that caught us in the middle.
And, most of the times, we were unable to find a clear and relevant response to give us the necessary clarifications. Therefore, we tried to give a clear answer to the question that is on everyone’s lips: Why do these economic crises occur?
The purpose of this paper is to highlight, from the perspective of an „austrian” mind, the main causes that can be blamed for triggering the recessions in general and the current global imbalance in particular and then to analyze the two main actors: monetary expansion though the state’s interventionism.
The main figures that represent the Austrian School of economics are able to see pass the appearances and consider as the main cause of the present situation, hyper-reglementation and believe that the imbalances are in fact normal and predictable expectations from a market that is suffocated by the burden of interventionism.
On this basis, economists representing the Austrian School have succeeded in reviving the most significant elements that have the guilt for the wrong policies, such as: the fractional-reserve problem, the role and effectiveness of national banks, the utility of hyper-regulation and last but not least, the role of risk management institutions.
CAUSES, CAUSES AND AGAIN CAUSES... Although some might say that the current crisis came without any warning, what could we
have expected, given the chaos on the global economic scene, a chaos which has been taking place for several years? The present situation does not represent a market failure, but a normal and predictable effect from an economic point of view, of government intervention in economy.
This situation that we have been dealing with for more than three years now, was thus, by no means, the fault of the capitalist system, as some might rush to support. But we might say that it was an error made by the government, an error manifested by an unjustified intervention in an ensemble as complex as the economy. We are talking about a vicious government policy materialized in a flawed monetary policy.
The Annals of The "Ştefan cel Mare" University of Suceava. Fascicle of The Faculty of Economics and Public Administration Vol. 11, No. 2(14), 2011
129
The safety inspired to people by banks, as well as their faith in government when it comes to handling as efficiently as possible micro and macroeconomics, have been compromised during the past years.
From the microeconomic point of view, emerges the idea that regulations used so far proved incapable of solving the problems, even more, they are responsible for the unhealthy way in which banks operate today. From the macroeconomic perspective, we are dealing with the hypothesis which claims that the starting point of the crisis is closely linked to the recent global economic imbalances, the reference here being made to the interest rate’s fluctuations, to the surplus of money from circulation, as well as to the interventions that aim to stimulate mortgage loans.
In order to understand much better the events that are happening around us, it is absolutely necessary to return to Ludwig von Mises and Friedrich Auguste von Hayek! What we have been dealing with, and unfortunately still have to face, is not a consequence of the lack of demand, in other words a lack of consumption or investment, as John Maynard Keynes used to claim. As a result, the state’s interventionism prescribed by Keynes and practiced in an abusive way is not righteous at all. On the contrary, these suffocating actions have only extended and deepened what they have already started: the crisis. A first cause for the present crisis is being outlined, a cause that can rightly be regarded as a triggering one. We are talking about the already known state interventionism (1), an interventionism indicated by the faulty monetary policies (2). As a basic factor of the crisis is the inflationary policy from the early 2000s, namely the “monetary relaxation” policy applied by Alan Greenspan. From this point springs the nature of all troubles.
We have to bring in light the fractional reserve system (3) as well, as a major cause which requires our attention. This system was accepted, legalized and permanently supported by the government, rather than a healthy and clean system as the one based on the 100% reserve. Within this system it is created the possibility of multiplying, therefore credit expansion, because of the confusion between real savings (refraining from present consumption) and fictional savings (which is based on money substitutes). Unfortunately, today if one mentions the abolition of fractional reserve system and proposes the return to the one based on the 100% reserve, the risk of being seen with bad eyes or considered an eccentric occurs. This brings us to another important cause which underlines the foundation of the current crisis, namely the artificial expansion of credit (4). This expansion has lead to a drastic decrease in the value of interest rates, which gave the impression of feasibility to some investments that were not at all possible because in reality they were not supported by the people’s savings needed for completion. Entrepreneurs were thrown against the wall. Hardly had they realized how things really work and that they cannot finish what they have already started. In their desperate attempt to save something, they continued to resort to banks, demanding for more and more credit. A loan that was much more expensive.
We should definitely mention as a cause of the current crisis the mortgage “boom” (5). The crisis basically erupted when the U.S. real estate bubble exploded in 2007. Gathered all together, the lax standards for approving the loans, the original advantageous terms and the long term expectations of growth in house prices, represented the needle that broke the bubble. If in 1994, 64% of the American population owned a home, in 2004 this value reached a record share of 69,2%. House prices recorded a noteworthy increase, especially between the years 1997-2006, more accurate an increase of 124%. Compared with the average annual household income, the average price of houses has increased from approximately 3 times to 4,6 times the average annual income in 2006. Mortgage loans with high risk (the subprime loans) increased from 5% in 1994 to 20% of all mortgage loans in 2006. The use of the new type of loans called NINJA (No Income No Job No Assets) has created real problems. As a result of the real estate bubble burst, everyone who invested in the real estate sector suffered tremendously. The signs of panic determined the financial institutions to admit the subprime mortgage losses and made every possible effort to follow a series of recovery measures. But it was already too late…
Finally, it should be noted as a cause that stood as foundation for the current recession the moral hazard (6) as well. Counting on the government as a last resort, the bankers have displayed an inappropriate behavior involving a multitude of risks. Who would worry about the good and

The Annals of The "Ştefan cel Mare" University of Suceava. Fascicle of The Faculty of Economics and Public Administration Vol. 11, No. 2(14), 2011
130
correct economic functioning when it is known that the encountered problems, the possible losses can be easily passed to the state? The state, through central banks that are specialized in the issue of currency, became known as the lender of last resort. He is able to clean the mess as it costs almost nothing to produce the money needed to cover those loses. This is essentially what the moral hazard represents.
However, we must remember a very important aspect, namely that the sin for what has happened, is still happening and most likely will happen in the future, undoubtedly falls on the shoulders of the STATE.
EXPANSION AND INTERVENTIONISM – DREADED ENEMIES The main reason for the triggering of economic crisis is, without any doubt, the monetary
expansion. The current crisis was no exception. First Mises and a little bit later, with relevant improvements and contributions, Hayek have
succeeded in presenting as clearly as possible the mechanism through which monetary expansion, accompanied by loans that exceed the rate of voluntary saving, could lead to a misallocation of resources, particularly affecting the capital structure. They are the ones who laid the foundation of the business cycle theory, a complex and logical theory that once understood can be a real treatment for the economies that apply it.
The business cycle theory is one of the strongest Austrian contributions to economics. The traditional Austrian point of view regarding the economic cycles begins with Mises (1912) and Hayek (1935) and changes very little over the years.
While explaining the business cycle, Mises starts with the distinction between the commodity credits which are transfers of savings from the hands of the people who initially chose to save to the hands of entrepreneurs who intend to use these funds in the process of production and the circulation credits which are granted by banks and are, as Mises use to say: “Circulation credit is granted out of funds especially created for this purpose by the banks. It increases the amount of money substitutes, of things which are taken and spent by the public in the same way in which they deal with money proper. It increases the buying power of the debtors. The debtors enter the market of factors of production with an additional demand, which would not have existed except for the creation of such banknotes and deposits. It is the main tool of policies aiming at cheap or easy money” (Mises, 1933).
In the terms of the current economy we are talking about the distinction between time and demand deposits. For years banks have been operating with the fractional reserve system, an unhealthy system that does not help us realize the major differences that exist between these two types of deposits. Whereas for the demand deposits the ownership remains permanently in the hands of the depositor, the bank being only engaged into keeping the deposit, protecting and returning it at any time the depositor might ask for it (Huerta de Soto, 2010a), in the case of time deposits, the ownership is temporarily transferred to the bank, the bank having the right to use that deposit for its own benefit throughout the contract, returning on the due date the exact amount plus the accrued interest. This is how a healthy banking system should work. We are talking about the 100% reserve system to which urges the Austrian School and which has long been forgotten. Unfortunately, at the urge and with the state’s support, the banks, hungry for substantial profit, began to grant loans based on demand deposits, practically they began to create money out of nothing. This additional amount of currency in circulation, this monetary expansion does not only lead to inflation, but also manages to draw down the credit along with the interest rate. How is this thing possible? We will take as an example in our analysis the current economic recession.
The crisis we are currently facing much too long already has as a starting point the monetary expansion during the mandate of Alan Greenspan at the FED. The constant fear regarding the onset of a possible deflation, due to the “dot.com” burst from 2000 and the events that took place on September 11, 2001 determined the Federal Reserve to resort to a series of measurements in order to revitalize the credit by lowering the normal level of interest rate. It started from an average of
The Annals of The "Ştefan cel Mare" University of Suceava. Fascicle of The Faculty of Economics and Public Administration Vol. 11, No. 2(14), 2011
131
6.5% in November 2000 and it got to the incredibly small value of only 1% in July 2003, a value at which it remained for almost a year, precisely until June 2004. The result brought, as expected, a series of new liquidity injections in economy, leading to a situation where “there are more headlines than money” according to the explanations given by Jörg Guido Hülsmann (Hülsmann, 2000). From the demand deposits banks have borrowed most part of the amount which, having reached another bank, represented the basis for a new loan. When we say most part of the amount, we refer to a value situated around 90%, the remaining of 10% representing the liquidity kept by banks for possible withdrawals. This is the fractional reserve system, a system that boosts on short term the economy by giving a promising momentum, but has disastrous long-term effects as it inevitably leads to the triggering of economic recessions.
These far too low interest rates represent the main instrument by which this expansion was operated, an expansion which was felt in the strongest way in the real estate sector. The manner in which loans were granted, “just by identity card”, to use the Romanian version, without a prior verification of their solvency or some potential guarantees led to an avalanche of loans that had a high degree of risk, the so-called “subprime” loans.
In 2004, when the FED had already begun to realize the harm that has been done until then, it was already too late. We refer mainly to the inflationary policy on which it relied until then, a policy of cheap money that was reached by reducing the normal value of interest rate. It all resorted from that moment on at a gradual increase of this value, hoping to avoid a new round of expansion. What actually happened was a reduction in the number of credits directed towards the real estate sector, which has determined a collapse of the real estate price. A large number of mortgage debts was accumulated, debts that were increasingly more difficult to refund and put pressure on bank’s liquidity, causing the failure of the lending action. The uncertainty determined banks to no longer lend to each other on the interbank market, all these marking the road towards a blockage of lending and cash flow. The scenario needed for triggering the crisis was ready to be implemented.
The first clue to a possible trigger of the current crisis could be seized since February 2007 when, in the U.S. the number of debts to the reimbursement of loans given on the “subprime” segment expanded. That was the moment when the actual bankruptcy of certain banks began, as they simply couldn’t handle the situation anymore. August 2007 can also be considered a trail that led to the outbreak of the current recession. In fact, if we analyze the situation, August 2007 can be considered the triggering point of today’s crisis. Stock markets collapsed at that point and the central banks did not stand aside and did not leave the market to self regulate as they should, but chose to interfere in order to support liquidity.
The expansion we have experienced during the last couple of years, this artificial boom exploded in 2007 and this explosion brought into light a crisis that has been smoldering lying in secrecy. The triggering point of the current crisis depended very much, as we have already seen, on the degree of government intervention in economy. The more the state was involved and tried to help through the imposed measures, the later the effects could be envisioned, gaining a more pernicious aspect. The adopted measures and the massive intervention in the economic mechanism have only postponed the triggering moment of the current recession, a delay of the inevitable.
One important thing should be well understood: when we have interventionism and expansion, we cannot escape from any recession.
THE AUSTRIAN THERAPEUTIC We have to admit that the problem we face is a very serious one. These recessions affect us
very much and they have to stop. How can we treat this disease that attacks the economy? In order to free ourselves from such situations to which we do not seem to be able to find solutions, we definitely need to implement radical measures.
In our attempt to find a possible treatment for the current situation, we will choose the path suggested by Jesus Huerta de Soto. This path involves creating a free financial-monetary system through the introduction of three major steps:
The Annals of The "Ştefan cel Mare" University of Suceava. Fascicle of The Faculty of Economics and Public Administration Vol. 11, No. 2(14), 2011
132
1. The return to the 100% reserve system, a system that has long been buried by the greedily banks. It is required an immediate withdrawal from the fractional reserve system and imposing the rule of keeping a 100% reserve at all times for the demand deposits, complying the traditional principles of law. It will also be taken into account the payment of certain custody fees. De Soto strongly believes that “nobody, not even a banker, should enjoy the privilege of lending something that has been entrusted to him as a demand deposit” (Huerta de Soto, 2010a).
2. Stopping state intervention in economy, the abolition of central banks and establishing a system of free enterprise banking. The monopoly exercised by central banks for a while now, along with the idea that these central banks dictate the monetary policy gives the impression of a return to the socialist system, the one with planned economies, against whom we fought for years. In addition, banks will become increasingly dangerous and will continue their destructive policy as long as they realize that the state, with the help of the money machine that is the central bank, comes to their rescue regardless of the situation and provides the coveted liquidity.
3. The complete freedom of choosing the currency, based on a standard metal (gold) that will replace all previously issued fiduciary media. De Soto supports, therefore, the privatization of the existing money and pleads for adopting a monetary system that cannot be manipulated by people, such as, for example, the former gold standard.
This radical reform will undoubtedly mark the death of the socialism that is apparently still haunting us. We believe this because our proposed therapy will entail a series of liberating principles that will give full rein to private property and will release the financial-banking system from the burden of central planning, the extreme interventionism and the monopoly exercised by the state.
CONCLUSIONS
We all are, or at least we should be, aware of the tragedy that arises from this string of events that affects the economy. But more tragic is the lack of accurate information about the triggering of economic recessions. A better understanding of the causes that triggered this atmosphere of confusion and uncertainty could be a real liberating solution.
The current crisis is clearly not a market failure as many economists rush to believe, but it is an error caused by the government’s intervention through central banks. In this regard, we consider to be quite relevant Jesus Huerta de Soto’s statement who claims that:
“Of course the spontaneous order of the unhampered market is not responsible for the current situation. And one of the most typical consequences of every past crisis and of course of this current one, is how many people are blaming the market and firmly believing that the recession is a market failure that requires more government intervention. The market is a process that spontaneously reacts in the way we have seen against the monetary aggression of the bubble years, which consisted of a huge credit expansion that was not only allowed but even orchestrated and directed by Central Banks, which are the institutions truly responsible for all the economic sufferings from the crisis and recession that are affecting the world”(Huerta de Soto, 2010b).
According to the Austrian economists, as the fundament for the initial phase of the cycle stands an increase in the volume of credit in economy. This generally occurs through an increase of prices and a decrease of interest rate below that level which would prevail in the absence of currency fluctuation (Rothbard, 2008). This extension of loans may be caused both by central bank intervention and by the fractional reserve system (Huerta de Soto, 2010a).
Broadly, the business cycle can be explained as follows (Rothbard, 1980): in a harmonious market economy appears an expansion of loans and money, encouraged and promoted by the government and its central bank. As the banks increase their money supply (currency or deposits) granting loans to companies, they push the interest rate below the “natural” rate of time preference,
The Annals of The "Ştefan cel Mare" University of Suceava. Fascicle of The Faculty of Economics and Public Administration Vol. 11, No. 2(14), 2011
133
meaning under the rate of the free market that reflect the public willing proportions between consumption and investment.
The first visible effect is therefore a relative increase in the prices of all the materials required in production (the concept of relative increase in prices refers to the prices of production goods in terms of consumption goods). As the prices of production goods will grow increasingly more, the profitability of investments will tend to decrease. If credit expansion does not accelerate, the increase in the prices of production goods will catch up the consumption prices, causing a drastic decrease in profitability. The crisis is triggered when, at the existing prices, producers cannot sell their goods (Mises, 1978). This explanation can be applied to the current situation as well.
Therefore, the main causes of economic crises that are responsible for economic crises are artificial credit expansion and state’s interventionism. The current crisis has followed the same “pattern”.
REFERENCES
1. Bouckaert, Boudewijn, Godard, Anette (2000), Hayek revisited, Cheltenham, United Kingdom
2. Ebeling, Richard M. (1996), The Austrian Theory of the Trade Cycle, Available at http://mises.org/books/austtrad.pdf
3. Ebeling, Richard M. (2007), Austrian Economics and the Political Economy of Freedom, Available at http://www.thefreemanonline.org/featured/austrian-economics-and-the-political-economy-of-freedom/
4. Evans, Anthony J., Baxendale, Toby (2008), Austrian Business Cycle Theory in Light of Rational Expectations: The Role of Heterogeneity, the Monetary Footprint, and Adverse Selection in Monetary Expansion, Available at http://mises.org/journals/qjae/pdf/qjae11_2_1.pdf
5. Garrison, R. (1991), New Classical and Old Austrian economics: Equilibrium business cycle theory in perspective, Available at http://www.springerlink.com/content/mt77546122125j36/
6. Hayek, A. Friedrich (1933), Monetary theory and the trade cycle, Available at http://mises.org/daily/3121
7. Hayek, Friedrich A. (1935/1967), Prices and Production, 2nd edition New York: Augustus M. Kelley.
8. Hill, Greg (2010), From Hayek to Keynes: G.L.S. shackle and ignorance of the future, Available at http://works.bepress.com/cgi/viewcontent.cgi?article=1004&context=greg_hill
9. Huerta, Jesus de Soto (2010), Moneda, creditul bancar şi ciclurile economice, Editura Universităţii „Alexandru Ioan Cuza” Iaşi, Institutul „Ludwig von Mises” România
10. Huerta, Jesus de Soto (2010), Economic Recessions, Banking Reform and the Future of Capitalism, Available at http://www.cobdencentre.org/author/huertadesoto/
11. Huerta, Jesus de Soto (2008), Financial Crisis and Recession, Available at http://mises.org/daily/3138
12. Huerta, Jesus de Soto (2008), The Essence of the Austrian School, Available at http://onlinelibrary.wiley.com/doi/10.1111/j.1468-0270.2009.01892.x/full
13. Hülsmann, Jörg, Guido (2000), Banks Cannot Create Money, Independent Review, V, No. 1, pp. 101-110, Avaliable at http://mises.ro/730/
14. Klausinger, Hansjorg (2005), The Austrians on relative inflation as a Cause of Crisis, Available at http://econpapers.repec.org/article/cupjhisec/v_3a25_3ay_3a2003_3ai_3a02_3ap_3a221-237_5f00.htm
15. Mises, Ludwig von (1963), Human Action. A Treatise on Economics, Available at http://mises.org/books/humanaction.pdf
The Annals of The "Ştefan cel Mare" University of Suceava. Fascicle of The Faculty of Economics and Public Administration Vol. 11, No. 2(14), 2011
134
16. Mises, Ludwig von (1981), The Theory of Money and Credit, Available at http://www.econlib.org/library/Mises/msT.html
17. Mises, Ludwig von (2006), The Causes of the Economic Crisis (And Other Essays Before and After the Great Depression), originally published as On the Manipulation of Money and Credit in 1978, Available at http://mises.org/resources/3361
18. Mises, Ludwig von (1933), The current status of business cycle. Research and its prospect for the immediate future, Princeton, Princeton University Press
19. Rothbard, Murray N. (2008), Economic Depressions: Their Cause and Cure, Available at http://mises.org/daily/3127
20. Rothbard, Murray N. (1980), Ludwig von Mises pe înţelesul tuturor, Available at http://mises.ro/244/
21. Rothbard, Murray N. (1990), What Has the Government Done With Our Money, Available at http://mises.org/books/whathasgovernmentdone.pdf
22. Roubini, Nouriel, Mihm, Stephen (2010), Economia crizelor. Curs-fulger despre viitorul finanţelor, Editura Publica, Bucureşti
This work was supported by the the European Social Fund in Romania, under the responsibility of the Managing Authority for the Sectoral Operational Programme for Human Resources Development 2007-2013 [grant POSDRU/CPP 107/DMI 1.5/S/78342]

SECTION 2
MANAGEMENT AND BUSINESS ADMINISTRATION
The Annals of The "Ştefan cel Mare" University of Suceava. Fascicle of The Faculty of Economics and Public Administration Vol. 11, No. 2(14), 2011
SUSTAINABLE DEVELOPMENT POLICIES IMPACT ON FOREIGN DIRECT INVESTMENT
Associate Professor PhD. Costică MIHAI
Faculty of Economics and Business Administration „Alexandru Ioan Cuza” University of Iaşi, Romania
Abstract: Increased environmental matters bring about the reconsideration of the development policies. In many
countries, by adopting the principles of sustainable development, severe restrictions were imposed on the economic activities. A change in the investment behaviour of companies is therefore necessary with a view to adapting their strategies to the restrictions concerning the use of the natural environment. As far as foreign direct investment is concerned, quantitative and structural variations are registered both as a reaction to the change in the conditions for carrying out business activities and as a response to changing management according to the requirements of sustainable development. By means of this study, we would like to highlight the directions adopted at the level of the management of multinational companies concerning the foreign direct investment in these circumstances.
Keywords: multinational management, foreign direct investment, sustainable development policies, multinational corporation, corporate responsability
JEL Classification: F21, M16, Q56 INTRODUCTION Despite their importance, the environmental goods and services available for the economy
and the society have been always undermined from the economic point of view, especially in the case of those environmental aspects which are not directly and visibly included into the processes related to different activities. Without being traded on any market, they remained outside the mechanism of the market, they were not “assessed” by means of the price system or they were related by circumstances to the system of economic levers from the dominant positions of the economic policy even if they manifested continuously and anywhere their essential character.
Nevertheless, as a result of a thorough analysis, the environment – in its whole, is a very important economic factor which, besides capital and work, can be traditionally considered as a factor of production.
For the economic and social system, the natural environment has at least a double functionality: it is a productive factor, generating primary inputs for different activities, also being “the recipient” of the residues generated by the production and consumption processes which will or will not be absorbed and neutralised in the complex framework of natural ecosystems according to their assimilation capacity.
However, the environment also provides a set of general services, being a “provider” of recreational services or other services related to the concept of the quality of life whose demand is caused by the level of development of society.
THE PRESENT EVOLUTION OF THE ENVIRONMENT AND ITS EFFECTS ON FOREIGN DIRECT INVESTMENT
Scientific literature pays special attention to the impact of foreign direct investment on the
economies and on the development of the countries in which they are carried out. It is assessed that, by their means, a spread and a more efficient use of technologies and resources takes place (Borensztein, Gregorio, & Lee, 1998, p.116). In fact, an infusion of capital, technology and knowledge takes place in the receiving economies of foreign direct investment and in case they are characterized by reduced levels of performance, the effect is one related to development, manifested
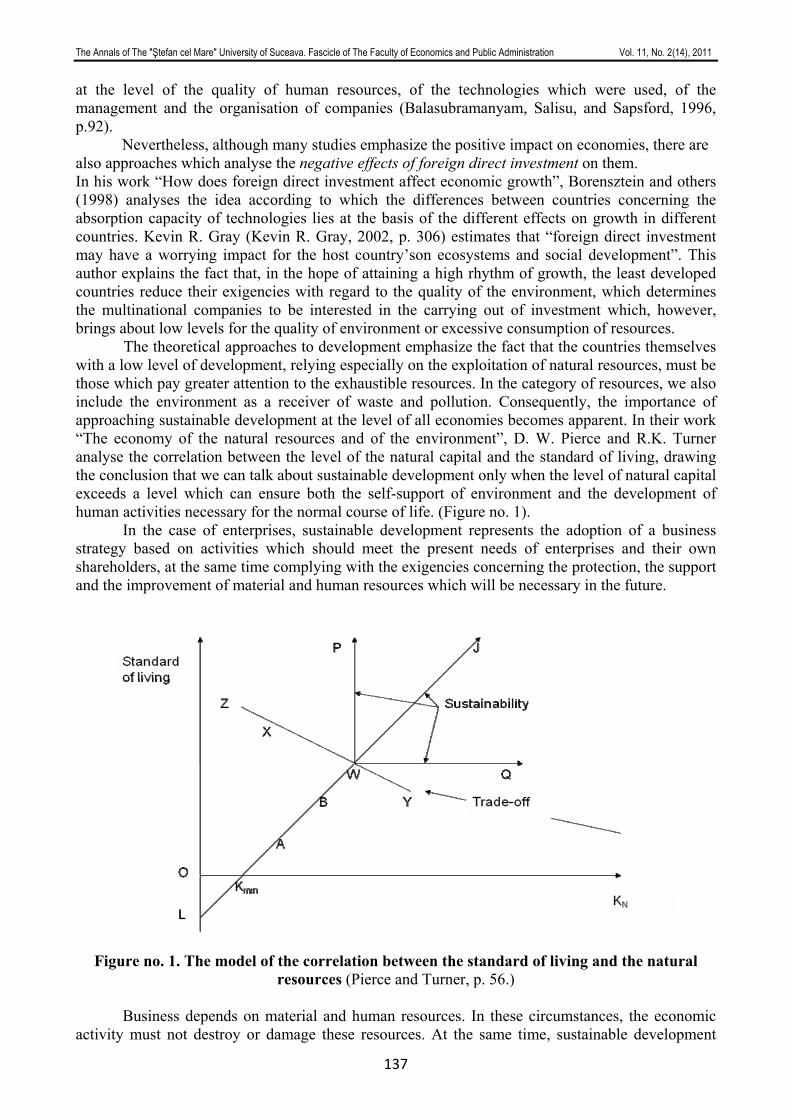
The Annals of The "Ştefan cel Mare" University of Suceava. Fascicle of The Faculty of Economics and Public Administration Vol. 11, No. 2(14), 2011
137
at the level of the quality of human resources, of the technologies which were used, of the management and the organisation of companies (Balasubramanyam, Salisu, and Sapsford, 1996, p.92).
Nevertheless, although many studies emphasize the positive impact on economies, there are also approaches which analyse the negative effects of foreign direct investment on them. In his work “How does foreign direct investment affect economic growth”, Borensztein and others (1998) analyses the idea according to which the differences between countries concerning the absorption capacity of technologies lies at the basis of the different effects on growth in different countries. Kevin R. Gray (Kevin R. Gray, 2002, p. 306) estimates that “foreign direct investment may have a worrying impact for the host country’son ecosystems and social development”. This author explains the fact that, in the hope of attaining a high rhythm of growth, the least developed countries reduce their exigencies with regard to the quality of the environment, which determines the multinational companies to be interested in the carrying out of investment which, however, brings about low levels for the quality of environment or excessive consumption of resources.
The theoretical approaches to development emphasize the fact that the countries themselves with a low level of development, relying especially on the exploitation of natural resources, must be those which pay greater attention to the exhaustible resources. In the category of resources, we also include the environment as a receiver of waste and pollution. Consequently, the importance of approaching sustainable development at the level of all economies becomes apparent. In their work “The economy of the natural resources and of the environment”, D. W. Pierce and R.K. Turner analyse the correlation between the level of the natural capital and the standard of living, drawing the conclusion that we can talk about sustainable development only when the level of natural capital exceeds a level which can ensure both the self-support of environment and the development of human activities necessary for the normal course of life. (Figure no. 1).
In the case of enterprises, sustainable development represents the adoption of a business strategy based on activities which should meet the present needs of enterprises and their own shareholders, at the same time complying with the exigencies concerning the protection, the support and the improvement of material and human resources which will be necessary in the future.
Figure no. 1. The model of the correlation between the standard of living and the natural resources (Pierce and Turner, p. 56.)
Business depends on material and human resources. In these circumstances, the economic
activity must not destroy or damage these resources. At the same time, sustainable development
The Annals of The "Ştefan cel Mare" University of Suceava. Fascicle of The Faculty of Economics and Public Administration Vol. 11, No. 2(14), 2011
138
cannot be achieved only through the isolated action undertaken by some enterprises. A sustainable behaviour of all the companies in the economy is necessary, irrespective of their type or nationality. The sustainable development is a philosophy in which each participant to the global economy must take part.
The environmental matters are essential but the economic growth contributes to their increase. The strict regulations in the field of environment often reduce the economic growth. Business firms are therefore restricted or determined to take measures with a view to making their activity efficient in the new circumstances, measures for limiting the access to resources or technologies. The instruments for the environment which were applied under the form of pollution taxes, environmental standards, performance bonds etc. generate external costs for companiesm, which can cause even the framing into the inefficiency state and which means in fact stopping the activity.
DIRECTIONS OF GOVERNMENTAL POLICIES FOR REGULATING THE
FDI Considering that companies aim at carrying out investment, the environmental restrictions
can lead to drastic reductions of the cost-effectiveness and of the added value of the new projects, which requires reconsidering the plans which were carried out or rejecting some projects which do not prove to be viable under the new conditions.
In order to achieve the objectives of sustainable development, considering that the advantages brought about by foreign direct investment are well known, the states will adopt policies (Mabey, N., McNally R., 1999, p. 7) which will take into account the following aspects:
a. The increase in the business responsibility of the multinational companies These measures aim at business firms and companies which must assume a greater responsibility for the operations undertaken abroad. By means of their investment projects, companies must exceed the phase of “corporate responsibility” and must adopt an active corporate position for imposing or promoting the environmental standards within the economies in which they will perform their activity. On the other hand, the certification of ecological products derived from the new activities of the companies can influence the companies to choose the use of renewable sources or the involvement of “environmentally-friendly technologies” considering that, at least in some sectors of activity, consumers are sensitive to such information related to the products or the services of companies.
b. The initiation and the development of some international agreements concerning the stimulation of direct investments which should not be contrary to environmental legislation Following their tendency to improve the economic parameters of different economies, the governments attempt to sign agreements making serious concessions with regard to the implementation of principles of environment protection. In fact, in order to ensure a real output favourable to economies, the investment projects must take into account the environmental regulations in each country. Besides them, it is necessary to abandon the compulsory performance levers for the new projects which could bring about high levels of intensity of the activity and implicitly pollution or exaggerate consumption of resources. In the framework of international agreements, the interest of communities must be prevalent – the true owner of natural resources and the reduction of the availability of governments to record immediate gains obtained from their granting concessions or direct disposal. c. The justification of environmental regulations and their improvement Whereas a loyal competition is desirable, there must be a limit to the freedom of action of companies which do not comply with the minimum levels for the protection of the environment, levels brought about by the activity developed through foreign direct investment. To that effect, the common international regulations related to environment have the role to protect the responsible societies which, through their own policies, are listed
The Annals of The "Ştefan cel Mare" University of Suceava. Fascicle of The Faculty of Economics and Public Administration Vol. 11, No. 2(14), 2011
139
in the direction of sustainable development. The role of local entities and of the civil society must be also strengthened with a view to imposing a responsible behaviour on the part of the companies. To that purpose, it is necessary to regulate, at the international level, the framework by means of which: there should be a good transparency of the investors’ actions with regard to their impact on the environment, the setting up of civil structures for supervision should be encouraged and the frameworks of the legal representation of citizens in the possible conflicts related to the abuses of multinational companies should be also fostered. The sustainable development can be achieved only through a larger governing system which should respect and improve human rights and workers’ rights and should promote the normal functioning of markets. All these directions of action expected by the governmental or international policies are
regarded at the level of the management of multinational companies as determining factors and as factors restricting the foreign direct investment flows. Companies are therefore interested in answering the exigencies of sustainable development and in changing both the managerial systems and the attitude of the management teams. To that effect, strategies and directions of action are adopted, which should lead to achieving organisational objectives and to delimiting a sustainable perspective for their business.
DIRECTIONS ADOPTED AT THE LEVEL OF THE MANAGEMENT OF MULTINATIONAL COMPANIES
The approach we analyse from a managerial point of view is not by all means one which
was laid down as a response to the environmental restrictions and policies and to the sustainable development policies of society but it is also a natural and structural evolution connected with the capacity of the decision-making factors within the large international companies to understand their role in promoting the use of recyclable materials, of good practices for using the resources etc. at the level of the economies within which they perform their activity.
In fact, sustainable development must be inserted into the processes relating to the management systems of the companies. Although the methods used in this respect are not fundamentally different from those which have been used up to the present, however, it is necessary to provide a new cultural direction and a new dimension to the systems, to the practices and the procedures used.
In the case of approaches relating to the management system of companies, it is necessary to take into account a better evidence of the stakeholders and a continuous improvement of the reporting practices with a view to facilitating a continuous and efficient process of internal and external monitoring of the quality of the sustainability of normal and investment processes within the companies.
The sustainable development will be taken into account both in the processes of planning business and in the field of the management of information and control systems.
Devising a process of sustainable good practice at the level of the companies’ management systems in the light of carrying out foreign direct investment must take into account the following concrete actions:
1. The analysis of the stakeholders This phase requires taking into account and listing all the stakeholders and/or the factors
affected by the activity of the multinational company. To that end, the following categories of persons will be listed as well as their interests in relation to the investment activity of the company: shareholders, providers and customers, creditors, employees and the population of the community in the area in which the foreign direct investment is carried out. All this information has the role to provide a better information concerning the company’s state and to identify, by means of investment projects, the eventual possibilities of valuing some opportunities noticed during this phase. As long as this information is made clear, we pass to emphasizing and analysing the effects of the company’s investments on the environment, the population and of assessing the needs of the
The Annals of The "Ştefan cel Mare" University of Suceava. Fascicle of The Faculty of Economics and Public Administration Vol. 11, No. 2(14), 2011
140
future generations. The management team must assess the present and the future neeeds of each category of stakeholders, highlighting as well the possible problems for covering them, both in the present and in the future. This process must have a continuous character if we also take into account the permanent change in the needs, preferences, or the exigencies of the stakeholders. The analysis of conflicts between these factors represents an important source of information which is also necessary to achieve the objectives of sustainable development.
2. The drawing up of sustainable development policies and objectives Drawing up the directions for action related to sustainable development: environment,
reduction of poverty, social equity and others. It is important that each policy should be explained by the general manager to the stakeholders and that it should be clearly appropriated by them. Mentioning the objectives to be achieved under the form of concrete indicators for achievement represents the key to accomplishing the sustainable development plan. In the case of foreign direct investment, the manager of the company must ensure that all the stakeholders took notice of the company’s intentions, that the results of the investment include the objectives characteristic to the process of sustainable development and that these objectives were correctly understood by the whole community in the host country. In order to provide a good definition of the company’s managerial policy, we must resort to an external monitoring of the whole process which should take into account some key subjects such as: new legislative regulations and those which were proposed, the standards and the practices specific to this field, the competition strategies, the policies and the activities of the community and of the stakeholders’ groups, the aspects concerning the trade union issues, the technological development. By monitoring the apects related to the new foreign direct investement, companies ensure that the policy adopted at the level of the management system corresponds to the dynamic environment in which the company’s activities take place.
3. The preparation and the accomplishment of the implementation plan In order to achieve the objectives of sustainable development which were drawn up, changes
in the management systems are necessary. These changes concern the whole organisational structure of the company and they refer to: changes in the organisational culture and in the attitude of the employees, the definition of responsibilities, the setting up of organisational structures, the systems for reporting the information and the organisational practices. All the departments of the multinational companies must be influenced by the implementation of the sustainable development plan: the organisational system, the cultural changes, business planning, marketing activities, production, financial planning. The successful implementation of the planned policies depends greatly on reconsidering many of the corporate, material and non-material aspects.
4. The development of a corporate culture of support In order to successfully achieve the objectives of the implementation plan for the sustainable
development at the level of the multinational companies, it is necessary for employees to be involved in the whole process of transformation. According to their involvement, we can talk about the success or the failure of the different policies which were adopted. This practice is not always efficient if it is not accompanied by a programme of continuous training and development for the employees which should contribute to their awareness-raising concerning the influence of pollution on the ecosystems, the importance of resources in the development of human civilization and the need to increase the people’s standard of living. A fact which must be taken into consideration is that a great part of the employees who will be involved in carrying out and operating investment will be from the host country; in this way the motivation and training degree could be different according to the characteristics of that country.
5. The development of measures and performance standards With a view to a good internal or external assessment of the activity of the company and its
headquarters which carry out the foreign direct investment, it is necessary to set up a reference system regarding the performances attained. The correlation between the real values and these values will define the quality of the sustainable development process which was implemented. Although many times the companies are the first ones which lay down such standards and reference levels in case they exist at the national level, it is good for the enterprise to collaborate with the
The Annals of The "Ştefan cel Mare" University of Suceava. Fascicle of The Faculty of Economics and Public Administration Vol. 11, No. 2(14), 2011
141
state in order to achieve a monitoring and reporting system which should be efficient and should comply with both the exigencies of the population and those related to the business. In the case of foreign direct investment, this process could be very complex, especially owing to the differences in approaching the issue of sustainable development in the host country and in the country from which the companies originate.
6. The preparation of reports The internal reports are useful for the managers of the company in order to monitor the
implementation of the strategy and the sustainable development policies. However, the other stakeholders (shareholders, employees, creditors, customers, population) also use the external reports in order to assess the performances of the corporation regarding the carrying out of activities and the achievement of some sustainable investment projects. The preparation of reports must also take into consideration the cultural peculiarities of the different countries as well as their destination.
7. The improvement of the process of internal monitoring The need to set up a personal system for monitoring and internal audit at the level of their
corporations and headquarters represents an important aspect taking into account that the activities which take place can have a strong impact on the environment. The procedure for the implementation of sustainable development can affect many of the aspects related to companies.
The whole process relating to the organisation of the implementation of the sustainable development policies is therefore objectified through an overall transformation of the management system and of the techniques tackled by the management team. Considering the structural complexity of the multinational companies and the particularities of the investment processes in which they are involved, it is worth mentioning that a systemic approach of the whole process represents the key to achieving the proposed goals. The legislative particularities and those related to regulations in the field of sustainable development in each country always require new approaches at the level of the management of multinational companies.
CONCLUSIONS In a world of change, the management of enterprises is constantly adapting to all the environments which enter its sphere of influence. When the change is required by major problems which the general natural environment and the whole society face, the concept of sustainable development comes into play, by means of which the decision-making factors aim at solving the existing problems without disregarding the upcoming problems. Nevertheless, this process is much more complex than the most complex problems which the economic agents have encountered so far. Furthermore, when the activity takes place in the economic and social environments in countries with different characteristics, experiences, cultures and expectations like in the case of foreign direct investment, there must be evidence of very much depth, organisation and prediction on the part of the management of multinational companies. The governments in different countries are the ones which have the role to assign economy and its agents a “sustainable” behaviour directed towards people and the future. On the one hand, multinational companies answer to these stimuli, but they have the possibility to forecast and prepare actions and targets which will finally offer them a long-term competitive advantage. In case of carrying out direct investments abroad, although many companies aim at valuing resources and favourable circumstances of different countries, the responsible companies organise the management system following implementation plans for sustainable development. They are carefully and thoroughly prepared so that the investments will not lose their efficiency, but, however, they will comply with the social and the environmental standards from the countries in which they were carried out. Considering that the markets and the economies would be efficient enough so that the information could be equally distributed and the disturbing factors could be isolated, the sustainable multinational companies should record the effects related to the efforts achieved. With that end in
The Annals of The "Ştefan cel Mare" University of Suceava. Fascicle of The Faculty of Economics and Public Administration Vol. 11, No. 2(14), 2011
142
view, the economic instruments of governments are meant to discourage the unlimited consumption of resources, the continuous pollution and the use of work regardless of the state of those who provide it. In these circumstances, the decisions of companies with regard to sustainable development really become strategic managerial measures having well-defined and justified goals.
This work benefited from financial support through the project: “Postdoctoral Studies in Economy: the programme for continuous training of high-flying researchers – SPODE”, funding contract no. POSDRU/89/1.5/S/61755, a project funded by the European Social Fund through the Sectoral Operational Programme Human Resources Development 2007-2013
REFERENCES
1. Balasubramanyam, V. N., Salisu, M., & Sapsford, D. (1996), Foreign direct investment and
growth in EP and IS countries. Economic Journal, 106(1), pp. 92-105. 2. Borensztein, E., Gregorio, J., & Lee, J. (1998). How does foreign direct investment affect
economic growth. Journal of International Economics, 45(1), pp. 115-135. 3. Conklin D.W., Hodgson R.C., Watson Eileen D.(1992) – Sustainable Development: A
Manager’s Handbook, National Round Table on Environment and Economy. Royal Bank of Canada
4. Kevin, R. G. (2002) Foreign Direct Investment and Environmental Impacts – Is the Debate Over?, RECIEL 11(3)
5. Gleckman, H.(1995) – Transnational Corporation’s Strategic Responses to Sustainable Development, vol. Helge Ole Bergesen, Georg Parmann, and Øystein B. Thommessen (eds.), Green Globe Yearbook of International Co -operation on Environment and Development, Oxford University Press, Oxford pp. 93 – 106.
6. Mabey, N., McNally R.(1999) – Foreign Direct Investment and the Environment: From Polution Havens to Sustainable Development, A WWF-UK Report, Godalming, http://stakeholderforum.org/policy/economic/fdi.pdf
7. Mihai, C. (2007), Consideraţii privind deciziile întreprinderii în condiţiile dezvoltării durabile, Dezvoltarea durabilă a spaţiului rural, Editura ASE, Bucureşti
8. Pearce, D.W. , R.K. Turner(1989), Economia delle risorse naturale e dell’ambiente, Editura Il Mulino, Bologna
9. *** (1992), Business Strategy for Sustainable Development: Leadership and Accountability for the 90s, International Institute for Sustainable Development in conjunction with Deloitte & Touche and the World Business Council for Sustainable Development, http://www.jussemper.org/Resources/Corporate%20Activity/Resources/ business_strategy.pdf
10. *** (2002), Foreign Direct Investment: A Lead Driver for Sustainable Development?, Economic Briefing Series No. 1, Towards Earth Summit, http://stakeholderforum.org/policy/economic/fdi.pdf
The Annals of The "Ştefan cel Mare" University of Suceava. Fascicle of The Faculty of Economics and Public Administration Vol. 11, No. 2(14), 2011
143
HUMAN RESOURCES MANAGEMENT MATURITY MODEL
Associate Professor PhD. Carmen CHAŞOVSCHI
University “Stefan cel Mare” University from Suceava, Romania [email protected]
Abstract: The paper provides an outline of a innovative concept – Human Resources Management Maturity Model
(HRM MM), an empiric description of the model and its utility. HRM MM was developed by the author as a tool meant to solve a problem identified in a longitudinal research developed between 2004-2011 in the companies from SE area of Romania (Chasovschi, 2004). This research has showed that Human Resource Management in most companies is facing important weaknesses, in methodology and in instruments applied at all level of HRM functions. The results were both surprising and predictable: the companies are more concerned about doing fast profit, instead of developing the human assets of the companies. HRM MM was designed as a managerial tool that can be used for self-assessment by the companies and helps identifying concrete steps that can lead to a higher performance of employees. The “Map of Maturity” is the main part of the “Maturity Model” and it shows by way of a polar diagram, the desired status of HRM System. Thereby, for the HR professionals within companies, is much easier to estimate the steps to be made in order to recuperate some delays and to implement some good practices. Romania should overtake not only the theories of HRM, but also the good practices, and to step forward to the implementation into practice of the recommendations made by HRM specialists from Romania and abroad.
Keywords: Human Resources Management - Maturity Model - Employee Performance - Map of Maturity
JEL Classification: J21, J24, J53, O15, M12, M50
1. PAPER MOTIVATION. SHORT BACKGROUND
The interest for the subject of the present paper has began with a longitudinal research started in 2004, “Health of Human Resource Management within the companies of S-E Romania” (Chasovschi, 2004). The results have showed a high difference between HRM (Human Resoures Management) theories from academic papers/ books and the practice of HRM in most interviewed companies. The results were confirmed by other results of several studies undertaken in Romania by different NGOs or research institutions [1].
If in theory, Romania joined the western countries in HRM and reached the same level of development (Manolescu, 2003; Lefter, 2007), the practice of HRM is still cached in old organizational frames, in formalism and administrative tasks.
It is the case not only Romania, but of other post-socialist countries, that had reconstructed the economies in a rush move toward private market. It is true that Romania has lost a lot of time, or like some other authors have mentioned, “HRM has had a late development in Romania” (Prodan and Clipa, 2008).
In the early 1980, when Europe was deepening into polemics such: Personnel Management vs. HRM, Romania’s workforce was lead by rules dictated by socialism system. This fact has directed the evolution of HR function on a different path that started with past-war period and ended in 1990. After 1990, the recovering process was quite slow, searching to adjust the practices to the modern theories from western countries. According to these, Human Resource Management is a combination of managerial decisions and practices that affect and influence directly human resources or people who work for organization (Shaw et all, 1999), a specialized function of management, responsible for the determination and implementation of policies and procedures in order to determine the stages of the recruitment cycle, in a manner that contributes to the well-being and quality of work of employees and organizational efficiency. Human resources management is described also as a managerial perspective, with theoretical and prescriptive dimensions, arguing the need to establish a series of integrated personnel policy in line with the strategy of the Organization, thereby enhancing the quality of the labor process, commitments and performance on the part of employees, organizational efficiency and competitive advantages (Huczynski, Buchanan,
The Annals of The "Ştefan cel Mare" University of Suceava. Fascicle of The Faculty of Economics and Public Administration Vol. 11, No. 2(14), 2011
144
2001). Certo is also stressing out the importance to establish an integrated series of staff policy in line with the strategy of the organization, which ensures the quality of life’s work, training and performance on the part of employees and efficiency and competitive advantage (Certo, 2001). Human resources management may be seen as a set of relational info policies with an ideological and philosophical support (Storey, 1995) with four aspects that are needed for its full version: a particular network of "creeds and allegation, decisions of information", "strategic confidence of level management", "the central involvement of level managers, trust in a small set of rules designed to harmonize" and a proper matching of employment relations and relationships between employees.
The purpose of the definitions is to give a brief explanation for what HRM within the modern companies should be, or which functionality should have.
Due its complexity, very often it is difficult to reach the entire range of activities that are addressed. Often the "core" of definition omits a whole variety of areas in which the function is involved. These include communication between employees, collective bargaining, organizational change, health and safety and a variety of reward services or assistance for employees. Extensive efforts were carried out in finding a single definition of human resources management, efforts which have not been successful. We have to admit however that which means a "unique definition" is relatively difficult to achieve, if not even impossible.
In the longitudinal research started in 2004, we have also observed the differences between theory and practice in HRM in Romanian companies. We identified the main reasons for the gap between the theory and the practice of HRM within these. Some of them are:
• HRM managers are not necessary HRM professionals; • The HR Function is not a priority for the company; • Less time for planning activities, that are not perceived as important; • Administrative tasks are preponderant in HRM System; • HRM is a very centralized function; • Not all the entrepreneurs are recognizing the HR as strategic resources of the
company. Through direct discussion with HR Managers, we realized that, sometime they don’t know
what are the basic condition for a proper HRM Function, or “how much is enough” in order to have good results from the employees of the company.
As result, we have designed a tool called “Human Resources Management Maturity Model” – HRM MM that could assist the HRM professionals in analyzing the health of HRM system within their company, and can indicate the corrective actions that should be taken. The model will serve mainly for self-assessment, as an “easy to use tool” for the HRM Professionals.
“HRM Maturity Model” can lead to a better planning and implementation of specific functions of HRM, and to a higher performance of the employees.
In the present paper we intent only to present a “raw” form of the model and to describe the first steps that were made in order to define the model and its utility.
2. DEVELOPMENT OF A “MATURITY MODEL” IN HUMAN RESOURCES MANAGEMENT The documentation made in order to identify „Maturity Models” in other research domains,
brought into the light not so many models described under this title. One is the Capability Maturity Model, named also "Humphrey's CMM” (Humphrey, 2008).
It was developed by Watts Humphrey, based on the earlier work of Phil Crosby, in software development field. The Capability Maturity Model (CMM) is defined as a process capability maturity model, which support the definition and understanding of an organization's processes: “The CMM was originally intended as a tool for objectively assessing the ability of government contractors' processes to perform a contracted software project. Though it comes from the area of
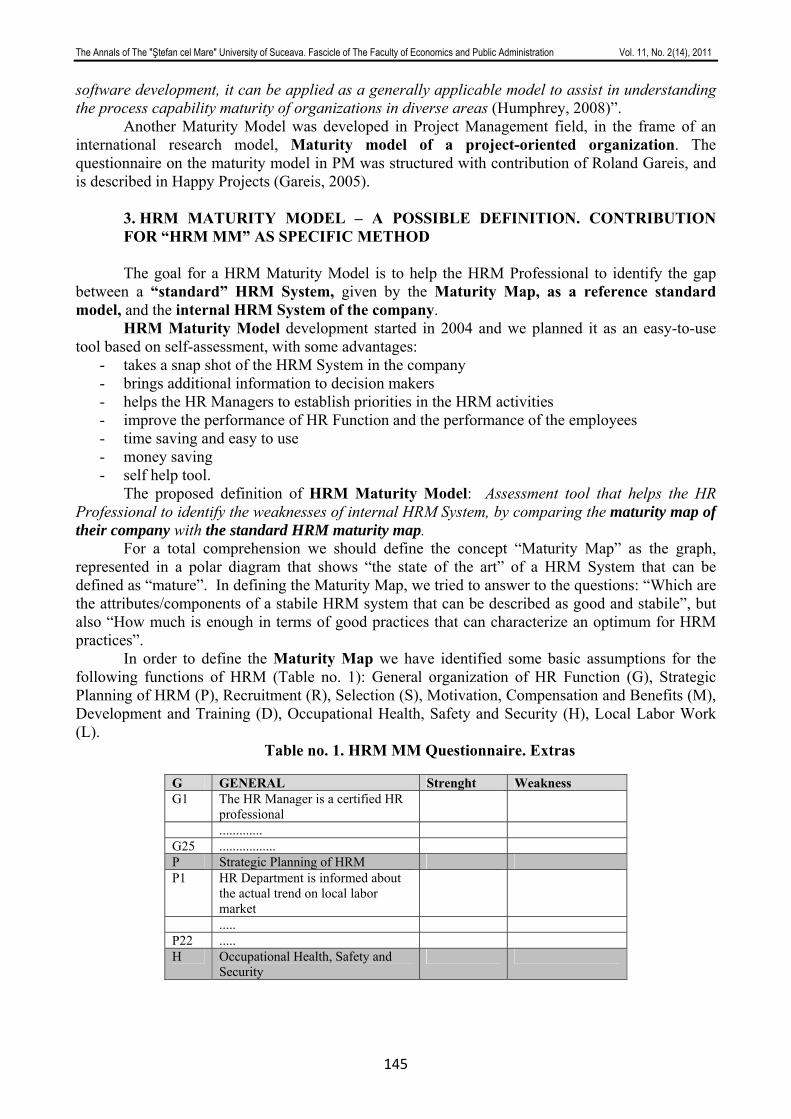
The Annals of The "Ştefan cel Mare" University of Suceava. Fascicle of The Faculty of Economics and Public Administration Vol. 11, No. 2(14), 2011
145
software development, it can be applied as a generally applicable model to assist in understanding the process capability maturity of organizations in diverse areas (Humphrey, 2008)”. Another Maturity Model was developed in Project Management field, in the frame of an international research model, Maturity model of a project-oriented organization. The questionnaire on the maturity model in PM was structured with contribution of Roland Gareis, and is described in Happy Projects (Gareis, 2005).
3. HRM MATURITY MODEL – A POSSIBLE DEFINITION. CONTRIBUTION FOR “HRM MM” AS SPECIFIC METHOD
The goal for a HRM Maturity Model is to help the HRM Professional to identify the gap
between a “standard” HRM System, given by the Maturity Map, as a reference standard model, and the internal HRM System of the company.
HRM Maturity Model development started in 2004 and we planned it as an easy-to-use tool based on self-assessment, with some advantages:
- takes a snap shot of the HRM System in the company - brings additional information to decision makers - helps the HR Managers to establish priorities in the HRM activities - improve the performance of HR Function and the performance of the employees - time saving and easy to use - money saving - self help tool.
The proposed definition of HRM Maturity Model: Assessment tool that helps the HR Professional to identify the weaknesses of internal HRM System, by comparing the maturity map of their company with the standard HRM maturity map.
For a total comprehension we should define the concept “Maturity Map” as the graph, represented in a polar diagram that shows “the state of the art” of a HRM System that can be defined as “mature”. In defining the Maturity Map, we tried to answer to the questions: “Which are the attributes/components of a stabile HRM system that can be described as good and stabile”, but also “How much is enough in terms of good practices that can characterize an optimum for HRM practices”.
In order to define the Maturity Map we have identified some basic assumptions for the following functions of HRM (Table no. 1): General organization of HR Function (G), Strategic Planning of HRM (P), Recruitment (R), Selection (S), Motivation, Compensation and Benefits (M), Development and Training (D), Occupational Health, Safety and Security (H), Local Labor Work (L).
Table no. 1. HRM MM Questionnaire. Extras
G GENERAL Strenght Weakness G1 The HR Manager is a certified HR
professional
............. G25 ................. P Strategic Planning of HRM P1 HR Department is informed about
the actual trend on local labor market
..... P22 ..... H Occupational Health, Safety and
Security
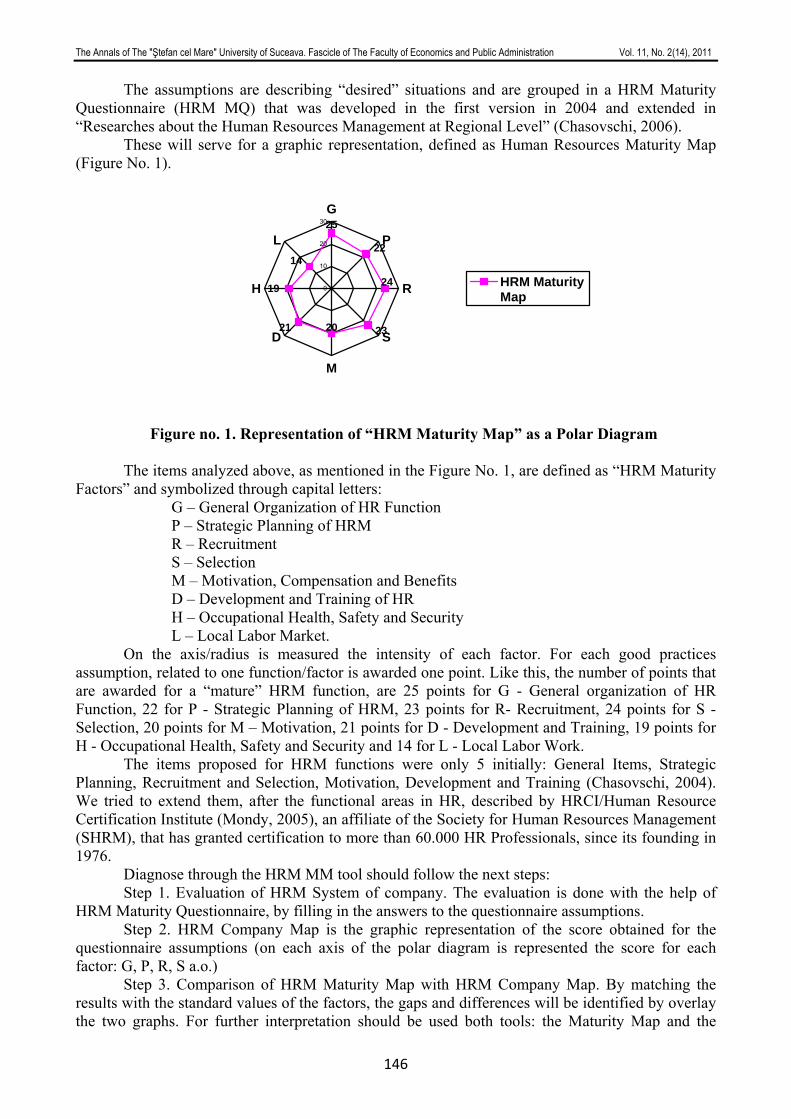
The Annals of The "Ştefan cel Mare" University of Suceava. Fascicle of The Faculty of Economics and Public Administration Vol. 11, No. 2(14), 2011
146
The assumptions are describing “desired” situations and are grouped in a HRM Maturity Questionnaire (HRM MQ) that was developed in the first version in 2004 and extended in “Researches about the Human Resources Management at Regional Level” (Chasovschi, 2006).
These will serve for a graphic representation, defined as Human Resources Maturity Map (Figure No. 1).
25
22
2321
19
14
24
20
0
10
20
30G
P
R
S
M
D
H
L
HRM MaturityMap
Figure no. 1. Representation of “HRM Maturity Map” as a Polar Diagram The items analyzed above, as mentioned in the Figure No. 1, are defined as “HRM Maturity
Factors” and symbolized through capital letters: G – General Organization of HR Function P – Strategic Planning of HRM R – Recruitment S – Selection M – Motivation, Compensation and Benefits D – Development and Training of HR H – Occupational Health, Safety and Security L – Local Labor Market.
On the axis/radius is measured the intensity of each factor. For each good practices assumption, related to one function/factor is awarded one point. Like this, the number of points that are awarded for a “mature” HRM function, are 25 points for G - General organization of HR Function, 22 for P - Strategic Planning of HRM, 23 points for R- Recruitment, 24 points for S - Selection, 20 points for M – Motivation, 21 points for D - Development and Training, 19 points for H - Occupational Health, Safety and Security and 14 for L - Local Labor Work.
The items proposed for HRM functions were only 5 initially: General Items, Strategic Planning, Recruitment and Selection, Motivation, Development and Training (Chasovschi, 2004). We tried to extend them, after the functional areas in HR, described by HRCI/Human Resource Certification Institute (Mondy, 2005), an affiliate of the Society for Human Resources Management (SHRM), that has granted certification to more than 60.000 HR Professionals, since its founding in 1976.
Diagnose through the HRM MM tool should follow the next steps: Step 1. Evaluation of HRM System of company. The evaluation is done with the help of
HRM Maturity Questionnaire, by filling in the answers to the questionnaire assumptions. Step 2. HRM Company Map is the graphic representation of the score obtained for the
questionnaire assumptions (on each axis of the polar diagram is represented the score for each factor: G, P, R, S a.o.)
Step 3. Comparison of HRM Maturity Map with HRM Company Map. By matching the results with the standard values of the factors, the gaps and differences will be identified by overlay the two graphs. For further interpretation should be used both tools: the Maturity Map and the
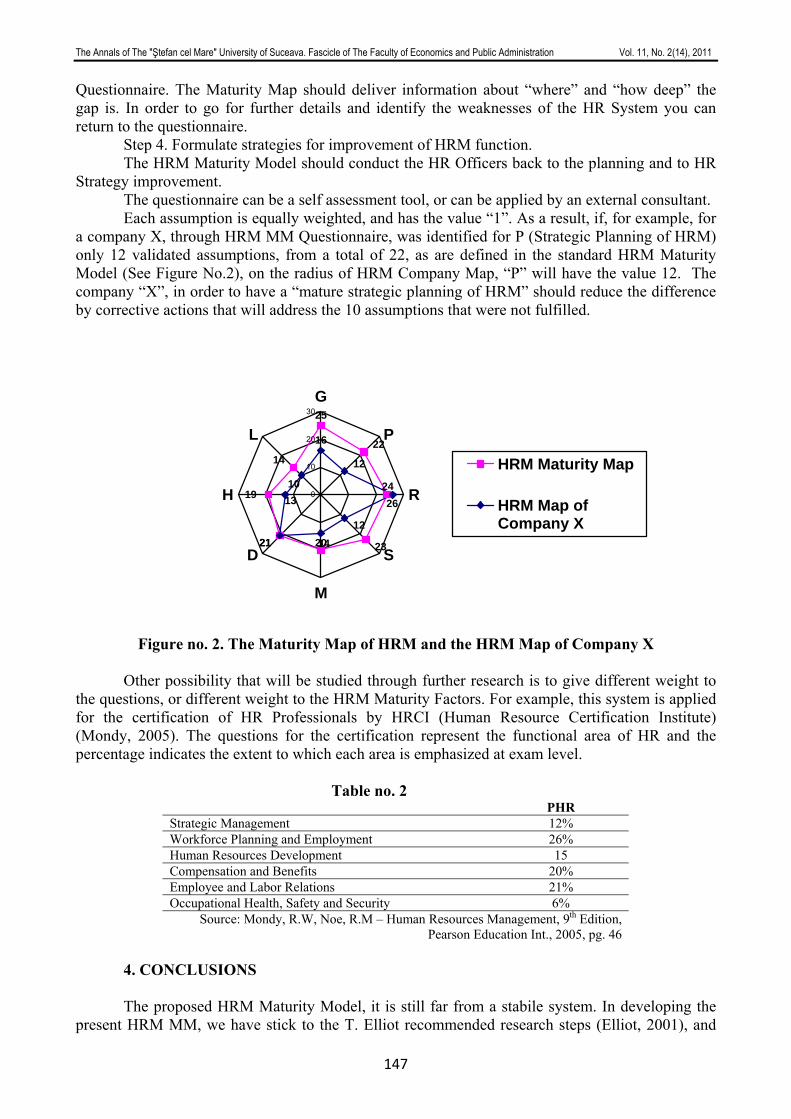
The Annals of The "Ştefan cel Mare" University of Suceava. Fascicle of The Faculty of Economics and Public Administration Vol. 11, No. 2(14), 2011
147
Questionnaire. The Maturity Map should deliver information about “where” and “how deep” the gap is. In order to go for further details and identify the weaknesses of the HR System you can return to the questionnaire.
Step 4. Formulate strategies for improvement of HRM function. The HRM Maturity Model should conduct the HR Officers back to the planning and to HR
Strategy improvement. The questionnaire can be a self assessment tool, or can be applied by an external consultant. Each assumption is equally weighted, and has the value “1”. As a result, if, for example, for
a company X, through HRM MM Questionnaire, was identified for P (Strategic Planning of HRM) only 12 validated assumptions, from a total of 22, as are defined in the standard HRM Maturity Model (See Figure No.2), on the radius of HRM Company Map, “P” will have the value 12. The company “X”, in order to have a “mature strategic planning of HRM” should reduce the difference by corrective actions that will address the 10 assumptions that were not fulfilled.
25
22
2321
19
14
16
12
1221
24
20
261310
14
0
10
20
30G
P
R
S
M
D
H
L
HRM Maturity Map
HRM Map ofCompany X
Figure no. 2. The Maturity Map of HRM and the HRM Map of Company X
Other possibility that will be studied through further research is to give different weight to
the questions, or different weight to the HRM Maturity Factors. For example, this system is applied for the certification of HR Professionals by HRCI (Human Resource Certification Institute) (Mondy, 2005). The questions for the certification represent the functional area of HR and the percentage indicates the extent to which each area is emphasized at exam level.
Table no. 2
PHR Strategic Management 12% Workforce Planning and Employment 26% Human Resources Development 15 Compensation and Benefits 20% Employee and Labor Relations 21% Occupational Health, Safety and Security 6%
Source: Mondy, R.W, Noe, R.M – Human Resources Management, 9th Edition, Pearson Education Int., 2005, pg. 46
4. CONCLUSIONS The proposed HRM Maturity Model, it is still far from a stabile system. In developing the
present HRM MM, we have stick to the T. Elliot recommended research steps (Elliot, 2001), and
The Annals of The "Ştefan cel Mare" University of Suceava. Fascicle of The Faculty of Economics and Public Administration Vol. 11, No. 2(14), 2011
148
we have checked the followings: formulation of general research plan (goal, objectives, target group, theoretic concepts and framework), initial documentation, generation of a tool and additional materials, validation of content.
As further methodological steps described by Elliot, we will revise the model according with the new studies and researches undertaken in 2011 and start the pilot testing of 2nd alternative of the model, (improved according to results of 1st testing phase), next revising of the model and the 3rd pilot testing phase.
Regarding the content related to HRM best practices, future developments will be done, related to further development of important assessing assumptions, definition of „mature” stage of the HRM Maturity Map, possibility to particularize the HRM Maturity Model for different types of companies, and after their life-stage, and the involvement of two assessment perspective: of HRM representatives and of employees.
REFERENCES: [1] Edu-Business in 2007.
BIBLIOGRAPHY:
1. Certo, S. C. - Managementul modern – Diversitatea, calitatea, etica şi mediul global, Editura Teora, Bucureşti, 2001, pag. 673
2. Chaşovschi, C. E. – Cercetări privind managementul resurselor umane în contextual dezvoltării regionale, PhD. Thesis, Iaşi, 2004
3. Chasovschi C.- Cercetări privind managementul resurselor umane in contextul dezvoltării regionale, Editura Didactică şi Pedagogică,Bucureşti, 2006
4. Chaşovschi Carmen, Albu Otilia, Cocieru Codrin – Human Resources Management State of the Art in Territorial Profile, Analele Universităţii "Ştefan cel Mare" Suceava. Fascicolul Facultăţii de Ştiinţe Economice şi Administraţie Publică, Volume 9, No. 1(9), 2009
5. Elliott, T, Regal R., a.o. – Design and Validation of Instruments to Measure Knowledge, 2001, ProQuest Central, p. 1586-1588
6. Fisher, C., Shaw., J.B. – Human Resource Management, Houghton Mifflin Co, Boston, 1999
7. Gareis, R. – Happy Projects, Manz Verlag, Vienna 2005 8. Heintz, M – Etica muncii la români, Editura Curtea Veche, Bucureşti 2005 9. Huczynski, Andrzej, Buchanan, D. – Organizational Behaviour – An Introductory Text,
Prentice Hall, Harlow, 2001, p. 674 10. Lefter, V. - Fundamente ale managementului resurselor umane, Bucureşti : Editura
Economică, 2007 11. Manolescu, Aurel. – Managementul resurselor umane . Ed. a 4-a. Bucureşti : Editura
Economică, 2003 12. Mondy, R. W., Noe, R. M. – Human Resources Management, 9th Edition, Pearson
Education, New Jersey 2005 13. Prodan, A., Clipa C., Clipa A. – The transfer of Romanian Human Resources Management
practices in Multinational Companies, MIBES 2008, p. 340 – 346 14. Storey, J – Human Resource Management: A critical Text, Editura Routledge, Londra,
1995, p. 23
The Annals of The "Ştefan cel Mare" University of Suceava. Fascicle of The Faculty of Economics and Public Administration Vol. 11, No. 2(14), 2011
149
EMPLOYABILITY MANAGEMENT: IS HIGHER EDUCATION IN CRISIS?
Assistant Professor Nikhil Chandra SHIL Department of Accounting
Faculty of Business Administration American International University - Bangladesh
Alok Kumar PRAMANIK Head, Department of Commerce
Bhatter College, Paschim Medinipur West Bengal, India
Abstract: The basic objective of higher education throughout the civilization was to be employable. Graduates are in
competition to perform a good figure in the job market while they are there. Higher education and employment is intertwined though for few, it may be different. Higher Education Institutions (HEIs) are also busy to develop ways to make their graduates employable. The performance of HEIs at the end of the day will depend on the success of its graduates to the race of employment. A careful observation of this game will reveal that some are performing this job smartly over others. While some others argue that to win an unhealthy game, HEIs are adopting some short-cut and derailed themselves from the right path. This debate becomes a regular issue. In such a situation, it is felt to conduct a study on employability, activities of HEIs in this regard, and integration among different stakeholders in the market. The paper presents some real life example of developing employability skills within the graduates undertaken by some benchmarking HEIs. The discussion is very much helpful for HEIs, educators, academia and market regulators for managing employability for the betterment of the society. The issue of employability becomes strategic thrust for educators and prioritized issue for regulators. A good management of HEIs will bring inconceivable success is the conclusion drawn in the paper.
Keywords: Higher Education, Higher Education Institutions, Employability, and Employability Management.
JEL Classification: I23
INTRODUCTION
Higher Education Institutions (HEIs) must recognize that for many students the transition
from education into employment is not a straightforward matter and in the past many students have been ill equipped for this transition. During 90s, this issue has been exacerbated because of the considerable expansion in graduate numbers within a relatively short period of time. Furthermore, the nature of graduate employment is changing; today it is only a minority of students who can hold any realistic expectation of employment in a position directly related to the discipline studied; this is particularly the case for those students whose focus remains within traditional academic disciplines. Whilst it is essential that the academic standards of particular disciplines or broader fields of study are not undermined, it is also important to be realistic and to note that the academic knowledge gained will (for most students) never be utilized directly in any employment context. More and more, the academic qualification of the degree is merely a statement that the graduate has demonstrated the ability to perform to a particular level of academic competence and, perhaps more importantly, possesses the ability to learn.
It is against this background that national debate has arisen about with what should universities and other institutions offer to their students. Since 1997, this debate has been fuelled by the report from the National Committee of Inquiry into Higher Education (Dearing Committee), which has recommended that:
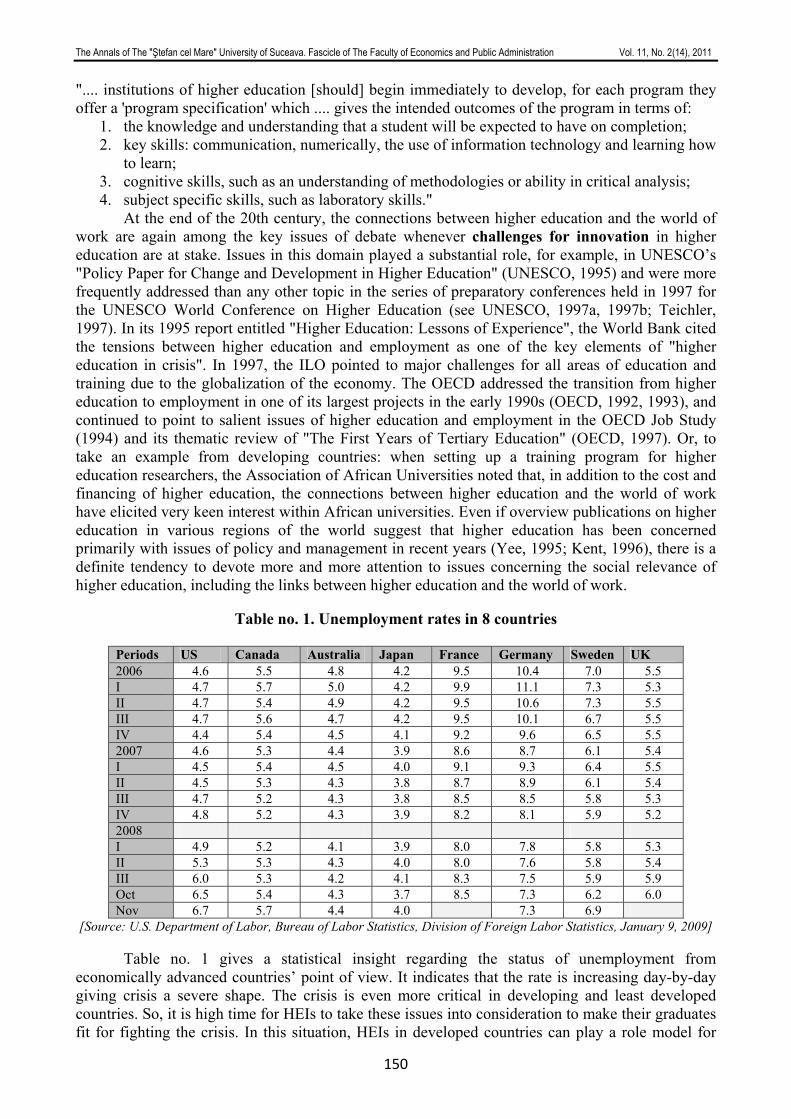
The Annals of The "Ştefan cel Mare" University of Suceava. Fascicle of The Faculty of Economics and Public Administration Vol. 11, No. 2(14), 2011
150
".... institutions of higher education [should] begin immediately to develop, for each program they offer a 'program specification' which .... gives the intended outcomes of the program in terms of:
1. the knowledge and understanding that a student will be expected to have on completion; 2. key skills: communication, numerically, the use of information technology and learning how
to learn; 3. cognitive skills, such as an understanding of methodologies or ability in critical analysis; 4. subject specific skills, such as laboratory skills."
At the end of the 20th century, the connections between higher education and the world of work are again among the key issues of debate whenever challenges for innovation in higher education are at stake. Issues in this domain played a substantial role, for example, in UNESCO’s "Policy Paper for Change and Development in Higher Education" (UNESCO, 1995) and were more frequently addressed than any other topic in the series of preparatory conferences held in 1997 for the UNESCO World Conference on Higher Education (see UNESCO, 1997a, 1997b; Teichler, 1997). In its 1995 report entitled "Higher Education: Lessons of Experience", the World Bank cited the tensions between higher education and employment as one of the key elements of "higher education in crisis". In 1997, the ILO pointed to major challenges for all areas of education and training due to the globalization of the economy. The OECD addressed the transition from higher education to employment in one of its largest projects in the early 1990s (OECD, 1992, 1993), and continued to point to salient issues of higher education and employment in the OECD Job Study (1994) and its thematic review of "The First Years of Tertiary Education" (OECD, 1997). Or, to take an example from developing countries: when setting up a training program for higher education researchers, the Association of African Universities noted that, in addition to the cost and financing of higher education, the connections between higher education and the world of work have elicited very keen interest within African universities. Even if overview publications on higher education in various regions of the world suggest that higher education has been concerned primarily with issues of policy and management in recent years (Yee, 1995; Kent, 1996), there is a definite tendency to devote more and more attention to issues concerning the social relevance of higher education, including the links between higher education and the world of work.
Table no. 1. Unemployment rates in 8 countries
Periods US Canada Australia Japan France Germany Sweden UK 2006 4.6 5.5 4.8 4.2 9.5 10.4 7.0 5.5 I 4.7 5.7 5.0 4.2 9.9 11.1 7.3 5.3 II 4.7 5.4 4.9 4.2 9.5 10.6 7.3 5.5 III 4.7 5.6 4.7 4.2 9.5 10.1 6.7 5.5 IV 4.4 5.4 4.5 4.1 9.2 9.6 6.5 5.5 2007 4.6 5.3 4.4 3.9 8.6 8.7 6.1 5.4 I 4.5 5.4 4.5 4.0 9.1 9.3 6.4 5.5 II 4.5 5.3 4.3 3.8 8.7 8.9 6.1 5.4 III 4.7 5.2 4.3 3.8 8.5 8.5 5.8 5.3 IV 4.8 5.2 4.3 3.9 8.2 8.1 5.9 5.2 2008 I 4.9 5.2 4.1 3.9 8.0 7.8 5.8 5.3 II 5.3 5.3 4.3 4.0 8.0 7.6 5.8 5.4 III 6.0 5.3 4.2 4.1 8.3 7.5 5.9 5.9 Oct 6.5 5.4 4.3 3.7 8.5 7.3 6.2 6.0 Nov 6.7 5.7 4.4 4.0 7.3 6.9
[Source: U.S. Department of Labor, Bureau of Labor Statistics, Division of Foreign Labor Statistics, January 9, 2009]
Table no. 1 gives a statistical insight regarding the status of unemployment from economically advanced countries’ point of view. It indicates that the rate is increasing day-by-day giving crisis a severe shape. The crisis is even more critical in developing and least developed countries. So, it is high time for HEIs to take these issues into consideration to make their graduates fit for fighting the crisis. In this situation, HEIs in developed countries can play a role model for
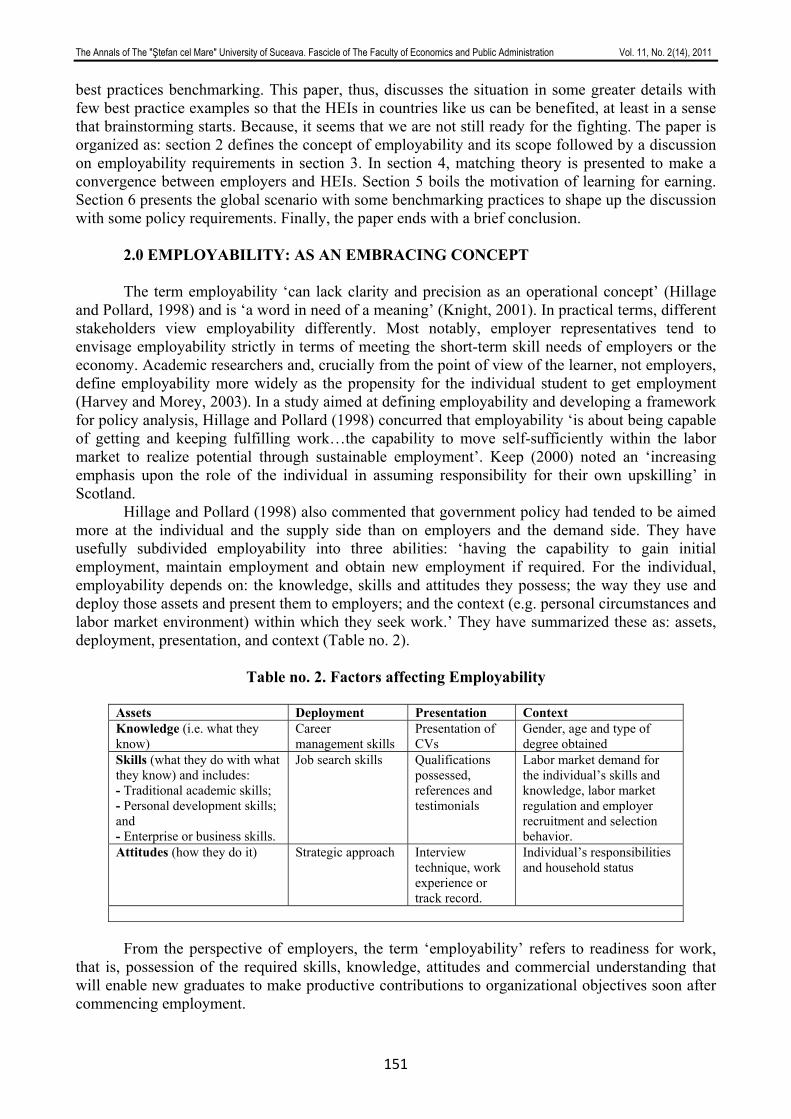
The Annals of The "Ştefan cel Mare" University of Suceava. Fascicle of The Faculty of Economics and Public Administration Vol. 11, No. 2(14), 2011
151
best practices benchmarking. This paper, thus, discusses the situation in some greater details with few best practice examples so that the HEIs in countries like us can be benefited, at least in a sense that brainstorming starts. Because, it seems that we are not still ready for the fighting. The paper is organized as: section 2 defines the concept of employability and its scope followed by a discussion on employability requirements in section 3. In section 4, matching theory is presented to make a convergence between employers and HEIs. Section 5 boils the motivation of learning for earning. Section 6 presents the global scenario with some benchmarking practices to shape up the discussion with some policy requirements. Finally, the paper ends with a brief conclusion.
2.0 EMPLOYABILITY: AS AN EMBRACING CONCEPT
The term employability ‘can lack clarity and precision as an operational concept’ (Hillage and Pollard, 1998) and is ‘a word in need of a meaning’ (Knight, 2001). In practical terms, different stakeholders view employability differently. Most notably, employer representatives tend to envisage employability strictly in terms of meeting the short-term skill needs of employers or the economy. Academic researchers and, crucially from the point of view of the learner, not employers, define employability more widely as the propensity for the individual student to get employment (Harvey and Morey, 2003). In a study aimed at defining employability and developing a framework for policy analysis, Hillage and Pollard (1998) concurred that employability ‘is about being capable of getting and keeping fulfilling work…the capability to move self-sufficiently within the labor market to realize potential through sustainable employment’. Keep (2000) noted an ‘increasing emphasis upon the role of the individual in assuming responsibility for their own upskilling’ in Scotland.
Hillage and Pollard (1998) also commented that government policy had tended to be aimed more at the individual and the supply side than on employers and the demand side. They have usefully subdivided employability into three abilities: ‘having the capability to gain initial employment, maintain employment and obtain new employment if required. For the individual, employability depends on: the knowledge, skills and attitudes they possess; the way they use and deploy those assets and present them to employers; and the context (e.g. personal circumstances and labor market environment) within which they seek work.’ They have summarized these as: assets, deployment, presentation, and context (Table no. 2).
Table no. 2. Factors affecting Employability
Assets Deployment Presentation Context Knowledge (i.e. what they know)
Career management skills
Presentation of CVs
Gender, age and type of degree obtained
Skills (what they do with what they know) and includes: - Traditional academic skills; - Personal development skills; and - Enterprise or business skills.
Job search skills
Qualifications possessed, references and testimonials
Labor market demand for the individual’s skills and knowledge, labor market regulation and employer recruitment and selection behavior.
Attitudes (how they do it) Strategic approach
Interview technique, work experience or track record.
Individual’s responsibilities and household status
From the perspective of employers, the term ‘employability’ refers to readiness for work, that is, possession of the required skills, knowledge, attitudes and commercial understanding that will enable new graduates to make productive contributions to organizational objectives soon after commencing employment.
The Annals of The "Ştefan cel Mare" University of Suceava. Fascicle of The Faculty of Economics and Public Administration Vol. 11, No. 2(14), 2011
152
However, in an extended discussion of the employability concept, Hillage and Pollard (1998) put more emphasis on individuals possessing the capability ‘to move self-sufficiently within the labor market to realize potential through sustainable employment’. Similarly, Harvey and Morey (2003) highlight the skills which graduates need in order to manage their own careers and those which will enable them to continue learning throughout their working lives. These broader conceptions of employability partly reflect the influence of the 1997 Dearing Report which identified a set of key skills which were ‘relevant throughout life, not simply in employment’ (NCIHE, 1997). Dearing defined these skills as Communication, numeracy, IT and Learning how to learn at a higher level and recommended that provision of such skills should become a central aim for higher education.
Above definitions give us a common reference of defining employability, that is, skill. Research findings till date listed a handful of skills required for graduate employability. The Employability Skills Framework, developed by the Australian Chamber of Commerce and Industry and the Business Council of Australia and published in Employability skills for the future (DEST, 2002), provides an excellent starting point for any discussion of employability skills in higher education. The eight employability skills – communication, teamwork, problem solving, self-management, planning and organizing, technology, life-long learning, and initiative and enterprise – and associated attributes were first published in that report.
‘Employability skills are defined as skills required not only to gain employment, but also to progress within an enterprise so as to achieve one’s potential and contribute successfully to enterprise strategic directions’ (DEST 2002).
The report contains a discussion of different terms being used in different environments to describe generic skills for all employees. It refers to the higher education sector and notes the work on generic skills and graduate attributes being undertaken at that time. Other publications (Allen Consulting Group, 2006 and DEST, 2006) link the term employability skills with other terms such as key skills, core skills, life skills, generic skills, essential skills, key competencies, necessary skills and transferable skills. Subsequent to the development of the Employability Skills Framework the vocational education and training sector (VET) has taken a system-wide approach and applied these eight employability skills to all nationally recognized qualifications. ATTRIBUTES
Sometimes, skills are confused with attributes that need further clarification. Graduate
attributes are defined as the qualities, skills and understandings a university community expects its students to develop during their stay at the institution and, consequently, shape the contribution they are able to make to their profession and as a citizen (ATN, 2000). Similarly, it may be also defined as: ‘…the qualities, skills and understandings a university community agrees its students should develop during their time with the university’ (Bowden et al., 2002). Since 1998, there has been much work done by universities to define these attributes and to integrate them in a variety of ways. Graduate attributes, as they are conceptualized in Australia, had their synthesis in the West Review in 1998, which provided a framework of generic attributes that ideally every graduate should have: • The capacity for critical, conceptual and reflective thinking in all aspects of intellectual and
practical activity; • Technical competence and an understanding of the broad conceptual and theoretical elements of
his or her fields of specialisation; • Intellectual openness and curiosity, and an appreciation of the interconnectedness, and areas of
uncertainty, in current human knowledge; • Effective communication skills in all domains (reading, writing, speaking and listening); • Research, discovery, and information retrieval skills and a general capacity to use information; • Multifaceted problem solving skills and the capacity for team work;
The Annals of The "Ştefan cel Mare" University of Suceava. Fascicle of The Faculty of Economics and Public Administration Vol. 11, No. 2(14), 2011
153
• High ethical standards in personal and professional life, underpinned by a capacity for self-directed activity. (DEETYA, 1998)
Since that time, all Australian universities have been required to develop policy statements which specify their generic graduate attributes as part of funding and reporting arrangements with the Department of Education, Science and Training. However, it should be acknowledged that many universities’ graduate attributes would include additional skills with broader social or other commitments, such as:
1. Social justice (Murdoch University) 2. Global perspective (University of New England) 3. Respect for ethical practice and social responsibility (Monash University) 4. An appreciation and valuing of cultural and intellectual diversity and the ability to function
in a multicultural or global environment (University of Wollongong) 5. Academic excellence (University of Melbourne)
2.2 GRADUATE OCCUPATION
The destination of employability is being absorbed in specific occupation. Again,
occupation may have different streams and categories. To define graduate occupation, Smith et al. includes both ‘traditional graduate’ and ‘graduate track’ occupations as defined by McKnight (1999) through the following categorization: ‘Traditional graduate’ occupations, e. g., doctors, lawyers, qualified engineers, teachers, high-level
managerial and technical occupations ‘Graduate track’ occupations, e. g., low level management jobs, technician jobs, skilled caring jobs,
high level sales jobs – that is, jobs which require high levels of education, are increasingly filled by graduates and which often constitute entry routes to higher level positions
‘Non-graduate’ occupations (those which clearly do not require high level qualifications and which are unlikely to make use of graduate-level skills and knowledge)
STAKEHOLDERS Graduates who are ready to fight should know different active groups in the market with
their specific needs and requirements. There are clearly a number of different groups with an interest in employability issues in higher education. These are illustrated in Table no. 3. They has different relationships to the issues in terms of the immediacy of impact and has been divided into three groups:
Table no. 3. Stakeholder Groups in Employability
Primary Secondary Tertiary Students Graduates
Employers Higher education institutions
Government Government agencies such as the Scottish Higher Education Funding Council
Students or graduates belong to primary category as employability will be effected through
them and from the HEIs’ consideration; they are the products available for sale. Employers and HEIs fall in secondary category and have some sort of conflicting relationship until their requirements are not matched. As a producer of graduates, HEIs are always in a pressure to prove that their products possess potentials and required qualities as demanded by the consumers (employers). Thus, when employers and HEIs requirements are overlapped and fulfilled, employability reaches to a match. Finally, government and other regulators in the market do watchdog function so that the tug of war between primary and secondary stakeholder groups results fair competition in the market. HEIs should always give emphasis on the convergence of students’
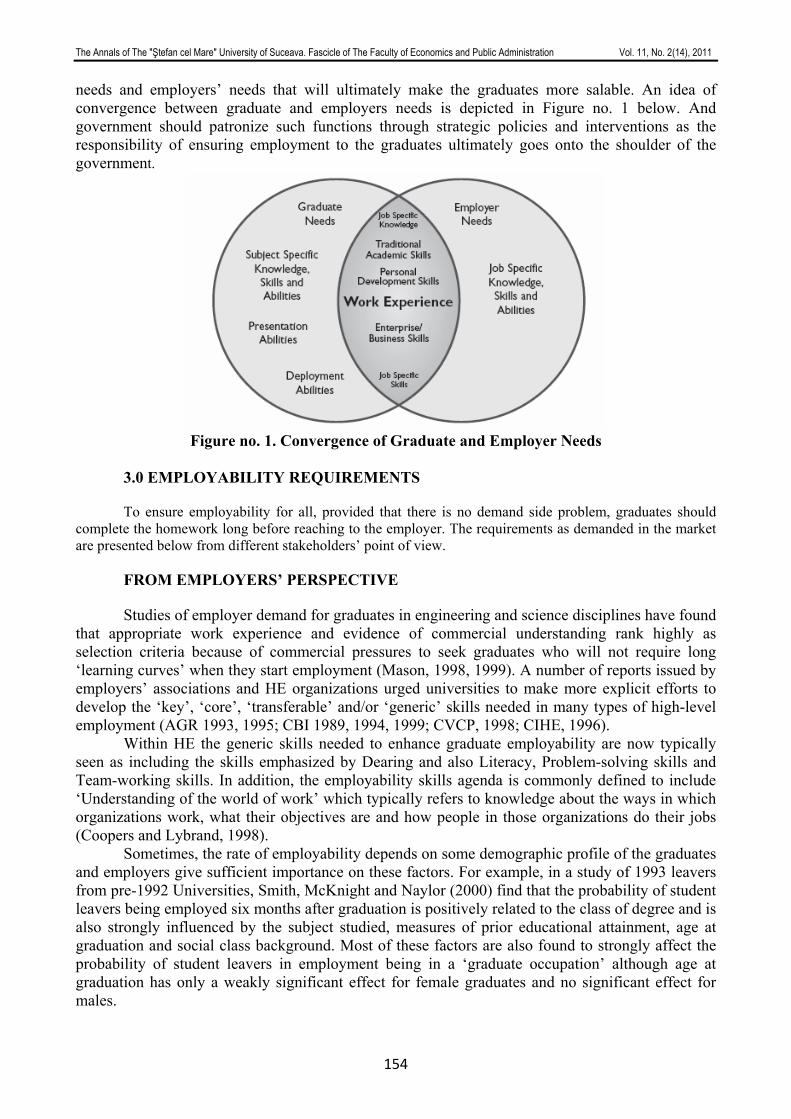
The Annals of The "Ştefan cel Mare" University of Suceava. Fascicle of The Faculty of Economics and Public Administration Vol. 11, No. 2(14), 2011
154
needs and employers’ needs that will ultimately make the graduates more salable. An idea of convergence between graduate and employers needs is depicted in Figure no. 1 below. And government should patronize such functions through strategic policies and interventions as the responsibility of ensuring employment to the graduates ultimately goes onto the shoulder of the government.
Figure no. 1. Convergence of Graduate and Employer Needs
3.0 EMPLOYABILITY REQUIREMENTS
To ensure employability for all, provided that there is no demand side problem, graduates should
complete the homework long before reaching to the employer. The requirements as demanded in the market are presented below from different stakeholders’ point of view.
FROM EMPLOYERS’ PERSPECTIVE
Studies of employer demand for graduates in engineering and science disciplines have found
that appropriate work experience and evidence of commercial understanding rank highly as selection criteria because of commercial pressures to seek graduates who will not require long ‘learning curves’ when they start employment (Mason, 1998, 1999). A number of reports issued by employers’ associations and HE organizations urged universities to make more explicit efforts to develop the ‘key’, ‘core’, ‘transferable’ and/or ‘generic’ skills needed in many types of high-level employment (AGR 1993, 1995; CBI 1989, 1994, 1999; CVCP, 1998; CIHE, 1996).
Within HE the generic skills needed to enhance graduate employability are now typically seen as including the skills emphasized by Dearing and also Literacy, Problem-solving skills and Team-working skills. In addition, the employability skills agenda is commonly defined to include ‘Understanding of the world of work’ which typically refers to knowledge about the ways in which organizations work, what their objectives are and how people in those organizations do their jobs (Coopers and Lybrand, 1998).
Sometimes, the rate of employability depends on some demographic profile of the graduates and employers give sufficient importance on these factors. For example, in a study of 1993 leavers from pre-1992 Universities, Smith, McKnight and Naylor (2000) find that the probability of student leavers being employed six months after graduation is positively related to the class of degree and is also strongly influenced by the subject studied, measures of prior educational attainment, age at graduation and social class background. Most of these factors are also found to strongly affect the probability of student leavers in employment being in a ‘graduate occupation’ although age at graduation has only a weakly significant effect for female graduates and no significant effect for males.
The Annals of The "Ştefan cel Mare" University of Suceava. Fascicle of The Faculty of Economics and Public Administration Vol. 11, No. 2(14), 2011
155
3.2 FROM UNIVERSITIES’ PERSPECTIVE University plays an important role for accelerating employability. University responses to
this agenda typically include modifications to existing course content (sometimes in response to employer suggestions), the introduction of new courses and teaching methods and expanded provision of opportunities for work experience – all intended to enhance the development of employability skills and/or ensure that the acquisition of such skills is made more explicit. In some cases university departments have sought to ‘embed’ the desired skills within courses; in other departments, students are offered ‘stand-alone’ skills courses which are effectively ‘bolted on’ to traditional academic programs. In fact many university departments now use a mix of embedded and stand-alone teaching methods in their efforts to develop employability skills. FROM REGULATORS PERSPECTIVE
As further evidence of the growing importance attached to graduate employability, the
Higher Education Funding Council for England (HEFCE) has developed measures of university performance which include indicators of graduate labor market outcomes, for example, the probability of new graduates finding employment after a specified time interval (HEFCE, 2001, 2002, 2003). Regulators are primarily concerned with the matching of demand and supply side of the employability. Creating opportunities for employment and, at the same time, producing qualified and skilled manpower need an equitable balance to ensure smooth running of the system. MATCHING THEORY
From the above discussion, a discussion of matching theory becomes pervasive and relevant
to the current area of interest. In matching theory, labor market ‘failure’ on the part of individual graduates – unemployment or underutilization of graduate-level skills in employment – reflects mismatches between graduates and employers which may come about for a number of reasons. For example, Coles and Smith (1998) emphasize that in a random matching model mismatches between job-seekers and employers may arise because of imperfect information, resulting in time and search costs for prospective partners to obtain information about better matches. They also propose an alternative ‘stock-flow matching’ model in which, after an initial round of match-making, agents may simply wait for appropriate partners to enter the market in a later time period. Other strands of matching theory emphasize the role of institutional and labor market rigidities in contributing to mismatches between job-seekers and employers, for example, the higher incidence of underutilization of skills among female graduates who combine part-time employment with care of young children (Green, McIntosh and Vignoles, 2002).
In a recent investigation of labor market mismatches in the Netherlands, Allen and van der Velden (2001) find that ‘education-job mismatches’ (individuals holding jobs for which their formal qualifications are higher or lower than required) do not correspond closely with ‘skill-job mismatches’ (individuals holding jobs for which their skills are above or below those required). One possible explanation for this is that, within given educational qualification categories such as degree-holders, there may be unmeasured differences in skills between individuals, and individuals deemed by employers to be relatively low-skilled may be less likely than others in their qualification group to be offered jobs which require their level of formal qualification.
Recent UK evidence in support of this hypothesis of ‘heterogeneous skills within qualification levels’ has been presented by Green and McIntosh (2002) who find that less than half of people identified in the 2001 Skills Survey as over-qualified (in terms of formal certification) for their jobs were also over-skilled (that is, in their own evaluation, not making much use of their skills and abilities in their present jobs).
Another proposition advanced by Allen and van der Velden is that the selection criteria used by employers when screening job applicants may include factors such as work experience, gender
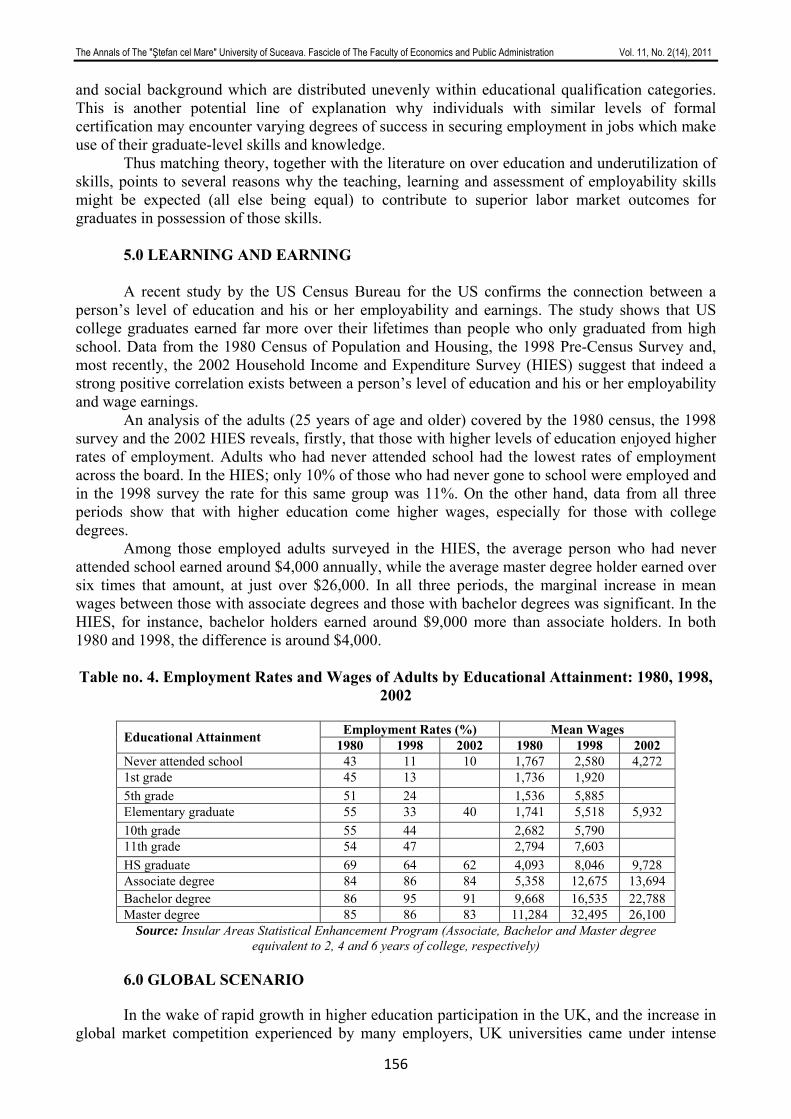
The Annals of The "Ştefan cel Mare" University of Suceava. Fascicle of The Faculty of Economics and Public Administration Vol. 11, No. 2(14), 2011
156
and social background which are distributed unevenly within educational qualification categories. This is another potential line of explanation why individuals with similar levels of formal certification may encounter varying degrees of success in securing employment in jobs which make use of their graduate-level skills and knowledge.
Thus matching theory, together with the literature on over education and underutilization of skills, points to several reasons why the teaching, learning and assessment of employability skills might be expected (all else being equal) to contribute to superior labor market outcomes for graduates in possession of those skills.
5.0 LEARNING AND EARNING A recent study by the US Census Bureau for the US confirms the connection between a
person’s level of education and his or her employability and earnings. The study shows that US college graduates earned far more over their lifetimes than people who only graduated from high school. Data from the 1980 Census of Population and Housing, the 1998 Pre-Census Survey and, most recently, the 2002 Household Income and Expenditure Survey (HIES) suggest that indeed a strong positive correlation exists between a person’s level of education and his or her employability and wage earnings.
An analysis of the adults (25 years of age and older) covered by the 1980 census, the 1998 survey and the 2002 HIES reveals, firstly, that those with higher levels of education enjoyed higher rates of employment. Adults who had never attended school had the lowest rates of employment across the board. In the HIES; only 10% of those who had never gone to school were employed and in the 1998 survey the rate for this same group was 11%. On the other hand, data from all three periods show that with higher education come higher wages, especially for those with college degrees.
Among those employed adults surveyed in the HIES, the average person who had never attended school earned around $4,000 annually, while the average master degree holder earned over six times that amount, at just over $26,000. In all three periods, the marginal increase in mean wages between those with associate degrees and those with bachelor degrees was significant. In the HIES, for instance, bachelor holders earned around $9,000 more than associate holders. In both 1980 and 1998, the difference is around $4,000.
Table no. 4. Employment Rates and Wages of Adults by Educational Attainment: 1980, 1998,
2002
Employment Rates (%) Mean Wages Educational Attainment 1980 1998 2002 1980 1998 2002 Never attended school 43 11 10 1,767 2,580 4,272 1st grade 45 13 1,736 1,920 5th grade 51 24 1,536 5,885 Elementary graduate 55 33 40 1,741 5,518 5,932 10th grade 55 44 2,682 5,790 11th grade 54 47 2,794 7,603 HS graduate 69 64 62 4,093 8,046 9,728 Associate degree 84 86 84 5,358 12,675 13,694 Bachelor degree 86 95 91 9,668 16,535 22,788 Master degree 85 86 83 11,284 32,495 26,100
Source: Insular Areas Statistical Enhancement Program (Associate, Bachelor and Master degree equivalent to 2, 4 and 6 years of college, respectively)
6.0 GLOBAL SCENARIO In the wake of rapid growth in higher education participation in the UK, and the increase in
global market competition experienced by many employers, UK universities came under intense
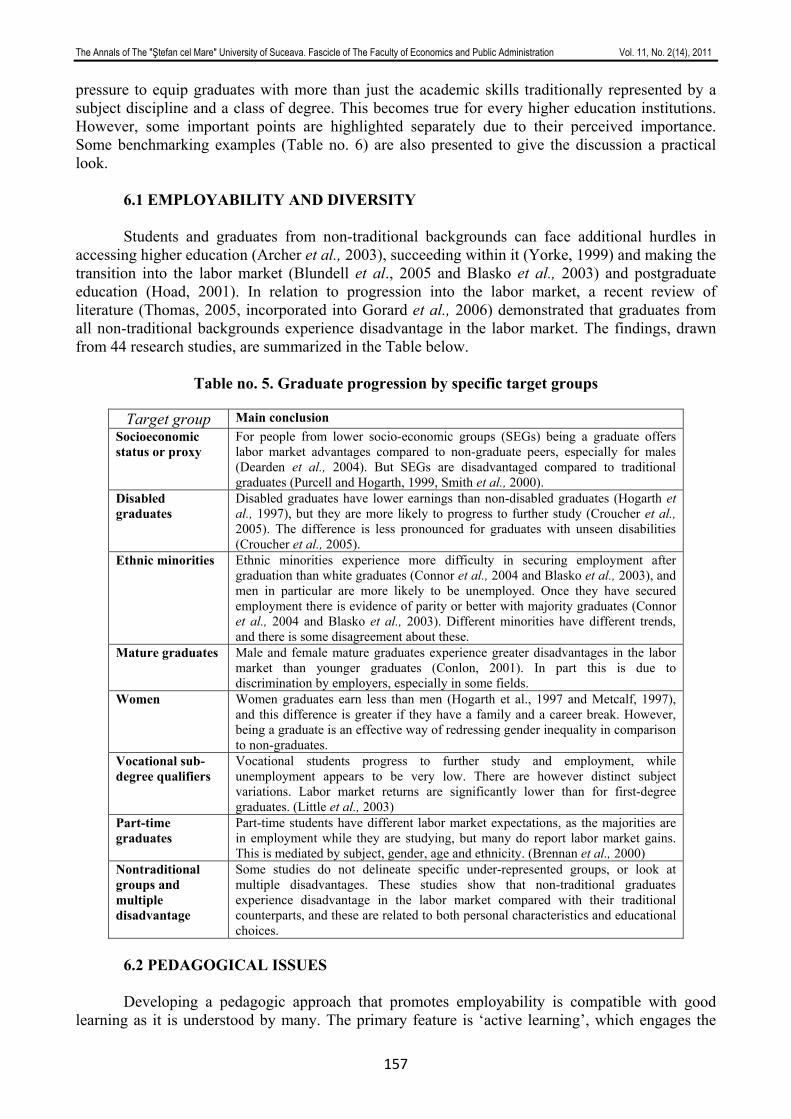
The Annals of The "Ştefan cel Mare" University of Suceava. Fascicle of The Faculty of Economics and Public Administration Vol. 11, No. 2(14), 2011
157
pressure to equip graduates with more than just the academic skills traditionally represented by a subject discipline and a class of degree. This becomes true for every higher education institutions. However, some important points are highlighted separately due to their perceived importance. Some benchmarking examples (Table no. 6) are also presented to give the discussion a practical look.
6.1 EMPLOYABILITY AND DIVERSITY
Students and graduates from non-traditional backgrounds can face additional hurdles in accessing higher education (Archer et al., 2003), succeeding within it (Yorke, 1999) and making the transition into the labor market (Blundell et al., 2005 and Blasko et al., 2003) and postgraduate education (Hoad, 2001). In relation to progression into the labor market, a recent review of literature (Thomas, 2005, incorporated into Gorard et al., 2006) demonstrated that graduates from all non-traditional backgrounds experience disadvantage in the labor market. The findings, drawn from 44 research studies, are summarized in the Table below.
Table no. 5. Graduate progression by specific target groups
Target group Main conclusion
Socioeconomic status or proxy
For people from lower socio-economic groups (SEGs) being a graduate offers labor market advantages compared to non-graduate peers, especially for males (Dearden et al., 2004). But SEGs are disadvantaged compared to traditional graduates (Purcell and Hogarth, 1999, Smith et al., 2000).
Disabled graduates
Disabled graduates have lower earnings than non-disabled graduates (Hogarth et al., 1997), but they are more likely to progress to further study (Croucher et al., 2005). The difference is less pronounced for graduates with unseen disabilities (Croucher et al., 2005).
Ethnic minorities Ethnic minorities experience more difficulty in securing employment after graduation than white graduates (Connor et al., 2004 and Blasko et al., 2003), and men in particular are more likely to be unemployed. Once they have secured employment there is evidence of parity or better with majority graduates (Connor et al., 2004 and Blasko et al., 2003). Different minorities have different trends, and there is some disagreement about these.
Mature graduates Male and female mature graduates experience greater disadvantages in the labor market than younger graduates (Conlon, 2001). In part this is due to discrimination by employers, especially in some fields.
Women Women graduates earn less than men (Hogarth et al., 1997 and Metcalf, 1997), and this difference is greater if they have a family and a career break. However, being a graduate is an effective way of redressing gender inequality in comparison to non-graduates.
Vocational sub-degree qualifiers
Vocational students progress to further study and employment, while unemployment appears to be very low. There are however distinct subject variations. Labor market returns are significantly lower than for first-degree graduates. (Little et al., 2003)
Part-time graduates
Part-time students have different labor market expectations, as the majorities are in employment while they are studying, but many do report labor market gains. This is mediated by subject, gender, age and ethnicity. (Brennan et al., 2000)
Nontraditional groups and multiple disadvantage
Some studies do not delineate specific under-represented groups, or look at multiple disadvantages. These studies show that non-traditional graduates experience disadvantage in the labor market compared with their traditional counterparts, and these are related to both personal characteristics and educational choices.
6.2 PEDAGOGICAL ISSUES
Developing a pedagogic approach that promotes employability is compatible with good
learning as it is understood by many. The primary feature is ‘active learning’, which engages the

The Annals of The "Ştefan cel Mare" University of Suceava. Fascicle of The Faculty of Economics and Public Administration Vol. 11, No. 2(14), 2011
158
student in deep as opposed to surface learning (Ramsden, 1992). The Pedagogy for Employability Group (2004, reissued 2006) suggest that pedagogical approaches that promote student engagement and employability might include:
1. Requiring students to work on learning tasks, where possible, in authentic and/or richly-resourced contexts (e.g. problem-based learning, analyzing case study material, summarizing complex material into a short briefing paper for a specific audience and similar activities);
2. Involving collaborative work where appropriate (e.g. group projects, the establishment of learning communities, preparation of group reports and presentations etc);
3. Providing cognitive ‘scaffolding’ to help students towards achievements currently beyond their unaided capability and progressively removing it as their capability develops (e.g. role playing, working in progressively larger groups to produce a response to a particular challenge, the use of formative assessment and resubmission); and
4. Encouraging the development of meta-cognition (e.g. reflection and self-regulation via PDP, writing critical commentaries and reviews, presenting a case and being prepared to justify it).
These types of learning activities both address many of the difficulties new students face in making the transition into higher education and enable students to develop many employability skills. Teaching staffs however need to take the opportunity to make the link between academic tasks and employability explicit. Students can be encouraged to reflect upon the broader learning that has taken place and, for example, document them in their personal development planning (PDP) portfolios.
6.3 CURRICULUM DEVELOPMENT AND EMPLOYABILITY
There is a spectrum of ways in which the curriculum can be developed to support student
employability. These include: 1. Employability through the whole curriculum 2. Employability in the core curriculum 3. Work-based or work-related learning incorporated as one or more components within the
curriculum 4. Employability-related module(s) within the curriculum 5. Work-based or work-related learning in parallel with the curriculum
Following Warren (2002), curriculum development to support employability can take either or all of the 3 forms: separate, semi-integrated and integrated (Warren, 2002). A separate approach implies that the intervention of support is offered in addition to mainstream teaching, for example supplementary instruction or skills modules. A semi-integrated approach includes initiatives, which are closely aligned to course curriculum and are developmental rather than ‘remedial’. Integrated approaches make the development central to the learning experience within the discipline context. Thus, in relation to employability, some institutions provide generic modules about employability and careers education (separate); others make use of subject specific employment modules or work experience (semi-integrated); while integrated approaches include work-based learning and the introduction of vocationally oriented programs. Warren suggests that semi-integrated and integrated approaches are more effective than separate interventions. However, before seeking to reform the curriculum it is useful to consider the extent to which the existing curriculum contents support employability goals. For example, Hughes’ Employability Audit Tool (www.heacademy.ac.uk/2644.htm) offers a quick way to assess the curriculum content and its relationship to the world beyond higher education.
The Annals of The "Ştefan cel Mare" University of Suceava. Fascicle of The Faculty of Economics and Public Administration Vol. 11, No. 2(14), 2011
159
6.4 PERSONAL DEVELOPMENT PLANNING (PDP) Knight and Yorke (2003) have described employability as a blend of understanding, skilful
practices, efficacy beliefs (or legitimate self confidence) and reflective ness (or meta-cognition). In this ‘USEM’ model the ‘E’ – for efficacy beliefs, student self theories and personal qualities and the ‘M’ – for self awareness and the ability to reflect, are both highly pertinent to PDP practice, particularly given the emphasis in a recent consultation (Ward et al., 2005) placed by practitioners on PDP as a holistic and integrated set of processes. The introduction of PDP into undergraduate programs offers an opportunity to assist all students to develop their employability. For example, students are not always able to translate their qualities and skills to meet employers’ recruitment criteria, and yet the ability to connect with recruitment criteria is highly valued by employers. The QAA (2002) states that PDP should help students to:
1. Become more effective, independent and confident self-directed learners; 2. Understand how they are learning and relate their learning to a wider context; 3. Improve their general skills for study and career management; 4. Articulate their personal goals and evaluate progress towards their achievement; and 5. Encourage a positive attitude to learning throughout life. PDP is now a core curriculum requirement in the UK, and thus enables employability to be
semi-integrated into undergraduate programs.
6.5 WORK-EXPERIENCE, VOLUNTEERING AND PART-TIME EMPLOYMENT Many of the recommendations and interventions in the literature relating to improving the
employability of students from under-represented groups focus on building suitable curriculum vitae. Emphases often fall on participation in work placements (Blackwell et al., 2001, Mason et al., 2003), volunteering, extra-curricular activities (Blasko et al., 2003 and Brown and Hesketh, 2003) and overseas study (Blasko et al., 2003). All are held to be advantageous to graduates in the labor market, while participation in part-time employment - unless related to field of study – tends to be regarded as detrimental to both fruitful study (Bamber and Tett, 2000) and success in the graduate labor market (Blasko et al., 2003).
However, for the majority of students from non-traditional backgrounds, particularly those from lower socio-economic groups and mature students, participation in part-time employment is essential (Susan and Williams, 2002). Research in Scotland found that 68% of students were working part-time in 1999-2000, compared with 43% three years earlier in 1996/7 (Sinclair and Dale, 2000). Furthermore, the study showed that almost a quarter of first year students in 1999/2000 were working more than 16 hours per week. Noble (2004) found that generally students who were in paid employment worked more than the maximum 12 hours recommended by the Select Committee on Education and Employment. This led to difficulties in meeting the academic demands of their courses. Likewise, by the end of Walker’s (1998) longitudinal project, two thirds of participants were engaged in part time employment, many working for more than 20 hours a week. Only one was in a job relevant to their course. Nevertheless, some institutions have recognized that part-time employment is now the reality for many students, and have developed modules to enable them to extract and reflect on skills developed there, and to relate them to their field of study and career aspirations.
By contrast, course-relevant work experience has a far more positive impact on graduates’ experience in the labor market. Blackwell et al. (2001) do not specifically focus on students from under-represented groups, but they provide data about the potential impact of work experience on employment in the graduate labor market. Of particular interest is a study reported by Blackwell et al that draws on HESA data for 74,922 graduates in 33 subject areas. This shows that sandwich courses have a positive impact on labor market employment: graduates from sandwich courses have higher post-graduation employment rates (69%) than students on equivalent non-sandwich courses
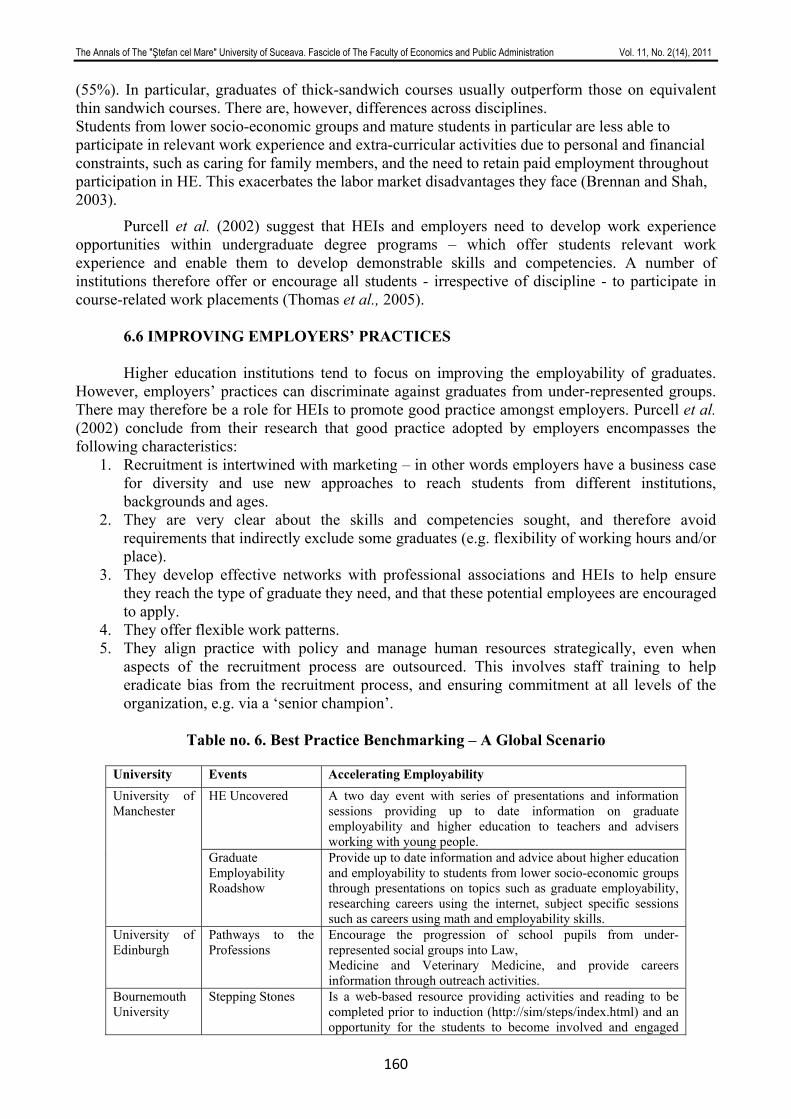
The Annals of The "Ştefan cel Mare" University of Suceava. Fascicle of The Faculty of Economics and Public Administration Vol. 11, No. 2(14), 2011
160
(55%). In particular, graduates of thick-sandwich courses usually outperform those on equivalent thin sandwich courses. There are, however, differences across disciplines. Students from lower socio-economic groups and mature students in particular are less able to participate in relevant work experience and extra-curricular activities due to personal and financial constraints, such as caring for family members, and the need to retain paid employment throughout participation in HE. This exacerbates the labor market disadvantages they face (Brennan and Shah, 2003).
Purcell et al. (2002) suggest that HEIs and employers need to develop work experience opportunities within undergraduate degree programs – which offer students relevant work experience and enable them to develop demonstrable skills and competencies. A number of institutions therefore offer or encourage all students - irrespective of discipline - to participate in course-related work placements (Thomas et al., 2005).
6.6 IMPROVING EMPLOYERS’ PRACTICES
Higher education institutions tend to focus on improving the employability of graduates. However, employers’ practices can discriminate against graduates from under-represented groups. There may therefore be a role for HEIs to promote good practice amongst employers. Purcell et al. (2002) conclude from their research that good practice adopted by employers encompasses the following characteristics:
1. Recruitment is intertwined with marketing – in other words employers have a business case for diversity and use new approaches to reach students from different institutions, backgrounds and ages.
2. They are very clear about the skills and competencies sought, and therefore avoid requirements that indirectly exclude some graduates (e.g. flexibility of working hours and/or place).
3. They develop effective networks with professional associations and HEIs to help ensure they reach the type of graduate they need, and that these potential employees are encouraged to apply.
4. They offer flexible work patterns. 5. They align practice with policy and manage human resources strategically, even when
aspects of the recruitment process are outsourced. This involves staff training to help eradicate bias from the recruitment process, and ensuring commitment at all levels of the organization, e.g. via a ‘senior champion’.
Table no. 6. Best Practice Benchmarking – A Global Scenario
University Events Accelerating Employability
HE Uncovered A two day event with series of presentations and information sessions providing up to date information on graduate employability and higher education to teachers and advisers working with young people.
University of Manchester
Graduate Employability Roadshow
Provide up to date information and advice about higher education and employability to students from lower socio-economic groups through presentations on topics such as graduate employability, researching careers using the internet, subject specific sessions such as careers using math and employability skills.
University of Edinburgh
Pathways to the Professions
Encourage the progression of school pupils from under-represented social groups into Law, Medicine and Veterinary Medicine, and provide careers information through outreach activities.
Bournemouth University
Stepping Stones Is a web-based resource providing activities and reading to be completed prior to induction (http://sim/steps/index.html) and an opportunity for the students to become involved and engaged
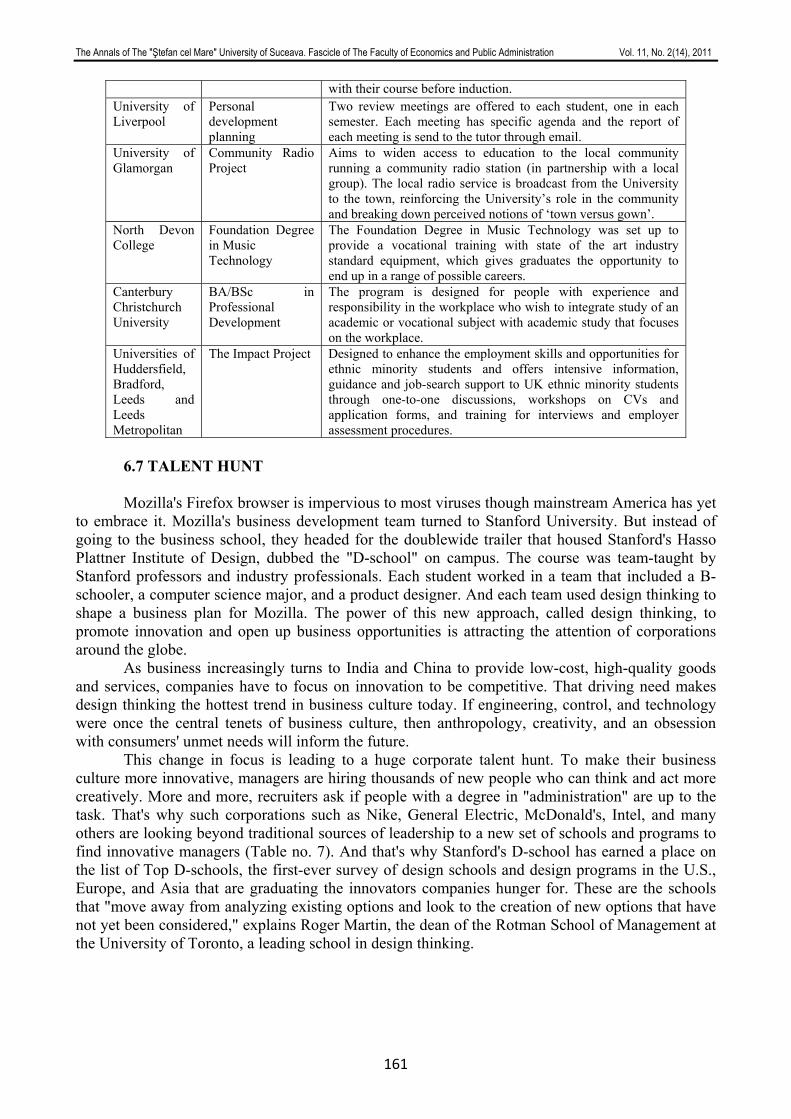
The Annals of The "Ştefan cel Mare" University of Suceava. Fascicle of The Faculty of Economics and Public Administration Vol. 11, No. 2(14), 2011
161
with their course before induction. University of Liverpool
Personal development planning
Two review meetings are offered to each student, one in each semester. Each meeting has specific agenda and the report of each meeting is send to the tutor through email.
University of Glamorgan
Community Radio Project
Aims to widen access to education to the local community running a community radio station (in partnership with a local group). The local radio service is broadcast from the University to the town, reinforcing the University’s role in the community and breaking down perceived notions of ‘town versus gown’.
North Devon College
Foundation Degree in Music Technology
The Foundation Degree in Music Technology was set up to provide a vocational training with state of the art industry standard equipment, which gives graduates the opportunity to end up in a range of possible careers.
Canterbury Christchurch University
BA/BSc in Professional Development
The program is designed for people with experience and responsibility in the workplace who wish to integrate study of an academic or vocational subject with academic study that focuses on the workplace.
Universities of Huddersfield, Bradford, Leeds and Leeds Metropolitan
The Impact Project Designed to enhance the employment skills and opportunities for ethnic minority students and offers intensive information, guidance and job-search support to UK ethnic minority students through one-to-one discussions, workshops on CVs and application forms, and training for interviews and employer assessment procedures.
6.7 TALENT HUNT
Mozilla's Firefox browser is impervious to most viruses though mainstream America has yet
to embrace it. Mozilla's business development team turned to Stanford University. But instead of going to the business school, they headed for the doublewide trailer that housed Stanford's Hasso Plattner Institute of Design, dubbed the "D-school" on campus. The course was team-taught by Stanford professors and industry professionals. Each student worked in a team that included a B-schooler, a computer science major, and a product designer. And each team used design thinking to shape a business plan for Mozilla. The power of this new approach, called design thinking, to promote innovation and open up business opportunities is attracting the attention of corporations around the globe.
As business increasingly turns to India and China to provide low-cost, high-quality goods and services, companies have to focus on innovation to be competitive. That driving need makes design thinking the hottest trend in business culture today. If engineering, control, and technology were once the central tenets of business culture, then anthropology, creativity, and an obsession with consumers' unmet needs will inform the future.
This change in focus is leading to a huge corporate talent hunt. To make their business culture more innovative, managers are hiring thousands of new people who can think and act more creatively. More and more, recruiters ask if people with a degree in "administration" are up to the task. That's why such corporations such as Nike, General Electric, McDonald's, Intel, and many others are looking beyond traditional sources of leadership to a new set of schools and programs to find innovative managers (Table no. 7). And that's why Stanford's D-school has earned a place on the list of Top D-schools, the first-ever survey of design schools and design programs in the U.S., Europe, and Asia that are graduating the innovators companies hunger for. These are the schools that "move away from analyzing existing options and look to the creation of new options that have not yet been considered," explains Roger Martin, the dean of the Rotman School of Management at the University of Toronto, a leading school in design thinking.
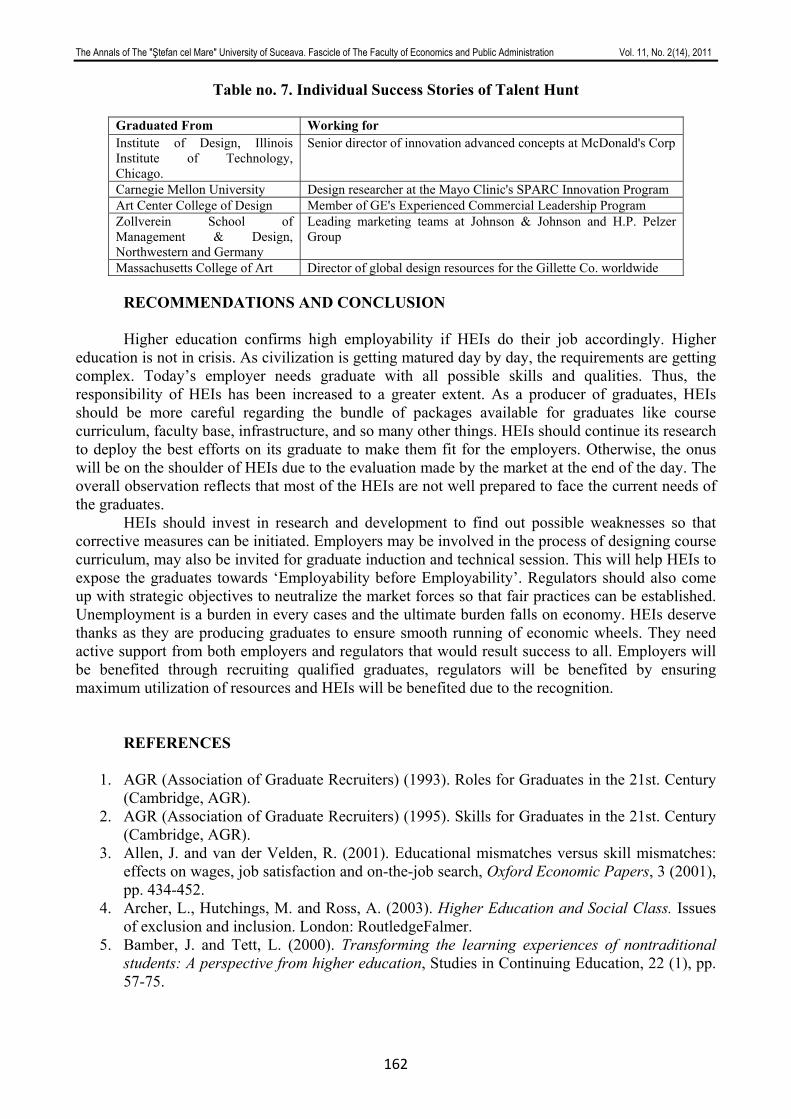
The Annals of The "Ştefan cel Mare" University of Suceava. Fascicle of The Faculty of Economics and Public Administration Vol. 11, No. 2(14), 2011
162
Table no. 7. Individual Success Stories of Talent Hunt
Graduated From Working for Institute of Design, Illinois Institute of Technology, Chicago.
Senior director of innovation advanced concepts at McDonald's Corp
Carnegie Mellon University Design researcher at the Mayo Clinic's SPARC Innovation Program Art Center College of Design Member of GE's Experienced Commercial Leadership Program Zollverein School of Management & Design, Northwestern and Germany
Leading marketing teams at Johnson & Johnson and H.P. Pelzer Group
Massachusetts College of Art Director of global design resources for the Gillette Co. worldwide RECOMMENDATIONS AND CONCLUSION
Higher education confirms high employability if HEIs do their job accordingly. Higher
education is not in crisis. As civilization is getting matured day by day, the requirements are getting complex. Today’s employer needs graduate with all possible skills and qualities. Thus, the responsibility of HEIs has been increased to a greater extent. As a producer of graduates, HEIs should be more careful regarding the bundle of packages available for graduates like course curriculum, faculty base, infrastructure, and so many other things. HEIs should continue its research to deploy the best efforts on its graduate to make them fit for the employers. Otherwise, the onus will be on the shoulder of HEIs due to the evaluation made by the market at the end of the day. The overall observation reflects that most of the HEIs are not well prepared to face the current needs of the graduates.
HEIs should invest in research and development to find out possible weaknesses so that corrective measures can be initiated. Employers may be involved in the process of designing course curriculum, may also be invited for graduate induction and technical session. This will help HEIs to expose the graduates towards ‘Employability before Employability’. Regulators should also come up with strategic objectives to neutralize the market forces so that fair practices can be established. Unemployment is a burden in every cases and the ultimate burden falls on economy. HEIs deserve thanks as they are producing graduates to ensure smooth running of economic wheels. They need active support from both employers and regulators that would result success to all. Employers will be benefited through recruiting qualified graduates, regulators will be benefited by ensuring maximum utilization of resources and HEIs will be benefited due to the recognition.
REFERENCES
1. AGR (Association of Graduate Recruiters) (1993). Roles for Graduates in the 21st. Century (Cambridge, AGR).
2. AGR (Association of Graduate Recruiters) (1995). Skills for Graduates in the 21st. Century (Cambridge, AGR).
3. Allen, J. and van der Velden, R. (2001). Educational mismatches versus skill mismatches: effects on wages, job satisfaction and on-the-job search, Oxford Economic Papers, 3 (2001), pp. 434-452.
4. Archer, L., Hutchings, M. and Ross, A. (2003). Higher Education and Social Class. Issues of exclusion and inclusion. London: RoutledgeFalmer.
5. Bamber, J. and Tett, L. (2000). Transforming the learning experiences of nontraditional students: A perspective from higher education, Studies in Continuing Education, 22 (1), pp. 57-75.
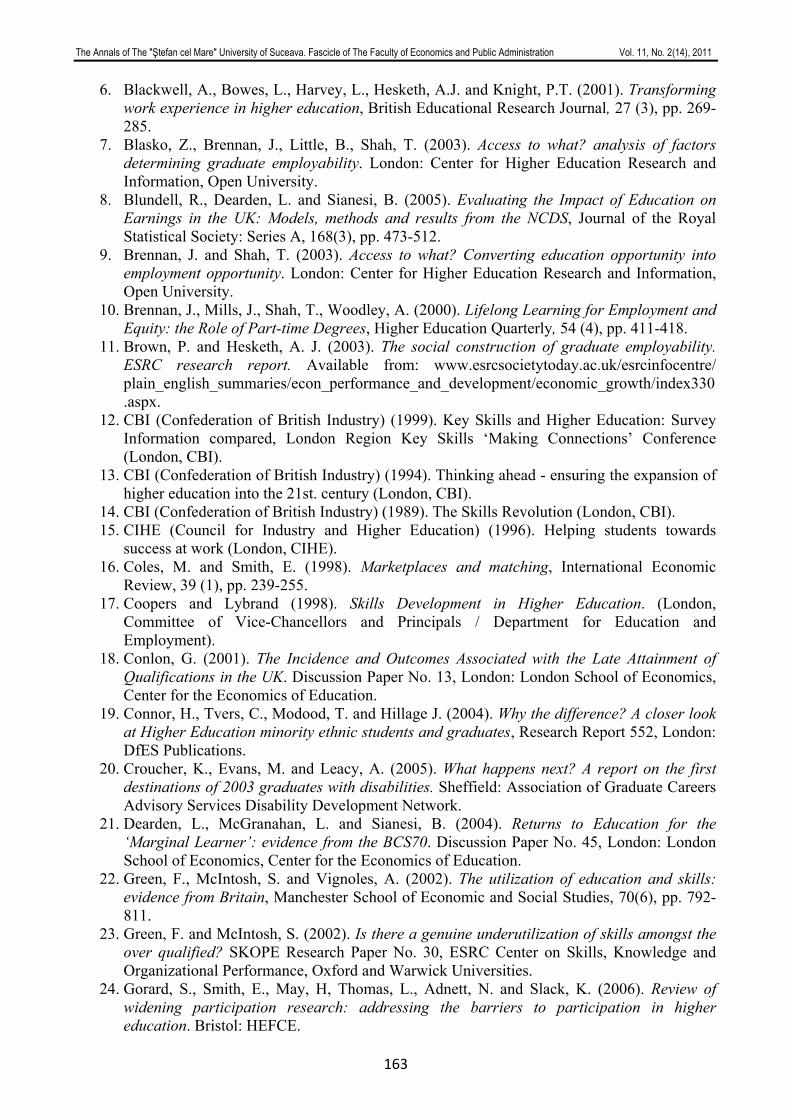
The Annals of The "Ştefan cel Mare" University of Suceava. Fascicle of The Faculty of Economics and Public Administration Vol. 11, No. 2(14), 2011
163
6. Blackwell, A., Bowes, L., Harvey, L., Hesketh, A.J. and Knight, P.T. (2001). Transforming work experience in higher education, British Educational Research Journal, 27 (3), pp. 269-285.
7. Blasko, Z., Brennan, J., Little, B., Shah, T. (2003). Access to what? analysis of factors determining graduate employability. London: Center for Higher Education Research and Information, Open University.
8. Blundell, R., Dearden, L. and Sianesi, B. (2005). Evaluating the Impact of Education on Earnings in the UK: Models, methods and results from the NCDS, Journal of the Royal Statistical Society: Series A, 168(3), pp. 473-512.
9. Brennan, J. and Shah, T. (2003). Access to what? Converting education opportunity into employment opportunity. London: Center for Higher Education Research and Information, Open University.
10. Brennan, J., Mills, J., Shah, T., Woodley, A. (2000). Lifelong Learning for Employment and Equity: the Role of Part-time Degrees, Higher Education Quarterly, 54 (4), pp. 411-418.
11. Brown, P. and Hesketh, A. J. (2003). The social construction of graduate employability. ESRC research report. Available from: www.esrcsocietytoday.ac.uk/esrcinfocentre/ plain_english_summaries/econ_performance_and_development/economic_growth/index330.aspx.
12. CBI (Confederation of British Industry) (1999). Key Skills and Higher Education: Survey Information compared, London Region Key Skills ‘Making Connections’ Conference (London, CBI).
13. CBI (Confederation of British Industry) (1994). Thinking ahead - ensuring the expansion of higher education into the 21st. century (London, CBI).
14. CBI (Confederation of British Industry) (1989). The Skills Revolution (London, CBI). 15. CIHE (Council for Industry and Higher Education) (1996). Helping students towards
success at work (London, CIHE). 16. Coles, M. and Smith, E. (1998). Marketplaces and matching, International Economic
Review, 39 (1), pp. 239-255. 17. Coopers and Lybrand (1998). Skills Development in Higher Education. (London,
Committee of Vice-Chancellors and Principals / Department for Education and Employment).
18. Conlon, G. (2001). The Incidence and Outcomes Associated with the Late Attainment of Qualifications in the UK. Discussion Paper No. 13, London: London School of Economics, Center for the Economics of Education.
19. Connor, H., Tvers, C., Modood, T. and Hillage J. (2004). Why the difference? A closer look at Higher Education minority ethnic students and graduates, Research Report 552, London: DfES Publications.
20. Croucher, K., Evans, M. and Leacy, A. (2005). What happens next? A report on the first destinations of 2003 graduates with disabilities. Sheffield: Association of Graduate Careers Advisory Services Disability Development Network.
21. Dearden, L., McGranahan, L. and Sianesi, B. (2004). Returns to Education for the ‘Marginal Learner’: evidence from the BCS70. Discussion Paper No. 45, London: London School of Economics, Center for the Economics of Education.
22. Green, F., McIntosh, S. and Vignoles, A. (2002). The utilization of education and skills: evidence from Britain, Manchester School of Economic and Social Studies, 70(6), pp. 792-811.
23. Green, F. and McIntosh, S. (2002). Is there a genuine underutilization of skills amongst the over qualified? SKOPE Research Paper No. 30, ESRC Center on Skills, Knowledge and Organizational Performance, Oxford and Warwick Universities.
24. Gorard, S., Smith, E., May, H, Thomas, L., Adnett, N. and Slack, K. (2006). Review of widening participation research: addressing the barriers to participation in higher education. Bristol: HEFCE.
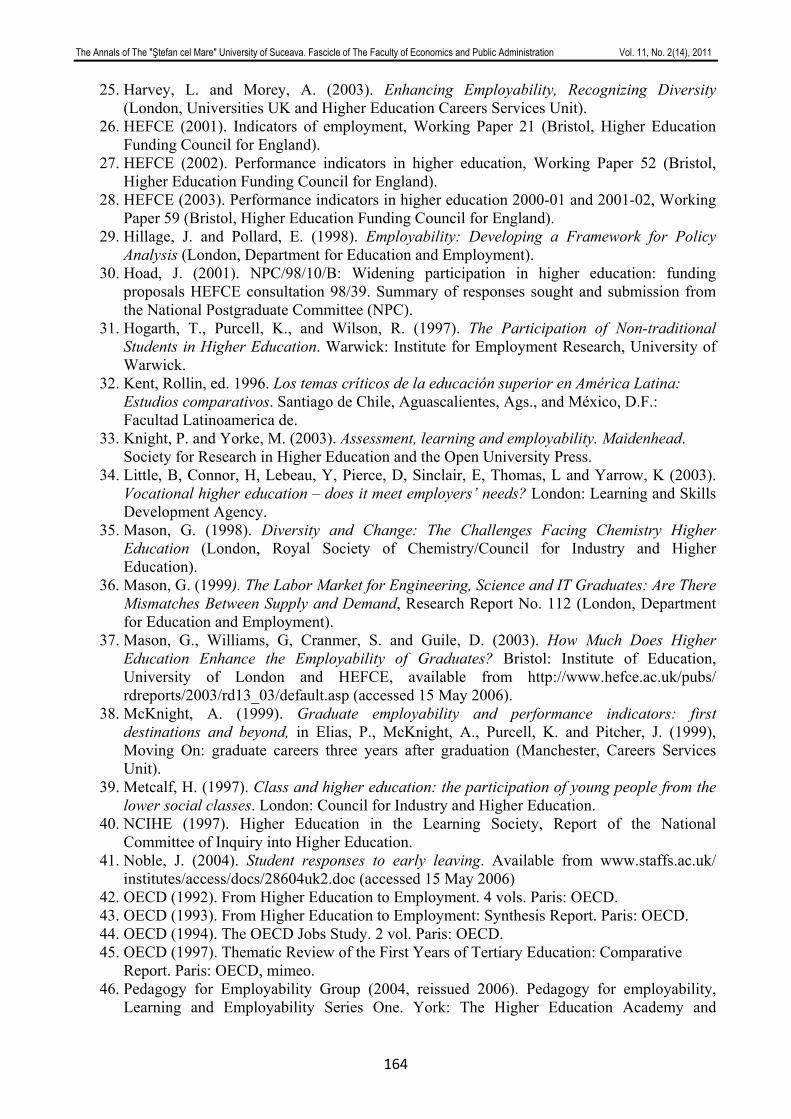
The Annals of The "Ştefan cel Mare" University of Suceava. Fascicle of The Faculty of Economics and Public Administration Vol. 11, No. 2(14), 2011
164
25. Harvey, L. and Morey, A. (2003). Enhancing Employability, Recognizing Diversity (London, Universities UK and Higher Education Careers Services Unit).
26. HEFCE (2001). Indicators of employment, Working Paper 21 (Bristol, Higher Education Funding Council for England).
27. HEFCE (2002). Performance indicators in higher education, Working Paper 52 (Bristol, Higher Education Funding Council for England).
28. HEFCE (2003). Performance indicators in higher education 2000-01 and 2001-02, Working Paper 59 (Bristol, Higher Education Funding Council for England).
29. Hillage, J. and Pollard, E. (1998). Employability: Developing a Framework for Policy Analysis (London, Department for Education and Employment).
30. Hoad, J. (2001). NPC/98/10/B: Widening participation in higher education: funding proposals HEFCE consultation 98/39. Summary of responses sought and submission from the National Postgraduate Committee (NPC).
31. Hogarth, T., Purcell, K., and Wilson, R. (1997). The Participation of Non-traditional Students in Higher Education. Warwick: Institute for Employment Research, University of Warwick.
32. Kent, Rollin, ed. 1996. Los temas críticos de la educación superior en América Latina: Estudios comparativos. Santiago de Chile, Aguascalientes, Ags., and México, D.F.: Facultad Latinoamerica de.
33. Knight, P. and Yorke, M. (2003). Assessment, learning and employability. Maidenhead. Society for Research in Higher Education and the Open University Press.
34. Little, B, Connor, H, Lebeau, Y, Pierce, D, Sinclair, E, Thomas, L and Yarrow, K (2003). Vocational higher education – does it meet employers’ needs? London: Learning and Skills Development Agency.
35. Mason, G. (1998). Diversity and Change: The Challenges Facing Chemistry Higher Education (London, Royal Society of Chemistry/Council for Industry and Higher Education).
36. Mason, G. (1999). The Labor Market for Engineering, Science and IT Graduates: Are There Mismatches Between Supply and Demand, Research Report No. 112 (London, Department for Education and Employment).
37. Mason, G., Williams, G, Cranmer, S. and Guile, D. (2003). How Much Does Higher Education Enhance the Employability of Graduates? Bristol: Institute of Education, University of London and HEFCE, available from http://www.hefce.ac.uk/pubs/ rdreports/2003/rd13_03/default.asp (accessed 15 May 2006).
38. McKnight, A. (1999). Graduate employability and performance indicators: first destinations and beyond, in Elias, P., McKnight, A., Purcell, K. and Pitcher, J. (1999), Moving On: graduate careers three years after graduation (Manchester, Careers Services Unit).
39. Metcalf, H. (1997). Class and higher education: the participation of young people from the lower social classes. London: Council for Industry and Higher Education.
40. NCIHE (1997). Higher Education in the Learning Society, Report of the National Committee of Inquiry into Higher Education.
41. Noble, J. (2004). Student responses to early leaving. Available from www.staffs.ac.uk/ institutes/access/docs/28604uk2.doc (accessed 15 May 2006)
42. OECD (1992). From Higher Education to Employment. 4 vols. Paris: OECD. 43. OECD (1993). From Higher Education to Employment: Synthesis Report. Paris: OECD. 44. OECD (1994). The OECD Jobs Study. 2 vol. Paris: OECD. 45. OECD (1997). Thematic Review of the First Years of Tertiary Education: Comparative
Report. Paris: OECD, mimeo. 46. Pedagogy for Employability Group (2004, reissued 2006). Pedagogy for employability,
Learning and Employability Series One. York: The Higher Education Academy and
The Annals of The "Ştefan cel Mare" University of Suceava. Fascicle of The Faculty of Economics and Public Administration Vol. 11, No. 2(14), 2011
165
ESECT. Available from: www.heacademy.ac.uk/resources.asp?process=full_record& section=generic&id=357 (accessed 15 May 2006).
47. Purcell, K., Morley, M. and Rowley, G. (2002). Employers in the New Graduate Labor Market: recruiting from a wider spectrum of graduates, Bristol: Employment Studies Unit, University of the West of England.
48. Purcell, K. and Hogarth, T. (1999). Graduate Opportunities, Social Class and Age: Employers’ Recruitment Strategies in the new graduate labor market. London: Council for Industry and Higher Education.
49. Quality Assurance Agency (QAA) (2002), Progress files for higher education, available at http://www.qaa.ac.uk/academicinfrastructure/progressFiles/default.asp.
50. Ramsden, P. (1992). Learning to Teach in Higher Education. London: Routledge. 51. Sinclair, H. and Dale, L. (2000). The effect of student tuition fees on the diversity of intake
within a Scottish new university. Paper presented at British Educational Research Association Annual Conference, 7-9 September 2000, Cardiff University.
52. Smith, J., McKnight, A. and Naylor, R. (2000). Graduate Employability: Policy, and performance in higher education, Economic Journal, 110 (464), pp. F382-411.
53. Susan, C. and Williams, J. (2002). The reluctant workforce: undergraduates’ part-time employment, Journal of Education and Training, 44 (1), pp.5-10.
54. Teichler, U. (1997). Graduate Employment: Challenges for Higher Education in the Twenty-First Century, Higher Education in Europe, vol. 22, no.1, pp. 75-84.
55. Thomas, L. (2005). Progression beyond higher education. Paper presented to the British Educational Research Association Annual Conference, Glamorgan University, September 2005.
56. Thomas, L., May, H., Harrop, H., Houston, M., Knox, H., Lee, M. F., Osborne, M., Pudner, H. and Trotman, C. (2005) From the margins to the mainstream: embedding widening participation in higher education. London: Universities UK.
57. UNESCO (1995). Policy Paper for Change and Development in Higher Education. Paris: UNESCO.
58. UNESCO (1997a). Higher Education: the Consequences of Change for Graduate Employment. Proceeding of the 5th UNESCO-NGO Collective Consultation on Higher Education. Paris, 10-12 February 1997. 3 volumes. Paris: UNESCO.
59. UNESCO (1997b). Consolidated Declarations and Plans of Action of the Regional Conferences on Higher Education held in Havana, Dakar, Tokyo and Palermo: Retained Lessons. Paris: UNESCO, Division of Higher Education, mimeo.
60. Walker, L. (1998). Longitudinal study of drop-out and continuing students who attended the Pre-University Summer School at the University of Glasgow, International Journal of Lifelong Education, 18 (3), pp.217 – 233.
61. Ward, R., Strivens, J. and Jackson, N. (2005). Progress files: are we achieving our goal? At www.recordingachievement.org/downloads/PFWorkingPaper.pdf.
62. Warren, D. (2002). Curriculum Design in a Context of Widening Participation in Higher Education. Arts and Humanities in Higher Education, 1 (1), pp.85-89.
63. Yee, Albert H., ed. (1995). East Asian Higher Education: Traditions and Transformations. Oxford: IAU Press/Pergamon.
64. Yorke, M. (1999). Leaving Early: Undergraduate non-completion in higher education. London: RoutledgeFalmer.
The Annals of The "Ştefan cel Mare" University of Suceava. Fascicle of The Faculty of Economics and Public Administration Vol. 11, No. 2(14), 2011
166
SOME FEATURES OF POSTWAR BUSINESS CYCLES
Assistant PhD. Student. Mihaela IFRIM „Al. I. Cuza” University, Faculty of Economics and Business Administration, Iaşi, România
Abstract: The last century economists have dared to predict, if not the end of the business cycle, at least the progress
towards economic stability. This was because of the stabilization policies and structural changes of the postwar economy that seemed to support the reduction of economic fluctuations, at least in the short term. Indeed, postwar expansions have been longer than those before World War I, indicating that recessions have occurred less frequently than in the past. What caused this evolution and what are the characteristics of business cycles since the Second World War are questions that we try to find answers in this paper.
Keywords: business cycle, macroeconomic policies, cyclical synchronization JEL Classification: E32, E51, F44
INTRODUCTION
Economic reality has seen significant changes after the Second World War and this is visible in every part of it. National incomes, economic growth rates, trade balances, unemployment, inflation, fiscal and monetary policies, the share of industry and services in national economies, foreign dependence, etc. have evolved different. Human existence itself is subject to a permanent social, historical, cultural, political and economic change. Ideas and truths changes, because their fundamentals are others. Instability is the one that always accompanies the search of equilibrium. Commonly, we get used to associate economic instability with cyclical movements, with the succession of expansion and recession periods. There have always been prosperous years and difficult years, because even the sense of prosperity has changed with changing aspirations and human performances.
We used to talk so much about economic development through expansions and recessions that often we do not perceive that our entire existence, not only the economic sphere, evolves cyclical. We talk for example about a daily cycle consisting of hours spent at work and those used to relax. Similarly, we can talk about a weekly cycle; we work five days and dedicate the other two to rest. If these periods of decline of our activities could not be better received, this is not the case when it comes to "rest" the economic activity. Recessions are commonly perceived as an evil that must be removed and not as a period when the economy take a break and prepare itself for another jump. When an economy enters a downward trend, no one could know how many months it will take or how severe the recession will be, how many companies will fail, or how many people will be unemployed. According to Nelson and Kim (1999), business cycle can be regarded as a common cold. Although broadly you know what to expect and what treatment to choose, you never know when you’ll get a new cold and how long the convalescence will last. In other words, although the phases of the business cycle repeats, their duration and intensity vary considerably
The period after the Second World War can be characterized in terms of cyclical fluctuations as a more stable one, with a somewhat more gentle evolution compared with previous periods. That's because recessions were generally lower in both duration and amplitude. In this respect, the data provided by National Bureau of Economic Research (NBER), somehow the official forum specialized in economic cycles of the United States, are eloquent. Thus, the average U.S. cyclical contractions decreased from 20.5 months in the prewar period to 10.7 months after the Second World War. Similarly, the average length of expansions has increased from 25.3 months to 49.9 months.
The aim of our approach is thus to identify the main characteristics of business cycles since the Second World War and the extent to which there was a coordinated between them. The main
The Annals of The "Ştefan cel Mare" University of Suceava. Fascicle of The Faculty of Economics and Public Administration Vol. 11, No. 2(14), 2011
167
difficulty of this approach lies in the limited data on business cycles outside the United States of America. If we can talk here even about a tradition in dating and explaining cyclical fluctuations, a similar NBER organization in Europe appeared only in 2003, but without to excel in processing and disseminating information on business cycles. On the other regions the data are even poorer. Existing studies are mainly focused on identifying a correlation between regional cycles, synchronization between them and less to make a chronology or to explain what caused these recessions. A more extensive literature is about financial crises, but more often they are presented outside the real economy's cyclical development.
POSTWAR CYCLICAL FLUCTUATIONS Postwar global economy has seen an upward trend, accentuated especially after the recovery
from the oil shocks in the ‘70s. We can even speak of a softening of cyclical fluctuations as economic variables have seen a lower volatility, to which have contributed both fiscal and monetary policies and the improved quality of institutions. Increased stability and durability of expansions seemed to be lasting features of global economy after the Second World War. But this lower volatility does not mean that business cycle has been abolished. The abrupt finish of sustained growth periods of ‘80s and ‘90s provides a lesson about the misfit on time of the policies to prevent emerging risks and new challenges of the economy.
A comparison of the business cycles in the last century indicates an increase in the amplitude of expansions and a reduction of the period spent by the global economy into recessions. In advanced economies, severe recessions almost disappeared after the Second World War. Only the ‘70s have been an exception, the unprecedented increase in oil prices marking a slowdown. (We specify that these features of postwar cyclical fluctuations are not taking into consideration the current global events, their analysis being subject of a future study).
Stabilization of postwar business cycles was attributed to several factors, among which we point higher rates of growth, the lower share of commodity based sectors, the introduction of bank deposit insurance (which has helped to reduce the bank panics) and macroeconomic stabilization policies.
It should be recognized that often some of the factors that determine a recession are considered new at that time. For example, the economic crisis from Asia Pacific was related to external financial vulnerability that has not been identified or properly understood before the crisis. Therefore, maintaining expansions requires the adjustment of macroeconomic policy decisions to commercial and financial globalization process that can generate new risks (see massive investments in American mortgage market).
MACROECONOMIC POLICIES ROLE According to Christina Romer (1999), the source of continuity and change in economic
fluctuations must be sought in macroeconomic policy since the Second World War that has removed much of the shocks responsible in the past for recessions, although it contributed to the introduction of new ones. Macroeconomic variables have become more stable and recessions less severe in the postwar period because both the monetary and fiscal policies have acted as shocks stabilizers. In contrast, the active involvement of governments proved in some cases to be a destabilizing force. We indicate here especially the effects of expansionary policies, to encourage easy access to credits, providing initially an impulse to the economy and placing it on an upward trend. But lacking of correlation between higher investments stimulated by cheap loans and real savings level caused inefficient allocation of resources and precipitated the crisis and the necessary corrections.
Rising prices due to monetary expansion and low demand for investments causes an opposite reaction from monetary authorities and commercial banks that decide to restrict lending and contribute to afferent economic contraction. As stated Rudy Dornbusch (2007), none of the
The Annals of The "Ştefan cel Mare" University of Suceava. Fascicle of The Faculty of Economics and Public Administration Vol. 11, No. 2(14), 2011
168
expansions of the last half century in the United States did not die in bed by good death, but were killed by the Federal Reserve System. We underline thus the view that governments have created recessions in order to reduce inflation (Romer, 1999). The fact that the postwar recessions have not been accompanied by deflation supports the idea that they were only to control rising prices, being stopped by government measures before getting worse. But we still retain that recessions corrects just the effects of expansionary monetary policies.
Although monetary expansion has generated rapid economic growth periods, it fueled price increases and boosted investments, often wrongly directed, notwithstanding the real needs of the economy. In essence, business cycles caused by "animal spirits" as Keynes believed were replaced by cycles induced by macroeconomic policies.
We don’t have to forget the fiscal policies, which in the good Keynesian tradition were, at their turn, expansionary. Increased investments caused by monetary stimulus have been combined with increased government spending. Stimulating aggregate demand in order to give an ascending trend to the economy has assumed increasing taxes and giving higher privileges to the state. And as we have already seen, state intervention in the economy has not generated each time stability, but often contributed to significant imbalances.
EXCHANGE RATES REGIME Between cyclical behavior of an economy and its trade regime there is a causal link
(Bergman, Bordo, Jonung, 1998). A convertible regime, such as gold standard, is characterized by the existence of some self-regulating market forces that tend to ensure long-term price stability. Thus, changes in gold supply offset inflationary or deflationary price movements. The problem arises when there are shocks on the supply or demand for gold that may substantially affect the price level and real income. Reporting national currency to the price of gold has provided a stable anchor for the international monetary system. In exchange for this stability, however, the economy is exposed to external shocks that can cause imbalances of income and employment. It is also lost the independence of monetary and fiscal policies, because the authorities focus mainly on maintaining the convertibility rather than stabilizing the national economy. Under a flexible regime, monetary authorities may use macroeconomic instruments to avoid shocks, but the lack of a nominal anchor determines the risk of using printing press for the fulfillment of political goals, which inevitably leads to inflation.
Before World War I, when national money supply depended on gold stocks, business cycles were influenced by the discoveries of new gold mines or changes in demand for gold as new states adopt this standard. Another important source of cyclical fluctuations was banking panics, banks portfolios were very less diversified and there was no lender of last resort. However, before 1914 most of the countries was less industrialized, agriculture being the dominant activity. In this context, bad crops were translated into major sources of imbalance. One country shocks were transmitted to other countries that had joined the gold parity through fixed exchange rates. However, the gold standard period was quite stable and experienced significant growth. We can not say the same about the interwar period that meant a mixed regime of floating, managed floating and convertibility. Great Depression, the last century’s biggest economic problem, is attributed to pro-gold contractionary policies of the United States, being transmitted globally through gold standard. Recovery occurred only after breaking ties with it (Bergman, Bordo, Jonung, 1998).
The system built at Bretton Woods had combined the flexibility of floating exchange rates supported by the British with nominal stability of gold standard supported by Americans. The system was based on crawling exchange rates; countries could adjust the parity in case of disruptions. The countries had appealed domestic stabilization policies using monetary and fiscal policies. Thus, we go back to the first topic discussed, namely the increased role of macroeconomic policies after the Second World War. Passage to a floating exchange rate regime in the ‘70s gave greater independence of monetary and fiscal policies. Monetary base had a higher rate of growth, as well as debts reported to Gross Domestic Product. Oil shocks led to recessions that were transmitted
The Annals of The "Ştefan cel Mare" University of Suceava. Fascicle of The Faculty of Economics and Public Administration Vol. 11, No. 2(14), 2011
169
between countries despite the specific independence of floating rates. Increased capital mobility interconnected greater the national business cycles.
BUSINESS CYCLES SYNCRONIZATION Increased global integration of markets for goods and capitals seems to be largely
responsible for the increased interdependence of national business cycles. Liberalization of capital movements, floating exchange rates and increased speculative activities have resulted in a closer correlation and synchronization between fluctuations of different economies. Business cycles are considered synchronized if the turning points ('peaks' and 'troughs') occur at approximately the same time. Increasing economic and financial interdependence after the Second World War made global shocks to be transmitted rapidly from one country to another. At the same time, the shocks produced in the United States, as center country, were rapidly transmitted to other countries. Regional economic integration in Europe and North America explains the synchronization of cyclical movements between countries belonging to the same group
Most often, the synchronization of business cycles is attributed to the influence of trade. But theory proved to be not sufficiently clear giving a verdict if the bilateral trade relations result in stronger or weaker synchronization between cycles. On the one hand, domestic shocks are transmitted through trade relations to partner countries and on the other hand, increased trade can lead to higher degrees of specialization, cycles becoming thus asynchronous (Bower, Guillemineau, 2006). However, economic specialization makes countries with similar industrial structures to observe some correlations of their business cycles.
Financial integration is another determinant of synchronizing business cycles. Evidence of financial crisis indicates a direct link between capital flows and business cycles synchronization. Financial ties can bring a greater synchronization between business cycles through domestic demand. For example, if consumers from different countries make significant investments in certain capital markets, their decline could cause a simultaneous decrease in demand for consumption and investment in these countries. Contagion effect transmitted through financial linkages could also result in the spread of economic fluctuations between countries.
International financial linkages could result in specialization of production through the reallocation of capital in a similar manner to comparative advantage in producing different goods. Specialization of production, which may cause a greater exposure to industrial shocks, is generally accompanied by a tendency to diversify the risks through operations on international financial markets.
The problem of synchronizing business cycles seems to be more complicated in the context of globalization. That's because, since the ‘80s, the world economy has seen a rapid increase in trade and financial linkages between countries. Conventional approach suggests that the forces of globalization have contributed to increased economic interdependence between countries and thus to the convergence of business cycles. On the other hand, the good performances of emerging economies, particularly China and India, seem not to be related to slowing growth in most industrialized countries. Such a decoupling of these emerging markets from the industrialized economies is observed (Kose, Otrok, Prasad, 2008), meaning that the cyclical fluctuations from the first are not always linked, synchronized with the cycles of the latter.
CYCLICAL MOVEMENTS VOLATILITY
One important features of the business cycle is volatility. Along with growth rate, volatility determines the length of expansions and recessions. The evolution of income volatility in the postwar period can be analyzed over several periods. In advanced economies, this volatility has been high in the '50s, partly because the Korean War and the rapid reconstruction of Europe and Japan after the Second World War. This volatility has declined in the late '60s, but increased again in ‘70s as a result of oil shocks and “stop-and-go” macroeconomic policies (IMF, 2007). After the
The Annals of The "Ştefan cel Mare" University of Suceava. Fascicle of The Faculty of Economics and Public Administration Vol. 11, No. 2(14), 2011
170
deflation of the early 80's, the volatility of the national income of developed countries begins to decline to about a half of that of the ‘60s.
The same tendency of decreasing volatility takes place in emerging economies, but this occurs later. For example, Latin American countries are experiencing a period of relative stability in the ‘60s, while China is facing a high volatility. Oil price shocks, increased commodity prices and some effects of contagion from developed countries determined the increase of volatility in these less developed economies, retaining a high level during the ‘80s and much of the ‘90s. These periods meant external debt crisis, when were mainly affected countries in Latin America and Africa, banking and financial crises in Asia, Central and Eastern Europe and Latin America. Also, a high volatility faced the states in transition from centralized to market economy. Despite progress towards a relative stability in developing economies, they continue to have a significantly higher volatility of domestic production compared to advanced countries. This is partly due to structural differences, developing countries maintaining agricultural sectors with significant share in total GDP, inefficient institutions and political instability.
Declined volatility after the Second World War is attributed to monetary and financial policies that have created a more stable framework for economic activity, but also on institutions that have worked especially in developed economies. It is not excluded any bit of luck, because external shocks of the postwar period have been limited, if we do not take into account the rising price of oil in ‘70s.
Relative decreased income volatility is due, to a large extent, to stabilized postwar demand. The accumulation process caused some stability of incomes and thus, of demand. The same effect had certain optimism about the favorable development of economy. Supply, also, has caused fewer fluctuations in the light of the increasing share of services in total output, thus reduced inventory.
Cyclical evolution of the postwar world economy can be characterized by a tendency to increasing global factors influence on the national business cycles. At the same time, for both industrialized and emerging economies, there is a growing importance of group-specific factors. Intensifying trade and financial relations translated into a better cycle convergence within each integrated group. However, domestic factors continue to exert considerable influence on the cyclical fluctuations of a country's economy, increasing trade and financial integration not always resulting into a better synchronization of national cycles.
We cannot speak necessarily about a cyclical wave transmission from developed countries to the periphery, but about their synchronization within either the group of industrialized countries or within the emerging economies group. For example, Asian countries, that used to react immediately to any fluctuation of economic activity in the United States, seems more stable today, partly because they have become more strongly rooted in the Chinese economy, transformed into a counterweight to the United States.
CONCLUSIONS Despite the forecasts made by Arthur Burns in the '60s, the business cycle is today as alive
as then. Even if the postwar period was indeed a time of relative stability, the cyclical fluctuations continue to accompany the course of the global economy, to be part of its resort.
Postwar recessions have seen a decline in terms of amplitude, although there are opinions like that of Christina Romer that puts in doubt that, because of reporting on insufficient data before the war. However, the general opinion seems to lean toward a favorable verdict about postwar stabilization. That's because after the World War II the world economy had impressive growth rates, increased trade and financial transactions, resulting global market integration. This increase is due not only to industrialized countries, largely also contributing to it developing countries, emerging economies, progress and development being the defining characteristic of the period. Volatility of economic aggregates is smaller, allowing stability and growth
Macroeconomic reforms seem to be at least a part of the explanation of this stabilization. And the reforms were made possible because of the institutions that supported them. These reforms,
The Annals of The "Ştefan cel Mare" University of Suceava. Fascicle of The Faculty of Economics and Public Administration Vol. 11, No. 2(14), 2011
171
however, have not always worked. It seems that the arsenal to fight recession was not always adapted to the shocks, which most often appeared to surprise the global economy. Oil crises, the debt crisis of Third World, the crisis in Mexico and the one in Asia, not to mention the current crisis, turned into exogenous shocks which led to massive reform efforts towards stabilization and avoidance of new destabilizing factors.
Globalization, beyond the increased phenomenon of markets integration, has resulted in two trends of cyclical fluctuations. On the one hand, being part of a global world means more exposure to fluctuations in other economies, but also can reduce the risks associated with a specialization in domestic production
Beyond the multitude of factors on whose behalf it is put the tendency of reducing postwar cyclical fluctuations, we retain the idea of change: change in policies, structures, institutions, demand, supply, consumer psychology and even the shocks. Of course, the business cycle itself has changed. It has changed, but not disappeared. Beyond the reality of some decades of growth very little deviated from trend, of the satisfied curators who claimed to have found the cure for recession, of the enthusiasm of supporters of a new economy from whose equation business cycle has disappeared, it seems to have revived and "shakes" well global economy. If the recessions of the last half century were mainly specific to each region of the globe, with own intensities and oscillations, we believe we’re not wrong to say that the actual world turmoil is an important turning point for a new business cycle, a global one.
REFERENCES
1. Bergman, Michael, Bordo, Michael, Jonung, Lars (1998) Historical Evidence on Business Cycles: The International Experience, Working Paper Series in Economics and Finance no. 255, Stockholm School of Economics.
2. Blanchard, Olivier (1993) Consumption and the Recession of 1990-1991, American Economic Review, American Economic Association, vol. 83; no. 2.
3. Bordo, Michael (2008) An Historical Perspective on the Crisis of 2007-2008, Central Bank of Chile Twelfth Annual Conference on Financial Stability, Monetary Policy and Central Banking, Santiago, Chile.
4. Bordo, Michael, Goldin, Claudia, White, Eugene (2002) The Defining Moment: The Great Depression and the American Economy in the Twentieth Century, NBER Working Paper no. 8716.
6. Bordo, Michael, Helbling, Thomas (2003) Have National Business Cycles Become More Synchronized”; NBER Working Paper no. 10130.
8. Botha, I., Greyling, L., Marais, D.J. (2005) The Evolution Of Business Cycles since 1960, University of Johannesburg, South Africa.
9. Bower, Uwe, Guillemineau, Catherine (2006) Determinants of Business Cycle Synchronisation across Euro Area, European Central Bank Working Paper Series no. 587.
10. Burns, Arthur F.(1969) The Business Cycle in a Changing World, NBER Book Series Studies in Business Cycles.
11. Camacho, Maximo, Perez-Quiros, Gabriel, Saiz, Lorenna (2008) Do European Business Cycles look like one?, Journal of Economic Dynamics and Control, vol. 32, no. 7.
12. Crafts, Nicholas, Toniolo, Gianni (1998) Economic Growth in Europe since 1945, Cambridge University Press.
13. DeLong, J. Bradford (2000) The Changing Cyclical Variability of the American Economy, http://www.j-bradford-delong.net/tceh/2000/seven/cyclical_variability.pdf
14. DeLong, J. Bradford (2003) Commentary: Has the Business Cycle Changed? Evidence and Explanations, http://www.kc.frb.org/Publicat/sympos/2003/pdf/DeLong2003.pdf
The Annals of The "Ştefan cel Mare" University of Suceava. Fascicle of The Faculty of Economics and Public Administration Vol. 11, No. 2(14), 2011
172
15. Dornbusch, Rudy (2007) Why this Recovery won’t fall off the Track soon, Business Week, http://www.businessweek.com/archives/1997/b3539036.arc.htm
16. Eckstein, Otto, Sinai, Allen (1986) The Mechanisms of the Business Cycle in the Postwar Era, NBER Book Series Studies in Business Cycles.
17. Eichengreen, Barry (1995) Europe’s Post-war Recovery, Cambridge University Press. 18. Eichengreen, Barry, Bordo, Michael (2002) Crises Now and Then: What Lessons from
the Last Era of Financial Globalization?, NBER Working Paper no. 8716. 19. Gordon, Robert J. (1986) The American Business Cycle: Continuity and Change, NBER
Book Series Studies in Business Cycles. 20. Ifrim, Mihaela, Ignat, Ion (2009) Trade and Business Cycle Synchronization, in
Globalization and Higher Education in Economics and Business Administration, Iaşi, pp. 206-210.
21. Kydland, Finn E., Prescott, Edward C. (1990) Business Cycles: Real Facts and a Monetary Myth, http://docenti.luiss.it/digiorgio/files/2008/01/kydland-e-prescott-1990.pdf
22. Kose, M. Ayhan, Otrok, Christopher, Prasad, Eswar S. (2008) Global Business Cycles: Convergence or Decoupling, NBER Working Paper no. 14292.
23. Kose, M. Ayhan, Otrok, Christopher; Whiteman, Charles H. (2003) Understanding the Evolution of World Business Cycles, International Monetary Fund.
24. Kose, M. Ayhan, Prasad, Eswar S., Terrones, Marco E. (2003) How Does Globalization Affect the Synchronization of Business Cycles?, The Institute for the Study of Labour, Bonn.
25. Nelson, Charles R., Kim, Chang-Jin (1999) Friedman’s Plucking Model of Business Fluctuations: Tests and Estimates of Permanent and Transitory Components, Journal of Money, Credit&Banking.
26. Nordhaus, William D. (2002) The Mildest Recession: Output, Profits, and Stock Prices as the U.S. Emerges from the 2001 Recession, NBER Working Paper no. 8938.
27. Romer, Christina D. (1999) Changes in Business Cycle: Evidence and Explanations, Journal of Economic Perspectives, vol. 13, no. 2.
28. Temin, Peter (1998) The Causes of American Business Cycles: An Essay in Economic Historiography, http://www.bos.frb.org/economic/conf/conf42/con42_03.pdf
29. Watson, Mark W. (1992) Business Cycle Durations and Postwar stabilization of the U.S. Economy, NBER Working paper no. 4005.
30. Zarnowitz, Victor (1996) Business Cycles: Theory, History, Indicators, and Forecasting, University of Chicago Press.
31. ***Business Cycle Dating Committee of the Centre for Economic Policy Research, http://www.cepr.org/press/dating.pdf
32. *** The Changing Dynamics of the Global Business Cycle (2007), World Economic Outlook , International Monetary Fund, http://www.imf.org/external/pubs/ft/weo
33. National Bureau of Economic Research Website; www.nber.org
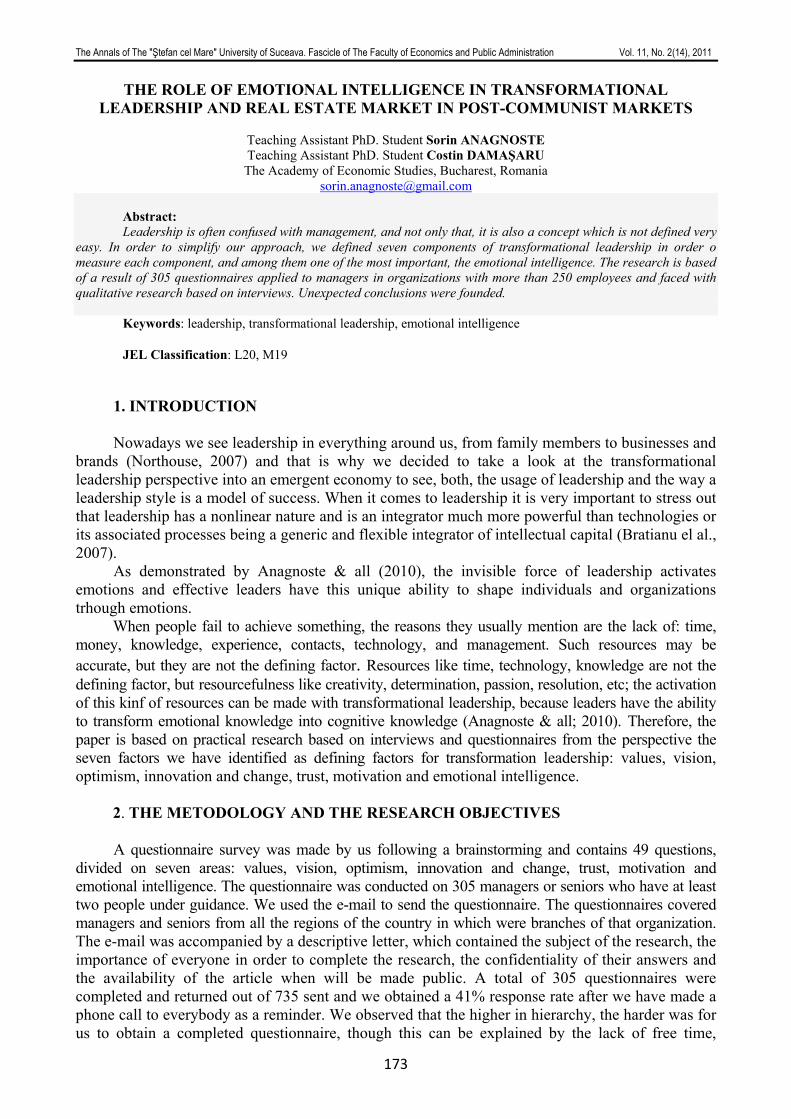
The Annals of The "Ştefan cel Mare" University of Suceava. Fascicle of The Faculty of Economics and Public Administration Vol. 11, No. 2(14), 2011
173
THE ROLE OF EMOTIONAL INTELLIGENCE IN TRANSFORMATIONAL LEADERSHIP AND REAL ESTATE MARKET IN POST-COMMUNIST MARKETS
Teaching Assistant PhD. Student Sorin ANAGNOSTE Teaching Assistant PhD. Student Costin DAMAŞARU The Academy of Economic Studies, Bucharest, Romania
[email protected] Abstract: Leadership is often confused with management, and not only that, it is also a concept which is not defined very
easy. In order to simplify our approach, we defined seven components of transformational leadership in order o measure each component, and among them one of the most important, the emotional intelligence. The research is based of a result of 305 questionnaires applied to managers in organizations with more than 250 employees and faced with qualitative research based on interviews. Unexpected conclusions were founded.
Keywords: leadership, transformational leadership, emotional intelligence
JEL Classification: L20, M19
1. INTRODUCTION Nowadays we see leadership in everything around us, from family members to businesses and
brands (Northouse, 2007) and that is why we decided to take a look at the transformational leadership perspective into an emergent economy to see, both, the usage of leadership and the way a leadership style is a model of success. When it comes to leadership it is very important to stress out that leadership has a nonlinear nature and is an integrator much more powerful than technologies or its associated processes being a generic and flexible integrator of intellectual capital (Bratianu el al., 2007).
As demonstrated by Anagnoste & all (2010), the invisible force of leadership activates emotions and effective leaders have this unique ability to shape individuals and organizations trhough emotions. When people fail to achieve something, the reasons they usually mention are the lack of: time, money, knowledge, experience, contacts, technology, and management. Such resources may be accurate, but they are not the defining factor. Resources like time, technology, knowledge are not the defining factor, but resourcefulness like creativity, determination, passion, resolution, etc; the activation of this kinf of resources can be made with transformational leadership, because leaders have the ability to transform emotional knowledge into cognitive knowledge (Anagnoste & all; 2010). Therefore, the paper is based on practical research based on interviews and questionnaires from the perspective the seven factors we have identified as defining factors for transformation leadership: values, vision, optimism, innovation and change, trust, motivation and emotional intelligence. 2. THE METODOLOGY AND THE RESEARCH OBJECTIVES
A questionnaire survey was made by us following a brainstorming and contains 49 questions,
divided on seven areas: values, vision, optimism, innovation and change, trust, motivation and emotional intelligence. The questionnaire was conducted on 305 managers or seniors who have at least two people under guidance. We used the e-mail to send the questionnaire. The questionnaires covered managers and seniors from all the regions of the country in which were branches of that organization. The e-mail was accompanied by a descriptive letter, which contained the subject of the research, the importance of everyone in order to complete the research, the confidentiality of their answers and the availability of the article when will be made public. A total of 305 questionnaires were completed and returned out of 735 sent and we obtained a 41% response rate after we have made a phone call to everybody as a reminder. We observed that the higher in hierarchy, the harder was for us to obtain a completed questionnaire, though this can be explained by the lack of free time,
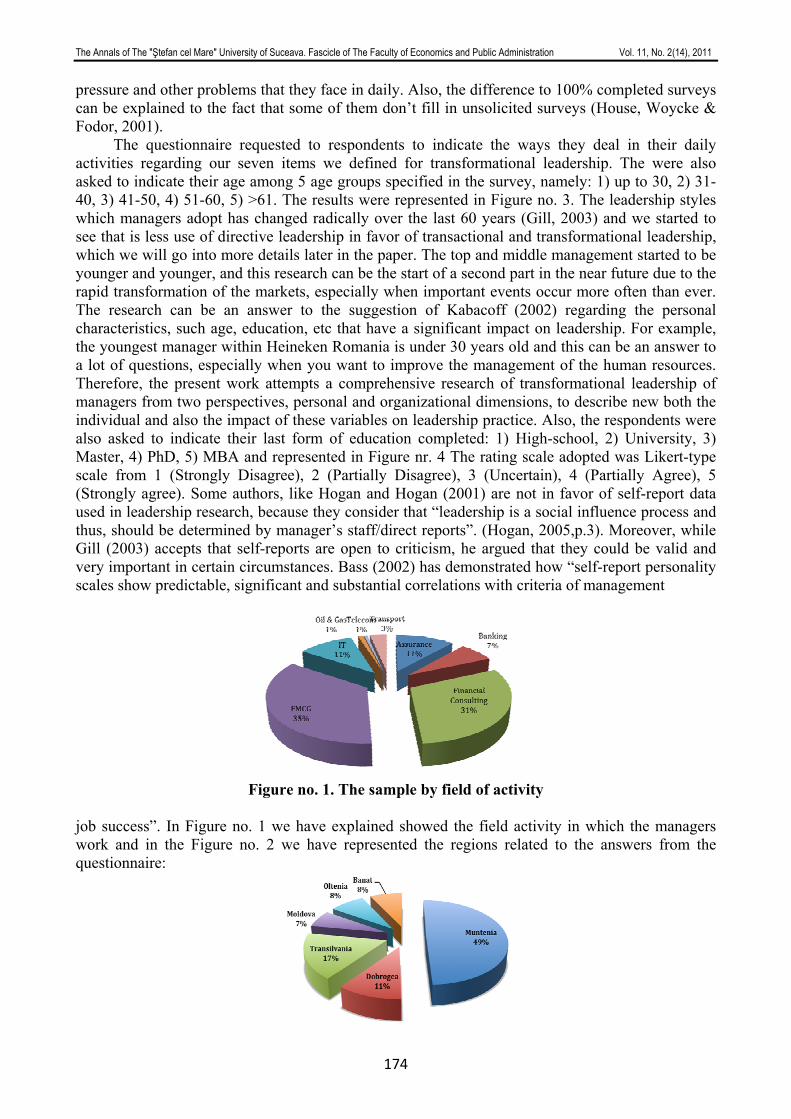
The Annals of The "Ştefan cel Mare" University of Suceava. Fascicle of The Faculty of Economics and Public Administration Vol. 11, No. 2(14), 2011
174
pressure and other problems that they face in daily. Also, the difference to 100% completed surveys can be explained to the fact that some of them don’t fill in unsolicited surveys (House, Woycke & Fodor, 2001).
The questionnaire requested to respondents to indicate the ways they deal in their daily activities regarding our seven items we defined for transformational leadership. The were also asked to indicate their age among 5 age groups specified in the survey, namely: 1) up to 30, 2) 31-40, 3) 41-50, 4) 51-60, 5) >61. The results were represented in Figure no. 3. The leadership styles which managers adopt has changed radically over the last 60 years (Gill, 2003) and we started to see that is less use of directive leadership in favor of transactional and transformational leadership, which we will go into more details later in the paper. The top and middle management started to be younger and younger, and this research can be the start of a second part in the near future due to the rapid transformation of the markets, especially when important events occur more often than ever. The research can be an answer to the suggestion of Kabacoff (2002) regarding the personal characteristics, such age, education, etc that have a significant impact on leadership. For example, the youngest manager within Heineken Romania is under 30 years old and this can be an answer to a lot of questions, especially when you want to improve the management of the human resources. Therefore, the present work attempts a comprehensive research of transformational leadership of managers from two perspectives, personal and organizational dimensions, to describe new both the individual and also the impact of these variables on leadership practice. Also, the respondents were also asked to indicate their last form of education completed: 1) High-school, 2) University, 3) Master, 4) PhD, 5) MBA and represented in Figure nr. 4 The rating scale adopted was Likert-type scale from 1 (Strongly Disagree), 2 (Partially Disagree), 3 (Uncertain), 4 (Partially Agree), 5 (Strongly agree). Some authors, like Hogan and Hogan (2001) are not in favor of self-report data used in leadership research, because they consider that “leadership is a social influence process and thus, should be determined by manager’s staff/direct reports”. (Hogan, 2005,p.3). Moreover, while Gill (2003) accepts that self-reports are open to criticism, he argued that they could be valid and very important in certain circumstances. Bass (2002) has demonstrated how “self-report personality scales show predictable, significant and substantial correlations with criteria of management
Figure no. 1. The sample by field of activity
job success”. In Figure no. 1 we have explained showed the field activity in which the managers work and in the Figure no. 2 we have represented the regions related to the answers from the questionnaire:
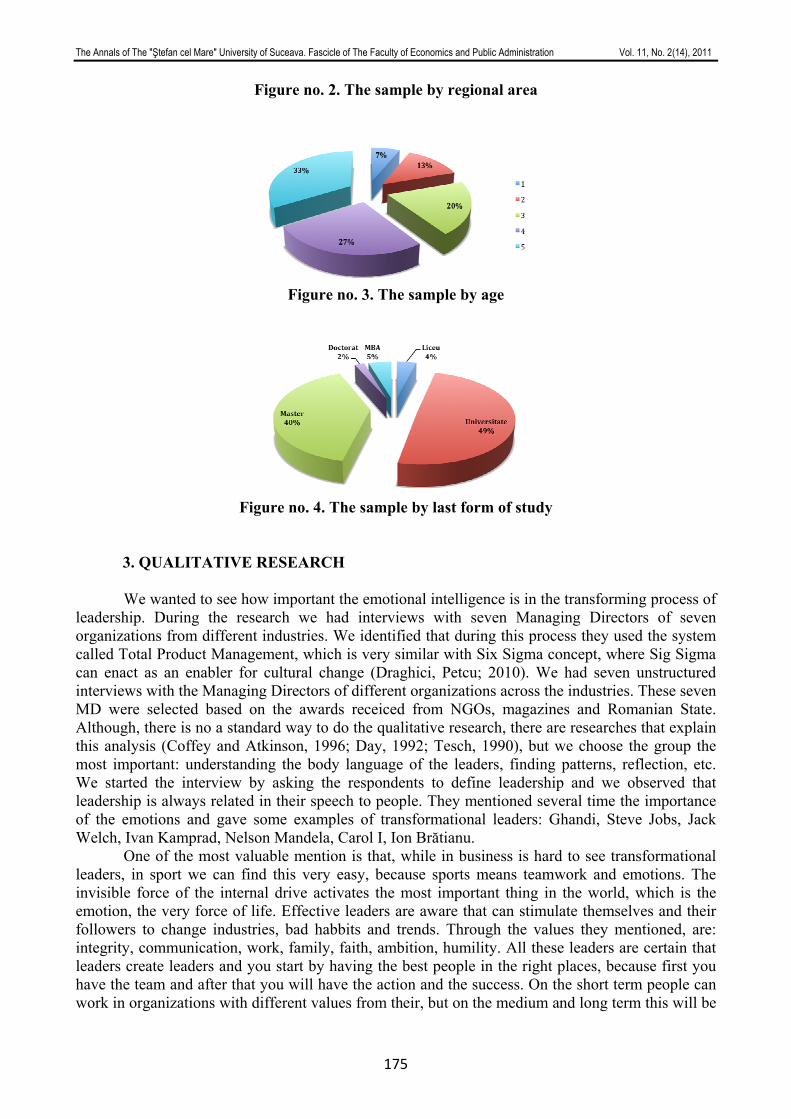
The Annals of The "Ştefan cel Mare" University of Suceava. Fascicle of The Faculty of Economics and Public Administration Vol. 11, No. 2(14), 2011
175
Figure no. 2. The sample by regional area
Figure no. 3. The sample by age
Figure no. 4. The sample by last form of study
3. QUALITATIVE RESEARCH
We wanted to see how important the emotional intelligence is in the transforming process of leadership. During the research we had interviews with seven Managing Directors of seven organizations from different industries. We identified that during this process they used the system called Total Product Management, which is very similar with Six Sigma concept, where Sig Sigma can enact as an enabler for cultural change (Draghici, Petcu; 2010). We had seven unstructured interviews with the Managing Directors of different organizations across the industries. These seven MD were selected based on the awards receiced from NGOs, magazines and Romanian State. Although, there is no a standard way to do the qualitative research, there are researches that explain this analysis (Coffey and Atkinson, 1996; Day, 1992; Tesch, 1990), but we choose the group the most important: understanding the body language of the leaders, finding patterns, reflection, etc. We started the interview by asking the respondents to define leadership and we observed that leadership is always related in their speech to people. They mentioned several time the importance of the emotions and gave some examples of transformational leaders: Ghandi, Steve Jobs, Jack Welch, Ivan Kamprad, Nelson Mandela, Carol I, Ion Brătianu.
One of the most valuable mention is that, while in business is hard to see transformational leaders, in sport we can find this very easy, because sports means teamwork and emotions. The invisible force of the internal drive activates the most important thing in the world, which is the emotion, the very force of life. Effective leaders are aware that can stimulate themselves and their followers to change industries, bad habbits and trends. Through the values they mentioned, are: integrity, communication, work, family, faith, ambition, humility. All these leaders are certain that leaders create leaders and you start by having the best people in the right places, because first you have the team and after that you will have the action and the success. On the short term people can work in organizations with different values from their, but on the medium and long term this will be
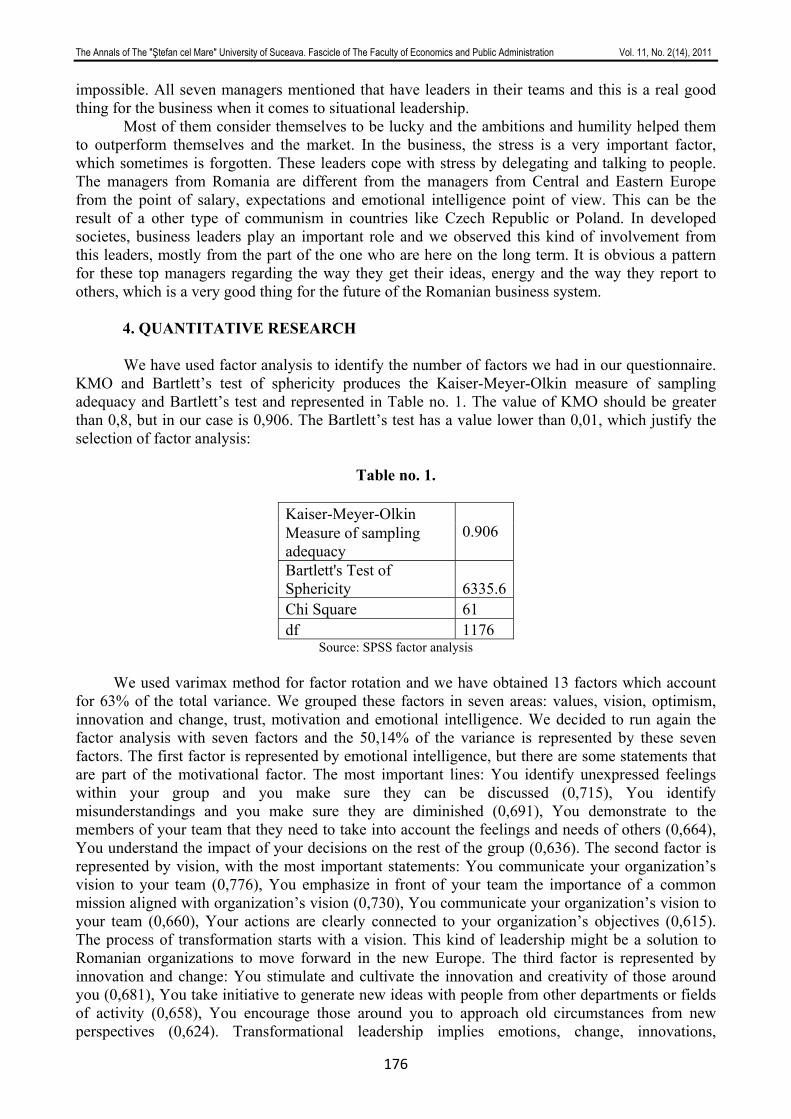
The Annals of The "Ştefan cel Mare" University of Suceava. Fascicle of The Faculty of Economics and Public Administration Vol. 11, No. 2(14), 2011
176
impossible. All seven managers mentioned that have leaders in their teams and this is a real good thing for the business when it comes to situational leadership.
Most of them consider themselves to be lucky and the ambitions and humility helped them to outperform themselves and the market. In the business, the stress is a very important factor, which sometimes is forgotten. These leaders cope with stress by delegating and talking to people. The managers from Romania are different from the managers from Central and Eastern Europe from the point of salary, expectations and emotional intelligence point of view. This can be the result of a other type of communism in countries like Czech Republic or Poland. In developed societes, business leaders play an important role and we observed this kind of involvement from this leaders, mostly from the part of the one who are here on the long term. It is obvious a pattern for these top managers regarding the way they get their ideas, energy and the way they report to others, which is a very good thing for the future of the Romanian business system.
4. QUANTITATIVE RESEARCH We have used factor analysis to identify the number of factors we had in our questionnaire.
KMO and Bartlett’s test of sphericity produces the Kaiser-Meyer-Olkin measure of sampling adequacy and Bartlett’s test and represented in Table no. 1. The value of KMO should be greater than 0,8, but in our case is 0,906. The Bartlett’s test has a value lower than 0,01, which justify the selection of factor analysis:
Table no. 1.
Kaiser-Meyer-Olkin Measure of sampling adequacy
0.906
Bartlett's Test of Sphericity 6335.6Chi Square 61 df 1176
Source: SPSS factor analysis We used varimax method for factor rotation and we have obtained 13 factors which account
for 63% of the total variance. We grouped these factors in seven areas: values, vision, optimism, innovation and change, trust, motivation and emotional intelligence. We decided to run again the factor analysis with seven factors and the 50,14% of the variance is represented by these seven factors. The first factor is represented by emotional intelligence, but there are some statements that are part of the motivational factor. The most important lines: You identify unexpressed feelings within your group and you make sure they can be discussed (0,715), You identify misunderstandings and you make sure they are diminished (0,691), You demonstrate to the members of your team that they need to take into account the feelings and needs of others (0,664), You understand the impact of your decisions on the rest of the group (0,636). The second factor is represented by vision, with the most important statements: You communicate your organization’s vision to your team (0,776), You emphasize in front of your team the importance of a common mission aligned with organization’s vision (0,730), You communicate your organization’s vision to your team (0,660), Your actions are clearly connected to your organization’s objectives (0,615). The process of transformation starts with a vision. This kind of leadership might be a solution to Romanian organizations to move forward in the new Europe. The third factor is represented by innovation and change: You stimulate and cultivate the innovation and creativity of those around you (0,681), You take initiative to generate new ideas with people from other departments or fields of activity (0,658), You encourage those around you to approach old circumstances from new perspectives (0,624). Transformational leadership implies emotions, change, innovations,
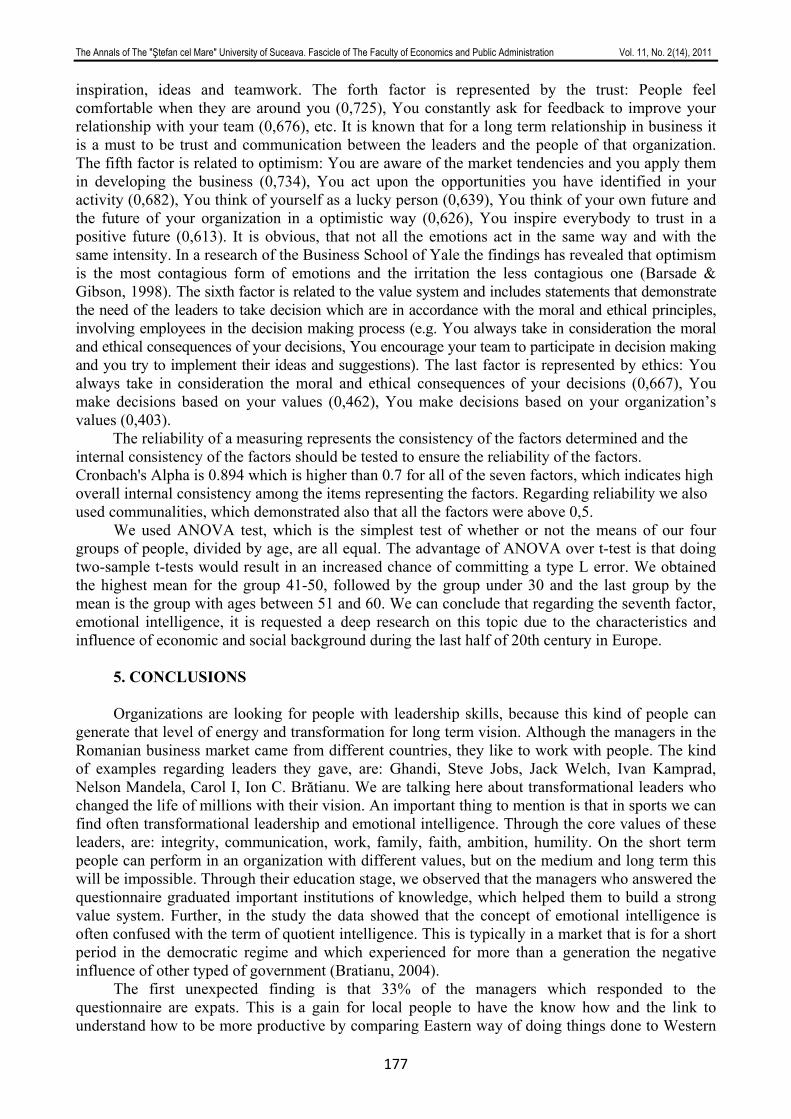
The Annals of The "Ştefan cel Mare" University of Suceava. Fascicle of The Faculty of Economics and Public Administration Vol. 11, No. 2(14), 2011
177
inspiration, ideas and teamwork. The forth factor is represented by the trust: People feel comfortable when they are around you (0,725), You constantly ask for feedback to improve your relationship with your team (0,676), etc. It is known that for a long term relationship in business it is a must to be trust and communication between the leaders and the people of that organization. The fifth factor is related to optimism: You are aware of the market tendencies and you apply them in developing the business (0,734), You act upon the opportunities you have identified in your activity (0,682), You think of yourself as a lucky person (0,639), You think of your own future and the future of your organization in a optimistic way (0,626), You inspire everybody to trust in a positive future (0,613). It is obvious, that not all the emotions act in the same way and with the same intensity. In a research of the Business School of Yale the findings has revealed that optimism is the most contagious form of emotions and the irritation the less contagious one (Barsade & Gibson, 1998). The sixth factor is related to the value system and includes statements that demonstrate the need of the leaders to take decision which are in accordance with the moral and ethical principles, involving employees in the decision making process (e.g. You always take in consideration the moral and ethical consequences of your decisions, You encourage your team to participate in decision making and you try to implement their ideas and suggestions). The last factor is represented by ethics: You always take in consideration the moral and ethical consequences of your decisions (0,667), You make decisions based on your values (0,462), You make decisions based on your organization’s values (0,403). The reliability of a measuring represents the consistency of the factors determined and the internal consistency of the factors should be tested to ensure the reliability of the factors. Cronbach's Alpha is 0.894 which is higher than 0.7 for all of the seven factors, which indicates high overall internal consistency among the items representing the factors. Regarding reliability we also used communalities, which demonstrated also that all the factors were above 0,5.
We used ANOVA test, which is the simplest test of whether or not the means of our four groups of people, divided by age, are all equal. The advantage of ANOVA over t-test is that doing two-sample t-tests would result in an increased chance of committing a type L error. We obtained the highest mean for the group 41-50, followed by the group under 30 and the last group by the mean is the group with ages between 51 and 60. We can conclude that regarding the seventh factor, emotional intelligence, it is requested a deep research on this topic due to the characteristics and influence of economic and social background during the last half of 20th century in Europe.
5. CONCLUSIONS Organizations are looking for people with leadership skills, because this kind of people can
generate that level of energy and transformation for long term vision. Although the managers in the Romanian business market came from different countries, they like to work with people. The kind of examples regarding leaders they gave, are: Ghandi, Steve Jobs, Jack Welch, Ivan Kamprad, Nelson Mandela, Carol I, Ion C. Brătianu. We are talking here about transformational leaders who changed the life of millions with their vision. An important thing to mention is that in sports we can find often transformational leadership and emotional intelligence. Through the core values of these leaders, are: integrity, communication, work, family, faith, ambition, humility. On the short term people can perform in an organization with different values, but on the medium and long term this will be impossible. Through their education stage, we observed that the managers who answered the questionnaire graduated important institutions of knowledge, which helped them to build a strong value system. Further, in the study the data showed that the concept of emotional intelligence is often confused with the term of quotient intelligence. This is typically in a market that is for a short period in the democratic regime and which experienced for more than a generation the negative influence of other typed of government (Bratianu, 2004).
The first unexpected finding is that 33% of the managers which responded to the questionnaire are expats. This is a gain for local people to have the know how and the link to understand how to be more productive by comparing Eastern way of doing things done to Western
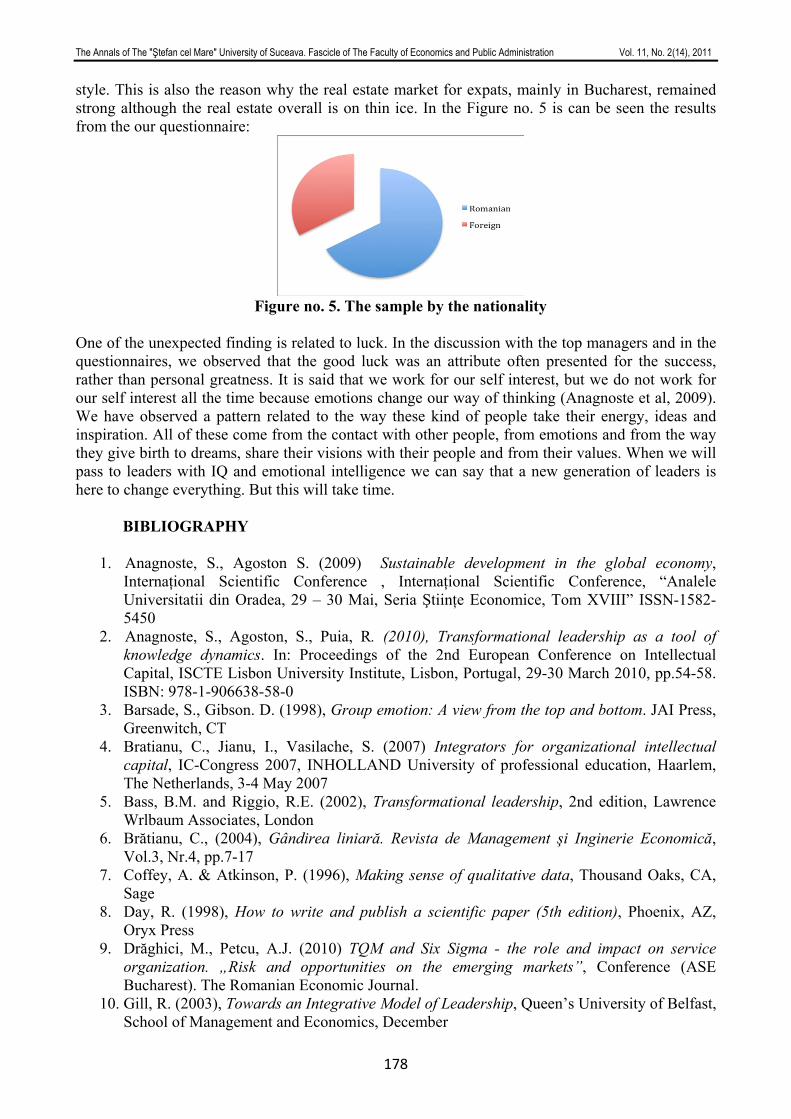
The Annals of The "Ştefan cel Mare" University of Suceava. Fascicle of The Faculty of Economics and Public Administration Vol. 11, No. 2(14), 2011
178
style. This is also the reason why the real estate market for expats, mainly in Bucharest, remained strong although the real estate overall is on thin ice. In the Figure no. 5 is can be seen the results from the our questionnaire:
Figure no. 5. The sample by the nationality
One of the unexpected finding is related to luck. In the discussion with the top managers and in the questionnaires, we observed that the good luck was an attribute often presented for the success, rather than personal greatness. It is said that we work for our self interest, but we do not work for our self interest all the time because emotions change our way of thinking (Anagnoste et al, 2009). We have observed a pattern related to the way these kind of people take their energy, ideas and inspiration. All of these come from the contact with other people, from emotions and from the way they give birth to dreams, share their visions with their people and from their values. When we will pass to leaders with IQ and emotional intelligence we can say that a new generation of leaders is here to change everything. But this will take time.
BIBLIOGRAPHY
1. Anagnoste, S., Agoston S. (2009) Sustainable development in the global economy, Internaţional Scientific Conference , Internaţional Scientific Conference, “Analele Universitatii din Oradea, 29 – 30 Mai, Seria Ştiinţe Economice, Tom XVIII” ISSN-1582-5450
2. Anagnoste, S., Agoston, S., Puia, R. (2010), Transformational leadership as a tool of knowledge dynamics. In: Proceedings of the 2nd European Conference on Intellectual Capital, ISCTE Lisbon University Institute, Lisbon, Portugal, 29-30 March 2010, pp.54-58. ISBN: 978-1-906638-58-0
3. Barsade, S., Gibson. D. (1998), Group emotion: A view from the top and bottom. JAI Press, Greenwitch, CT
4. Bratianu, C., Jianu, I., Vasilache, S. (2007) Integrators for organizational intellectual capital, IC-Congress 2007, INHOLLAND University of professional education, Haarlem, The Netherlands, 3-4 May 2007
5. Bass, B.M. and Riggio, R.E. (2002), Transformational leadership, 2nd edition, Lawrence Wrlbaum Associates, London
6. Brătianu, C., (2004), Gândirea liniară. Revista de Management şi Inginerie Economică, Vol.3, Nr.4, pp.7-17
7. Coffey, A. & Atkinson, P. (1996), Making sense of qualitative data, Thousand Oaks, CA, Sage
8. Day, R. (1998), How to write and publish a scientific paper (5th edition), Phoenix, AZ, Oryx Press
9. Drăghici, M., Petcu, A.J. (2010) TQM and Six Sigma - the role and impact on service organization. „Risk and opportunities on the emerging markets”, Conference (ASE Bucharest). The Romanian Economic Journal.
10. Gill, R. (2003), Towards an Integrative Model of Leadership, Queen’s University of Belfast, School of Management and Economics, December

The Annals of The "Ştefan cel Mare" University of Suceava. Fascicle of The Faculty of Economics and Public Administration Vol. 11, No. 2(14), 2011
179
11. Hogan, R., and Hogan, J. (2001). Assessing Leadership: A View from The Dark Side, International Journal of Selection and Assessment, 9, 40-51
12. House R.J., Woycke J., & Fodor E.M. (2001), Charismatic Leadership in US Presidential Office, paper presented at the annual Academy of Management Meetings, San Diego, California
13. Kabacoff, R.I. (2002). Leadership: What Has Age Got to do With It?, Research Release, New York: Management Research Group
14. Northouse, P.G. (2007) Leadership – theory and practice forth edition. Sage Publications, London
15. Tesch, R. (1990), Qualitative research: Analysis types and software tools, New York, Falmer

SECTION 3
ACCOUNTING ‐ FINANCES
The Annals of The "Ştefan cel Mare" University of Suceava. Fascicle of The Faculty of Economics and Public Administration Vol. 11, No. 2(14), 2011
DIFFERENTIAL FINANCIAL REPORTING FOR MICRO-ENTITIES: ADVANTAGES AND LIMITS
Professor PhD. Ramona NEAG
Universitatea “Petru Maior”, Tg. Mures, Romania [email protected]
Abstract: At European level, the European Commission supports the reduction of the information reporting
requirements for the small and medium-sized companies and makes the first move towards the classification of the unlisted entities in SMEs and micro-entities. For the last category of entities, the European Commission acknowledged that the rules of extensive reporting applied to these are not proportional with their accounting specific needs; they create an additional cost and can be an obstacle for the efficient use of the capital in productive purposes. Positive effects of the review will include a reduction of burden mainly for small enterprises ("think small first") as well as qualitative improvements for all enterprises in the scope of the Directives. We propose to present the need for simplification at our country level using some studies from the literature. We shall follow the implication of Romanian regulatory body in this process. The conclusion presented covers the analysed studies and the personal experience of the author.
Keywords: - financial reporting, micro-entities, “think small first”, simplifying, reduction of administrative burden
JEL Classification: M41
INTRODUCTION Small enterprises, where the owners are often also managers, consider that tax statements
are a useful and sufficient source of information. But this state perception decreases with the growth of the enterprise and the evolution of the information system (Paoloni, M. et al., 1999; Dugdale, D. et al., 1998) [1]. Together with the development of the company, the disadvantage of high costs is gradually transformed into an advantage of the drawing up of financial statements in a language understood by most accounting information users who operate in a competitive market (Keasey, K. and Short, H., 1990). The subsequent development of a former small enterprise (business) and its evolution into a listed company already involves the use of IFRSs for the drawing up of financial statements.
Neag shows that the preserving of national elements specific to the practices in the financial accounting field constitutes an opportunity, and IASB’s perspective of standardization of European accounting pays too little attention to the possibility that accounting practices in different communities could offer the alternatives required by the evolution of the market (Neag, R., 2003, p 20) [2]. Thus different accounting requirements arise, which gradually lead to … specific accounting practices. Meantime the Commission for Judicial Affairs of the European Parliament has noticed the more and more theoretical character of IASB standards, which actually have become so complex and theoretical, that SMEs, particularly, cannot follow them; at the same time it is questionable whether IFRS for for SMEs adequately reflects the needs of SMEs and the variety of modes and sizes in which they operate; it all regrets that the IFRS for SMEs doesn’t take adequate account of the specifics of these enterprises where the accounts’ addressees are not anonymous investors more interested in short term investments as it is the case of public limited companies (European Parliament, 2007) [3].
In the general context of better regulation, the European Commission has decided to simplify the regulatory environment for European businesses, in co-operation with the European Parliament and the Member States. The objective is to ensure that Community legislation in the fields of company law, accounting and auditing corresponds to today's business needs and allows European businesses to compete more effectively and to be more successful in a highly competitive global environment.
The Annals of The "Ştefan cel Mare" University of Suceava. Fascicle of The Faculty of Economics and Public Administration Vol. 11, No. 2(14), 2011
182
At European level the Directive 78/660CEE on annual accounts of certain types of companies contains provisions related to the presentation and content of annual accounts. Accordingly, three criteria (total assets, net turnover, average number of employees during the financial year) are use for classifying the entities in those which prepare five financial statements (balance sheet, profit and loss account, statement of changes in equity, statement of cash flow and explanatory notes) and entities that prepare three financial statements (balance sheet, profit and loss account and explanatory notes). By the Recommendation 2003/361/CEE, the Commission defined micro, small and medium-sized enterprises according to the same three criteria. In June 2007 the Commission published a report identifying the changes that could affect the accounting directives in order to reduce the administrative burdens for the micro-entities. These entities operate at local level and regional level; have low or inexistent cross-border activities and limited resources to meet the burdensome regulatory requirements.
In March 2009, the Commission of the European Communities issued a Proposal for a Directive of the European Parliament and of the Council amending Council Directive 78/660/EEC on the annual accounts of certain types of companies as regards micro-entities. The mentioned proposal suggests that a category of micro-entities as the smallest enterprises could be introduced into the EU legislative framework. Furthermore the European Parliament encourages the Commission to continue its activities with regard to the simplification of company law, accounting and auditing, in particular the 4th and 7th Company Law Directives. The role of published financial statements as regards micro-entities is considered to be limited. However the information presented by these entities must meet the needs of enterprises, managers, lenders, business partners or other stakeholders such as state authorities. [4]
Commenting on the micro-entities proposal, Michael Izza, Chief Executive of the “Institute of Chartered Accountants from England and Wales” (ICAEW), said: “This proposed exemption for micro-entities represents a bold step to enhance the long-term competitiveness of European business. It provides much needed flexibility for Member States to have a comprehensive debate as to the most appropriate financial reporting regime tailored to the needs of the smallest businesses. It is right to have this debate at national level as the majority of very small companies generally do not conduct their operations across borders – they rely on local clients, suppliers and banks – so the benefits of comparability across European borders are less compelling” [5]. The Committee on Economic and Monetary Affairs calls on the Committee on Legal Affairs, as the committee responsible, to propose rejection of the Commission proposal and to ask for a general revision of the 4th and 7th Company Law Directives in 2010, which focused, in particular, on reducing the administrative burden and simplifying the financial reporting requirements of micro-entities.
METHODOLOGY
The objective of this article is to present some ideas related to the simplification process at the European level as a result of reducing the administrative burden for the smallest entities and micro-entities. The main objectives of our study are:
1) To identify potential arguments that led to the simplification of financial reporting as a result of European initiatives; 2) To present some conclusions related to accounting simplification for the Romanian economic environment.
The documents used by the author were: the European proposal related to the mentioned subject, the specialized literature, others documents published at the European level and not in the last some practical elements from some studies realized at national and regional level.
In order to realize this material the author gathered and analyzed various information related to the subject, interweaving the conclusions from the mentioned documents with those from personal experience in the field.
The Annals of The "Ştefan cel Mare" University of Suceava. Fascicle of The Faculty of Economics and Public Administration Vol. 11, No. 2(14), 2011
183
PROBLEM FORMULATION
In February 2010 the European Parliament discussed (first reading), the Draft Legislative Resolution on the proposal for a directive of the European Parliament and of the Council amending Council Directive 78/660/EEC on the annual accounts of certain types of companies regarding micro-entities, presented by the Committee of Legal Affairs. The fact that the micro-entities are often subject to the same reporting rules as larger companies was highlighted. So, those rules put a burden on them which is not in proportion to their size. The annual accounts provide also an important input for statistical information. However, the obligation to keep records showing the company’s business transactions and financial situation must be kept. It was presented the possibility for the Member States to decide the different impact of the threshold values when implementing these modifications. [6]
The transparency of financial data offered by these micro-entities could also be a delicate subject. The possibility to provide financial information to those who are commercial partners could not be ignored. When these matters are discussed and analysed we suppose to look forward to those who are really involved in this process, the preparers and users of micro-entities financial reports and their information needs. The preparers group represent accountants providing accounting services to small and micro-entities. Those offering accounting services dealt with mostly small and micro-entities, limited companies, sole traders and partnerships.
The users and their information needs vary depending on the nature of the entity. In the case of small and micro-entities the main users are the owners, the lenders and commercial partners. A micro-entity engaged in cross border trading could be deprived of access to its trading partner annual accounts and therefore it would be deprived of a means to check the solvability of its trading partner. This could affect cross-border trade.
Exempting micro-entities to prepare and publish annual accounts (financial statements) will not exempt them from preparing tax-accounts. Nor will it prevent stakeholders and lenders from asking a micro-entity to have annual accounts prepared before doing business with them or before lending them money or extent credits. For the smallest entities the financial statements are only one component of the decision-making process for lenders, perhaps of greater importance are other non-financial indicators, such as the relationship that the bank has with the client and the client’s account history, lists of debtors and creditors, preparation of business plan for the client, site visits.
We should aware that for the smallest entities, lenders deal, many times, with owners themselves, rather than speaking to preparers/accountants. In many cases business owners are not financially literate and rely upon their accountant to represent them and their business in relation to the lenders. Presenting the financial reporting from the smallest entities in a standardized format is another issue. Such standardization makes it easier for the lenders to make decisions quickly and allow access to credit quickly whilst the business opportunity still exists.
It is clear – as the Commission rightly indicates in its impact assessment - that the statistical information now drawn from the annual accounts of micro-entities will have to be collected through other means, thereby significantly reducing and possibly even undo the advantages of the Commission proposal. [7]
Accounting is a source for financial security for the smallest entities that is why those issues presented above could not be ignored.
In March 2011 “Autorité des Normes Comptables (ANC)”, the French authority for accounting regulation, presented a proposal related to the simplification for SMEs for the entire obligation to draw up annual accounts in order to have access to finance for their own development. For accomplish theses objective they involved in the process the accounting profession, the national bank from France, the department for fiscal legislation. For their point of view the financial information presented through annual accounts must be useful for the owners, for fiscal matters, for commercial partners and represent a guarantee for the security of the transactions made. “For millions entrepreneurs in France, those financial statements represent the only important
The Annals of The "Ştefan cel Mare" University of Suceava. Fascicle of The Faculty of Economics and Public Administration Vol. 11, No. 2(14), 2011
184
information in order to lead there business, and they are, before other users, an economic guidance, with minimum information that must be know, ones a year”. [8]
The ANC made a proposal which will follow up three objectives: a) Reduction of the content for financial statements (annual accounts) and more precisely the notes to financial statements; b) In order to elaborate accounting standards to take into account the needs of the entities and their environment; c) Be aware of the volume and nature of the others information required from these entities.
The ANC is speaking about “micro-entities” (in French “micros sociétés”), the unlisted SMEs, listed SMEs and big companies. The ANC will focus on diminishing the contents of notes and the result will be a minimal content for this notes.
Why is important to mention the French ANC proposal? Because the way used by this normalization authority can be followed by other European countries. The modification of 4th European Directive is inevitable, that is way all European countries will improve the accounting regulation accordingly.
RESULTS AND FINDINGS FOR ROMANIAN ACCOUNTING REGULATION In Romania, in November 10, 2009, the Ministry of Finance issued the Order 3055 for the
approval of the accounting regulation complying with the Fourth Directive of the European Economic Communities, in use from January 1, 2010. So at the present the SMEs and big companies fall under the scope of the accounting regulations in line with the European Directives. Considering the new accounting orientation at European level we expected to find within this accounting regulation the new orientation. We expected to see how the proposal of the EU affects the Romania accounting regulation. We will find out the Romanian accounting regulator position regarding the European proposal for amending the European directives? Despite our expectation the accounting regulation are more complex compared to the previous one.
This regulation includes several aspects of differential reporting in terms of accounting. The companies which do not comply with two of three size criteria (total assets 3.650.000 Euros, turnover 7.300.000 Euros and number of employees 50) will prepare a set of financial statements that includes: a simplified balance sheet, profit and loss account and notes to financial statements. Those which exceed the mentioned criteria will fulfill a set of financial statements that includes: balance sheet, profit and loss account, and notes to financial statements, statement of cash flow and statement of change in equity.
The new accounting regulation didn’t mention anything about “micro-entities”. Because we understood the necessity for simplification we made a research in county
Mures, Romania, in order to see if it is a need for simplification in accounting. We address our questionnaire to the professionals, by fax or by e-mail, especially those who are working as CPA in entities which could meet the threshold criteria mentioned in European proposal. What is important to mention here is the fact that the professionals are in favor of differential accounting regulation for entities classified according to their size. In the same idea we tried to find out if the professional consider that “micro-entities”, as classified according to European proposal, must be exempt from the obligation to prepare financial statements. The answers were in favor of the obligation to prepare financial statements for smallest entities too. Also they were in favor of standardization for balance sheet and profit and loss account. According to other opinions, to submit a limited number of financial information rather than a balance sheet and a profit and loss account with standard form will not prevent banks and others creditors to require more complex financial reports from all entities, regardless their size. The state (80%), the banks (68.24%) and suppliers and customers (41.18%) represent, for the tested area, the real users of financial information. We wanted also to see the opinion related to cash accounting versus accrual accounting for “micro-entities”. The results can be surprising because the idea of simplification is not connected with cash accounting for “micro-entities”. Accrual accounting is the option for 44.71% of the respondents. It is also

The Annals of The "Ştefan cel Mare" University of Suceava. Fascicle of The Faculty of Economics and Public Administration Vol. 11, No. 2(14), 2011
185
interesting that 32.94% consider that the entities should have the possibility to choose between cash accounting and accrual accounting. (Neag and al., 2010) [9]
We could not extend our research among the owners of the smallest entities. We must be aware that almost all of them are not financially literate and they rely upon their accountant to represent them and their business in relation with others users of financial information. That is why we consider a limitation of the study research realised. We must notice that the area was limited to county Mures, Romania.
In 2011, another study was realised, but this one tried to cover a bigger area. The team wanted to identify the attitude of professional accountants from Romania regarding a simplified reporting system for small and medium – sized enterprises. The conclusion of this study revealed that 52,6% of the respondents consider that the current regulation do not provide for a reasonable level of simplification for the small and medium-sized enterprises and, consequently, a more simplified reporting is needed for the SMEs. Regarding the users of financial information the study revealed that the main user is the tax authority (42.6%) and the lenders represent also an important user (22.1%). The limitation of this study was also related to the fact that just the professional accountants were questioned. (Bunea and al., 2011). [10]
The debates regarding the necessity for simplification of accounting regulation related to micro-entities represent an issue of great interest for Romania too, not only because Romania is a Member State, but also due to the importance of the problems identified. There are voices that strongly affirm the opportunity of this process. At present the accounting regulator in Romania presented an exposure draft related to accounting reporting simplification. [11] The criteria used for classifying the entities do not have anything to do with the threshold criteria within European proposal. For our point of view the mentioned exposure draft is meant to point out that the Romanian government is taking into consideration the accounting issues related to simplification but nothing else. Compare with the French ANC release our proposal cannot be judged as serious.
Generally speaking when this simplification process is started you suppose to include in it all interested parties. Also you should notice the fact that the modification for accounting regulation must be in some limits, which are very clearly, specified when we are speaking about accounting Directives.
For each accounting regulator improving the accounting statement for SMEs and smallest entities in each European country suppose to be an important objective in his strategy. The accounting treatment for smallest entities must be simple and to cover the maximum of possible situation. The Ministry of Finance from Romania, the Department of accounting legislation, must propose new accounting texts or modification of existing ones just when this are responding to a general interest required by entities or to a new obligation or constrain.
CONCLUSION In June 28, 2011, the President of FEE wrote that an overwhelming majority in the SME’s
and accountancy profession communities expressed major concerns with both the initial Commission’s Proposal and the outcome of the first reading regarding the proposal for Directive on annual accounts of certain types of companies i.e. micro-entities. FEE outlined the importance of accrual accounting which they believe is essential and contributes to sound business management and to transparency and reliability of all financial information. The FEE supports the reduction of excessive and unnecessary administrative burdens and the simplification of the financial reporting requirements for micro and small companies within the scope of 4th Directive.
A professional organization, with his size and his importance worldwide cannot be ignored.
For Romania, we general support for attesting the statements of micro-entities. This should ideally take the form of a short report by an accountant rather than a statement established by the owner because many small business owners are not financially literate. We have general support
The Annals of The "Ştefan cel Mare" University of Suceava. Fascicle of The Faculty of Economics and Public Administration Vol. 11, No. 2(14), 2011
186
for standardization and fixed format for financial statements at the micro-entity level. A good set of financial statements are seen to be a good indicator of the control that the owner has managed his business.
We re-enforce the role of accrual accounting and the importance of preserving minimal transparency related to financial information presented by micro-entities for Romanian economic field. We believe the publications of financial information are a benefit to businesses and stakeholders in our country.
We are not defenders of eliminating the accounting obligations included in directives for micro-entities, not at all for SME, in Romania we only encourage a classification of the entities in small and medium-sized entities and micro-entities and we condition the accounting regulation for these categories of entities, by a public debate, as we have seen that other regulatory bodies have done.
In order to validate the conclusion presented for the Romanian entities we know that we suppose to have the entities opinions related to all the presented matters. But can we rely on them? Can we make them be interested in these debates? We think that all that we are doing is in the best interest of the entities. Are we wrong?
We know that in Romania and elsewhere are also others users of accounting information prepared by this “micro-entities”, like creditors, commercial partners and financial institutions. Who tested their opinions?
These questions could be a subject for further research realized in Romania, research that must cover all the interested parties.
REFERENCES:
1. Paoloni, M. et al. (1999), Financial reporting by SMEs in Italy and Spain, paper presented at the annual congress of the European accounting association, Bordeaux, France
2. Neag, R., “Contabilitatea financiara intre national si international”, Editura Universitatii Petru Maior, Tirgu Mures, 2003, p. 20.
3. European Commission (2007) “Communication from the Commission on a simplified business environment for companies in the areas of company law, accounting and auditing”, available on-line at http://ec.europa.eu/internal_market/company/docs/simplification/com2007_394_en.pdf
4. European Commission (2009) “Simplifying the business environment for companies” available on-line at http://ec.europa.eu/internal_market/company/simplification/index_en.htm
5. ICAEW 2009 6. Klaus-Heiner Lehne, 2010, REPORT on the proposal for a directive of the European
Parliament and of the Council amending Council Directive 78/660/EEC on the annual accounts of certain types of companies as regards micro-entities, European Parliament, Committee on Legal Affars, February 2010
7. Impact Assessment: Accompanying document to the Proposal for a directive of the European Parliament and the Council amending Council Directive 78/660/EEC on the annual accounts of certain types of companies as regards micro-entities, SEC(2009)206, 26.02.2009, p. 30
8. Autorité des Normes Comptables, Mars 2011, Livre blanc Warsmann.pdf, www.gouv.fr 9. Neag R, Masca E., Pascan I., 2010, “Research on the field tests in Mures county Romania
regarding the opportunity for different accounting requirements for “small entities” or “micro-entities”, AMIS 2010, Proceedings of the 5th International Accounting and Management Information Systems, Bucarest, Romania, www.isiknowledge.com
10. Bunea S., Sacarin M., Minu M., 2011, Romanian professional accountants’ perception on the differential financial reporting for small and medium-sized enterprises, AMIS 2011,

The Annals of The "Ştefan cel Mare" University of Suceava. Fascicle of The Faculty of Economics and Public Administration Vol. 11, No. 2(14), 2011
187
Proceedings of the 6th International Accounting and Management Information Systems, Bucarest, Romania
11. Ministry of Finance, Romania, Order for approval of simplified accounting regulation, June 2011, project, http://discutii.mfinante.ro
The Annals of The "Ştefan cel Mare" University of Suceava. Fascicle of The Faculty of Economics and Public Administration Vol. 11, No. 2(14), 2011
ASSESSING THE IMPACT OF XBRL IN RAPORTATIONS ISSUED BY CREDIT INSTITUTIONS
Lecturer Ph.D. Mariana VLAD
„Ștefan cel Mare” University, Suceava, Romania [email protected]
Ph.D. Student Ioana COLBU „Ștefan cel Mare” University, Suceava, Romania
[email protected] PhD. Student Alexandra Narcisa CIOBAN
„Ștefan cel Mare” University, Suceava, Romania Abstract: The main source of economic information for efficient driving of any institution, including a credit institution, is the current accounts. Accounting tools for accomplishing this are accounts. Credit institutions shall draw up annual financial statements that cover the same reports as those to be made by companies such as balance sheet, profit and loss situation in the specific structure of credit institutions, statement of changes in equity, cash flow statement and explanatory notes. In addition, because the object of activity, credit institutions have to prepare reports for prudential supervision purposes. In order to manage effectively business credit institutions, regulators use a language for collecting information on financial and accounting information in business processes, called XBRL. In Romania, prudential reporting framework has been harmonized with the standards recommended by CEBS to achieve a single European financial reports for supervisory purposes - FINREP(Financial Reporting) and prudential - COREP (Common Reporting) by configuring the reporting forms and their integration into electronic reporting system of the National Bank of Romania. Key words: XBRL, credit institution, prudential financial reports, FINREP, CONREP. JEL Classification: G21
INTRODUCTION
The liberalisation of banking and capital markets has substantially increased the required information for achieving financial stability, while providing useful information, appropriated to participants and their trading, has become essential for maintaining orderly and efficient markets. For this to be possible, appropriate and useful information should be provided, so that it satisfies the needs of every user. Market participants, depositors and the population in general are as interested in information as supervisor authorities are. Most regulatory authorities require credit institutions to undertake a minimum of presentations, including publishing specified parts of their prudential reports (which do not reveal information that can be used by competitors) and other relevant information. Financial disclosure requirements usually focus on presenting quantitative and qualitative information in a bank’s annual financial report, prepared on a consolidated basis and made available to all market participants. Presentation format usually requires a complete set of audited financial statements and information about corporate structure and risk management.
1. CREDIT INSTITUTION REPORTS The main source of economic information needed to conduct operatively any institution, including credit institutions, is the current accounts, whose main accounting tools are the accounts. However, experience shown that accounting synthesis works are needed and consist in summary statements or general concepts of the economic mechanism, from which to result assets and liabilities, solvency, profitability, leverage and other information regarding the institution. Such synthesis statements are prepared periodically, according to the law – quarterly and annually and whenever a situation demands, such as issuance of new shares, merger, change of control units and so on. Most frequently used reports by institutions are budgets, balance sheets, profit and loss statements and cash flows for equity, including statistical statements.
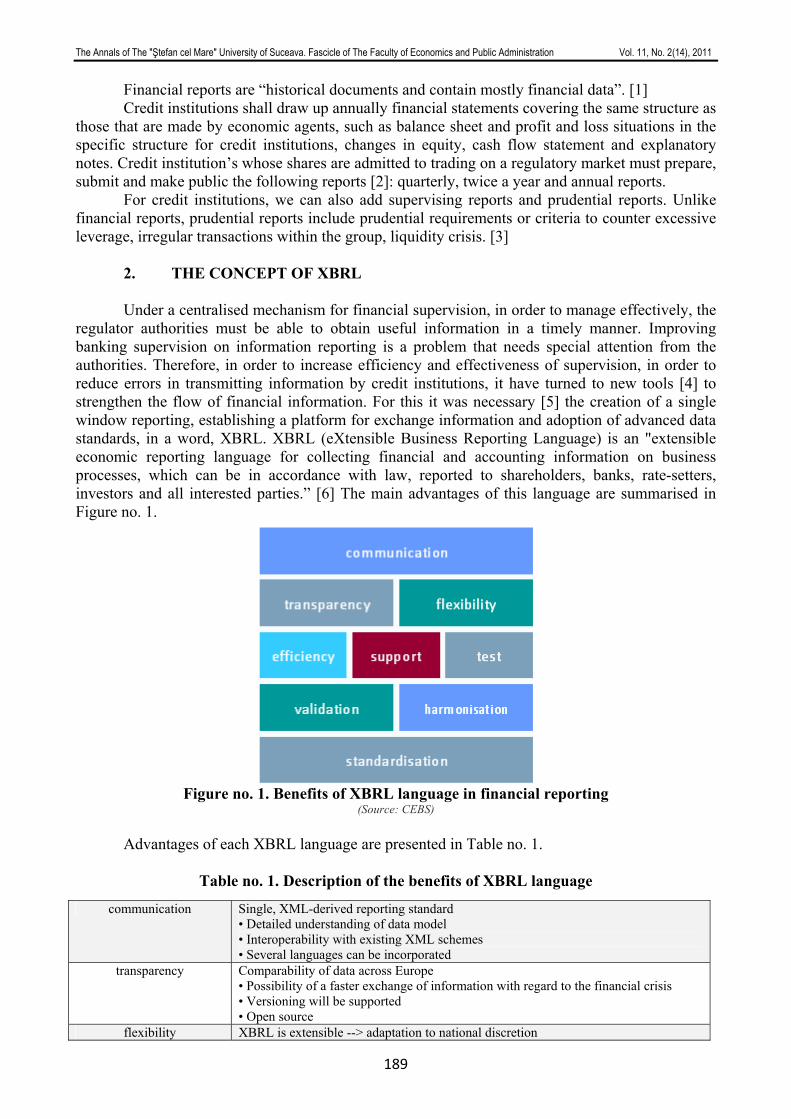
The Annals of The "Ştefan cel Mare" University of Suceava. Fascicle of The Faculty of Economics and Public Administration Vol. 11, No. 2(14), 2011
189
Financial reports are “historical documents and contain mostly financial data”. [1] Credit institutions shall draw up annually financial statements covering the same structure as those that are made by economic agents, such as balance sheet and profit and loss situations in the specific structure for credit institutions, changes in equity, cash flow statement and explanatory notes. Credit institution’s whose shares are admitted to trading on a regulatory market must prepare, submit and make public the following reports [2]: quarterly, twice a year and annual reports. For credit institutions, we can also add supervising reports and prudential reports. Unlike financial reports, prudential reports include prudential requirements or criteria to counter excessive leverage, irregular transactions within the group, liquidity crisis. [3]
2. THE CONCEPT OF XBRL Under a centralised mechanism for financial supervision, in order to manage effectively, the regulator authorities must be able to obtain useful information in a timely manner. Improving banking supervision on information reporting is a problem that needs special attention from the authorities. Therefore, in order to increase efficiency and effectiveness of supervision, in order to reduce errors in transmitting information by credit institutions, it have turned to new tools [4] to strengthen the flow of financial information. For this it was necessary [5] the creation of a single window reporting, establishing a platform for exchange information and adoption of advanced data standards, in a word, XBRL. XBRL (eXtensible Business Reporting Language) is an "extensible economic reporting language for collecting financial and accounting information on business processes, which can be in accordance with law, reported to shareholders, banks, rate-setters, investors and all interested parties.” [6] The main advantages of this language are summarised in Figure no. 1.
Figure no. 1. Benefits of XBRL language in financial reporting
(Source: CEBS)
Advantages of each XBRL language are presented in Table no. 1.
Table no. 1. Description of the benefits of XBRL language
communication Single, XML-derived reporting standard • Detailed understanding of data model • Interoperability with existing XML schemes • Several languages can be incorporated
transparency Comparability of data across Europe • Possibility of a faster exchange of information with regard to the financial crisis • Versioning will be supported • Open source
flexibility XBRL is extensible --> adaptation to national discretion
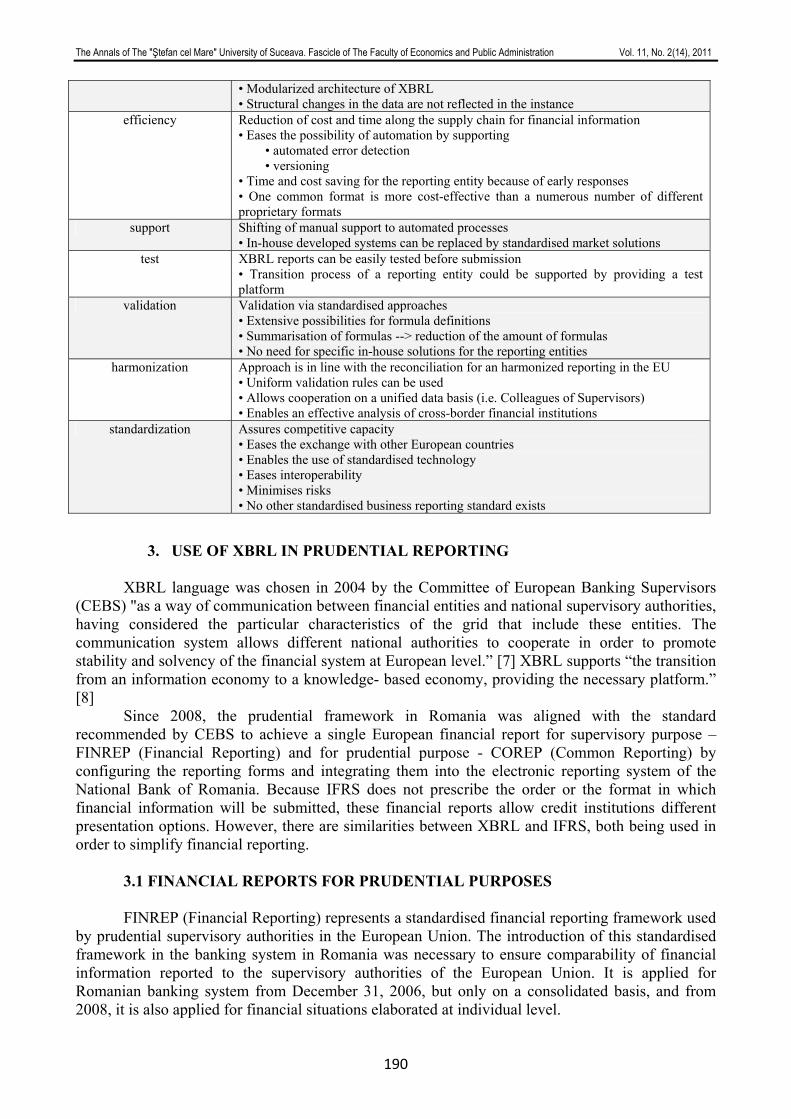
The Annals of The "Ştefan cel Mare" University of Suceava. Fascicle of The Faculty of Economics and Public Administration Vol. 11, No. 2(14), 2011
190
• Modularized architecture of XBRL • Structural changes in the data are not reflected in the instance
efficiency Reduction of cost and time along the supply chain for financial information • Eases the possibility of automation by supporting • automated error detection • versioning • Time and cost saving for the reporting entity because of early responses • One common format is more cost-effective than a numerous number of different proprietary formats
support Shifting of manual support to automated processes • In-house developed systems can be replaced by standardised market solutions
test XBRL reports can be easily tested before submission • Transition process of a reporting entity could be supported by providing a test platform
validation Validation via standardised approaches • Extensive possibilities for formula definitions • Summarisation of formulas --> reduction of the amount of formulas • No need for specific in-house solutions for the reporting entities
harmonization Approach is in line with the reconciliation for an harmonized reporting in the EU • Uniform validation rules can be used • Allows cooperation on a unified data basis (i.e. Colleagues of Supervisors) • Enables an effective analysis of cross-border financial institutions
standardization Assures competitive capacity • Eases the exchange with other European countries • Enables the use of standardised technology • Eases interoperability • Minimises risks • No other standardised business reporting standard exists
3. USE OF XBRL IN PRUDENTIAL REPORTING
XBRL language was chosen in 2004 by the Committee of European Banking Supervisors (CEBS) "as a way of communication between financial entities and national supervisory authorities, having considered the particular characteristics of the grid that include these entities. The communication system allows different national authorities to cooperate in order to promote stability and solvency of the financial system at European level.” [7] XBRL supports “the transition from an information economy to a knowledge- based economy, providing the necessary platform.” [8] Since 2008, the prudential framework in Romania was aligned with the standard recommended by CEBS to achieve a single European financial report for supervisory purpose – FINREP (Financial Reporting) and for prudential purpose - COREP (Common Reporting) by configuring the reporting forms and integrating them into the electronic reporting system of the National Bank of Romania. Because IFRS does not prescribe the order or the format in which financial information will be submitted, these financial reports allow credit institutions different presentation options. However, there are similarities between XBRL and IFRS, both being used in order to simplify financial reporting.
3.1 FINANCIAL REPORTS FOR PRUDENTIAL PURPOSES
FINREP (Financial Reporting) represents a standardised financial reporting framework used by prudential supervisory authorities in the European Union. The introduction of this standardised framework in the banking system in Romania was necessary to ensure comparability of financial information reported to the supervisory authorities of the European Union. It is applied for Romanian banking system from December 31, 2006, but only on a consolidated basis, and from 2008, it is also applied for financial situations elaborated at individual level.
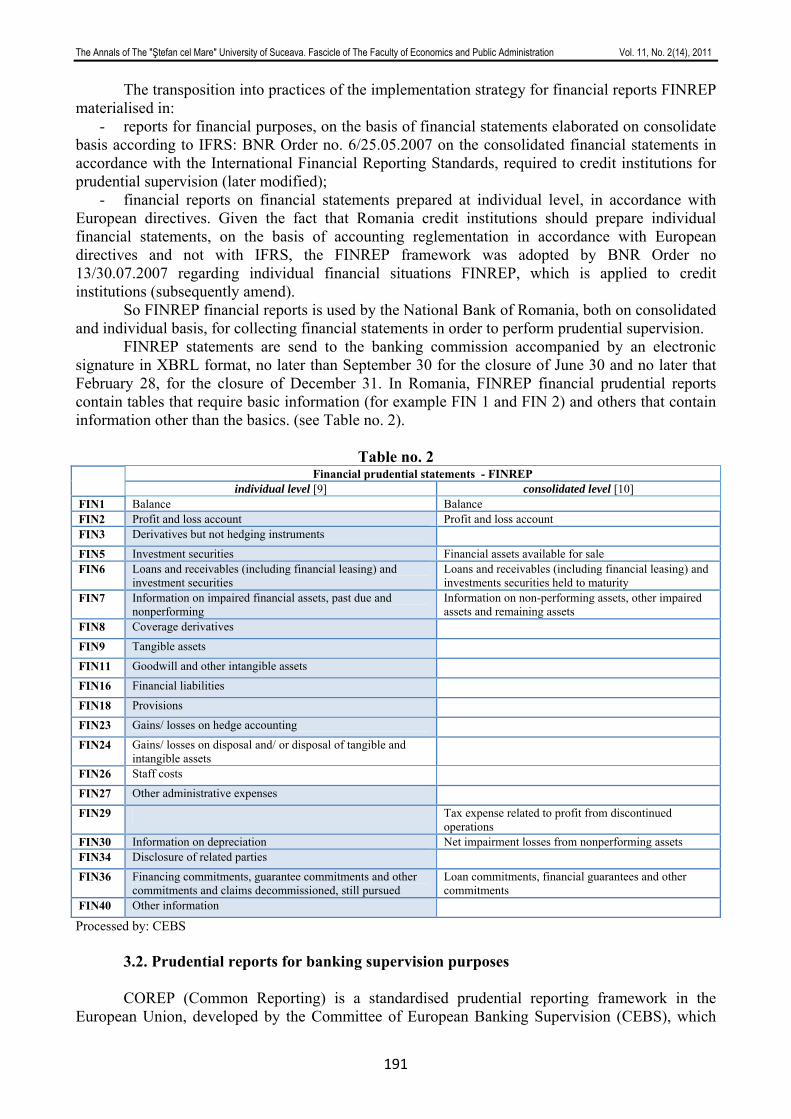
The Annals of The "Ştefan cel Mare" University of Suceava. Fascicle of The Faculty of Economics and Public Administration Vol. 11, No. 2(14), 2011
191
The transposition into practices of the implementation strategy for financial reports FINREP materialised in:
- reports for financial purposes, on the basis of financial statements elaborated on consolidate basis according to IFRS: BNR Order no. 6/25.05.2007 on the consolidated financial statements in accordance with the International Financial Reporting Standards, required to credit institutions for prudential supervision (later modified);
- financial reports on financial statements prepared at individual level, in accordance with European directives. Given the fact that Romania credit institutions should prepare individual financial statements, on the basis of accounting reglementation in accordance with European directives and not with IFRS, the FINREP framework was adopted by BNR Order no 13/30.07.2007 regarding individual financial situations FINREP, which is applied to credit institutions (subsequently amend). So FINREP financial reports is used by the National Bank of Romania, both on consolidated and individual basis, for collecting financial statements in order to perform prudential supervision. FINREP statements are send to the banking commission accompanied by an electronic signature in XBRL format, no later than September 30 for the closure of June 30 and no later that February 28, for the closure of December 31. In Romania, FINREP financial prudential reports contain tables that require basic information (for example FIN 1 and FIN 2) and others that contain information other than the basics. (see Table no. 2).
Table no. 2 Financial prudential statements - FINREP individual level [9] consolidated level [10]
FIN1 Balance Balance FIN2 Profit and loss account Profit and loss account FIN3 Derivatives but not hedging instruments FIN5 Investment securities Financial assets available for sale FIN6 Loans and receivables (including financial leasing) and
investment securities Loans and receivables (including financial leasing) and investments securities held to maturity
FIN7 Information on impaired financial assets, past due and nonperforming
Information on non-performing assets, other impaired assets and remaining assets
FIN8 Coverage derivatives FIN9 Tangible assets FIN11 Goodwill and other intangible assets FIN16 Financial liabilities FIN18 Provisions FIN23 Gains/ losses on hedge accounting FIN24 Gains/ losses on disposal and/ or disposal of tangible and
intangible assets FIN26 Staff costs FIN27 Other administrative expenses FIN29 Tax expense related to profit from discontinued
operations FIN30 Information on depreciation Net impairment losses from nonperforming assets FIN34 Disclosure of related parties FIN36 Financing commitments, guarantee commitments and other
commitments and claims decommissioned, still pursued Loan commitments, financial guarantees and other commitments
FIN40 Other information Processed by: CEBS
3.2. Prudential reports for banking supervision purposes
COREP (Common Reporting) is a standardised prudential reporting framework in the European Union, developed by the Committee of European Banking Supervision (CEBS), which
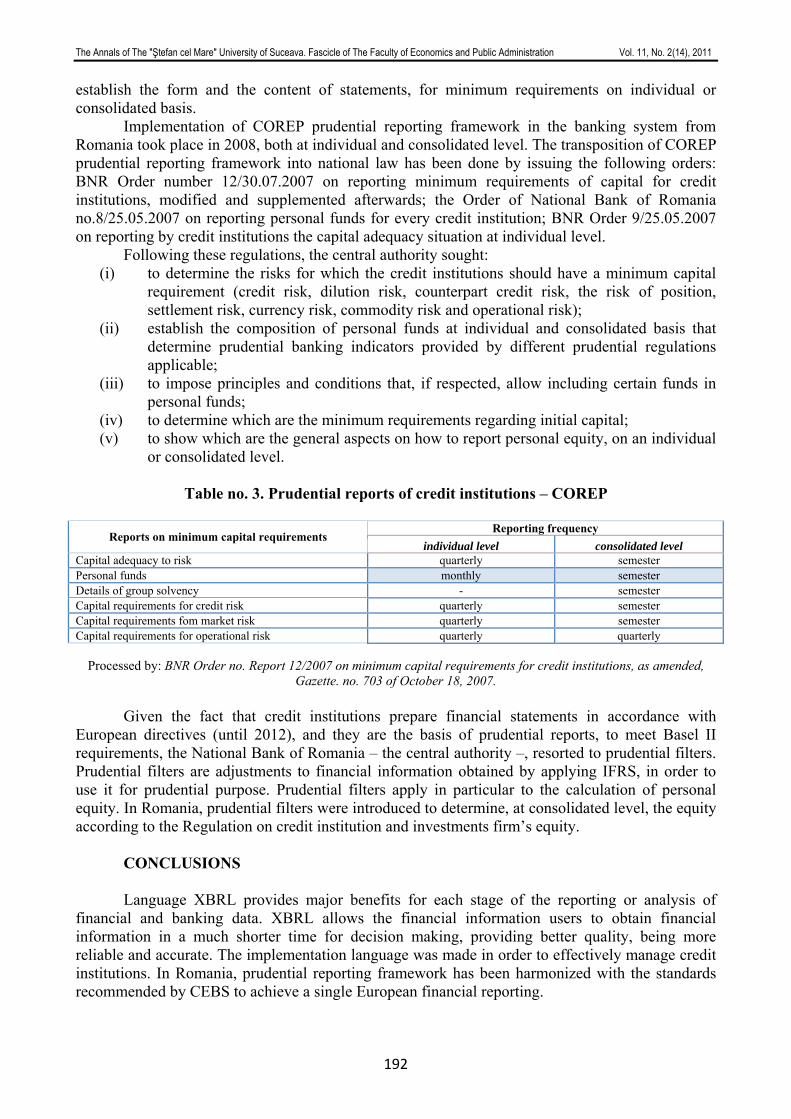
The Annals of The "Ştefan cel Mare" University of Suceava. Fascicle of The Faculty of Economics and Public Administration Vol. 11, No. 2(14), 2011
192
establish the form and the content of statements, for minimum requirements on individual or consolidated basis. Implementation of COREP prudential reporting framework in the banking system from Romania took place in 2008, both at individual and consolidated level. The transposition of COREP prudential reporting framework into national law has been done by issuing the following orders: BNR Order number 12/30.07.2007 on reporting minimum requirements of capital for credit institutions, modified and supplemented afterwards; the Order of National Bank of Romania no.8/25.05.2007 on reporting personal funds for every credit institution; BNR Order 9/25.05.2007 on reporting by credit institutions the capital adequacy situation at individual level. Following these regulations, the central authority sought:
(i) to determine the risks for which the credit institutions should have a minimum capital requirement (credit risk, dilution risk, counterpart credit risk, the risk of position, settlement risk, currency risk, commodity risk and operational risk);
(ii) establish the composition of personal funds at individual and consolidated basis that determine prudential banking indicators provided by different prudential regulations applicable;
(iii) to impose principles and conditions that, if respected, allow including certain funds in personal funds;
(iv) to determine which are the minimum requirements regarding initial capital; (v) to show which are the general aspects on how to report personal equity, on an individual
or consolidated level.
Table no. 3. Prudential reports of credit institutions – COREP
Reporting frequency Reports on minimum capital requirements
individual level consolidated level Capital adequacy to risk quarterly semester Personal funds monthly semester Details of group solvency - semester Capital requirements for credit risk quarterly semester Capital requirements fom market risk quarterly semester Capital requirements for operational risk quarterly quarterly
Processed by: BNR Order no. Report 12/2007 on minimum capital requirements for credit institutions, as amended,
Gazette. no. 703 of October 18, 2007. Given the fact that credit institutions prepare financial statements in accordance with European directives (until 2012), and they are the basis of prudential reports, to meet Basel II requirements, the National Bank of Romania – the central authority –, resorted to prudential filters. Prudential filters are adjustments to financial information obtained by applying IFRS, in order to use it for prudential purpose. Prudential filters apply in particular to the calculation of personal equity. In Romania, prudential filters were introduced to determine, at consolidated level, the equity according to the Regulation on credit institution and investments firm’s equity.
CONCLUSIONS Language XBRL provides major benefits for each stage of the reporting or analysis of financial and banking data. XBRL allows the financial information users to obtain financial information in a much shorter time for decision making, providing better quality, being more reliable and accurate. The implementation language was made in order to effectively manage credit institutions. In Romania, prudential reporting framework has been harmonized with the standards recommended by CEBS to achieve a single European financial reporting.
The Annals of The "Ştefan cel Mare" University of Suceava. Fascicle of The Faculty of Economics and Public Administration Vol. 11, No. 2(14), 2011
193
ENDNOTES [1] United Nation General Conference on Trade and Development (UECED), Commercial Bank Accounting and Disclosures, 1996, http://www.unctad.org [2] Muresan M., Palfi C., et all, Credit institution’s accounting, Ed. Casa Cartii de Stiinta, Cluj Napoca, 2009, p.284 [3] Central Bank of Trinidad de Tobago, Consolidated prudential reporting guideline for institutions licensed under the financial institutions act, 2008, http://www.central-bank.org.tt (accessed on November 12, 2009). [4] Patrascu R. M., Financial reporting in XXI century and the impact in economic decision making, article published in HoromneaE., Berheci I. (coordinator), Standardisation and harmonisation in Romanian accounting, Ed. Sedcom Libris, Iasi, 2004, p. 352. [5] Winston L., The importance of Unified Reporting of Banking Supervision Information, 2008, http://www.pwc.com (accessed on June 10, 2010) [6] And one I., XBRL – a new language for accounting and finance professionals, p. 26, published in Economic Informatics, no. 2(30)/2004, accessed at http://revistaie.ase.ro [7] Bonson-Ponte E., Escobar RodriguezT., Flores Munoz F., The role of metadata language implementation in the European banking supervision network, 2007, available at www.inderscience.com [8] CEBS, Basel II and financial reporting using XBRL, available at http://www.basel-ii-risk.com [9] In accordance with Romanian National Bank’s Order 13 on individual financial situations FINREP, applicable to credit institutions, Official Gazette 703/ October 18, 2007 [10] In accordance with Romanian National Bank’s Order 10 on modification and completion of Romanian National Bank’s Order 6/2007 regarding consolidated financial statement in compliance to IFRS for prudential supervision, Official Gazette 874/ December 18, 2009
REFERENCES
1. Andone I., XBRL – a new language for accounting and finance professionals, p. 26, published in Economic Informatics, no. 2(30)/2004, accessed at http://revistaie.ase.ro
2. Bonson-Ponte E., Escobar RodriguezT., Flores Munoz F., The role of metadata language implementation in the European banking supervision network, 2007, available at www.inderscience.com
3. CEBS, Basel II and financial reporting using XBRL, available at http://www.basel-ii-risk.com
4. http://www.central-bank.org.tt (accessed on November 12, 2009). 5. http://www.unctad.org 6. Muresan M., Palfi C., et all, Credit institution’s accounting, Ed. Casa Cartii de Stiinta, Cluj
Napoca, 2009, p.284 7. Patrascu R. M., Financial reporting in XXI century and the impact in economic decision
making, article published in HoromneaE., Berheci I. (coordinator), Standardisation and harmonisation in Romanian accounting, Ed. Sedcom Libris, Iasi, 2004, p. 352.
8. Romanian National Bank’s Order 10 on modification and completion of Romanian National Bank’s Order 6/2007 regarding consolidated financial statement in compliance to IFRS for prudential supervision, Official Gazette 874/ December 18, 2009
9. Romanian National Bank’s Order 13 on individual financial situations FINREP, applicable to credit institutions, Official Gazette 703/ October 18, 2007
10. Winston L., The importance of Unified Reporting of Banking Supervision Information, 2008, http://www.pwc.com (accessed on June 10, 2010)
The Annals of The "Ştefan cel Mare" University of Suceava. Fascicle of The Faculty of Economics and Public Administration Vol. 11, No. 2(14), 2011
194
QUALITY THROUGH EDUCATION IN AUDITING
Lecturer Ph.D. Ionela-Corina CHERSAN “Alexandru Ioan Cuza” University of Iaşi, Romania
[email protected] Lecturer Ph.D. Maria BERHECI (căs. GROSU)
“Alexandru Ioan Cuza” University of Iaşi, Romania [email protected]
Abstract:
The authors try to argue that quality of audit mission depends on competence of auditors. The differences in perception the results of statutory audit in Romania and the perception of the results of audits in the world show how many must be develop in Romania in educational system, in client firms, and in financial audit framework. In this context, the authors appreciate that developing and implementing International Education Standards for Professional Accountants can contribute to desirable outcomes, including: reduction in international differences in the requirements to qualify as a professional accountant, facilitation of the global mobility of professional accountants and provision of international benchmarks against which International Federation of Accountants member bodies can measure themselves. At the same time, even if the International Education Standards for Professional Accountants cannot legally override local laws and regulations, they will provide an authoritative reference for informing and influencing local regulators regarding generally accepted “good practice”. It is desirable like Romanian organizations of professional accountants to work towards implementation of all International Education Standards and to incorporate in their education programs the essential elements of the content and process of education on which International Education Standards are based.
Key words: auditing, competence, accounting profession, education standards, audit quality.
JEL Classification: M41, M42, M48.
INTRODUCTION
Today, the audit covers a field increasingly large, where independent offices and employees often perform complementary activities. Studying the practice of auditing, we can define multiple criteria for the auditors' grouping. Thus, considering the auditor's relationship with the audited company, we can distinguish between internal audit and external audit; considering auditor status, it is reasonable to distinguish between contractual audit and statutory audit; if the criteria are represented by the objectives assigned to an audit mission, it is reasonable to make distinction between statutory audit (leading to certification of annual financial statements) and operational audit (leading to improve performance of the entity). In addition, it is reasonable to show that, in present, one of the objectives of statutory audit is to express an opinion on company's managers, i.e. about the performance of companies they manage. These audit forms suggests the diversity of issues which a professional accountant have to face. In this context, the emergence of International Education Standards for Professional Accountants must provide a general framework allowing professional organizations to deal with the Professional Accounting Education Programs.
This paper takes as its starting point the auditing rules, represented mainly by the International Standards on Auditing and Quality Control, the IFAC Code of Ethics and the researches and studies undertaken in Romania and abroad about the current status of professional accounting; these studies try to show the possible development of the profession, that means keeping the status, increasingly questioned, of the auditor. Our research is focused on the content of International Education Standards for Professional Accountants because is generally accepted that an appropriate level of professional competence can be achieved and maintained only by a rigorous theoretical education and a strong practical experience followed by continuing development of professional competence.
The Annals of The "Ştefan cel Mare" University of Suceava. Fascicle of The Faculty of Economics and Public Administration Vol. 11, No. 2(14), 2011
195
WHAT DOES THE COMPETENCE IN AUDITING MEAN?
In our opinion, the first criterion for the assessment of competence in any field is given by compliance with rules. So, in a very simple manner, we can say that an auditor is competent if he is trained to satisfy his employers and clients needs or if he acts in accordance with applicable professional standards. This assertion is supported by the IFAC Code of Ethics, which, referring to competence, show that for respect the principle of professional competence, professional accountants have the following obligations (1):
• to maintain professional knowledge and skill at the level required to ensure that clients or employers receive competent professional service;
• to act diligently in accordance with applicable technical and professional standards when providing professional services.
In accounting, in general, and in auditing, in particular, these rules are very stringent and quite numerous. First, it's about the rules applied by the professional accountants when they carry out activities. Accounting and audit rules are a guide for the work of auditors and other professional accountants, giving them the tools necessary to meet the more extensive requirements of the financial reporting process. But these rules have been supplemented in recent years with rules that define the rules of "good practice" in training professional accountants. These rules, namely International Education Standards for Professional Accountants set the benchmark for training members of the accountancy profession, both those seeking membership of a professional body, and those who already have this status.
In the general framework of the Council for International Education Standards for Professional Accountants does exist a section (2) reserved for the relationship between capacity and competence, which may represent the starting point in discussing the contents of International Education Standards for Professional Accountants. The two concepts are described as two sides of a coin. Capacities are considered professional knowledge and skills, as well values, ethics and attitudes required to demonstrate competence. In other words, capabilities are rendering an individual able to perform tasks. Possession of these capacities provides an indication that a person has the ability to be competent in what he does. Competence is the ability to work on clearly defined standards, with reference to a real working environment. It refers to actions that people undertake to determine if they can be made to the required standards. When a person relies on its capacity to perform tasks according to standards, it is assumed that she has the necessary competence to perform those tasks.
Assuming that is acceptable the meaning given above to the notion of competence in auditing, we might ask ourselves: Who can make an assessment of competence in the audit?
A detailed response, which we concur, was given by Elisabeth Bertin (3). First, the author makes a distinction between the internal and external cabinet actors whose
activity must be evaluated. Thus, assessment of competence is achieved by the auditor himself when make decisions to
accept or not an assignment, to appoint to the audit team the persons that he consider competent, etc. Practical way of assessing the competence of its work involves comparing information about the activities of the professionals accounting who work in the same sector and analysis of so-called "file" which allows the auditor to decide on the need to maintain their competence and professional development. The “file" is a record of professional and personal activities and achievements of the auditor confirming his professional competence. Also, an internal assessment will be deemed to be made by the audit firms through the quality internal control, which allows comparisons both between the members of audit team and the evaluations of audit missions by supervisors. This rating is considered to be more formal as long as all the great offices practice this assessment in the assurance quality program. The person who assesses competence in audit see in competence the ability of the auditor to perform their duties in compliance with rules, contributing to grow cabinet efficiency, ensuring customer satisfaction and aiming at human resource development.
The Annals of The "Ştefan cel Mare" University of Suceava. Fascicle of The Faculty of Economics and Public Administration Vol. 11, No. 2(14), 2011
196
Turning to the assessment of competence by outside "actors", we find that the auditors' assessment of competence could be achieved by the audited company. If business is bound by law to audit the annual financial statements, we can not say with certainty that the assessment of competence is based on objective criteria. How it will be appreciated that an auditor who, in compliance with the rules, issues a qualified opinion, by comparison with another auditor who, with violation of professional obligations, issued an unqualified opinion?
Since the auditor serves public interests, we may assume that an assessment of competence may be made by the public. This appreciation is based on the opinions of financial analysts, on the information conveyed in the press (with effect on the reputation of the cabinet), on the fact that auditors received their status from an authority and they are subject of rigorous professional standards. For public, the competence is the ability of auditor to issue an audit report on the quality and veracity of reliable accounting and financial information submitted by the audited company.
If for most types of operations, effectiveness is a criterion for assessing quality, this criterion is useless in assessing the competence of the audit because the audit is not an obligation of result, but a means. Observable result of the audit is the opinion issued, but its relevance is hard to predict. A qualified opinion is not for anyone interested in the audit report a cause for concern, but if it is, it can be the starting point in making correct decisions. But if an audit report should contain a qualified opinion and it presented incorrectly an unqualified opinion, may be more serious consequences. Such audit opinions, in the context noted, may be caused by lack of competence of the auditor. So, not the efficiency prevail in audit , but competence, which requires the auditor to achieve all tests and procedures so that the opinion issued, favorable or not for the client company to provide a high level of assurance about the quality and veracity of financial information.
Although it is left ultimately in some countries (among which we can qualify Romania), the main criterion for assessing the competence of the audit is the reporting on compliance with rules. As a court in assessing the competence the professional organization intervenes by establishing quality control programs and continuing training requirement.
In this stage, it is necessary to describe the rules governing quality control.
QUALITY CONTROL FOR ACCOUNTING PROFESSION
It should be noted that not always a person who engages in an activity is necessarily competent. Situations of possible lack of competence of professional accountants engaged in audit led to concern for the national and international organizations of professionals in accounting and auditing for develop programs and define rules to prevent and eliminate situations of lack of competence of those working in their regulatory field. Thus, International Federation of Accountants has issued, in addition to the International Standard on Auditing (ISA) 220 “Quality Control for an Audit of Financial Statements”, the International Standard on Quality Control (ISQC) 1 "Quality Control for Firms that Perform Audits and Reviews of Financial Statements, and Other Assurance and Related Services Engagements" as a sign of commitment to ensuring an adequate level of quality for all work performed by auditors.
With reference to jurisdiction, the International Standard on Auditing (ISA) 220 “Quality Control for an Audit of Financial Statements” determines that the audit team and any other auditor’s experts participating in the mission, but are not part of the team, it should have "competence and collective ability to make an audit in accordance with professional standards and legal requirements and applicable regulatory" (4). At the same purpose, the International Standard on Quality Control (ISQC) a "Quality Control for Firms that Perform Audits and Reviews of Financial Statements, and Other Assurance and Related Services Engagements" refers, inter alia, to the policy of human resources in the firms who provide audit service (5). The policies and the procedures for selection and training of employees must be designed to provide a reasonable assurance that company has enough employees who have the ability, skills and commitment to follow ethical principles necessary to conduct the mission in accordance with professional standards and with applicable legal and regulatory requirements. Also, are shown elements relating with the competence of the
The Annals of The "Ştefan cel Mare" University of Suceava. Fascicle of The Faculty of Economics and Public Administration Vol. 11, No. 2(14), 2011
197
company personnel who must be to checked for decide if a new or existing audit engagement will be contracted, namely: if company employees have experience to carry out their duties or if they have the ability to obtain necessary skills and knowledge effectively and the number of employees with sufficient skills and competence necessary is enough. Beyond these circumstances, the appointment of engagement team involve a number of other elements that must be taken into account for obtaining insurance that the people who will be part of the audit team have capability and competence to carry out a quality audit.
Such elements, covering engagement teams, can refer to (6): • Understanding of, and practical experience with, engagements of a similar nature and
complexity through appropriate training and participation; • Understanding of professional standards and applicable legal and regulatory requirements; • Technical knowledge and expertise, including knowledge of relevant information
technology; • Knowledge of relevant industries in which the clients operate; • Ability to apply professional judgment; • Understanding of the firm’s quality control policies and procedures.
In addition to these international standards, the Chamber of Financial Auditors of Romania has been developed rules governing quality control of audit work and related services.
In fact, these rules do not cover for first time the requirement of quality control for activities mentioned, but harmonizes rules issued by the Chamber of Financial Auditors of Romania with another law (8) that has established the public oversight of statutory audit. This piece of legislation set up a The Public Oversight Board for the Statutory Audit Activity. The duties of this Board require amendment of rules for conducting quality control. It should be emphasized, in this context, that the last act was intended to transpose Directive 2006/43/CE from 17 May, 2006, issued by the European Parliament and the Council, on statutory audit of annual accounts and consolidated accounts, published in Official Journal EU no. L 157 of June 9, 2006, in the Romanian legislation.
The Directive 2006/43/CE 17May, 2006 realized a harmonized approach to statutory audit in the European Union, but Government Emergency Ordinance no. 90 of 24 June, 2008 aimed to ensure compliance with statutory audit requirements of European directives in Romania, through ongoing review of legislation, and creating a public oversight system for statutory auditors and audit firms based on European principles.
Operational structure through which quality control of audit and related services is represented by Monitoring department and professional competence of t the Chamber of Financial Auditors of Romania, which aims, on line assessment of professional competence of auditors, covering issues (9):
• compliance with professional standards and regulatory and legal requirements; • compliance with law in conduct financial audit in accordance with Minimum audit standards
of the Chamber of Financial Auditors of Romania and the International Standard on Auditing, In addition, the same department verifies if the audit company inspected has implemented
policies and procedures for internal quality control, as required in ISQC 1 and ISA 220, and compliance with these standards.
INTERNATIONAL EDUCATION STANDARDS FOR PROFESSIONAL
ACCOUNTANTS
As we shown at the beginning, our research aimed also training requirements provided by the International Federation of Accountants through International Education Standards for Professional Accountants (IAESB).
The framework published by the International Accounting Education Standards Board indicates the potential users of these standards, namely (10):
The Annals of The "Ştefan cel Mare" University of Suceava. Fascicle of The Faculty of Economics and Public Administration Vol. 11, No. 2(14), 2011
198
• Universities, employers, and other stakeholders who play a part in the design, delivery, or assessment of education programs for accountants;
• Regulators who are responsible for oversight of the work of the accountancy profession; • Government authorities with responsibility for legal and regulatory requirements related to
accounting education; • Accountants and prospective accountants who undertake their own learning and
development; • Any other parties interested in the work of the IAESB and its approach to developing
publications on accounting education. To better understand the role of the Council for International Education Standards for
Professional Accountants we present in a short manner the content of these standards and their accompanying documents issued by this organization in its regulatory domain.
IES 1 – Entry Requirements to a Program of Professional Accounting Education. The entry requirement for an individual seeking to begin a program of professional accounting should be at least equivalent to that for admission into a recognized university degree program or its equivalent. IES 2 – Content of Professional Accounting Education Programs. The content of professional accounting education should consist of:
• accounting, finance and related knowledge; • organizational and business knowledge; • information technology knowledge and competences. IES 3 – Professional Skills and General Education. The skills that professional accountants
should acquire are grouped under five main headings: a. intellectual skills; b. technical and functional skills; c. personal skills; d. interpersonal and communication skills; e. organizational and business management skills. IES 4 – Professional Values, Ethics and Attitudes. The Standard prescribes the professional
values, ethics and attitudes professional accountants should acquire during the education program leading to qualification.
IES 5 – Practical Experience Requirements. The aim of the Standard is to ensure that candidates seeking to qualify as professional accountants have acquired the practical experience a minimum three years.
IES 5 – Assessment of Professional Capabilities and Competence. The Standard prescribes the requirements for a final assessment of a candidate’s professional capabilities and competence before qualification.
IES 6 – Assessment of Professional Capabilities and Competence. The Standard prescribes the requirements for a final assessment of a candidate’s professional capabilities and competence before qualification.
IES 7 – Continuing Professional Development: A Program of Lifelong Learning and Continuing Development of Professional Competence. The Standard promote lifelong learning and make recommendations to member bodies to promote the importance of continuous improvement of competence for all professional accountants.
IES 8 – Competence Requirements for Audit Professionals. Describing the nature of the audit process, the standard prescribes competence requirements for audit professionals, including those working in specific environments and industries.
IEPS 1 – Approaches to Developing and Maintaining Professional Values, Ethics, and Attitudes. IEPS 1 sets out two possible approaches to the development of professional values, ethics and attitudes and also contains guidance on a number of methods for the delivery of ethics education, stressing the importance of workplace learning and assessment.
IEPS 2 – Information Technology for Professional Accountants. IEPS 2 has two section:

The Annals of The "Ştefan cel Mare" University of Suceava. Fascicle of The Faculty of Economics and Public Administration Vol. 11, No. 2(14), 2011
199
• Section 1 provides good practice guidance for IFAC member bodies on teaching and assessing IT at the pre-qualification stage.
• Section 2 provides guidance for IFAC member bodies on implementing IES 7, in relation to the post-qualification development of IT knowledge and competences.
IEPS 3 – Practical Experience Requirements — Initial Professional Development for Professional Accountants. This IEPS describe the objectives of a period of practical experience and the requirements for practical experience set by IFAC member bodies.
We appreciate that can be made several observations regarding the content of these standards. These standards were regarded as recommendations, so that the requirements of some of them are much less restrictive than national legislation. For instance, comparing to recommendations of IES 1, in Romania the law establishes that, to enter the training system to become member of the Chamber of Financial Auditors of Romania, a person must have a university degree in economics. On the other hand, if in the most part of rules there is a different degree of similarity between International standards and the rules issued by Romanian professional organizations, regarding IEPS 2 “Information Technology for Professional Accountants”, distance between requirements and reality is quite high, meaning that training and skills in information technology required for future Romanian accounting professionals are much less "hard" than those in IEPS 2.
CONCLUSIONS
This study shows that capacity is required to demonstrate competence. To reach the level of competence required by the audit engagement should be pass trough several stages of preparation, which generally include elements of theoretical education, professional accounting education and practical experience. To obtain quality of auditor or certified professional accountant and to become member of a professional organization member of IFAC is possible after completing all stages of theoretical and practical training and promoting a final exam. In addition, to enter the training cycle to be completed with this examination, the future professional accountant should prove a level deemed sufficient of knowledge, professional skills, and professional values, ethics and attitudes. These conditions are imposed by national laws. The significant differences between the requirements imposed by the national legislations in different countries regarding the conditions of access to the profession led international standardization body in accounting and auditing - IFAC - to issue International Education Standards for Professional Accountants, which may lead to the establishment minimum requirements of professional knowledge, including theoretical knowledge, practical experience and continuing professional development, and this can be considered a benchmark internationally.
If the educations rules are followed to obtain the desired quality, the importance of International Standards on Audit retain the auditor's attention throughout the performance of audit missions covered by these rules. The reasons for considering the rules like having a paramount importance to the auditor are set out below. First, they allow auditors to justify to the customer the nature and scope of work (tests, inspections, surveys) to complete. In other words, the standards support the auditors when confronted with attempts to limit their work by the client company managers. Secondly, if the cabinet works in compliance with the standards it is safely, meaning that it is under an obligation of means and not an obligation of results. In other words, the auditor is protected, for instance, from any client's attempts to request reductions of fees, by invoking the obligation to perform audits according to professional standards.
So we can say that an auditor who has became auditor respecting requirements of International Education Standards for Professional Accountants and who perform audits in compliance with International Standards on Auditing and IFAC Code of Ethics has adequate competence to conduct audits at an appropriate level of quality.
The Annals of The "Ştefan cel Mare" University of Suceava. Fascicle of The Faculty of Economics and Public Administration Vol. 11, No. 2(14), 2011
200
NOTES: (1) International Federation of Accountants, Handbook of the code of ethics for professional accountants, 2010
edition, section 130, p. 17, at http://web.ifac.org/ publications/international-ethics-standards-board-for-accountants/code-of-ethics
(2) International Accounting Education Standards Board, Handbook of International Education Pronouncemets, 2009, p. 23,at http://web.ifac.org/publications/international-accounting-education-standards-board
(3) Bertin, Elisabeth, Reflexions sur la competence en audit, pp. 185-213, în Cahier de Recherche du Le CERMAT (Centre d’Etudes et de Recherche en Management de Touraine),at http://cermat.iae.univ-tours.fr/IMG/pdf/ CAHIER_2004-119_ BERTIN.pdf
(4) Standardul Internaţional de Audit (ISA) 220 “Controlul calităţii pentru un audit al situaţiilor financiare”, pct. 14, în: Federaţia Internaţională a Contabililor, Manual de Standarde Internaţionale de Audit şi Control de Calitate. Audit financiar 2009, Editura Irecson, 2009, Bucureşti, p. 13
(5) Standardul Internaţional privind Controlul Calităţii (ISQC) 1 “Controlul calităţii pentru firmele care efectuează audituri şi revizuiri ale situaţiilor financiare, precum şi alte misiuni de asigurare şi servicii conexe”, pct. 29 şi A18 în: Federaţia Internaţională a Contabililor, Manual de Standarde Internaţionale de Audit şi Control de Calitate. Audit financiar 2009, Editura Irecson, 2009, Bucureşti, p. 45 şi p. 56
(6) Standardul Internaţional privind Controlul Calităţii (ISQC) 1 “Controlul calităţii pentru firmele care efectuează audituri şi revizuiri ale situaţiilor financiare, precum şi alte misiuni de asigurare şi servicii conexe”, pct. A31 în: Federaţia Internaţională a Contabililor, Manual de Standarde Internaţionale de Audit şi Control de Calitate. Audit financiar 2009, Editura Irecson, 2009, Bucureşti, p. 60
(7) Normele privind controlul calităţii activităţii de audit financiar şi a serviciilor conexe, aprobate prin Hotărârea Consiliului Camerei Auditorilor Financiari din România nr. 139 din 24 martie 2009, publicată în Monitorul Oficial al României nr. 308 din 11 mai 2009
(8) Ordonanţa de urgenţă a Guvernului nr. 90 din 24 iunie 2008 privind auditul statutar al situaţiilor financiare anuale şi al situaţiilor fiannciare consolidate, publicată în Monitorul Oficial al Românie nr. 481 din 30 iunie 2008
(9) Normele privind controlul calităţii activităţii de audit financiar şi a serviciilor conexe, aprobate prin Hotărârea Consiliului Camerei Auditorilor Financiari din România nr. 139 din 24 martie 2009, publicată în Monitorul Oficial al României nr. 308 din 11 mai 2009, art. 11, pct.1 şi 2
(10) International Accounting Education Standards Board, Framework for International Education Standards for Professional Accountants, p.4-5, at http://web.ifac.org/publications/international-accounting-education-standards-board
(11) International Accounting Education Standards Board, Handbook of International Education Pronouncements, 2009 edition, p.46-204, at http://web.ifac.org/publications/international-accounting-education-standards-board BIBLIOGRAPHY:
1. Bertin, Elisabeth, Reflexions sur la competence en audit, pp. 185-213, în Cahier de Recherche du Le CERMAT (Centre d’Etudes et de Recherche en Management de Touraine), at http://cermat.iae.univ-tours.fr/IMG/pdf/ CAHIER_2004-119_ BERTIN.pdf
2. Federaţia Internaţională a Contabililor, Manual de Standarde Internaţionale de Audit şi Control de Calitate. Audit financiar 2009, Editura Irecson, 2009, Bucureşti
3. International Accounting Education Standards Board, Framework for International Education Standards for Professional Accountants, at http://web.ifac.org/publications/international-accounting-education-standards-board
4. International Federation of Accountants, Handbook of the code of ethics for professional accountants, 2010 Edition, at http://web.ifac.org/publications/international-ethics-standards-board-for-accountants/code-of-ethics
5. International Accounting Education Standards Board, Handbook of International Education Pronouncemets, 2009, at http://web.ifac.org/publications/international-accounting-education-standards-board
6. Normele privind controlul calităţii activităţii de audit financiar şi a serviciilor conexe, aprobate prin Hotărârea Consiliului Camerei Auditorilor Financiari din România nr. 139 din 24 martie 2009, publicată în Monitorul Oficial al României nr. 308 din 11 mai 2009
7. Ordonanţa de urgenţă a Guvernului nr. 90 din 24 iunie 2008 privind auditul statutar al situaţiilor financiare anuale şi al situaţiilor fiannciare consolidate, publicată în Monitorul Oficial al Românie nr. 481 din 30 iunie 2008

The Annals of The "Ştefan cel Mare" University of Suceava. Fascicle of The Faculty of Economics and Public Administration Vol. 11, No. 2(14), 2011
201
THE ASSETS OF THE COMPANY – A THEORETICAL AND PRACTICAL APROACH RELATING PARTICULARLY TO INTELLECTUAL CAPITAL
Assistant PhD. Student Irina MIHAI
“Stefan cel Mare” University of Suceava, Romania [email protected]
PhD. Student Alexandra-Daniela SOCEA “Alexandru Ioan Cuza” University of Iaşi, Romania
[email protected] Assistant PhD. Student Marius CIUBOTARIU
“Stefan cel Mare” University of Suceava Suceava, Romania
Abstract: The present research “The assets of the company - a theoretical and practical approach relating particularly
to intellectual capital” focuses on defining the company’s assets, at national level, establishing the components of this concept, so that ultimately we can determine the position of the intellectual capital in the total assets of a company and the manner in which they can be approached.
The theoretical approach is based on the theoretical framework for the identification of the company’s assets, referring to the intellectual capital. The practical approach exemplified through the interview technique is trying to identify whether the theoretical basis of the intellectual capital can also be transposed into accounting practice.
The approach of these terms begins with a short incursion of definitions that refer to assets, intangible assets - intellectual capital, followed by a description of the intellectual capital components and their identification at national level through a practical study.
The purpose of this paper is intended to be the beginning of a research study regarding the concept of intellectual capital, in other words the identification and implementation of this concept in accounting practice.
The research is based on Bill Gates statement, who said that “my most valuable resource goes up and down with the elevator every day”, in other words the importance of human factor capitalization, but also the existence of an imaginary outline, less sketched at national level, concerning the definition and knowledge of the intellectual capital concept.
Keywords: intellectual capital, assets, knowledge, knowledge based economy, nonfinancial assets
JEL Classification: H32, M40, M41
1. INTRODUCTION
The introduction of the present research represents actually the research methodology through which we will present the current state of knowledge, the research purposes, objectives and methods.
In the present context, any national entity should be based on the potential offered by the intellectual capital, because the continuous change of technologies, the competitive economy and the obtainance of competitive advantages on the market require a high degree of expertise from employees, superior qualification and their recognition by the entity itself.
The current state of knowledge: the research was based on the study of various areas where can be found the concept of intellectual capital, noting that any entity focuses on employees’ knowledge and trainings as components of the intellectual capital. The concept of intellectual capital is rather less approached at national level, as opposed to international researches that are familiar with a wider area of development.
The study aim: to achieve the established objectives regarding the concept discussed, the main purpose of the present research is to obtaine the necessary information in order to clarify questions such as: How important is the recognition of intellectual capital as an intangible asset in a company? What are the elements that define the intellectual capital and are included in the current national accounting practice?
The Annals of The "Ştefan cel Mare" University of Suceava. Fascicle of The Faculty of Economics and Public Administration Vol. 11, No. 2(14), 2011
202
The methods used: as a qualitative research, which aims is to know the concept, the followed phases are those of a scientific method [1] including: setting the questions - the working hypotheses are formulated as guiding questions for the present study, that can be found at the beginning of each chapter, being tested during the interview; the documentation – the study of national and international literature regarding the concepts covered by our research; the hypotheses testing - some hypotheses can be tested, others not, so that the conclusion for each of them is approached in terms of confirmation or not, some of them still having no practical support to be confirmed.
The research objectives: will be pursued throughout the chapters, namely: What are the difficulties encountered in dealing with intellectual capital components? What is the impact of theory on practice regarding the structure of intellectual capital? How objective is the interview technique applicable to intangible assets of national companies?
2. THE INTELLECTUAL CAPITAL CONCEPT. DEFINITION AND MEANING
The concept of intellectual capital has its genesis in the new era of knowledge and is still in the stage of definition and development, becoming even more often the success key of the new millennium.
According to the International Accounting Standards, specifically IAS 38, an asset is a resource controlled by the enterprise, as a result of past events and which is expected to generate future economic benefits for the entity.
An intangible asset is an identifiable non-monetary asset without physical substance, held in order to be used in production or supply of goods or services, for rental to others or for administrative purposes. It can be recognized in the balance sheet if it is expected to generate future economic benefits for the entity and the cost of the asset can be measured reliably.
The literature provides divers informations, so that the utilisation of “intellectually” notion[2]may be questionable for at least two reasons. The first reasoning is based on the fact that, by its very one ambiguity, the term creates the idea of physical investment that is not even remotely of intellectual nature, but emphasizes on the possible evolution of an entity where managers focus on the “gray matter”. The second direction is pointed towards the accumulation of knowledge as intellectual capital.
3. THE COMPONENTS OF INTELECTUAL CAPITAL CONCEPT
3.1 The classic components of intellectual capital concept
Since in the previous chapter we presented different definitions of the intellectual capital, we intend to use the intellectual capital terminology in the present chapter, given that the final purpose of the research is regarding the intellectual capital concept.
According to Sveiby, the intellectual capital contains three component: the structural capital, the human capital and the clients’ capital.
The author focuses on the clients’ capital component. In our opinion, this model of intellectual capital components has a limited area, but this helps us to explain the concept even better. Therefore, for Sveiby’s model, clients are the main element of the intellectual capital, standing at the confluence of intellectual capital and human capital. The accounting draws our attention on defining the intangible assets components, namely: software, concessions, patents, licenses, trademarks, rights and similar assets, goodwill and development expenses. Including software in the intangible assets category [3] is not valiant for any type of software. For example, in case of a common software, it’s recognition as an intangible asset is not justified, so that the financial related effort goes directly on expenses. On the other hand, in the general accounting plan used by economic agents, there is no separate item for software, these being included in the category of other intangible assets.
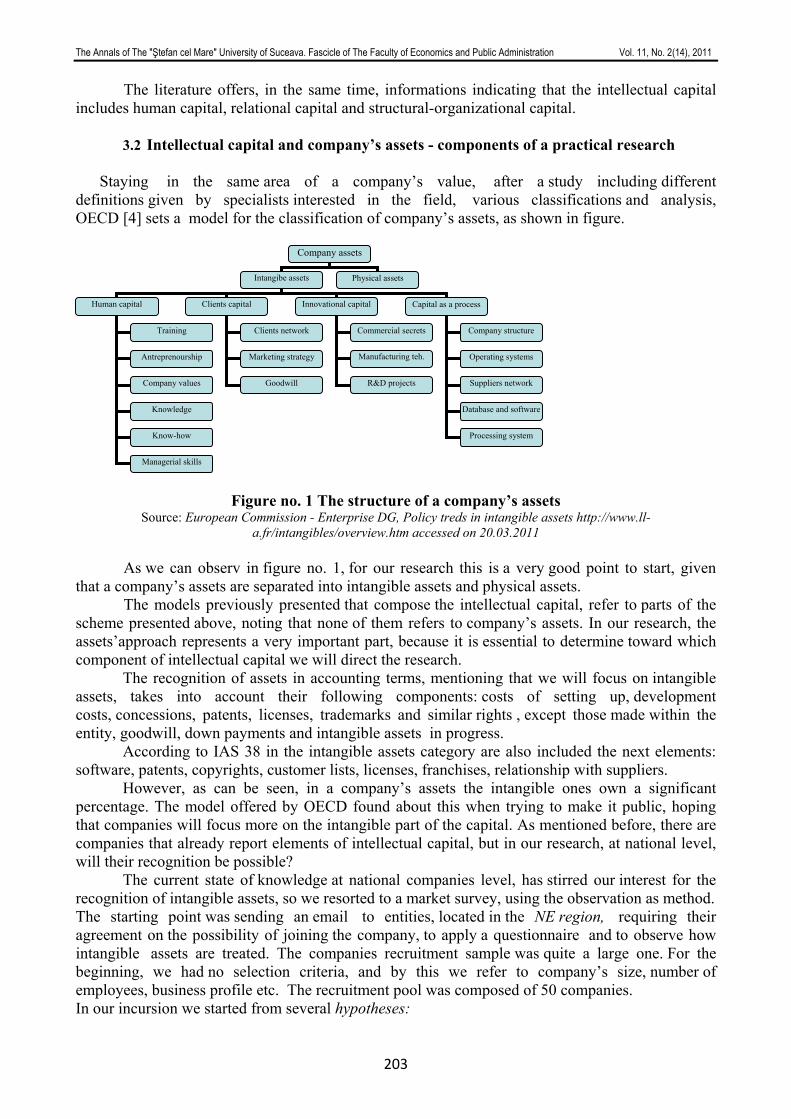
The Annals of The "Ştefan cel Mare" University of Suceava. Fascicle of The Faculty of Economics and Public Administration Vol. 11, No. 2(14), 2011
203
The literature offers, in the same time, informations indicating that the intellectual capital includes human capital, relational capital and structural-organizational capital.
3.2 Intellectual capital and company’s assets - components of a practical research
Staying in the same area of a company’s value, after a study including different definitions given by specialists interested in the field, various classifications and analysis, OECD [4] sets a model for the classification of company’s assets, as shown in figure.
Figure no. 1 The structure of a company’s assets Source: European Commission - Enterprise DG, Policy treds in intangible assets http://www.ll-
a.fr/intangibles/overview.htm accessed on 20.03.2011
As we can observ in figure no. 1, for our research this is a very good point to start, given that a company’s assets are separated into intangible assets and physical assets.
The models previously presented that compose the intellectual capital, refer to parts of the scheme presented above, noting that none of them refers to company’s assets. In our research, the assets’approach represents a very important part, because it is essential to determine toward which component of intellectual capital we will direct the research.
The recognition of assets in accounting terms, mentioning that we will focus on intangible assets, takes into account their following components: costs of setting up, development costs, concessions, patents, licenses, trademarks and similar rights , except those made within the entity, goodwill, down payments and intangible assets in progress.
According to IAS 38 in the intangible assets category are also included the next elements: software, patents, copyrights, customer lists, licenses, franchises, relationship with suppliers.
However, as can be seen, in a company’s assets the intangible ones own a significant percentage. The model offered by OECD found about this when trying to make it public, hoping that companies will focus more on the intangible part of the capital. As mentioned before, there are companies that already report elements of intellectual capital, but in our research, at national level, will their recognition be possible?
The current state of knowledge at national companies level, has stirred our interest for the recognition of intangible assets, so we resorted to a market survey, using the observation as method. The starting point was sending an email to entities, located in the NE region, requiring their agreement on the possibility of joining the company, to apply a questionnaire and to observe how intangible assets are treated. The companies recruitment sample was quite a large one. For the beginning, we had no selection criteria, and by this we refer to company’s size, number of employees, business profile etc. The recruitment pool was composed of 50 companies. In our incursion we started from several hypotheses:
Company assets
Intangibe assets Physical assets
Human capital Clients capital Innovational capital
Training
Antreprenourship
Company values
Knowledge
Know-how
Managerial skills
Clients network
Marketing strategy
Goodwill
Commercial secrets
Manufacturing teh.
R&D projects
Capital as a process
Company structure
Operating systems
Suppliers network
Database and software
Processing system
The Annals of The "Ştefan cel Mare" University of Suceava. Fascicle of The Faculty of Economics and Public Administration Vol. 11, No. 2(14), 2011
204
How important is for a company the recognition of intellectual capital as an intangible asset? What are the elements that define the intellectual capital and that can be found in the current accounting practice at national level? Expected results: That the theoretical concepts be easily implemented in the accounting practice of national companies. Results achieved: from the recruitment sample only 3 companies were open to share with us the data they hold. Obstacles encountered: this can be either about the time too short in providing data for the research, either about the business environment reticence in dealing with research or maybe the questions addressed that didn’t stirred their interest, that were ambiguous or that referred to confidential data. National companies
The companies who responded to our requirements are: Gold & Platin Suceava, Moldsilva Suceava, AutoMitric Suceava, having different activity profiles.
Table no. 1. Description of the companies that participated in the study Company Description InterviewCompany
GOLD & PLATIN
BUCOVINA
Member of the GOLD & PLATIN group, appeared on the auto market as importer and dealer for Opel & Chevrolet at the beginning of July 2005. The auto market from the Bucovina region has proven to be a flexible, ever changing market. Opening a new and modern auto complex in this area came as a result of market demand to assimilate brands that offer a very good price/quality ratio. New trends imposed by a constantly growing market, as the auto market, identification with customers increasingly more demanding, motivated by a various offer, compliance with high quality standards imposed by General Motors, are just some of target audiences that GOLD & PLATIN through its dealers manages to perform them.
participation in the study
YES
S.C. MOLDSILVA
S.A. SUCEAVA
a company specialized in panelized houses with wooden structure, better known in Romania under the name of “american houses”, Ossature Bois, Holzrahmenbau or Timber Frame. The company was founded in 1994 and its main object of activity was, from the beginning, the exploitation and processing of wood.
participation in the study
NO
AUTOMITRIC SUCEAVA
located on the beautiful lands of Bucovina, is one of the latest representatives of Volkswagen Concern in Romania. Founded in 1991, initially as a small auto repair shop, through its founders dedication and commitment, the company has grown every year now reaching acknowledgement far beyond the boundaries of Suceava. Currently, the main areas of activity consist in providing the full range of services in the field of auto repair, sale of new cars, sale of spare parts, consumables and car accessories, car rental services.
participation in the study
YES
Results achieved: GOLD & PLATIN Bucovina during the interview with the chief
accountant gave us details about the intellectual capital as consisting of: “human capital including trained employees , such as the Gold sellers (those employees in which they invested courses up
The Annals of The "Ştefan cel Mare" University of Suceava. Fascicle of The Faculty of Economics and Public Administration Vol. 11, No. 2(14), 2011
205
to 10000 euro), accountants trained in Cros-AM who implemented such an integrated system, mechanics with technician-diagnosis degree specialized in Opel-Chevrolet; relational capital, such as partnerships or agreements with various suppliers, like Augsburg for spare-parts, the franchise agreement with General Motors (manufacturer of Opel and Chevrolet); marketing campaigns who’s aim was that to promote the image of GOLD & PLATIN Bucovina; in this category there would be also brand and patents, but is not the case of Gold & PLATIN BUCOVINA”.
Conclusions: As it can be seen the practice provides us with helpful information in discovering the components of intellectual capital and the manner to register them in accounting. It can be observe that this company focuses on employees specialization and the courses they followed to define intellectual capital. Results achieved: Concerning the company AUTOMITRIC Suceava, from discussions with the regional manager we realized that the mechanics specialization is what gives value for the entity’s intellectual capital. In other words, the mechanics are sent to different trainings and the future economic benefits come from the value added to the company. The regional manager explained us that the mechanics have a certain target to reach regarding cars repair and there is a bonus allocation system. This is not the case of company’s marketing activity, because, as part of Volkswagen Concern Romania, everything regarding the marketing activity comes from the mother company. Conclusions: These are the first results we obtained from our market study and allow us to draw the following conclusion: at first sight it seems that components like knowledge and marketing activity are prior to indentify the intellectual capital concept. Public institutions In order to have more development directions for our research and to be able to analyse various points of view, we observed the role and position of the intellectual capital in a public institution. The institution analysed is the “Ştefan cel Mare” University of Suceava, where we talked to chief accountant. Results achieved: It is true that such an institution can have a valuable intellectual capital, but we observed the following: the institution recognizes the employees specialization only as an expense and not as an intellectual capital, the knowledge brought by every employee concernes his personal specialization, regarding the accounting of the public institution we can speak about accounting data only from expenses point of view. There is a budget allocated for this type of expenses, but not available for us, for confidential reasons. But what the public institution recognizes in terms of intellectual capital are patents held by each faculty. We had acces to such informations and we will analyse them in the following chapters. The brand is another element of the intellectual capital of the public institution, noting that the USV brand is registered at OSIM, the university having exclusive right of use. The international context gives us also a lot of informations, some of them can guide us in our research and others without substance or use for our aproach. However, we tried to identify some useful aspects for our research, to guide us discovering and treating intellectual capital at international level. We are still in the phase of collaboration in obtaining informations from an Institute in Sweden [5], which deals with intellectual capital for different companies in order to highlight the important value of intellectual capital for a company. The Institute treats intellectual capital having Edvisson as mentor and proposes the following approach for the intellectual capital:
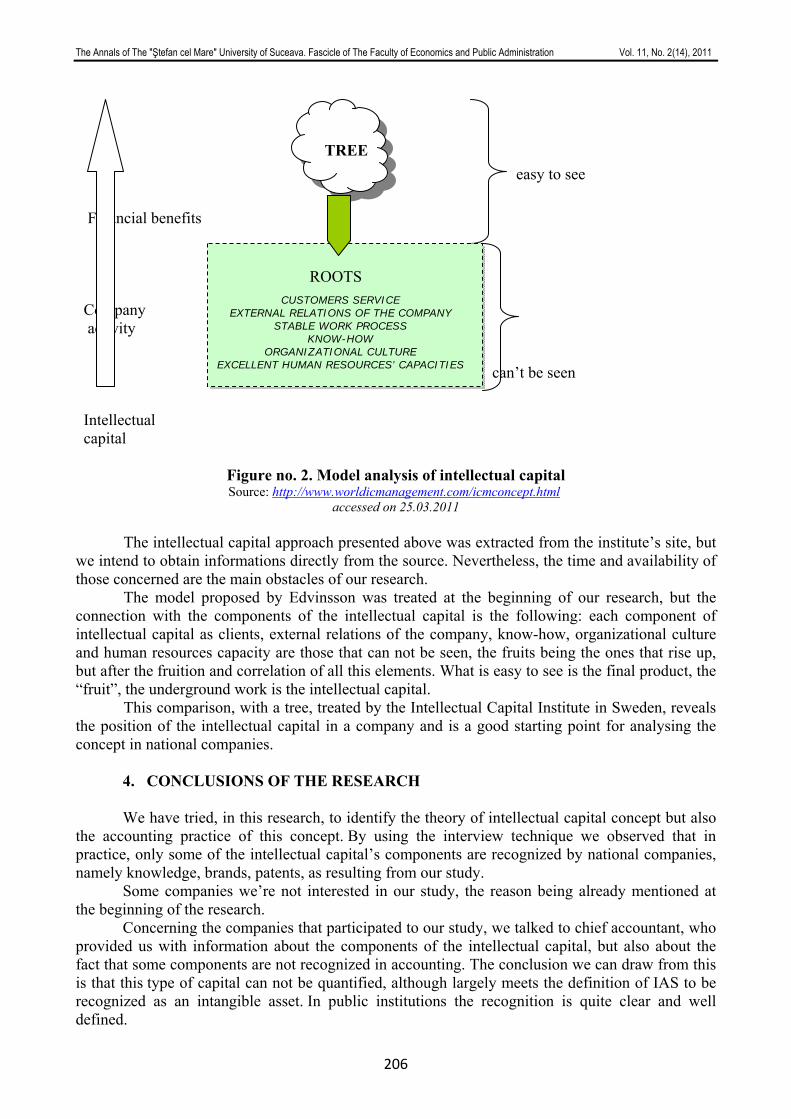
The Annals of The "Ştefan cel Mare" University of Suceava. Fascicle of The Faculty of Economics and Public Administration Vol. 11, No. 2(14), 2011
206
Financial benefits Company activity Intellectual capital
Figure no. 2. Model analysis of intellectual capital Source: http://www.worldicmanagement.com/icmconcept.html
accessed on 25.03.2011 The intellectual capital approach presented above was extracted from the institute’s site, but we intend to obtain informations directly from the source. Nevertheless, the time and availability of those concerned are the main obstacles of our research. The model proposed by Edvinsson was treated at the beginning of our research, but the connection with the components of the intellectual capital is the following: each component of intellectual capital as clients, external relations of the company, know-how, organizational culture and human resources capacity are those that can not be seen, the fruits being the ones that rise up, but after the fruition and correlation of all this elements. What is easy to see is the final product, the “fruit”, the underground work is the intellectual capital. This comparison, with a tree, treated by the Intellectual Capital Institute in Sweden, reveals the position of the intellectual capital in a company and is a good starting point for analysing the concept in national companies.
4. CONCLUSIONS OF THE RESEARCH
We have tried, in this research, to identify the theory of intellectual capital concept but also the accounting practice of this concept. By using the interview technique we observed that in practice, only some of the intellectual capital’s components are recognized by national companies, namely knowledge, brands, patents, as resulting from our study.
Some companies we’re not interested in our study, the reason being already mentioned at the beginning of the research.
Concerning the companies that participated to our study, we talked to chief accountant, who provided us with information about the components of the intellectual capital, but also about the fact that some components are not recognized in accounting. The conclusion we can draw from this is that this type of capital can not be quantified, although largely meets the definition of IAS to be recognized as an intangible asset. In public institutions the recognition is quite clear and well defined.
can’t be seen
ROOTS
CUSTOMERS SERVICE EXTERNAL RELATIONS OF THE COMPANY
STABLE WORK PROCESS KNOW-HOW
ORGANIZATIONAL CULTURE EXCELLENT HUMAN RESOURCES’ CAPACITIES
easy to see TREE
The Annals of The "Ştefan cel Mare" University of Suceava. Fascicle of The Faculty of Economics and Public Administration Vol. 11, No. 2(14), 2011
207
What we propose for future research is to be able to establish a modality to evaluate and quantify the intellectual capital, that could be introduced into accounting practice and recognized at national level.
Another perspective of this research is to introduce an annexe to annual financial statements entitled “policies and accounting options on recognition and measurement of intellectual capital”. AKNOWLEDGEMENTS: This work was supported by the the European Social Fund in Romania, under the responsibility of the Managing Authority for the Sectoral Operational Programme for Human Resources Development 2007-2013 [grant POSDRU/88/1.5/S/47646]. This paper has been financially supported within the project entitled „Doctorate: an Attractive Research Career”, contract number POSDRU/107/1.5/S/77946, co-financed by European Social Fund through Sectoral Operational Programme for Human Resources Development 2007-2013.
ENDNOTES [1] Andone, A., Georgescu, I., Toma, C. - Cercetare avansată în contabilitate, Ed. Wolters Kluwer, Bucureşti, 2010, p. 27 [2] Feleagă, N., Malciuc, L. - Provocările contabilităţii internaţionale la cumpăna dintre milenii. Modele de evaluare şi investiţii imateriale, Ed. Economică, Bucureşti, 2004, p. 118 [3] Istrate, C. - Contabilitatea nu-i doar pentru contabili!, Ed. Universul Juridic, Bucureşti, 2009, p. 58 [4] *** European Commision, Policy treds in intangible assets, http://www.lla.fr/intangibles/overview.htm, accessed on 20.03.2011 [5] ***http://icrating.com/content/definition , accessed on 27.10.2011 [6]*** http://www.worldicmanagement.com/icmconcept.html, accessed on 25.03.2011
REFERENCES
1. Andone, A., Georgescu, I., Toma, C. - Cercetare avansată în contabilitate, Ed. Wolters
Kluwer, Bucureşti, 2010 2. Feleagă, N., Malciuc, L. - Provocările contabilităţii internaţionale la cumpăna dintre
milenii. Modele de evaluare şi investiţii imateriale, Ed. Economică, Bucureşti, 2004 3. Istrate, C. - Contabilitatea nu-i doar pentru contabili!, Ed. Universul Juridic, Bucureşti,
2009 4. *** European Commision, Policy treds in intangible assets, http://www.ll-
a.fr/intangibles/overview.htm, 5. ***http://icrating.com/content/definition 6. ***http://www.worldicmanagement.com/icmconcept.html
The Annals of The "Ştefan cel Mare" University of Suceava. Fascicle of The Faculty of Economics and Public Administration Vol. 11, No. 2(14), 2011
208
THE TREASURY OPERATING MECHANISM IN ROMANIA
Nicoleta IONESCU (EFTENE) Valahia University of Targoviste, Romania
[email protected] Gabriela MIHAI (ANDREESCU)
Valahia University of Targoviste, Romania, [email protected]
Abstract: The establishment of the state treasury in our country has become an objective necessity, resulting from the
application program of the reform and the restructure of the economy, while the public finances were asked to amplify their role and functions regarding the management and a more efficient use of the public sector of the financial resources .
If in the years after 1990, for a more adequate mobilization of the resources for the public sector, especially taxes, a more appropriate legal and organizational framework has been created, similar measures were also necessary in the management and use of these resources under a more operational and efficient control of the state. The state treasury was necessary for complying with new commands and demands of the finance and tax reform, levers and resources on creating specific financial and budgetary market economy with which the state may favorably influence the country’s social and economic development.
In the modern economy, respecting the principles of the organizational unity, the autonomy and security operations by separating the duties and responsibilities of authorizing officers and accountants, in the process of diversification of the role and powers of the Treasury, the State has entrusted it with specific tasks and actions of its intervention in economy.
Keywords: State Treasury, public institutions, public resources, consolidated general budget, budgetary execution
JEL Classification: M41
INTRODUCTION
After 1989 it was imperative necessary to create specific mechanisms and instruments of a transitional economy, to stimulate the growth of the spirit of responsibility in building the state's financial resources and of how they are managed and used to achieve real social protection and efficient economy. Starting the Public Finance treasury in our country has become an objective necessity determined by the implementation of the reform and restructuring of the economy, while the public finances were asked to amplify the role and functions concerning a more efficient management and use of the financial resources of the public sector.
By implementing the measures imposed by the reform program in the public finances and the banking system, the role and the attributions of the public finances were fundamentally restructured, based on how the accounting of revenues and expenses was organized and, could not meet the new requirements. The state treasury was necessary for complying with new commands and demands of the finance and tax reform, levers and resources on creating specific financial and budgetary market economy with which the state may favorably influence the country’s social and economic development.
From the analysis and experience of some countries with a developed market economy,it results that they have organized the execution of the public sector budget through units which provide the management of the expenses in close correlation with the administration of the income taxes, etc.. Thus, Italy, France and U.S. have organized the state treasuries, the Ministry of Finance, with the subordinate territorial entities that ensure the operations of the public sector receipts and payments and other countries have special organs for the collection and tracking of revenues and others for payments.
The Annals of The "Ştefan cel Mare" University of Suceava. Fascicle of The Faculty of Economics and Public Administration Vol. 11, No. 2(14), 2011
209
Whatever the system adopted in all these countries, it fully confirms the principle that the administration of taxes on the one hand, and spendings, on the other hand, must form a coherent whole, a basic attribute of the Government which is accomplished through organs that are strictly specialized and subordinated to it.
With our country transition to a competitive market economy and being given the changes occurring in the banking system, the Romanian authorities' decision to create a uniform system regarding the management of the state’s financial resources, covering all phases from establishment, monitoring, to their final use, was fully justified.
By this measure, the Ministry of Finances has specific tools of analysis at all stages of development, approval and execution of the state budget, of the state social security budget and local budgets to ensure financial stability, monetary, currency and proper management of the public internal and external debt of the state.
The organization of the state treasury in Romania, as an integrated system, centralized and decentralized at the Ministry of Finances, in territorial level, was provided by an appropriate legislative framework that the Accounting Law, Government Decision nr.78/15.02.1992, the methodological rules given in its application, and especially nr.66/1994 Government Ordinance, as amended.
THE BASIC PRINCIPLES REGARDING THE FUNCTIONING OF THE STATE TREASURY IN ROMANIA.
The new institution, specific to the public sector, is designed to operate by the following rules:
• The reality of the information. In many cases, to the organization of the state treasury, the information on the structure of
the public revenues was distorted because of the errors made on the revenues of the subdivisions of the budgetary classification, due to an insufficient control of the document through which payments were made to the budget. Also, for the cash payments, the drawback was that due to the lack of control, cash payments were made, which were inconsistent with the subdivisions of the budgetary classification for which the budgetary credits were approved.
Basically, in many cases, significant diversion of resources were made; • Achieving the control act.
A fiscal control in terms of correct classification of the budgetary and extra-budgetary revenues on the subdivisions of the budgetary classification and other pursued criteria and a preventive control on all payment documents, with or without cash, regarding the execution of the components of the general consolidated budget.
• Universality. In the sense that we understand, in this context, it refers to the fact that the treasury activity
should expand nationwide. Likewise, referring to a universality, in territorial level, this institution, through its operational authorities, enforces the execution at county level for all the components of the general consolidated budget;
• Uniqueness. The subjective approach requires that all the budgets should be conducted only by treasury,
the public institutions are required to maintain availability only in the accounts opened here, the possibility to have accounts at commercial banks being excluded. The exceptions are paid for purchase of foreign currency availability, retention, including the receipts in that currency from its work, donations or sponsorships. Uniqueness refers then to the working methodology and the implemented mechanisms, the documents that pass through the treasury, the control objectives, the data processing technique and to develop the synthesis situations , which makes it easier to set up a unified informational system .
• The information efficiency.
The Annals of The "Ştefan cel Mare" University of Suceava. Fascicle of The Faculty of Economics and Public Administration Vol. 11, No. 2(14), 2011
210
The ensurance of the efficiency of the information regarding the execution of the components of the general consolidated budget, both at county and national level, is achieved through its own informational system, particularly important for speeding up the implementation of the state budget execution, of the local budgets, of the state social insurance budget and the special funds budgets. • The total correlation between the revenues and expenses with the budget from which they
are part of, is called in the German literature "of completeness." This principle requires that the received incomes be paid in full to the budget to which they
belong and the expenses, also in their totality to be borne by the budget to which they have been provided, the general rule being that an expense can not be financed only from a single budget. The same rule requires the authorizing officers not to make direct payments from revenues, so that they do not eliminate the possibility of fiscal control over revenues collecting and of the preventive one on the expenses performance by requiring the registration of all receipts and payments. • We note that this principle works well and in the case of the special funds budgets and extra-
budgetary funds, expenses could be made only after the necessary funds have been established in advance. • Balancing the treasury flows.
The public treasury requirement to balance the entries and the exists of the financial flows, are the iron rule which can not be violated under any circumstances, because this institution can not operate on "red. " The entering financial flows must fully cover at any time of the financiar exercise, the payments. If sufficient resources are not collected from their own taxes, to cover the payments, one appeals to complete them by loans.
To stop the payments during the execution of an approved budget , not to pay the salaries or other strictly necessary expenses on time, in addition to direct consequences on the matter, would create a strong state of panic and uncertainty over the state institutions with the most striking implications on the whole economy.
In the German literature, that we made reference to, in addition to the stated principles, there are also mentioned the "clarity" (the revenues and expenses are bounded according to their source of origin), the "probability" (the execution is limited until the approval of the budget) and the "precision "(the revenues and expenses to be evaluated or designed in the approved budget).
The rules which the state treasury assumed, according to which they work, are those resulting in the obligation to ensure the state’s necessary funds at any time of the exercise,so that this one can perform in the best of conditions the complex functions and atributions that it has.
THE FUNCTIONS OF THE STATE TREASURY IN ROMANIA.
The functions of the state treeasury in Romania, as a a financial institution, like it has been involved in the administration of the public funds since its establishment in 1993 and until now, could be summarized as it follows: • cashier of the public sector, which ensured the collection of the revenues, the cash payments
and keeping of the state budget, the state social insurance budget, the local budgets, the special funds and the extrabudgetary ones. Through this function, the state treasury ensured the achievement of the state budget provisions ,of the state social insurance budget and local budgets, reflecting the way of collecting the budgetary revenues from the taxpayers as well as the payments ordered by the authorizing officers. As the cashier of the public sector, the treasury ensures on the one hand, the execution of receipts and payments and on the other hand , the necessary disponibilities to meet the commitments assumed by the annual law of the state budget, the local budgets, the state social inssurance budgets and the special funds; • exercises a fiscal control on the collection of revenues and one preventive financial control
on the payments regarding respecting the limits and the destination of the budgetary credits as they have been approved;
The Annals of The "Ştefan cel Mare" University of Suceava. Fascicle of The Faculty of Economics and Public Administration Vol. 11, No. 2(14), 2011
211
• carries out collections and payments operations in the account of the public institutions, following the establishment and use of the extrabudgetary funds and special funds; • attracts the disponibilities of the ecoonomy through the state loans from individuals and
companies in order to cover the temporary cash gaps and the state budgetary deficit. • on the existing disponibilities in the current general account and from the equivalent in lei of
the external loans kept in the general account of the treasury, this one: • temporarily covers the state budget deficit, the state social insurance budget and special
funds budgets of previous years and current year, as well as the cash gaps recorded by the local budgets; • makes financial investments in the short-term, at commercial banks through the National
Bank of Romania, which acts as an agent of the state. • for the temporary cover of the gap between the receipts and payments of the General Account
of Treasury, it contracts short-term loans from the National Bank of Romania; • manages the internal and external debt providing evidence and payment of the internal and
external public debt. • carries out operations regarding the rights to collect and the obligations of payment of he
state, which are based on governmental agreements and conventions; • provides the accounting regarding the cash execution for all the operations of receipts and
payments of the public sector revenues and expenses; • ensures the proper functioning of the accounting informational system regarding the
reporting of the creation and use of the public funds. Compared with the traditional functions of the public treasury in the developed countries,
presented to the previous subchapter, the ones of the the state treasury in Romania, as they currently occur, have important similarities but also many differences. The differences mainly consist of the fact that the treasury functions of Romania do not include the entire range of functions and powers enjoyed by the treasuries in the Western countries have, namely: • the financial investments that the state treasury makes from its disponibilities are only made
for short-term loans, through the National Bank of Romania and not directly as the Treasury of France which makes these kind of operations directly, giving a wide range of short-term loans, medium and long-terms, to finance public investitions; • the influence of the treasury on the defense of the national currency rate is insignificant in
Romania, this issue remaining, so far, almost entirely the responsibility of the National Bank of Romania. The state treasury can not intervene in the foreign exchange market to support the national currency , because it has not created the necessary mechanism , this one has not yet the right to hold foreign currency in the account ; • the released banknotes and the minting of the coin is an exclusive attribute of the National
Bank of Romania, compared with most developed countries in which "treasuries are responsible for minting the coin and even banknotes (USA); • the state treasury means of intervention in the economy are much smaller and have a smaller
amplitude compared with those of other European treasuries as it follows: • it does not grant permits for certain economic activities that lead to preferential financing; • the instruments used by the state treasury in Romania to attract disponibilities in the
economy are much more limited than in other countries; • it does not grant refundable advances for research activities or priority of manufacture as in
France; • other means of state intervention in the economy practiced in Romania are rather the
attribute of the state budget provisions and not of the treasury, for example, the partial subsidization of some current economic activities (mining), etc.. or for investments; the grant of interest subsidy through the state budget financing of the difference in the interest of "cost" of the resource on the capital market and the interest incurred by the beneficiary; granting some requests for loans that the Government gives, on the state budget’s risk and generally all facilities provided to support the
The Annals of The "Ştefan cel Mare" University of Suceava. Fascicle of The Faculty of Economics and Public Administration Vol. 11, No. 2(14), 2011
212
export or attracting foreign capital, is directly reflected in the state budget expenses and only indirectly and ultimately their financial coverage is the treasury’s charge.
CONCLUSIONS
Through the establishment of the state’s Treasury, the Ministry of Finances has specific
means specific tools of analysis at all stages of development, approval and execution of the state budget, of the state social security budget and of the local budgets to ensure financial stability, monetary, currency and proper management of the internal and external public debt of the state. In Romania, the treasury is conceived as an integrated system, centralized at the Ministry of finaces’ level and and decentralized, in the territorial level, with functional and financial management units at the level of municipalities, cities and rural perceptions, the coordonation of their activities being provided by the counties’ Departments of Treasury and of Bucharest.
In the municipal, countryside and rural operative units, the financial flows are completed coming from the Commercial Banks, where the economic agents have opened accounts to pay their obligations to the budget. Also, through these units, the public institutions initiate the payments that they have to do to meet the tasks and duties that they have by law.
On how here, in these operational units, the proper and responsible activity is carried out, regarding the fiscal controls on financial flows of entry and preventive control over financial flows out, the "note" that the authorities can give to the activity of this institution depends on . If at this stage of the conduct of financial flows of resources and payments, the treasury’s authorities act with professionalism and responsibility, the public revenues will be properly shown on the subdivisions of the budgetary classification and on the payer depending on their nature and origin, and the expenses which hav eno legal basis, inappropriate or uneconomical, will be stopped.
The smaller tasks of the state treasury in Romania comparing with the treasuries of other states, constitute just as many real possibilities of their multipying and amplifying. Of these more practical possibilities, we consider that the following can be retained:
• the diversification of forms and techniques to launch the state loans. Firstly, the treasury share certificates may not be nominative, but bearer share certificates, as in this situation they could be traded on the securities market, which would lead to enhancing and accelerating the movement of the financial capitals. It is also necessary to diversify the technical issue of treasury bills as the system practiced in other countries (the roof mechanism, the coefficient of treasury, reserves, issuance of coupons in relation to the level of resources, etc..). Although through the normative acts which decided the establishment of the public finance treasury in Romania, its attribute was provided ’’to create deposits in the limelight and on time of the individual and companies and " the methodological rules"calls for the purposes of this provision "to attract disponibilities in the economy (financial institutions, traders, people) through the formation of deposits....", this right required by law is not exercised yet. A beginning in this regard has been made in 1999 through the launch of the state loans to the population, by issuing treasury certificates;
• the instruments of the intervention of the state in the economy through treasury, in a way which at least gets our country closer to the what is done in this regard in other countries. In this direction, we consider that the budget of the treasury should be better structured and enhanced. A budget whose resources are made up only of minor interest and fees can not afford actions and approaches on a large scale on the line of the intervention in the economy.
BIBLIOGRAPHY
1. Belean Pavel, Anghelache Gabriela, Georgescu Florin, Trezoreria statului:organizarea, functionarea si sistemul contabil, Editura Economica, Bucuresti, 2004
2. Belean Pavel, Metode si proceduri ale contabilitatii si controlul trezoreriei statului, Editura University Press, Arad, 2000
The Annals of The "Ştefan cel Mare" University of Suceava. Fascicle of The Faculty of Economics and Public Administration Vol. 11, No. 2(14), 2011
213
3. Mosteanu Tatiana, Buget si trezorerie publica, Editura DU STYLE, Bucuresti, 2000 4. Ungureanu Mihai Aristotel, Organizarea si conducerea trezoreriei finantelor publice in
conditiile economiei de piata in Romania, Editura Conphys, Ramnicu Valcea, 1996 5. Ordinul nr. 1235/2003 pentru aprobarea Normelor metodologice de aplicare a prevederilor
Ordonantei de urgent a Guvernului nr. 146/2002 privind formarea si utilizarea resurselor derulate prin trezoreria statului, aplicata cu modificari prin Legea nr. 201/2003
6. Ordinul 2254/2007 privind modificarea si completarea Ordinului ministrului finantelor publice nr. 1235/2003 pentru aprobarea normelor metodologice de alicare a prevederilor Ordonantei de Urgenta a Guvernului nr. 146/2002 privind formarea si utilizarea resurselor derulate prin trezoreria statului, aprobata cu modificari prin Legea nr. 201/2003
7. Normele metodologice privind organizarea şi funcţionarea trezoreriei Finanţelor publice nr. 5318
8. Legea nr. 82, privind contabilitatea republicată în Monitorul Oficial Partea I, nr. 629/26 august 2002
9. Ordonanţa de Urgenţă nr. 146/31.10. 2002, privind utilizarea resurselor derulate prin trezoreria statului publicată în Monitorul oficial Partea I, nr. 824/14 noiembrie 2002, cu modificările ulterioare
The Annals of The "Ştefan cel Mare" University of Suceava. Fascicle of The Faculty of Economics and Public Administration Vol. 11, No. 2(14), 2011
214
IMPLICATIONS OF FISCAL CONSOLIDATION IN EU ON THE BACKGROUND OF PROMOTING SUSTAINABLE ECONOMIC GROWTH
PhD. Candidate Elena TOMA
Faculty of Economics and Business Administration, “Alexandru Ioan Cuza” University of Iasi, Romania [email protected]
PhD. candidate Marius FRUNZĂ Faculty of Economics and Business Administration, “Alexandru Ioan Cuza” University of Iasi, Romania
Abstract: The process of fiscal consolidation, initiated at EU level, since the last decade are a necessity now, the
situation is significantly deteriorating for most of the Member States, as a result there is the occurrence and manifestation of economic and financial crisis. Recovery and promote growth, the goal outlined in the new European strategy, is including among the influences or is affected by its implementation, as we show in our analysis. The implications of fiscal consolidation process related to a number of costs and limited, on the one hand, due to the current crisis, and on the other hand, the need rallying Member States wishes strategy pursued by the "Europe 2020". Against this background, our paper aims to highlight possible solutions to the remaining public authorities in implementation of fiscal consolidation. Also, a study compared the economic situation, the level and trend of budget deficit and public debt, in Member States of the European Union in 2007-2010, allowed us to identify and group the Member States according to the constraints on they are subject in the recovering of the situation of public finances.
Keywords: fiscal consolidation, public debt, fiscal deficit, taxes, economic crisis, economic growth JEL Classification: H 62, H 63, H 30
INTRODUCTION The problem of fiscal consolidation in the European Union in 1993 aiming to put the budget
deficits triggered thereby halting the decades prior. However, at Community level beginning in 2000, promoting a sustainable economic growth was brought to the fore, with emphasis on the need to improve the level of education and training (qualification), adopting a new attitude towards professional development for the purposes of lifelong learning lifetime security reform and social inclusion.
The period in which the economic and financial crisis was triggered coincided with the period in which the European Union has outlined a new strategy on medium and long term which is considered to be the continuation of the Lisbon’s strategy. The new strategy, named „Europe 2020” prioritizes the bold economic and social objectives. Moreover, EU aims to develop a sustainable economic growth (on the one hand, with implications for the environmental protection and, on the other hand, by giving support to the SMEs) and this economic growth is sustained by the investments in the human capital area, in various shapes (stimulating the research, innovation and development activities). The effects are going to be seen by all the stakeholders (the growth of the employment share and the poverty reduction being the leading priorities). In a synthetisized utterance the EU’s objectives stated in the strategy of „Europe 2020” emerge in promoting the economic „smart, sustainable and comprehensive” growth.
The issue drawn by the new strategy, and some goals containing new and outlined background of worsening public finances, making of this the greatest problem which needs to be addressed and corrected, as it affects the economic growth, is represented by the public finances. By reducing the budget deficit and the government debt is urgent and necessary as it is shown in the reports from 2009 and 2010 of the European Commission, regarding the monitorization of the EU economic growth, in order to break the vicious circle which was caused by the existence of a huge public debt and it affects the financial market (involving a high level of interest) and thereby it reduces the economic growth (European Commission, 2010; European Commission, 2011).
The economic crisis has left a great impact on the economic situation on most of the Member States of the European Union, growing worse the economic key indicators and the
The Annals of The "Ştefan cel Mare" University of Suceava. Fascicle of The Faculty of Economics and Public Administration Vol. 11, No. 2(14), 2011
215
financial levels. In the year of 2009, all the Member States excepting Poland, registered a decrease of the domestic product, and, in some of the cases, even its collapse. As a response to the manifestation of these negative effects in the real economy, most of the states responded with economic measures in order to combat unemployment and economic recession triggered by it.
Most of the developed countries took measures of discretionary fiscal policy in an attempt to sanitize the economic crisis. Due to the nature of this particular crisis, the range of solutions has become very narrow. So, on the money line, the usage of a benchmark interest rate is limited; it can no longer help in the recovery of the economy, especially because it was at a very low level when the crisis started, phenomenon known as the liquidity trap.
On the background of these findings, we propose in our work, through an analysis as it is normative and empirical basis of one type to emphasize on the one hand, the implications of their actions taken by most states following the event economic crisis, as well as the final objective of combating the negative effects arise from this, as well as on public finances and on the other hand, under what conditions, the objectives of the strategy "Europe 2020" can be achieved in the context of shaping, as crucial necessary, fiscal consolidation process.
FISCAL CONSOLIDATION - NORMATIVE FRAMEWORK According to the literature in this domain, an episode of fiscal consolidation occurs when
the balance of the cyclically adjusted budget, after a budgetary year, improves with at least 1% of the potential groass domestic product or with at least 0.5% in two consecutive years. There are two possible solutions which can lead to reducing the budget deficit, and these are: reducing the public spending and increasing the revenues, especially the fiscal ones.
At EU level, the necessity of fiscal consolidation occurs in the background confluence of the factors that have worsened, directly or indirectly public finances: the Maastricht Treaty relaxation conditions, the extent of economic collapse following the crisis, which required fiscal-budgetary measures for its mitigation, plus the negative effects of promoting pro-cyclical policies in most Member States, in the years preceding the current crisis.
First, the change of the Stability and Growth Pact, in 2005, had some direct implications on the level of the budget’s deficit and on the government debt, allowing the states from the eurozone to exceed the threshold of 3% of the GDP concerning the annual budget deficit. That’s why the situations which explain the existence of the deficit already accepted (natural disasters, war, economic cycle) were added along with the situation of economic downturn which led to an increase in the public debt which was driven by the deficit financing. The changing of the European Union Treaty was seen as a complete relaxation of the fiscal rules and the convergence criteria risked to be seen as a minimum and not as a maximum.
Secondly, promoting the economic growth trough acceptance of public deficit (like a anti-cyclic mesure) has led to some negative phenomenom in real economy: some studies made by OECD and IMF show that EU fiscal policies, in the recent decades, were expansionary during the periods of economic growth and restrictive in the downturns. This whole situation led to undermining the effects of the incorporating stabilizers, and more, to abrupt developments of the GDP level. Thereby, the studies show us that in the 1960-2006 period, the fiscal policies were clearly pro-cyclical in the developing states and in the industrialized countries there were some elements of pro-cyclical (Talvi & Vegh, 2005; Kaminski et al., 2008). More than this, the final public consumption in the developing states emphasizes the economic cycle. However, at the level of G7 states, the fiscal policies were either acyclic or anti-cyclical (Tavi & Vegh, 2005). One of the possible explanations for this phenomenon is given, on the one hand, by the imperfections of the domestic credit market (unwise loans), and on the other hand, by the corruption and rent-seeking behaviour which is emphasized in the periods of economic growth.
Another cause of pro-cyclicality is determinate by some fiscal-budgetary measures are given by certain practical difficulties in implementation, such as the timing of intervention, especially the nature of the economic downturn (due to the economic cycle or is it just a change of trend).
The Annals of The "Ştefan cel Mare" University of Suceava. Fascicle of The Faculty of Economics and Public Administration Vol. 11, No. 2(14), 2011
216
In addition, political factor causes an asymmetry when it comes to taking anti-cyclical decisions, because an expansionary policy is more popular than a restrictive one and it does not involve political costs. The existence of the political cost and, even more, of electoral cycles, determine the retention of the expansionary measures when they should be replaced with restrictive ones instead.
Thirdly, fiscal and budgetary measures taken by most Member States, this occurrence is the manifestation of the crisis, that have raised the budget deficit, involves a number of shortcomings in the economy, their effects entirely missing the assumed objective.
In this conditions, the positive effects of discretionary policy can be neutralized to a large extent by the reaction of the people to the budget deficit resulted, which will proceed with the anticipated increase in tax savings in the future and is known as the Ricardo-Barro effect. The validity of this teory is still disputed by Pareto, who claims that populations does not have the ability to predict a future increase in taxes. The studies made by OECD have shown that, partially, the Baro effect manifests and it compensates approximately 50% of the short-term effects of the fiscal policy and about 70% of its long-term effects (Tanzi, 2004, p. 143). The Baro effect can be interpreted as the tendency people have to make savings in times of economic decline, based on general safety reasons, reducing their consumption. Therefore, the tax cut has a delayed effect, the additional disposable income is largely saved, and, in addition, it can be spent in a period when the growth of the consumption may further exacerbate the economic cycle. More, the introduction of the tax incentives under a precarious situation (already existing in some member states, at the start of crisis) of public finances and with a high public debt represents a bad measure with the potential negative impact on investors. They will anticipate that, given the existence of a high public debt, the government will have to change its fiscal policy in the near future, from an expansionary one to a restrictive one.
Moreover, the experience of the countries that recovered in a short period of time after the application of the restrictive fiscal policies, not because of the application of a expansionary fiscal policy, represents another element that needs to be taked into consideration when it comes to anti-crisis measures. There also is proof that a restrictive fiscal policy may be „expansionary” in certain ways, but the most important fact is that it can change the behaviour of the economic agents and investors by eliminating the fear of a possible increase of the taxes (Schuknecht& Tanzi, 2005), where fear materializes in reducing the consumption more than necessary on precaution criteria.
In addition, the deficit budget burdens the future generations, according to the intertemporal equivalence; in addition, it slows down the economic growth, and even though we make public expenditures of investment or of the final consumption, the public debt and its interest reduce the public investment. The econometric results show us that in the states where the public debt is over 90%, the economic growth is lower by 1.3% in comparison to those which have a low level of public debt (Reinhart& Rogoff, 2009).
Given that, at EU level is urgently needed to restart economic growth and sustainable development, fiscal consolidation, while reducing public debt, is subject to limitations in terms of budget and fiscal instruments that states can use its realization. The implications of using different types of fiscal budgetary tools we are highlighted below.
When it comes to the public spending, fiscal consolidation based on their reduction is considered to be more effective, as it is shown by the numerous studies conducted with this purpose (Alesina&Perotti, 1995; Alesina&Ardagna, 1998; Von Hagen et al., 2002; Maroto&Mulas-Granados, 2007). In addition, the public spending which lead to the economic growth (for education, research, infrastructure) and should represent the interest of the Member States, especially when the Europe 2020 strategy wants the economic growth based on investment in the human capital.
Though, also the increase of the tax revenue as an option to the fiscal consolidation, can be effective, but only with the condition that the overall tax burden, as a share of the tax revenue in the GDP, will be reduced and its implementation will be gradual (Tsibouris et al., 2006). The higher efficiency of the fiscal consolidation via the public expenditure can be justified by the signal
The Annals of The "Ştefan cel Mare" University of Suceava. Fascicle of The Faculty of Economics and Public Administration Vol. 11, No. 2(14), 2011
217
transmitted to the economy and to the financial markets is much stronger than the case of the increase of the tax revenues, especially since is is often accompanied by the reforms which aim to streamline the public services (Cotarelli&Viñals, 2009).
When it comes to tax, authorities should not raise the tax rates on the taxes which have a major impact on the economic growth, especially not on income tax or profit tax. As it is shown in the literature from this domain (Johansson et al., 2008), various types of taxes can be classified according to the gross domestic product relationship and the change in the various types of taxes results in a large or in a low change. The correlation coefficient between GDP and taxes lowers when it comes to the income tax, the consumption taxes and the taxes on wealth. In the case of the taxes on wealth, we add that their existence does not affect or modify at all the evolution of the GDP/inhabitant, the correlation coefficient being almost zero. Taking into consideration the above finding, the European Union calls for the increment of the financial wealth tax and the consumption taxe’s roles, among which the „green” taxes are considered to be an alternative which must be taken into consideration, especially when one of the declared objectives of the new Community Strategy is the environmental protection as a prerequisite of the assurance of a suitable economic growth. At the same time, the purpose is to reduce the taxes on labor in order to achieve another objective of the Community Strategy, which is the reduction of the unemployment while the share of the active population increases.
The introduction or increase of “green” taxes, which usually have a pigouvian tax form (indirect tax, which increases the final price of the output who generates negative externalities, thus decreasing the demand for that output – by A. C. Pigou -), may constitute a means of achieving dual objectives undertaken by the EU strategy: on the one hand, tax revenues increased, reaching the goal of fiscal consolidation, on the other hand, reduce consumption of polluting products (Toma, 2008). But, as the most of the "green" taxes are considered indirect taxes, the impact on the degree of fiscal equity should not be overlooked. Some low-income household consumption includes the consumption of polluting, the tax included in final price having a regressive character.
Taxes on wealth can be used simultaneously as a way to increase tax revenue, and as a means of correcting inequalities of wealth among members of society, partly offsetting lower degree of fiscal equity of indirect taxes, and "green" taxes, in particularly. The appeal on property taxes it involves certain limitations, especially politically: they are very "visible" to taxpayers, thanks to technical procedures for charging, which could lead to negative public reaction to their introduction or increasing , while the political factor’s reluctance to adopt such measures as they are essentially political cost carrier.
Even if tax rates increase revenue and profit is not an instrument of fiscal consolidation and friendly economic growth, increases tax revenues from these sources may be from other reasons: the European Commission recommends, on one hand, the expanditure on the tax base and, on the other hand, the improvement on the tax administration (including the increment on the degree of the collection of the revenue tax).
Eliminating the tax incentives, is based on the recent studies wich have shown that, in most of the times, they reduce the tax revenue and they also complicate the tax system without reaching the goals (Bird, 2000; Bird, 2008). The simplification of the tax base with the elimination of the inefficient tax incentives can be considered a win situation, both on the efficiency line (by reducing the administration costs, both at the taxpayers and at the tax authorities) and on the equity line (a more equitable distribution of the tax burden, for example, by eliminating the possibility of the legal tax evasion).
Hence, with the purpose of stimulating the investment, the tax incentives are, in most of the cases, ineffective. Moreover, the tax incentives for the SME investment are inefficient because their size is given by the size of the profits most of the times, the size of the profit being relatively low or even nonexistent. Remaining in the area of SMEs, there is a possibility that the application of the lower rates of the corporate tax will remain ineffective, because the small firms’ profit is often incorporated into the salaries of their owners.
The Annals of The "Ştefan cel Mare" University of Suceava. Fascicle of The Faculty of Economics and Public Administration Vol. 11, No. 2(14), 2011
218
However, in order to stimulate the research and the development, the effects are generally stronger than the alternative of granting subsidies, even though the studies show that the results are being modest. The support of the research and development activity can be considered another objective of the book „Europe 2020” and the tax incentives can be seen as a mean of achieving this goal.
In the case of income tax, it can be successfully used as a tax leverage, on the one hand in creating jobs (by reducing tax rates) and, on the other hand, by increasing the proportion of the assets and the elimination of the phenomenon of moral hazard, which is seen at people who receive various forms of social assistance. So, the tax incentives granted in order to make possible the return to employment, through income tax, have proved to be very effective: on the one hand, they reduced the social benefits, and, on the other hand, they lead to the increment of the tax revenues. The introduction of such incentives, along with the reduction of theprogressive rates (the coefficient of the correlation between the reduction of progressivity and GDP/inhabitant is high (Johansson et al., 2008) can also be seen as a solution that makes the welfare state to subsist (Sherman, 2008). In the same time, the effects will also be seen in the improvement of the public finances’ situation.
Though, the anti-cyclical fiscal policy should not be abandoned under severe depression conditions and, especially not when the situation of the public finances is good (Tanzi, 2005). It is well known that decline condition may persist for a long time if we do not apply an external stimulus which can change the downward trend of the social product. The existence of „some deep inbalances and dysfunctions of the market’s mechanisms, which affect both cash flows and real ones” justifies the promotion of a deficit budget financed by borrowing as an imposed measure, in the first place by the need to unlock and revive the economy in times of recesion or stagnations when it does not work normally and it does not fully regulate on its own (Filip, 2002). According with the existing literature, the effectiveness of the discretionary budget fiscal policy is assured only if several conditions are fulfilled. Among these we state: the propensity to consumption must be high; the preference for liquidity must be very sensitive to the interest rate and the investments must have a low elasticity in comparison to the rate of the interest; the additional demand created must meet a strong potential offer (highlighted by the existence of the underutilized production capacity in different sectors of the economy); automatic stabilizers should be reduced, fact that increases the budgetary discretion (in U.S.A. they are lower than the ones in Europe); the budget deficit created doesn’t have to lead to an unsustainable public debt.
FISCAL CONSOLIDATION – EMPIRICAL IMPLICATIONS Occurrence and manifestation of the economic crisis led to the worsening of public finances
situation. Thus, in all member states, in 2009, the public deficit was a certainty, in some of the states being very high and exceeding the average stated in 2009, at the EU level, of –6.8% from the gross domestic product. It is the case of Greece (-15.4%), Ireland (-14.4), Great Britain (-11.4%), Spain (-11.1%), Latvia (-10.2%), Portugal (-9.3%) and Lithuania (-9.2%).
If we take a look at the dynamics, the EU deficit budget, in 2009 increased sharply from 2008, when its value grew up to 2.3%of GDP, and especially from 2007 when its value was only 0.9% of the GDP (European Commission, 2011).
In most of the Member States, the deterioration of the budget balance was produced, on the one hand due to the structural factors (resulting in a decrease in the actual product which drew a decrease of the tax revenue, and on the other hand, increased the unemployment rate, leading to greater social benefits), and, on the other hand, also due to conjunctural factors (such as fiscal-budgetary measures taken in order to counter the economic crisis which resulted either in tax cuts or in a growth of public spending).
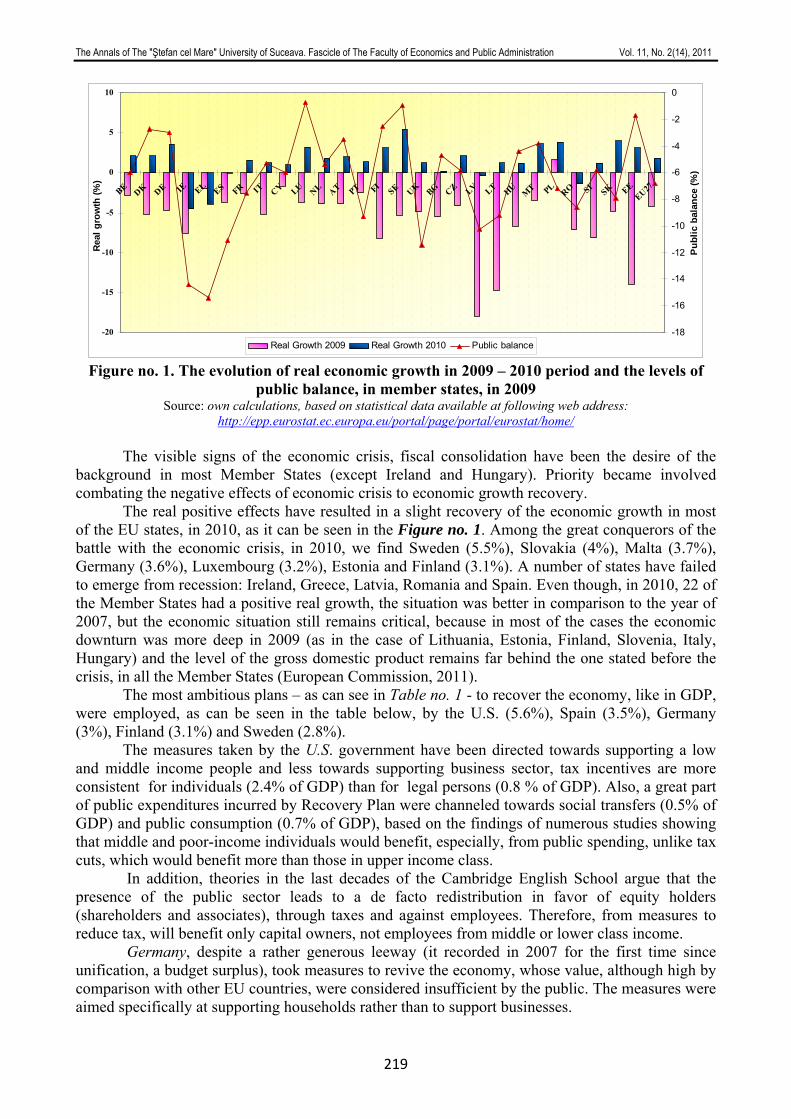
The Annals of The "Ştefan cel Mare" University of Suceava. Fascicle of The Faculty of Economics and Public Administration Vol. 11, No. 2(14), 2011
219
-20
-15
-10
-5
0
5
10
BE DK DE IE EL ES FR IT CY LU NL AT PT FISE UK BG CZ LV LT HU
MT PLRO SI
SK EEEU27
Real
gro
wth
(%)
-18
-16
-14
-12
-10
-8
-6
-4
-2
0
Pub
lic b
alan
ce (%
)
Real Growth 2009 Real Growth 2010 Public balance
Figure no. 1. The evolution of real economic growth in 2009 – 2010 period and the levels of public balance, in member states, in 2009
Source: own calculations, based on statistical data available at following web address: http://epp.eurostat.ec.europa.eu/portal/page/portal/eurostat/home/
The visible signs of the economic crisis, fiscal consolidation have been the desire of the
background in most Member States (except Ireland and Hungary). Priority became involved combating the negative effects of economic crisis to economic growth recovery.
The real positive effects have resulted in a slight recovery of the economic growth in most of the EU states, in 2010, as it can be seen in the Figure no. 1. Among the great conquerors of the battle with the economic crisis, in 2010, we find Sweden (5.5%), Slovakia (4%), Malta (3.7%), Germany (3.6%), Luxembourg (3.2%), Estonia and Finland (3.1%). A number of states have failed to emerge from recession: Ireland, Greece, Latvia, Romania and Spain. Even though, in 2010, 22 of the Member States had a positive real growth, the situation was better in comparison to the year of 2007, but the economic situation still remains critical, because in most of the cases the economic downturn was more deep in 2009 (as in the case of Lithuania, Estonia, Finland, Slovenia, Italy, Hungary) and the level of the gross domestic product remains far behind the one stated before the crisis, in all the Member States (European Commission, 2011).
The most ambitious plans – as can see in Table no. 1 - to recover the economy, like in GDP, were employed, as can be seen in the table below, by the U.S. (5.6%), Spain (3.5%), Germany (3%), Finland (3.1%) and Sweden (2.8%).
The measures taken by the U.S. government have been directed towards supporting a low and middle income people and less towards supporting business sector, tax incentives are more consistent for individuals (2.4% of GDP) than for legal persons (0.8 % of GDP). Also, a great part of public expenditures incurred by Recovery Plan were channeled towards social transfers (0.5% of GDP) and public consumption (0.7% of GDP), based on the findings of numerous studies showing that middle and poor-income individuals would benefit, especially, from public spending, unlike tax cuts, which would benefit more than those in upper income class.
In addition, theories in the last decades of the Cambridge English School argue that the presence of the public sector leads to a de facto redistribution in favor of equity holders (shareholders and associates), through taxes and against employees. Therefore, from measures to reduce tax, will benefit only capital owners, not employees from middle or lower class income.
Germany, despite a rather generous leeway (it recorded in 2007 for the first time since unification, a budget surplus), took measures to revive the economy, whose value, although high by comparison with other EU countries, were considered insufficient by the public. The measures were aimed specifically at supporting households rather than to support businesses.
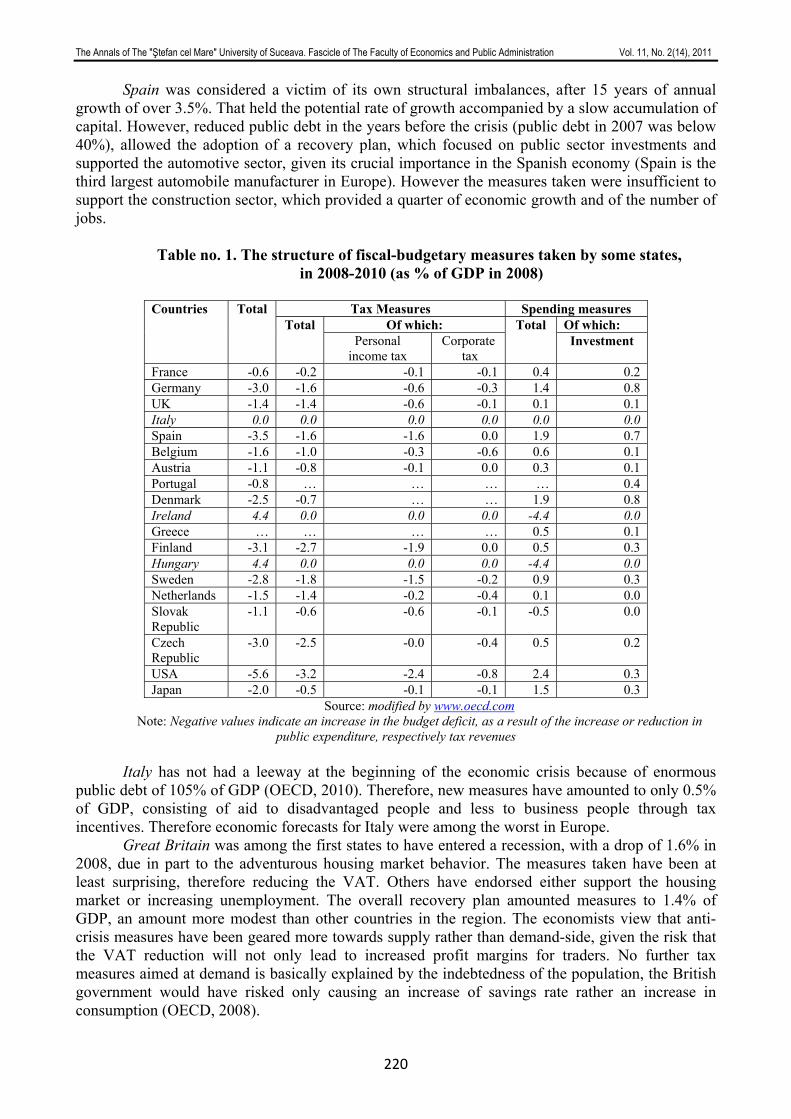
The Annals of The "Ştefan cel Mare" University of Suceava. Fascicle of The Faculty of Economics and Public Administration Vol. 11, No. 2(14), 2011
220
Spain was considered a victim of its own structural imbalances, after 15 years of annual growth of over 3.5%. That held the potential rate of growth accompanied by a slow accumulation of capital. However, reduced public debt in the years before the crisis (public debt in 2007 was below 40%), allowed the adoption of a recovery plan, which focused on public sector investments and supported the automotive sector, given its crucial importance in the Spanish economy (Spain is the third largest automobile manufacturer in Europe). However the measures taken were insufficient to support the construction sector, which provided a quarter of economic growth and of the number of jobs.
Table no. 1. The structure of fiscal-budgetary measures taken by some states, in 2008-2010 (as % of GDP in 2008)
Tax Measures Spending measures
Of which: Of which: Countries Total
Total Personal
income tax Corporate
tax
Total Investment
France -0.6 -0.2 -0.1 -0.1 0.4 0.2 Germany -3.0 -1.6 -0.6 -0.3 1.4 0.8 UK -1.4 -1.4 -0.6 -0.1 0.1 0.1 Italy 0.0 0.0 0.0 0.0 0.0 0.0 Spain -3.5 -1.6 -1.6 0.0 1.9 0.7 Belgium -1.6 -1.0 -0.3 -0.6 0.6 0.1 Austria -1.1 -0.8 -0.1 0.0 0.3 0.1 Portugal -0.8 … … … … 0.4 Denmark -2.5 -0.7 … … 1.9 0.8 Ireland 4.4 0.0 0.0 0.0 -4.4 0.0 Greece … … … … 0.5 0.1 Finland -3.1 -2.7 -1.9 0.0 0.5 0.3 Hungary 4.4 0.0 0.0 0.0 -4.4 0.0 Sweden -2.8 -1.8 -1.5 -0.2 0.9 0.3 Netherlands -1.5 -1.4 -0.2 -0.4 0.1 0.0 Slovak Republic
-1.1 -0.6 -0.6 -0.1 -0.5 0.0
Czech Republic
-3.0 -2.5 -0.0 -0.4 0.5 0.2
USA -5.6 -3.2 -2.4 -0.8 2.4 0.3 Japan -2.0 -0.5 -0.1 -0.1 1.5 0.3
Source: modified by www.oecd.com Note: Negative values indicate an increase in the budget deficit, as a result of the increase or reduction in
public expenditure, respectively tax revenues Italy has not had a leeway at the beginning of the economic crisis because of enormous
public debt of 105% of GDP (OECD, 2010). Therefore, new measures have amounted to only 0.5% of GDP, consisting of aid to disadvantaged people and less to business people through tax incentives. Therefore economic forecasts for Italy were among the worst in Europe.
Great Britain was among the first states to have entered a recession, with a drop of 1.6% in 2008, due in part to the adventurous housing market behavior. The measures taken have been at least surprising, therefore reducing the VAT. Others have endorsed either support the housing market or increasing unemployment. The overall recovery plan amounted measures to 1.4% of GDP, an amount more modest than other countries in the region. The economists view that anti-crisis measures have been geared more towards supply rather than demand-side, given the risk that the VAT reduction will not only lead to increased profit margins for traders. No further tax measures aimed at demand is basically explained by the indebtedness of the population, the British government would have risked only causing an increase of savings rate rather an increase in consumption (OECD, 2008).
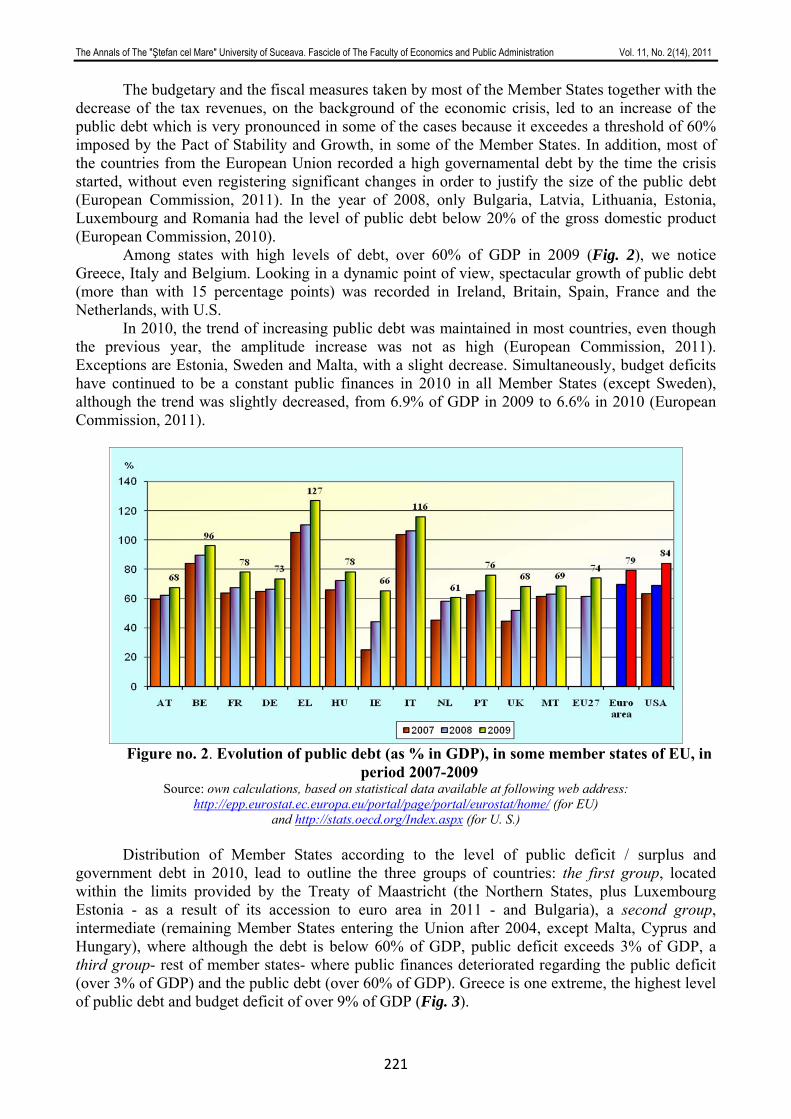
The Annals of The "Ştefan cel Mare" University of Suceava. Fascicle of The Faculty of Economics and Public Administration Vol. 11, No. 2(14), 2011
221
The budgetary and the fiscal measures taken by most of the Member States together with the decrease of the tax revenues, on the background of the economic crisis, led to an increase of the public debt which is very pronounced in some of the cases because it exceedes a threshold of 60% imposed by the Pact of Stability and Growth, in some of the Member States. In addition, most of the countries from the European Union recorded a high governamental debt by the time the crisis started, without even registering significant changes in order to justify the size of the public debt (European Commission, 2011). In the year of 2008, only Bulgaria, Latvia, Lithuania, Estonia, Luxembourg and Romania had the level of public debt below 20% of the gross domestic product (European Commission, 2010).
Among states with high levels of debt, over 60% of GDP in 2009 (Fig. 2), we notice Greece, Italy and Belgium. Looking in a dynamic point of view, spectacular growth of public debt (more than with 15 percentage points) was recorded in Ireland, Britain, Spain, France and the Netherlands, with U.S.
In 2010, the trend of increasing public debt was maintained in most countries, even though the previous year, the amplitude increase was not as high (European Commission, 2011). Exceptions are Estonia, Sweden and Malta, with a slight decrease. Simultaneously, budget deficits have continued to be a constant public finances in 2010 in all Member States (except Sweden), although the trend was slightly decreased, from 6.9% of GDP in 2009 to 6.6% in 2010 (European Commission, 2011).
Figure no. 2. Evolution of public debt (as % in GDP), in some member states of EU, in
period 2007-2009 Source: own calculations, based on statistical data available at following web address:
http://epp.eurostat.ec.europa.eu/portal/page/portal/eurostat/home/ (for EU) and http://stats.oecd.org/Index.aspx (for U. S.)
Distribution of Member States according to the level of public deficit / surplus and
government debt in 2010, lead to outline the three groups of countries: the first group, located within the limits provided by the Treaty of Maastricht (the Northern States, plus Luxembourg Estonia - as a result of its accession to euro area in 2011 - and Bulgaria), a second group, intermediate (remaining Member States entering the Union after 2004, except Malta, Cyprus and Hungary), where although the debt is below 60% of GDP, public deficit exceeds 3% of GDP, a third group- rest of member states- where public finances deteriorated regarding the public deficit (over 3% of GDP) and the public debt (over 60% of GDP). Greece is one extreme, the highest level of public debt and budget deficit of over 9% of GDP (Fig. 3).
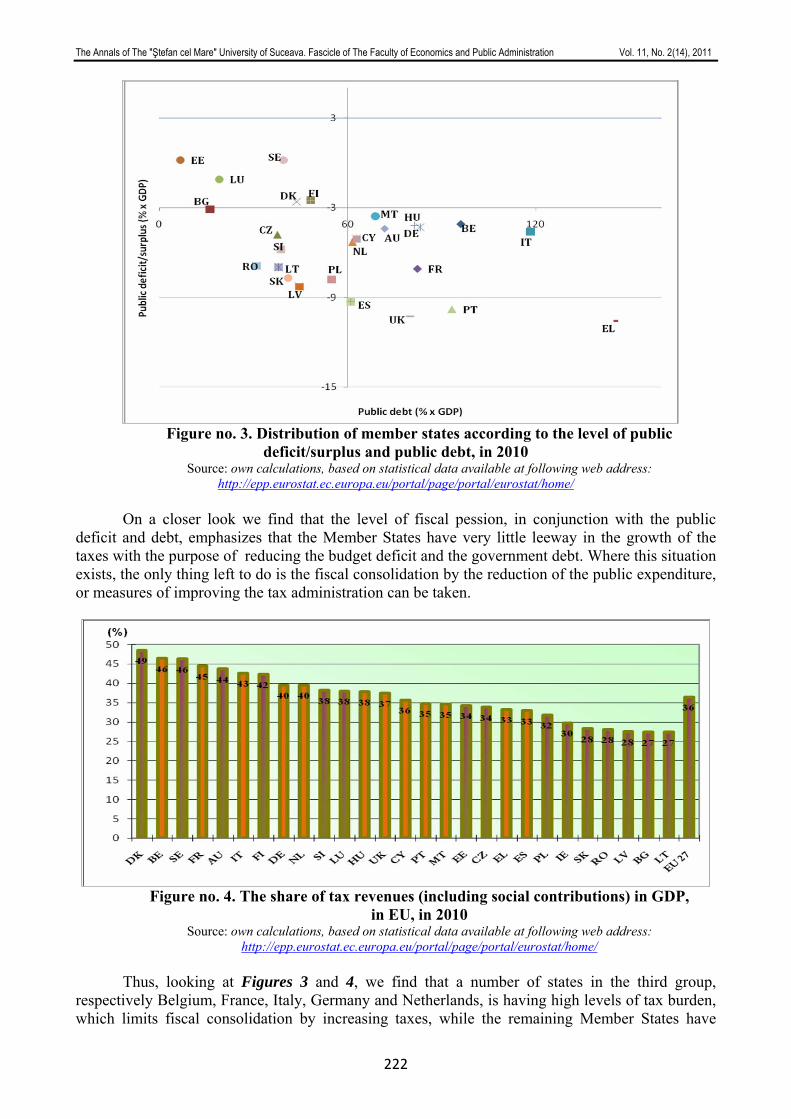
The Annals of The "Ştefan cel Mare" University of Suceava. Fascicle of The Faculty of Economics and Public Administration Vol. 11, No. 2(14), 2011
222
Figure no. 3. Distribution of member states according to the level of public
deficit/surplus and public debt, in 2010 Source: own calculations, based on statistical data available at following web address:
http://epp.eurostat.ec.europa.eu/portal/page/portal/eurostat/home/ On a closer look we find that the level of fiscal pession, in conjunction with the public
deficit and debt, emphasizes that the Member States have very little leeway in the growth of the taxes with the purpose of reducing the budget deficit and the government debt. Where this situation exists, the only thing left to do is the fiscal consolidation by the reduction of the public expenditure, or measures of improving the tax administration can be taken.
Figure no. 4. The share of tax revenues (including social contributions) in GDP,
in EU, in 2010 Source: own calculations, based on statistical data available at following web address:
http://epp.eurostat.ec.europa.eu/portal/page/portal/eurostat/home/
Thus, looking at Figures 3 and 4, we find that a number of states in the third group, respectively Belgium, France, Italy, Germany and Netherlands, is having high levels of tax burden, which limits fiscal consolidation by increasing taxes, while the remaining Member States have
The Annals of The "Ştefan cel Mare" University of Suceava. Fascicle of The Faculty of Economics and Public Administration Vol. 11, No. 2(14), 2011
223
margin in the manoeuvre of fiscal consolidation through increasing taxes, in both cases imposing of the major and immediate action of the public authorities; Member States of the second group, although debt levels well below 60 % of GDP, have high budget deficits, which also requires measures of fiscal consolidation, most imposing a regarding scope and its implementation through increased taxes (except Slovenia).
CONCLUSIONS In 2008- 2010, public finances worsened in the European Union due to economic and
financial crisis in almost all of Member States, the budget deficit and the public debt overtaking the limits imposed by the Maastricht treaty. Also, a number of Member States were registering budgetary deficits and public debt levels before the onset of the crisis, only it aggravating the existing situation.
Amid the emerging new European Union strategy whose central objective is to promote sustainable economic growth, fiscal consolidation, especially the public debt reduction has become a prerequisite for the restore growth.
Simultaneously, the pursuit of fiscal consolidation should be done in a manner consistent with promoting economic growth, which limits the appeal to a range of budgetary and fiscal instruments, either on line taxes or public spending on line.
The sacrifice, in present of situation of public finances to leverage, in future, growth as a prerequisite to achieve the objective of fiscal consolidation, is quite limited in those countries where public debt is high, due to turbulence financial market.
In these conditions in some Member States, of which we distinguish those of the third group examined, fiscal consolidation proves to be more difficult that of that economic crisis started in the previous period, being limited on the one hand the need for recovery growth, and on the other hand, and in some existing conditions (including the tax burden may be an important element) in the Member States concerned. As well, should not be overlooked in political and social implications of unpopular measures to increase taxes or reduction of public expenditure, which may attract a more difficult implementation of fiscal consolidation.
REFERENCES 1. Alesina, A. and Perotti R. (1997), Fiscal Adjustments in OECD Countries: Composition
and Macroeconomic Effects, IMF Staff Papers 44, p. 297-329, www.imf.org 2. Alesina, A. and Perotti R. (1995), Fiscal Expansions and Adjustments in OECD
Economies , Economic Policy n. 21, p. 207-48, www.imf.org 3. Alesina, A. and Ardagna S. (1998), Tales of Fiscal Adjustment, Economic Policy 13
(27), pp. 487-545, www.imf.org 4. Bird, R. M. (2000), Tax Incentives for Investment in Developing Countries,
www.ec.europa.eu 5. Bird, R. M. (2008), Tax Challenges Facing Developing Countries, www.ec.europa.eu 6. Cottarelli, C. and Vinals, J. (2009), A Strategy for Renormalizing Fiscal and Monetary
Policies in Advances Economies , IMF Staff Position Note 09/22 7. European Comission (2011), European economic statistics, 2010 Edition, article
avalaible at the following web address: www.ec.europa.eu/eurostat 8. European Comission (2010), Annual Growth Survey: advancing the EU's comprehensive
response to the crisis, article avalaible at the following web address: http://ec.europa.eu/europe2020/pdf/en_final.pdf
9. European Comission (2011), Annual Groeth Survey: SOLIDAR recommendations for a more social strategy to tackle the crisis, article avalaible at the following web address: http://cms.horus.be/files/99931/MediaArchive/27_SOLIDARAnnualGrowthSurvey.pdf
The Annals of The "Ştefan cel Mare" University of Suceava. Fascicle of The Faculty of Economics and Public Administration Vol. 11, No. 2(14), 2011
224
10. European Comission (2008), The quality of public finances and economic growth: Proceedings to the annual Workshop on public finance, article avalaible at the following web address: http://ec.europa.eu/economy_finance/publications/publication13101_en.pdf
11. Filip, Gheorghe (2002), Finanţe publice, Junimea Publishing House, Iasi 12. Johansson A., Heady C., Arnold J., Bris B., Vartia L. (2008), Tax and Economic
Growth, in The quality of public finances and economic growth, www.europa.eu 13. Kaminsky, G., Reinhart C. and Vegh C. ( 2004), When It Rains, It Pours: Procyclical
Capital Flows and Macroeconomic Policies, article avalaible at the following web address: http://www.nber.org/papers/w10780.pdf
14. Maroto, R. and Mulas-Granados, C. (2007), What Makes Fiscal Policy Sustainable? A Survival Analysis of Fiscal Consolidations in Europe, www.springerlink.com
15. OECD (2009), OECD Economic Outlook, Interim Report, article avalaible at the following web address: http://www.oecd.org/dataoecd/3/62/42421337.pdf
16. Reinhart, C. and Rogoff K. (2009), This Time Is Different: Eight Centuries of Financial Folly, p. 194
17. Schuknecht, L. and Tanzi, V. (2005), Reforming Public Expenditure in Industrialized Countries: Are There Trade Offs?, ECB Working Paper Series No. 435
18. Sherman, H., Can Welfare State Survive?, CESIfo studies, nr. 2/2008, www.cesifo-group.de
19. Talvi, E. and Vegh C. (2000), Tax Base Variability and Procyclical Fiscal Policy, NBER Working Paper No. 7499, in Journal of Development Economics
20. Tanzi, Vito (2004), The Stability and Growth Pact: Its Role and Future, Cato Journal, Vol. 24
21. Tanzi, Vito (2005), Fiscal policy and fiscal rules in the European Union, article avalaible at the following web address: http://www.ifo.de/portal/page/portal/DocBaseContent/ZS/ZS-CESifo_Forum/zs-for2005/zs-for-2005-3/forum3-05-special.pdf
22. Toma, E., (2008), L’harmonisation de la fiscalité environnementale dans l’UnionEuropéene: une étude comparative, article avalaible at the following web address: http://ideas.repec.org/a/ora/journl/v3y2009i1p401-407.html
23. Tsibouris, G.C., Horton M.A., Flanagan M.J. and Maliszewski W.S. (2006), Experience with large fiscal adjustments, IMF Occasional Paper 246, www.imf.org
24. Von Hagen, J. A., Hallett H., Strauch R. (2002), Budgetary institutions for sustainable fiscal policies, IMF Occasional Paper 265, www.imf.org
25. http://epp.eurostat.ec.europa.eu/portal/page/portal/eurostat/home/
The Annals of The "Ştefan cel Mare" University of Suceava. Fascicle of The Faculty of Economics and Public Administration Vol. 11, No. 2(14), 2011
225
CONVERGENCE PROCESS- PRECONDITION FOR ENSURING FINANCIAL AND MONETARY STABILITY IN EURO AREA
PhD. Student Anca Elena NUCU
Alexandru Ioan Cuza University of Iasi, Romania [email protected]
Abstract: In conditions of financial globalization, innovations’ development and a broad spectrum of risks’
amplification, between financial stability and monetary stability are created an interdependence relationship. Ensuring systemic financial-monetary stability has become a priority of the international economic agenda, particularly for candidate countries to the euro area. The purpose of this article is to highlight the importance of nominal and real convergence as a precondition for financial and monetary stability under Economic and Monetary Union (E.M.U.). Also, we made a comparative analysis of nominal convergence criteria on the example of Central and Eastern Europe countries during the period 2006-2010, stressing, finally, the need to revise the criteria for accession to the Euro zone.
Key words: financial stability, monetary stability, convergence criteria, economic and monetary union, catching-up process
JEL Classification: E42, F15, F36, F44
INTRODUCTION For adopting the single currency, European Union Member States had to meet nominal
criteria stipulated in the Maastricht Treaty in order not to destabilize European economy. The convergence is evaluated based on inflation and long-term nominal interest rate compared with countries that recorded the best performance (maximum three), with strict adherence to values related to government deficits and debt as a percentage of Gross domestic product (GDP) and a minimum period (two years) of exchange rate stability against the euro. A high level of nominal and real convergence has a positive impact on financial and monetary stability, due to reduced risks and performances’ anchoring from those registered in the states with the best indicators, considered as benchmarks in the evaluation process. Also, the financial stability can be influenced by the period of participation in ERM II (Albulescu, 2010). Monetary policy in Economic and Monetary Union (E.M.U.) will work best in an environment of financial stability, in which regional differences in the transmission mechanism are as small as possible (Arnold, 1999).
THE IMPORTANCE OF NOMINAL AND REAL CONVERGENCE AS A PRECONDITION FOR FINANCIAL AND MONETARY STABILITY
Nominal convergence criteria imposed by the Treaty establishing the European Union can
ensure financial and monetary stability, given the real and financial convergence realized in collateral. Maastricht Treaty mentions, indirectly, the fact that it is needed economic and social cohesion in order to remove the disparities between countries and regions. According to Isǎrescu’s opinion, the real convergence can be quantified by the following criteria: GDP per capita (expressed either the nominal or through standard purchasing power parity), the structure of the economy, the openness of the economy, the share of bilateral trade with EU countries in total foreign trade. Research on real convergence has highlighted opposing viewpoints on the degree of which business cycles are, or will be synchronized.
Caselli and Tenreyro (2005) suggest four channels to achieve real convergence:
• improvement marginal productivity per capita; • the process of catching-up technology; • gains from trade in previously relatively closed economies;
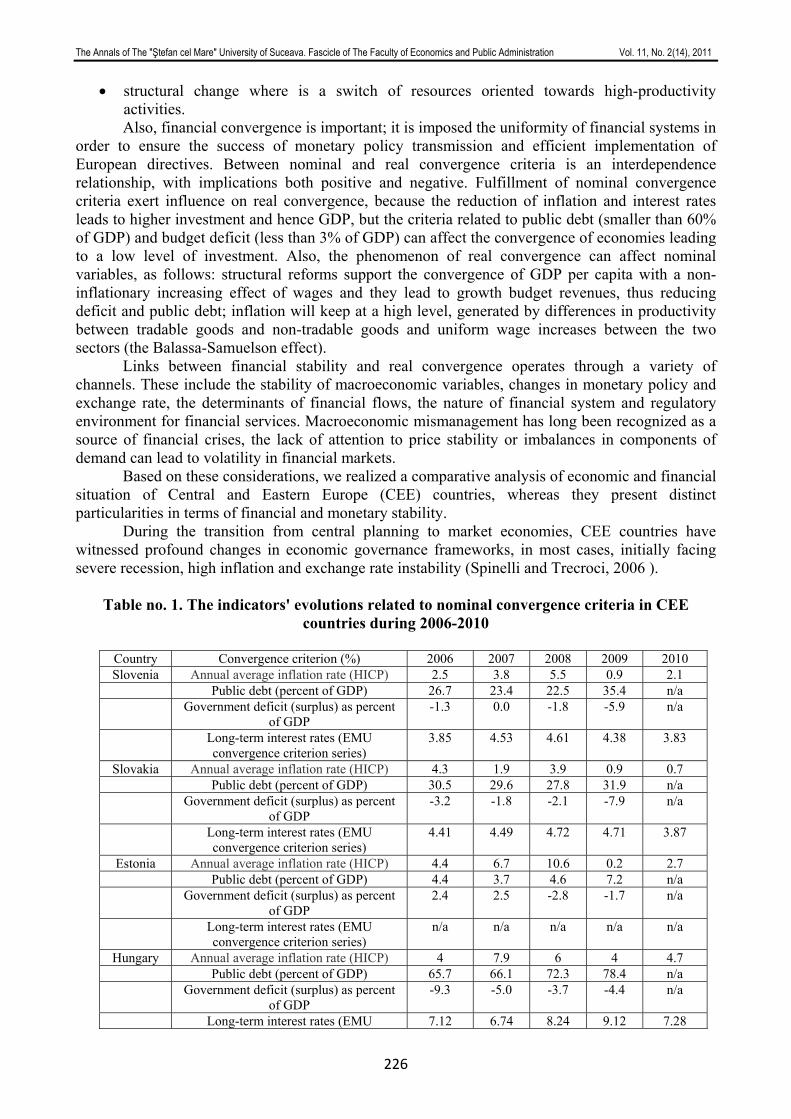
The Annals of The "Ştefan cel Mare" University of Suceava. Fascicle of The Faculty of Economics and Public Administration Vol. 11, No. 2(14), 2011
226
• structural change where is a switch of resources oriented towards high-productivity activities. Also, financial convergence is important; it is imposed the uniformity of financial systems in
order to ensure the success of monetary policy transmission and efficient implementation of European directives. Between nominal and real convergence criteria is an interdependence relationship, with implications both positive and negative. Fulfillment of nominal convergence criteria exert influence on real convergence, because the reduction of inflation and interest rates leads to higher investment and hence GDP, but the criteria related to public debt (smaller than 60% of GDP) and budget deficit (less than 3% of GDP) can affect the convergence of economies leading to a low level of investment. Also, the phenomenon of real convergence can affect nominal variables, as follows: structural reforms support the convergence of GDP per capita with a non-inflationary increasing effect of wages and they lead to growth budget revenues, thus reducing deficit and public debt; inflation will keep at a high level, generated by differences in productivity between tradable goods and non-tradable goods and uniform wage increases between the two sectors (the Balassa-Samuelson effect).
Links between financial stability and real convergence operates through a variety of channels. These include the stability of macroeconomic variables, changes in monetary policy and exchange rate, the determinants of financial flows, the nature of financial system and regulatory environment for financial services. Macroeconomic mismanagement has long been recognized as a source of financial crises, the lack of attention to price stability or imbalances in components of demand can lead to volatility in financial markets.
Based on these considerations, we realized a comparative analysis of economic and financial situation of Central and Eastern Europe (CEE) countries, whereas they present distinct particularities in terms of financial and monetary stability.
During the transition from central planning to market economies, CEE countries have witnessed profound changes in economic governance frameworks, in most cases, initially facing severe recession, high inflation and exchange rate instability (Spinelli and Trecroci, 2006 ).
Table no. 1. The indicators' evolutions related to nominal convergence criteria in CEE
countries during 2006-2010
Country Convergence criterion (%) 2006 2007 2008 2009 2010 Slovenia Annual average inflation rate (HICP) 2.5 3.8 5.5 0.9 2.1
Public debt (percent of GDP) 26.7 23.4 22.5 35.4 n/a Government deficit (surplus) as percent
of GDP -1.3 0.0 -1.8 -5.9 n/a
Long-term interest rates (EMU convergence criterion series)
3.85 4.53 4.61 4.38 3.83
Slovakia Annual average inflation rate (HICP) 4.3 1.9 3.9 0.9 0.7 Public debt (percent of GDP) 30.5 29.6 27.8 31.9 n/a Government deficit (surplus) as percent
of GDP -3.2 -1.8 -2.1 -7.9 n/a
Long-term interest rates (EMU convergence criterion series)
4.41 4.49 4.72 4.71 3.87
Estonia Annual average inflation rate (HICP) 4.4 6.7 10.6 0.2 2.7 Public debt (percent of GDP) 4.4 3.7 4.6 7.2 n/a Government deficit (surplus) as percent
of GDP 2.4 2.5 -2.8 -1.7 n/a
Long-term interest rates (EMU convergence criterion series)
n/a n/a n/a n/a n/a
Hungary Annual average inflation rate (HICP) 4 7.9 6 4 4.7 Public debt (percent of GDP) 65.7 66.1 72.3 78.4 n/a Government deficit (surplus) as percent
of GDP -9.3 -5.0 -3.7 -4.4 n/a
Long-term interest rates (EMU 7.12 6.74 8.24 9.12 7.28
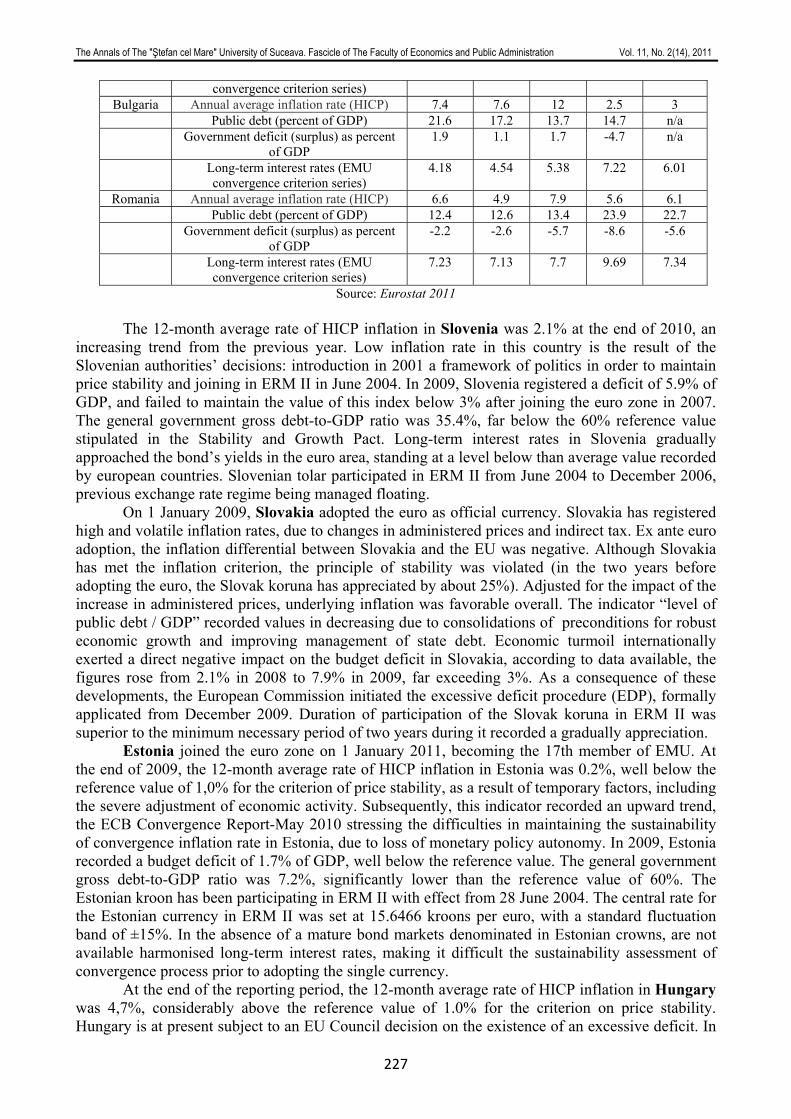
The Annals of The "Ştefan cel Mare" University of Suceava. Fascicle of The Faculty of Economics and Public Administration Vol. 11, No. 2(14), 2011
227
convergence criterion series) Bulgaria Annual average inflation rate (HICP) 7.4 7.6 12 2.5 3
Public debt (percent of GDP) 21.6 17.2 13.7 14.7 n/a Government deficit (surplus) as percent
of GDP 1.9 1.1 1.7 -4.7 n/a
Long-term interest rates (EMU convergence criterion series)
4.18 4.54 5.38 7.22 6.01
Romania Annual average inflation rate (HICP) 6.6 4.9 7.9 5.6 6.1 Public debt (percent of GDP) 12.4 12.6 13.4 23.9 22.7 Government deficit (surplus) as percent
of GDP -2.2 -2.6 -5.7 -8.6 -5.6
Long-term interest rates (EMU convergence criterion series)
7.23 7.13 7.7 9.69 7.34
Source: Eurostat 2011 The 12-month average rate of HICP inflation in Slovenia was 2.1% at the end of 2010, an
increasing trend from the previous year. Low inflation rate in this country is the result of the Slovenian authorities’ decisions: introduction in 2001 a framework of politics in order to maintain price stability and joining in ERM II in June 2004. In 2009, Slovenia registered a deficit of 5.9% of GDP, and failed to maintain the value of this index below 3% after joining the euro zone in 2007. The general government gross debt-to-GDP ratio was 35.4%, far below the 60% reference value stipulated in the Stability and Growth Pact. Long-term interest rates in Slovenia gradually approached the bond’s yields in the euro area, standing at a level below than average value recorded by european countries. Slovenian tolar participated in ERM II from June 2004 to December 2006, previous exchange rate regime being managed floating.
On 1 January 2009, Slovakia adopted the euro as official currency. Slovakia has registered high and volatile inflation rates, due to changes in administered prices and indirect tax. Ex ante euro adoption, the inflation differential between Slovakia and the EU was negative. Although Slovakia has met the inflation criterion, the principle of stability was violated (in the two years before adopting the euro, the Slovak koruna has appreciated by about 25%). Adjusted for the impact of the increase in administered prices, underlying inflation was favorable overall. The indicator “level of public debt / GDP” recorded values in decreasing due to consolidations of preconditions for robust economic growth and improving management of state debt. Economic turmoil internationally exerted a direct negative impact on the budget deficit in Slovakia, according to data available, the figures rose from 2.1% in 2008 to 7.9% in 2009, far exceeding 3%. As a consequence of these developments, the European Commission initiated the excessive deficit procedure (EDP), formally applicated from December 2009. Duration of participation of the Slovak koruna in ERM II was superior to the minimum necessary period of two years during it recorded a gradually appreciation.
Estonia joined the euro zone on 1 January 2011, becoming the 17th member of EMU. At the end of 2009, the 12-month average rate of HICP inflation in Estonia was 0.2%, well below the reference value of 1,0% for the criterion of price stability, as a result of temporary factors, including the severe adjustment of economic activity. Subsequently, this indicator recorded an upward trend, the ECB Convergence Report-May 2010 stressing the difficulties in maintaining the sustainability of convergence inflation rate in Estonia, due to loss of monetary policy autonomy. In 2009, Estonia recorded a budget deficit of 1.7% of GDP, well below the reference value. The general government gross debt-to-GDP ratio was 7.2%, significantly lower than the reference value of 60%. The Estonian kroon has been participating in ERM II with effect from 28 June 2004. The central rate for the Estonian currency in ERM II was set at 15.6466 kroons per euro, with a standard fluctuation band of ±15%. In the absence of a mature bond markets denominated in Estonian crowns, are not available harmonised long-term interest rates, making it difficult the sustainability assessment of convergence process prior to adopting the single currency.
At the end of the reporting period, the 12-month average rate of HICP inflation in Hungary was 4,7%, considerably above the reference value of 1.0% for the criterion on price stability. Hungary is at present subject to an EU Council decision on the existence of an excessive deficit. In

The Annals of The "Ştefan cel Mare" University of Suceava. Fascicle of The Faculty of Economics and Public Administration Vol. 11, No. 2(14), 2011
228
2009, Hungary recorded a deficit of 4.4% of GDP, well above the reference value of 3%. The general government gross debt-to-GDP ratio reached 78.4%, higher than the reference value of 60%. Hungarian forint did not participate in ERM II. In the period between mid 2008 and March 2009, the forint has depreciated heavily, after which recorded a period of relative stability since mid-2009. On 31.12.2010, the long-term interest rates were located, on average, at 7.28%, significantly higher than the reference value, corresponding to the interest rate convergence criterion.
At the end of 2010, the 12-month average rate of HICP inflation in Bulgaria was 3%, well above the reference value of 1.0% for the criterion on price stability. In Bulgaria consumer price inflation has been relatively volatile, noting an increase, on average, of 6.7% in annual terms over the period 2000-2009. Looking further ahead, the catching-up process is likely to have a bearing on inflation over the coming years, given that GDP per capita and price levels are still significantly lower in Bulgaria than in the euro area. But the currency board arrangement and limitations of alternative instruments of counter-cyclical policy make more difficult to prevent macroeconomic imbalances. Bulgaria is not subject to EU Council decision on the existence of an excessive deficit. In 2009, Bulgaria’s budget deficit was 4.7% of GDP, higher than the reference value of 3%. The general government gross debt-to-GDP ratio was 14.7%, well below the reference value of 60%. Long-term interest rates stood at 6.01% on average at the end of the period analyzed, higher than the reference level of convergence criterion. Bulgarian Lev has not participated in ERM II, but was anchored to the euro in the context of the currency board type arrangement adopted in July 1997. Creating a favorable environment to sustainable convergence in Bulgaria requires, among other things, implementation of economic policies to ensure macroeconomic stability, including sustainable price stability.
The 12-month average rate of HICP inflation in Romania was 6.1%, at the end of 2010, well above the reference value of 1.0% for the criterion on price stability. In a longer perspective, the catching-up process it is likely to have a positive impact on inflation and /or on nominal exchange rate, given that GDP per capita and the prices are still significant lower in Romania than in the euro area. The Romania’s performance on inflation criterion is comparable with that of other members with derogation. Romania is at present subject to an EU Council decision on the existence of an excessive deficit, EDP recommendations targeting the following: correcting the budget deficit below 3% until 2012; initiating aggregate measures regarding budget consolidation; State pension law revision; achieving an annual average effort to strengthen on 1.75 percentage points over 2010-2012. At 31.12.2010, Romania registered a budget deficit of 5.6% of GDP, far higher than the reference value of 3%. The general government gross debt-to-GDP ratio was 22.7%, well below the reference value of 60%. During the reference period of two years, the Romanian leu has not participated in ERM II, being traded under a flexible exchange rate regime. Multilateral Agreement of external funding developed under the EU and IMF coordination has contributed to alleviate the pressures felt by the Romanian currency depreciation. At 31.12.2010, the long-term interest rates were located on average at 7.34% higher than the reference value corresponding to convergence criterion on interest rates. In recent years, long-term interest rates in Romania have soared in the context of high levels of investor aversion to risk and uncertainty surrounding the economic outlook. Recently, these indicators have registered a downward trend, but continued to place at relatively high levels.
Relevant issues stemming from the analysis of economic and financial situation of the CEE countries are the following:
• three countries are members of the euro zone (Slovenia-2007-2009 Slovakia, Estonia, 2011); Hungary has announced its participation in ERM II before joining the EU setting unilaterally a fluctuation band of ± 15% against the euro, but not adopted yet the single currency; Bulgaria and Romania joined the EU in 2007, presenting a significant gap comparative with countries members of the EMU;
• between analysed countries, Romania has registered the worst performance in terms of price stability, but it is comparable to that of other candidate countries to the EMU; and
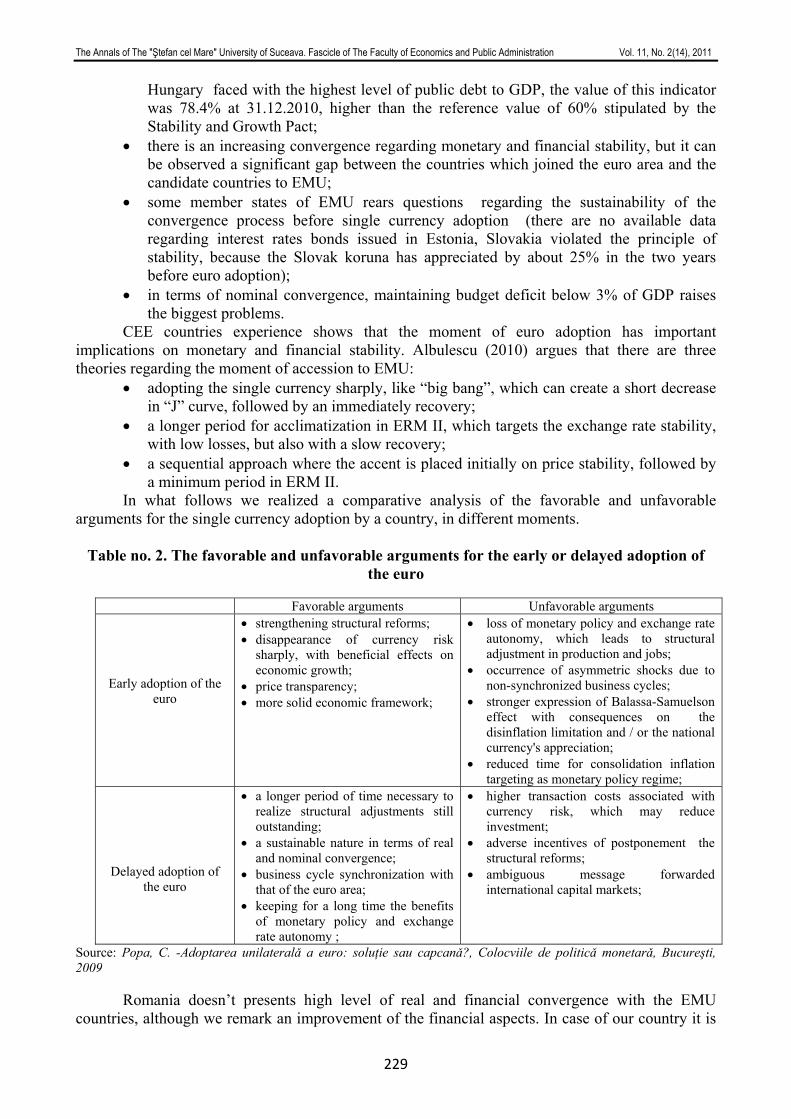
The Annals of The "Ştefan cel Mare" University of Suceava. Fascicle of The Faculty of Economics and Public Administration Vol. 11, No. 2(14), 2011
229
Hungary faced with the highest level of public debt to GDP, the value of this indicator was 78.4% at 31.12.2010, higher than the reference value of 60% stipulated by the Stability and Growth Pact;
• there is an increasing convergence regarding monetary and financial stability, but it can be observed a significant gap between the countries which joined the euro area and the candidate countries to EMU;
• some member states of EMU rears questions regarding the sustainability of the convergence process before single currency adoption (there are no available data regarding interest rates bonds issued in Estonia, Slovakia violated the principle of stability, because the Slovak koruna has appreciated by about 25% in the two years before euro adoption);
• in terms of nominal convergence, maintaining budget deficit below 3% of GDP raises the biggest problems.
CEE countries experience shows that the moment of euro adoption has important implications on monetary and financial stability. Albulescu (2010) argues that there are three theories regarding the moment of accession to EMU:
• adopting the single currency sharply, like “big bang”, which can create a short decrease in “J” curve, followed by an immediately recovery;
• a longer period for acclimatization in ERM II, which targets the exchange rate stability, with low losses, but also with a slow recovery;
• a sequential approach where the accent is placed initially on price stability, followed by a minimum period in ERM II.
In what follows we realized a comparative analysis of the favorable and unfavorable arguments for the single currency adoption by a country, in different moments.
Table no. 2. The favorable and unfavorable arguments for the early or delayed adoption of the euro
Favorable arguments Unfavorable arguments Early adoption of the
euro
• strengthening structural reforms; • disappearance of currency risk
sharply, with beneficial effects on economic growth;
• price transparency; • more solid economic framework;
• loss of monetary policy and exchange rate autonomy, which leads to structural adjustment in production and jobs;
• occurrence of asymmetric shocks due to non-synchronized business cycles;
• stronger expression of Balassa-Samuelson effect with consequences on the disinflation limitation and / or the national currency's appreciation;
• reduced time for consolidation inflation targeting as monetary policy regime;
Delayed adoption of the euro
• a longer period of time necessary to realize structural adjustments still outstanding;
• a sustainable nature in terms of real and nominal convergence;
• business cycle synchronization with that of the euro area;
• keeping for a long time the benefits of monetary policy and exchange rate autonomy ;
• higher transaction costs associated with currency risk, which may reduce investment;
• adverse incentives of postponement the structural reforms;
• ambiguous message forwarded international capital markets;
Source: Popa, C. -Adoptarea unilateralǎ a euro: soluţie sau capcanǎ?, Colocviile de politicǎ monetarǎ, Bucureşti, 2009
Romania doesn’t presents high level of real and financial convergence with the EMU countries, although we remark an improvement of the financial aspects. In case of our country it is
The Annals of The "Ştefan cel Mare" University of Suceava. Fascicle of The Faculty of Economics and Public Administration Vol. 11, No. 2(14), 2011
230
favorable for financial stability the progressive approach (Albulescu, 2010). Comparative with the EU accession which enjoyed public support in terms of considerable advantages (structural funds, attraction of foreign investor attention, free movement within the Community), joining the euro zone is not supported by public opinion due to structural reforms which affects life standard.
Dates for the changeover should take into account the fact that (National Bank of Romania, 2010):
• euro adoption is the last and not first phase of convergence; • must be based on the national political consensus, being the result of cultural, social and
academic efforts; • unilateral adoption of the euro is not viable, because it doesn't replace the structural
reforms and economic restructuring process. THE NEED TO REVIEW THE CONVERGENCE CRITERIA OF THE MAASTRICHT TREATY The ex-ante and ex post violation by EMU members of the requirements stipulated in the
Treaty establishing the EU requires rethinking their foundations. These criteria were designed when is not anticipate EU enlargement. Are there opinions which appreciate that maintaining the same provisions in an extended Union violates the equal treatment principle in the economic sense. Also, the budget deficit below 3% of GDP ensures the premises to low inflation, but determines a slow economic increase. However, Darvas, Rose and Szapáry (2007) showed that there is an indirect relationship between the fiscal criteria and business cycle synchronization. Applying an econometric model on a statistical series for 40 years, the authors found the following: • countries with similar government budget positions tend to have business cycles which
fluctuates more closely; • reduced fiscal deficits improves synchronization of business cycle, because deficit reduction and
fiscal convergence remove idiosyncratic shocks. Another criticism targets the formation of a monetary union without a budgetary union
(Turliuc et all., 2007), which could offset the impact of negative influences on the real economy, countered difficult by single monetary policy, likely inadequate to country specific issues.
The international crisis has affected the countries with a fixed operating system of exchange rate. Given the large share of loans in foreign currency, a sharp depreciation would have a devastating effect. However, under a fixed exchange rate, reducing current account deficits is necessary, which may leading, perhaps, to severe recession, unless domestic prices and wages are sufficiently flexible. This macroeconomic dilemma dominates political elections and it cannot be solved by early entry into the euro area. Also, the economic and financial crisis highlights significant asymmetries between member and candidate countries to E.M.U.
So, the asymmetry and “too ambitious standards” are another reason which justify reconsidering accession criteria to E.M.U. Also, numeric values and compliance period for the criteria are disputable (Darvas, 2010). The arguments are based on following observations:
• One-year period for which most of the criteria are assessed is considered being too short. Regarding price stability criterion, a candidate country might be tempted to resort to different techniques (freezing of administered prices, a reduction of consumption taxes) for being situated below the reference value. • Given the difference of 1.5 percentage points towards average inflation of Member States with the best performance (maximum three), many U.S. metropolitan areas would not be qualified to take part in the monetary area.
The Annals of The "Ştefan cel Mare" University of Suceava. Fascicle of The Faculty of Economics and Public Administration Vol. 11, No. 2(14), 2011
231
During economic and financial crisis, European officials have not taken any action to adjust the criteria for accession. This resistance to change has disadvantaged the countries that have seeked the stability and reliability offered by the eventual accession to the euro zone.
The review of the criteria could be realized on three levels (Darvas, 2010): • all criteria should be anchored to the average EU level and at the same time to extend the
compliance from one year to an average of two or three years; • criteria on price stability, interest rate and budget deficit allow a range of variation
towards the euro zone average; • formal change would allow a fundamental review.
CONCLUSIONS Full participation in EMU contributes to monetary and financial stability and to an increase
in the volume of trade by eliminating currency risk as a form of barrier. In order to materialize these advantages, the economy should be able to exploit the opportunities offered by joining the euro zone. The calibration process of convergence targets two sides in terms of financial stability: nominal convergence and real convergence, among which there is an interdependence relationship, with implications both positive and negative.
Comparative analysis on the example of Central and Eastern Europe countries highlights the fact that there is an increasing convergence in terms of financial and monetary stability, but we remark a significant gap between countries which joined the euro area and the candidate countries to EMU. Romania has registered the worst performance in terms of price stability, but it is comparable to that of other candidate countries to the EMU, and Hungary faced with the highest level of public debt to GDP, the value of this indicator was 78.4% at 31.12.2010. In case of Romania it is favorable for financial stability the progressive approach; our country has to catch up significant disparities on a new cycle of national economic growth.
Although European officials did not consider opportunely reviewing of criteria stipulated in the Treaty Establishing of EU, their sustainability raise questions in terms of following aspects: criteria were designed in the context of favorable economic and financial circumstances, it is formed a monetary union without a budgetary union, is there a significant asymmetry between member states and candidate countries to E.M.U., the budget deficit below 3% of GDP ensures the premises to low inflation, but determines a slow economic increase, numeric values and compliance period for the criteria are disputable.
Ensuring financial and monetary stability, under the impact of constraints imposed by nominal, real and financial convergence is a complex process, which contribute, in perspective, to refining the life standards.
ACKNOWLEDGEMENTS:
This work was supported by the the European Social Fund in Romania, under the responsibility of the Managing Authority for the Sectoral Operational Programme for Human Resources Development 2007-2013 [grant POSDRU/CPP 107/DMI 1.5/S/78342].
REFERENCES:
1. Albulescu, Tiberiu, Claudiu (2010), Stabilitatea sectorului financiar în condiţiile aderǎrii României la U.E.M., Editura Universitǎţii de Vest, Timişoara,
2. Begg, Iain (2005), Catch-up, the transition to full participation in EMU and financial stability, available at http://ec.europa.eu/economy_finance/events/2005/bx lforum1005 begg_en.pdf
The Annals of The "Ştefan cel Mare" University of Suceava. Fascicle of The Faculty of Economics and Public Administration Vol. 11, No. 2(14), 2011
232
3. Darvas, Zsolt (2010), The case for reforming euro area entry criteria, Working Paper 2010 Corvinus University of Budapest, http://web.uni-corvinus.hu/matkg/working_paper s/wp_2010_3_darvas.pdf
4. Darvas, Zsolt, Ferry, Jean Pisani (2009), The looming divide within Europe, http://www.voxeu.org/index.php?q=node/2820
5. Darvas, Zsolt, Andrew Rose and György Szapáry (2007), Fiscal Divergence and Business Cycle Synchronization: Irresponsibility is Idiosyncratic MIT Press: Cambridge, MA: 261-298.
6. Spinelli, Franco, Trecroci, Carmine (2006), Maastricht: New and Old Rules, Springerlink, http://www.springerlink.com/content/5n715228171767l3/fulltext.pdf
7. Salsecci, Gianluca, Pesce, Antonio (2008), Long-term Growth Perspectives and Economic Convergence of CEE and SEE Countries, Springerlink, http://www.springerlink.com /content/n4u73u1560m572r8/fulltext.pdf
8. Arnold, J. M. Ivo (1999), The Third Leg of the Stool: Financial Stability as a Prerequisite for EMU, Review of World Economics, Springerlink
9. Popa, Cristian (2009), Adoptarea unilateralǎ a euro: soluţie sau capcanǎ?, Colocviile de politicǎ monetarǎ, Bucureşti, http://www.bnro.ro/PublicationDocuments.aspx ?icid=6885
10. Turliuc, Vasile, Cocriş, Vasile, Dornescu, Vasile, Roman, Angela, Stoica, Ovidiu, Chirleşan, Dan (2011), Monedǎ şi credit, Editura Universitǎţii “Alexandru Ioan Cuza” Iaşi,
11. ***European Central Bank-Convergence Report, May 2010
The Annals of The "Ştefan cel Mare" University of Suceava. Fascicle of The Faculty of Economics and Public Administration Vol. 11, No. 2(14), 2011
233
OCKHAM’S RAZOR IN THE ANALYSIS OF INTANGIBLE CAPITAL?
PhD. student Cristina Ionela FĂDUR “Alexandru Ioan Cuza” University, Iaşi, Romania
[email protected] PhD. student Daniela CIOTINĂ
“Alexandru Ioan Cuza” University, Iaşi, Romania [email protected]
Abstract: Purpose – Economic development has determined deep changes in economic thinking. In the new information
era, the wealth of the nations resides in intangible capital: human capital and the know-how of the workers. This article aims to analyze intangible capital at a micro and macroeconomic level, looking at specific scientific statements through the perspective of the principle of parsimony – Ockham’s razor.
Methodology/design – We have resorted to the analysis of the reports drawn after performing regional and international research concerning the issue of intangible assets, and respectively intangible capital. The epistemological analysis of intangible capital has allowed us to identify the efforts made at an international level to reach harmonized practices in what concerns the acknowledgement, evaluation, and presentation of intangible capital.
Conclusions: Intangible capital is the key resource of the companies, as well as one of the main components of the wealth of nations. Within it, we can make a distinction between the term of goodwill, a concept that appeared as early as the 16th century in economy, respectively the beginning of the 19th century in the field of law. Although the term itself is quite “old”, being in time the object of numerous studies, the divergences related to the its evaluation and recording in accounting are still present. In M&A operations (Mergers&Acquisitions), the role of the commecial fund is vital, as it supports the decisions of the judges. Goodwill is the part of the unidentified intangible assets that quantifies the benefits obtained by the acquiring company.
Keywords: intangible capital, mergers, market value, MERITUM, RICARDIS
JEL Classification: M41, G34
PROLEGOMENA TO THE NOTION OF INTANGIBLE CAPITAL “Creative thinking is nowadays the most precious and profitable feature of each individual,
of each corporation and country. It has the ability to change both you and your business” – Robert P. Crawford.
The aspects related to intangible capital are a challenge for the current economic thinking: it is not first of all an accounting concept, being of interest for accountants as well as for managers, marketing and human resources specialists.
The binomial human capital–intangible assets is the driving force of the sustainability of the current economic development in the sense that it makes economic efficiency compatible with social justice and with the fight against the process of damaging the environmental factors (Zaman, 2007).
The issue of intangible resources has been approached both at a macroeconomic and at a microeconomic level, and intangible capital can be found in the contents of several standards drawn by the International Accounting Standards Board (IASB), as well as by the Financial Accounting Standards Board (FASB).
In accounting, the term of intangible capital is often mistaken for intangible assets, although they are just a part of intangible capital. Indeed, intangible assets are elements of intellectual capital susceptible of being acknowledged as assets if a series of recognition criteria imposed by the international accounting standards are met (Meritum, 2002).
Accounting rules state that intangible assets are non-monetary identifiable assets, without any material basis, owned in order to be used in the production process, in the provision of goods or services, in order to be rented to third parties or to administrative purposes.
The acknowledgement criteria (control, future economic benefits, credible cost measurement and the separation from goodwill) must be met before an intangible asset can be
The Annals of The "Ştefan cel Mare" University of Suceava. Fascicle of The Faculty of Economics and Public Administration Vol. 11, No. 2(14), 2011
234
recognized. For this reason, intangible assets can be considered elements of intangible capital, but accounting norms do not allow their global acknowledgement and measurement.
INTANGIBLE CAPITAL – COMPONENT OF THE WEALTH OF A NATION
At a macroeconomic level, intangible capital is the headstone of the wealth of a country, a
conclusion drawn after numerous studies performed by the World Bank and the European Union. Therefore, in 2002, the MERITUM project is launched (MEasuRing Intangibles To Understand and improve innovation Management), a research project funded by the European Union within the “Targeted SocioEconomic Research (TSER)” program.
The MERITUM project suggests the classification of intellectual capital into: Human capital, which is the part of intangible assets that leave the organization at the end of
the workday; Structural capital, which is the part of the value of the intangible assets that stays after the
workers leave after a workday; Relational capital, which is the part of the value of the relations that exist between the
company and the various economic and social agents with which it interacts. The objectives of the project have aimed, in fact, the following: obtaining a taxonomy of
intangible assets; identifying and analyzing the models used by European companies to measure intangible assets; the possible advantages obtained from reporting intangible capital and the analysis of the effect of not including intangible assets in establishing the market value; creating general directives to measure intangible assets and presenting information on them, and drawing conclusions and suggestions for accounting policies.
The World Bank has performed in 2006 a study called “Where Is the Wealth of Nations? Measuring Capital for the 21st Century”, which analyzes the economic context in the various countries in the world on three dimensions – natural capital (soil and natural wealth), produced capital (the actual result of the people’s work), intangible capital (the quality of education, the efficiency of the legal system, effective governance) – from whose composition there results the total value of that nation.
According to the World Bank report, the wealth of a nation primarily resides in intangible capital, which includes human capital, the skills and know-how of the work force. It also includes social capital, that is, the degree of confidence people have in society, as well as their ability to work together to a common purpose. It is also made up of those elements of governance that encourage productivity in economy.
The most surprising result of the study refers to the fact that in over 85% of the analyzed countries, intangible capital is more than 50% of the total wealth, which confirms the intuition of classical economists: human capital and other intangible assets play an important part in economic development. Over 90% of the variance of intangible capital, at a macroeconomic level, is explained by human capital (measured in years of education) and by the governance system (measured by those governance elements that encourage productivity in economy: a very effective legal system, clearly defined property rights).
Leif Edvinsson, a business mind sensitive to the “intangible acquisitions” of a company, states that “the world’s economies are nowadays lead by invisible things. The intellectual capital of the nations is the new capital of the nations”.
Most studies referring to intangible capital have been performed at a micro level, stressing the role of intangible assets in explaining the difference between the accounting value and the market value of a company, as well as in increasing the competitive advantage. Recently, pioneers in this field have extended their research area at a national and regional level.
The national intangible capital combines knowledge, wisdom, and expertise provided by a specific country in comparison with other countries. It is about an expecting opportunity, sustainability, ability to forecast, and added values. This way, developed countries create value
The Annals of The "Ştefan cel Mare" University of Suceava. Fascicle of The Faculty of Economics and Public Administration Vol. 11, No. 2(14), 2011
235
through the research and development activities and through innovating services (Lin and Edvinsson, 2010, p.3).
Starting from the imperative that Europe must use its knowledge and know-how in order to survive and play a role in the world’s economy, the European business environment has initiated the InCaS project (Intellectual Capital Statements for Europe), with the purpose of supporting the companies’ process of understanding, capitalizing, and presenting intellectual capital. The European Commission has performed several studies, of which of outstanding importance is the RICARDIS report – Reporting Intellectual Capital to Augment Research, Development and Innovation in SMEs. The RICARDIS report urges Europe to take immediate steps to stimulate the SMEs to draw statements concerning intellectual capital. Only few European countries have attempted to permanently include intangible capital in the annual statements of the companies. In Germany, accounting standards recommend companies to report their intellectual capital within management statements, although this is not a compulsory requirement. Denmark requests companies to provide information on their human capital only if it is relevant for the economic activity, while in Austria reporting human capital is now obligatory in all universities. Measuring and reporting intellectual capital is an unconditional practice of present management.
The importance of the correct evaluation and presentation of intangible capital has determined the big accounting companies to initiate the WICI global project –World Intellectual Capital Initiative. However, in spite of the efforts made by researchers and international bodies, intangible capital is still an unknown factor in its deep meanings...
INTANGIBLE CAPITAL – A KEY RESOURCE OF A COMPANY There is an obvious synergy between tangible and intangible production. In time, intangible assets have been considered as highly risky assets. Nevertheless, in
present economies, the real value of a company results from its intellectual capital, which in the opinion of Edvinsson and Malone (2000) includes human capital (knowledge, skills and competences of the employees), structural capital (the infrastructure that supports the activity performed by the employees: buildings, hardware, software, processes, patents, trademarks, the organizational structure, information systems and databases), innnovation capital (intellectual property and intangible assets, defined as the set of skills and theoretical knowledge that ensure the functionining of the company) and relational capital (relationships with the customers and providers, their loyalty).
Intangible assets have gradually become the most important sources of competitive advantage. According to the new perspective supported by the theory of endogenous knowledge and by other approaches, traditional production factors (natural resources, labor force, and capital) have gradually reduced their importance. In the new economy, competitive advantage mainly belongs to those who are sufficiently informed and wise so as to know and acknowledge that the true resources of the 21st century are knowledge, information, innovation, creativity, and intellectual capital (Suciu, 2008).
It is precisely these intangible assets, difficult to perceive and most of all to evaluate, that explain the differences between the market value of a company and its net accounting value, which has lead to concentrating the efforts in order to identify and quantify the “missing assets” (Brennan, 2001 and Gröjer and Johanson, 1998).
In what concerns the evaluation of intangible capital – a rather sensitive field because of its intangible nature – the Q ratio, conceptualized and suggested by the Nobel laureate James Tobin, is a successful attempt to transform the impossible into performance. Q is obtained by dividing the global value of the company to its patrimonial value, indicating the extent to which the company, through its functioning, creates value above its patrimonial value, over a specific period.
Since the introduction of the notion of “intellectual capital” in 1969 by Galbraith, all research in the field has been centered on intangible assets, seen as a hidden source of value creation, and analyzed from multiple perspectives, with the main purpose of designing a
The Annals of The "Ştefan cel Mare" University of Suceava. Fascicle of The Faculty of Economics and Public Administration Vol. 11, No. 2(14), 2011
236
measurement and evaluation model for intellectual capital. As a consequence, there are over 30 methods of evaluation of intellectual capital. However, the developed models do not take into consideration the possible obligations of the company to its stakeholders of acquiring and maintaining intangible assets. Starting from the classical accounting methods, intangible capital would equal the difference between the intangible assets and the intangible liabilities.
Although some contributions have taken into account the concept of intangible liabilities, they have generally referred to the effects of implementing a wrong idea, which may be seen rather as depreciations of intangible assets than intangible liabilities. Intangible liabilities are obligations associated with intangible assets.
Starting from the premise that goodwill proves the existence of intangible assets, then a net accounting value higher than the market value demonstrates the existence of intangible liabilities. From this perspective, intangible liabilities are the consequence of an inefficient decision process, which leads to the erosion of the company’s value. On the other hand, intangible liabilities can be seen as non-monetary obligations. The company’s failure in fulfilling its non-monetary obligations to its employees can lead to the depreciation of the human capital, and the non-fulfillment of the non-monetary obligations towards the commercial partners can determine the depreciation of relational capital. As a consequence, intangible liabilities are non-monetary obligations towards the stakeholders, which the company must fulfill, so as to avoid the depreciation of the intangible assets. Intangible liabilities stress the fact that an organization cannot use human and relational capital unless they take on certain obligations towards its internal and external stakeholders. As a result, managers will be able to effectively and efficiently manage intellectual capital only if they take into account both intangible assets and intangible liabilities.
GOODWILL – THE ACE IN THE SLEEVE IN M&A PROCESSES
The term of goodwill (commercial fund) was defined in specialized literature for the first time in the 1880s, both by economists and by legal consultants. Harris (1884) was the first author to introduce the term of commercial fund in economy and to be quoted in specialized literature. However, Leake (1948) states that the term itself had been used for a much longer time, its first occurrence taking place in 1571. The need to define this term also appeared in solving conflicts in court. Leake also claims that the first legal decision reported in the field of goodwill was in the case Crutwell vs. Lye (1810, 17 Ves. 335), when Lord Eldon commented: “the commercial fund that was the object of the sale is nothing else but the probability for old customers to go back to old locations” (by locations meaning stores). In the legal field, the Supreme Court of the United States used in 1892, in the case Metropolitan Bank vs. St. Louis Dispatch (1892) the first definition of “professional goodwill”: (commercial fund) is tangible only as an incident, being related to a business, a location, or a name, not being susceptible to be presented independently.
Since then, numerous articles have dealt with the term of goodwill. Entire generations of researchers, both in the field of accounting and in that of law, have promoted different theories, have offered numerous solutions, have tried over time various practices, which have been both accepted and rejected. What is certain is that goodwill is a notion that generates controversies. Still, the various definitions and discussions generated around the term of goodwill have a common element: it is classified rather as an intangible asset than a material, tangible one.
Today, commercial fund is mainly recognized in merger and acquisition operations. The reasoning that lies at the basis of the merger and acquisition processes is that two companies together are more valuable than two distinct companies. The alchemy of a merger or acquisition can be described by the following statement: one plus one is three. The objective followed in any transaction of this sort is to create a higher value than the sum of the value of the two merging companies.
The topic of mergers and acquisitions has continuously developed with respect to the investigations made in specialized literature in the last two decades (Appelbaum, S.H., Lefrancois,
The Annals of The "Ştefan cel Mare" University of Suceava. Fascicle of The Faculty of Economics and Public Administration Vol. 11, No. 2(14), 2011
237
F., Tonna, R., and Shapiro, B.T., 2007), as a result of the increase of the number of mergers and acquisitions worldwide, as well as of the development of the complexity of this phenomenon.
In the field of research, the merger and acquisition process has largely developed along disciplinary lines, and finance specialists focused mainly on the issue of value creation or of reducing the shareholders’ value after an acquisition. The multitude of proofs shows that, although company takeovers bring positive short term results for the associates of the target companies, the long term benefit for the investors, in the case of acquiring a company, is questionable (Cartwright, S., Schoenberg, R., 2006). Approximately 35-45% of the buyers achieve positive values in the 2-3 years following the transaction, with a computed standard deviation of 10% around the average (Conn, C., Cosh, A., Guest, p. and Hughes, A., 2001).
CONCLUSIONS
The efficiency and effectiveness in customer relations, the correct management of the providers, obtaining guarantees, as well as gaining the loyalty of the partners are more than just “trendy” concepts in specialized literature, making the difference between the success or failure of a business and defining the ability of a company to coordinate and combine all the resources, both endogenous and exogenous, in order to obtain a positive, sustainable, and increasing final result. This combination of relations and interactions can be capitalized economically, and thus represents an element of the company’s patrimony.
In the scientific research of intangible capital, it seems that we have to ignore Ockham’s principle: the simple explanation is not the admitted one, the complexity of the evaluation, as well as the difficulty of reporting intangible capital require various explanations, calculations, and methods, which are elaborate and difficult to pin within safe touchlines. The omitted explanations cannot be filled in mentally, through intuition or imagination. The stake is too high: in the dynamics of mergers and acquisitions, goodwill is “Achilles’ heel” of certain and rigorously supported calculus.
Although highly important, the evaluation of goodwill still raises problems. The decision to merge or to acquire another company is based on the advantages obtained as a result of such action, which can be measured mainly through the intangible part represented by goodwill. It is necessary to further deepen the research in the field, in order for the decision taken to be appropriately supported.
BIBLIOGRAPHY
1. Appelbaum, S.H., Lefrancois, F., Tonna, R., and Shapiro, B.T. (2007). Mergers 101 (part one): training managers for communications and leadership challenges. Industrial and Comercial Training, VOL. 39 NO. 3 , pp. 128-136.
2. Brennan N. (2001). Reporting intellectual capital in annual reports: evidence from Ireland. Accounting, Auditing and Accountability Journal , Vol. 10 No. 2, pp. 18-30.
3. Cartwright, S., Schoenberg, R. (2006). 30 years of mergers and aquisitions research: recent advances and future opportunities. British Journal of Management, Volume 17 Issue S1 , pp. S1-S5.
4. Conn, C., Cosh, A., Guest, p. and Hughes, A. (2001). Long Run Share Performance of UK firms engaging in cross border acquisitions. University of Cambridge, Centre for Business Related Research Working Paper No. 214.
5. Edvinsson L., Malone M.S. (2000). El capital intelectual: cómo identificar y calcular el valor de los recursos intangibles de su empresa, Gestión 2000, Barcelona.
6. Gröjer J.-E, Johanson U., (1998). Current development in human resource costing and accounting. Accounting, Auditing and Accountability Journal, Vol 11, No. 7, pp.14-21.
The Annals of The "Ştefan cel Mare" University of Suceava. Fascicle of The Faculty of Economics and Public Administration Vol. 11, No. 2(14), 2011
238
7. Harris, W., (1884), The Law and Practice in Relation to Goodwill. The Accountants’ Students’ Journal, Aprilie, pp. 256-263.
8. Leake, P.D., Commercial Goodwill. Gee$Company (Publishers) Ltd, 4th Edition, 1948. 9. Lin C., Edvinsson L., (2010). National Intellectual Capital: A Comparison of 40 Countries,
Springer; 1st Edition, London, available at: http://www.amazon.com/National-Intellectual-Capital-Comparison-Countries/dp/1441973761/ref=sr_1_5?s=books&ie=UTF8&qid=1302013229&sr=1-5, accessed on 5.04.2011.
10. Meritum (2002), Proyecto Meritum: Guidelines for Managing and Reporting Intangibles, Meritum, Madrid.
11. Suciu, M.Ch. (2008). Activele intangibilie şi capitalul intelectual – factori cheie ai convergenţei. The Romanian Academy. The national institution of economic research, Working Papers series, no. 7, available at: http://www.moyak.com/papers/convergence-economy-knowledge-competitive.pdf, accessed on 10.04.2011.
12. Zaman Gh., Goschin Z. (2007). Avuţia naţională-factor al integrării economice, in the papers of the symposium dedicated to the Economists’ Day sponsored by the General Association of Romanian Economists, the Association of the Romanian Faculties of Economics and the Academy of Economic Studies of Bucharest, and in the organization of the Center of Excellence for Economic Analyses and Policies and the Chair of Economics and Economic Policies, available at
http://store.ectap.ro/suplimente/simpozion_23_nov_2007_ro.pdf, accessed on 10.04.2011.
13. *** Where Is the Wealth of Nations? Measuring Capital for the 21st Century”, a study performed by the World Bank, available at: http://siteresources.worldbank.org/INTEEI/214578-1110886258964/20748034/All.pdf, accessed on 30.03.2011.
14. *** U.S. Supreme Court, Metropolitan Bank v. St. Louis Dispatch Co., 149 U.S. 436 (1893), available at http://supreme.justia.com/us/149/436/, accessed on 12.04.2011.
The Annals of The "Ştefan cel Mare" University of Suceava. Fascicle of The Faculty of Economics and Public Administration Vol. 11, No. 2(14), 2011
239
THE ROLE OF MUTUAL FUNDS IN U.S. ECONOMY
PhD. Student Delia-Elena DIACONAŞU Alexandru Ioan Cuza University
Faculty of Economics and Business Administration Iaşi, Romania
Abstract: The main aim of this article is to present the correlations between different macroeconomic indicators and the
dynamics of mutual funds in U.S. The direct relationship between inflation rate and net subscription of stock funds in the US market is validated. On the other hand, a lower interest rate in US means investing people’s savings in monetary and bond funds. We have also shown an indirect link between interest rate and bond funds. We couldn’t highlight the direct link between global funds and its balance of payments and the country's GDP. The weak correlation between balance of payments and global funds is due to the fact that in the current account balance are included other financial flows that are much larger and with a greater influence on it, such as imports and exports. Also, the weak correlation between the net assets of global funds and the evolution of GDP is due to influence of other factors that leads to the decision of investing internationally. We have also shown the importance of investment funds by increasing what they hold in total savings of the population. This increase is explained both by placing the weight of massive cash of traders in investment funds and by the existence of a higher utility of personal savings invested in investment funds aimed at saving for retirement. Also we briefly highlighted the role of investment companies in the State unemployment rate.
Keywords: financial markets, intestment funds, inflation rate, stocks, bonds, interest rate, monetary assets JEL Classification: E44; G12; G14; G15; G21
I. INTRODUCTION
Internationally, the importance of investment funds in the financial markets differs from one state to another, depending on how the sector is developed. So, in the developed states of the world such as USA, Great Britain, France, Japan, the role of investment funds in the financial system is much more pronounced than in some less developed countries. Imposing presence of the funds, however, depends not only on the size and economic development of the country, but also by internal regulations, tax benefits, industry experience and economic situation (eg Ireland, Luxembourg).
One of the main role of investment funds is the protection of people's savings against inflation. So, while the shares and other variable income securities increase their value once the general price index development, are among the few profitable ways of investing in conditions of rising inflation. A moderate increase in inflation leads also to upward trend of stock mutual funds, an increase of preference of placing people's savings in such portfolios in the hope of obtaining a higher gain.
On the other hand, a lower inflation rate usually means a lower interest rate, and hence investing people’s savings in funds that invest in fixed income assets. So, for example in the conditions in which the U.S. Government has kept and still maintain a zero interest rate, during the recession, has been observed that both the net assets and net subscriptions showed a favorable trend in bond and monetary funds. With the uncertainty characterizing financial markets, these two categories of funds were a viable alternative, particularly in the short term, for the investors not only from U.S. but also in the most of the countries.
Shares have traditionally been associated with an "asset class that cover inflation". So, recent studies such as those made by MSCIBarra and Dexia Asset Management (2010) are showing the existence of a direct relationship between moderate inflation (up to 4%) under a stable economic framework. After this limit, the stocks begin to struggle, due to economic imbalances.
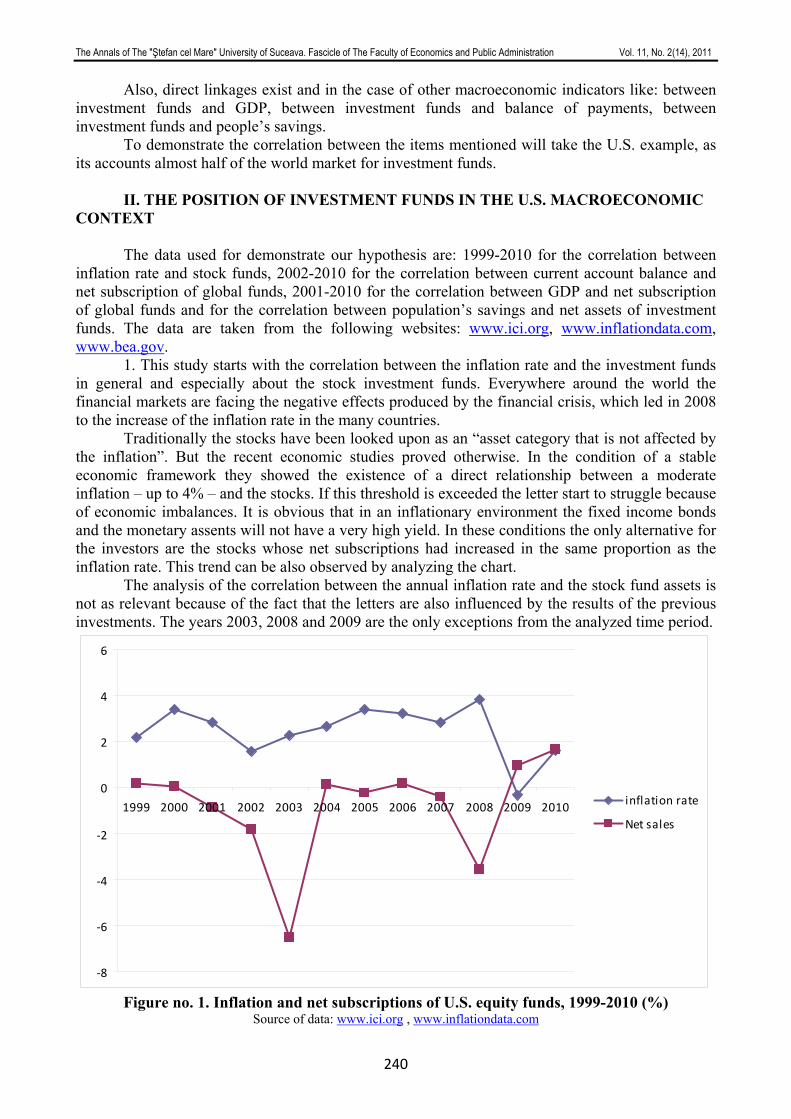
The Annals of The "Ştefan cel Mare" University of Suceava. Fascicle of The Faculty of Economics and Public Administration Vol. 11, No. 2(14), 2011
240
Also, direct linkages exist and in the case of other macroeconomic indicators like: between investment funds and GDP, between investment funds and balance of payments, between investment funds and people’s savings.
To demonstrate the correlation between the items mentioned will take the U.S. example, as its accounts almost half of the world market for investment funds.
II. THE POSITION OF INVESTMENT FUNDS IN THE U.S. MACROECONOMIC CONTEXT
The data used for demonstrate our hypothesis are: 1999-2010 for the correlation between
inflation rate and stock funds, 2002-2010 for the correlation between current account balance and net subscription of global funds, 2001-2010 for the correlation between GDP and net subscription of global funds and for the correlation between population’s savings and net assets of investment funds. The data are taken from the following websites: www.ici.org, www.inflationdata.com, www.bea.gov.
1. This study starts with the correlation between the inflation rate and the investment funds in general and especially about the stock investment funds. Everywhere around the world the financial markets are facing the negative effects produced by the financial crisis, which led in 2008 to the increase of the inflation rate in the many countries.
Traditionally the stocks have been looked upon as an “asset category that is not affected by the inflation”. But the recent economic studies proved otherwise. In the condition of a stable economic framework they showed the existence of a direct relationship between a moderate inflation – up to 4% – and the stocks. If this threshold is exceeded the letter start to struggle because of economic imbalances. It is obvious that in an inflationary environment the fixed income bonds and the monetary assents will not have a very high yield. In these conditions the only alternative for the investors are the stocks whose net subscriptions had increased in the same proportion as the inflation rate. This trend can be also observed by analyzing the chart.
The analysis of the correlation between the annual inflation rate and the stock fund assets is not as relevant because of the fact that the letters are also influenced by the results of the previous investments. The years 2003, 2008 and 2009 are the only exceptions from the analyzed time period.
‐8
‐6
‐4
‐2
0
2
4
6
1999 2000 2001 2002 2003 2004 2005 2006 2007 2008 2009 2010 inflation rate
Net sales
Figure no. 1. Inflation and net subscriptions of U.S. equity funds, 1999-2010 (%)
Source of data: www.ici.org , www.inflationdata.com
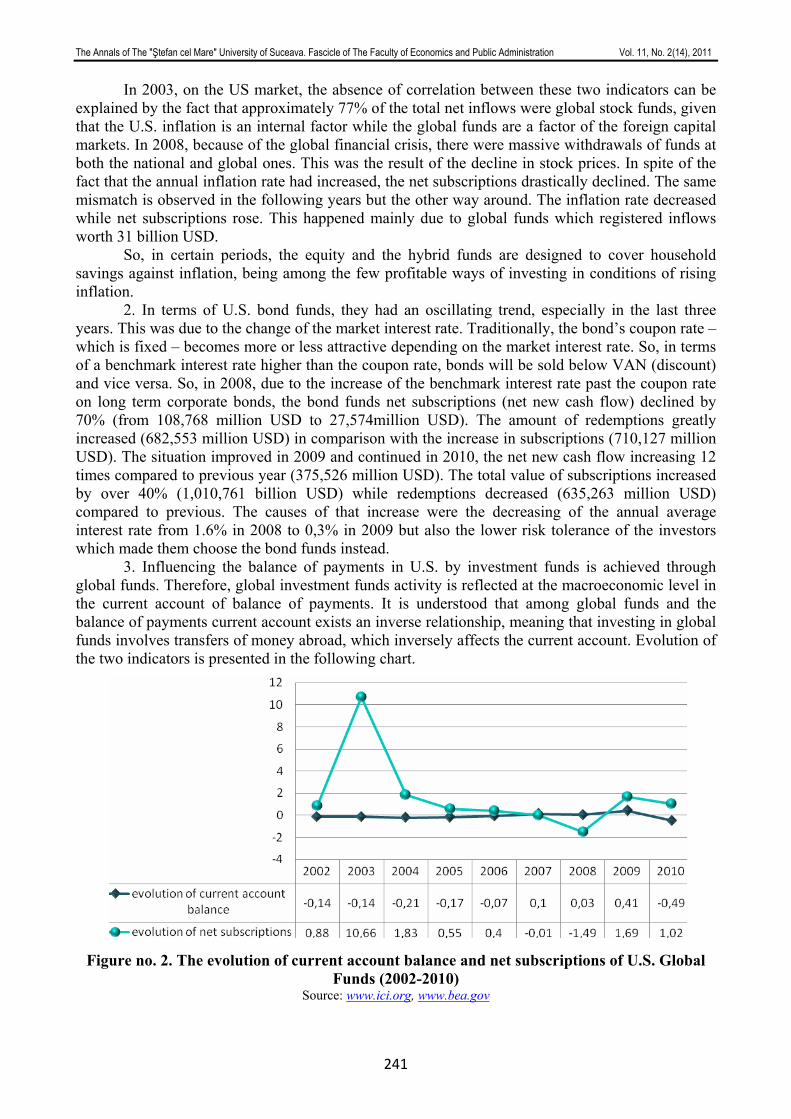
The Annals of The "Ştefan cel Mare" University of Suceava. Fascicle of The Faculty of Economics and Public Administration Vol. 11, No. 2(14), 2011
241
In 2003, on the US market, the absence of correlation between these two indicators can be explained by the fact that approximately 77% of the total net inflows were global stock funds, given that the U.S. inflation is an internal factor while the global funds are a factor of the foreign capital markets. In 2008, because of the global financial crisis, there were massive withdrawals of funds at both the national and global ones. This was the result of the decline in stock prices. In spite of the fact that the annual inflation rate had increased, the net subscriptions drastically declined. The same mismatch is observed in the following years but the other way around. The inflation rate decreased while net subscriptions rose. This happened mainly due to global funds which registered inflows worth 31 billion USD.
So, in certain periods, the equity and the hybrid funds are designed to cover household savings against inflation, being among the few profitable ways of investing in conditions of rising inflation.
2. In terms of U.S. bond funds, they had an oscillating trend, especially in the last three years. This was due to the change of the market interest rate. Traditionally, the bond’s coupon rate – which is fixed – becomes more or less attractive depending on the market interest rate. So, in terms of a benchmark interest rate higher than the coupon rate, bonds will be sold below VAN (discount) and vice versa. So, in 2008, due to the increase of the benchmark interest rate past the coupon rate on long term corporate bonds, the bond funds net subscriptions (net new cash flow) declined by 70% (from 108,768 million USD to 27,574million USD). The amount of redemptions greatly increased (682,553 million USD) in comparison with the increase in subscriptions (710,127 million USD). The situation improved in 2009 and continued in 2010, the net new cash flow increasing 12 times compared to previous year (375,526 million USD). The total value of subscriptions increased by over 40% (1,010,761 billion USD) while redemptions decreased (635,263 million USD) compared to previous. The causes of that increase were the decreasing of the annual average interest rate from 1.6% in 2008 to 0,3% in 2009 but also the lower risk tolerance of the investors which made them choose the bond funds instead.
3. Influencing the balance of payments in U.S. by investment funds is achieved through global funds. Therefore, global investment funds activity is reflected at the macroeconomic level in the current account of balance of payments. It is understood that among global funds and the balance of payments current account exists an inverse relationship, meaning that investing in global funds involves transfers of money abroad, which inversely affects the current account. Evolution of the two indicators is presented in the following chart.
Figure no. 2. The evolution of current account balance and net subscriptions of U.S. Global
Funds (2002-2010) Source: www.ici.org, www.bea.gov
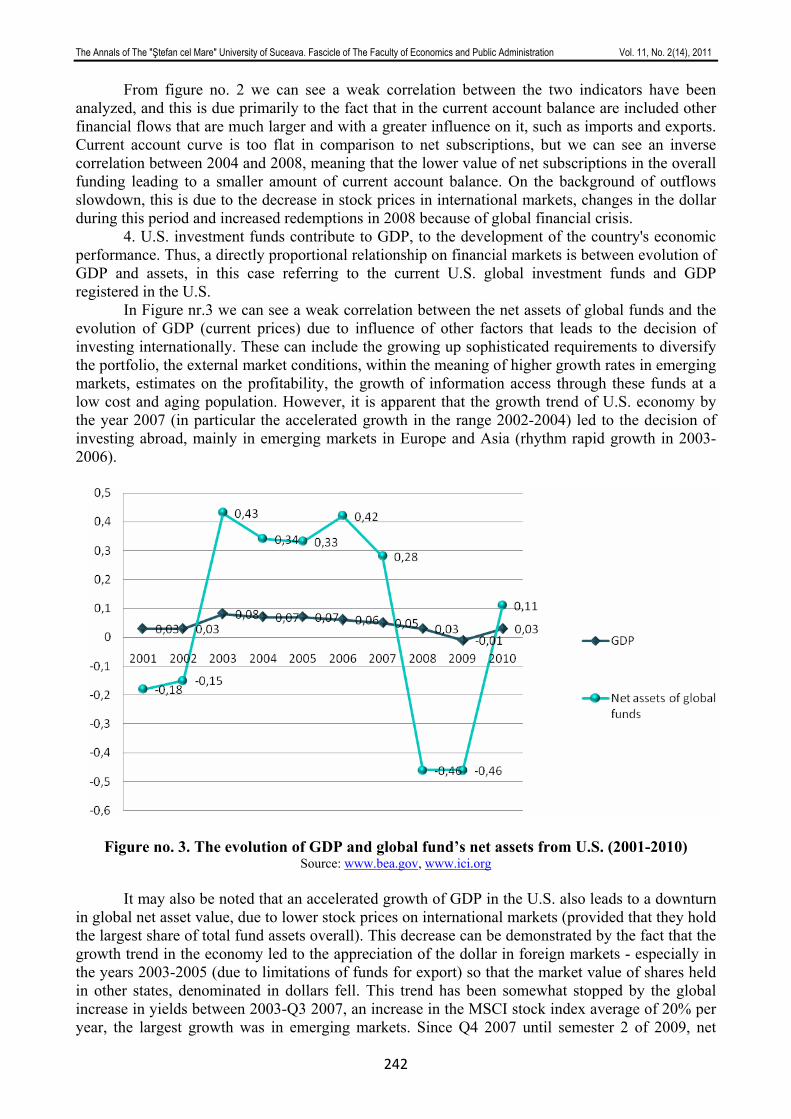
The Annals of The "Ştefan cel Mare" University of Suceava. Fascicle of The Faculty of Economics and Public Administration Vol. 11, No. 2(14), 2011
242
From figure no. 2 we can see a weak correlation between the two indicators have been analyzed, and this is due primarily to the fact that in the current account balance are included other financial flows that are much larger and with a greater influence on it, such as imports and exports. Current account curve is too flat in comparison to net subscriptions, but we can see an inverse correlation between 2004 and 2008, meaning that the lower value of net subscriptions in the overall funding leading to a smaller amount of current account balance. On the background of outflows slowdown, this is due to the decrease in stock prices in international markets, changes in the dollar during this period and increased redemptions in 2008 because of global financial crisis.
4. U.S. investment funds contribute to GDP, to the development of the country's economic performance. Thus, a directly proportional relationship on financial markets is between evolution of GDP and assets, in this case referring to the current U.S. global investment funds and GDP registered in the U.S.
In Figure nr.3 we can see a weak correlation between the net assets of global funds and the evolution of GDP (current prices) due to influence of other factors that leads to the decision of investing internationally. These can include the growing up sophisticated requirements to diversify the portfolio, the external market conditions, within the meaning of higher growth rates in emerging markets, estimates on the profitability, the growth of information access through these funds at a low cost and aging population. However, it is apparent that the growth trend of U.S. economy by the year 2007 (in particular the accelerated growth in the range 2002-2004) led to the decision of investing abroad, mainly in emerging markets in Europe and Asia (rhythm rapid growth in 2003-2006).
Figure no. 3. The evolution of GDP and global fund’s net assets from U.S. (2001-2010)
Source: www.bea.gov, www.ici.org It may also be noted that an accelerated growth of GDP in the U.S. also leads to a downturn
in global net asset value, due to lower stock prices on international markets (provided that they hold the largest share of total fund assets overall). This decrease can be demonstrated by the fact that the growth trend in the economy led to the appreciation of the dollar in foreign markets - especially in the years 2003-2005 (due to limitations of funds for export) so that the market value of shares held in other states, denominated in dollars fell. This trend has been somewhat stopped by the global increase in yields between 2003-Q3 2007, an increase in the MSCI stock index average of 20% per year, the largest growth was in emerging markets. Since Q4 2007 until semester 2 of 2009, net
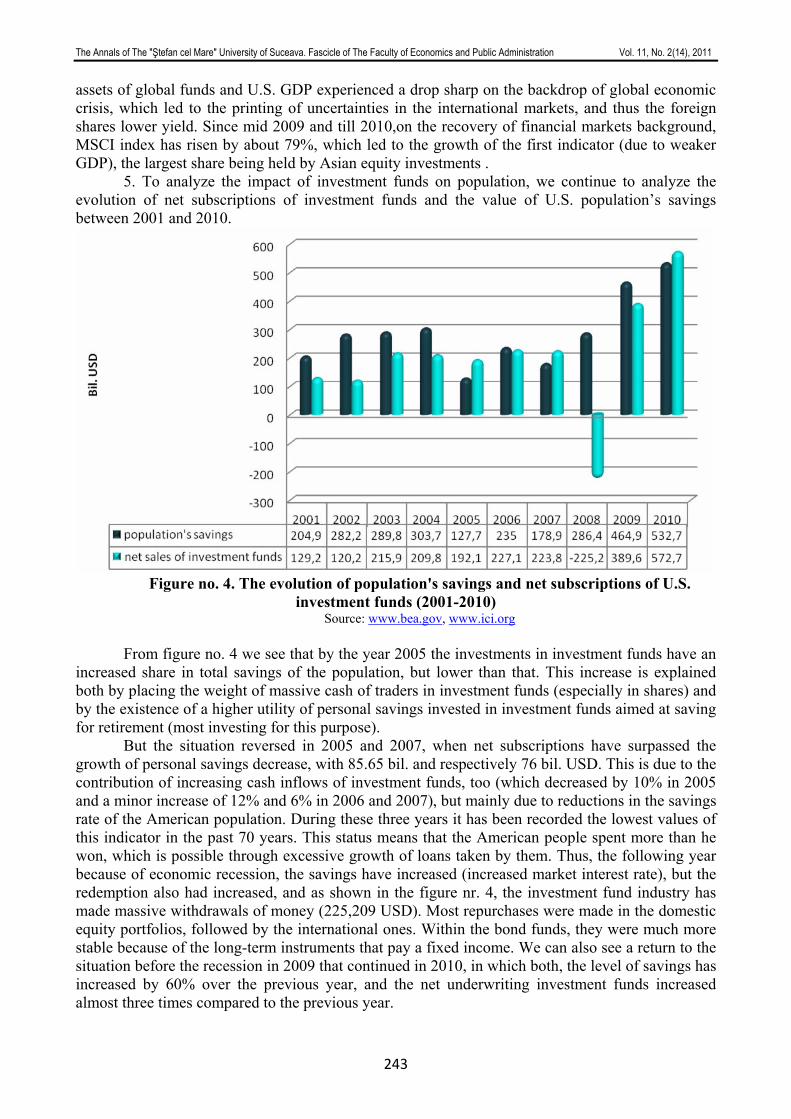
The Annals of The "Ştefan cel Mare" University of Suceava. Fascicle of The Faculty of Economics and Public Administration Vol. 11, No. 2(14), 2011
243
assets of global funds and U.S. GDP experienced a drop sharp on the backdrop of global economic crisis, which led to the printing of uncertainties in the international markets, and thus the foreign shares lower yield. Since mid 2009 and till 2010,on the recovery of financial markets background, MSCI index has risen by about 79%, which led to the growth of the first indicator (due to weaker GDP), the largest share being held by Asian equity investments .
5. To analyze the impact of investment funds on population, we continue to analyze the evolution of net subscriptions of investment funds and the value of U.S. population’s savings between 2001 and 2010.
Figure no. 4. The evolution of population's savings and net subscriptions of U.S.
investment funds (2001-2010) Source: www.bea.gov, www.ici.org
From figure no. 4 we see that by the year 2005 the investments in investment funds have an
increased share in total savings of the population, but lower than that. This increase is explained both by placing the weight of massive cash of traders in investment funds (especially in shares) and by the existence of a higher utility of personal savings invested in investment funds aimed at saving for retirement (most investing for this purpose).
But the situation reversed in 2005 and 2007, when net subscriptions have surpassed the growth of personal savings decrease, with 85.65 bil. and respectively 76 bil. USD. This is due to the contribution of increasing cash inflows of investment funds, too (which decreased by 10% in 2005 and a minor increase of 12% and 6% in 2006 and 2007), but mainly due to reductions in the savings rate of the American population. During these three years it has been recorded the lowest values of this indicator in the past 70 years. This status means that the American people spent more than he won, which is possible through excessive growth of loans taken by them. Thus, the following year because of economic recession, the savings have increased (increased market interest rate), but the redemption also had increased, and as shown in the figure nr. 4, the investment fund industry has made massive withdrawals of money (225,209 USD). Most repurchases were made in the domestic equity portfolios, followed by the international ones. Within the bond funds, they were much more stable because of the long-term instruments that pay a fixed income. We can also see a return to the situation before the recession in 2009 that continued in 2010, in which both, the level of savings has increased by 60% over the previous year, and the net underwriting investment funds increased almost three times compared to the previous year.
The Annals of The "Ştefan cel Mare" University of Suceava. Fascicle of The Faculty of Economics and Public Administration Vol. 11, No. 2(14), 2011
244
6. Also, the role of investment companies in the economy can be justified by the fact that it gives people jobs, so a development of this industry implicitly leads to a reduction in State unemployment rate. For example, the United States, in 2007 the estimated number of employees in this industry was 168,000 and in 2008 it dropped to 157,000 due to lower overall costs to the firm substantial decrease in revenues during this period under unemployment rate increased from 5% to 7.4% over the same period.
III. CONCLUSIONS
The U.S. investment funds market is important because it accounts for almost half the global
market share of net assets. In the analysis of U.S. investment funds market, direct correlations between inflation and stock funds on the one hand, and indirect linkages between interest rate and bond funds are recorded in almost all the years analyzed (exceptions in 2003, 2008 and 2009 in inflation-stock funds relationship). A moderate increase in inflation in US, leads to upward trend of stock mutual funds, an increase of people’s preference of placing their savings in such portfolios in the hope of obtaining a higher gain. Also, a lower inflation rate in US, usually means a lower interest rate, and hence investing people’s savings in funds that invest in fixed income assets (monetary and bond funds).
We couldn’t show a link between current account balance and global investment funds due to the lower volume of global funds. Also the lower volume of net sales of global funds hasn’t highlighted the direct link with the country's GDP. We have shown the importance of investment funds by increasing what they hold in total savings of the population, and by the fact that there exist direct linkages in almost all the periods. This increase is explained both by placing the weight of massive cash of traders in investment funds and by the existence of a higher utility of personal savings invested in investment funds aimed at saving for retirement. Also we briefly highlighted the role of investment companies in the State unemployment rate.
ACKNOWLEDGEMENTS: This work was supported by the European Social Fund in Romania, under the responsibility
of the Managing Authority for the Sectorial Operational Program for Human Resources Development 2007 – 2013 [grant POSDRU/CPP 107/DMI 1.5/S/78342].
REFERENCES:
1. Dexia Asset Management, Inflation and equity returns: what’s the link?, 2010, www.dexia-am.com.
2. Friedman, A.J., Wiles, R, Fondurile de investiţii, Ed. Hrema, Bucureşti, 2002. 3. MSCIBarra, Hedging inflation with equities, 2008, www.mscibarra.com. 4. Redman, A. L., Gullett, N. S., Manakyan, H., The performance of global and international
mutual funds, Journal of Financial and Strategic Decisions 13, Nr. 1, 2000. 5. Reilly, F. K., Norton, E. A., Investments, Seventh Edition, Ed. Thomson SouthWestern,
Canada, 2006. 6. Stoica, O., Mecanisme şi instituţii ale pieţei de capital. Pieţe de capital emergente, Ed.
Economică, Bucureşti,2002. 7. *** ICI Fact Book 2008, 2009, 2010, www.ici.org. 8. *** Morningstar's Performance Measures, www.morningstar.com. 9. *** Mutual fund operations, academic.cengage.com. 10. *** Relationship Between Bonds & Interest Rates, www.wellsfargoadvantagefunds.com. 11. www.inflationdata.com 12. www.bea.gov
The Annals of The "Ştefan cel Mare" University of Suceava. Fascicle of The Faculty of Economics and Public Administration Vol. 11, No. 2(14), 2011
245
ANALYSIS OF THE ECONOMICAL-FINANCIAL BUSINESS OF THE CONTRIBUTORS – SUPPORT OF THE TAX EVASION FIGHT
PhD. Student George Dorin DEDU
Alexandru Ioan Cuza University, Iasi, Romania [email protected]
Abstract: The work is trying to define and to impose the economical-financial analysis of the contributors as a main identification method of the fiscal evasion. The careful analysis of the financial documents of a company and their correlation with the factual reality must be the main identification method of the fiscal evasion on the economic agent level. This hereby work presents the main relevant financial indexes regarding their capacity to surprise the existence of the fiscal evasion on the level of a company and of the existing connections between their level and the existence of the fiscal evasion phenomenon. The economical-financial analysis becomes a support for the fiscal evasion fight especially through the fiscal inspection. Te calculation of the financial indexes and the settlement of an alert margin regarding their value can be clear indexes for the financial inspections concerning the existence of the phenomenon on the level of a company and will help them in the identification of the evasion methods.This hereby survey opens up the research opportunities regarding the existing connections between the economical-financial indexes of a company and the fiscal evasion on its level. Keywords: tax evasion, economical-financial analysis, financial indexes, financial inspection, tax evasion fight. JEL Classification: H26 INTRODUCTION The fiscal evasion is one of the economical-social phenomena of great importance with which, in a large or less extent all the states deal with. Some states fight against the phenomenon through well-lined policies, others through less clear measures, but one thing is for sure: no country succeeded to eradicate the phenomenon by now. Due to this reason, the fight against the fiscal evasion is an interest point for the scientific research in the finance field. The approach of the liaison between the economical-financial analysis and the fiscal evasion phenomenon is a departure point for such future surveys. CONTENTS The analysis of the economical-financial activity of the contributors may have a decisive contribution to the identification of the fiscal evasion and the fight against it. The accounting financial statements are the mirror of the contributors’ activity and supply relevant information regarding their activity and the correctness of the accounting registrations. As patrimony template, the balance sheet reinforces and gives synthetic expression to the information regarding the functional investment forms of the funds in the activity of a patrimony holder, as well as to the way of their formation within the relationships with the economical-social environment. This characterizes in numbers and in monetary standard the dimensional and structural balance relationships between the economical means managed by the patrimony holder and the procurement ways of these means. Therefore, the balance sheet proves the obtained financial output, as a result of the consumption and multiplication of the invested funds. The balance sheet is meant to generalize the current accounting data from time to time and to establish a series of synthetic economical-financial indexes, granting the accounting and informational template nature, but also of a management template of the material and monetary values under patrimony limits. On informational level, the balance sheet is emphasizing the cause relationships between the tangible assets and the money, as rightful objects and liabilities on the one hand, the holder’s rights and liabilities of the patrimony holder, between the use of their values and
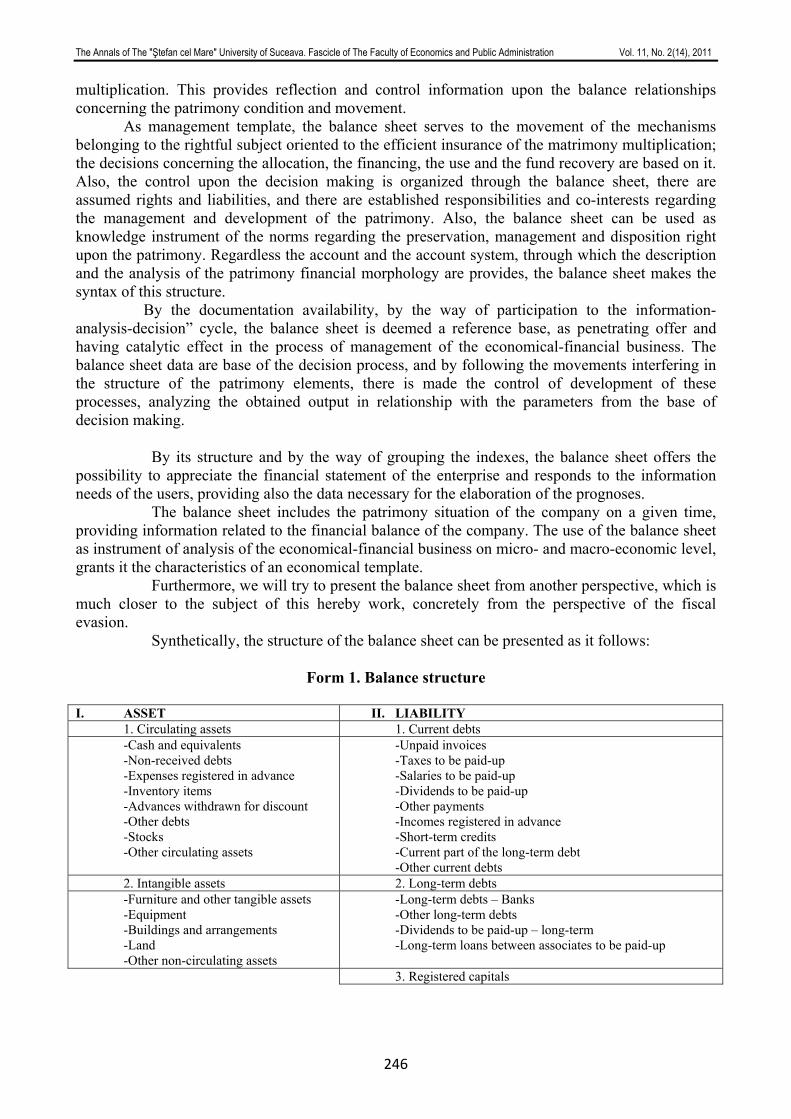
The Annals of The "Ştefan cel Mare" University of Suceava. Fascicle of The Faculty of Economics and Public Administration Vol. 11, No. 2(14), 2011
246
multiplication. This provides reflection and control information upon the balance relationships concerning the patrimony condition and movement. As management template, the balance sheet serves to the movement of the mechanisms belonging to the rightful subject oriented to the efficient insurance of the matrimony multiplication; the decisions concerning the allocation, the financing, the use and the fund recovery are based on it. Also, the control upon the decision making is organized through the balance sheet, there are assumed rights and liabilities, and there are established responsibilities and co-interests regarding the management and development of the patrimony. Also, the balance sheet can be used as knowledge instrument of the norms regarding the preservation, management and disposition right upon the patrimony. Regardless the account and the account system, through which the description and the analysis of the patrimony financial morphology are provides, the balance sheet makes the syntax of this structure.
By the documentation availability, by the way of participation to the information-analysis-decision” cycle, the balance sheet is deemed a reference base, as penetrating offer and having catalytic effect in the process of management of the economical-financial business. The balance sheet data are base of the decision process, and by following the movements interfering in the structure of the patrimony elements, there is made the control of development of these processes, analyzing the obtained output in relationship with the parameters from the base of decision making.
By its structure and by the way of grouping the indexes, the balance sheet offers the possibility to appreciate the financial statement of the enterprise and responds to the information needs of the users, providing also the data necessary for the elaboration of the prognoses.
The balance sheet includes the patrimony situation of the company on a given time, providing information related to the financial balance of the company. The use of the balance sheet as instrument of analysis of the economical-financial business on micro- and macro-economic level, grants it the characteristics of an economical template.
Furthermore, we will try to present the balance sheet from another perspective, which is much closer to the subject of this hereby work, concretely from the perspective of the fiscal evasion.
Synthetically, the structure of the balance sheet can be presented as it follows:
Form 1. Balance structure
I. ASSET II. LIABILITY 1. Circulating assets 1. Current debts -Cash and equivalents -Non-received debts -Expenses registered in advance -Inventory items -Advances withdrawn for discount -Other debts -Stocks -Other circulating assets
-Unpaid invoices -Taxes to be paid-up -Salaries to be paid-up -Dividends to be paid-up -Other payments -Incomes registered in advance -Short-term credits -Current part of the long-term debt -Other current debts
2. Intangible assets 2. Long-term debts -Furniture and other tangible assets -Equipment -Buildings and arrangements -Land -Other non-circulating assets
-Long-term debts – Banks -Other long-term debts -Dividends to be paid-up – long-term -Long-term loans between associates to be paid-up
3. Registered capitals
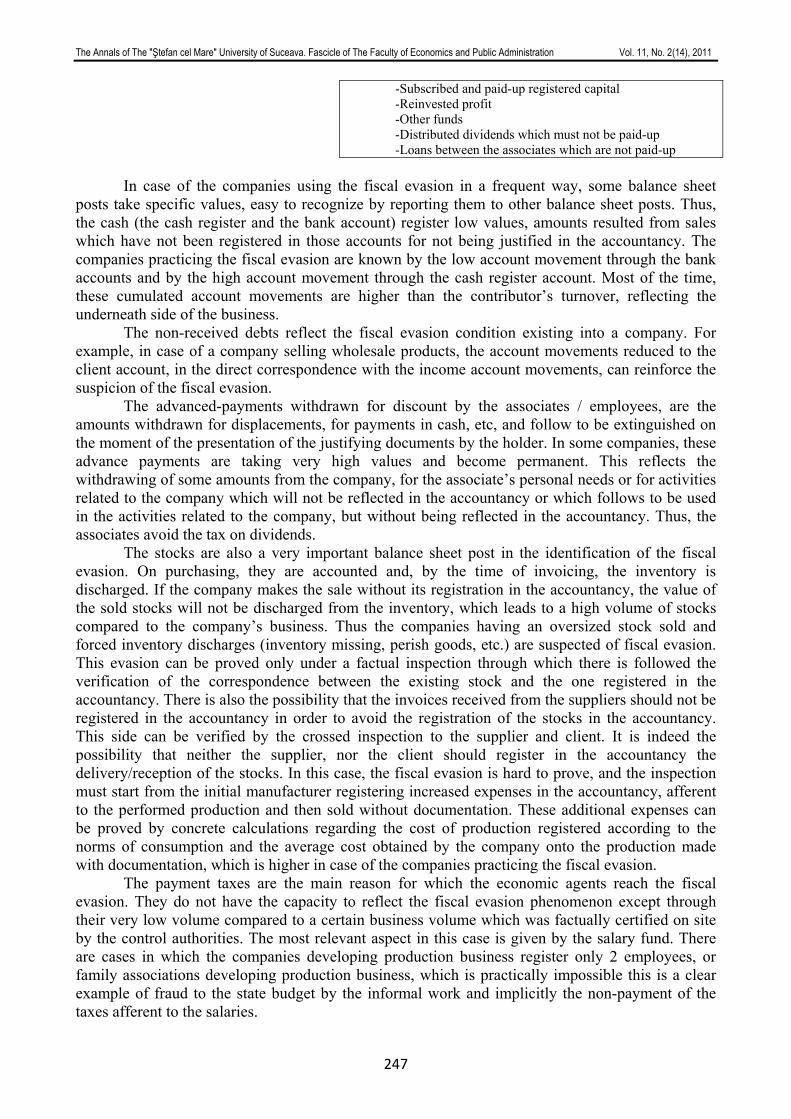
The Annals of The "Ştefan cel Mare" University of Suceava. Fascicle of The Faculty of Economics and Public Administration Vol. 11, No. 2(14), 2011
247
-Subscribed and paid-up registered capital -Reinvested profit -Other funds -Distributed dividends which must not be paid-up -Loans between the associates which are not paid-up
In case of the companies using the fiscal evasion in a frequent way, some balance sheet
posts take specific values, easy to recognize by reporting them to other balance sheet posts. Thus, the cash (the cash register and the bank account) register low values, amounts resulted from sales which have not been registered in those accounts for not being justified in the accountancy. The companies practicing the fiscal evasion are known by the low account movement through the bank accounts and by the high account movement through the cash register account. Most of the time, these cumulated account movements are higher than the contributor’s turnover, reflecting the underneath side of the business.
The non-received debts reflect the fiscal evasion condition existing into a company. For example, in case of a company selling wholesale products, the account movements reduced to the client account, in the direct correspondence with the income account movements, can reinforce the suspicion of the fiscal evasion.
The advanced-payments withdrawn for discount by the associates / employees, are the amounts withdrawn for displacements, for payments in cash, etc, and follow to be extinguished on the moment of the presentation of the justifying documents by the holder. In some companies, these advance payments are taking very high values and become permanent. This reflects the withdrawing of some amounts from the company, for the associate’s personal needs or for activities related to the company which will not be reflected in the accountancy or which follows to be used in the activities related to the company, but without being reflected in the accountancy. Thus, the associates avoid the tax on dividends.
The stocks are also a very important balance sheet post in the identification of the fiscal evasion. On purchasing, they are accounted and, by the time of invoicing, the inventory is discharged. If the company makes the sale without its registration in the accountancy, the value of the sold stocks will not be discharged from the inventory, which leads to a high volume of stocks compared to the company’s business. Thus the companies having an oversized stock sold and forced inventory discharges (inventory missing, perish goods, etc.) are suspected of fiscal evasion. This evasion can be proved only under a factual inspection through which there is followed the verification of the correspondence between the existing stock and the one registered in the accountancy. There is also the possibility that the invoices received from the suppliers should not be registered in the accountancy in order to avoid the registration of the stocks in the accountancy. This side can be verified by the crossed inspection to the supplier and client. It is indeed the possibility that neither the supplier, nor the client should register in the accountancy the delivery/reception of the stocks. In this case, the fiscal evasion is hard to prove, and the inspection must start from the initial manufacturer registering increased expenses in the accountancy, afferent to the performed production and then sold without documentation. These additional expenses can be proved by concrete calculations regarding the cost of production registered according to the norms of consumption and the average cost obtained by the company onto the production made with documentation, which is higher in case of the companies practicing the fiscal evasion.
The payment taxes are the main reason for which the economic agents reach the fiscal evasion. They do not have the capacity to reflect the fiscal evasion phenomenon except through their very low volume compared to a certain business volume which was factually certified on site by the control authorities. The most relevant aspect in this case is given by the salary fund. There are cases in which the companies developing production business register only 2 employees, or family associations developing production business, which is practically impossible this is a clear example of fraud to the state budget by the informal work and implicitly the non-payment of the taxes afferent to the salaries.
The Annals of The "Ştefan cel Mare" University of Suceava. Fascicle of The Faculty of Economics and Public Administration Vol. 11, No. 2(14), 2011
248
The loans between the associates reflect the amounts made available to the company by the associates. In most of the cases, in this account, there are registered amounts of money corresponding to the transactions not registered in the accountancy and which are subsequently introduced in the company as loans between the associates. Thus, very high amounts registered in the account 455 must draw attention of the control authorities upon the correctness of the development of the company’s business. The value of these amounts must be correlated with the contributor’s business, and with the associates’ incomes, which, most of the times, are lower than the amounts they have landed to the company. This is a clue of the existence of the fiscal evasion.
The profit and loss account synthesizes the economic flows, respectively the incomes and expenses of the inventory period.
The incomes include the value of all the enrichment deeds of the company related or not to the normal and current activity. The main part of the incomes is represented by the turnover performed by the company during the exercise. The expenses are the total of the cost elements borne by the company during the exercise.
If the balance sheet permits the knowledge of the financial position of the company, the profit and loss account grants information upon the company’s business, of the way in which the latter is managing the business through the incomes, expenses and the result they generate.
Synthetically, the structure of the profit and loss account may be presented as it follows: INCOMES FROM EXPLOITATION EXPENSES FROM EXPLOITATION Output from exploitation FINANCIAL INCOMES FINANCIAL EXPENSES Financial output Current output EXCEPTIONAL INCOMES EXCEPTIONAL EXPENSES Exceptional output TOTAL INCOMES TOTAL EXPENSES Gross output – Profit Tax = Net profit Regarding the profit and loss account, the fraud attempts are directed to the same aspect: the
maximization of the expenses and the minimization of the incomes. The maximization of the expenses is made through the accountancy registration of some
expenses which are not afferent to the activity developed by the company or the increase of some expenses over their real level. The minimization of the incomes is made by the non-accountancy of all the operations providing incomes to the company. The purpose of these operations is the decrease of the written profit and of its corresponding tax. Thus the profits make-ups (the profit make-up from exploitation, the net profit make-up, etc.) have a special importance in the appreciation of the reality of the financial statements of a company. These make-ups must be interpreted as a report between the profit from exploitation / net profit and the turnover and shows the profitability of the company. The make-up of the net profit should be compared with the interests the shareholders might obtain by submitting the registered capitals in the deposits with 0 risk or with the make-ups obtained by the companies with the same field of activity. In the way in which these are constantly low, here’s the question: Which is the reason for which the company’s shareholders keep their registered capitals into a company with lower profitability than a storehouse under the conditions of assuming a higher risk? The answer can be only the obtaining of some additional benefits not reflected in the net profit.
The Annals of The "Ştefan cel Mare" University of Suceava. Fascicle of The Faculty of Economics and Public Administration Vol. 11, No. 2(14), 2011
249
We are going to try to detail some relevant indexes for the appreciation of the financial statement of a company and for the identification of those practicing the fiscal evasion.
The liquidity of a company, more specifically the current liquidity to be calculated as a report between the circulating assets and the current debts. The value of this index must be supra-unitary. The companies applying the fiscal evasion are noticed through the high value of the stocks and their very high account movement due to their trading without the registration of the sale and discharge the inventory in the accountancy. In case of the companies practicing the fiscal evasion, the level of this index is high over 1.
Of course, the economic agents know that the inconsistency between the written stock and the factual one must be justified to a possible inspection and then they discharge forcedly those merchandises or finite products. This discharge is included on the expenses, generating a fiscal loss in most of the cases, which is not real but induced by the inventory discharge operation and encumbers the state budget from the amounts afferent to the profit tax. Due to this reason, the control authorities must check in detail the inventory discharge operations having high values, not consistent with the written business of the contributor. For example there can be made the comparison with the contributor’s turnover. An higher inventory discharge than the company’s business for a month must arise the suspicion of the control authorities regarding the existence of the fiscal evasion. This aspect must make the financial controllers think to the companies where the stock is not perishable.
Due to the non-discharge of the inventory of the products sold without being accounted, the revolving of the stocks is very slow, without correspondence in the real life of the company.
The degree of indebtedness, calculated as a report between the total debts and total assets, registers vey high values (close to 1), being usually affected by the amounts registered in the account 455 as loans between associates. The money obtained from the not-registered sale of the finite products or of the merchandises is introduced in the company’s business through the account 455 as contribution of the associate. The very high amounts reflected in the credit of this account must draw attention of the fiscal authorities. The value of these amounts must be correlated with the contributor’s activity and with the associates’ incomes which are most of the times lower than the amounts landed to the company. This is a clue of the existence of the fiscal evasion.
Nevertheless, the analysis of these financial indexes must be put under the law so that the fiscal authorities should have the legal possibility to question the associate / administrator regarding the more delicate aspects such as the personal incomes or the personal fortune. There must be also introduced clear regulations concerning the liability of the taxation of the personal fortunes of the associates / administrators, which cannot be justified through the results obtained by the company they owe / manage.
CONCLUSIONS As a conclusion, we can say that the economical-financial analysis of the contributors
cannot counter attack the fiscal evasion all by itself but it can provide important clues concerning its size and existence. The economical-financial analysis must be combined with the financial control for obtaining the desired effect of fighting against the fiscal evasion. This can be deemed a way of fight against it, but it’s a basic support in fighting against the phenomenon. The future surveys may line-up more clear and concrete liaisons between the abovementioned financial indexes and the level of the fiscal evasion, being able to reach a number of standard indexes which, according to the values we register, might generate a diagnostic concerning the fiscal evasion level. This result may be taken into account by the person performing the financial control for the intensification of the efforts to identify the fiscal evasion where the result presents suspicions regarding the existence of this phenomenon.
The study of the connection between the fiscal evasion and the financial indexes presented in this work will not lead to the eradication of the fiscal evasion, but through a better identification of the phenomenon, there are chances for the fighting methods to be more efficient and directly
The Annals of The "Ştefan cel Mare" University of Suceava. Fascicle of The Faculty of Economics and Public Administration Vol. 11, No. 2(14), 2011
250
oriented to the evasion’s source. Thus, we can say that the analysis of the economical-financial indexes must be a basic support for the fight against the fiscal evasion.
REFERENCES 1. Filip Gheorghe, Public finances, Junimea Publishing House, Iasi County 2002. 2. Hoanţă Nicolae, Economy and public finances, Polirom Publishing House, Iasi
County, 2000. 3. Hoanţă Nicolae, Fiscal evasion, Tribuna Economica Publishing House, Bucharest
1997. 4. Sheldon Artur, Prologue, Tax avoision, The institute of economic affairs, London,
1979. 5. Mihaiescu V. Sorin, Financial control for everybody, Sedcom Libris Publishing
House, Iasi County 2004 6. Şaguna Drosu Dan, Mihaela Tutungiu, Fiscal Evasion, Oscar Print Publishing House,
Bucharest, 1995. 7. Văcărel Iulian, Bistriceanu D. Gheorghe, Public Finances, Editura Didactică şi
Pedagogică, Bucharest 2008. 8. Law no. 87 / October 18th, 1994, concerning the fight against the fiscal evasion,
published in the Official Gazette no. 545/29.07.2003. 9. Law no. 241/July 15th, 2005 concerning the avoidance and fight against the fiscal
evasion, published in the Official Gazette no. 672/July 27th, 2005.

SECTION 4
STATISTICS, DATA PROCESSING (INFORMATICS) AND MATHEMATICS
The Annals of The "Ştefan cel Mare" University of Suceava. Fascicle of The Faculty of Economics and Public Administration Vol. 11, No. 2(14), 2011
STATISTICAL WAVES OF THE BUDGETARY FINANCING OF EDUCATION AND SCIENE IN UKRAINE
Associate Professor Ph.D. Olesia TOTSKA
Lesya Ukrainka Volyn National University, Lutsk, Ukraine E-mail: [email protected]
Abstract: In the article an author analysed the indexes of profits, charges and deficit of the State budget of Ukraine for
2002–2011. The prognosis model of the budgetary financing of Ukrainian education and science is built. The dynamics of particles of the government spending on education and science in profits and charges of country is determined. The name of statistical waves of the budgetary financing of education and science in Ukraine is given to these indexes.
Keywords: statistical waves, dynamics, prognosis model, education and science, the State budget of Ukraine,
profits and charges. JEL Classification: C53, H52, I22 INTRODUCTION In obedience to Law of Ukraine “On education”, education is basis of intellectual, cultural,
spiritual, social, economic development of society and state. Its purpose consists in comprehensive development of man as personality and the greatest value of society, development of its talents, mental and physical abilities, education of high moral qualities, forming of citizens, apt at a conscious public choice, enriching on this basis of intellectual, creative, cultural potential of people, increase of educational level of people, providing of national economy skilled specialists [1]. In Ukraine education is acknowledged the priority sphere of socio-economic, spiritual and cultural development of society. Accordingly it needs large financial investments from the side of the state.
Y. Benedik, T. Bogolib, N. Volkova, O. Robak, L. Yaremenko [2–6] and other economists-theorists devoted the scientific labours research of financial activity in the field of Ukrainian education. In particular, they analysed consisting and tendencies of financing of higher school of Ukraine [2], system and methods of financial analysis of financially-economic activity of higher educational establishments (HEE) [3], efficiency of the use of facilities of HEE [4], treasury maintenance of educational establishments [5], conducted the design of the system of effective management of financial streams of Department of education and science (DES) of Ukraine [6] and others like that. But in these publications the charges of the State budget of Ukraine on education were not probed, prognosis models were not built.
The purpose of writing of this article is an analysis of the state financing of education and science in Ukraine. For its realization it is needed to untie such tasks:
1) to build a table with the indexes of the State budget of Ukraine for 2002–2011; 2) to calculate the particles of charges of the State budget of Ukraine on Department of
education and science of Ukraine in profits and charges of the State budget of Ukraine accordingly; 3) to build the prognosis model of the budgetary financing of Ukrainian education and
science; 4) to define the dynamics of particle of the government spending on education and science
in profits and charges of country. EXPOSITION OF BASIC MATERIAL The system of Ukrainian education is represented on fig. nr. 1.
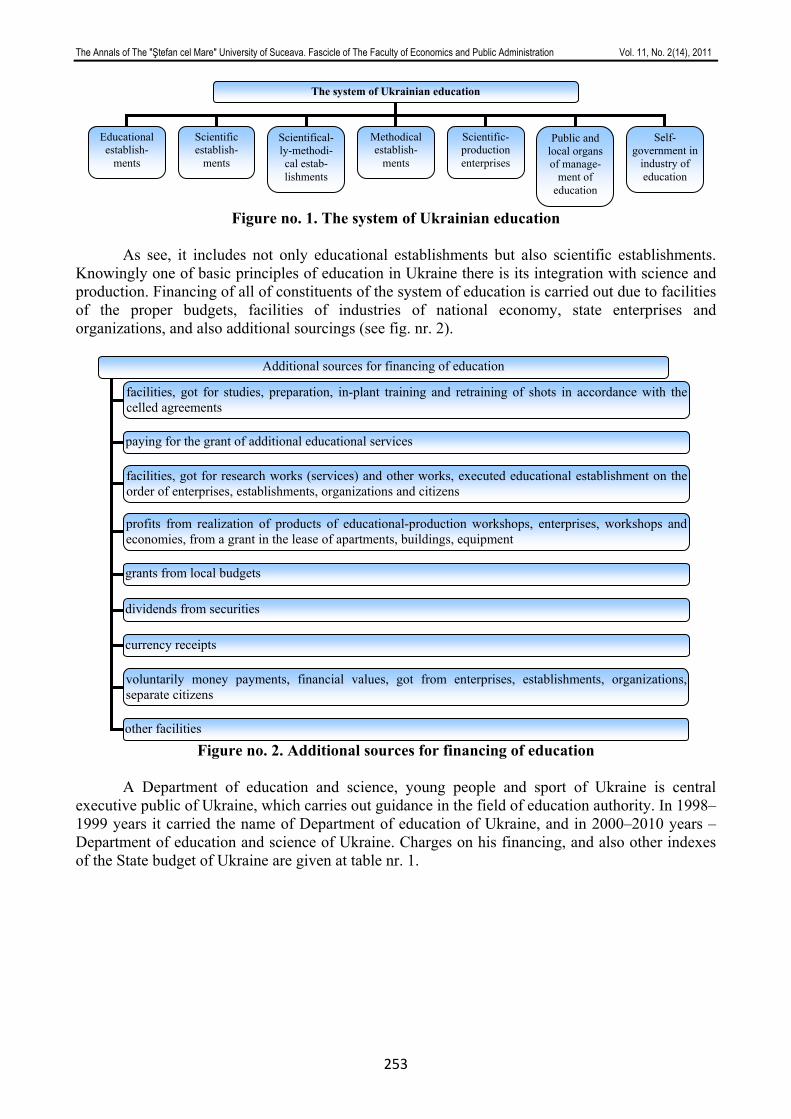
The Annals of The "Ştefan cel Mare" University of Suceava. Fascicle of The Faculty of Economics and Public Administration Vol. 11, No. 2(14), 2011
253
Additional sources for financing of education
facilities, got for studies, preparation, in-plant training and retraining of shots in accordance with the celled agreements
paying for the grant of additional educational services
facilities, got for research works (services) and other works, executed educational establishment on the order of enterprises, establishments, organizations and citizens
profits from realization of products of educational-production workshops, enterprises, workshops and economies, from a grant in the lease of apartments, buildings, equipment
grants from local budgets
dividends from securities
currency receipts
voluntarily money payments, financial values, got from enterprises, establishments, organizations,separate citizens
other facilities
Figure no. 1. The system of Ukrainian education
As see, it includes not only educational establishments but also scientific establishments. Knowingly one of basic principles of education in Ukraine there is its integration with science and production. Financing of all of constituents of the system of education is carried out due to facilities of the proper budgets, facilities of industries of national economy, state enterprises and organizations, and also additional sourcings (see fig. nr. 2).
Figure no. 2. Additional sources for financing of education
A Department of education and science, young people and sport of Ukraine is central executive public of Ukraine, which carries out guidance in the field of education authority. In 1998–1999 years it carried the name of Department of education of Ukraine, and in 2000–2010 years – Department of education and science of Ukraine. Charges on his financing, and also other indexes of the State budget of Ukraine are given at table nr. 1.
The system of Ukrainian education
Educational establish-
ments
Scientific establish-
ments
Scientifical-ly-methodi-cal estab-lishments
Methodical establish-
ments
Scientific-production enterprises
Public and local organs of manage-
ment of education
Self-government in
industry of education
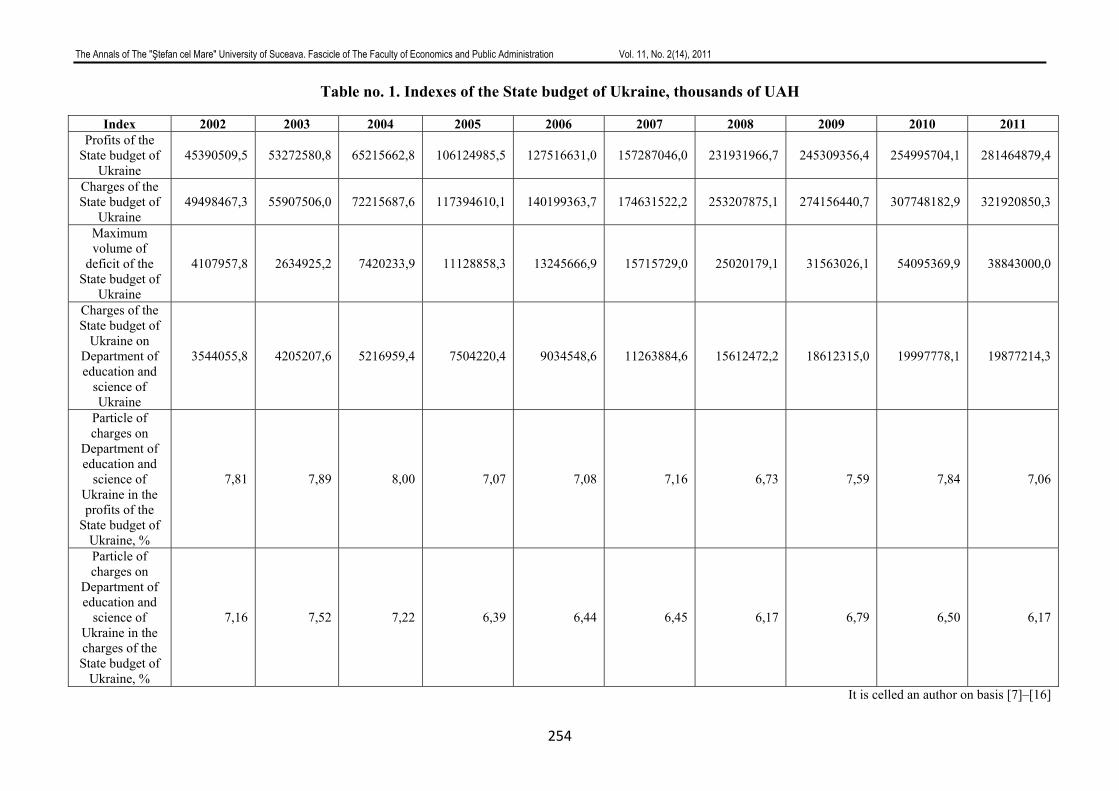
The Annals of The "Ştefan cel Mare" University of Suceava. Fascicle of The Faculty of Economics and Public Administration Vol. 11, No. 2(14), 2011
254
Table no. 1. Indexes of the State budget of Ukraine, thousands of UAH
Index 2002 2003 2004 2005 2006 2007 2008 2009 2010 2011 Profits of the
State budget of Ukraine
45390509,5 53272580,8 65215662,8 106124985,5 127516631,0 157287046,0 231931966,7 245309356,4 254995704,1 281464879,4
Charges of the State budget of
Ukraine 49498467,3 55907506,0 72215687,6 117394610,1 140199363,7 174631522,2 253207875,1 274156440,7 307748182,9 321920850,3
Maximum volume of
deficit of the State budget of
Ukraine
4107957,8 2634925,2 7420233,9 11128858,3 13245666,9 15715729,0 25020179,1 31563026,1 54095369,9 38843000,0
Charges of the State budget of
Ukraine on Department of education and
science of Ukraine
3544055,8 4205207,6 5216959,4 7504220,4 9034548,6 11263884,6 15612472,2 18612315,0 19997778,1 19877214,3
Particle of charges on
Department of education and
science of Ukraine in the profits of the
State budget of Ukraine, %
7,81 7,89 8,00 7,07 7,08 7,16 6,73 7,59 7,84 7,06
Particle of charges on
Department of education and
science of Ukraine in the charges of the State budget of
Ukraine, %
7,16 7,52 7,22 6,39 6,44 6,45 6,17 6,79 6,50 6,17
It is celled an author on basis [7]–[16]

The Annals of The "Ştefan cel Mare" University of Suceava. Fascicle of The Faculty of Economics and Public Administration Vol. 11, No. 2(14), 2011
Analysis of table nr. 1 shows that profits and charges of the State budget of Ukraine are annually increased. The maximum volume of deficit of the State budget of Ukraine grew during all of years, except 2003 and 2011. The dynamics of the government spending on Ukrainian education and science is well illustrated by fig. nr. 3.
Figure no. 3. Charges of the State budget of Ukraine on Department of education and science of Ukraine
From fig. nr. 3 evidently, that during 2002–2010 there was an annual increase of charges on
Ukrainian education and science, but in 2011 year, unfortunately, their diminishing took a place on 120563,8 thousands of UAH. Line, which represents the charges of the State budget of Ukraine on Department of education and science of Ukraine has the appearance of S-curve. In an order to hold the prognosis values of this index on next three years, will build trend prognosis model as S-curve
taaey /10+= by the programmatic package of Statgraphics 2.1 (Statistical Graphics System). Will get in the total, that a prognosis model will look like tey /96872,1657,16 −= , and prognosis information is on 2012 – 14332500 thousands of UAH, 2013 – 14547900 thousands of UAH, 2014 – 14732600 thousands of UAH. They testify that financing of education and science of Ukraine from the state budget in next three years will be approximately at the level of 2008 year.
As shows table nr. 1, calculated by the author particle of charges of the State budget of Ukraine on Department of education and science of Ukraine in the profits of the State budget of Ukraine during the last ten years made from 6,73 to 8,00 %. Such dynamics is inherent them: every three years there is an increase (2002–2004, 2005–2007, 2008–2010) after which a slump is on one year (from 2004 to 2005, from 2007 to 2008, from 2010 to 2011). Thus, this index can to interpret as a statistical wave of three-year growth of particle of the budgetary financing of Ukrainian education and science in the profits of country. As a wave repeated oneself already three times, it is possible to talk about large probability of its recreation in the future.
From table nr. 1 evidently, that calculated by the author particle of charges of the State budget of Ukraine on Department of education and science of Ukraine in the charges of the State budget of Ukraine during the last ten years made from 6,17 to 7,52 %. Such dynamics is inherent them: every three (two) years there is a slump (2003–2005, 2007–2008, 2009–2011) after which growth is on one (two) years (from 2005 to 2007, from 2008 to 2009). Thus, this index can to interpret as a statistical wave of three-year slump of particle of the budgetary financing of Ukrainian education and science in the charges of country. There is also large probability of its recreation in the future. It should be noted that comparatively with the first statistical wave, this wave takes a place with a delay on one year.
Both statistical waves of the budgetary financing of education and science in Ukraine well evidently on fig. nr. 4.
0,0
5000000,0
10000000,0
15000000,0
20000000,0
25000000,0
2002 2003 2004 2005 2006 2007 2008 2009 2010 2011
year
sum
, tho
usan
ds o
f UA
H
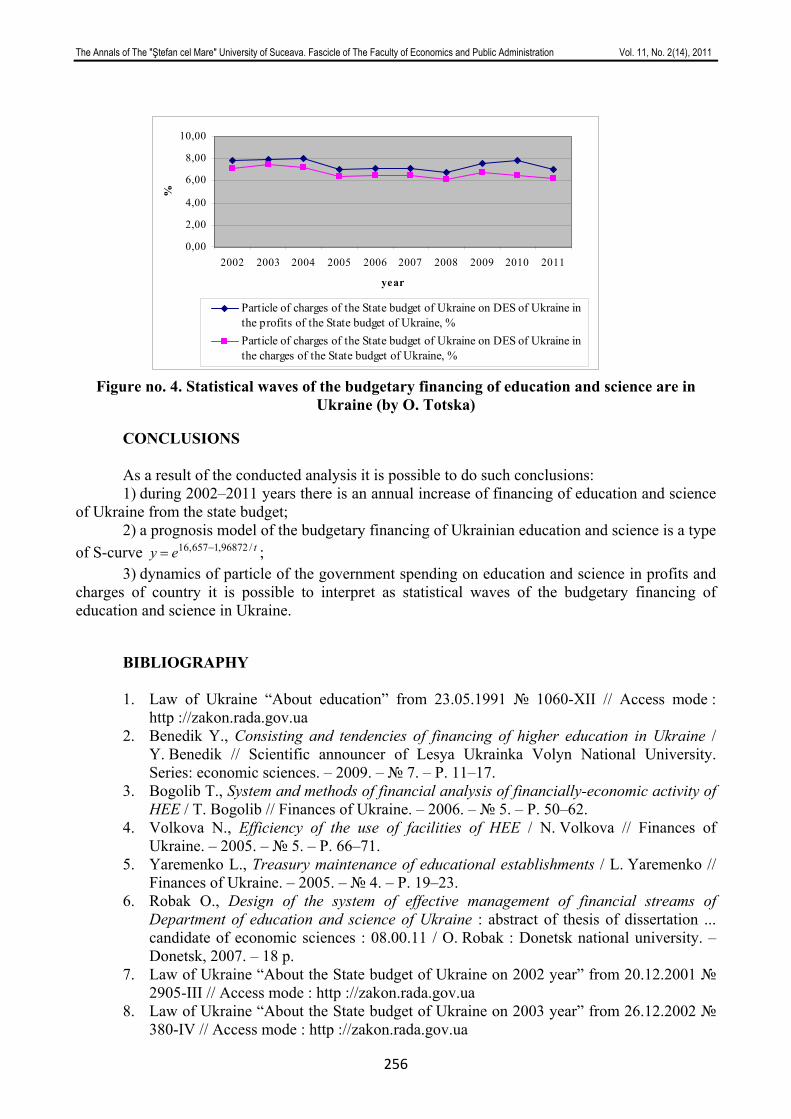
The Annals of The "Ştefan cel Mare" University of Suceava. Fascicle of The Faculty of Economics and Public Administration Vol. 11, No. 2(14), 2011
256
Figure no. 4. Statistical waves of the budgetary financing of education and science are in Ukraine (by O. Totska)
CONCLUSIONS As a result of the conducted analysis it is possible to do such conclusions: 1) during 2002–2011 years there is an annual increase of financing of education and science
of Ukraine from the state budget; 2) a prognosis model of the budgetary financing of Ukrainian education and science is a type
of S-curve tey /96872,1657,16 −= ; 3) dynamics of particle of the government spending on education and science in profits and
charges of country it is possible to interpret as statistical waves of the budgetary financing of education and science in Ukraine.
BIBLIOGRAPHY 1. Law of Ukraine “About education” from 23.05.1991 № 1060-XII // Access mode :
http ://zakon.rada.gov.ua 2. Benedik Y., Consisting and tendencies of financing of higher education in Ukraine /
Y. Benedik // Scientific announcer of Lesya Ukrainka Volyn National University. Series: economic sciences. – 2009. – № 7. – P. 11–17.
3. Bogolib T., System and methods of financial analysis of financially-economic activity of HEE / T. Bogolib // Finances of Ukraine. – 2006. – № 5. – P. 50–62.
4. Volkova N., Efficiency of the use of facilities of HEE / N. Volkova // Finances of Ukraine. – 2005. – № 5. – P. 66–71.
5. Yaremenko L., Treasury maintenance of educational establishments / L. Yaremenko // Finances of Ukraine. – 2005. – № 4. – P. 19–23.
6. Robak O., Design of the system of effective management of financial streams of Department of education and science of Ukraine : abstract of thesis of dissertation ... candidate of economic sciences : 08.00.11 / O. Robak : Donetsk national university. – Donetsk, 2007. – 18 p.
7. Law of Ukraine “About the State budget of Ukraine on 2002 year” from 20.12.2001 № 2905-III // Access mode : http ://zakon.rada.gov.ua
8. Law of Ukraine “About the State budget of Ukraine on 2003 year” from 26.12.2002 № 380-IV // Access mode : http ://zakon.rada.gov.ua
0,00
2,00
4,00
6,00
8,00
10,00
2002 2003 2004 2005 2006 2007 2008 2009 2010 2011
year
%
Particle of charges of the State budget of Ukraine on DES of Ukraine inthe profits of the State budget of Ukraine, %Particle of charges of the State budget of Ukraine on DES of Ukraine inthe charges of the State budget of Ukraine, %
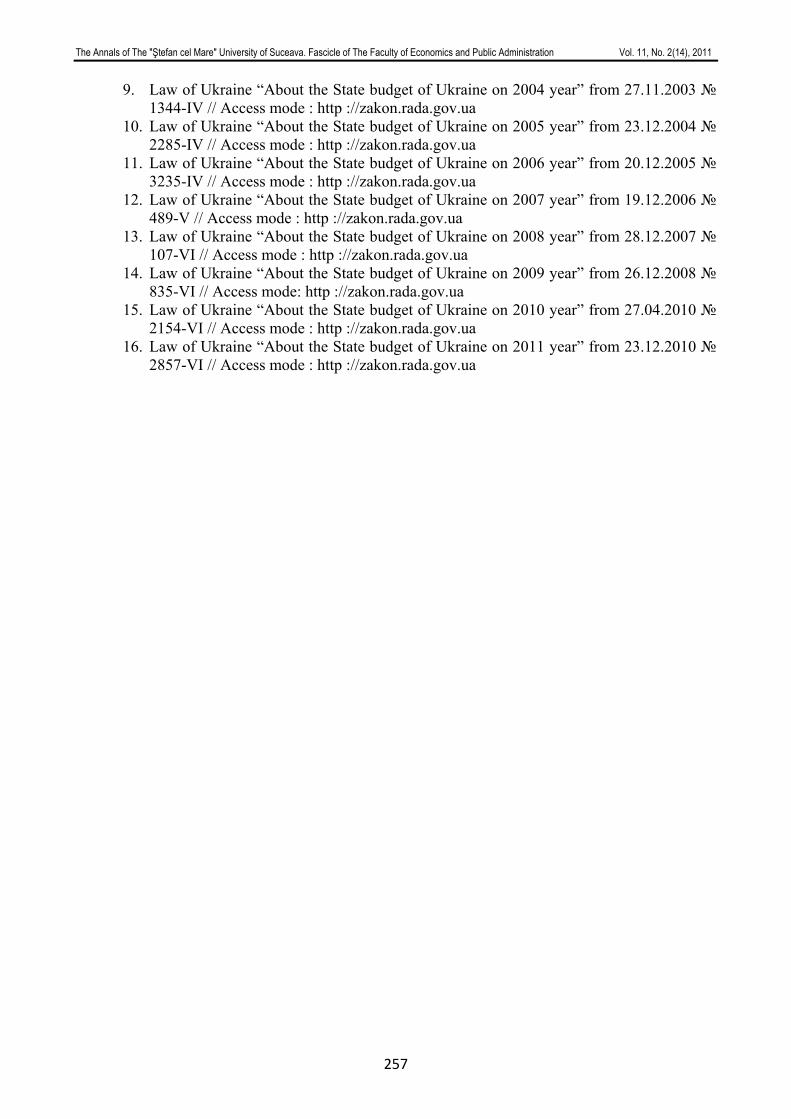
The Annals of The "Ştefan cel Mare" University of Suceava. Fascicle of The Faculty of Economics and Public Administration Vol. 11, No. 2(14), 2011
257
9. Law of Ukraine “About the State budget of Ukraine on 2004 year” from 27.11.2003 № 1344-IV // Access mode : http ://zakon.rada.gov.ua
10. Law of Ukraine “About the State budget of Ukraine on 2005 year” from 23.12.2004 № 2285-IV // Access mode : http ://zakon.rada.gov.ua
11. Law of Ukraine “About the State budget of Ukraine on 2006 year” from 20.12.2005 № 3235-IV // Access mode : http ://zakon.rada.gov.ua
12. Law of Ukraine “About the State budget of Ukraine on 2007 year” from 19.12.2006 № 489-V // Access mode : http ://zakon.rada.gov.ua
13. Law of Ukraine “About the State budget of Ukraine on 2008 year” from 28.12.2007 № 107-VI // Access mode : http ://zakon.rada.gov.ua
14. Law of Ukraine “About the State budget of Ukraine on 2009 year” from 26.12.2008 № 835-VI // Access mode: http ://zakon.rada.gov.ua
15. Law of Ukraine “About the State budget of Ukraine on 2010 year” from 27.04.2010 № 2154-VI // Access mode : http ://zakon.rada.gov.ua
16. Law of Ukraine “About the State budget of Ukraine on 2011 year” from 23.12.2010 № 2857-VI // Access mode : http ://zakon.rada.gov.ua
The Annals of The "Ştefan cel Mare" University of Suceava. Fascicle of The Faculty of Economics and Public Administration Vol. 11, No. 2(14), 2011
258
EDGES DETECTION METHODS BASED ON FILTERING FOLLOWED BY APPLICATION OF DIFFERENTIAL OPERATORS FOR FINGERPRINT
Ph.D. Student Cătălin LUPU
“Ştefan cel Mare ” University of Suceava, Romania [email protected]
Abstract: This article presents the advantages of edge detection methods using filtering operations followed by
application of differential operators fingerprint an image. When using methods based on differential operators when applying intensity variations can be detected by differentiation, but if noisy signals differentiation is dangerous due to the effect of amplifying the high frequencies. To eliminate this disadvantage must be designed optimal edge detectors (Canny) which satisfy the following criteria: accurate detection, correct location and a single response to a single edge.
Keywords: edge detectors, filter, differenţial operators, fingerprint JEL Classification: C 61 INTRODUCTION This article approaches the issue of improving the performances of edges detectors by noise
filtering followed by application of differential operators. It has been proposed the design of an optimal edge detector (Canny), namely, the finding of the filter with the best performances in relation to three criteria: accurate detection, correct location and a single response to a single edge.
EDGES DETECTION AND MARKING
The edge detection is technique that tries to identify areas with rapid variations of
intensities. Each technique is characterized by a set of operators also called edges detectors. Correct detection of edges is a very important issue in any biometric system. The edge
detection process serves at simplifying the analysis of images by strongly reducing the amount of data by preserving useful structural information about images contours of the fingerprint. Most component modules of the biometric system are directly or indirectly dependent of the edges detector performances used.
According to the principle used for edges detection, they are classified into: • Methods based on the application of differential operators; • Methods based on filtering followed by application of differential operators; • Methods based on approximation by one-dimensional surfaces with a similar profile
to the edge; • Residues method.
After the manner of execution of the derivation and filtering operations the methods are classified into:
• Methods working with discrete surfaces using discrete approximation of differential operators by finite differences;
• Methods working with approximated surfaces through a continuous function and use the analytical form of differential operators.
Edges detection techniques have two distinct stages: • Marking of the points characterized by rapid variations of intensities; • Selection of edge points.
METHODS BASED ON THE APPLICATION OF DIFFERENTIAL OPERATORS
Methods based on application of differential operators consist in the use of differentiation in
The Annals of The "Ştefan cel Mare" University of Suceava. Fascicle of The Faculty of Economics and Public Administration Vol. 11, No. 2(14), 2011
259
order to highlight the points where there are rapid variations of intensity, followed by application of a threshold in order to eliminate insignificant points. Rapid variations of intensity can be increased in an isotropic or anisotropic manner using derivative operators of even or uneven order.
Disadvantages Intensity variations can be detected by differentiation but for noisy signals the
differentiation is dangerous due to its effect of amplifying the high frequencies. In conclusion, the signal requires prior filtering. On the other hand, the filtering can be a dangerous operation because it can eliminate, besides the noise, the useful signal. The basic problem of edge detectors is to sense if there is or not, in the proximity, a signal variation. If the operator is working on a proximity too high, it may overlap over more than one edge or over the edge of a complex shape, so that the response may be wrong. If working on a proximity too small, the parameter estimation is not reliable. It is necessary to correlate the operators’ sizes with the united details sizes of the image.
Another disadvantage consists in the necessity of an additional step, generally not taken into account in the method assessment, consisting in edges thinning and removing of points with insignificant variations.
Therefore, we will present the methods based on filtering followed by application of differential operators.
METHODS BASED ON FILTERING FOLLOWED BY APPLICATION OF
DIFFERENTIAL OPERATORS
The question concerns the design of an optimal edge detector. Canny tried to find the filter that has the best performances in relation to the following criteria:
• Accurate detection There must be a low probability of unmarking a real edge point and a low probability of
marking a false edge point. These probabilities are monotonically increasing functions of the signal – noise ratio. This criterion corresponds to maximizing the signal – noise ratio.
• Correct location The points marked as edge points should be as close to the real point. • A single response to a single edge This criterion has been introduced beacuse the mathematical form of the first criterion can
not sense the situation of multiple responses. He gave a mathematical form to the three criteria, found the filter that maximizes them with a complicated expression, and showed that the first derivative of the Gaussian is very close to it (Figure no. 1). A similar result can be achieved with the second derivative of Gaussian.
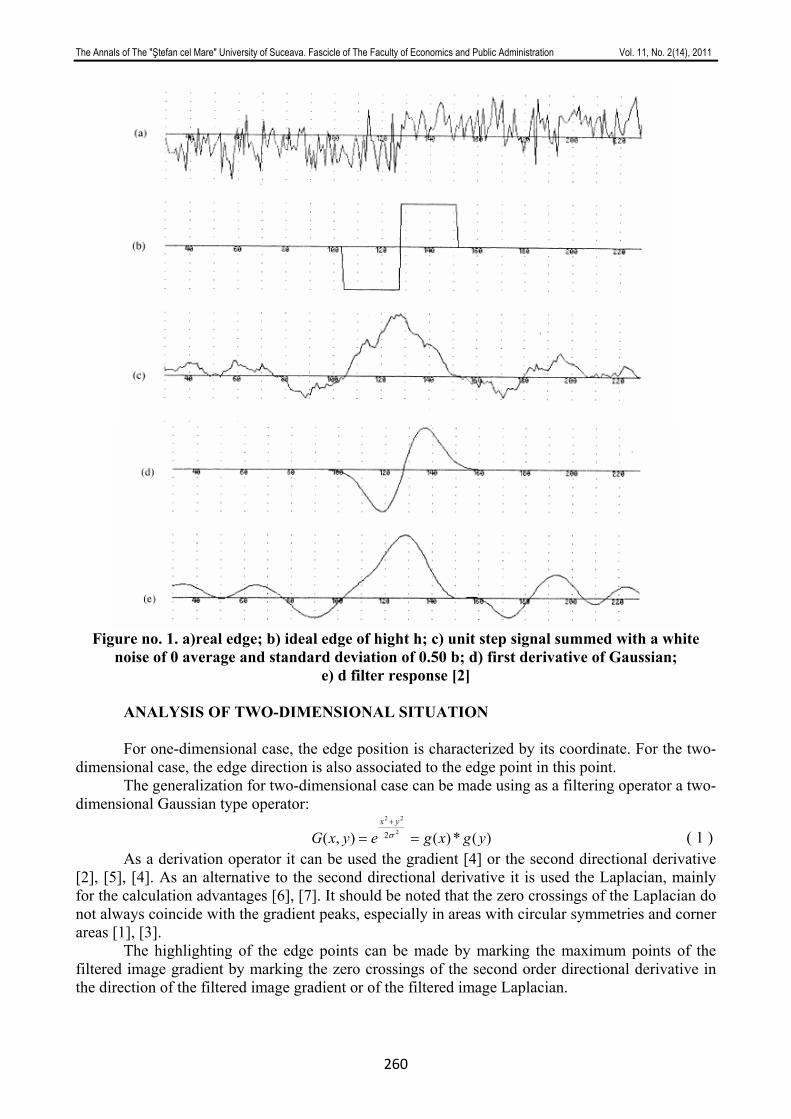
The Annals of The "Ştefan cel Mare" University of Suceava. Fascicle of The Faculty of Economics and Public Administration Vol. 11, No. 2(14), 2011
260
Figure no. 1. a)real edge; b) ideal edge of hight h; c) unit step signal summed with a white
noise of 0 average and standard deviation of 0.50 b; d) first derivative of Gaussian; e) d filter response [2]
ANALYSIS OF TWO-DIMENSIONAL SITUATION For one-dimensional case, the edge position is characterized by its coordinate. For the two-
dimensional case, the edge direction is also associated to the edge point in this point. The generalization for two-dimensional case can be made using as a filtering operator a two-
dimensional Gaussian type operator:
)(*)(),( 2
22
2 ygxgeyxGyx
==+
σ ( 1 ) As a derivation operator it can be used the gradient [4] or the second directional derivative
[2], [5], [4]. As an alternative to the second directional derivative it is used the Laplacian, mainly for the calculation advantages [6], [7]. It should be noted that the zero crossings of the Laplacian do not always coincide with the gradient peaks, especially in areas with circular symmetries and corner areas [1], [3].
The highlighting of the edge points can be made by marking the maximum points of the filtered image gradient by marking the zero crossings of the second order directional derivative in the direction of the filtered image gradient or of the filtered image Laplacian.
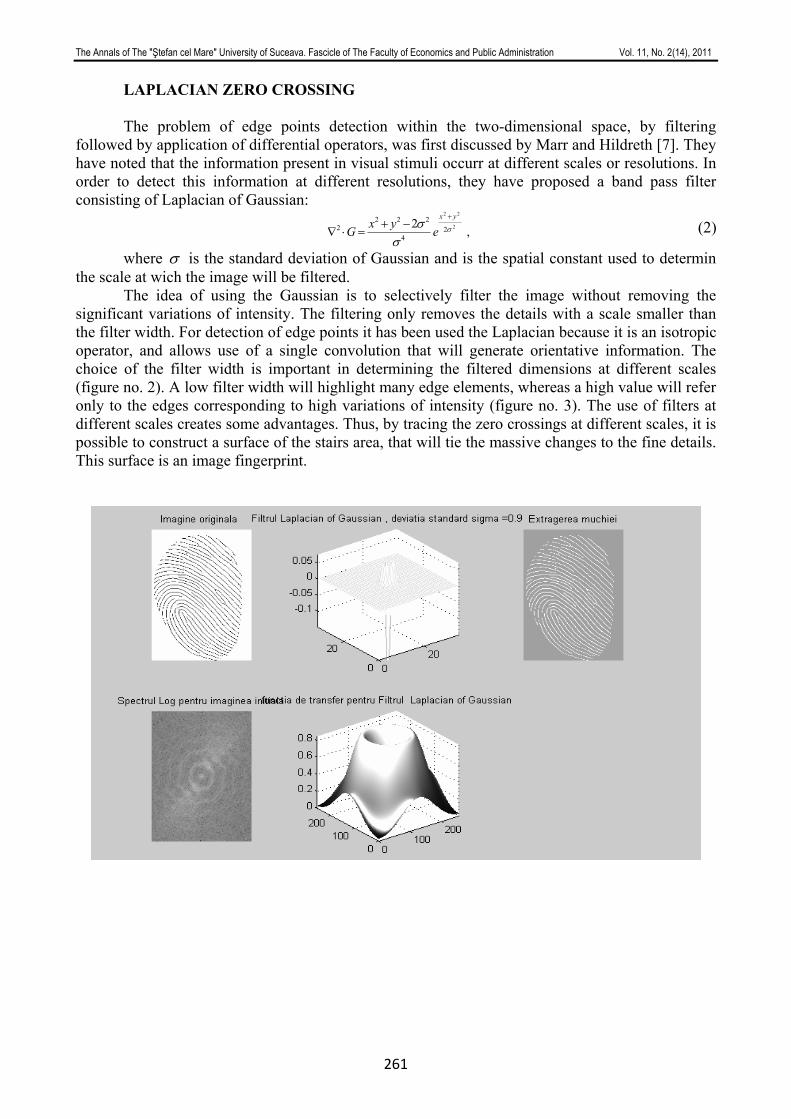
The Annals of The "Ştefan cel Mare" University of Suceava. Fascicle of The Faculty of Economics and Public Administration Vol. 11, No. 2(14), 2011
261
LAPLACIAN ZERO CROSSING The problem of edge points detection within the two-dimensional space, by filtering
followed by application of differential operators, was first discussed by Marr and Hildreth [7]. They have noted that the information present in visual stimuli occurr at different scales or resolutions. In order to detect this information at different resolutions, they have proposed a band pass filter consisting of Laplacian of Gaussian:
,2 2
22
24
2222 σ
σσ
yx
eyx
G+
−+=⋅∇ (2)
where σ is the standard deviation of Gaussian and is the spatial constant used to determin the scale at wich the image will be filtered.
The idea of using the Gaussian is to selectively filter the image without removing the significant variations of intensity. The filtering only removes the details with a scale smaller than the filter width. For detection of edge points it has been used the Laplacian because it is an isotropic operator, and allows use of a single convolution that will generate orientative information. The choice of the filter width is important in determining the filtered dimensions at different scales (figure no. 2). A low filter width will highlight many edge elements, whereas a high value will refer only to the edges corresponding to high variations of intensity (figure no. 3). The use of filters at different scales creates some advantages. Thus, by tracing the zero crossings at different scales, it is possible to construct a surface of the stairs area, that will tie the massive changes to the fine details. This surface is an image fingerprint.
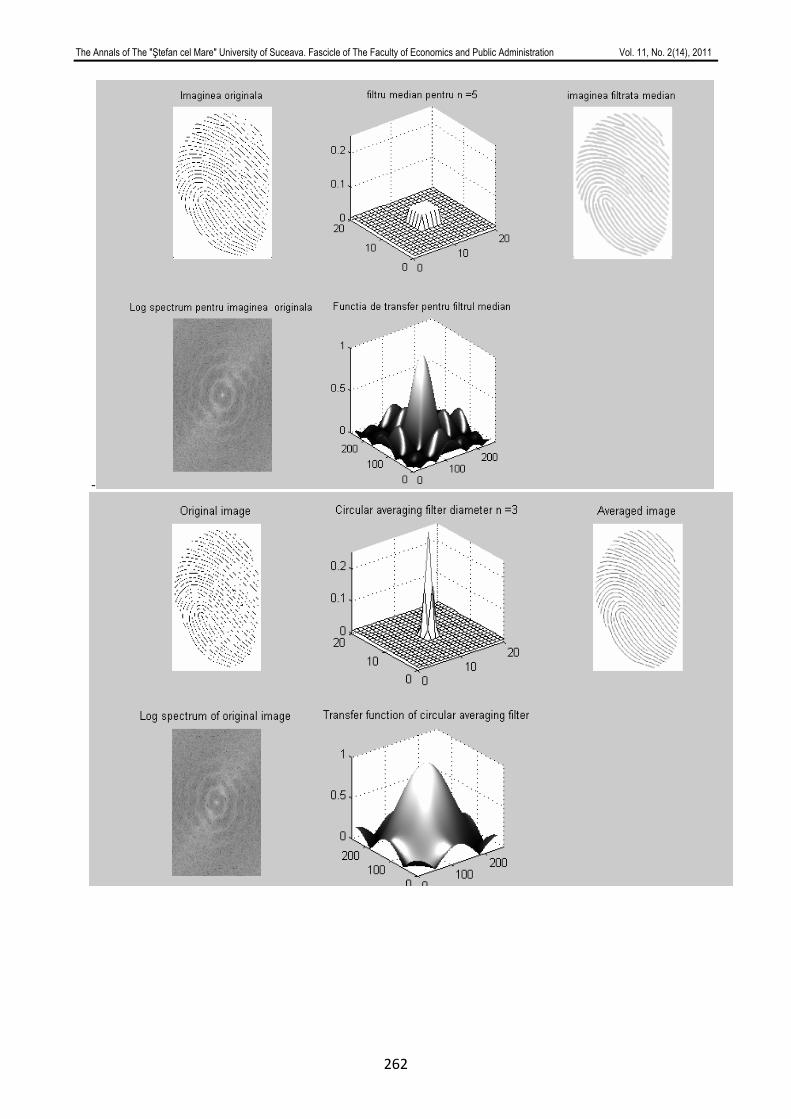
The Annals of The "Ştefan cel Mare" University of Suceava. Fascicle of The Faculty of Economics and Public Administration Vol. 11, No. 2(14), 2011
262
-
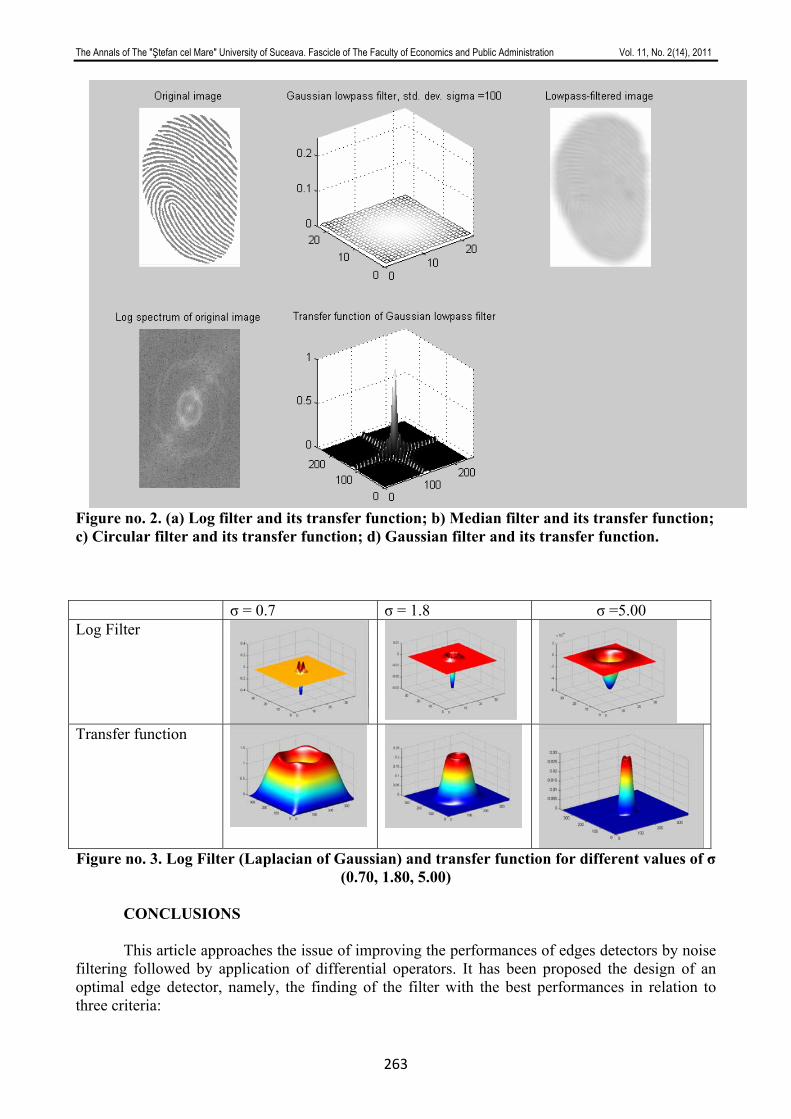
The Annals of The "Ştefan cel Mare" University of Suceava. Fascicle of The Faculty of Economics and Public Administration Vol. 11, No. 2(14), 2011
263
Figure no. 2. (a) Log filter and its transfer function; b) Median filter and its transfer function; c) Circular filter and its transfer function; d) Gaussian filter and its transfer function. σ = 0.7 σ = 1.8 σ =5.00 Log Filter
Transfer function
Figure no. 3. Log Filter (Laplacian of Gaussian) and transfer function for different values of σ (0.70, 1.80, 5.00)
CONCLUSIONS
This article approaches the issue of improving the performances of edges detectors by noise
filtering followed by application of differential operators. It has been proposed the design of an optimal edge detector, namely, the finding of the filter with the best performances in relation to three criteria:
The Annals of The "Ştefan cel Mare" University of Suceava. Fascicle of The Faculty of Economics and Public Administration Vol. 11, No. 2(14), 2011
264
• Accurate detection There must be a low probability of unmarking a real edge point and a low probability of
marking a false point edge. These probabilities are monotonically increasing functions of the signal – noise ratio. This criterion corresponds to maximizing the signal – noise ratio.
• Correct location The points marked as edge points should be as close to the real point. • A single response to a single edge This criterion has been introduced because the mathematical form of the first criterion can
not sense the situation of multiple responses. He gave a mathematical form to the three criteria, found that the filter that maximizes them with a complicated expression and showed that the first derivative of the Gaussian is very close to it. A similar result can be achieved with the second derivative of Gaussian.
REFERENCES
1. J.A.C. Bernsen, An Objective and Subective Evaluation of Edge Detection Methods in
Images, Philips J. Res., 46, 1991, pp.57 – 94; 2. J.Canny, A computational Approach to Edge Detection, IEEE Transaction on pattern
Analysis and Machine Intelligence, Vol.8, No.6, November 1986, pp. 679 – 698; 3. S.Castan, J.Zhao, J.Shen, Optimal Filter for Edge Detection Methods and Results, Proc.
On First European Conference on Computer Vision, Antibes, April, 1990, pp.13 – 17; 4. P.Grattoni, A.Guiducci, Contour Coding for Imge Description, Pattern Recognition
Letters, vol.11, No.2, February 1990, pp.95 – 105; 5. R.M. Haralik, Digital Step Edges from Zero Crossing of Second Directional Derivatives,
IEEE Transactions on Pattern Analysis and Machine Intelligence, vol.8, No.1, January 1986, pp. 58 – 68;
6. A.Huertas, G.Medioni, Detection of Intensity Changes with Subpixel Accuracy Using Laplacian – Gaussian Mask, IEEE Transaction on Pattern Analysis and Machine Intelligence, vol.8,No.5, September, 1986, pp.651 – 665;
7. D.Marr, E.C.Hildreth, Theory of Edge Detection, Proc. Royal Society of London Bulletin, vol.204, 1979, pp.301 – 328;
8. O.Monga, R.Deriche, G.Malandain, Recursive Filtering and Edge Closing: Two Primary Tools for 3D Edge Detection, Rapports de recherché, INRIA, No.1103, octomber, 1989.
SECTION 5
LAW AND PUBLIC ADMINISTRATION
MODELS OF THE IMPLEMENTATION IN ROMANIAN CIVIL SERVICE AT THE LOCAL LEVEL
Assoc. Prof. PhD. Dorina ŢICU [1] Al. I.Cuza University, Iaşi, Romania
Faculty of Philosophy and Social-Polictical Sciences [email protected]
Abstract: Implementation is one of the stages of public policy process which refers to the putting into practice of policies
projects. It is a purely practical step involved in administrative, organizational, political issues and not only and, therefore, it is extremely difficult to achieve successfully. Paper aims to identify the main models of implementation (the implementation as system management, the implementation as bureaucratic process, the implementation as organizational development and the implementation as negotiation), with their pluses and minuses and to outline a design process at the administrative level.
Key words: public policy, implementation as the system management, implementation as the birocracy,
implementation as the organisational development, implementation as the negociation
JEL Classification: D21, D22, D23, D71, D72, D73 1. INTRODUCTION. IMPLEMENTATION, DEFINITIONS AND THE OUTLINE
OF DISCURSIVE UNIVERSE
Implementation is a step of interest at the level of the cycle of a public policy which contains inside the term, a multitude of senses and tones intercepted by various authors.
The implementation represents “the commissioning of a certain public policy” (Pasquino, 2002). It is the process “underlining the outputs which are congruent to the original intentions” (Lane, 1987) (if we are to regard the systemic vision on public policies, as developed by Easton). To execute, to implement, to apply are synonyms. “Execution represents the step of the policy process by which one must reach the set targets. Within this step, the decisions become enforceable and must be applied” (Howlett, Ramesh, 2004). Implementation represents that phase of a long public policy which generates deeds and effects starting from a normative framework of intents, texts or political speeches. Implementation refers to two meanings: the meaning to have practical effects or enforcement and fulfilment” (Lane, 1987). In order to talk about implementation, we must take into account the following variables specific to the term: its purposes were clearly defined and understood, the necessary resources were made available, a command chain able to assembly and control the resources has been drafted, the system efficiently communicates and there are no organizational controls to prevent the concerned process (Miroiu, 2001).
Referring to the implementation models in the literature, authors such as Brown and Robert (1982), Giacchino, Kakabadse (2005), Vroom (1996), Minogue (1997) have differentiated between the implementation as management system, as the bureaucratic process, as organizational development or as negotiation.
Implementation becomes the process by which they assign certain resources for applying public policy projects they agreed upon, which involves the existence both of control and communication system.
Beyond the definitions of the term, implementation – as step of public policy cycle – is a dynamic process, getting into contact with practical realities, which assumes an institutional adaptation, as well as mechanisms. Hence, various models of implementation.
The Annals of The "Ştefan cel Mare" University of Suceava. Fascicle of The Faculty of Economics and Public Administration Vol. 11, No. 2(14), 2011
267
2. MODELS OF IMPLEMENTATION It can distinguish between: the implementation as management system, the implementation
as bureaucratic process, the implementation as organizational development and the implementation as negotiation .
The implementation models have been developed by different schools of thought: the implementation as the management system has been theorized by rationalist tradition of public policy analysis, the implementation as the bureaucratic process is predominantly sociological view of organizations, the implementation as the organizational development model is a combination of sociological with psychological theory (which focuses on the conflict between individual and organization's needs) and the implementation as the negotiation that analyses the situations from an individual psychological perspective (trying to bring to the same level the individuals with different interests) (Elmore, 1987).
Implementation as management system is based on a number of initial claims with axiological role. The organizations have reason as main value which they pursue to maximize. Their conduct is target oriented, their targets being built on a teleological dimension. The organizations are structured according to the principles of hierarchy and control and, hence, each department is carefully monitored, and its performance is considerately quantified. Its liabilities are divided at the level of each organizational component in order to increase the performance. Implementation assumes the definition of a detailed set of targets which underline the intentions of a given policy, the correlation of these target-purposes with the responsibilities recouped at the level of all organizational components, as well as monitoring these activities at the level of department, “the imposition of adjustments where they seem to be necessary, pursuing their performances and functionally integrates collections of parts which are able to act focused on one joint purpose” (Brown, Robert, 1982). Functional integration is identifiable at the level of organizations from the highest levels to the lowest levels and are grounded on rules clearly defined at an institutional level which lead to a firm hierarchic control so that, the lowest levels receive fixed directives for the policies to be implemented. Such a system is complex and many times hardens the decision-making or implementation process of policies. There must be and develop, between this dimension of hierarchic control and the subunits of the organization, “a suboptimization process” (Minogue, 1997) which shall grant the managers of the organization subunits the possibility to make decisions at their level which they shall subsequently present at a central level. They must decide first of all the “sub-issues” (Minogue, 1997), and afterwards the issues in the exactness, precision and understanding manner of preliminary policies. An unsuccessful implementation would mean a faulty management, that is, responsibilities which are not totally assumed, badly defined purposes of the policies, low performances which are not correlated to the expected results.
Implementation as bureaucratic process is grounded on the following features: the central attributes of the organizations are discretion and routine, the organizational conduct is reducible to the own action exerted by employees in their daily work, to make decisions and to “operational routines’ (Giacchino, Kakabadse, 2005) which they develop, in order to keep their position within the organization. It leads to power fragmentation among the control units which develop a strong control on their specific area of action. The structure of the organization becomes more and more complex and the units more and more specialized if holding power monopoly in their scope of action. All the proposals of change are judged by the units of the organization in disagreement terms against interiorized patterns. The decisions tend to get an incremental aspect. Implementation consists of identifying the focusing degree of the employees’ actions and in identifying the need to change the routines, to define alternative routines. The model starts from the meaning offered to the term of bureaucracy by Max Weber. We deal with a “fractional power” (Minogue, 1997). The individuals or units at the level of the organization spare their action space created by discrete actions, as this conduct guaranties them the keeping of the status at the level of the organization. Routine allows the simplification of daily work but capitalizes as well the specialization they work on, which grants safety to action. “One of the raised issues is that of
The Annals of The "Ştefan cel Mare" University of Suceava. Fascicle of The Faculty of Economics and Public Administration Vol. 11, No. 2(14), 2011
268
controlling the employees’ own actions” (Minogue, 1997). It is needed in a series of directions, like: budget planning and adopting, staff dismissal procedures, general assessment of the organizational system. In all these cases, they apply the standard technical procedures as well as a hierarchical vertical control. The difference involved if we correlate this model with the one of implementation as system management is that, if in the previously mentioned case, the organizations respond to the changes needed at the level of policies, in this case, organizations are reserved regarding change. If in the first case, the organizational units do what they are told, in the second, they continue what has been previously done.
The issue bureaucrats have to face is the concern to the method to express the policies in the law adopted at the level of rules or of needed guides to implement a policy. Despite it, the central level regulations get various valences at the applied level, or in the working groups within the organization.
Implementation as organizational development is grounded on the following assertions: the organizations should work in order to satisfy the basic social and psychological needs of the individuals, which should be able to be part in the decision making process. Organizations should be built so that they maximize the control of individuals. The effective decision depends on the current creation degree at the level of each and every group. The quality of interpersonal relations inside the organization determines the quality of the made decisions. Decision-making assumes first of all, the fulfilment of the consensus and the establishment of close relations amongst the members of the group. The implementation has fundamental structures like the consensus on purposes, concomitantly the individual autonomy, but also the responsibility assumed by the implementers.
An implementation with no success may mean an implementation which only regards the programs, without going beyond the regulations strictly clinging to them. The implementers strictly comply with the limits of programs and the circumstances generated by them, without marching on individual decisions. They have noticed the existence of a conduct beyond the limits of the organization itself, arisen from the autonomy need of individuals, activated by personal self-motivation, which is grounded on individual feelings and values. However, at the internal level of the organizations, we expect the individuals to manifest a dependent and passive behaviour to their superior managers, suppressing their feelings and values. A reasonable theory is to find a way to start from individual needs in order to reach the abstract properties of organizations. Open communication assumes “interpersonal skills” which are distinguished from “purely technical skills” by the fact that they give a fair expression of the feelings, values and attitudes of individuals, which they transpose to new ideas or which remain open to new ideas (Vroom, 1996). This kind of opening determines the transfer of responsibilities at the lowest levels of the organization. Implementation assumes a new vision which consists of the control management of these units and work groups, but also reaching the consensus at the level of groups. The presence of activated values, of motivations is necessary as their absence leads to the imposition of a hierarchic control. Work efficiency translates in work related to the members of the work groups. The criticism of this model assumes the lack of trust on the coordination and cooperation capacity among individuals in order to agree upon it. This model does not discuss on the elements related to power distribution at organizational level or on the changing nature of public policies, or on the negotiation and blocking processes which can appear at the level of the implementation stage.
Implementation as negotiation affirms that the organizations are real areas of conflict where the individuals and subunits have specific interests which pursue fulfilment of certain own advantages or the maximization of personal power or of organizational unit, the distribution of power at the level of the organization has an instable character, depending on the personal-individual capacity to gather resources which shall be used to mobilize the other members of the organization and to manipulate their behaviour. “Power is given less by the formal position at hierarchic level, but by the specialty knowledge, access to resources and capacity to control them, to mobilize the external political support” (Minogue, 1997). Decision-making at the level of the organization assumes a negotiation process among the subunits or among the individuals in the organization. Negotiation appears due to the fact that actors have different opinions, values,
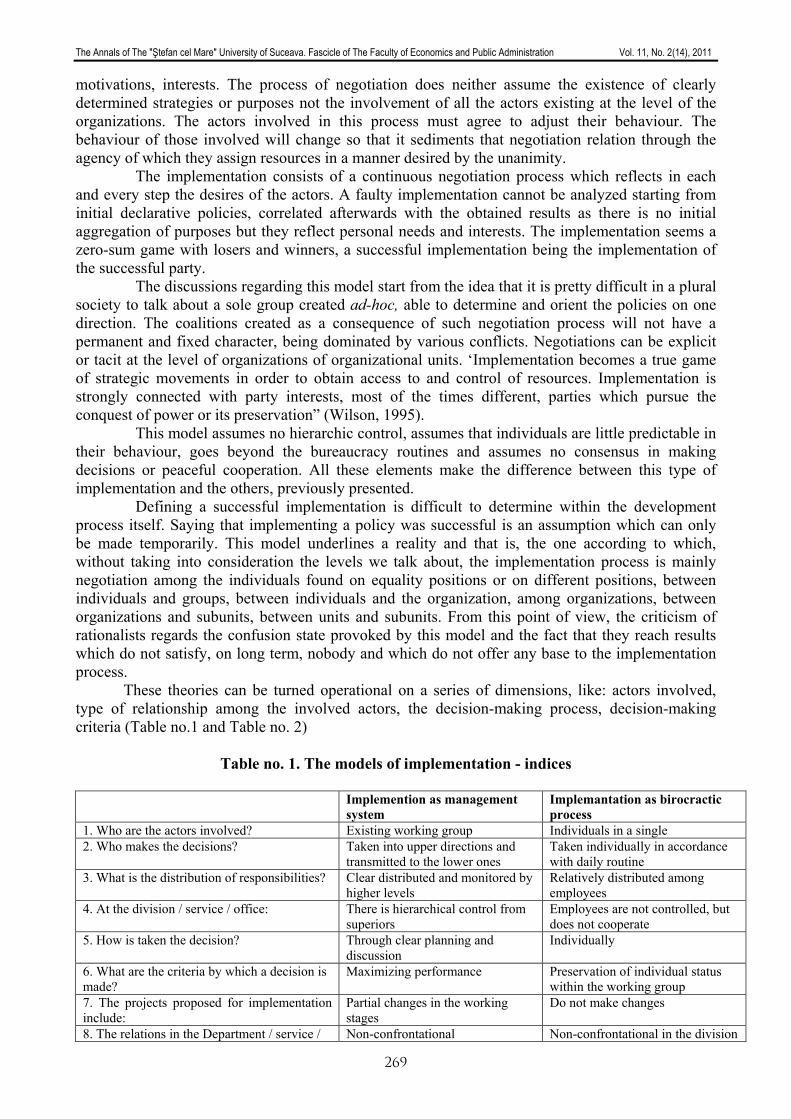
The Annals of The "Ştefan cel Mare" University of Suceava. Fascicle of The Faculty of Economics and Public Administration Vol. 11, No. 2(14), 2011
269
motivations, interests. The process of negotiation does neither assume the existence of clearly determined strategies or purposes not the involvement of all the actors existing at the level of the organizations. The actors involved in this process must agree to adjust their behaviour. The behaviour of those involved will change so that it sediments that negotiation relation through the agency of which they assign resources in a manner desired by the unanimity.
The implementation consists of a continuous negotiation process which reflects in each and every step the desires of the actors. A faulty implementation cannot be analyzed starting from initial declarative policies, correlated afterwards with the obtained results as there is no initial aggregation of purposes but they reflect personal needs and interests. The implementation seems a zero-sum game with losers and winners, a successful implementation being the implementation of the successful party.
The discussions regarding this model start from the idea that it is pretty difficult in a plural society to talk about a sole group created ad-hoc, able to determine and orient the policies on one direction. The coalitions created as a consequence of such negotiation process will not have a permanent and fixed character, being dominated by various conflicts. Negotiations can be explicit or tacit at the level of organizations of organizational units. ‘Implementation becomes a true game of strategic movements in order to obtain access to and control of resources. Implementation is strongly connected with party interests, most of the times different, parties which pursue the conquest of power or its preservation” (Wilson, 1995).
This model assumes no hierarchic control, assumes that individuals are little predictable in their behaviour, goes beyond the bureaucracy routines and assumes no consensus in making decisions or peaceful cooperation. All these elements make the difference between this type of implementation and the others, previously presented.
Defining a successful implementation is difficult to determine within the development process itself. Saying that implementing a policy was successful is an assumption which can only be made temporarily. This model underlines a reality and that is, the one according to which, without taking into consideration the levels we talk about, the implementation process is mainly negotiation among the individuals found on equality positions or on different positions, between individuals and groups, between individuals and the organization, among organizations, between organizations and subunits, between units and subunits. From this point of view, the criticism of rationalists regards the confusion state provoked by this model and the fact that they reach results which do not satisfy, on long term, nobody and which do not offer any base to the implementation process.
These theories can be turned operational on a series of dimensions, like: actors involved, type of relationship among the involved actors, the decision-making process, decision-making criteria (Table no.1 and Table no. 2)
Table no. 1. The models of implementation - indices
Implemention as management
system Implemantation as birocractic process
1. Who are the actors involved? Existing working group Individuals in a single 2. Who makes the decisions? Taken into upper directions and
transmitted to the lower ones Taken individually in accordance with daily routine
3. What is the distribution of responsibilities? Clear distributed and monitored by higher levels
Relatively distributed among employees
4. At the division / service / office: There is hierarchical control from superiors
Employees are not controlled, but does not cooperate
5. How is taken the decision? Through clear planning and discussion
Individually
6. What are the criteria by which a decision is made?
Maximizing performance Preservation of individual status within the working group
7. The projects proposed for implementation include:
Partial changes in the working stages
Do not make changes
8. The relations in the Department / service / Non-confrontational Non-confrontational in the division
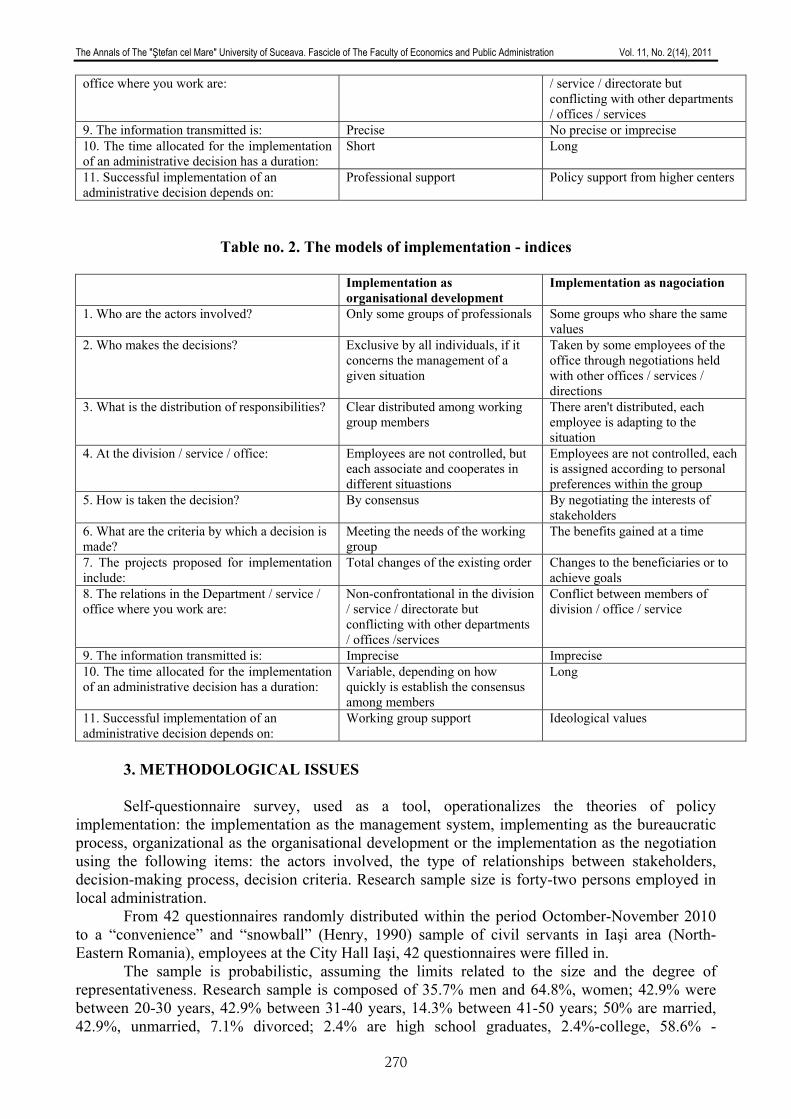
The Annals of The "Ştefan cel Mare" University of Suceava. Fascicle of The Faculty of Economics and Public Administration Vol. 11, No. 2(14), 2011
270
office where you work are: / service / directorate but conflicting with other departments / offices / services
9. The information transmitted is: Precise No precise or imprecise 10. The time allocated for the implementation of an administrative decision has a duration:
Short Long
11. Successful implementation of an administrative decision depends on:
Professional support Policy support from higher centers
Table no. 2. The models of implementation - indices
Implementation as organisational development
Implementation as nagociation
1. Who are the actors involved? Only some groups of professionals Some groups who share the same values
2. Who makes the decisions? Exclusive by all individuals, if it concerns the management of a given situation
Taken by some employees of the office through negotiations held with other offices / services / directions
3. What is the distribution of responsibilities? Clear distributed among working group members
There aren't distributed, each employee is adapting to the situation
4. At the division / service / office: Employees are not controlled, but each associate and cooperates in different situastions
Employees are not controlled, each is assigned according to personal preferences within the group
5. How is taken the decision? By consensus By negotiating the interests of stakeholders
6. What are the criteria by which a decision is made?
Meeting the needs of the working group
The benefits gained at a time
7. The projects proposed for implementation include:
Total changes of the existing order Changes to the beneficiaries or to achieve goals
8. The relations in the Department / service / office where you work are:
Non-confrontational in the division / service / directorate but conflicting with other departments / offices /services
Conflict between members of division / office / service
9. The information transmitted is: Imprecise Imprecise 10. The time allocated for the implementation of an administrative decision has a duration:
Variable, depending on how quickly is establish the consensus among members
Long
11. Successful implementation of an administrative decision depends on:
Working group support Ideological values
3. METHODOLOGICAL ISSUES Self-questionnaire survey, used as a tool, operationalizes the theories of policy
implementation: the implementation as the management system, implementing as the bureaucratic process, organizational as the organisational development or the implementation as the negotiation using the following items: the actors involved, the type of relationships between stakeholders, decision-making process, decision criteria. Research sample size is forty-two persons employed in local administration.
From 42 questionnaires randomly distributed within the period Octomber-November 2010 to a “convenience” and “snowball” (Henry, 1990) sample of civil servants in Iaşi area (North-Eastern Romania), employees at the City Hall Iaşi, 42 questionnaires were filled in.
The sample is probabilistic, assuming the limits related to the size and the degree of representativeness. Research sample is composed of 35.7% men and 64.8%, women; 42.9% were between 20-30 years, 42.9% between 31-40 years, 14.3% between 41-50 years; 50% are married, 42.9%, unmarried, 7.1% divorced; 2.4% are high school graduates, 2.4%-college, 58.6% -
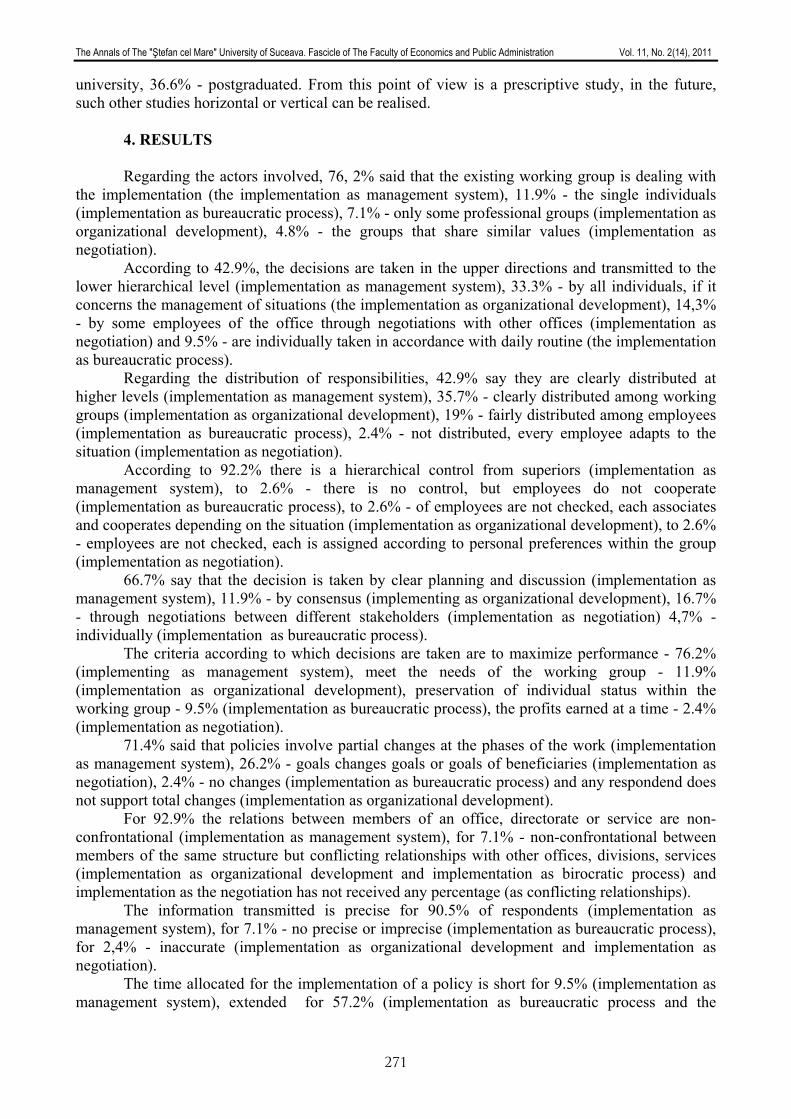
The Annals of The "Ştefan cel Mare" University of Suceava. Fascicle of The Faculty of Economics and Public Administration Vol. 11, No. 2(14), 2011
271
university, 36.6% - postgraduated. From this point of view is a prescriptive study, in the future, such other studies horizontal or vertical can be realised.
4. RESULTS Regarding the actors involved, 76, 2% said that the existing working group is dealing with
the implementation (the implementation as management system), 11.9% - the single individuals (implementation as bureaucratic process), 7.1% - only some professional groups (implementation as organizational development), 4.8% - the groups that share similar values (implementation as negotiation).
According to 42.9%, the decisions are taken in the upper directions and transmitted to the lower hierarchical level (implementation as management system), 33.3% - by all individuals, if it concerns the management of situations (the implementation as organizational development), 14,3% - by some employees of the office through negotiations with other offices (implementation as negotiation) and 9.5% - are individually taken in accordance with daily routine (the implementation as bureaucratic process).
Regarding the distribution of responsibilities, 42.9% say they are clearly distributed at higher levels (implementation as management system), 35.7% - clearly distributed among working groups (implementation as organizational development), 19% - fairly distributed among employees (implementation as bureaucratic process), 2.4% - not distributed, every employee adapts to the situation (implementation as negotiation).
According to 92.2% there is a hierarchical control from superiors (implementation as management system), to 2.6% - there is no control, but employees do not cooperate (implementation as bureaucratic process), to 2.6% - of employees are not checked, each associates and cooperates depending on the situation (implementation as organizational development), to 2.6% - employees are not checked, each is assigned according to personal preferences within the group (implementation as negotiation).
66.7% say that the decision is taken by clear planning and discussion (implementation as management system), 11.9% - by consensus (implementing as organizational development), 16.7% - through negotiations between different stakeholders (implementation as negotiation) 4,7% - individually (implementation as bureaucratic process).
The criteria according to which decisions are taken are to maximize performance - 76.2% (implementing as management system), meet the needs of the working group - 11.9% (implementation as organizational development), preservation of individual status within the working group - 9.5% (implementation as bureaucratic process), the profits earned at a time - 2.4% (implementation as negotiation).
71.4% said that policies involve partial changes at the phases of the work (implementation as management system), 26.2% - goals changes goals or goals of beneficiaries (implementation as negotiation), 2.4% - no changes (implementation as bureaucratic process) and any respondend does not support total changes (implementation as organizational development).
For 92.9% the relations between members of an office, directorate or service are non-confrontational (implementation as management system), for 7.1% - non-confrontational between members of the same structure but conflicting relationships with other offices, divisions, services (implementation as organizational development and implementation as birocratic process) and implementation as the negotiation has not received any percentage (as conflicting relationships).
The information transmitted is precise for 90.5% of respondents (implementation as management system), for 7.1% - no precise or imprecise (implementation as bureaucratic process), for 2,4% - inaccurate (implementation as organizational development and implementation as negotiation).
The time allocated for the implementation of a policy is short for 9.5% (implementation as management system), extended for 57.2% (implementation as bureaucratic process and the
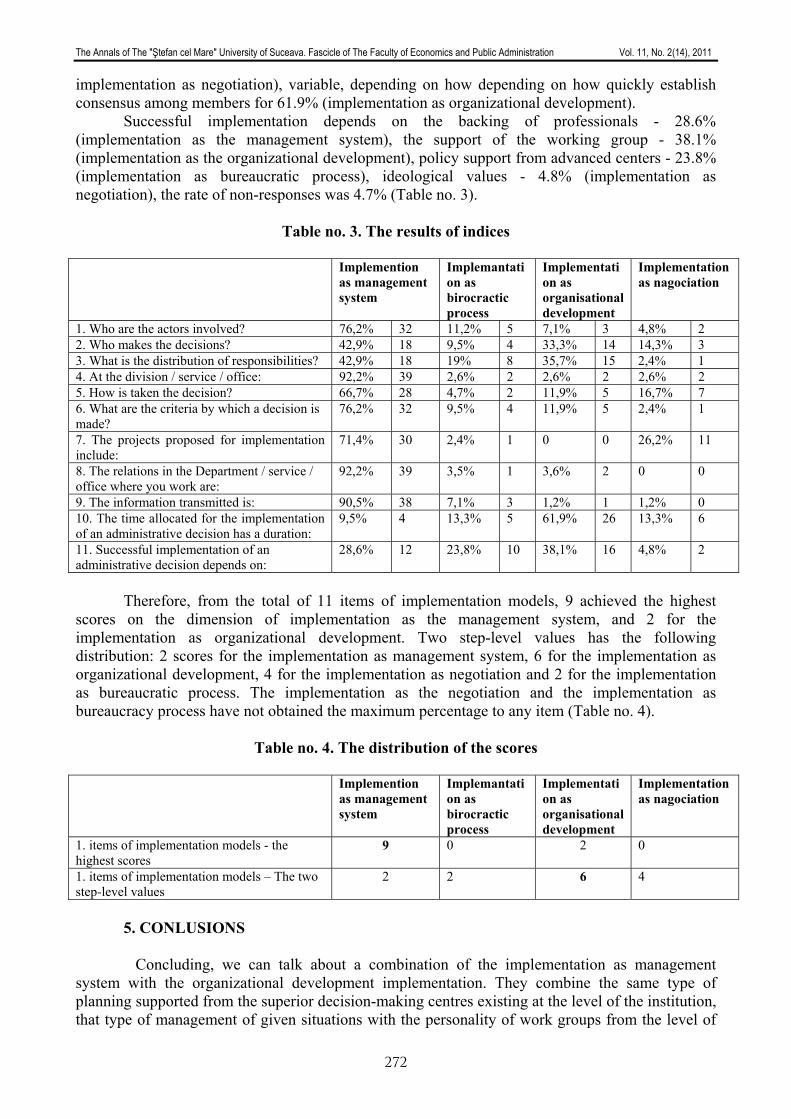
The Annals of The "Ştefan cel Mare" University of Suceava. Fascicle of The Faculty of Economics and Public Administration Vol. 11, No. 2(14), 2011
272
implementation as negotiation), variable, depending on how depending on how quickly establish consensus among members for 61.9% (implementation as organizational development).
Successful implementation depends on the backing of professionals - 28.6% (implementation as the management system), the support of the working group - 38.1% (implementation as the organizational development), policy support from advanced centers - 23.8% (implementation as bureaucratic process), ideological values - 4.8% (implementation as negotiation), the rate of non-responses was 4.7% (Table no. 3).
Table no. 3. The results of indices
Implemention
as management system
Implemantation as birocractic process
Implementation as organisational development
Implementation as nagociation
1. Who are the actors involved? 76,2% 32 11,2% 5 7,1% 3 4,8% 2 2. Who makes the decisions? 42,9% 18 9,5% 4 33,3% 14 14,3% 3 3. What is the distribution of responsibilities? 42,9% 18 19% 8 35,7% 15 2,4% 1 4. At the division / service / office: 92,2% 39 2,6% 2 2,6% 2 2,6% 2 5. How is taken the decision? 66,7% 28 4,7% 2 11,9% 5 16,7% 7 6. What are the criteria by which a decision is made?
76,2% 32 9,5% 4 11,9% 5 2,4% 1
7. The projects proposed for implementation include:
71,4% 30 2,4% 1 0 0 26,2% 11
8. The relations in the Department / service / office where you work are:
92,2% 39 3,5% 1 3,6% 2 0 0
9. The information transmitted is: 90,5% 38 7,1% 3 1,2% 1 1,2% 0 10. The time allocated for the implementation of an administrative decision has a duration:
9,5% 4 13,3% 5 61,9% 26 13,3% 6
11. Successful implementation of an administrative decision depends on:
28,6% 12 23,8% 10 38,1% 16 4,8% 2
Therefore, from the total of 11 items of implementation models, 9 achieved the highest
scores on the dimension of implementation as the management system, and 2 for the implementation as organizational development. Two step-level values has the following distribution: 2 scores for the implementation as management system, 6 for the implementation as organizational development, 4 for the implementation as negotiation and 2 for the implementation as bureaucratic process. The implementation as the negotiation and the implementation as bureaucracy process have not obtained the maximum percentage to any item (Table no. 4).
Table no. 4. The distribution of the scores
Implemention
as management system
Implemantation as birocractic process
Implementation as organisational development
Implementation as nagociation
1. items of implementation models - the highest scores
9 0 2 0
1. items of implementation models – The two step-level values
2 2 6 4
5. CONLUSIONS
Concluding, we can talk about a combination of the implementation as management
system with the organizational development implementation. They combine the same type of planning supported from the superior decision-making centres existing at the level of the institution, that type of management of given situations with the personality of work groups from the level of
The Annals of The "Ştefan cel Mare" University of Suceava. Fascicle of The Faculty of Economics and Public Administration Vol. 11, No. 2(14), 2011
273
the institution, which is identified with the existing offices or services and which develop at a certain degree of freedom regarding the own planning of actions at the level of the existing structures, beyond the directions offered by the superior decision-making centres, but also a type of communication and to establish the relations amongst the members of the group. One can talk about the existence of classical rationality of the actors pursuing the fulfilment of their actions purposes, maximization of performances. This type of rationality gets close to what can be named the new public management as well, which mainly pursues the performance. This view must not be generalized as we do not deal with a strictly economical transposition on the implementation process. We can however talk about implementation as management and the rules of managerial planning are identified at the level of the institution by: maximizing the performance, by planning the actions, by establishing a hierarchy for the general action directions. The motivation of actors becomes, in this context, the motivation to reach performance at institutional level.
Therefore, the implementation of public policies becomes a process pursuing classical lines but one must not forget the contingent aspects, institutional, group, individual aspects, as they can make the difference from one administrative unit to another, offering specificity to the process itself. However, the manner the implementation process is profiled is a creation of each and every institution, the causes of such explanatory step being a potential topic of subsequent research.
ENDNOTES [1] This work was supported by the the European Social Fund in Romania, under the responsibility of the
Managing Authority for the Sectoral Operational Programme for Human Resources Development 2007-2013 [grant POSDRU/CPP 107/DMI 1.5/S/78342].
REFERENCES 1. Brown, R., W. (1982), Performance Appraisal: A Policy Implementation Analisys,
Review of Public Personnel Administration, U.S. Office of Personnel Management, 2. 2. Elmore, R. E. (1978), Organizational models of social program implementation, Public
Policy, 26: 185-228. 3. Giacchino, S., Kakabadse, A. (2005), Successful Policy Implementation: The Route to
Building Self- Confident Government, International Review of Administrative Sciences, 69: 139 - 160.
4. Henry, G. T., Practical sampling. Applied research series, SAGE Publications, Newbury Park, 1990.
5. Howlett, M., Ramesh M. (2004), Studiul politicilor publice.Cicluri şi subsisteme ale politicilor, Chişinău: Epigraf.
6. Lane, J., E. (1987), Implementation, accountability and trust, European Journal of Political Research, 15 (5): 530
7. Minogue, M, (1997), Theory and Practice in public policy and administration, The policy process, Edinburg Gate: University of Newcastle upon Tyne, Prentice Hall..
8. Miroiu, A. (2001), Introducere în analiza politicilor publice, Bucureşti: Editura Punct. 9. Pasquino, G. (2002), Curs de Ştiinţă Politică, Iaşi: Institutul European. 10. Vroom, V. (1996), Work and Motivation, New York: New York Hill. 11. Wilson, Q., J. (1995), Political Organisations, Princeton: Princeton University Press.

The Annals of The "Ştefan cel Mare" University of Suceava. Fascicle of The Faculty of Economics and Public Administration Vol. 11, No. 2(14), 2011
274
THE LEGAL EUROPEAN CUSTOMS REGIME
Lecturer PhD. Dumitrita FLOREA (IONESCU) University "Stefan cel Mare" Suceava, Romania
[email protected] Lecturer PhD. Parascheva NISIOI
University "Stefan cel Mare" Suceava, Romania [email protected]
Abstract:
The activity of clearance is a particularly complex legal transaction, structured in several stages and carried out after a specific procedure, which expresses at a practical level the complexity of the legal customs reports and the social situations that may arise during the exercise by the customs authority of its rights and its obligations ,in the permanent consideration of the fundamental prerogatives of the individuals, subjects of these official legal reports .
The clearance is a complex operation whose content expresses in the most categorical way the substance of some specific social relations which through legal regulation became law reports, in this case, of public law. Therefore, as in any report or set of legal reports, and in the case of the clearance we identify the subjects of the law report and also a specific object of the activity of clearance.
The carriers of goods destined for free circulation, export or transit or their representatives are required to show to the customs frontier offices along the border the means of transport with the required documents.
The legal regulations for customs arose from the need for creating an appropriate legal framework and according to the circumstances actually created along with the movement of goods, the people and the values in the international regime.
Keywords: customs activity, customs legal regulations, customs legal report, customs policy, customs union JEL Classification: K 33, K 39 INTRODUCTION
The customs legal regulations originally came from the need to regularize the inter-state relations, because the evolutions and the conditions occurring in the social, political, economic and historical domain, having initially an obvious political character. Currently, there is an acute need to establish clear and precise rules of some factual situations in the movement of goods and services in the international regime.
Therefore, the customs service is nothing but a multitude of activities regulated by the law and other normative acts carried out by competent authorities, with the participation of the importers, of the exporters or their representatives in order to achieve export-import operations, so as to do them with the fulfilling their obligations towards the state [1].
Therefore, the customs law might be considered as a distinct branch of law governing its object, a special category of reports and specific characteristics. As a branch of the Romanian legal system, the customs law is made up from all the legal rules governing the customs in order to achieve the customs act, to prevent acts of evasion in customs and of committing any crimes in this area.
The customs’ subject is defending the economic interests of the state, taking into account that for the collection of the indirect tax which is represented by the customs tax ,a lot of complex activities which are elucidated, result in the damage of the society’s legal interests Performing under normal conditions the activity of customs and also making incomes at the state budget is provided by respecting the importers and exporters’ duties, including the individuals’, who sometimes make legal customs relations.
The legal rules are done through legal reports, the legal report is defined as a social report, concrete and historical, volitional, regulated by the legal norm, in which the participants are the holders of the rights and obligations and by exercising them the legal norm’s finality is achieved.
The customs legal reports are those relationships with specific structure that occur during the customs act itself, the nature of the report of customs law being patrimonial. The main selves of the legal customs report are, on the one hand, the customs authorities- as
The Annals of The "Ştefan cel Mare" University of Suceava. Fascicle of The Faculty of Economics and Public Administration Vol. 11, No. 2(14), 2011
275
representatives of state, more exactly of the financial authorities and on the other hand, the natural or legal persons, importers, exporters or their representatives.
THE CUSTOMS POLICY – COMPONENT OF THE FISCAL-TRADE POLICY The trade policy as part of the general economic policy is the one that establishes the
correlation of the national economy with the world’s economy through administrative, fiscal, customs and currency rules. The trade policy includes all the rules adopted by the state as an attribute of sovereignty to regulate the behavior of the authorized persons in the international trade. The trade policy has an important function in the mechanisms of the international economic interdependences and influence the international trade balance.
By trade policy states pursue: to promote exports of domestic products, to complete the need of the national economy with goods and services via import, to support the international economic cooperation, to protect the domestic industry and the other branches of production in front of the
foreign competition, to direct and control the import and the export of capital.
Since most payments of a country come with the trade flows relations, the trade policy is obvious exercised in close coordination with the exchange rate policy, which influences and oversees the national currency exchange rate against foreign currencies and determines guidelines about entries and exits of capital [2].
The objectives of the commercial policy are given by a series number of factors such as: the available economic potential of a state, the size of the territory, the population, the geographical location, the phenomenon of concourse of the international market or the global economy. We might say that the objectives of a state's trade policy aim to ensure the international trade balance.
The customs policy includes all the laws on the entry and the exit of goods in and out of the country, having a lot of economic and financial means and means of customs technique and procedure.
Romania has a customs policy in a relation of interdependence and subordination to the state's economic policy, its main objective being the development of the economic potential that determines the export offer and the import demand, as well as Romania's integration into the international trading system, by adopting measures through which to achieve the reduction of tariff and non tariff restrictions, that settle the trade between the states and protect the national economy [3].
THE CUSTOMS UNION - AN ESSENTIAL ELEMENT OF THE EUROPEAN
SINGLE MARKET The customs system is a complex structure that includes measures used by the state to
influence customs, the administrative and management methods, the institutional and legal framework and aims at the national economy’s level, to defend the economic interests of the state, the production of statistics in the foreign trade ,the creation of the state’s fiscal policy and the encouragement of the activities of export through different forms and ways.
The customs system operates in certain space called "customs territory" meaning "the territory where a certain customs regime, a certain customs legislation activates " [4]. During the postwar period, the states have agreed that through the extension or the stint of the customs territories, to impose special territorial customs regimes. Since the customs territory of the state is the national territory, the extending of the customs’ territory arises when two or more countries agree to form a customs union.
The Annals of The "Ştefan cel Mare" University of Suceava. Fascicle of The Faculty of Economics and Public Administration Vol. 11, No. 2(14), 2011
276
The customs union is the essential condition for an economic integration of all the European Union countries and it’s the framework in which it is possible to create, develop or manage a single common market where goods can move freely and where common rules are applied in the interior of external borders, the provisions of art. XXIV of GATT defines the customs union as “replacing several customs territories with a single customs territory.“ Without customs union, "the common commercial policy and the development policy of the EU, the agricultural common market and the effective coordination of the economic and monetary policies, would not be possible (after Gh. Caraiani ).
The essential feature of a customs union is that the participating countries abolish the tariff scales applied in the relations between them and applies in the relation with third parties a common trade policy, based on a single customs tariff. Another form of customs integration and economic cooperation is, besides the customs union, the free trade areas.
As a form of extending the customs territory, free trade areas meet two or more customs territories, with the objective of total eliminating, between the countries, of the customs taxes and the restrictive trade regulations, appearing when there is a desire of the countries for close economies, without integrating them or turning them into a single economy. In this situation, the extension of the customs territory regards only mutual trade, by maintaining the independence in the sphere of trade policy. Thus, each state shall preserve its own customs tariff and its own commercial policy opposite the outside world. So the rules governing what types of goods can move freely from one country to another within this area are defined. This concerns mainly the establishment of the rules of origin. The customs procedures should be maintained in order to check whether these rules are respected.
Unlike free trade areas, the customs union mainly aims for economic integration without restriction within the EU borders, although some internal taxes on sales accompany the process.
If there were no customs union and the fundamental principle of free movement of goods, then the creation of a single market and the economic expansion of the European Union wouldn’t have been possible, since before its foundation, there were already plenty of border customs formalities for transports of goods, which hindered the inter-community trade and made the EU companies to pay large sums of money and to lose time.
Customs’ role in implementing common policies of the European Union is obvious in health, environment, economy, agriculture and external relations. Thus, the customs union protects the citizens of the Community, by checking through the customs services of the member states, the import of food such as meat, milk, eggs, vegetables, fruit and wine to eliminate the health risks they may present, the import of hazardous or ozone-depleting products, thereby protecting the environment, monitors and prohibits the international trade with endangered species of flora and fauna, threatened with the extinction, and also controls on psychotropic substances, weapons and ammunition, etc..
In order to protect the economic interests of the European Union It’s necessary to use non-tariff instruments regarding unfair competition, to have quantitative restrictions on imports, counterfeit goods and pirated goods, as import rights are reduced, their range becomes wide.
CUSTOMS LEGAL REGIME IN THE EUROPEAN UNION When entering or leaving the customs territory of the EU with goods presented to the
customs office, the customs authority of any member state establishes the customs regime and hence the customs procedure attributed to the categories of goods in part. The EU customs regime includes all the rules that apply for the clearance, depending on the commercial operation or the goods’ destination. The customs regimes can be:
suspensive; final.
The Annals of The "Ştefan cel Mare" University of Suceava. Fascicle of The Faculty of Economics and Public Administration Vol. 11, No. 2(14), 2011
277
The European customs union is the legal framework for establishing and giving the customs regime to the goods submitted to the operations of foreign trade in and from the community space.
The Treaty of Rome on the European Economic Community signed on 25th of March 1957 and entered into force on 1st January 1958, stipulates in art. 23 that the customs union covers all trade with goods from the member states and towards the third countries a Common Customs Tariff will be applied. The customs regimes and practices adopted through the EU regulations and directives and governed by the laws in force are based on the EU Customs Code.
The EU Customs Code contains general rules and regulations relating to all customs regimes applicable to goods that are traded, being a summary of all the legislation enacted between 1968 and 1990 and that were replaced by it. The first Code was adopted in 1992 by The EEC Regulation (European Economic Community) No. 2913 from 12th of October 1992 and amended by Regulation no. 450/2008 regarding the establishment of the new Community Customs Code published in the Official Journal of the European Union on 4thof June 2008 [5].
Its provisions can be applied in the EU trade relations with third countries, to goods that are subject of The ECSC Treaty, the Treaty establishing EURATOM [6]. The EU customs Code also establishes the customs treatment applicable to goods from the EU customs territory until they have been released. Thus, the entry of goods into the community customs territory, lodging and unloading the goods in temporary storage or under the customs regime of temporary transit are approved. It regulates the treatment of goods according to their destination, establishing a tariff classification and obtaining a final customs regime (export or import) or suspensive (customs transit, customs warehouse, temporary admission - on import and export, the regime of active or passive perfecting, processing under control customs) and approval of goods for free circulation in the community’s space after their "customs release". The EU customs Code approaches the final and the suspensive customs regimes and also the exceptions from paying the customs taxes, granted under various schemes provided for the goods.
The export and the import to and from the EU are final customs regimes. Other regimes, called economic, correspond to situations with greater complexity, which require temporary storage of goods or transforming the goods by processing them. These regimes take into account the particularities of the economic circuit of goods and adapt to it, avoiding the payment of the customs taxes by the importing firms.
The common elements for the EU customs regimes are: any goods is the subject of a customs declarations corresponding to that customs regime.
Its representative, the holder of the transaction, completes the Single Administrative Document (SAD) on a standard form that he signs and he submits together with other documents at the customs office for accepting the requested customs regime. The date stated on the accepted SAD determines the application of the customs regime;
the control of the other documents by the customs authority; the total or partial physical control and also the sampling.
The transport of goods to the place where the customs control is carried out is on the risk and the expense of the customs declarant, who is entitled to attend the physical control and the sampling.
In terms of the customs regime and the customs procedure in connection established by the EU, the transactions made by traders who are in the category of final customs regimes are operations of import and export in and from the EU. Both types of transactions are the two basic customs regimes of international trade. From 1st of January 1993, these arrangements can only apply to trade from the European Union and the third countries, the European space being a single customs territory, as a consequence of the creation of the customs union.
The Annals of The "Ştefan cel Mare" University of Suceava. Fascicle of The Faculty of Economics and Public Administration Vol. 11, No. 2(14), 2011
278
THE CUSTOMS REGIME FOR EXPORTS IN THE EUROPEAN UNION The European Union rules consider as permanent export customs regime in the EU all the
goods sent abroad on a contractual basis and intended to remain permanently outside the community customs territory, except:
the goods sent abroad temporarily; the goods that are subject of a passive perfecting.
All the goods produced in the EU can be exported, also the previously imported, except those that are prohibited to be exported from the European Union, namely:
the prohibited goods; the restricted goods during the common trade policy.
In the European Union, the exports of goods may be carried out by legal persons established in an EU state, which have as object these operations.
When exporting goods from the European Union no taxes are charged, the only condition for their release is the goods leaving the UE customs territory in the same condition as they were in the customs declaration, which has a statistical purpose only. The elimination of the customs tax is due to the European community’s interests to stimulate the export of goods. When exporting goods from the European Union no value added tax (VAT) is applied.
The exporter is required to submit a SAD of export at the customs office, in whose area his office is situated or the place where the goods are packed or loaded for export. However, this declaration also can be made at a border customs office from the EU .
The goods for export, controlled and cleared in the country, are submitted to the customs control at the border, where they check only the number, the series and the integrity of the applied seals based on the document of export.
The following are subjects of customs control, on exports from the UE: • the vehicles and packages for export, cleared within the community’s space, which
arrived at its border without seals, with modified, or not properly implemented seals or seals which don’t match those specified in the documents;
• the vehicles and packages that do not qualify for sealing; • the vehicles where there is a presumption that there are other assets than those provided
in the documents. When there are not appropriately conditions at the border customs offices of the European
Union, the vehicles are directed to the nearest customs office where there are conditions for verification.
The transport, the handling, the packing and the unpacking of the goods in order to exercise customs control is carried out by the customs declarant, at its own expense or, eventually, at his representative [7].
THE CUSTOMS REGIME FOR IMPORTS FROM THE EUROPEAN UNION The main customs regime in the European Union is the final import. It consists in entering
the EU customs territory of foreign goods with the purpose of introducing them in the economic cycle, after the customs formalities at the community budget. In the EU, the import of goods is liberalized. However, certain categories of goods are submitted to quantitative restrictions or are submitted to control, in accordance with the international commitments. The list of goods subjected to licensing shall be determined periodically, by decisions of the community’s authorities. The methods and the formalities of clearance provided by the European regulations are part of the general principles defined by the GATT (WTO) (General Agreement on Tariffs and Trade). This means that the limits and the liberalism of the common commercial policy are reflected in the principle of reciprocal trade concessions.
The Annals of The "Ştefan cel Mare" University of Suceava. Fascicle of The Faculty of Economics and Public Administration Vol. 11, No. 2(14), 2011
279
The EU economic operators are required to carry out the importation of goods in accordance with their activity and take necessary measures to clear the goods for their immediate introduction into the economic circuit. Thus, they are obliged to declare and present the arrived goods, while submitting the customs documents. They are responsible for the delay in the goods’ clearance caused by failure to appear with the documents within the legal time.
The Customs Authority makes within the definitive import customs regime, three activities: clearance of goods; collection of customs taxes; application of the measures of EU trade policy.
The customs authorities shall be obliged, when clearing the goods to import, to ascertain whether the goods comply with the data in the customs documents, in terms of quantity and nature.
An important commodity will be submitted to customs taxes and VAT and also to other indirect taxes. The import operations are subject to a great number of formalities and constraints than the export operations. The importance and the financial stake for the Customs and the tax administration in such operations must be well defined for a good orientation of the EU’s economic and financial policy.
The EU import taxes are mostly ad valorem customs taxes. Only for 10% of the eight-digit tariff positions, the customs taxes are set on another basis than ad valorem : specific customs taxes, mixed customs taxes depending on certain components or as a maximum or a minimum limit of taxes. The customs taxes expressed in percentages are applied to the value of goods in the customs (CIF value at the EU border), expressed in Euro and are those referred to at the date of registration of the customs declaration.
The payment of the customs taxes are normally carried out during the clearance. In this principle, it ought to be the case for the EU, but despite its rating as a "Single market", it continues to show fiscal frontiers and the member countries continue to autonomously manage the VAT regimes. This feature leads to the distinction of two types of customs regimes for imports of goods in the EU: putting the goods in free circulation and releasing the goods for consumption.
CONCLUSIONS The legal rules, as components of the law, established by the Government or recognized by
it, which have to be respected, if necessary, through the coercive force of the state, are closely linked together, forming a whole, no matter how different in content. A different set of legal rules, that are organic linked between them and regulate the social relations that have the same object and use the same method of regulation, form the branch of law. The branches of law are closely interdependent, not isolated from each other.
Since the public right regards the formation of the state and of the public powers, the relationship between the state and particulars, and generally, all the acts done by people working for a general interest in virtue of a direct or indirect delegation of the state , the customs law can be included in the public law.
Starting from the fact that the customs act is particularly complex, because during the activity of customs, there is an application of many provisions regulated by other branches of law that are part of the Romanian law, it can be said that the customs law is in a close connection with them. One can observe, therefore, that the customs law has many connections with branches of law such as: financial law, administrative law, transportation law, commercial law and international trade law, environmental law, competition law, community law, private international law, civil law, etc. ..
The financial relations nowadays, as well as the customs relations, are the result of a complex historical process, which was and is influenced by the economic and social development so that the degree of development of the financial relations is closely linked to the state’s level and evolution. Along with the establishment of the state’s public force, the need for mechanisms to obtain material and financial resources, in order to maintain its structures, appeared.
The Annals of The "Ştefan cel Mare" University of Suceava. Fascicle of The Faculty of Economics and Public Administration Vol. 11, No. 2(14), 2011
280
The mechanism of the customs system is created and operates directly in this domain, in relation with the entire financial system established by the state at a certain moment. In this perspective, it can be noted that the purpose of customs law achieved by fulfilling its purpose is, in fact, the material source of law for other areas of law.
REFERENCES: [1] Ion Suceavă, The custom Right, Ed. Cris Book Universal, Bucureşti, 1997, p. 8 [2] Aurel Teodor Moldovan, The custom Right , Ed. C.H. Beck, Bucureşti, 2006, p. 21 [3] D.D. Şaguna, The Financial and fiscal Right, Ed. Eminescu, Bucureşti, 2003, p. 887 [4] D.D. Şaguna, op.cit., p. 888 [5] www.avocatnet.ro [6] Mihaela Belu, C. Joldes, Laura Marinas, The Custom Sistem, Ed. Economică, Bucureşti,
2003, p. 124 [7] Aurel Teodor Moldovan, The custom Right , Ed. C.H. Beck, Bucureşti, 2006, p. 32
BIBLIOGRAPHY: 1. Aurel Teodor Moldovan, The custom Right, Ed. C.H. Beck, Bucureşti, 2006 2. D.D. Şaguna, The Financial and fiscal Right, Ed. Eminescu, Bucureşti, 2003 3. Ion Suceavă, The custom Right ,Ed. Cris Book Universal, Bucureşti, 1997 4. Mihaela Belu, C. Joldes, Laura Marinas, The Custom Sistem, Ed. Economică, Bucureşti,
2003 5. www.avocatnet.ro
The Annals of The "Ştefan cel Mare" University of Suceava. Fascicle of The Faculty of Economics and Public Administration Vol. 11, No. 2(14), 2011
281
LAW FROM AUGUST 14, 1938 BETWEEN TRADITION AND INNOVATION, NECESSITY AND OPPORTUNITY
Lecturer PhD. Student Marilena-Oana NEDELEA Ştefan cel Mare University of Suceava, Romania
Abstract: The Administrative law of August 14, 1938 has organized the local public government by the principles of
strict centralism meant to give the Government a full control over local communities. By this law were established the lands whose existence was justified by the fact that they, being strong administrative bodies, are is considered to entail: personal spending economy and possibilities of large administrative achievements, exceeding the powers of counties.
Keywords: administrative law, public administration
JEL Classification: K 39, H 83
INTRODUCTION
The Constitution from February 1938 made the creation of administrative region in the form
of land possible, which comprises several counties, invested with legal personality (art. 1). The land represent "local interests" and exercises at the same time, also the "general administration duties." All rights and obligations of the former counties of administrative laws were passed onto the land. The 1938 Act has followed also an administrative deconcentration by placing in the residence cities of the lands of ministries of external services, which operated in addition to royal residence.
The new Constitution made no reference to administrative-territorial units, but included in art. 79 of Chapter VI that county and municipal institutions shall be established by law. Stated purpose of this form of regulation was to avoid enshrining constitutional of some principles of administrative organization, under the supremacy of the Constitution, so that it can be more then an obstacle to the desired reforms. They would thus accuse the 1923 Constitution, whose provisions had given rise to unnecessary discussions and various legal subterfuges, which were strongly criticized in their time. "The new constitution of February 27, 1938 releases the state administrative organization of a series of obligations that are included in its 1923 Constitution. Principles included in that Constitution, on the country's administrative division into districts and communes, had given rise to many administrative unnecessary and meaningless discussions."
The 1938 Constitution maintained some principles such as: national sovereignty, separation of powers, ministerial responsibility, along with some principles such as: freedom of education, labour, media, individual freedom, equality before the law.
The characteristic feature of economic policy was the increase in state intervention, expressed in measures aimed at coordinating the activities of various economic sectors, massive orders made within the heavy industry, in purchasing large amounts of grains and their storage, in making domestic loans, in directing foreign trade and traffic control (Scurtu, 1982).
Reflecting the political regime in the period in which was developed, the Administrative law of August 14, 1938 organized the public administration according to the principles of a rigorous centralism, designed to give the government a full control over local communities, to promote "the permanent interests of the homeland." To achieve this goal, the new regime has named prefects at county level, who were active militaries with the rank of lieutenant colonel and colonel.
By introducing new institutions and reforming the existing ones, the law initiators tried to solve a series of problems with which the public administration is confronted. Analyzing this normative law it’s worth noting that the law is generally characterized by clarity and simplicity that were not specific to the previous laws in this area. By this law, many of the mistakes which
The Annals of The "Ştefan cel Mare" University of Suceava. Fascicle of The Faculty of Economics and Public Administration Vol. 11, No. 2(14), 2011
282
had been hitherto have been corrected through legislative experience from previous years, more developed specialty doctrine and collaboration with the Royal Institute of Administrative Sciences.
Administrative law of 14 August 1938 was developed during the government led by Patriarch Miron Cristea. The draft law stipulates that the mayors were appointed by the prefect for a period of six years. In contrast, Demostene Botez, director of the newspaper "Dreptatea" required to recognize the citizen's right to choose the mayor, act in which he sees embodied the notion of freedom and civic dignity (Botez, 1938).
A Regulation on Administrative law of August 14, 1938 appeared on November 28, 1939. Armand Calinescu considers that "the project of administrative law of August 14, 1938 is the
first organic law in the new constitutional settlement of the country, drawing the first and most important line of the future image of our state appearances. Of course, it is a beginning which we consider of a crucial importance, but which will still not bring its benefits than by labour and civil faith, understanding and support of governments. Only under these conditions the project can become a real administrative reform".
STRUCTURE AND CONTENT In terms of Administrative law of August 14, 1938 content, it should be noted from the beginning that it is structured on 11 titles, comprising 197 articles, covering the following aspects: Title I contains general provisions, Title II governing the status of the village, Title III concerns the organization of land, Title IV administrative districts and control authorities, Title V summarizes a series of joint provision of local governments, Title VI refers to disciplinary actions against local government bodies, Title VII contains mandatory works, Title VIII aimed at local finances, Title IX refers to the control and protection of local governments, Title X presents the petition procedure, and Title XI includes transitional provisions.
Local administration is exercised through the following territorial districts: commune, post, county and province. The commune and land were juridical persons representing local interests and exercising at the same time general administrative duties conferred by law. Posts and counties were control precincts and deconcentration of general administration.
Deconcentrating state general administration services was done only on the basis of territorial constituencies under Administrative law of August 14, 1938.
By law, the communes were rural and urban areas. Rural communities were comprised of one or more villages. They must have sufficient ordinary funds to cover the required expenses of municipal administration.
Declaring the households as village settlements, declaring a village as rural commune, merging two or more rural communities, passing a village to a rural commune to another, the composition of rural communities from villages belonging to various different rural locations are decided by the commune councils that, under the chairmanship of the praetor, and shall require the prefect’s approval.
Regarding the organization of communes, the law refers to the mayor, mayor's assistant, the delegate of the village, municipal secretary, composition, powers and operation of municipal council, regulations issued by mayor and municipal council.
The Mayor has the following attributions: manage the commune’s interests, according to the rules established by the laws and
regulations, carry out the decisions of the board; represent the commune in court, sign the documents signed on behalf of the commune,
do any other acts necessary to preserve a right, personally or by proxy; call, proceed, license, grant leaves and disciplinary punishments applicable to municipal
officials, according to the status of civil servants and this law; sign and approve payment orders for public tenders;
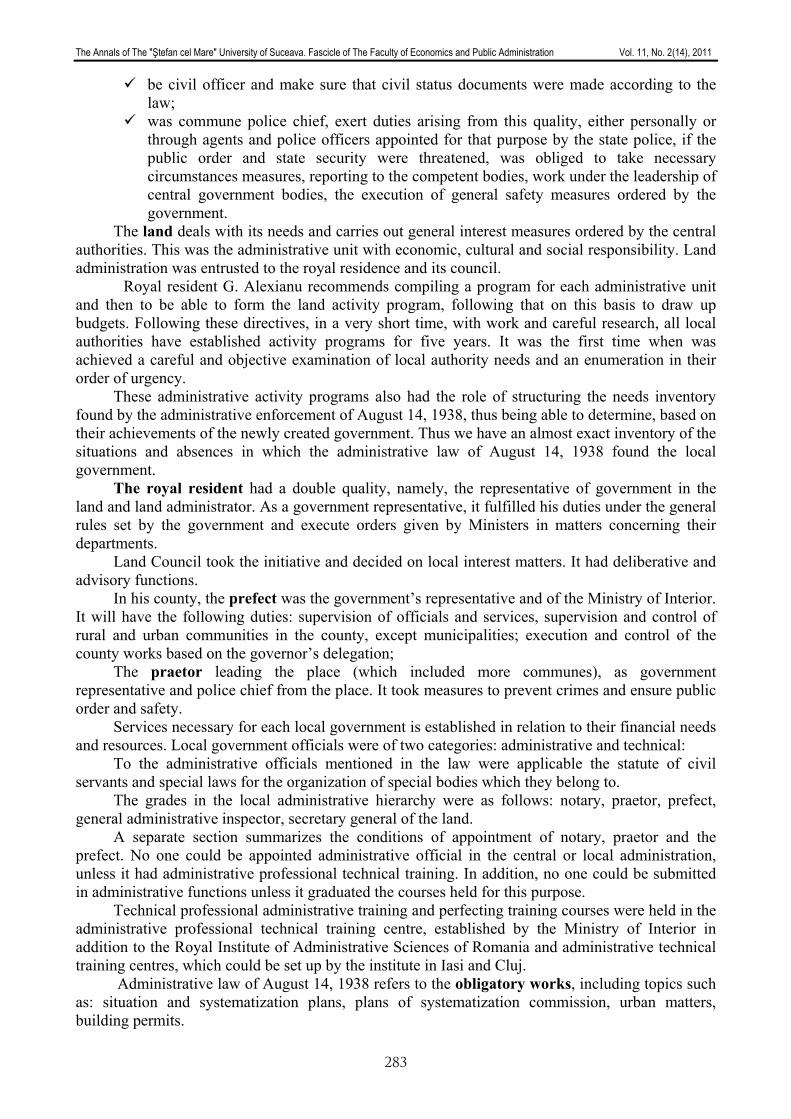
The Annals of The "Ştefan cel Mare" University of Suceava. Fascicle of The Faculty of Economics and Public Administration Vol. 11, No. 2(14), 2011
283
be civil officer and make sure that civil status documents were made according to the law;
was commune police chief, exert duties arising from this quality, either personally or through agents and police officers appointed for that purpose by the state police, if the public order and state security were threatened, was obliged to take necessary circumstances measures, reporting to the competent bodies, work under the leadership of central government bodies, the execution of general safety measures ordered by the government.
The land deals with its needs and carries out general interest measures ordered by the central authorities. This was the administrative unit with economic, cultural and social responsibility. Land administration was entrusted to the royal residence and its council.
Royal resident G. Alexianu recommends compiling a program for each administrative unit and then to be able to form the land activity program, following that on this basis to draw up budgets. Following these directives, in a very short time, with work and careful research, all local authorities have established activity programs for five years. It was the first time when was achieved a careful and objective examination of local authority needs and an enumeration in their order of urgency.
These administrative activity programs also had the role of structuring the needs inventory found by the administrative enforcement of August 14, 1938, thus being able to determine, based on their achievements of the newly created government. Thus we have an almost exact inventory of the situations and absences in which the administrative law of August 14, 1938 found the local government.
The royal resident had a double quality, namely, the representative of government in the land and land administrator. As a government representative, it fulfilled his duties under the general rules set by the government and execute orders given by Ministers in matters concerning their departments.
Land Council took the initiative and decided on local interest matters. It had deliberative and advisory functions.
In his county, the prefect was the government’s representative and of the Ministry of Interior. It will have the following duties: supervision of officials and services, supervision and control of rural and urban communities in the county, except municipalities; execution and control of the county works based on the governor’s delegation;
The praetor leading the place (which included more communes), as government representative and police chief from the place. It took measures to prevent crimes and ensure public order and safety.
Services necessary for each local government is established in relation to their financial needs and resources. Local government officials were of two categories: administrative and technical:
To the administrative officials mentioned in the law were applicable the statute of civil servants and special laws for the organization of special bodies which they belong to.
The grades in the local administrative hierarchy were as follows: notary, praetor, prefect, general administrative inspector, secretary general of the land.
A separate section summarizes the conditions of appointment of notary, praetor and the prefect. No one could be appointed administrative official in the central or local administration, unless it had administrative professional technical training. In addition, no one could be submitted in administrative functions unless it graduated the courses held for this purpose.
Technical professional administrative training and perfecting training courses were held in the administrative professional technical training centre, established by the Ministry of Interior in addition to the Royal Institute of Administrative Sciences of Romania and administrative technical training centres, which could be set up by the institute in Iasi and Cluj.
Administrative law of August 14, 1938 refers to the obligatory works, including topics such as: situation and systematization plans, plans of systematization commission, urban matters, building permits.
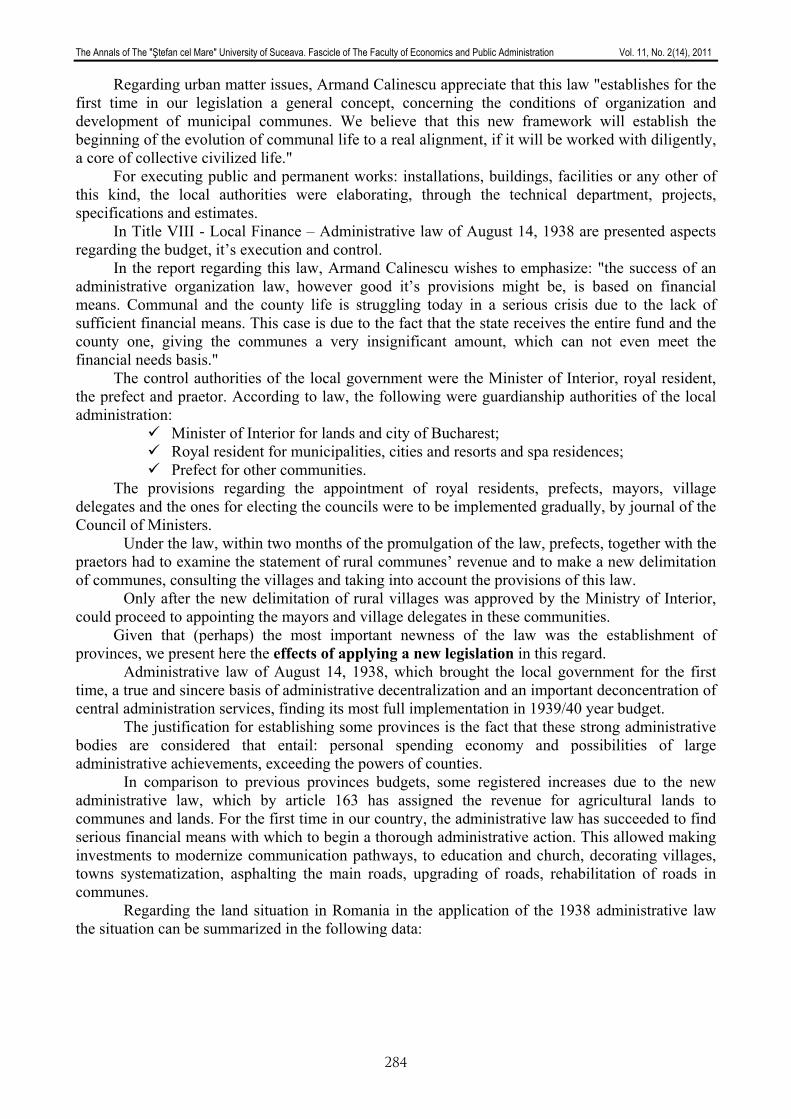
The Annals of The "Ştefan cel Mare" University of Suceava. Fascicle of The Faculty of Economics and Public Administration Vol. 11, No. 2(14), 2011
284
Regarding urban matter issues, Armand Calinescu appreciate that this law "establishes for the first time in our legislation a general concept, concerning the conditions of organization and development of municipal communes. We believe that this new framework will establish the beginning of the evolution of communal life to a real alignment, if it will be worked with diligently, a core of collective civilized life."
For executing public and permanent works: installations, buildings, facilities or any other of this kind, the local authorities were elaborating, through the technical department, projects, specifications and estimates.
In Title VIII - Local Finance – Administrative law of August 14, 1938 are presented aspects regarding the budget, it’s execution and control.
In the report regarding this law, Armand Calinescu wishes to emphasize: "the success of an administrative organization law, however good it’s provisions might be, is based on financial means. Communal and the county life is struggling today in a serious crisis due to the lack of sufficient financial means. This case is due to the fact that the state receives the entire fund and the county one, giving the communes a very insignificant amount, which can not even meet the financial needs basis."
The control authorities of the local government were the Minister of Interior, royal resident, the prefect and praetor. According to law, the following were guardianship authorities of the local administration:
Minister of Interior for lands and city of Bucharest; Royal resident for municipalities, cities and resorts and spa residences; Prefect for other communities.
The provisions regarding the appointment of royal residents, prefects, mayors, village delegates and the ones for electing the councils were to be implemented gradually, by journal of the Council of Ministers.
Under the law, within two months of the promulgation of the law, prefects, together with the praetors had to examine the statement of rural communes’ revenue and to make a new delimitation of communes, consulting the villages and taking into account the provisions of this law.
Only after the new delimitation of rural villages was approved by the Ministry of Interior, could proceed to appointing the mayors and village delegates in these communities.
Given that (perhaps) the most important newness of the law was the establishment of provinces, we present here the effects of applying a new legislation in this regard.
Administrative law of August 14, 1938, which brought the local government for the first time, a true and sincere basis of administrative decentralization and an important deconcentration of central administration services, finding its most full implementation in 1939/40 year budget.
The justification for establishing some provinces is the fact that these strong administrative bodies are considered that entail: personal spending economy and possibilities of large administrative achievements, exceeding the powers of counties.
In comparison to previous provinces budgets, some registered increases due to the new administrative law, which by article 163 has assigned the revenue for agricultural lands to communes and lands. For the first time in our country, the administrative law has succeeded to find serious financial means with which to begin a thorough administrative action. This allowed making investments to modernize communication pathways, to education and church, decorating villages, towns systematization, asphalting the main roads, upgrading of roads, rehabilitation of roads in communes.
Regarding the land situation in Romania in the application of the 1938 administrative law the situation can be summarized in the following data:
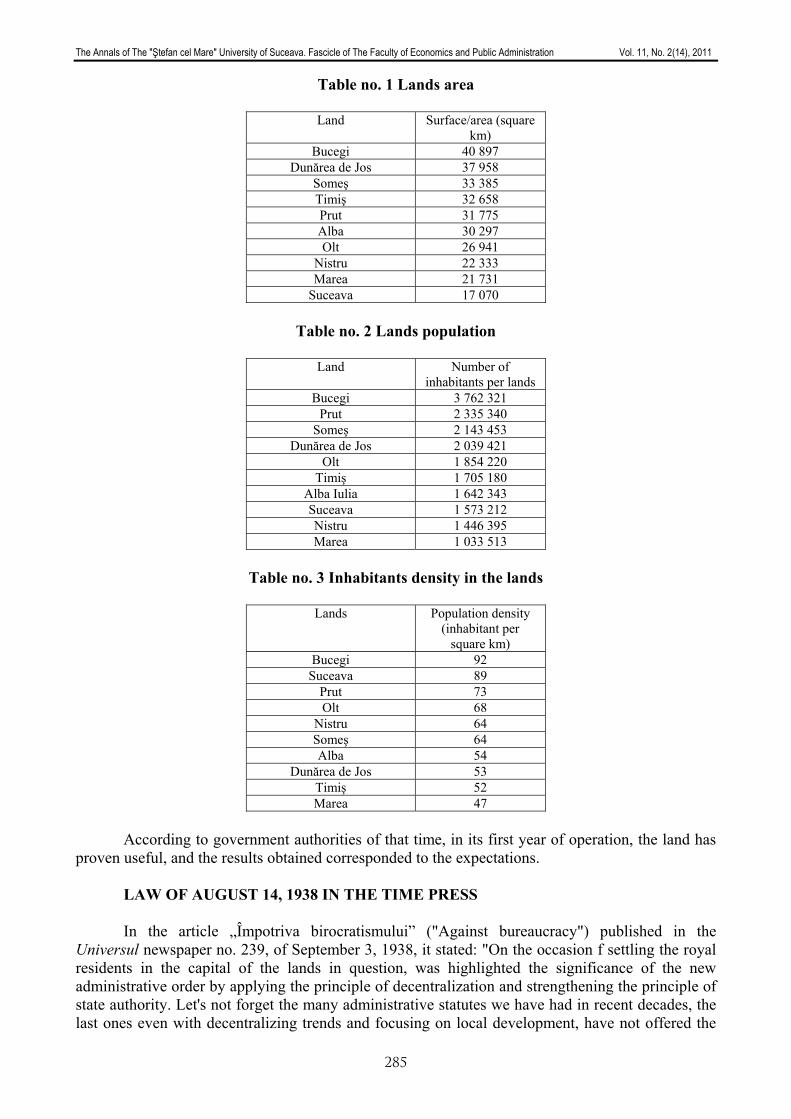
The Annals of The "Ştefan cel Mare" University of Suceava. Fascicle of The Faculty of Economics and Public Administration Vol. 11, No. 2(14), 2011
285
Table no. 1 Lands area
Land Surface/area (square km)
Bucegi 40 897 Dunărea de Jos 37 958
Someş 33 385 Timiş 32 658 Prut 31 775 Alba 30 297 Olt 26 941
Nistru 22 333 Marea 21 731
Suceava 17 070
Table no. 2 Lands population
Land Number of inhabitants per lands
Bucegi 3 762 321 Prut 2 335 340
Someş 2 143 453 Dunărea de Jos 2 039 421
Olt 1 854 220 Timiş 1 705 180
Alba Iulia 1 642 343 Suceava 1 573 212 Nistru 1 446 395 Marea 1 033 513
Table no. 3 Inhabitants density in the lands
Lands Population density
(inhabitant per square km)
Bucegi 92 Suceava 89
Prut 73 Olt 68
Nistru 64 Someş 64 Alba 54
Dunărea de Jos 53 Timiş 52 Marea 47
According to government authorities of that time, in its first year of operation, the land has
proven useful, and the results obtained corresponded to the expectations. LAW OF AUGUST 14, 1938 IN THE TIME PRESS
In the article „Împotriva birocratismului” ("Against bureaucracy") published in the
Universul newspaper no. 239, of September 3, 1938, it stated: "On the occasion f settling the royal residents in the capital of the lands in question, was highlighted the significance of the new administrative order by applying the principle of decentralization and strengthening the principle of state authority. Let's not forget the many administrative statutes we have had in recent decades, the last ones even with decentralizing trends and focusing on local development, have not offered the
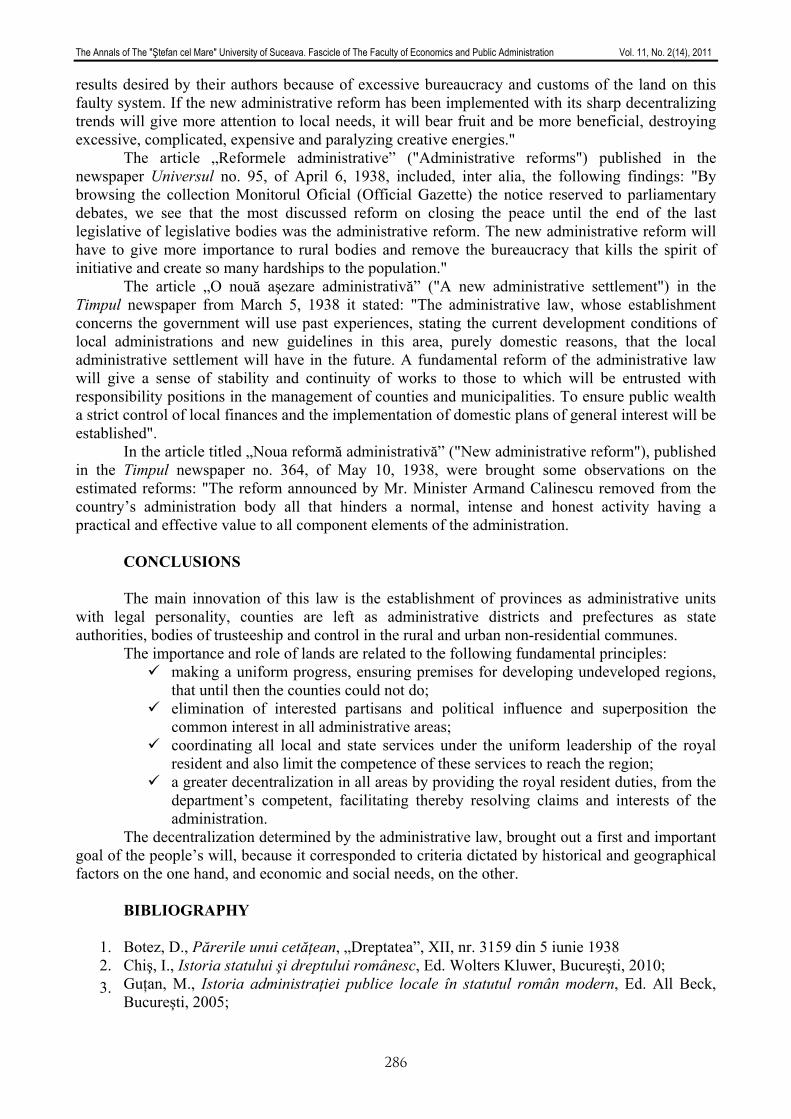
The Annals of The "Ştefan cel Mare" University of Suceava. Fascicle of The Faculty of Economics and Public Administration Vol. 11, No. 2(14), 2011
286
results desired by their authors because of excessive bureaucracy and customs of the land on this faulty system. If the new administrative reform has been implemented with its sharp decentralizing trends will give more attention to local needs, it will bear fruit and be more beneficial, destroying excessive, complicated, expensive and paralyzing creative energies."
The article „Reformele administrative” ("Administrative reforms") published in the newspaper Universul no. 95, of April 6, 1938, included, inter alia, the following findings: "By browsing the collection Monitorul Oficial (Official Gazette) the notice reserved to parliamentary debates, we see that the most discussed reform on closing the peace until the end of the last legislative of legislative bodies was the administrative reform. The new administrative reform will have to give more importance to rural bodies and remove the bureaucracy that kills the spirit of initiative and create so many hardships to the population."
The article „O nouă aşezare administrativă” ("A new administrative settlement") in the Timpul newspaper from March 5, 1938 it stated: "The administrative law, whose establishment concerns the government will use past experiences, stating the current development conditions of local administrations and new guidelines in this area, purely domestic reasons, that the local administrative settlement will have in the future. A fundamental reform of the administrative law will give a sense of stability and continuity of works to those to which will be entrusted with responsibility positions in the management of counties and municipalities. To ensure public wealth a strict control of local finances and the implementation of domestic plans of general interest will be established".
In the article titled „Noua reformă administrativă” ("New administrative reform"), published in the Timpul newspaper no. 364, of May 10, 1938, were brought some observations on the estimated reforms: "The reform announced by Mr. Minister Armand Calinescu removed from the country’s administration body all that hinders a normal, intense and honest activity having a practical and effective value to all component elements of the administration.
CONCLUSIONS The main innovation of this law is the establishment of provinces as administrative units
with legal personality, counties are left as administrative districts and prefectures as state authorities, bodies of trusteeship and control in the rural and urban non-residential communes.
The importance and role of lands are related to the following fundamental principles: making a uniform progress, ensuring premises for developing undeveloped regions,
that until then the counties could not do; elimination of interested partisans and political influence and superposition the
common interest in all administrative areas; coordinating all local and state services under the uniform leadership of the royal
resident and also limit the competence of these services to reach the region; a greater decentralization in all areas by providing the royal resident duties, from the
department’s competent, facilitating thereby resolving claims and interests of the administration.
The decentralization determined by the administrative law, brought out a first and important goal of the people’s will, because it corresponded to criteria dictated by historical and geographical factors on the one hand, and economic and social needs, on the other.
BIBLIOGRAPHY
1. Botez, D., Părerile unui cetăţean, „Dreptatea”, XII, nr. 3159 din 5 iunie 1938 2. Chiş, I., Istoria statului şi dreptului românesc, Ed. Wolters Kluwer, Bucureşti, 2010; 3. Guţan, M., Istoria administraţiei publice locale în statutul român modern, Ed. All Beck,
Bucureşti, 2005;
The Annals of The "Ştefan cel Mare" University of Suceava. Fascicle of The Faculty of Economics and Public Administration Vol. 11, No. 2(14), 2011
287
4. Negulescu, P., Alexianu, C., Tratat de drept public, vol. I şi II, Ed. Casa Şcoalelor, Bucureşti, 1943;
5. Ripeanu, A., Istoria statului şi dreptului românesc, Ed. Universul Juridic, Bucureşti, 2010; 6. Scurtu, I, Buzatu, Gh., Istoria românilor în secolul XX, Ed. Paideia, Bucureşti, 1999; 7. Tarangul, E.D., Tratat de drept administartiv român, Ed. Glasul Bucovinei, Cernăuţi, 1944; 8. Ţop, D., Mastacan O., Istoria statului şi dreptului românesc, Bucureşti, Ed. CH Beck,
2009; 9. Un an de la aplicarea legii administrative din 14 august 1938, Monitorul Oficial şi
Imprimeria Statului, Imprimeria Centrală, Bucureşti, 1939 Web resources www.arhivelenationale.ro; www.historia.ro; www.romaniainterbelica.memoria.ro.
The Annals of The "Ştefan cel Mare" University of Suceava. Fascicle of The Faculty of Economics and Public Administration Vol. 11, No. 2(14), 2011
288
AUTONOMY AND DECENTRALIZATION - CURRENT PRIORITIES IN THE LOCAL
PUBLIC ADMINISTRATION MANAGEMENT
University Assistant Ph.D. Candidate Petronela ZAHARIA “Stefan cel Mare” University of Suceava, Romania Faculty of Economics and Public Administration
Abstract: Autonomy and decentralization - current directions in the local public administration management - which this
study is built around, have generated extensive discussion and controversy, especially in the current administrative context. Enhancing local autonomy through the transfer of new skills in the process of decentralization has become more and more important, especially now when local administration is subject to genuine reform and restructuration.
Moreover, building an efficient administration which would respond to the needs of communities is only possible under a decentralized management, which would ensure recognition of autonomy in administrative-territorial units.
Keywords: local autonomy, decentralization, local government management, local communities JEL Classification: H83
INTRODUCTION
Without doubt, nowadays we are witnessing significant events that occur in the economic, social and political life which critically influence the organizational and functional management of public administration. Society, state, and especially the public are faced with essential and at the same time difficult challenges. Building an efficient administration, oriented towards the needs of society is not an easy goal to accomplish and neither a short-term action.
In this context, addressing the issue of strengthening the autonomy of collectivities within the decentralization process of local public administration management is an interesting and exciting approach, especially since this subject is highly new. In fact, the reality shows that increasing local autonomy in the process of decentralization is an ongoing phenomenon in our administration, lasting in our administration for several years. Certainly, this objective cannot be a superficial one and cannot be achieved immediately, a reason for which we consider as justified bringing in the discussion these two requirements - autonomy and decentralization - needed to be performed in local public administration management.
These arguments are merely meant to outline the role of local autonomy and decentralization in assuring the welfare of collectivities within the local territorial-administrative units, and moreover, in building an effective, qualitative and last but not least democratic public administration. In addition, the acceleration of the decentralization process and the guarantee of local autonomy are requirements of the times we go through, not infrequently these goals becoming the cause of vast controversies between the state authorities and the local ones. But good governance requires the involvement of both partners - central and local authorities - to ensure the favorable climate to promote local interests and stimulate local development processes.
EMPOWERING COMMUNITIES AND DECENTRALIZATION - CURRENT
DIRECTIONS IN LOCAL PUBLIC MANAGEMENT
According to legal regulations, local autonomy is the right and effective capacity of local authorities to address and manage, on behalf and in the interests of local communities they represent, public affairs (art. 3, paragraph 1 of the Local Public Administration Law no. 215/2001). Further, the law (Article 4 of Law no. 215/2001) sets the contents of local autonomy, having it be exercised only administratively and financially and concerns the organization, operation, powers,
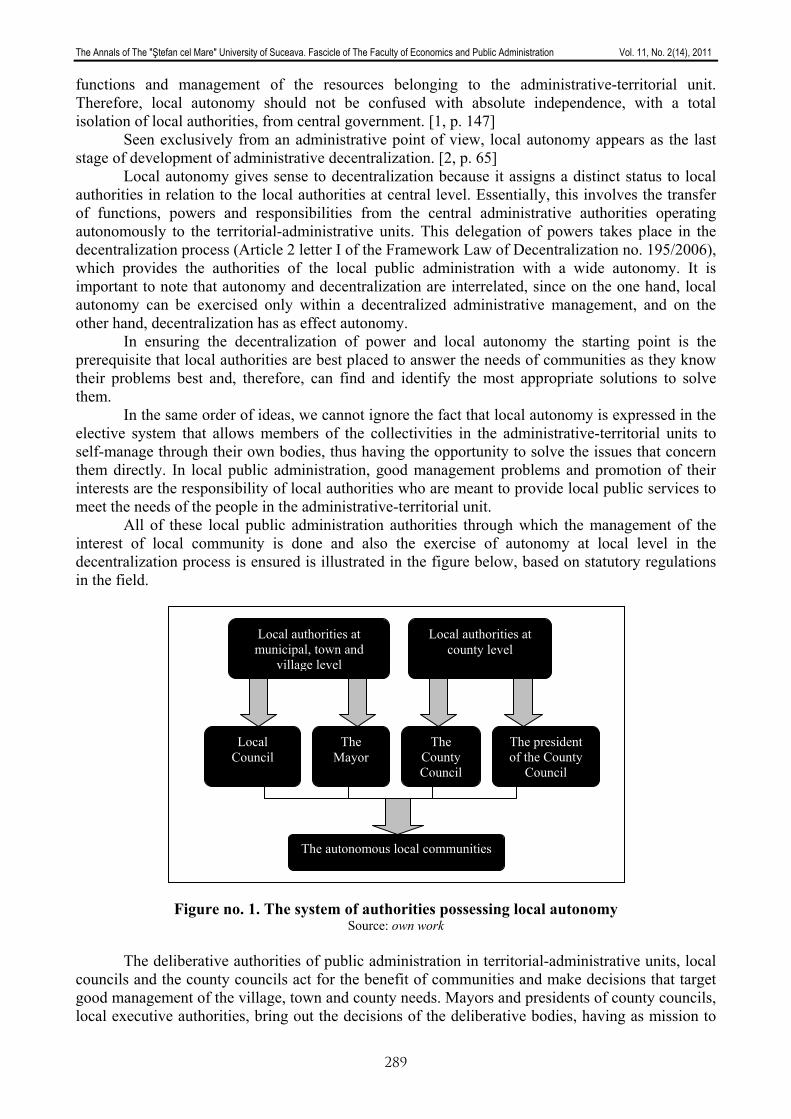
The Annals of The "Ştefan cel Mare" University of Suceava. Fascicle of The Faculty of Economics and Public Administration Vol. 11, No. 2(14), 2011
289
functions and management of the resources belonging to the administrative-territorial unit. Therefore, local autonomy should not be confused with absolute independence, with a total isolation of local authorities, from central government. [1, p. 147]
Seen exclusively from an administrative point of view, local autonomy appears as the last stage of development of administrative decentralization. [2, p. 65]
Local autonomy gives sense to decentralization because it assigns a distinct status to local authorities in relation to the local authorities at central level. Essentially, this involves the transfer of functions, powers and responsibilities from the central administrative authorities operating autonomously to the territorial-administrative units. This delegation of powers takes place in the decentralization process (Article 2 letter I of the Framework Law of Decentralization no. 195/2006), which provides the authorities of the local public administration with a wide autonomy. It is important to note that autonomy and decentralization are interrelated, since on the one hand, local autonomy can be exercised only within a decentralized administrative management, and on the other hand, decentralization has as effect autonomy.
In ensuring the decentralization of power and local autonomy the starting point is the prerequisite that local authorities are best placed to answer the needs of communities as they know their problems best and, therefore, can find and identify the most appropriate solutions to solve them.
In the same order of ideas, we cannot ignore the fact that local autonomy is expressed in the elective system that allows members of the collectivities in the administrative-territorial units to self-manage through their own bodies, thus having the opportunity to solve the issues that concern them directly. In local public administration, good management problems and promotion of their interests are the responsibility of local authorities who are meant to provide local public services to meet the needs of the people in the administrative-territorial unit.
All of these local public administration authorities through which the management of the interest of local community is done and also the exercise of autonomy at local level in the decentralization process is ensured is illustrated in the figure below, based on statutory regulations in the field.
Figure no. 1. The system of authorities possessing local autonomy Source: own work
The deliberative authorities of public administration in territorial-administrative units, local
councils and the county councils act for the benefit of communities and make decisions that target good management of the village, town and county needs. Mayors and presidents of county councils, local executive authorities, bring out the decisions of the deliberative bodies, having as mission to
The Mayor
The County Council
The president of the County
Council
The autonomous local communities
Local authorities at municipal, town and
village level
Local authorities at county level
Local Council
The Annals of The "Ştefan cel Mare" University of Suceava. Fascicle of The Faculty of Economics and Public Administration Vol. 11, No. 2(14), 2011
290
manage the affairs of the administrative-territorial units in which they are chosen for the benefit of those who have designated them.
As a justification of local autonomy, we consider important to note that both local authorities at county level and the one at municipality, city, town and village level have, in terms of autonomy, the same status. These public administration authorities which manage local interests are not placed in a hierarchical order, meaning that between the two levels there is not a relationship of subordination but of cooperation and solidarity in solving problems arising locally.
But for these local bodies to decide in favor of the community, they must have the necessary and sufficient resources needed to ensure the operational and concrete implementation of the directions for action to increase efficiency in local public administration management. In this respect, a pillar that is considered radical in implementing decentralization and strengthening the autonomy in local public administration management concerns the existence of financial resources available to the local community which it can use for self-management. Financial decentralization is considered rightly by most scholars as the backbone of the administrative decentralization system, financial resources being those that connect operationally the needs of local communities and the necessary modalities to meet them. [3, p. 66]
Thus, according to Chapter 19 - Public Administration Reform in the Government Program 2009-2012, one of the objectives of the present government is to increase local autonomy by transferring new decisional responsibilities as well as financial resources. [8]
We are in the presence of a genuine self-management only when the autonomy authorities have sufficient funds to cover the costs of management and resolution of local affairs. Lack of financial autonomy would make the notion of local autonomy without content. [2, p. 67]
Therefore, we consider appropriate to include in the current government program the financial decentralization objective, as a course of action in reforming public administration. One of the steps of materialization of financial decentralization is to increase the financial autonomy of administrative units and their local budgets revenues by:
- giving local authorities the right to change the local taxes according to local needs and level of affordability of the population;
- calculating the taxable value of buildings and land in built-up settlements by reference to their market value, where it is clearly higher than that determined by the current calculation formula;
- revision of rates of income tax deducted according to the new powers transferred to local authorities in the decentralization process;
- full allocation to local budgets of the proceeds of fines for legal persons, just as those from fines to individuals.
All these measures do nothing but to strengthen the financial autonomy as a key pillar in achieving decentralization in local public administration management.
INCREASING LOCAL AUTONOMY THROUGH DECENTRALIZATION OF PUBLIC SERVICES - POSSIBLE SOLUTION IN OVERCOMING THE CURRENT CRISIS
Decentralization and empowering of local communities are aimed at providing public services of better quality, in accordance with the requirements and preferences of beneficiaries, the upgrading of structures providing such services being concerned as well. No centralized system can meet the infinite variety of needs of local communities as well as local elected and accountable to them. [4, p. 341]
Thus, a range of public services are delivered more effectively locally. Hence the comparative advantage of the local government to the central collection of local taxes and tariffs for local public services provided. Local public administration is generally more effective in this respect because citizens are willing to pay for services that meet their needs or preferences. Therefore the right of decision regarding the administration and financing of a number of important
The Annals of The "Ştefan cel Mare" University of Suceava. Fascicle of The Faculty of Economics and Public Administration Vol. 11, No. 2(14), 2011
291
public services should be transferred to the authorities of the local public administration because they are the best to meet the specific requirements of each beneficiary local community.
University education and healthcare are just two of the public services for which local authorities are the best to make decisions on, regarding resource allocation.
And basically, today we are witnessing certain actions of decentralization in an attempt to make administration more efficient or, why not, in an attempt to seek an answer to remove the country from crisis response.
Thus, an essential step in this direction regards public health decentralization by transferring powers regarding the management of municipal, city, municipal, county hospitals to local authorities. This is justified in the fact that autonomous local authorities are able to better understand the basic needs of their communities when it comes to health, paying more attention to their satisfaction. Through health decentralization, the autonomous authorities can be involved in developing the health system and decide for the community they represent. But the transition of health units from ministries to local public authorities must be accompanied by funding resources, as without funding these units cannot function.
Another priority of the current government regards the implementation of the decentralization measures of powers to local public administration authorities in the field of pre-university education. In achieving this, local communities receive more rights and responsibilities in the administration of schools, the decentralization of the education systems being a necessary and long-waited process step in terms of efficient administration of public services. But the transfer of management skills in schools must be accompanied by an appropriate level of financial resources, especially given that currently central authorities give the highest part of the funds and are involved in major decisions on education.
And, of course, the list of public services forming the subject of decentralization is not exhausted only by presenting only the above. Moreover, the degree of autonomy at local level depends on the number of public services given to the competence of public authorities in the territorial-administrative units.
The decentralization is intended to confer a wide autonomy to the management of local communities, allowing the latter to define their own rules of action and to choose their means of intervention. In other words, decentralization offers local public administration the possibility to express a degree of originality in its activities. The decentralization process is conducted for the benefit of citizens by strengthening the power and the role of local public administration for sustainable economic and social development of the territorial-administrative units.
Thus decentralization creates prerequisites for strengthening the autonomy of local authorities by:
- coordination by local authorities of public services in accordance with local characteristics and needs;
- efficient use of financial, human and material resources, problems in solving the problems of local communities, which local government authorities perceive better than the bodies from the center;
- meeting the conditions promptly, according to the specific requirements and local priority needs of the administrative-territorial units;
- promotion of participatory management in the administration and governance of each administrative-territorial units.
In enhancing autonomy and decentralization, responsibility in local public administration management is the task of the autonomous authorities that are representative of local communities.
CONCLUSIONS
Taking into consideration the issues exposed in this paper, we conclude that, at present, in the management of local public administration we are dealing with a great challenge. It is called local autonomy and decentralization.
The Annals of The "Ştefan cel Mare" University of Suceava. Fascicle of The Faculty of Economics and Public Administration Vol. 11, No. 2(14), 2011
292
And for an effective public administration to be possible, autonomy and decentralization should not remain only on paper. If the situation is such, local authorities lose their main role of local actors who should represent the collectivity and in whose interests should act with priority, being unable to take new transferable skills and ensure their efficient management. Where is the autonomy if they needed approval from the center in managing local affairs? Is it a good idea to decentralize the management of public administration? Can it work if local authorities are passive observers of this process?
These are questions that call for discussions in the central administration and in that of administration in the territorial units, both having to identify the levers and tools for the implementation of the decentralization and strengthening of local autonomy. Clearly, we have a genuine and strong governance structure when the central structures do not retain complete responsibility and power within their reach, but share it with the governing bodies of the administrative-territorial units, possessors of local autonomy, which are entitled to exercise this autonomy on behalf of the community and for the community.
REFERENCES
1. Iordan N., (2010), Local public services management, C. H. Beck Publishing House, Bucharest
2. Munteanu V.A., (2009), Local public management, Tipo Moldova Publishing House, Iași
3. Dogariu E., (2010), Study on the local financial autonomy in Romania, Theoretical and Applied Economics, Volume XVII, No. 6(547), pp. 65 – 73
4. Tudor F., (2009), Financial inconveniencies of decentralization, Studia Universitatis “Vasile Goldiş” Arad, Ştiinţe Economice Series, nr. 19, Partea a III-a, pp. 340-344
5. Scutariu A.L., (2011), Aspects regarding rural tourism and its perspectives in the North-East region of Romania, Petroleum-Gas University of Ploiesti Bulletin, Economic Sciences Series, Volumul LXII, No. 4, pp.93-104
6. *** Local Public Administration Law no. 215/2001, published in the Official Gazette no. 204 of April 23, 2001
7. *** Framework Law on Decentralization no. 195/2006, published in the Official Gazette no. 453 of May 25, 2006
8. *** The Government Programme 2009-2012 available online on http://www.gov.ro/programul-de-guvernare-2009-2012__c12l1p1.html
The Annals of The "Ştefan cel Mare" University of Suceava. Fascicle of The Faculty of Economics and Public Administration Vol. 11, No. 2(14), 2011
293
LEGAL SYSTEM OF PUBLIC LIMITED LIABILITY COMPANIES
University Assistant Ph.D. Candidate Eugenia Gabriela LEUCIUC
“Ştefan cel Mare” University of Suceava, Romania Facultaty of Economic Sciences and Public Administration
Abstract: Whithin this scientific paper, we examine, especially from the perspective of the provisions in the New Civil
Code and the law which puts into practice this organic law, the legal system of the public limited liability company, form of company adopted pre-eminently by the quasi-majority of economic operators for its practical advantages presented. Concomitantly, in the elaboration of the work, we take into consideration the statistical data outlining the fact that, by their legal structure, adjustable to small and medium companies, public limited liability companies have reached in present a considerable development.
Keywords : company, share capital, contribution, affectio societatis, shareholders, share
JEL Classification: K12 GENERAL CONSIDERATIONS REGARDING THE CONCEPT OF COMPANY IN
THE PERSPECTIVE OF THE NEW CIVIL CODE
In special literature, the company is defined either as a group of individuals incorporated on the grounds of a memorandum of association, each of them having legal personality, and all partners agreeing on sharing certain goods in order to perform acts of merchant profit-making and benefits-sharing purposes(1), or as an institution organized by one or more individuals by means of a constitutive act, on benefits-making purposes, as a autonomous law subject or even without this characteristic, affecting the necessary goods in order to accomplish the act of merchant particular to the statutary object of activity (2).
In our opinion, when definining the notion of company, we should start from the previsions of art.1881 from the New Civil Code, where paragraph (1) defines the memorandum of association as the agreement by which two or more persons mutually bind themselves to cooperate in developing an activity and to contribute with money, goods, know-how or services, in the purpose of sharing the benefits or making use of the economy which could possibily outcome. Each shareholder contributes to the abidance of the losses proportionally with the participation to the distribution of the benefit, unless agreed differently (para. 2)
This definition oultines the deffining elements of a company, usually met cummulatively: the necessity of signing an agreement, also named memorandum of association; the consitution of a mutual fund, consisting of contributions of the members; the purpose of the members is that of realizing earnings to share between them; the common will of the members of co-working in the view of obtaining earnings is also known as affectio societatis.
Yet, a company cannot be reduced to a simple agreement, but it constitutes a subject of determined law (distinct of the shareholders forming it), with assets allowing it to bound and be liable for their accomplishment, a self purpose and a self-standing organisation.
The legal procedural framework of regulation of companies is represented by Company Act no. 31/1990, republished, with the ulterior adjustments and modifications, provisions which must be coroborated with those of the New Civil Code, pursuant to para. 1887 line (1), in which it is stipulated that the provisions of this procedural act constitutes the common law in matter of companies.
Unlike the provisions in para. 1887 line 2 from the New Civil Code making a clear distinction between different types of companies in considering the form, the nature or the object of activity, in para. 3 of the Company Act are stipulated five forms/types of company, using one single
The Annals of The "Ştefan cel Mare" University of Suceava. Fascicle of The Faculty of Economics and Public Administration Vol. 11, No. 2(14), 2011
294
criterium of enumeration – that of the company's length in what concerns the liability of the shareholders upon the obligations bound by the company (3):
• General Partnership, representing – historically speaking – the first type of company characterised by unlimited and solidary liability of the shareholders for social liabilities.
• Limited Partnership, which social capital is divided in interest-bearing shares, knows two categories of shareholders: sleeping partners who are continuously liable and solidary to the social liabilities and the active partners who are liable up to the concurrence of their contribution to the shared capital.
• Limited Joint Stock Company distinguishes from the limited partnership by the division of its social shares.
• Joint Stock Company is that company where the social capital is divided into shares, negociable and transmittable share securities, belonging to shareholders liable only up to the concurrence of their contribution.
• Private Limited Liability Company is the most recent form of company, regulated only in the XIXth century in Germany (4), which social capital is divided into equal shares. In this case also, the shareholders are liable up to the limit of their contribution to the social capital.
Traditionally, these types of company can be grouped in three categories: i) partnerships: General Partnership and Limited Partnership; ii) joint stock companies: Limited Joint Stock Company and Joint Stock Company and iii) the private limited liability company (which presents particular characteristics of the companies from the first two categories), taking into account the length of the shareholders' liability for the accomplishment of the company's liabilities.
The partnerships, “intuitu personae”, General and Limited, are characterised by a small number of partners who know each other very well and who count on the honesty, professional skills, solvability and devotion of each other. We have already shown that the liability of the partners is unlimited in the sense that, no matter the contribution of each partner to the foundation of the company, under the form of investment, each partner is liable for the company's debts with his whole personal wealth. May have the quality of partner in a partnership any legal or natural person, merchant or nonmerchant, who, by principle, does not own such quality in other concurrent partnership. For the foundation of the social capital, the partners can subscribe either money capital, natural capital or receivables. The social capital is divided into interest-bearing shares, share securities and they cannot be transmitted, by principle, unless it is stipulated expressely in the articles of incorporation, the continuance of the activity with the inheritor of the deceased under the form of the continuity of services with the successors clause. In such case, the law does not provide a minimum level of the social capital, taking into account that each partner guarantees with his entire wealth for the company's liabilities. The partners in the General Meeting adopt decisions only by unanimity of votes, and if lack of contrary provision, they can manage the company in the vertue of the presumption of a mutual contract of service given in this particular purpose (either the partners are managers, or, pursuant to Law no. 31/1990 republished, the third parties). The control of the economical-financial activity is realized usually by the partners, the appointment of censors being optional.
Closure of partnerships intervenes in certain situations provided by law: the withdrawal, the incapacity, the bankruptcy or the death of a partner, if so the number of partners does not reduce to a one individual, without the existence of any continuity of services with the successors clause in the articles of incorporation or any other way of ensuring the plurality of members, hence we deduce that the minimal number of partners for partnerships is two (enforced by the bilateral character of the articles of incorporation as well).
Unlike the general partnership, the limited partnership comprises two categories of partners: sleeping partners who are unlimitedly, solidarily and subsidiarily liable for the accomplishment of the company's liabilities; being able to occupy the function of managers of the company. The second category is formed by active partners who are liable only up to their contribution to the
The Annals of The "Ştefan cel Mare" University of Suceava. Fascicle of The Faculty of Economics and Public Administration Vol. 11, No. 2(14), 2011
295
social capital, reason why they are not allowed to operate in the behalf of the company, unless they are provided with a special statement of authority for this purpose. Joint stock companies “intuitu pecuniae” are characterized by a great number of partners, or shareholders, whose main liability is to subscribe to the social capital which minimal quantum, stipulated imperatively by the law, is of 90.000 lei (the equivalent of 25.000 euros).
The social capital is divided into shares, or share securities, negociable and transmittable, which cand be transactioned on organized financial markets. Shareholders can subscribe either money, either natural capital in the view of founding the social capital, or receivables, under the provisions of law. The liability of each shareholder for the trade liabilities of the stock company is limited to the quantum of the social contribution of each of them.
The company's will is set whithin the General Meetings of the Sharholders - ordinary and extraordinary, when the decisions are adopted on the principle of majority of the shareholders' votes.
For the management of a stock company, the shareholders may opt for one of the two systems of management: unitary or dualist systems. According to the unitary system, the company is managed by a single uni or pluripersonal organism of administration, representend by a board of directors. It can authorize the management of the company to one or more directors, one of them being named general director (para. 143 line 1).
In the conditions of the dualist system, the stock company is managed by two organisms: the directorate and the surveillance board, each of them having distinct and clearly stipulated by law attributions. The financial statement of joint stock companies opting for the dualist system of management are submitted to financial audit (para. 160 line 1 ind.1).
If the management control of the companies which anual financial statements are not submitted to financial audit, the General Meeting of the Sharholders will appoint a commission of censors composed by at least three censors and suppleants, unless the articles of incorporation stipulate a lager number (para. 159 line 1).
Beside the general, common causes of dissolution of companies, the stock company can be dissolved on account of specific causes: the decrease of the net capital to less than half of the amount of the subscribed social capital; the decrease of the social capital under the minimal compulsory level of 90 000 lei or the decrease of the shareholding to a single shareholder for a period longer than 9 months.
Starting from these particularities of each category of company. we may point out that the public limited liability company has a configuration of its own, boardly joining the personal element and the assets, best answering to certain concrete economical purposes. (5)
DEFINING CHARACTERISTICS OF THE PUBLIC LIMITED LIABILITY
COMPANIES
The public limited liability company joins the features of the partnerships and those of joint stock companies. This type of company presents a series of resemblances with the partnerships, as follows: the element intuitu personae imposes a maximal number of partners (50 individuals); the social capital is divided into equal shares – share securities without circulatory value, being transmitted by third parties by cession under restrictive conditions of quorum of vote; the adoption of the decisions within the General Meeting of the Shareholders regarding the alteration of the articles of incorporation needs the unanimous vote of the shareholdes; the exclusion of the shareholders from a public limited liability company or the representation of the company in relation with the third parties are governed by the same rules, stipulated also for the partnerships. The public limited liability company has close resemblance with the joint stock companies in what concernes the limited liability of the shareholders for the company's liabilities; at the foundation, it is issued a memorandum of association joining the typical stipulations for the act and articles of association (except for the single shareholder company); the performance of the right to
The Annals of The "Ştefan cel Mare" University of Suceava. Fascicle of The Faculty of Economics and Public Administration Vol. 11, No. 2(14), 2011
296
vote in the General Meetinf of the Shareholders depends on the number of shares held by each shareholder, the rule of the majority governs the normal life of the company; there are allowed only contributions in money or in nature; it is imperatively established by the law a minimal quantum of the social capital; the shareholders are allowed to withdraw from the company; the special causes of dissolution of the company (the decrease of the social capital under the minimum imposed by law, the increase or the decrease of the maximal or minimal number of shareholders provided by law). Alongside these defining characteristics, the public limited liability company, as any other type of company with legal personality, is defined also by a merchant nature, statuted in para.1 line(1) from acts of merchant, that is acts of production, merchandise or services (para.8 line.(2) from Law no. 71/2011 in order to put into practice Law no. 287/2009 concerning the Civil Code, issued in M. Of. no. 409/2011). The merchant aspect of the public limited liability company delimits it neatly from the private companies, simple companies, those with legal personality and professional companies with or without legal personality (para. 7 let. a-c of Law 71/2011) and determines the application of the provisions of Law no. 31/1990 and of Law no. 26/1990. Also, the public limited liability company is a distinct subject of law of the partners who found it and joins all the constitutive elements of a legal person of private law: an self-standing organization and proper assets, affected to the accomplishment of a certain lawful moral purpose, in accordance to the general interest (para. 1, line. 2 Company Act coroborates with para.187 and the following of the New Civil Code). On the other hand, the public limited liability company has capacity of use and exercise, as holder of rights and liabilities, participates directly and straightforwardly in the legal relations and is liable for the bonds in front of the third parties. As any law subject, the public limited liability company individualizes within the legal relations by: sign, registered head office and/or other offshoots, emblem, nationality inclusively. According to para. 1 line 2 of Company Act, companies with the registered head office in Romania are Romanian legal persons, being governed by the Romanian legislation. Special doctrine considers inefficient the unicity of the criteria of determination of the company's nationality, as it leaves unsolved the problem of the foreigners' condition, the foreing investments usually operating with a distinct criterium – that of the control performed by the shareholders over the company.(6)
FOUNDATION OF THE PUBLIC LIMITED LIABILITY COMPANY
Public limited liability company can be founded by incorporation of a maximum of 50 individuals or – with title of exception – by the expression of will of a single person, in the view of developing acts of merchant in any domain of economic activity, but for those which, according to special law, are reserved to economic operators organized under a different company form.
Doctrine stipulates that the analysis of the foundation of a public limited liability company firstly needs theoretical clarifications referring to the constitutive and/or institutional aspects of its legal nature.
For the purpose of a public limited liability company's foundation, the fondatory partners must accomplish certain conditions provided imperatively by the law. In such sense, there will be realized a series of procedures, as follows: reservation of the company's name, subscription, on the behalf of the company, of the amounts representing the contribution to the social capital; drafting of the memorandum of association under the form of the certificate under private signature, with certified date, (being compulsory to be certified in authentic form, if the contribution is a fixed asset), the statutory declarations of the partners, the managers and the censors if they accomplish the conditions provided by law etc.
In the case of the public limited liability company, the memorandum of association, expressing the agreement of the shareholders to constitute a mutual fund from their individual contributions, with the intention of collaborating in the development of an economical activity and of the state and, exceptionally consists of the memorandum in the case of the single shareholder company.
The Annals of The "Ştefan cel Mare" University of Suceava. Fascicle of The Faculty of Economics and Public Administration Vol. 11, No. 2(14), 2011
297
In the analysis of the conditions of validation of the memorandum of association (respectively of the act of association), we must bear in mind both the provisions in para. 1882 and the following of the New Civil Code, and those in para.5 and the following of the Company Act, all referring to: the capacity of the shareholders, the agreement of shareholders, the object and the cause of the act of association, as in the case of any other legal document. The agreement expressed in the purpose of signing the constitutive act must accomplish the following conditions: provenience from a person with power of discernment, expression of the intention to produce legal effects, exteriorization, uncorruptcy (unaffected by error, violence). In order for it to be availably signed, the constitutive act must have a determined object, possible, lawful and moral, as well as a real, lawful and moral cause.
If these availability conditions mentioned in the paragraph above are stipulated by the law for any legal document, for the memorandum of association, the law establishes certain specific elements: the constitution of a mutual fund by individual contributions of subscribed amounts to the social capital, the intention of the shareholders to collaborate for the development of the activity (affectio societatis) and for the participation to the division of the benefits and the abidance of the losses.
We underline the fact that the legislator pays a special attention to the drafting of the memorandum, establishing expressly the mentions to be comprised in such act.
Special doctrine stipulates that the accomplishment of the conditions of form lato sensu, provided imperatively by the Company Act no. 26/1990 regarding the Commerce Registry, involves covering a procedure and performing the publicity, having as finality the achievement of the legal personality, according to para. 200, line 2 coroborated with para. 205, line.1 of the New Civil Code (7).
Synthetising, the procedure implies a consensual phase, consisting of the elaboration of the memorandum of association, followed by a final phase in which are accomplished the publicitary formalities. (8) The disobeyance of the fond and form conditions – lato sensu – regarding the foundation of a public limited liability company may lead to the annulment of the company.
At the foundation of the company, each shareholder has the liability to constitute a contribution to the social capital, which can be of any economic value, presenting interest for the activity of the company. The shareholders' contributions should not be equal in value, or have the same object, nor the contribution of a shareholder has a unitary object.
Up to the limit of the contribution, the shareholder becomes debitor of the company, and after the integral subscription of it – its creditor, with all the consequences immerging from this quality. Non-performance of the contribution has the signification of the non-execution of the liability, with consequences stipulated by law (thus, the shareholder who overdues the deposit of the social contribution is liable for the damages caused to the company; and the shareholder who didn't accomplish the liability to contribute with money, owing also the legal interests since the date OF the subscription). The totality of the shareholder's contributions who participate to the foundation of the company form the social capital of the company which value can be adjusted during the existence of the company. In case of decrease of this value under the limit imposed by law, under 200 lei, the shareholders are obliged to complete or reduce the social capital, before the division or distribution of benefits. Having the role of general pledge of the creditors, the social capital must be real, which implies the effective entrance in the company's assets of all the goods as contributions from the shareholders, as well as the keeping in permanence in the company's assets of certain goods which values should not be smaller than the social capital. (9)
The social capital determines the benefits and calculates the company's resources. The social capital of the public limited liability company is divided into fractions – shares, of equal value; the minimal value of a share being 10 lei. According to law, shareholders achieve a number of shares, proportional to the value of each contribution, in exchange of the contribution.
Shares issued by the public social companies do not constitute negociable share securities and are transmittable: to the other shareholders, by decision of the General Meeting of the
The Annals of The "Ştefan cel Mare" University of Suceava. Fascicle of The Faculty of Economics and Public Administration Vol. 11, No. 2(14), 2011
298
Shareholders; to the inheritors, in case of continuity of services with the successors clause; to the third parties, by cession of shares, decide by vote of the shareholders, representing ¾ from the social capital.
The managers of the public limited liability company may issue, at demand, a certificate of good standing of all the rights on the shares, but mentioning that such certificate cannot serve as title for the transmission of the rights certificated, under the sanction of null transmission. Thus, the share certificate cannot be transmitted (neither by bill of exchange, by material remission, nor by registering the transmission). By their specificity, as shown in the special literature, certificates of shares can be qualified as titles of legitimation, lacking the constitutive character and literary of the credit titles. (10)
In principle, shares grant the holder the following rights: • to participate to the General Meeting of the Shareholders and to vote, rights performed
according to the principle of proportionality between the number of votes and the number of shares held;
• to ellect or to be ellected in the company's management organisms; • to receive the dividends representing the quota-part from the benefit paid to each
shareholder; • to be informed on the management of the company, being able to consult the company's
documents and duplicate certified copies of them; • to control the way of management in the company; • to obtain, in case of liquidation of the company, a part of the resulted net asset,
proportional to the contribution of the shareholder at the foundation of the company (the contribution and eventually other contributions which will be established by the final balance sheet).
The main obligations of the shareholders are: • to subscribe the entire contribution; • to abide the losses of the company proportionally to the countervalue of the
contribution. The purpose of the company is that of realising benefits from the commercial activity
developed and dividing them to the shareholders. The quota-part of the benefits is know under the name of dividend. They are paid in the term established by the General Meeting of the Shareholders, or in special laws, but not later than 6 months since the date of approval of the anual financial statement afferent to the closed financial year, on the contrary the company will pay compensation damages. The dividends are distributed only from profits determined according to law, on the contrary the shareholders who received them are obliged to return them, if they admitted or should admit the irregularity of the distribution. The procedure regarding the restitution of the dividend is prescribed in term of 3 yars since the date of their distribution.
Since the commercial activity could register losses instead of benefits, thanks to the social relationship which binds them, the shareholders must participate to the losses as well. Law prohibits that a shareholder perceives all the realized earnings and be exonerated of participation to the losses (leonine clause); each shareholder participates to the benefits and the losses of the company up to the quota of participation to the social capital, unless provided differently by the articles of constitution. The resources of the company are the amounts of money retained from the net profit for covering, at needm the receivables of the social creditors. The resources are lawful, also named reserve fund, and optional. In order to create the reserve fund, it is assigned annually at leat 5% from the profit, until it reaches minimum 1/5 from the social capital. This reserve fund also called legal resource, must be completed each time it is considered a decrease of its quantum under the minimum imposed by law. As well, the increase of the social capital determines new retains from the profit for the increase of the reserve fund. The reserve fund has a precise destination, being used only in case if the company registeres losses of capital or of net asset. There can be created also optional funds which are in fact the amounts of money destined by the company either for the
The Annals of The "Ştefan cel Mare" University of Suceava. Fascicle of The Faculty of Economics and Public Administration Vol. 11, No. 2(14), 2011
299
performance of investments, or the development of marketing activities or for covering certain losses in the assets under objective circumstances.
ORGANISATION AND FUNCTIONING OF PUBLIC LIMITATED LIABILITY COMPANIES
Such any legal person, the company has not an organic existence, thus, it's will is expressed by it's organisms, respectively: management, execution and control organisms of the company. The will of the company is formed within the General Meeting of the Shareholders and brought into accomplishment by the executive (management) organisms represented by the manager (gerent) or the managers. The control of the manager's activity is realized by the shareholders (in the virtue of the rights of information, control and audit) or, in certain cases, by a specialized organism, the censors of the company. The management of the company is realized by the shareholders within the General Meeting of the Shareholders by adopting the decisions of the regular problems for the life of the company, as well as on certain special problems, pointing fundamental elements of the company. Starting from the specific of attributions and, in the case of the public limited liability company, we make the distinction between ordinary and extraordinary meetings, although the legislator regulates such types of general meetings exclusively in the case of joint stock companies. In principle, the ordinary general meeting of the shareholders takes place at least once a year, not longer than 3 months since the closure of the financial year, in the pourpose of: approving the balance sheet, after consulting the report of the managers and censors, establishing the budget of incomes and expenses and, if case, the program of activity, for the next financial yea; fixing the dividend due to the shareholders; naming the managers and/or the censors etc. Usually, the general meeting of the shareholders decides by vote representing the absolute majority of shareholders and shares (it is then required, cumulatively, the percent of 50% plusn one of the number of shareholders, as well as the condition that they represent half plus one of the total shares). Unlike that, the extraordinary general meeting of the shareholders adopts decisions with unanimity of votes in problems implying the adjustment of the memorandum of association, like: increase or decrease of social capital; change of object or form of company; prolongation of the company's duration, change of registered head office; withdrawal or exclusion of a shareholder or incorporation of new shareholders, merge with other companies; dissolution of the company and any other aspects concerning the alteration of the memorandum of association. The will of any company is expressed in the general meeting, but it is put into practice by the management organisms of the company. According to Law no. 31/1990 republished, with the ulterior adjustments, the public limitated liability company can be managed by one or several director, shareholders or third parts, who can action together or separately. It seems worthy to outline tha fact that mutatis mutandis the provisions referring to the management of companies in general partnerships (para. 75, 76, 77 line 1 and 79) applies correspondently also to public limitated liability companies. Managers are assigned either by memorandum of association, or ulteriorly by decision of the General Meeting of Shareholders and are invested a 4 year mandate, presumed to be of 2 years, unless stipulated differently in the appointment act. It can be appointed as manager either a natural person or a legal person which pledges. Managers can sign any legal document necessary and useful for the accomplishment of the object of activity of the company, except for those which value excels half of the financial value of the company's shares, for which it is needed the aproval of the extraordinary general meeting of the shareholders. Shareholders' liability is governed by the stipulations of the contract of service from the civil law, and in case of plurality of managers, liability is solidary. (11) Control of the management in joint stock company is ensured by censors who survey on the good functioning of the company by developing an audit on the managers' activity. Censors, elected by the General Meeting of the Shareholders, form a committee of three members and a suppleant (unless it is provided a lager number by the memorandum of association); in all cases, the number
The Annals of The "Ştefan cel Mare" University of Suceava. Fascicle of The Faculty of Economics and Public Administration Vol. 11, No. 2(14), 2011
300
of the censors must be impair. The control of the management is regularly made by the shareholders, yet, when theit number excels 15 persons, the censors' appointment is mandatory. Exceptionally, also in the case of public limitated liability company, financial statements must be submitted to financial audit. Censors' liability is regulated by the mandate stipulations, their annulment being decided by the extraordinary general meeting of the shareholders only. The adjustment of the conditions in which is developed the activity of a company may determine the necessity of its modification. In such sense, the shareholders may consider useful the increase or decrease of social capital, change of object of activity or of its legal form, etc. Because the structural or identitary elements to be altered are established by memorandum of association of the company, their alteration imposes practically the alteration of the memorandum itself. (12) The alteration of the memorandum of association is made possible by will of shareholdes, while formulates within general meetings. In the case of joint stock companies and limited partnerships the decision may belong to the extraordinary general meeting of the shareholders, otherwise in the hypothesis of general partnerships and public limited liability companies, the decision must be unanimously taken by the General Meeting of the Shareholders. Such meeting takes places in order to alter the memorandum of association, which should be recorded in a certificate, representing the additional act of the memorandum. The additional act submits to the formality of registration to the Commerce Registry (Unique Bureau). In what concerns tne lawfulness control of the additional act, law distinguishes between the one drafted by the authorized judges, concretized in a closure (in the case of the most important modifications: change of the main object of activity, change of social capital, fusion and division, decrease or prolongation of the duration of the company, dissolution and liquidation, change of registered head office etc) and the one issued by a resolution of the Unique Bureau which authorizes the other modifications.
REORGANISATION AND CESSATION OF A PUBLIC LIMITED LIABILITY COMPANY According to provisions of para. 233 line1 from the New Civil Code, corroborated with those of the Company Act – para. 238 and sq., the reorganization of a public limited liability company realizes by fusion and division, by obeyance of an express procedure and imperativelu provided by special law (Company Act). Usually, as an effect of the reorganization one or several companies involved in this process cesses its existence. Cessation of a public limited liability company implies two distinct phases – that of the dissolution and that of the liquidation, except for the case when the company cesses existing as a consequence of the merge. Dissolution represents the typical way of cessation of the public limited liability company and marks the cessation of ist activity and the entering of the company in a new form of existence, characterised by a limites legal capacity to accomplish the liquidation procedures.(13) According to para. 227, line1 Company Act, the company can dissolve by: lapse of time established by the duration of the company, impossibility of achieving the object of activity of the company or its achievement, statement of nullity of the company, decision of the General Meeting of the Shareholders, court's decision, bankruptcy etc. Besides these general dissolution causes, the way they are qualified by special doctrine, there is stipulated a series of specific causes of the public limited liability company, as follows: when by bankruptcy, incapacity or exclusion of any of the shareholders their numer reduces to one (unless stipulated differently, the transformation of the company in single shareholder company), excelaration of the maximal number of shareholders, decrease of social capital under the minimal limit provided by law (undelss shareholders decide its completion before the term provided by law). As a consequence of the interfered dissolution of the company, there begins the liquidation procedure, which is a phase governed by certain principles:
• all documents issued by the company will mention the fact that it is in liquidation;
The Annals of The "Ştefan cel Mare" University of Suceava. Fascicle of The Faculty of Economics and Public Administration Vol. 11, No. 2(14), 2011
301
• liquidation is accomplished in the interest of the shareholders, which means liquidation may be demanded by the shareholders only with the exclusion of the company's creditors; shareholders' meeting appoints the liquidators (who underake the management of the company from its managers) and establish their powers; the conditions of the liquidation themselves can be settled by memorandum (by the shareholders);
• liquidation of company is mandatory because company cannot remain in the dissolution phase.
Liquidation procedures imply both the liquidation of the assets by transforming the company's goods into money and receiving the receivables the company has for it's third parties, and the liquidation of the liabilities, consisting in the payment of the debts the company has for it's creditors, the net assets resulted being finally divided between the shareholders. Such operations must happen until 3 years passed since the date of dissolution. Finally, the liquidators must solicit the radation of the company from the registry held by the Unique Bureau (date of end of the company's legal personality); the registries and the company's documents must be kept archived for 5 years after the date of their deposit to the Unique Bureau of the Chamber of Commerce. Both natural and legal persons may hold the quality of liquidators with the condition that they accomplish the criteria provided by law. In accomplishing the afferent liabilities, the liquidators are as liable as the managers and are submitted to the censors' control. The document of appointment of the liquidator by the general meeting (or, exceptionally, by court, when the circumstances of the convocation and the decision of liquidation are not accomplished) will be deposited at the Commerce Registry (the Unique Bureau).
FINAL CONCLUSIONS The problematics extremely complex of the companies, especially that of the public limited
liability company, represents a refference whithin my preoccupations. Whithin this paper, I analysed the public limited liability company in the context of the major modifications of the Romanian legislation, by entering into force of the New Civil Code, also bringing adjustments to the Law no. 31/1990 regarding the companies, Law no. 26/1990 regarding the Commerce Registry and annuls the Commercial Code.
As well, we conclude by stating that, taking into consideration the practical importance presented by this type of company, the public limited liability company has met during time transformations which enriched and reconfigured it's legal system. Thus, the public limited liability company rejoices of the following facilities: limitation of the number of shareholders, hence the company's closed character, limitation of the personal liability of the shareholder to his share and limitation to dispose freely, by cession, of the share.
ENDNOTES : (1) St.D.Cărpenaru, Tratat de drept comercial, Editura Universul Juridic, Bucureşti, 2009, p. 156 (2) O.Căpăţînă. Societăţile comerciale, Editura Lumina Lex, Bucureşti, 1996, p. 15 (3) C.Lefter, Societatea cu răspundere limitată în dreptul comparat, Editura Didactică şi Pedagogică, Bucureşti, 1993, p. 15 (4) C.Lefter, op.cit., p. 14 (5) C.Lefter, op.cit., p. 19 (6) see O.Căpăţînă, op.cit., p.73 and sq. (7) C.Lefter, op.cit., p. 60 (8) O Căpăţînă, op.cit., p. 133 (9) C.Stoica, S.Cristea, Drept societar, Editura Universitară, Bucureşti, 2008, p. 110 (10) C.Stoica, S.Cristea, op.cit., p. 123 (11) C.Stoica, S.Cristea, op.cit., p. 142
The Annals of The "Ştefan cel Mare" University of Suceava. Fascicle of The Faculty of Economics and Public Administration Vol. 11, No. 2(14), 2011
302
(12) C.Stoica, S.Cristea, op.cit., p. 162 (13) C Lefter, op. cit., p. 145 and sq.
BIBLIOGRAPHY:
1. Baias Fl.A., Prefaţă la Codul Civil (Legea nr.287/2009), Editura C.H.Beck, Bucureşti, 2009 2. Căpăţînă O., Societăţile comerciale, Editura Lumina Lex, Bucureşti, 1996 3. Cărpenaru Stanciu D., Tratat de drept comercial, Editura Universul Juridic, Bucureşti, 2009 4. Lefter Cornelia, Societatea cu răspundere limitată în dreptul comparat, Editura Didactică şi
Pedagogică, Bucureşti, 1993 5. Motica Radu I. şi Bercea Lucian, Drept comercial român, Editura Lumina Lex, Bucureşti,
2005 6. Schiau Ioan şi Prescure Titus, Legea societăţilor comerciale nr.31/1990. Analize şi
comentarii pe articole, Editura Hamangiu, Bucureşti, 2007 7. Turcu Ion, Tratat teoretic şi practic de drept comercial, Volumul II, Editura C.H. Beck,
Bucureşti, 2008
The Annals of The "Ştefan cel Mare" University of Suceava. Fascicle of The Faculty of Economics and Public Administration Vol. 11, No. 2(14), 2011
303
INSTRUCȚIUNI UTILE PENTRU AUTORI / AUTHOR GUIDELINES
RO Revista The Annals of the Stefan cel Mare University of Suceava. Fascicle of The Faculty of Economics and Public Administration primeste articole, din toate domeniile economice, pe cele 5 sectiuni: � Economie, comert, servicii � Management si administrarea afacerilor � Contabilitate-finante � Statistica, informatica si matematica � Drept si administratie publica
Este recomandabil ca lucrarile sa fie bine structurate astfel încât sa asigure claritatea continutului precum si esenta temei tratate. Toate articolele trebuie sa prezinte cercetari originale care nu au mai fost publicate sau trimise spre publicare în alta parte. Lucrarile prezentate la conferinte sunt acceptate cu conditia ca ele sa nu fi fost publicate în întregime in volumul conferintei. Lucrarile vor fi redactate în întregime în limba engleza. Lucrarile vor fi recenzate in sistem blind review. Titlul lucrarii Se va scrie cu Times New Roman, caracter 12, bold, centrat în partea de sus a paginii, si se va scrie cu majuscule. Autorii lucrarii Numele lor se va scrie la un rând după titlul lucrării, centrat, precizându-se: titlul stiintific, universitatea/instituţia, localitatea, ţara si e-mailul. Se va folosi Times New Roman, caracter 10, cu litere mici. Numele si prenumele autorului/autorilor va fi scris cu litere bold, iar numele de familie va fi scris cu litere mari (caps look). Rezumatul lucrarii Rezumatul se va scrie după autori, lăsând un rând liber înainte; trebuie sa cuprinda informatii suficiente pentru ca cititorii sa poata aprecia natura si semnificatia subiectului, caracterul adecvat al metodei de cercetare, rezultatele si concluziile lucrarii. Rezumatul nu este o introducere, acesta prezinta în sinteza rezultatele esentiale ale cercetarii. Rezumatul se va scrie cu Times New Roman, caracter 10, italic, justify. Este necesar ca el sa aiba un numar de 200-250 de cuvinte, spatiate la un rând. Cuvinte cheie Selectati 5-6 cuvinte cheie (cuvinte sau expresii) care surprind esenta lucrarii. Enumerati acesti termeni în ordinea descrescatoare a importantei lor. Acestia se vor scrie cu Times New Roman, caracter 10, la un rând liber după rezumat. Clasificare JEL Se va trece unul sau mai multe coduri JEL, in care lucrarea poate fi inclusa din perspectiva subiectului abordat. Lista cu coduri o gasiti la adresa: http://www.aeaweb.org/journal/jel_class_system.html Introducerea Pentru introducere, formulati scopul lucrarii, motivatia temei alese si explicati pe scurt modul de abordare si argumentele necesare. Înainte de introducere se lasă 2 rânduri libere. Continutul lucrarii Organizati corpul lucrarii utilizând titluri si subtitluri pentru a accentua atât continutul cât si claritatea acesteia. Titlurile şi subtitlurile se vor scrie cu litere mari, 12, bold, aliniate la stânga. Se va lăsa un rând liber înainte şi unul după. Trebuie avute în vedere urmatoarele:
terminologia recunoscuta a domeniului pentru a descrie orice subiecte sau proceduri experimentale folosite pentru colectarea si analiza datelor;
includerea metodelor detaliate, astfel încât cititorii sa poata urmari prezentarea materialului; formularea rezultatelor în mod clar si succint; evidentierea rezultatelor cercetarii si impactul acestora, atât global cât si specific.
Textul lucrarii se va scrie cu Times New Roman, caracter 12, spatiat la un rând. Tabelele si figurile sa fie dimensionate si plasate în corpul lucrarii asa cum doresc autorii sa apara în revista. Trebuie avut grija ca acestea sa se încadreze pe o singura pagina. Continutul lor se va scrie cu Times New Roman, caracter 10, iar titlul coloanelor tabelelor se va scrie cu Times New Roman, caracter 10, bold. Titlul si numarul tabelelor vor fi pozitionate deasupra acestora, iar titlul si numarul figurilor, sub acestea. Atunci când este cazul se va mentiona si sursa. Numarul tabelelor si figurilor va fi amplasat în corpul textului, într-o paranteza, acolo unde se fac referiri la ele, de exemplu: (fig. nr. 1); (tabel nr. 1) Graficele trebuie sa fie clar executate astfel încât sa ofere copii alb-negru cât mai lizibile. Numerotati toate ecuatiile si formulele folosite plasând numerele lor în paranteze, în dreapta acestora. Explicati abrevierile si acronimele prima data când apar în corpul textului, chiar daca au fost definite în rezumat. Nu folositi note de subsol, dar sunt permise note la finalul lucrarii (endnotes), situate înaintea bibliografiei.
The Annals of The "Ştefan cel Mare" University of Suceava. Fascicle of The Faculty of Economics and Public Administration Vol. 11, No. 2(14), 2011
304
Ele se vor scrie cu Times New Roman, caracter 10, italic. Concluzii Concluziile pot recapitula punctele principale ale lucrarii, dar nu trebuie sa reproduca rezumatul. Ele pot cuprinde aspecte legate de importanta lucrarii sau pot oferi sugestii referitoare la aplicatii ale acesteia sau directii de extindere a cercetarilor. Bibliografie Referintele bibliografice, din introducere sau corpul lucrarii, se fac prezentându-se, într-o paranteza, în ordine, numele autorului si anul aparitiei lucrarii, de exemplu: (James, 1984); (Collins si Fermont, 1977 - când sunt doi autori).); (Collins si altii, 1988 - când sunt trei sau mai multi autori). De asemenea, trimiterile bibliografice, din textul lucrarii se numeroteaza cu cifre arabe [1], iar când sunt mai multe trimiteri se va scrie [1] - [2]. Lista bibliografica, de la sfârsitul lucrarii, se va scrie în ordine alfabetica, dupa numele autorului, numerotându-se. Când anumite studii, lucrari, articole sunt publicate în volum, atunci se va mentiona numarul acestuia si paginile. Precizari importante
Articolele trebuie sa aiba 6-10 pagini, pe formatul A4, marginile stanga, dreapta, sus, jos: 2 cm. Lucrarile trimise trebuie sa fie formatate în Word cu extensia doc. Articolele care nu respecta aceste instructiuni vor fi respinse inainte de a fi date la peer review.
Vă rugăm manifestaţi foarte mare grijă pentru corectitudinea traducerii în limba engleză. Vă rugăm să trimiteţi şi varianta în limba română a art icolului, necesară pentru controlul ştiinţific. Veţi primi un răspuns în urma procesului de recenzare. Lucrarile se vor trimite pe adresa: [email protected] , menţionând la subject secţiunea pentru care optaţi (ECS, MAF, CF, SIM, APD); exemplu: “articol ECS”. Termenele limită vor fi afişate pe site. Pentru alte detalii sau noutăţi vă rugam urmăriţi site-ul revistei: www.seap.usv.ro/annals .
EN
The Annals of the Stefan cel Mare University of Suceava. Fascicle of The Faculty of Economics and Public Administration, welcomes theoretical and empirical articles, from all economic fields, according to the 5 sections: � Economy, trade, services � Management and business administration � Accounting-finance � Statisitics, data processing (informatics) and mathematics � Law and public administration It is expected that manuscripts will be organized in such a manner that maximize both the substance and clarity of the document. All articles should report original research that has not been published or submitted for publication elsewhere. Papers presented at conferences are accepted, provided that they have not been published in full in Conference Proceedings. The papers will be all written in English. The papers will be checked in blind review system. Paper Title Must be in 12-point bold type, Times New Roman, centered across the top of the page and will be writen in uppercase. Paper Authors Author’s names will be written under the paper title after a blank line, centered across the page, single spaced specifing: title, university/institution affiliation, country and e-mail address. It must be written in 10 point type, Times New Roman in lowercase. The first and last name of the authors(s) will be written with bold, and the last name will be written with caps look. Paper Abstract It will be written after authors leaving a blank line before. The abstract must include sufficient information for readers to judge the nature and significance of the topic, the adequacy of the investigative strategy, the nature of the results and the conclusions. An abstract is not an introduction, it summarizes the substantive results of the work. The abstract will be written in 10 point type italic, Times New Roman, justify. It must have 200 to 250 words, single spaced type. Keywords Select 5 to 6 keywords (words or expresions) that capture the essence of your paper. List the words in decreasing order of importance. All the key terms must be translated in English and attached to your abstract. It will be written in 10 point type, Times New Roman, after abstract leaving a blank line before. JEL Classification Please put one or several JEL codes, according to the subject of your paper. The codes can be found here: http://www.aeaweb.org/journal/jel_class_system.html Introduction
The Annals of The "Ştefan cel Mare" University of Suceava. Fascicle of The Faculty of Economics and Public Administration Vol. 11, No. 2(14), 2011
305
For introduction, state the purpose of the work, the motivation of the chosen theme and, briefly explain your approach and the necessary arguments.Before introduction please let 2 blank lines. Paper Content Organize the body of the paper using titles and subtitles to emphasize both content and clarity. The titles and subtitles will be written in caps, 12, bold, left aligned. Please let a blank line before and one after. Consider the following:
the accepted terminology of the field to describe any subjects or experimental procedures used to gather and analyze data;
include detailed methods, so readers could be able to follow the investigation; state the results clearly and succinctly; the implications of the findings and minutely discuss the impact of the results, both globally and
specifically. Typeface must be 12-point Times New Roman type single spaced. Tables and figures should be sized and placed in the body of the paper just as the authors want them printed in the journal. Care should be taken so that tables and figures could be on one page. The tables contents will be written in 10 point type, Times New Roman and the heading of the tables will be in 10 point type bold, Times New Roman. The titles and numbers will be positioned above the table and the title and number of the figures bellow. When it is needed, the source will be mentioned. The number of the tables and figures are to be positioned in the body of the text, in a paranthesis, wherever they are mentioned, for example: (fig. nr.1), (table nr. 1). The graphs must be executed clearly so as to give clear black and white copies. Number all the equations and formulas used positioning the numbers in paranthesis on their right side. Define abbreviations and acronyms the first time they are used in the text, even after they had already been defined in the abstract. Avoid the use of footnotes, but endnotes are encouraged at the end of the paper before the references. Endnotes must be in 10 point, Times New Roman, bold type. Conclusions Conclusions may review the main points of the paper, do not replicate the abstract as the conclusion. A conclusion might elaborate on the importance of the work or suggest applications and extensions and extensions of the research. References Related to in-text referencing cite the name of the author(s) and year of publication (James, 1984), (Collins and Fremont, 1977 – for two authors) and (Collins et al., 1988 – for three authors). Also, references in the articles will be numbered with [1] and if there are more than one reference with, [1] – [2]. Sources should be in alphabetical order by author’s last name, the list being numbered. When certain studies, research, articles are published in a volume, the volume numbers and pages will be specified. Important Specifications
The articles must be at least 6 to 10 pages long in the style A4 sheet, margins left, right, top, bottom: 2 cm.
Submitted documents must be in PC-formatted Word (.doc) file. The articles that don't respect specified guidelines will be rejected before they are sent to peer
review. The manuscripts should be submitted to: [email protected] , mentioning at subject the section that your paper fits (ECS, MAF, CF, SIM, APD) ; example: “article ECS”. The deadlines will be posted on our website . For other details or news, please visit our site: www.seap.usv.ro/annals . PENTRU COMENZI VA RUGAM SA NE CONTACTATI PE ADRESA DE E -MAIL A REVISTEI, MENŢIONATĂ ANTERIOR. FOR COMMANDS, PLEASE CONTACT US BY E -MAIL AT THE ADDRESS MENTIONED BEFORE.