Utility of Stewart's Approach to Diagnose Missed Complex
10
ORIGINAL ARTICLE Utility of Stewart’s Approach to Diagnose Missed Complex Acid–Base Disorders as Compared to Bicarbonate-anion Gap-based Methodology in Critically Ill Patients: An Observational Study Rohit Paliwal 1 , Adrian Pakavakis 2 , Jigeeshu V Divaa 3 , Atul P Kulkarni 4 A BSTRACT Background: Traditional arterial blood gas (ABG) analysis may miss out on some metabolic acid–base disorders. We prospectively compared Stewart’s approach in critically ill patients to traditional bicarbonate-anion gap-based methods (with and without correction for albumin) to diagnose acid–base disorders. Patients and methods: Five hundred ABG samples from medical or surgical patients in the ICU were analyzed with traditional bicarbonate-anion gap-based methodology with and without correction for albumin and Stewart’s biochemical approach. The primary outcome identification of additional metabolic disorders diagnosed with Stewart’s approach in comparison to bicarbonate system-based approaches. We also looked at the correlation between the strong ion gap (SIG) and the albumin-corrected anion gap (acAnion Gap). Results: Stewart’s approach detected missed metabolic disorders in 58 (11.6%) blood gas results reported as “within normal limits” with the bicarbonate-uncorrected anion gap approach. In 50 (10%) of these ABGs, the acAnion Gap approach was able to diagnose the missed metabolic disorders. Thus, the albumin-corrected anion gap method had a similar diagnostic performance to Stewart’s approach, as it missed additional disorders in only eight (1.6%) blood gases. Conclusion: In this study, we found that the acAnion Gap approach was similar in diagnostic performance to Stewart’s approach. We feel that the corrected anion gap approach can be safely used if a ready calculator for Stewart’s approach is not available. Keywords: Albumin-corrected anion gap, Anion gap, Bicarbonate-based ABG analysis, Stewart’s approach, Strong ion difference, Unidentified strong ions. Indian Journal of Critical Care Medicine (2022): 10.5005/jp-journals-10071-24077 I NTRODUCTION In critically ill intensive care patients, severe acid–base disturbances are the norm rather than an exception. 1 The most commonly used approach to acid–base analysis at the bedside is based on the bicarbonate-anion gap system. It is also widely used in most blood gas analyzers. This approach however is not perfect and has been shown to miss metabolic acid–base disorders in critically ill patients. 1 In the bicarbonate system, the calculation of the anion gap (AG) contributes additional diagnostic information on unmeasured anions, however, it is known that hypoalbuminemia reduces its usefulness. 2 Hence, it is recommended to adjust the anion gap to albumin levels (AG corrected ). 3,4 Stewart’s approach to acid–base chemistry applies basic physicochemical principles of aqueous solutions to blood. It is based on fundamental laws of electroneutrality and principles of chemical equilibrium (laws of conservation of mass and laws of mass action). 5 It takes into consideration the role of all the buffer molecules (including hemoglobin) contributing to acid–base equilibrium in the body. Since it accounts for all biochemical elements present in the blood, we considered Stewart’s approach to be the gold standard for this study. The negative charge of plasma proteins, mainly albumin, and other weak acids, participate in the electroneutrality of plasma and contribute to the acid–base status. 6,7 Albumin is the main contributor of total nonvolatile weak acid in plasma’s chemical © The Author(s). 2022 Open Access This article is distributed under the terms of the Creative Commons Attribution 4.0 International License (https://creativecommons. org/licenses/by-nc/4.0/), which permits unrestricted use, distribution, and non-commercial reproduction in any medium, provided you give appropriate credit to the original author(s) and the source, provide a link to the Creative Commons license, and indicate if changes were made. The Creative Commons Public Domain Dedication waiver (http://creativecommons.org/publicdomain/zero/1.0/) applies to the data made available in this article, unless otherwise stated. 1,2 Department of Intensive Care Medicine, Monash Medical Center, Clayton, Victoria, Australia 3,4 Department of Anaesthesia, Critical Care and Pain, Tata Memorial Hospital, Homi Bhabha National Institute, Mumbai, Maharashtra, India Corresponding Author: Atul P Kulkarni, Department of Anaesthesia, Critical Care and Pain, Tata Memorial Hospital, Homi Bhabha National Institute, Mumbai, Maharashtra, India, Phone: +91 9869077526, e-mail: [email protected] How to cite this article: Paliwal R, Pakavakis A, Divatia JV, Kulkarni AP. Utility of Stewart’s Approach to Diagnose Missed Complex Acid–Base Disorders as Compared to Bicarbonate-anion Gap-based Methodology in Critically Ill Patients: An Observational Study. Indian J Crit Care Med 2022;26(1):23–32. Source of support: Nil Conflict of interest: None equilibrium, since serum globulins do not carry a significant net electric charge. Most critically ill patients have low albumin, and this creates an alkalinizing effect which hides excess of unmeasured anions (lactate or ketoacids), confounding the acid–base status of the plasma, thus affecting the interpretation, unless we correct the anion gap for low albumin. 8
-
Upload
khangminh22 -
Category
Documents
-
view
3 -
download
0
Transcript of Utility of Stewart's Approach to Diagnose Missed Complex
ORIGINAL ARTICLE
Utility of Stewartrsquos Approach to Diagnose Missed Complex AcidndashBase Disorders as Compared to Bicarbonate-anion Gap-based Methodology in Critically Ill Patients An Observational StudyRohit Paliwal1 Adrian Pakavakis2 Jigeeshu V Divatia3 Atul P Kulkarni4
Ab s t r Ac tBackground Traditional arterial blood gas (ABG) analysis may miss out on some metabolic acidndashbase disorders We prospectively compared Stewartrsquos approach in critically ill patients to traditional bicarbonate-anion gap-based methods (with and without correction for albumin) to diagnose acidndashbase disordersPatients and methods Five hundred ABG samples from medical or surgical patients in the ICU were analyzed with traditional bicarbonate-anion gap-based methodology with and without correction for albumin and Stewartrsquos biochemical approach The primary outcome identification of additional metabolic disorders diagnosed with Stewartrsquos approach in comparison to bicarbonate system-based approaches We also looked at the correlation between the strong ion gap (SIG) and the albumin-corrected anion gap (acAnion Gap)Results Stewartrsquos approach detected missed metabolic disorders in 58 (116) blood gas results reported as ldquowithin normal limitsrdquo with the bicarbonate-uncorrected anion gap approach In 50 (10) of these ABGs the acAnion Gap approach was able to diagnose the missed metabolic disorders Thus the albumin-corrected anion gap method had a similar diagnostic performance to Stewartrsquos approach as it missed additional disorders in only eight (16) blood gasesConclusion In this study we found that the acAnion Gap approach was similar in diagnostic performance to Stewartrsquos approach We feel that the corrected anion gap approach can be safely used if a ready calculator for Stewartrsquos approach is not available Keywords Albumin-corrected anion gap Anion gap Bicarbonate-based ABG analysis Stewartrsquos approach Strong ion difference Unidentified strong ionsIndian Journal of Critical Care Medicine (2022) 105005jp-journals-10071-24077
In t r o d u c t I o nIn critically ill intensive care patients severe acidndashbase disturbances are the norm rather than an exception1 The most commonly used approach to acidndashbase analysis at the bedside is based on the bicarbonate-anion gap system It is also widely used in most blood gas analyzers
This approach however is not perfect and has been shown to miss metabolic acidndashbase disorders in critically ill patients1 In the bicarbonate system the calculation of the anion gap (AG) contributes additional diagnostic information on unmeasured anions however it is known that hypoalbuminemia reduces its usefulness2 Hence it is recommended to adjust the anion gap to albumin levels (AGcorrected)34
Stewartrsquos approach to acidndashbase chemistry applies basic physicochemical principles of aqueous solutions to blood It is based on fundamental laws of electroneutrality and principles of chemical equilibrium (laws of conservation of mass and laws of mass action)5 It takes into consideration the role of all the buffer molecules (including hemoglobin) contributing to acidndashbase equilibrium in the body Since it accounts for all biochemical elements present in the blood we considered Stewartrsquos approach to be the gold standard for this study
The negative charge of plasma proteins mainly albumin and other weak acids participate in the electroneutrality of plasma and contribute to the acidndashbase status67 Albumin is the main contributor of total nonvolatile weak acid in plasmarsquos chemical
copy The Author(s) 2022 Open Access This article is distributed under the terms of the Creative Commons Attribution 40 International License (httpscreativecommons orglicensesby-nc40) which permits unrestricted use distribution and non-commercial reproduction in any medium provided you give appropriate credit to the original author(s) and the source provide a link to the Creative Commons license and indicate if changes were made The Creative Commons Public Domain Dedication waiver (httpcreativecommonsorgpublicdomainzero10) applies to the data made available in this article unless otherwise stated
12Department of Intensive Care Medicine Monash Medical Center Clayton Victoria Australia34Department of Anaesthesia Critical Care and Pain Tata Memorial Hospital Homi Bhabha National Institute Mumbai Maharashtra IndiaCorresponding Author Atul P Kulkarni Department of Anaesthesia Critical Care and Pain Tata Memorial Hospital Homi Bhabha National Institute Mumbai Maharashtra India Phone +91 9869077526 e-mail kaivalyaakyahoocoinHow to cite this article Paliwal R Pakavakis A Divatia JV Kulkarni AP Utility of Stewartrsquos Approach to Diagnose Missed Complex AcidndashBase Disorders as Compared to Bicarbonate-anion Gap-based Methodology in Critically Ill Patients An Observational Study Indian J Crit Care Med 202226(1)23ndash32Source of support NilConflict of interest None
equilibrium since serum globulins do not carry a significant net electric charge
Most critically ill patients have low albumin and this creates an alkalinizing effect which hides excess of unmeasured anions (lactate or ketoacids) confounding the acidndashbase status of the plasma thus affecting the interpretation unless we correct the anion gap for low albumin8
Stewartrsquos Approach vs Bicarbonate Based Methods
Indian Journal of Critical Care Medicine Volume 26 Issue 1 (January 2022)24
The other problem with the bicarbonate approach is that phosphate which serves as a nonbicarbonate buffer is not accounted for6 In critically ill cancer patients phosphate concentrations are significantly increased in patients with hematological malignancies with tumor lysis syndrome or those with severe renal failure Similarly increased globulin levels in patients with plasma cell disorders ranging from solitary plasmacytoma to multiple myeloma or in patients on high doses of polymyxin antibiotics affect the interpretation of acidndashbase balance9 Albumin and phosphate concentrations are accounted for in Stewartrsquos approach unlike the traditional uncorrected bicarbonate approach
We hypothesized that owing to these omissions important metabolic acidndashbase abnormalities can be missed with the traditional approach in critically ill patients10ndash13 We therefore conducted this study to see if Stewartrsquos approach was better than the bicarbonate system-based approaches in the ability to diagnose disorders in arterial blood gases (ABGs) labeled as normal after analyzing them with both traditional approaches in critically ill patients
PAt I e n ts A n d Me t h o d sThis prospective observational study with a review of patient charts and investigations was carried out in the intensive care unit (ICU) of a tertiary referral cancer center The institutional review board approval was obtained which waived off written informed consent Data from five hundred ABG samples were randomly collected from patients admitted to our mixed medical-surgical ICU admissions over a period of 3 months (May 1 2013ndashJuly 31 2013) The patientrsquos demographic data medical record number presenting pathology acute medical issues and comorbidities were recorded For the purpose of the study only the data from the ABG collected simultaneously with biochemical investigations was analyzed The values from these results were used as inputs for Stewartrsquos calculator
The pH PO2 and PCO2 values were measured with the blood gas analyzer (radiometer COBAS B221 ROSCHE diagnostics) Samples of separated plasma were analyzed for Na+ and K+ Ca2+ and Mg2+ Clminus inorganic phosphate total protein serum albumin urea uric acid creatinine (DECMAN COULTER AU 2700) and hemoglobin (SIEMENS ADVIA 2120)
Bicarbonate ApproachUsing the measured pH and PCO2 the HCO3
minus was calculated by the blood gas analyzer using the HendersonndashHasselbalch equation A sequential stepwise approach to acidndashbase analysis was performed firstly for anion gap without correction for albumin and then with anion gap corrected for albumin Delta gap and delta ratio were calculated for all blood gas samples to identify mixed disturbances The results were then compared with Stewartrsquos approach (see Supplementary Material)
Stewartrsquos ApproachStewartrsquos approach calculations were performed by using a validated downloaded spreadsheet calculator AcidndashBase Calculator V108xls from the website wwwacidndashbaseorg (see Appendix) The calculator accepts laboratory data (pH PCO2 [Na]+1 [K]+1 [Cl]minus1 protein phosphate hemoglobin urea uric acid sulfate and other ionic concentrations) as inputs and displays a report which quantifies the three independent parameters
that are known to control acidity ie SID ATOT and PaCO2 (see Supplementary Material)
The pro forma used for data collection can be seen in Table 1 Normal values of parameters and reference ranges taken for analysis are mentioned in Table 2 Table 3 shows the parameters and their range in the study sample The diagnoses arrived at with traditional approaches (anion gap without and with correction for albumin) were then compared with the results of Stewartrsquos approach
The blood gases labeled as within normal limits by the bicarbonate-uncorrected anion gap methodology were evaluated for any missed disorders picked up by the corrected anion gap and Stewartrsquos approach The primary outcome for the study was the proportion of additional disorders diagnosed using Stewartrsquos approach and the corrected anion gap approach
A proportion of blood gases with hyperlactatemia (lactate levels gt2 mmolL) hypoalbuminemia (albumin lt34 gL) and metabolic alkalosis secondary to hypoalbuminemia (reduced ATOT with normal SID) was calculated
Table 1 Data collection pro forma
Patient Reg Noagesex
Diagnosiscomorbidities
pH[HCO3minus] (mmolL)base excess (mmolL)
PCO2 (kPa) PCO2 (mm Hg) PO2 (kPa) PO2 (mm Hg)
Base excess [Lactateminus] (mmolL) [Glucose] (mgdL)
[Na+] (mmolL) [K+] (mmolL) [Clminus] (mmolL)
[Ca2+] (mmolL) (total) [Mg2+] (mmolL)
[Phosphateminus] (mmolL) [Sulphate2minus] (mmolL)
[Total protein] (gL) [Albumin] (gL)
[Uric acid] (mmolL) [Creatinine] (mgdL) [Urea] (mgdL) [Hb] (gL) Anion gap
Albumin-corrected anion gap
Delta gapdelta gap (Alb corrected)
Delta ratiodelta ratio (albumin-corrected)
SIGSIDATOT
Results
Traditional approach
Traditional approach corrected for albumin
Stewartrsquos approachThis pro forma was used to collect data and enter the analysis of blood gases with all three approaches
Table 2 Normal reference ranges for ABG analysis
Parameter Reference rangepH 74 plusmn 005HCO3 24 plusmn 2 mEqLPaCO2 40 plusmn 5 mm HgSID (strong ion difference) 35 plusmn 2 mEqLAnion GAP 12 plusmn 2 mEqLSIGNUI (net unmeasured ions) plusmn3 mEqLAlbumin 40 plusmn 6 gLATOT (weak acid concentration) 17 plusmn 2 mEqL
Stewartrsquos Approach vs Bicarbonate Based Methods
Indian Journal of Critical Care Medicine Volume 26 Issue 1 (January 2022) 25
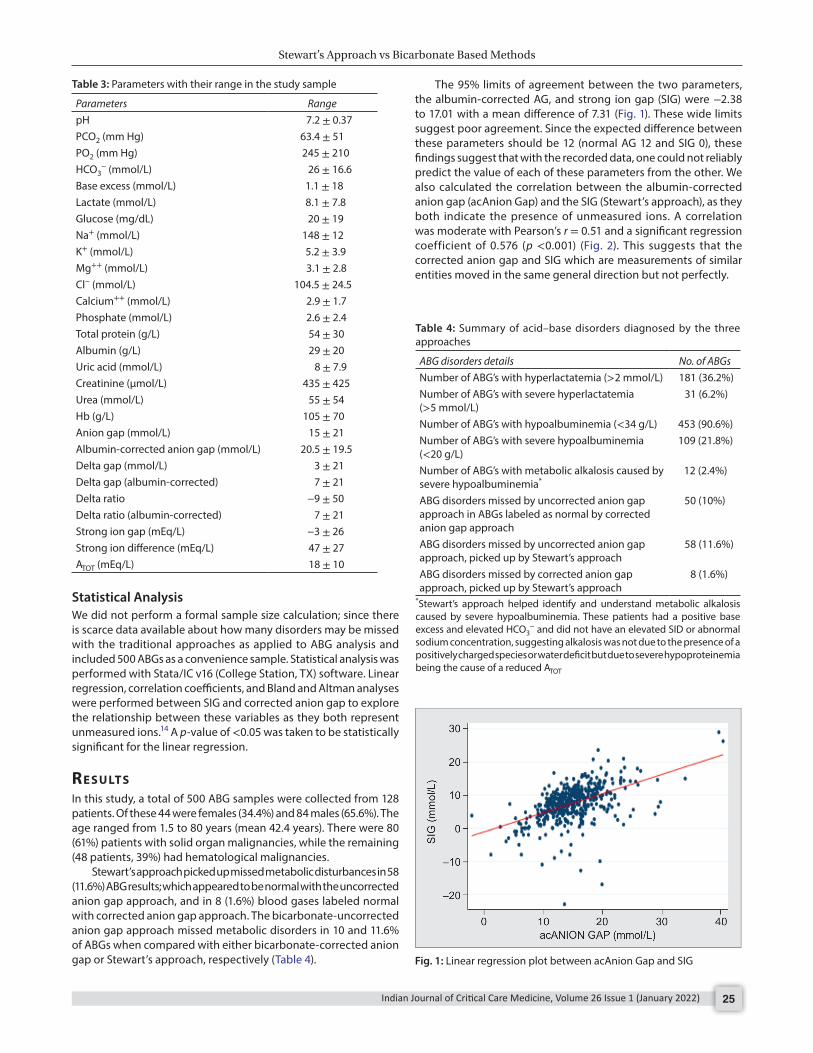
The 95 limits of agreement between the two parameters the albumin-corrected AG and strong ion gap (SIG) were minus238 to 1701 with a mean difference of 731 (Fig 1) These wide limits suggest poor agreement Since the expected difference between these parameters should be 12 (normal AG 12 and SIG 0) these findings suggest that with the recorded data one could not reliably predict the value of each of these parameters from the other We also calculated the correlation between the albumin-corrected anion gap (acAnion Gap) and the SIG (Stewartrsquos approach) as they both indicate the presence of unmeasured ions A correlation was moderate with Pearsonrsquos r = 051 and a significant regression coefficient of 0576 (p lt0001) (Fig 2) This suggests that the corrected anion gap and SIG which are measurements of similar entities moved in the same general direction but not perfectly
Table 3 Parameters with their range in the study sample
Parameters RangepH 72 plusmn 037PCO2 (mm Hg) 634 plusmn 51PO2 (mm Hg) 245 plusmn 210HCO3
minus (mmolL) 26 plusmn 166Base excess (mmolL) 11 plusmn 18Lactate (mmolL) 81 plusmn 78Glucose (mgdL) 20 plusmn 19Na+ (mmolL) 148 plusmn 12K+ (mmolL) 52 plusmn 39Mg++ (mmolL) 31 plusmn 28Clminus (mmolL) 1045 plusmn 245Calcium++ (mmolL) 29 plusmn 17Phosphate (mmolL) 26 plusmn 24Total protein (gL) 54 plusmn 30Albumin (gL) 29 plusmn 20Uric acid (mmolL) 8 plusmn 79Creatinine (micromolL) 435 plusmn 425Urea (mmolL) 55 plusmn 54Hb (gL) 105 plusmn 70Anion gap (mmolL) 15 plusmn 21Albumin-corrected anion gap (mmolL) 205 plusmn 195Delta gap (mmolL) 3 plusmn 21Delta gap (albumin-corrected) 7 plusmn 21Delta ratio minus9 plusmn 50Delta ratio (albumin-corrected) 7 plusmn 21Strong ion gap (mEqL) minus3 plusmn 26Strong ion difference (mEqL) 47 plusmn 27ATOT (mEqL) 18 plusmn 10
Table 4 Summary of acidndashbase disorders diagnosed by the three approaches
ABG disorders details No of ABGsNumber of ABGrsquos with hyperlactatemia (gt2 mmolL) 181 (362)Number of ABGrsquos with severe hyperlactatemia (gt5 mmolL)
31 (62)
Number of ABGrsquos with hypoalbuminemia (lt34 gL) 453 (906)Number of ABGrsquos with severe hypoalbuminemia (lt20 gL)
109 (218)
Number of ABGrsquos with metabolic alkalosis caused by severe hypoalbuminemia
12 (24)
ABG disorders missed by uncorrected anion gap approach in ABGs labeled as normal by corrected anion gap approach
50 (10)
ABG disorders missed by uncorrected anion gap approach picked up by Stewartrsquos approach
58 (116)
ABG disorders missed by corrected anion gap approach picked up by Stewartrsquos approach
8 (16)
Stewartrsquos approach helped identify and understand metabolic alkalosis caused by severe hypoalbuminemia These patients had a positive base excess and elevated HCO3
minus and did not have an elevated SID or abnormal sodium concentration suggesting alkalosis was not due to the presence of a positively charged species or water deficit but due to severe hypoproteinemia being the cause of a reduced ATOT
Statistical AnalysisWe did not perform a formal sample size calculation since there is scarce data available about how many disorders may be missed with the traditional approaches as applied to ABG analysis and included 500 ABGs as a convenience sample Statistical analysis was performed with StataIC v16 (College Station TX) software Linear regression correlation coefficients and Bland and Altman analyses were performed between SIG and corrected anion gap to explore the relationship between these variables as they both represent unmeasured ions14 A p-value of lt005 was taken to be statistically significant for the linear regression
re s u ltsIn this study a total of 500 ABG samples were collected from 128 patients Of these 44 were females (344) and 84 males (656) The age ranged from 15 to 80 years (mean 424 years) There were 80 (61) patients with solid organ malignancies while the remaining (48 patients 39) had hematological malignancies
Stewartrsquos approach picked up missed metabolic disturbances in 58 (116) ABG results which appeared to be normal with the uncorrected anion gap approach and in 8 (16) blood gases labeled normal with corrected anion gap approach The bicarbonate-uncorrected anion gap approach missed metabolic disorders in 10 and 116 of ABGs when compared with either bicarbonate-corrected anion gap or Stewartrsquos approach respectively (Table 4) Fig 1 Linear regression plot between acAnion Gap and SIG
Stewartrsquos Approach vs Bicarbonate Based Methods
Indian Journal of Critical Care Medicine Volume 26 Issue 1 (January 2022)26
when compared to the corrected anion gap approach Thus the diagnostic performance of the albumin-corrected anion gap approach was similar to Stewartrsquos approach McAuliffe suggested that hypoproteinemia (hypoalbuminemia) causes metabolic alkalosis hiding the metabolic acidosis caused by unmeasured anions if the traditional bicarbonate method is used Stewartrsquos approach will however lead to correct diagnosis and also the traditional method once we correct the anion gap for low albumin15
Stewartrsquos approach uses actual values of all parameters such as protein phosphate chloride hemoglobin urea uric acid and does not have any compensation rules or formulae It provides a complete description of the acidndashbase status of an individual In our study Stewartrsquos approach diagnosed extra acidndashbase disorders in 116 of blood gas samples reported as normal with the uncorrected anion gap approach
Dubin et al compared Stewar t rsquos approach with the bicarbonate and Base Excess method for evaluating acidndashbase disorders in 935 critically ill patients It detected metabolic disorders such as metabolic acidosis in 14 of patients who had normal bicarbonate and base excess However when the anion gap was corrected for albumin levels the difference came down to only 1 This is similar to our findings10 In another study Fencl et al compared Stewart rsquos approach with bicarbonate and base excessbase def icit methods in 152 critically ill patients Of these 96 of patients had hypoalbuminemia They looked at patients who had normal base excess or plasma bicarbonate concentration to see if Stewartrsquos approach could diagnose the missed metabolic acidndashbase disturbances They found that in 14 of the samples when the anion gap was corrected for hypoalbuminemia the hidden abnormalities became manifest Overall Stewartrsquos and corrected anion gap approaches gave close in their diagnostic ability and there was a good correlation between the anion gap and SIG11
While these studies have shown an exceptionally high degree of correlation of anion gap and SIG however in our study the correlation was only moderate which may have been due to potential differences in patient population illness severity or pathology
Chaiyakulsil et al obtained 1338-paired measures from 130 critically ill pediatric patients over a 2-year period They excluded
The base excess of extracellular fluid (BE ECF) indicates the nonrespiratory ie metabolic component in acidndashbase disorders (normal minus2 to +2 mEqL) while the strong ion difference (SID) indicates the balance between the anions and cations The normal SID is 0 ie the SID is neutralized by unmeasured anions The 95 limits of agreement between the base excess and SID were also wide at 3352ndash5399 (mean difference of 4376) indicating possibly that they cannot be used interchangeably The correlation however was stronger with Pearsonrsquos r = 069 and the regression coefficient was 0712 (p lt0001) (Figs 3 and 4)
Fig 2 Bland-Altman plot of acAnion Gap and SIG
Fig 3 Linear regression plot between BE ECF against SID
dI s c u s s I o nWe found that Stewartrsquos approach detected acidndashbase disorders in complex critically ill patients missed by the uncorrected anion gap bicarbonate method ie in 50 (10) 58 blood gas samples the acAnion Gap approach was able to correctly diagnose the missed metabolic disorders Hence Stewartrsquos approach identified additional disorders in only eight (16) blood gas samples
Fig 4 Bland-Altman plot of BE ECF and SID
Stewartrsquos Approach vs Bicarbonate Based Methods
Indian Journal of Critical Care Medicine Volume 26 Issue 1 (January 2022) 27
diagnosed by Stewartrsquos approach will affect the patient outcomes Future studies should evaluate the effect of treatment directed towards additional anomalies picked up using Stewartrsquos approach and patient outcomes
su P P l e M e n tA ry MAt e r I A l All the supplementary material from Supplementary 1ndash6 tables are available online on the website of wwwIJCCMorg
or c I d
Rohit Paliwal httpsorcidorg0000-0002-1005-6222Adrian Pakavakis httpsorcidorg0000-0003-0527-5348Jigeeshu V Divatia httpsorcidorg0000-0001-7384-4886Atul P Kulkarni httpsorcidorg0000-0002-5172-7619
re f e r e n c e s 1 Narins RG Emmett M Simple and mixed acidndashbase disorders a
practical approach Medicine (Baltimore) 198059(3)161ndash187 DOI 10109700005792-198005000-00001
2 Emmet M Narins RG Clinical use of anion gap Medicine (Baltimore) 197756(1)38ndash54 PMID 401925
3 Figge J Jabor A Kazda A Fencl V Anion gap and hypoproteinemia Crit Care Med 199826(11)1807ndash1810 DOI 10109700003246-199811000-00019
4 Durward A Mayer A Skellett S Taylor D Hanna S Tibby SM et al Hypoalbuminaemia in critically ill children Incidence prognosis and influence on the anion gap Arch Dis Child 200388(5)419ndash422 DOI 101136adc885419
5 Stewart PA Modern quantitative acidndashbase chemistry Can J Physiol Pharmacol 198361(12)1444ndash1461 DOI 101139y83-207
6 Van Slyke DD Hastings AB Hiller A Sendroy J Jr Studies of gas and electrolyte equilibria in blood XIV Amounts of alkali bound by serum albumin and globulin J Biol Chem 192879769ndash780 DOI 101016S0021-9258(20)79962-X
7 Figge J Rossing TH Fencl V The role of serum proteins in acidndashbase equilibria J Lab Clin Med 1991117(6)453ndash467 PMID 2045713
8 Fencl V Rossing TH AcidndashBase disorders in critical care medicine Annu Rev Med 19894017ndash29 DOI 101146annurevme40020189000313
9 Cook L Macdonald DH Management of paraproteinaemia Postgrad Med J 200783(978)217ndash223 DOI 101136pgmj2006054627
10 Dubin A Menises MM Masevicius FD Moseinco MC Kutscherauer DO Ventrice E et al Comparison of three different methods of evaluation of metabolic acidndashbase disorders Crit Care Med 200735(5)1264ndash1270 DOI 10109701CCM00002595361194390
11 Fencl V Jabor A Kazda A Figge J Diagnosis of metabolic acidndashbase disturbances in critically ill patients Am J Respir Crit Care Med 2000162(6)2246ndash2251 DOI 101164ajrccm16269904099
12 Murray T Long W Narins RG Multiple myeloma and the anion gap N Engl J Med 1975292(11)574ndash575 DOI 101056NEJM197503132921107
13 OrsquoConnor DT Stone RA Hyperchloremia and negative anion gap associated with polymyxin B administration Arch Intern Med 1978138(3)478ndash480 PMID 204265
14 Bland JM Altman DG Statistical methods for assessing agreement bet ween t wo methods of cl inical measurement Lancet 19861(8476)307ndash310 PMID 2868172
15 McAuliffe JJ Lind LJ Leith DE Fencl V Hypoproteinemic alkalosis Am J Med 198681(1)86ndash90 DOI 1010160002-9343(86)90187-7
16 Chaiyakulsil C Mueanpaopong P Lertbunrian R Chutipongtanate S Connecting two worlds positive correlation between physicochemical approach with blood gases and pH in pediatric ICU setting BMC Res Notes 201912(1)742 DOI 101186s13104-019-4770-6
17 Wilkes P Hypoproteinemia strong-ion difference and acidndashbase status in critically ill patients J Appl Physiol (1985) 199884(5)1740ndash1748 DOI 101152jappl19988451740
the samples with acidndashbase disturbances due to respiratory causes and evaluated the remaining 743-paired samples as a metabolic subgroup They looked at the correlation between various parameters obtained from Stewartrsquos approach (such as SID SIG SIDa and SIDe) and the traditional bicarbonate and base excess parameters approach to the pH of the ABG Of all parameters the SIDe (effective strong ion difference) showed the greatest correlation with the pH Among the traditional approaches standard base excess showed the best correlation with the pH The authors suggested that for purpose of simplification simple SID and Na-Cl gap be used for screening of metabolic disorders at the bedside16
The strength of this study was that we measured all the parameters (except sulfate) used in Stewartrsquos calculator to obtain accurate results The critically ill patients had severe derangements in albumin and metabolic state where a holistic approach like Stewarts was expected to perform better at picking up missed disorders
A limitation of this study is that it was a single-center study conducted on a highly specific group of patients with malignancy Thus the results may have limited external validity and generalizability In this study the normal reference ranges of parameters in the patient population were taken as well accepted textbook values and not determined from blood samples of healthy volunteers representative of the study population
Another potential weakness of this study was the use of multiple blood gas samples from the same patient over the duration of their ICU stay This may lead to over or underestimation of the effect size due to the potential correlation of results within an individual patient This was given due consideration whilst designing the study it was considered that the nature of acidndashbase status in critically unwell patients being dynamic each individual ABG would represent a new equilibrium state An additional limitation of our study was that we did not perform a formal sample size calculation since there is a lack of data about how many missed abnormalities will be picked up using Stewartrsquos approach as compared to the traditional methods
A limitation of the Stewartrsquos approach methodology is that although the calculator can quantify the relative contributions of the three independent factors to the overall acidndashbase situation it does not indicate whether a process is primary or compensatory as this often requires a medical history examination investigations and analysis hence comparison of results were restricted to analysis of metabolic derangements
We did not suggest that any interventions be performed based on the interpretation of the ABG data to the clinicians looking after the patients since this was an observational study The blood gas results were also not sequentially analyzed to see the effect of treatment being administered
We also did not document the ICU or hospital outcomes In any case none of the previous studies have shown any prognostic advantages of Stewartrsquos approach over the traditional approaches16ndash21
co n c lu s I o n In this study we found that the acAnion Gap approach was similar in diagnostic performance to Stewartrsquos approach in detecting missed acidndashbase disorders We feel that the corrected anion gap approach can be safely used if a ready calculator for Stewartrsquos approach is not available It remains unclear how treating the additional anomalies
Stewartrsquos Approach vs Bicarbonate Based Methods
Indian Journal of Critical Care Medicine Volume 26 Issue 1 (January 2022)28
20 Cusack RJ Rhodes A Lochhead P Jordan B Perry S Ball JA et al The strong ion gap does not have prognostic value in critically ill patients in a mixed medicalsurgical adult ICU Intensive Care Med 200228(7)864ndash869 DOI 101007s00134-002-1318-2
21 Carreira F Anderson RJ Assessing metabolic acidosis in the intensive care unit does the method make a difference Crit Care Med 200432(5)1227ndash1228 DOI 10109701ccm0000125513 26170d2
18 Kaplan LJ Kellum JA Initial pH base deficit lactate anion gap strong ion difference and strong ion gap predict outcome from major vascular injury Crit Care Med 200432(5)1120ndash1124 DOI 10109701ccm00001255172851774
19 Dondorp AM Chau TT Phu NH Mai NT Loc PP Chuong LV et al Unidentified acids of strong prognostic significance in severe malaria Crit Care Med 200432(8)1683ndash1688 DOI 10109701ccm000013290186681ca
Indian Journal of Critical Care Medicine Volume 26 Issue 1 (January 2022) 29
AP P e n d I x
Appendix 1 The Calculator for ABG Analysis with Stewartrsquos ApproachReady Excel spreadsheet calculator (AcidndashBase Calculator V108xls from Dr Peter Lloyd of Hawkersquos Bay Hospital Hasting New Zealand) was used for the interpretation of the blood gas with Stewartrsquos approach
This was a free public access download from the website acidbaseorg where it was made available by Dr Ross Freebairn (the Medical Director for Intensive Care Services at Hawkersquos Bay Hospital Hasting New Zealand)
The calculator accepts laboratory data as inputs and displays a report which quantifies the three independent parameters that are known to control acidity These parameters are the SID which summarizes the strong or fully dissociated electrolytes the total weak acid concentration (Atotminus) which summarizes the nonvolatile weak or partially dissociated electrolytes and the partial pressure of carbon dioxide (PCO2)
It quantifies the three independent factors that control acidity calculates the concentration and charge of unmeasured ions and displays graphically the value of the independent factors the predicted acidity the measured acidity and the net concentration of unmeasured ions Thus it produces a report based on these calculations and displays a Gamblegram depicting measured ionic species
The minimum data set required is pH PCO2 [Na]+1 [K]+1 [Cl]minus1 but it also takes protein phosphate hemoglobin urea uric acid sulfate and other ionic concentrations
The strong ion calculator takes the concentrations of the measured strong electrolytes (and in the case of calcium and magnesium converts the concentration into ionic strength) The only strong ion that is not routinely available for analysis in modern medical laboratories is sulfate Its concentration can increase greatly in renal failure
Indian Journal of Critical Care Medicine Volume 26 Issue 1 (January 2022)30
AP P e n d I x
Appendix 2 Data Entry Page for the Spreadsheet Calculator
Indian Journal of Critical Care Medicine Volume 26 Issue 1 (January 2022) 31
AP P e n d I x
Appendix 3 Example of Report Obtained from the Spreadsheet Calculator
The values of the three independent parameters are displayed at each corner of a triangle The direction and degree to which variation of each parameter individually affects the acidity are displayed in brackets The individual results that contributed to
the calculation of the independent parameters are tabulated nearby
Beneath this is a printed report box and the gamblegram for the patient
Report Box
Indian Journal of Critical Care Medicine Volume 26 Issue 1 (January 2022)32
AP P e n d I x
GamblegramGamblegram has two bars one depicting the concentration of cations the other anions
Strong ions are fully dissociated throughout the physiological range of acidity The weak acid anions (bicarbonate proteins phosphate) must change their equilibrium concentrations to
conform to the space available (the SID) Otherwise the solution would violate the requirement that at equilibrium the cations are opposed by an equal concentration of anions
- Utility of Stewartrsquos Approach to Diagnose Missed Complex Acid-base Disorders as Compared to Bicarbon
-
- Abstract
-
- Introduction
- Patients and Methods
-
- Bicarbonate Approach
- Stewartrsquos Approach
- Statistics
-
- Results
- Discussion
- Conclusion
- Orcid
- References
-

Stewartrsquos Approach vs Bicarbonate Based Methods
Indian Journal of Critical Care Medicine Volume 26 Issue 1 (January 2022)24
The other problem with the bicarbonate approach is that phosphate which serves as a nonbicarbonate buffer is not accounted for6 In critically ill cancer patients phosphate concentrations are significantly increased in patients with hematological malignancies with tumor lysis syndrome or those with severe renal failure Similarly increased globulin levels in patients with plasma cell disorders ranging from solitary plasmacytoma to multiple myeloma or in patients on high doses of polymyxin antibiotics affect the interpretation of acidndashbase balance9 Albumin and phosphate concentrations are accounted for in Stewartrsquos approach unlike the traditional uncorrected bicarbonate approach
We hypothesized that owing to these omissions important metabolic acidndashbase abnormalities can be missed with the traditional approach in critically ill patients10ndash13 We therefore conducted this study to see if Stewartrsquos approach was better than the bicarbonate system-based approaches in the ability to diagnose disorders in arterial blood gases (ABGs) labeled as normal after analyzing them with both traditional approaches in critically ill patients
PAt I e n ts A n d Me t h o d sThis prospective observational study with a review of patient charts and investigations was carried out in the intensive care unit (ICU) of a tertiary referral cancer center The institutional review board approval was obtained which waived off written informed consent Data from five hundred ABG samples were randomly collected from patients admitted to our mixed medical-surgical ICU admissions over a period of 3 months (May 1 2013ndashJuly 31 2013) The patientrsquos demographic data medical record number presenting pathology acute medical issues and comorbidities were recorded For the purpose of the study only the data from the ABG collected simultaneously with biochemical investigations was analyzed The values from these results were used as inputs for Stewartrsquos calculator
The pH PO2 and PCO2 values were measured with the blood gas analyzer (radiometer COBAS B221 ROSCHE diagnostics) Samples of separated plasma were analyzed for Na+ and K+ Ca2+ and Mg2+ Clminus inorganic phosphate total protein serum albumin urea uric acid creatinine (DECMAN COULTER AU 2700) and hemoglobin (SIEMENS ADVIA 2120)
Bicarbonate ApproachUsing the measured pH and PCO2 the HCO3
minus was calculated by the blood gas analyzer using the HendersonndashHasselbalch equation A sequential stepwise approach to acidndashbase analysis was performed firstly for anion gap without correction for albumin and then with anion gap corrected for albumin Delta gap and delta ratio were calculated for all blood gas samples to identify mixed disturbances The results were then compared with Stewartrsquos approach (see Supplementary Material)
Stewartrsquos ApproachStewartrsquos approach calculations were performed by using a validated downloaded spreadsheet calculator AcidndashBase Calculator V108xls from the website wwwacidndashbaseorg (see Appendix) The calculator accepts laboratory data (pH PCO2 [Na]+1 [K]+1 [Cl]minus1 protein phosphate hemoglobin urea uric acid sulfate and other ionic concentrations) as inputs and displays a report which quantifies the three independent parameters
that are known to control acidity ie SID ATOT and PaCO2 (see Supplementary Material)
The pro forma used for data collection can be seen in Table 1 Normal values of parameters and reference ranges taken for analysis are mentioned in Table 2 Table 3 shows the parameters and their range in the study sample The diagnoses arrived at with traditional approaches (anion gap without and with correction for albumin) were then compared with the results of Stewartrsquos approach
The blood gases labeled as within normal limits by the bicarbonate-uncorrected anion gap methodology were evaluated for any missed disorders picked up by the corrected anion gap and Stewartrsquos approach The primary outcome for the study was the proportion of additional disorders diagnosed using Stewartrsquos approach and the corrected anion gap approach
A proportion of blood gases with hyperlactatemia (lactate levels gt2 mmolL) hypoalbuminemia (albumin lt34 gL) and metabolic alkalosis secondary to hypoalbuminemia (reduced ATOT with normal SID) was calculated
Table 1 Data collection pro forma
Patient Reg Noagesex
Diagnosiscomorbidities
pH[HCO3minus] (mmolL)base excess (mmolL)
PCO2 (kPa) PCO2 (mm Hg) PO2 (kPa) PO2 (mm Hg)
Base excess [Lactateminus] (mmolL) [Glucose] (mgdL)
[Na+] (mmolL) [K+] (mmolL) [Clminus] (mmolL)
[Ca2+] (mmolL) (total) [Mg2+] (mmolL)
[Phosphateminus] (mmolL) [Sulphate2minus] (mmolL)
[Total protein] (gL) [Albumin] (gL)
[Uric acid] (mmolL) [Creatinine] (mgdL) [Urea] (mgdL) [Hb] (gL) Anion gap
Albumin-corrected anion gap
Delta gapdelta gap (Alb corrected)
Delta ratiodelta ratio (albumin-corrected)
SIGSIDATOT
Results
Traditional approach
Traditional approach corrected for albumin
Stewartrsquos approachThis pro forma was used to collect data and enter the analysis of blood gases with all three approaches
Table 2 Normal reference ranges for ABG analysis
Parameter Reference rangepH 74 plusmn 005HCO3 24 plusmn 2 mEqLPaCO2 40 plusmn 5 mm HgSID (strong ion difference) 35 plusmn 2 mEqLAnion GAP 12 plusmn 2 mEqLSIGNUI (net unmeasured ions) plusmn3 mEqLAlbumin 40 plusmn 6 gLATOT (weak acid concentration) 17 plusmn 2 mEqL
Stewartrsquos Approach vs Bicarbonate Based Methods
Indian Journal of Critical Care Medicine Volume 26 Issue 1 (January 2022) 25
The 95 limits of agreement between the two parameters the albumin-corrected AG and strong ion gap (SIG) were minus238 to 1701 with a mean difference of 731 (Fig 1) These wide limits suggest poor agreement Since the expected difference between these parameters should be 12 (normal AG 12 and SIG 0) these findings suggest that with the recorded data one could not reliably predict the value of each of these parameters from the other We also calculated the correlation between the albumin-corrected anion gap (acAnion Gap) and the SIG (Stewartrsquos approach) as they both indicate the presence of unmeasured ions A correlation was moderate with Pearsonrsquos r = 051 and a significant regression coefficient of 0576 (p lt0001) (Fig 2) This suggests that the corrected anion gap and SIG which are measurements of similar entities moved in the same general direction but not perfectly
Table 3 Parameters with their range in the study sample
Parameters RangepH 72 plusmn 037PCO2 (mm Hg) 634 plusmn 51PO2 (mm Hg) 245 plusmn 210HCO3
minus (mmolL) 26 plusmn 166Base excess (mmolL) 11 plusmn 18Lactate (mmolL) 81 plusmn 78Glucose (mgdL) 20 plusmn 19Na+ (mmolL) 148 plusmn 12K+ (mmolL) 52 plusmn 39Mg++ (mmolL) 31 plusmn 28Clminus (mmolL) 1045 plusmn 245Calcium++ (mmolL) 29 plusmn 17Phosphate (mmolL) 26 plusmn 24Total protein (gL) 54 plusmn 30Albumin (gL) 29 plusmn 20Uric acid (mmolL) 8 plusmn 79Creatinine (micromolL) 435 plusmn 425Urea (mmolL) 55 plusmn 54Hb (gL) 105 plusmn 70Anion gap (mmolL) 15 plusmn 21Albumin-corrected anion gap (mmolL) 205 plusmn 195Delta gap (mmolL) 3 plusmn 21Delta gap (albumin-corrected) 7 plusmn 21Delta ratio minus9 plusmn 50Delta ratio (albumin-corrected) 7 plusmn 21Strong ion gap (mEqL) minus3 plusmn 26Strong ion difference (mEqL) 47 plusmn 27ATOT (mEqL) 18 plusmn 10
Table 4 Summary of acidndashbase disorders diagnosed by the three approaches
ABG disorders details No of ABGsNumber of ABGrsquos with hyperlactatemia (gt2 mmolL) 181 (362)Number of ABGrsquos with severe hyperlactatemia (gt5 mmolL)
31 (62)
Number of ABGrsquos with hypoalbuminemia (lt34 gL) 453 (906)Number of ABGrsquos with severe hypoalbuminemia (lt20 gL)
109 (218)
Number of ABGrsquos with metabolic alkalosis caused by severe hypoalbuminemia
12 (24)
ABG disorders missed by uncorrected anion gap approach in ABGs labeled as normal by corrected anion gap approach
50 (10)
ABG disorders missed by uncorrected anion gap approach picked up by Stewartrsquos approach
58 (116)
ABG disorders missed by corrected anion gap approach picked up by Stewartrsquos approach
8 (16)
Stewartrsquos approach helped identify and understand metabolic alkalosis caused by severe hypoalbuminemia These patients had a positive base excess and elevated HCO3
minus and did not have an elevated SID or abnormal sodium concentration suggesting alkalosis was not due to the presence of a positively charged species or water deficit but due to severe hypoproteinemia being the cause of a reduced ATOT
Statistical AnalysisWe did not perform a formal sample size calculation since there is scarce data available about how many disorders may be missed with the traditional approaches as applied to ABG analysis and included 500 ABGs as a convenience sample Statistical analysis was performed with StataIC v16 (College Station TX) software Linear regression correlation coefficients and Bland and Altman analyses were performed between SIG and corrected anion gap to explore the relationship between these variables as they both represent unmeasured ions14 A p-value of lt005 was taken to be statistically significant for the linear regression
re s u ltsIn this study a total of 500 ABG samples were collected from 128 patients Of these 44 were females (344) and 84 males (656) The age ranged from 15 to 80 years (mean 424 years) There were 80 (61) patients with solid organ malignancies while the remaining (48 patients 39) had hematological malignancies
Stewartrsquos approach picked up missed metabolic disturbances in 58 (116) ABG results which appeared to be normal with the uncorrected anion gap approach and in 8 (16) blood gases labeled normal with corrected anion gap approach The bicarbonate-uncorrected anion gap approach missed metabolic disorders in 10 and 116 of ABGs when compared with either bicarbonate-corrected anion gap or Stewartrsquos approach respectively (Table 4) Fig 1 Linear regression plot between acAnion Gap and SIG
Stewartrsquos Approach vs Bicarbonate Based Methods
Indian Journal of Critical Care Medicine Volume 26 Issue 1 (January 2022)26
when compared to the corrected anion gap approach Thus the diagnostic performance of the albumin-corrected anion gap approach was similar to Stewartrsquos approach McAuliffe suggested that hypoproteinemia (hypoalbuminemia) causes metabolic alkalosis hiding the metabolic acidosis caused by unmeasured anions if the traditional bicarbonate method is used Stewartrsquos approach will however lead to correct diagnosis and also the traditional method once we correct the anion gap for low albumin15
Stewartrsquos approach uses actual values of all parameters such as protein phosphate chloride hemoglobin urea uric acid and does not have any compensation rules or formulae It provides a complete description of the acidndashbase status of an individual In our study Stewartrsquos approach diagnosed extra acidndashbase disorders in 116 of blood gas samples reported as normal with the uncorrected anion gap approach
Dubin et al compared Stewar t rsquos approach with the bicarbonate and Base Excess method for evaluating acidndashbase disorders in 935 critically ill patients It detected metabolic disorders such as metabolic acidosis in 14 of patients who had normal bicarbonate and base excess However when the anion gap was corrected for albumin levels the difference came down to only 1 This is similar to our findings10 In another study Fencl et al compared Stewart rsquos approach with bicarbonate and base excessbase def icit methods in 152 critically ill patients Of these 96 of patients had hypoalbuminemia They looked at patients who had normal base excess or plasma bicarbonate concentration to see if Stewartrsquos approach could diagnose the missed metabolic acidndashbase disturbances They found that in 14 of the samples when the anion gap was corrected for hypoalbuminemia the hidden abnormalities became manifest Overall Stewartrsquos and corrected anion gap approaches gave close in their diagnostic ability and there was a good correlation between the anion gap and SIG11
While these studies have shown an exceptionally high degree of correlation of anion gap and SIG however in our study the correlation was only moderate which may have been due to potential differences in patient population illness severity or pathology
Chaiyakulsil et al obtained 1338-paired measures from 130 critically ill pediatric patients over a 2-year period They excluded
The base excess of extracellular fluid (BE ECF) indicates the nonrespiratory ie metabolic component in acidndashbase disorders (normal minus2 to +2 mEqL) while the strong ion difference (SID) indicates the balance between the anions and cations The normal SID is 0 ie the SID is neutralized by unmeasured anions The 95 limits of agreement between the base excess and SID were also wide at 3352ndash5399 (mean difference of 4376) indicating possibly that they cannot be used interchangeably The correlation however was stronger with Pearsonrsquos r = 069 and the regression coefficient was 0712 (p lt0001) (Figs 3 and 4)
Fig 2 Bland-Altman plot of acAnion Gap and SIG
Fig 3 Linear regression plot between BE ECF against SID
dI s c u s s I o nWe found that Stewartrsquos approach detected acidndashbase disorders in complex critically ill patients missed by the uncorrected anion gap bicarbonate method ie in 50 (10) 58 blood gas samples the acAnion Gap approach was able to correctly diagnose the missed metabolic disorders Hence Stewartrsquos approach identified additional disorders in only eight (16) blood gas samples
Fig 4 Bland-Altman plot of BE ECF and SID
Stewartrsquos Approach vs Bicarbonate Based Methods
Indian Journal of Critical Care Medicine Volume 26 Issue 1 (January 2022) 27
diagnosed by Stewartrsquos approach will affect the patient outcomes Future studies should evaluate the effect of treatment directed towards additional anomalies picked up using Stewartrsquos approach and patient outcomes
su P P l e M e n tA ry MAt e r I A l All the supplementary material from Supplementary 1ndash6 tables are available online on the website of wwwIJCCMorg
or c I d
Rohit Paliwal httpsorcidorg0000-0002-1005-6222Adrian Pakavakis httpsorcidorg0000-0003-0527-5348Jigeeshu V Divatia httpsorcidorg0000-0001-7384-4886Atul P Kulkarni httpsorcidorg0000-0002-5172-7619
re f e r e n c e s 1 Narins RG Emmett M Simple and mixed acidndashbase disorders a
practical approach Medicine (Baltimore) 198059(3)161ndash187 DOI 10109700005792-198005000-00001
2 Emmet M Narins RG Clinical use of anion gap Medicine (Baltimore) 197756(1)38ndash54 PMID 401925
3 Figge J Jabor A Kazda A Fencl V Anion gap and hypoproteinemia Crit Care Med 199826(11)1807ndash1810 DOI 10109700003246-199811000-00019
4 Durward A Mayer A Skellett S Taylor D Hanna S Tibby SM et al Hypoalbuminaemia in critically ill children Incidence prognosis and influence on the anion gap Arch Dis Child 200388(5)419ndash422 DOI 101136adc885419
5 Stewart PA Modern quantitative acidndashbase chemistry Can J Physiol Pharmacol 198361(12)1444ndash1461 DOI 101139y83-207
6 Van Slyke DD Hastings AB Hiller A Sendroy J Jr Studies of gas and electrolyte equilibria in blood XIV Amounts of alkali bound by serum albumin and globulin J Biol Chem 192879769ndash780 DOI 101016S0021-9258(20)79962-X
7 Figge J Rossing TH Fencl V The role of serum proteins in acidndashbase equilibria J Lab Clin Med 1991117(6)453ndash467 PMID 2045713
8 Fencl V Rossing TH AcidndashBase disorders in critical care medicine Annu Rev Med 19894017ndash29 DOI 101146annurevme40020189000313
9 Cook L Macdonald DH Management of paraproteinaemia Postgrad Med J 200783(978)217ndash223 DOI 101136pgmj2006054627
10 Dubin A Menises MM Masevicius FD Moseinco MC Kutscherauer DO Ventrice E et al Comparison of three different methods of evaluation of metabolic acidndashbase disorders Crit Care Med 200735(5)1264ndash1270 DOI 10109701CCM00002595361194390
11 Fencl V Jabor A Kazda A Figge J Diagnosis of metabolic acidndashbase disturbances in critically ill patients Am J Respir Crit Care Med 2000162(6)2246ndash2251 DOI 101164ajrccm16269904099
12 Murray T Long W Narins RG Multiple myeloma and the anion gap N Engl J Med 1975292(11)574ndash575 DOI 101056NEJM197503132921107
13 OrsquoConnor DT Stone RA Hyperchloremia and negative anion gap associated with polymyxin B administration Arch Intern Med 1978138(3)478ndash480 PMID 204265
14 Bland JM Altman DG Statistical methods for assessing agreement bet ween t wo methods of cl inical measurement Lancet 19861(8476)307ndash310 PMID 2868172
15 McAuliffe JJ Lind LJ Leith DE Fencl V Hypoproteinemic alkalosis Am J Med 198681(1)86ndash90 DOI 1010160002-9343(86)90187-7
16 Chaiyakulsil C Mueanpaopong P Lertbunrian R Chutipongtanate S Connecting two worlds positive correlation between physicochemical approach with blood gases and pH in pediatric ICU setting BMC Res Notes 201912(1)742 DOI 101186s13104-019-4770-6
17 Wilkes P Hypoproteinemia strong-ion difference and acidndashbase status in critically ill patients J Appl Physiol (1985) 199884(5)1740ndash1748 DOI 101152jappl19988451740
the samples with acidndashbase disturbances due to respiratory causes and evaluated the remaining 743-paired samples as a metabolic subgroup They looked at the correlation between various parameters obtained from Stewartrsquos approach (such as SID SIG SIDa and SIDe) and the traditional bicarbonate and base excess parameters approach to the pH of the ABG Of all parameters the SIDe (effective strong ion difference) showed the greatest correlation with the pH Among the traditional approaches standard base excess showed the best correlation with the pH The authors suggested that for purpose of simplification simple SID and Na-Cl gap be used for screening of metabolic disorders at the bedside16
The strength of this study was that we measured all the parameters (except sulfate) used in Stewartrsquos calculator to obtain accurate results The critically ill patients had severe derangements in albumin and metabolic state where a holistic approach like Stewarts was expected to perform better at picking up missed disorders
A limitation of this study is that it was a single-center study conducted on a highly specific group of patients with malignancy Thus the results may have limited external validity and generalizability In this study the normal reference ranges of parameters in the patient population were taken as well accepted textbook values and not determined from blood samples of healthy volunteers representative of the study population
Another potential weakness of this study was the use of multiple blood gas samples from the same patient over the duration of their ICU stay This may lead to over or underestimation of the effect size due to the potential correlation of results within an individual patient This was given due consideration whilst designing the study it was considered that the nature of acidndashbase status in critically unwell patients being dynamic each individual ABG would represent a new equilibrium state An additional limitation of our study was that we did not perform a formal sample size calculation since there is a lack of data about how many missed abnormalities will be picked up using Stewartrsquos approach as compared to the traditional methods
A limitation of the Stewartrsquos approach methodology is that although the calculator can quantify the relative contributions of the three independent factors to the overall acidndashbase situation it does not indicate whether a process is primary or compensatory as this often requires a medical history examination investigations and analysis hence comparison of results were restricted to analysis of metabolic derangements
We did not suggest that any interventions be performed based on the interpretation of the ABG data to the clinicians looking after the patients since this was an observational study The blood gas results were also not sequentially analyzed to see the effect of treatment being administered
We also did not document the ICU or hospital outcomes In any case none of the previous studies have shown any prognostic advantages of Stewartrsquos approach over the traditional approaches16ndash21
co n c lu s I o n In this study we found that the acAnion Gap approach was similar in diagnostic performance to Stewartrsquos approach in detecting missed acidndashbase disorders We feel that the corrected anion gap approach can be safely used if a ready calculator for Stewartrsquos approach is not available It remains unclear how treating the additional anomalies
Stewartrsquos Approach vs Bicarbonate Based Methods
Indian Journal of Critical Care Medicine Volume 26 Issue 1 (January 2022)28
20 Cusack RJ Rhodes A Lochhead P Jordan B Perry S Ball JA et al The strong ion gap does not have prognostic value in critically ill patients in a mixed medicalsurgical adult ICU Intensive Care Med 200228(7)864ndash869 DOI 101007s00134-002-1318-2
21 Carreira F Anderson RJ Assessing metabolic acidosis in the intensive care unit does the method make a difference Crit Care Med 200432(5)1227ndash1228 DOI 10109701ccm0000125513 26170d2
18 Kaplan LJ Kellum JA Initial pH base deficit lactate anion gap strong ion difference and strong ion gap predict outcome from major vascular injury Crit Care Med 200432(5)1120ndash1124 DOI 10109701ccm00001255172851774
19 Dondorp AM Chau TT Phu NH Mai NT Loc PP Chuong LV et al Unidentified acids of strong prognostic significance in severe malaria Crit Care Med 200432(8)1683ndash1688 DOI 10109701ccm000013290186681ca
Indian Journal of Critical Care Medicine Volume 26 Issue 1 (January 2022) 29
AP P e n d I x
Appendix 1 The Calculator for ABG Analysis with Stewartrsquos ApproachReady Excel spreadsheet calculator (AcidndashBase Calculator V108xls from Dr Peter Lloyd of Hawkersquos Bay Hospital Hasting New Zealand) was used for the interpretation of the blood gas with Stewartrsquos approach
This was a free public access download from the website acidbaseorg where it was made available by Dr Ross Freebairn (the Medical Director for Intensive Care Services at Hawkersquos Bay Hospital Hasting New Zealand)
The calculator accepts laboratory data as inputs and displays a report which quantifies the three independent parameters that are known to control acidity These parameters are the SID which summarizes the strong or fully dissociated electrolytes the total weak acid concentration (Atotminus) which summarizes the nonvolatile weak or partially dissociated electrolytes and the partial pressure of carbon dioxide (PCO2)
It quantifies the three independent factors that control acidity calculates the concentration and charge of unmeasured ions and displays graphically the value of the independent factors the predicted acidity the measured acidity and the net concentration of unmeasured ions Thus it produces a report based on these calculations and displays a Gamblegram depicting measured ionic species
The minimum data set required is pH PCO2 [Na]+1 [K]+1 [Cl]minus1 but it also takes protein phosphate hemoglobin urea uric acid sulfate and other ionic concentrations
The strong ion calculator takes the concentrations of the measured strong electrolytes (and in the case of calcium and magnesium converts the concentration into ionic strength) The only strong ion that is not routinely available for analysis in modern medical laboratories is sulfate Its concentration can increase greatly in renal failure
Indian Journal of Critical Care Medicine Volume 26 Issue 1 (January 2022)30
AP P e n d I x
Appendix 2 Data Entry Page for the Spreadsheet Calculator
Indian Journal of Critical Care Medicine Volume 26 Issue 1 (January 2022) 31
AP P e n d I x
Appendix 3 Example of Report Obtained from the Spreadsheet Calculator
The values of the three independent parameters are displayed at each corner of a triangle The direction and degree to which variation of each parameter individually affects the acidity are displayed in brackets The individual results that contributed to
the calculation of the independent parameters are tabulated nearby
Beneath this is a printed report box and the gamblegram for the patient
Report Box
Indian Journal of Critical Care Medicine Volume 26 Issue 1 (January 2022)32
AP P e n d I x
GamblegramGamblegram has two bars one depicting the concentration of cations the other anions
Strong ions are fully dissociated throughout the physiological range of acidity The weak acid anions (bicarbonate proteins phosphate) must change their equilibrium concentrations to
conform to the space available (the SID) Otherwise the solution would violate the requirement that at equilibrium the cations are opposed by an equal concentration of anions
- Utility of Stewartrsquos Approach to Diagnose Missed Complex Acid-base Disorders as Compared to Bicarbon
-
- Abstract
-
- Introduction
- Patients and Methods
-
- Bicarbonate Approach
- Stewartrsquos Approach
- Statistics
-
- Results
- Discussion
- Conclusion
- Orcid
- References
-
Stewartrsquos Approach vs Bicarbonate Based Methods
Indian Journal of Critical Care Medicine Volume 26 Issue 1 (January 2022) 25
The 95 limits of agreement between the two parameters the albumin-corrected AG and strong ion gap (SIG) were minus238 to 1701 with a mean difference of 731 (Fig 1) These wide limits suggest poor agreement Since the expected difference between these parameters should be 12 (normal AG 12 and SIG 0) these findings suggest that with the recorded data one could not reliably predict the value of each of these parameters from the other We also calculated the correlation between the albumin-corrected anion gap (acAnion Gap) and the SIG (Stewartrsquos approach) as they both indicate the presence of unmeasured ions A correlation was moderate with Pearsonrsquos r = 051 and a significant regression coefficient of 0576 (p lt0001) (Fig 2) This suggests that the corrected anion gap and SIG which are measurements of similar entities moved in the same general direction but not perfectly
Table 3 Parameters with their range in the study sample
Parameters RangepH 72 plusmn 037PCO2 (mm Hg) 634 plusmn 51PO2 (mm Hg) 245 plusmn 210HCO3
minus (mmolL) 26 plusmn 166Base excess (mmolL) 11 plusmn 18Lactate (mmolL) 81 plusmn 78Glucose (mgdL) 20 plusmn 19Na+ (mmolL) 148 plusmn 12K+ (mmolL) 52 plusmn 39Mg++ (mmolL) 31 plusmn 28Clminus (mmolL) 1045 plusmn 245Calcium++ (mmolL) 29 plusmn 17Phosphate (mmolL) 26 plusmn 24Total protein (gL) 54 plusmn 30Albumin (gL) 29 plusmn 20Uric acid (mmolL) 8 plusmn 79Creatinine (micromolL) 435 plusmn 425Urea (mmolL) 55 plusmn 54Hb (gL) 105 plusmn 70Anion gap (mmolL) 15 plusmn 21Albumin-corrected anion gap (mmolL) 205 plusmn 195Delta gap (mmolL) 3 plusmn 21Delta gap (albumin-corrected) 7 plusmn 21Delta ratio minus9 plusmn 50Delta ratio (albumin-corrected) 7 plusmn 21Strong ion gap (mEqL) minus3 plusmn 26Strong ion difference (mEqL) 47 plusmn 27ATOT (mEqL) 18 plusmn 10
Table 4 Summary of acidndashbase disorders diagnosed by the three approaches
ABG disorders details No of ABGsNumber of ABGrsquos with hyperlactatemia (gt2 mmolL) 181 (362)Number of ABGrsquos with severe hyperlactatemia (gt5 mmolL)
31 (62)
Number of ABGrsquos with hypoalbuminemia (lt34 gL) 453 (906)Number of ABGrsquos with severe hypoalbuminemia (lt20 gL)
109 (218)
Number of ABGrsquos with metabolic alkalosis caused by severe hypoalbuminemia
12 (24)
ABG disorders missed by uncorrected anion gap approach in ABGs labeled as normal by corrected anion gap approach
50 (10)
ABG disorders missed by uncorrected anion gap approach picked up by Stewartrsquos approach
58 (116)
ABG disorders missed by corrected anion gap approach picked up by Stewartrsquos approach
8 (16)
Stewartrsquos approach helped identify and understand metabolic alkalosis caused by severe hypoalbuminemia These patients had a positive base excess and elevated HCO3
minus and did not have an elevated SID or abnormal sodium concentration suggesting alkalosis was not due to the presence of a positively charged species or water deficit but due to severe hypoproteinemia being the cause of a reduced ATOT
Statistical AnalysisWe did not perform a formal sample size calculation since there is scarce data available about how many disorders may be missed with the traditional approaches as applied to ABG analysis and included 500 ABGs as a convenience sample Statistical analysis was performed with StataIC v16 (College Station TX) software Linear regression correlation coefficients and Bland and Altman analyses were performed between SIG and corrected anion gap to explore the relationship between these variables as they both represent unmeasured ions14 A p-value of lt005 was taken to be statistically significant for the linear regression
re s u ltsIn this study a total of 500 ABG samples were collected from 128 patients Of these 44 were females (344) and 84 males (656) The age ranged from 15 to 80 years (mean 424 years) There were 80 (61) patients with solid organ malignancies while the remaining (48 patients 39) had hematological malignancies
Stewartrsquos approach picked up missed metabolic disturbances in 58 (116) ABG results which appeared to be normal with the uncorrected anion gap approach and in 8 (16) blood gases labeled normal with corrected anion gap approach The bicarbonate-uncorrected anion gap approach missed metabolic disorders in 10 and 116 of ABGs when compared with either bicarbonate-corrected anion gap or Stewartrsquos approach respectively (Table 4) Fig 1 Linear regression plot between acAnion Gap and SIG
Stewartrsquos Approach vs Bicarbonate Based Methods
Indian Journal of Critical Care Medicine Volume 26 Issue 1 (January 2022)26
when compared to the corrected anion gap approach Thus the diagnostic performance of the albumin-corrected anion gap approach was similar to Stewartrsquos approach McAuliffe suggested that hypoproteinemia (hypoalbuminemia) causes metabolic alkalosis hiding the metabolic acidosis caused by unmeasured anions if the traditional bicarbonate method is used Stewartrsquos approach will however lead to correct diagnosis and also the traditional method once we correct the anion gap for low albumin15
Stewartrsquos approach uses actual values of all parameters such as protein phosphate chloride hemoglobin urea uric acid and does not have any compensation rules or formulae It provides a complete description of the acidndashbase status of an individual In our study Stewartrsquos approach diagnosed extra acidndashbase disorders in 116 of blood gas samples reported as normal with the uncorrected anion gap approach
Dubin et al compared Stewar t rsquos approach with the bicarbonate and Base Excess method for evaluating acidndashbase disorders in 935 critically ill patients It detected metabolic disorders such as metabolic acidosis in 14 of patients who had normal bicarbonate and base excess However when the anion gap was corrected for albumin levels the difference came down to only 1 This is similar to our findings10 In another study Fencl et al compared Stewart rsquos approach with bicarbonate and base excessbase def icit methods in 152 critically ill patients Of these 96 of patients had hypoalbuminemia They looked at patients who had normal base excess or plasma bicarbonate concentration to see if Stewartrsquos approach could diagnose the missed metabolic acidndashbase disturbances They found that in 14 of the samples when the anion gap was corrected for hypoalbuminemia the hidden abnormalities became manifest Overall Stewartrsquos and corrected anion gap approaches gave close in their diagnostic ability and there was a good correlation between the anion gap and SIG11
While these studies have shown an exceptionally high degree of correlation of anion gap and SIG however in our study the correlation was only moderate which may have been due to potential differences in patient population illness severity or pathology
Chaiyakulsil et al obtained 1338-paired measures from 130 critically ill pediatric patients over a 2-year period They excluded
The base excess of extracellular fluid (BE ECF) indicates the nonrespiratory ie metabolic component in acidndashbase disorders (normal minus2 to +2 mEqL) while the strong ion difference (SID) indicates the balance between the anions and cations The normal SID is 0 ie the SID is neutralized by unmeasured anions The 95 limits of agreement between the base excess and SID were also wide at 3352ndash5399 (mean difference of 4376) indicating possibly that they cannot be used interchangeably The correlation however was stronger with Pearsonrsquos r = 069 and the regression coefficient was 0712 (p lt0001) (Figs 3 and 4)
Fig 2 Bland-Altman plot of acAnion Gap and SIG
Fig 3 Linear regression plot between BE ECF against SID
dI s c u s s I o nWe found that Stewartrsquos approach detected acidndashbase disorders in complex critically ill patients missed by the uncorrected anion gap bicarbonate method ie in 50 (10) 58 blood gas samples the acAnion Gap approach was able to correctly diagnose the missed metabolic disorders Hence Stewartrsquos approach identified additional disorders in only eight (16) blood gas samples
Fig 4 Bland-Altman plot of BE ECF and SID
Stewartrsquos Approach vs Bicarbonate Based Methods
Indian Journal of Critical Care Medicine Volume 26 Issue 1 (January 2022) 27
diagnosed by Stewartrsquos approach will affect the patient outcomes Future studies should evaluate the effect of treatment directed towards additional anomalies picked up using Stewartrsquos approach and patient outcomes
su P P l e M e n tA ry MAt e r I A l All the supplementary material from Supplementary 1ndash6 tables are available online on the website of wwwIJCCMorg
or c I d
Rohit Paliwal httpsorcidorg0000-0002-1005-6222Adrian Pakavakis httpsorcidorg0000-0003-0527-5348Jigeeshu V Divatia httpsorcidorg0000-0001-7384-4886Atul P Kulkarni httpsorcidorg0000-0002-5172-7619
re f e r e n c e s 1 Narins RG Emmett M Simple and mixed acidndashbase disorders a
practical approach Medicine (Baltimore) 198059(3)161ndash187 DOI 10109700005792-198005000-00001
2 Emmet M Narins RG Clinical use of anion gap Medicine (Baltimore) 197756(1)38ndash54 PMID 401925
3 Figge J Jabor A Kazda A Fencl V Anion gap and hypoproteinemia Crit Care Med 199826(11)1807ndash1810 DOI 10109700003246-199811000-00019
4 Durward A Mayer A Skellett S Taylor D Hanna S Tibby SM et al Hypoalbuminaemia in critically ill children Incidence prognosis and influence on the anion gap Arch Dis Child 200388(5)419ndash422 DOI 101136adc885419
5 Stewart PA Modern quantitative acidndashbase chemistry Can J Physiol Pharmacol 198361(12)1444ndash1461 DOI 101139y83-207
6 Van Slyke DD Hastings AB Hiller A Sendroy J Jr Studies of gas and electrolyte equilibria in blood XIV Amounts of alkali bound by serum albumin and globulin J Biol Chem 192879769ndash780 DOI 101016S0021-9258(20)79962-X
7 Figge J Rossing TH Fencl V The role of serum proteins in acidndashbase equilibria J Lab Clin Med 1991117(6)453ndash467 PMID 2045713
8 Fencl V Rossing TH AcidndashBase disorders in critical care medicine Annu Rev Med 19894017ndash29 DOI 101146annurevme40020189000313
9 Cook L Macdonald DH Management of paraproteinaemia Postgrad Med J 200783(978)217ndash223 DOI 101136pgmj2006054627
10 Dubin A Menises MM Masevicius FD Moseinco MC Kutscherauer DO Ventrice E et al Comparison of three different methods of evaluation of metabolic acidndashbase disorders Crit Care Med 200735(5)1264ndash1270 DOI 10109701CCM00002595361194390
11 Fencl V Jabor A Kazda A Figge J Diagnosis of metabolic acidndashbase disturbances in critically ill patients Am J Respir Crit Care Med 2000162(6)2246ndash2251 DOI 101164ajrccm16269904099
12 Murray T Long W Narins RG Multiple myeloma and the anion gap N Engl J Med 1975292(11)574ndash575 DOI 101056NEJM197503132921107
13 OrsquoConnor DT Stone RA Hyperchloremia and negative anion gap associated with polymyxin B administration Arch Intern Med 1978138(3)478ndash480 PMID 204265
14 Bland JM Altman DG Statistical methods for assessing agreement bet ween t wo methods of cl inical measurement Lancet 19861(8476)307ndash310 PMID 2868172
15 McAuliffe JJ Lind LJ Leith DE Fencl V Hypoproteinemic alkalosis Am J Med 198681(1)86ndash90 DOI 1010160002-9343(86)90187-7
16 Chaiyakulsil C Mueanpaopong P Lertbunrian R Chutipongtanate S Connecting two worlds positive correlation between physicochemical approach with blood gases and pH in pediatric ICU setting BMC Res Notes 201912(1)742 DOI 101186s13104-019-4770-6
17 Wilkes P Hypoproteinemia strong-ion difference and acidndashbase status in critically ill patients J Appl Physiol (1985) 199884(5)1740ndash1748 DOI 101152jappl19988451740
the samples with acidndashbase disturbances due to respiratory causes and evaluated the remaining 743-paired samples as a metabolic subgroup They looked at the correlation between various parameters obtained from Stewartrsquos approach (such as SID SIG SIDa and SIDe) and the traditional bicarbonate and base excess parameters approach to the pH of the ABG Of all parameters the SIDe (effective strong ion difference) showed the greatest correlation with the pH Among the traditional approaches standard base excess showed the best correlation with the pH The authors suggested that for purpose of simplification simple SID and Na-Cl gap be used for screening of metabolic disorders at the bedside16
The strength of this study was that we measured all the parameters (except sulfate) used in Stewartrsquos calculator to obtain accurate results The critically ill patients had severe derangements in albumin and metabolic state where a holistic approach like Stewarts was expected to perform better at picking up missed disorders
A limitation of this study is that it was a single-center study conducted on a highly specific group of patients with malignancy Thus the results may have limited external validity and generalizability In this study the normal reference ranges of parameters in the patient population were taken as well accepted textbook values and not determined from blood samples of healthy volunteers representative of the study population
Another potential weakness of this study was the use of multiple blood gas samples from the same patient over the duration of their ICU stay This may lead to over or underestimation of the effect size due to the potential correlation of results within an individual patient This was given due consideration whilst designing the study it was considered that the nature of acidndashbase status in critically unwell patients being dynamic each individual ABG would represent a new equilibrium state An additional limitation of our study was that we did not perform a formal sample size calculation since there is a lack of data about how many missed abnormalities will be picked up using Stewartrsquos approach as compared to the traditional methods
A limitation of the Stewartrsquos approach methodology is that although the calculator can quantify the relative contributions of the three independent factors to the overall acidndashbase situation it does not indicate whether a process is primary or compensatory as this often requires a medical history examination investigations and analysis hence comparison of results were restricted to analysis of metabolic derangements
We did not suggest that any interventions be performed based on the interpretation of the ABG data to the clinicians looking after the patients since this was an observational study The blood gas results were also not sequentially analyzed to see the effect of treatment being administered
We also did not document the ICU or hospital outcomes In any case none of the previous studies have shown any prognostic advantages of Stewartrsquos approach over the traditional approaches16ndash21
co n c lu s I o n In this study we found that the acAnion Gap approach was similar in diagnostic performance to Stewartrsquos approach in detecting missed acidndashbase disorders We feel that the corrected anion gap approach can be safely used if a ready calculator for Stewartrsquos approach is not available It remains unclear how treating the additional anomalies
Stewartrsquos Approach vs Bicarbonate Based Methods
Indian Journal of Critical Care Medicine Volume 26 Issue 1 (January 2022)28
20 Cusack RJ Rhodes A Lochhead P Jordan B Perry S Ball JA et al The strong ion gap does not have prognostic value in critically ill patients in a mixed medicalsurgical adult ICU Intensive Care Med 200228(7)864ndash869 DOI 101007s00134-002-1318-2
21 Carreira F Anderson RJ Assessing metabolic acidosis in the intensive care unit does the method make a difference Crit Care Med 200432(5)1227ndash1228 DOI 10109701ccm0000125513 26170d2
18 Kaplan LJ Kellum JA Initial pH base deficit lactate anion gap strong ion difference and strong ion gap predict outcome from major vascular injury Crit Care Med 200432(5)1120ndash1124 DOI 10109701ccm00001255172851774
19 Dondorp AM Chau TT Phu NH Mai NT Loc PP Chuong LV et al Unidentified acids of strong prognostic significance in severe malaria Crit Care Med 200432(8)1683ndash1688 DOI 10109701ccm000013290186681ca
Indian Journal of Critical Care Medicine Volume 26 Issue 1 (January 2022) 29
AP P e n d I x
Appendix 1 The Calculator for ABG Analysis with Stewartrsquos ApproachReady Excel spreadsheet calculator (AcidndashBase Calculator V108xls from Dr Peter Lloyd of Hawkersquos Bay Hospital Hasting New Zealand) was used for the interpretation of the blood gas with Stewartrsquos approach
This was a free public access download from the website acidbaseorg where it was made available by Dr Ross Freebairn (the Medical Director for Intensive Care Services at Hawkersquos Bay Hospital Hasting New Zealand)
The calculator accepts laboratory data as inputs and displays a report which quantifies the three independent parameters that are known to control acidity These parameters are the SID which summarizes the strong or fully dissociated electrolytes the total weak acid concentration (Atotminus) which summarizes the nonvolatile weak or partially dissociated electrolytes and the partial pressure of carbon dioxide (PCO2)
It quantifies the three independent factors that control acidity calculates the concentration and charge of unmeasured ions and displays graphically the value of the independent factors the predicted acidity the measured acidity and the net concentration of unmeasured ions Thus it produces a report based on these calculations and displays a Gamblegram depicting measured ionic species
The minimum data set required is pH PCO2 [Na]+1 [K]+1 [Cl]minus1 but it also takes protein phosphate hemoglobin urea uric acid sulfate and other ionic concentrations
The strong ion calculator takes the concentrations of the measured strong electrolytes (and in the case of calcium and magnesium converts the concentration into ionic strength) The only strong ion that is not routinely available for analysis in modern medical laboratories is sulfate Its concentration can increase greatly in renal failure
Indian Journal of Critical Care Medicine Volume 26 Issue 1 (January 2022)30
AP P e n d I x
Appendix 2 Data Entry Page for the Spreadsheet Calculator
Indian Journal of Critical Care Medicine Volume 26 Issue 1 (January 2022) 31
AP P e n d I x
Appendix 3 Example of Report Obtained from the Spreadsheet Calculator
The values of the three independent parameters are displayed at each corner of a triangle The direction and degree to which variation of each parameter individually affects the acidity are displayed in brackets The individual results that contributed to
the calculation of the independent parameters are tabulated nearby
Beneath this is a printed report box and the gamblegram for the patient
Report Box
Indian Journal of Critical Care Medicine Volume 26 Issue 1 (January 2022)32
AP P e n d I x
GamblegramGamblegram has two bars one depicting the concentration of cations the other anions
Strong ions are fully dissociated throughout the physiological range of acidity The weak acid anions (bicarbonate proteins phosphate) must change their equilibrium concentrations to
conform to the space available (the SID) Otherwise the solution would violate the requirement that at equilibrium the cations are opposed by an equal concentration of anions
- Utility of Stewartrsquos Approach to Diagnose Missed Complex Acid-base Disorders as Compared to Bicarbon
-
- Abstract
-
- Introduction
- Patients and Methods
-
- Bicarbonate Approach
- Stewartrsquos Approach
- Statistics
-
- Results
- Discussion
- Conclusion
- Orcid
- References
-
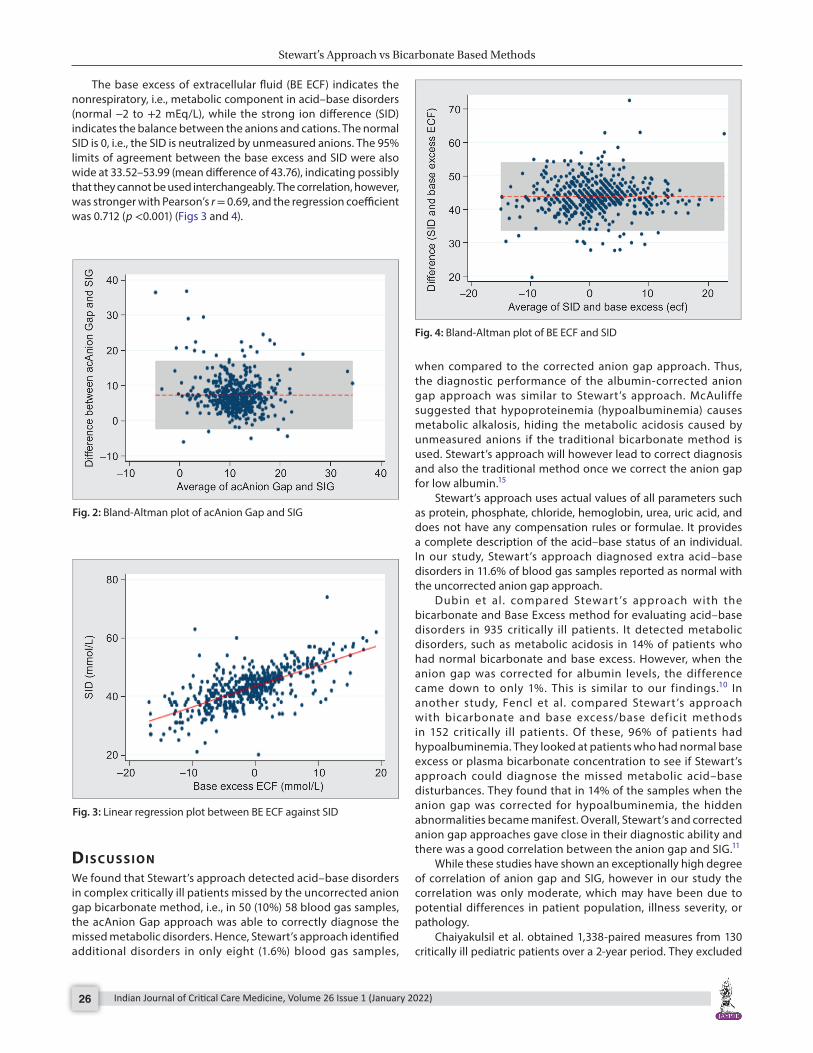
Stewartrsquos Approach vs Bicarbonate Based Methods
Indian Journal of Critical Care Medicine Volume 26 Issue 1 (January 2022)28
20 Cusack RJ Rhodes A Lochhead P Jordan B Perry S Ball JA et al The strong ion gap does not have prognostic value in critically ill patients in a mixed medicalsurgical adult ICU Intensive Care Med 200228(7)864ndash869 DOI 101007s00134-002-1318-2
21 Carreira F Anderson RJ Assessing metabolic acidosis in the intensive care unit does the method make a difference Crit Care Med 200432(5)1227ndash1228 DOI 10109701ccm0000125513 26170d2
18 Kaplan LJ Kellum JA Initial pH base deficit lactate anion gap strong ion difference and strong ion gap predict outcome from major vascular injury Crit Care Med 200432(5)1120ndash1124 DOI 10109701ccm00001255172851774
19 Dondorp AM Chau TT Phu NH Mai NT Loc PP Chuong LV et al Unidentified acids of strong prognostic significance in severe malaria Crit Care Med 200432(8)1683ndash1688 DOI 10109701ccm000013290186681ca
Indian Journal of Critical Care Medicine Volume 26 Issue 1 (January 2022) 29
AP P e n d I x
Appendix 1 The Calculator for ABG Analysis with Stewartrsquos ApproachReady Excel spreadsheet calculator (AcidndashBase Calculator V108xls from Dr Peter Lloyd of Hawkersquos Bay Hospital Hasting New Zealand) was used for the interpretation of the blood gas with Stewartrsquos approach
This was a free public access download from the website acidbaseorg where it was made available by Dr Ross Freebairn (the Medical Director for Intensive Care Services at Hawkersquos Bay Hospital Hasting New Zealand)
The calculator accepts laboratory data as inputs and displays a report which quantifies the three independent parameters that are known to control acidity These parameters are the SID which summarizes the strong or fully dissociated electrolytes the total weak acid concentration (Atotminus) which summarizes the nonvolatile weak or partially dissociated electrolytes and the partial pressure of carbon dioxide (PCO2)
It quantifies the three independent factors that control acidity calculates the concentration and charge of unmeasured ions and displays graphically the value of the independent factors the predicted acidity the measured acidity and the net concentration of unmeasured ions Thus it produces a report based on these calculations and displays a Gamblegram depicting measured ionic species
The minimum data set required is pH PCO2 [Na]+1 [K]+1 [Cl]minus1 but it also takes protein phosphate hemoglobin urea uric acid sulfate and other ionic concentrations
The strong ion calculator takes the concentrations of the measured strong electrolytes (and in the case of calcium and magnesium converts the concentration into ionic strength) The only strong ion that is not routinely available for analysis in modern medical laboratories is sulfate Its concentration can increase greatly in renal failure
Indian Journal of Critical Care Medicine Volume 26 Issue 1 (January 2022)30
AP P e n d I x
Appendix 2 Data Entry Page for the Spreadsheet Calculator
Indian Journal of Critical Care Medicine Volume 26 Issue 1 (January 2022) 31
AP P e n d I x
Appendix 3 Example of Report Obtained from the Spreadsheet Calculator
The values of the three independent parameters are displayed at each corner of a triangle The direction and degree to which variation of each parameter individually affects the acidity are displayed in brackets The individual results that contributed to
the calculation of the independent parameters are tabulated nearby
Beneath this is a printed report box and the gamblegram for the patient
Report Box
Indian Journal of Critical Care Medicine Volume 26 Issue 1 (January 2022)32
AP P e n d I x
GamblegramGamblegram has two bars one depicting the concentration of cations the other anions
Strong ions are fully dissociated throughout the physiological range of acidity The weak acid anions (bicarbonate proteins phosphate) must change their equilibrium concentrations to
conform to the space available (the SID) Otherwise the solution would violate the requirement that at equilibrium the cations are opposed by an equal concentration of anions
- Utility of Stewartrsquos Approach to Diagnose Missed Complex Acid-base Disorders as Compared to Bicarbon
-
- Abstract
-
- Introduction
- Patients and Methods
-
- Bicarbonate Approach
- Stewartrsquos Approach
- Statistics
-
- Results
- Discussion
- Conclusion
- Orcid
- References
-