Breast Cancer Prevention: Missed opportunities and why we must act now
65
Breast Cancer Prevention: missed opportunities and why we must act now Graham A Colditz, MD DrPH Niess-Gain Professor Department of Surgery Division of Public Health Sciences
Transcript of Breast Cancer Prevention: Missed opportunities and why we must act now

Breast Cancer Prevention: missed opportunities and
why we must act now
Graham A Colditz, MD DrPH Niess-Gain Professor
Department of Surgery Division of Public Health Sciences

Department of Surgery Division of Public Health Sciences
Conflict of interest
• I have no financial relationships to disclose
• I will not discuss off-label use and or investigational use in my presentation

Department of Surgery Division of Public Health Sciences
Goals
• Review burden • What we know • What drive breast cancer • Implications for prevention

Department of Surgery Division of Public Health Sciences
A growing population, or preventing cancer will not put anyone in the room out of a job!
Most recent: 317,456,363 (February 1, 2014) • 1 birth every 8 sec • 1 immigrant (net) every 39 sec • 1 death every 13 sec
Net increase 1 person every 14 sec
! www.census.gov/population

Department of Surgery Division of Public Health Sciences
Aging US population !Over 65 rising from 13% in 2012 to more than 20% of pop. in 2050
Cancer burden • Assume incidence per 100,000 holds steady at
each age • Number of new cancer cases will double by 2050
simply due to aging population

Department of Surgery Division of Public Health Sciences

Department of Surgery Division of Public Health Sciences

Department of Surgery Division of Public Health Sciences
Edwards, et al. Cancer 2002
Projected number of cases, USA

Department of Surgery Division of Public Health Sciences
Global burden, 2012
1.7 Million new cases of breast cancer 25% of all cancer diagnosed in women
Globocan 2012, IARC

Department of Surgery Division of Public Health Sciences
Cancer care Cost – billions ($US 125b in 2010) Breast cancer: $US 16.6 b, or 13% in 2010 • 36% of this cost in the last year of life
Increasing burden direct and indirect costs of cancer Lost productivity due to breast cancer $US 10.9b • Competition among drug manufacturers,
surgical, radiation oncology, etc • What are system perspectives and patient
perspectives? Hassett & Elkin, 2013

Department of Surgery Division of Public Health Sciences
Why are we not preventing breast cancer now?
Multiple barriers: • Skepticism that cancer can be prevented • Short term focus of cancer research • Interventions deployed too late in life • Research focused on treatment not prevention • Debates among scientists • Societal factors ignored • Lack of transdisciplinary training • Complexity of implementation
Colditz et al Sci Transl Med 2012: March 28

Department of Surgery Division of Public Health Sciences
Armitage and Doll, Br J Cancer 1954
Female cancer mortality by age
Cancer mortality England and Wales 1950 and 1951 Log10 (50) = 1.7

Department of Surgery Division of Public Health Sciences
Biology – association with age
• Armitage & Doll – increase with age – multistage model, BJC 1954
• Moolgavkar et al.,1981 JNCI evaluated data from Denmark, Japan, Iceland and the USA.
• The underlying effect of age is modulated by birth cohort
• Normalized incidence curves to age 40-44 in Connecticut
! Moolgavkar JNCI 1979:62:493-501

Department of Surgery Division of Public Health Sciences
Moolgavkar et al JNCI 1979

Department of Surgery Division of Public Health Sciences
If we conclude that attained age is marker of risk, then:
What does attained age mean? • Accumulated exposure up to an age? • Some other function of age? • Menopause tells us “hormones” or
accumulation through premenopausal years must be important

Department of Surgery Division of Public Health Sciences
Attained age finding generates other key prevention questions:
• Which lifestyle component to change? • At what age? • By how much? • For how long? • When will benefit be observed, and how
long will benefit last?
See Colditz, Cancer Causes and Control 2010 Colditz and Taylor, Ann Rev Public Health 2010

Department of Surgery Division of Public Health Sciences
Why are childhood and adolescence important?
• Risk accumulation from menarche to first birth and then to menopause
• Age at menarche has strong history of relation with breast cancer
• Dramatic changes with industrialization • Menarche reduced from 17 or 18 to 12 eliminating one
third of growth and development period
• Growth and height are related to risk
Colditz and Frazier CEBP 1995

Department of Surgery Division of Public Health Sciences
Pike model – Nature 1983
To accommodate the higher incidence with late first birth, we add a constant representing an increase in risk with FFTP (+b) in figure
Pike, et al. Nature 1983

Department of Surgery Division of Public Health Sciences
Understanding the accumulation of breast cancer risk: Pike model
• Factors associated with reduced risk of breast cancer were considered to lower the rate of breast tissue aging ! Pike et. al., Nature 1983;303:767-70
• We translated this to mean the rate of cell division and accumulation of molecular damage on the pathway to breast cancer
Department of Surgery Division of Public Health Sciences
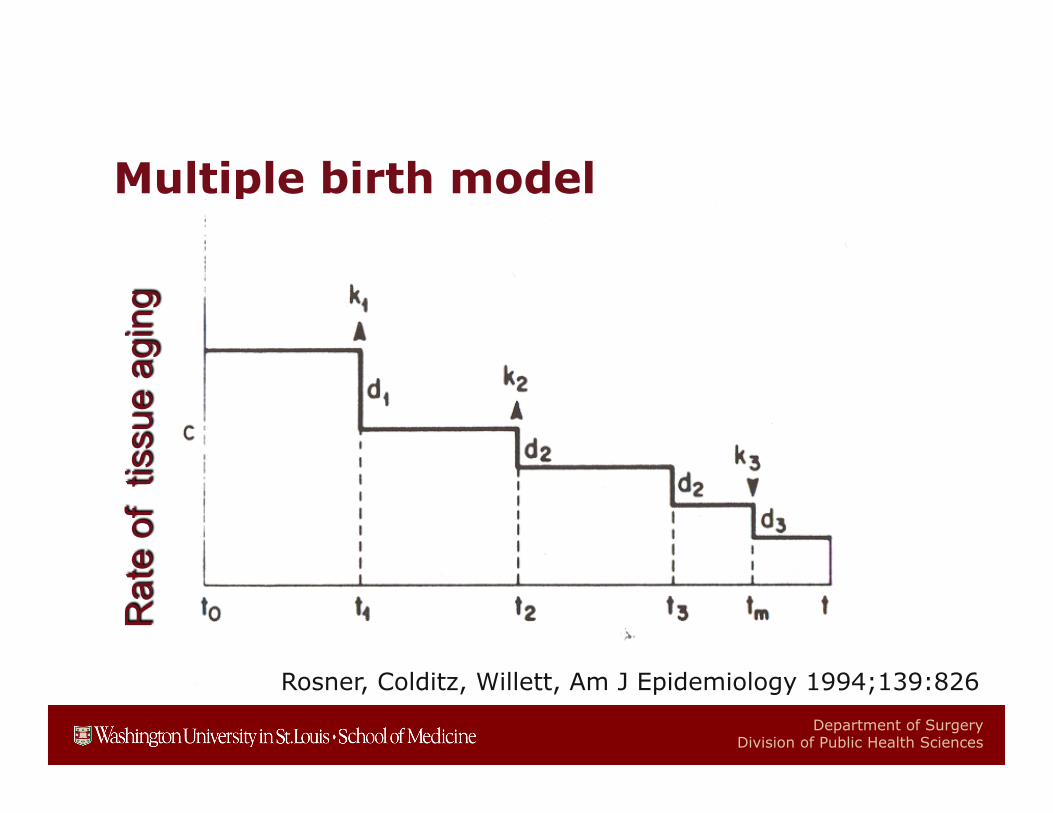
Multiple birth model
Rosner, Colditz, Willett, Am J Epidemiology 1994;139:826
Rat
e of
tis
sue
agin
g

Department of Surgery Division of Public Health Sciences
Multiple birth model
Rosner, Colditz, Willett, Am J Epidemiology 1994;139:826
9% /yr
2.5% /yr

Department of Surgery Division of Public Health Sciences
Extensions to modeling
• Includes time from birth to menarche • Allows the impact of the first birth to vary
with age at first birth • Fits log incidence (Poisson regression)
model giving terms that are interpretable • Contrast contribution of risk factors for
receptor positive and negative breast cancer
Colditz and Rosner AJE 2000

Department of Surgery Division of Public Health Sciences
Given biology – key questions

Department of Surgery Division of Public Health Sciences
What drives risk?
Hormonal drivers Change in height and growth velocity Lifestyle changes arising from economic development
Colditz, submitted 2014

Department of Surgery Division of Public Health Sciences
Hormonal drivers
Estrogen plus progestin therapy after menopause SERMs and AIs reduce risk in high risk women Menopause

Department of Surgery Division of Public Health Sciences
Risk accumulation
Menarche to first birth Change in reproductive patterns - industrialization

Department of Surgery Division of Public Health Sciences
Norway
Finland
Sweden

Department of Surgery Division of Public Health Sciences
Change in menarche, Korea
Cho Eur J Pediatr 2009
30 years

Department of Surgery Division of Public Health Sciences
Trends in Fertility
Calendar year Ito et al NEBR, 2008

Department of Surgery Division of Public Health Sciences

Department of Surgery Division of Public Health Sciences
Breast Cancer Incidence, Korea
1998 4o, born 1958 2008 40, born 1968
Jung et al, J Breast Ca, 2011

Department of Surgery Division of Public Health Sciences
Population changes and Breast Cancer incidence in Korea
Age at menarche is decreasing ! Women born 1920-1924: 16.9 ! Women born 1980-1985: 13.8
Fertility rate is decreasing ! 1970: 4.53 ! 2010: 1.23
Age at first birth is increasing ! 1993: 27.6 ! 2010: 31.3
Increasing incidence of breast cancer for women age 45-59
! Women born 1943-1945: 45 cases per 100,000
! Women born 1960-1962: 140 cases per 100,000
G. J. Cho et al., Age at menarche in a Korean population: secular trends and influencing factors. Eur J Pediatr 169, 89 (Jan, 2010). J. W. Lim, The changing trends in live birth statistics in Korea, 1970 to 2010. Korean journal of pediatrics 54, 429 (Nov, 2011). K. W. Jung et al., Prediction of cancer incidence and mortality in Korea, 2013. Cancer research and treatment : official journal of Korean Cancer Association 45, 15 (Mar, 2013).4
0
1
2
3
4
5
1970 1980 1990 2000 2010
Fertility Rate
0
50
100
150
1943-1945 1960-1962 Date of Birth
BC Incidence ages 45-49
24
26
28
30
32
Age at First Birth

Department of Surgery Division of Public Health Sciences
So how to prevent breast cancer?
Timing matters
• Growth velocity • Urbanization (diet, lack of activity) • Alcohol intake

Department of Surgery Division of Public Health Sciences
HEIGHT GROWTH VELOCITY

Department of Surgery Division of Public Health Sciences
Height and relative risk of breast cancer incidence, Korea. 339,000 women, 10 yr
Sung J, et al AJE 2009
Rel
ativ
e risk

Department of Surgery Division of Public Health Sciences
Drivers for growth velocity (Stuart study)
• Harvard growth study • Females born in 1930s and 1940s,
followed to age 18 ! Age at menarche recorded to month ! Annual height measurements (estimate year in which
girl experienced most rapid adolescent height growth) ! Mother interviewed annually on dietary intake over past
6 months while child being examined/measured, etc.

Department of Surgery Division of Public Health Sciences
Growth curve of a girl, HLS Peak height velocity = greatest growth in single year
Berkey et al, Cancer 1999

Department of Surgery Division of Public Health Sciences
Peak height velocity
Berkey et al, Cancer 1999

Department of Surgery Division of Public Health Sciences
Predictors measured from birth through age 5
Age at menarche = 12.8 (0.12) – 0.38 (0.12)height at age 3 to 5yr + 2.19 (0.91) vegetable protein ages 3 to 5 yr.
Peak height growth velocity = 14.2 + 4.25 (1.07) calories – 0.39 BMI ages 3 to 5yr + 2.08 (0.95) animal protein ages 3 to 5yr
! Berkey, …, Colditz AJE 2000

Department of Surgery Division of Public Health Sciences
Milk and growth velocity
Previously published from GUTS Higher growth velocity increased risk of BBD (Berkey) Also, Increased risk of pre and postmenopausal breast cancer Milk intake positively related to increase in peak height growth velocity
Now meta-analysis of 12 controlled trials • 0.4cm per year additional height growth for each
8oz (cup) of milk consumed
! De Beer. Dairy products and physical stature. Economics and human biology 2012;10:299-309

Alcohol
A known breast carcinogen

Department of Surgery Division of Public Health Sciences
What predicts incidence of BBD?
NHSII – incident BBD (RO1-CA50385) • Central pathology review • Study of adolescent:
! diet ! physical activity ! body shape at ages 5 and 10
GUTS, Growing Up Today Study ! Self-report benign breast disease confirmed by breast
biopsy

Department of Surgery Division of Public Health Sciences
Alcohol and BBD – GUTS data
• 6899 females, 9-15 in 1996 • 2000, 2001, 2003 assessed alcohol • 147 confirmed physician diagnosed
benign breast disease • Those who drank typically 3 to 5 days per
week at increased risk (RR 2.99, 1.26-7.09)
Berkey et al, Pediatrics, 2010

Department of Surgery Division of Public Health Sciences
Alcohol and incident proliferative BBD, NHSII
• Adolescent recall of high school diet • Incident BBD – proliferative lesions on
central pathology review • 678 cases of proliferative BBD among
29,329 women followed over 10 years • Alcohol intake directly related to
subsequent risk of proliferative BBD
Liu et al – Pediatrics, April 2012

Department of Surgery Division of Public Health Sciences
Alcohol intake, ages 18-22, incident proliferative BBD
Alcohol intake (grams/day)
Cases Person-yr RR (95% CI)
None 155 64,827 1.0 reference 0.1-4.9 193 78,365 1.11 (0.89, 1.38) 5.0-14.9 236 88,310 1.36 (1.09, 1.69) >15 30 9519 1.35 (1.01, 1.81)
p, trend <0.01
Liu et al – Pediatrics, April 2012

Department of Surgery Division of Public Health Sciences
Alcohol before first pregnancy, NHSII
Liu, Colditz, Tamimi JNCI 2013

Department of Surgery Division of Public Health Sciences

Vegetable protein intake
Surrogates – soy, fiber, fruit and vegetables

Department of Surgery Division of Public Health Sciences
Adolescent fiber & BBD: NHSII
Su et al, Cancer Causes Control, March 2010

Department of Surgery Division of Public Health Sciences
Move back to GUTS cohort
112 women confirmed biopsy for benign breast lesion • 6950 free from biopsy FFQ at entry 1996, then 1997, and 1998 • Veg fat significantly related to reduced risk, but
not veg protein • Peanut consumption (peanut butter and bags of
peanuts) significantly inverse

Department of Surgery Division of Public Health Sciences
Cumulative dietary intake 1996 to 1998 and risk of BBD Dietary intake Mean
intake OR 95%
Confidence Interval
Vegetable protein (10gm/d) 24 g 0.86 0.55-1.34
Vegetable fat (10gm/d) 33 g 0.72 0.52-0.98
Peanut butter and bags of peanuts (servings/3d)
0.52 0.56 0.35-0.87
Beans, lentils, soybeans (servings/3d)
0.24 0.95 0.55-1.62
Corn (servings/3d) 0.40 0.73 0.37-1.43
Total servings per day of peanut butter, bags of nuts, beans, lentils, soybeans, and corn
0.38 0.33 0.13-0.82
Multivariable adjusted models further include childhood adiposity, age at menarche, adolescent alcohol intake, and pregnancy (ever). (Berkey et al. Breast Ca Res Treat, 2013)

Department of Surgery Division of Public Health Sciences
Ontario, Canada: Population-based case-control study
Recall of adolescent diet ! (55 food items)
High participation ! (2865 cases, 3299 controls)
Top vs. bottom quintile of intake ! Fiber mvOR = 0.66 (0.55 - 0.78) ! Vegetable protein mvOR = 0.80 (0.68 – 0.95) ! Nuts mvOR = 0.76 (0.61 - 0.95)
Liu, Y., et al. (2014). Adolescent Dietary Fiber, Vegetable Fat, Vegetable Protein, and Nut Intakes and Breast Cancer Risk. Unpublished manuscript.

Department of Surgery Division of Public Health Sciences
Relations as trends
Fiber 10g/day increase mvOR = 0.73 (0.65 – 0.8a) Vegetable protein 5g/day increase mvOR = 0.92 (0.87 – 0.98)
Liu, Y., et al. (2014). Adolescent Dietary Fiber, Vegetable Fat, Vegetable Protein, and Nut Intakes and Breast Cancer Risk. Unpublished manuscript.

Department of Surgery Division of Public Health Sciences
NOTE: Weights are from random effects analysis
Overall (I-squared = 0.0%, p = 0.642)
Su
Author
Linos
Frazier
2010
Year
2010
2004
824
Cases
455
361
28656
Noncases
38813
47517
0.81 (0.69, 0.95)
0.75 (0.59, 0.96)
ES (95% CI)
0.90 (0.67, 1.20)
0.81 (0.58, 1.13)
100.00
44.83
Weight
31.28
23.89
%
0.81 (0.69, 0.95)
0.75 (0.59, 0.96)
ES (95% CI)
0.90 (0.67, 1.20)
0.81 (0.58, 1.13)
100.00
44.83
Weight
31.28
23.89
%
Reduces Risk Increases Risk 1.5 1 2
Adolescent Total Fiber Intake and Risk of BBD or Breast Cancer Meta-Analysis of 3 Studies
McGilvray, M, et al. (2014). Adolescent Fiber Intake and Risk of Adult Breast Cancer or Benign Breast Disease. Unpublished manuscript.

Department of Surgery Division of Public Health Sciences
Food consumption trends in China (ages 2-18), 1991 to 2011
178.6
87.6
59.5
236.4
41.8
59.5
266.2
25.4
46.1
0
50
100
150
200
250
300
Total animal-source foods
Coarse grains Legumes and products
Kca
l/day
1991
2000
2011
F. Y. Zhai et al., Dynamics of the Chinese diet and the role of urbanicity, 1991-2011. Obes Rev 15 Suppl 1, 16 (Jan, 2014).

Physical activity

Department of Surgery Division of Public Health Sciences
Physical activity and risk of BBD Data from GUTS
OR= 0.59 p= .035
OR= 1.12 p= .045
OR= 2.25 p= .037
Ris
k of
BBD
Lo
wer
risk
H
ighe
r ris
k
Girls with more walking time at 14
(>30 min/day vs <15 min/day)
Girls who were more inactive (mean inactivity over 3 years,
age-BMI-adjusted)
Girls who increased level of inactivity over 5 years
(largest vs smallest increase)
Berkey, CS, et al. (2014). Adolescent Physical Activity and Inactivity: A Prospective Study of Risk for Benign Breast Disease in Young Women. Unpublished manuscript

Department of Surgery Division of Public Health Sciences
-13% Regular physical activity
-25% Having children (4)
-18% Avoiding alcohol
-16% Breast feeding
No children Breast Cancer Risk Reduction Starting in Early Life
Ris
k A
ccum
ulat
ion
Births (20, 23, 26, 29)
Menopause
Age
10 20 30 40 50 60 70
Colditz and Bohlke 2014

Department of Surgery Division of Public Health Sciences
No post-menopausal hormones
Physical activity No alcohol
Medications to lower risk (for high risk women)
Healthy weight
Average woman – overweight
Obesity
Breast Cancer Risk Reduction Starting in Mid Life
Ris
k A
ccum
ulat
ion
Births (20, 23, 26, 29)
Menopause
Age
10 20 30 40 50 60 70
Colditz & Bohlke 2014

Department of Surgery Division of Public Health Sciences
Obesity
No post-menopausal hormones
Physical activity No alcohol
Medications to lower risk (for high risk women)
Healthy weight
Average woman – overweight Breast Cancer Risk Reduction Starting in Mid Life
Ris
k A
ccum
ulat
ion
Births (20, 23, 26, 29)
Menopause
Age
10 20 30 40 50 60 70

Department of Surgery Division of Public Health Sciences
Conclusions: breast cancer prevention • Timing matters • To maximize benefits we must focus on
biologically relevant periods • Untapped potential for childhood and
adolescent diet ! What intermediate marker can we measure?
• Must identify strategies to counter adverse effect of alcohol
• We already have many tools for prevention that are not fully used

Department of Surgery Division of Public Health Sciences
Messages for 16 to 30 year old women?
Go big with plant based foods – fruits, vegetables, nuts, and whole grains Think before you drink Put on those dancing – and Walking and Running and Cycling shoes Don’t obsess – But watch your weight

Department of Surgery Division of Public Health Sciences