The Potential of Urbanisation to Accelerate Post-COVID ...
192
21 August 2020 The Potential of Urbanisation to Accelerate Post-COVID Economic Recovery REPORT TO THE XV FINANCE COMMISSION
-
Upload
khangminh22 -
Category
Documents
-
view
1 -
download
0
Transcript of The Potential of Urbanisation to Accelerate Post-COVID ...

21 August 2020
The Potential of Urbanisationto Accelerate Post-COVIDEconomic Recovery
REPORT TO THE XV FINANCE COMMISSION


Report to the XV Finance Commission
The Potential of Urbanisation to Accelerate Post-COVID Economic Recovery 21 August 2020

This work is a product of the Indian Institute for Human Settlements (IIHS).
I. Rights and Permissionsa. Licence for Use:
This work is available under the following licence: All the content created by the author(s) for the purpose of The Potential of Urbanisation to Accelerate Post-COVID Economic Recovery: Report to the XV Finance Commission is copyrighted. For permission to reproduce copyright materials, contact the authors of the copyright and IIHS, noted as the 'Source' on each page. You are free to share, to copy, distribute and transmit the work under the following conditions:
Attribution: You must attribute the work in the manner specified by the author or licensor (but not in any way that suggests that the author endorses you/ your use of the work).
Non-commercial: You shall not use this work for commercial purposes.
Restrictions on use: The content of this work shall not be modified, edited or altered in any manner without prior written permission of IIHS.
With the understanding that:
Public Domain - Where the work or any elements is in the public domain under applicable law, that status is in no way affected by the licence.
Other Rights - In no way are any of the following rights affected by the licence:
Your fair dealing or fair use rights, or other applicable copyright exceptions and limitations; The author's moral rights; Rights other persons may have either in the work itself or in how the work is used, such as publicity or privacy rights;
Explanation: “Work” means the literary and/or artistic work offered under the terms of this license including without limitation any production in the literary, scientific and artistic domain, whatever may be the mode or form of its expression including digital form, such as a book, pamphlet and other writing; a work of drawing, painting, architecture, sculpture, engraving or lithography; a photographic work to which are assimilated works expressed by a process analogous to photography; a work of applied art; an illustration, map, plan, sketch or three- dimensional work relative to geography, topography, architecture or science; a performance; a broadcast; a phonogram; a compilation of data to the extent it is protected as a copyrightable work.
Trademarks: The logos and names of the organisers on The Potential of Urbanisation to Accelerate Post-COVID Economic Recovery: Report to the XV Finance Commission are trademarks of the organisation. Use, reproduction, copying or redistribution of trademarks, without written permission of the logo/ name's respective owner is prohibited. The IIHS logo in The Potential of Urbanisation to Accelerate Post-COVID Economic Recovery: Report to the XV Finance Commission is a trademark of IIHS.
b. Translation: Where a translation of this work has been created by a third party, prior written permission must be obtained from IIHS. Attribution to IIHS shall be accompanied by the following disclaimer:
''All rights in relation to the material contained in the original work vest with the Indian Institute for Human Settlements (IIHS).”
c. Adaptation: Where an adaptation of the original work has beencreated, prior written permission must be obtained from IIHS. Attribution to IIHS shall be accompanied by the following disclaimer:
'' All rights in relation to the material contained in the original work vest with the Indian Institute for Human Settlements (IIHS). This work is an adaptation of the original work created by IIHS. IIHS does not endorse the modified content or views/opinions contained in this adaptation in any manner.''
d. Third Party Content: This work contains third party ownedmaterial which has been duly attributed by IIHS. It is the responsibility of the user to determine the requirements for permission and obtain such permission from the respective copyright owner(s) in the event of use/reuse of third party owned material that constitutes a component of this work. Examples of components may include, but are not limited to, tables or figures. IIHS shall not be liable for any claims arising out of the infringement of material owned by a third party as a result of use/reuse by a user.
e. Citation: Please cite the work as follows: Revi, A., Ray, M., Mitra, S., Anand, S., Sami, N., Malladi, T. (2020). Reportto the XV Finance Commission on The Potential of Urbanisation to Accelerate Post-COVID Economic Recovery
f. DOI: https://doi.org/10.24943/XVFC08.2020
g. Cover and interior design:All images and illustrations that appear in this work have been usedwith the permission of the creator. For further use/reuse, relevant permission must be obtained from the creator.
All queries on rights and licenses should be addressed to: [email protected]
Disclaimer: The boundaries, colours and other information shown on any map in this work are purely representational in nature and do not imply any judgment on the part of IIHS concerning the status of any territory or acceptance of such boundaries. All the maps in this work are in conformity with the maps of India as published by the Survey of India. The external boundaries and coastlines are from Administrative Atlas of India 2011, by Census of India 2011, which are in conformity with the Record/ Master copy certified by Survey of India.
AUTHORS Aromar Revi, Mainak Ray, Neha Sami, Shriya Anand, Sudeshna Mitra, Teja Malladi
ANALYTICAL SUPPORT Pushkara S V, Pooja Rao, Dhananjayan M, Lokesh B S
EDITORIAL & PRODUCTION Rekha Raghunathan, Kaavya Pradeep Kumar, Shruti Chandrashekar
DESIGN & LAYOUT Vikrant M S
Table of Contents
Executive Summary ................................................................................................................................ 1
Chapter 1: India’s Urban Context ...................................................................................................... 9
India’s Urban Growth Trends: (1951-2051) .......................................................................................... 11
The Experience of New Cities and Towns and SEZs in India (1951-2020) ........................................ 14
Key Drivers of India’s Urban and Economic Development ................................................................. 23
Urban Employment & Informality ......................................................................................................... 29
Migration .................................................................................................................................................. 32
Sustainable Urbanisation ....................................................................................................................... 34
.................................................................................. 42
Chapter 2: Post-COVID Priorities ....................................................................................................... 45
Post-COVID Urban Economic Recovery ................................................................................................ 47
Addressing Post - COVID Urban Risk .................................................................................................. 51
Post-Covid Intervention Strategies and Regional Priority ................................................................... 53
Chapter 3: Implementation ................................................................................................................ 57
Building on current Urban Development and Reform Programmes ................................................ 59
Land ........................................................................................................................................................... 60
Urban Governance ………………………………….……………………….……………………….…………………………….. 63
Finance & Investment ............................................................................................................................. 65
Chapter 4: Conclusions ......................................................................................................................... 69
Chapter 5: Recommendations ............................................................................................................ 77
Annex I ............................................................................................................ 91 ........................................ Annex II ......................................................................................................... 119 ................................ .......
Annex III ...................................... .........................................................................................................171
Annex IV ...................................... .........................................................................................................179
Building Resilience Against Urban Hazard Risk
Regional Development Strategies for the 100-largest cities by population ................................... 54
Bibliography ............................................................................................................ 85 ..............................

List of Figures
Figure 1.1: Distribution of Population by Settlement Size Classes (1951 – 2051) ............................ 12Figure 1.2: Distribution of Population across Cities, Towns and Villages (2011) ............................. 13Figure 1.3: Distribution of Population across Cities, Towns and Villages (2011) ............................. 13Figure 1.4: Distribution of Greenfield Cities (2011) ............................................................................. 15Figure 1.5: Strategic Infrastructure ........................................................................................................ 25Figure 1.6: Estimated concentration of economic output from Night Lights Data (2011) .............. 28Figure 1.7: Corridors and the Distribution of Population across Cities, Towns and Villages (2011) ................................................................................................................................................................... 29Figure 1.8: Workforce Participation (2011) ........................................................................................... 31Figure 1.9: Where India’s Migrants Came From ................................................................................... 32Figure 1.10: Movement Across Rural and Urban Areas (millions) ..................................................... 32Figure 1.11: Inter State Migration Flows (2011) ................................................................................... 33Figure 1.12: Block Wise Groundwater Resources Assessment (2017) .............................................. 35Figure 1.13: Distribution of Evergreen, Deciduous, Shrub Forests and Grasslands (2011) ............ 36Figure 1.14: Composite Hazard Risk for Cities with Population Greater than 0.1 million (2011) .. 38Figure 1.15: Earthquake Hazard Risk for Cities with Population Greater than 0.1 million (2011) . 39Figure 1.16: Cyclonic wind speed hazard risk for cities with population greater than 0.1 million (2014) ........................................................................................................................................................ 41Figure 1.17: Flood Hazard Risk for Cities with Population Greater than 0.1 million (2014) ........... 42
List of Tables
Table ES1: Indicative Urban Upgradation and Expansion Investment Estimates (2021-31) .......... 11Table 1.1: Pre-Liberalisation New Towns in India ................................................................................ 20Table 1.2: Post-Liberalisation New Towns in India .............................................................................. 21Table 1.3: Projected Population of India's 10-largest Mega Urban Regions & Emerging Clusters (2031) ........................................................................................................................................................ 27Table 3.1: Urban Development and Reform Programmes ................................................................. 59Table 3.2: India: Indicative Urban Upgradation & Expansion Investment Estimates (2021-31) .... 66Table 5.1: Indicative Urban Upgradation and Expansion Investment Estimates (2021-31) ........... 81

List of Abbreviations AIF Alternative Investment Fund AIIB Asian Infrastructure Investment Bank AMRUT Atal Mission for Rejuvenation and Urban Transformation CAG Comptroller and Auditor General CIDCO City and Industrial Development Corporation (of Maharashtra) DMP Disaster Management Plan EMC Electronics Manufacturing Cluster FC Finance Commission GDP Gross Domestic Product GST Goods and Services Tax HFC Housing Finance Company HPEC High Powered Expert Committee HRIDAY Heritage City Development and Augmentation Yojana IBRD International Bank for Reconstruction and Development (World Bank Group) ICT Information and Communications Technology IL&FS Infrastructure Leasing and Financial Services Limited ITES Information Technology Enabled Services JNNURM Jawaharlal Nehru National Urban Renewal Mission JNPT Jawaharlal Nehru Port Terminal JUA Jamshedpur Urban Agglomeration JUSCO Jamshedpur Utilities and Services Company Limited LCL Lavasa Corporation Limited MIDC Maharashtra Industrial Development Corporation MFI Micro-Finance Institutions MMRDA Mumbai Metropolitan Region Development Authority MSME Micro, Small and Medium Enterprises NBFC Non-Banking Financial Company NMMC Navi Mumbai Municipal Corporation NPA Non-Performing Asset NULM National Urban Livelihoods Mission PFC Power Finance Corporation PLFS Periodic Labour Force Surveys PMAY Pradhan Mantri Aawas Yojana REC Rural Electrification Corporation RERA Real Estate (Regulation and Development) Act, 2016 SBM Swachh Bharat Mission SDG Sustainable Development Goals SEZ Special Economic Zone SPV Special Purpose Vehicle TISCO Tata Iron and Steel Company ULB Urban Local Body

[This page is intentionally left blank]
Executive Summary
1

[This page is intentionally left blank]
Executive Summary & Recommendations Introduction
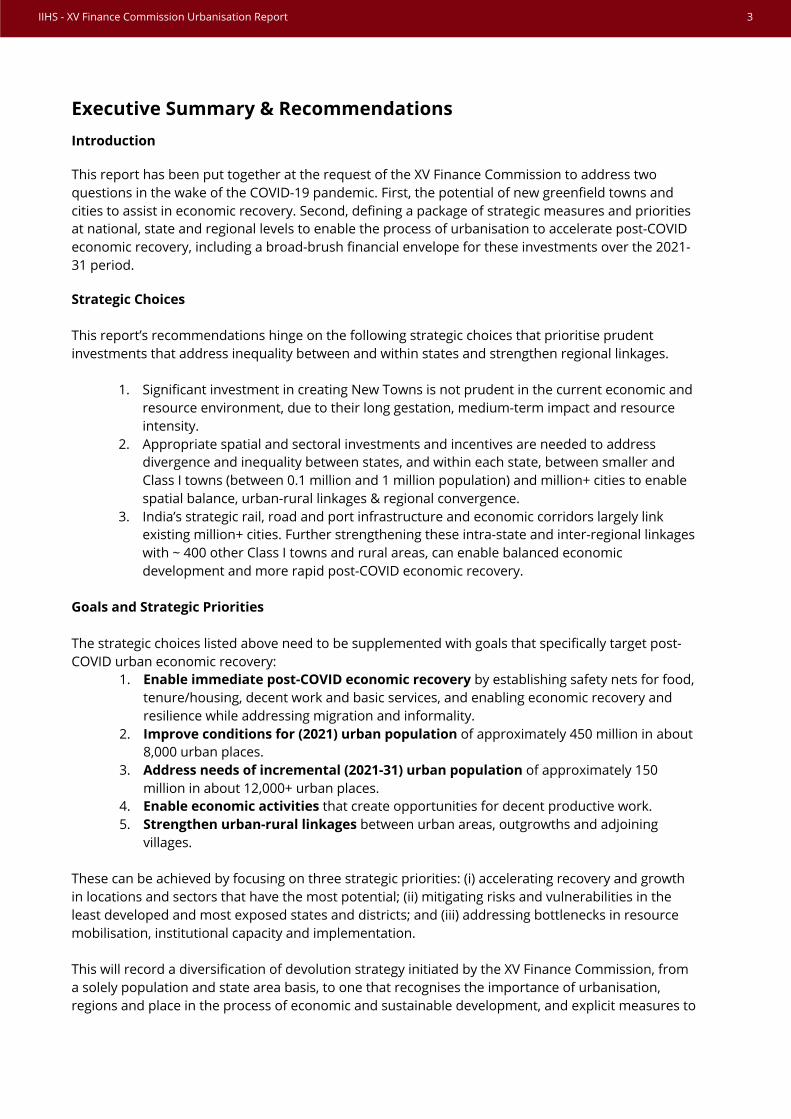
This report has been put together at the request of the XV Finance Commission to address two questions in the wake of the COVID-19 pandemic. First, the potential of new greenfield towns and cities to assist in economic recovery. Second, defining a package of strategic measures and priorities at national, state and regional levels to enable the process of urbanisation to accelerate post-COVID economic recovery, including a broad-brush financial envelope for these investments over the 2021-31 period.
Strategic Choices
This report’s recommendations hinge on the following strategic choices that prioritise prudent investments that address inequality between and within states and strengthen regional linkages.
1. Significant investment in creating New Towns is not prudent in the current economic andresource environment, due to their long gestation, medium-term impact and resourceintensity.
2. Appropriate spatial and sectoral investments and incentives are needed to addressdivergence and inequality between states, and within each state, between smaller andClass I towns (between 0.1 million and 1 million population) and million+ cities to enablespatial balance, urban-rural linkages & regional convergence.
3. India’s strategic rail, road and port infrastructure and economic corridors largely linkexisting million+ cities. Further strengthening these intra-state and inter-regional linkageswith ~ 400 other Class I towns and rural areas, can enable balanced economicdevelopment and more rapid post-COVID economic recovery.
Goals and Strategic Priorities
The strategic choices listed above need to be supplemented with goals that specifically target post-COVID urban economic recovery:
1. Enable immediate post-COVID economic recovery by establishing safety nets for food,tenure/housing, decent work and basic services, and enabling economic recovery andresilience while addressing migration and informality.
2. Improve conditions for (2021) urban population of approximately 450 million in about8,000 urban places.
3. Address needs of incremental (2021-31) urban population of approximately 150million in about 12,000+ urban places.
4. Enable economic activities that create opportunities for decent productive work.5. Strengthen urban-rural linkages between urban areas, outgrowths and adjoining
villages.
These can be achieved by focusing on three strategic priorities: (i) accelerating recovery and growth in locations and sectors that have the most potential; (ii) mitigating risks and vulnerabilities in the least developed and most exposed states and districts; and (iii) addressing bottlenecks in resource mobilisation, institutional capacity and implementation.
This will record a diversification of devolution strategy initiated by the XV Finance Commission, from a solely population and state area basis, to one that recognises the importance of urbanisation, regions and place in the process of economic and sustainable development, and explicit measures to
IIHS - XV Finance Commission Urbanisation Report 3

address regional inequality, potential and risks between and with states (Revi, A., Bazaz, A. 2019). Hence, to match with the distribution of India’s population the proportion of grants between rural and urban local bodies should shift from 67.5:32.5 in (2020-21) to 65:35 in (2024-25), or an annual transition of 0.5 percent of divisible pool for local bodies.
Sectoral and Locational Priorities and Interventions
1. Sectoral priorities supported by central and state schemes should converge toenable economic recovery and development across Micro, Small and Medium Enterprises(MSME) in manufacturing, trade and tourism; construction; clean energy; and carbon-neutral mobility. Climate and disaster resilient infrastructure across environmentalservices such as water, sanitation and solid waste; energy services including solar, gasand efficiency, e-mobility and logistics, and ICT, should also be enabled.
2. Multiple reforms are necessary in land systems and affordable housing. Theseinclude a focus on land and property tax systems reform, planning for integrated landuse, mobility and infrastructure, and economic development. Housing needs should betackled with a multi-pronged approach of enabling upgradation and rental housing andmaking affordable new construction.
3. Improved governance and finance policies improve urban economic and fiscal dataand digital management and are essential to strengthen the fiscal base and ability ofUrban Local Bodies (ULB) to access and deploy finances. They also strengthen theirinstitutional capacity via state municipal cadres as well as their governance frame anddevolution.
4. State-led strategic interventions crowd-in other resources leveraging and redirectingexisting central schemes and programmes. They also: (i) strengthen the capacity of ULBsand state governments to mobilise, implement and regulate; (ii) build enterprise capacityto implement and finance; (iii) build disaster resilience and mitigate climate risk; and (iv)implement regional development strategies.
5. In addition to central and state interventions, balanced regional priorities acrossstates such as investments in and around existing urban centres and linked settlementsystems, and economic corridors along the top five mega-urban regions, emerging urbanclusters, economic corridors, and less developed states and risk-prone regions, isnecessary, in addition to investments in creating new towns and cities.
4 IIHS - XV Finance Commission Urbanisation Report
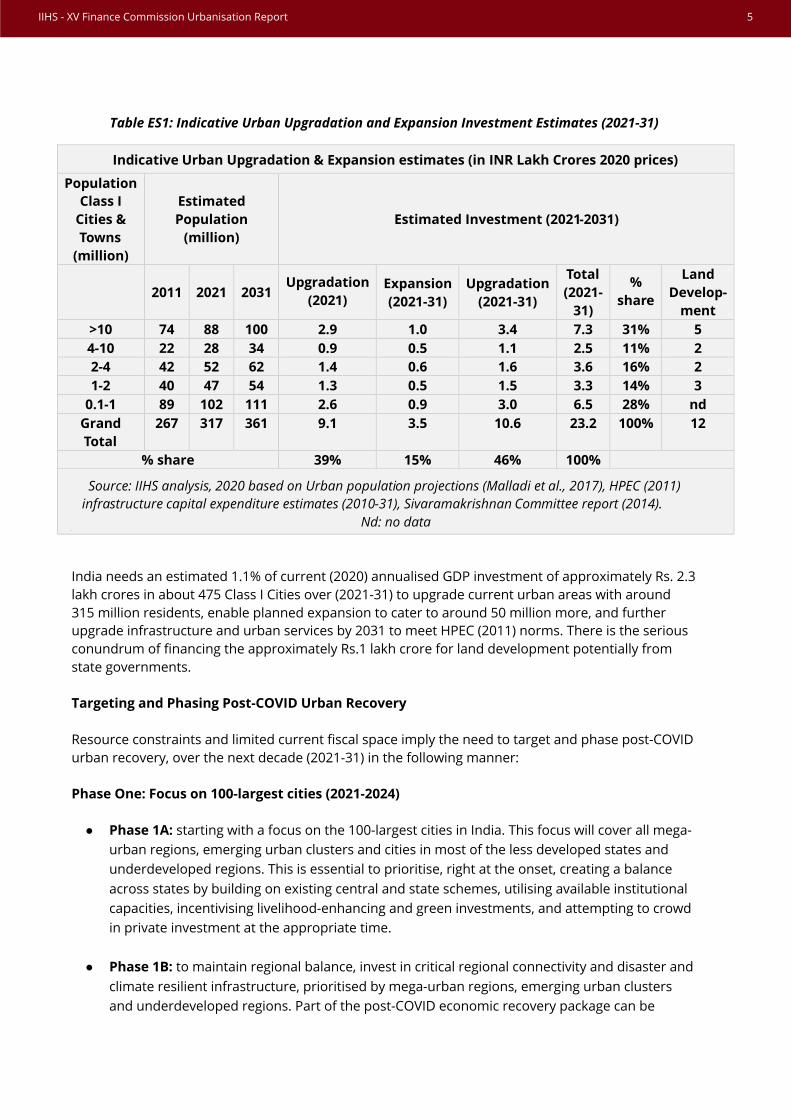
Table ES1: Indicative Urban Upgradation and Expansion Investment Estimates (2021-31)
India needs an estimated 1.1% of current (2020) annualised GDP investment of approximately Rs. 2.3 lakh crores in about 475 Class I Cities over (2021-31) to upgrade current urban areas with around 315 million residents, enable planned expansion to cater to around 50 million more, and further upgrade infrastructure and urban services by 2031 to meet HPEC (2011) norms. There is the serious conundrum of financing the approximately Rs.1 lakh crore for land development potentially from state governments.
Targeting and Phasing Post-COVID Urban Recovery
Resource constraints and limited current fiscal space imply the need to target and phase post-COVID urban recovery, over the next decade (2021-31) in the following manner:
Phase One: Focus on 100-largest cities (2021-2024)
● Phase 1A: starting with a focus on the 100-largest cities in India. This focus will cover all mega-urban regions, emerging urban clusters and cities in most of the less developed states andunderdeveloped regions. This is essential to prioritise, right at the onset, creating a balanceacross states by building on existing central and state schemes, utilising available institutionalcapacities, incentivising livelihood-enhancing and green investments, and attempting to crowdin private investment at the appropriate time.
● Phase 1B: to maintain regional balance, invest in critical regional connectivity and disaster andclimate resilient infrastructure, prioritised by mega-urban regions, emerging urban clustersand underdeveloped regions. Part of the post-COVID economic recovery package can be
Population
Class I
Cities &
Towns
(million)
Estimated
Population
(million)
Estimated Investment (2021-2031)
>10 74 88 100 2.9 1.0 3.4 7.3 31% 5
4-10 22 28 34 0.9 0.5 1.1 2.5 11% 2
2-4 42 52 62 1.4 0.6 1.6 3.6 16% 2
1-2 40 47 54 1.3 0.5 1.5 3.3 14% 3
0.1-1 89 102 111 2.6 0.9 3.0 6.5 28% nd
Grand
Total
267 317 361 9.1 3.5 10.6 23.2 100% 12
% share 39% 15% 46%
2011 2021 2031 Upgradation
(2021)
Expansion
(2021-31)
Upgradation
(2021-31)
Total
(2021-
31)
%
share
Land
Develop-
ment
100%
Source: IIHS analysis, 2020 based on Urban population projections (Malladi et al., 2017), HPEC (2011)
infrastructure capital expenditure estimates (2010-31), Sivaramakrishnan Committee report (2014).
Nd: no data
Indicative Urban Upgradation & Expansion estimates (in INR Lakh Crores 2020 prices)
IIHS - XV Finance Commission Urbanisation Report 5

channelled for this, and this public investment-led initiative could create appropriate conditions for PPP opportunities and private investments.
Phase Two: Expand to all ~ 500 Class I towns (2024-2029)
Expanding the investment phase to all Class I Towns that are currently beneficiaries of the AMRUT scheme. This should follow a strong push for state-level urban and land system reforms initiated in Phase One, to promote security of tenure and affordable housing, improved regional and intra-state connectivity and building institutional capacity though a state-level municipal cadre. This could be a secondary focus of the XV Finance Commission.
Phase Three: Expand to cover all ~ 10,000+ Urban Centres by 2031 This phase should ultimately strengthen ULBs via fiscal federalism, by expanding their fiscal base, governance mandate and capacity to address all urban areas. This could enable coverage of an incremental 150 million people through regionally-defined processes of expansion, nucleation, decongestion and densification (as outlined in Chapter 2). This may be part of the XVI Finance Commission mandate.
Priorities and Institutional Arrangements
The XV Finance Commission’s contribution towards accelerating post-COVID economic recovery may be limited due to mandate and fiscal envelope constraints. Nevertheless, a set of concrete steps could be taken, within the current framework:
• Policy convergence of Finance Commission transfers with the Govt. of India’s economicstimulus package and commitment to the sustainable development of urban areas, is a no-cost high-impact contribution.
• Strengthening land and property tax systems reform and tenure security under aGovernance, Finance and Outcome Monitoring Improvement grant to ~500 Class I towns andcities across all States. This would be distributed on a population (90%) and expenditureperformance (10%) basis and converge strongly with the Govt. of India’s Housing for Allprogramme expenditure and outcomes.
• Strengthening Municipal governance and capacity and information systems under aGovernance, Finance and Outcome Monitoring Improvement grant to improve urbaneconomic and fiscal data and digital management in ~500 Class I towns and cities across allStates.
• Incentivising the building of all infrastructure in at least the 100-largest urban areas todisaster and climate resilient standards, under FC grants, as per NDMA guidelines, would bea significant step forward and in keeping with the FCs disaster management priorities andmandate.
6 IIHS - XV Finance Commission Urbanisation Report

Dedicated Urban Governance and Financial Resilience Fund
To accelerate and incentive these processes, the Finance Commission could create a dedicated Urban Governance, Financial Resilience and Outcome Monitoring Improvement grant fund to 500 Class I towns and cities across all States, at ~5 per cent share of the total Finance Commission grant to Urban Local Bodies. This would help strengthen local government capacities in line with the 74th Constitutional Amendment and attempt to address key bottlenecks around land systems and ULB financing.
This grant fund could be provided oversight by a national committee with representatives of the Ministries of Housing and Urban Affairs, Finance, NITI Aayog, State governments and leading urban experts. Within this, three strategic outcomes could be targeted:
• A Rs. 3,000 crore Urban Land and Property systems Reform grant fund to enable: (a) thereform of revenue, peri-urban and urban land systems to enable access of land to enable tenuresecurity, upgradation in-situ, affordable housing and disaster and climate resilient infrastructuredevelopment; (b) the implementation and strengthening of digital property taxation, registrationand land records systems and land value capture, to enable greater buoyancy of ULB financesaround their single most important source of revenue. This could be distributed on a population(90%) and expenditure performance (10%) basis and implemented by the 100-largest ULBs bypopulation size and the State governments for other urban centres
• A Rs. 2,000 crore Municipal Cadre development grant fund, to enable: (a) the strengthening ofMunicipal cadres in the states where they exist; (b) help create them over 2021-25 in States thathave levels of urbanisation over 33 per cent, and (c) prepare other states that have lower thanthe national average levels of urbanisation to assess the feasibility and necessary steps to createsuch a cadre, including a pooled cadre in some regions. This could be drawn from the UrbanGovernance, Financial Resilience grant fund and allocated on a population basis by Stategovernments and targeted at the 500 Class I towns (greater than 0.1 million) to enable focusseduse of these resources.
• A dedicated Rs. 1,000 crore Economic and Financial Data systems improvement grant fundto enable: the establishment of institutional capacities in the 100-largest cities and at the Statelevel to track, monitor and report on economic activity, public investment, expenditure andoutcomes, and the monitoring of large-scale urban and regional infrastructure investments. Thiscould be executed by an appropriate set of third-party institutions including universities,thinktanks, research institutions and urban observatories with a track record in addressingquestions of urbanisation.
IIHS - XV Finance Commission Urbanisation Report 7

8 IIHS - XV Finance Commission Urbanisation Report

CHAPTER 1
India’s Urban Context
9

[This page is intentionally left blank]
10 IIHS - XV Finance Commission Urbanisation Report

India’s Urban Growth Trends: (1951-2051)
India has gone from close to one-fifth urban in 1971 to two-third urban in 2011 and is expected to reach 50% urbanisation by 2051 (Revi et al., 2015). India will also become the largest national population in the world in the mid-2020s, overtaking China with a population of over 1.45 billion people (United Nations et al., 2019). This implies that India’s urbanisation will be the largest urbanisation in human history, overtaking that of China’s from the late 1980s to the 2020s. India is expected to have a rural population of over 750 million people in the 2050s, unless there is a catastrophic collapse of agrarian systems, due to climate change or economic shock.
India, therefore, is in a unique position of plotting a very different development path, than other high and high-middle income countries over the 19th and 20th centuries, by having both a large rural and urban population (Revi et al., 2015). It will also have a heterodox economic structure that is led by the service sector, along with a significant secondary and manufacturing sector to address both domestic consumption demand and robust exports in some sectors. Moreover, India will have a potentially resilient rural and agrarian sector with much improved per capita productivity, and hence quality of life, to address the food security and ecosystem services needs of over 1.5 billion people. Achieving these outcomes, will need a deep and long-term strategic view of India’s urbanisation trends to address the need to balance regional priorities across the rural-urban spectrum. This outlook would also enable the development of a balanced hierarchy of places that embraces the potential resilience and sustainability of rural India, along with the vigour, productivity and dynamism of urban India, as outlined in the following sections. (Revi et al., 2019; Jain et al., 2018).
Growth of Million+ Cities (1951-2001)
India had a relatively stable economic geography and settlement structure for over two centuries before Independence, linked to a precolonial urban structure and a largely agrarian and trade-dominated economic structure. At Independence, only five cities had a population of over 1 million: the three Presidency port and mercantile towns of Bombay, Calcutta and Madras, the national capital of Delhi, and Hyderabad. This grew slowly to nine cities including Pune, Bangalore and Lucknow by 1971, and Kanpur, Nagpur and Jaipur by 1981. A major growth spurt in the 1980s added 17 new million+ cities and a further dozen in the first decade of economic reform and liberalisation in the 1990s (Revi et al., 2015; Malladi et.al, 2017).
This was accompanied by accelerated economic growth, urban expansion and the growth of informal settlements in most urban centres as access to land, affordable housing and basic services failed to match urban population growth. The development opportunity that urbanisation presented for India was first recognised in the 1980s (Ministry of Urban Development, 1987), along with the need to address its challenges that grew in the 1990s with liberalisation: urban expansion, poverty, inequality and divergence between states.
IIHS - XV Finance Commission Urbanisation Report 11

India’s Settlement Structure: Urban and Rural (2011)
India was about two-third (67%) rural and one-third (33%) urban in terms of population in 2011 as shown in Figure 1.1. In 2011, India had about 0.65 million villages of various sizes, ranging from hamlets to large villages of over 10,000 people. It had close to 8,000 urban centres, of which 468 had a population of over 0.1 million, as shown in Figure 1.2. Among this group, were 48 million+ cities and five mega-cities of over 10 million (Census, 2011; Revi et al., 2015).
India’s settlement structure is both highly dispersed across its villages and small towns and highly concentrated in a few large cities. Close to 15% of its population lives in million+ cities in < 0.1% of the places and < 0.2% of the land area (Revi et al., 2011). There is wide variation in state levels of urbanisation: with three states above the 50% urbanisation mark, two states close to 50%, four between 40-50%, and 16 states below the national mean of 34% (Revi et al., 2015).
India’s development trajectory and investments are poorly matched to this spatial structure except in some states like Kerala, Tamil Nadu and Punjab, as shown in Figure 1.3. The country’s economic policies are weakly linked to its economic geography leading to severe bottlenecks and spatial inequality in infrastructure access and connectivity, housing and working conditions and hence impacting work productivity, output, investment and contributing to poverty. Appropriate spatial and sectoral investments and corrections to address urban-rural linkages and regional divergence, as well as support the development of smaller towns and medium-sized cities are needed. Better inter-Census data on the dynamics of urbanisation at the city and regional levels would assist this.
Figure 1.1: Distribution of Population by Settlement Size Classes (1951 – 2051)
Source: Revi et al., 2015
12 IIHS - XV Finance Commission Urbanisation Report

Figure 1.2: Distribution of Population across Cities, Towns and Villages (2011)
Source: Census of India, 2011
Figure 1.3: Distribution of Population across Cities, Towns and Villages, 2011
Source: Census of India, 2011
IIHS - XV Finance Commission Urbanisation Report 13

Projected Growth of Million+ Cities (2011-2051) Unlike China, India has a lower number and proportion of its population living in million+ cities. There were 53 million+ cities in 2011 (Revi et al., 2011), that produced about 32% of India’s economic output, and hence were the primary focus of first-generation urban reforms (JNNURM) from 2007-2014. Million+ cities are expected to rise to 70 by 2031 and will be moderately well dispersed across most states (Revi et al., 2015; Malladi et al., 2017). A significant share of economic output and incremental employment will come from these cities. Second generation urban reforms (AMRUT and PMAY) are appropriately targeted at ~ 500 Class I (population between 0.1 million and 1 million) cities. This is also an emphasis of the XV Finance Commission devolution to ULBs (Revi, A., Bazaz, A. 2019). Million+ cities are also a potential focus of investments and incentives of the post-COVID stimulus package. India will have the largest national population by the mid-2020s at over 1.4 billion. It is anticipated to touch ~35% urbanisation by 2031, ~50% by 2051 with ~750 million people living in urban areas, of which 300 million in the largest million+ cities (Malladi et al., 2017). India’s Urbanisation: Implications for the XV Finance Commission Urban areas are and will be India’s most important driver of growth, incremental employment, international trade and investment, as well as taxes (Bazaz et al., 2017) But, as mentioned above, with India’s economic policies weakly linked to its economic geography, sustainable linkages to employment and investment are limited. Despite the devolution of governance through the 74th constitutional amendment, ULBs too have been chronically neglected and underinvested in terms of finances and institutional capacity. This situation remains unchanged despite two decades of urban reforms, significant changes in the tax base through the introduction of the Goods and Services Tax (GST) and the Finance Commission’s emphasis on strengthening ULBs. Additionally, the stark inequality between states, as well as within them between smaller and Class I towns and million+ cities needs to be addressed through appropriate regional and sectoral investments. This can enable both a vertical and horizontal spatial balance, facilitate urban-rural linkages and address regional divergence.
The Experience of New Cities and Towns and SEZs in India (1951-2020) Growth of New Towns and Cities in India (1951-2011) Contrary to popular perception, new towns and cities have contributed marginally to the share of India’s urban population (<2%) and number of settlements (<0.1%) over the 20th century as shown in Fig 1.4. They have typically emerged for four main reasons:
1. Post-Independence reconstruction (e.g. Faridabad) 2. New state capitals and administrative centres during the linguistic reorganisation of states
(1956 and onwards) (for e.g. Bhubaneshwar, Chandigarh, Navi Mumbai, Gandhinagar), the subsequent creation of new states (e.g. Naya Raipur, Amaravati)
3. The creation of new industrial, trade and financial centres (e.g. Bhadravati, Jamshedpur, Durgapur, Bhilai, Rourkela, Gurugram)
4. New tourism hubs and hill stations (e.g. Lavasa)
14 IIHS - XV Finance Commission Urbanisation Report

These towns have typically taken 30-50 years to reach critical economic mass and a population size of one million. They have been more expensive to plan and build and have typically overshot their initial budgets by significant amounts, due to delays in execution and inflation. New towns have a limited impact on India’s economic landscape, disproportionate to their imagination in policy, documented in detail in Annex I. Urban outgrowths and SEZs are not enumerated as new towns: they are usually small and rarely reach a population size of one million. The impact of SEZs on urbanisation in India has also been marginal in spite of the relatively large amount of land that has been mobilised for them, of which a large proportion is not utilised. Key characteristics of four new towns that emerged at different points over the past century, Jamshedpur, Chandigarh, Navi Mumbai and Amaravati, are summarised below, with detailed case studies presented in Annex 1.
Figure 1.4: Distribution of Greenfield Cities (2011)
IIHS - XV Finance Commission Urbanisation Report 15

Jamshedpur (1909-2011)
● Population: 1.4 million (2011
Census) ● The city covers an area of around
~225 sq. km. ● The city’s economy is centred
around the TISCO steel plant, with many ancillary and related companies
● There are governance challenges between the Jamshedpur Utility Services Company Limited (JUSCO), the SPV that manages services to the planned TISCO industrial township and other local bodies in the region.
● Lack of a single planning entity has led to issues such as inadequate good quality housing, poor service provision, environmental contamination and traffic congestion.
● Sharp inequality in housing, infrastructure and services between the planned and unplanned areas of the city is a key issue.
The city of Jamshedpur developed around the steel industry and its economy remains centred around this sector. The fragmentation of governance and lack of a single governing body has led to administration challenges affecting equitable and inclusive development of the city (for details, see Annex I).
16 IIHS - XV Finance Commission Urbanisation Report

Chandigarh (1956-2011)
● Population: 1 million (2011 Census) ● Chandigarh Union Territory covers
114 sq. km, while the city itself covers 60 sq. km.
● Capital of two states, Punjab and Haryana
● This post-independence new town became a symbol of modernist planning and architecture
● Rigidity in planning norms and lack of flexibility has led to challenges in effective land-use and diversification of the economy
● Intense unplanned growth of peripheral areas and urban villages has led to deep informality and poor housing and services.
● Governance challenges between the UT administration and the Chandigarh City Municipal Corporation.
Rigidity in planning norms has led to challenges in effective land-use planning as the city has grown beyond the imagination of the original plan leading to intense, informal and unplanned growth of peripheral areas. The city’s growth is also impacted by governance challenges between overlapping jurisdictions in the Chandigarh region (for details, see Annex I).
IIHS - XV Finance Commission Urbanisation Report 17

Navi Mumbai (1972-2011)
● Population: 1.1 million (2011 Census) ● This satellite town covers an area of
~345 sq. km. ● This planned satellite town was
initially conceived as a new town to decongest Mumbai. The initial development significantly exceeded the planned time and allocated budget
● It took decades for critical economic activities to take off here, including manufacturing and IT/ITES, with an adjacent port and a much-delayed international airport.
● The investment in the development of the Bandra-Kurla complex also impacted Navi Mumbai’s ability to act as an alternate location for government and business offices.
● The town’s geographical position, with its proximity to the coast and Western Ghats, poses high risks of flooding and rainfall-related extreme events.
● Division of governance responsibilities between CIDCO, MMRDA, MIDC, NMMC, and other ULBs has created governance challenges especially when it comes to the management of land.
Navi Mumbai’s original purpose of decongesting Mumbai was not achieved mainly because connectivity projects have taken many decades to be implemented, and public and private sector enterprises were reluctant to relocate away from southern and central Mumbai.
18 IIHS - XV Finance Commission Urbanisation Report

Amaravati (2014-2020)
● Population: 0.1 million (2011 Census) ● Proposed greenfield ‘central’ capital
city for the bifurcated (2014) state of Andhra Pradesh located in a highly productive agricultural area exposed to flood and earthquake risks
● Ambitious 30,000-acre land pooling experiment to work around Andhra Pradesh’s revenue deficit that limited the ability to use publicly financed land acquisition. This led to significant land speculation in the region.
● Initial investment estimated to be Rs. 0.45 lakh crores (USD 6-7 billion).
● Following a change of state government leadership, the plan to build Amaravati as a 5 million+ city in five years, was abandoned in favour of a decentralised 3-capital zone plan for the state
● Major multilateral lenders such as the World Bank and the Asian Infrastructure Investment Bank pulled out from the project.
● Andhra Pradesh state’s capital functions will now be dispersed between Vishakhapatnam (administrative), Kurnool (judicial), and Amaravati (legislative) capitals.
Amaravati highlights a number of challenges faced by large-scale greenfield urban projects in India: (i) Despite political will, these projects require long-gestation periods and sustained large long-term investments; (ii) Large-scale land aggregation is complex, takes time and resources and is exposed to judicial review; (iii) Environmental and risk constraints; (iv) Challenges associated with management of investment risks, management of public perceptions and addressing the perceived gap between development proposals and development needs (for details, see Annex I).
Status of Pre-Liberalisation New Cities
IIHS - XV Finance Commission Urbanisation Report 19

The broad status of new cities that were planned and executed before the process of economic liberalisation was initiated in 1991 are presented in Table 1.1 with detailed analyses in Annex 1. This analysis covers a broad swathe, from Jamshedpur that was planned as a joint industrial township by the colonial British government and the Tata Iron and Steel Company (TISCO) in 1909, to the new capitals of Odisha, Punjab and Haryana that emerged during the linguistic reorganisation of the 1950s: Bhubaneshwar (Odisha) planned by Otto Konigsberg, and Chandigarh, the joint-capital of Punjab and Haryana designed by Le Corbusier (Kalia, 1999; Kalia, 1994). It also includes the steel township of Durgapur (West Bengal) that was part of a large industrial cluster involving the Damodar Valley Corporation, and was planned by Joseph Stein in 1955, as well as Charles Correa and Shirish Patel’s magnum opus of Navi Mumbai in 1972 (Patel et al., 1965), which was a major initiative to decongest Mumbai in the wake of the bifurcation of Gujarat and Maharashtra, along with the expansion of informal settlements in the city.
All of these cases have faced significant planning and implementation challenges, taking 30 to 50 years to achieve critical mass in terms of population size and economic activity. Most have not been able to diversify economically, with the exception of Navi Mumbai, which saw the development of the Nava Sheva port, an ongoing second international airport for Mumbai and a possible new link between the island city and the mainland.
Environmental risks, pollution, and hazards that come with 20th century-style industrialisation, in the case of Durgapur, are also common recurring themes. Bhubaneshwar has done relatively better than other cities but is still exposed to moderate to severe risks of flooding and cyclonic storms because of its location.
Almost all these cities have had serious planning challenges, as in the case of both Chandigarh and Navi Mumbai that are struggling to address the strong and often rigid guidelines established by the initial Master Plans and the bane of multiple planning, housing and infrastructure, and services jurisdictions.
Table 1.1: Pre-Liberalisation New Towns in India*
Name Significance Size
(sq. km.)
Population (million
2011)
Density (persons/sq. km.)
Key issues
Jamshedpur (1909)
Early industrial town,
partnership between TISCO
and GoI
~225 1.4 6,223
Governance challenges leading to lack of adequate service provision, housing,
rising inequality
Bhubaneshwar (1949)
Planned new capital for
Odisha 135 0.9 6,667
Environmental risks and natural hazards (cyclones,
drought)
Chandigarh (1952)
Planned new capital for
Punjab and Haryana
114 1.1 9,258 Rigid planning guidelines
inhibiting further growth and development
20 IIHS - XV Finance Commission Urbanisation Report
Durgapur (1955)
Greenfield Steel city and
counter-magnet to
Kolkata
154 0.6 3,896 Pollution (esp. air); challenges in unanticipated MSME-based
economic development
Navi Mumbai (1971)
Planned satellite city to
decongest Mumbai
~345 1.1 3,257
Aim of decongesting Mumbai not achieved. Long delays in development, massive cost
overruns
*Full citations and data sources in Annex 1
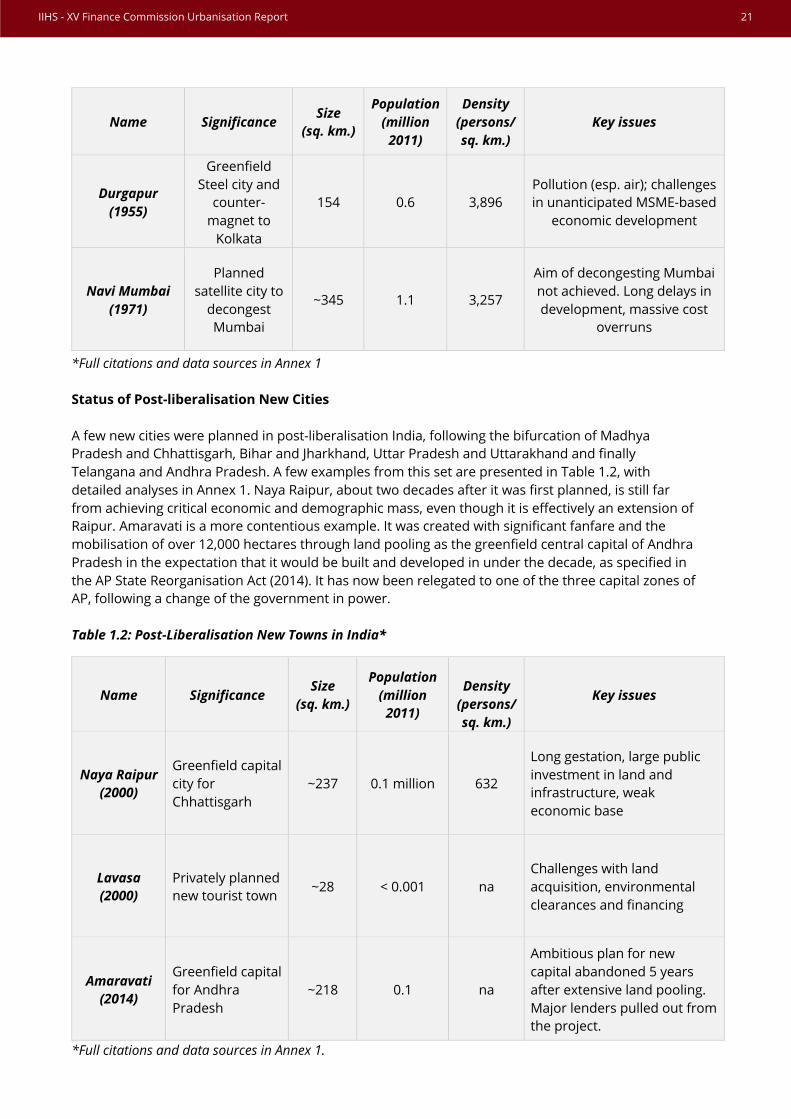
Status of Post-liberalisation New Cities
A few new cities were planned in post-liberalisation India, following the bifurcation of Madhya Pradesh and Chhattisgarh, Bihar and Jharkhand, Uttar Pradesh and Uttarakhand and finally Telangana and Andhra Pradesh. A few examples from this set are presented in Table 1.2, with detailed analyses in Annex 1. Naya Raipur, about two decades after it was first planned, is still far from achieving critical economic and demographic mass, even though it is effectively an extension of Raipur. Amaravati is a more contentious example. It was created with significant fanfare and the mobilisation of over 12,000 hectares through land pooling as the greenfield central capital of Andhra Pradesh in the expectation that it would be built and developed in under the decade, as specified in the AP State Reorganisation Act (2014). It has now been relegated to one of the three capital zones of AP, following a change of the government in power.
Table 1.2: Post-Liberalisation New Towns in India*
Name Significance Size
(sq. km.)
Population (million
2011)
Density (persons/ sq. km.)
Key issues
Naya Raipur (2000)
Greenfield capital city for Chhattisgarh
~237 0.1 million 632
Long gestation, large public investment in land and infrastructure, weak economic base
Lavasa (2000)
Privately planned new tourist town
~28 < 0.001 na Challenges with land acquisition, environmental clearances and financing
Amaravati (2014)
Greenfield capital for Andhra Pradesh
~218 0.1 na
Ambitious plan for new capital abandoned 5 years after extensive land pooling. Major lenders pulled out from the project.
*Full citations and data sources in Annex 1.
Name Significance Size
(sq. km.)
Population (million
2011)
Density (persons/sq. km.)
Key issues
IIHS - XV Finance Commission Urbanisation Report 21

Bidadi (for details, see Annex I) presents the complex challenges of multiple attempts of a state government or private sector and PPP-led new town development that has been unable to achieve closure over more than a decade. Lavasa illustrated the high risk of private new town development, now close to being in receivership, after nearly a quarter-century of attempts at institutional innovation and resolving financial, environmental and displacement-related challenges (for details, see Annex I). The fiscal base of most Indian states, along with limited financial mobilisation, regulatory and implementation capacity at the city and regional scales, points to the serious challenges and risk of implementing greenfield mega-urban visions. This also corroborated by the fact that outside China, most new cities (from Brazilia, Putrajaya to even Canberra) take many decades to go to scale. In the absence of state municipal cadres and institutional development, there are few national examples, of effective regulatory oversight of private or PPP development, over the medium-run – that is necessary for these cities and towns to grow to critical mass, over many decades. Building this institutional capacity over 2021-31 is a necessary condition for India to use urbanisation as a strategic measure to further its sustainable development agenda. SEZs and Economic Enclaves
Distinct from the new towns are SEZs and economic enclaves. India has a long history of economic enclaves with autonomous jurisdictions. Early examples include industrial townships, industrial parks and export processing zones. Most Special Economic Zones (SEZ) are located near large urban centres and have not aided decentralised development. India has a large number of SEZs with 423 formally-approved zones, 357 notified zones, seven central government zones, 12 state government/ private zones (established before the 2005 SEZ Act) and 32 zones that have received in principle approvals as of May 2020. More than 48,000 hectares of land have been designated for SEZs, of which 42,000 hectares have been either notified or are under central or state government (CAG, 2014).
Key lessons from the development of SEZs are:
1. Lack of land is often highlighted as a barrier to SEZ development. Yet, more than 50% of current SEZ land remains unutilised (CAG, 2014) and is predominantly held by private sector developers.
2. New SEZs typically do not create new economic opportunities but leverage proximity to urban centres to reduce investment risks.
3. New SEZs concentrate economic investments and exacerbate existing spatial inequalities. 4. SEZs are not enumerated as New Towns: they are usually small and rarely reach the million-
population city size. 5. They have had limited impact on India’s economic geography especially its employment
landscape.
22 IIHS - XV Finance Commission Urbanisation Report

Mixed Experience of New Towns and Cities (1951-2021) India’s experience, based on the development of over 100 new towns and cities over the last century, has been mixed (Home, 2013; Glover, 2012; Kalia, 2006) with the largest 12 growing to a population size of just over 1 million each, typically over a period of 30-50 years. Their current combined population (2021 projection) is less than 15 million, or ~3% of the total urban population. In the post-1991 era, there has been an attempt to create less than five new cities, less than two by private developers. None have created significant new employment or emerged as noteworthy economic hubs over a 30-year period. Most private developments have floundered because of land assembly, environmental clearances and financing challenges.
The creation of new state capitals, from Bhubaneshwar and Chandigarh to Naya Raipur and Amaravati, are in line with the typical international and national trend of taking 30-50 years to ‘go critical’ in terms of population, economic outputs, employment; and developing significant local knowledge and cultural institutions. The recent Andhra Pradesh experience around Amaravati highlights the challenges of matching ambition and institutional capacity, with fiscal and financial resources, land assembly, local political economy and risks, even when there is strong political will and mandate to implement.
Given India’s economic and fiscal environment in the early 2020s, significant new investment in creating new towns may not be prudent. The emphasis should be on using existing urban regions, clusters and the regional settlement structures to further sustainable regional or territorial development. This has been successfully enabled across many parts of Europe, Latin America, parts of North America and East Asia. This approach leverages existing settlement systems, economic concentrations and activities, strengthens urban-rural linkages and limits large-scale land alienation and displacement. A range of strategies to operationalise this are presented in Chapter 2.
Key Drivers of India’s Urban and Economic Development In 2011, India’s urban population was 377 million. By 2031, it could touch 600 million or 40% of its projected 1.48 billion people. This is the population for which future investments and incentives should be designed by the XV and XIV Finance Commissions, if India is to develop a pro-active and forward-looking urbanisation and urban development trajectory (IIHS, 2018). India’s 53 million+ cities made up 12% of its 2011 population, which is expected to rise to about 14% by 2031. In 2011, the Census accounted for 468 Class I cities (population between 0.1 million and 1 million), which made up 10% of India’s population. This is expected to rise by 11% by 2031 (see Figure 1.1). India’s 7,425 Class II and IV towns (population less than 0.1 million) made up 13% of the total population in 2011 (Census, 2011, Revi et al., 2015). In addition, by 2031, a sizeable fraction of 23,000 large villages (or 15% of the 2011 population) are expected to take on an urban character but may not be formally classified as urban areas (Revi et al., 2015). Urban investment in India will need to target three broad goals: (i) improving conditions for the (2021) urban population of 450 million in 8,000 settlements; (ii) addressing the needs of an incremental population of 150 million over the 2020s; and (iii) strengthening urban-rural linkages especially between areas currently classified as urban, their outgrowths and ~10,000 large villages using a spatially differentiated development strategy (Revi et al., 2015).
IIHS - XV Finance Commission Urbanisation Report 23

Strategic Infrastructure and Economic Corridors As India’s economy expanded in the post-liberalisation era, a range of new strategic infrastructure initiatives and economic corridors were initiated as ‘national’ projects to catalyse economic growth, connectivity, regional development and stimuli following the 1997 and 2008 economic crises. Many of these cut across multiple states. The most significant such initiatives are presented in Figure 1.5. This includes the Golden Quadrilateral and East-West Road Corridors; a series of major ports, under the Sagarmala programme; three major rail corridors starting with the Konkan railway, the Delhi-Mumbai and Amritsar-Kolkata Dedicated Freight corridors and five industrial corridors that are at various stages of planning and implementation. Taken together these regional infrastructure and economic corridors connect most of the 100-largest urban centres that create much of India’s value addition and provide strong transport linkages for domestic trade and international export and import. They are still however, powered by 20th century infrastructure systems that need to be transformed to meet the decarbonised, high resource efficiency economic and environmental services backbone of the 21st century Indian economy, including a modal shift towards rail for logistics, high speed passenger rail and electrification using renewable power. Electrification and greater efficiency in road transport would also facilitate decarbonisation.
Major Ports
1. Deendayal (Kandla) 2. Mumbai 3. JNPT 4. Mormugaon 5. Kamrajar (Ennore) 6. Chennai 7. V.O. Chidambaraner (Tutucorin) 8. New Mangalore 9. Cochin 10. Visakhapatnam 11. Paradip 12. Kolkata 13. Haldia
Rail corridors
1. Konkan railway 2. Delhi-Mumbai Dedicated Freight
corridor 3. Amritsar-Kolkata Dedicated Freight
corridor
Road corridors 1. Golden Quadrilateral 2. North-South and East-West Corridors
Industrial corridors
1. Amritsar-Kolkata Freight and Industrial Corridor
2. Delhi-Mumbai Industrial Corridor 3. Bengaluru-Mumbai Economic Corridor 4. Bengaluru-Chennai Industrial Corridor 5. Bengaluru-Kochi Industrial Corridor
24 IIHS - XV Finance Commission Urbanisation Report

Figure 1.5: Strategic Infrastructure
In addition to focusing investment in the different categories of urban areas described in Chapter 1, India’s growth also hinges on its strategic rail, road and port infrastructure as well as economic corridors that link the existing million+ cities. Further intra-state and regional linkages with ~ 410 other Class I towns and the villages linked to them will need to be rapidly strengthened to enable sustainable and balanced economic development and rapid post-COVID economic recovery (Revi et al., 2015; Bazaz et al. 2017; IIHS, 2020). Key Drivers of Economic Scale-Agglomeration in India (2001-11) India’s expanding urbanisation has led to significant wealth and income agglomeration across the rural-urban continuum, as shown in Figure 1.6. India needs to maintain the balance between rural and urban areas in terms of disparities in work, income and wealth levels. Investments in housing, physical and social infrastructure are key drivers of scale agglomeration especially in Class I towns and cities (population between 0.1 and 1 million) (Bazaz et al. 2017). Key drivers of scale agglomeration of cities and towns, include:
● Adequate housing ● Safe water and sanitation ● Improved roads ● Accessible power supply ● ICT access (Bazaz et al., 2017)
Urban areas also concentrate poverty, inequality, climate and disaster risk (Revi, 2018), which have emerged as key COVID fault lines. Strong risk adjustments for negative externalities of poverty,
IIHS - XV Finance Commission Urbanisation Report 25

inequality, disaster and conflict that concentrate in cities, will be necessary as part of a COVID recovery plan. Short-term post-COVID economic recovery will depend on income support measures, as well as the provision of food and basic services (Revi, A., 2020). While, investing in housing and infrastructure in urban areas can help in medium-run post-COVID recovery. India’s Economic Concentration: Regions, Clusters and Corridors (2017) India has a highly concentrated spatial structure at the metropolitan scale, with an estimated 15% of GDP coming from the largest-10 urban centres, a further 35% from the next 90-largest centres, i.e. 40% of India’s GDP coming from the largest-10 urban centres, that include mega-urban regions of 20 million or more, mega-cities of 10-million or more, million cities and a few > 0.5 million-sized cities (Revi et al., 2011). Given the dynamic and rapid growth of population in these urban centres, it is advisable to move beyond India’s traditional ‘infrastructure-catches up with-urbanisation’ strategy. It is important to shift to a strategy of preparing for expanding urbanisation and economic development in the 2020s by pre-emptively upgrading existing areas, along with mobilising land, developing infrastructure and connectivity, targeted at areas that will host large urban populations and a significant share of India’s GDP in the 2030s. It is also important to balance this with the development needs and aspirations of less-developed, remote and risk-prone states and regions. Pre-emptive planning for future urbanisation, land development, infrastructure and economic development, as well as state and ULB financing and institutional capacity-building to implement, are necessary. The projected pattern of urban development and economic concentration in mega-urban regions, clusters and corridors is shown in Figure 1.6. Following 30 years of economic reform, five mega-urban regions (> 20 million population) are set to emerge in India, plus five emerging economic corridors in south, central and eastern India. Simultaneously, urbanisation, infrastructure and development of five historically underdeveloped regions need to be addressed, especially in the north-eastern and hill states. These include three opportunities for sustainable urbanisation in ecologically sensitive areas: along the Konkan coast, between Mumbai-Nagpur to Kolkata and in the Andaman & Nicobar Islands. These will need to be pursued with extreme caution because of the fragile nature of ecosystems, the extreme poverty and vulnerability of large populations living in these regions, and the potential to exacerbate ongoing conflict in many areas.
Mega-urban regions (2031)
1. NCR++ 2. Mumbai-Pune-Nashik 3. Greater Kolkata-Asansol 4. Chennai-Coimbatore-Trichy 5. Ahmedabad-Vadodara-Surat
Emerging economic corridors
1. Greater Bengaluru-Mysore 2. Greater Hyderabad 3. Chandigarh-Amritsar-Ludhiana 4. Coastal Andhra 5. Raipur-Durg-Bilaspur
26 IIHS - XV Finance Commission Urbanisation Report

Underdeveloped Regions
1. Mumbai-Nagpur-Raipur-Kolkata traverse
2. North-eastern states (7 states) 3. Hill states & UTs (4 states) 4. Konkan coast 5. Andaman & Nicobar Islands
Table 1.3: Projected Population of India's 10-largest Mega Urban Regions & Emerging Clusters (2031)
Projected Population of India's 10-largest Mega Urban Regions & Emerging Clusters (2031)
Rank Urban Region Projected Urban Population (million 2031)
1 a NCR 41 1 b NCR + (western UP, Rajasthan) 13 1 NCR ++ 54 2 Mumbai- Pune- Nashik 44 3 Greater Kolkata- Asansol 26 4 Chennai- Coimbatore- Trichy 25 5 Ahmedabad- Vadodara- Surat 23 6 Greater Bengaluru- Mysore 17 7 Greater Hyderabad 16 8 Chandigarh- Amritsar-Ludhiana 12 9 Coastal Andhra 9
10 Raipur-Durg-Bilaspur 4 Grand Total 229
Source: IIHS Analysis, Revi. et al. 2015
Regional Economic Concentration and Convergence
Drawing on the Soviet model of economic planning, India’s post-Independence development planning emphasised sectoral investment focusing on particular types of industrial or economic development (Chakravorty, 2000). This approach has, until recently, failed to acknowledge or recognise the inherently spatial nature of development.
Concern about regional disparities was first highlighted in the First Plan in 1951, with various measures being undertaken to ensure balanced regional industrialisation such as directing industrial investment to lagging states (like Madhya Pradesh and Bihar), and discouraging and eventually forbidding the location of heavy industry in metropolitan regions (ibid).
Despite this, as Chakravorty (2000: 373) writes, industrially advanced states and districts, where major metropolitan centres like Mumbai, Chennai, and Kolkata were located, continued to receive large shares of private investment: until 1980, almost 55% of capita subsidies went to only 25 out of nearly 300 eligible lagging districts; all 25 of which were located in industrially advanced states. The Freight Equalisation Policy further disadvantaged Bihar, West Bengal, Orissa, and Madhya Pradesh.
IIHS - XV Finance Commission Urbanisation Report 27

Regional inequality was on the rise before liberalisation in 1991 with the western region of the country gaining significantly, followed by the southern and northern regions. In addition to uneven economic development, there has also been uneven investment in social infrastructure such as health, and education, which has further exacerbated regional inequalities.
Using NASA night light data analysis as a proxy for economic output, the analysis in Figure 1.6 below shows clear patterns of concentration that highlight unbalanced regional development in India. Denser pockets, correlated with higher economic outputs, are concentrated in particular regions in the north, west, and south.
Figure 1.6: Estimated concentration of economic output from Night Lights Data (2011)
Implications for the XV Finance Commission Economic development in India has been uneven and regionally imbalanced. Indian development planning has emphasised sectoral investment focusing on particular types of industrial or economic development, largely ignoring economic geography. Industrially advanced states and districts, with major million+ cities continue to receive large shares of private investment. Regional economic concentration has been amplified by the development of transportation corridors that connect larger urban centres, with some improvement in intra-state and district logistics and passenger mobility. Proposed economic corridors capitalise on already existing connections between the different metropolitan regions across the country as shown in Figure 1.7
28 IIHS - XV Finance Commission Urbanisation Report

Figure 1.7: Corridors and the Distribution of Population across Cities, Towns and Villages (2011)
The strongest differentials are observed in less developed states and regions that have large pools of migrant and under-employed rural labour, or those which are in high-risk zones. Uneven investment in health and education infrastructure have further exacerbated regional inequality. Economic corridors offer an opportunity to rebalance regional development by focusing on four critical infrastructure networks: renewable electric power, gas, rail and road transport; as well as ICT facilities and access to sustainable environmental services. One of the most critical constraints to operationalising this is the lack of systematic and time-series information on the economic output, value addition, productivity, and public and private investments (ideally by key sectors) for the major urban centres in the country. Given that close to two-thirds of the economic output comes from urban areas, about 40 per cent from the top-100 urban areas, evidence-based policy and rule-based transfers by the Finance Commission become almost impossible to implement. With the expansion and rationalisation of the tax network, advances in survey techniques, and technology it should be possible for detailed economic studies, monitoring and public disclosure on an annual or bi-annual basis. This will assist in planning and tracking economic activity, public investment, expenditure and outcomes, and the monitoring of large-scale urban and regional infrastructure investments.
Urban Employment & Informality India was facing a serious employment crisis even before the COVID-induced economic crisis, with 10% GDP growth creating only a 1% increase in jobs (Basole, 2018). Over 2011-17, the number of
IIHS - XV Finance Commission Urbanisation Report 29

new jobs created was lower than the number of additions to the working age population. India has seen an absolute decrease in the size of the workforce over this period - a phenomenon observed for the first time in the history of the National Sample Surveys (Himanshu, 2019; Kannan and Raveendran, 2019; Vyas, 2019). In addition, since 2011-12, there has been an increase in unemployment, particularly for the youth and for women. The 2017-18 Periodic Labour Force Survey (PLFS) shows a decline in the absolute number of jobs from 2011-12, driven by a large decline in the rural workforce and decline in jobs for those with less than secondary level of education. Professional activities, information and communication, transport, health and education sectors have seen increases in employment. These sectors however, account for less than 10% of the national workforce and are only able to create jobs for those with higher levels of education (Kannan and Raveendran, 2019). Most of India’s urban employment continues to be informal (80%). Wage growth has not kept pace with GDP growth, and there is a big gender gap in labour force participation as well as in wages. The manufacturing sector has largely followed a capital-intensive growth path over the last two decades, with a strong dependence on intermediate goods imports. Growth in the construction sector with consistent employment and output elasticity has also substantially slowed over 2011-17. This decline in jobs in rural areas and for the less educated has important implications for the questions at hand, since any new investments focused on urban areas will need to create jobs for this segment of the workforce. Currently, only limited opportunities for decent quality jobs are being created. Many policy assumptions behind ‘Make in India’ and the National Urban Livelihoods Mission (NULM) are being challenged by structural limitations in sectors such as energy, water, housing and regional connectivity.
Support to the urban poor, informal sector workers and MSMEs are critical to facilitate a ‘jobs-rich’ post-COVID economic recovery. Proposals for an urban employment guarantee scheme need to be considered, but its exact provisions should be tailored to meet the needs of each city, region and sector. The following section details India’s levels of workforce participation based on the 2011 Census. India: Workforce participation India has a median workforce participation rate of 40%. Large cities and settlements along the Gangetic Plain have lower than average workforce participation rates as shown in Figure 1.8. In big cities, this is because female workforce participation rates are lower than average. This highlights India’s regional economic development and urbanisation conundrum. Much of the post-liberalisation incremental income and employment growth has taken place in particular regions and clusters. It is not a surprise that much of the post-COVID distress return migration, has taken place to districts and states in northern and eastern India.
30 IIHS - XV Finance Commission Urbanisation Report

Figure 1.8: Workforce Participation (2011)
Implications for the XV Finance Commission India needs to prioritise urban job creation and a possible urban employment guarantee scheme to support its post-COVID economic recovery. As the rural economy sheds millions of jobs, we need sustained public investment to address the deepest jobs crisis, over the last many decades. The assumptions that the manufacturing sector will lead this shift is unlikely to materialise, given its capital-intensive nature and the slowdown in global manufacturing. The 2017-18 PLFS survey indicates that the largest numbers of job losses were in rural areas and impacting those with very low levels of education. As employment growth in the construction sector slows down, options become even more limited for this group. Skills development or other interventions in urban areas will need to consider this structural challenge as they select areas of focus. The COVID lockdown and consequent migrant crisis highlighted the extreme vulnerabilities of the migrant workforce in cities. Strong governmental support in the form of a minimum urban employment guarantee or rapid deployment of a deep urban social safety nets are the most credible alternatives to address the livelihoods-informality-migration crisis in urban areas. Gaps in urban economic data are a serious constraint to the planning, management and tracking of urban employment, which is a necessary condition for India’s post-COVID economic recovery.
IIHS - XV Finance Commission Urbanisation Report 31

Migration Migration Trends (2001-2011) India’s urbanisation is not driven by rural to urban migration, but by ‘natural’ population growth and reclassification of existing areas as urban (Revi et al., 2015). In India, national-level information on migration primarily comes from the population Census and the National Sample Surveys. However, many of the complex patterns of migration such as short-term and circular migration (Nayyar and Kim, 2018), and women’s mobility for work (Mazumdar et al., 2013), are largely missing in these data sets. Only a small part of migrants in India are inter-state migrants – 12% of the 455.8 million migrants (54 million persons) (Census of India, 2011) as shown in Figure 1.9. Uttar Pradesh and Bihar are the largest senders of migrants, followed by Rajasthan, Maharashtra and Madhya Pradesh. Maharashtra and the NCT of Delhi were the states that received the largest number of interstate migrants, with 17% and 12% of the total respectively, followed by Uttar Pradesh, West Bengal and Gujarat.
Figure 1.9: Where India’s Migrants Came From
Source: Census, 2011 A lot of this migration is mainly to neighbouring states and districts, for instance, from Bihar to UP and Jharkhand, and from western Uttar Pradesh to the NCT of Delhi, as shown in Figure 1.11. The Census tends to undercount part-time, seasonal and circular migrants (Nayyar and Kim, 2018), while the Economic Survey 2016-17 made substantially higher estimates of inter-state migration (60 million persons).
Figure 1.10: Movement Across Rural and Urban Areas (millions)
Source: Census, 2011
32 IIHS - XV Finance Commission Urbanisation Report

Figure 1.11: Inter State Migration Flows (2011)
Migration During the COVID-19 Pandemic A large number of migrant workers, most of them short-term, seasonal and cyclical migrants, returned to their homes from urban centres during the COVID-19 pandemic. According to the Indian Railways (Ministry of Railways, 2020a; Ministry of Railways, 2020b): 4,277 special Shramik trains brought back 6 million workers to their home states by 12 June 2020. A vast majority (68%) of these trains originated in Gujarat (24%), Maharashtra (19%), Punjab (10%), UP (7%), and Bihar (7%) and overwhelmingly ended up in UP (41%), Bihar (36%), Jharkhand (5%), Odisha (5%) and West Bengal (4%). The COVID crisis has highlighted the extreme vulnerabilities faced by India’s migrant population. The pattern of returning migrants maps onto development patterns and regional disparities. State governments and urban areas will need to improve welfare and social protection measures and secure work opportunities in order to get this workforce to return to cities. Implications for the XV Finance Commission Migration is a structural response to under-development in some regions and economic and educational opportunities in others. It is a complex phenomenon which is poorly understood and even worse addressed in state and regional development policy. The COVID lockdown has forced an examination of questions of access to food, basic infrastructure and services, adequate housing, and decent and secure work for migrants.
IIHS - XV Finance Commission Urbanisation Report 33

It has also highlighted the low economic resilience of most million+ cities, considering informal enterprises and the large population of workers in this sector account for up to 40% of India’s GDP. Finance Commission investments need to carefully evaluate their needs and target interventions that will balance between sending and receiving regions for migration, but with a different emphasis in both:
● In sending regions: Improvements in economic opportunity, productivity, infrastructure and services, and access to finance in the local economies need to be prioritised.
● In receiving regions: Creation of universal social safety nets and employment security. Gaps in data on migration is a serious challenge to planning urban and regional development, employment creation and building the resilience of the urban and national economy to shocks that COVID has clearly showed us. A special thick-round round of the National Sample Survey should be conducted once every 3-4 years that covers both the source districts and key destination districts and the 100-largest urban centres. This will cover all mega-urban regions, emerging urban clusters and less developed regions.
Sustainable Urbanisation Sustainable urbanisation in India is a considerable opportunity for at least a third of the population, but it also presents a set of complex challenges as large, highly vulnerable populations live in poverty in multi-hazard environments and climate change hotspots. Indian cities can increase sustainability and resilience by reducing vulnerability and exposure by providing access to safe housing, basic services and sustainable livelihoods. India’s urban areas have the potential to drive regional, national, and global sustainable development, but this growth needs to align with the country’s commitments to the UN Sustainable Development Goals (SDGs), Habitat III Agenda and the Paris Climate Agreement. Groundwater Deficit (2017) Water is the most critical constraint to urbanisation in much of India, even though urban areas still make up less than 10 percent of the gross water demand. This is because of the mix of serious surface water deficits that are forcing mega-cities to draw water from 150-300 km. away via pipelines and canals from dams and reservoirs that are becoming increasingly unsustainable due to local environmental impacts, drought and flooding that come with climate variability and change. Hence, most cities and a large number of households within them with the resources, have shifted to the extensive use of groundwater (Revi et al., 2015). Groundwater use may be highly unsustainable especially in hard rock terrains in peninsular India and in mountain areas where much of the water being drawn comes from fossil aquifers that may not be possible to recharge over the lifetimes of these settlements. In coastal and other areas, saline intrusion or high levels of arsenic, iron and fluoride could contaminate groundwater making it either very expensive to treat or a serious risk to human health. Hence, very close attention to groundwater is necessary to address the sustainability of urban development as presented in Figure 1.12, which outlines the mega-urban regions, clusters and corridors that are at risk due to groundwater-related challenges.
34 IIHS - XV Finance Commission Urbanisation Report

Figure 1.12: Block Wise Groundwater Resources Assessment (2017)
Critical to over-exploited Groundwater
Mega-urban regions (2031)
1. NCR+ 2. Chennai-Coimbatore-Trichy 3. Greater Kolkata-Asansol 4. Ahmedabad-Vadodara-Surat
Emerging economic corridors
1. Chandigarh-Amritsar-Ludhiana 2. Greater Bengaluru-Mysore 3. Greater Hyderabad
IIHS - XV Finance Commission Urbanisation Report 35

Forests & Ecologically Sensitive Areas India has been attempting to maintain a fair balance of areas under forests and tree cover, that is now close to 22% against a policy goal of 25% of its geographical area by 2025 (Forest Survey of India, 2019). Urbanisation has been a serious threat to this. Urbanisation is in direct conflict with forest, coastal and ecosystem conservation in many parts of India. Conservation of forests and ecologically-sensitive areas are critical for the long-term survival of its cities and the well-being of its people, as they provide ecosystem services: e.g. clean water, clean air, flood control and biomaterials that these human settlements need. New urban and infrastructure development, urban expansion needs to be managed to deliver sustainable development outcomes through planning, regulation and incentives, to limit their environmental impacts.
Figure 1.13: Distribution of Evergreen, Deciduous, Shrub Forests and Grasslands (2011)
Mega-urban regions (2031) 1. NCR+ 2. Mumbai-Pune 3. Greater Chennai 4. Greater Kolkata 5. Surat
Emerging economic corridors 1. Greater Bengaluru 2. Coastal Andhra 3. Raipur-Durg-Bilaspur
36 IIHS - XV Finance Commission Urbanisation Report
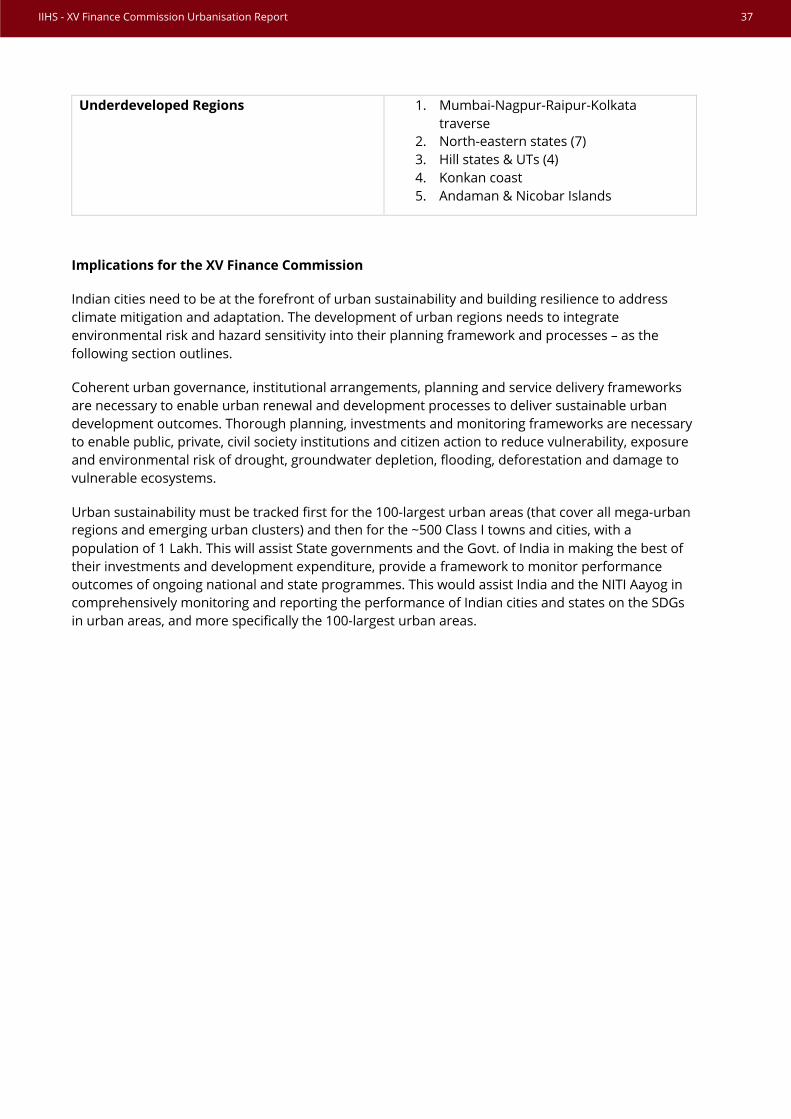
Underdeveloped Regions 1. Mumbai-Nagpur-Raipur-Kolkatatraverse
2. North-eastern states (7)3. Hill states & UTs (4)4. Konkan coast5. Andaman & Nicobar Islands
Implications for the XV Finance Commission
Indian cities need to be at the forefront of urban sustainability and building resilience to address climate mitigation and adaptation. The development of urban regions needs to integrate environmental risk and hazard sensitivity into their planning framework and processes – as the following section outlines.
Coherent urban governance, institutional arrangements, planning and service delivery frameworks are necessary to enable urban renewal and development processes to deliver sustainable urban development outcomes. Thorough planning, investments and monitoring frameworks are necessary to enable public, private, civil society institutions and citizen action to reduce vulnerability, exposure and environmental risk of drought, groundwater depletion, flooding, deforestation and damage to vulnerable ecosystems.
Urban sustainability must be tracked first for the 100-largest urban areas (that cover all mega-urban regions and emerging urban clusters) and then for the ~500 Class I towns and cities, with a population of 1 Lakh. This will assist State governments and the Govt. of India in making the best of their investments and development expenditure, provide a framework to monitor performance outcomes of ongoing national and state programmes. This would assist India and the NITI Aayog in comprehensively monitoring and reporting the performance of Indian cities and states on the SDGs in urban areas, and more specifically the 100-largest urban areas.
IIHS - XV Finance Commission Urbanisation Report 37

Composite Hazard Risk
Composite Hazard Risk brings together multiple hazards that impact the Indian subcontinent including earthquakes, cyclonic storms and surge, flooding and drought as presented in Figure 1.14. This outlines the mega-urban regions, clusters and corridors and the 100-largest cities that are exposed to risk.
Figure 1.14: Composite Hazard Risk for Cities with Population Greater than 0.1 million (2011)
Building Resilience Against Urban Hazard Risk
Urban Risk and Resilience
Urban infrastructure and resilience investments are important to reduce future economic losses, and to fulfil the economic and livelihood creation role of urban areas. Indian cities are complex, multi-hazard environments and climate change hotspots. Growing concentrations of people and built and economic assets in Indian cities increase their exposure to disaster risk. Many are highly vulnerable to both everyday risks as well as extreme events and risks arising from climate change-related variability such as drought-induced water scarcity and food insecurity, localised urban floods, and urban heat island effect, as well as environmental and health risks.
Cities also accumulate and generate new environmental risks through unplanned development. They are vulnerable to food, energy and water scarcity and consequent social and political unrest. These risks and challenges undermine the potential of cities to foster inclusive and sustainable growth. Building resilience to risk needs to be a foundational principle of urban development in India and should govern planning, investment and infrastructure development decision making.
38 IIHS - XV Finance Commission Urbanisation Report

A large number of India’s larger cities and urban regions are exposed to multiple risks. This not only induces economic shocks after a major event, but can cause large loss of life, buildings and capital stocks that have negative impacts on future output. Urban areas concentrate vulnerability and risk. Hence planning, investment and disaster risk reduction need to be integrated in urban development and investment decisions.
Indian cities face risks on multiple fronts and the following sections delve into three key hazards: earthquakes, cyclones and floods.
Earthquake Hazard Risk
Earthquakes are among the most devastating risks that cities are exposed to in India, starting from the Bihar-Nepal earthquake of 1932 to the Gujarat earthquake of 2001. The earthquake hazard risk map in Figure 1.15 outlines the mega-urban regions, clusters and corridors and the 100-largest cities that are exposed to earthquake risk across seismic Zones I to V (Jain et al., 2015).
Moderate to High Composite Hazard risk Mega-urban regions 1. NCR+
2. Mumbai-Pune-Nasik3. Chennai-Coimbatore-Trichy4. Greater Kolkata-Asansol5. Ahmedabad-Vadodara-Surat
Emerging economic corridors 1. Chandigarh-Amritsar-Ludhiana2. Coastal Andhra
Underdeveloped Regions 1. Mumbai-Nagpur-Raipur-Kolkatatraverse
2. North-eastern states (7)3. Hill states & UTs (4)4. Konkan coast5. Andaman & Nicobar Islands
IIHS - XV Finance Commission Urbanisation Report 39
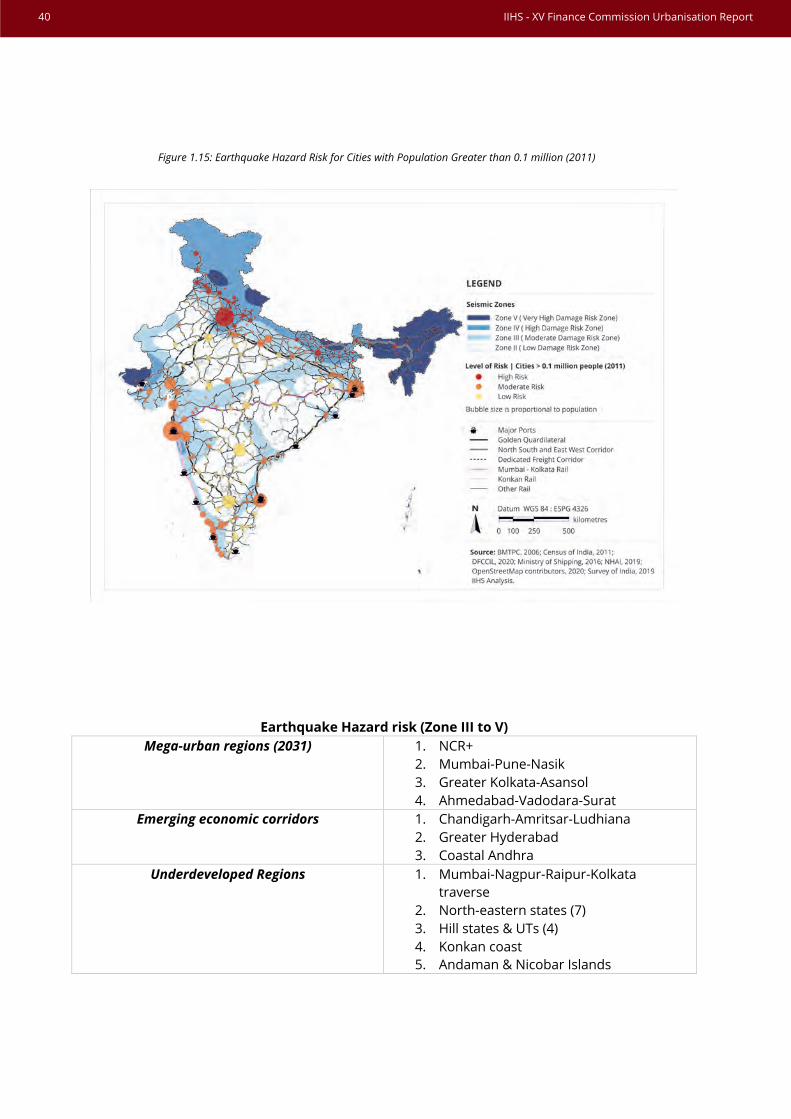
Earthquake Hazard risk (Zone III to V) Mega-urban regions (2031) 1. NCR+
2. Mumbai-Pune-Nasik3. Greater Kolkata-Asansol4. Ahmedabad-Vadodara-Surat
Emerging economic corridors 1. Chandigarh-Amritsar-Ludhiana2. Greater Hyderabad3. Coastal Andhra
Underdeveloped Regions 1. Mumbai-Nagpur-Raipur-Kolkatatraverse
2. North-eastern states (7)3. Hill states & UTs (4)4. Konkan coast5. Andaman & Nicobar Islands
Figure 1.15: Earthquake Hazard Risk for Cities with Population Greater than 0.1 million (2011)
40 IIHS - XV Finance Commission Urbanisation Report

Cyclone Hazard Risk (2014) Cyclonic storms and associated storm surges have been the cause of significant casualties and destruction of property in India, including the Orissa supercyclone of 1999. The cyclone hazard risk map in Figure 1.16 outlines the mega-urban regions, clusters and corridors and the 100-largest cities that are exposed to cyclonic storm risk (Jain et al., 2015).
Figure 1.16: Cyclonic wind speed hazard risk for cities with population greater than 0.1 million (2014)
Mega-urban regions (2031) 1. Mumbai-Pune-Nasik 2. Chennai-Coimbatore-Trichy 3. Greater Kolkata-Asansol 4. Ahmedabad-Vadodara-Surat
Emerging economic corridors 1. Chandigarh-Amritsar-Ludhiana 2. Greater Bengaluru-Mysore 3. Greater Hyderabad 4. Coastal Andhra 5. Raipur-Durg-Bilaspur
Underdeveloped Regions 1. North-eastern states (4) 2. Konkan coast 3. Andaman & Nicobar Islands
IIHS - XV Finance Commission Urbanisation Report 41

Flood Hazard Risk (2014) Flooding is the most widespread hazard that Indian cities and settlements are exposed to. Some regions, especially in the plains of the Ganga and Brahmaputra are impacted every year. The flood risk map in Figure 1.17 outlines the mega-urban regions, clusters and corridors and the 100-largest cities that are exposed to recurrent flood risk at 10-year return periods or less. A large area of eastern and north-eastern India, and some parts of coastal and western India are exposed to recurrent flooding. This can be expected to increase in frequency and intensity with extreme climate events. Local flooding is a widespread challenge to hundreds of Indian cities because of unplanned development and poor or no drainage.
Figure 1.17: Flood Hazard Risk for Cities with Population Greater than 0.1 million (2014)
Recurrent Flood risk
Mega-urban regions (2031)
1. Delhi and parts of NCR+ 2. Greater Mumbai 3. Chennai 4. Greater Kolkata 5. Ahmedabad-Surat
Emerging economic corridors 1. Greater Bengaluru 2. Coastal Andhra 3. Greater Hyderabad
42 IIHS - XV Finance Commission Urbanisation Report

Implications for the XV Finance Commission
A coherent framework needs to be built involving the public and private sectors, and civil society to ensure urban development that links short-run priorities with long-run strategic actions. States and cities need strong fiscal incentives to take pre-emptive measures to reduce vulnerability and exposure and build resilience and institutional capacity for disaster risk reduction. The capacities of ULBs and other local governance institutions needs to be improved for disaster mitigation. Resilience building can be incentivised by:
1. Reducing loss of life by establishing agile and robust early warning and emergency response systems and developing long-term plans for managing lifeline infrastructure;
2. Mitigation of output losses via robust economic production systems; 3. Mitigation of capital losses and building of long-term resilience, as part of all new
infrastructure investments; 4. Building ULB/other local institutional capacity to raise their own revenue, plans and execute
retrofits and new resilient infrastructure and public buildings; 5. Addressing future population growth in urban areas (particularly accounting for high-
intensity peri-urban growth) and balancing current and future infrastructure investment needs.
Resources can be specifically directed (based on the 100-largest cities: other urban areas: rural population share) to enable urban resilience to multiple hazards, reduction of multi-dimensional vulnerability and building of disaster risk reduction capacities. This builds on the XV Finance Commission’s emphasis on disaster risk reduction and resilience building in urban areas (Revi, A., Bazaz, A. 2019).
IIHS - XV Finance Commission Urbanisation Report 43

44 IIHS - XV Finance Commission Urbanisation Report

CHAPTER 2
Post-COVID Priorities
45

[This page is intentionally left blank]
46 IIHS - XV Finance Commission Urbanisation Report

Post-COVID Urban Economic Recovery India’s Pre-COVID Economic Condition (2019-20) Key economic sectors in India were experiencing a slowdown well before COVID-19 struck. Since 2019, India’s GDP growth had slowed1, narrowing the fiscal space for intervention. A decline in urban private sector investments in construction and infrastructure played a key role in this slowdown2. The effect of the economic slowdown on livelihoods and employment was also severe. Construction3, manufacturing and agriculture account for three-fourths of India’s working population as well as a significant share of informal workers. All these sectors experienced pre-COVID contraction in employment in 2019. Moreover, employment in manufacturing declined and the growth rate of jobs in construction declined over the 2011-12 and 2017-18 period. Pre-COVID economic and employment growth slowdown constrains the space for economy recovery. But a stimulus in basic infrastructure, housing and urban development sectors, along with a focus on underlying vulnerabilities can assist in long-term recovery and expand livelihood opportunities in the urban informal sector. The COVID-19 Pandemic and Resulting Urban Economic Shock
The COVID-19 shock started in India’s metropolitan areas with higher incomes, assets and better health and other infrastructure, than smaller cities and villages. As India’s total infections crossed two million, the pandemic is expected to expand to smaller cities and towns across the country, over 2020-21. This will continue to disrupt economic activity and exacerbate existing regional and spatial inequalities, especially in its poorer and more vulnerable states and districts.
The March to May 2020 lockdown was applied nationwide and provided a critical breather to build state health infrastructure and response systems, but it led to massive economic disruption. This came with differential economic impacts with the worst-affected being vulnerable and migrant groups in many urban areas, with limited financial resources and low resilience. Most chose to return to their home villages and states, even though they knew economic opportunities and health services were poorer there. Post-COVID urban interventions and investments need to accelerate economic and employment recovery and proactively address underlying vulnerability and risk. This could be initiated in the largest 100 urban areas but expanded in phases to cover ~500 1 lakh+ AMRUT towns and eventually, the whole country.
1 See https://www.businesstoday.in/current/economy-politics/gdp-slowdown-longest-india-2019/story/391754.html 2 See https://api.anarock.com/uploads/research/Private-Equity-in-Indian-Real-Estate-ANAROCK-Capital.pdf 3 See http://iamrindia.gov.in/writereaddata/UploadFile/report6_1007.pdf
IIHS - XV Finance Commission Urbanisation Report 47

The GoI’s Post-COVID Economic Recovery Package
The Rs. 20-lakh crore economic recovery package announced in May 20204 targeted groups and economic sectors vulnerable to the pre-lockdown economic slowdown and liquidity crisis. This was compounded by the economic impact of the COVID lockdown. Key interventions in urbanisation-relevant areas include:
1. A range of loan packages and a ‘Fund of Funds’ to facilitate equity investments in MSMEs, as they are seen as key to economic recovery5.
2. Pre-COVID financial and the liquidity crises impacting the energy sector was addressed by provision for loans to repay GENCOs, against state guarantees through PFC and REC6.
3. Airport auctions announced in a dozen Tier II urban centres7. 4. Liquidity boost to NBFCs/ HFCs/ MFIs via a ‘Stressed Asset Fund’, Partial Credit Guarantee
Scheme 2.0. Plus, special refinance facilities, a special liquidity facility for MFs and extension of loan moratoria were also announced8.
The real estate liquidity crisis9 drew prominent interventions to induce and infuse liquidity by rescuing private entities and projects via government guarantees. Moreover, bad investment instruments were purchased without requiring these entities to liquidate underlying physical assets. Steps were also taken to provide credit guarantees, loan extensions10, ease RERA date stipulations, and increase Viability Gap Funding for social infrastructure projects11. The focus of the economic recovery package on MSMEs and acknowledgement of the deep liquidity crises in the real estate and construction sectors are important steps towards medium-term economic recovery in urban areas. But private investment that follows public expenditure will be key, and this may be difficult due to fiscal constraints.
Post-COVID Economic Recovery: Real Estate and Construction
Housing and infrastructure sectors require ‘patient’ long-term capital with financial horizons of 10-30 years and more. As discussed above, real estate and construction sectors are currently facing multiple crises, ranging from a demand-supply mismatch to a severe liquidity crisis. The returns for investors in the residential sector in India dropped to 2-3% in 2019. Infrastructure Leasing & Financial Services (IL&FS), a key NBFC involved in financing and developing infrastructure, collapsed in September 201812 due to a loss of liquidity, underlining a deep crisis in the industry13.
4 See https://pib.gov.in/PressReleseDetailm.aspx?PRID=1623601 5 See https://www.factchecker.in/before-msme-fund-of-funds-a-rs60000cr-fund-for-startups-disbursed-6-of-target/ 6 See https://www.crisil.com/en/home/newsroom/press-releases/2020/05/rs90000-crore-liquidity-injection-a-breather-for-power-gencos.html 7 See https://www.business-standard.com/article/pti-stories/govt-to-auction-six-more-airports-under-ppp-model-fm-120051600847_1.html 8 See https://www.outlookindia.com/outlookmoney/magazine/story/housing-sector-crisis-and-beyond-371 9 See https://assets.kpmg/content/dam/kpmg/in/pdf/2019/08/disruptions-real-estate-india.pdf 10 See https://www.financialexpress.com/industry/rbi-allows-nbfcs-to-extend-dcco-for-loans-to-commercial-real-estate-by-one-year/1931435/ 11 See https://www.outlookindia.com/newsscroll/vgf-support-for-social-infra-enhanced-to-30-on-higher-rs-8100-cr-outlay/1836575 12 See https://thewire.in/business/ilfs-downfall-banking-india-economy 13 See https://economictimes.indiatimes.com/industry/banking/finance/a-year-after-ilfs-collapse-debt-destruction-and-dithering/articleshow/70868024.cms?from=mdr
48 IIHS - XV Finance Commission Urbanisation Report

The real estate crisis14 had attracted pre-COVID public policy interventions to infuse liquidity, including:
• The establishment of a Rs. 25,000 crores ‘Alternative Investment Fund’ (AIF)15; • A range of regulatory support measures, for e.g. credit guarantees and NPA write-offs16; • Judicial interventions that brought public sector agencies (e.g. NBCC) to complete private
sector projects17.
India’s real estate industry currently poses high risks to both domestic and foreign investors, due to the following reasons:
• A significant price mismatch between housing demand and supply; • High financing costs and risky practices of fund management; • Low returns which are insufficient to offset risks; and • Delayed deliveries and litigation, leading to the deployment of the Insolvency and Bankruptcy
Code.
In the current economic environment, easy availability of ‘patient capital’ is unlikely, with domestic markets’ illiquidity and a post-COVID shrinking of the global economy. It would be best to be deeply conservative on large private sector participation in urban and infrastructure development-led post-COVID economic recovery. Post-COVID Urban Economic Recovery: Sectoral Opportunities
A range of urban economic opportunities that have not yet been targeted by recovery packages, have the potential to build on existing public programmes and schemes and release institutional barriers and bottlenecks:
1. Economic recovery and development: The informal sector was and continues to be severely impact by the pandemic and lockdown. Focusing on the needs of groups such as construction workers, street vendors, domestic workers is key to recovery. Supporting MSMEs to uplift sectors such as manufacturing, trade and tourism – also affected by the lockdown – should be a priority area. The post-COVID reality offers opportunities to proactively move towards clean energy sources. This would not only spur sustainable urban development but is also a step towards realising India’s climate commitments. Connected to this is also the opportunity to transition towards carbon-neutral or e-mobility on a large scale. This could mean more job opportunities in manufacturing as well as moving to transportation systems that are more efficient and cleaner.
2. Climate and disaster resilient infrastructure: Related to the previous point, mitigation and adaptation to climate change is essential to move towards more resilient economies. Identifying cleaner energy sources such as solar and ensuring more widespread energy access is integral for growth. Plus, lack of basic infrastructure compounds vulnerability among poorer sections. Hence, investing in
14 See https://realty.economictimes.indiatimes.com/news/industry/banks-reluctant-to-lend-to-realty-sector-on-rising-npa-survey/62703764 15 See https://bfsi.economictimes.indiatimes.com/news/policy/government-approves-rs-25000-crore-alternate-fund-for-stalled-housing-projects-nirmala-sitharaman/71948211 16 See https://www.indiatoday.in/business/story/severe-cash-crunch-in-real-estate-leaves-beleaguered-banks-exposed-1609029-2019-10-14 17 See https://timesofindia.indiatimes.com/india/sc-asks-nbcc-to-take-over-housing-projects-orders-ed-probe-against-amrapali/articleshow/70341361.cms
IIHS - XV Finance Commission Urbanisation Report 49
environmental services and tackling neglected, yet essential, infrastructure such as water supply, drainage and sanitation services, will be key for longer-term recovery.
3. Securing tenure and affordable housing: COVID has also underlined the need for multiple reforms in land systems and affordable housing. These include a focus on land and property tax systems reform, planning for integrated land use, mobility and infrastructure, and economic development. Housing needs should be tackled with a multi-pronged approach of enabling upgradation and rental housing and making affordable new construction.
4. Improved governance and finance: Despite the 74th Constitutional Amendment and subsequent reforms, it is essential to work towards strengthening ULBs’ fiscal base as well as institutional capacities. Governance and finance policies that improve urban economic and fiscal data and digital management are essential. Improved capacities can be achieved through state municipal cadres as well as governance reform and devolution.
The XV Finance Commission’s contribution towards accelerating post-COVID economic recovery may be limited due to mandate and fiscal envelope constraints. Nevertheless, set of concrete steps could be taken, within the current framework:
• Policy convergence of Finance Commission transfers with the Govt. of India’s economic stimulus package and commitment to the sustainable development of urban areas, is a no-cost high-impact contribution.
• Incentivising the building of all infrastructure in at least the 100-largest urban areas to disaster and climate resilient standards, under FC grants, as per NDMA guidelines, would be a significant step forward and in keeping with the FCs disaster management priorities and mandate.
• Strengthening land and property tax systems reform and tenure security under a Governance, Finance & Outcome Monitoring Improvement grant to ~500 Class I towns and cities across all States. This would be distributed on a population (90%) and expenditure performance (10%) basis and converge strongly with Govt. of India’s Housing for All programme expenditure and outcomes.
• Strengthening Municipal governance and capacity and information systems under a Governance, Finance & Outcome Monitoring Improvement grant to improve urban economic and fiscal data and digital management in ~500 Class I towns and cities across all States.
50 IIHS - XV Finance Commission Urbanisation Report

Addressing Post-COVID Urban Risk Urban areas concentrate risk because of their density of population, location (often near sources of water or risk-prone areas because of the economic and strategic advantages they provide) and inequality that forces a large proportion of people to live in unsafe locations (e.g. flood plains or seismically unstable locations and slopes) because of land market and livelihood access constraints. The COVID pandemic has brought into sharp focus the risks that urban areas concentrate during a pandemic, for e.g. rapid and sometimes exponential infection transmission, difficulty of breaking the chain because of the very high population densities in cities and especially in informal settlements. This section provides an overview of a wide range of risks that urban areas are exposed to in India. They need to be systematically addressed if post-COVID recovery has to be effected rapidly and sustainably, keeping equity in mind. Economic Risks
1. GDP slowdown and consequent sectoral challenges especially in construction and real estate, transport, tourism, trade, manufacturing, utilities and banking.
2. Decline in overall employment and livelihood opportunities, especially in MSMEs and the informal sector.
3. Lower savings and investment and urban consumer demand. 4. Very limited fiscal space for public expenditure in urban infrastructure, services and asset
building-led recovery. Financial Risks
1. Highly constrained liquidity and widespread insolvency especially among urban MSMEs, own-account enterprises.
2. Debt and NPA crisis deepen in particular sectors, for e.g., real estate, transport, power utilities, banking and finance.
3. Long gestation for incremental investment especially in smaller towns and depressed regions.
4. Higher risk premium for long-gestation infrastructure and urban development projects, especially with land, regulation and implementation delay-related constraints.
Social and Health Risks The COVID pandemic has exposed the fault lines in urban health systems, gaps in a universal social safety net and the consequent impact on livelihood security, migration and the economy. Land and investment-related risks are long standing constraints to planned urbanisation and economic development, which the COVID crisis may provide an opening to address.
1. Universal social safety net is needed to protect the poor and vulnerable and mitigate the economic and human consequences of urban economic and livelihood shock inflicted by the spread of COVID-19 and ensuing lockdowns.
2. Urban health systems are critical to enable universal coverage and access to affordable health services, as well as address the deepening multi-pronged burdens of common diseases, pollution, accidents and epidemics.
3. Migration has emerged as a primary faultline in urban India, with tens of millions of workers with little or no safety net in terms of livelihoods, food and tenure security and very limited economic opportunities in areas from where they migrated from. This will require a systemic response to deepen social safety nets, provide universal entitlements, irrespective of location and enable balanced regional development to create economic and livelihood opportunities in less-developed states, regions and districts.
IIHS - XV Finance Commission Urbanisation Report 51

4. Urban education systems have suffered tremendous dislocation as they are the last service to come online, impacting the lives, education and nutrition-support of hundreds of millions of school children, students in higher educational institutions and teachers across the country. A re-imagination of the resilience and accessibility to education, in a country with a deep digital divide will be necessary.
Regulatory and Legal Risks
1. Land-related legal and regulatory risks are serious impediments to land acquisition, assembly, land-use change and planning that inhibit tenure security, local economic development, infrastructure provisioning and sustainable land-use planning.
2. Investment-related risks are serious impediments to safe, cost-effective, productive, employment-enhancing and ecologically sustainable urban and infrastructure development required to lower cost of capital, ensure higher liquidity and accessibility of finance.
Environmental Risks
1. In terms of urban pollution and health risk, the COVID lockdown has shown that drastic reduction in air and water pollution is possible with a positive impact on human health.
2. Deteriorating urban ecosystems and services can be addressed with changes in production and consumption systems and working within regional resource constraints.
3. Vulnerability of ecosystem services, i.e., food, energy and water security need to be addressed by transitioning to a green circular economy, powered by renewable energy.
4. Unplanned and unsustainable urban growth can be addressed through environmentally-sensitive land-use planning and by integrating climate and disaster resilience into investment.
Climate Risks
1. Climate-induced extreme weather requires risk mitigation responses to urban flooding, storm surge, cyclonic winds as they become more frequent and intense.
2. Urban drought risk combined with overuse of groundwater will need to be addressed through water efficiency schemes, recycling and conjunctive water resource management.
3. Urban heat stress will need to be managed to reduce the impact of urban heat waves, exacerbated by urban heat island effect, on human health and outdoor work.
4. Sea level rise is a long-term constraint to the location and expansion of cities and threatens the safety of infrastructure in low-elevation coastal zones.
5. For air pollution, mitigation responses can be linked to deep decarbonisation of urban energy and transport systems and a transition to e-mobility.
52 IIHS - XV Finance Commission Urbanisation Report

Post-COVID Goals, Outcomes and Strategic Policy Options
The risks detailed above need to be examined in the context of pre-COVID levels of differential vulnerability across communities and sectors. This understanding yields a list of broad strategic options and goals that can haul the country back on the path towards recovery:
1. Enable short-term post-COVID economic recovery 2. Establish safety nets for food, tenure/housing, decent work and basic services. 3. Enable jobs-rich economic recovery and resilience while addressing migration, informality &
precarity. 4. Improve conditions for current (2021) urban population: ~450 m. in ~8,000 places. 5. Address needs of incremental (2031) urban population: ~150 m. in ~12,000+ places, in the
2020s. 6. Strengthen urban-rural linkages between urban areas, outgrowths and adjoining villages.
Priority Development Outcomes
Over the next 5 to 10 years, tangible development outcomes are necessary, including: (i) accelerating recovery and growth possibilities in locations and sectors that have the most potential; (ii) addressing the employment crisis by focusing on an informal work and MSME-led recovery that is broad-based and can stimulate demand in the economy; (iii) mitigating risks and vulnerabilities in the least developed states and districts; and (iv) addressing key bottlenecks in institutional capacity and implementation.
The XV Finance Commission could make a significant contribution to building the capacity to address short and medium-term risk across the multiple dimensions outlined above by enabling a shift in focus from reactive to proactive risk mitigation. This is well addressed by shifting the proportion of grants to urban areas to match and track ongoing levels of urbanisation e.g. moving from 32.5 percent to 35 percent over (2020-25) with 0.5 percent increments each year. This addressed both the current and incremental urban population. Second expanding the coverage of basic services investments in urban areas to include health and education. Third, specifying that all investments in urban and regional infrastructure meet national disaster and climate resilient standards. Fourth, specifying that all investments will be made with full cognisance of the multidimensional risks that they are be exposed to, with mitigation measures pre-identified.
Post-COVID Intervention Strategies and Regional Priorities
The COVID-19 pandemic has exposed a wide range of fault lines across India, between urban and rural areas, metropolitan areas, large cities and small towns, the formal and informal sectors, residents and ‘migrants’. Each of these is underpinned by regional and spatial inequality, that have not been adequately addressed over the last-30 odd years of liberalisation and economic reform, in spite of a long history of uneven and divergent economic development that successive Finance Commissions have sought to correct, using population-based and development performance based metrics. This report presents strong evidence around the need to address inter-state, intra-state divergence, inequality and differentials in resources, productivity, income and wealth using place and regional clusters as an organising principle as this is a key dimension of India’s economic geography.
IIHS - XV Finance Commission Urbanisation Report 53

A territorial, regional cluster-based approach outlined below provides the opportunity to link places across the rural-urban continuum from hamlets and villages, through small towns, million-cities to large mega-urban regions. These circuits of connectivity, value addition, agglomeration economies and migration, can provide the basis to mobilise, prioritise, target and phase post-COVID intervention strategies. Balancing Opportunities Across States Investments in and around existing urban centres and linked settlement systems, and economic corridors, needs to be organised around:
● Mega-Urban regions ● Emerging Urban clusters ● 5 Economic corridors ● 5 Less developed States and risk-prone regions
Investments in creating new towns and cities are not advisable in the current economic and fiscal environment Post-COVID Urban Economic Recovery: Intervention Strategies Schemes that are initially state-led, followed by crowding-in of other resources, can be implemented via the following strategic interventions:
● Leverage and redirect existing central schemes and programmes ● Strengthen ULBs and state governments’ capacity to mobilise, implement and regulate ● Build enterprise capacity to implement and finance projects ● Build disaster resilience and mitigate climate risk ● Use differential spatial development strategies
Regional Development Strategies for the 100-largest cities by population Coverage of all of India’s urban areas is ideal, but seriously constrained on the supply-side by limited resources and on the demand-side by limited institutional capacities to plan, deliver and monitor. Hence, a targeted and phased approach appears the most pragmatic way forward. The detailed methodology for phased and targeted regional development strategies for the 100-largest cities by population is presented below and in greater detail in Annex IV.
● Expansion: Spatial expansion of urban area and planning boundaries, typically via de facto change in peripheral land use, along corridors, urban outgrowths or the integration of non-urban areas; or via a de jure expansion or modification of planning boundaries.
● Nucleation: Spatial expansion through the creation of new outgrowths, countermagnets or the upgradation of Census towns or non-urban areas, adjacent or outside existing urban boundaries.
● Decongestion: Decreasing or altering gross built-up densities of urban land-uses within existing urban boundaries to acceptable levels, for e.g. 175 persons per Ha.
● Densification: Increasing gross built-up densities of urban land-uses within existing urban boundaries within acceptable levels e.g. 175 persons per Ha.
● Access (Regional & intra-urban): The development of climate and disaster resilient physical and social infrastructure networks, sustainable ecosystems services and green infrastructure at the regional level.
54 IIHS - XV Finance Commission Urbanisation Report

Finance Commission transfers should incentivise a set of strong contextual regional development strategies, and only support weak strategies, as outlined below, when locally warranted. 100 Largest Cities: Expansion Potential India’s 100-largest cities have limited potential to expand, especially in the Mumbai-Pune-Nasik and NCR region; Greater Bengaluru, Chennai and Kolkata, Hyderabad and a few smaller cities still have some potential.
1. Megacities: Greater Bengaluru, Chennai & Kolkata 2. Million+ cities: Surat, Ahmedabad 3. Other Class I towns
100 Largest Cities: Nucleation Potential India’s 100-largest cities have considerable potential for nucleation including the large and dense: Mumbai, Kolkata and NCR mega-urban regions. This will emerge as a key spatial strategy could support the development of regional networks with greater economic potential along with deeper resilience, if adequately planned and incentivised.
1. Megacities: Bengaluru, Chennai 2. Million+ cities: moderate to strong 3. Other Class I towns: most
100 Largest Cities: Decongestion Potential Most of India’s 100-largest cities have the potential for decongestion within their planned boundaries, including the NCR and Greater Bengaluru. This is a key spatial development strategy to improve liveability, if implemented along with sustainable mobility and appropriate planning and land market interventions.
1. Megacities: Mumbai, Kolkata, Chennai 2. Million+ cities: many 3. Other Class I towns: most
100 Largest Cities: Densification Potential Only a few of India’s 100-largest cities have residual potential for densification. Greater Bengaluru is an exception, along with a range of million+ cities: e.g. Jaipur & Mysore
1. Megacities: Bengaluru 2. Million+ cities: few 3. Other Class I towns: few
100 Largest Cities: Regional Connectivity Potential Improving regional connectivity is an important strategic option across many regions and corridors, especially mega-urban regions. Central India cities and many in the Gangetic plain, need further strategic infrastructure investments to integrate better with their region and major economic & infrastructure corridors.
1. Megacities: All 2. Million+ cities: some 3. Other Class I towns: some
IIHS - XV Finance Commission Urbanisation Report 55

100 Largest Cities: Intra-Urban Connectivity Potential Almost all of India’s 100-largest cities have considerable potential to improve intra-city mobility and connectivity, especially if low-carbon and electric technological options and integrated planning are considered.
1. Megacities: All 2. Million+ cities: All 3. Other Class I towns: most
Implications for the XV Finance Commission Differential contextualised and coordinated regional development strategies are necessary for both national and state-level development as India urbanises to match limited resources with local potential, priorities and binding constraints. A mix of weak and strong strategies for the 100-largest cities are noted below. Strong strategies
● Nucleation: India’s 100-largest cities have considerable potential for nucleation including the large and dense mega-urban regions
● Decongestion: Most of India’s 100-largest cities have the potential for decongestion within their planned boundaries
● Regional Connectivity & Access: Improving regional connectivity is an important strategic option across many regions and corridors, especially mega-urban regions
● Intra-Urban Connectivity & Access: Almost all of India’s 100-largest cities have considerable potential to improve intra-city mobility and connectivity
Weak strategies
● Densification: Only a few of India’s 100-largest cities have residual potential for densification.
● Expansion: Most of India’s 100-largest cities have limited potential to expand Finance commission transfers should incentivise strong regional development strategies: nucleation, decongestion and regional and intra-urban connectivity; and only support weak strategies when locally warranted. This focus on the 100-largest cities will cover all mega-urban regions, emerging urban clusters and many of the less developed States.
56 IIHS - XV Finance Commission Urbanisation Report

CHAPTER 3
Implementation
57

[This page is intentionally left blank]
58 IIHS - XV Finance Commission Urbanisation Report

Building on current Urban Development and Reform Programmes Second and Third Generation Urban Development and Reform Programmes India is in the midst of its third generation of urban development programmes and reforms, since 2015, following on from a first generation of reforms in the 1990s, and a second-generation from 2005-14. Convergence between these reforms and post-COVID economic recovery will be necessary to mobilise enhanced investment, create appropriate enabling conditions and incentives for urban regeneration, upgradation, expansion and decongestion. Table 3.1: Urban Development and Reform Programmes
Scheme Mission Period
Total Central Allocation (crore INR)
State/ULB/Parastatal Share
Cities/Towns Covered
Second Generation Urban Reforms
JNNURM 2005-2013 66,085 (2005-2012)
14,000 (2013-2014)
UIG (10-65%); BSUP (10-50%); UIDSSMT (10%);
IHDSP (20%)
65 (UIG, BSUP); Remaining cities and
towns (UIDSSMT, IHSP)
Third Generation Urban Reforms
AMRUT 2015-2020 50,000 State contribution to not less than 20%
500 across India
PMAY (U) 2015-2022 Varies by component
- All statutory towns (4,041 Census 2011)
Swachh Bharat
2014-2019 14,623 Minimum of 25% of GoI funding
Smart Cities 2015-2020 48,000 Equal amount, on a match-funding basis
100 across India
HRIDAY 2014-2019 500 - 12 heritage cities
Sources: CAG 2012, Performance Audit of Jawaharlal Nehru National Urban Renewal Mission (JNNURM); SBM-U Guidelines, Smart Cities Guidelines, HRIDAY Operational Guidelines
https://amrut.gov.in/writereaddata/Preparation%20of%20SAAPs.pdf, Press Information Bureau, GoI MoHUA Feb 2018
Three critical areas of intervention are necessary to enable the convergence of third generation urban reforms and an urbanisatiion-led post-COVID economic stimulus. These are: land system reform, urban governance reform as well as appropriate financing and institutional arrangements to enable them, as outlined in the following sections.
IIHS - XV Finance Commission Urbanisation Report 59
Land Land is one of the binding constraints to sustainable urban development in India and the creation of regional and urban infrastructure, which will be key drivers of post-COVID recovery. Over the last few decades, it has become a critical financial, legal and social challenge, faced by large-scale development projects across the country. This is because of multiple causes, including: the scale of direct and indirect displacement that it may cause, the economic and financial value of the land itself, that may grow many times in a speculative market; the legal and procedural challenges of land acquisition, land pooling and aggregation, by the public or the private sector; and multiple contests, both outside and inside of India’s judicial system. The fiscal, governance and legal responsibilities of making land available are the mandate of state governments and cities. This is because land is a state subject. Many ULBs, state governments and central government agencies (e.g. Railways, Forests and Defence) have large ‘land banks’ within or on the peripheries of the 100-largest cities in the country and hence, are important stakeholders in medium-term urban development. In addition, the current generation of centrally-sponsored urban programmes such as AMRUT and Smart Cities do not provide for land costs – which have to be mobilised by the ULBs, development authorities or state governments. This can become an impediment to accelerate implementation, along with environmental clearances, and impact mitigation. The significant financial resources required for urban infrastructure development, as calculated in the HPEC report, also does not include land costs as indicated in a broad-brush estimate presented in Table 3.2. The cost of land and amelioration of the social, economic and ecological costs associated with acquiring or aggregating large parcels of land is necessary, but not a sufficient condition for successful project implementation. The recent case of the pooling of 30,000 acres of land for Amaravati in Andhra Pradesh highlights the risks associated with large-scale aggregation that can impact public agencies, multilateral lending agencies, private investors, as well as individual owners. A set of key land-related issues that need to be addressed while using urban development as a strategic driver, to accelerate economic recovery, include: ● Land is expensive in most Indian cities, with land markets that are often distorted (Morris and
Pandey, 2009)18. Not only are the monetary costs of land high, but so also are the social, economic, ecological and political costs (Morris and Pandey, 2007)19. The administrative and fiscal risks of aggregating large land parcels are significant, and impact the functioning, fiscal management and risk management capacities of not only government bodies, but also private developers and investors20. Including land costs (even at subsidized, non-market rates) in larger cities, typically makes development financially infeasible, and create market distortions that can open the space for elite projects that target high-income groups and speculative investors (Sivam, 2002)21. These conditions often compromise the delivery of affordable housing and
18 Morris, S., & Pandey, A. (2009). Land markets in India: Distortions and issues. India Infrastructure Report.
19 Morris, S., & Pandey, A. (2007). Towards reform of land acquisition framework in India. Economic and Political Weekly, 2083-2090.
20 Searle, L. G. (2016). Landscapes of accumulation: Real estate and the neoliberal imagination in contemporary India. University of Chicago Press.
21 Sivam, A. (2002). Constraints affecting the efficiency of the urban residential land market in developing countries: a case study of India. Habitat International, 26(4), 523-537.
60 IIHS - XV Finance Commission Urbanisation Report

public access to infrastructure despite regulations, such as RERA, that attempt to prioritise the concerns of homeowners.
● The use of Eminent Domain for Land acquisition that was prevalent in the pre-liberalisation and early states of economic reform is associated with high social, political and monetary costs (Morris and Pandey, 2007). Public protests against the use of the eminent domain for key projects such as the Maha Mumbai SEZ, Nandigram and Singur (Chakravorty, 2016)22, played a role in the replacement of colonial era legislation with the LARR Act (2013). The subsequent changes in key clauses in the LARR, such as the need to conduct a Social Impact Assessment, has affected the Act’s power to address the social and economic concerns that triggered earlier public protests. Yet, there are very few examples of the new LARR Act being successfully used for land acquisition for large developments over the last few years.
● Land pooling for large-scale land aggregation involves high costs, places high levels of social and monetary responsibilities on participating landowners and means significant increase in project gestation periods. Detailed negotiations with landowners, adds to project costs and risks. Even small-scale land pooling exercises, as a part of town planning schemes in Gujarat and Maharashtra have taken more than 15 years to be implemented (Ballaney, 2008).23
● Large-scale land pooling, such as in Amaravati, are unique and highlights the importance of state governments taking on the long-term responsibility of regular compensation to landowners during project implementation. This will almost certainly, add to project costs and risks.
● The Amaravati case offers several lessons regarding the high monetary, political and social risks associated with large-scale land pooling. Mandatory participation by landowners in a large land pooling exercise is essential. This mandatory nature, as well as other terms and conditions of land pooling, may make land pooling similar to outright acquisition (in terms of complexity of implementation, and the tine-value of money) through eminent domain, adding to project financial, legal and political risk.
● Large-scale land acquisition and land pooling in long gestation urban infrastructure and development projects are now under greater public, judicial, banking and insurance and investor scrutiny. This is another important factor to consider in implementing urban development projects.
● Large-scale land assembly by private parties is difficult and severely constrained by the current system of land legislations and regulations in India (Sheshadri, 2012).24
● Foreign private equity investment interest in land has declined after the negative experiences of private equity investors over 2005-2008. After the mass exit of private equity firms from India following the 2008 global financial crisis, equity has been replaced by mezzanine debts and structured loans via NBFCS that typically do not invest in projects at the land aggregation stage (Anarock, 2019)25. This effectively translates to low levels of foreign equity interest in land aggregation investment in urban development, marking a return to a burden on government and public institutions to aggregate land. This implies, that the assumption of public investment crowding in private finance in post-COVID urban development may be far-fetched.
22 Chakravorty, S. (2016). Land acquisition in India: The political-economy of changing the law. Area Development and Policy, 1(1), 48-62.
23 Ballaney, Shirley, (2008) The Town Planning Mechanism in Gujarat, India (Washington: World Bank Institute). 24 Seshadri, T. (2012). An analysis of the feasibility of private land assembly for Special Economic Zones in India. Urban Studies, 49(10), 2285-2300.
25 Anarock Capital Advisors (2019). Private Equity in Indian Real Estate. Available at https://api.anarock.com/uploads/research/Private-Equity-in-Indian-Real-Estate-ANAROCK-Capital.pdf, Retrieved on 27th July 2020
IIHS - XV Finance Commission Urbanisation Report 61

● PPPs have been used extensively to fill this gap (Nataraj, 2014)26. But there are multiple examples of government agencies not even receiving payment for the value of land they have provided to private partners in a PPP arrangement, even after these parties made high value exits from projects.
● Domestic investor interest in land is typically short- term and speculative rather than ‘patient’ as is required for long gestation urban development projects. Domestic and foreign investment is also tempered by alternate investment options in India with higher risk adjusted returns on investment (Anarock, 2019).
● It is often stated that the lack of land is a critical barrier to development, Nevertheless, empirical evidence across many states, shows that even when land is available in ample quantities and at low costs, project implementation and delivery has not taken place. For example, more than half of the land aggregated for SEZs in India, i.e. more than 20,000 hectares of land, currently lies unutilized (CAG, 2014)27. Another example is Greater NOIDA, where land with infrastructure has been made available to developers at low prices by the government, for which original owners are not fully compensated. Yet, developers have not completed housing delivery. Under court supervision, NBCC has been asked to come in to complete some of these projects (Economic Times, 2019)28.
● Public lands in India’s megacities have been under increasing pressure for monetisation (Gandhi and Phatak, 2016)29, given the scarcity of developable land for transport infrastructure and low-income housing. As it is difficult and expensive for state governments or ULBs to acquire lands in prime locations where livelihood access is high or green spaces are imperative - it is important that these lands are utilised for ‘public purpose’.
India’s urbanisation, development of strategic regional infrastructure and urban infrastructure, cannot take place without the steady and systemic availability of land that is not risk prone, environmentally sensitive, displaces large numbers of people or their livelihoods, and exacerbates inequality - that in turn deepens economic and social vulnerability. This is a complex set of simultaneous constraints that may have to be addressed, state-by-state to find a pragmatic way forward. State governments, ULBs, development authorities and other parastatals and SPVs will be critical to addressing this challenge and protecting the public interest, as the appetite for private investment in this space is limited and seriously constrained. This is one of the key factors that makes the creation of greenfield new cities and towns a long-term prospect.
26 Nataraj, G. (2014). Infrastructure challenges in India: The role of public-private partnerships. Observer Research Foundation.
27 CAG (2014). Report No. 21 of 2014 - Performance Audit of Special Economic Zones SEZs of Union Government, Department of Revenue - Indirect Taxes, Customs. Available at https://cag.gov.in/content/report-no-21-2014-performance-audit-special-economic-zones-sezs-union-government-department, Retrieved on 27th July 2020 28 Economic Times (2019). Supreme Court directs NBCC to complete home projects in Noida, Greater Noida. Available at https://economictimes.indiatimes.com/news/politics-and-nation/supreme-court-directs-nbcc-to-complete-home-projects-in-noida-greater-noida/articleshow/72335118.cms, , Retrieved on 27th July 2020
29 Gandhi, S., & Phatak, V. K. (2016). Land-based financing in metropolitan cities in India: The case of Hyderabad and Mumbai. Urbanisation, 1(1), 31-52.
62 IIHS - XV Finance Commission Urbanisation Report

Urban Governance Addressing the Roots of India’s Weak Urban Governance
India suffers from weak urban governance for multiple reasons. The implementation of the 74th Constitutional amendment which mandates the devolution of governance to ULBs has been patchy over a quarter century, largely because of limited interest at state level and very limited flows of finances to them from the Govt. of India, State Finance Commissions and even the Finance Commission (IIHS, 2019). This has resulted in most ULBs having weak or non-existent fiscal bases, especially post-GST, in spite of the Finance Commission’s efforts (XIII Finance Commission, 2009; XIV Finance Commission, 2014).
Moreover, little space exists in the 74th Constitutional amendment for multi-stakeholder and multi-scalar governance necessary for economic recovery and acceleration and nimble resource mobilisation. Fragmentation between state governments, ULBs and parastatals responsible for key urban sectors and outcomes needs to urgently rectified. Innovative new forms of regional and metropolitan governance need to be operationalised starting with mega-urban regions and emerging economic clusters. This governance revamp needs to operate along clear transition timelines and implement through short-term institutions such SPVs and PPPs to constitutionally-mandated ULBs and/or innovative new regional governance institutions. There is a need to build and strengthen ULBs via a dedicated state municipal cadre, starting with five states with >40% urbanisation, with plans in place for other states to do so, over the decade. Regional and Metropolitan Governance An effective third-tier of metropolitan and regional governance is critical to plan and manage mega-urban regions, economic clusters and metropolitan areas, finance regional infrastructure, manage resources and mitigate risk. Urban and metropolitan governance is crippled by a lack of governance capacity and there is a need to adopt a more comprehensive approach at this scale. Fragmentation has contributed to poor urban service delivery and resource mobilisation. All mega-urban regions and emerging economic clusters require the implementation of multi-scalar, multi-stakeholder and multi-sectoral governance. Similarly, regional governance requires a more comprehensive approach that is cognisant of the multiple stakeholders and sectors involved. More robust regional and sometimes cross-state governance is necessary to integrate economic development, spatial planning and hence, investments. Environmental governance, especially the management of water resources and air pollution, as well as risk governance are best undertaken at regional level defined by watersheds, airsheds and risk zones. The current context of weak institutional frameworks for environmental, climate and risk governance need to be urgently addressed. Some of the key themes include urban pollution and risk; vulnerability of deteriorating urban ecosystems and services such as food, energy, water security and green cover; and unplanned and unsustainable urban growth. In terms of climate risk, focus needs to be accorded to climate-induced extreme weather, urban drought risk, urban heat stress and sea-level rise.
IIHS - XV Finance Commission Urbanisation Report 63

Establishing and Strengthening State Municipal cadres Apart from the financial resourcing crisis that ULBs face in India (ICRIER, 2019a, 2019b) the most serious governance challenge that our cities and towns face is a massive vacuum of institutional capacity and a fragmentation and overlap of mandate between local representative municipal governance and parastatal institutions ranging from development authorities to water, wastewater and energy utilities that are governed and managed by state government, and land use and other regulators that operate from the state or national level.
Within this institutional morass, is a deep challenge of the lack of specialised, trained and motivated professionals who can manage the planning, management and development of the most important economic entities in the country, which are home to at least a third of our people. Most officials who manage these institutions are on deputation from parent departments and have little formal training and capacity to address a range of complex and interrelated urban issues as outlined in this document. Most are staffed by engineers, accountants or other generalist administrators who have no training or incentives to address economic, social and environmental questions that are central to urban development. It is no surprise, that our cities and towns suffer from poor management.
A number of states have initiated the creation of a state Municipal cadre, as part of the second generation of urban reforms, starting in the 2010s. Others have initiated this process on paper, but not enabled the legal frameworks, resources, cadre control and capacity building process that would enable the institutionalisation of this necessary condition for the implementation of the 74th Constitutional Amendment. This is especially important for states that have higher than the national average rate of urbanisation, and critical for the five states that have crossed the 40 percent urbanisation level and will soon cross the 50 percent urbanisation mark.
The Finance Commission is well placed to incentivise and catalyse the institutionalisation and operationalisation of Municipal cadres at State level. This would initiate the process of building significant state- and ULB-level public institutional capacities, which in turn would help not only everyday management and service delivery, but resource mobilisation, planning, outcome monitoring and accountability along with a stronger emphasis on efficiency, transparency and accountability to citizens.
A dedicated fund of Rs. 1,000 crore Municipal cadre fund, could be created by the XV Finance Commission to enable: (a) the strengthening of Municipal cadres in the states where they exist; (b) help create them over 2020-25 in States that have levels of urbanisation over 33 percent, and (c) prepare other states that have lower than the national average levels of urbanisation to assess the feasibility and necessary steps to create such a cadre. This could be drawn from a Governance, Finance & Outcome Monitoring Improvement grant and allocated on a population basis by State governments to the 500 Class I towns (greater than 0.1 million) to enable focussed use of these resources.
64 IIHS - XV Finance Commission Urbanisation Report
Finance & Investment Estimating Investment Requirements for Post-COVID Urban Recovery Investments in urban areas will be central to a rapid and sustainable post-COVID economic and employment recovery as it is the source of close to 60% of the national GVA, and also contributes to bulk of incremental employment (Revi et al., 2015). Given weak consumer demand, market illiquidity and the ongoing financial crisis in the real estate and construction sectors – a public expenditure lead is desirable, for an urbanisation-led economic recovery, even though it may be difficult given the current fiscal situation. As the economy returns to its new normal, savings and investments rebound and much needed urban sector reforms are put into place, private investment could follow a public expenditure lead. It is unrealistic given the current economic situation, especially in the real estate and infrastructure sectors to expect a pure-play private sector lead. The core questions, are therefore:
1. What is the gross order of magnitude of these investments? 2. What objects of expenditure should they be targeted at? 3. Which locations or sizes of cities should be prioritised? How could investment phasing be
structured? 4. Could this facilitate better balance between states or lead to further divergence? 5. How could the fiscal base of ULBs be strengthened to enable greater stability and autonomy
and less reliance on central, state and Finance Commission transfers, in the medium-run? India needs to commit steady and significant public expenditure to urban areas, starting with the 100-largest cities to enable sustainable post-COVID recovery. The dependence of ULBs on central, state and Finance Commission transfers needs to be significantly reduced to enable greater stability and autonomy on delivering outcomes at the third-tier. These actions are contingent on understanding potential investment needs over this decade, which the following section will examine. Estimating Urban Investment Needs (2021-31) Only very broad estimates of urban investments can be made due to a massive gap in terms of data on city-wise urban economic output and investment, as well as considerable lag in reliable urban population data since Census 2011. Hence, a range of gross assumptions have been made, building on the base of the HPEC (2011) report and its estimates for the 2021-31 period. A significant shift in methods used in the past, to move from a state population-based investment estimates to a city size-class and urban region-based estimates, should incentivise better ULB performance, agency and sustainability of development and economic outcomes. The broad method utilised to make projections is based on the following constraints:
1. Projected population estimates were made for Class I cities to 2031 using Census trends to enable prioritisation based on expected share of economic output and balance between states.
2. Estimates of investment needs were made (for ~450 million residents) to upgrade current cities to meet HPEC norms in 2021.
3. Based on analysis of satellite data of spatial growth and of plans (where available) estimates of investments needed for spatial expansion (where viable) were made.
4. Estimates of investment needs for ~150 million incremental urban residents by 2031 to upgrade cities to meet HPEC norms in 2021, were made.
IIHS - XV Finance Commission Urbanisation Report 65

5. Based on analysis of satellite data of spatial growth and of Master Plans (where available)estimates of investment needs for land for spatial expansion, nucleation and newinfrastructure were made, at indexed prices based on the Sivaramakrishnan Committeereport (GoI, 2014).
These are only order of magnitude investments as presented in Table 3.2. There are limited by serious data gaps on city-wise urban economic output and investments and inter-Census urban populations that constrain evidence-based urban policy. This needs to be corrected at the earliest.
Table 3.2: India: Indicative Urban Upgradation & Expansion Investment Estimates (2021-31)
An estimated annual investment of 1.1% of India’s current (2020) annualised GDP of around Rs. 2.3 lakh crores will be necessary to execute this strategy to its logical conclusion, to meet HPEC (2011) investment norms. This would enable:
• Upgradation of ~475 Class I Cities, home to ~315 million residents;• Planned urban expansion that caters to ~50 million more residents and• Further upgradation of infrastructure and urban services for this population by 2031
These projections will require systematic public investments of around Rs 1 lakh crore per year, on land development which is primarily a state government responsibility. This may be the most serious operational constraint, given the post-COVID fiscal stress and deficits that states are labouring under.
Targeting and Phasing Post-COVID Urban Economic Recovery
Considering the enormity of the challenge, it is critical that post-COVID urban recovery is carefully targeted and carried out in three phases over the next decade (2021 to 2031). It needs to be cognisant of the current limited fiscal space and its resource constraints.
Indicative Urban Upgradation & Expansion estimates (in INR Lakh crores 2020 prices)
Population
Class I
Cities &
Towns
(million)
Estimated
Population
(million)
Estimated Investment (2021-2031)
>10 74 88 100 2.9 1.0 3.4 7.3 31% 5
4-10 22 28 34 0.9 0.5 1.1 2.5 11% 2
2-4 42 52 62 1.4 0.6 1.6 3.6 16% 2
1-2 40 47 54 1.3 0.5 1.5 3.3 14% 3
0.1-1 89 102 111 2.6 0.9 3.0 6.5 28% nd
Grand
Total
267 317 361 9.1 3.5 10.6 23.2 100% 12
% share 39% 15% 46%
Note: based on IIHS population projections (Malladi et al.,2017), HPEC infrastructure Capex estimates (2010-31),
Sivaramakrishnan Committee report (2014)
2011 2021 2031 Upgradation
(2021)
Expansion
(2021-31)
Upgradation
(2021-31)
Total
(2021-
31)
%
share
Land
Develop-
ment
100%
66 IIHS - XV Finance Commission Urbanisation Report

Phase One: Focus on 100-largest cities over 2021-2024 The first phase can be broadly split into two parts: starting with a focus on the 100-largest cities in India. This focus will cover all mega-urban regions, emerging urban clusters and cities in most of the less developed states and underdeveloped regions. This is essential to prioritise, right at the onset, creating a balance across states by building on existing central and state schemes, utilising available institutional capacities, incentivise livelihood-enhancing and green investments and attempt to crowd in private investment at the appropriate time. The second part is to maintain regional balance, it is necessary to invest in critical regional connectivity and disaster and climate resilient infrastructure, prioritised by mega-urban regions, emerging urban clusters and underdeveloped regions. Part of the post-COVID economic recovery package can be channelled for this, and this public investment-led initiative could create appropriate conditions for PPP opportunities and private investments. This should be a primary focus of the XV Finance Commission. Phase Two: Expanding to all ~ 500 Class I towns (2025-2029) The second phase needs to prioritise expanding the investment phase to all Class I Towns that are currently beneficiaries of the AMRUT scheme. This should follow a strong push for state-level urban and land system reforms, initiated in Phase One to promote security of tenure and affordable housing, improved regional and intra-state connectivity and building institutional capacity though a state-level municipal cadre. This could be a secondary focus of the XV Finance Commission. Phase Three: Expand to cover all ~ 10,000+ Urban Centres by 2031 This phased approach should ultimately strengthen ULBs via fiscal federalism, by expanding their fiscal base, governance mandate and capacity to address all urban areas. This could enable coverage of an incremental 150 million people through regionally-defined processes of expansion, nucleation, decongestion and densification (as outlined in Chapter 2). This may be part of the XVI Finance Commission’s mandate.
IIHS - XV Finance Commission Urbanisation Report 67

68 IIHS - XV Finance Commission Urbanisation Report

CHAPTER 4
Conclusions
69

[This page is intentionally left blank]
70 IIHS - XV Finance Commission Urbanisation Report

This section presents a set of consolidated conclusions from earlier sections of the report, on key cross-cutting themes. Urbanisation Trends and Drivers
● Urban areas are India’s most important driver of growth, incremental employment, international trade, investment and taxes
● India needs to maintain a balance between rural and urban areas around work, income, wealth and inequality.
● Investment in housing, physical and social infrastructure are key drivers of scale agglomeration in cities, that facilitate development. Risk adjustments of economic output for poverty, inequality, disasters, epidemics and conflict that concentrate in cities, are necessary to start internalising the costs of these externalities
● India’s economic policies are weakly linked to its economic geography, leading to severe bottlenecks - exacerbating spatial inequality and impacting employment, economic value added, investment and poverty reduction.
● Following 30-years of economic reforms, five mega-urban regions (> 20 million) are set to emerge in India, as well as five emerging economic corridors in south, central and eastern India.
● The urbanisation, infrastructure and development needs of five other, historically underdeveloped regions do need to be addressed to maintain horizontal balance
● India’s strategic rail, road and port infrastructure and economic corridors link existing million+ cities. Further intra-state and regional linkages with ~ 470 other Class I towns and the villages linked to them, can enable sustainable and balanced economic development and rapid post-COVID economic recovery
● Urban Local Bodies are chronically underinvested in terms of both, finances and institutional capacity, in spite of the 74th Constitutional Amendment. This has not changed substantially, even after three generations of urban reforms, significant changes in the tax base post-GST and the Finance Commission’s emphasis on transfers to, and the strengthening of ULBs
Urban Economic Development and Employment Creation
● The post-COVID migrant crisis has highlighted the extreme vulnerabilities of the urban migrant workforce
● India needs to prioritise urban job recovery and creation to support its post-COVID economic recovery.
● The assumptions that the manufacturing sector will lead this shift is unlikely to materialise, given its capital-intensive nature & slowdown in global manufacturing.
● The largest numbers of job losses are in rural areas, and with very low levels of education. As employment growth in the construction sector slows down, there are limited urban options available for these workers
● Skills training or other interventions in urban areas will need to consider this structural challenge as they select areas of focus.
● Strong public sector support in the form of a minimum urban employment guarantee, or rapid deployment of a deep urban social safety net is the most credible alternative to address the livelihoods-informality-migration crisis in urban areas.
● Medium-term Urban investment in India needs to be targeted at four broad goals: o Improve conditions for current (2021) urban population: ~450 m. in ~8,000 places o Address needs of incremental (2031) urban population: ~150 m. in ~12,000+ places,
over the 2020s o Enable and incentivise economic activity that creates opportunities for decent
productive work
IIHS - XV Finance Commission Urbanisation Report 71

o Strengthen urban-rural linkages: between urban areas, outgrowths & adjoining villages
Regional Concentration and Convergence ● Economic development in India has been uneven and regionally imbalanced ● Indian development planning has emphasized sectoral investment focusing on particular
types of industrial or economic development, largely ignoring the economic geography ● Industrially advanced states and districts, with major million+ cities continue to receive large
shares of private investment ● This is despite measures to balance regional industrialisation, for e.g. directing industrial
investment to lagging states and discouraging the location of heavy and polluting industry in metropolitan regions.
● Regional inequality was on the rise before liberalization in 1991: western India gaining differentially, followed by the southern and north-western India.
● Regional economic concentration has been amplified by the development of transportation corridors that connect larger urban centres, with limited improvement in intra-state logistics & passenger mobility
● The strongest differentials are observed in less developed states and regions that have large pools of migrant and under-employed rural labour or are in high-risk zones
● Uneven investment in health and education infrastructure have further exacerbated regional inequality.
● Corridors offer an opportunity to rebalance regional development along with a balance of four critical regional infrastructure networks: renewable electric power, gas, rail and road transport, ICT apart from local and regional access to sustainable environmental services
Regional Development Strategies Regional spatial development strategies are necessary for both national & state development as India urbanises, to match limited resources with local potential, priorities and binding constraints. India’s economic and fiscal environment in the early 2020s indicates that significant new investment in creating New Towns may not be prudent A mix of weak and strong regional development strategies for the 100-largest cities: Strong Strategies:
• Nucleation: India’s 100-largest cities have considerable potential for nucleation including the large and dense mega-urban regions
• Decongestion: Most of India’s 100-largest cities have the potential for decongestion within their planned boundaries
• Regional Connectivity & Access: Improving regional connectivity is an important strategic option across many regions and corridors, especially mega-urban regions
• Intra-urban Connectivity & Access: Almost all of India’s 100-largest cities have considerable potential to improve intra-city mobility and connectivity
Weak strategies • Densification: Only a few of India’s 100-largest cities have residual potential for
densification. • Expansion: Most of India’s 100-largest cities have limited potential to expand
Finance Commission transfers should incentivise strong regional development strategies: nucleation, decongestion and regional and intra-urban connectivity; and only support weak strategies when locally warranted
72 IIHS - XV Finance Commission Urbanisation Report

COVID-19 and Resulting Urban Economic Shock COVID-19 has exacerbated existing faultlines in India’s political economy especially across states and regions and within urban areas, as outlined below:
• The COVID-19 shock started in India’s metropolitan areas with higher incomes, assets and better health and other infrastructure, than smaller cities and villages.
• As India’s total infections are set to cross 2 million, the pandemic is expected to expand to
smaller cities and towns across the country, over the year
• This will continue to disrupt economic activity and exacerbate existing regional and spatial inequalities, esp. in our poorer and more vulnerable states and districts
• The March to May 2020 national lockdown was universally applicable and provided a critical
breather to build state health infrastructure and response systems, but led to massive economic disruption and the space for nationwide spread of the pandemic, accelerated by distress migration
• This came with differential economic impacts esp. on vulnerable and migrant groups in many
urban areas, with limited financial resources and low resilience. Most chose to return to their home villages and states, even though they knew economic opportunities and health services were poorer there
• Post-COVID economic recovery can be initiated in the largest-100 urban areas, but expand in
a second phase to cover ~ 500 AMRUT cities and towns and eventually, the whole country, in a third phase
Post-COVID urban interventions and investments need to accelerate economic and employment recovery and proactively addressing underlying vulnerability and risk. These may start with the largest-100 urban areas, but expand in phases to cover smaller cities and towns and then, the entire country. Addressing Data and Information Gaps One of the most critical constraints to operationalising this is the lack of systematic and time-series information on the economic output, value addition, productivity, public and private investments (ideally by key sectors) for the major urban centres in the country. Given, that close to two-thirds of the economic output comes from urban areas, about 40 percent from the top-100 urban areas, evidence based policy and rule-based transfers by the Finance Commission become almost impossible to implement. Given the expansion and rationalisation of the tax network, advances in survey techniques and technology it should be possible for detailed economic studies, monitoring and public disclosure on an annual or bi-annual basis. This will assist in planning, tracking economic activity, public investment, expenditure and outcomes, and the monitoring of large-scale urban and regional infrastructure investments. Gaps in urban economic data, are also serious constraint to the planning, management and tracking of urban employment, which is a necessary condition for India’s post-COVID economic recovery. Gaps in data on migration is a serious challenge to planning urban and regional development, employment creation and building the resilience of the urban and national economy to shocks that
IIHS - XV Finance Commission Urbanisation Report 73

COVID has clearly showed us. A special thick-round round of the National Sample Survey should be conducted once every 3-4 years that covers both the source districts and key destination districts and the 100-largest urban centres.
Post-COVID Urban Economic opportunities
A range of urban economic opportunities have yet to be targeted by the economic recovery package, building on existing public programmes and schemes and releasing institutional barriers and bottlenecks:
● Economic recovery & developmento Clean Energyo Housing: upgrading, new construction & rentalo e-Mobility or Carbon-neutral Mobility
● Climate and Disaster Resilience Infrastructureo Environmental services: water, sanitation & solid wasteo Energy services: solar, gas and energy efficiencyo ICT
● Accessible Land and Affordable Housingo Land and property tax systems reformo Planning for integrated land use, mobility and infrastructure & economic
development● Improved Governance & Finance
o Strengthen ULB fiscal base and ability to access and deploy financeso Rapidly strengthen ULB institutional capacity via state municipal cadres
Post-COVID economic recovery in Real estate & Construction • The Housing and Infrastructure sectors require ‘patient’ long-term capital’ with financial
horizons of 10-30 years & more.• The Indian real estate and construction sectors are currently facing multiple crises, ranging
from a demand-supply mismatch to a severe liquidity crisis.• The real estate crisis attracted pre-COVID public policy interventions to infuse liquidity,
including:• The establishment of an INR 25,000 crores ‘Alternative Investment Fund’ (AIF)• A range of regulatory support measures e.g. credit guarantees and NPA write-offs• Judicial interventions that brought public sector agencies (e.g. NBCC) to complete
private sector projects• India’s Real Estate industry currently poses high risks to both domestic and foreign, due to
• A significant price mismatch between housing demand and supply• High financing costs and risky practices of fund management• Low returns, insufficient to offset risks• Delayed deliveries and litigation, leading to the deployment of the Insolvency and
Bankruptcy Code
In the current economic environment, easy availability of ‘patient capital’ is unlikely, with domestic markets illiquidity and a post-COVID shrinking of the global economy. It would be best to be deeply conservative on large-scale private sector participation in urban and infrastructure development-led post-COVID economic recovery.
74 IIHS - XV Finance Commission Urbanisation Report

• Indian cities need to be at the forefront of urban sustainability and building resilience toaddress climate mitigation and adaptation
• Development of urban regions needs to integrate environmental risk and hazard sensitivityinto the planning framework & process
• Coherent urban governance, institutional arrangements, planning and service deliveryframeworks are necessary to link urban renewal and development with sustainable urbandevelopment
• Coherent planning, investment and monitoring framework is necessary, to enable public,private, civil society institutions and citizen action reduce vulnerability, exposure and risk
Tracking urban sustainability first for the 100-largest urban areas and then for the ~500 Class I towns and cities, with a population of 1 Lakh will assist State governments and the Govt. of India in making the best of their investments and development expenditure, provide a framework to monitor performance outcomes of ongoing national and state programmes. This would assist India and the Niiti Aayog in comprehensive monitoring and reporting the performance of Indian cities and states on the SDGs in urban areas, and more specifically the 100-largest urban areas.
Urban Risk Reduction • Building a coherent risk reduction framework for urban development will need new set of
incentives & structures to balance short-run priorities with long-run strategic actions and linkacross the public, private and civil society sectors
• Strong fiscal incentives for states and cities to act pre-emptively to reduce vulnerability &exposure, build resilience and institutional capacity for disaster risk reduction
• Building state government and ULB’s risk reduction capacities & incentivising resiliencebuilding by:
• Reducing loss of life by establishing agile and robust Early Warning and EmergencyResponse Systems;
• Mitigation of output losses via robust economic production systems;• Mitigation of capital losses and building of long-term resilience, as part of all new
infrastructure investments• Developing long-term plans for managing lifeline infrastructure• Building of ULB institutional capacity to raise their own revenue, plan and execute
retrofits and new resilient infrastructure and public buildings.• Addressing future population growth in urban areas, particularly to account for high-intensity
peri-urban growth and taking into account future changes in city size classes, balancingcurrent, and future infrastructure investment needs.
Resources can be specifically directed (based on the 100-largest cities: other urban areas: rural population share) to enable urban resilience to multiple hazards, reduction of multi-dimensional vulnerability and building of disaster risk reduction capacities. This builds on the XV Finance Commission’ emphasis on disaster risk reduction and resilience building in urban areas.
The XV Finance Commission could make a significant contribution to building the capacity to address short and medium-term risk across the multiple dimensions, outlined above by enabling a shift in focus from reactive to proactive risk mitigation. This is well addressed by shifting the proportion of grants to urban areas to match and track ongoing levels of urbanisation e.g. moving from 32.5 per cent to 35 per cent over (2020-25) with 0.5 per cent increments each year. This addressed both the current and incremental urban population. Second expanding the coverage of basic services investments in urban areas to include health and education. Third, specifying that all investments in
Sustainable Urbanisation
IIHS - XV Finance Commission Urbanisation Report 75

urban and regional infrastructure meet national disaster and climate resilient standards. Fourth, specifying that all investments will be made with full cognisance of the multidimensional risks that they are be exposed to, with mitigation measures pre-identified.
State Municipal Cadres The Finance Commission is well placed to incentivise and catalyse the institutionalisation and operationalisation of Municipal cadres at the State level. This would initiate the process of building significant state- and ULB-level public institutional capacities, which in turn would help not only everyday management and service delivery, but also resource mobilisation, planning, outcome monitoring and accountability along with a stronger emphasis on efficiency, transparency and accountability to citizens.
76 IIHS - XV Finance Commission Urbanisation Report

CHAPTER 5
Recommendations
77

[This page is intentionally left blank]
78 IIHS - XV Finance Commission Urbanisation Report

This section presents key recommendations to the XV Finance Commission based on key policy questions on urbanisation and post-COVID economic recovery and a wide-ranging analysis across key states and regions, themes and issues of concern. A high-level estimate of the scale of investments that are needed to address current and future (2021-31) urbanisation are also presented to assist in helping define a method to aid regional convergence and development, prioritisation and phasing of investment.
Strategic Choices This report’s recommendations hinge on the following strategic choices that prioritise prudent investments that address inequality between and within states and strengthen regional linkages.
1. Significant investment in creating New Towns is not prudent in the current economic andresource environment, due to their long gestation, medium-term impact and resourceintensity.
2. Appropriate spatial and sectoral investments and incentives are needed to addressdivergence and inequality between states, and within each state, between smaller andClass I towns (between 0.1 million and 1 million population) and million+ cities to enablespatial balance, urban-rural linkages & regional convergence.
3. India’s strategic rail, road and port infrastructure and economic corridors largely linkexisting million+ cities. Further strengthening these intra-state and inter-regional linkageswith ~ 400 other Class I towns and rural areas, can enable balanced economicdevelopment and more rapid post-COVID economic recovery.
Goals and Strategic Priorities The strategic choices listed above need to be supplemented with goals that specifically target post-COVID urban economic recovery:
1. Enable immediate post-COVID economic recovery by establishing safety nets forfood, tenure/housing, decent work and basic services, and enabling economicrecovery and resilience while addressing migration and informality.
2. Improve conditions for (2021) urban population of approximately 450 million inabout 8,000 urban places.
3. Address needs of incremental (2021-31) urban population of approximately 150million in about 12,000+ urban places.
4. Enable economic activities that create opportunities for decent productive work.5. Strengthen urban-rural linkages between urban areas, outgrowths and adjoining
villages.
These can be achieved by focusing on three strategic priorities: (i) accelerating recovery and growth in locations and sectors that have the most potential; (ii) mitigating risks and vulnerabilities in the least developed and most exposed states and districts; and (iii) addressing bottlenecks in resource mobilisation, institutional capacity and implementation.
This will record a diversification of devolution strategy initiated by the XV Finance Commission, from a solely population and state area basis, to one that recognises the importance of regions and place in the process of economic and sustainable development, and explicit measures to address regional inequality, potential and risks between and with states (Revi, A., Bazaz, A. 2019). Hence, to match with the distribution of India’s population the proportion of grants between rural and urban local bodies should shift from 67.5:32.5 in (2020-21) to 65:35 in (2024-25), or an annual transition of 0.5 percent of divisible pool for local bodies.
IIHS - XV Finance Commission Urbanisation Report 79

1. Sectoral priorities supported by central and state schemes should converge to enableeconomic recovery and development across Micro, Small and Medium Enterprises (MSME) inmanufacturing, trade and tourism; construction; clean energy; and carbon-neutral mobility.Climate and disaster resilient infrastructure across environmental services such as water,sanitation and solid waste; energy services including solar, gas and efficiency, e-mobility andlogistics, and ICT, should also be enabled.
2. Multiple reforms are necessary in land systems and affordable housing. These include afocus on land and property tax systems reform, planning for integrated land use, mobilityand infrastructure, and economic development. Housing needs should be tackled with amulti-pronged approach of enabling upgradation and rental housing and making affordablenew construction.
3. Improved governance and finance policies improve urban economic and fiscal data anddigital management and are essential to strengthen the fiscal base and ability of Urban LocalBodies (ULB) to access and deploy finances. They also strengthen their institutional capacityvia State Municipal cadres as well as their governance frame and devolution.
4. State-led strategic interventions crowd-in other resources leveraging and redirectingexisting Central Schemes and Programmes. They also: (i) strengthen the capacity of ULBs andstate governments to mobilise, implement and regulate; (ii) build enterprise capacity toimplement and finance; (iii) build disaster resilience and mitigate climate risk; and (iv)implement regional development strategies.
5. In addition to central and state interventions, balanced regional priorities across statessuch as investments in and around existing urban centres and linked settlement systems,and economic corridors along the top 5: mega-urban regions, emerging urban clusters,economic corridors, and less developed states and risk-prone regions, is necessary, inaddition to investments in creating new towns and cities.
Sectoral and Locational Priorities and Interventions
80 IIHS - XV Finance Commission Urbanisation Report

Table 5.1: Indicative Urban Upgradation and Expansion Investment Estimates (2021-31)
An estimated annual investment of 1.1% of India’s current (2020) annualised GDP of around Rs. 2.3 lakh crores will be necessary to execute this strategy to its logical conclusion, to meet HPEC (2011) investment norms. This would enable:
• Upgradation of ~475 Class I Cities, home to ~315 million residents;• Planned urban expansion that caters to ~50 million more residents and• Further upgradation of infrastructure and urban services for this population by 2031
These projections will require systematic public investments of around Rs 1 lakh crore per year, on land development which is primarily a state government responsibility. This may be the most serious operational constraint, given the post-COVID fiscal stress and deficits that states are labouring under.
Targeting & Phasing Post-COVID Urban Recovery
Resource constraints and limited current fiscal space imply the need to target and phase post-COVID urban recovery, over the next decade (2021-31) in the following manner:
Phase One: Focus on 100-largest cities (2021-2024)
● Phase 1A: starting with a focus on the 100-largest cities in India. This focus will cover all mega-urban regions, emerging urban clusters and cities in most of the less developed states andunderdeveloped regions. This is essential to prioritise, right at the onset, creating a balanceacross states by building on existing central and state schemes, utilising available institutionalcapacities, incentivise livelihood-enhancing and green investments and attempt to crowd inprivate investment at the appropriate time.
Population
Class I
Cities &
Towns
(million)
Estimated
Population
(million)
Estimated Investment (2021-2031)
>10 74 88 100 2.9 1.0 3.4 7.3 31% 5
4-10 22 28 34 0.9 0.5 1.1 2.5 11% 2
2-4 42 52 62 1.4 0.6 1.6 3.6 16% 2
1-2 40 47 54 1.3 0.5 1.5 3.3 14% 3
0.1-1 89 102 111 2.6 0.9 3.0 6.5 28% nd
Grand
Total
267 317 361 9.1 3.5 10.6 23.2 100% 12
% share 39% 15% 46%
2011 2021 2031 Upgradation
(2021)
Expansion
(2021-31)
Upgradation
(2021-31)
Total
(2021-
31)
%
share
Land
Develop-
ment
100%
Source: IIHS analysis, 2020 based on Urban population projections (Malladi et al., 2017), HPEC (2011)
infrastructure capital expenditure estimates (2010-31), Sivaramakrishnan Committee report (2014).
Nd: no data
Indicative Urban Upgradation & Expansion estimates (in INR Lakh Crores 2020 prices)
IIHS - XV Finance Commission Urbanisation Report 81
● Phase 1B: to maintain regional balance, invest in critical regional connectivity and disaster andclimate resilient infrastructure, prioritised by mega-urban regions, emerging urban clustersand underdeveloped regions. Part of the post-COVID economic recovery package can bechannelled for this, and this public investment-led initiative could create appropriateconditions for PPP opportunities and private investments.
Phase Two: Expand to all ~ 500 Class I towns (2024-2029)
Expanding the investment phase to all Class I Towns that are currently beneficiaries of the AMRUT scheme. This should follow a strong push for state-level urban and land system reforms, initiated in Phase One to promote security of tenure and affordable housing, improved regional and intra-state connectivity and building institutional capacity though a state-level municipal cadre. This could be a secondary focus of the XV Finance Commission.
Phase Three: Expand to cover all ~ 10,000+ Urban Centres by 2031
This phase should ultimately strengthen ULBs via fiscal federalism, by expanding their fiscal base, governance mandate and capacity to address all urban areas. This could enable coverage of an incremental 150 million people through regionally-defined processes of expansion, nucleation, decongestion and densification (as outlined in Chapter 2). This may be part of the XVI Finance Commission mandate.
Priorities & Institutional Arrangements
The XV Finance Commission’s contribution towards accelerating post-COVID economic recovery may be limited due to mandate and fiscal envelope constraints. Nevertheless, a set of concrete steps could be taken, within the current framework:
• Policy convergence of Finance Commission transfers with the Govt. of India’s economicstimulus package and commitment to the sustainable development of urban areas, is a no-cost high-impact contribution.
• Strengthening land and property tax systems reform and tenure security under aGovernance, Finance & Outcome Monitoring Improvement grant to 500 Class I towns andcities across all States. This would be distributed on a population (90%) and expenditureperformance (10%) basis and converge strongly with Govt. of India’s Housing for Allprogramme expenditure and outcomes and ongoing attempts to reform land recordsystems.
• Strengthening Municipal governance and capacity and information systems under aGovernance, Finance & Outcome Monitoring Improvement grant to improve urban economicand fiscal data and digital management in ~500 Class I towns and cities across all States.
• Incentivising the building of all infrastructure in at least the 100-largest urban areas todisaster and climate resilient standards, under FC grants, as per NDMA guidelines, would bea significant step forward and in keeping with the FCs disaster management priorities andmandate. This would require minimal resourcing.
82 IIHS - XV Finance Commission Urbanisation Report

Dedicated Urban Governance & Financial Resilience Fund
To accelerate and incentive these processes, the Finance Commission could create a dedicated Urban Governance, Financial Resilience & Outcome Monitoring Improvement grant fund to 500 Class I towns and cities across all States, at ~5 percent share of the total Finance Commission grant to Urban Local Bodies. This would help strengthen local government capacities in line with the 74th Constitutional Amendment and attempt to address key bottlenecks around land systems and ULB financing.
This grant fund could be provided oversight by a national committee with representatives of the Ministries of Housing and Urban Affairs, Finance, Niiti Aayog, State governments and leading urban experts. Within this, three strategic outcomes could be targeted:
• A Rs. 3,000 crore Urban Land and Property systems Reform grant fund to enable: (a) thereform of revenue, peri-urban and urban land systems to enable access of land to enable tenuresecurity, upgradation in-situ, affordable housing and disaster and climate resilient infrastructuredevelopment; (b) the implementation and strengthening of digital property taxation, registrationand land records systems and land value capture, to enable greater buoyancy of ULB financesaround their single most important source of revenue. This could be distributed on a population(90%) and expenditure performance (10%) basis and implemented by the 100-largest ULBs bypopulation size and the State governments for other urban centres
• A Rs. 2,000 crore Municipal Cadre development grant fund, to enable: (a) the strengthening ofMunicipal cadres in the states where they exist; (b) help create them over 2021-25 in States thathave levels of urbanisation over 33 percent, and (c) prepare other states that have lower than thenational average levels of urbanisation to assess the feasibility and necessary steps to createsuch a cadre, including a pooled cadre in some regions. This could be drawn from the UrbanGovernance, Financial Resilience grant fund and allocated on a population basis by Stategovernments and targeted at the 500 Class I towns (greater than 0.1 million) to enable focusseduse of these resources.
• A dedicated Rs. 1,000 crore Economic and Financial Data systems improvement grant fundto enable: the establishment of institutional capacities in the 100-largest cities and at State levelto track, monitor and report on economic activity, public investment, expenditure and outcomes,and the monitoring of large-scale urban and regional infrastructure investments. This could beexecuted by an appropriate set of third-party institutions including universities, thinktanks,research institutions and urban observatories with a track record in addressing question ofurbanisation.
IIHS - XV Finance Commission Urbanisation Report 83

84 IIHS - XV Finance Commission Urbanisation Report
Bibliography
85

[This page is intentionally left blank]
86 IIHS - XV Finance Commission Urbanisation Report

Anarock Capital Advisors (2019). Private Equity in Indian Real Estate. Available at https://api.anarock.com/uploads/research/Private-Equity-in-Indian-Real-Estate-ANAROCK-Capital.pdf, Retrieved on 27th July 2020
Ballaney, Shirley, (2008) The Town Planning Mechanism in Gujarat, India (Washington: World Bank Institute).
Basole, A., 2018, State of Working India, 2018, Bengaluru, Azim Premji University, https://cse.azimpremjiuniversity.edu.in/wp-content/uploads/2019/02/State_of_Working_India_2018-1.pdf,
Bazaz, A., Jana, A., Revi, A., & Malladi, T. (2017). Unpacking Population Scaling Effects. Bengaluru. BMTPC. (2006). India Earthquake Hazard Map: Vulnerability Atlas −2nd Edition; Peer Group,
MoH&UPA; Map is Based on digitised data of SOI, GOI; Seismic Zones of India Map IS:1893 −2002, BIS, GOI, Seismotectonic Atlas of India and its Environs, GSI, GOI. New Delhi.
CAG (2014). Report No. 21 of 2014 - Performance Audit of Special Economic Zones SEZs of Union Government, Department of Revenue - Indirect Taxes, Customs. Available at https://cag.gov.in/content/report-no-21-2014-performance-audit-special-economic-zones-sezs-union-government-department, Retrieved on 27th July 2020
Census of India, 2011. Provisional population totals, census of India, 2011; urban agglomerations/cities having population 1 lakh and above. Census of India, New Delhi, India, Accessed on July 29, 2013
Chakravorty, S. 2000. How does structural reform affect regional development? Resolving contradictory theory with evidence from India. Economic Geography, 76 (4) (367-394)
Chakravorty, S. (2016). Land acquisition in India: The political-economy of changing the law. Area Development and Policy, 1(1), 48-62.
CGWB. (2019). National Compilation on Dynamic Ground Water Resources of India, 2017. Faridabad. DFCCIL. (2020). Dedicated Freight Corridor. Retrieved from
https://uic.org/IMG/pdf/d2_s4_mechanised_maintenance_philosophy_of_railway_assets_punit_agrawal_india_part2.pdf
Forest Survey of India. (2019). State of Forest Report. Gandhi, S., & Phatak, V. K. (2016). Land-based financing in metropolitan cities in India: The case of
Hyderabad and Mumbai. Urbanisation, 1(1), 31-52. Glover , W. J. 2012. The troubled passage from ‘village communities’ to planned new town
developments in mid-twentieth-century South Asia. Urban History, 39 (01) (108-127) Himanshu. 2019. The Seriousness of the Unemployment Problem in India. LiveMint, 1 Aug 2019.
https://www.livemint.com/opinion/columns/opinion-the-seriousness-of-the-problem-of-unemployment-in-india-1564679281965.html.
Home, R. 2013. Of planting and planning: The making of British colonial cities, Routledge. ICRIER (2019a) State of Municipal Finances in India ICRIER (2019b) Finances of Municipal Corporations in Metropolitan Cities of India Jain, G., Jigyasu, R., Gajjar, S. P., & Malladi, T. (2015). Cities Provide a Transformational Opportunity to
Reduce Risk Accumulation. RF Policy Briefs. Https://Doi.Org/10.24943/9789387315075. Jain, G., Revi, A., Koduganti, J., & Abbas, A. (2018). Localising SDGs for India.
https://doi.org/10.24943/sdgsindia.2018 Jana, A., Malladi, T., Raju, J. S. M., & Rao, P. (2015). Urban India 2015: Evidence (Demographic
Dynamics). Https://Doi.Org/10.24943/Urbindia.2015_1. Kalia, R. 1994. Bhubaneswar: from a temple town to a capital city, SIU Press. Kalia, R. 1999. Chandigarh: The making of an Indian city, Oxford University Press New Delhi. Kalia, R. 2006. Modernism, modernization and post-colonial India: a reflective essay. Planning
Perspectives, 21 (2) (133-156) Routledge Kannan, K. & Raveendran, G. 2019. From Jobless to Job-loss Growth. Economic & Political Weekly, 54
(44) (39)
IIHS - XV Finance Commission Urbanisation Report 87

Malladi, T., Chatterji, N., & Jana, A. (2017). India Urban Atlas 2017: Visualising and Understanding Urban Growth and Expansion. Bengaluru: Indian Institute for Human Settlements. https://doi.org/https://doi.org/10.24943/urbindia.2017
Mazumdar, I., Neetha, N. & Agnihotri, I. 2013. Migration and gender in India. Economic and Political Weekly, (54-64)
Ministry of Shipping. (2016). Sagaamala National Perspective Plan. Ministry of Railways. 2020a. Indian Railways operationalizes 4197 Shramik Special trains. Available:
https://pib.gov.in/PressReleasePage.aspx?PRID=1629043. Ministry of Railways. 2020b. Indian Railways to continue to give Shramik Special Trains to States as
demanded. Available: https://pib.gov.in/PressReleasePage.aspx?PRID=1631092. Ministry of Urban Development (1987). The National Commission on Urbanisation Report Morris, S., & Pandey, A. (2007). Towards reform of land acquisition framework in India. Economic and
Political Weekly, 2083-2090. Morris, S., & Pandey, A. (2009). Land markets in India: Distortions and issues. India Infrastructure
Report. Nataraj, G. (2014). Infrastructure challenges in India: The role of public-private partnerships. Observer
Research Foundation. Nayyar, G. & Kim, K. Y. 2018. India's internal labour migration paradox: the statistical and the real, The
World Bank. NHAI. (2019). National Highways Development Project. Retrieved from https://nhai.gov.in/nhdp-
english-map.htm NOAA -NGDC. (2011). Version 4 DMSP-OLS Nighttime Lights Time Series. Boulder, Colarado: Image
and data processing by NOAA’s National Geophysical Data Center. DMSP data collected by US Air Force Weather Agency.
OpenStreetMap contributors. (2020). Planet dump. retrieved 2013-10-19.[Online]. Available: http://www. openstreetmap. org. Retrieved from https://planet.openstreetmap.org/
Patel, S., Mehta, P. & Correa, C. 1965. Planning for Bombay: 1. Patterns of Growth 2. The Twin City 3. Current Proposals. MARG [Online], 18, 3, Available: https://marg-art.org/product/UHJvZHVjdDozMDA5 [Accessed July 10, 2020].
Revi, A. (2020) Where & When to Lift a Lockdown, What to Do to enable a Transition to Normalcy? (https://doi.org/10.24943/WWLETN.2020)
Revi, A., Idicheria, C., Jain, G., Anand, G., Sudhira, H. S., Seddon, J., … Srinivasan, S. (2011). Urban India 2011: Evidence (Third Edit). Indian Institute for Human Settlements. https://doi.org/10.24943/9789350674307
Revi, A., Jana, A., Malladi, T., Anand, G., Anand, S., Bazaz, A., Bhan, G., JS, M. R., Koduganti, J., Harish, S., Wankhade, K., MJ, V., Rao, P., Sami, N. & Shah, S. 2015. Urban India 2015: Evidence, Bangalore, Indian Institute for Human Settlements.
Revi, A., Sen, G., Suresh, Y., Kuruvilla, R., & Bazaz, A. (2019). Localising SDGs for India: 2019. Bengaluru.
Revi, A., Bazaz, A. (2019). Study for the XV Finance Commission on Urban Infrastructure and Resilience
Searle, L. G. (2016). Landscapes of accumulation: Real estate and the neoliberal imagination in contemporary India. University of Chicago Press.
Seshadri, T. (2012). An analysis of the feasibility of private land assembly for Special Economic Zones in India. Urban Studies, 49(10), 2285-2300.
Sivam, A. (2002). Constraints affecting the efficiency of the urban residential land market in developing countries: a case study of India. Habitat International, 26(4), 523-537.
Survey of India. (2019). Political Map of India - Ninth Edition. Dehradun, India: Department of Science and Technology, Government of India. Retrieved from http://www.surveyofindia.gov.in/files/Political Map of India.jpg
88 IIHS - XV Finance Commission Urbanisation Report

UNEP-GRID. (2014). PREVIEW Global Risk Data Platform. Geneva, Switzerland. Retrieved from https://preview.grid.unep.ch
United Nations, Department of Economic and Social Affairs, & Population Division. (2019). World Population Prospects 2019, Volume I: Comprehensive Tables. New York.
Vyas, M. 2019. Surveying India's Unemployment Numbers. The Hindu, 9 Feb 2019. https://www.thehindu.com/opinion/lead/surveying-indias-unemployment-numbers/article26218615.ece.
XIII Finance Commission (2009). Report of the XIII Finance Commission, Government of India. XIV Finance Commission (2014) Report of the XIV Finance Commission, Government of India. XV Finance Commission (2014) Report of the XV Finance Commission for the year 2020-21,
Government of India.
IIHS - XV Finance Commission Urbanisation Report 89

90 IIHS - XV Finance Commission Urbanisation Report

Select cases of new city and town development
in India (1909-2020)
ANNEX I
91

[This page is intentionally left blank]
92 IIHS - XV Finance Commission Urbanisation Report
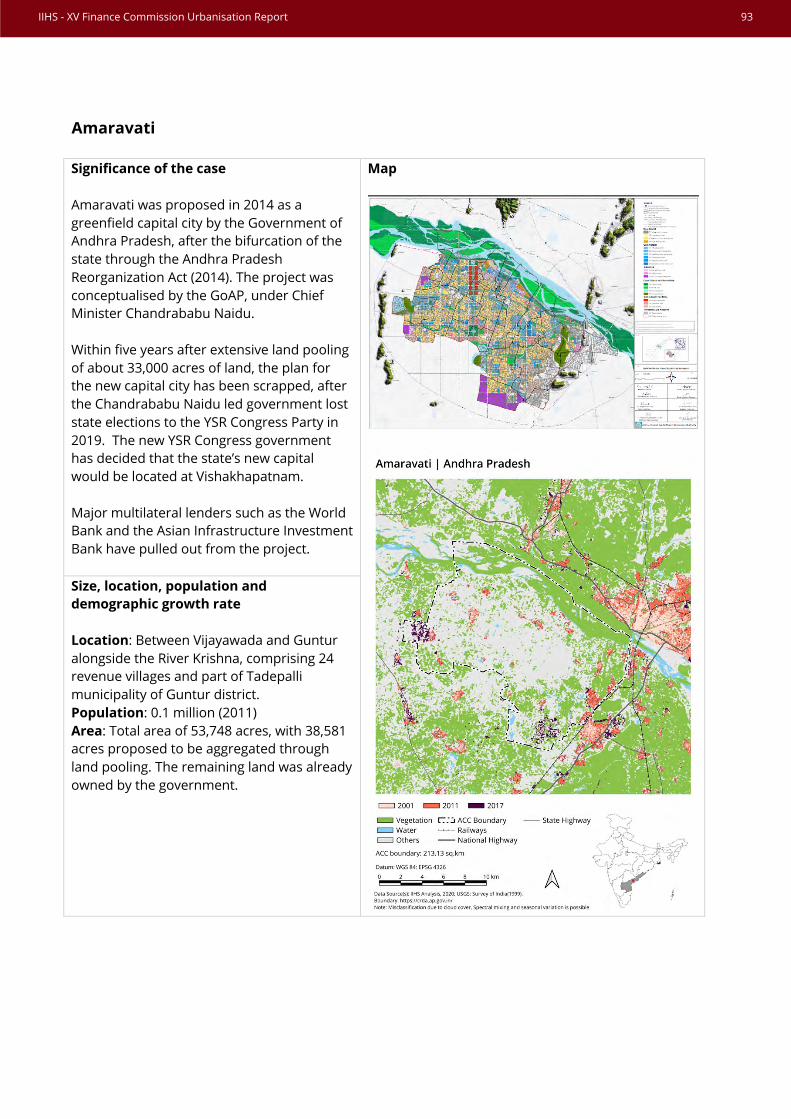
Amaravati
Significance of the case Amaravati was proposed in 2014 as a greenfield capital city by the Government of Andhra Pradesh, after the bifurcation of the state through the Andhra Pradesh Reorganization Act (2014). The project was conceptualised by the GoAP, under Chief Minister Chandrababu Naidu. Within five years after extensive land pooling of about 33,000 acres of land, the plan for the new capital city has been scrapped, after the Chandrababu Naidu led government lost state elections to the YSR Congress Party in 2019. The new YSR Congress government has decided that the state’s new capital would be located at Vishakhapatnam. Major multilateral lenders such as the World Bank and the Asian Infrastructure Investment Bank have pulled out from the project.
Map
Size, location, population and demographic growth rate Location: Between Vijayawada and Guntur alongside the River Krishna, comprising 24 revenue villages and part of Tadepalli municipality of Guntur district. Population: 0.1 million (2011) Area: Total area of 53,748 acres, with 38,581 acres proposed to be aggregated through land pooling. The remaining land was already owned by the government.
IIHS - XV Finance Commission Urbanisation Report 93

Vision and reasons for establishment Amaravati was envisioned as the greenfield capital city for the newly formed state of Andhra Pradesh. It was launched as the ‘People’s Capital’. The Master Plan incorporated nine ‘theme’ cities at Amaravati: Government City, Justice City, Finance City, Knowledge City, Electronics City, Health City, Sports City, Media City and Tourism City. Land aggregation and investments Amaravati was proposed at a location, which predominantly consisted of agricultural fields, mainly with commercial crops, spread across 25 villages in three mandals (Thulluru, Mangalagiri and Tadepalli) of Guntur District. The land pooling approach was adopted to aggregate land, to avoid the costs, delays and public opposition against land acquisition. The land pooling scheme was started in January 2015, with the aim of obtaining 38,581 acres of land. As per official reports, 22 out of the 24 villages approached to give up their land agreed within four months of the scheme’s announcement. It was also decided that the Land Acquisition Act would be used to assemble land from the villages that did not agree to the land pooling scheme. This makes the Amaravati land pooling exercise more compulsory than voluntary. The official report prepared by the APCRDA in July 2018 pegged the required investment for the new city to be between Rs 424.5 billion to Rs 495 billion (USD 6 billion to USD 7 billion). IBRD (World Bank) financing was proposed to be US$300 million, with co-financing from the Asian Infrastructure Investment Bank (AIIB) of US$200 million. At the time of the project being scrapped projects worth Rs 281 million (around USD400 million) had been launched. The Andhra Pradesh Capital Region Development Authority (APCRDA) also raised Rs 200 million by issuing Amaravati bonds, which witnessed a 1.53 times oversubscription. In 2019 the new government allowed subscribers who had purchased the bonds the option of consensual premature termination of these instruments. Implementation and governance structure Lead role in visioning, land pooling, investment pooling and coordination: Government of Andhra Pradesh Planning and development authority for Amaravati: APCRDA: Preparation of the Master Plan: Surbana, Jurong Pvt. Ltd: Master Plan for the government complex: Norman Fosters: Infrastructure development and implementation: Amaravati Development Corporation/ VGTMUDA: All powers and loans of the APCRDA were transferred to the VGTMUDA in 2019 ADC partners to develop the new city: Ascendas- Singbridge and Sembcorp, Ascendas- Singbridge Andhra Investment Holdings, Singapore Amaravati Investment Holdings (JV): Amaravati Metro Rail Corporation Limited Key issues The new capital project was ambitious in its greenfield imagination, the scale of the planned city, and the short gestation period that was envisioned. As other examples highlight, urban areas often take two-three decades to be established economically and socially, over and beyond the demographic
94 IIHS - XV Finance Commission Urbanisation Report
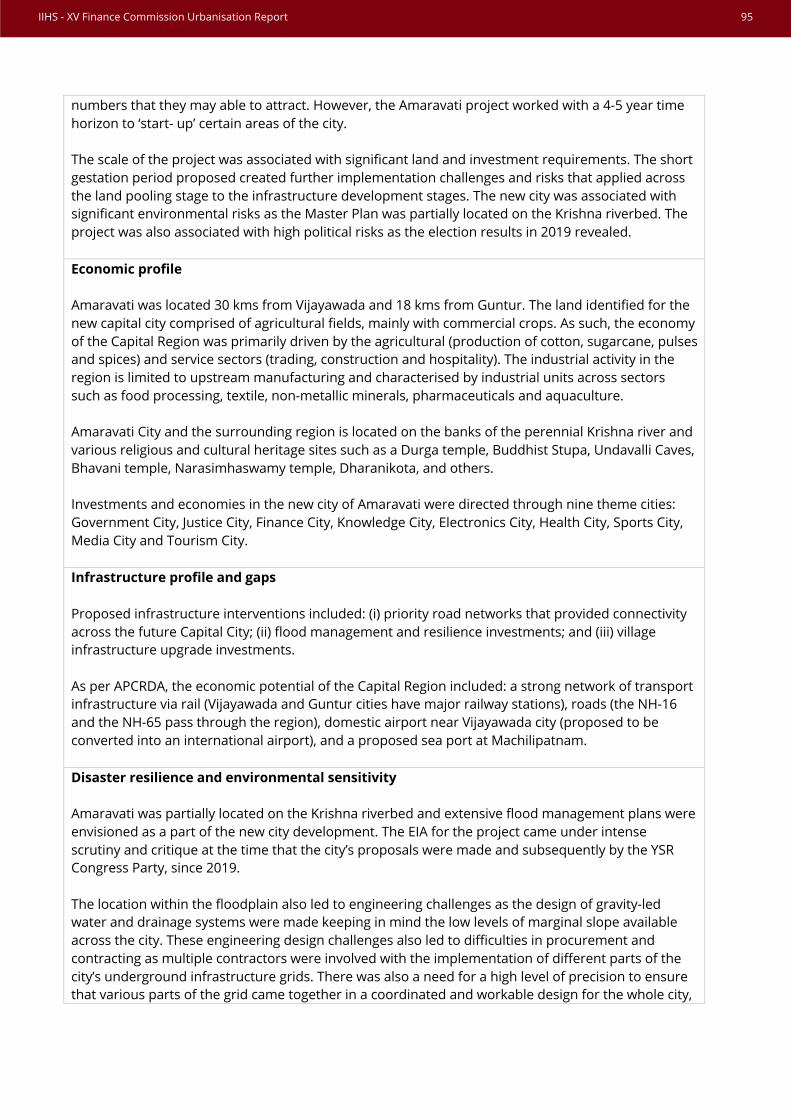
numbers that they may able to attract. However, the Amaravati project worked with a 4-5 year time horizon to ‘start- up’ certain areas of the city. The scale of the project was associated with significant land and investment requirements. The short gestation period proposed created further implementation challenges and risks that applied across the land pooling stage to the infrastructure development stages. The new city was associated with significant environmental risks as the Master Plan was partially located on the Krishna riverbed. The project was also associated with high political risks as the election results in 2019 revealed. Economic profile Amaravati was located 30 kms from Vijayawada and 18 kms from Guntur. The land identified for the new capital city comprised of agricultural fields, mainly with commercial crops. As such, the economy of the Capital Region was primarily driven by the agricultural (production of cotton, sugarcane, pulses and spices) and service sectors (trading, construction and hospitality). The industrial activity in the region is limited to upstream manufacturing and characterised by industrial units across sectors such as food processing, textile, non-metallic minerals, pharmaceuticals and aquaculture. Amaravati City and the surrounding region is located on the banks of the perennial Krishna river and various religious and cultural heritage sites such as a Durga temple, Buddhist Stupa, Undavalli Caves, Bhavani temple, Narasimhaswamy temple, Dharanikota, and others. Investments and economies in the new city of Amaravati were directed through nine theme cities: Government City, Justice City, Finance City, Knowledge City, Electronics City, Health City, Sports City, Media City and Tourism City. Infrastructure profile and gaps Proposed infrastructure interventions included: (i) priority road networks that provided connectivity across the future Capital City; (ii) flood management and resilience investments; and (iii) village infrastructure upgrade investments. As per APCRDA, the economic potential of the Capital Region included: a strong network of transport infrastructure via rail (Vijayawada and Guntur cities have major railway stations), roads (the NH-16 and the NH-65 pass through the region), domestic airport near Vijayawada city (proposed to be converted into an international airport), and a proposed sea port at Machilipatnam. Disaster resilience and environmental sensitivity Amaravati was partially located on the Krishna riverbed and extensive flood management plans were envisioned as a part of the new city development. The EIA for the project came under intense scrutiny and critique at the time that the city’s proposals were made and subsequently by the YSR Congress Party, since 2019. The location within the floodplain also led to engineering challenges as the design of gravity-led water and drainage systems were made keeping in mind the low levels of marginal slope available across the city. These engineering design challenges also led to difficulties in procurement and contracting as multiple contractors were involved with the implementation of different parts of the city’s underground infrastructure grids. There was also a need for a high level of precision to ensure that various parts of the grid came together in a coordinated and workable design for the whole city,
IIHS - XV Finance Commission Urbanisation Report 95

with low margins of change/ error possible during implementation, within fast- tracked implementation schedules. Conclusions Amaravati highlights several issues associated with large-scale greenfield urban projects, including the challenges of large-scale land aggregation, the fallouts of underplaying environmental considerations, the challenges of managing investment risks that can be allayed by large government guarantees but only over the short term, the fallouts of managing public participation towards pre-determined goals, as well as the challenges of managing the gap between development proposals and development needs. References
- APCRDA: https://crda.ap.gov.in/apcrdav2/views/home.aspx - APCRDA Resettlement Policy Framework: Total investment:
https://crda.ap.gov.in/apcrdacommuni/media/asccdp/16082017/Amaravati%20RPF-Cleared%20by%20RSA.pdf - World Bank EIA Plan: http://documents1.worldbank.org/curated/en/334341534487697595/pdf/Environmental-
Impact-Assessment-Environment-Management-Plan-Report-for-Flood-Mitigation-Works.pdf - World Bank Environment and Social Management Framework:
http://documents1.worldbank.org/curated/pt/650051486971245674/pdf/Environmental-and-Social-Management-Framework.pdf
- Land pooling case study by Director of Planning, APCRDA: https://blog.avenue.in/2018/08/02/case-study-amaravati-land-pooling-scheme/
- Malladi, T., Chatterji, N., & Jana, A. (2017). India Urban Atlas 2017: Visualising and Understanding Urban Growth and Expansion. Bengaluru: Indian Institute for Human Settlements. https://doi.org/https://doi.org/10.24943/urbindia.2017
96 IIHS - XV Finance Commission Urbanisation Report

Bidadi
Significance of the case In 2006, the Government of Karnataka approved five townships to be developed by BMRDA/ BDA in Bangalore’s periphery. These were in addition to townships that were approved as a part of the NICE project. In time, four of the BMRDA/ BDA townships were denotified. However, Bidadi a proposed new Knowledge City in the southern periphery of Bangalore, continues to be held by the BMRDA/ BDA. Bidadi is proposed over 9,178 acres, across 10 villages. The project has experienced several attempts by the BMRDA/ BDA to bring in private sector developers and private sector investments.
Map
IIHS - XV Finance Commission Urbanisation Report 97

A brief chronology • 2006: In a major move, land use conversions in the identified area were frozen. This meant that
farmers and land owners in the area could sell their land but only as agricultural land, thus effectively freezing the increase in land values in the area. This however did not stop the land values in surrounding areas to increase, compromising the economic options for project affected persons. The land freeze has been in place for the past 15 years. In response, project affected persons have formed the Sri Ranganatha Raitha Hitarakshana Samithi, which has been the petitioner in High court against BMRDA for land acquisition in the area.
• 2007: DLF was selected to prepare a Master Plan for Bidadi and offered a turn key role from
master planning to development to delivery. DLF was supported by a range of other private sector actors/ activities – e.g. Calthorpe prepared the 2007 Master Plan for Bidadi Township, Alcon Consulting Engineers Pvt. Ltd. conducted the detailed survey of proposed peripheral ring road for a length of 117 Km for BDA and also conducted detailed survey for the layout plan and DPR at Bidadi Phase 2 Industrial area for KIADB, Limitless, a Dubai based developer, part of Nakheel group had 50% stake in the DLF led consortium. However, in 2009 DLF made an exit citing land concerns.
• 2010: BMRDA revived the project with an RFQ that divided the project into smaller parts. GVK, Reliance, Hindustan Construction were among the developers shortlisted. However, land concerns continued, and in 2011 the project was shelved.
• 2015: BMRDA revived the project under a TPS format, a form of land pooling in an effort to build support with the project affected persons that had formed the Sri Ranganatha Raitha Hitarakshana Samithi. However not much progress was made, and the project was again shelved.
• 2017: A fresh BMRDA/ BDA call was advertised inviting bids only to prepare a Master Plan for Bidadi rather than a private sector turn- key approach, as attempted earlier.
Key issues Bidadi enjoys several advantages of economic and urban agglomeration benefits due to its proximity to Bangalore as well as the increasing congestion being experienced in the city’s existing IT hubs, ranging from Electronic City in the South-East to Whitefield and Sarjapur Road in the East. However, these advantages have not been sufficient to derisk the project to facilitate its implementation through private sector participation and investments. The project has been attempted through various modes of private sector participation for the past 15 years. Implementation challenges have included managing the investment and risk appetite of the private sector, as well as managing the needs of project affected persons. Through the years BDA/ BMRDA have attempted several strategies to derisk the project to facilitate implementation – from a turnkey private sector-led approach, it moved to spatial division of the township into smaller projects, followed by a land pooling approach. However, none of these approaches have been adequate to address underlying land concerns and the private sector’s perceptions of risk and investment appetite. References:
- Malladi, T., Chatterji, N., & Jana, A. (2017). India Urban Atlas 2017: Visualising and Understanding Urban Growth and Expansion. Bengaluru: Indian Institute for Human Settlements. https://doi.org/https://doi.org/10.24943/urbindia.2017
98 IIHS - XV Finance Commission Urbanisation Report

Bhubaneshwar
Significance of the case Bhubaneshwar was reinstated as the capital of Odisha in 1948 as riverine natural barriers inhibited the further expansion of Cuttack. It became functional and shifted officially only in 1959 (Census Handbook). It was planned and built as an administrative and service sector city using the gridiron pattern (Routray et al 1996). Industrial establishments emerged only in 1980, but the city continues to have a high population working in the tertiary sector (India Smart City Profile).
Map
Size, location, population and demographic growth rate Bhubaneswar is the largest city in Odisha, with a Municipal Corporation area covering approximately 135 sq.km. The city was planned by Otto H Koenigsberger for 40,000 people across 16 sq. km. The population has grown considerably from 0.038 million in 1961 to 0.88 million in 2011, due to migration in the metropolitan region. It was planned as an administrative state and employed close to 90% of its population in the tertiary sector until 1991 (Routray et al 1996).
IIHS - XV Finance Commission Urbanisation Report 99

Vision and reasons for establishment Its location near the eastern coast of India with good connectivity to existing and emerging ports, petrochemical and steel hubs at Paradip, Kalinga Nagar, Dhamra and Gopalpur, makes Bhubaneshwar a strategic regional gateway for South-East India. Several new ports are being proposed along the Odisha coast, which could further improve the connectivity required for exports. Tourism is another important industry for Bhubaneswar as it serves as the gateway to the Golden Tourist Triangle of Puri, Konark and Chilika Lake. Land aggregation and investments Most of the growth is taking place to the north, northeast and southwest. The city can be broadly divided into the old town, planned city (or state capital), added areas and outer peripheral areas. It is subdivided into Units and Colonies. Though parts of the city followed the Master Plan, others have grown rapidly, outstripping the planning process. The peripheral areas are outside the municipal boundary or have subsequently been included within the extended boundary, including Tomando, Patia and Raghunathpur. Most of these areas were developed in a haphazard manner, without proper planning. Implementation and governance structure The Legislative Assembly of Odisha was shifted from Cuttack to Bhubaneswar in 1949. From 1952 to 1979, it was administered by a Notified Area Council or a Nagar Panchayat; a municipality was established only in 1979. Bhubaneswar Municipal Corporation was established in 1994. Bhubaneshwar secured the first place in the national Smart City Challenge competition to emerge as one the first contenders to be selected for funding under the Smart City Mission. The city has done justice to this, by adopting and integrating ‘smart’ elements across all infrastructure to enable improved services and living conditions for its citizens. Among the significant development projects, Bhubaneshwar has re-invented its public services with e-governance initiatives, paved the way for a Capital City Transport Authority to streamline policy formulation, planning and implementation of its motorised and non-motorised transport. Key issues
● The city is prone to disasters due to its geographical location ● Bhubaneshwar has a significant slum population which is being addressed through various
Centrally sponsored Schemes to enable tenure security and better access to employment. ● Connectivity to the port and strategic economic corridor is important to accelerate economic
development. Economic profile Bhubaneswar has a rich cultural heritage and a strong regional economic base. The city has emerged as a major destination for the IT industry, higher education and advanced medical care along with the boom in the metals and metal processing industries. Bhubaneswar is the only Tier-2 city in the country with the presence of top Indian IT firms as well as high employment growth. The city has a dedicated IT SEZ and is also one of the four notified ‘Information Technology Investment Region’ in India. The city also has several eminent institutions like IIT, NIFT, AIIMS, NISER, IIIT, XIMB, XUB, BGU, and KIIT. Bhubaneshwar has been recognised
100 IIHS - XV Finance Commission Urbanisation Report

internationally for its social equity programs e.g. Gram Tarang (skill development) and KISS (Tribal residential education). Infrastructure profile and gaps Odisha has borne the brunt of extreme climate events over the years ( e.g. a supercyclone and drought in 1999) along with significant portion of its population being poverty. Bhubaneshwar was reported to have a slum population of 30% in 2011. The city has subsequently improved and upgraded its infrastructure, enabling improved services for its citizens. The implementation of urban development programs like RAY and PMAY have helped improved conditions in slums and informal settlements, consolidated by Odisha’s pioneering urban tenure initiative. Disaster resilience and environmental sensitivity Odisha and Bhubaneswar are exposed to multiple weather and climate related risks from: heat waves to cyclones and storm surge; droughts to floods. The city was severely affected by the Extremely Severe Cyclonic Fani in 2019, that disrupted passenger traffic at the only major airport in the state for several days. The cyclone caused a lot of loss of green cover leading to heat waves in 2019. The increase in the frequency and intensity of hydro-meteorological hazards such as cyclones, floods and droughts are being linked to climate change. The city is exposed to urban and riverine flooding from River Kuakhai to the east, and the Daya river in the west. Bhubaneshwar lies in moderate Earthquake Damage Risk Zone (Zone III). Conclusions Bhubaneshwar has the potential to:
● Accelerate employment generation, that can be built on for post-COVID recovery ● Emerge as a logistics hub, based on its proximity to the East-coast transport corridor ● Improve its attractiveness for investment through better infrastructure and public services ● Enable tenure security and employment potential in slums and informal settlements ● Improve institutional capacity to respond to and build urban disaster reliance
References
- https://www.bmc.gov.in/ - https://www.bda.gov.in/ - https://www.smartcitybhubaneswar.gov.in/ - https://censusindia.gov.in/2011census/dchb/2117_PART_B_DCHB_KHORDHA.pdf - https://www.sciencedirect.com/science/article/pii/026427519500128X - http://www.dataforall.org/dashboard/censusinfoindia_pca/ - Malladi, T., Chatterji, N., & Jana, A. (2017). India Urban Atlas 2017: Visualising and Understanding Urban Growth and
Expansion. Bengaluru: Indian Institute for Human Settlements. https://doi.org/https://doi.org/10.24943/urbindia.2017
IIHS - XV Finance Commission Urbanisation Report 101

Chandigarh
Significance of the case Chandigarh, planned by the French architect Le Corbusier in the late 1950s, is considered a symbol of post-Independent India’s foray into planned urbanisation. It was one of the pioneering 20th century experiments in greenfield urban planning and modern architecture. The Master Plan was developed by Le Corbusier who also designed the Capital Complex and established the architectural and urban design controls for the city. Chandigarh offers historical and contemporary lessons in the challenges that planners and builders of ‘new towns’ face as the region deals with the adaptability of formal, rigid planned development with the growing demands of spatial and economic urban growth (Kalia, 1985).
Map
Size, location, population and demographic growth rate The Union Territory (UT) of Chandigarh is located near the foothills of the Shivalik range in northwest India and has a total area of 114 sq. km. Chandigarh witnessed a decennial population growth (2001-2011) of 27 percent with a metropolitan population of 1 million (Census, 2011).
Vision and reasons for establishment Chandigarh, the capital of two states Punjab and Haryana, has a strong regional influence over hinterlands in both states, especially the satellite towns of Mohali (Punjab) and Panchkula (Haryana). As a planned city with strict development controls and bye-laws, Chandigarh displays high service levels. With a population density of 9,258 persons/ sq.km. (Census, 2011) the city is challenged by urban sprawl and the expansion of unplanned outgrowths, slums and informal settlements.
102 IIHS - XV Finance Commission Urbanisation Report

Land aggregation and investments The site for Chandigarh was selected in 1948 considering its central location, proximity to Delhi, availability of water, moderate climate, fertile soil, gradient for natural drainage, and a panorama of hills as backdrop. The Government of Punjab, in consultation with the Government of India, approved the site for the new capital. The foundation stone for the city was laid in 1952. Implementation and governance structure At the time of the reorganisation of Punjab, Haryana and Himachal Pradesh, in 1966, it was declared a Union Territory under the direct control of the Central Government and the capital of both Punjab and Haryana. The Municipal Corporation of Chandigarh was established in 1995. The Chandigarh Administration and Municipal Corporation have overlapping jurisdictions. Key issues Chandigarh’s limited land area, rigid planning guidelines and unplanned peripheries make for a challenging case of sustainable urban management. Peripheral and former village abadi lands are extensively encroached, in spite of the Chandigarh administration’s rehabilitation drive across almost 18,000 dwellings, to regularise tenure. The relationship between the city and its region in two states, makes for a serious governance challenge as there are three separate jurisdictions that need to be addressed. Economic profile Chandigarh has become one of the wealthiest towns in India with a high per capita income and a Human Development Index. The economic character of the UT, conceived as an administrative centre is changing character, with the development of several knowledge and service industries. Chandigarh has high quality health and education services with premier medical, research and educational institutions. Infrastructure profile and gaps The bulk of Chandigarh is well planned and has high quality of infrastructure and services, outside the peripheral unplanned development. This is partially because of an industrial policy that only permits non-polluting industries that are run on electricity to be based in the city. It is also making the slow transition to solar PV-based power. Conservation of the Sukhna lake and other water bodies and watershed development and groundwater recharge are also key initiatives. Chandigarh’s green cover has increased by almost 9%, over the last two decades. Chandigarh airport is expected be upgraded into an international airport to improve global connectivity. Disaster resilience and environmental sensitivity Chandigarh, along with adjoining urban agglomerations of Mohali and Panchkula in the adjoining states, due to its locational proximity at the foothills of the Shivalik range, is vulnerable towards natural and manmade calamities like, Floods, Earthquakes, Windstorms, Sunstroke, Heat and Cold Wave, Fire Accidents and Chemical and Biological accidents/threats etc. The Chandigarh Disaster Management Plan (CDMP) has been envisaged as a preparedness plan and has been incorporated
IIHS - XV Finance Commission Urbanisation Report 103

within the Chandigarh Master Plan 2031. The CDMP addresses earthquake as a prime potential hazard due to its location at the foothills of Himalayas, among other multiple hazards. Earthquake simulation exercises have been carried out at the district level by NDMA to assess ‘multi-state Disaster Preparedness’. Risk and Vulnerability Analysis of Chandigarh has also identified several environmental risks like chemical spills on the environmental resources in Chandigarh like the lakes, leisure parks, reserved forests, etc. Environmental resources may be impacted when a primary hazard (earthquake, flood) leads to secondary hazards like chemical spills, sewage overflow, etc. Chandigarh lies in the high earthquake damage risk zone (Zone IV) and faces urban floods with heavy rainfall. The city disaster management plan recognises the earthquake as the most critical risk to the city and lists enforcement of the building codes and laws, retrofitting existing structures, mock drill and training as some of the key activities for risk mitigation in the city. Conclusions Since its conception in 1952, Chandigarh has emerged as one of India’s leading planned cities, with a strong balance of education, health and knowledge institutions, emerging technology and innovation:
● Ranked first on the Human Development Index. ● Rated as the “wealthiest town” in India and the sixth most prosperous city, in terms of family
wealth, with a high economic growth rate. ● Bank deposits of USD 4 billion. ● Education: Panjab University, PGIMER, an Architecture and Fine Arts college, ISB. ● Health: Seven large government hospitals and other hospitals in the private sector. ● Research Institutes: IMTECH, CSIO, NIPER.
It has taken over 50 years for the city to get to a critical economic and demographic mass, even though it is a UT, capital of two of India’s more prosperous states and part of one of the largest mega-urban regions in the world. References:
- http://mcchandigarh.gov.in/ - http://chandigarh.gov.in/welcome.asp - http://chandigarh.gov.in/pdf/civild18-cdmp.pdf - http://chandigarh.gov.in/cmp2031/disaster.pdf - Malladi, T., Chatterji, N., & Jana, A. (2017). India Urban Atlas 2017: Visualising and Understanding Urban Growth and
Expansion. Bengaluru: Indian Institute for Human Settlements. https://doi.org/https://doi.org/10.24943/urbindia.2017
104 IIHS - XV Finance Commission Urbanisation Report

Durgapur
Significance of the case Durgapur is one of the fastest emerging cities of West Bengal, planned as a countermagnet to Kolkata. Popularly known as the Steel city of eastern India, Durgapur was a greenfield city planned in the post-Independence era. Known as the "Ruhr of India, born out of the vision of Dr. B. C. Roy, the Chief Minister of West Bengal (1948-62). The well laid out industrial township was designed by Joseph Allen Stein and Benjamin Polk as an integrated industrial town. It is home to Durgapur Steel Plant, one of the largest integrated steel plants of SAIL. Durgapur was planned and remains one of the biggest industrial hubs in India.
Map
Size, location, population and demographic growth rate Durgapur is in Paschim Bardhaman district of West Bengal, an undulating topography on the banks of the River Damodar just before it enters the alluvial plains of Bengal. The coal-bearing area of the Raniganj coalfields lies just beyond Durgapur. Durgapur is the third largest city in West Bengal in terms of area (154 sq. km) and population 0.6 million (2011 Census). The city was planned along the Grand Trunk road, with the residential areas to the north of and the industrial areas to the south.
Vision and reasons for establishment The topography of the lower Damodar Valley region along with proximity to the Raniganj coal fields, made Durgapur a suitable site for the location of a giant steel plant. The opening of Chittaranjan Locomotive Works in 1951 was an important driver for the location of several heavy and medium
IIHS - XV Finance Commission Urbanisation Report 105

industries in the steel and alloy, mining and allied machinery sectors. Hundreds of ancillary industries at Durgapur have completely changed the industrial landscape of the region. Land aggregation and investments The urbanisation in Burdwan district started in the mid-19th century with the opening of modern coal mines at Raniganj and steel production in Asansol. The Durgapur Steel township was planned in 1961, adjoining a Coke Oven Plant and an Alloy Steel Plant on three distinct pieces of land sandwiched and separated by the Damodar river, railway and NH2 highway alignment. The Durgapur Development Authority was formed in 1958 to coordinate and integrate development across the industrial city. In 1966, an Intermediate Development Plan was prepared that paved the way for the half a dozen townships that currently make up the city. Implementation and governance structure Durgapur City is the headquarters of the Durgapur subdivision consisting of the Durgapur Municipal Corporation and five community development blocks. The five blocks contain 36 Gram Panchayats and 30 census towns. The Durgapur Urban Agglomeration includes the Durgapur (Municipal Corporation), Bamunara (Census town) and Arrah (Census town). The Durgapur Notified Area Authority was created in1962 to bring individual industrial townships into the municipal structure as ratepayers. The state later passed a Municipal Act in 1994 to transfer powers of this body to the Durgapur Municipal Corporation. Key issues
● Air Pollution from steel industries/ industrial establishments is severe. ● Unplanned growth in the peripheral areas housing small scale enterprises and workers
contributes to the 40% slum population of the city. ● Some upgradation of slum infrastructure has been achieved via BSUP. ● Limited planning framework with limited development regulations within various private
townships. Economic profile Durgapur has a large industrial base of with the Durgapur Steel Plant and Alloy Steel Plant with their respective townships. Other major industries include: thermal power, cement, chemicals, and machinery. NTPC, DVC, CMERI, Durgapur Cements, Durgapur Chemicals, Graphite India Ltd, Philips Carbon Black Ltd. (PCBL), Ultratech Cement Ltd and ALSTOM Projects India Ltd are located here, as well as a large number of MSMEs. Infrastructure profile and gaps A new greenfield Aerotropolis is being developed at Andal to cater to the cargo needs of the industrial townships. Connectivity with Kolkata has been upgraded with a 200km long expressway. The Damodar Valley Corporation Power project provides a dedicated source of power and water for the area. The Durgapur Municipal Corporation has upgraded water supply and sewage treatment in the city via JNNURM to improve water supply to new townships and the Aerotropolis.
106 IIHS - XV Finance Commission Urbanisation Report

Disaster resilience and environmental sensitivity Durgapur is located in the Raniganj coal mining belt and on the Damodar river is exposed to several multiple hazards. Key risks include land subsistence, flood and drought. Durgapur has also witnessed water scarcity due to groundwater extraction by heavy industries, Environmental risks like air pollution and chemical accidents are also important risks to the city. Conclusions Over a period of more than 70 years Durgapur, along with the industrial town of Asansol, has developed into an industrial and employment countermagnet to Kolkata’s urban agglomeration, but at less than a twentieth of its size. A strong industrial base of steel and coal-based industries has developed but will be deeply challenged by the decarbonisation imperatives of the 21st century to address climate change. The city will have deep challenges diversifying, even with the creation of a new greenfield aerotropolis and improved road connectivity with Kolkata through a 200 km expressway. References
- http://www.durgapurmunicipalcorporation.org/ - Urbanisation and Rural Change in West Bengal, Economic and Political Weekly, Vol. 22, No. 7 (Feb. 14, 1987), pp. 276-
287 (12 pages) - https://www.researchgate.net/publication/306346235_The_Impact_of_Urbanization_on_Environment_A_Study_in_Dur
gapur_City - https://shodhganga.inflibnet.ac.in/bitstream/10603/159805/13/13_chapter%208.pdf - https://www.censusindia.gov.in/2011-prov-
results/paper2/data_files/India2/Table_3_PR_UA_Citiees_1Lakh_and_Above.pdf - https://www.jstor.org/stable/pdf/4376849.pdf?casa_token=ieOkeFi3-
aMAAAAA:GRo6fnYZU5gNPWskzbqtt6zCgnALcauEXaY90lnM_fuednMiTAh5A1vOYgfEGKzm4S3gyAnbgoGRke_u50tAtt1bLcKRb8ycLLseY2nk9mSLFgCQQWOt
- https://sarthac.gov.in/view-act-file?file_id=1514 - https://censusindia.gov.in/2011census/dchb/1909_PART_B_DCHB_BARDDHAMAN.pdf - https://books.google.co.in/books?hl=en&lr=&id=tBslBQAAQBAJ&oi=fnd&pg=PP1&dq=durgapur+city+planning&ots=cJ
_CtQpbkt&sig=aTImrlCvR5hD1zWwKgDbIRfLd8Q&redir_esc=y#v=onepage&q&f=true - http://wbdmd.gov.in/writereaddata/uploaded/DP/DPPaschim%20Bardhaman20500.pdf - Malladi, T., Chatterji, N., & Jana, A. (2017). India Urban Atlas 2017: Visualising and Understanding Urban Growth and
Expansion. Bengaluru: Indian Institute for Human Settlements. https://doi.org/https://doi.org/10.24943/urbindia.2017
IIHS - XV Finance Commission Urbanisation Report 107

Jamshedpur
Significance of the case Jamshedpur is one of India’s earliest steel towns, and an early example of a privately built industrial settlement that was built through a partnership between the Tata Iron and Steel Company and the colonial Indian government. After Independence, several other steel towns were developed and modelled on Jamshedpur, including Bhilai, Rourkela and Durgapur. While it has expanded a lot since the early decades of its establishment, this growth has been very uneven across the constituent units of the Jamshedpur Urban Agglomeration (JUA). The City Development Plan prepared for Jamshedpur under JNNURM, as well as the Master Plan 2027, highlight significant issues in governing and managing the JUA, including the absence of a local tax base.
Map
Size, location, population and demographic growth rate Jamshedpur Urban Agglomeration: 1.4 million (2011 Census).
Vision and reasons for establishment The city of Jamshedpur was built around Jamsedji Tata’s vision of building India’s first steel plant and town to support it. Based on the agreement between the Tata Iron and Steel Company (TISCO, later renamed Tata Steel Ltd.) and the Government of India in 1909, the government acquired approximately 3,500 acres of land for the company to establish a steel plant. Considered one of the most significant experiments in building an industrial town in India, it became the model for other post-Independence steel towns. During the colonial period, several American and British architects, engineers and firms drew up Master Plans for the town of Jamshedpur, including the final pre-
108 IIHS - XV Finance Commission Urbanisation Report

Independence plan in 1943 by Otto Koenigsberger. For many years, the company town of Jamshedpur had a very high quality of service provision and a planned approach to development that was implemented by the Town Planning Division of the Tatas. After multiple extensions of their lease agreement, the Tatas now pay an agreed sum of money to the government of Jharkhand in exchange for maintaining services in the Jamshedpur Notified Area, while the adjoining areas Adityapur, Mango and Jugsalai have their own Notified Area Committees or municipalities. Land aggregation and investments Initially, the government acquired approximately 3,500 acres of land for the company to establish a steel plant. Subsequent agreements between the government and the company provided more land for expansion and for the provision of housing and civic amenities. Implementation and governance structure Jamshedpur does not have a democratically elected urban local body, an issue that has been contested in the High Courts and the Supreme Court since the late 1980s. JUA consists of several constituent units: JUSCO (Jamshedpur Utilities and Services Company, a Tata enterprise responsible for the management of the township), Jamshedpur Notified Area Committee (JNAC), Adityapur Notified Area Committee (ANAC), Mango Notified Area Committee (MNAC), Jugsalai Municipality, 8 village panchayats, and Adityapur Industrial Development Authority (AIDA). One of the main concerns for Jamshedpur is that it needs a unified entity with a legal status to implement its Master Plan and to provide unified administrative and civic services required for the entire JUA area as it expands. Key issues As Jamshedpur and the steel industry have grown, ancillaries and other firms have come up in surrounding areas. Successive plans for the city since its formation, including those formulated by British and American engineers and planners since 1909, have highlighted the issue of inadequate housing for workers, and the issue of bastis with inadequate services adjoining well-planned areas (Sinha and Singh, 2011). The final pre-Independence plan drawn up by Otto Koenigsberger in 1943, also included a plan for the relocation and redevelopment of bastis. The constituent units of the JUA have done their own planning and implemented projects (particularly in the area of transport planning and housing). Hence a unified approach to the overall region does not exist, leading to issues like inadequate housing of decent quality, poor service provision, environmental contamination due to the absence of adequate treatment infrastructure, and traffic congestion. In particular, the sharp inequality in access to infrastructure, services, and adequate housing between the planned and unplanned parts of the city is a key issue. The lack of a local tax base in order to bring about improvements is also a major concern, limiting the ability of the government to bring about infrastructure improvements. Economic profile The economy of the Jamshedpur area is centered around the original steel industry, with many ancillaries and other related companies coming up around it in subsequent decades, such as Telco, Tinplate Company, Indian Cable Company, Tata Robins Frazer, and others. In addition to the tinplate, steel and cable industries that started in the 1920s, the post-Independence state
IIHS - XV Finance Commission Urbanisation Report 109

government established a new satellite industrial town (Adityapur) in the 1960s for firms and industries that were providing inputs to Tata Steel. Infrastructure profile and gaps A key factor when selecting the original location was its proximity to a railway station on the Bombay-Calcutta line, which allowed goods to be transported easily to Calcutta port. When assessing existing service levels and quality, Jamshedpur’s City Development Plan highlights that there is a highly uneven level of service provision for water supply, sewerage and sanitation, storm water drainage, solid waste management, and transport, as well as slum settlements across the JUA as contrasted with the JUSCO areas having very high levels of service provision. There are also major concerns around traffic congestion, with a lot of outbound traffic carrying industrial output from Jamshedpur and Adityapur, as well as traffic cutting through the city from the south to the north (Sinha and Singh, 2011). The absence of overall planning for the Urban Agglomeration limits the possibilities of addressing the transport problem in a holistic way. Conclusions While Jamshedpur originally came up with a clearly identified economic and industrial logic, the very nature of its industrial history and governance prevents it from having a unified planned approach to its urban growth. Issues of inadequate housing and uneven service provision across the different constituents are not new for Jamshedpur. However, bringing in either a democratically elected local body or a parastatal to manage the urban agglomeration and bring about improvements for its residents, seem elusive – outlining one of the most serious governance challenges with industry or private sector-led new town development. References
- Sinha, A. & Singh, J. (2011) Jamshedpur: Planning an ideal steel city in India. Journal of Planning History, 10 (4), 263-281.
- Malladi, T., Chatterji, N., & Jana, A. (2017). India Urban Atlas 2017: Visualising and Understanding Urban Growth and Expansion. Bengaluru: Indian Institute for Human Settlements. https://doi.org/https://doi.org/10.24943/urbindia.2017
110 IIHS - XV Finance Commission Urbanisation Report

Lavasa
Significance of the case Lavasa is a privately built ‘new town’ that was initially focused on increasing tourism in the area, made possible as a result of the Hill Station Regulation passed by the Government of Maharashtra in 1996. The project has been opposed on environmental grounds and has also faced resistance from local residents. Development has been halted recently due to financial challenges that the parent company – Lavasa Corporation Limited (LCL) has been facing (Balakrishnan, 2019; Parikh, 2015). Size, location, population and demographic growth rate Lavasa is being planned and built by a private corporation: the Lavasa Corporation Limited (LCL). It began as a 7,000-acre development in 2000 and grew to 25,000 acres by 2005 and was originally planned for a stable population of 240,000 and 2 million annual visitors. Current estimates (as of 2018-19) show that only one of the proposed five towns – Dasve – has been partially built, with a population of less than 10,000 residents (Balakrishnan, 2019; Antony and Pandya, 2018b; Antony and Pandya, 2018a). Vision and reasons for establishment Planned to be independent India’s first hill station, Lavasa was the first such new town to be built entirely by a private corporation. It aimed to offer a new (private) model of building, planning and governing cities that would respond to failed planning and governance history in contemporary urban India. The development of Lavasa has run into financial difficulties with the corporation engaged in resolution processes under IBC 2016. Construction and development have now been halted. Land aggregation and investments It went through very complex and political processes of land acquisition through several subsidiary companies that eventually came together/sold their land to Lavasa Corporation. It was made possible by the Hill Station Regulation passed by the GoM in 1996-97. Implementation and governance structure Lavasa has a private governance structure that is run largely by the LCL with little to no resident involvement. There has also been little to no involvement of erstwhile residents or residents from surrounding jurisdictions. Key issues Lavasa is being planned and developed entirely by a private enterprise – LCL, which is a subsidy of the Hindustan Construction Company (HCC). The development of Lavasa was funded through equity, including through Foreign Institutional Investors (FIIs) of about USD 492 million (Balakrishnan, 2019). However, LCL is now struggling to repay lenders, and the company is engaging in resolution processes under the IBC 2016 (Antony and Pandya, 2018a). Failure and financial crises have compromised investors and residents, several of whom are retirees. The state government, in a controversial move, had transferred land-use planning powers to LCL, effectively granting regulatory
IIHS - XV Finance Commission Urbanisation Report 111

control over the proposed development area to a private firm (Balakrishnan, 2019), leading to a lack of accountability to residents. Economic profile Lavasa was planned primarily as a retirement and tourism destination in the Western Ghats. However, given the ongoing challenges with project completion, this has not been entirely realised, and it remains to be seen if the project will be completed as envisioned. Infrastructure profile and gaps One of the key selling points for Lavasa was its relative isolation from urban centres like Mumbai and Pune. Infrastructure on site was managed privately by LCL, while drawing on water from nearby sources. Although situated off the Mumbai-Pune expressway, road connectivity is limited. There are plans to connect Lavasa to the two metros through a series of underground tunnels, but the construction of these has been stayed by the national government, citing environmental concerns (Balakrishnan, 2019). Disaster resilience and environmental sensitivity Lavasa is located in the Western Ghats, which is an ecologically sensitive and fragile region. There are also concerns around water use, potential landslides and erosion as a result of construction. Conclusions As the financial challenges facing Lavasa show, transferring new town development entirely to a private firm is a high-risk strategy. There is little public oversight, and concerns around the legitimacy of private authority to take on state functions such as land-use and infrastructure planning remain (Balakrishnan, 2019). References
- Balakrishnan, S. 2019. Shareholder Cities: Land Transformations Along Urban Corridors in India, Philadelphia, PA, University of Pennsylvania Press.
- Antony, A. & Pandya, D. 2018a. How the unfinished city of Lavasa became a nightmare for Indian banks. Business Standard [Online], Available: https://www.business-standard.com/article/current-affairs/how-the-unfinished-city-of-lavasa-became-a-nightmare-for-indian-banks-118061900095_1.html [Accessed July 10, 2020].
- Antony, A. & Pandya, D. 2018b. Lavasa: Indian billionaire’s paradise has now become a hell on earth. The Print [Online], Available: https://theprint.in/featured/lavasa-indian-billionaires-paradise-has-now-become-a-hell-on-earth/72043/ [Accessed July 10, 2020].
- Parikh, A. 2015. The private city: planning, property, and protest in the making of Lavasa New Town, India. The London School of Economics and Political Science (LSE).
112 IIHS - XV Finance Commission Urbanisation Report

Navi Mumbai
Significance of the case New Bombay (now Navi Mumbai) was planned as a satellite town and built by CIDCO, to act as a countermagnet to Mumbai and its suburbs. The explicit aim as laid out in the 1964 Development Plan was decongestion and industrial decentralisation of Mumbai within the Greater Mumbai area (Shaw, 2004). The primary aim was to move tertiary sector workers to Navi Mumbai and decongest the southern end of Mumbai. This has not been entirely achieved, partly due to the reluctance of public and private sector enterprises to move away from Mumbai, and the decision to invest in redeveloping the Bandra-Kurla Complex as an alternate business district within Mumbai. Navi Mumbai however has managed to grow into a manufacturing location building on nearby industrial estates and is planning to develop IT/ITES zones as economic growth drivers.
Map
Vision and reasons for establishment Located on mainland Maharashtra on the Mumbai-Pune highway, Navi Mumbai was planned to be about 345 sq. km in area. Since it was planned as a countermagnet to Mumbai, it needed to be in close proximity to the city. Founded in 1971, it was functional by the end of 1991. Its population in 1971 was 0.11 million and had reached 1.1 million by 2011, with a density of 3,257 people/sq.km. The plan and the city’s development were characterised by multiple nodes which were multi-nucleated settlements along a mass transit railway line, with each settlement being self-contained in terms of amenities such as schools, shopping, and other essential services. Land aggregation and investments The primary aims were to decongest Mumbai by building a satellite town, and to provide an alternate growth centre within the Mumbai Metropolitan Region (Patel et al., 1965). The original plan was to decongest industry and commerce and move tertiary sector workers to a new planned satellite town, to be called Navi Mumbai and decongest the Central Business District in the southern end of Mumbai.
IIHS - XV Finance Commission Urbanisation Report 113

Land acquisition and investments The capital expenditure for land acquisition and development was to be financed through Municipal bonds. The plan proposal indicated an estimate of Rs. 730 crores for the acquisition, reclamation and development of low-lying land (Shaw, 2004; Patel et al., 1965). However, by 1998, CIDCO had spent Rs. 48,000 crores on physical infrastructure alone (Shaw, 2004). Implementation and governance structure Navi Mumbai was planned and built by CIDCO. Its main governing body is the Navi Mumbai Municipal Corporation (NMMC) which governs the built-up area (about 56% of the total land). CIDCO continues to own and develop vacant plots within Navi Mumbai. Key issues The actual amount of investment required for the development of Navi Mumbai was much more than anticipated. There were also challenges around developing the land, with significant costs for reclamation as well as resistance from local residents to sell land, which increased the cost of development. The original aim of decongesting Mumbai was not fulfilled (Shaw, 2004). Although the individual nodes were envisaged as being self-contained in terms of jobs, this has not happened. According to a 2011 report by CIDCO, only 35% of the people living in Navi Mumbai had migrated from Mumbai. The lack of commitment from the Government of Maharashtra to move administrative offices to Navi Mumbai also impacted the city’s development. Economic profile The city was originally planned as a countermagnet to Mumbai with the aim of decongesting the Central Business District in South Mumbai, focusing primarily on tertiary sector, white collar jobs, and decentralising industrial development. These goals were not entirely met. Navi Mumbai has a mix of economic activities from fisheries to financial markets. It includes manufacturing (industry), trade and commerce (wholesale and warehousing), as well as service sector (office) jobs. The Navi Mumbai Special Economic Zone (NMSEZ) is located at the heart of Navi Mumbai and comprises four zones, namely Dronagiri, Kalamboli, Ulwe and the Jawaharlal Nehru Port Terminal (JNPT) area. The NMSEZ is slated to provide for world-class infrastructure, utilities, service for business, living, learning, recreation and healthcare. The per household monthly income of Navi Mumbai is reported to be about Rs. 24,000 (CIDCO, 2012). The Taloja Industrial Area consists of 277 Industrial Units – large, medium and small. All types of process industries including chemical, paper and plastic are located here (IIHS, 2018). The Trans Thane Industrial Belt developed by the Maharashtra Industrial Development Corporation (MIDC) in the mid-sixties witnessed a sharp growth of industries in terms of number of units, capital deployed, employment and turnover. Most of the industrial units continue to be high capital-intensive industries. The Thane Belapur Industrial belt had 72 industrial units in 1974. Now there are about 2,300 industrial units with an employment of over 1 lakh with an annual turnover of more than Rs. 10,000 crores. Thirteen major wholesale Agricultural Produce Markets from Mumbai were shifted to APMC Vashi with the necessary facilities provided to facilitate trade. The Jawaharlal Nehru Port is India’s biggest container port, handling around 60% of the country's containerised cargo.
114 IIHS - XV Finance Commission Urbanisation Report

Infrastructure profile and gaps The development plan of Navi Mumbai provides for an integrated transportation system. Rail and road are the two main surface transport modes providing connectivity to Mumbai and Thane, with controlled access roadways being planned. The MMRDA is also planning waterways along Wharf, Vashi, Nerul and Belapur. The Mumbai International Airport is the closest airport and a new airport at Khargar is being planned. Water Supply to Navi Mumbai is supplied through the Morbe Dam, which is owned by the Navi Mumbai Municipal Corporation (NMMC). It has the capacity to provide 450 MLD water, of which only 330 MLD is being utilised today. The Hetawane Water Supply Project, which is owned by the Irrigation Department, has also provided additional supply with a capacity to provide 350 MLD water. As of 2017, only 3% of households in the NMMC area have unsafe source of drinking water (Andharia, et al., 2017). CIDCO has provided 1-2 Sewerage Treatment Plants (STP) in each node. These are state-of-the-art C-Tech/SBR STPs which run on gravity and pumping mechanisms. Standards of the Maharashtra Pollution Control Board are met before the treated effluent is discharged. This treated effluent is used for landscaping and gardening. Despite this planning, about 2.2% of households in the NMMC area have no access to latrines and 12.5% have unsafe drainage (Andharia, et al., 2017). Disposal of rain water from the city area is a critical issue: about 20% land is low lying and prone to tidal submergence. The height of surrounding hill ranges varies from 50 to 500 metres above MSL, increasing surface runoff. Reclaimed land also makes it difficult for storm water drain construction. Disaster resilience and environmental sensitivity Navi Mumbai faces a high risk of urban flooding, particularly due to coastal storm surge and heavy rainfall. Around 10% of Navi Mumbai has been declared as a low-lying area. As per its disaster management plan, nearly 90 locations have recurring water logging problems during the monsoon and around 41 slum pockets at various locations are affected. The city’s growing population increases the vulnerability of the city to natural hazards. Conclusions Navi Mumbai has taken much longer to develop with unforeseen challenges around land acquisition. The state government has also prioritised investment in reclaiming/developing locations in Mumbai as opposed to Navi Mumbai (for example, BKC). Manufacturing and IT/ITES seems to be the proposed driver of employment and economic growth in Navi Mumbai. It has not been able to grow into a tertiary sector hub yet, but the creation of IT parks and SEZs that focus on related sectors may change that. The division of governance responsibilities between CIDCO, MMRDA, MIDC, NMMC, and other ULBs has created governance challenges especially when it comes to the management of land. Flooding remains a key concern because of coastal storm surges, heavy rain, and inadequate drainage. References
- Yaseen, S. M., Nalla, V., Dhanapal.G., Jain, G., Anand, G., Mohan, R.J.S., Jain, S., Malladi, T. (2018). Navi Mumbai City profile: Developing Resilient Cities Through Risk Reduction. Indian Institute for Human Settlements
- Malladi, T., Chatterji, N., & Jana, A. (2017). India Urban Atlas 2017: Visualising and Understanding Urban Growth and Expansion. Bengaluru: Indian Institute for Human Settlements. https://doi.org/https://doi.org/10.24943/urbindia.2017
- Shaw, A. 2004. The Making of Navi Mumbai, Orient Blackswan. - Patel, S., Mehta, P. & Correa, C. 1965. Planning for Bombay: 1. Patterns of Growth 2. The Twin City 3. Current
Proposals. MARG [Online], 18, 3, Available: https://marg-art.org/product/UHJvZHVjdDozMDA5 [Accessed July 10, 2020].
IIHS - XV Finance Commission Urbanisation Report 115

Naya Raipur
Significance of case Naya Raipur Atal Nagar was created as the greenfield capital city for the newly formed state of Chhattisgarh. It currently functions as an administrative hub with a population of 0.1 million in 2011. Naya Raipur has been in the making since 2000, with substantial Master Planning inputs and investments into physical and social infrastructure. However, the new city is yet to attract a sustainable urban population base. The Naya Raipur experience highlights that long gestation periods (20 years+) are required to create an urban agglomeration in a greenfield location. It also highlights the need for large-scale public investment in land and infrastructure, supplemented by concrete administrative and economic hub-making policies.
Map
Demographic Profile Location: 17 kms to the south-east of Raipur, Chhattisgarh, comprising of 41 villages Population: 0.1 million (2011) Area: 95 sq.kms. (core), 130 sq.kms. (peripheral region, 12sq.kms. (airport), 237 sq.kms. (total) Density (pp. sq.km): 631.79 (2011) Vision and reasons for establishment of the city In November 2000, Chhattisgarh was created from 16 districts previously part of Madhya Pradesh. Following this, Raipur, the existing capital, experienced a demographic surge. It was decided that to accommodate future development a new greenfield capital city with new hubs for: State government offices, regional financial, healthcare, cultural and educational centres. In addition 50% of the planned area is dedicated to green uses to promote a sustainable urban lifestyles. A radius of 50 kms around Raipur was screened to select a potential location for Naya Raipur. The location selected was based on water availability, road connectivity via NH30 and NH53, new and proposed airport and rail networks, absence of mining and low pollution levels, natural water bodies that could be converted into recreational areas, and availability of barren/ non- agricultural lands and government owned lands, in sufficient quantities.
116 IIHS - XV Finance Commission Urbanisation Report

Land aggregation and investments The land acquired covered 41 villages, which were incorporated into the Master Plan 2031, rather than relocating the population. The Master Plan has been designed into 41 blocks and incorporates Village Development Plans with a proposed expenditure of Rs. 6 to 20 crores per village. The land was acquired by notifying a ‘special area’ under section 64 of Nagar Tatha Gramnivesh Adhiniyam 1973 at estimated investment was Rs. 1,500 crores. Implementation and governance structure Naya Raipur Atal Nagar Vikas Pradhikaran was created under the Chhattisgarh Nagar Tatha Gram Nivesh Adhiniyam, 1973. The Chhattisgarh Housing Board is building housing units across five designated residential sectors of Naya Raipur. Key issues Naya Raipur consists of over 237 sq. kms. of land that was acquired over 20 years ago in 2000, with extensive investments in water, power, drainage, telecommunications and social infrastructure. It highlights that creating greenfield urban agglomerations requires extensive land, extensive investments and long gestation periods. It also highlights that extensive public investments do not guarantee that corporate/ private sector investments will follow immediately, as Naya Raipur is still to see extensive private sector investment interest beyond the education sector. Economic profile Naya Raipur accommodates the administrative block for the Chhattisgarh state government. The Central Business District of over 1 sq. km. has been planned to accommodate retail, office and government space requirements. Each sector has commercial hubs. An Electronics Manufacturing Cluster (EMC) has been set up and offers incentives under Chhattisgarh Electronics and ITeS Policy (2014-19). The EMC is integrated with the city’s Command and Control Center. Twenty hectares have been designated as an IT park in Sector 22, which is under development. The government plans to invite domestic and foreign IT corporates to establish a base in Naya Raipur. Other planned economic zones include a sports complex, gems and jewellery park, and a logistics hub. Major educational institutions in Naya Raipur include IIIT, IIMT, HMI, IIM and ITM University, National Law University and an AIIMS. Infrastructure profile and gaps Naya Raipur has been branded as a ‘Integrated Smart City’ with SCADA infrastructure, for water, power supply and LED and solar PV street lighting, managed through a command and control center. Basic services: Underground water, sewerage, drainage, telecommunications, and electricity networks are being developed with provisions for 24-hour power and water supply, and decentralised sewage treatment. Transportation: The city has six and four-lane expressways totalling 140 kms as well as a BRTS. The city is connected to Raipur through NH 53 and NH30. Roads have been constructed to connect the new international airport to Naya Raipur and Raipur. There is a train line proposed to connect Naya Raipur to Mumbai. Green spaces: The Master Plan incorporates a dedicated green belt. The Nandanvan Forest Reserve in the city incorporates the land that had substantial wildlife cover at the time of land acquisition.
IIHS - XV Finance Commission Urbanisation Report 117

Telecom: Eight Optical Fibre Cable (OFC) ducts are in place covering 32 sq. km. of which 10 blocks that cater to private telecom operators. T hese will be extended to all remaining sectors, especially the IT hub in Sector 22. The government has also built cellular network towers and is waiting for private telecom companies to use them. Housing: The Chhattisgarh Housing Board is building residential units across five designated residential sectors. The Development Authority has allotted land to developers to build residential zones in the city. An 18-hole golf course is being constructed at Sector 24. Recreational facilities, such as a laser show, dome theatre and jungle safari, have been built. Theme parks, water parks, bowling alley and go-karting are proposed. Disaster resilience and environmental sensitivity The Master Plan incorporates a dedicated green belt. The Nandanvan Forest Reserve in the city incorporates the land that had substantial wildlife cover at the time of land acquisition. The site was selected keeping water availability in mind. Conclusions Naya Raipur is based on Master Planning principles, extensive investment and with government offices providing an economic anchor. The city has attracted significant institutional presence and incorporated Smart City features through considerable public investment over the past 20 years. However, a sustainable urban agglomeration is still to take hold. References
- NRANVP website: https://navaraipuratalnagar.com/wps/portal/Home/ - Government of India, Planning Commission. State Human development reports.
<http://planningcommission.nic.in/plans/stateplan/shdr.php?state=b_shdrbody.htm> Government of India, Census 2011. <http://censusindia.gov.in/>Jawaharlal Nehru National Urban Renewal Mission, City Development plan. <http://jnnurm.nic.in/citywise-cdp.html>Naya Raipur development authority (2008) Naya Raipur Development Plan 2031.
- Malladi, T., Chatterji, N., & Jana, A. (2017). India Urban Atlas 2017: Visualising and Understanding Urban Growth and Expansion. Bengaluru: Indian Institute for Human Settlements. https://doi.org/https://doi.org/10.24943/urbindia.2017
118 IIHS - XV Finance Commission Urbanisation Report

India’s 100-largest cities demographic, infrastructure
and connectivity profile
ANNEX II
119

[This page is intentionally left blank]
120 IIHS - XV Finance Commission Urbanisation Report

India’s Top 300 cities demographic profile | 2011 – 2031
City Name State Projected Population size 2031
Population 2011 Projected Population 2021
Projected Population 2031
1 Delhi UA Delhi > 10 million 16.3 20.3 24.1
2 Greater Mumbai UA Maharashtra > 10 million 18.4 21.4 23.6
3 Kolkata UA West Bengal > 10 million 14.1 15.3 15.8
4 Bangalore UA Karnataka > 10 million 8.5 10.9 13.4
5 Chennai UA Tamil Nadu > 10 million 8.7 10.4 11.9
6 Hyderabad UA Telangana > 10 million 7.7 9.7 11.7
7 Ahmadabad UA Gujarat 4-10 million 6.4 7.9 9.5
8 Surat UA Gujarat 4-10 million 4.6 6.2 8.0
9 Pune UA Maharashtra 4-10 million 5.0 6.4 7.7
10 Jaipur (M Corp.) Rajasthan 4-10 million 3.1 3.9 4.7
11 Lucknow UA Uttar Pradesh 4-10 million 2.9 3.6 4.2
12 Kanpur UA Uttar Pradesh 2-4 million 2.9 3.3 3.5
13 Indore UA Madhya Pradesh 2-4 million 2.2 2.7 3.3
14 Kochi UA Kerala 2-4 million 2.1 2.7 3.3
15 Coimbatore UA Tamil Nadu 2-4 million 2.2 2.7 3.2
16 Ghaziabad UA Uttar Pradesh 2-4 million 2.4 2.9 3.2
17 Nagpur UA Maharashtra 2-4 million 2.5 2.9 3.2
18 Patna UA Bihar 2-4 million 2.0 2.5 2.9
19 Thiruvananthapuram UA Kerala 2-4 million 1.7 2.2 2.8
20 Kozhikode UA Kerala 2-4 million 2.0 2.5 2.8
21 Bhopal UA Madhya Pradesh 2-4 million 1.9 2.3 2.7
22 Vasai Virar City (M Corp.) Maharashtra 2-4 million 1.2 1.9 2.7
23 Thrissur UA Kerala 2-4 million 1.9 2.2 2.5
24 Vadodara UA Gujarat 2-4 million 1.8 2.2 2.5
IIHS - XV Finance Commission Urbanisation Report 121

City Name State Projected Population
size 2031 Population 2011 Projected
Population 2021 Projected
Population 2031
25 Agra UA Uttar Pradesh 2-4 million 1.7 2.1 2.5
26 Greater Vishakapatnam (MC) Andhra Pradesh 2-4 million 1.7 2.1 2.5
27 Nashik UA Maharashtra 2-4 million 1.6 2.0 2.5
28 Malappuram UA Kerala 2-4 million 1.7 2.1 2.3
29 Faridabad (M Corp.) Haryana 2-4 million 1.4 1.8 2.3
30 Kannur UA Kerala 2-4 million 1.6 2.0 2.2
31 Vijayawada UA Andhra Pradesh 2-4 million 1.5 1.9 2.2
32 Ludhiana (M Corp.) Punjab 2-4 million 1.6 1.9 2.2
33 Rajkot UA Gujarat 2-4 million 1.4 1.8 2.2
34 Meerut UA Uttar Pradesh 2-4 million 1.4 1.7 2.0
35 Aurangabad UA Maharashtra 1-2 million 1.2 1.5 1.9
36 Raipur UA Chhattisgarh 1-2 million 1.1 1.5 1.8
37 Srinagar UA J&K 1-2 million 1.3 1.6 1.8
38 Madurai UA Tamil Nadu 1-2 million 1.5 1.6 1.8
39 Varanasi UA Uttar Pradesh 1-2 million 1.4 1.6 1.8
40 Asansol UA West Bengal 1-2 million 1.2 1.5 1.8
41 Jamshedpur UA Jharkhand 1-2 million 1.3 1.6 1.8
42 Tiruppur UA Tamil Nadu 1-2 million 1.0 1.3 1.7
43 Jodhpur UA Rajasthan 1-2 million 1.1 1.4 1.6
44 Ranchi UA Jharkhand 1-2 million 1.1 1.4 1.6
45 Amritsar UA Punjab 1-2 million 1.2 1.4 1.6
46 Allahabad UA Uttar Pradesh 1-2 million 1.2 1.4 1.5
47 Jabalpur UA Madhya Pradesh 1-2 million 1.3 1.4 1.5
48 Kollam UA Kerala 1-2 million 1.1 1.4 1.5
49 Kota (M Corp.) Rajasthan 1-2 million 1.0 1.3 1.5
50 Gwalior UA Madhya Pradesh 1-2 million 1.1 1.3 1.5
122 IIHS - XV Finance Commission Urbanisation Report
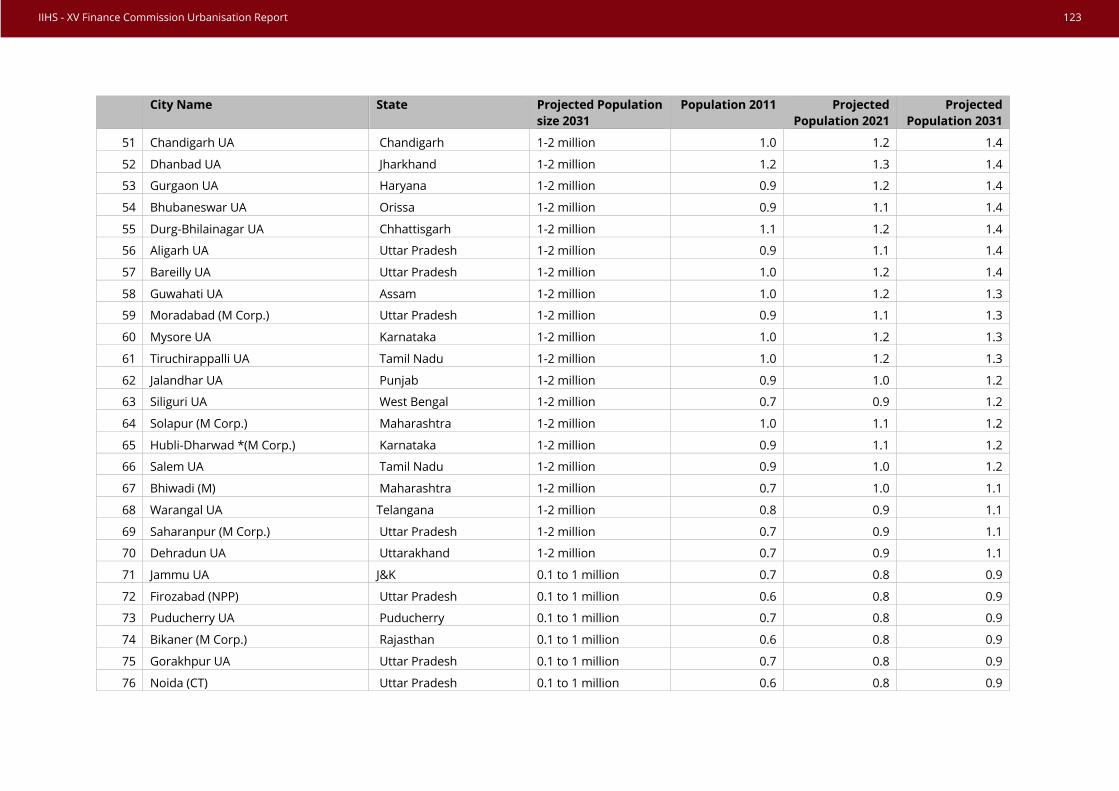
City Name State Projected Population
size 2031 Population 2011 Projected
Population 2021 Projected
Population 2031
51 Chandigarh UA Chandigarh 1-2 million 1.0 1.2 1.4
52 Dhanbad UA Jharkhand 1-2 million 1.2 1.3 1.4
53 Gurgaon UA Haryana 1-2 million 0.9 1.2 1.4
54 Bhubaneswar UA Orissa 1-2 million 0.9 1.1 1.4
55 Durg-Bhilainagar UA Chhattisgarh 1-2 million 1.1 1.2 1.4
56 Aligarh UA Uttar Pradesh 1-2 million 0.9 1.1 1.4
57 Bareilly UA Uttar Pradesh 1-2 million 1.0 1.2 1.4
58 Guwahati UA Assam 1-2 million 1.0 1.2 1.3
59 Moradabad (M Corp.) Uttar Pradesh 1-2 million 0.9 1.1 1.3
60 Mysore UA Karnataka 1-2 million 1.0 1.2 1.3
61 Tiruchirappalli UA Tamil Nadu 1-2 million 1.0 1.2 1.3
62 Jalandhar UA Punjab 1-2 million 0.9 1.0 1.2
63 Siliguri UA West Bengal 1-2 million 0.7 0.9 1.2
64 Solapur (M Corp.) Maharashtra 1-2 million 1.0 1.1 1.2
65 Hubli-Dharwad *(M Corp.) Karnataka 1-2 million 0.9 1.1 1.2
66 Salem UA Tamil Nadu 1-2 million 0.9 1.0 1.2
67 Bhiwadi (M) Maharashtra 1-2 million 0.7 1.0 1.1
68 Warangal UA Telangana 1-2 million 0.8 0.9 1.1
69 Saharanpur (M Corp.) Uttar Pradesh 1-2 million 0.7 0.9 1.1
70 Dehradun UA Uttarakhand 1-2 million 0.7 0.9 1.1
71 Jammu UA J&K 0.1 to 1 million 0.7 0.8 0.9
72 Firozabad (NPP) Uttar Pradesh 0.1 to 1 million 0.6 0.8 0.9
73 Puducherry UA Puducherry 0.1 to 1 million 0.7 0.8 0.9
74 Bikaner (M Corp.) Rajasthan 0.1 to 1 million 0.6 0.8 0.9
75 Gorakhpur UA Uttar Pradesh 0.1 to 1 million 0.7 0.8 0.9
76 Noida (CT) Uttar Pradesh 0.1 to 1 million 0.6 0.8 0.9
IIHS - XV Finance Commission Urbanisation Report 123
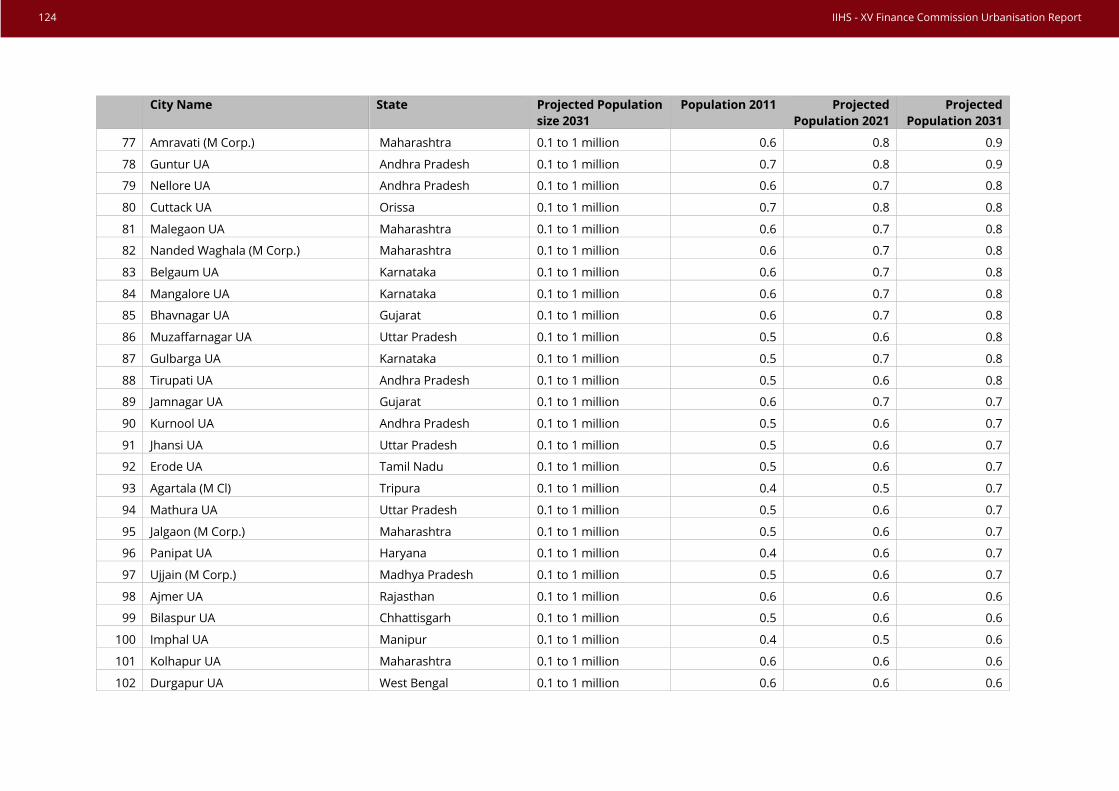
City Name State Projected Population
size 2031 Population 2011 Projected
Population 2021 Projected
Population 2031
77 Amravati (M Corp.) Maharashtra 0.1 to 1 million 0.6 0.8 0.9
78 Guntur UA Andhra Pradesh 0.1 to 1 million 0.7 0.8 0.9
79 Nellore UA Andhra Pradesh 0.1 to 1 million 0.6 0.7 0.8
80 Cuttack UA Orissa 0.1 to 1 million 0.7 0.8 0.8
81 Malegaon UA Maharashtra 0.1 to 1 million 0.6 0.7 0.8
82 Nanded Waghala (M Corp.) Maharashtra 0.1 to 1 million 0.6 0.7 0.8
83 Belgaum UA Karnataka 0.1 to 1 million 0.6 0.7 0.8
84 Mangalore UA Karnataka 0.1 to 1 million 0.6 0.7 0.8
85 Bhavnagar UA Gujarat 0.1 to 1 million 0.6 0.7 0.8
86 Muzaffarnagar UA Uttar Pradesh 0.1 to 1 million 0.5 0.6 0.8
87 Gulbarga UA Karnataka 0.1 to 1 million 0.5 0.7 0.8
88 Tirupati UA Andhra Pradesh 0.1 to 1 million 0.5 0.6 0.8
89 Jamnagar UA Gujarat 0.1 to 1 million 0.6 0.7 0.7
90 Kurnool UA Andhra Pradesh 0.1 to 1 million 0.5 0.6 0.7
91 Jhansi UA Uttar Pradesh 0.1 to 1 million 0.5 0.6 0.7
92 Erode UA Tamil Nadu 0.1 to 1 million 0.5 0.6 0.7
93 Agartala (M Cl) Tripura 0.1 to 1 million 0.4 0.5 0.7
94 Mathura UA Uttar Pradesh 0.1 to 1 million 0.5 0.6 0.7
95 Jalgaon (M Corp.) Maharashtra 0.1 to 1 million 0.5 0.6 0.7
96 Panipat UA Haryana 0.1 to 1 million 0.4 0.6 0.7
97 Ujjain (M Corp.) Madhya Pradesh 0.1 to 1 million 0.5 0.6 0.7
98 Ajmer UA Rajasthan 0.1 to 1 million 0.6 0.6 0.6
99 Bilaspur UA Chhattisgarh 0.1 to 1 million 0.5 0.6 0.6
100 Imphal UA Manipur 0.1 to 1 million 0.4 0.5 0.6
101 Kolhapur UA Maharashtra 0.1 to 1 million 0.6 0.6 0.6
102 Durgapur UA West Bengal 0.1 to 1 million 0.6 0.6 0.6
124 IIHS - XV Finance Commission Urbanisation Report

City Name State Projected Population
size 2031 Population 2011 Projected
Population 2021 Projected
Population 2031
103 Patiala UA Punjab 0.1 to 1 million 0.4 0.5 0.6
104 Sangali UA Maharashtra 0.1 to 1 million 0.5 0.6 0.6
105 Udaipur UA Rajasthan 0.1 to 1 million 0.5 0.6 0.6
106 Vellore UA Tamil Nadu 0.1 to 1 million 0.5 0.6 0.6
107 Gaya UA Bihar 0.1 to 1 million 0.5 0.6 0.6
108 Raurkela UA Orissa 0.1 to 1 million 0.6 0.6 0.6
109 Cherthala UA Kerala 0.1 to 1 million 0.5 0.5 0.6
110 Tirunelveli UA Tamil Nadu 0.1 to 1 million 0.5 0.6 0.6
111 Bokaro Steel City UA Jharkhand 0.1 to 1 million 0.6 0.6 0.6
112 Latur (M Cl) Maharashtra 0.1 to 1 million 0.4 0.5 0.6
113 Davanagere (M Corp.) Karnataka 0.1 to 1 million 0.4 0.5 0.6
114 Korba UA Chhattisgarh 0.1 to 1 million 0.4 0.5 0.6
115 Rajahmundry UA Andhra Pradesh 0.1 to 1 million 0.5 0.5 0.6
116 Thoothukkudi UA Tamil Nadu 0.1 to 1 million 0.4 0.5 0.6
117 Bellary (M Corp.) Karnataka 0.1 to 1 million 0.4 0.5 0.6
118 Kakinada UA Andhra Pradesh 0.1 to 1 million 0.4 0.5 0.6
119 Ahmednagar UA Maharashtra 0.1 to 1 million 0.4 0.5 0.5
120 Muzaffarpur UA Bihar 0.1 to 1 million 0.4 0.5 0.5
121 Yamunanagar UA Haryana 0.1 to 1 million 0.4 0.5 0.5
122 Bhilwara (M Cl) Rajasthan 0.1 to 1 million 0.4 0.4 0.5
123 Rohtak (M Cl) Haryana 0.1 to 1 million 0.4 0.5 0.5
124 Anantapur UA Andhra Pradesh 0.1 to 1 million 0.3 0.4 0.5
125 Kadapa UA Andhra Pradesh 0.1 to 1 million 0.3 0.4 0.5
126 Baharampur UA West Bengal 0.1 to 1 million 0.3 0.4 0.5
127 Santipur UA West Bengal 0.1 to 1 million 0.3 0.4 0.5
128 Akola (M Corp.) Maharashtra 0.1 to 1 million 0.4 0.5 0.5
IIHS - XV Finance Commission Urbanisation Report 125
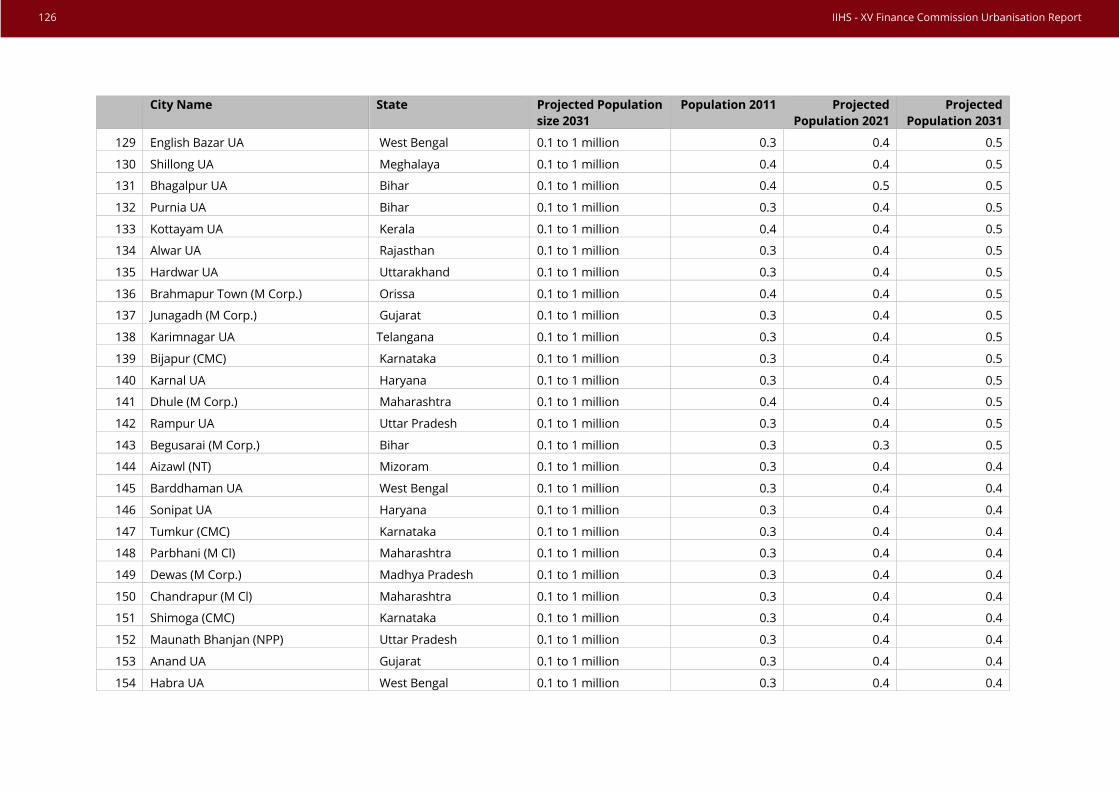
City Name State Projected Population
size 2031 Population 2011 Projected
Population 2021 Projected
Population 2031
129 English Bazar UA West Bengal 0.1 to 1 million 0.3 0.4 0.5
130 Shillong UA Meghalaya 0.1 to 1 million 0.4 0.4 0.5
131 Bhagalpur UA Bihar 0.1 to 1 million 0.4 0.5 0.5
132 Purnia UA Bihar 0.1 to 1 million 0.3 0.4 0.5
133 Kottayam UA Kerala 0.1 to 1 million 0.4 0.4 0.5
134 Alwar UA Rajasthan 0.1 to 1 million 0.3 0.4 0.5
135 Hardwar UA Uttarakhand 0.1 to 1 million 0.3 0.4 0.5
136 Brahmapur Town (M Corp.) Orissa 0.1 to 1 million 0.4 0.4 0.5
137 Junagadh (M Corp.) Gujarat 0.1 to 1 million 0.3 0.4 0.5
138 Karimnagar UA Telangana 0.1 to 1 million 0.3 0.4 0.5
139 Bijapur (CMC) Karnataka 0.1 to 1 million 0.3 0.4 0.5
140 Karnal UA Haryana 0.1 to 1 million 0.3 0.4 0.5
141 Dhule (M Corp.) Maharashtra 0.1 to 1 million 0.4 0.4 0.5
142 Rampur UA Uttar Pradesh 0.1 to 1 million 0.3 0.4 0.5
143 Begusarai (M Corp.) Bihar 0.1 to 1 million 0.3 0.3 0.5
144 Aizawl (NT) Mizoram 0.1 to 1 million 0.3 0.4 0.4
145 Barddhaman UA West Bengal 0.1 to 1 million 0.3 0.4 0.4
146 Sonipat UA Haryana 0.1 to 1 million 0.3 0.4 0.4
147 Tumkur (CMC) Karnataka 0.1 to 1 million 0.3 0.4 0.4
148 Parbhani (M Cl) Maharashtra 0.1 to 1 million 0.3 0.4 0.4
149 Dewas (M Corp.) Madhya Pradesh 0.1 to 1 million 0.3 0.4 0.4
150 Chandrapur (M Cl) Maharashtra 0.1 to 1 million 0.3 0.4 0.4
151 Shimoga (CMC) Karnataka 0.1 to 1 million 0.3 0.4 0.4
152 Maunath Bhanjan (NPP) Uttar Pradesh 0.1 to 1 million 0.3 0.4 0.4
153 Anand UA Gujarat 0.1 to 1 million 0.3 0.4 0.4
154 Habra UA West Bengal 0.1 to 1 million 0.3 0.4 0.4
126 IIHS - XV Finance Commission Urbanisation Report

City Name State Projected Population
size 2031 Population 2011 Projected
Population 2021 Projected
Population 2031
155 Gandhidham (M) Gujarat 0.1 to 1 million 0.2 0.3 0.4
156 Shahjahanpur UA Uttar Pradesh 0.1 to 1 million 0.3 0.4 0.4
157 Bathinda (M Corp.) Punjab 0.1 to 1 million 0.3 0.4 0.4
158 Hisar UA Haryana 0.1 to 1 million 0.3 0.4 0.4
159 Ichalkaranji UA Maharashtra 0.1 to 1 million 0.3 0.4 0.4
160 Satna UA Madhya Pradesh 0.1 to 1 million 0.3 0.3 0.4
161 Dindigul UA Tamil Nadu 0.1 to 1 million 0.3 0.3 0.4
162 Biharsharif (M Corp.) Bihar 0.1 to 1 million 0.3 0.4 0.4
163 Jalna (M Cl) Maharashtra 0.1 to 1 million 0.3 0.3 0.4
164 Palakkad UA Kerala 0.1 to 1 million 0.3 0.3 0.4
165 Coonoor Tamil Nadu 0.1 to 1 million 0.2 0.3 0.4
166 Khammam UA Telangana 0.1 to 1 million 0.3 0.3 0.4
167 Morvi UA Gujarat 0.1 to 1 million 0.2 0.3 0.4
168 Hapur (NPP) Uttar Pradesh 0.1 to 1 million 0.3 0.3 0.4
169 Navsari UA Gujarat 0.1 to 1 million 0.3 0.3 0.4
170 Darbhanga UA Bihar 0.1 to 1 million 0.3 0.3 0.4
171 Thanjavur UA Tamil Nadu 0.1 to 1 million 0.3 0.3 0.4
172 Ranaghat UA West Bengal 0.1 to 1 million 0.2 0.3 0.4
173 Farrukhabad-cum-Fatehgarh UA Uttar Pradesh 0.1 to 1 million 0.3 0.3 0.4
174 Etawah (NPP) Uttar Pradesh 0.1 to 1 million 0.3 0.3 0.4
175 Haldwani-cum-Kathgodam UA Uttarakhand 0.1 to 1 million 0.2 0.3 0.4
176 Arrah (M Corp.) Bihar 0.1 to 1 million 0.3 0.3 0.4
177 Karur UA Tamil Nadu 0.1 to 1 million 0.2 0.3 0.4
178 Nizamabad (M Corp.) Telangana 0.1 to 1 million 0.3 0.3 0.4
179 Bharatpur UA Rajasthan 0.1 to 1 million 0.3 0.3 0.4
180 Sikar UA Rajasthan 0.1 to 1 million 0.2 0.3 0.3
IIHS - XV Finance Commission Urbanisation Report 127

City Name State Projected Population
size 2031 Population 2011 Projected
Population 2021 Projected
Population 2031
181 Ratlam UA Madhya Pradesh 0.1 to 1 million 0.3 0.3 0.3
182 Panchkula (M Cl) Haryana 0.1 to 1 million 0.2 0.3 0.3
183 Bulandshahr UA Uttar Pradesh 0.1 to 1 million 0.2 0.3 0.3
184 Faizabad UA Uttar Pradesh 0.1 to 1 million 0.3 0.3 0.3
185 Silchar UA Assam 0.1 to 1 million 0.2 0.3 0.3
186 Rewa (M Corp.) Madhya Pradesh 0.1 to 1 million 0.2 0.3 0.3
187 Pali (M Cl) Rajasthan 0.1 to 1 million 0.2 0.3 0.3
188 Mirzapur-cum-Vindhyachal UA Uttar Pradesh 0.1 to 1 million 0.2 0.3 0.3
189 Katihar UA Bihar 0.1 to 1 million 0.2 0.3 0.3
190 Sambalpur UA Orissa 0.1 to 1 million 0.3 0.3 0.3
191 Panvel (M Cl) Maharashtra 0.1 to 1 million 0.2 0.2 0.3
192 Mahbubnagar UA Telangana 0.1 to 1 million 0.2 0.3 0.3
193 Ganganagar UA Rajasthan 0.1 to 1 million 0.3 0.3 0.3
194 Proddatur UA Andhra Pradesh 0.1 to 1 million 0.2 0.3 0.3
195 Nandyal UA Andhra Pradesh 0.1 to 1 million 0.2 0.3 0.3
196 Vizianagaram UA Andhra Pradesh 0.1 to 1 million 0.2 0.3 0.3
197 Bidar UA Karnataka 0.1 to 1 million 0.2 0.3 0.3
198 Kharagpur UA West Bengal 0.1 to 1 million 0.3 0.3 0.3
199 Bharuch UA Gujarat 0.1 to 1 million 0.2 0.3 0.3
200 Kanhangad UA Kerala 0.1 to 1 million 0.2 0.3 0.3
201 Sambhal (NPP) Uttar Pradesh 0.1 to 1 million 0.2 0.3 0.3
202 Madanapalle UA Andhra Pradesh 0.1 to 1 million 0.2 0.2 0.3
203 Ongole UA Andhra Pradesh 0.1 to 1 million 0.2 0.3 0.3
204 Raichur (CMC) Karnataka 0.1 to 1 million 0.2 0.3 0.3
205 Orai UA Uttar Pradesh 0.1 to 1 million 0.2 0.2 0.3
206 Haldia (M) West Bengal 0.1 to 1 million 0.2 0.2 0.3
128 IIHS - XV Finance Commission Urbanisation Report

City Name State Projected Population
size 2031 Population 2011 Projected
Population 2021 Projected
Population 2031
207 Bhind (M) Madhya Pradesh 0.1 to 1 million 0.2 0.2 0.3
208 Eluru UA Andhra Pradesh 0.1 to 1 million 0.3 0.3 0.3
209 Morena (M) Madhya Pradesh 0.1 to 1 million 0.2 0.2 0.3
210 Hospet (CMC) Karnataka 0.1 to 1 million 0.2 0.2 0.3
211 Chapra UA Bihar 0.1 to 1 million 0.2 0.2 0.3
212 Mahesana UA Gujarat 0.1 to 1 million 0.2 0.2 0.3
213 Jalpaiguri UA West Bengal 0.1 to 1 million 0.2 0.2 0.3
214 Puri Town (M) Orissa 0.1 to 1 million 0.2 0.2 0.3
215 Chhindwara UA Madhya Pradesh 0.1 to 1 million 0.2 0.2 0.3
216 Ambala (M Cl) Haryana 0.1 to 1 million 0.2 0.2 0.3
217 Ambala UA Haryana 0.1 to 1 million 0.2 0.2 0.3
218 Bhuj UA Gujarat 0.1 to 1 million 0.2 0.2 0.3
219 Alappuzha UA Kerala 0.1 to 1 million 0.2 0.3 0.3
220 Fatehpur (NPP) Uttar Pradesh 0.1 to 1 million 0.2 0.2 0.3
221 Murwara (Katni) (M Corp.) Madhya Pradesh 0.1 to 1 million 0.2 0.2 0.3
222 Guna (M) Madhya Pradesh 0.1 to 1 million 0.2 0.2 0.3
223 Raiganj UA West Bengal 0.1 to 1 million 0.2 0.2 0.3
224 Nadiad UA Gujarat 0.1 to 1 million 0.2 0.2 0.3
225 Bhiwani (M Cl) Haryana 0.1 to 1 million 0.2 0.2 0.3
226 Kancheepuram UA Tamil Nadu 0.1 to 1 million 0.2 0.2 0.3
227 Munger (M Corp.) Bihar 0.1 to 1 million 0.2 0.2 0.3
228 Unnao (NPP) Uttar Pradesh 0.1 to 1 million 0.2 0.2 0.3
229 Rae Bareli (NPP) Uttar Pradesh 0.1 to 1 million 0.2 0.2 0.3
230 Karaikkudi UA Tamil Nadu 0.1 to 1 million 0.2 0.2 0.3
231 Porbandar UA Gujarat 0.1 to 1 million 0.2 0.2 0.3
232 Amroha (NPP) Uttar Pradesh 0.1 to 1 million 0.2 0.2 0.3
IIHS - XV Finance Commission Urbanisation Report 129

City Name State Projected Population
size 2031 Population 2011 Projected
Population 2021 Projected
Population 2031
233 Sitapur UA Uttar Pradesh 0.1 to 1 million 0.2 0.2 0.2
234 Udupi UA Karnataka 0.1 to 1 million 0.2 0.2 0.2
235 Shivpuri (M) Madhya Pradesh 0.1 to 1 million 0.2 0.2 0.2
236 Modinagar UA Uttar Pradesh 0.1 to 1 million 0.2 0.2 0.2
237 Gandhinagar Gujarat 0.1 to 1 million 0.2 0.2 0.2
238 Jind (M Cl) Haryana 0.1 to 1 million 0.2 0.2 0.2
239 Hassan UA Karnataka 0.1 to 1 million 0.2 0.2 0.2
240 Sirsa (M Cl) Haryana 0.1 to 1 million 0.2 0.2 0.2
241 Veraval UA Gujarat 0.1 to 1 million 0.2 0.2 0.2
242 Sagar UA Madhya Pradesh 0.1 to 1 million 0.3 0.3 0.2
243 Robertson Pet UA Karnataka 0.1 to 1 million 0.2 0.2 0.2
244 Burhanpur (M Corp.) Madhya Pradesh 0.1 to 1 million 0.2 0.2 0.2
245 Shimla UA Himachal Pradesh 0.1 to 1 million 0.2 0.2 0.2
246 Krishnanagar UA West Bengal 0.1 to 1 million 0.2 0.2 0.2
247 Tonk (M Cl) Rajasthan 0.1 to 1 million 0.2 0.2 0.2
248 Bahraich (NPP) Uttar Pradesh 0.1 to 1 million 0.2 0.2 0.2
249 Khandwa (M Corp.) Madhya Pradesh 0.1 to 1 million 0.2 0.2 0.2
250 Nagercoil (M) Tamil Nadu 0.1 to 1 million 0.2 0.2 0.2
251 Bhusawal UA Maharashtra 0.1 to 1 million 0.2 0.2 0.2
252 Phusro UA Jharkhand 0.1 to 1 million 0.2 0.2 0.2
253 Saharsa (NP) Bihar 0.1 to 1 million 0.2 0.2 0.2
254 Ramagundam UA Telangana 0.1 to 1 million 0.3 0.3 0.2
255 Adoni UA Andhra Pradesh 0.1 to 1 million 0.2 0.2 0.2
256 Chittoor UA Andhra Pradesh 0.1 to 1 million 0.2 0.2 0.2
257 Valsad UA Gujarat 0.1 to 1 million 0.2 0.2 0.2
258 Vidisha (M) Madhya Pradesh 0.1 to 1 million 0.2 0.2 0.2
130 IIHS - XV Finance Commission Urbanisation Report

City Name State Projected Population
size 2031 Population 2011 Projected
Population 2021 Projected
Population 2031
259 Banda UA Uttar Pradesh 0.1 to 1 million 0.2 0.2 0.2
260 Rewari (M Cl) Haryana 0.1 to 1 million 0.1 0.2 0.2
261 Godhra UA Gujarat 0.1 to 1 million 0.2 0.2 0.2
262 Nabadwip UA West Bengal 0.1 to 1 million 0.2 0.2 0.2
263 Giridih UA Jharkhand 0.1 to 1 million 0.1 0.2 0.2
264 Hanumangarh (M Cl) Rajasthan 0.1 to 1 million 0.2 0.2 0.2
265 Hathras UA Uttar Pradesh 0.1 to 1 million 0.2 0.2 0.2
266 Medinipur (M) West Bengal 0.1 to 1 million 0.2 0.2 0.2
267 Hindupur (M) Andhra Pradesh 0.1 to 1 million 0.2 0.2 0.2
268 Neyveli UA Tamil Nadu 0.1 to 1 million 0.2 0.2 0.2
269 Moga UA Punjab 0.1 to 1 million 0.2 0.2 0.2
270 Batala UA Punjab 0.1 to 1 million 0.2 0.2 0.2
271 Hazaribag UA Jharkhand 0.1 to 1 million 0.2 0.2 0.2
272 Gadag-Betigeri (CMC) Karnataka 0.1 to 1 million 0.2 0.2 0.2
273 Rajnandgaon (M Corp.) Chhattisgarh 0.1 to 1 million 0.2 0.2 0.2
274 Palwal UA Haryana 0.1 to 1 million 0.1 0.2 0.2
275 Botad (M) Gujarat 0.1 to 1 million 0.1 0.2 0.2
276 Khargone UA Madhya Pradesh 0.1 to 1 million 0.1 0.2 0.2
277 Gangapur City UA Rajasthan 0.1 to 1 million 0.1 0.2 0.2
278 Beawar UA Rajasthan 0.1 to 1 million 0.2 0.2 0.2
279 Budaun (NPP) Uttar Pradesh 0.1 to 1 million 0.2 0.2 0.2
280 Sasaram (NP) Bihar 0.1 to 1 million 0.1 0.2 0.2
281 Adilabad UA Telangana 0.1 to 1 million 0.1 0.2 0.2
282 Jaunpur (NPP) Uttar Pradesh 0.1 to 1 million 0.2 0.2 0.2
283 Balurghat UA West Bengal 0.1 to 1 million 0.2 0.2 0.2
284 Chirala UA Andhra Pradesh 0.1 to 1 million 0.2 0.2 0.2
IIHS - XV Finance Commission Urbanisation Report 131

City Name State Projected Population
size 2031 Population 2011 Projected
Population 2021 Projected
Population 2031
285 Damoh UA Madhya Pradesh 0.1 to 1 million 0.1 0.2 0.2
286 Mainpuri UA Uttar Pradesh 0.1 to 1 million 0.1 0.2 0.2
287 Cuddalore (M) Tamil Nadu 0.1 to 1 million 0.2 0.2 0.2
288 Chitradurga UA Karnataka 0.1 to 1 million 0.1 0.2 0.2
289 Etah UA Uttar Pradesh 0.1 to 1 million 0.1 0.2 0.2
290 Malerkotla (M Cl) Punjab 0.1 to 1 million 0.1 0.2 0.2
291 Bahadurgarh (M Cl) Haryana 0.1 to 1 million 0.2 0.2 0.2
292 Chakdaha UA West Bengal 0.1 to 1 million 0.1 0.2 0.2
293 Khanna (M Cl) Punjab 0.1 to 1 million 0.1 0.2 0.2
294 Deoria (NPP) Uttar Pradesh 0.1 to 1 million 0.1 0.2 0.2
295 Chirkunda UA Jharkhand 0.1 to 1 million 0.1 0.1 0.2
296 Sawai Madhopur (M) Rajasthan 0.1 to 1 million 0.1 0.2 0.2
297 Bid (M Cl) Maharashtra 0.1 to 1 million 0.1 0.2 0.2
298 Tiruvannamalai (M) Tamil Nadu 0.1 to 1 million 0.1 0.2 0.2
299 Jorhat UA Assam 0.1 to 1 million 0.2 0.2 0.2
300 Dibrugarh UA Assam 0.1 to 1 million 0.2 0.2 0.2
132 IIHS - XV Finance Commission Urbanisation Report

India’s Top 300 cities | Strategic Infrastructure
City Name State Golden Quadrilateral
North-South / East West Corridor
Proposed Dedicated Freight corridor
Existing / Proposed Industrial Corridor
Port International / Domestic Airport
1 Delhi UA Delhi
2 Greater Mumbai UA Maharashtra
3 Kolkata UA West Bengal
4 Bangalore UA Karnataka
5 Chennai UA Tamil Nadu
6 Hyderabad UA Telangana
7 Ahmadabad UA Gujarat
8 Surat UA Gujarat
9 Pune UA Maharashtra
10 Jaipur (M Corp.) Rajasthan
11 Lucknow UA Uttar Pradesh
12 Kanpur UA Uttar Pradesh
13 Indore UA Madhya Pradesh
14 Kochi UA Kerala
15 Coimbatore UA Tamil Nadu
16 Ghaziabad UA Uttar Pradesh
17 Nagpur UA Maharashtra
18 Patna UA Bihar
19 Thiruvananthapuram UA Kerala
20 Kozhikode UA Kerala
21 Bhopal UA Madhya Pradesh
22 Vasai Virar City (M Corp.) Maharashtra
IIHS - XV Finance Commission Urbanisation Report 133

City Name State Golden
Quadrilateral North-South / East West Corridor
Proposed Dedicated Freight corridor
Existing / Proposed Industrial Corridor
Port International / Domestic Airport
23 Thrissur UA Kerala
24 Vadodara UA Gujarat
25 Agra UA Uttar Pradesh
26 Greater Vishakapatnam (MC) Andhra Pradesh
27 Nashik UA Maharashtra
28 Malappuram UA Kerala
29 Faridabad (M Corp.) Haryana
30 Kannur UA Kerala
31 Vijayawada UA Andhra Pradesh
32 Ludhiana (M Corp.) Punjab
33 Rajkot UA Gujarat
34 Meerut UA Uttar Pradesh
35 Aurangabad UA Maharashtra
36 Raipur UA Chhattisgarh
37 Srinagar UA J&K
38 Madurai UA Tamil Nadu
39 Varanasi UA Uttar Pradesh
40 Asansol UA West Bengal
41 Jamshedpur UA Jharkhand
42 Tiruppur UA Tamil Nadu
43 Jodhpur UA Rajasthan
44 Ranchi UA Jharkhand
45 Amritsar UA Punjab
46 Allahabad UA Uttar Pradesh
134 IIHS - XV Finance Commission Urbanisation Report

City Name State Golden
Quadrilateral North-South / East West Corridor
Proposed Dedicated Freight corridor
Existing / Proposed Industrial Corridor
Port International / Domestic Airport
47 Jabalpur UA Madhya Pradesh
48 Kollam UA Kerala
49 Kota (M Corp.) Rajasthan
50 Gwalior UA Madhya Pradesh
51 Chandigarh UA Chandigarh
52 Dhanbad UA Jharkhand
53 Gurgaon UA Haryana
54 Bhubaneswar UA Orissa
55 Durg-Bhilainagar UA Chhattisgarh
56 Aligarh UA Uttar Pradesh
57 Bareilly UA Uttar Pradesh
58 Guwahati UA Assam
59 Moradabad (M Corp.) Uttar Pradesh
60 Mysore UA Karnataka
61 Tiruchirappalli UA Tamil Nadu
62 Jalandhar UA Punjab
63 Siliguri UA West Bengal
64 Solapur (M Corp.) Maharashtra
65 Hubli-Dharwad *(M Corp.) Karnataka
66 Salem UA Tamil Nadu
67 Bhiwadi (M) Maharashtra
68 Warangal UA Telangana
69 Saharanpur (M Corp.) Uttar Pradesh
70 Dehradun UA Uttarakhand
IIHS - XV Finance Commission Urbanisation Report 135

City Name State Golden
Quadrilateral North-South / East West Corridor
Proposed Dedicated Freight corridor
Existing / Proposed Industrial Corridor
Port International / Domestic Airport
71 Jammu UA J&K
72 Firozabad (NPP) Uttar Pradesh
73 Puducherry UA Puducherry
74 Bikaner (M Corp.) Rajasthan
75 Gorakhpur UA Uttar Pradesh
76 Noida (CT) Uttar Pradesh
77 Amravati (M Corp.) Maharashtra
78 Guntur UA Andhra Pradesh
79 Nellore UA Andhra Pradesh
80 Cuttack UA Orissa
81 Malegaon UA Maharashtra
82 Nanded Waghala (M Corp.) Maharashtra
83 Belgaum UA Karnataka
84 Mangalore UA Karnataka
85 Bhavnagar UA Gujarat
86 Muzaffarnagar UA Uttar Pradesh
87 Gulbarga UA Karnataka
88 Tirupati UA Andhra Pradesh
89 Jamnagar UA Gujarat
90 Kurnool UA Andhra Pradesh
91 Jhansi UA Uttar Pradesh
92 Erode UA Tamil Nadu
93 Agartala (M Cl) Tripura
94 Mathura UA Uttar Pradesh
136 IIHS - XV Finance Commission Urbanisation Report

City Name State Golden
Quadrilateral North-South / East West Corridor
Proposed Dedicated Freight corridor
Existing / Proposed Industrial Corridor
Port International / Domestic Airport
95 Jalgaon (M Corp.) Maharashtra
96 Panipat UA Haryana
97 Ujjain (M Corp.) Madhya Pradesh
98 Ajmer UA Rajasthan
99 Bilaspur UA Chhattisgarh
100 Imphal UA Manipur
101 Kolhapur UA Maharashtra
102 Durgapur UA West Bengal
103 Patiala UA Punjab
104 Sangali UA Maharashtra
105 Udaipur UA Rajasthan
106 Vellore UA Tamil Nadu
107 Gaya UA Bihar
108 Raurkela UA Orissa
109 Cherthala UA Kerala
110 Tirunelveli UA Tamil Nadu
111 Bokaro Steel City UA Jharkhand
112 Latur (M Cl) Maharashtra
113 Davanagere (M Corp.) Karnataka
114 Korba UA Chhattisgarh
115 Rajahmundry UA Andhra Pradesh
116 Thoothukkudi UA Tamil Nadu
117 Bellary (M Corp.) Karnataka
118 Kakinada UA Andhra Pradesh
IIHS - XV Finance Commission Urbanisation Report 137
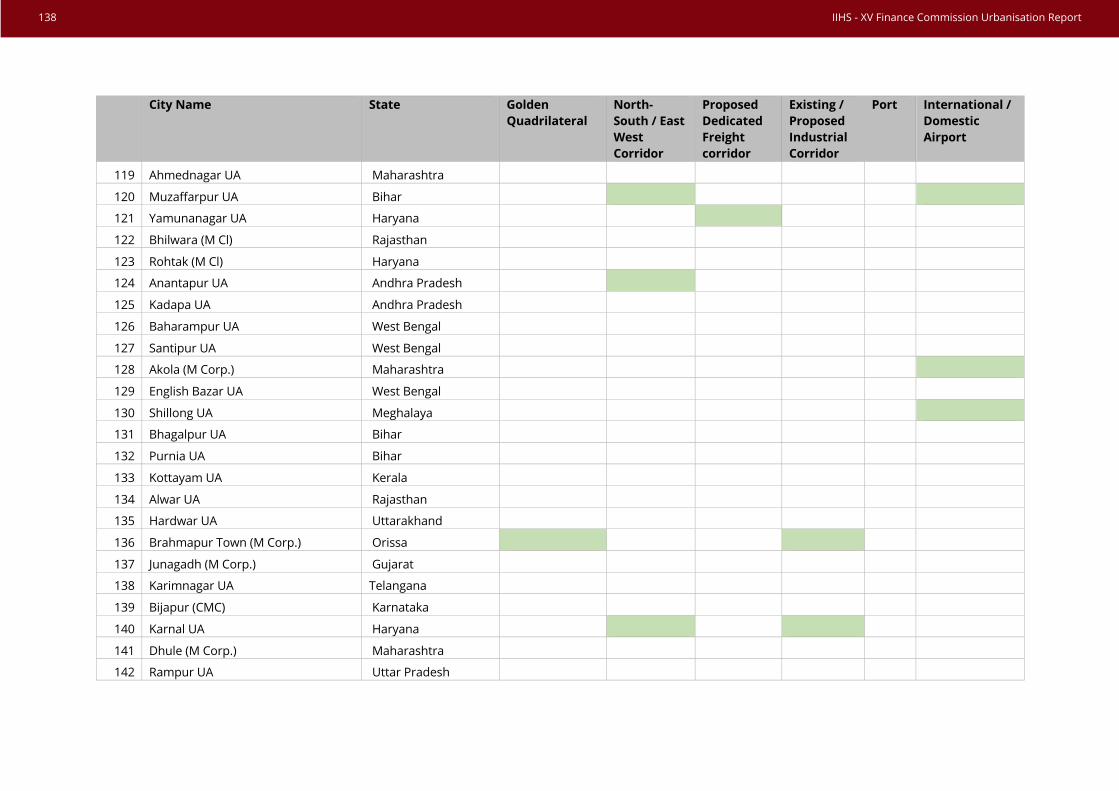
City Name State Golden
Quadrilateral North-South / East West Corridor
Proposed Dedicated Freight corridor
Existing / Proposed Industrial Corridor
Port International / Domestic Airport
119 Ahmednagar UA Maharashtra
120 Muzaffarpur UA Bihar
121 Yamunanagar UA Haryana
122 Bhilwara (M Cl) Rajasthan
123 Rohtak (M Cl) Haryana
124 Anantapur UA Andhra Pradesh
125 Kadapa UA Andhra Pradesh
126 Baharampur UA West Bengal
127 Santipur UA West Bengal
128 Akola (M Corp.) Maharashtra
129 English Bazar UA West Bengal
130 Shillong UA Meghalaya
131 Bhagalpur UA Bihar
132 Purnia UA Bihar
133 Kottayam UA Kerala
134 Alwar UA Rajasthan
135 Hardwar UA Uttarakhand
136 Brahmapur Town (M Corp.) Orissa
137 Junagadh (M Corp.) Gujarat
138 Karimnagar UA Telangana
139 Bijapur (CMC) Karnataka
140 Karnal UA Haryana
141 Dhule (M Corp.) Maharashtra
142 Rampur UA Uttar Pradesh
138 IIHS - XV Finance Commission Urbanisation Report

City Name State Golden
Quadrilateral North-South / East West Corridor
Proposed Dedicated Freight corridor
Existing / Proposed Industrial Corridor
Port International / Domestic Airport
143 Begusarai (M Corp.) Bihar
144 Aizawl (NT) Mizoram
145 Barddhaman UA West Bengal
146 Sonipat UA Haryana
147 Tumkur (CMC) Karnataka
148 Parbhani (M Cl) Maharashtra
149 Dewas (M Corp.) Madhya Pradesh
150 Chandrapur (M Cl) Maharashtra
151 Shimoga (CMC) Karnataka
152 Maunath Bhanjan (NPP) Uttar Pradesh
153 Anand UA Gujarat
154 Habra UA West Bengal
155 Gandhidham (M) Gujarat
156 Shahjahanpur UA Uttar Pradesh
157 Bathinda (M Corp.) Punjab
158 Hisar UA Haryana
159 Ichalkaranji UA Maharashtra
160 Satna UA Madhya Pradesh
161 Dindigul UA Tamil Nadu
162 Biharsharif (M Corp.) Bihar
163 Jalna (M Cl) Maharashtra
164 Palakkad UA Kerala
165 Coonoor Tamil Nadu
166 Khammam UA Telangana
IIHS - XV Finance Commission Urbanisation Report 139

City Name State Golden
Quadrilateral North-South / East West Corridor
Proposed Dedicated Freight corridor
Existing / Proposed Industrial Corridor
Port International / Domestic Airport
167 Morvi UA Gujarat
168 Hapur (NPP) Uttar Pradesh
169 Navsari UA Gujarat
170 Darbhanga UA Bihar
171 Thanjavur UA Tamil Nadu
172 Ranaghat UA West Bengal
173 Farrukhabad-cum-Fatehgarh UA Uttar Pradesh
174 Etawah (NPP) Uttar Pradesh
175 Haldwani-cum-Kathgodam UA Uttarakhand
176 Arrah (M Corp.) Bihar
177 Karur UA Tamil Nadu
178 Nizamabad (M Corp.) Telangana
179 Bharatpur UA Rajasthan
180 Sikar UA Rajasthan
181 Ratlam UA Madhya Pradesh
182 Panchkula (M Cl) Haryana
183 Bulandshahr UA Uttar Pradesh
184 Faizabad UA Uttar Pradesh
185 Silchar UA Assam
186 Rewa (M Corp.) Madhya Pradesh
187 Pali (M Cl) Rajasthan
188 Mirzapur-cum-Vindhyachal UA Uttar Pradesh
189 Katihar UA Bihar
190 Sambalpur UA Orissa
140 IIHS - XV Finance Commission Urbanisation Report

City Name State Golden
Quadrilateral North-South / East West Corridor
Proposed Dedicated Freight corridor
Existing / Proposed Industrial Corridor
Port International / Domestic Airport
191 Panvel (M Cl) Maharashtra
192 Mahbubnagar UA Telangana
193 Ganganagar UA Rajasthan
194 Proddatur UA Andhra Pradesh
195 Nandyal UA Andhra Pradesh
196 Vizianagaram UA Andhra Pradesh
197 Bidar UA Karnataka
198 Kharagpur UA West Bengal
199 Bharuch UA Gujarat
200 Kanhangad UA Kerala
201 Sambhal (NPP) Uttar Pradesh
202 Madanapalle UA Andhra Pradesh
203 Ongole UA Andhra Pradesh
204 Raichur (CMC) Karnataka
205 Orai UA Uttar Pradesh
206 Haldia (M) West Bengal
207 Bhind (M) Madhya Pradesh
208 Eluru UA Andhra Pradesh
209 Morena (M) Madhya Pradesh
210 Hospet (CMC) Karnataka
211 Chapra UA Bihar
212 Mahesana UA Gujarat
213 Jalpaiguri UA West Bengal
214 Puri Town (M) Orissa
IIHS - XV Finance Commission Urbanisation Report 141

City Name State Golden
Quadrilateral North-South / East West Corridor
Proposed Dedicated Freight corridor
Existing / Proposed Industrial Corridor
Port International / Domestic Airport
215 Chhindwara UA Madhya Pradesh
216 Ambala (M Cl) Haryana
217 Ambala UA Haryana
218 Bhuj UA Gujarat
219 Alappuzha UA Kerala
220 Fatehpur (NPP) Uttar Pradesh
221 Murwara (Katni) (M Corp.) Madhya Pradesh
222 Guna (M) Madhya Pradesh
223 Raiganj UA West Bengal
224 Nadiad UA Gujarat
225 Bhiwani (M Cl) Haryana
226 Kancheepuram UA Tamil Nadu
227 Munger (M Corp.) Bihar
228 Unnao (NPP) Uttar Pradesh
229 Rae Bareli (NPP) Uttar Pradesh
230 Karaikkudi UA Tamil Nadu
231 Porbandar UA Gujarat
232 Amroha (NPP) Uttar Pradesh
233 Sitapur UA Uttar Pradesh
234 Udupi UA Karnataka
235 Shivpuri (M) Madhya Pradesh
236 Modinagar UA Uttar Pradesh
237 Gandhinagar Gujarat
238 Jind (M Cl) Haryana
142 IIHS - XV Finance Commission Urbanisation Report

City Name State Golden
Quadrilateral North-South / East West Corridor
Proposed Dedicated Freight corridor
Existing / Proposed Industrial Corridor
Port International / Domestic Airport
239 Hassan UA Karnataka
240 Sirsa (M Cl) Haryana
241 Veraval UA Gujarat
242 Sagar UA Madhya Pradesh
243 Robertson Pet UA Karnataka
244 Burhanpur (M Corp.) Madhya Pradesh
245 Shimla UA Himachal Pradesh
246 Krishnanagar UA West Bengal
247 Tonk (M Cl) Rajasthan
248 Bahraich (NPP) Uttar Pradesh
249 Khandwa (M Corp.) Madhya Pradesh
250 Nagercoil (M) Tamil Nadu
251 Bhusawal UA Maharashtra
252 Phusro UA Jharkhand
253 Saharsa (NP) Bihar
254 Ramagundam UA Telangana
255 Adoni UA Andhra Pradesh
256 Chittoor UA Andhra Pradesh
257 Valsad UA Gujarat
258 Vidisha (M) Madhya Pradesh
259 Banda UA Uttar Pradesh
260 Rewari (M Cl) Haryana
261 Godhra UA Gujarat
262 Nabadwip UA West Bengal
IIHS - XV Finance Commission Urbanisation Report 143

City Name State Golden
Quadrilateral North-South / East West Corridor
Proposed Dedicated Freight corridor
Existing / Proposed Industrial Corridor
Port International / Domestic Airport
263 Giridih UA Jharkhand
264 Hanumangarh (M Cl) Rajasthan
265 Hathras UA Uttar Pradesh
266 Medinipur (M) West Bengal
267 Hindupur (M) Andhra Pradesh
268 Neyveli UA Tamil Nadu
269 Moga UA Punjab
270 Batala UA Punjab
271 Hazaribag UA Jharkhand
272 Gadag-Betigeri (CMC) Karnataka
273 Rajnandgaon (M Corp.) Chhattisgarh
274 Palwal UA Haryana
275 Botad (M) Gujarat
276 Khargone UA Madhya Pradesh
277 Gangapur City UA Rajasthan
278 Beawar UA Rajasthan
279 Budaun (NPP) Uttar Pradesh
280 Sasaram (NP) Bihar
281 Adilabad UA Telangana
282 Jaunpur (NPP) Uttar Pradesh
283 Balurghat UA West Bengal
284 Chirala UA Andhra Pradesh
285 Damoh UA Madhya Pradesh
286 Mainpuri UA Uttar Pradesh
144 IIHS - XV Finance Commission Urbanisation Report

City Name State Golden
Quadrilateral North-South / East West Corridor
Proposed Dedicated Freight corridor
Existing / Proposed Industrial Corridor
Port International / Domestic Airport
287 Cuddalore (M) Tamil Nadu
288 Chitradurga UA Karnataka
289 Etah UA Uttar Pradesh
290 Malerkotla (M Cl) Punjab
291 Bahadurgarh (M Cl) Haryana
292 Chakdaha UA West Bengal
293 Khanna (M Cl) Punjab
294 Deoria (NPP) Uttar Pradesh
295 Chirkunda UA Jharkhand
296 Sawai Madhopur (M) Rajasthan
297 Bid (M Cl) Maharashtra
298 Tiruvannamalai (M) Tamil Nadu
299 Jorhat UA Assam
300 Dibrugarh UA Assam
IIHS - XV Finance Commission Urbanisation Report 145

India’s Top 300 cities | Urban Development Schemes
City Name State JNNURM AMRUT Smart City HRIDAY
1 Delhi UA Delhi 2 Greater Mumbai UA Maharashtra 3 Kolkata UA West Bengal 4 Bangalore UA Karnataka 5 Chennai UA Tamil Nadu 6 Hyderabad UA Telangana 7 Ahmadabad UA Gujarat 8 Surat UA Gujarat 9 Pune UA Maharashtra
10 Jaipur (M Corp.) Rajasthan 11 Lucknow UA Uttar Pradesh 12 Kanpur UA Uttar Pradesh 13 Indore UA Madhya Pradesh 14 Kochi UA Kerala 15 Coimbatore UA Tamil Nadu 16 Ghaziabad UA Uttar Pradesh 17 Nagpur UA Maharashtra 18 Patna UA Bihar 19 Thiruvananthapuram UA Kerala 20 Kozhikode UA Kerala 21 Bhopal UA Madhya Pradesh 22 Vasai Virar City (M Corp.) Maharashtra 23 Thrissur UA Kerala 24 Vadodara UA Gujarat 25 Agra UA Uttar Pradesh
146 IIHS - XV Finance Commission Urbanisation Report

City Name State JNNURM AMRUT Smart City HRIDAY
26 Greater Vishakapatnam (MC) Andhra Pradesh 27 Nashik UA Maharashtra 28 Malappuram UA Kerala 29 Faridabad (M Corp.) Haryana 30 Kannur UA Kerala 31 Vijayawada UA Andhra Pradesh 32 Ludhiana (M Corp.) Punjab 33 Rajkot UA Gujarat 34 Meerut UA Uttar Pradesh 35 Aurangabad UA Maharashtra 36 Raipur UA Chhattisgarh 37 Srinagar UA J&K 38 Madurai UA Tamil Nadu 39 Varanasi UA Uttar Pradesh
40 Asansol UA West Bengal 41 Jamshedpur UA Jharkhand 42 Tiruppur UA Tamil Nadu 43 Jodhpur UA Rajasthan 44 Ranchi UA Jharkhand 45 Amritsar UA Punjab
46 Allahabad UA Uttar Pradesh 47 Jabalpur UA Madhya Pradesh 48 Kollam UA Kerala 49 Kota (M Corp.) Rajasthan 50 Gwalior UA Madhya Pradesh 51 Chandigarh UA Chandigarh
IIHS - XV Finance Commission Urbanisation Report 147

City Name State JNNURM AMRUT Smart City HRIDAY
52 Dhanbad UA Jharkhand 53 Gurgaon UA Haryana 54 Bhubaneswar UA Orissa 55 Durg-Bhilainagar UA Chhattisgarh 56 Aligarh UA Uttar Pradesh 57 Bareilly UA Uttar Pradesh 58 Guwahati UA Assam 59 Moradabad (M Corp.) Uttar Pradesh 60 Mysore UA Karnataka 61 Tiruchirappalli UA Tamil Nadu 62 Jalandhar UA Punjab 63 Siliguri UA West Bengal 64 Solapur (M Corp.) Maharashtra 65 Hubli-Dharwad *(M Corp.) Karnataka 66 Salem UA Tamil Nadu 67 Bhiwadi (M) Maharashtra 68 Warangal UA Telangana
69 Saharanpur (M Corp.) Uttar Pradesh 70 Dehradun UA Uttarakhand 71 Jammu UA J&K 72 Firozabad (NPP) Uttar Pradesh 73 Puducherry UA Puducherry 74 Bikaner (M Corp.) Rajasthan 75 Gorakhpur UA Uttar Pradesh 76 Noida (CT) Uttar Pradesh 77 Amravati (M Corp.) Maharashtra
148 IIHS - XV Finance Commission Urbanisation Report

City Name State JNNURM AMRUT Smart City HRIDAY
78 Guntur UA Andhra Pradesh 79 Nellore UA Andhra Pradesh 80 Cuttack UA Orissa 81 Malegaon UA Maharashtra 82 Nanded Waghala (M Corp.) Maharashtra 83 Belgaum UA Karnataka 84 Mangalore UA Karnataka 85 Bhavnagar UA Gujarat 86 Muzaffarnagar UA Uttar Pradesh 87 Gulbarga UA Karnataka 88 Tirupati UA Andhra Pradesh 89 Jamnagar UA Gujarat 90 Kurnool UA Andhra Pradesh 91 Jhansi UA Uttar Pradesh 92 Erode UA Tamil Nadu 93 Agartala (M Cl) Tripura 94 Mathura UA Uttar Pradesh
95 Jalgaon (M Corp.) Maharashtra 96 Panipat UA Haryana 97 Ujjain (M Corp.) Madhya Pradesh 98 Ajmer UA Rajasthan
99 Bilaspur UA Chhattisgarh 100 Imphal UA Manipur 101 Kolhapur UA Maharashtra 102 Durgapur UA West Bengal 103 Patiala UA Punjab
IIHS - XV Finance Commission Urbanisation Report 149

City Name State JNNURM AMRUT Smart City HRIDAY
104 Sangali UA Maharashtra 105 Udaipur UA Rajasthan 106 Vellore UA Tamil Nadu 107 Gaya UA Bihar
108 Raurkela UA Orissa 109 Cherthala UA Kerala 110 Tirunelveli UA Tamil Nadu 111 Bokaro Steel City UA Jharkhand 112 Latur (M Cl) Maharashtra 113 Davanagere (M Corp.) Karnataka 114 Korba UA Chhattisgarh 115 Rajahmundry UA Andhra Pradesh 116 Thoothukkudi UA Tamil Nadu 117 Bellary (M Corp.) Karnataka 118 Kakinada UA Andhra Pradesh
119 Ahmednagar UA Maharashtra
120 Muzaffarpur UA Bihar
121 Yamunanagar UA Haryana
122 Bhilwara (M Cl) Rajasthan
123 Rohtak (M Cl) Haryana
124 Anantapur UA Andhra Pradesh
125 Kadapa UA Andhra Pradesh
126 Baharampur UA West Bengal
127 Santipur UA West Bengal
128 Akola (M Corp.) Maharashtra
129 English Bazar UA West Bengal
150 IIHS - XV Finance Commission Urbanisation Report

City Name State JNNURM AMRUT Smart City HRIDAY
130 Shillong UA Meghalaya
131 Bhagalpur UA Bihar
132 Purnia UA Bihar
133 Kottayam UA Kerala
134 Alwar UA Rajasthan
135 Hardwar UA Uttarakhand
136 Brahmapur Town (M Corp.) Orissa
137 Junagadh (M Corp.) Gujarat
138 Karimnagar UA Telangana
139 Bijapur (CMC) Karnataka
140 Karnal UA Haryana
141 Dhule (M Corp.) Maharashtra
142 Rampur UA Uttar Pradesh
143 Begusarai (M Corp.) Bihar
144 Aizawl (NT) Mizoram
145 Barddhaman UA West Bengal
146 Sonipat UA Haryana
147 Tumkur (CMC) Karnataka
148 Parbhani (M Cl) Maharashtra
149 Dewas (M Corp.) Madhya Pradesh
150 Chandrapur (M Cl) Maharashtra
151 Shimoga (CMC) Karnataka
152 Maunath Bhanjan (NPP) Uttar Pradesh
153 Anand UA Gujarat
154 Habra UA West Bengal
155 Gandhidham (M) Gujarat
IIHS - XV Finance Commission Urbanisation Report 151

City Name State JNNURM AMRUT Smart City HRIDAY
156 Shahjahanpur UA Uttar Pradesh
157 Bathinda (M Corp.) Punjab
158 Hisar UA Haryana
159 Ichalkaranji UA Maharashtra
160 Satna UA Madhya Pradesh
161 Dindigul UA Tamil Nadu
162 Biharsharif (M Corp.) Bihar
163 Jalna (M Cl) Maharashtra
164 Palakkad UA Kerala
165 Coonoor Tamil Nadu
166 Khammam UA Telangana
167 Morvi UA Gujarat
168 Hapur (NPP) Uttar Pradesh
169 Navsari UA Gujarat
170 Darbhanga UA Bihar
171 Thanjavur UA Tamil Nadu
172 Ranaghat UA West Bengal
173 Farrukhabad-cum-Fatehgarh UA Uttar Pradesh
174 Etawah (NPP) Uttar Pradesh
175 Haldwani-cum-Kathgodam UA Uttarakhand
176 Arrah (M Corp.) Bihar
177 Karur UA Tamil Nadu
178 Nizamabad (M Corp.) Telangana
179 Bharatpur UA Rajasthan
180 Sikar UA Rajasthan
181 Ratlam UA Madhya Pradesh
152 IIHS - XV Finance Commission Urbanisation Report

City Name State JNNURM AMRUT Smart City HRIDAY
182 Panchkula (M Cl) Haryana
183 Bulandshahr UA Uttar Pradesh
184 Faizabad UA Uttar Pradesh
185 Silchar UA Assam
186 Rewa (M Corp.) Madhya Pradesh
187 Pali (M Cl) Rajasthan
188 Mirzapur-cum-Vindhyachal UA Uttar Pradesh
189 Katihar UA Bihar
190 Sambalpur UA Orissa
191 Panvel (M Cl) Maharashtra
192 Mahbubnagar UA Telangana
193 Ganganagar UA Rajasthan
194 Proddatur UA Andhra Pradesh
195 Nandyal UA Andhra Pradesh
196 Vizianagaram UA Andhra Pradesh
197 Bidar UA Karnataka
198 Kharagpur UA West Bengal
199 Bharuch UA Gujarat
200 Kanhangad UA Kerala
201 Sambhal (NPP) Uttar Pradesh
202 Madanapalle UA Andhra Pradesh
203 Ongole UA Andhra Pradesh
204 Raichur (CMC) Karnataka
205 Orai UA Uttar Pradesh
206 Haldia (M) West Bengal
207 Bhind (M) Madhya Pradesh
IIHS - XV Finance Commission Urbanisation Report 153

City Name State JNNURM AMRUT Smart City HRIDAY
208 Eluru UA Andhra Pradesh
209 Morena (M) Madhya Pradesh
210 Hospet (CMC) Karnataka
211 Chapra UA Bihar
212 Mahesana UA Gujarat
213 Jalpaiguri UA West Bengal
214 Puri Town (M) Orissa
215 Chhindwara UA Madhya Pradesh
216 Ambala (M Cl) Haryana
217 Ambala UA Haryana
218 Bhuj UA Gujarat
219 Alappuzha UA Kerala
220 Fatehpur (NPP) Uttar Pradesh
221 Murwara (Katni) (M Corp.) Madhya Pradesh
222 Guna (M) Madhya Pradesh
223 Raiganj UA West Bengal
224 Nadiad UA Gujarat
225 Bhiwani (M Cl) Haryana
226 Kancheepuram UA Tamil Nadu
227 Munger (M Corp.) Bihar
228 Unnao (NPP) Uttar Pradesh
229 Rae Bareli (NPP) Uttar Pradesh
230 Karaikkudi UA Tamil Nadu
231 Porbandar UA Gujarat
232 Amroha (NPP) Uttar Pradesh
233 Sitapur UA Uttar Pradesh
154 IIHS - XV Finance Commission Urbanisation Report

City Name State JNNURM AMRUT Smart City HRIDAY
234 Udupi UA Karnataka
235 Shivpuri (M) Madhya Pradesh
236 Modinagar UA Uttar Pradesh
237 Gandhinagar Gujarat
238 Jind (M Cl) Haryana
239 Hassan UA Karnataka
240 Sirsa (M Cl) Haryana
241 Veraval UA Gujarat
242 Sagar UA Madhya Pradesh
243 Robertson Pet UA Karnataka
244 Burhanpur (M Corp.) Madhya Pradesh
245 Shimla UA Himachal Pradesh
246 Krishnanagar UA West Bengal
247 Tonk (M Cl) Rajasthan
248 Bahraich (NPP) Uttar Pradesh
249 Khandwa (M Corp.) Madhya Pradesh
250 Nagercoil (M) Tamil Nadu
251 Bhusawal UA Maharashtra
252 Phusro UA Jharkhand
253 Saharsa (NP) Bihar
254 Ramagundam UA Telangana
255 Adoni UA Andhra Pradesh
256 Chittoor UA Andhra Pradesh
257 Valsad UA Gujarat
258 Vidisha (M) Madhya Pradesh
259 Banda UA Uttar Pradesh
IIHS - XV Finance Commission Urbanisation Report 155

City Name State JNNURM AMRUT Smart City HRIDAY
260 Rewari (M Cl) Haryana
261 Godhra UA Gujarat
262 Nabadwip UA West Bengal
263 Giridih UA Jharkhand
264 Hanumangarh (M Cl) Rajasthan
265 Hathras UA Uttar Pradesh
266 Medinipur (M) West Bengal
267 Hindupur (M) Andhra Pradesh
268 Neyveli UA Tamil Nadu
269 Moga UA Punjab
270 Batala UA Punjab
271 Hazaribag UA Jharkhand
272 Gadag-Betigeri (CMC) Karnataka
273 Rajnandgaon (M Corp.) Chhattisgarh
274 Palwal UA Haryana
275 Botad (M) Gujarat
276 Khargone UA Madhya Pradesh
277 Gangapur City UA Rajasthan
278 Beawar UA Rajasthan
279 Budaun (NPP) Uttar Pradesh
280 Sasaram (NP) Bihar
281 Adilabad UA Telangana
282 Jaunpur (NPP) Uttar Pradesh
283 Balurghat UA West Bengal
284 Chirala UA Andhra Pradesh
285 Damoh UA Madhya Pradesh
156 IIHS - XV Finance Commission Urbanisation Report

City Name State JNNURM AMRUT Smart City HRIDAY
286 Mainpuri UA Uttar Pradesh
287 Cuddalore (M) Tamil Nadu
288 Chitradurga UA Karnataka
289 Etah UA Uttar Pradesh
290 Malerkotla (M Cl) Punjab
291 Bahadurgarh (M Cl) Haryana
292 Chakdaha UA West Bengal
293 Khanna (M Cl) Punjab
294 Deoria (NPP) Uttar Pradesh
295 Chirkunda UA Jharkhand
296 Sawai Madhopur (M) Rajasthan
297 Bid (M Cl) Maharashtra
298 Tiruvannamalai (M) Tamil Nadu
299 Jorhat UA Assam
300 Dibrugarh UA Assam
IIHS - XV Finance Commission Urbanisation Report 157

India’s Top 300 cities| Hazard Risk Exposure
City Name State Earthquake Cyclone Storm Surge Flooding Groundwater Deficit (from GCWB blocks)
1 Delhi UA Delhi High Low Low High Saline/ Over-exploited / Critical
2 Greater Mumbai UA Maharashtra Moderate High High High Safe
3 Kolkata UA West Bengal Moderate High Low High Not Assessed
4 Bangalore UA Karnataka Low Moderate Low High Saline/ Over-exploited / Critical
5 Chennai UA Tamil Nadu Moderate High High High Not Assessed
6 Hyderabad UA Telangana Low Moderate Low High Safe
7 Ahmadabad UA Gujarat Moderate Moderate Low High Semi-critical
8 Surat UA Gujarat Moderate High High High Safe
9 Pune UA Maharashtra Moderate Moderate Low High Safe
10 Jaipur (M Corp.) Rajasthan Low Low Low High Saline/ Over-exploited / Critical
11 Lucknow UA Uttar Pradesh Moderate Low Low High Safe
12 Kanpur UA Uttar Pradesh Moderate Low Low High Safe
13 Indore UA Madhya Pradesh Low Low Low High Saline/ Over-exploited / Critical
14 Kochi UA Kerala Moderate Moderate High High Not Assessed
15 Coimbatore UA Tamil Nadu Moderate Moderate Low Low Saline/ Over-exploited / Critical
16 Ghaziabad UA Uttar Pradesh High Low Low High Saline/ Over-exploited / Critical
17 Nagpur UA Maharashtra Low Low Low High Safe
18 Patna UA Bihar High Low Low High Safe
19 Thiruvananthapuram UA Kerala Moderate Moderate High High Safe
20 Kozhikode UA Kerala Moderate Moderate High Low Not Assessed
21 Bhopal UA Madhya Pradesh Moderate Low Low High Semi-critical
22 Vasai Virar City (M Corp.) Maharashtra Moderate High High High Safe
23 Thrissur UA Kerala Moderate Moderate Low High Safe
24 Vadodara UA Gujarat Moderate Moderate Low High Not Assessed
158 IIHS - XV Finance Commission Urbanisation Report

25 Agra UA Uttar Pradesh Moderate Low Low High Saline/ Over-exploited / Critical
26 Greater Vishakapatnam (MC) Andhra Pradesh Low High High High Safe
27 Nashik UA Maharashtra Moderate Moderate Low Low Safe
28 Malappuram UA Kerala Moderate Moderate Low Low Safe
29 Faridabad (M Corp.) Haryana High Low Low High Saline/ Over-exploited / Critical
30 Kannur UA Kerala Moderate Moderate High High Safe
31 Vijayawada UA Andhra Pradesh Moderate High Low High Safe
32 Ludhiana (M Corp.) Punjab High Low Low High Saline/ Over-exploited / Critical
33 Rajkot UA Gujarat Moderate High Low Low Safe
34 Meerut UA Uttar Pradesh High Low Low High Saline/ Over-exploited / Critical
35 Aurangabad UA Maharashtra Low Moderate Low Low Semi-critical
36 Raipur UA Chhattisgarh Low Moderate Low High Saline/ Over-exploited / Critical
37 Srinagar UA J&K High Low Low High Safe
38 Madurai UA Tamil Nadu Low Moderate Low High Safe
39 Varanasi UA Uttar Pradesh Moderate Low Low High Safe
40 Asansol UA West Bengal Moderate Moderate Low Moderate Safe
41 Jamshedpur UA Jharkhand Low High Low High Safe
42 Tiruppur UA Tamil Nadu Moderate Moderate Low High Saline/ Over-exploited / Critical
43 Jodhpur UA Rajasthan Low Low Low Moderate Saline/ Over-exploited / Critical
44 Ranchi UA Jharkhand Low Moderate Low High Semi-critical
45 Amritsar UA Punjab High Low Low Low Saline/ Over-exploited / Critical
46 Allahabad UA Uttar Pradesh Low Low Low High Saline/ Over-exploited / Critical
47 Jabalpur UA Madhya Pradesh Moderate Low Low High Safe
48 Kollam UA Kerala Moderate Moderate High High Not Assessed
49 Kota (M Corp.) Rajasthan Low Low Low High Saline/ Over-exploited / Critical
50 Gwalior UA Madhya Pradesh Low Low Low Low Safe
51 Chandigarh UA Chandigarh High Low Low Moderate Safe
IIHS - XV Finance Commission Urbanisation Report 159

52 Dhanbad UA Jharkhand Moderate Moderate Low Low Safe
53 Gurgaon UA Haryana High Low Low High Saline/ Over-exploited / Critical
54 Bhubaneswar UA Orissa Moderate High Low High Safe
55 Durg-Bhilainagar UA Chhattisgarh Low Moderate Low Moderate Semi-critical
56 Aligarh UA Uttar Pradesh High Low Low Low Safe
57 Bareilly UA Uttar Pradesh High Low Low High Safe
58 Guwahati UA Assam High Low Low High Safe
59 Moradabad (M Corp.) Uttar Pradesh High Low Low High Not Assessed
60 Mysore UA Karnataka Low Moderate Low Low Semi-critical
61 Tiruchirappalli UA Tamil Nadu Low Moderate Low High Safe
62 Jalandhar UA Punjab High Low Low High Saline/ Over-exploited / Critical
63 Siliguri UA West Bengal High Low Low Low Not Assessed
64 Solapur (M Corp.) Maharashtra Moderate Low Low Low Safe
65 Hubli-Dharwad *(M Corp.) Karnataka Low Moderate Low Low Safe
66 Salem UA Tamil Nadu Moderate Moderate Low Low Not Assessed
67 Bhiwadi (M) Maharashtra High Low Low Low Saline/ Over-exploited / Critical
68 Warangal UA Telangana Low Moderate Low Moderate Safe
69 Saharanpur (M Corp.) Uttar Pradesh High Low Low Low Saline/ Over-exploited / Critical
70 Dehradun UA Uttarakhand High Low Low Low Not Assessed
71 Jammu UA J&K High Low Low High Safe
72 Firozabad (NPP) Uttar Pradesh Moderate Low Low High Saline/ Over-exploited / Critical
73 Puducherry UA Puducherry Low High High High Safe
74 Bikaner (M Corp.) Rajasthan Moderate Low Low Low Saline/ Over-exploited / Critical
75 Gorakhpur UA Uttar Pradesh High Low Low High Safe
76 Noida (CT) Uttar Pradesh High Low Low High Saline/ Over-exploited / Critical
77 Amravati (M Corp.) Maharashtra Low Low Low Low Semi-critical
78 Guntur UA Andhra Pradesh Moderate Moderate Low Low Safe
160 IIHS - XV Finance Commission Urbanisation Report
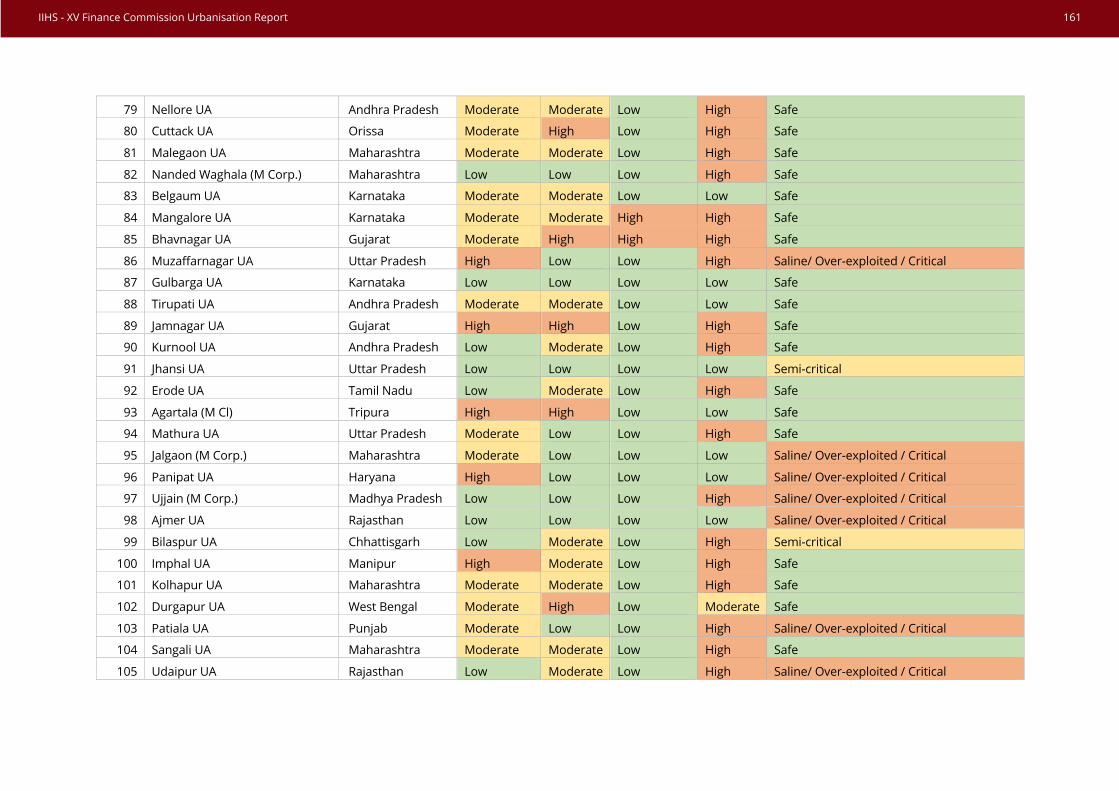
79 Nellore UA Andhra Pradesh Moderate Moderate Low High Safe
80 Cuttack UA Orissa Moderate High Low High Safe
81 Malegaon UA Maharashtra Moderate Moderate Low High Safe
82 Nanded Waghala (M Corp.) Maharashtra Low Low Low High Safe
83 Belgaum UA Karnataka Moderate Moderate Low Low Safe
84 Mangalore UA Karnataka Moderate Moderate High High Safe
85 Bhavnagar UA Gujarat Moderate High High High Safe
86 Muzaffarnagar UA Uttar Pradesh High Low Low High Saline/ Over-exploited / Critical
87 Gulbarga UA Karnataka Low Low Low Low Safe
88 Tirupati UA Andhra Pradesh Moderate Moderate Low Low Safe
89 Jamnagar UA Gujarat High High Low High Safe
90 Kurnool UA Andhra Pradesh Low Moderate Low High Safe
91 Jhansi UA Uttar Pradesh Low Low Low Low Semi-critical
92 Erode UA Tamil Nadu Low Moderate Low High Safe
93 Agartala (M Cl) Tripura High High Low Low Safe
94 Mathura UA Uttar Pradesh Moderate Low Low High Safe
95 Jalgaon (M Corp.) Maharashtra Moderate Low Low Low Saline/ Over-exploited / Critical
96 Panipat UA Haryana High Low Low Low Saline/ Over-exploited / Critical
97 Ujjain (M Corp.) Madhya Pradesh Low Low Low High Saline/ Over-exploited / Critical
98 Ajmer UA Rajasthan Low Low Low Low Saline/ Over-exploited / Critical
99 Bilaspur UA Chhattisgarh Low Moderate Low High Semi-critical
100 Imphal UA Manipur High Moderate Low High Safe
101 Kolhapur UA Maharashtra Moderate Moderate Low High Safe
102 Durgapur UA West Bengal Moderate High Low Moderate Safe
103 Patiala UA Punjab Moderate Low Low High Saline/ Over-exploited / Critical
104 Sangali UA Maharashtra Moderate Moderate Low High Safe
105 Udaipur UA Rajasthan Low Moderate Low High Saline/ Over-exploited / Critical
IIHS - XV Finance Commission Urbanisation Report 161

106 Vellore UA Tamil Nadu Moderate Moderate Low High Not Assessed
107 Gaya UA Bihar Moderate Moderate Low High Not Assessed
108 Raurkela UA Orissa Low High Low High Safe
109 Cherthala UA Kerala Moderate Moderate High Low Safe
110 Tirunelveli UA Tamil Nadu Low Moderate Low High Safe
111 Bokaro Steel City UA Jharkhand Moderate Moderate Low Moderate Semi-critical
112 Latur (M Cl) Maharashtra Low Low Low Low Semi-critical
113 Davanagere (M Corp.) Karnataka Low Moderate Low Low Saline/ Over-exploited / Critical
114 Korba UA Chhattisgarh Low Moderate Low High Safe
115 Rajahmundry UA Andhra Pradesh Moderate High Low High Safe
116 Thoothukkudi UA Tamil Nadu Low Moderate High Low Safe
117 Bellary (M Corp.) Karnataka Low Moderate Low Low Safe
118 Kakinada UA Andhra Pradesh Moderate High High High Not Assessed
119 Ahmednagar UA Maharashtra Moderate Moderate Low Low Safe
120 Muzaffarpur UA Bihar High Low Low High Safe
121 Yamunanagar UA Haryana High Low Low Low Saline/ Over-exploited / Critical
122 Bhilwara (M Cl) Rajasthan Low Low Low High Saline/ Over-exploited / Critical
123 Rohtak (M Cl) Haryana High Low Low High Safe
124 Anantapur UA Andhra Pradesh Low Moderate Low Low Safe
125 Kadapa UA Andhra Pradesh Low Moderate Low Low Safe
126 Baharampur UA West Bengal Moderate High Low High Safe
127 Santipur UA West Bengal Moderate High Low High Safe
128 Akola (M Corp.) Maharashtra Low Low Low Low Safe
129 English Bazar UA West Bengal High Moderate Low High Safe
130 Shillong UA Meghalaya High Moderate Low Low Safe
131 Bhagalpur UA Bihar High Moderate Low High Safe
132 Purnia UA Bihar High Moderate Low Low Safe
162 IIHS - XV Finance Commission Urbanisation Report

133 Kottayam UA Kerala Moderate Moderate High High Safe
134 Alwar UA Rajasthan High Low Low Low Saline/ Over-exploited / Critical
135 Hardwar UA Uttarakhand High Low Low High Semi-critical
136 Brahmapur Town (M Corp.) Orissa Low High High High Safe
137 Junagadh (M Corp.) Gujarat Moderate High Low Low Safe
138 Karimnagar UA Telangana Low Moderate Low High Safe
139 Bijapur (CMC) Karnataka Low Low Low Low Safe
140 Karnal UA Haryana Moderate Low Low High Saline/ Over-exploited / Critical
141 Dhule (M Corp.) Maharashtra Moderate Moderate Low High Safe
142 Rampur UA Uttar Pradesh High Low Low High Not Assessed
143 Begusarai (M Corp.) Bihar High Moderate Low Moderate Safe
144 Aizawl (NT) Mizoram High Moderate Low High Safe
145 Barddhaman UA West Bengal Moderate High Low High Safe
146 Sonipat UA Haryana High Low Low Low Saline/ Over-exploited / Critical
147 Tumkur (CMC) Karnataka Low Moderate Low Low Saline/ Over-exploited / Critical
148 Parbhani (M Cl) Maharashtra Low Low Low Low Safe
149 Dewas (M Corp.) Madhya Pradesh Low Low Low Low Saline/ Over-exploited / Critical
150 Chandrapur (M Cl) Maharashtra Moderate Moderate Low High Safe
151 Shimoga (CMC) Karnataka Low Moderate Low High Safe
152 Maunath Bhanjan (NPP) Uttar Pradesh Moderate Low Low High Safe
153 Anand UA Gujarat Moderate Moderate Low Low Safe
154 Habra UA West Bengal Moderate High Low Low Safe
155 Gandhidham (M) Gujarat High High High High Saline/ Over-exploited / Critical
156 Shahjahanpur UA Uttar Pradesh High Low Low Low Saline/ Over-exploited / Critical
157 Bathinda (M Corp.) Punjab Moderate Low Low Low Saline/ Over-exploited / Critical
158 Hisar UA Haryana Moderate Low Low High Semi-critical
159 Ichalkaranji UA Maharashtra Moderate Moderate Low High Safe
IIHS - XV Finance Commission Urbanisation Report 163

160 Satna UA Madhya Pradesh Low Low Low High Semi-critical
161 Dindigul UA Tamil Nadu Low Moderate Low Low Not Assessed
162 Biharsharif (M Corp.) Bihar High Moderate Low High Safe
163 Jalna (M Cl) Maharashtra Low Moderate Low Low Safe
164 Palakkad UA Kerala Moderate Moderate Low High Saline/ Over-exploited / Critical
165 Coonoor Tamil Nadu Not Assessed
166 Khammam UA Telangana Moderate Moderate Low High Safe
167 Morvi UA Gujarat High High Low High Safe
168 Hapur (NPP) Uttar Pradesh High Low Low High Saline/ Over-exploited / Critical
169 Navsari UA Gujarat Moderate High Low High Safe
170 Darbhanga UA Bihar High Low Low Moderate Safe
171 Thanjavur UA Tamil Nadu Low High Low Low Safe
172 Ranaghat UA West Bengal Moderate High Low Low Safe
173 Farrukhabad-cum-Fatehgarh UA Uttar Pradesh Moderate Low Low Low Semi-critical
174 Etawah (NPP) Uttar Pradesh Low Low Low High Safe
175 Haldwani-cum-Kathgodam UA Uttarakhand High Low Low Low Semi-critical
176 Arrah (M Corp.) Bihar High Low Low High Safe
177 Karur UA Tamil Nadu Low Moderate Low High Saline/ Over-exploited / Critical
178 Nizamabad (M Corp.) Telangana Low Moderate Low Low Safe
179 Bharatpur UA Rajasthan Moderate Low Low High Saline/ Over-exploited / Critical
180 Sikar UA Rajasthan Low Low Low Low Saline/ Over-exploited / Critical
181 Ratlam UA Madhya Pradesh Low Moderate Low High Saline/ Over-exploited / Critical
182 Panchkula (M Cl) Haryana High Low Low Moderate Not Assessed
183 Bulandshahr UA Uttar Pradesh High Low Low High Saline/ Over-exploited / Critical
184 Faizabad UA Uttar Pradesh Moderate Low Low High Safe
185 Silchar UA Assam High Moderate Low High Safe
186 Rewa (M Corp.) Madhya Pradesh Low Low Low High Safe
164 IIHS - XV Finance Commission Urbanisation Report

187 Pali (M Cl) Rajasthan Low Low Low High Saline/ Over-exploited / Critical
188 Mirzapur-cum-Vindhyachal UA Uttar Pradesh Moderate Low Low High Saline/ Over-exploited / Critical
189 Katihar UA Bihar High Moderate Low High Safe
190 Sambalpur UA Orissa Moderate Moderate Low High Safe
191 Panvel (M Cl) Maharashtra Moderate High High High Safe
192 Mahbubnagar UA Telangana Low Moderate Low Low Safe
193 Ganganagar UA Rajasthan Low Low Low Low Safe
194 Proddatur UA Andhra Pradesh Low Moderate Low High Safe
195 Nandyal UA Andhra Pradesh Low Moderate Low High Safe
196 Vizianagaram UA Andhra Pradesh Low High Low Low Safe
197 Bidar UA Karnataka Low Low Low Low Safe
198 Kharagpur UA West Bengal Moderate High Low Low Safe
199 Bharuch UA Gujarat Moderate Moderate Low High Safe
200 Kanhangad UA Kerala Moderate Moderate Low Low Not Assessed
201 Sambhal (NPP) Uttar Pradesh High Low Low Low Saline/ Over-exploited / Critical
202 Madanapalle UA Andhra Pradesh Low Moderate Low Low Safe
203 Ongole UA Andhra Pradesh Moderate Moderate Low High Safe
204 Raichur (CMC) Karnataka Low Moderate Low Low Semi-critical
205 Orai UA Uttar Pradesh Low Low Low Low Safe
206 Haldia (M) West Bengal Moderate High High High Not Assessed
207 Bhind (M) Madhya Pradesh Low Low Low Low Safe
208 Eluru UA Andhra Pradesh Moderate High Low High Safe
209 Morena (M) Madhya Pradesh Low Low Low Low Safe
210 Hospet (CMC) Karnataka Low Low Low Low Safe
211 Chapra UA Bihar High Low Low High Safe
212 Mahesana UA Gujarat Moderate Moderate Low Low Saline/ Over-exploited / Critical
213 Jalpaiguri UA West Bengal High Moderate Low Moderate Safe
IIHS - XV Finance Commission Urbanisation Report 165
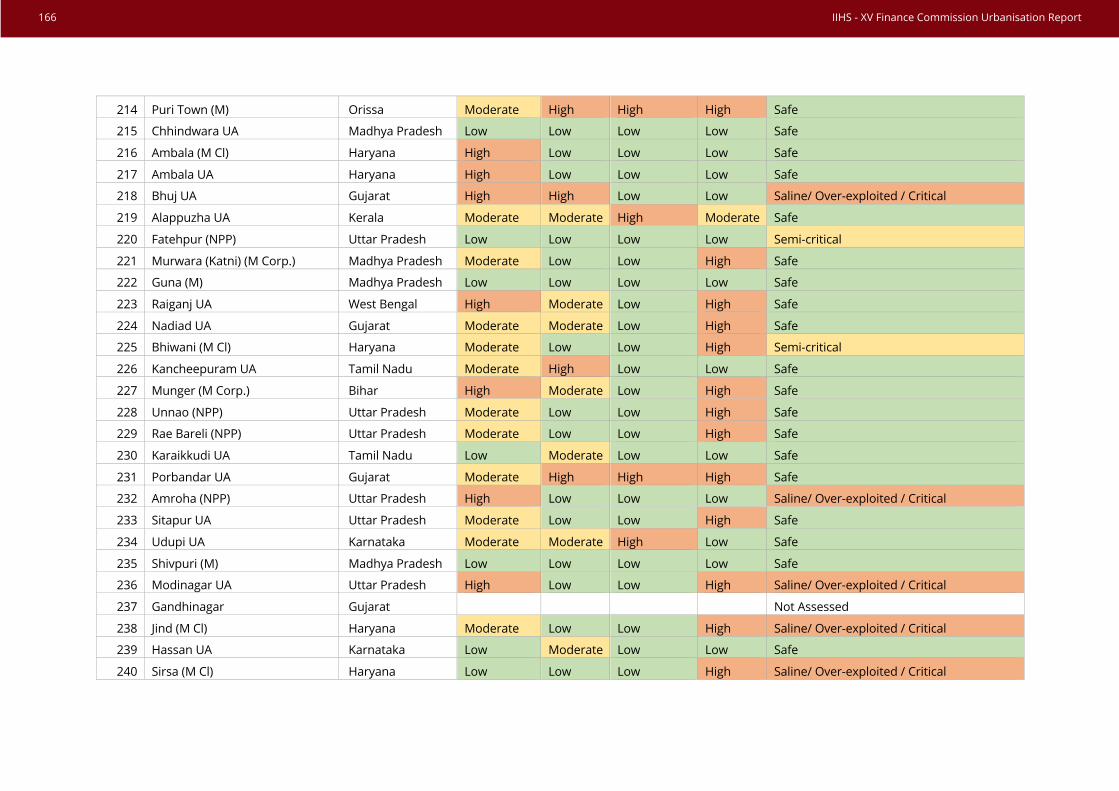
214 Puri Town (M) Orissa Moderate High High High Safe
215 Chhindwara UA Madhya Pradesh Low Low Low Low Safe
216 Ambala (M Cl) Haryana High Low Low Low Safe
217 Ambala UA Haryana High Low Low Low Safe
218 Bhuj UA Gujarat High High Low Low Saline/ Over-exploited / Critical
219 Alappuzha UA Kerala Moderate Moderate High Moderate Safe
220 Fatehpur (NPP) Uttar Pradesh Low Low Low Low Semi-critical
221 Murwara (Katni) (M Corp.) Madhya Pradesh Moderate Low Low High Safe
222 Guna (M) Madhya Pradesh Low Low Low Low Safe
223 Raiganj UA West Bengal High Moderate Low High Safe
224 Nadiad UA Gujarat Moderate Moderate Low High Safe
225 Bhiwani (M Cl) Haryana Moderate Low Low High Semi-critical
226 Kancheepuram UA Tamil Nadu Moderate High Low Low Safe
227 Munger (M Corp.) Bihar High Moderate Low High Safe
228 Unnao (NPP) Uttar Pradesh Moderate Low Low High Safe
229 Rae Bareli (NPP) Uttar Pradesh Moderate Low Low High Safe
230 Karaikkudi UA Tamil Nadu Low Moderate Low Low Safe
231 Porbandar UA Gujarat Moderate High High High Safe
232 Amroha (NPP) Uttar Pradesh High Low Low Low Saline/ Over-exploited / Critical
233 Sitapur UA Uttar Pradesh Moderate Low Low High Safe
234 Udupi UA Karnataka Moderate Moderate High Low Safe
235 Shivpuri (M) Madhya Pradesh Low Low Low Low Safe
236 Modinagar UA Uttar Pradesh High Low Low High Saline/ Over-exploited / Critical
237 Gandhinagar Gujarat Not Assessed
238 Jind (M Cl) Haryana Moderate Low Low High Saline/ Over-exploited / Critical
239 Hassan UA Karnataka Low Moderate Low Low Safe
240 Sirsa (M Cl) Haryana Low Low Low High Saline/ Over-exploited / Critical
166 IIHS - XV Finance Commission Urbanisation Report

241 Veraval UA Gujarat Moderate High High Low Safe
242 Sagar UA Madhya Pradesh Low Low Low High Safe
243 Robertson Pet UA Karnataka Low Moderate Low Low Saline/ Over-exploited / Critical
244 Burhanpur (M Corp.) Madhya Pradesh Moderate Low Low High Safe
245 Shimla UA Himachal Pradesh High Low Low Low Not Assessed
246 Krishnanagar UA West Bengal Moderate High Low High Semi-critical
247 Tonk (M Cl) Rajasthan Low Low Low Low Semi-critical
248 Bahraich (NPP) Uttar Pradesh High Low Low High Safe
249 Khandwa (M Corp.) Madhya Pradesh Moderate Low Low Low Safe
250 Nagercoil (M) Tamil Nadu Moderate Moderate Low Low Not Assessed
251 Bhusawal UA Maharashtra Moderate Moderate Low High Semi-critical
252 Phusro UA Jharkhand Moderate Moderate Low High Safe
253 Saharsa (NP) Bihar High Low Low Low Safe
254 Ramagundam UA Telangana Moderate Moderate Low Moderate Safe
255 Adoni UA Andhra Pradesh Low Moderate Low Low Safe
256 Chittoor UA Andhra Pradesh Moderate Moderate Low Low Not Assessed
257 Valsad UA Gujarat Moderate High High High Safe
258 Vidisha (M) Madhya Pradesh Low Low Low High Safe
259 Banda UA Uttar Pradesh Low Low Low Low Semi-critical
260 Rewari (M Cl) Haryana High Low Low Low Saline/ Over-exploited / Critical
261 Godhra UA Gujarat Moderate Moderate Low Low Safe
262 Nabadwip UA West Bengal Moderate High Low High Safe
263 Giridih UA Jharkhand Moderate Moderate Low Low Safe
264 Hanumangarh (M Cl) Rajasthan Low Low Low High Safe
265 Hathras UA Uttar Pradesh Moderate Low Low High Saline/ Over-exploited / Critical
266 Medinipur (M) West Bengal Moderate High Low High Safe
267 Hindupur (M) Andhra Pradesh Low Moderate Low High Saline/ Over-exploited / Critical
IIHS - XV Finance Commission Urbanisation Report 167

268 Neyveli UA Tamil Nadu Low High Low Low Safe
269 Moga UA Punjab Moderate Low Low Low Saline/ Over-exploited / Critical
270 Batala UA Punjab High Low Low Low Saline/ Over-exploited / Critical
271 Hazaribag UA Jharkhand Moderate Moderate Low Low Safe
272 Gadag-Betigeri (CMC) Karnataka Low Moderate Low Low Saline/ Over-exploited / Critical
273 Rajnandgaon (M Corp.) Chhattisgarh Low Moderate Low Low Semi-critical
274 Palwal UA Haryana High Low Low Low Saline/ Over-exploited / Critical
275 Botad (M) Gujarat Moderate High Low Low Safe
276 Khargone UA Madhya Pradesh Moderate Moderate Low High Safe
277 Gangapur City UA Rajasthan Low Low Low Low Saline/ Over-exploited / Critical
278 Beawar UA Rajasthan Low Low Low Low Saline/ Over-exploited / Critical
279 Budaun (NPP) Uttar Pradesh Moderate Low Low High Semi-critical
280 Sasaram (NP) Bihar Moderate Low Low High Safe
281 Adilabad UA Telangana Low Moderate Low Low Safe
282 Jaunpur (NPP) Uttar Pradesh Moderate Low Low High Saline/ Over-exploited / Critical
283 Balurghat UA West Bengal High Moderate Low High Safe
284 Chirala UA Andhra Pradesh Moderate High Low High Safe
285 Damoh UA Madhya Pradesh Low Low Low Low Safe
286 Mainpuri UA Uttar Pradesh Moderate Low Low Low Semi-critical
287 Cuddalore (M) Tamil Nadu Low High High High Safe
288 Chitradurga UA Karnataka Low Moderate Low Low Saline/ Over-exploited / Critical
289 Etah UA Uttar Pradesh Moderate Low Low Low Safe
290 Malerkotla (M Cl) Punjab Moderate Low Low Low Saline/ Over-exploited / Critical
291 Bahadurgarh (M Cl) Haryana High Low Low Low Safe
292 Chakdaha UA West Bengal Moderate High Low Low Safe
293 Khanna (M Cl) Punjab High Low Low Low Saline/ Over-exploited / Critical
294 Deoria (NPP) Uttar Pradesh High Low Low Low Safe
168 IIHS - XV Finance Commission Urbanisation Report
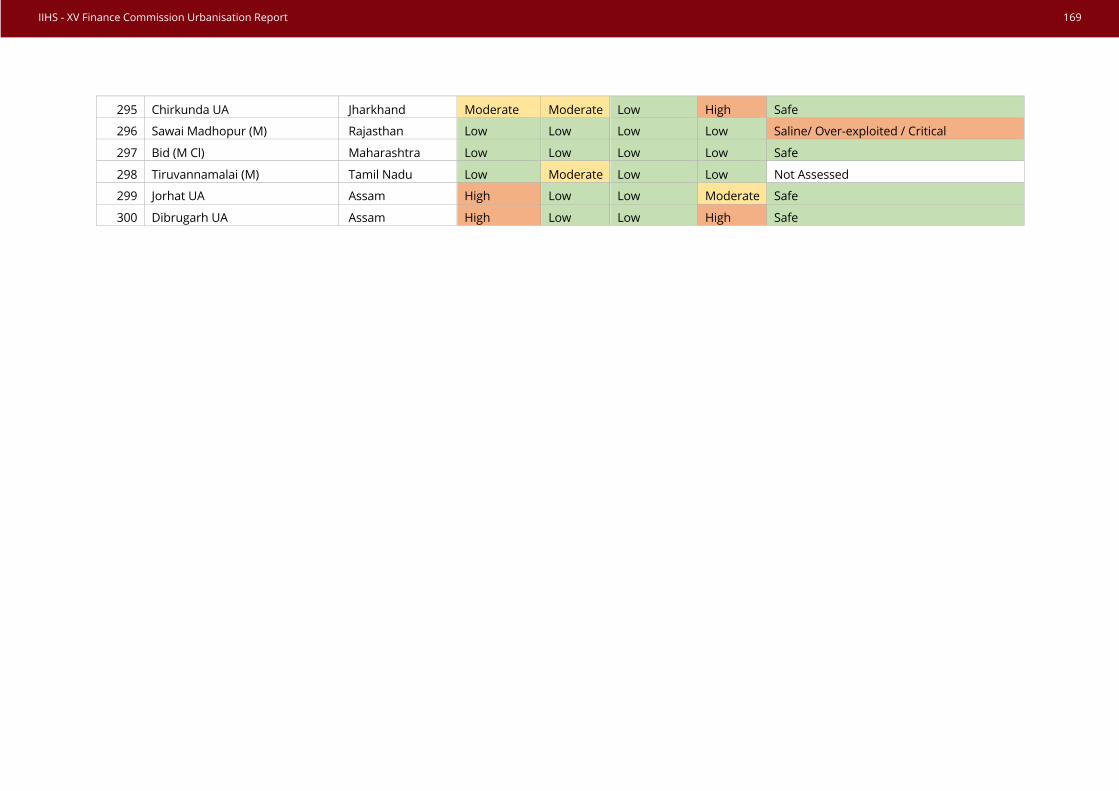
295 Chirkunda UA Jharkhand Moderate Moderate Low High Safe
296 Sawai Madhopur (M) Rajasthan Low Low Low Low Saline/ Over-exploited / Critical
297 Bid (M Cl) Maharashtra Low Low Low Low Safe
298 Tiruvannamalai (M) Tamil Nadu Low Moderate Low Low Not Assessed
299 Jorhat UA Assam High Low Low Moderate Safe
300 Dibrugarh UA Assam High Low Low High Safe
IIHS - XV Finance Commission Urbanisation Report 169

170 IIHS - XV Finance Commission Urbanisation Report

Indicative regional & urban development strategy for
India’s 100-largest cities
ANNEX III
171

172 IIHS - XV Finance Commission Urbanisation Report

Methodology for Development Strategy Analysis for India’s 100-largest Cities Expansion: Expansion potential for development has been estimated based on land allocated for planning and development as available in various proposed Master Plans and Regional Plans of respective City Development and Local Planning Authorities. A qualitative assessment of the graded relative difference of land available for urbanisation between the proposed and current Master Plans/ Regional Plans was undertaken to determine the potential for expansion as below: Strong: Strong development potential for expansion with over 500 sq.km of land planned for proposed urbanisation. Moderate: Moderate development potential for expansion with 50-500 sq.km of land planned for proposed urbanisation. Weak: Weak development potential for expansion with less thank 50 sq.km of land planned for proposed urbanisation. Densification: Densification potential for development has been estimated based on the proposed urban density of various cities in 2031 as per IIHS’ population projection for 2031 of 100 Urban Agglomerations and land proposed for planned urbanisation as per various City Master Plans/ Regional Plans for 2031 and onwards. A qualitative assessment was undertaken, comparing the relative grading of proposed estimated density in 2031 with respective ‘ideal’ urban density for various city sizes for Class I Cities/ Towns (as per HPEC, 2011), to determine the potential for densification as below: Strong: Potential to increase density by 100 to 125 persons per hectare (pph) to achieve ideal overall urban density of 125-175 pph as per the City class by population size for 2031 Moderate: Potential to increase density by 50 to 80 persons per hectare (pph) to achieve ideal overall urban density of 100-125 pph depending on estimated City class by population size for 2031 Weak: No further densification as ideal urban density has been planned or surpassed, as per the City class by population size for 2031 Nucleation: Nucleation potential has been estimated based on available built-up data generated from GIS Land Cover Growth Maps and analysis by IIHS from 2001 to 2017 for India’s100-largest cities. A qualitative assessment was undertaken by relative grading of change in built-up cover from 2001 to 2017 correlated with a visual assessment of urban sprawl morphology, connectivity and linkages from land cover growth maps and area planned for expansion as per proposed Master Plans to estimate nucleation potential as below: Strong: Strong potential for nucleation Moderate: Moderate potential for nucleation Decongestion: Decongestion measures were estimated based on urban transport projects like MRTS and BRTS undertaken/ proposed to decongest cities, particularly for inner areas of cities. A qualitative assessment was undertaken, correlating transport projects against potential density estimated for 2031 to determine decongestion potential as below: Strong: Strong potential to decongest city areas as per current operational/ under-construction or proposed MRTS and BRTS. Moderate: Moderate potential to decongest city areas as per current operational/ under-construction or proposed BRTS. Weak: No proposal or measure to decongest city area, given potential for high density planned for 2031.
IIHS - XV Finance Commission Urbanisation Report 173
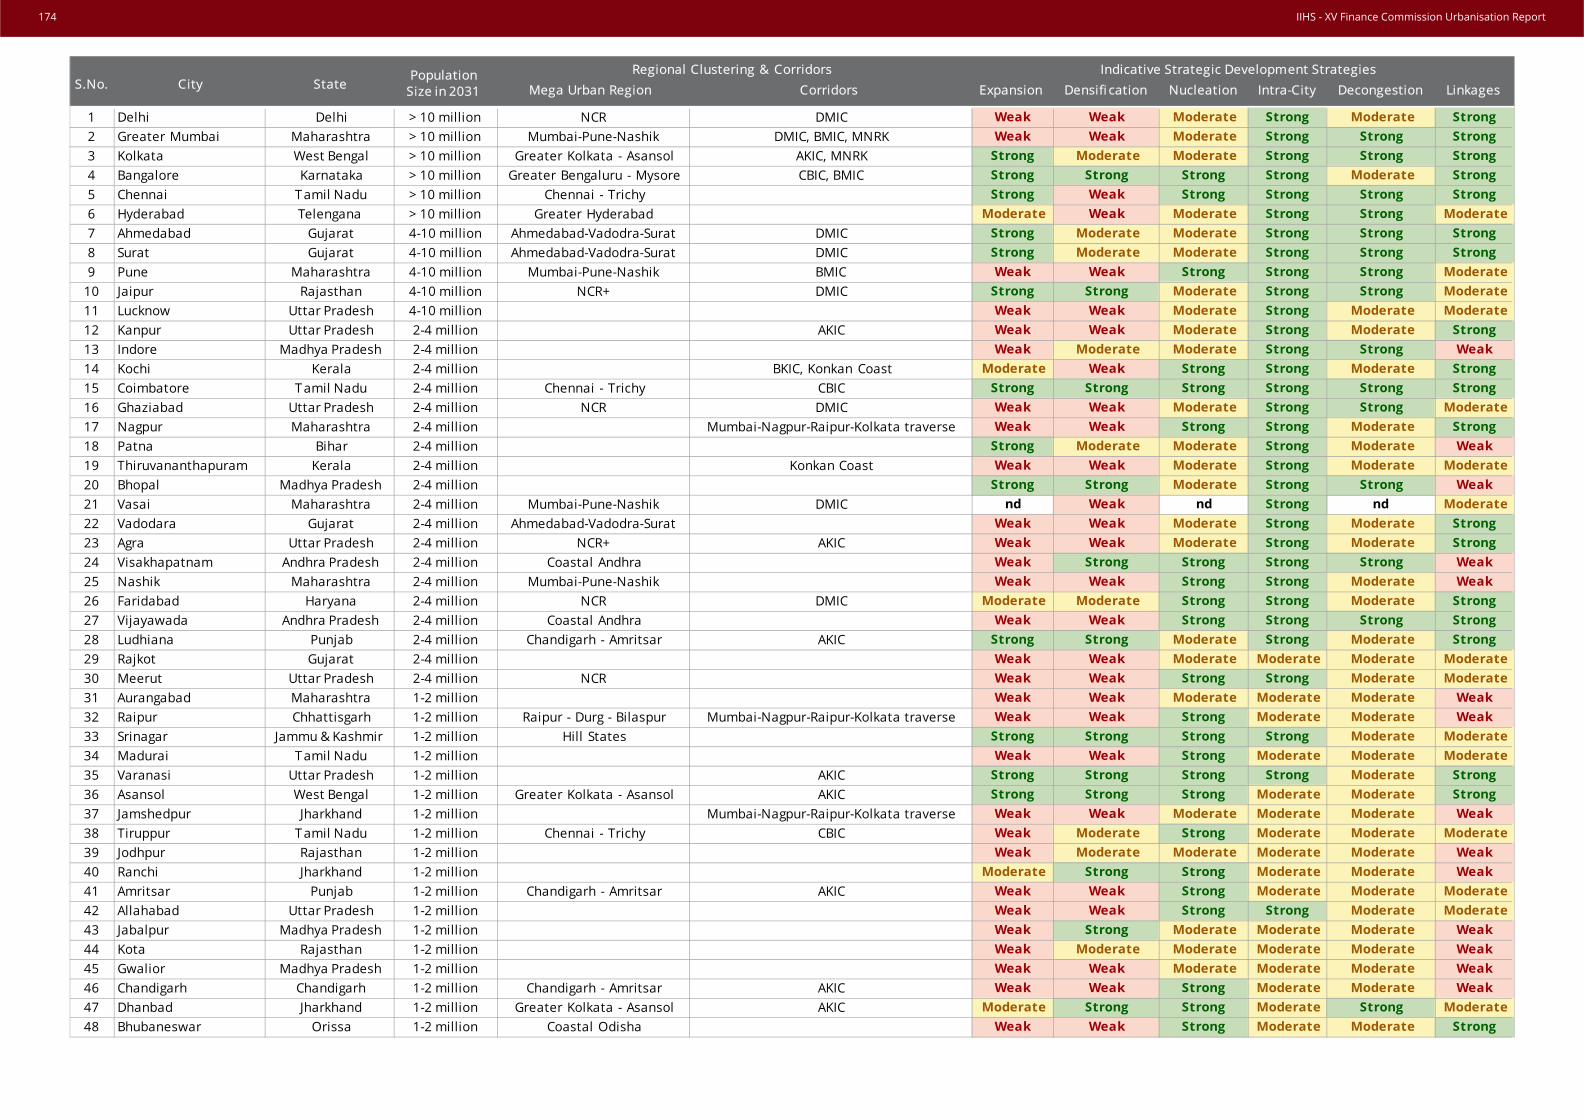
1 Delhi Delhi > 10 million NCR DMIC Weak Weak Moderate Strong Moderate Strong
2 Greater Mumbai Maharashtra > 10 million Mumbai-Pune-Nashik DMIC, BMIC, MNRK Weak Weak Moderate Strong Strong Strong
3 Kolkata West Bengal > 10 million Greater Kolkata - Asansol AKIC, MNRK Strong Moderate Moderate Strong Strong Strong
4 Bangalore Karnataka > 10 million Greater Bengaluru - Mysore CBIC, BMIC Strong Strong Strong Strong Moderate Strong
5 Chennai Tamil Nadu > 10 million Chennai - Trichy Strong Weak Strong Strong Strong Strong
6 Hyderabad Telengana > 10 million Greater Hyderabad Moderate Weak Moderate Strong Strong Moderate
7 Ahmedabad Gujarat 4-10 million Ahmedabad-Vadodra-Surat DMIC Strong Moderate Moderate Strong Strong Strong
8 Surat Gujarat 4-10 million Ahmedabad-Vadodra-Surat DMIC Strong Moderate Moderate Strong Strong Strong
9 Pune Maharashtra 4-10 million Mumbai-Pune-Nashik BMIC Weak Weak Strong Strong Strong Moderate
10 Jaipur Rajasthan 4-10 million NCR+ DMIC Strong Strong Moderate Strong Strong Moderate
11 Lucknow Uttar Pradesh 4-10 million Weak Weak Moderate Strong Moderate Moderate
12 Kanpur Uttar Pradesh 2-4 million AKIC Weak Weak Moderate Strong Moderate Strong
13 Indore Madhya Pradesh 2-4 million Weak Moderate Moderate Strong Strong Weak
14 Kochi Kerala 2-4 million BKIC, Konkan Coast Moderate Weak Strong Strong Moderate Strong
15 Coimbatore Tamil Nadu 2-4 million Chennai - Trichy CBIC Strong Strong Strong Strong Strong Strong
16 Ghaziabad Uttar Pradesh 2-4 million NCR DMIC Weak Weak Moderate Strong Strong Moderate
17 Nagpur Maharashtra 2-4 million Mumbai-Nagpur-Raipur-Kolkata traverse Weak Weak Strong Strong Moderate Strong
18 Patna Bihar 2-4 million Strong Moderate Moderate Strong Moderate Weak
19 Thiruvananthapuram Kerala 2-4 million Konkan Coast Weak Weak Moderate Strong Moderate Moderate
20 Bhopal Madhya Pradesh 2-4 million Strong Strong Moderate Strong Strong Weak
21 Vasai Maharashtra 2-4 million Mumbai-Pune-Nashik DMIC nd Weak nd Strong nd Moderate
22 Vadodara Gujarat 2-4 million Ahmedabad-Vadodra-Surat Weak Weak Moderate Strong Moderate Strong
23 Agra Uttar Pradesh 2-4 million NCR+ AKIC Weak Weak Moderate Strong Moderate Strong
24 Visakhapatnam Andhra Pradesh 2-4 million Coastal Andhra Weak Strong Strong Strong Strong Weak
25 Nashik Maharashtra 2-4 million Mumbai-Pune-Nashik Weak Weak Strong Strong Moderate Weak
26 Faridabad Haryana 2-4 million NCR DMIC Moderate Moderate Strong Strong Moderate Strong
27 Vijayawada Andhra Pradesh 2-4 million Coastal Andhra Weak Weak Strong Strong Strong Strong
28 Ludhiana Punjab 2-4 million Chandigarh - Amritsar AKIC Strong Strong Moderate Strong Moderate Strong
29 Rajkot Gujarat 2-4 million Weak Weak Moderate Moderate Moderate Moderate
30 Meerut Uttar Pradesh 2-4 million NCR Weak Weak Strong Strong Moderate Moderate
31 Aurangabad Maharashtra 1-2 million Weak Weak Moderate Moderate Moderate Weak
32 Raipur Chhattisgarh 1-2 million Raipur - Durg - Bilaspur Mumbai-Nagpur-Raipur-Kolkata traverse Weak Weak Strong Moderate Moderate Weak
33 Srinagar Jammu & Kashmir 1-2 million Hill States Strong Strong Strong Strong Moderate Moderate
34 Madurai Tamil Nadu 1-2 million Weak Weak Strong Moderate Moderate Moderate
35 Varanasi Uttar Pradesh 1-2 million AKIC Strong Strong Strong Strong Moderate Strong
36 Asansol West Bengal 1-2 million Greater Kolkata - Asansol AKIC Strong Strong Strong Moderate Moderate Strong
37 Jamshedpur Jharkhand 1-2 million Mumbai-Nagpur-Raipur-Kolkata traverse Weak Weak Moderate Moderate Moderate Weak
38 Tiruppur Tamil Nadu 1-2 million Chennai - Trichy CBIC Weak Moderate Strong Moderate Moderate Moderate
39 Jodhpur Rajasthan 1-2 million Weak Moderate Moderate Moderate Moderate Weak
40 Ranchi Jharkhand 1-2 million Moderate Strong Strong Moderate Moderate Weak
41 Amritsar Punjab 1-2 million Chandigarh - Amritsar AKIC Weak Weak Strong Moderate Moderate Moderate
42 Allahabad Uttar Pradesh 1-2 million Weak Weak Strong Strong Moderate Moderate
43 Jabalpur Madhya Pradesh 1-2 million Weak Strong Moderate Moderate Moderate Weak
44 Kota Rajasthan 1-2 million Weak Moderate Moderate Moderate Moderate Weak
45 Gwalior Madhya Pradesh 1-2 million Weak Weak Moderate Moderate Moderate Weak
46 Chandigarh Chandigarh 1-2 million Chandigarh - Amritsar AKIC Weak Weak Strong Moderate Moderate Weak
47 Dhanbad Jharkhand 1-2 million Greater Kolkata - Asansol AKIC Moderate Strong Strong Moderate Strong Moderate
48 Bhubaneswar Orissa 1-2 million Coastal Odisha Weak Weak Strong Moderate Moderate Strong
Mega Urban Region Corridors Expansion Densifi cation Nucleation Intra-City Decongestion LinkagesRegional Clustering & Corridors
S.No. City StatePopulation
Size in 2031
Indicative Strategic Development Strategies
174 IIHS - XV Finance Commission Urbanisation Report

49 Durg-Bhilai Nagar Chhattisgarh 1-2 million Raipur - Durg - Bilaspur Mumbai-Nagpur-Raipur-Kolkata traverse Weak Weak Strong Moderate Moderate Moderate
50 Aligarh Uttar Pradesh 1-2 million NCR+ Weak Weak Strong Moderate Moderate Weak
51 Bareilly Uttar Pradesh 1-2 million Weak Weak Strong Strong Moderate Weak
52 Guwahati Assam 1-2 million NE States Moderate Strong Strong Strong Strong Strong
53 Moradabad Uttar Pradesh 1-2 million Weak Weak Strong Moderate Moderate Weak
54 Mysore Karnataka 1-2 million Greater Bengaluru - Mysore Moderate Strong Moderate Moderate Moderate Weak
55 Tiruchirappalli Tamil Nadu 1-2 million Chennai - Trichy Weak Weak Moderate Moderate Moderate Moderate
56 Jalandhar Punjab 1-2 million Chandigarh - Amritsar AKIC Strong Strong Moderate Moderate Moderate Moderate
57 Siliguri West Bengal 1-2 million Hill States Strong Strong Strong Moderate Moderate Moderate
58 Solapur Maharashtra 1-2 million Weak Moderate Moderate Moderate Moderate Weak
59 Hubli and Dharwad Karnataka 1-2 million BMIC Weak Moderate Strong Moderate Moderate Moderate
60 Salem Tamil Nadu 1-2 million Chennai - Trichy CBIC Weak Weak Strong Moderate Moderate Moderate
61 Bhiwandi Maharashtra 1-2 million Mumbai-Pune-Nashik DMIC Moderate Moderate Strong Moderate Moderate Moderate
62 Warangal Telengana 1-2 million Greater Hyderabad Strong Strong Moderate Moderate Moderate Weak
63 Saharanpur Uttar Pradesh 1-2 million NCR+ Weak Weak Strong Moderate Moderate Weak
64 Dehradun Uttarakhand 1-2 million Hill States Moderate Strong Strong Strong Strong Weak
65 Jammu Jammu & Kashmir 0.1 to 1 million Hill States Moderate Moderate Strong Strong Strong Moderate
66 Firozabad Uttar Pradesh 0.1 to 1 million AKIC Weak Weak Strong Moderate Moderate Moderate
67 Puducherry Puducherry 0.1 to 1 million Chennai - Trichy Weak Moderate Strong Moderate Moderate Weak
68 Bikaner Rajasthan 0.1 to 1 million Weak Moderate Strong Moderate Moderate Weak
69 Gorakhpur Uttar Pradesh 0.1 to 1 million Weak Weak Moderate Strong Strong Weak
70 Amravati Maharashtra 0.1 to 1 million Mumbai-Nagpur-Raipur-Kolkata traverse Weak Weak Moderate Moderate Moderate Weak
71 Guntur Andhra Pradesh 0.1 to 1 million Coastal Andhra Weak Weak Strong Moderate Moderate Moderate
72 Nellore Andhra Pradesh 0.1 to 1 million Coastal Andhra CBIC Weak Weak Moderate Moderate Moderate Moderate
73 Cuttack Orissa 0.1 to 1 million Coastal Odisha Moderate Moderate Strong Moderate Moderate Moderate
74 Malegoan Maharashtra 0.1 to 1 million Mumbai-Pune-Nashik Weak Weak Moderate Moderate Weak Weak
75 Nanded Waghala Maharashtra 0.1 to 1 million Weak Weak Moderate Moderate Moderate Weak
76 Belgaum Karnataka 0.1 to 1 million BMIC Weak Weak Moderate Moderate Moderate Moderate
77 Mangalore Karnataka 0.1 to 1 million Konkan Coast Moderate Moderate Moderate Moderate Moderate Strong
78 Bhavnagar Gujarat 0.1 to 1 million Weak Weak Moderate Moderate Moderate Weak
79 Muzaffarnagar Uttar Pradesh 0.1 to 1 million NCR nd Weak nd Moderate nd Weak
80 Gulbarga Karnataka 0.1 to 1 million Weak Moderate Moderate Moderate Moderate Weak
81 Tirupati Andhra Pradesh 0.1 to 1 million nd Strong nd Moderate nd Moderate
82 Jamnagar Gujarat 0.1 to 1 million Weak Moderate Strong Moderate Moderate Weak
83 Kurnool Andhra Pradesh 0.1 to 1 million nd Weak nd Moderate nd Weak
84 Jhansi Uttar Pradesh 0.1 to 1 million Weak Moderate Moderate Moderate Moderate Weak
85 Erode Tamil Nadu 0.1 to 1 million Chennai - Trichy Weak Weak Strong Moderate Moderate Weak
86 Agartala Tripura 0.1 to 1 million NE States Kolkata-Dhaka-Sylhet-Imphal corridor nd Weak nd Moderate nd Weak
87 Mathura Uttar Pradesh 0.1 to 1 million NCR+ AKIC nd Weak nd Moderate nd Moderate
88 Jalgaon Maharashtra 0.1 to 1 million Mumbai-Nagpur-Raipur-Kolkata traverse Moderate Weak Strong Moderate Moderate Weak
89 Panipat Haryana 0.1 to 1 million NCR AKIC nd Weak nd Moderate nd Weak
90 Ujjain Madhya Pradesh 0.1 to 1 million Weak Weak Moderate Moderate Moderate Weak
91 Ajmer Rajasthan 0.1 to 1 million Weak Moderate Moderate Moderate Moderate Weak
92 Bilaspur Chhattisgarh 0.1 to 1 million Raipur - Durg - Bilaspur Mumbai-Nagpur-Raipur-Kolkata traverse nd Weak nd Moderate nd Weak
93 Imphal Manipur 0.1 to 1 million NE States Kolkata-Dhaka-Sylhet-Imphal corridor nd Weak nd Moderate nd Weak
94 Kolapur Maharashtra 0.1 to 1 million BMIC Weak Weak Strong Moderate Moderate Moderate
95 Durgapur West Bengal 0.1 to 1 million Greater Kolkata - Asansol Moderate Strong Strong Moderate Moderate Weak
96 Patiala Punjab 0.1 to 1 million Chandigarh - Amritsar nd Strong nd Moderate nd Weak
Mega Urban Region Corridors Expansion Densifi cation Nucleation Intra-City Decongestion LinkagesRegional Clustering & Corridors
S.No. City StatePopulation
Size in 2031
Indicative Strategic Development Strategies
IIHS - XV Finance Commission Urbanisation Report 175

97 Sangli Miraj Kupwad Maharashtra 0.1 to 1 million Weak Weak Strong Moderate Moderate Weak
98 Udaipur Rajasthan 0.1 to 1 million DMIC Moderate Moderate Moderate Moderate Moderate Strong
99 Vellore Tamil Nadu 0.1 to 1 million Chennai - Trichy CBIC Weak Weak Strong Moderate Moderate Moderate
100 Gaya Bihar 0.1 to 1 million Weak Weak Moderate Moderate Moderate Weak
101 Raurkela Orissa 0.1 to 1 million Weak Moderate Moderate Moderate Moderate Weak
102 Bokaro Jharkhand 0.1 to 1 million Weak Moderate Strong Moderate Moderate Weak
Mega Urban Region Corridors Expansion Densifi cation Nucleation Intra-City Decongestion LinkagesRegional Clustering & Corridors
S.No. City StatePopulation
Size in 2031
Indicative Strategic Development Strategies
176 IIHS - XV Finance Commission Urbanisation Report
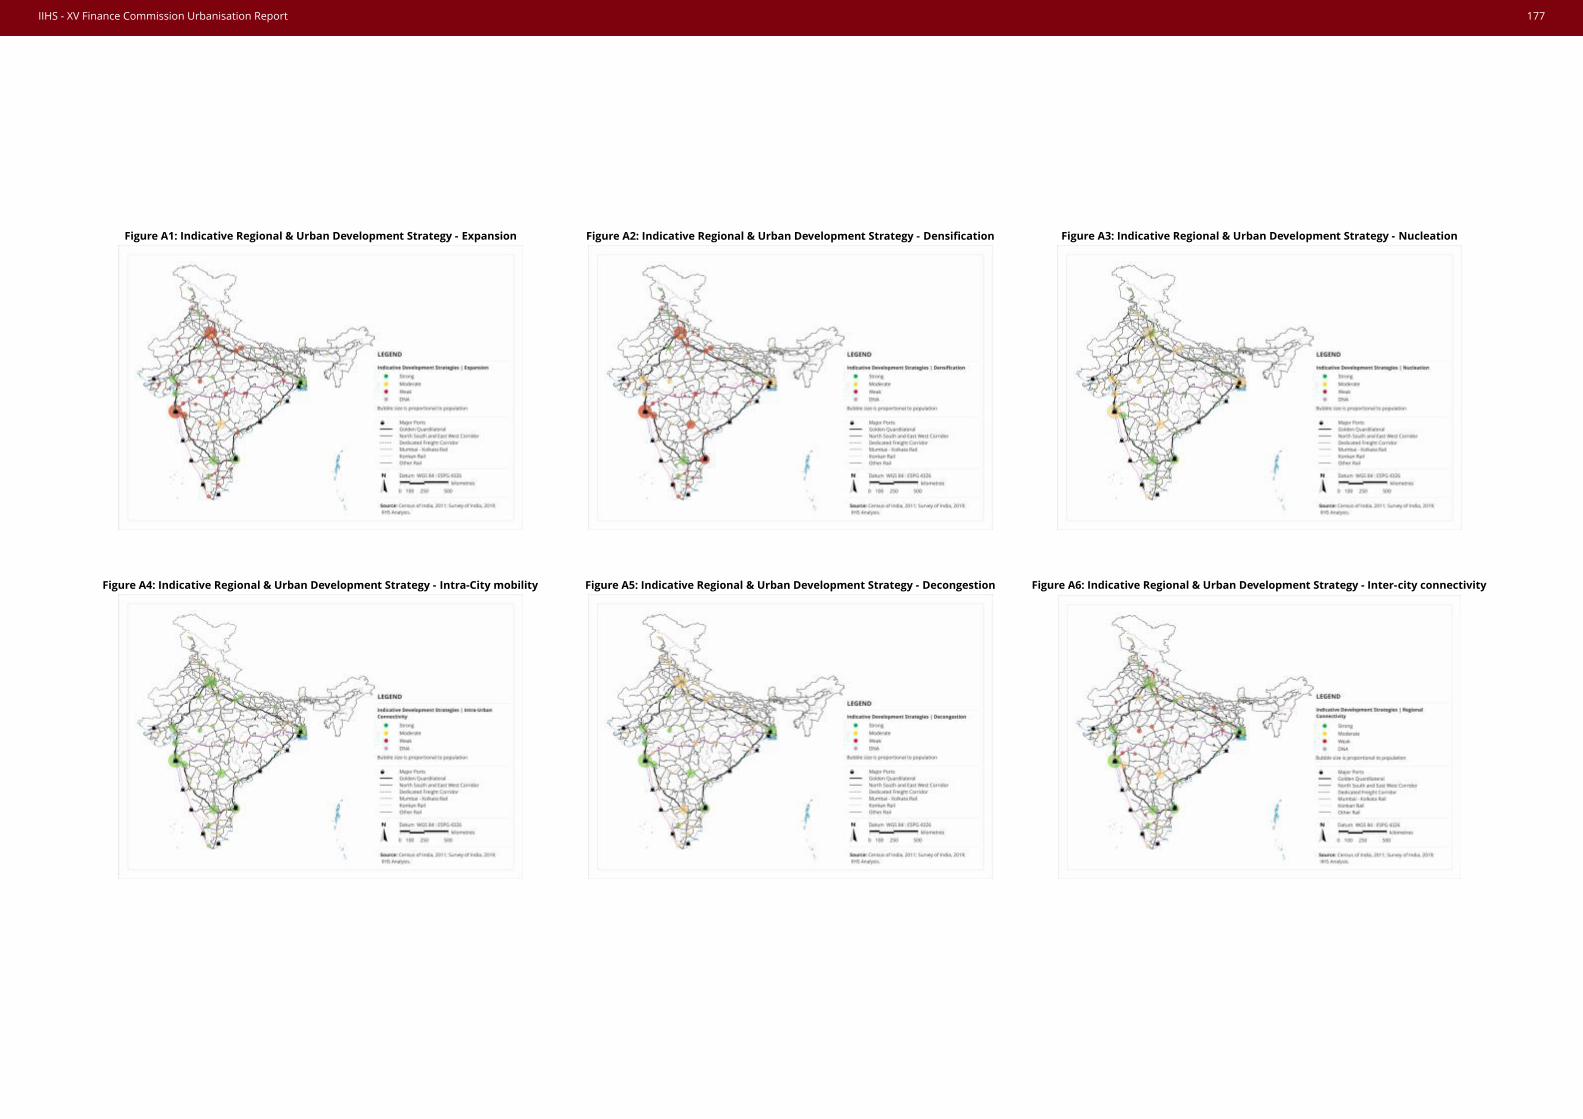
Figure A1: Indicative Regional & Urban Development Strategy - Expansion Figure A2: Indicative Regional & Urban Development Strategy - Densification Figure A3: Indicative Regional & Urban Development Strategy - Nucleation
Figure A4: Indicative Regional & Urban Development Strategy - Intra-City mobility Figure A5: Indicative Regional & Urban Development Strategy - Decongestion Figure A6: Indicative Regional & Urban Development Strategy - Inter-city connectivity
IIHS - XV Finance Commission Urbanisation Report 177

Figure A15: India’s projected million+ cities in 2031*Figure A14: India’s projected million+ cities in 2021Figure A13: India’s million+ cities in 2011
Figure A12: India’s million+ cities in 2001Figure A11: India’s million+ cities in 1991Figure A10: India’s million+ cities in 1981
Figure A9: India’s million+ cities in 1971Figure A8:India’s million+ cities in 1961Figure A7: India’s million+ cities in 1951
Growth of India’s Million Plus cities (1951-2031)
178 IIHS - XV Finance Commission Urbanisation Report
Urban infrastructure investment estimates
(2021-31)
ANNEX IV
179

[This page is intentionally left blank]
180 IIHS - XV Finance Commission Urbanisation Report

Methodology for urban infrastructure upgradation and expansion estimates
For the purpose of this report, urban infrastructure investment estimates consider the following infrastructure assets:
• Water supply production and distribution system• Sewerage network system• Solid waste management system• Storm Water Drainage network• Road and traffic support infrastructure• Public transport systems (for Class 1 cities above 5 million population)• Street lighting
Upgradation (2021): Urban infrastructure upgradation cost for 2021 has been estimated at an assumption of 40% of capital expenditure (capex) estimates. Typically, as per best engineering practices, refurbishment costs for urban infrastructure constitute in the range of 30-50% of overall life cycle costs (that includes capex, operations & maintenance (O&M) and refurbishment costs) of various urban infrastructure. Capex for urban infrastructure for 2021 of various city size class has been estimated based on Per Capita Infrastructure Cost (PCIC) (PCIC assumed as per HPEC Report for each city size class, 2009-10 rates appropriately escalated at an assumption of 3% for 2020-21 rates) for population projected for 2021 by IIHS analysis.
Expansion (2031): Urban infrastructure expansion capex for 2031 of various city size class has been estimated based on Per Capita Infrastructure Cost (PCIC) (as per HPEC Report for each city size class, 2009-10 rates appropriately escalated at 3% for 2020-21 rates) for marginal increase in population projected for 2031 from 2021 by IIHS analysis.
Upgradation (2021-31): Urban infrastructure upgradation cost for 2021-31 has been estimated at an assumption of 40% of capital expenditure (capex) estimates for urban infrastructure for 2031. Typically, as per best engineering practices, refurbishment costs for urban infrastructure constitute in the range of 30-50% of overall life cycle costs (that includes capex, operations & maintenance (O&M) and refurbishment costs) of various urban infrastructure. Capex for urban infrastructure for 2031 of various city size class has been estimated based on Per Capita Infrastructure Cost (PCIC) (PCIC assumed as per HPEC Report for each city size class, 2009-10 rates appropriately escalated at an assumption of 3% for 2020-21 rates) for population projected for 2031 by IIHS analysis.
Land Development (2021-31): Land development cost has been estimated for additional land required for expansion to accommodate increase in population from 2021 to 2031 as per IIHS analysis for Cities with population above 1 million. The additional land area is enumerated based on data available for additional land required and/ or planned for urbanisation as per proposed Master Plans/ Regional Plans for various cities above 1 million population. Land development rate for cities with population above 10 million has been assumed as per the Sivaramakrishnan Committee Report for the AP Capital (at INR 40 Lakhs/ acre for Cities with population above 10 million at 2014 prices, appropriately escalated at an assumption of 3% for 2020 prices). The land development rate for smaller cities with population of 1-10 million has been assumed at 50% of rate assumed for cities with population above 10 million.
IIHS - XV Finance Commission Urbanisation Report 181

Table A4: Indicative Urban Infrastructure Investment estimates (2021-31)
182 IIHS - XV Finance Commission Urbanisation Report