Urbanisation in the North-East: Patterns, trends, and policy prongs
24
http://sch.sagepub.com/ Social Change http://sch.sagepub.com/content/35/2/47 The online version of this article can be found at: DOI: 10.1177/004908570503500204 2005 35: 47 Social Change Vimal Khawas Urbanisation in the North-East: Patterns, trends, and policy prongs Published by: http://www.sagepublications.com On behalf of: Council for Social Development can be found at: Social Change Additional services and information for http://sch.sagepub.com/cgi/alerts Email Alerts: http://sch.sagepub.com/subscriptions Subscriptions: http://www.sagepub.com/journalsReprints.nav Reprints: http://www.sagepub.com/journalsPermissions.nav Permissions: http://sch.sagepub.com/content/35/2/47.refs.html Citations: What is This? - Jun 1, 2005 Version of Record >> at Sikkim University on September 29, 2013 sch.sagepub.com Downloaded from at Sikkim University on September 29, 2013 sch.sagepub.com Downloaded from at Sikkim University on September 29, 2013 sch.sagepub.com Downloaded from at Sikkim University on September 29, 2013 sch.sagepub.com Downloaded from at Sikkim University on September 29, 2013 sch.sagepub.com Downloaded from at Sikkim University on September 29, 2013 sch.sagepub.com Downloaded from at Sikkim University on September 29, 2013 sch.sagepub.com Downloaded from at Sikkim University on September 29, 2013 sch.sagepub.com Downloaded from at Sikkim University on September 29, 2013 sch.sagepub.com Downloaded from at Sikkim University on September 29, 2013 sch.sagepub.com Downloaded from at Sikkim University on September 29, 2013 sch.sagepub.com Downloaded from at Sikkim University on September 29, 2013 sch.sagepub.com Downloaded from at Sikkim University on September 29, 2013 sch.sagepub.com Downloaded from at Sikkim University on September 29, 2013 sch.sagepub.com Downloaded from at Sikkim University on September 29, 2013 sch.sagepub.com Downloaded from at Sikkim University on September 29, 2013 sch.sagepub.com Downloaded from at Sikkim University on September 29, 2013 sch.sagepub.com Downloaded from at Sikkim University on September 29, 2013 sch.sagepub.com Downloaded from at Sikkim University on September 29, 2013 sch.sagepub.com Downloaded from at Sikkim University on September 29, 2013 sch.sagepub.com Downloaded from at Sikkim University on September 29, 2013 sch.sagepub.com Downloaded from at Sikkim University on September 29, 2013 sch.sagepub.com Downloaded from at Sikkim University on September 29, 2013 sch.sagepub.com Downloaded from at Sikkim University on September 29, 2013 sch.sagepub.com Downloaded from
-
Upload
sikkimuniversity -
Category
Documents
-
view
0 -
download
0
Transcript of Urbanisation in the North-East: Patterns, trends, and policy prongs
http://sch.sagepub.com/Social Change
http://sch.sagepub.com/content/35/2/47The online version of this article can be found at:
DOI: 10.1177/004908570503500204
2005 35: 47Social ChangeVimal Khawas
Urbanisation in the North-East: Patterns, trends, and policy prongs
Published by:
http://www.sagepublications.com
On behalf of:
Council for Social Development
can be found at:Social ChangeAdditional services and information for
http://sch.sagepub.com/cgi/alertsEmail Alerts:
http://sch.sagepub.com/subscriptionsSubscriptions:
http://www.sagepub.com/journalsReprints.navReprints:
http://www.sagepub.com/journalsPermissions.navPermissions:
http://sch.sagepub.com/content/35/2/47.refs.htmlCitations:
What is This?
- Jun 1, 2005Version of Record >>
at Sikkim University on September 29, 2013sch.sagepub.comDownloaded from at Sikkim University on September 29, 2013sch.sagepub.comDownloaded from at Sikkim University on September 29, 2013sch.sagepub.comDownloaded from at Sikkim University on September 29, 2013sch.sagepub.comDownloaded from at Sikkim University on September 29, 2013sch.sagepub.comDownloaded from at Sikkim University on September 29, 2013sch.sagepub.comDownloaded from at Sikkim University on September 29, 2013sch.sagepub.comDownloaded from at Sikkim University on September 29, 2013sch.sagepub.comDownloaded from at Sikkim University on September 29, 2013sch.sagepub.comDownloaded from at Sikkim University on September 29, 2013sch.sagepub.comDownloaded from at Sikkim University on September 29, 2013sch.sagepub.comDownloaded from at Sikkim University on September 29, 2013sch.sagepub.comDownloaded from at Sikkim University on September 29, 2013sch.sagepub.comDownloaded from at Sikkim University on September 29, 2013sch.sagepub.comDownloaded from at Sikkim University on September 29, 2013sch.sagepub.comDownloaded from at Sikkim University on September 29, 2013sch.sagepub.comDownloaded from at Sikkim University on September 29, 2013sch.sagepub.comDownloaded from at Sikkim University on September 29, 2013sch.sagepub.comDownloaded from at Sikkim University on September 29, 2013sch.sagepub.comDownloaded from at Sikkim University on September 29, 2013sch.sagepub.comDownloaded from at Sikkim University on September 29, 2013sch.sagepub.comDownloaded from at Sikkim University on September 29, 2013sch.sagepub.comDownloaded from at Sikkim University on September 29, 2013sch.sagepub.comDownloaded from at Sikkim University on September 29, 2013sch.sagepub.comDownloaded from
47-69 Social Change : June 2005 : Vol. 35 No. 2
Urbanisation in the North-East : Patterns, trends, and policy prongs
Vimal Khawas*
Pre-Independence, the North-Eastern region was largely rural, but in the second half of the 20th century, urbanisation levels here shot up. Indications are that development projects initiated by State and Cen t ra l governments and the role of missionaries in creating educational infrastructure were key contributory factors. The data also show that urban concentration in the North-East, as in the rest of the country, has been top-heavy. Not only that, the spatial distribution of urban units gets more and more uneven a t higher levels of urban concentration. On the other hand, data from the 2001 Census reveals, medium and small towns (towns of class 111, IV and V), which together account for over 80% of towns in the region, are more evenly distributed. There is, in this context, a need to nurture the smaller towns, which display an encouraging potential for growth. Within the States also, urbanisation is uneven, which too suggests a high potential for a more balanced pattern of urbanisation in future.
he term ‘urbanisation’ essentially refers to the increase in population T concentration in ‘urban’ settlements over a period of time. When we speak of ‘level of urbanisation’ we refer to the ratio of ‘urban’ population to total population, and the change, if any, over time.
In India, the definitions and attributes of ‘urban’ which provide basis of all quantitative analysis of urbanisation, have been undergoing several changes and modifications. In the 1901 Census, the definition adopted for an urban area was as follows:
1. Every municipality of whatever size; 2. All civil lines not included within municipal limits;
Associate Fellow, Council for Social Development, 53. Lodi Estate, New Delhi -110003 <vimalkhawas@grnail corn>

48 So-ial Change : June 2005
3. Every other continuous collection of houses, permanently inhabited by not less than 5,000 persons, which the Provincial Superintendent may decide to treat as a town for Census purposes.
In the above definition, administrative set-up and size appear to be the basic considerations for deciding the status of any settlement as urban or rural, and not necessarily economic parameters. Many places which had thus been treated as towns were in reality no more than overgrown villages. The same definition of town continued up to the 195 1 Census.
A more realistic and meaningful definition of urban entity was adopted for the first time in the Census of 196 1, primarily to avoid the anomalies in the earlier definition. The new definition brought under its fold economic characteristics in addition to the other administrative and demographic criteria. The definition adopted in 196 1 was as follows:
1. A place should be either a municipal corporation or cantonment board, notified town area committee, etc;
2. It should have
(i) a minimum population of 5,000, (ii) a density of at least 400 people per sq. km. and (iii)at least 75% of the male labour force in non-agricultural
occupations.
These criteria of 1961 census were carried forward also in the census of 1971. Subsequently, the urban criteria of 1981 and 1991 incorporated some additional features. Besides the definition of urban entities as established in 196 1, the directors of Census operations in States / Union Territories (UTs) were allowed to include, in consultation with the concerned State governments / UT administrations and the Census Commissioner of India, some places with distinct urban characteristics, even if such places did not strictly satisfy all the criteria mentioned in (2) above. Such marginal cases include major project colonies, areas of intensive industrial development, railway colonies, important tourist centres, etc. (Census of India 1991). Additionally, outgrowths (OGs) of cities and towns have also been treated as urban. Each such town or city, together with its outgrowth(s), is treated as an integrated urban area and is designated as an urban agglomeration'.
I Census of India (1991) 1992 l i n a l Population Totals Paper I / ( 4 )

49 Social Change : June 2005
THE NORTH-EAST
The north-eastern region of India comprises eight sister states2, namely, Arunachal Pradesh, Assam, Manipur, Meghalaya, Nagaland, Mizoram, Sikkim and Tripura. Two - Arunachal Pradesh and Sikkim - form the eastern part of the Himalayan belt, while together, the N-E Sates are
collectively called the north-eastem hills. The region is endowed with innumerable natural
the Brahmaputra plains of Assam, it is mainly hilly in character.
Urbanisatign in this region has a long
~ history that started before the advent of
i the British. The earliest i urban clusters were
mainly the capital cities built by different rulers. They were essentially rural in
character, made up mainly of palaces, high walls, temples, pavilions, etc. With the advent of the British and subsequent colonisation on Indian soil, centres for collection and other related activities started, along with the development of administrative activities. At a later point of time, the partition of India affected the towns by changing their population size and area.
Under planned development in the post-Independence era, administrative units were reorganised and decentralisation activities initiated. It was in this context that, the second half of the 20th century saw a tremendous acceleration in the level of urbanisation in this so- called backward region. Between I98 l and 199 l , against the average urban growth of 36.09% in India, the seven north-eastern states
Levels of Urbanisation-2001
resources. Excluding
Not to Scale
2 Although people in the North-East still prefer to call the region ‘the land o f seven sister Sates’ this paper views it as ‘the land of eight sister states’, as Sikkim is the latest addition and is now an integral part of the North-Eastern Hill Council.
50 Social Chasge : June 2005
notched 49.79%. The most spectacular growth was in Mizoram where the urban population almost doubled and the number of towns almost quadrupled from 6 to 22 during the period. Part of the reason coold be that in the 1980s, the Central government carried out a large-scale administrative re-organisation of the districts of Mizoram as part of a bid to sharpen counter-insurgency operations. This saw several villages being regrouped into urban centres. However, it should be pointed out that even in 2001, the level of urbanisation in the North-East was less than 22%, far lower than the national average of 28%.
The structure of north-eastern India’s urbanisation, according to the 2001 Census, extends over 254 towns, which also includes the towns under 9 urban agglomerations, accounting for 21.50% of the total population in the region. The preliminary Census report suggests that the urban population here is unevenly distributed among the different size classeh of towns and cities, as also over space. Nearly 28% of the urban population is concentrated in about 4% of the cities. More than 73% of the small towns in the region collectively accommodate only just over 35% of the total urban population as of 200 1. Thus, the distribution of urban population in the North-East is as top-heavy as in mainland India. The implication may, however, be different in the North-East. This is a region that is mostly hill terrain, which may not permit scope for lateral expansion of cities as in the plains. Moreover, the majority of the region’s cities are not planned; they grew historically a s trade or administrative centres. The small and medium towns, particularly class 111, IV and V, however have the potential for planned development to accommodate the rising urban population in the region.
It is noteworthy also that the distribution of urban population is not uniform across the States of the North-East. Mizoram, for instance, had already attained an urbanisation level of about 50%, while Assam and Sikkim were still crawling at 12% and 1 I % , respectively, even in the year 200 1 .
It should be noted here that the N-E is a neglected region. Of the vast chunk of mainstream urban literature available in the post-Independence period, very few studies have attempted to examine the issues of N-E urban dynamics. The bulk of urban literature talks of only the ‘major states’, of which the north-eastern states (except Assam) are not a part. As a result, there is heavy shortage of literature in the N-E with reference to the dynamics of urban environment.

51 Social Chnnge : June 2005
OBJECTIVES
The objectives of this study are : 0 To ascertain the levels of urbanisation in the region and across its
States over time. 0 To bring out the distribution and growth of towns and cities in
different size classes and the respective population therein.
To study the spatial distributioddistrict-wise distribution of different size class towns and the level of urbanisation across the North-Eastern states.
URBANISATION TRENDS : NORTH-EAST AND ALL INDIA
Figure 1 shclws trends in the levels of urbanisation in India and the north-eastern region. Right from the onset of the 20th century, the N- E was far behind the average all-India urbanisation levels. In fact, it was almost rural till the 1950s. The region had less than 5% urban population and indeed witnessed a decreasing compound annual growth rate (CAGR) almost throughout the first half of the 20th century and even a negative growth rate in 1951. By contrast, the average all- India urbanisation levels showed a steady and gradual increase during the period, except in 191 1 when large numbers of small towns were declassified.
Fig. 1
Trend in the levels of Urbanisation in North-East and India - 190 1-200 1
30.00 -
m
0 g 15.00 .. L
Q
-,-- .f. 5.00 . -..a_ ..
I T - . O C O L- . .-
1901' 1911' 1921' 1931' 1941' 1951' 1961' 1971' 1981' 1991' 2001'
Years
I Northeast -India 1 L .--I
52 Sc>cial Change : June 2005
Such a situation in the North-East region possibly stemmed from its tribal and hilly character and lack of development interventions. Subsequently, the partition of India in 1947 also impacted the region negatively when many settlements, mostly in Assam, were transferred to erstwhile East Pakistan. This may possibly account for the negative growth rate of urban population in 195 1.
In the next decade, the share of urban population more than doubled from 3.57% to 6.87% (Table 1) and the CAGR reached almost 12% (Table 2). The region maintained the pace till 1981 in terms of increasing levels of urbanisation, though the CAGR came down drastically (Tables 1 and 2). The rise in the levels of urbanisation was appreciable during the census years 199 1 and 200 1, when the CAGRs were above the national average, although the last couple of decades have seen the ratios declining (Tables 1 and Q3
Taking the whole of the North-East as a unit, it can be seen that the region witnessed different urbanisation levels before and after Independence. The underlying factors were many.‘ First, the massive, post-Independence reorganisation of the administrative and political boundaries resulted in the creation of new states like Nagaland, Arunachal, Manipur, etc. Secondly, the region attracted impressive development projects from the State and Central governments. Thirdly, the contribution of Christian missionaries in terms of upgrading the quality of lives of tribals was no less noteworthy. They invested heavily in the education and infrastructure sectors, playing an important role in enhancing urbanisation levels. There may be several other important forces that have acted and reacted in the region which the urban planners need to explore in order to direct the region on the path of sustainable development in the long run.
Although the level of urbanisation in the north-eastern region is still below the national average of 28%, the CAGR for the urban population is a major cause of concern. Right through the 20th century, it has been higher than the national average (excluding the Census year of 195 I ) , and much higher in the post-Independence period. If the trend
3 As we have seen the definition o f ‘urban’ changed during this period to cover not just administrative, but also. economic criteria Yet. the region was largely urndeveloped in the pre independence period, so subsequent addition of the economic criteria should not have affected comparability
I hese. a\ reported here, are based on discussions with experts 4

53 Social Change : June 2005
continues, the region, in the next couple of decades, will see a large percentage of its population living in urban centres. Efficient planning interventions will be needed.
Thus, urban planners and policy-makers need to evolve possible solutions for checking the trend and direction of its increasing urban population. None of the urban centres are planned towns; they have grown organically over time. Consequently, they are growing at an increasing pace and in an unplanned manner, which could eventually burden the already degraded environment in the region.
URBANISATION ACROSS STATES A study of urbanisation trends among the states of the North-East (figures 2-9) highlights some important features that need to be noted by urban planners and policy-makers.
First, states like Mizoram and Arunachal Pradesh started urbanising relatively later, in the post-Independence period and at a tremendous pace. (figures 3 and 6) This is particularly true in the case of Mizoram, where the urban population rose from about 25% in 1981 to 46% in 1991 and almost 50% by 2001.
Arunachal witnessed appreciable levels of urbanisation in the last 30 years, reaching almost 2 1 % by 200 1.
Sikkim, an exception to the general pattern, started its urbanisation in the Census year 195 1 itself, and achieved appreciable level of urbanisation by 198 1, but registered a lower level in 199 1.
Fig 2 Fig 3

54 Social Change : June 2005
Fig 4 Fig 5
Fig 6 Fig 7
Nagaland: Urbanisation T r a d
Fig 8 Fig 9
I Tnprra Urbarnsabon Trend
45 40 35 30 25 20 15 10
5 0
55 Social Change : June 2005
Manipur, which accommodated over 25% of its total population in urban areas by the turn of the 19th century itself, saw a continuous decline in the share of urban population, and by 1951, its urbanisation level had come down to less than 1%. It regained momentum post-Independence, reaching about 28% by 1991, i.e., 2% above the national average, but by 200 1 , the share again declined to about 24%.
The rest of the States were relatively rural in the first half of the 20th century. They gradually started getting urbanised in the second half of the century but are still far behind the national average even today, at less than 20% even in 2001.
These figures highlight the spatial disparity in the trend and pattern of urbanisation and thereby in its varying levels across north-eastern India. The pattern might be partly owing to the fact that the region underwent major arrangements and rearrangements with respect to its administrative boundaries, including urban areas, in the post-Independence period; many new states came up during 1960s and 1 9 7 0 ~ ~ which resulted in differences in the units for which data were aggregated. Moreover, the partition of the country had a lasting impact on some States, particularly the border States.
However, it is not enough to attribute the patterns and trends in urbanisation in the region to these factors alone. A series of factors have histori.cally acted in the region, and ultimately resulted in a complex mosaic in its urban pattern.
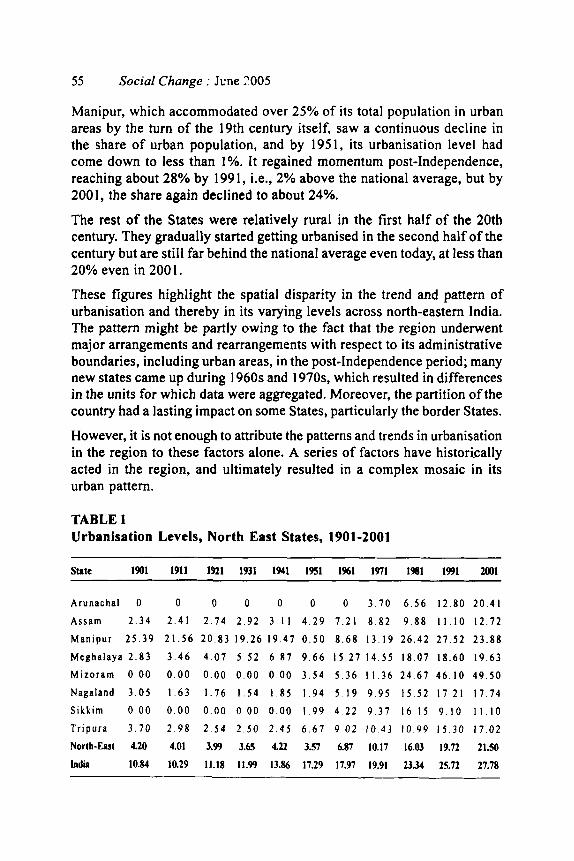
TABLE 1 Urbanisation Levels, North East States, 1901-2001
sate 1901 1911 1921 1931 1941 1951 1%1 1971 1981 1991 2001
Arunachal 0 0 0 0 0 0 0 3 7 0 6 5 6 12.80 2 0 . 4 1
Assam 2 . 3 4 2 . 4 1 2 . 7 4 2 . 9 2 3 . 1 1 4 . 2 9 7 . 2 1 8 8 2 9 . 8 8 11 .10 12 .72
Manipur 2 5 . 3 9 2 1 . 5 6 2 0 . 8 3 19 .26 19 .47 0 . 5 0 8 . 6 8 1 3 . 1 9 26 .42 27.52 23 .88
Mcghalaya 2 . 8 3 3 . 4 6 4 . 0 7 5 5 2 6 . 8 7 9 . 6 6 1 5 . 2 7 1 4 . 5 5 1 8 . 0 7 18 .60 1 9 . 6 3 Mizoram 0 . 0 0 0 . 0 0 0 .00 0 . 0 0 0 . 0 0 3 . 5 4 5 . 3 6 1 1 . 3 6 2 4 . 6 7 4 6 . 1 0 4 9 . 5 0
Nagaland 3 . 0 5 1 . 6 3 1.76 1 .54 1 8 5 1 . 9 4 5 19 9 9 5 15 .52 1 7 21 17 .74
Sikkim 0.00 0 . 0 0 0 . 0 0 0 0 0 0 . 0 0 1 . 9 9 4 . 2 2 9 37 16 1 5 9 10 1 1 10
T r i p u r a 3 . 7 0 2 . 9 8 2 . 5 4 2 . 5 0 2 . 4 5 6 . 6 7 9 0 2 10 4 3 10 .99 1 5 . 3 0 1 7 . 0 2
North-EUt 4.20 4.01 3.99 3.65 4.22 3.57 6.87 10.17 16.03 19.72 2 1 3
India 10.84 10.29 11.18 11.99 13.86 17.29 17.97 19.91 23.34 25.72 27.78
56 Social Change : June 2005
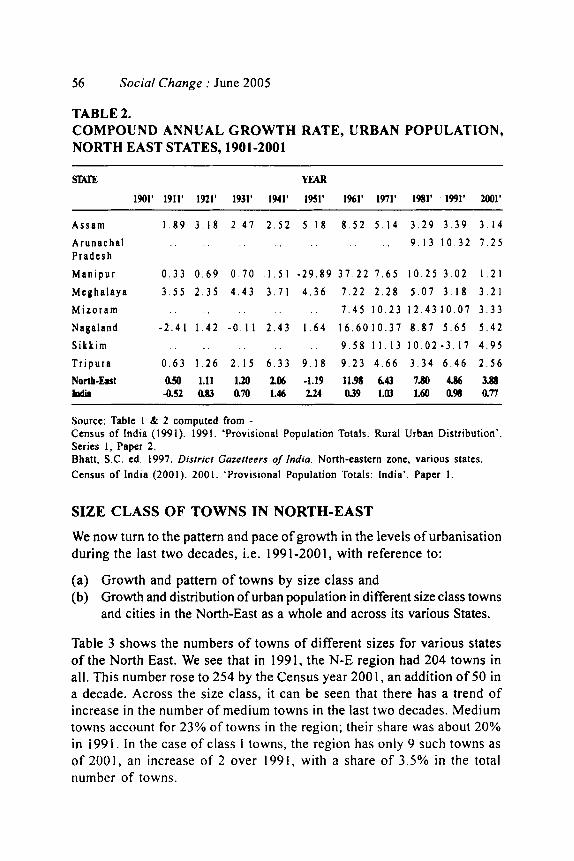
TABLE 2. COMPOUND ANNUAL GROWTH RATE, URBAN POPULATION, NORTH EAST STATES, 1901-2001
SGUE YEAR
1901' 1911' 1921' 1931' 1941' 1951' 1961' 1971' 1981' 1991' 2001'
Assam Arunachal Pradcsh Manipur Mcghalaya Mizoram Nagaland S i k k i m Tripura North-ht I#lir
1 . 8 9 3 . 1 8 2 . 4 7 2 . 5 2 5 . 1 8 8 . 5 2 5 . 1 4 3 . 2 9 3 . 3 9
. . . . . . . . . . 9 . 1 3 1 0 . 3 2
0 . 3 3 0 . 6 9 0 . 7 0 . 1 . 5 1 - 2 9 . 8 9 3 7 . 2 2 7 . 6 5
3 . 5 5 2 . 3 5 4 . 4 3 3 . 7 1 4 . 3 6 7 . 2 2 2 . 2 8
. . . . . . . . 7 . 4 5 1 0 . 2 3
- 2 . 4 1 1 . 4 2 - 0 . 1 1 2 . 4 3 1 . 6 4 1 6 . 6 0 1 0 . 3 7
. . . . . . 9 . 5 8 1 1 . 1 3
0 . 6 3 1 . 2 6 2 . 1 5 6 . 3 3 9 . 1 8 9 . 2 3 4 . 6 6
0.9 1.11 130 2.06 -1.19 11.98 643 -0.52 083 a70 1.6 w 039 1.0)
1 0 . 2 5 3 . 0 2
5 . 0 7 3 . 1 8
1 2 . 4 3 1 0 . 0 7
8 . 8 7 5 . 6 5
1 0 . 0 2 - 3 . 1 7
3 . 3 4 6 . 4 6
7 .a 4.86 1.60 a%
3 . 1 4
7 . 2 5
1 . 2 1
3 . 2 1
3 . 3 3
5 . 4 2
4 . 9 5
2 . 5 6
3.88 an
Source: Table 1 & 2 computed from - Census of India (1991). 1991. 'Provisional Population Totals: Rural Urban Distribution'. Series 1, Paper 2. Bhatt, S.C. cd. 1997. District Goretteers of India. North-eatern zone, various states. Census of India (2001). 2001. 'Provisional Population Totals: India'. Paper 1.
SIZE CLASS OF TOWNS IN NORTH-EAST
We now turn to the pattern and pace of growth in the levels of urbanisation during the last two decades, i.e. 1991-2001, with reference to:
(a) Growth and pattern of towns by size class and (b) Growth and distribution of urban population in different size class towns
and cities in the North-East as a whole and across its various States.
Table 3 shows the numbers of towns of different sizes for various states of the North East. We see that in 1991, the N-E region had 204 towns in all. This number rose to 254 by the Census year 2001, an addition of 50 in a decade. Across the size class, it can be seen that there has a trend of increase in the number of medium towns in the last two decades. Medium towns account for 23% of towns in the region; their share was about 20% in 1991. In the case of class I towns, the region has only 9 such towns as of 2001, an increase of 2 over 1991, with a share of 3.5% in the total number of towns.

57 Social Change : June 2005
Nearly 70% towns in the region are small towns, and the number has remained stable. However, the number of class VI towns has dipped sharply from about 19% in 1991 to 10% in 2001, with a correspondingly sharp rise in class V towns - an indication perhaps that many of the smallest towns are growing fast.
The region has also witnessed a sharp increase in Census towns in the last decade - increasing from 44 in 1991 to 106 in 2001 (Annexure table 6). This perhaps indicates that many of the transitional villages which could not be classified as urban in the last decade have since been upgraded.
It can be seen also that across States, there is a large regional variation in the distribution and growth of different size class towns. Assam, with its predominant plains, accommodated about 50% of the total urban centres in the region in 2001. It had 94 towns in 1991 and added 3 1 more towns by 200 1. Besides Assam, Arunachal and Tripura, the other states did not witness much addition of new towns. No new town was added at all in Mizoram and Nagaland.
Assam and Nagaland added one class I town each in the last one decade. Nagaland had no class I town till 1991 and Dimapur town was upgraded to a city in Census year 2001. In Assam, Nagaon (a class I1 town till 1991) climbed to the class I category in 2001. The other States with one class I town and which witness no addition in this category include Manipur, Meghalaya, Mizoram and Tripura. Arunachal and Sikkim do not have class I towns as yet. Arunachal did not even have class I1 and I11 towns till 1991, while Sikkim had one class 111 town (Gangtok).
Medium towns, which include class I1 and 111 towns, dominate the region. Their numbers have been rising in almost all the States. They constitute 55% in Nagaland and 9% in Manipur. These towns show growth potential and hence need to be tackled in a planned way.
Note that Arunachal Pradesh has added three new class 111 towns in the last one decade; it had no medium towns till 1991. This implies that the small towns in this hitherto forested and mainly tribal region are fast expanding.
Assam, Manipur, Meghalaya, Nagaland and Tripura also saw their medium towns rise in number, but not Mizoram and Sikkim.
MORPHOLOGY OF SMALL TOWNS The number of small towns (class IV, V, and VI) varies across States : from 56% in Meghalaya to about 90% in Sikkiin in 2001, about the same
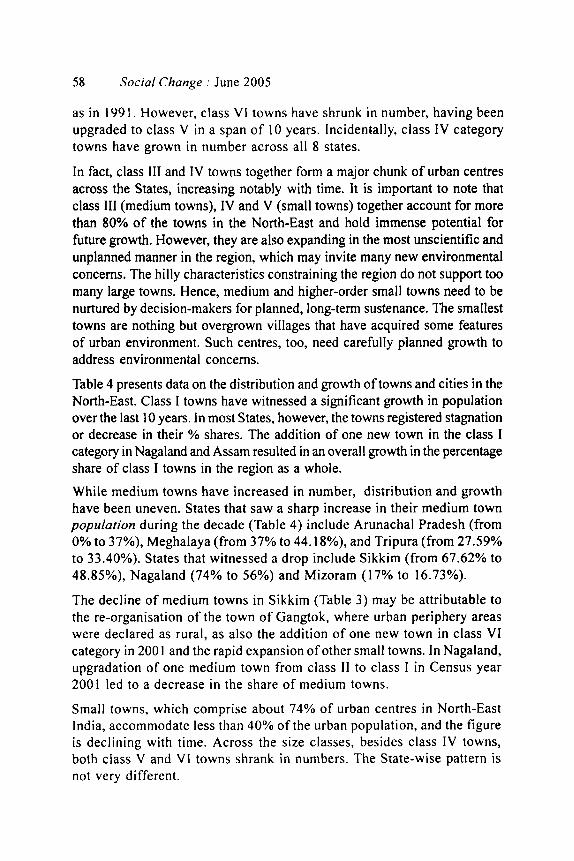
58 Social Change : June 2005
as in 1991. However, class Vl towns have shrunk in number, having been upgraded to class V in a span of 10 years. Incidentally, class IV category towns have grown in number across all 8 states.
In fact, class 111 and IV towns together form a major chunk of urban centres across the States, increasing notably with time. It is important to note that class 111 (medium towns), IV and V (small towns) together account for more than 80% of the towns in the North-East and hold immense potential for future growth. However, they are also expanding in the most unscientific and unplanned manner in the region, which may invite many new environmental concerns. The hilly characteristics constraining the region do not support too many large towns. Hence, medium and higher-order small towns need to be nurtured by decision-makers for planned, long-term sustenance. The smallest towns are nothing but overgrown villages that have acquired some features of urban environment. Such centres, too, need carefully planned growth to address environmental concerns.
Table 4 presents data on the distribution and growth of towns and cities in the North-East. Class I towns have witnessed a significant growth in population over the last 10 years. In most States, however, the towns registered stagnation or decrease in their % shares. The addition of one new town in the class I category in Nagaland and Assam resulted in an overall growth in the percentage share of class I towns in the region as a whole.
While medium towns have increased in number, distribution and growth have been uneven. States that saw a sharp increase in their medium town population during the decade (Table 4) include Arunachal Pradesh (from 0% to 37%), Meghalaya (from 37% to 44.18%), and Tripura (from 27.59% to 33.40%). States that witnessed a drop include Sikkim (from 67.62% to 48.85%), Nagaland (74% to 56%) and Mizoram (17% to 16.73%).
The decline of medium towns in Sikkim (Table 3 ) may be attributable to the re-organisation of the town of Gangtok, where urban periphery areas were declared as rural, as also the addition of one new town in class VI category in 200 1 and the rapid expansion of other small towns. In Nagaland, upgradation of one medium town from class 11 to class I in Census year 2001 led to a decrease in the share of medium towns.
Small towns, which comprise about 74% of urban centres in North-East India, accommodate less than 40% of the urban population, and the figure is declining with time. Across the size classes, besides class IV towns, both class V and Vl towns shrank in numbers. The State-wise pattern is not very different.

v,
TA
BL
E 3
\o
Urb
an c
entr
es b
y ca
tego
ry a
nd r
espe
ctiv
e pe
rcen
tage
sha
res,
Nor
th E
ast
Stat
es,
1991
-200
1
CA
TE
GO
RY
OF
UR
BA
N C
EN
TR
ES
2 A
ll
Cit
ies
Med
ium
to
wn
s Sm
all
tow
ns
2.
Cla
sse9
E
3 C
lass
C
lass
C
lass
T
otal
C
lass
C
lass
C
lass
T
otal
Q
I %
11
%
11
1 Y
Ye
IV
Ye
V %
V
I Ye
Ye
5
Yrs
. St
ate
..
1991
Aru
nach
al
10
0 0.
00
0 0.00
0 0.00
0.00
5
50.0
0 5
50.0
0 0
0.00
10
0.00
2
20
0 I
17
0 0.
00
0 0.
00
3 17
.65
17.6
5 7
41.1
8 5
29.4
1 2
11.7
6 82
.35
1991
A
ssam
9
4
3 3.
19
5 5.
32
19
20.2
1 25
.53
35
37.2
3 20
21
.28
12
12.7
7 71
.28
2001
12
5 4
3.20
9
7.20
23
18
.40
25.6
0 34
27
.20
51
40
.80
4 3.
20
71.2
0 19
91
Man
ipur
3
1
I 3.
23
0 0
.00
3
9.68
9.
68
5 16
.13
18
58 0
6 4
12.9
0 87
.09
200
1 33
1
3.03
0
0.00
4
12.1
2 12
.12
7 21
.21
16
48.4
8 5
15.1
5 84
.85
1991
Meg
hala
ya
12
I 8.
33
0 0.
00
4 33
.33
33.3
3 4
33.3
3 3
25.0
0 0
0.00
58
.33
200
1 16
I
6.25
1
6.25
5
31.2
5 37
.50
8 50
.00
I 6
25
0 0.
00
56.2
5 19
91
Miz
oram
22
1
4.55
0
0.00
2
9.09
9.
09
3 13
.64
5 22
.73
I I
50.0
0 86
.36
200
I 22
I
4.55
0
0.00
2
9.09
9.
09
4 18
.18
7 31
.82
8 36
.36
86.3
6 19
91
Nag
alan
d 9
0 0.
00
2 22
.22
2 22
.22
44.4
4 3
33 3
3 2
22.2
2 0
0.00
55
.56
200
I 9
I 11
.11
11
1.1
1
4 44
.44
55.5
6 3
33.3
3 0
0.00
0
0.0
0
33.3
3 19
91
Sikk
im
8 0
0.00
0
0.00
I
12.5
0 12
.50
0 0.
00
0 0.
00
7 87
.50
87.5
0 20
0 1
9 0
0.00
0
0.00
I
11.1
1 11
.11
I 11
.11
I 11
.11
6 66
.67
88.8
9 19
91
Tri
pura
18
1
5.56
0
0.00
4
22.2
2 22
.22
7 38
.89
4 22
.22
2 11
.11
72.2
2 20
0 I
23
I 4.
35
0 0
.00
6
26.0
9 26
.09
8 34
.78
8 34
.78
0 0.
00
69.5
7 19
91 N
orth
-Eas
t 20
4 7
3.43
7
3.43
35
17
.16
20.5
9 6
2
30.3
9 57
27
.94
36
17.6
5 75
.98
200
1 25
4 9
3.54
I1
4.
33
48
18.9
0 23
.23
72
28.3
5 89
35
.04
25
9.84
73
.23

60 Social Change : June 2005
Population in all the states in case of class VI towns has declined over the decade (Table 4). Even in the case of class V towns, the population share has fallen, except in Sikkim, Assam and Tripura where either class VI towns have been upgraded to fifth category or new towns have been introduced in this category.
As for Mizoram, the population share of medium towns declined; the State saw a notable increase in its city population and also the population in class IV towns.
TABLE 4 Urban Centre by percentage share of urban population, North East States, 199 1-200 1
Yrs. State CATEGORY OF URBAN CENTRE
Cities Medium towns Small towns
Class I Class I1 Class 111 Total Class IV Class VClass VI Total
2001 Arunachal Pr 0.00 1991 0.00 2001 Assam 33.13 1991 33.56 2001 Manipur 38.56 1991 38.75 2001 Meghalaya 29.36 1991 39.71 2001 Mizoram 52.08 1991 48.68 2001 Nagaland 30.44 1991 0.00 2001 Sikkirn 0.00 1991 0.00
2001 Tripura 34.89 1991 37.62 200 I North-East 27.31 1991 24.79
0.00 0.00 17.49 14.98 0.00 0.00 12.90 0.00
0.00 0.00
22.27
52.38 0.00 0.00
0.00 0.00
6.58 8.42
37.66 0.00
21.16 23.50 19.64 18.03 31.28 37.57 16.73 17.79 34.40 21.71 48.85 67.62
33.40 27.59 30.39 26.73
37.66 0.00
38.65 38.48 19.64 18.03 44.18 37.57 16.73 17.79 56.67 74.08 48.85 67.62
33.40 27.59 36.97 35.15
43.23 66.14 16.22 20.44 17.33 14.86 24.55 15.73 15.19 12.87 12.89 17.75 24.33 0.00
21.14 24.66 21.86 21.56
15.40 33.86 11.41 6.12
20.94 25.60 1.91 6.98 10.48 10.08 0.00
8.17 9.01 0.00
10.57 7.96 9.96 12.35
3.72 0.00 0.59 1.78 3.53 2.76 0.00 0.00
5.51 10.58 0.00
0.00 17.8 I 32.38 0.00 2.16 3.90 6.2 1
62.34 100.00 28.22 28.34 41.80 43.22 26.46 22.71 31.19 33.53 12.89
25.92 51.15 32.38 31.71 34.78 35.72 40.11
Source: Table 3 & 4: Computed from- Census of India, ( 1991 ), Provisional Population Totals: Rural Urban Distribution, Series I . Paper 2 of 199 I . Census of' India (2001 ). Provisional Population Totals: India. Paper I o f 200 I .
61 Social Change : June 2005
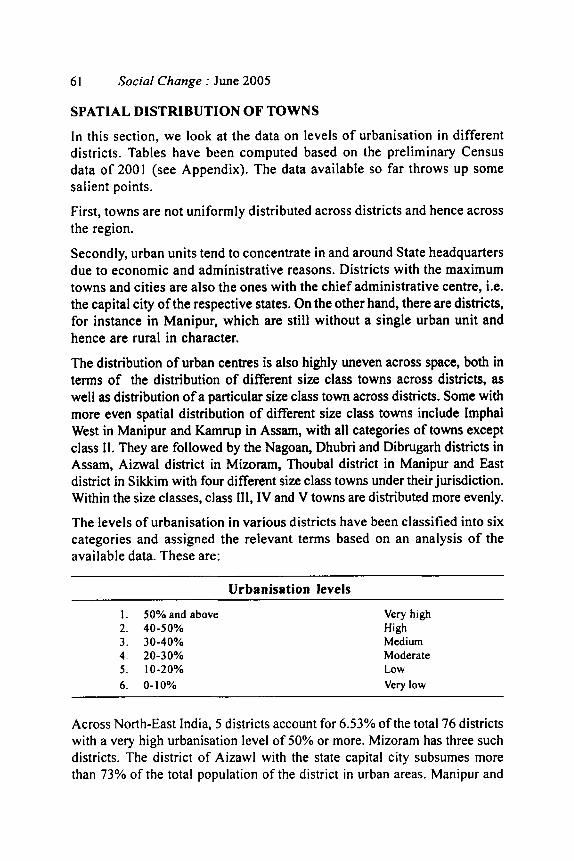
SPATIAL DISTRIBUTION OF TOWNS
In this section, we look at the data on levels of urbanisation in different districts. Tables have been computed based on the preliminary Census data of 2001 (see Appendix). The data available so far throws up some salient points.
First, towns are not uniformly distributed across districts and hence across the region.
Secondly, urban units tend to concentrate in and around State headquarters due to economic and administrative reasons. Districts with the maximum towns and cities are also the ones with the chief administrative centre, i.e. the capital city of the respective states. On the other hand, there are districts, for instance in Manipur, which are still without a single urban unit and hence are rural in character.
The distribution of urban centres is also highly uneven across space, both in terms of the distribution of different size class towns across districts, as well as distribution of a particular size class town across districts. Some with more even spatial distribution of different size class towns include Imphal West in Manipur and Kamrup in Assam, with all categories of towns except class 11. They are followed by the Nagoan, Dhubri and Dibrugarh districts in Assam, Aizwal district in Mizoram, Thoubal district in Manipur and East district in Sikkim with four different size class towns under their jurisdiction. Within the size classes, class 111, IV and V towns are distributed more evenly.
The levels of urbanisation in various districts have been classified into six categories and assigned the relevant terms based on an analysis of the available data. These are:
Urbanisstion levels
I . 50% and above Very high 2. 40-50% High 3. 30-40% Medium 4. 20-30% Moderate 5. 10-20% Low 6. 0-10% Very low
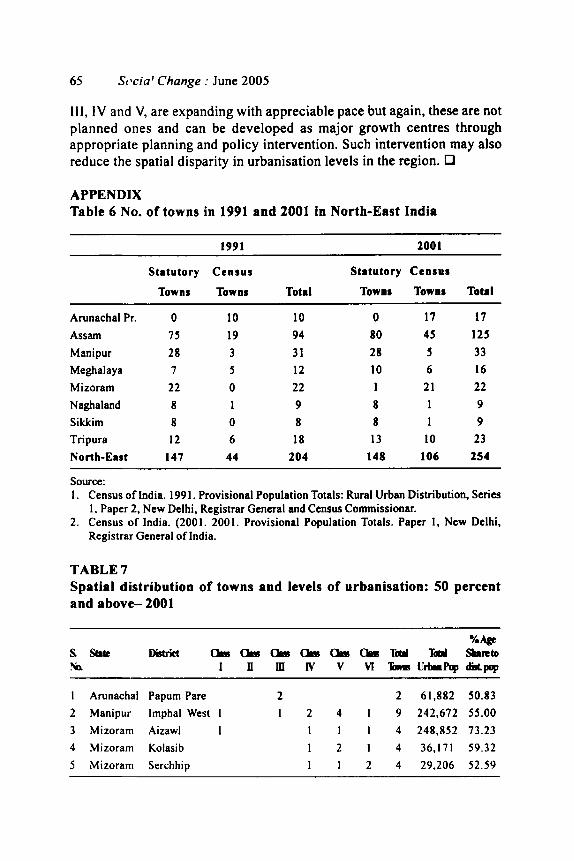
Across North-East India, 5 districts account for 6.53% of the total 76 districts with a very high urbanisation level of 50% or more. Mizoram has three such districts. The district of Aizawl with the state capital city subsumes more than 73% of the total population of the district in urban areas. Manipur and

62 Social Change : June 2005
Arunachal follow Mizoram with one district each under their share in this category. Surprisingly, some districts in both Mizoram and Arunachal Pradesh, which were rural till 1950s, attained such high levels of urbanisation in a span of just 50 years. Three districts in the region in Meghalaya, Nagaland and Mizoram with a rather high level of 40-50%, considering that just over 20% of the region as a whole is urbanised. Almost 8% of the districts have a
Table 5 Spatial distribution of urbanisation - 2001
~
Levels of States Districts urbanisation 2001 (Yo)
50 and above Arunachal, Manipur Mizoram
Nagaland Mizoram
30-40 Manipur Assam Mizoram
Manipur Nagaland Sikkim Tripura
40-50 Meghalaya
20-30 Arunachal
10-20 Arunachal
Manipur Meghalaya Nagaland ASSm
Mizoram Tripura
0-10 Arunachal Manipur Meghalaya Nagaland ASSm
Mizoram SikLim Trimra
Papum Pare lmphal West Ainval, Kolasib, Serchip East Khashi hills Dimapur Lunglei Bishnupur, Toubal, Kamrup, North Cachar Hills Saiha, Champhai East Kamang, East Siang, Upper Subansiri Imphal East, Kohima, Wokha East District, South District West Tripura Dibang Valley, Lohit, Lower Subansiri, Tawang, Tirap, West Siang Chandel, East Garo hills, West Garo hills, West Khasi hills Mokokchung, Zunheboto Bongaigaon, Chachar, Dhubri, Dibrugarh, Jorhat, Karbianglong, Tinsukia, Nagoan, North Mamit Tripura Changlang, Upper Siang, West Kameng Churachandpur, Senapati, Tamanglong, Ukhrul, Jainta Hills, Ri Bhoi, South Garo Hills, Mon, Phek, Tuensang, Barpeta, Darrang, Dhemaji. Goalpara, Golaghat, Hailakandi, Karimganj, Kokrajhar, Lakhimpur, Marigaon. Nalhari, Sibsagar, Sonitpur Lawngtlai West District, North District Dhalai. South Tripura
63 Social Change : June 2005
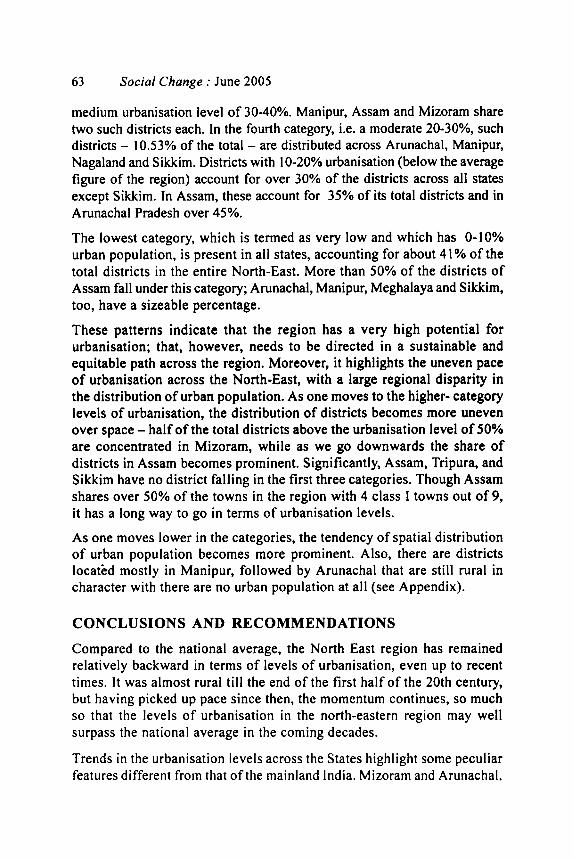
medium urbanisation level of 3040%. Manipur, Assam and Mizoram share two such districts each. In the fourth category, i.e. a moderate 20-30%, such districts - 10.53% of the total - are distributed across Arunachal, Manipur, Nagaland and Sikkim. Districts with 10-20% urbanisation (below the average figure of the region) account for over 30% of the districts across all states except Sikkim. In Assam, these account for 35% of its total districts and in Arunachal Pradesh over 45%.
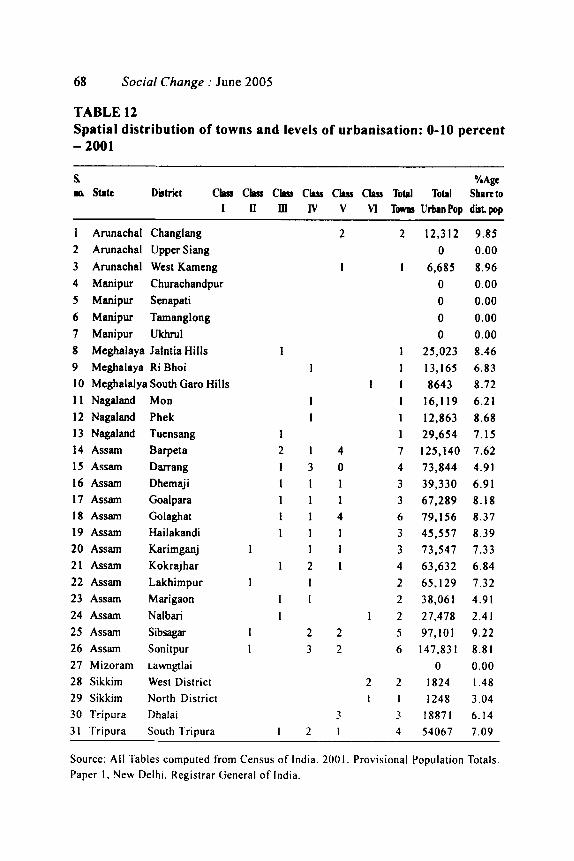
The lowest category, which is termed as very low and which has O-lO% urban population, is present in all states, accounting for about 4 1% of the total districts in the entire North-East. More than 50% of the districts of Assam fall under this category; Arunachal, Manipur, Meghalaya and Sikkim, too, have a sizeable percentage.
These patterns indicate that the region has a very high potential for urbanisation; that, however, needs to be directed in a sustainable and equitable path across the region. Moreover, it highlights the uneven pace of urbanisation across the North-East, with a large regional disparity in the distribution of urban population. As one moves to the higher- category levels of urbanisation, the distribution of districts becomes more uneven over space - half of the total districts above the urbanisation level of 50% are concentrated in Mizoram, while as we go downwards the share of districts in Assam becomes prominent. Significantly, Assam, Tripura, and Sikkim have no district falling in the first three categories. Though Assam shares over 50% of the towns in the region with 4 class I towns out of 9, it has a long way to go in terms of urbanisation levels.
As one moves lower in the categories, the tendency of spatial distribution of urban population becomes more prominent. Also, there are districts located mostly in Manipur, followed by Arunachal that are still rural in character with there are no urban population at all (see Appendix).
CONCLUSIONS AND RECOMMENDATIONS
Compared to the national average, the North East region has remained relatively backward in terms of levels of urbanisation, even up to recent times. It was almost rural till the end of the first half of the 20th century, but having picked up pace since then, the momentum continues, so much so that the levels of urbanisation in the north-eastern region may well surpass the national average in the coming decades.
Trends in the urbanisation levels across the States highlight some peculiar features different from that of the mainland India. Mizoram and Arunachal,
64 Social ClTanfe : June 2005
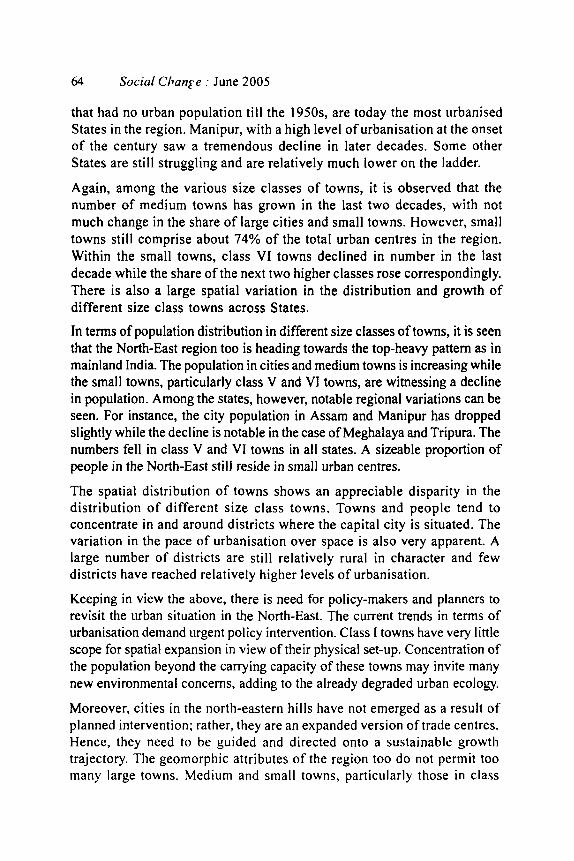
that had no urban population till the 1950s, are today the most urbanised States in the region. Manipur, with a high level of urbanisation at the onset of the century saw a tremendous decline in later decades. Some other States are still struggling and are relatively much lower on the ladder.
Again, among the various size classes of towns, it is observed that the number of medium towns has grown in the last two decades, with not much change in the share of large cities and small towns. However, small towns still comprise about 74% of the total urban centres in the region. Within the small towns, class VI towns declined in number in the last decade while the share of the next two higher classes rose correspondingly. There is also a large spatial variation in the distribution and growth of different size class towns across States.
In terms of population distribution in different size classes of towns, it is seen that the North-East region too is heading towards the top-heavy pattern as in mainland India. The population in cities and medium towns is increasing while the small towns, particularly class V and VI towns, are witnessing a decline in population. Among the states, however, notable regional variations can be seen. For instance, the city population in Assam and Manipur has dropped slightly while the decline is notable in the case of Meghalaya and Tripura. The numbers fell in class V and V1 towns in all states. A sizeable proportion of people in the North-East still reside in small urban centres.
The spatial distribution of towns shows an appreciable disparity in the distribution of different size class towns. Towns and people tend to concentrate in and around districts where the capital city is situated. The variation in the pace of urbanisation over space is also very apparent. A large number of districts are still relatively rural in character and few districts have reached relatively higher levels of urbanisation.
Keeping in view the above, there is need for policy-makers and planners to revisit the urban situation in the North-East. The current trends in terms of urbanisation demand urgent policy intervention. Class I towns have very little scope for spatial expansion in view of their physical set-up. Concentration of the population beyond the carrying capacity of these towns may invite many new environmental concerns, adding to the already degraded urban ecology.
Moreover, cities in the north-eastern hills have not emerged as a result of planned intervention; rather, they are an expanded version of trade centres. Hence, they need to be guided and directed onto a sustainable growth trajectory. The geomorphic attributes of the region too do not permit too many large towns. Medium and small towns, particularly those in class
65 Siicia' Change : June 2005
111, iV and V, are expanding with appreciable pace but again, these are not planned ones and can be developed as major growth centres through appropriate planning and policy intervention. Such intervention may also reduce the spatial disparity in urbanisation levels in the region. 0
APPENDIX Table 6 No. of towns in 1991 and 2001 in North-East India
1991 2001
Statutory Census Statutory Ceasus
Towns Towar Total Towar Townr Total
Arunachal Pr. 0 Assam 75 Manipur 28
Mizoram 22
Naghaland 8 Sikkim 8
Meghalaya 7
Tripura 12 North-East 147
10 19 3 5 0 1 0 6
44
10 94 31 12 22 9 8 18
204
0 80 28 10 1 8 8 13
148
17 45 5 6
21 1 1
10 106
17 125 33 16 22 9 9
23 254
source: 1. Census of India. 1991. Provisional Population Totals: Rural Urban Distribution, Series
I. Paper 2, New Delhi, Registrar General and Census Commissionar. 2. Census of India. (2001. 2001. Provisional Population Totals. Paper 1, New Delhi.
Registrar General of India.
TABLE 7 Spatial distribution of towns and levels of urbanisation: 50 percent and above- 2001
% Agc
Na I n m Iy v M'FarnUrtmPllpdbtpop S W Dirtria - ~ C h s C h s h C h T o t r l Tabt Sbmto
I Arunachal Papum Pare 2 2 61,882 50.83 2 Manipur lmphal West 1 1 2 4 1 9 242,672 55.00 3 Mizoram Aizawl I I 1 1 4 248,852 73.23 4 Mizoram Kolasib I 2 1 4 36,171 59.32 5 Mizoram Serchhip 1 1 2 4 29,206 52.59

66 Social Change : Jiine ?005
TABLE 8 Spatial distribution of towns and levels of urbanisation: 40 -50 percent - 2001
s %A@ Na State District Clpu Cho Clrcs C b Cho Clw Total Total Shareto
I U Ill IV V VI T m UhnPop d i n p o p
1 Meghalaya East Khasi Hills 1 0 3 4 8 277,967 42.05 2 Nagaland Dimapur 1 1 2 123,892 40.17 3 Mizoram Lunglei 1 1 1 3 58,153 42.40
TABLE 9 Spatial distribution of towns and levels of urbanisation: 30-40 percent - 2001
S Na State
1 Manipur 2 Manipur 3 Assam 4 Assam 5 Mizoram 6 Mizoram
% Age District CLa chu C h Chcs Chu Chcs Total Total Sbrnto
I Il III IV V VI TmLJlhnpOp dibpop
Bishnupur 3 4 7 73,268 36.00 Thoubal 3 1 4 2 10 131,270 36.00 Kamrup 1 1 2 4 1 9 900,518 35.81 North Cachar hill 1 3 4 58,079 31.19 Saiha 1 1 19,731 32.44 Champhai 1 1 1 3 38,124 37.6
TABLE 10 Spatial distribution of towns and levels of urbanisation: 20-30 percent - 2001
s %Age Na Ststc District Class Clpu C h Clan Clpu Clau Total UrbPnPop Sbsrcto
I U III IV V VI Towm Total dictpop
1 2 3 4 5 6 7 8 9 -
Arunachal Arunachal Arunachal Manipur Nagaland Nagaland Sikkim Sikkim Trioura
East Kameng East Siang Upper Subansiri Imphal East Kohima Wokha East District South District West TriDura 1
1 I
I 4
1 I I l l
3 5 4
1 I 1
2 6 1 1
1 4 2 2
13
14965 26.22 21,972 25.13 15,468 28.13
108,240 27.00 78,584 25.00 37,696 23.40 52987 21.65 3946 30.00
407501 26.62

67 Social Chcnge : June 2005
TABLE 11 Spatial distribution of towns and levels of urbanisation: 10-20 percent - 2001
1
2
3
4
5
6
7
8
9
10
11
12
13
14
I5
16
17
18
19
20
21
22
~
Arunachal Dibang Valley
Arunachal Lohit
Arunachal Lower Subansiri
Arunachal Tawang
Arunachal Tirap
Arunachal West Siang
Manipur Chandel
Meghalalya East Garo Hills
Meghalalya West Garo Hills
Meghalalya West Khasi Hills
Nagaland Mokokchung
Nagaland Zunheboto
Assam Bongaigaon
Assam Cachar 1
Assam Dhubn
Assam Dibrugarh 1
Assam Jorhat
Assam Karbianglong
Assam Tinsukia
Assam Nagaon 1
Mizoram Mamit
Tripura North Tripura
1 1
2 2
1 1
1 1
2 2
1 1 2
1
2 2
1 1
1 1 2
1 1
1 1
1 3 1 5
1 5 7
1 3 2 2 8
1 2 5 9
1 1 5 7
1 1 2 2 6
1 2 3 4 10
4 2 3 10
1 2 3
3 3
10,106 17.56
26,596 18.54
12,289 12.59
4,456 12.84
15,289 15.25
20,668 19.95
14,960 12.00
35,903 14.50
58,391 11.32
33,520 11.40
31.204 13.73
22,809 14.72
110,287 12.17
201,418 13.97
190,546 11.66
219,976 18.77
170,648 16.91
92,751 11.42
224,174 19.49
277,921 12.00
10803 17.34
62655 10.61
68 Social Change : June 2005
TABLE 12 Spatial distribution of towns and levels of urbanisation: 0-10 percent - 2001
s m stltc District C h C h C k C k C h
1 n m l v v
%Age C l w Total Total Shareto M T m UrbraPop dinpop
1 Arunachal Changlang 2 Arunachal Upper Siang 3 Arunachal West Kameng 4 Manipur Churachandpur 5 Manipur Senapati 6 Manipur Tamanglong 7 Manipur Ukhrul 8 Meghalaya Jaintia Hills 9 Meghalaya RiBhoi 10 Meghalalya South Garo Hills 11 Nagaland Mon 12 Nagaland Phek 13 Nagaland Tuensang 14 Assam Barpeta I5 Assam Darrang 16 Assam Dhemaji 17 Assam Goalpara 18 Assam Golaghat 19 Assam Hailakandi 20 Assam Karimganj 21 Assam Kokrajhar 22 Assam Lakhimpur 23 Assam Marigaon 24 Assam Nalbari 25 Assam Sibsagar 26 Assam Sonitpur 27 Mizoram Lawngtlai 28 Sikkim West District 29 Sikkim North District 30 Tripura Dhalai 3 1 Tripura South I ripura
1 I
1 1
1 2 1 4 1 3 0 I l l 1 1 1 1 1 4 1 1 1
1 1 1 1 2 1
1 I 1 1 1
I 2 2 1 3 2
3 1 2 1
I 1
1 1 I 1 1 7 4
3 3 6 3 3 4 2 2
1 2 5 6
2 2 1 1
3 4
12,312 0
6,685 0 0 0 0
25,023 13,165 8643
16,119 12,863 29,654 125,140 73,844 39,330 67,289 79,156 45,557 73,547 63,632 65,129 38,061 27,478 97,101 147,831
0 I824 1248
I887 I 54067
9.85 0.00 8.96 0.00 0.00 0.00 0.00 8.46 6.83 8.72 6.21 8.68 7.15 7.62 4.9 1 6.91 8.18 8.37 8.39 7.33 6.84 7.32 4.91 2.41 9.22 8.8 I 0.00 I .48 3.04 6. I4 7.09
Source: All Tables computed from Census of India. 2001. Provisional Population Totals. Paper I . New Delhi. Registrar General of India.

69 Social Change : Jure 2005
REFERENCES
Bhatt. S.C. ed. 1997. District gazetteers of India. North Eastern Zone. Various states. New Delhi: Gyan Publishing House.
Census of India. 1991. Provisional Population Totals: Rural Urban Distribution. I (2). New Delhi: Registrar General and Census Commissioner.
Census of India. 1992. Final Population Totals. I .
Khawas, Vimal. 2003. ‘Trend in Urbanisation and Urban Growth in the Eastern Indian Himalayas - The Case of Manipur, Sikkim and Tripura’. www.mtnforum.org
Majumdar, Paromita. 1998. ‘The Trend in Urbanisation and Urban Growth in Haryana: 1901-1991’. Geographical Review of India. DX (I). 84-97.
Shah, Piyushkumar Shantilal. 1983. ‘Urbanisation Trends and Pattern in Gujarat’. Unpublished post-graduate thesis. Ahmedabad: School of Planning, CEPT. 0