The pivotal role of micro-environmental cells in a human blood ...
17
Gerhartl et al. Fluids Barriers CNS (2020) 17:19 https://doi.org/10.1186/s12987-020-00179-3 RESEARCH The pivotal role of micro-environmental cells in a human blood–brain barrier in vitro model of cerebral ischemia: functional and transcriptomic analysis Anna Gerhartl † , Nadja Pracser † , Alexandra Vladetic, Sabrina Hendrikx, Heinz‑Peter Friedl and Winfried Neuhaus * Abstract Background: The blood–brain barrier (BBB) is altered in several diseases of the central nervous system. For example, the breakdown of the BBB during cerebral ischemia in stroke or traumatic brain injury is a hallmark of the diseases’ progression. This functional damage is one key event which is attempted to be mimicked in in vitro models. Recent studies showed the pivotal role of micro‑environmental cells such as astrocytes for this barrier damage in mouse stroke in vitro models. The aim of this study was to evaluate the role of micro‑environmental cells for the functional, paracellular breakdown in a human BBB cerebral ischemia in vitro model accompanied by a transcriptional analysis. Methods: Transwell models with human brain endothelial cell line hCMEC/D3 in mono‑culture or co‑culture with human primary astrocytes and pericytes or rat glioma cell line C6 were subjected to oxygen/glucose deprivation (OGD). Changes of transendothelial electrical resistance (TEER) and FITC‑dextran 4000 permeability were recorded as measures for paracellular tightness. In addition, qPCR and high‑throughput qPCR Barrier chips were applied to investi‑ gate the changes of the mRNA expression of 38 relevant, expressed barrier targets (tight junctions, ABC‑transporters) by different treatments. Results: In contrast to the mono‑culture, the co‑cultivation with human primary astrocytes/pericytes or glioma C6 cells resulted in a significantly increased paracellular permeability after 5 h OGD. This indicated the pivotal role of micro‑environmental cells for BBB breakdown in the human model. Hierarchical cluster analysis of qPCR data revealed differently, but also commonly regulated clustered targets dependent on medium exchange, serum reduction, hydro‑ cortisone addition and co‑cultivations. Conclusions: The co‑cultivation with micro‑environmental cells is necessary to achieve a functional breakdown of the BBB in the cerebral ischemia model within an in vivo relevant time window. Comprehensive studies by qPCR revealed that distinct expression clusters of barrier markers exist and that these are regulated by different treatments (even by growth medium change) indicating that controls for single cell culture manipulation steps are crucial to understand the observed effects properly. © The Author(s) 2020. This article is licensed under a Creative Commons Attribution 4.0 International License, which permits use, sharing, adaptation, distribution and reproduction in any medium or format, as long as you give appropriate credit to the original author(s) and the source, provide a link to the Creative Commons licence, and indicate if changes were made. The images or other third party material in this article are included in the article’s Creative Commons licence, unless indicated otherwise in a credit line to the material. If material is not included in the article’s Creative Commons licence and your intended use is not permitted by statutory regulation or exceeds the permitted use, you will need to obtain permission directly from the copyright holder. To view a copy of this licence, visit http://creativeco mmons.org/licenses/by/4.0/. The Creative Commons Public Domain Dedication waiver (http://creativecommons.org/publicdomain/ zero/1.0/) applies to the data made available in this article, unless otherwise stated in a credit line to the data. Open Access Fluids and Barriers of the CNS *Correspondence: [email protected] † Anna Gerhartl and Nadja Pracser contributed equally as first authors Competence Unit Molecular Diagnostics, Center Health and Bioresources, AIT–Austrian Institute of Technology GmbH, Giefinggasse 4, 1210 Vienna, Austria
-
Upload
khangminh22 -
Category
Documents
-
view
1 -
download
0
Transcript of The pivotal role of micro-environmental cells in a human blood ...
Gerhartl et al. Fluids Barriers CNS (2020) 17:19 https://doi.org/10.1186/s12987-020-00179-3
RESEARCH
The pivotal role of micro-environmental cells in a human blood–brain barrier in vitro model of cerebral ischemia: functional and transcriptomic analysisAnna Gerhartl†, Nadja Pracser†, Alexandra Vladetic, Sabrina Hendrikx, Heinz‑Peter Friedl and Winfried Neuhaus*
Abstract
Background: The blood–brain barrier (BBB) is altered in several diseases of the central nervous system. For example, the breakdown of the BBB during cerebral ischemia in stroke or traumatic brain injury is a hallmark of the diseases’ progression. This functional damage is one key event which is attempted to be mimicked in in vitro models. Recent studies showed the pivotal role of micro‑environmental cells such as astrocytes for this barrier damage in mouse stroke in vitro models. The aim of this study was to evaluate the role of micro‑environmental cells for the functional, paracellular breakdown in a human BBB cerebral ischemia in vitro model accompanied by a transcriptional analysis.
Methods: Transwell models with human brain endothelial cell line hCMEC/D3 in mono‑culture or co‑culture with human primary astrocytes and pericytes or rat glioma cell line C6 were subjected to oxygen/glucose deprivation (OGD). Changes of transendothelial electrical resistance (TEER) and FITC‑dextran 4000 permeability were recorded as measures for paracellular tightness. In addition, qPCR and high‑throughput qPCR Barrier chips were applied to investi‑gate the changes of the mRNA expression of 38 relevant, expressed barrier targets (tight junctions, ABC‑transporters) by different treatments.
Results: In contrast to the mono‑culture, the co‑cultivation with human primary astrocytes/pericytes or glioma C6 cells resulted in a significantly increased paracellular permeability after 5 h OGD. This indicated the pivotal role of micro‑environmental cells for BBB breakdown in the human model. Hierarchical cluster analysis of qPCR data revealed differently, but also commonly regulated clustered targets dependent on medium exchange, serum reduction, hydro‑cortisone addition and co‑cultivations.
Conclusions: The co‑cultivation with micro‑environmental cells is necessary to achieve a functional breakdown of the BBB in the cerebral ischemia model within an in vivo relevant time window. Comprehensive studies by qPCR revealed that distinct expression clusters of barrier markers exist and that these are regulated by different treatments (even by growth medium change) indicating that controls for single cell culture manipulation steps are crucial to understand the observed effects properly.
© The Author(s) 2020. This article is licensed under a Creative Commons Attribution 4.0 International License, which permits use, sharing, adaptation, distribution and reproduction in any medium or format, as long as you give appropriate credit to the original author(s) and the source, provide a link to the Creative Commons licence, and indicate if changes were made. The images or other third party material in this article are included in the article’s Creative Commons licence, unless indicated otherwise in a credit line to the material. If material is not included in the article’s Creative Commons licence and your intended use is not permitted by statutory regulation or exceeds the permitted use, you will need to obtain permission directly from the copyright holder. To view a copy of this licence, visit http://creat iveco mmons .org/licen ses/by/4.0/. The Creative Commons Public Domain Dedication waiver (http://creat iveco mmons .org/publi cdoma in/zero/1.0/) applies to the data made available in this article, unless otherwise stated in a credit line to the data.
Open Access
Fluids and Barriers of the CNS
*Correspondence: [email protected]†Anna Gerhartl and Nadja Pracser contributed equally as first authorsCompetence Unit Molecular Diagnostics, Center Health and Bioresources, AIT–Austrian Institute of Technology GmbH, Giefinggasse 4, 1210 Vienna, Austria
Page 2 of 17Gerhartl et al. Fluids Barriers CNS (2020) 17:19
BackgroundCerebral ischemic insults are an immense burden for the national health care systems. Stroke is estimated to cost the EU economy €45 billion a year, whereby 44% (€20 bil-lion) is due to direct health care costs, 22% (€9 billion) to productivity losses and 35% (€16 billion) to the infor-mal care of people with stroke [51]. The total European annual health care cost of traumatic brain injury (TBI) is over €33 billion [2].
The blood–brain barrier (BBB) plays an important role in both clinical pictures (stroke, TBI). The reduced sup-ply of oxygen and nutrients such as glucose causes dam-age of the BBB, which contributes to the development of brain edema. After reperfusion, damage to the BBB occurs in several phases, whereby it is assumed that after several hours, an increase in the transcytosis rate is ini-tially observed, followed by a break-up of the paracellu-lar tight junctions after 1 and 2 days [20]. Investigations in even shorter periods of time showed that an opening and dysfunction of the BBB can already occur within 30–45 min after the insult [41]. The BBB has the task to protect the central nervous system (CNS) from physical, chemical and biological damage and to maintain homeo-stasis within the CNS. The main sealing component of the BBB are the brain capillary endothelial cells (BCECs). They are characterized by very tight cell–cell junctions and a battery of transporter proteins and enzymes that enable them to build a physical, a transport and a meta-bolic barrier. In contrast to peripheral endothelial cells, BCECs have hardly fenestrae, a significantly reduced pinocytosis rate and a significantly higher mitochon-drial density to provide the energy for maintaining bar-rier function [18]. The paracellular gap is sealed by tight junctions and this prevents the uncontrolled transport of hydrophilic molecules. Currently, the presumably most important tight junction (TJ) proteins of the BBB are the sealing claudins-1, -3, -5, -11 and -12 and the TJ struc-ture regulating proteins occludin, tricellulin, LSR and zonula occludens 1 (ZO-1). At the moment, however, there is a lively discussion about the role of individual claudins at the BBB. For example, it was recently shown that the claudins-3 and -12 in the BBB of the mouse do not have the previously believed importance for BBB function [7, 8]. In addition, there are postulated species differences that make it difficult to get a clear picture of which claudins are present in the human BBB and which function they fulfill [3]. Previous studies have in com-mon that they prove the essential role of claudin-5 in all species. However, in vivo tissue and in vitro data from
recent publications indicate that the TJ claudin network at the BBB may be much more complex than previously assumed [11, 24, 47]. To maintain the transport barrier, the BCECs use an array of transporter proteins, most of which belong to either the ABC or the SLC transporter families. According to current knowledge, ABCB1 (P-gyl-coprotein), ABCG2 (BCRP, breast cancer resistance protein) and ABCC1-5 (MRP1-5, multidrug-resistance related proteins) are mainly responsible for preventing the entry into the CNS of undesirable substances such as xenobiotics and/or drugs [33]. The function of both the TJs and the ABC transporters on the BBB is strictly regulated by the microenvironment. The closest cells to the BCECs on the CNS side are the pericytes, which even share the basement membrane with the BCECs, and the astrocytes, whose terminal endfeet cover up to 90% of the capillary surface on the CNS side. Astrocytes are thought to induce BBB properties such as the paracellular barrier or ABC transporter activities, whereas pericytes suppress peripheral endothelial cell properties in BCECs such as the significantly higher peripheral pinocytosis rate [10]. In the case of cerebral ischemia, the BBB is damaged within a few hours, whereby the TJ lose their integrity and some ABC transporters are regulated to protect the cells [5, 17, 28, 41]. This loss of function can be measured by increased entry of permeability markers into the CNS. In vitro, this can also be determined non-invasively by measuring the reduction of the transendothelial electri-cal resistance (TEER). During cerebral ischemia, glucose transporters such as SLC2A1 (Glut-1) are upregulated, by which BCECs try to take up the remaining glucose for stabilizing the energy balance. Like the vascular endothe-lial growth factor (VEGF), this upregulation is hypoxia-dependent and can also be used as a marker for the reaction of BCECs to hypoxic states [30, 52]. Although a large number of research projects were carried out on novel therapies for the treatment of cerebral ischemia, clinical success to date has been marginal. Several reports showed that the stabilization of the BBB during acute insults can lead to a significant reduction in brain edema and neurological damage [19, 32, 43]. Nevertheless, the mechanisms during cerebral ischemia are not yet suffi-ciently understood. In addition, the existing studies were mostly performed in rodents both in vivo and in vitro. However, to ensure a useful translation to the human situation, well validated human in vitro models of the BBB for cerebral ischemia are required. It is noticeable that the incubation times applying OGD (oxygen/glucose deprivation as treatment to simulate cerebral ischemia)
Keywords: Brain endothelial cells, Claudin, Cerebral ischemia, Stroke, Traumatic brain injury

Page 3 of 17Gerhartl et al. Fluids Barriers CNS (2020) 17:19
to detect functional damage in in vitro models were often much longer (up to 24 h) than in in vivo models or known from the clinic [36, 37]. In this context, it was shown in in vitro mouse models that co-cultivation with micro-environmental cells such as astrocytes or glioma cells significantly shortened incubation times to more in vivo relevant durations while achieving the same func-tional damage [29, 31]. Therefore, one major objective of this study was to establish a human in vitro BBB model of cerebral ischemia that achieves a functional dam-age of approximately 35–60% TEER decline in less than 6 h. This TEER decline was defined in previous mouse in vitro studies as optimal for therapy testing, as too lit-tle damage makes the read-out of positive effects difficult and too much damage shows insufficient reversibility [31, 32]. The other major objective was to investigate com-prehensively the influences of experimental parameters on the expression of TJ proteins and ABC transporters. As human in vitro BBB model, the most commonly used human cell line hCMEC/D3 [49] was cultivated and co-cultured with rat glioma cell line C6 or primary human astrocytes/pericytes under normoxic and OGD condi-tions. Cell line C6 was chosen, since their usability for inducing BBB breakdown has already been proven in a mouse ischemia model [31, 32].
MethodsCell cultureThe human immortalized cell line hCMEC/D3 [50] was obtained from Merck Milipore, Darmstadt, Germany (Ref.: SCC066) and cultured on 0.5% gelatin-coated cul-ture flasks (Gelatin: SERVA Electrophoresis GmbH, Heidelberg, Germany; 22,151.02; culture flasks: Cell-Star, Greiner Bio-one, Kremsmünster, Austria; 690175 or 658175) in EBM-2 (Lonza, Basel, Swiss; CC 3156) supplemented with 5% Fetal Calf Serum (FCS; Sigma-Aldrich, St. Louis, USA; F9665), 1% penicillin/strepto-mycin (Biochrom GmbH, Berlin, Germany; A2213) as well as 10 mM HEPES (Sigma-Aldrich, St. Louis, USA; H0887), 5 µg/mL ascorbic acid (Sigma-Aldrich, St. Louis, USA; A4544-25G) and 1 ng/mL hbFGF (Sigma-Aldrich, St. Louis, USA; F0291-25UG). For maintenance hCMEC/D3 were treated with 0.25% trypsin/EDTA (Biochrom GmbH, Berlin, Germany; L2143) for 3–5 min at 37 °C and subcultivated in a ratio of 1:3 once a week. Human pri-mary astrocytes (hA; Provita AG, Germany; SC-1800-5) and human primary pericytes (hP; Provita AG, Germany; SC-1200) were cultured on 10 µg/mL Poly-l-Lysine (Sci-enCell, Carlsbad, USA; 413) coated culture flasks in either astrocyte medium AM (ScienCell, Carlsbad, USA; 1801) supplemented with 2% FCS (ScienCell, Carlsbad, USA; sc-0010), 1% of penicillin/streptomycin (ScienCell, Carls-bad, USA, sc-0503) and 1% astrocyte growth supplement
(ScienCell, Carlsbad, USA; sc-1852) or pericyte medium PM (ScienCell, Carlsbad, USA; sc-1201) supplemented with 2% FCS (ScienCell, Carlsbad, USA; 0010), 1% of pen-icillin/streptomycin (ScienCell, Carlsbad, USA; sc-0503) and 1% pericyte growth supplement (ScienCell, Carlsbad, USA; sc-1252) respectively. For subcultivation hA and hP were treated with Accutase (Sigma-Aldrich, St. Louis, USA; A6964-100ML) for 2–3 min at 37 °C and seeded in a cell density of 6700 cells/cm2 [1]. The rat glioma cell line C6 was obtained from ATCC and kept in culture on 0.5% gelatin-coated culture flasks in high-glucose DMEM (Sigma-Aldrich, St. Louis, USA; D5796) supplemented with 10% FCS (Sigma-Aldrich, St. Louis, USA; F9665) and 1% penicillin/streptomycin (Biochrom GmbH, Ber-lin, Germany; A2213). For subcultivation C6 were treated with 0.25% trypsin/EDTA (Biochrom GmbH, Berlin, Germany; L2143) for 1–3 min at 37 °C until detachment and re-seeded in a ratio of 1:20. All cell types were kept in an incubator (Thermo Fisher Scientific HERACell Vios 160i CO2 Incubator) at 37 °C in 5% CO2/95% air atmos-phere and 95% humidity.
Oxygen/glucose deprivation treatmentFor Figs. 1 and 3 hCMEC/D3 cells were seeded onto 0.5% gelatin-coated 6-well plates (Falcon, BD Biosciences, Franklin Lakes, USA; 353 502) at a density of 40,000 cells/cm2. Medium change was performed every other day. On day 5, the serum concentration of EBM-2 was optionally reduced from 5% to 0.25% FCS or 0.25% FCS with 100 nM hydrocortisone for 24 h. On day 6, oxygen/glucose depri-vation (OGD) was performed. Hypoxic conditions were established by changing the medium to DMEM with-out glucose and without serum (Gibco®, Thermo Fisher Scientific, Waltham, USA; 11966-025) and by reducing the O2 level to 1% by placing the plate into a biospheryx chamber (37 °C, 5% CO2; Biospheryx, USA) for 5 h. As normoxia controls, the cells were kept in EBM-2 with 5 or 0.25% FCS or were cultivated in DMEM with glu-cose (Gibco®, Thermo Fisher Scientific, Waltham, USA; 31966-021) but without serum for 5 h in an incubator (37 °C, 5% CO2). The experimental treatment scheme is presented in Fig. 2. After 5 h, cell lysis was conducted with RA-1 buffer containing 1% β-Mercaptoethanol (Sigma-Aldrich, St. Louis, USA, 913148-250ML) accord-ing to manual instructions of the NucleoSpin® RNA kit (Macherey–Nagel, Düren, Germany; 740955.250). RNA samples were stored at − 80 °C until RNA isolation.
For Figs. 4, 5, 6, 7 Transwell experiments were con-ducted based on recent publications [31, 34]. Briefly, hCMEC/D3 were seeded in a density of 80,000 cells/cm2 onto four 24-well inserts per condition and experi-ment (Costar Corning, Corning, USA; 3470, pore size: 0.4 µm, polyester membrane) coated with a mixture of

Page 4 of 17Gerhartl et al. Fluids Barriers CNS (2020) 17:19
collagen IV (0.1 mg/mL; Sigma-Aldrich, St. Louis, USA; C5533) and fibronectin (1 mg/mL; Sigma-Aldrich, St. Louis, USA; F1141-5MG) in sterile Millipore water or PBS (Thermo Fisher Scientific, Waltham, USA; 14190094). For co-cultures, human primary astrocytes (hA) and human primary pericytes (hP) respectively the rat glioma cell line C6 were cultivated in 24-well plates either coated with Poly-l-Lysine (P-l-L; Scien-Cell, Carlsbad, USA; 0413) for hA and hP or 0.5% gela-tin for C6 with a cell density of 25.000 cells/cm2 each for hA and hP and a cell number of 20,000 cells/cm2 for C6. hA and hP were seeded 3 days, C6 were seeded 6 days prior experiment conduction. Medium was changed every other day. On day 6 after seeding the hCMEC/D3, the hCMEC/D3 were put into co-culture
with hA and hP or C6 and were exposed to OGD for barrier breakdown induction. Hence, the mono- and co-cultures were treated with DMEM without glucose and without serum and were placed in the biosheryx chamber (37 °C, 5% CO2) with controlled O2 level of 0.1% (hAP) respectively 1% (C6) for 5 h. As control in normoxic condition, mono- and co-cultures were cul-tivated in DMEM with glucose but without serum for 5 h in an incubator with atmospheric O2 levels (37 °C, 5% CO2). After 5 h treatment, barrier breakdown was assessed by TEER (transendothelial electrical resist-ance) measurements with a chopstick electrode (Mili-pore, Burlington, USA) after a 30 min RT equilibration period and by permeability studies with the paracellu-lar marker fluorescein isothiocyanate-dextran (10 µM; FD4; 4 kDa; Sigma-Aldrich, St. Louis, USA; FD4-250MG, 1 mM stock solution of FD4 ultra-filtered with Amicon tubes with a cut-off 3 kDa to separate from residual, free FITC). The actual TEER values [Ω cm2] were determined by substracting the mean value of the blank values multiplied by the growth surface area of 0.336 cm2. Data were normalized to normoxia controls and expressed in [%]. The FD4 permeability coefficient was calculated as previously published according the clearance principle substracting the permeability of the blank inserts without cells to obtain the permeability coefficient of the cell layers only [34]. Additionally, cells were lysed after the experiments in RA-1 buffer and samples of the same treatment were pooled (i.e. all four inserts per treatment) for subsequent mRNA analysis.
Real‑time quantitative PCR (qPCR)Samples for qPCR analysis were generated by har-vesting hCMEC/D3 cultivated on either 6-well plates or on 24-well inserts in mono- or co-culture after experiment conduction and physical barrier integ-rity assessment. RNA isolation was performed with the NucleoSpin RNA Kit according to manufacturer’s instructions (Machery-Nagel, Düren, Germany; Ref.: 740.955.250). For cDNA synthesis either 250 ng or 1 µg RNA was reversely transcribed into 20 µL total volume using the High Capacity cDNA Reverse Tran-scription Kit (Applied Biosystems/Thermo Fisher Scientific; Ref.: 4368814). For Figs. 4 and 6 qPCR was conducted with the PowerUp SybrGreen Mas-terMix (Applied Biosystems/Thermo Fisher Scien-tific; Ref.: A2 5742) and a primer dilution of 1:33. The LightCycler®480 (Roche Applied Science, Basel, Swit-zerland) was programmed as following: Holding Stage 95 °C for 20 s, 40 cycles at 95 °C for 3 s and 60 °C for 30 s; Melting Stage 95 °C for 15 s and 60 °C for 1 min followed by 95 °C for 15 s. For Figs. 1 and 3 the analy-sis was accomplished by high-throughput qPCR using
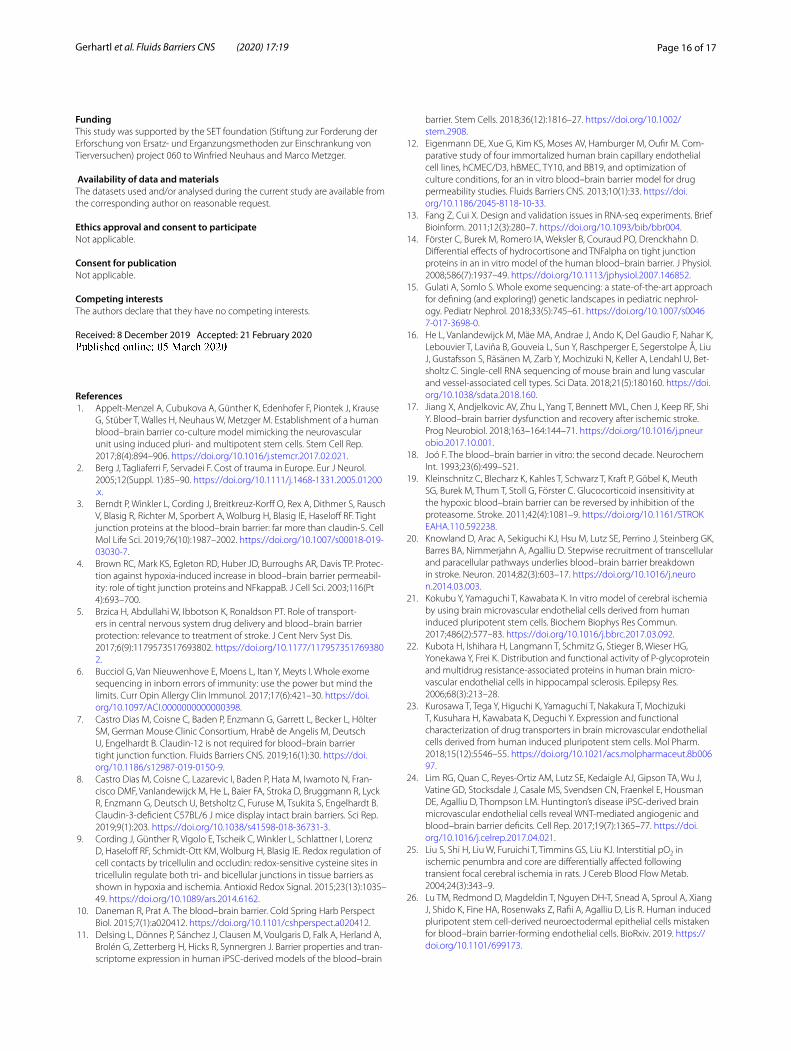
Fig. 1 Expression levels of tight junction proteins, ABC‑transporters, VE‑cadherin (CDH5), SLC2A1 (GLUT‑1) and VEGFa in hCMEC/D3 cells cultivated in EBM‑2 medium with 5% FCS for 5 days and incubated in EBM‑2 medium with a reduced serum amount of 0.25% for additional 24 h from day 5 to day 6. After normalization to endogenous control b‑actin and correction by individual primer efficacies, claudin‑1 expression was set to 1000. Data are presented as mean ± SEM, n = 4 from four independent experiments
Page 5 of 17Gerhartl et al. Fluids Barriers CNS (2020) 17:19
96 samples × 96 targets chips (Fluidigm®) as published recently [38]. The targets investigated included: PPIA, β-actin, GAPDH, B2M, claudin-1 to claudin-25, JAM-1 to JAM-3, ZO-1 to ZO-3, SCL2A1 (GLUT-1), VEGFa, VE-cadherin (CDH5), occludin, ABCB1, ABCG2, ABCC1-5 and tricellulin. All primers were validated by controlling the amplicon product sizes on agarose gels, assessing the melting curves after each qPCR run and determination of the primer efficiencies with at least four different cDNA concentrations. 2ΔCt-values were calculated and normalized to the endogenous house-keeping gene PPIA. Differences in mRNA level of the targets of interest are visualized in heat maps gener-ated with the software Qlucore Omics Explorer 3.3.
StatisticsStatistical analysis was performed by Two-Way ANOVA with all pairwise multiple comparison Holm-Sidak in case of non-normality distribution or non-equal vari-ances using SigmaPlot 14. Hierarchical cluster analysis was performed with the Qlucore Omics Explorer 3.3.
ResultsHuman brain endothelial hCMEC/D3 cells express several tight junction and multidrug‑resistant ABC transporter proteinsFirst the relative expression of claudins and ABC trans-porters in hCMEC/D3 cells was investigated under standard cultivation in EBM-2 medium with 5% FCS for 5 days followed by a serum reduction step in EBM-2
medium with 0.25% FCS for additional 24 h from day 5 to day 6. Interestingly, hCMEC/D3 expressed almost all claudins, only claudin-2 and -19 were not detected at the mRNA level (claudin-13 and -21 do not exist in human). Data were normalized to claudin-1 expression which was set to the value 1000 (Fig. 1, images of the agarose gels of the PCR products were summarized in Additional file 1). Compared to claudin-1 expression (1000), only clau-din-11 (3189), ZO-2 (1065), JAM-1 (1347) and SLC2A1 (1065) showed a higher abundance. The ranking order for the claudins is listed in Table 2. In case of the ABC trans-porters the highest abundant was ABCC1 (478) followed by ABCC4 (299), ABCB1 (106), ABCC3 (93), ABCC5 (92), ABCG2 (29) and ABCC2 (9). Quite high and mod-erate expression was found for JAM3 (320), ZO-1 (315), CDH5 (294) and Occludin (145), whereas low expression was found for Tricellulin (27) and JAM-2 (0.23).
Medium exchange, serum reduction, hydrocortisone and oxygen/glucose deprivation alter the target expressions in hCMEC/D3 cellsSince serum reduction and addition of hydrocortisone were published to increase paracellular tightness of hCMEC/D3 cells [14], it was decided to investigate the influence of these treatments—in our case serum reduc-tion from 5 to 0.25% FCS and the addition of 100 nM hydrocortisone—on the expression of the selected bar-rier targets. After these treatments from day 5 to day 6, cells were either changed to the same previous treat-ment media or to DMEM (+ glucose) or subjected to
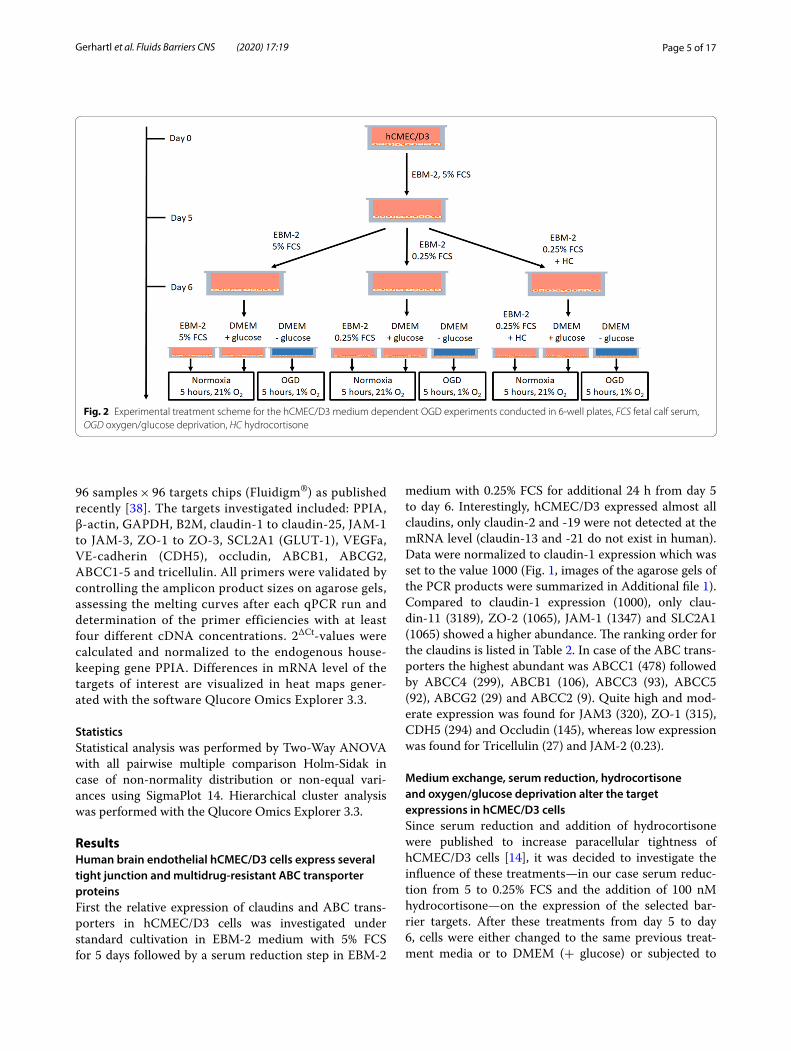
Fig. 2 Experimental treatment scheme for the hCMEC/D3 medium dependent OGD experiments conducted in 6‑well plates, FCS fetal calf serum, OGD oxygen/glucose deprivation, HC hydrocortisone

Page 6 of 17Gerhartl et al. Fluids Barriers CNS (2020) 17:19
OGD (at 1% O2) in DMEM without glucose for 5 h (see scheme on Fig. 2). The data were normalized to the nor-moxia samples in DMEM (+ glucose, see Table 1). Com-parison of these data revealed that the serum reduction under normoxia conditions led to a significant upregula-tion of JAM-1 from 0.91 ± 0.07 to 1.27 ± 0.11 and down-regulation of ABCC2 from 1.22 ± 0.12 to 0.94 ± 0.02, SLC2A1 from 1.41 ± 0.16 to 0.85 ± 0.07 and VEGFa from 2.93 ± 0.50 to 1.26 ± 0.14 compared to EBM-2 with 5% FCS, whereas the addition of hydrocortisone at 0.25% FCS significantly decreased claudin-11 expression from 0.81 ± 0.05 to 0.58 ± 0.06 and increased ABCC3 from 0.91 ± 0.06 to 2.19 ± 0.16 and ABCC4 from 0.68 ± 0.02 to 1.33 ± 0.3 in comparison to 0.25% FCS normoxia. Several changes were induced by only changing the
medium from EBM-2 with 0.25% FCS to DMEM (+ glu-cose) under normoxia conditions for 5 h. For example, claudin-1 (0.62 ± 0.07), claudin-11 (0.81 ± 0.05), ZO-1 (0.65 ± 0.06), occludin (0.78 ± 0.06), CDH5 (0.83 ± 0.03), ABCB1 (0.79 ± 0.06), ABCC4 (0.68 ± 0.02) and SLC2A1 (0.85 ± 0.07) were upregulated to 1.00 (normalized values of samples in DMEM plus glucose medium), whereas claudin-12 tv1 (1.48 ± 0.18), claudin-12 tv2 (1.72 ± 0.19) and JAM-1 (1.27 ± 0.11) were downregu-lated because of the growth medium change from EBM-2 (0.25% FCS) to DMEM (plus glucose). In addition, OGD increased expression of claudin-1 (1.52 ± 0.10), claudin-5 (1.35 ± 0.14), claudin-12 tv2 (1.89 ± 0.19), claudin-12 tv3 (1.63 ± 0.14), ZO-2 (1.39 ± 0.14), ZO-3
Fig. 3 Hierarchical clustering of mRNA expression x‑fold data normalized to the mean value (from n = 8 from four independent experiments) with of each single target from hCMEC/D3 cells cultivated for 5 days in EBM‑2 medium with 5% FCS, subjected to 24 h serum reduction from 5 to 0.25% FCS and were cultivated on day 6 for 5 h under normoxic conditions in DMEM medium with glucose. Norm_Ctrl = 5 h in normoxia in EBM‑2 medium on day 6, Norm_Gluc = 5 h in normoxia in DMEM medium containing glucose, OGD = 5 h in DMEM glucose‑free medium in the hypoxia chamber at 1% O2, 5% 6d = cells remained in medium supplemented with 5% FCS from day 5 to day 6, 0.25% 6d = cells underwent serum reduction from 5 to 0.25% FCS in the according medium, HC = addition of 100 nM hydrocortisone from day 5 to day 6. The colour code legend is formatted in log‑scale
Page 7 of 17Gerhartl et al. Fluids Barriers CNS (2020) 17:19
(1.71 ± 0.30), CDH5 (1.23 ± 0.09), ABCC1 (1.27 ± 0.09), ABCC5 (1.45 ± 0.15), SLC2A1 (3.62 ± 0.43) and VEGFa (5.63 ± 0.49) or decreased claudin-18 tva (0.31 ± 0.08), claudin-20 (0.38 ± 0.12), JAM-1 (0,80 ± 0.07), ABCC3 (0.72 ± 0.04) and ABCC4 (0.59 ± 0.06) when comparing cells cultured in EBM-2 with 0.25% FCS and changed into DMEM (+ glucose) for the normoxia and DMEM (with-out glucose) for the OGD treatment (further details in Table 1).
In order to elucidate whether specific treatments and targets were regulated in clusters together, a hierarchi-cal cluster analysis of the data from the nine treatments was performed (Fig. 3). With regard to the treatments it was found that samples in the same cultivation media under normoxic conditions (EBM-2 media normoxia,
5 and 0.25% FCS = Norm_Ctrl 5% 6d, Norm_Ctrl 0.25% 6d; DMEM (+ glucose) normoxia precultured in EBM-2 = Norm_Gluc_5% 6d, Norm_Gluc_0.25% 6d) clustered together. Also the samples treated with hydro-cortisone clustered, suggesting that the serum reduction per se was a weaker regulator than the medium exchange. With regard to the targets several clusters were identified proposing a similar regulation behavior for claudin-20 with claudin-18 tv 1b, JAM-1 with JAM-2 and ABCC4, ABCC2 with claudin-7, claudin-12 tv1 and claudin-16, ABCC1 with ABCC5 and tricellulin, ABCB1 with clau-din-15, occludin and ZO-1, Jam-3 with claudin-12 tv3 and ABCG2, ZO-2 with CDH5 and claudin-22, ABCC3 with claudin-3, claudin-4 and claudin-24, claudin-1 with claudin-11 and claudin-14, claudin-5 with claudin-6, claudin-12 tv2, claudin-18 tv2a and ZO-3, VEGFa with SLC2A1 and claudin-8 with claudin-9, claudin-10 tv a, claudin-10 tv b, claudin-17 and claudin-25.
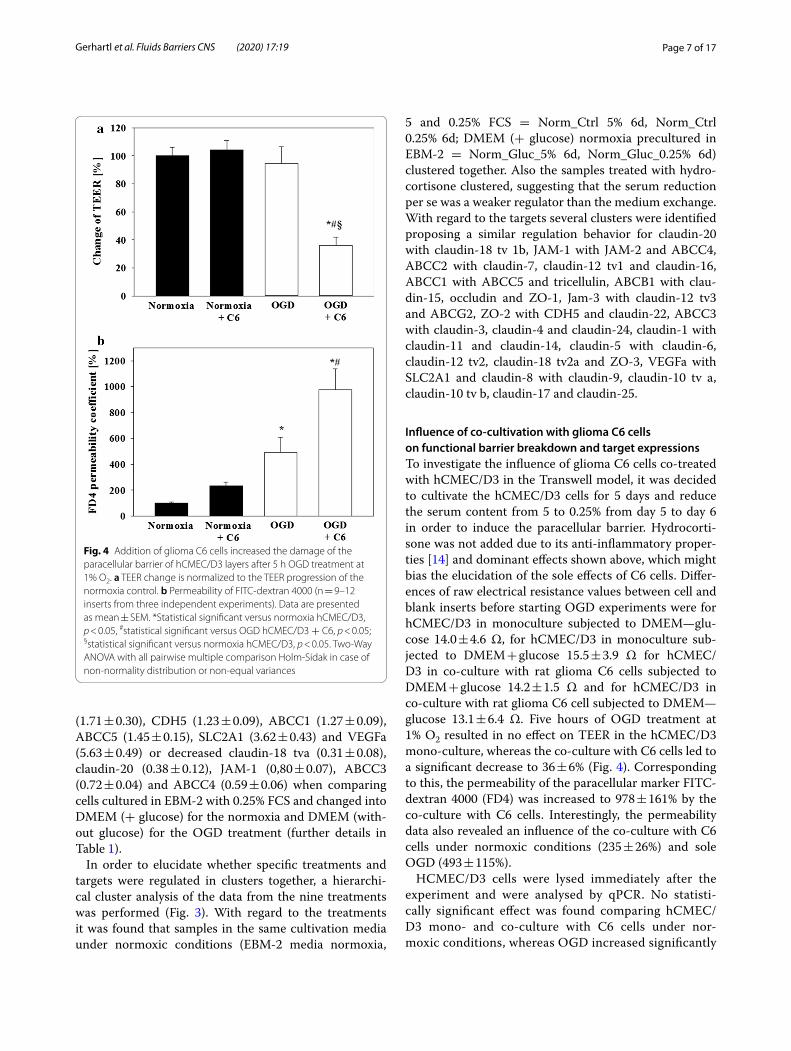
Influence of co‑cultivation with glioma C6 cells on functional barrier breakdown and target expressionsTo investigate the influence of glioma C6 cells co-treated with hCMEC/D3 in the Transwell model, it was decided to cultivate the hCMEC/D3 cells for 5 days and reduce the serum content from 5 to 0.25% from day 5 to day 6 in order to induce the paracellular barrier. Hydrocorti-sone was not added due to its anti-inflammatory proper-ties [14] and dominant effects shown above, which might bias the elucidation of the sole effects of C6 cells. Differ-ences of raw electrical resistance values between cell and blank inserts before starting OGD experiments were for hCMEC/D3 in monoculture subjected to DMEM—glu-cose 14.0 ± 4.6 Ω, for hCMEC/D3 in monoculture sub-jected to DMEM + glucose 15.5 ± 3.9 Ω for hCMEC/D3 in co-culture with rat glioma C6 cells subjected to DMEM + glucose 14.2 ± 1.5 Ω and for hCMEC/D3 in co-culture with rat glioma C6 cell subjected to DMEM—glucose 13.1 ± 6.4 Ω. Five hours of OGD treatment at 1% O2 resulted in no effect on TEER in the hCMEC/D3 mono-culture, whereas the co-culture with C6 cells led to a significant decrease to 36 ± 6% (Fig. 4). Corresponding to this, the permeability of the paracellular marker FITC-dextran 4000 (FD4) was increased to 978 ± 161% by the co-culture with C6 cells. Interestingly, the permeability data also revealed an influence of the co-culture with C6 cells under normoxic conditions (235 ± 26%) and sole OGD (493 ± 115%).
HCMEC/D3 cells were lysed immediately after the experiment and were analysed by qPCR. No statisti-cally significant effect was found comparing hCMEC/D3 mono- and co-culture with C6 cells under nor-moxic conditions, whereas OGD increased significantly
Fig. 4 Addition of glioma C6 cells increased the damage of the paracellular barrier of hCMEC/D3 layers after 5 h OGD treatment at 1% O2. a TEER change is normalized to the TEER progression of the normoxia control. b Permeability of FITC‑dextran 4000 (n = 9–12 inserts from three independent experiments). Data are presented as mean ± SEM. *Statistical significant versus normoxia hCMEC/D3, p < 0.05, #statistical significant versus OGD hCMEC/D3 + C6, p < 0.05; §statistical significant versus normoxia hCMEC/D3, p < 0.05. Two‑Way ANOVA with all pairwise multiple comparison Holm‑Sidak in case of non‑normality distribution or non‑equal variances

Page 8 of 17Gerhartl et al. Fluids Barriers CNS (2020) 17:19
the expression of claudin-1 (3.06 ± 0.21), claudin-5 (1.70 ± 0.10), claudin-12 tv2 (1.77 ± 0.12), claudin-12 tv3 (1.66 ± 0.15), claudin-15 (3.27 ± 0.42), clau-din-16 (1.45 ± 0.11), claudin-24 (1.60 ± 0.35), ZO-1 (1.74 ± 0.16), ZO-2 (2.29 ± 0.18), occludin (2.15 ± 0.22), CDH5 (1.43 ± 0.13) in comparison to mono-culture normoxic samples (1.00 ± 0.00), but decreased the expression of claudin-3 (0.29 ± 0.09) and claudin-7 (0.78 ± 0.06) (Additional file 2). With regard to the other
targets ABCB1 (1.82 ± 0.31), ABCC1 (1.45 ± 0.11), ABCC5 (1.79 ± 0.04) and VEGFa (2.38 ± 0.49) were significantly upregulated after OGD in comparison to the mono-culture normoxic samples (1.00 ± 0.00), whereas ABCC4 (0.67 ± 0.03) was significantly down-regulated. Similar effects were found when comparing co-culture OGD with co-culture normoxia samples, except that in this case also claudin-11 (0.58 ± 0.07) and JAM-1 (0.83 ± 0.05) were downregulated after
Fig. 5 Hierarchical clustering of mRNA expression x‑fold data normalized to the mean value (n = 3 from three independent experiments, pooling of four replicates in each single experiment was performed) of each single target from hCMEC/D3 cells incubated under normoxia or OGD conditions (1% O2) as mono‑ or co‑culture with glioma C6 cells for 5 h. The colour code legend is formatted in log‑scale

Page 9 of 17Gerhartl et al. Fluids Barriers CNS (2020) 17:19
OGD. Interestingly, the co-cultivation with C6 cells led to a less pronounced upregulation of hypoxia marker VEGFa in comparison to the mono-culture OGD. Fur-ther detailed data and the statistical analysis between the OGD treatments in mono- versus co-culture could be found in Additional file 2. Figure 5 depicted the hier-archical cluster analysis of the according qPCR results. With regard to the treatment, a clear distinction was found between normoxia and OGD samples. Cluster analysis revealed following target clusters: Jam-2 with claudin-16, ABCC1 with claudin-22 and claudin-24, CDH5 with claudin-6 and Jam-3, ABCG2 with clau-din-12 tv1 and tricellulin, ABCC5 with claudin-14,
ABCB1 and ZO-1, claudin-12 tv2 with claudin-12 tv3 and occludin, claudin-7 with claudin-11, claudin-20, Jam-1, ABCC3 and ABCC4, claudin-4 with claudin-18 tv 1b and claudin-23, claudin-5 with claudin-9, clau-din-1 with claudin-15 and ZO-2, VEGFa with SLC2A1, claudin-8 with claudin-10 tv a, claudin-10 tv b, clau-din-17, claudin-18 tv 2a and claudin-25.
Influence of co‑cultivation with primary human astrocytes and pericytes on functional barrier breakdown and target expressionsPreliminary experiments with co-culture of hA and hP revealed that reduction to 1% O2 was not sufficient to achieve the aimed barrier damage between 35 and 60%. Therefore, following experiments were carried out at 0.1% O2. Differences of raw electrical resistance values between cell and blank inserts before starting OGD experiments were for hCMEC/D3 in monocul-ture subjected to DMEM—glucose 19.4 ± 2.9 Ω, for hCMEC/D3 in monoculture subjected to DMEM + glu-cose 12.4 ± 2.5 Ω, for hCMEC/D3 in co-culture with hA/hP subjected to DMEM + glucose 11.5 ± 2.5 Ω and for hCMEC/D3 in co-culture with hA/hP subjected to DMEM—glucose 18.1 ± 2.3 Ω. Data showed that OGD alone already decreased TEER to 56 ± 3% and the co-cultivation even further reduced TEER to 39 ± 2%. Corresponding to the TEER data, FITC-dextran 4000 permeability increased mostly to 205 ± 35% after the co-culture with astrocytes and pericytes, but OGD had no significant effect (124 ± 15%) in comparison to the normoxic mono-culture control (Fig. 6). qPCR analysis of the collected hCMEC/D3 samples after the experi-ments showed that the presence of astrocytes/pericytes decreased the expression of claudin-22 (0.74 ± 0.11) and claudin-24 (0.69 ± 0.18) under normoxic condi-tions (Additional file 3). OGD treatment led to sig-nificantly increased claudin-12 tv 1 (1.59 ± 0.25) and occludin (1.71 ± 0.12), but to a decrease of mRNA levels of claudin 18 tv1b (0.50 ± 0.18), claudin-22 (0.79 ± 0.08) and JAM-1 (0.76 ± 0.02) compared to normoxia sam-ples. Co-cultivation with astrocytes/pericytes revealed an upregulation of claudin-15 (1.37 ± 0.26) after OGD in comparison to co-cultured hCMEC/D3 cells under normoxic conditions (0.76 ± 0.05). In case of other targets OGD treatment of mono-cultured hCMEC/D3 significantly decreased ABCC3 (0.64 ± 0.13) and ABCC4 (0.63 ± 0.02) mRNA expression and increased SLC2A1 (3.40 ± 1.10) when compared to mono-cul-ture normoxia samples (1.00 ± 0.00). Further detailed data analysis is listed in Additional file 3. With regard to the hierarchical cluster analysis again the normoxia samples as well as the OGD samples grouped together.
Fig. 6 Addition of a 1:1 mixture of human primary astrocytes and pericytes increased the damage of the paracellular barrier of hCMEC/D3 layers after 5 h OGD treatment at 0.1% O2. a TEER change is normalized to the TEER progression of the normoxia control. b Permeability of FITC‑dextran 4000 (n = 12 inserts from three independent experiments). Data are presented as mean ± SEM. *Statistical significant versus normoxia hCMEC/D3, p < 0.05, #Statistical significant versus OGD hCMEC/D3, p < 0.05; §statistical significant versus normoxia hCMEC/D3 + hA/hP, p < 0.05. Two‑Way ANOVA with all pairwise multiple comparison Holm‑Sidak in case of non‑normality distribution or non‑equal variances
Page 10 of 17Gerhartl et al. Fluids Barriers CNS (2020) 17:19
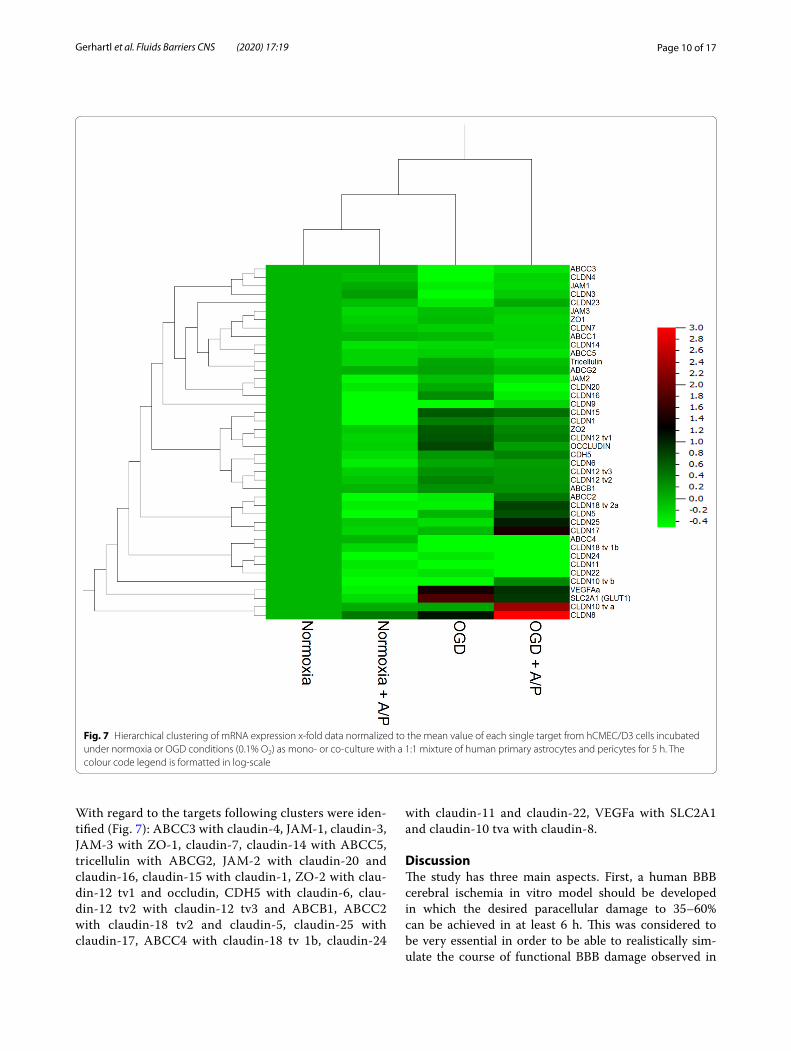
With regard to the targets following clusters were iden-tified (Fig. 7): ABCC3 with claudin-4, JAM-1, claudin-3, JAM-3 with ZO-1, claudin-7, claudin-14 with ABCC5, tricellulin with ABCG2, JAM-2 with claudin-20 and claudin-16, claudin-15 with claudin-1, ZO-2 with clau-din-12 tv1 and occludin, CDH5 with claudin-6, clau-din-12 tv2 with claudin-12 tv3 and ABCB1, ABCC2 with claudin-18 tv2 and claudin-5, claudin-25 with claudin-17, ABCC4 with claudin-18 tv 1b, claudin-24
with claudin-11 and claudin-22, VEGFa with SLC2A1 and claudin-10 tva with claudin-8.
DiscussionThe study has three main aspects. First, a human BBB cerebral ischemia in vitro model should be developed in which the desired paracellular damage to 35–60% can be achieved in at least 6 h. This was considered to be very essential in order to be able to realistically sim-ulate the course of functional BBB damage observed in
Fig. 7 Hierarchical clustering of mRNA expression x‑fold data normalized to the mean value of each single target from hCMEC/D3 cells incubated under normoxia or OGD conditions (0.1% O2) as mono‑ or co‑culture with a 1:1 mixture of human primary astrocytes and pericytes for 5 h. The colour code legend is formatted in log‑scale

Page 11 of 17Gerhartl et al. Fluids Barriers CNS (2020) 17:19
Table 1 Regulation of 38 barrier targets on the mRNA level in hCMEC/D3 samples, which were treated either with 5% FCS, 0.25% FCS or 0.25% FCS plus 100 nM hydrocortisone (HC) in EBM-2 medium prior OGD treatment
Day 5 on 6 5% EBM‑2 0.25% EBM‑2 0.25% EBM‑2 + HC
5% EBM‑2 0.25% EBM‑2 0.25% EBM‑2 + HC
5% EBM‑2 0.25% EBM‑2 0.25% EBM‑2 + HC
5 h treatment
5% EBM‑2 0.25% EBM‑2 0.25% EBM‑2 + HC
DMEM + Glu DMEM + Glu DMEM + Glu DMEM–Glu DMEM–Glu DMEM–Glu
Normoxia/OGD
N N N N N N OGD OGD OGD
Claudin‑1 0.63 ± 0.10* 0.62 ± 0.07* 0.46 ± 0.07* 0.94 ± 0.10 1.00 ± 0.00 0.92 ± 0.15 0.83 ± 0.07*§ 1.52 ± 0.10* 0.77 ± 0.06*§
Claudin‑3 1.25 ± 0.24 1.89 ± 0.88 1.83 ± 0.53 0.80 ± 0.14 1.00 ± 0.00 1.38 ± 0.32 0.58 ± 0.28 0.44 ± 0.11* 1.86 ± 0.93
Claudin‑4 1.28 ± 0.24 1.49 ± 0.31 1.97 ± 0.42* 0.85 ± 0.08 1.00 ± 0.00 1.19 ± 0.17 0.66 ± 0.22 0.59 ± 0.07* 1.92 ± 0.89
Claudin‑5 1.17 ± 0.26 1.51 ± 0.47 3.00 ± 0.72* 1.03 ± 0.11 1.00 ± 0.00 1.42 ± 0.30 1.31 ± 0.32 1.35 ± 0.14* 3.98 ± 1.40
Claudin‑6 1.48 ± 0.49 1.93 ± 0.86 2.54 ± 0.98 0.97 ± 0.19 1.00 ± 0.00 1.43 ± 0.40 1.39 ± 0.70 1.07 ± 0.18 5.66 ± 3.09
Claudin‑7 1.41 ± 0.22 1.14 ± 0.08 1.21 ± 0.08* 1.28 ± 0.15 1.00 ± 0.00 0.97 ± 0.11 0.96 ± 0.09 0.88 ± 0.10 1.08 ± 0.22
Claudin‑8 7.28 ± 4.89 7.41 ± 4.06 18.02 ± 12.19 2.09 ± 1.76 1.00 ± 0.00 3.13 ± 1.81 10.05 ± 8.27 2.40 ± 0.95 53.64 ± 35.49
Claudin‑9 3.25 ± 1.48 3.93 ± 2.04 12.19 ± 8.17 1.20 ± 0.60 1.00 ± 0.00 1.82 ± 0.63 5.44 ± 4.16 0.80 ± 0.16 20.00 ± 13.21
Claudin‑10 tva
3.91 ± 2.46 4.77 ± 2.16 9.09 ± 5.88 1.31 ± 1.02 1.00 ± 0.00 1.96 ± 1.11 5.58 ± 4.60 1.96 ± 0.74 29.76 ± 19.82
Claudin‑10 tvb
14.02 ± 8.92 8.74 ± 5.73 26.92 ± 18.18 4.12 ± 3.57 1.00 ± 0.00 4.53 ± 2.51 11.80 ± 10.29 2.21 ± 0.79 61.32 ± 40.30
Claudin‑11 1.02 ± 0.13 0.81 ± 0.05* 0.58 ± 0.06#* 1.28 ± 0.18 1.00 ± 0.00 0.78 ± 0.05* 0.66 ± 0.05* 0.82 ± 0.09 0.54 ± 0.06*§
Claudin‑12 tv1
1.43 ± 0.12* 1.48 ± 0.18* 1.78 ± 0.14* 0.98 ± 0.08 1.00 ± 0.00 1.00 ± 0.10 0.83 ± 0.05* 1.00 ± 0.12 1.06 ± 0.09
Claudin‑12 tv2
1.73 ± 0.21* 1.72 ± 0.19* 1.96 ± 0.08* 1.17 ± 0.13 1.00 ± 0.00 1.07 ± 0.13 1.27 ± 0.09*§ 1.87 ± 0.19* 1.98 ± 0.28*
Claudin‑12 tv3
1.17 ± 0.16 1.26 ± 0.13 1.31 ± 0.04* 1.14 ± 0.12 1.00 ± 0.00 0.95 ± 0.10 0.99 ± 0.08§ 1.63 ± 0.14* 1.49 ± 0.24
Claudin‑14 1.22 ± 0.14 0.77 ± 0.14 0.84 ± 0.13 1.01 ± 0.07 1.00 ± 0.00 1.16 ± 0.29 0.75 ± 0.08* 0.99 ± 0.16 0.52 ± 0.07*§
Claudin‑15 1.01 ± 0.13 0.90 ± 0.12 1.77 ± 0.47 1.17 ± 0.07* 1.00 ± 0.00 1.41 ± 0.34 0.81 ± 0.12§ 1.22 ± 0.14 1.88 ± 0.22*§
Claudin‑16 1.81 ± 0.28* 1.62 ± 0.32 1.25 ± 0.20 0.99 ± 0.11 1.00 ± 0.00 1.07 ± 0.21 0.70 ± 0.05*§ 1.08 ± 0.11 0.66 ± 0.12*§
Claudin‑17 12.78 ± 8.63 11.44 ± 8.08 35.16 ± 24.62 4.33 ± 3.99 1.00 ± 0.00 5.63 ± 3.59 20.47 ± 18.10 2.14 ± 0.57 119.56 ± 83.89
Claudin‑18 tva
1.16 ± 0.26 1.07 ± 0.23 2.97 ± 1.20 1.09 ± 0.13 1.00 ± 0.00 1.97 ± 0.70 0.23 ± 0.07* 0.31 ± 0.08* 0.88 ± 0.39
Claudin‑18 tvb
1.53 ± 0.57 3.03 ± 1.25 4.07 ± 2.79 0.61 ± 0.27 1.00 ± 0.00 0.77 ± 0.25 1.89 ± 1.37 1.07 ± 0.33 8.96 ± 5.38
Claudin‑20 1.24 ± 0.17 1.19 ± 0.27 2.04 ± 0.59 0.66 ± 0.13* 1.00 ± 0.00 1.77 ± 0.49 0.25 ± 0.10* 0.38 ± 0.12* 0.63 ± 0.22
Claudin‑22 0.81 ± 0.11 0.85 ± 0.08 1.18 ± 0.16 0.99 ± 0.10 1.00 ± 0.00 1.14 ± 0.17 0.62 ± 0.12* 0.93 ± 0.14 1.57 ± 0.45
Claudin‑23 0.82 ± 0.08* 0.99 ± 0.07 0.92 ± 0.21 0.80 ± 0.15 1.00 ± 0.00 0.70 ± 0.17 0.64 ± 0.15* 0.95 ± 0.16 1.72 ± 0.76
Claudin‑24 0.87 ± 0.15 0.98 ± 0.28 1.51 ± 0.31 1.05 ± 0.13 1.00 ± 0.00 1.62 ± 0.36 0.57 ± 0.17* 0.81 ± 0.13 2.34 ± 0.98
Claudin‑25 3.47 ± 1.94 8.17 ± 4.46 8.08 ± 5.39 1.04 ± 0.65 1.00 ± 0.00 1.77 ± 0,76 4.02 ± 2.93 3.39 ± 0.14 22.29 ± 14.18
ZO‑1 0.80 ± 0.15 0.65 ± 0.06* 1.16 ± 0.42 1.20 ± 0.20 1.00 ± 0.00 1.78 ± 0.56 0.86 ± 0.11 1.53 ± 0.33 1.62 ± 0.33
ZO‑2 0.81 ± 0.08* 0.93 ± 0.08 1.26 ± 0.17 0.99 ± 0.09 1.00 ± 0.00 1.16 ± 0,19 0.86 ± 0.08§ 1.39 ± 0.14* 1.61 ± 0.21*
ZO‑3 1.21 ± 0.24 2.12 ± 0.70 3.81 ± 0.96* 1.37 ± 0.39 1.00 ± 0.00 3.39 ± 0.72* 0.79 ± 0.21§ 1.71 ± 0.30* 2.80 ± 0.42*
JAM‑1 0.90 ± 0.07# 1.27 ± 0.11* 1.42 ± 0.08* 0.94 ± 0.12 1.00 ± 0.00 1.14 ± 0.18 0.56 ± 0.05*§ 0.80 ± 0.07* 0.87 ± 0.12
JAM‑2 0.69 ± 0.31 1.23 ± 0.24 1.92 ± 0.42* 1.45 ± 0.70 1.00 ± 0.00 0.84 ± 0.23 0.79 ± 0.13 1.30 ± 0.21 0.54 ± 0.13*§
JAM‑3 0.91 ± 0.12 1.43 ± 0.39 1.13 ± 0.11 1.05 ± 0.13 1.00 ± 0.00 0.94 ± 0.07 0.84 ± 0.08 1.13 ± 0.11 1.42 ± 0.22
Occludin 0.89 ± 0.10 0.78 ± 0.06* 1.23 ± 0.29 1.00 ± 0.12 1.00 ± 0.00 1.67 ± 0.54 0.85 ± 0.10§ 1.28 ± 0.15 1.23 ± 0.15
Tricellulin 1.00 ± 0.07 1.21 ± 0.11 2.56 ± 0.98 0.84 ± 0.09 1.00 ± 0.00 1.56 ± 0.40 0.74 ± 0.05*§ 1.05 ± 0.07 1.27 ± 0.14
CDH5 0.81 ± 0.09 0.83 ± 0.03* 1.04 ± 0.26 0.94 ± 0.09 1.00 ± 0.00 1.11 ± 0.27 0.80 ± 0.05*§ 1.23 ± 0.09* 1.05 ± 0.14
ABCB1 (PgP) 0.82 ± 0.11 0.79 ± 0.06* 1.81 ± 0.53 1.30 ± 0.16 1.00 ± 0.00 1.61 ± 0.50 1.01 ± 0.09 1.07 ± 0.13 1.41 ± 0.19
ABCC1 (MRP1)
1.28 ± 0.16 1.00 ± 0,10 2.31 ± 0.96 1.20 ± 0.10 1.00 ± 0.00 1.88 ± 0.71 1.13 ± 0.19 1.27 ± 0.09* 1.48 ± 0.16*
ABCC2 (MRP2)
1.22 ± 0.12# 0.94 ± 0.03* 1.45 ± 0.37 1.25 ± 0.14 1.00 ± 0.00 1.45 ± 0.60 0.99 ± 0.07 1.13 ± 0.12 1.04 ± 0.16
ABCC3 (MRP3)
0.91 ± 0.10 0.91 ± 0.06 2.19 ± 0.16#* 0.85 ± 0.09 1.00 ± 0.00 1.94 ± 0.41* 0.66 ± 0.07* 0.72 ± 0.04* 1.65 ± 0.28*§
ABCC4 (MRP4)
0.65 ± 0.06* 0.68 ± 0.02* 1.33 ± 0.30 1.01 ± 0.09 1.00 ± 0.00 1.32 ± 0.37 0.55 ± 0.05* 0.59 ± 0.06* 0.74 ± 0.12

Page 12 of 17Gerhartl et al. Fluids Barriers CNS (2020) 17:19
Data were normalized on β-actin (n = 8 from four independent experiments). Claudin-2 und—19 were not detected, claudin-13 and -21 are not present in human, tv = transcript variant. Data are presented as mean ± SEM of the x-fold regulation related to hCMEC/D3 cells, which were cultivated from day 5 to 6 in EBM-2 with 0.25% FCS, their medium was changed on day 6 in DMEM plus glucose and treated for 5 h under normoxic conditions. Statistically significant regulations were marked with: *p < 0.05 versus 0.25% EBM-2 (day 5 to 6) and DMEM + Glu (5 h treatment) and N (normoxia); #p < 0.05 versus 0.25% EBM-2 (day 5 to 6) and 0.25% EBM-2 (5 h treatment) and N (normoxia); §p < 0.05 versus 0.25% EBM-2 (day 5 to 6) and DMEM—Glu (5 h treatment) and OGD (oxygen/glucose deprivation
Table 1 (continued)
Day 5 on 6 5% EBM‑2 0.25% EBM‑2 0.25% EBM‑2 + HC
5% EBM‑2 0.25% EBM‑2 0.25% EBM‑2 + HC
5% EBM‑2 0.25% EBM‑2 0.25% EBM‑2 + HC
5 h treatment
5% EBM‑2 0.25% EBM‑2 0.25% EBM‑2 + HC
DMEM + Glu DMEM + Glu DMEM + Glu DMEM–Glu DMEM–Glu DMEM–Glu
Normoxia/OGD
N N N N N N OGD OGD OGD
ABCC5 (MRP5)
1.27 ± 0.21 1.14 ± 0.07 2.54 ± 0.90 1.22 ± 0.13 1.00 ± 0.00 1.52 ± 0.50 1.11 ± 0.11 1.45 ± 0.15* 1.88 ± 0.24*
ABCG2 (BCRP) 1.04 ± 0.10 1.14 ± 0.08 1.48 ± 0.16* 1.01 ± 0.10 1.00 ± 0.00 1.20 ± 0.26 1.04 ± 0.07 1.28 ± 0.15 1.49 ± 0.25
SLC2A1 (Glut1)
1.41 ± 0.16#* 0.85 ± 0.07* 0.85 ± 0.15 1.00 ± 0.10 1.00 ± 0.00 1.19 ± 0.25 2.62 ± 0.36* 3.63 ± 0.42* 4.09 ± 0.51*
VEGFa 2.93 ± 0.50* 1.26 ± 0.14 1.25 ± 0.36 1.06 ± 0.11 1.00 ± 0.00 1.29 ± 0.40 4.46 ± 0.62* 5.63 ± 0.49* 5.83 ± 0.57*
Table 2 Comparison of claudin expression data in brain endothelial cells or capillaries derived from the present work (hCMEC/D3), from Berndt et al. [3] (laser-microdissected human brain capillaries), the Barres1 (isolated brain endothelial cells) and the Betsholtz data base2 (single cell sequences brain capillary endothelial cells—capEC)
nd = not detected; CLDN21 = CLDN22 at human; na = not available; #: not encoded in human; ##: not encoded in mouse; adata listed are for Cldn10 tva and tvb; bdata listed are for Cldn12 tv1, tv2, tv3; cdata listed are for Cldn18 tv1b and tv2a.; 1Zhang et al. [54], accessed on 21st of January 2020: https ://web.stanf ord.edu/group /barre s_lab/brain _rnase q.html; 2Vanlandewijck et al. [46], He et al. [16], accessed on 21st of January 2020: http://betsh oltzl ab.org/Vascu larSi ngleC ells/datab ase.html; 3mean values related to Cldn1, which was set to 1000; 4mean values * 10−4 from the supplementary file of Berndt et al. [3]
Species Current work qPCR3 Rank Berndt et al. [3]qPCR4
Rank Barres data base (FPKM)
Rank Betsholtz data base (counts)
Rank
Human Human Mouse Mouse
Cldn1 1000 2 30 4 0.2 7 nd –
Cldn2 nd – 1.26 15 0.1 11 3 4
Cldn3 5.2 20 6.08 9 0.3 5 0.05 9
Cldn4 18 16 4.43 11 0.1 11 nd –
Cldn5 39 9 205 1 < 3500 1 1500 1
Cldn6 18 15 7.51 7 2 3 0.1 7
Cldn7 219 5 nd – 0.12 9 nd –
Cldn8 18 14 nd – 0.1 11 nd –
Cldn9 25 12 13.4 5 0.15 8 nd –
Cldn10 142, 116 6a nd – nd – nd –
Cldn11 3189 1 162 2 nd – nd –
Cldn12 281, 18, 291 3, 4, 13b 114 3 5 2 20 3
Cldn13 # – # – 0.1 11 nd –
Cldn14 69 7 nd – nd – nd –
Cldn15 17 17 6.13 8 0.4 4 nd –
Cldn16 8 19 nd – 0.1 11 0.02 10
Cldn17 30 10 5.85 10 0.1 11 nd –
Cldn18 27, 3.71 11, 22c nd – 0.1 11 0.1 7
Cldn19 nd – nd – 0.1 11 < 0.1 11
Cldn20 52 8 3.35 13 0.1 11 0.4 5
Cldn21 nd – nd – ## – ## –
Cldn22 9.97 18 3.95 12 0.3 5 0.2 6
Cldn23 0.25 24 1.59 14 0.1 11 nd –
Cldn24 3.65 23 nd – 0.12 9 na –
Cldn25 4.77 21 nd – na – 30 2

Page 13 of 17Gerhartl et al. Fluids Barriers CNS (2020) 17:19
in vivo models and in the clinic [41]. Secondly, by using the standard growth medium for the hCMEC/D3 cells, a medium change to another basal medium for OGD treatment is necessary (from EBM-2 to DMEM), since no glucose-free EBM-2 medium is available by default. In order to better interpret the data from the OGD experi-ments, it is necessary to check to what extent the change to a distinctly different basal medium has a relevant influ-ence on the final results. In addition, the influence of common cultivation variants for hCMEC/D3 prior to the OGD experiment was tested on the expression of barrier relevant targets. Thirdly, there has been a discussion for a long time which tight junction proteins, especially which claudins, occur at the BBB in general, but also species-specifically. The investigation on the protein level is very difficult because there is a lack of specific antibodies for all claudins due to their high sequence homologies. For this reason, we have decided to conduct a comprehensive study on the transcript level in which all human clau-dins 1–25 were analyzed together with other TJ and BBB relevant ABC transporters in the most different condi-tions. Since first publications showed that the compen-sation of claudins can play an important role in the post stroke regeneration process [42] and that data on jointly regulated clusters of these targets are hardly known, it was decided to perform hierarchical cluster analysis. The obtained data can then be applied to propose pos-sibly first coherent regulatory clusters. For these analy-ses we have deliberately opted for qPCR as the analytical method, as this has the widest dynamic range, the lowest quantification limits and the least biased results in com-parison to microarrays or RNA-seq analysis [6, 13, 15]. This is especially important for TJ proteins as they are often regulated within a small range of 0.5 to twofold.
In recent years, in vitro BBB models for cerebral ischemia based on mouse brain endothelial cells have shown that co-culture was essential for a significant bar-rier damage within a few hours. Both rat glioma cell line C6 and primary glial cells were applied in these mouse models using 0–1% O2 [29, 31]. The selected oxygen range of 0–1% is physiologically relevant considering the fact that almost no oxygen is left in the ischemic core (less than 5 mm Hg pO2) after 1 h cerebral ischemia in vivo [25]. Preliminary experiments with hCMEC/D3 showed that incubation with glioma C6 cells for 5 h could be sufficient for the desired barrier collapse. Since the paracellular barrier of hCMEC/D3 cells is generally rather moderate, it is important to note that methodi-cally the use of Corning Costar inserts is advantageous for this type of studies due to the slits that define spatially the measuring point for the chopstick electrodes, and the higher porosity and thus lower inherent electrical resist-ance of the porous membranes. For the Transwell studies
hCMEC/D3 were incubated as mono- and co-cultures for 5 h under normoxia and OGD conditions. Cell viabil-ity of hCMEC/D3 was not detrimentally reduced under these conditions (Additional file 4) which was also con-firmed by others [36, 53]. In this context, it was previ-ously shown that it was necessary to apply 16–24 h OGD at 1% O2 to reduce cell viability and TEER of mono-cultures of hCMEC/D3 to 5–20% or of hiPSC-BCECs (hiPSC = derived from human induced pluripotent stem cells) to 20–50% of the respective normoxia controls [21, 36, 37, 53]. Moreover, hCMEC/D3 mono-cultures treated with OGD at 1% O2 for 6 h resulted in slight, but not sig-nificant changes of TEER and fluorescein permeability compared to the 6 h incubated normoxia control [37]. These data together with ours confirmed that no reason-able BBB breakdown was achievable without co-cultures in the aimed time window of maximum 6 h. Co-cultiva-tion of hCMEC/D3 with rat glioma C6 cells resulted in the aimed barrier breakdown after 5 h of OGD treatment at 1% O2. In the case of co-cultivation with the 1:1 mix-ture of primary, human astrocytes/pericytes, in contrast to 1% O2, clear barrier damage was achieved at 0.1% O2 after 5 h (effects at 1% O2, see Additional file 5). Note-worthy, the integrity of the mono-cultures were also significantly disrupted under these conditions. The differ-ence between the effects of the co-cultures with C6 and the primary human cells could be explained by the differ-ent amounts of secreted growth factors, since the C6 cells secrete e.g. significant more barrier damaging VEGF than primary astrocytes [4, 52].
As first step for the comprehensive barrier target analy-sis the relative expression of these targets was assessed in hCMEC/D3 under standard growth conditions. In the BBB research field the claudins-1, -3, -5, -11 and -12 are mostly investigated as surrogate markers for TJs, whereas recent studies with knock-out mice raised doubts about the presence and role of claudin-3 and -12 at the BBB [7, 8]. In the last 2 to 3 years some reports with expression data of primary human BCECs and hiPSC-BCECs have been published. These confirmed the expression of almost all claudins in human BBB in vitro models [11, 24, 47]. However, these data were mostly obtained from RNA-seq analysis and were not validated by a second method, so there is still a need to validate them with e.g. qPCR. For example, an open-accessible, but yet not peer reviewed report claims that the hiPSC-BCECs do not express claudin-5, although this has already been shown by many other groups [26]. This may be due to the gen-eral problem of lab-to-lab reproducibility of experiments and in particular by the lab-to-lab reproducibility of hiPSC differentiation protocols as well as the lack of vali-dation of these expression data. Nevertheless, these data indicate that the human BBB may contain significantly

Page 14 of 17Gerhartl et al. Fluids Barriers CNS (2020) 17:19
more claudins than have been researched in detail so far. In order to classify the expression data of the hCMEC/D3 cells obtained in this work, Table 2 shows a comparison of these data with data from human isolated brain capil-laries [3] and mouse brain endothelial cells from two RNAseq databases [46, 54]. The most strongly expressed claudins in the mouse brain endothelium found in both databases were claudin-5, claudin-12 and claudin-6. In addition, claudin-2, claudin-3, claudin-16, claudin-18, claudin-20 and claudin-22 were also listed in both data-bases. In case of the human capillary samples the most prominent claudins were claudin-5, claudin-11, clau-din-12 and claudin-1. In comparison to these data, hCMEC/D3 cells expressed most claudin-11, claudin-1, claudin-12 and claudin-10. Interestingly, claudin-11 was not found in the mouse databases, whereas it was very strong in the human capillaries as well as in hCMEC/D3 cells. In this regard, Berndt et al. [3] proved the expres-sion of claudin-11 also in mouse brain capillaries by qPCR indicating how important it is to validate RNAseq data by a second method. The most striking differences to the other samples was that hCMEC/D3 showed a high expression of claudin-10 and relatively low expression of claudin-5. In this context, the role of claudin-10 in hCMEC/D3 would still need to be investigated. Accord-ing to Berndt et al. [3] claudin-10 is a paracellular pore forming claudin. It could be speculated, whether the knock-down of claudin-10 in hCMEC/D3 might increase paracellular tightness of hCMEC/D3 layers. The low amount of claudin-5 in hCMEC/D3 cells and the proba-bly associated moderate paracellular barrier function were already shown by several groups [12] and confirmed by low TEER values in the present study. Recently, it was shown that the overexpression of claudin-5 in hCMEC/D3 cells led to a reduction in the permeation of A549 cancer cells by approximately two-thirds, but did not lead to a noticeable improvement in electrical impedance. This suggested that additional mechanisms were missing to functionally incorporate claudin-5 at the tight junc-tions in the cell membrane [27]. Single cell RNA-seq data of mouse brain derived cells from the Betsholtz group [46] showed that fibroblast-like cells and not brain capil-lary endothelial cells expressed claudin-1. This led to the question whether claudin-1 is present at the BBB and how relevant it is. In contrast to these data, claudin-1 was found in RNA-seq data of mouse brain endothelial cells by Zhang et al. [54]. Moreover, human brain capillaries and hCMEC/D3 cells showed significant expression of claudin-1 (Table 2). In this regard, a recent study showed that claudin-1 replaces claudin-5 at the TJ of brain capil-lary endothelial cells during the regeneration phase after stroke. This replacement was associated with a weaker barrier [42]. Considering these data it could be
speculated whether the strong expression of claudin-1 in the hCMEC/D3 may also be partly responsible for the weaker barrier of hCMEC/D3 cell layers. Finally, it must be mentioned that Berndt et al. [3] reported that the gene Cldnd1 was expressed in human brain capillaries as the strongest claudin, even significantly more than claudin-5. Cldnd1 was also strongly expressed in mouse brain endothelial cells and seems to have sealing properties [3, 54]. It has to be mentioned that the cell line hCMEC/D3 was originally immortalized from brain endothelial cells isolated from resected brain tissue from an epileptic patient [50]. Thus, it cannot be totally excluded that still disease specific properties are present in this cell line. This could be e.g. relevant for ABC transporter profiles, since it is known that the transporter ABCB1 can be upregulated during epilepsy [22]. The comparison of the expression of ABC transporters in hCMEC/D3 under standard conditions with mRNA and proteomics data from isolated capillaries showed that only ABCB1, ABCG2 and ABCC4 were detected at the protein level in human brain capillaries, whereas on the mRNA level ABCB1, ABCC5, ABCG2, ABCC1 and ABCC4 could be found in this expression order (ABCC2 and ABCC3 were not measured on the mRNA level in the brain capillaries [23, 40, 45]). Analysis of hCMEC/D3 samples showed that all tested ABC transporters of this work were also found in previous publications, but partly in different order (mRNA: ABCB1, ABCC3, ABCC1, ABCC4, ABCC5 and very little ABCC2, [48]; protein: ABCB1, ABCG2, ABCC1, ABCC4 (ABCC2, 3 and 5 under detec-tion limit); [35]. This may also have been due to the fact that a different basal growth medium was used in the compared publication or barrier regulating supplements such as hydrocortisone were already present in the medium [48]. For this reason, the effects of switching the medium from EBM-2 to DMEM for the OGD experi-ment were also investigated as a parameter of transcript analysis. In this regard, it is known that EBM-2 basal medium contains significantly less glucose than the used DMEM (1.2 versus 4.5 g glucose/L) and that ABC trans-porters can be regulated by different glucose levels [39]. Moreover, it was shown recently that sole medium exchange in the controls of OGD experiments led to a significant decrease of paracellular tightness of a BBB in vitro model based on primary endothelial cells [44]. In addition, the influence of serum reduction and the addi-tion of hydrocortisone was included in the study as both treatments were used to increase the low claudin-5 con-tent and thus the paracellular barrier of hCMEC/D3 lay-ers [14]. The mRNA expression data were then not only used to learn about the relative regulations dependent on the different conditions, they were also subjected to hier-archical cluster analysis (Figs. 3, 5 and 7) to identify more

Page 15 of 17Gerhartl et al. Fluids Barriers CNS (2020) 17:19
general regulation patterns. In this case, the differences in experimental designs should be not neglected such as the type of growth surface (well plates—Fig. 3; Transwell inserts—Fig. 5 and 7) or the amount of data points (Fig. 3 > than Figs. 5 or 7). However, some general obser-vations could be made. The hypoxia markers VEGFa and SLC2A1 clustered together in every of the three experi-mental series as expected and confirmed the reliability of the applied method. Interestingly, several target pairs clustered together only in both Transwell experimental set-ups, for example, claudin-1 with claudin-15, clau-din-17 with claudin-25, ABCC3 with JAM-1, ABCG2 with tricellulin and CDH5 with claudin-6. On the con-trary, ABCC3 clustered with claudin-3 and claudin-4 in the co-culture Transwell experiment with human pri-mary astrocytes/pericytes (Fig. 7) as well as in the well-plate experiment (Fig. 2) just like claudin-5 with claudin-18 tv2a, whereas ABCB1 clustered together with ZO-1 in the co-culture set-up with glioma C6 cells (Fig. 5) and the well-plate experiment (Fig. 2). Interest-ingly, the clustering of claudin-3 with claudin-4, clau-din-5 with claudin-18 and CDH5 with claudin-6 isconcerning paracellular sealing proteins, whereas the clustering of claudin-17 with claudin-25 represented a claudin pairwhich is known for paracellular pore-forma-tion [3]. In case of the cluster pair ABCG2 and tricellulin it was shown for both targets that they were regulated under hypoxic or OGD conditions [9, 44].
Although claudin-1 and claudin-5 were not found in the same cluster of the first level, these two major seal-ing proteins were located in quite near clusters (Figs. 3 and 5) indicating possible connected regulations. In this regard, Sladojevic et al. (2018) reported that claudin-1 was embedded in the TJ complex after stroke and coun-teracted regeneration processes by inhibiting the renewal of claudin-5 within the TJ structure. In summary, it was shown that hierarchical cluster analysis could be used to suggest novel regulatory relationships of barrier targets, but also highlighted that single experimental manipula-tions can have a significant impact on the outcome. Fur-ther in-depth studies have to be conducted to investigate and validate the found relationships on a molecular level.
ConclusionThe first conclusion of this study is that micro-environ-mental cells significantly strengthen the functional break-down in a human BBB in vitro model of cerebral ischemia and shift the necessary duration of OGD treatments into a more in vivo-relevant time window. Based on the data, it could be recommended to use the co-culture model with the C6 cells for therapeutic screening applications, since the barrier breakdown is stronger in this model. For purely biological basic questions the model with
the primary astrocytes/pericytes should be preferred. If studies on the influence of glioblastoma cells on the BBB during cerebral ischemia were the goal, one should con-sider using human glioblastoma rather than rat glioma C6 cells for the co-culture model. Future studies could deal with the secretome in the two co-culture models to better understand the different effects of C6 cells and the astrocyte/pericyte mixture on the barrier. The second conclusion is that different cultivation methods (serum reduction, hydrocortisone addition) prior to OGD treat-ment have a significant effect on the results and regula-tion of barrier targets. Therefore, it is essential to test the influence of these parameters and consider them in the experimental design. The third conclusion is that hierar-chical cluster analysis can be a very helpful tool to eluci-date regulated gene clusters, to find counter-regulations and to understand relevant parameters for the experi-mental design.
Supplementary informationSupplementary information accompanies this paper at https ://doi.org/10.1186/s1298 7‑020‑00179 ‑3.
Additional file 1. Agarose gel of PCR products for several claudins expressed in hCMEC/D3 cells.
Additional file 2. Regulation of mRNA expression of barrier markers in hCMEC/D3 cells in mono‑ or co‑culture with rat glioma C6 cells after OGD treatment
Additional file 3. Regulation of mRNA expression of barrier markers in hCMEC/D3 cells in mono‑ or co‑culture with astrocytes and pericytes after OGD treatment
Additional file 4. Influence of OGD treatment (0.1% O2, 5 h) on cell viabil‑ity of mono‑cultured hCMED/D3 cells on Transwell inserts
Additional file 5. Influence of five hours OGD (1% O2) on barrier function‑ality of hCMEC/D3 in mono‑culture and in co‑culture with astrocytes and pericytes
AbbreviationsABC: ATP binding cassette; BBB: Blood–brain barrier; BCEC: Brain capillary endothelial cell; Claudin: CLDN; FCS: Fetal calf serum; FD4: FITC dextran 4000; hA: Human astrocyte; hbFGF: Human basic fibroblast growth factor; hiPSC: Human induced pluripotent stem cell; hP: Human pericyte; JAM: Junctional adhesion molecule; OGD: Oxygen/glucose deprivation; PBS: Phosphate buffered saline; P‑l‑L: poly‑l‑lysine; qPCR: Quantitative polymerase chain reac‑tion; RNA‑seq: RNA‑sequencing; TEER: Transendothelial electrical resistance; TJ: Tight junction; tv: Transcript variant; VEGF: Vascular endothelial growth factor; ZO: Zonula occludens.
AcknowledgementsWe are very grateful to Silvia Schönthaler, Manuela Hofner and Walter Pulverer (AIT‑ Austrian Institute of Technology, GmbH, Vienna, Austria) for their exper‑tise and support developing the high‑throughput qPCR‑Chip.
Authors’ contributionsAG designed experiments, analyzed qPCR data and wrote the manuscript, NP conducted cell culture experiments and qPCR analysis, AV developed and accomplished the high‑throughput qPCR, SH analyzed qPCR data and con‑ducted hierarchical cluster analysis, HPF conducted cell culture experiments, WN designed the experiments, analyzed qPCR data, wrote and revised the manuscript. All authors read and approved the final manuscript.
Page 16 of 17Gerhartl et al. Fluids Barriers CNS (2020) 17:19
FundingThis study was supported by the SET foundation (Stiftung zur Forderung der Erforschung von Ersatz‑ und Erganzungsmethoden zur Einschrankung von Tierversuchen) project 060 to Winfried Neuhaus and Marco Metzger.
Availability of data and materialsThe datasets used and/or analysed during the current study are available from the corresponding author on reasonable request.
Ethics approval and consent to participateNot applicable.
Consent for publicationNot applicable.
Competing interestsThe authors declare that they have no competing interests.
Received: 8 December 2019 Accepted: 21 February 2020
References 1. Appelt‑Menzel A, Cubukova A, Günther K, Edenhofer F, Piontek J, Krause
G, Stüber T, Walles H, Neuhaus W, Metzger M. Establishment of a human blood–brain barrier co‑culture model mimicking the neurovascular unit using induced pluri‑ and multipotent stem cells. Stem Cell Rep. 2017;8(4):894–906. https ://doi.org/10.1016/j.stemc r.2017.02.021.
2. Berg J, Tagliaferri F, Servadei F. Cost of trauma in Europe. Eur J Neurol. 2005;12(Suppl. 1):85–90. https ://doi.org/10.1111/j.1468‑1331.2005.01200 .x.
3. Berndt P, Winkler L, Cording J, Breitkreuz‑Korff O, Rex A, Dithmer S, Rausch V, Blasig R, Richter M, Sporbert A, Wolburg H, Blasig IE, Haseloff RF. Tight junction proteins at the blood–brain barrier: far more than claudin‑5. Cell Mol Life Sci. 2019;76(10):1987–2002. https ://doi.org/10.1007/s0001 8‑019‑03030 ‑7.
4. Brown RC, Mark KS, Egleton RD, Huber JD, Burroughs AR, Davis TP. Protec‑tion against hypoxia‑induced increase in blood–brain barrier permeabil‑ity: role of tight junction proteins and NFkappaB. J Cell Sci. 2003;116(Pt 4):693–700.
5. Brzica H, Abdullahi W, Ibbotson K, Ronaldson PT. Role of transport‑ers in central nervous system drug delivery and blood–brain barrier protection: relevance to treatment of stroke. J Cent Nerv Syst Dis. 2017;6(9):1179573517693802. https ://doi.org/10.1177/11795 73517 69380 2.
6. Bucciol G, Van Nieuwenhove E, Moens L, Itan Y, Meyts I. Whole exome sequencing in inborn errors of immunity: use the power but mind the limits. Curr Opin Allergy Clin Immunol. 2017;17(6):421–30. https ://doi.org/10.1097/ACI.00000 00000 00039 8.
7. Castro Dias M, Coisne C, Baden P, Enzmann G, Garrett L, Becker L, Hölter SM, German Mouse Clinic Consortium, Hrabě de Angelis M, Deutsch U, Engelhardt B. Claudin‑12 is not required for blood–brain barrier tight junction function. Fluids Barriers CNS. 2019;16(1):30. https ://doi.org/10.1186/s1298 7‑019‑0150‑9.
8. Castro Dias M, Coisne C, Lazarevic I, Baden P, Hata M, Iwamoto N, Fran‑cisco DMF, Vanlandewijck M, He L, Baier FA, Stroka D, Bruggmann R, Lyck R, Enzmann G, Deutsch U, Betsholtz C, Furuse M, Tsukita S, Engelhardt B. Claudin‑3‑deficient C57BL/6 J mice display intact brain barriers. Sci Rep. 2019;9(1):203. https ://doi.org/10.1038/s4159 8‑018‑36731 ‑3.
9. Cording J, Günther R, Vigolo E, Tscheik C, Winkler L, Schlattner I, Lorenz D, Haseloff RF, Schmidt‑Ott KM, Wolburg H, Blasig IE. Redox regulation of cell contacts by tricellulin and occludin: redox‑sensitive cysteine sites in tricellulin regulate both tri‑ and bicellular junctions in tissue barriers as shown in hypoxia and ischemia. Antioxid Redox Signal. 2015;23(13):1035–49. https ://doi.org/10.1089/ars.2014.6162.
10. Daneman R, Prat A. The blood–brain barrier. Cold Spring Harb Perspect Biol. 2015;7(1):a020412. https ://doi.org/10.1101/cshpe rspec t.a0204 12.
11. Delsing L, Dönnes P, Sánchez J, Clausen M, Voulgaris D, Falk A, Herland A, Brolén G, Zetterberg H, Hicks R, Synnergren J. Barrier properties and tran‑scriptome expression in human iPSC‑derived models of the blood–brain
barrier. Stem Cells. 2018;36(12):1816–27. https ://doi.org/10.1002/stem.2908.
12. Eigenmann DE, Xue G, Kim KS, Moses AV, Hamburger M, Oufir M. Com‑parative study of four immortalized human brain capillary endothelial cell lines, hCMEC/D3, hBMEC, TY10, and BB19, and optimization of culture conditions, for an in vitro blood–brain barrier model for drug permeability studies. Fluids Barriers CNS. 2013;10(1):33. https ://doi.org/10.1186/2045‑8118‑10‑33.
13. Fang Z, Cui X. Design and validation issues in RNA‑seq experiments. Brief Bioinform. 2011;12(3):280–7. https ://doi.org/10.1093/bib/bbr00 4.
14. Förster C, Burek M, Romero IA, Weksler B, Couraud PO, Drenckhahn D. Differential effects of hydrocortisone and TNFalpha on tight junction proteins in an in vitro model of the human blood–brain barrier. J Physiol. 2008;586(7):1937–49. https ://doi.org/10.1113/jphys iol.2007.14685 2.
15. Gulati A, Somlo S. Whole exome sequencing: a state‑of‑the‑art approach for defining (and exploring!) genetic landscapes in pediatric nephrol‑ogy. Pediatr Nephrol. 2018;33(5):745–61. https ://doi.org/10.1007/s0046 7‑017‑3698‑0.
16. He L, Vanlandewijck M, Mäe MA, Andrae J, Ando K, Del Gaudio F, Nahar K, Lebouvier T, Laviña B, Gouveia L, Sun Y, Raschperger E, Segerstolpe Å, Liu J, Gustafsson S, Räsänen M, Zarb Y, Mochizuki N, Keller A, Lendahl U, Bet‑sholtz C. Single‑cell RNA sequencing of mouse brain and lung vascular and vessel‑associated cell types. Sci Data. 2018;21(5):180160. https ://doi.org/10.1038/sdata .2018.160.
17. Jiang X, Andjelkovic AV, Zhu L, Yang T, Bennett MVL, Chen J, Keep RF, Shi Y. Blood–brain barrier dysfunction and recovery after ischemic stroke. Prog Neurobiol. 2018;163–164:144–71. https ://doi.org/10.1016/j.pneur obio.2017.10.001.
18. Joó F. The blood–brain barrier in vitro: the second decade. Neurochem Int. 1993;23(6):499–521.
19. Kleinschnitz C, Blecharz K, Kahles T, Schwarz T, Kraft P, Göbel K, Meuth SG, Burek M, Thum T, Stoll G, Förster C. Glucocorticoid insensitivity at the hypoxic blood–brain barrier can be reversed by inhibition of the proteasome. Stroke. 2011;42(4):1081–9. https ://doi.org/10.1161/STROK EAHA.110.59223 8.
20. Knowland D, Arac A, Sekiguchi KJ, Hsu M, Lutz SE, Perrino J, Steinberg GK, Barres BA, Nimmerjahn A, Agalliu D. Stepwise recruitment of transcellular and paracellular pathways underlies blood–brain barrier breakdown in stroke. Neuron. 2014;82(3):603–17. https ://doi.org/10.1016/j.neuro n.2014.03.003.
21. Kokubu Y, Yamaguchi T, Kawabata K. In vitro model of cerebral ischemia by using brain microvascular endothelial cells derived from human induced pluripotent stem cells. Biochem Biophys Res Commun. 2017;486(2):577–83. https ://doi.org/10.1016/j.bbrc.2017.03.092.
22. Kubota H, Ishihara H, Langmann T, Schmitz G, Stieger B, Wieser HG, Yonekawa Y, Frei K. Distribution and functional activity of P‑glycoprotein and multidrug resistance‑associated proteins in human brain micro‑vascular endothelial cells in hippocampal sclerosis. Epilepsy Res. 2006;68(3):213–28.
23. Kurosawa T, Tega Y, Higuchi K, Yamaguchi T, Nakakura T, Mochizuki T, Kusuhara H, Kawabata K, Deguchi Y. Expression and functional characterization of drug transporters in brain microvascular endothelial cells derived from human induced pluripotent stem cells. Mol Pharm. 2018;15(12):5546–55. https ://doi.org/10.1021/acs.molph armac eut.8b006 97.
24. Lim RG, Quan C, Reyes‑Ortiz AM, Lutz SE, Kedaigle AJ, Gipson TA, Wu J, Vatine GD, Stocksdale J, Casale MS, Svendsen CN, Fraenkel E, Housman DE, Agalliu D, Thompson LM. Huntington’s disease iPSC‑derived brain microvascular endothelial cells reveal WNT‑mediated angiogenic and blood–brain barrier deficits. Cell Rep. 2017;19(7):1365–77. https ://doi.org/10.1016/j.celre p.2017.04.021.
25. Liu S, Shi H, Liu W, Furuichi T, Timmins GS, Liu KJ. Interstitial pO2 in ischemic penumbra and core are differentially affected following transient focal cerebral ischemia in rats. J Cereb Blood Flow Metab. 2004;24(3):343–9.
26. Lu TM, Redmond D, Magdeldin T, Nguyen DH‑T, Snead A, Sproul A, Xiang J, Shido K, Fine HA, Rosenwaks Z, Rafii A, Agalliu D, Lis R. Human induced pluripotent stem cell‑derived neuroectodermal epithelial cells mistaken for blood–brain barrier‑forming endothelial cells. BioRxiv. 2019. https ://doi.org/10.1101/69917 3.
Page 17 of 17Gerhartl et al. Fluids Barriers CNS (2020) 17:19
27. Ma SC, Li Q, Peng JY, Zhouwen JL, Diao JF, Niu JX, Wang X, Guan XD, Jia W, Jiang WG. Claudin‑5 regulates blood–brain barrier permeability by modifying brain microvascular endothelial cell proliferation, migration, and adhesion to prevent lung cancer metastasis. CNS Neurosci Ther. 2017;23(12):947–60. https ://doi.org/10.1111/cns.12764 .
28. Morris ME, Rodriguez‑Cruz V, Felmlee MA. SLC and ABC transporters: expression, localization, and species differences at the blood–brain and the blood–cerebrospinal fluid barriers. AAPS J. 2017;19(5):1317–31. https ://doi.org/10.1208/s1224 8‑017‑0110‑8.
29. Mysiorek C, Culot M, Dehouck L, Derudas B, Staels B, Bordet R, Cecchelli R, Fenart L, Berezowski V. Peroxisome‑proliferator‑activated receptor‑alpha activation protects brain capillary endothelial cells from oxygen‑glucose deprivation‑induced hyperpermeability in the blood–brain barrier. Curr Neurovasc Res. 2009;6(3):181–93.
30. Neuhaus W, Burek M, Djuzenova CS, Thal SC, Koepsell H, Roewer N, Förster CY. Addition of NMDA‑receptor antagonist MK801 during oxygen/glucose deprivation moderately attenuates the upregulation of glucose uptake after subsequent reoxygenation in brain endothelial cells. Neuro‑sci Lett. 2012;506(1):44–9. https ://doi.org/10.1016/j.neule t.2011.10.045.
31. Neuhaus W, Gaiser F, Mahringer A, Franz J, Riethmüller C, Förster C. The pivotal role of astrocytes in an in vitro stroke model of the blood–brain barrier. Front Cell Neurosci. 2014;28(8):352. https ://doi.org/10.3389/fncel .2014.00352 .
32. Neuhaus W, Krämer T, Neuhoff A, Gölz C, Thal SC, Förster CY. Multifaceted mechanisms of WY‑14643 to stabilize the blood–brain barrier in a model of traumatic brain injury. Front Mol Neurosci. 2017;10:149. https ://doi.org/10.3389/fnmol .2017.00149 (eCollection 2017).
33. Neuhaus W, Noe CR. Transport at the blood–brain barrier. In: Ecker GF, Chiba P, editors. Transporters as drug carriers. Weinheim: Whiley‑VCH Verlag GmbH & Co. KGaA; 2009. p. 263–98.
34. Neuhaus W, Plattner VE, Wirth M, Germann B, Lachmann B, Gabor F, Noe CR. Validation of in vitro cell culture models of the blood–brain barrier: tightness characterization of two promising cell lines. J Pharm Sci. 2008;97(12):5158–75. https ://doi.org/10.1002/jps.21371 .
35. Ohtsuki S, Ikeda C, Uchida Y, Sakamoto Y, Miller F, Glacial F, Decleves X, Scherrmann JM, Couraud PO, Kubo Y, Tachikawa M, Terasaki T. Quantita‑tive targeted absolute proteomic analysis of transporters, receptors and junction proteins for validation of human cerebral microvascular endothelial cell line hCMEC/D3 as a human blood–brain barrier model. Mol Pharm. 2013;10(1):289–96. https ://doi.org/10.1021/mp300 4308.
36. Page S, Munsell A, Al‑Ahmad AJ. Cerebral hypoxia/ischemia selectively disrupts tight junctions complexes in stem cell‑derived human brain microvascular endothelial cells. Fluids Barriers CNS. 2016;13(1):16.
37. Page S, Raut S, Al‑Ahmad A. Oxygen‑glucose deprivation/reoxygen‑ation‑induced barrier disruption at the human blood–brain barrier is partially mediated through the HIF‑1 pathway. Neuromolecular Med. 2019;21(4):414–31. https ://doi.org/10.1007/s1201 7‑019‑08531 ‑z.
38. Ramme AP, Koenig L, Hasenberg T, Schwenk C, Magauer C, Faust D, Lorenz AK, Krebs AC, Drewell C, Schirrmann K, Vladetic A, Lin GC, Pabinger S, Neuhaus W, Bois F, Lauster R, Marx U, Dehne EM. Autologous induced pluripotent stem cell‑derived four‑organ‑chip. Future Sci OA. 2019;5(8):FSO413. https ://doi.org/10.2144/fsoa‑2019‑0065.
39. Sajja RK, Cucullo L. Altered glycaemia differentially modulates efflux transporter expression and activity in hCMEC/D3 cell line. Neurosci Lett. 2015;26(598):59–65. https ://doi.org/10.1016/j.neule t.2015.05.015.
40. Shawahna R, Uchida Y, Declèves X, Ohtsuki S, Yousif S, Dauchy S, Jacob A, Chassoux F, Daumas‑Duport C, Couraud PO, Terasaki T, Scherrmann JM. Transcriptomic and quantitative proteomic analysis of transporters and drug metabolizing enzymes in freshly isolated human brain microvessels. Mol Pharm. 2011;8(4):1332–41. https ://doi.org/10.1021/mp200 129p.
41. Shi Y, Zhang L, Pu H, Mao L, Hu X, Jiang X, Xu N, Stetler RA, Zhang F, Liu X, Leak RK, Keep RF, Ji X, Chen J. Rapid endothelial cytoskeletal reorganiza‑tion enables early blood–brain barrier disruption and long‑term ischae‑mic reperfusion brain injury. Nat Commun. 2016;27(7):10523. https ://doi.org/10.1038/ncomm s1052 3.
42. Sladojevic N, Stamatovic SM, Johnson AM, Choi J, Hu A, Dithmer S, Blasig IE, Keep RF, Andjelkovic AV. Claudin‑1‑dependent destabilization of the blood–brain barrier in chronic stroke. J Neurosci. 2019;39(4):743–57. https ://doi.org/10.1523/JNEUR OSCI.1432‑18.2018.
43. Thal SC, Schaible EV, Neuhaus W, Scheffer D, Brandstetter M, Engel‑hard K, Wunder C, Förster CY. Inhibition of proteasomal glucocorticoid receptor degradation restores dexamethasone‑mediated stabilization of the blood–brain barrier after traumatic brain injury. Crit Care Med. 2013;41(5):1305–15. https ://doi.org/10.1097/CCM.0b013 e3182 7ca49 4.
44. Tornabene E, Helms HCC, Pedersen SF, Brodin B. Effects of oxygen‑glucose deprivation (OGD) on barrier properties and mRNA transcript levels of selected marker proteins in brain endothelial cells/astrocyte co‑cultures. PLoS ONE. 2019;14(8):e0221103. https ://doi.org/10.1371/journ al.pone.02211 03.
45. Uchida Y, Ohtsuki S, Katsukura Y, Ikeda C, Suzuki T, Kamiie J, Terasaki T. Quantitative targeted absolute proteomics of human blood–brain barrier transporters and receptors. J Neurochem. 2011;117(2):333–45. https ://doi.org/10.1111/j.1471‑4159.2011.07208 .x.
46. Vanlandewijck M, He L, Mäe MA, Andrae J, Ando K, Del Gaudio F, Nahar K, Lebouvier T, Laviña B, Gouveia L, Sun Y, Raschperger E, Räsänen M, Zarb Y, Mochizuki N, Keller A, Lendahl U, Betsholtz C. A molecular atlas of cell types and zonation in the brain vasculature. Nature. 2018;554(7693):475–80. https ://doi.org/10.1038/natur e2573 9.
47. Vatine GD, Al‑Ahmad A, Barriga BK, Svendsen S, Salim A, Garcia L, Garcia VJ, Ho R, Yucer N, Qian T, Lim RG, Wu J, Thompson LM, Spivia WR, Chen Z, Van Eyk J, Palecek SP, Refetoff S, Shusta EV, Svendsen CN. Modeling psychomotor retardation using iPSCs from MCT8‑deficient patients indicates a prominent role for the blood–brain barrier. Cell Stem Cell. 2017;20(6):831–843.e5. https ://doi.org/10.1016/j.stem.2017.04.002.
48. Veszelka S, Tóth A, Walter FR, Tóth AE, Gróf I, Mészáros M, Bocsik A, Hellinger É, Vastag M, Rákhely G, Deli MA. Comparison of a rat primary cell‑based blood–brain barrier model with epithelial and brain endothe‑lial cell lines: gene expression and drug transport. Front Mol Neurosci. 2018;22(11):166. https ://doi.org/10.3389/fnmol .2018.00166 .
49. Weksler B, Romero IA, Couraud PO. The hCMEC/D3 cell line as a model of the human blood brain barrier. Fluids Barriers CNS. 2013;10(1):16. https ://doi.org/10.1186/2045‑8118‑10‑16.
50. Weksler BB, Subileau EA, Perrière N, Charneau P, Holloway K, Leveque M, Tricoire‑Leignel H, Nicotra A, Bourdoulous S, Turowski P, Male DK, Roux F, Greenwood J, Romero IA, Couraud PO. Blood–brain barrier‑specific properties of a human adult brain endothelial cell line. FASEB J. 2005;19(13):1872–4.
51. Wilkins E, Wilson L, Wickramasinghe K, Bhatnagar P, Leal J, Luengo‑Fernandez R, Burns R, Rayner M, Townsend N. European cardiovascular disease statistics 2017. Brussels: European Heart Network; 2017.
52. Yeh WL, Lin CJ, Fu WM. Enhancement of glucose transporter expression of brain endothelial cells by vascular endothelial growth factor derived from glioma exposed to hypoxia. Mol Pharmacol. 2008;73(1):170–7.
53. Zaum S. Die hCMEC/D3‑Zelllinie als humanes in vitro‑Modell der Blut‑Hirn‑Schranke im ischämischen Schlaganfall, PhD thesis at the Medical Faculty of the Julius‑Maximilians University Würzburg, Germany. 2017. p. 1–74.
54. Zhang Y, Chen K, Sloan SA, Bennett ML, Scholze AR, O’Keeffe S, Phatnani HP, Guarnieri P, Caneda C, Ruderisch N, Deng S, Liddelow SA, Zhang C, Daneman R, Maniatis T, Barres BA, Wu JQ. An RNA‑sequencing transcrip‑tome and splicing database of glia, neurons, and vascular cells of the cer‑ebral cortex. J Neurosci. 2014;34(36):11929–47. https ://doi.org/10.1523/JNEUR OSCI.1860‑14.2014.
Publisher’s NoteSpringer Nature remains neutral with regard to jurisdictional claims in pub‑lished maps and institutional affiliations.