The Pilot Maternal, Neonatal and Child Health Project (MNCH) at Nilphamari: Profiling the Changes...
61
Working Paper No. 5 The Pilot Maternal, Neonatal and Child Health Project (MNCH) at Nilphamari: Profiling the Changes During 2006-07 Shahnawaz Mohammad Rafi Hashima-e-Nasreen Sarawat Rashid November 2008 Research and Evaluation Division, BRAC, 75 Mohakhali, Dhaka 1212, Bangladesh Telephone: (88-02) 9881265-72, 8824180-7 (PABX) Fax: (88-02) 8823542, 8823614 E-mail: [email protected], Website: www.brac.net/research
-
Upload
independent -
Category
Documents
-
view
1 -
download
0
Transcript of The Pilot Maternal, Neonatal and Child Health Project (MNCH) at Nilphamari: Profiling the Changes...

Working Paper No. 5
The Pilot Maternal, Neonatal and Child Health Project (MNCH) at Nilphamari: Profiling the Changes During 2006-07
Shahnawaz Mohammad Rafi Hashima-e-Nasreen
Sarawat Rashid
November 2008
Research and Evaluation Division, BRAC, 75 Mohakhali, Dhaka 1212, Bangladesh Telephone: (88-02) 9881265-72, 8824180-7 (PABX) Fax: (88-02) 8823542, 8823614 E-mail: [email protected], Website: www.brac.net/research

Working Paper No. 5 Copyright © 2008 BRAC November 2008 Published by: BRAC 75 Mohakhali Dhaka 1212 Bangladesh E-mail: [email protected] Telephone: (88-02) 9881265-72, 8824180-7 (PABX) Fax: (88-02) 8823542, 8823614 Website: www.brac.net/research Printing and Publication Altamas Pasha Cover design Md. Abdur Razzaque Design & layout Md. Akram Hossain BRAC/RED publishes research reports, scientific papers, monographs, working papers, research compendium in Bangla (Nirjash), proceedings, manuals, and other publications on subjects relating to poverty, social development, health, nutrition, education, gender, and environment. Printed by BRAC Printers at Tongi, Gazipur, Bangladesh.

iii Pilot MNCH at Nilphamari: profiling the changes during 2006-07
Abbreviations ANC Antenatal Care BHP BRAC Health Programme CHW Community Health Worker DH District Hospital FP Family Planning EmOC Emergency Obstetric Care FWA Family Welfare Assistant FWV Family Welfare Visitor FWC Family Welfare Center HA Health Assistant MCWC Maternal and Child Welfare Center MNCH Maternal, Neonatal and Child Health MDG Millennium Development Goal MIS Management Information System ORS Oral Rehydration Solution PNC Post-natal Care PO Programme Organizer SS Shasthya Shebika SK Shasthya Karmi TBA Traditional Birth Attendants TTBA Trained Traditional Birth Attendants TT Tetanus Toxoid UHC Upazila Health Complex

iv RED Working Paper No. 5
Acknowledgements
We are grateful to the women and other study participants in the Nilphamari district for their cooperation and valuable time in illuminating us about the state of current maternal, neonatal and child health in the area. The support and cooperation of Dr. Imran Matin, Deputy Executive Director, BRAC is gratefully acknowledged. We are thankful to Dr. Syed Masud Ahmed, Research Coordinator, Dr. Monira Parveen, Research Fellow, RED, BRAC and Dr. Kaosar Afsana Programme Coordinator, BHP for reviewing the report. Sincerely thanks to Mr. Hasan Shareef Ahmed for editing the manuscript. Thanks are also due to Mr. Syed Suaib Ahmed for logistic and management support. We are grateful to BRAC for giving us the opportunity to conduct this study. BRAC is supported by countries, donor agencies and others who share its concerns to have a just, enlightened, healthy and democratic Bangladesh free from hunger, poverty, environmental degradation and all forms of exploitation based on age, sex, religion, and ethnicity. Current major donors include AGA Khan Foundation, RNE, NOVIB, Department for International Development (DFID), CIDA, NORAD, Swiss development Corporation, European Commission, Embassy of Denmark, Government of Bangladesh, GITAC Consult GmbH, Birmingham Young University (UK), Scojo Foundation Incorporation, Plan Bangladesh, SDC, Institute of Dev. Studies-Sussex (UK), World Bank, Oxfam NOVIB, Australian High Commission, Charities Aid Foundation (USA), Conrad N. Hilton Foundation, The Johanniter, UNICEF, United Way International, ULG Northumbian, CAD-America, Sight Savers, ICLARM, World Fish Center, World Food Programme, SIDA, Land O Lakes, WHO, AusAID, Population Council (USA), Hospital for Sick Children, The Global Fund, Fidelis FRANC, Columbia University (USA), Inter Co-operation Bangladesh, Embassy of Japan, DGIS, University of Calgory, GTZ-Germany, International Research and Exchanges, Manusher Jonno Foundation, Bill and Melinda Gates Foundation, The University of Manchester (UK), University of Leeds (UK), Micro-Nutrient Initiative, NOVIB, International Committee of the Red Cross (ICRC), and ICDDRB.

v Pilot MNCH at Nilphamari: profiling the changes during 2006-07
Abstract This population based cross-sectional survey collected data from the randomly selected six upazilas of Nilphamari district (Nilphamari Sadar, Joldhaka, Kishoriganj, Syedpur, Dimla, and Domar) during both baseline (2006) and the follow-up (2008) using quantitative methods. A total of 1,800 respondents, comprising currently pregnant women (n=600), mothers of under-1 children (n=600) and mothers of under-5 children (n=600) were sampled at each phase. All information was collected with reference to the last pregnancy or the last birth. Comparative analysis was done between baseline and one year since intervention to document changes, if any, with respect to variables of interest. Findings revealed that there was no significant backward or forward shift in the age of the pregnant women and mothers of under-5 children during the study period. A decrease in induced abortion was observed. Use of herbs for induced abortion decreased; however, self-treatment and treatment-seeking from informal providers for complication of abortion remained high. Pills are gaining popularity as a family planning method; also discontinuation and switch to another method was decreasing. Mean number of ANC visit increased as also attendance of deliveries by skilled providers than at baseline. However, majority of deliveries continued to take place at home; the proportion delivered by the TBAs remained substantial. Post-natal follow-up was increasing, as also attending to these visits by the Shasthya Kormis (SKs) and trained TBAs. For treatment of neonatal complications, mothers increasingly preferred UHCs/district hospitals. Management of illnesses of the under-fives is fragmentary and the thrust is on prevention only. In conclusion, The MNCH intervention in Nilphamari made some noteworthy improvement in the coverage of ANC, vaccination of children, safe delivery, etc., but failed to provide primary and secondary level of basic emergency obstetric care (EmOC) adequately. The proportion of actual referral did not reach the desired level which give the programme opportunities to rethink and reorganize their system. The implications of these findings for scaling up phase of the programme is discussed.

vi RED Working Paper No. 5
Executive Summary Introduction BRAC health programme (BHP) initiated a pilot maternal, neonatal and child health project (MNCH) in Nilphamari in 2006 to improve the health status of women of reproductive age including neonates and children, through instituting necessary systems and measures. Before launching the programme, a baseline survey was done to help design intervention and future impact evaluation of the project. Subsequently, a follow-up survey was done during middle of 2007 to assess the changes, if any, taking place as a result of the MNCH intervention over the period 2006-‘07. This report presents key findings from this comparison of baseline and follow-up survey. Materials and methods This population based cross-sectional survey collected data from the randomly selected six upazilas of Nilphamari district (Nilphamari Sadar, Joldhaka, Kishoriganj, Syedpur, Dimla, and Domar) during both baseline and the follow-up using quantitative (for socio-demographic and MNCH related knowledge/ practice) methods. A total of 1,800 respondents, comprising currently pregnant women (n=600), mothers of under-1 children (n=600) and mothers of under-5 children (n=600) were sampled at each phase. The sample size for the survey was determined using formula for the cross-sectional descriptive study. All information was collected with reference to the last pregnancy or the last birth. Key findings Socio-demographic profile Age of pregnant women and mothers of under-5 children was found to be similar during follow-up survey compared to baseline. The intervened women were mostly housewives. No notable difference in literacy or years of schooling was observed. The mean years of schooling of the study population remained more or less stagnant and it was found that lesser proportion of women were involved in income earning activities.

vii Pilot MNCH at Nilphamari: profiling the changes during 2006-07
Again, 19% of the mothers of under-5 children were (compared to 15% in baseline) BRAC members during the follow-up and the percentage was around 17% for pregnant mothers. On an average, 46% of the women in both the groups sold manual labour and were also eligible for BRAC membership on both occasions. There was small change in the age of husbands of both the groups. Most of the husbands earned their livings as wage labour or doing small trade. Reproductive history The mean number of children born to currently pregnant women (1.37 vs. 2.18) and mothers of under-5 children (2.79 vs. 2.64) was found similar in both baseline and the follow-up. The percentage of mothers having at least two children increased among pregnant women and mothers of under-5 children while the number of mothers of under-6 children having more than three children slightly decreased. There was no considerable change observed in the number of children’s death. A significant decline in the death of stillbirth and a rise in death of 1-2 years old children was observed among mothers of both categories between baseline and the follow-up. History of abortion Majority of the women had experienced of just one abortion and the proportion increased from baseline to follow-up. The proportion of induced abortion significantly (p<0.01) decreased both for pregnant women (from 67% to 28%) and mothers of under-5 children (from 81% to 17%). Use of herbs for inducing abortion also decreased (p<0.01) during the study period. The health seeking behaviour for abortion complications revealed two scenarios: firstly, self-treatment increased among pregnant women (from 26% to 42%, p<0.01) and mothers of under-5 children (from 17% to 54%, p<0.01); secondly, the service provision by informal providers remained high (p<0.05). Family Planning Fifty percent of the pregnant women and around 82% mothers of under-5 children ever used any kind of family planning (FP) methods. In case of mothers of under-5 children, the use of pills increased significantly over baseline (p<0.05), as also the reporting of side effects. Interestingly, both discontinuation and switch to another FP method decreased significantly among mothers of under-5 children over the study period. Antenatal care The level of knowledge on number of possible antenatal care (ANC) visits of pregnant women was high on both occasions. Actual ANC visits was lower

viii RED Working Paper No. 5
(median 3) than reported knowledge at follow-up (median 5). Thanks to intervention, only 5% of pregnant women visited informal health providers and majority of them received treatment from trained or formal health providers. Only 12% of the mothers of under-1 children were sent for referral (11% for pregnant women), and of them a great portion sought care from non-government organization (NGO) clinics. Intake of iron tablets and tetanus toxoid (TT) vaccination increased at follow-up over baseline. Delivery care Above 80% of the deliveries of mothers of under-5 and under-1 children took place at home, and 43% of these were conducted by trained traditional birth attendants (TTBAs) at follow-up compared to 21% during the baseline. Practices of safe delivery showed that attendants washed their hands with soap and water in 74% of the cases and in 44% of cases, the delivery was conducted using clean plastic sheet for lying. TTBAs and traditional birth attendants (TBAs) in most of the cases cut the umbilical cord using new and boiled blade (82% for a mothers of under-5 and 66% for mothers of under-1 children). At follow-up, 22% of the women suffered from retained placenta during delivery and village doctors treated 43% of them vs. 23% in baseline. Post-natal care Around 91% of the mothers of under-1 children did not face any post-natal complications. Of those who had, non-formal health providers were sought more frequently at follow-up (66%). Sixty-two percent of these mothers received post-natal care within 48 hours of delivery and were served by Shasthaya Karmis (SKs) (42%) and the trained TBAs (31%). Neonatal care Fever (70%) and pneumonia (50%) were the two most frequently cited illnesses that the women (mothers of under-1 children) were worried about. For the neonatal complications, 67% of the women preferred upazila health complex (UHC)/district hospital for treatment. There was small increase in immediate colostrums feeding (from 91% to 94%). It was further observed that 74% of the neonates received essential newborn care. To manage body temperature of both normal weight and LBW babies, wrapping with warm clothes (80%) was the favourite choice of mothers. Reported illness of the neonates rose to 67% relative to baseline (58%) and 63% of them took care from homeopaths, which was 53% in baseline.

ix Pilot MNCH at Nilphamari: profiling the changes during 2006-07
Under-5 children care Vaccination of the under-5 children showed no improvements (rose only 2% during follow-up) and currently 89% of them are vaccinated in satellite clinics. There is a 24% jump (from 62% during baseline) in the intake vitamin-A capsules of under-5 children and again, 93% of them are served by satellite clinics. The top three diseases that affect under-5 children were fever (86%), common cold (64%) and cough (55%), but they mostly took care from informal health providers (52%). Summary findings • There was no significant backward or forward shift in the age of the
pregnant women and mothers of under-5 children during the study period.
• A decrease in induced abortion was observed. Use of herbs for induced abortion decreased; however, self-treatment and treatment-seeking from informal providers for complication of abortion remains high.
• Pills are gaining popularity as a family planning method; also discontinuation and switch to another method was decreasing.
• Mean number of ANC visit increased; also, increased proportion were attended by skilled providers than at baseline. Intake of iron tabs and TT vaccination increased.
• Majority of deliveries continued to take place at home; Though deliveries by trained TBAs increased since baseline, the proportion delivered by the TBAs remained substantial.
• Post-natal follow-up was increasing, as also attending to these visits by the Shasthya Kormis (SKs) and trained TBAs.
• For treatment of neonatal complications, mothers increasingly preferred UHCs/district hospitals.
• Management of illnesses of the under-fives is fragmentary and the thrust is on prevention only.
Programmatic implications This cross-sectional descriptive study compares the baseline and the follow-up data to assess the outcome of the pilot MNCH intervention implemented in Nilphamari district during 2006-2007. The results from this study will inform the programme to fill up the gaps observed during the pilot phase and fine-tune during planned scaling up in new areas. These can be summarized as follows:

x RED Working Paper No. 5
• There is a gap in the management of abortion complications. Women should be motivated to take treatment from skilled/trained healthcare providers. During scaling up, an integrated approach to promote better abortion care services from trained health providers is needed.
• During scaling up, monitoring and management of side-effects and drop-out/methods-shift should be given priority to increase contraception coverage.
• Strengthen monitoring to increase the number of referrals for pregnancy complications is needed because detection of pregnancy complications and treatment seeking is still much lower than expected. Therefore, the programme need to deploy a pool of trained health workers to improve the referral system
• Traditional healers continued to conduct majority of the deliveries at home. So, the traditional healers should be trained in modern techniques to provide better service during delivery at home or to provide quality post-natal care (PNC) or to quickly refer the women when there is emergency.
• Though the provision of essential newborn care (ENC) was found to be improving, treating babies with birth asphyxia was below potential level and traditional healers have been found to fill in this gap. A pragmatic step is necessary to enhance provision of ENC.
• The programme emphasizes vaccination and intake of vitamin A tablets among under-5 children, but overlooks details of the disease pattern. So, an integrated approach such as IMCI (Integrated Management of Childhood Illnesses) is needed for effective reduction of morbidity and mortality in under-fives.
Conclusion The MNCH intervention in Nilphamari made some noteworthy improvement in the coverage of ANC, vaccination of children, safe delivery, etc., but failed to provide primary and secondary level of basic emergency obstetric care (EmOC) adequately. The proportion of actual referral did not reach the desired level which give the programme opportunities to rethink and reorganize their system. Lessons learned from this pilot study points to the necessity of upgrading existing pregnancy care facilities, building functional referral network, deploying adequate number of trained health professionals and finally, strengthening collaboration with the government, NGO and for-profit private sector for ensuring a sustainable MNCH intervention in the future.

1 Pilot MNCH at Nilphamari: profiling the changes during 2006-07
Introduction
Background Each year in the world around half a million women die from pregnancy-related complications, seven million neonates die and finally, 10 million children die under the age of five (Sines et al. 2006 and Safe Motherhood 2006). Maternal death and disability are the leading cause of healthy life years lost for women of reproductive age in developing countries, accounting for more than 28 million disability-adjusted life years (Daly’s) lost and at least 18% of the burden of disease in these women (Reproductive Health Outlook 2006). Approximately 99% of the said maternal mortality and morbidities occur in developing countries. The risk of dying from pregnancy-related complications is highest in sub-Saharan Africa and in South-central Asia. A mother's death carries profound consequences on child survival. In some developing countries, if the mother dies, the risk of death for her under-5 children is doubled or tripled. In Bangladesh, at present, about 12,000 women die each year from maternal causes and the MMR, and IMR are unacceptably high compared to other developing countries (NIPORT, Mitra and Associates, and Macro International Inc. 2003). Bangladesh is also a poor performer with respect to skilled attendance at birth and essential obstetric care (NIPORT, ORC Macro, John Hopkins University, ICDDRB 2003). Whatever government health facilities are available at various levels; these are not adequately utilized (UNDP 2004). Bangladesh being a moderate developing nation sets its goals of reproductive health as per provision of the MDGs and government of Bangladesh is also committed to fulfill those within the year 2015. In 2001, government of Bangladesh launched the much awaited camping of National Strategy of Maternal Health (NSMH) to reduce MMR focusing on the EmOC and the core intervention was taken on the basis of famous ‘three delays framework’. But this national plan overlooked the welfare of the newborns and under-5 children (Tinker and Ransom 2002). Recent trends of MMR, IMR, under-five mortality rates revealed that they are declining at a slower pace than expected, casting a doubt about the efficacy of the National Health and Population Sector Programme (HPSP) between 1998-2003. Thus, in the next implementation plan (2003-2006), the government has identified MNCH as one of the five priority areas of Health, Nutrition and Population Sector Programme (HNPSP) which

2 RED Working Paper No. 5
allows various players in the reproductive health to concentrate heavily on these issues. Keeping pace with national strategies and MDG targets, BRAC, the largest NGO in Bangladesh, consolidating its more than 30 years of experience in health interventions, has launched a pilot MNCH programme for rural populations in Nilphamari in August 2005. As a prologue to these activities, the Research and Evaluation Division of BRAC has carried out a cross-sectional survey in Niplhamari in 2006 (Nasreen et al. 2007) to collect benchmark information on relevant MNCH issues to design intervention and future impact evaluation of the project. The baseline survey revealed that the knowledge on risky pregnancy, pregnancy care, delivery care, neonatal care, etc. are in a formidable state but the respective practices were far below than expectation. Immunization coverage of the babies, vitamin A intake, and birth planning found to be at an acceptable state whereas the TT intake of pregnant women (only around 37%), is not at a satisfactory level. A follow-up survey was conducted one year later (in 2007) to assess the changes and improvements in the motivations, knowledge, and practices in various intervention components and provide necessary feedbacks for scaling up and sustainability in the near future. Objectives This study aimed to compare and contrast changes, if any, of MNCH-related knowledge and practices occurring during 2006-2007, following intervention. More specifically it aimed to: • Study women’s knowledge and practices including maternity (pregnancy
identification, ante-, intra- and post- natal), neonatal and under-5 child care;
• Explore the state of abortion including its complications, and reproductive morbidities;
• Assess the referral network for MNCH services provided to the socially vulnerable women;
• Examine health-seeking behaviour with respect to maternal and neonatal complications, and sicknesses of neonates and under-5 children;
• Understand community needs/demands for MNCH services.

3 Pilot MNCH at Nilphamari: profiling the changes during 2006-07
Methods
Study design This is a population-based descriptive study where data were collected through quantitative survey. The quantitative survey collected information on socio-demographic characteristics of the households having pregnant women, mothers of under-one children, mothers of under-five children and their knowledge and practice on family planning, antenatal care, delivery, neonatal, post-natal and under-5 care, and other related issues such as immunization, breastfeeding and weaning food for infants. During 2006 the Research and Evaluation Division (RED) of BRAC carried a baseline survey in the selected area and a follow-up survey was also carried out in 2007 to see the effects/changes of this intervention. This baseline study was designed in an intervention-comparison retrospective scenario; the intervention area was chosen where the main core programmes (microfinance, health and education) of BRAC are in action, whereas the comparison was selected on the basis of non-existence of BRAC health intervention aiming at the women from BRAC eligible households. In contrary, the follow-up survey was carried out only on the intervened population to compare with the baseline and hence there was no comparison group in the follow-up survey. Study site The study was conducted in six upazilas (Nilphamari Sadar, Joldhaka, Kishoriganj, Syedpur, Dimla, and Domar) of Nilphamari district (385 km north of Dhaka, the capital of Bangladesh), where BRAC Health Programme (BHP) initiated the maternal, neonatal and child health project (MNCH) in August 2005. In intervention areas, all the three core programme (microfinance, health and education) of BRAC are in place; however the comparison area is excluded from the health intervention. BRAC targeted women from BRAC eligible households. The criteria for the BRAC eligibility is that the household owns no more than half acres of land including the homestead land and at least one member of the household sells at least 100 days of manual labour in a year to earn a livelihood. BRAC provides them the social awareness education, skill development training and loan to carry out income generating activities (Chowdhury and Bhuiya 2004).
4 RED Working Paper No. 5
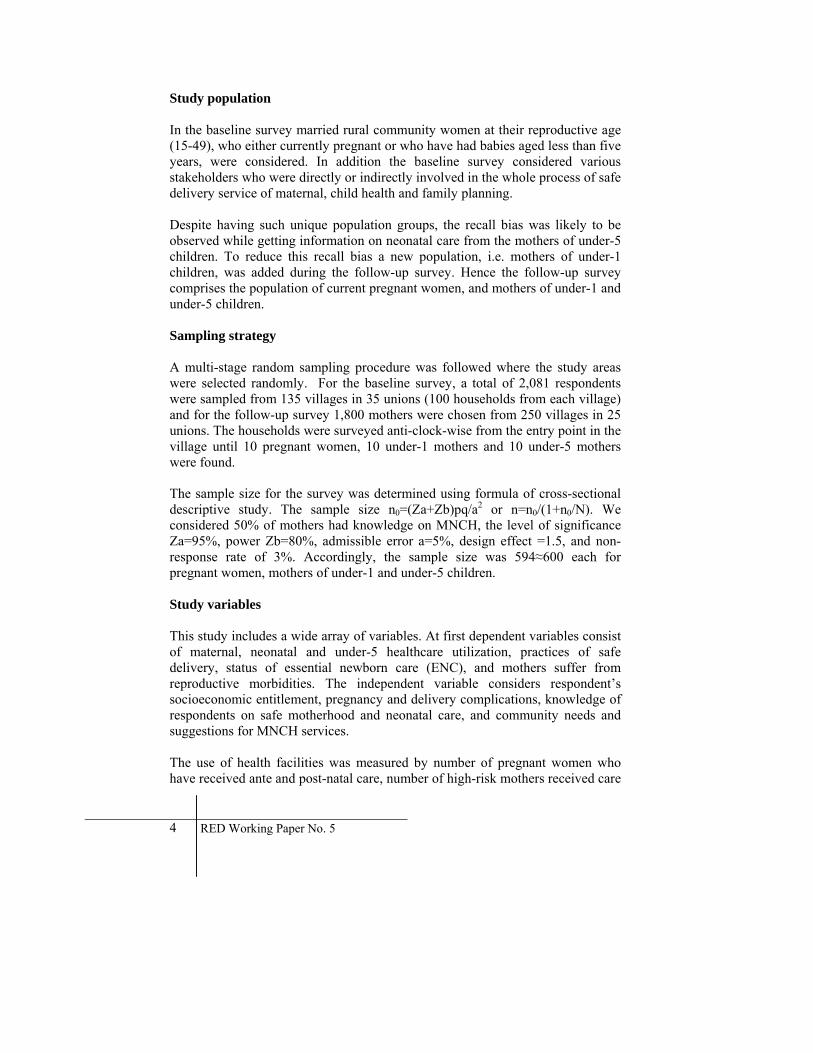
Study population In the baseline survey married rural community women at their reproductive age (15-49), who either currently pregnant or who have had babies aged less than five years, were considered. In addition the baseline survey considered various stakeholders who were directly or indirectly involved in the whole process of safe delivery service of maternal, child health and family planning. Despite having such unique population groups, the recall bias was likely to be observed while getting information on neonatal care from the mothers of under-5 children. To reduce this recall bias a new population, i.e. mothers of under-1 children, was added during the follow-up survey. Hence the follow-up survey comprises the population of current pregnant women, and mothers of under-1 and under-5 children. Sampling strategy A multi-stage random sampling procedure was followed where the study areas were selected randomly. For the baseline survey, a total of 2,081 respondents were sampled from 135 villages in 35 unions (100 households from each village) and for the follow-up survey 1,800 mothers were chosen from 250 villages in 25 unions. The households were surveyed anti-clock-wise from the entry point in the village until 10 pregnant women, 10 under-1 mothers and 10 under-5 mothers were found. The sample size for the survey was determined using formula of cross-sectional descriptive study. The sample size n0=(Za+Zb)pq/a2 or n=n0/(1+n0/N). We considered 50% of mothers had knowledge on MNCH, the level of significance Za=95%, power Zb=80%, admissible error a=5%, design effect =1.5, and non-response rate of 3%. Accordingly, the sample size was 594≈600 each for pregnant women, mothers of under-1 and under-5 children. Study variables This study includes a wide array of variables. At first dependent variables consist of maternal, neonatal and under-5 healthcare utilization, practices of safe delivery, status of essential newborn care (ENC), and mothers suffer from reproductive morbidities. The independent variable considers respondent’s socioeconomic entitlement, pregnancy and delivery complications, knowledge of respondents on safe motherhood and neonatal care, and community needs and suggestions for MNCH services. The use of health facilities was measured by number of pregnant women who have received ante and post-natal care, number of high-risk mothers received care

5 Pilot MNCH at Nilphamari: profiling the changes during 2006-07
from BRAC or other facilities, number of maternal complicated cases received services from any facilities, neonates received essential newborn care, and number of neonatal and under-5 infections treated. Data collection and quality control A structured questionnaire was developed encompassing the said variables. The questionnaire was pre-tested, modified and edited on the basis of feedback received before finalization. Thirty enumerators collected data during April-May 2006 (baseline) and September-October 2007 (follow-up). To ensure quality of data a four-layered monitoring system was developed. The first layer was composed of three team leaders who monitored activities of their respective teams. Three rotating monitors who inter-changed their places at an interval of three days in turn cross-checked their work. The whole field activities were controlled and monitored by a field supervisor. Lastly, the researchers at the head office monitored field activities through field visits at regular intervals. Data analysis The data were analyzed using STATA and the analysis was done in two phases, phase one entails the bi-variate differential analysis of the study variables between the baseline and follow-up, and in phase II a univariate and multivariate log regression was run to see the effect of any third variables on it.

6 RED Working Paper No. 5
Findings
This section presents a comparative analysis of some key variables between baseline and follow-up survey of pilot MNCH intervention in Nilphamari district. The analysis focused on socio-demographic profile of the respondents, characteristics of the husbands, (Table 2), status of reproductive history, family planning, changes achieved in ANC, PNC and delivery care, post-natal complications, neonatal care, under-5 care, and use of health service utilization. Socio-demographic profile of the respondents (Table 1) Age The mean years of age of both groups of women remained similar during baseline and follow-up, and majority of women belonged to the age group of 19-34 years. Religion and marital status Majority (over 80%) of the women were Muslims and 99% of them were currently married. Literacy and school enrolment A decline in literacy (who could at least read and write) was observed during the follow-up. No significant change was observed in mean years of schooling and a high proportion of women (above 30%) had no experience of schooling. Occupation and NGO entitlement Little more than 84% of the women were housewives at baseline. A little variation in BRAC membership was observed during follow-up and proportion of membership in BRAC micro-finance i.e. the Dabi programme was higher. A bulk of non-BRAC members were either of member of Grameen Bank or ASA. Land ownership and other dynamics Fifty percent of the population owned 1-50 decimals of land and number of landless people declined. There was no variation in selling manual labour, but the proportion of BRAC eligible women reduced by a very small margin.

7 Pilot MNCH at Nilphamari: profiling the changes during 2006-07
Table 1. Comparative statistics of socio-demographic profile (%)
Pregnant Women Mother of Under-5 Children Baseline Follow-up Baseline Follow-up Age <18 years 32.4 28.26 13.7 10.83 19 – 34 years 64.5 69.06 75.0 81.17 ≥35 years 3.1 2.68 11.3 2.68 Mean age 21.94 22.29 24.97 24.77 Religion Muslim 82.5 83.61 84.5 80.83 Others 17.5 16.39 15.5 19.17 Marital status Married 99.3 99.83 98.8 99.61 Divorced/separated/widow 0.7 0.17 1.2 0.39 Literacy Can read and write 55.4 51.0 42.7 49.33 Cannot read and write 44.6 49.0 57.3 50.67 Educational status Primary 33.4 31.77 36.0 33.17 Secondary 30.9 31.61 21.8 28 SSC+ 8.4 2.51 5.8 1.67 Did not attend school 27.3 34.11 36.3 37.17 Mean years of schooling 4.61 4.5 3.53 4.80 Involved in income earning 15.9 9.87 20.7 16.67 Women’s occupation Housewife 84.1 96.66 79.3 94.34
Domestic aid and small trade 1.5 0.50 2.5 0.83 Poultry rearing 10.1 0.83 11.3 2.00 Wage labour 1.8 1.17 4.8 1.83 Others 2.5 0.83 2.0 1.00 BRAC membership 15.0 16.83 15.3 19.30 Types of membership TUP 11.0 19.80 10.9 14.66 IGVGD 1.1 0 1.1 0 Dabi 84.6 66.34 84.8 71.55 Unnoti 3.3 6.93 3.3 9.48 Pragati - 0.99 - - Other NGO membership 24.3 33.67 36.2 37.10 RDRS 10.7 6.44 18.4 5.38 Grammeen Bank 44.6 21.78 37.8 28.70 ASA 29.2 42.08 32.3 36.90 Proshika 7.7 3.96 4.6 6.28 Others 14.9 25.74 13.9 22.74 Total land owned (decimal) Landless 16.5 11.67 16.0 11.98 1-50 decimal 49.8 59.83 51.8 58.07 > 51 decimal 33.7 28.50 32.2 29.95 Sale manual labour 51.7 48.32 49.7 46.6
BRAC eligibility 47.8 46.33 46.0 45.6 N 605 598 600 600
8 RED Working Paper No. 5
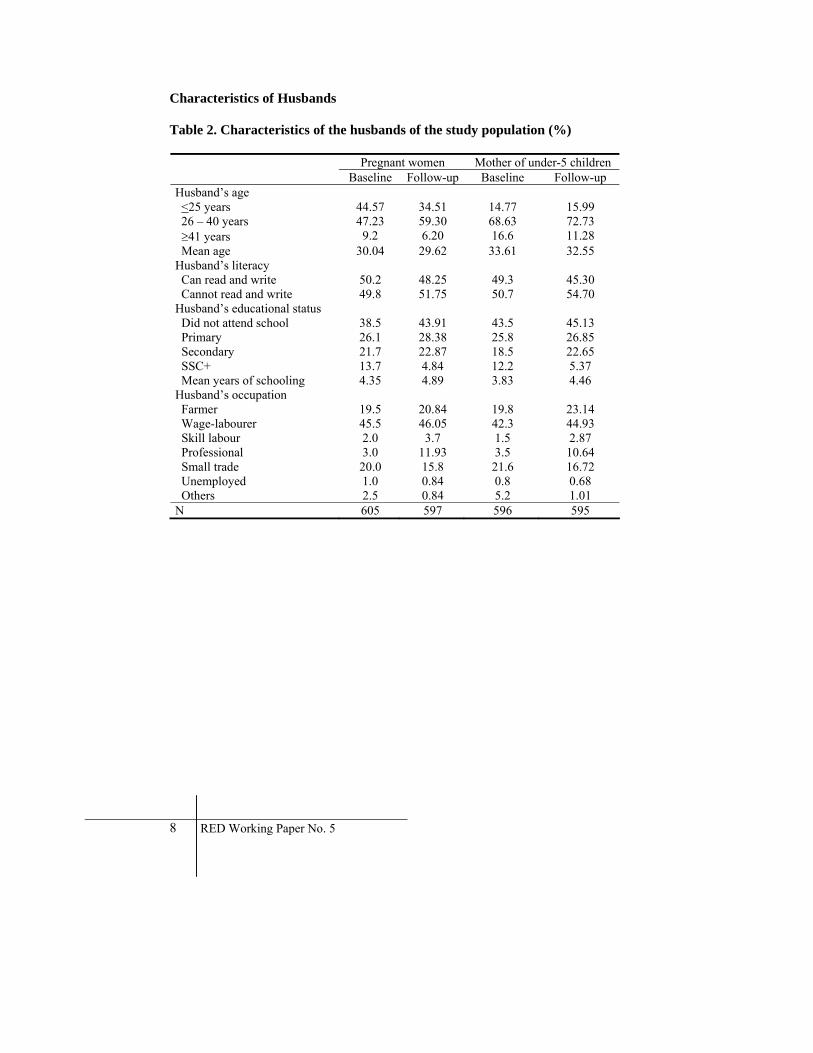
Characteristics of Husbands Table 2. Characteristics of the husbands of the study population (%)
Pregnant women Mother of under-5 children Baseline Follow-up Baseline Follow-up
Husband’s age <25 years 44.57 34.51 14.77 15.99 26 – 40 years 47.23 59.30 68.63 72.73 ≥41 years 9.2 6.20 16.6 11.28 Mean age 30.04 29.62 33.61 32.55 Husband’s literacy Can read and write 50.2 48.25 49.3 45.30 Cannot read and write 49.8 51.75 50.7 54.70 Husband’s educational status Did not attend school 38.5 43.91 43.5 45.13 Primary 26.1 28.38 25.8 26.85 Secondary 21.7 22.87 18.5 22.65 SSC+ 13.7 4.84 12.2 5.37 Mean years of schooling 4.35 4.89 3.83 4.46 Husband’s occupation Farmer 19.5 20.84 19.8 23.14 Wage-labourer 45.5 46.05 42.3 44.93 Skill labour 2.0 3.7 1.5 2.87 Professional 3.0 11.93 3.5 10.64 Small trade 20.0 15.8 21.6 16.72 Unemployed 1.0 0.84 0.8 0.68 Others 2.5 0.84 5.2 1.01 N 605 597 596 595

9 Pilot MNCH at Nilphamari: profiling the changes during 2006-07
Status in reproductive health Table 3. Reproductive history of the study population (%) Pregnant women Mother of under-5 children Baseline Follow-up P value Baseline Follow-up P value Children born None 34.4 28.00 P<0.05 - - ns 1-2 46.1 49.17 ns 50.8 55.24 P<0.05 3-5 18.3 21.17 ns 42.3 39.10 ns >6 1.2 1.67 ns 6.8 5.66 ns Mean 1.37 2.18 ns 2.79 2.64 ns N 605 598 ns 600 600 ns Children died ns ns None 77.4 67.36 ns 75.8 75.87 ns 1 18.7 24.31 ns 17.2 17.80 ns 2 3.1 5.09 ns 4.7 5.32 ns > 3 0.8 3.24 ns 2.3 1.00 ns N 397 432 600 600 Age stratification of dead children
Still birth 28.3(47) 21.16 (33) P<0.05 26.6(55) 19.27 (32) P<0.01 Death during delivery 16.3(27) 12.82 (20) P<0.05 16.9(35) 13.25 (22) ns Neonatal 37.9(63) 37.18 (58) ns 35.3(73) 33.73 (56) ns Infant 11.4(19) 14.10 (22) ns 14.0(29) 19.88 (33) P<0.05 1-2 yrs 1.2(2) 7.70 (12) P<0.05 4.3(9) 5.42 (9) ns 3-5 yrs 3.6(6) 5.77 (9) ns 2.4(5) 6.02 (10) ns >5 yrs 1.2(2) 2.56 (4) ns 0.5(1) 2.41 (4) ns N 166 158 207 166 Birth scenario Table 3 shows the comparative changes of reproductive history in the intervention area regarding childbirth, mortality, etc. During the baseline 34.4% of the women became pregnant for the first time, which decreased to 28% during the follow-up period. The proportion of mothers having 1 to 2 children increased. Mortality The mortality figures suggest death of one/two babies in both the group increased. There was a significant decrease in the number of stillbirth as well as death during delivery during 2006-2007. Infant mortality among under-5 mothers and children of 1-2 years mortality increased over one year of intervention.

10 RED Working Paper No. 5
History of abortion Table 4. History of abortion of the study population (%) Pregnant women Mother of under-5 children Baseline Follow-up P value Baseline Follow-up P value Experience of abortion 12.7 10.5 - 10.5 8.82 ns Frequency of abortion 1 77.9 87.30 P<0.01 76.2 90.57 P<0.01 2 13.0 9.52 P<0.05 17.5 9.43 P<0.01 >3 9.1 3.18 P<0.01 6.3 - ns N 77 63 63 53 Period of abortion in months 2 15.6 11.11 P<0.05 14.3 11.32 ns 3 42.9 31.75 P<0.01 42.9 35.85 P<0.05 4 20.8 26.98 P<0.05 28.6 22.64 P<0.05 5 14.3 12.70 - 9.5 16.98 P<0.01 6 6.5 12.70 P<0.05 3.2 7.55 ns 7 - 1.59 - 1.6 3.77 ns Types of abortion Spontaneous 32.5(25) 71.4 (48) P<0.01 19.0(12) 83.0(44) P<0.01 Induced 67.5(52) 28.6(15) P<0.01 81.0(51) 17.0(9) P<0.01 Methods used for induced abortion
Herbs and Medicine by mouth
92.3 80 P<0.01 92.2 77.8 P<0.01
Menstrual regulation (MR) 5.8 6.67 - 7.8 22.22 P<0.01 Dilation and curettage (D & C)
1.9 - - - - ns
Health seeking behaviour for abortion complications
Self-treatment 26.0 42.86 P<0.01 17.5 54.72 P<0.01 District hospital 3.9 6.35 - 1.6 3.77 ns UHC/MCWC 22.1 28.57 P<0.05 25.4 13.11 P<0.01 Private clinic 16.9 15.20 ns 20.6 21.89 ns MBBS doctor 6.5 1.59 P<0.05 6.3 1.89 P<0.05 FWV 2.6 1.59 - 6.3 7.55 ns Traditional healers 20.8 15.88 P<0.05 17.5 20.75 ns Others 5.2 3.17 - 6.3 - ns N 77 63 63 53
Abortion experience Tables 4 presents a profile of the abortion situation during the baseline and follow-up. Firstly, abortion experienced among the pregnant women and mothers of under-5 children did not change overtime. Secondly, proportion of women experiencing at least one abortion increased at a high rate in both the groups, while the proportion of subsequent abortion decreased.
11 Pilot MNCH at Nilphamari: profiling the changes during 2006-07
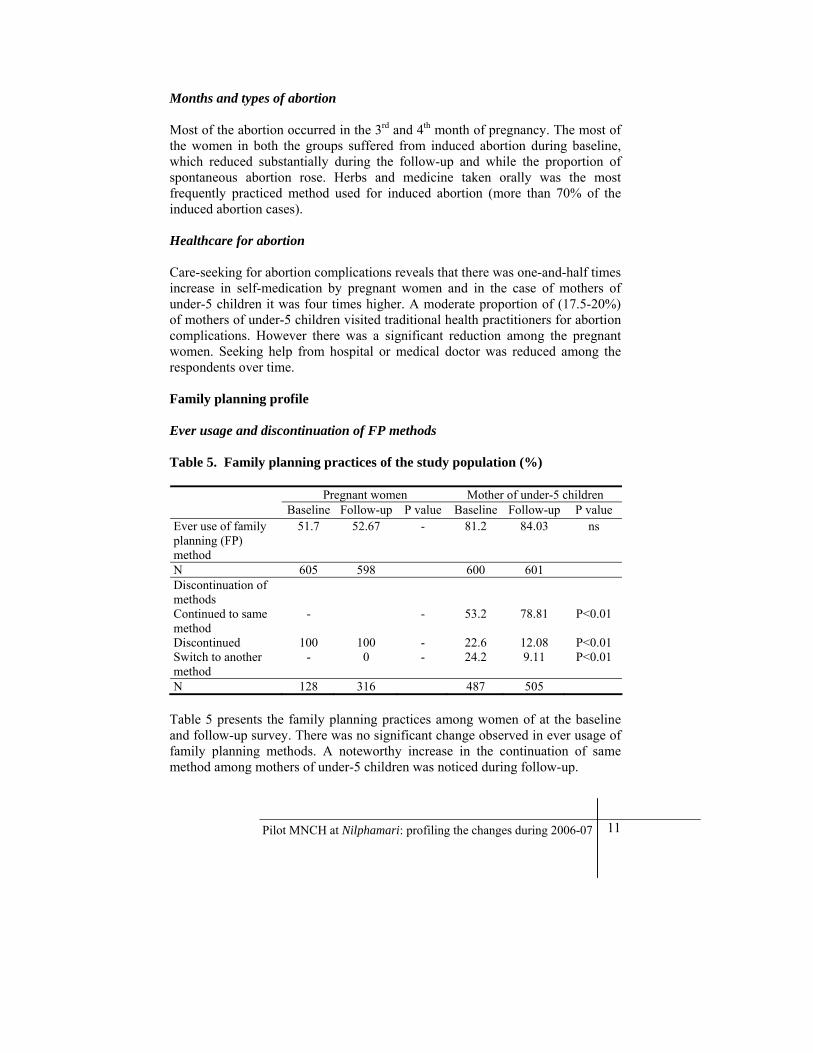
Months and types of abortion Most of the abortion occurred in the 3rd and 4th month of pregnancy. The most of the women in both the groups suffered from induced abortion during baseline, which reduced substantially during the follow-up and while the proportion of spontaneous abortion rose. Herbs and medicine taken orally was the most frequently practiced method used for induced abortion (more than 70% of the induced abortion cases). Healthcare for abortion Care-seeking for abortion complications reveals that there was one-and-half times increase in self-medication by pregnant women and in the case of mothers of under-5 children it was four times higher. A moderate proportion of (17.5-20%) of mothers of under-5 children visited traditional health practitioners for abortion complications. However there was a significant reduction among the pregnant women. Seeking help from hospital or medical doctor was reduced among the respondents over time. Family planning profile Ever usage and discontinuation of FP methods Table 5. Family planning practices of the study population (%) Pregnant women Mother of under-5 children Baseline Follow-up P value Baseline Follow-up P value Ever use of family planning (FP) method
51.7 52.67 - 81.2 84.03 ns
N 605 598 600 601 Discontinuation of methods
Continued to same method
- - 53.2 78.81 P<0.01
Discontinued 100 100 - 22.6 12.08 P<0.01 Switch to another method
- 0 - 24.2 9.11 P<0.01
N 128 316 487 505 Table 5 presents the family planning practices among women of at the baseline and follow-up survey. There was no significant change observed in ever usage of family planning methods. A noteworthy increase in the continuation of same method among mothers of under-5 children was noticed during follow-up.

12 RED Working Paper No. 5
Types of FP methods used and their sources Type of currently used FP methods Figure 1 represents a comparison of currently used FP methods by mothers of under-5 children (Annex Table 1). It was observed that women commonly used pill and injection. Usage of pill was five times higher than usage of injection during the follow-up period, which was approximately four times higher during the baseline. Figure 1. Currently used family planning methods by mothers of under-5 children
0
10
20
30
40
50
60
70
80
Pill Injection Ligation Safe period Others
Perc
enta
ge
Baseline:under-5motherFollow-up:under-5mother
Sources of FP commodities Table 6 reports that mothers of under-5 children mostly availed FP commodities either from the FWV/FWA or from local pharmacy/village doctors during baseline. During the follow-up period Shasthya Shebika (SS), Satellite clinics, FWV/FWA, pharmacy, etc. were found as potential supply sources of FP commodities.

13 Pilot MNCH at Nilphamari: profiling the changes during 2006-07
Table 6. Sources of FP commodities (multiple responses %)
Baseline Follow-up P value Mother of under-5
children Mother of under-5
children
Sources of FP commodities SS 5.6 9.01 P<0.05 FWV/FWA 44.6 25.73 P<0.01 Pharmacy/village doctor 24.1 25.29 ns Grocery shop/Market 11.7 8.0 ns MCWC/FWC/UHC 5.6 6.30 ns District hospital /MBBS doctor 1.9 0.45 ns NGO clinics 3.3 3.63 ns Satellite clinics - 10.59 ns N 355 443
Side effects of FP methods and their management Side effect FP methods The reported side effects of pill and injection experienced by mothers of under-5 children rose significantly from 11 to 28% and 5 to 11% respectively during 2006-2007 (Annex Table 2) Healthcare for side effects (Table 7) It was observed that women usually did not seek any help for the side effects experienced by pill and injection. However, a gradual shifting to seek help in case they had side effects from the providers of any kind was observed after 1-year of intervention. The informal health providers like village doctors played a potential role in this regard. Antenatal care (ANC) Changes in the knowledge of ANC A snapshot of knowledge shows that more than 95% of the pregnant women were aware of ANC visits. The median number of expected visits rose to 5 compared to 3 in baseline (Annex Table 3).

14 RED Working Paper No. 5
Table 7. Side effects and its management by mothers who currently used FP methods (Multiple response %)
Baseline Follow-up P value Mother of under-5
children Mother of under-5
children
Side effects of pill 10.66(64) 28.42(170) P<0.01 Side effects of Injection 4.66(28) 11.16(67) P<0.05 N 600 600 Managements of FP side effects No action taken 80.6 70.68 P<0.01 Self medication 7.1 1.05 P<0.05 Village doctor 3.1 16.75 P<0.01 MBBS doctor 6.1 4.71 ns FWA/FWV - 1.05 ns Drinking more water/milk - 10.5 ns Eating more vegetable - 6.81 ns Others 5.0* 21.98 ns N 98 197
* The proportion of drinking more water and eating vegetables was included in others during baseline.
Actual changes made in ANC check-up Current pregnancy stage and ANC visits Table 8 provides a detailed comparative description of current ANC practices of pregnant women. Fourth-fifth of the pregnant women were performed ANC check-up either in the 2nd or 3rd trimester of their pregnancy. However, the median number of visits rose to 3 from 2 in the baseline (Fig. 2) after initiation of intervention.

15 Pilot MNCH at Nilphamari: profiling the changes during 2006-07
Table 8. Antenatal check-up of the pregnant women (%)
Baseline Follow-up P value Pregnant
women Pregnant women
Stages of pregnancy First trimester 17.4 9.17 P<0.01 Second trimester 44.1 45.83 ns Third trimester 38.2 45.00 ns Don’t know 0.3 - ns N 600 598 Persons performing the ANC (multiple response) SS/SK 35.0 84.38 P<0.01 NGO clinics 19.4 1.77 P<0.01 MBBS doctor /Gynaecologist 7.2 11.52 P<0.05 FWV/FWA - 11.33 ns RDRS worker - 8.98 ns LAMB worker - 2.15 ns Non-formal health providers 1.7 5.67 P<0.05 Private hospital/clinic 3.1 - ns FWC (Family welfare centre) 23.3 0.44 P<0.01 UHC/MCWC 11.1 0.22 P<0.01 BRAC Shushasthya 3.9 - ns Satellite clinic 2.8 - ns District hospital 1.1 - ns Others 7.8 0.8 P<0.05 N 600 598
Figure 2. Pattern of actual ANC visits of pregnant women
0 5
10 15 20 25 30 35 40
Perc
enta
ge
1 2 3 >3(4-12) MedianVisits
Baseline: PregnantMother
Follow-up:PregnantMother

16 RED Working Paper No. 5
ANC care-seeking behaviour A sharp rise of ANC provided by SS/SK was observed during the follow-up (84%), which was 35% during baseline. The contribution of NGO clinics including RDRS and LAMB had remained same during the follow-up survey. Referral dynamics during ANC Figure 3. Referral of women for ANC check up during follow-up
0 5 10 15 20 25 30 35
% (Multiple response)
Pregnantwomen
Mother ofunder-1children
Did not go elsewhere
MCWC
District hospital
Non-formal healthprovidersParamedic
MBBS doctor
Private clinic
UHC
FWV
NGO clinics
Referral and referred places Trend of referral (Annex Table 5) shows that 11.72% of the pregnant women were referred for ANC check-up whereas the proportion for the mothers of under-1 children was slightly higher (12.37%). Pattern of referrals in Figure 3 shows that NGO clinics, FWV, UHC are the three most preferred places for referral.
17 Pilot MNCH at Nilphamari: profiling the changes during 2006-07
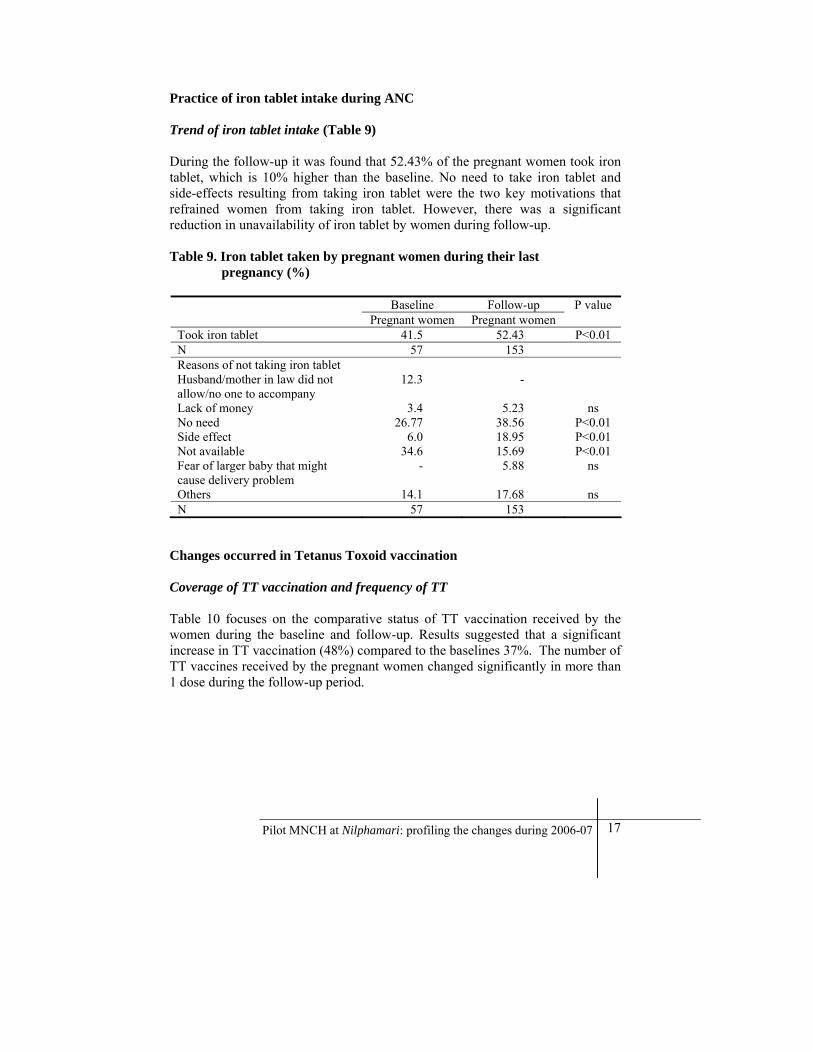
Practice of iron tablet intake during ANC Trend of iron tablet intake (Table 9) During the follow-up it was found that 52.43% of the pregnant women took iron tablet, which is 10% higher than the baseline. No need to take iron tablet and side-effects resulting from taking iron tablet were the two key motivations that refrained women from taking iron tablet. However, there was a significant reduction in unavailability of iron tablet by women during follow-up. Table 9. Iron tablet taken by pregnant women during their last pregnancy (%)
Baseline Follow-up P value Pregnant women Pregnant women
Took iron tablet 41.5 52.43 P<0.01 N 57 153 Reasons of not taking iron tablet Husband/mother in law did not allow/no one to accompany
12.3 -
Lack of money 3.4 5.23 ns No need 26.77 38.56 P<0.01 Side effect 6.0 18.95 P<0.01 Not available 34.6 15.69 P<0.01 Fear of larger baby that might cause delivery problem
- 5.88 ns
Others 14.1 17.68 ns N 57 153
Changes occurred in Tetanus Toxoid vaccination Coverage of TT vaccination and frequency of TT Table 10 focuses on the comparative status of TT vaccination received by the women during the baseline and follow-up. Results suggested that a significant increase in TT vaccination (48%) compared to the baselines 37%. The number of TT vaccines received by the pregnant women changed significantly in more than 1 dose during the follow-up period.

18 RED Working Paper No. 5
Table 10. Tetanus Toxoid (TT) vaccine taken by pregnant women (%)
Baseline Follow-up P value Pregnant women Pregnant women
TT immunization received during pregnancy
37.2 48.33 P<0.01
Number of times TT vaccine received
1 74.2 65.52 P<0.01 2 19.1 26.55 P<0.05 3 5.3 3.1 ns 4 -7 0.9 4.83 P<0.05 Can’t remember 0.5 - ns Person gave TT vaccine BRAC CHW (SK/SS/PO) 5.8 0.34 P<0.05 FWV/FWA 78.2 8.97 P<0.01 Doctor (Hospital) 8.4 - ns Satellite clinic/Community clinic 0.4 82.41 P<0.01 NGO clinics 2.2 2.4 ns Health assistant - 2.41 ns Others 6.7 4.45 ns N 255 290
Figure 4. Sources of Tetanus Toxoid (TT) during baseline and follow-up
0%
20%
40%
60%
80%
100%
Pregnant women Pregnant women
Base line Follow up
Others
HA
NGO clinics
Satellite clinic
Doctor (Hospital)
FWV/FWA
BRAC CHW (SK/SS/PO)
Service provider of TT vaccination The baseline findings (Fig. 4) shows that the FWVs (78%) were the major suppliers of TT vaccines but reported statistic of follow-up shows that role of FWVs declined drastically to around 9%. The ranking and role of satellite clinics as a potential source of TT vaccination went up more than 200 times during the follow-up.

19 Pilot MNCH at Nilphamari: profiling the changes during 2006-07
Birth planning and planned attendants of the pregnant women Table 11. Birth planning for the current pregnancy (%)
Baseline Follow-up P value Pregnant women Pregnant women
At home 96.0 97..83 ns District hospital/UHC/MCWC 3.8 3.17 ns N 605 600
Birth planning Birth planning of women is the concomitant characteristic that features how responsive the pregnant women are about their preferred place of delivery. Table 11 delineates that most of the women i.e. around 96-98% preferred to give birth at their respective homes in both time periods.
Planned attendants The study result revealed that both the pregnant women and mothers of under-1 children mostly wanted TTBAs and TBAs to attend their delivery.(Table 12) Also15-18% of the women preferred to invite non-formal health providers to perform their delivery. Table 12. Planned birth attendants during pregnancy (multiple responses %)
Follow-up Pregnant women Mother ofUnder-1 children
TTBA 55.05 46.43 TBA 25.09 35.18 Non-formal health providers 17.94 14.83 Spontaneous 3.49 4.82 Doctor/Nurse at UHC 4.18 2.68 FWV 1.39 1.61 Relatives 1.05 2.86 N 598 598

20 RED Working Paper No. 5
Level of knowledge on the high risk of pregnancy After one year of intervention nearly one-third mothers correctly mentioned the signs of risky pregnancy such as edema (31%), convulsion (37%), bleeding through vagina (39%), severe headache (44%), and high fever (33%). During baseline, edema (17%), convulsion (23%) and weakness (15%) were the reported signs of risky pregnancy. The study shows that a large proportion of the women identified both edema and convulsion as high risk during pregnancy in both time period (Annex Table 6). Awareness about emergency preparation during pregnancy
Figure 5 presents the level of knowledge on emergency preparation by the families during pregnancy period. More than 50% of women in both the group knew PO’s cell phone number so that they could make phone calls in case of emergencies. The awareness on transport arrangement and motivate women to save in “Piggy bank (Matir Bank)” also proved to be successful. Families of the pregnant women and mothers of under-1 children were not at all prepared to manage a blood donor. Figure 5. Knowledge on emergency preparation in pregnancy period during
follow-up
0
10
20
30
40
50
60
70
Perc
enta
ge
pregnant women Mothers of under-1 children
Knows PO's cell no
Transportarrangement
Savings (in MatirBank)
Manage a blooddonor

21 Pilot MNCH at Nilphamari: profiling the changes during 2006-07
Details of pregnancy complications Prevalence and types of pregnancy complications There was no change in the pattern of complications overtime. Lower abdominal pain ranked top among the possible range of pregnancy complications (Annex Table 7). Treatment for pregnancy complications During the baseline majority of (40%) the women took self-medication at home, which was reduced to 12% during the follow-up. However, in both the period the informal health providers like village doctors, Kabiraz, homeopaths, etc. continued to play a major role in managing complications during delivery. In 2007 nearly one–third sought help from the government hospitals. Delivery care Places of delivery Table 13 showed that in both periods more than 80% of the women gave birth of their babies at home, only 8-10% of delivery took place at the nearby district hospital and upazila health complex (UHC). Attendants during delivery TBAs and TTBAs mostly perform the deliveries at home. TBAs, mainly the untrained TBAs conducted delivery during baseline; this situation had become reversed after one year of intervention (Table 13).

22 RED Working Paper No. 5
Table 13. Delivery care for mother during last delivery (%)
Baseline Follow-up Mother of under-
5 children Mother of under-
1 children Places of delivery Home 86.7 84.33 District hospital/UHC 8.1 10.34 Private clinic/hospital 2.3 1.0 BRAC Shushasthya 1.2 0.67 NGO clinics 1.7 1.33 Tried at home first then move to another place - 2.33 Birth attendants at last delivery Untrained TBA 31.3 36.54 Trained TBA 21.3 43.61 Relatives/Friends/Neighbour/Mother-in-law/Mother
19.0 15.72
Spontaneous 12.7 6.48 MBBS doctor/Nurses 10 0.4 FWV 1.5 1.38 Caesarean section 1.8 - SS - 2.36 Others 2.3 0.79 N 600 598
Practices of safe delivery Around 74% of birth attendants washed their hands with soap and water before attending delivery and 44% of birth attendants used clean plastic sheet for lying mothers on it (Table 14). However, use of new and boiled blade for cord cutting was significantly reduced from 82% to 67% during 2006-2007. Table 14. Practices followed for safe delivery
Baseline Follow-up Mother of under-5 children Mother of under-1 children Washing hands with soap and water
- 74.46
Clean plastic sheet used for lying
- 44.29
Blade new and boiled 82.2 66.6 N 600 598

23 Pilot MNCH at Nilphamari: profiling the changes during 2006-07
Persons who cut the cord The TBAs mostly cut the cord during the baseline but their contribution declined by 4.3% during the follow-up. Most remarkable change that emerges from programme intervention is that nearly 20% rise in the role of Trained TBAs in cutting cord (Fig. 6) Figure 6. A relative comparison of person who cut the cord between baseline
and follow-up survey
0 10 20 30 40 50
TBA
TTBA
Mother/ Relatives
MBBS/ Nurses
Village doctor
SS
Others
Percentage
Follow-up: Motherof under-1 children
Baseline: Mother ofunder-5 children

24 RED Working Paper No. 5
Complications during delivery and health seeking- behaviour Table 15. Practices followed for complications during delivery (multiple
response %) Baseline Follow-up Mother of under-5 children Mother of under-1 children Complication during delivery 13.66 10.0 Type of complications Excessive bleeding 3.7 16.67 Hand/leg prolapsed 4.9 10.0 Mal presentation 8.5 5.0 Prolong labour 48.8 19.01 Retained placenta 9.8 21.67 Convulsion 2.4 3.33 Uterine os is not open 3.7 5.0 No pain/no uterine contraction
15.9 25.0
Others 12.2 5.14 Healthcare for complications Village doctor 23.2 43.33 TBA 25.6 10.0 UHC/MCWC 14.6 8.33 Private practitioners (doctors)
12.2 3.33
No action taken 4.9 30.0 District Hospital 12.2 ** Others 7.3 5.0 N 82 60
** None of the women sough care from district hospital Problems during delivery The reported delivery complications of mothers of under-1 children during the follow-up diminished 10% relative to 14% of the mothers of under-5 children during baseline. In the baseline nearly half of the women were suffered from prolonged labour problem, whereas during follow-up, the reported complications were excessive bleeding (17%), prolonged labour (19%), retained placenta (22%), no uterine contraction (25%) and so on. Places visited for complications The study reveals that village doctors likely to meet the demand of 23% of women, but they were found to meet the demands of 47% of women during the follow-up. Another negative outcome of this study is the high rate of decline of health-seeking from the formal health providers such as TBAs, UHC, MCWC,
25 Pilot MNCH at Nilphamari: profiling the changes during 2006-07
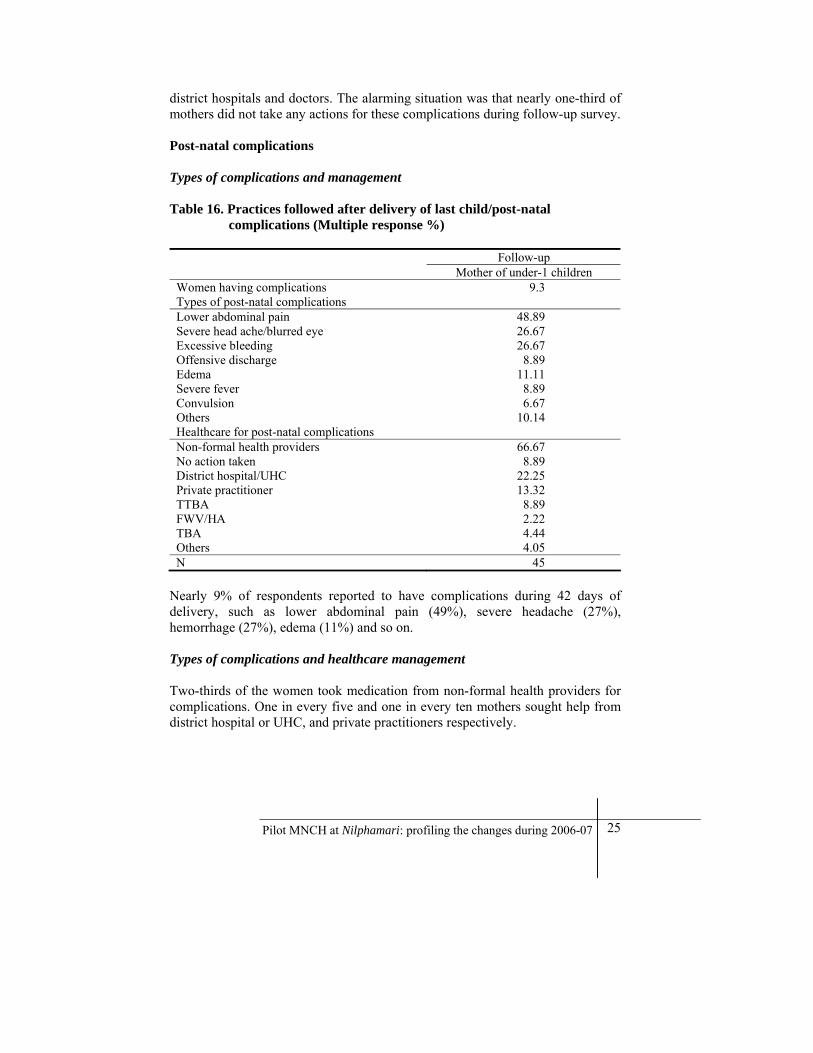
district hospitals and doctors. The alarming situation was that nearly one-third of mothers did not take any actions for these complications during follow-up survey. Post-natal complications Types of complications and management Table 16. Practices followed after delivery of last child/post-natal
complications (Multiple response %)
Follow-up Mother of under-1 children Women having complications 9.3 Types of post-natal complications Lower abdominal pain 48.89 Severe head ache/blurred eye 26.67 Excessive bleeding 26.67 Offensive discharge 8.89 Edema 11.11 Severe fever 8.89 Convulsion 6.67 Others 10.14 Healthcare for post-natal complications Non-formal health providers 66.67 No action taken 8.89 District hospital/UHC 22.25 Private practitioner 13.32 TTBA 8.89 FWV/HA 2.22 TBA 4.44 Others 4.05 N 45
Nearly 9% of respondents reported to have complications during 42 days of delivery, such as lower abdominal pain (49%), severe headache (27%), hemorrhage (27%), edema (11%) and so on. Types of complications and healthcare management Two-thirds of the women took medication from non-formal health providers for complications. One in every five and one in every ten mothers sought help from district hospital or UHC, and private practitioners respectively.

26 RED Working Paper No. 5
PNC Check ups within 48 hours of delivery Table 17. Status of post-natal check-up within 48 hours of delivery (%)
Follow-up Mother of under-1 children Care received 62.33 Provided by SK 42.25 TTBA 31.55 TBA 20.05 SS 9.63 Relatives/Mother/Mother-in-law 6.42 FWV 1.07 Others 2.41 Frequency of care 1 45.96 2 27.02 3 12.53 > 3 (4 –15) 14.49 N 359
Table 17 showed the care received by the mothers within 48 hours of delivery. Two-thirds of mothers received PNC after one year of intervention. The main PNC caregivers were found to be SK (42%), TTBA (32%) and TBA (20%). Figure 7. Type of PNC check-up (within 48 hours) given to ailing mothers
during follow-up
0
10
20
30
40
50
60
70
80
Perc
enta
ge
Under-1 Mother
Given advice
Help to breast feed
Pulse examination
Blood pressure
Anemia
Others

27 Pilot MNCH at Nilphamari: profiling the changes during 2006-07
Types and frequency of care (Fig 7) In most of the cases the situations of women were not highly critical as it is reflected that 70% of them received only advices and in 50% cases newborn weight was taken. Majority of the mothers (46%) received only one PNC within 48 hours of delivery. Neonatal care Knowledge on neonatal complication among study population Around 70% of the mothers of under-1 children ranked fever as the top most complication that needs to be treated immediately. Apart from this pneumonia, jaundice gets the 2nd and 3rd spot consecutively with 50% women acknowledged Pneumonia and 47% favoured jaundice (Annex Table 8) Knowledge on health -seeking behaviour for neonatal complications Around 68% mothers of under-1 children reported that they would take their babies to the nearby upazila health complex (UHC) and 42% of them were keen to visit formal heath providers mainly at the district hospitals and MBBS doctors (Table 18). However, one-third of them preferred to go to the non-formal health providers in the community. Table 18. Knowledge of study population about places to visit for
management of neonatal complications (Multiple responses %)
Follow-up Mother of under-1 children Upazila health complex 67.67 Non-formal health providers 30.83 District hospital 24.83 MBBS 17.33 BRAC Shushasthya 11.67 Private clinic 6.5 TTBA 6.0 MCWC 5.5 FWV/HA/FWC 5.00 TBA 2.33 Others 3.67 N 598

28 RED Working Paper No. 5
Breast feeding practices Ninety one percent of babies were fed colostrums immediately during the baseline, but in the follow-up the proportion increased to 93.81%. During the follow-up there was significant reduction in the number of babies who were exclusively bread-fed (i.e. without a single drop of water/milk (other than breast milk up to 6 months). The percentage of pre-lacteal food given to the babies was 11.87% during the follow-up (Table 19). Table 19. Feeding of the newborn (%) Baseline Follow-up Mother of
under-5 childrenMother of
under-1 children Newborn was fed colostrums (within one hour) 91.2 93.81 Newborn was exclusively breast fed 93.5 67.22 Newborn feed with prelacteal food (first three days)
- 11.87
N 600 598 Essential newborn care for healthy newborns Table 20. ENC care for the normal weight babies (%)
Follow-up Mother of under-1 children Babies received essential neonatal care (%) 74.50 ENC provided by TTBA 32.11 TBA 26.17 SK 23.49 Relatives/Neighbours 11.63 SS 9.17 FWV 1.57 Mother herself 1.34 Others 2.67 Types of ENC care Cutting and tying umbilicus cord 65.77 Wiping the baby with clean dry cloth 60.85 Wrapping with clean soft cloth including head 43.85 Giving colostrums within half-hour 26.4 Others 41.17 N 445
Table 20 shows the coverage and types of essential newborn care (ENC) to be given during follow-up. Nearly three-fourth of the babies received ENC care

29 Pilot MNCH at Nilphamari: profiling the changes during 2006-07
immediately after birth. The main caregivers for ENC were TTBA (32%), TBA (26%), SK (23%) and relatives/neighbuors (12%). The common care practices included cutting the umbilical cord (66%), wiping the baby with dry clean cloth (61%), and wrapping body and head with clean soft cloth (44%). Thermal control of normal weight babies The most widely practiced method to maintain temperature of the normal baby was to wrap the baby with warm clothes (80%) and massage the body with oil (49%). The other common practices were observed during follow-up period were not giving bath within 7 days after birth (37%), not giving bath within 3 days after birth (20%), fomentation (18%), not shaving hair (11%), and sun-bath (11%). (Appendix Table 9) Management of temperature for the LBW babies Table 21. Actions taken to maintain the body temperature of LBW during
follow-up (multiple response %)
Follow-up Mother of under-1 children Wrapping with warm clothes 80.0 Not giving bath within 7days 47.69 Not shaving hair within one month 36.92 Skin contact 20.0 Using baby jacket 10.77 Massage with oil 10.77 Frequent breast feeding 3.08 N 65
Table 21 reported the actions taken by mothers to maintain the body temperatures of their LBW babies. Eighty percent of the mothers wrapped their bodies with soft clean cloth immediately after birth followed by 48% mothers who did not bathe their babies within 7 days, and 37% did not shave hairs within one month. Only 11% used baby jacket provided by the programme. Birth asphyxia of the newborn Birth asphyxia and management Table 22 gives detailed information on breathing difficulties of the newborn together with the place from where they received care and the types of care. During the follow-up it was observed that only 9% of the children suffered from birth asphyxia and around 30% of them received treatment from the TTBAs and MBBS doctors, and 6% of SS/SK provided care for birth asphyxia. The

30 RED Working Paper No. 5
commonly practiced care included mouth-to-mouth breathing (43%), tapping feet (38%), and cleaning mouth (28%). Only 9% of cases were sent to hospital. Table 22. Prevalence and management of birth asphyxia among the neonates
during follow-up (Multiple response %)
Follow-up Mother of under-1 children Breathing difficulties during birth 8.86 Providers TTBA 18.51 MBBS doctor 11.32 TBA 13.21 Self treatment 12.96 Homeopath/village doctor 10.33 Nurse 9.43 FWV 7.41 Relatives 7.55 SS/SK 5.55 Types of care Mouth to mouth breathing 42.55 Flip/tapping feet 38.30 Mouth cleaning 27.66 Rubbing body with soft clean cloth 17.02 Give water in mouth 12.77 Sending hospital 8.51 Give medicine 8.51 Wrapping the baby 6.38 Slap on the back 6.38 Given Oxygen 6.38 Others 6.39 Can’t remember 2.13 N 53

31 Pilot MNCH at Nilphamari: profiling the changes during 2006-07
Illness of the newborn and health-seeking practices Illness of newborn Reported illness of newborns increased at a significant rate of 9.5%. During both the periods the neonates commonly suffered from fever (Fig. 8). Nearly 34% of newborns suffered from jaundice during the follow-up. Figure 8. Disease pattern of newborns
0
10
20
30
40
50
60
70Fe
ver
Com
mon
col
d
Mea
sles
/Ras
h
Jaun
dice
Pneu
mon
ia
Res
pira
tory
dist
ress
/A
sthm
a
Perc
enta
ge
Baseline: Mother ofunder-5children
Follow-up:Mother ofunder-1children
Management of illness Relative comparative picture of health-seeking behaviour between the mothers of under-5 and under-1 children (Table 23) showed that no changes had been achieved as homeopath doctors provided service to the majority of sick newborns (64% vs. 53%), followed by village doctors/kabiraj (32% vs. 27%) during the both time periods. Only one in every ten sick neonates sought treatment from the MBBS doctor or district hospital/MCWC/UHC.

32 RED Working Paper No. 5
Table 23. Reported illness of the newborn (multiple response %)
Baseline Follow-up Mother of under-5
children Mother of under-1
children Newborn suffered illness within one month 58.3 (600) 67.83 (598) Management of illness Homeopath 52.9 63.39 Village doctor/Kabiraj 32.3 27.07 MBBS doctor/Child specialist 13.7 8.6 District Health/UHC/MCWC 9.2 10.08 Self treatment 1.7 7.62 No action taken 1.7 - Others 4.0 2.70 N 350 406
Care for under-5 children Immunization and vitamin A intake of children Vaccination coverage and provider role Table 24 showed immunization programme cover more than 95% of children in both baseline and the follow-up period. The popularity of satellite clinics as the place of immunization has increased significantly in the one-year period and currently 89% of children were immunized at the satellite clinic compared to 64% in baseline.

33 Pilot MNCH at Nilphamari: profiling the changes during 2006-07
Table 24. Immunization of children (%) Baseline Follow-up P value Mother of under-
5 children Mother of under-5
children
Immunization of children 94.95 (600) 97.34 (585) ns Place of giving immunization SS/SK/BRAC Shushasthya 1.9 0.9 ns UHC 3.7 1.37 ns FWC 29.9 - ns Satellite Clinic 64.1 89.06 P<0.01 MCWC 3.5 2.91 ns CNC/CNP 1.1 - ns NGOs 1.6 2.0 ns FWC - 6.84 ns Others 0.2 0.16 ns N 600 585 Vitamin A capsule in last immunization day
62.50 (600) 86.36 (519) P <0.01
Person provided vitamin A capsule SS/SK/BRAC Shushasthya 2.4 0.96 ns FWV 12.5 1.35 P<0.01 FWC 21.6 4.43 P<0.01 Satellite Clinic 62.7 93.06 P<0.01 Others (NGOs, MBBS doctor, Private hospital/Clinic, Village doctor
0.8 0.57 -
N 600 519 Vitamin A intake coverage and provider information Overall coverage of the vitamin A capsule intake also proved to be a success for the programme as more than 80% of the children had been fed during the follow-up period compared to 62% in the baseline. Satellite clinics were found to be a significant place where majority of children received vitamin A capsule along with immunization.

34 RED Working Paper No. 5
Illnesses of under-5 children and health-seeking practices Diseases pattern Table 25 focused on the patterns of diseases that mostly occur in under-5 children during the follow-up period. The results shows that fever (86%) and common cold (65%) were the two top most diseases that frequently affected under-5 children; followed by cough (56%), diarrhoea (47%), pneumonia (31%) and so on. Table 25. Under-5 children suffered from illness (Multiple response %)
Follow-up Mother of under-5 children Under-5 children suffered from illness 24.16 (600) Types of illness Fever 86.52 Common cold 64.73 Cough 55.74 Diarrhoea 46.59 Pneumonia 30.78 Dysentery 18.8 Oral ulcer 7.49 Measles 2 Others 14.49 N 145 Health seeking behaviour Non-formal health provider 52.42 MBBS doctor 27.59 UHC/MCWC/FWC 27.59 District hospital 13.1 Private clinic 4.14 FWV/HA 2.07 Others (Treatment by own, BRAC Shusasthya)
1.38
N 145 Treatment taken Amongst those 145 cases of complications majority (52%) went to non-formal health providers like village doctors, homeopath, kabiraj, etc. followed by 28% of each went to MBBS doctors and UHC/MCWC/FWC.

35 Pilot MNCH at Nilphamari: profiling the changes during 2006-07
Socioeconomic implications of rural MNCH intervention This section entails a stratified analysis (Annex Table 10) of some important indicators (ever use of FP, ANC check up during pregnancy, TT vaccination, prevalence of pregnancy complications, essential PNC care and essential newborn care). The objective is to figure out effects of significant socioeconomic variables during the follow-up. In the subsequent section socioeconomic differential in the outcome of significant intervention indicators using multi-variate analysis (logistic regression) is explored. Results from multivariate analysis of ever usage of family planning and ANC check-up on some significant variables are presented in Table 26. Age of pregnant women was found to have strong impact on ever usage of family planning. The odds ratio of literacy indicated a positive association for usage of FP and ANC check-up, while occupations of women being housewives explains that their proportion was higher than women involved in other occupations. Table 26 presents outcomes of regression models on TT vaccination of women and complications during pregnancy. The women who were housewives and attended school had better coverage of TT vaccination. Women belonged to age group of 19-34 years were mostly suffered from pregnancy-related compilations, while the odds ratio 1.19 for BRAC eligible women suggests they were most likely to have pregnancy complications. A logistic regression was also done to find out effect of essential PNC care and newborn care. Women who owned land and attended school received some sort of PNC care (though odds ratios were not statistically significant). Again, the husbands those women who attended school and own land, were most likely to receive essential newborn care (the odds ratios are 2.09 and 1.22 respectively).

36 RED Working Paper No. 5
Table 26. Odds ratio for some significant indicators during follow-up (all independent variables are included in the multivariate analysis) Ever usage of FP ANC check up TT vaccination Pregnancy
complications Essential PNC
care Essential newborn
care OR 95% CI OR 95% CI OR 95% CI OR 95% CI OR 95% CI OR 95% CI
Age 19-34 year old women
Univariate Multivariate
3.63 2.78
2.92 -4.50 2.23 –3.48
0.94 0.88
0.62-1.44 0.58-1.32
ns ns 1.36 1.570
1.00-1.87 1.16-2.13
ns ns 1.08 0.95
0.72-1.61 0.63-1.44
Literacy level Literate
Univariate Multivariate
1.04 1.06
0.86-1.27 0.79-1.43
1.31 0.73
0.89-1.93 0.42-1.28
ns ns 0.92 1.10
0.70-1.21 0.73-1.68
1.10 0.82
0.79-1.54 0.49-1.38
1.86 1.24
1.27-2.72 0.70-2.22
Education Who attend school
Univariate Multivariate
ns ns ns ns 0.77 1.07
0.60-0.99 0.74-1.54
0.99 1.19
0.74-1.33 0.77-1.86
1.22 1.32
0.85-1.74 0.77-2.26
1.95 1.30
1.28-2.99 0.68-2.47
Occupation Housewives
Univariate Multivariate
1.72 1.52
1.02-2.92 0.85-2.53
1.07 1.04
0.38-3.06 0.36-2.99
1.07 1.02
0.57-2.02 0.53-1.95
0.82 0.81
0.36-1.71 0.36-1.87
0.70 0.73
0.30-1.60 0.33-1.77
- -
BRAC membership Yes
Univariate Multivariate
1.70 0.60
1.29-2.36 0.45-0.80
0.97 0.98
0.57-1.62 0.58-1.66
ns ns ns ns 1.14 0.85
0.74-1.76 0.55-1.32
1.33 1.30
0.80-2.23 0.76-2.22
Land Own 1-50 decimal land
Univariate Multivariate
ns ns 1.26 1.34
0.85-1.86 0.88-2.05
0.79 1.01
0.62-1.01 0.80-1.29
ns ns 1.02 0.87
0.73-1.43 0.61-1.24
1.42 1.22
0.98-2.06 0.81-1.83
BRAC eligibility Yes
Univariate Multivariate
ns ns ns ns ns ns 0.78 0.95
0.59-1.03 0.63-1.40
ns ns 1.38 1.08
0.95-2.01 0.62-1.92
Husband’s education Who attend school
Univariate Multivariate
ns ns 0.84 0.90
0.57-1.24 0.57-1.41
0.85 ns
0.64-1.12 ns
ns ns 1.31 1.26
0.93-1.84 0.86-1.87
2.44 2.09
1.63-3.65 1.33-3.30
Husband’s occupation Day labourer
Univariate Multivariate
ns ns ns ns 0.92 0.94
0.72-1.20 0.67-1.31
0.79 0.93
0.60-1.10 0.61-1.38
ns ns ns ns

37 Pilot MNCH at Nilphamari: profiling the changes during 2006-07
Discussion
This study compares baseline and follow-up data to record the changes made in various aspects of MNCH as a result of BRAC-MNCH in Nilphamari district. These data are expected to inform policy planners of MNCH project in making changes and strategies, if needed and can be used as benchmark for later evaluation. State of abortion Unsafe abortion is a cause of maternal morbidity, mortality and measures of abortion complications are also important for monitoring progress towards MDG 5 (Sedgh et al. 2007). The prevalence of abortion among the studied population was on an average 10% during both periods, which is much higher than the national average of 26-30 per 1000 and lower than that of abortion rate of 24 % in the South Asia (Singh et al. 1997, Sedgh et al. 2007). The majority of the abortion occurred in the third month (around 13 weeks) of pregnancy, which converges to abortion that happened between 13-22 weeks in Philippines (Singh et al. 1997). The composition of changes in abortion reveals that spontaneous abortion increased substantially than during follow-up seemed to be misclassification while collecting data as it contradicts the baseline, national and South-Asian trends (NIPORT, Mitra and Associates, ORC Macro 2004, Singh et al. 1997, Sedgh et al. 2007). The health-seeking for abortion complications depicts that percentage of self-treatment by the women (in both groups) during the follow-up period has gone up robustly and treatment taken from trained providers decreased. A plausible explanation would be the lack of access to legal menstrual regulation services by the poor in rural areas and the other reason might be exclusion from modern medical facilities (Begum and Kamal 1984). Seeking care from informal health providers is still much higher and this was also true in the Uttar Pradesh in India and other developing countries (Johnston et al. 2004). Therefore, the programme may break the chain of abortion care through widespread campaigning for menstrual regulation and strengthening referral system to the appropriate formal health providers like district hospitals, MBBS doctors, etc.

38 RED Working Paper No. 5
Proven changes in family planning Bangladesh is often projected as the model for successful nation to increase the practice of family planning method all over the country since the early 80s, though family planning was considered more a mechanism to improve the health of mothers and children than a method of population control (Santhya 2003, Visaria 2000; Visaria and Chari 1998). Ever use of any family planning method among mothers of under-5 children (84%) was higher than the national average of 56% and the contraceptive prevalence in India (46.2%) and other developing countries (57%) (NIPORT, Mitra and Associates, ORC Macro 2004, Santhya, 2003, Sass and Ashford 2002; Ministry of Health Cambodia 2007). However, use pattern (e.g., pills and injection) was found to be similar to national trends. A key concern of family planning programme intervention is to deal with discontinuation of contraception and the reasons for such discontinuation because contraceptive continuation may become more important than acceptance in increasing contraceptive prevalence (Jain 1989, Santhya 2003). The discontinuation of FP methods is decreased over one-year (from 23% to 12%), but still higher than that of the rural India (9.8%) (Santhya 2003). The reasons behind this discontinuation is unknown, hence to reduce this trend programme should provide the FP users a guideline about choice of methods, side-effects and their management. In the study area 45% of the total supply FP commodities are provided by NGOs, whereas government accounted for 6%. Hence, it poses doubt over moderate level of availability of FP commodities (57%) to women by the public sector (NIPORT, Mitra & Associates and ORC Macro 2005). Sources of FP commodities are key to the widespread success of FP intervention and we found that contribution of NGOs are small (Bongaarts and Bruce 1995). Antenatal care: frontiers of challenges Though there has been no changes observed in receiving antenatal care over one year in the study area, the proportion of women in their current pregnancy received at least three ANC visits is double than the national average. Around 22% of the current pregnant women received full coverage (three visits) of ANC, which was much less than rural national average of 53% in rural India (Singh and Yadav 2000). However, based on one-year of MNCH intervention, the status of TT vaccination (37% to 48%) and iron intake (42% to 52%) by pregnant women was found improved but lag behind our national average as well as the national figure in rural India (Singh and Yadav 2000). The aspects of ANC demands immediate attention because the women start ANC check-up in late pregnancy and few women complete the minimum recommended number of visits. The trends in identification of high-risk mothers and care seemed to be better in our

39 Pilot MNCH at Nilphamari: profiling the changes during 2006-07
study area compared with some South-Asian countries. On an average, 20% of the pregnancies were identified as high-risk for both the groups and 12% of those were sent for referral. However, Albrecht, Maureen and Usha (2000) found 41% of pregnancies in Nepal were identified as high risk and of those 15% received referral advice, which was followed in only 32% cases. The awareness level was for severe, life-threatening complications (e.g., bleeding per vagina, edema, convulsion and sever headache) much lower among mothers of under-five children though little improvement was observed between baseline and follow-up survey. (NIPORT, ORC Macro, JHU, and ICDDR,B 2003). Delivery care: revelation of care One of the proxy indicator remains resistant to change is place of delivery. Nearly 87% of the deliveries during baseline were held at home and 84% during follow-up in 2007, which are not lagging behind the national figure (85%) shown in BDHS 2007. Similar state is also observed in rural Nepal (90%) (Osrin et al. 2002). It should be noted that there has been an increasing trend in deliveries by medically trained providers (doctors, trained nurses/midwives and trained TBAs) from 34% in baseline to 48% in 2007, which is greater than the national average of 18% and 6% in Nepal (NIPORT, Mitra and Associates, ORC Macro 2007, Osrin et al. 2002) In Sri Lanka 94% of the births are attended by skilled birth attendants (Zulfiqar et al. 2004, Sazawal et al. 2001, Kinare et al. 2000) Complementary to the hunch for safe delivery care patterns we further explored the types of practices for cord cutting, instruments used, and about the complications during delivery. Outcomes from safe delivery intervention reveal that 43.62% of deliveries of mothers of under-1 children were conducted using safe delivery kit that is much more higher than 8 percentages in rural Nepal (Osrin et al. 2002). However, washing hands and using clean plastic sheet was 74.46% and 44.29% respectively in rural Nilphamari, which is more than double in rural Nepal (Osrin et al. 2002). The use of new or boiled blade was found to be lower (67%) during follow-up compared to the baseline (82%). Keeping in mind this result, the programme can think about the ways to ensure the new blades to be placed with the birth attendants. National figures of delivery complications shows prolonged labour and excessive bleeding were the top two complications. Findings suggests this was indeed true during the baseline period which is not valid in the follow-up as performance of programme is remarkable and programmatic implications for this will have wide range of effects in the coming days. In order to increase the use of safe delivery care, delivery services need to be placed within a context of acceptability by women and their families in addition to the availability of methods for reaping benefits of safe delivery (Bloom et al. 1999).

40 RED Working Paper No. 5
Changes in knowledge and practices during Post-natal period Practices related to PNC visit among the study women was found lower (9%) than that of the national average (21%) (NIPORT, Mitra and Associates, ORC Macro 2007). It is much lower than that of rural Nepal (34%) (Albrecht, Maureen and Shah 2000). The most successful outcome from the programme perspective would be giving substantial amount of post-natal care within the 2 days of delivery, which is nearly 62% and 4 times higher than the survey outcome of BDHS 2004. However in South-Asian countries nearly one in every five women received PNC within 48 hours of giving birth and this figure is very much lower compared to the developed countries where 90% of women received PNC (Hove et al. 1999, Albrecht, Maureen and Shah 2000). However the worst scenario prevailed with respect to receiving care during sickness at this period. In this study it is found that 9.3% of the mothers of under-1 children were currently having post-natal complications. Majority of the women (67%) were treated by non-formal health providers like village doctors, kabiraj etc. that is much lesser (87%) than Nepal but much higher than the national rural average (26%) where 31% received care from qualified medical doctor ((Albrecht, Maureen and Usha 2000), (NIPORT, Mitra and Associates, ORC Macro 2007). This indicates the importance of strengthening PNC package to raise awareness and take appropriate action. Neonatal care: facts and changes Care at birth and in the first few days of life not only saves the lives of mothers and newborns, but also reduces serious complications that may have long-term effects. This study explores some encouraging findings regarding the ENC, such as 61% of the babies were wiped with clean dry clothes. It was found that 94% of the babies were fed colostrums within one hour of their birth, whereas 67% were exclusively breast-fed, which is identical with the national figure and with the findings of studies in rural Nepal (64%) ((Osrin et al. 2002, NIPORT, Mitra and Associates, ORC Macro 2007). Least attention was given in other components of ENC. The MNCH programme has already adopted and implemented the saving newborn lives (SNL) initiative developed by Save the Children USA (SC/USA 2004), however a supportive supervision is essential to make notable success in putting newborn to mother’s breast, newborn check-up, exclusive breastfeeding, and so on. This study found that nearly 58% of the neonates suffered from common cold, fever, jaundice, measles/rash, pneumonia, and other infections. Also 9% suffered from birth asphyxia. The consultation was primarily with homeopaths or drug sellers or traditional healers, who were the key healthcare providers in rural areas. Use of the government primary healthcare system and doctors were limited. The major obstacle to seeking care was found to be ignorance and limited capacity to

41 Pilot MNCH at Nilphamari: profiling the changes during 2006-07
recognize danger signs. In population with such a poor economic and nutritional status, high ignorance and lacking medical facilities, the neonatal mortality and morbidity can be reduced significantly through health education, home-based neonatal care, detection of high-risk neonates, home-based management of pre-term and LBW babies, and integrated management of sick neonate/children approach proposed by WHO. This model was found to be successful in reduction of neonatal mortality and morbidity in India and Guatemala (Bang et al. 1999, Bartlett et al. 1991). Improvement in under-5 children care in MNCH intervention The most dramatic achievement in child health has been the universal level of immunization of under-5 children, which has greatly augmented the chances of their survival, but this needs to be sustained. However, these children are often the victims to various diseases and the knowledge level of parents is limited to take immediate steps in this regard. ARI (cough, common cold and pneumonia) and fever (86%) are is the most prolific killers of under-5 children in Nilphamari district. The most challenge faced by the programme is that nearly 52% of the sick children takes healthcare from the non-formal health providers, which is a bit higher than the national figure (50%) (NIPORT, Mitra & Associates and ORC Macro 2005). To meet MDG 4, the key lesson is the need to teach families and communities with targeted messages and information. Families and parents require making right decision regarding care for children. Integrated management of child illness (IMCI) may play an important role in this regard. Taking the pilot initiatives on IMCI into account by the government of Bangladesh, it is important to note that health system support for IMCI rarely reach adequate level in Bangladesh (Arifeen 2005). Inadequacies of case management are not due to the lack of necessary supplies and equipments, but due to lack of skills, inadequate performance of the health workers, and absence of monitoring and supervision system. Thus it can be concluded that the programme has made some noteworthy changes in the coverage of ANC, vaccination of children, and ensuring safe delivery, etc., but still failed to facilitate the primary and secondary level of health system with basic EmOC. The proportion of referral did not reach the optimum level despite the existence of well-linked MNCH referral network, which calls for programme to rethink and reorganize their system. The lessons from this comparative study will allow programme to upgrade existing health facilities, building functional network, and deployment of adequate number of trained health professional. In addition it will help strengthening collaboration between government, NGO and private sector health facilities to maintain a sustainable MNCH intervention in future. The comparison between baseline and follow-up shows an understanding of not only of what works, but why and how it works, as well as what does not work and why, also what may diminish or enhance the approach on a larger scale.

42 RED Working Paper No. 5
Programmatic Implications
Taking experiences of MNCH pilot initiatives in Nilphamari district into account, upgrading the quality and coverage of MNCH services will have the largest payoff in averting deaths and reducing disability among women and children in rural Bangladesh (Tinker et al. 2002). The pilot MNCH has made efforts to reduce maternal mortality in Bangladesh implementing various kinds of services. The service includes low cost health-care facilities for women and children, strong referral system for complications etc. For scaling up of these tasks, particular emphasis should be placed on developing human resources with adequate training at all level. It involves training up TBAs/midwives for skilled assistance during delivery at homes; community health volunteers/workers for raising awareness, motivation, neonatal and IMCI care. Again train doctors for providing EOC services, monitors and supervisors for effective monitoring and supervision, etc. The future scale-up of MNCH intervention requires fulfilling gaps identified in the pilot study so that in the long run this intervention remained sustainable. So, the key recommendations for attaining the goal of improving the accessibility, quality of maternal and neonatal healthcare, and future sustainability for a large-scale programme are as follows. Intervened population 1. The knowledge level of study population on MNCH knowledge and practices
is still inadequate, and in some cases only superficial. A proper programmatic action is required to raise their knowledge level which must also include involvement of family members and community.
Health system 2. MNCH programme needs to integrate family planning and abortion care
services with the existing MNCH interventions. Apart from contraceptive prevalence rate, the family planning component should emphasize more on continuation of methods, side effect management, choice of methods, and supply. The existing referral system should also take into account of abortion complications and care for those complications.

43 Pilot MNCH at Nilphamari: profiling the changes during 2006-07
3. The pilot MNCH shows that women/community still sought care from informal health providers like homeopaths, village doctors, kabiraj etc. and this implies that healthcare personnel of programme (SK, SS) failed to reach grass roots people. So, the programme has to sort out the best available alternatives to ensure these services. To ensure sustainability, the programme can train informal health providers on modern methods of basic ANC, delivery, PNC, etc. related care, identification of risks of pregnancy and process of referral. These informal health providers will then play a supplementary role and strengthen the coverage of service delivery.
4. The structure of programme’s health system has limitation in identifying
women/babies with problem. There are some under-reporting of complications due to improper maintenance of register books by the SKs. In addition to the SSs, TBAs are linked with providing lower MNCH services as many of them failed to motivate women to take healthcare and even they engage in un-authorized practices. The best way to reduce this habit and improve performance is to revise the honorarium/incentive scheme.
5. A strong referral system needs to be operational from the community level to
the upper tier of health facilities. BHP already established such referral system with district/private and medical college hospitals and engaged a pool of trained professionals in referral i.e. POs/SKs/TBAs/SSs at the community level, provision of emergency transportation, cell phone for prompt communication, etc. But neither of this strong referral practices has been reflected in the referrals of pregnant women (12% referred) and sick neonates during the follow-up period. Hence, the programme has to revise the whole process of referral to plug-in the loopholes and make it more efficient in giving the timely needed services.
Monitoring and supervision 6. A supportive supervisory system needs to be developed and followed-up to
ensure the quality of service delivery and to develop functional MIS at different level. A full system of MIS needs to be created to flow the information to the planners and decision-makers at a regular interval to let them inform whether the programme is following the expected paths and take decisions accordingly.

44 RED Working Paper No. 5
References Albrecht J, Maureen DL and Usha S DIESFELD HJ (2000). Maternity care in rural Nepal: a health service analysis. Tropical medicine & international health, vol5(9): 657-65.
Arifeen SE, et al. (2005). Quality of care for under-fives in first-level health facilities in one district of Bangladesh. Bulletin of World Health Organization 83:260-167.
Bang AT, Bang RA, Baitule SB, Reddy MH, Deshmukh MD. Effect of home-based neonatal care and management of sepsis on neonatal mortality: field trial in rural India. Lancet. 1999 Dec 4;354(9194):1955-61.
Bartlett AV, Paz de Bocaletti ME. Intrapartum and neonatal mortality in a traditional indigenous community in rural Guatemala. Acta Paediatr Scand. 1991 Mar;80(3):288-96.
Begum SF, Kamal H and Kamal GM (1984). A study on menstrual regulation providers in Bangladesh. BAPSA, Dhaka.
Bhutta AZ et al. (2004). Maternal and child health: is south asia ready for change? Br Med J 328:816-9.
Bloom S, Lippiveld T and Wypij D (1999). Does antenatal care make a difference to safe delivery? A study in urban Uttar Pradesh, India. Health policy plann 14(1):38-48.
Bongaarts, J and Bruce J (1995). The causes of unmet need for contraception and the social content of services. Studies in Family Planning 26(2): 57–75.
Chowdhury AMR, Bhuiya A. (2004). The wider impacts of BRAC poverty alleviation programme in Bangladesh. /Journal of International Development /16, 369--386.
Department of Planning and Health Information (2007). Ministry of health, the reproductive health association of Cambodia, and PRB.
Hove I, Siziya S, Katilo C, Tshimanga M (1999). Prevalence and associated factors for non-utilisation of post-natal care services: Population-based study in Kuwadzana peri-urban areas, Zvimba district of West Province, 89 Zimbabwe”, Afr J Reprod Health, 3:25-32.
Jain AK (1989). Fertility reduction and the quality of family planning services. Studies in Family Planning 20(1): 1–16.
Johnston HB, Ved R, Lyall N, Agarwal K (2004). Where do rural women obtain post abortion care? The case of Uttar Pradesh India. Int Fam Plann Pers Vol29(4).
Kinare AS et al. (2000) “Low mid-pregnancy placental volume in rural Indian women: a cause of low birth weight,?” Br Med J 182:443-8.
NIPORT, Mitra and Associates, ORC Macro (2003). Bangladesh demographic and health survey 2004. Dhaka and Claverton: NIPORT, Mitra and Associates, and ORC Macro.

45 Pilot MNCH at Nilphamari: profiling the changes during 2006-07
NIPORT (National Institute of Population Research and Training), Mitra and Associates, ORC Macro (2005). /Bangladesh// Demographic and Health Survey 2004./ Dhaka and Claverton: NIPORT, Mitra and Associates, and ORC Macro.
NIPORT, ORC Macro, John Hopkins University, ICDDR,B (2003). Bangladesh maternal health services and mortality survey 2001. Dhaka and Claverton: National institute of population research and Ttraining (NIPORT), ORC Macro, John Hopkins University and ICDDRB.
Osrin D, Tumbahangphe KM, Shrestha D, Mesko N, Shrestha BP, Manandhar MK, Standing H, Manandhar DS, Costello AMDL (2002) “Cross sectional, community based study of care of newborn infants in Nepal,” Br Med J 325:1063.
Safe Motherhood (2006). http://www.safemotherhood.org Accessed 2 February 2006.
Santhya KG (2003). Changing family planning scenario in India: An overview of recent evidences. Population Council, New Delhi, India, Regional working paper series no-17.
Sass J and Ashford L (2002). Women of Our World 2002, Washington DC: Population Reference Bureau.
Save the Children (SC)/USA, (2004). Savings newborn lives, Newborn care practices in Bangladesh. Evaluation survey 2004. Dhaka: Association for Community and Population Research and Save the Children, USA.
Sazawal S, Black RE, Menon VP, Dinghra P, Caulfield LE, Dhingra U, Bagati A ( 2001). Zinc supplementation in infants born small for gestational age reduces mortality: a prospective, randomized, controlled trial. Pediatrics108: 1280-6.
Sedgh G, Henshaw S, Singh S, Åhman E Shah I.H (2007). Induced abortion: estimated rates and trends worldwide., Lancet 370: 1338–45.
Sines A, Tinker A, Ruben, J (2006) The maternal-neonatal-child health continuum of care: A collective effort to save Lives, Policy Perspective on Newborn Health, Save the Children.
Singh P and Yadav RJ (2000). Antenatal care of pregnant women in India. Ind J of Comm Medi 25(3):112-7.
Singh S, Josefina VC, Hossain A, Kamal AH, Perez AE (1997). Estimating the level of abortion In the Philippines and Bangladesh. Int Fam Plann Pers,23(3):100-7.
Singh S, Juarez F, Cabigon J, Ball H, Hussain R Nadeau J (2006). Unintended pregnancy and induced abortion in the Philippines: Causes and Consequences.Newyork, Guttmacher Institute,44 p.
Sreeramareddy CT, Joshi HS, Sreekumaran BV, Giri S and Chuni N (2006). Home delivery and newborn care practices among urban women in western Nepal: a questionnaire survey. BMC Pregnancy and Childbirth 6:27.
Tinker A and Ransom E (2002). Healthy mothers and healthy newborns: The vital link. population reference bureau and saving newborn lives initiative.
UNDP (2004). /Human Development Report 2004. /Available from: http://hdr.undp.org /statistics/data/cty/cty_f_BGD.html <http://hdr.undp.org%20/statistics/data/cty/ cty_f_BGD.html>. (accessed 12 July 2005)
Vanneste A, Ronsmans C, Chakraborty J, Francisc A. de (2000) Prenatal screening in rural Bangladesh: from prediction to car.’ Health Policy and Plann 15(1):1-10.

46 RED Working Paper No. 5
Visaria L (2000). From contraceptive targets to informed choice: “The Indian experience in women’s reproductive health in India., ed. R. Ramasubban and S.J. Jejeebhoy. New Delhi: Rawat Publications, pp. 331–382.
Visaria P and Chari V (1998). India’s population policy and family planning programme: Yesterday, today and tomorrow,” in do population policies matter? Fertility and politics in Egypt,India, Kenya and Mexico. ed. A. Jain. New York: Population Council, pp. 53–112.
Viswanathan H, Godfrey S, Yinger N (1998). Reaching Women: A Study of unmet need in Uttar Pradesh, India. Washington, DC: International Center for Research on Women.
World Health Report (2005). World Health Organization (WHO).

47 Pilot MNCH at Nilphamari: profiling the changes during 2006-07
Annex Table 1. FP methods currently used (%)
Baseline Follow-up P value Mother of under-5
children Mother of under-5
children
Types of methods Pill 69.2 75.9 P<0.05 Injection 19.9 15.09 P<0.05 Ligation 4.5 2.7 - Safe period 2.4 2.48 - Norplant 0.5 - Others 3.5 3.84 - N 355 442
Table 2. Side effects and its management by mothers who currently use pill and
injection (%)
Baseline Follow-up P value Mother of under-5
children Mother of under-5
children
Side effects experienced by pill Headache/vertigo/dizziness 82.8 74.12 P<0.05 Irregular menstruation 15.6 18.82 - Burning body 6.3 18.82 - Weakness 31.3 36.47 P<0.05 Vomiting 14.1 - - Blurring of vision 3.1 14.71 P<0.01 Anorexia in food - 14.71 - N 64 147 Side effects experienced by injection Irregular menstruation 39.3 64.10 P<0.01 Vertigo/dizziness 21.4 23.08 - Weakness 39.3 25.64 P<0.05 Abdominal pain 10.7 ** - Blurred vision 7.1 7.69 - Excessive bleeding* 10.7 7.69 - Anorexia 10.7 2.56 P<0.01 Burning hand/leg - 15.38 - Others 3.6 2.98 N 28 39
* Inter-menstrual bleeding ** during follow-up reported info on satellite clinic is available.

48 RED Working Paper No. 5
Table 3. Knowledge of study population on ANC visits (%)
Baseline Follow-up P value Pregnant women Pregnant women
Knows about ANC 98.2 97.7 - Number of ANC visit to be received One visit 0.5 1.03 - Two 3.9 1.54 - Three 23.4 14.24 P<0.01 Four or More 44.9 54.89 P<0.01 Don’t know 27.3 28.30 - Median number of ANC visit 3.00 5.00 - N 594 598
Table 4. Antenatal check-up of the pregnant mothers (%) Baseline Follow-up P value Pregnant women Pregnant women Number of ANC Visit 1 38.97 24.24 P<0.01 2 20.66 22.78 - 3 19.72 22.22 - >3(4-12) 20.18 30 P<0.01 Can’t remember 0.47 0.56 - Median ANC visits 2.00 3.00 - N 600 598
Table 5. Referral of women for ANC check up
Follow-up Pregnant women Mother of under-1 children
Send for referral 11.72 12.2 N 358 554 Referred Places (Multiple response) NGO clinics 35.0 22.54 FWV 23.33 16.9 UHC 13.33 16.9 Private clinic 6.67 11.27 MBBS doctor 5.0 15.49 Paramedic 5.0 4.23 Non-formal health providers 6.67 2.82 District hospital 1.67 4.23 MCWC 1.67 4.23 TTBA - 2.82 Did not go elsewhere 10.0 11.27 N 41 68

49 Pilot MNCH at Nilphamari: profiling the changes during 2006-07
Table 6. Knowledge on high-risk pregnancy of study population (%) Baseline Follow-up P value Mother of under-5
children Mother of under-5
children
Signs for identifying a risky pregnancy
High blood pressure 2.8 4.0 - Oedema 17.5 30.83 P<0.01 Convulsion 22.6 37.33 P<0.01 Severe bleeding (APH) 5.3 - - Excessive vomiting 1.0 2.83 - Weakness (severe)/anaemia 14.7 - - Mal position 2.5 - - Severe lower abdominal pain 5.3 9.5 P<0.05 High fever 2.6 33 P<0.01 Anorexia 1.0 - - Bleeding through vagina - 38.83 - Severe headache - 43.83 - Others 7.8 11.15 - N 600 601
Table 7. Complications during current pregnancy (Multiple response %)
Baseline Follow-up P value Pregnant women Pregnant women
Suffered from pregnancy related complication
23.8 19.50 -
Types of complication during last pregnancy Lower abdominal pain 50.0 48.72 - Weakness/pale eye/anaemia 18.1 9.4 P<0.01 Vomiting/anorexia 12.5 2.56 P<0.01 Edema 4.9 14.53 P<0.01 Burning of hand/feet 8.3 1.71 P<0.05 Bleeding 2.8 4.27 - High blood pressure 1.4 3.42 - Vertigo 6.9 - - No foetal movement 0.7 - - Others 34.7 46.12 P<0.01 Persons/Places visited for complications Self treatment 39.6 12.12 P<0.01 Non-formal health provider 25.7 30.31 P<0.05 District hospital/UHC/FWC/FWA/MCWC 16.7 28.79 P<0.01 MBBS doctor /gynaecologists 14.6 12.12 - SS/SK 1.4 9.09 P<0.01 BRAC Shusasthya 1.4 6.07 P<0.05 Private hospital/clinic - 3.03 - Others (Paramedic, RDRS etc) 6.3 3.4 - N 144 117

50 RED Working Paper No. 5
Table 8. Knowledge of study population on neonatal complications requiring treatment (Multiple responses) (%)
Follow-up
Mother of under-1 children Decrease in breast feeding/can not have breast feeding
4.5
Diarrhoea 8.5 Pneumonia/Difficulty in breathing 50.33 Jaundice 47.5 Blister/infection in skin 13.33 Fever 70.33 Convulsion 17.17 Measles 17.5 Suction of chest cage 13.33 Common cold 12.33 Severe vomiting 16.33 Infected umbilicus 4.67 Distended abdomen 4.5 Red eye/dust/fungus in eye 3.67 Others 6.02 N 598
Table 9. Action taken by mothers to keep the baby warm (Multiple response %) Baseline Follow-up Mother of under-5
children Mother of under-1
children mother Skin contact 6.5 - Wrap with warm clothes 80.0 80.27 Massage with oil 46.2 52.68 Fomentation 9.0 18.06 Not giving bath within 3 days - 20.0 Not shaving hair within one month - 10.77 Not giving bath within 7 days - 36.92 Giving bath just after birth - 3.08 Keep in sunlight - 10.77 Others 0.3 1.54 N 600 533

51 Pilot MNCH at Nilphamari: profiling the changes during 2006-07
Table 10. Changes observed in various outcomes of intervention in terms of socio-economic status
FP
usage ANC
check upTT
vaccinationPregnancy
complicationsEssential PNC care
Essential newborn care
Age 14-18 years 13.07 27.82 28.41 21.09 29.57 26.52 19-34 years 80.79* 69.04* 68.64* 74.22* 66.94* 69.66*
>34 years 6.75 3.14 2.96 4.69 3.49 3.82 Literacy level Can read and write 51.92 53.31 55.70 54.30 53.21 50.34 Can not read and write
48.08 46.69 44.30 45.70 46.79 49.66
Education Primary 31.88 30.66 30.35 27.73 29.95 30.43 Secondary 31.54 34.16 35.98 35.16 34.49 32.21 Above SSC 2.22 2.30 2.43 3.91 1.60 1.57 Didn’t attend school 34.36** 32.16** 31.24** 33.20** 33.96** 35.79**
Occupation Housewife 94.88* 96.22* 96.16* 96.88* 96.52* 96.87*
Involved in income generating activities
5.12 3.78 3.84 3.12 3.48 3.13
BRAC membership 20.38** 17.13** 15.24** 16.80** 16.58** 18.34**
Non-BRAC member 37.43 33.89 32.39 35.55 33.16 33.56 Land ownership Landless 10.91 12.15 13.06 12.11 13.37 13.87 1-50 decimal 57.12* 59.21* 56.72* 53.13* 57.75* 59.73*
> 50 decimal 31.97 28.64 30.22 34.77 28.88 26.40 BRAC eligible 43.39* 45.95* 45.71* 41.41* 48.66* 47.87*
Husband’s education Primary 27.77 27.05 28.50 29.69 27.08 26.07 Secondary 23.23 23.55 23.88 20.31 22.25 20.45 Above SSC 6.83 6.09 6.16 10.16 5.36 5.39 Did not attend school 45.18* 43.31* 41.43* 39.84 45.31* 48.09*
Husband’s occupation Agro-farmer 23.06 22.16 20.59 23.83 23.32 22.47 Rickshaw puller 10.59 10.90 10.91 10.55 14.21 13.26 Day labourer 29.63* 31.02* 30.94 28.13* 28.69* 30.11*
Small business 16.14 16.07 14.76 17.19 16.35 16.63 Others 20.58 19.85 20.80 20.31 17.43 17.53 N 1171 1083 779 256 373 445
* Denotes p < 0.01, ** Denotes p < 0.05