Maternal Blood Lead Concentration, Diet During Pregnancy, and Anthropometry Predict Neonatal Blood...
6
Environmental Health Perspectives • VOLUME 111 | NUMBER 2 | February 2003 195 Maternal Blood Lead Concentration, Diet During Pregnancy, and Anthropometry Predict Neonatal Blood Lead in a Socioeconomically Disadvantaged Population Lawrence M. Schell, 1 Melinda Denham, 2 Alice D. Stark, 3 Marta Gomez, 3 Julia Ravenscroft, 2 Patrick J. Parsons, 4 Aida Aydermir, 5 and Renee Samelson 6 1 Department of Epidemiology, and 2 Department of Anthropology, University at Albany, State University of New York, Albany, New York, USA; 3 Bureau of Environmental and Occupational Epidemiology, New York State Department of Health, Troy, NY, USA; 4 Lead Poisoning/Trace Elements Laboratory Wadsworth Center, New York State Department of Health, Albany, New York, USA; 5 Department of Biostatistics, University at Albany, State University of New York, Albany, New York, USA; 6 Department of Obstetrics and Gynecology, Albany Medical Center, Albany, NY, USA The average blood lead concentration among young children in the United States has decreased markedly since 1980 (Brody et al. 1994; Pirkle et al. 1994); but in many inner- city, socioeconomically disadvantaged com- munities, worrisome numbers of children continue to be diagnosed with elevated lead levels (Brown et al. 2000; Centers for Disease Control and Prevention 2001; LaFlash et al. 2000; Litaker et al. 2000). Lead is related to adverse health effects in children including interference with neurobehavioral develop- ment, reduced physical growth, impaired heme synthesis, kidney and liver failure, seizures, and even death (ATSDR 1988). A child’s lead burden begins before birth with lead transferred from maternal circula- tion and increases rapidly in the first few years of life, as exposure to environmental lead increases (ATSDR 1988; Brody et al. 1994; Pirkle et al. 1994). During pregnancy, lead is liberated from the maternal skeleton (Gulson et al. 1997) and transferred from mother to child in utero. It is useful to know the factors that may influence this transfer in order to manipulate them and reduce fetal exposure and its effects. Although many risk factors for lead exposure such as past maternal education or race/ethnicity cannot be altered, maternal diet during pregnancy and nutritional status can be. The goal of this investigation is to determine the influence of these two factors on the concentration of blood lead in the newborn in a socioeconomically disadvan- taged population at risk for lead exposure. Materials and Methods The Albany Pregnancy Infancy Lead Study (APILS), a prospective, longitudinal study, was initiated to address the question of nutri- ent–lead interaction and to explore the impact of early lead concentration on infant growth and development (the subject of other reports). The study was conducted in two phases that differed in follow-up protocol and lead concentration measurement methods: phase one from 1986 to 1992 and phase two from 1992 to 1998; both phases have been described elsewhere (Schell et al. 1997, 2000). This report is based on data from the second phase. All procedures for both studies were reviewed and approved by the Institutional Review Boards of the New York State Department of Health, Albany Medical Center and the State University of New York at Albany. Informed consent was obtained before data collection. Data collection and sample recruitment. The APILS sample was drawn from a socioe- conomically disadvantaged population of pregnant women at risk for lead exposure due to poverty, urban residence in old, dilapidated housing, and close proximity to industrial and vehicular emissions. Pregnant women were recruited into the study if they sought prenatal care at either the Albany County Department of Health (ACDH) Clinic or the Albany Medical Center (AMC) Obstetrics Clinic. Once enrolled, a woman was seen for a study visit once during each trimester of her pregnancy. To be eligible for the study, a par- ticipant must a ) have been a resident of Albany county; b) have been eligible for the Women, Infants and Children program (WIC; < 185% of poverty level); c) have been pregnant < 24 weeks; d) have planned to use either the ACDH or AMC clinics for prena- tal care for at least two of the three trimesters of pregnancy (depending upon the timing of entry into the study); e) have permitted a cord blood sample to be taken; and, f) have planned to deliver at AMC and have the child followed at the ACDH or AMC pediatric clinic. Potential participants were excluded if they a) already had a child in the study; b) were unable to complete interviews in English (indicating insufficient linguistic ability to complete the cognitive performance assess- ment on maternal IQ tests needed to inter- pret infant development measures); c) were high-risk pregnancies (these were referred by clinic staff to a specialized clinic); or d) were pregnancies involving multiple fetuses. Newborns were not excluded on the basis of APGAR score or infant size. The sample used in this study represents all the participants recruited into the study between September 1992 and October 1998, when recruitment was completed. Address correspondence to L.M. Schell, A&S 237, University at Albany, State University of New York, 1400 Washington Ave. Albany, NY 12222 USA. Telephone: (518) 442-4714. Fax: (518) 442-4563. E-mail: [email protected] We thank A. Cardemon, J. Crucetti, G. Deane, M. Egolstein, M. Gordon, W.A. Grattan, M. Heigel, M. Schmidt, J. Waldron, P. Weinbaum, M.E. White, and staff at the County of Albany Department of Health and at the Albany Medical College. This study was supported by the National Institute of Environmental Health Sciences grant # R01-ES 05280. Received 11 March 2002; accepted 20 September 2002. To determine the influences of maternal diet and nutrition during pregnancy on the blood lead level of neonates, we conducted a study of mother–infant pairs from lower socioeconomic circum- stances living in Albany County, New York. Maternal blood lead (MBPb), anthropometry, and diet were assessed in each trimester. Neonates’ blood lead (NBPb) levels were low (geometric mean = 1.58 μg/dL), and none had elevated blood lead. More than 50% of the mothers had intakes below the recommended dietary allowances for zinc, calcium, iron, vitamin D, and kilo- calories. As expected, MBPb was strongly and positively related to NBPb. Among the anthropo- metric measures of maternal nutritional status, variables measuring gain in weight and arm circumference were negatively related to NBPb. In multivariable models reflecting different ana- lytic strageties and including MBPb, anthropometry, and sociodemographic characteristics, dietary intakes of iron and vitamin D were negatively related to NBPb. The effect of zinc varied substantially depending on model covariates. Effects of dietary constituents are difficult to distin- guish, given the intercorrelated nature of nutrients in the diet. Nevertheless, the influences of maternal anthropometric variables, iron, and vitamin D on neonatal lead levels are clear in our analyses. Key words: anthropometry, calcium, children, diet, iron, lead, neonates, nutrition, zinc. Environ Health Perspect 111:195–200 (2003). [Online 28 October 2002] doi:10.1289/ehp.5592 available via http://dx.doi.org/ Children’s Health Articles
Transcript of Maternal Blood Lead Concentration, Diet During Pregnancy, and Anthropometry Predict Neonatal Blood...
Environmental Health Perspectives • VOLUME 111 | NUMBER 2 | February 2003 195
Maternal Blood Lead Concentration, Diet During Pregnancy, andAnthropometry Predict Neonatal Blood Lead in a SocioeconomicallyDisadvantaged Population
Lawrence M. Schell,1 Melinda Denham,2 Alice D. Stark,3 Marta Gomez,3 Julia Ravenscroft,2 Patrick J. Parsons,4
Aida Aydermir,5 and Renee Samelson6
1Department of Epidemiology, and 2Department of Anthropology, University at Albany, State University of New York, Albany, New York,USA; 3Bureau of Environmental and Occupational Epidemiology, New York State Department of Health, Troy, NY, USA; 4LeadPoisoning/Trace Elements Laboratory Wadsworth Center, New York State Department of Health, Albany, New York, USA; 5Departmentof Biostatistics, University at Albany, State University of New York, Albany, New York, USA; 6Department of Obstetrics and Gynecology,Albany Medical Center, Albany, NY, USA
The average blood lead concentration amongyoung children in the United States hasdecreased markedly since 1980 (Brody et al.1994; Pirkle et al. 1994); but in many inner-city, socioeconomically disadvantaged com-munities, worrisome numbers of childrencontinue to be diagnosed with elevated leadlevels (Brown et al. 2000; Centers for DiseaseControl and Prevention 2001; LaFlash et al.2000; Litaker et al. 2000). Lead is related toadverse health effects in children includinginterference with neurobehavioral develop-ment, reduced physical growth, impairedheme synthesis, kidney and liver failure,seizures, and even death (ATSDR 1988).
A child’s lead burden begins before birthwith lead transferred from maternal circula-tion and increases rapidly in the first few yearsof life, as exposure to environmental leadincreases (ATSDR 1988; Brody et al. 1994;Pirkle et al. 1994). During pregnancy, lead isliberated from the maternal skeleton (Gulsonet al. 1997) and transferred from mother tochild in utero. It is useful to know the factorsthat may influence this transfer in order tomanipulate them and reduce fetal exposureand its effects. Although many risk factors forlead exposure such as past maternal educationor race/ethnicity cannot be altered, maternaldiet during pregnancy and nutritional statuscan be. The goal of this investigation is to
determine the influence of these two factorson the concentration of blood lead in thenewborn in a socioeconomically disadvan-taged population at risk for lead exposure.
Materials and Methods
The Albany Pregnancy Infancy Lead Study(APILS), a prospective, longitudinal study,was initiated to address the question of nutri-ent–lead interaction and to explore theimpact of early lead concentration on infantgrowth and development (the subject of otherreports). The study was conducted in twophases that differed in follow-up protocol andlead concentration measurement methods:phase one from 1986 to 1992 and phase twofrom 1992 to 1998; both phases have beendescribed elsewhere (Schell et al. 1997,2000). This report is based on data from thesecond phase. All procedures for both studieswere reviewed and approved by theInstitutional Review Boards of the New YorkState Department of Health, Albany MedicalCenter and the State University of New Yorkat Albany. Informed consent was obtainedbefore data collection.
Data collection and sample recruitment.The APILS sample was drawn from a socioe-conomically disadvantaged population ofpregnant women at risk for lead exposure dueto poverty, urban residence in old, dilapidated
housing, and close proximity to industrialand vehicular emissions. Pregnant womenwere recruited into the study if they soughtprenatal care at either the Albany CountyDepartment of Health (ACDH) Clinic or theAlbany Medical Center (AMC) ObstetricsClinic. Once enrolled, a woman was seen fora study visit once during each trimester of herpregnancy. To be eligible for the study, a par-ticipant must a) have been a resident ofAlbany county; b) have been eligible for theWomen, Infants and Children program(WIC; < 185% of poverty level); c) have beenpregnant < 24 weeks; d) have planned to useeither the ACDH or AMC clinics for prena-tal care for at least two of the three trimestersof pregnancy (depending upon the timing ofentry into the study); e) have permitted acord blood sample to be taken; and, f) haveplanned to deliver at AMC and have the childfollowed at the ACDH or AMC pediatricclinic. Potential participants were excluded ifthey a) already had a child in the study; b)were unable to complete interviews in English(indicating insufficient linguistic ability tocomplete the cognitive performance assess-ment on maternal IQ tests needed to inter-pret infant development measures); c) werehigh-risk pregnancies (these were referred byclinic staff to a specialized clinic); or d) werepregnancies involving multiple fetuses.Newborns were not excluded on the basis ofAPGAR score or infant size. The sample usedin this study represents all the participantsrecruited into the study between September1992 and October 1998, when recruitmentwas completed.
Address correspondence to L.M. Schell, A&S 237,University at Albany, State University of New York,1400 Washington Ave. Albany, NY 12222 USA.Telephone: (518) 442-4714. Fax: (518) 442-4563.E-mail: [email protected]
We thank A. Cardemon, J. Crucetti, G. Deane,M. Egolstein, M. Gordon, W.A. Grattan, M.Heigel, M. Schmidt, J. Waldron, P. Weinbaum,M.E. White, and staff at the County of AlbanyDepartment of Health and at the Albany MedicalCollege.
This study was supported by the National Instituteof Environmental Health Sciences grant # R01-ES05280.
Received 11 March 2002; accepted 20 September 2002.
To determine the influences of maternal diet and nutrition during pregnancy on the blood leadlevel of neonates, we conducted a study of mother–infant pairs from lower socioeconomic circum-stances living in Albany County, New York. Maternal blood lead (MBPb), anthropometry, anddiet were assessed in each trimester. Neonates’ blood lead (NBPb) levels were low (geometricmean = 1.58 µg/dL), and none had elevated blood lead. More than 50% of the mothers hadintakes below the recommended dietary allowances for zinc, calcium, iron, vitamin D, and kilo-calories. As expected, MBPb was strongly and positively related to NBPb. Among the anthropo-metric measures of maternal nutritional status, variables measuring gain in weight and armcircumference were negatively related to NBPb. In multivariable models reflecting different ana-lytic strageties and including MBPb, anthropometry, and sociodemographic characteristics,dietary intakes of iron and vitamin D were negatively related to NBPb. The effect of zinc variedsubstantially depending on model covariates. Effects of dietary constituents are difficult to distin-guish, given the intercorrelated nature of nutrients in the diet. Nevertheless, the influences ofmaternal anthropometric variables, iron, and vitamin D on neonatal lead levels are clear in ouranalyses. Key words: anthropometry, calcium, children, diet, iron, lead, neonates, nutrition, zinc.Environ Health Perspect 111:195–200 (2003). [Online 28 October 2002]doi:10.1289/ehp.5592 available via http://dx.doi.org/
Children’s Health Articles
Measurement of blood lead. Maternalblood was drawn in each trimester during aregularly scheduled visit to the prenatal clinicand at delivery by a trained phlebotomistusing a lead-free venous blood collection kit.The infant’s cord blood (3 cc) was collected inthe delivery room in most cases (90%). Whencord blood could not be collected, venousblood (3 cc) was drawn in the neonatal nurs-ery within the first 3 days (except in one case,drawn on day 8). All blood lead measure-ments were performed by the WadsworthCenter’s Lead Poisoning/Trace ElementsLaboratory, the New York State Departmentof Health’s reference laboratory for the test.The analytic method for blood lead determi-nation was electrothermal atomization atomicabsorption spectrometry with Zeeman back-ground correction; it has been fully validatedand described in the literature (Parsons andSlavin 1993).
Measurement of maternal diet andnutrition. During each prenatal interview,maternal diet for the month leading up to theinterview was assessed using a modified ver-sion of the National Cancer Institute FoodQuestionnaire. The modifications allowed forreporting actual amounts consumed ratherthan small, medium, or large portions, andfor specifying ethnic or foreign foods notincluded in the food list. A program was writ-ten to compute the 30-day intake of 37macronutrients, vitamins, and minerals.
Maternal nutritional status with regard toserum Vitamin D (1,25-OH Vitamin D) wasassessed in the second and third trimesters andwas analyzed by Metpath Labs, Inc.(Teterboro, NJ). Maternal nutritional statusalso was assessed at each interview by anthro-pometric measures including weight, mid-upper arm circumference, and triceps skinfoldthickness. Height and biepicondylar breadthof the humerus were measured once at thefirst prenatal visit. The latter measurement isan index of skeletal frame size (Frisancho andFlegel 1983). All measurements were made byone of the authors (L.M.S.) and nurses orgraduate research assistants trained by thatauthor using standard, published protocols(Cameron 1986; Lohman et al. 1988).Retraining sessions were performed at approx-imately 6-month intervals. Prepregnancyweight was obtained from the medical chartbased on subject recall.
The sample. Of the 317 eligible women,71 terminated their pregnancies, discontin-ued participation, moved, or transferred careto another facility. In addition, blood from26 newborns was not drawn at delivery for nomedical reason, or was clotted and unanalyz-able. These losses to the study left 220 new-borns with a measured blood lead level at thetime of delivery; thus, 220 is the maximumnumber used for analyses of relationships
among mothers’ and newborns’ lead levels.This sample differs slightly from that used ina previous analysis of APILS data (Schell et al.2000) because the previous analysis requiredtwo consecutive maternal blood lead levelsduring pregnancy. The blood lead levels ofthe sample mothers do not differ significantlyfrom those excluded (n = 97) during preg-nancy or at delivery; excluded mothers hadmarginally higher second-trimester blood leadlevels than included mothers (2.2 µg/dL and2.0 µg/dL respectively), though this differ-ence was not statistically significant.
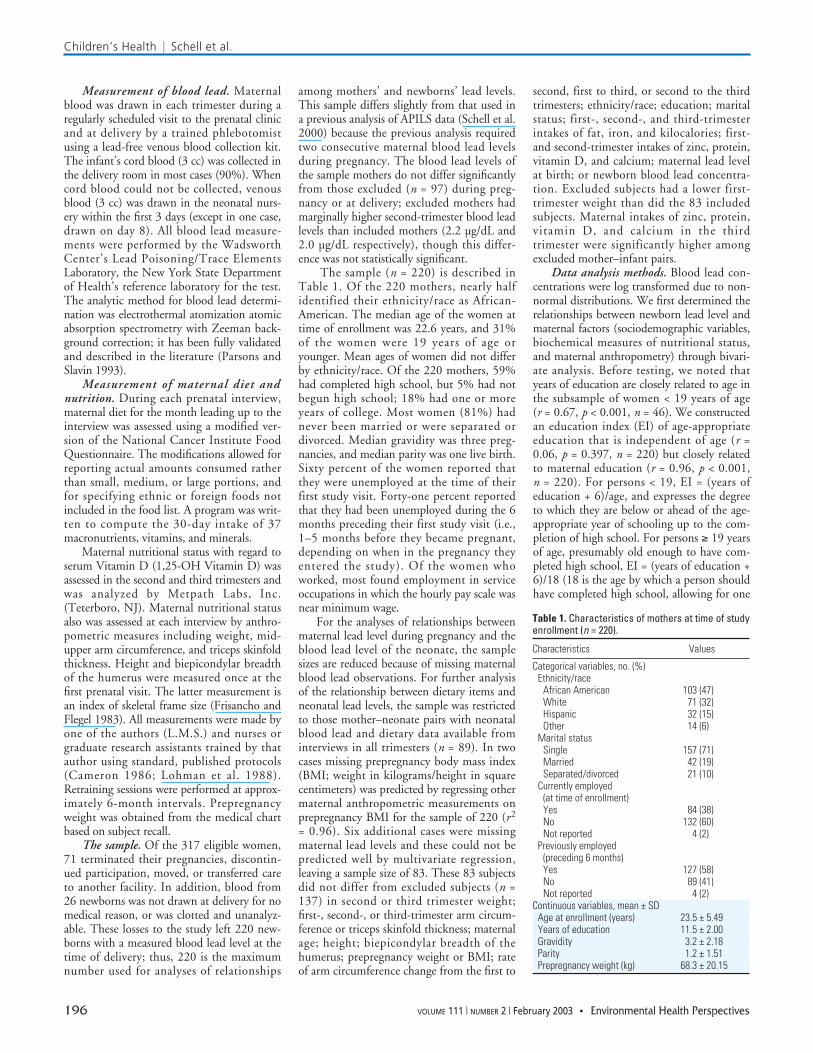
The sample (n = 220) is described inTable 1. Of the 220 mothers, nearly halfidentified their ethnicity/race as African-American. The median age of the women attime of enrollment was 22.6 years, and 31%of the women were 19 years of age oryounger. Mean ages of women did not differby ethnicity/race. Of the 220 mothers, 59%had completed high school, but 5% had notbegun high school; 18% had one or moreyears of college. Most women (81%) hadnever been married or were separated ordivorced. Median gravidity was three preg-nancies, and median parity was one live birth.Sixty percent of the women reported thatthey were unemployed at the time of theirfirst study visit. Forty-one percent reportedthat they had been unemployed during the 6months preceding their first study visit (i.e.,1–5 months before they became pregnant,depending on when in the pregnancy theyentered the study). Of the women whoworked, most found employment in serviceoccupations in which the hourly pay scale wasnear minimum wage.
For the analyses of relationships betweenmaternal lead level during pregnancy and theblood lead level of the neonate, the samplesizes are reduced because of missing maternalblood lead observations. For further analysisof the relationship between dietary items andneonatal lead levels, the sample was restrictedto those mother–neonate pairs with neonatalblood lead and dietary data available frominterviews in all trimesters (n = 89). In twocases missing prepregnancy body mass index(BMI; weight in kilograms/height in squarecentimeters) was predicted by regressing othermaternal anthropometric measurements onprepregnancy BMI for the sample of 220 (r2
= 0.96). Six additional cases were missingmaternal lead levels and these could not bepredicted well by multivariate regression,leaving a sample size of 83. These 83 subjectsdid not differ from excluded subjects (n =137) in second or third trimester weight;first-, second-, or third-trimester arm circum-ference or triceps skinfold thickness; maternalage; height; biepicondylar breadth of thehumerus; prepregnancy weight or BMI; rateof arm circumference change from the first to
second, first to third, or second to the thirdtrimesters; ethnicity/race; education; maritalstatus; first-, second-, and third-trimesterintakes of fat, iron, and kilocalories; first-and second-trimester intakes of zinc, protein,vitamin D, and calcium; maternal lead levelat birth; or newborn blood lead concentra-tion. Excluded subjects had a lower first-trimester weight than did the 83 includedsubjects. Maternal intakes of zinc, protein,vitamin D, and calcium in the thirdtrimester were significantly higher amongexcluded mother–infant pairs.
Data analysis methods. Blood lead con-centrations were log transformed due to non-normal distributions. We first determined therelationships between newborn lead level andmaternal factors (sociodemographic variables,biochemical measures of nutritional status,and maternal anthropometry) through bivari-ate analysis. Before testing, we noted thatyears of education are closely related to age inthe subsample of women < 19 years of age(r = 0.67, p < 0.001, n = 46). We constructedan education index (EI) of age-appropriateeducation that is independent of age (r =0.06, p = 0.397, n = 220) but closely relatedto maternal education (r = 0.96, p < 0.001,n = 220). For persons < 19, EI = (years ofeducation + 6)/age, and expresses the degreeto which they are below or ahead of the age-appropriate year of schooling up to the com-pletion of high school. For persons ≥ 19 yearsof age, presumably old enough to have com-pleted high school, EI = (years of education +6)/18 (18 is the age by which a person shouldhave completed high school, allowing for one
Children’s Health | Schell et al.
196 VOLUME 111 | NUMBER 2 | February 2003 • Environmental Health Perspectives
Table 1. Characteristics of mothers at time of studyenrollment (n = 220).
Characteristics Values
Categorical variables, no. (%)Ethnicity/race
African American 103 (47)White 71 (32)Hispanic 32 (15)Other 14 (6)
Marital statusSingle 157 (71)Married 42 (19)Separated/divorced 21 (10)
Currently employed(at time of enrollment)Yes 84 (38)No 132 (60)Not reported 4 (2)
Previously employed(preceding 6 months)Yes 127 (58)No 89 (41)Not reported 4 (2)
Continuous variables, mean ± SDAge at enrollment (years) 23.5 ± 5.49Years of education 11.5 ± 2.00Gravidity 3.2 ± 2.18Parity 1.2 ± 1.51Prepregnancy weight (kg) 68.3 ± 20.15
extra year). Two persons who have completedtwo years of college, one 40 years old and one25 years old, have the same EI value.
For analysis of maternal dietary effectswe created two multivariable models (usingthe subsample of 83 mother–newborn pairswith complete dietary information) eachcontaining a set of core control variables:prepregnancy BMI, ethnicity, age, educa-tion, anthropometry, second-trimester lead,delivery lead, and kilocalories. The latter wasincluded to control for nutrient density. Wedid not include the following variables thatwere not related to neonatal blood lead inbivariate analysis: maternal arm circumfer-ence and triceps skinfold in first and thirdtrimesters; weight in first, second, or thirdtrimesters; maternal height; biepicondylarbreadth of humerus; rate of change inmaternal triceps skinfold (all trimesters); rateof change in maternal weight and arm cir-cumference from first to second trimester;second- and third-trimester and deliveryserum ferritin and vitamin D; use of dietarysupplements during pregnancy; marital sta-tus; and employment status. High intercor-relation prevented including all significantanthropometric predictors of newborn leadin the models. Variables were chosen tominimize redundancy among anthropomet-rics while retaining full explanatory power.The first multivariate model also controlledfor calcium (or vitamin D), iron, zinc, pro-tein, and fat. To allow for the impact ofintercorrelation among dietary variables inthe multivariate model, we constructed asecond model with the same core controlvariables, to which we added one dietaryvariable at a time, repeating the analysis witha different dietary variable each time. All cal-culations were performed using SPSS,Version 10.1 (SPSS, Chicago, IL). All p-values reported here are from two-tailed(nondirectional) tests.
Dietary intake of calcium, vitamin D,iron, zinc, protein, kilocalories, and fat werecompared across trimesters and found not todiffer significantly. Because multiple assess-ments of dietary intake provide a better esti-mate of true intake (Todd et al. 1983) andthe intakes did not differ by trimester, weaveraged each nutrient intake across all threetrimesters to reduce intrasubject variation andrandom measurement error (Gibson 1990).
In this sample, averaging intakes considerablyreduced the variance of dietary intake mea-sures. The variance of the averaged intakes ofcalcium, iron, fat, kilocalories, vitamin D,and zinc was, on average, only 58% of theindividual trimester values.
Results
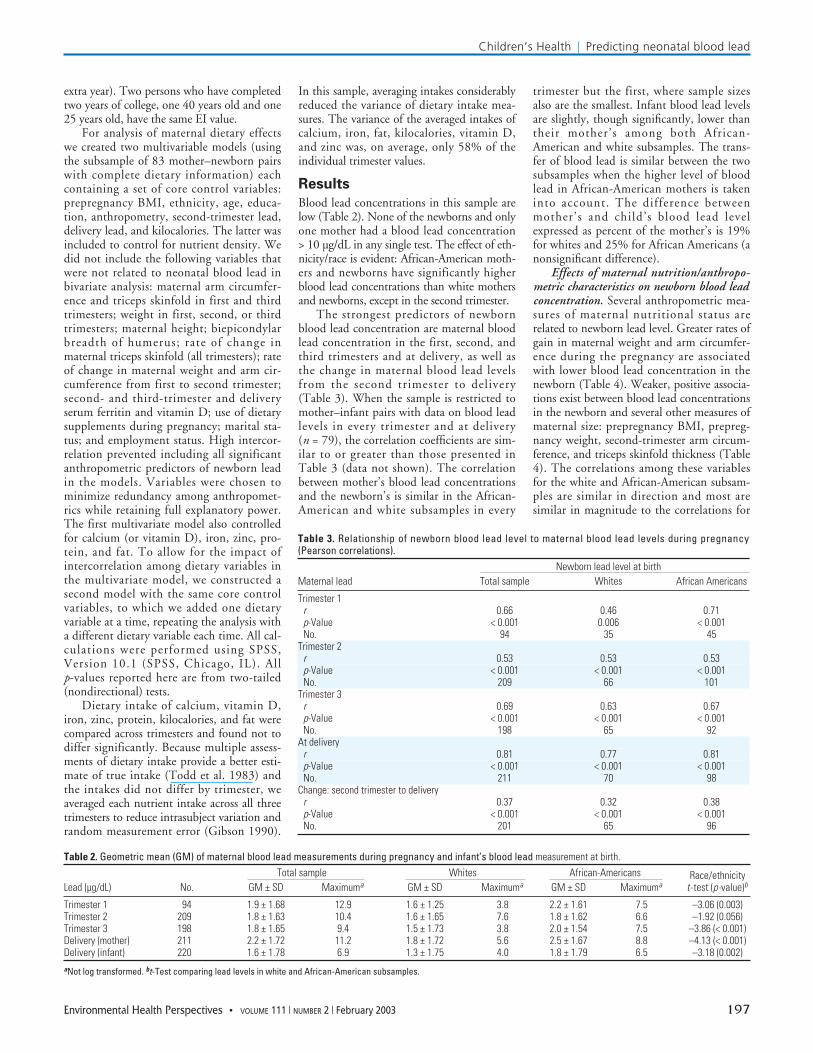
Blood lead concentrations in this sample arelow (Table 2). None of the newborns and onlyone mother had a blood lead concentration> 10 µg/dL in any single test. The effect of eth-nicity/race is evident: African-American moth-ers and newborns have significantly higherblood lead concentrations than white mothersand newborns, except in the second trimester.
The strongest predictors of newbornblood lead concentration are maternal bloodlead concentration in the first, second, andthird trimesters and at delivery, as well asthe change in maternal blood lead levelsfrom the second trimester to delivery(Table 3). When the sample is restricted tomother–infant pairs with data on blood leadlevels in every trimester and at delivery(n = 79), the correlation coefficients are sim-ilar to or greater than those presented inTable 3 (data not shown). The correlationbetween mother’s blood lead concentrationsand the newborn’s is similar in the African-American and white subsamples in every
trimester but the first, where sample sizesalso are the smallest. Infant blood lead levelsare slightly, though significantly, lower thantheir mother’s among both African-American and white subsamples. The trans-fer of blood lead is similar between the twosubsamples when the higher level of bloodlead in African-American mothers is takeninto account. The difference betweenmother’s and child’s blood lead levelexpressed as percent of the mother’s is 19%for whites and 25% for African Americans (anonsignificant difference).
Effects of maternal nutrition/anthropo-metric characteristics on newborn blood leadconcentration. Several anthropometric mea-sures of maternal nutritional status arerelated to newborn lead level. Greater rates ofgain in maternal weight and arm circumfer-ence during the pregnancy are associatedwith lower blood lead concentration in thenewborn (Table 4). Weaker, positive associa-tions exist between blood lead concentrationsin the newborn and several other measures ofmaternal size: prepregnancy BMI, prepreg-nancy weight, second-trimester arm circum-ference, and triceps skinfold thickness (Table4). The correlations among these variablesfor the white and African-American subsam-ples are similar in direction and most aresimilar in magnitude to the correlations for
Children’s Health | Predicting neonatal blood lead
Environmental Health Perspectives • VOLUME 111 | NUMBER 2 | February 2003 197
Table 2. Geometric mean (GM) of maternal blood lead measurements during pregnancy and infant’s blood lead measurement at birth.Total sample Whites African-Americans Race/ethnicity
Lead (µg/dL) No. GM ± SD Maximuma GM ± SD Maximuma GM ± SD Maximuma t -test (p-value)b
Trimester 1 94 1.9 ± 1.68 12.9 1.6 ± 1.25 3.8 2.2 ± 1.61 7.5 –3.06 (0.003)Trimester 2 209 1.8 ± 1.63 10.4 1.6 ± 1.65 7.6 1.8 ± 1.62 6.6 –1.92 (0.056)Trimester 3 198 1.8 ± 1.65 9.4 1.5 ± 1.73 3.8 2.0 ± 1.54 7.5 –3.86 (< 0.001)Delivery (mother) 211 2.2 ± 1.72 11.2 1.8 ± 1.72 5.6 2.5 ± 1.67 8.8 –4.13 (< 0.001)Delivery (infant) 220 1.6 ± 1.78 6.9 1.3 ± 1.75 4.0 1.8 ± 1.79 6.5 –3.18 (0.002)aNot log transformed. bt-Test comparing lead levels in white and African-American subsamples.
Table 3. Relationship of newborn blood lead level to maternal blood lead levels during pregnancy(Pearson correlations).
Newborn lead level at birthMaternal lead Total sample Whites African Americans
Trimester 1r 0.66 0.46 0.71p-Value < 0.001 0.006 < 0.001No. 94 35 45
Trimester 2r 0.53 0.53 0.53p-Value < 0.001 < 0.001 < 0.001No. 209 66 101
Trimester 3r 0.69 0.63 0.67p-Value < 0.001 < 0.001 < 0.001No. 198 65 92
At deliveryr 0.81 0.77 0.81p-Value < 0.001 < 0.001 < 0.001No. 211 70 98
Change: second trimester to deliveryr 0.37 0.32 0.38p-Value < 0.001 < 0.001 < 0.001No. 201 65 96
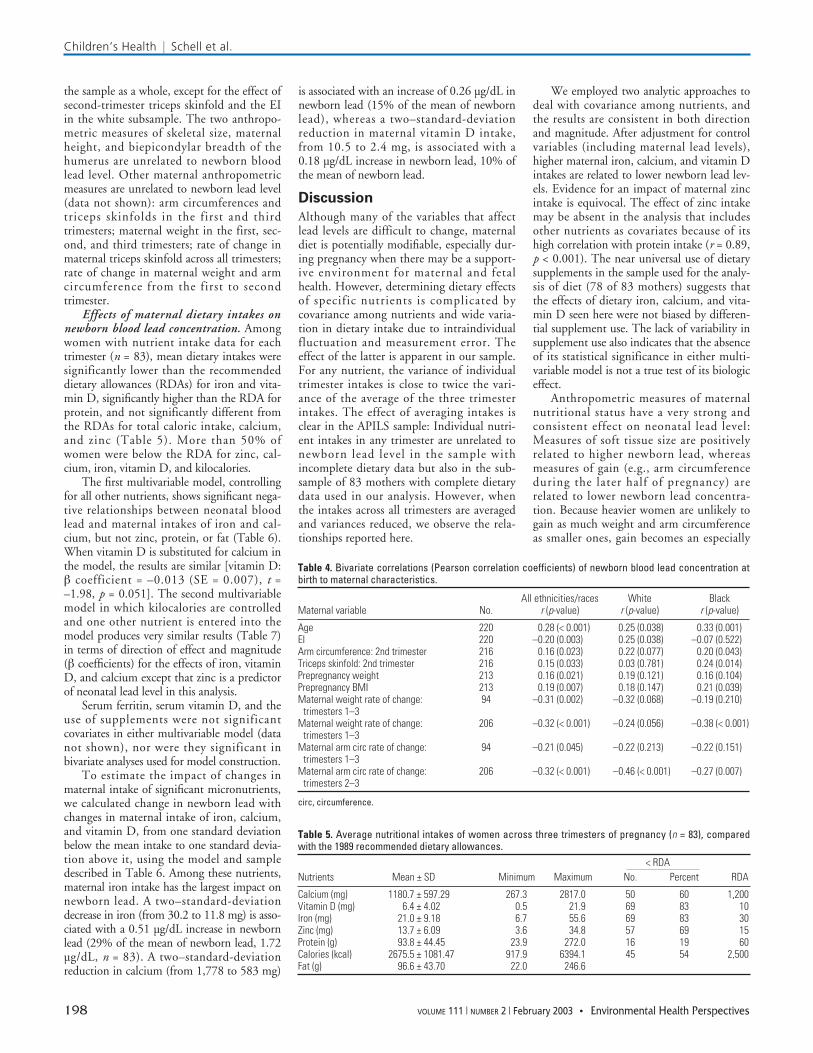
the sample as a whole, except for the effect ofsecond-trimester triceps skinfold and the EIin the white subsample. The two anthropo-metric measures of skeletal size, maternalheight, and biepicondylar breadth of thehumerus are unrelated to newborn bloodlead level. Other maternal anthropometricmeasures are unrelated to newborn lead level(data not shown): arm circumferences andtriceps skinfolds in the first and thirdtrimesters; maternal weight in the first, sec-ond, and third trimesters; rate of change inmaternal triceps skinfold across all trimesters;rate of change in maternal weight and armcircumference from the first to secondtrimester.
Effects of maternal dietary intakes onnewborn blood lead concentration. Amongwomen with nutrient intake data for eachtrimester (n = 83), mean dietary intakes weresignificantly lower than the recommendeddietary allowances (RDAs) for iron and vita-min D, significantly higher than the RDA forprotein, and not significantly different fromthe RDAs for total caloric intake, calcium,and zinc (Table 5). More than 50% ofwomen were below the RDA for zinc, cal-cium, iron, vitamin D, and kilocalories.
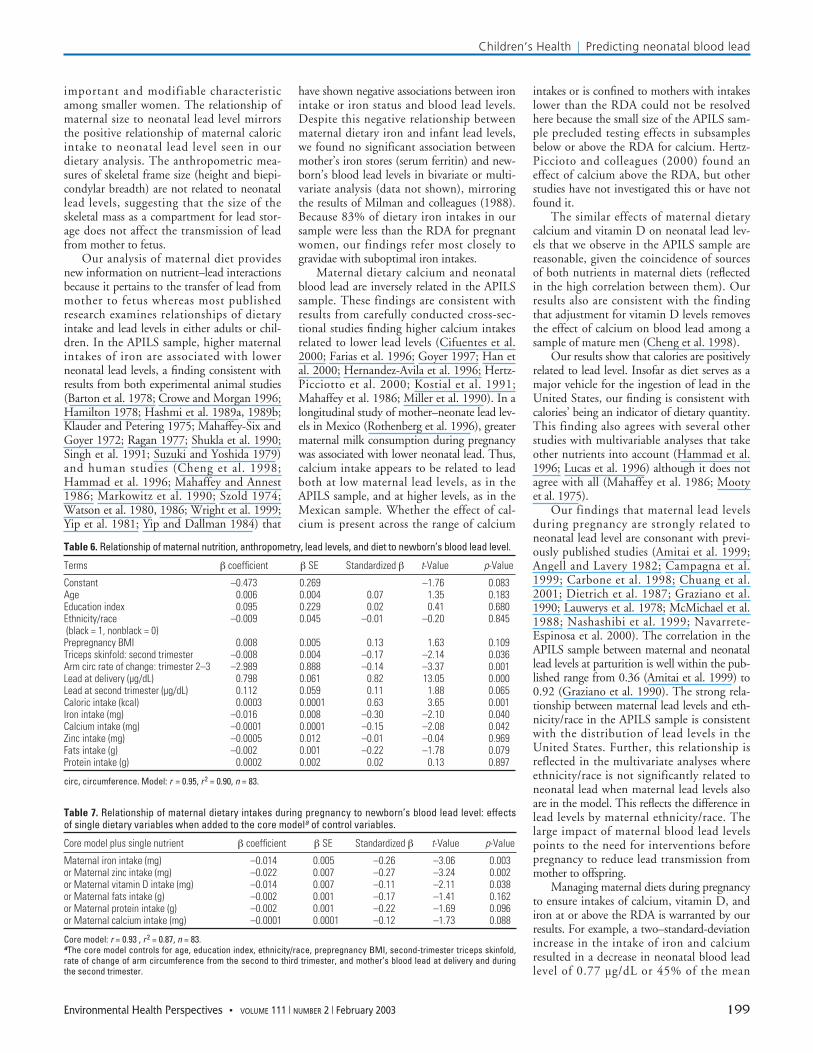
The first multivariable model, controllingfor all other nutrients, shows significant nega-tive relationships between neonatal bloodlead and maternal intakes of iron and cal-cium, but not zinc, protein, or fat (Table 6).When vitamin D is substituted for calcium inthe model, the results are similar [vitamin D:β coefficient = –0.013 (SE = 0.007), t =–1.98, p = 0.051]. The second multivariablemodel in which kilocalories are controlledand one other nutrient is entered into themodel produces very similar results (Table 7)in terms of direction of effect and magnitude(β coefficients) for the effects of iron, vitaminD, and calcium except that zinc is a predictorof neonatal lead level in this analysis.
Serum ferritin, serum vitamin D, and theuse of supplements were not significantcovariates in either multivariable model (datanot shown), nor were they significant inbivariate analyses used for model construction.
To estimate the impact of changes inmaternal intake of significant micronutrients,we calculated change in newborn lead withchanges in maternal intake of iron, calcium,and vitamin D, from one standard deviationbelow the mean intake to one standard devia-tion above it, using the model and sampledescribed in Table 6. Among these nutrients,maternal iron intake has the largest impact onnewborn lead. A two–standard-deviationdecrease in iron (from 30.2 to 11.8 mg) is asso-ciated with a 0.51 µg/dL increase in newbornlead (29% of the mean of newborn lead, 1.72µg/dL, n = 83). A two–standard-deviationreduction in calcium (from 1,778 to 583 mg)
is associated with an increase of 0.26 µg/dL innewborn lead (15% of the mean of newbornlead), whereas a two–standard-deviationreduction in maternal vitamin D intake,from 10.5 to 2.4 mg, is associated with a0.18 µg/dL increase in newborn lead, 10% ofthe mean of newborn lead.
Discussion
Although many of the variables that affectlead levels are difficult to change, maternaldiet is potentially modifiable, especially dur-ing pregnancy when there may be a support-ive environment for maternal and fetalhealth. However, determining dietary effectsof specific nutrients is complicated bycovariance among nutrients and wide varia-tion in dietary intake due to intraindividualfluctuation and measurement error. Theeffect of the latter is apparent in our sample.For any nutrient, the variance of individualtrimester intakes is close to twice the vari-ance of the average of the three trimesterintakes. The effect of averaging intakes isclear in the APILS sample: Individual nutri-ent intakes in any trimester are unrelated tonewborn lead level in the sample withincomplete dietary data but also in the sub-sample of 83 mothers with complete dietarydata used in our analysis. However, whenthe intakes across all trimesters are averagedand variances reduced, we observe the rela-tionships reported here.
We employed two analytic approaches todeal with covariance among nutrients, andthe results are consistent in both directionand magnitude. After adjustment for controlvariables (including maternal lead levels),higher maternal iron, calcium, and vitamin Dintakes are related to lower newborn lead lev-els. Evidence for an impact of maternal zincintake is equivocal. The effect of zinc intakemay be absent in the analysis that includesother nutrients as covariates because of itshigh correlation with protein intake (r = 0.89,p < 0.001). The near universal use of dietarysupplements in the sample used for the analy-sis of diet (78 of 83 mothers) suggests thatthe effects of dietary iron, calcium, and vita-min D seen here were not biased by differen-tial supplement use. The lack of variability insupplement use also indicates that the absenceof its statistical significance in either multi-variable model is not a true test of its biologiceffect.
Anthropometric measures of maternalnutritional status have a very strong andconsistent effect on neonatal lead level:Measures of soft tissue size are positivelyrelated to higher newborn lead, whereasmeasures of gain (e.g., arm circumferenceduring the later half of pregnancy) arerelated to lower newborn lead concentra-tion. Because heavier women are unlikely togain as much weight and arm circumferenceas smaller ones, gain becomes an especially
Children’s Health | Schell et al.
198 VOLUME 111 | NUMBER 2 | February 2003 • Environmental Health Perspectives
Table 4. Bivariate correlations (Pearson correlation coefficients) of newborn blood lead concentration atbirth to maternal characteristics.
All ethnicities/races White BlackMaternal variable No. r (p-value) r (p-value) r (p-value)
Age 220 0.28 (< 0.001) 0.25 (0.038) 0.33 (0.001)EI 220 –0.20 (0.003) 0.25 (0.038) –0.07 (0.522)Arm circumference: 2nd trimester 216 0.16 (0.023) 0.22 (0.077) 0.20 (0.043)Triceps skinfold: 2nd trimester 216 0.15 (0.033) 0.03 (0.781) 0.24 (0.014)Prepregnancy weight 213 0.16 (0.021) 0.19 (0.121) 0.16 (0.104)Prepregnancy BMI 213 0.19 (0.007) 0.18 (0.147) 0.21 (0.039)Maternal weight rate of change: 94 –0.31 (0.002) –0.32 (0.068) –0.19 (0.210)
trimesters 1–3Maternal weight rate of change: 206 –0.32 (< 0.001) –0.24 (0.056) –0.38 (< 0.001)
trimesters 1–3Maternal arm circ rate of change: 94 –0.21 (0.045) –0.22 (0.213) –0.22 (0.151)
trimesters 1–3Maternal arm circ rate of change: 206 –0.32 (< 0.001) –0.46 (< 0.001) –0.27 (0.007)
trimesters 2–3
circ, circumference.
Table 5. Average nutritional intakes of women across three trimesters of pregnancy (n = 83), comparedwith the 1989 recommended dietary allowances.
< RDANutrients Mean ± SD Minimum Maximum No. Percent RDA
Calcium (mg) 1180.7 ± 597.29 267.3 2817.0 50 60 1,200 Vitamin D (mg) 6.4 ± 4.02 0.5 21.9 69 83 10Iron (mg) 21.0 ± 9.18 6.7 55.6 69 83 30Zinc (mg) 13.7 ± 6.09 3.6 34.8 57 69 15Protein (g) 93.8 ± 44.45 23.9 272.0 16 19 60Calories (kcal) 2675.5 ± 1081.47 917.9 6394.1 45 54 2,500Fat (g) 96.6 ± 43.70 22.0 246.6
important and modifiable characteristicamong smaller women. The relationship ofmaternal size to neonatal lead level mirrorsthe positive relationship of maternal caloricintake to neonatal lead level seen in ourdietary analysis. The anthropometric mea-sures of skeletal frame size (height and biepi-condylar breadth) are not related to neonatallead levels, suggesting that the size of theskeletal mass as a compartment for lead stor-age does not affect the transmission of leadfrom mother to fetus.
Our analysis of maternal diet providesnew information on nutrient–lead interactionsbecause it pertains to the transfer of lead frommother to fetus whereas most publishedresearch examines relationships of dietaryintake and lead levels in either adults or chil-dren. In the APILS sample, higher maternalintakes of iron are associated with lowerneonatal lead levels, a finding consistent withresults from both experimental animal studies(Barton et al. 1978; Crowe and Morgan 1996;Hamilton 1978; Hashmi et al. 1989a, 1989b;Klauder and Petering 1975; Mahaffey-Six andGoyer 1972; Ragan 1977; Shukla et al. 1990;Singh et al. 1991; Suzuki and Yoshida 1979)and human studies (Cheng et al. 1998;Hammad et al. 1996; Mahaffey and Annest1986; Markowitz et al. 1990; Szold 1974;Watson et al. 1980, 1986; Wright et al. 1999;Yip et al. 1981; Yip and Dallman 1984) that
have shown negative associations between ironintake or iron status and blood lead levels.Despite this negative relationship betweenmaternal dietary iron and infant lead levels,we found no significant association betweenmother’s iron stores (serum ferritin) and new-born’s blood lead levels in bivariate or multi-variate analysis (data not shown), mirroringthe results of Milman and colleagues (1988).Because 83% of dietary iron intakes in oursample were less than the RDA for pregnantwomen, our findings refer most closely togravidae with suboptimal iron intakes.
Maternal dietary calcium and neonatalblood lead are inversely related in the APILSsample. These findings are consistent withresults from carefully conducted cross-sec-tional studies finding higher calcium intakesrelated to lower lead levels (Cifuentes et al.2000; Farias et al. 1996; Goyer 1997; Han etal. 2000; Hernandez-Avila et al. 1996; Hertz-Picciotto et al. 2000; Kostial et al. 1991;Mahaffey et al. 1986; Miller et al. 1990). In alongitudinal study of mother–neonate lead lev-els in Mexico (Rothenberg et al. 1996), greatermaternal milk consumption during pregnancywas associated with lower neonatal lead. Thus,calcium intake appears to be related to leadboth at low maternal lead levels, as in theAPILS sample, and at higher levels, as in theMexican sample. Whether the effect of cal-cium is present across the range of calcium
intakes or is confined to mothers with intakeslower than the RDA could not be resolvedhere because the small size of the APILS sam-ple precluded testing effects in subsamplesbelow or above the RDA for calcium. Hertz-Piccioto and colleagues (2000) found aneffect of calcium above the RDA, but otherstudies have not investigated this or have notfound it.
The similar effects of maternal dietarycalcium and vitamin D on neonatal lead lev-els that we observe in the APILS sample arereasonable, given the coincidence of sourcesof both nutrients in maternal diets (reflectedin the high correlation between them). Ourresults also are consistent with the findingthat adjustment for vitamin D levels removesthe effect of calcium on blood lead among asample of mature men (Cheng et al. 1998).
Our results show that calories are positivelyrelated to lead level. Insofar as diet serves as amajor vehicle for the ingestion of lead in theUnited States, our finding is consistent withcalories’ being an indicator of dietary quantity.This finding also agrees with several otherstudies with multivariable analyses that takeother nutrients into account (Hammad et al.1996; Lucas et al. 1996) although it does notagree with all (Mahaffey et al. 1986; Mootyet al. 1975).
Our findings that maternal lead levelsduring pregnancy are strongly related toneonatal lead level are consonant with previ-ously published studies (Amitai et al. 1999;Angell and Lavery 1982; Campagna et al.1999; Carbone et al. 1998; Chuang et al.2001; Dietrich et al. 1987; Graziano et al.1990; Lauwerys et al. 1978; McMichael et al.1988; Nashashibi et al. 1999; Navarrete-Espinosa et al. 2000). The correlation in theAPILS sample between maternal and neonatallead levels at parturition is well within the pub-lished range from 0.36 (Amitai et al. 1999) to0.92 (Graziano et al. 1990). The strong rela-tionship between maternal lead levels and eth-nicity/race in the APILS sample is consistentwith the distribution of lead levels in theUnited States. Further, this relationship isreflected in the multivariate analyses whereethnicity/race is not significantly related toneonatal lead when maternal lead levels alsoare in the model. This reflects the difference inlead levels by maternal ethnicity/race. Thelarge impact of maternal blood lead levelspoints to the need for interventions beforepregnancy to reduce lead transmission frommother to offspring.
Managing maternal diets during pregnancyto ensure intakes of calcium, vitamin D, andiron at or above the RDA is warranted by ourresults. For example, a two–standard-deviationincrease in the intake of iron and calciumresulted in a decrease in neonatal blood leadlevel of 0.77 µg/dL or 45% of the mean
Children’s Health | Predicting neonatal blood lead
Environmental Health Perspectives • VOLUME 111 | NUMBER 2 | February 2003 199
Table 6. Relationship of maternal nutrition, anthropometry, lead levels, and diet to newborn’s blood lead level.
Terms β coefficient β SE Standardized β t-Value p-Value
Constant –0.473 0.269 –1.76 0.083Age 0.006 0.004 0.07 1.35 0.183Education index 0.095 0.229 0.02 0.41 0.680Ethnicity/race –0.009 0.045 –0.01 –0.20 0.845(black = 1, nonblack = 0)Prepregnancy BMI 0.008 0.005 0.13 1.63 0.109Triceps skinfold: second trimester –0.008 0.004 –0.17 –2.14 0.036Arm circ rate of change: trimester 2–3 –2.989 0.888 –0.14 –3.37 0.001Lead at delivery (µg/dL) 0.798 0.061 0.82 13.05 0.000Lead at second trimester (µg/dL) 0.112 0.059 0.11 1.88 0.065Caloric intake (kcal) 0.0003 0.0001 0.63 3.65 0.001Iron intake (mg) –0.016 0.008 –0.30 –2.10 0.040Calcium intake (mg) –0.0001 0.0001 –0.15 –2.08 0.042Zinc intake (mg) –0.0005 0.012 –0.01 –0.04 0.969Fats intake (g) –0.002 0.001 –0.22 –1.78 0.079Protein intake (g) 0.0002 0.002 0.02 0.13 0.897
circ, circumference. Model: r = 0.95, r 2 = 0.90, n = 83.
Table 7. Relationship of maternal dietary intakes during pregnancy to newborn’s blood lead level: effectsof single dietary variables when added to the core modela of control variables.
Core model plus single nutrient β coefficient β SE Standardized β t-Value p-Value
Maternal iron intake (mg) –0.014 0.005 –0.26 –3.06 0.003or Maternal zinc intake (mg) –0.022 0.007 –0.27 –3.24 0.002or Maternal vitamin D intake (mg) –0.014 0.007 –0.11 –2.11 0.038or Maternal fats intake (g) –0.002 0.001 –0.17 –1.41 0.162or Maternal protein intake (g) –0.002 0.001 –0.22 –1.69 0.096or Maternal calcium intake (mg) –0.0001 0.0001 –0.12 –1.73 0.088
Core model: r = 0.93 , r 2 = 0.87, n = 83.aThe core model controls for age, education index, ethnicity/race, prepregnancy BMI, second-trimester triceps skinfold,rate of change of arm circumference from the second to third trimester, and mother’s blood lead at delivery and duringthe second trimester.
neonatal level. A further opportunity forlowering lead levels by adjusting nutrientintakes may occur during infancy, and a futurereport from this data set will address thisproblem.
REFERENCES
ATSDR. 1988. The Nature and Extent of Lead Poisoning inChildren in the United States: A Report to Congress.Atlanta, GA:Agency for Toxic Substances and DiseasesRegistry.
Amitai Y, Katz D, Lifshitz M, Gofin R, Tepferberg M, Almog S.1999. Prenatal lead exposure in Israel: an internationalcomparison. Isr Med Assoc J 1(4):250–253.
Angell NF, Lavery PJ. 1982. The relationship of blood lead levelsto obstetric outcome. Am J Obstet Gynecol 142:40–46.
Barton JC, Conrad ME, Harrison N. 1978. Effects of iron on theabsorption and retention of lead. J Lab Clin Med 91:536–547.
Brody DJ, Pirkle JL, Kramer RA, Flegal KA, Matte TD, GunterEW, et al. 1994. Blood lead levels in the US population.phase 1 of the Third National Health and NutritionExamination Survey (NHANES III, 1988–1991). JAMA272(4):277–283.
Brown MJ, Shenassa E, Matte TD, Catlin SN. 2000. Children inIllinois with elevated blood lead levels, 1993–1998, andlead-related pediatric hospital admissions in Illinois,1993–1997. Public Health Rep 115(6):532–536.
Cameron N. 1986. The methods of auxological anthropometry.In: Human Growth: Methodology; Ecological, Genetic, andNutritional Effects on Growth (Falkner F, Tanner JM, eds).New York:Plenum Press, 3–46.
Campagna D, Huel G, Girard F, Sahuquillo J, Blot P. 1999.Environmental lead exposure and activity of delta-aminolevulinic acid dehydratase (ALA-D) in maternal andcord blood. Toxicology 134(2–3):143–152.
Carbone R, Laforgia N, Crollo E, Mautone A, Iolascon A. 1998.Maternal and neonatal lead exposure in southern Italy.Biol Neonate 73(6):362–366.
Centers for Disease Control and Prevention. 2001. Trends inblood lead levels among children—Boston, Massachusetts,1994–1999. Morb Mortal Wkly Rep 50(17):337–339.
Cheng Y, Willet WC, Schwartz J, Sparrow D, Weiss S, Hu H.1998. Relation of nutrition to bone lead and blood lead lev-els in middle-aged to elderly men. Am J Epidemiol147(12):1162–1174.
Cifuentes E, Villanueva J, Sanin LH. 2000. Predictors of bloodlead levels in agricultural villages practicing wastewaterirrigation in central Mexico. Int J Occup Environ Health6(3):177–182.
Chuang H-Y, Schwartz J, Gonzales-Cossio T, Lugo MC,Palazuelos E, Aro A, et al. 2001. Interrelations of lead levelsin bone, venous blood, and umbilical cord blood withexogenous lead exposure through maternal plasma lead inperipartum women. Environ Health Perspect 109:527–532.
Crowe A, Morgan EH. 1996. Interactions between tissueuptake of lead and iron in normal and iron-deficient ratsduring development. Biol Trace Elem Res 52(3):249–261.
Dietrich KN, Krafft KM, Bornschein RL, Hammond PB, BergerOG, Succop PA, et al. 1987. Low-level fetal lead exposureeffect on neurobehavioral development in early infancy.Pediatrics 80(5):721–730.
Farias P, Borja-Aburto VH, Rios C, Hertz-Piciotta I, Rojas-LopezM, Chavez-Ayala R. 1996. Blood lead levels in pregnantwomen high and low socioeconomic status in MexicoCity. Environ Health Perspect 104:1070–1074.
Frisancho AR, Flegel PN. 1983. Elbow breadth as a measure offrame size for US males and females. Am J Clin Nutr37:311–314.
Gibson RS. 1990. Principles of Nutritional Assessment. NewYork:Oxford University Press.
Goyer RA. 1997. Toxic and essential metal interactions. AnnuRev Nutr 17:37–50.
Graziano JH, Popovac D, Factor-Litvak P, Shrout P, Kline JK,Murphy MJ, et al. 1990. Determinants of elevated bloodlead during pregnancy in a population surrounding a leadsmelter in Kosovo, Yugoslavia. Environ Health Perspect89:95–100.
Gulson BL, Jameson CW, Mahaffey KR, Mizon KJ, Korsch MJ,Vimpani GV. 1997. Pregnancy increases mobilization oflead from maternal skeleton. J Lab Clin Med 130(1):51–62.
Hamilton DL. 1978. Interrelationship of lead and iron retentionin iron deficient mice. Toxicol Appl Pharmacol 46:651–661.
Hammad TA, Sexton M, Langenberg P. 1996. Relationshipbetween blood lead and dietary iron intake in preschoolchildren: a cross-sectional study. Ann Epidemiol 6:30–33.
Han S, Pfizenmaier DH, Garcia E, Eguez ML, Ling M, Kemp FW,et al. 2000. Effects of lead exposure before pregnancy anddietary calcium during pregnancy on fetal development andlead accumulation. Environ Health Perspect 108:527–531.
Hashmi NS, Kachru DN, Tandon SK. 1989a. Interrelationshipbetween iron deficiency and lead intoxication (part 1). BiolTrace Elem Res 22(3):287–297.
Hashmi NS, Kachru DN, Khandelwal S, Tandon SK. 1989b.Interrelationship between iron deficiency and lead intoxi-cation (part 2). Biol Trace Elem Res 22(3):299–307.
Hernandez-Avila M, Gonzalez-Cossio T, Palazuelos E, RomieuI, Aro A, Fishbein E, et al. 1996. Dietary and environmentaldeterminants of blood and bone lead levels in lactatingpostpartum women living in Mexico City. Environ HealthPerspect 104:1076–1083.
Hertz-Picciotto I, Schramm M, Watt-Morse M, Chantala K,Anderson J, Osterloh J. 2000. Patterns and determinantsof blood lead during pregnancy. Am J Epidemiol152(9):829–837.
Klauder DS, Petering HG. 1975. Protective value of dietarycopper and iron against some toxic effects of lead in rats.Environ Health Perspect 12:77–80.
Kostial K, Dekanic D, Telisman S, Blanusa M, Duvancic S,Prpic-Majic D, et al. 1991. Dietary calcium and blood leadlevels in women. Biol Trace Elem Res 28(3):181–185.
LaFlash S, Joosse-Coons M, Havlena J, Anderson HA. 2000.Wisconsin children at risk for lead poisoning. Wisc Med J99(8):18–22.
Lauwerys R, Buchet JP, Roels H, Hubermont G. 1978. Placentaltransfer of lead, mercury, cadmium, and carbon monoxidein women. I. Comparison of the frequency distributions ofthe biological indices in maternal and umbilical cordblood. Environ Res 15(2):278–289.
Litaker D, Kippes CM, Gallagher TE, O’Connor ME. 2000.Targeting lead screening: The Ohio Lead Risk Score.Pediatrics 106(5):E69.
Lohman TG, Roche AF, Martorell R. 1988. AnthropometricStandardization Reference Manual. Champaign, IL:HumanKinetics Books.
Lucas SR, Sexton M, Langenberg P. 1996. Relationshipbetween blood lead and nutritional factors in preschoolchildren: a cross-sectional study. Pediatrics 97(1):74–78.
Mahaffey KR, Annest JL. 1986. Association of EP with bloodlead level and iron status in the second National Healthand Nutrition Examination Survey. Environ Res 41:327–328.
Mahaffey KR, Gartside PS, Glueck CJ. 1986. Blood lead levelsand dietary calcium intake in 1- to 11-year-old children:The second National Health and Nutrition ExaminationSurvey, 1976 to 1980. Pediatrics 78(2):257–262.
Mahaffey-Six KM, Goyer RA. 1972. The influence of irondeficiency on tissue content and toxicity of ingested leadin the rat. J Lab Clin Med 79(1):128–136.
Markowitz ME, Rosen JF, Bijur PE. 1990. Effect of irondeficiency on lead excretion in children with moderate
lead intoxication. J Pediatr 116:360–364.McMichael AJ, Baghurst PA, Wigg NR, Vimpani GV, Robertson
EF, Roberts RJ. 1988. Port Pirie Cohort Study: environmen-tal exposure to lead and children’s abilities at the age offour years. N Engl J Med 319(8):468–475.
Miller GD, Massaro TF, Massaro EJ. 1990. Interactionsbetween lead and essential elements: a review. Neurotox11:99–120.
Milman N, Christensen JM, Ibsen KK. 1988. Blood lead anderythrocyte zinc protoporphyrin in mothers and newborninfants. Eur J Pediatr 147:71–73.
Mooty J, Ferrand CF, Harris P. 1975. Relationship of diet to leadpoisoning in children. Pediatrics 55(5):636–639.
Nashashibi N, Cardamakis E, Bolbos G, Tzingounis V. 1999.Investigation of kinetic of lead during pregnancy and lac-tation. Gynecol Obstet Invest 48(3):158–162.
Navarrete-Espinosa J, Sanin-Aguirre LH, Escandon-Romero C,Benitez-Martinez G, Olaiz-Fernandez G, Hernandez-AvilaM. 2000. Lead blood levels in mothers and newborninfants covered by the Mexican Institute of SocialSecurity. Salud Publica Mex 42(5):391–396.
Parsons P, Slavin W. 1993. A rapid zeeman graphite-furnaceatomic absorption spectrometric method for the determi-nation of lead in blood. Spectrochim Acta B 48B:925–939.
Pirkle JL, Brody DJ, Gunter EW, Kramer RA, Paschal DC, FlegalKM, et al. 1994. The decline in blood lead levels in theUnited States: the National Health and NutritionExamination Surveys (NHANES). JAMA 272(4):284–291.
Ragan HA. 1977. Effects of iron deficiency on the absorptionand distribution of lead and cadmium in rats. J Lab ClinMed 90(4):700–706.
Rothenberg SJ, Karchmer S, Schnaas L, Perroni E, Zea F,Salinas V, et al. 1996. Maternal influences on cord bloodlead levels. J Expo Anal Environ Epidemiol 6(2):211–227.
Schell LM, Czerwinski S, Stark AD, Parsons PJ, Gomez M,Samelson R. 2000. Variation in blood lead and hematocritlevels during pregnancy in a socioeconomically disadvan-taged population. Arch Environ Health 55(2):134–140.
Schell LM, Stark AD, Gomez MI, Grattan WA. 1997. Blood leadlevel by year and season among poor pregnant women.Arch Environ Health 52(4):286–291.
Shukla A, Agarwal KN, Shukla GS. 1990. Effect of latent irondeficiency on the levels of iron, calcium, zinc, copper,manganese, cadmium and lead in liver, kidney and spleenof growing rats. Experientia 46(7):751–752.
Singh US, Saxena DK, Singh C, Murthy RC, Chandra SV. 1991.Lead-induced fetal nephrotoxicity in iron-deficient rats.Reprod Toxicol 5(3):211–217.
Suzuki T, Yoshida A. 1979. Effect of dietary supplementation ofiron and ascorbic acid on lead toxicity in rats. J Nutr109(6):983–988.
Szold PD. 1974. Plumbism and iron deficiency. N Engl J Med290:520.
Todd KS, Hudes M, Calloway DH. 1983. Food intake measurement:problems and approaches. Am J Clin Nutr 37(1):139–146.
Watson WS, Hume R, Moore MR. 1980. Oral absorption of leadand iron. Lancet 2:236–237.
Watson WS, Morrison J, Bethel MIF, Baldwin NM, Lyon DTB,Dobson H, et al. 1986. Food iron and lead absortion inhumans. Am J Clin Nutr 44:248–256.
Wright RO, Shannon MW, Wright RJ, Hu H. 1999. Associationbetween iron deficiency and low-level lead poisoning inan urban primary care clinic. Am J Public Health89(7):1049–1053.
Yip R, Dallman PR. 1984. Developmental changes in EP: Rolesof iron deficiency and lead toxicity. J Pediatr 104:710–713.
Yip R, Norris TN, Anderson AS. 1981. Iron status of children withelevated blood lead concentration. J Pediatr 53:597–646.
Children’s Health | Schell et al.
200 VOLUME 111 | NUMBER 2 | February 2003 • Environmental Health Perspectives