The Performance of SolarScan An Automated Dermoscopy Image Analysis Instrument for the Diagnosis of...
10
STUDY The Performance of SolarScan An Automated Dermoscopy Image Analysis Instrument for the Diagnosis of Primary Melanoma Scott W. Menzies, MB, BS, PhD; Leanne Bischof, M Biomed E; Hugues Talbot, PhD; Alex Gutenev, PhD; Michelle Avramidis, BSc; Livian Wong, BSc; Sing Kai Lo, PhD; Geoffrey Mackellar, PhD, BSc; Victor Skladnev, PhD; William McCarthy, MB, BS, MEd; John Kelly, MD, BS; Brad Cranney, MB, BS; Peter Lye, MB, BS; Harold Rabinovitz, MD; Margaret Oliviero, ARNP; Andreas Blum, MD; Alexandra Virol, B Med; Brian De’Ambrosis, MB, BS; Roderick McCleod, MB, BS; Hiroshi Koga, MD; Caron Grin, MD; Ralph Braun, MD; Robert Johr, MD Objective: To describe the diagnostic performance of SolarScan (Polartechnics Ltd, Sydney, Australia), an au- tomated instrument for the diagnosis of primary mela- noma. Design: Images from a data set of 2430 lesions (382 were melanomas; median Breslow thickness, 0.36 mm) were divided into a training set and an independent test set at a ratio of approximately 2:1. A diagnostic algorithm (ab- solute diagnosis of melanoma vs benign lesion and esti- mated probability of melanoma) was developed and its performance described on the test set. High-quality clini- cal and dermoscopy images with a detailed patient his- tory for 78 lesions (13 of which were melanomas) from the test set were given to various clinicians to compare their diagnostic accuracy with that of SolarScan. Setting: Seven specialist referral centers and 2 general practice skin cancer clinics from 3 continents. Compari- son between clinician diagnosis and SolarScan diagnosis was by 3 dermoscopy experts, 4 dermatologists, 3 trainee dermatologists, and 3 general practitioners. Patients: Images of the melanocytic lesions were ob- tained from patients who required either excision or digi- tal monitoring to exclude malignancy. Main Outcome Measures: Sensitivity, specificity, the area under the receiver operator characteristic curve, me- dian probability for the diagnosis of melanoma, a direct com- parison of SolarScan with diagnoses performed by humans, and interinstrument and intrainstrument reproducibility. Results: The melanocytic-only diagnostic model was highly reproducible in the test set and gave a sensitivity of 91% (95% confidence interval [CI], 86%-96%) and specificity of 68% (95% CI, 64%-72%) for melanoma. SolarScan had comparable or superior sensitivity and specificity (85% vs 65%) compared with those of ex- perts (90% vs 59%), dermatologists (81% vs 60%), train- ees (85% vs 36%; P =.06), and general practitioners (62% vs 63%). The intraclass correlation coefficient of intra- instrument repeatability was 0.86 (95% CI, 0.83-0.88), indicating an excellent repeatability. There was no sig- nificant interinstrument variation (P = .80). Conclusions: SolarScan is a robust diagnostic instru- ment for pigmented or partially pigmented melanocytic lesions of the skin. Preliminary data suggest that its per- formance is comparable or superior to that of a range of clinician groups. However, these findings should be con- firmed in a formal clinical trial. Arch Dermatol. 2005;141:1388-1396 A LTHOUGH EARLY DETEC- tion of melanoma is criti- cal for controlling mortal- ity from the disease, it is clear that diagnostic accu- racy in the field is suboptimal. 1,2 There- fore, a considerable effort has gone into producing automated diagnostic instru- ments (so-called machine diagnosis) for primary melanoma of the skin. Studies conducted before March 2002 3 and after March 2002 4-11 were reviewed; from these reviews, basic quality requirements for de- scribing such instruments were out- lined 3 : (1) selection of lesions should be random or consecutive; (2) inclusion and exclusion criteria should be clearly stated; (3) all lesions clinically diagnosed as me- lanocytic should be analyzed; (4) the study setting should be clearly defined; (5) to avoid verification bias, clearly benign le- sions that were not excised should be in- cluded, with the diagnostic gold stan- dard being short-term follow-up with digital monitoring; (6) instrument cali- bration should be reported; (7) repeat- For editorial comment see page 1444 Author Affiliations are listed at the end of this article. (REPRINTED) ARCH DERMATOL/ VOL 141, NOV 2005 WWW.ARCHDERMATOL.COM 1388 ©2005 American Medical Association. All rights reserved. Downloaded From: http://archderm.jamanetwork.com/ on 02/25/2013
-
Upload
independent -
Category
Documents
-
view
0 -
download
0
Transcript of The Performance of SolarScan An Automated Dermoscopy Image Analysis Instrument for the Diagnosis of...

STUDY
The Performance of SolarScan
An Automated Dermoscopy Image Analysis Instrumentfor the Diagnosis of Primary Melanoma
Scott W. Menzies, MB, BS, PhD; Leanne Bischof, M Biomed E; Hugues Talbot, PhD; Alex Gutenev, PhD;Michelle Avramidis, BSc; Livian Wong, BSc; Sing Kai Lo, PhD; Geoffrey Mackellar, PhD, BSc; Victor Skladnev, PhD;William McCarthy, MB, BS, MEd; John Kelly, MD, BS; Brad Cranney, MB, BS; Peter Lye, MB, BS;Harold Rabinovitz, MD; Margaret Oliviero, ARNP; Andreas Blum, MD; Alexandra Virol, B Med;Brian De’Ambrosis, MB, BS; Roderick McCleod, MB, BS; Hiroshi Koga, MD;Caron Grin, MD; Ralph Braun, MD; Robert Johr, MD
Objective: To describe the diagnostic performance ofSolarScan (Polartechnics Ltd, Sydney, Australia), an au-tomated instrument for the diagnosis of primary mela-noma.
Design: Images from a data set of 2430 lesions (382 weremelanomas; median Breslow thickness, 0.36 mm) weredivided into a training set and an independent test set ata ratio of approximately 2:1. A diagnostic algorithm (ab-solute diagnosis of melanoma vs benign lesion and esti-mated probability of melanoma) was developed and itsperformance described on the test set. High-quality clini-cal and dermoscopy images with a detailed patient his-tory for 78 lesions (13 of which were melanomas) fromthe test set were given to various clinicians to comparetheir diagnostic accuracy with that of SolarScan.
Setting: Seven specialist referral centers and 2 generalpractice skin cancer clinics from 3 continents. Compari-son between clinician diagnosis and SolarScan diagnosiswas by 3 dermoscopy experts, 4 dermatologists, 3 traineedermatologists, and 3 general practitioners.
Patients: Images of the melanocytic lesions were ob-tained from patients who required either excision or digi-tal monitoring to exclude malignancy.
Main Outcome Measures: Sensitivity, specificity, thearea under the receiver operator characteristic curve, me-dianprobabilityforthediagnosisofmelanoma,adirectcom-parisonofSolarScanwithdiagnosesperformedbyhumans,and interinstrument and intrainstrument reproducibility.
Results: The melanocytic-only diagnostic model washighly reproducible in the test set and gave a sensitivityof 91% (95% confidence interval [CI], 86%-96%) andspecificity of 68% (95% CI, 64%-72%) for melanoma.SolarScan had comparable or superior sensitivity andspecificity (85% vs 65%) compared with those of ex-perts (90% vs 59%), dermatologists (81% vs 60%), train-ees (85% vs 36%; P=.06), and general practitioners (62%vs 63%). The intraclass correlation coefficient of intra-instrument repeatability was 0.86 (95% CI, 0.83-0.88),indicating an excellent repeatability. There was no sig-nificant interinstrument variation (P=.80).
Conclusions: SolarScan is a robust diagnostic instru-ment for pigmented or partially pigmented melanocyticlesions of the skin. Preliminary data suggest that its per-formance is comparable or superior to that of a range ofclinician groups. However, these findings should be con-firmed in a formal clinical trial.
Arch Dermatol. 2005;141:1388-1396
A LTHOUGH EARLY DETEC-tion of melanoma is criti-cal for controlling mortal-ity from the disease, it isclear that diagnostic accu-
racy in the field is suboptimal.1,2 There-fore, a considerable effort has gone intoproducing automated diagnostic instru-ments (so-called machine diagnosis) forprimary melanoma of the skin. Studiesconducted before March 20023 and afterMarch 20024-11 were reviewed; from thesereviews, basic quality requirements for de-scribing such instruments were out-lined3: (1) selection of lesions should be
random or consecutive; (2) inclusion andexclusion criteria should be clearly stated;(3) all lesions clinically diagnosed as me-lanocytic should be analyzed; (4) the studysetting should be clearly defined; (5) to
avoid verification bias, clearly benign le-sions that were not excised should be in-cluded, with the diagnostic gold stan-dard being short-term follow-up withdigital monitoring; (6) instrument cali-bration should be reported; (7) repeat-
For editorial commentsee page 1444
Author Affiliations are listed atthe end of this article.
(REPRINTED) ARCH DERMATOL/ VOL 141, NOV 2005 WWW.ARCHDERMATOL.COM1388
©2005 American Medical Association. All rights reserved.
Downloaded From: http://archderm.jamanetwork.com/ on 02/25/2013

ability analysis should be carried out (interinstrumentand intrainstrument); (8) classification should be car-ried out on an independent test set; and (9) computerdiagnosis should be compared with human diagnosis.
We have previously published12 pilot data on an auto-mated diagnostic instrument (Mk1 Skin PolarProbe;Polartechnics Ltd, Sydney, Australia), which uses imageanalysis of dermoscopy (surface microscopy) features ofpigmented skin lesions. Following that report, the digitalsurface microscopy (dermoscopy) video instrument So-larScan (Polartechnics Ltd) was developed, and data werecollected from 9 clinical sites around the world. Herein weassess the performance of this instrument in terms of thesequality requirements.
METHODS
DATA COLLECTION
Between the period of June 15, 1998, and September 30, 2003,images were taken of pigmented skin lesions using SolarScan from9 clinical centers. Of these, 7 were specialist referral centers: theSydney Melanoma Unit (Sydney Melanoma Diagnostic Cen-tre), Sydney, Australia; Skin and Cancer Associates, Miami, Fla;Department of Dermatology, University of Tübingen, Tübin-gen, Germany; the Skin and Cancer Foundation, Sydney; Kel-lyDerm, the private clinic of one of the authors ( J.K.), Mel-bourne, Australia; and South East Dermatology and the PrincessAlexandra Hospital, Brisbane, Australia. Two centers were at pri-vate skin cancer clinics in Australia: Central Coast Skin CancerClinic, Gosford, and the Chatswood Skin Cancer Clinic, Syd-ney, all staffed by general practitioners. Images were taken afterformal written consent by patients, and the research protocol wasreviewed by the local ethics committee of each clinic site.
The instrument specifications of the SolarScan have been de-scribed previously.13 In addition to imaging, a patient history wasrecorded that indicated whether the lesion had, within the pre-vious 2 years, bled without being scratched, changed in color orpattern, or increased in size (answer choices: yes, no, uncer-tain). In all but 1 clinic site, the sole indication for imaging wasthat the pigmented lesion was to be excised, usually because of aclinical suspicion. However, clinics were inconsistent in imag-ing excised lesions from their own practices, with some clinicsobtaining images of lesions with a predominately high probabil-ity of melanoma. Reports of histopathologic findings provided byeach clinic were then used as the gold standard for diagnosis. Theselesions made up 71% of the data set. In 1 clinic site (Sydney Mela-noma Unit), some images were taken of nonmelanocytic pig-mented lesions that were diagnosed clinically but not excised.These lesions represented only 3% of the total image set. Also atthe Sydney Melanoma Unit, melanocytic lesions that underwentshort-term digital monitoring over a 3-month period and re-mained unchanged were classified as benign according to the pre-viously described protocol.13 These lesions were either moder-ately atypical melanocytic lesions without a patient history ofchange or mildly atypical lesions with a history of change. Theseimages represented 26% of the data set. In all centers, some re-peated images were taken to permit a reproducibility analysis.
Lesions were excluded from analysis if they were outside thefield of view (24�18 mm), could not be calibrated reliably be-cause of contamination of calibration surfaces, or had excess ar-tifacts (hair, air bubbles, or movement artifacts). Clipping ex-cess hair before imaging was suggested. Lesions that werenonpigmented, ulcerated, or at an acral site, or that were diag-nosed as pigmented basal cell carcioma, pigmented Bowen dis-ease, or squamous cell carcinoma were also excluded. Although
pure amelanotic lesions were excluded (using dermoscopy im-aging of absent brown, blue, gray, or black pigmentation), par-tially pigmented or lightly pigmented lesions were included. Fi-nally, lesions from anatomical areas that could not be imagedadequately using the SolarScan headpiece (eg, eyelids, some partsof the pinna, some genital sites, and perianal and mucosal sur-faces) were unable to be assessed. The diagnostic frequency ofthe 2430 analyzed lesions are shown in Table 1.
IMAGE PROCESSING
Each image was calibrated using a procedure of black and whitebalance, shading correction, setup of camera dynamic range,and capture of an image of a reference surface of known re-flectivity, followed by tracing of the colors of the captured le-sion to a color space common for all SolarScan instruments, aspreviously described13 (System and Method for Examining, Re-cording and Analyzing Dermatological Conditions; US Patentfiling No. 09/473270). The lesion border was then determinedby a semiautomated procedure and confirmed as accurate by 2clinicians (S.W.M. and H.K.). For those lesions in which theborder was not correctly segmented by this procedure (24%),the lesion border was manually created. An automated proce-dure was then performed to mask out hair and air bubble ar-tifacts. A total of 103 automated image analysis variables con-sisting of various properties of color, pattern, and geometry wereextracted from the segmented lesion images (Diagnostic Fea-ture Extraction in Dermatological Examination; US Patent fil-ing No. 10/478078).
ALGORITHM DEVELOPMENT
The entire set of 2430 lesions was divided into a training setand an independent test set at a ratio of approximately 2:1, re-spectively. These sets were created by a random allocation oflesions stratified by diagnostic category and Breslow thickness.Before algorithm development, each lesion diagnostic categorywas assigned a “weight” based on a linear representation (range,
Table 1. Diagnostic Frequency of Lesions AnalyzedFrom the Complete Data Set
Diagnosis No. (%)
Invasive melanoma 238 (9.8)SSM 221 (9.1)Nodular 12 (0.5)Lentigo maligna melanoma 5 (0.2)
In situ melanoma 144 (5.9)Lentigo maligna 28 (1.2)In situ SSM 116 (4.8)
Benign melanocytic 1835 (75.6)Digitally monitored unchanged 630 (25.9)Ephelis/lentigo 49 (2.1)Banal nevi 497 (20.5)Spindle/Spitz nevi 18 (0.8)Dysplastic nevi 602 (24.8)Blue or deep penetrating nevi 39 (1.6)
Benign nonmelanocytic lesions 213 (8.8)Dermatofibromas 6 (0.3)Hemangiomas 20 (0.8)Seborrheic keratoses 140 (5.8)Solar keratoses 9 (0.4)Other 38 (1.6)
Total 2430 (100)
Abbreviation: SSM, superficial spreading melanoma.
(REPRINTED) ARCH DERMATOL/ VOL 141, NOV 2005 WWW.ARCHDERMATOL.COM1389
©2005 American Medical Association. All rights reserved.
Downloaded From: http://archderm.jamanetwork.com/ on 02/25/2013
0.25-20) of correctly classifying the lesion as benign or mela-noma. These weights were arbitrarily determined based on dan-ger of misdiagnosis, ease of clinical diagnosis, and frequency ofdiagnosis in the field. Melanomas were weighted as a functionof Breslow thickness (weight, 5�Breslow thickness in milli-meters), from 1.0 (in situ) to 20 (�4.0-mm Breslow thickness).Examples of other diagnostic weights are dysplastic or Spitznevi, 0.25; other benign melanocytic lesions, 0.5; seborrheic kera-toses, blue nevi, and hemangiomas requiring clinical diagnosiswithout excision, 0.75.
The patient history features described in the “Data Collec-tion” subsection and the 103 image analysis variables, in com-bination with the diagnostic weights, were used in the train-ing set to model 2 diagnostic algorithms (see the “AlgorithmModel” subsection). First, we created a model differentiatingmelanomas from all pigmented benign nonmelanomas. Sec-ond, we formed a model differentiating melanomas from pig-mented benign melanocytic lesions. We determined the diag-nostic accuracy by running these optimized models on theindependent test set.
ALGORITHM MODEL
The algorithm model used by SolarScan is an optimized set offixed discriminant variables with associated weighting factorsand relationships features (Australian Patent application No.20022308395 and Australian Patent No. 2003905998).
We used the distributions of algorithm indices within ourdata set for melanoma and benign nonmelanocytic cases to cal-culate a point estimate of the probability of melanoma as a func-tion of an index value. In this way, a new lesion could be ana-lyzed and an algorithm index value and estimate of theprobability of melanoma (based solely on our data set) de-rived. The method used to derive this probability function isas follows. The frequency distribution for melanoma cases asa function of algorithm index was fitted using Gaussian mod-els with 2, 3, or 4 mixture components using an expectationmaximization algorithm. The best fit was obtained with a 3-com-ponent model. A separate model for benign nonmelanocytic le-sions was developed using a similar method, and in this casethe best fit was obtained using a 2-component model. Both dis-tributions were then normalized and scaled to the number ofcases of each type to yield the relative likelihood, expressed as
a function of the index value. The posterior probability of mela-noma was then derived as the ratio of the value of the mela-noma likelihood to the total likelihood. This method was ap-plied only to the evaluation set and to the combined data set.No significant difference between the point estimates was ob-served except for areas with low representation in the evalua-tion set. Because the total data set is less prone to statistical noisefor extreme values of index, the probability derived from theentire data set is used within the instrument.
REPRODUCIBILITY ANALYSIS
Intrainstrument Reproducibility
Two sets of repeated images were used to test the intrainstru-ment reproducibility of the diagnostic algorithm. First, repeatedimages with an orientation of 90° rotation were taken of 387 le-sions. Second, 304 images of lesions that were undergoing 3-monthdigital monitoring and that remained unchanged were collectedand compared with their baseline image taken 3 months before.These were taken at the same orientation. In both of these sets,the images were processed as described herein and the algo-rithm probability calculated. The intraclass correlation coeffi-cient (ICC) (3,1)14 was used to assess the intramachine reliabil-ity. Here, a coefficient greater than 0.75 indicates excellentreliability.15 We also denoted the reproducibility by describingthe median of the algorithm probability differences between therepeated images and median experimental error. Here, the ex-perimental errorequalsthedifferencebetweenrepeated lesionprob-abilities times 100 divided by the lesion probability. Finally, therepeatability of the algorithm diagnosis using the arbitrary indexcutoff (ie, the percentage of lesions that have the same diagnosisin their repeats) for both true melanomas or nonmelanomas weredescribed.
Interinstrument Reproducibility
A total of 48 lesion images were taken on 3 SolarScan instru-ments (3 repeated images per instrument). The images wereprocessed, the algorithm probabilities calculated, and the meanvalue of the repeats given. The ICC (2,1) was used to assessthe intermachine reliability.14 Again, a coefficient greater than0.75 indicates excellent reliability. In this experimental de-sign, the calculated interinstrument experimental percentageerror is the addition of the intrainstrument and the true inter-instrument percentage errors. Hence, the true interinstru-ment error can be calculated. For this study, the experimentalpercentage error was the standard error of the mean (repeats)times100 divided by the mean lesion probability.
DIAGNOSIS BY HUMANS VS ALGORITHM
To assess performance of the SolarScan diagnostic melano-cytic algorithm vs diagnoses performed by humans, all mela-nocytic lesions from the independent test set taken at the Syd-ney Melanoma Unit that had clinical and dermoscopyphotographic images (taken with a Heine Dermaphot camera,Heine Ltd, Herrsching, Germany); patient details of age, sex,and lesion site; and a recorded history of whether the lesionhad, within the past 2 years, bled without being scratched,changed in color or pattern, or increased in size (answer choices:yes, no, uncertain) were collected. All lesions had diagnosesbased on histological findings. This resulted in a set of 78 me-lanocytic lesions (Table 2). These images and patient histo-ries were given to 13 independent clinicians who were not in-volved in the data collection for the study. Three wereinternational dermoscopy experts who headed pigmented le-
Table 2. Diagnosis Frequency of Melanocytic Lesions Usedto Compare Human Performance With SolarScan*
Histological Diagnosis† No. (%)
Melanoma 13 (16.6)Invasive‡ 5 (6.4)In situ superficial spreading 6 (7.7)Lentigo maligna 2 (2.6)
Benign melanocytic lesions 65 (83.3)Lentigo 2 (2.6)Lentiginous nevi 2 (2.6)Junctional nevi 2 (2.6)Compound nevi 12 (15.4)Dermal nevi 1 (1.3)Spitz nevi 1 (1.3)Blue nevi 2 (2.6)Dysplastic junctional nevi 14 (17.9)Dysplastic compound nevi 29 (37.2)
*Polartechnics Ltd, Sydney, Australia.†All lesions were taken from the independent test set.‡Breslow thickness range of invasive melanomas was 0.35 to 1.4 mm.
(REPRINTED) ARCH DERMATOL/ VOL 141, NOV 2005 WWW.ARCHDERMATOL.COM1390
©2005 American Medical Association. All rights reserved.
Downloaded From: http://archderm.jamanetwork.com/ on 02/25/2013
sion clinics (C.G., R.B., and R.J.), 4 were practicing dermatolo-gists from the Sydney metropolitan area, 3 were dermatologyregistrars (trainee dermatologists), and 3 were primary care phy-sicians from the Sydney metropolitan area. For each of theselesions, the following questions were answered: diagnosis of(1) melanoma (in situ or invasive) or (2) benign nevus (in-cluding dysplastic); probability of melanoma (0%-100%), where0% is certain for being benign and 100% represents certain mela-noma; management by (1) excision or referred for a second opin-ion, (2) close observation (eg, monitoring for 3 months), or(3) routine observation.
RESULTS
ALGORITHM PERFORMANCEDISTINGUISHING MELANOMAS
FROM ALL BENIGN PIGMENTED LESIONS
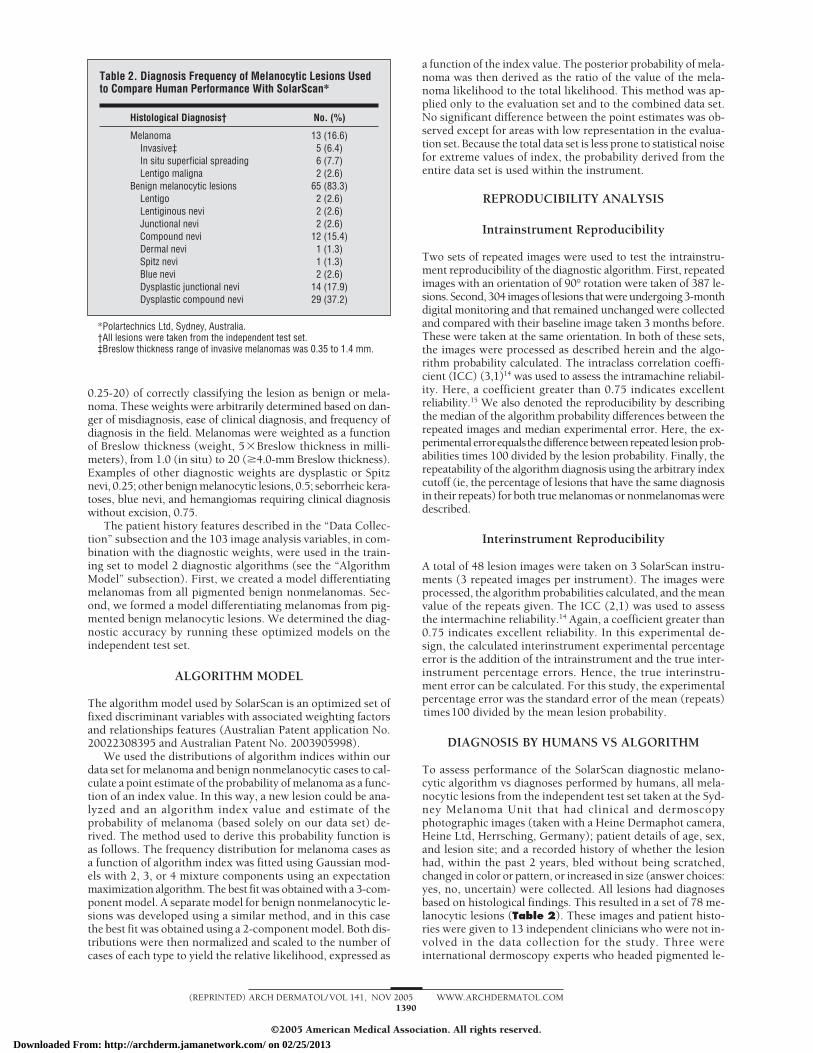
From the training set of 1644 lesions, of which 260 weremelanomas (97 in situ and 163 invasive; overall medianBreslow thickness, 0.37 mm), a diagnostic algorithm wasdeveloped to distinguish melanomas from all benign pig-mented lesions. This model was run on an independenttest set of 786 lesions, 122 of which were melanomas (47in situ and 75 invasive; overall median Breslow thick-ness, 0.36 mm) (see the “Methods” section and Table 1).The receiver operator characteristic curve of both diag-nostic models is shown in Figure 1A. Here, the perfor-mance of the algorithm is shown to be reproducible, withlittle difference of the area under the receiver operatorcharacteristic between the test and training set (0.871 vs0.877, respectively; P=.78 for 2-sided Z test). Using anarbitrary cutoff developed in the training set, the sensi-tivity for melanoma was 90% (95% confidence interval
[CI], 86%-94%) and specificity 61% (95% CI, 58%-64%). In the test set, this was shown to be reproduciblewith a sensitivity of 91% (95% CI, 86%-96%) and a speci-ficity of 65% (95% CI, 61%-69%). On examination of thealgorithm performance as a function of diagnostic cat-egories, no difference existed in the proportion of cor-rectly classified lesions in the training or test set(Table 3). However, although the algorithm per-formed well on melanocytic lesions, it performed poorlyon benign nonmelanocytic lesions. In particular, sebor-rheic keratoses that were diagnosed on routine dermos-copy examination were correctly classified by the algo-rithm in only 6 (13%) of 47 cases (combined test andtraining sets). In addition, hemangiomas and dermato-fibromas were correctly classified in less than 50% of cases.
ALGORITHM PERFORMANCEDISTINGUISHING MELANOMA
FROM BENIGN MELANOCYTIC LESIONS
Because the developed algorithm failed to adequately dis-tinguish melanomas from pigmented nonmelanocytic le-sions, a new algorithm was developed to distinguish mela-nomas from benign melanocytic lesions. Here, the trainingset consisted of 260 melanomas and 1239 benign nonme-lanocytic lesions, and the test set, 122 melanomas and 596benign nonmelanocytic lesions, as detailed in Table 3. Themedian Breslow thickness was 0.37 mm. The optimummodel remained that described all pigmented lesions.Figure 1B shows the receiver operator characteristic curvesof both diagnostic models. The area under the curve is largerthan the algorithm for modeling all pigmented lesions(Figure 1A), and again, there is good reproducibility be-
1.0
0.3
0.4
0.2
0.1
0.7
0.8
0.9
0.6
0.5
0 0.2 0.4 0.6 0.8 1.00.1 0.3 0.5
Training Set: Area 0.877Test Set: Area 0.871
0.7 0.91–Specificity
Sens
itivi
ty
1.0
0.3
0.4
0.2
0.1
0.7
0.8
0.9
0.6
0.5
0 0.2 0.4 0.6 0.8 1.00.1 0.3 0.5 0.7 0.91–Specificity
Sens
itivi
ty
Training Set: Area 0.887Test Set: Area 0.881
A B
Figure 1. A, Receiver operator characteristic curve for melanomas vs all benign pigmented nonmelanomas; B, receiver operator characteristic curve formelanomas vs benign melanocytic lesions.
(REPRINTED) ARCH DERMATOL/ VOL 141, NOV 2005 WWW.ARCHDERMATOL.COM1391
©2005 American Medical Association. All rights reserved.
Downloaded From: http://archderm.jamanetwork.com/ on 02/25/2013
tween the performance of the algorithm in the test andtraining set (0.881 vs 0.887 receiver operator character-istic curve areas, respectively; P=.77 for 2-sided Z test).Using an arbitrary cutoff developed in the training set, thesensitivity for melanoma was 90% (95% CI, 86%-94%) andspecificity was 64% (95% CI, 61%-67%). In the test set,this result was shown to be reproducible with a sensitiv-ity of 91% (95% CI, 86%-96%) and a specificity of 68%(95% CI, 64%-72%). The model performance as a func-tion of diagnostic category is described in Table 3. As stated,there was excellent reproducibility in the test set, with nosignificant difference in the proportion of correctly clas-sified lesions as a function of their diagnostic category inthe training and test sets.
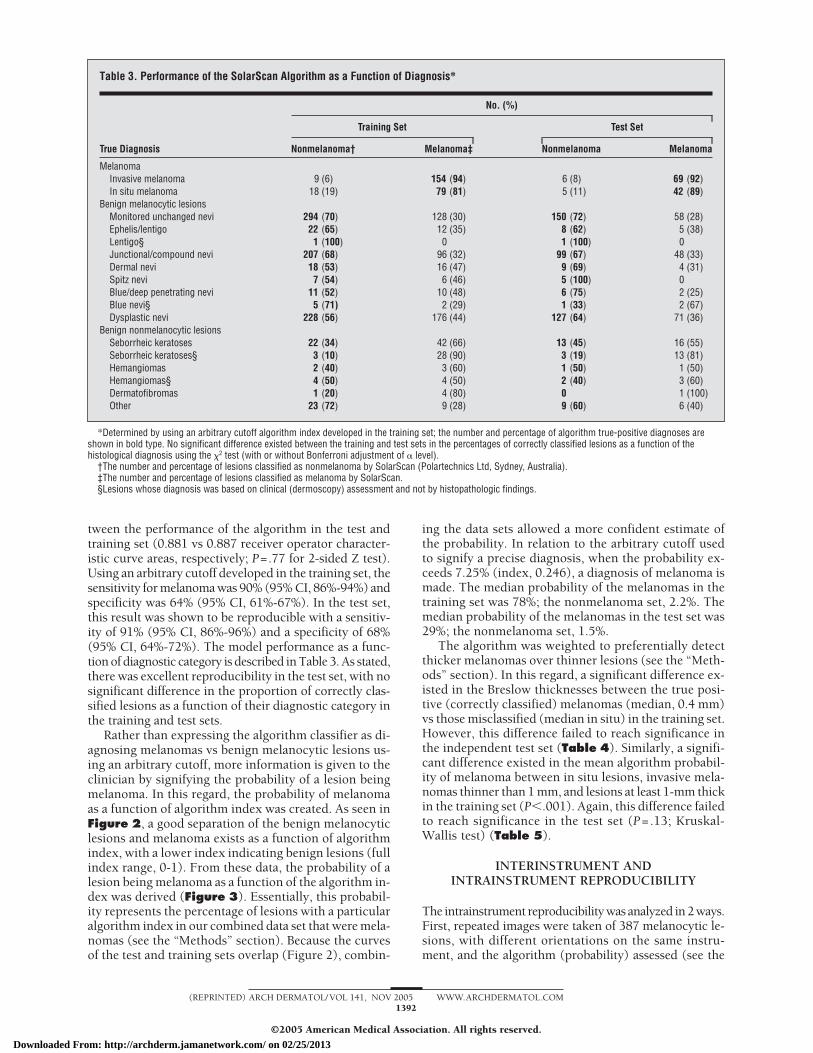
Rather than expressing the algorithm classifier as di-agnosing melanomas vs benign melanocytic lesions us-ing an arbitrary cutoff, more information is given to theclinician by signifying the probability of a lesion beingmelanoma. In this regard, the probability of melanomaas a function of algorithm index was created. As seen inFigure 2, a good separation of the benign melanocyticlesions and melanoma exists as a function of algorithmindex, with a lower index indicating benign lesions (fullindex range, 0-1). From these data, the probability of alesion being melanoma as a function of the algorithm in-dex was derived (Figure 3). Essentially, this probabil-ity represents the percentage of lesions with a particularalgorithm index in our combined data set that were mela-nomas (see the “Methods” section). Because the curvesof the test and training sets overlap (Figure 2), combin-
ing the data sets allowed a more confident estimate ofthe probability. In relation to the arbitrary cutoff usedto signify a precise diagnosis, when the probability ex-ceeds 7.25% (index, 0.246), a diagnosis of melanoma ismade. The median probability of the melanomas in thetraining set was 78%; the nonmelanoma set, 2.2%. Themedian probability of the melanomas in the test set was29%; the nonmelanoma set, 1.5%.
The algorithm was weighted to preferentially detectthicker melanomas over thinner lesions (see the “Meth-ods” section). In this regard, a significant difference ex-isted in the Breslow thicknesses between the true posi-tive (correctly classified) melanomas (median, 0.4 mm)vs those misclassified (median in situ) in the training set.However, this difference failed to reach significance inthe independent test set (Table 4). Similarly, a signifi-cant difference existed in the mean algorithm probabil-ity of melanoma between in situ lesions, invasive mela-nomas thinner than 1 mm, and lesions at least 1-mm thickin the training set (P�.001). Again, this difference failedto reach significance in the test set (P=.13; Kruskal-Wallis test) (Table 5).
INTERINSTRUMENT ANDINTRAINSTRUMENT REPRODUCIBILITY
The intrainstrument reproducibility was analyzed in 2 ways.First, repeated images were taken of 387 melanocytic le-sions, with different orientations on the same instru-ment, and the algorithm (probability) assessed (see the
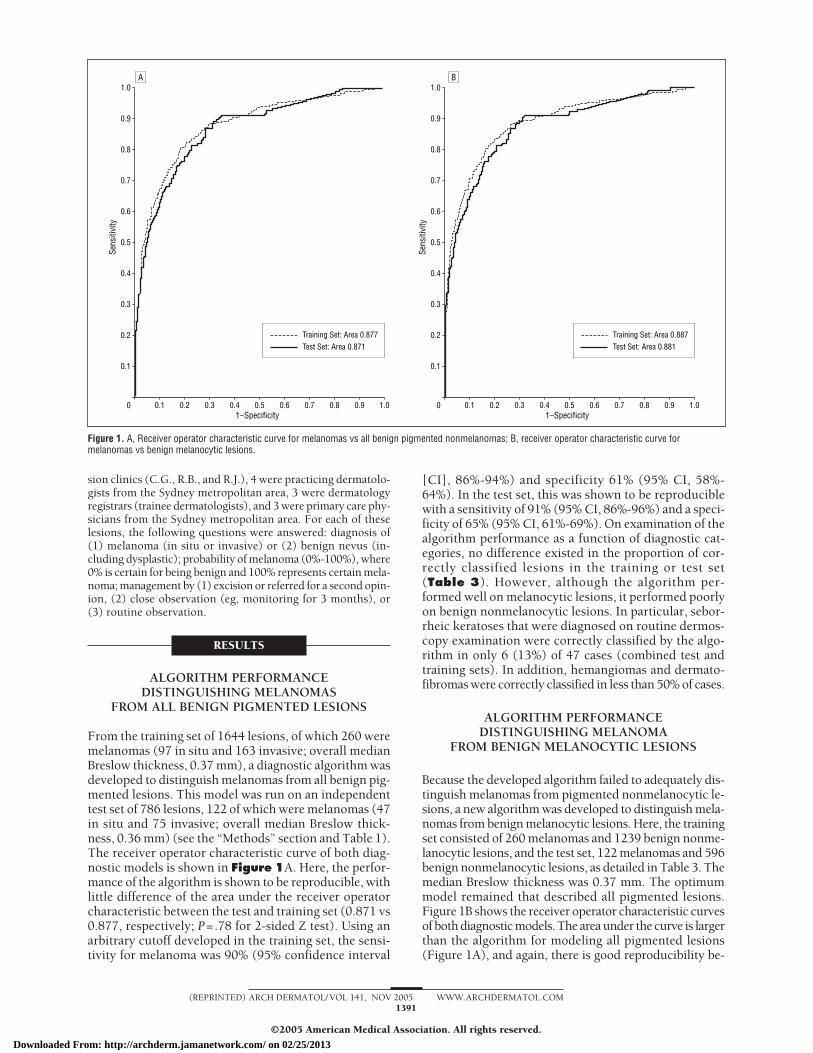
Table 3. Performance of the SolarScan Algorithm as a Function of Diagnosis*
True Diagnosis
No. (%)
Training Set Test Set
Nonmelanoma† Melanoma‡ Nonmelanoma Melanoma
MelanomaInvasive melanoma 9 (6) 154 (94) 6 (8) 69 (92)In situ melanoma 18 (19) 79 (81) 5 (11) 42 (89)
Benign melanocytic lesionsMonitored unchanged nevi 294 (70) 128 (30) 150 (72) 58 (28)Ephelis/lentigo 22 (65) 12 (35) 8 (62) 5 (38)Lentigo§ 1 (100) 0 1 (100) 0Junctional/compound nevi 207 (68) 96 (32) 99 (67) 48 (33)Dermal nevi 18 (53) 16 (47) 9 (69) 4 (31)Spitz nevi 7 (54) 6 (46) 5 (100) 0Blue/deep penetrating nevi 11 (52) 10 (48) 6 (75) 2 (25)Blue nevi§ 5 (71) 2 (29) 1 (33) 2 (67)Dysplastic nevi 228 (56) 176 (44) 127 (64) 71 (36)
Benign nonmelanocytic lesionsSeborrheic keratoses 22 (34) 42 (66) 13 (45) 16 (55)Seborrheic keratoses§ 3 (10) 28 (90) 3 (19) 13 (81)Hemangiomas 2 (40) 3 (60) 1 (50) 1 (50)Hemangiomas§ 4 (50) 4 (50) 2 (40) 3 (60)Dermatofibromas 1 (20) 4 (80) 0 1 (100)Other 23 (72) 9 (28) 9 (60) 6 (40)
*Determined by using an arbitrary cutoff algorithm index developed in the training set; the number and percentage of algorithm true-positive diagnoses areshown in bold type. No significant difference existed between the training and test sets in the percentages of correctly classified lesions as a function of thehistological diagnosis using the �2 test (with or without Bonferroni adjustment of � level).
†The number and percentage of lesions classified as nonmelanoma by SolarScan (Polartechnics Ltd, Sydney, Australia).‡The number and percentage of lesions classified as melanoma by SolarScan.§Lesions whose diagnosis was based on clinical (dermoscopy) assessment and not by histopathologic findings.
(REPRINTED) ARCH DERMATOL/ VOL 141, NOV 2005 WWW.ARCHDERMATOL.COM1392
©2005 American Medical Association. All rights reserved.
Downloaded From: http://archderm.jamanetwork.com/ on 02/25/2013

“Methods” section). The ICC (3,1) was 0.86 (95% CI, 0.83-0.88), which indicates an excellent correlation. The me-dian absolute difference of the probabilities between therepeated images was 1.2%, with a median melanoma prob-ability of the lesion set of 12%. The median experimentalerror was 7.6%. These errors have been plotted as a func-tion of algorithm index in Figure 3. Finally, the algo-rithm diagnosis reproducibility was 95% for true melano-mas and 83% for true benign melanocytic lesions.
Second, repeated images of 304 lesions were taken 3months after the baseline images using the same instru-ment. All of these were morphologically unchanged andhence benign. The ICC (3,1) was 0.73 (95% CI, 0.67-0.78). The median absolute difference of the probabili-ties between the repeated images was 0.14%, with a me-dian melanoma probability of the lesion set of 2.9%. Themedian experimental error was 4.4%. Finally, the algo-rithm diagnosis reproducibility was 84% (all true be-nign melanocytic lesions).
To assess whether there was any effect of having a le-sion border generated by the manual or automated method(see the “Methods” section), we analyzed 22 paired le-sion images taken on the same instrument with an au-tomated border generated on one and a manual borderon the other. The ICC (3,1) was 0.89 (95% CI, 0.74-0.95), which indicated an excellent correlation.
We examined the interinstrument reproducibility ofthe algorithm (algorithm probability) by analyzing 48 pig-mented lesions on 3 SolarScan instruments. The ICC (2,1)was 0.88 (95% CI, 0.82-0.93), well above the 0.75 limitof excellent reliability. There was no significant differ-ence between the experimental percentage errors of theinterinstrument (11.4%) and intrainstrument (11.8%) re-producibility (P=.13, Wilcoxon signed rank test). Thisindicates that no significant true interinstrument varia-tion exists among the 3 instruments.
THE DIAGNOSTIC PERFORMANCEOF HUMANS VS SOLARSCAN
To test the performance of the diagnostic algorithm (formelanocytic lesions only), all lesions that had good-quality clinical and dermoscopy images and complete pa-tient and lesion history details from the independent testset were collected from 1 site (Sydney Melanoma Unit)and compared with a range of clinician groups (see the“Methods” section and Table 2). When we compared thediagnoses performed by humans with those of theSolarScan algorithm (based on the index cutoff as de-scribed herein), no statistically significant difference ex-isted in the sensitivity (based on either the absolute di-agnosis or the decision to excise as diagnosing melanoma)between any clinician group and the algorithm (Table6).However, a significant power problem secondary to a lowsample size of melanomas may confound these results.In this regard, SolarScan had a sensitivity comparable withthat of dermoscopy experts, dermatologists, and traineedermatologists, and had a substantial superior sensitiv-ity compared with general practitioners. For analysis ofspecificity, SolarScan’s performance was superior to thatof trainee dermatologists (P=.01) and had a higher speci-ficity than all 4 clinical groups (based either on absolute
diagnosis or the decision to not excise a benign lesion).On the assumption that the prevalence of melanoma
was the same in the clinical test as in the population ofexcised lesions in the field, the positive predictive value
0.05
0.10
0.15
0.20
0.25
0.30
0.35
0.40
0 0.1 0.2 0.3 0.4
Training Set, MelanomaTest Set, MelanomaTraining Set, NonmelanomaTest Set, Nonmelanoma
0.5 0.6 0.7 0.90.8 1.0Algorithm Index
Norm
alize
d Fr
eque
ncy
Figure 2. The normalized frequency of melanoma and benign melanocyticlesions as a function of algorithm index.
0.1
0.2
0.3
0.4
0.5
0.6
0.7
0.8
0.9
1.0
0 0.1 0.20.246
0.3 0.4 0.5 0.6 0.7 0.90.8 1.0Algorithm Index
P m
el
Figure 3. The SolarScan (Polartechnics Ltd, Sydney, Australia) “probabilityof lesion being melanoma” (Pmel) output as a function of algorithm index. Thealgorithm probability of melanoma is plotted as a function of algorithm index(solid line) (see the “Methods” section). The cutoff between melanoma andnonmelanoma is shown by the dashed line (index, 0.246; probability,7.25%). The box plots of the median and interquartile ranges of absolutedifferences of probability between repeated images (intrainstrument error)are shown within the index ranges of 0 to 0.2, 0.2 to 0.4, 0.4 to 0.6, 0.6 to0.8, and 0.8 to 1.0.
Table 4. Thickness of Melanomas Correctly Classifiedvs Misclassified
Data SetMedian BreslowThickness, mm Sample Size
Training set*True positive 0.40 233False negative In situ 27
Test set†True positive 0.40 111False negative 0.25 11
*There was a significant difference of the median Breslow thicknessbetween the correctly classified (true-positive) vs incorrectly classified(false-negative) melanomas in the training set (Kruskal-Wallis test). P = .002.
†P = .47
(REPRINTED) ARCH DERMATOL/ VOL 141, NOV 2005 WWW.ARCHDERMATOL.COM1393
©2005 American Medical Association. All rights reserved.
Downloaded From: http://archderm.jamanetwork.com/ on 02/25/2013
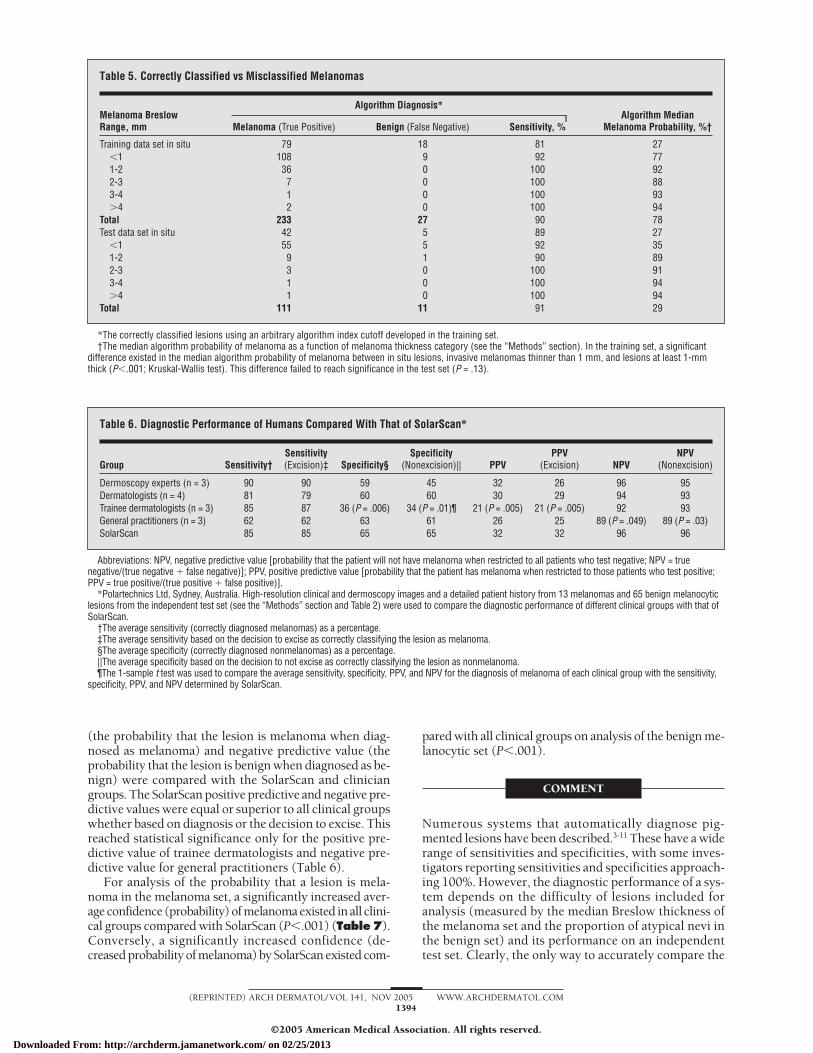
(the probability that the lesion is melanoma when diag-nosed as melanoma) and negative predictive value (theprobability that the lesion is benign when diagnosed as be-nign) were compared with the SolarScan and cliniciangroups. The SolarScan positive predictive and negative pre-dictive values were equal or superior to all clinical groupswhether based on diagnosis or the decision to excise. Thisreached statistical significance only for the positive pre-dictive value of trainee dermatologists and negative pre-dictive value for general practitioners (Table 6).
For analysis of the probability that a lesion is mela-noma in the melanoma set, a significantly increased aver-age confidence (probability) of melanoma existed in all clini-cal groups compared with SolarScan (P�.001) (Table7).Conversely, a significantly increased confidence (de-creased probability of melanoma) by SolarScan existed com-
pared with all clinical groups on analysis of the benign me-lanocytic set (P�.001).
COMMENT
Numerous systems that automatically diagnose pig-mented lesions have been described.3-11 These have a widerange of sensitivities and specificities, with some inves-tigators reporting sensitivities and specificities approach-ing 100%. However, the diagnostic performance of a sys-tem depends on the difficulty of lesions included foranalysis (measured by the median Breslow thickness ofthe melanoma set and the proportion of atypical nevi inthe benign set) and its performance on an independenttest set. Clearly, the only way to accurately compare the
Table 5. Correctly Classified vs Misclassified Melanomas
Melanoma BreslowRange, mm
Algorithm Diagnosis*Algorithm Median
Melanoma Probability, %†Melanoma (True Positive) Benign (False Negative) Sensitivity, %
Training data set in situ 79 18 81 27�1 108 9 92 771-2 36 0 100 922-3 7 0 100 883-4 1 0 100 93�4 2 0 100 94
Total 233 27 90 78Test data set in situ 42 5 89 27
�1 55 5 92 351-2 9 1 90 892-3 3 0 100 913-4 1 0 100 94�4 1 0 100 94
Total 111 11 91 29
*The correctly classified lesions using an arbitrary algorithm index cutoff developed in the training set.†The median algorithm probability of melanoma as a function of melanoma thickness category (see the “Methods” section). In the training set, a significant
difference existed in the median algorithm probability of melanoma between in situ lesions, invasive melanomas thinner than 1 mm, and lesions at least 1-mmthick (P�.001; Kruskal-Wallis test). This difference failed to reach significance in the test set (P = .13).
Table 6. Diagnostic Performance of Humans Compared With That of SolarScan*
Group Sensitivity†Sensitivity(Excision)‡ Specificity§
Specificity(Nonexcision)|| PPV
PPV(Excision) NPV
NPV(Nonexcision)
Dermoscopy experts (n = 3) 90 90 59 45 32 26 96 95Dermatologists (n = 4) 81 79 60 60 30 29 94 93Trainee dermatologists (n = 3) 85 87 36 (P = .006) 34 (P = .01)¶ 21 (P = .005) 21 (P = .005) 92 93General practitioners (n = 3) 62 62 63 61 26 25 89 (P = .049) 89 (P = .03)SolarScan 85 85 65 65 32 32 96 96
Abbreviations: NPV, negative predictive value [probability that the patient will not have melanoma when restricted to all patients who test negative; NPV = truenegative/(true negative � false negative)]; PPV, positive predictive value [probability that the patient has melanoma when restricted to those patients who test positive;PPV = true positive/(true positive � false positive)].
*Polartechnics Ltd, Sydney, Australia. High-resolution clinical and dermoscopy images and a detailed patient history from 13 melanomas and 65 benign melanocyticlesions from the independent test set (see the “Methods” section and Table 2) were used to compare the diagnostic performance of different clinical groups with that ofSolarScan.
†The average sensitivity (correctly diagnosed melanomas) as a percentage.‡The average sensitivity based on the decision to excise as correctly classifying the lesion as melanoma.§The average specificity (correctly diagnosed nonmelanomas) as a percentage.||The average specificity based on the decision to not excise as correctly classifying the lesion as nonmelanoma.¶The 1-sample t test was used to compare the average sensitivity, specificity, PPV, and NPV for the diagnosis of melanoma of each clinical group with the sensitivity,
specificity, PPV, and NPV determined by SolarScan.
(REPRINTED) ARCH DERMATOL/ VOL 141, NOV 2005 WWW.ARCHDERMATOL.COM1394
©2005 American Medical Association. All rights reserved.
Downloaded From: http://archderm.jamanetwork.com/ on 02/25/2013

diagnostic accuracy of systems is by directly comparingtheir results for the same set of lesions.
The data for algorithm development and testing werecollected from 9 centers in 3 continents. Such a designincreases the generalizability of the instruments’ perfor-mance. In all but 1 clinic site, the lesions collected wereexcised or monitored because of clinical suspicion. Toreduce verification bias, lesions thought to be benign bythe clinician but that required short-term digital moni-toring for confirmation of their benign nature wereincluded.3 Furthermore, a small sample of lesions wereincluded that were clearly benign and diagnosed byclassic dermoscopy features. This again reduces verifi-cation bias.
All image analysis features isolated by SolarScan wereautomated (ie, without input from the clinician). The clini-cal history features taken were modeled but not used in thefinal diagnostic algorithm. The only exception to the com-plete automated nature of the algorithm was the creationof the lesion border. Here, a 3-tiered system is used. First,an automated best-guess lesion boundary is created. If thisboundary is rejected by the clinician, then a second seriesof automated boundaries are created. If neither of these areconsidered accurate, then a manual border is created bythe clinician. We believe that it is an essential responsibil-ity of the clinician to define the true lesion boundary foranalysis. It is also important that the lesion border does notoversegment the lesion, that is, normal skin should not beincluded within the lesion boundary. If this occurs, sig-nificant differences occur with the algorithm output. Forthis reason, 24% of the lesions require a manual proce-dure to create the border. However, our results showed nosignificant difference in algorithm performance when com-paring manual and automated boundaries.
The first diagnostic model attempted to correctly clas-sify all pigmented benign lesions that were not melano-mas. However, nonmelanocytic pigmented lesions suchas seborrheic keratoses and hemangiomas were poorlydiscriminated. Because these lesions were weighted rela-tively highly in the benign set to be correctly classifiedduring the algorithm development, it is likely that theyare morphologically too similar to melanomas when us-ing the image analysis features selected. A less impor-tant but possible contributing reason for the poor dis-crimination of the nonmelanocytic lesions was theirrelatively small sample size.
For these reasons, a model designed to discriminate onlypigmented melanocytic lesions from melanoma was de-veloped. The model was highly reproducible in the test setand gave a sensitivity of 91% and specificity of 68% for mela-noma. The median probability of the melanomas in the testset was 29% and only 1.5% in the nonmelanoma set, whichindicates a good separation of the 2 classes. However, be-cause the nonmelanoma set included predominately sus-picious lesions that required either excision or short-termdigital monitoring for management, the true specificity inthe field will be much greater. Furthermore, the medianBreslow thickness was only 0.36 mm, which indicates a rela-tively difficult set of thin melanomas.
There is clearly a clinical limitation for an instrumentthat does not diagnose pigmented nonmelanocytic le-sions. However, because there are strict dermoscopy cri-
teria for distinguishing melanocytic from nonmelanocyticlesions, this clinical limitation should have less impact ina specialist setting. Nevertheless, it remains to be seenwhether this is a significant limitation in general practice.
The final requirement of an automated diagnostic sys-tem is to compare its performance with diagnoses per-formed by humans. Although palpation of the lesion is notincluded for assessment by the participating clinicians, thisexperimental approach allows direct comparison of per-formance within the various clinician groups examined. Itis important that none of these clinicians were involved indata collection for SolarScan algorithm development.SolarScan’s sensitivity was comparable with that of der-moscopy experts, dermatologists, and trainee dermatolo-gists, and had a substantially superior sensitivity (whichdid not, however, reach statistical significance) comparedwith that of general practitioners. In analysis of specific-ity, SolarScan’s performance was superior to that of traineedermatologists and had a higher specificity than all 4 clini-cal groups (based either on absolute diagnosis or the de-cision to not excise a benign lesion).
The analysis of the human performance compared withthat of SolarScan is somewhat limited by the relativelysmall sample size examined. The next stage in assess-ment of diagnosis by humans compared with that ofSolarScan should be a formal clinical trial that incorpo-rates both suspicious lesions and randomly selected ba-nal lesions. Nevertheless, it seems clear from the data re-ported herein that SolarScan can be expected to performwell against all clinician groups in such a setting and hencewould be a valuable asset for both dermatologists and pri-mary care physicians.
The aim of this project is to produce an instrument thatgives an automated diagnosis of melanoma. Because suchinstrumentation will never achieve 100% diagnostic ac-curacy, and because the gold standard of histopathologicdiagnosis suffers from significant interobserver discon-cordance, the absolute computer diagnosis will likely neverbe used as an absolute clinical diagnosis. Rather, it is morelikely to be used as an expert second opinion, an auxil-iary for clinical decision making.
Table 7. Diagnostic Performance of Humans vs SolarScan*
Group
Probability of Melanoma, %(SEM)†
MelanomaData Set
NonmelanomaData Set
Dermoscopy experts (n = 3) 80 (6.3) 43 (2.7)Dermatologists (n = 4) 73 (7.6) 38 (2.8)Trainee dermatologists (n = 3) 77 (7.3) 55 (2.9)General practitioners (n = 3) 59 (5.5) 43 (2.3)SolarScan 30 (8.5) 11 (2.0)
*Polartechnics Ltd, Sydney, Australia. There was a significantly increasedmean probability of melanoma estimated by all clinician groups comparedwith SolarScan in the melanoma set (Table 2) using 1-sample t test.Conversely, there was a significant reduction in mean probability ofmelanoma in the benign melanocytic lesion group diagnosed with SolarScancompared with all clinician groups.
†P�.001 for all.
(REPRINTED) ARCH DERMATOL/ VOL 141, NOV 2005 WWW.ARCHDERMATOL.COM1395
©2005 American Medical Association. All rights reserved.
Downloaded From: http://archderm.jamanetwork.com/ on 02/25/2013
Accepted for Publication: May 18, 2005.Author Affiliations: Sydney Melanoma Diagnostic Cen-tre, Sydney Cancer Centre, Royal Prince Alfred Hospital,Camperdown, and Faculty of Medicine (Drs Menzies andMcCarthy and Ms Avramidis) and George Institute for In-ternational Health (Dr Lo), University of Sydney, Syd-ney, Australia; Commonwealth Scientific and IndustrialResearch Organisation, Mathematical and Information Sci-ences, Macquarie University, North Ryde, Australia (DrsBischof and Talbot); Polartechnics Ltd, Sydney (DrsGutenev, Mackellar, and Skladnev and Ms Wong); Vic-torian Melanoma Service and Department of Medicine, Al-fred Hospital, Monash University, Victoria, Australia (DrKelly); Central Coast Skin Cancer Clinic, Toukley, Aus-tralia (Dr Cranney); Chatswood Skin Cancer Clinic, Chats-wood, Australia (Dr Lye); Skin and Cancer Associates, Plan-tation, Fla (Dr Rabinovitz and Ms Oliviero); Skin andCancer Foundation, Darlinghurst, Australia (Dr Virol);South East Dermatology, Carina Heights, Australia (DrDe’Ambrosis); Melanoma Unit, Princess Alexandra Hos-pital, Woolloongabba, Australia (Dr McCleod); Depart-ment of Dermatology, Shinshu University, Matsumoto, Na-gano, Japan (Dr Koga); Department of Dermatology,University of Connecticut Health Center, Farmington (DrGrin); Department of Dermatology, University HospitalGeneva, Geneva, Switzerland (Dr Braun); and PigmentedLesion Clinic, School of Medicine, University of Miami,Boca Raton, Fla (Dr Johr). Dr Blum is in private practicein Konstanz, Germany.Correspondence: Scott W. Menzies, MB, BS, PhD,Sydney Melanoma Diagnostic Centre, Sydney CancerCentre, Royal Prince Alfred Hospital, Camperdown 2050,New South Wales, Australia ([email protected]).Author Contributions: Study concept and design: Men-zies, Bischof, Talbot, Gutenev, Mackellar, and Sklad-nev. Acquisition of data: Menzies, Gutenev, Avramidis,McCarthy, Kelly, Cranney, Lye, Rabinovitz, Oliviero,Blum, Virol, De’Ambrosis, McCleod, Koga, Grin, Braun,and Johr. Analysis and interpretation of data: Mackellar,Lo, Gutenev, Wong, and Menzies. Drafting of the manu-script: Menzies, Gutenev, and Mackellar. Critical revi-sion of the manuscript for important intellectual content: Allauthors. Statistical analysis: Wong, Lo, Mackellar, andMenzies. Obtained funding: Skladnev. Administrative, tech-nical, and material support: Skladnev and Menzies. Studysupervision: Menzies.Financial Disclosure: Dr Menzies is a paid consultant forPolartechnics Ltd, the company with full ownership ofthe intellectual property for SolarScan. Polartechnics Ltdhas filed for patents for the System and Method for Ex-amining, Recording, and Analyzing Dermatological Con-ditions (US Patent filing No. 09/473270), the BoundaryFinding in Dermatological Examination (US Patent fil-
ing No. 10/478077), and the Diagnostic Feature Extrac-tion in Dermatological Examination (US Patent filingNo. 10/478078). Polartechnics Ltd has filed for pa-tients on the Diagnostic Feature Extraction in Derma-tological Examination (Australian Patent application No.20022308395 and Australian Patent No. 2003905998).Funding/Support: This research was funded in part by anAustralian Federal Government Research and Develop-ment Syndication Grant (13812/18/01) in 1994 and Re-search and Development Start Grant (STG 00186) in 1997.Previous Presentation: An interim analysis of SolarScanperformance (not the final data as shown herein) was pre-sented at the American Academy of Dermatology 62nd An-nual Meeting; February 2004; Washington, DC.
REFERENCES
1. Grin CM, Kopf AW, Welkovich B, Bart RS, Levenstein MJ. Accuracy in the clini-cal diagnosis of malignant melanoma. Arch Dermatol. 1990;126:763-766.
2. Marks R, Jolley D, McCormack C, Dorevitch AP. Who removes pigmented skinlesions? J Am Acad Dermatol. 1997;36:721-726.
3. Rosado B, Menzies S, Habauer A, et al. Accuracy of the computer diagnosis ofmelanoma: a quantitative meta-analysis. Arch Dermatol. 2003;139:361-367.
4. Piccolo D, Ferrari A, Peris K, Daidone R, Ruggeri B, Chimenti S. Dermoscopicdiagnosis by a trained clinician vs a clinician with minimal dermoscopy trainingvs computer-aided diagnosis of 341 pigmented skin lesions: a comparative study.Br J Dermatol. 2002;147:481-486.
5. Rubegni P, Cevenini G, Burroni M, et al. Automated diagnosis of pigmented skinlesions. Int J Cancer. 2002;101:576-580.
6. Rubegni P, Burroni M, Cevenini G, et al. Digital dermoscopy analysis and artifi-cial neural network for the differentiation of clinically atypical pigmented skin le-sions: a retrospective study. J Invest Dermatol. 2002;119:471-474.
7. Jamora M, Wainwright B, Meehan S, Bystryn J. Improved identification of po-tentially dangerous pigmented skin lesions by computerized image analysis. ArchDermatol. 2003;139:195-198.
8. Rubegni P, Cevenini G, Burroni M, et al. Digital dermoscopy analysis of atypicalpigmented skin lesions: a stepwise logistic discriminant analysis approach. SkinRes Technol. 2002;8:276-281.
9. Gerger A, Stolz W, Pompl R, Smolle J. Automated epiluminescence micros-copy: tissue counter analysis using CART and 1-NN in the diagnosis of melanoma.Skin Res Technol. 2003;9:105-110.
10. Hoffmann K, Gambichler T, Rick A, et al. Diagnostic and neural analysis of skincancer (DANAOS): a multicentre study for collection and computer-aided analy-sis of data from pigmented skin lesions using digital dermoscopy. Br J Dermatol.2003;149:801-809.
11. Blum A, Luedtke H, Ellwanger U, Schwabe R, Rassner G, Garbe C. Digital imageanalysis for diagnosis of cutaneous melanoma: development of a highly effec-tive computer algorithm based on analysis of 837 melanocytic lesions. Br JDermatol. 2004;151:1029-1038.
12. Menzies SW, Bischof LM, Peden G, et al. Automated instrumentation for the di-agnosis of invasive melanoma: image analysis of oil epiluminescence microscopy.In: Altmeyer P, Hoffman K, Stucker M, eds. Skin Cancer and UV Radiation. Ber-lin, Germany: Springer Verlag; 1997.
13. Menzies SW, Gutenev A, Avramidis M, Batrac A, McCarthy WH. Short-term digi-tal surface microscopy monitoring of atypical or changing melanocytic lesions.Arch Dermatol. 2001;137:1583-1589.
14. Shrout PE, Fleiss JL. Intraclass correlations: uses in assessing rater reliability.Psychol Bull. 1979;2:420-428.
15. Bosner B. Fundamentals of Biostatistics. 4th ed. Belmont, Calif: Duxbury Press;1995.
ARCHIVES Feature
Free color publication if color illustrations enhance thedidactic value of the article.
(REPRINTED) ARCH DERMATOL/ VOL 141, NOV 2005 WWW.ARCHDERMATOL.COM1396
©2005 American Medical Association. All rights reserved.
Downloaded From: http://archderm.jamanetwork.com/ on 02/25/2013

ease or to the time required for efalizumab to correct thepathophysiologic conditions. Further investigations of thisdrug in patients with atopic dermatitis will help to clarifythe role of efalizumab in this condition.
Accepted for Publication: June 20, 2005.Correspondence: Jeffrey M. Weinberg, MD, Depart-ment of Dermatology, St. Luke’s-Roosevelt Hospital Cen-ter, 1090 Amsterdam Ave, Suite 11D, New York, NY 10025([email protected]).Author Contributions: Study concept and design: Wein-berg and Siegfried. Acquisition of data: Weinberg and Sieg-fried. Analysis and interpretation of data: Weinberg andSiegfried. Drafting of the manuscript: Weinberg and Sieg-fried. Critical revision of the manuscript for important in-tellectual content: Weinberg and Siegfried. Statistical analy-sis: Weinberg and Siegfried. Obtained funding: Weinbergand Siegfried. Administrative, technical, and material sup-port: Weinberg and Siegfried. Study supervision: Wein-berg and Siegfried.Financial Disclosure: Dr Weinberg is a member of thespeakers’ bureau for Amgen, Thousand Oaks, Calif, andGenentech. Dr Siegfried has served as a paid consultantfor Amgen and Genentech.Additional Information: There was no industry sup-port for preparation and publication of this manuscript.
REFERENCES
1. Saini R, Tutrone WD, Weinberg JM. Advances in therapy for psoriasis: an over-view of infliximab, etanercept, efalizumab, alefacept, adalimumab, tazarotene, andpimecrolimus. Curr Pharm Des. 2005;11:273-280.
2. Lebwohl M. Psoriasis. Lancet. 2003;361:1197-1204.
3. Lebwohl M, Tyring SK, Hamilton TK, et al. A novel targeted T-cell modulator, efali-zumab, for plaque psoriasis. N Engl J Med. 2003;349:2004-2013.
4. Leung DY, Jain N, Leo HL. New concepts in the pathogenesis of atopic dermatitis.Curr Opin Immunol. 2003;15:634-638.
5. van Joost T, Kozel MM, Tank B, Troost R, Prens EP. Cyclosporine in atopic der-matitis: modulation in the expression of immunologic markers in lesional skin.J Am Acad Dermatol. 1992;27:922-928.
6. Raptiva (efalizumab) [package insert]. South San Francisco, Calif: Genentech, Inc;2004.
7. Gordon KB, Papp KA, Hamilton TK, et al; Efalizumab Study Group. Efalizumab forpatients with moderate to severe plaque psoriasis: a randomized controlled trial.JAMA. 2003;290:3073-3080.
8. Menter A, Gordon K, Carey W, et al. Efficacy and safety observed during 24 weeksof efalizumab therapy in patients with moderate to severe plaque psoriasis. ArchDermatol. 2005;141:31-38.
Correction
Error in Byline. In the the Study by Menzies et al titled“The Performance of SolarScan: An Automated Der-moscopy Image Analysis Instrument for the Diagnosisof Primary Melanoma,” published in the November2005 issue of the ARCHIVES (2005;141:1388-1396), thename of the one of the authors was misspelled. Theauthor’s name is Alexandra Varol, B Med.
Submissions
Clinicians, residents, and fellows are invited to submit casesof challenges in management and therapeutics to this sec-tion. Cases should follow the established pattern. Manu-scripts should be prepared double-spaced with rightmargins nonjustified. Pages should be numbered con-secutively with the title page separated from the text (seeInstructions for Authors for information about prepara-tion of the title page). Clinical photographs, photo mi-crographs, and illustrations must be sharply focused andsubmitted as separate JPG files with each file numberedwith the figure number. Material must be accompaniedby the required copyright transfer statement (see Instruc-tions for Authors). Preliminary inquiries regarding sub-missions for this feature may be submitted to George J.Hruza, MD ([email protected]). Manuscripts should besubmitted via our online manuscript submission and re-view system (http://manuscripts.archdermatol.com).
(REPRINTED) ARCH DERMATOL/ VOL 142, MAY 2006 WWW.ARCHDERMATOL.COM558
©2006 American Medical Association. All rights reserved.
Downloaded From: http://archderm.jamanetwork.com/ on 02/25/2013