Pim3 negatively regulates glucose-stimulated insulin secretion
Upload
independentCategory
view
2download
0
Development/Plasticity/Repair
The p75 Neurotrophin Receptor NegativelyModulates Dendrite Complexity and Spine Density inHippocampal Neurons
Marta Zagrebelsky,1 Andreas Holz,2 Georg Dechant,3 Yves-Alain Barde,4 Tobias Bonhoeffer,1 and Martin Korte1
Departments of 1Cellular and Systems Neurobiology and 2Neuroimmunology, Max Planck Institute of Neurobiology, D-82152 Martinsried, Germany,3Institute for Neuroscience, Innsbruck Medical University, A-6020 Innsbruck, Austria, and 4Division of Pharmacology/Neurobiology, Biozentrum,University of Basel, CH-4003 Basel, Switzerland
The correlation between functional and structural neuronal plasticity is by now well documented. However, the molecular mechanismstranslating patterns of neuronal activity into specific changes in the structure of neurons remain unclear. Neurotrophins can be releasedin an activity-dependent manner, and they are capable of controlling both neuronal morphology and functional synaptic changes. Theyare thus attractive molecules to be studied in the context of synaptic plasticity. In the CNS, most of the work so far has focused on the roleof BDNF and of its tyrosine kinase B receptor (TrkB), but relatively little is known about the function of the pan-neurotrophin receptorp75 NTR. In this study, we show in loss-of-function experiments that postnatal hippocampal pyramidal cells in two mutant lines of p75 NTR
have a higher spine density and greater dendritic complexity than wild-type (WT) mice. Conversely, in a gain-of-function approach,p75 NTR overexpression in WT neurons significantly reduces dendritic complexity, as well as spine density in all dendritic compartments.These results show that p75 NTR negatively modulates dendritic morphology in adult hippocampal pyramidal neurons and documents anew case of functional antagonism between Trk and p75 NTR signaling.
Key words: dendritic morphology; neurotrophin receptors; spine density; hippocampus; pyramidal neurons; p75 neurotrophin receptor
IntroductionA striking feature of mammalian neurons is the complexity oftheir dendritic tree, on which they receive, process, and integrateinputs from their presynaptic partners. Dendrites of many neu-rons are decorated with spines, which are small and specializedcompartments representing the postsynaptic sites of excitatorysynapses. The shape and extent of the dendritic arbor of a neuronundergo significant alterations during development, and they areprofoundly influenced by neuronal activity (Bliss and Col-lingridge, 1993; Dunaevsky et al., 1999; Malenka and Nicoll,1999). In addition, changes in synaptic strength have been corre-lated with the remodeling of spines (Engert and Bonhoeffer,1999; Maletic-Savatic et al., 1999; Toni et al., 1999) (for review,see Yuste and Bonhoeffer, 2004).
Among attractive molecular candidates as modulators of neu-ronal morphology are the neurotrophins and their receptors.Neurotrophins constitute a family of molecules, which includesnerve growth factor, brain-derived neurotrophic factor (BDNF),
neurotrophin-3, and neurotrophin-4. They are secretory pro-teins that are released from neurons in an activity-dependentmanner. Two types of receptors mediate neurotrophin action:tyrosine kinase A (TrkA), TrkB, and TrkC, (Patapoutin andReichardt, 2001) and a pan-neurotrophin receptor p75 (p75 NTR)that belongs to the tumor necrosis factor receptor (TNFR) family(Dechant and Barde, 2002). This dual-receptor system accountsfor the diverse, often antagonistic, effects exerted by neurotro-phins. The well known trophic functions of neurotrophins, in-cluding, for example, the prevention of programmed cell deathduring development (Levi Montalcini and Booker, 1960; Snider,1988; Ernfors et al., 1995), are mediated by Trk receptors. Con-versely, the binding of neurotrophins to p75 NTR can cause celldeath in the nervous system (e.g., the septal nucleus, the spinalcord, and the retina) (Frade et al., 1996) (for review, see Fried-man, 2000). Neurotrophins also exert antagonistic effects duringactivity-dependent synaptic plasticity processes. For example,BDNF and its receptor TrkB play a crucial role in the inductionand maintenance of hippocampal long-term potentiation (LTP)(for review, see Poo, 2001). In contrast, deletion of p75 NTR leadsto a significant impairment in long-term depression (Rosch et al.,2005; Woo et al., 2005), without affecting LTP.
With regard to structural plasticity, neurotrophins controlneuronal morphology by promoting both dendritic (for review,see McAllister et al., 1999) and axonal elongation and arboriza-tion (Cohen-Cory and Fraser, 1995). These effects are thought tobe mediated by activation of Trk receptors. In contrast, p75 NTR is
Received June 17, 2005; revised Sept. 7, 2005; accepted Sept. 8, 2005.This work was supported by the Max Planck Society (A.H., M.K., M.Z., T.B.), the Volkswagen Foundation (Project
I176781 to M.K., T.B., and Y.-A.B.), by a Heisenberg stipend from the Deutsche Forschungsgemeinschaft (DFG), andby the DFG Research Unit 471 (M.K.). We thank Irene Arnold-Ammer and Volker Staiger for their outstandingtechnical assistance and Hans Thoenen for comments on previous versions of this manuscript.
Correspondence should be addressed to Dr. Martin Korte, Zoological Institute, Technische Universitat Braun-schweig, Mendelssohnstrasse 4, D-38106 Braunschweig, Germany. E-mail: [email protected].
DOI:10.1523/JNEUROSCI.2492-05.2005Copyright © 2005 Society for Neuroscience 0270-6474/05/259989-11$15.00/0
The Journal of Neuroscience, October 26, 2005 • 25(43):9989 –9999 • 9989
thought to block process elongation by virtue of its ability toactivate a Rho GTPase (Yamashita et al., 1999). It has also beenshown to mediate axonal growth inhibition by myelin-derivedneurite growth inhibitors (Wang et al., 2002). In the developingcerebral cortex, there is striking evidence that neurotrophins playan important role in regulating dendrite growth and branching indeveloping cortical neurons in a layer-specific and activity-dependent manner (McAllister et al., 1999). Also, BDNF exoge-nous application modulates the number and shape of dendriticspines in mature hippocampal pyramidal neurons (Tyler andPozzo-Miller, 2001).
To further explore the mechanisms controlling neuronalmorphology, we analyzed whether p75 NTR is involved in modu-lating the dendritic structure of mature neurons.
Materials and MethodsPreparation of hippocampal slice cultures. Hippocampal organotypic cul-tures were prepared from postnatal day 5 (P5) to P6 C57BL/6 wild-type(WT), p75 NTRexonIV (p75 NTRIV), or p75 NTRexonIII (p75 NTRIII) knock-out(KO) mice following the method of Stoppini et al. (1991). Briefly, thehippocampus was dissected in ice-cold sterile Gey’s balanced salt solu-tion, containing 0.5 ml of kynurenic acid (100 mM stock solution) and 0.5ml of glucose (50% stock solution) and adjusted to pH 7.2. Hippocampiwere then sliced transversely at a thickness of 400 �m on a tissue chopper(McIllwain, Wood Dale, IL). The slices were plated onto Millicell CMmembrane inserts (Millipore, Bedford, MA) and cultivated in a 37°C, 7%CO2, 99% humidity incubator. The slices were maintained in a mediumcontaining 50% DMEM with HBSS without glutamine, 25% HBSS, 1 mlof glucose (50%), 25% Donor Equine Serum (HyClone, Logan, UT), and0.5 ml of L-glutamine (200 mM stock solution) with medium changesevery third day. To reduce the number of non-neuronal cells, the sliceswere treated for 24 h with a mixture of antimitotic drugs (cytosine arabi-noside, uridine, and fluorodeoxyuridine, 10 �6 to 10 �7
M each; Sigma,Munich, Germany).
Plasmids and reagents. To visualize pyramidal cells within organotypiccultures, we transfected individual neurons with green fluorescent pro-tein (GFP; GFP-N1; Clontech, Mountain View, CA) under a cytomega-lovirus (CMV) promoter. To analyze spine morphology, we expressed afarnesylated form of GFP, targeted specifically to the membrane, drivenby the CMV promoter (Clontech). The mouse full-length p75 NTR cDNAplasmid (GenBank accession number BC038365) was subcloned into thepSP70 vector.
Particle-mediated gene transfer. Hippocampal slice cultures were trans-fected using the particle-mediated gene-transfer device Helios Gene GunSystem (Bio-Rad, Hercules, CA) after 15 d in vitro (DIV). Plasmids werepurified on a Qiagen (Valencia, CA) column and precipitated onto 0.6�m gold microcarrier particles according to the instruction manual forthe Helios Gene Gun (Bio-Rad). For cotransfection, the DNA loadingratio was 3:1 (p75 NTR to GFP) for a total of 2 �g/mg gold. For controlexperiments with GFP, the plasmid total amount was also 2 �g/mg gold.The gold beads coated with expression plasmids were then propelledfrom plastic tubing bullets onto the slices with a rapid helium burst of 50psi. The gold beads exited the gene gun at �1 cm above the slices andpassed through a filter with a pore size of 3 �m to prevent big clusters ofbeads from reaching the slices. Between 2 and 4 d after transfection, sliceswere fixed and used for immunohistochemistry.
Immunohistochemistry. Immunohistochemistry using antibodies top75 NTR was performed routinely on all slices to distinguish p75 NTR over-expressing from control neurons expressing only GFP. Slices were brieflyfixed with 4% paraformaldehyde and incubated for 1 h in a blockingsolution containing 0.2% Triton X-100 and 10% normal goat serum inPBS. Slices were then incubated overnight at 4°C with primary antibody(anti-human p75 NTR; Promega, Madison, WI) diluted 1:500 in blockingsolution and, finally, with the secondary antibody diluted 1:400 in PBS[cyanine 3 (Cy3)- or Cy5-conjugated anti-rabbit IgG; Jackson Immu-noResearch, West Grove, PA] for 4 h at room temperature. After wash-ing, the slices were mounted using an aqueous mounting medium con-
taining anti-fading agents (Biomeda, Foster City, CA). For the synapsin Istaining, we used a lengthy protocol in which shot slices were fixed in 4%PFA overnight and incubated for 1 d in a blocking solution containing0.4% Triton X-100, 1.5% normal horse serum, and 0.1% BSA in PBS.Slices were then incubated for 7–10 d at 4°C in the primary antibody(anti-human synapsin I; Chemicon, Temecula, CA) diluted 1:500 in thesame blocking solution without BSA. The secondary antibody was di-luted 1:400 in PBS, and the slices were incubated for 1–2 d at 4°C in thedark. After washing, the slices were mounted using an aqueous mountingmedium containing anti-fading agents (Biomeda). Appropriate controls,lacking the primary antibodies, were performed for each antibody.
Neuron selection. The delivery of a single gold particle carrying GFPunder the control of the CMV promoter resulted in the intense labelingof the entire dendritic arbor (see Fig. 2 A, B) as well as of all dendriticspines (see Fig. 3A) of individual pyramidal neurons. Only nonoverlap-ping labeled neurons were selected for our analysis to allow an unambig-uous reconstruction of the entire dendritic tree. Reliable cotransfectionwas achieved by coating gold particles with a 3:1 mixture of DNAs en-coding the p75 NTR construct as well as GFP. Post hoc immunohistochem-istry was used to confirm p75 NTR overexpression. All analyzed neuronsderived from cultures prepared from P5–P6 mice and cultivated for14 –18 DIV. Small numbers of individual pyramidal neurons were trans-fected in each culture, allowing to easily follow the complete dendriticprocesses of each labeled neuron. Anatomical criteria were used to iden-tify a neuron as a dentate gyrus granule cell, CA1 pyramidal cell, CA3pyramidal cell, or interneuron, respectively. Neurons selected for analy-sis were both CA1 and CA3 pyramidal cells, completely filled with GFPand not showing signs of degeneration.
Neuronal imaging and analysis. Neurons selected for analysis were im-aged with either a Leica (Nussloch, Germany) TCS-NT or a Leica SP2confocal microscope. Each neuron was first imaged using a 40� objec-tive [numerical aperture (NA), 1.25] and z-sectioned at 0.5 �m incre-ments. Single image stacks were then collapsed, imported in Photoshop(Adobe Systems, San Jose, CA) and mounted to obtain a two-dimensional reconstruction of the entire neuron subsequently used forSholl analysis (Sholl, 1953) of dendritic length and complexity. The Shollanalysis was obtained using the Neurolucida software (MicroBrightField,Colchester, VT), which calculates the cumulative number of dendriticintersections at 10-�m-interval distance points from each neuron start-ing from the cell body. The analysis of the number of dendrite crossingswas performed separately for basal and apical dendrites. We also calcu-lated the total number of crossings for each cell as an index for totaldendritic complexity. Spine density was measured separately for basal,mid-apical, and most-apical dendrites. The selected dendrite segmentswere imaged using a 63� objective (NA, 1.32) with a zoom of 2 and werez-sectioned at 0.3 �m increments. The number of spines and the den-dritic length were counted on three-dimensional (3D) stacks using themeasurement tool of the Imaris software (Bitplane, Zurich, Switzerland).Care was taken to ensure that each spine was counted only once byfollowing its course through the adjacent z-sections. The number ofspines was normalized per micrometer of dendritic length. Spine countswere performed blindly, without knowledge of the identity of the samplesduring the analysis. Both for dendritic complexity, as well as for spinedensity values, we did not find any significant difference between CA1and CA3 pyramidal dendrites. Therefore, neurons from both areas werecombined in our quantification.
Classification of spines. Dendritic spines were classified according totwo main criteria (Harris et al., 1992; Koh et al., 2002). First, their lengthwas measured from their base at the dendrite to the tip of their head (seeFig. 4 A, L). In addition, spine shape was defined by the ratio between theminimum (min) and the maximum (max) diameters of the spine, neck,and head, respectively, allowing us to classify them following standardcategories (Peters and Kaisrman-Abramof, 1969) as stubby (type I),mushroom (type II) and thin (type III) (see Fig. 4 A). In particular, spineswere analyzed one by one and were allocated to a specific category de-pending on the relationship between their length, their minimum diam-eter, and their maximum diameter We were thus able to distinguish threemain spine subtypes: stubby, in which the length is �1 �m and themaxhead/minneck ratio is �1.5; thin, in which the maxhead/minneck ratio is
9990 • J. Neurosci., October 26, 2005 • 25(43):9989 –9999 Zagrebelsky et al. • p75 Negatively Modulates Dendrite Complexity and Spine Density
�1.5 and the length �1 �m; and mushroom, in which the maxhead/minneck ratio is �1.5 (independent of their length). This method has theadvantage that the category of the spines is determined by objectivecriteria. To measure spine length, max diameter, and min diameter, theimages of dendrite stretches, from the most-apical, mid-apical, and basalcompartments, were acquired using a Leica SP2 confocal microscopewith a 63� objective (NA, 1.32) and a zoom of 8 and were z-sectioned at0.3 �m increments. During the measurements, we did not consider any3D information. Spine measurements were performed using the mea-surement tool in the Imaris software (Bitplane).
Quantification of synapsin I-positive dendritic spines. To assess whetherthe additional spines in p75 NTR KO mice contained functional synapses,we performed immunolabeling for synapsin I in hippocampal slices, andwe analyzed the proportion of dendritic spines colocalized to synapsinI-positive dots both in WT and p75 NTRIV KO mice. GFP-labeled den-dritic spines were considered colocalized when in close apposition to asynapsin I-positive dot in the same z-section or in one section above orbelow. Images of stretches of the most apical, mid-apical and basal den-dritic tree were acquired using a Leica SP2 confocal microscope with a63� (NA 1.32) objective using a zoom of 8 and z-sectioned at 0.3 �mincrements. Spine measurements were performed blindly using the mea-surement tool in the Imaris software (Bitplane).
Statistical analysis. The statistical analysis was performed using Mi-crosoft (Redmond, WA) Excel or Statistica. The data obtained were com-pared between two different experimental conditions using either a two-tailed Student’s t test or, for n � 5, a Mann–Whitney nonparametric test.
Values of p � 0.05 were considered significant.The Sholl analysis data were tested applying atwo-tailed Student’s t test point by point. Alldata shown are presented as mean � SEM.
Real-time PCR analysis. Quantitative real-time PCR was performed to determine relativegene expression levels of p75 NTR in the devel-oping hippocampus and cerebellum and inhippocampal slices. Total RNA was extracted(Chomczynski and Sacchi, 1987) and was con-verted into cDNA using Superscript II reversetranscriptase (Invitrogen, Carlsbad, CA).Primer Express software (Applied Biosystems,Foster City, CA) was used to design two inde-pendent p75 NTR primer and probe combina-tions: probe set p75 NTR-A, “p75 primer sense1,” 5�-CCC CAC CAG AGG GAG AGA A; “p75primer antisense (AS) 2,” 5�-GGC TAC TGTAGA GGT TGC CAT CA and “p75 probe #3”5�-(FAM)-5�-ACT GCC TCA GCC CAA GCCCTC AA-3�-(TAMRA); probe set p75 NTR-A,“p75 primer sense 13,” 5�-TGT GGG CCT TGTGGC TTA TAT; “p75 primer AS 14,” 5�-AGTTTC TCT CCC TCT GGT GGG; and “p75probe 15,” 5�-(FAM)-5�-TTG CTT GCA GCTGTT CCA TCT CTT GAA AG-3�-(TAMRA).To normalize p75 NTR expression GAPDHmRNA levels were determined with a describedprimer/probe set (Giulietti et al., 2001). Allreal-time PCRs were performed in triplicate us-ing the 2� Thermo-start QPCR system (AB-gene, Epsom, UK) and 0.5 �l of synthesizedcDNA. Thermal cycling was performed on aGenAmp 5700 system (Applied Biosystems),and real-time PCR data were analyzed usingGenAmp 5700 SDS and Excel software(Microsoft).
Riboprobe synthesis and in situ hybridization.Nucleotide positions 835–1270 of a p75 NTR
cDNA plasmid (GenBank accession numberBC038365) were subcloned into the pSP70 vec-tor. This allowed the generation of strand-specific p75 NTR riboprobes labeled with digoxi-genin (Holz et al., 1996). The probe
corresponded to parts of the extracellular, transmembrane, and deathdomains of the p75 NTR molecule without overlap with conserved TNFRdomains.
In situ hybridization of slice cultures and tissue sections was performedas described previously (Holz et al., 1996). Tissue was fixed with 4%paraformaldehyde in phosphate buffer, acetylated, and permeabilized.After incubation in hybridization buffer [50% formamide, 5� SSC, and2% blocking reagent (Roche Diagnostics, Indianapolis, IN)], tissue washybridized with either the sense or antisense p75 NTR riboprobe at 68°Cfor 16 h. After stringent washes in 0.2� SSC at 70°C, specifically boundriboprobes were detected by an alkaline phosphatase-conjugated anti-digoxigenin antibody (Roche Diagnostics) and a nitroblue tetrazolium/5-bromo-4-chloro-indolyl-phosphate color reaction. Before photomi-croscopic analysis, the tissue was counterstained with 4�,6�-diamidino-2-phenylindole dihydrochloride.
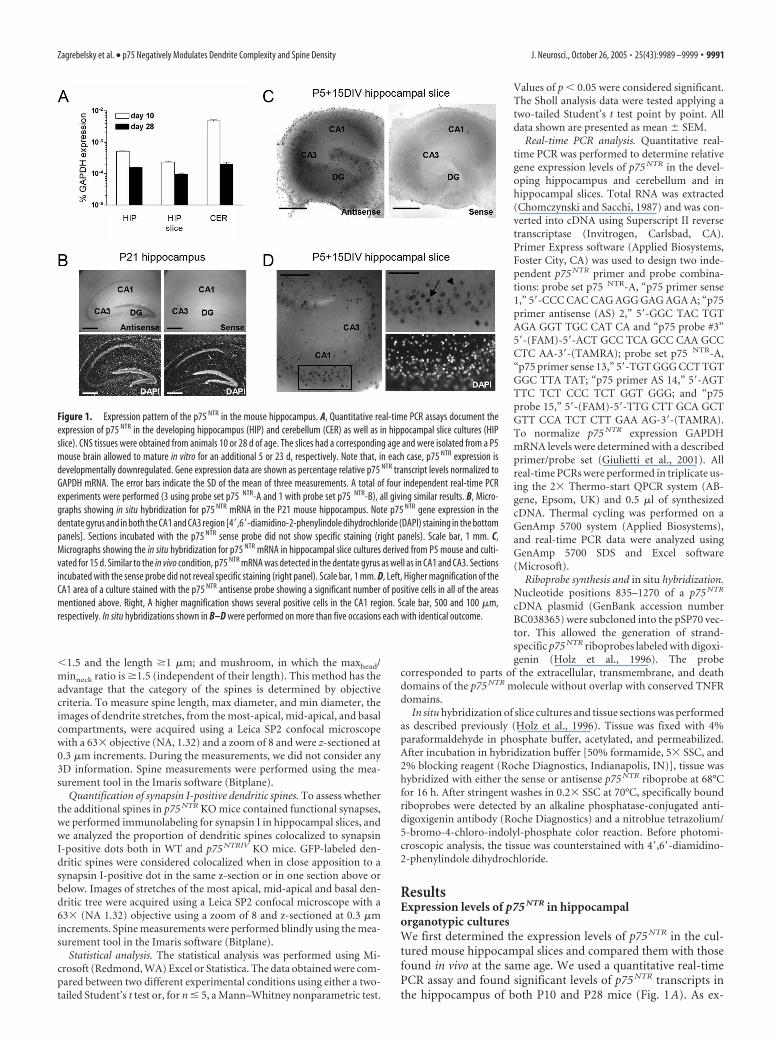
ResultsExpression levels of p75 NTR in hippocampalorganotypic culturesWe first determined the expression levels of p75 NTR in the cul-tured mouse hippocampal slices and compared them with thosefound in vivo at the same age. We used a quantitative real-timePCR assay and found significant levels of p75 NTR transcripts inthe hippocampus of both P10 and P28 mice (Fig. 1A). As ex-
Figure 1. Expression pattern of the p75 NTR in the mouse hippocampus. A, Quantitative real-time PCR assays document theexpression of p75 NTR in the developing hippocampus (HIP) and cerebellum (CER) as well as in hippocampal slice cultures (HIPslice). CNS tissues were obtained from animals 10 or 28 d of age. The slices had a corresponding age and were isolated from a P5mouse brain allowed to mature in vitro for an additional 5 or 23 d, respectively. Note that, in each case, p75 NTR expression isdevelopmentally downregulated. Gene expression data are shown as percentage relative p75 NTR transcript levels normalized toGAPDH mRNA. The error bars indicate the SD of the mean of three measurements. A total of four independent real-time PCRexperiments were performed (3 using probe set p75 NTR-A and 1 with probe set p75 NTR-B), all giving similar results. B, Micro-graphs showing in situ hybridization for p75 NTR mRNA in the P21 mouse hippocampus. Note p75 NTR gene expression in thedentate gyrus and in both the CA1 and CA3 region [4�,6�-diamidino-2-phenylindole dihydrochloride (DAPI) staining in the bottompanels]. Sections incubated with the p75 NTR sense probe did not show specific staining (right panels). Scale bar, 1 mm. C,Micrographs showing the in situ hybridization for p75 NTR mRNA in hippocampal slice cultures derived from P5 mouse and culti-vated for 15 d. Similar to the in vivo condition, p75 NTR mRNA was detected in the dentate gyrus as well as in CA1 and CA3. Sectionsincubated with the sense probe did not reveal specific staining (right panel). Scale bar, 1 mm. D, Left, Higher magnification of theCA1 area of a culture stained with the p75 NTR antisense probe showing a significant number of positive cells in all of the areasmentioned above. Right, A higher magnification shows several positive cells in the CA1 region. Scale bar, 500 and 100 �m,respectively. In situ hybridizations shown in B–D were performed on more than five occasions each with identical outcome.
Zagrebelsky et al. • p75 Negatively Modulates Dendrite Complexity and Spine Density J. Neurosci., October 26, 2005 • 25(43):9989 –9999 • 9991
pected (Buck et al., 1988; Lu et al., 1989)p75 NTR expression in the hippocampuswas developmentally regulated (Fig. 1A).Likewise, significant levels of p75 NTR werealso detected in hippocampal slice cul-tures isolated at P5 and allowed to maturein vitro for an additional 5 or 23 d. Similarto our in vivo observations, p75 NTR ex-pression was found to be reduced after 2additional weeks of in vitro maturation(Fig. 1A).
To determine which cell types expressthe p75 NTR gene, we performed in situ hy-bridization experiments using a p75 NTR-specific antisense riboprobe and com-pared p75NTR expression in the brain ofP21 mice with hippocampal cultures ob-tained from the P5 mouse brain and culti-vated for 2 weeks in vitro. At P21, p75 NTR
expression was limited to the hippocam-pus, the cerebellum, and the septum (datanot shown). In the P21 hippocampus, thespecific p75 NTR antisense detected highlevels of p75 NTR mRNA in neurons of thedentate gyrus and of the CA1 and CA3 re-gions (Fig. 1B; compare with the sense-treated sections on the right). Similarly,age-matched hippocampal organotypiccultures showed significant levels ofp75 NTR expression (Fig. 1C). Neurons inboth the CA1 and CA3 region of the hip-pocampal cultures showed p75 NTR ex-pression (Fig. 1D). In both areas, two dif-ferent cell populations were observed andcharacterized by either a high (Fig. 1D, ar-row) or low (arrowhead) p75 NTR expres-sion level.
Analysis of dendritic morphology usingparticle-mediated GFP transfectionTo visualize the fine structure of pyrami-dal neurons in organotypic cultures, wetransfected individual cells with enhancedGFP using particle-mediated gene trans-fer. As described for ferret cortical neu-rons (Lo et al., 1994), this technique typi-cally yields between one and a fewtransfected cells per slice and reveals finestructural details without exerting anytoxic effect (Lo et al., 1994). We could thusreadily visualize the complete dendriticarbor, including fine branches as well asdendritic spines, of individual neurons(Figs. 2A, 3A). We analyzed neurons inhippocampal slices prepared from P5mice and cultured for 2 weeks in vitro. Bythis age, the neurons have developed acomplex, three-dimensional morphologywith many oblique dendritic branches ex-tending from the primary apical and basalprocesses. In addition, dendrites are stud-ded with numerous spine-like protrusionsof varying size and shape. In WT, the mor-
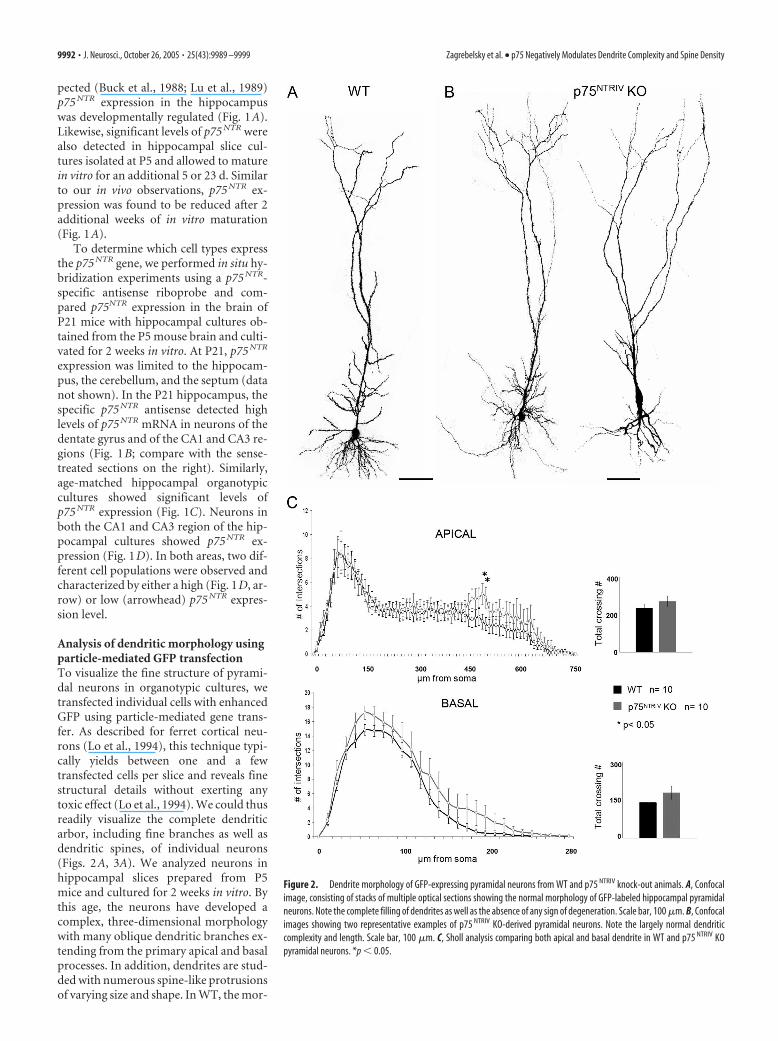
Figure 2. Dendrite morphology of GFP-expressing pyramidal neurons from WT and p75 NTRIV knock-out animals. A, Confocalimage, consisting of stacks of multiple optical sections showing the normal morphology of GFP-labeled hippocampal pyramidalneurons. Note the complete filling of dendrites as well as the absence of any sign of degeneration. Scale bar, 100 �m. B, Confocalimages showing two representative examples of p75 NTRIV KO-derived pyramidal neurons. Note the largely normal dendriticcomplexity and length. Scale bar, 100 �m. C, Sholl analysis comparing both apical and basal dendrite in WT and p75 NTRIV KOpyramidal neurons. *p � 0.05.
9992 • J. Neurosci., October 26, 2005 • 25(43):9989 –9999 Zagrebelsky et al. • p75 Negatively Modulates Dendrite Complexity and Spine Density
phology of CA1 and CA3 pyramidal neurons detected by GFP(Fig. 2A) was similar to the one described in previous studiesfilling neurons with a fluorescent dye (Tyler and Pozzo-Miller,2001). Specifically, both CA1 and CA3 pyramidal cells are char-acterized by a basal dendritic tree consisting of three to five pri-mary branched dendrites and by an apical dendritic tree formedby a single thick, highly branched, apical dendrite emerging fromthe opposite portion of the cell body. A detailed analysis of den-dritic complexity and length using the Sholl analysis (Fig. 2C)(n � 10) confirmed previous descriptions of hippocampal pyra-midal neurons (Nakayama et al., 2000), thus demonstrating thatthe GFP biolistic transfection did not cause any detectable dele-terious effect on neuronal morphology, as shown previously (Loet al., 1994).
Dendrite morphology and spine density in p75 NTRIV neuronsTo examine the role of p75 NTR, we first used a mouse line inwhich the exon IV of the p75 NTR (P75 NTRIV) gene was targeted(von Schack et al., 2001). Compared with GFP-expressing WT
neurons (Fig. 2A), GFP-expressing p75 NTRIV KO pyramidal neu-rons show a largely normal dendritic morphology (Fig. 2B). Weused Sholl analysis to calculate the total number of dendritecrossings as an objective measurement of the total dendritic com-plexity. This analysis revealed for p75 NTRIV KO neurons an in-crease in dendritic complexity that was somewhat more pro-nounced for the basal compartment when compared with WTneurons. However, for the apical and for the basal compartment,the difference was not statistically significant (Fig. 2C, inset) (api-cal, p � 0.344; basal, p � 0.15; WT, n � 10; KO, n � 10). A moredetailed Sholl analysis revealed a statistically significant increasein dendritic complexity in the mid-distal portion of the apicaldendrite (Fig. 2C, left) (WT, n � 10; KO, n � 10; p � 0.05between 480 and 520 �m from the soma). This area roughlycorresponds to the distal portion of the stratum radiatum inwhich most of the CA3 and mossy fiber axons synapse, respec-tively, on CA1 and CA3 pyramidal neurons. No significant dif-ferences were apparent in the total length of the apical and basaldendritic compartments between WT and p75 NTRIV KO neurons(Fig. 2C, left) (apical, p � 0.67; basal, p � 0.77).
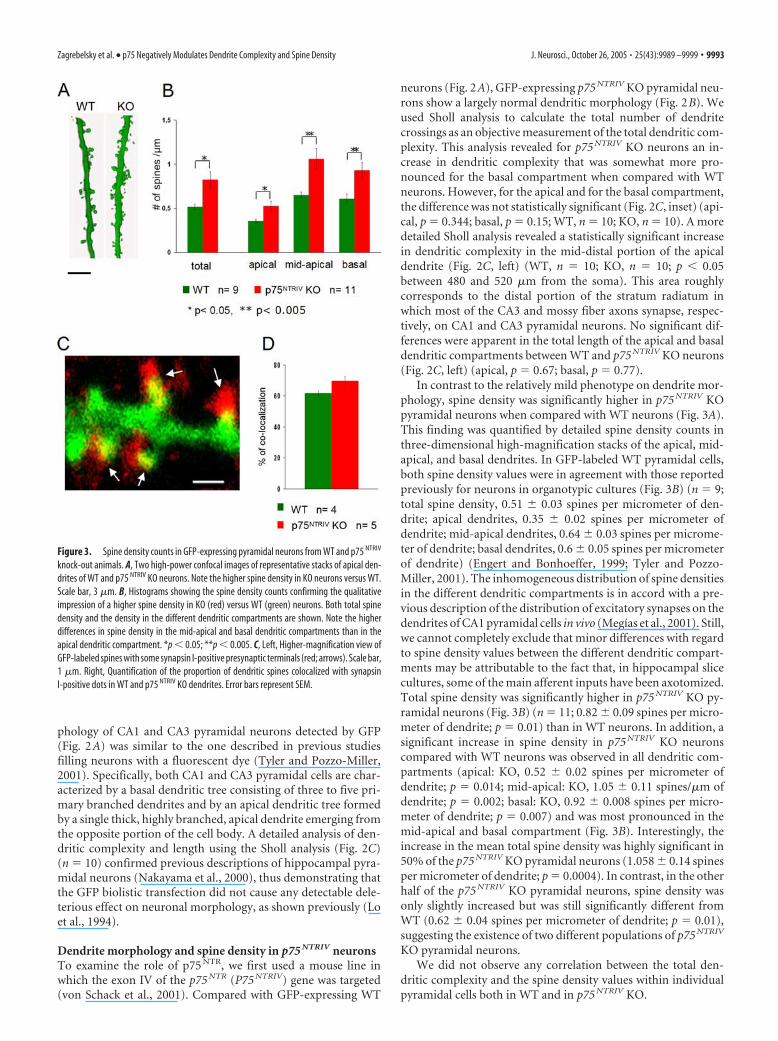
In contrast to the relatively mild phenotype on dendrite mor-phology, spine density was significantly higher in p75 NTRIV KOpyramidal neurons when compared with WT neurons (Fig. 3A).This finding was quantified by detailed spine density counts inthree-dimensional high-magnification stacks of the apical, mid-apical, and basal dendrites. In GFP-labeled WT pyramidal cells,both spine density values were in agreement with those reportedpreviously for neurons in organotypic cultures (Fig. 3B) (n � 9;total spine density, 0.51 � 0.03 spines per micrometer of den-drite; apical dendrites, 0.35 � 0.02 spines per micrometer ofdendrite; mid-apical dendrites, 0.64 � 0.03 spines per microme-ter of dendrite; basal dendrites, 0.6 � 0.05 spines per micrometerof dendrite) (Engert and Bonhoeffer, 1999; Tyler and Pozzo-Miller, 2001). The inhomogeneous distribution of spine densitiesin the different dendritic compartments is in accord with a pre-vious description of the distribution of excitatory synapses on thedendrites of CA1 pyramidal cells in vivo (Megıas et al., 2001). Still,we cannot completely exclude that minor differences with regardto spine density values between the different dendritic compart-ments may be attributable to the fact that, in hippocampal slicecultures, some of the main afferent inputs have been axotomized.Total spine density was significantly higher in p75 NTRIV KO py-ramidal neurons (Fig. 3B) (n � 11; 0.82 � 0.09 spines per micro-meter of dendrite; p � 0.01) than in WT neurons. In addition, asignificant increase in spine density in p75 NTRIV KO neuronscompared with WT neurons was observed in all dendritic com-partments (apical: KO, 0.52 � 0.02 spines per micrometer ofdendrite; p � 0.014; mid-apical: KO, 1.05 � 0.11 spines/�m ofdendrite; p � 0.002; basal: KO, 0.92 � 0.008 spines per micro-meter of dendrite; p � 0.007) and was most pronounced in themid-apical and basal compartment (Fig. 3B). Interestingly, theincrease in the mean total spine density was highly significant in50% of the p75 NTRIV KO pyramidal neurons (1.058 � 0.14 spinesper micrometer of dendrite; p � 0.0004). In contrast, in the otherhalf of the p75 NTRIV KO pyramidal neurons, spine density wasonly slightly increased but was still significantly different fromWT (0.62 � 0.04 spines per micrometer of dendrite; p � 0.01),suggesting the existence of two different populations of p75 NTRIV
KO pyramidal neurons.We did not observe any correlation between the total den-
dritic complexity and the spine density values within individualpyramidal cells both in WT and in p75 NTRIV KO.
Figure 3. Spine density counts in GFP-expressing pyramidal neurons from WT and p75 NTRIV
knock-out animals. A, Two high-power confocal images of representative stacks of apical den-drites of WT and p75 NTRIV KO neurons. Note the higher spine density in KO neurons versus WT.Scale bar, 3 �m. B, Histograms showing the spine density counts confirming the qualitativeimpression of a higher spine density in KO (red) versus WT (green) neurons. Both total spinedensity and the density in the different dendritic compartments are shown. Note the higherdifferences in spine density in the mid-apical and basal dendritic compartments than in theapical dendritic compartment. *p � 0.05; **p � 0.005. C, Left, Higher-magnification view ofGFP-labeled spines with some synapsin I-positive presynaptic terminals (red; arrows). Scale bar,1 �m. Right, Quantification of the proportion of dendritic spines colocalized with synapsinI-positive dots in WT and p75 NTRIV KO dendrites. Error bars represent SEM.
Zagrebelsky et al. • p75 Negatively Modulates Dendrite Complexity and Spine Density J. Neurosci., October 26, 2005 • 25(43):9989 –9999 • 9993
Additional spines in p75 NTRIV-deficient animalscontain synapsesTo ascertain whether the additional spines observed in p75 NTRIV
KO-derived neurons bear synapses, we stained our slices withantibodies to synapsin I to mark presynaptic terminals. We thenanalyzed the proportion of dendritic spines colocalized with syn-apsin I-positive puncta in both genotypes. Dendritic spines ofWT neurons were in close apposition (�0.3 �m) with synapsin Idots (Fig. 3C, left) in 61.6 � 1.68% of the cases (four cells fromthree WT slices) (Fig. 3C, right). In p75 NTRIV KO neurons, theproportion of spines colocalized with a synapsin I-positive dotwas slightly, but not significantly, higher (69.5 � 3.05%; p � 0.07;five cells from three KO slices) (Fig. 3C) than in WT cells. Theequal proportion of spines colocalized with synapsin I suggests anet higher number of synapses in p75 NTRIV KO than in WT neu-rons. The percentage of colocalized spines in our samples repre-sents a lower limit of the proportion of spines with presynapticpartners. However, because it is consistent with previously pub-lished studies (Tyler and Pozzo-Miller, 2001), we suggest that thisis attributable to the limited detection sensitivity of the immuno-cytochemical reaction in slice cultures and therefore does notinfluence the comparison between WT and KO neurons.
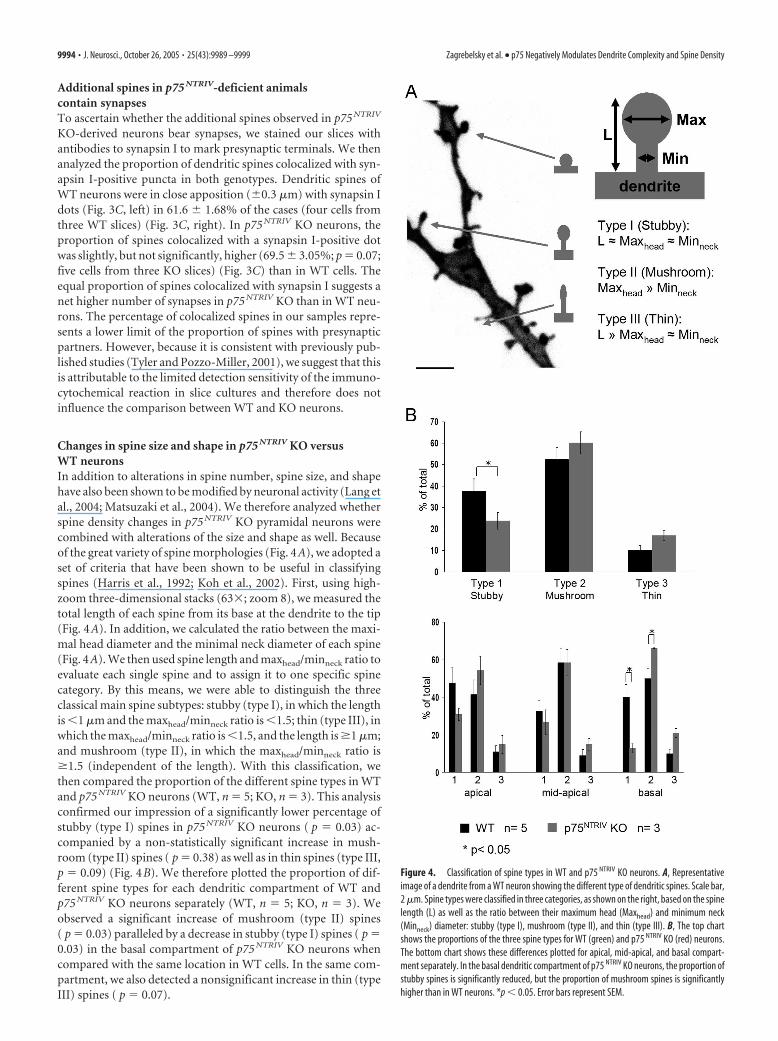
Changes in spine size and shape in p75 NTRIV KO versusWT neuronsIn addition to alterations in spine number, spine size, and shapehave also been shown to be modified by neuronal activity (Lang etal., 2004; Matsuzaki et al., 2004). We therefore analyzed whetherspine density changes in p75 NTRIV KO pyramidal neurons werecombined with alterations of the size and shape as well. Becauseof the great variety of spine morphologies (Fig. 4A), we adopted aset of criteria that have been shown to be useful in classifyingspines (Harris et al., 1992; Koh et al., 2002). First, using high-zoom three-dimensional stacks (63�; zoom 8), we measured thetotal length of each spine from its base at the dendrite to the tip(Fig. 4A). In addition, we calculated the ratio between the maxi-mal head diameter and the minimal neck diameter of each spine(Fig. 4A). We then used spine length and maxhead/minneck ratio toevaluate each single spine and to assign it to one specific spinecategory. By this means, we were able to distinguish the threeclassical main spine subtypes: stubby (type I), in which the lengthis �1 �m and the maxhead/minneck ratio is �1.5; thin (type III), inwhich the maxhead/minneck ratio is �1.5, and the length is �1 �m;and mushroom (type II), in which the maxhead/minneck ratio is�1.5 (independent of the length). With this classification, wethen compared the proportion of the different spine types in WTand p75 NTRIV KO neurons (WT, n � 5; KO, n � 3). This analysisconfirmed our impression of a significantly lower percentage ofstubby (type I) spines in p75 NTRIV KO neurons ( p � 0.03) ac-companied by a non-statistically significant increase in mush-room (type II) spines ( p � 0.38) as well as in thin spines (type III,p � 0.09) (Fig. 4B). We therefore plotted the proportion of dif-ferent spine types for each dendritic compartment of WT andp75 NTRIV KO neurons separately (WT, n � 5; KO, n � 3). Weobserved a significant increase of mushroom (type II) spines( p � 0.03) paralleled by a decrease in stubby (type I) spines ( p �0.03) in the basal compartment of p75 NTRIV KO neurons whencompared with the same location in WT cells. In the same com-partment, we also detected a nonsignificant increase in thin (typeIII) spines ( p � 0.07).
Figure 4. Classification of spine types in WT and p75 NTRIV KO neurons. A, Representativeimage of a dendrite from a WT neuron showing the different type of dendritic spines. Scale bar,2 �m. Spine types were classified in three categories, as shown on the right, based on the spinelength (L) as well as the ratio between their maximum head (Maxhead) and minimum neck(Minneck) diameter: stubby (type I), mushroom (type II), and thin (type III). B, The top chartshows the proportions of the three spine types for WT (green) and p75 NTRIV KO (red) neurons.The bottom chart shows these differences plotted for apical, mid-apical, and basal compart-ment separately. In the basal dendritic compartment of p75 NTRIV KO neurons, the proportion ofstubby spines is significantly reduced, but the proportion of mushroom spines is significantlyhigher than in WT neurons. *p � 0.05. Error bars represent SEM.
9994 • J. Neurosci., October 26, 2005 • 25(43):9989 –9999 Zagrebelsky et al. • p75 Negatively Modulates Dendrite Complexity and Spine Density
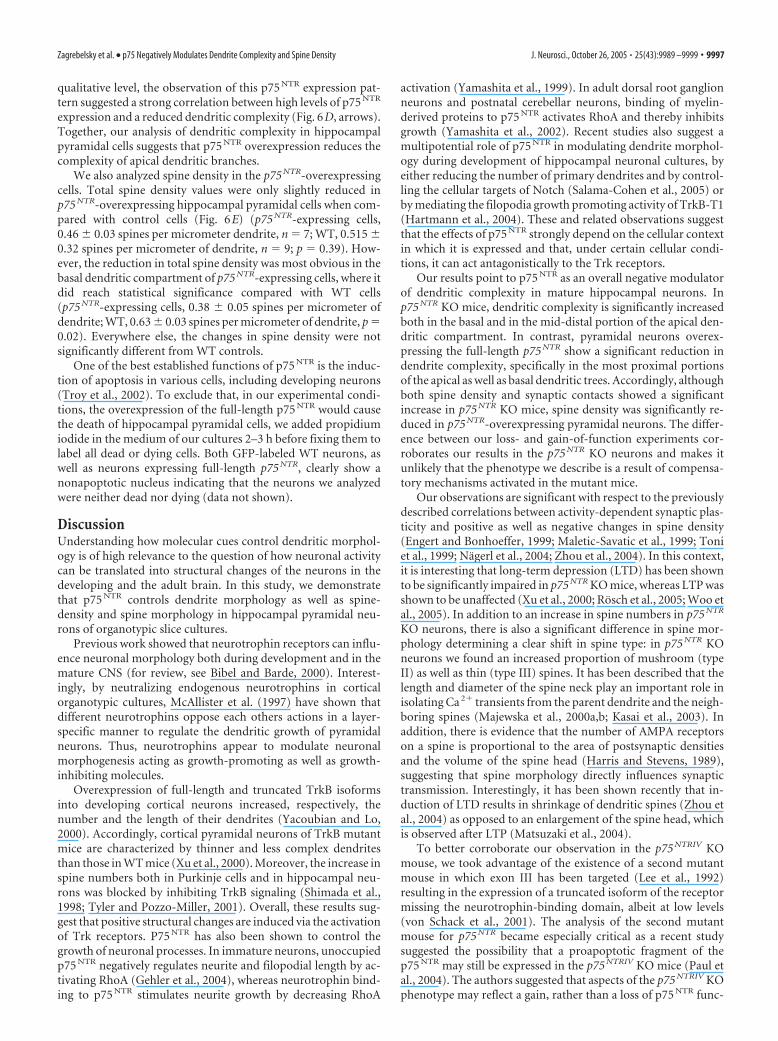
Dendrite morphology and spine density in p75 NTRIII
KO neuronsTo corroborate our observations suggesting that p75 NTR plays animportant role in negatively modulating dendrite as well as spine
morphology, we took advantage of the ex-istence of a second mutant of the p75 NTR
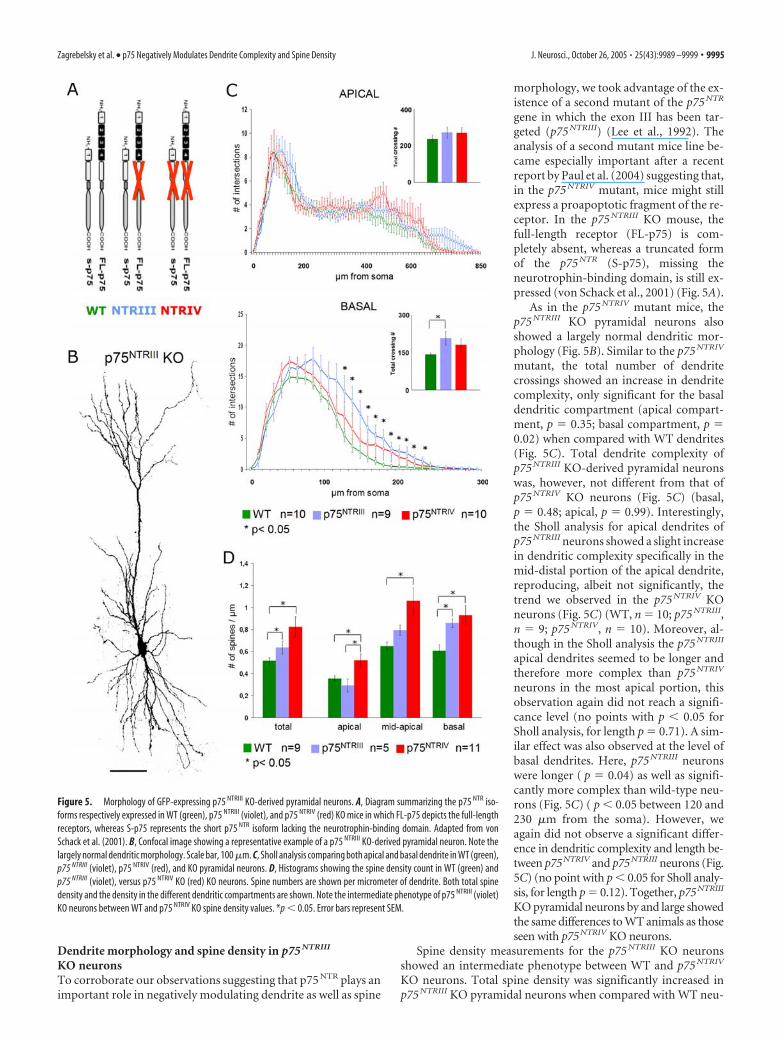
gene in which the exon III has been tar-geted (p75 NTRIII) (Lee et al., 1992). Theanalysis of a second mutant mice line be-came especially important after a recentreport by Paul et al. (2004) suggesting that,in the p75 NTRIV mutant, mice might stillexpress a proapoptotic fragment of the re-ceptor. In the p75 NTRIII KO mouse, thefull-length receptor (FL-p75) is com-pletely absent, whereas a truncated formof the p75 NTR (S-p75), missing theneurotrophin-binding domain, is still ex-pressed (von Schack et al., 2001) (Fig. 5A).
As in the p75 NTRIV mutant mice, thep75 NTRIII KO pyramidal neurons alsoshowed a largely normal dendritic mor-phology (Fig. 5B). Similar to the p75 NTRIV
mutant, the total number of dendritecrossings showed an increase in dendritecomplexity, only significant for the basaldendritic compartment (apical compart-ment, p � 0.35; basal compartment, p �0.02) when compared with WT dendrites(Fig. 5C). Total dendrite complexity ofp75 NTRIII KO-derived pyramidal neuronswas, however, not different from that ofp75 NTRIV KO neurons (Fig. 5C) (basal,p � 0.48; apical, p � 0.99). Interestingly,the Sholl analysis for apical dendrites ofp75 NTRIII neurons showed a slight increasein dendritic complexity specifically in themid-distal portion of the apical dendrite,reproducing, albeit not significantly, thetrend we observed in the p75 NTRIV KOneurons (Fig. 5C) (WT, n � 10; p75 NTRIII,n � 9; p75 NTRIV, n � 10). Moreover, al-though in the Sholl analysis the p75 NTRIII
apical dendrites seemed to be longer andtherefore more complex than p75 NTRIV
neurons in the most apical portion, thisobservation again did not reach a signifi-cance level (no points with p � 0.05 forSholl analysis, for length p � 0.71). A sim-ilar effect was also observed at the level ofbasal dendrites. Here, p75 NTRIII neuronswere longer ( p � 0.04) as well as signifi-cantly more complex than wild-type neu-rons (Fig. 5C) ( p � 0.05 between 120 and230 �m from the soma). However, weagain did not observe a significant differ-ence in dendritic complexity and length be-tween p75NTRIV and p75NTRIII neurons (Fig.5C) (no point with p � 0.05 for Sholl analy-sis, for length p � 0.12). Together, p75NTRIII
KO pyramidal neurons by and large showedthe same differences to WT animals as thoseseen with p75NTRIV KO neurons.
Spine density measurements for the p75 NTRIII KO neuronsshowed an intermediate phenotype between WT and p75 NTRIV
KO neurons. Total spine density was significantly increased inp75 NTRIII KO pyramidal neurons when compared with WT neu-
Figure 5. Morphology of GFP-expressing p75 NTRIII KO-derived pyramidal neurons. A, Diagram summarizing the p75 NTR iso-forms respectively expressed in WT (green), p75 NTRIII (violet), and p75 NTRIV (red) KO mice in which FL-p75 depicts the full-lengthreceptors, whereas S-p75 represents the short p75 NTR isoform lacking the neurotrophin-binding domain. Adapted from vonSchack et al. (2001). B, Confocal image showing a representative example of a p75 NTRIII KO-derived pyramidal neuron. Note thelargely normal dendritic morphology. Scale bar, 100 �m. C, Sholl analysis comparing both apical and basal dendrite in WT (green),p75 NTRIII (violet), p75 NTRIV (red), and KO pyramidal neurons. D, Histograms showing the spine density count in WT (green) andp75 NTRIII (violet), versus p75 NTRIV KO (red) KO neurons. Spine numbers are shown per micrometer of dendrite. Both total spinedensity and the density in the different dendritic compartments are shown. Note the intermediate phenotype of p75 NTRIII (violet)KO neurons between WT and p75 NTRIV KO spine density values. *p � 0.05. Error bars represent SEM.
Zagrebelsky et al. • p75 Negatively Modulates Dendrite Complexity and Spine Density J. Neurosci., October 26, 2005 • 25(43):9989 –9999 • 9995
rons (p75 NTRIII, 0.63 � 0.05 spines/�m,n � 5; WT, 0.51 � 0.03 spines/�m, n � 9;p � 0.02) (Fig. 5D). In contrast, total spinedensity in p75 NTRIII mutant neurons wasnotably, but not significantly, lower thanthe one observed in p75 NTRIV KO neurons(0.82 � 0.09 spines/�m; p � 0.37; n � 11).The tendency of an intermediate pheno-type was maintained in all different den-dritic compartments, although it wasmore pronounced for the mid-apical andbasal dendrites in which the spine densityvalues in P75 NTRIII are significantly differ-ent from WT but not from the P75 NTRIV
(apical: P75 NTRIII, 0.29 � 0.05 spines permicrometer of dendrite, versus WT, p �0.32, against P75 NTRIV, p � 0.02; mid-api-cal: P75 NTRIII 0.79 � 0.4 spines per micro-meter of dendrite, versus WT, p � 0.06,against P75 NTRIV, p � 0.07; basal:P75 NTRIII 0.85 � 0.03 spines per micro-meter of dendrite, against WT, p � 0.04,against P75 NTRIV, p � 0.99) (Fig. 5D).
Overexpression of full-length p75 NTR
significantly reduces both dendritecomplexity and dendritic spine densityOur observations in both lines of p75 NTR
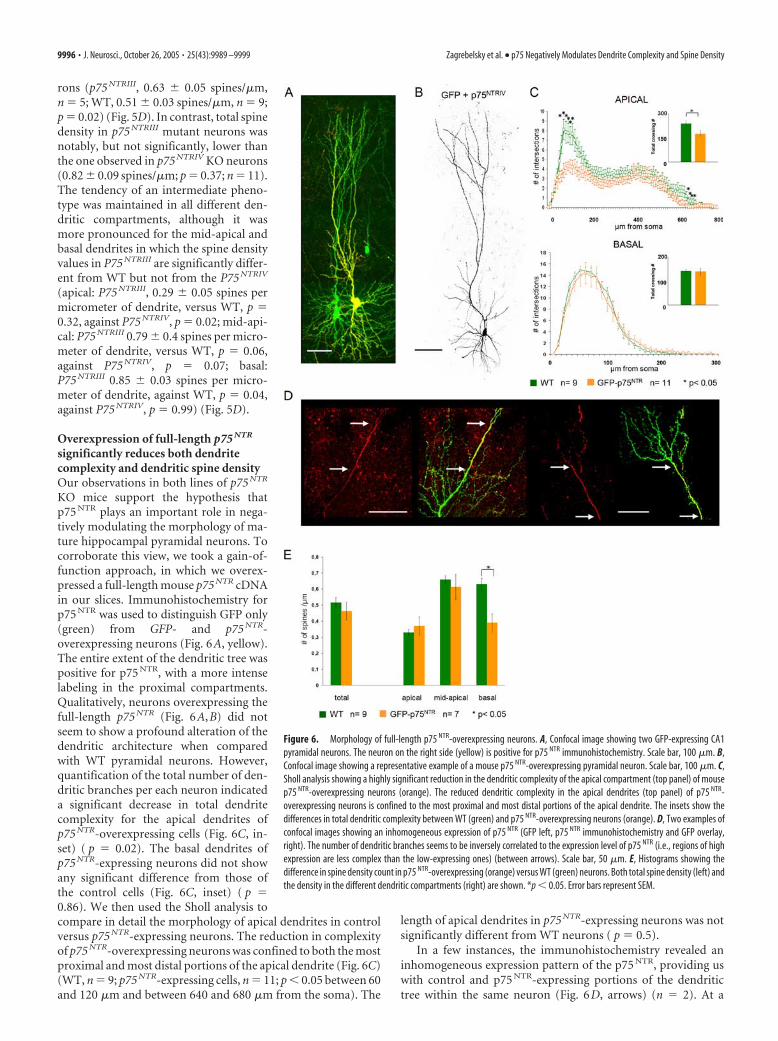
KO mice support the hypothesis thatp75 NTR plays an important role in nega-tively modulating the morphology of ma-ture hippocampal pyramidal neurons. Tocorroborate this view, we took a gain-of-function approach, in which we overex-pressed a full-length mouse p75 NTR cDNAin our slices. Immunohistochemistry forp75 NTR was used to distinguish GFP only(green) from GFP- and p75 NTR-overexpressing neurons (Fig. 6A, yellow).The entire extent of the dendritic tree waspositive for p75 NTR, with a more intenselabeling in the proximal compartments.Qualitatively, neurons overexpressing thefull-length p75 NTR (Fig. 6A,B) did notseem to show a profound alteration of thedendritic architecture when comparedwith WT pyramidal neurons. However,quantification of the total number of den-dritic branches per each neuron indicateda significant decrease in total dendritecomplexity for the apical dendrites ofp75 NTR-overexpressing cells (Fig. 6C, in-set) ( p � 0.02). The basal dendrites ofp75 NTR-expressing neurons did not showany significant difference from those ofthe control cells (Fig. 6C, inset) ( p �0.86). We then used the Sholl analysis tocompare in detail the morphology of apical dendrites in controlversus p75 NTR-expressing neurons. The reduction in complexityof p75 NTR-overexpressing neurons was confined to both the mostproximal and most distal portions of the apical dendrite (Fig. 6C)(WT, n � 9; p75 NTR-expressing cells, n � 11; p � 0.05 between 60and 120 �m and between 640 and 680 �m from the soma). The
length of apical dendrites in p75 NTR-expressing neurons was notsignificantly different from WT neurons ( p � 0.5).
In a few instances, the immunohistochemistry revealed aninhomogeneous expression pattern of the p75 NTR, providing uswith control and p75 NTR-expressing portions of the dendritictree within the same neuron (Fig. 6D, arrows) (n � 2). At a
Figure 6. Morphology of full-length p75 NTR-overexpressing neurons. A, Confocal image showing two GFP-expressing CA1pyramidal neurons. The neuron on the right side (yellow) is positive for p75 NTR immunohistochemistry. Scale bar, 100 �m. B,Confocal image showing a representative example of a mouse p75 NTR-overexpressing pyramidal neuron. Scale bar, 100 �m. C,Sholl analysis showing a highly significant reduction in the dendritic complexity of the apical compartment (top panel) of mousep75 NTR-overexpressing neurons (orange). The reduced dendritic complexity in the apical dendrites (top panel) of p75 NTR-overexpressing neurons is confined to the most proximal and most distal portions of the apical dendrite. The insets show thedifferences in total dendritic complexity between WT (green) and p75 NTR-overexpressing neurons (orange). D, Two examples ofconfocal images showing an inhomogeneous expression of p75 NTR (GFP left, p75 NTR immunohistochemistry and GFP overlay,right). The number of dendritic branches seems to be inversely correlated to the expression level of p75 NTR (i.e., regions of highexpression are less complex than the low-expressing ones) (between arrows). Scale bar, 50 �m. E, Histograms showing thedifference in spine density count in p75 NTR-overexpressing (orange) versus WT (green) neurons. Both total spine density (left) andthe density in the different dendritic compartments (right) are shown. *p � 0.05. Error bars represent SEM.
9996 • J. Neurosci., October 26, 2005 • 25(43):9989 –9999 Zagrebelsky et al. • p75 Negatively Modulates Dendrite Complexity and Spine Density
qualitative level, the observation of this p75 NTR expression pat-tern suggested a strong correlation between high levels of p75 NTR
expression and a reduced dendritic complexity (Fig. 6D, arrows).Together, our analysis of dendritic complexity in hippocampalpyramidal cells suggests that p75 NTR overexpression reduces thecomplexity of apical dendritic branches.
We also analyzed spine density in the p75 NTR-overexpressingcells. Total spine density values were only slightly reduced inp75 NTR-overexpressing hippocampal pyramidal cells when com-pared with control cells (Fig. 6E) (p75 NTR-expressing cells,0.46 � 0.03 spines per micrometer dendrite, n � 7; WT, 0.515 �0.32 spines per micrometer of dendrite, n � 9; p � 0.39). How-ever, the reduction in total spine density was most obvious in thebasal dendritic compartment of p75 NTR-expressing cells, where itdid reach statistical significance compared with WT cells(p75 NTR-expressing cells, 0.38 � 0.05 spines per micrometer ofdendrite; WT, 0.63 � 0.03 spines per micrometer of dendrite, p �0.02). Everywhere else, the changes in spine density were notsignificantly different from WT controls.
One of the best established functions of p75 NTR is the induc-tion of apoptosis in various cells, including developing neurons(Troy et al., 2002). To exclude that, in our experimental condi-tions, the overexpression of the full-length p75 NTR would causethe death of hippocampal pyramidal cells, we added propidiumiodide in the medium of our cultures 2–3 h before fixing them tolabel all dead or dying cells. Both GFP-labeled WT neurons, aswell as neurons expressing full-length p75 NTR, clearly show anonapoptotic nucleus indicating that the neurons we analyzedwere neither dead nor dying (data not shown).
DiscussionUnderstanding how molecular cues control dendritic morphol-ogy is of high relevance to the question of how neuronal activitycan be translated into structural changes of the neurons in thedeveloping and the adult brain. In this study, we demonstratethat p75 NTR controls dendrite morphology as well as spine-density and spine morphology in hippocampal pyramidal neu-rons of organotypic slice cultures.
Previous work showed that neurotrophin receptors can influ-ence neuronal morphology both during development and in themature CNS (for review, see Bibel and Barde, 2000). Interest-ingly, by neutralizing endogenous neurotrophins in corticalorganotypic cultures, McAllister et al. (1997) have shown thatdifferent neurotrophins oppose each others actions in a layer-specific manner to regulate the dendritic growth of pyramidalneurons. Thus, neurotrophins appear to modulate neuronalmorphogenesis acting as growth-promoting as well as growth-inhibiting molecules.
Overexpression of full-length and truncated TrkB isoformsinto developing cortical neurons increased, respectively, thenumber and the length of their dendrites (Yacoubian and Lo,2000). Accordingly, cortical pyramidal neurons of TrkB mutantmice are characterized by thinner and less complex dendritesthan those in WT mice (Xu et al., 2000). Moreover, the increase inspine numbers both in Purkinje cells and in hippocampal neu-rons was blocked by inhibiting TrkB signaling (Shimada et al.,1998; Tyler and Pozzo-Miller, 2001). Overall, these results sug-gest that positive structural changes are induced via the activationof Trk receptors. P75 NTR has also been shown to control thegrowth of neuronal processes. In immature neurons, unoccupiedp75 NTR negatively regulates neurite and filopodial length by ac-tivating RhoA (Gehler et al., 2004), whereas neurotrophin bind-ing to p75 NTR stimulates neurite growth by decreasing RhoA
activation (Yamashita et al., 1999). In adult dorsal root ganglionneurons and postnatal cerebellar neurons, binding of myelin-derived proteins to p75 NTR activates RhoA and thereby inhibitsgrowth (Yamashita et al., 2002). Recent studies also suggest amultipotential role of p75 NTR in modulating dendrite morphol-ogy during development of hippocampal neuronal cultures, byeither reducing the number of primary dendrites and by control-ling the cellular targets of Notch (Salama-Cohen et al., 2005) orby mediating the filopodia growth promoting activity of TrkB-T1(Hartmann et al., 2004). These and related observations suggestthat the effects of p75 NTR strongly depend on the cellular contextin which it is expressed and that, under certain cellular condi-tions, it can act antagonistically to the Trk receptors.
Our results point to p75 NTR as an overall negative modulatorof dendritic complexity in mature hippocampal neurons. Inp75 NTR KO mice, dendritic complexity is significantly increasedboth in the basal and in the mid-distal portion of the apical den-dritic compartment. In contrast, pyramidal neurons overex-pressing the full-length p75 NTR show a significant reduction indendrite complexity, specifically in the most proximal portionsof the apical as well as basal dendritic trees. Accordingly, althoughboth spine density and synaptic contacts showed a significantincrease in p75 NTR KO mice, spine density was significantly re-duced in p75 NTR-overexpressing pyramidal neurons. The differ-ence between our loss- and gain-of-function experiments cor-roborates our results in the p75 NTR KO neurons and makes itunlikely that the phenotype we describe is a result of compensa-tory mechanisms activated in the mutant mice.
Our observations are significant with respect to the previouslydescribed correlations between activity-dependent synaptic plas-ticity and positive as well as negative changes in spine density(Engert and Bonhoeffer, 1999; Maletic-Savatic et al., 1999; Toniet al., 1999; Nagerl et al., 2004; Zhou et al., 2004). In this context,it is interesting that long-term depression (LTD) has been shownto be significantly impaired in p75 NTR KO mice, whereas LTP wasshown to be unaffected (Xu et al., 2000; Rosch et al., 2005; Woo etal., 2005). In addition to an increase in spine numbers in p75 NTR
KO neurons, there is also a significant difference in spine mor-phology determining a clear shift in spine type: in p75 NTR KOneurons we found an increased proportion of mushroom (typeII) as well as thin (type III) spines. It has been described that thelength and diameter of the spine neck play an important role inisolating Ca 2� transients from the parent dendrite and the neigh-boring spines (Majewska et al., 2000a,b; Kasai et al., 2003). Inaddition, there is evidence that the number of AMPA receptorson a spine is proportional to the area of postsynaptic densitiesand the volume of the spine head (Harris and Stevens, 1989),suggesting that spine morphology directly influences synaptictransmission. Interestingly, it has been shown recently that in-duction of LTD results in shrinkage of dendritic spines (Zhou etal., 2004) as opposed to an enlargement of the spine head, whichis observed after LTP (Matsuzaki et al., 2004).
To better corroborate our observation in the p75 NTRIV KOmouse, we took advantage of the existence of a second mutantmouse in which exon III has been targeted (Lee et al., 1992)resulting in the expression of a truncated isoform of the receptormissing the neurotrophin-binding domain, albeit at low levels(von Schack et al., 2001). The analysis of the second mutantmouse for p75 NTR became especially critical as a recent studysuggested the possibility that a proapoptotic fragment of thep75 NTR may still be expressed in the p75 NTRIV KO mice (Paul etal., 2004). The authors suggested that aspects of the p75 NTRIV KOphenotype may reflect a gain, rather than a loss of p75 NTR func-
Zagrebelsky et al. • p75 Negatively Modulates Dendrite Complexity and Spine Density J. Neurosci., October 26, 2005 • 25(43):9989 –9999 • 9997
tion. With regard to the morphological analysis of pyramidalneurons, this possibility can be excluded because the morpholog-ical effects for both p75 NTR mutant lines are similar. We also notethat the overexpression of p75 NTR causes the opposite phenotype,namely massive cell losses (Majdan et al., 1997) and that, inSchwann cells cultured from p75 NTRIV KO animals, no p75 NTR
fragments were detected (von Schack et al., 2001). Similar to theresults in the peripheral nervous system and in the medial septalnucleus (von Schack et al., 2001; Naumann et al., 2002), the mor-phology of hippocampal pyramidal cells is also more stronglyaffected in the p75 NTRIV mutation than in the p75 NTRIII mutation.As previously suggested, this may indicate that the S-p75 inp75 NTRIII KO mice partially compensates the lack of FL-p75 inthe p75 NTRIV KO mice by interacting both with cytoplasmic in-teractors of p75 NTR as well as Trk receptors (Bibel et al., 1999; vonSchack et al., 2001).
P75 NTR is known to be strongly expressed in hippocampalpyramidal cells in the early postnatal period and downregulatedwithin the first 2 weeks (Buck et al., 1988; Lu et al., 1989), al-though it is still expressed at detectable levels at P9 –P14 (Buck etal., 1988). These results are consistent with our observations. Inaddition, we also showed p75 NTR expression in pyramidal cells in2-week-old organotypic hippocampal cultures, thus indicatingthat p75 NTR is indeed expressed at relevant time points and in theappropriate cell types in our experimental preparation. Most im-portantly, we clearly see detectable levels of p75 NTR expression inboth CA1 and CA3 pyramidal cells as well as in granule cells of thedentate gyrus in vivo up to P21.
This opens the possibility that the p75 NTR receptor has acuteeffects in the adult nervous system. How might p75 NTR interactwith the cytoskeleton to change spine and dendritic morphologyin an acute manner? Previous observations indicate that p75 NTR
controls the activity of RhoA (Yamashita et al., 1999, 2002) andthat the Rho GTPases are involved in maintaining dendriticbranches and spine development in pyramidal neurons (Na-kayama et al., 2000; Tashiro et al., 2000; Li et al., 2002). Specifi-cally, unoccupied p75 NTR has been shown to constitutively acti-vate RhoA and, consequently, to negatively modulate the lengthof neurites and filopodia, whereas binding of neurotrophinsmodulates p75 NTR function by decreasing RhoA activation (Ya-mashita et al., 1999; Gehler et al., 2004). In addition, p75 NTR hasbeen also shown to inhibit axonal growth mediating the negativeeffect of myelin-associated glycoprotein (Yamashita et al., 2002)and Nogo (Wang et al., 2002). In addition, Woo et al. (2005) haverecently described a specific function of pro-BDNF in facilitatinghippocampal LTD via the activation of p75 NTR. However, ourresults should not be taken to necessarily imply that the effects ofp75 NTR in regulating the morphology of hippocampal pyramidalcells are ligand mediated. They may be accounted for by intracel-lular mechanisms such as the modulation of small GTP-bindingprotein (see above).
In conclusion, our results add new insights to the bidirectionalmode of neurotrophin signaling in controlling the morphologyof neurons in the CNS. Specifically, they suggest a role of p75 NTR
as a negative modulator of structural changes in neurons andfurther strengthen the view of a functional antagonism mediatedby the two different neurotrophin receptor types.
ReferencesBibel M, Barde YA (2000) Neurotrophins: key regulators of cell fate and cell
shape in the vertebrate nervous system. Genes Dev 14:2919 –2937.Bibel M, Hoppe E, Barde YA (1999) Biochemical and functional interac-
tions between the neurotrophin receptors trk and p75 NTR. EMBO J18:616 – 622.
Bliss TVP, Collingridge GL (1993) A synaptic model of memory-long-termpotentiation in the hippocampus. Nature 361:31–39.
Buck CR, Martinez HJ, Chao MV, Black IB (1988) Differential expression ofthe nerve growth factor receptor gene in multiple brain areas. Dev BrainRes 44:259 –268.
Chomczynski P, Sacchi N (1987) Single-step method of RNA isolation byacid guanidinium thiocyanate-phenol-chloroform extraction. Anal Bio-chem 162:156 –159.
Cohen-Cory S, Fraser SE (1995) Effects of brain-derived neurotrophic fac-tor on optic axon branching and remodelling in vivo. Nature378:192–196.
Dechant G, Barde YA (2002) The neurotrophin receptor p75(NTR): novelfunctions and implications for diseases of the nervous system. Nat Neu-rosci 5:1131–1136.
Dunaevsky A, Tashiro A, Majewska A, Mason C, Yuste R (1999) Develop-mental regulation of spine motility in the mammalian central nervoussystem. Proc Natl Acad Sci USA 96:13438 –13443.
Engert F, Bonhoeffer T (1999) Dendritic spine changes associated with hip-pocampal long-term synaptic plasticity. Nature 399:66 –70.
Ernfors P, Van de Water T, Loring J, Jaenisch R (1995) Complementaryroles of BDNF and NT-3 in vestibular and auditory development. Neuron[Erratum (1995) 15:739] 14:1153–1164.
Frade JM, Rodriguez-Tebar A, Barde YA (1996) Induction of cell death byendogenous nerve growth factor through its p75 receptor. Nature383:166 –168.
Friedman WJ (2000) Neurotrophins induce death of hippocampal neuronsvia the p75 receptor. J Neurosci 20:6340 – 6346.
Gehler S, Gallo G, Veien E, Letourneau PC (2004) p75 neurotrophin recep-tor signaling regulates growth cone filopodial dynamics through modu-lating RhoA activity. J Neurosci 24:4363– 4372.
Giulietti A, Overbergh L, Valckx D, Decallonne B, Bouillon R, Mathieu C(2001) An overview of real-time quantitative PCR: applications to quan-tify cytokine gene expression. Methods 25:386 – 401.
Harris KM, Stevens JK (1989) Dendritic spines of CA 1 pyramidal cells inthe rat hippocampus: serial electron microscopy with reference to theirbiophysical characteristics. J Neurosci 9:2982–2997.
Harris KM, Jensen FE, Tsao B (1992) Three-dimensional structure of den-dritic spines and synapses in rat hippocampus (CA1) at postnatal day 15and adult ages: implications for the maturation of synaptic physiologyand long-term potentiation. J Neurosci 12:2685–2705.
Hartmann M, Brigadski T, Erdmann KS, Holtmann B, Sendtner M, Narz F,Lessmann V (2004) Truncated TrkB receptor-induced outgrowth ofdendritic filopodia involves the p75 neurotrophin receptor. J Cell Sci117:5803–5814.
Holz A, SchaerenWiemers N, Schaefer C, Pott U, Colello RJ, Schwab ME(1996) Molecular and developmental characterization of novel cDNAsof the myelin-associated oligodendrocytic basic protein. J Neurosci16:467– 477.
Kasai H, Matsuzaki M, Noguchi J, Yasumatsu N, Nakahara H (2003)Structure-stability-function relationships of dendritic spines. TrendsNeurosci 26:360 –368.
Koh IY, Lindquist WB, Zito K, Nimchinsky EA, Svoboda K (2002) An imageanalysis algorithm for dendritic spines. Neural Comput 14:1283–1310.
Lang C, Barco A, Zablow L, Kandel ER, Siegelbaum SA, Zakharenko SS(2004) Transient expansion of synaptically connected dendritic spinesupon induction of hippocampal long-term potentiation. Proc Natl AcadSci USA 101:16665–16670.
Lee KF, Li E, Huber LJ, Landis SC, Sharpe AH, Chao MV, Jaenisch R (1992)Targeted mutation of the gene encoding the low affinity NGF receptorp75 leads to deficits in the peripheral sensory nervous system. Cell69:737–749.
Levi-Montalcini R, Booker B (1960) Destruction of the sympathetic gangliain mammals by an antiserum to a nerve-growth protein. Proc Natl AcadSci USA 46:384 –391.
Li Z, Aizenman CD, Cline HT (2002) Regulation of rho GTPases bycrosstalk and neuronal activity in vivo. Neuron 33:741–750.
Lo DC, McAllister AK, Katz LC (1994) Neuronal transfection in brain slicesusing particle-mediated gene transfer. Neuron 13:1263–1268.
Lu B, Buck CR, Dreyfus CF, Black IB (1989) Expression of NGF and NGFreceptor mRNAs in the developing brain: evidence for local delivery andaction of NGF. Exp Neurol 104:191–199.
Majdan M, Lachance C, Gloster A, Aloyz R, Zeindler C, Bamji S, Bhakar A,
9998 • J. Neurosci., October 26, 2005 • 25(43):9989 –9999 Zagrebelsky et al. • p75 Negatively Modulates Dendrite Complexity and Spine Density
Belliveau D, Fawcett J, Miller FD, Barker PA (1997) Transgenic miceexpressing the intracellular domain of the p75 neurotrophin receptorundergo neuronal apoptosis. J Neurosci 17:6988 – 6998.
Majewska A, Brown E, Ross J, Yuste R (2000a) Mechanisms of calcium de-cay kinetics in hippocampal spines: role of spine calcium pumps andcalcium diffusion through the spine neck in biochemical compartmental-ization. J Neurosci 20:1722–1734.
Majewska A, Tashiro A, Yuste R (2000b) Regulation of spine calcium dy-namics by rapid spine motility. J Neurosci 20:8262– 8268.
Malenka RC, Nicoll RA (1999) Long-term potentiation—a decade ofprogress? Science 285:1870 –1874.
Maletic-Savatic M, Malinow R, Svoboda K (1999) Rapid dendritic morpho-genesis in CA1 hippocampal dendrites induced by synaptic activity. Sci-ence 283:1923–1927.
Matsuzaki M, Honkura N, Ellis-Davies GCR, Kasai H (2004) Structural ba-sis of long-term potentiation in single dendritic spines. Nature429:761–766.
McAllister AK, Katz LC, Lo DC (1997) Opposing roles for endogenousBDNF and NT-3 in regulating cortical dendritic growth. Neuron18:767–778.
McAllister AK, Katz LC, Lo DC (1999) Neurotrophins and synaptic plastic-ity. Annu Rev Neurosci 22:295–318.
Megıas M, Emri Z, Freund TF, Gulyas AI (2001) Total number and distri-bution of inhibitory and excitatory synapses on hippocampal CA1 pyra-midal neurons. Neuroscience 102:527–540.
Nagerl UV, Eberhorn N, Cambridge SB, Bonhoeffer T (2004) Bidirectionalactivity-dependent morphological plasticity in hippocampal neurons.Neuron 44:759 –767.
Nakayama AY, Harms MB, Luo L (2000) Small GTPases Rac and Rho in themaintenance of dendritic spines and branches in hippocampal pyramidalneurons. J Neurosci 20:5329 –5338.
Naumann T, Casademunt E, Hollerbach E, Hofmann J, Dechant G, FrotscherM, Barde YA (2002) Complete deletion of the neurotrophin receptorp75 NTR leads to long-lasting increases in the number of basal forebraincholinergic neurons. J Neurosci 22:2409 –2418.
Patapoutin A, Reichardt LF (2001) Trk receptors: mediators of neurotro-phin action. Curr Opin Neurobiol 11:272–280.
Paul CE, Vereker E, Dickson KM, Barker PA (2004) A pro-apoptotic frag-ment of the p75 neurotrophin receptor is expressed in p75NTR ExonIV nullmice. J Neurosci 24:1917–1923.
Peters A, Kaisreman-Abramof IR (1969) Small pyramidal neuron of rat ce-rebral cortex-synapses upon dendritic spines. Z Zellforsch Mikrosk Anat100:487-506.
Poo MM (2001) Neurotrophins as synaptic modulators. Nat Rev Neurosci2:24 –32.
Rosch H, Schweigreiter R, Bonhoeffer T, Barde YA, Korte M (2005) Theneurotrophin receptor p75NTR modulates long-term depression andregulates the expression of AMPA receptor subunits in the hippocampus.Proc Natl Acad Sci USA 102:7362–7367.
Salama-Cohen P, Arevalo MA, Meier J, Grantyn R, Rodriguez-Tebar A(2005) NGF controls dendrite development in hippocampal neurons by
binding to p75(NTR) and modulating the cellular targets of notch. MolBiol Cell 16:339 –347.
Shimada A, Mason CA, Morrison ME (1998) TrkB signaling modulatesspine density and morphology independent of dendrite structure in cul-tures neonatal Purkinje cells. J Neurosci 18:8559 – 8570.
Sholl DA (1953) Dendritic organization in the neurons of the visual andmotor cortices of the cat. J Anat 87:387– 406.
Snider WD (1988) Nerve growth-factor enhances dendritic arborization ofsympathetic-ganglion cells in developing mammals. J Neurosci8:2628 –2634.
Stoppini L, Buchs PA, Muller D (1991) A simple method for organotypiccultures of nervous tissue. J Neurosci Methods 37:173–182.
Tashiro A, Minden A, Yuste R (2000) Regulation of dendritic spine mor-phology by the rho family of small GTPases: antagonistic roles of Rac andRho. Cereb Cortex 10:927–938.
Toni N, Buchs PA, Nikonenko I, Bron CR, Muller D (1999) LTP promotesformation of multiple spine synapses between a single axon terminal anda dendrite. Nature 402:421– 425.
Troy CM, Friedman JE, Friedman WJ (2002) Mechanisms of p75-mediateddeath of hippocampal neurons. Role of caspases. J Biol Chem277:34295–34302.
Tyler WJ, Pozzo-Miller LD (2001) BDNF enhances quantal neurotransmit-ter release and increases the number of docked vesicles at the active zonesof hippocampal excitatory synapses. J Neurosci 21:4249 – 4258.
von Schack D, Casademunt E, Schweigreiter R, Meyer M, Bibel M, Dechant G(2001) Complete ablation of the neurotrophin receptor p75NTR causesdefects both in the nervous and the vascular system. Nat Neurosci4:977–978.
Wang KC, Kim JA, Sivasankaran R, Segal R, He Z (2002) p75 interacts withthe Nogo receptor as a co-receptor for Nogo, MAG and OMgp. Nature420:74 –78.
Woo NH, Teng HK, Siao C-J, Chiaruttini C, Pang PT, Milner TA, HempsteadBL, Lu B (2005) Activation of p75NTR by proBDNF facilitates hip-pocampal long-term depression. Nat Neurosci 8:1069 –1077.
Xu BJ, Gottschalk W, Chow A, Wilson RI, Schnell E, Zang KL, Wang DA,Nicoll RA, Lu B, Reichardt LF (2000) The role of brain-derived neuro-trophic factor receptors in the mature hippocampus: modulation of long-term potentiation through a presynaptic mechanism involving TrkB.J Neurosci 20:6888 – 6897.
Yacoubian TA, Lo DC (2000) Truncated and full-length TrkB receptors reg-ulate distinct modes of dendritic growth. Nat Neurosci 3:342–349.
Yamashita T, Tucker KL, Barde YA (1999) Neurotrophin binding to the p75receptor modulates Rho activity and axonal outgrowth. Neuron24:585–593.
Yamashita T, Higuchi H, Tohyama M (2002) The p75 receptor transducesthe signal from myelin-associated glycoprotein to Rho. J Cell Biol157:565–570.
Yuste R, Bonhoeffer T (2004) Genesis of dendritic spines: insights from ul-trastructural and imaging studies. Nat Neurosci Rev 5:24 –34.
Zhou Q, Homma KJ, Poo Mm (2004) Shrinkage of dendritic spines associ-ated with long-term depression of hippocampal synapses. Neuron 44:749 –757.
Zagrebelsky et al. • p75 Negatively Modulates Dendrite Complexity and Spine Density J. Neurosci., October 26, 2005 • 25(43):9989 –9999 • 9999
Copyright © 2022 FDOKUMEN