Growth and characterization of Cu (II) doped negatively soluble lithium sulfate monohydrate crystals
6
Growth and characterization of Cu (II) doped negatively soluble lithium sulfate monohydrate crystals K. Boopathi a , P. Ramasamy a,n , G. Bhagavannarayana b a Centre for Crystal Growth, Siva Subramaniya Nadar College of Engineering, Kalavakkam 603110, India b Materials Characterization Division, National Physical Laboratory, Council of Scientific and Industrial Research, New Delhi 110012, India article info Article history: Received 17 May 2013 Received in revised form 7 September 2013 Accepted 18 September 2013 Communicated by S.R. Qiu Available online 25 September 2013 Keywords: A1. Single crystal Growth A2. Growth from solutions B1. Lithium compounds B2. Nonlinear optical material B2. Piezoelectric crystals abstract Single crystals of pure and Cu (II) doped negatively soluble lithium sulfate monohydrate have been grown by slow evaporation solution technique. In the present work, to improve the crystalline quality of lithium sulfate monohydrate crystal, metal dopant was incorporated into the pure crystals. The as grown crystals are clear, transparent and the sizes of the crystals were up to 18 12 3 mm 3 and 50 15 5 mm 3 . The presence of metal dopant has been confirmed by energy dispersive spectroscopy, atomic absorption spectroscopy analysis. Single crystal and powder X-ray diffraction studies were carried out to ascertain lattice parameters and identify different phase nature. Optical transmission spectrum of the grown crystals was recorded. FT-IR and thermal analysis were carried out to investigate the functional group and thermal behavior of the grown crystals respectively. The grown crystal was subjected to Vickers micro hardness, HRXRD, piezoelectric, laser damage threshold measurements and second harmonic generation efficiency studies. & 2013 Elsevier B.V. All rights reserved. 1. Introduction Nonlinear optical materials find a variety of applications to perform functions like frequency conversion, light modulation, optical memory storage, second harmonic generation, and optical switching. In recent years, there has been extensive investigation in the growth of non- linear optical (NLO) materials because of their wide applications in optoelectronics and photonic applications [1, 2]. Lithium sulfate mono- hydrate, Li 2 SO 4 H 2 O, in its monoclinic point group P2 1 was first described by Groth (1908) hundred years ago [3]. The first measure- ments of the pyroelectric coefficient were published by Ackermann in 1912 [4]. In the phase matched direction Bohaty et al., [5] have observed high efficiency conversion from pump power to Stokes and anti-Stokes lines by the cascaded self-stimulated Raman scattering effect. In addition, lithium sulfate monohydrate has remarkable piezo- electric and electro-optic properties [6]. Recently, Li 2 SO 4 H 2 O was classified as a promising material for Raman laser frequency con- verters. Inorganic materials like KDP, ZnSO 4 , doped ZnSO 4 , niobate crystals such as potassium lithium niobate, borate crystals like lithium triborate have already been reported [6,7] to be NLO active materials. It is seen from the literature that lithium on its combination with materials like glycine, selenate [8,9] proves to be highly NLO active. Also, many new crystals in the lithium sulfate family [10] are excellent NLO materials. In earlier work, we have reported solubility and unidirectional growth of lithium sulfate monohydrate [11]. In the present work, attempts have been made to improve the physico- chemical properties of lithium sulfate monohydrate by incorporating metal dopant. A systematic study has been carried out on the growth of pure and metal (Cu (II)) doped LSMH crystals. In solution grown method it has been observed that certain dopants are playing vital role to enhance the physical properties of single crystals. The presence of very low concentration of certain dopant enhances crystalline perfection. Suitable additives are known to reduce or eliminate the defects in a crystal thus enhancing crystal- line perfection [12]. Single crystals were grown from aqueous lithium sulfate solution containing 0.1 and 1 mol% of copper sulfate pentahy- drate (CuSO 4 5H 2 O) using deionized water as a solvent by slow evaporation method. Both the crystals were harvested after 20–25 days. The 1 mol% doped crystal had many inclusions and was of poor quality. Hence, we have studied the 0.1 mol% Cu (II) doped lithium sulfate monohydrate crystal alone for the present communication. Single crystal X-ray diffraction studies were carried out and the lattice parameters of the grown pure and doped crystals are evaluated. The content of Cu(II) has been determined by energy dispersive X-ray analysis (EDS), atomic absorption spectroscopy studies (AAS). 2. Experimental 2.1. Crystal growth Single crystals of pure and Cu 2 þ added lithium sulfate mono- hydrate were grown by slow evaporation method using water as Contents lists available at ScienceDirect journal homepage: www.elsevier.com/locate/jcrysgro Journal of Crystal Growth 0022-0248/$ - see front matter & 2013 Elsevier B.V. All rights reserved. http://dx.doi.org/10.1016/j.jcrysgro.2013.09.028 n Corresponding author. Tel.: þ91 9283105760; fax: þ91 44 27475166. E-mail addresses: [email protected], [email protected] (P. Ramasamy). Journal of Crystal Growth 386 (2014) 32–37
Transcript of Growth and characterization of Cu (II) doped negatively soluble lithium sulfate monohydrate crystals

Growth and characterization of Cu (II) doped negatively solublelithium sulfate monohydrate crystals
K. Boopathi a, P. Ramasamy a,n, G. Bhagavannarayana b
a Centre for Crystal Growth, Siva Subramaniya Nadar College of Engineering, Kalavakkam 603110, Indiab Materials Characterization Division, National Physical Laboratory, Council of Scientific and Industrial Research, New Delhi 110012, India
a r t i c l e i n f o
Article history:Received 17 May 2013Received in revised form7 September 2013Accepted 18 September 2013Communicated by S.R. QiuAvailable online 25 September 2013
Keywords:A1. Single crystal GrowthA2. Growth from solutionsB1. Lithium compoundsB2. Nonlinear optical materialB2. Piezoelectric crystals
a b s t r a c t
Single crystals of pure and Cu (II) doped negatively soluble lithium sulfate monohydrate have been grown byslow evaporation solution technique. In the present work, to improve the crystalline quality of lithium sulfatemonohydrate crystal, metal dopant was incorporated into the pure crystals. The as grown crystals are clear,transparent and the sizes of the crystals were up to 18�12�3mm3 and 50�15�5 mm3. The presence ofmetal dopant has been confirmed by energy dispersive spectroscopy, atomic absorption spectroscopy analysis.Single crystal and powder X-ray diffraction studies were carried out to ascertain lattice parameters and identifydifferent phase nature. Optical transmission spectrum of the grown crystals was recorded. FT-IR and thermalanalysis were carried out to investigate the functional group and thermal behavior of the grown crystalsrespectively. The grown crystal was subjected to Vickers micro hardness, HRXRD, piezoelectric, laser damagethreshold measurements and second harmonic generation efficiency studies.
& 2013 Elsevier B.V. All rights reserved.
1. Introduction
Nonlinear optical materials find a variety of applications to performfunctions like frequency conversion, light modulation, optical memorystorage, second harmonic generation, and optical switching. In recentyears, there has been extensive investigation in the growth of non-linear optical (NLO) materials because of their wide applications inoptoelectronics and photonic applications [1,2]. Lithium sulfate mono-hydrate, Li2SO4 �H2O, in its monoclinic point group P21 was firstdescribed by Groth (1908) hundred years ago [3]. The first measure-ments of the pyroelectric coefficient were published by Ackermann in1912 [4]. In the phase matched direction Bohaty et al., [5] haveobserved high efficiency conversion from pump power to Stokes andanti-Stokes lines by the cascaded self-stimulated Raman scatteringeffect. In addition, lithium sulfate monohydrate has remarkable piezo-electric and electro-optic properties [6]. Recently, Li2SO4 �H2O wasclassified as a promising material for Raman laser frequency con-verters. Inorganic materials like KDP, ZnSO4, doped ZnSO4, niobatecrystals such as potassium lithium niobate, borate crystals like lithiumtriborate have already been reported [6,7] to be NLO active materials.It is seen from the literature that lithium on its combination withmaterials like glycine, selenate [8,9] proves to be highly NLO active.Also, many new crystals in the lithium sulfate family [10] are excellentNLO materials. In earlier work, we have reported solubility and
unidirectional growth of lithium sulfate monohydrate [11]. In thepresent work, attempts have been made to improve the physico-chemical properties of lithium sulfate monohydrate by incorporatingmetal dopant. A systematic study has been carried out on the growthof pure and metal (Cu (II)) doped LSMH crystals.
In solution grown method it has been observed that certaindopants are playing vital role to enhance the physical properties ofsingle crystals. The presence of very low concentration of certaindopant enhances crystalline perfection. Suitable additives are knownto reduce or eliminate the defects in a crystal thus enhancing crystal-line perfection [12]. Single crystals were grown from aqueous lithiumsulfate solution containing 0.1 and 1mol% of copper sulfate pentahy-drate (CuSO4 �5H2O) using deionized water as a solvent by slowevaporation method. Both the crystals were harvested after 20–25days. The 1 mol% doped crystal had many inclusions and was of poorquality. Hence, we have studied the 0.1 mol% Cu (II) doped lithiumsulfate monohydrate crystal alone for the present communication.
Single crystal X-ray diffraction studies were carried out and thelattice parameters of the grown pure and doped crystals are evaluated.The content of Cu(II) has been determined by energy dispersive X-rayanalysis (EDS), atomic absorption spectroscopy studies (AAS).
2. Experimental
2.1. Crystal growth
Single crystals of pure and Cu2þ added lithium sulfate mono-hydrate were grown by slow evaporation method using water as
Contents lists available at ScienceDirect
journal homepage: www.elsevier.com/locate/jcrysgro
Journal of Crystal Growth
0022-0248/$ - see front matter & 2013 Elsevier B.V. All rights reserved.http://dx.doi.org/10.1016/j.jcrysgro.2013.09.028
n Corresponding author. Tel.: þ91 9283105760; fax: þ91 44 27475166.E-mail addresses: [email protected],
[email protected] (P. Ramasamy).
Journal of Crystal Growth 386 (2014) 32–37

solvent. According to the solubility data (39.9 g at 30 1C) the saturatedsolution of lithium sulfate monohydrate was prepared [11]. Repeatedrecrystallizationwas carried out in order to eliminate the impurities inthe LSMH crystal. An ion in the form of CuSO4 �5H2O was used asdopant. The concentration of the dopant is 0.1 mol% of CuSO4 �5H2O.The saturated solution was prepared for pure and doped LSMHseparately and each was stirred well for 4 h to get homogenoussolution. The transparent, good quality crystals were collected after20–25 days. The grown pure and doped crystals are shown in Fig. 1,which possess the crystallography-dependent growth shape as con-firmed by the chemical bonding theory of single crystal growth [13].The morphology of the crystal has been already reported [5]. Themorphology of the grown crystal is given in Fig. 2.
Lithium sulfate monohydrate and Copper sulfate penta hydrateused in the present study were bought from M/S. SRL (AR grade),Merck (GR grade) India and the deionized water got fromMilliporewater purification unit. The resistivity of used deionized water is18.2 MΩ cm.
2.2. Characterization
The presence of metals in the crystal lattice of grown crystalswas determined by using AA6300 Shimadzu Atomic AbsorptionSpectrophotometer. Quanta 200 FEG scanning electron microscopewas used to evaluate qualitative and quantitative determinationsof the elements present in the sampled volume. This method candetect elements from the presence of elements down to boron(B) in the periodic table. The single crystal X-ray diffraction studiesof pure and doped LSMH single crystals were carried out. BrukerAxs (Kappa Apex II) diffractometer with Mo Kα (0.71073 Å)radiation was used to obtain the cell parameters of the growncrystal at room temperature. Powder form of the above mentionedcrystal was taken for the powder X-ray diffraction analysis using aREICH SEIFERT X-ray diffractometer employing Cu Kα (1.54058 Ǻ)with a scan speed of 1 1/min. The transmittance spectra weretaken on flat polished crystal samples of about 3 mm thicknessemploying a Perkin-Elmer Lambda 35 UV–vis–NIR spectrometer ina wide wavelength range 200–1100 nm at room temperature. Thethermogravimetric analysis (TGA) and differential thermal analysis(DTA) experiments were carried out using Perkin-Elmer DiamondTG/DTA instrument with a heating rate of 10 1C min�1 from 35 1Cto 500 1C. The FT-IR spectra recorded for pure and doped crystalswere obtained from KBr pellets on a JASCO FT-IR 410 spectrometerby the KBr pellet method to study the functional groups in samplein the region 4000–400 cm�1. Identically Cut and polished (100)crystal samples were subjected to indentation along their mostdeveloped plane surface using MATSUZAWA model MMT-X seriesmicro hardness tester fitted with diamond indenter and load wasvaried from 1 to 50 g with dwell time of 5 s. A multicrystal XRDdeveloped at NPL [14] has been used to record high-resolutiondiffraction curves (DCs). The piezoelectric charge coefficient d33
(pC/N) was measured using piezometer (PM300, PiezoTest, UK).The powder technique of Kurtz and Perry [15] was used for thecomprehensive analysis of second-order nonlinearity, which isregarded as the simplest method to assess the nonlinearities. AnNd: YAG laser with fundamental radiation of 1064 nm was used asthe optical source and directed onto these powder samples.
3. Results and discussion
3.1. Atomic absorption spectroscopy (AAS) analysis
10 mg of fine powder of the doped LSMH crystals was dissolvedin 100 ml of triple distilled water. The prepared solution wasanalyzed using atomic absorption spectroscopy. From the results,the amount of Cu (II) was found to be 1.9 mg/L. Experiments wererepeated and reproducibility was ascertained. The calculationshows that only 1.9 mg of Cu (II) is present in the samples for100 mg (0.1 mol%) of the crystal.
3.2. EDS analysis
The incorporation of Cu (II) into the crystalline matrix wasconfirmed by EDS performed on LSMH crystal (Fig. 3). It appearsthat the accommodating capability of host crystal is limited andonly a small quantity is incorporated into the LSMH crystallinematrix. Further, analysis of surface at different sites indicates thatthe incorporation is non-uniform over the surface, connected withadsorption mechanisms at ledges of steps.
Fig. 1. Photograph of grown crystals (a) pure lithium sulfate monohydrate and (b) Cu (II) doped crystal.
Fig. 2. Morphology of the crystal.
K. Boopathi et al. / Journal of Crystal Growth 386 (2014) 32–37 33

3.3. Single crystal and powder X-ray diffraction
The calculated parameter values are tabulated in Table 1. It isobserved that both the pure and the doped LSMH crystallize intomonoclinic system and belong to the P21 space group. However,there are slight variations in the lattice parameters as well as inthe cell volume values. It is believed that the incorporation ofmetal ions in LSMH lattice account for these variations. Thepowder XRD pattern is recorded by REICH SEIFERT X-ray diffract-ometer employing Cu Kα (1.54058 Å) with a scan speed of 1 deg/min and analyzed by using ‘TWO THETA’ refinement software andFig. 4(a) and (b) shows powder X-ray diffraction pattern of pureand doped crystal. It shows single phase with a slight reduction inpeak intensities accompanied by a small shift in their positionsand it could be due to lattice strain as a result of metal doping.
3.4. UV–vis–NIR analysis
It is evident from the spectrum (Fig. 5) that the percentage oftransmission is high for doped LSMH crystals, which is a desirableproperty for the crystals used for NLO applications. In addition, thelight absorbing properties of doped ones are less that the parentLSMH. In the transmission spectrum, the absorption at 968 nm isdue to the presence of Cu ions. Normally Cu containing com-pounds have light absorption in the range between 800 nm and1000 nm [16]. According to the newly proposed electronegativityscale for crystallized ions [17], we can conveniently select propermetal ions as dopants in crystal lattice to meet our demands forvarious property modifications. However, by doping with a variety
of metal ions it is easy to generate suitable defects in a crystalstructure in order to increase a range for NLO applications [18].
3.5. FT-IR spectral analysis
Infrared spectrum is an important record, which provides moreinformation about the functional group of the compound. In thistechnique, almost all functional groups in a molecule absorbcharacteristically a definite range of frequency [19]. The peakappearing at 3494 cm�1 is attributed to the presence of watermolecule in the title compound. The characteristic stretchingvibrations of SO�
4 group appear at 1118, 887 and 648 cm�1. TheFT-IR spectrum of Cu (II) (0.1 mol%) doped LSMH crystal is shownin Fig. 6. Although it provides similar features as that of pure LSMHspectrum, there is a peak suggesting wide range of interactions forthe groupings.
3.6. Thermal studies
The thermogravimetric analysis (TGA) and differential thermalanalysis (DTA) were carried out using Perkin-Elmer Diamond TG/DTA instrument in the presence of nitrogen atmosphere. A trace ofTG/DTA curve is shown in Fig. 7(a) and (b). For pure LSMH, the
Fig. 3. EDS spectrum of Cu (II) doped Lithium sulfate monohydrate.
Table 1Crystal lattice parameters of the grown crystal.
Parameters Single crystal XRD(present work)
Single crystalXRD [2]
a (Ǻ) 5.49 5.45 (2)b (Ǻ) 4.88 4.85 (2)c (Ǻ) 8.18 8.16 (3)α (1) 90.00 90.00ß (1) 107.56 107.37γ (1) 90.00 90.00Volume (Ǻ3) 845.00 831.3 (2)Crystal system Monoclinic monoclinicSpace group P21 P21
0
200
400
600
800
1000
(100
)
(001
)
(0
31)
(001
)
(100
)
(3
05)
(0
20)
(2
0-1)
(1
0 2)
(0
12)
(1
-1 2
)
(1
10)
(1
01)
(1
0-2)
(1
0-1)
Cu-LSMH
Inte
nsity
(Cps
)
2 degree
(0
10)
10 20 30 40 50 60
10 20 30 40 50 60
0
200
400
600
800
1000
(3
05)
(0
31)
(0
20) (2
0-1)
(012
)
(1
02)
(1
-1 2
)
(1
10)
(1
0-2)
(1
01)
(0
10)
(10
-1)
LSMH
Inte
nsity
(Cps
)
2 degree
Fig. 4. Powder XRD pattern of pure and Cu doped lithium sulfate monohydratecrystal.
Fig. 5. UV–vis–NIR transmission spectra of pure and Cu (II) doped crystals.
K. Boopathi et al. / Journal of Crystal Growth 386 (2014) 32–3734

endothermic peak appears at 142 1C. The residue in termsof percentage after release of water molecule is calculated forpure sample as 85.6%. The Cu doped LSMH crystals show samefeatures as that of pure LSMH, but there is a distinct shift in the
decomposition temperature. As a result of Cu (II) doping, the peakmaximum in DTA corresponding to first stage of decomposition isshifted to 79.16 1C that indicates loss of water molecules which ispresent in the dopant and second stage decomposition values isshifted to higher values by 11 1C. Recently, interests in theinfluence of dopants on the thermal behavior of optical materialshave attracted many researchers to study the mechanismsbetween them.
3.7. Microhardness studies
The structure and nature of bonding of the crystalline solidshave influence on their mechanical hardness [20]. Microhardnesstesting is one of the methods of understanding the mechanicalproperties of materials such as fracture behavior, yield strength,brittleness index, and temperature of cracking [21]. The (100)crystal slices are well polished with a thickness 3 mm to avoid thesurface defects which may influence the hardness value strongly.Fig. 8 shows the variation of P versus Vickers hardness number(Hv). Vickers microhardness was calculated from the relation
Hv¼ 1:8544P=d2
where P is the applied load in gram and d is the average diagonallength of the indented impressions in mm. It is evident from theplot that the Vickers hardness number increases with the appliedload. The hardness experiment on pure and doped crystalssuggests that the sample has a VHN of 107.4 and 136.5 kg mm2
for an applied load of 50 g on the [100] plane. In solution growncrystal, it has been observed in all the cases [22,23] that a moreprefect crystal has higher hardness than a crystal with lessperfection. In the case of solution grown crystal the micro-particles of solution that get into the crystal are responsible forcrystal defects and the inclusion of solution micro-particles intothe crystal results in decrease of hardness.
3.8. HRXRD studies
Fig. 9(a) shows the diffraction curve (DC) recorded for a typicalSEST grown lithium sulfate monohydrate (LSMH) single crystalspecimen using (100) diffracting planes in symmetrical Bragggeometry. As seen in the figure, the DC contains a single sharppeak and indicates that the specimen is free from structural grainboundaries. The FWHM (full width at half maximum) of the curveis 18″ which is somewhat more than that expected from the planewave theory of dynamical X-ray diffraction [24] for an ideally
Fig. 6. FT-IR spectrum of (a) pure and (b) Cu (II) doped crystals.
Fig. 7. (a) TG and DTA curve of pure crystal. (b) TG and DTA curve of Cu(II) dopedcrystal.
Fig. 8. Variation of microhardness with load of pure and doped crystal.
K. Boopathi et al. / Journal of Crystal Growth 386 (2014) 32–37 35
perfect crystal. The broadening of diffraction curve without thepresence of any splitting can be attributed to variety of defects likerandomly oriented mosaic blocks, dislocations, Frankel defects,implantation induced defects (due to simultaneous existence ofvacancies as well as interstitial defects) etc. But depending uponthe nature of asymmetry, as investigated in the Refs. [14,25,26],one can expect predominant occupation of vacancy or interstitialdefects, which can be realized in the following way. For aparticular angular deviation (Δθ) of glancing angle with respectto the peak position, the scattered intensity is much more in thenegative direction in comparison to that of the positive direction.This feature clearly indicates that the crystal contains predomi-nantly vacancy type of defects than that of interstitial defects. Thiscan be well understood by the fact that due to vacancy defects, asshown schematically in the inset, the lattice around these defectsundergo tensile stress and the lattice parameter d (interplanarspacing) increases and leads to give more scattered (also known asdiffuse X-ray scattering) intensity at slightly lower Bragg angles(θB) as d and sin θB are inversely proportional to each other in theBragg equation (2dsin θB¼nλ; n and λ being the order of reflectionand wavelength respectively which are fixed). However, thesepoint defects with much lesser density as in the present casehardly give any effect on the performance of the devices based onsuch crystals. If the concentration is high, the FWHM would bemuch higher and often lead to structural grain boundaries [26].Point defects up to some extent are unavoidable due to thermo-dynamical considerations and growth conditions [25].
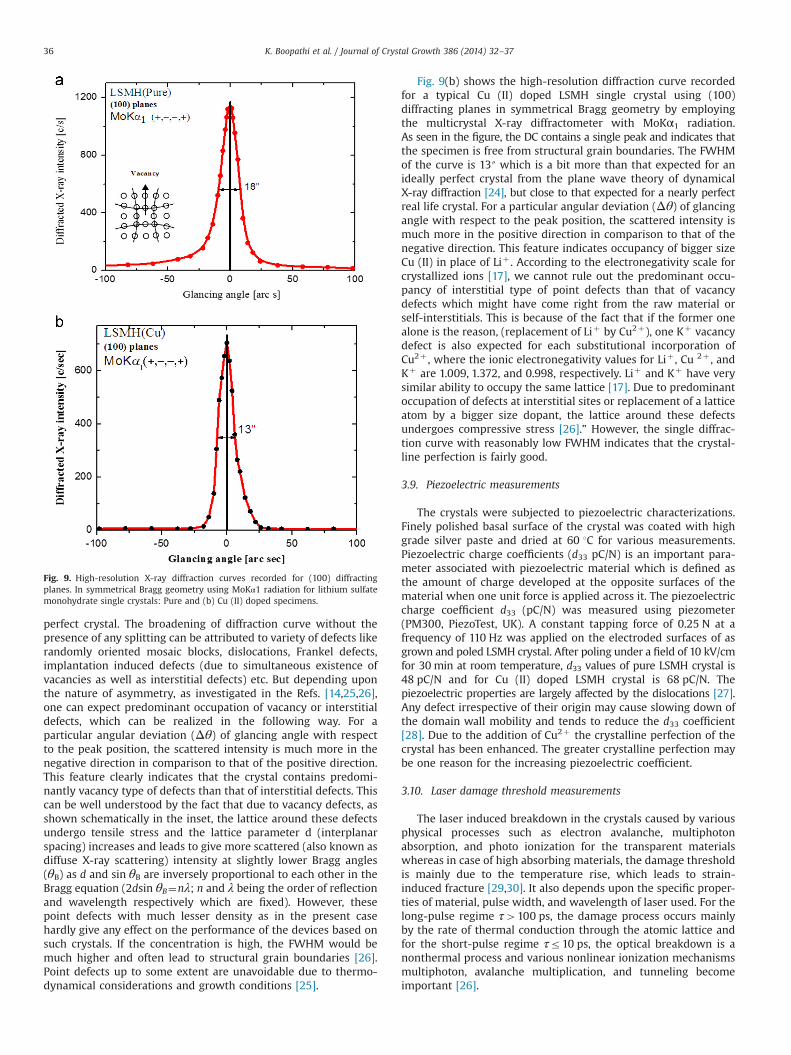
Fig. 9(b) shows the high-resolution diffraction curve recordedfor a typical Cu (II) doped LSMH single crystal using (100)diffracting planes in symmetrical Bragg geometry by employingthe multicrystal X-ray diffractometer with MoKα1 radiation.As seen in the figure, the DC contains a single peak and indicates thatthe specimen is free from structural grain boundaries. The FWHMof the curve is 13″ which is a bit more than that expected for anideally perfect crystal from the plane wave theory of dynamicalX-ray diffraction [24], but close to that expected for a nearly perfectreal life crystal. For a particular angular deviation (Δθ) of glancingangle with respect to the peak position, the scattered intensity ismuch more in the positive direction in comparison to that of thenegative direction. This feature indicates occupancy of bigger sizeCu (II) in place of Liþ . According to the electronegativity scale forcrystallized ions [17], we cannot rule out the predominant occu-pancy of interstitial type of point defects than that of vacancydefects which might have come right from the raw material orself-interstitials. This is because of the fact that if the former onealone is the reason, (replacement of Liþ by Cu2þ), one Kþ vacancydefect is also expected for each substitutional incorporation ofCu2þ , where the ionic electronegativity values for Liþ , Cu 2þ , andKþ are 1.009, 1.372, and 0.998, respectively. Liþ and Kþ have verysimilar ability to occupy the same lattice [17]. Due to predominantoccupation of defects at interstitial sites or replacement of a latticeatom by a bigger size dopant, the lattice around these defectsundergoes compressive stress [26].” However, the single diffrac-tion curve with reasonably low FWHM indicates that the crystal-line perfection is fairly good.
3.9. Piezoelectric measurements
The crystals were subjected to piezoelectric characterizations.Finely polished basal surface of the crystal was coated with highgrade silver paste and dried at 60 1C for various measurements.Piezoelectric charge coefficients (d33 pC/N) is an important para-meter associated with piezoelectric material which is defined asthe amount of charge developed at the opposite surfaces of thematerial when one unit force is applied across it. The piezoelectriccharge coefficient d33 (pC/N) was measured using piezometer(PM300, PiezoTest, UK). A constant tapping force of 0.25 N at afrequency of 110 Hz was applied on the electroded surfaces of asgrown and poled LSMH crystal. After poling under a field of 10 kV/cmfor 30 min at room temperature, d33 values of pure LSMH crystal is48 pC/N and for Cu (II) doped LSMH crystal is 68 pC/N. Thepiezoelectric properties are largely affected by the dislocations [27].Any defect irrespective of their origin may cause slowing down ofthe domain wall mobility and tends to reduce the d33 coefficient[28]. Due to the addition of Cu2þ the crystalline perfection of thecrystal has been enhanced. The greater crystalline perfection maybe one reason for the increasing piezoelectric coefficient.
3.10. Laser damage threshold measurements
The laser induced breakdown in the crystals caused by variousphysical processes such as electron avalanche, multiphotonabsorption, and photo ionization for the transparent materialswhereas in case of high absorbing materials, the damage thresholdis mainly due to the temperature rise, which leads to strain-induced fracture [29,30]. It also depends upon the specific proper-ties of material, pulse width, and wavelength of laser used. For thelong-pulse regime τ4100 ps, the damage process occurs mainlyby the rate of thermal conduction through the atomic lattice andfor the short-pulse regime τr10 ps, the optical breakdown is anonthermal process and various nonlinear ionization mechanismsmultiphoton, avalanche multiplication, and tunneling becomeimportant [26].
Fig. 9. High-resolution X-ray diffraction curves recorded for (100) diffractingplanes. In symmetrical Bragg geometry using MoKα1 radiation for lithium sulfatemonohydrate single crystals: Pure and (b) Cu (II) doped specimens.
K. Boopathi et al. / Journal of Crystal Growth 386 (2014) 32–3736

In the present investigation, Q switched Nd: YAG laser operat-ing at 1064 nm radiation was used. The laser was operated at therepetition rate 10 Hz with pulse width of the laser beam 10 ns. Forthe LDT measurement diameter of the laser beam is 1 mm, laserbeam was focused on the crystal with a 20 cm focal length convexlens and the crystal was placed just at the focal point. LDT valuesfor (100) planes of pure and doped crystals were recorded whenthe clear visible spot occurred on surface with audible sound.As given in the experimental details, to get the bulk LDT values,the beam was focused inside the crystal, but close to the surfacewith a predetermined spot size of diameter 0.20 mm in air. Thepulse energy of each shot was measured using the combination ofphototube and oscilloscope. The surface damage threshold of thecrystal was calculated using the expression:
Power density ðPdÞ ¼ E=τπr2
where E is the input energy (mJ), τ is the pulse width (ns) and r isthe radius of the spot (mm). The measured multiple shot laserdamage threshold value for pure and Cu (II) added LSMH is 2.8 and3.1 GW/cm2. The higher crystalline perfection of grown crystalmay be responsible for the larger laser damage threshold. Azarovet al. [31] reported that the damage threshold was influenced bythe dislocation in the crystal and the crystal with many disloca-tions presented low damage threshold.
3.11. NLO property studies
The NLO property of the crystal was confirmed by the KurtzPerry powder technique [15]. The crystals are ground to powderand packed between two transparent glass slides. The firstharmonic output of 1064 nm from Nd: YAG laser was made to fallnormally, passed through the pure and doped LSMH powdersample. The SHG behavior in these crystals was confirmed fromthe emission of intense green radiation (λ¼532 nm) by thesample. The Cu2þ doped crystal has lower intensity of the greenradiation than pure LSMH. The depressed SHG efficiency may bedue to the disturbance of electronic charge distribution in dopedcrystal [32].
4. Conclusions
Good quality single crystals of pure, Cu (II) doped LSMH weregrown successfully by slow evaporation solution technique. AAS,EDS result reveals that the amount of dopant incorporated into thecrystal lattice is less than the concentration of the dopant in thecorresponding solution. Single crystal X-ray diffraction studyshows that the small variation in lattice parameter values is dueto the contribution of metal dopant in the interstitial sites. Thepowder X-ray diffraction analysis shows small shift in intensityand peak position. The pure and doped LSMH crystals have goodtransmission in the range 200–1100 nm and the doped crystalspossess increased transmission. Using the FT-IR spectroscopyfunctional group of the compounds has been confirmed. It is seenfrom thermal analysis that the decomposition temperature of thedoped LSMH crystals increases, when compared to pure LSMH.
The HRXRD result shows that the crystalline perfection of thedoped crystal is considerably good compared to pure crystal. Thepiezoelectric studies show that doped crystals have higher piezo-electric coefficient than pure LSMH crystal. The laser damagethreshold value for pure and Cu (II) doped LSMH was found tobe 2.8 and 3.1 GW/cm2 at 1064 nm wavelength of Nd: YAG laserradiation. Form the SHG efficiency analysis doped LSMH crystalhas less efficiency than that of pure LSMH.
Acknowledgment
The authors are thankful to Dr. Binay Kumar, Department ofPhysics and Astrophysics, University of Delhi, India for the piezo-electric measurements, Dr. R. Gopalakrishnan, Anna University,Chennai for providing microhardness studies and SAIF, IIT Madras,
References
[1] P.N. Prasad, D.J. Williams, Introduction to Nonlinear Optical Effects in Moleculesand Polymers, Wiley, New York, 1990.
[2] D. Xu, D. Xue, Journal of Crystal Growth 310 (2008) 2161.[3] P. Groth, Chemische Krystallographie (Leipzig German. vol. 2, 1908).[4] W. Ackermann, Annalen der Physik 46 (1912) 197.[5] L. Bohaty, P. Becker, H.J. Eichler, J. Hanuza, M. Maczka, K. Takaichi, K. Ueda,
A.A. Kaminskii, Laser Physics 15 (2005) 1509.[6] S.B. Lang, Physical Review B 4 (1971) 3603.[7] G. Pasupathi, P. Philominathan, Materials Letters 62 (2008) 4386.[8] S. Podlojenov, J. Stade, M. Burianek, M. Muhlberg, Crystal Research and
Technology 41 (2006) 344.[9] M.R. Suresh Kumar, H.J. Ravindra, S.M. Dharmaprakash, Journal of Crystal
Growth 306 (2007) 361.[10] R.J.C. Lima, et al., Acta Crystallographica Section C 59 (2003) 67.[11] K. Boopathi, P. Rajesh, P. Ramasamy, Journal of Crystal Growth 345 (2012) 6.[12] R. Ramesh Babu, R. Ramesh, R. Gopalakrishnan, K. Ramamurthi,
G. Bhagavannarayana, Spectrochimica Acta Part A 76 (2010) 470.[13] D. Xu, D. Xue, Journal of Crystal Growth 310 (2008) 1390.[14] K. Lal, G. Bhagavannarayana, Journal of Applied Crystallography 22 (1989) 209.[15] S.K. Kurtz, T.T. Perry, Journal of Applied Physics 44 (1968) 455.[16] G. Wilkinson, R.D. Gillard, J.A. McCleverty (Eds.), Comprehensive Coordination
Chemistry, Vol.1, Pergamon press, Elmsford, New York, 1987, p. 380.[17] K. Li, D. Xue, Journal of Physical Chemistry A 110 (2006) 11337.[18] D. Xue, X. He, Physical Review B 73 (2006) 064113.[19] P. Kalsi, Spectroscopy of Organic Compounds, Wiley Eastern, New Delhi, 1985.[20] K. Li, P. Yang, Advanced Sciences and Engineering 1 (2012) 2279.[21] B.R. Lawn, E.R. Fuller, Journal of Materials Science 9 (1975) 2016.[22] Urit Charoen-In, P. Ramasamy, P. Manyum, Journal of Crystal Growth 312
(2010) 2369.[23] D. Nagaraju, P.V. Raja Shekar, T. Bhaskar Rao, K.Kishan Rao, Materials Letters
64 (2010) 267.[24] B.W. Batterman, H. Cole, Reviews of Modern Physics 36 (1964) 681.[25] G. Bhagavannarayana, P. Rajesh, P. Ramasamy, Journal of Applied Crystal-
lography 43 (2010) 1376.[26] K. Senthilkumar, S. Moorthy Babu, G. Bhagavannarayana, Journal of Applied
Crystallography 44 (2011) 313.[27] A. Saxena, V. Gupta, K. Sreenivas, Journal of Crystal Growth 263 (2004) 192.[28] X. Guisheng, L. Haosu, W. Pingchu, X. Haiqing, Y. Zhiwen, Chinese Science
Bulletin 45 (2000) 491.[29] W.L. Smith, Optical Engineering 17 (1959) 489.[30] B.C. Stuart, M.D. Feit, A.M. Rubenchik, B.M. Shore, M.D. Perry, Physical Review
Letters 74 (1995) 2248.[31] C.V. Azarov, L.V. Atroshchenko, Yu.K Danileiko, M.I. Kolybaevs, Yu.P Minaev, V.
N. Nikolaev, A.V. Sidorin, B.I. Zakharkin, Soviet Journal of Quantum Electronics15 (1985) 89.
[32] Y. Wang, D.F. Eaton, Chemical Physics Letters 120 (1985) 441.
K. Boopathi et al. / Journal of Crystal Growth 386 (2014) 32–37 37