The Effect of a Screening Instrument to Determine Teacher ...

Targets as perceivers: How people determine when they will benegatively stereotyped
Daryl A. Wout,John Jay College-City University of New York
Margaret J. Shih,University of California Los Angeles
James S. Jackson, andUniversity of Michigan
Robert M. SellersUniversity of Michigan
AbstractResearch on stereotype threat has demonstrated that when targets are forced to contend with the threatof being negatively stereotyped, their academic performance suffers (Steele & Aronson, 1995). Thepresent research explored how the targets of negative stereotypes determine when they must contendwith this threat. Across five experiments, we manipulated both the possibility and probability thatBlack and female students would be stereotyped as unintelligent prior to taking an analytical test.Collectively, these experiments showed that these students only contended with stereotype threatwhen they perceived that it was both possible and probable that they would be negatively stereotyped.We discuss the implications of these findings on the experience of being the target of negativestereotypes and on the academic achievement of Blacks and women.
KeywordsStereotype threat; meta-stereotypes; stereotypes; racial attitudes; social perception; academicachievement; Blacks; women in math
Being viewed through the lens of a negative stereotype can be an adverse experience (Allport,1954; Schmader & John, 2003; Steele, 1997). Given that most social situations are fraught withambiguity, the challenge facing the targets of negative stereotypes is to accurately determiningwhen the threat of being stereotyped actually exists. If targets conclude that this threat doesexist, they must then psychologically prepare to cope with it. Although preparing for this threatserves a protective function, it also depletes cognitive resources, thereby impairingperformance on intellectual tasks (Schmader & John, 2003; Steele & Aronson, 1995). If, onthe other hand, targets conclude that this threat does not exist, they can then preserve theircognitive resources, and optimize their performance on intellectual tasks. The potentialdownside of concluding that a threat does not exist is that targets will be unprepared to copewith the negative psychological consequences of being stereotyped if the threat actuallymaterializes.
Please address correspondence to: Daryl A. Wout, Department of Psychology, 2105 North Hall, John Jay College-City University ofNew York, 445 West 59th Street, New York, NY 10019, [email protected].
NIH Public AccessAuthor ManuscriptJ Pers Soc Psychol. Author manuscript; available in PMC 2009 December 10.
Published in final edited form as:J Pers Soc Psychol. 2009 February ; 96(2): 349–362. doi:10.1037/a0012880.
NIH
-PA Author Manuscript
NIH
-PA Author Manuscript
NIH
-PA Author Manuscript

Given the potential costs and benefits associated with each decision, it is important tounderstand how targets determine when they must deal with the threat of being negativelystereotyped. To date, there has been little research investigating this issue. The present researchattempts to address this deficit in the literature by exploring the psychological processes targetsuse in determining when it is necessary to contend with the threat of being stereotyped.
Stereotype ThreatOver the past few decades, researchers have become increasingly interested in understandingthe challenges facing the targets of stereotyping and prejudice (Crocker & Major, 1989;Crocker, Major, & Steele, 1998; Crocker, Voelkl, Testa, & Major, 1991; Steele, 1992; Steele,1997; Swim & Stangor, 1998). One popular theory arising from this interest is stereotypethreat (Steele, 1997; Steele & Aronson, 1995; Steele, Spencer, & Aronson, 2002). This theoryproposes that when a negative stereotype is relevant to a social setting, the targets of thestereotype have to contend with the threat of being viewed or judged through the lens of thestereotype. Targets contend with this threat in various ways, ranging from simply increasingtheir vigilance of their social settings to becoming concerned or anxious that they will benegatively stereotyped (Steele, Spencer, & Aronson, 2002). Unfortunately, contending withthis threat is cognitively taxing, and in academic domains can impair targets’ academicperformance (Inzlicht, McKay, & Aronson, 2006; Schmader & John, 2003; Steele & Aronson,1995).
In a landmark study on stereotype threat, Steele and Aronson (1995) had Black and WhiteStanford students take a verbal test that was administered by a White experimenter. Theexperimenter described the test as being a diagnostic indicator of verbal ability for half of theparticipants, but non-diagnostic of verbal ability for the other half. Test results revealed thatBlack students performed worse than White students on the “diagnostic” test, but not on the“non-diagnostic” test. In addition, Black students performed worse on the diagnostic test thanon the non-diagnostic test. Because Whites are not negatively stereotyped as unintelligent, thecharacterization of the test had no effect on the White students’ test performance. Thesefindings provide compelling evidence that Black students’ academic performance can sufferwhen they contend with the Black “unintelligent” stereotype.
Targets’ Determination of ThreatAlthough research has shown that targets’ test performance is impaired when they are forcedto contend with the threat of being negatively stereotyped, prior research has failed toadequately investigate how targets determine that the threat is present in their immediate socialsetting. Since social settings vary in the degree that they are threatening (Major & O’Brien,2005; Steele, 1997; Steele, Spencer, & Aronson, 2002), the psychological process targets useto determine when they must contend with the threat of being stereotyped remains unidentified.In the present set of experiments, we attempt to extend the research on stereotype threat bydemonstrating that targets only contend with the threat of being stereotyped when they perceivethat it is both possible for the stereotype to be applied, and probable that others will apply thestereotype to them.
Possibility of Being StereotypedConsistent with Steele’s (1997) notion that stereotypes are “in the air”, we argue that in orderfor targets to feel the need to contend with the threat of being stereotyped, they must first beaware that a negative stereotype can be applied to them in their present social setting. We referto this awareness as the possibility of being stereotyped. Targets assess the possibility of beingstereotyped by determining if the stereotype is relevant to both the broader social context aswell as the immediate social setting.
Wout et al. Page 2
J Pers Soc Psychol. Author manuscript; available in PMC 2009 December 10.
NIH
-PA Author Manuscript
NIH
-PA Author Manuscript
NIH
-PA Author Manuscript

The broader social context can inform targets if a particular stereotype is relevant and thus ifit is possible for the stereotype to be applied to them. Take, for instance, the stereotype that“women are bad at math.” This stereotype is relevant in math contexts, but not in creativewriting contexts. Therefore, women must contend with the possibility of being stereotype whenthey are in math contexts, but not in creative writing contexts (Inzlicht & Ben-Zeev, 2000;Steele, 1997; Steele, Spencer, & Aronson, 2002).
Even when the stereotype is relevant to the broader social context (i.e., women in a mathcontext), situational cues in the immediate social setting can make the stereotype less relevant,thereby reducing the possibility of being stereotyped. For example, characterizing a test asbeing incapable of measuring ability (i.e., a non-diagnostic test), or incapable of assessing thestereotype (i.e., a gender-fair or racially-fair test), removes the relevance of the stereotype fromthe immediate social setting, and thus removes the possibility of being stereotyped (Blascovich,Spencer, Quinn, & Steele, 2001; Spencer, Steele, & Quinn, 1999; Steele & Aronson, 1995).Due to the powerful role that the possibility of being stereotyped plays in initiating stereotypethreat, the vast majority of stereotype threat research has focused on removing this possibility.
Probability of Being StereotypedWhile the possibility of being stereotyped is a necessary requirement for stereotype threat tooccur, we believe that it is not a sufficient requirement. Although stereotypes are widely knownin society (Devine, 1989), both individuals and social groups vary in their endorsement of thesestereotypes (Devine & Elliot, 1995). Targets’ awareness of this variability makes it inefficientfor them to expend cognitive resources towards contending with the threat of being stereotypedevery time the possibility exists. A more cognitively efficient, and potentially more accurate,approach would be for targets to also assess the likelihood that the people in their social settingwill apply the stereotype to them. It is this assessment that we refer to as the probability ofbeing stereotyped.
Although these probability assessments are subjective, we have classified them into two broadcategories: probable and improbable. We classify assessments as “probable” if they approachor exceed a 50/50 chance that the stereotype would be applied. When targets conclude that thepossibility is also probable, it is psychologically protective for them to contend with the threatof being stereotyped. In contrast, we classify assessments as “improbable” if they fall wellbelow a 50/50 chance. When targets conclude that being stereotyped is improbable, it is morecognitively efficient for them not to contend with the possibility of being stereotyped.
We argue that targets make their probability assessments by utilizing two fundamental socialperceptual tools—1) social stereotypes, and 2) individuating information about the otherindividuals in their social environment. Social stereotypes enable perceivers to attributecharacteristics to others based upon their group membership (Brewer, 1988; Fiske & Neuberg,1990; Kunda & Thagard, 1996). Perceivers can then use these stereotypes to make inferencesand create behavioral expectations of these other people. Similarly, meta-stereotypes, people’sbeliefs regarding the stereotypes that outgroup members hold of their ingroup, enable peopleto make inferences and expectations about others who are likely to stereotype them (Brown &Dobbins, 2004; Sigelman & Tuch, 1997; Vorauer, Hunter, Main, & Roy, 2000; Vorauer &Kumhyr, 2001; Vorauer, Main, & O’Connell, 1998). Blacks and other ethnic minorities expectWhites to stereotype them as being aggressive, lazy, and unintelligent (Sigelman & Tuch,1997; Brown, 1998). Similarly, women expect to stereotype them as being poor at math,emotional, and lacking leadership ability (Crocker, Major, & Steele, 1998; Marx & Roman,2002).
Given the significance people place on group membership, it seems logical for targets to usegroup membership as a cue in determining the probability that others will negatively stereotype
Wout et al. Page 3
J Pers Soc Psychol. Author manuscript; available in PMC 2009 December 10.
NIH
-PA Author Manuscript
NIH
-PA Author Manuscript
NIH
-PA Author Manuscript

them. Based on these group-based probability judgments, targets should perceive that it isprobable that they will be stereotyped when in the presence of out-group members, butimprobable that they will be stereotyped when in the presence of in-group members. Researchon solo status, being the only member of one’s social group, provides support for this reasoning.Being a solo in a domain where one’s group is negatively stereotyped has been shown to havea detrimental impact on academic performance (Inzlicht & Ben-Zeev, 2000; Lord & Saenz,1985; Sekaquaptewa & Thompson, 2002; Sekaquaptewa & Thompson, 2003). For instance,Sekaquaptewa & Thompson (2002) found that Black students’ performance suffered whenthey were a racial solo compared to when they were among members of their own racial group.One interpretation of these findings is that the Black students perceived that it was probablethat they would be negatively stereotyped when they were a racial solo, but improbable whenthey were in a racially homogeneous group. As a result, the Black students had to contend withbeing stereotyped when they were in the presence of Whites, but not when they were in thepresence of other Blacks.
Consistent with the research on solo status and meta-stereotypes, we propose that when targetsengage in a stereotype-relevant task, they use the group membership of the people in theirtesting environment as a cue in determining the probability that they will be negativelystereotyped. Specifically, we propose that when the possibility of being stereotyped is present,targets will be forced to contend with the possibility of being stereotyped when their evaluatoris an outgroup member, but not when their evaluator is an ingroup member. Consequently,stereotype threat should impair targets’ test performance when they believe an outgroupmember will evaluate them, but not when they believe that an ingroup member will evaluatethem. When the possibility of being stereotyped is removed from the testing situation, such aswhen the test is non-diagnostic of ability, targets should not have to contend with the stereotype.As a result, the evaluator’s group membership should be unrelated to targets’ test performance.
While people’s perceptions of others are profoundly influenced by social stereotypes and meta-stereotypes, individuating information can modify, or even override, these perceptions(Brewer, 1988; Fiske, Neuberg, Beattie, & Milberg, 1987; Jussim, Nelson, Manis, & Soffin,1995; Kunda & Thagard, 1996; Locksley Borgida, Brekke, & Hepburn, 1980; Nisbett, Zukier,& Lemley, 1981). Given the power of individuating information, we argue that targets shouldonly rely on group membership when they lack individuating information about the people intheir social setting. When provided with counter-stereotypical individuating information aboutthe beliefs of the people in the social setting, targets should base their probability judgmentson this individuating information instead of on social group membership. Thus, while targetsare likely to use group membership as a cue in determining the probability of being stereotyped,they should not rely on this cue when they are provided with counter-stereotypicalindividuating information about their evaluator.
Overview of ResearchThe primary objective of the present research was to investigate how targets determine whetherthey should contend with the threat of being negatively stereotyped. Specifically, this researchexplored whether Black and female students’ perceptions of both the possibility and probabilityof being negatively stereotyped effected their susceptibility to stereotype threat. In Experiment1 we manipulated both the possibility and the probability that the “unintelligent” stereotypewould be applied to Black students. In Experiments 2 through 5 we held constant the possibilitythat the stereotype would be applied, while manipulating the probability that a negativeintellectual stereotype would be applied to either Black students (Experiments 2, 3, and 4) orfemale students in a math context (Experiment 5). In Experiment 4 and 5 we also tested thehypothesis that Black and female students’ perceptions of the probability of being stereotypedmediates the effect of stereotype threat on their test performance.
Wout et al. Page 4
J Pers Soc Psychol. Author manuscript; available in PMC 2009 December 10.
NIH
-PA Author Manuscript
NIH
-PA Author Manuscript
NIH
-PA Author Manuscript
Experiment 1Experiment 1 examined the effect of manipulating the possibility and probability that Blackstudents would be negatively stereotyped in a testing environment. We manipulated thepossibility of being stereotyped by describing an analytical test as either diagnostic ofintellectual ability (possible to be stereotyped) or non-diagnostic of ability (not possible to bestereotyped). Furthermore, we manipulated the probability of being stereotyped by having thestudents’ performance evaluated by either a White evaluator (probable) or a Black evalator(improbable). If stereotype threat is dependent upon targets’ perception that it is both possibleand probable that they will be negatively stereotyped, then Black students’ test performanceshould only suffer when the test is diagnostic of their intellectual ability and when their testevaluator is White. When the test is characterized as being non-diagnostic of intellectual ability,the students’ performance should not be affect by stereotype threat because they can concludethat it is not possible to be stereotyped by either the White or the Black test evaluator. Whenthe test is characterized as being diagnostic of intellectual ability and their evaluator is Black,the students should conclude that it is possible to be stereotyped but improbable that the Blackevaluator would stereotype them. As a result, the students’ test performance should not beaffected by stereotype threat when the test is diagnostic and their evaluator is Black.
MethodParticipants—Fifty Black women and 17 Black men from various colleges and universitiesacross the country participated in an online study. Participants were recruited from an emaillist, maintained by a private university, of individuals interested in participating in onlinestudies. All participants received a $10 gift certificate from an online retailer for participatingin the study.
Procedure—Participants were emailed an invitation to take part in this on-line study. Afterlogging into the website, participants read a letter from Dr. Robert Jones, a supposed businessprofessor. All participants read that standardized tests have been widely used in botheducational and business settings to select qualified students and job applicants. Participantsin the diagnostic condition also read that the purpose of the present study was to investigatethe cognitive processes involved solving standardized test questions. Furthermore, they readthat they would take a 15-item standardized test, and that their performance would be anaccurate indicator of both their intellectual ability and their academic and professional success.Finally they read that Dr. Jones would personally email their test score, along with detailedfeedback on their intellectual strengths and weaknesses.
Participants in the non-diagnostic condition read that purpose of the present study was todevelop an unbiased standardized analytical test. They then read that they would take a 15-item standardized test developed by Dr. Jones, and that preliminary use of this test has shownit to be free of test bias. The participants’ responses to the test questions would be used to selectthe most appropriate questions for the final version of the test. Finally they read that becausethe test was still in development, it would not be used to measure their intellectual ability.
At the end of the letter, all participants were presented with Dr. Jones’ signature and his picture.We manipulated the picture of Dr. Jones such that for some participants he was a middle-agedWhite man wearing a suit, while for others he was a middle-aged Black man wearing a suit.
After reading about the purpose of the study, the participants were shown a sample test question.Then they were asked to report their gender, race, first name, email address, and a performanceexpectancy question. They were then given 20 minutes to complete 15 analytical questions.At the end of the 20 minutes, the web program informed them that their time was up and to go
Wout et al. Page 5
J Pers Soc Psychol. Author manuscript; available in PMC 2009 December 10.
NIH
-PA Author Manuscript
NIH
-PA Author Manuscript
NIH
-PA Author Manuscript

to the next webpage. The participants then answered a few questions about the test and thenreceived a detailed written debriefing.
MaterialsAnalytical test: The primary dependent variable was the number of questions participantsanswered correctly on a 15-item analytical test. The analytical test was created from analyticalquestions from Graduate Record Exam (GRE).
Performance expectancies: An alterative prediction is that the description of the test and therace of the evaluator impair the participants’ actual performance by changing their expectationsof their performance (Cadinu, Maass, Frigerio, Impagliazzo, & Latinotti, 2003; Stangor, Carr,& Kiang, 1998). To explore this possibility, participants responded to the question, “How welldo you expect to perform on this test?” Participants answered this question after theexperimental manipulations, but prior to the test. The response scale for this expectancy itemranged from 1 (very poorly) to 10 (extremely well). If performance expectancies account forcondition differences in test performance, then this performance expectancy item should differby condition and be predictive of the participants’ test performance.
Results and DiscussionNumber Correct—A 2(test description: diagnostic vs. non-diagnostic) × 2(race of testevaluator: Black vs. White) ANOVA on number correct yielded a marginally significant effectof the test description, F(1,63) = 3.10, p = .09. This main effect was qualified by the predictedtest description by race of the test evaluator interaction, F(1, 63) = 3.81, p = .05. Simple effectstests revealed that when the analytical test was characterized as being non-diagnostic ofintellectual ability, participants with a Black evaluator (M = 4.90) performed as well as thosewith a White evaluator (M = 5.60) F(1,63) = 0.76, p > .10, ns. When the test was characterizedas being diagnostic of ability, students with the Black evaluator (M = 5.00) answered morequestions correctly than students with the White evaluator (M = 3.44), F(1,63) = 4.00, p = .05.Replicating the standard stereotype threat effect, when the test evaluator was White, thestudents answered more questions correctly on non-diagnostic test than on the diagnostic test,F(1,63) = 7.27, p > .01.
Performance Expectancies—An ANOVA on the participants’ pre-test performanceexpectancies did not reveal any significant effects (all Fs < 1). Furthermore, pre-testexpectancies were unrelated to the number of questions participants answered correctly (r = .08 p > .10, ns).
Experiment 1 provided initial evidence for the possibility/probability hypothesis. Blackstudents’ test performance was unaffected by the race of their evaluator when their analyticaltest was described as being non-diagnostic of intelligence. In contrast, when the test wasdescribed as being diagnostic of intelligence, students with a Black evaluator performedsignificantly better then students with a White evaluator. In addition, when the evaluator wasWhite, students performed better when the test was non-diagnostic compared to diagnostic ofability.
The students’ pre-test performance expectations were not affected by either the description ofthe test or the race of the test evaluator. All students expect to perform relatively well on test.Additionally, the students’ pre-test performance expectations were uncorrelated with theiractual performance. Thus it does not appear that expectancies can account for the performanceeffects.
Wout et al. Page 6
J Pers Soc Psychol. Author manuscript; available in PMC 2009 December 10.
NIH
-PA Author Manuscript
NIH
-PA Author Manuscript
NIH
-PA Author Manuscript
In Experiment 1, we only collected data on Black students. Because White students are notnegatively stereotyped academically, it is neither possible nor probable that they will benegatively stereotyped. In most stereotype threat studies show that non-stereotyped groupmembers receive a slight boost in performance in the standard threat condition (Steele &Aronson, 1995; Spencer et al., 1999: Walton & Cohen, 2003). Since the present researchfocuses on how the targets of negative stereotyped, we did not include White students inExperiment 1. While this omission does not allow us to directly test whether non-stereotypedgroup members are affected by the possibility and probability cues in the present experiment,we do address this issue empirically in the final experiment.
Experiment 2While Experiment 1 showed that Black students’ test performance on the diagnostic test wasbuffered by their awareness that their test evaluator was Black, we do not believe that an ingroupevaluator will always lead to safety from stereotype threat. Targets should only use groupmembership as a cue of safety when they lack individuating information about the ingroupevaluator that is inconsistent with their meta-stereotypes. When individuating informationabout an ingroup evaluator is counter to targets’ meta-stereotypes, they should abandon thesemeta-stereotypes and rely on the individuating information to determine the probability thatthe ingroup evaluator will stereotype them. Specifically, we predicted that Black students’ testperformance would suffer if they learned that their Black evaluator endorses negativestereotype about Black people. Experiment 2 tested this prediction.
In this experiment, all of the Black students had a Black test evaluator. Unlike the Experiment1, the possible of being stereotyped was held constant—in all three experimental conditionsthe participants were aware that their intellectual ability would be evaluated. The probabilityof being stereotyped was varied by manipulating the situational cues in the testing environment—specifically, by providing individuating information about the experimenter (i.e., whetherthe Black test evaluator expressed that he either endorsed or rejected group differences inintellectual ability). We predicted that when the Black test evaluator expressed that he endorsedgroup differences in intelligence, the students would conclude that the probability of beingstereotyped was too high to ignore. This increased probability should force them to contendwith being stereotyped, and result in impaired test performance. In contrast, we predicted thatwhen the Black test evaluator expressed that he did not believe that there were group differencesin ability, the students would conclude that it was still improbable that he would stereotypethem, thus freeing them from having to contend with being stereotyped. The students’perception of stereotype safety should result in optimal test performance.
MethodParticipants and Design—Fifty-one self-identified Black undergraduate students (36women, 15 men) from a large mid-western university participated in this experiment. Thestudents received either $15 or course credit as compensation for their participation. Theparticipants were randomly assigned to one of three conditions–1) a diagnostic condition(control condition), 2) a stereotype endorsement condition, or 3) a stereotype rejectioncondition.
Manipulation—Participants in the control condition received the test instructions from thediagnostic test condition in Experiment 1. Participants in the remaining two conditions weretold that the purpose of the study was to test two competing explanations for group differenceson standardized tests—1) that there are actual group differences in ability, or 2) thatstandardized test are biased against certain groups. In order to test these competingexplanations, the researchers created an unbiased standardized test that that the participantswould take. In the stereotype endorsement condition, the test evaluator predicted that there
Wout et al. Page 7
J Pers Soc Psychol. Author manuscript; available in PMC 2009 December 10.
NIH
-PA Author Manuscript
NIH
-PA Author Manuscript
NIH
-PA Author Manuscript

would still be group differences on the unbiased test, whereas in the stereotype rejectioncondition the evaluator predicted that there would not be group differences on the unbiasedtest.
Procedure—Participants arrived at the laboratory individually and were greeted by one ofthree Black male test evaluators. After being seated, the participants read that the purpose ofthe study was to investigate students’ analytical reasoning ability. The participants thenreceived specific instructions that comprised part of the experimental manipulation.Participants in the diagnostic condition read the diagnostic testing instructions used inExperiment 1. The diagnostic test manipulation was chosen as the control in the present studybecause it had no effect on participants’ test performance in the first experiment when theevaluator was Black. Additionally, the diagnostic test description enabled us to hold constantthe possibility of being stereotyped.
In the stereotype endorsement and stereotype rejection conditions, participants read that thepurpose of the study was to investigate group differences on standardized tests. Specifically,they read:
The purpose of the present study is to investigate group differences on standardizedtests. Recently, there has been a great deal of debate regarding the validity andusefulness of standardized tests. A number of studies have shown that certain groupstend to perform more poorly than other groups on standardized tests. Some researchersand educators have proposed that these group differences are due to differences inability, whereas others have proposed that these group differences are due to biasedstandardized tests. The objective of this research is to investigate these groupdifferences using test items that have been proven to be unbiased.
Today you will take a standardized analytical reasoning test. This test consists of 20difficult analytical questions. These questions were selected from variousstandardized tests. All of the items selected for this test have previously been shownto be unbiased. You will have 25 minutes to complete 20 analytical questions. At theend of the study you will be provided with feedback on your strengths and weaknessesin analytical reasoning ability.
The test description for the stereotype rejection and stereotype endorsement conditions wasintended to heighten participants’ awareness that their performance would be used to eitherconfirm or refute the stereotype that there are actual group differences in intellectual ability.If the participants performed poorly, it would provide evidence that there are actual groupdifferences in intellectual ability. In contrast, if they performed well on the test it would provideevidence that there are not group differences in ability.
After reading the instructions, the test evaluator stated his prediction for the outcome of theunbiased test. The test evaluator’s prediction was manipulated by condition. For participantsin the stereotype endorsement condition, the test evaluator stated that he believed that therewould still be group differences on the unbiased test. Specifically, the evaluator stated:
I’m conducting this study with my advisor as part of my Senior Honors Thesis.Personally, I believe that there are actual group differences in ability. Therefore I ampredicting that this unbiased test will still show group differences in test performance.You will have 25 minutes to complete the 20-item test. At the end of the study, I’llscore your test and give you feedback on your analytical ability.
For participants in this condition, the Black evaluator’s prediction of group differences wascontrary to their stereotypical perception that it is improbable that other Blacks would endorse
Wout et al. Page 8
J Pers Soc Psychol. Author manuscript; available in PMC 2009 December 10.
NIH
-PA Author Manuscript
NIH
-PA Author Manuscript
NIH
-PA Author Manuscript

or apply the “unintelligent” Black stereotype. This counter-stereotypical information shouldserve as a cue that it was now probable that the evaluator would stereotype them.
For participants in the stereotype rejection condition, the Black evaluator made the samecomments as in the stereotype endorsement condition, except that he expressed that he believedthat there were not group differences in ability. In addition, he predicted that there would notbe group differences on the unbiased test. For participants in this condition, the test evaluator’sprediction of no group differences was consistent with their stereotypical perceptions of Blacks,and should therefore serve to reinforce their belief that it was improbable that the test evaluatorwould stereotype them.
After receiving the instructions, participants in all three conditions were given three minutesto work on two practice items. They then reported how well they believed they would performon the test. All participants were then given 25 minutes to complete the 20-item analytical test.At then end of the 25 minutes, the test evaluator collected the test and asked the participantsto complete a short questionnaire and a demographic form. The participants were paid andfully debriefed.
MaterialsAnalytical test: As with Experiment 1, the primary dependent measure was the number of testquestions that participants answered correctly on a 20-item analytical test. The participantswere given 25 minutes to complete this test.
Results and DiscussionNumber Correct—Data from six participants were excluded from the study, thus leaving asample of forty-five African American participants (32 females, 13 males).1 We predicted thatparticipants would answer fewer questions correctly when the Black test evaluator endorsedgroup differences in ability (stereotype endorsement condition) compared to when theevaluator either did not endorse group differences (stereotype rejection condition) or when theparticipants took a diagnostic test (control condition). Supporting our hypothesis, a one-wayANOVA on the number of questions answered correctly revealed a significant effect ofcondition, F(2,42) = 4.18, p < .05. Planned contrasts revealed that participants in the stereotypeendorsement condition answered fewer questions correctly (M = 4.57) than participants in thediagnostic control condition (M = 6.06), t(42) = 2.10, p < .05; and also fewer questions correctlythan participants in the stereotype rejection condition (M = 6.60); t(42) = 2.80, p < .01. Thenumber of questions answered correctly by participants in the stereotype rejection conditiondid not differ from participants in the diagnostic control condition, t(42) = .77, p >.10, ns (SeeTable 1).
Performance Expectancies—A one-way ANOVA on participants’ expectation of theirperformance prior to the test revealed no condition differences, F(2,42) = .05, p > .10, ns (SeeTable 1). As with Experiment 1, participants’ pre-test expectations were uncorrelated with thenumber of questions they answered correctly (r = −.10, p > .10, ns).
Experiment 2 provided further evidence that targets determine whether a threat exists by relyingon their assessments of the probability that others will stereotype them. Whereas the possibility
1Three participants were excluded from because the participants could not recall the evaluator’s prediction. Three other participants wereexcluded because they reported being familiar with the stereotype threat theory. At the end of the study, these participants reported thatthey believed the study was about how concerns about being stereotyped affect minority students’ test scores. Two participants actuallywrote stereotype threat by name. Research has shown that informing targets about the affects of negative stereotypes on academic abilitybuffers them from stereotype threat (Johns, Schmader, and Martens, 2005). Because their knowledge of stereotype threat likely bufferedthem from our threat manipulation, we excluded these 3 participants.
Wout et al. Page 9
J Pers Soc Psychol. Author manuscript; available in PMC 2009 December 10.
NIH
-PA Author Manuscript
NIH
-PA Author Manuscript
NIH
-PA Author Manuscript

of being stereotyped was held constant, the probability that the stereotype would be appliedwas manipulated. Students performed worse when their Black evaluator endorsed the“unintelligent” stereotype than when their evaluator either rejected this stereotype or did notexpress his beliefs about the stereotype.
These test performance results demonstrate that Black students can experience the detrimentaleffects of stereotype threat with a Black test evaluator if they perceive that there is a sufficientlyhigh probability that this evaluator will negatively stereotype them. When this probabilityincreased, they were forced to contend with the threat of being stereotyped, which negativelyaffected their test performance. Furthermore, these findings suggest that the Black evaluatorbuffered the students from stereotype threat in Experiment 1 by enabling the students toconclude that it was improbable that the evaluator would negatively stereotyped.
Consistent with Experiment 1, pre-test performance expectancies did not differ byexperimental condition. Furthermore, pre-test performance expectancies were unrelated to theparticipants’ actual test performance. These findings suggest that the performance effects werenot driven by the participants’ expectations of how well they thought they would perform onthe test.
Experiment 3If counter-stereotypical individuating information can override Black students use of meta-stereotyped when their evaluator is Black, then the opposite should be true when their evaluatoris White. Specifically, Black students’ test performance should be buffered from stereotypethreat if they learned that their White test evaluator does not endorse the “unintelligent”stereotype. While Black students may use meta-stereotypes and assess the probability of beingstereotyped by a White test evaluator as high when there is no other individuating informationabout the evaluator present, we argue that counter-stereotypical individuating informationabout the White test evaluator would serve to reduce Black students’ perceived probability ofbeing negatively stereotyped. The reduction of this probability should free the students fromhaving to contend with the stereotype, thereby improving their test performance. Experiment3 explores this prediction.
MethodParticipants and Design—Thirty-nine self-identified Black undergraduates (26 women,13 men) from a large mid-western university participated in this experiment. Participants werepaid $15 for their participation. The participants were randomly assigned to one of three testingconditions—1) a stereotype endorsement condition, 2) a stereotype rejection condition or 3) ano information condition (control condition). The stereotype endorsement and stereotyperejection conditions were the same as Experiment 2. The cover story for the no informationcondition was the same as the other two conditions (i.e., that the study was investigating twoexplanations for group differences on standardized tests). The only difference between thecontrol and the other two conditions was that the test evaluator did not state his beliefs regardingthe cause of group differences on standardized tests.
Procedure—The experimental protocol was the same as Experiment 2, with twomodifications. First, the Black male test evaluator from Experiment 2 was replaced with oneof three White male test evaluators. Second, in the control condition the evaluator told theparticipants that the purpose of the study was to investigate group differences on standardizedtests, but he did not make a prediction regarding the cause of these differences. Because thetest evaluator was White and the participants’ ability was being assessed, we hypothesized thatthe control condition would force Black students to contend with the threat of beingstereotyped. Outside of these two changes, the procedures were the same as those used in
Wout et al. Page 10
J Pers Soc Psychol. Author manuscript; available in PMC 2009 December 10.
NIH
-PA Author Manuscript
NIH
-PA Author Manuscript
NIH
-PA Author Manuscript

Experiment 2. At the end of the study, the participants were fully debriefed and paid $15 fortheir participation.
Materials—We used the same materials from Experiment 2, except that we modified theanalytical test. Four items from the test used in Experiment 2 were removed because less than20% of the participants answered these items correctly. Those items were replaced with lessdifficult items. As a result, the items selected for the present study were slightly easier than theitems used in Experiment 2. No other changes were made to the study materials.
ResultsNumber Correct—Three participants were excluded from the study, thus leaving a sampleof 36 African American participants.2 We predicted that participants would answer morequestions correctly when the White test evaluator predicted that there would not be groupdifferences on the unbiased test (stereotype rejection condition) compared to when the testevaluator predicted that there would be group differences on the unbiased test (stereotypeendorsement condition) or when the test evaluator did not make a prediction (no informationcondition). A one-way ANOVA on the number of questions answered correctly supported thisprediction, F(2,33) = 4.48, p < .05. Planned contrasts revealed that participants in the stereotyperejection condition answered more questions correctly (M = 7.00) than participants in eitherthe no information condition (M = 5.42), t(33) = 2.59, p < .05; or participants in the stereotypeendorsement condition (M = 5.52); t(33) = 2.59, p < .05 (see Table 1).
Performance Expectancies—A one-way ANOVA on participants’ performanceexpectations before the test revealed no condition differences, F(2,33) = 1.41, p > .10, ns (seeTable 2). Again, the participants’ pre-test performance expectations were unrelated with thenumber of questions they answered correctly (r = −.16, p > .10, ns).
DiscussionStudy 3 demonstrated that Black students’ test performance could be buffered from stereotypethreat when they perceived that it was improbable that their White evaluator would stereotypethem. Consistent with our hypothesis, Black students answered more questions correctly whentheir White test evaluator rejected the “unintelligent” stereotype compared to when the Whitetest evaluator either endorsed the stereotype or did not state his beliefs regarding the stereotype.Collectively, these test performance findings provide further support for our proposal thattargets make determinations of threat based upon both the possibility and probability that theywill be stereotyped.
While Experiments 2 and 3 had slightly different designs and were conducted at different timepoints, they share enough overlap to allow us to make comparisons across experiments. In bothexperiments, the control condition consisted of the test evaluator administering a standardizedtest that was designed to measure the participants’ analytical ability. The main differencebetween the control conditions in these experiments was that in Experiment 2 the evaluatorwas Black, while in Experiment 3 the evaluator was White. These two conditions were similarto the “diagnostic” conditions used in Experiment 1. In Experiment 1, Black students performedbetter in the diagnostic condition when their evaluator was Black compared to when theirevaluator was White. Similarly, the Black students performed at an optimal level in the controlcondition in Experiment 2 because their evaluator was Black, but their performance suffered
2Data from three participants were excluded from Study 4. One participant expressed that he did not believe the cover story. Anotherparticipant was a research assistant for the fourth author, and was therefore excluded. The third participant had test performance scoresthat were more than 4 standard deviations above both the condition mean and the sample mean (15 questions correct out of 20). Thisparticipant was in the stereotype rejection condition.
Wout et al. Page 11
J Pers Soc Psychol. Author manuscript; available in PMC 2009 December 10.
NIH
-PA Author Manuscript
NIH
-PA Author Manuscript
NIH
-PA Author Manuscript

in the control condition in Experiment 3 because their evaluator was White. These findings areconsistent with our reasoning that Black students would use racial stereotypes to determine theprobability of being stereotyped in the absence of individuating information about theevaluator. The students perceived that it was improbable that the Black evaluator wouldstereotype them, thereby enabling them not to have to contend with the threat of beingstereotyped. As a result, the students performed at a more optimal level. In contrast, the studentsperceived that it was probable that the White evaluator would stereotype them. This, in turn,forced them to contend with the threat, which ultimately resulted in poor test performance.
When the students received individuating information about the evaluator, both theirprobability assessments and their performance changed accordingly. The students performedpoorly on the analytical test when the evaluator endorsed the stereotype, regardless of the raceof the evaluator. When either the Black (Experiment 2) or the White (Experiment 3) evaluatorendorsed the stereotype, the students concluded that there was a sufficiently high probabilityof being stereotyped that they had to contend with this threat. When the evaluator rejected thestereotype the students performed at an optimal level, regardless of the race of the evaluator.The evaluator’s rejection of the stereotype enabled the students to conclude that it wasimprobable that the evaluator would stereotype them. As a result, the students did not have tocontend with the threat.
Experiment 4The experiments presented thus far have demonstrated that Black students’ test performancecan be affected by their assessment of the probability of being negatively stereotyped. Althoughthe test performance results in these experiments are consistent with our predictions, it ispossible that other psychological processes, other than the probability of being stereotyped,affected the students’ test performance. The primary objective of Experiment 4 was to directlytest if Black students’ perception of the probability that their White evaluator endorses the“unintelligent” stereotype would mediate the stereotype threat effect.
The secondary objective of Experiment 4 was to further explore performance expectancies asan alternative explanation for the performance effects. Although Experiments 1–3 provided noevidence that participants’ pre-test performance expectations affected their actual performance,one possibility is that the participants’ actual performance was affected by their beliefsregarding the test evaluator’s expectations of their performance. In other words, theexperimental manipulations in Experiments 1–3 may have simply affected how participantsthought the test evaluator expects them to perform, which in turn affected how well theparticipants actually performed. Experiment 4 directly tests this possibility.
MethodParticipants and Design—Twenty-nine self-identified Black undergraduates (22 women,7 men) from a large mid-western university participated in this study for $15. Participants wererandomly assigned to either the “no information” or the “stereotype rejection” conditions usedin Experiment 3.
Procedure—The procedure for this experiment was the same as Experiment 3, except forone important addition. After the experimental manipulation, but prior to the test, theparticipants answered a series of questions. Embedded within these questions were twoquestions designed to measure the participants’ perceived probability that the evaluatorendorses the stereotype. These questions were, “What do you think the likelihood is that yourtest evaluator believes that previous group differences on standardized tests are the result ofbiases in standardized testing?” and “What do you think the likelihood is that your test evaluator
Wout et al. Page 12
J Pers Soc Psychol. Author manuscript; available in PMC 2009 December 10.
NIH
-PA Author Manuscript
NIH
-PA Author Manuscript
NIH
-PA Author Manuscript
believes that previous group differences on standardized tests are the result of actual groupdifferences in ability?”
Participants were also asked two performance expectancy questions, “How well do you thinkyou will perform on this test?” and “How well do you think your test evaluator expects you toperform on this test?” Participants then completed the 20-item test from Experiment 3, followedby a short questionnaire where they reported their Math and Verbal SAT scores. Participantswere then paid and fully debriefed.
Results and DiscussionNumber Correct—To account for individual differences in participants’ previousperformance on standardized tests, we included the average of participants’ Math and VerbalSAT scores as a covariate for number correct. Three participants did not report their SATscores, and were excluded from all analyses. This left a sample of 26 participants. AnANCOVA with the experimental manipulation as the independent variable, controlling forparticipants’ average SAT scores, revealed that SAT scores were a significant predictor of thenumber of questions they answered correctly, F(1,23) = 4.53, p = .05. Furthermore, thisANCOVA revealed that participants in the stereotype rejection condition (M = 6.92) answeredmore questions correctly than participants in the no information condition (M = 5.77), F(1,23)= 4.56, p < .05.
Performance Expectancies—Similar to the first 3 experiments, the ANCOVA did notreveal a condition effect on participants’ expectations of their performance, F(1,23) = 2.05,p >.10, ns. Also consistent with the prior experiments, participants’ pre-test expectancies wereuncorrelated with the number of questions they answered correctly (r = .08, p > .10).Furthermore, the participants’ pre-test expectancies were not significantly correlated with theprobability ratio (r = .27, p > .10). In terms of the second expectancy measure (How well doyou think your test evaluator expects you to perform on this test?), there was a marginallysignificant effect of the experimental condition, such that participants thought that the testevaluator expected them to perform better in the stereotype rejection condition (M = 4.38) thanin the control condition (M = 3.54), F(1,23) = 4.06, p = .06. The participants beliefs regardinghow well their test evaluator expected them to perform was neither related to their actual testperformance (r = .29, p > .10), nor the probability ratio (r = .15, p > .10). Thus it appears thatneither measure of performance expectancies can account for condition differences in actualperformance.
Probability Ratio—Participants’ responses to the two likelihood questions were used tocreate a probability ratio (likelihood the evaluator believes differences are due to biased testing/likelihood the evaluator believes that differences are due to differences in ability). Scores above1 on this ratio indicate that participants perceived that it was more probable that the evaluatorbelieved that previous group differences were the result of biased testing than actual groupdifferences in ability (i.e., low probability of being stereotyped). In contrast, scores below 1indicate that participants perceived that it was more probable that the evaluator believed thatprevious group differences were due to actual group differences in ability than to biases instandardized testing (i.e., high probability of being stereotyped). A score of 1 indicates thatparticipants perceived that it was equally probable that the evaluator believed these twoexplanations for why there are group differences on standardized tests (i.e., highly probabilityof being stereotyped).
We predicted that participants in the stereotype rejection condition would have higher scoreson this probability ratio than participants in the no information condition. Whereas SAT scoreswere not predictive of the probability ratio, F(1,23) = 1.91, p > .10, there was a significant
Wout et al. Page 13
J Pers Soc Psychol. Author manuscript; available in PMC 2009 December 10.
NIH
-PA Author Manuscript
NIH
-PA Author Manuscript
NIH
-PA Author Manuscript

effect of the experimental manipulation. As predicted, participants in the stereotype rejectioncondition thought that it was more probable that the evaluator believed that previous groupdifferences were due to biased testing than to actual differences in ability (M = 2.94), whereasparticipants in the no information condition thought it was equally probable that the evaluatorbelieved these two explanations (M = 1.25), F(1,23) = 10.84, p < .01.
Mediational Analyses—To test if the probability ratio mediated the effect of theexperimental manipulation on test performance, we conducted a series of regressions detailedby Baron and Kenny (1986). As outlined by these authors, three conditions must be met todemonstrate evidence of mediation. First, the independent variable (experimentalmanipulation: coded 0 = control condition, 1 = stereotype rejection condition) must predictboth the proposed mediator (probability ratio) and the dependent variable (test performance).Next, the mediator must be related to the dependent variable. Finally, the relationship betweenthe independent variable and the dependent variable must be reduced when the mediator isincluded in the regression model.
As previously reported, the experimental manipulation, after controlling for participants SATscores, was a significant predictor of both the probability ratio, B = 1.93, SE B = .59, β = .59,t(23) = 3.29, p < .01, and number correct, B = 1.65, SE B = .77, β = .41, t(23) = 2.14, p < .05.An additional regression revealed that the probability ratio, after controlling for SAT scores,was a significant predictor of number correct, B = .75, SE B = .19, β = .60, t(23) = 3.87, p < .01. When number correct was regressed on the experimental manipulation, SAT scores, andthe probability ratio, the experimental manipulation was no longer a significant predictor ofthe number of questions the participants answered correctly, B = .31, SE B = .81, β = .08, t(22)= .38, p = .71, ns, whereas the probability ratio was still a significant predictor, B = .70, SEB = .24, β = .56, t(22) = 2.92, p < .01 (see Figure 3). A Sobel test revealed that the reductionin the direct effect of experimental manipulation was significant, Z = 2.18, p < .05, thusproviding direct evidence that the participants’ test performance was driven by their perceptionof the probability that the evaluator endorsed the stereotype.
While in Experiments 1–3 we manipulated the probability of being stereotyped, in Experiment4 we both manipulated the probability of being stereotyped as well as measured Black students’perception of the probability that their White evaluator would stereotype them. The results ofthis experiment demonstrated that the students’ perception of the probability of beingstereotyped, and not performance expectancies, mediated the effect of the experimentalmanipulation on the number of questions the participants answered correctly.
Experiment 5The primary objective of the final experiment was to test the generalizability of the possibility/probability hypothesis. Cues about the possibility and probability of being stereotyped shouldnot be specific to Blacks, but instead should be informative to all targets of negative stereotypes.To investigate the generalizability of the possibility/probability hypotheses, the presentexperiment explores the effects of stereotype threat with another negative stereotyped socialgroup—women in math settings. Research has consistently shown that the math performanceof highly math-identified women suffers as a result of stereotype threat (Schmader & John,2003; Spencer et al., 1999). If women are attune to situational cues that inform them of thepossibility and probability of being stereotyped, then learning that their male test evaluatorrejects the “women are bad at math” stereotype should buffer female students’ test performancefrom the effects of stereotype threat, compared to not knowing the beliefs of the male evaluator.
The second objective was to determine if these possibility/probability cues were uniquelyrelevant to members of negatively stereotyped groups, or if non-stereotyped group members
Wout et al. Page 14
J Pers Soc Psychol. Author manuscript; available in PMC 2009 December 10.
NIH
-PA Author Manuscript
NIH
-PA Author Manuscript
NIH
-PA Author Manuscript

were also attune to these cues. We have argued that members of negatively stereotyped groupsactively search for cues that will inform them if they will be stereotyped in the immediate socialsetting. Non-stereotyped group members should not have to contend with the threat beingstereotyped in these settings, and therefore should be less effected by cues suggesting thatmembers of another social group may be devalued. Therefore, men’s test performance shouldnot be affected by our manipulation of the probability that women will be stereotyped.
MethodParticipants—Forty-six women and 53 men from various colleges and universities acrossthe country participated in this online study. Similar to Experiment 1, participants wererecruited from an email list that was maintained by a private university. Participants receiveda $10 gift certificate from an online retailer for participating in the study.
Procedure—As with Experiment 1, participants took the study on-line. Participants receivedan invitation to participate in an on-line study. Once they logged into the website, they wereasked to report their math SAT score and two questions about their math identification. Thenall participants read a cover story similar those used in Experiments 2 and 3. Specifically, theyread a letter from Dr. Robert Jones that stated that there has been a deal of debate regardingthe true cause of gender differences on standardized math tests. Some researchers suggest thatthese gender differences are due to actual differences in ability, while others contend that thedifferences are due to gender biases on standardized math tests. They then read that the purposeof the present study was to determine the true cause of gender differences by using a math testthat has been shown to be free of gender bias. The participants read that they would be takinga 15-item unbiased standardized math test. If there were still gender differences on this unbiasedmath test, then it would strongly suggest that previous gender differences were actually due togender differences in math ability. If, on the other hand, there were no gender differences onthe unbiased test, it would strongly suggest that previous differences were due to test bias.
Participants in the stereotype rejection condition read that Dr. Jones believed that there werenot gender differences in ability, and therefore would not be gender differences on the unbiasedtest. Participants in the no information condition did not receive any information about Dr.Jones’ beliefs regarding the cause of gender differences on standardized math tests. Finally,all participants read that Dr. Jones would email them their test score, along with feedback ontheir math ability, a few days after the study. At the bottom of the letter all participants saw apicture of Dr. Jones, who was depicted as a middle-aged White man in a shirt and tie.
After seeing a picture of Dr. Jones, the saw a sample test question, and then reported their firstname, their gender, email address, the two probability ratio from Experiment 4, as well as howwell they thought they would perform on the math test. Then were then given 10 minutes tocomplete the math test. When the 10 minutes were up, a prompt instructed them to proceed tothe next webpage. They were then debriefing and emailed a $10 gift certificate.
Results and DiscussionPreliminary Analyses—Previous research on stereotype threat and women’s mathperformance has shown that only highly math-identified women are affected by stereotypethreat (Aronson, Lustina, Good, Keough, Steele, & Brown, 1999; Brown & Joseph, 1999;Schmader 2002; Spencer et al., 1999). Consistent with this prior research, we only analyzeddata for participants that reported a Math SAT score of at least 500 and an average of at leasta 4 on the two math identification items—“My math abilities are very important to me”, and“It is important that I do well on math related tasks” (1 = strongly disagree; 7 = strongly agree)(see Schmader 2002; Schmader & John, 2003; and Spencer et al., 1999 for similar selectioncriteria).3 There were no significant effects of gender or experimental manipulation on the
Wout et al. Page 15
J Pers Soc Psychol. Author manuscript; available in PMC 2009 December 10.
NIH
-PA Author Manuscript
NIH
-PA Author Manuscript
NIH
-PA Author Manuscript

participants self-reported math SAT scores (all p > .10). For math identification, there was onlya significant main effect of gender, such that men report being more math identified (M = 6.21)than women (M = 5.47), F(1,94) = 20.92, p < .001.
Number Correct—Participants’ self-reported Math SAT scores were used as a covariate fornumber correct. An ANCOVA on number correct revealed only a gender × experimentalmanipulation interaction, F(1,94) = 4.59, p < .05. Simple effects tests revealed that in the noinformation condition, men (M = 6.68) answered more questions correctly than women (M =5.01), F(1,94) = 6.34, p = .01. In the stereotype rejection condition there were no performancedifferences between men (M = 6.04), and women (M = 6.34), F(1,94) = 0.25, p > .10, ns.Furthermore, women in the stereotype rejection condition answered more questions correctlythan women in the no information condition, F(1,94) = 4.07, p <.05.
Performance Expectancies—An ANCOVA on participants’ pre-test expectations onlyrevealed a main effect of gender, such that men (M = 5.64) expected to perform better thanwomen (M = 5.00), F(1,94) = 11.20, p = .001. Unlike Experiments 1–3, the participant’s pre-test expectations were correlated with their test performance (r = .30; p < .01). Whenperformance expectancies were added as another covariate to the ANCOVA for numbercorrect, the gender × experimental manipulation was still significant, F(1,93) = 4.33, p < .05,while performance expectancies were not a significant predictor of performance, F(1,93) =0.42, p > .10, ns. Thus it appears that performance expectancies cannot account for the testperformance findings.
Probability Ratio—An ANCOVA on the probability ratio found a main effect of theexperimental manipulation, F(1,94) = 12.80, p = .001. The predicted gender × experimentalmanipulation did not reach statistical significance, F(1,94) = 2.42, p = .12, ns. When theprobability ratio was run with only the females, there was a significant effect of theexperimental manipulation, F(1,94) = 13.97, p < .05. Specifically, women in the stereotyperejection condition reported a higher ratio score (M = 2.50) than women in the no informationcondition (M = 1.42). When women’s math scores were regressed on SAT-M, the experimentalmanipulation, and the probability ratio, there only remained a significant effect of SAT-M, B= .31, SE B = .01, β = .42, t(42) = 3.17, p < .01. Neither the experimental manipulation, B = .86, SE B = .75, β = .17, t(42) = 1.14, p = .26, ns; nor the probability ratio, B = .20, SE B = .17,β = .6, t(42) = 1.09, p = .26, ns; were significant. Thus it appears that the probability ratiomediated the effect of stereotype threat on performance for Blacks but not for women.
The results of Experiment 5 demonstrated that women taking a math test are also attuned tocues that inform them of the possibility and probability that they will be negatively stereotyped.Women who had a male test evaluator who rejected the “bad at math” stereotype performedbetter on a math test then women who had a male evaluator who did not state his beliefsregarding the validity of the stereotype. Furthermore, when the male evaluator rejected thestereotype, women’s test performance was comparable to that of the men. Men’s testperformance was unaffected by the evaluator’s beliefs regard the gender stereotype. Whilethese findings support our claim that targets are affected by cues that signal the possibility andprobability that they will be stereotyped, we did not find showing that women’s probabilityratings mediated their math performance.
3Two more men were excluded because their ST-M scores were below 500. Furthermore, seven women and two men were excludedbecause they scored below the midpoint (4 on a 1– 7 scale) on the math identification measure. When all of the excluded participantswere included in the analyses, there was a marginally significant effect of gender, F(1,107) = 3.38, p = .07, and a marginally significantgender × experimental manipulation interaction, F(1,107) = 2.93, p = .09. For the probability ratio, there was a significant effect of theexperimental manipulation, F(1,107) = 18.35, p < .001. This effect was qualified by a significant gender × experimental manipulationinteraction, F(1,107) = 4.39, p = .04.
Wout et al. Page 16
J Pers Soc Psychol. Author manuscript; available in PMC 2009 December 10.
NIH
-PA Author Manuscript
NIH
-PA Author Manuscript
NIH
-PA Author Manuscript

General DiscussionPrevious research has demonstrated that when targets contend with the threat of beingnegatively stereotyped, their test performance suffers. The present research both complimentsand advances this research by demonstrating how targets determine when this threat exists.Specifically, the present research shows that the targets determine whether a threat exists byassessing both the possibility and the probability that they will be negatively stereotyped.Assessments of the possibility of being stereotyped enable targets to determine whether theirimmediate social setting is one where they could be stereotyped, while assessments of theprobability enable them to determine the likelihood that others in that setting will apply thestereotype to them. We reasoned that targets should only contend with stereotyped threat whenthey conclude that it is both possible and probable that they would be negatively stereotyped.
Across 5 experiments, we manipulated both the possibility and probability that Black andfemale students would be negatively stereotyped. Experiment 1 demonstrated that when thepossibility of being stereotyped was present, Black students’ race-based probability judgmentsforced them to contend with the threat of being stereotyped when their evaluator was White,but buffered them from having to contend with this threat when their evaluator was Black.When the possibility of being stereotyped was removed, the students did not have to contendwith the stereotype. As a result, the race of the evaluator had no effect on their test performance.
Experiments 2 – 4 demonstrated that counter-stereotypical individuating information couldoverride Black and female students’ use of meta-stereotypes when determining the probabilityof being stereotyped. In Experiment 2, Black students had to contend with the threat when theirBlack evaluator endorsed the “unintelligent” stereotype. In contrast, they did not have tocontend with the threat when their Black evaluator either rejected the stereotype or refrainedfrom stating his beliefs about the stereotype. In Experiment 3, Black students had to contendwith the threat when their White evaluator either endorsed the stereotype or refrained fromstating his beliefs regarding the stereotype, but they were buffered from having to contend withthe threat when their White evaluator rejected the stereotype. Experiment 4 demonstrated thatBlack students’ perception of the probability that their White evaluator endorsed racialstereotypes predicts when they had to contend with the threat. Finally in Experiment 5demonstrated the generalizability of the possibility/probability hypothesis. Female mathtakers’ test performance was buffered from stereotype threat when they learned that their maleevaluator did not endorse the “bad at math” gender stereotyped. When the male evaluator didnot express his beliefs, their test performance suffered as a result of stereotype threat. Men, anon-stereotyped group in math settings, were not affected by the male evaluator’s beliefsregarding the stereotype.
In Experiment 4, Black students’ test performance was mediated by their perception of theprobability of being stereotyped. In contrast, in Experiment 5, women’s math performance wasnot mediated by their perceived probability of being stereotyped. While the probability ratiodid not reach statistical significance for the women, the general pattern of results was consistentwith our possibility/probability hypothesis. Women in the stereotype rejection condition hada higher probability rating than women in the control condition. One possible explanation forthe probability ratio was a mediator Blacks but not for women, is that Blacks are simple moreconsciously aware of the cues that signal the probability of being stereotyped than women.Blacks are negatively stereotyped in all academic domains, so they may be more consciouslyattune to the situational cues of threat than women in math settings (Steele, Spencer, &Aronson, 2002). Future research should develop more sensitive measures to assess women’sperceptions of the probability of being stereotyped.
Wout et al. Page 17
J Pers Soc Psychol. Author manuscript; available in PMC 2009 December 10.
NIH
-PA Author Manuscript
NIH
-PA Author Manuscript
NIH
-PA Author Manuscript

Collectively the results of the present experiments illuminate and clarify the stereotype threatprocess. Specifically, these experiments demonstrate that the antecedents of stereotype threatare the targets’ awareness that a negative stereotype could be applied to them in the socialsituation, and their perception that it is sufficiently probable that the people in that situationwill stereotype them. If either requirement is not met, it is more cognitively efficient for themnot to contend with the threat. When targets do not have to contend with being stereotyped,their cognitive resources are preserved, which results in optimal performance on intellectualtasks. If both requirements are met, it is psychologically protective for them to contend withthe threat. When targets contend with the threat, their cognitive functioning is impaired,resulting in suboptimal performance on intellectual tasks.
While it is a relatively straightforward task for targets to determine whether it is possible to bestereotyped, is much more challenging for them to determine the probability that other peoplewill stereotype them. Deciphering the beliefs and motives of others is a complex task that canoften lead to incorrect conclusions. To simplify this task, targets rely on both social stereotypesand individuating information. They then use this information to make one of two decisions—either that the threat of being stereotyped is probable enough to contend with it, or that it isimprobable, and therefore they should not contend with it. The former decision initiates thestereotype threat process, whereas the latter inhibits this process. It is important to highlightthat these probability assessments enable targets to determine if they should prepare for thepotential of being stereotyped. Targets do not have to be 100% certain that they will bestereotyped for the stereotype threat process to begin; they only need to conclude that theprobability is too high to be ignored. When the probability of being stereotyped is sufficientlyhigh, stereotype threat processes are initiated.
Fortunately, research has consistently shown that situational factors can essentially “turn off”the stereotype threat process. The bulk of this previous research has focused on preventing theprocess by removing the possibility that the stereotype could be applied (for examples seeSteele & Aronson, 1995; Spencer, Steele, & Quinn, 1999). The present research shows thatreducing targets’ perception of the probability that others will apply the stereotype to them canalso turn off the stereotype threat process. In Experiments 2 – 5, it was always possible for theBlack and female students to be stereotyped. The students’ awareness that it was possible tobe stereotyped only affected their test performance when they perceived that it was alsoprobable that their test evaluator would stereotype them. We were able to sufficiently reducethe students’ perceived probability of being stereotyped by introducing an ingroup evaluatorin Experiments 1 and 2, by introducing an outgroup evaluator who explicitly rejected thestereotype in Experiments 3 through 5. When the probability was perceived to be low, thestudents did not have to contend with the stereotype, which resulted in optimal performance.
Steele and colleagues (Steele, Spencer, & Aronson, 2002) argue that the targets of negativestereotypes have two competing motivations—the motivation to see a threat when it exists,and the motivation to conclude that a threat does not exist. The latter motivation is driven bythe target’s desire to not have to contend with the stereotype. Because they do not want tocontend with the threat, targets are likely to gravitate towards situational cues that inform themthat the probability of being stereotyped is sufficiently low. This may explain why the outgroupevaluator’s rejection of the stereotype was so effective in Studies 3 through 5. The studentsdid not want to contend with the threat, so they were receptive to the outgroup evaluator’srejection of the stereotype. Plus, the students had no compelling reason not to believe theoutgroup evaluator. As a result of these two factors, they were able to conclude that the threatwas improbable, and were freed from having to contend with the stereotype. It is important topoint out that the outgroup evaluator’s rejection of the stereotype worked in our controlledexperimental environment because the students lacked any additional individuatinginformation about the outgroup evaluator. If the evaluator had acted in a manner that was
Wout et al. Page 18
J Pers Soc Psychol. Author manuscript; available in PMC 2009 December 10.
NIH
-PA Author Manuscript
NIH
-PA Author Manuscript
NIH
-PA Author Manuscript

inconsistent with his explicit rejection of the stereotype, the students would have likelyreassessed the situation and concluded that there was now a sufficiently high probability thatthey would be stereotyped.
Stereotype Threat and Performance ExpectanciesOur studies also provide some insight into the role of performance expectancies on stereotypethreat. There has been some debate regarding the role of targets’ performance expectancies inthe stereotype threat process (see Steele, Spencer, & Aronson, 2002 for a review). While someresearch suggests that stereotype threat impairs targets’ test performance by lowering theirperformance expectancies (Cadinu, Maass, Frigerio, Impagliazzo, & Latinotti, 2003; Stangor,Carr, & Kiang, 1998), other research has failed to find a relationship between performanceexpectancies and actual performance (Brown & Joseph, 1999; Sekaquaptewa & Thompson,2003; Spencer, Steele, & Quinn, 1999).
The present experiments failed to find evidence that expectancies affect Black students’ testperformance. In each experiment the students’ performance expectancies were measured priorto the analytical test, and in each study these expectancies neither differed by experimentalcondition nor correlated with either measure of test performance. In Experiment 4 and 5 wealso measured how well the students thought their test evaluator expected them to perform.While there was a condition difference on this expectancy question in Experiment 4, thisdifference had no effect on the participants’ test performance. Furthermore, when both thestudents’ perception of the evaluator’s expectations of their performance and their assessmentsof the probability of being stereotyped were simultaneously tested as mediators, only theprobability assessments worked as a mediator. Collectively, these results indicate thatexpectancies cannot account for any of the performance findings.
It is possible that expectancies had no effect on performance in the present experiments becauseexpectancies are not a prerequisite for targets to have to contend with the threat of beingstereotyped. Believing that you will perform poorly or that others expect you to perform poorlysignifies a level of certainty in that belief. Targets do not need to be certain that they will bestereotyped in order to have to contend with being stereotyped. All that is required is that theyrecognize that it is possible to be stereotyped in the setting, and that that the probability ofbeing stereotyped is equal to the probability that they won’t be stereotyped. Once theprobability of being stereotyped approaches a 50/50 chance, it is advantageous for targets toprepare for the threat in the event that it does occur. If they don’t, they may find themselvesunprepared to cope with an actual threat if it occurs. This is why the mere presence of anoutgroup evaluator forced the Black and female students to contend with the stereotype. Thestudents were not certain of the outgroup evaluator’s beliefs, but they did recognize that theprobability of a outgroup member stereotyping them was too high to ignore. It was thisambiguity that forced them to contend with the threat. Thus, we believe that ambiguityregarding the probability of being stereotyped is necessary for targets to contend with the threat,not low expectancies.
Educational ImplicationsThe present research also has implications for educators. First, this research suggests thatstudents of color, and women in math contexts, will likely have to contend with the threat ofbeing stereotyped when they have White or male teachers (see also, Brown, 1998). Therefore,these teachers should be aware that students of color and women have to contend with thisthreat because they have limited information about the teachers’ beliefs. Based on the presentresearch, it appears that students of color and women may have to contend with this threat untiltheir teachers behave in a manner that reduces the students’ perception of the probability ofbeing stereotyped.
Wout et al. Page 19
J Pers Soc Psychol. Author manuscript; available in PMC 2009 December 10.
NIH
-PA Author Manuscript
NIH
-PA Author Manuscript
NIH
-PA Author Manuscript

In the present research, an outgroup evaluator was able prevent Black and female students fromcontending with the threat by informing them that he/she did not endorse the stereotype.Without this additional information, the students were forced to contend with the threat.Therefore, it may be wise for teachers to find appropriate ways of conveying to their studentsthat they do not endorse negative group stereotypes. Whereas one piece of information wassufficient to reduce the threat in the present experiments, in actual educational settings it maybe necessary for teachers to consistently convey that they do not endorse the stereotype beforestudents of color feel safe from being viewed stereotypically by the teacher. The strategy usedin the present experiments is just one of many possible strategies that can be used to createstereotype-free learning environments for students of color (see Cohen, Steele, & Ross,1999; Johns, Schmader, & Martens, 2005; Steele, 1997 for additional strategies).
The results of Experiments 1 and 2 also suggest that students of color and women may bebuffered from stereotype threat if they have an ingroup teacher, or if they attend institutionsof higher learning that are more homogeneous in composition (e.g., Historically Black Collegeand Universities; all women’s colleges). Increasing the number of faculty of color, and femalefaculty in math related fields, can serve two important functions. First it can provide thesestudents with positive role models who can demonstrate that success in academia is possible(Marx & Roman, 2002). Second, these faculty members can serve to reduce the concerns thatstudents may have about being viewed stereotypically. Thus, faculty of color and female facultycan provide safety from stereotype threat. At an institutional level, more homogeneousinstitutions may provide a level of stereotype threat safety that may not be present in morediverse institutions. Similarly, homogeneous institutions can create broad learningenvironments that are relatively free of stereotype threat. The stereotype safety provided inthese institutions may allow students to focus their cognitive energy on learning instead of oncontending with being stereotyped or devalued as a result of their ethnicity or gender.
ConclusionThe findings in the present experiments demonstrate that the targets of negative stereotypesare motivated social perceivers. Similar to other social perceivers, targets incorporatestereotypes and individuating information to understanding the beliefs and attitudes of thepeople in their social environment. Specifically, targets use stereotypes and individuatinginformation to assist them in determining the probability that others will negatively stereotypethem. These studies refocus the attention onto the targets’ perceptions of their socialenvironment. Among Blacks and women, this refocus is crucial because unfortunately theirbehaviors, attitudes and perceptions have often been marginalized. Too frequently Blacks andwomen have been characterized as passive recipients of society’s actions towards them, insteadof respondents who actively engage with their social environment (Shelton, 2000). Althoughthe results from the present studies paint a somewhat bleak situation for these students, theyalso demonstrate that they are actively interacting with their academic environment, and thatgiven a stereotype-safe environment, they can excel.
ReferencesAllport, GW. The nature of prejudice. Reading, MA: Addison-Wesley; 1954.Aronson J, Lustina M, Good C, Keough K, Steele C, Brown J. When white men can’t do math: Necessary
and sufficient factors in stereotype threat. Journal of Experimental Social Psychology 1999;35:29–46.Baron RM, Kenny DA. The moderator-mediator variable distinction in social psychology research:
Conceptual, strategic, and statistical considerations. Journal of Personality and Social Psychology1986;51:1173–1182. [PubMed: 3806354]
Blascovich J, Spencer S, Quinn D, Steele C. African Americans and high blood pressure: The role ofstereotype threat. Psychological Science 2001;12:225–229. [PubMed: 11437305]
Wout et al. Page 20
J Pers Soc Psychol. Author manuscript; available in PMC 2009 December 10.
NIH
-PA Author Manuscript
NIH
-PA Author Manuscript
NIH
-PA Author Manuscript

Brewer, MB. A duel process model of impression formation. In: Srull, TK.; Wyer, RS., Jr, editors.Advances in Social Cognition. Vol. 1. Hillsdale, NJ: Erlbaum; 1988. p. 1-36.
Brown JM. Ethnic stigma as a contextual experience: A possible selves perspective. Personality andSocial Psychology Bulletin 1998;24:163–172.
Brown RP, Josephs RA. A burden of proof: Stereotype relevance and gender differences in mathperformance. Journal of Personality and Social Psychology 1999;76:246–257.
Brown LM, Dobbins H. Students’ of Color and European American students’ stigma-relevant perceptionsof university instructors. Journal of Social Issues 2004;60:157.
Cadinu M, Maass A, Frigerio S, Impagliazzo L, Latinotti S. Stereotype threat: The effect of expectancyon performance. European Journal of Social Psychology 2003;33:267–285.
Cohen GL, Steele CM, Ross LD. The mentor’s dilemma: Providing critical feedback across the racialdivide. Personality and Social Psychology Bulletin 1999;25:1302–1318.
Crocker J, Major B. Social stigma and self-esteem: The self-protective properties of stigma. PsychologicalReview 1989;96:608–630.
Crocker, J.; Major, B.; Steele, C. Social stigma. In: Gilbert, D.; Fiske, ST.; Lindzey, G., editors. TheHandbook of Social Psychology. 4. Vol. 2. Boston: McGraw-Hill; 1998. p. 504-553.
Crocker J, Voelkl K, Testa M, Major B. Social stigma: The affects of attributional ambiguity. Journal ofPersonality and Social Psychology 1991;60:218–228.
Devine P. Stereotypes and prejudice: Their automatic and controlled components. Journal of Personalityand Social Psychology 1989;60:5–18.
Devine P, Elliot A. Are racial stereotypes really fading? The Princeton trilogy revisited. Personality andSocial Psychology Bulletin 1995;22:22–37.
Fiske, ST.; Neuberg, SL. A continuum of impression formation, from category-based to individuatingprocesses: Influences of information and motivation on attention and interpretation. In: Zanna, M.,editor. Advances in Experimental Social Psychology. San Diego, CA: Academic Press; 1990. p. 1-74.
Fiske ST, Neuberg SL, Beattie AE, Milberg SJ. Category-based and attribute-based reactions to others:Some informational conditions of stereotyping and individuating processes. Journal of ExperimentalSocial Psychology 1987;23:399–427.
Inzlicht M, Ben-Zeev T. A threatening intellectual environment: Why females are susceptible toexperiencing problem-solving deficits in the presence of males. Psychological Science 2000;11:365–371. [PubMed: 11228906]
Inzlicht M, McKay L, Aronson J. Stigma as ego depletion: How being the target of prejudice affects self-control. Psychological Science 2006;17:262–269. [PubMed: 16507068]
Johns M, Schmader T, Martens A. Knowing is half the battle: Teaching stereotype threat as a means ofimproving women’s math performance. Psychological Science 2005;16:175–179. [PubMed:15733195]
Jussim LJ, Nelson TE, Manis M, Soffin S. Prejudice, stereotypes, and labeling effects: Sources of biasin person perception. Journal of Personality and Social Psychology 1995;68:228–246.
Kunda Z, Thagard P. Forming impressions from stereotypes, traits, and behaviors: A parallel-constraint-satisfaction theory. Psychological Review 1996;103:284–308.
Locksley A, Borgida N, Brekke N, Hepburn C. Sex stereotypes and social judgment. Journal ofPersonality and Social Psychology 1980;39:821–831.
Lord CG, Saenz DS. Memory deficits and memory surfeits: Differential cognitive consequences oftokenism for tokens and observers. Journal of Personality and Social Psychology 1985;49:918–926.[PubMed: 4057050]
Major B, O’Brien LT. The social psychology of stigma. Annual Review of Psychology 2005;56:393–421.
Marx D, Roman J. Female role models: Protecting women’s math performance. Personality and SocialPsychology Bulletin 2002;9:1183–1193.
Nisbett RE, Zukier H, Lemley RE. The dilution effect: Nondiagnostic information weakens theimplications of diagnostic information. Cognitive Psychology 1981;13:248–277.
Schmader T, Johns M. Converging evident that stereotype threat reduces working memory capacity.Journal of Personality and Social Psychology 2003;85:440–452. [PubMed: 14498781]
Wout et al. Page 21
J Pers Soc Psychol. Author manuscript; available in PMC 2009 December 10.
NIH
-PA Author Manuscript
NIH
-PA Author Manuscript
NIH
-PA Author Manuscript
Sekaquaptewa D, Thompson M. The differential effects of solo status on members of high and low statusgroups. Personality and Social Psychology Bulletin 2002;28:694–707.
Sekaquaptewa D, Thompson M. Solo status, stereotype threat, and performance expectancies: Theireffects on women’s performance. Journal of Experimental Social Psychology 2003;39:68–74.
Sigelman L, Tuch SA. Metastereotypes: Blacks’ perceptions of whites’ stereotypes of blacks. PublicOpinion Quarterly 1997;61:87–101.
Spencer SJ, Steele CM, Quinn DM. Stereotype threat and women’s math performance. Journal ofExperimental Social Psychology 1999;35:4–28.
Stangor C, Carr C, Kiang L. Activating stereotypes undermines task performance expectations. Journalof Personality and Social Psychology 1998;75:1191–1197.
Steele CM. A threat in the air: How stereotypes shape intellectual identity and performance. AmericanPsychologist 1997;52:613–629. [PubMed: 9174398]
Steele CM, Aronson J. Stereotype threat and the intellectual test performance of African Americans.Journal of Personality and Social Psychology 1995;69:797–811. [PubMed: 7473032]
Steele, C.; Spencer, S.; Aronson, J. Contending with group image: The psychology of stereotype andsocial identity threat. In: Zanna, MP., editor. Advances in Experimental Social Psychology. Vol. 34.San Diego, CA: Academic Press; 2002. p. 379-440.
Swim, J.; Stangor, C. Prejudice from the targets perspective: Introduction. In: Swim, J.; Stangor, C.,editors. Prejudice: The Target’s Perspective. San Diego: Academic Press; 1998. p. 1-8.
Vorauer JD, Hunter AJ, Main KJ, Roy SA. Metastereotype activation: Evidence from indirect measuresfor specific evaluative concerns experienced by members of dominant groups in intergroupinteractions. Journal of Personality and Social Psychology 2000;78:690–707. [PubMed: 10794374]
Vorauer JD, Kumhyr SM. Is this about you or me? Self-versus other-directed judgments and feelings inresponse to intergroup interactions. Personality and Social Psychology Bulletin 2001;27:706–719.
Vorauer JD, Main KJ, O’Connell G. How do individuals expect to be viewed by members of lower statusgroups? Content and implications of meta-stereotypes. Journal of Personality and Social Psychology1998;75:917–937. [PubMed: 9825528]
Walton GM, Cohen GL. Stereotype lift. Journal of Experimental Social Psychology 2003;39:456–467.
Wout et al. Page 22
J Pers Soc Psychol. Author manuscript; available in PMC 2009 December 10.
NIH
-PA Author Manuscript
NIH
-PA Author Manuscript
NIH
-PA Author Manuscript

Figure 1.Study 4: Test of likelihood ratio as a mediator of the effect of evaluator’s prediction on numbercorrect.
Wout et al. Page 23
J Pers Soc Psychol. Author manuscript; available in PMC 2009 December 10.
NIH
-PA Author Manuscript
NIH
-PA Author Manuscript
NIH
-PA Author Manuscript
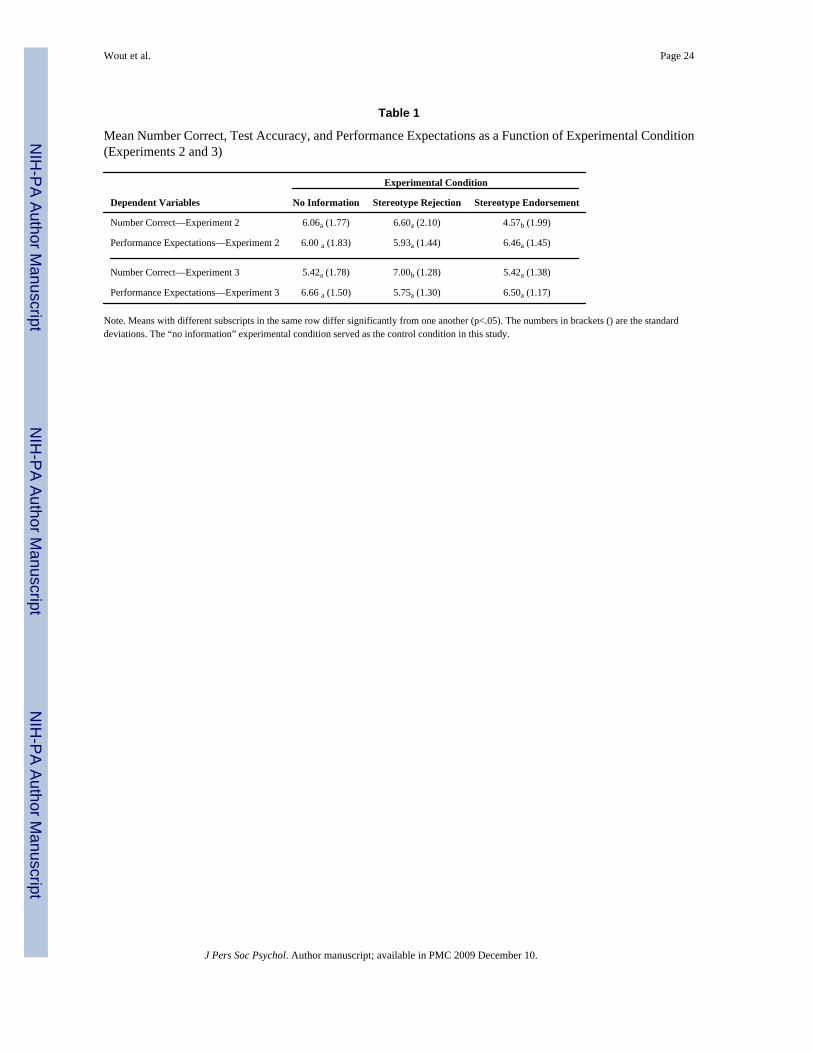
NIH
-PA Author Manuscript
NIH
-PA Author Manuscript
NIH
-PA Author Manuscript
Wout et al. Page 24
Table 1
Mean Number Correct, Test Accuracy, and Performance Expectations as a Function of Experimental Condition(Experiments 2 and 3)
Experimental Condition
Dependent Variables No Information Stereotype Rejection Stereotype Endorsement
Number Correct—Experiment 2 6.06a (1.77) 6.60a (2.10) 4.57b (1.99)
Performance Expectations—Experiment 2 6.00 a (1.83) 5.93a (1.44) 6.46a (1.45)
Number Correct—Experiment 3 5.42a (1.78) 7.00b (1.28) 5.42a (1.38)
Performance Expectations—Experiment 3 6.66 a (1.50) 5.75a (1.30) 6.50a (1.17)
Note. Means with different subscripts in the same row differ significantly from one another (p<.05). The numbers in brackets () are the standarddeviations. The “no information” experimental condition served as the control condition in this study.
J Pers Soc Psychol. Author manuscript; available in PMC 2009 December 10.
Copyright © 2022 FDOKUMEN