The Effect of a Screening Instrument to Determine Teacher ...
121
University of Tennessee, Knoxville University of Tennessee, Knoxville TRACE: Tennessee Research and Creative TRACE: Tennessee Research and Creative Exchange Exchange Doctoral Dissertations Graduate School 8-2004 The Effect of a Screening Instrument to Determine Teacher The Effect of a Screening Instrument to Determine Teacher Effectiveness as Measured by Academic Gain Scores Effectiveness as Measured by Academic Gain Scores David Eugene Loyd University of Tennessee, Knoxville Follow this and additional works at: https://trace.tennessee.edu/utk_graddiss Part of the Education Commons Recommended Citation Recommended Citation Loyd, David Eugene, "The Effect of a Screening Instrument to Determine Teacher Effectiveness as Measured by Academic Gain Scores. " PhD diss., University of Tennessee, 2004. https://trace.tennessee.edu/utk_graddiss/4532 This Dissertation is brought to you for free and open access by the Graduate School at TRACE: Tennessee Research and Creative Exchange. It has been accepted for inclusion in Doctoral Dissertations by an authorized administrator of TRACE: Tennessee Research and Creative Exchange. For more information, please contact [email protected].
-
Upload
khangminh22 -
Category
Documents
-
view
0 -
download
0
Transcript of The Effect of a Screening Instrument to Determine Teacher ...
University of Tennessee, Knoxville University of Tennessee, Knoxville
TRACE: Tennessee Research and Creative TRACE: Tennessee Research and Creative
Exchange Exchange
Doctoral Dissertations Graduate School
8-2004
The Effect of a Screening Instrument to Determine Teacher The Effect of a Screening Instrument to Determine Teacher
Effectiveness as Measured by Academic Gain Scores Effectiveness as Measured by Academic Gain Scores
David Eugene Loyd University of Tennessee, Knoxville
Follow this and additional works at: https://trace.tennessee.edu/utk_graddiss
Part of the Education Commons
Recommended Citation Recommended Citation Loyd, David Eugene, "The Effect of a Screening Instrument to Determine Teacher Effectiveness as Measured by Academic Gain Scores. " PhD diss., University of Tennessee, 2004. https://trace.tennessee.edu/utk_graddiss/4532
This Dissertation is brought to you for free and open access by the Graduate School at TRACE: Tennessee Research and Creative Exchange. It has been accepted for inclusion in Doctoral Dissertations by an authorized administrator of TRACE: Tennessee Research and Creative Exchange. For more information, please contact [email protected].

To the Graduate Council:
I am submitting herewith a dissertation written by David Eugene Loyd entitled "The Effect of a
Screening Instrument to Determine Teacher Effectiveness as Measured by Academic Gain
Scores." I have examined the final electronic copy of this dissertation for form and content and
recommend that it be accepted in partial fulfillment of the requirements for the degree of Doctor
of Education, with a major in Educational Administration.
Gerald C. Ubben, Major Professor
We have read this dissertation and recommend its acceptance:
Cynthia Norris, Gregory Petty, Michael Winstead
Accepted for the Council:
Carolyn R. Hodges
Vice Provost and Dean of the Graduate School
(Original signatures are on file with official student records.)

To the Graduate Council:
I am submitting herewith a dissertation written by David Eugene Loyd entitled "The Effect of a Screening Instrument to Determine Teacher Effectiveness as Measured by Academic Gain Scores." I have examined the final paper copy of this dissertation for form and content and recommend that it be accepted in partial fulfillment of the requirements for the degree of Doctor of Education, with a major in Educational Administration and Policy Studies.
We have read this dissertation and recommend its acceptance:
Gerald C. Ubben, Major Professor
Acceptance for the Council:
�� �Vice Chancellor and Dea of
Graduate St es
THE EFFECT OF A SCREENING INSTRUMENT TO DETERMINE TEACHER
EFFECTIVENESS AS MEASURED BY ACADEMIC GAIN SCORES
A Dissertation
Presented for the
· Doctor of Education
Degree
The University of Tennessee, Knoxville
David Eugene Loyd
August 2004
DEDICATION
This dissertation is dedicated to my parents, Herman and Margaret Loyd, my
wife, Karen S. Loyd, and my children, Emily, Jordan, Ryan, and Jonathan. I thank my
parents for a Christian upbringing and the constant encouragement and belief that an
· education makes a person better enlightened. To my children, you will never know how
much I missed my times with you, yet you always seemed to understand and support me.
Karen, words cannot express how much I appreciate your desire and dedication to keep
the family functioning. Thank you for enduring this whole process with me, along "";'ith
your support and encouragement.
ii
ACKNOWLEDGEMENTS
· I would like to express my gratefulness to the members of my doctoral
committee: Dr. Gerald Ubben, Dr. Cynthia Norris, Dr. Gregory Petty, and Dr. Michael
Winstead. I have a special thanks to Dr. Ubben, chairman, for his assistance, support, and
encouragement throughout the research. Dr. Norris, �hank you for your kind and
encouraging words when I needed them. Dr. Petty, thank you for.your advice and
suggestions to make the study more credible. I especially want to thank Dr. Winstead for
his advice, direction, statistical knowledge, and his insight that helped the study come ·
together.
I could not have accomplished this ·goal without the loving encouragement of my
family and friends. I appreciate all of the concerns and prayers that were displayed in
support of my endeavor. Each and every one of them are very dear to my heart and will
never· be· forgotten.
I :thank the new found friends I have through the cohort program at the University
of Tennessee: Connie, Denise, Faye, Jess Anne, Karen, Linda, Myrna, Susan, Duran,
· Edd, Patton, and Steve. We shared a valuable part of our lives together that will never be
forgotten. The support we had for each other provided the ability to endure the hard times
and cherish the good times.
I appreciate the patience and understanding of the faculty and staff of Lamar
School. Since I was principal, there were many days that I left with things ·undone; yet,
the tolerance and encouragement persisted.
111
A special thanks goes out to Mrs. Reva Gamble and Mrs. Mildred Stoots for all of
the delicious food during our long journey down the road several days throughout the .
I
years. We appreciate your thoughtfulness and good cooking.
A heartfelt thanks goes out to Patton and Barbara Gamble for the friendship and
encouragement-during the mariy years. Patton and I shared many educational
c�nversations, _ along with life�l�mg though!s _during our travels to Knoxville. Without his
constant encouragement, l do not know if I would have completed the degree. Barbara,
thank you for the· assurances that we were capable to finish the task .. Also, thank' yo� for
taking care of business at the school while I was gone. Most of all, I appreciate the
friendship that both of you have shown me.
Lastly, there.is a �pecfa:Uh�nk� to· my closest family members for keeping me in
- their thoughts ·and praye�s: Karen, Etnily: Jo�dan, Ryan, Jonathan Loyd; H�rman and
Margaret °Loyd; Artie and Diana· O'Nea�; Keith, Kathy, Grayson,' �nd Connor Loyd;
Bartley.and Helen Sparks; Kevtn, ·o�wn, Lauren:� Mattison, and Hannah Sparks; and Jay,
Kim, Zachary, and Samantha Harris.
One last thought, without the grace of God granting me safety, patience,
: perseverance, and understanding, the completion of the doctoral program would not have
been.possibl�-.
lV
ABSTRACT
Schools and school districts are constantly faced with the task of scre�ning and
hiring potential teachers who will impact student achievement. The Knox County School.
System addressed this challenge by using a screening instrument called the Urban
Teacher Perceiver, which was designed by The Gallup Organization. Tenne�see used a
statistical methodology entitled the Tennessee Value Added Assessment System to
measure teacher effectiveness. The purpose of this study was to determine if there was
any effect between a selected teacher-screening instrument and teacher effectiveness as
measured by academic gain scores in mathematics, reading, and language .. Also, the study
examined the interaction effect between the screening scores and gender, race, age when
hired, grade level taught, and school setting (urban, suburban, or rural) in regard to
teacher effectiveness as measured_ by academic gain scores in mathematics, reading� and
language.
· The population consisted of t�o hundred forty-two third through eighth grade
teachers in the Knox County School System who were hired between 1993 and 2001 and
had both an Urban Teacher Perceiver (UTP) score and a three-year average Tennessee
Value Added Assessment System (TV AAS) score in mathematics, reading, or-language.
The sample also included demographic information: gender, race, age when hired, grade
level taught, and school setting. The data were analyzed using an ANOVA to detennine if
there was a main effect between the UTP and TV AAS scores for teachers. The other five
hypotheses used the General Linear Model procedure to investigate the interaction effect
between all of the factors.
V

The data analyses were generated with a statistical significance set at a .05 level.
The six hypotheses investigated in this study revealed that there was no significant effect
in any of the factors statistically assessed. The effect between a teacher's screening score
on the Urban Teacher Perceiver (UTP) and the effectiveness of their teaching as
measured by the Tennessee Value Added Assessment System (TV AAS) demonstrated no
significant main effect in mathematics, reading, and language scores .. Also, there was no
significant difference in the interaction effect between the overall UTP score and gender,
race, age when hired, grade level taught, and school setting iri regard to TV AAS scores in
mathematics, reading, and language, except for the interaction of the UTP and particular
grade levels in regard to mathematics.
The conclusion of the study was that the teacher's overall Urban Teacher
Perceiver score does not provide adequate information to predict a teacher's effectiveness
. .
·as measured by academic gain scores. The school system was recommended to re-
. .
evaluate their reasoning for the use of the screening instrument and not to use it as the
sole determiner for hiring potential teachers.
vi

TABLE OF CONTENTS
CHAPTER ONE: STATEMENT OF THE PROBLEM ....................................... 1
Introduction ............................................................................................ 1 Problem .. � ...................................................................................... _ ....... 2 Purpose of the Study ............................................................ _ ..................... 4
. Questions with Hypotheses ................................................... ; ...................... .4 Theoretical Framework ............................... ·.; ..................................... � .... · .... 5 Significance of the Study ............................................................................ 8 Delimitation .... · ................................................................... · .................... 8Limitations ............. : .................................... _ .............................. _ .........•... 8 Assumptions ............................................................................... � ........... 9 Definition o.f Terms ............................................................................. · ....... 9 Organization of the Study ................................. ··········�·····.··························10
CHAPTER TWO: REVIEW OF LITERATURE .............................................. 12
Introduction ....................................................... ; ................................... 12 The Screening Process .............................................................................. 13
Importance ........................................ _. � ....................................... : .. 13 Selection ........................... : ................................................. · ........ 14 Legal Implications ............................................................ : ............ _.16 Conclusion of the Screening Process ... � .......................................... : ..... 21
Meth�d� for Screening Potential Teach�rs ...................................................... 21 National Teacher Examination ...................................................... : .... 22 Personality Tests as Viable Options ....................... � ....................... �-..... 23
Urban Teacher Perceiver ............. � ........... : ............................... 24 Studies Outside of the Gallup Organization of the Urban Teacher ......... 26 Myers-Briggs Type Indicator ....................... · ............................. 31 Five Factor Model ................................................................. 33
Task-Oriented Approaches as Viable Options ................... ;· ...................... 35 Structured Interviews· ............................................................. 3 5 Performance-Based Interviews ............ � ..................................... 36 Work Sample Tests ............................................................... 36 Assessment Centers ............................................................... 37
Synthesis of Selection Metho4s .......................................................... 38 Haberman's Concerns of Urban Schools ......................................................... 38 The Urban Teacher Perceiver ..................................................................... 43
The Gallup Organization ......................... � ....................................... .43 · Beginning of the Urban Teacher Perceiver ............................................ .44 Development of the Urban Teacher Perceiver ......................................... .47
The Tennessee Value Added Assessment System (TV AAS) .............................. : .. 50 Brief History of Mixed-Model Methodology .......................................... 51 Purpose ofTVAAS ........................................................................ 53
Vll
· Dr. William Sanders ........................................................................ 53 Advantages of TV AAS .................................................................... 56 Disadvantages of TV AAS ........................................................ � ........ 58 Discoveries from TV AAS Data ............................. ; ........................ , .... 61 Conclusion of TV AAS: .......................................................... · ......... 61
. David Cook ............... � ......................... · ........................... � ............ 62 John Killeffer, Jr .................................... � .......................... .-........... 63
Conclusion ........................................................................................... 63
CHAPTER THREE: METHODOLOGY ....................................................... 65
Introduction ......................................................... · .......... � ................. : .... 65 · Population ............................................................................................ 65 Procedures and Data Collection ........... · ........... · ............................................. 66 Data Analysis ........................................•...................................... , . .-...... _.69 Conclusion ...................................... .-............................... : ............... ,: .... 71
CHAPTER FOUR: . DAT A ANALYSIS ......................................................... 72
Introduction .......................................................................................... 72 Description of Data .......................................................... · ....... .' .......... � .... 72 Analysis of Data ........................................................................... � .· ......... 7 5 Summary ... -................................................................................... � .. � ... 80
CHAPTER FIVE: SUMMARY, CONCLUSIONS, AND RECOMMENDATIONS1
• • • 82
Summary ..................... · ................. -. -· ......................... � ......... � ............. ·. · ... 82. Conclusion and Discussion ......................................................................... 85 Recommendations .......................................................... : ... .' ... --�:-.......... �.· .. 88
REFERENCES .................. � ................................................ .-.. ·: ............... 91 APPENDICES .................................................................................. � .. 100 VITA ........................................................... : ........ : .......... : .. � ............... 107
vm

LIST OF TABLES
TABLE PAGE
4.1 Frequency of Urban Teacher Perceiver Scores ............... ············�········ ...... 73
4.2 Frequency of Gender and Race ................................................ · ........... 73
4.3 Frequency of Age Hired ............................................................. -...... 74:
4.4 Frequency of Grade Levels ..................... · ......... : .................. � .... � ........ 74
4.5 Frequency of School Setting .............................................................. 75
4.6 Main Effect between the UTP and TV AAS ..... ; .............. ; ......... ,: ...... " ...... 75
4. 7 Interaction Effects between Factors with each Subject. ............................... 80
IX
LIST OF FIGURES
FIGURE PAGE
1 Framework of study ................... �.· ................................... · ................. 7
2 Scatter graph of UTP scores and Math TV AAS scores with linear representation
· for Rural, Suburban, and Urban Schools ................................................ 77
3 Scatter graph ofUTP scores and Reading TV AAS scores with linear
representation for Rural, Suburban, and Urban Schools .............................. 77
4 Scatter graph of UTP scores and Language TV AAS scores with linear
representation for Rural, Suburban, and Urban Schools ............................... 78
5 Interaction Effect Between UTP and Grade Level in Mathematics .................. 81
X
Introduction
CHAPTER ONE
Statement of the Problem
In this age of standardized testing, teachers are being held more accountable for
student performance. School districts' personnel directors are responsible for the
important task of screening and hiring teachers who will be effective with students.
According to Haberman (1993), the hiring of teachers is a school district's most ctitical
decision and the quality of schools is directly related to the quality ofteach_ers hired. With
this in mind, a study to determine the effect of a screening instrument and its potential for
identifying a .successful teacher would have a major impact on the screening and hiring
practice of school systems across the United States.
Many school districts have invested money, time, and effort into selection
instruments for the screening of potential school personnel. The Gallup Organization
(Urban Teacher Research, 1993) developed a screening instrument called the Urban
Teacher Perceiver {UTP) that is "a scientifically researched and validated interviewing
system: designed to elicit information relevant to a person's strengths and potential for
outstanding job performance" (Urban Teacher Perceiver, 1996, p.3). The Urban Teacher
Perceiver gives an overall score and individual life theme scores, which research claims
can reliably predict how a person will behave in a given situation. If the UTP can predict
·the potential for outstanding job performance, then there could be an effect between job
performance and a teacher's effectiveness with students.
1

Tennessee used a statistical mixed-model method of determining the effectiveness
of school systems, schools, and teachers in sustaining academic growth for student
populations called the Tennessee Value Added Assessment System (TV AAS). The
TV AAS information is based on a yearly-standardized test given in late March or early
April. It is a computationally complex model developed to determine the progress of
students based upon their past performances. The individual student's growth rate does
not provide adequate information about his/her teacher, but when the data are looked at
by classroom, by school, and by district, patterns begin to emerge� This becomes strong
. and powerful evidence regarding instruction (Hill, 2000). By using the screening .
instrument, Urban Teacher Perceiver, and TV AAS scores of teachers, this research
attempted to· determine if there was any effect between the screening instrument and
teacher effectiveness in sustaining academic growth for students.
Problem
S.chool systems across the United States are constantly faced with the dilemma of
making a good choice of hiring the most effective teacher for a particular position. The.
job of screening these potential teachers is crucial in the hiring process to determine how
effective the teacher will be when assessing the students' academic growth. According to
William L. Sanders (1998), the single largest factor affecting academic growth of
populations of students is differences in effectiveness of individual classroom teachers.
Caster and Young (2001) assert that screening potential teachers is a critical issue of the
selection process because of the impact of poor teaching on children.
2

The United States Department of Education's 2002 No Child Left Behind Act
placed stronger accountability measures on states and school systems in the areas of
teacher quality and student performance (U. · S. Department of Education, 2002). This
places greater responsibility on school systems to hire teachers who will have a positive
impact on students. Thus, the selection process of hiring potential teachers is crucial for
the education of our children.
Within the dilemma of selecting the appropriate teacher there lies compliance
issues with the federal and state regulatory controls. Several landmark court decisions,
such as, Kirkland v. New York State Department of Correctional Services, Griggs v. Duke
Power, 1971, Albemarle Paper Co. v. Moody, 1975, and Connecticut v. Teal, 1982, made
personnel selection procedures a legal issue. The Equal Employment Opportunity
Commission (EEOC) requires school systems' job-specifications to be realistic and
directly related to the job with low adverse impact, meaning it should not violate any of
the equal employment opportunities pertaining to race, _color, religion, sex, or national•
origin. Also, the selection process should be reliable and valid, demonstrating consistency
and closely related to job performance (U.S. Department of Labor, :1998), making the
legal implications an important role in the hiring of a potential teacher.
School districts Bpend a great deal oftime,.money, and effort in the selection of
personnel. It is of utmost importance that the screening process produces the outcome
that is expected for the betterment of the students' education. Therefo�e, the problem
exists in wisely selecting a teacher that will be effective in increasing a s�udent's
academic growth.
3

Purpose of the Study
The purpose of this study was to determine if there was any effect between a
selected teacher-screening instrument and teacher effectiveness as measured by academic
gain scores in mathematics, reading, and language. The study utilized the overall life
theme score of the Urban Teacher Perceiver (UTP), which is·a structured interviewing
screening instrument, and the teacher's effectiveness as measured by the Tennessee
Value Added Assessment System (TV AAS). The value-added instrument is a statistical
and computationally complex mixed-model methodology for determining the
effectiveness of schools systems, schools, and teachers in_ sustaining academic growth for
student populations. Also, analyzed was whether or not there is an interaction effect
between the teacher's screening instrument score and gender, race, age wllen hired, grade
level taught, and school setting in regard to the teacher's effectiveness as measured by
academic gain scores in teaching mathematics, reading, and language.
Questions with Hypotheses
This study focused on two research questions. First, the main effect between the
teachers' overall Urban Teacher Perceiver score and the teachers' TV AAS scores in
mathematics, reading, and language were explored. Second, the interaction effect
between the overall Urban Teacher Perceiver scores and gender, race, age when hired,
grade level taught, or school setting (urban, suburban, and rural) in regard to the teachers'
TV AAS scores in mathematics, reading, and language were examined. Six hypotheses
were developed to answer the research questions.
4
Hypothesis 1: There is no significant main effect between the teachers' overall Urban
Teacher Perceiver score and the teachers' TV AAS scores in mathematics, refiding, and
language.
Hypothesis 2: There is no interaction effect between the overall Urban Teacher Perceiver
score and gender in regard to the teachers' TV AAS scores in mathematics, �eading, and
language.
Hypothesis 3: There is no interaction effect between the overall Urban Teacher Perceiver
score and race in regard to the teachers' TV AAS scores in mathematics, reading, and
language.
Hypothesis 4: There is no interaction effect between the overall Urban Teacher Perceiver
score-and age when hired in regard to the teachers' TV AAS scores in mathematics,
reading, and language.
. .
Hypothesis 5: There is no interaction effect between the overall Urban Teacher Perceiver
score and grade level taught in regard to the teachers' TV AAS scores in mathematics,
reading, and language.
Hypothesis 6: There is no·interaction effect between the overall Urban Teacher Perceiver
score and school setting (urban, suburban, and rural) in regard to the teachers' TV.AAS
scores in mathematics, reading, and language.
Theoretical Framework
.
.
This was a study to determine the effect of a screening instrument and teacher's
students' success as measured by academic gain scores. Previous studies done by Kanipe_
(1996) and Cook (1985) used principal's perceptions to determine effective teachers.
5
Kanipe' s study connecte_d a screening instrument and principals' perceptions of teachers, ·
while Cook's study connected the principals' perceptions of teachers and student success
as measured by achievement scores. However, there had not been a study connecting a
screening instrument and a measurement of a teacher's students' success as measured by
academic gain scores. It was determined that a study of this magnitude could help in
assessing the validity of a screening instrument and its interac_tion with the future success
of teacher effectiveness as measured by academic gain scores.
Mary Lou Smith Kanipe (1996) researched the validity of the Urban Teacher
Perceiver talent scores and the principal's perception regarding teachers' effectiveness in
the Knox County School System. She found that a perspective teacher's overall Perceiver
score does not provide adequate information in predicting teacher's success in the
classroom as foreseen through a principal questionnaire. The study did find that the
Urban Perceiver may be more predictive of teacher success in the classroom when
dealing with minority teachers and with teachers between the ages of thirty-one and forty.
The only positive correlation of the eleven life themes of the Urban Teacher Perceiver
(Appendix B) was the Stimulator theme, with a correlation in the positive direction for -
the Involver, Empathy, Input, and Concept themes.
David Cook (1985) conducted a study in the Blount County, Tennessee School
System of fifth grade students that examined the use of standardized achievement test
scores, ranking of classroom teachers based on the students' scores, and the correlation
with principal and supervisory ratings. His study suggested that principals were more
capable of ranking teachers in order of student achievement than were supervisors. The
principals' expected rankings and the achievement based ranking had a moderate to
6
strong positive relationship especially in reading and math. An interesting observation in
the study was that principals had a better idea of who were the bad or ineffective teachers
than they did the best teachers. The study also showed that the principal did not have a
good idea of the difference between the good and average teacher.
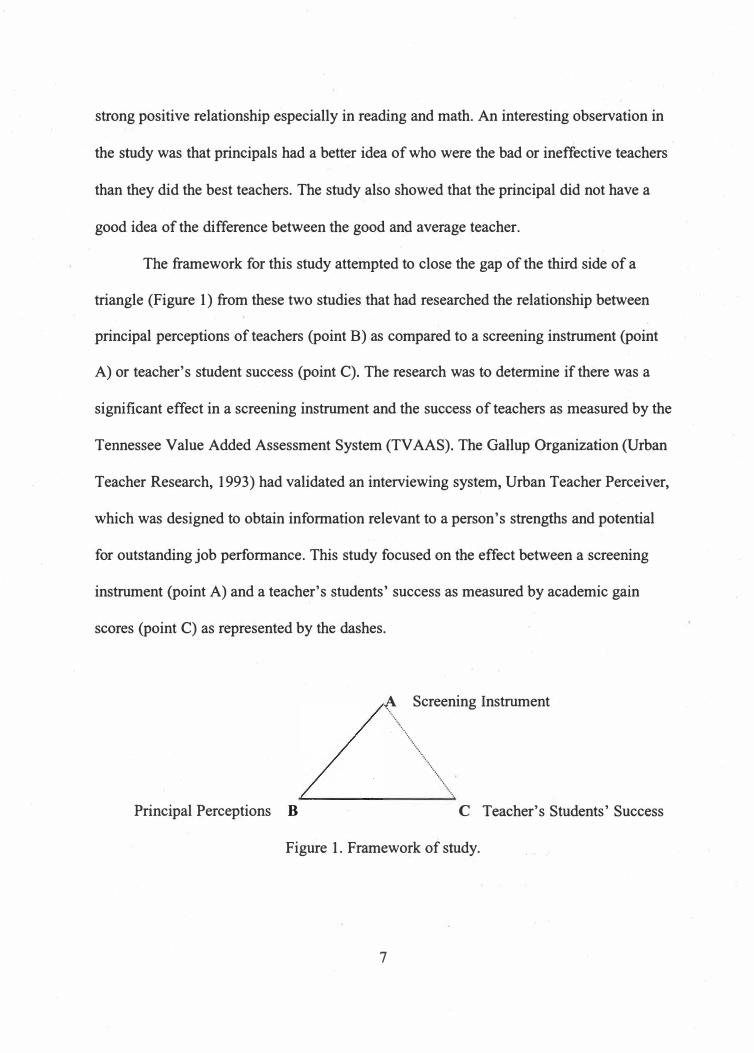
The framework for this study attempted to close the gap of the third side of a
triangle (Figure 1) from these two studies that had researched the relationship between
principal perceptions of teachers (point B) as compared to a screening instrument (point
A) or teacher's student success (point C). The research was to determine if there was a
significant effect in a screening instrument and the success of teachers as measured by the
Tennessee Value Added Assessment System (TV AAS). The Gallup Organization (Urban
Teacher Research, 1993) had validated an interviewing system, Urban Teacher Perceiver,
which-was designed to obtain information relevant to a person's strengths and potential
for outstanding job performance. This study focused on the effect b�tween a screening
instrument (point A) and a teacher's students' success as measured by academic gain
scores (point C) as represented by the dashes.
� Screening Instrument
'·,., .. , .... ,\, ____
_ \ ___
_ _
. Principal Perceptions B · C Teacher's Students' Success
Figure 1. Framework of study.
7

Significance of the Study
Accountability is a critical issue for educators and policy makers in today's
society. The importance placed o_n standardized tests has focused attention on policies
that enhance academic performance; making the screening process for human resource
departments a critical part of the school systems initiatives. A study to determine the
effect of using a screening instrument to anticipate a teacher's success as measured by
academic gain scores in the areas of mathematics, reading, and language arts could have a
inajor impact on the selection process and hiring practices of s�hool districts. A1so, �he
study could provide information to school systems as to whether the time, money, and
effort invested in screening instruments would be well spent.
Delimitation
1. The population for this study consisted of the third through eighth grade teachers
in the Knox County School System who had been hired since 1993 and had both
an Urban Teacher Perceiver score and a three-year average Tennessee Value
Added Assessment System score in mathematics, reading, or language.
Limitations
1. The teacher's years of experience prior_ to participating in the Urban Teacher
Perceiver and TV AAS score may vary.
2. The teacher's quality of education prior to the screening process may differ.
3. The teacher's previous knowledge concerning the Urban Teacher Perceiver may
impact the screening process.
8
4. Only a portion of the full range of Urban Teacher·Perceiver scores could be used
since TV AAS data will not be available for anyone not hired.
Assumptions
1. The Tennessee Value-Added Assessment System {TV AAS) is a valid measure of
student academic growth.
2. The TV AAS data are a valid measure of teacher performance, effectiveness, and
success.
Definition of Terms
For the purpose of this study, the following terms are defined.
· Effective - As used in this study, effective is an adjective used to describe the .
level of performance of a teacher as determin�d by the Tennessee Va�ue Added
Assessment System {TV AAS) in mathematics, reading, and language.
Life Themes - Life themes are spontaneous, recurring patterns of thought, feeling
and behavior. A persons dominant theme will emerge in a given situation. The life
themes on_ the Urban Teacher Perceiver are: commitment, dedication, individualized
perception, caring, involver, empathy, positivity, initiator, stimulator, input, and concept.
SASinSchool - SASitiSchool is an information center containing a depository of
test data. The SAS program is capable of merging Tennessee Value Added Assessment
System scores with other pertinent data, while keeping individual teacher's information
confidential.
9
Tennessee Value Added Assessment System (TVAAS)-The Tennessee Value
Added Assessment System (TV AAS) is a statistically complex mixed-model method of
determining the effectiveness of school systems, schools, and teachers in sustaining
academic growth for student populations. Value-added analysis compares the gains each
student makes from year to year and compares it to the gains made by a normative '
'
sample for that same subject between those same grades. The TV AAS information is
based on a yearly-standardized test given in late March or early April to third through
eighth grade students in Tennessee public schools.
Urban Teacher Perceiver -The Urban Teacher Perceiver (UTP) is the
structured interview process, consisting of open-ended items, developed by the Gallup
Organization to obtain information relevant to a person's strengths and potential for
outstanding job performance. Each item of the UTP is read to an applicant by a trained
assessor who scores the responses on each item. The interview process establishes eleven '
'
re.curring themes that have point values from zero to five; which calculates to a total
summation interview score ranging from zero to 55 points. The overall score can reliably
predict how a person will react in a given situation by placing the candidate in
hypothetical situations and ask for responses. The structured approach allows each
applicant an equal opportunity in the interview (Urban Teacher Research, 1993 &
Gordon, 1999).
Organization of the Study
The study was comprised of five Chapters. Chapter one has an overview of the
study containing an introduction with background information, the problem, the purpose ·
10

of the study, six hypotheses, theoretical framework, and the significance of the study_.
Delimitations, limitations and assumptions of the study were described for the
hypotheses. Terms were defined to provide clarity for the reader.
Chapter two included a review of the related literature. It was divided into five
main sections. First there was some discussion about the screening process: �he
importance, the selection process, and legal implications. Second, a variety of methods
for screening potential teachers were revealed. Third, Haberman's concerns for urban
schools were discussed. Fourth, the review described the development, validity, and·
potential of the Urban Teacher Perceiver. Fifth, the background, advantages, and
disadvantages of the Tennessee Value-Added Assessment System (TV AAS) were
discussed.
Chapter three discussed the research methods and procedures used in the study.··
Chapter four provided the findings of the research. The last chapter, Chapter five,
provided a brief review of the study, conclusions, and recommendations.
11
CHAPTER TWO
Review of Literature
Introduction
· In an attempt to develop an understanding of what qualities a teacher should
possess in order to have an impact on urban student learning, the literature was divided
into five sections: the teachers' screening process, the methods used for screening,
Haberman's concerns for urban schools, the Urban Teacher Perceiver, and the Tennessee
Value Added-Assessment System. First, the screening process was researched concerning
importance, the selection process, and the legal implications. Second, a description of a
variety of screening methods was reviewed. Third, Haberman's view of what
characteristics teachers need for urban schools was revealed. Fourth, a detailed
description of the Urban Teacher Perceiver was presented. Lastly, the history, purpose,
advantages, and disadvantages of the Tennessee Value-Added Assessment System
revealed what the research validated concerning student achievement.
According to Stronge (2002), teachers have a powerful, long-lasting affect on
students. His research reinforces the notion that certain teaching characteristics and
behaviors matter in terms of student achievement. Sanders ( 1998) has contended for
years that the largest factor affecting student academic growth is the individual classroom
teacher. Haberman ( 1993) represents the views of Stronge and Sanders by insisting that
the hiring of teachers is the most critical decision that school districts will make.
12

The Screening Process
Importance
Personnel Selection is the methodical placement of individuals into jobs. Its impact on the organization is realized when employees achieve years or decades of service to the employer. The process of selection follows a methodology to collect information about an individual in order to determine if that individual should be employed. The methodology used . should . not violate any laws regarding personnel selection (U.S. Department of Labor, 1998, 0301).
According to �illiam Castetter and Phillip Young (2000), "the impact of poor
teaching on children is so serious that the selection process in education is a critical
issue" (p. 123). If the selection process is to focus on hiring effective people, then work
behaviors need to be identified. There are three main procedural components used to
identify these essential work behavior�; job analysis, job criteria, and job predictors. Job
analysis is directed. to what tasks are performed, how, and why. Job criteria reflect the
knowledge and skills required to perform the tasks. Job predictors are used to assess the
competencies of the applicant as it relates to the job criteria (Castetter & Young, 2000).
No matter what procedural component is being used, it only has "validity" if a clear
relationship can be shown between the selection procedures itself and the job for which
the individuals are being selected (U.S. Department of Labor, 1998).
It is of the utmost importance when selecting a screening instrument thatjob
relatedness to the test content and test items be based on a careful translation of a job.
analysis. Validity studies should be used and based upon a review of information about
the job, which includes a job analysis. The job analysis should not only describe the
tasks, how, and why, but it should include work behaviors and the tasks associated with
them. A content-valid job analysis could be crucial for employers facing legal action and
it should identify the essential functions of a job, along with identifying reasonable
13
accommodations that may be made, Kirkland v. New York State Department of
Correctional Services (U.S. Department of Labor, 1998).
The broad purpose of the human resource function in any educ�tional institution is to attract, develop, retain, and motivate personnel in order to achieve the. system's mission; assist members to achieve position and work unit standards of performance; maximize the career development of every employee; and reconcile individual and organizational objectives (Castetter & Young, 2000).
The number one influence on the quality of schools and the instruction provided
is the quality of excellence found within the instructional staff, the teacher. It is the
caliber of the personnel that makes a system mediocre or effective. Therefore, it.is of the
utmost importance that significant efforts be spent in seeking the very best match for each
and every position in a school. This is more than. just filling a position; instead it i�
selecting an outstanding staff member (Smith, 1998). Linda Darling-Hammond (2000) ·
argues that there is a stronger influence on student achievement than background factors;
it is the effects of the well-prepared and qualified teacher.
Selection
The selection process is crucial for the education of children and should not be
taken lightly. The first step in the process should include a job analysis, which will help
to validate the selection process and the job. Among the most important issues dealing
with the selection process are the legal implications. The selection process should have
highjob-relatedness with low adverse impact, meaning the instrument used should be
closely related to the job performance expected and not violate any of the equal·
employment opportunity issues pertaining to race, color, religion, sex, or national origin ..
The selection process should meet high standards relating to reliability and validity.
Reliability relates the consistency of scores no matter how many times it is used, while
14

validity is concerned with the internal items being closely related to the job performance.
Obviously the legal emphasis on job-related selection criteria is of the utmos_t importance
(U.S. Department of Labor, 1998).
School systems have one of two philosophies surrounding employment policies:
equal employment opportunities or affirmative action. Equal employment o�portunity
perspective is proactive and future oriented. The applicants and employees are treated
similarly without regard to protected class characteristics such as race and sex; the hiring
is based solely on the principle of merit.· Affirmative action goes beyond the' proactive
stance as in the equal employment opportunity. It seeks to correct past injustices by
adopting recruitment and selection policies that give preferential treatment to certain
protected class groups (Castetter & Young, 2000). For most"urban school districts, it
would be more beneficial to follow the affirmative action perspective rather.than the·
equal employment perspective because of the minority issue that may exist within the .
demographics of the community (Haberman, 1993, 1996).
The selection process generally has three main components: paper screening,
personal interviewing, and reference checking (Smith, 1998). First, candidates will need
an application consisting of information for the screening process. Most oft.he
information will fall into the following categories: personal data, education and
professional preparation, experience, and references, remembering to ask other
· information such as ethnic group on a separate card for legal reasons. The applications
may be rated according to a rubric as being unacceptable, marginal, acceptable, above
acceptable, and superior. The screening by personal interviewing or performance
. demonstration follows the application process. A trained _interviewer to determine
15
behavioral qualities of the candidate can administer an instrument such as the Urban
Teacher Perceiver as discussed in this research. The next step in the screening process
involves constituents, who have been trained in the selection/confidentiality process,
from the school community interviewing the applicant. Interviewing is a· time consuming
process, but if used wisely it will produce results that will benefit everyone concerned ..
Third, reference checks are completed for specific areas of concern, such as discipline
and classroom management (Smith, 1998). Darling-Hammond (1997) stresses the
importance of school personnel having control of the interviewing process by stating:
Allocating funds directly and equitably to schools rather than allocating · staff positions on the basis of formulas or staffing ratios accomplishes two things at once: it puts schools more directly in charge of their decision making about resource allocations, and it equalizes their ability to hire high-quality teachers (Darling-Hammond, 1997, p.284)
Once a recommendation is made, applicants not being hired should be
informed of decisions directly concerning the applicant. The candidate who is
· selected should be recommended to the human resource department for a final
review of information. At this time all credentials, responses to areas of concern
and directions for entering the work force would need to be reviewed with the
personnel director. Salary schedules and policy information should also be
discus�ed and it is helpful if an in-service is planned for all new personnel (Smith,
1998).
Legal Implications
How to select the best-qualified candidate for an unfilled position is a perennial organizational problem. The selection process is fraught with possibilities for s·erious errors that can be costly to the school systems, the community, the taxpayer, and the pupils. However, many of these potential errors cari be minim1zed or eliminated by developing and applying an effective selection system (Castetter & Young, 2000).
16

Before establishing a selection process, the employer should be aware of and
abide by the laws surrounding the process. Public concern for equal emploYIJlent
opportunities, especially over the treatment of minorities, led to the passage of the 1964
Civil Rights Act (CRA). The Act prohibited employment practices that would "fail or
refuse to hire or to discharge any individual, or otherwise to discriminate ag�inst any
individual with respect to his compensation, terms, conditions, or privileges·of
employment, because of such individual's race, color, religion, sex, or national origin"
(U.S. Department of Labor, 1998). The passage of this Act opened the door-for personnel
selection procedures to be challenged in the Courts. Several landmark Supreme Court
decisions were made in the following cases: 'Griggs v. Duke Power, 1971, Albemarle
Paper Co. v. Moody, 1975, and Connecticut v. Teal, 1982. The cases centered on Title
VII of the 1964 Civil Rights Act and the courts responded as follows: "Nothing in the Act
precludes the use of testing or measuring procedures; obviously they are useful. What·
Congress has forbidden is giving.these devices and mec4anisms controlling force unless
they are demonstratably a reasonable measure of job performance ... What Congress has
commanded is ·that any tests used must measure the person for the job and not the person
in the abstract" (U.S. Department of Labor, 1998). In all three of�ese _case�, the "burden
of proving that the tests were job related" was the mission of the respondent. It was·very
obvious that the validity of the test was of utmost importance.
Further legislation added more to the Civil Rights Act of 1964, the Age
Discrimination In Employment Act of 1967 (ADEA) and the Ame�ca�s with Disabilities
Act of 1990 (ADA). Employers having 15 or more employees, employment agencies, and
labor unions are subject to these laws. The ADEA prohibits discrimination against
17

employees or applicants-age 40 or older, this also includes testing and assessment
discrimination. The ADA prohibits discrimination based upon a qualified individual with
disabilities. A qualified individual with a disability is one who can perform the essential
functions of a job, with or without reasonable accommodation. These Acts are protected
by the -Equal Employment Opportunity Commission of 1972 (EEOC) ifit is determined
that an �nlawful employment practice occurred by "reasonable cause" (U.S. Department
ofLabor, 1998).
Ano.ther legislation that was part of the Title VII portion of the· Civil Rights Act
was the Tower Amendment. The Tower Amendment stipulates that professionally
developed workplace tests can be used for employinent decisions� However, the· ' ' .
instruments should not discriminate against any protected group and must be tests . . '
developed by ·experts, who have.demonstrated the job qualifications (U.'S. Department of
Labor� 1998).
The Title I of the Civil Rights Act of 1991 reaffirmed the principles of the Title
VII of the CRA of i°964, but made three significant changes. First, the Act requires
demonstration of both the job-relatedness and business necessity of assessment·
instruments or procedures that cause adverse impact. The business necessity requirement
is more difficulHo satisfy in defending challenged practices than a business purpose test.
Second, the Act prohibits score adjustments, the use of different cut-off scores for
different groups· of test takers, or alteration of employmerit-rated test results based on the
demographtes of the test takers, called race norming or within-group norming. Third, the
Act makes compensatory and punitive damages available as a .remedy to claims of
18

intentional discrimination under Title VII and the ADA (U.S. Department of Labor,
1998).
The court case, Soroka v. Dayton Hudson, 1991, suggested that some items for
personality tests might be too intrusive. The case was concerning the screening test for
security guard at Target Stores. Plaintiffs questioned the Rodgers Condensed CP/MMPI
test and claimed that it violated their privacy rights. They asserted that questions referred
to religion and sexual orientation violated their rights under the California Constitution
and certain anti-discrimination laws. The Superior Court denied �he injunctive relief
stating that the plaintiffs had failed to establish that Target had based its hiring decisions
on religious beliefs or sexual traits or that the questions were designed to reveal such
information. The California Court of Appeals reversed the decision because the questions
that violate privacy must be directly related to the nature of the employee's duties. Target
filed a petition for review with the California Supreme Court, which was granted, but
before the case w_as settled, it was dismissed since the parties settled out of court. Once
the review had .been granted, the Court of Appeals decision �as "depublished" and
rendered uncitable. Even though this happened, So_ro_k� has been codified in the
California Labor Code, 1992, which was designed to transform the court decision .
. .
prohibiting discrimination based on sexual ori
en�tion into law (effect�ve 1/1/93) (Soroka
v. Dayton Hudson Corp., 1991).
The general purpose of employment laws and regulations is to prohibit unfair
discrimination in employment and provide equal employment opportunity for all. The
Uniform Guidelines on Employee Selection Procedures, 1978 provides the framework for
employers to determine the proper use of tests and other selection procedures. They are ·
19

legally binding under several civil right laws and were designed by the Equal
Employment Opportunity Commission, Civil Service Commission (now Office of
Personnel Management), Labor Department, and Justice Department. The courts support
these Guid�lines, since they provide technical standards for establishing the job
relatedness tests (U.S. Department of Labor, 199-8).
A basic principle of the Uniform Guidelines is that it is unlawful to use a test or.
selection procedure that creates "adverse impact," unless justified. "Adverse impact
occurs when there is a substantially different rate of selection in hiring, promotion, or
employment decisions that work to the disadvantage of members of a race, sex; or ethnic
group" (U.S. Department of Labor,-1998). Statistical techniques may provide information
regarding adverse impact. Adverse impact is indicated when the- selection rate of one
group is less than 80% (4/5) that of another, called the four-fifths or 80% rule. However,
when used in either large or sinall samples, more sensitive tests of statistical significance
should be employed besides the 4/5 rule. If there is no charge of adverse impact, the
Guidelines do not require that the assessment show job-relatedness, even though it is
encouraged.
Another issue of importance in the Uniform Guidelines is fairness. )'he principle
of assessment is to "use only assessment instruments that are unbiased and fair to all
groups. It is possible to have a fair and unbiased test and it still result in adverse impact . .
because the procedure used may be unfair or a self made test could be biased. It is best to
consult with an expert. If a user has made a reasonable effort to become aware of·
alternative procedures and validity has been demonstrated in accordance with the
20

guidelines, the use of the test or other selection procedure may continue (U.S.
Department of Labor, 1998).
Conclusion of the Screening Process
The selection process is crucial for the education of children and·should be
considered of the utmost importance. The first step in the .process should in�lude a job
analysis; this will help to validate the selection process and the job. Among the most
important issues dealing with the selection process is the legal implications. The process
should have high job-relatedness with lo� a�verse impact, meaning the instrument used
should be closely related to the job performance expected and not violate any of the equal
employment opportunities pertaining �o race, color, religion, sex, or national origin. Also,
the selection process should meet high standards relating to reliability and validity.
Reliability relates the consistency of scores no matter how many times it is used, while
· validity is· concerned with the internal items being closely related to the job performance.
Obviously, the legal emphasis on job"'.'related selection criteria is critical to the hiring of
qualified personnel.
Methods for Screening Potential Teachers
According to Stronge (2002), how to recruit and prepare teachers is one of the
major educational issues today. Much of the major research is concerned with connecting
teacher behaviors to student achievement. His research found that the psychological
· influence of teachers on students has been linked to a students' academic success. The
major characteristics of an effective teacher are: the role of caring, listening,
understanding, knowing students, the role of fairness and respect, social interaction with
21
students, promotion of enthusiasm and motivation for learning, attitude toward the
teaching profession, and the role of reflective practice (Stronge, 2002). How a teacher
presents himself makes an impression on everyone around him, especially the student.
How a teacher relates to the pupils and the enthusiasm and competence he exhibits will
have a-lasting impact on the students' experience in the classroom (Stronge, 2002).
National Teacher Examination
In the middle of the twentieth century, the National Association for the
Advancement of Colored People (NAACP) was very insistent at demanding equality of
salaries between the white and black teachers. After several c·ourt cases in the south
concerning white supremacy in the schools, the court leftit to the southern school boards
to decide what educational equality meant. The issue of racism and meritocracy was
addressed by southern school boards through the use of the National Teacher
Examination (NTE), "an ostensibly objective test that has never been shown to be a valid
measure of teacher competence" (Baker, 1995, p. 50). Ben Wood, testing and
measurement specialist, jumped at the opportunity to implement his already developed
NTE to aid in the process of teacher selection. Wood formed the National Committee on
Teacher Examination (NCTE) in the 1930's and secured a grant from the.Carnegie
Foundation to construct and administer the battery of exams. The NTE became a way of
determining salaries but not to the satisfaction of the NAACP. The Association still
contended that the.test was not a valid way of equalizing salaries, nor·a means of
determining who would be the best teachers. South Carolina's adoption of the NTE in the
1940's and its survival in the courts made the way for other state legislatures to adopt the
22

use of the ex�m in the selection process of teachers, which is still required of teachers
today (Baker, 1995).
States require all individuals seeking elementary or subject area certification to
pass a National Teacher Examination� the Praxis (2002). The Praxis has three levels: I.)
Pre-Professional Skills Test (PPST®), Academic Skills, which is taken early in the
college career on reading, writing, and math; II.) Subject Assessment, which include
specialty areas, multiple subjects, and principles of learning; and III.) Classroom
Performance, which is an on-site observation. Teacher candidates for.the state of
Tennessee must complete an approved teacher preparation program and satisfy licensure
test requirements, the Praxis I and II. These scores are to only .have value as an indicator
of general literacy, not to determine a teacher's classroom effectiveness (The Praxis
Series, 2002).
Personality Tests as Viable Options
Personality tests are a selection procedure that measures applicant's personality
characteristics that are related to futurejob performance. Most measure one or more of
five personality dimensions: extroversion, emotional stability, agreeableness,
conscientiousness, and openness to experience. Employers who choose to use the
personality tests need to select traits carefully so that it does not exclude groups of people
based on race, color, religion, sex, or national origin, select tests carefully that have been
analyzed for high reliability and low adverse impact, and not used exclusively for
selecting applicants (U.S. Department of Labor, 1998). Darling-Hammond (2000) and
Weitzul (1992) express their use of traits and behaviors as follows:
23

The research on teachers' personality traits and behaviors has produced few consistent findings with the exception of studies finding positive relationships between teachers and students learning in the teachers' flexibility, creativity, or adaptability t_raits. In addition to teacher's ability to create and adapt instructional strategies, research has linked student learning to teacher clarity, enthusiasm, task-oriented behavior, variability of lesson approaches, and. students' opportunities to learn criterion material (Darling-Hammond, 2000, p. 10).
· Human behavior is diverse and complex. Each of us is unique, different,and separate from any · other · person. At the same time, we readily exhibit · characteristics and traits that allow us to be categorized into certain groups (Weitzul, 1992, p. 7).
Three personality tests are discussed in the literature review: Urban Teacher
Perceiver, Myers-Briggs Type Indicator, and the Five Factor Model. Studies relating to
· the Urban Teacher Perceiver are also called the Teacher Perceiver and the Teacher
Perceiver Interview. The Gallup Organization (Urban Teacher Research, 1993)
developed a screening instrument called the Urban Teacher Perceiver (UTP) that is "a
scientifically researched and validated int�rviewing system design�d to elicit information
relevant to a person's strengths and potential for outstanding job performance" (Urban
Teacher Perceiver, 1996, p.3). The Urban Teacher Perceiver gives an overall score and
individual life the�e scores, which research claims, can reliably predict how a person
will behave in a given situation.
Urban Teacher Perceiver
A study of 173 teachers from across the United States was conducted by the·
Gallup Organization (1990) concerning the validity of the Teacher Perceiver. The study
found that: construct validity demonstrated by themes being interrelated_yet measuring
unique and independent constructs; each theme contributed significantly to the total score·
evaluation; criterion validity demonstrated by themes and total scores being correlated to
performance rating; the teachers rated in the top quartile, on the average, scored highest 24

on the interview, followed by the second quartile, the third quartile, and the fourth
quartile; and age, race, gender, and years of teaching experience were not statistically
related to the Teacher Perceiver total score.
In 1994, the Gallup Organization (1994) conducted a validation study of the
Teacher Perceiver on 211 teachers. The teachers rated in the top quartile by principals, on
the average, scored highest on the interview, followed by the second quartile, the third
quartile, and the fourth quartile. The total scores were significantly correlated with
principal-given quartile rating. All themes w.ere correlated in the positive direction with
.quartile rating, while seven of the themes significantly correlated with the quartile rating.
A research study by The Gallup Organizat�on (2000) gave support to the Teacher
Perceiver for being a valid instrument for teacher selection. The conclusions were as
follows: 1.) The empathy theme on the Teacher Perceiver correlated to the Student
Average Daily Attendance (SADA). The higher the empathy theme, the better the SADA.
· 2.) The Teacher Perceiver to�al score, empathy sco�e, input drive score, and activation·
score, were correlated to the T<;?acher Average Daily Attendance (TADA). Higher scores
on these themes were associated with better teacher attendance. 3.) Higher focus scores
and empathy scores were related to higher Student Mathematics Achievement. 4.) The
higher the total score, empathy score, input drive score, and activation score, the less
personal illness time taken by teachers. 5.) The higher empathy and total score were
related to less family illness time taken by teachers, 6.) The higher empathy and total
scores were related to les� personal leave time taken by teachers. 7.) The higher the
Teacher Perceiver total score, the higher the overall job satisfaction of the teacher.
25

· The Gallup Organization has developed a spin-off of the Urban Teacher Perceiver
called the Strengths Finders. It is a web-based assessment that identifies a person's five
most dominant themes of talent and learns fundamental lessons on_ strengths theory and
the 34 themes of talent. Participants explore their themes and focus on strengths while
managing non-strengths (The Gallup Organization, 2001 ). Sandra Sloan (2001 ),
Superintendent of Odessa, Missouri schools, asserts that the.ir staff's training from the
Gallup organization was well worth the money. She states, "The committee decided to . . .
use a strengths ·approach with new faculty members by incorporating·a Gallup-led
mentoring program into the new teacher orientation. After utilizing the mentor match
instrument for pairing, mentors and mentees spent concentrated time together learning
about their own and each other's strengths, relationship styles and priorities. Participants
ended the workshop by affirming each other's strengths and feeling more comfortable
and familiar with ways to make that vital mentoring relationship successful. 'Our
P:t;ofessional Development Committee feels this is one of the most powerful things we've·
ever done for new teachers"' (p. 2). Using the talent themes to identify mentors seems to .
.
be the more useful way of using the research-based instrument, more for development,
rather than screening.
Studies Outside the Gallup Organization of the Urban Teacher Perceiver
A study conducted outside of the Gallup Organization by J._D. Miller (1977)
. revealed some worthy conclusions about the Teacher Perceiver Interview. The
investigation took place in the Austin, Texas, Independent School District where a series
of interviews of practitioners and administrators compared the Teacher Perceiver
Interview with traditional methods of teacher selection. Four major conclusions were
26

drawn: ( 1) empirical bases for claims of various Perceiver systems were weak; (2) th_er�
was evidence that the 60 question format of the Teacher Perceiver is somewl,tat predicti�e
of student ratings of new teachers, but not predictive of outcomes of good teaching; (3)
there was no evidence that the Teacher Perceiver was superior to classical interview
techniques; and ( 4) there had been questions of conflict of interest and inva�ion of
privacy. It was noted in the study that the Perceiver Interview.process should not be the
only source in the teacher selection process.
In 1993, O'Bannon (1993) conducted a study to d�termine the perceptions.of
urban teachers and university faculty regarding the role of an effective urb�n teacher and
to compare these perceptions to the natural behavioral styles of teacher candidates for an
alternative licensure program. An instrument called The Role Behavi�r Analysis (RBA)
was administered to urban teachers in the Memphis City School System and urban· . '
university professors at Memphis State University to-define the role of an effective urban
teacher. The Personal Profile System (PPS) was administered to candidates seeking
admission to an alternative licensure program similar to the Metropolitan Multicultural
Teacher Education Program at the University of Wisconsin in Milwaukee to determine
their natural behavioral styles. The prediction for success of the candidates �s indicated
by the Urban Teacher Selection Interview was compared to the perceptions of the urban
teachers and the urban university faculty. The study indicated similarities between the
expectations of urban teachers and university faculty concerning the behaviors of
· effective teachers in urban schools. Conversely, the study showed no relationship.
between the expectations of urban teachers and urban university faculty and the Urban
Teacher Selection Interview's predictions of success (O'Bannon, 1993).
27
Mary Lou Smith Kanipe (1996) found in her dissertation research of Knox
County Schools that a teacher's overall Urban Perceiver score does not provide adequate
information to predict classroom success, as perceived by principal questionnaires. A
teacher's individual talent scores do not necessarily coincide with the principal's
perceptions of effectiveness in specific areas (principals tended to score teachers higher
than the perceiver). The Urban Perceiver may be more predictive of teacher success in
the classroom when dealing with minority teachers and with teachers between the ages of
thirty�one and forty. However, there was a negative correlation for male teachers in the
Commitment and Dedication themes. The only positive correlation of the eleven themes
for all teachers was the Stimulator theme, especially 'for male teachers, elementary
teachers, and teachers between the ages of 31 and 40; also there was a correlation in the
positive direction for the Involver, Empathy, Input, and Concept themes· but not
significant. Kanipe concluded by stating that the· Urban Teacher Perceiver Interview
definitely lends itself to further research.
Schmidt and Rader (1999) conducted a meta-analysis study concerning the
validity of the structured interview process of the Teacher Perceiver as it related to
supervisory ratings. The interview examined was different from traditional structured
interviews in being empirically constructed, administered by telephone, and scored later
by a qualified examiner based on a tape transcript. Based upon 107 validity estimates,
Schmidt and Rader (1999) found that validity of the interview was an acceptable format
for predicting supervisory ratings of job performance and that there were a sufficient
number of positive features for this type of interviewing instrument to be considered in
the selection system. One of Schmidt and Rader' s concerns was in the range restrictions
28
for the population studied since the scores came from those individuals who were hired.
Other concerns were whether there was enough information available for development of
those hired and if this was as effective as expected, since interviewees did not have to
receive lodging and travel but the examiners did require training and time to listen and
interpret scores.
Gordon (1999) asserts that finding·the right teacher for urban schools is the first
step for helping those schools improve. He emphasizes that the Urban Teacher Perceiver
(UTP) Interview is not a quick fix to the hiring of the right teachers· for urban schools but
it is a step in the right direction. The UTP is a structured interview process designed to
find the talents arid common themes that may make a teacher better suited to teach in an
urban situation. It places the candidate in hypothetical situations and asks for responses.
A trained interviewer scores each candidate according to his or her responses. The
structured approach allows for an equal opportunity in the interview. Gordon (1999)
considers the Urban Teacher Perceiver Interview as the basis of an. overall human
resource system for staff selection and development.
Young and Delli (2002) conducted a·series of studies assessing the relationship
between pre-employment responses of teacher candidates on the Teacher Perceiver
Interview (TPI), as well as an abbreviated version of the TPI, and post-employment
ratings by principals/supervisors and absenteeism using a predictive validity paradigm.
They purported that their findings filled a gap in the literature and knowledge about the
teacher selection process as it relates to preemployment and postemployment
assessments. Young and Delli (2002) assert that there is a vast amount of knowledge
pertaining to the selection process of teachers, but not enough concerning the selection
29

outcomes. Performance outcomes of teachers had mostly come from student ratings,
parent ratings, and principal/supervisor ratings, very little had objective measures such as
achievement testing. Their population consisted of 196 teachers from two public school
districts. They found that the complete version of the TPI were better predictors of
postemployment teacher job performance than the composite score of the abbreviated
version. An attempt was also made to determine a relationship among themes but
principals were not trained relative to the meaning of the themes; however, the regression
analysis did indicate that the predictive validity was enhanced as it relates to teacher .
.
performance. Young and Delli (2002) did suggest that the Teacher Perceiver Interview
increased the reliability of the teachers' selection process for employment decisions and
that asking the same question to all candidates provided consistency within the decision .
process. They also contended that the TPI may well be the best ·alternative available
because of the relationship between preemployment decisions and postemployment
o�tcomes, realizing that there were range-restriction problems, the only teachers' studied
were those who had been hired, concerns for using attendance data, and the potential for
the assessor to be bias.
Gallup's (Drozd, 2003) defense of the Young and Delli (2002) article found six
key observations. 1.) The effect sizes have not been corrected for range restrictions or
measurement error in the criterion variables since school districts hire the candidate with
the higher scores leaving less variations in those being hired. 2.) The theme and total
score reliabilities reported in the article were biased in a range-restricted sample, which
normally range from .75 to .80. 3.) The TPI is an assessment that looks at the composite
score and not the theme scores independently to predict performance. 4.) The abbreviated
30

version of the TPI has been used to screen candidates and p�edict total scores of the
longer version, not the underlying theme scores. 5.) A regression equation is.not applied
to theme scores to predict teaching success, predictions are based on total scores. 6.)
Gallup does not represent that the TPI scores are the only criteria to be used for selecting
teachers. The position paper concluded by the Gallup Organization encoura�ng open and
straightforward dialogue and critique of its research and instruments. They contend that
Young and Delli failed to review literature that was available concerning the Teacher
Perceiver and ignored meta-analysis information concerning the instrument (Drozd,
2003).
Myers-Briggs Type Indicator
For years the Myers-Briggs Type Indicator (MBTI) has been a psychological
instrument used to find variations in normal attitudes and behaviors of people. Katherine . .
Cook Briggs first becameinterested in the early l 900's with her daughter, Isabel Briggs
Myers, joining her endeavor later._ They based the MBTI on years of observations by
psychologist Carl Jung,· 1921. Their ideas help to explain why different people are
interested in different kinds of things, are good in different kinds of work, and yet often
find it hard to understand each other. The instrument was first tried in 1962 for research
purposes and later published for the public in 197 5. It has been used in all aspects of life,
from having fun just learning about yourself to organizations using it to improve
communication, teamwork, leadership,_and a part of personnel selection (Myers-Briggs
Type Indicator Narrative Report, 1988).
· The MBTI instrument indicates 16 personality type·s, by the use of eight terms
that combine into four unique patterns of preference (a group of four letters). The four
31

mental process terms are: Sensing (S) and Intuition (N), different ways of perceiving or
gathering information; and Thinking (T) and Feeling (F), kinds of judgment or decision
making. The other four are more worldly terms: Extraversion (E) and Introversion (I),
different orientations or attitudes toward the world; and Judging (J) and Perceiving (P),
ways of living in the world around us. It is assumed that every person uses all eight
qualities, but seems to lean one way or the other. There is no wrong combination, it is
like the difference between being right or left handed. Both hands are valuable, but one is
used more and becomes more skillful (Myers-Briggs Type Indicator Narrative Report,
(1988).
A study by John Mccutcheon, Charles Schmidt, and Samuel Bolden (1991)
supports suggestions that the Myers-Briggs Type Indicator (MBTI) is particularly
relevant to the prediction of specific teacher behaviors by observing student teachers. At
first reflection, they had determined the students with higher grade point averages (GPA)
and Pre-professional Skills Test (PPST) was the better prediction of student teachers'
overall success, but later determined that they had already screened in the better
applicants just by their requirements, although this should be considered when hiring
teachers. Some examples of their Myers-Briggs results are: student teachers whose MBTI
included Extraversion (E), exhibited ·instruction that accommodated students of different
skill levels; those who included Extraversion (E) or Perception (P) were seen as
accommodating students with varying interest. These patterns were important because
most student teachers were so textbook driven.
The study showed that the MBTI has promising factors for the field of education
and career choice. The largest subgroup for an elementary career was ESFJ (42%), while
32
secondary was not as significant but indicated ISTJ (14.3%) type. John McCutcheon,
Charles Schmidt, and Samuel Bolden ( 1991) suggest that their study clearly gives
credence to personality-based careers and that the MBTI profiles may be very useful for
elementary and secondary education.
Roy S. Jones' (1983) wrote his dissertation comparing College and {!-niversity
personnel administration with the reliable and valid, 'MBTI. He found that there was a
relationship significant at the .05 level among the answers to the MBTI and the present
position of the respondents. Also, he found a relationship significant at the .05 level
among the career goals of the respondent and the MBTI. These findings have shown that
there is a connection to careers and the Myers-Briggs Type Indicator.
Five Factor Model
According to Dr. Randall H. Lucius, Ph.D. (2001), current psychologist's most
popular approach to studying personality traits is the Five-Factor model or the Big Five
dimensions of personality. The five factors were derived from analyses of self and peer
reports on personality-relevant adjectives and questionnaire items. The Big Five
dimensions; as identified by the Fitability System, are: work (how tasks are approached),
social ( express self and interact with others), tact (importance of others opi�i_ons and
feelings), stress ( response to adversity or pressure), and interest ( openness to individuals
and ideas). The important characteristics. of the five factors are: they are dimensions, not
types, people vary continuously; they are stable over a 45-year period beginning in young .
. .
adulthood; they are heritable (genetic) in part; and they are considered universal.
The Five Factor model has evolved from the Myers-Briggs Type Indicator
_ (MBTI). The new model _is not a radical departure from the MBTI, but a significant shift
33

in thinking. The MBTI was based on Carl Jung's theory of categorizing someone in one .
.
of 16possible types, while the Five Factor model is not based on the theory of one person
but rather on the language of how people understand one another. The differences
between the two models are: the MBTI is a four-dimension model, bimodal distribution
of scores on each dimension, sixteen independent types, and the concept of a primary
function determined by Judger/Perceiver preference; the Five Factor model is five
dimensions of personality, a normal distribution of scores on the dimensions, an emphasis
·. on individual personality traits (the type concept is gone), and preferences indicated by
.strength of score (Lucius, 2001 ).
A brief history of the Five Factor model began in 1933 with Louis Thurstone
noting 60 adjectives on an assessment he developed could be reduced to five factors.
Allport and Odbert, 1936, found 4,500 adjectives that are used to describe personality,
and formed the starting point for Raymond Cattell 's, 16-personality factors assessment.
Fiske, 1945, discovered that five, not sixteen, factors accounted for the variance in
personality trait descriptors. Building on Cattell and Fiske, Tupes and Christal, 1961,
established the five factors used for assessment. Then Warren Norman, 1963, replicated
Tupes and Christal's study and confirmed the five-factor structure for traits taxonomy, .
'
.
.
calling it "Norman's Big Five." However, during the ,1960's and the 1970.'s, traits were
not preferred, only behaviors and situational responses were allowed. Presently, an
abundance of personality researchers have established the Five-Factor Model as the basic
pattern for personality research (Lucius, 2001 ).
Dr. Lucius (2001) studies and research contend that personality assessment
contributes distinctive information to the prediction of job performance, much more than
34

by methods such as cognitive ability testing and managerial assessment centers. Different
jobs demand different personality profiles. Lucius (2001) research has shown that non
cognitive based measures, in addition to, or instead of, g-based ( cognitive - include
traditional tests ofknowledge, skills, and abilities) measures can significantly improve
the prediction of whether or not a person will be effective, while at the same time
reducing adverse impact. There is much smaller differences observed between races on
measures of personality than g-based measures. If employers use personality measures
and previous experience, along with good interviewing practices, they will have a better
idea of whether someone is the right fit for the job.
Task-Oriented Approaches as Viable Options
For many organizations, interviews are the only or most important selection tool
used to make personnel selection decisions. Companies <;lo not realize.that some types of
. structured behavioral and competency interviews can be problematic and they may be
missing out on hiring the best person for the job. Structured and competency interviews
eliminate many biases with the behaviorally anchored rating scale and are a vast
improvement over the unstructured interview. All of these types of interviews are limited
and can be upgraded fairly easily to a more effective performance-based interview
(Jackson,.2001 ) .
. Structured Interviews
Structured interview questions have become widespread and easily accessible;
therefore, well-prepared applicants may in fact, not hold all of the true knowledge and
skills/abilities needed for the job but are good at recognizing questions and responding
with memorized answers. This interview process can be time-consuming with
35
interviewers asking recycled questions, which causes applicants to memorize the correct
responses, seriously impacting the validity of the interview. Also, interviewers will ask
leading questions or allow the interviewees to select previous work experiences, which
put the applicant in a better possible light for the job (Jackson, 2001).
Performance-Based Interviews
While structured behavioral and competency interviews prove that an applic'ant
can talk the talk; performance-based interviews ensure identity of a top performer who
meets or exceeds expectations. Performance-based interview questions are specific to the - .
.
vacancy, company problems, and company culture. This procedure exposes the strengths
and weaknesses of the applicant through a five-point performance-based rating scale in
which the correctness and completeness of the applicant's responses are evaluated with
answers exceeding expectations. Applicants are actually asked to perform critical
components or verbally resolve problems that are typical of the job. Since the questions
are easily modified, this prevents memorization of the responses, which means the only
way an applicant can successfully answer the question is if they can truly perform the
task (Jackson, 2001).
Work Sample Tests
A type of task-oriented approach is the use of Work Sample tests. Work Sample
tests are designed to have high content validity through a close relationship with the job.
They are based on the premise that the best predictor of future behavior is observed
behavior under similar situations. The tests require an applicant to perform tasks similar
to those performed on the job.
36
Work Sample tests are high in reliability and high in content validity since work
samples are similar to the actual work performed on the job, with a low adverse impact.
Because the work-sample tests closely relate to the job, these tests are typically viewed
more favorable by examinees than aptitude (mechanical, clerical, or spatial) or·
personality tests. Another aspect that helps validity is that it is difficult for al'plicants to
fake job proficiency, which helps to increase the relationship between test scores and job
performance. Work Sample tests use equipment that is the same or similar to the actual
equipment used on the job (U.S. Department of Labor, 1998).
Some disadvantages of Work Sample tests are they may limit their use. They may
be costly to administer to one applicant at a time. If a job requires days or weeks, the tests.
have less ability to predict performance, along with measuring abilities needed for
difficult jobs. One other validity concern is criterion validity. If it relies on supervisors to
. · evaluate, it allows for rater errors or leniency. Some.suggestions that might help are using
time limits, logging time to complete task, or number and type of errors (U.S. Department
of Labor, 1998).
Assessment Centers
Assessment Centers are another form of task-oriented approac.hes for selection of
personnel. An Assessment Center consists of a variety of testing techniques ·designed to
allow candidates to demonstrate under standard evaluations; job related simulations,
. interviews, and/or psychological tests. Job simulations are used to evaluate behaviors
relevant to the job. Several trained observers and techniques are used to make judgments
about behavior and are then recorded. Then the assessors meet and rate the applicant,
37
leading into a discussion, which will result in the evaluation of the performance (U.S.
Department of Labor, 1998).
Synthesis of Selection Methods
In relation to which selection criterion is best, personality tests or task-oriented, it
· is obvious that the task-oriented method wiHproduce more reliable evidence of the right
person for thejob by identifying strengths and weaknesses. If time allows and trained
observers/assessors are prepared for the task, it is easier to identify the most appropriate
candidate for a job since it would be hard to deceive the assessors� Caution would need to
be. taken by the assessors to not lead an applicant or allow personal views to hinder the
validity of the test. As in all selection criteria, the applicant should be performing tasks
that are related to the job.
Personality testing or any type of screening instrument should not be the only
means of selecting personnel. If job-related tests are used along with other means of
selection, it will provide an added dimension to the process. It is of the utmost
importance that the screening of school personnel be done in a manner that will withstand
any legal implications.
Haberman's Concerns of Urban Schools
Our national educational system represents three main sub-systems: rural,
suburbia, and urban. All school systems need to improve; however, the rural, small-town,
and suburban schools educate large numbers of students in an acceptable manner. This
cannot be said for urban schools, metropolitan, since they tend to have a higher drop out
38

rate. It is not realized how many lives can be enhanced and the total society advanced had
people been more fully educated (Haberman, 1987).
The environment of urban education consists of 2,000 children falling into
poverty every day, more and more children being born to teenage mothers, and several . .
will not finish school. Urban schools lead the way in these statistics. Urban school
systems constantly need teachers, of these; probably about 10% will be new teachers.· The
number of teachers leaving the profession is higher in urban schools, possibly from poor
training programs. There are an increasing number of ethnic minority groups, yet there
· are not enough minority teachers who understand the child's dilemma. Haberman (1987)
states, "Not enough teachers from ethnic minorities will be prepared unless new methods
ofrecruitment and preparation are developed for untapped constituencies" (p. 3).
According to Haberman (1987), there is a considerable amount of knowledge o_n
the ·problems facing beginning teachers in urban schools; their perceived problems, their
real problems, and the kind of knowledge and skills they believe they need to be effective
but were not taught. However, he contends that teacher education has not dealt with
preparing urban teachers, especially in the area of equity and ·access for: at.:.risk students.
Some examples of these at-risk issues are: the percent of students living in poverty, the
increase 'in drug use, the increase in homicides, the increase in teenage unemployment,
the number of dropouts, increase in number of teenage births, and the increase of school
age children not living with two parents. These -issues were a component of the No Child
Left Behind initiative and what the legislation lacks .(Bainbridge, 2002). Accountability
measures will not bridge the learning gap that exists between children from homes of
39

various socio-economic levels. The testing cannot erase the fact that children from homes
of parents with little education and minimal resources have many strikes against them.
The continuing need for urban teachers exists for several reasons: during periods
of white flight from selected urban areas the total population of school age _children did
not increase, but the number of minority school age children increased; the urban teacher
shortage persisted through periods of teacher oversupply; the shortage of urban teachers
in selected subject areas and grade levels during periods when non-urban school systems
had an oversupply; and the hiring practices and assignment procedures of selected �rban
school districts, for example: beginning teachers may not know the grade level ·or the
subject they were to teach until after the school year had begun·(Haberman, 1987). Some
reasons for the shortage were: 1) Supply and demand of college graduates since some
_ occupations provided opportunities for higher salaries and higher social statuses; 2) Out
of-teaching career opportunities for women such as law and business; 3) The condition of
p�actice of just filling a teaching slot regardless of class· size, clerical demands,
instructional material and equipment, and poor safety conditions; 4) Irrelevance of
teacher education programs since teachers can learn best on the job; 5) Racism relation to
hiring practices; 6) Fear related to the in and out of class activities; 7) The perception that
the everyday work of the teacher is the maintenance of discipline; 8) Bureaucracy and the
depersonalization of employees; 9) Sense of efficacy where teacher perception of how
. much a student can learn because of conditions out of their control; 10) Hard work
needed to commit for a life time is unrealistic; 11) Geographic parochialism, teacher
shortage in urban schools only; 12) Location of major teacher preparing institutions serve
students from small towns and suburban areas and not in the immediate urban schools;
40

and 13) Lack of urban teaching experience among School of Education faculty
contributes to the problem of recruiting and retention (Haberman, 1987).
Haberman's (1987) selection process for predicting possible success or failure of
potential college students to teach in urban schools was as follows:
1; The most valid criterion for selecting teacher education students is to observe the candidates' interaction with children and youth (minority students).
2. A personal interview should be part of every selection process for urbanteachers (UrbanTeacher Perceiver).
3. The first course in Education should be the most rigorous course and shouldserve as an integral part of the selection process.
4. Selection should be reconceptualized as a continuous process: acceptedstudents should pass through a decision point prior t"o student teaching which .enables them and the faculty to reass�ss their continuation in the teacher:education program.
5. In order to be relevant to urban teaching, selection. must be a continuousprocess of evaluating students' reasons for wanting to teach ( teach pupilseffectively whether lovable pupils or not).
6. As a continuing process, teacher education programs must evaluate theability of their students to function as professional learners - students ofteaching.
7. Master urban classroom teachers should be centrally involved in the process. ·of selecting students into teacher education.
8. Every institution should have a workably effective system for recruiting,selecting, and inducting members of minority groups into urban teachereducation programs.
9. In order to _recruit, select, _and prepare urban teachers, systems for recruitingnew constituencies need to be developed.
Haberman (1987) als� identifies five content areas for selecting future urban
teachers, which is derived from an analysis of attributes and behaviors of successful,
practicing urb'1:n teachers. They are: 1) persistence, will and ability to plan new and/or
better instructional activities; 2) the teacher's response to authority, willingness to work_ .
. .
in, with, and around school authority; 3) ability to see the application of generalization,
principles, and research findings to his/her particular classrooms; 4) acceptance of,
41
respect for, understanding of, and how students become "at-risk"; and 5) teachers need
for approval and the reasons the teachers seek to teach urban children and youth.
· In 1993, the Haberman Foundation was established to continue Haberman's
(1995) search for better ways to find excellent teachers for children living in poverty .. Haberman's research emphasizes the criticalness of selecting teachers since 50% of the
· teachers entering the profession leave in the first five years with a greater percentage
leaving urban schools (Haberman, 1995). Haberm_an set out to establish a selection .
instriunent by interviewing teachers who principals, parents, and other"teachers;,an1
students named ·as "highly" successful with �t-risk students and determine characteristics
they had in common. Fr�m his data,. lie developed a. structured interview process that
would ·get at the effective characteristics and named them "Star" teachers. ·The seven
. �orrimon characteristics found include: persistence, promoting learning, theory and
practice, approach to at-risk,. professional versus pe�sonal, burnout, and fallibility. These
"Star" teacher� realized that there would be problems .. as part of the job; therefore, they
were constantly· looking for effective teaching practices and encouraging the students to
· do· better by demonstrating that they care, re.spect, and trust them.
, Haberman °(1993) conducted a study in ·1993 called the MilwaukeeTrials.to test.
whether the Urban Teacher Selection Interview can predict the success of urban teachers. . .
.
Two interviewers evaluated teachers' responses from· the Milw_aukee Public Schools. The
· teachers �ere ranked according to the interviewers predictions of success from the Urban
. Teacher Selection Interview as compared to how the teachers ranked �ased on.their
teaching practices. The data indicated that there was a ranked order correlation and that
42

the Urban Teacher Selection Interview can be used to predict the future success of
teachers.
The-Urban Teacher Perceiver
The Gallup Organization
The Gallup Organization was founded in 193·5 by Dr. George Gallup (The Gallup
Organization, 2002). He determined that his guiding principle would be independence
· and that he would seek the will pf the people. This independence stance meant that
special interest groups, such as the Republican and Democratic Parties, could not sponsor
or payfor'any.poll undertaking. This chosen ethical principal has made the Gallup name
famous in the democratic process around the world (The Gallup Organization, 2002).
I� the· Early 1_930:'·�' George Gallup was vice-president of Young and Rubicam _iri
New Y orlc City, !ind the first_ m_arket dir�ctor of an advertising agency while he was
introducing The· Gallup Poll. This ·i·s where he originated many of his basic '
. .
methodologies and technical procedures. In 1936, J?r. Gallup made his initial break
through when he correctly predicted that Franklin Roosevelt would defeat-Alfred Landon
for the president of the United States, contradicting the Literary Digest, the poll-of-record
at the time (The Gallup Organization, 2002).
Dr. George Gallup died in 1984 and in October of 1988, James Clifton, a leader in
the employee-:-owned Selection Research, Incorporated company;made an improvable
merge with the Gallup Organization after four years_ of negotiations. Mr. Clifton became
CEO of the Gallup Organization orchestrating an increase in business volume by tenfold
and expanding to 20 foreign countries. The Selection Research Incorporated (SRI) still
43

used products grounded in its 1969 practices of conducting structured psychological
interviews to identify the talents of individuals and where they best fit in an organization. f
This was the beginning of how the Gallup name has been connected to selection
instruments used to find strengths in individuals and improve employee engagement in
the workplace (The Gallup Organization, 2002).
Beginning of the Urban Teacher Perceiver
The Urban Teacher Perceiver is an instrument that was introduced in 1993 by the
Gallup Organization to assist in the screening ofte·achers. Prior to the Urba� Teach�r
Perceiver, an instrument was used entitled the Selection Research Incorporated (SRI)·
Teacher Perceiver Interview which can· be tracked ·back as early as the 1950's (SRI
Teacher Perceiver Executive Summary, 19.90). Donald Clifton and William Hall, at the '
.
University of Nebraska, began trying to identify characteristics of effective teachers : .
) .
while working with students.who were serving as counselors for other students. The'
common bond between behaviors that they found were in the areas ofrdated attitudes
about students, human interactions, motivation and intentions, and commitment to ' '
teaching (Wise et al., 1987). The foundation set by Clifton and Hall enticed the Selection
Research Institute (SRI) in Lincoln, Nebraska to c·ommercially develop an instrument for
teacher selection interviews, which was designed and utilized in 1971 (SRI Teacher
Perceiver Executive Summary, 1990).
The SRI interview instrument identified 12 life themes for highly talented
teachers: Mission, Empathy, Rapport Drive, Individualized Perception, Listening,
Investment, Input Drive, Activation, Innovation, Gestalt, Objectivity, and Focus. The SRI
Teacher Perceiver Executive Summary (1990) conducted a study to update the efficacy of
44
the SRI Teacher Perceiver by having principals from across America to place teachers
into four quartiles based on their overall teaching talents. The results indicatc:d that
quartile rating correlated in the positive direction for all twelve themes, while the quartile
rating was significantly correlated to .six of the themes. The report concluded that their
was an acceptable degree of criterion-related validity and that the SRI interv.iew process
continues to provide important information on whether prospective teachers· have the
qualities necessary to have positive experiences with students (SRI Teacher Perceiver
Executive Summary, 1990).
The Urban Teacher Perceiver, which is a version of the SRI Teacher Perceiver
Interview, was a screening instrument used in the Knox County School System to
interview prospective teachers regarding their potential for success in the classroom
developed through The Gallup Organization since 1993. "The Gallup interview is a
scientifically researched and validated interviewing _system designed to elicit information
relevant to a person's strengths and potential for outstanding job performance" (Urban
Teacher Perceiver, 1996, p. 3). The interview is not a test, yet a part of the selection
process for teachers.
The Management Research Group of Gallup, Inc. (Gallup) collabor�ted with
school systems across the United States to conduct 3: study consistent with its mission, "to
be sure there is a teacher in every classroom who cares that every day every student
learns and grows and feels like a real human being," (Urban !eacher Research, 1993, p.
1) ultimately to discover the recurring life themes describing outstanding urban teachers.
The consistency and proven results of the Gallup interview process assures that each
applicant is provided an equal opportunity without forgoing the need to hire top
45

performing candidates. Structured, personal interviews are administered, consisting of
open-ended items, in an effort to measure the psychological characteristics among
outstanding urban teachers. What is unique about the screening instrument is that it uses
an objective, reliable scoring system and is valid when used face to face or over the
telephone (Urban Teacher Perceiver, 1996).
Individuals can be taught to administer and analyze the candidate's strengths for
both selection and development after hiring. The person certified to administer and score
the instrument must consistently demonstrate an 85% item-by-item scoring agreement
with Gallup analysts, with a�ual re-licensing. The key point to remember is the
Perceiver process results in an understanding for the applicants being hired into the . .
system (Urban Teacher Perceiver, 1996 & Gallup, 2002).
The interview process developed established eleven recurring patterns of thought,
feeling, and behavior called themes. If you understand a person's dominant theme, you
can reliably predict how a person will behave in a given situation (Urban Teacher
Perceiver, 1996). The themes identified for the Urban Teacher Perceiver are: .
. .
Commitment, Dedication, Individualized Perception, Caring, Involver, Empathy,
Positivity, Initiator, Stimulator, Input, and Concept A brief description of the themes
from the Urban Teacher Perceiver Interview Guide (1996) follows:
COMMITMENT - The teacher with high commitment has made a very conscious decision to contribute to people through education and primarily to work where there is the greatest need. This teacher generates feelings and ideas about how to help students, parents and other teachers. ·commitment means sticking with students and teaching in spite of obstacles. DEDICATION - This theme describes the teacher who· finds satisfaction from each step of progress in a student's life. There is typically evidence of a history of investing in others and emotionally becoming a part of others' futures. INDIVIDUALIZED PERCEPTION - The urban teachers who are most valued by their students have a sense of the differences present in each student and
46

express regard for individuality. It is natural for them to personalize their teaching even when they see many students every day. CARING - Students bring out the best in teachers with strong Caring themes. These teachers show warmth and affection to their students and give priority to relationship development as an avenue to student growth. INVOLVER - A teacher with a strong Involver theme sees life as a two-way street. The teacher wants to be a partner to students, to parents, and to other teachers. Students have more say in their education when ·teacher is an involver. EMPATHY - Sensitivity and anticipation mark the teachers who bring empathy to the classroom. Students are better ready to accept themselves and e�tablish relationships when they work w�th a teacher who acknowledges and understa�ds their feelings. POSITIVITY - There is a hopeful attitude toward students when a teacher has high positivity. This teacher looks for.what is right and helps others feel better in the presence of this person.
· INITIATOR - An initiator is an advocate of students. This teacher is willing tospeak up when it makes a difference for a student.
· · · ·
STIMULATOR - There is more emotion and excitement in a classroom whenthe teacher has a strong stimulator 'theme. This teacher can be personallydramatic as well as very receptive to the ideas and opinions of students.INPUT - This teacher is· intrigued with ideas and searches for those ideas andactivities, which are applicable to the 'classroom. Creating new techniques andsharing them with others meets the learning-needs of the teacher.CONCEPT - This teacher has developed a philosophy about what is bestfor students and is guided by positive learning concepts.
Development of the Urban Teacher Perceiver
The Urban Teacher Perceiver Research process was initiated and conducted with
a focus group of outstanding teachers in Columbus, Ohio and Washington, D. C. to allow
Gallup researchers to begin surmising characteristics that influence success in an urban
environment. Participants answered questions about their jobs on a day-to-�y basis; the
culture they work in, various work behaviors, work responsibilities, and questions about
how and why teachers do their job. Construct analysis was used to develop 140 open-.
'
ended questions, measuring 20 life themes for a pilot interview with 100 teachers from
school districts in five cities; Columbus, Ohio, New York, New York, Knoxville,
Tennessee, Los Angles, California, and Washington, D.C.
47
Principals in the selected city school districts were asked to identify teachers they
would "like to see more like" (Study Group) and teachers more representative of all
teachers (Contrast Group). Principals were also responsible for gathering student ratings
for each teacher. The sample included 53 Caucasian and 47 minority teachers, 75 females
and 25 males, 64 forty years of age or older and 36 under 40, 85 from urban _locations and
15 from other locations,·and 53 elementary, 24 middle school, and 23 high school
teachers. Also, a means was provided to differentiate teachers based on socioeconomic
context, since the study included teachers having 59.63% racial minority student
compositi�� and 54.69% free or reduced lunches offered. The overall sample included 60
teachers in the Study Group and 40 in the Contrast Group (Urban Teacher Research,
1993).
Once· the performance criteria became available from the pilot interview,
interview items, themes, and total scores could be related to the performance criteria,
which included the prindpal and student's ratings of the teachers. Now the 140 pilot
interview questions were condensed into 55-field interview questions measuring 11 life
themes based on the urban teachers' success profile. Five items ranging from zero to five
points measured each theme score, while the total summation interview score ranges
from zero to 55 points (Urban Teacher Research, 1993).
Total scores and themes were gathered from the results. The average overall
sample was 26. 76 ( out of a possible 55) with the most occurring themes being: caring,
stimulator, input, dedication, and positivity; with the least occurring being empathy and
individualized perception. In relationship to the perception of principals, the average
score for the Study Group was 28.20 as compared to the average score for the Contrast
48

Group of 24.60. The difference between groups was statistically significant (p =. 016)
with dedication, involver, and input being the significantly correlated themes. The
interview questions were significantly correlated with the overall student rating of the
teacher at a magnitude of .57 (p = 0), with the significantly correlated themes of
commitment, dedication, individualized perception, caring, empathy, positivity,
stimulator, input, and concept (Urban Teacher Research, 1993).
In conclusion, the results indicated that the sample size was adequate and there
was no significant difference of total score across groups of legally protected and
nonprotected categories ofrace, gender, and age (Urban Teacher Research, 1993). Also
Gallup has conducted a recent research in May, 2001, investigating the use of the Urban
Teacher Perceiver Screener (2001) (a 22 item screener for systems having to watch their
finances) and finding that it also correlates with the Urban Teacher Perceiver total score,
meeting all expectations of reliability, validity, and any law implications. .
.
According to Dee Drozd (2002), Research Director, of the Gallup Organization,
the Urban Teacher Perceiver is a viable option for the teacher selection process. She
states:
The focus groups and qualitative research that Gallup conducts in interview development define job-related behaviors and strengths. In addition to focus groups, often job observation is conducted to further understand the job. We also collect performance data and top/contrast performance ratings to see how the interview functions in respect to job performance.
Further, when interviews are developed at Gallup, race, gender, and age are evaluated to make sure the interview is not discriminating. Additionally, when we conduct predictive validity studies of our interviews, we evaluate the interview in respect to the EEOC 4/5 Guidelines. Our predictive validity studies . also show us how the interview is related to job performance.
49
The Tennessee Value Added Assessment System (TV AAS)
The Tennessee Value Added Assessment System {TV AAS) is a statistically and
computationally complex model developed by Dr. William L. San�ers (1998). Its
foundation is based on a mixed-model methodology invented by Charles R. Henderson.
The mixed-model approach has been around for years and widely is used in the business
and agriculture world. Dr. Sanders was the first to apply it in the educational arena. The
following subdivision will discuss how the mixed-model approach is applied to measure
the value-added effects in Tennessee, along with the history, purpose, advantages a�d.
disadvantages of TV AAS.
In the early l 980's, Sanders' (1998) research initiated the development ofthe
Tennessee Value-Added Assessment System, a statistical mixed-model method of
determining the effectiveness of school systems, schools, and teachers in sustaining
academic growth for student populations. The process is an advanced form of "analysis
of variance" known as Henderson's mixed-model and is statistically and computationally
complex. To ensure fairness, sensitivity, and reliability the method must accommodate
several difficult problems such as; students who move, students who miss tests, teachers ·
who work in self-contained classroom, teaching teams, departmentalized teachers,
students who were retained, students who skipped a grade, and many other factors that
must be overcome. Sanders assert that the longitudinal (large data ·source) value-added
system addresses these problems and many others.
The mixed-model has a built-in protection process that helps to eliminate the.
possibility of someone being put at the low end of a growth curve because of the lack of
information on students. The idea is to collect as much information as possible to include
50
in the computer management system. The process is a weighting of results based on how
much information one has. The analysis actually performed is called "shrinkage
estimation," and what it yields is termed a Best Linear Unbiased Predictor, or B,LUP
(Archer, 1999). This procedure corrects for gain scores regressing to the mean:
The value-added assessment represents an assemblage of technologi�s from many
different academic areas by exploiting the improvements that psychometricians have
made and built on the mixed-model theory and methodology. The speed and power of ..
I?odem computers, ·along with new algorithms, allow for solutions of large sets of
equations in an expeditious way (Sanders, 1998). ''Compared to other methodologies for
computing pupil achievement gains, mixed model analysis is moJ'.e precise. and less
vulnerable to manipulations that can distort results" (Stone, 1999, p. 242).
Regarding the fundamental question of whether teaching, in all its messy and · complicated glory, can be quantified, Sanders has this to say: "There is n? way you can measure all of the important things a teacher does in the classroom. But that doesn't mean you shou�dn't be measuring the things that can be measured" (Hill, 2000, p.10).
Brief History of Mixed-Model Methodology
The mixed model methodology has been around for years and �idely used in
business and agriculture. Dr. William L. Sanders extended Charles Roy Henderson's
mixed-model approach into the education arena. Henderson's methods have been around
since the early 1950's and applied to statistical analyses in many disciplines.
Henderson's mixed model equation was the·merging of the selection index
· method of Sewall Wright and Jay Laurence Lush and the fixed model approach of
Englanders, Fisher and Yates. He developed methods first to estimate the genetic
parameters needed for the application for improvement then to predict most accurately
51

the genetic values of animals available for selection. The methodology was able to take a·
linear mod�l with many fixed environmental and many random genetic factors with many
missing subclasses and predict an outcome. A colleague researcher, Shayle R. Searle,
introduced another important discovery with Henderson, matrix algebra. This significant
new knowledge allowed mixed model equations to be augmented to include equations for
animals without.records (Van Vleck, 1997). This process of predicting outcomes is part
of Dr. Sanders' method for calculating the "value" that is "added" to a student's yearly
academic endeavor.
The sum of the discoveries of Henderson can be categorized into three main areas.
1.) The modification of the least squares equations to form mixed model equation with
solutions that have best linear unbiased estimators (BLUE) .and best linear unbiased
predictor (BLUP) properties. 2.) The easy calculation of A-1, which allowed the use of
information on all relatives of an animal rather than only records of selected close
relatives (automatically corrects evaluation for one parent for the genetic merit of the
other parent - the mate). In other words, he was able to determine a pattern.· 3.) The
augmentation of the mixed model equations to include equations for animals without
records has provided animal breeders with the best possible tools for genetic selection.
"Henderson's mixed model equations have allowed the proliferation of statistical
packages that now handle messy unbalanced data with models including fixed and
random effects" (Van Vleck, 1997, p. 11). Henderson's name may eventually fade from
his discovery, but his finding will continue to enrich the scientific and statistical
communities, thus the Sanders' model.
52
Purpose of TV AAS
·The purpose of the Tennessee Value-Added Assessment System (TV AAS) is to
follow the progress of each individual child and compare him/her to his/her own past
performance, not test scores of other students. The individual student's. growth rate does
not provide much information about his/her teacher, but when the data is examined by
classroom, by school, and by district, patterns begin to emerge. This becomes strong and
powerful evidence regarding instruction (Hill, 2000).
Each year, late March or early April, students in grades 3 through 8 (some
districts may elect to test grades below 3rd, yet ·it is not used as value-added information)
take a battery of tests known as the Tennessee Comprehensive Assessment Program
(TCAP) in five subject areas: reading, language, math, science, and social studies. Scores
are then sent to Sanders and his staff, entered on their computer system, which merges
with the previous years data. This enables statisticians to track student achievement over
time. Then in the fall, schools receive their report cards from the previous academic year
showing improvement or not in each subject, based on national norms� This shows how
much the students have learned over the course of a year or how much "value" has been
"added" to their learning (Hill, 2000).
Dr. William L. Sanders
An interview of Dr. Sanders by David Hill (2000) revealed that the Tennessee
native was a "spokesman for the data." By this, he meant that taking students' test scores,
entering the data into a computer, and measuring how the students improved from one
academic year to the next could quantify the art of teaching. According to· Sanders, "all
students can and should learn commensurate with their abilities" (Hill, 2000, p. 2). He
53
insists that he is interested in helping teachers, especially the weak teacher to improve ..
The data should be used for diagnostic purposes so teachers can evaluate what they are
doing and how they may improve. Sanders does have one major concern about
ineffective teachers; together with his wife, Dr. June Rivers, they have found that if a
student has two consecutive years of ineffective teaching between the grades of third and
fifth, without major interventions, the child will never recover.
Dr. Sanders (1998) contends, "The single largest factor affecting academic growth
· of populations of students is differences in effectiveness of individual classroom
teachers" (p. ·27). This influence is many times greater than the other contextual factors
such as th� school's socioeconomic status, class size, student variability within the
classroom, etc.
In 1982, Sanders read a newspaper article asserting that teacher effectiveness
could not be measured quantitatively by looking at students' test scores. Lamar
Alexander (Governor of Tennessee at that time) was proposing a plan that would identify
the best teachers in the state and allow them to receive higher salaries, greater status, and
new roles. There had been many articles citing two or three statistical reasons why
student achievement data could not be used, Sanders was convinced it could be done and
decided to prove it (Hill, 2000).
William Sanders and his colleague, Robert McLean sent a letter to the governor's
. office stating that they would like to use something called the "mixed model" statistical
methodology. A renowned animal breeder at Cornell University, Charles Roy Henderson,·
originally developed this approach. The "mixed model" was used in hopes to show that
student achievement data could in fact be used for teacher assessment. By using three
54

years of student test scores from the Knox County School System in Tennessee� Sanders
and McLean proved their theory. They contacted the_education department in Nashville
and said that they were ready. At first they were not taken very seriously and conducted
two later studies, which confirmed the Knoxville data, but no one seemed.interested in
Sanders' research (Hill, 2000).
Several years later, education reform was on the minds ofTennessee·legi'slators
and an approach to· school accountability. In 1990, Sanders found himself spending about
four months in the state capitol meeting with officials and the governor, Ned McWherter.
Sanders advocated that his system be used statewide and was somewhat caught off guard
that it might actually happen.Then in 1992, legislators incorporated Sanders'
methodology by Mc Wherter signing into law the Education Improvement Act. This
model was called the Tennessee Value-Added Assessment System (TV AAS) and was
part of a court order, which was to equalize funding between rural and.urban schools.
Sanders then asked to return home and assemble a team to build a software system, which
came to be known as the Value-Added Research and Assessment Center at the University
of Tennessee (Hill, 2000).
Even though policymakers.found the method appealing, not everyon� in the state.
was as accepting. Teachers were skeptical with some being hostile toward Sanders
stating, "How could you use a statistical method developed for evaluating farm animals
to measure the effectiveness of teachers" (Hill, 2000, p. 4)? Sanders admits himself that
the TV AAS approach is complicated and teachers must take it on faith that the computer
methodology is fair and accurate. He asserts that the mixed-model can be learned, but a
55

person would have to spend much time and energy to perfect his/her knowledge. Also,
the more data that is collected, the more the statistical variations will decrease.
Advantages of TV AAS
"Tennessee is light years ahead of the rest of the country. I've studied the whole world. I think it is one of the best systems in the whole world, not just the United
· States" Dr. Bruce S. Cooper, Fordham University Graduate School·of Education(Shearon, 2001, p. 1)
For years educators have argued that it was unfair to compare students'
standardized test scores from disadvantaged backgrounds with those of more affluent
children. Policymakers find the method appealing because it seems to filter out external
factors such as socioeconomic levels of students (Sanders, 1998). Other factors that have
been shown to be unrelated are the number of free and reduced lunch students, racial
composition of the student body, or location (rural, urban, and suburban) (Sanders &
Hom, 1995). Sanders "value added" system focuses on students' academic gains rather
. on their raw achievement scores, allowing individual teachers and schools to draw some
conclusions about how they are performing (Hill, 2000). Schools and systems have
benefited from the value added scores along with other criteria. If they have met the
expected criteria, financial rewards have been a positive reward. School systems that
have schools not meeting the value-added criteria are concerned about their effectiveness,
funding for staff development, materials, and other necessities for school improvement.
If TV AAS information is used appropriately, administrators and teachers can use
the data to improve teaching by identifying strengths and areas to strengthen. Effective
teachers can in their particular area, establish mentoring programs to help each other. The
value-added data can help teachers to make decisions on quantitative information about
students instead of relying on an inward feeling.
56

The current obsession for assessment and accountability throughout the nation
makes the Sanders' method a reasonable way to evaluate schools, taking into
consideration the various levels of student performance. Any concern for statistical
variations will decrease over time as more and more data is collected.
Sanders TV AAS methodology puts Tennessee in the forefront with President
Bush's education policy, "No Child Left Behind." The current accountability issue in
Tennessee requires schools to demonstrate adequate yearly progress in reading, math, and
· language arts, along with meeting a 100% or more gain in value-added.
J.E. Stone (1999) identifies six main advantages of the value-added system·
toward educational accountability. 1.) The Tennessee value-added assessment expresses
teacher, school and school system effectiveness in terms of increases in achievement over
previous performance (students. are compared to their own record). 2.).It excludes from
the estimates of teacher, school, and school systems ·effectiveness the infl�ence of ·
preexisting differences among students (race, socioeconomic status, previous learning,·
intelligence, and other factors, know and unknown, that have influenced previous
achievement). 3.) Mixed.:.model value-added assessment is able to isolate the achievement
effects produced by an individual teacher so long as students have had that teacher for at
least seventy-five days per semester or one hundred fifty days per year. 4.) The value
added system takes a very conservative approach to assessing teacher impact and thus
ensures that those who are identified as effective or ineffective are deserving of their
classification. 5.) Value-added assessment using mixed-model methodology makes use of
all student scores despite the fact that some students will have missed a test or have
incomplete data. 6.) Value-added assessment permits comparisons to national average
57

gains of all enrolled students and thus provides an understandable measure of student
progress. The TV AAS reports also include average levels of achievement along with the
appropriate national norms against which these may be judged.
Disadvantages of TV AAS
The policy implications of Sanders' system are enormous. Some may see it as an
objective method for evaluating teachers. Teachers worry that the data could be used
against them and have concerns that effective teaching translates into improved test
sc_ores (Hill, 2000). Bratton, Hom, and Wright (1996) state that good teachers have
nothing to worry about, while poor teachers should have been wo�ed long before
TV AAS came along. Individual teacher's TV AAS results are not made public, but if
there is only one teacher in a school teaching a particular grade level then his/her data is.
made public in the school report. Since the state does print a school report card, teachers
and schools are under the public eye and are sometimes ridiculed and looked down upon
without any interventions or funding to implement necessary strategies for improvement.
It can be demoralizing and cause teachers to be "stressed out."
Hill (2000) identified that one of the major reasons why teachers were skeptical is
because they do not really understand the value-added system and therefore ignores or
just does not pay much attention to the data available; believing that it is just a fad that
will go away. Some schools may not take the time to look at the quartiles of the students'
achievement levels and determine if they are teaching to a particular academic group,
such as teaching to the lower achieving students and not to the higher achieving. Another
area some schools will not take the time to look at is when they are meeting expected
achievementlevels but not making the necessary gains for the students; therefore, not
58
having at least one year of academic growth. One other criticism is that normed data is
often used to compare and place student.s in certain classes (Sanders & Hom,. 1995).
The methods of assessment are constantly being debated. Critics evoke strong
emotions toward the use of standardized testing and debate the lack of alternative
methods of assessment. Alternative forms (portfolios, performance based, authentic
assessment, open ended questions, etc.) are viable tools for assessing student progress ·
and attainment, as long as care is taken to assure their validity and reliability. Since some
alternative assessments would be expensive and difficult to develop, administer, �d-.
.
score, their usefulness for large-scale assessment is questionable. However, if other
· assessment models achieve reliability and validity as standard measures no_w possess,
they would be considered standardized (Sanders & Hom, 1995). Regardless of the
method:of standardized test measuring achievement, TV AAS results would still indicate
progress.
Lynn Olson (2001) discussed issues shared by educators concerning President
Bush's education agenda on testing grades three through ·eight. She expressed some
concerns of Dr. William Sanders, who at the time of publication was at the University of
North Carolina. He mentioned a definite problem for states would be the cost for
· implementing the tests and scoring _them. A suggestion proposed by Sanders was for
states to pool their resources for the construction and maintenance of testing programs.
Another real problem that Sanders identified was, too few schools use the test results for
diagnostic purposes or have staff that is not trained to identify the systems, school's, and
teacher's problems.
59
Critics complain _about large year-to-year swings in value�added scores that
cannot be explained (Hill, 2000). They also fault the system for its assumption that all
learning takes place in the classroom and purely teacher related. Critics' complaints do
not have adequate evidence to support their contentions (Hill, 2000). Also critics contend
that the accountability causes teachers to "teach to the test;" causing the test objectives to
become the standards for teaching especially if the state has poor curriculum alignment.
Opponents of TV AAS were concerned about the socioeconomic status of schools
and the mobility rate of students moving from school to school. Researchers are
concerned with the possibility of low achievement scores for students who move a great
deal and are from low-income, less-educated families. These factors do make educators
apprehensive, but Sanders (1998) contends that his formula allows for these issues. Even
though he tries to defend his model with much confidence, recent reports question
Sanders' conclusions. Robert Linn (2001) doubts the validity and reliability of TV AAS
results because of findings questioning the socioeconomic background of students, the
percent of minority students, per pupil expenditures, and publisher provided test that may
not be aligned with the state standards.
Currently, regular classroom teachers are not held accountable for special
education students and those students who were not enrolled for 150 days during the
school year on their yearly TV AAS results (Tennessee Code Annotated, 2000, 49-1-606).
However, the special education students' achievement scores will be refle,cted on all
other data.
60

Discoveries from TV AAS Data
David Shearon (2001) identifies some of the amazing discoveries of TV AAS
research. 1.) When populations of students change buildings, ·regardless. of t_he grade
level, the loss in expected academic gain is dramatic. 2.) The effectiveness of a· school in
helping students make gains cannot be predicted based on its racial or economic makeup.
3.) There are huge variations in the effectiveness of schools. 4.) Schools are getting
better. More and more are achieving over 110% gain of the national norm, while fewer
are scoring less than 70%. 5.) Three straight.years of 5th (top teacher) qui�tile teacb.er�
from 3rd through 5th grades result in math scores averaging the 85th to 95th percentile.
Three straight years of the least_effective teachers (1st quintile) teachers res_ult in scores
from 35th to 45th percentile. 6.) High a_chievin�. students gain little or nothing during years
when they ar:e with a 1st
, 2nd, or 3rd quintile teacher.
. .
Conclusions of TV AAS
"Value-added assessment holds the promise to revolutionize education" (Stone,
1999, p. 245). As complex as the statistics may be, it creates a simple but important
change that will enable parents, taxpayers, and e�ucation decision-makers to· determine if
schools are working. It simplifies the process of interpreting reports on school
effectiveness along with assessing teacher quality (Stone, 1999).
"If the purpose of educational evaluation is to improve the educational process,
· and if such improvement is characterized by improved academic growth of students_, then
the inclusion of measures of the effectiveness of schools, schools systems, and teachers in
facilitating such growth is essential if the purpose is to be realized" (Sanders & Horn,
61

1998, p.250). Sanders' TV AAS model appears to be the fairest method of determining
true growth of students and effectiveness of teachers and schools.
David Cook
David Cook ( 1985) developed a study that built upon Sanders' work by adjusting
and utilizing the Best Linear Unbiased Prediction (BLUP) procedure to control for the .
regression to the mean problem. The purpose of Cook's study was to determine if
standardized achievement tests could be utilized in assessing a classroom teacher's
effectiveness. He had determined that before a teacher could be held accountable of their
students' test results, the test objectives should be congruent with instructional objectives.
He concluded that as· long as baseline achievement test data was available, a system could
use the analysis of covariance to calculate an adjusted mean score ·and the BLUP
procedure to control for the regression to the mean as part of the evaluation process for
teachers based upon student achievement test scores.
David Cook (1985) conducted his study in the Blount County, Tennessee School
System of fifth grade students that examined the use of standardized ·achievement test
scores, ranking of classroom teachers based on the students' scores� and the. correlation.
with principal and supervisory ratings. His study suggested that principals were more
capable of ranking teachers in order of student achievement than were supervisors. The .
.
.
.
principals' expected rankings and the achievement based ranking had a moderate to
strorig positive.relationship especially in reading and math. An interesting observation in
the study was that principals had a better idea of who were th.e bad or ineffective teachers
than they did the best teachers. The study also showed that the principal did not have a
good idea of the difference between the good and average teacher.
62
John Killeffer, Jr.
John Killeffer's (1989) study investigated Sanders' value-added concept to
determine school effectiveness characteristics and how it correlated with the students'
achievement test gains in grades 4 through 6. The seven school effectiveness
characteristics examined were: safe, orderly environment; clear school mission;
instructional leadership; high expectations; opportunity to learn and student time on task;
frequent monitoring of student progress; and home/school relations. Killeffer's study
found no relationship between effective schools correlates and achievement gain of the
students. The study also found that the students' achievement gain was not significantly
correlated with the social economic status of the school. The study differed from most of
his literature review since it was unable to determine whether or not schools that have a
high level of effective schools correlates produced higher student gairis.
Conclusion
This literature review revealed the importance of the screening process for
teachers while sharing a diverse way of thinking by many researchers. The Urban
Teacher Perceiver is discussed within the review, but there is very little research
conducted outside of the Gallup Organization. No matter what means of selection a
school district may use it is of the utmost importance that the legal implications be
examined and carefully monitored. Several studies mentioned the importance of the
teacher toward a student being successful; therefore, it would be appropriate to assume
that research on student achievement and teachers hired could provide guidelines that"
would influence effective teacher screening.
63

The literature review identified the use of the Tennessee Value Added
Assessment System (TV AAS) as a reliable means of assessing teacher effectiveness. The
mixed-model methodology developed by Dr. William Sanders can effectively determine
the value that a teacher has added to a group of students� The capability of the TV AAS
data will provide important information to further the study of hiring effective teachers.
64

Introduction
CHAPTER THREE
Methodology
This quantitative study determined the effect between a screening instrument and
teacher effectiveness as measured by academic gain scores. The research investigated the
main effect of a teacher's overall Urban Teacher Perceiver score and their effectiveness
as determined by the Tennessee Value Added Assessment System; it also provide9
information about the strength of the interaction effects between categorical variables and
multiple dependent variables.
Population
The population for this study consisted of the third through eighth grade teachers
in the Knox County School System who had been hired since 1993 and had both an
Urban Teacher Perceiver score and a three-year average Tennessee Value-Added
Assessment System score in mathematics, reading, or language. The Perceiver. has been
used since 1993 in Knox County; therefore, some teachers may have had more than one
three-year average TV AAS score; however this study used the first three-year average.
In order to determine the population for this study the researcher first identified
the Knox County teachers who had an UrbanTeacher Perceiver score since 1993 through
the help of the Human Resource Department. The department had the UTP scores, while
the Payroll Department provided other pertinent information (gender, race, age when
hired, grade level taught, and school setting) pertaining to the teachers hired. ·The Gallup
65
Organization granted permission for the release of UTP scores. In most situations, the
Knox County _School_ System required a prospective teacher to have a UTP score of at
least 25 out of 55 to be granted an interview for a position. Since 1993, the Knox County
School System hired 3,987 applicants with 372 teachers teaching at least three years in
grades three through eight in reading, math, or language. Of the selected teachers, 245
had an Urban Teacher Perceiver score on file. The file containing the pertinent
information for these 245 teachers was sent to SASinSchooL They were able to match the
value-added scores for 242 of them. This group became the population for this study .
. Most of the 242 teachers taught all three subjects; however the samples varied among
each dependent variable; 203 math teachers, 222 reading teachers, and 200 language arts ·
teachers who had both a UTP score and TV AAS score.
Procedures and Data Collection
Before any data were collected for this study, permission was granted from the
Knox County School System and the Gallup Organization. Then the rese·archer retrieved
new hire information from the Knox County Human Resource Departmentconceming.
the teachers' Urban Teacher Perceiver scores and merged the data with gender, race, age
when hired, grade level taught, and school setting from the Knox County Payroll
Department. The information was stored in a Microsoft© Excel file so that the
SASinSchool organization could convert the information that was needed for analysis.
Teacher identification numbers corresponding with the merged data were sent to
SASinSchool. The organization merged the data with the appropriate TV AAS gain
scores in mathematics, reading, and language and e-mailed the analysis to the Director of
66

Research and Evaluation to assist in the interpretation of data for the researcher. An
analysis of variance, ANOVA, was calculated to determine if there was main effect
between UTP scores and mathematics, reading, and language TV AAS scores. A General
Linear Model (GLM) was used to examine the interaction effect with gender, race, age,
grade level taught, and school setting.
In conjunction with carrying out this study, it was necessary to obtain permission
for the use of the Urban Teacher Perceiver scores in Knox County. Upon· initial contact
with the Gallup Organization, a description of the study was offered for approval. In
order to conduct outside research using their copyrighted instrument from the Gallup
Organization, the following guidelines were followed: 1) The research must present real
value to The Gallup Organization, as determined by· The Gallup Organization; 2) The
research must be conducted in keeping with the accepted standards and be of reputable
integrity; 3) The outside researcher must have a Gallup sponsor or mentor; 4) Gallup
must have approval power of the public release of the research; 5) An agreement must be
signed and executed by the researcher and someone affiliated with the sponsoring
institution.
Second, permission had to be obtained from Knox County's Director of Schools,
the Human Resource Department, and the Coordinator of Research and Evaluation
(Appendix A). Since teacher TV AAS data were confidential information, it was
mandatory that teachers' names not be linked to the data gathered.
The selected teachers' identification number and information, assisted by the
Knox County's Office of Research and Evaluation, was sent to SASinSchool (Sanders,
2000) organization. These scores were matched with the teachers overall Urban Teacher
67
Perceiver score to determine if there was any effect between the_ two scores. In order to
· have a TV AAS score, teachers must have taught in a particular grade from third through
eighth for three consecutive years. Therefore, the final population for this study was those
teachers·who were hired and had both Urban Teacher Perceiver scores and their first
three-year average TV AAS scores in mathematics, reading, or language.
Since the Urban Teacher Perceiver was first used in 1993, the first three-year
average TV AAS data was from the 1996-97 school year to the 2002-03 school year ..
There were 203 math teachers, 222 reading teachers, and 200 language teachers w�o fell
within this seven-year observation data. The samples vary because some teachers teach
all three subjects, while others teacher one or two of the subjects.
· The SAS software program was used to derive the effect of the merging data from
the SASinSchool org�zation. An ANOV A was the concept u·sed to compute the main
effect between the Urban Teacher Perceiver scores and the TV AAS scores in
mathematics, reading, and language. An AN OVA determines the differences between
samples of to whether it is by chance or a systematic treatment effect caused by
differences in the groups' scores. It will measure the size of differences or the amount of
variability in dependent and independent variables. General Linear Model (GLM) was
applied to distinguish the effects of categorical independent variables on multiple
dependent variables. The dependent variables were· the mathematics, reading, and
language TV AAS scores, while the independent variables were gender, race, age when ·
hired, grade level taught, and school setting (urban, suburban, and rural). With the GLM, ·
parameters are created for every category of every factor; therefore handling the problem
of empty cells. The GLM automatically transforms declared categorical variables into
68

sets of indicator variables. Two levels of interest were given for an independent variable,
then calculate the value of dependent variables under two conditions, holding all other
. variables constant at their mean value (Garson, 2004). The SASinSchool organization
merged the data and sent the information to the researcher and the Knox County Director
of Research and Evaluation for analysis and interpretation.
Data Analysis
The data collected were analyzed to determine the effect between variables and
among categories of teachers. The data analyses were derived from six hypotheses,
calculating an F value and determining its level of significance set at less than .05. The F
value indicates whether the sample means of various factors in the research significantly
differ from each other. A level of significance ofless than .05 was the basis for accepting
or rejecting a hypothesis (Borg & Gall, 1989). The procedures used for the hypotheses
follow one and six.
Hypothesis 1: There is no significant main effect between the teachers' overall Urban
. .
.
Teacher Perceiver score and the teachers' TV AAS scores in mathematics; reading, and
language.
An ANOVA analysis from the SASinSchool organization was used to determine
the main effect of the overall Urban Teacher Perceiver score and the teachers' TV AAS
scores in mathematics, reading, and language. The concept was applied on three separate
occasions since the independent variable from the UTP was analyzed through three
dependent variables. The Urban Teacher Perceiver score was compared with each
teacher's firstthree-year average TV AAS score in mathematics, reading, and language. If
69

there is a strong effect then there is some predictability for determining a teacher's
effectiveness to impact student achievement.
Hypothesis 2: There is no interaction effect between the overall Urban Teacher Perceiver
score and gender in regard to the teachers' TV AAS scores in mathematics, reading, and
language.
Hypothesis 3: There is no interaction effect between the overall Urban Teacher Perceh-:er
score and race in regard to the teachers' TV AAS scores in mathematics, reading, and_
language.
Hypothesis 4: There is no interaction_ effect between the· overall Urban Teacher Perceiver
score and age when hired in regard to the teachers' TV AAS scores in mathematics,
reading, and language:
Hypothesis 5: There is no interaction effect between the overall Urban Teacher Perceiver
score and grade level taught in regard to the teachers' TV AAS scores in mathematics,
reading, and language.
Hypothesis 6: There is no interaction effect between the overall Urban Teacher Perceiver
score and school setting (urban, suburban, and rural) in regard to the teachers' TV AAS
scores in mathematics, reading, and language.
A General Linear Model (OLM), which includes each factor, was used· to
determine the interaction effect between the Urban Teacher Perceiver overall score and
. the teacher's gender, race, age when hired, grade level taught, or school setting in regard
to the teachers' first three-year average TV AAS scores in mathematics, reading, and
language. The OLM analysis focused on each categorical independent interaction and the
70
overall Urban Teacher Perceiver score in regard to the dependent TV AAS mathematics,
reading, and language scores.
Conclusion
By comparing the Urban Teacher Perceiver scores with the teacher's .three-year .
'
average TV AAS scores in mathematics, reading, and language, a determination 'was
made as to whether the UTP relates with the TV AAS scores. This provided initial
research to the capabilities of screening instruments and their effect at.determining a
teacher's effectiveness.
71
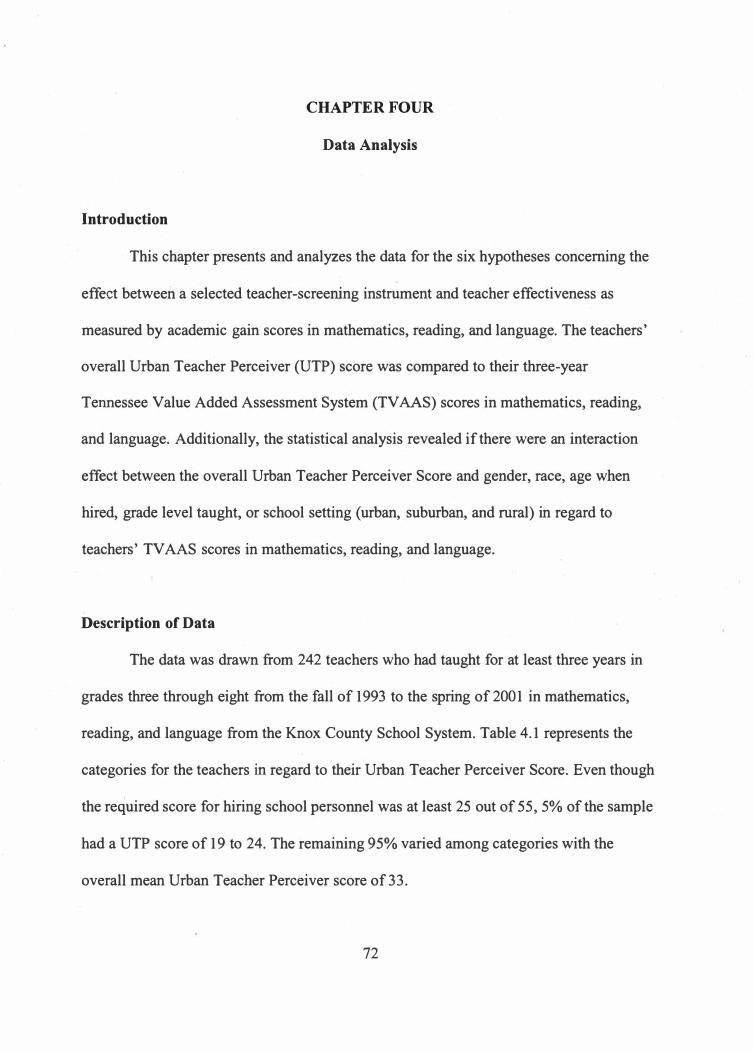
CHAPTER FOUR
Data Analysis
Introduction
· This chapter presents and analyzes the data for the six hypotheses concerning the
effect between a selected teacher-screening instrument and teacher effectiveness as
measured by academic gain scores in mathematics, reading, and language. The teachers'
overall Urban Teacher Perceiver (UTP) score was compared to their three-year
Tennessee Value Added Assessment System (TV AAS) scores in mathematics, reading,
and language. Additionally, the statistical analysis revealed if there were an interaction
effect between the overall Urban Teacher Perceiver Score and gender, race, age when
hired, grade level taught, or school setting (urban, suburban, and rural) in regard to
teachers' TV AAS scores in mathematics, reading, and language.
Description of Data
The data was drawn from 242 teachers who had taught for at least three years in
grades three through eight from the fall of 1993 to the spring of 2001 in mathematics,
reading, and language from the Knox County School System. Table 4.1 represents the
categories for the teachers iri regard to their Urban Teacher Perceiver Score. Even though
the required score for hiring school personnel was at least 25 out of 55, 5% of the sample
had a UTP score of 19 to 24. The remaining 95% varied among categories with the
overall mean Urban Teacher Perceiver score of 33.
72

Table 4.1: Frequency of Urban Teacher Perceiver Scores
Urban Teacher Perceiver Score
19-2425-2930-3435-3940-4445-50
Frequency (N=245)
13 60 77 55 33 7
Percent
5% 25% 31% 22% 13% 3%
Table 4.2: Frequency of Gender and Race
Gender or Race
Male Female African-American White
Frequency (N=245)
25
220 19
226
Percent
10% 90% 8%
92%
The gender and race of the teachers studied were predominately the white female.
Table 4.2 displays the 90% females and the 92% white categories for teachers in the
study. The only two categories that were identified by the data in race were African
American and White. Since there are such a disparity between the number of males and
females and African-American and white, it limits the study's effectiveness in finding
differences involving gender and race.
The age that a teacher was hired is divided into four main categories: ages 21 to
30, 31 to 40, 41 to 50, and greater than 50. As expected the majority of the newly hired
personnel slanted in the 21 to 30 age category with 60%. Table 4.3 denotes the
distribution of the ages. The average age of those hired was 32.
73

Age Hired 21-3031-4041-5051 and above
Table 4.3: Frequency of Aged Hired
Frequency (N=245) 148 49 42 6
Table 4.4: . Frequency by Grade Levels·
Grade Level Elementary Title 1 3rd
4th5th 6th?1h
gth
Frequency (N=245) 6-
60 51 44 29 28 27
Percent 60%
.20% 17% 2%
Percent 2%
25% 21% 18% 12% 11% 11%
. .
The grade level distribution tilted toward the elementary grades, t�ird through
fifth, rather than the middle grades, sixth through eighth. The sixth through eighth grades
are departmentalized _with 37 math teachers, 11 reading teachers and 36 language arts
teachers. The third through fifth grades, including elementary Title 1 teachers,
contributed to 66% of the sample while 34% consisted_of sixth through eighth grade
teachers. Table 4.4 includes the percentage of teachers in each grade level.
The school setting information was. distributed similar to the Knox County School
Systems community. Since the system is located in and around.the city of Knoxville, the
data demonstrated the distribution in Table 4.5 showing that 11 % of the sample was
located in rural schools, 42% in the suburban schools, and 47% in the urban schools.
74

School Setting
Rural Suburban Urban
Table 4.5: Frequency of School Setting
Frequency (N=245)
28 102 115
Percent
11% 42% 47%
Table 4.6: Main Effect between the UTP and TV AAS
UTP* TVAAS UTP * mathematics UTP * reading UTP * language
Analysis of Data
F Value 0.56 0.70 0.69
p-value0.45340.40340.4058
There were six hypotheses for this study. The first hypothesis was tested using an
ANOV A; while the other five were analyzed using a more complex procedure, called the
General Linear Model that computes multiple factors at once, investigating possible
interactions. The results, tables, and graphs are analyzed and illustrated throughout this.
chapter. In order to determine significance throughout the study, the F ratio was assessed
with the level of significance set at less than .05 (p < .05).
Hypothesis 1: There is no significant main effect between the teachers' overall Urban
Teacher Perceiver score and the teachers' TV AAS scores in mathematics, reading, and
language.
An analysis of variance, ANOV A, was conducted involving the overall Urban
· Teacher Perceiver (UTP) score and three-year average TV AAS scores in mathematics,
reading, and language. Table 4.6 displays no significant main effect found between any
of the variables since the level of significance was greater than .05 in every analysis.
75

Three scatter plot graphs comparing the UTP and the mathematics, reading, and
language TV AAS in Figures 2, 3, and 4 clearly illustrate that the results show no
significance to the UTP score and TV AAS score, almost forming a circle effect with the
points. Further study is a viable option since the analysis is significant concerning the
lack of difference between an interviewee's UTP score whether it is 25 or 50. As a result
of this analysis, teachers who had a higher UTP score should not be considered as a better
candidate for teacher effectiveness as measured by academic gain scores. The overall
UTP score should not be the sole determiner for selecting a potential teacher over
another.
Figures 2, 3, and 4 have an added dimension illustrating the interaction of rural,
suburban and urban schools and UTP scores in regard to TV AAS scores. If there were no
interaction, the lines would be nearly parallel. All three figures illustrate a slight positive.
incline with two of the factors but the gains are not significant. An interesting observation
was the decline in rural settings in regard to mathematics (Figure 2) and language (Figure
4); however, the interaction was not statistically significant. Figure l's illustration of
decline for rural settings is primarily because of three influential points. One rural teacher
scored high on the UTP but had low gains, while two teachers had low UTP scores with
high gains. The study may have shown a difference with rural teachers if there had been
more in the sample.
76
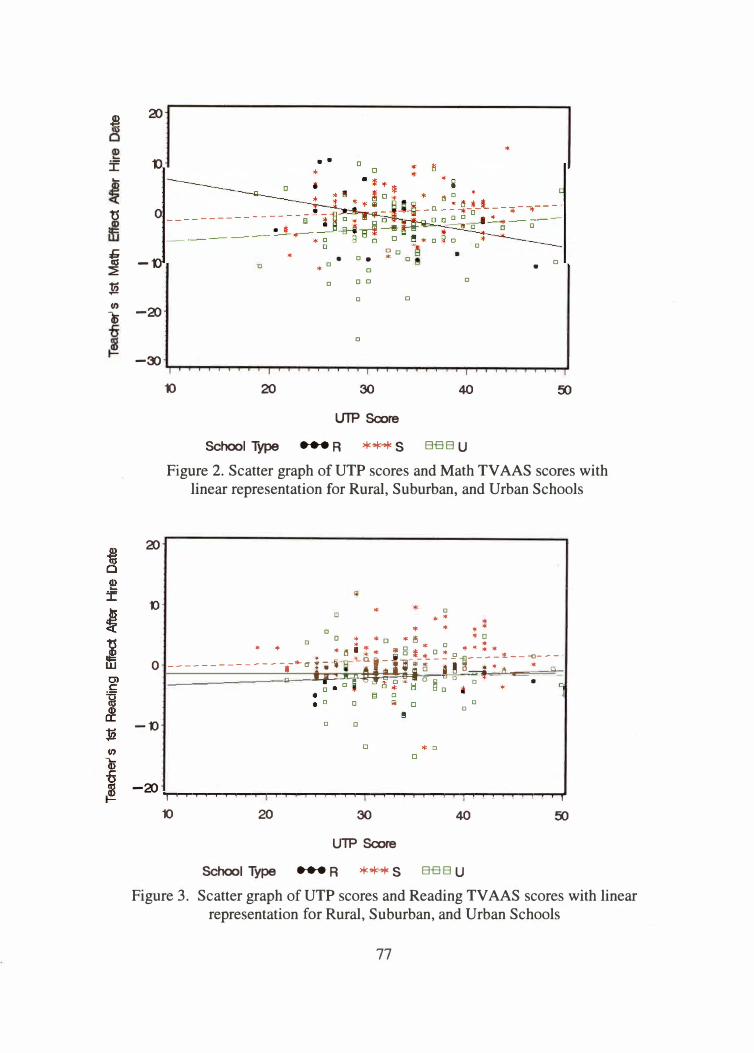
$
...
:E ...
ts
t �
i (I)
-a;
20
1)
0
-1)
-20
-3:>
20
1)
10
• • D
* � C 0 •
* 0 C
0 D C 0
0 C
0
20 30 40
U1P Score
School Type ... R **°* S BBB U
*
0
C •
50
Figure 2. Scatter graph of UTP scores and Math TV AAS scores with linear representation for Rural, Suburban, and Urban Schools
* 0 * *
0 "' * * *D * >le *� *D o ,. a * 0 * * * *�' "' * ill c ,1c a* ****
.. ,. ;;_ _j c_*-*---.Q il ____ !!.---a---0 --------------.->4"-al---:!x:n-:'Jl 'Ii� ! � � D; * r, :.a=* D
D - M D C *D �
D O t •
0 0
-1)0 D
-20.,...,__,....,....,__,....,....,__,....,....,1""""'1""""1""""11""""'1""""1""""11""""'1""""1""""11""""'1""""1""""11""""'1""""1""""1--.-""1""""11""""'1""""1""""11""""'1""""1""""1_""1""""1_ ........ I I
10 20 30
U1P Score
40
School Type ... R **"* S BBB U
50
Figure 3. Scatter graph of UTP scores and Reading TV AAS scores with linear representation for Rural, Suburban, and Urban Schools
77

�
...
I n
� G)
i
t) *
* D a a + *
* * a a * * 0
0
D
* a
• 0
a 0
-1)*
a
-a>
10 20 30 40 50
UTP Score
School Type ... A ***S B-BBU
Figure 4. Scatter graph of UTP scores and Language TV AA� scores with linear representation for Rural, Suburban, and Urban Schools
The remaining hypotheses are discussed as a whole since the results were very
similar. The only exception was the discussion of math teacher's and the grade level
taught. The teacher's gender, race, age when hired, grade level taught, and school setting
were analyzed to determine their interaction effect.
Hypothesis 2: There is no interaction effect between the overall Urban Teacher Perceiver
score and gender in regard to the teachers' TV AAS scores in mathematics, reading, and
language.
Hypothesis 3: There is no interaction effect between the overall Urban Teacher Perceiver
score and race in regard to the teachers' TV AAS scores in mathematics, reading, and
language.
78

Hypothesis 4: There is no interaction effect between the overall Urban Teacher Perceiver
score and age when hired in regard to the teachers' TV AAS scores in mathematics,
reading, and language.
Hypothesis 5: There is no interaction effect between the overall Urban_ Teacher Perceiver
score and grade level taught in regard to the teachers' TV AAS scores in mathematics,
reading, and language.
Hypothesis 6: There is no interaction effect between the overall Urban Teacher Perceiver
score and school setting (urban, suburban, and rural) in regard to the teachers' TV AAS
scores in mathematics, reading, and language.
The General Linear Model procedure was used to examine the interaction
between UTP and gender, race, age when hired, grade level taught, and school setting.
There.was no significant interaction effect found between any of the factors except for a
teacher's UTP score and grade level taught in regards to mathematics. With the one
exception, Table 4. 7 reveals no significance of the interaction effect between the overall
Urban Teacher Perceiver score and gender, race, age when hired, grade level taught, and·
school setting in regard to the teacher's TV A.AS scores in mathematics, reading, and
language while all F values are expressed with a level of significance greater than .05.
One last investigation explored the area of school setting. The researcher assumed that
since the screening instrument was first designed for urban teachers, it would reveal a
significance regarding school setting (rural, suburban, and urban); however, it did not.
79
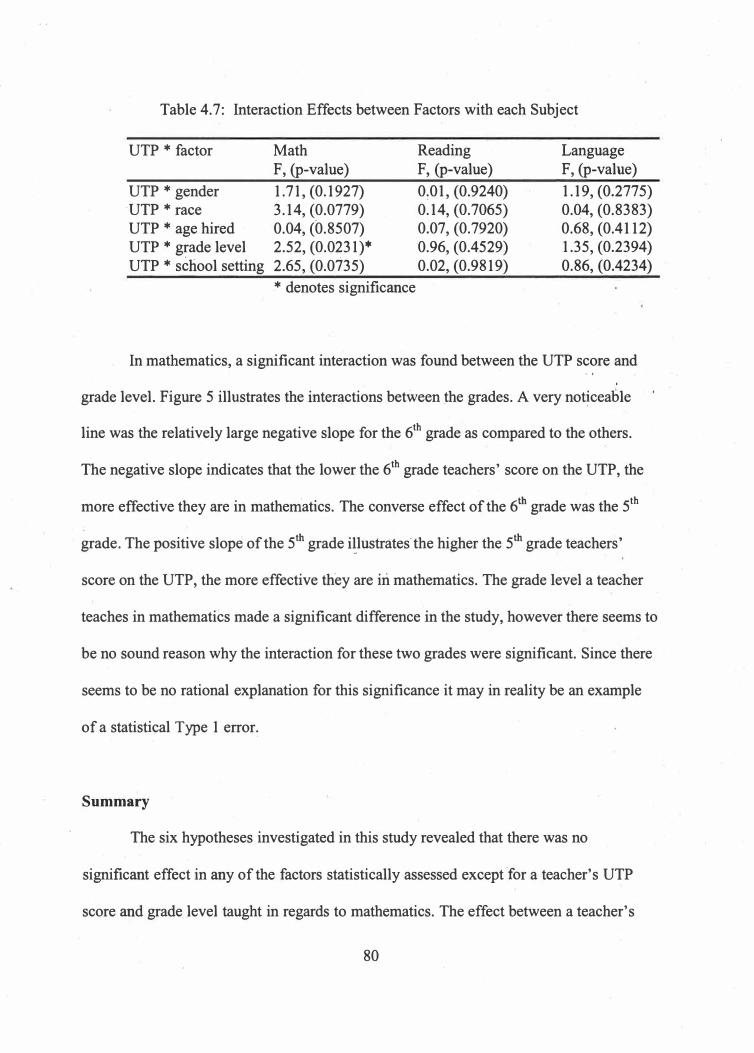
Table 4.7: Interaction Effects between Factors with each Subject
UTP * factor
UTP * gender ·UTP * raceUTP * age hiredUTP * grade levelUTP * school setting
Math F, (p-value) 1.71, (0.1927) 3.14, (0.0779) 0.04, (0.8507) 2.52, (0.0231 )* 2.65, (0.0735) * denotes significance
Reading F, (p-value) 0:01, (0.9240) 0.14, (0.7065) 0.07, (0.7920) 0.96, (0.4529) 0.02, (0.9819)
Language F, (p-value) 1.19, (0.2775) 0.04, (0.8383) 0.68, (0.4112) 1.35, (0.2394) 0.86, (0.4234)
In mathematics, a significant interaction was found between the UTP score and '
. .
' I
grade level. Figure 5 illustrates the interactions between the grades. A very not�ceable
line was the relatively large negative slope for the 6th grade as compared to the others.
The negative slope indicates that the lower the 6th grade teachers' score on the UTP, the
more effective they are in mathematics. The converse effect of the 6th grade was the 5th
· grade. The positive slope of the 5th grade i!lustrates· the higher the 5th grade teachers'
score on the UTP, the more effective they are iri mathematics. The grade level a teacher
teaches in mathematics made a significant difference in the study, however there seems to
be no sound reason why the interaction for these two grades were significant. Since there
seems to be no rational explanation for this significance it may in reality be an example
of a statistical Type 1 error'.
Summary
The six hypotheses investigated in this study revealed that there was no
significant effect in any of the factors statistically assessed except for a teacher's UTP
score and grade level taught in regards to mathematics. The effect between a teacher's
80
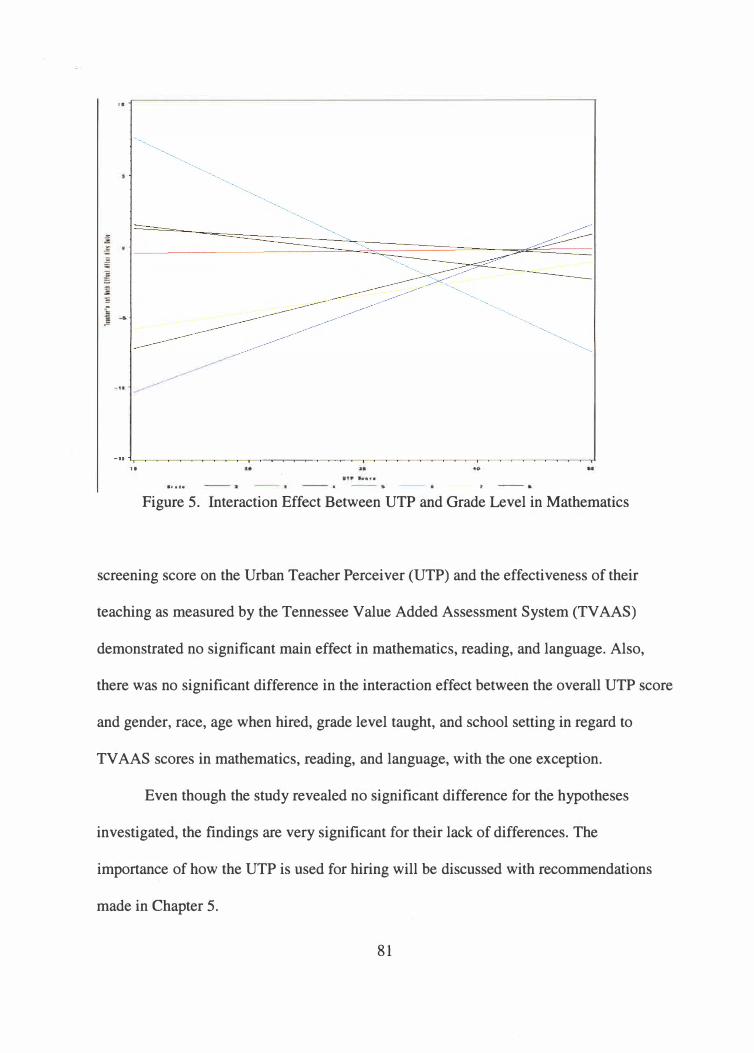
Figure 5. Interaction Effect Between UTP and Grade Level in Mathematics
screening score on the Urban Teacher Perceiver (UTP) and the effectiveness of their
teaching as measured by the Tennessee Value Added Assessment System (TV AAS)
demonstrated no significant main effect in mathematics, reading, and language. Also,
there was no significant difference in the interaction effect between the overall UTP score
and gender, race, age when hired, grade level taught, and school setting in regard to
TV AAS scores in mathematics, reading, and language, with the one exception.
Even though the study revealed no significant difference for the hypotheses
investigated, the findings are very significant for their lack of differences. The
importance of how the UTP is used for hiring will be discussed with recommendations
made in Chapter 5.
81
CHAPTER FIVE
Summary, Conclusions, and Recommendations
Summary
According to the literature, the selection and hiring of potentially effective
teachers is crucial to a student's academic growth (Haberman, 1993; Sanders, 1998;
Caster and Young, 2001). This puts a great deal of pressure and responsibility on schools
and school districts to select the best possible teacher to positively impact student
achievement. Therefore, schools and school systems must strive to find an effective
means to identify the best possible selection process of teachers for their students.
The purpose of this study was to determine if there was any effect between a
selected teacher-screening instrument and teacher effectiveness as measured by academic
gain scores in mathematics, reading, and language. Also, to be determined was whether
or not there was an interaction effect between the teacher's screening instrument score
and gender, race, age when hired, grade level taught, and school setting in regard to the
teacher's effectiveness in mathematics, reading, and language learning.
The Knox County School System has attempted to solve this problem of hiring
the most effective teachers by using a screening instrument developed by The Gallup
Organization entitled the Urban Teacher Perceiver (UTP). According to the school
system's procedures, the potential teacher's overall score must be a minimum of 25 out
of a possible 55 to be granted a possible interview. The Human Resource Department
placed a great deal of emphasis on the overall UTP score for hiring.
82
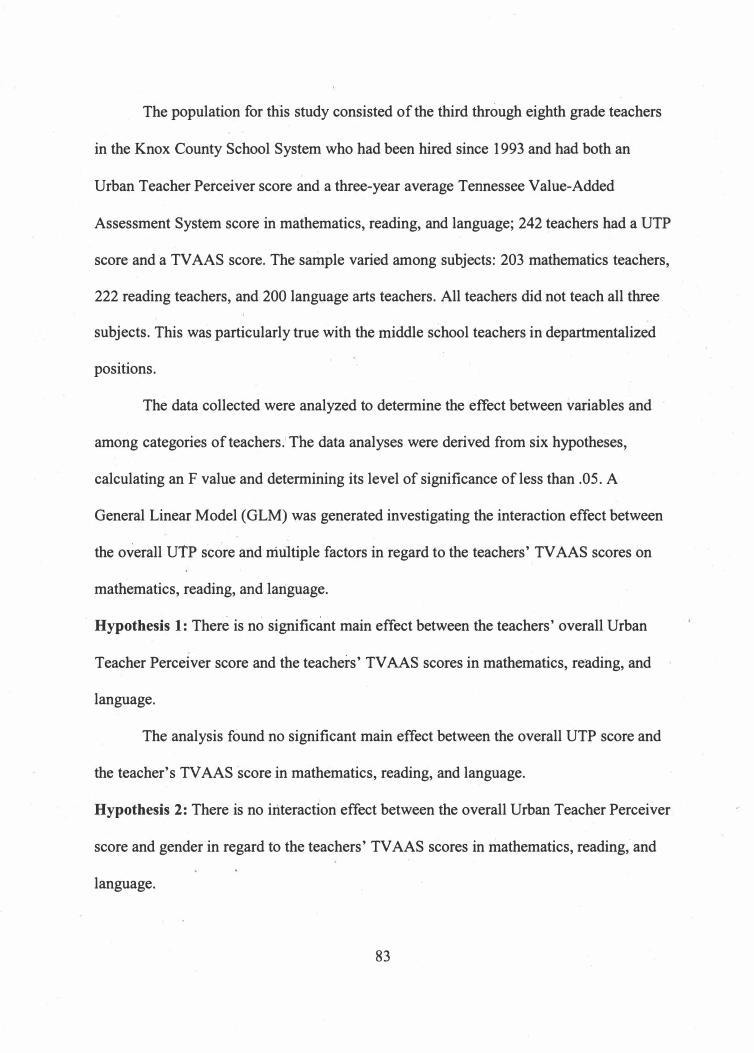
The population for this study consisted of the third through eighth grade teachers
in the Knox County School System who had been hired since 1993 and had both an
Urban Teacher Perceiver score and a three-year average Tennessee Value-Added
Assessment System score in mathematics, reading, and language; 242 teachers had a UTP
score and a TV AAS score. The sample varied among subjects: 203 mathematics teachers,
222 reading teachers, and 200 language arts. teachers. All teachers did not teach all three
subjects. This was particularly true with the middle school teachers in departmentalized
positions.
The data collected were analyzed to determine the effect between variables and
among categories of teachers.! the data analyses were derived from six hypotheses,
calculating an F value and determining its level of significance ofless than .05. A
General Linear Model (GLM) was generated investigating the interaction effect between
the overall UTP score and multiple factors in regard to the teachers' TV AAS scores on
mathematics, reading, and language.
. Hypothesis 1: There is no significant main effect between the teachers' overall Urban
Teacher Perceiver score and the·teachers' TV AAS scores in mathematics, reading, and
language.
The analysis found no significant main effect between the overall UTP score and
the teacher's TV AAS score in mathematics, reading, and language.
Hypothesis 2: There is no interaction effect between the overall Urban Teacher Perceiver
score and gender in regard to the teachers' TV A.AS scores in mathematics, reading; and
language.
83
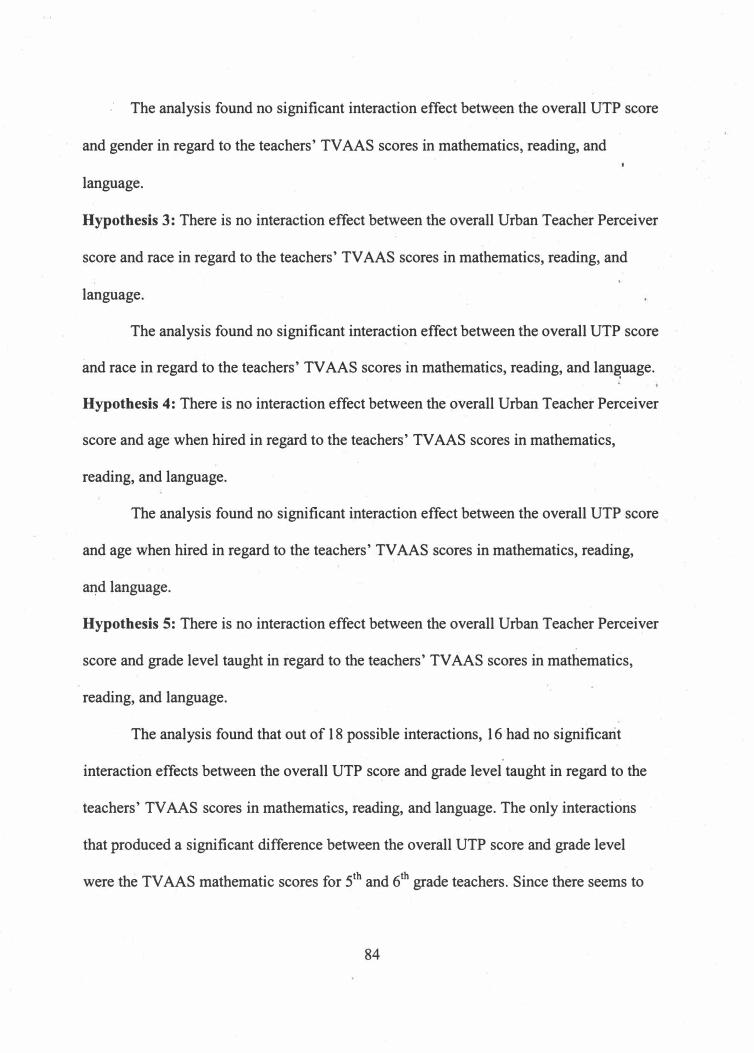
-' The analysis found no significant interaction effect between the overall UTP score
and gender in regard to the teachers' TV AAS scores in mathematics, reading, and
language.
Hypothesis 3: There is no interaction effect between the overall Urban Teacher Perceiver
score and race in regard to the teachers' TV AAS scores in mathematics, reading, and
language.
The analysis found no significant interaction effect between the overall UTP score
and race in regard to the teachers' TV AAS scores in mathematics, reading, and lan&11age.
Hypothesis 4: There is no interaction effect between the.overall Urban Teacher Perceiver
score and age·when hired in regard to the teachers' TV AAS scores in mathematics,
reading, and language.
The analysis found no significant interaction effect between the overall UTP score
and age when hired in regard to the teachers' TV AAS scores in mathematics, reading,
a11-d language.
Hypothesis 5: There is no interaction effect between the overall Urban Teacher Perceiver
score and grade level taught in regard to the teachers' TV AAS scores in mathematics,
reading, and language.
The analysis found that out of 18 possible interactions, 16 ·had no significarit
interaction effects between the overall UTP score and grade level taught in regard to the
. teachers' TV AAS scores in mathematics, reading, and lan�age. The only interactions
that produced a significant difference between the overall UTP score and grade level
were the TV AAS mathematic scores for 5th and 6th grade teachers. Since there seems to
84
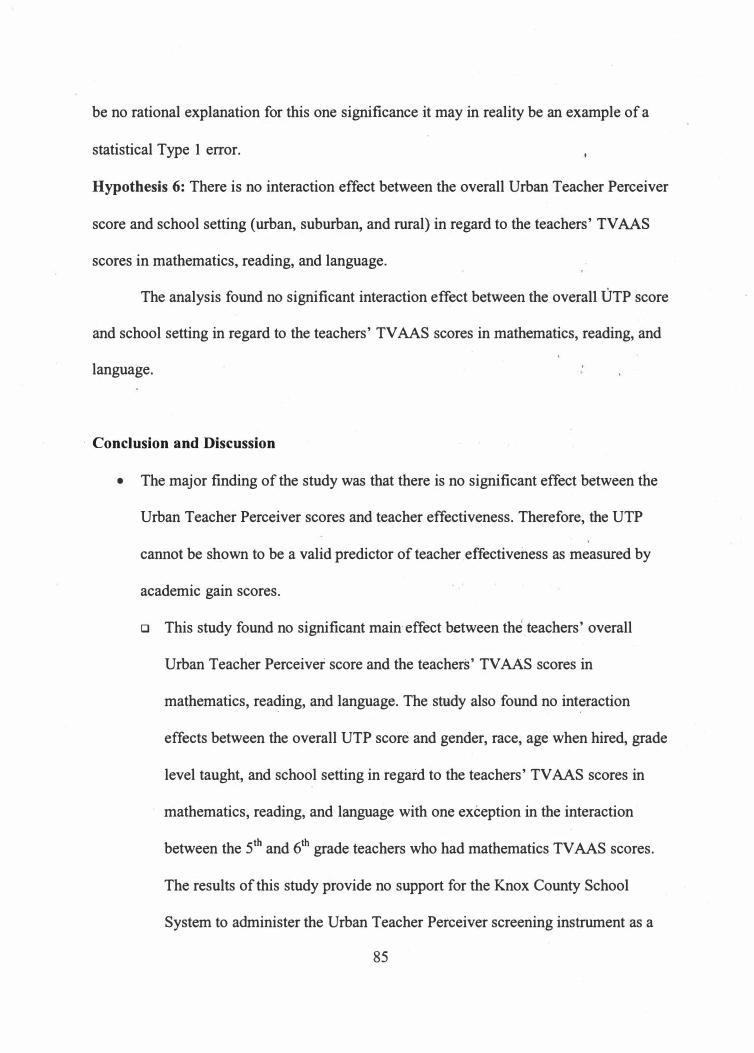
be no rational explanation for this one significance it may in reality be an example of a
statistical Type 1 error.
Hypothesis 6: There is no interaction effect between the overall Urban Teacher Perceiver
score and school setting (urban, suburban, and rural) in regard to the teachers' TV AAS
scores in mathematics, reading, and language.
The analysis found no significant interaction e�ect between the overall UTP score
and school setting in regard to the teachers' TV AAS scores in mathematics, reading, and
language.
· Conclusion and Discussion
• The major finding of the study was that there is no significant effect between the
Urban Teacher Perceiver scores and teacher effectiveness. Therefore, the UTP
cannot be sh_own to be a valid predictor of teacher _effectiveness as measured by
academic gain scores.
o This study found no significant main· effect between the _teachers' overall
Urban Teacher Perceiver score and the teachers' TV AAS scores in
mathematics, rea�ing, and language. The study also found no int�raction
effects between the overall UTP score and gender, race, age when hired, grade
level taught, and school setting in regard to the teachers' TV AAS scores in
mathematics, reading, and language with one exception in the interaction
between the 5th and 6th grade teachers who had mathematics TV AAS scores.
The results of this study provide no support for the Knox County School
System to administer the Urban Teacher Perceiver screening instrument as a
85

sole means of hiring effective teachers as measured by academic gain scores
and principal's perceptions of effective teaching. Is it worthwhile to spend the
time, money, and effort on screening potential teachers in this manner if it has
no influence on academic gain scores? The UTP should definitely not be the
sole determiner for hiring potential teachers ..
o One design concern of this study held by the researcher was the use of
academic gain scores as a measure for teacher effectiveness. While this is the
predominant measure of student success at the time of this research, the focus
of the instrument being examined was designed to measure the affective
attributes of teachers. The Urban Teacher Perceiver (1996) was a humanistic
approach of screening by establishing patterns of thought, feeling, and
behavior called themes. The themes were: commitment, dedication,
individualized perception, caring, involver, empathy, positivity, initiator,
stimulator, input, and concept. Haberman (1993 & 1995) asserted that the
UTP could predict the future success of teachers by demonstrating to students
that they cared, respected, and trusted them. Therefore a criticism of the
Urban Teacher Perceiver based on academic gain scores might be considered
to be somewhat unjust since it was never designed to measure or predict
academic gain scores. On the other hand, a humanistic approach to screening
potential teachers should still have some affect on a student's academic
growth if these attributes in teachers are effective. motivators for student
performance. This study was also based on the assumption that TV AAS were
a valid means for determining teacher effectiveness. The fault of this study
86

may lie in that conflict between affective and cognitive measures of teacher.
performance.
CJ This study was supported by previous research (Kanipe, 1996 & Miller, 1997)
that found no significant relationship between the Urban Teacher Perceiver
and effective teaching. Young and Delli (2002) assert that there i.s a gap in the
literature concerning the Teacher Perceiver outside of the Gallup Organization
as far as analyzing selection outcomes. O'Bannon (1993) found no
relationship between the urban teacher and the Urban Teacher Perceiver. -
Reflecting back to the framework ofthis·study, Kanipe (1996) found that a
perspective teacher's overall Urban Teacher Perceiver does not provide
adequate information in predicting teacher's success in the classroom as
foreseen through a principal questionnaire. This study and Kanipe's (1996)
study were both conducted within the Knox County School System with no
significance found regarding the Urban Teacher Perceiver and teacher -
effectiveness as measured by academic gain scores and principal perceptions
of teachers. Research having similar findings should have an impact on the
· use of the instrument as a screening tool for determining a teacher's
effectiveness as measun::d by academic gain scores.
CJ Given these findings, it is important to note one major concern with this
research. One potential weakness ·of the study was that it was not able to
produce a full range of Urban Teacher Perceiver data. A_ full range of data
would include a potential distribution range of0 to 55 and include teachers
screened out of employment. This study was able to use only the scores of
87
f I

employed teachers since teacher effectiveness ·data was in the form of
. academic gain scores. These teachers' scores ranged from 19 to 55. However
the analysis of this 19 to 55 data set did not show any effect or even trends
toward significance. Cook's study (1985) determined that principals could
identify bad or ineffective teachers by a ranking quartile between the teachers
and their student's achievement, yet this study's parameters did not allow the
·use of lower scores on the UTP. Previous researchers (Drozd, 2003; Young &
Delli, 2002; Schmidt & Rader, 1999; & Kanipe 1996) have communicated
similar range restriction problems. An argument of UTP supporters may be
that the range restriction limits the- study to a more uniform type teacher,
however this research provided a sufficient range of UTP scores.
Recommendations
• This study definitely lends itself to further research, since the study is no more
accurate than the validity of the instruments. A replicate study could be conducted. -
in another school system to clarify the effect of the Urban Teacher Perceiver to
determine teacher effectiveness as measured by academic gain scores. If teacher
applicants screened out of employment in Knox County School System were
ultimately employed elsewhere, it might be interesting to compare the Urban
Teacher Perceiver scores with their TV AAS score in mathematics, reading, and
language. If further research concerning the UTP and. teacher effectiveness as
measured by academic gain scores keeps producing the same re�ults as this study,
88
school systems should consider not using the instrument as the sole determiner for
screening potential teachers.
• The Knox County School System should re-evaluate their purpose for using the
Urban Teacher Perceiver as part of their screening process. This study, along with
Kanipe' s ( 1996) study, does not support the use of the UTP for predicting a
teacher's effectiveness as measured by academic gain scores and principal
perceptions of teachers as a major criteria for elimination. If the UTP had no
influence on academic gain scores, the school system should determine if the
time, money, and effort of screening potential teachers in this manner is
worthwhile. Is the school system more interested in the affective attributes of
teachers who work with their students? The UTP should definitely not be the sole
determiner for hiring a potential teacher.
• The Gallup Organization could conduct further research on the Urban Teacher
Perceiver addressing the full range of scores since they had access to the broader
body of data. Since Gallup (Urban Teacher Perceiv·er, 1996) asserts that their
instrument provides information for determining the potential of a teacher's
outstanding job performance, does this address the issue of academic gain scores?
Even though The Gallup Organization(Drozd,.2003) does not represent the
screening score as the only criteria that should be used in selecting teachers, why
would school systems want to use the instrument if research is not finding an
effect on academic gain scores? The Gallup Organization could conduct more
· studies addressing how the screening instruments could be used to predict a
89

teacher's effectiveness as measured by academic gain scores. Can an affective
instrument determine a cognitive measure of teacher performance?
In closing, this research added to the literature concerning a screening instrument
and teacher effectiveness as measured by academic gain scores. Educators and
researchers should continue to establish the best practices for screening and hiring
effective teachers for a student's academic growth. Effective guidelines for screening and
hiring practices of teachers would benefit our leaders of tomorrow, the students.
90

· REFERENCES
91

References
Archer, J. (1999, May). Sanders 101. Education Week [On-line]. Retrieved March
11, 2002, Available: http://www.edweek.org/ew/vol-18/34sander.h18
Bainbridge, W. (2002, April 23). Kids need the basics in education. The
Columbus Dispatch [On-line]. Retrieved April 25, 2002, Available:
http://www.dispatch.com/editorials-
Baker, S. (1995). Testing equality: The national teacher examination and the
NAACP's legal campaign to equalize teachers' salaries in the south, 1936-:63. History of
Education Quarterly, 35, (1) 49-64.
Borg, W. R., & Gall, M. D. (1989). Educational research: An introduction (5th
ed.). New York: Longman.
Bratton, S., Hom, S. & Wright, S. (1996). Using and interpreting Tennessee's
value-added assessment system: A primer for teachers and principals. Value-Added
Research and Assessment Center, [On-line]. Knoxville, Tennessee. Retrieved March 11,
2002, Available: http://shearonforschools.com/documents/TV AAS.HTML
Castetter, W. B. (1996). The human resource function in educational
administration ( 6th ed.). Columbus, Ohio: Merrill.
Castetter, W. & Young, I. P. (2000). The human resource function in educational
administration (ih ed.). Columbus, Ohio: Merrill.
Cook, D. L. (1985). An objective component for the evaluation of teaching.
Unpublished doctoral'dissertation, The University of Tennessee, Tennessee.
Darling-Hammond, L. (1997). The right to learn. San Francisco: Jossey-Bass
Publishers.
92
Darling-Hammond, L. (2000, January). Teacher quality and student achievement:
A review of state policy evidence. In G. Glass (Ed.), Education Policy Analysis Archives
� (1), [On-line]. Retrieved February 28, 2002, Available:
http://olam.ed.asu.edu/epaa/v8n1/
Drozd, D. (2002). Research Director of the Gallup Organization (e-mail).·
Available: [email protected]
Drozd, D. (2003, June 5) Research Director of the Gallup Organization. Young
Delli Position Paper4. Retrieved June 5, 2003, Available from: [email protected]
Garson, G.D. (2004). OLM: Manova and mancoava [On-line]. Retrieved April 6,
2004 from Dr. Garson's web page at North Carolina State University, Available:
http:/ /www2.chass.ncsu.edu/ garson/pa7 65/manova.htm
Gordon, G. (1999, December). Teacher talent and urban schools. Phi Delta
Kappan, 81 (4), 304.
Haberman, M. (1987). Recruiting and selecting teachers for urban schools. New
York: ERIC Clearinghouse on Urban Education.
Haberman, M. (1993). Predicting the success of urban teachers: the Milwaukee
trials. Action in Teacher Education, 1-5.
Haberman, M. ( 1995). Star teachers of children in poverty. West Lafayette,
Indiana: Kappa Delta Pi.
Hill, D. (2000, May). He's got your number. Teacher Magazine [On-line].
Retrieved May 10, 2000, Available:
http:www.teachermagazine.org/tm/tm_printstory.cfm?slug=08sanders.h11
93
Jackson, S. (2001). Are you hiring the best person for the job? HR Guide to the
Internet: Personnel Selection: Articles: Performance Based Interviews [On-line].
Retrieved March 30, 2002, Available: http://www.hr-guide.com/data/A301.httn
Jones, R. S. (1983). A comparison of present position of selected college and
university personnel administrators in the southeastern United States to the Myers-Briggs
type indicator. Unpublished doctoral dissertation, East Tennessee State University,
Tennessee.
Kanipe, M. L. (1996). A study of the predictive validity of the Urban Teach�r
Perceiver Interview in the Knox County School System. Unpublished doctoral
dissertation, The University of Tennessee, Tennessee.
Killeffer, J. (1989). Effective schools correlates and achievement gain: A
relational study. Unpublished doctoral dissertation, The University of Tennessee,
Tennessee.
Linn, R. (2001 ). The design and evaluation of educational assessment and
accountability systems. Center for the Study of Evaluation Technical Report, 539 (p. 16 -
17). Los Angeles: National Center for Research on Evaluation, Standards, and Student
Testing.
Lomax, R. (2001 ). An introduction to statistical concepts for education and
behavioral sciences. Mahwah, New Jersey: Lawrence Erlbaum Associates, Publishers.
Lucius, R. (2001). Introduction and history of the five factor model. Fitability
Systems [On-line]. Retrieved April 1, 2002, Available:
http://WWW.fitability.com/page.asp?itemid=5 l 362&
94
Lucius, R. (2001 ). Using personality tests: Believe or beware? Fitability Systems
[On-line]. Retrieved April 1, 2002, Available:
http://www.fitability.com/page.asp?itemid=51366&
. Mccutcheon J., Schmidt, C., & Bolden, S. (1991, Spring). Relationships among
selected personality v ariables, academic and student teaching behavior. Journal of
Research and Development in Education, 24(3 ), 3 7-44.
McTague, T. S. (2001). Hiring in good times and bad: A comprehensive guide to
entry-level staffing. Westport, Connecticut: Quorum Books.
Miller, J., Clements, R., & Gardner, C. (1977). A preliminary investigation of the
teacher perceiver instrument for teacher selection. (Report No. RDCTE-TR-5077). Texas
University, Austin: Research and Development Center for Teacher Education. (ERIC
Document Reproduction Service No. ED 206 706)
Myers-Briggs Type Indicator® Narrative Report. (1988). Registered trademark
of Consulting Psychologists Press, Inc., Gainesville, Florida.
O'Bannon, B. (1993). A comparison ofrole expectations for effective urban
teachers and behavioral profiles of candidate� for alternative teacher licerisure. Paper
presented at the Mid-South Educational Research Association, New Orleans, Louisiana.
Olson, L. (2001; February}. Usefulness of annual testing varies by state.
Education Week [On-line]. Retrieved January 16, 2002, Available:
· http://www.edweek.com/ew/ewstory.cfm?slug=23annua1.h20
Sanders, W. (1998). Value-added assessment. The School Administrator,
December, 24-27.
95

Sanders, W. L. (2000, July 21). "Value-Added Assessment from Student
Achievement Data: Opportunities and Hurdles." CREATE NATIONAL EVALUATION
INSTITUTE. SASinSchool c SAS Institute, Inc. Cary, NC.
Sanders, W. & Hom, S. (1995, March). Education assessment reassessed: The
usefulness of standardized and alternative measures of student achievement as indicators
for the assessment of educational outcomes. Education Policy Analysis Archives, 3 (6),.
[On-line]. Retrieved March 11, 2002, Available: http://epaa.asu.edu/epaa/v3n6.html
Sanders, W. & Hom, S. (1998). Research findings from the Tennessee valu�
added assessment system (TV AAS) database: Implications for educational evaluation and
research. The Tennessee Value-Added System, [On-line]. Retrieved March·12, 2002,
Available: http://www.mdk 12 .org/practices/ensure/tva/implications.html
Schmidt, F.L. & Rader, M. (1999). Exploring the boundary conditions for
interview validity: meta-analytic validity findings for a new interview type. Personnel
Psychology, 52, 445-464.
Shearon, D. (2001). The Tennessee value-added assessment system.TVAAS, [On
line]. Retrieved March· 11, 2002, Available:
http://www.shearonforschools.com/TV AAS �Splash.htm
Sloan, S. (2001, September). Schools in Odessa, Missouri, focus on strengths.
Gallup Educator, 1-2.
Smith, R. E. (1998). Human resources administration: A school-based
perspective. Larchmont, New York: Eye on Education.
96

Soroka v. Dayton Hudson Corp., dba Target Stores, lower court case: 1
Cal.Rptr.2d 77 (1991). PsycLaw [On-line]. Retrieved April 1, 2002, Available:
http://www. psyclaw .org/soroka.html
SRI teacher perceiver executive summary. (1990, January). Lincoln, Nebraska:
· SRI Gallup.
Stone, J. (1999). Value-added assessment: An accountability revolution. ·Better
Teachers, Better Schools [On-line] 239-249. Washington, DC: Thomas B. Fordham
Foundation. Retrieved March 11, 2002, Available:
http://www.edexcellence.net/better/tchrs/btbs.htm·
Stronge, J. H. (2002). Qualities of effective teachers. Alexandria, Virginia:
Association for Supervision and Curriculum Development.
Tennessee Code Annotated (2000). Part 6-Performance goals and assessment
(Sanders' model) (2000 Supplement, Volume 9). Lexis Publishing.
Tennessee State Board of Education. (2002). The Master Plan for Tennessee
Schools. Nashville: Author.
TexaSoft©. (1996). WINKS 4.l c Professional Edition� (Software program).
The Gallup Organization. (1990, January). SRI Teacher Perceiver c�ncurrent
validity study. Available from Dee Drozd, Research Director of the Gallup Organization:
[email protected]. Lincoln, NE: Author.
The Gallup Organization. (1994). Gallup/SRI Teacher Perceiver up-dated
research. Available from Dee Drozd, Research Director of the Gallup Organization:
Dee_ [email protected]. Lincoln, NE: Author.
97

The Gallup Organization. (2000, May). A study of talent, attitudes, and
teacher/student outcomes. Available from Dee Drozd, Research Director of the Gallup
Organization: Dee_ [email protected]. Lincoln, NE: Author.
The Gallup Organization. (2001, December). The Gallup Teacherlnsight System
facts.-Gallup Educator, 3.
The Gallup Organization. (2002). History of the Gallup organization. Retrieved
May 6, 2003, Available from Dee Drozd, Research Director of the Gallup Organization:
[email protected]. Lincoln, NE: Author.
The Gallup Organization (2003). Talented-based hiring [On-line]. Retrieved May
4, 2003, Available: http://gallup.com/management/SRl.asp
The Praxis Series (2002). The praxis series: 2002-3 Registration Bulletin [On
line]. ETS Educational Testing Service: Teaching and learning division. Retrieved
October 17, 2002, Available: http://www.ets.org/praxis/prxtn.html#whomust
Urban Teacher Perceiver™: Interview Process. (1996 (6/97)). The gallup
organization [Brochure]. Lincoln, Nebraska: Gallup, Inc.
Urban Teacher Perceiver Screener Research. (2001, May). The gallup
organization [Attachment]. Lincoln, Nebraska: Gallup, Inc.
Urban Teacher Research: Summary oflntervi�w Development Study. (1993,
January). The gallup organization. Lincoln, Nebraska: Gallup, Inc.
U. S. Department of Education. (2002). No Child Left Behind. Washington D. C.:
Author.
98

U.S. Department of Labor, Employment and Training Administration. (1998 -
2001). The fundamentals of human resource management [On-line]. Retrieved March 30,
2002, Available: http://www.hr-guide.com
Van Vleck, L. D. (1997). Charles Roy Henderson, 1911-1989: A brief biography.
NAP Home Page [On-line]. Retrieved March 6, 2002, Available:
http:/ /stills.nap.edu/html/bio 73h/henderson.html
Weitzul, J.B. (1992). Evaluating interpersonal skills in the job interview: A guide
for human resource professionals. New York: Quorum Books.
Wise, A. E., et al. (1987, January). Effective teacher selection: From recruitment
to retention--case studies. A special report prepared for the National Institute of
Education by the Rand Corporation ..
Young, I. P., Delli, D. A. (2002). The validity of the teacher perceiver interview
for predicting performance of classroom teachers. Educational Administration Quarterly, .
38, (5), 586-612.
99

APPENDICES
100

APPENDIXA
Permission Forms for Study
101

David E. "Gene" Loyd 508 Sand Valley Rd. Jonesborough, TN 37659
Dr. Charles Lindsey Director of Knox County School System 912 South Gay St. Knoxville, TN 3 7902
Dear Dr. Lindsey:
I am a doctoral student at the University of Tennessee and am presently working on the research needed for my dissertation. The purpose of the study is to determine if there is a main effect between teachers' Urban Perceiver score and the teachers' TV AAS scores in mathematics, reading, and language in the Knox County School System. The results of this study, along with a previous study by Mary Lou Kanipe, could provide information to the school system as to whether the time, money, and effort invested in the Urban Teacher Perceiver process is well spent.
May I have permission froni you to contact Dr. Mike Winstead, Coordinator of Research and Evaluation, and Betty Sue Sparks, Human Resource Director, to ask for data from Knox County teachers' Urban Teacher Perceiver scores and TV AAS scores? Since privacy is of the utmost importance, Dr. Winstead will be asked to assign an identification number to the participants so that names never appear. Ms. Sparks will be asked some general information concerning the background and use of the Urban Teacher
· Perceiver Interview process. Please sign in the designated area if you give permission forme to conduct this study.
If I am allowed permission to conduct this study, please let me assure you that the strictest confidentiality will be followed and no names will be identified. D,r. Winstead and Dr. Sparks will have the right to choose whether or not to participate in the study. If, for some reason he/she feels uncomfortable at any time during the process, they have the right to withdraw from the study with complete confidentiality. I would also be happy to provide you with the results of my study if you like.
· Please indicate if you agree to grant permission by signing below. If you have anyquestions, please do not hesitate to call me at home (753-6263) or at work (753-1130).
Thank you for considering my request,
David E. "Gene" Loyd
Director of Knox County School System's Signature
102
Date
David E. "Gene" Loyd 508 Sand Valley Rd. Jonesborough, TN 37659
Betty Sue Sparks Knox County School System 912 South Gay St.
. Knoxville, TN 3 7902
Dear Ms. Sparks:
I am a doctoral student,at the University of Tennessee and am presently working on the research needed for my dissertation. The purpose of the study is to determine if there is a main effect between teachers' Urban Perceiver score and the teachers' TV AAS scores in. mathematics, reading, and language in the Knox County School System. The.results of this study, along with a previous study by Mary Lou Kanipe, could provide information to the school system as to whether the time, money, and effort invested in.the Urban Teacher Perceiver process is well spent.
I have secured permission from Dr. Lindsey, Director of Knox County School System, to conduct this study and have included a copy of the_ letter he has signed. May I have your permission to use you as a source of information for the study? Please sign in the. designated area if you are willing to participate in the study.
If I am allowed permission to conduct this study, please let me assure you that the strictest confidentiality will be followed and no names will be identified. You have the right to choose whether or not to participate in the study. If, for _some reason you feel · uncomfortable at any time during the process, then you have the right to withdraw from the study with complete confidentiality. I would also be happy to provide you with the results of my study if you like.
Please indicate if you agree to grant permission by signing below. If you have any questions, please do not hesitate to call me at home (753-6263) or at work (753-1130).
Thank you for considering my request,
David E. "Gene" Loyd
Signature 'Date
103

David E. "Gene" Loyd 508 Sand Valley Rd. Jonesborough, TN 37659
Dr. Mike Winstead Knox County School System 912 South Gay St. Knoxville, TN 3 7902
D,ear Dr. Winstead:
I am a doctoral student at the University of Tennessee and am presently working on the research needed for my dissertation. The purpose of the study is to determine if there is a main effect between teachers' Urban Perceiver score and the teachers' TV AAS scores in mathematics, reading, and language in the Knox County School System. The results of this study, along with a previous study by Mary.Lou Kanipe, could provide informition to the school system as to whether the time, money, and effort.invested in the Urban-. Teacher Perceiver process is well spent.
I have secured permission from Dr. Lindsey, Director of Knox County School System, to conduct this study and have included a copy of the letter he ha_s signed. May I have your permission to use you as a source of information for the study? Please sign in the
. designated area if you are willing to participate in the study.
If I am allowed permission to conduct this study, please let me assure you that_ the strictest confidentiality will be followed and no names will be identified._ You· have the right to choose whether or not to participate in the study. If, for some reason you feel uncomfortable at any time during the process, then you have the right to withdraw from the study with complete confidentiality. I would also be happy to provide you with the results of my study if you like.
Please indicate if you agree to grant permission by signing below. If you have any questions, please do not hesitate to call me at home (753-6263) or at work (753-1130).
Thank you for considering my request,
David E. "Gene" Loyd
Signature Date
104

APPENDIXB
Gallup Urban Teacher Perceiver Themes
105
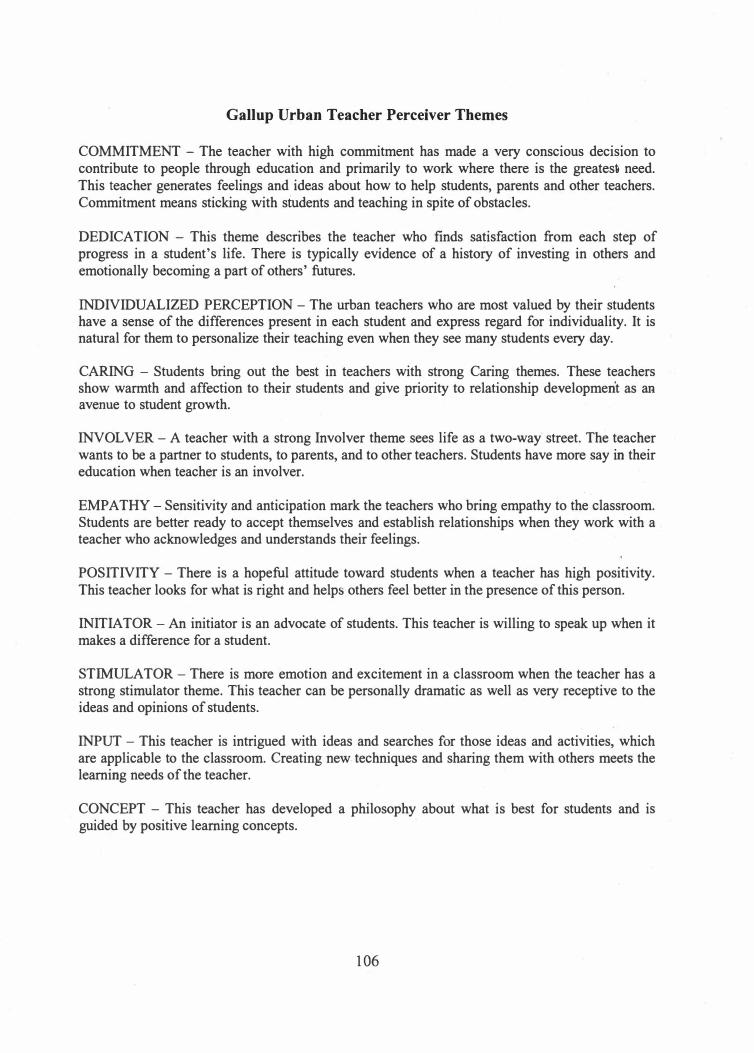
Gallup Urban Teacher Perceiver Themes
COMMITMENT - The teacher with high commitment has made a very conscious decision to contribute to people through education and primarily to work where there is the greatesi need. This teacher generates feelings and ideas about how to help students, parents and other teachers. Commitment means sticking with students and teaching in spite of obstacles.
DEDICATION - This theme describes the teacher who finds satisfaction from each step of progress in a student's life. There is typically evidence of a history of investing in others and emotionally becoming a part of others' futures.
INDIVIDUALIZED PERCEPTION - The urban teachers who are most valued by their students have a sense of the differences present in each student and express regard for individuality. It is natural for them to personalize their teaching even when they see many students every day.
CARING - Students bring out the best in teachers with strong Caring themes. These teachers show warmth and affection to their students and give priority to relationship development as an avenue to student growth.
INVOLVER - A teacher with a strong Involver theme sees life as a two-way street. The teacher wants to be a partner to students, to parents, and to other teachers. Students have more say in their education when teacher is an involver.
EMPATHY - Sensitivity and anticipation mark the teachers who bring empathy to the classroom. Students are better ready to accept themselves and establish relationships when they work with a teacher who acknowledges and understands their feelings.
POSITIVITY - There is a hopeful attitude toward students when a teacher has high positivity. This teacher looks for what is right and helps others feel better in the presence of this person.
INITIATOR - An initiator is an advocate of students. This teacher is willing to speak up when it makes a difference for a student.
STIMULATOR - There is more emotion and excitement in a classroom when the teacher has a strong stimulator theme. This teacher can be personally dramatic as well as very receptive to the ideas and opinions of students.
INPUT - This teacher is intrigued with ideas and searches for those ideas and activities, which are applicable to the classroom. Creating new techniques and sharing them with others meets the learning needs of the teacher.
CONCEPT - This teacher has developed a philosophy about what is best for students and is guided by positive learning concepts.
106

VITA·
David Eugene "Gene" Loyd was born in Washington County, Tennessee on April.· I
23, 1958. He attended West View Elementary School and graduated from �avid Crockett
High School, Jonesborough, Tennessee in 1976. Gene entered �ast Tenp.essee State
University in the fall of 1976 and graduated in the summer of 1980 with a B3:chelor of
Science degree in Education.
In August 1980, Gene began his teaching career at South Central .Elementary and
in three years, 1983, he returned to his alma mater, David Crockett High 'scqool, t? teach
mathematics and coach basketball, track, and golf While teaching and coaching at David
Crockett, along with starting a family, Gene received a Masters Degree in Supervision
and Administration from East Tennessee State Universityin 1986.
In 1991, Gene began substituting for the assistant principals at David Crock�tt
High School when needed, along with teaching students at the Optional·Diploma High
School in the evenings. The leadership opportunities that came from this endeavor lead to
a principalship position at Lamar Elementary School (K-8) in 1993, where he was
employed during the publishing of this dissertation. While at Lamar School, Gene began
his doctoral program at the University of Tennessee in August of 1999.
He married Karen Sparks in 1982 and they had four children: Emily, Jordan,
Ryan, and Jonathan. At the writing of this document they were living in Jonesborough,
Tennessee.
107

1643 4866 � 4 ('J 11/03/04 tm '