The NEXT100 experiment for neutrinoless double beta decay searches (Conceptual Design Report
176
CONCEPTUAL DESIGN REPORT The NEXT-100 experiment for ββ 0ν searches at LSC (16 May 2011) Abstract We propose an EASY (Electroluminescent ApparatuS of high Yield ) and SOFT (Separated Optimized FuncTion ) time-projection chamber for the NEXT experiment, that will search for neutrinoless double beta decay (ββ 0ν ) in 136 Xe. Our experiment must be competitive with the new generation of ββ 0ν searches already in operation or in construction. This requires a detector with very good energy resolution (. 1%), very low background con- tamination (∼ 10 -4 counts/(keV · kg · y)) and large target mass. In addition, it needs to be operational as soon as possible. The design described here optimizes energy resolution thanks to the use of proportional electroluminescent amplification (EL), which provides a large yield of photons as a signal; it is compact, as the Xe gas is under high pressure; and it allows the measurement of the topological signature of the event to further reduce the background contamination. The SOFT design uses different sensors for tracking and calorimetry. We propose the use of SiPMs (MPPCs) coated with a suitable wavelength shifter for the tracking, and the use of radiopure photomultipliers for the measurement of the energy and the primary scintillation needed to estimate the t 0 . This design provides the best possible energy resolution compared with other NEXT designs based on avalanche gain devices. The baseline design is an Asymmetric Neutrino Gas EL apparatus (ANGEL), which was already outlined in the NEXT LOI. ANGEL is conceived to be easy to fabricate. It requires very little R&D and most of the proposed solutions have already been tested in the NEXT-1 prototypes. Therefore, the detector can be ready by 2013. The detector may be upgraded to a fiducial mass of 1 ton after the initial physics runs, following the successful approach of GERDA and XENON experiments. With our design, NEXT will be competitive and possibly out-perform existing proposals for next-generation neutrinoless double-beta decay experiments. In this Conceptual Design Report (CDR) we discuss first the physics case, present a full design of the detector, describe the NEXT-1 EL prototypes and their initial results, and outline a project to build a detector with 100 kg of enriched xenon to be installed in the Canfranc Underground Laboratory in 2013. arXiv:1106.3630v1 [physics.ins-det] 18 Jun 2011
-
Upload
independent -
Category
Documents
-
view
1 -
download
0
Transcript of The NEXT100 experiment for neutrinoless double beta decay searches (Conceptual Design Report

CONCEPTUAL DESIGN REPORT
The NEXT-100 experiment forββ0ν searches at LSC
(16 May 2011)
Abstract
We propose an EASY (Electroluminescent ApparatuS of high Yield) and SOFT (SeparatedOptimized FuncTion) time-projection chamber for the NEXT experiment, that will searchfor neutrinoless double beta decay (ββ0ν) in 136Xe. Our experiment must be competitivewith the new generation of ββ0ν searches already in operation or in construction. Thisrequires a detector with very good energy resolution (. 1%), very low background con-tamination (∼ 10−4 counts/(keV · kg · y)) and large target mass. In addition, it needs tobe operational as soon as possible. The design described here optimizes energy resolutionthanks to the use of proportional electroluminescent amplification (EL), which providesa large yield of photons as a signal; it is compact, as the Xe gas is under high pressure;and it allows the measurement of the topological signature of the event to further reducethe background contamination. The SOFT design uses different sensors for tracking andcalorimetry. We propose the use of SiPMs (MPPCs) coated with a suitable wavelengthshifter for the tracking, and the use of radiopure photomultipliers for the measurement ofthe energy and the primary scintillation needed to estimate the t0. This design providesthe best possible energy resolution compared with other NEXT designs based on avalanchegain devices.The baseline design is an Asymmetric Neutrino Gas EL apparatus (ANGEL), which wasalready outlined in the NEXT LOI. ANGEL is conceived to be easy to fabricate. Itrequires very little R&D and most of the proposed solutions have already been tested inthe NEXT-1 prototypes. Therefore, the detector can be ready by 2013. The detectormay be upgraded to a fiducial mass of 1 ton after the initial physics runs, following thesuccessful approach of GERDA and XENON experiments.With our design, NEXT will be competitive and possibly out-perform existing proposals fornext-generation neutrinoless double-beta decay experiments. In this Conceptual DesignReport (CDR) we discuss first the physics case, present a full design of the detector,describe the NEXT-1 EL prototypes and their initial results, and outline a project tobuild a detector with 100 kg of enriched xenon to be installed in the Canfranc UndergroundLaboratory in 2013.ar
Xiv
:110
6.36
30v1
[ph
ysic
s.in
s-de
t] 1
8 Ju
n 20
11
The NEXT collaboration
E. Gomez, R.M. Gutierrez, M. Losada, G. Navarro
Universidad Antonio Narino, Bogota, Colombia
A.L. Ferreira, C.A.B. Oliveira, J.F.C.A. Veloso
Universidade de Aveiro, Aveiro, Portugal
D. Chan, A. Goldschmidt, D. Hogan, T. Miller, D. Nygren,
J. Renner, D. Shuman, H. Spieler, T. Weber
Lawrence Berkeley National Laboratory, Berkeley CA, USA
F.I.G. Borges, C.A.N. Conde, T.H.V.T. Dias, L.M.P. Fernandes, E.D.C. Freitas,
J.A.M. Lopes, C.M.B. Monteiro, H. Natal da Luz, F.P. Santos, J.M.F. dos Santos
Universidade de Coimbra, Coimbra, Portugal
M. Batalle, L. Ripoll
Universitat de Girona, Girona, Spain
P. Evtoukhovitch, V. Kalinnikov, A. Moiseenko, Z. Tsamalaidze, E. Velicheva
Joint Institute for Nuclear Research (JINR), Dubna, Russia
E. Ferrer-Ribas, I. Giomataris, F.J. Iguaz
IRFU, Centre d’Etudes Nucleaires de Saclay, Gif-sur-Yvette, France
J.A. Hernando Morata, D. Vazquez
Universidade de Santiago de Compostela, Santiago de Compostela, Spain
C. Sofka, R. C. Webb, J. White
Texas A&M University, College Station TX, USA
J.M. Catala, R. Esteve, V. Herrero,
A. Mendez, J.M. Monzo, F.J. Mora, J.F. Toledo
I3M, Universidad Politecnica de Valencia, Valencia, Spain
R. Palma, J.L. Perez-Aparicio
Universidad Politecnica de Valencia, Valencia, Spain
V. Alvarez, M. Ball, J. Bayarri, S. Carcel, A. Cervera,J. Dıaz, P. Ferrario, A. Gil, J.J. Gomez-Cadenas∗, K. Gonzalez,
I. Liubarsky, D. Lorca, J. Martın-Albo, F. Monrabal, J. Munoz Vidal,
M. Nebot, J. Perez, J. Rodrıguez, L. Serra, M. Sorel, N. Yahlali
Instituto de Fısica Corpuscular (IFIC), CSIC & Univ. de Valencia, Valencia, Spain
J.M. Carmona, J. Castel, S. Cebrian, T. Dafni, H. Gomez, D.C. Herrera,
I.G. Irastorza, G. Luzon, A. Rodrıguez, L. Seguı, A. Tomas, J.A. Villar
Lab. de Fısica Nuclear y Astropartıculas, Universidad de Zaragoza, Zaragoza, Spain
∗Spokesperson. Contact email: [email protected]
2
Contents
1 The Physics 51.1 Majorana neutrinos and double beta decay . . . . . . . . . . . . . . . . . 51.2 Double beta decay experiments . . . . . . . . . . . . . . . . . . . . . . . . 61.3 The double beta race . . . . . . . . . . . . . . . . . . . . . . . . . . . . . . 8
1.3.1 CUORE . . . . . . . . . . . . . . . . . . . . . . . . . . . . . . . . . 81.3.2 GERDA . . . . . . . . . . . . . . . . . . . . . . . . . . . . . . . . . 101.3.3 EXO . . . . . . . . . . . . . . . . . . . . . . . . . . . . . . . . . . . 101.3.4 KamLAND-Zen . . . . . . . . . . . . . . . . . . . . . . . . . . . . . 11
1.4 The NEXT challenge . . . . . . . . . . . . . . . . . . . . . . . . . . . . . . 11
2 EASY & SOFT 142.1 Energy resolution in xenon detectors . . . . . . . . . . . . . . . . . . . . . 14
2.1.1 Scintillation . . . . . . . . . . . . . . . . . . . . . . . . . . . . . . . 162.1.2 Ionization . . . . . . . . . . . . . . . . . . . . . . . . . . . . . . . . 162.1.3 Intrinsic energy resolution . . . . . . . . . . . . . . . . . . . . . . . 17
2.2 Electroluminescence . . . . . . . . . . . . . . . . . . . . . . . . . . . . . . 202.2.1 The Gas Proportional Scintillation Chamber . . . . . . . . . . . . 202.2.2 Xenon atomic energy structure . . . . . . . . . . . . . . . . . . . . 222.2.3 Simulation of EL in NEXT . . . . . . . . . . . . . . . . . . . . . . 222.2.4 Electroluminescence yield . . . . . . . . . . . . . . . . . . . . . . . 23
2.3 The SOFT concept . . . . . . . . . . . . . . . . . . . . . . . . . . . . . . . 26
3 The ANGEL design 303.1 Source mass . . . . . . . . . . . . . . . . . . . . . . . . . . . . . . . . . . . 303.2 The energy plane . . . . . . . . . . . . . . . . . . . . . . . . . . . . . . . . 31
3.2.1 PMTs and pressure . . . . . . . . . . . . . . . . . . . . . . . . . . 323.2.2 How many PMTs? . . . . . . . . . . . . . . . . . . . . . . . . . . . 32
3.3 The tracking plane . . . . . . . . . . . . . . . . . . . . . . . . . . . . . . . 373.3.1 MPPCs . . . . . . . . . . . . . . . . . . . . . . . . . . . . . . . . . 373.3.2 Coating MPPCs with TPB . . . . . . . . . . . . . . . . . . . . . . 373.3.3 Implementation of the tracking plane . . . . . . . . . . . . . . . . . 38
3.4 Pressure Vessel . . . . . . . . . . . . . . . . . . . . . . . . . . . . . . . . . 413.5 Field cage, high voltage and electroluminescence grids . . . . . . . . . . . 45
1

4 The NEXT-1 prototypes 494.1 The energy function in the NEXT-1 prototypes . . . . . . . . . . . . . . . 504.2 FE readout electronics for the PMTs . . . . . . . . . . . . . . . . . . . . 504.3 The NEXT1 prototype at LBNL . . . . . . . . . . . . . . . . . . . . . . . 54
4.3.1 Gas system design and construction . . . . . . . . . . . . . . . . . 544.3.2 Electroluminescent TPC . . . . . . . . . . . . . . . . . . . . . . . . 544.3.3 DAQ design, implementation and PMT measurements . . . . . . . 56
4.4 The NEXT1 prototype at IFIC . . . . . . . . . . . . . . . . . . . . . . . . 564.4.1 Design and construction . . . . . . . . . . . . . . . . . . . . . . . 574.4.2 The gas system . . . . . . . . . . . . . . . . . . . . . . . . . . . . . 594.4.3 Field cage and light tube . . . . . . . . . . . . . . . . . . . . . . . 594.4.4 High voltage and feedthroughs . . . . . . . . . . . . . . . . . . . . 594.4.5 The tracking plane . . . . . . . . . . . . . . . . . . . . . . . . . . . 594.4.6 FE readout electronics for SiPMs . . . . . . . . . . . . . . . . . . . 614.4.7 Commissioning . . . . . . . . . . . . . . . . . . . . . . . . . . . . . 65
5 Initial results from the NEXT-1 prototypes 665.1 First results from the LBNL prototype . . . . . . . . . . . . . . . . . . . . 66
5.1.1 Setup and trigger . . . . . . . . . . . . . . . . . . . . . . . . . . . . 665.1.2 The Cs-137 analysis . . . . . . . . . . . . . . . . . . . . . . . . . . 685.1.3 Other analysis . . . . . . . . . . . . . . . . . . . . . . . . . . . . . 755.1.4 Drift velocity and nitrogen . . . . . . . . . . . . . . . . . . . . . . 775.1.5 EL Yield . . . . . . . . . . . . . . . . . . . . . . . . . . . . . . . . 795.1.6 Outlook . . . . . . . . . . . . . . . . . . . . . . . . . . . . . . . . . 82
5.2 A first look at alpha events in NEXT1-IFIC . . . . . . . . . . . . . . . . . 825.2.1 General features . . . . . . . . . . . . . . . . . . . . . . . . . . . . 825.2.2 Selection of alpha particles . . . . . . . . . . . . . . . . . . . . . . 835.2.3 Energy Reconstruction . . . . . . . . . . . . . . . . . . . . . . . . . 885.2.4 Dependence on Spatial Location . . . . . . . . . . . . . . . . . . . 885.2.5 Energy Resolution . . . . . . . . . . . . . . . . . . . . . . . . . . . 89
5.3 Other Measurements . . . . . . . . . . . . . . . . . . . . . . . . . . . . . . 895.3.1 Drift Velocity . . . . . . . . . . . . . . . . . . . . . . . . . . . . . . 895.3.2 S2-to-S1 Ratio . . . . . . . . . . . . . . . . . . . . . . . . . . . . . 915.3.3 Longitudinal Diffusion and Range of Alpha Particles . . . . . . . . 93
6 Sensitivity of NEXT-100 956.1 Sources of background in NEXT . . . . . . . . . . . . . . . . . . . . . . . 95
6.1.1 214Bi and 208Tl . . . . . . . . . . . . . . . . . . . . . . . . . . . . . 956.1.2 Radon . . . . . . . . . . . . . . . . . . . . . . . . . . . . . . . . . . 976.1.3 Cosmic rays and laboratory rock backgrounds . . . . . . . . . . . . 97
6.2 Signal and background characterization in NEXT . . . . . . . . . . . . . . 976.2.1 The topological signature . . . . . . . . . . . . . . . . . . . . . . . 976.2.2 Selection criteria . . . . . . . . . . . . . . . . . . . . . . . . . . . . 99
6.3 The topological signature . . . . . . . . . . . . . . . . . . . . . . . . . . . 101
2

6.3.1 Voxelization . . . . . . . . . . . . . . . . . . . . . . . . . . . . . . . 1016.3.2 Rudiments of graph theory . . . . . . . . . . . . . . . . . . . . . . 1016.3.3 The Breadth First Search algorithm . . . . . . . . . . . . . . . . . 102
6.4 Sensitivity . . . . . . . . . . . . . . . . . . . . . . . . . . . . . . . . . . . . 1036.4.1 Event selection . . . . . . . . . . . . . . . . . . . . . . . . . . . . . 1036.4.2 Signal efficiency and background rejection power . . . . . . . . . . 103
6.5 Sensitivity of the NEXT experiment to a light Majorana neutrino . . . . . 104
7 Shielding options for the NEXT detector 1077.1 Shielding requirements . . . . . . . . . . . . . . . . . . . . . . . . . . . . . 1077.2 The Lead-Copper Castle option . . . . . . . . . . . . . . . . . . . . . . . . 108
7.2.1 The XENON concept . . . . . . . . . . . . . . . . . . . . . . . . . 1087.2.2 Water bricks . . . . . . . . . . . . . . . . . . . . . . . . . . . . . . 1087.2.3 Proposed design for the NEXT100 shielding . . . . . . . . . . . . . 1097.2.4 Basic copper and lead layers with supporting structure . . . . . . . 1107.2.5 Water bricks and supporting structure . . . . . . . . . . . . . . . . 1137.2.6 Opening sequence . . . . . . . . . . . . . . . . . . . . . . . . . . . 1137.2.7 Lead and copper . . . . . . . . . . . . . . . . . . . . . . . . . . . . 1157.2.8 Overall dimensions and final Cost . . . . . . . . . . . . . . . . . . 116
7.3 The Water Tank option . . . . . . . . . . . . . . . . . . . . . . . . . . . . 1187.3.1 Design and construction of the water tank . . . . . . . . . . . . . . 1197.3.2 Connecting the TPC to the water tank . . . . . . . . . . . . . . . 1207.3.3 Water Purification System . . . . . . . . . . . . . . . . . . . . . . . 121
8 Toward the NEXT-100 technical design 1298.1 The NEXT-100 detector . . . . . . . . . . . . . . . . . . . . . . . . . . . . 1298.2 Engineering design of the pressure vessel . . . . . . . . . . . . . . . . . . . 129
8.2.1 Layout . . . . . . . . . . . . . . . . . . . . . . . . . . . . . . . . . . 1308.2.2 PMT Head . . . . . . . . . . . . . . . . . . . . . . . . . . . . . . . 1308.2.3 Design Requirements . . . . . . . . . . . . . . . . . . . . . . . . . . 1318.2.4 Pressure Vessel Construction Issues . . . . . . . . . . . . . . . . . . 1328.2.5 Assembly of Pressure Vessel . . . . . . . . . . . . . . . . . . . . . . 134
8.3 The NEXT-100 gas system . . . . . . . . . . . . . . . . . . . . . . . . . . 1358.3.1 Xenon purification . . . . . . . . . . . . . . . . . . . . . . . . . . . 1358.3.2 Rn Trapping . . . . . . . . . . . . . . . . . . . . . . . . . . . . . . 1388.3.3 The Re-Circulation pump . . . . . . . . . . . . . . . . . . . . . . . 1408.3.4 Xenon recovery system . . . . . . . . . . . . . . . . . . . . . . . . . 1408.3.5 Monitoring and Control . . . . . . . . . . . . . . . . . . . . . . . . 1438.3.6 Electron Lifetime Monitor . . . . . . . . . . . . . . . . . . . . . . . 1438.3.7 Vacuum Evacuation . . . . . . . . . . . . . . . . . . . . . . . . . . 144
8.4 Data Acquisition . . . . . . . . . . . . . . . . . . . . . . . . . . . . . . . . 1458.4.1 FE electronics and Data Acquisition for the tracking plane . . . . 149
8.5 The NEXT offline software . . . . . . . . . . . . . . . . . . . . . . . . . . 1508.6 Shifting the VUV light for NEXT . . . . . . . . . . . . . . . . . . . . . . . 152
3

8.6.1 TPB coating technique at ICMOL . . . . . . . . . . . . . . . . . . 1538.6.2 TPB fluorescence spectrum . . . . . . . . . . . . . . . . . . . . . . 1568.6.3 Deposition homogeneity . . . . . . . . . . . . . . . . . . . . . . . . 1568.6.4 Transmittance of the TPB at its emission wavelength . . . . . . . 1578.6.5 Response of coated SiPMs as a function of TPB thickness . . . . . 1588.6.6 Coating and testing of NEXT1-EL SiPM Daughter-Boards . . . . 159
8.7 NEXT Project . . . . . . . . . . . . . . . . . . . . . . . . . . . . . . . . . 1618.7.1 The Pressure vessel project . . . . . . . . . . . . . . . . . . . . . . 1638.7.2 The EL project . . . . . . . . . . . . . . . . . . . . . . . . . . . . . 1638.7.3 The light tube project . . . . . . . . . . . . . . . . . . . . . . . . . 1638.7.4 Energy plane sensors . . . . . . . . . . . . . . . . . . . . . . . . . . 1648.7.5 Construction and testing of SiPMs daughter boards . . . . . . . . 1648.7.6 Coating of DB with TPB . . . . . . . . . . . . . . . . . . . . . . . 1648.7.7 Testing of functionality of DB . . . . . . . . . . . . . . . . . . . . . 1648.7.8 Mother board design and construction . . . . . . . . . . . . . . . . 1658.7.9 SiPM FE electronics . . . . . . . . . . . . . . . . . . . . . . . . . . 1658.7.10 Data acquisition and online monitoring . . . . . . . . . . . . . . . 1658.7.11 Slow Controls . . . . . . . . . . . . . . . . . . . . . . . . . . . . . . 1658.7.12 Shielding . . . . . . . . . . . . . . . . . . . . . . . . . . . . . . . . 1658.7.13 The Gas system . . . . . . . . . . . . . . . . . . . . . . . . . . . . 1668.7.14 Integration . . . . . . . . . . . . . . . . . . . . . . . . . . . . . . . 1668.7.15 Safety . . . . . . . . . . . . . . . . . . . . . . . . . . . . . . . . . . 1668.7.16 Offline software and quality control . . . . . . . . . . . . . . . . . 1668.7.17 Monte Carlo simulation . . . . . . . . . . . . . . . . . . . . . . . . 1668.7.18 Calibration . . . . . . . . . . . . . . . . . . . . . . . . . . . . . . . 1678.7.19 Radiopurity . . . . . . . . . . . . . . . . . . . . . . . . . . . . . . . 1678.7.20 Gas Mixtures . . . . . . . . . . . . . . . . . . . . . . . . . . . . . . 1678.7.21 NEXT Project Management Plan . . . . . . . . . . . . . . . . . . . 1678.7.22 Further Developments . . . . . . . . . . . . . . . . . . . . . . . . . 168
4
Chapter 1
The Physics
1.1 Majorana neutrinos and double beta decay
Neutrinos could be the only truly neutral particles among the elementary fermions. Atruly neutral particle would be identical to its antiparticle, as proposed by Ettore Ma-jorana more than 70 years ago [1]. The existence of such Majorana neutrinos wouldhave profound implications in particle physics and cosmology. For instance, they pro-vide a natural explanation for the smallness of neutrino masses, the so-called seesawmechanism. Besides, Majorana neutrinos violate lepton-number conservation. This, to-gether with CP-violation, is a basic ingredient to help uncover the reasons why matterdominates over antimatter in our Universe.
The only practical way to establish experimentally that neutrinos are their ownantiparticles is the detection of neutrinoless double beta decay (ββ0ν) [2, 3]. This is ahypothetical, very rare nuclear transition that occurs if neutrinos are massive Majoranaparticles [4,5]. It involves the decay of a nucleus with Z protons into a nucleus with Z+2protons and the same mass number A, accompanied by the emission of two electrons:(Z,A)→ (Z+2, A)+2e−. The sum of the kinetic energies of the two emitted electrons isalways the same, and corresponds to the mass difference between mother and daughternuclei, Qββ . The decay violates lepton number conservation and is therefore forbiddenin the Standard Model.
The simplest underlying mechanism of ββ0ν is the virtual exchange of light Majorananeutrinos, although, in general, any source of lepton number violation (LNV) can induceββ0ν and contribute to its amplitude. If we assume that the dominant LVN mechanismat low energies is the light-neutrino exchange, the half-life of ββ0ν can be written as:(
T 0ν1/2
)−1= G0ν
∣∣∣M0ν
∣∣∣2 m2ββ (1.1)
where G0ν(E0, Z) is an exactly-calculable phase-space factor, |M0ν | is a nuclear matrixelement, and mββ is the effective Majorana mass of the electron neutrino:
mββ =∣∣∣∑
i
U2ei mi
∣∣∣, (1.2)
5

where mi are the neutrino mass eigenstates and Uei are elements of the neutrino mix-ing matrix. Therefore, a measurement of the ββ0ν decay rate would provide directinformation on neutrino masses.
Neutrino oscillation measurements constrain how the effective Majorana mass changeswith the absolute neutrino mass scale, defined as the smallest neutrino mass eigenstate.Currently, only upper bounds on the absolute mass scale, of about 1 eV, exist. Also, cur-rent oscillation data does not allow to differentiate between two possible mass eigenstatesorderings, usually referred to as normal and inverted hierarchies. In the normal hierar-chy —where the gap between the two lightest eigenstates corresponds to the small massdifference, measured by solar experiments— the effective Majorana mass can be as lowas 2 meV. If the mass ordering is the inverted —the gap between the two lightest statescorresponds to the large mass difference, measured by atmospheric experiments—, mββ
can be as low as 15 meV. In the particular case in which the neutrino mass differencesare very small compared to its absolute scale, we speak of the degenerate spectrum. Inthis case, larger values for mββ , approximately above 50 meV, can be obtained.
Cosmological measurements provide a further constrain on the effective Majoranamass, since they measure the sum of the masses of the three neutrino flavors. The lessrestrictive cosmological bounds exclude values of mββ larger than a few hundred meV,while the most restrictive cosmological bounds exclude values above some 100 meV [6].
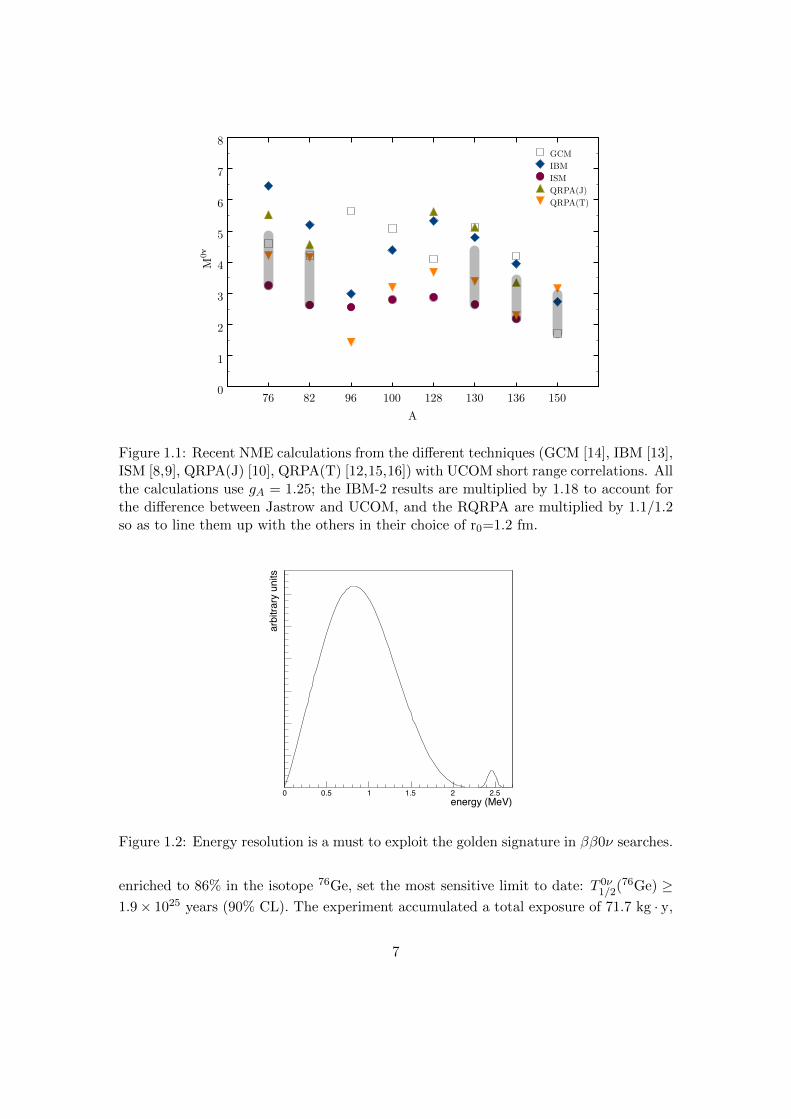
All nuclear structure effects in ββ0ν are included in the nuclear matrix element(NME). Its knowledge is essential in order to relate the measured half-life to the neutrinomasses, and therefore to compare the sensitivity and results of different experiments, aswell as to predict which are the most favorable nuclides for ββ0ν searches. Unfortunately,NMEs cannot be separately measured, and must be evaluated theoretically. In the lastfew years the reliability of the calculations has greatly improved, with several techniquesbeing used, namely: the Interacting Shell Model (ISM) [7–9]; the Quasiparticle RandomPhase Approximation (QRPA) [10–12]; the Interacting Boson Model (IBM) [13]; and theGenerating Coordinate Method (GCM) [14]. Figure 1.1 shows the most recent resultsof the different methods.
1.2 Double beta decay experiments
Double beta decay experiments are designed, in general, to measure the kinetic energy ofthe electrons emitted in the decay. The golden signature available to a ββ0ν experimentis the sum of such kinetic energies, which, for a perfect detector, equals Qββ . However,due to the finite energy resolution of any detector, ββ0ν events are reconstructed withina non-zero energy range centered around Qββ , typically following a gaussian distribution(Figure 1.2). Unfortunately, any background event falling in this energy range limits dra-matically the sensitivity of the experiment. Good energy resolution is therefore essential.That’s why germanium-based experiments have dominated the field so far: in a 76Geexperiment, a region able to contain most of the signal —called the region of interest(ROI), and often taken as 1 FWHM around Qββ— would be only a few keV wide.
The Heidelberg-Moscow (HM) experiment [17], using high-purity germanium diodes
6
76 82 96 100 128 130 136 150 A
0
1
2
3
4
5
6
7
8GCMIBMISMQRPA(J)QRPA(T)
M0ν
Figure 1.1: Recent NME calculations from the different techniques (GCM [14], IBM [13],ISM [8,9], QRPA(J) [10], QRPA(T) [12,15,16]) with UCOM short range correlations. Allthe calculations use gA = 1.25; the IBM-2 results are multiplied by 1.18 to account forthe difference between Jastrow and UCOM, and the RQRPA are multiplied by 1.1/1.2so as to line them up with the others in their choice of r0=1.2 fm.
energy (MeV)0 0.5 1 1.5 2 2.5
arbi
trary
uni
ts
Figure 1.2: Energy resolution is a must to exploit the golden signature in ββ0ν searches.
enriched to 86% in the isotope 76Ge, set the most sensitive limit to date: T 0ν1/2(
76Ge) ≥1.9× 1025 years (90% CL). The experiment accumulated a total exposure of 71.7 kg · y,
7

and achieved a background rate in the ROI of 0.18 counts/(keV · kg · y). The energyresolution (FWHM) at Qββ was 4.23±0.14 keV. A subset of the Collaboration observedevidence for a ββ0ν signal [18]. The claim has been severely questioned [19], but no onehas been able to prove it wrong. According to it, the isotope 76Ge would experimentββ0ν decay with a lifetime of about 1.5× 1025 years.
Unfortunately, energy resolution is not enough by itself: a continuous spectrum aris-ing from natural decay chains can easily overwhelm the signal peak, given the enormouslylong decay times explored. Consequently, additional signatures to discriminate betweensignal and backgrounds are desirable. Also, the experiments require underground oper-ation and a shielding to reduce external background due to cosmic rays and surroundingradioactivity, and the use of very radiopure materials. In addition, large detector masses,high ββ isotope enrichment, and high ββ detection efficiency are clearly desirable, giventhe rare nature of the process searched for.
One way to evaluate the interest of new proposals is to compare their performancewith that of the HM experiment. This can be done in terms of the three basic quantitiesmentioned above. The total exposure, the expected background rate in the ROI and theenergy resolution.
1.3 The double beta race
Clearly, when considering a new ββ0ν experiment such as NEXT, one must take intoaccount the expected performance and schedule of the competition. However, this isnot easy for several reasons: a) there are many ββ0ν proposals, at very different stagesof development; b) there are significant uncertainties in the schedules of most projects;and c) there are significant uncertainties in the expected performance of the differentexperiments.
On the other hand, it is still important to estimate the sensitivity to a light Majorananeutrino that can be reached by the major ββ0ν players, in a time window that wouldcorrespond to the “next generation” of experiments. In [20], it was found that thefour most promising experiments searching for ββ0ν processes were GERDA, CUORE,EXO and KamLAND-Zen. In this section we estimate their expected performance,extrapolated until 2020, and considering for each one two possible stages or phases asactually planned by GERDA and KamLAND-Zen.
1.3.1 CUORE
CUORE [21–26] is an array of TeO2 bolometers. Because 130Te has a large naturalabundance (∼34%), the need for enrichment is less important than in other isotopes.CUORE can collect a large mass of isotope (∼ 200 kg for a total detector mass of740 kg). The advantages and disadvantages of the technique are similar to those of76Ge experiments with about the same energy resolution and efficiency for the signal.However, the ratio surface to active volume is better in the 76Ge experiments.
CUORICINO measured an irreducible background of 0.153±0.006 counts/(keV·kg·y)
8

Exp
erim
ent
Isot
op
eR
esol
uti
on
Effi
cien
cyP
has
eM
ass
Exp
osu
reB
ackgr
oun
dra
teS
ensi
tivit
y(k
eV)
(kg)
(kg·
year
)(c
ounts/(k
eV·k
g·y
))(m
eV)
CU
OR
E130T
e5
0.8
2015
–201
7(I
)20
060
010
−1
140
2018
–202
0(I
I)20
060
04×
10−2
85
EX
O136X
e10
00.
720
12–2
014
(I)
160
480
7×
10−3
185
(II)
2016
–202
016
080
05×
10−3
150
GE
RD
A76G
e5
0.8
2012
–201
4(I
)18
5410
−2
214
2016
–202
0(I
I)35
175
10−3
112
Kam
LA
ND
-Zen
136X
e25
00.
820
13–2
015
(I)
360
1440
10−3
9720
17–2
020
(II)
3527
005×
10−4
60
Tab
le1.1
:P
rop
osa
lsco
nsi
der
edin
themββ
sen
siti
vit
yco
mp
aris
on.
For
each
pro
pos
al,
the
isot
ope
that
wil
lb
euse
d,
toge
ther
wit
hes
tim
ates
for
det
ecto
rp
erfo
rman
cep
ara
met
ers
—F
WH
Men
ergy
reso
luti
on,
det
ecti
oneffi
cien
cyan
db
ackgr
oun
dra
tep
eru
nit
of
ener
gy,
tim
ean
dββ
isot
op
em
ass
—ar
egi
ven
.T
wo
pos
sib
leop
erat
ion
ph
ases
,w
ith
esti
mat
esfo
rth
ed
etec
tor
mas
san
dth
eb
ackgro
un
dra
teach
ieve
d,
are
give
nfo
rea
chex
per
imen
t.
9

(in kilograms of detector mass). The major sources of contamination are Compton eventsfrom 2615 keV peak of 208Tl (from 232Th cryostat contamination) and degraded alphason copper and crystal surfaces. The more recent Three Tower Test (TTT) measures0.122±0.001 counts/(keV ·kg ·y)(detector mass), or about 4×10⁻¹ counts/(keV ·kg ·y) inisotope mass. CUORE expects to be able to reduce the background to 10−2counts/(keV ·kg · y) (per kg of detector), or about 4× 10⁻² counts/(keV · kg · y) (per kg of isotope).
CUORE is scheduled to start data taking in 2014. We assume a commissioning runof one year (2014–2015), a physics run of 2 years (2015, 2016) at the background level of10−1 counts/(keV · kg · y) per kg of isotope. For stage II, after one year off for upgrade,we assume a run of three years (2017-2020) with a background 4 × 10⁻² counts/(keV ·kg · y) per kg of isotope.
1.3.2 GERDA
GERDA [27–30] will search for ββ0ν in 76Ge using arrays of high-purity germaniumdetectors. This is a well-established technique that offers outstanding energy resolu-tion (better than 0.2% FWHM at the Q-value) and high efficiency (∼ 0.80). Its maindrawback is the scalability to large masses.
The first phase of GERDA will run with the same detectors used by HM and IGEX,for a total of 18 kg of isotope. Currently, the measured background rate is at the levelof 5 × 10⁻² counts/(keV · kg · y), while the goal of the collaboration is to reduce it to10−2 counts/(keV ·kg ·y). The second phase will add 40 kg of thick-window p-type BEGedetectors (34 kg of isotope). Such detectors have enhanced background discrimination,due to pulse shape analysis. They are also optimized to suppress surface backgrounds.The experiment expects to reach 10−3 counts/(keV · kg · y).
GERDA is already commissioning the detector with depleted Ge crystals, and willprobably start a physics run in 2011. We assume that their background target will bereached in 2012 and a full run of 3 years (2012-2014) for phase I, followed by one yearoffline for upgrade to phase II and commissioning and 5 years run (2016-2020) at theirtarget background rate of 10−3 counts/(keV · kg · y).
1.3.3 EXO
The Enriched Xenon Observatory (EXO) [31] will search for ββ0ν decay in 136Xe using aliquid-xenon TPC (LXe) with 200 kg total 136Xe mass (enriched at 80% in 136Xe). Theuse of liquefied xenon results in a relatively modest energy resolution (∼ 4% FWHMresolution at Qββ [32]). The strong point of a LXe TPC is self-self-shielding and goodposition resolution. It is then possible to select a fiducial volume capable to rejectsuperficial backgrounds and multi-hit events, in such a way that only energetic gammasfrom 208Tl and 214Bi constitute a significant source of background1.
1The ultimate goal of the EXO Collaboration, whose benefits are not considered here, is to developthe so-called barium tagging. This technique would allow the detection of the ion product of the 136Xedecay, and thus eliminate all backgrounds but the intrinsic ββ2ν
10
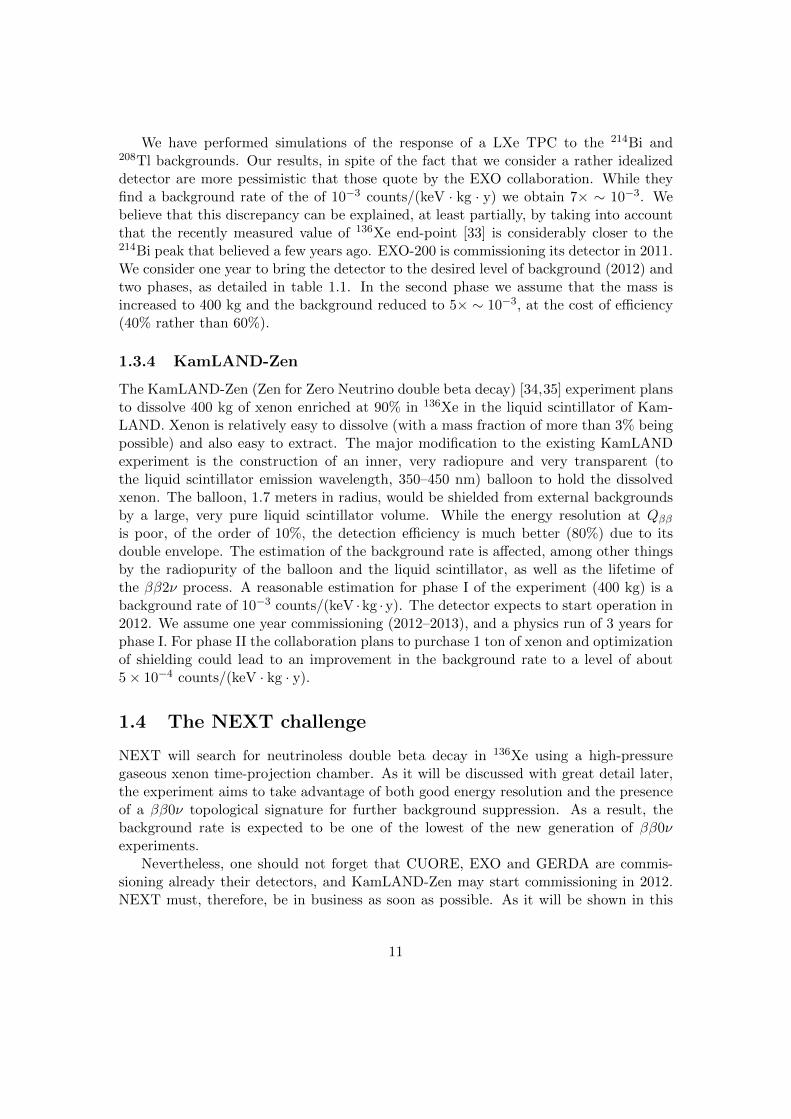
We have performed simulations of the response of a LXe TPC to the 214Bi and208Tl backgrounds. Our results, in spite of the fact that we consider a rather idealizeddetector are more pessimistic that those quote by the EXO collaboration. While theyfind a background rate of the of 10−3 counts/(keV · kg · y) we obtain 7× ∼ 10−3. Webelieve that this discrepancy can be explained, at least partially, by taking into accountthat the recently measured value of 136Xe end-point [33] is considerably closer to the214Bi peak that believed a few years ago. EXO-200 is commissioning its detector in 2011.We consider one year to bring the detector to the desired level of background (2012) andtwo phases, as detailed in table 1.1. In the second phase we assume that the mass isincreased to 400 kg and the background reduced to 5× ∼ 10−3, at the cost of efficiency(40% rather than 60%).
1.3.4 KamLAND-Zen
The KamLAND-Zen (Zen for Zero Neutrino double beta decay) [34,35] experiment plansto dissolve 400 kg of xenon enriched at 90% in 136Xe in the liquid scintillator of Kam-LAND. Xenon is relatively easy to dissolve (with a mass fraction of more than 3% beingpossible) and also easy to extract. The major modification to the existing KamLANDexperiment is the construction of an inner, very radiopure and very transparent (tothe liquid scintillator emission wavelength, 350–450 nm) balloon to hold the dissolvedxenon. The balloon, 1.7 meters in radius, would be shielded from external backgroundsby a large, very pure liquid scintillator volume. While the energy resolution at Qββis poor, of the order of 10%, the detection efficiency is much better (80%) due to itsdouble envelope. The estimation of the background rate is affected, among other thingsby the radiopurity of the balloon and the liquid scintillator, as well as the lifetime ofthe ββ2ν process. A reasonable estimation for phase I of the experiment (400 kg) is abackground rate of 10−3 counts/(keV ·kg ·y). The detector expects to start operation in2012. We assume one year commissioning (2012–2013), and a physics run of 3 years forphase I. For phase II the collaboration plans to purchase 1 ton of xenon and optimizationof shielding could lead to an improvement in the background rate to a level of about5× 10−4 counts/(keV · kg · y).
1.4 The NEXT challenge
NEXT will search for neutrinoless double beta decay in 136Xe using a high-pressuregaseous xenon time-projection chamber. As it will be discussed with great detail later,the experiment aims to take advantage of both good energy resolution and the presenceof a ββ0ν topological signature for further background suppression. As a result, thebackground rate is expected to be one of the lowest of the new generation of ββ0νexperiments.
Nevertheless, one should not forget that CUORE, EXO and GERDA are commis-sioning already their detectors, and KamLAND-Zen may start commissioning in 2012.NEXT must, therefore, be in business as soon as possible. As it will be shown in this
11

report, the detector can be built by 2013 and commissioned in 2014. This would allowa 5-years run until 2020. This schedule is aggressive but feasible, since it is based ina technology amply demonstrated by the NEXT-1 prototypes, and will benefit of theexperience in radiopurity available in the Collaboration and elsewhere.
The construction of NEXT-10 —an intermediate, radiopure “demonstrator” of about10 kg—, as initially foreseen in our LOI [36], would introduce, we believe, an unaccept-able delay. NEXT-10 could only be built after the final technological solutions arespecified. Building and commissioning the detector would take one year, and anotheryear would be needed to analyze the data. Irrespectively of the additional costs, theconstruction of a fully-fledged NEXT-10 detector would push the start date of NEXTto circa 2017, leaving only a 3 years run before 2020.
We examine now the various parameters that define the detector:
1. Mass: The LSC has already procured 100 kg of xenon, enriched at 90% in 136Xe.We argue that, if the initial NEXT run (2015 and 2016) is successful, the masscould be increased to 1 ton. This would require a new vessel and more instrumen-tation, but would benefit from many of the infrastructures available for NEXT100,including the gas system and the shielding.
2. Resolution: The intrinsic energy resolution (FWHM at Qββ) that can be achievedby an EL xenon detector operating at high pressure is about 0.3% [37,38]. Boloz-dynia [39] and White [40] have demonstrated resolutions of around 0.5% in largesystems equipped with 19 and 7 PMTs respectively. The resolution of the PMTsinitially considered for the NEXT detector has also been measured [41] to be about0.4%. The intrinsic resolution of micro-bulk micromegas have also been measuredin the NEXT collaboration to be about 3% at 10 bar [42]. It follows that anEL TPC is the best option in terms of resolution. Our initial results from theNEXT1-LBNL prototype show a resolution of 0.8–0.9 % at Qββ .
3. Background rate: The background rate depends on three factors. Good shieldingfrom external backgrounds (this can be achieved by standard shielding techniques,such as installing the chamber inside a water tank); low activity of the constructionmaterials (which in turn requires low activity sensors and a radiopure metal to buildthe vessel and field cage rings, as well as isolating any electronics near the fiducialvolume and carefully measuring the radioactive budget of any component in thechamber), and detector performance (which depends on the energy resolution, aswell as the topological rejection factor).
To motivate our choices, we start by defining a reference scenario (R), with a totalmass of 90 kg 136Xe, a fiducial efficiency of 20% (that takes into account that some 136Xeis wasted since our design considers only a single gas volume) and a 6-years run (2015to 2020). We assume an energy resolution of 0.8%, as measured by Bolozdynya [39],and consistent with our initial results described later in this document. Our detailedsimulations of the detector, also described later yield a background rate of 2 × 10⁻⁴
counts/(keV · kg · y).
12

Proposal Sensitivity(meV)
A 38R 89S 115
Table 1.2: Sensitivity of NEXT under different scenarios (see text for further details).
We also define a “slow scenario” (S), which differs from the previous one in a shorterrun (3 years) and an “aggressive scenario” (A) which assumes a 2 years run with 90 kgof xenon and the ANGEL baseline and 3 years run with 1 ton and an improved detectorwith a somewhat lower background rate (10−4counts/(keV · kg · y)).
Table 1.2 summarizes the sensitivity of NEXT under the different scenarios discussedabove. We argue that the aggressive scenario is entirely possible and would result in asensitivity capable to outperform even that of KamLAND-Zen. NEXT is still verycompetitive in our reference scenario, at the level of GERDA and CUORE. The slowscenarios is, obviously, less interesting.
The lessons are clear: given the current situation, the challenge that the NEXTcollaboration must face is to build a state of the art detector, with the best possibleresolution, and as fast as possible. There is no room in the current race for a prototypeof 10 kg. Rather, we should keep in mind that the 100 kg detector can and should beupgraded to 1 ton in a not-too-distant future. In spite of the fierce competition, NEXThas the chance to be among the leaders of the next generation of ββ0ν experiment.
13

Chapter 2
EASY & SOFT
2.1 Energy resolution in xenon detectors
Excellent energy resolution is a crucial ingredient for a ββ0ν experiment. Indeed, physicsallows such resolution to be attained in a high-pressure gaseous xenon chamber (HPGXe)(instead, those very same intrinsic physics processes appear to limit the performance ina liquid xenon chamber, LXe). This is clearly seen in Figure 2.1, reproduced fromBolotnikov and Ramsey (1997) [37]. The resolutions displayed were extracted fromthe photo-conversion peak of the 662 keV gamma ray from the 137Cs isotope. Only theionization signal was detected. A striking feature in Figure 2.1 is the apparent transitionat density ρt ∼ 0.55 g/cm3. Below this density, the energy resolution is approximatelyconstant:
δE/E = 6× 10⁻³ FWHM. (2.1)
For densities greater than ρt, energy resolution deteriorates rapidly, approaching aplateau at LXe density.
The most plausible explanation underlying this strange behavior is the appearance,as density increases, of two-phase xenon (see [43] and references therein). In contrast,given the xenon critical density, the intrinsic resolution in the gas phase is very goodup to pressures in the vicinity of 50 bar, at room temperature, although practical andtechnical issues dictate operation at smaller pressures, in the range of 10 to 20 bar.
Extrapolating the observed resolution in Figure 2.1 as√E to the 136Xe Q-value (2458
keV), a naive energy resolution is predicted:
δE/E = 3× 10⁻³ FWHM. (2.2)
Based on ionization signals only, the above energy resolution reflects an order ofmagnitude improvement relative to LXe. For densities less than ρt, the measured energyresolution in Figure 2.1 matches the prediction based on Fano’s theory [44]. The Fanofactor F reflects a constraint, for a fixed energy deposited, on the fluctuations of energypartition between excitation and the ionization yield NI . For electrons depositing afixed energy E, the rms fluctuations σI in the total number of free electrons NI can be
14

Figure 2.1: The energy resolution (FWHM) is shown for 137Cs 662 keV gamma rays, asa function of xenon density, for the ionization signal only. Reproduced from [37].
expressed as:σI =
√F NI . (2.3)
For pure gaseous xenon (GXe), various measurements [43] show that:
FGXe = 0.15± 0.02 (2.4)
In LXe, however, the anomalously large fluctuations in the partitioning of energy toionization produce an anomalous Fano factor:
FLXe ∼ 20, (2.5)
larger than the one corresponding to GXe by about two orders of magnitude.A second advantage of gas relative to liquid is the ability to exploit the topological
signal of a ββ0ν event, that is the tracks left in the gas by the two electrons producedin the ββ0ν decay. At 10 bar the track length of the electrons is of the order of 30 cmand can be easily imaged in a TPC. Such a topological signature is not available in LXedetectors, due to the high density of the liquid phase. This two advantages (good energyresolution and topological signature) are the key reason why NEXT can be competitivewith a LXe experiment such as EXO and a Xenon-liquid-scintillator experiment such asKamLAND-ZEN.
Next we examine the various signals available in an HPGXe and how they can beexploited to search for ββ0ν events.
15

2.1.1 Scintillation
Two processes are produced in xenon, as a response to the passage of charged particles.The first one is ionization of the gas (call WI to the average energy spent in the creationof one electron-ion pair); the second is emission of scintillation light (call Ws to theaverage energy spent in the creation of one primary scintillation photon). The detectionof primary scintillation allows the measurement of the start-of-the-event t0, needed toplace an event properly in 3-D space in a TPC.
A recent measurement, within the context of the NEXT R&D [41] yields:
Ws = 76± 6 eV (2.6)
Since the end-point of the 136Xe → 136Ba transition is Qββ = 2457.83 keV, we obtainthat this translates in
Ns = 32342± 2551 photons. (2.7)
These photons are emitted isotropically and need to be readout with photosensorscapable to count single photoelectrons, that is, photomultipliers. Furthermore, it im-plies the use of pure xenon, since primary scintillation signals are quenched by commonmolecular additives such as nitrogen, hydrogen or methane.
2.1.2 Ionization
Ionization can be used to measure both the energy of the (ββ0ν) event and to track thetwo signature electrons. In order to do so, electrons must be first drifted towards theanode. This, in turn, requires a suitable electric field.
The longitudinal diffusion of electrons drifting towards the anode has a minimum inxenon given by:
E/p = 0.03V/cmTorr (2.8)
or 375 V/cm at 15 bar, with a drift velocity of about 1 mm/µs.At E/p above that given by 2.8, the drift velocity changes slowly. A low drift velocity
is not necessarily a disadvantage in a low-rate experiment such as NEXT, assuming thatattachment (whose effect increases with drift time) is kept under control. Indeed, tooa high electric field can result in unwanted systematic effect [45]. Finding the optimumelectric field, that maximizes the resolution and minimizes systematic effects is one ofthe goals of the NEXT-1 program. However, we expect it not to be very different fromthe value defined by Eq. (2.8). Indeed, the initial results from our prototypes show thatresolution of the photoelectric Cs-137 peak stays constant for values of the drift fieldbetween 400 V/cm and about 2 kV/cm.
The diffusion depends on both electric field and electron temperature. For a driftof 1 m and an electric field of 375 V/cm (at 15 bar) the transverse diffusion is of theorder of 1 cm. This value is large, but seems acceptable. At 15 bar the track of the twoelectrons produced in a ββ0ν is of the order of 20 cm, and thus a pitch of 1 cm allows totrack the event comfortably. On the other hand, the large value of the diffusion implies
16

that there is no obvious advantage on a too fine grain pitch, since the intrinsic resolutionis dictated by the physics.
For pure gaseous xenon, various measurements [43] show that:
WI = 24.8 eV . (2.9)
This results in a number of primary electrons at Qββ of:
NI = 2457.8/24.8 = 99112 (2.10)
or, roughly, 105 primary electrons for a 136Xe ββ0ν event.
2.1.3 Intrinsic energy resolution
For electrons depositing a fixed energy E, the (rms) fluctuations σl in the total numberof free electrons NI can be expressed as:
σl = (FNI)1/2 = (0.15× 10⁵)1/2 = 122 rms electrons (2.11)
The intrinsic energy resolution (FHWM) can be obtained as:
δE/E = 2.35 σl/NI = 2.35× 122/105 ∼ 3× 10⁻³ FWHM (2.12)
which corresponds to the value found in [37].Of course, there are many factors that can spoil this very good intrinsic resolution.
Among these, we mention the following:
1. Losses of drifting electrons due to electronegative impurities, volume recombina-tion, grid transparency, etc., represented by a factor L = 1 − ε, where ε is theoverall electron collection efficiency.
2. Gain processes such as avalanche multiplication, which multiply the signal bym and introduce fluctuations in the detected signal, represented by a varianceG.
3. Electronic noise, in electrons RMS at signal processing input, represented by n.
In addition there are other important sinks of resolution, such as fluctuations asso-ciated to Bremsstrahlung losses, channel equalization, non-linearities, etc. However, ananalysis of the previous list is sufficient to understand the main issues to be addressedto approach the intrinsic resolution. Assuming that all the above-mentioned sources aregaussian and uncorrelated, we can combine them in quadrature:
σ2n = (F +G+ L)NI +n2
m. (2.13)
where σn is the total number of electrons (rms), due to fluctuations in all sources. Then:
17

Figure 2.2: Pulse amplitude (open symbols) and energy resolution (full symbols) for 5.9 keVX-rays absorbed in a NEXT-0 prototype as a function of: E/p-scint, the reduced electric fieldin the scintillation region. Notice that the resolution for E/p above 3 is about the same for allpressures, near 8%. This extrapolates to better than 0.5% at Qββ .
δE/E =2.35 σnNIε
(2.14)
= 2.35
[F +G+ L+ n2
mNI
NIε2
]1/2, (2.15)
The challenge in NEXT is to minimize the factor L (this can be achieved with avery clean gas that minimizes attachment) and the gain fluctuation factor G.
The gain factor turns is considerably larger than F in gas proportional countersinvolving avalanche multiplication. On the other hand, G can be made at least as smallas F using electroluminescence.
A recent measurement done in the context of the NEXT R&D ( [41]), shows, indeed,that the use of EL allows to achieve resolutions close to intrinsic. Figure 2.2 showspulse amplitude (open symbols) and energy resolution (full symbols) for 5.9 keV X-rays absorbed in a NEXT-0 prototype as a function of the reduced electric field in thescintillation region. Notice that the resolution for E/p above 3 is about the same for allpressures, near 8%. This extrapolates to about 0.4% at Qββ .
In the next section we will describe the physics of electroluminescence in more detail.Notice, on the other hand, that intrinsic resolution is not the only merit of using linearamplification rather than avalanche gain. As we have seen, the use of conventionalmolecular additives (quenchers) seems prohibitive in a HPGXe detector. But stable
18

Figure 2.3: Resolution of a micro-bulk Micromegas (the last generation of micromegas devices)as a function of the pressure for 22.1 keV photons. The resolution varies between 12% at 1 bar(∼ ) about 1% at Qββ , to 32% at 10 bar, 3% at Qββ . The results were measured as a part ofthe NEXT collaboration R&D [42].
operation of avalanche-based devices requires normally the use of such quenchers tostabilize the gas and avoids sparks.
However, some of the most robust gain devices, such as the Micromegas can performwell even in pure xenon and at high pressures. Nonetheless, their resolution appear todegrade with increased pressure, as demonstrated in [42]. Figure 2.3 shows that the res-olution attainable at Qββ by the last-generation micro-bulk micromegas at 10 bar wouldbe 3%, to be compared with that of 0.4% found in ( [41], Figure 2.2), using electrolumi-nescence. Both measurements were carried out with very small setups, in close-to-idealconditions, and therefore can be taken as reflecting the intrinsic performance of thedevices under study.
Thus, the choice of an avalanche-gain device such as micromegas does not appear tobe optimal in terms of energy resolution. On the other hand, the micro-bulk micromegashas been measured to be very radiopure and it could, conceivably, improve the topologicalsignature in NEXT if a mixture capable to reduce the diffusion could be found. In thiscase one could take advantage of a reduced pitch, and the use of such devices as a trackerscould be interesting. Thus, within the context of our R&D for a detector upgrade, wewill keep exploring the possibility of using micromegas as tracking devices compatiblewith an EL TPC.
19
2.2 Electroluminescence
2.2.1 The Gas Proportional Scintillation Chamber
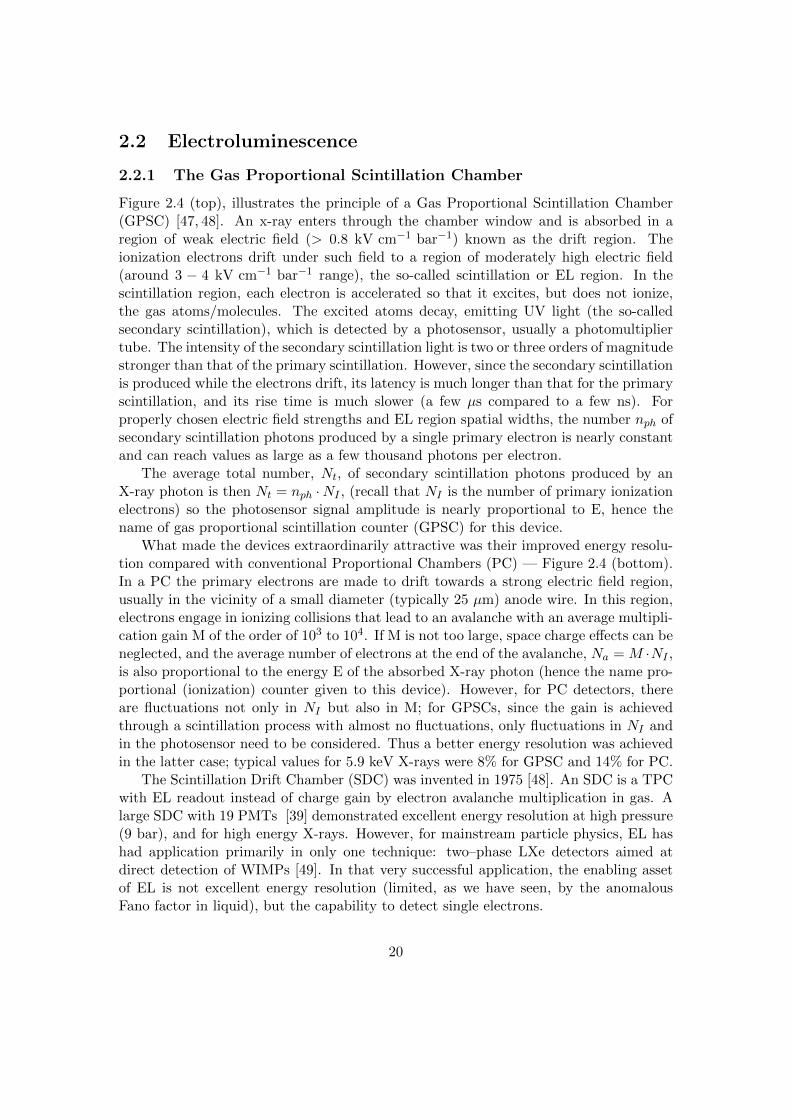
Figure 2.4 (top), illustrates the principle of a Gas Proportional Scintillation Chamber(GPSC) [47, 48]. An x-ray enters through the chamber window and is absorbed in aregion of weak electric field (> 0.8 kV cm−1 bar−1) known as the drift region. Theionization electrons drift under such field to a region of moderately high electric field(around 3 − 4 kV cm−1 bar−1 range), the so-called scintillation or EL region. In thescintillation region, each electron is accelerated so that it excites, but does not ionize,the gas atoms/molecules. The excited atoms decay, emitting UV light (the so-calledsecondary scintillation), which is detected by a photosensor, usually a photomultipliertube. The intensity of the secondary scintillation light is two or three orders of magnitudestronger than that of the primary scintillation. However, since the secondary scintillationis produced while the electrons drift, its latency is much longer than that for the primaryscintillation, and its rise time is much slower (a few µs compared to a few ns). Forproperly chosen electric field strengths and EL region spatial widths, the number nph ofsecondary scintillation photons produced by a single primary electron is nearly constantand can reach values as large as a few thousand photons per electron.
The average total number, Nt, of secondary scintillation photons produced by anX-ray photon is then Nt = nph ·NI , (recall that NI is the number of primary ionizationelectrons) so the photosensor signal amplitude is nearly proportional to E, hence thename of gas proportional scintillation counter (GPSC) for this device.
What made the devices extraordinarily attractive was their improved energy resolu-tion compared with conventional Proportional Chambers (PC) — Figure 2.4 (bottom).In a PC the primary electrons are made to drift towards a strong electric field region,usually in the vicinity of a small diameter (typically 25 µm) anode wire. In this region,electrons engage in ionizing collisions that lead to an avalanche with an average multipli-cation gain M of the order of 103 to 104. If M is not too large, space charge effects can beneglected, and the average number of electrons at the end of the avalanche, Na = M ·NI ,is also proportional to the energy E of the absorbed X-ray photon (hence the name pro-portional (ionization) counter given to this device). However, for PC detectors, thereare fluctuations not only in NI but also in M; for GPSCs, since the gain is achievedthrough a scintillation process with almost no fluctuations, only fluctuations in NI andin the photosensor need to be considered. Thus a better energy resolution was achievedin the latter case; typical values for 5.9 keV X-rays were 8% for GPSC and 14% for PC.
The Scintillation Drift Chamber (SDC) was invented in 1975 [48]. An SDC is a TPCwith EL readout instead of charge gain by electron avalanche multiplication in gas. Alarge SDC with 19 PMTs [39] demonstrated excellent energy resolution at high pressure(9 bar), and for high energy X-rays. However, for mainstream particle physics, EL hashad application primarily in only one technique: two–phase LXe detectors aimed atdirect detection of WIMPs [49]. In that very successful application, the enabling assetof EL is not excellent energy resolution (limited, as we have seen, by the anomalousFano factor in liquid), but the capability to detect single electrons.
20

Figure 2.4: Top: principle of a Gas Proportional Scintillation Counter. Bottom: principle of aGas Proportional Counter with avalanche gain (from [46]).
21

2.2.2 Xenon atomic energy structure
In the EL region the drift electrons are accelerated and collide with the gas atoms. Ifthe electric field is not too large the electrons collide elastically with the atoms andcan also excite but not ionize them. In the case that an excitation collision happens,the atom can stay in one of several excited levels. Since, at high pressures (abovefew hundreds of torr [50]), the time intervals between collisions of an excited atom withother atoms of the gas are much smaller than the atomic radiative lifetimes [51] the mainchannel of de-population of these excited atoms is through the formation of excimers–electronically excited molecular states. Excimers, R∗∗
2 , are formed through three-bodycollisions between one excited atom, R∗, and two atoms in the ground state, R:
R∗ + 2R→ R∗∗2 +R (2.16)
The excimers responsible for the VUV electroluminescence, 0+u(1Σ+
u
), (ν = 0)1 Σ+
u
and (ν = 0)3 Σ+u , are formed from 1s4 and 1s5 atomic levels (J = 3/2) [52] or by radiative
transitions from higher excited molecular levels which are formed from atoms with anenergy higher than 1s4 and 1s5 [53]. The excimers represented with “(ν = 0)”, R∗
2, arevibrationally relaxed through two-body collisions between the unrelaxed excimers, e.g.0+u(1Σ+
u
), R∗∗
2 , and ground atoms, R:
R∗∗2 +R→ R∗
2 +R (2.17)
Vibrational unrelaxed excimers can decay to the repulsive ground state, 1Σ+g , emit-
ting a VUV photon:R∗∗
2 → 2R+ hν (2.18)
as well as vibrational relaxed excimers:
R∗2 → 2R+ hν (2.19)
In the case that the radiative decay is from R∗∗2 the energy of the VUV photon is
slightly higher than if the decay is from R∗2. In this way it is, at low gas pressures, ob-
served a continuum emission spectrum with two peaks, usually called “first continuum”- at higher frequencies - and “second continuum” - at lower frequencies. The reason why,at high pressures, one usually only observe the “second continuum” is because process(2.17) is preferable to (2.18) due to the increasing in the number of atom collisions.
2.2.3 Simulation of EL in NEXT
NEXT software includes a platform to simulate EL [51], based in Garfield [54] andMagboltz [55,56]. We have used it to study the expected EL yield and energy resolution.
Primary drift electrons were allowed to drift a distance of d = 5 mm under theinfluence of an uniform electric field created by two infinite parallel planes (except inthe edges this arrangement simulates well the large EL grids in the NEXT detector). Itwas considered that the gas is at a pressure p = 10 bar and at a temperature of 293K.A set of Ne = 10.000 primary electrons was used for each value of the potential appliedbetween the parallel planes, V .
22

2.2.4 Electroluminescence yield
0
200
400
600
800
1000
1200
0 1 2 3 4 5 6 7 0
20
40
60
80
100
120
Y / p
[pho
tons
ele
ctro
n-1 c
m-1
bar
-1]
Q [%
]
E / p [kV cm-1 bar-1]
QexcQexc (MC)
QELQEL (MC)
Y/pY/p (fit)Y/p (Exp)
Figure 2.5: Reduced electroluminescence yield,(Yp
), as a function of the reduced elec-
tric field (pressure units),(Ep
). Excitation efficiency, Qexc, and electroluminescence
efficiency, QEL, as a function of the reduced electric field. are also shown. Full symbolsare results of this work. Former Monte Carlo results of Qexc and QEL [57] as well asexperimental measurements of the reduced EL yield [58] are included (open symbols)for comparison.
In Figure 2.5 it is shown the reduced electroluminescence yield,(Yp
), as a function of
the reduced electric field,(Ep
). The reduced electroluminescence yield is defined as being
the number of photons emitted per primary electron and per unit of drift length divided
by the number density of the gas, N . The behavior of(Yp
)with
(Ep
)is approximately
linear even when the actual ionization threshold is achieved at(Ep
)∼ 3 kV cm−1bar−1.
In Figure 2.6 it can be easily seen that this threshold is achieved since, for higher valuesof the electric field, the fluctuations in the secondary charge production, which arebigger than in the electroluminescence, start to dominate. The EL yield keeps its linearbehavior while the probability of ionization is low.
23
Performing a linear fit to the obtained points we obtain the dependence:(Y
p
)= (130± 1)
(E
p
)− (80± 3)
[photons electron−1 cm−1 bar−1
](2.20)
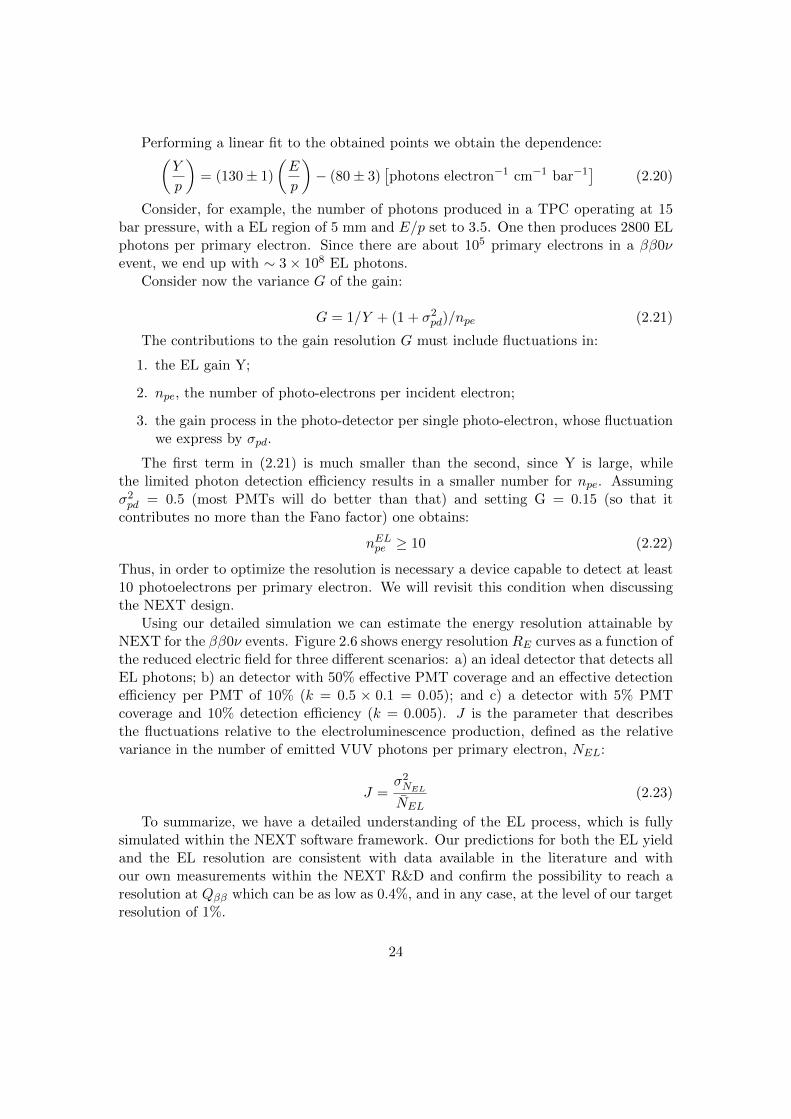
Consider, for example, the number of photons produced in a TPC operating at 15bar pressure, with a EL region of 5 mm and E/p set to 3.5. One then produces 2800 ELphotons per primary electron. Since there are about 105 primary electrons in a ββ0νevent, we end up with ∼ 3× 10⁸ EL photons.
Consider now the variance G of the gain:
G = 1/Y + (1 + σ2pd)/npe (2.21)
The contributions to the gain resolution G must include fluctuations in:
1. the EL gain Y;
2. npe, the number of photo-electrons per incident electron;
3. the gain process in the photo-detector per single photo-electron, whose fluctuationwe express by σpd.
The first term in (2.21) is much smaller than the second, since Y is large, whilethe limited photon detection efficiency results in a smaller number for npe. Assumingσ2pd = 0.5 (most PMTs will do better than that) and setting G = 0.15 (so that itcontributes no more than the Fano factor) one obtains:
nELpe ≥ 10 (2.22)
Thus, in order to optimize the resolution is necessary a device capable to detect at least10 photoelectrons per primary electron. We will revisit this condition when discussingthe NEXT design.
Using our detailed simulation we can estimate the energy resolution attainable byNEXT for the ββ0ν events. Figure 2.6 shows energy resolution RE curves as a function ofthe reduced electric field for three different scenarios: a) an ideal detector that detects allEL photons; b) an detector with 50% effective PMT coverage and an effective detectionefficiency per PMT of 10% (k = 0.5 × 0.1 = 0.05); and c) a detector with 5% PMTcoverage and 10% detection efficiency (k = 0.005). J is the parameter that describesthe fluctuations relative to the electroluminescence production, defined as the relativevariance in the number of emitted VUV photons per primary electron, NEL:
J =σ2NEL
NEL(2.23)
To summarize, we have a detailed understanding of the EL process, which is fullysimulated within the NEXT software framework. Our predictions for both the EL yieldand the EL resolution are consistent with data available in the literature and withour own measurements within the NEXT R&D and confirm the possibility to reach aresolution at Qββ which can be as low as 0.4%, and in any case, at the level of our targetresolution of 1%.
24

Figure 2.6: Relative variance in the number of emitted EL photons as a function of thereduced electric field. Energy resolution, RE , as a function of the reduced electric field forthree different scenarios: a) an ideal detector that detects all EL photons; b) an detectorwith 50% effective PMT coverage and an effective detection efficiency per PMT of 10%(k = 0.5 × 0.1 = 0.05); and c) a detector with 5% PMT coverage and 10% detectionefficiency (k = 0.005). The value of RE if only the fluctuations in the production ofprimary charge contributed is also shown (red line). Notice that the resolution is alwaysbetter than 0.5% even in case c).
25

2.3 The SOFT concept
A HPGXe TPC design for ββ0ν searches must capture true events with high efficiencywhile rejecting backgrounds to the greatest extent possible. From this, three mainchallenges emerge:
1. Determination of the total energy of each candidate event with near-intrinsic reso-lution. Our target goal is to measure the energy with a resolution better than 1%FWHM at Qββ . This energy resolution goal can be met using secondary scintilla-tion or electroluminescence (EL).
2. Determination of the complete topology of each event in 3-D, based on energy-sensitive tracking of the ββ decay electrons and identification of “satellite” de-posits of energy. The 3-D localization requires efficient detection of the primaryscintillation light to accurately define the start-of-the-event time, t0.
3. Fabrication materials of sufficient radio-purity such that the background rejectioncapabilities of the HPGXe TPC provide the desired sensitivity.
Readout Plane A
-‐ posi%on
Readout Plane B -‐ energy
Electroluminescent Layer
Figure 2.7: The SOFT concept. EL light generated at the anode is recorded in the photosensorplane right behind it and used for tracking. It is also recorded in the photosensor plane behindthe transparent cathode and used for a precise energy measurement.
The concept of a Separated Function TPC was proposed by Nygren in [43] andextended by Nygren and Gomez-Cadenas in the NEXT LOI document [36], proposing
26

that tracking and energy measurements were carried out by different sensors. Figure 2.7illustrates an asymmetric TPC with Separated Optimized Functions. An event, shownas a wiggly track, generates primary scintillation recorded at both planes (this is calledthe S1 signal, following the slang used by the experiments searching for direct detectionof Dark Matter). EL light generated at the anode (S2) is recorded in the photosensorplane right behind it and used for tracking. It is also recorded in the photosensor planebehind the transparent cathode and used for a precise energy measurement.
To understand the advantages of the SOFT approach consider first the case in whichboth the cathode and the anode are instrumented with PMTs. Recording S1 at anypoint in the TPC requires PMTs optimizes for detecting single photoelectrons (e.g, highgain). Instead, recording the light pattern that defines a track with the anode PMTsrequires, in general, lower gain, to avoid saturation (since a lot of light is produced verynear the PMTs). Furthermore, the energy of the event can be measure with relativelysparse coverage, while a detailed tracking may require a denser coverage. If the TPC isdesigned as non SOFT (e.g, a symmetric TPC with the same instrumentation in anodeand cathode) it is difficult to reconcile this conflicting requirements. Instead the SOFTparadigm would prescribe to instrument the anode with a dense array of small, low-gain PMTs and the cathode with a sparse array of large, high-gain PMTs. It followsthat the separation of functions allows optimizing the TPC performance. The next stepmay be to decide that the anode PMTs can be replaced by other sensors. In our designSiPMs are chosen on the grounds of low cost, low expected radioactivity and good sensorresponse.
Figure 2.8: The soft dependence of solid angle in the soft concept.
An important question is the radial dependence of the light collected in the PMTplane. The notion is illustrated in Figure 2.8. A photon impinging in the center of thechamber spans a solid angle:
a1 = a2 = arctan(d/2
L) .
27
As the track moves along the radius the fraction of the solid angle described by a1 anda2 changes according to:
a1 = arctand1L
a2 = arctand− d1L
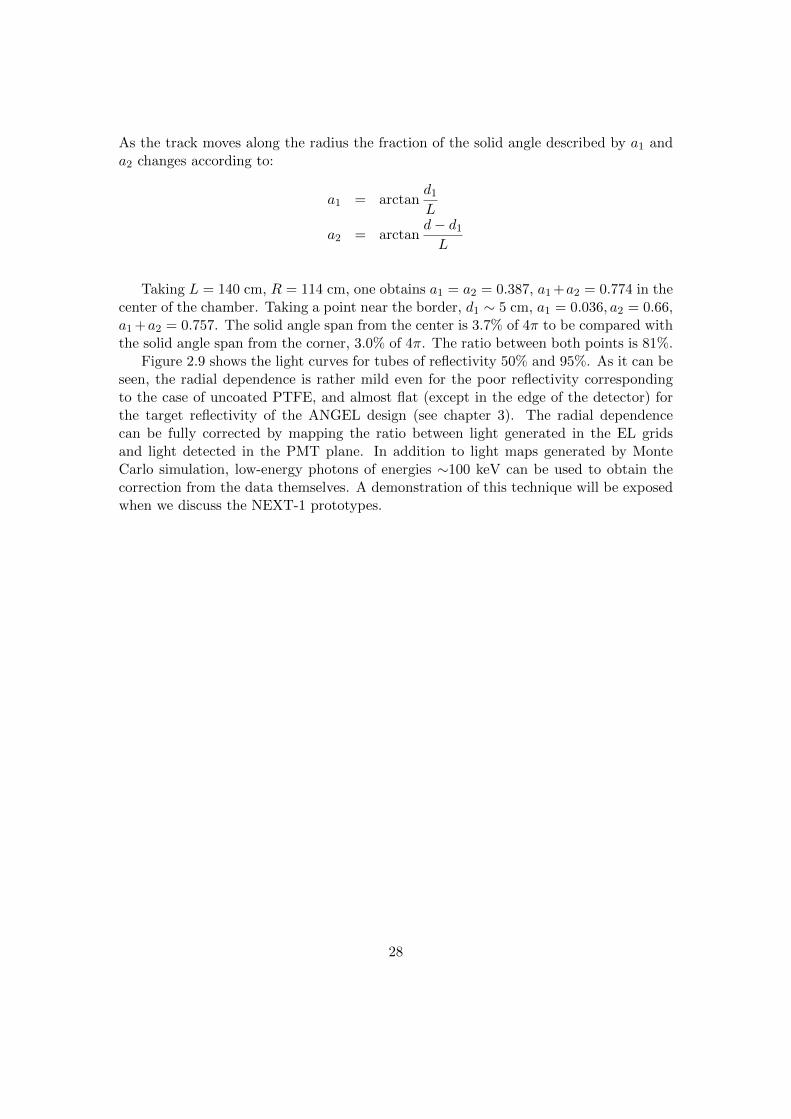
Taking L = 140 cm, R = 114 cm, one obtains a1 = a2 = 0.387, a1 +a2 = 0.774 in thecenter of the chamber. Taking a point near the border, d1 ∼ 5 cm, a1 = 0.036, a2 = 0.66,a1 +a2 = 0.757. The solid angle span from the center is 3.7% of 4π to be compared withthe solid angle span from the corner, 3.0% of 4π. The ratio between both points is 81%.
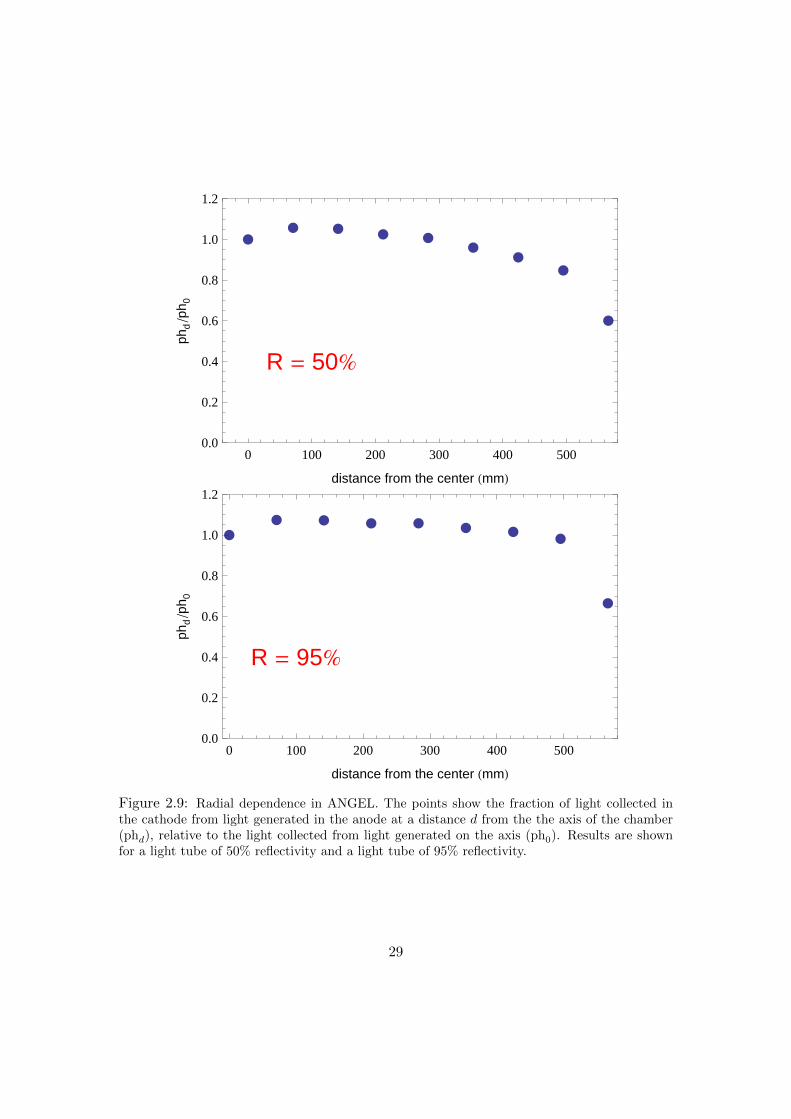
Figure 2.9 shows the light curves for tubes of reflectivity 50% and 95%. As it can beseen, the radial dependence is rather mild even for the poor reflectivity correspondingto the case of uncoated PTFE, and almost flat (except in the edge of the detector) forthe target reflectivity of the ANGEL design (see chapter 3). The radial dependencecan be fully corrected by mapping the ratio between light generated in the EL gridsand light detected in the PMT plane. In addition to light maps generated by MonteCarlo simulation, low-energy photons of energies ∼100 keV can be used to obtain thecorrection from the data themselves. A demonstration of this technique will be exposedwhen we discuss the NEXT-1 prototypes.
28
R = 50%
0 100 200 300 400 5000.0
0.2
0.4
0.6
0.8
1.0
1.2
distance from the center HmmL
phd
ph 0
R = 95%
0 100 200 300 400 5000.0
0.2
0.4
0.6
0.8
1.0
1.2
distance from the center HmmL
phd
ph 0
Figure 2.9: Radial dependence in ANGEL. The points show the fraction of light collected inthe cathode from light generated in the anode at a distance d from the the axis of the chamber(phd), relative to the light collected from light generated on the axis (ph0). Results are shownfor a light tube of 50% reflectivity and a light tube of 95% reflectivity.
29
Chapter 3
The ANGEL design
Our baseline design for the NEXT-100 detector is the Asymmetric Neutrino Gas ELApparatus (ANGEL), an asymmetric high-pressure gas xenon TPC with separated-optimized functions (SOFT). The energy function is provided by PMTs located behind atransparent cathode and sealed inside pressure-resistant individual housings. The track-ing function is provided by SiPMs (also known as MPPCs) located behind transparentEL grids and coated with TPB. The fiducial mass is chosen to be 100 kg, and theoperative pressure 15 bar.
ANGEL has been chosen as our baseline following the principle of designing thesimplest TPC that can result in a competitive physics program in the shortest possibletime. As a consequence, we have opted for solutions that require little or no additionalR&D on top of the program already under way with the NEXT-1 prototypes.
Since the number of parameters that define the detector is large, it is useful todescribe the design examining the detector from different angles. This are: the choicesrelatives to the target; those related with the pressure vessel; those related with the fieldcage, high-voltage and EL grids; the energy plane; and the tracking plane.
3.1 Source mass
The source mass of the NEXT experiment is gas xenon enriched in the 136Xe isotope.In the ANGEL design the xenon is also used as electric insulator. As such, an annulusof 4 cm radius around the field cage is needed to insulate the high voltage. This choicehas the drawback that a significant amount of valuable enriched xenon is wasted. Itcould be avoided by enclosing the fiducial volume inside a xenon vessel, and using anadditional, cheaper gas (such as nitrogen) as electric buffer. However, the use of sucha vessel implies a considerable complication from the engineering point of view. Thefirst problem is the choice of the construction material for the vessel, which must benon-conducting and radiopure. Kevlar or acrylic glass are among the possibilities. Thelatter is more radiopure, but xenon diffusion into the buffer gas may be an issue. Theenriched xenon and the buffer gas must be kept at the same pressure (in fact the buffergas must track the pressure of the xenon, to avoid a transient that could break the
30
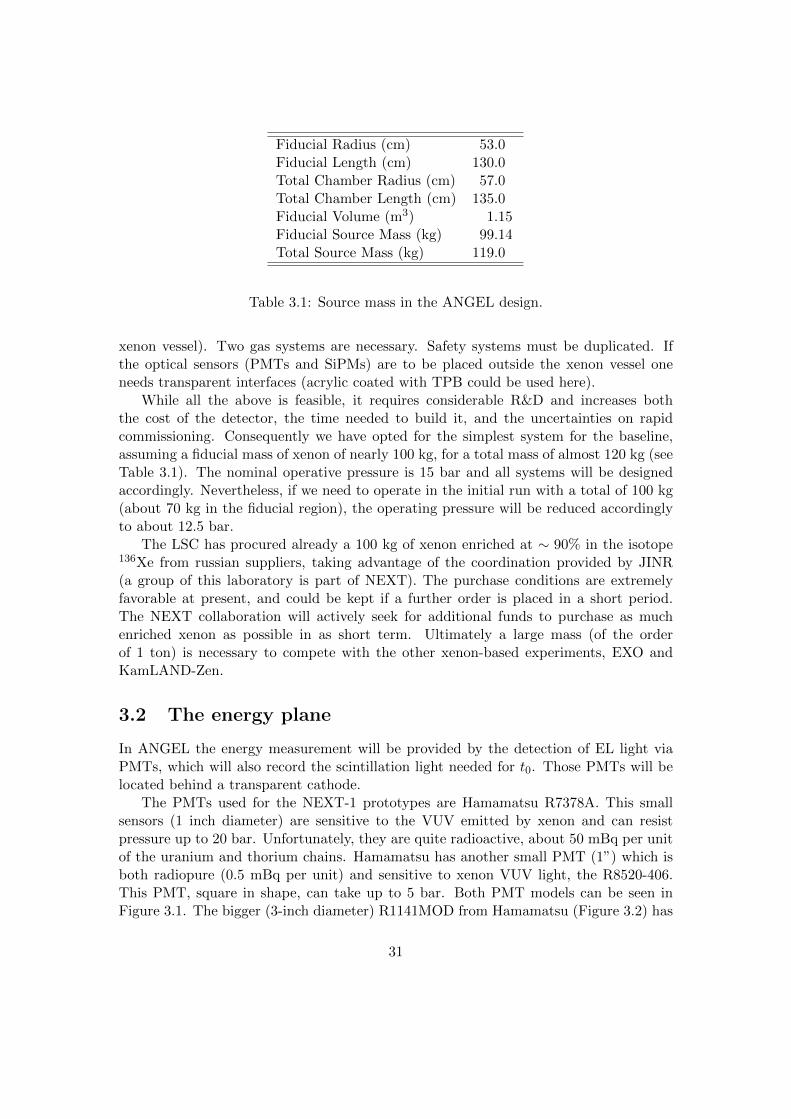
Fiducial Radius (cm) 53.0Fiducial Length (cm) 130.0Total Chamber Radius (cm) 57.0Total Chamber Length (cm) 135.0Fiducial Volume (m3) 1.15Fiducial Source Mass (kg) 99.14Total Source Mass (kg) 119.0
Table 3.1: Source mass in the ANGEL design.
xenon vessel). Two gas systems are necessary. Safety systems must be duplicated. Ifthe optical sensors (PMTs and SiPMs) are to be placed outside the xenon vessel oneneeds transparent interfaces (acrylic coated with TPB could be used here).
While all the above is feasible, it requires considerable R&D and increases boththe cost of the detector, the time needed to build it, and the uncertainties on rapidcommissioning. Consequently we have opted for the simplest system for the baseline,assuming a fiducial mass of xenon of nearly 100 kg, for a total mass of almost 120 kg (seeTable 3.1). The nominal operative pressure is 15 bar and all systems will be designedaccordingly. Nevertheless, if we need to operate in the initial run with a total of 100 kg(about 70 kg in the fiducial region), the operating pressure will be reduced accordinglyto about 12.5 bar.
The LSC has procured already a 100 kg of xenon enriched at ∼ 90% in the isotope136Xe from russian suppliers, taking advantage of the coordination provided by JINR(a group of this laboratory is part of NEXT). The purchase conditions are extremelyfavorable at present, and could be kept if a further order is placed in a short period.The NEXT collaboration will actively seek for additional funds to purchase as muchenriched xenon as possible in as short term. Ultimately a large mass (of the orderof 1 ton) is necessary to compete with the other xenon-based experiments, EXO andKamLAND-Zen.
3.2 The energy plane
In ANGEL the energy measurement will be provided by the detection of EL light viaPMTs, which will also record the scintillation light needed for t0. Those PMTs will belocated behind a transparent cathode.
The PMTs used for the NEXT-1 prototypes are Hamamatsu R7378A. This smallsensors (1 inch diameter) are sensitive to the VUV emitted by xenon and can resistpressure up to 20 bar. Unfortunately, they are quite radioactive, about 50 mBq per unitof the uranium and thorium chains. Hamamatsu has another small PMT (1”) which isboth radiopure (0.5 mBq per unit) and sensitive to xenon VUV light, the R8520-406.This PMT, square in shape, can take up to 5 bar. Both PMT models can be seen inFigure 3.1. The bigger (3-inch diameter) R1141MOD from Hamamatsu (Figure 3.2) has
31

levels of 214Bi and 208Tl activity per unit of area smaller than that of the R8520. Ithas been developed for use in cryogenic noble liquid detectors for dark matter searchesand cannot resist high pressure. A more ambitious possibility —suitable perhaps for anupgrade of NEXT— would be the QUPID (Figure 3.3), which features high QE (33%)and even smaller background, 0.5 mBq for the U chain and 0.5 mBq for the Th chain.
3.2.1 PMTs and pressure
The R8520 cannot be used at our baseline pressure of 15 bar, and is probably risky touse it at its nominal pressure of 5 bar, due to the possibility of failure after several cyclesof vacuum-pressure (we have observed this phenomenon in the R7378A, in spite of thefact that the PMT has not operated at a pressure higher than 10 bar).
The collaboration has studied a number of PMTs reinforced by Hamamatsu. Thesesamples were placed under high pressure in argon, and single photoelectron data wastaken. The tests show that the metal body shrinks for pressures above 6 bar. At 7 barthe effect becomes visually apparent, and at 9 bar the shrinking is such that the sidesurface moves more than 1mm inside the PMT volume (see Figure 3.4). After being fewhours at 9 bar, the PMT stops functioning. It appears as if the PMT sealing is stillgood, but the shrinking causes a short circuit inside the device. Further tests will beconducted during the next few months. However it appears unlikely that the R8520 canoperate reliably at high pressure during long periods.
If the PMTs cannot be directly operated under pressure, the obvious solution isto leave the devices outside of the pressurized volume, viewing the chamber through atransparent, pressure-resistant window. This concept was tested in the IFIC’s NEXT-0detector (Figure 3.5), where a quartz (fused silica) window, 15 mm thick, that can resistpressure up to 15 bar, seals the fiducial volume. Clear EL signals were observed in aR8520 PMT optically coupled to the window.
Sapphire is a better material than quartz to build large windows (it has a 10 timeshigher tensile strength). While UV-grade sapphire is available, it is also possible to coatthe windows with TPB, that will shift the VUV light to blue.
With the PMTs protected in their houses it is possible to use either the R8520 orthe R11410MOD. In the first case, one would house 4 small PMTs in each individualhousing. At present we have not yet made a final decision about which type of PMTto use although it appears likely that the first run uses the R8520, which appears to bemore readily available than the R11410MOD.
3.2.2 How many PMTs?
To answer this question let’s first consider the detection of scintillation light. The numberof photons that arrive to the PMT housing windows depend of the properties of thereflector as well as the transparency of the EL grids. Our simulation shows that a lighttube of 50% reflectivity (which could be made of uncoated PTFE) transfer 3% of thephotons produced in the EL grids to the cathode. A light tube of 90% reflectivity (madeof PTFE coated with TPB) will transfer 9% of the photons.
32

Figure 3.1: On the left, the Hamamatsu R8520-406 PMT. This is a radiopure PMT,sensitive to VUV, that can take up to 5 bar pressure. On the right, the PMT used inthe NEXT-1 prototypes, model R7378A. This phototube is also sensitive to VUV andcan resist pressure up to 20 bar, but is not radiopure.
Figure 3.2: The Hamamatsu R11410MOD phototube. This is a large PMT, 3” indiameter, with an average radioactivity of 3 mBq for the U chain and 2 mBq for the Thchain.
33

Figure 3.3: Left and center: principle of operation of the QUPID. Right: a picture of theactual device. Each QUPID has in average a radioactivity of 0.5 mBq for the U chainand 0.5 mBq for the Th chain.
Figure 3.4: PMTs after the pressure resistant tests. The R8520 starts to shrink at 7 bar.The deformation becomes large at 9 bar. After few hours at this pressure the PMTsstop working.
34

Figure 3.5: The NEXT-0 detector at IFIC has tested the concept of sealing quartzwindows to separate the pressure atmosphere from the PMT.
Figure 3.6: A detail of the housing protecting the PMTs in ANGEL.
35

Figure 3.7: The ANGEL torispheric head, showing housing for 60 PMTs (30% coverage).
Assume now that an event is produced near the EL grids (the worst scenario for thedetection of primary scintillation light with the cathode PMTs). Recall from Eq. (2.7)that 13158 scintillation photons are produced per MeV. Then the number of photoelec-trons (pes) detected by the PMTs at the cathode is:
(13158 photons/MeV)× C × TR × TW ×QE
where C is the cathode coverage, TR is the reflector transfer function, TW is the hous-ing window transfer function and QE is the PMT quantum efficiency. Monte Carlosimulation yields TW = 0.75 for a sapphire window coated with TPB. Then, settingC = 0.15, R = 0.03 (R=50%) and QE = 0.3 we obtain:
(13158 photons/MeV)× 0.15× 0.03× 0.75× 0.3 ∼ 13 (pes/MeV )
While for a light tube of 90% reflectivity we have a factor 3 more, ∼ 40 pes/MeV. Thus areflector of R = 0.9 allows to detect S1 in the full chamber range up to energies of about100 keV. This is important, not only to study the lower part of the ββ2ν spectrum, butalso to trigger in low energy gammas sources for detector calibration.
Consider now EL light. According to Eq. 2.22, we need at least 10 pes per primaryelectron to optimize resolution. ANGEL optical gain is near 3×10³. The number of pesper electron for 15% coverage and 50% reflector is:
3× 10³ (photons/electron) 0.15× 0.03× 0.75× 0.3 ∼ 3 (pes/electron)
36

Here one can immediately see that, in order to fully exploit the potential of the PMTswe need a extra factor of 3 that can come either from a 90% reflector or doubling thecoverage to some 30%.
3.3 The tracking plane
In ANGEL the tracking function is provided by a plane of photo-sensors operating asa light-pixels and located behind the transparent EL grids. In addition to positioninformation tracking pixels need to provide a rough measurement of the energy (sincewe are interested in measuring the energy per unit length of the track), but they canhave much less resolution than PMTs. In exchange, they must be smaller, since physicsdictates a pitch of around 1 cm (while the PMTs have a diameter of 7.5 cm). Theyalso must have much less radioactivity and cost per unit, since they are needed in largenumbers (5,000 to 10,000 depending on the pitch).
3.3.1 MPPCs
Figure 3.8: Left: detail of a multi-pixel photon counter (MPPC), showing the multiple APDpixels composing the MPPC. Right: two MPPC detectors (1 mm2) from Hamamatsu Photonics.
The best option for light pixels at present appears to be the so-called Silicon Photo-multipliers (SiPMs), also called Multi-Pixel Photon Counter (MPPCs) by Hamamatsu(Figure 3.8). MPCCs are cheap when delivered in large quantities (about 10 euro perunit), have large gain (close to 106), Figure 3.9) and very low levels of radioactivity (aMPPC is a 1 mm2 piece of silicon).
3.3.2 Coating MPPCs with TPB
The main drawback of SiPMs is that they are not sensitive to VUV light (their particledetection efficiency, PDE, peaks near the blue, as shown in Figure 3.10) and therefore itis necessary to coat them with a WLS, such as terphenyl-butadiene (TPB) to shift thelight to blue, where SiPMs are most sensitive. The procedures is illustrated in Figure
37

Voltage (V)71.5 72 72.5 73 73.5
Ga
in
150
200
250
300
350
400
450
500
550
6003
10!
Hamamatsu S10362-11-025C
SiPM ref 1
SiPM ref 2
Figure 3.9: Gain of two SiPMs Hamamatsu S10362-11-025C measured as a function ofthe operating voltage.
8.27, which shows how a TPB-coated glass (and a TPB coated SiPM board) glows withblue light (emitted by the TPB) when illuminated with VUV light. Figure 8.38 showsthe response of TPB-coated SIPMs compared with that on non-coated devices. Noticethat the response of the uncoated SiPMs at low wavelengths is about a factor 10 lowerthan that in the blue region. With coating, however, the response increases by a factor3, making light detection with these detectors feasible.
3.3.3 Implementation of the tracking plane
Figure 3.13 shows the implementation of the tracking plane in the NEXT-1-IFIC proto-type. The SiPMs are mounted in daughter boards (DB), made of cuflon, (PTFE fixed toa copper back plane). Most DB mounts 16 SiPMs. The DB are connected to a MotherBoard (MB) that distributes signals and power to the SiPMs. Each DB is coated withTPB in a facility available at ICMOL, an institute near IFIC before installation. A totalof 248 SiPM are mounted in the MB, located 2 mm behind the anode grid.
The ANGEL design will be a larger version of the NEXT-1 tracking plane. We planto build DB holding 64 SiPMs each in an array of 8×8. About 160 such DB (assuminga pitch of 1 cm and 10,000 SiPMs) will need to be mounted and coated with TPB.
38

Figure 3.10: The Photon Detection Efficiency as a function of the wavelength of theincident light for the two SiPM models considered in NEXT.
Figure 3.11: Illumination with UV light of a glass-slice (left) and a 5-SiPM board (right)both coated with TPB.
39

Wavelength (nm)240 260 280 300 320 340 360 380 400
A)µ
Aver
age
Curr
ent (
0
50
100
150
200
250 Non coated SiPM DB
TPB coated SiPM DB
Figure 3.12: Average current in the TPB coated SiPMs DB compared to the averagecurrent of a non coated SIPM DB. Both SiPM DB are illuminated by the same XenonLamp coupled to a Monochromator to select the input wavelength.
Figure 3.13: Left: SiPM Daughter-Boards containing each 4 × 4 SiPMs mounted on aCuflon support for the central ones and 2×4 or 3×4 SiPMs for the ones on the externaledges of the plane. Right: Mother-Board with the front-end electronics on which centerone of the Daughter-Boards is connected
40

Each DB will have its own biasing and the signals from the SiPMs will be amplified andserialized inside the chamber, before being dispatched via optical link (see chapter 7).
Tracking with MPPCs
SiPMs generate nearly uniform single photoelectron (spe) pulses. However, the unifor-mity of the SiPMs noise pulses and the large intensities of tracking signals allows to seta digital threshold (at about 5 p.e) high enough to eliminate almost all noise, withoutdegrading the spatial resolution.
Each primary electron entering the meshes produces EL light for a time intervalgiven by the gap size divided by the drift velocity. For E/p ∼ 3.5 kV/cm bar, this timeinterval is about 3 µs. Typically, 600–1200 electrons contribute to the track imagingat any moment. Tracks less parallel to the TPC axis contribute the higher number ofelectrons within the EL gap. With so many primary electrons per mm, the statisticalcontribution to spatial resolution is ∼1 mm rms, even for the maximum possible diffusionwithin the chamber.
With an EL gain of around 3000 and a track population of ∼1000 electrons within theEL meshes, the total EL luminosity is in the range of 3× 10⁶ photons per µs (countingonly the forward-going photons). A detection element of 1 mm2 at a distance of 5 mmfrom the luminous region will subtend a solid angle fraction of ∼0.003. Hence, about3,000 photons per µs will impinge on such a 1 mm2 detection area. From the measuredresponse of the coated SiPMs (Figure 8.38) we take a transmittance of 30% at 170 nmrelative to the peak transmittance in the blue region. The PDE in the blue is about50%. Therefore one expects to record about 500 p.e. per µs, plenty for good tracking.
In a more quantitative way, Figure 3.14 shows the Monte Carlo simulation of thelight received in an array of 4 SiPMs (labeled (0,0), (0,1), (1,0) and (1,1)) when gammasof various energies produce light in an EL region of 5 mm at E/p of 4. In each case thesignal is shown for the four SiPMs of the array as a function of time. A suitable cut toget rid of the dark current in a SiPM is 3–4 p.e., thus, with a count of 7 p.e, for the 1keV case, the SiPMs are sensitive to small energy deposits.
Figure 3.15 shows a Monte Carlo simulation of an event tracked by SiPMs. The lightbackground collected by cells outside the track is at most 10−4 of the total track, and10−5–10−6 for most cells.
3.4 Pressure Vessel
The construction material chosen for the pressure vessel is pure titanium, ASTM grade2 or grade 3 (depending on the final results of the material screening now being carriedout at the LSC). The choice of titanium over pure copper (ASTM oxygen-free copperC11000), material traditionally used in low background experiments, is motivated byengineering reasons. Although finite element simulations indicate that it is possible tobuild a vessel made of ultra-radiopure copper, the material is not contemplated in theASME code and standards, which will be followed through in the construction of the
41

Figure 3.14: Light received in an array of 4 SiPMs (labeled (0,0), (0,1), (1,0) and (1,1)) whengammas of various energies produce light in an EL region of 5 mm at E/P of 4. In each casethe signal is shown for the four SiPMs of the array as a function of time. A suitable cut to getrid of the dark current in a SiPM is 3–4 p.e., thus, with a count of 7 p.e, for the 1 keV case, theSiPMs are sensitive to small energy deposits.
42
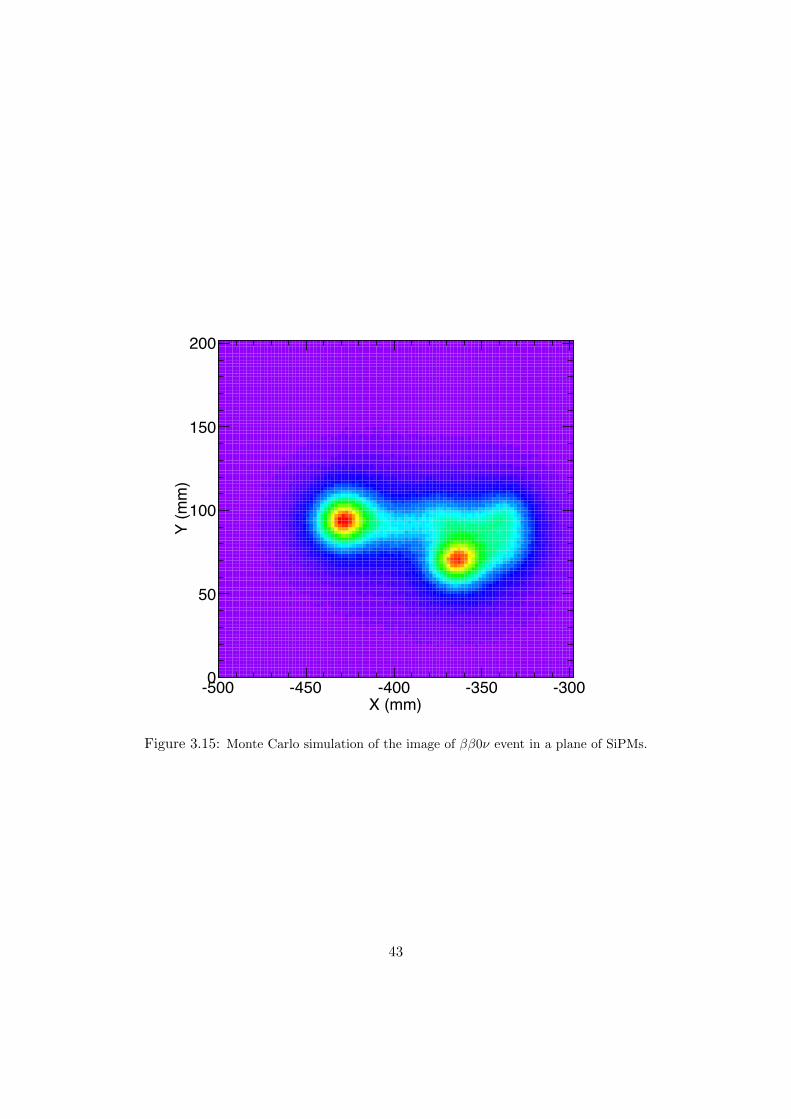
X (mm)-500 -450 -400 -350 -300
Y (m
m)
0
50
100
150
200
Figure 3.15: Monte Carlo simulation of the image of ββ0ν event in a plane of SiPMs.
43
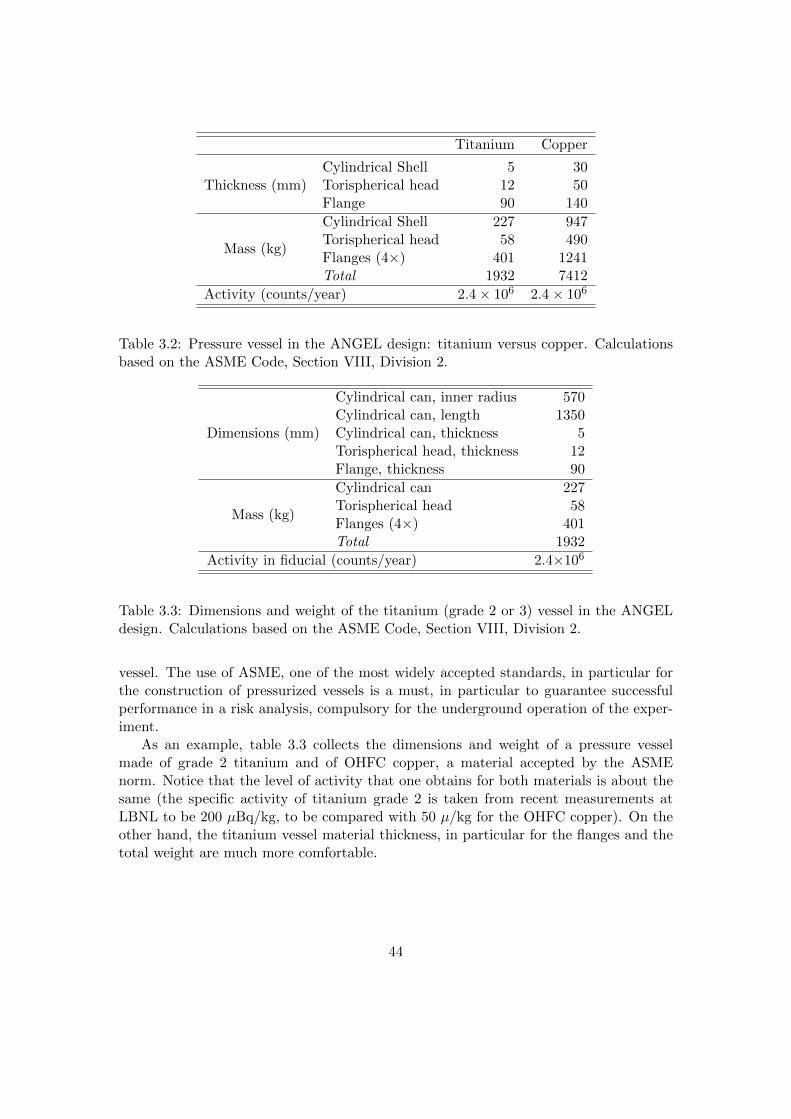
Titanium Copper
Thickness (mm)Cylindrical Shell 5 30Torispherical head 12 50Flange 90 140
Mass (kg)
Cylindrical Shell 227 947Torispherical head 58 490Flanges (4×) 401 1241Total 1932 7412
Activity (counts/year) 2.4× 10⁶ 2.4× 10⁶
Table 3.2: Pressure vessel in the ANGEL design: titanium versus copper. Calculationsbased on the ASME Code, Section VIII, Division 2.
Dimensions (mm)
Cylindrical can, inner radius 570Cylindrical can, length 1350Cylindrical can, thickness 5Torispherical head, thickness 12Flange, thickness 90
Mass (kg)
Cylindrical can 227Torispherical head 58Flanges (4×) 401Total 1932
Activity in fiducial (counts/year) 2.4×10⁶
Table 3.3: Dimensions and weight of the titanium (grade 2 or 3) vessel in the ANGELdesign. Calculations based on the ASME Code, Section VIII, Division 2.
vessel. The use of ASME, one of the most widely accepted standards, in particular forthe construction of pressurized vessels is a must, in particular to guarantee successfulperformance in a risk analysis, compulsory for the underground operation of the exper-iment.
As an example, table 3.3 collects the dimensions and weight of a pressure vesselmade of grade 2 titanium and of OHFC copper, a material accepted by the ASMEnorm. Notice that the level of activity that one obtains for both materials is about thesame (the specific activity of titanium grade 2 is taken from recent measurements atLBNL to be 200 µBq/kg, to be compared with 50 µ/kg for the OHFC copper). On theother hand, the titanium vessel material thickness, in particular for the flanges and thetotal weight are much more comfortable.
44
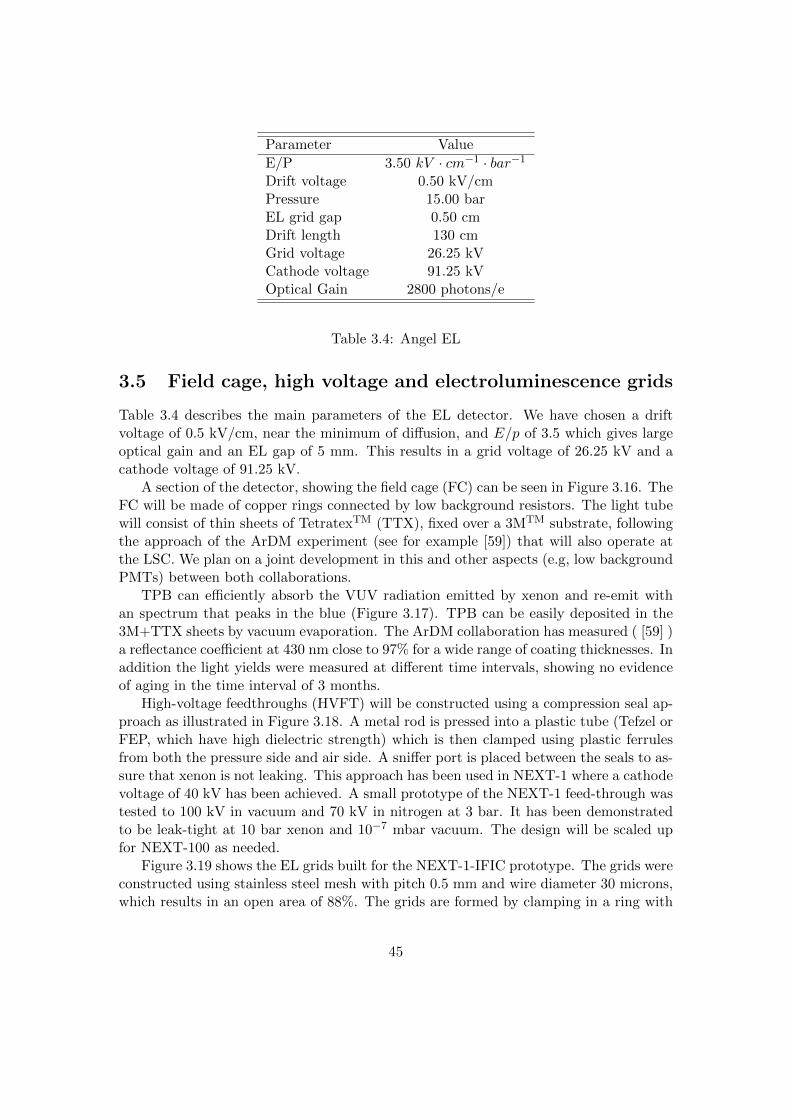
Parameter Value
E/P 3.50 kV · cm−1 · bar−1
Drift voltage 0.50 kV/cmPressure 15.00 barEL grid gap 0.50 cmDrift length 130 cmGrid voltage 26.25 kVCathode voltage 91.25 kVOptical Gain 2800 photons/e
Table 3.4: Angel EL
3.5 Field cage, high voltage and electroluminescence grids
Table 3.4 describes the main parameters of the EL detector. We have chosen a driftvoltage of 0.5 kV/cm, near the minimum of diffusion, and E/p of 3.5 which gives largeoptical gain and an EL gap of 5 mm. This results in a grid voltage of 26.25 kV and acathode voltage of 91.25 kV.
A section of the detector, showing the field cage (FC) can be seen in Figure 3.16. TheFC will be made of copper rings connected by low background resistors. The light tubewill consist of thin sheets of TetratexTM (TTX), fixed over a 3MTM substrate, followingthe approach of the ArDM experiment (see for example [59]) that will also operate atthe LSC. We plan on a joint development in this and other aspects (e.g, low backgroundPMTs) between both collaborations.
TPB can efficiently absorb the VUV radiation emitted by xenon and re-emit withan spectrum that peaks in the blue (Figure 3.17). TPB can be easily deposited in the3M+TTX sheets by vacuum evaporation. The ArDM collaboration has measured ( [59] )a reflectance coefficient at 430 nm close to 97% for a wide range of coating thicknesses. Inaddition the light yields were measured at different time intervals, showing no evidenceof aging in the time interval of 3 months.
High-voltage feedthroughs (HVFT) will be constructed using a compression seal ap-proach as illustrated in Figure 3.18. A metal rod is pressed into a plastic tube (Tefzel orFEP, which have high dielectric strength) which is then clamped using plastic ferrulesfrom both the pressure side and air side. A sniffer port is placed between the seals to as-sure that xenon is not leaking. This approach has been used in NEXT-1 where a cathodevoltage of 40 kV has been achieved. A small prototype of the NEXT-1 feed-through wastested to 100 kV in vacuum and 70 kV in nitrogen at 3 bar. It has been demonstratedto be leak-tight at 10 bar xenon and 10−7 mbar vacuum. The design will be scaled upfor NEXT-100 as needed.
Figure 3.19 shows the EL grids built for the NEXT-1-IFIC prototype. The grids wereconstructed using stainless steel mesh with pitch 0.5 mm and wire diameter 30 microns,which results in an open area of 88%. The grids are formed by clamping in a ring with
45
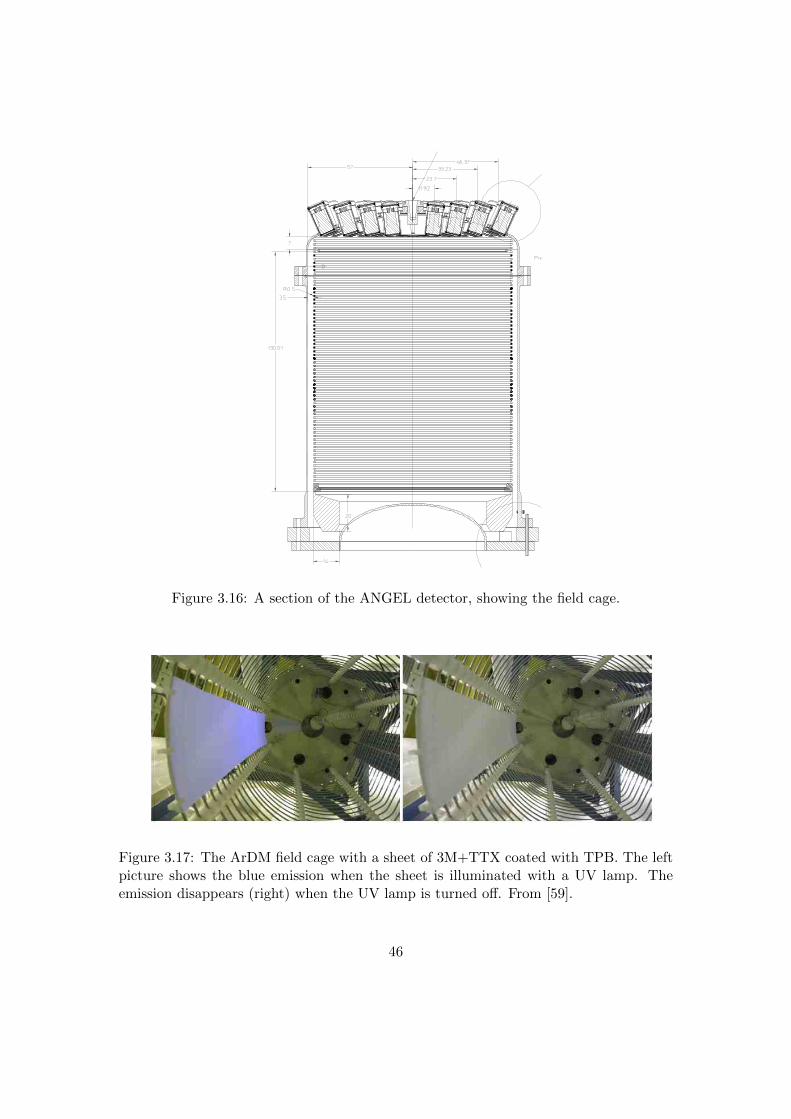
Figure 3.16: A section of the ANGEL detector, showing the field cage.
Figure 3.17: The ArDM field cage with a sheet of 3M+TTX coated with TPB. The leftpicture shows the blue emission when the sheet is illuminated with a UV lamp. Theemission disappears (right) when the UV lamp is turned off. From [59].
46

Figure 3.18: High-Voltage feedthroughs designed and built by Texas A&M for NEXT-1-IFIC.
a tongue and a groove to hold the mesh and using a tensioning ring that is torqued withset-screws to achieve the optimum tension. There is considerable experience with thisapproach since the grids are similar to ones built for ZEPLIN II, LUX, and a numberof other test chambers. The cathode and PMT shield will be wire grids with pitchesof 0.5 to 1 cm to maximize open area. Again, the design will be based on previouslyconstructed grids that are well understood. One important issue is that for the largediameter required in ANGEL, preliminary estimates show that the EL grids will bow asmuch as 1 mm given the modulus of elasticity of the mesh and required voltage. If thisis verified and if the bowing introduces a systematic effect in the energy resolution thatcannot be corrected (Monte Carlo studies are under way to assess this problem) severalalternatives are possible. One possibility is to pre-stress the ground grid following themeasured curvature of the HV grid. Another possibility is a design where the anode iscomposed of acrylic that is metalized with a transparent coating such as Indium-Tin-Oxide (ITO) and coated with TBP. In this case, the acrylic can be bowed to match thedeflection of the gate grid to maintain a uniform gap. If this plate is coated on bothsides, the anode side can be at positive HV and the back side grounded so that theSiPMs can still be close to the anode.
47

Figure 3.19: NEXT-1-IFIC EL meshes designed and built by Texas A&M.
48

Chapter 4
The NEXT-1 prototypes
The main aim of the NEXT1 prototypes built at LBNL and IFIC is demonstrating NEXTenergy resolution at reasonably high energies (e.g, using positron annihilation 511 keVgamma rays, 137Cs 660 keV gamma rays and 60Co 1.1 MeV gamma rays). Some of thechallenges in designing an electroluminescence TPC with near optimal energy resolutionare:
1. The total signal is distributed over many PMTs. Therefore accurate relative cali-brations are needed for integration.
2. Signal duration and amplitude depends on event shape.
(a) Low drift velocity ∼1 mm/µs.
(b) Diffusion spreads out track signal: 0.3 mm/√
cm longitudinal, 0.8 mm/√
cmtransverse.
(c) Signals spread over time: minimum for tracks parallel to luminescence plane,maximum for tracks normal to luminescence plane (2.5 MeV electron tracklength ∼16 cm).
3. Large electroluminescent gain and light collection/photo-efficiency is required toreduce the statistical error on photo-electron signals.
4. Light collection efficiency depends somewhat on track radial position.
5. Electroluminescent gain must be stable and uniform over the EL surface.
6. Contaminants that quench signals must be controlled (gas purification).
7. Xenon light emission is at 173 nm, in the VUV region; this requires quartz-window(VUV grade) photodetectors, or coated windows.
8. Energy resolution is measured with high-energy gammas:
(a) Compton events are predominant, leading to distributed energy.
49
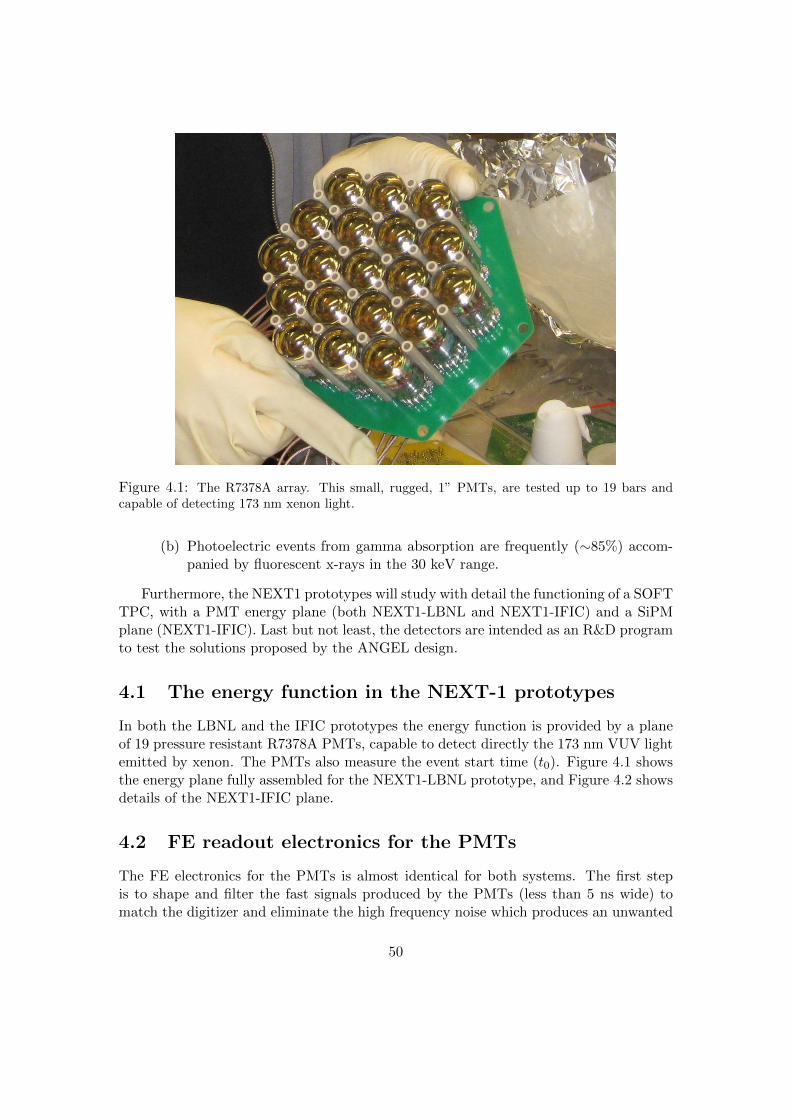
Figure 4.1: The R7378A array. This small, rugged, 1” PMTs, are tested up to 19 bars andcapable of detecting 173 nm xenon light.
(b) Photoelectric events from gamma absorption are frequently (∼85%) accom-panied by fluorescent x-rays in the 30 keV range.
Furthermore, the NEXT1 prototypes will study with detail the functioning of a SOFTTPC, with a PMT energy plane (both NEXT1-LBNL and NEXT1-IFIC) and a SiPMplane (NEXT1-IFIC). Last but not least, the detectors are intended as an R&D programto test the solutions proposed by the ANGEL design.
4.1 The energy function in the NEXT-1 prototypes
In both the LBNL and the IFIC prototypes the energy function is provided by a planeof 19 pressure resistant R7378A PMTs, capable to detect directly the 173 nm VUV lightemitted by xenon. The PMTs also measure the event start time (t0). Figure 4.1 showsthe energy plane fully assembled for the NEXT1-LBNL prototype, and Figure 4.2 showsdetails of the NEXT1-IFIC plane.
4.2 FE readout electronics for the PMTs
The FE electronics for the PMTs is almost identical for both systems. The first stepis to shape and filter the fast signals produced by the PMTs (less than 5 ns wide) tomatch the digitizer and eliminate the high frequency noise which produces an unwanted
50

Figure 4.2: The NEXT-1 PMT plane. The lower support of the energy plane PMTs is made ofpeek and the upper one of PTFE (which has more reflectivity to the light). The energy plane islocated behind a transparent cathode.
Figure 4.3: Typical Pulse from the NEXT1 prototypes PMT Plane (average of 200 pulses).
51

ringing. The ringing, schematically shown in Figure 4.3, is shown superimposed to thefast PMT pulses.
Figure 4.4: Charge integration can be carried out by adding a capacitor to the PMT base.
The key concept to eliminate ringing is to realize that the phenomenon does notchange the total charge, which should be measured rather than a fast voltage pulse. Anintegrator can be implemented by simply adding a capacitor and a resistor (50 Ω in ourcase) to the PMT base (Figure 4.4). The pulse rise time is formed by the width of thePMT current pulse. The decay time is simply:
τ = RLC = 50C >1
fsample(4.1)
Figure 4.5: PMT output pulse with 200 pF anode shunt capacitor.
The effect of the charge integration capacitor shunting the anode can be seen inFigure 4.5. It lengthens the pulse and reduces the primary signal peak voltage to:
V =Q
C(4.2)
However the amplitude of the ringing component is not reduced since it does notaffect the signal current!
52

Figure 4.6: The PMT output is fed to an a chain amplifier + low pass filter.
Instead of feeding the ADC directly, the integrated signal is fed to an amplifier withmuch lower noise (Figure 4.6). Currently we are using Lecroy 660 A modules rentedfrom the CERN pool. The signal-to-noise ratio of the single photoelectron PMT pulsesets the capacitance C and a low-pass filter is inserted at the output of the amplifier.This limits the signal bandwidth to < 0.5 × ADC sampling rate and reduces the totalnoise, since the amplifier has a greater bandwidth.
Figure 4.7: The bandwidth limit of the amplifier together with a 50 MHz low-pass filter at itsoutput attenuates the PMT ringing components to form a clean pulse fed to the ADC, whichhas a 10 ns sampling time.
The low-pass filter is configured to provide the desired load resistance to the amplifierand attenuation to match the ADCs maximum input voltage. Furthermore, the amplifierprovides additional attenuation at high frequencies. The result can be seen in Figure4.7.
53
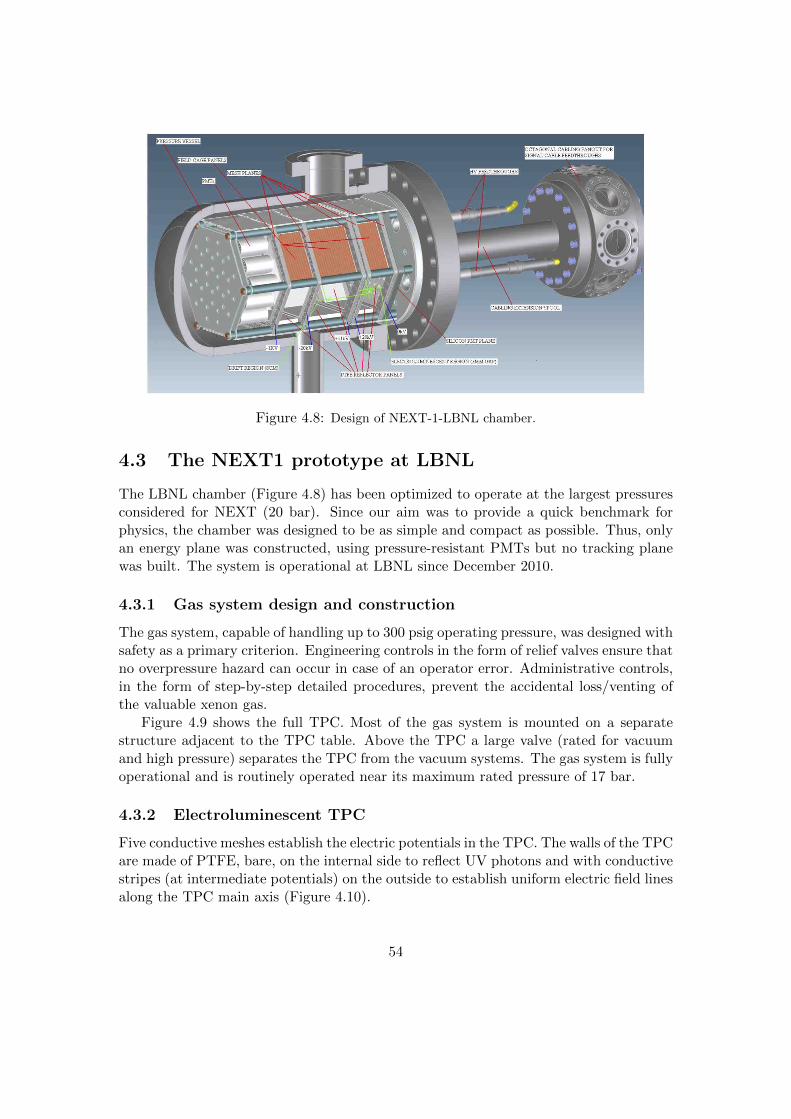
Figure 4.8: Design of NEXT-1-LBNL chamber.
4.3 The NEXT1 prototype at LBNL
The LBNL chamber (Figure 4.8) has been optimized to operate at the largest pressuresconsidered for NEXT (20 bar). Since our aim was to provide a quick benchmark forphysics, the chamber was designed to be as simple and compact as possible. Thus, onlyan energy plane was constructed, using pressure-resistant PMTs but no tracking planewas built. The system is operational at LBNL since December 2010.
4.3.1 Gas system design and construction
The gas system, capable of handling up to 300 psig operating pressure, was designed withsafety as a primary criterion. Engineering controls in the form of relief valves ensure thatno overpressure hazard can occur in case of an operator error. Administrative controls,in the form of step-by-step detailed procedures, prevent the accidental loss/venting ofthe valuable xenon gas.
Figure 4.9 shows the full TPC. Most of the gas system is mounted on a separatestructure adjacent to the TPC table. Above the TPC a large valve (rated for vacuumand high pressure) separates the TPC from the vacuum systems. The gas system is fullyoperational and is routinely operated near its maximum rated pressure of 17 bar.
4.3.2 Electroluminescent TPC
Five conductive meshes establish the electric potentials in the TPC. The walls of the TPCare made of PTFE, bare, on the internal side to reflect UV photons and with conductivestripes (at intermediate potentials) on the outside to establish uniform electric field linesalong the TPC main axis (Figure 4.10).
54
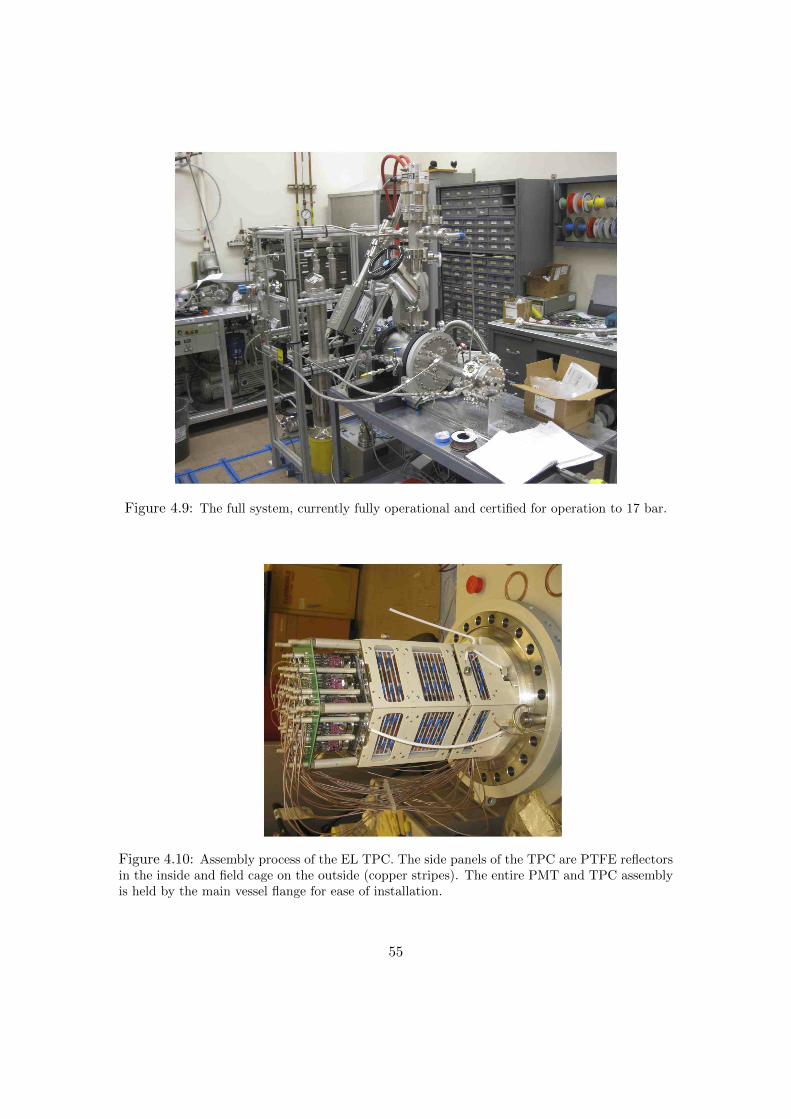
Figure 4.9: The full system, currently fully operational and certified for operation to 17 bar.
Figure 4.10: Assembly process of the EL TPC. The side panels of the TPC are PTFE reflectorsin the inside and field cage on the outside (copper stripes). The entire PMT and TPC assemblyis held by the main vessel flange for ease of installation.
55

All HV and signal cables come out through the main large flange for ease of assembly.Large HV for the drift and EL region come out through dedicated SHV feedthroughsdirectly on the main flange. PMT HV and signal cables come out through the centraltube and through multipin feedthroughs on the sides of an 8-port vessel. The PMTarray connects to a base-plane, with receptacles for the PMT pins and with electroniccomponents for the PMTs voltage dividers. Capacitors on the last few PMT dynodesprovide voltage stability for the long multi-photoelectron pulses expected from event sizepassing into a large-gain EL region. Differential signal sensing, with isolated grounds,has been implemented to avoid ground-loop noise.
Previous measurements by Bolotnikov et al. (using a small ionization chamber)showed a large dependence of the energy resolution in high pressure xenon on the driftelectric field that is not fully understood, although a case can be made that the effectis an artifact of that setup. In the NEXT1-LBNL TPC the drift region is 8 cm longand the maximum HV on the dedicated feedthroughs is both ±20 kV. It then allows usto measure the energy resolution for drift fields from 0 to 4 kV/cm (thus spanning thepreviously measured range) while maintaining a constant EL gain.
4.3.3 DAQ design, implementation and PMT measurements
The DAQ design for the 19 PMT array begins with low-noise amplifiers, close to the de-tector, as described above. These are connected to Struck digitizers by low-pass circuitsthat shape the fast PMT pulses (less than 5 ns wide) to match the digitizer samplingrate of 100 MHz. The Struck digitizer modules have genuine 13-14 bit resolution, andare read out through a VME controller card with USB output directly into a PC runningLinux.
Currently we are using standard NIM modules for the amplification stage but plan totransition to a custom made solution based on commercially available preamp integratedcircuits. The Struck 8-channel digitizer modules are controlled by provided firmware toprovide trigger generation and determine the number of samples to capture per trigger,the amount of pre-trigger, and other functions.
In normal operation the trigger is formed by the logical-or of all the digitizer channels(one OR signal per 8-channel group). For each channel an amplitude or charge thresholdcan be used. A threshold at a few photo-electron level will be efficient for the EL signaland should have a very low noise-trigger rate. In calibration mode we use tagged Na-22(two back to back 511 keV gamma rays. One of the gammas is tagged by a dedicated NaIscintillator/PMT detector) with a low threshold on the TPC signals; the other gammais highly likely to have entered the active volume of the detector.
4.4 The NEXT1 prototype at IFIC
The NEXT1 prototype at IFIC is the second prototype of the NEXT-1 EL series. Itis intended to fully test and demonstrate the baseline ANGEL design. Accordingly,NEXT1 is an asymmetric (non radiopure) SOFT TPC, with a SiPM tracking plane
56

and a PMT energy plane. It extends both in size and in instrumentation the design ofNEXT1-LBNL.
The detector has been built and commissioned, and data analysis has started. NEXT1is conceived as an evolving prototype/demonstrator, that will allow us to fully test mostof the solutions proposed for ANGEL. Specifically, we foresee the following stages (hence-forth referred to as ‘Runs”).
• Run I (March–September 2011): Commissioning and initial data taking withtwo PMT planes, one behind the cathode, the other behind the EL grids. EachPMT plane has 19 pressure resistant R7378A. The energy function is carried outby the cathode plane. The anode plane provides an additional measurement of theenergy, important to study in detail the SOFT concept and coarse tracking.
• Run II (October–December 2011): The SiPM plane has already been builtand is being tested in an independent setup with several light sources, includinga xenon lamp. In this way, the tracking plane will be fully debugged before beinginstalled in the chamber in early July. Run II will fully demonstrate tracking withSiPMs as well as study the stability of TPB coating in the sensors. In Run II wewill also take data with the final FE electronics for PMTs and the final DAQ thatwill be used by NEXT-100.
• Run III (January-June 2012): The energy plane will be replaced, changingthe R7378A inside the gas by a set of PMTs outside the chamber. The PMTswill be optically coupled to sapphire windows and will allow us to fully test theANGEL design. In addition, the light tube will be changed from uncoated PTFE toTTX+3M foils, following the ANGEL design. Run III will show energy resolutionin a system with housed PMTs will continue studying tracking with SiPMs andwill study the properties and stability of a high reflectivity light tube.
• Run IV (June 2012-December 2012): For Run IV the SiPM electronics willbe located inside the chamber.
In our LOI we considered the possibility of a radiopure detector (NEXT-10) witha mass of about 10 kg as an intermediate detector between NEXT-1 and NEXT-100.However, such a detector appears today prohibitive in terms of costs, man power and,very importantly, time. Instead, NEXT-1 can be evolved as described above to providenot only a full bench test of the ANGEL design, but also the needed operational experi-ence. Along this line some of the Runs of NEXT-1 (probably Run IV but perhaps alsoRun III) will, very likely, be taken at the LSC. In this way, we will gain experience andprepare the underground operation of NEXT-100.
4.4.1 Design and construction
NEXT1-IFIC is presently the largest operational HPGXe TPC in the World. It canoperate up to 15 bars, although the optimal operating pressure is 10 bar. The TPCfits inside a steel chamber 600 mm long and 300 mm inner diameter (Figure 4.11),
57
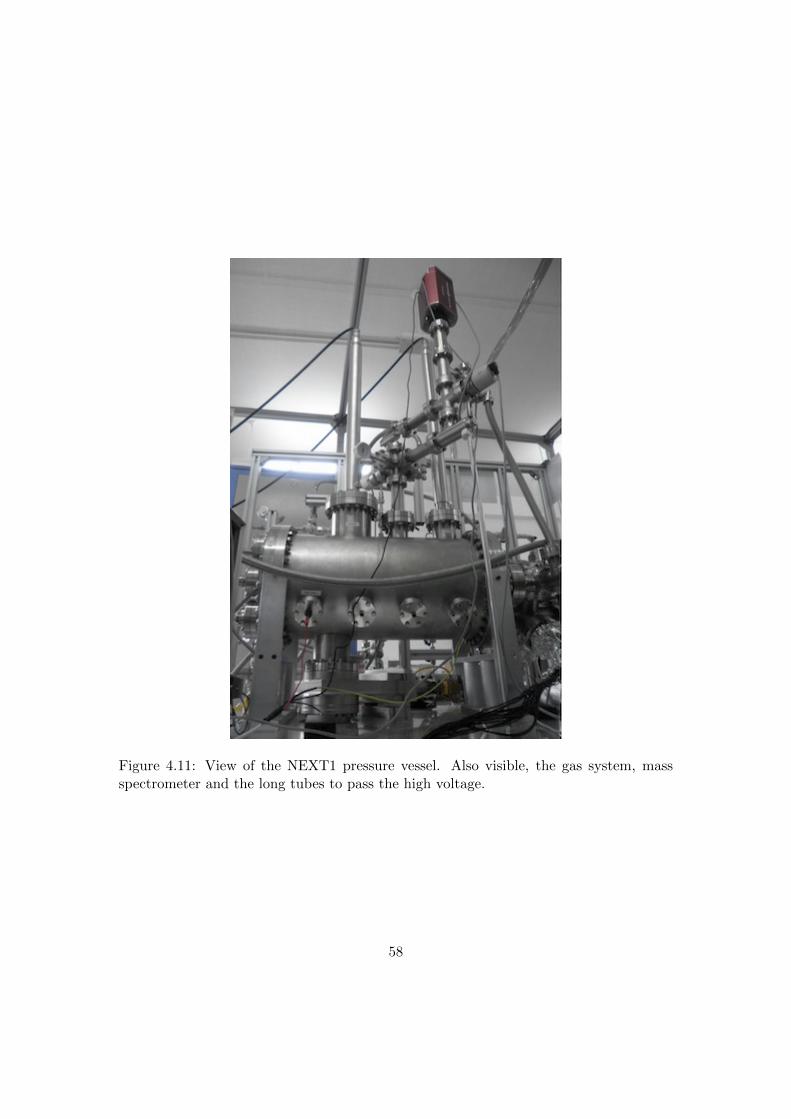
Figure 4.11: View of the NEXT1 pressure vessel. Also visible, the gas system, massspectrometer and the long tubes to pass the high voltage.
58
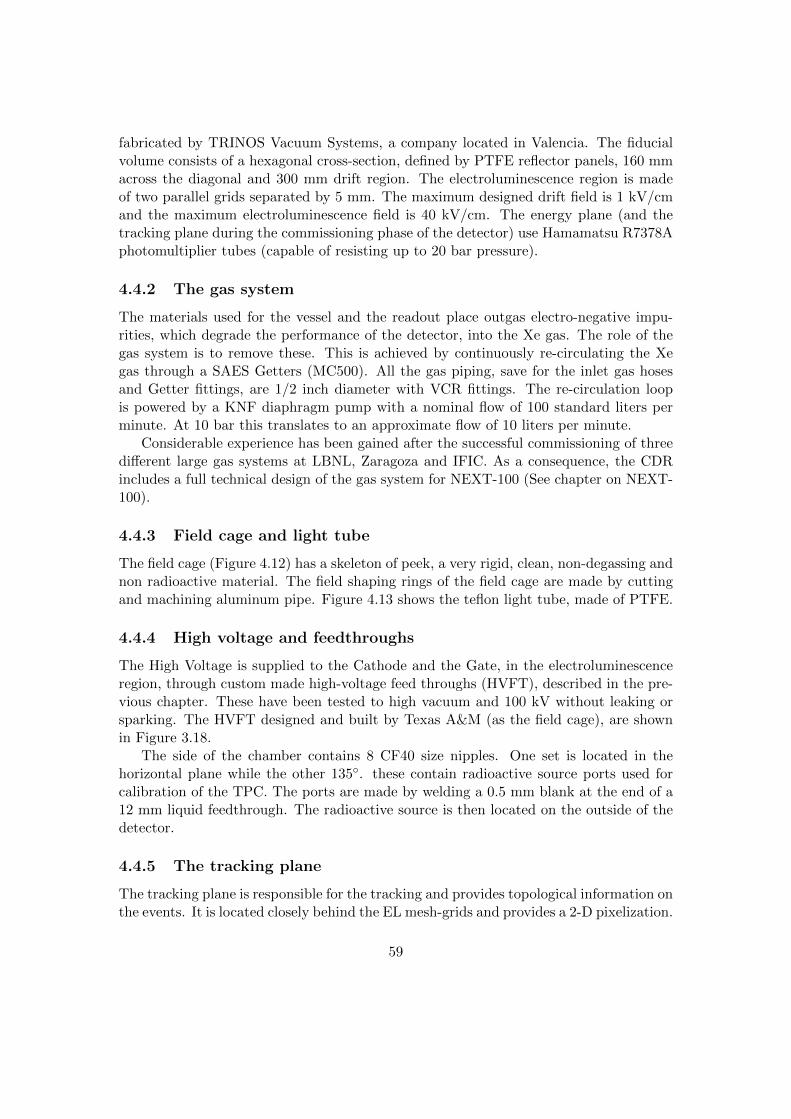
fabricated by TRINOS Vacuum Systems, a company located in Valencia. The fiducialvolume consists of a hexagonal cross-section, defined by PTFE reflector panels, 160 mmacross the diagonal and 300 mm drift region. The electroluminescence region is madeof two parallel grids separated by 5 mm. The maximum designed drift field is 1 kV/cmand the maximum electroluminescence field is 40 kV/cm. The energy plane (and thetracking plane during the commissioning phase of the detector) use Hamamatsu R7378Aphotomultiplier tubes (capable of resisting up to 20 bar pressure).
4.4.2 The gas system
The materials used for the vessel and the readout place outgas electro-negative impu-rities, which degrade the performance of the detector, into the Xe gas. The role of thegas system is to remove these. This is achieved by continuously re-circulating the Xegas through a SAES Getters (MC500). All the gas piping, save for the inlet gas hosesand Getter fittings, are 1/2 inch diameter with VCR fittings. The re-circulation loopis powered by a KNF diaphragm pump with a nominal flow of 100 standard liters perminute. At 10 bar this translates to an approximate flow of 10 liters per minute.
Considerable experience has been gained after the successful commissioning of threedifferent large gas systems at LBNL, Zaragoza and IFIC. As a consequence, the CDRincludes a full technical design of the gas system for NEXT-100 (See chapter on NEXT-100).
4.4.3 Field cage and light tube
The field cage (Figure 4.12) has a skeleton of peek, a very rigid, clean, non-degassing andnon radioactive material. The field shaping rings of the field cage are made by cuttingand machining aluminum pipe. Figure 4.13 shows the teflon light tube, made of PTFE.
4.4.4 High voltage and feedthroughs
The High Voltage is supplied to the Cathode and the Gate, in the electroluminescenceregion, through custom made high-voltage feed throughs (HVFT), described in the pre-vious chapter. These have been tested to high vacuum and 100 kV without leaking orsparking. The HVFT designed and built by Texas A&M (as the field cage), are shownin Figure 3.18.
The side of the chamber contains 8 CF40 size nipples. One set is located in thehorizontal plane while the other 135. these contain radioactive source ports used forcalibration of the TPC. The ports are made by welding a 0.5 mm blank at the end of a12 mm liquid feedthrough. The radioactive source is then located on the outside of thedetector.
4.4.5 The tracking plane
The tracking plane is responsible for the tracking and provides topological information onthe events. It is located closely behind the EL mesh-grids and provides a 2-D pixelization.
59

Figure 4.12: The NEXT-1 field cage.
Figure 4.13: A view from the top of the NEXT1 field cage, showing the light tube,made of very reflective Teflon slabs. The energy plane honeycomb can clearly been seenthrough the transparent grids.
60
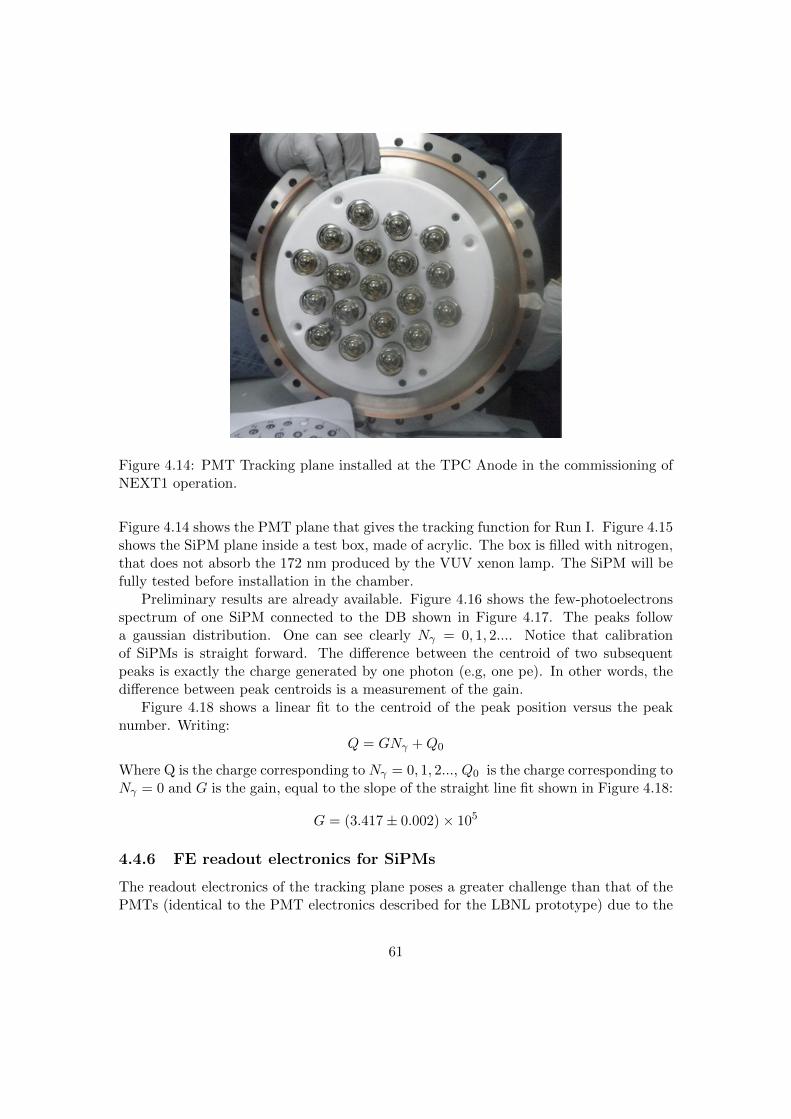
Figure 4.14: PMT Tracking plane installed at the TPC Anode in the commissioning ofNEXT1 operation.
Figure 4.14 shows the PMT plane that gives the tracking function for Run I. Figure 4.15shows the SiPM plane inside a test box, made of acrylic. The box is filled with nitrogen,that does not absorb the 172 nm produced by the VUV xenon lamp. The SiPM will befully tested before installation in the chamber.
Preliminary results are already available. Figure 4.16 shows the few-photoelectronsspectrum of one SiPM connected to the DB shown in Figure 4.17. The peaks followa gaussian distribution. One can see clearly Nγ = 0, 1, 2.... Notice that calibrationof SiPMs is straight forward. The difference between the centroid of two subsequentpeaks is exactly the charge generated by one photon (e.g, one pe). In other words, thedifference between peak centroids is a measurement of the gain.
Figure 4.18 shows a linear fit to the centroid of the peak position versus the peaknumber. Writing:
Q = GNγ +Q0
Where Q is the charge corresponding to Nγ = 0, 1, 2..., Q0 is the charge corresponding toNγ = 0 and G is the gain, equal to the slope of the straight line fit shown in Figure 4.18:
G = (3.417± 0.002)× 105
4.4.6 FE readout electronics for SiPMs
The readout electronics of the tracking plane poses a greater challenge than that of thePMTs (identical to the PMT electronics described for the LBNL prototype) due to the
61

Figure 4.15: The SiPM plane inside a test box, made of acrylic.
Figure 4.16: Photoelectron spectrum of the SiPMs connected to the DB in the SiPMplane.
62

Figure 4.17: Mother Board with one SiPM Daughter board connected.
63
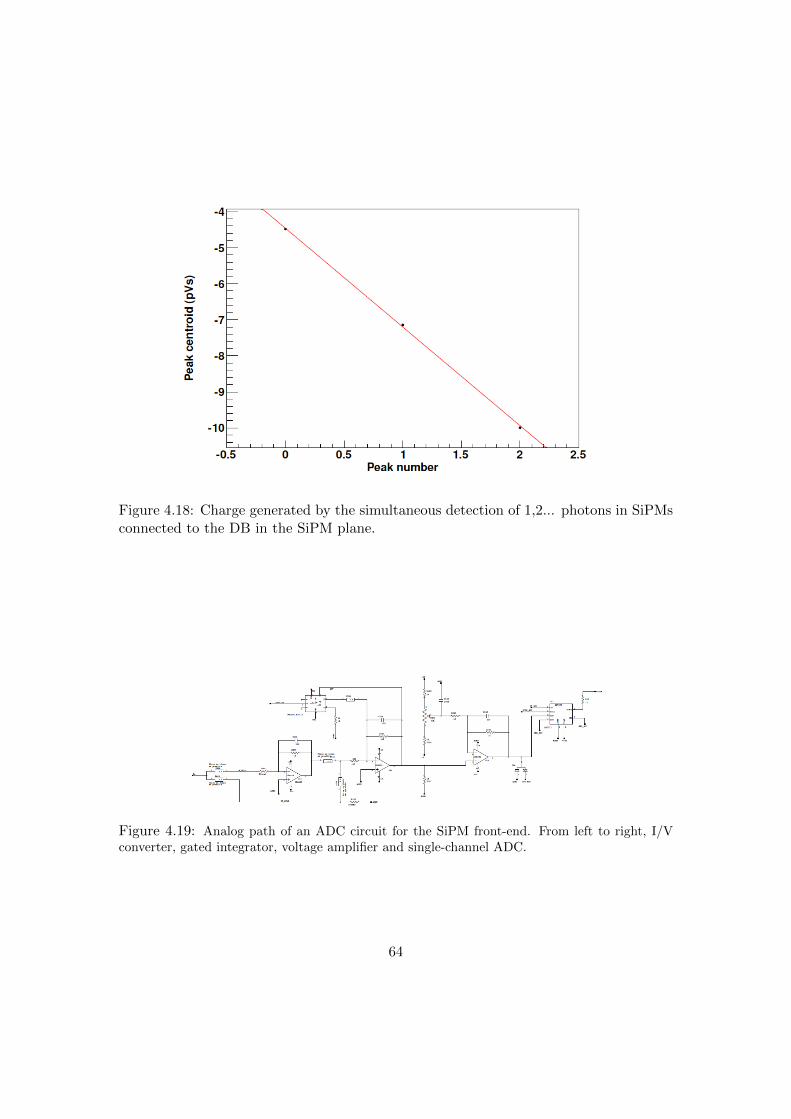
Figure 4.18: Charge generated by the simultaneous detection of 1,2... photons in SiPMsconnected to the DB in the SiPM plane.
Figure 4.19: Analog path of an ADC circuit for the SiPM front-end. From left to right, I/Vconverter, gated integrator, voltage amplifier and single-channel ADC.
64

much higher number of channels. Figure 4.19 shows the analog path of an ADC circuitfor the SiPM front end. It includes I/V converter, gated integrator, voltage amplifierand single-channel ADC. In NEXT1, this FE electronics is implemented as a part ofa special card outside the chamber, and the signals are passed through flat cables andmulti-pin feedthroughs.
However, ten thousand signal wires across the TPC vessel, as needed for NEXT-100appear as rather challenging. This leads us to the final improvement to the baselinedesign, which is to install the front-end electronics, digitizers and some sort of datamultiplexers inside the vessel in order to reduce the number of feedthroughs.
A possible solution consists in using 64-ch ASICs that include the analog chain (am-plifier + integrator in Figure 4.19), the digitizers and the data multiplexer. A commercialserializer/deserializer chip interfaces the ASIC to an optical transceiver, using a singleoptical fiber for a full-duplex data connection to the DAQ stage (FECs equipped withspecific add-in cards). With this multiplexing factor, 10k channels require just 157 op-tical links across the vessel. Alternatively to the use of an ASIC it is possible to developsmall scale discreet electronics that will also fit in the chamber (recall that the ANGELdesign includes a thick ultra-pure copper ring to shield the electronics from the maingas volume).
4.4.7 Commissioning
The NEXT1 prototype has been designed and built in less than one year. The detec-tor has been operating since January 2011. During the commissioning phase we haveintroduced a number of improvements to the original chamber, including new grids thatwithstand higher voltages. Drift voltages close to 50 kV and anode voltages close to 25kV have been achieved. The detector has been operating routinely for many hours in avery stable way. A significant incident, however, has been the rupture, during the monthof April, of the recirculation pump diaphragm, for causes yet unknown. The pump isbeing repaired and the system continues running with a spare, smaller pump. Additionalsafety systems will be build in the next few months to close automatically the systemin the event of a similar failure, avoiding the loosing of valuable xenon. In addition,a system of slow control is being developed. This incident brings home the need of atriple diaphragm pump (as well as additional emergency devices) for the NEXT-100 gassystem (see chapter 7).
The electronic system of the noise was originally quite high due to electronic pickup.Addition of RC filters, as described above has almost eliminated the problem. Thereremains a small pickup introduced in the power line of the PMTs that will be cured inthe next few week.
65

Chapter 5
Initial results from the NEXT-1prototypes
5.1 First results from the LBNL prototype
The LBNL NEXT prototype went into operation in December 2010. Since then morethan 2 Terabytes of data have been taken at various pressures (10, 11 and 15 bar), driftelectric fields (0.5 kV/cm through 2 kV/cm), E/P electroluminescent gains (1.0 though2.6 kV/(cm bar)), trigger configurations, glass flow rates and with different calibrationsources: 22Na, 137Cs, 241Am, 60Co and cosmic ray muons.
5.1.1 Setup and trigger
In the current implementation the TPC has 19 PMTs on the energy measurement sideand no dedicated tracking sensor. The 19 PMTs are 13 cm away for the 3mm EL gapregion and the active drift volume is 8 cm long in the drift direction and has a 14 cmtransversal span. Typical high voltage differences across the EL gap are 8 to 15 kVdepending on the pressure and typical voltage differences across the drift region are 4 to16 kV. The PMTs are typically operated at a gain of 1.4x10⁶.
The trigger configuration has evolved over the 4 months since first operation. Themost successful configurations involve a fast 3-fold coincidence with a few photoelectronthreshold from groups of PMTs which initiates a 5-100 µs gate during which a singlechannel S2 energy threshold is required to fire. The S2 energy threshold is built from a20µs peaking charge amplifier.
Signals from the 19 PMTs are then digitized with the 16-bit Struck digitizers for 160µs leaving typically 60 µs of pretrigger and 100 µs of signal region including the S1 andS2 signals. Figure 5.1 shows a typical waveform resulting from the sum of the 19 PMTssignals. Valid events are selected to have a narrow S1 signal followed by one or more S2wide signals. As seen in Figure 5.2 the summed waveforms have small noise permittingsingle photoelectron efficient 5σ analysis thresholds.
66

Figure 5.1: Pulse finding and integration algorithm: Shown is a typical 19-PMTsummed waveform a 60Co source (1.1 and 1.3 MeV gammas). The S1 pulse is requiredto be a small width pulse. S2 pulses are separately identified and integrated if there isenough baseline level waveform samples between them.
Figure 5.2: Noise and analysis threshold: Histogram of pretrigger samples of the19-PMT summed waveforms with a fit to a gaussian of the central noise band. Belowthe main noise peak are samples from genuine PMT pulses. Shown also are the 5σanalysis threshold to find S1 and S2 pulses as well as the typical amplitude of a singlephotoelectron. Thus the effective offline threshold is highly efficient. Of note also is thelack of outliers in the positive side indicating the absence of extraneous non-gaussiannoise sources.
67

Figure 5.3: S1 signal vs position: The approximate number of primary scintillationS1 photoelectrons measured for 662 keV depositions is shown as a function of the eventdistance from the PMT plane (computed from the drift time). The large dependenceon position is due to the large solid angle variation with position. Still, the S1 signal isstrong in all cases (hundreds of photoelectrons) leading to a very efficient and low noise t0measurement. A good S1 measurement may facilitate an event-by-event recombinationestimation.
5.1.2 The Cs-137 analysis
In order to demonstrate the capabilities and performance of the LBNL NEXT prototypewe will describe the analysis steps and data features for a single run taken with a 1 mCi137Cs 662 keV gamma ray source highly collimated and on the TPC axis entering thepressure vessel through a 2 mm thick stainless steel window on a reentrance port. Thisrun taken at 10 bar pressure had -10.6 kV applied to the mesh that defines the start ofthe drift region, +2.7 kV to the first EL mesh and +10.6kV to the second EL mesh.
The analysis starts with the identification of S1 signal, whose primary function is todetermine the t0 for the TPC drift. In addition, the S1 signals are useful for identifyingpileup events and could shed light on the amount of recombination. As seen in figure 5.3hundreds of photoelectrons are measured in the S1 of full energy 662 keV events thusreliable S1 signals can be obtained for energy depositions as low as 10 keV. The largeposition dependence of the S1 signal is mainly a solid angle effect at play due to thelimited reflectivity of the PTFE walls.
Figure 5.4 shows the integrated S2 charge versus the drift time for valid events in therun with an S1 and one or more S2 pulses. A highest narrow energy band correspondsto full energy 662 keV depositions. The drift time span of the events corresponds to themaximum drift time, given by the maximum 8 cm drift length and the drift velocity.
68

Figure 5.4: Raw S2 vs Drift Time: Total charge from the electroluminescent (S2)pulse versus the drift time with a 1 mCi 137Cs 662 keV gamma ray source highly colli-mated and on the TPC axis. The band slopes are the result of attachment impuritiesin the xenon. These data taken at 10 bar pressure show an electron lifetime of 900microseconds. This, according to a Magboltz simulation, corresponds to O2 impuritiesat the 0.05 part per million in the drift region.
The slope in the energy bands is due to electron attachment by O2 molecules in the driftregion.
The charge spectrum for this run shown in figure 5.5 shows a clear full energy peakwhere the distribution is calibrated, a Compton edge at the expected 480 keV anda Compton backscatter peak at the expected 180 keV. Even in the presence of thehardware trigger threshold in the 100 keV region, a narrow 30 keV peak can be discernedcaused by events in which only the xenon x-rays (29-36 keV) following photoelectricinteractions entered the active region of the TPC.
The electron attachment energy correction for the exponential charge loss versus drifttime is applied to the data a posteriori through the use of charge moments constructedfrom the taylor expansion of an ex weighting function. Figure 5.6 shows the attachmentcorrected data showing horizontal energy bands. Figure 5.7 shows a fit to the attachmentcorrected spectrum with a 2.5% FWHM for the 662 keV line. About 300,000 photoelec-trons are measured for full energy peaks. This corresponds to about 10 photoelectrons(PE) measured per ionization electron. At this EL gain and photoelectron yield the PEstatistics have a similar contribution to the resolution function as the Fano factor, about0.6%.
We investigated the stability of the data by looking at the peak energy as a functionof time. Figure 5.8 shows a small trend of gain loss during the 3 hour duration of the run.However, the effect is small and its contribution would amount to 0.2% in quadratureto the resolution. As such, we did not include an explicit time correction to the data.
69

Total Calibrated S2 Charge (keV)0 100 200 300 400 500 600 700 800 900
Co
un
ts
0
200
400
600
800
1000
/ ndf 2χ 6.874 / 3Constant 18.0± 735.4 Mean 0.4± 661 Sigma 0.36± 14.88
Figure 5.5: Calibrated S2 charge spectrum: Shown is the S2 spectrum calibratedusing the full energy peak of 137Cs. In this run at 10 bar and E/P of 2.56 kV/(barcm)in the EL region about 300,000 photoelectrons are measured for events in the full energypeak. The Compton edge from single scatters with the loss of the scattered gamma,expected at 477 keV, is clearly visible. The peak from backscattered gamma rays,expected at 184 keV, is also visible above the normal Compton spectrum. The risingedge near 100 keV is due to the hardware trigger threshold. The peak near 30keV isdue to xenon x-rays (29-36 keV) following photoelctric absorption of gamma rays. Theflat region between 500 and 600 keV is due to multiple Compton scattering events withescape of scattered gamma/s. The uncorrected energy resolution is 5.3% FWHM for 662keV.
70
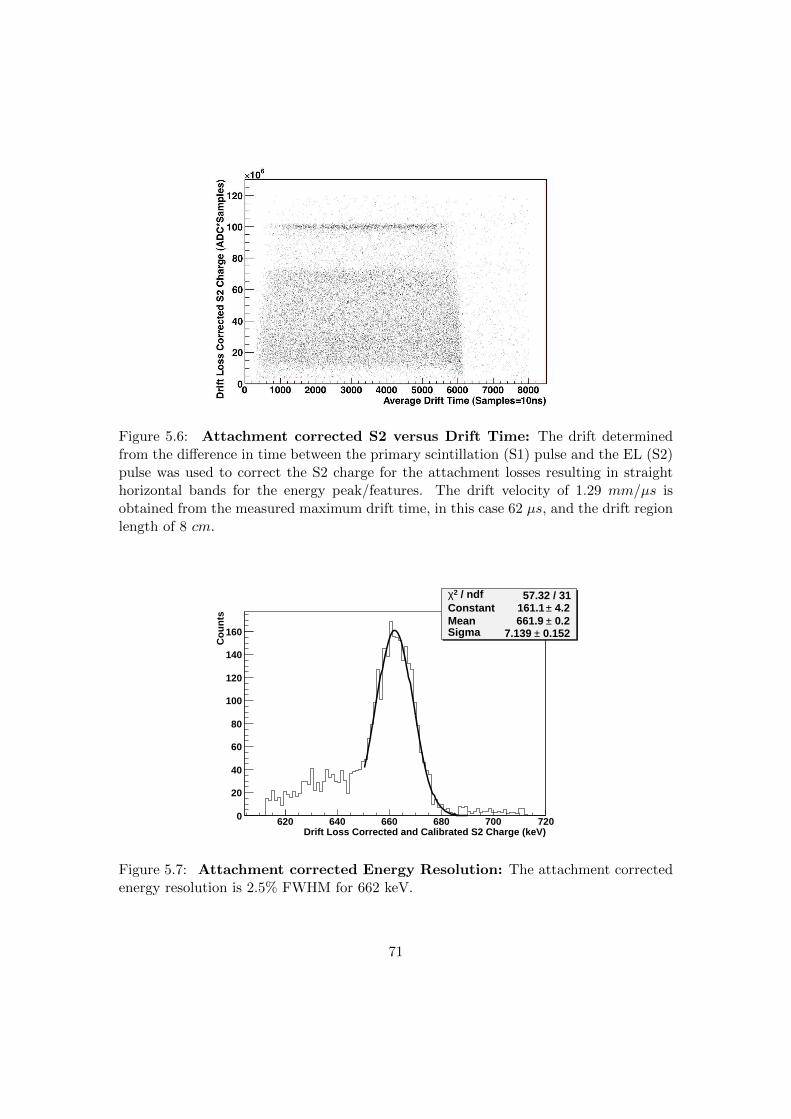
Figure 5.6: Attachment corrected S2 versus Drift Time: The drift determinedfrom the difference in time between the primary scintillation (S1) pulse and the EL (S2)pulse was used to correct the S2 charge for the attachment losses resulting in straighthorizontal bands for the energy peak/features. The drift velocity of 1.29 mm/µs isobtained from the measured maximum drift time, in this case 62 µs, and the drift regionlength of 8 cm.
Drift Loss Corrected and Calibrated S2 Charge (keV)620 640 660 680 700 720
Co
un
ts
0
20
40
60
80
100
120
140
160
/ ndf 2χ 57.32 / 31Constant 4.2± 161.1 Mean 0.2± 661.9 Sigma 0.152± 7.139
Figure 5.7: Attachment corrected Energy Resolution: The attachment correctedenergy resolution is 2.5% FWHM for 662 keV.
71

Time since beginning of run (hours)0 0.5 1 1.5 2 2.5 3
Pea
k en
erg
y (k
eV)
650
652
654
656
658
660
662
664
666
668
670
Figure 5.8: Time stability: This run that collected 40,000 events in 3 hours showsa peak-to-peak gain drift of 0.6%. No correction for this effect is applied for this runsince its contribution is about 0.2% in quadrature to the resolution. Trends in themeasured gain (as the slow one seen in this run) can be caused by changes in temperature,pressure, PMT high voltages, grids high voltages and electronics. In situ and continuouscalibration sources are important to control this type of systematic shifts as well asmonitoring systems.
Continuous monitoring of the voltages, currents, pressure, temperatures, flows are beingimplemented and are important to control and track this type of systematic effect. Inaddition, a set of LEDs will be installed inside the TPC volume to provide end-to-endelectronics and PMT calibration as well as data stability information.
Even though the PMT plane is 13 cm away from the EL region, the TPC with onlyenergy side sensors has position sensitivity and thus tracking capabilities. For each validevent an average x and y position is found by weighting the PMT positions by thecharge observed in each. Because the light is relatively uniform at the PMT plane (20-30% variations) a scaling factor (of 30) is required to transform the calculated averagepositions to true x-y TPC coordinates. Figure 5.9 shows the position of valid events withone S2 pulse. The hexagonal boundaries of the drift region can be clearly identified. Thedense region in the middle is the spot size of the source after the collimation (a 3 mmhole on a 8 cm long lead block placed about 70 cm from the TPC active region). Figure5.10 shows the subset of events that were in the full energy peak forming a spot size ofabout 2 cm radius.
Systematic gain variations are expected as a function of the event location fromforward scatters of gammas in the collimator or window, from optical response non-uniformity due to finite reflectivity of the walls and to mesh deformation due to theelectrostatic force amongst others. In particular radial systematic gain effects needto be measured and understood. Figure 5.11 shows the full energy peak position as a
72
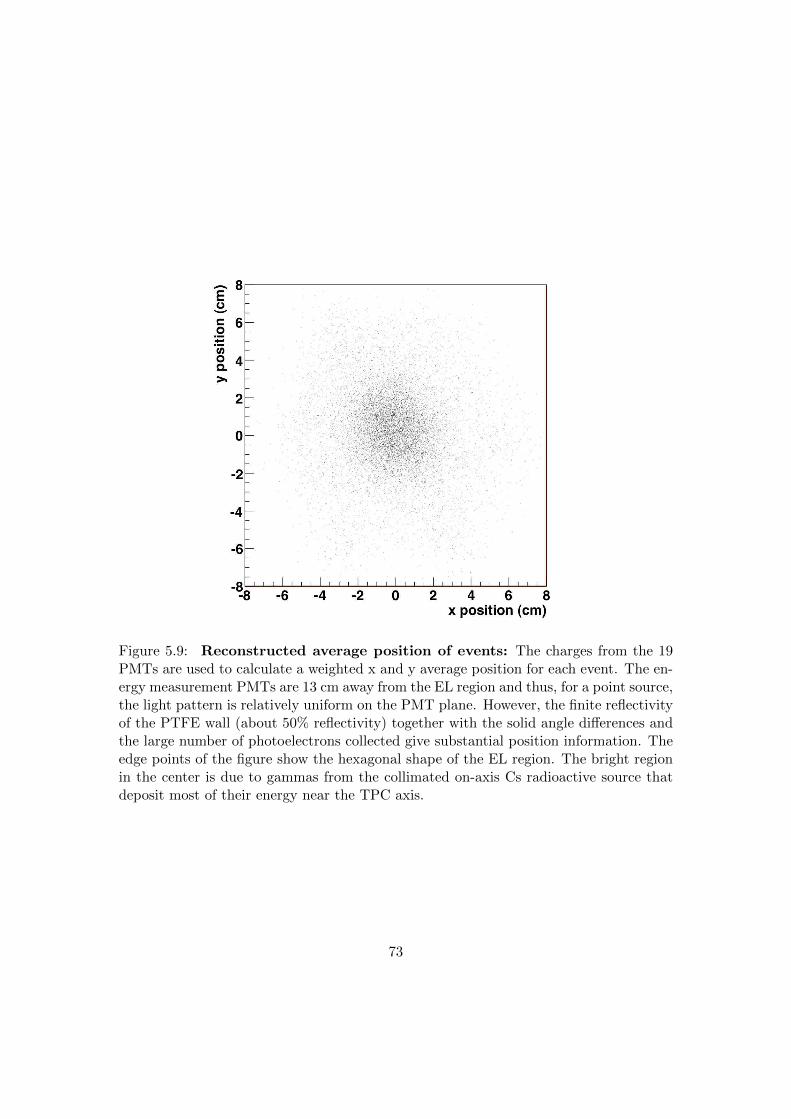
Figure 5.9: Reconstructed average position of events: The charges from the 19PMTs are used to calculate a weighted x and y average position for each event. The en-ergy measurement PMTs are 13 cm away from the EL region and thus, for a point source,the light pattern is relatively uniform on the PMT plane. However, the finite reflectivityof the PTFE wall (about 50% reflectivity) together with the solid angle differences andthe large number of photoelectrons collected give substantial position information. Theedge points of the figure show the hexagonal shape of the EL region. The bright regionin the center is due to gammas from the collimated on-axis Cs radioactive source thatdeposit most of their energy near the TPC axis.
73

x position (cm)-8 -6 -4 -2 0 2 4 6 8
y po
sitio
n (c
m)
-8
-6
-4
-2
0
2
4
6
8
Figure 5.10: Reconstructed position of full energy events: Shown are the positionsof the subset of events that deposited energies within 30 keV of the peak. The spot size isapproximately 2 cm in radius, and is primarily due to the source and collimator geometryand distance from the TPC active region.
74

/ ndf 2χ 32.83 / 19p0 1.2± 663.4 p1 1.300± -1.521 p2 0.3096± -0.7842
0 0.5 1 1.5 2 2.5 3 3.5 4
Cal
ibra
ted
S2
Cha
rge
(keV
)
600
610
620
630
640
650
660
670
/ ndf 2χ 32.83 / 19p0 1.2± 663.4 p1 1.300± -1.521 p2 0.3096± -0.7842
Figure 5.11: Full Energy peak charge vs radial position (in cm): Shown is thefull energy peak charge as a function radial position (in cm) of the event. A parabolic fitdescribes the radial gain dependence well. A peak-to-peak variation of 2% is observed.For this analysis only events with radius less than 1.5 cm are used where the gain showsgood uniformity without a correction. Possible sources of this radial dependence to thegain include: forward scatters of gammas in the collimator or window, optical responsenon-uniformity from finite reflectivity of the walls, mesh deformation due to electrostaticforce.
function of the reconstructed average radius of the event. The systematic effect observedis small (or absent) in the region with radius smaller than 1.5 cm. Since most of the fullenergy events are the central region, a cut was applied to the data to select only centralevents thus avoiding the larger radius gain variations.
After selecting central events the spectrum in figure 5.12 is obtained. It shows aFWHM of 1.8% at 662 keV and a well formed gaussian response shape. A smaller peak30 keV lower is due to xenon x-rays escaping from the active region. This results isrepresentative of our good energy resolution configurations and runs. In the comingmonths we expect to explore the systematic effects that may be limiting the resolutionfrom the 0.9% expected from the Fano factor and total PE statistics.
5.1.3 Other analysis
Besides the workhorse 137Cs calibration source, we analyzed events with 511 keV photonsfrom positron annihilation and 59.4 keV from an 241Am source. The energy spectrum(with corrections) is shown in figure 5.13. A fit to the upper edge of the full energypeak shown in figure 5.14 yielded a 4.6% FWHM resolution at the 59.4 keV peak. Moreinvestigations are planned to understand the asymmetric nature of this peak. A naive
75
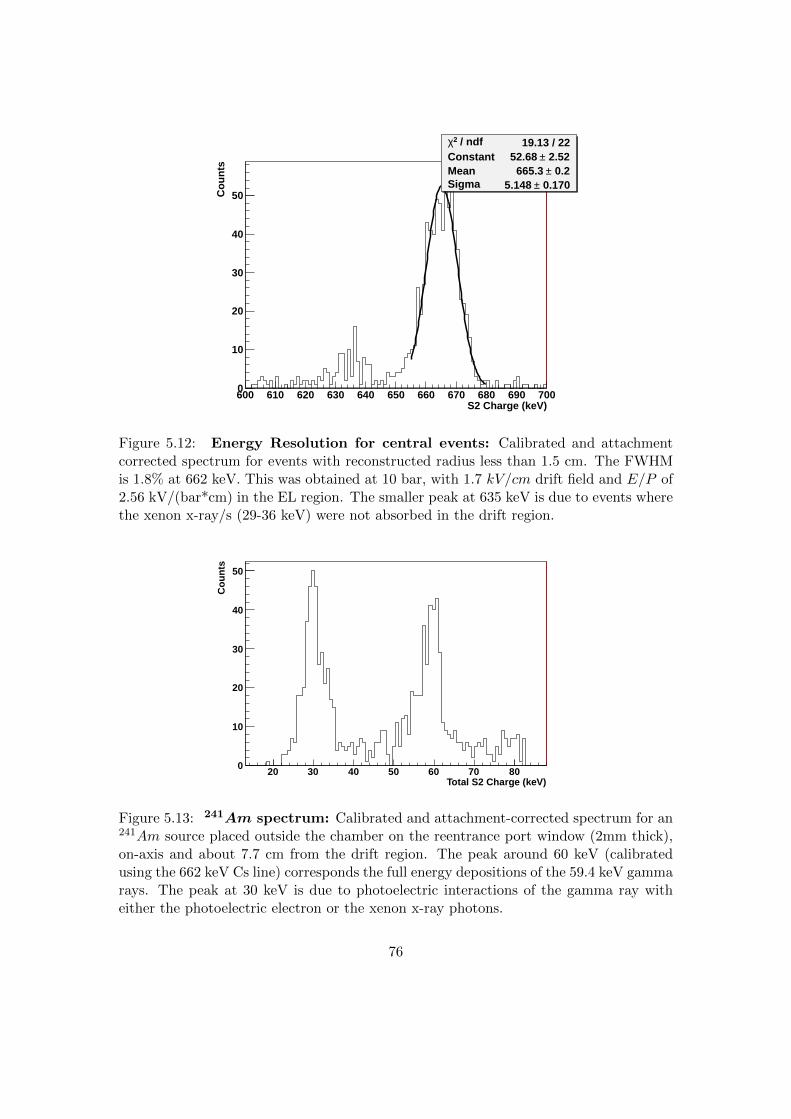
S2 Charge (keV)600 610 620 630 640 650 660 670 680 690 700
Co
un
ts
0
10
20
30
40
50
/ ndf 2χ 19.13 / 22Constant 2.52± 52.68 Mean 0.2± 665.3 Sigma 0.170± 5.148
Figure 5.12: Energy Resolution for central events: Calibrated and attachmentcorrected spectrum for events with reconstructed radius less than 1.5 cm. The FWHMis 1.8% at 662 keV. This was obtained at 10 bar, with 1.7 kV/cm drift field and E/P of2.56 kV/(bar*cm) in the EL region. The smaller peak at 635 keV is due to events wherethe xenon x-ray/s (29-36 keV) were not absorbed in the drift region.
Total S2 Charge (keV)20 30 40 50 60 70 80
Co
un
ts
0
10
20
30
40
50
Figure 5.13: 241Am spectrum: Calibrated and attachment-corrected spectrum for an241Am source placed outside the chamber on the reentrance port window (2mm thick),on-axis and about 7.7 cm from the drift region. The peak around 60 keV (calibratedusing the 662 keV Cs line) corresponds the full energy depositions of the 59.4 keV gammarays. The peak at 30 keV is due to photoelectric interactions of the gamma ray witheither the photoelectric electron or the xenon x-ray photons.
76
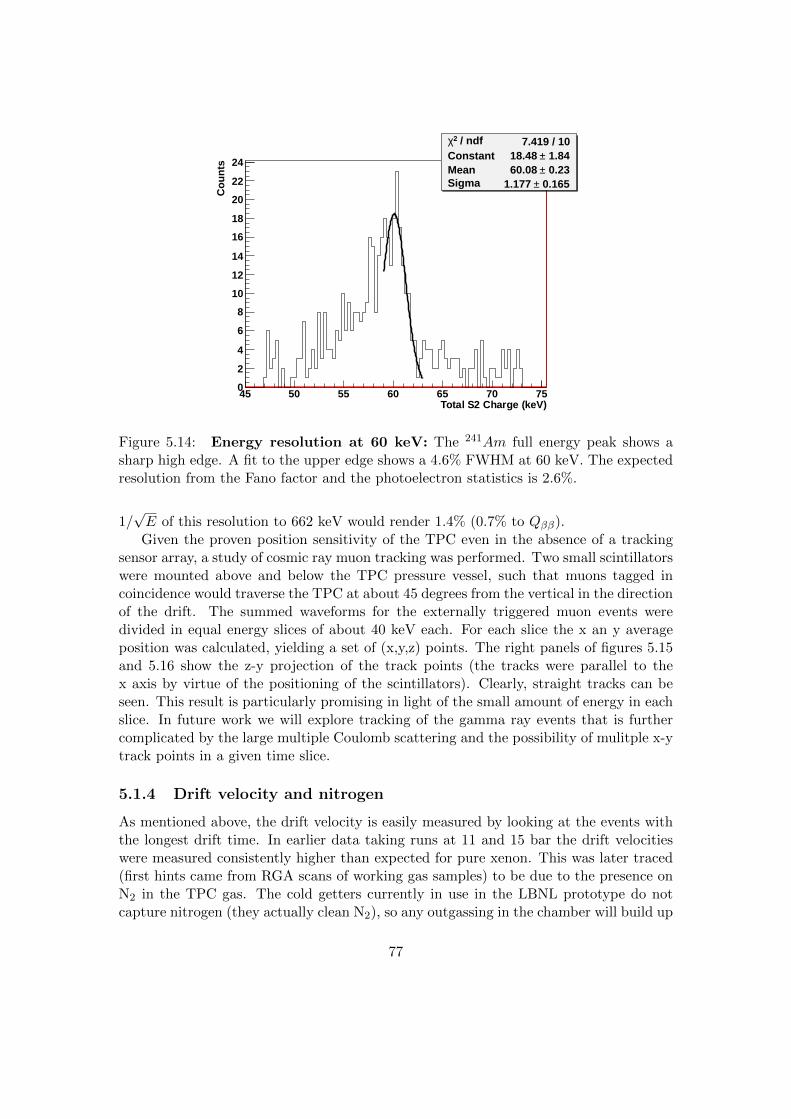
Total S2 Charge (keV)45 50 55 60 65 70 75
Co
un
ts
0
2
4
6
8
10
12
14
16
18
20
22
24
/ ndf 2χ 7.419 / 10Constant 1.84± 18.48 Mean 0.23± 60.08 Sigma 0.165± 1.177
Figure 5.14: Energy resolution at 60 keV: The 241Am full energy peak shows asharp high edge. A fit to the upper edge shows a 4.6% FWHM at 60 keV. The expectedresolution from the Fano factor and the photoelectron statistics is 2.6%.
1/√E of this resolution to 662 keV would render 1.4% (0.7% to Qββ).
Given the proven position sensitivity of the TPC even in the absence of a trackingsensor array, a study of cosmic ray muon tracking was performed. Two small scintillatorswere mounted above and below the TPC pressure vessel, such that muons tagged incoincidence would traverse the TPC at about 45 degrees from the vertical in the directionof the drift. The summed waveforms for the externally triggered muon events weredivided in equal energy slices of about 40 keV each. For each slice the x an y averageposition was calculated, yielding a set of (x,y,z) points. The right panels of figures 5.15and 5.16 show the z-y projection of the track points (the tracks were parallel to thex axis by virtue of the positioning of the scintillators). Clearly, straight tracks can beseen. This result is particularly promising in light of the small amount of energy in eachslice. In future work we will explore tracking of the gamma ray events that is furthercomplicated by the large multiple Coulomb scattering and the possibility of mulitple x-ytrack points in a given time slice.
5.1.4 Drift velocity and nitrogen
As mentioned above, the drift velocity is easily measured by looking at the events withthe longest drift time. In earlier data taking runs at 11 and 15 bar the drift velocitieswere measured consistently higher than expected for pure xenon. This was later traced(first hints came from RGA scans of working gas samples) to be due to the presence onN2 in the TPC gas. The cold getters currently in use in the LBNL prototype do notcapture nitrogen (they actually clean N2), so any outgassing in the chamber will build up
77

Figure 5.15: Cosmic ray muon tracking: Cosmic ray muon measured in the xenonTPC prototype at 10 bar. The left panel shows the summed waveform of the 19 PMTs(x axis is proportional to time). The right panel shows track points reconstruction: onthe y-axis is the sample number (drift time) of a charge in a small time slice and thex-axis is the reconstructed position in the vertical direction perpendicular to the drift.The errors in the reconstruction are likely underestimated, but the straight line fromthe muon track is evident. Individual points represent about 40keV energy depositionsand the full track is about 20 cm long with a total of approximately 1.2 MeV energydeposition. The trigger was provided by two scintillator pads above and below the TPCthat defined muons that traverse the TPC diagonally, as reconstructed.
78
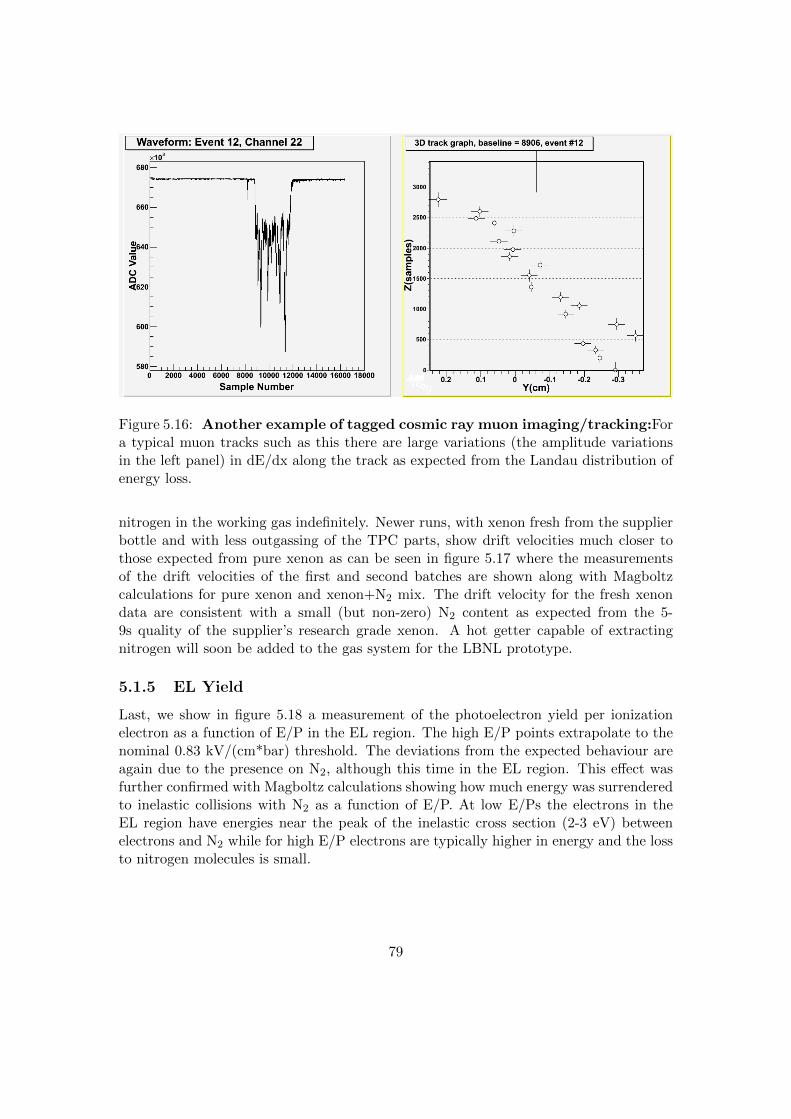
Figure 5.16: Another example of tagged cosmic ray muon imaging/tracking:Fora typical muon tracks such as this there are large variations (the amplitude variationsin the left panel) in dE/dx along the track as expected from the Landau distribution ofenergy loss.
nitrogen in the working gas indefinitely. Newer runs, with xenon fresh from the supplierbottle and with less outgassing of the TPC parts, show drift velocities much closer tothose expected from pure xenon as can be seen in figure 5.17 where the measurementsof the drift velocities of the first and second batches are shown along with Magboltzcalculations for pure xenon and xenon+N2 mix. The drift velocity for the fresh xenondata are consistent with a small (but non-zero) N2 content as expected from the 5-9s quality of the supplier’s research grade xenon. A hot getter capable of extractingnitrogen will soon be added to the gas system for the LBNL prototype.
5.1.5 EL Yield
Last, we show in figure 5.18 a measurement of the photoelectron yield per ionizationelectron as a function of E/P in the EL region. The high E/P points extrapolate to thenominal 0.83 kV/(cm*bar) threshold. The deviations from the expected behaviour areagain due to the presence on N2, although this time in the EL region. This effect wasfurther confirmed with Magboltz calculations showing how much energy was surrenderedto inelastic collisions with N2 as a function of E/P. At low E/Ps the electrons in theEL region have energies near the peak of the inelastic cross section (2-3 eV) betweenelectrons and N2 while for high E/P electrons are typically higher in energy and the lossto nitrogen molecules is small.
79
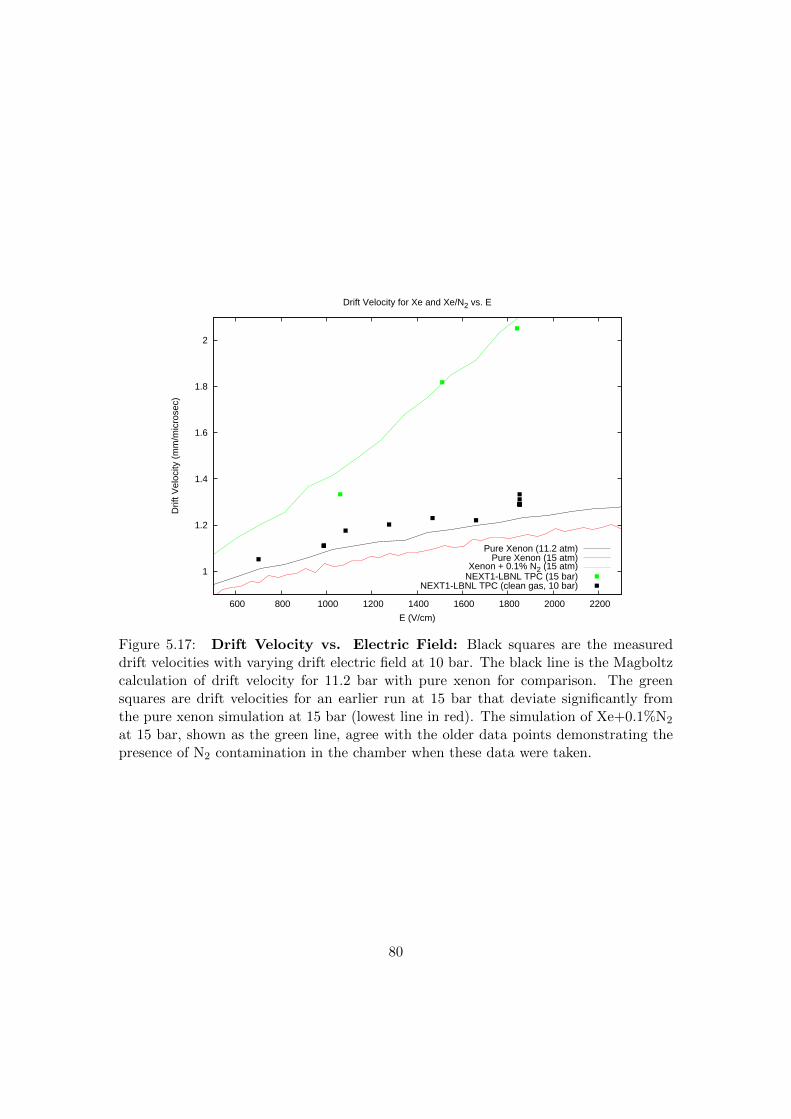
1
1.2
1.4
1.6
1.8
2
600 800 1000 1200 1400 1600 1800 2000 2200
Drif
t Vel
ocity
(m
m/m
icro
sec)
E (V/cm)
Drift Velocity for Xe and Xe/N2 vs. E
Pure Xenon (11.2 atm)Pure Xenon (15 atm)
Xenon + 0.1% N2 (15 atm)NEXT1-LBNL TPC (15 bar)
NEXT1-LBNL TPC (clean gas, 10 bar)
Figure 5.17: Drift Velocity vs. Electric Field: Black squares are the measureddrift velocities with varying drift electric field at 10 bar. The black line is the Magboltzcalculation of drift velocity for 11.2 bar with pure xenon for comparison. The greensquares are drift velocities for an earlier run at 15 bar that deviate significantly fromthe pure xenon simulation at 15 bar (lowest line in red). The simulation of Xe+0.1%N2
at 15 bar, shown as the green line, agree with the older data points demonstrating thepresence of N2 contamination in the chamber when these data were taken.
80

Figure 5.18: Photoelctron per ionization electron yield vs. E/P: The x-axisshows the E/P in the EL region in kV/(bar*cm) for series of runs at 10 bar pressure withthe 137Cs source. The y-axis shows the approximate number of detected photoelectronsper secondary ionization electron assuming a WI value 24.9 eV and using 300 ADCsamples as the average single photoelectron charge. A line crossing the x axis at thenominal E/P EL threshold value of 0.83 is also shown with slope to match the high E/Ppoints. The lower light yield of the low E/P points is due to the presence on N2 at the1/100,000 level, as demonstrated by Magboltz simulations for the fields relevant in theEL region.
81
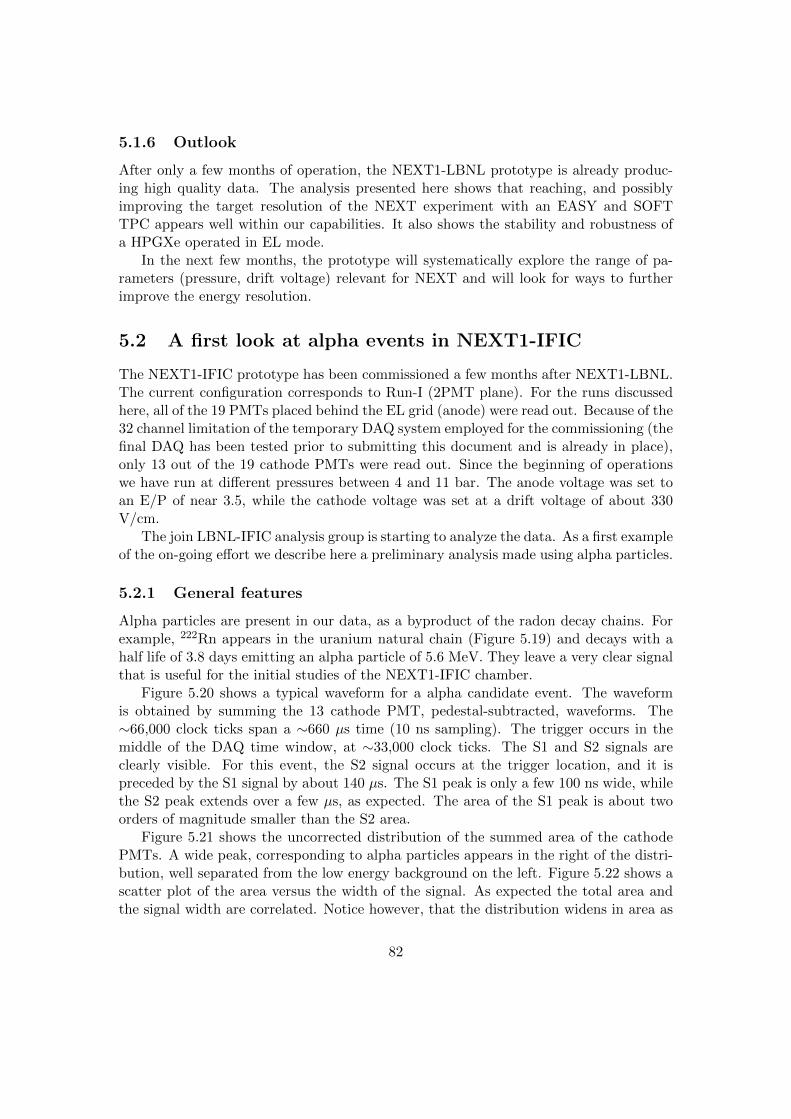
5.1.6 Outlook
After only a few months of operation, the NEXT1-LBNL prototype is already produc-ing high quality data. The analysis presented here shows that reaching, and possiblyimproving the target resolution of the NEXT experiment with an EASY and SOFTTPC appears well within our capabilities. It also shows the stability and robustness ofa HPGXe operated in EL mode.
In the next few months, the prototype will systematically explore the range of pa-rameters (pressure, drift voltage) relevant for NEXT and will look for ways to furtherimprove the energy resolution.
5.2 A first look at alpha events in NEXT1-IFIC
The NEXT1-IFIC prototype has been commissioned a few months after NEXT1-LBNL.The current configuration corresponds to Run-I (2PMT plane). For the runs discussedhere, all of the 19 PMTs placed behind the EL grid (anode) were read out. Because of the32 channel limitation of the temporary DAQ system employed for the commissioning (thefinal DAQ has been tested prior to submitting this document and is already in place),only 13 out of the 19 cathode PMTs were read out. Since the beginning of operationswe have run at different pressures between 4 and 11 bar. The anode voltage was set toan E/P of near 3.5, while the cathode voltage was set at a drift voltage of about 330V/cm.
The join LBNL-IFIC analysis group is starting to analyze the data. As a first exampleof the on-going effort we describe here a preliminary analysis made using alpha particles.
5.2.1 General features
Alpha particles are present in our data, as a byproduct of the radon decay chains. Forexample, 222Rn appears in the uranium natural chain (Figure 5.19) and decays with ahalf life of 3.8 days emitting an alpha particle of 5.6 MeV. They leave a very clear signalthat is useful for the initial studies of the NEXT1-IFIC chamber.
Figure 5.20 shows a typical waveform for a alpha candidate event. The waveformis obtained by summing the 13 cathode PMT, pedestal-subtracted, waveforms. The∼66,000 clock ticks span a ∼660 µs time (10 ns sampling). The trigger occurs in themiddle of the DAQ time window, at ∼33,000 clock ticks. The S1 and S2 signals areclearly visible. For this event, the S2 signal occurs at the trigger location, and it ispreceded by the S1 signal by about 140 µs. The S1 peak is only a few 100 ns wide, whilethe S2 peak extends over a few µs, as expected. The area of the S1 peak is about twoorders of magnitude smaller than the S2 area.
Figure 5.21 shows the uncorrected distribution of the summed area of the cathodePMTs. A wide peak, corresponding to alpha particles appears in the right of the distri-bution, well separated from the low energy background on the left. Figure 5.22 shows ascatter plot of the area versus the width of the signal. As expected the total area andthe signal width are correlated. Notice however, that the distribution widens in area as
82

Figure 5.19: Uranium chain.
it moves toward higher values of the width. This shows the effect of the drift field inalpha particles moving at angles with respect to the field lines.
Figure 5.23 (upper) shows a scatter plot of the S1 area versus the drift time, obtainedfrom the difference in position between S1 and S2. The same distribution is shown asa profile in the lower plot. The light read by the cathode PMTs int the end closer tothem is about a factor 5 larger than the light in events happening near the anode. Sinceour current light tube is made of uncoated PTFE we expect a rather poor reflectivity,of about 50%, consistent with the observed effect.
5.2.2 Selection of alpha particles
Figure 5.24 summarizes the selection of alpha candidates in NEXT-1-EL. The followingcuts are applied:
Energy cut (Fig. 5.24, top left): Given that alpha events are expected to be highlyionizing, only events with a cathode sum > 20 · 106 ADC counts are selected.
Waveform peaks cut (Fig. 5.24, top right): Alpha events are expected to yielda nearly point-like energy deposition within the chamber. For this reason, onlyevents with a single S2 candidate peak in the cathode PMT summed waveform areselected. In order to obtain a full 3-dimensional reconstruction of the event, theS1 signal needs to be detected. For this reason, the analysis also requires a singleS1 candidate peak for the event. As can be seen from the figure, once the energycut is applied, this (1 S1 + 1 S2) signature is the predominant one.
83
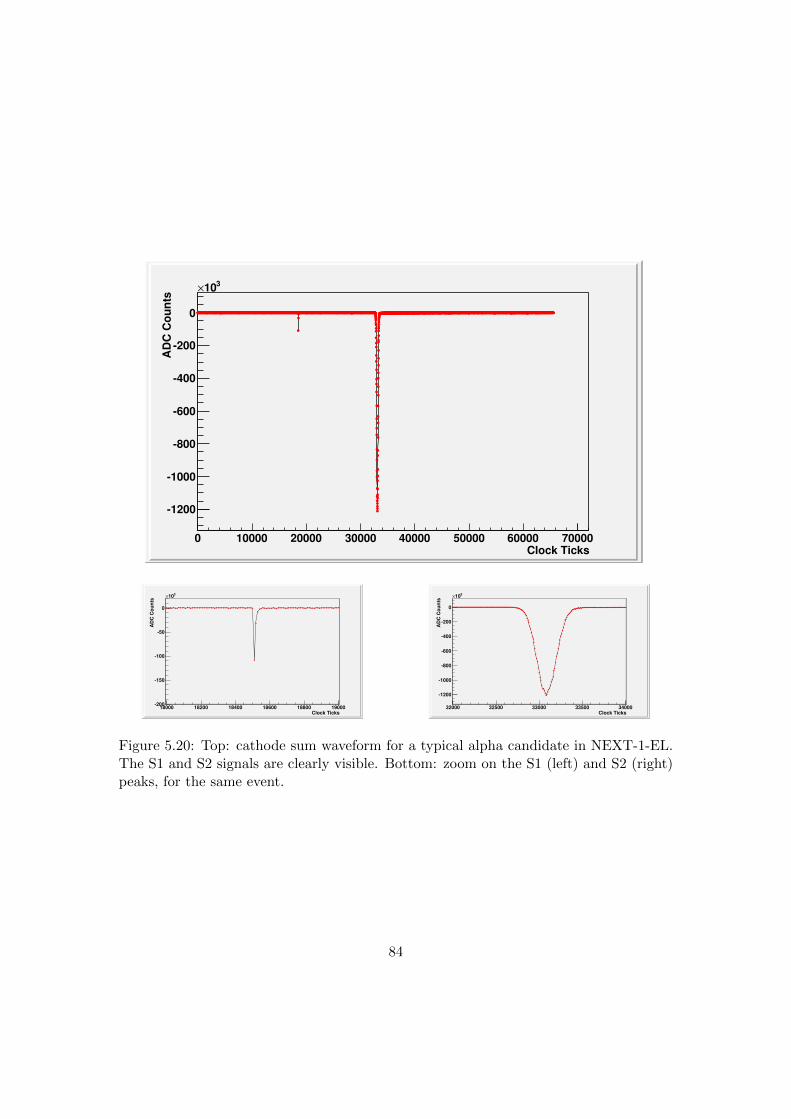
Clock Ticks
0 10000 20000 30000 40000 50000 60000 70000
AD
C C
ou
nts
1200
1000
800
600
400
200
0
310×
Clock Ticks
18000 18200 18400 18600 18800 19000
AD
C C
ou
nts
200
150
100
50
0
310×
Clock Ticks
32000 32500 33000 33500 34000
AD
C C
ou
nts
1200
1000
800
600
400
200
0
310×
Figure 5.20: Top: cathode sum waveform for a typical alpha candidate in NEXT-1-EL.The S1 and S2 signals are clearly visible. Bottom: zoom on the S1 (left) and S2 (right)peaks, for the same event.
84
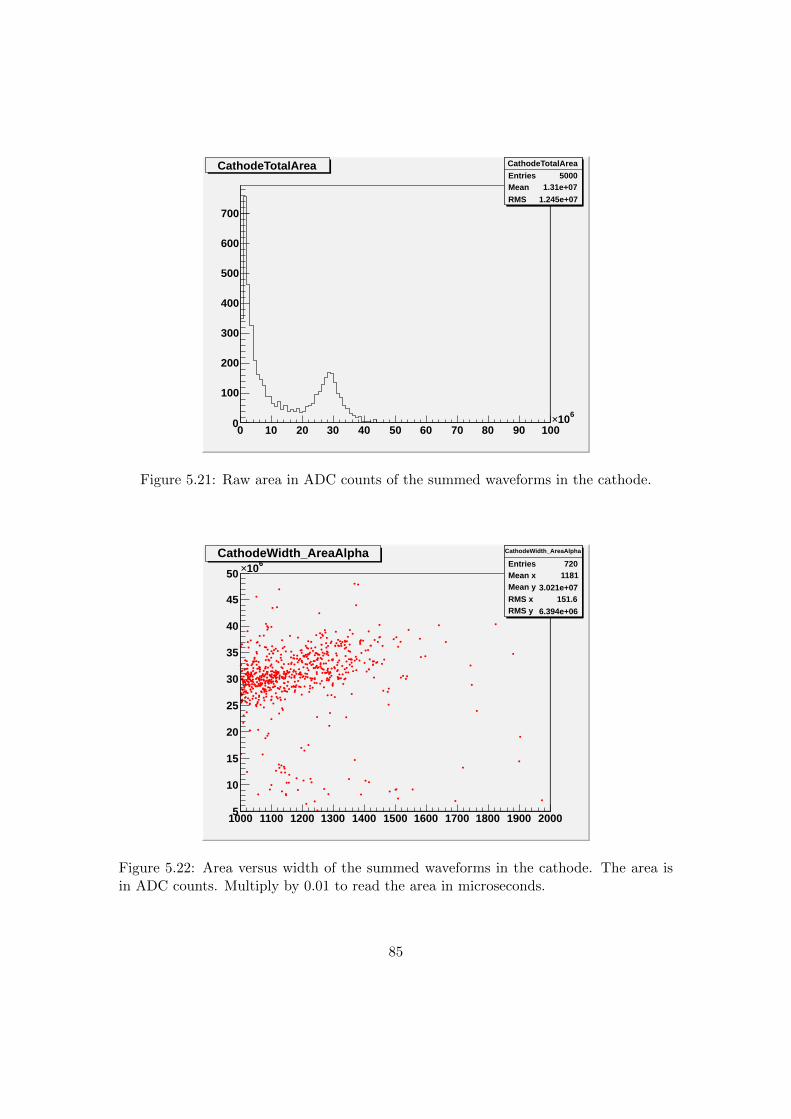
CathodeTotalArea
Entries 5000Mean 1.31e+07
RMS 1.245e+07
0 10 20 30 40 50 60 70 80 90 100
610×0
100
200
300
400
500
600
700
CathodeTotalArea
Entries 5000Mean 1.31e+07
RMS 1.245e+07
CathodeTotalArea
Figure 5.21: Raw area in ADC counts of the summed waveforms in the cathode.
1000 1100 1200 1300 1400 1500 1600 1700 1800 1900 20005
10
15
20
25
30
35
40
45
50610×
CathodeWidth_AreaAlpha
Entries 720Mean x 1181Mean y 3.021e+07RMS x 151.6RMS y 6.394e+06
CathodeWidth_AreaAlpha
Entries 720Mean x 1181Mean y 3.021e+07RMS x 151.6RMS y 6.394e+06
CathodeWidth_AreaAlpha
Figure 5.22: Area versus width of the summed waveforms in the cathode. The area isin ADC counts. Multiply by 0.01 to read the area in microseconds.
85

CathodeDelta_AreaS1
0 5000 10000 15000 20000 25000
50
100
150
200
250
300
350
400
450
500310×
CathodeDelta_AreaS1
Entries 720Mean x 1.143e+04Mean y 1.143e+05RMS x 4451RMS y 5.471e+04
CathodeDelta_AreaS1
Entries 720Mean x 1.143e+04Mean y 1.143e+05RMS x 4451RMS y 5.471e+04
PCathodeDelta_AreaS1
Entries 720Mean 1.143e+04Mean y 1.143e+05RMS 4451RMS y 5.471e+04
0 5000 10000 15000 20000 250000
20
40
60
80
100
120
140
160
180
200
220310×
PCathodeDelta_AreaS1
Entries 720Mean 1.143e+04Mean y 1.143e+05RMS 4451RMS y 5.471e+04
PCathodeDelta_AreaS1
Figure 5.23: (top): Area of the S1 signal versus width of the summed waveforms in thecathode. The area is in ADC counts. Multiply by 0.01 to read the time in microseconds;(bottom) a profile of the same distribution, showing the light attenuation as a functionof the distance.
86

EnergyHistoEntries 911Mean 13.09RMS 14.39
ADC counts * Samples)6Cathode Sum Energy (10
0 10 20 30 40 50 60 70 80
En
trie
s / b
in
0
100
200
300
400
500
600
700
800
900
EnergyHistoEntries 5848
Mean 13.14RMS 15.75
0
200
400
600
800
1000
1200
Number of S1 Peaks
-0.5 0 0.5 1 1.5 2 2.5 3 3.5
Nu
mb
er o
f S
2 P
eaks
-0.5
0
0.5
1
1.5
2
2.5
3
3.5
PeakHistoEntries 1650
Mean x 0.9182Mean y 0.9975
RMS x 0.4564RMS y 0.1007
PeakHistoEntries 1650
Mean x 0.9182Mean y 0.9975
RMS x 0.4564RMS y 0.1007
0
200
400
600
800
1000
1200
DeltaTHistoEntries 216Mean 107.4RMS 43.21
s)µDrift Time (
0 50 100 150 200 250
En
trie
s / b
in
0
10
20
30
40
50
DeltaTHistoEntries 1280
Mean 96.28RMS 46.84
X (mm)
-60 -40 -20 0 20 40 60
Y (
mm
)
-60
-40
-20
0
20
40
60
Figure 5.24: Selection of alpha candidates in NEXT-1-EL. See text for details.
87
Drift time cut (Fig. 5.24, bottom left): Once (1 S1 + 1 S2) events have been se-lected, the drift time can be estimated by taking the time difference between theS1 and S2 signals. As can be seen from the figure, events extend up to ∼ 170µsdrift time for this run. Assigning this maximum drift time to the full drift lengthof the chamber (30 cm) yields a drift velocity of about 1.8 mm/µs. We select onlyevents with a drift time comprised between 40 and 160 µs. This cut ensures thatonly events that are well separated spatially from the chamber metallic grids, andwith a unambiguous (1 S1 + 1 S2) signature, are selected.
Radial cut: (Fig. 5.24, bottom right): Information from the anode PMT plane isused for a coarse and very preliminary reconstruction of the (x, y) position of theevent. This is possible because the face of the anode PMTs is only 3-4 mm awayfrom the EL region. While the (x, y) reconstruction algorithm will certainly be im-proved in the future, its current implementation is sufficient to clearly reconstructthe hexagonal shape of the NEXT-1-EL light tube, as can be seen in the figure.To ensure that the energy deposition occurs entirely within the xenon gas, a strictrequirement on the reconstructed radius of < 35 mm is used.
5.2.3 Energy Reconstruction
In the SOFT concept, the basic observable we use for energy reconstruction is the sumof all (13, in this case) cathode PMTs. While the supply voltage for each PMT has beenseparately adjusted to provide a uniform PMT gain of 2 · 106, a small (about 20% RMSspread) channel-to-channel variation is seen and corrected for offline. In the following,we discuss how the energy reconstruction changes as a function of spatial location withinthe chamber, and provide a first energy resolution measurement with NEXT-1-IFIC.
5.2.4 Dependence on Spatial Location
Once alpha candidate events have been selected, we can study how the amount of lightdetected by the sum of all cathode PMTs varies, on average, as a function of the eventlocalization within the chamber. The profile histogram in Fig. 5.25 (left) shows how thereconstructed energy varies with drift time. As expected from electron attachment, thereconstructed energy decreases with increasing drift time. Nevertheless, for this currentrun the variation is mild and well understood. Performing an exponential fit to thisprofile histogram yields a (723± 92) µs electron lifetime.
Once the correction for electron attachment has been applied, we can study how thereconstructed energy varies with reconstructed radial position within the chamber. Giventhe isotropic nature of the EL light, and the fact that the light guide panels in NEXT-1-IFIC are far from being perfect VUV light reflectors, we expect the reconstructed energyto decrease with reconstructed radius. This is what has been observed on average, ascan be seen from the profile histogram in Fig. 5.25 (right). While the effect is sizable asone extends past 35 mm reconstructed radius, the variation is less than 10% up to 35
88

e2vsdtEntries 370
Mean 108.3Mean y 0.9994
RMS 35.51
RMS y 0.1429
/ ndf 2χ 9.368 / 8
p0 0.022± 1.164 p1 91.5± 722.8
s)µDrift Time (
40 60 80 100 120 140 160
Ener
gy (a
rb. u
nits
)
0.9
0.95
1
1.05
1.1
e2vsdtEntries 370
Mean 108.3Mean y 0.9994
RMS 35.51
RMS y 0.1429
/ ndf 2χ 9.368 / 8
p0 0.022± 1.164 p1 91.5± 722.8
e1vsrEntries 370
Mean 24.23
Mean y 1.16
RMS 7.99
RMS y 0.1559
/ ndf 2χ 1.541 / 6
p0 0.02± 1.19
p1 1.962e-05± 4.083e-05
Radius (mm)
0 5 10 15 20 25 30 35
Ener
gy (a
rb. u
nits
)
1.1
1.15
1.2
1.25
1.3
e1vsrEntries 370
Mean 24.23
Mean y 1.16
RMS 7.99
RMS y 0.1559
/ ndf 2χ 1.541 / 6
p0 0.02± 1.19
p1 1.962e-05± 4.083e-05
Figure 5.25: Drift time (left) and radial (right) energy corrections in NEXT-1-IFIC.
mm. A sufficiently good description of this dependence is obtained by fitting the averagereconstructed energy to a (1− c · r2) functional form, with c = (4.1± 2.0) · 10−5 mm−2.
5.2.5 Energy Resolution
Figure 5.26 shows the energy spectrum of the alpha candidate events, having alreadyapplied the PMT relative gain, drift time and radial corrections to the energy. Theidentification of alpha lines is difficult because of the poor statistics and the poor energyresolution. From these data, we estimate an energy resolution of about 10% FWHM(see gaussian fit in Fig. 5.26). We are now studying why this first energy resolutionmeasurement is poor. Recombination, in particular given the low drift field for thismeasurement may be among the explanations. Needless to say, the current results shownhere need not be taken as a projection of the expected ultimate performance for NEXT-1-IFIC, but rather as a status report on our current understanding of the chamber afteronly a few weeks of commissioning.
5.3 Other Measurements
In addition to measurements related to energy reconstruction (discussed above), thealpha analysis provides a few other ancillary measurements, discussed in the following.
5.3.1 Drift Velocity
As can be seen from Fig. 5.24 (bottom left), events extend up to ∼ 170µs drift time forthis run. Assigning this maximum drift time to the full drift length of the chamber (30cm) yields a drift velocity of about 1.75 mm/µs.
89

e4Entries 370
Mean 1.199
RMS 0.1395
/ ndf 2χ 6.739 / 5p0 0.28± 2.84 p1 0.005± 1.111 p2 0.0055± 0.0475
Energy (arb. units)
0.8 0.9 1 1.1 1.2 1.3 1.4 1.5
Entr
ies
/ bin
0
5
10
15
20
25
30
e4Entries 370
Mean 1.199
RMS 0.1395
/ ndf 2χ 6.739 / 5p0 13.8± 142 p1 0.005± 1.111 p2 0.0055± 0.0475
Figure 5.26: Energy spectrum for alpha candidates. PMT relative gain, drift time and radialcorrections to the energy have been applied.
90
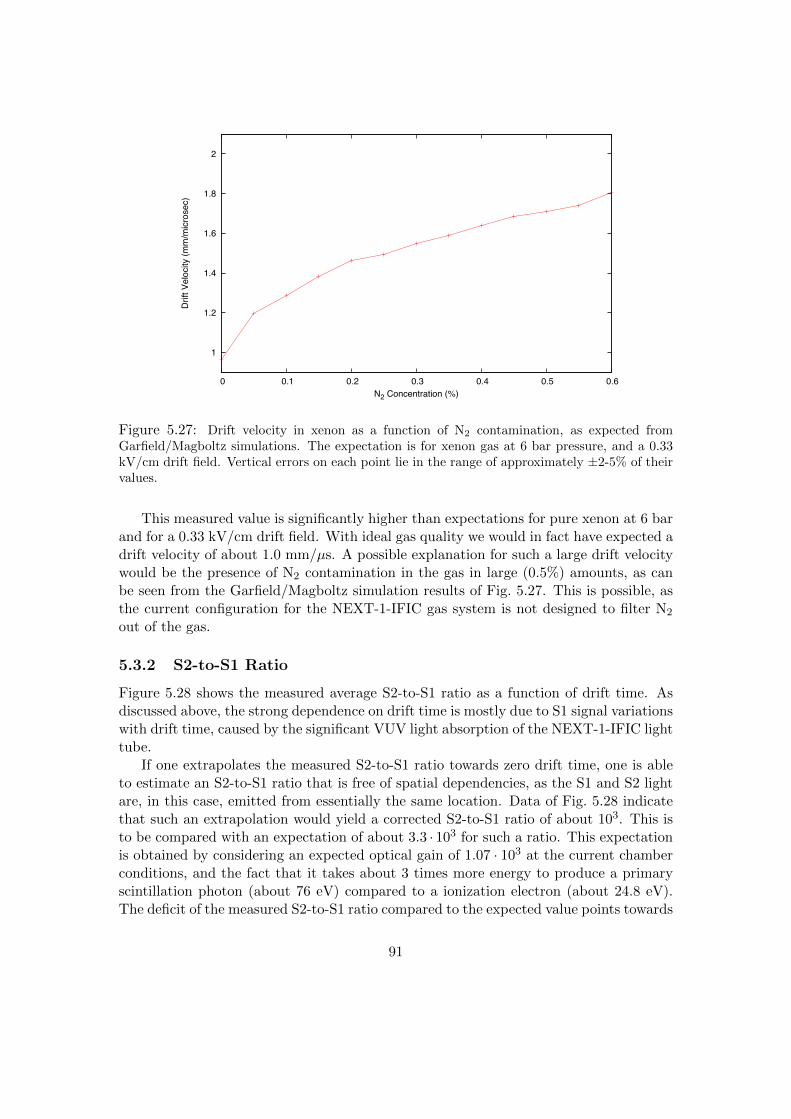
1
1.2
1.4
1.6
1.8
2
0 0.1 0.2 0.3 0.4 0.5 0.6
Drif
t Vel
ocity
(mm
/mic
rose
c)
N2 Concentration (%)
Drift Velocity for Xe and Xe/N2 vs. N2 Concentration (6 bar, 333 V/cm Electric Field)Calculations Performed with Magboltz (interfaced through Garfield)
Vertical errors on each point lie in the range of approx. (+/-) 2-5% of their values
Figure 5.27: Drift velocity in xenon as a function of N2 contamination, as expected fromGarfield/Magboltz simulations. The expectation is for xenon gas at 6 bar pressure, and a 0.33kV/cm drift field. Vertical errors on each point lie in the range of approximately ±2-5% of theirvalues.
This measured value is significantly higher than expectations for pure xenon at 6 barand for a 0.33 kV/cm drift field. With ideal gas quality we would in fact have expected adrift velocity of about 1.0 mm/µs. A possible explanation for such a large drift velocitywould be the presence of N2 contamination in the gas in large (0.5%) amounts, as canbe seen from the Garfield/Magboltz simulation results of Fig. 5.27. This is possible, asthe current configuration for the NEXT-1-IFIC gas system is not designed to filter N2
out of the gas.
5.3.2 S2-to-S1 Ratio
Figure 5.28 shows the measured average S2-to-S1 ratio as a function of drift time. Asdiscussed above, the strong dependence on drift time is mostly due to S1 signal variationswith drift time, caused by the significant VUV light absorption of the NEXT-1-IFIC lighttube.
If one extrapolates the measured S2-to-S1 ratio towards zero drift time, one is ableto estimate an S2-to-S1 ratio that is free of spatial dependencies, as the S1 and S2 lightare, in this case, emitted from essentially the same location. Data of Fig. 5.28 indicatethat such an extrapolation would yield a corrected S2-to-S1 ratio of about 103. This isto be compared with an expectation of about 3.3 · 103 for such a ratio. This expectationis obtained by considering an expected optical gain of 1.07 · 103 at the current chamberconditions, and the fact that it takes about 3 times more energy to produce a primaryscintillation photon (about 76 eV) compared to a ionization electron (about 24.8 eV).The deficit of the measured S2-to-S1 ratio compared to the expected value points towards
91

s2overs1vsdt
Entries 370
Mean 108.3
Mean y 380.9
RMS 35.51
RMS y 179
s)µDrift Time (
0 20 40 60 80 100 120 140 160 180 200
S2/S
1
0
100
200
300
400
500
600
700
800
s2overs1vsdt
Entries 370
Mean 108.3
Mean y 380.9
RMS 35.51
RMS y 179
Figure 5.28: Profile histogram of average S2-to-S1 ratio measured in NEXT-1-IFIC as a functionof drift time. The ratio extrapolates to S2/S1 ∼ 1000 for no drift, that is for S1 and S2 lightemitted from the same spatial location.
92

s)µDrift Time (40 60 80 100 120 140 160
s)µS2
Wid
th (
2
3
4
5
6
7
8
Figure 5.29: Time width of the S2 signal (full width at 10% of maximum) versus drift time.The effects of longitudinal diffusion and alpha particle range can be shown.
a alpha ionization quenching factor of about 3 in the current chamber conditions.
5.3.3 Longitudinal Diffusion and Range of Alpha Particles
It is also possible to perform S2 pulse shape analysis on the selected alpha candidates,and study whether the measured S2 time spreads are consistent with expectations. Asindicator of the S2 time width we use the full S2 peak width at 10% of its maximum. Ascatter plot of the S2 width as a function of the drift time for all selected alpha candidatesis shown in Fig. 5.29. The increase in the average S2 width with increasing drift timecan be explained via longitudinal diffusion of the ionization electrons during drift. Theexpected longitudinal diffusion constant for xenon at 6 bar and for 0.33 kV/cm driftfield is about 0.6 mm/
√cm, qualitatively in agreement with observations. The spread
of about 2 µs in the S2 width, approximately constant for all drift times, is instead dueto the expected range of alpha paticles. As can be inferred from Fig. 5.30, we expecta 3.4 mm projected range at 6 bar for alpha particles at the typical energies of 5 MeV.Considering the measured 1.75 mm/µs drift velocity, this corresponds to about a 2 µsS2 width spread due to the orientation of the alpha particle direction with respect to
93
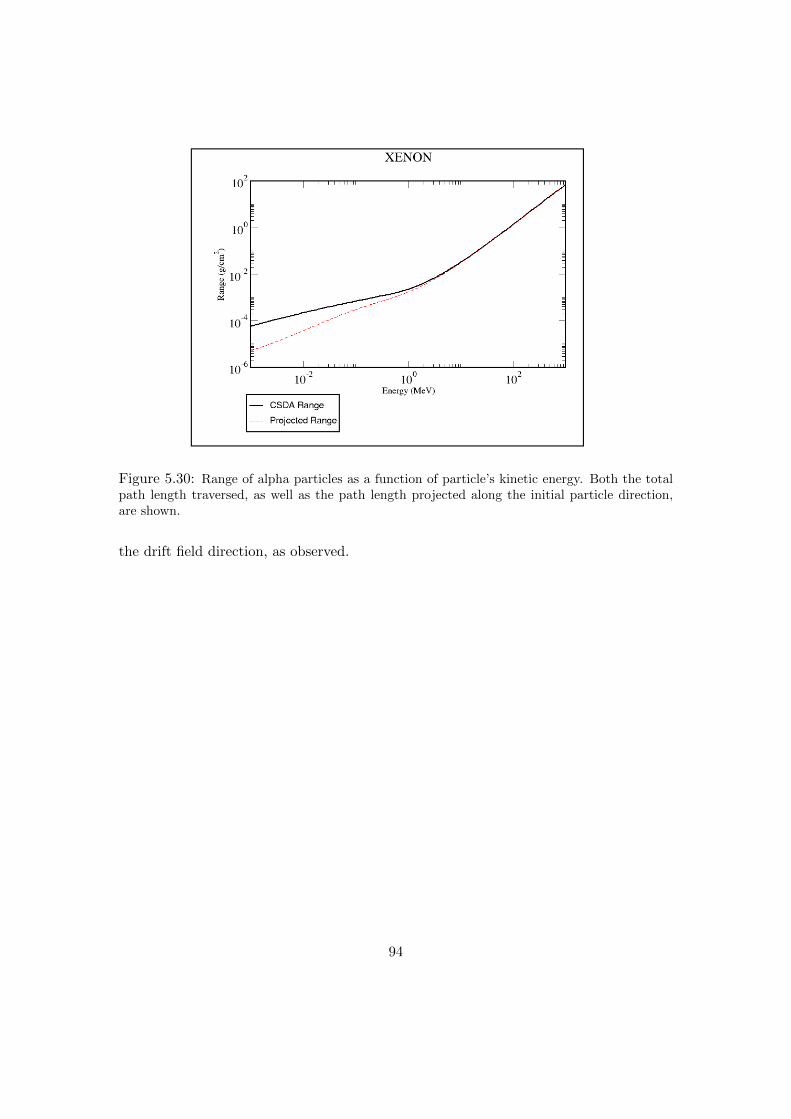
Figure 5.30: Range of alpha particles as a function of particle’s kinetic energy. Both the totalpath length traversed, as well as the path length projected along the initial particle direction,are shown.
the drift field direction, as observed.
94
Chapter 6
Sensitivity of NEXT-100
6.1 Sources of background in NEXT
6.1.1 214Bi and 208Tl
The ββ0ν peak of 136Xe is located in the energy region of the naturally-occurring ra-dioactive processes. The half-life of the parents of the natural decay chains, of the orderof the age of the universe, is, however, very short compared to the desired half-life sen-sitivity of the new ββ0ν experiments (∼ 1026 years). For that reason, even small tracesof these nuclides create notable event rates.
The only significant backgrounds for NEXT are the high energy gammas producedin the β-decays of the isotopes 208Tl and 214Bi, found in the thorium and uranium series,respectively (Figure 6.1).
The daughter of 208Tl, 208Pb, emits a de-excitation photon of 2614 keV with a 100%intensity. The Compton edge of this gamma is at 2382 keV, well below Qββ . However,the scattered gamma can interact and produce other electron tracks close enough to theinitial Compton electron so they are reconstructed as a single object falling in the energyregion of interest (ROI). Photoelectric electrons are produced above the ROI but canloose energy via bremsstrahlung and populate the window, in case the emitted photonsescape out of the detector. Pair-creation events are not able to produce single-trackevents in the ROI.
After the decay of 214Bi, 214Po emits a number of de-excitation gammas with energiesabove 2.3 MeV. The gamma line at 2447 keV (intensity: 1.57%) is very close to Qββ .The photoelectric peak infiltrates into the ROI for resolutions worse than 0.5%. Thegamma lines above Qββ have low intensity and their contribution is negligible. Thecontribution of pair-creation events is also insignificant.
All materials contain impurities of 208Tl and 214Bi in a given amount. The dominantsource of background in NEXT is the pressure vessel (PV). As discussed in chapter3, the mass of the PV is circa 2 tons if titanium is used as construction material andmore than 8 tons if copper is used. In this CDR and for the calculations that follow wewill assume conservative specific activities of 200 µBq/kg and 50 µBq/kg for this two
95

Energy (MeV)2 2.1 2.2 2.3 2.4 2.5 2.6 2.7 2.8 2.9
A.U
.
0
10000
20000
30000
40000
50000
60000
70000
80000Tl208Bi214Signal
Backgrounds
Figure 6.1: The landscape near the end-point of 136Xe, as a function of deposited energy. Thenormalization of the different peaks is arbitrary. The assumed resolution is 0.5%. The purpose ofthe plot is to show how the ββ0ν signal lies between the dominant 214Bi and 208Tl backgrounds.
materials respectively. We believe that there is ample room to build a more radiopurePV, either by using very radiopure batches of titanium or by combining it with veryresistant and light composites, such as carbon fiber.
The next source of background in NEXT are PMTs. We know of at least tworadipoure PMTs suitable for our needs, the Hamamatsu models R8520 (1”) and R11410-MOD (3”). The 208Tl and 214Bi activity of the R8520 has been measured to be between0.5 and 1 mBq and that of R11410-MOD, which seems better adapted for our needs,given its larger size, between 2 and 3 mBq. As we discuss later, with a coverage of 25%the contribution of PMT to the radioactive budget is small compared with that of thevessel.
All the other components of the detector can be made of PTFE, copper, peek, etc.Careful selection and screening should guarantee that they do not contribute significantlyto the radioactive budget. The electronics for the SiPMs will be shielded by a thickplate of very radiopure copper and located in the periphery of the fiducial volume. Itscontribution, therefore, is also small compared with that emanating from the bulk of thevessel.
However, the Zaragoza group has performed an independent sensitivity study whichincludes a very detailed background model. This study has been performed using asa reference detector a TPC based in micromegas and is not further discussed in thisreport, although their results are fully compatible with those presented here. We planto introduce such a detailed background model in our Monte Carlo in the near future.
96
6.1.2 Radon
Radon constitutes a dangerous source of background due to the radioactive isotopes222Rn (half-life of 3.8 d) from the 238U chain and 220Rn (half-life of 55 s) from the 232Thchain. As a gas, it diffuses into the air and can enter the detector.
214Bi is a decay product of 222Rn, and 208Tl a decay product of 220Rn. In both cases,the radon suffers from an alpha decay into polonium, producing a negative ion which isdrifted towards the anode by the electric field of the TPC. As a consequence, 214Bi and208Tl contaminations can be assumed to be deposited on the anode surface. Radon maybe eliminated from the TPC gas mixture by recirculation through appropriate filters.There are also ways to suppress radon in the volume defined by the shielding, whetherthis is a water tank or a lead castle.
Radon control is a major task for a ββ0ν experiment, and will be of uppermostimportance for NEXT.
6.1.3 Cosmic rays and laboratory rock backgrounds
Cosmic particles can also affect our experiment by producing high energy photons or ac-tivating materials. This is the reason why double beta decay experiments are conducteddeep underground. At these depths, muons are the only surviving cosmic ray particles,but their interactions with the rock produce neutrons and electromagnetic showers. Fur-thermore, the rock of the laboratory itself is a rather intense source of 208Tl and 214Bibackgrounds as well as neutrons.
The above backgrounds can be reduced below those intrinsic to the detector (PV,PMTs, etc) by shielding. A water tank providing 3 meters of ultrapure water shield willreduce the flux of gammas to negligible levels and will also suppress neutron and muonbackground. The same shielding capabilities can be provided by a lead-copper housing(“castle”) made of 25 cm radiopure lead and 10 cm radiopure copper.
Given the topological capabilities of NEXT the residual muon and neutron back-ground do not appear to be significant for our experiment. However, there is the pos-sibility of instrumenting the tank for a detector upgrade. An active veto will furthersuppress backgrounds other than those emanating from the detector itself.
6.2 Signal and background characterization in NEXT
6.2.1 The topological signature
Double beta decay events have a distinctive topological signature in HPGXe (Figure6.2) : a ionization track, of about 20 cm length at 15 bar, tortuous because of multiplescattering, and with larger depositions or blobs in both ends.
As the track propagates in the dense gas it emits δ-rays and bremsstrahlung radiation.Those are typically low-energy gammas (Table 6.1) with a mean free path below 1 cm.The convolution of emission of electromagnetic energy with the effect of diffusion (about1 cm for a drift of 1 m) results in a track for ββ0ν events that looks more like a wiggly,
97

X (mm)0 50 100 150 200
Y (
mm
)
-300
-250
-200
-150
Figure 6.2: Double beta decay events have a distinctive topological signature in HPGXe: aionization track, of about 20 cm length at 15 bar, tortuous because of multiple scattering, andwith larger depositions or blobs in both ends.
98
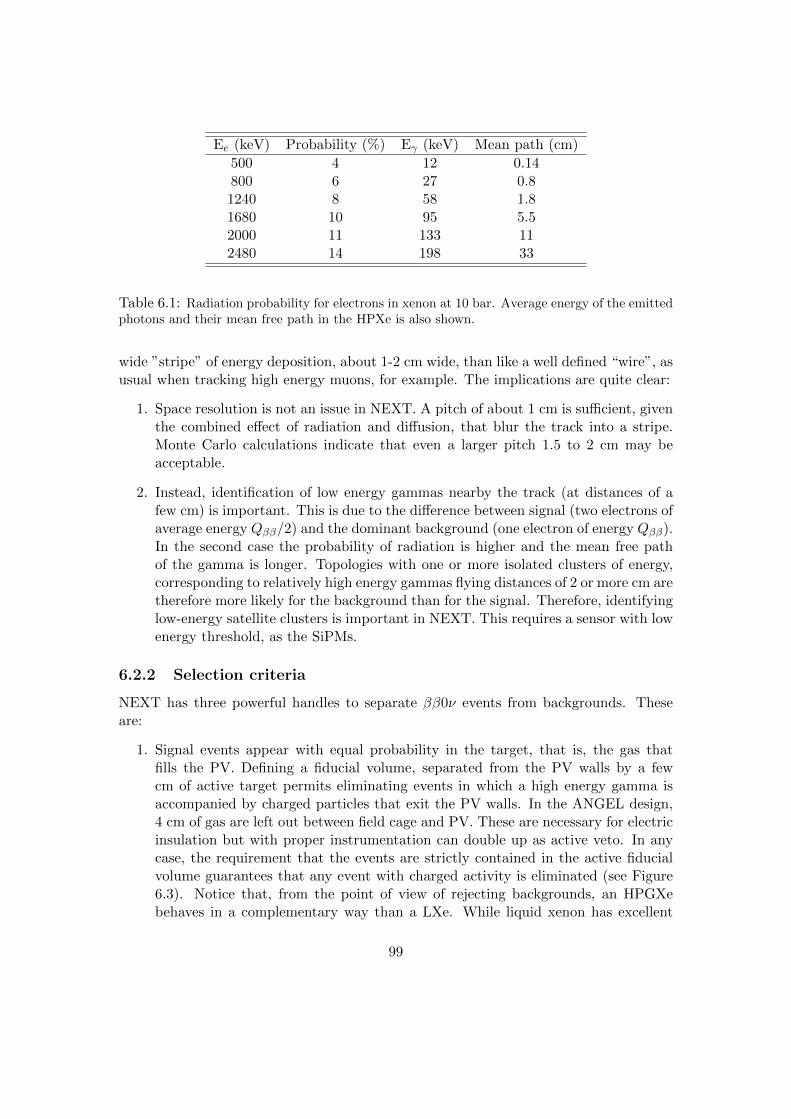
Ee (keV) Probability (%) Eγ (keV) Mean path (cm)
500 4 12 0.14800 6 27 0.81240 8 58 1.81680 10 95 5.52000 11 133 112480 14 198 33
Table 6.1: Radiation probability for electrons in xenon at 10 bar. Average energy of the emittedphotons and their mean free path in the HPXe is also shown.
wide ”stripe” of energy deposition, about 1-2 cm wide, than like a well defined “wire”, asusual when tracking high energy muons, for example. The implications are quite clear:
1. Space resolution is not an issue in NEXT. A pitch of about 1 cm is sufficient, giventhe combined effect of radiation and diffusion, that blur the track into a stripe.Monte Carlo calculations indicate that even a larger pitch 1.5 to 2 cm may beacceptable.
2. Instead, identification of low energy gammas nearby the track (at distances of afew cm) is important. This is due to the difference between signal (two electrons ofaverage energy Qββ/2) and the dominant background (one electron of energy Qββ).In the second case the probability of radiation is higher and the mean free pathof the gamma is longer. Topologies with one or more isolated clusters of energy,corresponding to relatively high energy gammas flying distances of 2 or more cm aretherefore more likely for the background than for the signal. Therefore, identifyinglow-energy satellite clusters is important in NEXT. This requires a sensor with lowenergy threshold, as the SiPMs.
6.2.2 Selection criteria
NEXT has three powerful handles to separate ββ0ν events from backgrounds. Theseare:
1. Signal events appear with equal probability in the target, that is, the gas thatfills the PV. Defining a fiducial volume, separated from the PV walls by a fewcm of active target permits eliminating events in which a high energy gamma isaccompanied by charged particles that exit the PV walls. In the ANGEL design,4 cm of gas are left out between field cage and PV. These are necessary for electricinsulation but with proper instrumentation can double up as active veto. In anycase, the requirement that the events are strictly contained in the active fiducialvolume guarantees that any event with charged activity is eliminated (see Figure6.3). Notice that, from the point of view of rejecting backgrounds, an HPGXebehaves in a complementary way than a LXe. While liquid xenon has excellent
99

gamma
charged particle
Figure 6.3: Charged particle backgrounds entering the detector active volume can be rejectedwith complete 3D-reconstruction (top left). The mean free path of xenon for the high-energygammas emitted in 214Bi and 208Tl decays is > 3 m, and thus many of them cross the detectorwithout interacting (top right). Also, 214Bi and 208Tl decay products include low-energy gam-mas which interact in the vetoed region close to the chamber walls (bottom left). Only thosebackground events with tracks fully-contained within the fiducial volume may mimic the signal(bottom right).
100

self-shielding properties, xenon gas, even at (moderately) high pressures, is verytransparent to gammas.
2. Signal events have all the same energy. NEXT target resolution is 1% FWHM andbetter resolutions can be achieved (our measurements with small detectors pointout to 0.4%, close to the intrinsic resolution in xenon). Imposing that the eventsare in the ROI (taken as 1% FWHM) eliminates substantially the backgrounds.
3. Signal events have a distinctive topological signature that can be exploited tofurther suppress the background. Our calculations yield a rejection factor of 20at moderate efficiency cost. This is one of the strongest points offered by NEXTtechnology.
6.3 The topological signature
6.3.1 Voxelization
The initial processing of the event allows the “voxelization” of the track, which is formedin terms of connected 3D “voxels” formed using the 2D position given by the trackingplane and the third dimension given by time information. The initial voxels are cubes of1 cm3 in volume, corresponding to the pitch between the SiPMs and twice the EL griddistance. The size of isolated photons is typically one voxel, while a ββ0ν “track” willconsist of about 20 voxels.
Dedicated software (e.g, the RESET algorithm, described in chapter 5) is being de-veloped to voxelize the event. REST also obtains the energy of the event, after correctingfor all relevant effects (position of the event, attachment, etc.). The list of (unconnected)voxels is then passed to the pattern recognition algorithms.
6.3.2 Rudiments of graph theory
For each event, the set of voxels with an energy deposition different from zero can beregarded as a graph: that is, a set of vertices and edges that connect pairs of vertices.Two voxels (1 and 2 ) belonging to a specific set (and regarded as cubes) are connectedif they have either one side, one edge or one vertex in common. Mathematically:
x1 = x2 (±1)
y1 = y2 (±1)
z1 = z2 (±1)
Every group of voxels with energy deposition different from zero is characterized bya square matrix a of dimension equal to the number of voxels belonging to that group.It is called adjacency matrix, because it describes the closeness of each pair of voxels.
101

The voxels are ordered and numbered, 1, 2, 3, . . . Then, the matrix element a(i, j) isbuilt in the following way:
a(i, j) =
1 if
xi = xj ± 1yi = yjzi = zj
or
xi = xj
yi = yj ± 1zi = zj
or
xi = xjyi = yj
zi = zj ± 1
√2 if
xi = xj ± 1yi = yj ± 1zi = zj
or
xi = xj ± 1yi = yj
zi = zj ± 1or
xi = xj
yi = yj ± 1zi = zj ± 1
√3 if
xi = xj ± 1yi = yj ± 1zi = zj ± 1
109 if
xi = xjyi = yjzi = zj
0 elsewhere
where x(y, z)i is the x(y, z) coordinate of the voxel i. A matrix element different fromzero means that the corresponding voxels are close (and the number represents thedistance in cm between the centers of the voxels), while if it is zero, the two voxels arenot close. The diagonal elements are conventionally set to an arbitrary high number.
6.3.3 The Breadth First Search algorithm
With the adjacency matrix it is possible to “walk” across connected voxels, therefore toidentify connected subsets (the tracks) and follow paths along tracks. In order to do thisthe so called BFS (Breadth First Search) algorithm is exploited. The BFS starts froma voxel and calculates the (shortest) path to any other voxel. In this way it is possibleto identify the number of tracks for each event and to calculate the length of the pathbetween any pair of voxels of each track.
Using the BFS we calculate the paths between any pair of voxels and pick up thelongest of such paths. The corresponding voxels of the pair are called the extremes ofthe track. Afterwards, for each extreme, the voxels whose distance from it is smallerthan a radius R are considered and their energies summed up to give ER1(2), where label
1(2) is given to the extreme with higher (lower) energy. In Fig. 6.4 the distributionsof the energy contained in the sphere of radius R around the extremes of the track areshown. Fig. 6.4 shows the energy inside R for signal and the 214Bi background. In thecase of the signal the energy of both extremes is quite similar, as expected, while thebackground shows very different shapes for the track extremes. A good cut to exploitthis difference is to impose that an event have both ER1 and ER2 greater than a thresholdvalue Eth.
102

According to our Monte Carlo calculations a cut Eth = 0.4 MeV and R = 2.5 cmkeeps 78% of the signal while suppressing the background by more than one order ofmagnitude. The background suppression can be increased to a factor 20 at the expenseof less efficiency (55%).
6.4 Sensitivity
6.4.1 Event selection
An event is accepted as a ββ0ν candidate if:
1. The event is fully contained in the fiducial volume
2. Only one reconstructed track: That is the BFS algorithm finds only one connectedset of voxels. Events with more than one object (tracks or disconnected voxels)are rejected.
3. Energy in the ROI: The event is required to be within 1 FWHM (1%) of Qββ .
4. ββ0ν signature: the unique track ends in two blobs of high energy, as expected fora ββ event. This is translated into a cut Eth = 0.4− 0.55 MeV and R = 2.5− 3.0cm, that allows a suppression factor between 10 and 20 for the background at theexpense of selection efficiency between 78% and 55%.
6.4.2 Signal efficiency and background rejection power
To estimate the performance of the NEXT ANGEL design ββ0ν and background datasamples have been generated with the NEXUS Monte Carlo simulation. Signal eventsare simulated in the volume inside the vessel. Backgrounds (208Tl and 214Bi decays) aresimulated in the vessel and in the readout planes. The events thus generated are passedthrough the selection procedure.
Selection criteria Fraction of events surviving cuts
Events analyzed 108
Fiducial, 1 track 6× 10⁻⁵
ROI 2.2× 10⁻⁶
Topology 1.9× 10⁻⁷
Table 6.2: Suppression of the 214Bi events by the selection cuts.
Tables 6.4.2, 6.4.2 and 6.4.2 summarize the rejection factors for 214Bi and 208Tlbackgrounds as well as the signal efficiency. The background rate of the experiment isobtained multiplying by the activity emanating from the pressure vessel, the PMTs andthe rest of the components of NEXT.
103
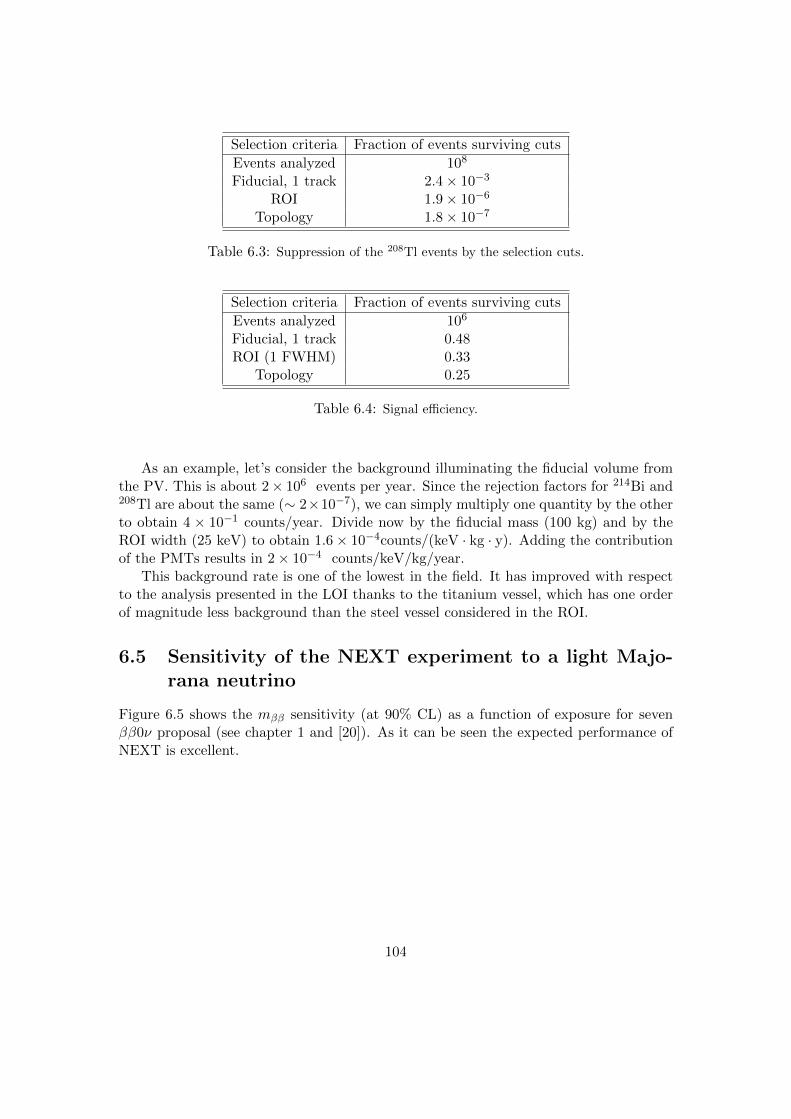
Selection criteria Fraction of events surviving cuts
Events analyzed 108
Fiducial, 1 track 2.4× 10⁻³
ROI 1.9× 10⁻⁶
Topology 1.8× 10⁻⁷
Table 6.3: Suppression of the 208Tl events by the selection cuts.
Selection criteria Fraction of events surviving cuts
Events analyzed 106
Fiducial, 1 track 0.48ROI (1 FWHM) 0.33
Topology 0.25
Table 6.4: Signal efficiency.
As an example, let’s consider the background illuminating the fiducial volume fromthe PV. This is about 2× 10⁶ events per year. Since the rejection factors for 214Bi and208Tl are about the same (∼ 2×10⁻⁷), we can simply multiply one quantity by the otherto obtain 4 × 10⁻¹ counts/year. Divide now by the fiducial mass (100 kg) and by theROI width (25 keV) to obtain 1.6× 10⁻⁴counts/(keV · kg · y). Adding the contributionof the PMTs results in 2× 10⁻⁴ counts/keV/kg/year.
This background rate is one of the lowest in the field. It has improved with respectto the analysis presented in the LOI thanks to the titanium vessel, which has one orderof magnitude less background than the steel vessel considered in the ROI.
6.5 Sensitivity of the NEXT experiment to a light Majo-rana neutrino
Figure 6.5 shows the mββ sensitivity (at 90% CL) as a function of exposure for sevenββ0ν proposal (see chapter 1 and [20]). As it can be seen the expected performance ofNEXT is excellent.
104

0 0.2 0.4 0.6 0.8 1 1.2 1.4 1.6 1.8 20
10
20
30
40
50
60
70
Extreme Blob Cut: BB0nu
0 0.2 0.4 0.6 0.8 1 1.2 1.4 1.6 1.8 20
10
20
30
40
50
60
70
80
Extreme Blob Cut: Bi214 endcap surface
Figure 6.4: Distributions of the energy inside a sphere of R = 2 cm in both extremes, for ββ0νevents (top) and for 214Bi backgrounds. The higher energy blob is shown in red.
105

10 100 1000 1000010
100
1000
CUOREEXOGERDAKamLAND-ZenNEXTSNO+SuperNEMO
mββ (
meV
)
exposure (kg year)
(a)
Figure 6.5: The mββ sensitivity (at 90% CL) as a function of exposure of the sevendifferent ββ0ν proposals considered. The expected performance of the experiments otherthan NEXT has been discussed in chapter 1 and in [20]. For illustrative purposes, thefilled circles indicate 10 years of run-time.
106
Chapter 7
Shielding options for the NEXTdetector
7.1 Shielding requirements
As extensively discussed elsewhere in this report, an exposure of the order of the ton–year of 136Xe, and a neutrino effective mass of 50 meV, result in only a few counts peryear at the Qββ energy of 2.457 MeV. To be sensitive to such low rates NEXT projectsa background of the order of 10−4 counts/(keV · kg · y). This forces a very effectiveshielding to protect the experiments against the laboratory walls contamination, mainlythe 2.615 MeV and 2.448 MeV photons coming from the 208Tl and 214Bi isotopes.
The NEXT collaboration has studied two possibilities for shielding. One of them isbased on housing the detector in a lead-copper structure (henceforth called the LeadCastle), the other one in the use of a water tank.
Radon in air, water and from material emanation will affect the experiment and theshielding scheme must be designed to suppress sufficiently this contribution. Considerfor example the case of a Lead Castle. The radon contamination at the LSC is of theorder of 100 Bq/m3. Assume that the volume of air around the detector is 2.55 m3 (thiscorresponds to around 20 cm of distance between vessel and shielding). Then, morethan 100 counts would be registered after cuts in the ROI. On the other hand, air-borneradon can effectively be suppressed by enclosing the detector in a “plastic bag” in whicha continuous flux or nitrogen is established, or working in a radon free atmosphere (theair in the inner volume passes through radon scrubbers).
Radon in the water is also a concern in the case of a water tank (for example, GERDAmeasures around 7-19 mBq/m3). Radon suppression in this case is achieved by a slightlyover-pressurized nitrogen blanket which will be kept between the water level and theroof of the tank. In addition the water will be bubbled through a column of nitrogen toeliminate radon degassing from the tank walls.
107

7.2 The Lead-Copper Castle option
A lead castle, similar to the XENON100 one, has been investigated for the shielding ofNEXT100 against the external gamma radiation. The goal is to develop a simple andcompact design that allows an easy access to the detector. Rectangular and a roundgeometries have been studied also to minimize the mass of the lead and the dimensionsof the supporting structure; additionally different lead providers have been contacted fora preliminary investigation of the price.
This shielding design offers several advantages:
- More compact design even replacing a few cm’s of lead by water bricks.
- Once it has been mounted is easy to maintain.
- This design could grow up with the experiment.
- It is flexible enough to face up to any unexpected change (extra space for electron-ics, extra inner shielding ...).
- Nitrogen flux not only prevents radon from approaching the detector outer surface,but also offers a certain degree of thermic bath.
7.2.1 The XENON concept
A shield made out of lead bricks has been build by the XENON collaboration for the10 kg detector (see figure 7.1), operated at Laboratori Nazionali del Gran Sasso (LNGS)during the period 2006-2007. Due to its good performances, the same lead castle hasbeen re-used (after minor modifications) for the XENON100 experiment that is currentlyoperating in the same site. The design foresees a cubic steel-framed structure consistingof 20 cm of Pb with an additional layer of high density polyethylene. The shield structureis secured by steel panels along the outer walls. The detector is attached to a movabledoor placed on two rails, and it can be easily put in and out by one person. Lead wassupplied in standard bricks (5×10×20) by two different companies: Plombum (Poland)for the outer 15 cm and Fondery de Gentilly (France) for more radiopure inner 5 cm layer.An additional inner 5 cm layer of high-purity copper has been added during the upgradefor XENON100. All the holes of the shield have been sealed with low–radioactivitysilicon gel thus the cubic internal cavity ( 1m3) can sustain a slight over pressure. Inorder to reduce the Rn concentration inside the shield, N2 is continuously flushed at arate of 1.5 l/min. Due to the need of additional shielding, water tanks have been placedaround this shield.
7.2.2 Water bricks
This are just containers filled up with water to further reduce the external radiation.The final size of these containers have not yet been defined as there are many differentsizes and geometries of water containers available in the market. Even costumed made
108

Figure 7.1: Picture showing the XENON10 shielding and the steel moving structure.
containers adapted to the inner shielding could be used. In our design, we have used240 mm × 290 mm × 380 mm as an arbitrary choice.
One of the advantages of including water containers in the shielding is the possibilityto add PMTs to use the system as an active veto against muons and external radiation.
7.2.3 Proposed design for the NEXT100 shielding
This proposal is based on the XENON-like option. The pre-requisitess for our designare:
- The vessel dimensions, adjusted to the ANGEL design plus a safety margin.
- Vertical position of vessel.
- Max. length of cables 5 m.
Some basic points for the shielding design are:
1. A shield made up of several different layers (a sandwich or onionstyle shield), with:
- inner level: 5 cm of copper, with the possibility of upgrading to 10 cm ormore1,
- mid level: 15 cm of lead,
- outer level: 1 m of water, placed into water bricks (plastic containers filled upwith water).
1The standard sheet thickness supplied by LUVATA is 2.5 cm. Two or four plates will be used
109

2. The shield geometry is composed of straight horizontal and vertical walls.
3. On the ground level a thicker layer of lead is foreseen (30 cm) as no water brickscan be used under such a heavy structure.
4. Cabling and piping require spaces between shield and vessel: at least 100–150 mmbetween the side wall of the vessel and the shield and at least 300 mm between thevessel endcaps and the shield.
5. The service plate of the vessel is on the upper part. A covered opening at theshield roof allows cables and pipes to get the vessel.
6. Once installed, the detector should stay in place, motionless, due mostly to itsweight, but also to avoid small displacements of inner part of the detector.
7. After installation, the shielding needs a mechanism to allow an easy access to theimmobile detector. This will be done through sliding walls at the front of theshield. Then, cables and pipes will not be affected by the opening of the shieldand won’t need to be disconnected.
8. To prevent radon contamination, a plastic bag will be place surrounding the struc-ture and nitrogen flux will be flushed inside.
9. Finally, standard properties or supplier specifications have been considered formaterial involved in the design (steel, copper and lead).
The building method we propose consists of copper panels and chevroned lead bricks.These lead bricks are commonly used for radiation isolation, have standard geometriesand, as they fit one into the other, the built wall are stronger and with less spaces forthe radiation to traverse them. They have been placed in an upright position for thewalls and lying on their side for the floor and roof, water containers have been piled,and supported steel structures hold the whole assembly. Two different structures areneeded: one for the inner copper plus lead shield and another one for water containers.Catia V5 R19 has been used for the design and Ansys 11.0 for mechanical calculations.
7.2.4 Basic copper and lead layers with supporting structure
The basic elements of the lead shield are:
- an U-shaped wall (thickness: 150 mm)
- the front wall (thickness: 150 mm) divided into two halves due to its more than9.5 Tons weight.
- the floor (thickness: 300 mm)
- the roof (thickness: 150 mm)
110

The roof (6 Ton weight) has to be supported by an independent steel structure insteadto lie upon the lead walls to avoid the collapse of these vertical walls. In addition, somestructural elements will prevent buckling of the vertical walls. A supplementary elementwith a layer of copper and a layer of lead has been added over the roof to cover the holethrough which cables and pipes exit the inner shield (details in figures 7.2 and 7.3)
Figure 7.2: Inner copper and lead shield with doors half open (left). View of the struc-ture, supporting the copper and lead shielding, and the door opening mechanism (right).
Figure 7.3: Isometric view of the assembly cut by a parallel to the front wall plane.
For the design we have performed static calculations, which take into account theeffect of large displacements, and buckling calculations, considering standard properties
111

for lead and steel, and Luvata datasheet’s for copper. Each wall has been considered asa continuous whole body for the calculations, independently of the construction basicelements used for building them. These elements have been thought to fit togetherproperly and eventually be fixed together (glued). The chosen global solution should nothave horizontal solicitations or displacements too high on the vertical walls, to maintainthis continuity condition.
Under these assumptions we got as results:
- Front walls or U-shaped wall alone
The general load case doesn’t originate problems since deformations produce amaximum total displacement of less that 0.3 mm and a maximum stress of lessthan 0.57 MPa (well below 1.4 MPa, the elastic limit for lead).
Buckling (or compressive instability) is dangerous. A little pressure on the upperside of the walls would make them fall down. Without reinforcement elements,the first buckling mode appears at P=87.7 Pa in front walls and at P=755.8 Pa inU-shaped wall, well below the pressure caused by a single lead brick (1134 Pa).
- Roof alone
The weight of the whole roof is near 6 Tm. Taking into account the bucklingproblems of the walls, the roof should not lie upon the lead walls of the castlebecause it would cause the collapse of these walls. Instead of this, it has to besupported by an independent outer structure. In our design, the roof has beenplaced on a 20 cm thick steel plate held from 4 anchor points placed at each lateralside of the plate by an outer structure from the top.
According to calculations, there are no major problems for the general load case.First, we have calculated the reaction forces by considering the anchor points ashard points (we need these forces to apply them on the outer structure that shouldhold the roof). Then we have considered these anchor points as cylindrical holeswith one of their borders fixed (to be closer to a realistic situation). Finally, wehave considered a more realistic case: the anchor points are cylindrical holes on theplate and a cylindrical crown around the border of the hole is fixed. For this lastcase, the maximum displacement that appears on the plate is around 0.5 mm (thatwe consider acceptable) and the maximum stress is around 45 MPa (well below theelastic limit of 220 MPa for steel).
- Assembly with the front walls and the U-shaped wall
We have performed several calculations of the buckling behavior of this assemblyand some structural elements have to be added to prevent buckling of the verticalwalls.
In the assembly without any reinforcement the first buckling mode appears at apressure level of 754 Pa (below the level of 1134 Pa that is the effect of the additionof a single layer of bricks). However, after an iterative process of reinforcement,we have arrived to a final configuration where the first buckling mode appears at
112

a pressure level of 1457 Pa (near 30% above 1134 Pa). Further investigations canbe done to improve this result.
Coming back to the independent elements (the U-shaped wall and the front walls),no problems are expected for the U-shaped wall due the reinforcement structuredefined for the assembly, but we also need to define a narrow support element forthe inner side not compromising radiopurity (shielded by the copper layer) in thecase of the front walls.
- Support structure for the lead roof
We have started the definition of the structural elements needed to support theroof. Initial studies show that the designed structure built with standard steelbeams do not suffer any deformation or buckling, even if we constrain all thedegrees of freedom at the joining points.
7.2.5 Water bricks and supporting structure
The water bricks will surround the rest of the shield with upper water bricks (around2400 kg) placed on a platform above the rest thanks to an independent structure. Thedesign presented here is preliminary and should be refined in future design stages. Here,we have divided the water bricks into different groups:
- upper water bricks over the roof of the lead structure,
- side water bricks, beside the arms of the U-shaped lead wall,
- back water bricks, beside the back of the U-shaped wall,
- front water bricks, beside the front lead wall,
- diagonal water bricks at each one of the 4 corners of the shield.
Vertical panels could be included at inner sides of each group of water bricks, to preventthem from falling down. Calculations of the structure needed to hold the water tankswill be done in future stages of development of the castle. In any case, we think thatthis structure will be less problematic than the one needed for the lead.
A schematic representation of the final assembly can be observed in figure 7.4.
7.2.6 Opening sequence
The present onion setup foresees the option of running with the complete shield or withjust some layers. An intermediate configuration, with only part of the shield in place,can be considered during the preliminary underground tests when frequent hardwareoperation on the detector (feedthrough, gas system, etc) will be required.
Once the complete shield is installed, the opening sequence would proceed as follows:
1. Front and side water containers removed
113
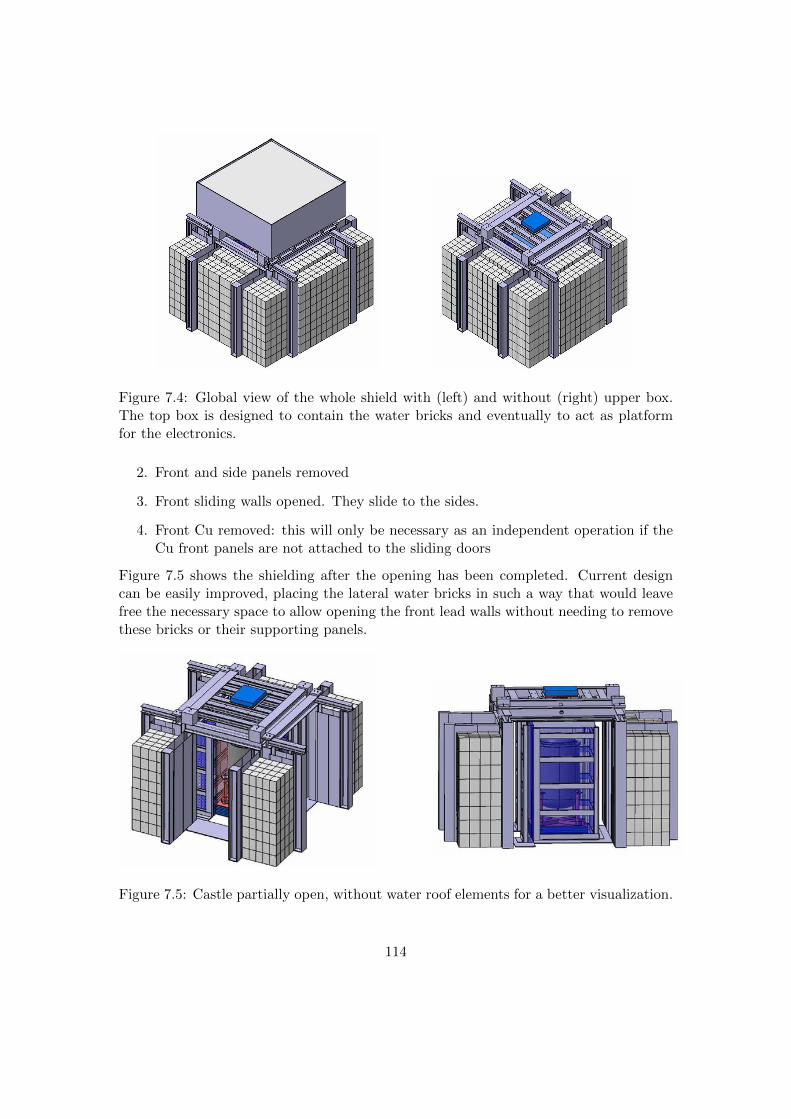
Figure 7.4: Global view of the whole shield with (left) and without (right) upper box.The top box is designed to contain the water bricks and eventually to act as platformfor the electronics.
2. Front and side panels removed
3. Front sliding walls opened. They slide to the sides.
4. Front Cu removed: this will only be necessary as an independent operation if theCu front panels are not attached to the sliding doors
Figure 7.5 shows the shielding after the opening has been completed. Current designcan be easily improved, placing the lateral water bricks in such a way that would leavefree the necessary space to allow opening the front lead walls without needing to removethese bricks or their supporting panels.
Figure 7.5: Castle partially open, without water roof elements for a better visualization.
114
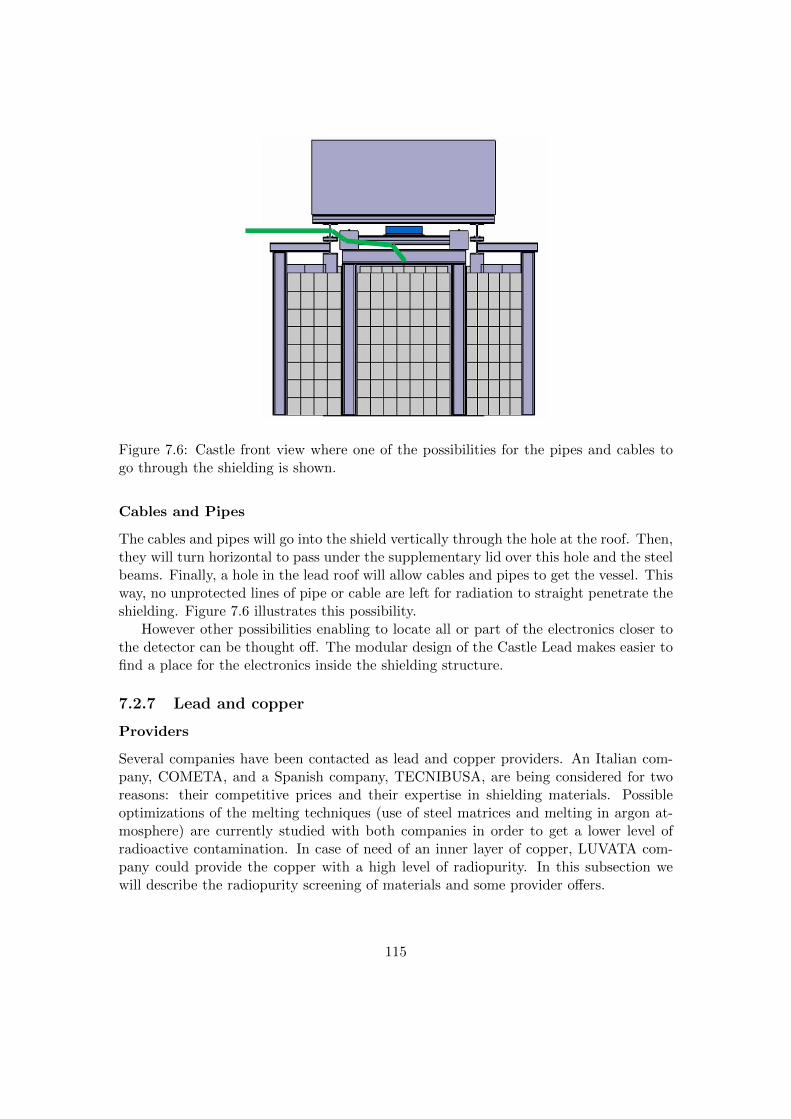
Figure 7.6: Castle front view where one of the possibilities for the pipes and cables togo through the shielding is shown.
Cables and Pipes
The cables and pipes will go into the shield vertically through the hole at the roof. Then,they will turn horizontal to pass under the supplementary lid over this hole and the steelbeams. Finally, a hole in the lead roof will allow cables and pipes to get the vessel. Thisway, no unprotected lines of pipe or cable are left for radiation to straight penetrate theshielding. Figure 7.6 illustrates this possibility.
However other possibilities enabling to locate all or part of the electronics closer tothe detector can be thought off. The modular design of the Castle Lead makes easier tofind a place for the electronics inside the shielding structure.
7.2.7 Lead and copper
Providers
Several companies have been contacted as lead and copper providers. An Italian com-pany, COMETA, and a Spanish company, TECNIBUSA, are being considered for tworeasons: their competitive prices and their expertise in shielding materials. Possibleoptimizations of the melting techniques (use of steel matrices and melting in argon at-mosphere) are currently studied with both companies in order to get a lower level ofradioactive contamination. In case of need of an inner layer of copper, LUVATA com-pany could provide the copper with a high level of radiopurity. In this subsection wewill describe the radiopurity screening of materials and some provider offers.
115
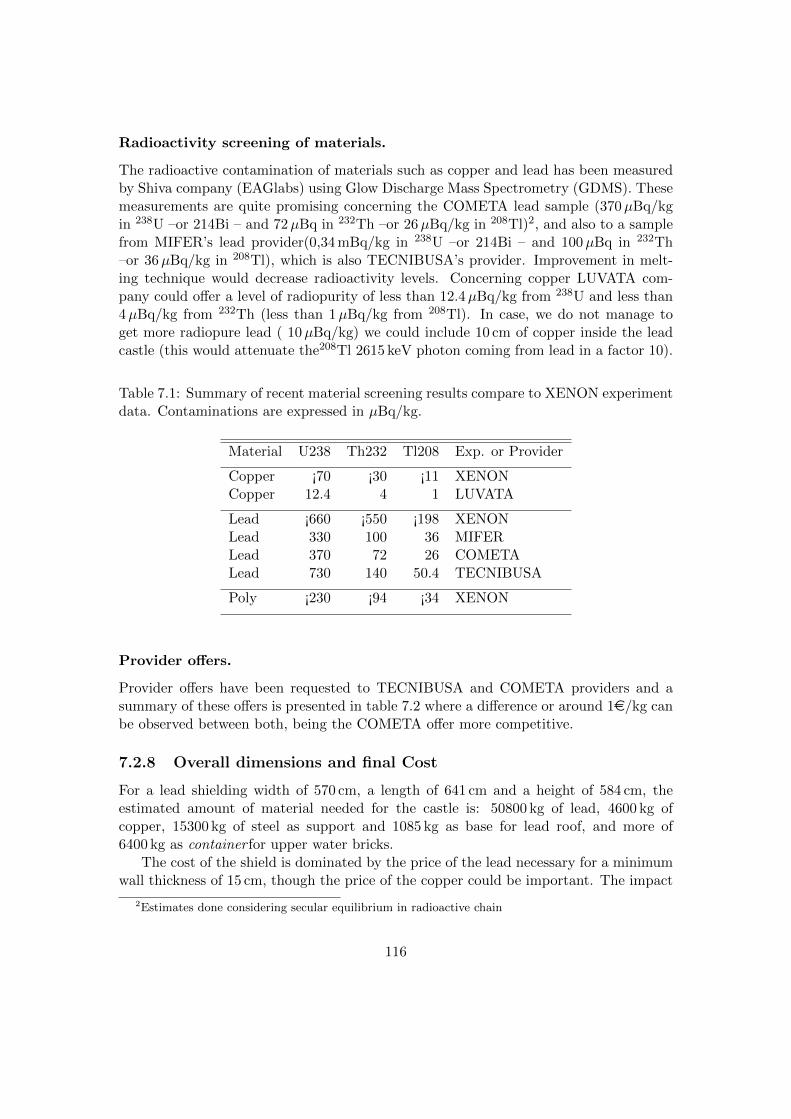
Radioactivity screening of materials.
The radioactive contamination of materials such as copper and lead has been measuredby Shiva company (EAGlabs) using Glow Discharge Mass Spectrometry (GDMS). Thesemeasurements are quite promising concerning the COMETA lead sample (370µBq/kgin 238U –or 214Bi – and 72µBq in 232Th –or 26µBq/kg in 208Tl)2, and also to a samplefrom MIFER’s lead provider(0,34 mBq/kg in 238U –or 214Bi – and 100µBq in 232Th–or 36µBq/kg in 208Tl), which is also TECNIBUSA’s provider. Improvement in melt-ing technique would decrease radioactivity levels. Concerning copper LUVATA com-pany could offer a level of radiopurity of less than 12.4µBq/kg from 238U and less than4µBq/kg from 232Th (less than 1µBq/kg from 208Tl). In case, we do not manage toget more radiopure lead ( 10µBq/kg) we could include 10 cm of copper inside the leadcastle (this would attenuate the208Tl 2615 keV photon coming from lead in a factor 10).
Table 7.1: Summary of recent material screening results compare to XENON experimentdata. Contaminations are expressed in µBq/kg.
Material U238 Th232 Tl208 Exp. or Provider
Copper ¡70 ¡30 ¡11 XENONCopper 12.4 4 1 LUVATA
Lead ¡660 ¡550 ¡198 XENONLead 330 100 36 MIFERLead 370 72 26 COMETALead 730 140 50.4 TECNIBUSA
Poly ¡230 ¡94 ¡34 XENON
Provider offers.
Provider offers have been requested to TECNIBUSA and COMETA providers and asummary of these offers is presented in table 7.2 where a difference or around 1e/kg canbe observed between both, being the COMETA offer more competitive.
7.2.8 Overall dimensions and final Cost
For a lead shielding width of 570 cm, a length of 641 cm and a height of 584 cm, theestimated amount of material needed for the castle is: 50800 kg of lead, 4600 kg ofcopper, 15300 kg of steel as support and 1085 kg as base for lead roof, and more of6400 kg as container for upper water bricks.
The cost of the shield is dominated by the price of the lead necessary for a minimumwall thickness of 15 cm, though the price of the copper could be important. The impact
2Estimates done considering secular equilibrium in radioactive chain
116
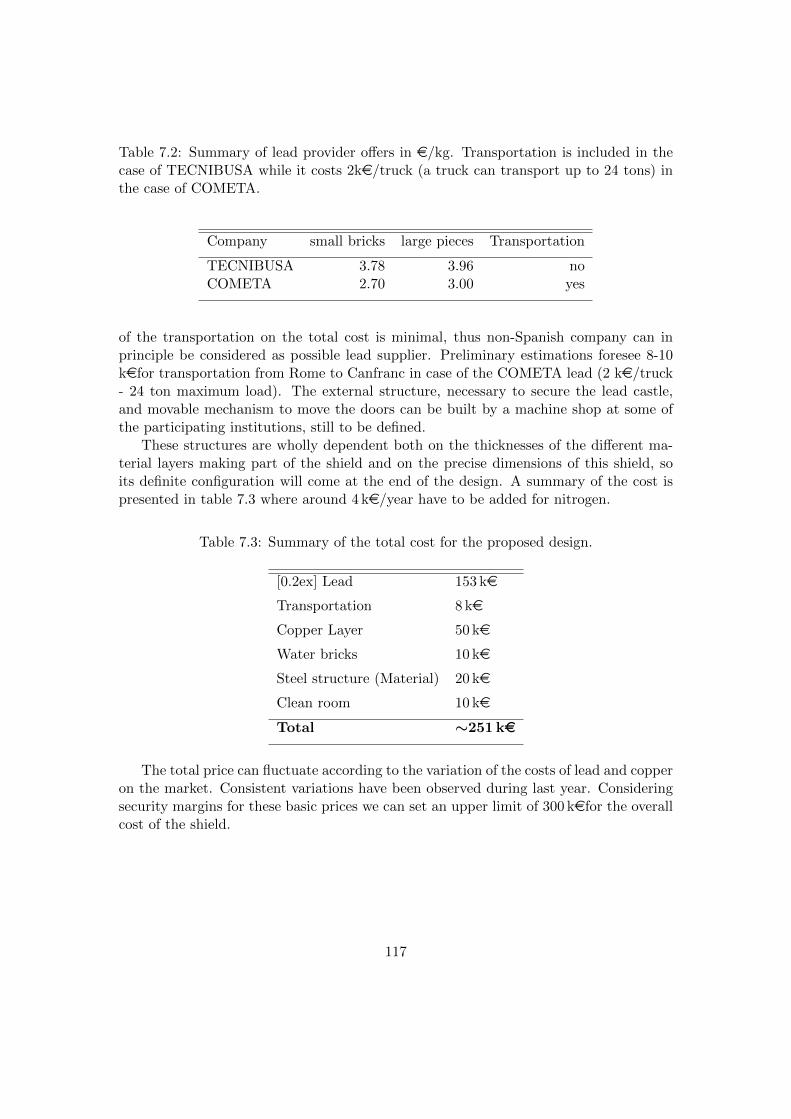
Table 7.2: Summary of lead provider offers in e/kg. Transportation is included in thecase of TECNIBUSA while it costs 2ke/truck (a truck can transport up to 24 tons) inthe case of COMETA.
Company small bricks large pieces Transportation
TECNIBUSA 3.78 3.96 noCOMETA 2.70 3.00 yes
of the transportation on the total cost is minimal, thus non-Spanish company can inprinciple be considered as possible lead supplier. Preliminary estimations foresee 8-10kefor transportation from Rome to Canfranc in case of the COMETA lead (2 ke/truck- 24 ton maximum load). The external structure, necessary to secure the lead castle,and movable mechanism to move the doors can be built by a machine shop at some ofthe participating institutions, still to be defined.
These structures are wholly dependent both on the thicknesses of the different ma-terial layers making part of the shield and on the precise dimensions of this shield, soits definite configuration will come at the end of the design. A summary of the cost ispresented in table 7.3 where around 4 ke/year have to be added for nitrogen.
Table 7.3: Summary of the total cost for the proposed design.
[0.2ex] Lead 153 ke
Transportation 8 ke
Copper Layer 50 ke
Water bricks 10 ke
Steel structure (Material) 20 ke
Clean room 10 ke
Total ∼251 ke
The total price can fluctuate according to the variation of the costs of lead and copperon the market. Consistent variations have been observed during last year. Consideringsecurity margins for these basic prices we can set an upper limit of 300 kefor the overallcost of the shield.
117
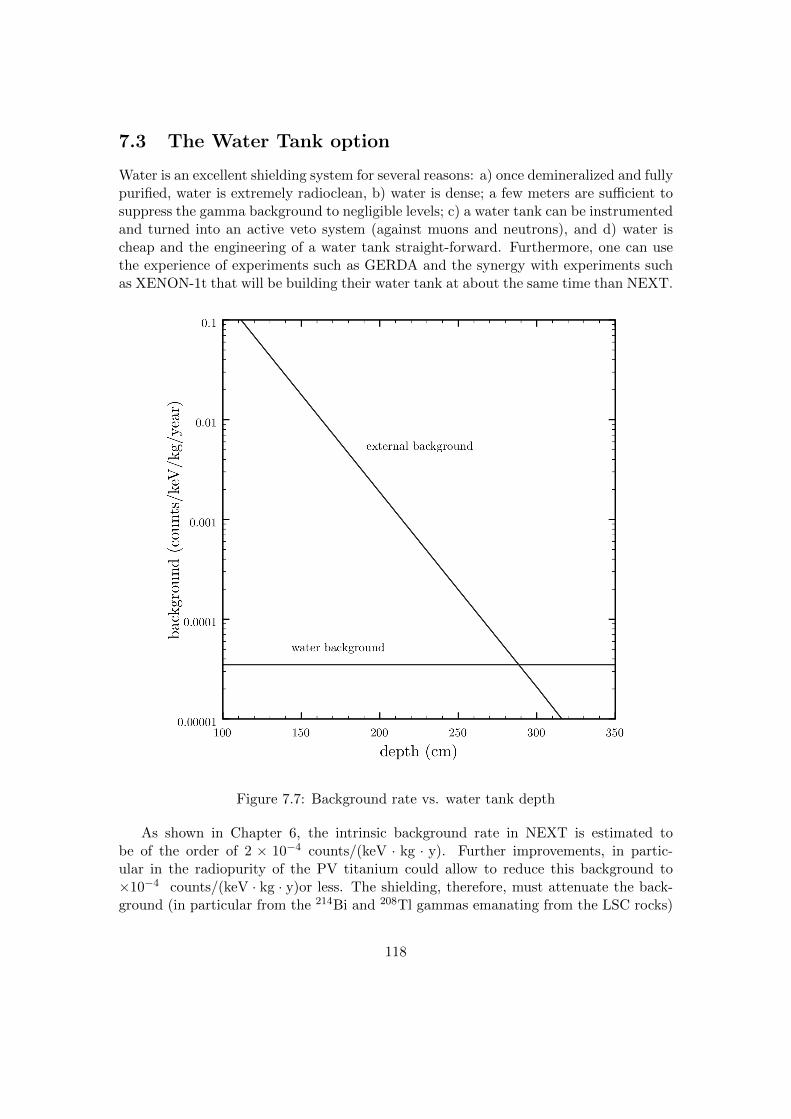
7.3 The Water Tank option
Water is an excellent shielding system for several reasons: a) once demineralized and fullypurified, water is extremely radioclean, b) water is dense; a few meters are sufficient tosuppress the gamma background to negligible levels; c) a water tank can be instrumentedand turned into an active veto system (against muons and neutrons), and d) water ischeap and the engineering of a water tank straight-forward. Furthermore, one can usethe experience of experiments such as GERDA and the synergy with experiments suchas XENON-1t that will be building their water tank at about the same time than NEXT.
Figure 7.7: Background rate vs. water tank depth
As shown in Chapter 6, the intrinsic background rate in NEXT is estimated tobe of the order of 2 × 10⁻⁴ counts/(keV · kg · y). Further improvements, in partic-ular in the radiopurity of the PV titanium could allow to reduce this background to×10−4 counts/(keV · kg · y)or less. The shielding, therefore, must attenuate the back-ground (in particular from the 214Bi and 208Tl gammas emanating from the LSC rocks)
118
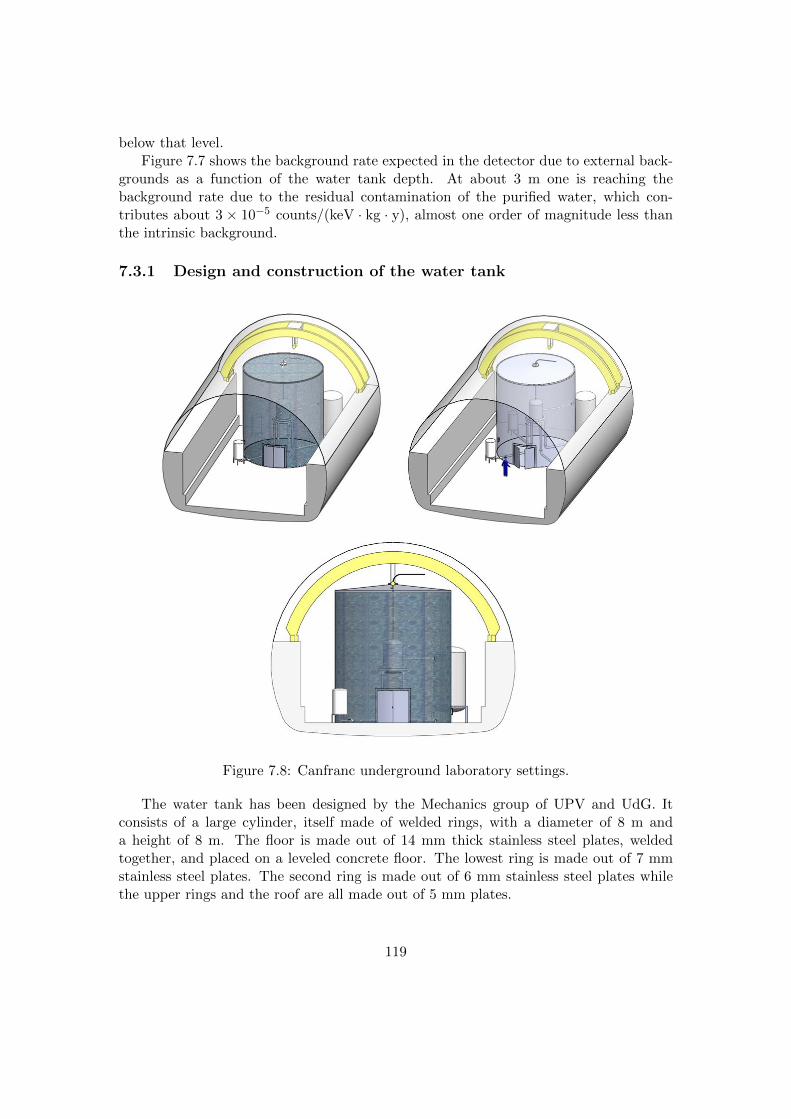
below that level.Figure 7.7 shows the background rate expected in the detector due to external back-
grounds as a function of the water tank depth. At about 3 m one is reaching thebackground rate due to the residual contamination of the purified water, which con-tributes about 3 × 10⁻⁵ counts/(keV · kg · y), almost one order of magnitude less thanthe intrinsic background.
7.3.1 Design and construction of the water tank
Figure 7.8: Canfranc underground laboratory settings.
The water tank has been designed by the Mechanics group of UPV and UdG. Itconsists of a large cylinder, itself made of welded rings, with a diameter of 8 m anda height of 8 m. The floor is made out of 14 mm thick stainless steel plates, weldedtogether, and placed on a leveled concrete floor. The lowest ring is made out of 7 mmstainless steel plates. The second ring is made out of 6 mm stainless steel plates whilethe upper rings and the roof are all made out of 5 mm plates.
119

Radon suppression within the tank will be achieved by a slightly over-pressurizednitrogen blanket which will be kept between the water level and the roof of the tank.In addition the water will be bubbled through a column of nitrogen to eliminate radondegassing from the tank walls.
The water tank will be built according to industrial standards. In particular, the API650 code will be adopted together with Eurocodice 8 for seismic activities. In addition,the Spanish safety regulations will be followed. A certified commercial company willbuild the water tank. The construction is expected to start in fall 2011. The GERDAwater tank serves as a reference concerning the safety aspects and the quality of the finalproduct.
Due to its dimensions the tank will be built on-site. Construction materials andtechnical gases for welding will be procured by the contracted company. To build thetank we will make use of the 10 t crane for lifting the parts of the tank as it gets built.After construction, the welds will be tested by radiography, and the tightness of the tankwill be tested with normal water.
The TPC will be built in place, inside the water tank. After testing with normalwater, the tank will be emptied and dried, then transformed in a clean (dust-free). Thedetector will be assembled and tested inside the tent before filling with clean water.
To fill the water tank one needs extremely clean water. The simplest way to producesuch water is to rent a water plant to a commercial company, unless the LSC decides toincorporate a clean water plant to its infrastructures. In order to keep the water as pureas possible, a continuous water purification will have to be done. Approximately 4 m3/hwill be pumped from the top of the water tank, filtered, and returned to the bottom ofthe tank. The purification loop will include:
1. particulate removal
2. radon stripping
3. deionization
Each one of these tasks can be accomplished by commercially available off-the-shelfequipment.
7.3.2 Connecting the TPC to the water tank
The construction of the tank itself is a relatively straight forward task. From the engi-neering point of view the main challenge is the pipe structure that plays a double role:a) supports the TPC, which has to be well centered in the water tank, and b) drives thesignals, power and gases in/out the water tank.
The following connections are needed between tank and TPC vessel.
• 2 Xe circulation 1/2” flexible hoses
• 1 Xe chamber vacuum CF100 rigid tube
120

Figure 7.9: Sections of tank, auxiliary systems and vessel
• 1 vacuum tubes CF100 rigid tube, including a manifold
• 1 HV 100 kV flexible hose
• 1 HV 30 kV flexible hose
• 1 CF100 rigid tube for emergency cryogenic deposit
• 1 in / out inlet for hot air with HEPA filter
• 4 rigid tubes for signal and power electronic PMT and Si-PM (also vessel supportbeams)
All service tubes entering the vessel will include special radiation shield connectors inthe vessel side. Many other special requirements will have to be taken into account, suchas the xenon vacuum pump being as close as possible to the vessel, mobile platforms tomaintain and repair the vessel etc.
7.3.3 Water Purification System
A purification system to provide ultra–pure water is needed for the experiment. Therequirements of this system depend on the desired water quality and, in general, use acombination of purification technologies, which must be used in an appropriate sequenceto optimize their particular removal capabilities. In essence, it will consist of a reverseosmosis system to filter most of the impurities and of a re–gasification system withbubbling N2 to continuously eliminate radon.
Next we describe the major components of the water purification system.
121

Raw water
The raw water is obtained from a spring and pumped to the laboratory. Hall A hastwo water taps, one inside and the other one in the entrance. In both cases, the pipe isDN20 and the flow is 0.5 l/s, approximately.
The analysis of the raw water has been performed by the Analaqua (http://www.laboratorio-medioambiental.com/index.htm) company. The results are shown in Table 7.4.
Ions Total concentration mg/l
Ammonium (NH4) <0.05
Potassium (K) 0.2
Sodium (Na) 1.3
Magnesium (Mg) 4.1
Calcium (Ca) 36.1
Strontium (Sr) <2 µg/l
Barium (Ba) <0.2
Carbonate (CO3) <0.5
Bicarbonate (HCO3) 117
Nitrate (NO3) 1.0
Chloride (Cl) 4.6
Fluoride (F) <0.1
Sulfate (SO4) 6.8
Silica (SiO2) 4.1
Boron (B) 0.12
Conductivity 186 µS/cm
pH 7.6 U.
Table 7.4: Raw water analysis.
Water requirements
Table 7.5 compares the water quality parameters to be used in NEXT to those used inGERDA and LUX. Notice that symbol ? denotes that the information has not beenprovided and - that the parameters are not checked.
Two particular features of GERDA are: i) the water tank temperature is in equilib-rium with the laboratory temperature, about 10C, and ii) only the electric resistivityis monitorized.
Purification system
In addition to the initial fill of ultra-clean water, the purification system has to guaranteethat water quality is maintained during operations (this requires recirculation of thewater) and that air quality (dust free) is maintained in operations with dry tank.
122

Parameters Units LUX GERDA NEXT
Elect. Resist at 25C MΩ/cm <18 17.5 <18
Coliform bact. concent. % ml <10 - <10/100
Total Organic Carbon ppb <50 - <50
U ppb <0.002 <0.00023 <0.0001
Th ppb <0.004 <0.0001 <0.0001226Ra mBq/m3 ? <2 <2222Rn mBq/m3 - <0.1 <0.1
Dissolved O2 ppm <0.5 - <0.5
Ultrafiltration µm 0.2 0.1 0.2
Temperature C ? 8 10
Recirculation Rate lit. per min. 26.46 ? 26.5
Fill Rate lit. per min. 26.46 ? 26.5
Table 7.5: Water requirements. ? denotes information not provided, and - parameternot checked
There are several procedures to obtain Ultra–Pure Water (UPW) which must beapplied in an appropriate sequence (pretreatment, reverse osmosis and refining systems)to optimize performance.
Figure 7.10 shows a scheme of the various procedures:
• The pretreatment equipments such as water softening and carbon filters are de-signed to remove contaminants that may affect purification equipment locatedafter.
• Reverse osmosis removes from 90% to 99% of all contaminants: dissolved solids,turbidity, asbestos, lead and other toxic heavy metals, radium, bacteria and manydissolved organics.
• Filter system removes the impurities from water already pretreated. For example,ultraviolet radiation to reduce the TOC; ion exchanger to remove ions; vacuumde–gasser to remove about 99% of the oxygen and 96% of the radon.
Figure 7.11 shows the design of the purification system developed by the SMACcompany. Notice that the water flows through all components of the system for filling,while through only a few of them for the circulation. We discuss next the most importantsystems.
Pretreatment equipments
Coarse Filter
50 micron filter with a pleated cartridge filter (not winding) of 20 inches, mountedon a opaque polypropylene container.
123
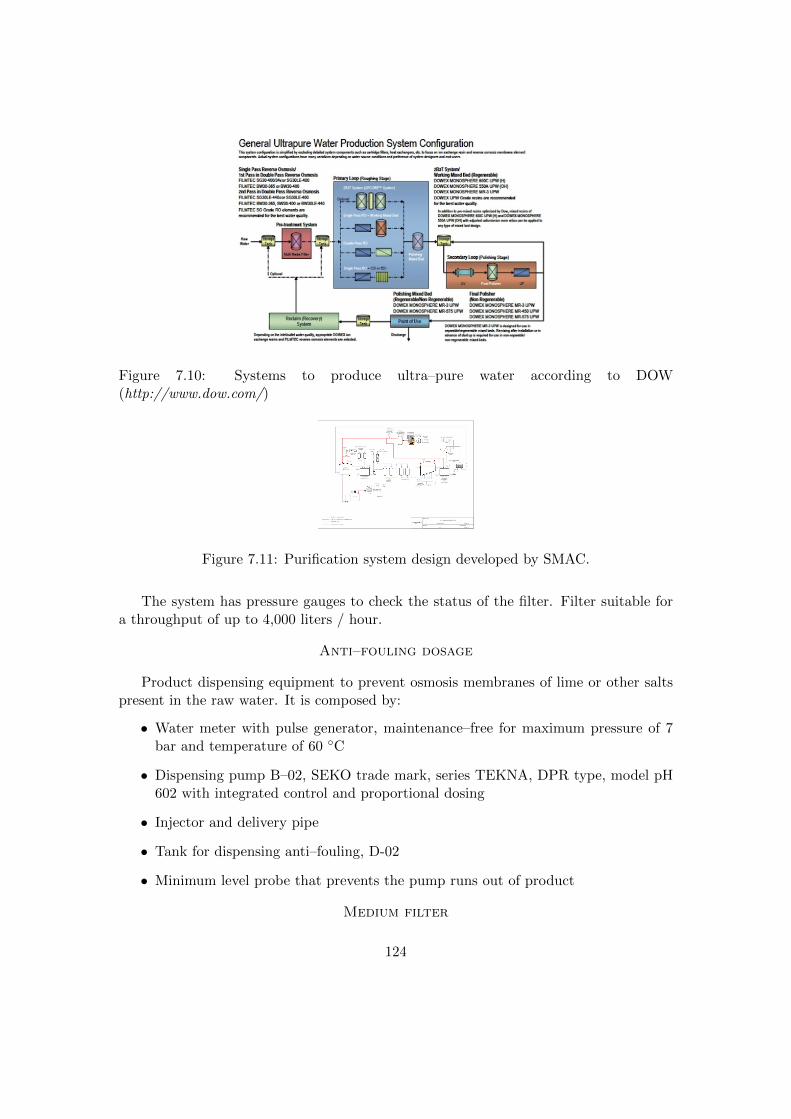
Figure 7.10: Systems to produce ultra–pure water according to DOW(http://www.dow.com/)
Figure 7.11: Purification system design developed by SMAC.
The system has pressure gauges to check the status of the filter. Filter suitable fora throughput of up to 4,000 liters / hour.
Anti–fouling dosage
Product dispensing equipment to prevent osmosis membranes of lime or other saltspresent in the raw water. It is composed by:
• Water meter with pulse generator, maintenance–free for maximum pressure of 7bar and temperature of 60 C
• Dispensing pump B–02, SEKO trade mark, series TEKNA, DPR type, model pH602 with integrated control and proportional dosing
• Injector and delivery pipe
• Tank for dispensing anti–fouling, D-02
• Minimum level probe that prevents the pump runs out of product
Medium filter
124
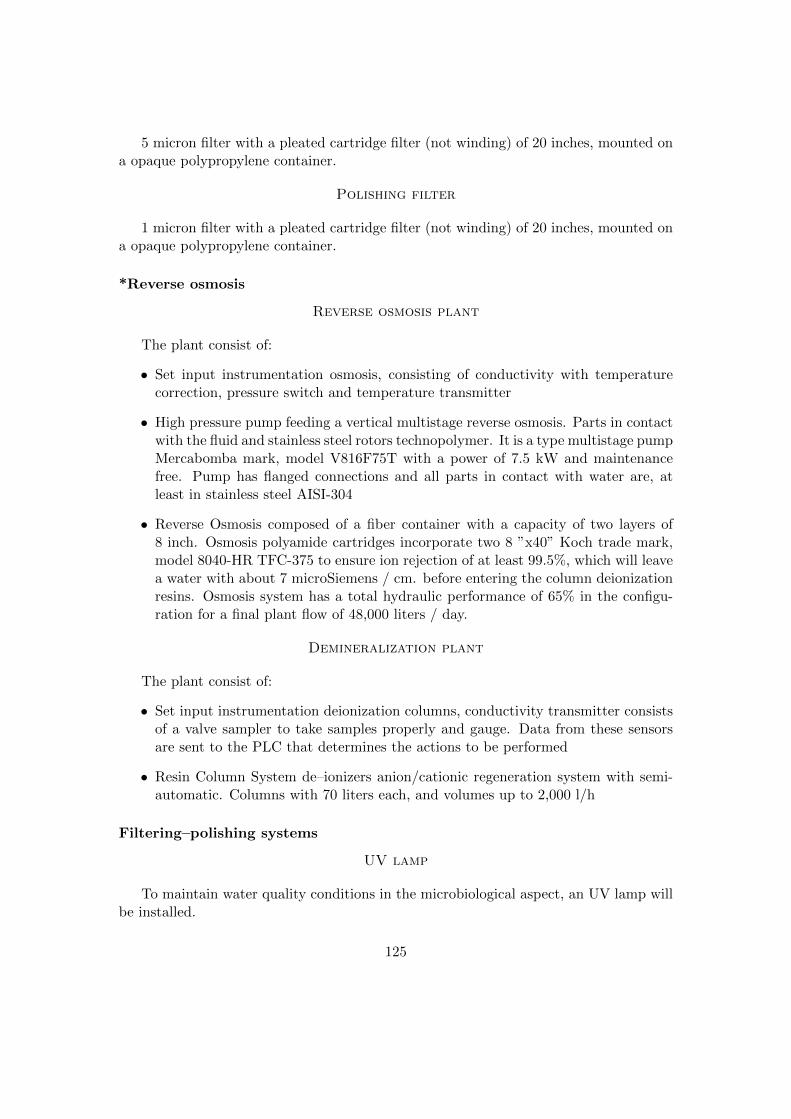
5 micron filter with a pleated cartridge filter (not winding) of 20 inches, mounted ona opaque polypropylene container.
Polishing filter
1 micron filter with a pleated cartridge filter (not winding) of 20 inches, mounted ona opaque polypropylene container.
*Reverse osmosis
Reverse osmosis plant
The plant consist of:
• Set input instrumentation osmosis, consisting of conductivity with temperaturecorrection, pressure switch and temperature transmitter
• High pressure pump feeding a vertical multistage reverse osmosis. Parts in contactwith the fluid and stainless steel rotors technopolymer. It is a type multistage pumpMercabomba mark, model V816F75T with a power of 7.5 kW and maintenancefree. Pump has flanged connections and all parts in contact with water are, atleast in stainless steel AISI-304
• Reverse Osmosis composed of a fiber container with a capacity of two layers of8 inch. Osmosis polyamide cartridges incorporate two 8 ”x40” Koch trade mark,model 8040-HR TFC-375 to ensure ion rejection of at least 99.5%, which will leavea water with about 7 microSiemens / cm. before entering the column deionizationresins. Osmosis system has a total hydraulic performance of 65% in the configu-ration for a final plant flow of 48,000 liters / day.
Demineralization plant
The plant consist of:
• Set input instrumentation deionization columns, conductivity transmitter consistsof a valve sampler to take samples properly and gauge. Data from these sensorsare sent to the PLC that determines the actions to be performed
• Resin Column System de–ionizers anion/cationic regeneration system with semi-automatic. Columns with 70 liters each, and volumes up to 2,000 l/h
Filtering–polishing systems
UV lamp
To maintain water quality conditions in the microbiological aspect, an UV lamp willbe installed.
125

Figure 7.12: Ultraviolet (UV) lamp
Active carbon filtration
For adsorption of particles and organic nature pollutants will be installed two activecarbon filters MG1050 of 486 mm in diameter and 150 l of carbon. Only one will be onduty, changing it manually when you reach the limit of service. With this system weobtain a filtration rate of 10.8 m / h, slow enough to allow adsorption of the pollutants.The bottles will be equipped with a manual valve KERAMIS K56.
Polishing mixed bed
Two bottles will be installed with 150 l of exchange resin of mixed bed refining unitto achieve and to maintain the desired conductivity.
Conductivity
To control the conductivity in the recirculation will be installed a probe CONDU-MAX ENDRES + HAUSER W CLS 15D. For the transmission and control of signalwill be installed a transmitter LIQUILINE CM442.
Ultrafiltration
Compact installation of a filtration plant Likuid-URA -20.
Rn elimination
Henry law determines the solubility of a gas in water is directly proportional to thepartial pressure of gas to pressurize in a nitrogen atmosphere. The objective is to makethe rest o the gases (oxygen, carbon dioxide, radon, ...) insoluble in water. For this
126

purpose, a pump with a pressurizing and depressurizing area with ultra–pure nitrogenatmosphere and positive pressure will be installed.
All equipment will be built in AISI 314 L, with an area of 1 m2 depressurization andrecirculation flow rate of 1 m3/h.
Auxiliary components
Flowmeter
All systems work at a constant flow regulated by a PID and a flowmeter. It willbe installed a flowmeter ENDRES + HAUSER PROWIRL PROLINE 72 F, which isVortex type and it has no moving parts. In addition, it is calibrated to measure liquidvolumes of very low conductivity.
Figure 7.13: Flowmeter
Auxiliary tanks
To maintain the overall system and ensure the correct booster two auxiliary tankswill be installed PP, closed and pressurized ultrapure nitrogen atmosphere, with corre-sponding levels ENDRES + HAUSER trade mark PTP model 31. These deposits willbe lined with an insulation of total thickness 0.6 mm.
Pumps
Installation of a pump PROLAC SWFI 20 OD KIT T100/112 CL in each pumpingdeposit.
Cooling system
Two refrigeration/evaporator machines with forced ventilation and a heat exchangerwill be installed to keep down the temperature of the water reservoir.
Gas line
For the removal of Rn, it is needed to work on atmosphere of nitrogen and to preventthe dissolution of atmospheric gases in water, especially carbon dioxide would increasethe conductivity and aggressiveness of water. For this purpose, a nitrogen generationsystem with a wealth of 99.999% and a capacity of 600 l/h for ”inert” all deposits willbe used.
127

Air quality
In order to maintain the air quality during periods of maintenance (empty water tank),an air conditioning (TECNIVEL, CHF-4-AE) will be installed. This devices has twooperating modes:
• Mode recirculating air drying before starting maintenance work and after drainingthe tank
• Normal mode, with complete air
This system keeps humidity and air temperature in the tank and the installed filterscan match the quality of air to a cleanroom.
128

Chapter 8
Toward the NEXT-100 technicaldesign
8.1 The NEXT-100 detector
The NEXT-100 detector consists of:
1. The shielding system, described in the previous chapter.
2. The NEXT-100 TPC, whose design is based in the ANGEL concept, described inchapter 3.
3. The gas system.
4. Other systems (DAQ, slow controls, monitoring).
In addition, the detector requires a data analysis system (DAS) to process the data.In this chapter we describe some engineering aspects of the NEXT-100 TPC, as well
as the gas system, DAQ and DAS. We also describe the general techniques masteredby our collaboration for TPB coating. Last but not least, we sketch an outline of theNEXT project, that will be further developed in the near future.
8.2 Engineering design of the pressure vessel
The entire detector including the pressure vessel and internals are all supported on asupport flange of the pressure vessel. There is a large copper shield ring having extension”fingers” around its periphery which rest in a groove of this support flange. This shieldring provides a base for mounting the SiPM plane, EL mesh and field cage. The SiPMfront end electronics boards have some activity and are located behind this shield ring.The copper shield provides a heatsink for the F.E. electronics and will conduct heat tothe support flange which is in contact with both water and the other pressure vesselparts, providing passive cooling.
129

8.2.1 Layout
The pressure vessel comprises four parts, all of pure titanium, ASTM grade 3 (or 2)which are bolted together:
1. An upper head which contains the PMTs,
2. A main cylindrical vessel, which incorporates at its base a thick section whichallows penetrations for services (Xe gas flows, power and signal feedthroughs, ELHV cable, etc.),
3. A support flange, upon which the detector is built, and to which floor supportsconnect to,
4. A lower inverted elliptical head, designed to withstand pressure on its convexsurface; the inverted design minimizes wasted Xe volume. This lower head isremoved to access the SiPM plane and front-end electronics.
All flange pairs are bolted together with grade 3 titanium bolts and nuts, and have O-ringpairs for sealing. PCTFE is the preferred O-ring material, having the lowest leakage ofany polymer. A small pumpout port samples the annulus between the O-rings to checkfor either Xe (out) or water (in) leakage.
8.2.2 PMT Head
The choices for this head shape (in axial cross section) are elliptical, torispheric or flat.The torispheric head has a spherical center section called a ”crown” with a toroidal edgesection (”knuckle”), to transition to a short cylindrical section that is welded to theflange. It was chosen over an elliptical shape because the spherical shape of the crownallows all edges of radial openings drilled into it (normal to the surface) to be circular;this simplifies the machining of these openings and any flanges that mate to them. Thetorispheric (and elliptic) shape is far more mass efficient than a flat plate for holdingpressure; a thickness of 15mm is required, whereas a flat plate requires close to 100 cmor more. It is only somewhat harder to machine the openings than for a flat head, CNCmachining is not required.
The crown has 3 concentric rings of openings that accommodate pure titanium CF(NW100 size, 15 cm O.D.) flanges with diffusion bonded sapphire windows, for a totalof 36 PMTs. A central opening having a large inside radius is used for the high voltagefeedthrough, either the TAMU designed feedthrough, or a standard cable receptacle for a100 kV medical X-ray machine (e.g. Federal Standard or Euro RXX designs) as picturedhere: 8.1 which can be made in radiopure materials, and rated for pressure. CF flangesare also used on the outer surface of the crown (with a welded-in housing) to both sealthe PMT’s against water, and to provide a secondary containment for Xenon, shoulda sapphire window break or gasket leak. This design is chosen as the nominal designsince, apart from the-beam welding of the head shell to the flange, no further welding isrequired and all the openings for PMTs and CF flanges can be machined into the crown.
130

Figure 8.1: Hydraulic Bolt Tensioner
An optional head having 60 PMT heads is also feasible, but will require the e-beamwelding of custom machined PMT housings into bored holes in the torispheric head, sincethe close spacing disallows the use of CF flanges. Polymer gaskets , such as PCTFE orPEEK would be used to seal the sapphire windows instead of CF metal seals. Windowsor gaskets are replaceable without removing the head in this design. This head has afurther advantage in that the PMT faces need not be flush with the crown, and can beinserted down into the cathode buffer space, up to where the faces are roughly in a plane,thus reducing wasted Xenon volume. This head will be significantly more expensive tofabricate and require significant prototyping.
8.2.3 Design Requirements
The pressure vessel is designed to safely maintain a maximum operating internal pressureof 15 bar (absolute), with atmospheric pressure on the outside, and also to withstand anexternal pressure of 1.5 bar (5 m H2O hydrostatic pressure on outside, with full vacuumon inside). It also serves as ground potential, on its inside surface for the field cage, andmust be compatible with the insulation gas, here Xenon, and withstand any breakdown.There is over 2 MJ of stored energy, which would be catastrophic if suddenly releasedby vessel rupture. It is designed in full accordance with American Society of MechanicalEngineering (ASME) Pressure Vessel (PV) Code, section VIII- Division 2 (or equivalentEuropean Standard), and will be pressure tested to a minimum of 1.25x the maximumallowable pressure.
The Pressure Vessel will necessarily be a welded construction due to the size. Shellswill be roll formed and seam welded, machined, then welded to machined flanges. Theremay be a final machining of each flange face after welding. Welds will be exclusivelyelectron beam, made in high vacuum, and all welds will be fully radiograph inspected
131

afterwards; this allows the welds to have full strength, reducing the wall thickness needed.Titanium is very easily e-beam welded, even in thick sections, with excellent resultingproperties. Laser or diffusion bonding (welding) methods are also possible, however laserwelding typically does not have the penetrating power of e-beam, and diffusion bondingis not mentioned as an allowable process in the ASME PV code.
The pressure vessel must also be corrosion resistant in ultrapure water. Titaniumhas excellent corrosion resistance in pure water; copper corrodes in ultrapure water, andwould need some sort of radiopure barrier coating.
The pressure vessel interior surface also serves as a ground boundary for the fieldcage and must withstand potential sparkovers. It is not known whether titanium hasbetter spark damage resistance than copper, it has a higher melting point, but lowerthermal conductivity; testing is warranted.
8.2.4 Pressure Vessel Construction Issues
The final design of the Pressure Vessel will only be released after close consultation withthe fabricator, to assure that no unexpected difficulties arise. A detailed specificationwill be drafted and potential manufacturers will be required to submit a full fabricationplan. Crucial details must be worked out with fabricators, material suppliers etc. tonot only assure that the vessel is constructed in full accordance withe the PV code butremains radiopure when finished. Many important details must be worked out based onpractical realities of supplier and manufacturer capability, such as where to place flangewelds, what prototyping and testing must be done to assure the vessel is made correctly,what material samples are to be taken, what are permissible cleaning and preparationprocesses, etc. Below are some initial concerns with fabrication and assembly of thevarious sections:
CF Flange 36 PMT Torispheric Head This head requires no welding of PMThousings into the crown, but is limited to 36 PMTs due to the large CF flange OD. Theshell is formed by metal spinning, the crown is thicker than the knuckle and cylindricalsection, so these sections my be formed separately and e-beam welded together. Dueto the flange stud holes, which limit the reinforcing area around the PMT opening, athicker shell is required, 20mm instead of 13mm for the welded 60 PMT head. It stillrequires welding the formed shell to the flange; this will be e-beam welded. Howeverflange welds should not require a CNC controlled e-gun (as in the 60 PMT head), a fixedgun will work, with a rotary table holding and spinning the head. If the knuckle cannotbe formed integral to the crown, it can be e-beam welded to it in the same manner.Machining of the CF flange ports should be straightforward, and could be done with amill having a tilting head, with the PV head. The ports can be machined using millingcutters, for less chatter, but the final surface of the knife-edge will need be machined,ground, or burnished using a single axis (spindle) rotating tool such as a boring/facinghead, to avoid scratches across the knife edge. Gaskets for the outer CF flanges shouldbe chosen to be as soft as possible, as the knife edges may be more delicate in titanium
132
than in stainless steel. Silver may be a good choice, especially for the outer CF flangegasket which must not create galvanic corrosion in either the Ti or gasket. Copper willcorrode in ultrapure water. Tin may be an option as well, as it can be made radiopure.An option is to use O-ring seals; these may even be used in CF flanges. The insidesurface of the head may need machining after welding to assure that a smooth groundsurface results.
Welded-in 60 PMT Torispheric Head (option) This head will likely require aCNC controlled e-gun to make the PMT housing to crown welds. The crown will bebored for the PMT holes; and then accurately measured in a coordinate measuringmachine (CMM) afterwards as most of the crown metal is being removed, and nominaldimensions will change once all the holes are bored (Swiss cheese effect). The PMThousings will be machined to fit snugly in the bores, and they will need to be held inplace with individual fixtures. Some provision for the e-beam to be absorbed withoutdamaging these holding fixtures may need to be incorporated. There will be some degreeof shrinkage around the welds, as the metal cools; this will require several intermediateCMM measurements of the remaining bores to assure that the welds are being madein the right place (unless welder can otherwise assure precise positioning). Thus thefixturing of PMT housings in bores will need to be staged, and the sequence of weldingwill need to be carefully thought through to assure accurate welding. It is likely thateach ring of PMT’s will need to be fixtured and welded separately, and welds should bedone around each ring in a staggered fashion, as is typically done in tightening boltedflanges uniformly. The PMT housings themselves will need to be machined from thickpipe or perhaps even solid bar, since the reinforcement section (large fillets on weldflange) must have a substantial radial dimension and cannot be formed as part of thecrown.
Main cylindrical Vessel There will be a longitudinal seam weld made after rollforming the cylinder which may need to be ground smooth. Edges will need machiningto allow precise welding to flanges and to the lower thick section, which will likely bemade separately.
Support Flange This is a relatively straightforward machined plate, though requiredthickness may be high as this plate supports the entire detector, including the largeinternal copper shield, transferring weight to the outside legs. There will be a significantedge moment in the plate, and we desire to maximize the internal radius so as to provideclear access to the feedthroughs.
Lower Flat/Elliptical Head This is also a relatively straightforward to fabricate.Shell thickness is nominally 6mm so this should be easy to spin. Carrying an externalpressure requires tight tolerances on out of roundness or ellipticity, so CMM measure-ments should be made before welding. A method for safely lowering this head andmoving it out of the way for SiPM service access is needed, as crane access is difficult.
133
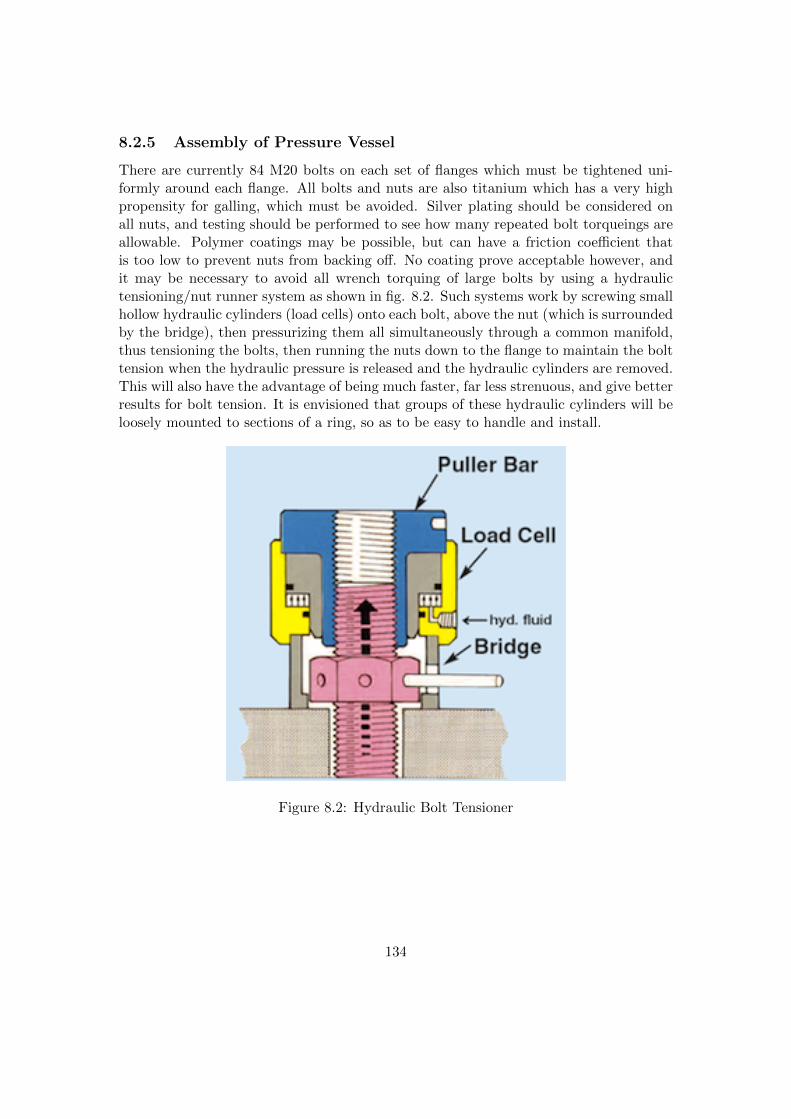
8.2.5 Assembly of Pressure Vessel
There are currently 84 M20 bolts on each set of flanges which must be tightened uni-formly around each flange. All bolts and nuts are also titanium which has a very highpropensity for galling, which must be avoided. Silver plating should be considered onall nuts, and testing should be performed to see how many repeated bolt torqueings areallowable. Polymer coatings may be possible, but can have a friction coefficient thatis too low to prevent nuts from backing off. No coating prove acceptable however, andit may be necessary to avoid all wrench torquing of large bolts by using a hydraulictensioning/nut runner system as shown in fig. 8.2. Such systems work by screwing smallhollow hydraulic cylinders (load cells) onto each bolt, above the nut (which is surroundedby the bridge), then pressurizing them all simultaneously through a common manifold,thus tensioning the bolts, then running the nuts down to the flange to maintain the bolttension when the hydraulic pressure is released and the hydraulic cylinders are removed.This will also have the advantage of being much faster, far less strenuous, and give betterresults for bolt tension. It is envisioned that groups of these hydraulic cylinders will beloosely mounted to sections of a ring, so as to be easy to handle and install.
Figure 8.2: Hydraulic Bolt Tensioner
134

8.3 The NEXT-100 gas system
The gas system performs one of the pivotal roles in NEXT. It is responsible for remov-ing electronegative impurities that would degrade the performance of the detector byreducing the drift length of charged tracks as well as causing opacity to UV light. Theexpected level of outgassing from the materials that make up the field cage and thereflector demand a constant purification of the gas in a re-circulation loop to a level of afew parts per billion (ppb) of unwanted contaminants. Additionally removal of the radonfrom the gas is highly important as the decay daughters would add an unacceptable levelof background inside the active volume of the detector. The nominal re-circulation flowrate of 100 slpm has been identified as the required goal. NEXT-100 will operate at15 bar, thus leading to the appropriate volumetric reduction from the standard tem-perature and pressure flow rate stated previously. During the physics exploitation runsthe detector will operate with gas enriched to 90% level of 136Xe isotope. The enrichedgas has already been acquired by the LSC and delivered to the site. The high cost ofthe enriched gas places additional demands on the gas system to minimize accidentalleakages and achieve full gas recovery in case of accidents.
The design of the system responsible for the filtration of the xenon follows closelythe experienced gained at University of Coimbra, LBNL, UNIZAR and IFIC from con-structing and operating smaller Xe purification systems. A CDR for the NEXT-100 gassystem [60] intended for installation at the LSC has been approved by the Collabora-tion and is presently being constructed. System schematic and engineering drawing areshown in Figure 8.3 and Figure 8.4, respectively.
To insure the gas tightness and purity of the system, all piping and all the fittingshave been chosen as 1/2” VCR stainless steel. All the gas valves are metal-to-metal sealswith all the wetted surfaces also manufactured from stainless steel. An example of suchvalve is shown in Figure 8.5. These components were chosen to insure the cleanlinessof the gas system as well as to allow the plumbing to be baked at high temperature( 200C) to remove water contamination prior to use.
8.3.1 Xenon purification
MicroTorr cold getter model number MC4500-902FV has been chosen as the purificationfilter for the Xe gas. Capable of removing electron negative impurities to less than 1ppb, the model chosen has a nominal flow rate of 200 slpm, well in excess of the requiredflow rates for NEXT 100, offering sufficient spare capacity. The gas system will containtwo such getters in parallel with a bypass. This configuration has been developed andused by the smaller gas systems operating at UNIZAR and IFIC. The second sparegetter is placed in parallel in the event of accidental contamination of one of the getters,allowing uninterrupted running. The ability to bypass the getters will allow the testingof the purification of the gas and aid in diagnostic and monitoring of the gas system. Adrawing of the MC4500-902FV getter is shown in Figure 8.6 (left).
While cold getter technology is capable of reaching the required purity levels inwater and oxygen, a hot getter, like the one shown in Figure 8.6 (right), can also remove
135

Figure 8.3: Schematic of the NEXT-100 gas system.
136
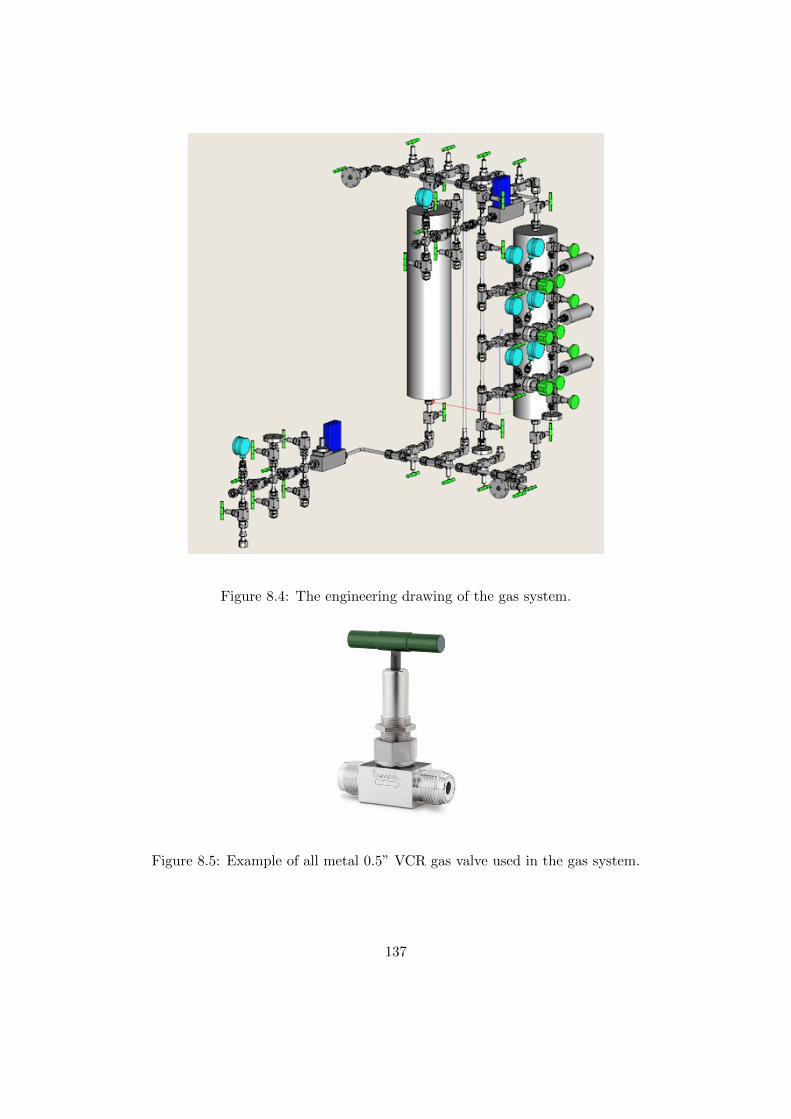
Figure 8.4: The engineering drawing of the gas system.
Figure 8.5: Example of all metal 0.5” VCR gas valve used in the gas system.
137

Figure 8.6: Left: Drawing of the MC4500-902FV SAES Pure Gas getter, with VCRvalves, to be used for the purification of the Xe. The gas system will contain two suchparallel getters. Right: Example of a heated SAES getter model number PS4-MT50with nominal flow of 150 slpm. This is a possible future upgrade to the gas system. Thehot getter has been reported to be better at filtering out 222Rn and therefore can bepreferred purification technology to achieve ultra low radiation background rates.
nitrogen and methane. Furthermore, 362 g of cold getter material has been measured toemit 1.64 atoms of Rn [61]. In that regard a future upgrade to a hot getter technologyhas been considered. Alternatively (or in addition to the use of hot getters) an effectivemeans of removing Rn can be used. We discuss Rn trapping below.
8.3.2 Rn Trapping
Radon is a natural by product in the decay chain of Uranium. Therefore, most materialswill emanate Rn adding to the radioactive background. Several research groups in theworld have been interested in developing methods of trapping Rn and preventing itsentry into ultra low background detectors. A group at Queens University, KingstonOntario, Canada has recently produced such a device [62]. Figure 8.7 shows such a trap.The trapping mechanism operates by passing the gas being filtered through a cooled
138
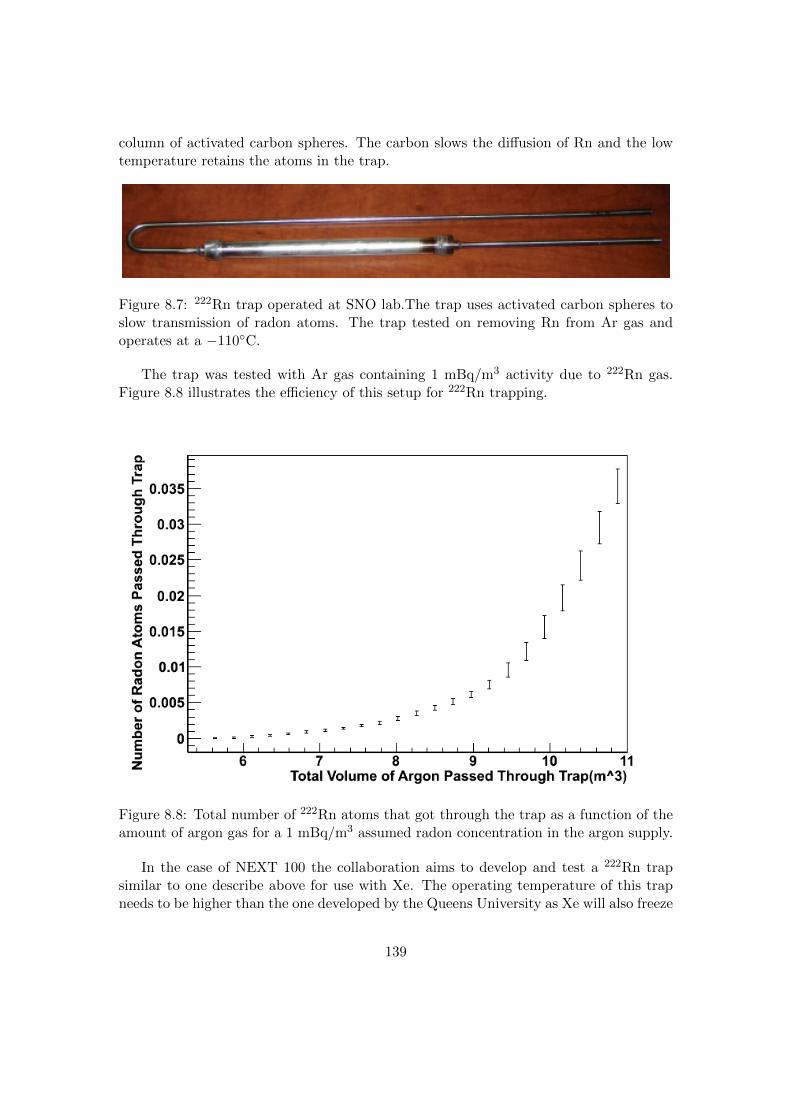
column of activated carbon spheres. The carbon slows the diffusion of Rn and the lowtemperature retains the atoms in the trap.
Figure 8.7: 222Rn trap operated at SNO lab.The trap uses activated carbon spheres toslow transmission of radon atoms. The trap tested on removing Rn from Ar gas andoperates at a −110C.
The trap was tested with Ar gas containing 1 mBq/m3 activity due to 222Rn gas.Figure 8.8 illustrates the efficiency of this setup for 222Rn trapping.
Figure 8.8: Total number of 222Rn atoms that got through the trap as a function of theamount of argon gas for a 1 mBq/m3 assumed radon concentration in the argon supply.
In the case of NEXT 100 the collaboration aims to develop and test a 222Rn trapsimilar to one describe above for use with Xe. The operating temperature of this trapneeds to be higher than the one developed by the Queens University as Xe will also freeze
139
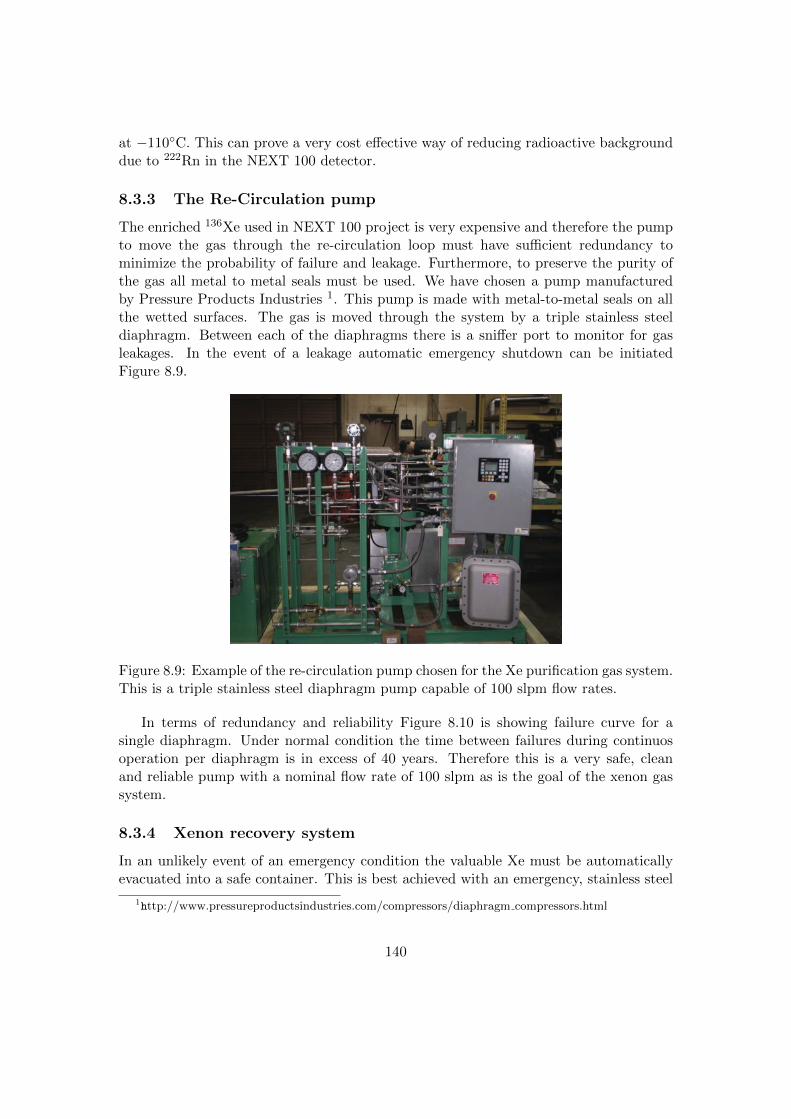
at −110C. This can prove a very cost effective way of reducing radioactive backgrounddue to 222Rn in the NEXT 100 detector.
8.3.3 The Re-Circulation pump
The enriched 136Xe used in NEXT 100 project is very expensive and therefore the pumpto move the gas through the re-circulation loop must have sufficient redundancy tominimize the probability of failure and leakage. Furthermore, to preserve the purity ofthe gas all metal to metal seals must be used. We have chosen a pump manufacturedby Pressure Products Industries 1. This pump is made with metal-to-metal seals on allthe wetted surfaces. The gas is moved through the system by a triple stainless steeldiaphragm. Between each of the diaphragms there is a sniffer port to monitor for gasleakages. In the event of a leakage automatic emergency shutdown can be initiatedFigure 8.9.
Figure 8.9: Example of the re-circulation pump chosen for the Xe purification gas system.This is a triple stainless steel diaphragm pump capable of 100 slpm flow rates.
In terms of redundancy and reliability Figure 8.10 is showing failure curve for asingle diaphragm. Under normal condition the time between failures during continuosoperation per diaphragm is in excess of 40 years. Therefore this is a very safe, cleanand reliable pump with a nominal flow rate of 100 slpm as is the goal of the xenon gassystem.
8.3.4 Xenon recovery system
In an unlikely event of an emergency condition the valuable Xe must be automaticallyevacuated into a safe container. This is best achieved with an emergency, stainless steel
1http://www.pressureproductsindustries.com/compressors/diaphragm compressors.html
140
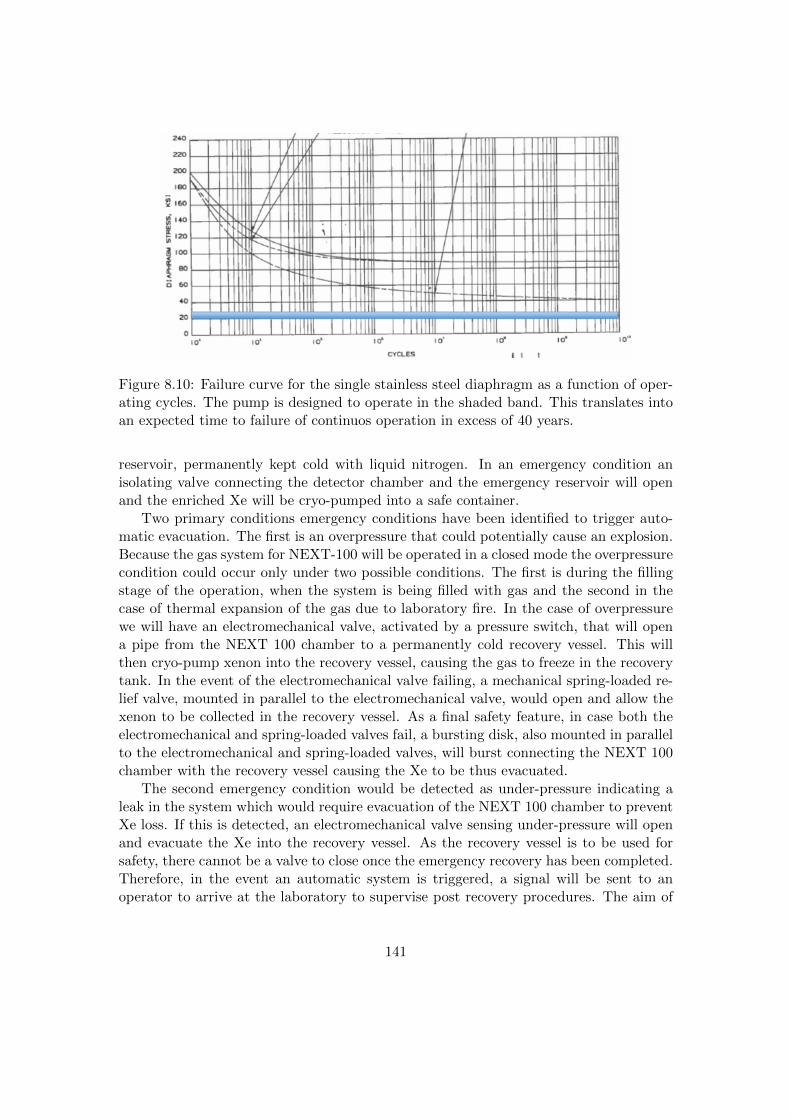
Figure 8.10: Failure curve for the single stainless steel diaphragm as a function of oper-ating cycles. The pump is designed to operate in the shaded band. This translates intoan expected time to failure of continuos operation in excess of 40 years.
reservoir, permanently kept cold with liquid nitrogen. In an emergency condition anisolating valve connecting the detector chamber and the emergency reservoir will openand the enriched Xe will be cryo-pumped into a safe container.
Two primary conditions emergency conditions have been identified to trigger auto-matic evacuation. The first is an overpressure that could potentially cause an explosion.Because the gas system for NEXT-100 will be operated in a closed mode the overpressurecondition could occur only under two possible conditions. The first is during the fillingstage of the operation, when the system is being filled with gas and the second in thecase of thermal expansion of the gas due to laboratory fire. In the case of overpressurewe will have an electromechanical valve, activated by a pressure switch, that will opena pipe from the NEXT 100 chamber to a permanently cold recovery vessel. This willthen cryo-pump xenon into the recovery vessel, causing the gas to freeze in the recoverytank. In the event of the electromechanical valve failing, a mechanical spring-loaded re-lief valve, mounted in parallel to the electromechanical valve, would open and allow thexenon to be collected in the recovery vessel. As a final safety feature, in case both theelectromechanical and spring-loaded valves fail, a bursting disk, also mounted in parallelto the electromechanical and spring-loaded valves, will burst connecting the NEXT 100chamber with the recovery vessel causing the Xe to be thus evacuated.
The second emergency condition would be detected as under-pressure indicating aleak in the system which would require evacuation of the NEXT 100 chamber to preventXe loss. If this is detected, an electromechanical valve sensing under-pressure will openand evacuate the Xe into the recovery vessel. As the recovery vessel is to be used forsafety, there cannot be a valve to close once the emergency recovery has been completed.Therefore, in the event an automatic system is triggered, a signal will be sent to anoperator to arrive at the laboratory to supervise post recovery procedures. The aim of
141

post recovery is to move the collected Xe from the recovery vessel to a closable gas bottlefor future purification and use once the problems that caused the emergency conditionshave been rectified. This operation must be conducted by the responsible person andwould involve cryo-pumping the gas collected in the recovery vessel into a stainless steelbottle which will be valved off post transfer. The same system can be used for controlledrecovery of Xe if work needs to be done on the NEXT-100 chamber.
A conceptual drawing of the cold reservoir is shown in Figure 8.11. This sort of systemhas been already developed and built for the LUX collaboration by our TAMU collab-orators. As a final line of defense in the extremely unlikely event that cryo-evacuationhas failed the xenon will be evacuated into a flexible fuel bladder like one shown in Fig-ure 8.12. In that way loss of Xe to the atmosphere will be held at an absolute minimalrisk level.
Figure 8.11: Cutaway view of the conceptualdesign for a permanently Cold Emergence Xerecovery tank. This is a triple wall vesselwith liquid nitrogen cooling the inner cylin-der. In an an emergence condition the Xe willbe cryo-evacuated into the inner vessel wherethe temperature of the wall will cause it tocondense and freeze on the walls.
Figure 8.12: Flexible fuel bladder like this onecan be used as a last level of security in thehighly unlikely event that all the other safetymeasures to prevent the loss of enriched 136Xeto the atmosphere fail.
142
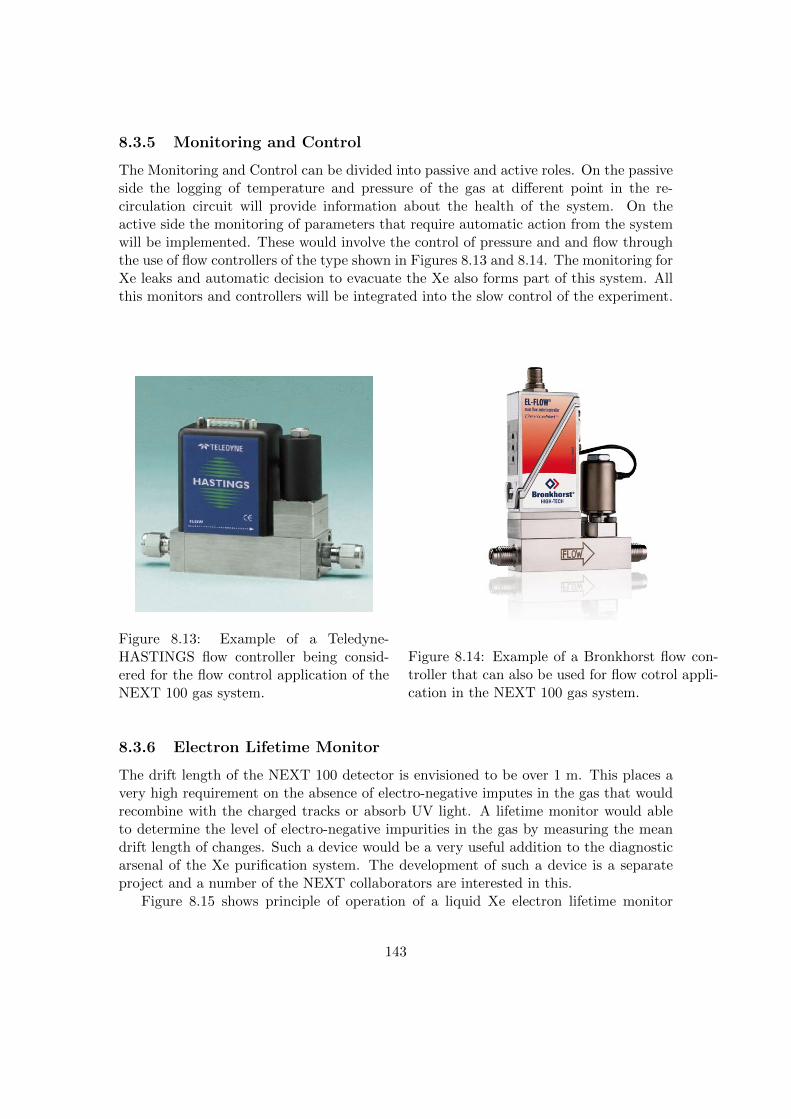
8.3.5 Monitoring and Control
The Monitoring and Control can be divided into passive and active roles. On the passiveside the logging of temperature and pressure of the gas at different point in the re-circulation circuit will provide information about the health of the system. On theactive side the monitoring of parameters that require automatic action from the systemwill be implemented. These would involve the control of pressure and and flow throughthe use of flow controllers of the type shown in Figures 8.13 and 8.14. The monitoring forXe leaks and automatic decision to evacuate the Xe also forms part of this system. Allthis monitors and controllers will be integrated into the slow control of the experiment.
Figure 8.13: Example of a Teledyne-HASTINGS flow controller being consid-ered for the flow control application of theNEXT 100 gas system.
Figure 8.14: Example of a Bronkhorst flow con-troller that can also be used for flow cotrol appli-cation in the NEXT 100 gas system.
8.3.6 Electron Lifetime Monitor
The drift length of the NEXT 100 detector is envisioned to be over 1 m. This places avery high requirement on the absence of electro-negative imputes in the gas that wouldrecombine with the charged tracks or absorb UV light. A lifetime monitor would ableto determine the level of electro-negative impurities in the gas by measuring the meandrift length of changes. Such a device would be a very useful addition to the diagnosticarsenal of the Xe purification system. The development of such a device is a separateproject and a number of the NEXT collaborators are interested in this.
Figure 8.15 shows principle of operation of a liquid Xe electron lifetime monitor
143
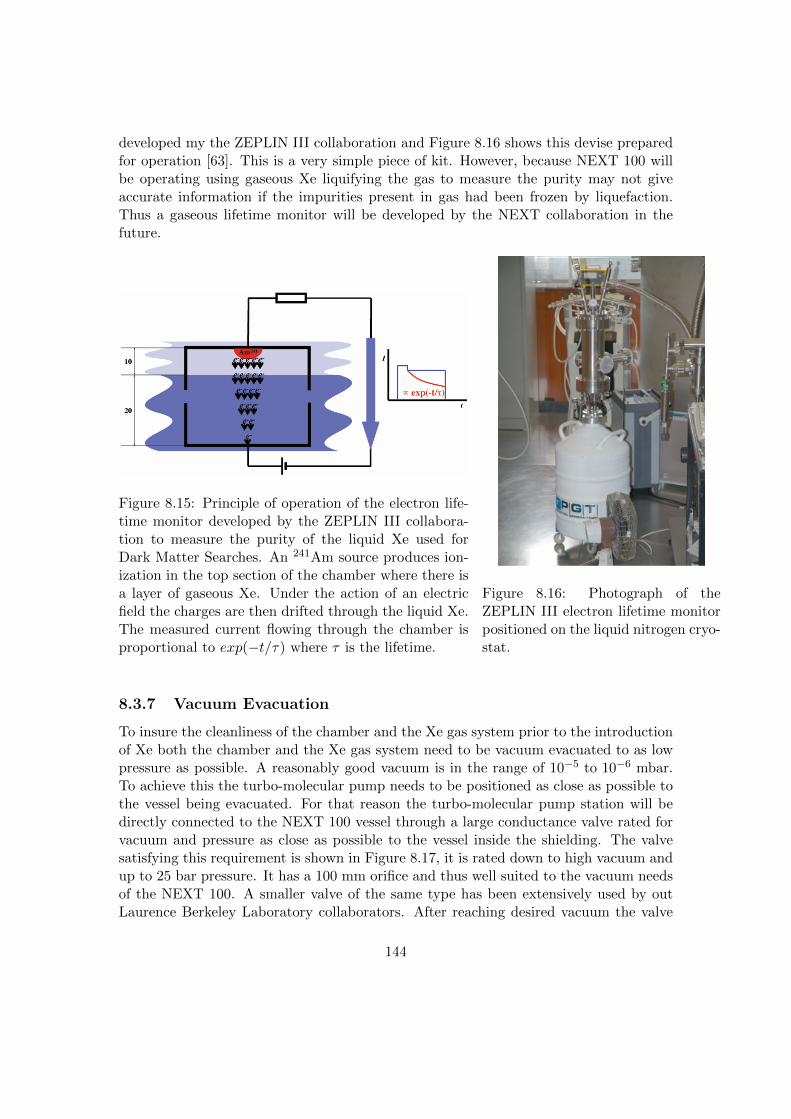
developed my the ZEPLIN III collaboration and Figure 8.16 shows this devise preparedfor operation [63]. This is a very simple piece of kit. However, because NEXT 100 willbe operating using gaseous Xe liquifying the gas to measure the purity may not giveaccurate information if the impurities present in gas had been frozen by liquefaction.Thus a gaseous lifetime monitor will be developed by the NEXT collaboration in thefuture.
Figure 8.15: Principle of operation of the electron life-time monitor developed by the ZEPLIN III collabora-tion to measure the purity of the liquid Xe used forDark Matter Searches. An 241Am source produces ion-ization in the top section of the chamber where there isa layer of gaseous Xe. Under the action of an electricfield the charges are then drifted through the liquid Xe.The measured current flowing through the chamber isproportional to exp(−t/τ) where τ is the lifetime.
Figure 8.16: Photograph of theZEPLIN III electron lifetime monitorpositioned on the liquid nitrogen cryo-stat.
8.3.7 Vacuum Evacuation
To insure the cleanliness of the chamber and the Xe gas system prior to the introductionof Xe both the chamber and the Xe gas system need to be vacuum evacuated to as lowpressure as possible. A reasonably good vacuum is in the range of 10−5 to 10−6 mbar.To achieve this the turbo-molecular pump needs to be positioned as close as possible tothe vessel being evacuated. For that reason the turbo-molecular pump station will bedirectly connected to the NEXT 100 vessel through a large conductance valve rated forvacuum and pressure as close as possible to the vessel inside the shielding. The valvesatisfying this requirement is shown in Figure 8.17, it is rated down to high vacuum andup to 25 bar pressure. It has a 100 mm orifice and thus well suited to the vacuum needsof the NEXT 100. A smaller valve of the same type has been extensively used by outLaurence Berkeley Laboratory collaborators. After reaching desired vacuum the valve
144

will be closed, the pumping station removed and the valve enclosed in a radio pure capto shield the detector from the radioactive impurities in the materials that make up thevalve but also to protect the valve from the corrosive action of the purified water. Thedetails of the water shielding is discussed elsewhere.
However, many internal structures of the NEXT 100 detector, such as the light pipesurrounding the active volume will now allow good conductance for vacuum evacuation.Therefore, the chamber will be flushed with Ar and again evacuated a number of times.Furthermore, continuos re-circulation of the Xe gas will further aid it cleaning the systemof impurities.
The Xe gas system constructed from 1/2” pipe will have low conductance for vacuumevacuation and therefore instead of evacuating the system from a single pint the vacuummanifold will be connected to several points simultaneously and the system heated to200C to remove water. Also flushing with Ar several times with air in the cleaningprocess. Finally, as in the case of the main detector, continuous gas re-circulation willclean the Xe gas system.
Figure 8.17: The HF4000 CARTEN valve.
8.4 Data Acquisition
The DAQ has been developed in close collaboration with the CERN RD-51 collaboration[64]. RD-51 defines a scalable (target applications ranging from small setups to largescale experiments) and configurable (based on programmable logic, allowing differenttrigger and DAQ schemes) DAQ architecture that has been developed by CERN-PH-AID and UPV-ELEC under the name SRS (Scalable Readout System) [65]. Figure 8.18shows the main SRS components that are the base for NEXT-100 electronics.
The three main hardware components in the proposed architecture for the DAQ andTrigger systems are:
• The FEC card: The Front-End Concentrator card (FEC card) (Figure 8.19) is ageneric interface between a wide range of front-ends and the Online system. This
145
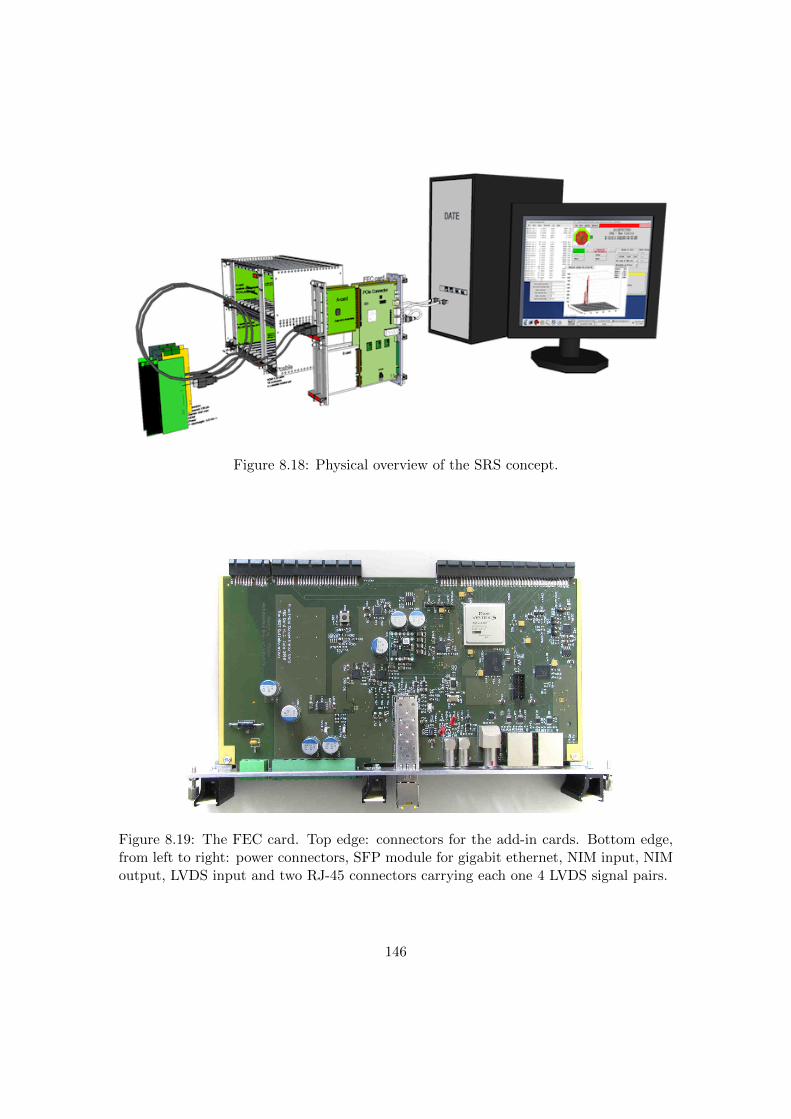
Figure 8.18: Physical overview of the SRS concept.
Figure 8.19: The FEC card. Top edge: connectors for the add-in cards. Bottom edge,from left to right: power connectors, SFP module for gigabit ethernet, NIM input, NIMoutput, LVDS input and two RJ-45 connectors carrying each one 4 LVDS signal pairs.
146

Figure 8.20: FEC (designed by NEXT) and the ADC digitizer card (designed at CERN)form a 6U × 220 mm Eurocard. Used to readout the PMT plane.
147
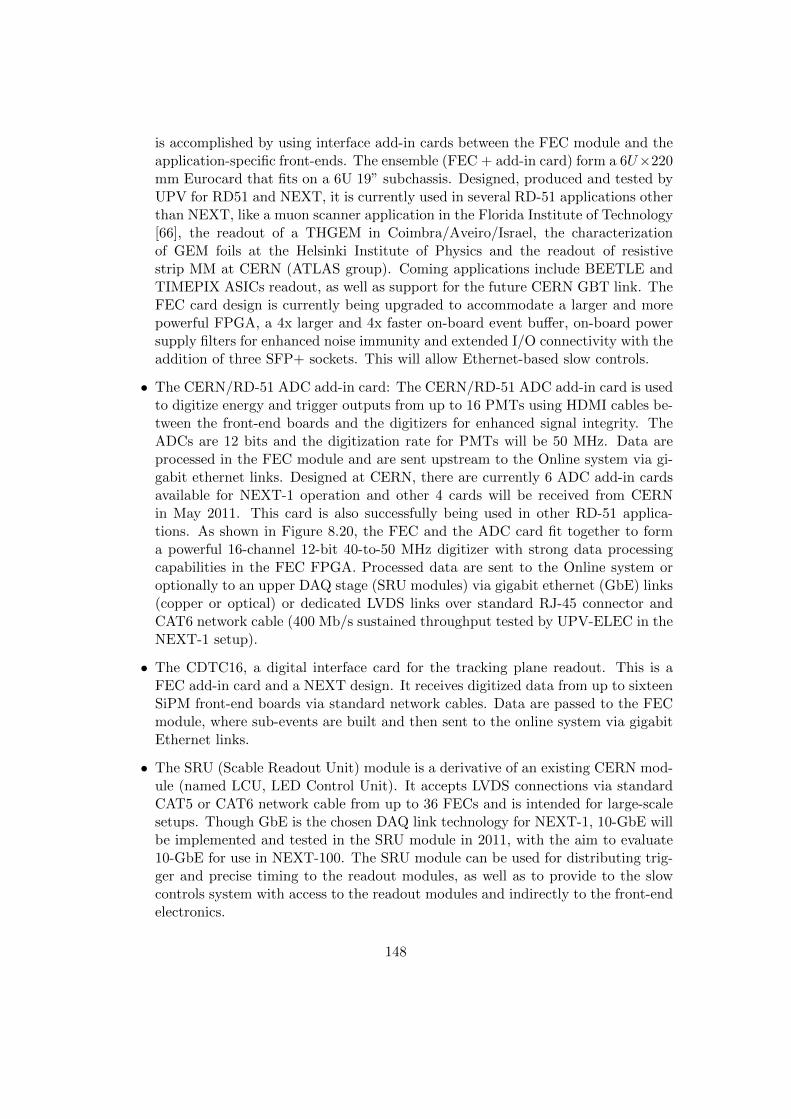
is accomplished by using interface add-in cards between the FEC module and theapplication-specific front-ends. The ensemble (FEC + add-in card) form a 6U×220mm Eurocard that fits on a 6U 19” subchassis. Designed, produced and tested byUPV for RD51 and NEXT, it is currently used in several RD-51 applications otherthan NEXT, like a muon scanner application in the Florida Institute of Technology[66], the readout of a THGEM in Coimbra/Aveiro/Israel, the characterizationof GEM foils at the Helsinki Institute of Physics and the readout of resistivestrip MM at CERN (ATLAS group). Coming applications include BEETLE andTIMEPIX ASICs readout, as well as support for the future CERN GBT link. TheFEC card design is currently being upgraded to accommodate a larger and morepowerful FPGA, a 4x larger and 4x faster on-board event buffer, on-board powersupply filters for enhanced noise immunity and extended I/O connectivity with theaddition of three SFP+ sockets. This will allow Ethernet-based slow controls.
• The CERN/RD-51 ADC add-in card: The CERN/RD-51 ADC add-in card is usedto digitize energy and trigger outputs from up to 16 PMTs using HDMI cables be-tween the front-end boards and the digitizers for enhanced signal integrity. TheADCs are 12 bits and the digitization rate for PMTs will be 50 MHz. Data areprocessed in the FEC module and are sent upstream to the Online system via gi-gabit ethernet links. Designed at CERN, there are currently 6 ADC add-in cardsavailable for NEXT-1 operation and other 4 cards will be received from CERNin May 2011. This card is also successfully being used in other RD-51 applica-tions. As shown in Figure 8.20, the FEC and the ADC card fit together to forma powerful 16-channel 12-bit 40-to-50 MHz digitizer with strong data processingcapabilities in the FEC FPGA. Processed data are sent to the Online system oroptionally to an upper DAQ stage (SRU modules) via gigabit ethernet (GbE) links(copper or optical) or dedicated LVDS links over standard RJ-45 connector andCAT6 network cable (400 Mb/s sustained throughput tested by UPV-ELEC in theNEXT-1 setup).
• The CDTC16, a digital interface card for the tracking plane readout. This is aFEC add-in card and a NEXT design. It receives digitized data from up to sixteenSiPM front-end boards via standard network cables. Data are passed to the FECmodule, where sub-events are built and then sent to the online system via gigabitEthernet links.
• The SRU (Scable Readout Unit) module is a derivative of an existing CERN mod-ule (named LCU, LED Control Unit). It accepts LVDS connections via standardCAT5 or CAT6 network cable from up to 36 FECs and is intended for large-scalesetups. Though GbE is the chosen DAQ link technology for NEXT-1, 10-GbE willbe implemented and tested in the SRU module in 2011, with the aim to evaluate10-GbE for use in NEXT-100. The SRU module can be used for distributing trig-ger and precise timing to the readout modules, as well as to provide to the slowcontrols system with access to the readout modules and indirectly to the front-endelectronics.
148

The Online System is a PC farm running the proven and supported CERN ALICEDAQ software (named DATE after Data Acquisition and Test Environment). DATEhas been modified to support GbE technology in request of RD-51 and also as candidatetechnology for the ALICE DAQ upgrade. NEXT signed a memorandum of understand-ing that granted us the right to use DATE.
Figure ?? shows the DAQ system currently operating at NEXT-1-IFIC. Each modulecan take up to 8 PMT channels in raw data mode in the current FEC version, but willbe able to accommodate 16 channels with the revised FEC available in Winter 2011.We need 5 modules to run the current configuration of NEXT-1-IFIC (38 PMTs) and8 modules to run the ANGEL detector (60 PMTs). The system is essentially ready forNEXT-100 operation.
The proposed DAQ system can work either in external trigger or in self-triggeredmode. In the external trigger mode, either a single SRU or two dedicated FEC+CDTC16ensembles act as clock+trigger fanout to all DAQ FECs using the available RJ-45 con-nectors. This scheme has already been proven in the NEXT-1 prototype in Valencia. Inself-triggered mode, the upstream channels in the RJ-45 connectors carry trigger candi-dates from the DAQ FECs to the trigger SRU module, where a centralized low-latencytrigger algorithm is run.
8.4.1 FE electronics and Data Acquisition for the tracking plane
The tracking plane poses a greater challenge due to the much higher number of channels.Although having ten thousand signal wires across the TPC vessel is in principle feasible,in-chamber electronics appears as a more practical solution. This implies installing SiPMfront-end electronics, digitizers and data multiplexers inside the vessel in order to reducethe number of feedthroughs.
Currently we are studying two options: a) using 64-ch ASICs that include the analogchain (amplifier + integrator), the digitizers and the data multiplexer, and b) small scalediscreet electronics mounted in 64 PC boards.
The possibility of adapting one of the existing ASICs for our application arises fromthe expertise existing in the UPV group concerning the development of chips such asthe ALTRO, widely used in ALICE and in many other HEP experiments. On the otherhand, we need a solution fully operative in less than 2 years. Therefore we will alsoexplore the use small PCBs with discreet components. Each PCb would also serve 64channels, corresponding to a Daughter Board.
In both cases a commercial serializer/deserializer chip interfaces the ASIC/PCb toan optical transceiver, using a single optical fiber for a full-duplex data connection to theDAQ stage (FECs equipped with specific add-in cards). With this multiplexing factor,10k channels require just 157 optical links across the vessel.
The group’s expertise and know-how on ASIC design for PMT and SiPM readout isshown in [67,68]. Moreover, R. Esteve is one of the co-designers of the popular ALTROchip
A modification of the existing CDTC16 card in which RJ-45 connectors are replacedby optical transceivers has to be designed. This card will interface the readout of the
149

SiPMs to the FEC cards. The multiplexing factor in the FECs is determined by thetrigger rate and the channel occupancy, taking into account that the FEC throughputis limited to a nominal 1 Gb/s, but a factor of 8 is a conservative one and will result inthe need of 157/8=20 FECs with its optical-to-electrical add-in cards.
We must also design and test a full-duplex optical link for 1.25 Gbps that includesthe following elements:
• Serializer/deserializer: a commercial IC that interfaces the ASIC via 8 or 10 bitbuses and, on the other side, an optical transceiver. As an example, the TLK1221part from Texas Instruments could be used. It has a power dissipation of 200 mW.
• Optical transceiver in a reduced footprint like 1×9, low power, preferably carryingthe upstream and downstream channels in a single fiber.
• A fiber optic vacuum feedthrough and 4 or 8 optical fibers in order to reduce asmuch as possible the number of feedthroughs in the vessel.
• An air-side fiber of approx. 25m, a mating optical transceiver and a receivingFPGA.
With a total of 30 FECs, a single SRU unit (3ke) can be used to receive triggercandidates and distribute trigger, slow controls commands and a common clock to allthe approx. 30 DAQ FECs in the experiment, resulting in a compact and cost-effectivetrigger system.
8.5 The NEXT offline software
NEXT software includes the NEXUS detector simulation framework, the nextofflinesoftware framework for reconstruction and data analysis, and the nextonline frameworkwhich has been summarized in the DAQ section.
NEXUS includes:
• A simulation package using the latest version of Geant4 (version 4.9.3 at the time ofpreparing this CDR). This version contains important, non-backward compatible,improvements in the low-energy electromagnetic physics processes, an essentialfeature for our simulations.
• Charge drift and electroluminescence packages.
• Microscopic models of EL based on Garfield.
• Detailed geometries for the different prototypes (NEXT-0, NEXT-1) as well as forNEXT-100, including the water tank (see, for instance, Figure 8.21).
• A preliminary version of an event generator for the gamma particles reachingthe LSC Hall-A has been developed. This uses measurements taken in the “old”laboratory. As soon as new measurements are available, they will be incorporatedinto the imulation.
150
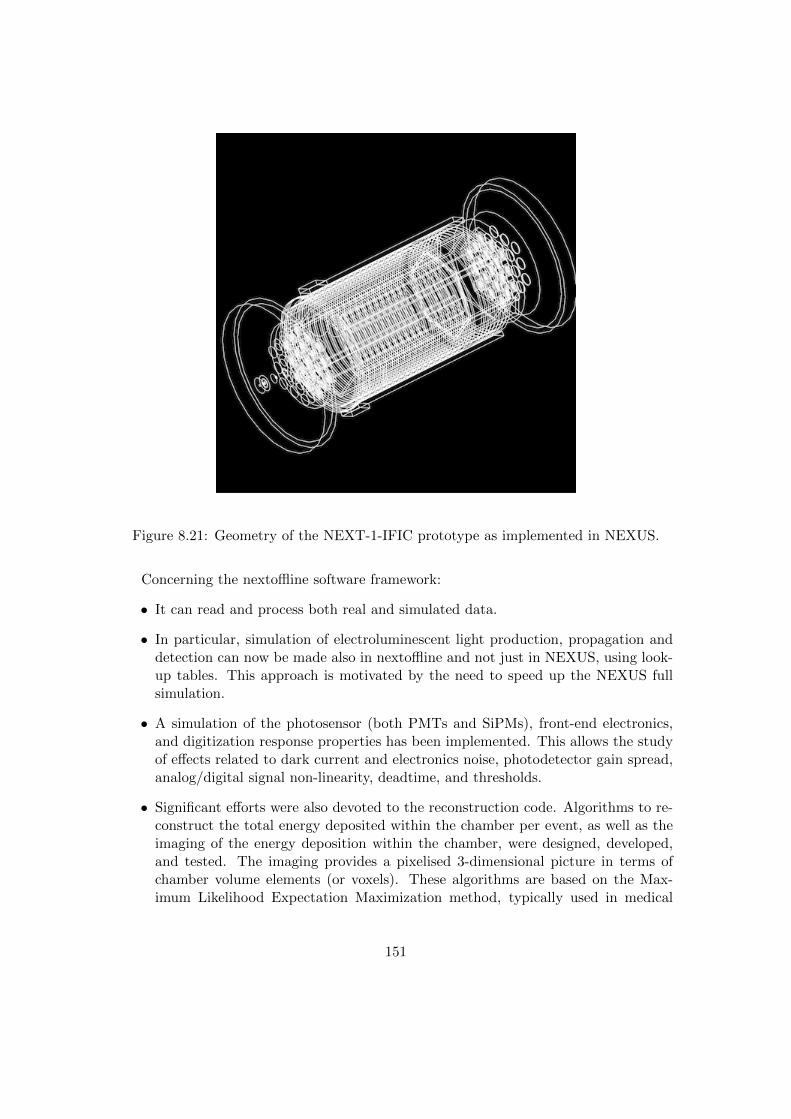
Figure 8.21: Geometry of the NEXT-1-IFIC prototype as implemented in NEXUS.
Concerning the nextoffline software framework:
• It can read and process both real and simulated data.
• In particular, simulation of electroluminescent light production, propagation anddetection can now be made also in nextoffline and not just in NEXUS, using look-up tables. This approach is motivated by the need to speed up the NEXUS fullsimulation.
• A simulation of the photosensor (both PMTs and SiPMs), front-end electronics,and digitization response properties has been implemented. This allows the studyof effects related to dark current and electronics noise, photodetector gain spread,analog/digital signal non-linearity, deadtime, and thresholds.
• Significant efforts were also devoted to the reconstruction code. Algorithms to re-construct the total energy deposited within the chamber per event, as well as theimaging of the energy deposition within the chamber, were designed, developed,and tested. The imaging provides a pixelised 3-dimensional picture in terms ofchamber volume elements (or voxels). These algorithms are based on the Max-imum Likelihood Expectation Maximization method, typically used in medical
151

Full 3D, X-Y-Projection
Figure 8.22: Example of a 3D reconstruction of a track in NEXT. The track energy ismeasured in the PMT plane applying corrections from the positions measured by theSIPMt pixels. The blobs can be clearly seen.
imaging, and it assumes an EL TPC, although it could be easily adapted to othertechnologies. An example of a reconstructed track is shown in Figure 8.22.
• An improved and more realistic algorithm to reconstruct tracks (for the topologicalsignature) has been developed, starting from the imaging of the energy depositionwithin the chamber discussed above. Such algorithm is based on graph theory: foreach event, the group of voxels with an energy deposition different from zero can beregarded as a graph, that is a set of vertices and edges that connect pairs of vertices.Notice that the algorithm is used to search for the two-electron (“spaghetti withtwo meat balls”) signature, but not to compute the total energy of the event,which is found by adding (after geometrical corrections) the contributions of allthe PMTs.
Much progress has also been made in differentiating signal from background eventsvia topological information, using simulated data, as described in the previous chapter.
8.6 Shifting the VUV light for NEXT
In NEXT detector application, the SiPMs are the photosensors mostly suitable for thepattern reconstruction as argued earlier, with the only drawback of poor sensitivityto the Xenon 175 nm scintillation light. The high cost of APD’s and UV sensitive
152
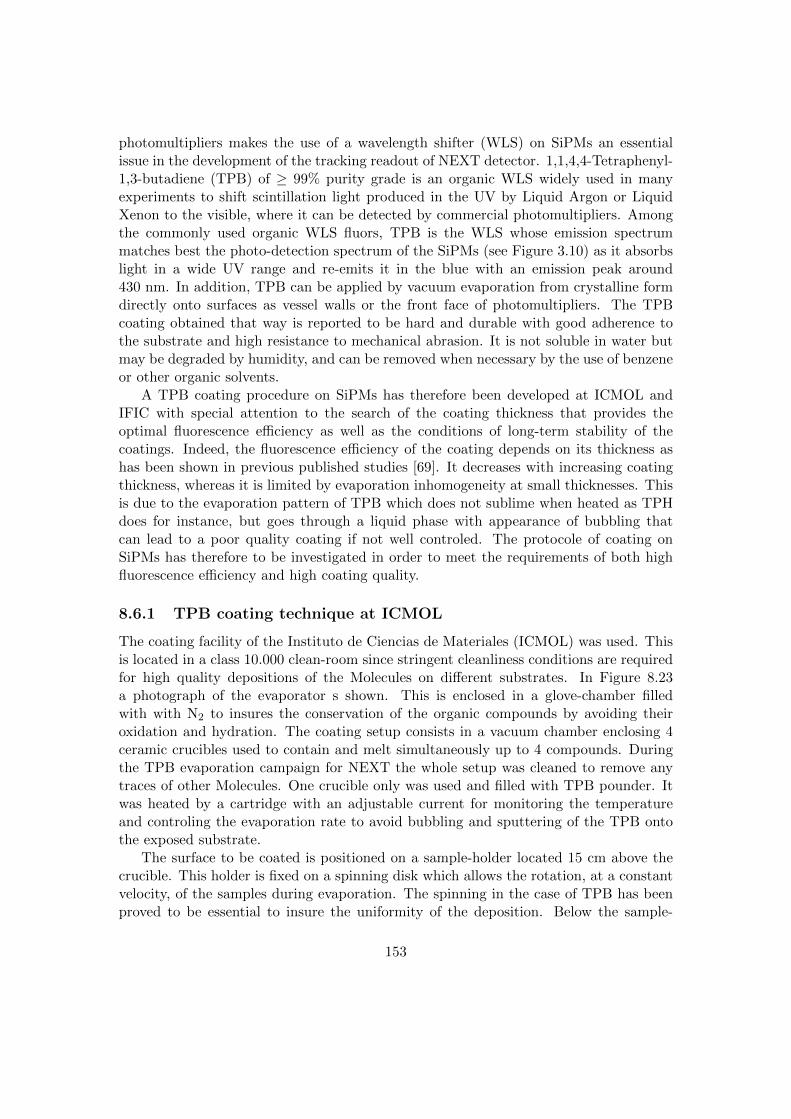
photomultipliers makes the use of a wavelength shifter (WLS) on SiPMs an essentialissue in the development of the tracking readout of NEXT detector. 1,1,4,4-Tetraphenyl-1,3-butadiene (TPB) of ≥ 99% purity grade is an organic WLS widely used in manyexperiments to shift scintillation light produced in the UV by Liquid Argon or LiquidXenon to the visible, where it can be detected by commercial photomultipliers. Amongthe commonly used organic WLS fluors, TPB is the WLS whose emission spectrummatches best the photo-detection spectrum of the SiPMs (see Figure 3.10) as it absorbslight in a wide UV range and re-emits it in the blue with an emission peak around430 nm. In addition, TPB can be applied by vacuum evaporation from crystalline formdirectly onto surfaces as vessel walls or the front face of photomultipliers. The TPBcoating obtained that way is reported to be hard and durable with good adherence tothe substrate and high resistance to mechanical abrasion. It is not soluble in water butmay be degraded by humidity, and can be removed when necessary by the use of benzeneor other organic solvents.
A TPB coating procedure on SiPMs has therefore been developed at ICMOL andIFIC with special attention to the search of the coating thickness that provides theoptimal fluorescence efficiency as well as the conditions of long-term stability of thecoatings. Indeed, the fluorescence efficiency of the coating depends on its thickness ashas been shown in previous published studies [69]. It decreases with increasing coatingthickness, whereas it is limited by evaporation inhomogeneity at small thicknesses. Thisis due to the evaporation pattern of TPB which does not sublime when heated as TPHdoes for instance, but goes through a liquid phase with appearance of bubbling thatcan lead to a poor quality coating if not well controled. The protocole of coating onSiPMs has therefore to be investigated in order to meet the requirements of both highfluorescence efficiency and high coating quality.
8.6.1 TPB coating technique at ICMOL
The coating facility of the Instituto de Ciencias de Materiales (ICMOL) was used. Thisis located in a class 10.000 clean-room since stringent cleanliness conditions are requiredfor high quality depositions of the Molecules on different substrates. In Figure 8.23a photograph of the evaporator s shown. This is enclosed in a glove-chamber filledwith with N2 to insures the conservation of the organic compounds by avoiding theiroxidation and hydration. The coating setup consists in a vacuum chamber enclosing 4ceramic crucibles used to contain and melt simultaneously up to 4 compounds. Duringthe TPB evaporation campaign for NEXT the whole setup was cleaned to remove anytraces of other Molecules. One crucible only was used and filled with TPB pounder. Itwas heated by a cartridge with an adjustable current for monitoring the temperatureand controling the evaporation rate to avoid bubbling and sputtering of the TPB ontothe exposed substrate.
The surface to be coated is positioned on a sample-holder located 15 cm above thecrucible. This holder is fixed on a spinning disk which allows the rotation, at a constantvelocity, of the samples during evaporation. The spinning in the case of TPB has beenproved to be essential to insure the uniformity of the deposition. Below the sample-
153
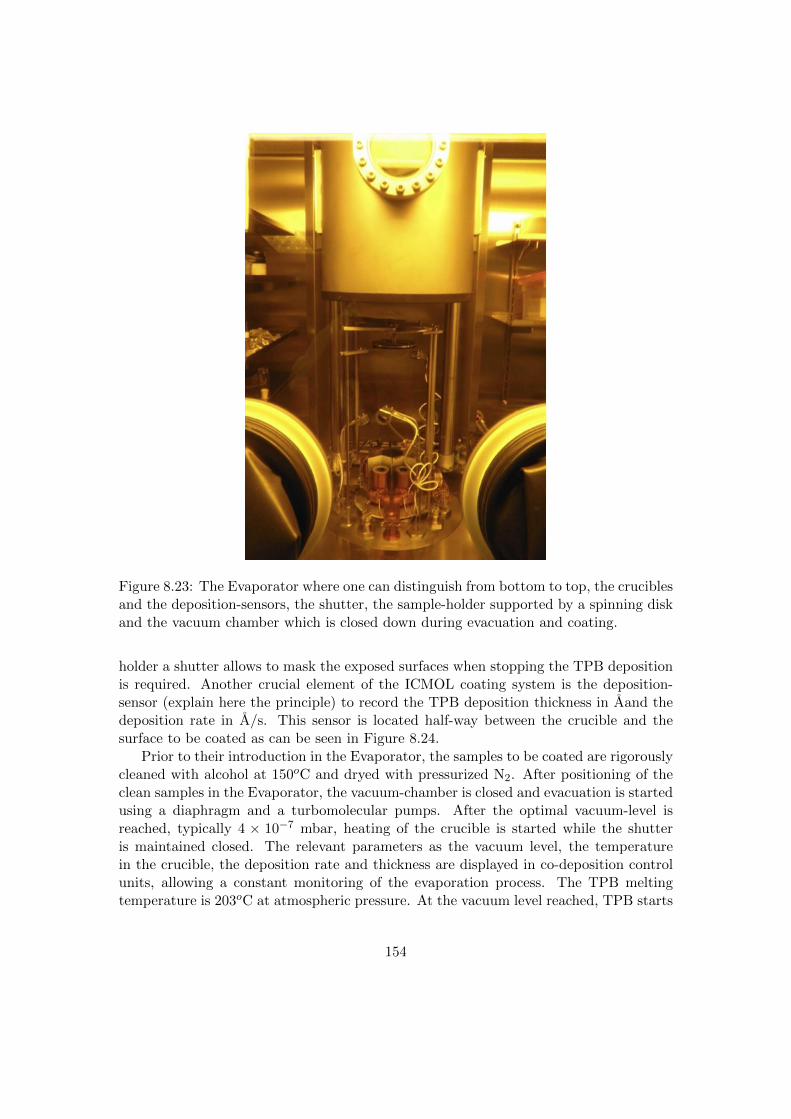
Figure 8.23: The Evaporator where one can distinguish from bottom to top, the cruciblesand the deposition-sensors, the shutter, the sample-holder supported by a spinning diskand the vacuum chamber which is closed down during evacuation and coating.
holder a shutter allows to mask the exposed surfaces when stopping the TPB depositionis required. Another crucial element of the ICMOL coating system is the deposition-sensor (explain here the principle) to record the TPB deposition thickness in Aand thedeposition rate in A/s. This sensor is located half-way between the crucible and thesurface to be coated as can be seen in Figure 8.24.
Prior to their introduction in the Evaporator, the samples to be coated are rigorouslycleaned with alcohol at 150oC and dryed with pressurized N2. After positioning of theclean samples in the Evaporator, the vacuum-chamber is closed and evacuation is startedusing a diaphragm and a turbomolecular pumps. After the optimal vacuum-level isreached, typically 4 × 10⁻⁷ mbar, heating of the crucible is started while the shutteris maintained closed. The relevant parameters as the vacuum level, the temperaturein the crucible, the deposition rate and thickness are displayed in co-deposition controlunits, allowing a constant monitoring of the evaporation process. The TPB meltingtemperature is 203oC at atmospheric pressure. At the vacuum level reached, TPB starts
154
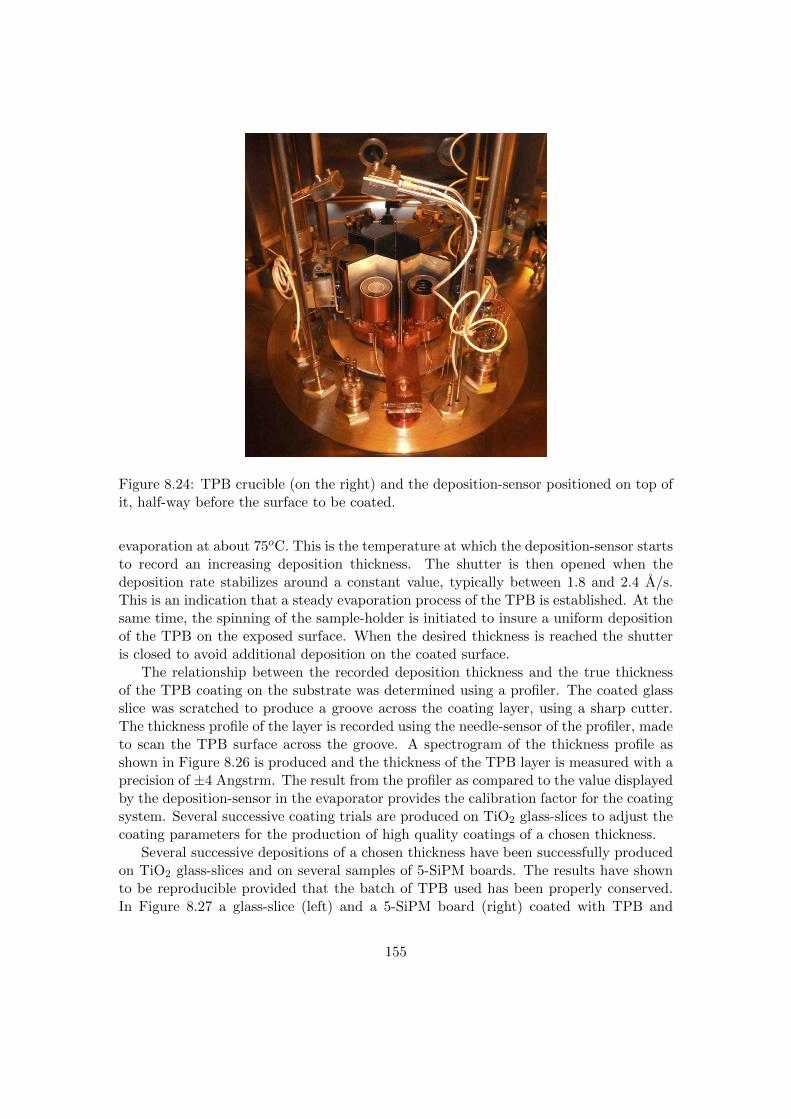
Figure 8.24: TPB crucible (on the right) and the deposition-sensor positioned on top ofit, half-way before the surface to be coated.
evaporation at about 75oC. This is the temperature at which the deposition-sensor startsto record an increasing deposition thickness. The shutter is then opened when thedeposition rate stabilizes around a constant value, typically between 1.8 and 2.4 A/s.This is an indication that a steady evaporation process of the TPB is established. At thesame time, the spinning of the sample-holder is initiated to insure a uniform depositionof the TPB on the exposed surface. When the desired thickness is reached the shutteris closed to avoid additional deposition on the coated surface.
The relationship between the recorded deposition thickness and the true thicknessof the TPB coating on the substrate was determined using a profiler. The coated glassslice was scratched to produce a groove across the coating layer, using a sharp cutter.The thickness profile of the layer is recorded using the needle-sensor of the profiler, madeto scan the TPB surface across the groove. A spectrogram of the thickness profile asshown in Figure 8.26 is produced and the thickness of the TPB layer is measured with aprecision of ±4 Angstrm. The result from the profiler as compared to the value displayedby the deposition-sensor in the evaporator provides the calibration factor for the coatingsystem. Several successive coating trials are produced on TiO2 glass-slices to adjust thecoating parameters for the production of high quality coatings of a chosen thickness.
Several successive depositions of a chosen thickness have been successfully producedon TiO2 glass-slices and on several samples of 5-SiPM boards. The results have shownto be reproducible provided that the batch of TPB used has been properly conserved.In Figure 8.27 a glass-slice (left) and a 5-SiPM board (right) coated with TPB and
155
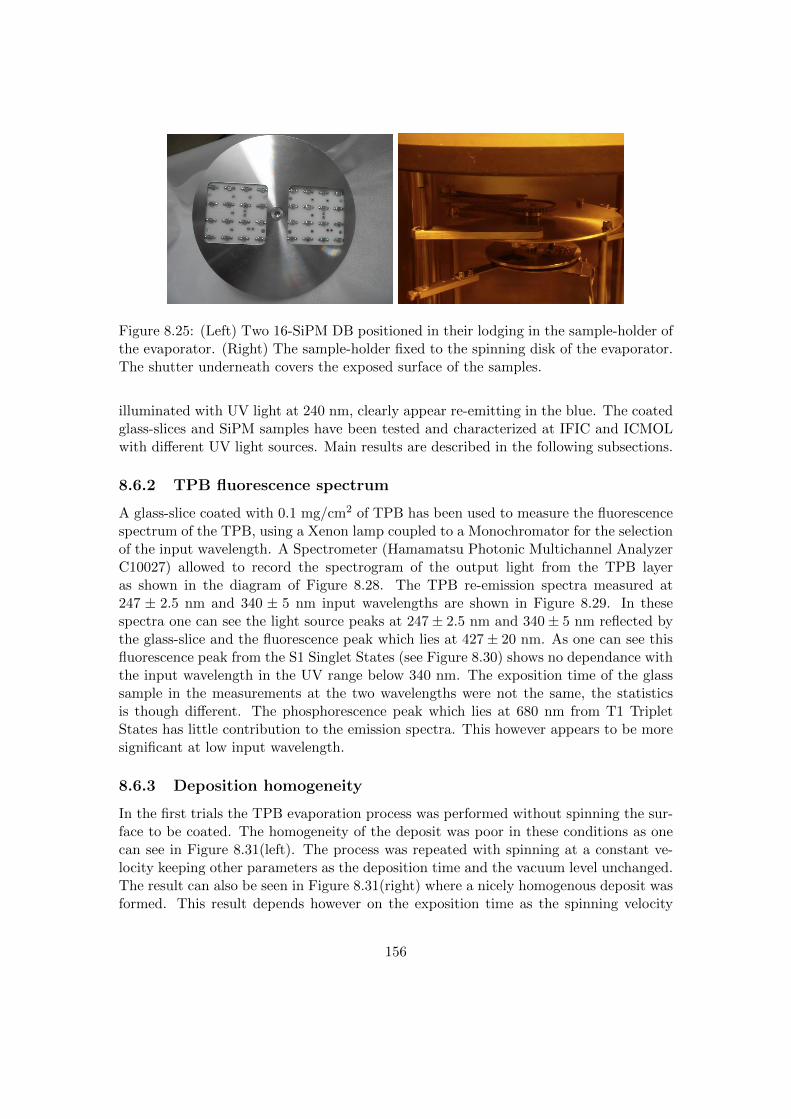
Figure 8.25: (Left) Two 16-SiPM DB positioned in their lodging in the sample-holder ofthe evaporator. (Right) The sample-holder fixed to the spinning disk of the evaporator.The shutter underneath covers the exposed surface of the samples.
illuminated with UV light at 240 nm, clearly appear re-emitting in the blue. The coatedglass-slices and SiPM samples have been tested and characterized at IFIC and ICMOLwith different UV light sources. Main results are described in the following subsections.
8.6.2 TPB fluorescence spectrum
A glass-slice coated with 0.1 mg/cm2 of TPB has been used to measure the fluorescencespectrum of the TPB, using a Xenon lamp coupled to a Monochromator for the selectionof the input wavelength. A Spectrometer (Hamamatsu Photonic Multichannel AnalyzerC10027) allowed to record the spectrogram of the output light from the TPB layeras shown in the diagram of Figure 8.28. The TPB re-emission spectra measured at247 ± 2.5 nm and 340 ± 5 nm input wavelengths are shown in Figure 8.29. In thesespectra one can see the light source peaks at 247± 2.5 nm and 340± 5 nm reflected bythe glass-slice and the fluorescence peak which lies at 427± 20 nm. As one can see thisfluorescence peak from the S1 Singlet States (see Figure 8.30) shows no dependance withthe input wavelength in the UV range below 340 nm. The exposition time of the glasssample in the measurements at the two wavelengths were not the same, the statisticsis though different. The phosphorescence peak which lies at 680 nm from T1 TripletStates has little contribution to the emission spectra. This however appears to be moresignificant at low input wavelength.
8.6.3 Deposition homogeneity
In the first trials the TPB evaporation process was performed without spinning the sur-face to be coated. The homogeneity of the deposit was poor in these conditions as onecan see in Figure 8.31(left). The process was repeated with spinning at a constant ve-locity keeping other parameters as the deposition time and the vacuum level unchanged.The result can also be seen in Figure 8.31(right) where a nicely homogenous deposit wasformed. This result depends however on the exposition time as the spinning velocity
156
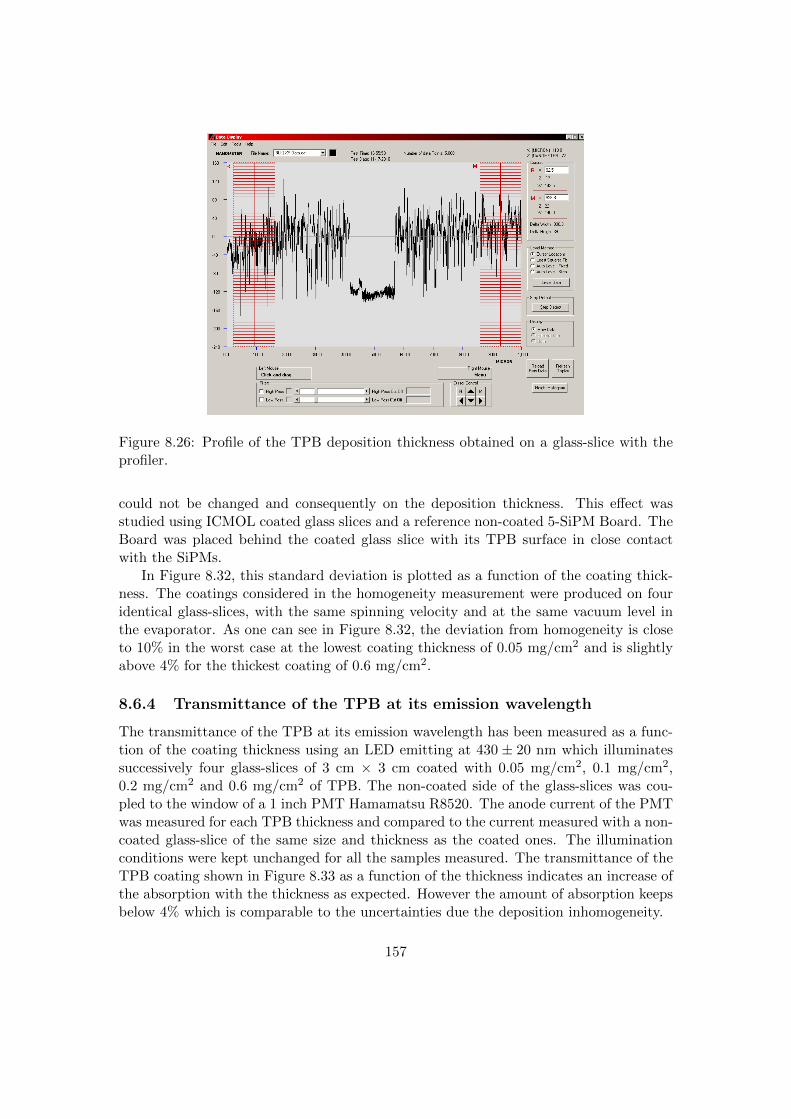
Figure 8.26: Profile of the TPB deposition thickness obtained on a glass-slice with theprofiler.
could not be changed and consequently on the deposition thickness. This effect wasstudied using ICMOL coated glass slices and a reference non-coated 5-SiPM Board. TheBoard was placed behind the coated glass slice with its TPB surface in close contactwith the SiPMs.
In Figure 8.32, this standard deviation is plotted as a function of the coating thick-ness. The coatings considered in the homogeneity measurement were produced on fouridentical glass-slices, with the same spinning velocity and at the same vacuum level inthe evaporator. As one can see in Figure 8.32, the deviation from homogeneity is closeto 10% in the worst case at the lowest coating thickness of 0.05 mg/cm2 and is slightlyabove 4% for the thickest coating of 0.6 mg/cm2.
8.6.4 Transmittance of the TPB at its emission wavelength
The transmittance of the TPB at its emission wavelength has been measured as a func-tion of the coating thickness using an LED emitting at 430 ± 20 nm which illuminatessuccessively four glass-slices of 3 cm × 3 cm coated with 0.05 mg/cm2, 0.1 mg/cm2,0.2 mg/cm2 and 0.6 mg/cm2 of TPB. The non-coated side of the glass-slices was cou-pled to the window of a 1 inch PMT Hamamatsu R8520. The anode current of the PMTwas measured for each TPB thickness and compared to the current measured with a non-coated glass-slice of the same size and thickness as the coated ones. The illuminationconditions were kept unchanged for all the samples measured. The transmittance of theTPB coating shown in Figure 8.33 as a function of the thickness indicates an increase ofthe absorption with the thickness as expected. However the amount of absorption keepsbelow 4% which is comparable to the uncertainties due the deposition inhomogeneity.
157

Figure 8.27: Illumination with 240 nm UV light of a glass-slice (left) and a 5-SiPM board(right) both coated with TPB.
Figure 8.28: Diagram of the fluorescence measurement setup.
Several 5-SiPM boards coated with different TPB thickness have been tested withcollimated light from LEDs emitting at different wavelengths. The response of thecoated SiPMs to UV light as a function of the coating thickness has been measured andcompared to their response to the same illumination prior to coating. The increase in theSiPMs photo-detection efficiency produced by the TPB layer is plotted in Figure 8.34as a function of the TPB thickness. It is clearly seen that the response of the coatedSiPMs increases with decreasing coating thickness and is maximum at 0.05 mg/cm2.This result confirms previous published studies on TPB depositions [59,69].
8.6.5 Response of coated SiPMs as a function of TPB thickness
An important issue addressed for coating the SiPMs in NEXT is the search of the coatingthickness which allows the optimal conversion efficiency of the TPB. For this purpose,depositions of various thickness of TPB were performed on 5-SiPM Boards which were
158

Wavelength (nm)200 300 400 500 600 700 800
Coun
ts
210
310
410
510 2.5 nm ± = 340 ! Input 2.5 nm ± = 246 ! Input
Figure 8.29: TPB emission spectra measured at ICMOL using a glass-slice coated with0.1 mg/cm2 of TPB illuminated at 246 nm and 340 nm.
characterized using a collimated LED emitting at 260 nm. The current output from thecoated SiPMs was measured and compared to the current measured prior to coating withthe same illumination and temperature conditions. In Figure 8.34 the increase of currentof the SiPMs after coating when illuminated at 260 nm is shown as a function of the TPBthickness. This current increase similar to an increase of the photo-detection efficiencyof the SiPMs depends on the coating thickness and is shown to have maximum value at0.05 mg/cm2. This result confirms reported studies on TPB depositions performed onPhotomultipliers [59]. However for the coating of the SiPMs of NEXT1-EL DBs and dueto the small size of the active area of the SiPMs (1×1 mm2), a compromise between thedeposition homogeneity and the fluorescence efficiency of the TPB was considered. Thusa thickness of 0.1 mg/cm2 was chosen as it fulfills both conditions of good homogeneityand high enough fluorescence efficiency.
8.6.6 Coating and testing of NEXT1-EL SiPM Daughter-Boards
Prior to coating the SiPM-DBs were tested with an LED and then cleaned using iso-propanol in an ultrasonic bath. They were after dried in an oven at 70oC during 2hours, then stored in the N2 atmosphere of the ICMOL coating facility until their in-troduction in the coating chamber. The cleaning protocol was previously agreed withHamamatsu to be safe for the SiPMs which were tested before and after this process. The18 SiPM-DBs of NEXT1-EL tracking plane were coated with 0.1 mg/cm2 of TPB andthen stored in a vacuum chamber until their mounting on the readout Mother-Board.A couple of SiPM-DB samples have been dedicated to testing with an LED emitting at240 nm immediately after coating. The currents produced in the SiPMs measured before
159

Figure 8.30: Energy levels diagram of an organic molecule with Π-electron structure.
and after coating in the same illumination and temperature conditions are compared.In Figure 8.36 the dispersion in the current increase measured in the 16 SiPMs of onecoated DB is shown. More than 45% of current increase is measured at 240 nm whichis more than what has been measured with previous samples at 260 nm. The dispersionof this measurement is within the current dispersion obtained in the SiPMs of one DBoperated at the same voltage (71.15 V) and below the current dispersion due to the TPBinhomogeneity at 0.1mg/cm2 thickness, which is an indication of an excellent coatingquality.
The response of the SiPMs of the DB sample as a function of the wavelength wasmeasured using a Xenon lamp coupled to a Monochromator which allowed to select theinput wavelength from the Xenon emission spectrum down to 240 nm, with a spread of±5 nm. The DB was plugged into a readout PCB placed inside a testing black-box asshown in Figure 8.35. An SMA feedthrough on the top cover of the black-box allowedto plug the optical fiber from the Monochromator to illuminate a chosen SiPM of theDB. A spectrometer was also used to analyze the spectra from the Monochromatoroutput in order to determine the input spectrum used to illuminate the coated SiPM-DBs. An example of such spectrum is shown in Figure 8.37 from the Monochromatorset at 247 nm. The average current from the SiPMs of the DB is recorded at eachinput wavelength using an Electrometer and compared to the typical average currentof the non-coated SiPMs of the DBs obtained in the same illumination conditions. InFigure 8.38 a significant increase of the current in the coated SiPMs is observed at inputwavelengths below 340 nm.
160

Figure 8.31: (left) Glass sample coated without spinning. (right) Glass sample coatedwith spinning.
8.7 NEXT Project
The NEXT project (NP) refers to the sharing, organization, coordination, tracking andresource management of the different tasks related with the construction, commissioningand operation of the NEXT-100 detector.
The NP defines the following projects.
1. PV: Design and construction of the NEXT-100 pressure Vessel.
2. EL: Design and construction of the field cage, EL grids and High Voltage feedthroughs.
3. LT: Design and construction of the light tube.
4. EP: Energy plane sensors (PMTs) and front end electronics.
5. SiPM: Construction and testing of SiPMs daughter boards (DB).
6. DB-TPB: Coating of the DB with TPB prior to mounting in Mother Board (MB).
7. MB: Mother board design and construction.
8. DB-FE: FE electronics for the DB (discreet version).
9. DB-CHIP: FE electronics for the DB (ASICs version).
10. DB-OPT: Optical links for SiPMs.
11. DAQ: Data acquisition and online monitoring.
12. SLOW: Slow controls.
13. SHL: Shielding design and construction.
161
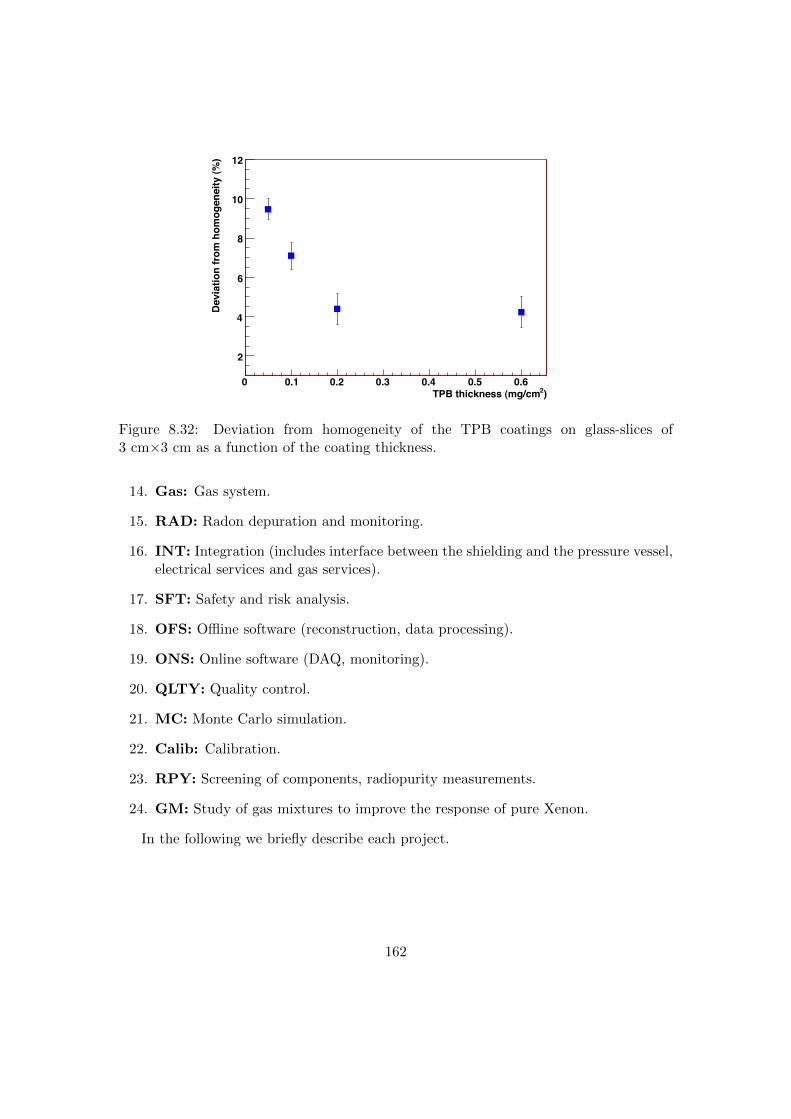
)2TPB thickness (mg/cm0 0.1 0.2 0.3 0.4 0.5 0.6
Devi
atio
n fro
m h
omog
enei
ty (%
)
2
4
6
8
10
12
Figure 8.32: Deviation from homogeneity of the TPB coatings on glass-slices of3 cm×3 cm as a function of the coating thickness.
14. Gas: Gas system.
15. RAD: Radon depuration and monitoring.
16. INT: Integration (includes interface between the shielding and the pressure vessel,electrical services and gas services).
17. SFT: Safety and risk analysis.
18. OFS: Offline software (reconstruction, data processing).
19. ONS: Online software (DAQ, monitoring).
20. QLTY: Quality control.
21. MC: Monte Carlo simulation.
22. Calib: Calibration.
23. RPY: Screening of components, radiopurity measurements.
24. GM: Study of gas mixtures to improve the response of pure Xenon.
In the following we briefly describe each project.
162
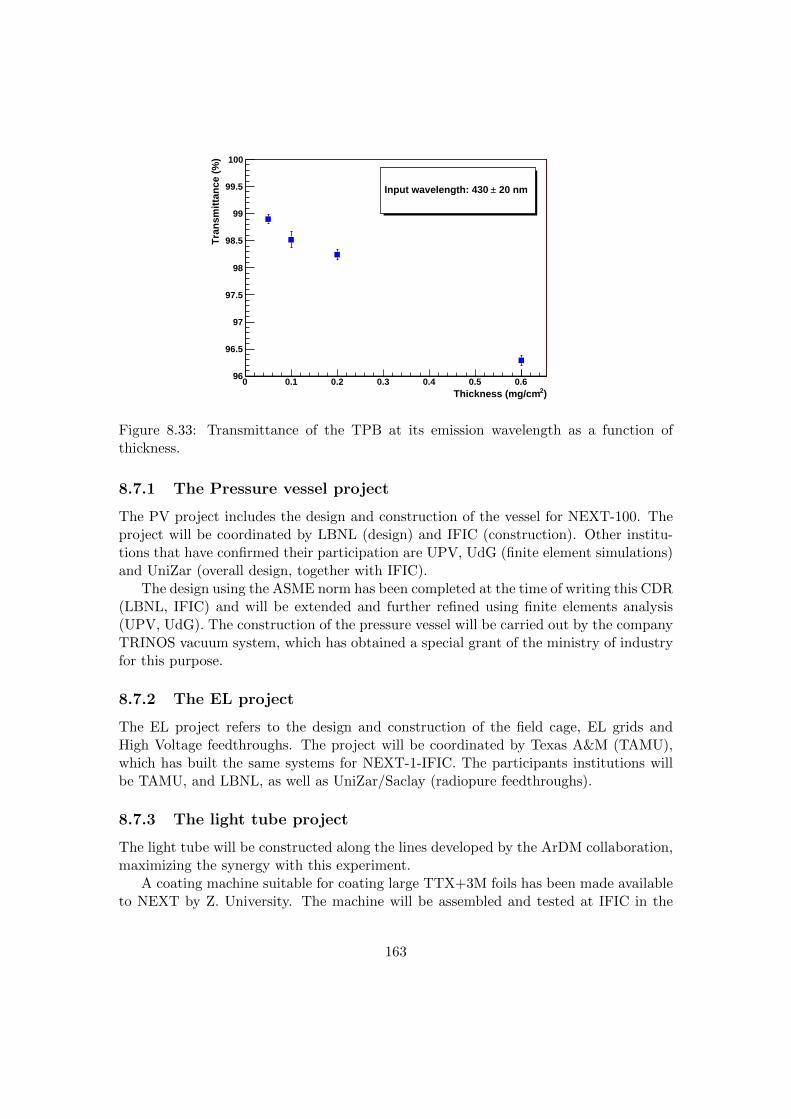
)2Thickness (mg/cm0 0.1 0.2 0.3 0.4 0.5 0.6
Tra
nsm
itta
nce
(%
)
96
96.5
97
97.5
98
98.5
99
99.5
100
20 nm±Input wavelength: 430
Figure 8.33: Transmittance of the TPB at its emission wavelength as a function ofthickness.
8.7.1 The Pressure vessel project
The PV project includes the design and construction of the vessel for NEXT-100. Theproject will be coordinated by LBNL (design) and IFIC (construction). Other institu-tions that have confirmed their participation are UPV, UdG (finite element simulations)and UniZar (overall design, together with IFIC).
The design using the ASME norm has been completed at the time of writing this CDR(LBNL, IFIC) and will be extended and further refined using finite elements analysis(UPV, UdG). The construction of the pressure vessel will be carried out by the companyTRINOS vacuum system, which has obtained a special grant of the ministry of industryfor this purpose.
8.7.2 The EL project
The EL project refers to the design and construction of the field cage, EL grids andHigh Voltage feedthroughs. The project will be coordinated by Texas A&M (TAMU),which has built the same systems for NEXT-1-IFIC. The participants institutions willbe TAMU, and LBNL, as well as UniZar/Saclay (radiopure feedthroughs).
8.7.3 The light tube project
The light tube will be constructed along the lines developed by the ArDM collaboration,maximizing the synergy with this experiment.
A coating machine suitable for coating large TTX+3M foils has been made availableto NEXT by Z. University. The machine will be assembled and tested at IFIC in the
163

)2TPB Thickness (mg/cm0.04 0.06 0.08 0.1 0.12 0.14 0.16 0.18 0.2
Curr
ent i
ncre
ase
in c
oate
d Si
PM (%
)
22
24
26
28
30
32
Input wavelength = 260 nm
Figure 8.34: Response of the TPB coated SiPMs to UV light (260 nm) as a function ofthe coating thickness. For each thickness, the average of the currents measured in eachof the 5 SiPMs of a board is represented.
next few months.The project will be coordinated by IFIC, with the participation of JINR.
8.7.4 Energy plane sensors
The procuration and testing of PMTs will be carried out at IFIC. The front-end elec-tronics of the PMTs will be jointly developed by IFIC and UPV.
8.7.5 Construction and testing of SiPMs daughter boards
About 160 SiPM daughter boards, each with 64 SiPMs must be mounted and fullytested. The project will be coordinated by U. of Aveiro, with the participation ofCoimbra, Aveiro, U. Santiago and UAN.
8.7.6 Coating of DB with TPB
The coating of NEXT1 DB with TPB will be done at IFIC, using a machine availablefrom ICMOL.
8.7.7 Testing of functionality of DB
An acrylic chamber with gloves for external manipulation has been prepared at IFIC forNEXT-1. The chamber is being used to test the SiPM MB of NEXT-1. For NEXT-100we plan to build a mother board ”mockup” (MBM) that will have the same functionality
164
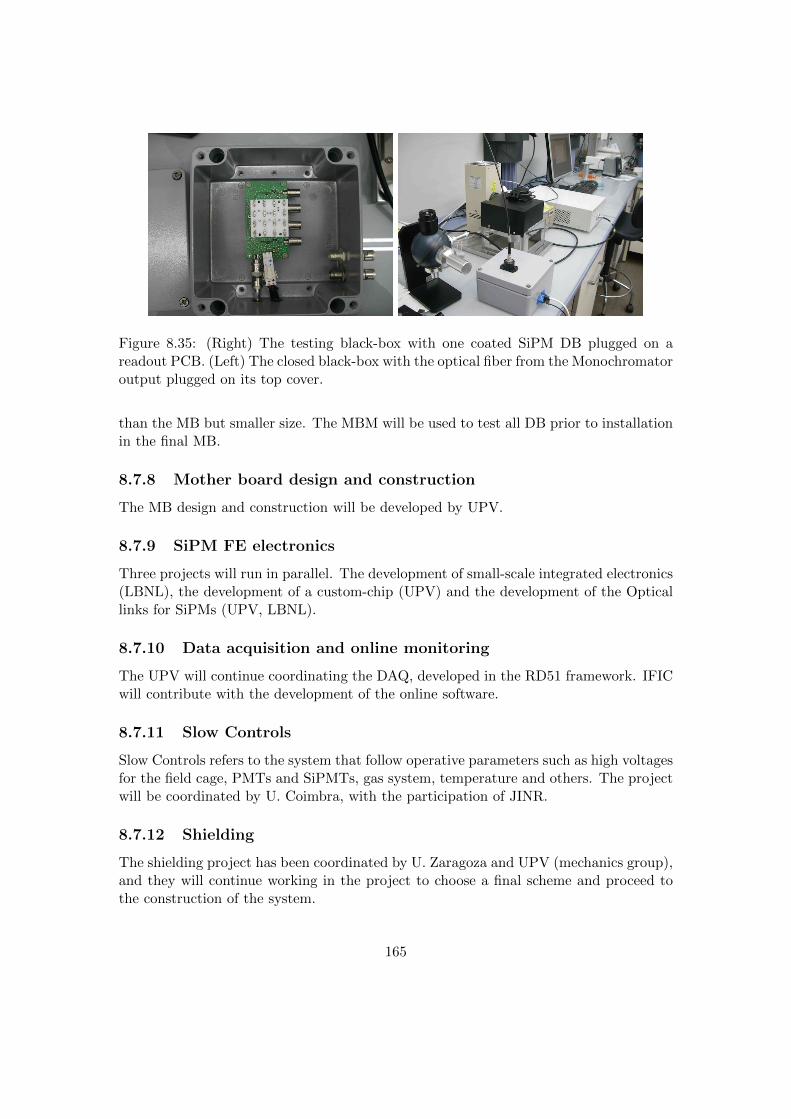
Figure 8.35: (Right) The testing black-box with one coated SiPM DB plugged on areadout PCB. (Left) The closed black-box with the optical fiber from the Monochromatoroutput plugged on its top cover.
than the MB but smaller size. The MBM will be used to test all DB prior to installationin the final MB.
8.7.8 Mother board design and construction
The MB design and construction will be developed by UPV.
8.7.9 SiPM FE electronics
Three projects will run in parallel. The development of small-scale integrated electronics(LBNL), the development of a custom-chip (UPV) and the development of the Opticallinks for SiPMs (UPV, LBNL).
8.7.10 Data acquisition and online monitoring
The UPV will continue coordinating the DAQ, developed in the RD51 framework. IFICwill contribute with the development of the online software.
8.7.11 Slow Controls
Slow Controls refers to the system that follow operative parameters such as high voltagesfor the field cage, PMTs and SiPMTs, gas system, temperature and others. The projectwill be coordinated by U. Coimbra, with the participation of JINR.
8.7.12 Shielding
The shielding project has been coordinated by U. Zaragoza and UPV (mechanics group),and they will continue working in the project to choose a final scheme and proceed tothe construction of the system.
165
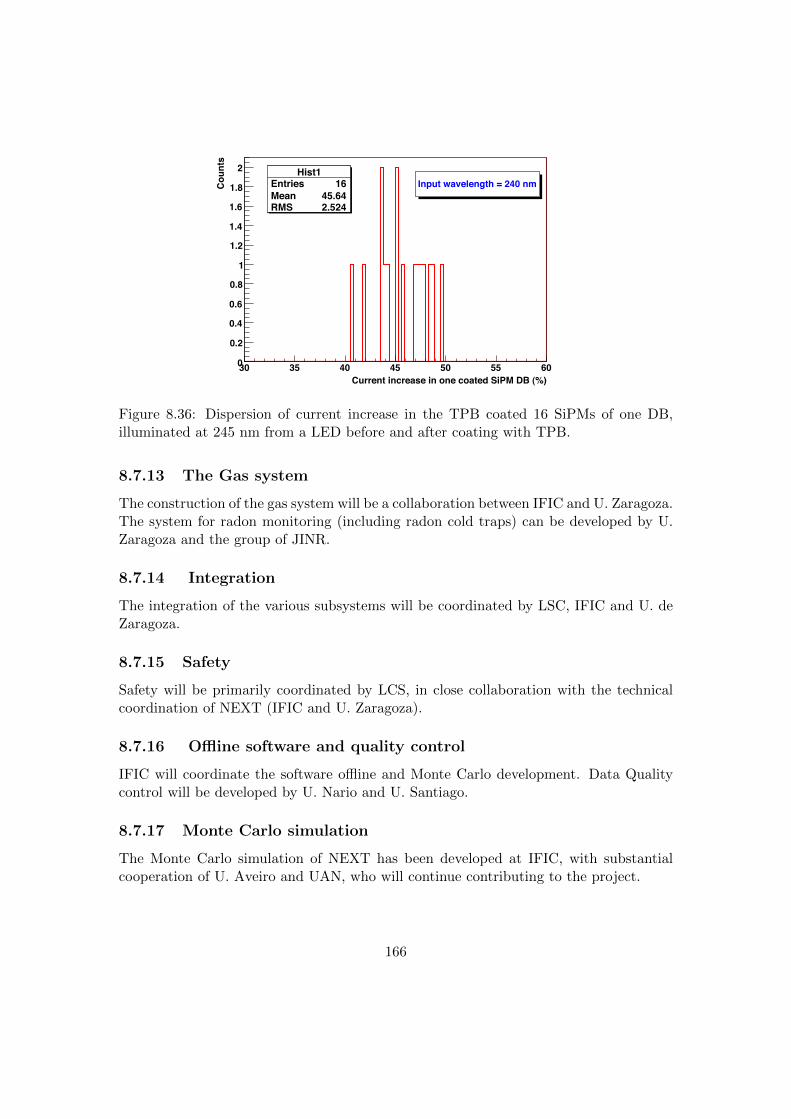
Hist1Entries 16Mean 45.64RMS 2.524
Current increase in one coated SiPM DB (%)30 35 40 45 50 55 60
Coun
ts
0
0.2
0.4
0.6
0.8
1
1.2
1.4
1.6
1.8
2 Hist1Entries 16Mean 45.64RMS 2.524
Input wavelength = 240 nm
Figure 8.36: Dispersion of current increase in the TPB coated 16 SiPMs of one DB,illuminated at 245 nm from a LED before and after coating with TPB.
8.7.13 The Gas system
The construction of the gas system will be a collaboration between IFIC and U. Zaragoza.The system for radon monitoring (including radon cold traps) can be developed by U.Zaragoza and the group of JINR.
8.7.14 Integration
The integration of the various subsystems will be coordinated by LSC, IFIC and U. deZaragoza.
8.7.15 Safety
Safety will be primarily coordinated by LCS, in close collaboration with the technicalcoordination of NEXT (IFIC and U. Zaragoza).
8.7.16 Offline software and quality control
IFIC will coordinate the software offline and Monte Carlo development. Data Qualitycontrol will be developed by U. Nario and U. Santiago.
8.7.17 Monte Carlo simulation
The Monte Carlo simulation of NEXT has been developed at IFIC, with substantialcooperation of U. Aveiro and UAN, who will continue contributing to the project.
166
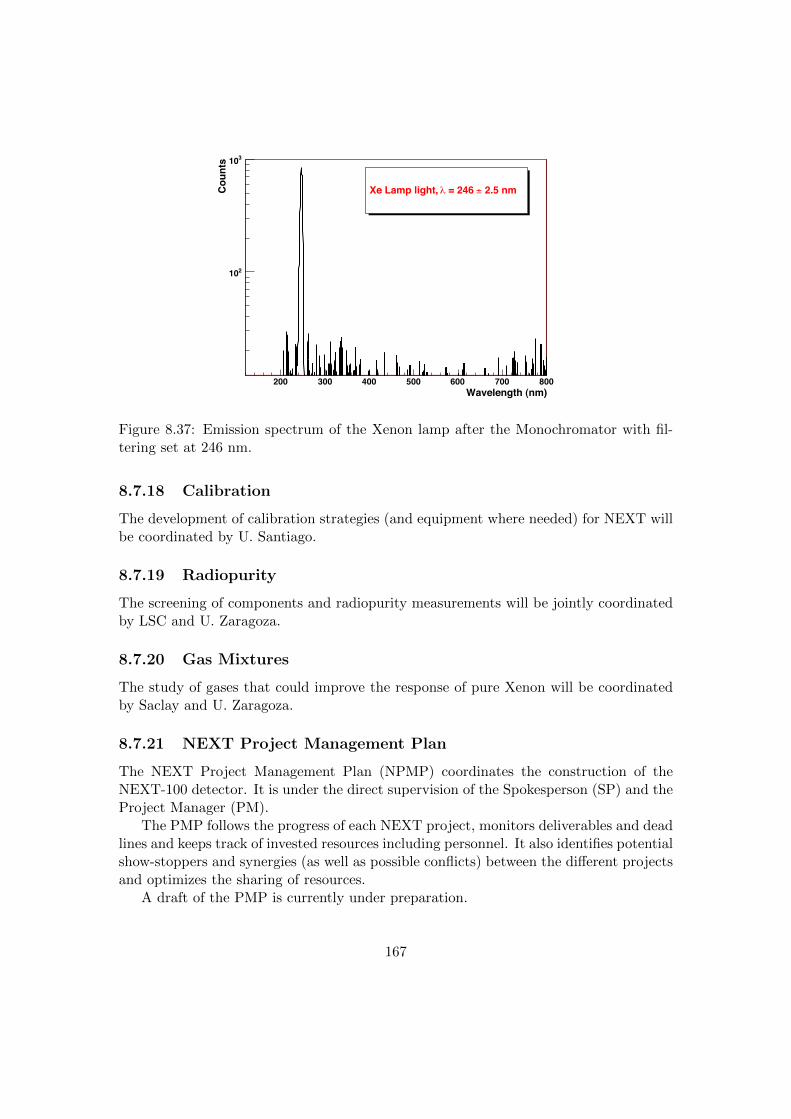
Wavelength (nm)200 300 400 500 600 700 800
Coun
ts
210
310
2.5 nm± = 246 !Xe Lamp light,
Figure 8.37: Emission spectrum of the Xenon lamp after the Monochromator with fil-tering set at 246 nm.
8.7.18 Calibration
The development of calibration strategies (and equipment where needed) for NEXT willbe coordinated by U. Santiago.
8.7.19 Radiopurity
The screening of components and radiopurity measurements will be jointly coordinatedby LSC and U. Zaragoza.
8.7.20 Gas Mixtures
The study of gases that could improve the response of pure Xenon will be coordinatedby Saclay and U. Zaragoza.
8.7.21 NEXT Project Management Plan
The NEXT Project Management Plan (NPMP) coordinates the construction of theNEXT-100 detector. It is under the direct supervision of the Spokesperson (SP) and theProject Manager (PM).
The PMP follows the progress of each NEXT project, monitors deliverables and deadlines and keeps track of invested resources including personnel. It also identifies potentialshow-stoppers and synergies (as well as possible conflicts) between the different projectsand optimizes the sharing of resources.
A draft of the PMP is currently under preparation.
167

Wavelength (nm)240 260 280 300 320 340 360 380 400
A)µ
Aver
age
Curr
ent (
0
50
100
150
200
250 Non coated SiPM DB
TPB coated SiPM DB
Figure 8.38: Average current in the TPB coated SiPMs DB compared to the averagecurrent of a non coated SIPM DB. Both SiPM DB are illuminated by the same XenonLamp coupled to a Monochromator to select the input wavelength.
8.7.22 Further Developments
The Next Project and the Next Project Management Plan will be fully developed bythe collaboration in the next few months, and will be the focus of our next report to theLSC. In addition we will submit a full costing of the detector.
168
Acknowledgements
This work received support by the Spanish Ministry of Science and Innovation (MICINN)under grants CONSOLIDER-INGENIO 2010 CSD2008-0037 (CUP), FPA2009-13697-C04-04 and RYC-2008-03169. J. Renner acknowledges the support of a US DOE NNSAStewardship Science Graduate Fellowship, under contract number DE-FC52-08NA28752.
169
Bibliography
[1] E. Majorana, Theory of the Symmetry of Electrons and Positrons, Nuovo Cim. 14(1937) 171–184.
[2] F. T. Avignone III, S. R. Elliott, and J. Engel, Double Beta Decay, MajoranaNeutrinos, and Neutrino Mass, Rev. Mod. Phys. 80 (2008) 481–516,[arXiv:0708.1033].
[3] A. Giuliani, Searches for neutrinoless double beta decay, Acta Phys. Polon. B41(2010) 1447–1468.
[4] J. Schechter and J. W. F. Valle, Neutrinoless double-beta decay in SU(2)×U(1)theories, Phys. Rev. D25 (1982) 2951.
[5] M. Hirsch, S. Kovalenko, and I. Schmidt, Extended Black Box Theorem for LeptonNumber and Flavor Violating processes, Phys. Lett. B642 (2006) 106–110,[hep-ph/0608207].
[6] M. C. Gonzalez-Garcia, M. Maltoni, and J. Salvado, Robust Cosmological Boundson Neutrinos and their Combination with Oscillation Results, JHEP 08 (2010)117, [arXiv:1006.3795].
[7] E. Caurier, J. Menendez, F. Nowacki, and A. Poves, The Influence of pairing onthe nuclear matrix elements of the neutrinoless beta beta decays, Phys. Rev. Lett.100 (2008) 052503, [arXiv:0709.2137].
[8] J. Menendez, A. Poves, E. Caurier, and F. Nowacki, Disassembling the NuclearMatrix Elements of the Neutrinoless beta beta Decay, Nucl.Phys. A818 (2009)139–151, [arXiv:0801.3760].
[9] J. Menendez, A. Poves, E. Caurier, and F. Nowacki, The Occupancies ofindividual orbits and the nuclear matrix element of the Ge-76 neutrinoless betabeta decay, Phys.Rev. C80 (2009) 048501, [arXiv:0906.0179].
[10] J. Suhonen and O. Civitarese, Effects of orbital occupancies and spin-orbitpartners on 0 nu beta beta-decay rates, Nucl.Phys. A847 (2010) 207–232.
170

[11] F. Simkovic, A. Faessler, V. Rodin, P. Vogel, and J. Engel, Anatomy of nuclearmatrix elements for neutrinoless double-beta decay, Phys.Rev. C77 (2008) 045503,[arXiv:0710.2055].
[12] F. Simkovic, A. Faessler, H. Muther, V. Rodin, and M. Stauf, The 0nbb-decaynuclear matrix elements with self- consistent short-range correlations, Phys. Rev.C79 (2009) 055501, [arXiv:0902.0331].
[13] J. Barea and F. Iachello, Neutrinoless double-beta decay in the microscopicinteracting boson model, Phys. Rev. C79 (2009) 044301.
[14] T. R. Rodrıguez and G. Martınez-Pinedo, Energy density functional study ofnuclear matrix elements for neutrinoless ββ decay, arXiv:1008.5260.
[15] F. Simkovic, A. Faessler, and P. Vogel, 0 nu beta beta nuclear matrix elements andthe occupancy of individual orbits, Phys.Rev. C79 (2009) 015502,[arXiv:0812.0348].
[16] D.-L. Fang, A. Faessler, V. Rodin, and F. Simkovic, Neutrinoless double-beta decayof 150Nd accounting for deformation, Phys.Rev. C82 (2010) 051301,[arXiv:1009.5579].
[17] H. Klapdor-Kleingrothaus et. al., Latest results from the Heidelberg-Moscow doublebeta decay experiment, Eur. Phys. J. A12 (2001) 147–154, [hep-ph/0103062].
[18] H. V. Klapdor-Kleingrothaus, A. Dietz, H. L. Harney, and I. V. Krivosheina,Evidence for Neutrinoless Double Beta Decay, Mod. Phys. Lett. A16 (2001)2409–2420, [hep-ph/0201231].
[19] C. E. Aalseth et. al., Comment on ’Evidence for Neutrinoless Double Beta Decay’,Mod. Phys. Lett. A17 (2002) 1475–1478, [hep-ex/0202018].
[20] J. J. Gomez-Cadenas et. al., Sense and sensitivity of double beta decayexperiments, arXiv:1010.5112.
[21] CUORE Collaboration, C. Arnaboldi et. al., Physics potential and prospects forthe CUORICINO and CUORE experiments, Astropart. Phys. 20 (2003) 91–110,[hep-ex/0302021].
[22] R. Ardito et. al., CUORE: A cryogenic underground observatory for rare events,hep-ex/0501010.
[23] CUORE Collaboration, I. C. Bandac, Search for neutrinoless double beta decaywith the CUORE detector, J. Phys. Conf. Ser. 110 (2008) 082001.
[24] CUORE Collaboration, G. Gervasio, CUORICINO - Large cryogenic detector fordouble beta decay, WIMPS and solar axions, Nucl. Phys. A663 (2000) 873–876.
171

[25] CUORE Collaboration, M. Sisti, From Cuoricino to CUORE: Investigatingneutrino properties with double beta decay, J. Phys. Conf. Ser. 203 (2010) 012069.
[26] CUORICINO Collaboration, C. Arnaboldi et. al., Results from a search for the0νββ−decay of 130Te, Phys. Rev. C78 (2008) 035502, [arXiv:0802.3439].
[27] GERDA Collaboration, I. Abt et. al., A new Ge-76 double beta decay experimentat LNGS, hep-ex/0404039.
[28] M. Barnabe Heider et. al., Operation of a GERDA Phase I prototype detector inliquid argon and nitrogen, arXiv:0812.3976.
[29] I. Barabanov et. al., Shielding of the GERDA experiment against external gammabackground, Nucl. Instrum. Meth. A606 (2009) 790–794.
[30] GERDA Collaboration, G. Zuzel, The GERDA experiment at Gran Sasso, ActaPhys. Polon. B41 (2010) 1469.
[31] M. Danilov et. al., Detection of very small neutrino masses in double-beta decayusing laser tagging, Phys. Lett. B480 (2000) 12–18, [hep-ex/0002003].
[32] EXO Collaboration, E. Conti et. al., Correlated fluctuations between luminescenceand ionization in liquid xenon, Phys. Rev. B68 (2003) 054201, [hep-ex/0303008].
[33] M. Redshaw, E. Wingfield, J. McDaniel, and E. G. Myers, Mass anddouble-beta-decay q value of 136xe, Phys. Rev. Lett. 98 (Feb, 2007) 053003.
[34] KamLAND Collaboration, A. Terashima et. al., R&D for possible futureimprovements of KamLAND, J. Phys. Conf. Ser. 120 (2008) 052029.
[35] M. Koga, KamLAND double beta decay experiment using 136Xe, in InternationalConference on High Energy Physics (ICHEP), 2010.
[36] NEXT Collaboration, F. Granena et. al., NEXT, a HPGXe TPC for neutrinolessdouble beta decay searches, arXiv:0907.4054.
[37] A. Bolotnikov and B. Ramsey, The spectroscopic properties of high-pressure xenon,Nucl. Inst. Meth. A396 (1997) 360–370.
[38] D. Nygren, High-pressure xenon gas electroluminescent TPC for 0nu betabeta-decay search, Nucl. Instrum. Meth. A603 (2009) 337–348.
[39] A. Bolozdynya et. al., A high pressure xenon self-triggered scintillation driftchamber with 3D sensitivity in the range of 20-140 keV deposited energy, Nuc.Inst. Meth. A385 (1997) 225.
[40] J. White, A high pressure xenon chamber read with 7 PMTs, xxx. xxx (xxx) xxx.
172

[41] L. M. P. Fernandes et. al., Primary and secondary scintillation measurements in axenon Gas Proportional Scintillation Counter, JINST 5 (2010) P09006,[arXiv:1009.2719].
[42] C. Balan et. al., Micromegas operation in high pressure xenon: charge andscintillation readout, arXiv:1009.2960.
[43] D. Nygren, Optimal detectors for WIMP and 0νββ searches: Identicalhigh-pressure xenon gas TPCs?, Nucl. Instrum. Meth. A581 (2007) 632–642.
[44] U. Fano, Ionization Yield of Radiations. 2. The Fluctuations of the Number ofIons, Phys. Rev. 72 (1947) 26–29.
[45] L. Tavora, C. Conde, F. Santos, T. Dias, and P. Rachinhas, Intrinsic limitationsin the energy resolution of drift-field based radiation detectors: a Monte Carlosimulation study of Xe-filled counters, Rad. Phys. Chem. 71 (2004) 723–725.
[46] C. A. N. Conde, Gas Proportional Scintillation Counters for x-ray spectrometry.John Wiley & sons, 2004. Chapter 4.2 in X-ray Spectrometry: Recent TechnicalAdvances, K. Tsuji, J. Injuk and R. van Greiken, eds.
[47] C. A. N. Conde and A. J. P. L. Policarpo Nucl. Instr. Meth. 53 (1967) 7–12.
[48] G. Charpak, S. Majewski, and F. Sauli, The scintillating drift chamber: A newtool for high accuracy, very high rate particle localization, Nucl. Instr. Meth. 126(1975) 381.
[49] E. Aprile, A. I. Bolotnikov, A. I. Bolozdynya, and T. Doke, Noble gas detectors.Wiley-VCN, 2006.
[50] A. S. Tanaka, Y. Jursa and F. J. LeBlanc, Continuous Emission Spectra of RareGases in the Vacuum Ultraviolet Region II: Neon and Helium, Journal of theOptical Society of America 48 (1958) 304–308.
[51] C. A. B. Oliveira et. al., A simulation toolkit for electroluminescence assessmentin rare event experiments, arXiv:1103.6237.
[52] R. S. Mulliken, Potential Curves of Diatomic Rare-Gas Molecules and Their Ionswith Particular Reference to Xe∗2, JThe Journal of Chemical Physics 52 (1970)5170–5180.
[53] H. A. Koehler et. al., Vacuum-ultraviolet emission from high-pressure xenon andargon excited by high-current relativistic electron beams, Phys. Rev. A 9 (1974)768–780.
[54] http://garfield.web.cern.ch/garfield/.
173
[55] S. F. Biagi, Monte Carlo simulation of electron drift and diffusion in countinggases under the influence of electric and magnetic fields, Nucl. Inst. Meth. A 421(1999) 234–240.
[56] http://consult.cern.ch/writeup/magboltz/.
[57] T. H. V. T. Dias and others., Three-dimensional Monte Carlo calculation of theVUV electroluminescence and other electron transport parameters in xenon,Journal of Physics D 27 (1994) 42–48.
[58] C. M. B. Monteiro and others., Secondary scintillation yield in pure xenon,Journal of Instrumentation 2 (2007) P05001.
[59] The ArDM Collaboration, V. Boccone et. al., Development of wavelength shiftercoated reflectors for the ArDM argon dark matter detector, JINST 4 (2009)P06001, [arXiv:0904.0246].
[60] T. Dafni and I. Liubarsky, The Gas System for NEXT-10 and NEXT-100(Conceptual Design Report), tech. rep., NEXT Collaboration, 2010.
[61] “Unpublished Report.”.
[62] E. O’Dwyer, Radon Background Reduction in DEAP-1 and DEAP-3600. PhDthesis, Queens University-Kingston, Ontario, Canada, 2011.
[63] R. Walker for the ZEPLIN III Collaboration, “Electron Lifetime Monitor forZEPLIN III.”.
[64] RD51 Collaboration Collaboration, “Development of micro-pattern gasdetectors technologies.” http://rd51-public.web.cern.ch/rd51-public/.
[65] H. Mueller, What is SRS?, August 11th, 2010.
[66] K. Gnanvo et al. (including J. Toledo as co author), Detection and Imaging ofHigh-Z Materials with a Muon Tomography Station Using GEM Detectors, IEEENucl. Sci. Symp. Conference Records (2010) [arXiv:1011.3231].
[67] V. Herrero et. al., “AMIC: An Expandable Front-End for Gamma-ray Detectorswith Light Distribution Analysis Capabilities.” Presented at the IEEE Real TimeConference 2010.
[68] V. Herrero et. al., Position sensitive scintillator based detector improvements bymeans o an integrated front-end, NIM A604 (2009) 77–81.
[69] C. H. Lally, G. J. Davies, W. G. Jones, and N. J. T. Smith, UV quantumefficiencies of organic fluors, Nuclear Instruments and Methods in PhysicsResearch B 117 (1996) 421–427.
174