DETECTION AND ANALYSIS OF THE WOOD DECAY ...
441
DETECTION AND ANALYSIS OF THE WOOD DECAY FUNGUS LENTINUS LEPIDEUS FR. USING IMMUNOLOGICAL PROBES. Heather Glancy BSc. (Hons) This thesis is presented to the Council for National Academic Awards in partial fulfillment of the requirements for the award of the degree of Doctor of Philosophy. Department of Molecular and Life Sciences, Dundee Institute of Technology. October, 1990.
-
Upload
khangminh22 -
Category
Documents
-
view
2 -
download
0
Transcript of DETECTION AND ANALYSIS OF THE WOOD DECAY ...
DETECTION AND ANALYSIS OF THE WOOD DECAY FUNGUSLENTINUS LEPIDEUS FR. USING IMMUNOLOGICAL PROBES.
Heather Glancy BSc. (Hons)
This thesis is presented to the Council for National Academic Awards in partial fulfillment of the requirements for the award of the degree of Doctor of Philosophy.
Department of Molecular and Life Sciences, Dundee Institute of Technology.
October, 1990.
TO GERARD, BEN, ROBERT, SAM AND MY MOTHER - THANKS GUYS !
Acknowledgements.
I would like to express my sincere gratitude to my supervisors Drs John W. Palfreyman, David Button, Alan Bruce and Prof. Bernard King for their supervision and guidance throughout this project and for their constructive criticism of this manuscript. I would also like to thank my external advisor Dr A.J. Bravery of the Building Research Establishment for his advice.
In addition, I would like to extend my thanks to Mrs Ann Farrow for her help with the statistical analysis, Miss Mabel Clark for modifying the computer program Fungush Plot to enable me to produce computer maps of my field trial data and Mr George Hunter who produced the majority of my photographs.
I am very appreciative of the advice and encouragement given by my fellow research students and to the technical staff of the Department of Molecular and Life Sciences. Special thanks go to Mrs Anne Vigrow for all her help in preparing my field samples and for her much valued support and friendship.
Finally, special thanks are reserved for my family, Gerard, Ben, Robert, Sam and my mother for their continuing support andencouragement.
DETECTION AND ANALYSIS OF THE WOOD DECAY FUNGUS LENTINUS LEPIDEUS USING IMMUNOLOGICAL PROBES.Heather Glancy BSc. (Hons)Abstract.
Immunological probes (antibodies) were raised in New Zealand White rabbits against the wood decay fungus Lentinus lepideus Fr. and thereafter employed in a variety of immunological techniques to (i) develop an immunodetection system for the fungus and (ii) to analyse L. lepideus antigens. Preliminary experiments indicated that immunological techniques could be used to detect the fungus. Nitrocellulose-based systems proved to be the most sensitive and offered the greatest potential as a routine detection system for L. lepideus.
The cross-reactivity of the L. lepideus antiserum mirrored the degree of taxonomic relatedness between L. lepideus and the fungal isolates tested. Other L. lepideus strains and Lentinus species cross-reacted most strongly followed by in descending order of magnitude, brown rot basidiomycete fungi, white rot basidiomycete fungi and deuteromycete fungi.
Wood blocks artificially infected with L. lepideus were prepared, pine (Pinus sylvestris .L) and lime (Tilia vulgaris .Hayne) being chosen as a representative softwood and hardwood respectively. Conventional weight loss studies were carried out in tandem with immunological analysis. L. lepideus could be detected within extracts from wood blocks showing no, or minimal, weight loss. Immunocytochemical and immunofluorescence techniques proved useful in mapping the spread of L . lepideus within wood block sections.
A small field trial using nine creosote-treated distribution pole stubs was established. L. lepideus was identified within core sections removed from the poles using microbiological isolation techniques and the dot-immunobinding assay. A statistically significant level of association between positive microbiological isolations of the fungus and positive reactions in the immunoassay was found.
Chemical analysis and characterisation studies of L. lepideus antigens revealed that carbohydrate is the maj or fungal component with significant amounts of protein also being present. The majority of the antigens are glycoproteins although some protein antigens were identified. The antigenicity of the fungus varies with age and when cultured on different growth substrates.
The application of immunological techniques to the detection and analysis of L. lepideus and the potential of such techniques as a screening system for incipient fungal decay in creosote treated distribution poles is discussed.
CONTENTS. PAGE.CHAPTER 1. INTRODUCTION. 11.1. Wood. 21.2. Microorganisms associated with wood decay. 151.3. Decay of creosote treated timber by Lentinus lepideus Fr. 251.4. Importance of early detection of decay. 271.5. Methods of detecting fungal decay in wood. ■ 291.6. Immunoassays. 37
1.6.1. Application of immunological techniques in mycology. 381.7. Description and aims of project. 42CHAPTER 2. MATERIALS AND METHODS. 452.1. Fungal isolates. 462.2. Culture of organisms. 462.3. Production of fungal mycelium for freeze-drying. 482.4. Freeze-drying of fungi and antigen preparation. 482.5. The production of antisera against L. lepideus FPRL 7F 49
mycelium.2.5.1. The production of antisera to liquid cultures of 49
L. lepideus.2.5.2. The production of antisera to wood grown cultures of 50
L. lepideus.2.6. Determination of the titre and specificity of the antisera. 512.6.1. Immunodiffusion. 5 ?2.6.2. Indirect enzyme immunoassays. 562.6.2.1. Soluble antigen EIA. 562.6.2.2. Insoluble antigen EIA. 5§2.6.3. Dot-immunobinding assay. S*?2.6.4. SDS-PAGE electrophoresis and western blotting. 6o
2.7. Absorption of antisera. 6A2.8. Preparation of coverslips with adherent mycelium for 63
immunocytochemical and immunofluoresence staining.2.9. Wood block test systems. 6S’
2.9.1. Preparation and sterilisation of wood blocks. 652.9.2. Exposure of wood blocks to fungal mycelium. 6S2.9.3. Electron microscopy of wood blocks infected with 6?
L. lepideus.2.9.4. Preparation of wood block extracts/sections for 6>
immunological analysis.2.9.4.1. Dot-immunobinding assay / Radioimmunoassay. 6>2.9.4.2. Antigen capture assay. 682.9.4.3. Western blotting. 682.9.4.4. Staining methods. 68
2.10. Immunocytochemistry. 6°*2.11. Immunofluorescence. 1°2.12. Safranin/Picro-aniline blue staining of fungal mycelium 71
in wood sections.2.13. Radioimmunoassay of wood block extracts. IX
2.14. Antigen capture assay. 742.14.1. Purification of IgG from, antisera. 742.14.2. Conjugation of IgG to horse radish peroxidase enzyme. 762.14.3. Antigen capture assay protocol. 74
2.15. Isolation of fungal cell walls and extraction of wall 7fcomponents.
2.16. Characterisation of L. lepideus antigens. 782.16.1. Estimation of total protein content of L. lepideus
mycelium.2.16.2. Estimation of total carbohydrate content of 8°
L. lepideus mycelium.2.16.3. Effect of heat. 802.16.4. Enzymes. 812.16.5. Treatment of antigen extracts with sodium meta- 8JL
periodate.2.16.6. Lectins. 832.16.7. Effect of cultural conditions on L. lepideus 84
antigenicity.2.16.7.1. Effect of culture age. 842.16.7.2. Effect of incorporation of benomyl into growth 84
medium.2.16.7.3. Effect of different growth substrates. 842.16.8. Comparison of different antisera. 852.16.9. Staining of polyacrylamide gels. 852.16.9.1. Staining of gels for protein, 852.16.9.2. Staining of gels for carbohydrate. 8^
2.17. Exoantigen production. 862.18. Field trial. 8b2.18.1. Setting up of the field test site. 842.18.2. Screening of field trial samples. 8S
CHAPTER 3. APPLICATION OF IMMUNOLOGICAL TECHNIQUES TO THE 91ANALYSIS OF LENTINUS LEPIDEUS.
PAGE.
3.1. General introduction. 9A3.2. Immunodiffusion. 9*
3.2.1. Introduction. 92,3.2.2. Results. 953.2.2.1. Staining of immunodiffusion gels with Coomassie blue. 953.2.2.2. Amplification of immunoprecipitates in 9>
immunodiffusion gel by horse radish peroxidase labelled anti-rabbit IgG.
3.3. Enzyme immunoassays. 553.3.1. Introduction. 543.3.2. Results. 1013.3.2.1. Enzyme immunoassay to detect "soluble" antigens. 10*3.3.2.2. Enzyme immunoassay to detect "insoluble" antigens. 1043.3.2.3. Antigen capture assay. Ill
3.4. Dot-immunobinding assay. 1233.4.1. Introduction. 1233.4.2. Results. 121*3.4.2.1. The choice of chromogen. 127-3.4.2.2. Radioimmunoassay. 12%3.4.2.3. Quantitation. 1 3 0

3.5. SDS-PAGE electrophoresis and western blotting. 1333.5.1. Introduction. 133.3.5.2. Results. 1343.5.2.1. Gel systems. 1343.5.2.2. Protein staining of gels. 13 S3.5.2.3. Western blotting parameters. 13?*
3.6. Direct staining methods of fungal hyphae in wood sections 144 - immunocytochemical and immunofluorescence staining.
3.7. Discussion. 146CHAPTER 4. CHARACTERISATION OF LENTINUS LEPIDEUS ANTISERUM. 154
PAGE.
4.1. Introduction. 15tS4.2. Results. 1 ^
4.2.1. Determination of the titres of L. lepideus antiserum. ISSi4.2.1.1. Immunodiffusion. 13°*4.2.1.2. Dot-immunobinding assay. 1614.2.1.3. EIA for "soluble" antigens. 1614.2.2. Determination of the specificity of the L. lepideus 164
antiserum.4.2.2.1. Immunodiffusion. 1644.2.2.2. EIA for "soluble" antigens. 1684.2.2.3. EIA for "insoluble" antigens. 1734.2.2.4. Dot-immunobinding assay. 1744.2.3. Determination of the molecular specificity of the 181
L. lepideus antiserum.4.2.3.1. Western blotting. 1814.2.4. Absorption of antiserum. 201
4.3. Discussion. 203CHAPTER 5. CHARACTERISATION OF LENTINUS LEPIDEUS ANTIGENS. 2235.1. Introduction. 2245.2. Results. 226
5.2.1. Chemical characterisation of L. lepideus extract. 2265.2.1.1. Estimation of total protein content. 2265.2.1.2. Estimation of total carbohydrate content. 22^5.2.1.3. Staining of SDS-PAGE gels for protein. 221-5.2.2. Effect of cultural conditions on L. lepideus 23*i
antigenicity.5.2.2.1. Effect of culture age 23°l5.2.2.2. Effect of the incorporation of benomyl into the 23^
liquid culture growth medium.5.2.2.3. Comparison of antisera raised against mycelial 233
L. lepideus antigens and L. lepideus antigenscultured on lime wood blocks.
5.2.3. Determination of the chemical nature of individual 233L. lepideus antigen bands.
5.2.3.1. Enzyme hydrolysis. 2335.2.3.2. Binding of lectins. 24t>
5.3. Discussion. 24>
6.1. Introduction. 25*6.2. Results. 253
6.2.1. Weight loss in infected blocks. 2536.2.2. Immunological detection systems. 25S6.2.2.1. Dot-immunobinding assay. 2556.2.2.2. Radioimmunoassay.6.2.2.3. Antigen capture assay. 26*6.2.3. Direct staining techniques. 2656.2.3.1. Safranin/picro-aniline blue staining. 26®*6.2.3.2. Immunocytochemical staining. 27*6.2.3.3. Immunofluorescence staining. 2716.2.4. Electron microscopy. 276
6.3. Discussion. 28ACHAPTER 7. FIELD TRIAL STUDY. 296
PAGE.CHAPTER 6. APPLICATION OF IMMUNOLOGICAL TECHNIQUES TO THE 25^
DETECTION OF L. LEPIDEUS IN ARTIFICIALLY INFECTEDWOOD BLOCKS.
7.1. Introduction. A'nV7.2. Results.7.3. Discussion. 32PCHAPTER 8. GENERAL DISCUSSION. 33l
REFERENCES. 3 5?APPENDICES.PUBLICATIONS.
Abbreviations.AbABTSACAAECBLOTTOBSABS-1Con ADABEIAELISAFITCHRPiIgGkDMWMXAMXBNCNCSNDSNGSNRSPAGEPAPPBSPEGPISPPMPVPRIAsSASDSTTBSThTMBWCEWGA
antibody2,2'-azino-di(3-ethylbenzthiazoline-6-sulfonic acid) antigen capture assay 3-amino-9-ethyl carbazolebovine lacto transfer technique optimiserbovine serum albuminBandeirraea simplicifolia lectinconcanavalin A lectin3,3'-diaminobenzidineenzyme immunoassayenzyme-linked immunosorbent assayfluorescein isothiocyanatehorse radish peroxidaseL. lepideus "insoluble" antigen extractimmunoglobulin class Gkilodaltonmolecular weightmalt extract agarmalt extract brothnitrocellulosenewborn calf serumnormal donkey serumnormal goat serumnormal rabbit serumpolyacrylamide gel electrophoresisperoxidase-antiperoxidasephosphate buffered salinepolyethylene glycolp r e- immune s e rumparts per millionpolyvinyl pyrrolidoneradioimmunoassayL. lepideus "soluble" antigen extractsodium azidesodium dodecyl sulphatetween 20tris buffered saline Trichoderma harzianum extract 3,3*,5,5*-tetramethylbenz idine L. lepideus whole cell extract wheat germ agglutinin
CHAPTER 1. INTRODUCTION.
1.1. Wood.
Wood is one of the most widely used natural resources providing fuel and shelter. Wood and wood products are used in a variety of industries including paper manufacture, the production of synthetic textiles, building construction, production of decorative furnishings and as transmission/distribution poles. Properties such as toughness, strength, natural beauty and the renewability of wood ensure its continued use. The inherent problems of natural size limitation and fire hazard have largely been overcome, respectively, by the development of the laminated beam process, whereby planks of wood are glued together to give units of predetermined size and strength and the development of flame retardant treatments (Bruce, 1983).
However, the use of wood and wood products has a further disadvantage, susceptibility to deterioration by environmental factors. Physical, chemical and biological factors including mechanical wear, weather damage, chemical decomposition and most importantly attack by insects and microorganisms, all can have a deleterious affect on wood. Overcoming the detrimental effects of these biological factors can greatly enhance the durability of timber, for example, in Scandinavia and parts of Russia, very low temperatures have enabled certain wooden buildings to remain in a good condition for more than a 1000 years (King, 1981).
1.2. The chemistry and biochemistry of wood decay.
The microorganisms that decompose wood do so to gain food and energy for growth and reproduction. They bring about changes in the high molecular weight polymers that make up wood cell
walls, ultimately degrading them to small molecules which can be ingested and serve as sources of energy, nitrogen and carbon. The specific changes they cause produce the gross changes in physical properties associated with decay.
1.2.1. The chemical composition of wood.
Wood is made up mainly of three polymeric materials: cellulose, the hemicelluloses and lignin. Other substances such as nitrogenous materials, pectins, starch, low molecular weight sugars and minerals (e.g. Fe, Mg and Mn ions) are also present.In addition, a variety of extraneous materials (lignans, terpenes and polyphenols are found in varying amounts depending upon the wood type (Kirk, 1973). Pectin, starch and the low molecular weight carbohydrates may be especially important as initial carbon sources for the establishment of decay microorganisms in wood (Nayagam, 1987). Nitrogenous materials, present usually in minimal quantities in wood, are essential for the growth and activities of wood-rotting organisms and therefore exert considerable influence on the rate of decay. It has been postulated that wood-rotting fungi utilise their own autolytic products to conserve nitrogen (Levi et al., 1968) and that they can adapt their physiologies by preferential allocation of valuable nitrogen reserves to the production of enzymes for substrate utilisation (Levi and Cowling, 1969). Certain
extractive components of wood are toxic to wood-rotting microorganisms and these also have an important role in the decay process. The variation in decay susceptibility of the different wood species is due, in part, to the presence of extractive components (Scheffer and Cowling, 1966) .
The relative amounts of the major structural components in a common angiosperm (hardwood) and a common gymnosperm (softwood) are shown in Table 1.1.
Temperate zone hardwoods generally contain 17-24% lignin whereas softwoods vary between 25-34% lignin. The cellulose content of most temperate zone woods is between 40-50%, the hemicelluloses comprise the remainder (Kirk, 1973). A brief review of the chemical structures of cellulose, lignin and the major hemicelluloses is presented in the following sections.
1.2.1.1. Cellulose.
Cellulose is a linear polymer of anhydro-D-glucopyranose units linked by beta(l-4) glycosidic bonds. Each molecule of wood cellulose contains an average of about 7-10,000 glucose residues (Kirk, 1973). The physical structure of cellulose is less certain. In the cell walls of plants the cellulose molecules are organised into linear bundles called elementary fibres. Within these fibres the molecules are bound laterally by numerous hydrogen bonds, which in aggregate produce strong interactions. This association and near perfect alignment gives rise to crystallinity. X-ray diffraction measurements of wood cell wall cellulose indicates that it is approximately 70% crystalline but
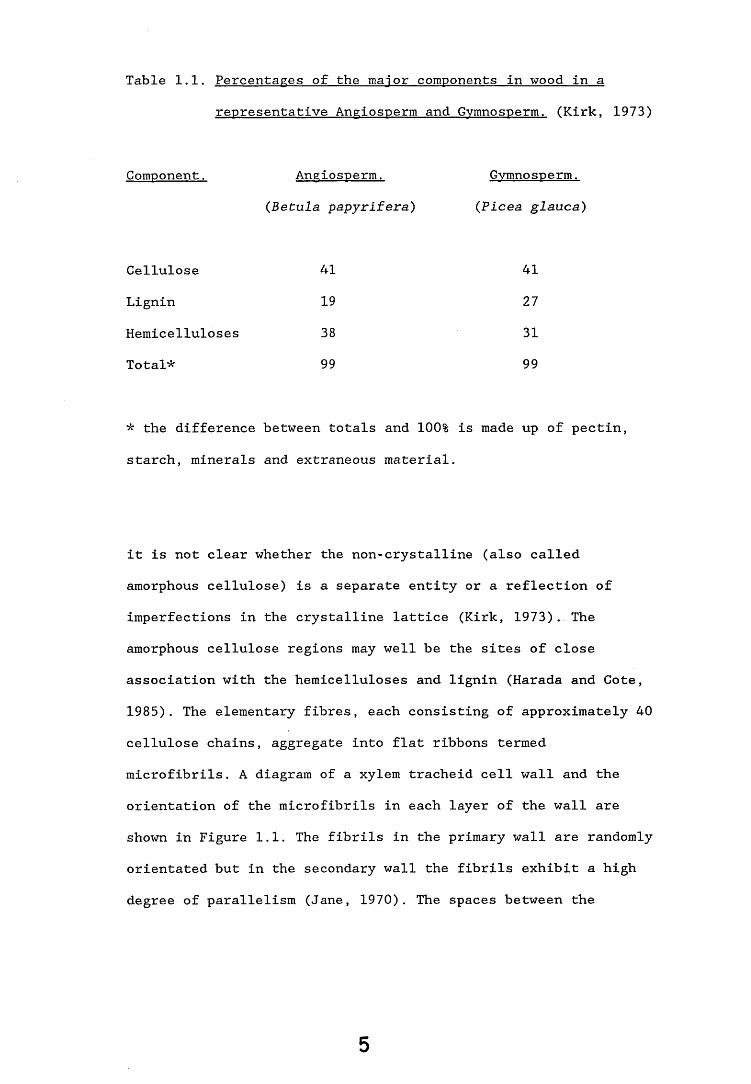
Table 1.1. Percentages of the major components in wood in arepresentative Angiosperm and Gvmnosperm. (Kirk, 1973)
Component. Angiosperm. Gvmnosperm.(Betula papyrifera) (Picea glauca)
Cellulose 41 41Lignin 19 27Hemicelluloses 38 31Total* 99 99
* the difference between totals and 100% is made up of pectinstarch, minerals and extraneous material.
it is not clear whether the non-crystalline (also called amorphous cellulose) is a separate entity or a reflection of imperfections in the crystalline lattice (Kirk, 1973) ... The amorphous cellulose regions may well be the sites of close association with the hemicelluloses and lignin (Harada and Cote, 1985). The elementary fibres, each consisting of approximately 40 cellulose chains, aggregate into flat ribbons termed microfibrils. A diagram of a xylem tracheid cell wall and the orientation of the microfibrils in each layer of the wall are shown in Figure 1.1. The fibrils in the primary wall are randomly orientated but in the secondary wall the fibrils exhibit a high degree of parallelism (Jane, 1970). The spaces between the
5
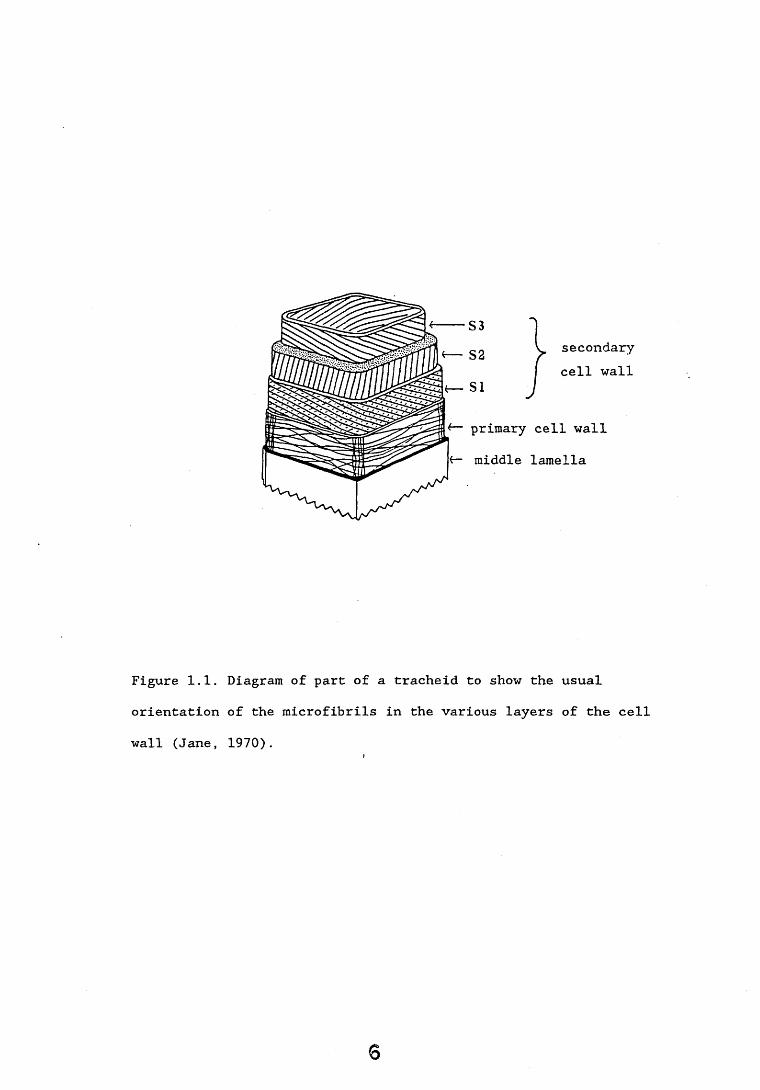
S3S2SI
secondary cell wall
primary cell wall middle lamella
Figure 1.1. orientation wall (Jane,
Diagram of part of a tracheid to show the of the microfibrils in the various layers1970).
6
usualof the cell
microfibrils in the cell walls are filled with hygroscopic hemicelluloses and lignin. The exact associations between the three components are not known.
1.2.1.2. Hemicelluloses.
Hemicelluloses are polymers of anhydro sugar units linked by beta(l-4) glycosidic bonds. A given hemicellulose may contain several different sugar residues. Hemicelluloses tend to be branched and are of a much lower molecular weight than cellulose. The major hemicelluloses of wood are polymers of D-glucose, D-galactose, L-arabinose, D-xylose and 4-0-methyl-D-glucoronic acid (Dekker, 1985). Softwoods and hardwoods differ in the dominant hemicelluloses present.
In hardwoods, the major hemicellulose present (20-35% of wood) is O-acetyl-4-O-methyl glucoronoxylan (Kirk, 1973, Meier, 1985). This is made up of a backbone of xylan (200 residues) linked beta(l-4). The xylan polymer may be slightly branched and is substituted at irregular intervals with 4-O-methylglucoronic acid residues. Acetyl groups are also distributed along the xylan backbone with approximately 7 out of 10 xylose residues being substituted. The second important hemicellulose in hardwoods (3-5% of wood) is a glucomannan (Kirk, 1973, Meier, 1985). This is a polymer of glucose and mannose in a ratio of 1:1 or 1:2 and linked beta(l-4). The polymer is essentially linear, the sequential arrangement of glucose and mannose is not known but is assumed to be random.
The major hemicellulose of softwoods (12-18% of wood) are the O-acetylgalactoglucomannans (Kirk, 1973, Meier, 1985). These
consist of a backbone of glucose and mannose residues linked

beta(l-4), with galactose residues and acetyl groups substituted along the length of the backbone. The ratio of glucose:mannose is usually 2:7, the amount of galactose is generally low but may vary considerably. The backbone is at least 150 residues long and may be branched. Softwoods also contain the hemicellulose arabino-4-O-methyl glucoronoxylan (7-14% of wood) which is similar to the major hemicellulose present in hardwoods (Kirk, 1973). The backbone xylan chain is substituted not only with 4-0-methylglucoronic acid residues but also with arabinose residues, acetyl groups are absent. A glucoronic acid residue is substituted every 5-6 xylose residues and an arabinose residue is substituted every 8-9 xylose residues.
Both softwoods and hardwoods also contain other hemicelluloses but these are present only in very small quantities. Some can be extracted from wood with water and these, like the low molecular weight sugars, pectin and starch, may be important in helping decay microorganisms to become established (Nayagam, 1987). The hemicelluloses are present in an amorphous state in the cell walls and together with lignin form a matrix which surrounds the cellulose microfibrils.
1.2.1.3. Lignin.
Lignin is an amorphous, highly branched three-dimensional polymer composed of oxyphenylpropane units derived from three substituted cinnamyl alcohols: p-coumaryl, coniferyl and sinapyl alcohols (Kirk, 1973). The proportions of the three alcohols vary considerably between softwoods and hardwoods and also among the various hardwood species. In a polymerisation process that involves primarily radical coupling, these starting materials are
8
combined to form the lignin polymer (Kirk, 1973, Kirk and Fenn, 1982). The polymerisation process is such that the chemical bonds linking the individual phenylpropane units together are of several different types. This, as well as the fact three cinnamyl alcohols are involved and that secondary reactions can occur, leads to the complexity of lignin.
About 70% of lignin in woody plant cells is located in the secondary wall layers. The rest of the lignin is located in the thin middle lamella regions where it is the main constituent.
1.2.2. Distribution of the major structural components across the the cell walls.
The lignin, hemicelluloses and cellulose are not uniformly distributed across the wood cell walls.
In the fibres of Betula papyrifera (birch, a hardwood), the secondary wall contains 16-19% lignin, the middle lamella contains 34-40% lignin and the cell corners contain 72-85% lignin (Fergus and Goring, 1970). The structure of the lignin differs substantially between the secondary wall and the middle lamellacell corner regions because different proportions of the cinnamyl alcohols are involved. Cellulose constitutes approximately 41% of the polysaccharides in the middle lamella/primary cell wall layer of Betula fibres, the remainder being hemicelluloses. Between 48-60% of the polysaccharides in the secondary cell wall is cellulose, the highest concentrations of which are nearest the cell lumina. Hemicelluloses, by contrast compose 40-52% of the polysaccharides and are in the lowest concentration nearest the lumina (Kirk, 1973).
In Picea mariana (spruce, a softwood) tracheids, the
9
distribution of lignin differs between earlywood and latewood. In both, the secondary walls contain about 22% lignin. In latewood, the middle lamella is about 60% lignin and the cell corners are essentially 100% lignin, whereas in earlywood the middle lamella is about 50% lignin and the cell corners about 85% lignin (Fergus et al., 1969). The structure of the lignin within the different regions is much more similar in spruce than in birch. About 33% of the polysaccharides in the middle lamella/primary cell wall region of the Picea tracheids is cellulose, the remainder being hemicelluloses. In the secondary cell wall, cellulose accounts for between 55-64% of the polysaccharides, the highest concentration being nearest the lumina. Hemicelluloses comprise 36-45% of the polysaccharides with the lowest concentration being nearest the lumina. Differences between earlywood and latewood in the distribution of polysaccharides across the cell wall are minor (Kirk, 1973).
1.2.3. Biochemistry of wood decay.
Most of the degradative reactions involved in wood decay are enzyme-catalysed. Some of the enzymes involved have been partially purified and characterised. They are relatively large complexes with subunits in excess of MW 10,000 and it is likely that they are at least partially induced. For example, cellulytic microorganisms grown on glucose release only traces of beta(l-4)-glucanases. However, when the organisms are grown on cellulose they produce the enzyme in substantial amounts (Kirk,
1973) .Several factors can affect the enzymatic degradation of
wood.
1. Moisture content.Wood will not decay unless the moisture content is at least
above fibre saturation point, usually around 30% of the initial oven dry weight of the wood. The hydration of the wood has several consequences; swelling of the wood polymers creates openings in the polymer matrix which do not exist in dry wood, and enlarges existing openings. These effects are necessary to allow the diffusion of enzymes. Furthermore, the water acts as a continuum between the organism and the substrate. Water is also required as a reactant in hydrolytic reactions (Kirk, 1973).
2. Size of enzymes/openings in wood.The natural openings in water swollen wood e.g. lumina and
pit apertures are large enough (200-1000nm diameter) to permit easy access of organisms and their enzymes. However, the highly structured crystalline nature of the wood cell wall means that the enzymes (cellulytic enzymes are on average 5nm in diameter) are unable to penetrate through the small apertures (approximately lnm in diameter) in the cell walls of the wood tracheids. These problems of accessibility must be overcome to allow degradation within the cell wall, presumably through some mechanism of enlargement of the openings (Kirk, 1973). 3 *
3. Conformation and rigidity of wood polymers.It is likely that enzymatic attack is hindered not only by
inaccessibility, but also by steric rigidity and unfavourable conformations caused by the close association of the wood polymers. Crystalline cellulose, with its rigid orientation of glucose units, is apparently not favourable to attack by enzymes (Kirk, 1973). Probably considerable portions of the lignin and
hemicelluloses are also sterically orientated in such a way so as to hinder interaction with enzymes. Degradation of the wood by enzymes would depend on the disruption of the protective association between the polymers. The enzymatic removal of any single component, is unlikely to be possible without the alteration or subsequent removal of another component.
4. Structural interrelationships of the wood polymers.Intact untreated wood is resistant to degradation by
polysaccharidases that can rapidly degrade isolated wood polysaccharides (Kirk, 1973). This has been attributed to the interrelationship between the polysaccharides and lignin in the wood structure. If lignin is even partially removed, or modified sufficiently, the polysaccharides become much more susceptible to the enzymes that degrade them in isolation. Indeed, wood-rotting fungi causing the three different types of rot i.e. soft, white and brown rot, all alter lignin even though they do not all metabolise it (Nilsson, 1988), 5
5. The presence of substituent groups.Contact is required between substrate and enzyme and most
enzymes are very substrate specific. Therefore, almost any synthetic modification of the substrate will reduce or prevent effective contact of enzymes at reaction sites. Thus substitution, such as acetylation or cyanoethylation, of polysaccharides decreases their susceptibility to enzymatic hydrolysis (Kirk, 1973). Wood-rotting fungi have evolved with the capacity to accommodate the naturally occurring substituent groups found in lignin and the hemicelluloses, although it may be expected that organisms vary in their ability to cope with
specific substituent groups. It has been shown that wood can be protected from wood-rotting fungi by acetylation, cyanoethylation, and other treatments which do not significantly alter its physical properties (Goldstein et al., 1961, Rowell et al., 1987).
1.2.3.1. Action of polvsaccharidase enzymes.
Most studies on the mechanism of action of polysaccharidase enzymes have been carried out on cellulases since cellulose is the major constituent of wood. Although less work has been carried out on hemicellulases, the mode of action of the two classes of enzyme appears to be similar (Kirk, 1973). It has been shown that varying types and numbers of cellulase enzymes are produced by different organisms in response to the same substrate (Montgomery, 1982). There are two main types of cellulases, exoglucanases and endoglucanases. Exoglucanases hydrolyse glucose or cellobiose residues from the end of the polyglucose chain. The enzyme must become attached to the end of the chain in order to remove the glucose units, therefore, the enzyme is ineffective against crystalline cellulose since the ends are not sufficiently exposed (Montgomery, 1982). Endoglucanases act randomly within the cellulose chain breaking the chemical bonds and thus creating free ends to which the exoglucanases can bind. The two types of enzyme act synergistically. The current concept of cellulose degradation is that the endoglucanases break the bonds within the crystalline cellulose enabling the exoglucanases to catalyse
hydrolysis from the exposed ends (Montgomery, 1982). The specific mechanisms of polysaccharide degradation by the various wood-rotting organisms will be discussed later.
1.2.3.2. Lignin degradation.
Our current understanding of lignin degradation stems from elucidation of the chemical and physical characterisation of partially degraded lignin isolated and purified from rotted wood. However, the chemistry and biochemistry of lignin degradation is far from being fully understood. Work has been restricted mainly to relatively few white rot basidiomycete fungi although it has shown that soft rot fungi, some deuteromycete fungi and certain bacteria can all degrade lignin (Crawford, 1981). The interpretation of the data has concluded that, at least in certain white rot basidiomycete fungi, oxidative attack of both aliphatic side chains and aromatic nuclei still attached to the polymer, is the method of lignin degradation (Kirk and Fenn,1982) . Lignin degradation is associated with secondary metabolism (metabolic activities that occur only after primary growth is complete) (Crawford, 1981). High levels of nitrogen are inhibitory to lignin degradation since they enable organisms to maintain primary metabolism. Growth is continued and the establishment of secondary metabolism and hence lignin degradation prevented (Keyser et al., 1978). When lignin degrading basidiomycete fungi invade a woody substrate, primary growth is initially only a transient stage, involving the establishment of hyphae. Non-structural components of wood serve as the initial substrate for primary growth. Nitrogen rapidly becomes limiting and secondary metabolism, including lignin
14
degradation, begins. As the fungus spreads throughout the wood substrate there will be hyphae at all stages of development i.e. primary growth, secondary metabolism and senescence. Growth can therefore occur alongside lignin degradation but not as a direct consequence of it (Kirk et al., 1976). Removal of the lignin further exposes cellulose and the hemicelluloses, and the progressive decay of these wood components ensues.
1.3. Microorganisms associated with wood decay.
Microorganisms can have a variety of effects on wood all of which can come under the heading of "decay". These effects range
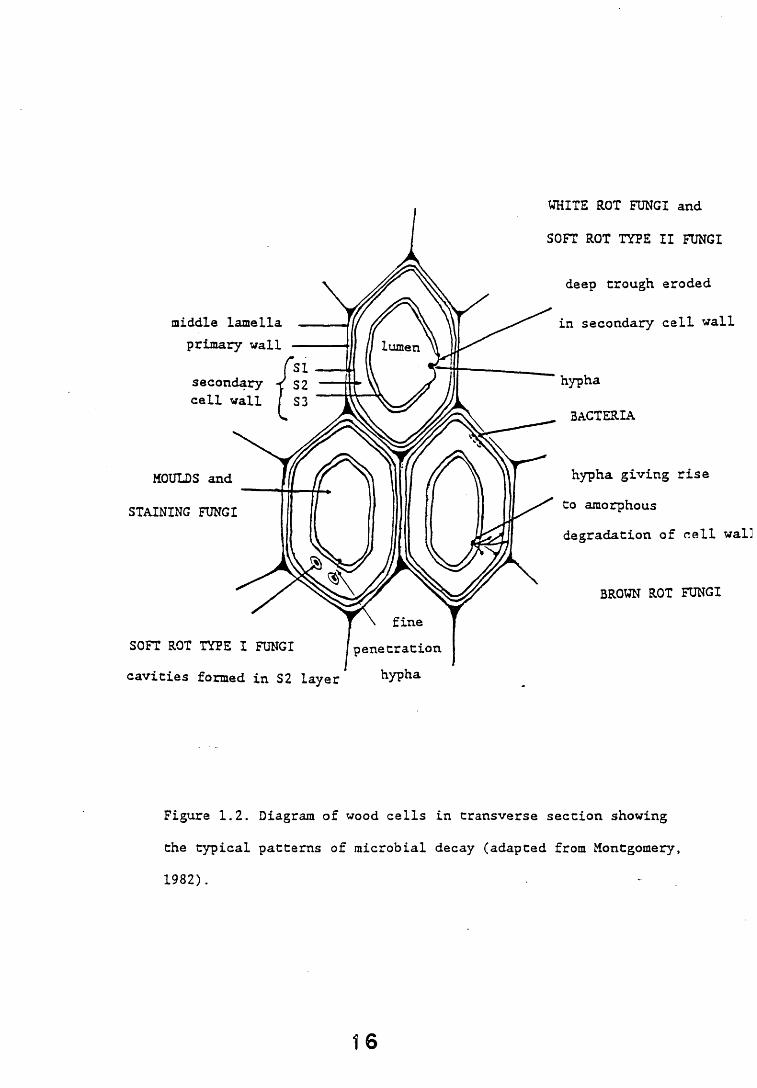
from the simple utilisation of soluble nutrients within the wood, to the degradation of wood components and ultimately the loss of structural elements causing the production of wood rot. Studies on microorganisms colonising wood and on the sequence of events leading to the onset of decay have shown the importance of categorising the species involved, irrespective of taxonomic identity, into a small number of groups relevant to their effect on the wood. Six such groups have been recognised, these comprise bacteria, primary moulds, "stainers", soft rot fungi, basidiomycete fungi (white and brown rots) and secondary moulds (Levy, 1982). A diagrammatic representation of a wood cell showing the composition and typical microbial decay patterns is shown (Figure 1.2).
WHITE ROT FUNGI and
SOFT ROT TYPE II FUNGI
deep trough eroded
in secondary cell wall
hypha
BACTERIA
hypha giving rise to amorphousdegradation of cell wall
BROWN ROT FUNGI
Figure 1.2. Diagram of wood cells in transverse section showing the typical patterns of microbial decay (adapted from Montgomery,1982).
16
1.3.1. Bacteria.
A wide range of bacterial species have been isolated from wood including Micrococcus spp (Lutz et al. , 1966), Bacillus spp, Pseudomonas spp (McCreary et al., 1965) and Serratia spp (Greaves, 1970). Actinomycetes, such as Streptomyces spp, have also been shown to decay wood (Baecker, 1981). These organisms are usually the first colonizers of wood, especially when wet. They have been shown to increase the permeability of woods (Levy, 1982) and this has been attributed to the partial, or total, destruction of pit membranes by bacteria. The opening up of pit membranes can result in less anaerobic conditions within the wood and may also give access to microorganisms incapable of causing lysis of of the cell walls or pits (Levy and Dickinson, 1981).The fixation of atmospheric nitrogen in wood by some bacteria has been reported (Levy, 1982). This may provide an additional source of nitrogen to supplement the low levels normally found in wood. Bacteria can cause significant degradation of the wood cell wall, primarily in the S2 layer (Nilsson and Daniel, 1983, Nilsson and Singh, 1984). In contrast to fungal decay organisms, wood degrading bacteria, with the exception of some actinomycetes, have not yet been isolated in pure culture. Investigations on bacterial degradation of wood have been restricted to decay caused by a mixed flora in natural environments.
17j
1.3.2. Primary moulds.
These organisms are the first fungal colonists of wood and can be regarded as akin to Garrett's sugar fungi (Garrett, 1955) They do not possess enzymes capable of degrading wood and their nutrient source is primarily the sugars or simple carbohydrates present in the ray parenchyma or derived from soil. They can penetrate wood only through natural openings, such as end-grain apertures, or those made by other microorganisms, i.e. through pits after bacteria have destroyed the membranes. Phycomycetes, ascomycetes and fungi imperfecti are all represented in this group.
1.3.3. "Stainers”.
"Stainers" can be subdivided into "moulds" and "staining fungi" (King and Oxley, 1975). These fungi generally colonise the sapwood of freshly felled timber that has been stored under poor drying conditions. "Mould" fungi produce a superficial discolouration by sporulation which may be easily planed or brushed off, however they may also penetrate deeply into the wood. The "staining fungi", for example Ceratocystis spp in pine (Dickinson, 1982), cause a deeply penetrating, dark stain produced by dark pigmentation of the mycelium or by chemical reaction with the wood (King and Oxley, 1975). These discolourations result in aesthetic defects of timber and the subsequent economic devaluation of the wood. The fungi colonise the ray parenchyma cells of the sapwood utilising the cell contents and the stored food reserves of the tree (e.g. starch)
1
as a nutrient source. These organisms can penetrate through cell walls by fine constriction of the hyphae, normal size and shape is resumed upon emergence into the lumen. In this way the hyphae are able to pass from one ray cell to another in a horizontal tangential direction through the intervening cells and cell
walls. Scheffer and Cowling (1966) have suggested that most "stainers" could cause soft rot (see section 1.3.4.) under prolonged, favourable conditions. Ascomycetes and fungi imperfecti are the major representatives in this group.
1.3.4. Soft rot fungi.
Savory (1954) proposed that the term "soft rot" should be used for
"decay caused by cellulose-destroying microfungi to distinguish it from the brown and white rots caused by wood-destroying Basidiomycetes".
The term "soft rot" was proposed because it had been observed that the wood surface was very soft when degraded by microfungi. Currently all types of wood degradation caused by microfungi are classified as soft rot, regardless of whether the wood surfaces are softened or not (Nilsson, 1976).
Microfungi produce two morphologically distinct types of degradation in wood. One, called Type I attack (Corbett, 1965) is characterised by the formation of cavities within the S2 layer of the wood cell wall. Chaetomium globosum (Levi, 1965, Levi and Preston, 1965), Graphium spp and Monodictys spp (Eslyn et al., 1975) are some of the most commonly studied type I attack fungi. The other, called Type II attack (Corbett, 1965), as typified by
Alternaria spp (Levi, 1965), is characterised by the erosion of
19
the cell walls starting from the lumen. The cell wall degrading enzymes are secreted by the hyphae present in the cell lumen. These enzymes can then act directly on the luminal walls causing the typical erosion pattern, similar to white rot degradation (see section 1.3.5.1). Cavity formation is the more complicated degradative process and this decay pattern is restricted to a specialised group of microfungi, whereas the erosion form of attack appears to be much more common among wood-degrading microfungi (Nilsson, 1976).
The fungi primarily degrade the polysaccharide fractions of the cell wall although lignin is also depleted but at a much slower rate. The soft rot fungi are the first wood-rotting fungi to colonise wood in ground contact (Levy, 1982). They become established where there is little competition from other fungi and can cause economic losses of timber. However, where basidiomycete fungi are able to establish dominance, the soft rot fungi rarely become the main causal organisms of fungal decay.
1.3.5. Basidiomvcete fungi.
Basidiomycete fungi, commonly termed wood-rotting fungi, are responsible for the greatest loss of strength and durability of wood in temperate climates. Severe economic losses of timber can result from the decay caused by these organisms.The fungi are separated into two groups, the white rotsand the brown rots, dependent on the pattern of decay produced.
2 0
1.3.5.1. White rot funsi.
White rot fungi are capable of utilising all the major components of wood, cellulose, the hemicelluloses and lignin (Kirk, 1973) . The relative amounts of the individual components degraded and utilised by specific white rots vary, as does the order of preferential attack (Eriksson and Wood, 1985). The hyphae of the white rot fungi penetrate into the cell lumen and lie on the inner surface of the wood cell wall. Lysis of the wall occurs along the area of hyphal contact, forming a groove or trough with a central ridge upon which the hypha rests. As the hyphae branch, new troughs are formed which eventually coalesce and cause the erosion of the wood cell wall (Levy, 1982) .The formation of troughs in the cell wall by the white rot fungi suggests that some restriction of free diffusion of the enzymes away from the hyphae occurs. Retention of the enzymes about the hypha would be beneficial to the organism as in a nitrogen-limiting system protein loss would be minimised (Montgomery, 1982). The white rot fungus Coriolus versicolor has been shown to possess an extracellular mucilagenous layer which may provide a binding site for the polysaccharidase enzymes (Montgomery, 1982). This would be consistent with the ability of white rot fungi to limit the degradation of the cell wall to a region in close association with the fungal hyphae.
The enzymatic degradation of wood cell wall polysaccharides is essentially as described in section 1.2.3.1. Enzymes of Sporotrichum pulverulentum can be used as model polysaccharidase enzymes since they have been extensively researched. To date, the
following enzymes have been isolated and characterised.
i. Five endo-l-4-beta-glucanases (Eriksson and Pettersson,1975a), that attack the cellulose chain at random hydrolysing the beta(l-4) linkages.ii. One exo-l-4-beta-glucanase (Eriksson and Pettersson, 1975b), that splits off either cellobiose or glucose residues from the non-reducing end of the cellulose.iii. Two 1-4-beta-glucosidases (Deshpande et al., 1978) that hydrolyse cellobiose and other water-soluble cellodextrins to glucose.The white rot fungi cause a gradual decrease in the degree of polymerisation (DP) of the cellulose as degradation proceeds (Kirk, 1973).
The mechanism of hemicellulose degradation is probably similar to that of cellulose. Beta(l-4)-xylanase,Beta(l-4)-mannanase, Beta(l-4)-xylosidase and Beta(l-4)-mannosidase activities have been demonstrated in culture filtrates of the white rot fungi Heterobasidion annosum (syn. Fomes annosus), Stereum sanguinolentum, and Chrysosporium lignorum (Kirk, 1973).
1.3.5.2. Brown rot fungi.
Brown rot fungi utilise the polysaccharide components of the wood cell wall and although the fungi are incapable of degrading lignin they do modify it, mainly by the removal of methoxyl groups (Ander and Eriksson, 1978). The hyphae penetrate the lumen and lie on the inner surface of the cell wall. Scanning electron micrographs of wood degraded by brown rot fungi show that the S3
layer adjacent to the lumen is changed very little but the other cell wall layers are completely altered, that is, the
22

polysaccharide degradation occurs at some distance from the fungal hyphae (Eriksson et al., 1980). This is in contrast to white and soft rot degradation which are closely associated with the fungal hyphae. Brown rot attack is characterised by a gradual thinning of the wood cell wall as polysaccharides are removed, eventually all that remains is a brown friable residue consisting of mainly modified lignin.
Recent observations suggest that brown rot basidiomycetes degrade polysaccharides by a mechanism different from that of other fungi. Brown rot fungi produce endo-l-4-beta-glucanases but seem to lack the exo-l-4-beta-glucanases (Highley, 1975). Therefore, brown rot fungi cannot degrade crystalline cellulose by the synergistic action of endo- and exo-glucanases, as is the case for white rot fungi. In the initial stages of brown rot attack there is a rapid decrease in the DP of cellulose. This rapid decrease in the cellulose chain length implies that the catalyst that facilitates the depolymerisation readily gains access to the cellulose chains. It has been reported by several authors that brown rot fungi oxidise cellulose (Koenigs, 1974a). It is therefore an attractive hypothesis that their initial attack on cellulose takes place via a chemical agent of low molecular weight, which can easily diffuse through the wood fibre walls rather than via an enzyme with limited diffusibility.
A 0.4% solution of hydrogen peroxide in 0.2M ferroussulphate at pH 4.2 can solubilise cotton fibres at a rate ofabout 5mg per 7 days (Montgomery, 1982). Koenigs (1974b) has
2+shown that wood breakdown by a H^O^/Fe system was very similar to that of brown rot fungi. Futhermore, it has been reported that brown rot fungi do indeed produce hydrogen peroxide (Koenigs, 1972, 1974a). Functioning alone H O acts very slowly, but a
23
/Fe system works much more quickly. It has been estimated that3 +there is enough Fe present to sustain decomposition in decaying
wood, though this would have to be enzymatically converted to the2+active Fe form (Montgomery, 1982). The hydrogen peroxide could
be produced by the oxidation of sugars to sugar lactones by thefungal enzymes. The need for such a reaction would explain thefindings of Highley (1978) that Poria placenta was unable todegrade crystalline cellulose unless other polysaccharides (suchas hemicelluloses) were present. Highley (1977, 1978) concludedthat there was strong evidence that brown rot fungi employ anon-protein oxidative mechanism to breakdown cellulose in wood.In addition, he found that washing culture solids in a variety ofchemical reagents failed to liberate further activity indicatingthat immobilised enzymes, associated with the fungal hyphae, werenot implicated in this type of rot.
2+If a H^O^/Fe cellulose degrading system exists in brown rot fungi a suitable safety mechanism must also have evolved since hydrogen peroxide is highly toxic to living cells. It can form free radicals, by homolytic cleavage, that rapidly attack lipid membranes (Montgomery, 1982). The localisation of polysaccharide degradation at some distance from brown rot hyphae may well be a protective mechanism.
1.3.6. Secondary moulds.
This group includes all those fungi which do not appear to be able to degrade wood but possess an active cellulase system, as exemplified by the clearance of ball-milled cellulose in agar culture (Levy, 1982). They are unable to degrade cellulose when it is intimately associated with the other wood polymers (lignin
24
and hemicelluloses) but can degrade isolated cellulose. Their position in the succession appears to be associated with the eventual dominance of the decay fungi, particularly the basidiomycetes. The role of these "secondary moulds", predominantly Trichoderma viride and Gliocladium roseum (Levy, 1982), is probably one of utilising the cellulose, derived from the breakdown of wood, which is excess to the requirements of the decay fungus. Alternatively, there may be competition between the two groups for the partially decayed substrate.
1.4. Decay of creosote-treated timber by Lentinus levideus.
The increasing cost and limited availability of mature timber are important reasons for prolonging the in-service life of commercial timbers. The potential for degradation of wood in contact with the ground has been appreciated for many years and it has been reported that untreated sapwood in ground contact may be totally degraded within five years (Dickinson, 1982) . Commercial timbers used in this situation are normally of a known durable species or treated with wood preservatives. Coal tar creosote is the oldest industrial wood preservative having been employed throughout the world for almost 150 years (Wilkinson, 1979) . It is a highly effective preservative and can protect timber from splitting and weathering, also since creosote is insoluble in water it is resistant to leaching. The majority of distribution poles in the UK have been preserved with creosote and service lives in excess of 60 years can be expected if poles
■25
are adequately treated.The principal fungus causing the decay of creosote treated
wood is Lentinus lepideus Fr. This fungus is widely distributed in Europe and North America, it is not very common in forests being found occasionally on coniferous stumps, nevertheless this fungus occurs frequently on worked timber that has been inadequately creosoted. L. lepideus is often associated with the decay of railway sleepers, distribution poles and paving blocks as well as being an important factor in the decay of timber in mines. If the spores of this fungus can gain access, through checks and cracks etc, to untreated wood in the interior of the timber, decay will spread throughout the whole piece since the organism can readily attack pine heartwood (Cartwright and Findlay, 1958). L. lepideus is a brown rot basidiomycete. At early stages of colonisation there are little visible signs of decay, but in the advanced stage the wood darkens and breaks up by cracking along and across the grain. However, in some cases, wood in an advanced state of decay can appear superficially sound with a skin of well preserved sapwood (Bruce, 1983). When fresh, wood decayed by L. lepideus has quite a characteristic strong aromatic smell, resembling that of Peru balsam, which can be used as an aid in identification (Birkinshaw and Findlay, 1940).
The dominance of L. lepideus in causing decay of creosote treated timber has been attributed to its remarkable resistance to creosote (Cartwright and Findlay, 1958). The toxic threshold of creosote for L. lepideus (19kg per cubic metre of wood) was significantly higher than that of other wood decay fungi tested (Cockcroft, 1974). Birkinshaw and Findlay (1940) have suggested that the resistance to creosote may be connected with the ability
of the fungus to elaborate aromatic substances such as
26
p-methoxycinnamic acid and anisic acid which are methoxyl derivatives of phenolic acids. Possibly the fungus may apply the same method to the phenolic constituents of creosote, which are presumably the most active fungicidal agents present and thus affect at least partial detoxification. Methylation is a method of detoxifying harmful substances often found in plants (Birkinshaw and Findlay, 1940).
1.5. Importance of early detection of decay.
For the purposes of this study the term "incipient decay" refers to the early stages of fungal colonisation and decay of wood occurring prior to strength loss and/or structural degradation within the wood.
The detection of incipient decay in distribution poles is required for two reasons. Firstly, decaying poles represent a serious public safety hazard. Kennedy (1958) has shown that strength losses of up to 50% can occur even at the very early stages of decay. Loss of strength has serious implications for the safety of workers who have to climb poles to service and repair power/telephone lines. Disruption of the power supply and telephone system can also occur when such poles fail in service. Secondly, there are strong financial reasons why the early detection of decay is required. There are approximately 6 million distribution poles in the UK (Bruce, 1983) each with a replacement cost of upwards of £300. Dickinson (1982) has carried out a small survey of 300 poles and estimated approximately 5% were affected by decay. If this figure is applied to the total pole population of the UK then approximately 300,000 poles may be affected by decay with a replacement cost in excess of £90 million. In the USA
it has been estimated that 20% (approximately 25 million poles) need replacing at an estimated cost of 23 billion dollars (Hayes, 1986). Minimising the rate of pole replacement not only reduces user costs but, equally significant, also reduces the consumption of a natural renewable resource, effectively increasing wood supply.
There are a variety of remedial preservative treatments that can be applied to decaying poles. In the UK the most commonly used treatment is the Cobra method (B. King, Dundee Institute of Technology, personal communication). This involves the injection of a sodium fluoride-dinitrophenol-arsenious anhydride compound directly into the affected area and the treatment can be effective for ten years. In the USA volatile agricultural fumigants, such as Vapam and Vorlex, are also used as remedial treatments for poles (Hayes, 1986). The active ingredient in both formulations is methy1isothiocyanate. Tests have shown Vapam to give effective protection against decay for 8-10 years and Vorlex to be effective for up to 15 years (Hayes, 1986). However, these chemicals are highly noxious and have not been approved for use in the UK and
Europe (B. King, personal communication). Remedial treatments are of little value unless they are used at the early stages of decay before any structural degradation has occurred. A combination of a reliable system for detecting incipient decay and an effective remedial preservative treatment would permit the extension of the in-service lives of distribution poles with potentially huge savings.
28
1.6. Methods of detecting fungal decay in wood.
Despite the obvious economic benefits to be gained from the early detection of decay and the continuing development of new testing methods, the most common method of determining whether a pole requires replacement is simple hammer-sounding (Hayes, 1986). The pole is rapped with a hammer and a hollow sound indicates the presence of a decay pocket. This method is very subjective and only effective in detecting decay after the formation of cavities within the wood, at which point remedial preservative treatment is not worthwhile. Often in conjunction with hammer-sounding the pole is bored. By drilling into the pole at several levels and examining the wood core removed, decay can be detected if it has advanced adequately to give visual indications and if, of course, the corer does not miss the decay pocket.
Microbiological analysis of cores removed from poles is another method used in the detection of decay and is primarily used to confirm the presence of decay organisms in suspect poles. Although the method can be successful in detecting the presence of decay fungi, it is time consuming (a minimum incubation period of 3 weeks is required) and gives no indication of the extent of the decay (Gibson et al., 1985).
In experimental systems, degradation of wood is measured in terms of percentage weight loss (expressed as a % of the original dry weight). Weight losses of less than 3% are considered to be insignificant since this can be due simply to the loss of soluble wood components but weight losses of greater than 3% are
indicative of degradation of the wood (King, 1981). Wilcox (1978) has reported that weight losses of only 2% can result in strength
29'
losses of up to 50% therefore, this method is not sensitive enough to detect incipient decay.
In recent years several quantitative and semi-quantitative methods have been developed for the detection of incipient decay in timber (Table 1.2). These systems generally give good results under experimental conditions and at least some of them have been applied to a limited extent in field situations. The methods can be conveniently subdivided into physical, chemical and biological types and examples of some of the new techniques which have been developed and their applicability, or otherwise, to the routine detection of incipient decay in distribution poles is evaluated below.
1.6.1. Physical methods.
The electrical conductivity meter measures the resistance between two contact points on a twisted wire probe (Hayes, 1986). Readings in the sound preserved outer shell are used as the reference value and decayed wood shows a dramatic drop (up to 75%) from the reference value. However, this procedure can give false positives (for decay) and microbiological analysis of all poles identified as positive is required. In addition interpretation of results is subjective.
The Pilodyn is a small hand held device that measures the depth to which a blunt pin is driven into the shell of a pole by a spring loaded to a constant energy (Friis-Hansen, 1980). The Pilodyn does not detect internal decay therefore it is not applicable in the detection of basidiomycete decay, rather it measures the soundness of the shell of the pole and was developed
primarily for soft rot detection.
3 0
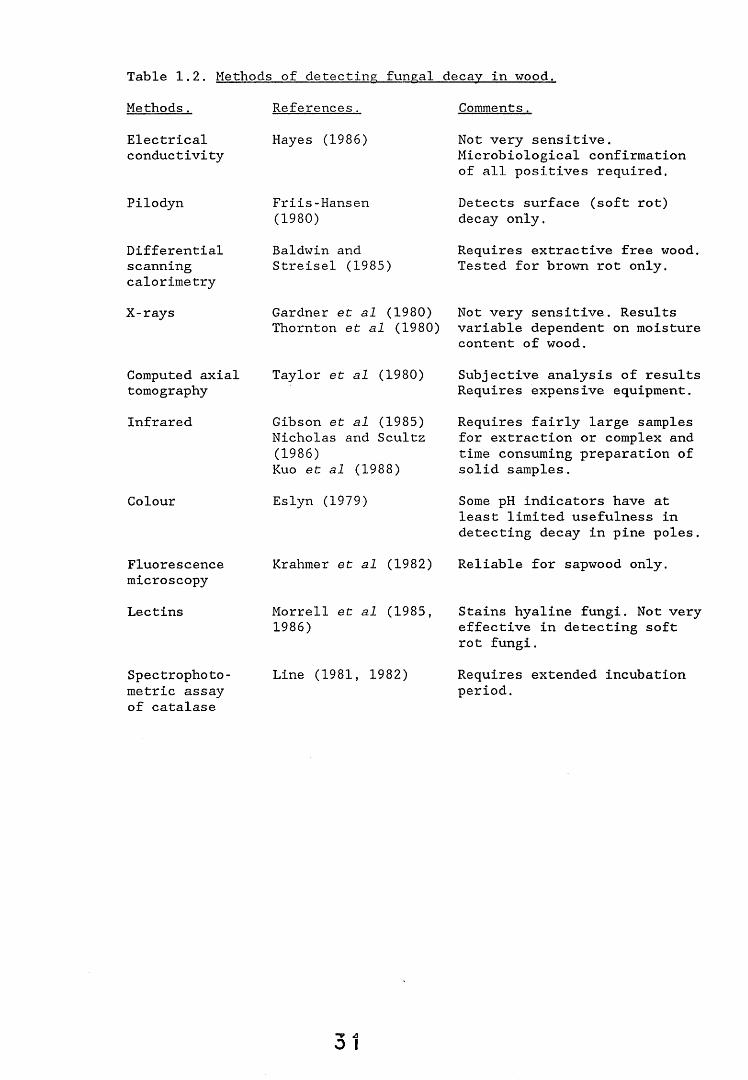
Table 1.2. Methods of detecting fungal decay in wood.Methods. References. Comments.Electricalconductivity
Hayes (1986) Not very sensitive. Microbiological confirmation of all positives required.
Pilodyn Friis-Hansen(1980)
Detects surface (soft rot) decay only.
Differentialscanningcalorimetry
Baldwin and Streisel (1985)
Requires extractive free wood. Tested for brown rot only.
X-rays Gardner et al (1980) Thornton et al (1980)
Not very sensitive. Results variable dependent on moisture content of wood.
Computed axial tomography
Taylor et al (1980) Subjective analysis of results Requires expensive equipment.
Infrared Gibson et al (1985) Nicholas and Scultz (1986)Kuo et al (1988)
Requires fairly large samples for extraction or complex and time consuming preparation of solid samples.
Colour Eslyn (1979) Some pH indicators have at least limited usefulness in detecting decay in pine poles.
Fluorescencemicroscopy
Krahmer et al (1982) Reliable for sapwood only.
Lectins Morrell et al (1985, 1986)
Stains hyaline fungi. Not very effective in detecting soft rot fungi.
Spectrophoto- metric assay
Line (1981, 1982) Requires extended incubation period.
of catalase
Baldwin and Streisel (1985) have used differential scanning calorimetry (DSC) to detect incipient decay (up to 5% weight loss) by the brown rot Gloeophyllum trabeum in hybrid poplar. These workers found that the endothermic transitions measured by DSC correlated well with chemical measurements of fungal degradation. The method was found to be a reliable means of evaluating fungal degradation in extractive-free wood and purified cellulose and hemicellulose, however, it could not be applied to whole wood and therefore time consuming sample preparation is required.
The use of X-ray techniques to detect incipient decay has been reported by Gardner et al. (1980). X-ray equipment is used by some utility companies (Hayes, 1986), however, whilst X-ray techniques are able to detect cracks and cavities, they cannot detect decay at its very early stages. Thornton et al. (1980) have reported that moisture content has a marked affect on the time taken for X-rays to pass through poles and argue that the interpretation of data taken at an unknown moisture content may be questionable. This factor coupled with the need to transport power sources, developing chemicals and equipment, and the potential for exposure of personnel to harmful radiation limits the use of X-ray based technologies as a routine screening method.
Modified computed axial tomography (CAT scan), a technique widely applied in medicine, has also been applied to detection of decay in distribution poles (Taylor et al, 1980). Tomographic devices scan a section of the pole using gamma rays and produce cross-sectional pictures which have a resolution of approximately 1mm. Details of knots, growth rings, surface cracks, penetration
of preservatives and early and severe rot can be shown. It takes
approximately 60 minutes to make the scans necessary to characterise a full scale pole and analysis of results is
subjective. Commercial devices modified for use with distribution poles are available but they are difficult to transport and strict internal controls are required, therefore they have not proved practical as routine test devices. Currently, several portable advanced systems are at the design stage and these may overcome the problems of the first generation models.
Physical methods of detecting decay in timber rely on the presence of changes in the physical or structural properties of the wood. Such changes do not occur until the decay process is well advanced and therefore physical detection methods are not sensitive enough to detect incipient decay.
1.6.2. Chemical methods.
Chemical breakdown of the wood cell wall occurs before any weight loss can be detected and the breakdown products are extractable with water. Infrared analysis of warm water extracts of decayed and undecayed control wood samples show that major differences occur in the range 1,800 - 1,500 cm (Gibson et al., 1985). An absorption peak at 1,720 cm was present for all decayed wood samples but absent for all controls. The 1,720 peak generally appeared 2 days, or more, before matched samples showed any weight loss and the magnitude of the peak increased as the incubation period or the weight loss increased. This system can successfully detect incipient brown rot decay, however, the need for fairly large samples for extraction and the lengthy procedure involved limits the application of this method. The use of such conventional infrared techniques to analyse solid samples (i.e. wood) presents some difficulties, including the opaqueness and light scattering properties of the sample. These problems have
largely been overcome by the development of more sophisticated techniques such as Fourier transform infrared spectroscopy (Nicholas and Schultz, 1986) and more recently, Fourier transform infrared photoaccoustic spectroscopy (Kuo et al., 1988). Both of the latter systems permit the analysis of unextracted wood samples. Although both systems can detect incipient brown rot decay, and may well be applicable to the detection of both white and soft rot decay, the complex sample preparation required and the need for sophisticated technology render them unsuitable as a routine testing system.
The direct visualisation of decay fungi in wood and/or structural changes caused by the decay fungi are obviously indicative of infection. However by the time hyphae of the decay fungus are readily visible substantial wood degradation may already have occurred (Morrell et al., 1985). Consequently much work has centred on the development of indicators that detect the chemical changes associated with wood decay as well as on stains that enhance the appearance of the fungi in wood. Eslyn (1979) used the fact that prior to extensive growth, fungi produce metabolic acids which lower the pH in infected wood samples and hence developed colour indicators to detect fungal presence. PH indicators such as Methyl orange and Benzo yellow have been shown to have at least a limited usefulness in the detection of decay in pine poles. Krahmer et al. (1982), using fluorescence microscopy and Acridine orange stain, detected early decay by the brown rot Gloeophyllum trabeum in southern pine sapwood. Non-decayed control wood fluoresced green whilst decayed samples, showing greater than 3% weight loss, fluoresced orange. The main drawback of many staining techniques is they are often only applicable to a few wood/fungal species e.g. the latter technique was not applicable
34
in Douglas fir heartwood samples.Indicators specific for chemicals universally present in
fungal hyphae or decayed wood are required. Chitin, a long chain polymer of N-acetylglucosamine, is present in the cell walls of most fungi and Morrell et al. (1986) have found plant lectins useful in detecting fungal chitin. These workers, using fluorescence-labelled wheat germ agglutinin (WGA), which is specific for N-acetylglucosamine residues, screened 35 selected basidiomycete, ascomycete and fungi imperfecti fungal species.They found that the lectin generally reacted with hyaline and slightly coloured fungi but not dematiaceous (pigmented) fungi, however,such pigmented fungi are easily visualised under the bright field microscope. The application of this technique to the detection of decay fungi in wood sections (Morrell et al., 1985) indicated the system could detect brown and white rot fungi and to a limited extent soft rot fungi. Visualisation of very fine decay hyphae, which are typically difficult to see by conventional microscopy, was possible. The method was applied to three different wood species with similar results indicating the potential universal applicability of the method which is partially chemical and partially biological in nature.
The use of the above staining techniques requires the preparation of thin sections for microscopy. It may be possible to produce such sections from cores removed from poles but the length and difficulty of sample preparation precludes the use of such techniques as routine screening tests.
Chemical systems rely on the detection of chemical changes
associated with wood decay or the direct chemical staining of the fungal hyphae. Unlike the physical changes associated with the fungal decay of wood, the chemical changes seem to occur at the
early stages of colonisation. The detection of such changes should permit the detection of incipient decay. The sensitivity of the particular system will dictate at what stage in the colonisation and decay process the fungus can be detected.
1.6.3. Biological methods.
Biological systems are potentially the most effective detection systems for decay fungi since they involve the direct measurement of fungal activity and/or presence. Such systems have the potential to detect the fungus at the early stages of colonisation even before it has begun to utilise the wood components.
It has been reported that catalase activity of fungi in wood is correlated with the degree of decay, at least in the early stages of microbial attack (Line, 1981). Traditionally catalase activity is detected by the production of O 2 however, a colorimetric assay of catalase activity has been described (Sinha, 1972). Line (1982) has developed such a colorimetric assay to detect catalase activity in decaying wood samples using the redox indicator dichloroindophenol. Preparation of samples is complex and time consuming and the usefulness of the indicator was limited by its sensitivity to changes in pH. However, the method clearly differentiated decayed wood samples from undecayed controls. The use of more stable redox indicators and the streamlining of sample preparation techniques potentially could enable the development of this method into a routine test.
One biological detection method used extensively is the immunoassay. Immunoassays use the specific interaction of antigen with antibody to provide information about the concentration of
36 ’
antigen (or antibody) in unknown samples. Such systems are highly adaptable and easily modified to suit the specific purpose required. The application of immunoassays to the detection of decay fungi in wood samples forms the basis of the current investigation.
1.7. Immunoassays.
The widespread use of immunoassay systems has developed because immunological probes (antibodies) offer assays with high sensitivity, specificity and rapidity.
Immunoassay systems can detect specific products (antigens) at very low concentrations, potentially p mole amounts. The increase in sensitivity over established physico-chemical procedures, for measuring substances of biological significance in the blood, can be of the order 1 x 10 ^(Edwards, 1985).
Immunological probes can be highly specific, indeed they can distinguish molecules differing in only one substituent group (Edwards, 1985). This specificity also permits the localisation
of antigens within contaminating substrate material.In many immunoassay systems the need for complex sample
preparation can be avoided and this fact together with the rapidity of such techniques, (most assays can be completed within a few hours and some within 2-3 minutes), allows a high throughput of samples.
Immunoassay techniques are readily adapted to suit the particular antigen/environment under study and indeed, modifications to the basic procedures are continuously being
reported.Most immunoassays, termed heterogeneous immunoassays,
*37v 0
require a separation step to distinguish bound from free antibody. Such assays are suitable for the detection of macromolecules. Common heterogeneous assays fall into two categories, "direct" procedures where antigen immobilised on a solid phase is detected with labelled specific antibody, and "indirect" procedures, in which immobilised antigen is a target for unlabelled specific antibody which is in turn detected using labelled anti-immunoglobulin probes. A wide variety of detection systems have been developed for immunological probes including radioisotopic measurement, fluorescence, luminescence, agglutination, precipitation and enzyme colour reactions. The type of label is often the most distinguishing aspect of the assay and hence it is the basis of the system of classification e.g. radioimmunoassay, fluoroimmunoassay, enzyme immunoassay etc. Various modifications of the basic immunoassay procedure including the use of labelled antigen, different solid and liquid phases and a wide range of detection systems have been described, however, the same fundamental concepts and principles apply to all immunoassays (for review see Edwards, 1985, Engvall, 1980, Voller and Bidwell, 1980).
1.7.1. Application of immunological techniques in mycology.
The application of immunological techniques in mycology has increased markedly in recent years though their use in this field is still not as comprehensive as in the fields of virology (Tyrell, 1978) or bacteriology (Grant, 1978). The natural variation in fungi is probably responsible for one of the outstanding difficulties in fungal immunology, namely, that of obtaining reproducible results. Different strains of the same
381
species and even daughter colonies of a single spore culture may, and usually do, vary within great inherent morphological, cultural and physiological limits (Pepys and Longbottom, 1978). Immunological techniques have been applied to taxonomic studies, the development of diagnostic tests, fungal morphogenesis and the study of fungi in their natural environment.
1.7.1.1. Medical mycology.
In medical mycology immunological techniques have been widely applied in the study of fungi pathogenic to man. In particular, many different methods have been used to detect and identify fungi which cause pulmonary diseases. Immunodiffusion techniques have been used to study Aspergillus fumigatus (Hearn and MacKenzie, 1979, 1980) and Coccidioides immitis (Rowe et al., 1963). Counter immunoelectrophoresis has been shown to be a rapid and sensitive method for demonstrating precipitins against fungal antigens (Glaussio et al., 1973). Immunofluorescence techniques have been used to study filamentous fungi not suitable for agglutination tests and for those organisms which grow poorly and yield little antigen (Pepys and Longbottom, 1978). Young cultures too immature for morphological identification can be rapidly identified by immunofluorescence tests. Problems of autofluorescence of fungi and non-specific reactions with control sera occur, however, these can be eliminated by absorption. An enzyme-linked immunosorbent assay (ELISA) for the detection of anti-A. fumigatus IgG has also been described (Shale and Faux,
1985) .
3 9
More recently, exoantigens have proven valuable for the inununoidentification of fungal pathogens and for resolving taxonomic problems. Exoantigens have been defined as
"antigens or soluble immunogenic macromolecules produced by fungi early in their development" (Kaufman and Standard, 1987) .
These antigens are readily detected in culture broths or aqueous extracts of slant cultures. The exoantigen test depends on the interaction between concentrated or unconcentrated antigen(s), produced by the fungus in culture, with homologous antibodies that are specifically generated to precipitate them. The complex(es) or precipitate(s) formed are readily checked for fusion with preselected reference precipitates in counterimmunoelectrophoresis or immunodiffusion tests to establish the identity of the fungus producing the antigen(s). This technique has allowed the rapid and specific detection of pathogenic dimorphic fungi such as C. immitis (Cox and Britt, 1986), Histoplasma capsulatum (Kaufman et al., 1983) and Blastomyces dermititidis (Sekhon et al., 1986a).
1.7.1.2. Plant pathology.
Immunological methods have also been applied to the study of plant pathogenic fungi. Immunodiffusion and immunoelectrophoresis have been used to study the relationships between species within the genus Smittium (Sanger et al., 1972), between different species of Phytophthora (Burrell et al., 1966; Halsall, 1976) and to differentiate between Ceratocystis species (Amos and Burrell, 1967) . Immunofluorescence techniques have been applied to the
40
detection of fungal mycelium in barley grains (Warnock, 1971), the identification of vesicular-arbuscular mycorrhizal fungi (Wilson et al., 1983) and to study the ecology of the leaf litter fungus Mycena galopus (Chard et al., 1983, 1985a,b). ELISA methodology has been applied to the detection of Phoma exigua in infected potato tissue (Aguelon and Dunez, 1984) and Sclerotinia sclerotiorum in sunflower (Walcz et al., 1985). Such techniques have been used to identify endomycorrhizal fungi and may have an application as an aid in taxonomic studies of this group (Aldwell et al., 1983, 1985).
Enzyme immunoassays have been used to monitor the spread and interaction of endomycorrhizal fungi with each other and the resident fungal flora (Rice et al., 1984; Aldwell and Hall,1986). Direct staining methods, using immunogold labelling and electron microscopy, have been used to visualise the plant pathogen Colletrichum lindemuthianum and to study the distribution of pathogen products within infected tissues (O'Connell et al., 1986). This method potentially can be used to localise molecules involved in plant-pathogen interactions and to elucidate their function.
1.7.1.3. Biodeterioration.
Biodeterioration has been defined by Hueck (1968) as the process of biological interactions with materials resulting in a loss in the economic value of the material after such activity.
Though not widely used, at present, in biodeterioration studies, the use of immunological techniques to study wood decay fungi is a rapidly growing area of research. Several fungi, including basidiomycetes, which can colonise and/or decay wood
have been studied immunologically. Immunodiffusion and immunoelectrophorectic techniques have been used to study the taxonomic relationships of Fusarium spp. (Hornock, 1980), Fomes spp. (Madhosingh and Ginns, 1974) and Gloeophyllum spp. (Madhosingh and Ginns, 1975). Immunoelectrophorectic techniques have also been used to study the antigenic differences between basidiomycete cap, mycelial and spore extracts of Pleurotus ostreatus (Weissmann et al., 1987). Goodell and Jellison (1986) have developed an ELISA system to detect Poria placenta whilst Palfreyman et al. (1987, 1988b) have studied the wood decay fungi Coriolus versicolor and Serpula lacrymans using immunodot-blot and immunocytochemical techniques. Recently it has been shown that fungal antigens can be detected immunologically within the wood.substrate (Benhamou et al., 1986, Breuil et al. 1988, Dewey and Brasier, 1988). Antibodies raised to fungal extracellular metabolites, in combination with immunogold labelling and electron microscopy, have been used to localise a ligninase enzyme produced by the white rot fungus Phanerochaete chrysosporium (Daniel et al., 1989) and to detect Poria placenta within wood sections (Goodell et al., 1988, Jellison and Goodell, 1986).
1.8. Description and aims of the project.
This project was initiated to develop, apply and evaluate the use of immunological techniques, concentrating primarily on enzyme-based systems, in the study of wood decay fungi. Lentinus
lepideus FPRL 7F was chosen as the test fungus and creosote treated distribution poles as the wood environment. This simple system of economic importance was chosen since the tolerance of
L. lepideus for creosote often results in it being the dominant, and occasionally sole, fungal inhabitant of creosoted timber. However, the techniques developed may well be applicable, with minor modifications, to any decay fungus in any wood
environment. The application of immunological probes in two areas of study was investigated:1. Detection systems (immunoassays) for incipient fungal decay of
wood.2. Investigation of the antigenic nature of L. lepideus.
There is a need to develop a routine method of detecting incipient fungal decay in timber both for safety and financial reasons. The ideal method would meet several criteria viz it should be simple, cheap, quick, quantifiable and be usable in a field situation. In addition, the method should be sensitive enough to detect the presence of decay organisms at a stage that permits remedial preservative treatment, and preferably before any strength losses have occurred. Immunoassay systems have the potential to fulfill all of these criteria and therefore the development and application of immunoassays to the detection of wood decay fungi will be examined.
The application of immunological techniques in mycology has been hindered by the lack of understanding of the chemistry of fungal antigens. The variability in morphological, cultural and physiological characteristics of fungi dependent on environment, stage of development, age etc can lead to difficulties in reproducing results. Even the simplest fungal antigen can excite different individual patterns of antibody production in animals/
A Xnr
man although these usually have some common features (Pepys and Longbottom, 1978). This project will therefore undertake to study the use of immunological probes to investigate L. lepideus
The specific aims of this project are1. Production of L. lepideus antisera and the determination of
their titre and specificity.2. Development of immunoassay systems.3. Application of immunological techniques to the analysis of
extracts from artificially infected wood blocks.4. Application of immunodetection systems in a small field trial5. Analysis and characterisation of L. lepideus antigens.
CHAPTER 2. MATERIALS AND METHODS.
A C*t
2.1. Fungal isolates.
The majority of fungal isolates were obtained from the Culture collections at the Forest Products Research Laboratory
(FPRL), Princes Risborough, Aylesbury, Bucks; the Commonwealth Mycological Institute (CMI), Kew; and the Bundesanstalt fur Materialprufung (BAM), Berlin. Alternatively, fungi were isolated from in-service creosote treated distribution poles by researchers at Dundee Institute of Technology, Dundee, (see Table 2.1 for details of the fungal isolates used).
A range of fungi, both decay and non-decay, which normally inhabit distribution poles and closely related Lentinus species were tested in specificity studies of the Lentinus lepideus antisera. The isolates were tested in specificity studies involving immunodiffusion, enzyme immunoassays, dot-immunobinding assays and western blotting.
2.2. Culture of organisms.
All fungi were maintained at 25°C in the dark on 3% (w/v) malt extract agar, (MXA, Oxoid No CM59). Benomyl, at a final concentration of 4 parts per million (ppm), was added to the basidiomycete culture media to inhibit the growth of microfungi. Stock cultures of fungal isolates were inoculated onto 3% MXA slopes, incubated at 25°C for 7-10 days then stored at 4°C. Stock cultures were subcultured every six months.
A ao
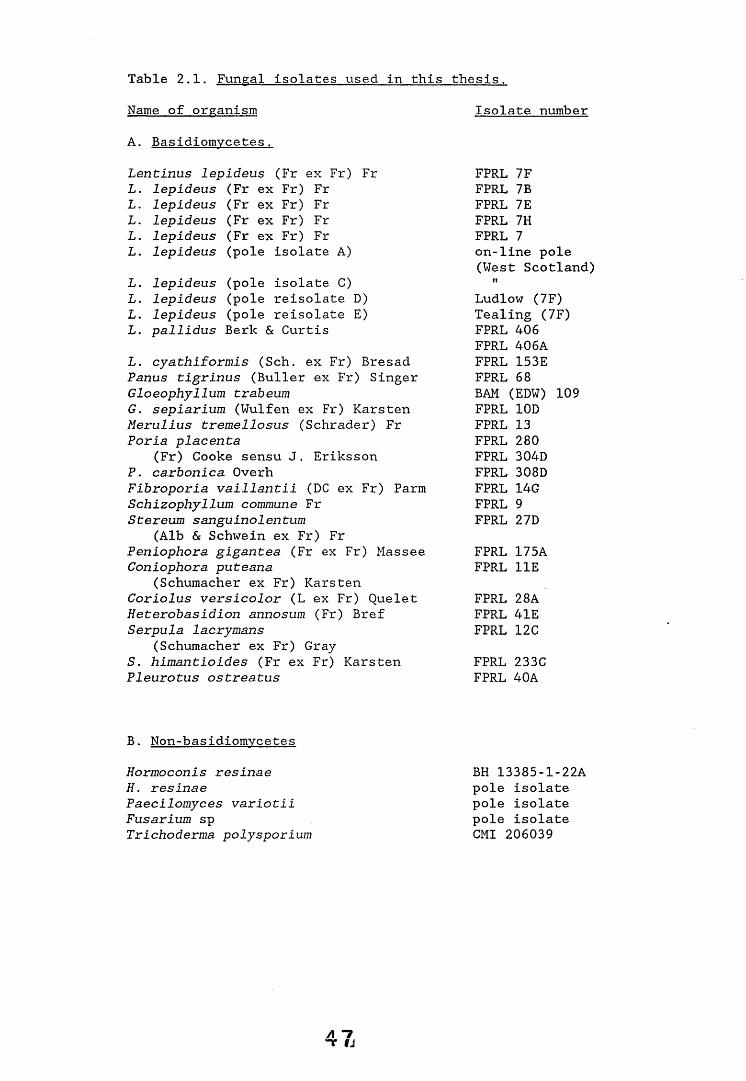
Table 2.1. Fungal isolates used in this thesis.Name of organismA. Basidiomycetes.Lentinus lepideus (Fr ex Fr) Fr L. lepideus (Fr ex Fr) Fr L. lepideus (Fr ex Fr) Fr L. lepideus (Fr ex Fr) Fr L. lepideus (Fr ex Fr) Fr L. lepideus (pole isolate A)L. lepideus (pole isolate C)L. lepideus (pole reisolate D)L. lepideus (pole reisolate E)L. pallidus Berk & CurtisL. cyathiformis (Sch. ex Fr) Bresad Panus tigrinus (Buller ex Fr) Singer Gloeophyllum trabeum G. sepiarium (Wulfen ex Fr) Karsten Merulius tremellosus (Schrader) Fr Poria placenta
(Fr) Cooke sensu J. Eriksson P. carbonica OverhFibroporia vaillantii (DC ex Fr) Parm Schizophyllum commune Fr Stereum sanguinolentum
(Alb & Schwein ex Fr) Fr Peniophora gigantea (Fr ex Fr) Massee Coniophora puteana
(Schumacher ex Fr) Karsten Coriolus versicolor (L ex Fr) Quelet Heterobasidion annosum (Fr) Bref Serpula lacrymans
(Schumacher ex Fr) Gray S. himantioides (Fr ex Fr) Karsten Pleurotus ostreatus
B. Non-basidiomvcetesHormoconis resinae H. resinaePaecilomyces variotii Fusarium spTrichoderma polysporium
Isolate number
FPRL 7F FPRL 7B FPRL 7E FPRL 7H FPRL 7on-line pole (West Scotland)
ft
Ludlow (7F) Tealing (7F) FPRL 406 FPRL 406A FPRL 153E FPRL 68 BAM (EDW) 109 FPRL 10D FPRL 13 FPRL 280 FPRL 304D FPRL 308D FPRL 14G FPRL 9 FPRL 27DFPRL 175A FPRL H EFPRL 28A FPRL 41E FPRL 12CFPRL 233C FPRL 40A
BH 13385-1-22A pole isolate pole isolate pole isolate CMI 206039
2.3. Production of fungal mycelium for freeze drying:.
Fungal mycelia were grown on 3% (w/v) malt extract broth (MXB, Oxoid No CM57). In some basidiomycete cultures benomyl (4ppm) was added. Broth was poured into sterile petri dishes (Sterilin, 90mm x 15mm) to a depth of 8mm and a 6mm core from a MXA plate of the particular fungus was inoculated into the broth so that the mycelial core was suspended on the surface. The MXB plates were incubated until approximately 50% of the surface of the broth was covered by mycelium, (8 days for L. lepideus FPRL 7F). Mycelial mats were harvested by filtration through Whatman No 1 filter paper (Whatman Ltd). The mycelium was washed with distilled water until the filtrate ran clear. Mycelium was then stored at -20°C or freeze dried immediately.
2.4. Freeze-drving of fungi and antigen preparation.
Fungal mycelium was harvested as described above and collected in round bottomed flasks for freeze-drying. Samples were freeze dried using a vacuum freeze drier (Model No FD 500/60, Birchover Instruments Ltd.). The fungal samples were collected in universal bottles and stored at -20°C. The lyophilised fungal mycelia were used as sources of fungal antigens in all subsequent studies. Whole cell (wc) antigens were prepared by grinding freeze dried mycelium with phosphate buffered saline (PBS, lOmM phosphate, pH 7.4). The concentration of antigen varied from 0.5mg-50mg per ml of PBS dependent on the required application. Soluble (s) and insoluble (i.) antigens were prepared in a similar way but mycelial fragments were separated by centrifugation (12,000g, Eppendorf microfuge 5412, Eppendorf
Gerateban Netheler & Hinz G.m.b.H.). The supernatant was used as the source of soluble antigens, the pellet as the source of insoluble antigens.
2.5. The production of antisera against L. lepideus FPRL 7Fmycelium.
2.5.1. The production of antisera to liquid cultures of L. lepideus.
Antisera were raised in New Zealand White rabbits. Antigens were prepared by grinding lyophilised fungal mycelium in PBS (lOmM, pH 7.4) at a concentration of 5mg mycelium per ml of PBS. Whole cell antigen preparation (1.5ml) was mixed with an equal volume of Freund's complete adjuvant (Gibco Laboratories) to give an emulsion. The water-in-oil emulsion was prepared by the gradual addition of the antigen preparation (20ul aliquots) to the adjuvant. After each addition of antigen, the mixture was repeatedly recycled through a fine gauge needle (syringe) then vortexed on a rotary mixer for several minutes to ensure adequate dispersal of the water droplets throughout the oil. This emulsion was then inoculated subcutaneously at six dorsal sites. Booster injections of the antigen preparation mixed with Freund's incomplete adjuvant were given two weeks later. Rabbits were bled from the marginal ear vein ten days after the booster injection. Subsequently rabbits were repeatedly given a booster injection followed by three bleeds at approximately fortnightly intervals. Blood samples were allowed to clot overnight at 4°C, the serum was separated from the blood cells , by centrifugation (2,500g)
A A
and stored in either 1ml or lOOul aliquots at -20°C. A stock of pre-immune control serum was obtained by bleeding rabbits prior to inoculation with fungal antigens.
2.5.2. The production of antisera to wood grown cultures of L. levideus.
L. lepideus FPRL 7F was cultured on both lime (Tilia vulgaris .Hayne) and pine (Pinus sylvestris .L) sapwood blocks of lcm x 1cm x 1cm dimensions, (for details of culture method see section 2.9). A lime block infected with the fungus and showing an 8.4% weight loss was subsequently used as the source of fungal antigens. The block was hammer-milled through a 0.5mm mesh filter (Micro Hammer Mill C.580, Glen Creston) and the sawdust prepared for immunisation as described above for agar grown mycelium. The sawdust was used at a concentration of 7.5mg per ml of PBS. Antisera were collected as described above.
2.6. Determination of the titre and specificity of the antisera.
The titres of the antisera were assessed using immunodiffusion, indirect enzyme immunoassays and dot immunobinding assays. These techniques together with western blotting were also applied to study the specificity of the antisera.
50
2.6.1. Materials.
2.6.1.1. Sera.
The following sera were kindly supplied by the Scottish Antibody Production Unit (SAPU), Carluke, Scotland.1. Horse radish peroxidase-labelled anti-rabbit IgG (donkey),
HRP-Ab2.2. Fluorescein isothiocyanate-labelled anti-rabbit IgG (donkey),
FITC-Ab2.3. Anti-rabbit IgG precipitating serum (donkey).4. Peroxidase-anti-peroxidase complex (rabbit).5. Normal donkey serum.
2.6.1.2. Reagents and buffers.
A variety of reagents and buffers were employed in the different immunological techniques. Details of the reagents used are given below. For convenience they have been assigned into one of three groups, blocking buffers (Table 2.2), washing and antibody diluting buffers (Table 2.3) and chromogens (Table 2.4). Each reagent and buffer has been designated an abbreviation which will subsequently be used throughout the text. The numbers used in the abbreviations refer to the percentage concentration of the particular component.
R 1'
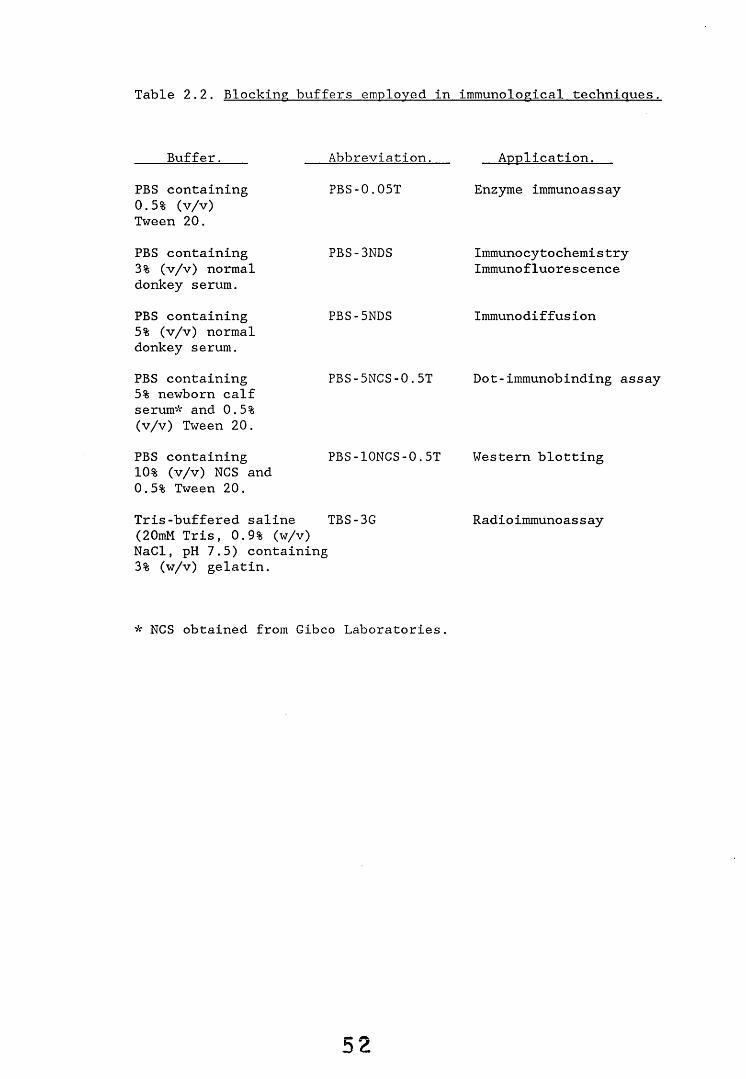
Table 2.2. Blocking buffers employed in immunological techniques.
Buffer.PBS containing 0.5% (v/v)Tween 20.PBS containing 3% (v/v) normal donkey serum.PBS containing 5% (v/v) normal donkey serum.PBS containing 5% newborn calf serum* and 0.5% (v/v) Tween 20.PBS containing 10% (v/v) NCS and 0.5% Tween 20.
Abbreviation. Application.PBS - 0.05T Enzyme immunoassay
PBS-3NDS ImmunocytochemistryImmunofluorescence
PBS-5NDS Immunodiffusion
PBS-5NCS-0.5T Dot-immunobinding assay
PBS-10NCS-0.5T Western blotting
Tris-buffered saline TBS-3G Radioimmunoassay(20mM Tris, 0.9% (w/v)NaCl, pH 7.5) containing 3% (w/v) gelatin.
* NCS obtained from Gibco Laboratories.
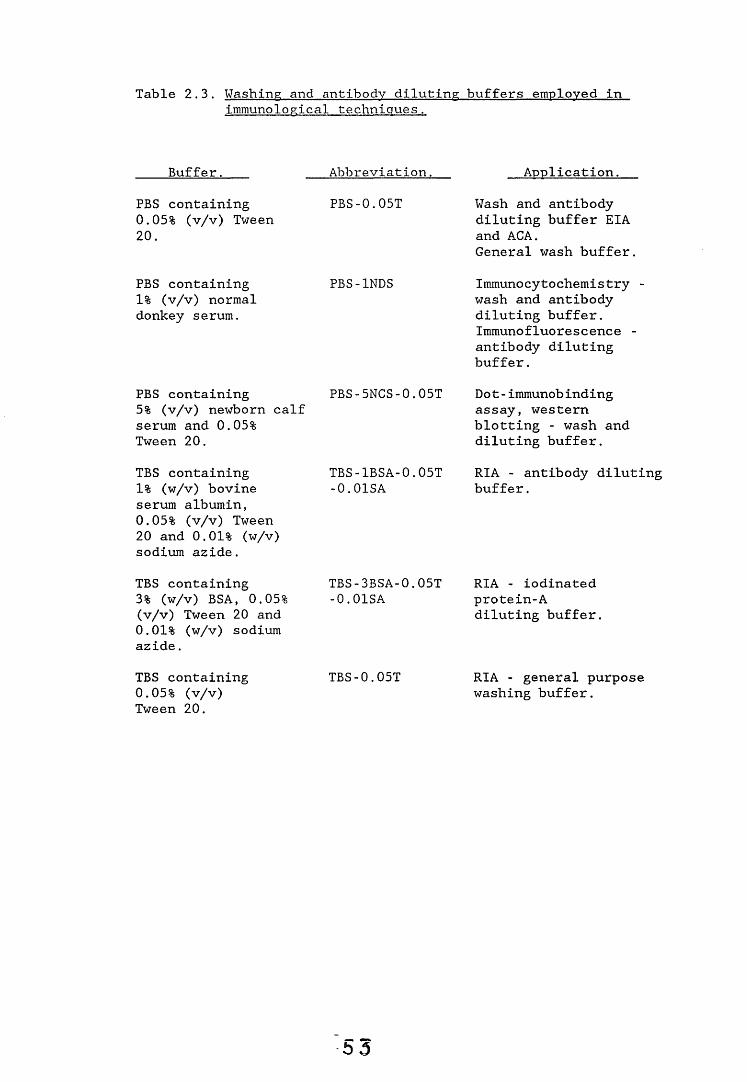
Table 2.3. Washing and antibody diluting buffers employed inimmunological techniques.
Buffer. Abbreviation. Application.PBS containing 0.05% (v/v) Tween 20.
PBS-0.05T Wash and antibody diluting buffer EIA and ACA.General wash buffer.
PBS containing 1% (v/v) normal donkey serum.
PBS-1NDS Immunocytochemistry - wash and antibody diluting buffer. Immunofluorescence - antibody diluting buffer.
PBS containing 5% (v/v) newborn calf serum and 0.05%Tween 20.
PBS-5NCS-0.05T Dot-immunobinding assay, western blotting - wash and diluting buffer.
TBS containing 1% (w/v) bovine serum albumin, 0.05% (v/v) Tween 20 and 0.01% (w/v) sodium azide.
TBS-1BSA-0.05T-0.01SA
RIA - antibody diluting buffer.
TBS containing 3% (w/v) BSA, 0.05% (v/v) Tween 20 and 0.01% (w/v) sodium azide.
TBS -3BSA-0.05T -0.01SA
RIA - iodinated protein-A diluting buffer.
TBS containing 0.05% (v/v) Tween 20.
RIA - general purpose washing buffer.
TBS-0.05T
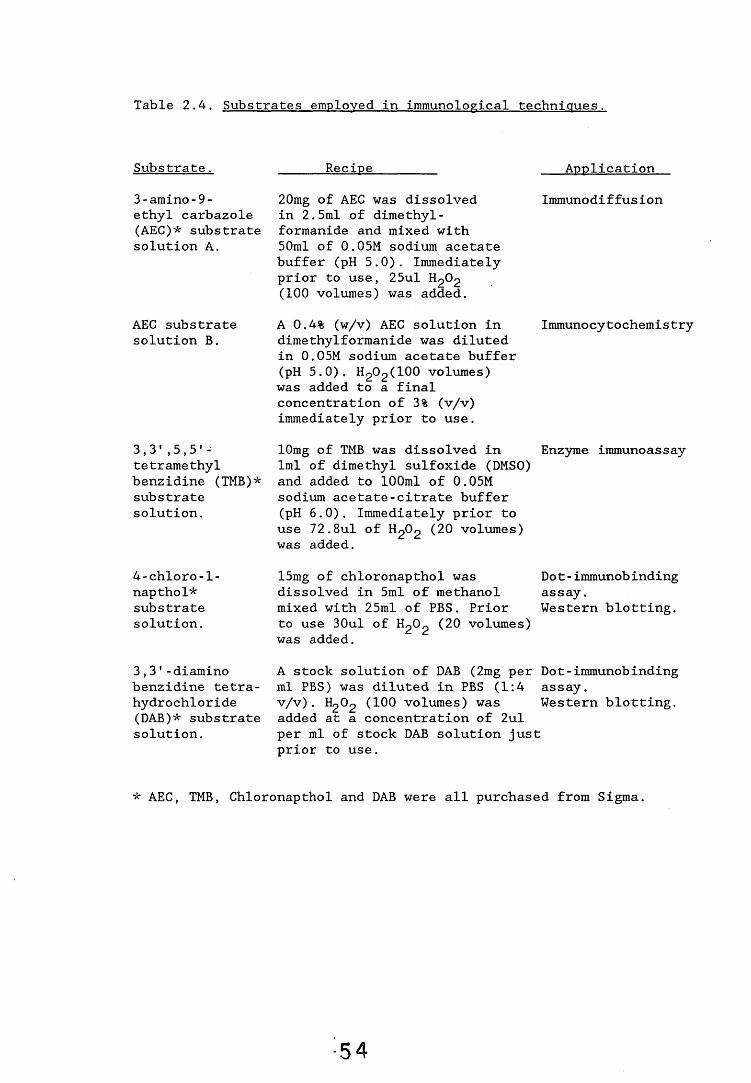
Table 2.4. Substrates employed in immunological techniques.
Substrate. Recipe Application3 -amino- 9 - ethyl carbazole (AEC)* substrate solution A.
20mg of AEC was dissolved in 2.5ml of dimethyl- formanide and mixed with 50ml of 0.05M sodium acetate buffer (pH 5.0). Immediately prior to use, 25ul H2 O2 (100 volumes) was added.
Immunodiffusion
AEC substrate A 0.4% (w/v) AEC solution in Immunocytochemistry solution B. dimethylformanide was diluted
in 0.05M sodium acetate buffer (pH 5.0). H202(100 volumes) was added to a final concentration of 3% (v/v) immediately prior to use.
3,3',5,5'- tetramethyl benzidine (TMB)* substrate solution.
lOmg of TMB was dissolved in Enzyme immunoassaylml of dimethyl sulfoxide (DMSO)and added to 100ml of 0.05Msodium acetate-citrate buffer(pH 6.0). Immediately prior touse 72.8ul of H 2 O2 (20 volumes)was added.
4-chloro-l-napthol*substratesolution.
15mg of chloronapthol was Dot-immunobindingdissolved in 5ml of methanol assay,mixed with 25ml of PBS. Prior Western blotting, to use 30ul of HgOg (20 volumes) was added.
3,3'-diamino benzidine tetra- hydrochloride (DAB)* substrate solution.
A stock solution of DAB (2mg per Dot-immunobindingml PBS) was diluted in PBS (1:4 assay.v/v). H2 O2 (100 volumes) was Western blotting.added at a concentration of 2ulper ml of stock DAB solution justprior to use.
* AEC, TMB, Chloronapthol and DAB were all purchased from Sigma.
•54
2.6.2. Immunodiffusion.
Immunodiffusion was carried out in tissue culture petri dishes (Corning, 60x15mm). Agarose, (1% w/v, Bio-Rad electrophoresis grade), was dissolved in PBS (lOmM, pH 7.4), (Method A), or Tris-barbital buffer (20mM, pH 8.6) containing polyethylene glycol, MW 8,000, at a final concentration of 2% (w/v) (Method B). Molten agarose, containing 0.2% (w/v) sodium azide as a preservative, was poured into dishes to a depth of 5mm. The agarose was allowed to set and wells were cut into the gel using a 2.0mm diameter corer. The resulting wells were filled with antigen suspension or antiserum as appropriate and incubated at 4°C for 48 hours. Whole cell suspensions of the fungal antigens were prepared by grinding 50mg of lyophilised mycelium in 1ml of PBS.
After immunodiffusion the gels were stained in one of two ways. The first procedure was applied to those gels prepared by Method A; such gels were deproteinised by press-drying with Whatman No 1 filter paper followed by washing in PBS. This process was repeated three times. The gels were then rinsed in
distilled water for 10 minutes, air-dried and stained with 0.01% (w/v) Coomassie Blue (Brilliant Blue R, Sigma) in a methanol:distilled water:acetic acid mixture (5:5:1, by volume) for 30 minutes. Gels were destained in solvent alone, rinsed in PBS:glycerol (1:1 v/v), air-dried and stored at room temperature.
The second procedure, applied to those gels prepared by Method B, was based on the horse-radish peroxidase (HRP) amplification technique previously described (Kjaervig-Broe and Ingild, 1983). Gels were deproteinised as before except they were
c c
washed 3x in 0.1M NaCl. Gels were then flooded with PBS-5NDS to block free binding sites (and thus prevent non-specific binding). Subsequently, the gels were treated with the HRP-Ab2, diluted 1:100 (v/v) in PBS-5NDS, which binds to the antigen-antibody precipitates. Bound enzyme-linked antibodies were visualised by reaction with AEC substrate solution A.Antigen-antibody arcs appear red against a pale pink background. Gels were stored at 4°C.
When determining the titre of an antiserum seven wells were punched into the agar (Figure 2.1a). The central well was filled with antigen suspension with two-fold serial dilutions of the test antiserum and a negative control (pre-immune serum) being placed in the peripheral wells. In specificity studies five wells were cut into the agar (Figure 2.1b). The central well was filled with undiluted antiserum, the top and bottom wells with L. lepideus FPRL 7F as positive controls and the side wells with antigen preparations of isolates to be tested for cross -reactivity.
2.6.3. Indirect enzyme immunoassays.
Soluble (s) and insoluble (i) antigens were prepared as previously described (see section 2.4). The two fractions were then tested in separate indirect enzyme immunoassays (EIA).
2.6.3.1. Soluble antigen EIA.
Aliquots (50ul) of s antigen preparations were dispensed into microtitre plate wells (Titertek immunoassay plate, Cat. no. 77-173-05, Flow Laboratories) and incubated overnight at room
5 6
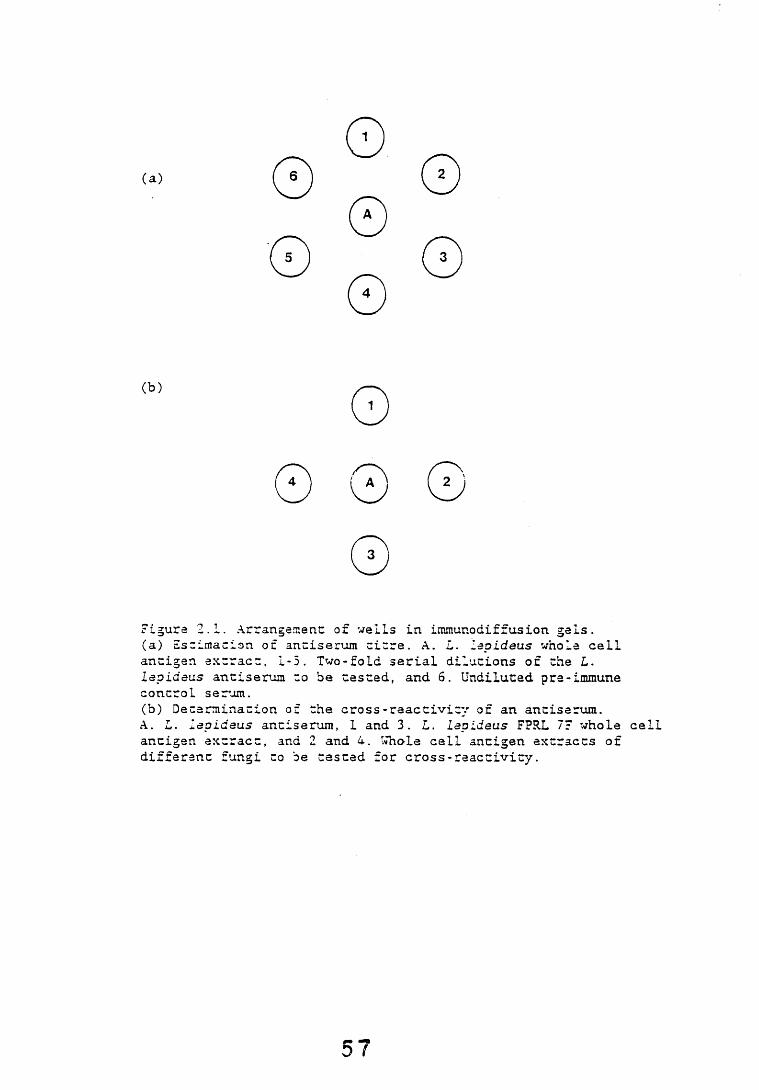
(a)
(b)
v !
3
Figura 2.1. Arrangement: of veils In immunodiffusion gels.(a) Estimation of antiserum titre. A. L. Lapideus whole cell antigen extract, 1-5. Two-fold serial dilutions of “he L. lapidaus antiserum to be reseed, and 6. Undiluted pre-immune concrol serum.(b) Decarminacion of the cross-reactivity of an antiserum.A. L. Lapideus antiserum, 1 and 3. L. Lapideus FPRL 7F whole cell antigen extract, and 2 and 4. Whole cell antigen extracts of different fungi to be rested for cross-reactivity.
d r
temperature to allow antigen binding to the plates. The plates were rinsed by flooding six times with PBS-0.05T after this and all subsequent steps. All incubations were carried out at room temperature. Free binding sites on the plates were blocked by incubation with PBS-0.5T for 60 minutes then aliquots (50ul) of test antisera at a range of dilutions, diluted in PBS-0.05T, were added and the plates incubated for 60 minutes. Specific binding was detected by HRP-Ab2 diluted 1:500 (v/v) in PBS-0.05T. After 30 minutes incubation and the subsequent washing, enzyme activity was detected using TMB substrate solution. The extent of the reaction was measured spectrophotometrically (absorbance at 405nm) using an automated microtitre plate reader (Titertek Multiskan Plus, Flow Laboratories). Negative controls of pre-immune serum were used to give background values of non-specific binding.
2.6.3.2. Insoluble antigen EIA.
The pellets, from PBS extracts of the various mycelia (source of i. antigens), were resuspended in 1ml of PBS. Aliquots (30ul) of this suspension were dispensed into eppendorf tubes and assayed for antigenic activity. The assay protocol used was similar to that used in the EIA for s antigens except the antigens were not bound to a solid phase. The pellet, to which any specific antibodies bind, was retained after each incubation step by centrifugation. Dilution curves over the range of antiserum dilutions 1:5,000-1:30,000 (v/v) were used to assess the titres of the antisera. Aliquots (200ul) of the appropriate antiserum dilution were added to each antigen containing tube. Enzyme-linked secondary antisera was diluted 1:500 (v/v) and
pellets were washed 6x with PBS-0.05T (1ml) after each incubation step. TMB substrate solution (500ul) was added to each tube and incubated for 30 minutes. The samples were then centrifuged (12,000g), 200ul of the supernatants was transferred to microtitre plate wells and the extent of colour development was determined spectrophotometrically.
2.6.4. Dot-immunobinding assays.
Whole cell antigen suspensions (25 mg mycelium per ml PBS) were centrifuged, 13,000g for 10 minutes, and 2ul aliquots of the supernatants were 'dotted' onto nitrocellulose membranes (NC, Bio-Rad Trans-Blot Transfer Medium). Free binding sites on the NC were blocked by incubation with PBS-5NCS-0.5T for 60 minutes. Subsequently the NC membranes were incubated with test antisera diluted 1:500 (v/v) in PBS-5NCS-0.05T for 60 minutes at room temperature. The NC was washed 6x in PBS-5NCS-0.05T after this and subsequent incubation steps. After 60 minutes incubation in enzyme-labelled secondary antiserum, diluted 1:250 (v/v) in PBS-5NCS-0.05T, the NC was washed and enzyme activity detected by reaction with chloronaphthol substrate solution. Positive reactions were recognised as black/purple coloured dots against the white filter background. Alternatively enzyme activity was detected using DAB substrate solution. A positive reaction was detected as a brown coloured dot against the white filter background. The use of the DAB had several advantages over the chloronaphthol1. Firstly, it was more sensitive and secondly, results could be analysed semi-quantitatively as previously described (Palfreyman et al., 1988a). Quantitation was achieved
by treating the NC membranes with xylene which cleared the NC
5 9
(i.e. made it transparent) but did not affect the intensity of the dots. The absorbances of the dots were then measured using a Laser scanning densitometer (Ultroscan Laser Densitometer LKB 2202, LKB Produkter AB).
2.6.5. SDS-PAGE electrophoresis and western blotting.
Whole cell fungal antigen preparations were used at a concentration of 25mg per ml of PBS. Proteins were separated on 7.5% SDS-polyacrylamide slab minigels (Bio-Rad Mini-PROTEAN II cell apparatus), with a 3.725% acrylamide stacking gel and using the discontinuous buffer system as modified by Marsden et al. (1978) from the method of Laemmli (1970). Details of the reagents and buffers used in the SDS-PAGE electrophoresis technique are given below.1. 30% acrylamide (2.5% cross -linker):
Acrylamide (29.25g) and bis-acrylamide (0.75g) were dissolved in ultrapure water, made up to a 100ml and filtered before use.2. Resolving gel buffer:
Tris base (18.15g) and SDS (0.4g) were dissolved in @80ml of ultrapure water. The pH was adjusted to 8.9 using concentrated HC1 then ultrapure water added to a final volume of 100ml.3. Stacking gel buffer:
Tris base (5.9g) and SDS (0.4g) were dissolved in @80ml of ultrapure water, the pH adjusted to 6.7 by the addition of concentrated HC1 and ultrapure water added to a final volume of 100ml.4. Ammonium persulphate:
A 10% (w/v) solution was used, note the reagent must be made
5. TEMED (N,N,N',N'-tetraethylenediamine).6. Butan-l-diol:
Used to overlay the resolving gel and prevent desiccation.7. Boiling mix:
The boiling mix was prepared by mixing stacking gel buffer (1.0ml), 25% (w/v) SDS solution (0.8ml), B-mercaptoethanol (0.5ml), glycerol (1.0ml) and bromophenol blue dye (0.001% w/v). Samples were diluted 2:1 (v/v) in the boiling mix, heated to 100°C for 2 minutes and centrifuged (13,000g) for 5 minutes. The supernatants were then loaded onto the gels.8. Electrode buffer:
Stock electrode buffer was prepared by dissolving Tris base (9g), glycine (43.2g) and SDS (3g) in 600ml of ultrapure water. The stock electrode buffer was diluted 1:5 (v/v) with ultrapure water prior to electrophoresis.
Aliquots (5ul) of the sample supernatants were loaded into separate lanes. Molecular weight standards used were bovine albumin (66,000), egg albumin (45,000),glyceraldehyde-3-phosphate dehydrogenase (36,000), carbonic anhydrase (29,000), trypsinogen (24,000), trypsin inhibitor (20,100) and a-lactalbumin (14,200) (MW-SDS-70, Sigma). Gels were run at 200V until the bromophenol blue marker dye was approximately 3mm from the bottom of the gel. Gels were silver stained for protein using the Bio-Rad Silver Stain Kit (see Bio-Rad Bulletin No 1089). Alternatively gel proteins were electrophoretically transferred to NC membranes using a modification of the method of Towbin and Gordon (1984). Electrophoresis was carried out in a tris-glycine buffer (150mM
fresh for each experiment.
After blotting the NC was washed 2x in PBS-0.5T. MW marker proteins were detected by overnight staining at room temperature with 0.0001% (v/v) Pelikan black drawing ink (Pelikan No 17) in PBS-0.5T. The protocol for treatment of NC carrying blotted fungal antigens was similar to that used in the dot-immunobinding assay but the blocking buffer contained 10% (v/v) NCS and the NC was incubated overnight in primary antibody solution diluted 1:200 (v/v) in PBS-5NCS-0.05T. Enzyme activity was detected using the DAB substrate solution. Positive reactions were detected as brown bands against a white filter background. All incubation steps of the immunoblotting procedure were carried out on a
rocking platform.
2.7. Absorption of antisera.
Antiserum was diluted to 2x the final concentration required and mixed with an equal volume of an absorbing agent in PBS (2mg per ml). This agent was either the mycelium of a cross-reacting fungal isolate or lime sawdust or pine sawdust. The mixture was incubated for 60 minutes at room temperature with continuous stirring and centrifuged (2,500g) for ten minutes. The supernatant was decanted and used in subsequent experiments.
glycine, 20mM tris-base containing 20% v/v methanol). The currentwas maintained at 92mA and transfer was complete in 3 hours.
2.8. Preparation of coverslips with adherent fungal mycelium forimmunocytochemical and immunofluorescence staining.
A glass slide (70 x 26mm) and three coverslips were arranged as shown (Figure 2.2) and placed within a glass petri-dish. The assembled apparatus was then sterilised by heating for one hour at 160°C. Cores (0.5cm diameter) of L. lepideus FPRL 7F, cultured on 3% (w/v) MXA plates, were aseptically transferred onto the slide and the coverslips were placed on top of the fungal mycelium. The petri-dish was incubated within a humid chamber at 25°C for 21 days until a fine halo of fungal mycelium had grown out onto the coverslip. The coverslips were carefully removed from the underlying cores and dried at 37°C for 20 minutes. The subsequent treatment of the coverslips was dependent on the experimental technique to be used, either immunocytochemical staining (peroxidase-anti-peroxidase, PAP) or immunofluorescence staining.
Coverslips which were to be stained by the PAP method were firstly fixed by dipping in acetone. Subsequently, the coverslips were incubated sequentially in 70% (v/v) ethanol, methanol containing 1% (v/v) hydrogen peroxide, and 70% (v/v) ethanol to quench any endogenous peroxidase activity. All incubation steps were carried out for 10 minutes at room temperature. Coverslips were dried at 37°C for 20 minutes and stored desiccated at -20°C until required.
Coverslips to be stained by immunofluorescence methods were fixed by washing in acetone for 20 minutes, then dried and storedas above.
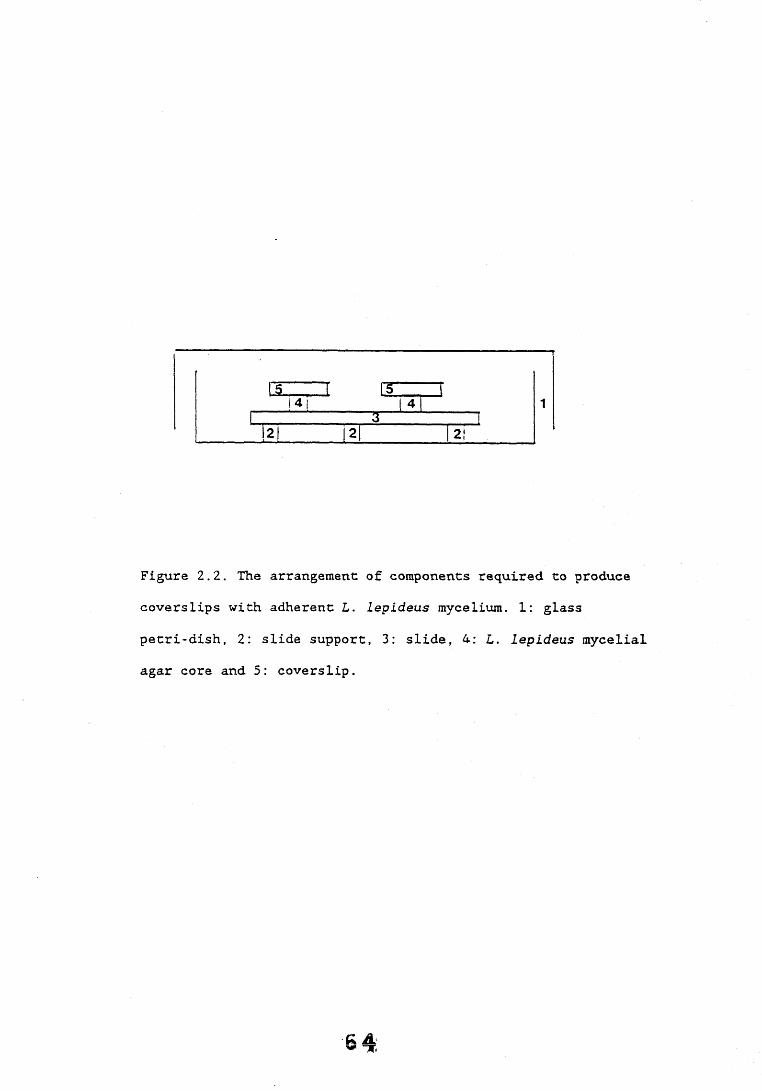
Figure 2.2. The arrangement of components required to produce coverslips with adherent L. lepideus mycelium. 1: glass petri-dish, 2: slide support, 3: slide, 4: L. lepideus mycelial agar core and 5: coverslip.
2.9. Wood block test systems.
2.9.1. Preparation and sterilisation of wood blocks.
Sapwood from pine (Pinus sylvestris.L) and lime (Tilia vulgaris. Hayne) was cut into blocks of 1cm x 1cm x 1cm dimension. These blocks were appropriately labelled, dried in an oven (103°C) until they achieved constant weight and the dry weights were recorded. The blocks were put into a desiccator and sterilised by ethylene oxide gas (10ml liquid ethylene oxide per litre of desiccator volume) for 24 hours (Smith, 1965). A small volume of sterile water was also introduced into the desiccator to allow blocks to moisten in preparation for fungal colonisation. After sterilisation blocks were ventilated within a sealed isolation chamber for 48 hours to remove all traces of ethylene oxide. This is important since it is known that residual ethylene oxide can have a deleterious affect on fungal growth (Dr A.F. Bravery, Building Research Establishment, personal communication). To determine whether the ethylene oxide sterilising method was having any effect on fungal colonisation
and subsequent decay of the blocks, a parallel study using blocks sterilised by gamma-irradiation, was undertaken and the rates of decay compared.
2.9.2 Exposure of wood blocks to fungal mycelium.
Cultures of L. lepideus FPRL 7F were grown on 3% (w/v) MXA
in vented screw top glass jars until a mycelial mat covered the agar surface and either eight weighed pine or eight lime
sterile blocks were placed upon thin plastic sterilised supports on top of the fungal mycelium. Direct contact between the blocks and the agar was avoided since this can cause excessive moisture uptake by the blocks. The aim of the system was to produce wood blocks at different stages of fungal colonisation and incipient decay, therefore blocks were harvested after 3,6,9 and 12 weeks for pine and 1,3,5,7 and 9 weeks for lime. Control blocks were placed onto plastic supports on sterile agar then exposed to the same conditions as test blocks. After harvesting, fungal growth on block surfaces was removed and the blocks were reweighed (uplift weight). The blocks were freeze-dried, weighed (final dry weight) and stored in liquid nitrogen (-180 C) until required. Infection of the blocks by L. lepideus was confirmed by weight loss measurements and microscopic examination. The percentage moisture content and the percentage weight loss were calculated for each block using the standard formulae (Wilkinson,1979),i.e.
% moisture content = uplift weight - final dry weight x 100final dry weight 1
% weight loss = original dry weight - final dry weight x 100original dry weight 1
Thin sections of the blocks were differentially stained with lactophenol cotton blue and safranin (Cartwright, 1929) before being screened microscopically for the presence of fungal hyphae. The fungus is stained blue, the wood pink.
2.9.3. Electron microscopy of wood blocks infected withL. lepideus.
Thin slivers of pine and lime wood blocks infected with L. lepideus were mounted onto metal stubs with the tangential longitudinal face uppermost and subsequently gold coated (Agar Aids sputter coater Model P53, Agar Aids, Standsted, Essex) for two minutes. The samples were examined under a scanning electron microscope (SEM model JEOL-JSM T100) and samples photographed on Ilford FP4 120 black and white film.
2.9.4. Preparation of wood block extracts/sections for immunological analysis.
The wood blocks were milled to a fine sawdust after small sections of selected blocks had been retained for subsequent staining. A variety of extracts were prepared and used in the different immunoassay systems.
2.9.4.1. Dot-immunobinding assay / Radioimmunoassay
Sawdust in PBS (50 mg per ml) was ground to a slurry using a mortar and pestle. The extract was centrifuged (12,000g) for ten minutes, the supernatant was decanted and used at the appropriate dilution in the assays. Samples screened in the dot-immunobinding assay were tested over a range of six two-fold dilutions. Samples were scored 0-6 dependent on the dilution which gave the last
positive result; 0= negative, 6= sample positive at all dilutions*,
2.9.4.2. Antigen capture assay.
Sawdust in extraction buffer (lOmg per ml) was ground to a slurry using a mortar and pestle. The extract was centrifuged (13,000g for 10 minutes) and diluted 1-1:10,000 (v/v) in different sample buffers and tested in the assay.
2.9.4.3. Western blotting.
Preliminary western blots of PBS extracts of wood blocks (50 mg sawdust per ml) gave negative results i.e. no bands. This could be accounted for by the presence of insufficient levels of fungal antigens, therefore, the samples were concentrated by freeze-drying. Sawdust (50mg) was ground to a slurry in 2ml of deionised water. The extract was then centrifuged (2,500g) for 10 minutes, the supernatant was decanted into eppendorf tubes and freeze-dried. The lyophilised material was dissolved in lOOul of diluted boiling mix and prepared as described for fungal antigens (section 2.6.5).
2.9.4.4. Staining methods.
Tangential longitudinal sections (nominal thickness 5um) were cut from thawed, PBS saturated blocks, previously infected with L. lepideus, using a sledge microtome. Sections were quenched for endogenous peroxidase activity as described for
6 8
coverslip fungal cultures (section 2.8). Wood block sections were stained by immunocytochemical, immunofluorescence and safranin/picro-aniline blue staining methods.
2.10. Immunocvtochemistrv.
Coverslip cultures of L. lepideus FPRL 7F were prepared as described above (section 2.8). The peroxidase-antiperoxidase (PAP) staining method used was essentially similar to that described by Johnstone and Thorpe (1982). After quenching of any endogenous peroxidase activity coverslips were placed on small plastic supports and incubated with PBS (1ml per coverslip) for 15 minutes. The PBS was drained from the coverslips by gentle blotting on tissue paper then 200ul of either test or pre-immune control serum, diluted in PBS-1NDS, added and the coverslips incubated for 60 minutes. In preliminary experiments, the optimum dilution of primary antiserum was found to be 1:200 and therefore this dilution was used in all subsequent experiments. The coverslips were washed 4x in PBS-1NDS after each incubation step and all incubations were carried out at room temperature. Free
binding sites were blocked by incubation with PBS-3NDS for 15 minutes (500ul per coverslip). The second antiserum, donkey anti-rabbit IgG precipitating serum, was diluted 1:10 (v/v) in PBS-1NDS and added to the coverslips for 30 minutes. The coverslips were subsequently washed and a second blocking stage carried out. The third antiserum, rabbitperoxidase-antiperoxidase was diluted 1:50 (v/v) in PBS-1NDS and incubated with the coverslips for 30 minutes. After washing 4x in
PBS-1NDS, the coverslips were rinsed once in 0.05M sodium acetate buffer, pH 5.0, prior to the visualisation of the PAP complex by
6 9
AEC substrate solution B. Coverslips were rinsed in 3x PBS and mounted in PBS:glycerol (1:1 v/v). The edges of the coverslips were sealed with clear nail varnish to prevent desiccation, then examined microscopically for the presence or absence of stained fungal hyphae. The reaction product is red.
Sections of infected wood blocks were prepared as described above (section 2.9.3.4) and treated in the same way as coverslip cultures with minor modifications. The primary antiserum was preabsorbed with either lime or pine sawdust as appropriate and sections were mounted in PBS:glycerol:0.1% (w/v) sodium azide.All incubation steps and washes were carried out in Linbro tissue culture plate wells (Flow Laboratories).
2.11. Immunofluorescence.
Coverslip cultures of L. lepideus FPRL 7F were prepared as described above. After removal from -20°C storage the coverslips were allowed to thaw and rinsed 3x in PBS. Coverslips were blocked with PBS-3NDS for 15 minutes followed by 60 minutes incubation with primary antiserum (either test or pre-immune control serum diluted 1:50 (v/v) in PBS-1NDS). Each incubation step was followed by 3x wash in PBS and all incubation steps were carried out at room temperature. FITC-Ab2, diluted 1:20 (v/v) in
PBS, was added to each coverslip (lOOul) and incubated for 30 minutes. (Note, to reduce non-specific background staining the FITC-Ab2 was centrifuged at 13,000g for 5 minutes prior to use to remove any particulate matter). After washing the coverslips were mounted in PBS:glycerol (1:9 v/v), sealed with nail varnish to prevent desiccation, and stored at 4°C in the dark.
Wood block sections were treated in a similar way with the
following modifications. Primary antiserum was used at a 1:400 (v/v) dilution, FITC-Ab2 used at a 1:40 (v/v) dilution and both antisera were preabsorbed with either lime or pine sawdust as appropriate. All incubation and wash steps were carried out in tissue culture wells as described above.
Goverslip cultures and wood block sections were examined for the presence or absence of fluorescent staining using the Leitz Laborlux K microscope fitted with the 3-A-Ploemopak fluorescence illuminator (Ernst Leitz (Instruments) Ltd, Luton). Positive specimens were photographed on Kodak Ektachrome 200 slide film.
2.12. Safranin/Picro-aniline blue staining of fungal mycelium in wood sections.
The safranin/picro-aniline blue staining method, first reported by Cartwright (1929), permits the non-specific staining of fungal mycelium in wood. The system was used to verify the presence of fungal hyphae in wood blocks to be screened by immunocytochemical and immunofluorescence methods. In addition, since the safranin/picro-aniline blue stain detects all fungal hyphae regardless of their antigenicity, comparisons of staining patterns between this method and the two more specific immunological methods could be made.
Briefly wood sections were prepared as described earlier (section 2.8.3.4). Each section was stained with a 1% (w/v) aqueous solution of safranin for 40 seconds, washed once in ultrapure water and placed in a small beaker and flooded with
picro-aniline blue. The beaker, containing the wood section and stain, was heated until liquid was just beginning to boil. The section was removed and washed in ultrapure water until all
excess stain had been removed. Sections were dehydrated by washing twice in 70% ethanol (30 seconds) followed by a single wash in absolute ethanol (30 seconds) and cleared in clove oil (30 seconds). Finally sections were washed in xylene (30 seconds)
then mounted in DPX mountant before evaporation of xylene could occur. Slides were examined microscopically for the presence of fungal hyphae which stain blue. The wood material stains pink.
2.13. Radioimmunoassay of wood block extracts.
The radioimmunoassay (RIA) system used was basically a modified version of the dot-immunobinding assay (section 2.6.3) with iodinated-Protein A (Amersham International) replacing the
enzyme-labelled second antibody. Whole cell mycelial antigen suspensions of L. lepideus FPRL 7F were prepared in PBS (5.0mg per ml). After centrifugation, 13,000g for 5 minutes, the supernatant was decanted, a dilution series ranging from undiluted to 1:2,048 (v/v) prepared and used to construct a standard curve. Pre-immune control serum was tested against the lowest four dilutions to obtain values of background non-specific binding. The control and infected wood block extracts were prepared in PBS (50mg sawdust per ml). After centrifugation the resultant supernatants were screened undiluted, at a 1:2 (v/v) dilution and at a 1:4 (v/v) dilution against test antiserum; pre-immune control serum was tested against undiluted samples only. Preliminary experiments were carried out to determine the optimum reagent concentrations and assay conditions for the system, the experimental details reported here represent these optimum conditions which were routinely used in all subsequent experiments.
"7 9r
Aliquots (2ul) of the appropriate supernatant preparationswere 'dotted' onto nitrocellulose membrane (NC) and allowed toair dry. The NC was blocked by incubation in two changes ofTBS-3G blocking buffer for 60 minutes at 37°C. The NC was washed2x in TBS-0.05T. All washes and subsequent incubation steps werecarried out at room temperature. Primary antiserum, either testor pre-immune control serum, was preabsorbed with pine or limesawdust as appropriate and diluted 1:100 (v/v) inTBS -1BSA-0.05T-0.01SA. After 60 minutes incubation the NC was
125washed twice in TBS-0.05T. Iodinated-Protein A ( I-Protein A)5was diluted to a reactivity of 2.0 x 10 c.p.m. per ml of
TBS-3BSA-0.05T-0.01SA and incubated for 60 minutes with the NC membrane. All incubation steps were carried out on a rocking platform. The NC was dried, individual 'dotted' samples cut out and the protein-A binding determined using a gamma counter (LKB 1275 Minigamma). All samples were assayed in triplicate. The total count for each sample over a 5 minute time period was recorded, the mean value determined and the values adjusted for pre-immune serum background controls. The antigen concentrations of infected wood samples were determined from the L. lepideus
standard curve.The correlation of RIA results with the percentage weight
losses of blocks (taken as a crude indicator of the amount of fungal colonisation and/or decay) was calculated. Statistical analysis was carried out using the Minitab Statistical package on the VMS/VAX system and a BBC microcomputer disc programme (Disc 4, Statistics programme, Microcomputers in Biology, RIL Press). The correlation between the RIA results and the dot-immunobinding results (section 2.9.3.1) was also calculated.
73
2.14. Antigen Capture Assay.
2.14.1. Purification of IgG from antiserum.
The IgG fraction was purified from test serum by each of two methods. Method one used salt precipitation followed by ion exchange chromatography (Johnstone and Thorpe, 1982). Anhydrous sodium sulphate was mixed with antiserum (2ml) to a final concentration of 18% (w/v) and incubated for 30 minutes at 25°C. The solution was centrifuged, 3,000g for 30 minutes, and the supernatant was discarded. The precipitate was redissolved in 1ml of distilled water and sodium sulphate added to a final concentration of 14% (w/v). The suspension was incubated for a further 30 minutes. The solution was centrifuged as before and the precipitate redissolved in 0.6ml of distilled water. The solution was either dialysed against PBS (for storage at -20°C) or 0.07M sodium phosphate buffer, pH 6.3, (for further purification). Samples were dialysed against two changes of buffer (500ml) overnight at 4°C. The IgG samples were further purified on a DEAE cellulose anion exchange column (50ml wet settled volume, Whatman DE52). The column was equilibrated with 0.07M sodium phosphate buffer pH 6.3, (starting buffer), before samples were loaded. The IgG was eluted from the column by the starting buffer in the first few fractions. The presence of protein (presumed to be IgG) was monitored by measuring absorbance at 280nm. The concentration of IgG in each fraction was calculated using the formula:
concentration of sample = absorbance at 280nm_________ xlO mg/mlextinction coefficient at 280
The extinction coefficient (E J) of rabbit IeG is 13.5,
i.e. the absorbance of a lOmg per ml solution at 280nm (Johnstone and Thorpe, 1982). Samples were stored at 4°C with 0.02% (w/v) sodium azide added as a preservative.
Alternatively, IgG was purified from serum by the octanoic acid method (Steinbuch and Andran, 1969). Briefly this required the serum to be diluted 1:3 (v/v) in 0.06M sodium acetate buffer, pH 4.0 and 25ul of octanoic acid was added dropwise to each ml of diluted serum with continuous stirring. The mixture was incubated for 30 minutes at room temperature then centrifuged, 3,000g for 10 minutes, to remove precipitate. The supernatant was decanted, the pellet washed with 0.15M sodium acetate buffer, pH 4.8, and the washings added to the first supernatant. The supernatant was adjusted to pH 5.7 by the addition of dilute NaOH and dialysed against at least two changes of 0.015M sodium acetate buffer, pH 5.7, overnight at 4°C. IgG samples subsequently conjugated with horse radish peroxidase enzyme were dialysed against 0.1M sodium carbonate buffer, pH 9.6.
The IgG was further purified by batch absorption with DEAE cellulose (DE52) preequilibrated with 0.015M sodium acetate buffer, pH 5.7 (30mg DE52 per ml of dialysate incubated for 15 minutes at room temperature). However, the increase in purity of IgG resulting from this procedure was insufficient to justify its use and therefore, this step was subsequently omitted. '
The octanoic acid method gave higher yields of IgG than the
salt precipitation /ion exchange chromatography method and was a less complex and time consuming method. Subsequently, IgG was routinely purified by the octanoic acid method.
2.14.2. Conjugation of IgG to horse radish peroxidase enzyme.
Conjugation of IgG to horse radish peroxidase was carried out using a two step method based on that described by Avrameas and Ternynck (1971). IgG was purified from serum as described above, dialysed extensively against 0.1M sodium carbonate buffer, pH 9.6 and concentrated to 20 mg per ml by incubation with polyethylene glycol flakes (PEG MW 4,000, BDH Chemicals Ltd) at 4°C. Horse radish peroxidase (HRP, Sigma type II, E.C. 1.11.1.7) was dissolved in PBS (50mg per ml), glutaraldehyde added to a final concentration of 1.25% (v/v) and the mixture incubated overnight at room temperature. This activated HRP was diluted 1:5 (v/v) in 0.1M sodium carbonate buffer, pH 9.6, and dialysed against several changes of the same buffer overnight at 4°C. The IgG was coupled to the activated HRP by mixing 1ml of IgG preparation with 4ml of activated HRP solution and incubating overnight at room temperature. The coupling reaction was stopped by the addition of 0.8ml of 2M lysine in 0.1M sodium carbonate buffer, pH 9.6, for each ml of IgG used and mixed for at least 2 hours at room temperature. The conjugate was diluted 1:2 (v/v) in PBS-0.1% sodium azide-0.1% bovine serum albumin-10% glycerol and
stored at -20°C until required.
2.14.3. Antigen capture assay protocol.
Aliquots of purified IgG (lOOul) were dispensed into microtitre plate wells and incubated overnight at 4°C. The plates were rinsed six times with washing buffer (see Table 2.3) after each incubation step. All subsequent incubation steps were carried out at room temperature. Free binding sites on the plates were blocked by incubation with blocking buffer (see Table 2.2) for 60 minutes. Antigen samples were prepared in extraction buffer (0.5mg per ml) and aliquots (lOOul) added to the appropriate wells and incubated for 60 minutes. Antigen binding was detected by HRP-Ab2 diluted 1:100 (v/v) and incubated for 30 minutes. Enzyme activity was detected by adding 200ul of TMB substrate solution to each well. After 30 minutes incubation the reaction was stopped by the addition of lOOul of 1M sulphuric acid to each well. The extent of the reaction was determined spectrophotometrically (absorbance at 405nm) on an automated plate reader.
2.15. Isolation of fungal cell walls and extraction of wall components,
Lyophilised, sonicated L. lepideus FPRL 7F mycelium (500mg) was incubated with 5ml of dichloromethane:methanol (2:1 v/v) for 30 minutes at room temperature. The suspension was centrifuged, 4,000g for 10 minutes. The supernatant was discarded and the pellet was taken as the source of purified cell walls (pellet 1). The purified cell walls were degraded stepwise as previously described by Mahadevan and Tatum (1965). Pellet 1 was
ex1 (
H SO for 16 hours at 90°C and finally with 1M NaOH for 30 2 4
minutes at 25°C. The reaction mixtures were centrifuged after each incubation step. The supernatants were decanted, numbered 1-3 and tested in the EIA for soluble antigens (section 2.6.2.1) for reactivity. Small portions of each resultant pellet (1-4) were retained and tested in the EIA for insoluble antigens (section 2.6.2.2) for loss of reactivity.
2.16. Characterisation of L. lepideus antigens.
L. lepideus antigens from fungus cultured in liquid medium, on lime (T. vulgaris .Hayne) and on pine (P. sylvescris . L) wood blocks, were characterised in a variety of ways (see 2.16.1 - 2.16.6) In addition, comparisons of antigens extracted from the fungus grown in liquid culture or on wood and between the antigens extracted from the two different wood species, were made (2.16.7.1,2,3). In the experiment liquid culture grown fungal mycelium was used at a concentration of 25mg per ml buffer throughout unless otherwise stated. Sawdust infected with L. lepideus and control uninfected sawdust were used at a concentration of 50mg per ml of buffer. The samples tested in the western blotting technique were prepared as described earlier (sections 2.6.5. and 2.9.3.3.). Antigenic extracts from fungus grown on wood were screened against primary antibody preabsorbed
with the appropriate sawdust.
sequentially incubated with 2M NaOH for 16 hours at 25°C, 0.5M
78

2.16.1. Estimation of the total protein content of L. levideus
mycelium.
An extract of L. lepideus lyophilised mycelium was prepared in distilled water (5.0mg per ml) and was ground to a slurry in a mortar and pestle before the protein content was determined by two separate methods. The first method used was the dye binding microassay method (Bio-Rad Protein assay kit II) based on the method described by Bradford (1976). Bovine serum albumin (BSA, 0-30ug) was used as the standard. Solutions and appropriately diluted samples (1ml aliquots) were dispensed into test tubes and 0.2ml of the Bio-Rad dye reagent added. The contents were mixed and incubated for 10 minutes. The absorbance at 595nm was measured against a reagent blank, a standard curve constructed and the protein concentration of the samples was determined from this curve.
In addition, the protein content was determined using a modified Folin-Ciocalteu-Lowry assay (Lowry et al.t 1951).Protein standards (0-lmg BSA per ml) and appropriately diluted samples (0.5ml) were mixed with 0.5ml 0.5M NaOH and incubated at room temperature for 20 minutes. Subsequently 2.5ml of alkaline copper reagent, (2% w/v sodium carbonate, 100ml, 2% w/v disodium tartrate, 1ml, and 1% w/v copper sulphate, 1ml), was added and the solutions were incubated for a further 20 minutes.Absorbances were measured at 540nm and a standard curve constructed. The protein content of samples was estimated using this standard curve. All samples were assayed in triplicate.
79
2.16.2. Estimation of the total carbohydrate content ofL. lepideus mycelium.
An extract of L. lepideus mycelium was prepared as described above (section 2.16.1). The carbohydrate assay procedure used was based on a colorimetric method for the determination of sugars (Dubois et al. , 1956). Samples (2ml) of a range of glucose standards (0-30ug per ml) and appropriately diluted samples were dispensed into wide-mouthed test tubes (16-20mm diameter) and 0.05ml of an aqueous phenol solution (80% w/v) added. Analar concentrated sulphuric acid (5ml) was dispensed rapidly into each tube using a calibrated automatic dispenser. The contents of the tubes were mixed and incubated for 30 minutes. The absorbance at 485nm was measured against a reagent blank and a standard curve was constructed. The carbohydrate content (as glucose) of the samples was determined from the standard curve. All samples were assayed in triplicate.
2.16.3. Effect of heat.
A PBS extract of the L. lepideus antigens was prepared. The extract was centrifuged (13,000g for 10 minutes) and the supernatant decanted. The supernatant was tested for heat denaturation by boiling the sample at 100°C for 5 minutes. This extract was screened by western blotting against both untreated supernatant and whole cell extract controls.
2.16.4. Enzymes.
The mycelial and wood extracts were treated with a variety of enzymes which were prepared in PBS, unless otherwise stated, at the appropriate optimum pHs. The enzymes used were proteinase K (E.C. 3.4.21.14), trypsin (E.C. 3.4.21.4), lipase (E.C.3.1.1.3) all pH 7.6, B-galactosidase (E.C. 3.2.1.23) pH 7.4, a-amylase (E.C. 3.2.1.1) and a-glucosidase (E.C. 3.2.1.20) pH6.8. Cellulase (E.C. 3.2.1.4), B-glucosidase (E.C. 3.2.1.21) both pH 5.0, and N-acetyl glucosaminidase (E.C. 3.2.1.30) pH 4.2, were diluted in 0.01M sodium acetate buffer. The enzymes were purchased from The Sigma Chemical Company Ltd. and were used at a final concentration of lmg per ml except N-acetyl glucosaminidase which was used at 1 unit of activity per ml. Antibiotics, chloramphenicol 12.5ug per ml, and cycloheximide 25ug per ml, were added to samples which were then incubated overnight in a 37°C waterbath. Enzyme treated samples were screened by western blotting against untreated control samples and enzyme only controls.
In addition to the commercially prepared enzymes, three crude enzyme extracts were prepared from Trichoderma harzianum (strain CMI 206040) which has been shown to lyse L. lepideus
mycelium in agar plate interaction studies (Bruce, 1983). The lytic enzyme extracts were prepared by a method based on that described by Peberdy and Isaacs (1976). T. harzianum was grown on a medium supplemented with both chitin and laminarin (Th extract 1), or chitin alone (Th extract 2) and on malt extract broth (Th extract 3). The chitin and laminarin were purchased from Sigma and the chitin was hammer-milled before use. Conidia for
r t 4 iO I
media solidified with agar (15g per litre). Cultures wereincubated with constant illumination to maximise conidiaproduction. Litre flasks containing 200ml of the individual mediawere inoculated with a suspension of conidia in sterile water to
9give a final concentration of 1 x 10 per ml. The cultures were incubated at 25°C on a rotary shaker (200rpm) with constant illumination for 4 days. Cultures were harvested by centrifugation (10,000g for 15 minutes). Supernatants were decanted and aliquots concentrated by either freeze-drying or filtration through a Diaflo ultrafiltration membrane (UM2, >MW 1000, Amicon Corporation, USA). Filtrates were subsequently centrifuged (15,000g, 15 minutes), then passed through a membrane filter (Whatman, pore size 0.A5um) and stored at -20°C till required. This method resulted in a 5-fold increase in the concentration of the original extract. Freeze-dried Th extracts were reconstituted in PBS (pH 7.4) to give a 20-fold increase in concentration.
The mycelial and wood antigen extracts were prepared in PBS (25 and 50mg per ml respectively) and mixed with an equal volume of the Th extracts. Samples were incubated in conical flasks on a rotary shaker for 3 hours at room temperature then analysed by western blotting.
2.16.5. Treatment of antigen extracts with sodium-metaperiodate .
Antigen samples were western blotted onto NC membranes as normal and the NC was incubated with PBS-1% Tween 20 for 60 minutes then washed 5x in PBS. The NC strips were incubated in
inoculation of liquid cultures were obtained from the appropriate
0.01M sodium acetate buffer, pH 4.5, with sodium meta-periodate added to a final concentration of 0.05M, for 18 hours at 4°C. Strips were washed three times in PBS-0.05T and immunostained as normal (section 2.6.5) but omitting the blocking step. Control strips were incubated with acetate buffer only.
2.16.6. Lectins.
Antigen samples separated by SDS-PAGE and transferred onto NC strips as described above were then reacted with HRP-labelled lectins to localise antigens bearing specific sugar residues. Three lectins were tested: Concanavalin A (Con A), Triticum vulgaris (WGA, wheat germ agglutinin) and Bandeiraea simplicifolia (BS-1). The enzyme-labelled lectins were purchased from the Sigma Chemical Company Ltd. as freeze-dried powders and reconstituted in PBS. Divalent calcium and manganese ions (ImM) were added to the Con-A solution to stabilise the Con-A diamer. Aliquots (25ul) of the lectins were placed into eppendorf tubes and stored frozen till required. After blotting the NC strips were washed twice then reacted with the appropriate lectin solution for 60 minutes at room temperature. WGA was used at a final concentration of 20ug per ml and BS-1 at a final concentration of lOOug per ml. Both lectins were diluted in PBS-0.05T and the NC strips treated with these lectins were washed with the same buffer. The Con-A lectin was used at a final concentration of 5ug per ml and diluted in a Tris-Tween-saline buffer, (lOmM Tris-HCl, pH 7.5 containing 0.05% Tween 20, 0.15M NaCl, ImM CaCl and ImM MnCl), as described by Kijimoto-Ochiai et al. (1985). The same buffer was used to wash the NC strips.Enzyme activity, and hence lectin binding, was detected by
reacting the strips with DAB substrate solution. The resultant banding pattern produced was compared with immunostained
controls.
2.16.7. Effect of cultural conditions on L. lepideus antigenicity.
2.16.7.1. Effect of culture age,
L. lepideus FPRL 7F antigens were cultured on MXB plus benomyl (4ppm) for 3, 8 and 14 days. L. lepideus FPRL 7B and G. trabeum were grown until their colony diameters were equivalent to L. lepideus FPRL 7F, at the three stages of growth. Mycelial mats were harvested as described above (section 2.3) and the extracts (section 2.4) analysed by western blotting to determine whether any changes in antigenic profile occurred.
2.16.7.2. Effect of incorporation of benomyl into growth medium.
L. lepideus FPRL 7F antigens grown on MXB only or MXB with added benomyl (4ppm) were analysed by western blotting and the antigenic profiles compared.
2.16.7.3. Different growth substrates.
L. lepideus antigens were cultured on agar, lime (T. vulgaris.Hayne) and pine (P. sylvestris.L) sapwood blocks. Antigenic extracts were analysed to determine whether different antigenic profiles were expressed in liquid culture and wood
grown extracts. Comparisons of the antigenic profiles of L. lepideus cultured in the two different wood species were also made.
2.16.8. Comparison of different antisera.
Antisera were raised to L. lepideus antigens cultured on
agar or wood (section 2.5). Antigenic extracts of both liquid culture and wood grown fungus were western blotted and reacted with the two different antisera. The antigenic profiles produced were compared.
2.16.9. Staining of polyacrylamide gels.
2.16.9.1. Staining of gels for protein.
Silver staining is a highly sensitive method for detecting proteins in polyacrylamide slab gels. Fungal extracts were separated on 7.5% PAGE gels as described above (section 2.6.5) then stained for protein. Gels were stained using the Bio-Rad silver stain kit (Bio-Rad 161-0443) based on the method described by Switzer et al. (1979). The protein stained profiles on the gels were compared with immunostained controls to identify and localise protein-containing antigens.
2.16.9.2. Staining of gels for carbohydrate.
Gels were stained for carbohydrate using the periodic acid- Schiff reagent as described by Fairbanks et al. (1971). The
8 S’
staining profiles on the gels were compared with immunostained controls to identify and localise carbohydrate or glycoprotein antigens.
2.17. Exoantigen production.
L. lepideus FPRL 7F mycelium was cultured on 3% (w/v) malt extract broth as previously described (section 2.3). After eight days incubation the fungal mats were harvested by filtration through Whatman No 1 filter paper and the mycelial mats were rinsed with 10ml of PBS; this gentle washing facilitated the retention of the soluble exoantigens. The mycelium was freeze-dried and stored at -20°G until required. Freeze-dried fungal mycelium (O.lg) was mixed with 10ml of distilled water.The suspension was subsequently agitated on a rotary shaker for 60 minutes at 4°C and centrifuged, 13,000g for 10 minutes. The supernatant decanted and used as a source of exoantigens. For certain assays the supernatant was concentrated by freeze-drying. Exoantigen extracts were screened by western blotting and
compared with the standard SDS-solubilised antigen extract (section 2.6.5).
2.18. Field Trial.
A field trial to investigate the applicability of immunological systems to the detection of L. lepideus was undertaken.
86 '
2.18.1. Setting: up of the field test site.
Nine creosote treated distribution pole stubs of approximately 2.7m length were kindly supplied by the North of Scotland Electricity Board. The field test site was located within the Electricity Board's Substation near Tealing, to the north of Dundee. These pole stubs were buried to a depth of approximately 1.2m and allowed to settle for one month. Each pole was sampled at two points, at a height of 3cm from the groundline, to test for possible presence of inherent L. lepideus
infection. Core samples were removed using a Mattson auger No 4337 (And Mattson, Sweden), positioned at an angle of forty-five degrees with respect to the pole. Percentage moisture contents of the pole interiors were determined using a Timbermaster moisture
meter, (Protimeter, Model D378T), whenever sampling and/or inoculation of poles was carried out. Cores removed from the poles were divided into two halves, one half plated onto 3% (w/v) malt extract agar and the other onto benomyl agar (MXA/benomyl 4ppm). All poles were negative for the presence of L. lepideus after the initial screening.
The poles were assigned into three subgroups: group 1 = poles 1,2 and 3; group 2 = poles 4,5 and 6; group 3 = poles 7,8 and 9, and inoculated with L. lepideus FPRL 7F at various time points. The total incubation period for each subgroup was; poles 1-3, 22 months, poles 4-6, 18 months and poles 7-9, 6 months. Poles were inoculated at three sites, at a height of 3cm from the groundline, with both infected sawdust and infected pine dowls. Poles 1-3 were reinoculated four months after the initial
inoculation date. Poles were sampled 4-6 weeks after the date of inoculation to determine whether L. lepideus either remained viable or had become established.
2.18.2. Screening of Field Trial samples.
Upon termination of the field trial the poles were uprooted, middle sections ranging from 23-30cm either side of the groundline were removed and brought back to the laboratory to be tested for the presence of fungal colonisation and/or decay. Pole stubs were halved and each half sampled at seven standardised points (Figure 2.3). Cores removed from the sampling points were cut into 0.5cm sections and numbered from the pole centre outwards. Odd-numbered sections were screened in the dot-immunobinding assay (section 2.6.4), even-numbered sections were screened microbiologically.
Sections to be screened in the dot-immunobinding assay were milled (section 2.5.2). The resultant sawdust was suspended in PBS (50mg per ml) and ground to a slurry in a mortar and pestle. The suspensions were centrifuged, 13,000g for 10 minutes, and the supernatants screened undiluted against test antiserum preabsorbed with pine sawdust. Negative controls of uninfected wood and both positive wood and mycelial controls were included. Samples were scored from 0-6 dependent on the intensity of the dot produced, (0 = negative; 6 = equivalent to mycelial control). The results were scored by five independent assessors and a mean score calculated for each sample.
Sections to be screened microbiologically were plated onto 3% (w/v) MXA with added benomyl (4ppm) and streptomycin
r» oo o
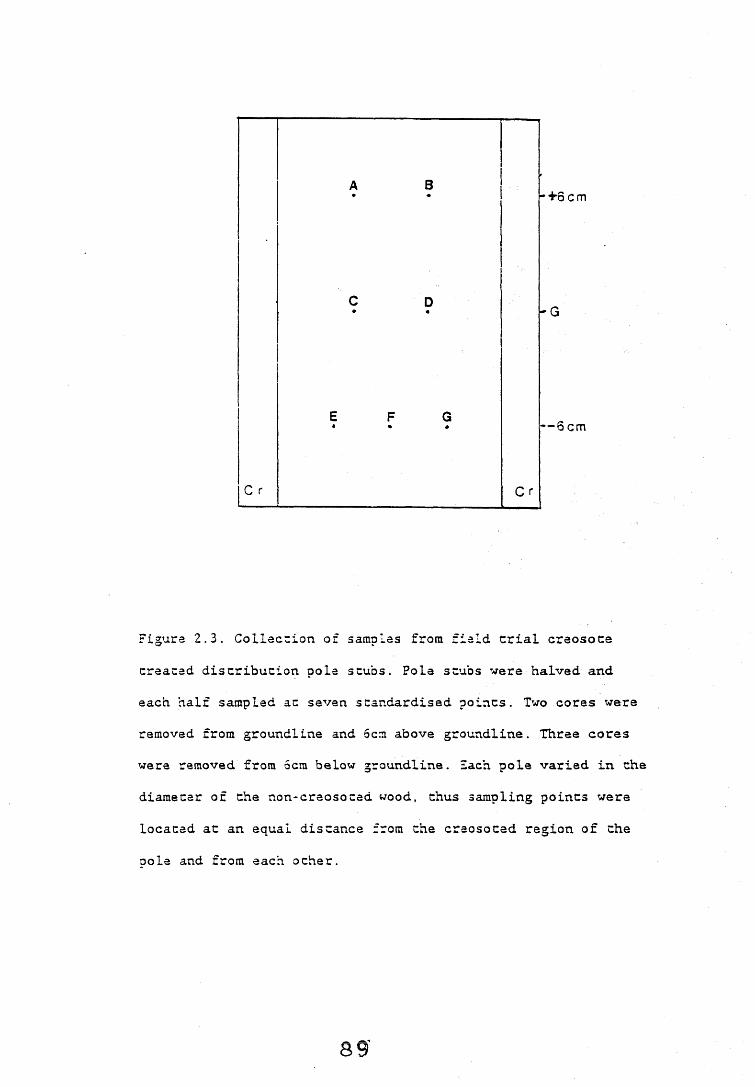
-+ 6 cmA B
C D - G
E F G — 6 cm
C r C r
Figure 2.3. Collection of samples from field trial creosote created distribution pole stubs. Pole stubs were halved and each half sampled at seven standardised points. Two cores were removed from groundline and 6cm above groundline. Three cores were removed from 6cm below groundline. Each pole varied in the diameter of the non-creosocad wood, thus sampling points were located at an equal distance from the craosoted region of the pole and from each ocher.
8 9’
(0.1% w/v). Plates were incubated at 25°C for up to sixweeks and scored for the presence or absence of L. lepideus. Thecorrelation between the two systems was assessed.
9 0
CHAPTER 3. APPLICATION OF IMMUNOLOGICAL TECHNIQUES TO THE ANALYSIS OF LENTINUS LEPIDEUS.
3.1. General introduction.
A variety of immunological techniques were investigated to determine their applicability to the analysis of the wood decay basidiomycete fungus L. lepideus. A brief introduction to the theory and background of each technique is presented followed by the results of any development work carried out to permit its application for the analysis of L. lepideus. An overall discussion of the applicability of the various techniques tested is also presented. The main objectives of the work reported in
this chapter were:
1. To evaluate a variety of immunological techniques as applied to the detection and analysis of L. lepideus.
2. To identify a detection method(s) with potential for application as a field testing system.
The development of the various techniques is reported here, the results obtained from any subsequent applications of the techniques will be reported in later chapters (as appropriate).
3.2. Immunodiffusion.
3.2.1. Introduction.
The principle of immunodiffusion involves the diffusion of antigen and antibody from separate sources into a gel matrix, usually composed of agar or agarose. During diffusion concentration gradients are established and where antigen and
9 2
specific antibody meet under optimal relative concentrations, (termed equivalence), a precipitation line may form. Each antigen-antibody system in a complex mixture of serological reactants can potentially give rise to an individual precipitate. With a suitable arrangement of different antigen sources the technique is well suited for comparative studies. When using immunodiffusion for such studies four "type reactions" can be used as a basis for interpretation (Nilsson, 1983) viz complete fusion (reaction of identity), no interference (reaction of non-identity), partial fusion and inhibition (both of which are reactions of partial identity). Diagrammatic illustrations of each reaction type are shown in Figure 3.1. In the current studies immunodiffusion was the primary screening technique used to compare the antigenicity of different fungi and assess the specificity of the L. lepideus antisera produced. It is a simple, easily reproducible technique and allows the direct comparison of precipitation patterns of test fungi with that obtained using L. lepideus FPRL 7F control antigens. However, the system has its limitations; it is not as sensitive as some other immunological techniques e.g. radioimmunoassay, enzyme-linked immunoassay (ELISA) and the sensitivity of the precipitation reaction is dependent on a variety of factors. For example, the concentration of reagents, the distance between wells and the thickness/viscosity of the gel matrix can all affect the precipitation patterns and care must be taken to standardise the procedures.
9 3
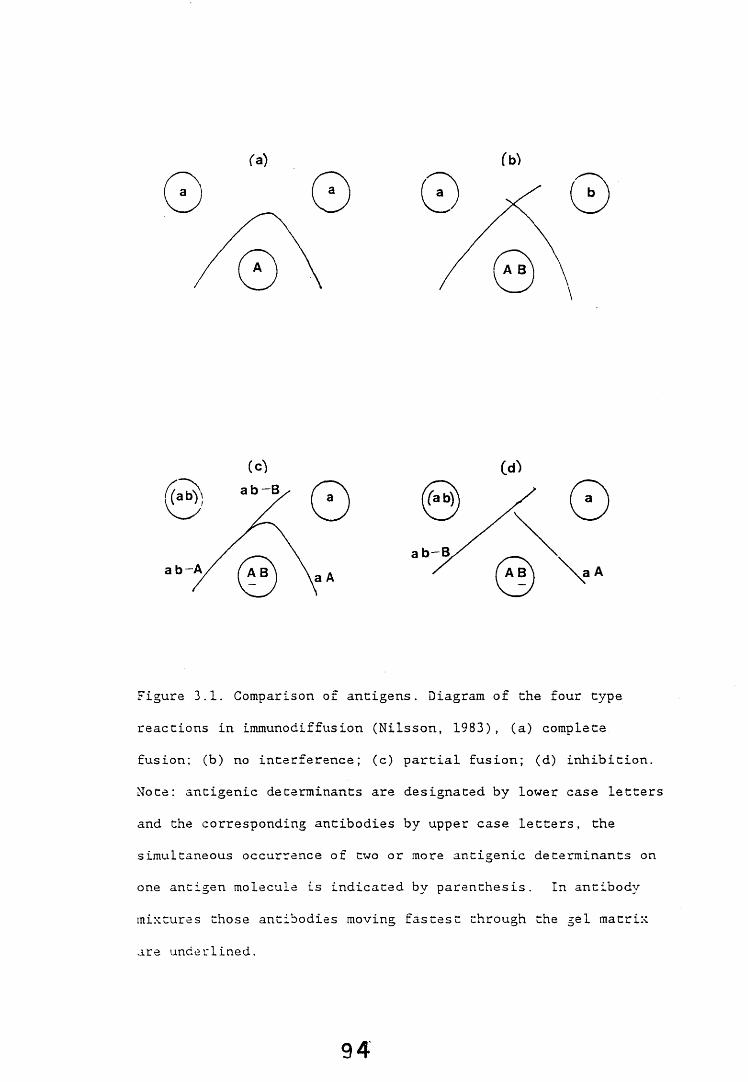
(a) (b)
(c) Cd
Figure 3.1. Comparison of antigens. Diagram of the four type
reactions in immunodiffusion (Nilsson, 1983), (a) complete fusion; (b) no interference; (c) partial fusion; (d) inhibition. Note: antigenic determinants are designated by lower case letters and the corresponding antibodies by upper case letters, the simultaneous occurrence of two or more antigenic determinants on one antigen molecule is indicated by parenthesis. In antibody
mixtures those antibodies moving fastest through the gel matrix
are underlined.
94
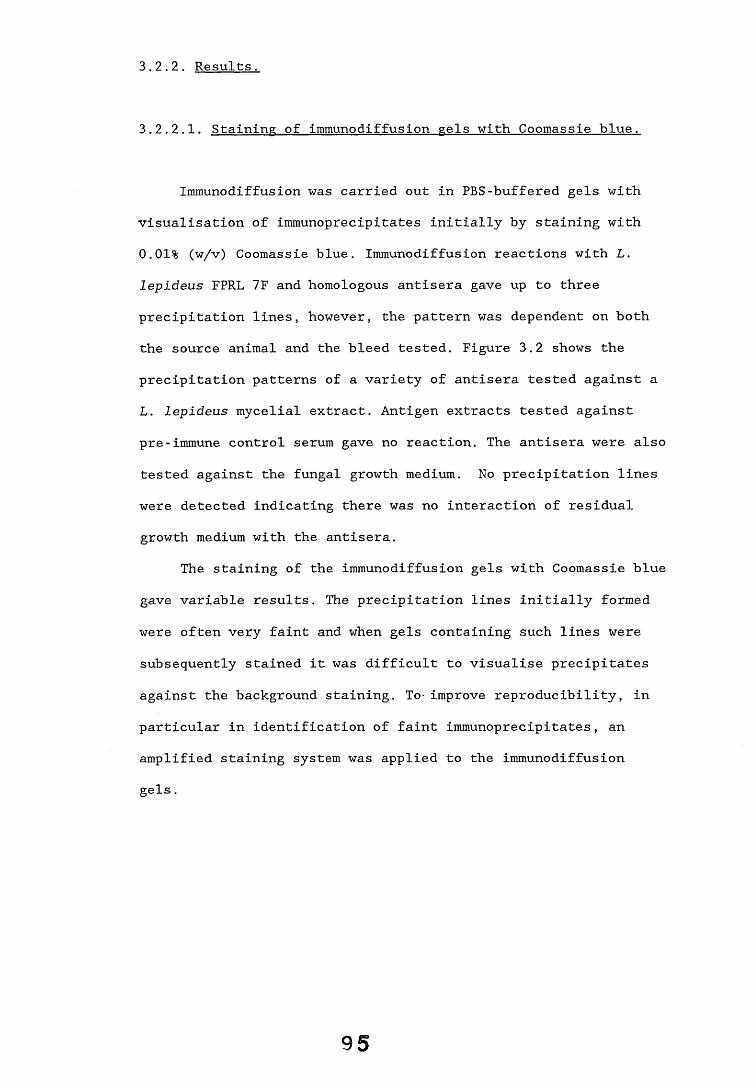
3.2.2. Results.
3.2.2.1. Staining of immunodiffusion gels with Coomassie blue.
Immunodiffusion was carried out in PBS-buffered gels with visualisation of immunoprecipitates initially by staining with 0.01% (w/v) Coomassie blue. Immunodiffusion reactions with L. lepideus FPRL 7F and homologous antisera gave up to three precipitation lines, however, the pattern was dependent on both the source animal and the bleed tested. Figure 3.2 shows the precipitation patterns of a variety of antisera tested against a L. lepideus mycelial extract. Antigen extracts tested against pre-immune control serum gave no reaction. The antisera were also tested against the fungal growth medium. No precipitation lines were detected indicating there was no interaction of residual growth medium with the antisera.
The staining of the immunodiffusion gels with Coomassie blue gave variable results. The precipitation lines initially formed were often very faint and when gels containing such lines were subsequently stained it was difficult to visualise precipitates against the background staining. To- improve reproducibility, in particular in identification of faint immunoprecipitates, an amplified staining system was applied to the immunodiffusion gels.
9 5
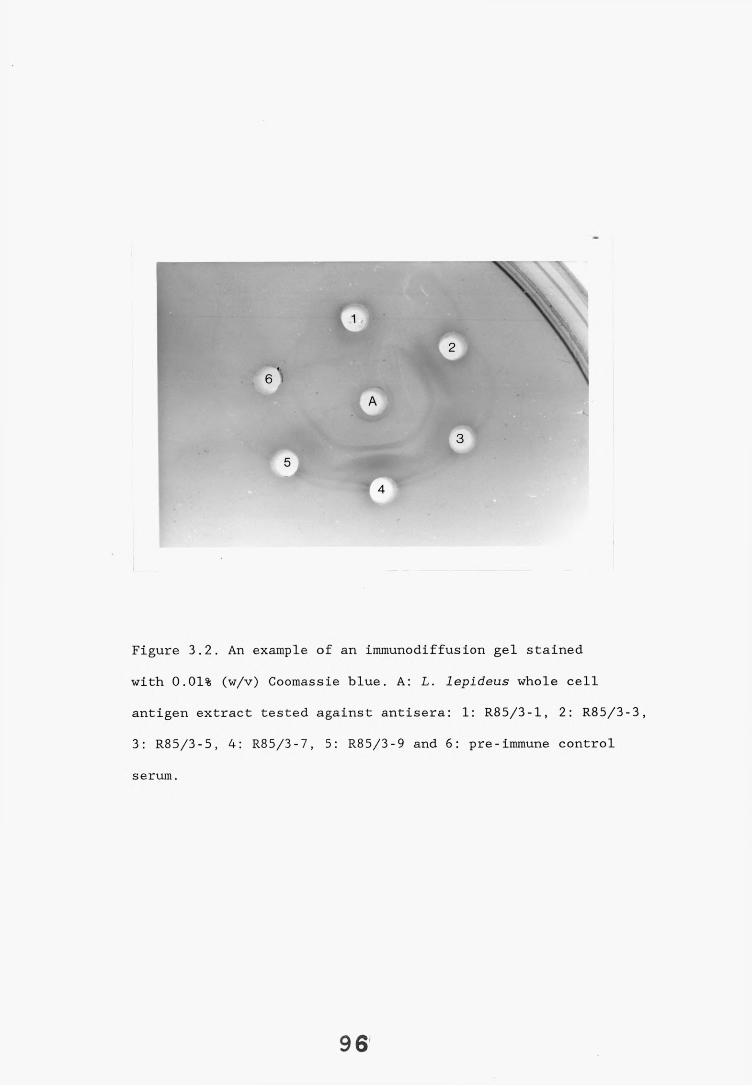
Figure 3.2. An example of an immunodiffusion gel stained with 0.01% (w/v) Coomassie blue. A: L. lepideus whole cell antigen extract tested against antisera: 1: R85/3-1, 2: R85/3-3, 3: R85/3-5, 4: R85/3-7, 5: R85/3-9 and 6: pre-immune control serum.
9 6
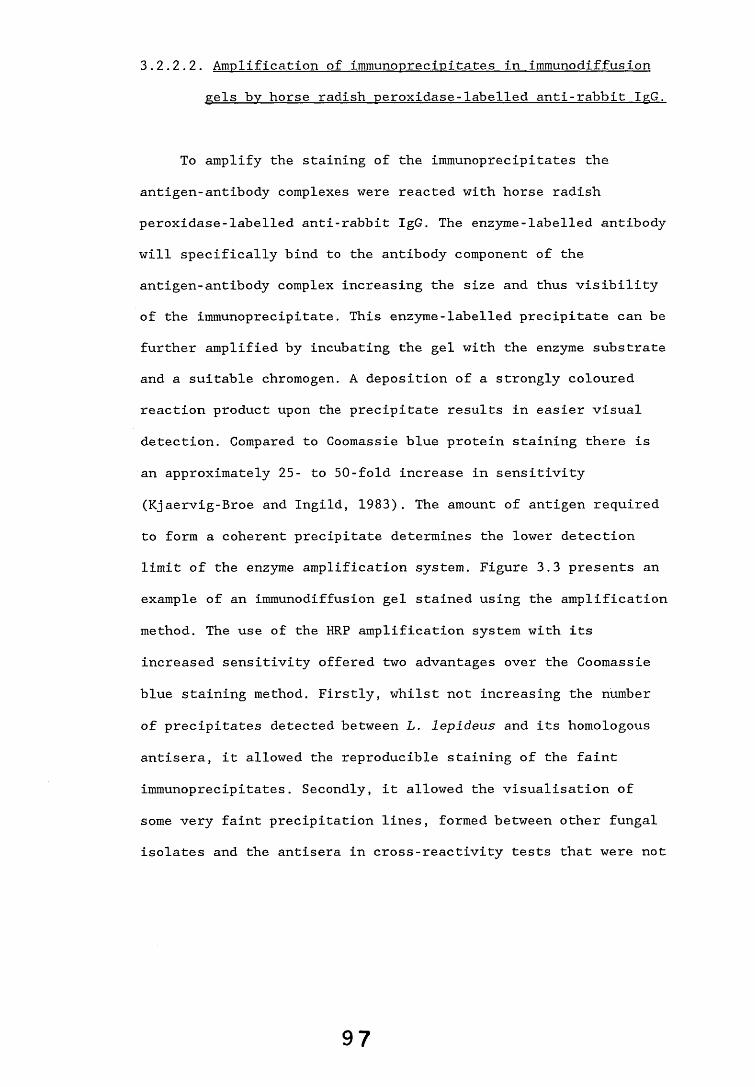
3.2.2.2. Amplification of immunoprecipitates in immunodiffusiongels by horse radish peroxidase-labelled anti-rabbit IgG.
To amplify the staining of the immunoprecipitates the antigen-antibody complexes were reacted with horse radish peroxidase-labelled anti-rabbit IgG. The enzyme-labelled antibody will specifically bind to the antibody component of the antigen-antibody complex increasing the size and thus visibility of the immunoprecipitate. This enzyme-labelled precipitate can be further amplified by incubating the gel with the enzyme substrate and a suitable chromogen. A deposition of a strongly coloured reaction product upon the precipitate results in easier visual detection. Compared to Coomassie blue protein staining there is an approximately 25- to 50-fold increase in sensitivity (Kjaervig-Broe and Ingild, 1983). The amount of antigen required to form a coherent precipitate determines the lower detection limit of the enzyme amplification system. Figure 3.3 presents an example of an immunodiffusion gel stained using the amplification method. The use of the HRP amplification system with its increased sensitivity offered two advantages over the Coomassie blue staining method. Firstly, whilst not increasing the number of precipitates detected between L. lepideus and its homologous antisera, it allowed the reproducible staining of the faint immunoprecipitates. Secondly, it allowed the visualisation of some very faint precipitation lines, formed between other fungal isolates and the antisera in cross-reactivity tests that were not
9 7
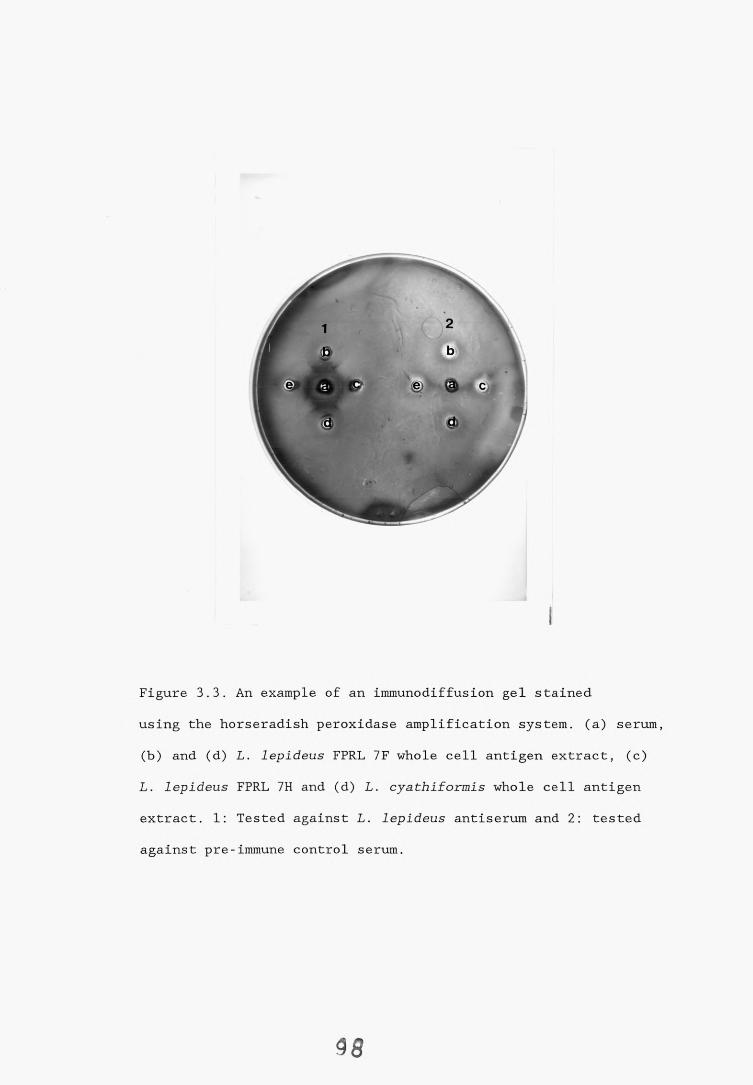
Figure 3.3. An example of an immunodiffusion gel stainedusing the horseradish peroxidase amplification system, (a) serum,(b) and (d) L. lepideus FPRL 7F whole cell antigen extract, (c)L. lepideus FPRL 7H and (d) L. cyathiformis whole cell antigen extract. 1: Tested against L. lepideus antiserum and 2: tested against pre-immune control serum.
<53
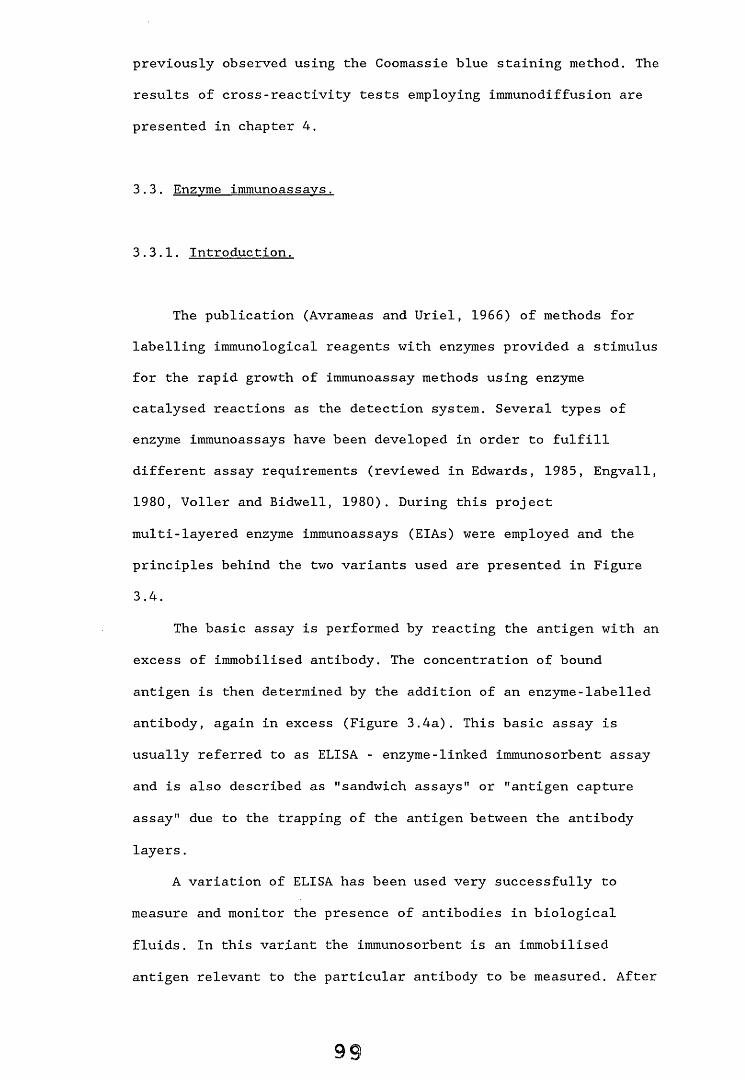
3.3. Enzyme immunoassays.
3.3.1. Introduction.
The publication (Avrameas and Uriel, 1966) of methods for labelling immunological reagents with enzymes provided a stimulus for the rapid growth of immunoassay methods using enzyme catalysed reactions as the detection system. Several types of enzyme immunoassays have been developed in order to fulfill different assay requirements (reviewed in Edwards, 1985, Engvall, 1980, Voller and Bidwell, 1980). During this project multi-layered enzyme immunoassays (EIAs) were employed and the principles behind the two variants used are presented in Figure3.4.
The basic assay is performed by reacting the antigen with an excess of immobilised antibody. The concentration of bound antigen is then determined by the addition of an enzyme-labelled antibody, again in excess (Figure 3.4a). This basic assay is usually referred to as ELISA - enzyme-linked immunosorbent assay and is also described as "sandwich assays" or "antigen capture assay" due to the trapping of the antigen between the antibody
layers.A variation of ELISA has been used very successfully to
measure and monitor the presence of antibodies in biological fluids. In this variant the immunosorbent is an immobilised antigen relevant to the particular antibody to be measured. After
previously observed using the Coomassie blue staining method. Theresults of cross-reactivity tests employing immunodiffusion arepresented in chapter 4.
99
( a )
Figure 3.4. Diagrammatic representation of the most common types of enzyme immunoassay. Key: <S> = antigen, A =■ antibody, =anti-immunoglobulin antibody and©** enzyme label, (a) Antigen capture assay, the antigen is trapped between solid phase antibody and enzyme-labelled second antibody, (b) Solid phase antigen ELISA for detecting antibodies, the antibodies are subsequently detected by enzyme-labelled anti-immunoglobulin antibodies.
reacting the immobilised antigen with the varying concentrations of antibody present in the samples, the bound antibodies are subsequently detected with enzyme-labelled anti-immunoglobulin antibodies (Figure 3.4b).
3.3.2. Results.
3.3.2.1. Enzyme immunoassay to detect "soluble" antigens.
3.2.2. la.. Antigen dilution curves.
Two-fold serial dilutions of a PBS-soluble antigen preparation s. (section 2.6.3.1) were tested in. a microtitre plate solid phase antigen EIA. The primary unlabelled antiserum was diluted 1:100 (v/v) in PBS-0.05T. Antigen dilution curves were constructed for a range of different sera to determine the optimum antigen dilution. All samples were tested in duplicate. Similar results were obtained for all the individual antisera tested. Figure 3.5. shows an example of an antigen dilution curve obtained. Subsequently a 1:32 (v/v) dilution of the s. antigen preparation was used in further applications of the assay.
3.3.2.1b. Antibody dilution curves.
Antibody dilution curves were constructed by testing two-fold serial dilutions of antisera (1:100 - 1:51,200 v/v), diluted in PBS-0.05T, against a 1:32 (v/v) dilution of the s. antigen extract. Titres of the antisera were assessed from the antibody dilution curves. For the purposes of this thesis, the titre was defined as the highest antibody dilution showing 100%
All samples were assayed in duplicate. Figure 3.6 shows an example of an antibody dilution curve. The antiserum with the highest titre (R85/3-13) was subsequently used in the cross-reactivity tests.
3.3.2.1c. Controls.
A number of controls were included in the assay viz pre-immune control serum (PIS), immune control serum, no-antiserum control and no-antigen control. Table 3.1 gives an example of absorbance values (A 405nm) of the L. lepideus
antisera and control sera screened against a 1:8 (v/v) dilution of the s. antigen preparation and a no-antigen control.
The PIS control values were similar to the background values of the assay indicating the reactivity of the test antiserum was stimulated by the immunogen and the animals had not been pre- exposed to L. lepideus or related antigens. The immune control serum, which was an antiserum raised against a Herpes simplex viral protein, was included to determine whether the antibodies raised were due entirely, or in part, to the adjuvant. The serum gave similar results when tested against the antigen and the no-antigen controls indicating that the adjuvant had not produced antibodies which gave false positives in the assay. The higher absorbance values registered for the immune control serum compared to the other controls may well be due to the increase in the level of circulating antibodies after immunisation. The no-antigen and no-antiserum controls were included to determine the background levels of the assay system.
antigen binding i.e. saturation of antigen binding sites.
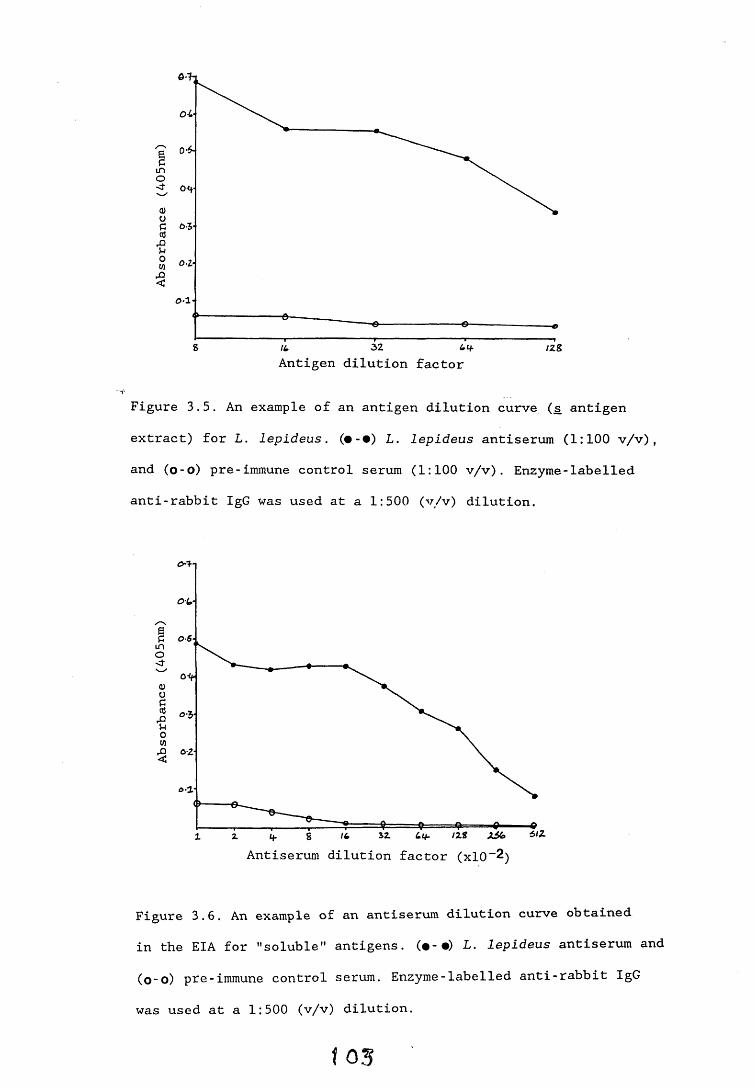
Figure 3.5. An example of an antigen dilution curve (,s antigen extract) for L. lepideus. (•-•) L. lepideus antiserum (1:100 v/v), and (o-o) pre-immune control serum (1:100 v/v). Enzyme-labelled anti-rabbit IgG was used at a 1:500 (v/v) dilution.
Figure 3.6. An example of an antiserum dilution curve obtained in the EIA for "soluble" antigens. (•-•) L. lepideus antiserum and (o-o) pre-immune control serum. Enzyme-labelled anti-rabbit IgG
was used at a 1:500 (v/v) dilution.
t 03
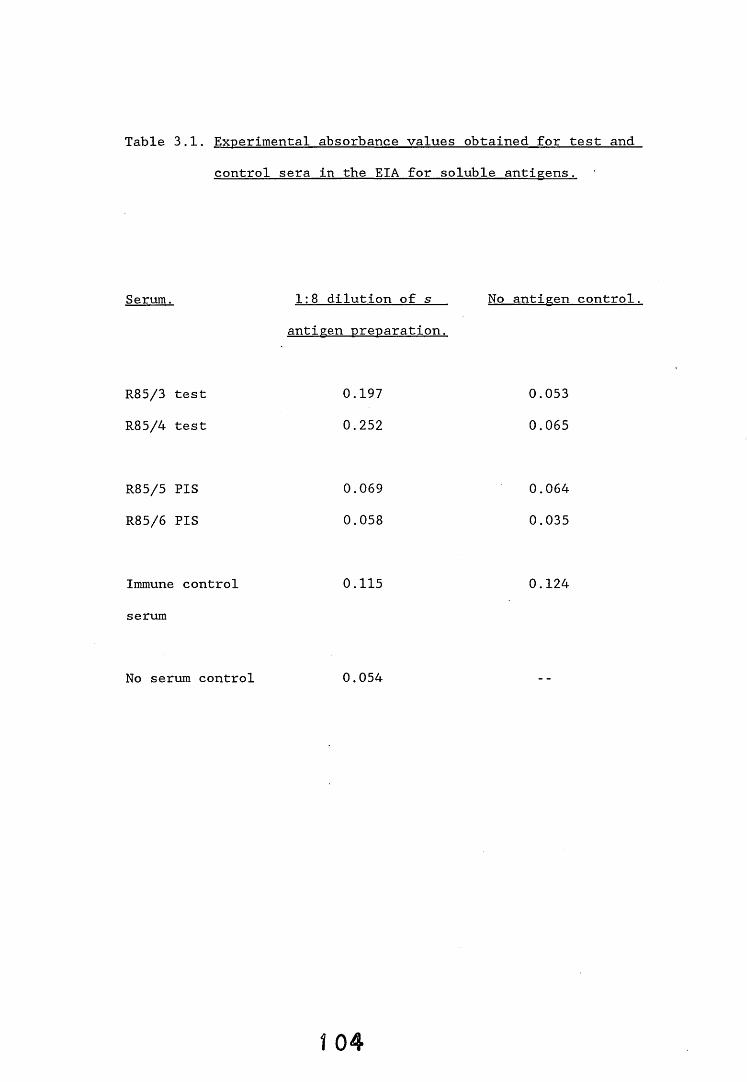
Table 3.1. Experimental absorbance values obtained for test andcontrol sera in the EIA for soluble antigens
Serum. 1:8 dilution of s No antigenantigen preparation.
R85/3 test 0.197 0.053R85/4 test 0.252 0.065
R85/5 PIS 0.069 0.064R85/6 PIS 0.058 0.035
Immune control 0.115 0.124serum
control.
No serum control 0.054
3.3.2.Id Solubilisation of antigens.
Although the L. lepideus s. antigens could be detected in the EIA, the test:control absorbance ratios obtained varied considerably between different antisera and could be as low as 3:1. This was considered too low for a workable detection system, therefore efforts were made to increase the signal and signal:noise ratio by employing a variety of procedures to solubilise the antigens and thus increase the amount of antigen available for reaction in the assay.
Whole cell antigen extracts (50mg per ml) were incubated at 30°C for 30 minutes in a PBS-0.1% (v/v) detergent solution. The detergents tested were Triton-X-100, Tween 20 and SDS. In addition, a whole cell antigen extract was prepared in deionised water (50mg per ml) and heated to 50-60°C for 30 minutes. The extracts were dialysed against two changes of PBS (lOOx sample volume) at 4°C for 24 hours, centrifuged at 13,000g for 5 minutes and the resultant supernatants tested in the EIA to detect soluble antigens. An untreated (i.e. s. antigen extract) antigen extract was included for comparative purposes. The pellets were retained and tested for reactivity in the EIA for insoluble antigens (section 3.3.2.2). Antigen dilution curves were constructed for the various extracts using primary antiserum which was diluted 1:100 (v/v) in PBS-0.05T.
The untreated antigen extract and the hot water extract gave similar absorbance values, however, the three detergent treated extracts all gave much lower values than the untreated control (Table 3.2). The results from the analysis of the pellets in the EIA for insoluble antigens showed a greater than 50% reduction in
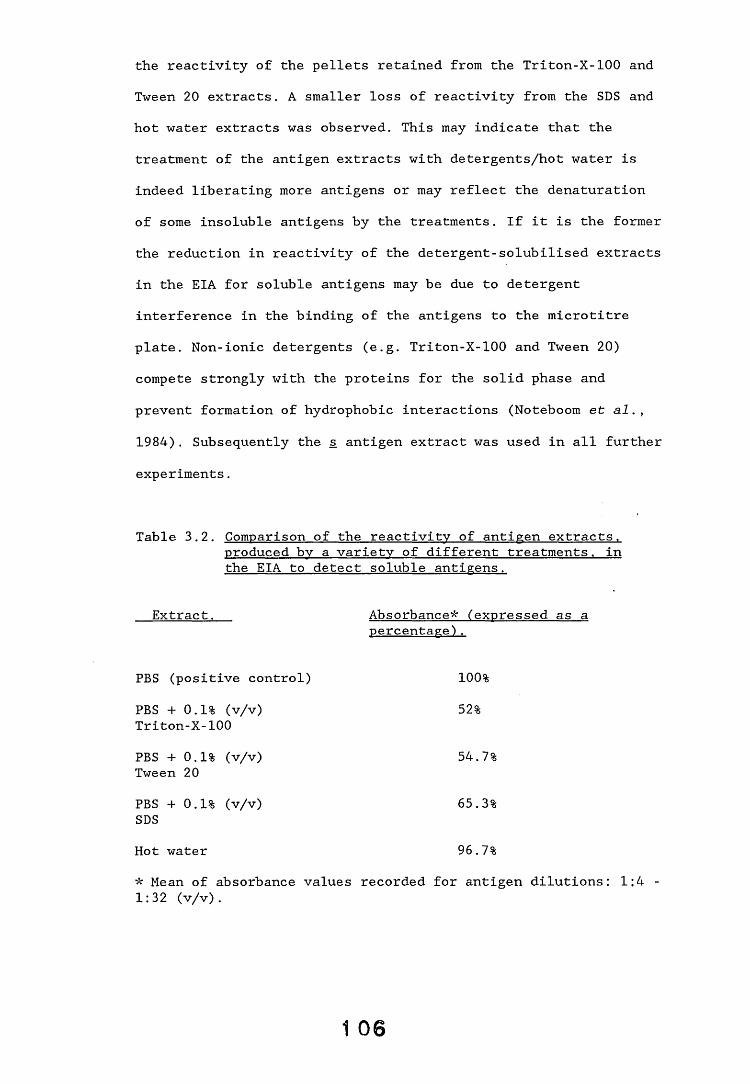
the reactivity of the pellets retained from the Triton-X-100 and Tween 20 extracts. A smaller loss of reactivity from the SDS and hot water extracts was observed. This may indicate that the treatment of the antigen extracts with detergents/hot water is indeed liberating more antigens or may reflect the denaturation of some insoluble antigens by the treatments. If it is the former the reduction in reactivity of the detergent-solubilised extracts in the EIA for soluble antigens may be due to detergent interference in the binding of the antigens to the microtitre plate. Non-ionic detergents (e.g. Triton-X-100 and Tween 20) compete strongly with the proteins for the solid phase and prevent formation of hydrophobic interactions (Noteboom et al., 1984). Subsequently the s antigen extract was used in all further
experiments.
Table 3.2. Comparison of the reactivity of antigen extracts.produced by a variety of different treatments. in the EIA to detect soluble antigens.
Extract. Absorbance* (expressed as apercentage).
PBS (positive control) 100%PBS +0.1% (v/v) 52%Triton-X-100PBS +0.1% (v/v) 54.7%Tween 20PBS +0.1% (v/v) 65.3%SDSHot water 96.7%* Mean of absorbance values recorded for antigen dilutions: 1:4 - 1:32 (v/v).
1 06
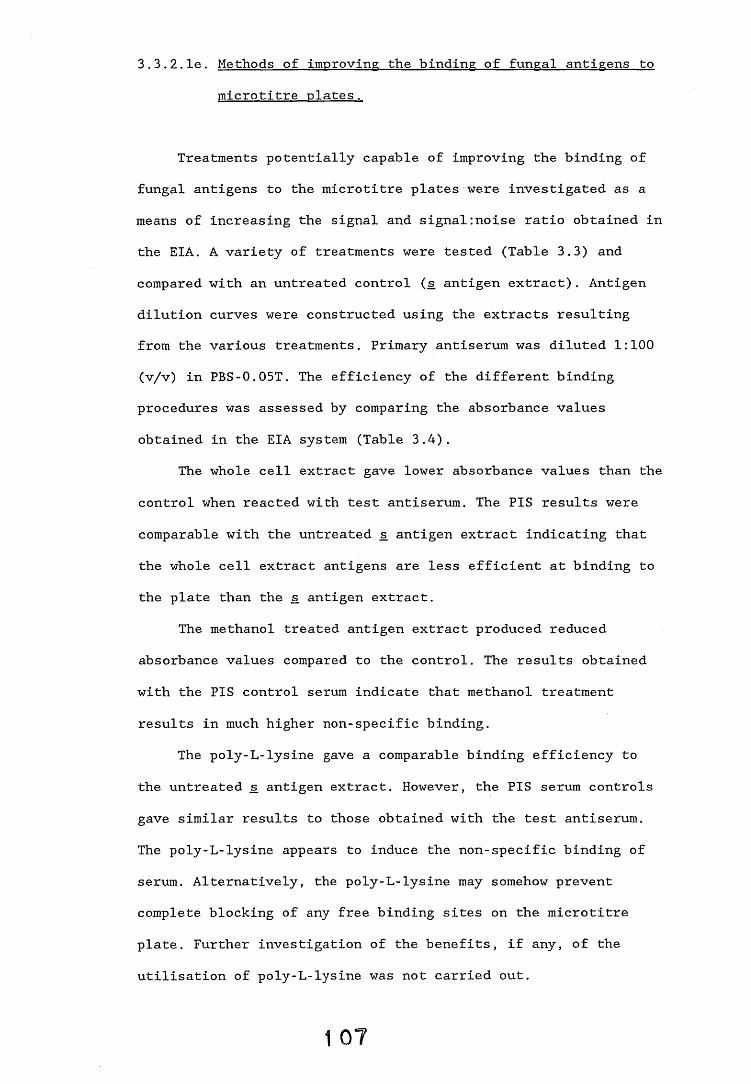
3.3.2.le. Methods of improving the binding of fungal antigens tomicrotitre plates.
Treatments potentially capable of improving the binding of fungal antigens to the microtitre plates were investigated as a means of increasing the signal and signal:noise ratio obtained in the EIA. A variety of treatments were tested (Table 3.3) and compared with an untreated control (s. antigen extract). Antigen dilution curves were constructed using the extracts resulting from the various treatments. Primary antiserum was diluted 1:100 (v/v) in PBS-0.05T. The efficiency of the different binding procedures was assessed by comparing the absorbance values obtained in the EIA system (Table 3.4).
The whole cell extract gave lower absorbance values than the control when reacted with test antiserum. The PIS results were comparable with the untreated s antigen extract indicating that the whole cell extract antigens are less efficient at binding to the plate than the s antigen extract.
The methanol treated antigen extract produced reduced absorbance values compared to the control. The results obtained with the PIS control serum indicate that methanol treatment results in much higher non-specific binding.
The poly-L-lysine gave a comparable binding efficiency to the untreated s. antigen extract. However, the PIS serum controls gave similar results to those obtained with the test antiserum. The poly-L-lysine appears to induce the non-specific binding of serum. Alternatively, the poly-L-lysine may somehow prevent complete blocking of any free binding sites on the microtitre plate. Further investigation of the benefits, if any, of the utilisation of poly-L-lysine was not carried out.
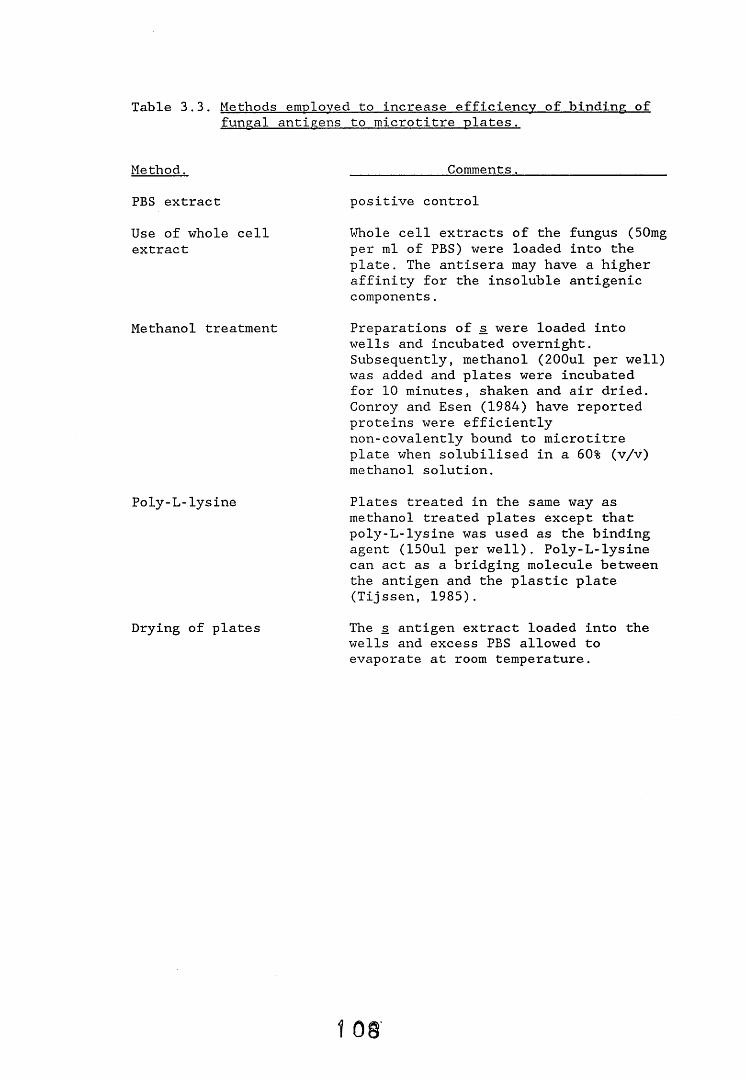
Table 3.3. Methods employed to increase efficiency of binding: of fungal antigens to microtitre plates.
Method. Comments.PBS extract positive control
Use of whole cell extract
Whole cell extracts of the fungus (50mg per ml of PBS) were loaded into the plate. The antisera may have a higher affinity for the insoluble antigenic components.
Methanol treatment Preparations of s were loaded into wells and incubated overnight. Subsequently, methanol (200ul per well) was added and plates were incubated for 10 minutes, shaken and air dried. Conroy and Esen (1984) have reported proteins were efficiently non-covalently bound to microtitre plate when solubilised in a 60% (v/v) methanol solution.
Poly-L-lysine
Drying of plates
Plates treated in the same way as methanol treated plates except that poly-L-lysine was used as the binding agent (150ul per well). Poly-L-lysine can act as a bridging molecule between the antigen and the plastic plate (Tij ssen, 1985).The s antigen extract loaded into the wells and excess PBS allowed to evaporate at room temperature.
Drying of plates
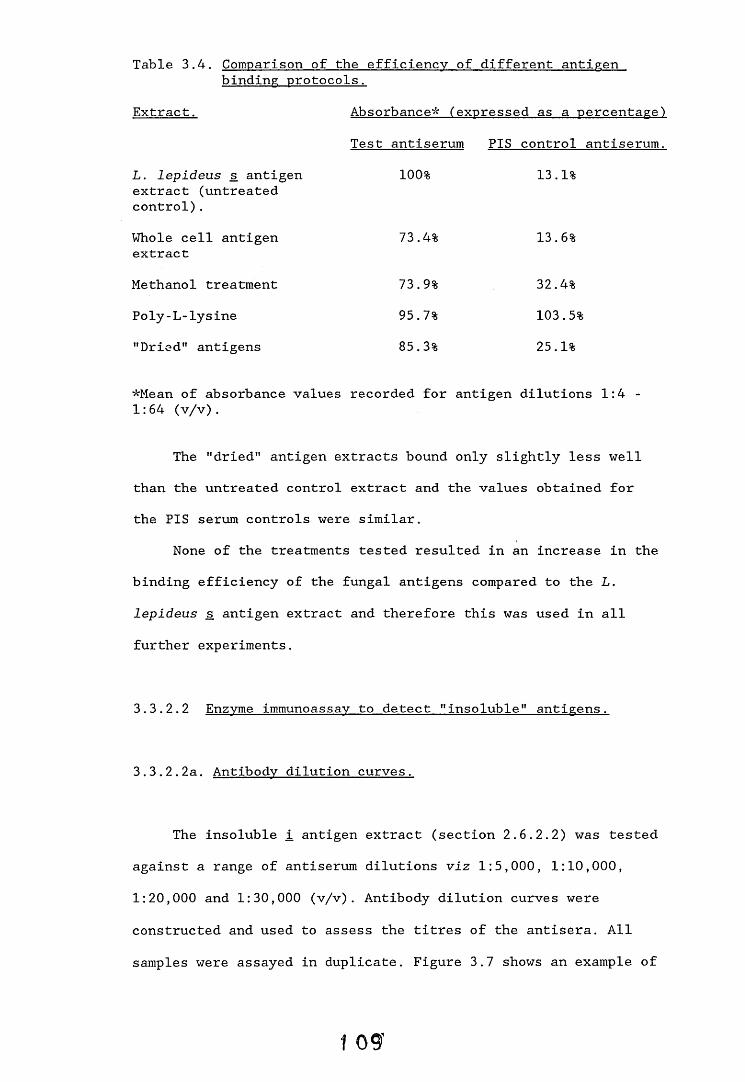
Table 3.4. Comparison of the efficiency of different antigen binding protocols.
Extract. Absorbance* (expressed as a percentage)Test antiserum PIS control antiserum.
L. lepideus s antigen extract (untreated control).
100% 13.1%
Whole cell antigen extract
73.4% 13.6%
Methanol treatment 73.9% 32.4%Poly-L-lysine 95.7% 103.5%"Dried" antigens 85.3% 25.1%
*Mean of absorbance values recorded for antigen dilutions 1:4 - 1:64 (v/v).
The "dried" antigen extracts bound only slightly less well than the untreated control extract and the values obtained for the PIS serum controls were similar.
None of the treatments tested resulted in an increase in the binding efficiency of the fungal antigens compared to the L. lepideus s. antigen extract and therefore this was used in all further experiments.
3.3.2.2 Enzyme immunoassay to detect "insoluble" antigens.
3.3.2.2a. Antibody dilution curves.
The insoluble i antigen extract (section 2.6.2.2) was tested against a range of antiserum dilutions viz 1:5,000, 1:10,000, 1:20,000 and 1:30,000 (v/v). Antibody dilution curves were
constructed and used to assess the titres of the antisera. All samples were assayed in duplicate. Figure 3.7 shows an example of
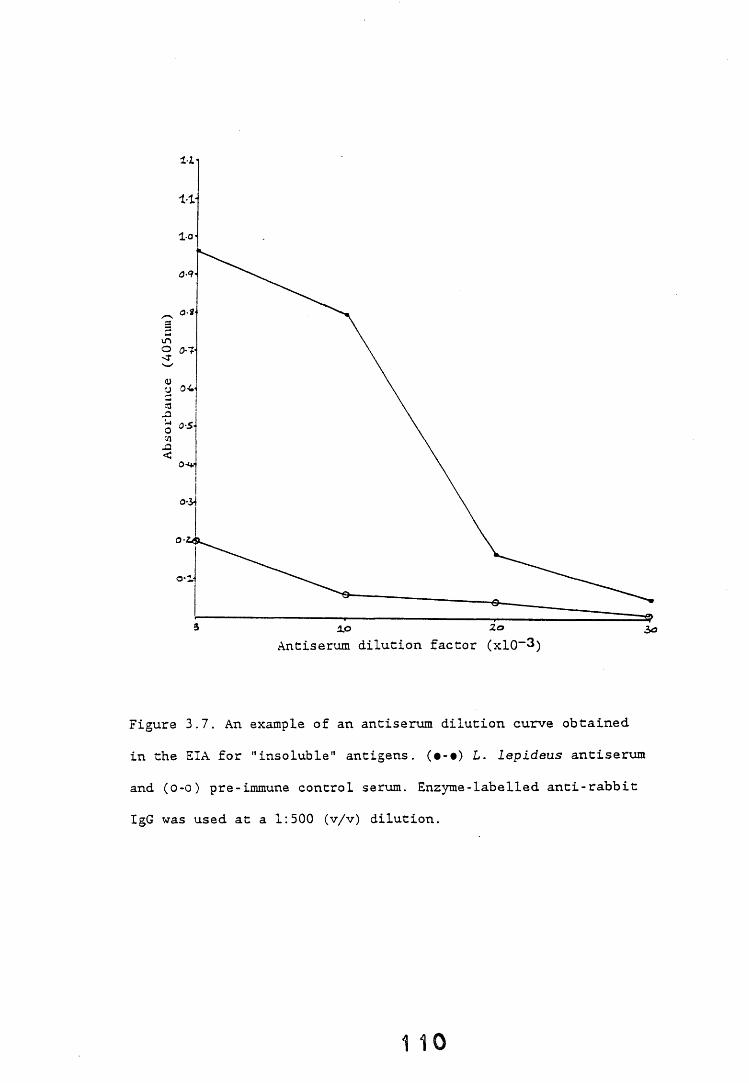
Figure 3.7. An example of an antiserum dilution curve obtained in the EIA for "insoluble'' antigens. (•-•) L. Lepideus antiserum and (o-o) pre-immune control serum. Enzyme-labelled anti-rabbit
IgG was used at a 1:500 (v/v) dilution.
1 10
an antibody dilution curve obtained in the EIA for insoluble antigens. The PIS control serum gave high background readings when used at the 1:5,000 (v/v) dilution but this effect was not apparent when the antiserum was diluted further.
Despite the background problems encountered in both the EIA systems described above, the assays were applied to determine the specificity of the L. lepideus antisera. The results obtained in these experiments will be reported in chapter 4.
3.3.2.3. Antigen capture assay (ACA).
In an attempt to overcome the problem of low signal:noise ratios associated with the indirect EIAs previously described, the development and evaluation of an antigen capture assay (ACA) was undertaken. The ACA has certain advantages over the indirect EIA systems. Firstly, immunoglobulins are known to bind well to microtitre plates which should overcome the problems of weak and inconsistent binding to the microtitre plates by the fungal antigens. Secondly, when samples containing both antigenic and non-antigenic material are incubated in microtitre plate competition for binding sites will occur and assay sensitivity will not be optimised. In the ACA, where antibodies are bound to the solid phase and the antigen samples added, only antigens will bind to the antibodies and any non-antigenic material will be removed by subsequent washes. Thus samples "contaminated" with extraneous non-antigenic material can be tested in the ACA system. This can be advantageous when there are large numbers of samples to be tested since complex and time-consuming pre-treatment of
the samples can be avoided.
3.3.2.3a. Purification of IgG.
A preliminary step in the development of an ACA is the purification of IgG from antisera. In this study IgG was purified by either, a combination of salt precipitation and ion-exchange chromatography, or by the octanoic acid method (see section 2.14.1). The salt precipitation method yielded, on average, 6.5mg IgG per ml of serum whilst the octanoic acid method yielded approximately 7.0mg IgG per ml of serum. The latter method was subsequently used to purify IgG from other antisera because of the higher yields of IgG obtained and the comparative simplicity of the method.
3.3.2.3b. Assay -parameters.
1. Unlabelled IgG.Purified IgG was diluted in coating buffer and tested at a
range of concentrations: O.lug, l.Oug, lOug, 20ug, 40ug and 50ug per ml of buffer. The fungal antigen extract was prepared (0.5mg per ml PBS-0.05T) and enzyme-conjugated IgG was used at a 1:100 (v/v) dilution. Suitable controls, viz no-antibody and no-antigen, were included in the assay. All samples were tested in duplicate. Saturation of binding sites occurred at the three highest concentrations (Figure 3.8) and therefore, IgG was subsequently used at a concentration of 20ug per ml.
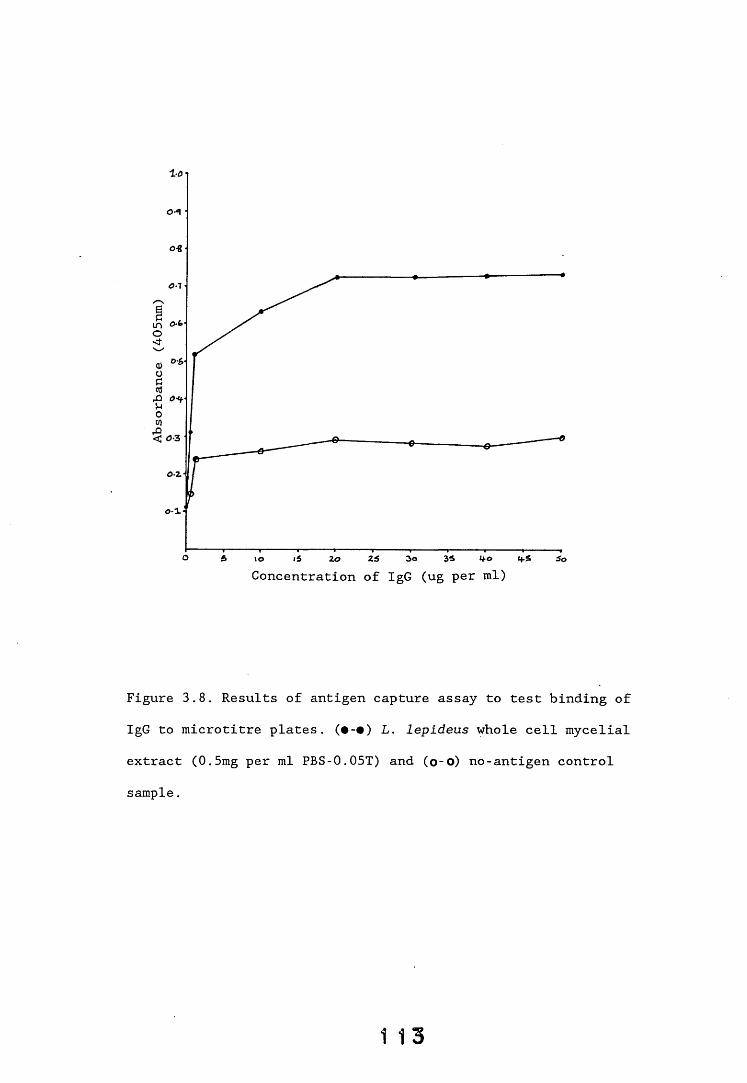
Figure 3.8. Results of antigen capture assay to test binding of IgG to microtitre plates. (•-•) L. lepideus whole cell mycelial extract (0.5mg per ml PBS-0.05T) and (o-o) no-antigen control sample.
1 1 3
2. Temperature of incubation.The IgG samples were incubated at 4°C and 25°C overnight, or
at 37°C for 60 minutes to allow binding of the IgG to the microtitre plate. Plates incubated at 4°C gave marginally better results and therefore this incubation temperature/time was used in subsequent experiments.3. Mycelial antigens.
Lyophilised L. lepideus mycelial antigen extracts (0.5mg,2.5mg and 5.0mg per ml of extraction buffer) were tested for reactivity in the ACA. Similar absorbance values were obtained with all three antigen extract concentrations and subsequently an antigen concentration 0.5mg mycelium per ml buffer was used in further experiments.
Both whole cell antigen (WCE) and soluble (s.) antigen preparations were tested in the ACA system. Antigen dilution curves (1-1:10,000, v/v) were constructed for the two extracts. Four replicates of each sample were tested. The WCE extract gave higher level of reactivity than the s. antigen extract (Figure 3.9). The no-antigen control background values were unacceptably high and therefore, a variety of antigen extraction buffers and different blocking/diluting/washing buffer systems were investigated (Table 3.5) in an attempt to either increase the signal:noise ratio or to decrease the values of the no-antigen controls.
Mycelial antigens were extracted into a range of buffers in an attempt to increase the number of available binding sites. The buffers tested were PBS-0.05% (v/v) Tween 20 (untreated control), PBS-0.1% (v/v) Tween 20, PBS-0.1% (v/v) Triton-X-100 and PBS-0.1%
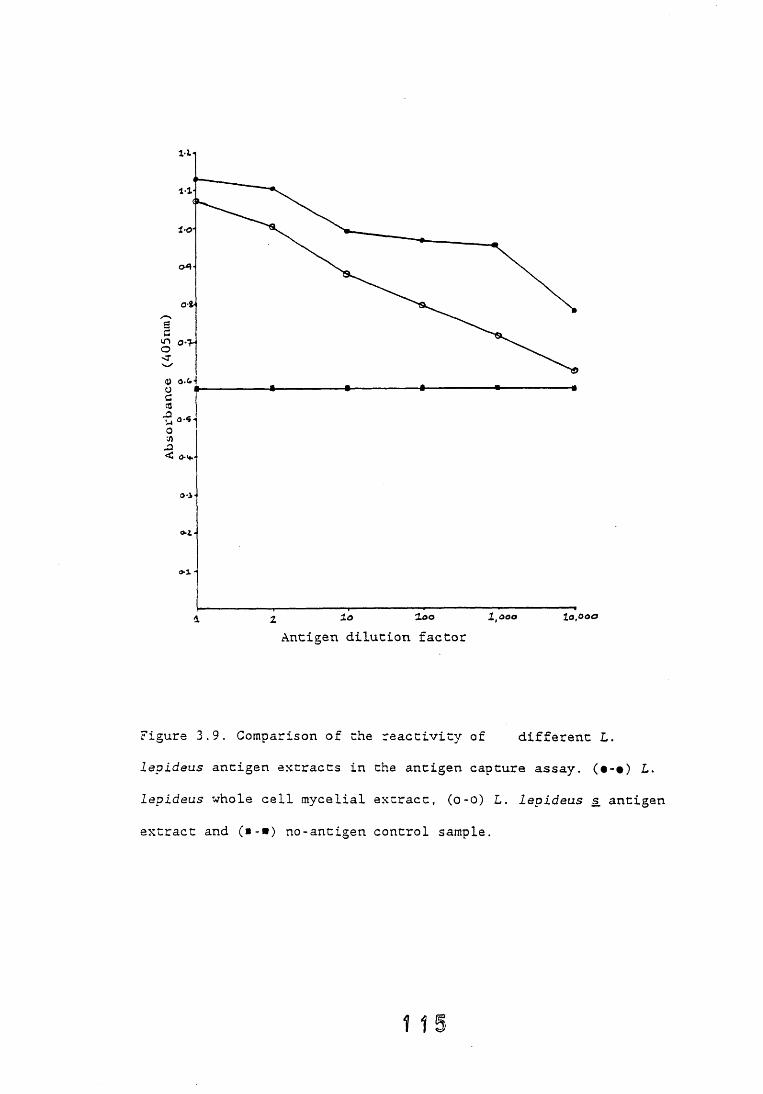
l-l
cfl■S«o'•Si
< o-i*.-
o-i -
»1 ■
^ 2 loo l,ooo 1 ofoooAntigen dilution factor
Figure 3.9. Comparison of the reactivity of different L. lepideus antigen extracts in the antigen capture assay. (•-•) L. Lepideus whole cell mycelial extract, (o-o) L. lepideus s. antigen
extract and (»-») no-antigen control sample.
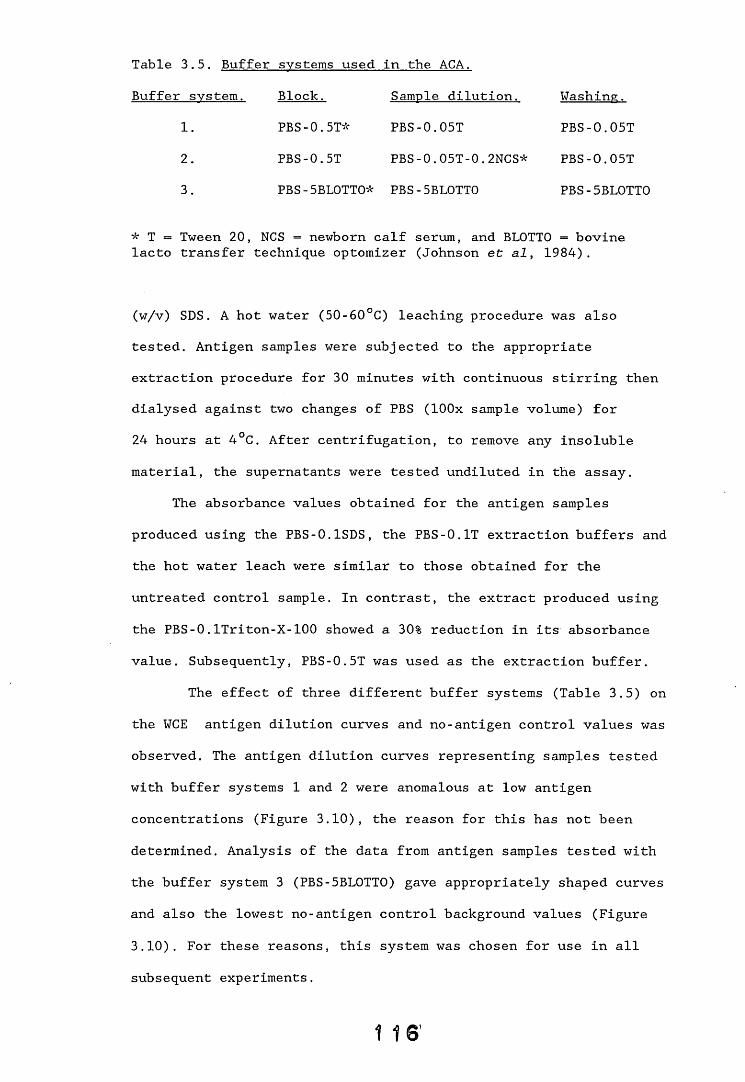
Table 3.5. Buffer systems used in the ACA.Buffer system. Block. Sample dilution. Washing.
1. PBS-0.5T* PBS-0.05T PBS-0.05T2 . PBS-0.5T PBS-0.05T-0.2NCS* PBS-0.05T3. PBS-5BL0TT0* PBS-5BL0TT0 PBS-5BL0TT0
* T = Tween 20, NCS = newborn calf serum, and BLOTTO = bovine lacto transfer technique optomizer (Johnson et al, 1984).
(w/v) SDS. A hot water (50-60°C) leaching procedure was also tested. Antigen samples were subjected to the appropriate extraction procedure for 30 minutes with continuous stirring then dialysed against two changes of PBS (lOOx sample volume) for 24 hours at 4°C. After centrifugation, to remove any insoluble material, the supernatants were tested undiluted in the assay.
The absorbance values obtained for the antigen samples produced using the PBS-0.1SDS, the PBS-0.IT extraction buffers and the hot water leach were similar to those obtained for the untreated control sample. In contrast, the extract produced using the PBS-0.ITriton-X-100 showed a 30% reduction in its absorbance value. Subsequently, PBS-0.5T was used as the extraction buffer.
The effect of three different buffer systems (Table 3.5) onthe WCE antigen dilution curves and no-antigen control values was observed. The antigen dilution curves representing samples tested with buffer systems 1 and 2 were anomalous at low antigen concentrations (Figure 3.10), the reason for this has not been determined. Analysis of the data from antigen samples tested with the buffer system 3 (PBS-5BLOTTO) gave appropriately shaped curves and also the lowest no-antigen control background values (Figure 3.10). For these reasons, this system was chosen for use in all subsequent experiments.
1 1 6 ’
Figure 3.10. Comparison of the efficacy of the different buffer systems used in the antigen capture assay. (•-•) PBS/Tween 20 system, (■-■) PBS/NCS/Tween 20 system and (A-A) PBS-5BL0TT0 system. The open symbols represent the corresponding no-antigencontrols.
4. Fungal antigens extracted from infected wood.The ACA was applied to screen extracts from L. lepideus-
infected and uninfected control wood blocks. In preliminary experiments the control blocks gave similar absorbance values as the infected test blocks. Therefore, a number of procedures were undertaken in an attempt to reduce the high background values of the controls and enable the differentiation of test and control samples. PBS-5BL0TT0 antigen extracts and a mycelial antigen extract (Figure 3.11a) were included for comparative purposes. The procedures undertaken included the preabsorption of the enzyme-labelled IgG with sawdust (see section 2.7), the incubation of antigen samples overnight at 4°C and the subsequent removal of any precipitated debris by centrifugation before the samples were used in the assay and the inclusion of 2% (w/v)polyvinylpyrrolidone (PVP, MW 44,000) in antigen samples. The use of preabsorbed enzyme-labelled serum had no effect on either the ACA assay values of the test samples or the no antigen control samples (Figure 3.11b). The overnight incubation had no effect on the values obtained for the infected test samples, however, it reduced the values obtained for the control samples by approximately 25% (Figure 3.11c). Although the differences between the absorbance values of the test and control samples were not very large, the treatment did allow the differentiation of test and control samples. The addition of 2% (w/v) PVP-MW 44,000 to antigen samples reduced the assay values of both the test and control samples equally (Figure 3.lid) and therefore was not successful in differentiating test from control samples.5. Chromogen.
Enzyme activity was detected by either TMB substrate solution (Table 2.4) or 2,2'-azino-di(3-ethylbenzthiazoline-6-sullfonic
Figure 3.11. Application of the ACA to screen extracts from L. lepideus-infected wood blocks and uninfected controls.(a) (•-•) L. lepideus mycelial antigen dilution curve (0.5mg mycelium per ml of PBS-5BL0TT0) and (o-o) no-antigen control sample.(b) Effect of preabsorbing enzyme conjugate with uninfected lime sawdust. (•-•) a L. lepideus-infected test block extract and (o-o) an uninfected control block extract screened against untreated conjugate. (■-•) a L. lepideus-infected test block extract and (o -cj) an uninfected control block extract screened against preabsorbed conjugate.(c) Effect of overnight incubation at 4°C of antigen samples.(#-•) a L. lepideus-infected test block extract, (■-•) an uninfected control block extract and (d -d ) L. lepideus-infected test block extract prepared in PBS-5BL0TT0 (untreated control).(d) Effect of addition of 2% (w/v) polyvinylpyrrolidone (MW 44,000) to antigen samples. (o-o) a L. lepideus-infected test block extract, (■-») an uninfected control block extract control block and (a-o) a L. lepideus-infected test block extract prepared in PBS-5BL0TT0 (untreated control).
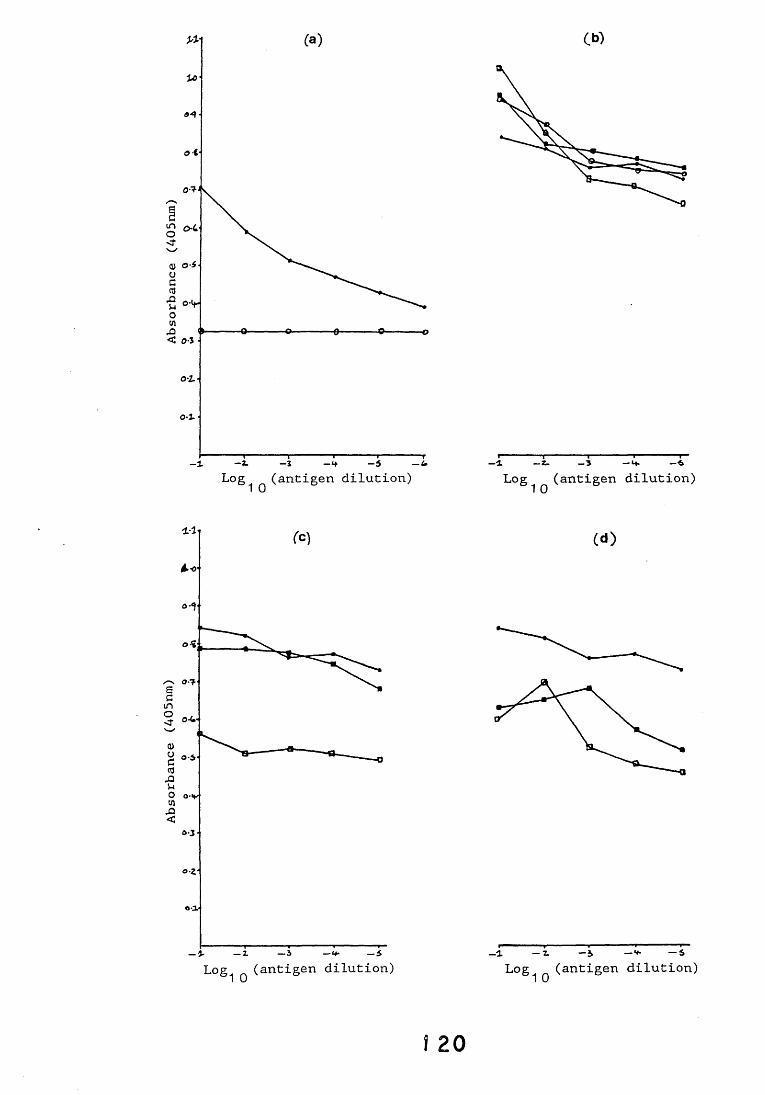
Absorb
ance
(405nm)
Abso
rban
ce (
405nm)
(<0
- b — * • — 6
(antigen dilution)
I 20
acid) substrate solution (ABTS). The ABTS substrate solution was prepared as follows, 40mg of ABTS was dissolved in 100ml of 0.1M phosphate-citrate buffer, pH 4.0. Hydrogen peroxide was added immediately prior to use). Much higher absorbance values were obtained when the TMB chromogen was used and thus it was used in all subsequent experiments. The optimum concentration of hydrogen peroxide was determined and found to be 0.003% (v/v) for both substrates.
3.3.2.3c. Dot blot ACA.
The use of NC as an alternative solid support for the IgG was investigated. The assay procedure was a modification of the microtitre plate ACA: purified IgG was used at a concentration of lOmg per ml in coating buffer and mycelial antigens were prepared in sample diluting buffer (2.5 mg per ml or dilutions thereof). Enzymic activity was detected by DAB substrate solution (Table 2.4).
IgG was purified from a number of different antisera, namely R85/3 bleed 7, 9, 12, 13, 15 and normal rabbit serum (NRS). The IgG fractions were screened in the ACA against five two-fold serial dilutions of L. lepideus antigens prepared in PBS-0.05T (2.5mg per ml) and a no-antigen control. IgG from bleed 13 was shown to be the most reactive and therefore this was used in all subsequent experiments.
The main problem encountered in the dot blot ACA was again the high background values of the no-antigen control samples. In addition, when newborn calf serum (NCS) was included in the blocking buffer the whole strip became stained although the
individual dots could still be identified. Both normal rabbit
serum (NRS) and PIS control serum have been shown to bind L. lepideus antigen extracts only very poorly when tested in the EIAs for soluble and insoluble antigens. However, when NRS, PIS and NCS were "dotted" directly onto the NC and tested in the ACA, these sera gave positive results comparable to the test antiserum. L. lepideus antiserum and purified IgG, PIS, NRS and NCS were therefore tested in the dot blot ACA against three different blocking buffers; PBS-0.5T-5NCS, PBS-0.5T and PBS-1BSA (bovine serum albumin). The three blocking buffers gave similar results, none eliminated the non-specific binding to the PIS, NRS or NCS, neither did they reduce the background values of the no-antigen controls of the whole sera.
Johnson et si. (1984) have reported that the milk protein casein is superior to BSA in preventing non-specific absorption in western blotting and in the reduction of background. PBS-5BL0TT0 was prepared by dissolving 5% (w/v) nonfat dried milk and 0.001% (w/v) merthiolate in PBS and thereafter was used as the blocking, sample diluting and washing buffer. The effectiveness of PBS-5BL0TT0 as a blocking agent was compared to that of PBS-0.5T. L.lepideus whole antiserum and purified IgG and whole serum, PIS, NRS and NCS were "dotted" onto NC. Purified IgG was used at a concentration of 10 and 50ug per ml of buffer and whole serum diluted 1:800 to give approximately similar IgG levels (there are 8-10mg of IgG in 1ml of antiserum, Johnstone and Thorpe, 1982). Four strips were tested: strips 1/2 were treated with the PBS/Tween buffer system and strips 3/4 were treated with PBS-5BL0TT0. The even-numbered strips were exposed to a L. lepideus mycelial antigen preparation (0.5mg mycelium per ml of buffer) and odd-numbered strips were exposed to buffer only, i.e. no-antigen controls. The results obtained are presented in Table
3.6 and Figure 3.12. Significant non-specific staining of all IgG/serum dots was observed in the no-antigen control strip treated with PBS/Tween. In contrast, very little background staining was observed in the no-antigen control strip treated with PBS-5BL0TT0. The PBS-5BL0TT0 buffer system therefore permitted the differentiation of positive mycelial antigen samples and negative
samples in the dot blot ACA.
3.4 . Dot-immunobinding assay.
3.4.1. Introduction.
The dot-immunobinding assay involves the "dotting" of antigen
samples onto a paper support. A variety of paper supports have been used including activated cellulose (Herbrink et al., 1982) and DBM (diazotized aminobenzyloxymethyl) paper (Towbin and Gordon, 1984). However, nitrocellulose (NC) is generally the medium of choice at present for dot-immunobinding studies because it has a very high capacity for protein binding (Palfreyman et al., 1988a). The original method of Hawkes et al. (1982) involved the application of dots of the antigen to NC sheets followed by the saturation of other binding sites with BSA (any unrelated inert protein or other blocking agent can be used). The sheets were then cut up and squares containing a single dot were put into microtitre wells and incubated with monoclonal antibodies. A variation of this involved the inversion of microtitre plates containing polyclonal antibodies over sheets with a matrix of dotted antigen and the tight sealing of the assembly for the duration of antibody-antigen incubation (Bennet and Yeaman, 1983). These techniques allow the paper bound with antigen to have
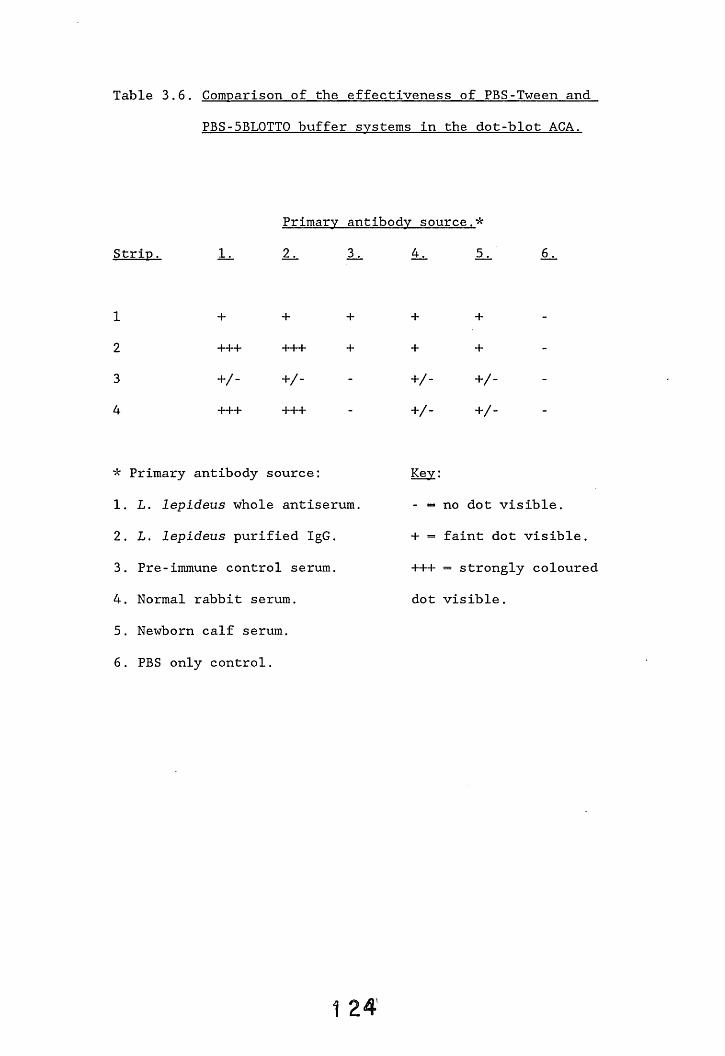
Table 3.6. Comparison of the effectiveness of PBS-Tween andPBS-5BL0TT0 buffer systems in the dot-blot ACA. 6
Primary antibody source.*Strip. 1. 2j_ 3_j_ 4*. 5_ 6_j.
1 + + + + + -2 +++ +++ + + + -3 +/ - +/- - +/- +/- -4 +++ +++ - +/- +/- -
* Primary antibody source: Key:
1. L. lepideus whole antiserum. - == no dot visible.2. L. lepideus purified IgG. + = faint dot visible.3. Prei-immune control serum. +++ = strongly coloured4. Normal rabbit serum. dot visible.5. Newborn calf serum.6. PBS only control.
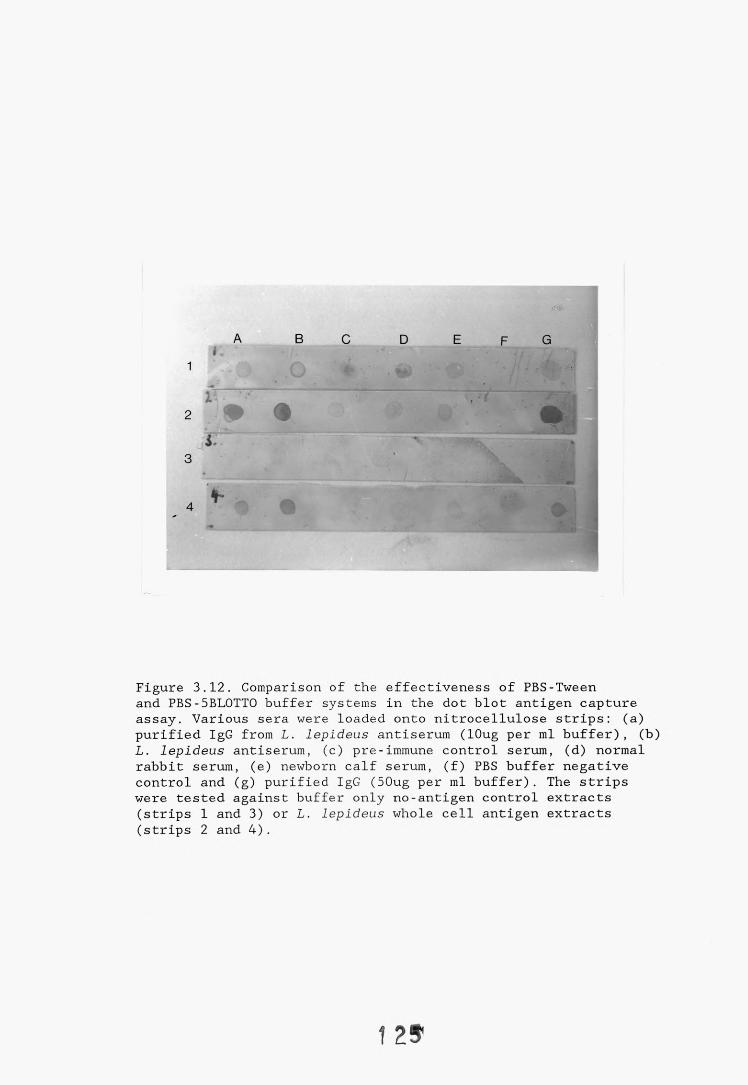
Figure 3.12. Comparison of the effectiveness of PBS-Tween and PBS-5BL0TT0 buffer systems in the dot blot antigen capture assay. Various sera were loaded onto nitrocellulose strips: (a)purified IgG from L. lepideus antiserum (lOug per ml buffer), (b) L. lepideus antiserum, (c) pre-immune control serum, (d) normal rabbit serum, (e) newborn calf serum, (f) PBS buffer negative control and (g) purified IgG (50ug per ml buffer). The strips were tested against buffer only no-antigen control extracts (strips 1 and 3) or L. lepideus whole cell antigen extracts (strips 2 and 4).
1 2
contact with a large amount of antibody. Alternatively, small volumes (lul) of the antibody solution, either monoclonal or polyclonal, can be directly overlaid onto the antigen dots (Sternberg and Jeppesen, 1983). For the detection of antibodies bound to the dot, immuno-peroxidase staining is extremely sensitive and most convenient (Towbin and Gordon, 1984). The use of iodinated-anti-immunoglobulin serum has also been reported (Sternberg and Jeppesen, 1983).
The dot-immunobinding assay is claimed to be equally sensitive to or more sensitive than ELISA assays (Campbell, 1984). The technique is very simple and therefore permits the screening of large numbers of antibody samples in a short period of time and at minimal cost. Hawkes et al. (1982) considers the dot-immunobinding assay to have two advantages over microtitre plate ELISAs. Firstly, the amount of antigen required is greatly reduced because of the dot size (O.lul sample volumes give a clearly visible dot). If sufficient antigen is not contained in a single aliquot it is possible to make several applications of a dilute solution allowing the paper to dry each time. The visibility of the dot depends on the contrast of the colour generated against the background and is thus dependent on the density and not the amount of antigen present in the dot.Secondly, the use of NC permits the reaction to be viewed against a background that is almost white increasing the visual discriminatory power of the system and therefore it becomes easier to detect positive reactions. Furthermore, antigens may be bound to these membranes in the presence of detergents, although a lower
efficiency of binding is observed when the concentration of non-ionic detergents (e.g. Tween 80 and Triton-X-100) exceeds0.01% (v/v) (Tijssen, 1985).
3.4.2! Results.
Those assay parameters shown to give the most promising results in the EIA systems were used as a starting point in the optimisation of the dot-immunobinding assay system and were found, with only minor modifications, to give satisfactory results. Therefore further work to optimise the system was not undertaken. The standard experimental details employed in the dot-immunobinding assay have been fully reported in the methods section (2.6.4). The development work undertaken concentrated on two areas. Firstly, the choice of chromogen and secondly, quantification of the assay.
3.4.2.1. The choice of chromogen.
Initially, chloronaphthol was used as the chromogen in theX
dot-immunobinding assay. It produced distinct dots and its apparent lack of carcinogenicity gave it handling advantages. However, using DAB as the chromogen gave a more sensitive system and also permitted the semi-quantitative analysis of results by conventional densitometry (Palfreyman et al., 1988a). Chloronaphthol was not applicable to this method of quantitation
since the dots developed were not stable in xylene. Therefore DAB was the chromogen used in all further dot-immunobinding assays.
3.4.2.2. Radioimmunoassay.
A modified version of the dot-immunobinding assay was employed as a radioimmunoassay wherein the enzyme-labelled second antibody was replaced by iodinated Protein A (see section 2.13). This detection system was investigated in an attempt to fully quantify the assay.
3.4.2.2a. Assay parameters.
1. Optimal concentration of Protein A.Four replicate antigen dilution curves (two-fold serial
dilutions of the supernatant from a 5mg per ml mycelial antigensuspension in PBS) were reacted with primary antiserum, diluted1:500 in TBS-1BSA-0.05T-0.01SA. The strips were subsequently
125incubated with solutions of I-Protein A at various 4 54 5concentrations (5 x 10 c.p.m. - 4 x 10 c.p.m.). No-antigen
controls were included to determine the background values of the assay and results were adjusted accordingly. The optimum
5concentration of Protein A was found to be 2 x 10 c.p.m. (Figure 3.13). Control experiments identified that Protein A did not bind to the antigen directly.2. Primary antiserum.
Primary antiserum was tested in the system at 1:50, 1:100, 1:250 and 1:500 (v/v) dilutions. A 1:100 (v/v) dilution was identified as the highest dilution showing maximum antigen binding and was employed in all subsequent assays.3. Antigen samples.
A standard curve of fifteen mycelial antigen concentrations
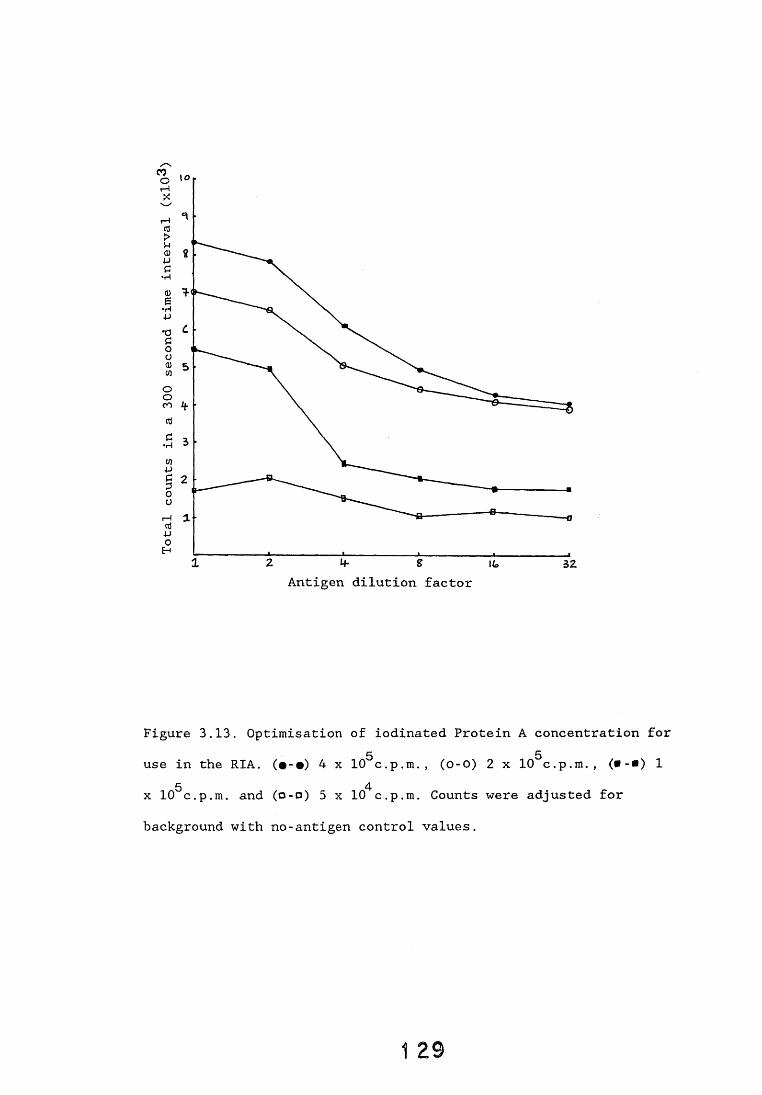
Figure 3.13. Optimisationuse in the RIA. (•-•) 4 x
5x 10 c.p.m. and (o-o) 5 x
of iodinated Protein A concentration for5 510 c.p.m., (o-o) 2 x 10 c.p.m., (■-•) 1410 c.p.m. Counts were adjusted for
background with no-antigen control values.
(2.44 - 5000 ug per ml) was included in each experiment. Wood block samples were tested undiluted and diluted 1:2 and 1:4 in PBS against L. lepideus antiserum preabsorbed with the appropriate wood sawdust. Only undiluted samples were screened against PIS serum.4. Assay protocol.
The length of time the NC strips remained in the final wash12 5buffer (to remove unbound I-Protein A), had some effect on the
L. lepideus standard curve. The strips were washed for 30, 60 or 120 minutes. Those strips washed for 30 minutes gave the highest counts for the test serum, however, it also gave relatively high background values. Strips washed for 60 or 120 minutes showed a level of background activity approximately half of that observed in the strip washed for 30 minutes. However, the strip washed for 60 minutes gave markedly higher counts for the test serum than the strip washed for 120 minutes (Figure 3.14). This difference may well reflect the binding of low affinity antibodies to the antigen extract which are lost during the longer wash. Subsequently, a final wash of 60 minutes duration was employed.
3.4.2.3. Quantitation.
Although subsequent experiments demonstrated that the dot-immunobinding assay provides a good qualitative test for the presence of decay fungi, the development of a fuller quantitative system is desirable. The radioimmunoassay investigated using iodinated Protein A as the detection system was however, only semi-quantitative when applied to infected wood block extracts. Antigenicity of L. lepideus infected wood blocks did not dilute
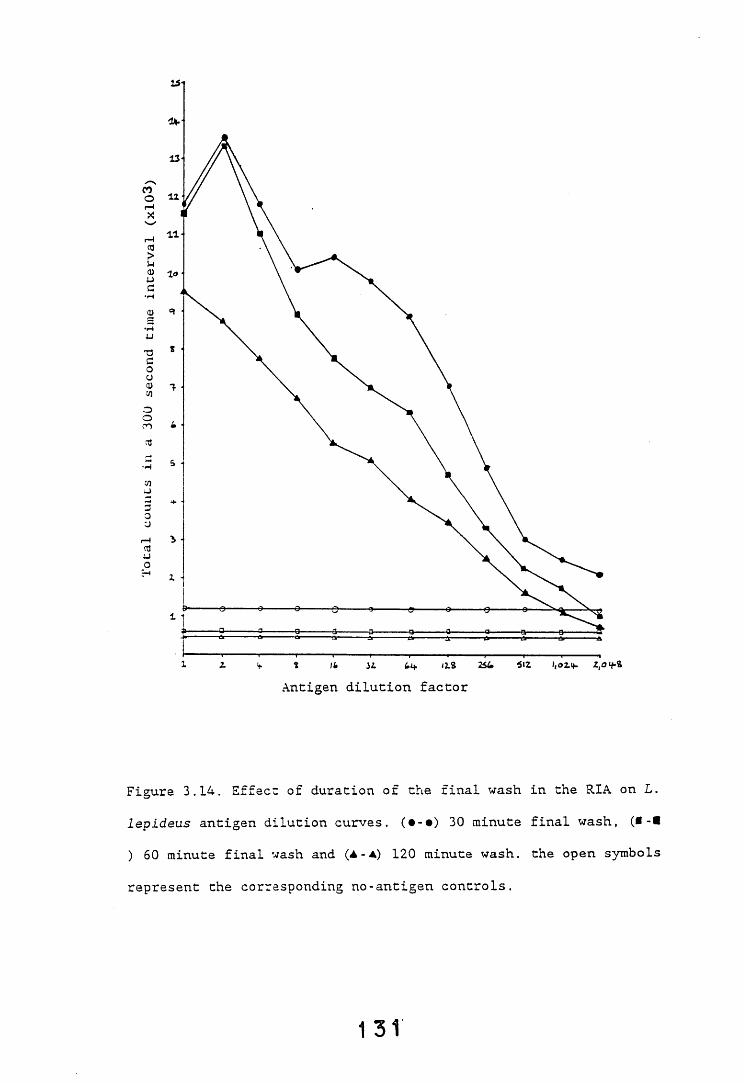
Figure 3.14. Effect: of duration of the final wash in the RIA on L. Lepideus antigen dilution curves. (•-•) 30 minute final wash, (■-* ) 60 minute final wash and (A - A) 120 minute wash, the open symbols
represent the corresponding no-antigen controls.
131

An alternative method of quantifying immunodots is to use reflectance densitometric equipment (Towbin and Gordon, 1984).This equipment is expensive and was not available in this laboratory, therefore, an alternative system was developed. Seshi (1986) reported that nitrocellulose could be rendered transparent by treatment with xylene. This overcomes the major problem, i.e. the opacity of nitrocellulose, in using conventional densitometry to quantify immunodots. The quantitation of both xylene-treated immunoperoxidase stained immunodots and immunoblots on NC was carried out.
3.5. SDS-PAGE electrophoresis and western blotting.
3.5.1. Introduction.
Electrophoretic methods are widely applied to analyse complex mixtures of proteins, one of the most common techniques being used is polyacrylamide gel electrophoresis particularly in the presence of sodium dodecyl sulphate (SDS-PAGE). The detergent SDS solubilises and complexes with essentially all proteins in a proportion of approximately 1.4g SDS per lg of protein (Tijssen, 1985). The extreme diversity in the structure, charge and solubility of proteins is minimised by interaction with SDS and the separation of SDS-proteins reflects differences in the molecular weights of the original proteins. Polyacrylamide gel electrophoresis systems are classified according to (i) the buffer system, used as continuous or discontinuous, dependent on whether the same or different buffers are used in the gel and electrode
out in parallel with the standard mycelial preparation indicatinga heterogeneous response to the primary antiserum.
compartments, and (ii) the presence or absence of dissociating agents. Gordon (1975) has published a detailed review of the practice of PAGE of proteins. The proteins separated on the gels can be stained either with dyes e.g. Coomassie blue or using chemical reactions e.g. the ultrasensitive silver stain. Silver staining, although more complex than Coomassie blue staining, is at least one hundred times more sensitive (Tijssen, 1985). Both these techniques stain all proteins and can provide provide little
information on the nature of the proteins other than molecular weight. Enzymes separated on gels can be studied by using enzymic stains, however such detection systems are not usually compatible with the denaturation caused by SDS.
In recent years, the blotting method used originally to transfer nucleic acids from agarose to membrane filters (Southern, 1975), has been adapted to facilitate the transfer of proteins from gels to a variety of types of membrane. This modified technique is often referred to as "western blotting" (Gershoni and Palade, 1983). Transfer of proteins both diffusion (Bowen et al.,1983) and in an electric field (Towbin et al., 1979) have been reported, though the efficiency of the latter transfer method has resulted in it becoming the most commonly employed. The transferring of proteins to paper supports and their subsequent immunodetection has permitted the combination of the high resolution of gel techniques with the simplicity and sensitivity of solid phase immunoassays. Such methods have a sensitivity comparable to that of silver staining (Tijssen, 1985). The use of western blotting and allied techniques allows the identification, characterisation and purification of specific antigens within complex protein mixtures. Though direct immunostaining of gels has
been reported (Burridge, 1978), this method is time consuming, background staining of the acrylamide is often observed and has been superceded by western blotting. The applications of western blotting and the numerous modifications of the original technique which have been published in recent years are too numerous to mention, therefore, further information can be obtained from review articles by Gershoni and Palade (1983) and Towbin and Gordon (1984).
3.5.2. Results.
3.5.2.1. Gel systems.
Two different gel systems were employed during this project.1. The LKB 2001 vertical electrophoresis unit using polyacrylamide linear gels (7.5%) or gradient (5-12.5%) gels (14cm x 13cm x 1.5mm thickness). The majority of gels employed were gradient gels. Fungal samples were prepared as previously described (section 2.6.5) and 15ul aliquots of the supernatants were loaded into each lane. The current was maintained at 20mA and electrophoresis was complete in @3.5 hours. Gels were either stained for protein or blotted onto nitrocellulose membrane overnight at a constant current of 92mA.2. The Bio-Rad PROTEAN II mini-gel unit using 7.5% polyacrylamide linear gels (8.4cm x 6cm x 1mm thickness). This system was employed under the conditions described in section 2.6.5.
The latter system was chosen as the routine method of choice for several reasons. Firstly, the separation time was shorter and dependent on the incubation times required for the visualisation
of the blotted antigens, the whole process could be carried out in a single day. Secondly, blotting of proteins from linear gels may be more reproducible than that from gradient gels. Gershoni and Palade (1983) have reported that there is a slight effect of acrylamide concentration on the efficiency of BSA electroelution from a polyacrylamide gradient gel of 5-15%. High molecular weight oligomers or contaminant substances seem to be preferentially retained in the gel at higher acrylamide concentrations. The use of linear gels avoids this potential problem.
3.5.2.2. Protein staining of gels.
The SDS-PAGE gels were stained with either 0.01% Coomassie blue or using the Bio-Rad silver staining method (Bio-Rad Bulletin 1089). The Coomassie blue stained the molecular weight marker proteins very well, however, it was much less efficient at staining fungal proteins. This probably reflects the presence of markedly lower concentrations of the fungal proteins within the gels. The silver staining method was found to be much more sensitive than the Coomassie blue and permitted the visualisation
of fungal proteins within the gels. Figure 3.15 shows results obtained with the two techniques. Subsequently, if only molecular weight marker proteins were to be stained, Coomassie blue was used, if fungal samples were to be stained, silver staining was used.
I 3 5
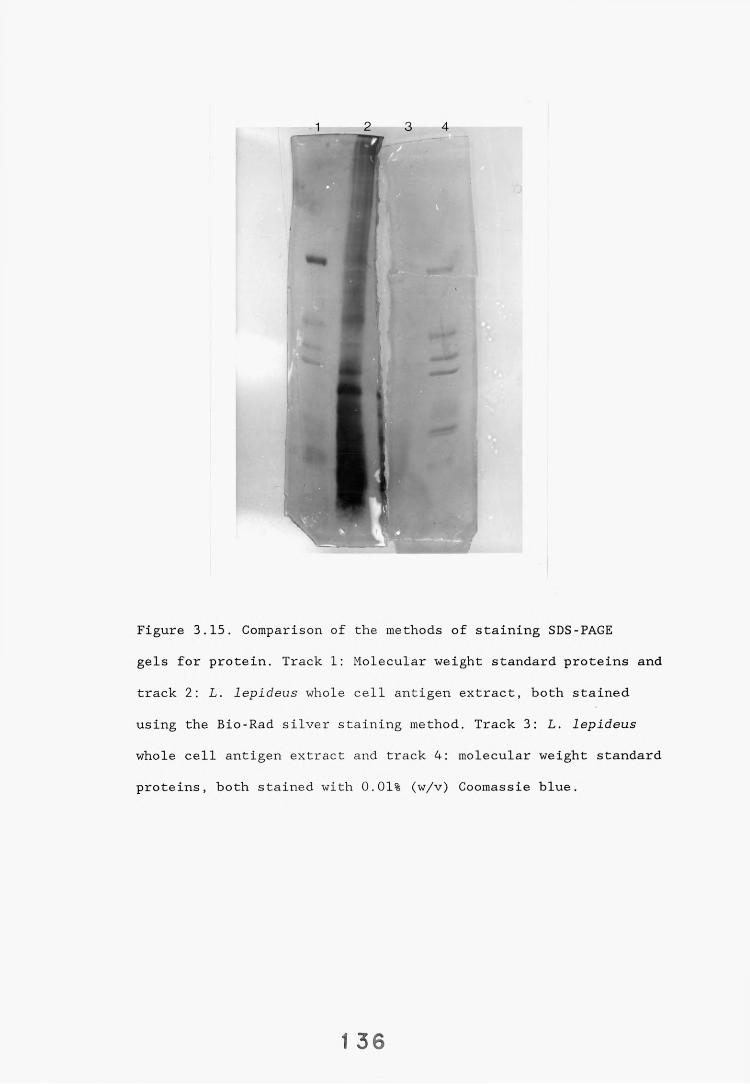
1 2 3 4
Figure 3.15. Comparison of the methods of staining SDS-PAGE gels for protein. Track 1: Molecular weight standard proteins and track 2: L. lepideus whole cell antigen extract, both stained using the Bio-Rad silver staining method. Track 3: L. lepideus
whole cell antigen extract and track 4: molecular weight standard proteins, both stained with 0.01% (w/v) Coomassie blue.
1 36
3.5.2.3 . Western blotting, parameters .
A variety of experimental parameters were investigated in an attempt to optimise the conditions for western blotting. Table 3.7 outlines the parameters tested and those finally selected are underlined. A detailed description of the routine western
blotting technique used is given in the methods section (see section 2.6.5).
Analysis of fungal isolates by western blotting was undertaken to (i) analyse the cross-reactivity of the antisera with a range of fungal isolates, (ii) to investigate the molecular specificity of the antigenic components of L. lepideus, (iii) to compare the antigenic species present in L. lepideus grown under different cultural conditions and (iv) to determine the biochemical nature of the molecular antigens. The first three studies were successfully completed and the results will be presented in chapter 4 ( cross-reactivity and molecular specificity) and chapter 5 (effect of different cultural conditions). However, subsequent to these studies a number of technical difficulties were encountered which reduced the scope of the studies proposed. In particular three major problems, either singly or in various combinations, were encountered.1. A smear effect i.e. an area of staining within which individual bands could not be identified, sometimes localised in the central region and sometimes spread across the length of the strip developed on a number of blots.2. Non-reproducibility of band intensity, bands which had stained intensely in some experiments, in particular those on the cross-reactivity of the antisera, stained only faintly in others.
1 37
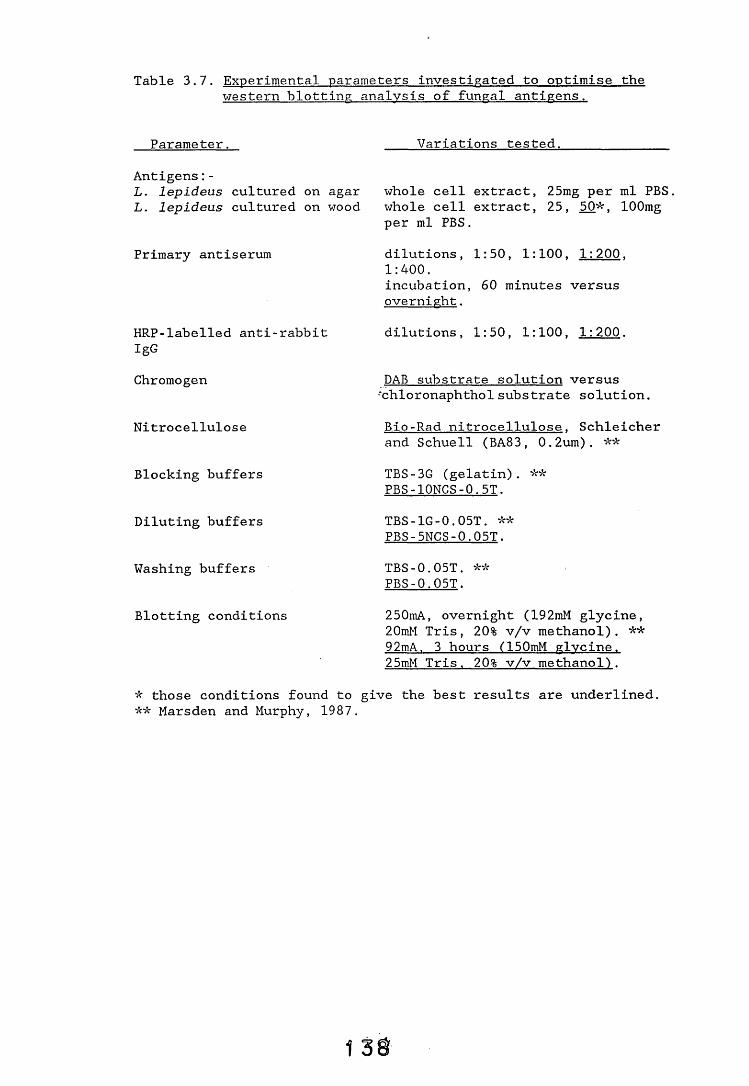
Table 3.7. Experimental parameters Investigated to optimise the western blotting analysis of fungal antigens.
Parameter. Variations tested.
Antigens:-L. lepideus cultured on agar L. lepideus cultured on wood
whole cell extract, 25mg per ml PBS whole cell extract, 25, 50*. lOOmg per ml PBS.
Primary antiserum dilutions. 1:50. 1:100. 1:200. 1:400.incubation, 60 minutes versus overnight.
HRP-labelled anti-rabbit IgG
dilutions. 1:50. 1:100. 1:200.
Chromogen DAB substrate solution versus ■'chloronaphthol substrate solution.
Nitrocellulose Bio-Rad nitrocellulose. Schleicher and Schuell (BA83, 0.2um). **
Blocking buffers TBS-3G (gelatin). ** PBS-10NCS-0.5T.
Diluting buffers TBS-1G-0.05T. ** PBS-5NCS-0.05T.
Washing buffers TBS-0.05T. ** PBS-0.05T.
Blotting conditions 250mA, overnight (192mM glycine, 20mM Tris, 20% v/v methanol). ** 92mA. 3 hours (150mM elvcine. 25mM Tris. 20% v/v methanol).
* those conditions found to give the best results are underlined.** Marsden and Murphy, 1987.
3. Loss of bands from the antigenic profile, many bands which had been identified in the cross-reactivity studies subsequently did not stain. This may reflect the apparent failure of low concentration antigens to be stained and is likely to be an extension of the second problem.
A wide variety of experimental parameters were investigated to overcome these problems (Table 3.8). In addition, individual reagents were systematically tested to determine whether they were wholly, or partially, responsible for the problems encountered.
Several different antigen preparations were tested and of these, the supernatant sample showed a much reduced smear effect and allowed the differentiation of several bands. Both the whole cell extract and the pellet extract gave a marked smear effect. Freshly harvested material gave a similar profile to the freeze-dried stock material, however the staining was generally more intense. This may reflect a slight deterioration in antibody binding capacity of the antigen in storage. Serpula lacrymans was used as a control to determine whether the problems were associated with the L. lepideus alone and indeed, less smearing and sharper bands within the antigenic profile were obtained with the S. lacrymans antigen extracts.
It was postulated that the smear was caused by the presence of carbohydrate antigens moieties. If so, it would be possible to remove the smear by somehow inactivating these antigens. Many complex carbohydrates are labile at pHs above 7.0. The standard pH of the boiling mix was 6.7 (same as the stacking gel buffer) and samples were also prepared in boiling at pH 7.5, pH 8.0, pH 8.5 and pH 9.0. There was no real differences in samples prepared in boiling mix at pH ^7.5, however, the use of these higher pH boiling mixes did give better results than those obtained using
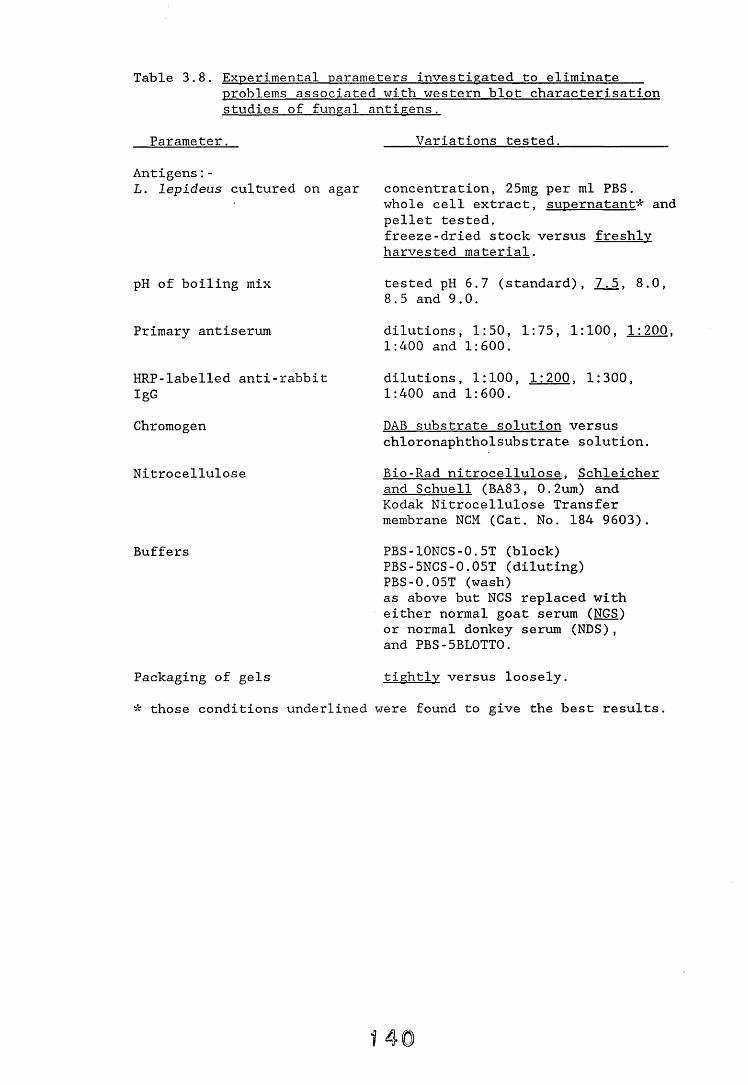
Table 3.8. Experimental parameters investigated to eliminateproblems associated with western blot characterisationstudies of fungal antigens.
Parameter. Variations tested.
Antigens:-L. lepideus cultured on agar concentration, 25mg per ml PBS
whole cell extract, supernatant* and pellet tested.freeze-dried stock versus freshlv harvested material.
pH of boiling mix tested pH 6.7 (standard), 7.5. 8.0, 8.5 and 9.0.
Primary antiserum dilutions. 1:50. 1:75. 1:100. 1:200. 1:400 and 1:600.
HRP-labelled anti-rabbit IgG
dilutions. 1:100. 1:200. 1:300. 1:400 and 1:600.
Chromogen DAB substrate solution versus chloronaphtholsubstrate solution.
Nitrocellulose Bio-Rad nitrocellulose. Schleicher and Schuell (BA83. 0.2um) and Kodak Nitrocellulose Transfer membrane NCM (Cat. No. 184 9603).
Buffers PBS-10NCS-0.5T (block) PBS-5NCS-0.05T (diluting) PBS-0.05T (wash) as above but NCS replaced with either normal goat serum (NGS) or normal donkey serum (NDS), and PBS-5BL0TT0.
Packaging of gels tightlv versus loosely.* those conditions underlined were found to give the best results.
boiling mix at pH 6.7 (Figure 3.16).Chloronaphthol was originally the chromogen of choice for use
in western blotting for reasons stated earlier (section 3.3.2.1). However it was found that use of DAB had two advantages over chloronaphthol) firstly, the bands developed much more quickly (2-5
minutes) than in chloronaphthol (> 40 minutes) and secondly, the resulting bands were more intensely stained. Visualisation of all the bands detected by DAB required an overnight incubation in chloronaphthol resulting in high background. In comparison, strips developed in DAB gave a low background permitting easy discrimination of the bands. Strips developed in chloronaphthol often had a smear located In the central region (Figure 3.17). The smear was not always present and protein staining of gels electrophoresed in parallel indicated that protein separation had occurred correctly.
The results obtained in the experiments indicated that a 1:200 dilution of both the primary and enzyme-labelled secondary antisera gave the best results and confirmed that DAB was the superior substrate. No real differences were observed between the different types of nitrocellulose although the nitrocellulose obtained from Kodak tended to give a slightly higher background.
Comparisons of different buffer systems showed that those systems which included whole serum gave better results than those which contained milk protein (PBS-5BL0TT0). Of the three whole sera tested, the normal goat serum gave the best results.
Close contact between the gel and the nitrocellulose is required for effective blotting, therefore the packaging of gels was investigated. Comparisons were made between tightly packed gel/NC sandwiches (10 pieces of filter paper each side) and loosely packed gel/NC sandwiches (2 pieces filter paper each
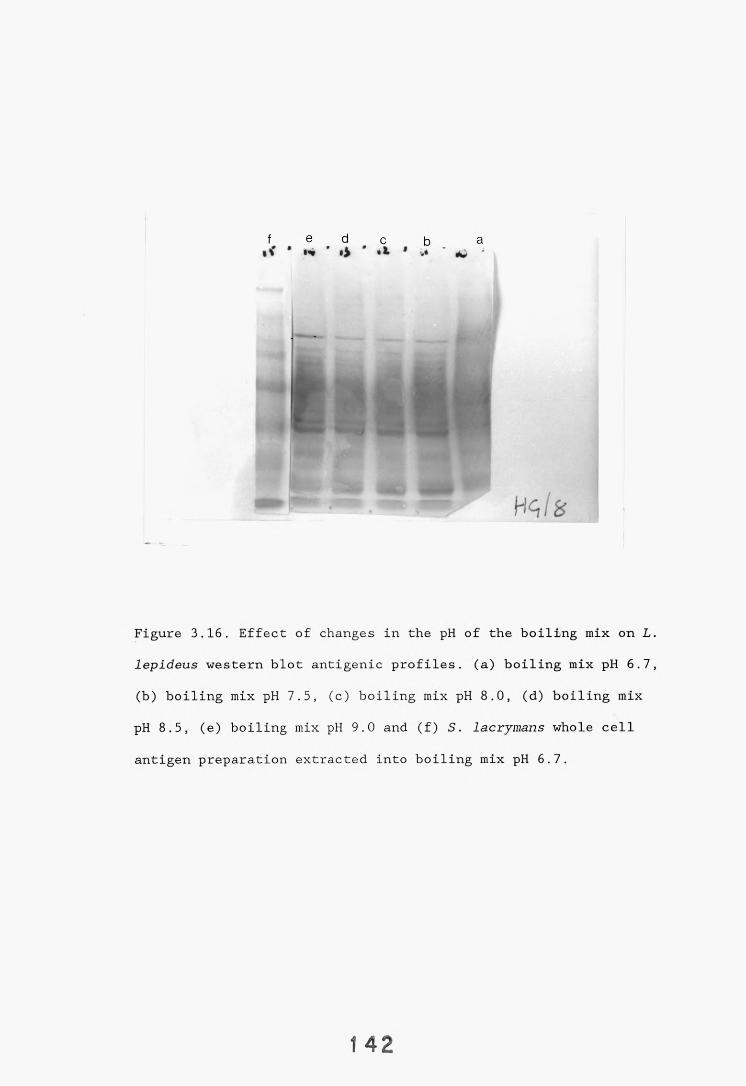
Figure 3.16. Effect of changes in the pH of the boiling mix on L. lepideus western blot antigenic profiles, (a) boiling mix pH 6.7, (b) boiling mix pH 7.5, (c) boiling mix pH 8.0, (d) boiling mix pH 8.5, (e) boiling mix pH 9.0 and (f) S. lacrymans whole cell antigen preparation extracted into boiling mix pH 6.7.
1 42
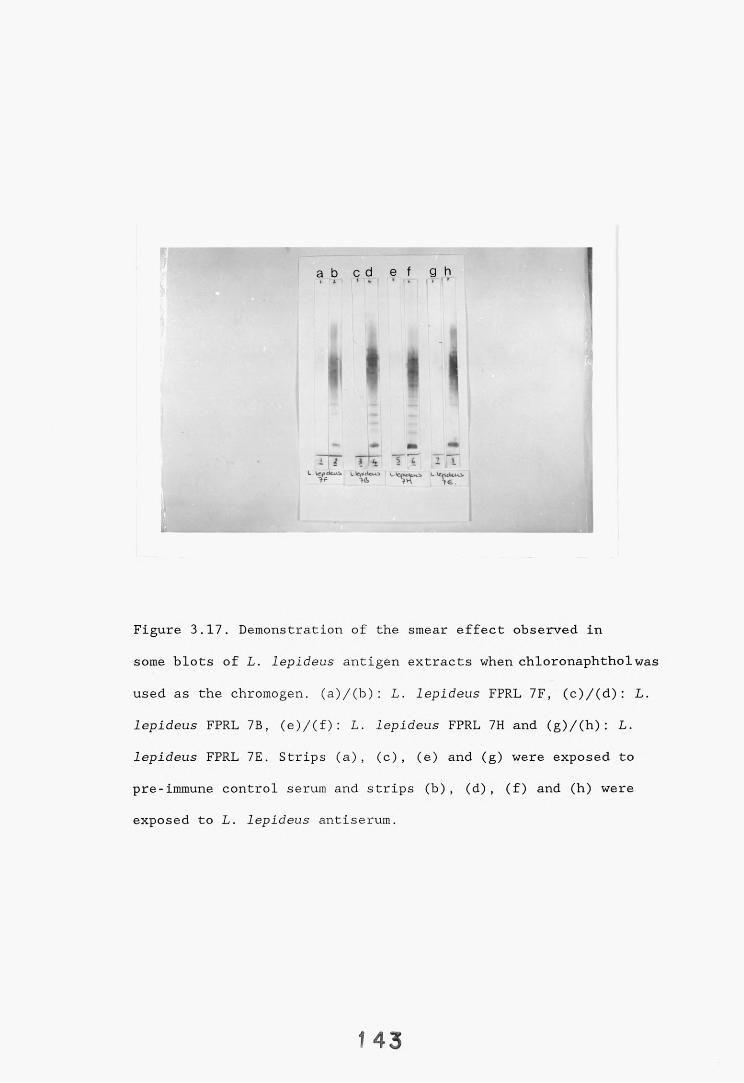
a b c d e f g h
I I I
L.Vcf'CkiAi L V yvcW l u 'c / x c Ic m . * L Ae/vcUiO.I ? > & ? H i £ .
Figure 3.17. Demonstration of the smear effect observed in some blots of L. lepideus antigen extracts when chloronaphtholwas used as the chromogen. (a)/(b): L. lepideus FPRL 7F, (c)/(d): L. lepideus FPRL 7B, (e)/(f): L. lepideus FPRL 7H and (g)/(h): L. lepideus FPRL 7E. Strips (a), (c), (e) and (g) were exposed to pre-immune control serum and strips (b), (d), (f) and (h) wereexposed to L. lepideus antiserum.
1 43
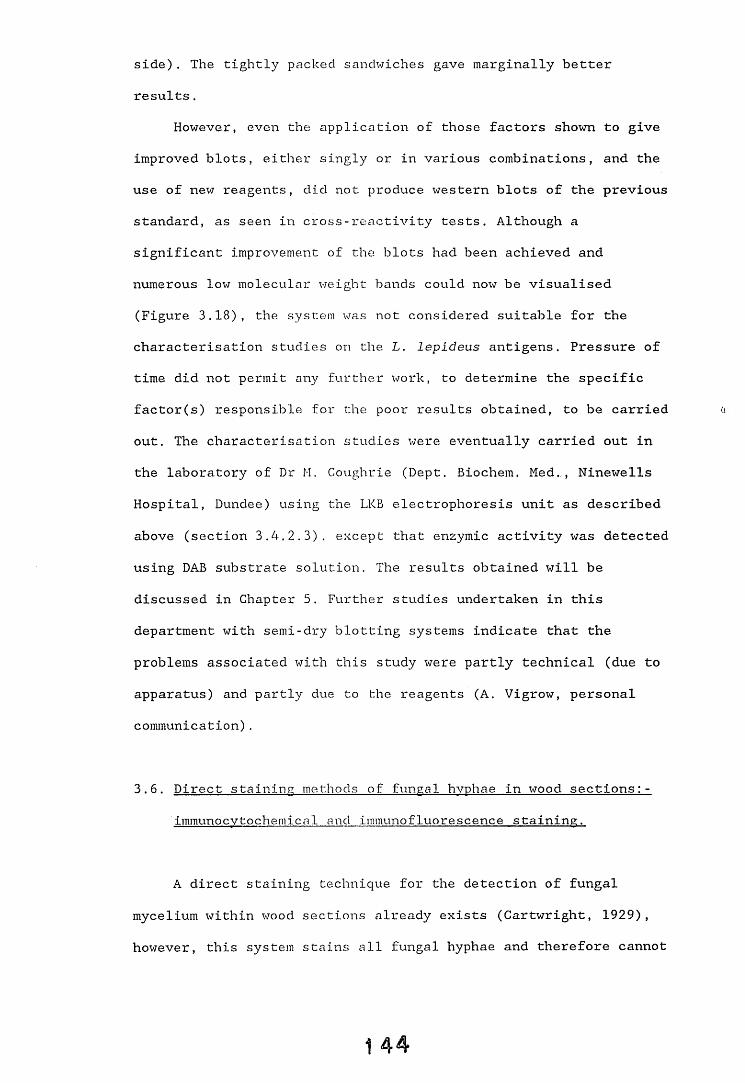
side). The tightly packed sandwiches gave marginally better results.
However, even the application of those factors shown to give improved blots, either singly or in various combinations, and the use of new reagents, did not produce western blots of the previous standard, as seen in cross - reactivity tests. Although a significant improvement of the blots had been achieved and numerous low molecular weight bands could now be visualised (Figure 3.18), the system was not considered suitable for the characterisation studies on the L. lepideus antigens. Pressure of time did not permit any further work, to determine the specific factor(s) responsible for the poor results obtained, to be carried out. The characterisation studies were eventually carried out in the laboratory of Dr M. Coughrie (Dept. Biochem. Med., Ninewells Hospital, Dundee) using the LKB electrophoresis unit as described
above (section 3.4.2.3). except that enzymic activity was detected using DAB substrate solution. The results obtained will be discussed in Chapter 5. Further studies undertaken in this department with semi-dry blotting systems indicate that the problems associated with this study were partly technical (due to apparatus) and partly due to the reagents (A. Vigrow, personal communication).
3.6. Direct staining methods of fungal hvphae in wood sectionsimmunocytochemical end immunofluorescence staining.
A direct staining technique for the detection of fungal mycelium within wood sections already exists (Cartwright, 1929), however, this system stains all fungal hyphae and therefore cannot
Figure 3.18. Western blot antigenic profiles of L. lepideus after inclusion of factors shown to improve blots. A: L. lepideus
FPRL 7F and B-E: different L. lepideus pole isolates recovered from creosote - treated distribution poles.
1 45
differentiate one fungal colonist from another. Immunocytochemical and immunofluorescence staining methods were investigated as a means of specifically staining L. lepideus hyphae within wood sections removed from wood blocks artificially infected with L. lepideus. The techniques did not require specific development and were essentially similar to previously reported techniques, as detailed in the methods section (see sections 2.10 - 2.12). Preliminary experiments were carried out to determine the optimum antiserum dilutions, incubation times etc. and the final parameters used are reported in the methods section (see sections 2.10-2.12). The results of the immunocytochemical and immunofluorescence staining of L. lepideus infected wood blocks will be reported later (Chapter 6). Although these systems are not suitable as a routine detection system, because of the time required for sample preparation and the need to screen results microscopically, they can be applied to localise antigens on the fungal hypha, map the growth and spread of the specific decay organism through the wood and in interaction studies between fungi, to elicit the effect of such interactions on antigenicity.
3.7. Discussion.
In general, the results indicate that immunological techniques can be applied to the analysis and detection of L. lepideus.
3.7.1. Immunodiffusion.
Immunodiffusion techniques have, until recently, been the most commonly used immunological methods in mycology. These techniques have been employed widely in medical mycology and plant pathology and to a limited extent in biodeterioration studies. In medical mycology, immunodiffusion has been applied to the diagnosis and the study of the antigenic nature of Aspergillus fumigatus (Hearn and MacKenzie, 1979, 1980) and Coccidioides immitis (Cox and Britt, 1986, Rowe et al., 1963). More recently, with the development of the exo-antigen technique (Kaufman and Standard, 1987) , immunodiffusion has been shown to be a powerful diagnostic tool in the identification of pathogenic dimorphic fungi such as Histoplasma capsulatum (Kaufman et al., 1983) and Blastomyces dermititidis (Sekhon et al., 1986a,b). In plant pathology, such techniques have been used to differentiate species of Phytophthora (Burrell et al., 1966, Halsall, 1976) and Ceratocystis (Amos and Burrell, 1967). Furthermore, immunodiffusion methods have been used to study the ecology of the leaf litter fungus Mycena galopus (Chard, 1981). The techniques have been employed in biodeterioration studies to determine the serological relationships between different Fomes (syn. Heterobasidion) species (Madhosingh and Ginns, 1974) and between different Gloeophyllum species (Madhosingh and Ginns, 1975).
During this project, immunodiffusion was used to assess the titre of the L. lepideus antisera and to determine the crossreactivity of the sera with other fungal isolates. The results of these experiments will be presented in Chapter 4. Although immunodiffusion is widely used in mycology, its use as a routine
detection system for L. lepideus was not feasible for various reasons, in particular the relative insensitivity of the technique. Although precipitates were formed between L. lepideus mycelial antigen extracts and the homologous antisera, none was identified as specific for the fungus (see chapter 4).Furthermore, no precipitates were observed between extracts from L. lepideus-infected wood blocks and the antisera.
3.7.2. Enzyme immunoassays.
Two basic types of enzyme immunoassay were developed during this project. Classification of the assay depended upon whether the solid phase used was a microtitre plate (EIA/ELISA and ACA) or nitrocellulose (dot blot ACA and dot immunobinding assay). ELISA systems have been applied extensively to detect and study fungi, particularly in the areas of medical mycology e.g. Aspergillus species (Hearn and Mackenzie, 1979, 1980, Sepulveda et al., 1979, Richardson and Warnock, 1984, and Richardson et al., 1983) and plant pathology e.g. Phoma exigua infection in potatoes (Aguelon and Dunez, 1984) and Sclerotinia sclerotiorum infection in sunflowers (Walcz et al., 1985). More recently, ELISA has been used to detect and study the fungi Poria placenta (Goodell and Jellison, 1986, 1988) and Ophiostoma species (Breuil et al., 1988, Dewey and Brasier, 1988) within wood extracts.
However, the three separate EIA systems investigated for L. lepideus were all beset by the same problem, that is, a low signal:noise ratio. Attempts to maximise the signal in the EIA by either solubilisation of antigens or improving the binding of fungal antigens to microtitre plates using a variety of
During the development and application of the ACA assay, the major problem encountered was the high background values obtained for no-antigen control samples. Results from experiments comparing different blocking buffers indicated that incomplete blocking of free binding sites was unlikely to be the cause of the non-specific binding.
Despite the high no-antigen control background values it was possible to discriminate between samples containing L. lepideus mycelial antigens and negative controls using both the EIAs and the ACA. However, when the ACA system was used to screen extracts from L. lepideus-infected wood blocks, the uninfected control block extracts gave similar results to the test block extracts and therefore, no such discrimination was possible. Comparison of the systems under development in this laboratory with methodology for the immunodetection of the fungal pathogen Ophiostoma ulmi in elms (Dewey and Brasier,1988) indicated a number of common problems and methods recommended in this paper were applied to the ACA for L. lepideus. Dewey and Brasier (1988) reported that the extensive cross-reaction observed between healthy tissue and the fungal antiserum could be markedly reduced by incubating the antigen samples overnight at 4°C and spinning out the precipitated debris before use in the assay. Similar results were found in this study for L. lepideus and further work is required to optimise this procedure.
When NC was used as the solid support in the ACA the high levels of background staining in the no-antigen controls were Again apparent, however, the results indicated that the enzyme conjugate was binding non-specifically to a serum component. The
reagents/methods met with little success.
inclusion of the milk protein casein (PBS-5BL0TT0) in the blocking/diluting/ washing buffers used iri the dot blot ACA eliminated the problems of high background staining on no-antigen control strips. The differences observed between the microtitre plate-based ACA and the dot blot ACA may reflect the differences in the binding characteristics of the two solid phases. Further development of the dot blot ACA and testing of its applicability to the screening of L. lepideus infected wood block extracts is recommended.
The results obtained in the EIAs for "soluble" and "insoluble" antigens and in the ACA could be explained by the presence of low-affinity antibodies in the L. lepideus antiserum. There is considerable elution of low-affinity antibodies in EIA systems (or bound antigen in the ACA). For good results it is very important that high-affinity antibodies are used in solid phase EIAs (Tijssen, 1985). Although the optimal immunisation protocol for the production of high affinity antibodies against L. lepideus could be determined by systematic testing of all individual parameters this was not undertaken during this study due to lack of animals.
The EIAs/ACA used in conjunction with the L. lepideus antiserum cannot at their current stage of development be used to screen field samples for incipient fungal decay. Further development to identify the factor(s) responsible for the high background values obtained for the no-antigen controls in the ACA and the production of high affinity antisera to increase the signal obtained in the EIAs/ACA could potentially permit the use of such systems as a routine detection system for L. lepideus.
1 50
3.7.3. Dot-immunobinding assay.
The results of the ACA effectively demonstrate that NC-based immunodetection systems are likely to be more appropriate for detecting L. lepideus antigens, using the reagents produced to date, than microtitre plate-based EIA systems. The NC-based dot-immunobinding assay proved to have several advantages: (i) antigens bind well to to NC and therefore subsequent elution of the antigens during washing steps is limited, (ii) non-specific binding sites are easily and rapidly blocked, for example using PBS-5BL0TT0, avoiding background problems and (iii) although the system is primarily qualitative, semi-quantitation was achieved using conventional densitometry (Palfreyman et al., 1988a) or a RIA system employing iodinated Protein A. Alternatively, visual grading of dot intensity could be, and was, employed. It is probable that the system could be made more fully quantitative with further development.
The method provided a simple, quick, test for the detection of fungal antigens and was applied in cross-reactivity tests (see chapter 4) and to screen wood block extracts (see chapter 6). The dot-immunobinding assay detected L. lepideus antigens in extracts from blocks with no measurable weight loss. This factor, in combination with the other advantages described above, endows the assay with considerable potential as a field testing system. Subsequently, the applicability of the system to screen field samples from creosote-treated distribution poles was tested (see chapter 7).
151

3.7.4. Other immunological studies.
The western blotting technique permits the analysis of the different antigenic components of the fungus. The technique was successfully applied to analyse the molecular specificity of the L. lepideus antiserum (see chapter 4), however, because of the technical problems encountered little information on L. lepideus antigens within infected wood blocks was obtained. Palfreyman et al. (1988b) have shown that western blotting techniques can be applied to detect and study the white rot basidiomycete decay fungus Coriolus versicolor within the wood substrate. The inability to produce reproducible and distinct blots of L. lepideus infected wood blocks could be due to several factors. First amongst these is technical difficulties experienced during the latter part of the project. In addition, it is known that the cultural conditions effect the antigenicity of an organism (Burrell et al., 1966, Chard, 1981, Clayton et al., 1964, Vigrow et al. , 1989, 1990). Possibly, when grown on wood, L. lepideus produces modified and/or novel antigens which are not detected by the antiserum raised against liquid culture grown mycelium. Alternatively, the antigens may be only modified slightly but these modifications may be sufficient to decrease the affinity of the antibodies for the antigens. This decrease in an already low-affinity system would increase the chances that the antibodies would be dissociated from the antigens in the washing stages and cause a decrease and/or loss in detectability. The results obtained with C. versicolor infected blocks may reflect a higher affinity antiserum. The complexity of the western blotting
methodology renders it unsuitable as a routine detection system for L. lepideus incipient fungal decay.
Immunocytochemical and immunofluorescence staining methods were successfully applied to detect L. lepideus mycelium within wood sections with little modification of standard protocols (see chapter 6). Non-specific binding of the antiserum to the wood was eliminated by preabsorption with the appropriate sawdust. The potential of these techniques as routine detection systems is limited by the complexity of both the sample preparation and methodology involved.
In conclusion, the results indicate that immunological techniques can be successfully applied to detect and analyse wood decay basidiomycete fungi. Several difficulties have arisen during application of the techniques, however, all of these are likely to be overcome either by the production of higher affinity antibodies, possibly through different immunisation protocols, or by modifying and/or further development of individual techniques.
CHAPTER 4. CHARACTERISATION OF LENTINUS LEPIDEUS ANTISERUM.
4.1. Introduction.
After the initial production of test antiserum it's characterisation was undertaken. Three characteristics were investigated, antiserum titre, specificity and molecular specificity.
Titre is a measure of the amount of antiserum needed to complex a given quantity of antigen (Edwards, 1985). It is therefore necessary to decide upon an arbitrary level of antigen binding prior to determining titres. The level of binding chosen is one of personal choice and can range from twice the background control value (e.g. Goodell and Jellison, 1986) to saturation of all antigen binding sites (e.g. Edwards, 1985). Binding can be expressed as a percentage of the level of saturation binding (when both measured in terms of absorbance) and the highest antiserum dilution at which this level of binding can be achieved then determines the titre (Tijssen, 1985). However, such quantification of antigen binding is not possible when using qualitative immunological techniques, for example immunodiffusion, and alternative methods of deducing antiserum titre are required. For the purposes of this thesis two definitions of antiserum titre
were employed dependent on the system of testing used. Firstly, in the case of the enzyme immunoassays, the titre was defined as the highest antiserum dilution at which 100% antigen binding occurredi.e. saturation of antigen binding sites by antibody (as determined from antiserum dilution curves). Secondly, in the case of immunodiffusion and the dot-immunobinding assay, the titre was defined as the highest antiserum dilution at which, respectively, a visible precipitate or dot was formed. There are a variety of methods for estimating antiserum titre. The most common methods
employed are titration (highest dilution still giving a positive visual reaction) and the measurement of absorbance in enzyme-based immunoassays (Tijssen, 1985). In the titration method, serial dilutions of the antiserum are tested to establish the limit at which interaction between antigen and antibody can no longer be visually detected. This interaction can be detected as precipitates, agglutination or by visualisation of enzyme reaction products using appropriately labelled antibodies.
Alternatively, the results obtained in solid phase EIA can be expressed in terms of absorbance values whereby levels of enzyme reaction product, and indirectly antigen/antibody levels, can be determined. However, the techniques suffer from several drawbacks, for example, the definition of the titre may be confusing since the titre for a single serum may vary greatly when measured in different immunoassay systems. Titrations are also work-intensive, costly and yield a discontinuous scale of results. Furthermore, it is difficult to establish the dilution (e.g. 1:256 or reciprocal 256) at which the real end-point occurs. Thus, estimated titre values may easily be a one or two-fold dilution difference from the accurate value. However, titration methods have several applications, (i) the identification of the most reactive antiserum in a collection of sera, (ii) the demonstration of a "rising titre", an increase in antibody titre which is indicative of an infection and (iii) the detection of antibodies to antigens when no quantitative system exists and/or the equipment required for absorbance measurement is not available. Using absorbance values can circumvent some of the disadvantages of titration-based systems since the inclusion of internal standards permits cut-off values to be determined and the subjectivity factor removed.
However, although a continuous scale of absorbance values may be obtained it is not very reliable outside the 0.2-0.8 range as the coefficient of variation tends to increase significantly outside this range (Tijssen, 1985). Furthermore the absorbance values are not linearly proportional to the titres, that is, a two-fold increase in titre does not result in a two-fold increase in the absorbance. Although both titration and absorbance measurement methods have disadvantages, they offer simple tests for comparing the antibody activity of two antisera. Estimation of antiserum titre is important for several reasons, namely, to prevent wastage and to provide information on the optimum amount of antiserum to be used in any particular system. During this project titration and absorbance measurement were employed to identify the sera with the highest titres, thus permitting their subsequent use in cross-reactivity tests. Visual inspection of results was carried out when either immunodiffusion or the dot-immunobinding assay were employed. Absorbances were measured in both the EIAs for "soluble" and "insoluble" antigens.
Once the titre of an antiserum had been established its specificity was investigated. Specificity can, in general, be described as "the uniqueness, or lack of such, of a binding site on an antibody for an antigen" (Edwards, 1985). Thus, a highly
specific antibody will be understood to possess binding sites which interact only with an antigen epitope with a unique molecular structure. Conversely, a non-specific antibody would react with a variety of antigens showing different overall molecular structures. A polyclonal antiserum will normally contain many different antibodies of various specificities. The usual method of determining the specificity of an antiserum is to carry out cross-reactivity tests, wherein the serum is tested for
reactivity against both closely related antigens (e.g. in the studies described here, other L. lepideus strains and Lentinus species), and against other antigens which may be encountered during the use of the assay. In addition, the molecular specificity of an antiserum was investigated by SDS-PAGE electrophoresis and western blotting. Individual antigens were identified by molecular weight and their specificity determined.
A variety of immunological techniques were employed in the studies reported in this chapter. The work had several objectives
1. The determination of the titres of the various antisera produced in rabbits after immunisation with L. lepideus FPRL 7F whole cell extracts and to identify the antiserum(a) with the highest titre(s) for their subsequent use in specificity studies.
2. The determination of the specificity of the antiserum(a) using cross-reactivity testing.
3. The determination of the molecular specificity of the antiserum by western blot analysis against selected fungal
isolates. 4
4. The improvement of the specificity of antiserum(a), if possible, by preabsorption of the antiserum(a) with cross-reacting fungal isolates.
4.2. Results.
4.2.1. Determination of the titres of L. levideus antisera.
The titres of individual antisera were determined using both titration methodology (immunodiffusion and the dot-immunobinding assay) and measurement of absorbance (EIA for "soluble" antigens). The determined titre of an individual serum varied considerably dependent on the immunological technique used as would be expected. However, comparative analysis of the results permitted the identification of the antiserum with the highest titre - R85/3 bleed 13 (R85/3-13) which was subsequently used in all specificity tests reported in this chapter.
4.2.1.1. Immunodiffusion.
The titre of an antiserum was determined by testing two-fold serial dilutions of the serum against a whole cell antigen preparation at a fixed concentration (50mg per ml PBS). Figure4.1. presents the results obtained with the antiserum R85/3-13.The titre was expressed as a reciprocal of the highest dilution still giving a visible precipitate and in this case was 8. No precipitates were formed between the antigen extracts and undiluted pre-immune control serum.
1 5 9
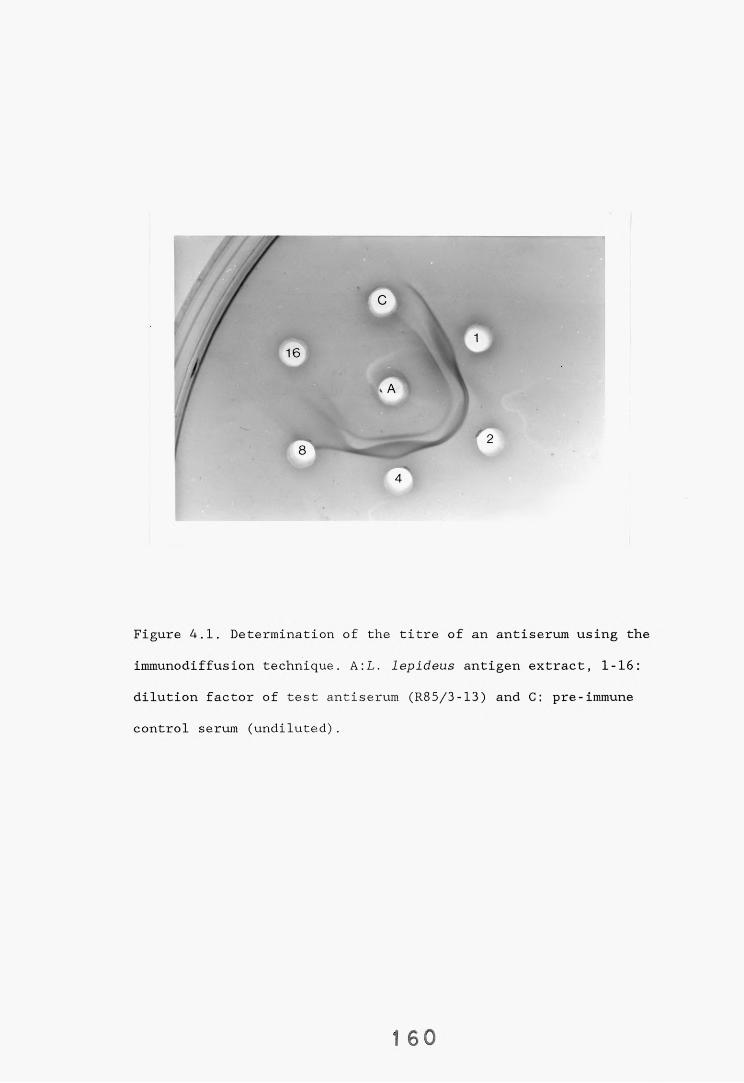
Figure 4.1. Determination of the titre of an antiserum using the immunodiffusion technique. A:L. lepideus antigen extract, 1-16: dilution factor of test antiserum (R85/3-13) and G: pre-immune control serum (undiluted).
1 6 0
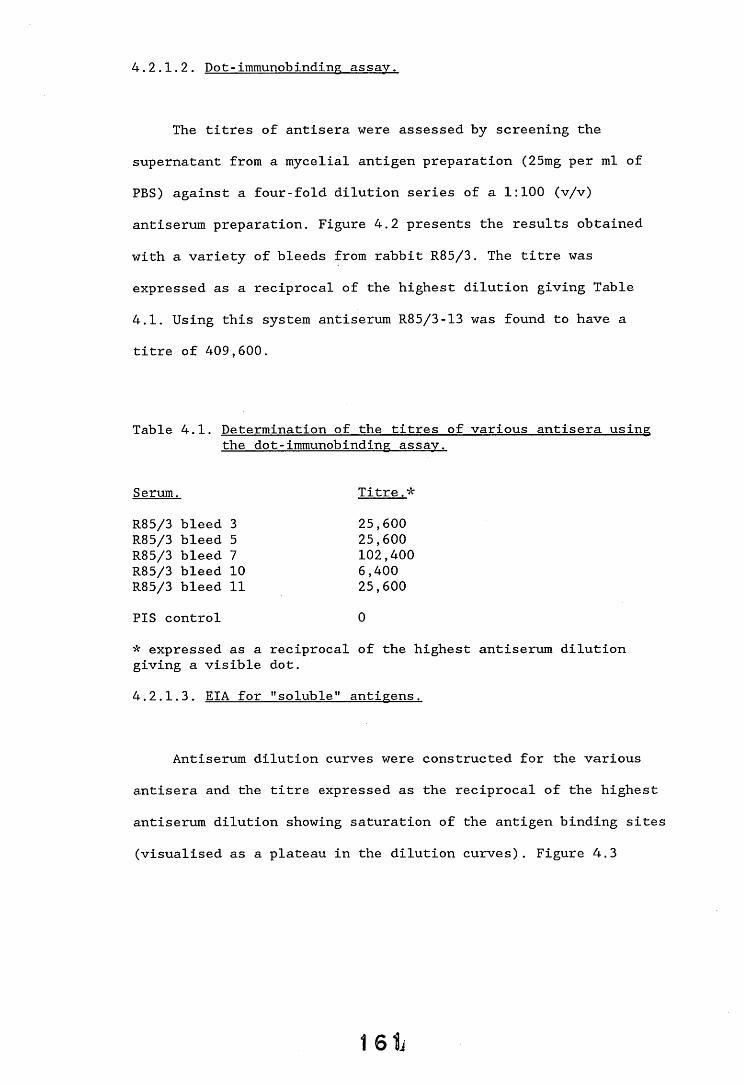
4.2.1.2. Dot-immunobinding assay.
The titres of antisera were assessed by screening the supernatant from a mycelial antigen preparation (25mg per ml of PBS) against a four-fold dilution series of a 1:100 (v/v) antiserum preparation. Figure 4.2 presents the results obtained with a variety of bleeds from rabbit R85/3. The titre was expressed as a reciprocal of the highest dilution giving Table4.1. Using this system antiserum R85/3-13 was found to have a titre of 409,600.
Table 4.1. Determination of the titres of various antisera using the dot-immunobinding assay.
Serum. Titre.*R85/3 bleed 3 25,600R85/3 bleed 5 25,600R85/3 bleed 7 102,400R85/3 bleed 10 6,400R85/3 bleed 11 25,600PIS control 0* expressed as a reciprocal of the highest antiserum dilution giving a visible dot.4.2.1.3. EIA for "soluble" antigens.
Antiserum dilution curves were constructed for the various antisera and the titre expressed as the reciprocal of the highest antiserum dilution showing saturation of the antigen binding sites (visualised as a plateau in the dilution curves). Figure 4.3
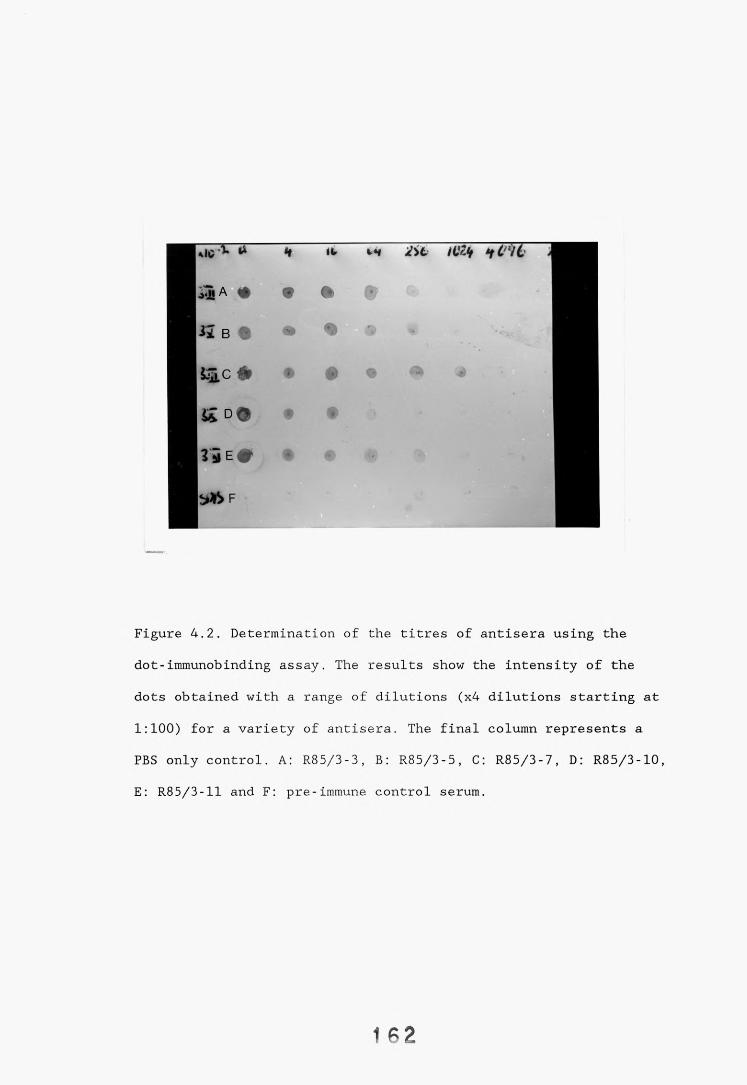
UlC X * i t t s iCZtf J
u 3»a + 9 » 1
h i b e m @ 1
$ 3 .c 4* m # 9 I
& D O 9 •
2 3 e # % #
Figure 4.2. Determination of the titres of antisera using the dot-immunobinding assay. The results show the intensity of the dots obtained with a range of dilutions (x4 dilutions starting at 1:100) for a variety of antisera. The final column represents a PBS only control. A: R85/3-3, B: R85/3-5, C: R85/3-7, D: R85/3-10, E: R85/3-11 and F: pre-immune control serum.
1 6 2
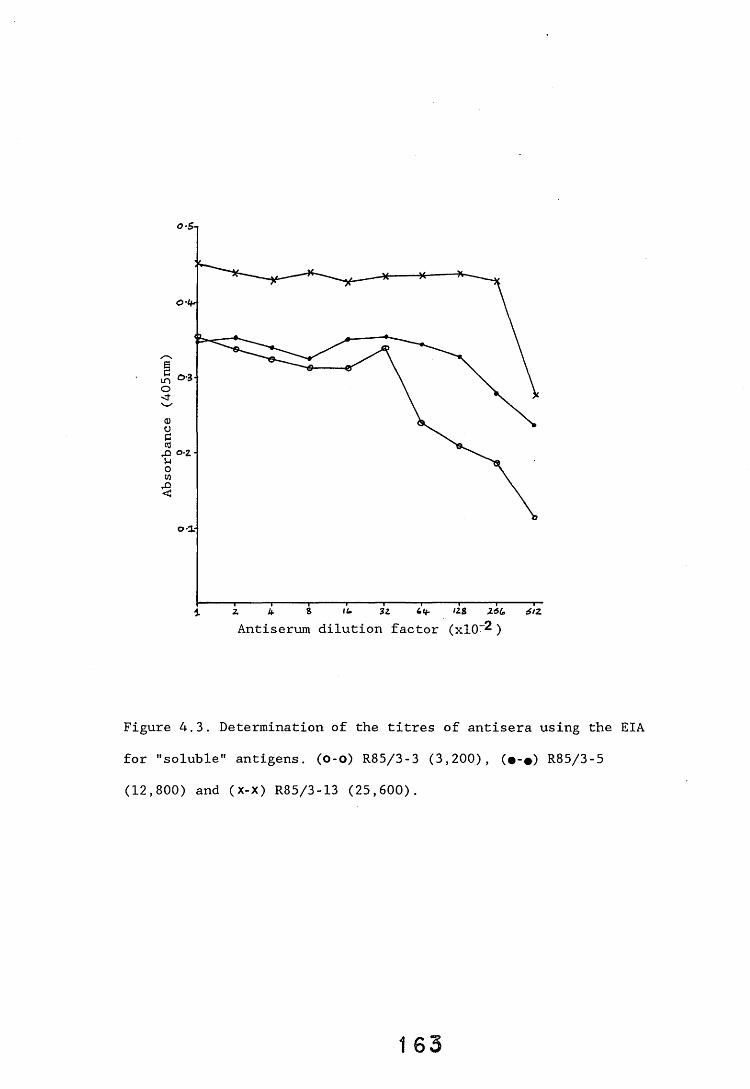
o-S-\
1 Z A 8 It. 3Z 6i#- I2g Z5& rf/Z
Antiserum dilution factor (xl0~2 )
Figure 4.3. Determination of the titres of antisera using the EIA for "soluble" antigens, (o-o) R85/3-3 (3,200), (•-#) R85/3-5 (12,800) and (x-x) R85/3-13 (25,600).
1 6 3
presents the dilution curves obtained for antisera R85/3-3,R85/3-5 and R85/3-13, which had titres of 3,200, 12,800 and 25,600 respectively.
4.2.2. Determination of the specificity of the L. levideus
antiserum.
4.2.2.1. Immunodiffusion.
The precipitation patterns obtained during this project are described in relation to the pattern produced by the L. lepideus
FPRL 7F isolate. Figure 4.4 shows the arrangement of wells and the nomenclature of the precipitation lines used in the immunodiffusion tests. The precipitation patterns of mycelial extracts of eighteen test fungal isolates were compared with that of L. lepideus FPRL 7F to assess the specificity of the antisera. Diffusion plates were stained using the horse-radish peroxidase amplification system (Kjaervig-Broe and Ingild, 1983). The patterns obtained are presented diagramatically in Figure 4.5 and a photograph of a representative immunodiffusion gel is shown in Figure 4.6.
The three strains of L. lepideus showed the same precipitation patterns as L. lepideus FPRL 7F, that is, three precipitation lines (outer, middle and inner). The different Lentinus species showed various levels of cross-reactivity, L. cyathiformis gave a line of identity (complete fusion) with the inner line only, whilst the L. pallidus strains gave lines of identity with the outer line and, either an inner line of identity (strain FPRL 406) or a middle line of identity (strain FPRL 406A). The reactions observed with brown rot basidiomycete fungi varied.
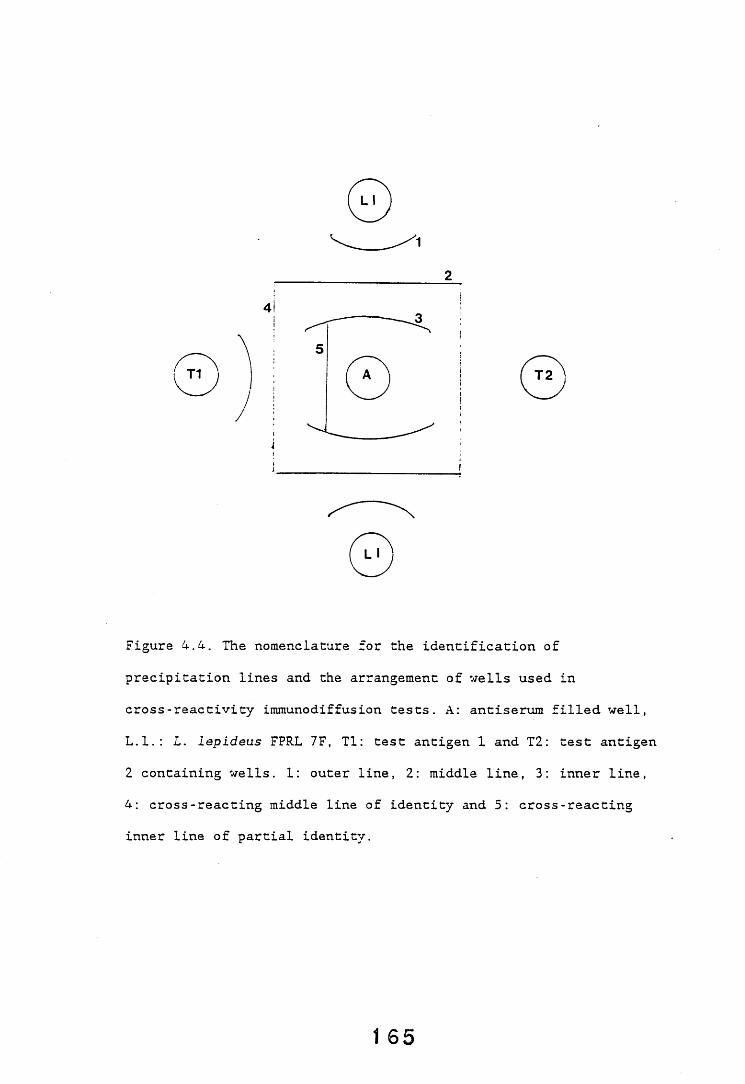
2
4i
ii»J
5
A A
LI
™)
Figure 4.4. The nomenclature for the identification of precipitation lines and the arrangement of wells used in cross-reactivity immunodiffusion tests. A: antiserum filled well, L.I.: L. lepideus FPRL 7F, Tl: test antigen 1 and T2: test antigen 2 containing wells. 1: outer line, 2: middle line, 3: inner line, 4: cross - reacting middle line of identity and 5: cross-reacting inner line of partial identity.
1 65
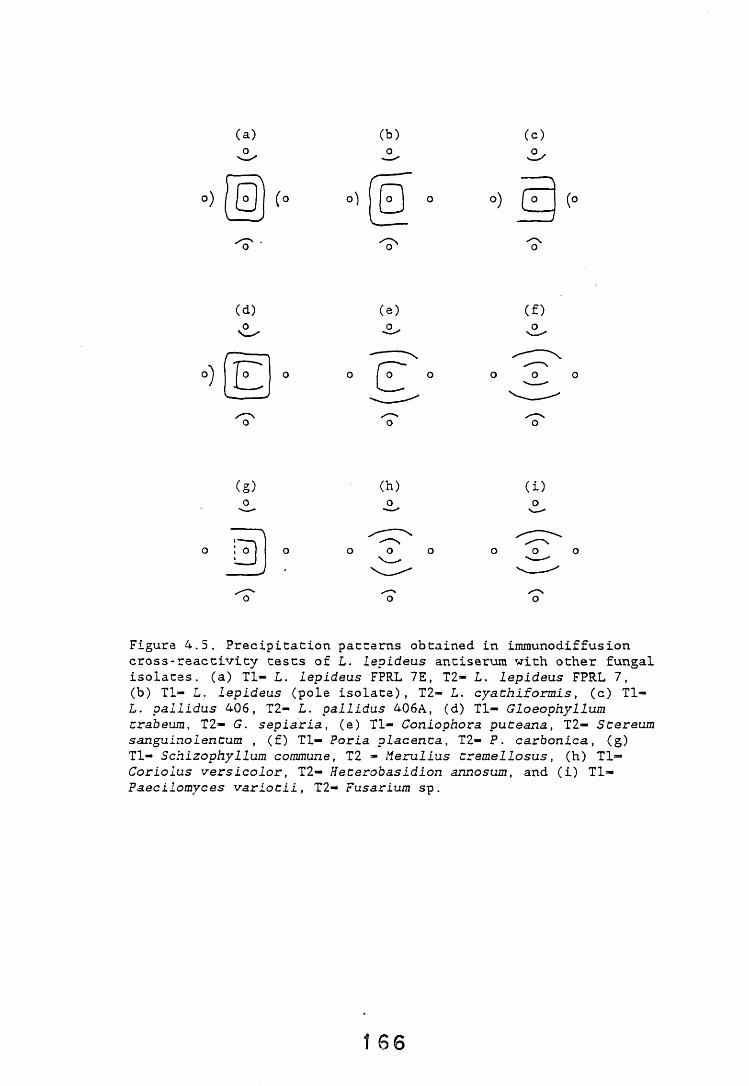
(a)
°)
(b) (c) o „
>) £ r (
(d)o
o
o
(f)
o o
o
(g) (h) (i)o
o o
o o
Figure 4.5. Precipitation patterns obtained in immunodiffusion cross-reactivity tests of L. lepideus antiserum with other fungal isolates, (a) Tl- L. lepideus FPRL 7E, T2- L. lepideus FPRL 7,(b) Tl- L. lepideus (pole isolate), T2- L. cyathiformis, (c) Tl- L. pallidus 406, T2- L. pallidus 406A, (d) Tl- Gloeophyllum trabeum, T2— <7. sepiaria, (e) Tl- Coniophora puCeana, T2— Stereum sanguinolentum , (f) Tl— Poria placenta, T2- P. carbonica, (g)Tl- Schizophyllum commune, T2 - herulius tremellosus, (h) Tl— Coriolus versicolor, T2- Heterooasidion annosum, and (i) Tl- Paecilomyces variotii, T2- Fusarium sp.
16 6
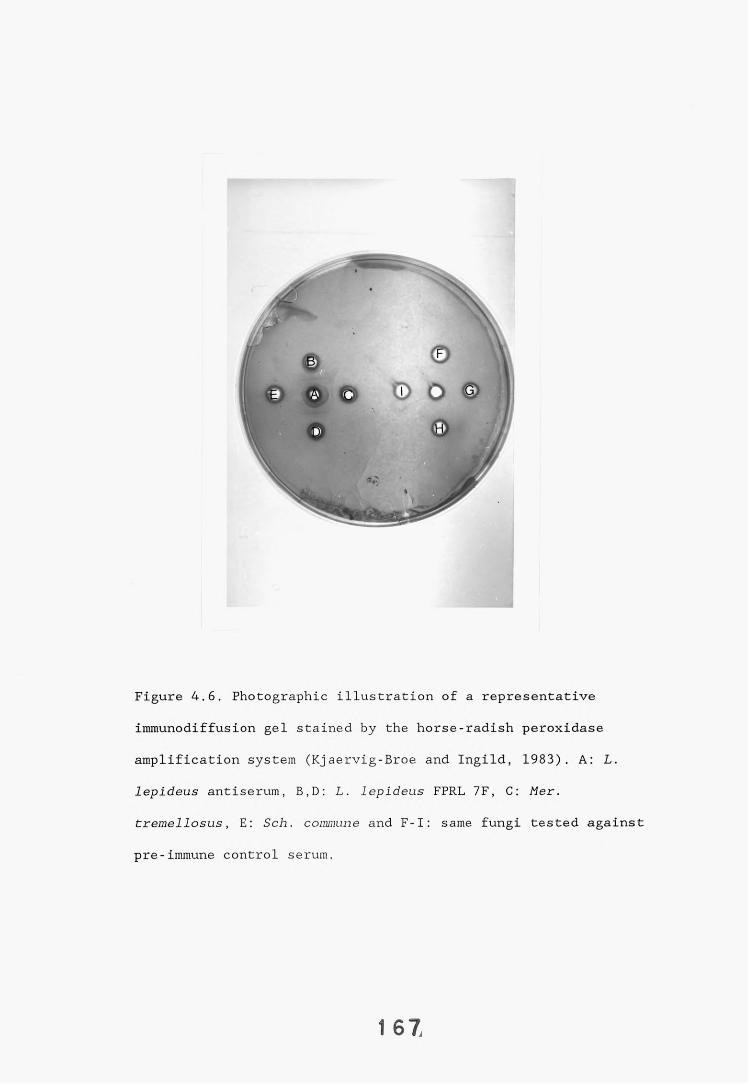
Figure 4.6. Photographic illustration of a representative immunodiffusion gel stained by the horse-radish peroxidase amplification system (Kjaervig-Broe and Ingild, 1983). A: L. lepideus antiserum, B,D: L. lepideus FPRL 7F, C: Mer. tremellosus, E: Sch. commune and F-I: same fungi tested against pre-immune control serum.
1 67
Gloeophyllum trabeum cross-reacted strongly, giving two lines of identity (outer and middle lines) and a line of partial identity (partial fusion) with the inner line. At the other extreme, no precipitates were formed between Poria placenta FPRL 280 and P. carbonica antigen extracts and L. lepldeus antiserum. The white rot basidiomycete fungi screened all gave a negative reaction with the exception of Schizophyllum commune which gave a weak inner line of identity. There was no reaction between the antiserum and the deuteromycete fungi tested. The immunodiffusion technique did not however identify a precipitation line specific for L. lepideus.
4.2.2.2. EIA for "soluble" antigens.
The specificity of the R85/3-13 antiserum in the EIA for "soluble" antigens was determined using twelve fungal isolates (Table 4.2). The fungal isolates were of four representative groups, (a) different L. lepldeus strains, (b) brown rot basidiomycete fungi, (c) white rot basidiomycete fungi and (d) deuteromycete fungi. The antiserum dilution curves obtained from the data are represented in Figure 4.7. The L. lepideus FPRL 7B strain gave a similar binding pattern with the antiserum as the FPRL 7F strain, however, both the FPRL 7H and the pole isolate A strains showed a much lower level of cross-reactivity with the antiserum. The brown rot basidiomycetes G. trabeum and Con. puteana exhibited a similar pattern to the L. lepideus FPRL 7H and pole isolate A strains. P. placenta FPRL 280 exhibited a high level of cross-reactivity at the lower antiserum dilutions but this reactivity was quickly diluted out. A higher level of cross-reactivity was observed with the white rot basidiomycete
Table 4.2. Fungal isolates tested for cross-reactivity withL. lepideus antiserum in the EIAs for "soluble" "insoluble" antigens.
Strains/isolates:L. lepideus FPRL 7F L. lepideus FPRL 7B
L. lepideus FPRL 7H L. lepideus pole isolate A
Brown rots:G. trabeum
Con. puteana
P. placenta FPRL 280
White rots:H. annosum
C. versicolor
Deuteromycetes:Horm. resinae
Paec. variotii
Fusarium sp.
and
1 69
Figure 4.7. Antiserum dilution curves obtained in cross-reactivity- tests with fungal isolates in the EIA for soluble antigens.(a) . Cross-reactivity of different strains of L. lepideus, (• -• ) L. lepideus FPRL 7F, ( o-o ) L. lepideus FPRL 7B, ( ■ -» ) L. lepideus FPRL 7H and (a -a ) L.lepideus pole isolate A.(b) . Cross-reactivity of brown rot basidiomycete fungi, (• -• ) L. lepideus FPRL 7F, (o -o ) G. trabeum, (■ -■ ) Con. puteana and( a-a ) P. placenta FPRL 280.(c) . Cross-reactivity of white rot basidiomycete fungi, ( • - • )L. lepideus FPRL 7F, (o -o ) C. versicolor and (a -B ) H. annosum.(d) . Cross-reactivity of deuteromycete fungi, (©-• ) L. lepideus FPRL 7F, ( o - o ) Norm, resinae, (■ -■ ) Paec. variotii and (o -a ) Fusarium sp.
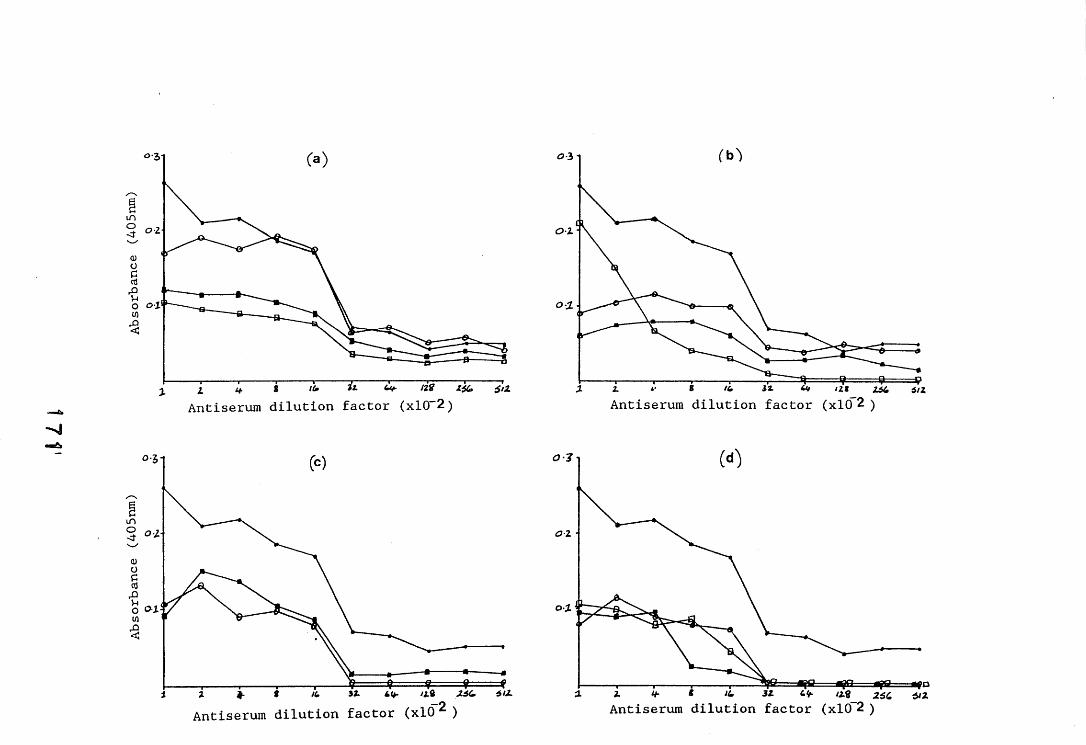
Antiserum dilution factor (xlO 2)
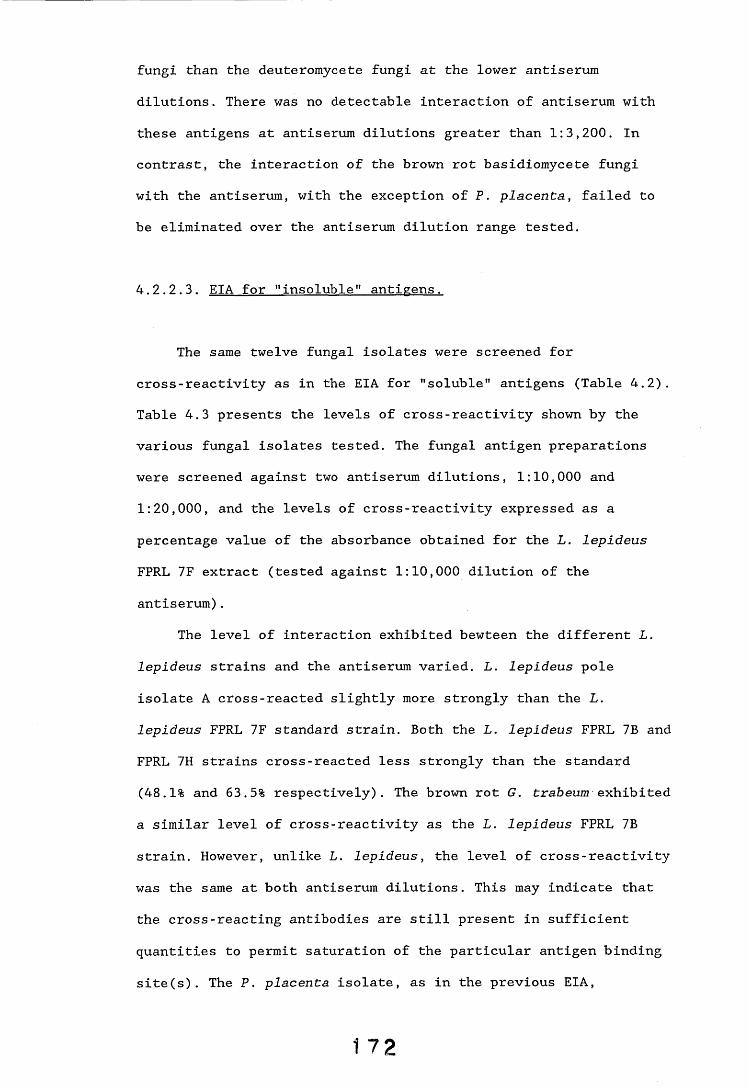
fungi than the deuteromycete fungi at the lower antiserum dilutions. There was no detectable interaction of antiserum with these antigens at antiserum dilutions greater than 1:3,200. In contrast, the interaction of the brown rot basidiomycete fungi with the antiserum, with the exception of P. placenta, failed to be eliminated over the antiserum dilution range tested.
4.2.2.3. EIA for “insoluble” antigens.
The same twelve fungal isolates were screened for cross-reactivity as in the EIA for "soluble" antigens (Table 4.2). Table 4.3 presents the levels of cross-reactivity shown by the various fungal isolates tested. The fungal antigen preparations were screened against two antiserum dilutions, 1:10,000 and 1:20,000, and the levels of cross-reactivity expressed as a percentage value of the absorbance obtained for the L. lepideus FPRL 7F extract (tested against 1:10,000 dilution of the antiserum).
The level of interaction exhibited bewteen the different L. lepideus strains and the antiserum varied. L. lepideus pole isolate A cross-reacted slightly more strongly than the L. lepideus FPRL 7F standard strain. Both the L. lepideus FPRL 7B and FPRL 7H strains cross-reacted less strongly than the standard (48.1% and 63.5% respectively). The brown rot G. trabeum exhibited a similar level of cross-reactivity as the L. lepideus FPRL 7B strain. However, unlike L. lepideus, the level of cross-reactivity was the same at both antiserum dilutions. This may indicate that the cross-reacting antibodies are still present in sufficient quantities to permit saturation of the particular antigen binding site(s). The P. placenta isolate, as in the previous EIA,
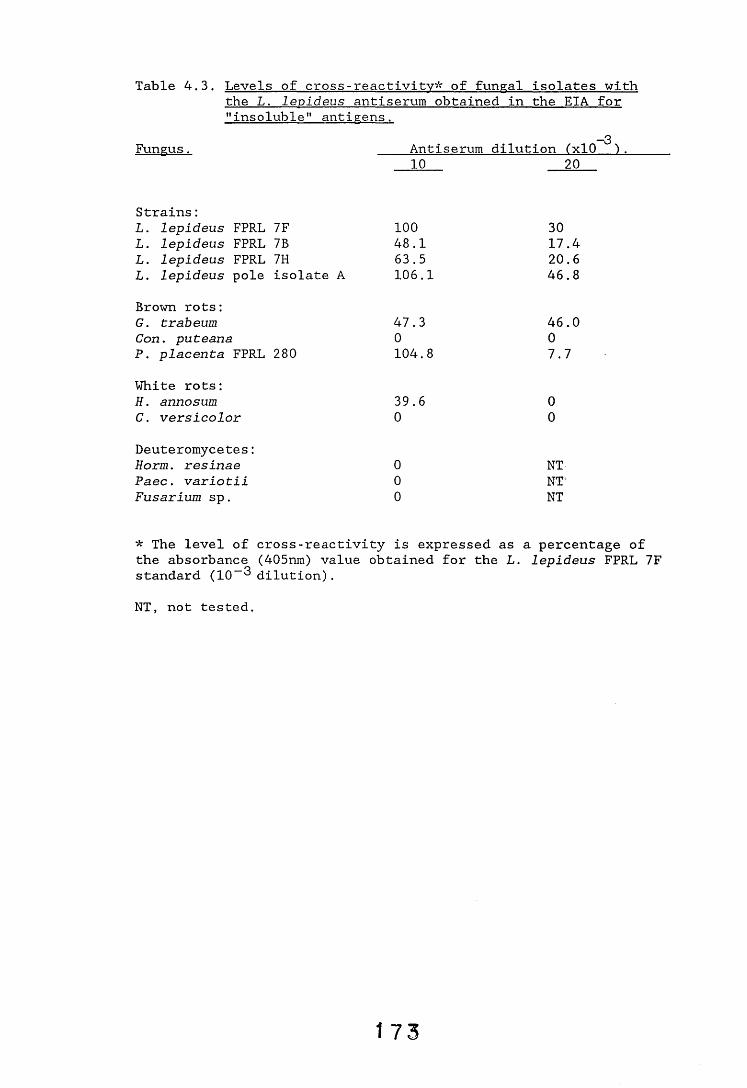
_3Fungus. ____Antiserum dilution (xlO ).10 20
Table 4.3. Levels of cross-reactivity* of fungal isolates withthe L. levideus antiserum obtained in the EIA for"insoluble" antigens.
Strains:L. lepideus FPRL 7F 100 30L. lepideus FPRL 7B 48.1 17.4L. lepideus FPRL 7H 63.5 20.6L. lepideus pole isolate A 106.1 46.8Brown rots:G. trabeum 47.3 46.0Con. puteana 0 0P. placenta FPRL 280 104.8 7.7White rots:H. annosum 39.6 0C. versicolor 0 0Deuteromycetes:Horm. resinae 0 NTPaec. variotii 0 NTFusarium sp. 0 NT
* The level of cross-reactivity is expressed as a percentage of the absorbance (405nm) value obtained for the L. lepideus FPRL 7F standard (10-^ dilution).NT, not tested.
exhibited a high level of cross-reactivity at the lower antiserum dilution but this was significantly reduced at the higher antiserum dilution. The Con. puteana isolate failed to cross-react with the antiserum in this assay. Of the white rot basidiomycete fungi tested H. annosum showed a moderate level of cross-reaction at the lower antibody dilution (39.6%), but this was completely diluted out at the higher dilution. C. versicolor, on the contrary, did not cross-react with the L. lepideus antiserum in this assay. The deuteromycete fungi tested showed no cross-reaction.
4.2.2.4. Dot-immunobinding assay.
Two separate cross-reactivity tests employing the dot-immunobinding assay technique were carried out. The first test screened fifteen fungal isolates (Table 4.4) and the chromogen used in this assay was chloronaphthol * The second test screened twenty-seven fungal isolates (Table 4.4) and diaminobenzidine (DAB) was used as the chromogen.
The results obtained with the chloronaphthol are presented in Figure 4.8. Visual inspection of the results indicated that the most intense reaction was obtained with the different strains/isolates of L. lepideus. In general, the brown rot basidiomycete fungi gave a more intense reaction than the white rot basidiomycetes. The deuteromycete fungi tested did not cross-react with the antiserum. As a control, the fungal isolates were tested for non-specific reaction with pre-immune control serum. The brown rot fungi Con. puteana and M. tremellosus gave a
positive reaction although it was not as intense as that obtained with the test antiserum. The white rot fungus H. annosum also gave
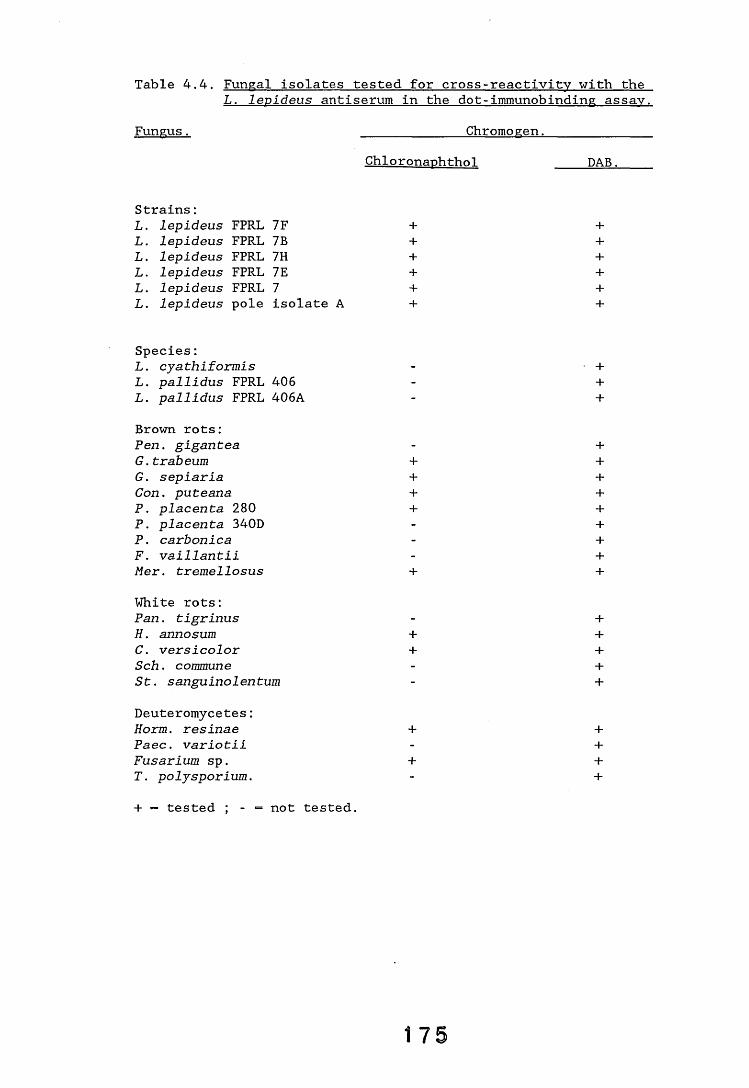
Table 4.4. Fungal isolates tested for cross-reactivity with the L. lepideus antiserum in the dot-immunobinding assay.
Fungus . _____________ Chromogen._____________Chloronaphthol ____DAB.____
Strains:L. lepideus FPRL 7F + +L. lepideus FPRL 7B + +L. lepideus FPRL 7H + +L. lepideus FPRL 7E + +L. lepideus FPRL 7 + +L. lepideus pole isolate A + +
Species:L . cyathiformis - +L. pallidus FPRL 406 - +L. pallidus FPRL 406A - +Brown rots:Pen. gigantea - +G .trabeum + +G. sepiaria + +Con. puteana + +P. placenta 280 + +P. placenta 340D - +P. carbonica - +F. vaillantii - +tier, tremellosus + +White rots:Pan. tigrinus - +H. annosum + +C. versicolor + +Sch. commune - +St. sanguinolenturn - +Deuteromycetes:Horm. resinae + +Paec. variotii - +Fusarium sp. + +T. polysporium. - ++ = tested ; - = not tested.
1 7 5
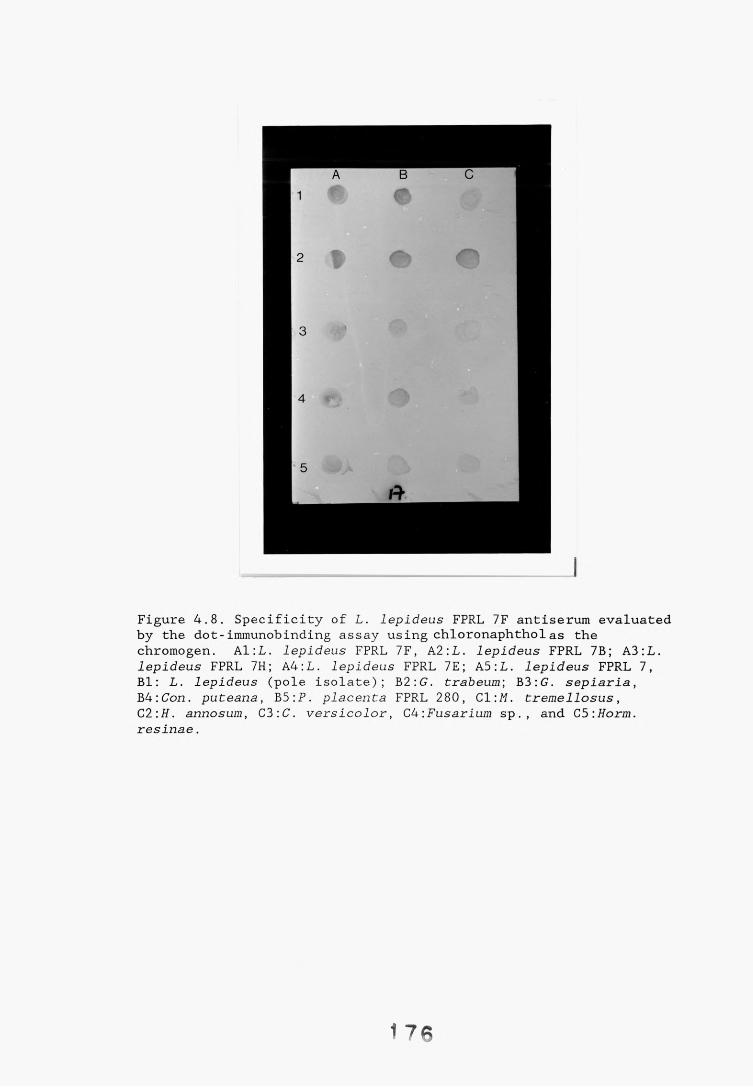
Figure 4.8. Specificity of L. lepideus FPRL 7F antiserum evaluated b y the dot-immunobinding assay using chloronaphthol as the chromogen. Al:L. lepideus FPRL 7F, A2:L. lepideus FPRL 7B; A3:L. lepideus FPRL 7H; A4:L. lepideus FPRL 7E; A5:L. lepideus FPRL 7,B1: L. lepideus (pole isolate); B2:G. trabeum; B3:G. sepiaria,B4\Con. puteana, B5:P. placenta FPRL 280, Cl:M. tremellosus,C2:H. annosum, C3:C. versicolor, CU\Fusarium sp., and C5:Horm. resinae.
1 7 6
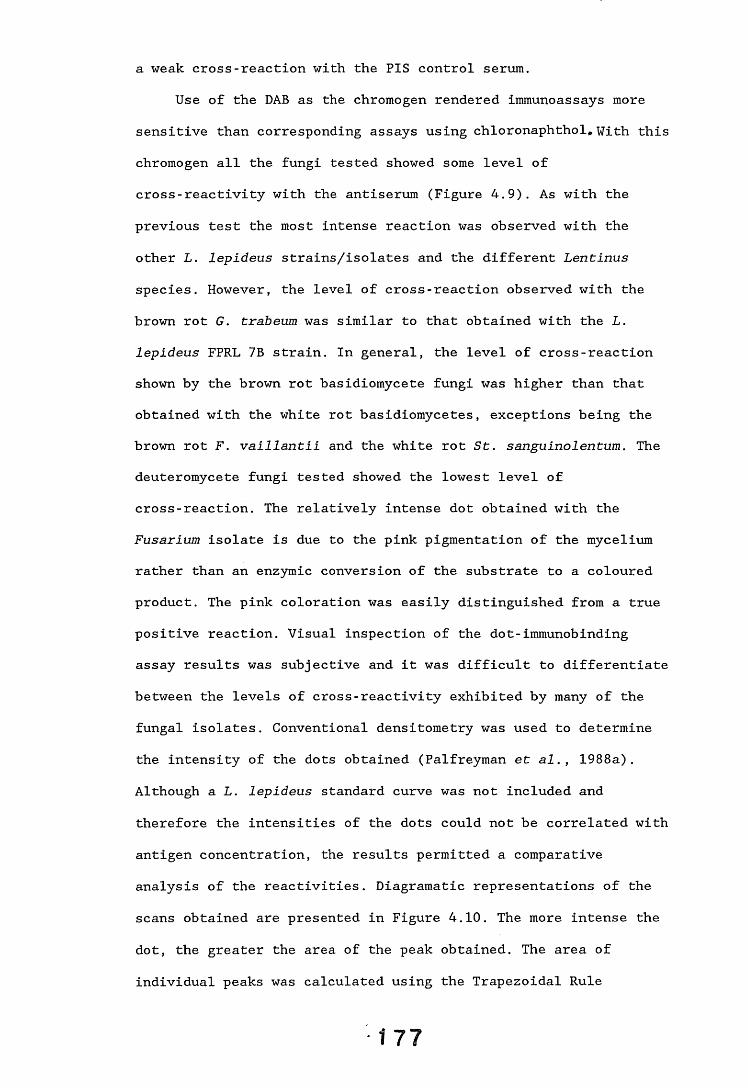
a weak cross-reaction with the PIS control serum.Use of the DAB as the chromogen rendered immunoassays more
sensitive than corresponding assays using chloronaphthol* With this chromogen all the fungi tested showed some level of cross-reactivity with the antiserum (Figure 4.9). As with the previous test the most intense reaction was observed with the other L. lepideus strains/isolates and the different Lentinus species. However, the level of cross-reaction observed with the brown rot G. trabeum was similar to that obtained with the L. lepideus FPRL 7B strain. In general, the level of cross-reaction shown by the brown rot basidiomycete fungi was higher than that obtained with the white rot basidiomycetes, exceptions being the brown rot F. vaillantii and the white rot St. sanguinolentum. The deuteromycete fungi tested showed the lowest level of cross-reaction. The relatively intense dot obtained with the Fusarium isolate is due to the pink pigmentation of the mycelium rather than an enzymic conversion of the substrate to a coloured product. The pink coloration was easily distinguished from a true positive reaction. Visual inspection of the dot-immunobinding assay results was subjective and it was difficult to differentiate between the levels of cross-reactivity exhibited by many of the fungal isolates. Conventional densitometry was used to determine the intensity of the dots obtained (Palfreyman et al., 1988a). Although a L. lepideus standard curve was not included and therefore the intensities of the dots could not be correlated with antigen concentration, the results permitted a comparative analysis of the reactivities. Diagramatic representations of the scans obtained are presented in Figure 4.10. The more intense the dot, the greater the area of the peak obtained. The area of individual peaks was calculated using the Trapezoidal Rule
1 7 7
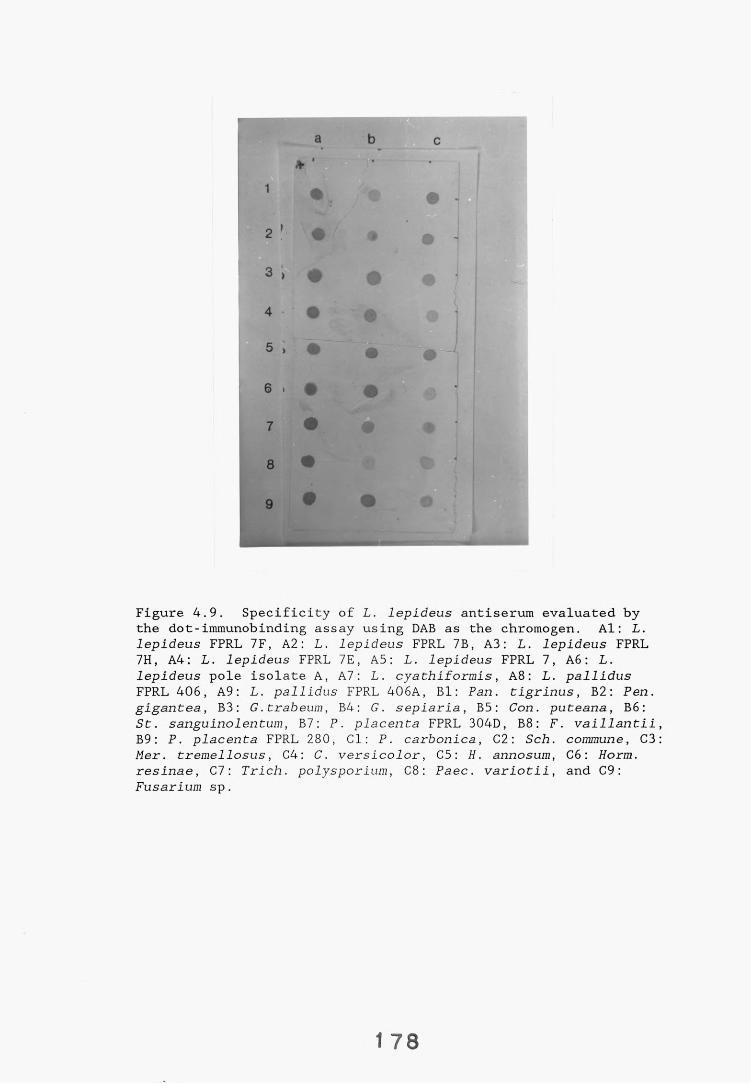
a b c
Figure 4.9. Specificity of L. lepideus antiserum evaluated by the dot-immunobinding assay using DAB as the chromogen. Al: L. lepideus FPRL 7F, A2: L. lepideus FPRL 7B, A3: L. lepideus FPRL 7H, A4: L. lepideus FPRL 7E, A5: L. lepideus FPRL 7, A6: L. lepideus pole isolate A, A7: L. cyathiformis, A8: L. pallidus FPRL 406, A9: L. pallidus FPRL 406A, Bl: Pan. tigrinus, B2: Pen. gigantea, B3: G.trabeum, B4: G. sepiaria, B5: Con. puteana, B6: St. sanguinolentum, B7: P. placenta FPRL 304D, B8: F. vaillantii B9: P. placenta FPRL 280, Cl: P. carbonica, C2: Sch. commune, C3 Her. tremellosus, C4: C. versicolor, C5: H. annosum, C6: Horm. resinae, C7: Trich. polysporium, C8: Paec. variotii, and C9: Fusarium sp.
1 78
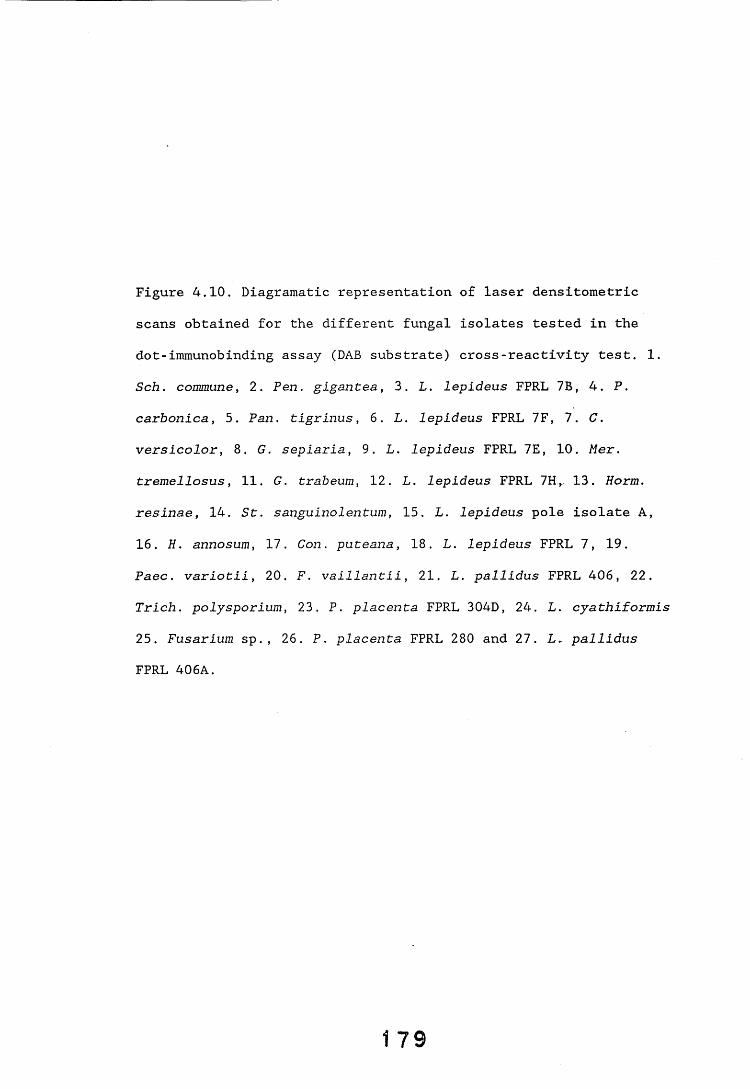
Figure 4.10. Diagramatic representation of laser densitometric scans obtained for the different fungal isolates tested in the dot-immunobinding assay (DAB substrate) cross-reactivity test. 1. Sch. commune, 2. Pen. gigantea, 3. L. lepideus FPRL 7B, 4. P. carbonica, 5. Pan. tigrinus, 6. L. lepideus FPRL 7F, 7. C. versicolor, 8. G. sepiaria, 9. L. lepideus FPRL 7E, 10. Mer. tremellosus, 11. G. trabeum, 12. L. lepideus FPRL 7Hy 13. Horm. resinae, 14. St. sanguinolentum, 15. L. lepideus pole isolate A, 16. H. annosum, 17. Con. puteana, 18. L. lepideus FPRL 7, 19.Paec. variotii, 20. F. vaillantii, 21. L. pallidus FPRL 406, 22. Trich. polysporium, 23. P. placenta FPRL 304D, 24. L. cyathiformis 25. Fusarium sp., 26. P. placenta FPRL 280 and 27. L. pallidusFPRL 406A.
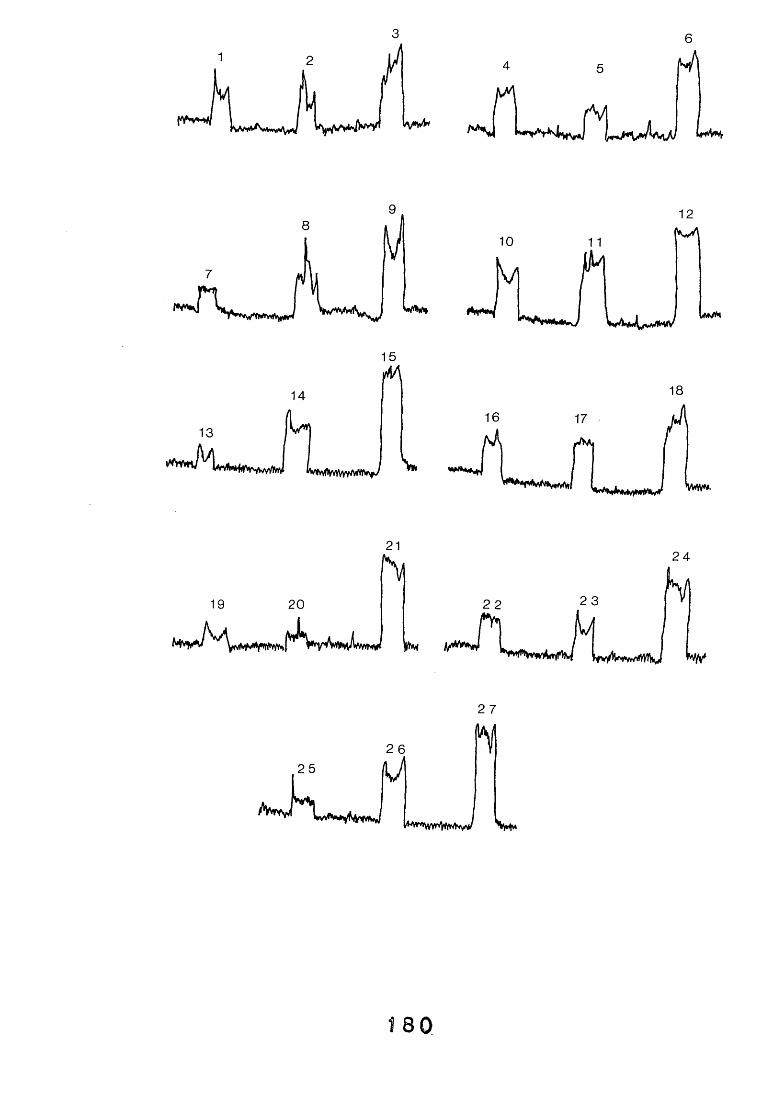
3 6
21
25 M
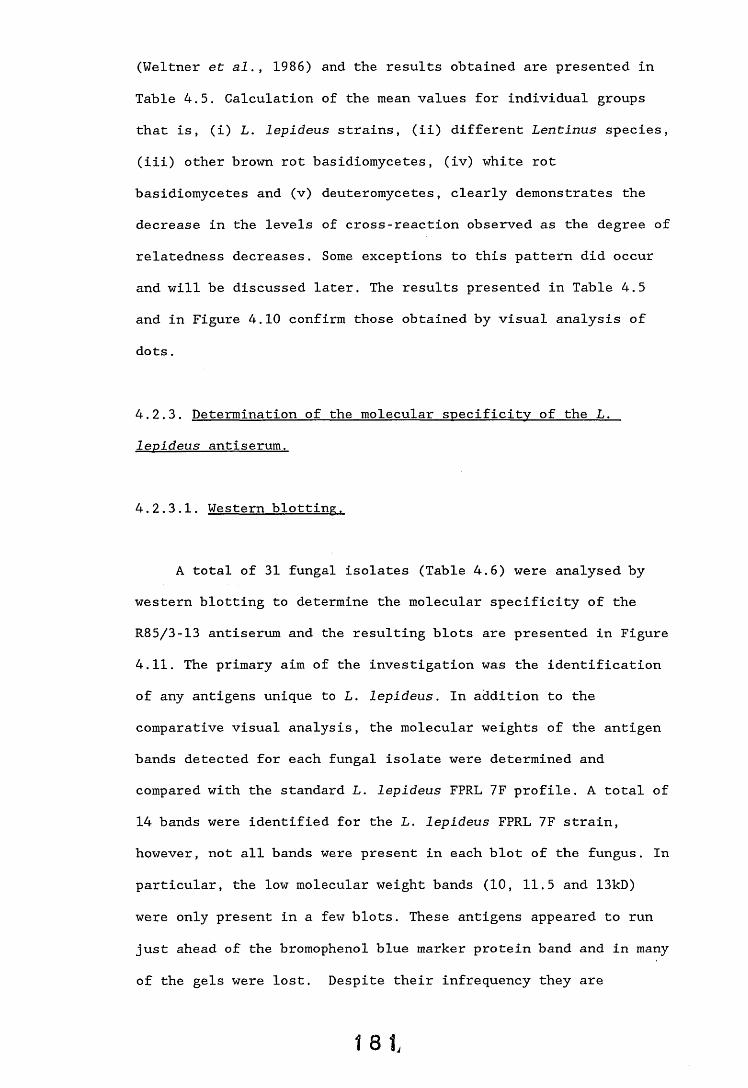
(Weltner et al., 1986) and the results obtained are presented in Table 4.5. Calculation of the mean values for individual groups that is, (i) L. lepideus strains, (ii) different Lentinus species, (iii) other brown rot basidiomycetes, (iv) white rot basidiomycetes and (v) deuteromycetes, clearly demonstrates the decrease in the levels of cross-reaction observed as the degree of relatedness decreases. Some exceptions to this pattern did occur and will be discussed later. The results presented in Table 4.5 and in Figure 4.10 confirm those obtained by visual analysis of dots.
4.2.3. Determination of the molecular specificity of the L. levideus antiserum.
4.2.3.1. Western blotting.
A total of 31 fungal isolates (Table 4.6) were analysed by western blotting to determine the molecular specificity of the R85/3-13 antiserum and the resulting blots are presented in Figure 4.11. The primary aim of the investigation was the identification of any antigens unique to L. lepideus. In addition to the comparative visual analysis, the molecular weights of the antigen bands detected for each fungal isolate were determined and compared with the standard L. lepideus FPRL 7F profile. A total of 14 bands were identified for the L. lepideus FPRL 7F strain, however, not all bands were present in each blot of the fungus. In particular, the low molecular weight bands (10, 11.5 and 13kD)
were only present in a few blots. These antigens appeared to run just ahead of the bromophenol blue marker protein band and in many of the gels were lost. Despite their infrequency they are
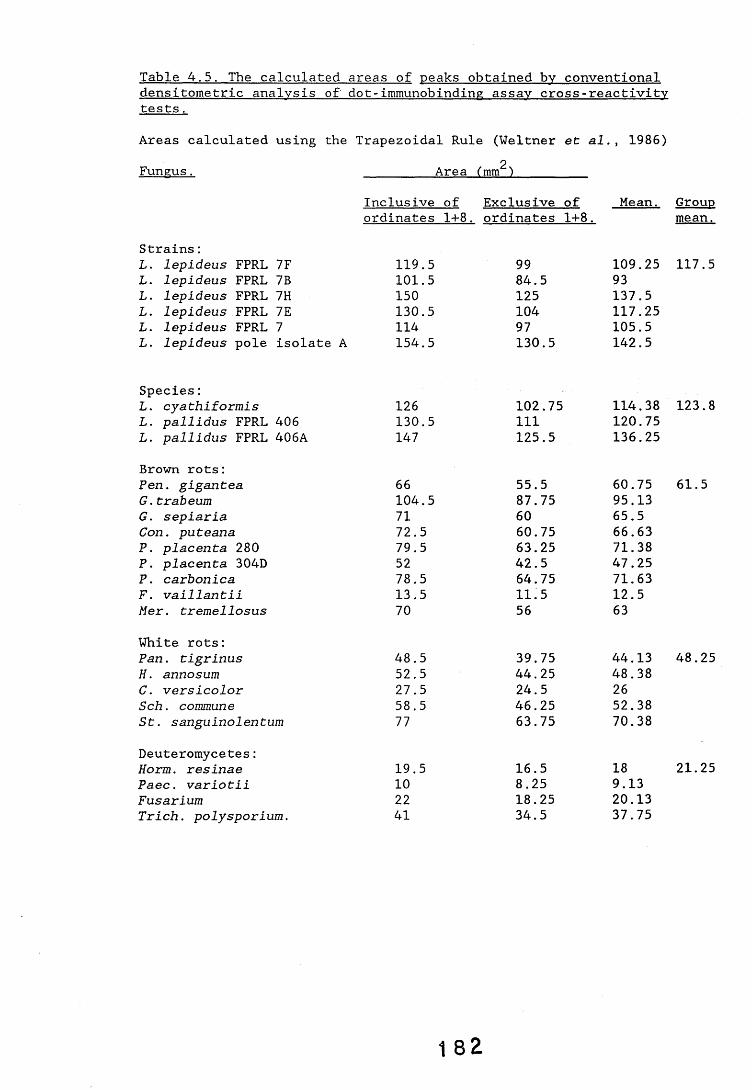
Table 4.5. 'rhe calculated areas of peaks obtained by conventionaldensitometric analysis of dot-immunobindine assay cross-reactivitytests.Areas calculated using the Trapezoidal Rule (Weltner et al. , 1986)Funeus. Area (mm^)
Inclusive of Exclusive of Mean. Groupordinates 1+8 . ordinates 1+8. mean.
Strains:L. lepideus FPRL 7F 119.5 99 109.25 117.5L. lepideus FPRL 7B 101.5 84.5 93L. lepideus FPRL 7H 150 125 137.5L. lepideus FPRL 7E 130.5 104 117.25L. lepideus FPRL 7 114 97 105.5L. lepideus pole isolate A 154.5 130.5 142.5
Species:L. cyathiformis 126 102.75 114.38 123.8L. pallidus FPRL 406 130.5 111 120.75L. pallidus FPRL 406A 147 125.5 136.25
Brown rots:Pen. gigantea 66 55.5 60.75 61.5G.trabeum 104.5 87.75 95.13G. sepiaria 71 60 65.5Con. puteana 72.5 60.75 66.63P. placenta 280 79.5 63.25 71.38P. placenta 304D 52 42.5 47.25P. carbonica 78.5 64.75 71.63F. vaillantii 13.5 11.5 12.5Mer. tremellosus 70 56 63White rots:Pan. tigrinus 48.5 39.75 44.13 48.25H. anno sum 52.5 44.25 48.38C. versicolor 27.5 24.5 26Sch. commune 58.5 46.25 52.38St. sanguinolentum 77 63.75 70.38
Deuteromycetes: Horm. resinae 19.5 16.5 18 21.25Paec. variotii 10 8.25 9.13Fusarium 22 18.25 20.13Trich. polysporium. 41 34.5 37.75
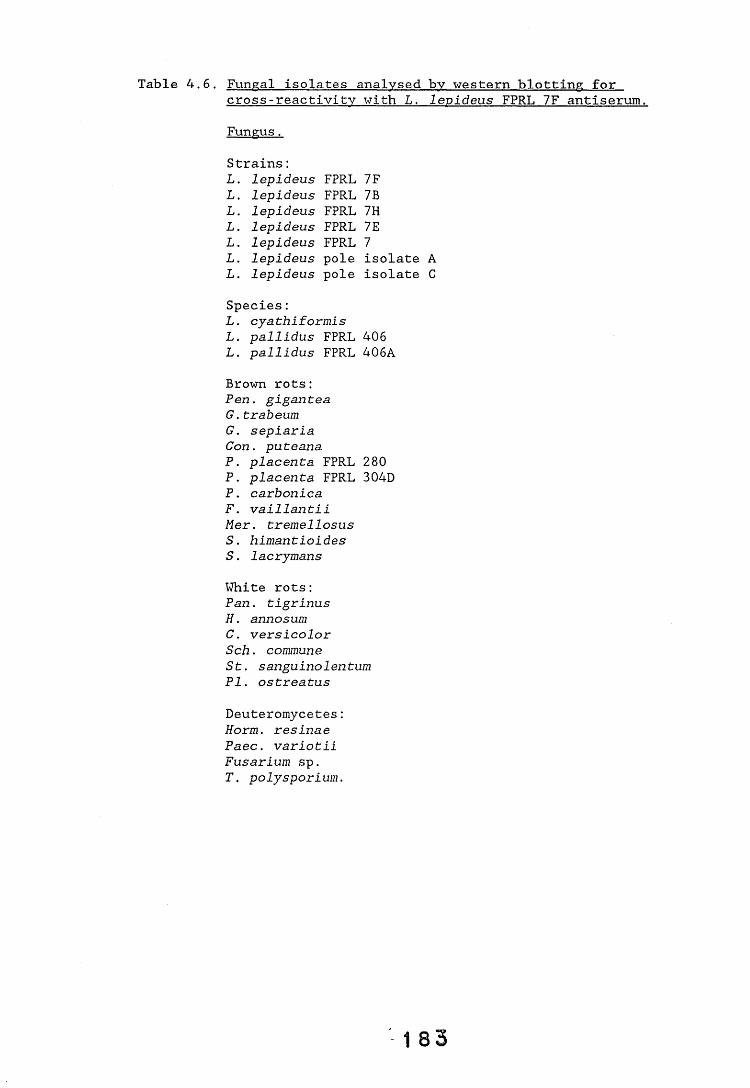
Fungus.
Strains:L. lepideus FPRL 7FL. lepideus FPRL 7BL. lepideus FPRL 7HL. lepideus FPRL 7EL. lepideus FPRL 7L. lepideus pole isolate AL. lepideus pole isolate CSpecies:L. cyathiformis L. pallidus FPRL 406 L. pallidus FPRL 406ABrown rots:Pen. giganteaG .trabeumG. sepiaria Con. puteanaP. placenta FPRL 280P. placenta FPRL 304DP. carbonica F. vaillantii her. tremellosus S. himantioidesS . lacrymans
White rots:Pan. tigrinusH. annosumC. versicolor Sch. commune St. sanguinolentum PI. ostreatus
Deuteromycetes:Horm. resinae Paec. variotii Fusarium sp.T. polysporium.
Table 4.6. Fungal isolates analysed by western blotting forcross-reactivity with L. levideus FPRL 7F antiserum.
18 3
Figure 4.11. Western blot antigenic profiles of fungal isolates tested fo cross-reactivity with L. lepideus FPRL 7F. la - 3a represents the antigenic profiles obtained when blots stained using pre-immune controlserum.
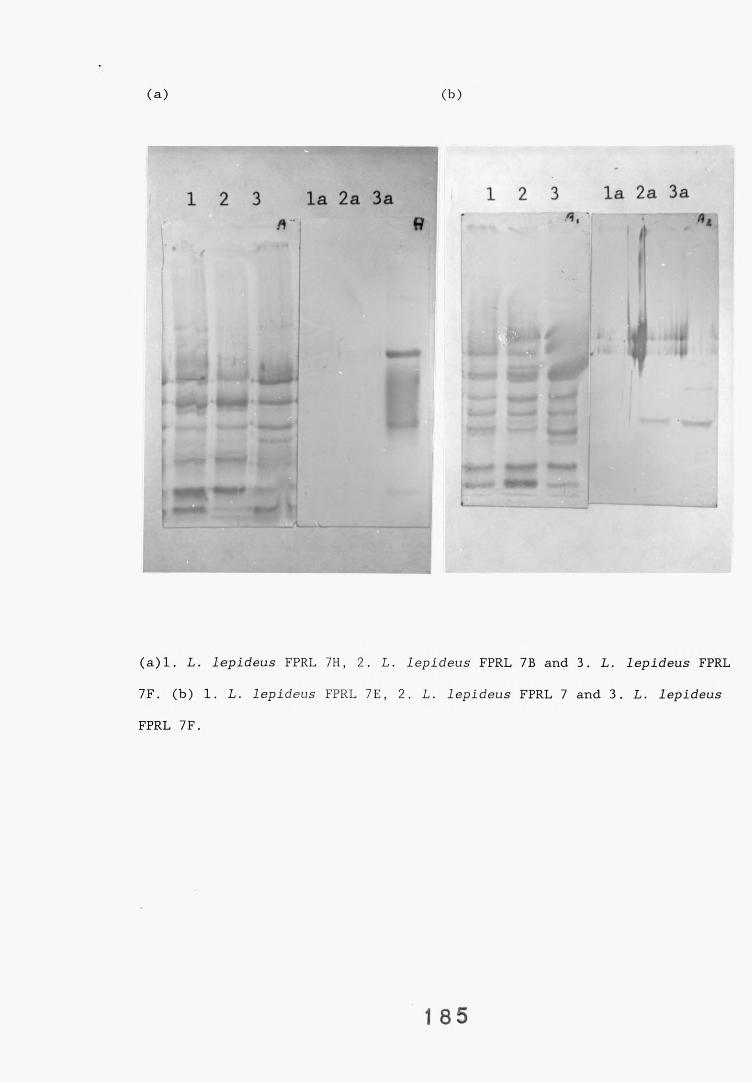
(a) ( b )
(a)l. L. lepideus FPRL 7H, 2. L. lepideus FPRL 7B and 7F. (b) 1. L. lepideus FPRL 7E, 2. L. lepideus FPRL 7 FPRL 7F.
3. L. lepideus FPRL and 3. L. lepideus
1 85
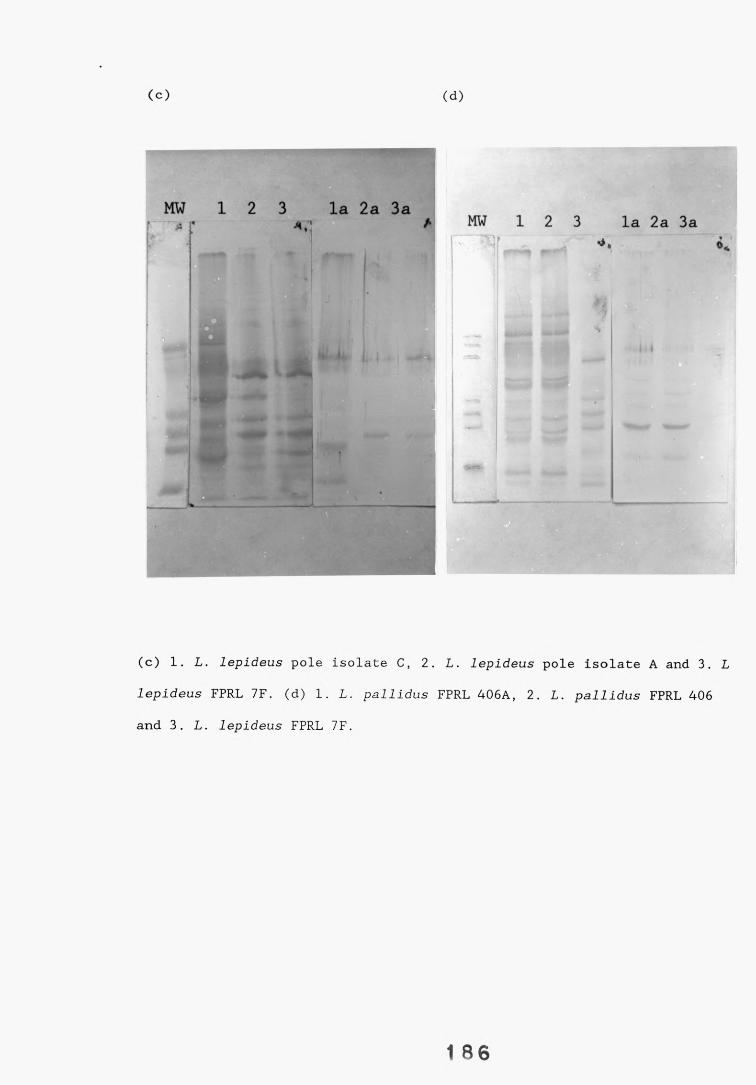
( c ) ( d )
(c) 1. L. lepideus pole isolate C, 2. L. lepideus pole isolate A and 3. L lepideus FPRL 7F. (d) 1. L. pallidus FPRL 406A, 2. L. pallidus FPRL 406 and 3. L. lepideus FPRL 7F.
t 86
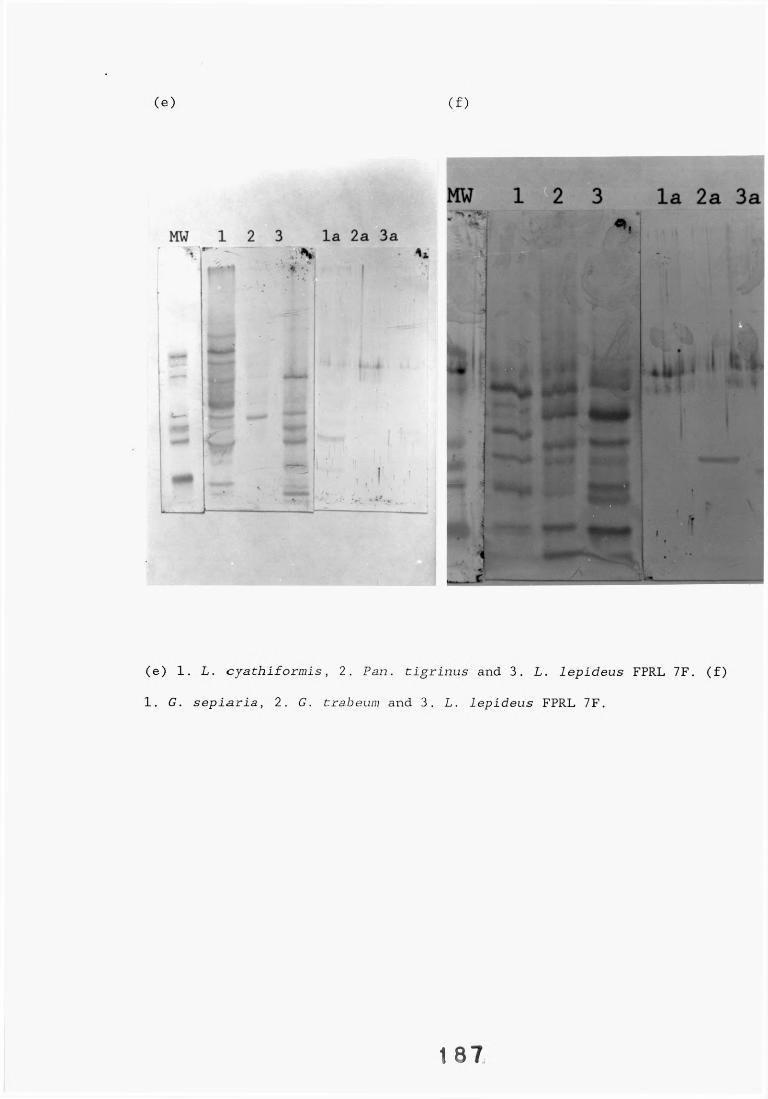
( e ) ( f )
MW 1 2 3 l a 2a 3a
MW 1 2 3 la 2a 3a~ . V *• - ' V ■
L", ,,| ■ .i
I
(e) 1. L. cyathiformis, 2. Pan. tigrinus and 3. L. lepideus FPRL 7F. (f)1. G. sepiaria, 2. G. trabeum and 3. L. lepideus FPRL 7F.
t 87;
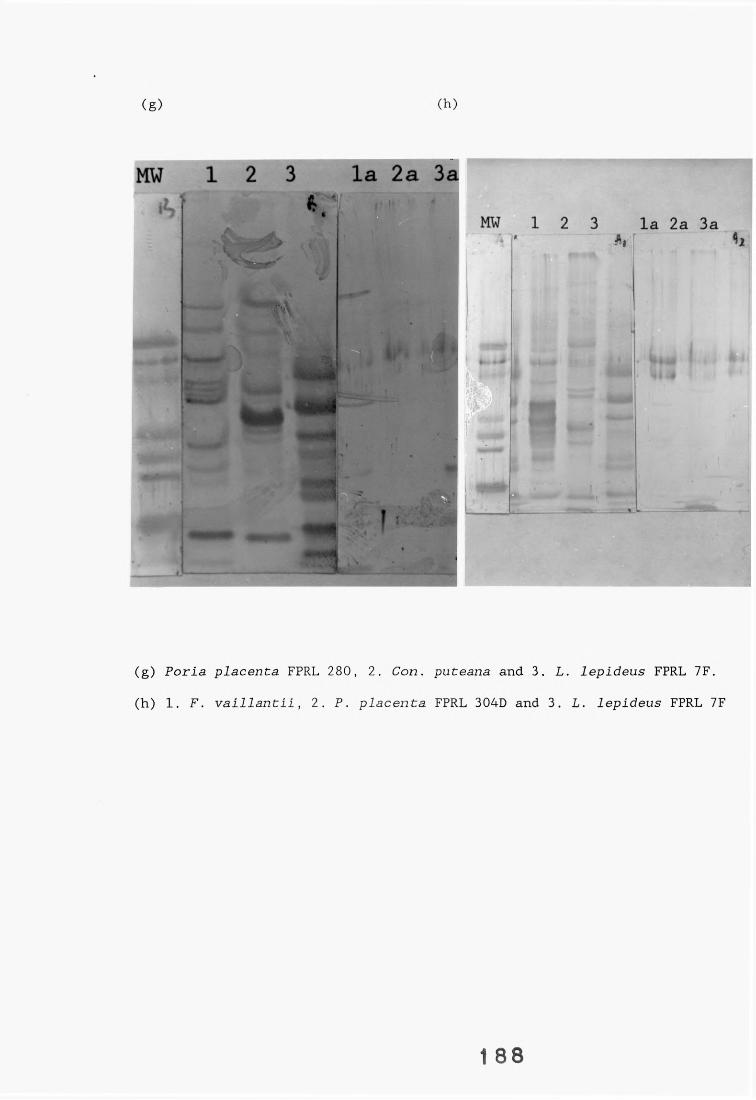
(g) (h)
(g) Poria placenta FPRL 280, 2. Con. puteana and 3.(h) 1. F. valllantii, 2. P. placenta FPRL 304D and 3
1 8 8
II
2 3 l a 2 a 3 a
. lepideus FPRL 7F. L. lepideus FPRL 7F
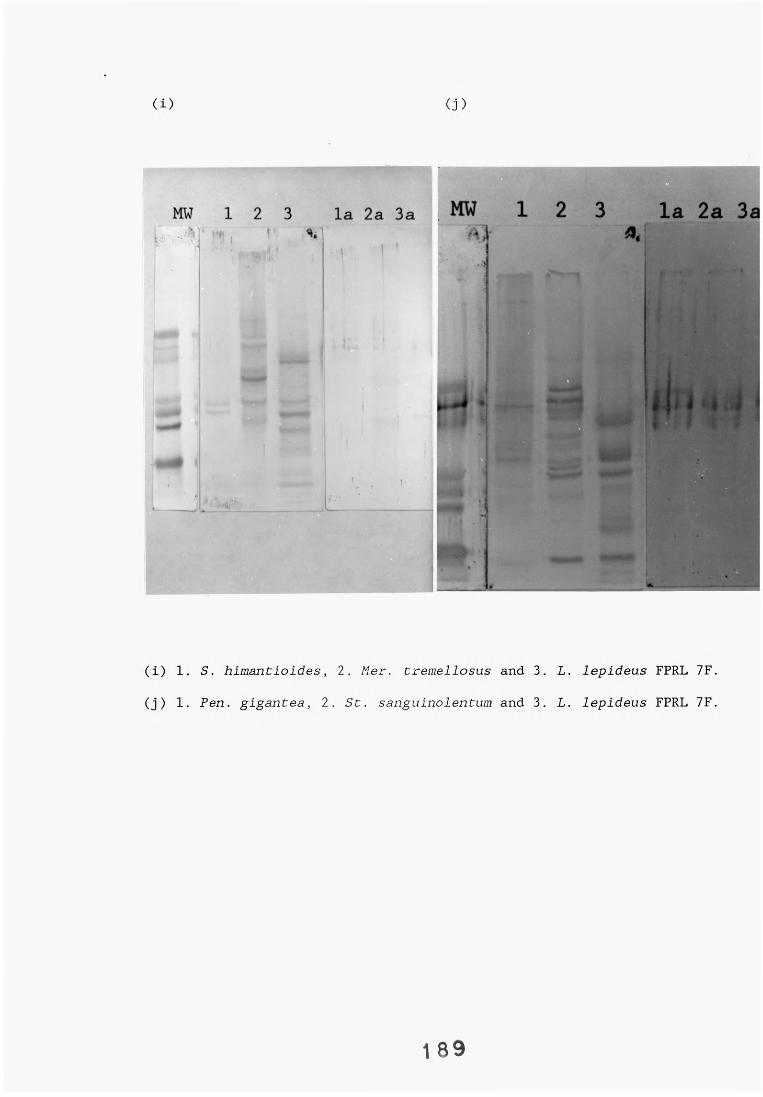
( i ) (j)
(i) 1. S. himantioides, 2. Mer. tremellosus and 3. L.
(j) 1. Pen. gigantea, 2. St. sanguinolentum and 3. L.
lepideus FPRL 7F. lepideus FPRL 7F.
1 8 9
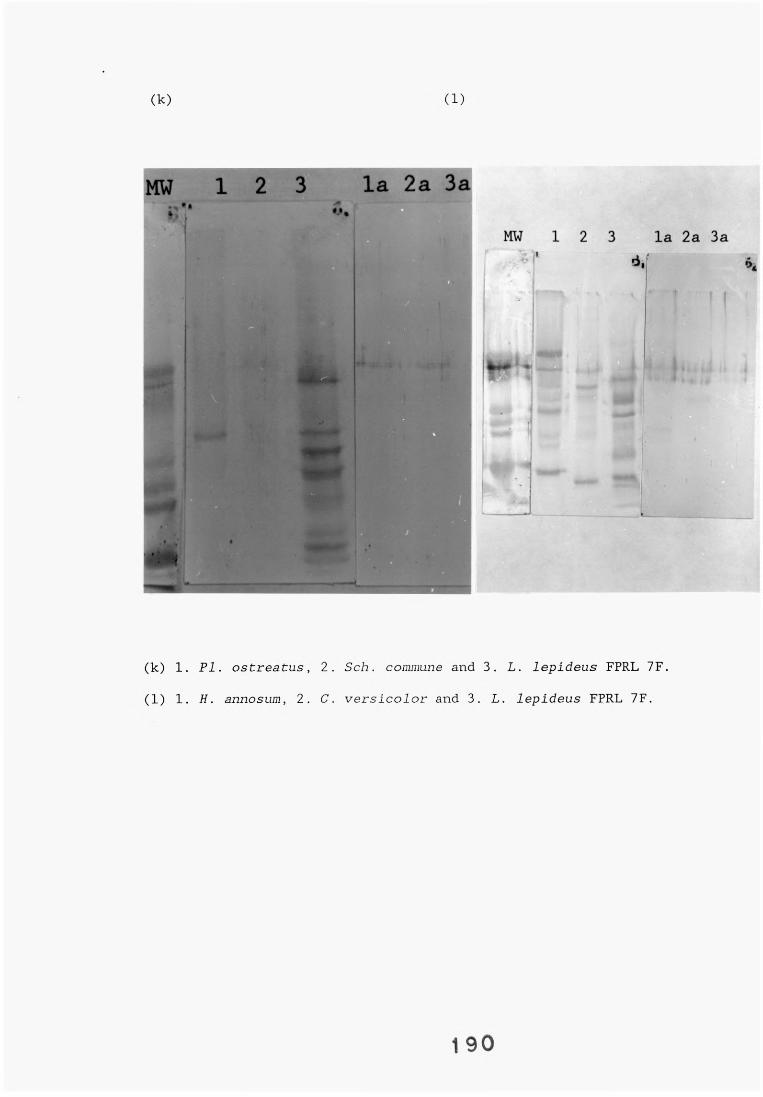
(k) ( 1 )
(k) 1 . PI. ostreatus, 2
(1) 1 . H. annosum, 2. C
Sch. commune and 3. L. lepideus FPRL 7F. versicolor and 3. L. lepideus FPRL 7F.
1 9 0
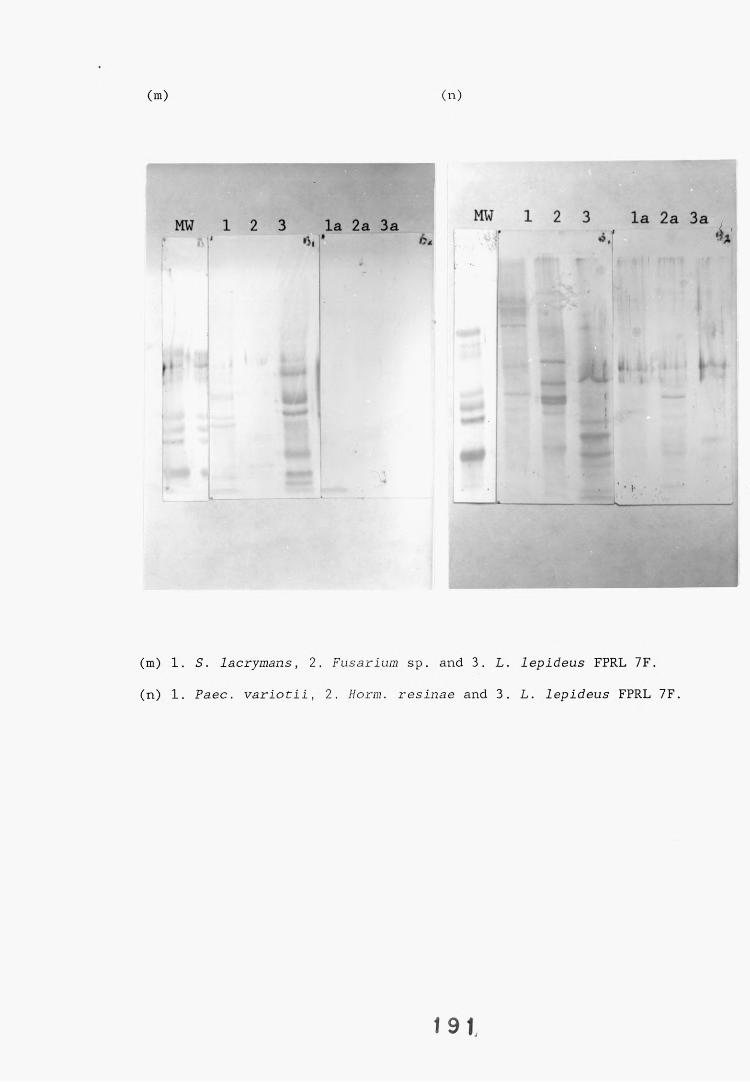
(m) (n)
MW 1 2 3 la 2a 3a MW 1 2 3 l a 2a 3aI *1 • h
(m) 1. S. lacrymans, 2. Fusarium sp. and 3. L. lepideus FPRL 7F.(n) 1. Paec. variotii, 2. Norm, resinae and 3. L. lepideus FPRL 7F.
t 91,
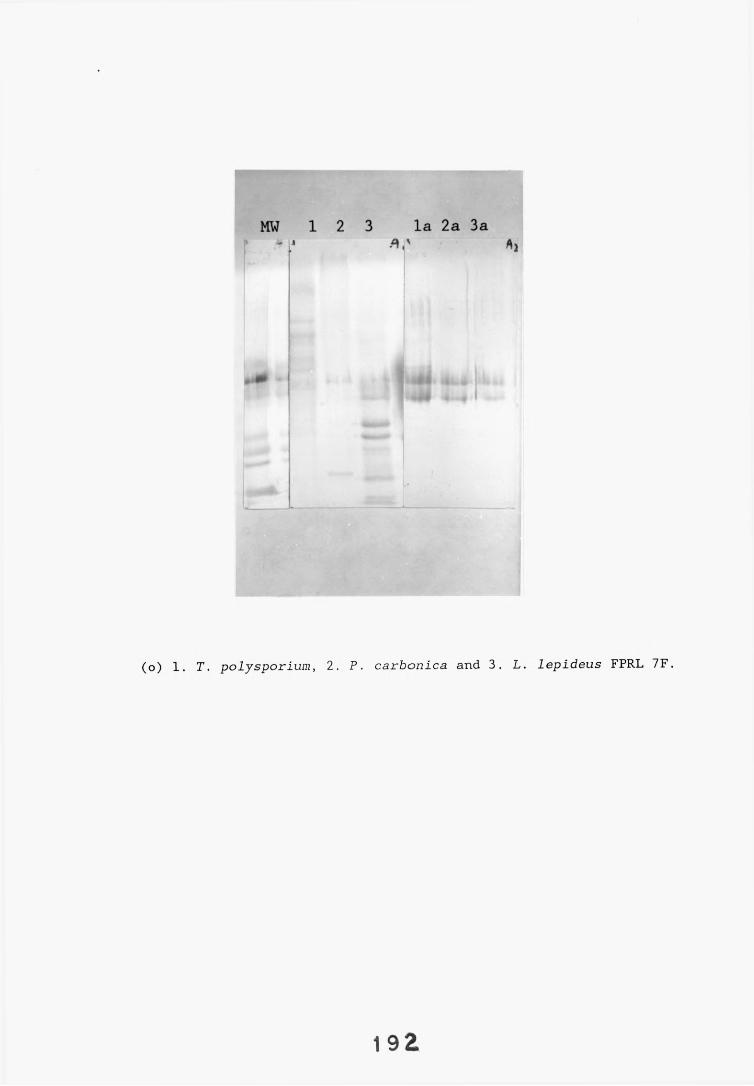
MW 1 2 3 la 2a 3a
(o) 1. T. polysporium, 2. P. carbonica and 3. L. lepideus FPRL 7F.
1 9 2
included in the L. lepideus FPRL 7F profile for completeness. It should be noted however, that the lack of such bands in the profiles of other fungi is not conclusive of their non-existance and therefore no comparative analysis between isolates concerning these three bands was carried out.
The different strains of L. lepideus and species of Lentinus tested all showed a marked similarity to the L. lepideus FPRL 7F antigenic profile (Table 4.7), that is they shared many common bands (Table 4.11). The degree of similarity between the antigenic profiles of the various Lentinus strains/species and the L. lepideus FPRL 7F strain was, as would be expected, greater than that observed with the other fungal isolates tested. Four bands were common to all the strains/species tested (MW 30.5, 19, 17.5 and 13.5kD). The antigen band of MW 17.5kD was not observed in the antigenic profile of any other fungal isolate, that is, it was genus-specific for Lentinus. All the Lentinus strains/species tested possessed bands not apparent in L. lepideus FPRL 7F. This may be due to the presence of common antigenic determinants carried on molecules of different molecular weights, or alternatively, the presence of related (cross-reacting) antigenic determinants. The L. lepideus FPRL 7 strain was unusual in that no high molecular weight bands were present (i.e. no bands >34kD) whereas all the other Lentinus strains/species possessed several bands with molecular weights in excess of 34kD. This indicates that these antigens were either not produced by this strain of the fungus, or produced in insufficient quantities to permit detection in the western blotting system.
The antigenic profiles of ten brown rot basidiomycete fungi tested varied considerably in their similarity to the L. lepideus FPRL 7F standard. The molecular weights of the antigen bands
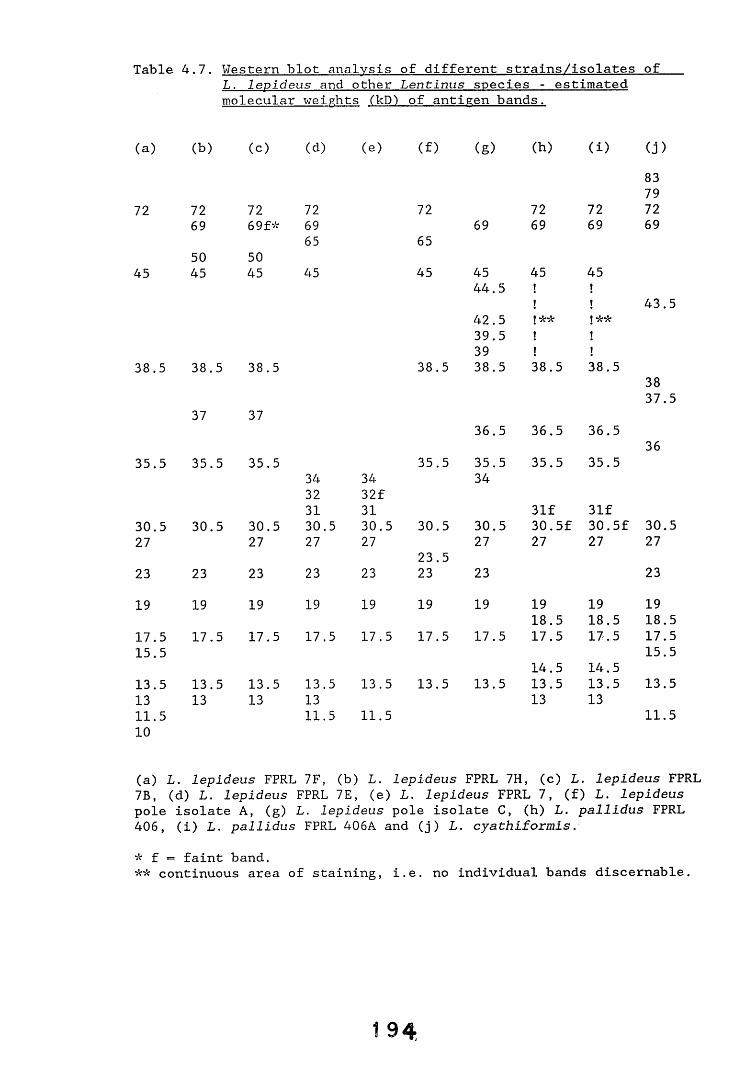
Table 4.7. Western blot analysis of different strains/isolates ofL. lepideus and other Lentinus species - estimatedmolecular weights (kD) of antigen bands.
(a) (b) (c) (d) (e) (f) (g) (h) (i) (j)8379
72 72 72 72 72 72 72 7269 69 f* 69 69 69 69 69
65 6550 50
45 45 45 45 45 45 45 4544.5 1 1
i « 43.542.5 !**39.5 I t39 s i
38.5 38.5 38.5 38.5 38.5 38.5 38.53837.5
37 3736.5 36.5 36.5
3635.5 35.5 35.5 35.5 35.5 35.5 35.5
34 34 3432 32f31 31 31f 31f
30.5 30.5 30.5 30.5 30.5 30.5 30.5 30.5f 30.5f 30.527 27 27 27 27 27 27 27
23.523 23 23 23 23 23 23 23
19 19 19 19 19 19 19 19 19 1918.5 18.5 18.5
17.5 17.5 17.5 17.5 17.5 17.5 17.5 17.5 17.5 17.515.5 15.5
14.5 14.513.5 13.5 13.5 13.5 13.5 13.5 13.5 13.5 13.5 13.513 13 13 13 13 1311.5 11.5 11.5 11.510
(a) L. lepideus FPRL 7F, (b) L. lepideus FPRL 7H, (c) L. lepideus FPRL 7B, (d) L. lepideus FPRL 7E, (e) L. lepideus FPRL 7, (f) L. lepideus pole isolate A, (g) L. lepideus pole isolate C, (h) L. pallidus FPRL 406, (i) L. pallidus FPRL 406A and (j) L. cyathiformis.* f = faint band.** continuous area of staining, i.e. no individual bands discernable.
observed in the blots of the various fungi are presented in Table 4.8. Visually G. trabeum appeared to bear the greatest similarity to the L. lepideus FPRL 7F antigenic profile and of the ten bands observed in the G. trabeum profile, five bands were shared and three were within 0.5kD of a band present in the L. lepideus profile (Table 4.11). In contrast, S. himantioides produced only one band in its antigenic profile and this was distinct from those observed in the L. lepideus FPRL 7F profile. F. vaillantii and P. placenta FPRL 280 produced twenty and nineteen bands in their respective antigenic profiles. Although over one third (7) of the bands in the F. vaillantii were shared with L. lepideus the presence of so many non-shared bands permitted easy discrimination between the two species. Likewise, P. placenta FPRL 280 shared only four bands with L. lepideus. Overall, with the exception of G. trabeum which is visually very similar to L. lepideus, the different brown rot basidiomycete fungi tested could be readily distinguished from L. lepideus. The G. trabeum isolate did not possess the 17.5kD Lentinus-specific band thereby permitting its discrimination.
The antigenic profiles of six white rot basidiomycete fungi were analysed and compared with the L. lepideus FPRL 7F standard. Five of the six fungi tested shared at least one band with L. lepideus FPRL 7F, the exception being Sch. commune, no bands were observed on the western blot of this fungus (Table 4.9). The extent of the similarity to the standard profile observed with the other five fungi tested varied. H. annosum and St. sanguinolentum each possessed three shared bands and three bands within 0.5kD of bands present in the L. lepideus profile. However, despite this level of similarity, the two antigenic profiles were visually distinct from that of L. lepideus FPRL 7F. In contrast PI.
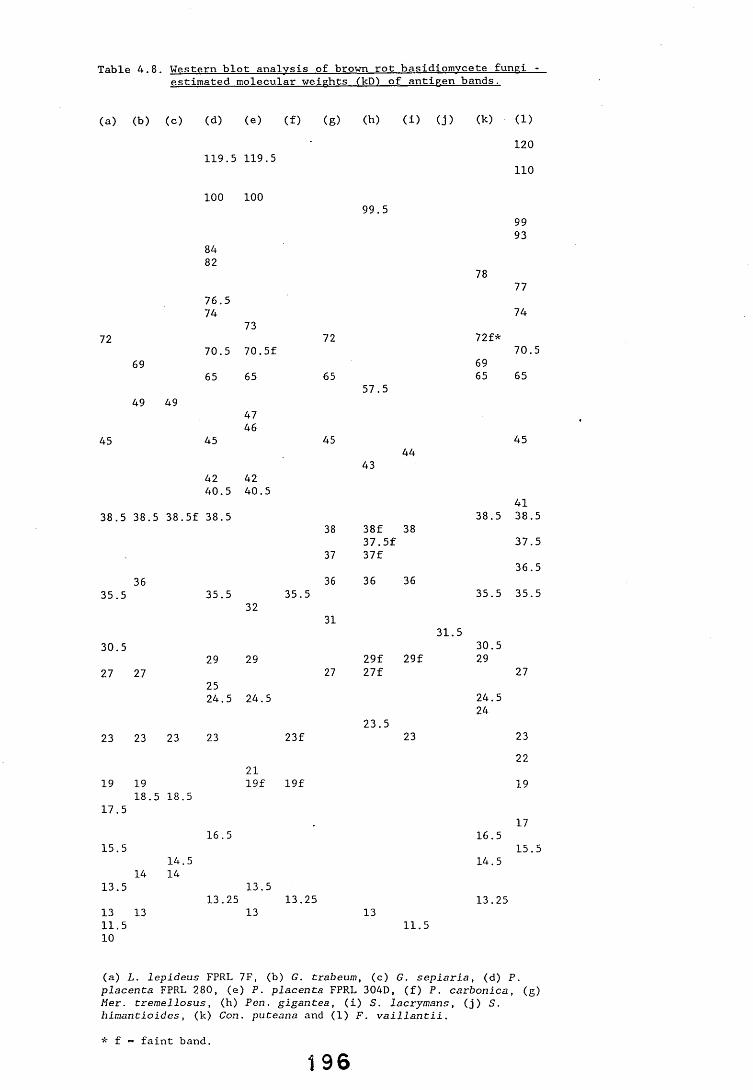
Table 4.8. Western blot analysis of brown rot basidiomycete fungi -estimated molecular weights (kD>) of antieen bands.
( a ) ( b ) ( c ) ( d ) ( e ) ( f ) ( g )
1 1 9 . 5 1 1 9 . 5
72
69
100 100
8 48 2
7 6 . 5 7 4
73
7 0 . 5 7 0 . 5 f
6 5 6 5
4 9 4 94 74 6
4 5 4 5
4 2 4 24 0 . 5 4 0 . 5
3 8 . 5 3 8 . 5 3 8 . 5 f 3 8 . 5
363 5 . 5 3 5 . 5
32
3 0 . 529 2 9
2 7 27252 4 . 5 2 4 . 5
2 3 23 2 3 23
2 11 9 19 1 9 f
1 8 . 5 1 8 . 51 7 . 5
1 6 . 51 5 . 5
1 4 . 514 1 4
1 3 . 51 3 . 2 5
1 3 . 5
1 3 13 13
7 2
6 5
4 5
3 5 . 5
2 3 f
1 3 . 2 5
( h ) ( i ) ( j ) ( k ) ( 1 )
120
110
9 9 . 5
5 7 . 5
4 44 3
9 99 3
7 7
7 4
7 0 . 5
6 5
4 5
4 13 8 . 5 3 8 . 5
78
7 2 f *
6965
38 3 8 f 3 7 . 5 f
383 7
37 3 7 f36
36 36 363 5 . 5 3 5
313 1 . 5
3 0 . 52 9 f 2 9 f 29
27 2 7 f 2 7
2 4 . 52 4
2 3 . 523
1 6 . 5
1 4 . 5
1 3 . 2 5
23
22
19
17
1 5 . 5
131 1 . 510
1 1 . 5
( a ) L. l e p i d e u s FPRL 7 F , ( b ) G. trabeum, ( c ) G. s e p i a r i a , ( d ) P . p l a c e n t a FPRL 2 8 0 , ( e ) P . p l a c e n t a FPRL 3 0 4 D , ( f ) P . c a r b o n i c a , ( g ) Mer. t r e m e l l o s u s , ( h ) P e n . gigan t e a , ( i ) S. l a c r y m a n s , ( j ) S. h i m a n t i o i d e s , ( k ) Con. p u t e a n a a nd ( 1 ) F . v a i l l a n t i i .
* f - f a i n t b a n d .
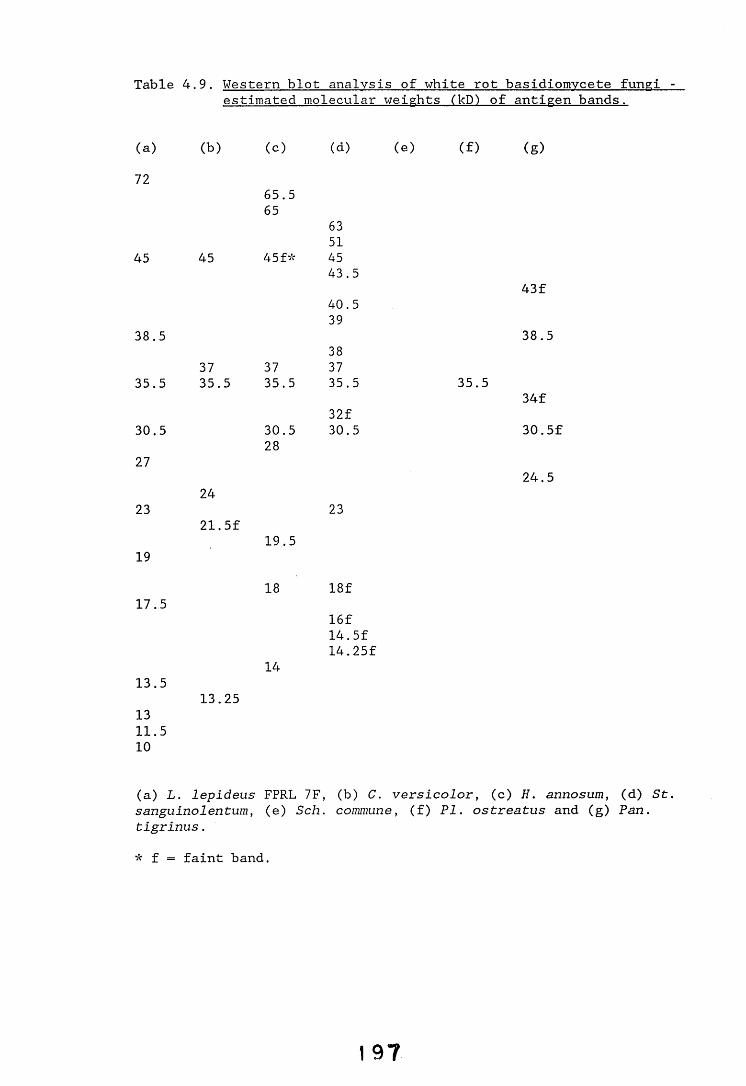
Table 4.9. Western blot analysis of white rot basidlomycete fungi -estimated molecular weights (kD) of antigen bands.
(a) (b) (c) <d) (e) (f) (g)72
65.565
6351
45 45 45 f* 4543.5
43f40.539
38.538
38.5
37 37 3735.5 35.5 35.5 35.5 35.5
34f32f
30.5 30.5 30.5 30.5f28
2724
24.523
21.5f19.5
23
1918 18f
17.5
14
16f 14.5f 14.25f
13.513.25
1311.510
(a) L. lepideus FPRL 7F, (b) C. versicolor, (c) H . annosumsanguinolentum, (e) Sch. commune, (f) PI. ostreatus and (g) Pan. tigrinus.
* f = faint band.
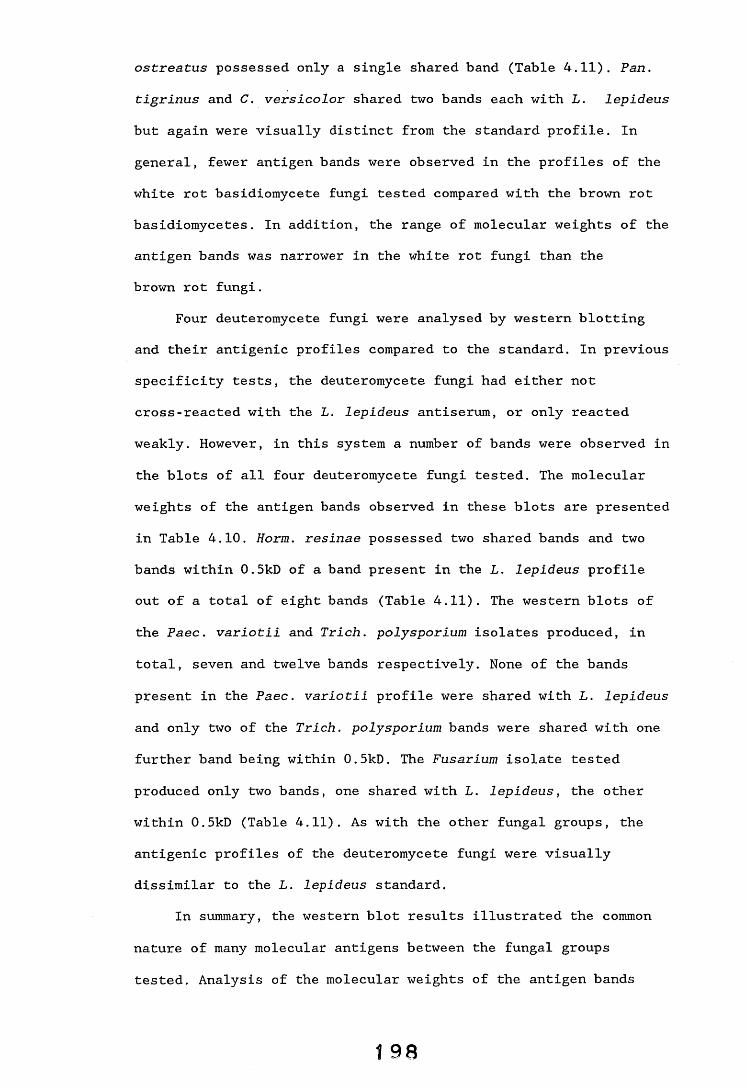
ostreatus possessed only a single shared band (Table 4.11). Pan. tigrinus and C. versicolor shared two bands each with L. lepideus
but again were visually distinct from the standard profile. In general, fewer antigen bands were observed in the profiles of the white rot basidiomycete fungi tested compared with the brown rot basidiomycetes. In addition, the range of molecular weights of the antigen bands was narrower in the white rot fungi than the brown rot fungi.
Four deuteromycete fungi were analysed by western blotting and their antigenic profiles compared to the standard. In previous specificity tests, the deuteromycete fungi had either not cross-reacted with the L. lepideus antiserum, or only reacted weakly. However, in this system a number of bands were observed in the blots of all four deuteromycete fungi tested. The molecular weights of the antigen bands observed in these blots are presented in Table 4.10. Horm. resinae possessed two shared bands and two bands within 0.5kD of a band present in the L. lepideus profile out of a total of eight bands (Table 4.11). The western blots of the Paec. variotii and Trich. polysporium isolates produced, in total, seven and twelve bands respectively. None of the bands present in the Paec. variotii profile were shared with L. lepideus
and only two of the Trich. polysporium bands were shared with one further band being within 0.5kD. The Fusarium isolate tested produced only two bands, one shared with L. lepideus, the other within 0.5kD (Table 4.11). As with the other fungal groups, the antigenic profiles of the deuteromycete fungi were visually dissimilar to the L. lepideus standard.
In summary, the western blot results illustrated the common nature of many molecular antigens between the fungal groups tested. Analysis of the molecular weights of the antigen bands
1 98
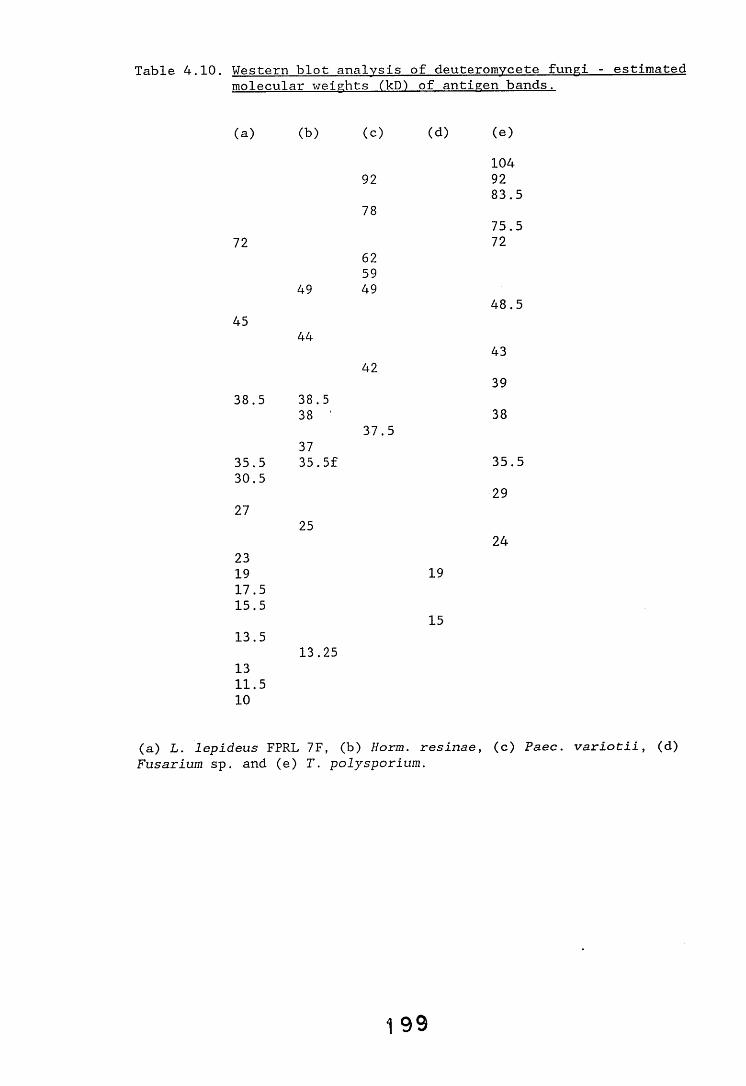
Table 4.10. Western blot analysis of deuteromvcete fun^i - estimatedmolecular weights CkD) of antigen bands.
(a) (b) (c) (d) (e)104
92 9283.5
7875.5
7262
7259
49 4948.5
4544
424339
38.5 38.538 '
37.538
3735.5 35.5f 35.530.5
2927
2524
2319 1917.515.5
1513.5
13.251311.5 10
(a) L. lepideus FPRL 7F, (b) Horm. resinae, (c) Paec. variotii, (d) Fusarium sp. and (e) T. polysporium.
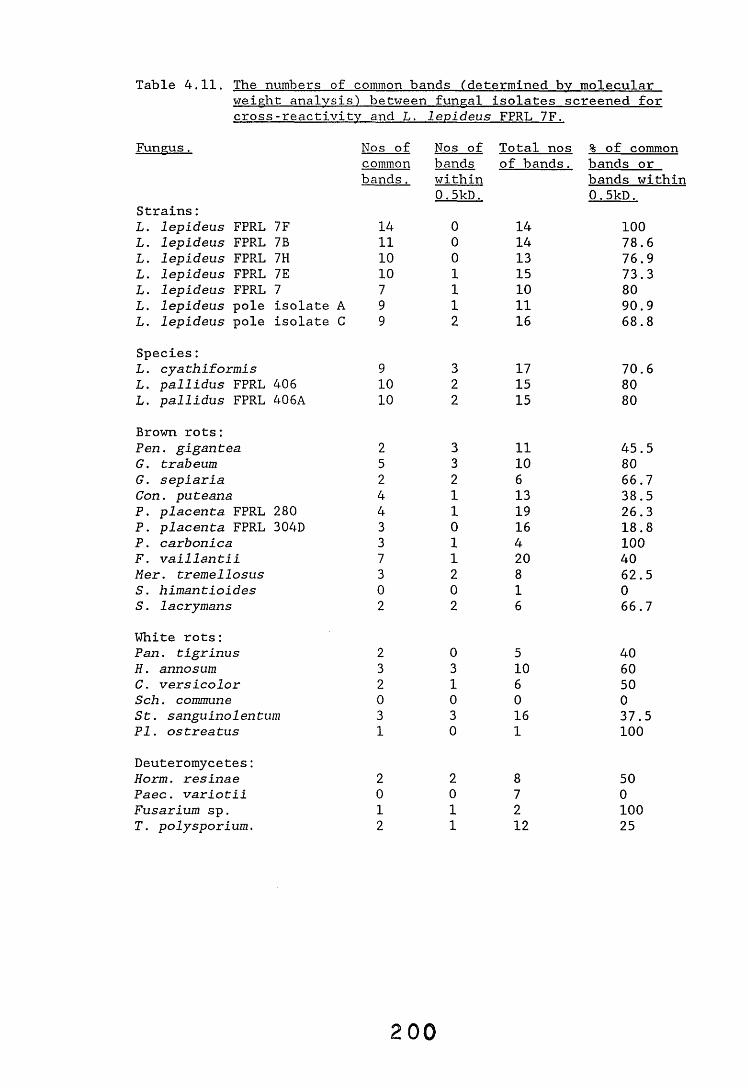
Table 4.11. The numbers of common bands (determined by molecularweight analysis) between fungal isolates screened forcross-reactivity and L. levideus FPRL 7F.
Fungus. Nos of Nos of Total nos % of commoncommon bands of bands. bands orbands. within bands within
0.5kD. 0.5kD.Strains:L. lepideus FPRL 7F 14 0 14 100L. lepideus FPRL 7B 11 0 14 78.6L. lepideus FPRL 7H 10 0 13 76.9L. lepideus FPRL 7E 10 1 15 73.3L. lepideus FPRL 7 7 1 10 80L. lepideus pole isolate A 9 1 11 90.9L. lepideus pole isolate C 9 2 16 68.8Species:L. cyathiformis 9 3 17 70.6L. pallidus FPRL 406 10 2 15 80L. pallidus FPRL 406A 10 2 15 80Brown rots:Pen. gigantea 2 3 11 45.5G. trabeum 5 3 10 80G. sepiaria 2 2 6 66.7Con. puteana 4 1 13 38.5P. placenta FPRL 280 4 1 19 26.3P. placenta FPRL 304D 3 0 16 18.8P. carbonica 3 1 4 100F. vaillantii 7 1 20 40Her. tremellosus 3 2 8 62.5S. himantioides 0 0 1 0S . lacrymans 2 2 6 66.7White rots:Pan. tigrinus 2 0 5 40H . annosum 3 3 10 60C. versicolor 2 1 6 50Sch. commune 0 0 0 0St. sanguinolentum 3 3 16 37.5PI. ostreatus 1 0 1 100Deuteromycetes:Horm. resinae 2 2 8 50Paec. variotii 0 0 7 0Fusarium sp. 1 1 2 100T . polysporium. 2 1 12 25
produced on the blots identified a single Lentinus genus-specific band of MW 17.5kD. Futhermore, the data provided information on the general specificity of the L. lepideus antiserum. In general, the more closely related taxonomically a fungus was to L. lepideus, the greater the similarity in antigenic profiles. The overall pattern of cross-reactivity exhibited by the by the fungi analysed by western blotting confirmed those observed in the immunodiffusion, EIAs and the dot-immunobinding assay.
4.2.4. Absorption of antiserum.
An investigation into the effects of preabsorption of the L. lepideus antiserum with a limited number of individual fungi was carried out in an attempt to improve the specificity of the antiserum. L. lepideus FPRL 7F antigens were separated by SDS-PAGE, western blotted onto nitrocellulose then immunostained using either untreated antiserum or preabsorbed antiserum. Preabsorption was carried out with either L. lepideus (all FPRL strains tested individually), G. trabeum, Pen. gigantea or F. vaillantii. Comparative analysis of the resulting antigenic profiles was then carried out. It should be noted that due to limited supply, antiserum R85/3-12 was used in this experiment, resulting in a slightly different profile being obtained for L. lepideus FPRL 7F (c.f. results with antiserum R85/3-13).
The antigen profile obtained for L. lepideus FPRL 7F in this experiment contained eleven bands. It differed from the standard profile observed with the R85/3-13 antiserum by missing the 15.5 and 23kD bands and having an extra band of 69kD. In addition, the low molecular weight bands (10 and 11.5kD) were absent but as noted before, detection of these bands was variable. The molecular
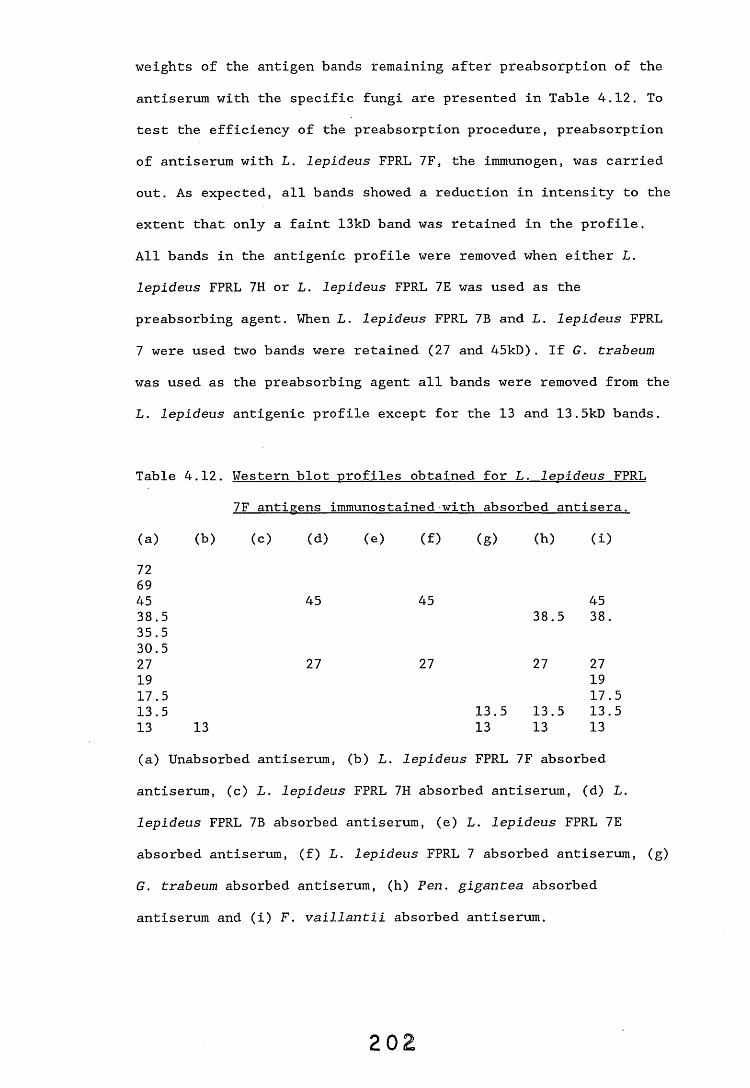
weights of the antigen bands remaining after preabsorption of the antiserum with the specific fungi are presented in Table 4.12. To test the efficiency of the preabsorption procedure, preabsorption of antiserum with L. lepideus FPRL 7F, the immunogen, was carried out. As expected, all bands showed a reduction in intensity to the extent that only a faint 13kD band was retained in the profile.All bands in the antigenic profile were removed when either L. lepideus FPRL 7H or L. lepideus FPRL 7E was used as the preabsorbing agent. When L. lepideus FPRL 7B and L. lepideus FPRL 7 were used two bands were retained (27 and 45kD). If G. trabeum
was used as the preabsorbing agent all bands were removed from the L. lepideus antigenic profile except for the 13 and 13.5kD bands.
Table 4.12. Western blot profiles obtained for L. lepideus FPRL 7F antigens immunostained with absorbed antisera.
(a) (b) (c) (d) (e) (f) (s) (h) (i)726945 45 45 4538.5 38.5 38.35.530.527 27 27 27 2719 1917.5 17.513.5 13.5 13.5 13.513 13 13 13 13(a) Unabsorbed antiserum, (b) L. lepideus FPRL 7F absorbed antiserum, (c) L. lepideus FPRL 7H absorbed antiserum, (d) L. lepideus FPRL 7B absorbed antiserum, (e) L. lepideus FPRL 7E absorbed antiserum, (f) L. lepideus FPRL 7 absorbed antiserum, (g) G. trabeum absorbed antiserum, (h) Pen. gigantea absorbed antiserum and (i) F. vaillantii absorbed antiserum.
2 0 2
There are six bands in the L. lepideus FPRL 7F antigenic profile not shared with G. trabeum, including the Lentinus-specific 17.5kD band. Of these only one was retained (13.5kD) in the profile when immunostained with antiserum preabsorbed with G. trabeum mycelium. The use of Pen. gigantea and F. vaillantii as the preabsorbing agents resulted in the retention of four and seven bands respectively, in the L. lepideus FPRL 7F standard antigenic profile. Comparing the results from the the three non-Lentinus basidiomycete fungi only one band (13.5kD) was identified as being unique to L. lepideus.
4.3. Discussion.
The work described in this chapter can be divided into two sections: (i) the characterisation of the L. lepideus antiserum viz the determination of titre and specificity, and (ii) the identification of specific L. lepideus antigens and/or the production of a more specific antiserum. The results of the former, obtained using a variety of immunological techniques, and their significance will be discussed. In addition, the success or otherwise of the latter study will be discussed alongside alternative procedures.
The first characteristic determined for any individual antiserum was the titre. The titres of the antisera varied from animal to animal, and from one bleed to another taken from the same animal (c.f. rabbit R85/3 results). The occurrence of such variations is well documented in the literature (Edwards, 1985; Tijssen, 1985). Furthermore, the estimated titre for a single antiserum varied greatly depending on which immunological testing system was employed. For example, the titre of antiserum
R85/3-13 was estimated as 8 (immunodiffusion), 25,600 (EIA for "soluble" antigens) and 409,600 (dot-immunobinding assay).
Several factors can affect the titre of an antiserum including the nature of the immunogen, use of adjuvants, manner and amount of administration of the immunogen, the age, species and health of the animal and whether the animal has been in contact with the immunogen before (Tijssen, 1985). In addition, the choice of criterion, that is whether a minimal or maximal response is being estimated, will affect the titre measurement. Differences in the detectability of the three immunological testing systems employed could account for the variations in estimated titres for any particular antiserum. In general, the highest titres were obtained using the dot-immunobinding assay and the lowest using the immunodiffusion system.
After identifying the antiserum with the highest titre (R85/3-13), it*s specificity was investigated. The circulating antibodies are determined by the type and amount of antigen(s) remaining after injection. Therefore, variations in the antigenic nature of separate immunogen preparations could potentially result in differences in antibody composition (and possibly specificity) between the various bleeds. During this project comprehensive specificity testing, i.e. cross-reactivity tests employing immunodiffusion, EIAs and the dot-immunobinding, was only carried out on antiserum R85/3-13. Specificity studies were carried out on other antisera/bleeds employing only one or two techniques and
results indicated that the overall pattern of cross-reactivity observed for R85/3-13 was exhibited by all the other antisera/bleeds tested (data not shown).
2 0 4
4.3.1. Immunodiffusion.
This technique permitted the direct comparison of precipitation patterns obtained with mycelial extracts from test fungi with that obtained with L. lepideus FPRL 7F. Analysis of precipitation lines and comparison with those obtained for the standard L. lepideus FPRL 7F gave information on the extent of shared antigens in cross-reacting fungal isolates. The different strains of L. lepideus tested all gave identical precipitation patterns, this reflects their very close taxonomic relationship.In contrast, the two strains of L. pallidus tested gave non-identical precipitation patterns although closely related taxonomically. This may reflect the absence of the antigens or alternatively, their presence in too small quantities to permit the formation of a visible precipitate. The strong cross-reaction observed between G. trabeum and the antiserum indicates this fungus shares several antigens with L. lepideus. Many fungi did not cross-react with the antiserum, those that did reacted with one, two or all three of the lines obtained with L. lepideus hence no lines were specific to this organism.
4.3.2. Enzyme immunoassays (EIAs).
Specificity studies carried out using the EIAs for "soluble" (s antigen preparation) and "insoluble" (i antigen preparation) antigens confirmed those results obtained in the immunodiffusion study, that is, the more closely related the fungus/fungal group to L. lepideus, the greater, in general, the level of
cross-reaction with the antiserum.A number of factors may affect the degree of cross-reactivity
2 0 5
found between an antiserum and a specific fungal species. For example, it has been established that the growth medium used can effect the antigenic nature of an organism (Burrell et al. , 1966, Chard, 1981) and not all antigens are produced/expressed at all stages of development (Weissman et al. 1987). Furthermore, the location and thus solubility of particular antigen epitopes and the relative concentrations of such epitopes in different species could potentially influence the degree of cross-reactivity observed. These types of effect may account for the results found in this study. There were some marked differences in the cross-reactivity observed for individual fungi. For example, the FPRL 7B strain of L. lepideus gave a similar level of reactivity to L. lepideus FPRL 7F in the EIA for "soluble" antigens but only 50% of the level of reactivity in the EIA for "insoluble" antigens. It is possible that any non-shared antigens between the two strains are located predominately in the insoluble antigen fraction i.e. the cell wall. L. lepideus FPRL 7F is the strain endemic to the United Kingdom (Bruce, 1983) and as such, isolates from on-line poles are assumed to be of this strain. Based on this assumption it could be expected that the L. lepideus pole isolate would react in a similar manner to the standard strain. However, a reduction in the interaction of the pole isolate and the antiserum in the EIA for "soluble " antigens was observed. As previously mentioned, the antigenicity of a fungus can alter when cultured on different growth media, and this might account for the differences observed with the L. lepideus pole isolate. The presence of residual wood-degrading enzymes and/or modified enzymes present in the pole isolate, produced while growing on the wood substrate, could account for the apparent antigenic differences between the two isolates of the same strain. Alternatively, the repeated
subculturing of the standard L. lepideus FPRL 7F over several years could have resulted in the loss and/or modification of antigenic determinants. It has been previously reported (Onions and Smith, 1983) that repeated subculturing of fungi can result in morphological and physiological changes, that is, potentially the loss/modification of antigens. The failure of Con. puteana, C. versicolor and the deuteromycete fungi to show any cross-reaction in the EIA for "insoluble" antigens, although all had cross-reacted in the EIA for "soluble" antigens, may reflect the presence of differences in cell wall structure (see later) or alternatively, the failure to render cross-reacting antigens accessible during sample preparation.
The two EIA systems used in this study were not directly comparable in terms of sensitivity since they undoubtably detect different antigens. However, in the insoluble antigen assay higher antibody titres and absorbance values were obtained than in the soluble antigen assay. This suggests that there is a greater immune response to the insoluble components of L. lepideus. Either very little material is present in the soluble fraction, or the insoluble fraction has a greater intrinsic immunogenicity. Alternatively, the affinity of the antibodies for the soluble antigens could be very low.
4.3.3. Dot-immunobinding assay.
The two separate dot-immunobinding assay experiments, employing chloronaphtholand DAB as the respective chromogens, yielded results which followed the same general trend as observed
in the previous systems.The antigen extracts screened in the dot-immunobinding assay
are equivalent to the s. antigen preparations screened in the EIA for "soluble” antigens. Although the overall trend in the pattern of cross-reactivity is the same, the comparative reactivities of certain individual fungi in the two systems varied. A possible explanation of this could be the improved binding of the soluble fungal antigens to the nitrocellulose compared to the microtitre plate or alternatively, a reflection of differences in the efficiency of antigen extraction during sample preparation.
4.3.4. Western blotting.
Although the primary aim of the western blotting study was the identification of specific L. lepideus antigens and not cross-reactivity testing, the results produced useful information on the specificity of the antiserum. During this study the "strength" of cross-reactivity between a fungus and the antiserum was gauged by comparing the antigenic profile of the fungus to that of the L. lepideus standard. The greater the number of antigen bands and the more similar their position to those bands produced by L. lepideus, the greater the cross-reaction was deemed to be. Using these criteria, the pattern of cross-reactivity generally followed the taxonomic relationship pattern, that is, the more closely related the fungus/fungal groups to L. lepideus,
the greater the cross-reactivity observed.
The three immunological methods employed to determine the specificity of antiserum R85/3-13 and the western blotting analysis, all produced results which followed the same general trend. That is, the different Lentinus strains/species cross-reacted to the greatest extent followed by, in descending
2 0 8
order brown rot basidiomycete fungi, white rot basidiomycete fungi and deuteromycete fungi. The differences noted in the results obtained in the three systems could well reflect the sensitivity of the individual techniques, the relative availability of antigens in these systems and the particular antigen sub-population tested.
4.3.5. Anomalous cross-reactions.
1. The two strains of L. pallidus could be discriminated when immunodiffusion was employed, however, the antigenic profiles obtained for the two strains in the western blots were identical. Possibly, the strains possess identical antigens though not in sufficient quantities to permit their detection in the immunodiffusion system. The increased sensitivity of the western blotting system permitted their detection and identical antigenic profiles were obtained.2. Sch. commune gave a moderate reaction in the dot-immunobinding assay but failed to cross-react in the western blotting system.The methodology employed in the dot-immunobinding assay ensures a relatively high concentration of individual PBS-soluble antigens located within the dot. In western blotting however, separation of antigenic determinants by molecular weight reduces the total concentration of antigen possibly to undetectable levels.3. The brown rot fungus F. vaillantii reacted strongly in the western blotting system but relatively weakly in thedot-immunobinding assay. The majority of common antigens between this fungus and L. lepideus may be located in the non-PBS soluble fractions, in particular the cell wall.
2 09'
4.3.6. Molecular specificity.
Analysis of the molecular specificity of the antiserum by western blotting was carried out to identify, if possible, any antigens specific for L. lepideus. Analysis of the data obtained indicated that no L. lepideus-specific bands were present, however, a Lentinus genus-specific band of MW 17.5kD was identified. In theory this antigen band could be excised from either the gel or the paper blot and used as an immunogen to produce a more specific antiserum. However, it should be noted that antigen bands, from two separate fungi, of the same molecular weight do not necessarily represent identical antigens. Likewise, a common epitope may be borne on carrier molecules of different molecular weights. Any antigen chosen as the immunogen to produce a more specific antiserum should fulfill several criteria, namely it should be unique to Lentinus and it should be expressed by all strains of L. lepideus and preferrably at all stages in it's growth and development. Furthermore, if the antiserum produced was
to be used as a diagnostic tool for fungal colonisation and/or decay of wood, the antigen should be expressed by the fungus when growing on wood.
Although the primary aim of the molecular specificity study was the identification of specific L. lepideus antigens, the data generated provided useful information on the taxonomic relationships between the various fungal isolates and groups. Conventional taxonomic classification of fungi requires detailed and time-consuming microbiological, biochemical and chemical analyses. More recently, the protein banding patterns, produced in polyacrylamide gel electrophoresis, have been used to identify and
2 1 0
illustrate taxonomic relationships between fungi. Hansen et al. (1986) have reported that protein electrophoresis was the most sensitive method of determining such relationships between various isolates of Phytophthora megasperma. This methodology has also
been applied to study the taxonomic relationships between, for example, Ophiobolus graminis isolates (Holland and Choo, 1970), Taphrina species (Snider and Kramer, 1974), Verticillium alboatrum and V. dahliae (Selvaraj and Meyer, 1974), Gaeumannomyces graminis isolates (Abbott and Holland, 1975) and Serpula lacrymans strains/isolates (Vigrow et al., 1989). Closely related fungi show a marked similarity in their profiles and more distantly related fungi can be readily discriminated using this methodology.Although all proteins present on gels will not be antigenic and thus be detectable in western blots, the data produced in this study is consistent with the idea that antigenic profiles obtained in western blots could also be used to determine the relatedness, or otherwise, of fungal isolates. However, many of the electrophoretic studies on fungi have shown that there were inherent problems in using electrophoresis for taxonomic studies. Many workers (Abbott and Holland, 1975, Burrell et al., 1966, Chard, 1981, Glynn and Reid, 1969 and Vigrow et al., 1989) have shown that the patterns and intensity of proteins varied with growth conditions i.e. age of the culture, temperature, the inoculum used and the composition of the growth medium. Caution must therefore be applied when interpretating western blot data and standardisation of antigen preparation is recommended.
The different L. lepideus strains showed a marked similarity in their antigenic profiles. Likewise, the profiles obtained for the other Lentinus species were also very similar to that of L. lepideus confirming their close taxonomic relationship. The degree
of interaction of the antiserum with the basidiomycete fungi tested varied greatly. The grouping of organisms within the Basidiomycotina family is likely to be reflected by a certain commonality of antigens and thus the possession of common antigen bands in the profiles of L. lepideus and other basidiomycete fungi is not suprising. G. trabeum produced an antigenic profile very similar to L. lepideus. This result, in conjunction with the high levels of cross-reactivity observed in the other immunological systems used, suggest that these fungi, whilst showing distinct morphological differences in culture, may be closely related taxonomically.
Deuteromycetes are classified as fungi which possess septate hyphae but for which no sexual stage in the life cycle has been identified (Stanier et al. , 1977). Therefore correct classification into either the Ascomycotina or the Basidiomycotina cannot be made and thus the elucidation of the taxonomic relationships of such fungi is difficult. Western blot analysis of such fungi could potentially resolve the question of which family any particular deuteromycete fungus belonged. All higher fungi (ascomycetes, basidiomycetes and deuteromycetes) evolved from the lower fungi (phycomycetes). This shared ancestry would result in a certain commonality of antigens. In particular, highly conserved proteins and cell wall polysaccharides could well be shared amongst taxonomically distinct fungal groups. For example, extensive cross-reactivity between fungal and bacterial polysaccharide antigens has been reported. Pepys and Longbottom (1978) reported that type-specific polysaccharides of the fungus Cryptococcus neoformis A cross-reacted with antisera raised against Types II and XIV pneumococcus. Although all four deuteromycete fungi tested interacted with the L. lepideus
2 1 2
antiserum, the level observed was less than that observed with the basidiomycete fungi tested. This was consistent with the cross-reactivity results obtained using the other immunological systems. Comparison of the antigenic profiles with that of L. lepideus indicated that the deuteromycete fungi were not closely related taxonomically to L. lepideus. The increased interaction of the deuteromycete fungi with the antiserum observed in the western blots may reflect the liberation of common cell wall antigens by the sample preparation procedure.
The potential application of western blotting in taxonomic studies is clearly illustrated by the results obtained with Pan. tigrinus. Until relatively recently this fungus was classified in the genus Lentinus, however, on the basis of standard taxonomic criteria e.g. morphology, cultural characteristics etc., it has been subsequently reclassified into the genus Panus. The western blot analysis of this fungus showed that it shared comparatively few antigens with L. lepideus and as such was unlikely to be closely related. Thus, potentially this single immunological test can give the same information as conventional taxonomic methods although further tests would have to be carried out to determine the correct taxonomic classification for a particular isolate.
4.3.7. Absorption of antisera.
Polyclonal antisera, prepared against crude antigen extracts, often give positive reactions i.e. cross-react with antigens other than the target antigen. The antisera can be rendered specific by (i) selective absorption and elution of antibodies of the required specificity, or by (ii) removal of the unwanted antibody. The former procedure requires at least partial purification of the
2 13
specific antigen which is subsequently used to "capture" the specific antibodies. These antibodies are then eluted and provide a specific antiserum. The most common method uesd to remove unwanted antibody is preabsorption of the antibody preparation with the cross-reacting antigens (if available). A suitable antigen immunosorbent is mixed with the antiserum and the resulting antibody-antigen complexes are removed by centrifugation. However, although the method is widely employed the effectiveness of the procedure can vary considerably (Tijssen, 1985) . Preabsorption of the antiserum with multiple antigen immunosorbents is often used to increase antiserum specificity (Chard, 1981). In this study preabsorption of the antiserum was undertaken to (i) produce a more specific antiserum and (ii) to determine whether the 17.5kD antigen band identified from the western blotting study was specific to L. lepideus. G. trabeum was an obvious choice as a preabsorbing agent because of the high level of cross-reactivity observed between this fungus and the antiserum. The different strains of L. lepideus were included in the study to confirm their antigenic similarity.
In the western blotting study antigen bands were differentiated on the basis of molecular weight. The removal of non-shared antigenic bands (on the basis of molecular weight) from the L. lepideus FPRL 7F profile, when immunostained with preabsorbed antiserum, suggests that common antigenic determinants may be borne on different carrier molecules within the various fungi. The 17.5kD antigen band identified as Lentinus-specific in the western blot study is removed when the antiserum is preabsorbed with G. trabeum or Pen. gigantea mycelial extracts indicating that although the carrier molecule of 17.5kD is specific for Lentinus, the actual antigenic epitope is not. This
would preclude the use of this antigen band to raise a specific antiserum. This phenomenon has been observed when other basidiomycete fungi have been used as the preabsorbing agent (data not shown) suggesting that the bearing of common antigenic determinants on different carrier molecules within basidiomycete fungi is fairly common. The production of a specific antiserum using preabsorption methods is theoretically possible although a more comprehensive study would be required to identify the most suitable fungal isolate(s). Absorption of the antiserum could be used to produce a serum which cross-reacts with only a small number of fungal isolates. A fundamental requirement of the antiserum, if used diagnostically, would be that no cross-reaction occurred with non-decay fungi thus eliminating the possibility of false positives. Further studies employing non-decay deuteromycete fungi as the preabsorbing agents would be required to determine the feasibility of this proposal.
There have been conflicting reports in the literature about the most likely location of specific fungal antigens. Antisera have been raised against against cell walls from several fungi and have been compared with those raised against cytoplasmic (soluble) and whole cell extracts. Halsall (1976) compared the specificity of antisera raised against the cytoplasmic and cell wall antigens of four species of Phytophthora. She was able to distinguish species of Pythium from Phytophthora by immunodiffusion using the cell wall antiserum and was also able to differentiate the four Phytophthora species into three subsets using either the cell wall antiserum or the cytoplasmic antiserum. Choo and Holland (1970) found that antisera raised against cell walls of Ophiobolus graminis produced no cross-reaction, whereas whole cell antisera produced seven cross-reactions when they were tested using
immunofluorescence with 52 isolates of fungi from the rhizosphere. They argued that this indicated that specific fungal antigens were more likely to be located in the cell wall. On the contrary, the undoubted success of the exo-antigen technique (for review see Kaufman and Standard, 1987) has proved the specificity of antisera raised against extracellular soluble antigens of fungi, for example Coccidioides immitis (Cox and Britt, 1986) and Histoplasma capsulation (Kaufman et al., 1983). The results obtained in the specificity studies detailed in this study suggest that the majority of common fungal antigenic determinants, between the isolates tested, are normally insoluble possibly situated within the cell wall.
Many polymers of the cell walls of various groups within the basidiomycetes are similar; glucans (R and S) and chitin being the major components. Proteins and lipids comprise 10-15% and 5-10% of the cell wall respectively and several sugars e.g. mannose and fucose are minor cell wall components (Rosenberger, 1976). The importance of proteins as structural components of the cell walls (Chard, 1981, Sietsma and Wessels, 1977) could ensure their conservation in different fungal groups. Homology of wall proteins was found in comparisons of peptide maps from Aspergillus niger
van Tiegh. and Chaetonium globosum Kunze ex Fr. (Mitchell and Taylor, 1969). The problem with the production of cell wall antisera in particular and with whole cell extract antiserum in general concerns this similarity of wall composition. The production of antibodies against the common wall components will result in the cross-reaction of the antiserum with many fungal species. However, it should be noted that antisera raised against specific cell wall components have been produced (Hearn and
Mackenzie, 1979, 1980).
2 16

The work reported in this chapter indicates that it is possible to produce L. lepideus antisera of reasonable titre. Although titre assessment of individual antisera encountered some minor problems, for example the variation in the titre dependent on the immunological detection system employed, the comparative analysis of different antisera identified the L. lepideus
antisera with the highest antibody activities. Of the immunological methods employed in titre assessment, the dot-immunobinding assay proved to be the most sensitive especially when DAB was used as the chromogen. A possible drawback to the exclusive use of this system in specificity analysis is that it only screens PBS-soluble antigens and both the EIA for "insoluble" antigens and the western blot data have shown that some non-PBS soluble antigens are shared between L. lepideus and various fungal isolates. However, the use of various detergents to solubilise normally insoluble antigens and the subsequent use of such extracts in nitrocellulose-based assays has been reported (Palfree and Elliott, 1982). The use of detergents would permit the "insoluble" antigens within the various fungal isolates to be screened for cross-reactivity with the antiserum thus providing more comprehensive information on antiserum specificity. Alternatively, if antiserum is only to be used exclusively in a single immunoassay system it would be sufficient to determine the specificity of the serum using that immunoaassay system alone.The specificity of the antisera produced to date is limited although they interact most strongly with the different
L. lepideus strains and other Lentinus species.A further aim of the work was the determination of the
molecular specificity of the antiserum and the identification of antigen bands specific to L. lepideus. Although a study of 31

fungal isolates identified a genus-specific antigen band, subsequent preabsorption experiments indicated that the epitope itself was not specific to Lentinus. Analysis of protein banding patterns on polyacrylamide gels may elucidate proteins specific for L. lepideus/Lentinus suitable for use as immunogens. Work carried out in this department has shown that different wood decay and non-decay fungi can be readily differentiated by their protein banding patterns on gels especially at a generic level. Differentiation of species within a genus is also possible although this is more problematic and computer analysis of data may be required (A. Vigrow, personal communication).
The final aim of the work was the production of a more specific antiserum by preabsorption with cross-reacting fungal isolates. Although only a limited study was carried out, it was shown that the preabsorption strategy would be of limited value.In all probability the method could, at least, be used to produce a serum which although cross-reacting with other decay fungi, would not react with non-decay fungi. There are several alternative strategies which could be used to increase the specificity of the L. lepideus antisera.
An alternative method, to preabsorption, of isolating specific antibodies within serum has been reported (Olmsted,1981). Heterogeneous protein samples were western blotted onto Diazotised Paper and thereafter identified specific antigen bands were excised and used to affinity purify particular antibodies. Subsequently, bound specific antibodies were eluted from the blots. This method requires the identification of specific antigen bands. Similarly Boulard and Lecroisey (1982) have reported the production of specific antisera by direct immunisation with slices of polyacrylamide gel containing identified specific protein
antigens. However, the results obtained in the western blot analysis illustrate the potential problems of these systems. The antigens are separated and classified on the basis of molecular weight but the preabsorption experiments indicate that common antigenic determinants can be borne on different carrier molecules. Thus bands which appear to be specific (e.g. 17.5kD Lentinus band) can possess a common antigenic epitope. The use of such 'specific' bands as immunogens to produce more specific antisera would, whilst limiting cross-reactivity to fungi which possess the same or very similar antigenic determinants, be of only limited success.
The relatively recent discovery of exo-antigens and the development of simple methods for their isolation (Kaufman and Standard, 1987) offers a further possibility for producing specific L. lepideus antigens and subsequently specific antisera. Exo-antigens have proven valuable in the immunoidentification of fungal pathogens difficult to identify by conventional methods.The specificity of exo-antigens is well documented (Sekhon et al., 1986a, 1986b and Kaufman et al., 1983) and they can be easily extracted from culture broths or aqueous extracts of slant cultures. The rigorous washing of mycelial mats employed during this project is likely to have resulted in the removal of the majority of exo-antigens and thus an antibody response to these antigens may well not have been elicited. To date, the exo-antigen technique has been mainly applied to study pathogenic dimorphic fungi however, the undoubted specificity of such antigens is likely to be paralleled in basidiomycete fungi. Analysis of the reactivity and specificity of resulting antisera would be required
to determine the applicability of the method to L. lepideus.A further strategy for producing more specific antisera would
Z 1 9
be the treatment of L. lepideus antigen extracts to purify, liberate and/or expose previously hidden specific antigenic determinants. Subsequently the treated extracts would be used as immunogens. A wide variety of treatments have been applied to fungi in order to at least partially purify antigens, for example detergent extraction and affinity chromatography (Hearn and MacKenzie, 1980), isoelectric focusing (Kurup et al., 1986) and ammonium sulphate salt fractionation followed by ion-exchange chromatography (Chard et al. , 1985). Some knowledge of the likely chemical nature of the specific antigen(s) would permit a more qualified decision on the most suitable type of treatment to be used. It has been reported (Pepys and Longbottom, 1978) that fungal polysaccharide antigens are in general responsible for type-specificity whereas protein antigens are responsible for broad species specificity. Polysaccharide antigens are reported to be less immunogenic than protein antigens (Smith et al., 1986) therefore purification and/or modification of immunisation protocols may be required to elicit an antibody response to the antigens.
Finally, the production of a specific antibody could be facilitated by the production of monoclonal antibodies. A clone of B-cells produces an antibody of a single specificity (Tijssen, 1985) . The method is advantageous in that virtually unlimited quantities of antibody can be produced and the selection procedure permits the use of complex antigen mixtures as an immunogen. Furthermore, antibodies can be produced to fulfill certain criteria e.g. high or low affinity constants (Campbell, 1984). There are, however, disadvantages in producing monoclonal antibodies. The time required and the expense of production is initially high. A monoclonal is unable to distinguish between
2 2 0
antigens which carry the same epitope and have been known to cross-react with totally unrelated molecules (Bundesen et al. , 1980). In addition, monoclonal antibodies can be much more sensitive than polyclonal antisera to inactivation by freezing and thawing, changes in pH and other physical properties important for their purification (Mosmann et al., 1980). The production of monoclonal antibodies to fungal antigens have been reported by several authors (Dewey and Brasier, 1988, Dewey et al., 1989 and Polonelli et al., 1986) and there is no reason to suggest this could not be accomplished for L. lepideus.
The strategy chosen would require to be compatible with in-house facilities. Furthermore, only preabsorption could be carried out using existing antisera; all the other methods would require the production of new antisera with all the attendant immunisations and assessments.
Several conclusions can be drawn from the work reported in this chapter.
1. The antisera produced to date are of limited specificity although useful in providing information on L. lepideus.
2. In general, different strains/species of Lentinus cross-react most strongly with the antiserum followed by brown rot basidiomycete fungi, white rot basidiomycete fungi and finally deuteromycete fungi. This parallels the closeness of taxonomic relationships between the groups. 3
3. The level of cross-reactivity observed varies dependent on the immunological system employed.
2 2 1
4. Although a genus-specific antigen band was identified for Lentinus in western blots, the actual antigenic determinant was shown to be non-specific.
5. Western blotting methodology could be used to determine taxonomic relationships between fungal isolates, providing antigen extracts were standardised.
6. The production of a specific antiserum by preabsorption was not possible using the fungal isolates investigated during this study. However, the method could be used to limit the number and/or type of cross-reacting fungal isolates.
7. Production of a specific antiserum may well require either the identification and partial purification of specific antigens and their subsequent use as immunogens, or the production of
monoclonal antibodies.
2 2 2
CHAPTER 5. CHARACTERISATION OF LENTINUS LEPIDEUS ANTIGENS.
2 2 3
5.1. Introduction.
It is useful to know the character of the antibody binding site (epitope) of an antigen and many studies (Azuma et al., 1971; Chard, 1981; Hayashi et al., 1978 and Hearn and MacKenzie, 1979, 1980) have involved the characterisation, or partial characterisation, of fungal antigenic components. The majority of these studies utilised at least partially purified antigenic components. Chemical characterisation of a substance can be achieved by using a variety of biochemical methods including many high resolution techniques such as mass spectrometry, X-ray crystallography, peptide mapping, amino acid sequencing etc. Such techniques are especially useful for characterising pure samples. Alternatively, or concomitantly, the chemical nature of the epitope can be determined by subjecting the antigenic fraction to enzymic degradation or biochemical modification. If antigenic reactivity is lost, then conclusions can be drawn on the character of the antigen. Numerous such characterisation studies have been carried out on antigens from individual fungi and some examples are given below.
Hayashi et al. (1978) partially purified a serologically active substance from Absidia cylindrospora and concluded that the active component was a carbohydrate since antigenic properties were lost on oxidation with periodate. Kurup et al. (1986) identified a glycoprotein antigen from Aspergillus fumigatus on the basis of concanavalin A (con A) binding. Hearn and MacKenzie (1979) subjected A. fumigatus extracts from the cell wall and protoplasts to a detailed chemical characterisation. In addition, the chemical natures of the epitopes were determined by con A precipitation, sodium-metaperiodate oxidation and enzyme
degradation; protein and carbohydrate moieties were consequently
identified.Unlike the majority of previous characterisation studies
carried out on fungal antigens, the work reported in this chapter was directed at obtaining information on all the antigens contained in a whole cell extract of L. lepideus. Individual antigens were separated, on the basis of molecular weight, using SDS-PAGE electrophoresis and western blotting. Due to technical problems (see chapter 3), an alternative electrophoresis/blotting system was employed for some of the work reported to that used in the molecular specificity study. Antigen extracts were either treated prior to loading onto gels (e.g enzyme-treated extracts), or blotted antigens were subjected to treatment (e.g. lectins) after binding to nitrocellulose. The resultant antigenic profiles/banding patterns were compared with untreated L. lepideus mycelial control samples.
The work undertaken to characterise the L. lepideus antigens had several aims:1. To determine some basic chemical characteristics of the antigen extract viz it's total protein content and it's total carbohydrate content.
2. To identify and localise protein components of the antigen extracts via silver staining of SDS-PAGE gels. 3
3. To determine whether changes in antigenic profiles occurred in response to changes in cultural conditions, specifically the effects of culture age and incorporation of benomyl into the
growth medium.
4. To determine the biochemical identity of individual antigen bands by subjecting them to a variety of enzyme/biochemical treatments.
5.2. Results.
5.2.1. Chemical characterisation of L. levideus extract.
5.2.1.1. Estimation of the total protein content.
The total protein content of the L. lepideus whole cell antigen extract (used both as an immunogen and in western blotting experiments) was determined using two methods, a dye-binding microassay method based on a method described by Bradford (1976), and a modified Folin-Ciocalteu-Lowry assay (Lowry et al., 1951). Bovine serum albumin (BSA) was used as the standard and the results obtained are presented in Table 5.1. Very little protein was detected using the dye-binding assay but a twelve-fold increase in the level of estimated protein was detected in the Lowry assay. The discrepancy observed between the results obtained with the two protein assays may be accounted for by the different solubilisation procedures employed in the two systems. The low levels of protein detected in the dye-binding assay could reflect inefficient solubilisation of the proteins.
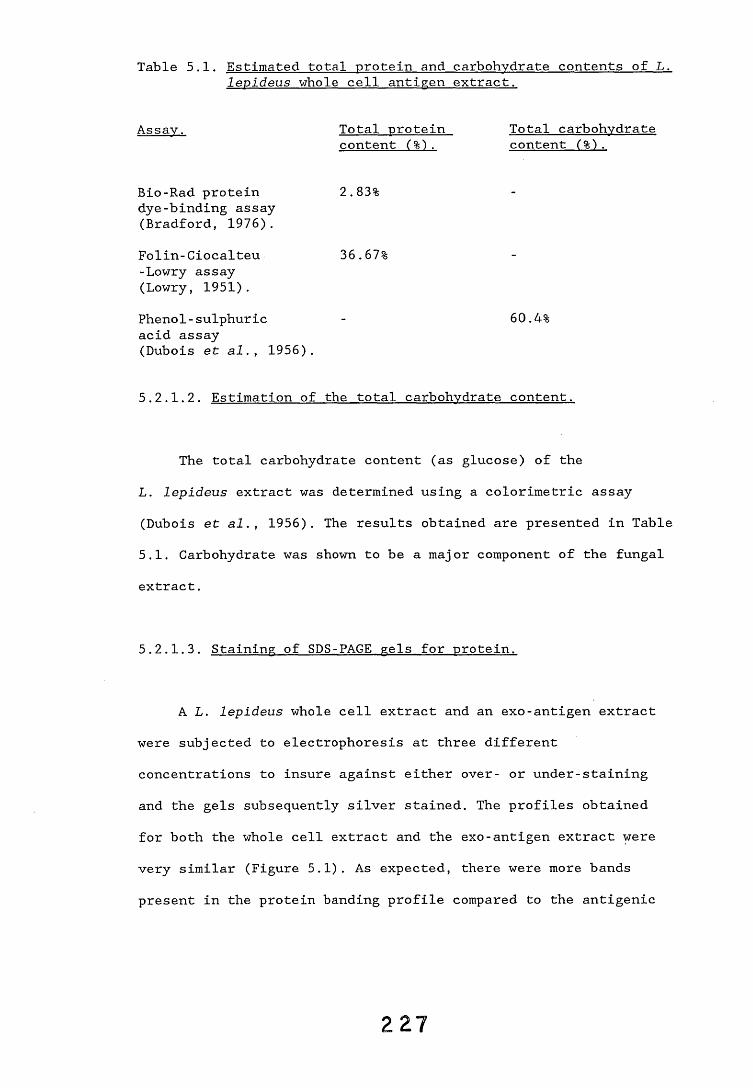
Table 5.1. Estimated total protein and carbohydrate contents of L. levideus whole cell antigen extract.
Assay. Total protein Total carbohydratecontent (%) . content (%).
Bio-Rad protein 2.83%dye-binding assay (Bradford, 1976).Folin-Ciocalteu 36.67%-Lowry assay (Lowry, 1951).Phenol-sulphuric - 60.4%acid assay(Dubois et al., 1956).
5.2.1.2. Estimation of the total carbohydrate content.
The total carbohydrate content (as glucose) of the L. lepideus extract was determined using a colorimetric assay (Dubois et al., 1956). The results obtained are presented in Table5.1. Carbohydrate was shown to be a major component of the fungal extract.
5.2.1.3. Staining of SDS-PAGE gels for protein.
A L. lepideus whole cell extract and an exo-antigen extract were subjected to electrophoresis at three different concentrations to insure against either over- or under-staining and the gels subsequently silver stained. The profiles obtained for both the whole cell extract and the exo-antigen extract were very similar (Figure 5.1). As expected, there were more bands present in the protein banding profile compared to the antigenic
2 2 7
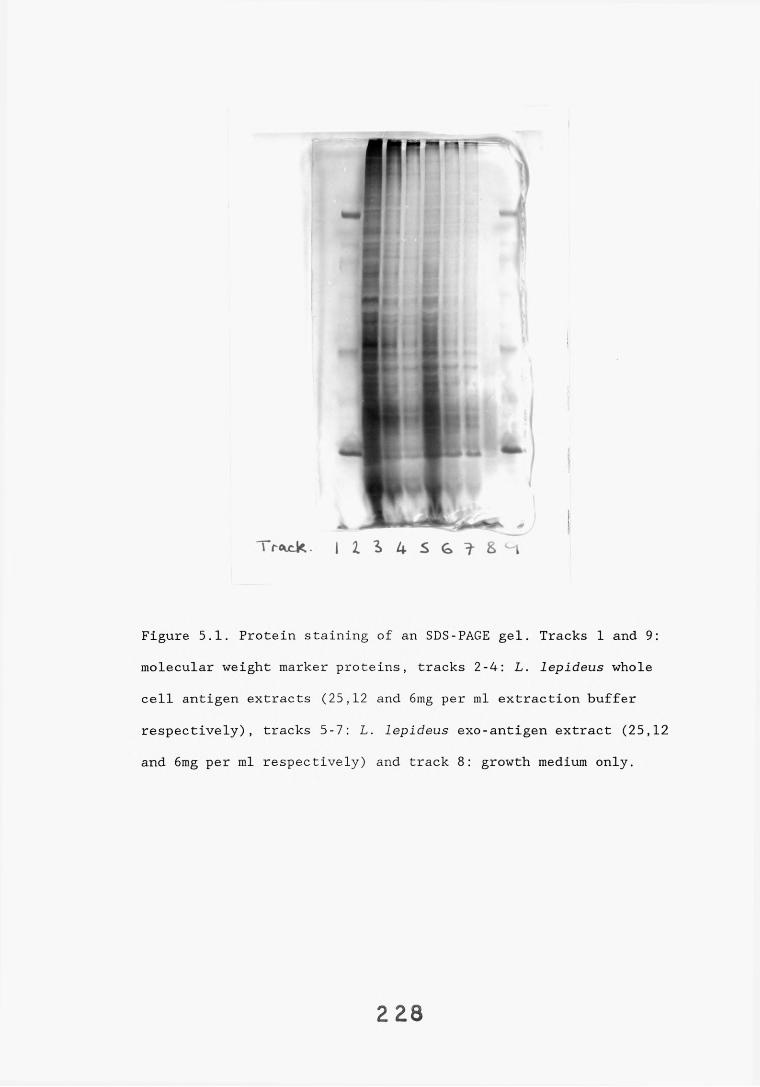
I rcwje.. I Z l 4 S e , ? 8 ^ i
Figure 5.1. Protein staining of an SDS-PAGE gel. Tracks 1 and 9: molecular weight marker proteins, tracks 2-4: L. lepideus whole cell antigen extracts (25,12 and 6mg per ml extraction buffer respectively), tracks 5-7: L. lepideus exo-antigen extract (25,12 and 6mg per ml respectively) and track 8: growth medium only.
2 2 8
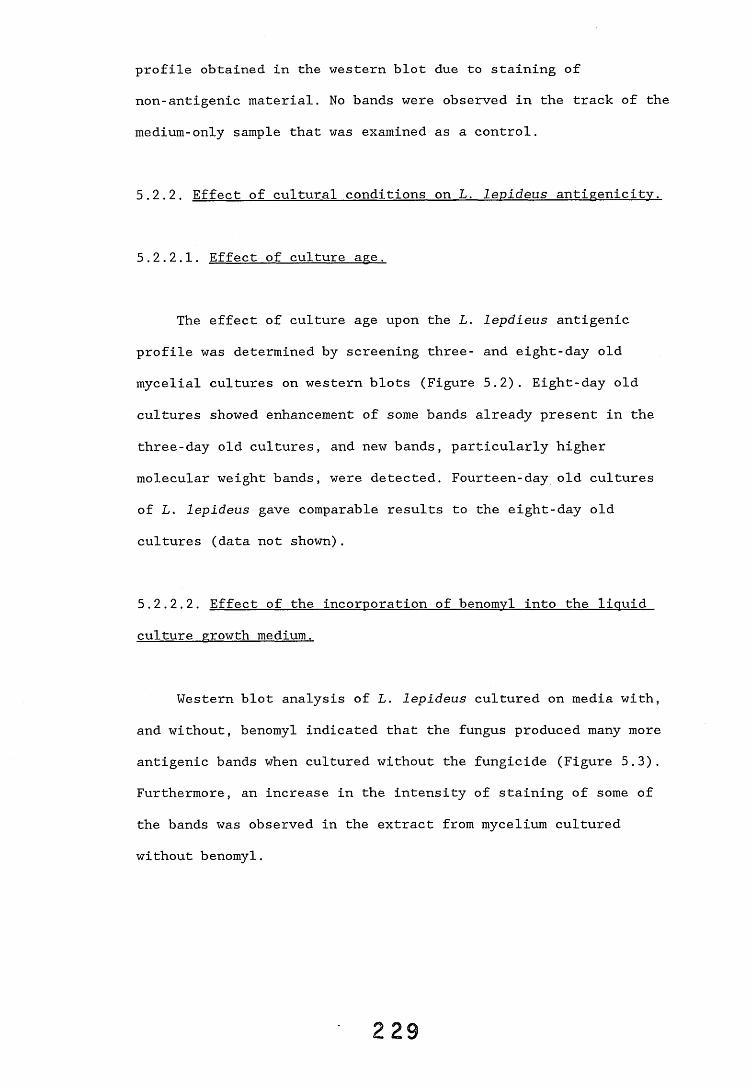
profile obtained in the western blot due to staining ofnon-antigenic material. No bands were observed in the track of themedium-only sample that was examined as a control.
5.2.2. Effect of cultural conditions on L. lepideus antigenicity.
5.2.2.1. Effect of culture age.
The effect of culture age upon the L. lepdieus antigenic profile was determined by screening three- and eight-day old mycelial cultures on western blots (Figure 5.2). Eight-day old cultures showed enhancement of some bands already present in the three-day old cultures, and new bands, particularly higher molecular weight bands, were detected. Fourteen-day old cultures of L. lepideus gave comparable results to the eight-day old cultures (data not shown).
5.2.2.2. Effect of the incorporation of benomvl into the liquid culture growth medium.
Western blot analysis of L. lepideus cultured on media with, and without, benomyl indicated that the fungus produced many more antigenic bands when cultured without the fungicide (Figure 5.3). Furthermore, an increase in the intensity of staining of some of the bands was observed in the extract from mycelium cultured without benomyl.
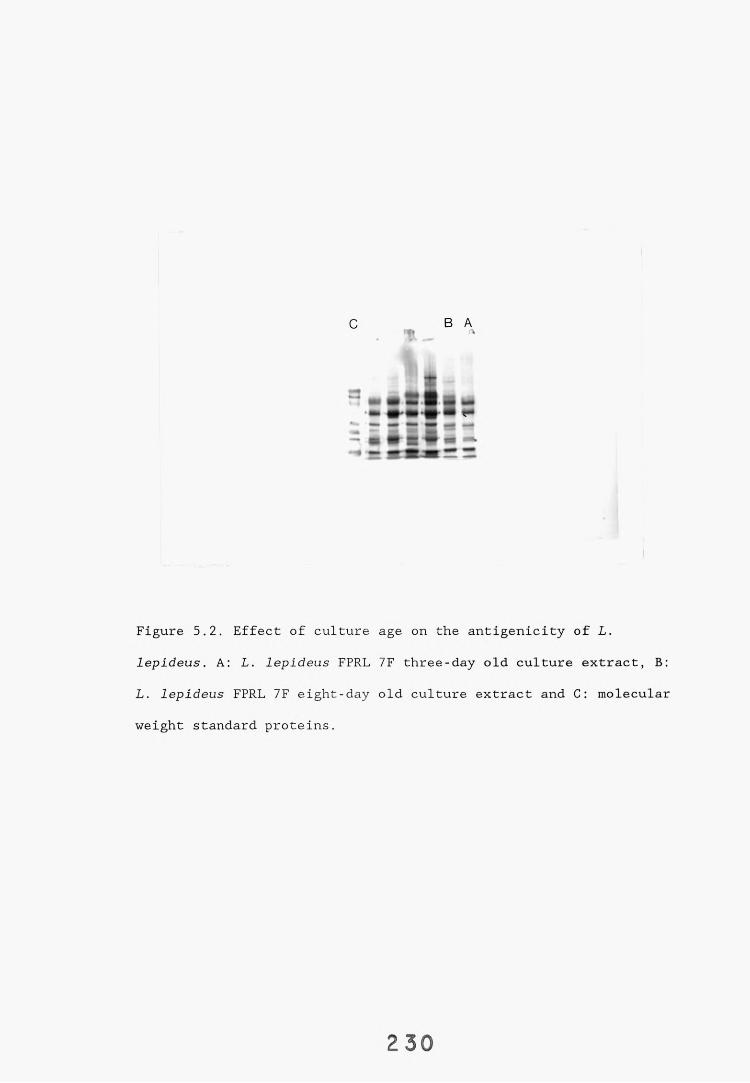
Figure 5.2. Effect of culture age on the antigenicity of L. lepideus. A: L. lepideus FPRL 7F three-day old culture extract, B: L. lepideus FPRL 7F eight-day old culture extract and C: molecular weight standard proteins.
2 3 0
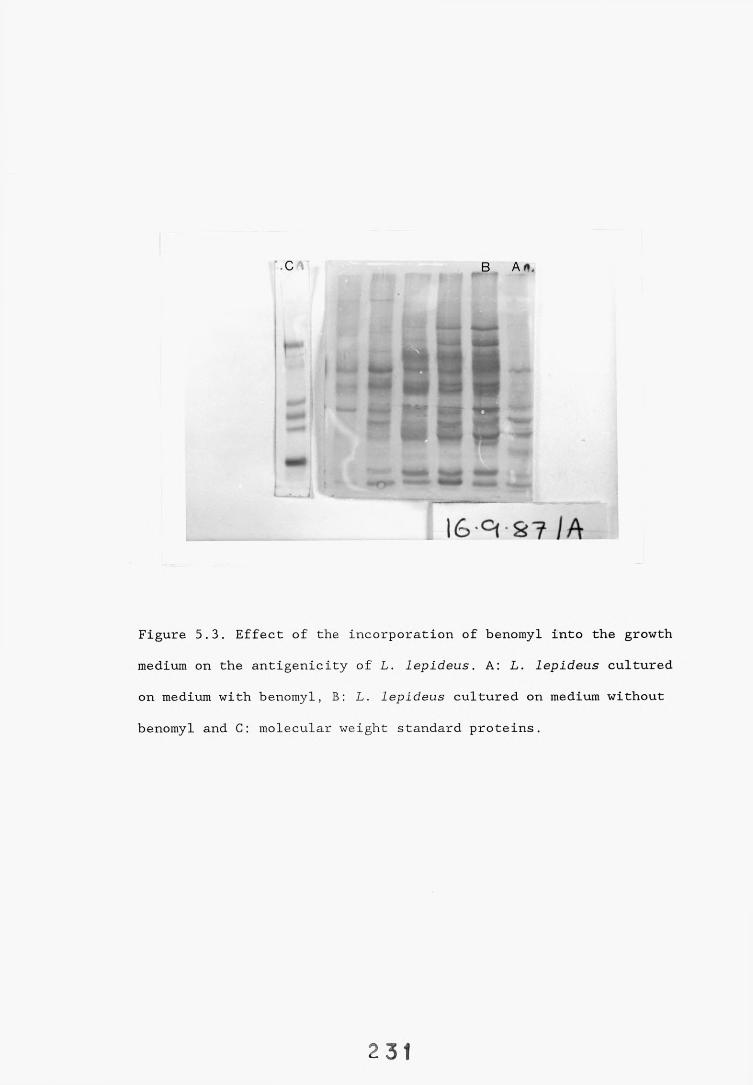
B Art.
\G °i S? /A
Figure 5.3. Effect of the incorporation of benomyl into the growth medium on the antigenicity of L. lepideus. A: L. lepideus cultured on medium with benomyl, B: L. lepideus cultured on medium without benomyl and C: molecular weight standard proteins.
231
5.2.2.3. Comparison of antisera raised against mycelial L. levideus antigens (AsM) and L. levideus antigens cultured on lime wood blocks (AsW).
Comparison of the antigenic profile obtained when tracks were stained with the two antisera showed far fewer bands were produced when the AsW antiserum was used (Figure 5.4 tracks 12-13). When the AsM antiserum was employed numerous antigen bands were observed including all those stained using the AsW antiserum.
5.2.3. Determination of the chemical nature of individual L. levideus antigen bands.
An alternative electrophoresis/blotting system was employed for this analysis and the L. lepideus antigenic profile obtained had many more bands than that observed using the Bio-Rad mini-gel system (see section 4.2.3). Detailed molecular weight analysis of the antigen bands obtained was not possible due to the severe background staining of the molecular weight standard tracks. Fourteen bands (numbered 1-14 in the increasing order of molecular weight) were clearly discernable in untreated extracts. Changes in the antigenic profiles observed will be discussed with with reference to these bands.
5.2.3.1. Enzyme hydrolysis.
L. lepideus whole cell antigen extracts were exposed to a variety of commercial and crude enzyme preparations and the affect on the antigenic profile noted. The enzymes were employed at their
2 3 2

optimum pHs (ranging from 4.2-7.6) and untreated L. lepideus mycelial antigens extracted under identical experimental conditions were included to eliminate the possibility of changes being caused by the different pH conditions. Enzyme-only control samples were also included. Band 8 was not detected in the blot shown in Figure 5.4 and therefore the effect of the proteases, lipase and B-galactosidase on this antigen band remain unknown.
5.2.3.1a. B-galactosidase.Treatment of the L. lepideus antigen extract with
B-galactosidase resulted in the elimination of five bands and a reduction in the intensity of four bands (Table 5.2). Although bands 12-14 were lost, several new bands were visualised in this region. The results obtained are presented in Figure 5.4 tracks A-C. A few faint bands, notably at positions 1, between 5 and 6, and 7 were present in the enzyme control track.
5.2.3.1b. Lipase.Treatment of the L. lepideus antigen extract with lipase
resulted in the elimination of seven bands and a reduction in the intensity of two (Table 5.2). The results obtained are presented in Figure 5.4 tracks D-F. A very faint band at position 1 was present in the enzyme control track.
5.2.3.I.C. Trypsin.Treatment of the L. lepideus antigen extract with trypsin
resulted in the elimination of eleven bands and a reduction in the
2 3 3
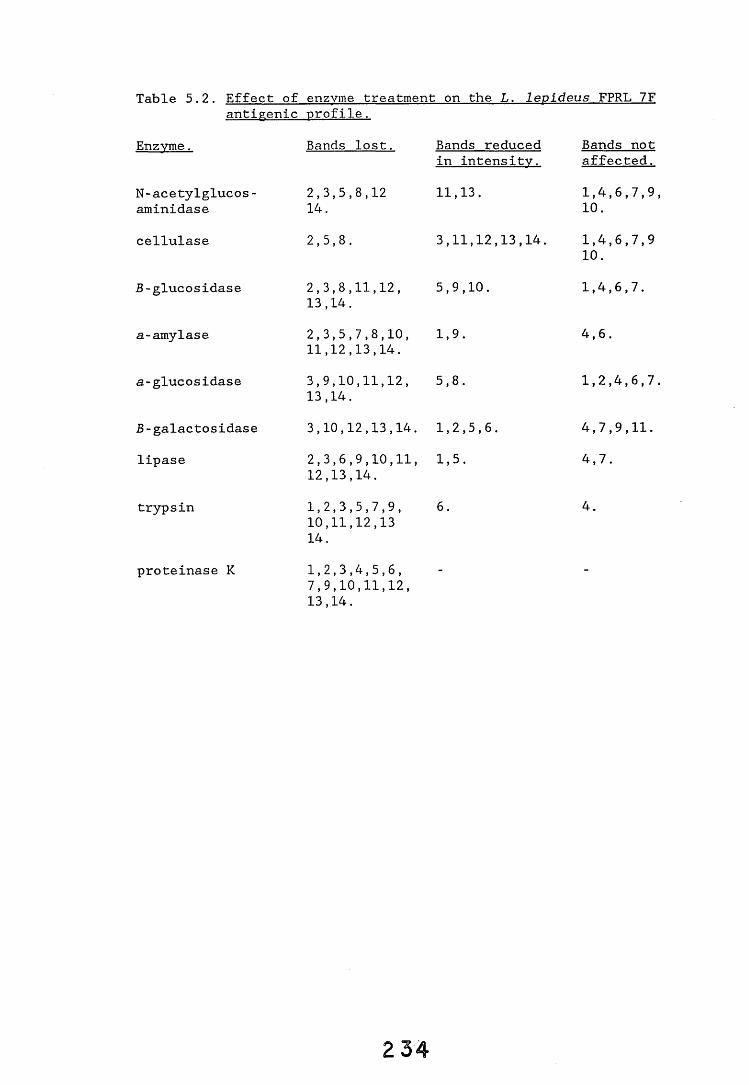
Table 5.2. Effect of enzyme treatment on the L. lepideus FPRL 7Fantigenic nrofile.
Enzyme. Bands lost. Bands reduced in intensity.
Bands not affected.
N-acetylglucos-aminidase
2,3,5,8,1214.
11,13. 1,4,6,7,9 10.
cellulase 2,5,8. 3,11,12,13,14. 1,4,6,7,9 10.
B-glucosidase 2,3,8,11,12,13,14.
5,9,10. 1,4,6,7.
a-amylase 2,3,5,7,8,10,11,12,13,14.
1,9. 4,6.
a-glucosidase 3,9,10,11,12,13,14.
5,8. 1,2,4,6,7
B-galactosidase 3,10,12,13,14. 1,2,5,6. 4,7,9,11.lipase 2,3,6,9,10,11,
12,13,14.1,5. 4,7.
trypsin 1,2,3,5,7,9,10,11,12,1314.
6. 4.
proteinase K 1,2,3,4,5,6,7,9,10,11,12,13,14.
- -
2 3 4
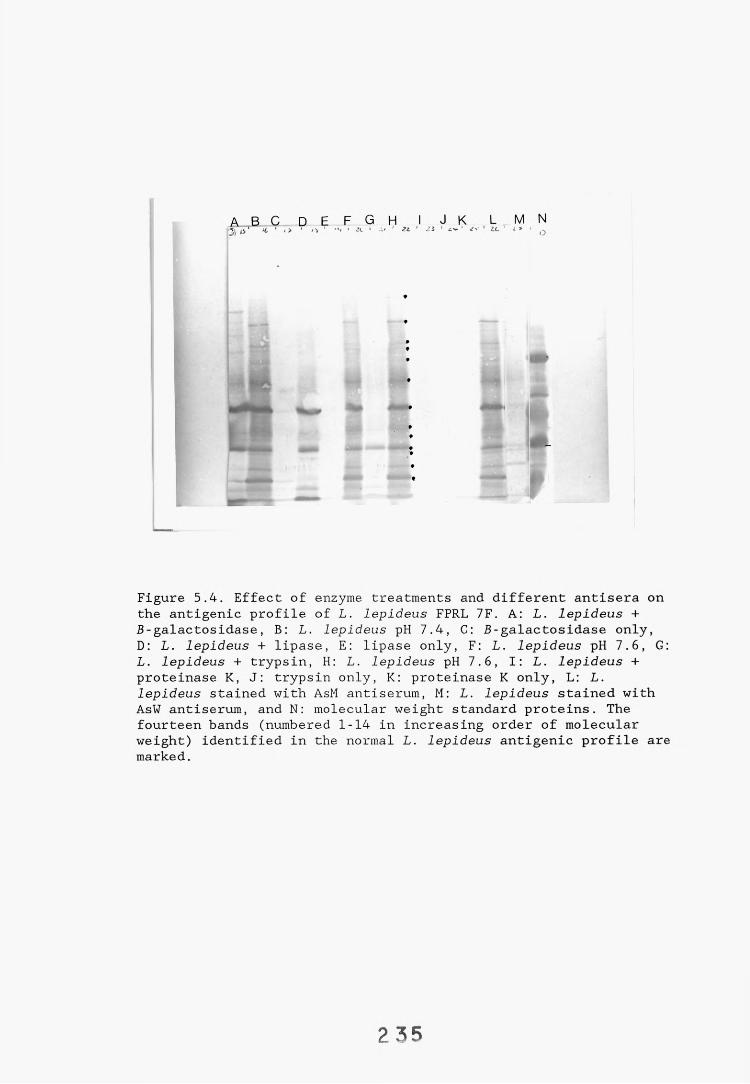
a b c d e f g h i j k l m nIS 1 t 1 •> ' 'V ' '*< ' .21. 1 - • ‘ zi ' 21 ’ £ • * ' <?■>■ 1 1C - » 1 £
Figure 5.4. Effect of enzyme treatments and different antisera on the antigenic profile of L. lepideus FPRL 7F. A: L. lepideus +B-galactosidase, B: L. lepideus pH 7.4, C: B-galactosidase only,D: L. lepideus + lipase, E: lipase only, F: L. lepideus pH 7.6, G: L. lepideus + trypsin, H: L. lepideus pH 7.6, I: L. lepideus + proteinase K, J: trypsin only, K: proteinase K only, L: L. lepideus stained with AsM antiserum, M: L. lepideus stained with AsW antiserum, and N: molecular weight standard proteins. The fourteen bands (numbered 1-14 in increasing order of molecular weight) identified in the normal L. lepideus antigenic profile are marked.
2 35
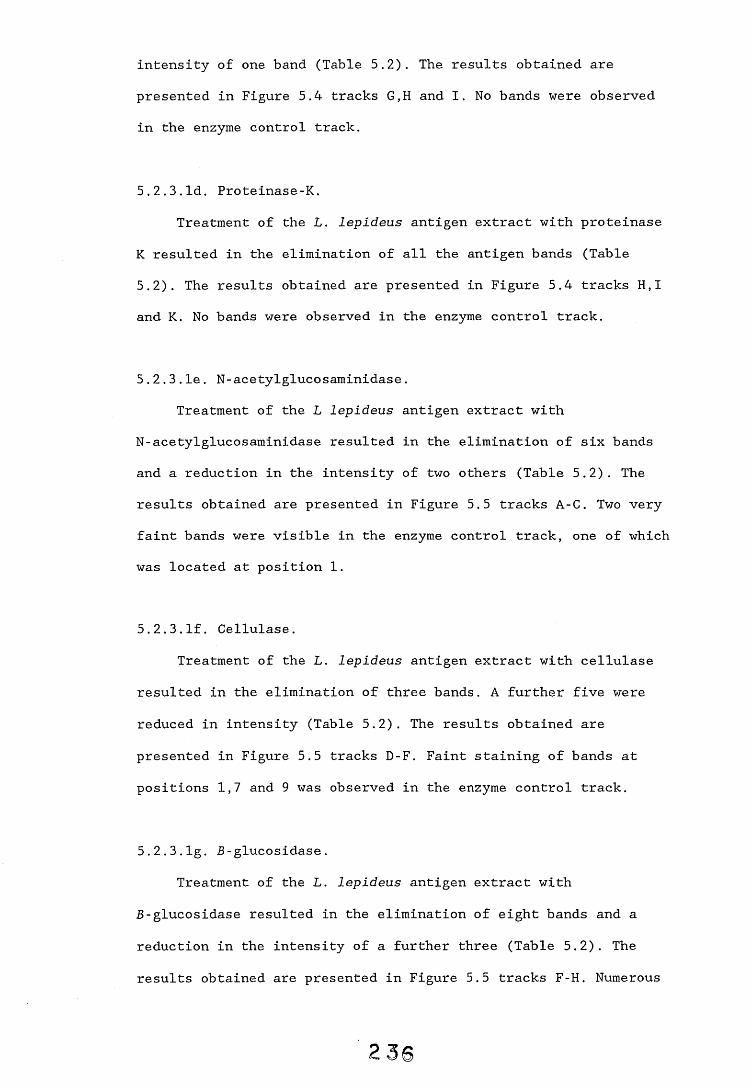
intensity of one band (Table 5.2). The results obtained are presented in Figure 5.4 tracks G,H and I. No bands were observed in the enzyme control track.
5.2.3.Id. Proteinase-K.Treatment of the L. lepideus antigen extract with proteinase
K resulted in the elimination of all the antigen bands (Table 5.2). The results obtained are presented in Figure 5.4 tracks H,I and K. No bands were observed in the enzyme control track.
5.2.3.le. N-acetylglucosaminidase.Treatment of the L lepideus antigen extract with
N-acetylglucosaminidase resulted in the elimination of six bands and a reduction in the intensity of two others (Table 5.2). The results obtained are presented in Figure 5.5 tracks A-C. Two very faint bands were visible in the enzyme control track, one of which was located at position 1.
5.2.3.If. Cellulase.Treatment of the L. lepideus antigen extract with cellulase
resulted in the elimination of three bands. A further five were reduced in intensity (Table 5.2). The results obtained are presented in Figure 5.5 tracks D-F. Faint staining of bands at positions 1,7 and 9 was observed in the enzyme control track.
5.2.3.1g. 5-glucosidase.Treatment of the L. lepideus antigen extract with
B-glucosidase resulted in the elimination of eight bands and a reduction in the intensity of a further three (Table 5.2). The results obtained are presented in Figure 5.5 tracks F-H. Numerous
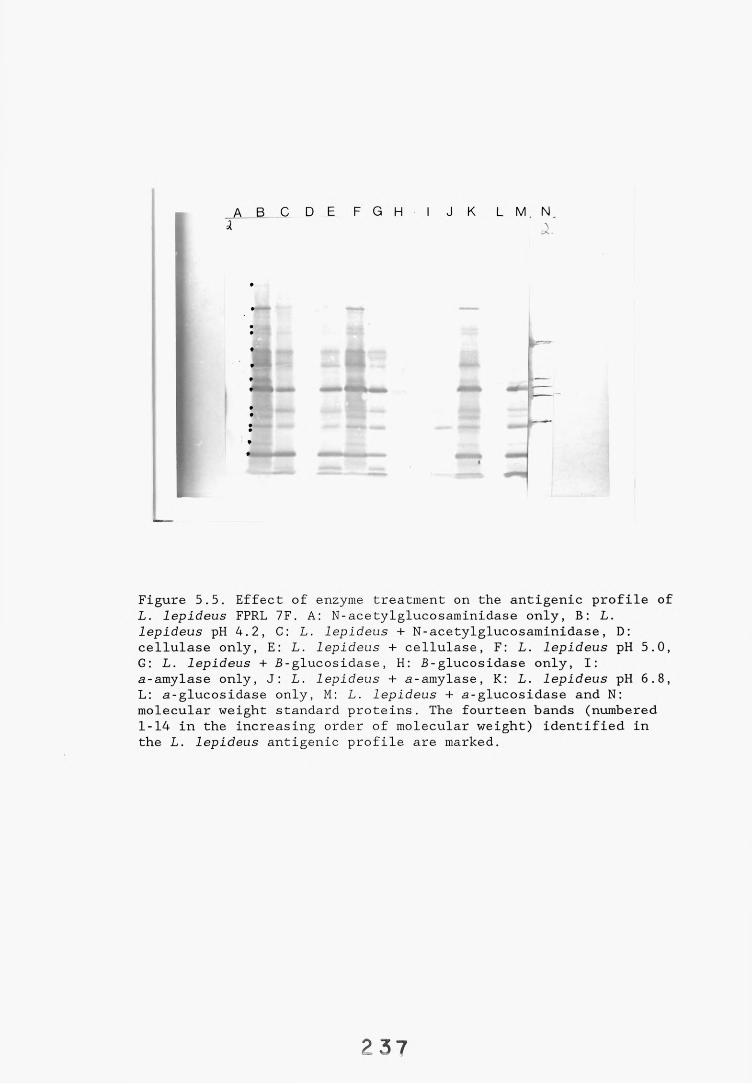
A B C D E F G H I J K L M . Nsi y
Figure 5.5. Effect of enzyme treatment on the antigenic profile of L. lepideus FPRL 7F. A: N-acetylglucosaminidase only, B: L. lepideus pH 4.2, C: L. lepideus + N-acetylglucosaminidase, D: cellulase only, E: L. lepideus + cellulase, F: L. lepideus pH 5.0, G: L. lepideus + B-glucosidase, H: £-glucosidase only, I: a-amylase only, J: L. lepideus + a-amylase, K: L. lepideus pH 6.8, L: a-glucosidase only, M: L. lepideus + a-glucosidase and N: molecular weight standard proteins. The fourteen bands (numbered 1-14 in the increasing order of molecular weight) identified in the L. lepideus antigenic profile are marked.
2 37
bands were visualised in the enzyme control track including a major band immediately below the band 10 position of the L. lepideus antigenic profile.
5.2.3.1h. a-amylase.Treatment of the L. lepideus antigen extract with a-amylase
resulted in the elimination of ten bands and a reduction in the intensity of a further two (Table 5.2). The results obtained are presented in Figure 5.5 tracks I-K. No bands were observed in the enzyme control track.
5.2.3.H. a-glucosidase.Treatment of the L. lepideus antigen extract with
a-glucosidase resulted in the elimination of seven bands and a reduction in the intensity of two bands (Table 5.2). The results obtained are presented in Figure 5.5 tracks K-M. A group of bands in the region of position 7-8 were present in the enzyme control track.
5.2.3.1j . Trichoderma harzianum crude enzyme extracts.Three crude enzyme extracts were prepared from T. harzianum
cultured on malt extract broth containing chitin and laminarin (Th extract 1), chitin only (Th extract 2) and no additives (Th extract 3). Treatment of the L. lepideus antigen extract with these extracts individually resulted in the elimination of several
bands and a reduction in the intensity of several others (Table 5.3). The results obtained are presented in Figure 5.6 tracks B and I-K. Identical results were obtained with extracts Th 1 and Th 2. Th 3 differed from the other two extracts in that it failed to have any effect on band 2 and only caused a reduction in band
2 3 8
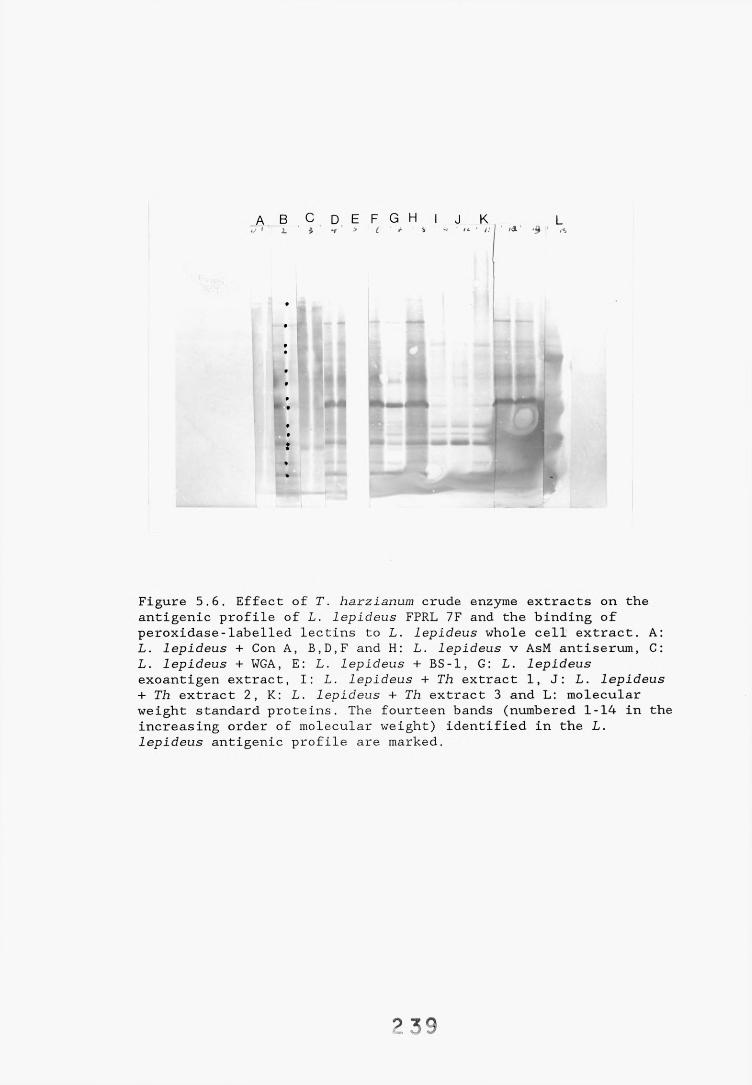
a b c d e f g h1 i *r > t ' +
J K L■ n. ‘ a ‘ (4.
Figure 5.6. Effect of T. harzianum crude enzyme extracts on the antigenic profile of L. lepideus FPRL 7F and the binding of peroxidase-labelled lectins to L. lepideus whole cell extract. A: L. lepideus + Con A, B,D,F and H: L. lepideus v AsM antiserum, C: L. lepideus + WGA, E: L. lepideus + BS-1, G: L. lepideus exoantigen extract, I: L. lepideus + Th extract 1, J: L. lepideus + Th extract 2, K: L. lepideus + Th extract 3 and L: molecular weight standard proteins. The fourteen bands (numbered 1-14 in the increasing order of molecular weight) identified in the L. lepideus antigenic profile are marked.
239
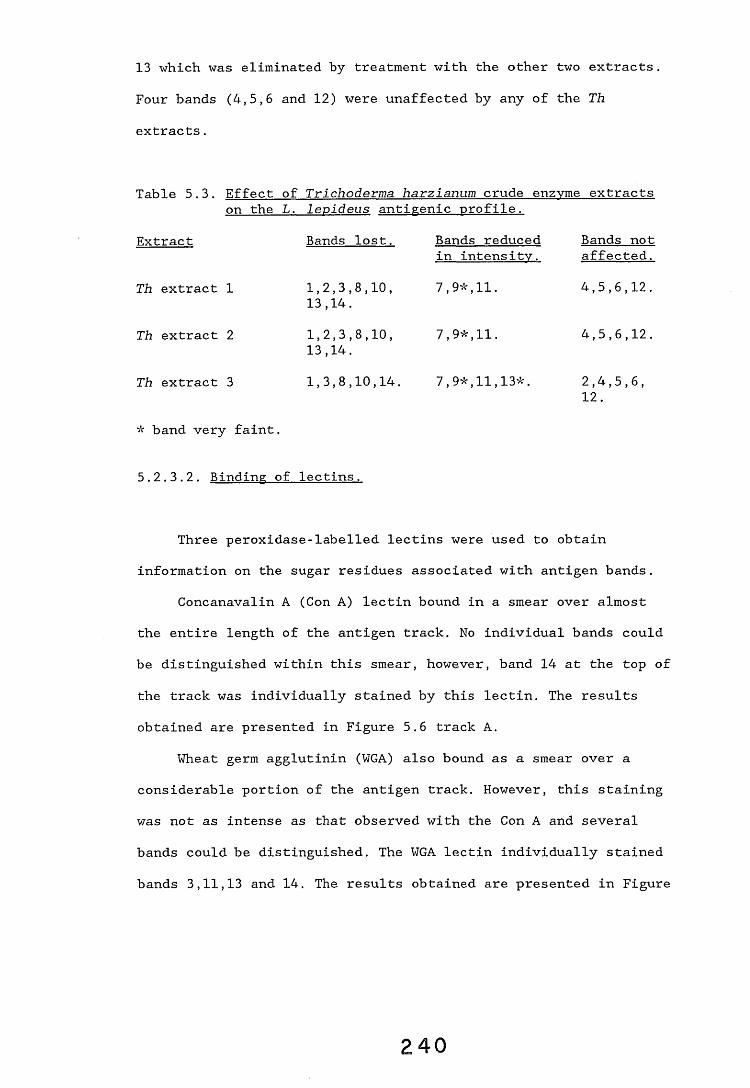
13 which was eliminated by treatment with the other two extracts. Four bands (4,5,6 and 12) were unaffected by any of the Th extracts.
Table 5.3. Effect of Trichoderma harzianum crude enzvme extractson the L. levideus antigenic -profile.
Extract Bands lost. Bands reduced in intensitv.
Bands not affected.
Th extract 1 1,2,3,8,10,13,14.
7,9*,11. 4,5,6,12.
Th extract 2 1,2,3,8,10,13,14.
7,9*,11. 4,5,6,12.
Th extract 3 1,3,8,10,14, 7,9*,11,13*. 2,4,5,6, 12.
* band very faint.
5.2.3.2. Binding of lectins.
Three peroxidase-labelled lectins were used to obtain information on the sugar residues associated with antigen bands.
Concanavalin A (Con A) lectin bound in a smear over almost the entire length of the antigen track. No individual bands could be distinguished within this smear, however, band 14 at the top of the track was individually stained by this lectin. The results obtained are presented in Figure 5.6 track A.
Wheat germ agglutinin (WGA) also bound as a smear over a considerable portion of the antigen track. However, this staining was not as intense as that observed with the Con A and several bands could be distinguished. The WGA lectin individually stained bands 3,11,13 and 14. The results obtained are presented in Figure
2 4 0
5.6 track C.No staining was observed when the Bandeiraea simplicifolia
(BS-1) lectin was used (Figure 5.6 track E).
5.3. Discussion.
There are several potential applications of the data generated by characterisation studies of fungal antigens. For example, identification of a specific antigenic epitope and its subsequent characterisation can permit the selection of the most appropriate extraction procedure. In addition, standard antigen extracts are required for use in diagnostic tests and the definition of chemical and immunological properties of such extracts is useful to check the efficiency of standardisation procedures. Furthermore, as in bacteria, variations in the overall wall composition tend to follow phylogenetic lines and the data has been of help in bacterial classification (Bartnicki-Garcia, 1968; Smith et al., 1986). Chemical and immunological analysis of fungal cell wall extracts could possibly form the basis of an improved classification scheme.
5.3.1. Chemical nature of L. lepideus antigen extracts.
Carbohydrates/polysaccharides were demonstrated to be the major component within the fungal antigen extract although a significant amount of protein was also detected. The importance of protein in the fungal extract was emphasised by the results obtained with the silver stained SDS-PAGE gel. The high level of carbohydrate found in the antigen extract is not unexpected since it is known that polysaccharides usually comprise more than 75%
(by weight) of the isolated fungal cell wall (Rosenberger, 1976). Numerous carbohydrate-based polymers have been isolated from fungal cell walls including, B (1-3)-glucan which when present can comprise between 15-30% of the total wall polysaccharide, a(l-3)-glucan, a major component (15-25%) of the walls of ascomycete and basidiomycete fungi. In addition, the majority of fungi including the Basidiomycotina have a microfibrillar cell wall chitin (£(1-4) poly-N-acetylglucosamine) component (Bartnicki-Garcia, 1968). The chitin content of walls is quite variable, from 5% (by weight) in Schizophyllum to 60% in Sclerotium (Rosenberger, 1976). Considerable quantities of protein (10-15% by weight) have also been shown to be present in the cell wall and may play a role in cross-linking polysaccharide components (Rosenberger, 1976). Furthermore, extensive protein will be present in the cell cytoplasm and membranes.
Studies on purified, or partially purified, fungal antigenic components have identified the important role of carbohydrates (Hayashi et al., 1978; Schumacher et al., 1975), proteins (Al-Rammahy et al., 1978; Chard et al., 1985) and glycoproteins (Graves et al. , 1986; Hearn and MacKenzie, 1979, 1980) in fungal antigenicity. Comparatively few reports of lipid-associated fungal antigens have been made. Azuma et al. (1967, 1969) identified a lipopolysaccharide antigenic component in Aspergillus fumigatus and Chard (1981) reported the involvement of lipid in an antigenic fraction from Mycena galopus.
2 4 2
5.3.2. Effect of cultural conditions.
Several authors (Burrell et al., 1968; Chard, 1981, Clayton
et al., 1964, Vigrow et al., 1989, 1990) have noted that the antigenicity of fungi can be affected by cultural conditions such as the type and concentration of the nitrogen source i.e. the growth medium and the age of the culture.
The results obtained in this study indicate that in the early stages of development not all antigens are present. As the fungal mycelium ages, some antigens increase in quantity and other new antigens are produced. It is also likely that at the late stage of development, some antigens would be reduced and/or lost due to autolysis of the fungal mycelium.
The incorporation of benomyl (methylbutylcarbamoyl benzimidazole, 2-yl-carbamate) into the growth medium caused a marked decrease in the number of bands observed in the L. lepideus
antigenic profile. The benomyl was initially included in the medium to prohibit contamination by mould fungi and its use was continued for the sake of standardisation in antigen preparations. However, benomyl has been shown to cause morphological and ultrastruetural alterations in several moulds (Richmond and Pring, 1971). Furthermore, Monistrol et al. (1988) have reported that although benomyl, at sub-lethal doses, does not have a marked effect on the total amount of extracellular proteins in the culture filtrate of Cladosporium cucumerinum the secretion of specific proteins appears to be affected. Electrophoretic analysis of fungal extracts of extracellular proteins showed that the banding profile was altered when benomyl was incorporated into the growth medium. A similar change in the electrophoretic profile of
243
L. lepideus when cultured with benomyl was observed in this study. Although the growth of L. lepideus is not inhibited by benomyl at the concentration used (4ppm), the fungicide may be affecting the expression of some antigens. The observed change in the antigenic profile of L. lepideus when cultured on medium containing benomyl could possibly be due to structural modification of antigens and/or interference in the secretion of extracellular antigens.
5.3.3. Characterisation of L. levideus antigens.
5.3.3.1. Enzyme hydrolysis.
The enzymes employed in the characterisation studies can be classified into four groups: (i) proteases; trypsin and proteinase K, which hydrolyse proteins, (ii) endoglycosidases; a-amylase and cellulase, which hydrolyse bonds within sugar chains, (iii) exoglycosidases; a-glucosidase, B-glucosidase, B-galactosidase and N-acetylglucosaminidase, which hydrolyse the bonds of terminal sugar residues, and (iv) lipase, which hydrolyse esters of fatty acids. Chemical analyses of 1. lepideus antigen extracts indicates that there are considerable quantities of both carbohydrate and protein present. The results obtained with the enzymes confirm the presence of both these chemical species, either singly or in combination as glycoproteins, in L. lepideus antigens.
The loss of antigenicity found after treatment with the protease enzymes indicates that protein moieties are associated with all fourteen of the antigen bands studied.
Similarily the results obtained with the endo- and exoglycosidase enzymes indicate that carbohydrates are associated with the majority of the L. lepideus antigens. The effects on
several bands of a number of carbohydrases emphasises the complexity of the carbohydrate moieties associated with these antigens. The observation that many of the antigen bands underwent hydrolysis when exposed to enzymes with specificities directed towards glucosides suggests that glucose is a major component of the extract and this is further supported by results obtained with the concanavalin A lectin, although the latter also binds to a-mannoside residues. Chemical analyses, carried out in this department, have also revealed that glucose is the principal monosaccharide in acid hydrolysates of L. lepideus extracts (D. Button, personal communication). These results are consistent with the information already known about the role of glucose in fungal cell walls.
The reduction in intensity of antigen bands observed with the exo-glycosidases could be explained by differences in antibody specificity within the polyclonal antiserum. That is, antibodies to proteins bearing sugar side chains (i.e. glycoproteins) could be directed to the protein component or the sugar component. Subsequently, treatment with individual exo-glycosidases would prevent attachment of antibodies to the sugar residue but still permit the attachment of antibodies recognising the protein moiety thus causing a reduction in the intensity of the antigen band but not its elimination.
Poly-N-acetylglucosamine is known to be major component in the cell walls of many fungi (Rosenberger, 1976). The results obtained using the N-aetylglucosaminidase and theperoxidase-labelled WGA lectin indicated that significant amounts of this sugar was present in the L. lepideus extract. Some
correlation was observed between those antigen bands affected by the enzyme treatment and those subsequently stained by the lectin.
2 4 5
These findings support those of Chen and Johnson (1983) who reported a cell wall chitin content of 9.58% for L. lepideus.
When L. lepideus antigen extracts were exposed to lipase the majority of the antigen bands in the profile were affected suggesting that fatty acid residues are associated with these antigens. This is perhaps suprising since relatively few reports of lipoprotein or lipopolysaccharide fungal antigens have been made in comparison with the large numbers of carbohydrate, protein and glycoproteins antigens.
In addition to the commercially prepared enzymes, three crude enzyme extracts from T. harzianum were prepared according to the method detailed by Peberdy and Isaacs (1976). Hearn and MacKenzie (1979) have reported that a crude culture filtrate from T. harzianum (prepared using chitin and laminarin in the medium) is capable of hydrolysing a wide range of polysaccharides and also shows protease activity. Furthermore, T. harzianum has been shown to lyse L. lepideus mycelium in agar interaction studies (Bruce,1983) and produce volatiles active against this fungus (Bruce,1984) . The results obtained using the three crude enzyme extracts indicate that the majority of the lytic enzymes are produced by the fungus when grown in any one of the three growth substrates. The factor responsible for the elimination of antigen band 2 is not produced in the malt extract broth medium and is induced in the presence of chitin. Possibly an N-acetylglucosamine component is associated with antigen band 2. The elimination of this band upon treatment with the commercial N-acetylglucosaminidase supports this hypothesis. Use of the Th extracts to characterise fungal antigens would require isolation and identification of the specific active components present. However, the crude extracts could have applications in the partial purification of L. lepideus
2 4 6
extracts by the removal of unwanted antigen bands.The enzymes used in this study were mainly commercial
preparations. Such preparations often contain impurities, for example other enzymes, which can interfere in the analysis by affecting unrelated components. The presence of such impurities in the lipase enzyme preparation would explain it's unexpectedly severe effect upon the L. lepideus antigen extract. The almost ubiquitous affect of the lipase enzyme is consistent with
protease/a-amylase contamination.In some enzyme treated extracts, new bands were present in
the antigenic profile. Possibly hydrolysis of the molecule was occurring in a region some distance from the antigenic site. This would result in a reduction in molecular weight but not affect the antibody binding site, thus permitting visualisation of the band but in slightly different position. However, further work is required before any conclusions can be drawn about such antigen processing.
5.3.3.2. Binding of lectins.
The use of peroxidase-labelled lectins to detect glycoproteins blotted onto nitrocellulose has been reported by several authors (Glass et al., 1981 and Kijimoto-Ochiai et al. ,1985) . The lectins employed in this study were used to localise specific sugar residues in the glycoprotein antigens.
Concanavalin A (Con A) has an affinity for terminal a-D-mannosyl and a-D-glucosyl (Gunther et al., 1973). The intensely stained smear obtained with the Con A indicates the presence of significant amounts of one or both of these sugar residues. Glucose has been implicated as a major component in the
2 4 7
antigen extract (see section 5.3.3.1) and therefore the a-D-glucosyl residue is likely to be the dominant residue.
Wheat germ agglutinin (WGA) has an affinity for N-acetyl-B-D-glucosamine oligomers (Nagata and Burger, 1974). The sensitivity of several antigen bands to N-acetylglucoaminidase and their subsequent staining with the WGA lectin indicates this sugar is a component of those antigens. The smear effect observed in the WGA stained track indicates that substantial quantities of this sugar are present in the L. lepideus antigen extract.
The Ban.deira.ea simplicifolia (BS-1) lectin has a major affinity for terminal a-D-galactosyl residues and a secondary affinity for terminal N-acetyl-a-D-galactosaminyl residues (Hayes and Goldstein, 1974). Although no staining was observed in the western blot, some interaction was observed between L. lepideus and this lectin in preliminary dot-immunobinding assay optimisation studies. This suggests that this sugar residue(s) may be present in small quantities in the L. lepideus antigen extract but may be below the detection limit in the western blotted antigens.
The aims of the study outlined at the start of this chapter have been partially fulfilled. The determination of some basic chemical characteristics and the effect of various cultural conditions on L. lepideus antigenicity have been ascertained. Although, a detailed structural analysis of any antigenic component was well without the scope of this study the results obtained in the characterisation study enabled general conclusions on the nature of L. lepideus antigens to be made. Several conclusions can be drawn from the work reported in this chapter:
1. Carbohydrate is the major component in the L. lepideus antigen extract but a significant quantity of protein is also present.
2. Cultural conditions, including the age of the culture and the growth substrate, effect the antigenicity of L. lepideus.
3. The majority of L. lepideus antigens investigated in this study were glycoproteins. Protein antigens were also identified. 4
4. Further work to elucidate the role of individual sugar residues in the glycoprotein antigens is required.
CHAPTER 6. APPLICATION OF IMMUNOLOGICAL TECHNIQUES TO THE DETECTION OF L. LEPIDEUS IN ARTIFICIALLY INFECTED WOOD BLOCKS.
2 5 0
6.1. Introduction.
Work already reported in this thesis (chapters 3-5) has shown that immunological techniques can be used to detect and analyse mycelial extracts of L. lepideus. However, a prerequisite of the development of an assay to detect incipient fungal decay, and in particular incipient decay in distribution poles, is the ability to detect fungal antigens within infected wood. Experience in other fields suggests that this would be possible. For example, immunological methods have been used extensively in plant pathology to diagnose fungal disease. ELISA has been used to detect fungi in field crops (Aguelon and Dunez, 1984, Johnson et al., 1982, Walcz et al., 1985), in woody twigs (Leise et al.,1982) and in stored rice grains (Dewey et al., 1989). Immunofluorescence techniques have been used to detect and study the ecology of the leaf litter fungus Mycena galopus (Chard et al., 1983, 1985) and in the detection of fungal mycelium in barley grains (Warnock, 1971). More recently immunological methods have been used to detect fungal disease/decay in both living trees and post-harvest timber. Dewey and Brasier (1988) have reported the use of ELISA to detect Ophiostoma ulmi in diseased elms and Benhamou et al. (1986) detected this fungus in elm wood sections using immunocytochemical methods. In addition immunological techniques have been used to detect the sap-staining fungus Ophiostoma sp. C28 (Breuil et al., 1988), and the wood decay fungi Poria placenta (Goodell and Jellison, 1986, Goodell et al., 1988), L. lepideus (Glancy et al., 1989), Serpula lacrymans and Coriolus versicolor (Palfreyman et al., 1987, 1988). During this project, to determine the ability of the reagents produced to react with fungal antigens in wood, systems were set up using both pine and
2 5 1
lime sapwood blocks. Conventional weight loss and a variety of immunological studies were subsequently.carried out on this material.
The conventional method of determining the extent of decay in laboratory wood block systems is weight loss (Bravery, 1975) . Wood blocks are subjected to fungal infection, any differences between the initial and final weights of individual blocks noted and percentage weight losses calculated. Weight losses were calculated for all the wood blocks used in this study to provide a standard by which immunological systems could be judged. A 3% level of weight loss is generally considered as the minimum criterion of decay (Bravery, 1968, 1975, BS 6009, 1982) since leaching of soluble nutrients can account for weight losses up to this level. Weight loss measurements can therefore give no indication of early colonisation of wood and can only be used to detect decay once an organism has become established. In contrast, immunologically-based detection systems, with their greater sensitivity, can potentially detect fungi at very early stages of colonisation (Goodell and Jellison, 1986).
Furthermore, in addition to the immunological detection systems mentioned in previous chapters, an antigen capture assay (ACA) was developed to screen the wood block extracts. Such assays enable the use of crude antigen extracts, are commonly employed to screen complex antigen mixtures and field samples (Clark and Bar-Joseph, 1984) and thus could be particularly suitable to screen wood block extracts.
2 5 2
aims.1. To determine whether immunological systems could be usedto detect L. lepideus in extracts from both softwood and hardwood
blocks.
2. To determine whether any correlation existed between the weight loss and antigen levels as measured by a variety of immunological systems.
3. To evaluate the potential of various immunological systems as screening assays for field samples from distribution poles.
4. To evaluate the use of immunological staining techniquesin obtaining information on the localisation and spread of the L. lepideus within wood.
6.2. Results.
6.2.1. Weight loss in infected blocks.
Pine and lime were chosen as a representative softwood and hardwood respectively. The mean weight losses obtained for each incubation period are presented in Table 6.1. The weight losses observed in the lime wood blocks were apparently higher than those observed in the pine wood blocks, that is, the hardwood seemed to be more susceptible to decay by L. lepideus than the softwood. The low weight losses observed in the pine after 12 weeks probably
The work undertaken and reported in this chapter had several
2 5 3
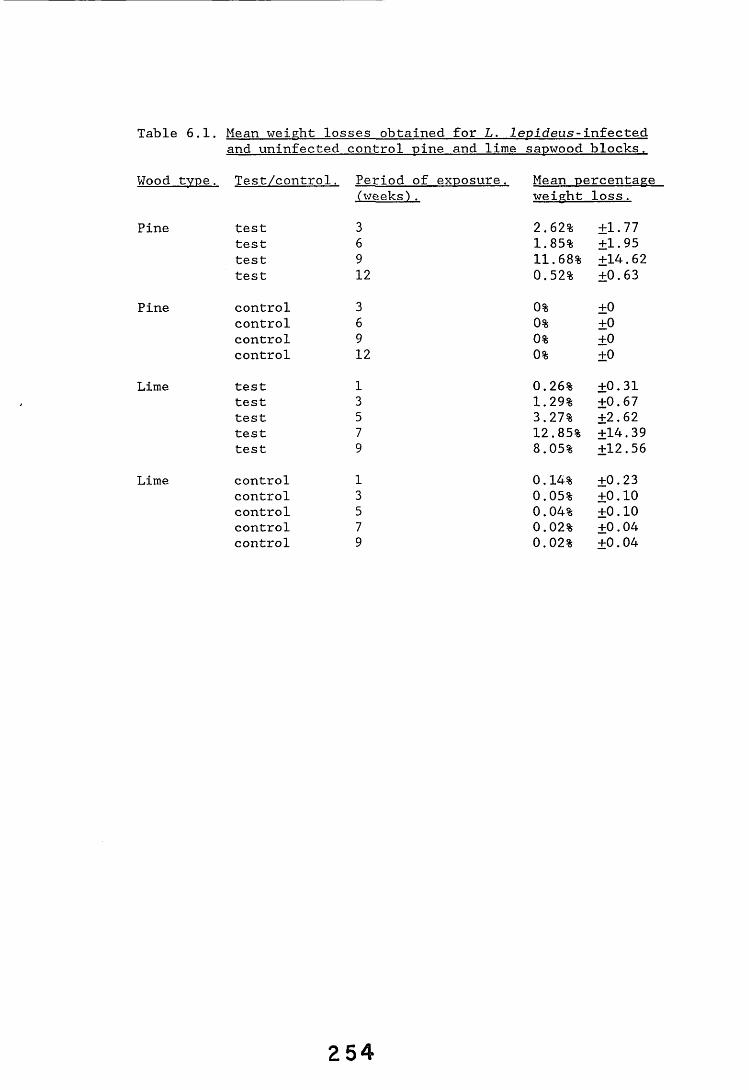
Table 6.1. Mean weight losses obtained for L. levideus-infected and uninfected control pine and lime sapwood blocks.
Wood type. Test/control. Period of exnosure. Mean Dercentage('weeks') . weight loss.
Pine test 3 2.62% ±1.77test 6 1.85% ±1.95test 9 11.68% ±14.62test 12 0.52% ±0.63
Pine control 3 0% ±0control 6 0% ±0control 9 0% ±0control 12 0% ±0
Lime test 1 0.26% ±0.31test 3 1.29% ±0.67test 5 3.27% ±2.62test 7 12.85% ±14.39test 9 8.05% ±12.56
Lime control 1 0.14% ±0.23control 3 0.05% +0.10control 5 0.04% ±0.10control 7 0.02% ±0.04control 9 0.02% ±0.04
2 5 4
reflects the fact these blocks had a very high moisture contents (>150%) which may have been limiting for fungal colonisation and/or decay.
6.2.2. Immunological detection systems.
Neither immunodiffusion or EIA proved useful methods for the immunodetection of L. lepideus in wood. No precipitation arcs were formed between the antiserum and any of the extracts tested from infected wood blocks. In the EIA for "soluble" antigens high levels of non-specific binding of antibody reagents to extracts from uninfected control blocks were encountered effectively preventing the use of this system to screen block extracts for the presence of L. lepideus.
6.2.2.1. Dot-immunobinding assay.
A total of 68 wood block extracts (29 pine and 39 lime) were screened in the dot-immunobinding assay for the presence of L. lepideus. Six two-fold dilutions of each block extract were tested against the antiserum. Uninfected wood block negative controls and L. lepideus mycelial extract positive controls (twelve two-fold dilutions) were included in each assay. The two least dilute preparations of each extract were also tested against pre-immune control serum. Previous experiments had indicated that rabbit serum cross-reacted non-specifically with both pine and lime sawdust and therefore sera were routinely preabsorbed with the appropriate sawdust before use in the assay. Representative results obtained in the assay screening a series of pine blocks and lime blocks are presented in Figures 6.1 and 6.2 respectively.
2 5 5
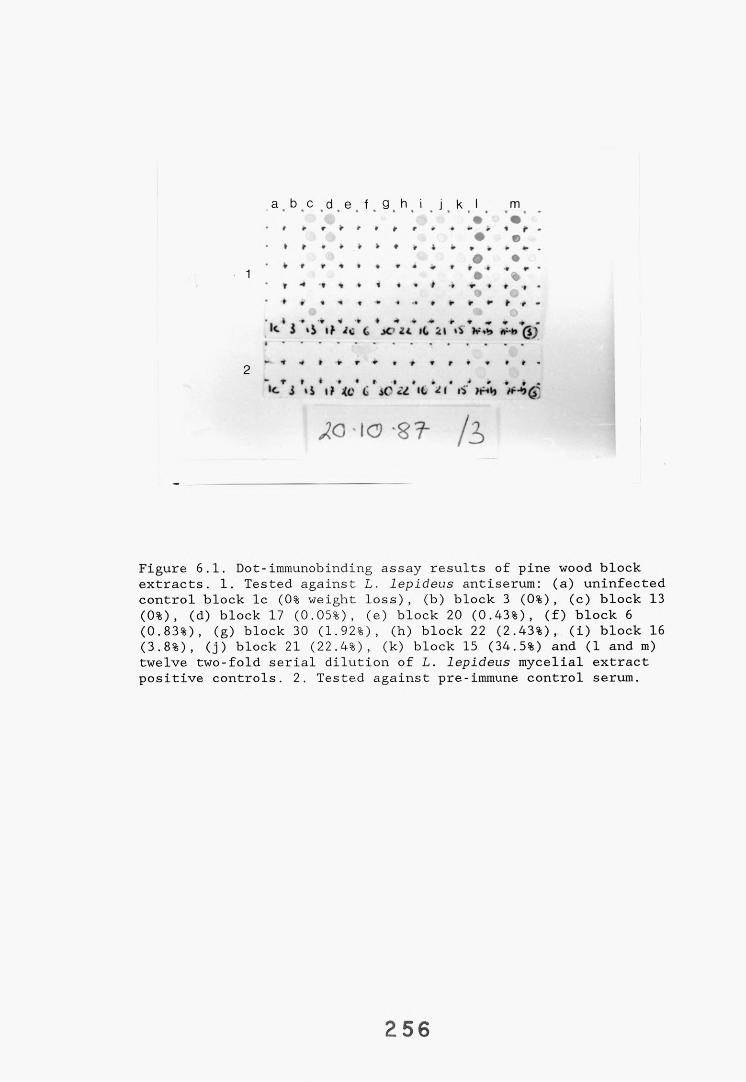
a b c d e f . g h i j k I m
t r r *
» f * * V r r *
» * •* %
* ■? » i • * r t « * * .•<* $ *5 I * C JC> it i t 21 «V frb (5 )
► *• r * *
* * r i ** f
* * * % .# •• %t « » / • » * • * r •» *• @
©♦ * » • r * «
“ T f • t • # » f r « f «*<- i ‘ i l? ic L iC I t l i /*-*>(£
^ 0 - l C ? ' § ? / 2 ,
Figure 6.1. Dot-immunobinding assay results of pine wood block extracts. 1. Tested against L. lepideus antiserum: (a) uninfectedcontrol block lc (0% weight loss), (b) block 3 (0%), (c) block 13(0%), (d) block 17 (0.05%), (e) block 20 (0.43%), (f) block 6 (0.83%), (g) block 30 (1.92%), (h) block 22 (2.43%), (i) block 16 (3.8%), (j) block 21 (22.4%), (k) block 15 (34.5%) and (1 and m) twelve two-fold serial dilution of L. lepideus mycelial extract positive controls. 2. Tested against pre-immune control serum.
256
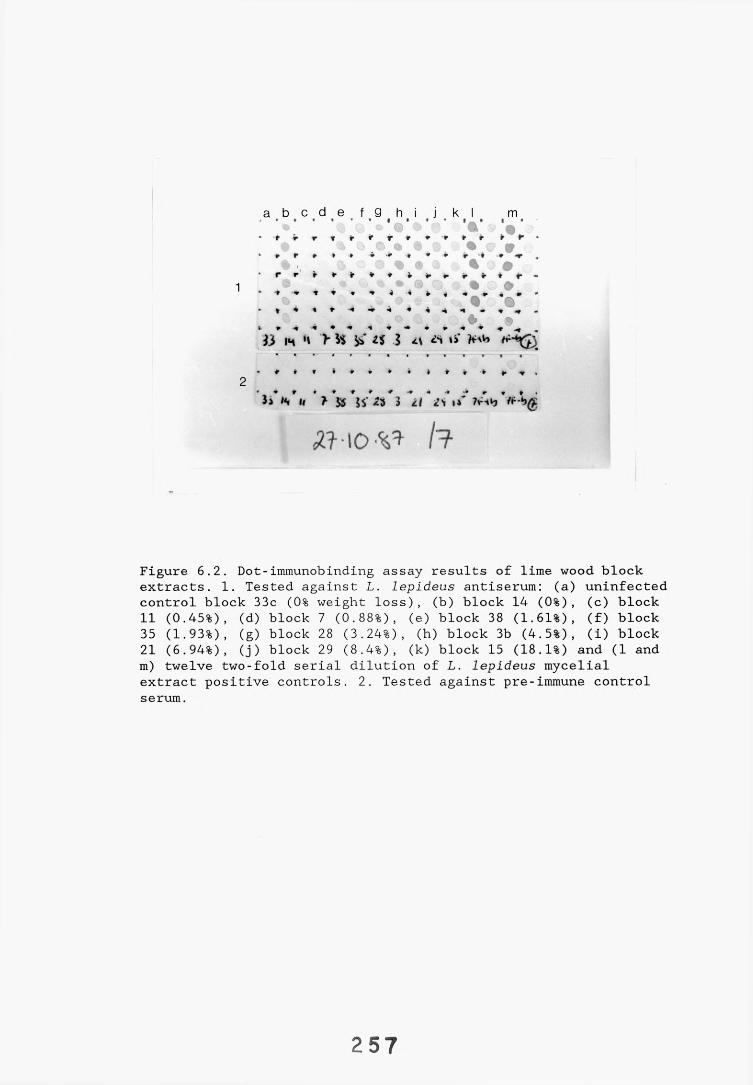
% % © © © • © %, qf r r t r i f r » * r t » ^ C •o i> * • © % q ff
* p r * i * • '+ t * » r * t «r ,% • % #
r r »• ► * ♦ * t * f r r » r -1 %
* • * * * * • ■ * < « * 4 * - r * * *
• * * @AC A ®| 4 « t -4 •* 4 < 4 4 4 > 4 4 - ^ 4 4 \ * *.
33 IH *» > % fc* 2S i> fr*V>
a b c d e f g h i j k l m
• P r » » » » » » » r » r *• v
Ji *S II > S5 5S' 23 3 */ 2S n" 7fH»jV4^g
# • 1 0 -V* /■?
Figure 6.2. Dot-immunobinding assay results of lime wood block extracts. 1. Tested against L. lepideus antiserum: (a) uninfectedcontrol block 33c (0% weight loss), (b) block 14 (0%), (c) block11 (0.45%), (d) block 7 (0.88%), (e) block 38 (1.61%), (f) block 35 (1.93%), (g) block 28 (3.24%), (h) block 3b (4.5%), (i) block 21 (6.94%), (j) block 29 (8.4%), (k) block 15 (18.1%) and (1 and m) twelve two-fold serial dilution of L. lepideus mycelial extract positive controls. 2. Tested against pre-immune control serum.
2 5 7
No reaction was detected between either uninfected pine or lime control block extracts and the preabsorbed Lentinus antiserum. The majority of test block extracts, however, did interact positively with the antiserum including extracts from blocks exhibiting a weight loss of between 0-3%. A non-specific interaction between some wood block extracts and pre-immune control serum was observed, this being most prominent in lime blocks with the highest weight losses. Non-specific interaction was also observed with L. lepideus mycelial extracts. However, in both cases this non-specific reaction was much less intense than the corresponding reaction with the L. lepideus antiserum. Extracts from some of those blocks showing relatively high weight losses, for example pine blocks 21 (22.4%) and 15 (34.5%) produced dots of lesser intensity than extracts from blocks showing a much lower level of weight loss. All wood block extracts were scored 0-6 dependent on the most dilute sample giving a visible dot. Tables 6.2 (pine) and 6.3 (lime) present those scores in relation to weight loss. This data was subsequently compared with that obtained in the radioimmunoassay (see 6.2.2.2.) to determine the degree of correlation between the results.
6.2.2.2. Radioimmunoassay (RIA).
To produce a more quantitative dot-immunobinding assay, iodinated Protein-A was substituted for the horse-radish peroxidase enzyme label and the amount of bound Protein A measured using a gamma counter. For each assay a standard curve was constructed using known quantities of a PBS-soluble L. lepideus mycelial extract (s. antigen extract). Wood block extracts were tested undiluted and at 1:2 and 1:4 dilutions. The amount of
2 5 8
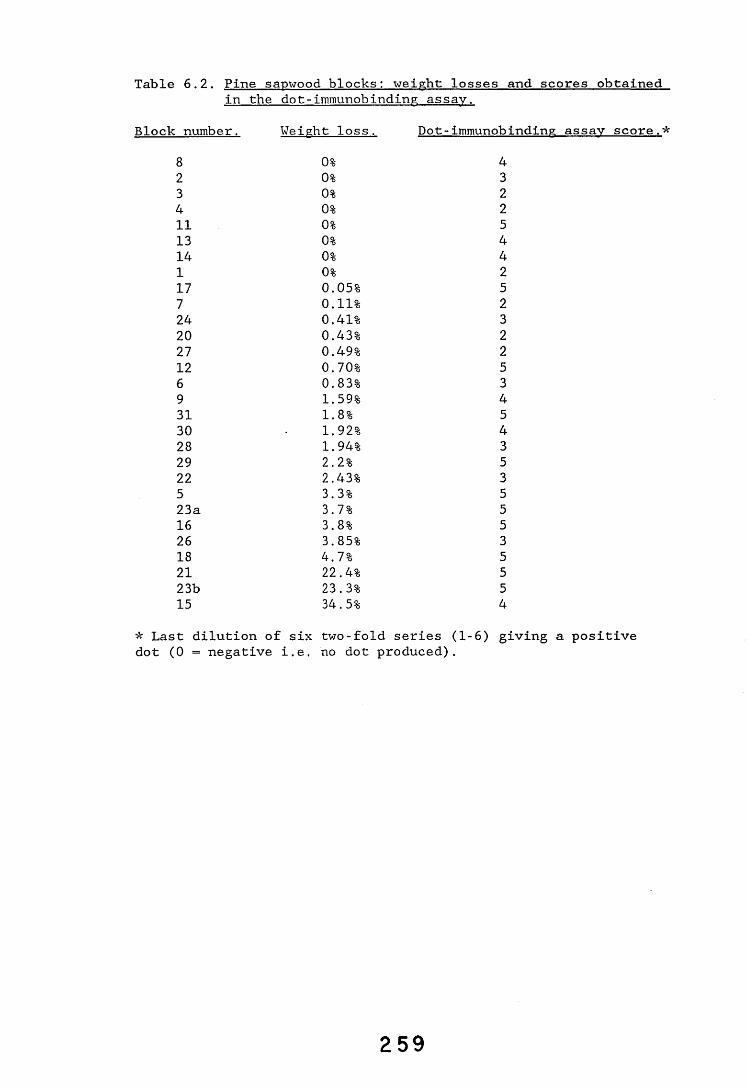
Table 6.2. Pine sanwood blocks; weight losses and scores obtainedin the dot-immunobinding assay.
Block number. Weight loss. Dot-immunobinding assav score.*
8 0% 42 0% 33 0% 24 0% 211 0% 513 0% 414 0% 41 0% 217 0.05% 57 0.11% 224 0.41% 320 0.43% 227 0.49% 212 0.70% 56 0.83% 39 1.59% 431 1.8% 530 1.92% 428 1.94% 329 2.2% 522 2.43% 35 3.3% 523a 3.7% 516 3.8% 526 3.85% 318 4.7% 521 22.4% 523b 23.3% 515 34.5% 4
* Last dilution of six two-fold series (1-6) giving a positive dot (0 = negative i.e. no dot produced).
2 5 9
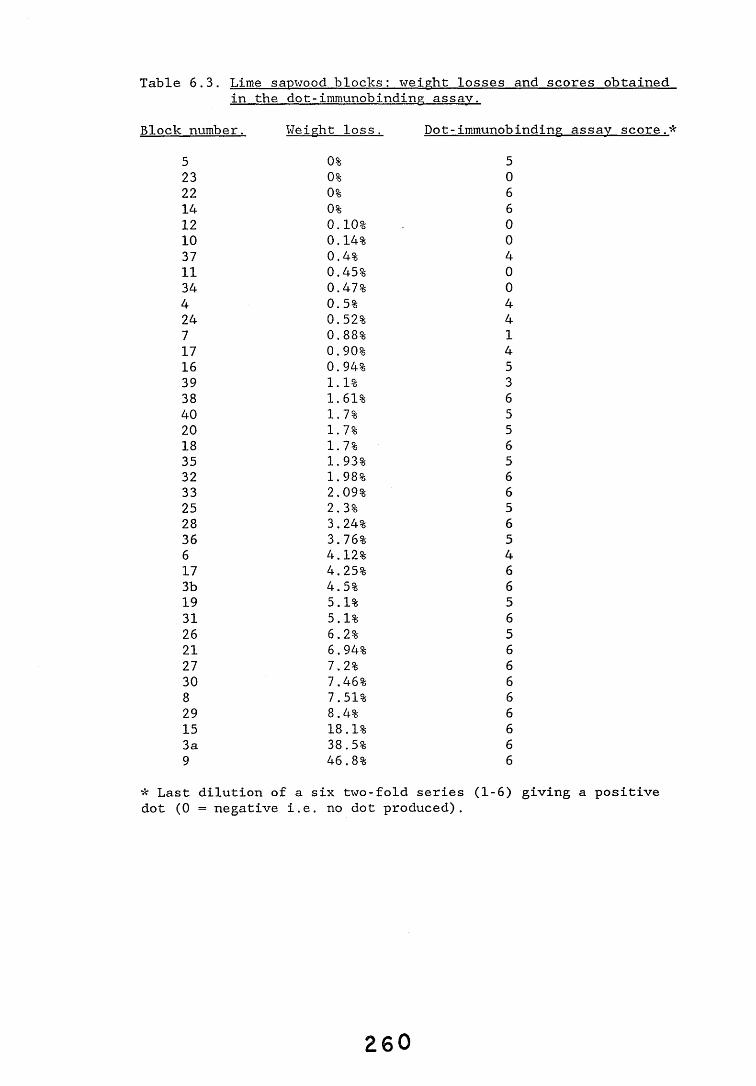
Block number. Weight loss. Dot-immunobinding assay score.*
Table 6.3. Lime sapwood blocks: weight losses and scores obtainedin the dot-immunobinding assay.
5 0% 523 0% 022 0% 614 0% 612 0.10% 010 0.14% 037 0.4% 411 0.45% 034 0.47% 04 0.5% 424 0.52% 47 0.88% 117 0.90% 416 0.94% 539 1.1% 338 1.61% 640 1.7% 520 1.7% 518 1.7% 635 1.93% 532 1.98% 633 2.09% 625 2.3% 528 3.24% 636 3.76% 56 4.12% 417 4.25% 63b 4.5% 619 5.1% 531 5.1% 626 6.2% 521 6.94% 627 7.2% 630 7.46% 68 7.51% 629 8.4% 615 18.1% 63a 38.5% 69 46.8% 6
* Last dilution of a six two-fold series (1-6) giving a positive dot (0 = negative i.e. no dot produced).
2 6 0
fungal antigens present, relative to the amount of Protein A bound was determined from the standard curve. All wood blocks of a single wood type, i.e. pine or lime, were screened simultaneously to eliminate any interassay variation factors and permit direct comparisons to be made between individual blocks. Tables 6.4 and6.5 present the calculated levels of antigen in relation to the observed weight losses obtained for the pine and lime wood block extracts respectively. The extent of covariance (i.e correlation) between the weight loss and the calculated amounts of antigen for each wood block extract and the appropriate dilutions were determined (Table 6.6). In addition, the correlation between the results obtained in the dot-immunobinding assay and the RIAs was calculated.
Since the highest three weight losses obtained with both the pine and lime wood blocks were much higher than those obtained with all the other blocks and could unduly influence the calculated coefficient, the coefficients were also calculated when these data were excluded. As shown in Table 6.6 in all cases tested there was a high degree of correlation between weight loss and the level of antigen estimated by RIA.
The correlation coefficients obtained between the dot-immunobinding assay scores and the RIA data are presented in Table 6.7. A highly significant level of correlation (p<0.001) was observed between the results obtained in the two systems.
6.2.2.3. Antigen capture assay (ACA),
Initial experiments employing the ACA to screen wood block extracts encountered the problem of very high background values for the uninfected control block extracts. Various methods were
2611
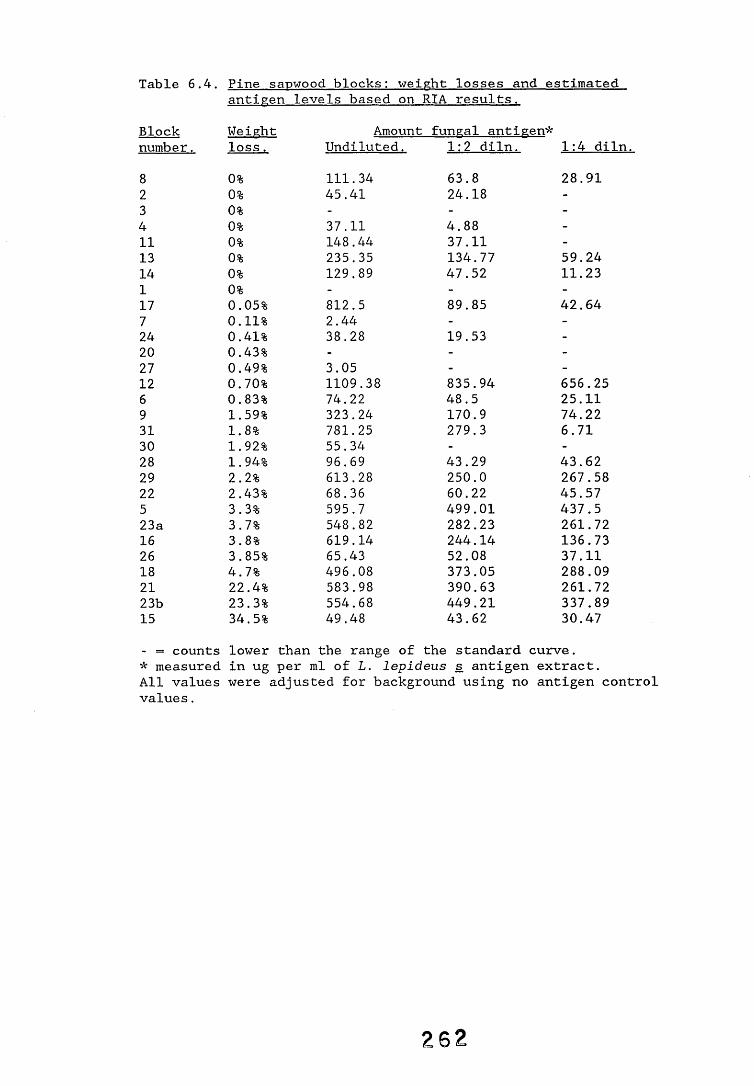
Table 6.4. Pine saowood blocks: weight losses and estimatedantisen levels based on RIA results.
Block Weight Amount fungal antigen*number. loss. Undiluted. 1:2 diln. 1:4 diln.
8 0% 111.34 63.8 28.912 0% 45.41 24.18 -
3 0% - - -
4 0% 37.11 4.88 -
11 0% 148.44 37.11 -
13 0% 235.35 134.77 59.2414 0% 129.89 47.52 11.231 0% - - -
17 0.05% 812.5 89.85 42.647 0.11% 2.44 - -
24 0.41% 38.28 19.53 -
20 0.43% - - -
27 0.49% 3.05 - -
12 0.70% 1109.38 835.94 656.256 0.83% 74.22 48.5 25.119 1.59% 323.24 170.9 74.2231 1.8% 781.25 279.3 6.7130 1.92% 55.34 - -
28 1.94% 96.69 43.29 43.6229 2.2% 613.28 250.0 267.5822 2.43% 68.36 60.22 45.575 3.3% 595.7 499.01 437.523a 3.7% 548.82 282.23 261.7216 3.8% 619.14 244.14 136.7326 3.85% 65.43 52.08 37.1118 4.7% 496.08 373.05 288.0921 22.4% 583.98 390.63 261.7223b 23.3% 554.68 449.21 337.8915 34.5% 49.48 43.62 30.47- = counts lower than the range of the standard curve.* measured in ug per ml of L. lepideus s antigen extract.All values were adjusted for background using no antigen control values.
2 6 2
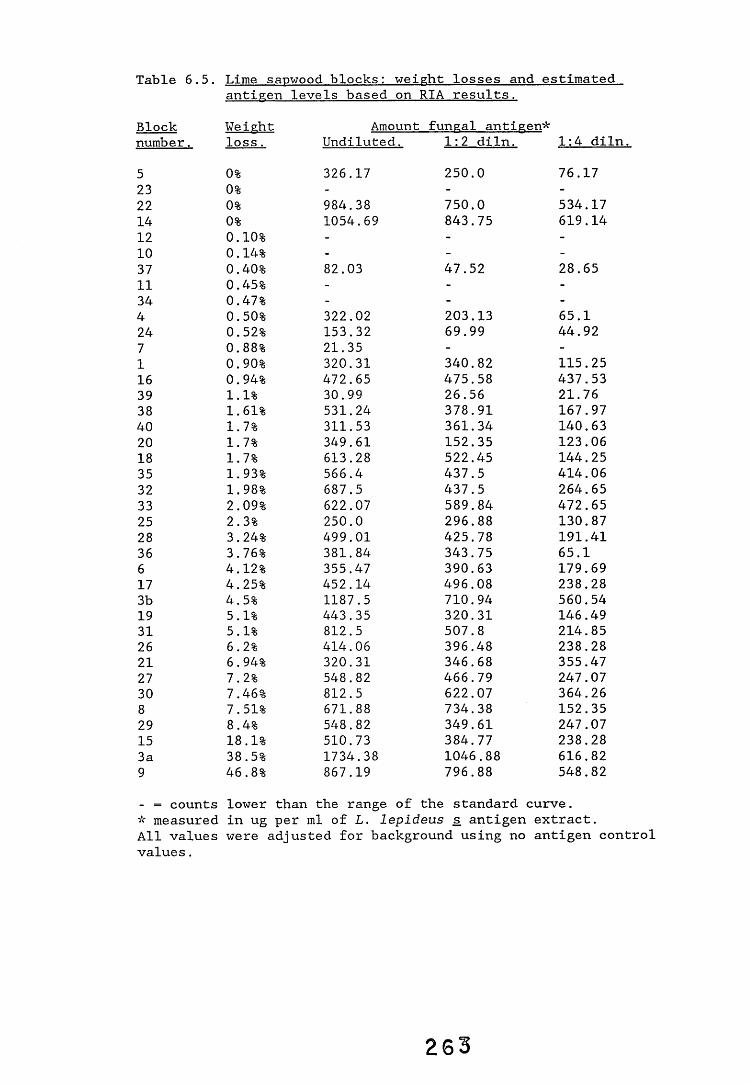
Table 6.5. Lime sanwood blocks: weight losses and estimatedantigen levels based on RIA results.
Block Weight Amount fungal antigen*number. loss. Undiluted. 1:2 diln. 1:4 diln.
5 0% 326.17 250.0 76.1723 0% - - -
22 0% 984.38 750.0 534.1714 0% 1054.69 843.75 619.1412 0.10% - - -
10 0.14% - - -
37 0.40% 82.03 47.52 28.6511 0.45% - - -
34 0.47% - - -
4 0.50% 322.02 203.13 65.124 0.52% 153.32 69.99 44.927 0.88% 21.35 - -
1 0.90% 320.31 340.82 115.2516 0.94% 472.65 475.58 437.5339 1.1% 30.99 26.56 21.7638 1.61% 531.24 378.91 167.9740 1.7% 311.53 361.34 140.6320 1.7% 349.61 152.35 123.0618 1.7% 613.28 522.45 144.2535 1.93% 566.4 437.5 414.0632 1.98% 687.5 437.5 264.6533 2.09% 622.07 589.84 472.6525 2.3% 250.0 296.88 130.8728 3.24% 499.01 425.78 191.4136 3.76% 381.84 343.75 65.16 4.12% 355.47 390.63 179.6917 4.25% 452.14 496.08 238.283b 4.5% 1187.5 710.94 560.5419 5.1% 443.35 320.31 146.4931 5.1% 812.5 507.8 214.8526 6.2% 414.06 396.48 238.2821 6.94% 320.31 346.68 355.4727 7.2% 548.82 466.79 247.0730 7.46% 812.5 622.07 364.268 7.51% 671.88 734.38 152.3529 8.4% 548.82 349.61 247.0715 18.1% 510.73 384.77 238.283a 38.5% 1734.38 1046.88 616.829 46.8% 867.19 796.88 548.82- = counts lower than the range of the standard curve.* measured in ug per ml of L. lepideus s antigen extract.All values were adjusted for background using no antigen control values.
2 6 3
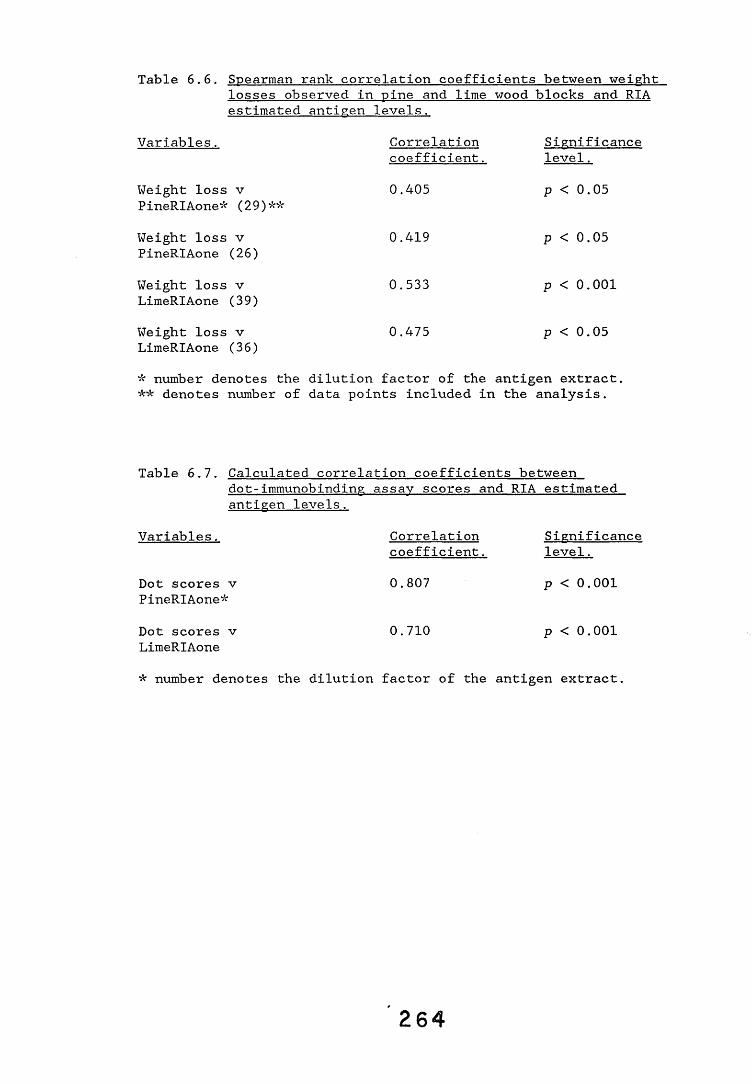
Table 6.6. Spearman rank correlation coefficients between weight losses observed in pine and lime wood blocks and RIA estimated antigen levels.
Variables. Correlation coefficient.
Significance level.
Weight loss v P ineRIAone* (29)**
0.405 p < 0.05
Weight loss v P ineRIAone (26)
0.419 p < 0.05
Weight loss v LimeRIAone (39)
0.533 p < 0.001
Weight loss v LimeRIAone (36)
0.475 p < 0.05
* number denotes the dilution factor of the antigen extract. ** denotes number of data points included in the analysis.
Table 6.7. Calculated correlation coefficients betweendot-immunobinding assay scores and RIA estimated antigen levels.
Variables.
Dot scores v PineRIAone*
Dot scores v LimeRIAone* number denotes the
Correlation coefficient.0.807
0.710
dilution factor of the
Significance level.p < 0.001
p < 0.001
antigen extract.
2 6 4
tried to reduce this high background (see section 3.3.2.3.) and one was found to be partially sucessful. Antigen samples were incubated overnight at 4oC and were freed from precipitated debris by centrifugation before being screened in the assay. Figure 6.3 presents some representative antigen dilution curves obtained with pine wood block extracts in the ACA. Although all the L. lepideus-infected wood block extracts gave higher absorbance values than the control block extract and could therefore be discriminated from it, the low signal:noise (background) ratio was not sufficient to permit the use of this system as a viable screening system for L. lepideus in wood.
6.2.3. Direct staining techniques.
A selection of both pine and lime blocks were sectioned and three adjacent sections stained by one of the following methods.1. Safranin/picro-aniline blue staining, a general stain for fungal mycelium within wood. 2. Peroxidase-antiperoxidase (PAP) immunocytochemical staining. 3. Immunofluorescence staining. The pine and lime wood blocks chosen for staining were matched, as far as possible, for weight loss (Table 6.8). In addition, uninfected control wood blocks were included to determine whether non-specific binding of the stains to the wood surfaces was occurring. Diagramatic representations of the structure of softwoods and hardwoods illustrating the typical tissues and their organisation are presented in Figures 6.4 and 6.5 respectively. Complete results (i.e. all staining methods) will be presented for a single pine (block 22, 2.43% weight loss) and a single lime (block 25, 2.3% weight loss) block.
2 6
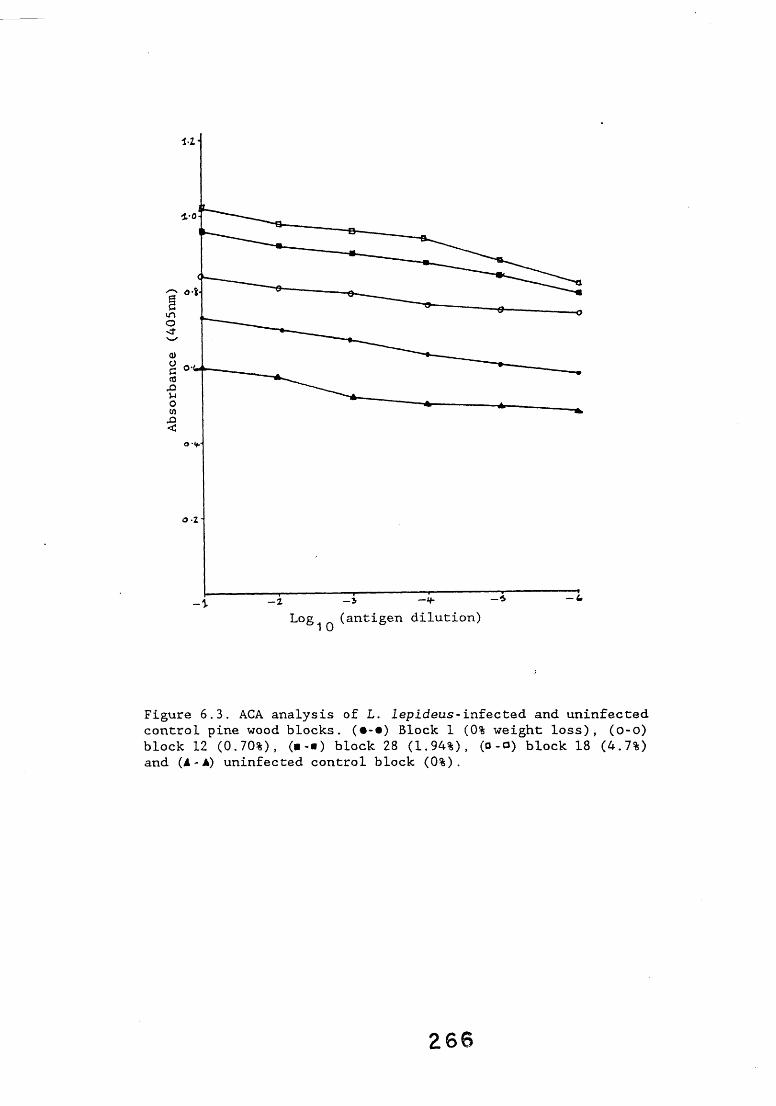
1-2*
»+•
o - Z -
- 2 - 6
Log 1 0 (antigen dilution)- u
Figure 6.3. ACA analysis of L. lepideus-infected and uninfected control pine wood blocks. (•-•) Block 1 (0% weight loss), (o-o) block 12 (0.70%), (■-■) block 28 (1.94%), (o-o) block 18 (4.7%) and (A - A) uninfected control block (0%).
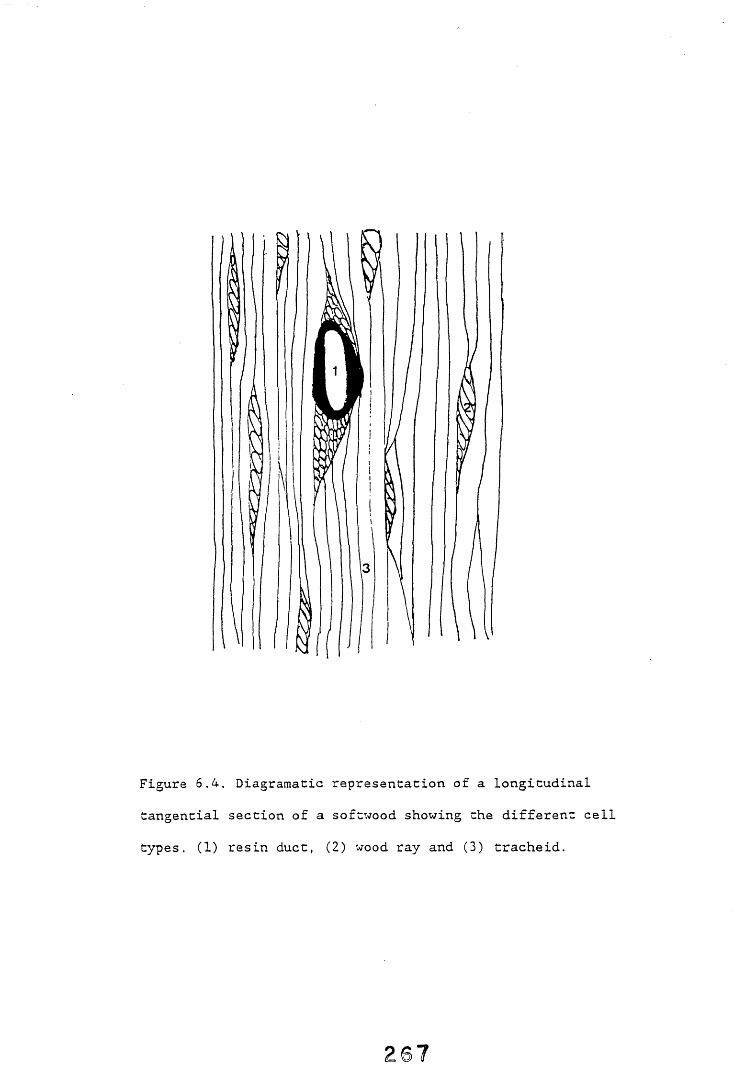
Figure 6.4. Diagramatic representation of a longitudinal
tangential section of a softwood showing the different cell
types. (1) resin duct, (2) wood ray and (3) tracheid.
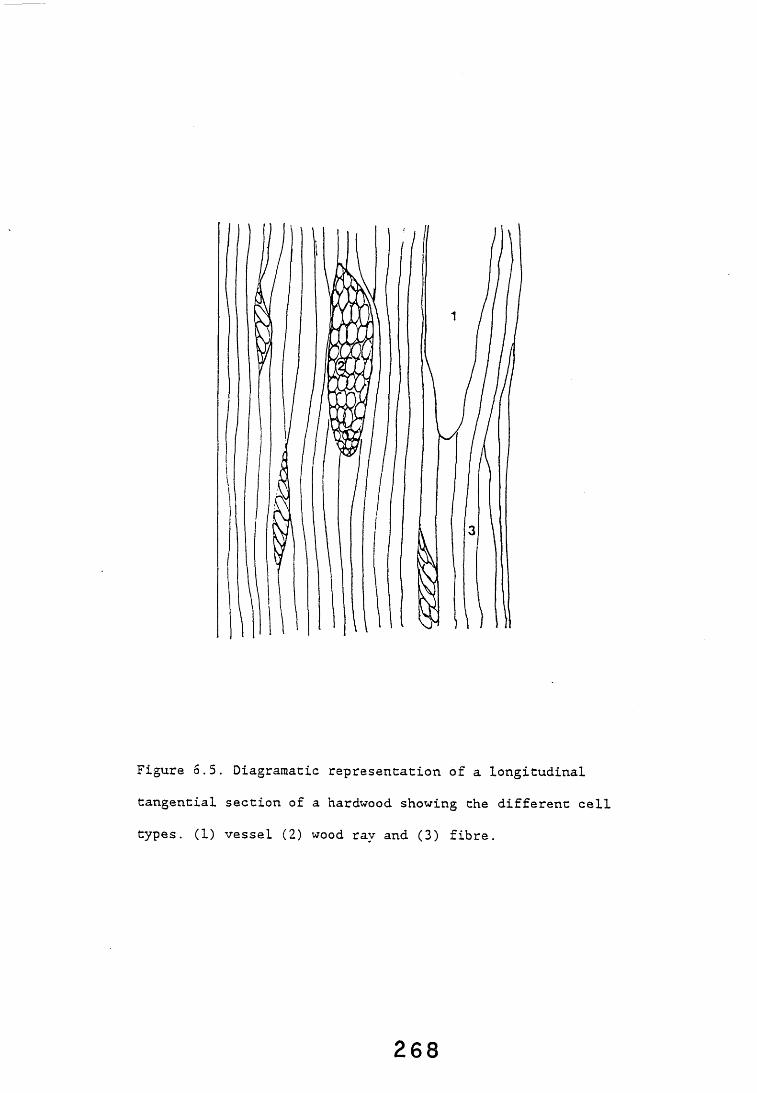
Figure 6.5. Diagraraatic representation of a longitudinal
tangential section of a hardwood showing the different cell types. (1) vessel (2) wood ray and (3) fibre.
2 6 8
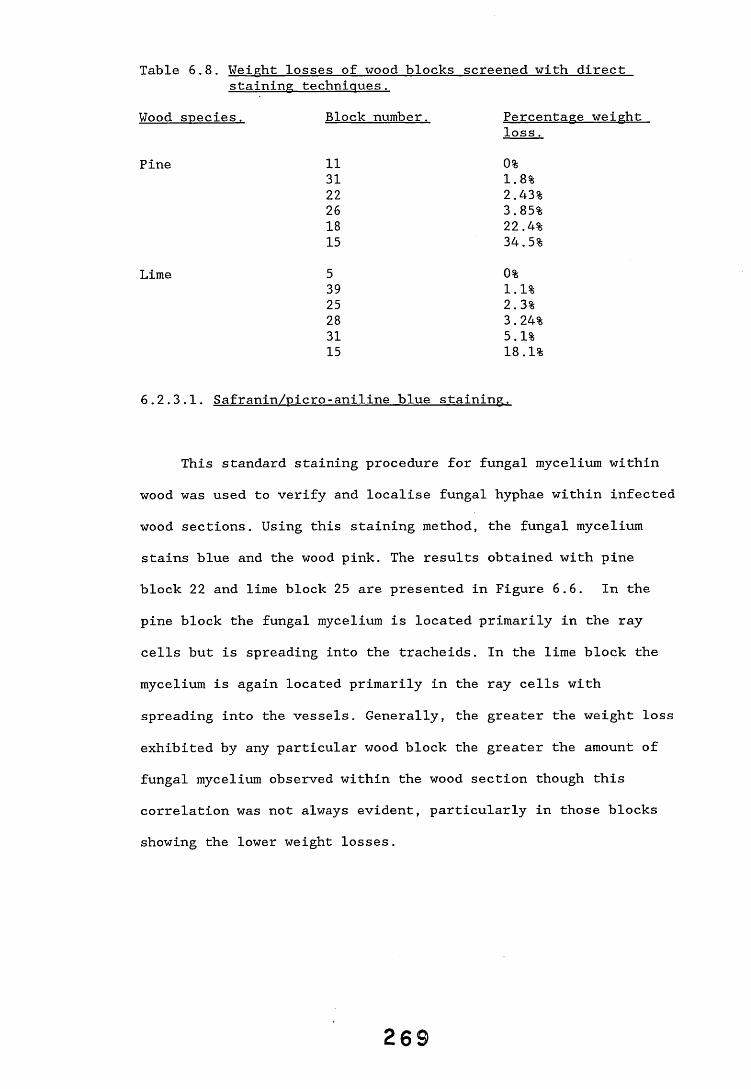
Table 6.8. Weight losses of wood blocks screened with direct staining techniques.
Wood species. Block number. Percentage weightloss.
Pine 11 0%31 1.8%22 2.43%26 3.85%18 22.4%15 34.5%
Lime 5 0%39 1.1%25 2.3%28 3.24%31 5.1%15 18.1%
6.2.3.1. Safranin/nicro-aniline blue staining.
This standard staining procedure for fungal mycelium within wood was used to verify and localise fungal hyphae within infected wood sections. Using this staining method, the fungal mycelium stains blue and the wood pink. The results obtained with pine block 22 and lime block 25 are presented in Figure 6.6. In the pine block the fungal mycelium is located primarily in the ray cells but is spreading into the tracheids. In the lime block the mycelium is again located primarily in the ray cells with spreading into the vessels. Generally, the greater the weight loss exhibited by any particular wood block the greater the amount of fungal mycelium observed within the wood section though this correlation was not always evident, particularly in those blocks showing the lower weight losses.
2 6 9
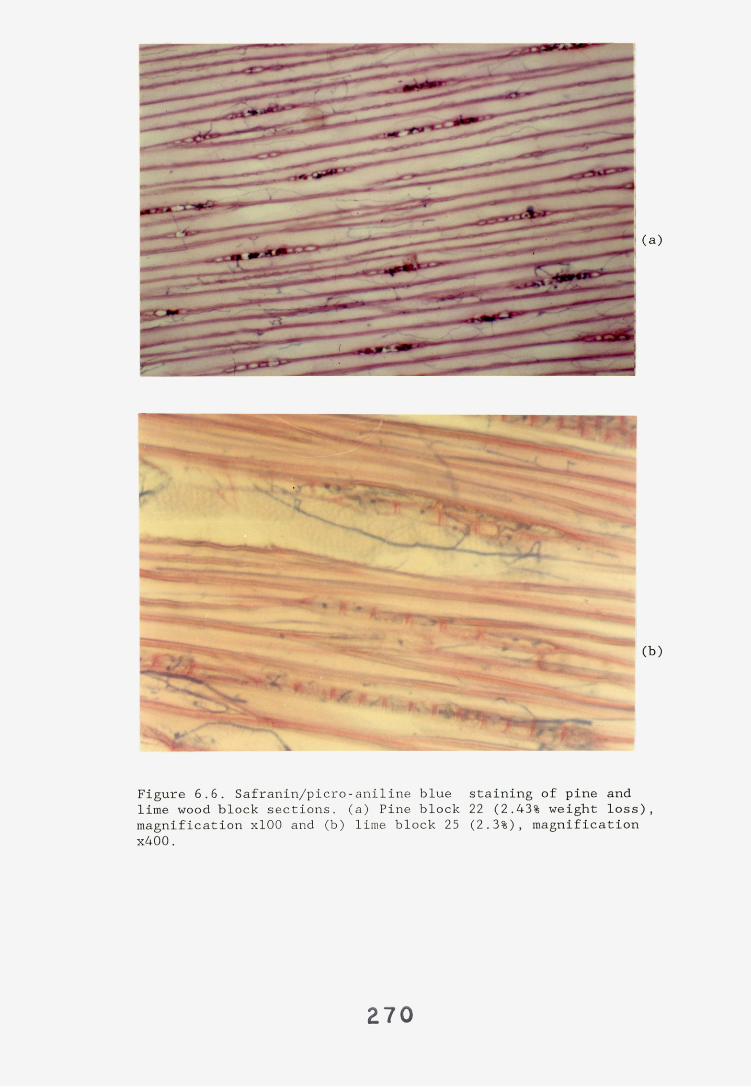
(b)
Figure 6.6. Safranin/picro- aniline blue lime wood block sections, (a) Pine block magnification xlOO and (b) lime block 25 x400.
staining of pine and 22 (2.43% weight loss), (2.3%), magnification
2 7 0
6.2.3.2. PAP immunocvtochemical staining.
The optimum dilutions of reagents and incubation times were determined using glass coverslips with adherent fungal mycelium (see chapter 2). These were found to be: test/pre-immune control serum (1:200, 60 minutes), anti-rabbit IgG precipitating serum (1:10, 30 minutes) and rabbit peroxidase-antiperoxidase (1:50, 30 minutes). Control samples were immunostained using pre-immune control serum to eliminate non-specific binding of rabbit serum as an interfering factor. No staining of any such samples was observed. Examples of the results obtained using the coverslips are presented in Figure 6.7. However, very occasionally limited non-specific binding of control serum was observed in the ray cells, particularly in those sections from blocks exhibiting the higher weight losses despite preabsorption of the antiserum with sawdust.
The staining patterns obtained for pine block 22 and lime block 25 are presented in Figures 6.8 and 6.9 respectively. The pink/red hyphae can be easily distinguished within the wood sections. The location of the hyphae generally mirrors that observed in the safranin/picro-aniline blue staining system.Figure 6.10 illustrates that even in blocks showing no weight loss, a significant amount of fungal mycelium can be present.
6.2.3.3. Immunofluorescence staining.
The optimum dilutions of reagents and incubation times were again determined using glass coverslips with adherent fungal mycelium (see chapter 2) These were found to be: test/pre-immune
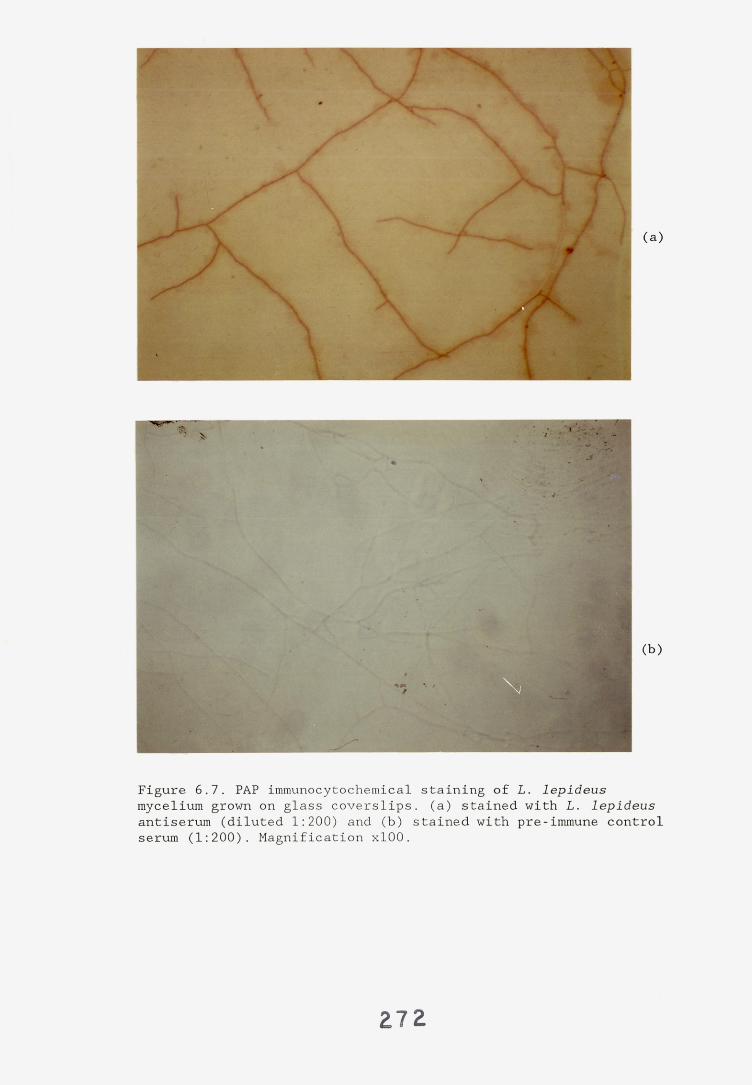
Figure 6.7. PAP immunocytochemical staining of L. lepideus mycelium grown on glass coverslips. (a) stained with L. lepideus antiserum (diluted 1:200) and (b) stained with pre-immune control serum (1:200). Magnification xlOO.
2 7 2
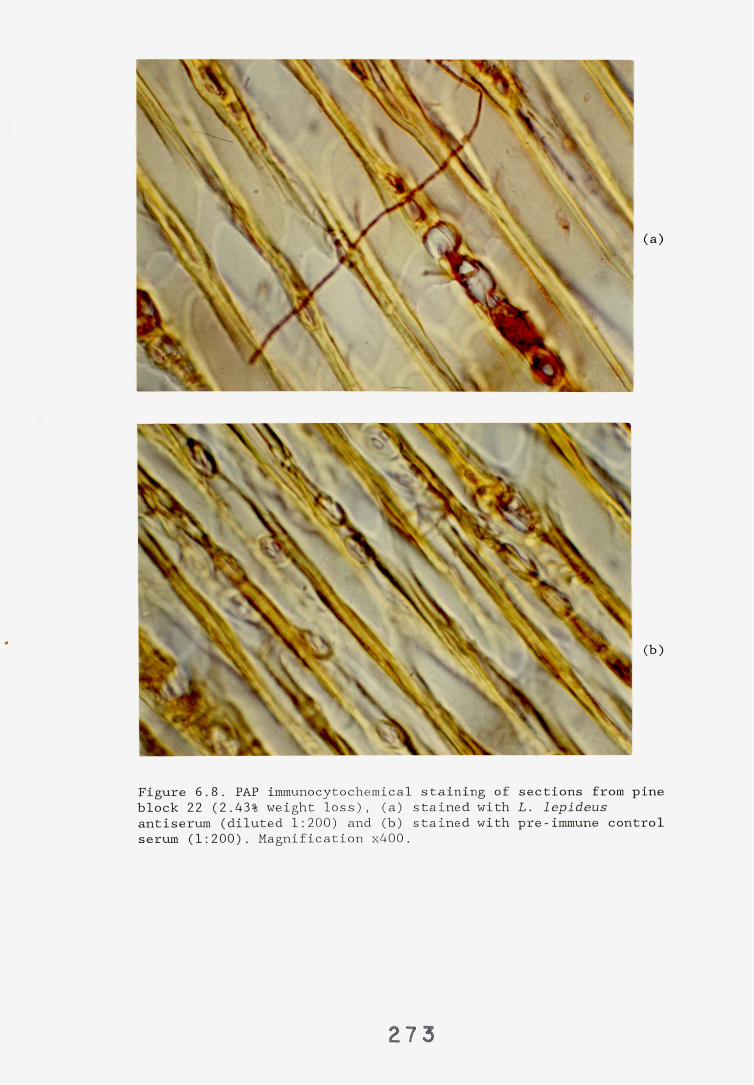
Figure 6.8. PAP immunocytochemical staining of block 22 (2.43% weight loss), (a) stained with antiserum (diluted 1:200) and (b) stained with serum (1:200). Magnification x400.
sections from pineL. lepideuspre-immune control
273
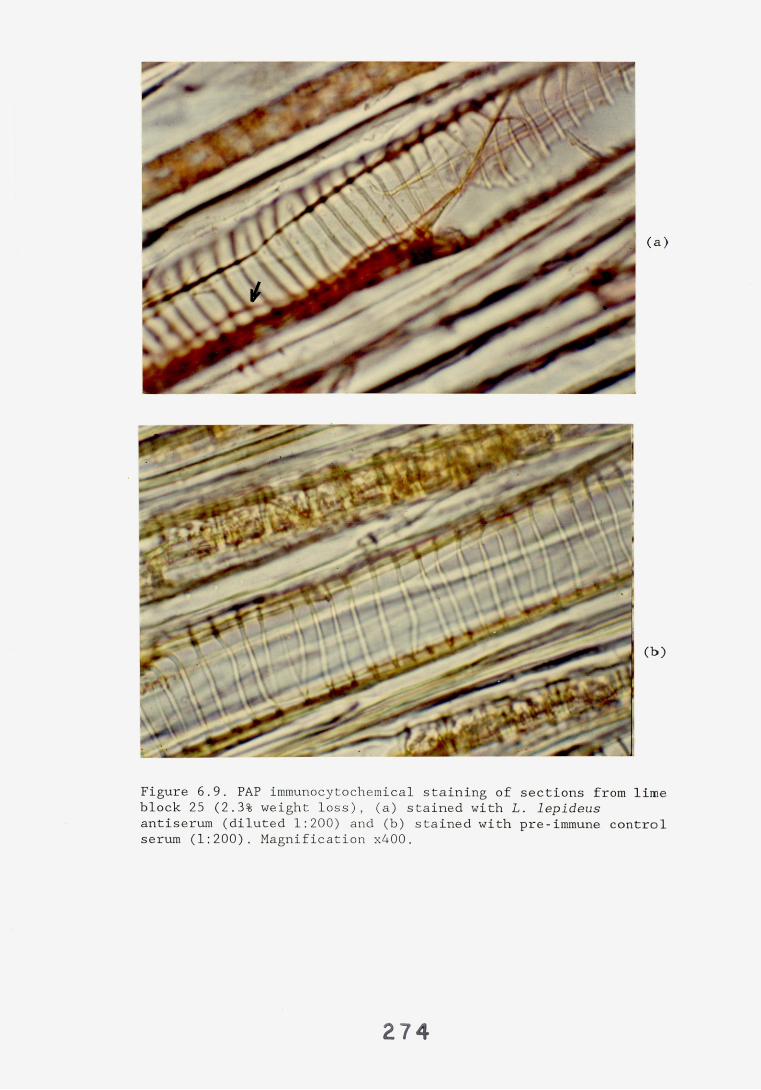
Figure 6.9. PAP immunocytochemical staining of sections from lime block 25 (2.3% weight loss), (a) stained with L. lepideus antiserum (diluted 1:200) and (b) stained with pre-immune control serum (1:200). Magnification x400.
2 7 4
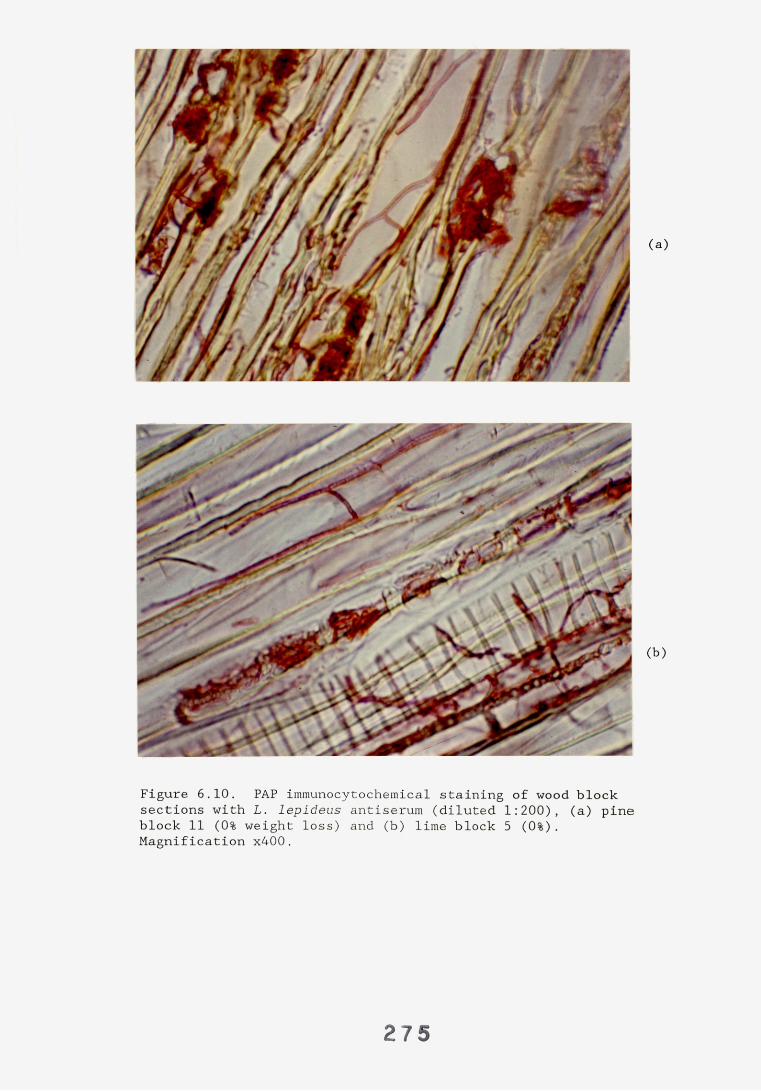
Figure 6.10. PAP immunocytochemical staining of wood block sections with L. lepideus antiserum (diluted 1:200), (a) pine block 11 (0% weight loss) and (b) lime block 5 (0%). Magnification x400.
275
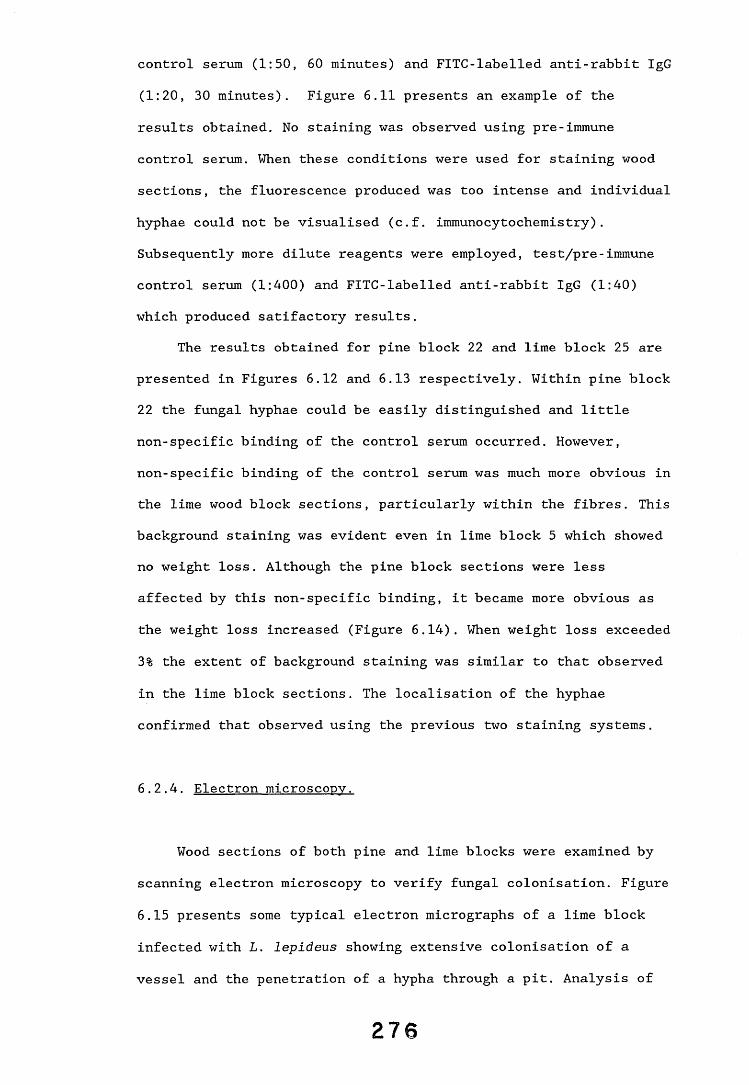
control serum (1:50, 60 minutes) and FITC-labelled anti-rabbit IgG (1:20, 30 minutes). Figure 6.11 presents an example of the results obtained. No staining was observed using pre-immune control serum. When these conditions were used for staining wood sections, the fluorescence produced was too intense and individual hyphae could not be visualised (c.f. immunocytochemistry). Subsequently more dilute reagents were employed, test/pre-immune control serum (1:400) and FITC-labelled anti-rabbit IgG (1:40) which produced satifactory results.
The results obtained for pine block 22 and lime block 25 are presented in Figures 6.12 and 6.13 respectively. Within pine block 22 the fungal hyphae could be easily distinguished and little non-specific binding of the control serum occurred. However, non-specific binding of the control serum was much more obvious in the lime wood block sections, particularly within the fibres. This background staining was evident even in lime block 5 which showed no weight loss. Although the pine block sections were less affected by this non-specific binding, it became more obvious as the weight loss increased (Figure 6.14). When weight loss exceeded 3% the extent of background staining was similar to that observed in the lime block sections. The localisation of the hyphae confirmed that observed using the previous two staining systems.
6.2.4. Electron microscopy.
Wood sections of both pine and lime blocks were examined by scanning electron microscopy to verify fungal colonisation. Figure 6.15 presents some typical electron micrographs of a lime block infected with L. lepideus showing extensive colonisation of a vessel and the penetration of a hypha through a pit. Analysis of
2 7 6
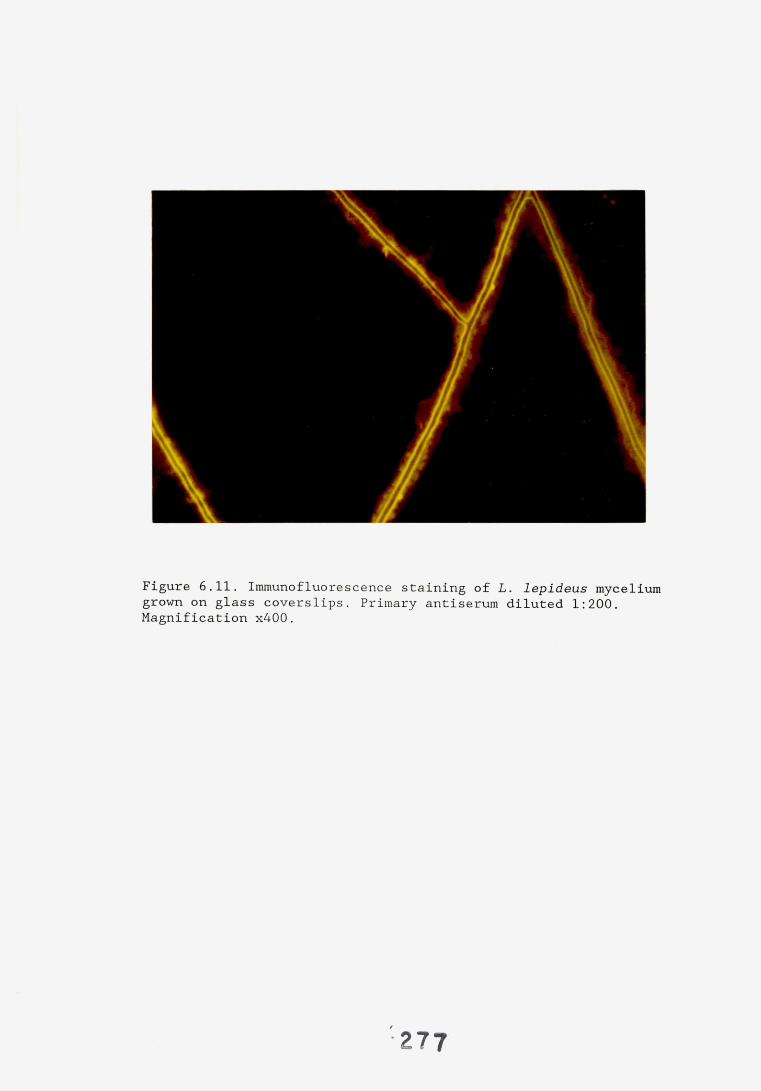
Figure 6.11. Immunofluorescence staining of L. lepideus mycelium grown on glass coverslips. Primary antiserum diluted 1:200. Magnification x400.
277
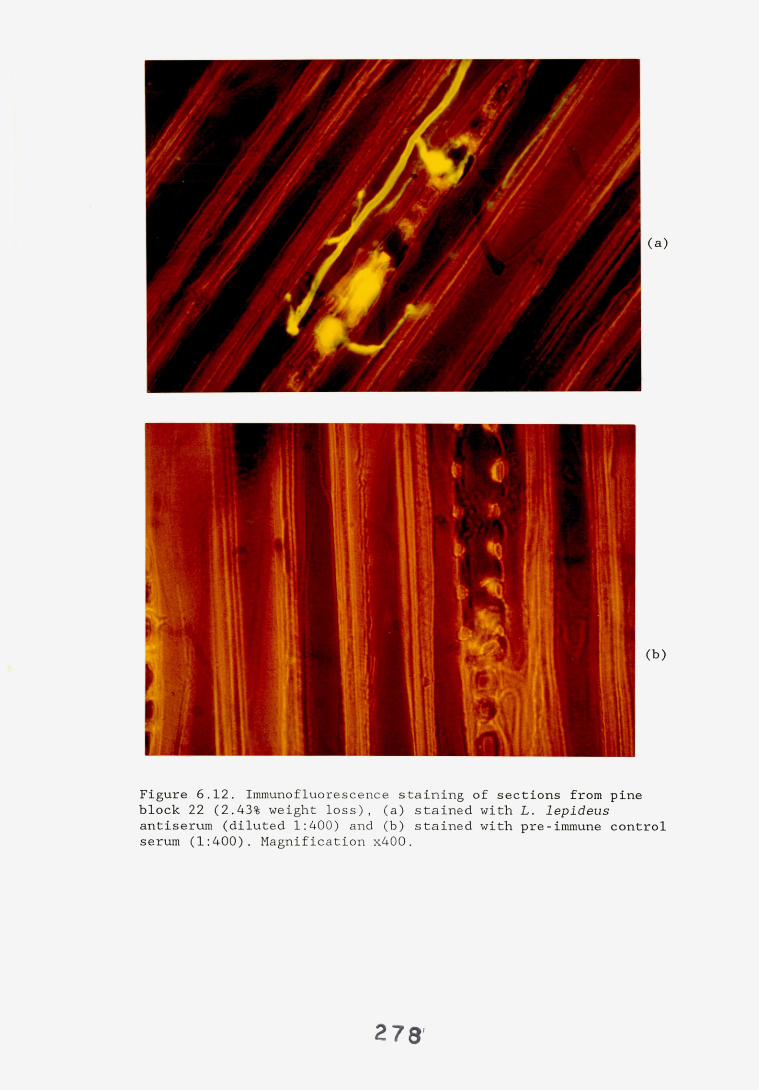
Figure 6.12. Immunofluorescence staining of sections from pine block 22 (2.43% weight loss), (a) stained with L. lepideus antiserum (diluted 1:400) and (b) stained with pre-immune control serum (1:400). Magnification x400.
278
Figure 6.13. Immunofluorescence staining of sections from lime block 25 (2.3% weight loss), (a) stained with L. lepideus antiserum (diluted 1:400) and (b) stained with pre-immune control serum (1:400). Magnification x400.
2 7 9
Figure 6.14. Immunofluorescence staining of pine wood blocksections showing the and weight loss, (a) (1.8%) and (c) block
concomitant increase in background staining Block 11 (0% weight loss), (b) block 31 26 (3.85%). Magnification x400.
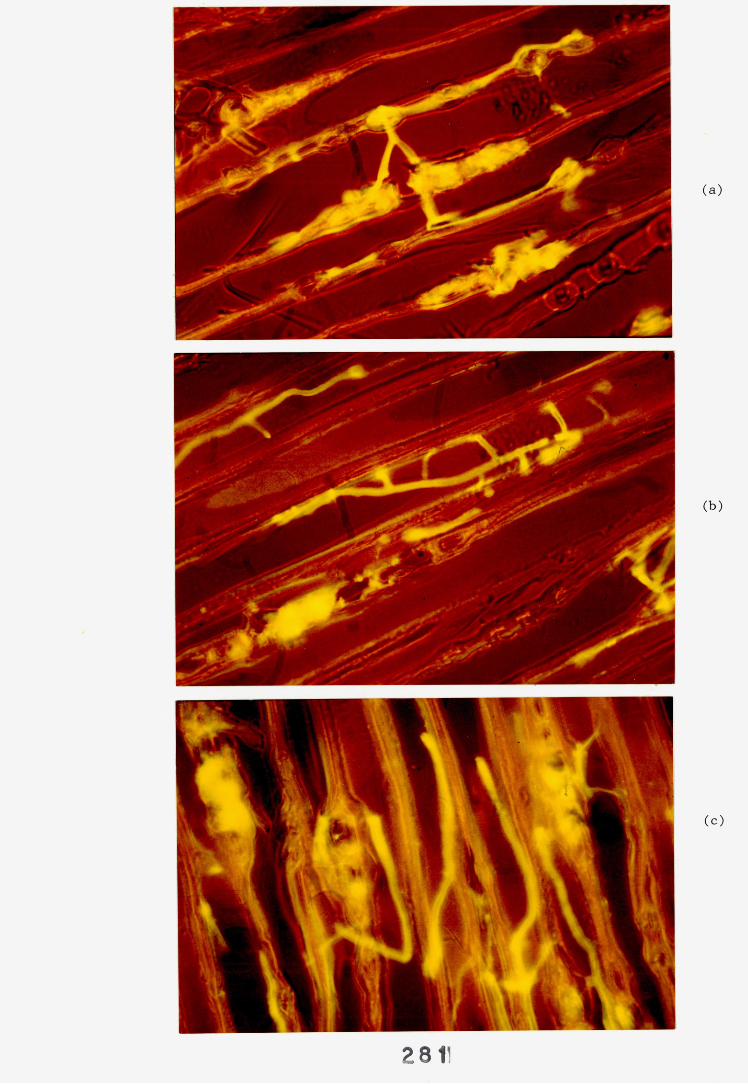
281!
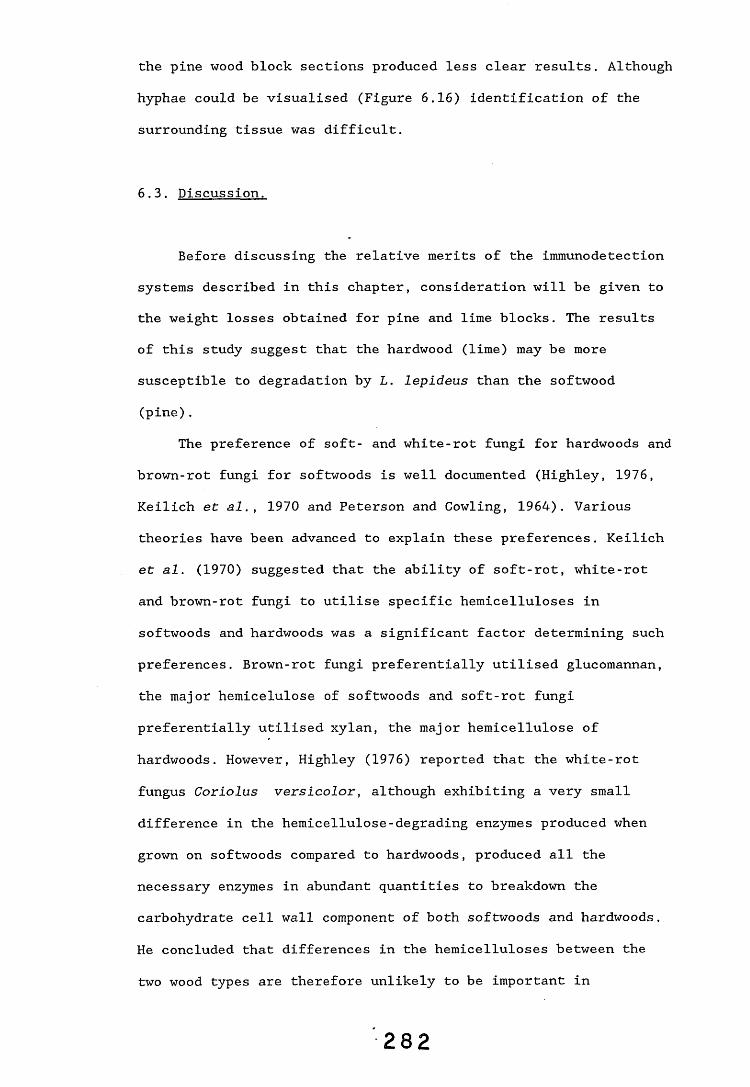
the pine wood block sections produced less clear results. Although hyphae could be visualised (Figure 6.16) identification of the surrounding tissue was difficult.
6.3. Discussion.
Before discussing the relative merits of the immunodetection systems described in this chapter, consideration will be given to the weight losses obtained for pine and lime blocks. The results of this study suggest that the hardwood (lime) may be more susceptible to degradation by L. lepideus than the softwood (pine).
The preference of soft- and white-rot fungi for hardwoods and brown-rot fungi for softwoods is well documented (Highley, 1976, Keilich et al.} 1970 and Peterson and Cowling, 1964). Various theories have been advanced to explain these preferences. Keilich et al. (1970) suggested that the ability of soft-rot, white-rot and brown-rot fungi to utilise specific hemicelluloses in softwoods and hardwoods was a significant factor determining such preferences. Brown-rot fungi preferentially utilised glucomannan, the major hemicelulose of softwoods and soft-rot fungi preferentially utilised xylan, the major hemicellulose of hardwoods. However, Highley (1976) reported that the white-rot fungus Coriolus versicolor, although exhibiting a very small difference in the hemicellulose-degrading enzymes produced when grown on softwoods compared to hardwoods, produced all the necessary enzymes in abundant quantities to breakdown the carbohydrate cell wall component of both softwoods and hardwoods. He concluded that differences in the hemicelluloses between the two wood types are therefore unlikely to be important in
2 8 2
Figure 6.15. Scanning electron micrographs of L. lepideus
growing in lime wood blocks, (a) L. lepideus growing within a vessel, magnification x350, (b) magnification x750 and (c)magnification x2000, note the penetration of a hypha through a pit in the vessel wall (arrowed).
2 8 3

Figure 6.16. Electron micrographs of L. lepideus FPRL 7F growing in pine wood blocks, (a) Magnification x750 and (b) magnification x2000.
2 8 4

determining the preference of white-rot fungi for hardwoods.These differences may still however explain the preference of brown-rot fungi for softwoods. Chemical analysis of brown-rotted coniferous wood showed glucomannan was removed faster than
cellulose suggesting that further degradation and removal of depolymerised cellulose may depend on prior removal of this maj or hemicellulose component (Kirk and Highley, 1973). Furthermore, Lyr (1969) reported that hemicelluloses are removed before the cellulose microfibrils are digested. Mannan has been shown to be the best inducer of carbohydrolases in the brown-rot Poria placenta (Highley, 1976). This author argued that the high mannan content of softwoods could enhance the production of cell wall degrading carbohydrate enzyme and thus explain the preference of brown-rot fungi for softwoods.
Peterson and Cowling (1964) have postulated that the differences in the types and amounts of lignin between softwoods and hardwoods is the major factor governing the preference of white-rot fungi for hardwoods. Brown rot fungi are not adversely affected by either the amount or type of lignin.
The weight losses produced by L. lepideus FPRL 7F during this, and previous studies in this department are lower than those expected (A. Bruce, personal communication), since for example, a minimum of 25% weight loss is expected in Scots pine sapwood exposed to L. lepideus FPRL 7H for 16 weeks (BS 6009, 1982). Several factors could be responsible for the relatively low weight losses observed in these studies. Repeated subculturing of some wood decay fungi on laboratory media can lead to a reduction in vigour (Cartwright and Findlay, 1958). Although the L. lepideus strains used here have been subcultured numerous times, more recent studies with the L. lepideus FPRL 7H strain using the
2 8 5
American Society for Testing and Materials soil block system (ASTM D2017, 1971) have produced the expected weight losses indicating the viability of the fungus has not been significantly affected (Bruce et al. , 1989). Thus some other factor(s) in the experimental set up is most probably the cause of the low weight losses observed. One crucial factor influencing the rate of wood decay is the moisture content, if it is below the fibre saturation point the fungus cannot colonise the wood and if it approaches saturation levels insufficient oxygen will be present to support fungal growth and subsequent decay (King, 1981). It is possible that the initial rate of moisture uptake by some blocks may have been insufficient to permit the large-scale colonisation of the wood by the fungus, a necessary prelude to decay.
6.3.2. Immunological detection systems.
The results obtained using immunological detection systems indicate that it is possible to apply these methods and the reagents developed in the study to screen wood extracts for the presence of L. lepideus. However, various problems were encountered and not all methods proved successful.
6.3.2.1. Immunodiffusion.
The failure to detect any fungal antigens within wood block extracts using immunodiffusion could be due to several factors.The antigens may be unable to diffuse through the gel or
2 8 6
6.3.2.2. EIA/ACA systems.
The major problem encountered in both the EIA and the ACA systems was the high background associated with uninfected wood block extracts. Despite numerous attempts to alleviate the problem the absorbance values obtained in both systems for the infected and control samples were very similar. This interaction between healthy (i.e. uninfected) wood tissue and fungal antiserum has been reported previously (Dewey and Brasier, 1988). Although a partial alleviation of the problem was observed in the ACA system, it was not of sufficient magnitude to enable the system to be employed to screen wood sample extracts.
Several factors could be responsible for the results obtained, for example, (i) non-specific interaction of the wood with rabbit serum or non-specific interaction of wood with the enzyme-labelled second antibody and (ii) low affinity antiserum.As discussed previously non-specific binding of rabbit serum to wood did occur but this was successfully eliminated by preabsorption of sera with sawdust. Preabsorption of enzyme-labelled second antibody with sawdust failed to reduce the high background. The possible effects of using low affinity antiserum have been discussed in chapter 3. To date it has not been possible to identify the specific factor(s) responsible for the high background. Appropriate action would be required to overcome the problem before such systems could be used to detect the fungus within wood samples. Further work could include (i)
insufficient quantities of the antigens may be present to form avisible precipitate. Since mycelial antigens are known to diffusethrough the gel the latter explanation is more likely.
development of alternative blocking/washing/diluting buffer systems, (ii) use of different microtitre plates and/or alternative solid phases e.g. nitrocellulose and, (iii) the production of higher affinity antiserum.
6.3.2.3. Nitrocellulose-based systems.
Nitrocellulose membranes have found a wide application in nucleic acid and protein research. The suitability of this solid phase in immunoassays is attested by the rapidly growing number of publications describing their use ( as outlined in Tijssen, 1985). The results of this study indicate that nitrocellulose-based assays can detect L. lepideus within wood block extracts at very early stages of colonisation and that the methods compare most favourably with conventional weight loss test systems.
The RIA developed allowed quantification of antibody binding to antigen. However, the failure of liquid and wood grown L. lepideus antigen extracts to be diluted out in a comparable way (i.e. the non-parallelism of antigen dilution curves)' implying differences in antigenicity, did not permit absolute quantification of the antigen to be produced. However, as increased weight losses corresponded to greater levels of fungal antigens being detected, the assay may be described as semi-quantitative.
The loss in dry weight expressed as a percentage of the initial dry weight is a simple measure by which to express quantitatively the amount of decay suffered by test blocks during the course of any experiment in timber decay. However, it has been reported (Cartwright and Findlay, 1958) that certain fungi decompose chemically, at least during the early stages of decay,
2 8 8
more wood substance than they are able to utilise and therefore, weight loss does not give an adequate reflection of colonisation and its usefulness is limited to an estimation of the degree of fungal decomposition. In addition, certain fungi preferentially use readily available non-structural carbohydrates before breaking down structural carbohydrates. Hence good fungal colonisation of the timber can occur before any measurable decay (weight loss) is produced. The high correlation coefficients observed between the weight loss data and the RIA data indicate that the immunological detection system can be considered at least as useful as weight loss in estimating the extent of fungal degradation. Furthermore, the RIA can detect the presence of the fungus at very early stages of colonisation before any degradation of the wood has occurred. Since the immunoassay directly detects the fungus, rather than an affect caused by the fungus, it has the potential to detect an incipient decay hazard rather than simply identifying the after effects of the fungus.
The statistical test employed in this study was the Spearman Rank Correlation coefficient (Siegel, 1956). This non-parametric test was employed because the weight loss data did not follow a normal bivariate distribution and thus the more commonly used parametric Pearson product-moment correlation coefficient would have been inappropriate.
A highly significant correlation observed between the dot-immunobinding scores and the RIA results indicates the two systems are, as would be expected, measuring similar parameters. The dot-immunobinding assay has several advantages over the RIA: it is technically simpler and does not require the use of potentially dangerous radioisotopes or expensive equipment to detect the signal. For these reasons the dot-immunobinding assay
2 8 9
has greater potential as a routine screening system for field samples.
The anomalous results encountered in this study fell into one of two categories; (i) those blocks exhibiting no, or low, weight loss yet containing high levels of fungal antigens based on the immunoassay results and (ii) those blocks exhibiting high weight loss yet relatively low levels of fungal antigens. The best example of the former category is lime block 14 which although showing a 0% weight loss contained 1054.69ug of fungal antigens per ml of L. lepideus s. antigen extract (based on RIA results). As stated earlier a large fungal biomass can be build up utilising available non-structural carbohydrates before any degradation of the wood, and thus weight loss, occurs. However, it is unlikely that the level of non-structural carbohydrates available, up to 3% of the dry weight of the wood (Bravery, 1968), could support this level of fungal biomass. Previous research has shown that small amounts of soluble amino acids are present in some woods (Nayagam, 1987). King (1975) demonstrated that the greatest amounts of this soluble nitrogen were located within the outer sapwood regions with lesser amounts being present in the heartwood region. The soluble nitrogenous materials have been shown to migrate and accumulate at the evaporative faces of wood during drying (King et al., 1974). Thus relatively small areas are produced which are rich in nitrogen. Those blocks showing the pattern of low weight loss/high antigen content might have been cut from areas rich in such nutrients which would result in a larger fungal biomass than normal being built up before any degradation of the wood occurred and could thereby account for the high antigen levels detected.
A particular example of those blocks exhibiting high weight loss but low antigen levels is pine block 15. Despite showing a
2 9 0
weight loss of 34.5% only 49.48ug of fungal antigens per ml of L. lepideus s, antigen extract was detected in the RIA system. These findings are supported by previous work carried out in this department which found similar results with Serpula lacrymans (A. Vigrow, personal communication) and suggests that wood blocks decayed to high weight losses lose fungal antigens. This loss may be due to autolysis of older fungal mycelium.
Although the dot-immunobinding assay has been shown to be applicable to screen wood extracts for the presence of L. lepideus, further areas of development are required before the system can be employed as a routine detection system for incipient fungal decay. These include full quantification of the system and discrimination between live and dead/dormant fungi. Reflectance densitometry could be used to quantify the intensity of the dots in the enzyme-based dot-immunobinding assay, however, the equipment required is expensive, not generally available and not suitable for field testing. Development of other immunological reagents may overcome the non-parallelism of the RIA.
In the detection systems reported to date it was not possible to discriminate between live and dead/dormant fungi. However, this inability is not a characteristic of the detection systems but rather of the antiserum used in this study. Discrimination could be achieved by developing reagents to fungal antigens which are only expressed when the fungus is actively degrading the wood e.g. wood degrading enzymes. This approach is being developed by several workers (Daniel et al., 1989, Goodell et al., 1988). The ability to distinguish active from inactive decay fungi would be particularly useful when deciding the necessity of remedial
preservative treatment. Identification of poles containing active fungi would permit their priority treatment in situations of limiting time and/or money.
6.3.3. Direct staining techniques.
Direct staining of fungal mycelium can provide information on both the extent and locality of fungal colonisation within wood sections. The safranin/picro-aniline blue staining system (Cartwright,1929) has been in use for a number of years and is an appropriate stain for fungal mycelium in wood. However, it is non-specific. In a natural environment for example, where timber can be exposed to numerous fungal species, the chance of a single pure fungal culture existing within wood is remote and identification of any single colonist is not possible using safranin/picro-aniline blue. Immunologically-based staining systems do not have this limitation. Specific antisera can be produced which will only react with a single fungal strain/species thereby permitting the identification of a specific species in wood sections colonised by a number of fungi. Such systems can also be used to detect and localise, for example, enzyme - dependent lignin degradation in situ in natural substrates (Daniel et al., 1989), extracellular metabolites from Poria placenta (Goodell et al., 1988) and host-parasite interactions (Benhamou et al., 1986).
Comparison of the three staining systems indicated that they were equally efficient at staining the L. lepideus mycelium within wood. The stained wood sections provided valuable information on the localisation and spread of the fungal hyphae within the two
2 9 2
wood types. However, the complexity of these methods renders them unsuitable as routine screening systems for L. lepideus in wood samples.
6.3.3.1. Localisation of L. lenideus mycelium in wood block sections.
The results obtained with the stains indicate that the
primary colonisation route is via the ray cells (see Figures 6.4 and 6.5). The ray parenchyma is a readily available nutrient source (Levy and Dickinson, 1981) and this may explain why the fungus colonises it in the initial stages. Thereafter, the fungal hyphae spread into the conducting tissue: tracheids in softwoods and vessels in hardwoods. Numerous tracheids can be accessed from a single ray cell. The hyphae penetrate the tracheids/vessels via pits in the cell walls and subsequently, can rapidly spread along the vertical axis of the timber (Coggins, 1980).
6.3.3.2. Non-specific staining.
As with the EIA/ACA systems, non-specific binding problems were encountered in the direct staining systems , particularly with the FITC-labelled probes. Chard (1981) has reported encountering similar problems with immunofluorescence staining of Mycena galopus and Dewey and Brasier (1988) have reported non-specific binding of pre-immune control serum to plant tissue infected with Ophiostoma ulmi. Furthermore, relatively intense background staining has been observed in stained wood sections infected with Coriolus versicolor and Serpula lacrymans (A.Vigrow, personal communication). The factor(s) responsible for the
2 9 3
non-specific binding have not as yet been determined. The concomitant increase in background staining in wood block sections and weight loss may be caused by the localisation of decay enzymes which have diffused away from the fungal hyphae through the woody tissue.
6.3.4. Electron microscopy.
In this study electron microscopy was used simply to confirm the localisation of fungal hyphae within wood sections. However, electron microscopy in conjunction with other techniques can also provide information on the pattern and extent of attack on lignin
and cellulose in wood (Goodell et al., 1986). Electron microscope studies have also been used to highlight the differences in the pattern of white-rot and brown-rot decay in wood cell walls (Kirk, 1983, Eriksson et al., 1980).
The work described in this chapter clearly illustrates that immunological detection systems can be applied to the screening of extracts from wood samples for fungal antigens and thus fungal colonisation and/or decay. Furthermore, such systems can be employed to map the spread of the fungus within the timber. The sensitivity of the nitrocellulose-based immunoassays identified them as potential screening systems for incipient fungal decay in distribution poles and subsequently the enzyme-based dot-immunobinding assay was evaluated in a small field trial (see chapter 7). Several conclusions can be drawn from the data
reported in this chapter.

1. Immunological detection systems can be employed to detect fungal antigens in wood block extracts and wood sections.
2. The nitrocellulose-based immunoassays can detect L. lepideus
within wood block extracts at the very early stages of colonisation.
3. The nitrocellulose-based immunoassays were the most effective of the immunological systems tested, the dot-immunobinding assay has the greatest potential as a general screening system due to its relative technical simplicity.
4. Colonisation of sapwood is initially via the ray cells subsequently spreading to the conductive tissue.
2 9 5
CHAPTER 7. FIELD TRIAL STUDY.
2 9 6
7.1. Introduction.
The results of the wood block test system experiments (Chapter 6) showed that, L. lepideus could be detected within timber extracts by a variety of immunological techniques. The dot-immunobinding assay was considered to offer the most potential for development as a routine detection system for testing distribution poles as it is a quick, sensitive and qualitative test for the initial screening of samples. Furthermore, positive samples can be analysed by conventional densitometry (Palfreyman et al., 1988a). The specificity of immunological probes permits the identification of specific antigens within large amounts of contaminating non-antigenic material. To determine if a system suitable for laboratory tests is applicable to the testing of field samples such as those obtained from on-line distribution poles, interference with, or deleterious effects on the assay caused by factors associated with such samples must be tested. Therefore to this end, a field trial involving nine creosote-treated distribution pole stubs was established (section 2.18 and Figure 7.1). The field trial study had two main aims:
1. To compare the results obtained using the dot-immunobinding assay system with those obtained by standard microbiological
isolation techniques.
Microbiological analysis (culturing) of cores removed from poles is commonly used as a confirmatory test for the presence of decay organisms in poles diagnosed as decay suspect by
2 9 7
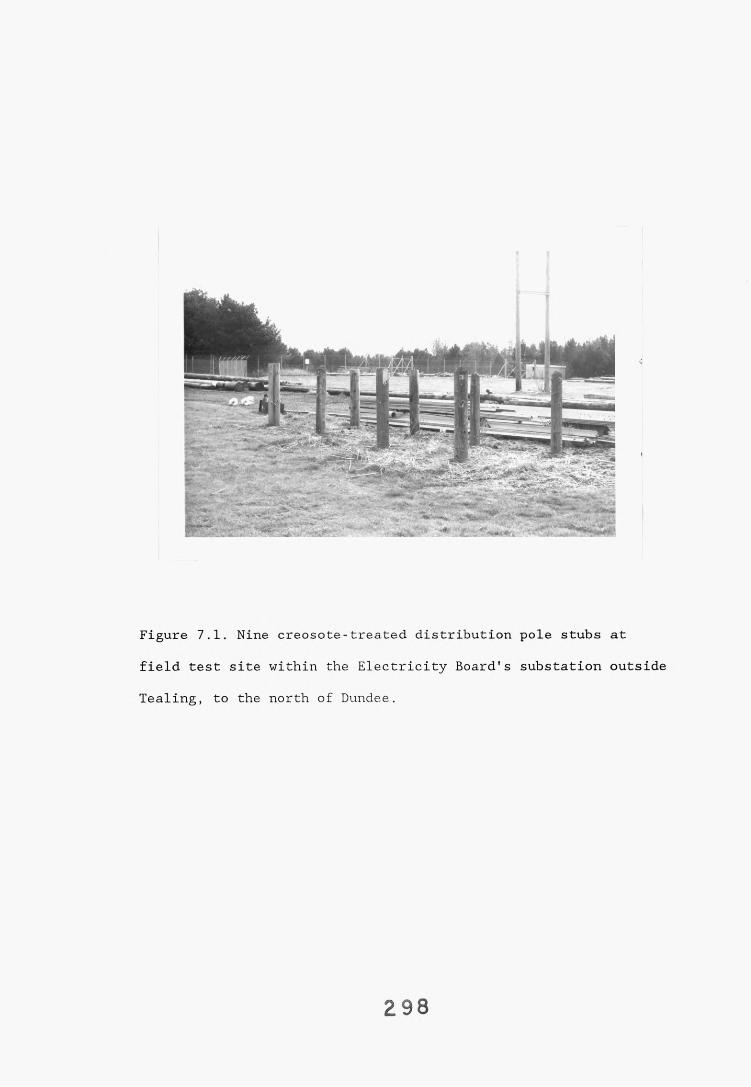
Figure 7.1. Nine creosote - treated distribution field test site within the Electricity Board's Tealing, to the north of Dundee.
pole stubs substation
atoutside
298
hammer-sounding, and can therefore be used as a standard method for evaluation of any new decay detection systems (Inwards and Graham, 1980).
2. To determine whether any additional factors present in on-line distribution poles, but not in laboratory wood block test systems, affected the performance of the immunoassay.
Several factors could potentially affect and/or interfere in the performance of the assay on field material. For example, the interaction of L. lepideus with the wood itself or with other microorganisms present within the wood, and the presence of cross-reacting organisms in the wood.
7.2. Results.
Throughout the chapter the following designated codes will beused.1. 1+ = immunologically positive sample (i.e. scoring >1 in the dot-immunobinding assay).2. I- = immunologically negative sample.3. M(L)+ = positive microbiological isolation of L. lepideus.
4. M(L)- = L. lepideus not isolated.5. M(named)+ = positive microbiological isolation of the named microorganism.6. M(named)- = named microorganism not isolated.
7. M+ = microbiologically positive sample (microorganism not specified).8. M- = microbiologically negative sample i.e no microorganism isolated.
The poles from the field trial were screened as described earlier (see section 2.18.2). Of the sections analysed microbiologically 73.01% (330 out of 452) gave a positive result (i.e. a microorganism grew out from the core section when cultured on laboratory media). Table 7.1 details the organisms isolated and the number of isolations observed. Fungal isolates were identified to genus level whenever possible. Growth of the majority of unidentified fungal isolates (125 out of 131) was inhibited by benomyl (4ppm) and therefore they were assumed to be moulds. No attempts were made to identify non-fungal isolates.
Core section samples tested in the dot-immunobinding assay were scored on a scale 0-6 dependent on the intensity of the colour produced (0 = negative, 6 = dot intensity obtained with a L. lepideus mycelial extract positive control). Each sample was scored by five independent assessors. The five independent scores and the median score for each core section sampled are presented in Appendix A. In all subsequent statistical analyses the median scores were used. Although the scoring system was based on a subjective visual measurement, there was a high level of agreement in the scores awarded for any particular sample. In only a few cases (3.51%) did the scores of the independent assessors vary by more than one point and this low level of variance justifies the consideration of the scoring system as an objective measurement. A
total of 511 core sections were analysed immunologically and of these 227 gave a measurable result (i.e. ^1). Table 7.2 shows the
3 0 0
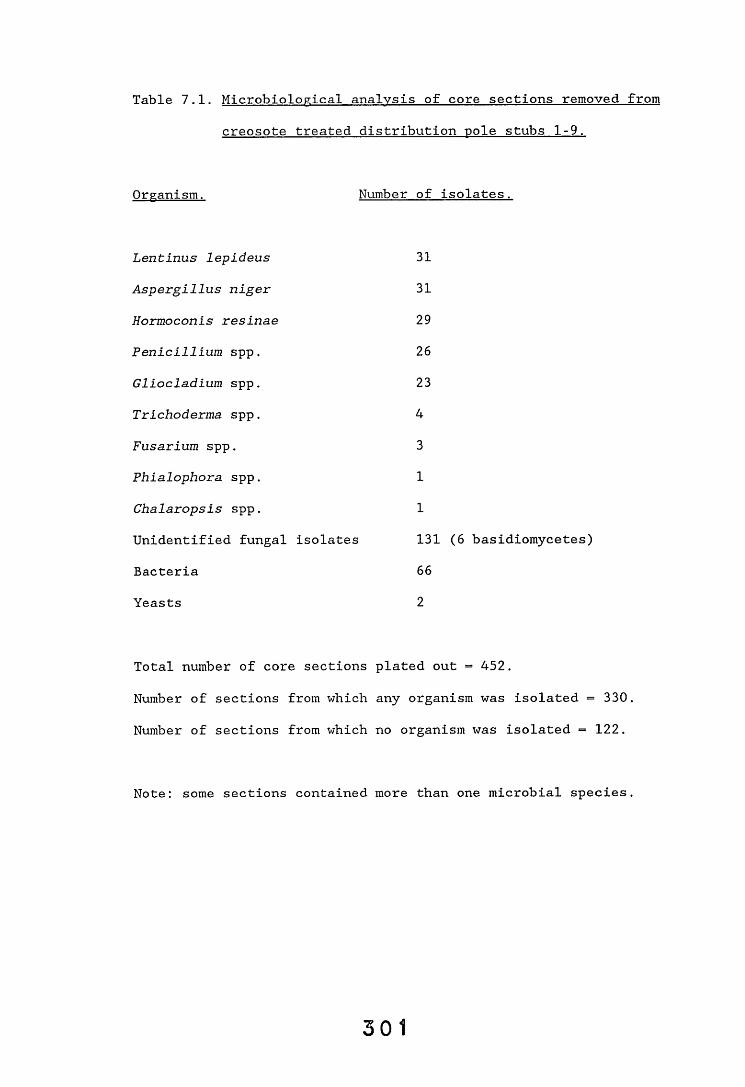
Table 7.1. Microbiological analysis of core sections removed from creosote treated distribution pole stubs 1-9.
Organism.
Lentinus lepideus
Aspergillus niger
Hormoconis resinae
Penicillium spp.Gliocladium spp.Trichoderma spp.Fusarium spp.Phialophora spp.Chalaropsis spp.Unidentified fungal isolatesBacteriaYeasts
Number of isolates.
31 31 29 26 23 4 3 1 1131 (6 basidiomycetes) 66
2
Total number of core sections plated out = 452.Number of sections from which any organism was isolated = 330. Number of sections from which no organism was isolated = 122.
Note: some sections contained more than one microbial species.
3 0 1
total number of samples scoring any particular value. All immunologically positive samples were tested for reactivity with pre-immune control serum (PIS). Eighteen samples (7.9%) were faintly positive (score = 1), twelve of these PIS positive samples were taken from pole 6. However, the distribution of the PIS positive samples was not associated with the presence of any one particular organism.
A computer program FUNGUSH written in FORTRAN (Bruce, 1983 modified by Clark, 1988, Appendix B) was used to map the distribution of the microbiologically and immunologically positive sections within the poles. The pole maps obtained are presented in Appendix C. Sections were scored as positive or negative and therefore the maps, whilst presenting visual information on the distribution of the immunological positives, do not give any indication as to the extent of the immunological reaction. Each pole was sampled at three levels; 6cm above the groundline, at groundline and 6cm below the groundline and these positions are represented on the computer maps. Table 7.3 presents the numbers of immunologically and microbiologically positive samples obtained from each pole.
Analysis of the microbiological and immunological data combined with the use of computer graphics permitted the identification of various patterns within the individual poles.
The results obtained with poles 4,6 and to a lesser extent 1 presented a pattern of numerous 1+ core sections but an absence of any positive microbiological isolations of L. lepideus in the
sections tested. Microbiological screening of the sections removed from pole 1 yielded relatively few microbial isolates with only 25% of the sections tested being M+. The microorganisms isolated were bacteria, A. niger, Penicillium spp. and unidentified fungi.
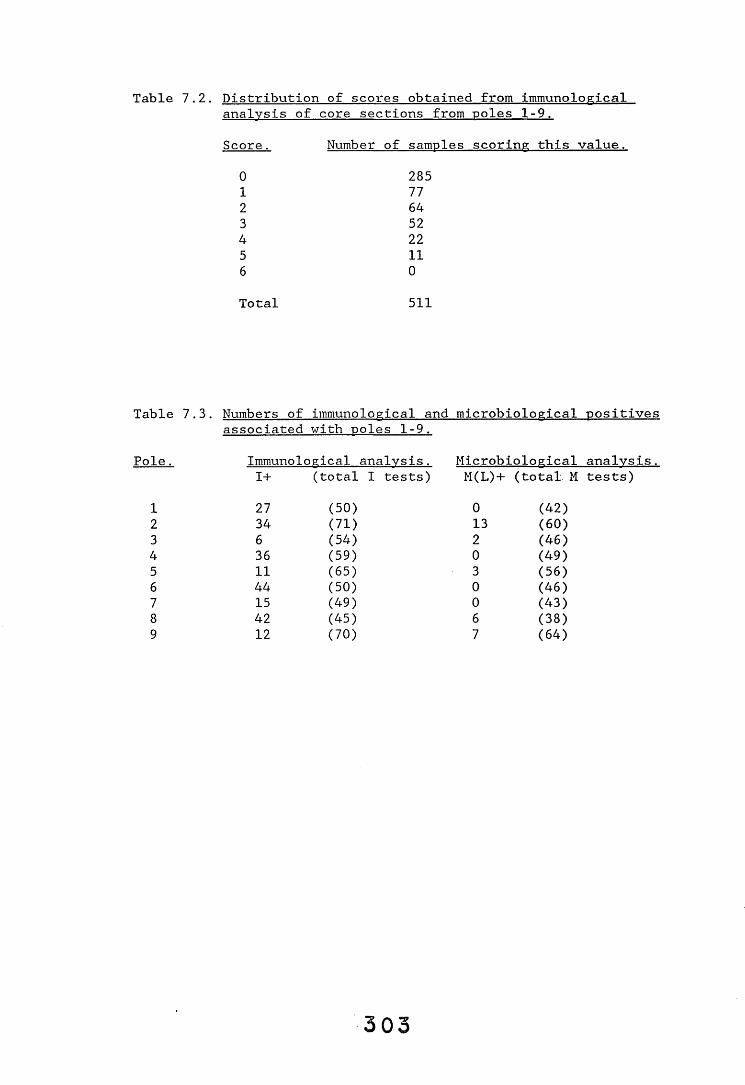
Table 7.2. Distribution of scores obtained from immunologicalanalysis of core sections from poles 1-9.Score. Number of samples scoring this value.
0 2851 772 643 524 225 116 0Total 511
Table 7.3. Numbers of immunological and microbiological positives associated with poles 1-9.
Pole. Immunological analysis. Microbiological analysis.1+ (total I tests) M(L)+ (total. M tests)
1 27 (50) 0 (42)2 34 (71) 13 (60)3 6 (54) 2 (46)4 36 (59) 0 (49)5 11 (65) 3 (56)6 44 (50) 0 (46)7 15 (49) 0 (43)8 42 (45) 6 (38)9 12 (70) 7 (64)
3 0 3
Immunological analysis however, identified over 50% of the sections tested as positive for L. lepideus and 11 sections out of a total of 27 positives had an I score ^3. The higher I scores tended to be located towards the pole perimeter. Microbiological screening of pole 4 core sections yielded numerous A. niger,
Penicillium spp and Gliocladium spp. isolates. The majority of sections tested in the immunoassay (61%) were identified as positive for L. lepideus. In general, higher I scores were observed in sections removed from the groundline and below groundline regions of the pole. Microbiological screening of pole 6 sections yielded numerous Penicillium spp., H. resinae and bacterial isolates. In total 50 sections were screened in the dot-immunobinding assay and the majority (88%) tested positive for L. lepideus. Over 50% of the 1+ samples had an I score ^3. The 1+ sections were distributed fairly evenly throughout the three sampling levels and there was a slight bias of higher scores towards the pole perimeter.
A second pattern was observed in the results obtained for pole 7. Although the pole was M(L)-/I+ (c.f. poles 1,4 and 6) there were fewer 1+ sections and their distribution was different. The majority of the 1+ sections were located at, or above, groundline with only very few 1+ sections being located below groundline. Microbiological screening of sections removed from pole 7 yielded a wide range of fungal and bacterial isolates (Table 7.1). Of the sections screened immunologically, approximately one third tested positive for L. lepideus, however, the highest I score obtained for any individual section was only 2. No bias was observed in the location of the 1+ sections across
the pole diameter.A third pattern was observed in the results obtained from
poles 2 and 5. L. lepideus was isolated from sections from both poles, however, the I scores obtained for sections associated with M(L)+ sections were relatively low (pole 2, range 0-4, mean 0.8; pole 5, range 0-2, mean 0.6). Microbiological screening of pole 2 core sections yielded numerous L. lepideus (22%) and bacterial isolates. L. lepideus was isolated mainly from sections removed from the pole centre and this was also where the sections with the highest I scores were located. The majority of M(L)+ sections were associated with at least one 1+ section. Positive microbiological detection of L. lepideus in pole 5 was limited to sections located below groundline as were most of the sections testing postive in the immunoassay. Of the three M(L)+ sections two were associated with at least one 1+ section. Below groundline a slight tendency for 1+ sections to be located towards the pole perimeter was observed. H. resinae was the most frequent microbiological isolate obtained from pole 5.
A fourth and final pattern was observed in the results obtained from poles 3,8 and 9. L. lepideus was isolated microbiologically from sections from these poles. In addition, the I scores obtained for sections associated with M(L)+ sections were higher than those observed in poles 2 and 5 (pole 3, range 0-4, mean 2, pole 8, range 1-5, mean 3.8 and pole 9, range 0-4, mean 1.7). The M(L)+ and 1+ sections identified in pole 3 were restricted mainly to a small pocket located towards the pole centre and above groundline. In addition to L. lepideus ,
microbiological screening of the sections yielded Gliocladium spp. and Penicillium spp. isolates. All the M(L)+ sections were associated with at least one 1+ section. The results obtained with the core sections removed from pole 8 showed a very good association between the M(L)+ and 1+ sections. All sections from
which L. lepideus was isolated were associated with an 1+ section on either side. In addition, over 80% of the M(L) + sections were associated with an I score ^3. The majority of M(L) + sections were located below groundline and the 1+ sections were distributed evenly over the three sampling levels. Marginally higher I scores were observed in sections removed from below groundline. Pole 9 was very similar to pole 8 in that the majority of M(L) + sections were associated with an I score ^3, however, it differed from pole 8 in the location of the positive sections. The M(L)+ and 1+ sections were located in small pockets although some isolated 1+ sections were observed. Both the M(L)+ and 1+ sections were restricted to, and below, groundline. In addition to L. lepideus, microbiological screening of pole 9 core sections yielded Penicillium spp., H. resinae and A. niger isolates.
The distribution of immunologically positive samples across the diameter of the pole varied. In poles 2 and 3, the 1+ samples tended to cluster in the pole centre. In poles 1, 5 and 6 they tended to be located towards the pole perimeter. Whilst in poles 4, 7, 8 and 9 no clustering was observed. The localisation of fungal growth is probably partly determined by the moisture patterns within the poles.
The actual I scores obtained for individual core sections within poles in the immunoassay are presented in Figure 7.2. The scores used are the median values obtained from the scores awarded by the five independent assessors. Statistical analysis of these results was undertaken using the Minitab Statistics package on the VMS/VAX system, to test the validity of the following hypotheses.
5 0 6
Figure 7.2. Immunological and microbiological analysis of creosote treated distribution pole stubs 1-9. Even-numbered core sections were analysed microbiologically and scored either positive or negative for growth of Lentinus lepideus. Odd- numbered core sections were tested in the dot-immunobinding assay and scored from 0-6.
0 = negative i.e. no dot visible.1 = faint dot, just visible.
2 = distinct dot.3 = dot of an intensity between 2-4.4 = dot obtained using L. lepideus infected wood sample
positive control.5 = dot of an intensity between 4-6.6 = dot obtained using a L. lepideus mycelial positive
control.
+ = positive microbiological isolation of L. lepideus.- = L. lepideus not isolated.
3 0 7
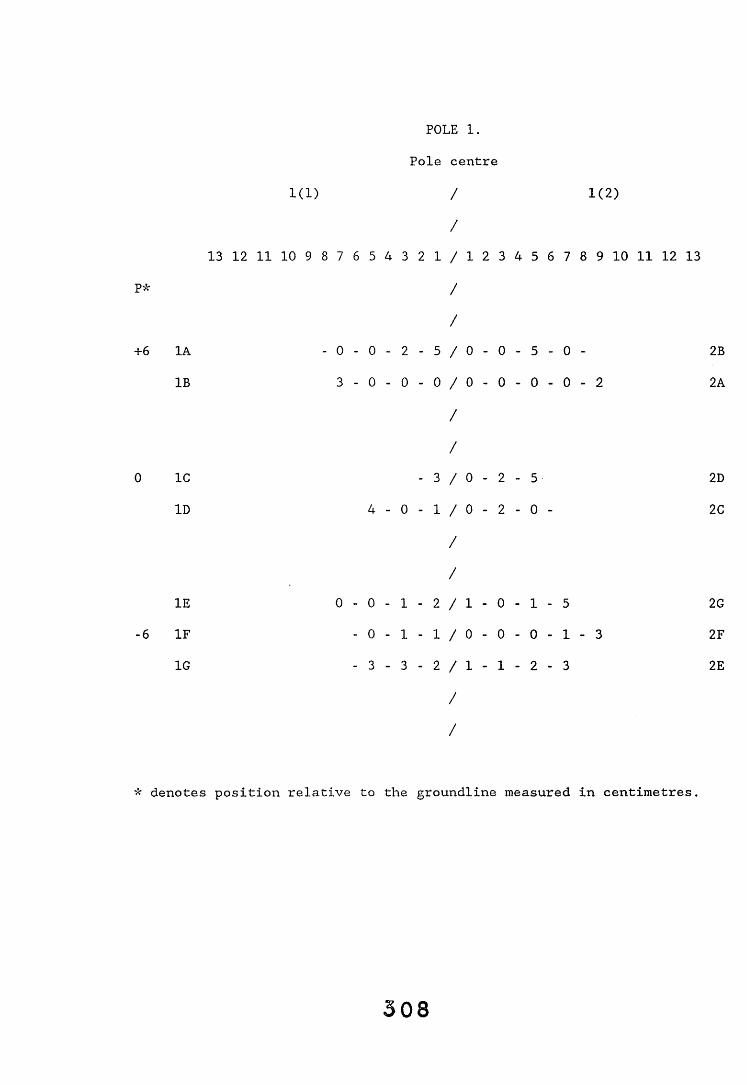
POLE 1.Pole centre
K l ) / 1 (2)
/
13 12 11 10 9 8 7 6 5 4 3 2 1 / 1 2 3 4 5 6 7 8 9 10 11 12 13p* /
/+6 1A - 0 - 0 - 2 - 5 / 0 - 0 - 5 - 0 - 2B
IB 3 - 0 - 0 - 0 / 0 - 0 - 0 - 0 - 2 2A
//
0 1C - 3 / 0 - 2 - 5 2DID 4 - 0 - 1 / 0 - 2 - 0 - 2C
//
IE 0 - 0 - 1 - 2 / 1 - 0 - 1 - 5 2G-6 IF - 0 - 1 - 1 / 0 - 0 - 0 - 1 - 3 2F
1G - 3 - 3 - 2 / 1 - 1 - 2 - 3 2E
/
/
* denotes position relative to the groundline measured in centimetres.
3 0 8
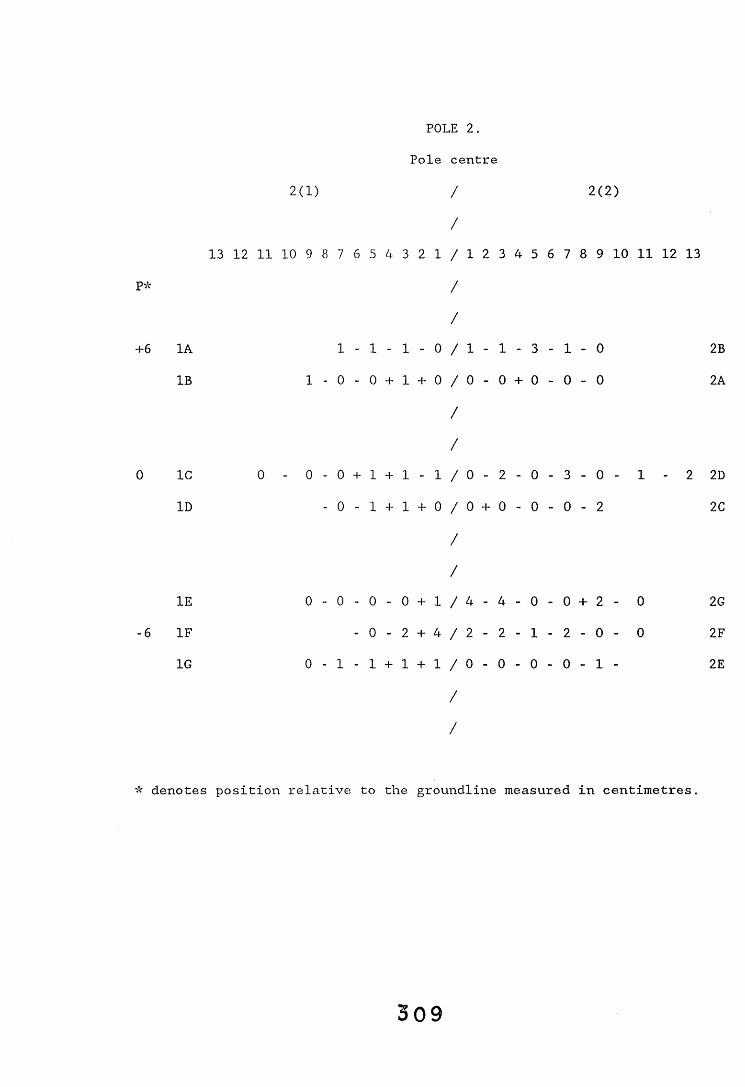
POLE 2.Pole centre
2(1) / 2(2)/
13 12 11 10 9 8 7 6 5 4 3 2 1 / 1 2 3 4 5 6 7 8 9 10 11 12 13
//
1A 1 - 1 - 1 - 0 / 1 - 1 - 3 - 1 - 0 2BIB 1 - 0 - 0 + 1 + 0 / 0 - 0 + 0 - 0 - 0 2A
//
0 1C 0 - 0 ■- 0 + 1 + 1 - 1 / 0 - 2 ■- 0 ■- 3 - 0 - 1 • 2 2DID - 0 - 1 1 + 0 / 0 + 0 -- 0 •- 0 - 2 2C
//
IE 0 ■- 0 - 0 - 0 + 1 / 4 - 4 ■- 0 -- 0 + 2 - 0 2G-6 IF - 0 - 2 + 4 / 2 - 2 •■ 1 ■■ 2 - 0 - 0 2F
1G 0 -• 1 - 1 + 1 + 1 / 0 - 0 -■ 0 ■■ 0 - 1 - 2E
/
/ *
* denotes position relative to the groundline measured in centimetres.
3 0 9
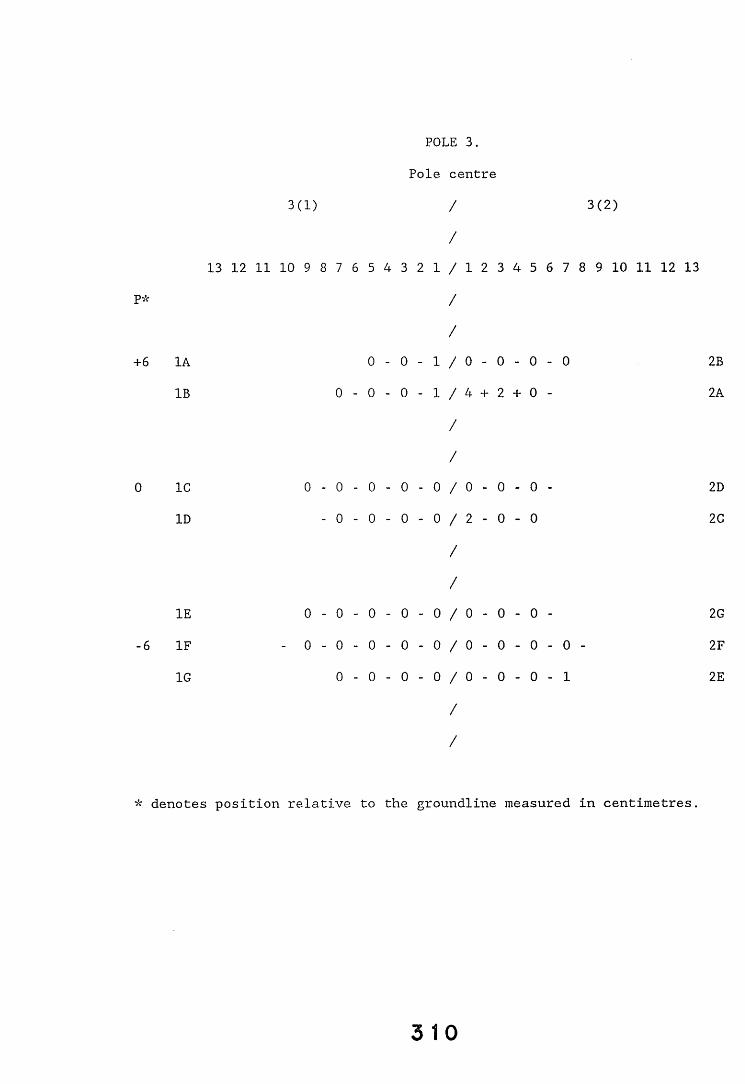
POLE 3.Pole centre
3(1) / 3(2)
/
13 12 11 10 9 8 7 6 5 4 3 2 1 / 1 2 3 4 5 6 7 8 9 10 11 12 13p* /
/+6 1A 0 - 0 - 1 / 0 - 0 - 0 - 0 2B
IB 0 - 0 - 0 - 1 / 4 + 2 + 0 - 2A
//
0 1C 0 - 0 - 0 - 0 - 0 / 0 - 0 - 0 - 2D
ID - 0 - 0 - 0 - 0 / 2 - 0 - 0 2C
//
IE 0 - 0 - 0 - 0 - 0 / 0 - 0 - 0 - 2G-6 IF - 0 - 0 - 0 - 0 - 0 / 0 - 0 - 0 - 0 - 2F
1G 0 - 0 - 0 - 0 / 0 - 0 - 0 - 1 2E
/
/
* denotes position relative to the groundline measured in centimetres.
3 10
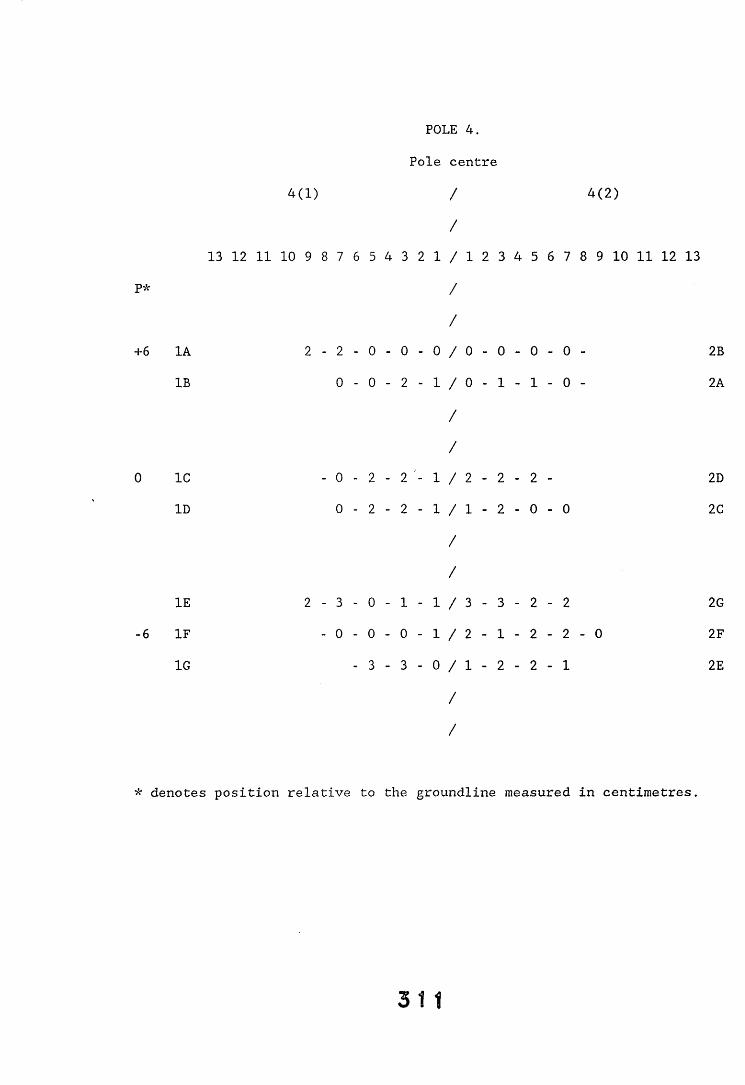
POLE 4.
Pole centre
4(1) / 4(2)
/
13 12 11 10 9 8 7 6 5 4 3 2 1 / 1 2 3 4 5 6 7 8 9 10 11 12 13
P* /
/
+6 1A 2 - 2 - 0 - 0 - 0 / 0 - 0 - 0 - 0 - 2BIB 0 - 0 - 2 - 1 / 0 - 1 - 1 - 0 - 2A
//
0 1C - 0 - 2 - 2 7- 1 / 2 - 2 - 2 - 2DID 0 - 2 - 2 - 1 / 1 - 2 - 0 - 0 2C
//
IE 2 - 3 - 0 - 1 - 1 / 3 - 3 - 2 - 2 2G-6 IF - 0 - 0 - 0 - 1 / 2 - 1 - 2 - 2 - 0 2F
1G - 3 - 3 - 0 / 1 - 2 - 2 - 1 2E
/
/
* denotes position relative to the groundline measured in centimetres.

POLE 5.Pole centre
5 ( 1 ) / 5 ( 2 )
/
13 1 2 11 10 9 8 7 6 5 4 3 2 1 / 1 2 3 4 5 6 7 8 9 1 0 1 1 12 1 3
P* /
/
+6 1A 0 - 0 - 0 - 0 - 0 - 0 / 0 - 0 - 0 - 0 2B
IB 0 - 0 - 0 - 0 - 0 - 0 / 0 - 0 - 0 - 0 2A
/
/
0 1C - 1 - 0 - 0 - 0 - 1 - 0 / 0 - 0 - 0 - 0 2D
ID - 0 - 0 - 0 / 0 - 0 - 0 - 0 2C
/
/
IE - 2 - 1 - 0 - 0 / 0 - 0 - 0 - 3 2G
-6 IF 0 - 3 - 0 - 2 - 0 - 0 / 0 + 1 + 2 - 0 - 2F
1G 0 - 0 - 1 - 3 - 0 + 0 / 2 - 0 - 0 - 0 - 2E
/
/
* denotes position relative to the groundline measured in centimetres.
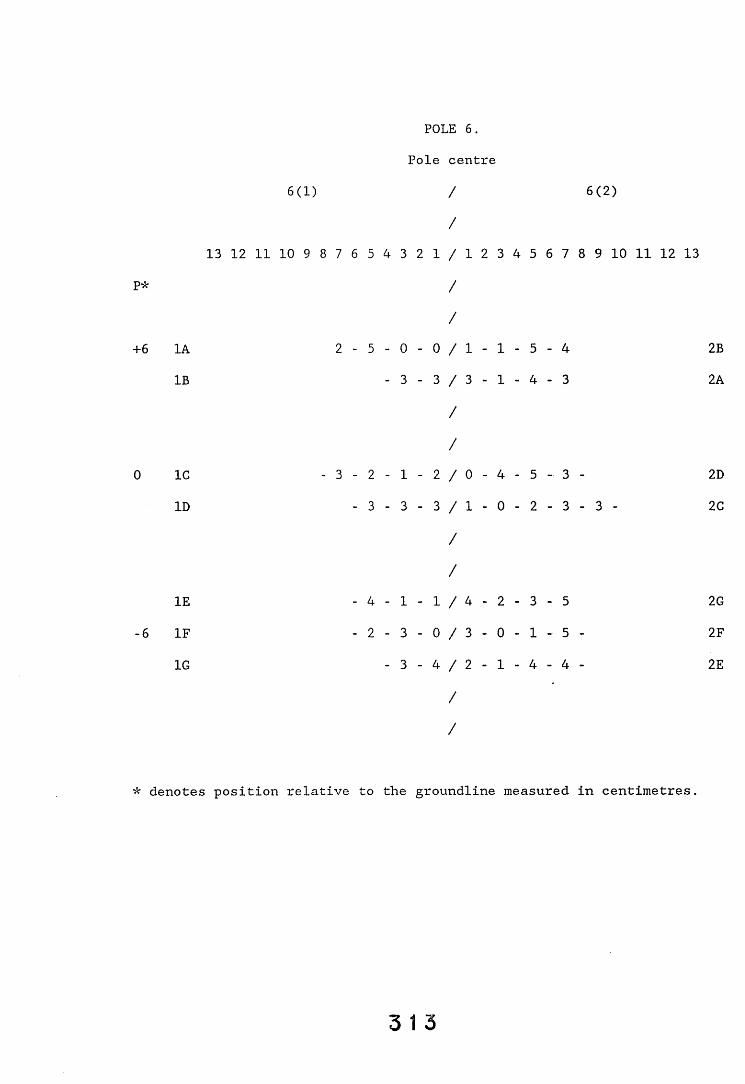
POLE 6.Pole centre
6(1) / 6(2)/
13 12 11 10 9 8 7 6 5 4 3 2 1 / 1 2 3 4 5 6 7 8 9 10 11 12 13
P* /
/
+6 1A 2 - 5 - 0 - 0 / 1 - 1 - 5 - 4 2BIB - 3 - 3 / 3 - 1 - 4 - 3 2A
/
/0 1C - 3 - 2 - 1 - 2 / 0 - 4 - 5 - 3 - 2D
ID - 3 - 3 - 3 / 1 - 0 - 2 - 3 - 3 - 2C
//
IE - 4 - 1 - 1 / 4 - 2 - 3 - 5 2G
-6 IF - 2 - 3 - 0 / 3 - 0 - 1 - 5 - 2F
1G - 3 - 4 / 2 - 1 - 4 - 4 - 2E
/
/
* denotes position relative to the groundline measured in centimetres.
3 1 3
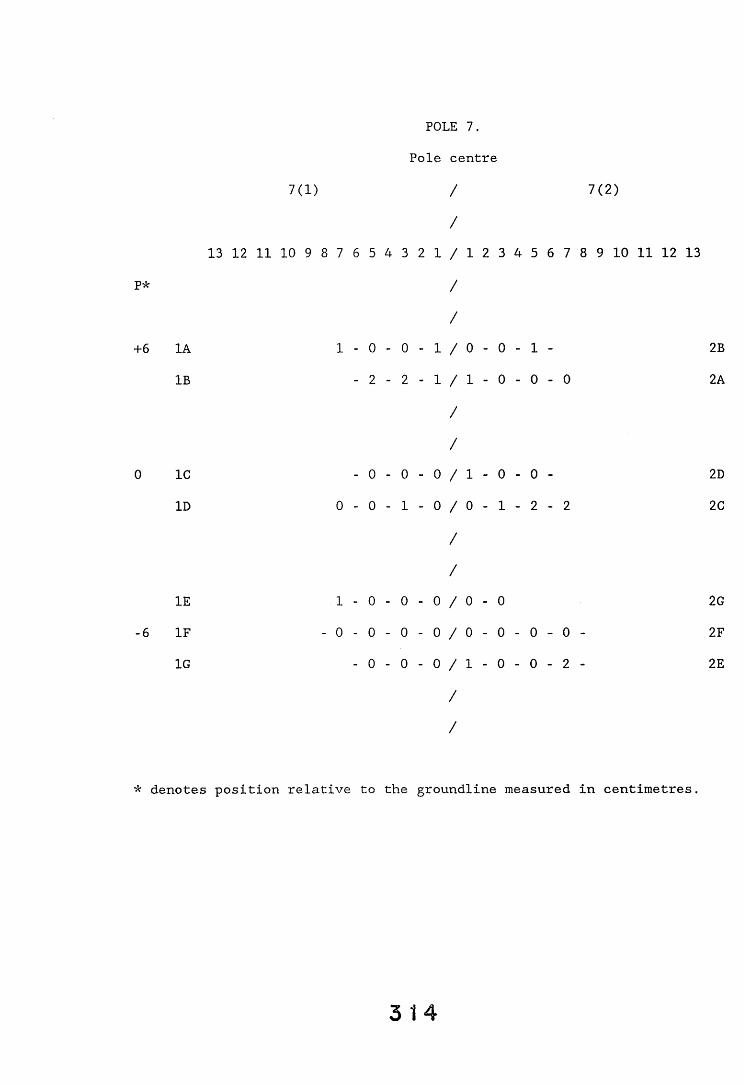
POLE 7.Pole centre
7(1) / 7(2)
/
13 12 11 10 9 8 7 6 5 4 3 2 1 / 1 2 3 4 5 6 7 8 9 10 11 12 13p* /
/+6 1A 1 - 0 - 0 - 1 / 0 - 0 - 1 - 2B
IB - 2 - 2 - 1 / 1 - 0 - 0 - 0 2A
//
0 1C - 0 - 0 - 0 / 1 - 0 - 0 - 2D
ID 0 - 0 - 1 - 0 / 0 - 1 - 2 - 2 2C
//
IE 1 - 0 - 0 - 0 / 0 - 0 2G-6 IF - 0 - 0 - 0 - 0 / 0 - 0 - 0 - 0 - 2F
1G - 0 - 0 - 0 / 1 - 0 - 0 - 2 - 2E
/
/
* denotes position relative to the groundline measured in centimetres.
3 1 4
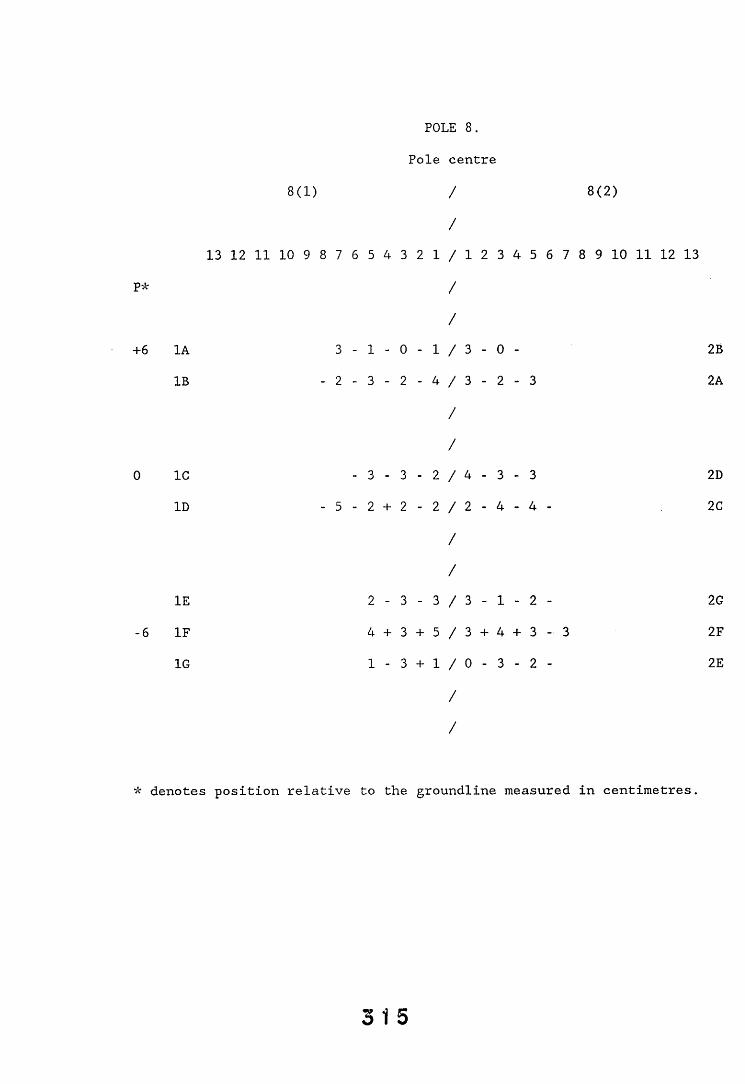
POLE 8.Pole centre
8(1) / 8(2)/
13 12 11 10 9 8 7 6 5 4 3 2 1 / 1 2 3 4 5 6 7 8 9 10 11 12 13
P* /
/
+ 6 1A 3 - 1 - 0 - 1 / 3 - 0 - 2B
IB - 2 - 3 - 2 - 4 / 3 - 2 - 3 2A
//
0 1C - 3 - 3 - 2 / 4 - 3 - 3 2DID - 5 - 2 + 2 - 2 / 2 - 4 - 4 - 2C
//
IE 2 - 3 - 3 / 3 - 1 - 2 - 2G
- 6 IF 4 + 3 + 5 / 3 + 4 + 3 - 3 2F
1G 1 - 3 + 1 / 0 - 3 - 2 - 2E
/
/
* denotes position relative to the groundline measured in centimetres.
3 1 5
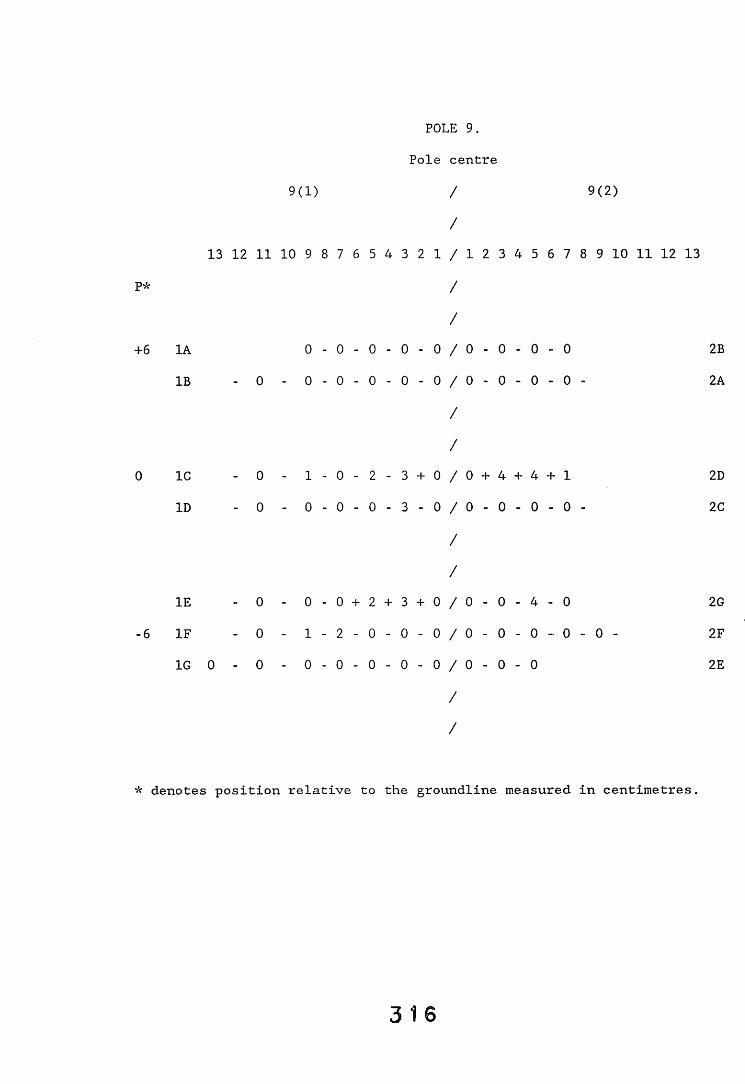
POLE 9.Pole centre
9(1) / 9(2)
/
13 12 11 10 9 8 7 6 5 4 3 2 1 / 1 2 3 4 5 6 7 8 9 10 11 12 13
p* /
/
+6 1A 0 - 0 - 0 - 0 - 0 / 0 - 0 - 0 - 0 2B
IB - 0 - 0 - 0 - 0 - 0 - 0 / 0 - 0 - 0 - 0 - 2A
/
/
0 1C - 0 - 1 ■- 0 - 2 - 3 + 0 / 0 + 4 + 4 + 1 2DID - 0 ■ 0 •- 0 - 0 - 3 - 0 / 0 - 0 - 0 - 0 - 2C
//
IE - 0 ■- 0 •- 0 + 2 + 3 + 0 / 0 - 0 - 4 - 0 2G
-6 IF - 0 -• 1 •■ 2 - 0 - 0 - 0 / 0 - 0 - 0 - 0 - 0 - 2F1G 0 - 0 -■ 0 ■■ 0 - 0 - 0 - 0 / 0 - 0 - 0 2E
/
/
* denotes position relative to the groundline measured in centimetres.
3 1 6
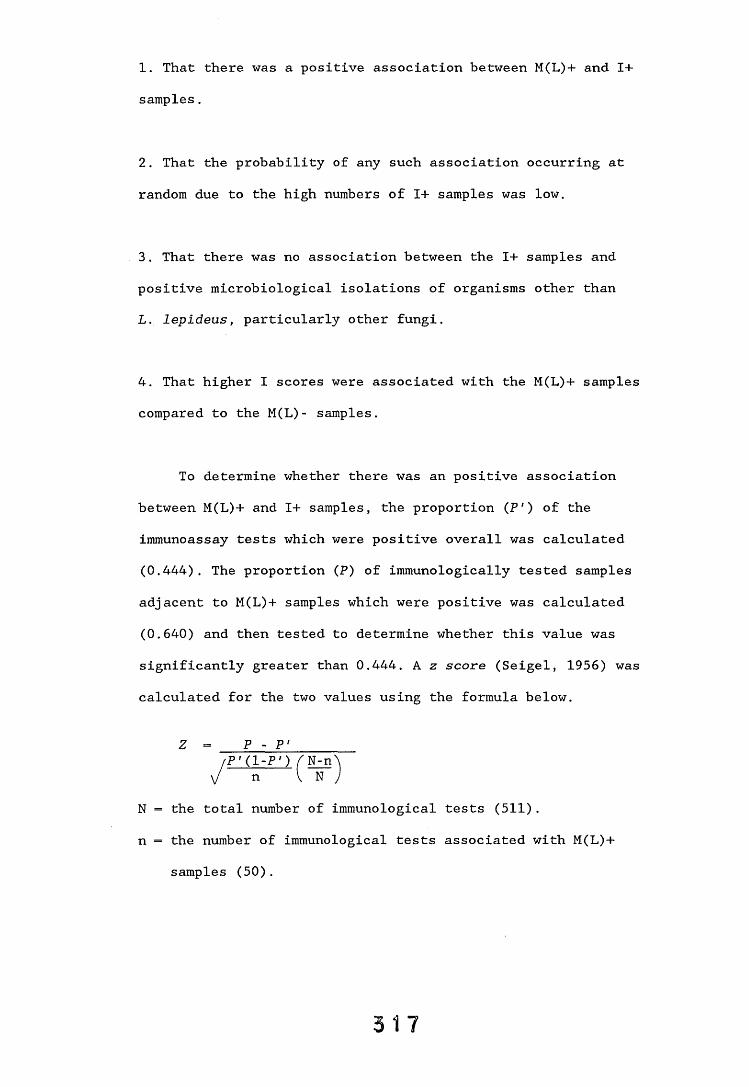
1. That there was a positive association between M(L)+ and 1+samples.
2. That the probability of any such association occurring at random due to the high numbers of 1+ samples was low.
3. That there was no association between the 1+ samples and positive microbiological isolations of organisms other than L. lepideus, particularly other fungi.
4. That higher I scores were associated with the M(L)+ samples compared to the M(L)- samples.
To determine whether there was an positive association between M(L)+ and 1+ samples, the proportion (P') of the immunoassay tests which were positive overall was calculated (0.444). The proportion (P) of immunologically tested samples adjacent to M(L)+ samples which were positive was calculated (0.640) and then tested to determine whether this value was significantly greater than 0.444. A z score (Seigel, 1956) was calculated for the two values using the formula below.
N = the total number of immunological tests (511). n = the number of immunological tests associated with M(L)+
samples (50).
P - P'
3 1 7
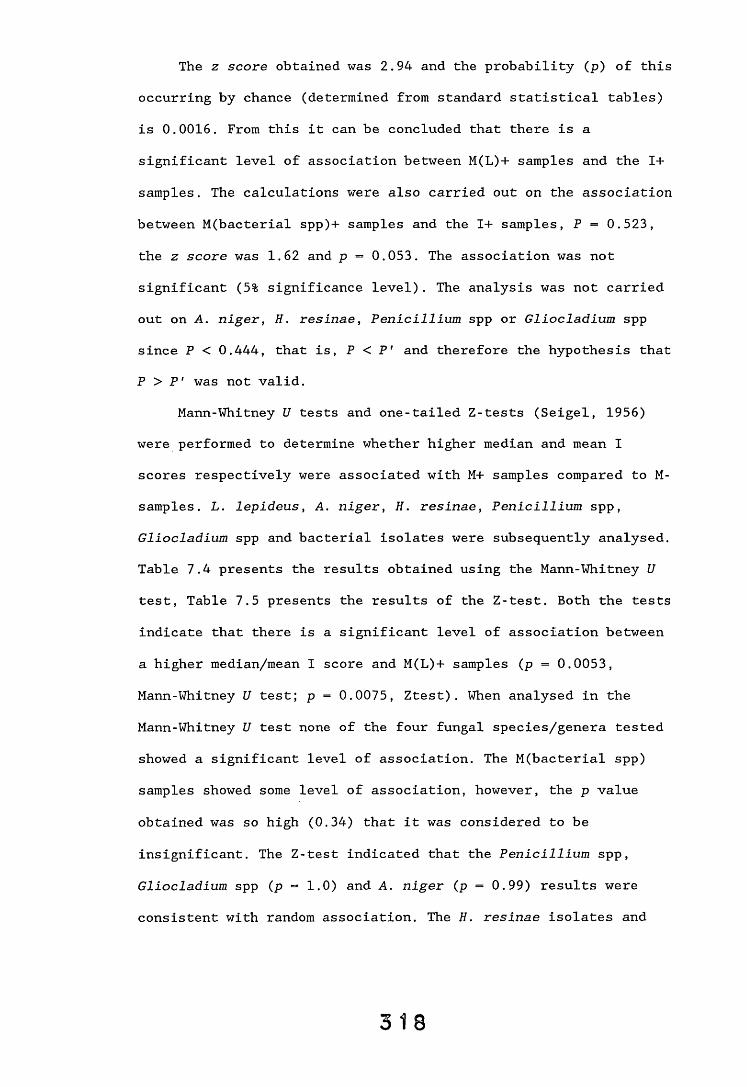
The z score obtained was 2.94 and the probability (p) of this occurring by chance (determined from standard statistical tables) is 0.0016. From this it can be concluded that there is a significant level of association between M(L)+ samples and the 1+ samples. The calculations were also carried out on the association between M(bacterial spp)+ samples and the 1+ samples, P = 0.523, the z score was 1.62 and p = 0.053. The association was not significant (5% significance level). The analysis was not carried out on A. niger, H. resinae, Penicillium spp or Gliocladium spp since P < 0.444, that is, P < P' and therefore the hypothesis that P > P' was not valid.
Mann-Whitney U tests and one-tailed Z-tests (Seigel, 1956) were performed to determine whether higher median and mean I scores respectively were associated with M+ samples compared to M- samples. L. lepideus, A. niger, H. resinae, Penicillium spp, Gliocladium spp and bacterial isolates were subsequently analysed. Table 7.4 presents the results obtained using the Mann-Whitney U test, Table 7.5 presents the results of the Z-test. Both the tests indicate that there is a significant level of association between a higher median/mean I score and M(L)+ samples (p = 0.0053, Mann-Whitney U test; p = 0.0075, Ztest). When analysed in the Mann-Whitney U test none of the four fungal species/genera tested showed a significant level of association. The M(bacterial spp) samples showed some level of association, however, the p value
obtained was so high (0.34) that it was considered to be insignificant. The Z-test indicated that the Penicillium spp, Gliocladium spp (p = 1.0) and A. niger (p = 0.99) results were consistent with random association. The H. resinae isolates and
3 18
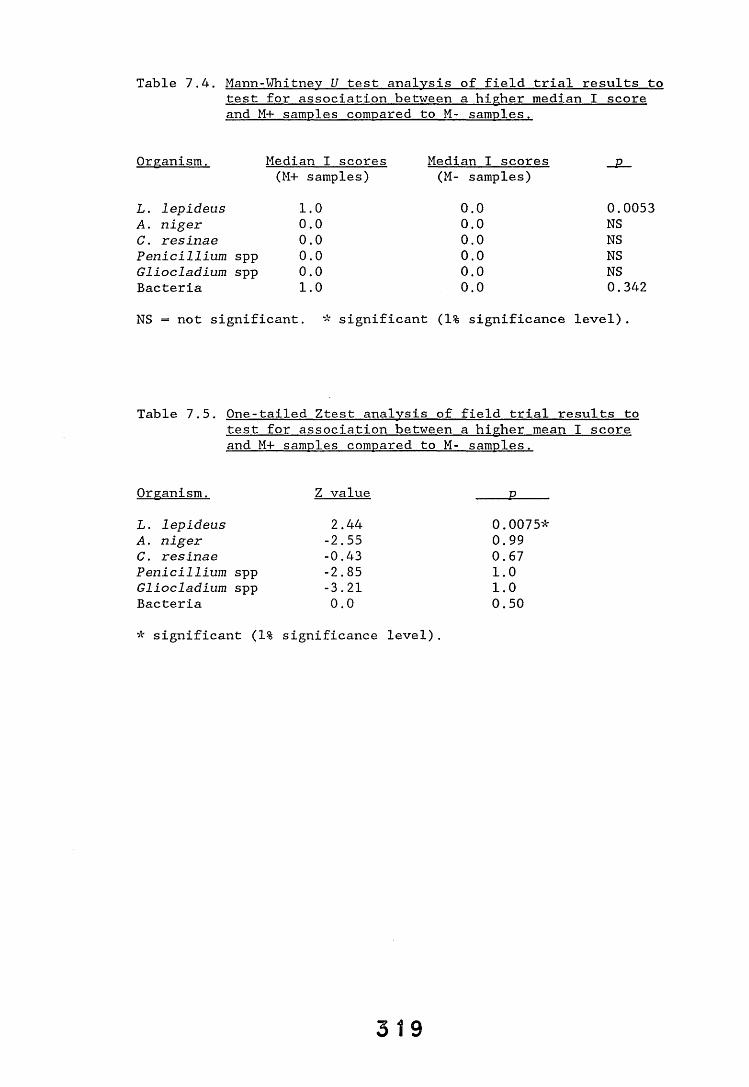
Table 7.4. Mann-Whitnev U test analysis of field trial results to test for association between a higher median I score and M+ samples compared to M- samples.
Organism. Median I scores Median I scores p
(M+ samples) (M- samples)
L. lepideus 1.0 0.0 0.0053A. niger 0.0 0.0 NSC. resinae 0.0 0.0 NSPenicillium spp 0.0 0.0 NSGliocladium spp 0.0 0.0 NSBacteria 1.0 0.0 0.342NS = not significant. * significant (1% significance level).
Table 7.5. One-tailed Ztest analysis of field trial results to test for association between a higher mean I score and M+ samples compared to M- samples.
Organism. Z value PL. lepideus 2.44 0.0075*A. niger -2.55 0.99C. resinae -0.43 0.67Penicillium spp -2.85 1.0Gliocladium spp -3.21 1.0Bacteria 0.0 0.50* significant (1% significance level).
3 19
bacteria, although having lower p values (0.67 and 0.50 respectively) still show no significant association between the M+ isolates and a higher mean I score.
7.3. Discussion.
Conventionally, microbiological analysis of core samples removed from poles suspected of being decayed is used to confirm the presence of decay organisms within the poles. Inwards and Graham (1980) compared the efficacy of a variety of physical detection systems for fungal decay with microbiological culturing techniques in the inspection of Douglas-Fir distribution poles in-service. They concluded that all the methods had disadvantages but the culturing technique was the most reliable method and advocated the routine microbiological analysis of groundline sections from poles. Physical detection systems are thought to be the least sensitive methods available (section 1.6.1.) and by using such systems as the comparative measure, the workers may well have over-stressed the usefulness of the culturing technique. The use of microbiological analysis as a routine detection system has several drawbacks. A major disadvantage is that the method typically requires an incubation period of 3-6 weeks to permit sufficient growth of the slow-growing decay organisms for their identification. In addition, bacteria and mould fungi often co-exist with decay fungi within poles. Upon culturing, these organisms often grow much more rapidly than the decay organism and can mask and/or prevent the establishment of it. Selective media, containing antibiotics and benomyl (Clubbe and Levy, 1977) to inhibit the bacteria and moulds respectively, are used to preferentially isolate the basidiomycete decay fungi. However,
3 2 0
bacterial isolates can be resistant to the chosen antibiotic andthe mould fungi, whilst prevented from growing onto the medium, can still cover the core section and obscure the presence of any decay organism. Furthermore, mould fungi may competitively inhibit the growth of decay fungi (A. Bruce, personal communication). Finally, the identification and classification of fungal isolates is a complex process. Identification either requires the production of the characteristic fruiting body or the use of complex identification keys (e.g. Noble, 1964). Both methods are time-consuming and require a high degree of skill and experience.
An objective of the field trial was to compare the results obtained with the immunological detection system with those obtained with the the standard isolation technique (see section 7.1). Due to the known sensitivity of immunoassay systems, it can be argued that such systems would be more effective in detecting L. lepideus and indeed, in general, the results of the field trial study support this proposition. The two statistical tests chosen to analyse the data were the parametric Z-test and the non-parametric Mann-Whitney U test. Basically both the tests determine whether two independent groups (in this case I scores associated with M+ samples and I scores associated with M- samples) have been drawn from the same population (Siegel, 1956).
The screening of immunologically positive samples against pre-immune control serum (PIS) demonstrated that the positive samples were not caused by a non-specific interaction with the rabbit serum. Of the 18 samples which gave a faintly positive response (score = 1) when reacted with PIS, 12 gave a score of ^2 when reacted with the L. lepideus antiserum, i.e. they could still be identified as positive samples.
3 2 1
In analysing the results of a diagnostic assay care must be taken to reduce or eliminate the possibility of either false positive or false negative results. One potential cause of false positive results was cross-reactivity of the L. lepideus antiserum with the contaminating non-antigenic material i.e. wood and/or with the other microorganisms present within the core sections. As reported previously (see chapter 6) rabbit antiserum was shown to bind non-specifically to wood but this could be eliminated by preabsorption of the antiserum with sawdust. Specificity analysis of the antiserum (see chapter 4) indicated that the antiserum cross-reacted with a range of basidiomycete fungi but to a much lesser extent with deuteromycete fungi. The vast majority of fungal isolates recovered from pole sections were deuteromycetes with many bacterial isolates also being recovered. The results of the statistical analyses showed that there was a significant association between the M(L)+ and the 1+ sections. In addition, these M(L)+ sections were associated with a significantly higher median/mean I score. In contrast, no such association between positive microbiological isolations and higher I scores was observed for either the bacterial isolates or the four deuteromycete fungi most commonly isolated i.e. A. niger, H. resinae, Penicillium spp. and Gliocladium spp. Statistical analysis to prove the absence of a positive association with the other fungi isolated was not possible because of the small numbers isolated. There were in total 131 unidentified fungal isolates, six of which were basidiomycetes. However, none of these were regularly associated with high I scores and although it cannot be proven statistically this would suggest cross-reaction of these isolates with the L. lepideus antiserum was not a major problem. Although the cross-reactivity of the L. lepideus antiserum is
3 2 2
likely to have some effect on assay performance, statistical analysis of the results indicate that the presence of the other microorganisms isolated during this study within'core sections is unlikely to result in high numbers of false positives. Quantification of the effect would require a more detailed analysis with higher sample numbers.
From the data it is apparent that the intensity of the immunological reaction did not correlate with the results of the microbiological analysis. Those individual poles showing the greatest level of infection by microbiological methods (i.e. gave the most L. lepideus isolations) did not always, as might be expected, give the most intense reactions in the dot-immunobinding assay. As detailed in the results the nine poles displayed one of four response patterns: (i) microbiologically negative (for L. lepideus) but with a good reactivity in the immunoassay (poles 1,4 and 6), (ii) microbiologically negative with a weak reactivity in the immunoassay (pole 7), (iii) microbiologically positive with a weak reactivity in the immunoassay (poles 2 and 5), and (iv) microbiologically positive with a strong reactivity in the immunoassay (poles 3, 8 and 9).
If the microbiological isolation technique, though having disadvantages, is taken as a standard method of detecting L. lepideus then an explanation for the variable immunological results is required. Though at first sight cross-reaction with other organisms might seem a possible explanation for the results, the statistical analysis reported would mitigate against this. Several possible factors could be responsible for the results obtained including (i) variations in L. lepideus antigenicity,
3 2 3
(ii) variations in the moisture content within poles and (iii) the extent of fungal viability. The effects of these parameters in relation to the results obtained will be discussed below.
7.3.1. Variations in the antigenicity of L. levideus.
The age of the culture and the nature of the growth substrate have been shown to effect the antigenicity of the fungus (see chapter 5 and also Burrell et al., 1966, Chard, 1981, Clayton et al., 1964 and Vigrow et al., 1990). It is possible therefore that the actual antigenicity of the organism varies in the core samples at different stages of its growth. The expression, in different prevailing conditions, of different sets of antigens with varying affinities for the antisera within the poles could result in the response patterns observed. It is very likely that certain antigens, not controlled by environmental conditions, are expressed at all stages of growth and development. Such antigens would permit the positive immunological detection of L. lepideus
in all the poles. Those poles (1,4 and 6) showing pattern 1 (M(L)-, strong 1+) may not contain sufficient fungal biomass in the areas sampled to allow isolation of L. lepideus, however, the fungal mycelium present may be expressing antigen(s) of high antibody binding capacity giving a strongly positive result in the immunoassay. The poles with the second pattern (7, M(L)-, weak 1+) may contain a smaller fungal biomass, which although expressing the high affinity antigen(s), does not have sufficient quantities of biomass to give a strong positive response. By contrast, those poles (2,5) showing the third response pattern (M(L)+, weak 1+) could have sufficient biomass to allow microbiological detection but be expressing antigens with a low antibody binding capacity.
3 2 4
The expression of a new set of antigens could reflect the transition from growth upon the remains of the sawdust/medium inoculum within the pole to actual degradation of the wood substrate. The postulated high affinity antigen(s) present in poles 1,4 and 6 would subsequently have been lost. The fourth response pattern (3,8, and 9, M(L)+, strong 1+) would by extension represent a situation between patterns 1 and 3. That is, sufficient fungal biomass has developed to permit microbiological detection but the fungus is still growing on the inoculum material within the pole. In this situation the fungus would not have begun to express low affinity antigens and still be expressing the high affinity antigen(s) responsible for the strong immunological reaction in the immunoassay. In pole 3 the M(L)+/I+ samples were located within a small pocket in the above groundline region. This pocket could be due to the continued presence of some of the L. lepideus inoculum.
7.3.2. Variations in moisture content within individual poles.
Alternatively, variations of moisture content within the poles could be responsible, either wholly or partly, for the results obtained. The actual percentage moisture content within a particular pole and the existance of moisture gradients , vertical or horizontal, throughout the pole, can affect the development of the fungus in several ways. L. lepideus cannot actively grow within the wood substrate unless the moisture content exceeds the fibre saturation point (approximately 28%), therefore moisture availability can affect both the biomass production and distribution of the fungus. In addition the fungus can switch to a dormant phase, this could partially explain the different results
3 2 5
obtained in the two systems. Microbiological isolation of the dormant fungus may be difficult but immunological detection still possible. Moisture availability can also affect the decay ability of the fungus. Unfortunately, due to equipment failure, complete
data concerning the moisture contents of the poles was not available. However, the data available indicated that pole 2 and to a lesser extent pole 5 had moisture contents exceeding the fibre saturation point. These higher moisture contents could have enabled the fungus to develop sufficient biomass to permit positive microbiological identification and in addition allowed the fungus to actively degrade the wood substrate. The switch to growing upon the wood itself could result in the expression of low affinity antigens (as detailed above) and account for the weak reaction in the immunoassay. The pattern observed in poles 1,4 and 6 (M(L)-/ strong reaction in the immunoassay) could be explained by an initial moisture content sufficient to permit build up of fungal biomass followed by a drop in moisture content prior to structural degradation of the timber occurring and therefore before any antigenic variation of L. lepideus could occur. A drastic fall in moisture content would cause either dormancy or death in the fungus thereby accounting for the negative microbiological results. A similar situation could have existed in poles 3,8 and 9 (M(L)+/ strong reaction in the immunoassay) except
the moisture content must have been sufficient to sustain the actively growing fungus although structural degradation of the timber by the fungus had not yet occurred to any degree resulting in a strong reaction in the immunoassay since high affinity antigens would still be expressed and the positive microbiological
isolations of L. lepideus. The situation in pole 7 (M(L)-/ weak
3 2 6
reaction in the immunoassay) could represent a very low moisture content such that development of fungal biomass is severely limited.
7.3.3. Viability of the fungus.
Another explanation of the results obtained is that they reflect the fact that the immunoassay cannot differentiate between dead/dormant fungal mycelium and actively growing mycelium. Although periodic testing of poles had shown the inoculum can remain viable for many months, various environmental conditions e.g. moisture content can affect the viability of the fungus. In
poles 1,4 and 6 sufficient L. lepideus biomass could have built up to account for the numerous immunologically-positive sections but if the mycelium subsequently became non-viable regardless of the cause, it would not be possible to recover isolates of the fungus upon culturing. The pattern in pole 7 could be explained by the presence of dead fungi in much smaller quantities. Obviously the fungus must be in a viable condition in those poles which yielded positive microbiological isolations of L. lepideus. The differences in the results obtained in the immunoassay for the M(L)+ poles (2,3,5,8 and 9) may represent differences in the antigenicity of the fungus as discussed above (see section 7.3.1). The difference observed between the sensitivity of the immunoassay and the microbiological isolation method could be at least partly explained by the ability of the former method to detect non-viable fungal mycelium.
3 2 7
The above explanations are, at present, highly conjectural, however the validity of the hypotheses could be determined by monitoring the effect of moisture content on both the physical development and antigenicity of the fungus. Immunological mapping of the spread of the fungus within virgin wood and its relation to the moisture content of the wood could be established.Furthermore, experiments to fully determine the effect on fungal antigenicity when growing on different substrates and at different stages of development using western blotting and antisera raised against the different antigens could be undertaken. Discrimination of dead/dormant fungi and active fungi could be achieved by raising antisera to antigens only produced when the fungus is actively degrading the timber e.g. wood degrading enzymes.
Overall the results of the field trial study demonstrate that the dot-immunobinding assay could be an effective detection system for L. lepideus within distribution poles. The system gives many more positive isolations of L. lepideus than the conventional microbiological isolation techniques which are prone to the problems discussed above. A different type of field trial which analysed single samples from 100 in-service poles also indicated that the immunoassay could detect not only microbiologically positive samples but also many microbiologically negative samples (J.W. Palfreyman, personal communication). In this trial a smaller proportion of immunologically positive samples were identified though this difference probably reflects slight modifications of the preparative sample techniques used. The current format of the immunoassay system used in these experiments has some disadvantages. Sample preparation was time consuming, however, preliminary experiments suggest that streamlining of the process
3 2 8
will be relatively straightforward. Secondly, the absence of a good correlation between the level of antibody binding and the positive microbiological isolation of L. lepideus prevents the quantification of the system. Although the most important criterion to be met by any test system is the detection of the fungus before decay, strength losses and structural damage can occur, quantification of the system to permit a more qualified decision on whether to remedially treat the pole or not would be advantageous. The identification of antigens whose expression was more closely related to biomass and/or the viability of the fungus and the production of, for example, monoclonal antibodies to these antigens to allow their quantification would overcome this problem.
Several conclusions can be drawn from the work reported in this chapter:
1. L. lepideus can be identified in extracts from field samples from creosote-treated distribution poles using thedot-immunobinding assay system.
2. The immunological detection system is more sensitive than the conventional microbiological isolation techniques although at least part of the increase in sensitivity is probably due to the detection of non-viable fungal mycelium in the immunoassay. 3
3. The presence of a range of deuteromycete (non-decay) fungi and bacteria within field samples did not interfere significantly in the performance of the assay.
3 2 9
4. The development of faster, simpler extraction procedures and the production of specific monoclonal antibodies should permit the use of the system as a routine detection system for incipient fungal decay.
CHAPTER 8. GENERAL DISCUSSION.
3 3 1
8.1. General discussion.
As detailed previously (chapter 1) many methods for detecting fungal decay within wooden structures rely on the detection of either physical or chemical changes associated with decay. A disadvantage of these techniques is that though they provide data on whether the timber needs replacing, they do not allow predictive information on future decay status to be obtained. This disadvantage could be overcome by detecting the responsible decay organisms rather than estimating the current state of the decay present. Various methods have been proposed and/or used to detect wood decay organisms including isolation techniques followed by identification based upon morphological characteristics (Noble, 1965) and relatively non-specific fungal stains (Cartwright, 1929, Morrell et al., 1985, 1986). However, such techniques lack specificity, can be time-consuming and require expert analysis. In recent years other areas of mycology have initiated the use of immunological probes to overcome the problems associated with traditional detection and identification methods. The use of such probes in biodeterioration studies is growing as witnessed by the increasing number of papers published in this field (e.g. Breuil et al., 1988, Glancy et al., 1989, Goodell and Jellison, 1986, Goodell et al., 1988, Palfreyman et al., 1987, 1988a,b, Vigrow et al., 1989, 1990).
A primary aim of this project was the development of an immunologically-based detection system(s) for L. lepideus in creosote-treated distribution poles. The data reported in this thesis shows conclusively that immunological techniques can be
used to both detect and analyse L. lepideus. A system based on the dot-immunobinding assay was developed and validated in a small field trial. This system is an effective tool for the rapid and sensitive detection of antigen-antibody interaction and has considerable potential as an efficient probe for a quick diagnosis of fungal presence in a large scale screening of wood extracts. With suitable modification and further development a dipstick assay could be produced which would permit in-field screening of samples removed from poles. Several authors (Benhamou et al.,1986, Dewey et al., 1989) have reported the successful application of the dot-immunobinding assay and/or dipstick assays to detect fungal antigens.
Two common problems encountered in this and other studies in fungal immunology were cross - reactivity of antisera and non-specific binding of reagents. Numerous authors have reported that fungal antisera cross-react widely with other fungi (Breuil et al., 1988, Chard, 1981, Goodell and Jellison, 1986) and with
host tissues (Dewey et al., 1984, Dewey and Brasier, 1988).Efforts to increase specificity by preabsorption have not been satisfactory (Chard et al., 1985, Clarke et al., 1986) and specificity has only been increased where antisera have been raised against selected fungal molecules such as genus-specific carbohydrates (Notermans et al., 1987). However, strain-, species- and genus-specific monoclonal antibodies have been raised against zoospores of Phytophthora and Pythium (Hardham et al., 1986,Callow et al., 1987) and mycelial fragments of Ophiostoma ulmi (Dewey et al., 1989).- Furthermore, the discovery of fungal exo-antigens (Kaufman and Standard, 1987) has indicated that specific fungal antigens can be readily identified and produced.
3 3 3
High backgrounds due to non-specific binding of assay reagents can also be problematic. Various authors (Aguelon and Dunez, 1984, Chard, 1981, Dewey and Brasier, 1988, Kurup et al., 1986,O'Connell et al., 1986) have reported encountering non-specific binding when using immunological techniques to detect and/or analyse fungi. Various theories have been advanced to explain this phenomenon from binding of components of rabbit serum (pre-immune control) to fungal antigens (O'Connell et al., 1986), to the production of a Protein-A type molecule by the fungus and/or host plant (Dewey and Brasier, 1988). Several authors have failed to speculate or identify the cause(s) of the non-specific binding (Aguelon and Dunez, 1984, Chard, 1981). The factor(s) responsible for the non-specific binding observed during this study was not identified. The development of a more specific antiserum and/or spepcific monoclonal antibodies should overcome these problems and permit the selective identification of L. lepideus in samples.
There are however, certain advantages in having a relatively non-specific antiserum. In the case of colonisation of distribution poles, the specific identification of a particular organism may well be less valuable than the recognition that the pole is being colonised by a basidiomycete since all basidiomycete fungi which colonise wood are capable of degrading the timber. In certain circumstances identification of specific organisms may be required, for example, the treatments required to eradicate the dry rot fungus Serpula lacrymans and wet rot fungi e.g. Coniophora puteana are different and therefore it would be necessary to discriminate between such fungi in order that the correct treatment be selected. This could be facilitated by the use of a two tier testing system. Initially samples would be screened with
an antiserum which cross-reacts with all, or most, of the most commonly occurring wood decay basidiomycetes and those samples testing positive would then be screened with a range of species-specific antisera/monoclonals.
The development of immunological probes which can discriminate between dead/dormant fungi and actively growing fungi is a logical progression in the development of an immunodetection system. The production of probes which react with enzymes and/or metabolites only synthesised when the fungus is actively growing and/or degrading the wood will permit such discrimination.
Although a major aim of this work was the development of an immunodetection system for L. lepideus, the immunological probes produced can be put to other uses such as the study of the antigenicity and molecular nature of the fungus. Such studies have traditionally focussed on pathogenic fungi the majority of which are yeasts, deuteromycetes and ascomycetes, comparatively little work has been carried out on basidiomycete fungi. An interesting offshoot of the development of immunodiagnostic tests for wood decay fungi has been and will continue to be the initiation of molecular studies on such fungi, for example, S. lacrymans (Vigrow et al., 1989, 1990) Immunological probes have widespread applications and could provide information on various issues including the molecular structure of basidiomycetes at various stages of their life cycle, the taxonomic relationships within the
Basidiomycotina, fungal interactions and further elucidation of the mechanisms involved in the enzymic degradation of wood.
In summary, this project has shown that immunological techniques can be successfully applied to detect L. lepideus, and thus incipient decay, in creosote-treated distribution poles. In
addition, taxonomic relationships between fungi and the character of fungal antigens have also been investigated. In general, the conclusions drawn from the work reported in this thesis concur with those reported by other workers investigating fungal immunology. Further development of various areas viz. full quantification of immunoassay systems, simpler and quicker extraction procedures, and production of high affinity antiserum and/or monoclonal antibodies would permit the use of immunoassay systems as routine diagnostic tests for L. lepideus and incipient decay in timber. Potentially the systems developed for L. lepideus
could be modified to detect and/or study the antigenicity of otherwood decay fungi.
REFERENCES.
3 57
Electrophoretic patterns of soluble proteins and izoenzymes of Gaeumannomyces graminis.Aust. J. Bot. 2.3 :1-12.
AGUELON,M . and DUNEZ,J. (1984)Immunoenzymatic techniques for the detection of Phoma exigua in infected potato tissues.Ann. Appl. Biol. 105 :463-469.
ALDWELL,F.E .B . and HALL,I.R. (1986)Monitoring the spread of Glomus mosseae through soil infested with Acaulospora laevis using serological and morphological techniques. Trans. Br. Mycol. Soc. .87(1) : 131-134.
ALDWELL,F.E.B., HALL,I.R. and SMITH,J.M.B. (1983)Enzyme-linked immunosorbent assay (ELISA) to identify endomycorrhizal fungi.Soil Biol. Biochem. 15.(3) :377-378.
ALDWELL,F.E.B., HALL,I.R. and SMITH,J.M.B. (1985)Enzyme-linked immunosorbent assay as an aid to taxonomy of the Endogonaceae.Trans. Br. Mycol. Soc. 84 :399-402.
AL-RAMMAHY,A.Kh., LEVY,J.G. and KELLY,B. (1978)Isolation and partial characterisation of immunologically reactive fractions from chitinase digested cell wall of Trichophyton mentagrophytes.
Mycopathologia 66(3) :129-137.AMERICAN SOCIETY FOR TESTING AND MATERIALS (1971)
Standard method of test for accelerated laboratory test of natural decay resistance of wood.
ABBOTT,L.K. and HOLLAND,A.A. (1975)
ASTM Des. D2017.

Serological differentiation in Ceratocystis.Phytopathology 57. :32-34.
ANDER,P . and ERIKSSON,K.-E. (1978)Lignin degradation and utilisation by microorganisms.Prog. Ind. Microbiol. 14 :l-58.
AVRAMEAS,S. and TERNYNCK,T. (1971)Peroxidase labelled antibody and Fab conjugates with enhanced intracellular penetration.Immunochemistry 8 :1175-1179.
AZUMA,I., KIMURA,H., HIRAO,F ., TSUBURA,E . and YAMAMURA,Y. (1967)Biochemical and immunological studies on Aspergillus. I. Chemical and biological investigations of lipopolysaccharide, protein and polysaccharide fractions isolated from Aspergillus fumigatus.Japan J. Med. Mycol. 8 :210-220.
AZUMA,I., KIMURA,H., HIRAO,F., TSUBURA,E. and YAMAMURA,Y. (1969) Biochemical and immunological studies on Aspergillus. II. Immunological properties of protein and polysaccharide fractions obtained from Aspergillus fumigatus.Mycopathol. Mycol. Appl. .37. : 289-303.
AZUMA,I., KIMURA.H., HIRAO,F., TSUBURA,E., YAMAMURA,Y . and MISAKI,A. (1971)
Biochemical and immunological studies on Aspergillus. III. Chemical and immunolgical properties of glycopeptide obtained from Aspergillus fumigatus.
Japan J. Micro. 15.(3) : 237-246.BAECKER,A .A .W . (1981)
The role of actinomycetes in the biodeterioration of wood.PhD Thesis, Dundee Institute of Technology.
AMOS,R.E. and BURRELL,R.G. (1967)
Detection of fungal degradation at low weight loss by differential scanning calorimetry.Wood and Fiber Sci. 17.(3) : 315-326.
BARTNICKI-GARCIA,S. (1968)Cell wall chemistry, morphogenesis and taxonomy of fungi.Ann. Rev. Microbiol. 22 :87-108.
BENHAMOU,N., QUELLETTE,G .B., GARDINER,R.B. and DAY,A.W. (1986)Immunocytochemical localisation of antigen-binding sites in the cell surface of two ascomycete fungi using antibodies produced against fimbriae from Ustilago violacea and Rhodotorula rubra.Can. J. Microbiol. 32 :871-883.
BENNET,F.C . and YEOMAN,L.C. (1983)An improved procedure for the dot immunobinding analysis of hybridoma supernatants.J. Immunol. Meths. 61 :201-207.
BIO-RAD BULLETIN No 1089 (1982)The Bio-Rad Silver Stain.
BIRKINSHAW,J .H . and FINDLAY,W.P.K. (1940)Biochemistry of the wood-rotting fungi. I. Metabolic products of Lentinus lepideus Fr.Biochem. J. 34 :82-88.
BOULARD,Ch. and LECR0ISEY,A. (1982)Specific antisera produced by direct immunisation with slices of polyacrylamide gel containing small amounts of protein.J. Immunol. Meths. 50 :221-226.
BALDWIN,R.C. and STREISEL,R.C. (1985)
3 4 0
BRADFORD,M. (1976)A rapid and sensitve method for the quantitation of microgram quantities of protein utilising the principle of protein dye binding.Anal. Biochem. 72 :248-254.
BRAVERY,A.F. (1968)Determining the tolerance of soft-rot fungi to wood preservatives: a comparison of test methods.Mat. u. Org. 3.(3) :313-327.
BREUIL,C.B ., SEIFERT,K.A., YAMADA,J ., ROSSIGNOL,L. and SADDLER,J .N . (1988)
Quantitative estimation of fungal colonisation of wood using an enzyme-linked immunosorbent assay.Can. J. For. Res. 18 :374-377.
BRITISH STANDARDS INSTITUTION (1982)Wood preservatives: determination of the toxic values against wood destroying Basidiomycetes cultured on agar medium.BS 6009 (EN 113)
BRUCE,A. (1983)Biological control of internal decay in creosoted distribution poles.PhD Thesis, Dundee Institute of Technology.
BRUCE,A., AUSTIN,W.J. and KING,B. (1984)Control of growth of Lentinus lepideus by volatiles from Trichoderma.Trans. Br. Mycol. Soc. 82. :423-428.
5 4 1
Decay resistance of wood removed from poles treated with Trichoderma.Internat. Res. Group Wood Pres. Doc. No. IRG/WP/1386.
BRUCE,C. (1983)Fungus Plot.Program for plotting distribution of fungi within creosoted poles, obtainable from The Computer Centre, Dundee Institute of Technology, Bell Street, Dundee. DD1 1HG.
BURRELL,R.G., CLAYTON,C.W ., GALLEGLY,M .E. and LILLY,V.G. (1966)Factors affecting the antigenicity of the mycelium of three species of Phytophthora.Phytopathology 56. :422-426.
BURRIDGE,K . (1978)Direct identification of specific glycoproteins and antigens in sodium dodecyl sulfate gels.In Methods in Enzymology vol L. (ed. V. Ginsburg) . Academic Press Inc. (London) Ltd.
CALLOW,J.A., ESTRADA-GARCIA,M.T. and GREEN,J .R . (1987)Recognition of non-self: the causation and avoidance of disease. Ann. Bot. 60(suppl. 4) :3-14.
CAMPBELL,A.M. (1984)Monoclonal antibody technology: the production and characterisation of rodent and human hybridomas.In Laboratory techniques in biochemistry and molecular biology vol 13. (eds. R.H. Burdon and P.H. van Knippenberg). Elsevier, Oxford. 265pp.
BRUCE,A., KING,B . and HIGHLEY.T.L. (1989)
3 4 2
CARTWRIGHT,K.St.G. (1929)A satisfactory method of staining mycelium in wood sections.
Ann. Bot. 43 :412-413.CARTWRIGHT,K.St.G. and FINDLAY,W .P .K . (1958).
Decay of timber and its prevention.HMSO. London. 332pp.
CHARD,J.M. (1981)Development of an immunofluoresence technique for studying the ecology of Mycena galopus (Pers. ex. Fr.)Kummer.PhD Thesis, University of Essex.
CHARD,J.M., GRAY,T .R .G . and FRANKLAND,J .C. (1983)Antigenicity of Mycena galopus.Trans. Br. Mycol. Soc. 81 :503-511.
CHARD,J.M., GRAY,T .R .G . and FRANKLAND,J .C. (1985a)Purification of an antigen characteristic for Mycena galopus. Trans. Br. Mycol. Soc. 84 :235-241.
CHARD,J.M., GRAY,T .R .G . and FRANKLAND,J .C. (1985b)Use of anti-Mycena galopus serum as an immunofluorescence reagent. Trans. Br. Mycol. Soc. 84 :243-249.
CHEN,G .C. and JOHNSON,B.R. (1983)Improved colorimetric determination of cell wall chitin in wood decay fungi.Appl. Environ. Micro. 46(1) :13-16.
CHOO,Y.S. and HOLLAND,A.A. (1970)Direct and indirect fluorescent antibody staining of Ophiobolus graminis sacc. in culture and in the rhizosphere of cereal plants. Antonie van Leeuwenhoek 36 :549-554.
3 4 3
Enzyme immunosorbent assays in plant virology. In Methods in Virology vol 2. pp51-58.
CLARKE,J.H., MacNICOLL,A .D. and NORMAN,J .A . (1986)Immunological detection of fungi in plants including stored
cereals.CAB International Biodeterioration Suppl. 22 :123-129.
CLAYTON,C.W., LILLY,V.G. and BURRELL,R .G . (1964)The effect of age of mycelium and nitrogen source upon the nitrogen content of three species of Phytophthora.West Virginia Acad. Sci. Proc. 36 :30-34.
CLUBBE,C.P . and LEVY,J.F. (1977)Isolation and identification of the fungal flora in treated wood. A revised technique.Internat. Res. Group Wood Pres., Doc. No. IRG/WP/159.
COCKCROFT,R. (1974)Evaluation of the performance of wood preservatives against fungi. J. Inst. Wood Sci. 6 :2-8.
COGGINS,C.R. (1980)Decay of timber in buildings. Dry rot, wet rot and other fungi. Rentokil Ltd. East Grinstead, U.K. 115pp.
CONROY,J.M. and ESEN,A. (1984)An enzyme-linked immunosorbent assay for zein and other proteins using unconventional solvents for antigen adsorption.Anal. Biochem. 137 :182-187.
CORBETT,N.H. (1965)Micro-morphological studies on the degradation of lignified cell walls by Ascomycetes and Fungi imperfecti.J. Inst. Wood Sci. 3(14) :18-28.
CLARK,M.F. and BAR-JOSEPH,M. (1984)
Isolation and identification of an antigen specific for Coccidioides Lmmitis.
Infect. Immunity 52.(1) : 138-143.CRAWFORD,R.L. (1981)
Lignin biodegradation and transformation.Wiley-Interscience, New York.
DANIEL,G.F., PETTERSSON,B., NILSSON,T and VOLC,J. (1989)Cytoplasmic and extracellular localisation of manganese II dependent peroxidase(s) in white rot fungi during degradation of woody materials.Internat. Res. Group Wood Pres., Doc. No. IRG/WP/1416.
DEKKER,R .F.H . (1985)Biodegradation of hemicelluloses.In Biosynthesis and biodegradation of wood components, (ed. T. Higuchi). pp505-533, Academic Press Inc (London) Ltd.
DESHPANDE,V., ERIKSSON,K.-E. and PETTERSSON,B. (1978)Production, purification and partial characterisation of 1,4-B glucosidase enzymes from Sporotrichum pulverulentum.Eur. J. Biochem. 90 :191-198.
DEWEY,F.M. and BRASIER,C.M. (1988)Development of ELISA for Ophiostoma ulmi using antigen coated wells.Plant Pathol. 37. :28-35.
DEWEY,F.M., MacDONALD,M .M . and PHILLIPS,S.I. (1989)Development of monoclonal-antibody-ELISA, -DOT-BLOT and -DIP-STICK immunoassays for Humicola lanuginosa in rice.
COX,R.A. and BRITT,L.A. (1986)
J. Gen. Micro. 135 :361-374.
Immunofluorescent microscopy for detection and identification of propagules of Phaseolus schweinitzii in infested soil.Phytopathol. 74 :291-296.
DICKINSON,D.J. (1982)The decay of commercial timbers.In Decomposer Basidiomycetes: their biology and ecology, (eds. J.C. Frankland, J.N. Hedger and M.J. Swift). ppl79-190, Cambridge University Press.
DUBOIS,M., GILLES,K.A., HAMILTON,J .K ., REBERS,P .A .Colorimetric method for determination of sugars substances.Anal. Chemistry 28.(3) : 350-356.
EDWARDS,R. (1985)Immunoassay. An introduction.Heinemann Medical Books (London).
ENGVALL,E . (1980)Enzyme immunoassay ELISA and EMIT.In Methods in Enzymology vol 70. (eds. H. van Vunakis and J.J. Langone). pp419-439. Academic Press Inc. (London) Ltd.
ERIKSSON,K.-E. and PETTERSSON,B. (1975a)Extracellular enzyme system utilised by the fungus Sporotrichum pulverulentum (Chrysosporium lignonum) for the breakdown of cellulose. 1. Separation, purification and physico-chemical characterisation of five endo-1,4,B-glucanases.
DEWEY,F.M., BARRETT,D.K., VOSE.I.R. and LAMB,C.J. (1984)
and SMITH,F. (1956) and related
Eur. J. Biochem. 51 :193-206.
ERIKSSON,K.-E. and PETTERSSON,B . (1975b)Extracellular enzyme system utilised by the fungus Sporotrichum pulverulentum (Chrysosporium lignonum) for the breakdown of cellulose. 3. Purification and physico-chemical characterisation of an exo-1,4,B-glucanase.Eur. J. Biochem. 51 :213-218.
ERIKSSON,K.-E. and WOOD,T.M. (1985)Biodegradation of cellulose.In Biosynthesis and biodegradation of wood components, (ed. T. Higuchi). pp469-503, Academic press Inc. (London) Ltd.
ERIKSSON,0., GORING,D.A.I. and LINDGREN,B .0. (1980)Structural studies on the chemical bonds between lignins and carbohydrates in spruce wood.Wood Sci. Technol. 14 :267-279.
ESLYN,W.E. (1979)Utility pole decay. Part 3: Detection in pine by colour indicators. Wood Sci. Technol. 13 :117-126.
ESLYN,W.E., KIRK,T .K . and EFFLAND,M .J . (1975)Changes in the chemical composition of wood caused by six soft rot fungi.Phytopathol. 65. : 473-476.
FAIRBANKS,G ., STECK,T.L. and WALLACH,D .F .H . (1971)Electrophorectic analysis of the major polypeptides of the human erythrocyte membrane.Biochemistry 10 (13) :2606-2617.
FERGUS,B.J. and GORING,D.A.I. (1970)The distribution of lignin in birch wood as determined by ultraviolet microscopy.Holzforschung 24 :118-124.
The distribution of lignin in spruce wood as determined by- ultraviolet microscopy.Wood Sci. Technol. 3. : 117-138.
FRISS-HANSEN,H. (1980)A summary of tests and practical experiences with the Pilodyn wood testing instruments.Internat. Res. Group Wood Pres., Doc. No. IRG/WP/282.
GALUSSIO,J .C., FRIDMAN,J.L. and NEGRONI,R . (1973)Rapid diagnosis of pulmonary mycosis by counterelectrophoresis. Mycopath. Mycol. Appl. 51(2-3) :143-146.
GARDNER,W.D., JOHNSTONE,R.S. and PITT,W. (1980)Detection of defects in standing poles by X-ray techniques. Internat. Res. Group Wood Pres., Doc. No. IRG/WP/2132.
GARRETT,S.D. (1955)Microbial ecology of the soil.Trans. Br. Mycol. Soc. 38.(1) : 1 - 9.
GERSHONI,J .M . and PALADE,G.E. (1983)Protein blotting: principles and applications.Anal. Biochem. 131 :1-15.
GIBSON,D.G., KRAHMER,R .L . and DEGR00T,R .C. (1985)Early detection of brown rot decay in Douglas-fir and Southern yellow pine by infrared spectrophotometry.Wood and Fiber Sci. 17.(4) : 522-528.
GLANCY.H., BRUCE,A., BUTTON,D., PALFREYMAN,J .W . and KING,B. (1989) Application of immunological methods to the analysis and detection of Lentinus lepideus Fr.Internat. Res. Group Wood Pres. Doc. No. IRG/WP/1422.
FERGUS,B.J., PROCTER,A.R., SCOTT,J.A.N. and GORING,D.A.I. (1969)
3 4 8
Use of lectins for detection of electrophoretically separated glycoproteins transferred onto nitrocellulose.Anal. Biochem. 115 :219-224.
GLYNN,A.N. and REID,J. (1969)Electrophoretic patterns of soluble fungal proteins and their possible use as taxonomic criteria in the genus Fusarium.Can. J. Bot. 47 :1823-1831.
GOLDSTEIN,I.S., JEROSKI,E.B., LUND,A.E., NIELSON,J.F. and WEAVER,J.W. (1961)
Acetylation of wood in lumber thickness.Forest Prod. J. JJ_ :363-370.
G00DELL,B.S. and JELLISON,J.J . (1986)Detection of a brown-rot fungus using serological assays.Internat. Res. Group Wood Pres., Doc. No. IRG/WP/1305.
GOODELL,B.S., DANIEL,G., JELLISON,J. and NILSSON,T. (1988)Immunolabelling of Poria placenta in wood.Internat. Res. Group Wood Pres., Doc. No. IRG/WP/1361
GORDON,A.H. (1975)Electrophoresis of proteins in polyacrylamide and starch gels.In Laboratory techniques in biochemistry and molecular biology vol. 1 (eds. T.S. Work and E. Work). 216pp. Elsevier/North Holland, Amsterdam.
GRANT,J. (1978)Immunological methods in bacteriology.In Handbook of experimental immunology, vol. 3, Application of immunological techniques (ed. D.M. Weir). pp39.1-39.15 . Blackwell
Scientific Publications.
GLASS,W.F., BRIGGS,R.C. and HNILICA,L.S. (1981)
3 4 9
Analyses of rat Pneumocystis carinii antigens recognised by human and rat antibodies by using western blotting.Infect. Immun. 54(1) :96-103.
GREAVES,H. (1970)The effect of selected bacteria and actinomycetes on the decay capacity of some wood-rotting fungi.Mat. u Org. 5.(4) :265-279.
GUNTHER,G.R., WANG,J.L., YAHARA,I., CUNNINGHAM,B .A . and EDELMAN,G.M. (1973)
Concanavalin A derivatives with altered biological activities.Proc. Natl. Acad. Sci. U.S.A. 70(4) -.1012-1016.
HALSALL,D.M. (1976)Specificity of cytoplasmic and cell-wall antigens from four species of Phytophthora.J. Gen. Micro. 94 :149-158.
HARADA,H . and COTE,W.A. (1985)The structure of wood.In Biosynthesis and biodegradation of wood components, (ed. T. Higuchi). ppl-42. Academic Press Inc. (London) Ltd.
HARDHAM,A.R., SUZAKI,E. and PERKIN,J .L . (1986)Monoclonal antibodies to isolate-, species- and genus-specific components on the surface of zoospores and cysts of the fungus Phytophthora cinnamomi.Can. J. Bot. 64 :311-321.
HAWKES,R ., NIDAY,E. and GORDON,J. (1982)A dot-immunobinding assay for monoclonal and other antibodies.
Anal. Biochem. 119 :142-147.
GRAVES,D.C., McNABB,S.J .N . , WORLEY,M.A., DOWNS,T.D. and IVEY,M.H.(1986)
3 5 0
Purification and partial characterisation of the serologically active substance from Absidia cylindrospora.J. Gen. Micro. 106 :289-295.
HAYES,C.E. and GOLDSTEIN,I.J. (1974)An a-D-galactosyl-binding lectin from Bandeiraea simplicifolia seeds. Isolation by affinity chromatography and characterisation.
J. Biol. Chem. 249(6) :1904-1914.HAYES,W.C. (1986)
Extending wood pole life: solving a billion/year problem. Electrical World 200(2) :41-47.
HEARN,V.M. and MacKENZIE,D.W .R . (1979)
The preparation and chemical composition of fractions from Aspergillus fumigatus wall and protoplasts possessing antigenic activity.J. Gen. Micro. 112 :35-44.
HEARN,V.M. and MacKENZIE,D.W.R. (1980)The preparation and partial purification of fractions from mycelial fungi with antigenic activity.Mol. Immunol. 17 :1097-1103.
HERBRINK,P ., VAN BUSSEL,F.J. and WARNAAR,S.0. (1982)The antigen spot test (AST) :a highly sensitive assay for the detection of antibodies.J. Immunol. Meths. 48. : 293-298.
HIGHLEY,T.L. (1975)Properties of cellulases of two brown-rot and two white-rot fungi.
HAYASHI,0., YAMADA,H., YADOMAE,T . and MIYAZAKI,T . (1978)
Wood Fiber 6 :275-281.
HIGHLEY,T.L. (1976)Hemicellulases of white- and brown-rot fungi in relation to host preferences.Mat. u Org. 11 :33-46.
HIGHLEY,T.L. (1977)Requirements for cellulose degradation by a brown-rot fungus.Mat. u Org. 12 :25-36.
HIGHLEY,T.L. (1978)Degradation of cellulose by culture filtrates of Poria placenta. Mat. u Org. 12 :161-174.
HOLLAND,A.A. and CHOO.Y.S. (1970)Immunoelectrophoretic characteristics of Ophiobolus graminis .Sacc as an aid in classification and determination.Antonie van Leeuwenhoek 36 :541-548.
H0RN0CK,L. (1980)Serotaxonomy of Fusarium species of the sections Gibbosum and Discolor.Trans. Br. Mycol. Soc. 74(1) :73-78.
HUECK,H .J . (1968)The biodeterioration of materials - an appraisal.In Biodeterioration of materials. Microbiological and allied aspects. Proc. 1st Internat. Biodeterioration Symposium, (eds. A.H. Walters and J.J. Elphick). pp6-12. Elsevier, London.
INWARDS,R.D. and GRAHAM,R.D. (1980)Comparing methods for inspecting Douglas-fir poles in service.Am. Wood. Pres. Assoc. 76 :283-289.
JANE,F.W. (1970)The structure of wood.
A&C Black, London.
3 52
JOHNSON,D.A., GAUTSCH,J.W., SPORTSMAN,J.R. and ELDER,J .H . (1984) Improved technique utilising nonfat dry milk for analysis of proteins and nucleic acids transferred to nitrocellulose.Gene Anal. Techn. 1 :3 - 8 .
JOHNSON,M.C., PIRONE,T .P ., SIEGEL,M.R. and VARNEY,D .R . (1982)Detection of Epichloe typhina in Tall Fescue by means of enzyme linked immunosorbent assay.Phytopath. 72(6) :647-650.
JOHNSTONE,A. and THORPE,R. (1982)Immunochemistry in Practice.Blackwell Scientific Publications, London.
KAUFMAN,L. and STANDARD,P.G . (1987)Specific and rapid identification of medically important fungi by exoantigen detection.Ann. Rev. Microbiol. 41 :209-225.
KAUFMAN,L., STANDARD,P. and PADHYE,A.A. (1983)Exoantigen tests for the immunoidentification of fungal cultures. Mycopathologia .82. :3-12.
KEILICH,G., BAILEY,P. and LIESE,W. (1970)Enzymatic degradation of cellulose, cellulose derivatives and hemicelluloses in relation to the fungal decay of wood.Wood Sci. Technol. 4 :273-283.
KENNEDY,R.W. (1958)Strength retention in wood decayed to small weight losses.Forest Prod. J. 8 :308-314.
KEYSER,P., KIRK.T.K. and ZEIKUS,J .G . (1978)Ligninolytic enzyme system of Phanerochaete chrysosporium: synthesised in the absence of lignin in response to nitrogen starvation.J. Bacteriology 135 .'790-797.
KIJIMOTO-OCHIAI, S. , KATAGIRI,Y.U. andOCHIAI,H. (1985)Analysis of N-linked oligosaccharide chains on nitrocellulose using lectin-labelled reagents.Anal. Biochem. 147 :222-229.
KING,B. (1975)Ecological aspects of early microbial colonisation of wood.PhD Thesis, University of Aston.
KING,B. (1981)The durability of timber and timber products.Bull. Inst. Corrosion Sci. Tech. 19 :5-ll.
KING,B . and OXLEY,T.A. (1975)A nutritional basis for microbial succession and decay in wood.In Proc. 3rd Int. Biodeterioration. Symp. pp987-994.Elsevier, London.
KING,B., OXLEY,T.A. and LONG,K.D. (1974)Soluble nitrogen in wood and its redistribution on drying.Mat. u Org. 9.(4) :251-254.
KIRK,T .K . (1973)The chemistry and biochemistry of decay.
In Wood deterioration and its prevention by preservative treatments. Vol.l, (ed. D .D.Nicholas). ppl49-182, Syracuse Univ. Press, New York.
KIRK,T .K . and FENN,P. (1982)Formation and action of the lignolytic system in basidiomycetes.In Decomposer Basidiomycetes: their biology and ecology, (eds. J.C. Frankland, J.N. Hedger and M.J. Swift). pp67-90, Cambridge University Press.
Quantitative changes in structural components of conifer woods during decay by white- and brown-rot fungi.Phytopath. 63. : 1338-1342.
KIRKjT.K., CROON,S., TIEN,M., MURTAGH,K .E. and FARRELL,R .L . (1986) Production of multiple ligninases by Phanerochaete chrysosporium: effect of selected growth conditions and use of mutant strain. Enzyme Microb. Techno 1. .8 :27-32.
KJAERVIG-BROE,M . and INGILD,A. (1983)Amplification of immunoprecipitates in agarose gels by horseradish peroxidase labelled antibody.Scand. J. Immunol. 17 Suppl. 10 :255-258.
KOENIGS,J.W. (1972)Effects of hydrogen peroxide on cellulose and on its susceptibility to cellulase.Mat. u Org. 7. : 133-147.
KOENIGS,J.W. (1974a)Hydrogen peroxide and iron: a proposed system for decomposition of wood by brown rot basidiomycetes.Wood and Fiber 6(1) : 66 - 80.
KOENIGS,J.W. (1974b)Production of hydrogen peroxide by wood-rotting fungi in wood and its correlation with weight loss, depolymerisation and pH changes. Arch. Microbiol. 99 :129-145.
KRAHMER,R.L., DEGROOT,R .C. and LOWELL,E .C. (1982)Detecting incipient brown rot with fluorescence microscopy.Wood Sci. 15(2) :78-80.
KIRK,T.K. and HIGHLEY,T.L. (1973)
3 55
KUO,M-L., MCCLELLAND,J.F., LUO.S., CHIEN,P-L., WALKER,R.D. and HSE, C-Y. (1988)
Applications of infrared photoaccoustic spectroscopy for wood
samples.Wood and Fiber Sci. 20(1) :132-145.
KURUP,V .P., J0HN,K.V., RESNICK,A. and FINK,J.N. (1986)A partially purified glycoprotein antigen from Aspergillus fumigatus.Int. Archs. Allergy Appl. Immun. 79, :263-269.
LAEMMLI,U .K . (1970)Cleavage of structural proteins during the assembly of the head of Bacteriophage T4.Nature 227 :680-685.
LEVI,M .P . (1965)Decay patterns produced by Chaetonium globosum in beechwood fibres. A chemical and microscopic study.Holz. und Organismen 1 :119-126.
LEVI,M .P. and COWLING,E.B. (1969)Role of nitrogen in wood deterioration. VII. Physiological adaptation of wood-destroying and other fungi to substrates deficient in nitrogen.Phytopathology 59. : 460-468.
LEVI,M .P . and PRESTON,R.D. (1965)Chemical and microscopic examination of the action of the soft rot fungus Chaetonium globosum on beechwood (Fagus sylv.). Holzforschung 19. : 183-190.
3 56'
Role of nitrogen in wood deterioration. VI. Mycelial fractions and model nitrogen compounds as substrates for growth of Polyporus versicolor and other wood-destroying and wood-inhabiting fungi. Phytopathology 58 :626-634.
LEVY,J .F . (1982)The place of basidiomycetes in the decay of wood in contact with the ground.In Decomposer Basidiomycetes: their biology and ecology, (eds. J.C. Frankland, J.N. Hedger and M.J. Swift). ppl61-178, Cambridge University Press.
LEVY,J .F . and DICKINSON,D.J. (1981)Wood.In Economic microbiology vol. 6. Microbial biodeterioration, (ed. A.H. Rose). ppl9-60. Academic Press Inc. (London) Ltd.
LINE,M.A. (1981)Catalase activity as an indicator of microbial colonisation of wood.In Proc. 5th Int. Biodeterioration Symp. (eds. T.A. Oxley and S. Barry). Wiley, London.
LINE,M.S. (1982)Towards a colour assay of wood degradation.Internat. Res. Group Wood Pres., Doc. No. IRG/WP/2180.
LOOMIS,W.D., LILE,J .D ., SANDSTROM,R .P . and BURBOTT,A .J . (1979) Adsorbent polystyrene as an aid in plant enzyme isolation. Phytochemistry 18 :1049-1054.
LOWRY,0., R0SEBR0UGH,N., FARR,A. and RANDALL,R. (1951)Protein measurement with the Folin phenol reagent.J. Biol. Chem. 193 :265-275.
LEVI, M . P ., MERRILL,W. and COWLING,E .B . (1968)
3 5 7
Some effects of bacterial action on rotary-cut southern pine veneer.Forest Prod. J. 16(8) :23-28.
MADHOSINGH,C. and GINNS,J. (1974)Serological relationship between Fomes fraxinophilus andF. ellisianus.
Can. J. Microbiol. 20 :1399-1401.MADHOSINGH,C. and GINNS,J. (1975)
Serological relationship between Gloeophyllum trabeum andG. sepiarium.
Can. J. Microbiol. 21 :412-414.MAHADEVAN,P .R . and TATUM,E.L. (1965)
Relationship of the major constituents of the Neurospora crassa cell wall to wild-type and colonial morphology.J. Bacteriology 90 (4) :1073-1081.
MARSDEN,H. and MURPHY,M. (1987)Western blotting: transfer of proteins to nitrocellulose membranes and detection of antigens with antisera.Unpublished.
MARSDEN,H.S., STOW.N.D., PRESTON,V.G., TIMBURY,M .C. and WILKIE,N.M. (1978)
Physical mapping of Herpes simplex virus-induced polypeptides.J. Virology 28. :624-642.
McCREARY,M., C0SENZA,B. and SHIG0,A.L. (1965)Bacteria isolated from decays and discolorations in northern hardwoods.Phytopath. 55, :129-130 (Abstr) .
LUTZ,J .F., DUNCAN,C.G. and SCHEFFER,T.C. (1966)
3 5 8
MEIER,H. (1985)Localisation of polysaccharides in wood cell walls.In Biosynthesis and biodegradation of wood components, (ed. T. Higuchi). pp43-62. Academic Press Inc. (London) Ltd.
MITCHELL,A.D. and TAYLOR,I.E .P. (1969)Cell wall proteins of Aspergillus niger and Chaetonium globosum.J. Gen. Micro. 59, : 103-109.
MONISTROL,I.F ., PEREZ LE BLIC,M.I. and LABORDA,F . (1988)Effect of sublethal dose of benomyl on extracellular enzyme production by Cladosporium cucumerinum.Trans. Br. Mycol. Soc. £0(2) :193-197.
MONTGOMERY,R .A .P . (1982)The role of polysaccharidase enzymes in the decay of wood.In Decomposer Basidiomycetes: their biology and ecology, (eds. J.C. Frankland, J.N. Hedger and M.J. Swift). pp51-65, Cambridge University Press.
MONTREUIL,J ., BOUQUELET,S., DEBRAY,H., FOURNET,B ., SPIK,G. and STRECKER,G. (1986)
Glycoproteins.In Carbohydrate analysis: a practical approach, (eds. M.F. Chaplin
and J.F. Kennedy). ppl43-204. IRL Press.MORRELL,J.J., GIBSON,D.G. and KRAHMER,R.L. (1985)
Effect of fluorescent-labelled lectins on visualisation of decay fungi in wood sections.Phytopathology 75(3) :329-332.
MORRELL,J.J., KRAHMER,R .L. and LING CHWUN,L. (1986)Use of fluorescent-coupled lectins as probes for studying fungal degradation of wood.Internat. Res. Group Wood Pres., Doc. No. IRG/WP/1288.
3 5 9
MOSMANN,T.R., GALLATIN,M. and LONGENBECKER,B .M . (1980)Alteration of apparent specificity of monoclonal (hybridoma) antibodies recognising polymorphic histocompatibility and blood group determinants.J. Immunol. 125(3) :1152-1156.
NAGATA,Y . and BURGER,M.M. (1974)Wheat germ agglutinin. Molecular characteristics and specificity for sugar binding.J. Biol. Chem. 249(10) :3116-3122.
NAYAGAM,S. (1987)Studies on soluble nutrient components in wood and their influence on decay susceptibility and preservative efficacy.PhD Thesis, Dundee Institute of Technology.
NEURATH,A .R . and STRICK,N. (1981)Enzyme-linked fluorescence immunoassays using B-galactosidase and antibodies covalently bound to polystyrene plates.J. Virol. Meths. .3 :155-165.
NICHOLAS,D .D . and SCHULTZ,T.P. (1986)Detection of incipient brown rot decay in wood by Fourier Transform infrared spectrophotometry.Internat. Res. Group Wood Pres., Doc. No. IRG/WP/2275.
NILSSON,L.-A. (1983)Double diffusion-in-gel.Scand. J. Immunol. 17(suppl. 10) :57-68.
NILSSON,T. (1976)Soft-rot fungi -decay patterns and enzyme production.Mat. u Org. 3 :103-112.
3 6 0
Defining fungal decay types - final proposal.Internat. Res. Group Wood Pres., Doc. No. IRG/WP/1355.
NILSSON,T. and DANIEL,G. (1983)Tunnelling bacteria.Internat. Res. Group Wood Pres., Doc. No. IRG/WP/1186.
NILSSON,T. and SINGH,A.P. (1984)Cavitation bacteria.Internat. Res. group Wood Pres., Doc. No. IRG/WP/1235.
NOBLES,M.K. (1965)Identification of cultures of wood-inhabiting Hymenomycetes.Can. J. Bot. 43 :1097-1139.
N0TEB00M,W.D., KNURR,K.E., KIM.H.S., RICHMOND,W.G., MARTIN,A.P. and VORBECK,M .L . (1984)
An ELISA for screening hybridoma cultures for monoclonal antibodies against a detergent solubilised integral membrane protein.J. Immunol. Meths. : 141-148.
NOTERMANS,S., WIETEN,G., ENGEL,H.W.B., RAMBOUTS,R.M., H00GERH0UT,P. and VAN B00M,J.H. (1987)
Purification and properties of extracellular polysaccharide (EPS) antigens produced by different mould species.J. Appl. Bacteriology 62. :157-166.
O'CONNELL,R.J., BAILEY,J.A., V0SE,I.R. and LAMB,C.J. (1986)Immunogold labelling of Phaseolus vulgaris infected by Colletotrichum lindemuthianum.
Physiol. Mol. Plant Path. 28 :99-105.
NILSSON,T. (1988)
3 61
OLMSTED,J.B. (1981)Affinity purification of antibodies from diazotised paper blots of
heterogeneous protein samples.J. Biol. Chem. 253 :11955-11957.
ONIONS,A.H.S. and SMITH,D. (1983)A manual on the preservation of fungi.Commonwealth Mycologial Institute, Kew, Surrey, England.
PALFREE,R .G .E. and ELLIOTT,B.E. (1982)An enzyme-linked immunosorbent assay (ELISA) for detergent solubilised la glycoprotein using nitrocellulose membrane discs.J. Immunol. Meths. 52. : 395-408.
PALFREYMAN.J .W ., VIGR0W,A., BUTTON,D. and GLANCY,H. (1988a)Simple method for scanning immunoblots.J. Immunol. Meths. 109 :199-201.
PALFREYMAN,J.W., BRUCE,A., BUTTON,D., GLANCY,H., VIGROW.A. and KING,B. (1987)
Immunological methods for the detecton and characterisation of wood decay basidiomycetes.In Biodeterioration 7. (eds. D.R. Houghton, R.N. Smith and H.O.W. Eggins). pp709-713. Elsevier, London.
PALFREYMAN,J.W., GLANCY,H., BUTTON,D., BRUCE,A., VIGR0W,A., SCORE,A. and KING,B. (1988b)
Use of immunoblotting for the analysis of wood decay basidiomycetes.Internat. Res. Group Wood Pres., Doc. No. IRG/WP/2307.
PEBERDY,J .F . and ISAACS,S. (1976)An improved procedure for protoplast isolation from Aspergillus nidulans.Microbios Letters 3 :7-9.
3 6 2

Immunological methods in mycology.In Handbook of experimental immunology, vol. 3, Application of immunological techniques (ed. D.M. Weir) pp41.1-41.27.Blackwell Scientific Publications.
PETERSON,C.A. and COWLING,E.B. (1964)Decay resistance of extractive-free coniferous woods to white-rot
fungi.Phytopath. 54 :542-547.
POLONELLI,L ., CASTAGNOLA,M . and MORACE,G. (1986)Identification and serotyping of Microsporium canis isolates by monoclonal antibodies.J. Clin. Micro. 23. :609-615.
RICE,W.A., OLSEN,P.E. and PAGE,W.J. (1984)ELISA evaluation of the competitive abilities of two Rhizobium melilotti strains.Can. J. Microbiol. 30 :1187-1191.
RICHARDSON,M .D . and WARN0CK,D.W. (1984)Antigen and antibody attachment in ELISA for Aspergillus fumigatus IgG antibodies.J. Immunol. Metbs. 66 :119-132.
RICHARDS0N,M.D., TURNER,A., WARNOCK,D.W. and LLEWELLYN,P .A . (1983) Computer-assisted rapid enzyme-linked immunosorbent assay (ELISA) in the serological diagnosis of Aspergillosis.J. Immunol. Meths. 56. : 201-207.
RICHMOND,D.V. and PRING,R.J. (1971)The effect of benomyl on the fine structure of Botrytis fabae.J. Gen. Micro. 66. :79-94.
PEPYS,J . and LONGBOTTOM,J.L . (1978)
3 63
ROSENBERGER,R .F. (1976)The cell wall.In The filamentous fungi vol. II. Biosynthesis and metabolism.(eds. J.E. Smith and D.R. Berry). pp328-344. Edward Arnold,London.
ROWE,J .R ., NEWCOMER,V.D. and WRIGHT,E .T. (1963)Studies of the soluble antigens of Coccidioides Lmmitis by immunodiffusion.J. Invest. Derm. 41 :225-233.
ROWELL,R .M ., ESENTHER,G .R., YOUNGQUIST,J .A., NICHOLAS,D.D.,NILSSON,T., IMAMURA,Y., KERNER-GANG,W., TRONG,L. and DEON,G. (1987)
Wood modification in the protection of wood composites.Proc. Symp. protection of wood composite materials (in press).
SANGARjV.K., LICHTWARDT,R.W., KIRSCH,J.A.W. and LESTER,R.N. (1972) Immunological studies on the genus Smittium (Trichomycetes). Mycologia 64 :342-358.
SAVORY,J.G. (1954)Breakdown of timber by ascomycetes and fungi imperfecti.Ann. Appl. Biol. 41(2) :336-347.
SCHEFFER,T.C. and COWLING,E.B. (1966)Natural resistance of wood to microbial deterioration.Phytopath. 4 :147-170.
SCHUMACHER,M.J., McCLATCHY,J.K., FARR,R .S. and MINDEN,P. (1975)Primary interaction between antibody and components of Allemaria.I. Immunological and chemical characteristics of labelled antigens.J. Allergy Clin. Immunol. .56 :39-53.
SEKHON,A.S., STANDARD.P.G., KAUFMAN,L. and GARG,A.K. (1986a) Reliability of exoantigens for differentiating Blastomyces dermititidis and Histoplasma capsulatum from Chrysosporium Geomyces species.Diagn. Microbiol. Infect. Dis. 4 :215-221.
SEKHON,A.S., STANDARD,P.G. , KAUFMAN,L., GARG,A .K . and CIFUENTES,P . (1986b)
Grouping of Aspergillus species with exoantigens.Diagn. Immunol. 4 :112-116.
SELPULVEDA,R., LONGBOTTOM,J .L . andPEPYS,J. (1979)Enzyme-linked immunosorbent assay (ELISA) for IgG and IgE antibodies to protein and polysaccharide antigens of Aspergillus fumigatus.Clin. Allergy 9 :359-371.
SELVARAJ,J.C. and MEYER,J.A. (1974)Electrophoretic protein and enzyme patterns and antigenic structure in Verticillium dahliae and V. albo-atrum.Mycopath. Mycol. Appl. .54 :549-558.
SESHI,B. (1986)Cell blotting: techniques for staining and microscopical examination of cells blotted onto nitrocellulose.Anal. Biochem. 157 :331-342.
SHALE,D.J. and FAUX,J.A. (1985)The evaluation of a quantitative enzyme-linked immunosorbent assay (ELISA) for anti-Aspergillus fumigatus IgG.J. Immunol. Meths. 77. : 197-205.
SIEGEL,S. (1956)Non-parametric statistics for the behavioural sciences.McGraw-Hill. 312pp.
3 6 5
Chemical analysis of the hyphal walls of Schizophyllum commune. Biochim. Biophys. Acta 496 :225-239.
SINHA,A.K. (1972)Colorimetric assay of catalase.Anal. Biochem. 47 :389-394.
SMITH,G.L.F., CUMMING.C.G. andROSS,P.W. (1986)Immunochemical characterisation of the cell surface carbohydrate antigens of Peptostreptococcus anaerobius.J. Gen. Micro. 132 :525-530.
SMITH,R.S. (1965)Sterilisation of wood test blocks by volatile chemicals: effects on Lentinus lepideus.Trans. Br. Mycol. Soc. 48(3) :341-347.
SNIDER,R.D. and KRAMER,C.L. (1974)An electrophoretic protein analysis and numerical taxonomy study of the genus Taphrina.Mycologia 66 :754-772.
SOUTHERN,E.M. (1975)Detection of specific sequences among DNA fragments separated by gel electrophoresis.J. Mol. Biol. 98 :503-517.
SOWDEN,J.C. (1957)The saccharinic acids.Adv. Carbohyd. Chem. 12 :35 -79.
STANIER,R.Y., ADELBERG,E.A . and INGRAHAM,J.L. (1977)General microbiology.MacMillan Press Ltd. London.
SIETSMA,J.H. and WESSELS,J .G .H . (1977)
3
The isolation of IgG from mammalian sera with the aid of caprylic acid.Arch. Biochem. Biophys. 134 :279-284.
STERNBERG,J. and JEPPESEN,P. (1983)Dot-blotting - a novel screening assay for antibodies in hybridoma cultures.J. Immunol. Meths. 64 :39-43.
SUTER,M . (1982)A modified ELISA technique for anti-hapten antibodies.J. Immunol. Meths. .53 :103-108.
SWITZER,R.C., MERRIL,C.R. and SHIFRIN.S. (1979)A highly sensitive silver stain for detecting proteins and peptides in polyacrylamide gels.Anal. Biochem. 98. :231-237.
TAYLOR,J.A., MORGAN,I.L. and ELLINGER,H. (1980)Examination of poles by computerised tomography.Internat. Res. Group Wood Pres., Doc. No. IRG/WP/2142.
THORNTON,J.D., CRAFFIELD,J.W. and COLLETT,0. (1980)On the laboratory use of X-rays in timber decay evaluation. Internat. Res. Group Wood Pres., Doc. No. IRG/WP/2144.
TIJSSEN,P. (1985)Practice and theory of enzyme immunoassays.In Laboratory techniques in biochemistry and molecular biology vol. 15 (eds R.H. Burdon and P.H. van Knippenberg). 549pp. Elsevier, Amsterdam.
T0WBIN,H. and GORDON,J. (1984)Immunoblotting and dot-immunobinding - current status and outlook. J. Immunol. Meths. 72 :313-340.
STEINBUCH,M. and AUDRAN,R . (1969)
3 6 7
Immunological methods in virology.In Handbook of experimental immunology, vol. 3, Application of immunological techniques, (ed. D.M. Weir). pp40.1-40.28. Blackwell Scientific Publications.
VIGROWjA., PALFREYMAN,J.W. and KING,B. (1990)On the identity of certain isolates of Serpula lacrymans.Submitted for publication.
VIGR0W,A., BUTTON,D., PALFREYMAN,J .W ., KING,B . and HEGARTY,B . (1989) Molecular studies on isolates of Serpula lacrymans.Internat. res. Group Wood Pres., Doc. No. IRG/WP/1421.
VOLLER,A . and BIDWELL,D.E. (1980)The enzyme linked immunosorbent assay. Volume 2.Microsystems Ltd., Guernsey.
WALCZ,I., PACSA,A.S., EMODY,L . and SZAB0,L.GY. (1985)Detection of Sclerotinia sclerotiorum in sunflower by enzyme-linked immunosorbent assay (ELISA).Trans. Br. Mycol. Soc. 85(3) :485-488.
WALLIS,C., MELNICK,J.L. and GERBA,C.P . (1979)Concentration of viruses from water by membrane chromatography.Ann. Rev. Microbiol. .33 :413-437.
WARNOCK,D.W. (1971)Assay of fungal mycelium in grains of barley including the use of the fluorescent antibody technique for individual fungal species.
J. Gen. Micro. 67 :197-205.WEISSMANN.D.N., HALMEPURO.L., SALVAGGIO,J .E. and LEHRER,S.B . (1987)
Antigenic/allergenic analysis of basidiomycete cap, mycelia and
spore extracts.Int. Archs. Allergy Appl. Immun. 84 :56-61.
TYRRELL,D .A .J . (1978)
3 6 8
Mathematics for engineers and scientists.Stanley-Thorne (Publishers) Ltd. U.K. 512pp.
WILCOX,W.W. (1978)Review of literature on the effects of early stages of decay on wood strength.Wood Fiber 9(4) :252-257.
WILKINSON,J.G. (1979)Industrial Timber Preservation.Associated Business Press, London.
WILSON,J.M., TRINICK,M.J. and PARKER,C.A . (1983)The identification of versicular-arbuscular mycorrhizal fungi using immunofluorescence.Soil Biol. Biochem. 15 :439-446.
WELTNER,K., GROSJEAN,J., SCHUSTER,P. and WEBER,W .J . (1986)
3 6 9

APPENDICES.
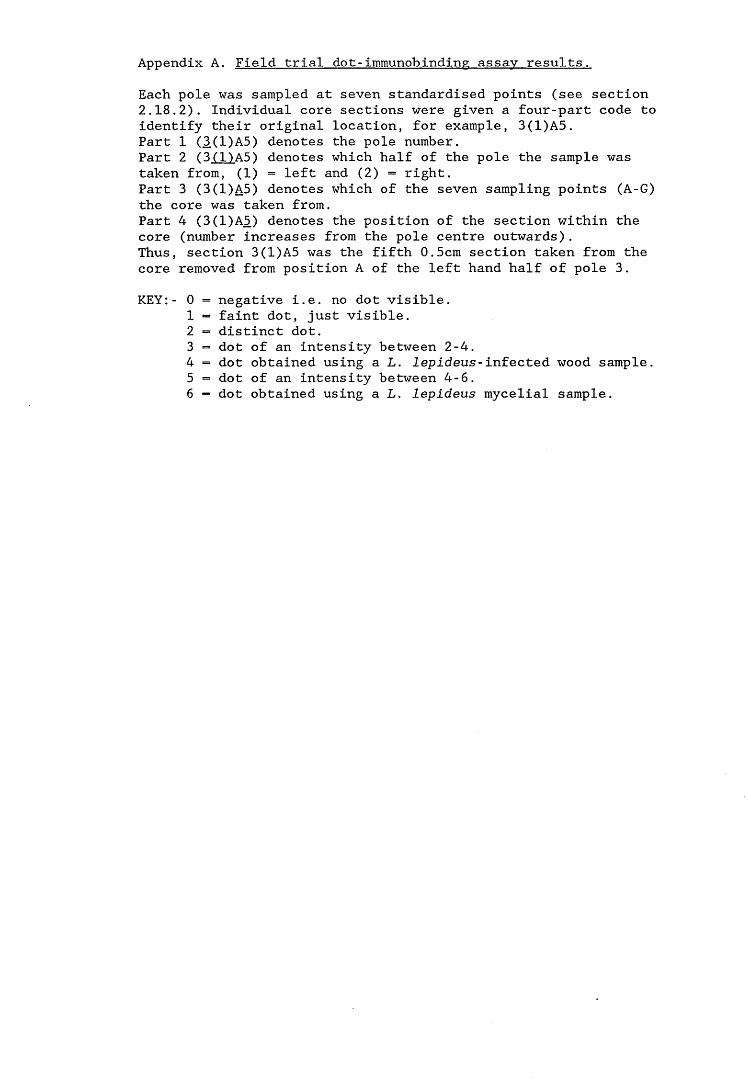
Appendix A. Field trial dot-immunobinding assay results.Each pole was sampled at seven standardised points (see section 2.18.2). Individual core sections were given a four-part code to identify their original location, for example, 3(1)A5.Part 1 (3.(1)A5) denotes the pole number.Part 2 (3(1)A5) denotes which half of the pole the sample was taken from, (1) = left and (2) = right.Part 3 (3(1)A5) denotes which of the seven sampling points (A-G) the core was taken from.Part 4 (3(1)A5.) denotes the position of the section within the core (number increases from the pole centre outwards).Thus, section 3(1)A5 was the fifth 0.5cm section taken from the core removed from position A of the left hand half of pole 3.KEY:- 0 = negative i.e. no dot visible.
1 = faint dot, just visible.2 = distinct dot.3 = dot of an intensity between 2-4.4 = dot obtained using a L. lepideus-infected wood sample.5 = dot of an intensity between 4-6.6 = dot obtained using a L. lepideus mycelial sample.
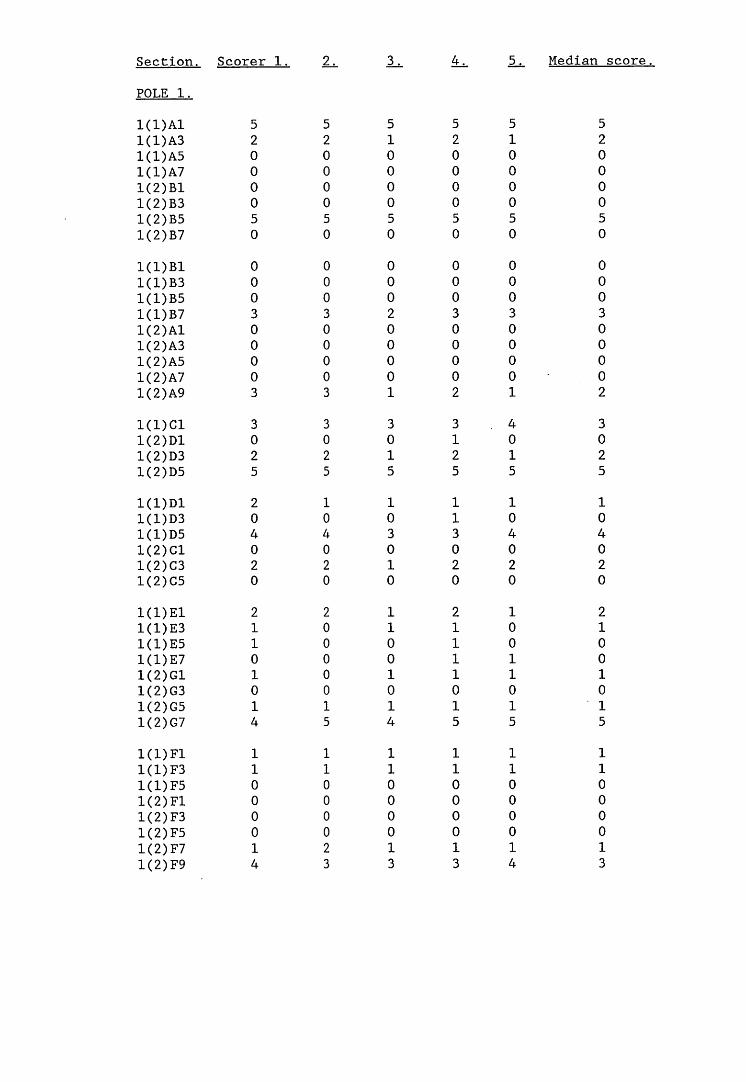
Section. Scorer 1. 2.POLE 1.1(1)Al 5 51(1)A3 2 21(1)A5 0 0K1)A7 0 01(2)B1 0 01(2)B3 0 01(2)B5 5 51(2)B7 0 0
1(1)B1 0 01(1)B3 0 01(1)B5 0 01(1)B7 3 31(2)A1 0 01(2)A3 0 01(2)A5 0 01(2)A7 0 01(2)A9 3 3
1(1)C1 3 31(2)D1 0 01(2)D3 2 21(2)D5 5 51(1)D1 2 11(1)D3 0 01(1)D5 4 41(2)C1 0 01(2)C3 2 21(2)C5 0 0
1(1)E1 2 21(1)E3 1 01(1)E5 1 01(1)E7 0 01(2)G1 1 01(2)G3 0 01(2)G5 1 11(2)G7 4 51(1)FI 1 11(1)F3 1 11(1)F5 0 01(2)FI 0 01(2)F3 0 01(2)F5 0 01(2)F7 1 21(2)F9 4 3
4^ JL. Median :
5 5 52 1 20 0 00 0 00 0 00 0 05 5 50 0 00 0 00 0 00 0 03 3 30 0 00 0 00 0 00 0 02 1 23 4 31 0 02 1 25 5 51 1 11 0 03 4 40 0 02 2 20 0 02 1 21 0 11 0 01 1 01 1 10 0 01 1 15 5 51 1 11 1 10 0 00 0 00 0 00 0 01 1 13 4 3
3.
51000050
000200001
3015103010
1100101411000013
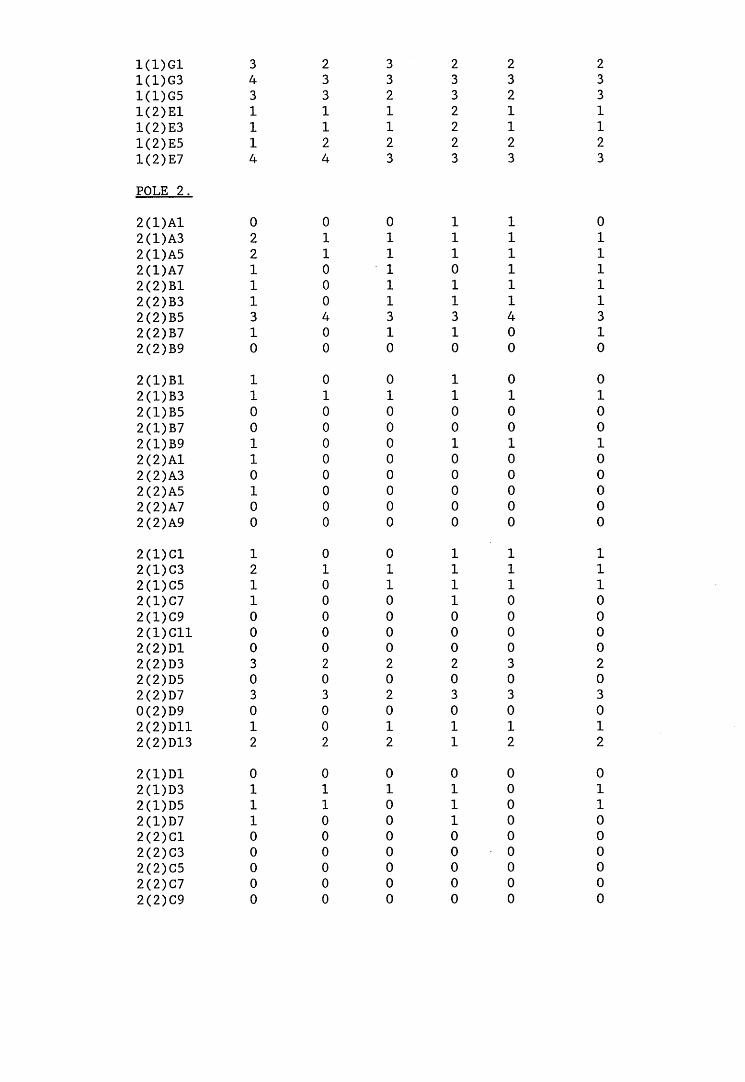
CM CO CO i—I i—I CM COO
t—
I t—
I 1—
I i—I
i—I CO
i—I
oO
i—
lO
Or
—IO
OO
OO
t—li—li—
IO
OO
OC
MO
cOO
t—ICM
Oi—
Ir—IO
OO
OO
O
CM CO CM H
H
CM
COH
rl
rl
rl
Hr
ls
tO
O
Or
HO
Ot
HO
OO
OO
1—I
i—I
i—I
OO
OO
cOO
cOO
i—IC
Mo
oo
oo
oo
oo
CM CO
CO CM
CM CM
CO1—
I t—
I t—
I O
I—
I I—
I C
O
I—I
Oi
Hr
-l
OO
l—
IO
OO
OO
i—
I i—
I i—
I i—I
O
O O
CM O
CO
O
i—I
i—I
OrH o
o o
o
o
CO CO CM
rl H
CM CO
O
i—I
r—I
i—I
i—I
i—I
cO i—
I O
Or
—IO
OO
OO
OO
O
O
i—I i—
IO
OO
OC
MO
CM
Oi—
ICM
Oi—
IO
OO
OO
OO
CM CO m
H H
CM s
fO
i-
li
-I
OO
O<
tO
O
Oi
—I
OO
OO
OO
OO
Or
—I
OO
OO
OC
MO
CO
OO
CM
O
r-
Ir
HO
OO
OO
O
co co
i—l
i—I
i—I
<}■O
CM
CM
i—I i—
I i—
I CO i—IO
i—
I i—
I O
O
i—I
i—1 O
i—
IO
OC
Mi—
li—I
OO
OcO
OcO
Oi—
ICM
O
i—
I i—
I i—
I O
O
O
O
O
i—I
i—I
CO
tHCO
inrH
COm
CMrH
COin
rHCO
inON
rHCO
inO
nrH
COin
I-"*ON
rHCO
inr^
ONrH
rHCO
mON
rHrH
oO
Ow
ww
W<
C<
<1eq
cqcq
cqcq
CQCQ
CQCQ
CQc
<<
<<3
OCJ
Oo
OO
Q/-\
X~N/-N
/Nw
x-sX“N
✓~NX~N
X"“V/-s
x~sx~\
X“N✓“s
s~s✓~s
X~\X*N
x-sX
Sx~\
X"N✓ s
/ N/*\
f Ns
rHrH
rHCM
CMCM
CMrH
rHrH
rHCM
CMCM
CMCM
rHrH
rHrH
rHCM
CMCM
CMCM
rHrH
rHrH
rHrH
CMCM
CMCM
CMCM
CM'w
'v^x
s-/ V-/
ov
-/v
-/s-x
'w'
V-/V-/
sxv—'
s-xV—x
XwX's-X
__'
V'—
rHI—
1rH
rHi—
!t—
!rH
PUCM
CMCM
CMCM
CMCM
CMCM
CMCM
CMCM
CMCM
CMCM
CMCM
CMCM
CMCM
CMCM
CMCM
CMCM
oCM
CM
i—Ic
OU
Ol
• H CO if)
0\
OO
OO
Oi—
li—li—
I i—
I CM CN CM
CM CM
CM
CM
CM
CM
CM
CM
CM
CM
CM
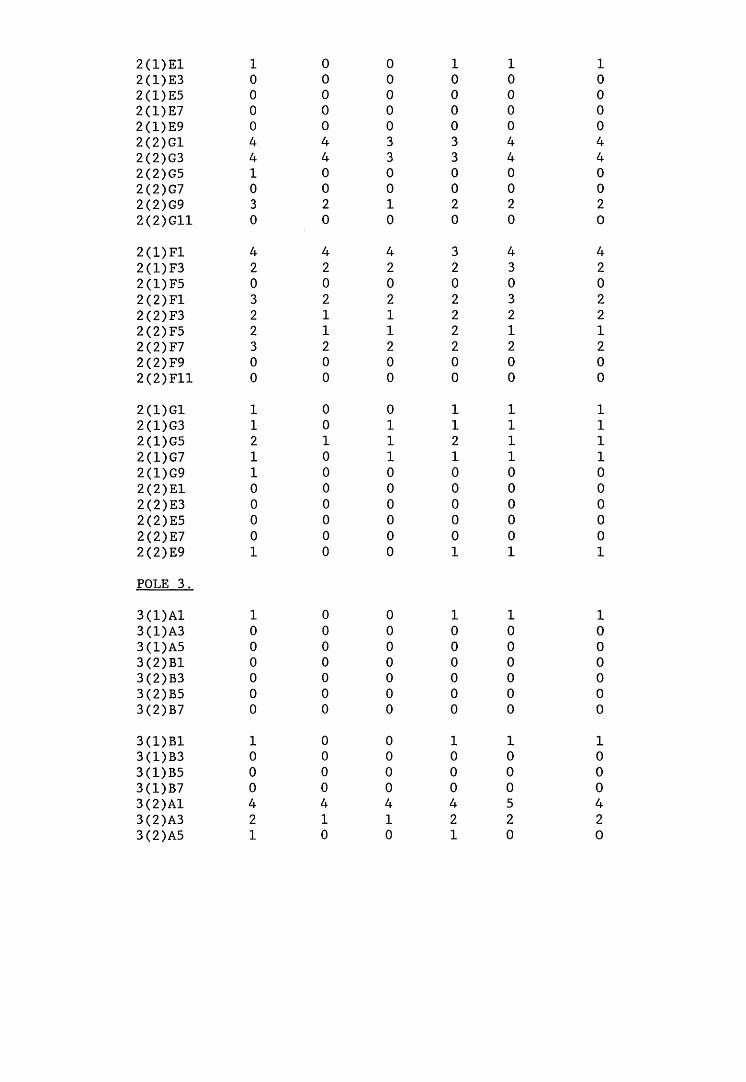
i-
IO
OO
O<
t<
J-
OO
CM
OM
frCM
OC
MC
Mt—
IC
MO
Oi—
It—li—
lO
OO
OO
t—I
tH O
O O
O O
Or—l O
O O
CM
O
r—IO
OO
O<
i"
<t
'OO
CM
O
<J
-cO
Oc
OC
Mt—
ICM
OO
t—
It—Ir—
lt—l
OO
OO
Ot
—I
r-
HO
OO
OO
O
i—I
O O
O
LO
Csl
O
t—I
OO
OO
cOcO
OO
CM
O
CO
CM
OC
MC
MC
MC
MO
O
tHi—
lCM
t—l
OO
OO
Ot
—I
tH
OO
OO
OO
t—
I O
O
O
<j-
CM
i—I
OO
OO
Oc
Oc
nO
Ot
HO
s
tC
MO
NH
HC
MO
O
Or
Ht
-l
t-
IO
OO
OO
OO
OO
OO
OO
O
O
O
O
<J"
t—I
O
00
00
0<
t"
<t
00
CM
0
st
CM
OC
MH
rlC
MO
O
OO
rH
OO
OO
OO
OO
OO
OO
OO
O
O
O
O
<1-
t-H o
i—I
O
O
O
O
<t
<j" t—
I O
CO
O
<tC
MO
cO
CM
CM
CO
OO
r
Ht
-IC
Mr
-lt
-IO
OO
Ot
-l
t—I
O
O
O
O
O
O
r-l O
O
O
CM t-l
WW
WW
WO
OO
OO
O\ /—
S /<~S /—S /—
\ /'■N ^
i—It—
It—It—
I H CM
CM M
CM OJ
CM w
v
'w
' w
vC
MC
MC
MC
MC
MC
MC
MC
MC
MC
MC
M
i—IC
OL
Dt—
I M
IT) h
' O' i—
I
i—It—
It—I CM
CM CM CM
M CM
^ ^
^
^
C
MC
MC
MC
MC
MC
MC
MC
MC
M
ricomr^O
tHcoinr^o
coo
oo
oo
ww
ww
w/—N S N ^
/-N
/>~S ^
fl}t—
t t—
1 t-i
i—I t—
I CM
CM CM
CM CM
>-3V
'__-- W
V—
'w' v
O
CM
CM
CM
CM
CM
CM
CM
CM
CM
CM
P4
h n in H co in Is<3
<
«U pq cq
pq pq
/N rN
S"*\
/*-\ /-St—
I t—
I r—I CM CM
CM CM
'w'
v-x \w
v-xCO
CO CO CO CO
CO CO
p^ co in
i-
i pq
pq pq
pq <;
/""N /—s /-N
H r
l H
rH
CM
V-/ V
-/ v s
/CO
CO CO
CO CO
3 (2) A3 3(2)A5
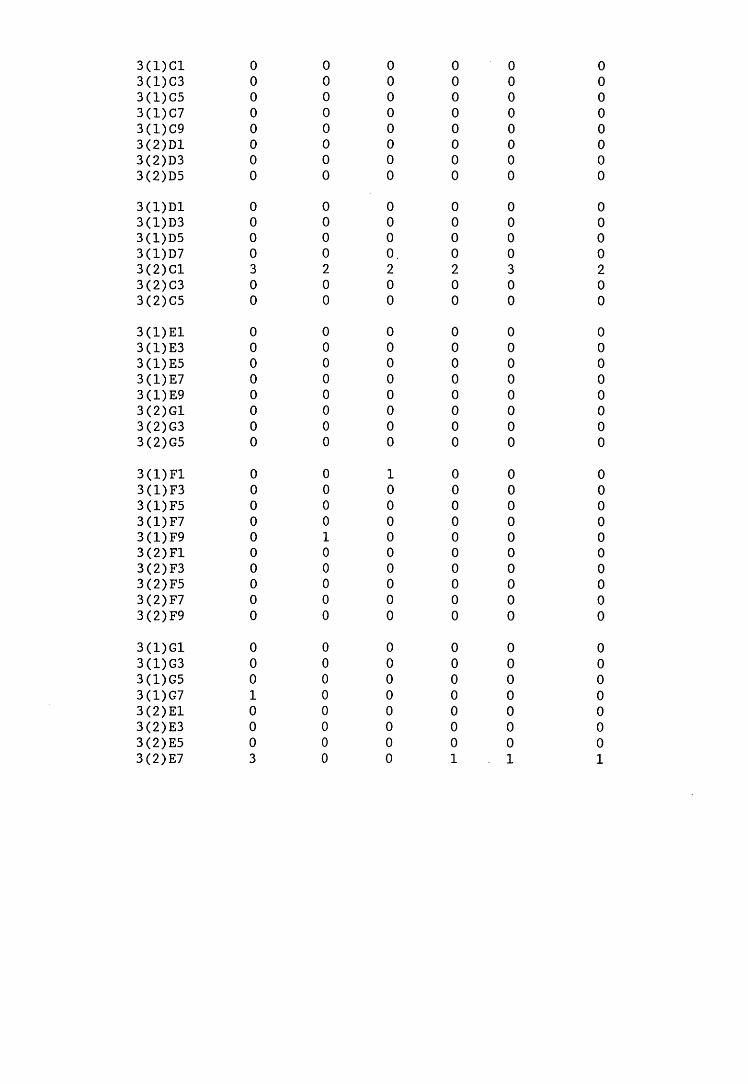
oo
oo
oo
oo
O
O
O
O
CM O
O
oo
oo
oo
oo
oo
oo
oo
oo
oo
OO
OO
OO
Or
H
OO
OO
OO
OO
O
O
O
O
CO
O
O
o
oo
oo
oo
oo
oo
oo
oo
oo
oO
OO
OO
OO
rH
OO
OO
OO
OO
O
OO
OC
MO
O
oo
oo
oo
oo
oo
oo
oo
oo
oo
OO
OO
OO
Or
H
OO
OO
OO
OO
O
OO
OC
MO
O
oo
oo
oo
oo
I—IOO
OO
OO
OO
Oo
oo
oo
oo
o
OO
OO
OO
OO
O
OO
OC
MO
O
oo
oo
oo
oo
OO
OO
rH
OO
OO
Oo
oo
oo
oo
o
oo
oo
oo
oo
O O
O O
CO o o
oo
oo
oo
oo
oo
oo
oo
oo
oo
OO
Oi
—I
OO
OcO
r-ICO
inr^
CT
vrH
CO
Ln
OU
OO
OQ
rH
i—I
H
H
i—I
CM
CM
CMV
/ W
cocococococococo
rH
CO
lO
I •
t—I
CO
I/O
Q Q Q Q U O UrH
i—
I i—
I rH
CM
CM
CM
v-x 'w
' v—/ w
^co
co co
co co
co co
Hc
Oi
nM
J'H
Oi
nw
ww
ww
oo
oi—
I i—
( rH
i—
I !—
1 CM
CM
CM
V/ '—
/ __'
v-' '--✓ ^ ^
co
co
co
co
co
co
co
co
rHcoinr^c\H
coini^o%PnpL,pL,pnfi|fe[L|plHpl,plL|i—
I rH
t—
I rH
rH
CM
CM
CM
CM
CM
v—* '_' ^
^
^
/ WC
OC
OC
OC
OC
OC
OC
OC
OC
OC
O
rHcOLOr^rHcOinr^o
oo
ow
ww
wH
rHrH
rlCM
CM
CM
CM
^ Vw'
'w' ' ---
^ V_
'C
OC
OC
OC
OC
OC
OC
OC
O
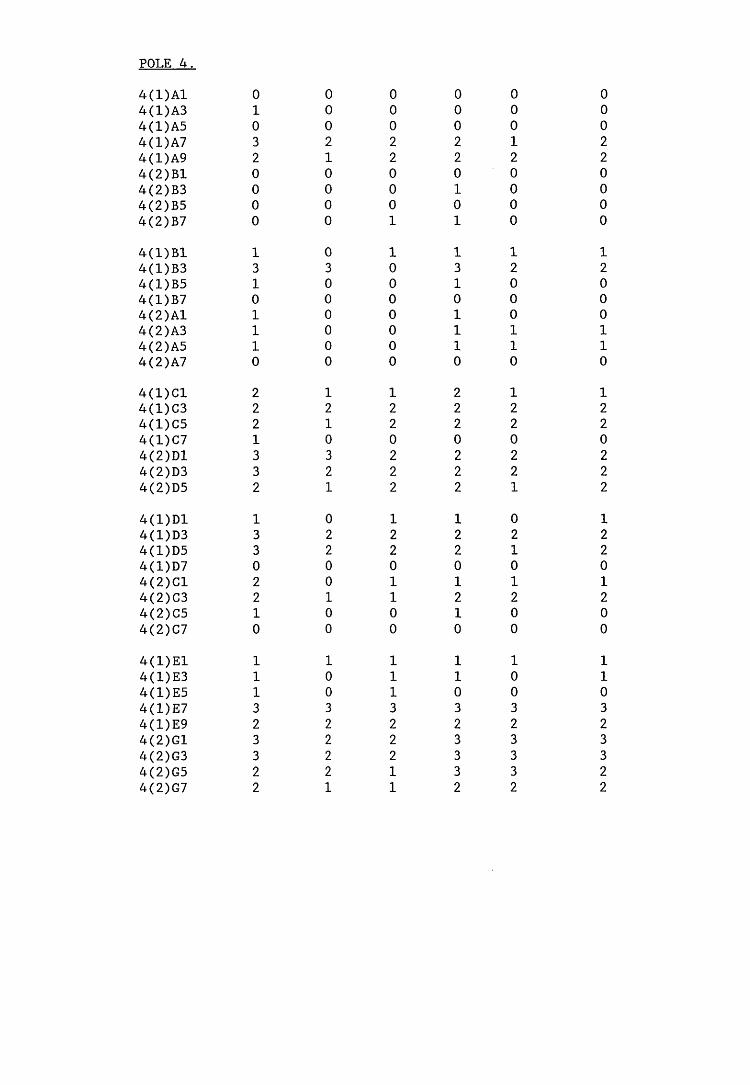
-P'-
P'-
P'-
P'-
P'-
P'-
P'-
P'-
P'
^ /—
\ /—
S /~
x ✓“
N /'—
XM
Mro
rOH
HH
HH
W -
-----
----'
----
x_x
x_r
w
x_
*'Q
tDO
OM
Mm
MM
'xJ
UiW
HV
Ov
JU
lWH
-P~-P
'-P
>-P
>-P
'-P
'-P
'-P
>^
X
/^X
^x
^
/—X
/^x
^
-s
I^x
K)f
OrO
N)H
HH
Hv_
x X__/
X^
x^ x
_x V
^< X
_^/
oo
oo
oo
oo
vJU
iWH
'xjm
wH
4> 4>
4>
4>
-f>
-P*
✓~X
~X /
—X ^
X
^XN5
(O N3
H H
H
H
___
< X_
_-
x_
/ x
^
X^
x
^
xy
o o
o o
o o
oin
W H
n|
Ui
W H
4>
-p'-
p'-
P'-
P'-
P'£
'4>
✓~
x X
/—X
/—x
^x
/~
x /"
-x ✓
—x
Nt
OM
tO
HH
HH
X/
W x
^ x
_x x
/ X
^ '—/ \s
>>
>>
ww
ww
xJU
iWH
vlU
iWH
-P'-
P'.
P'.
P'-
F'-
P'-
P'-
P'-
P'
/~X
^~
X /
x /—
X ^~
X ✓~
~X /
~X
^
xN
MM
MH
HH
HH
'—/
x_^
x_x
x_^
x
^ x
__/
x^
» '—
/ '--
-
WbaW
b3>>
>>>
NlU
iWH
vO’x
Jlnw
H
Mt
OW
Wf
OW
HH
H
OH
to
rO
OW
WH
ro
W
W
H
to
ro
N
) O
HH
HO
HW
H
OO
OO
ro
UJ
OM
O
I—1
M M
W
SO W
O
O
I—
1 O
OM
OO
fO
ro
O
H W
U
O
H
M
H
OO
OO
OO
OJ
O
OO
OO
Mf
OO
OO
HH
fO
fO
tO
UH
HH
O
OP
HO
N5
MH
M
fO
N
) O
M
M
H
O
OO
OO
OO
H
h-
'O
OO
ro
ro
OO
O
N5
WW
WN
JW
OH
H
Ob
jr'
Oh-‘
OrO
K>
H-‘
JO
N
) fO
O
M
N
) 10
O
HH
HO
HU
H
MO
l—
‘O
NO
NO
OO
O
WW
WW
ro
uO
OH
O
OM
HO
HM
O
H M
M
O
M
M
H
O
t-*
l—'
OO
ON
>H
O
OO
Ot
OM
OO
O
N3
MW
WN
5W
OH
HO
ON
HO
ID
MH
l\5
to
M O
M M
H
Ot-
‘H
‘O
OO
K)
t-*
O
OO
Oh
Ot
sO
OO
O
POLE 4.
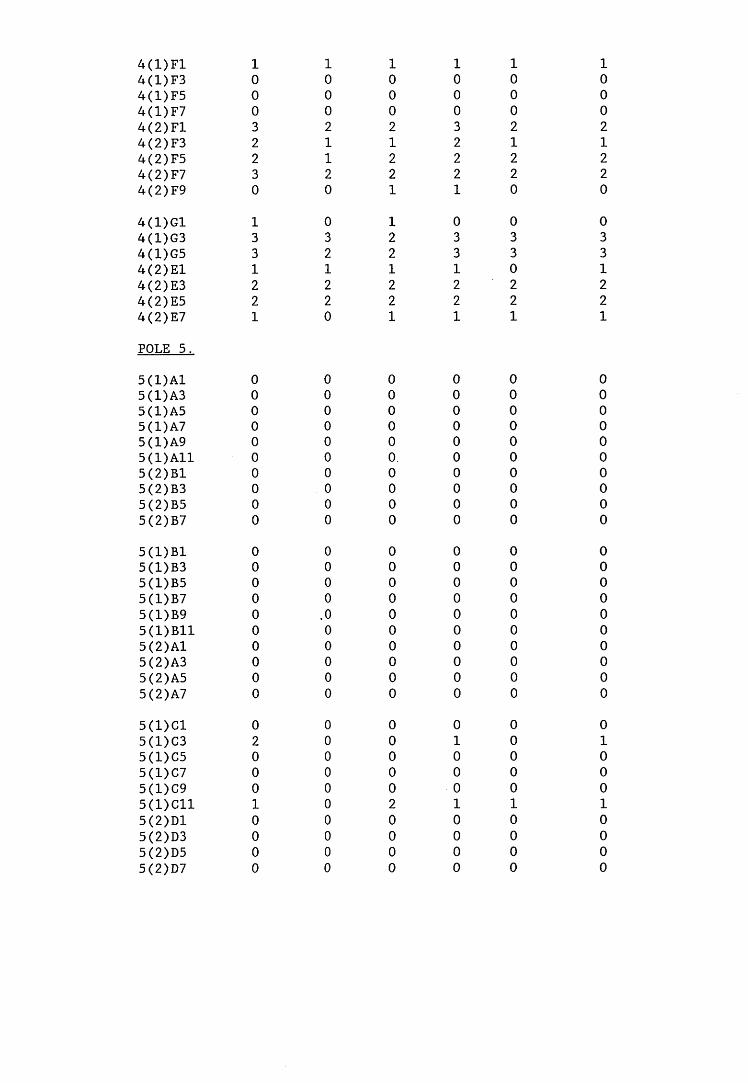
<—IO
OO
CM
i—I
CM CM
OO
CO
00 rH
CM
CM rH
oooooooooo
oooooooooo
Or
HO
OO
rH
OO
OO
rlO
OO
CM
rlC
MC
MO
O
CO
CO O
CM
CM rH
OO
OO
OO
OO
OO
O
OO
OO
OO
OO
O
OO
OO
Ot—
IO
OO
O
i—I
O
O
O
CO CM
CM CM
t—I
O
CO CO
I—I
CM CM
rHO
OO
OO
OO
OO
O
OO
OO
OO
OO
OO
O
r-
IO
OO
rH
OO
OO
i—I
OO
OC
Mi—
ICM
CM
i—I
rl CM
CM rH
CM
CM rH
OO
OO
OO
OO
OO
O
OO
OO
OO
OO
O
OO
OO
OC
MO
OO
O
i—I O
O
O
CM
rH
i—I
CM O
O
CO
CM i—
I CM
CM O
OOOOOOOOOO OOOOOOOOOO oooooooooo
rH
OO
OC
OC
MC
Mc
OO
H
ro CO H
CM CM
HO
OO
OO
OO
OO
Oo
oo
oo
oo
oo
oO
CM
OO
Or
HO
OO
O
HcO
inMH
cOiO
MC^
flHpLlpLlpLihpLitjLipLli—
I i—
I i—
I i—
I CM
CM CM
CM CM
W Vw'
v __' ^
v-/ '—'
H
CO in rl CO in
N
LD
o o o w w w w(T
\ f N rs
<r\
/—\ / N
pi]rH
rH
rH
CM
CM
CM
CM
hJ\«/
V—/ S/ OPn
Hc
Oi
nN
Oi
HH
CO
in
N<
;<3
<3
<3
<!<
;cq
cq
pq
tfi/—
\
^ s
s
✓—\
rH
rH
rH rH
rH
rH
CM CM CM
CMs_x
v
wm
inin
min
inin
inin
in
Hc
Oi
nM
Ji
HH
CO
in
Mc
qc
qc
Qc
qc
Qe
Q<
3<
3<
3<
3/"■S /*N /*N /*N /*S ✓-N /"S
/"Nt—
I rH
iH
\—1 i—
I rH
OJ CN
OJ
CNJSw
V-/ Vm
*' V
-/ S-X v«/ V V
V-/
inininininininminin
rl CO
IT) ^
t—
Io o o o o o
/TS X-S /N
/T~S
m m m m m m
5(2)D1 5(2)D3 5(2)D5 5(2)D7
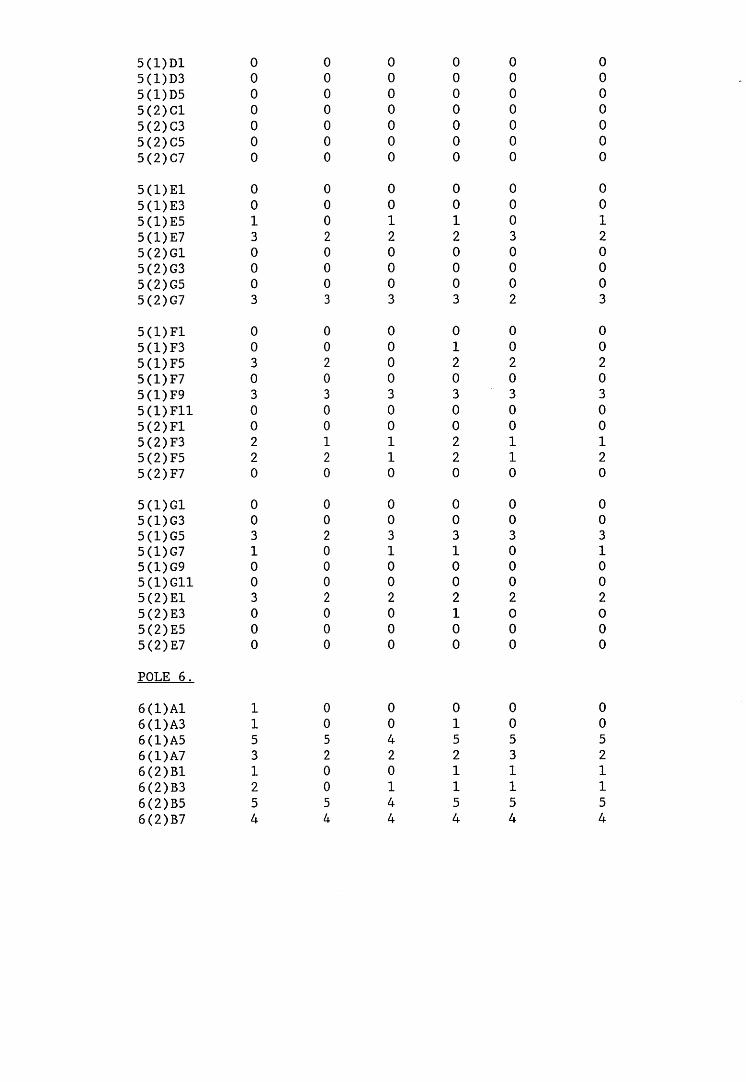
o
o
o
o
o
o
oO
Or
HC
MO
OO
CO
OO
CM
On
OO
HN
OO
Or
Oi
—I
OO
CM
OO
OO
Oi
nN
HH
if
Kt
OO
OO
OO
O
OO
Oc
OO
OO
CM
O
O
CM
O
CO O
O
i—
It—IO
O
OC
OO
OO
CM
OO
OoommHHin<r
OO
OO
OO
O
OO
rH
CM
OO
OC
O
Oi
HC
MO
cO
OO
CM
CM
O
OO
0O1H
OO
CM
1HO
Oo
i—i in c
m i—i i—i in -cf
OO
OO
OO
O
OO
tH
Cs
IO
OO
cO
O
OO
Oc
OO
Oe
Hr
HO
O
Or
Oi
—I
OO
CM
OO
OO
O
CM
O
i—
I <f
'd'
OO
OO
OO
O
OO
OC
MO
OO
oO
O
OC
MO
oo
OO
iM
CM
O
OO
CM
OO
OC
MO
OO
oo
mc
Nio
ot
n<
j-
OOOOOOO
oOtHcoooocoo
oc
oo
co
oo
cm
cm
oO
Oc
Or
HO
Oc
OO
OO
rH rH in
CO rH CM in <j"
h to m
h
n m
n
Q
Q
Q
O
O
O
O
i—I
<—It—
I CM
CM CM
CM'w
' '—/ W
W
'--✓in
m m
m m
m m
ricnmr^t-icninr^
WW
WH
OO
OO
i—I
i—i
T—I
H
CM
CM
CM
CMW
W ' _
' W V_/
^in
inin
min
inin
in
ricnmN
oit—iricninr^Pm PH
Pm Pl P-l
t—I H
rH
H
H
tH
CM CM
CM CM
^ w
V_X
'—✓ winininm
inininininin
rHCOinr^CTiiHrHcOinr^ vo
ou
oo
oo
ww
ww
/*\ /V (TN /-V
/ N ^
s n H
HH
HH
HH
CM
CM
CM
CM
i-J
'—/ '—/ W
V '—
' V.—' V—/ Q
inin
inin
inin
inin
inm
P-i
H to m
n
H to m
<
<3 <3 <3 PQ
PQ pq/—s /“s /*\
/~xrH i—
I rH tH CM CM CM
s_x \_
^VO VO VO VO VO VO VO
6(2)B7

6(1)B1 46(1)B3 46(2)A1 36(2)A3 16(2)A5 46(2)A7 46(1)C1 26(1)C3 16(1)C5 36(1)C7 36(2)D1 06(2)D3 46(2)D5 56(2)D7 46(1)D1 36(1)D3 46(1)D5 46(2)C1 26(2)C3 06(2)C5 36(2)C7 36(2)C9 3
6(1)E1 26(1)E3 26(1)E5 46(2)G1 46(2)G3 26(2)G5 36(2)G7 56(1)F1 06(1)F3 46(1)F5 26(2)FI 36(2)F3 06(2)F5 16(2)F7 56(1)G1 46(1)G3 36(2)E1 26(2)E3 16(2)E5 46(2)E7 4
3 3 43 3 43 2 30 0 14 3 43 3 41 1 20 0 12 2 23 3 30 0 04 3 45 4 52 2 32 3 33 3 44 3 30 1 10 0 01 1 22 2 33 3 3
1 1 11 1 14 3 43 3 42 1 23 2 35 4 50 0 13 3 41 1 23 3 30 0 10 1 15 5 53 4 42 2 31 1 21 1 14 3 44 3 4 4>
.p*
ro
ro l
o -
P"
m h
h w
ro
w h
u
i w
m p
p t
o m
e
ow
ro
oM
ww
w
ww
wh
wm
hm
w
p h
w w
w
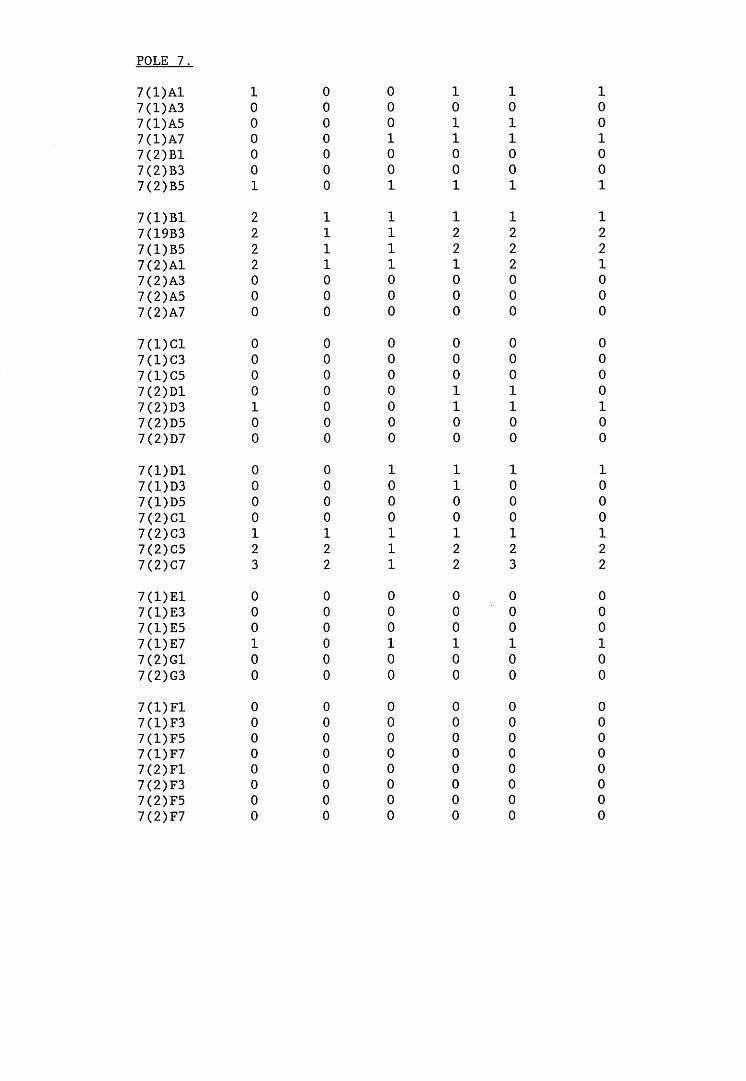
7(2)F7
>4 s
j sj
>sj
vj v
l vj
S S
/—
\ /—
s(OMMHHHH
' ---
Srf'
S_'
S_ S
_ '-
--hr
] ht
j br
j hr
j hr
) hi
j U
i W
H
s
i U
i W
H
si
sj s
i s
i s
j N
l✓
N /S
^S
^SM
1 H H H H
__s_
—X
w
'----'
O
O
PI
PI
w
mW
H
S
i U
1 w
H
s|
s|
si
si
si
si
s|
/S /
S /
S ^
S /—
s ^
s ^
stO
fO M W H H
Ho
o o
o o
o o
Si Ui W H m W H
s|
si
si
—I
si
s|
sj
/~s
^s
/S ^
s /~
s ^
s ^-
sM
tO
N
) tO
H
H
H
—/
s__
' '_
_' w
sy
sy
s_x
oo
oo
oo
os
j U
i W
H
U
1 W
H
sj
s|
s|
si
si
sj
si
^s
^s
/~\
^s
/—\
^s
/-s
to I
O t
o t
o H
H H
s_
x s
^ s
^»
s/
w
VO
s_
xJ>
J> >
J> trt
w w
sJ
Ul
W
H
UI
W
H
Sj
sj
Sj
S|
—I
*sj
/—s
^S >
S /~
s /S
/~s
to to
IO
H
H H
H
v_x
s_x
s_
x s
^ %
_✓ s
_x s
/
ww
w>
>>
>U
I W
H
s
i U
I W
H
O O O pi
OO
OO
OO
OO
O
O
I—1
O
O
O
U)
to I-1
O
O
O
O
O
OM
OO
OO
O
O
O
to t
o to
to
t-
'O
OO
OO
l-1
OO
OO
OO
OO
O
OO
OO
O
ts
otO
MO
OO
O
OO
OO
OO
O
O O
O
I—
1 I—
1 I—
1 I—
1 o
oo
oo
oo
OO
OO
OO
OO
O
OM
OO
O
I-1
I-1
I—1
O
O
O I—
1 O
OO
OO
OO
O
O
O
h-1
I—‘
h-1
I—1
I—1
O
O I
—1
o o
o
OO
OO
OO
OO
O
O
I-
1 O
O
O
ro
IO
H
O
O
H
H
O
O
h-
1 I—
1 O
O
O
O
O
O
H to
to
H
M0
0l
-‘
l-,
0
OO
OO
OO
OO
O
OM
OO
O
W t
o H
O O
O H
O
OI-
‘H
lO
OO
O
O O
M t
o to
H
H-1 O
O
I—1
I—1
O
I—1
OO
OO
OO
OO
O
O
I-*
o
o
oM
to
H o
O O
HO
O
I-
* o
o
o
o
OO
OH
tO
NH
I—1
O
O
I—1
O
O
I—1
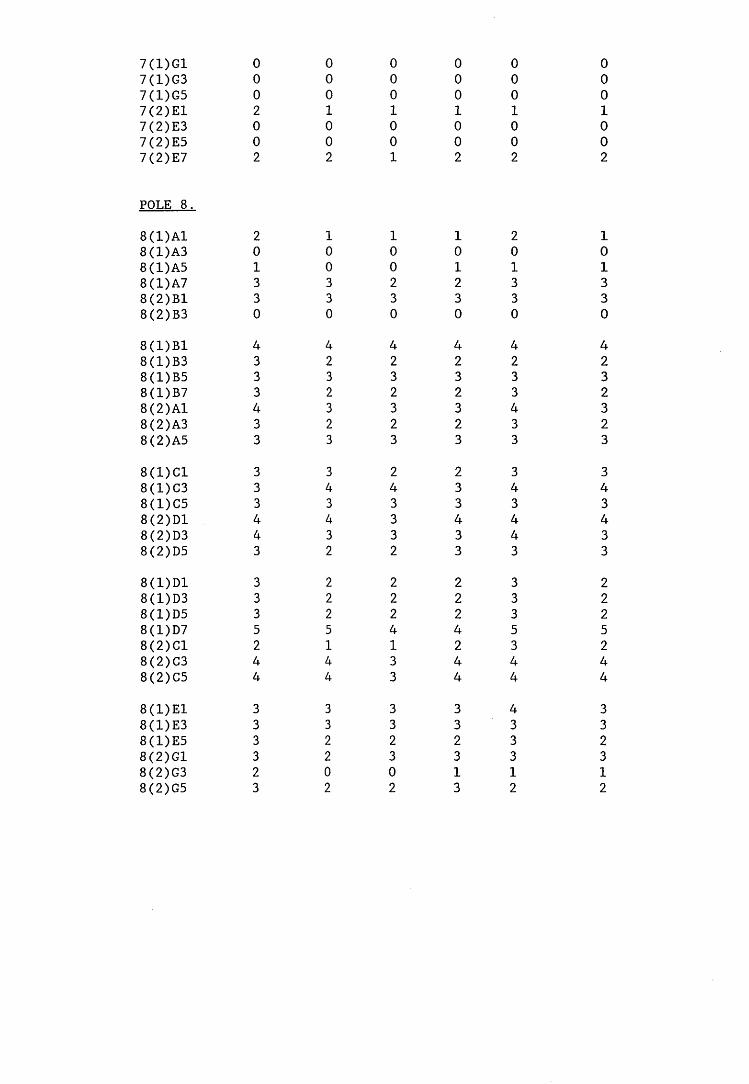
0001002
101330
4232323
3434332225244332312
0 0 0 0 00 0 0 0 00 0 0 0 02 1 1 1 10 0 0 0 00 0 0 0 02 2 1 2 2
2 1 1 1 20 0 0 0 01 0 0 1 13 3 2 2 33 3 3 3 30 0 0 0 04 4 4 4 43 2 2 2 23 3 3 3 33 2 2 2 34 3 3 3 43 2 2 2 33 3 3 3 3
3 3 2 2 33 4 4 3 43 3 3 3 34 4 3 4 44 3 3 3 43 2 2 3 33 2 2 2 33 2 2 2 33 2 2 2 35 5 4 4 52 1 1 2 34 4 3 4 44 4 3 4 43 3 3 3 43 3 3 3 33 2 2 2 33 2 3 3 32 0 0 1 13 2 2 3 2
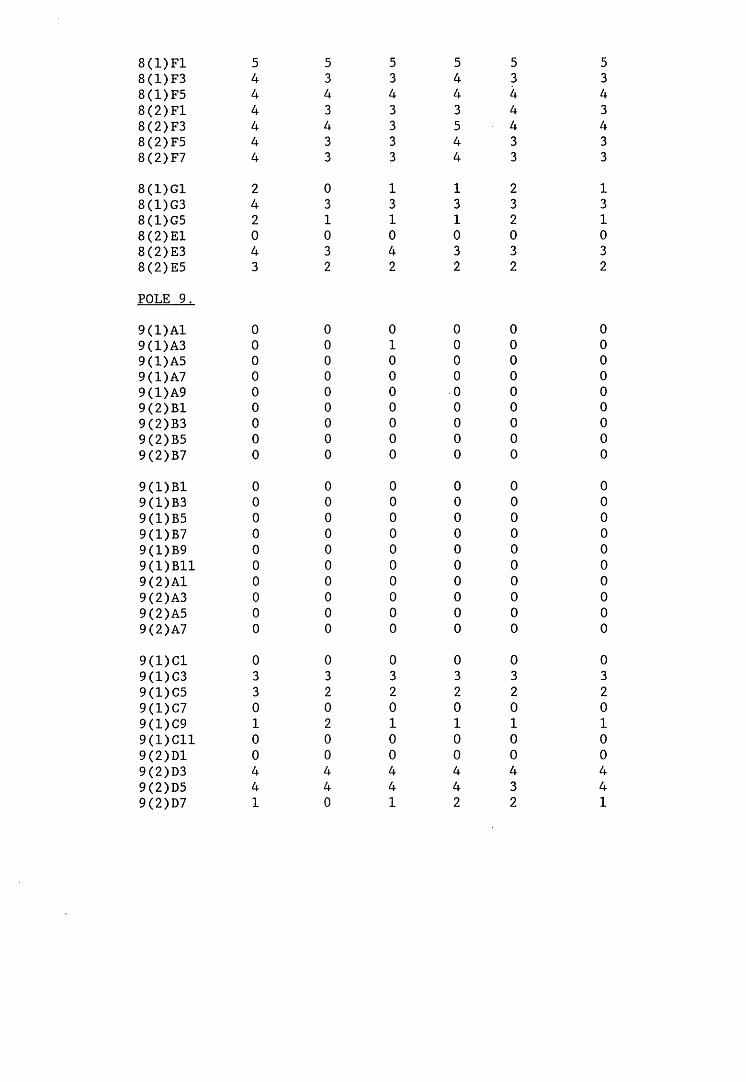
8(1)F1 5 5 5 5 5 58(1)F3 4 3 3 4 3 38(1)F5 4 4 4 4 4 48(2)F1 4 3 3 3 4 38(2)F3 4 4 3 5 4 48(2)F5 4 3 3 4 3 38(2)F7 4 3 3 4 3 38(1)G1 2 0 1 1 2 18(1)G3 4 3 3 3 3 38(1)G5 2 1 1 1 2 18(2)E1 0 0 0 0 0 08(2)E3 4 3 4 3 3 38(2)E5 3 2 2 2 2 2
POLE 9.9 (1) A1 0 0 0 0 0 09(1)A3 0 0 1 0 0 09(1)A5 0 0 0 0 0 09(1)A7 0 0 0 0 0 09(1)A9 0 0 0 0 0 09(2)B1 0 0 0 0 0 09(2)B3 0 0 0 0 0 09(2)B5 0 0 0 0 0 09(2)B7 0 0 0 0 0 0
9(1)B1 0 0 0 0 0 09(1)B3 0 0 0 0 0 09(1)B5 0 0 0 0 0 09(1)B7 0 0 0 0 0 09(1)B9 0 0 0 0 0 09(1)B11 0 0 0 0 0 09(2)Al 0 0 0 0 0 09(2)A3 0 0 0 0 0 09(2)A5 0 0 0 0 0 09(2)A7 0 0 0 0 0 0
9(1)Cl 0 0 0 0 0 09(1)C3 3 3 3 3 3 39(1)C5 3 2 2 2 2 29(1)C7 0 0 0 0 0 09(1)C9 1 2 1 1 1 19(1)C11 0 0 0 0 0 09(2)D1 0 0 0 0 0 09(2)D3 4 4 4 4 4 49(2)D5 4 4 4 4 3 49(2)D7 1 0 1 2 2 1
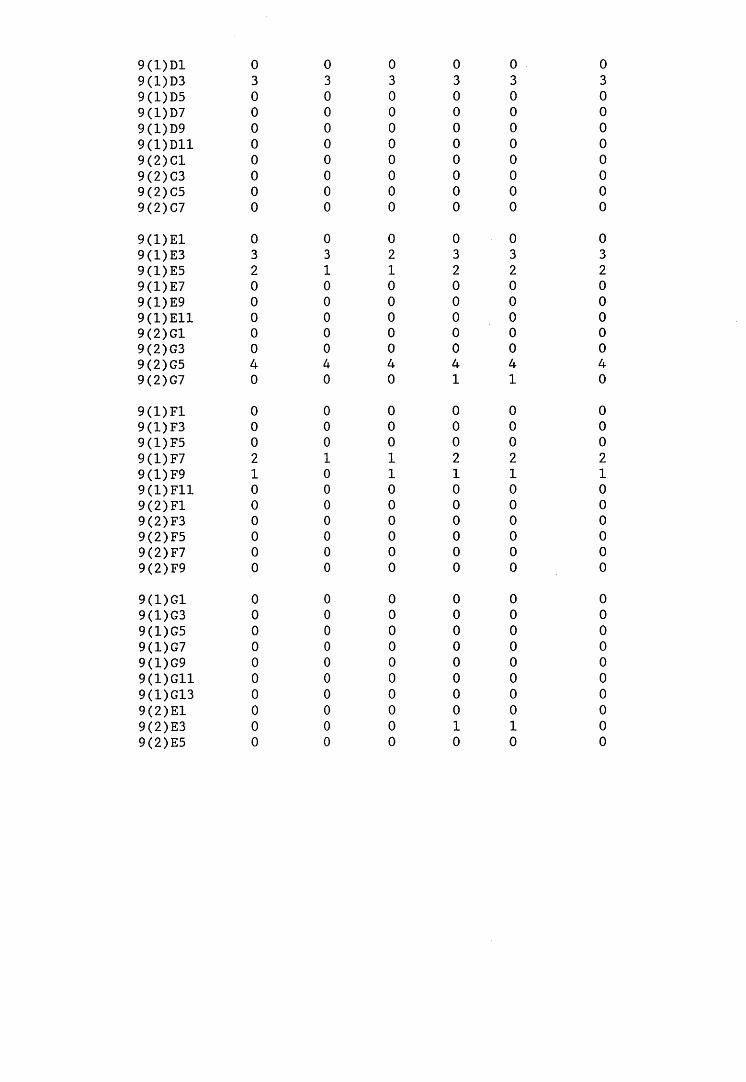
oc
oo
oo
oo
oo
oo
co
cM
OO
Oo
o<
fo
OO
OC
Mr
-I
OO
OO
OO
oooooooooo
OC
OO
OO
OO
OO
O
OC
OO
OO
OO
OO
O
oc
oo
oo
oo
oo
o
Ot
nN
OO
OO
Ov
fH
Oc
OC
MO
OO
OO
vt
rH
OC
Mt
HO
OO
OO
<f
O
OO
OC
Mr
—I
OO
OO
OO
OO
OC
Mr
HO
OO
OO
O
OO
Ot
—I
rH
OO
OO
OO
OO
OO
OO
OO
rH
O
OO
OO
OO
OO
rH
O
oo
oo
oo
oo
oo
OC
OO
OO
OO
OO
OO
cO
i—
IO
OO
OO
<t
O
O O
O
i—
I O
O
O
O
O
o
o
OO
OO
OO
OO
OO
OC
OO
OO
OO
OO
O
Oc
0C
MO
OO
OO
<J
"O
OO
OC
Mr
HO
OO
OO
O
oo
oo
oo
oo
oo
Hc
OlflM
3\
HH
cn
in
NQ
QO
UU
O
rH i—1 !—
! T—t rH t—I CM CM CM CM
rHCOinr^CTsrHrHcninr^w
ww
ww
we
ioo
e)
^ ✓“S y'-s
i—I rH rH i—
I rH rH CM CM CM CM
rH
cO
inr
^C
TiiH
rH
cn
LO
r^
CT
v
HH
HH
HH
CM
OJ
CM
CM
W
i—I coHPunrso\HHHcoino
oo
oo
oo
ww
wi—I rH
i—I i—I i—I t—I i—
I CM CM CMO
n0'>
O'i
Q\C
T'i
0''C
''0'\0
'\0'i
0'v
CT'i0'i
0'i
0'»CT
n0
nG
'i0
'»0
'i 0
%0
\0'<
CT
\(Tv
C7\O
nC
T\0
''<0'i
O'i
Appendix B. Computer program FUNGUSH written in FORTRAN (Bruce, 1983 modified by Clark, 1988) used to map the distribution of microbiologically positive and immunologically positive samples within field trial distribution pole stubs (1-9).
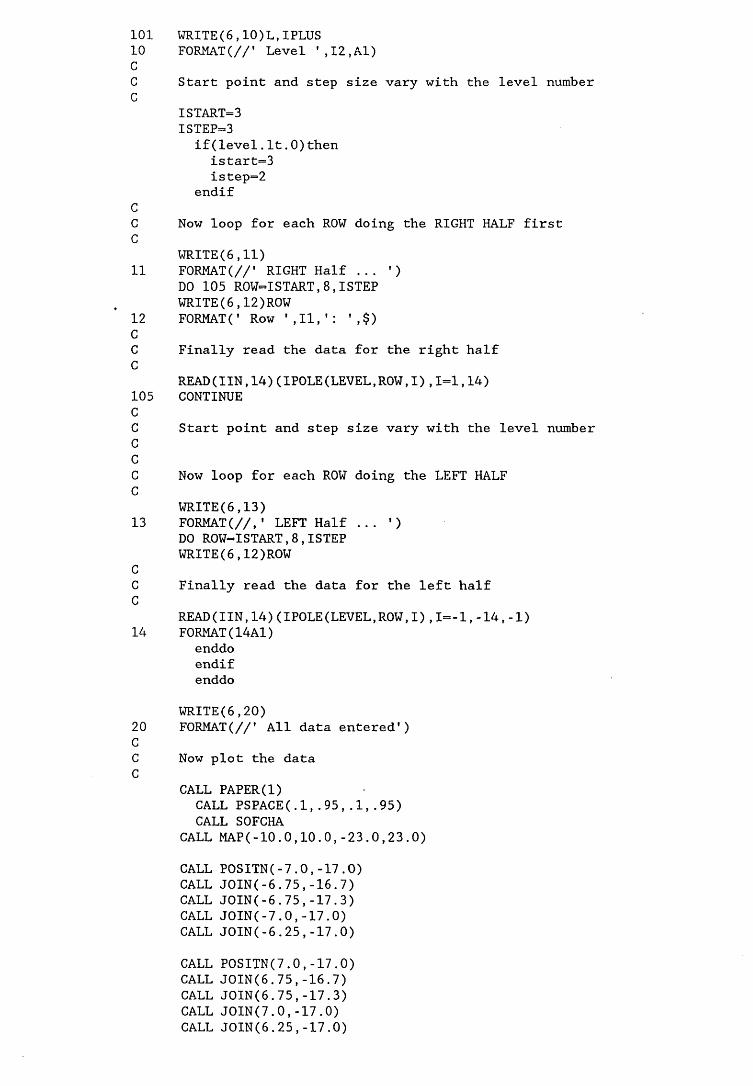
101 WRITE(6 ,10)L,IPLUS10 FORMAT(//' Level ',I2,A1)CC Start point and step size vary with the level numberC
ISTART=3ISTEP=3
if(level.It.0 )then istart=3 istep= 2
endif CC Now loop for each ROW doing the RIGHT HALF first C
WRITE(6 ,11)11 F0RMAT(//' RIGHT Half ... ' )
DO 105 R0W=ISTART,8 ,ISTEP WRITE(6 ,12)ROW
12 FORMAT(' Row ',11,': ',$)CC Finally read the data for the right halfC
READ(IIN,14)(1P0LE(LEVEL,ROW,I),1=1,14)105 CONTINUE CC Start point and step size vary with the level numberCCC Now loop for each ROW doing the LEFT HALF C
WRITE(6,13)13 FORMAT(//,' LEFT Half ... ’)
DO ROW=ISTART,8 ,ISTEP WRITE(6 ,12)ROW
CC Finally read the data for the left halfC
READ(IIN, 14) (I POLE (LEVEL, ROW, I) ,1— 1, -14,-1)14 FORMAT (14A1)
enddoendifenddo
WRITE(6 ,20)20 FORMAT(//' All data entered')CC Now plot the dataC
CALL PAPER(l)CALL PSPACE(.l,.95,.1,.95)CALL SOFCHA
CALL MAP(-10.0,10.0,-23.0,23.0)CALL POSITN(-7.0,-17.0)CALL JOIN(-6.75,-16.7)CALL JOIN(-6.75,-17.3)CALL JOIN(-7.0,-17.0)CALL JOIN(-6.25,-17.0)CALL POSITN(7.0,-17.0)CALL JOIN(6.75,-16.7)CALL JOIN(6.75,-17.3)CALL JOIN(7.0,-17.0)CALL JOIN(6.25,-17.0)
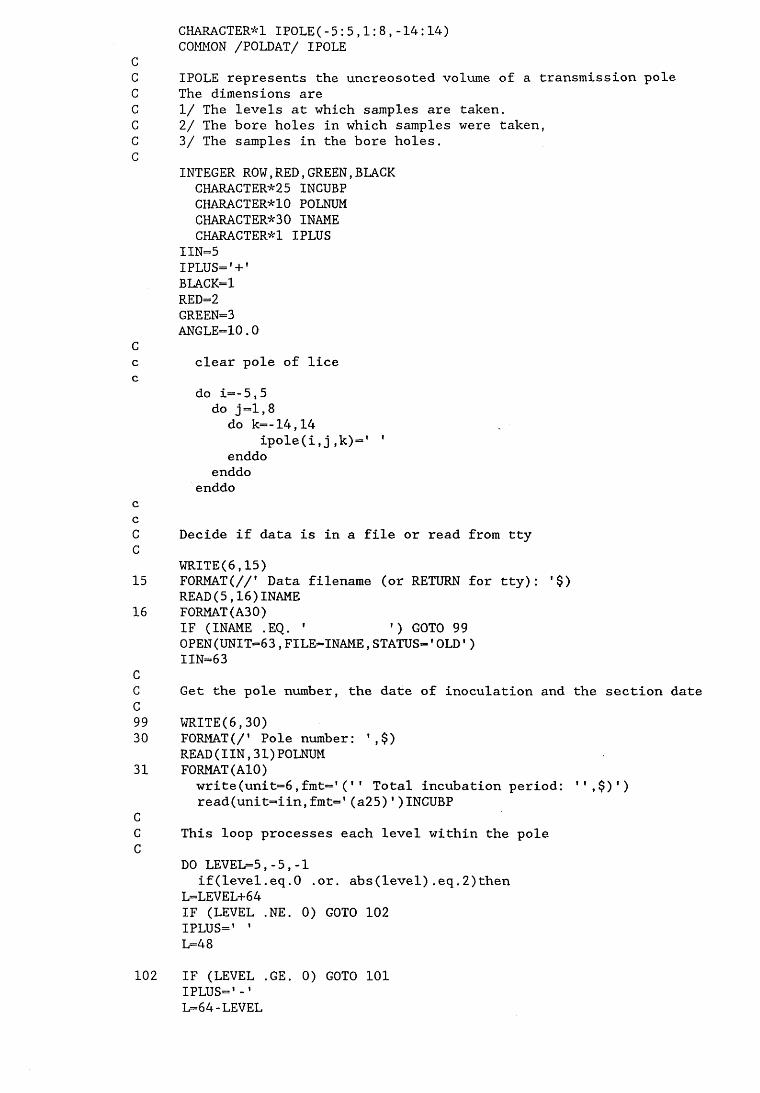
CHARACTER*1 IPOLE(-5:5,1:8 ,-14:14) COMMON /POLDAT/ IPOLE
CC IPOLE represents the uncreosoted volume of a transmission poleC The dimensions areC 1/ The levels at which samples are taken.C 2/ The bore holes in which samples were taken,C 3/ The samples in the bore holes.C
INTEGER ROW,RED,GREEN,BLACK CHARACTER*25 INCUBP CHARACTER*10 POLNUM CHARACTERS 0 INAME CHARACTER*1 IPLUS
IIN=5 IPLUS=’+'BLACK=1 REDS GREENS ANGLE=10.0
Cc clear pole of licec
do i=-5,5 do j =1 , 8
do k— 14,14ipole(i,j,k)=* '
enddo enddo
enddo c cC Decide if data is in a file or read from tty C
WRITE(6,15)15 FORMAT(//' Data filename (or RETURN for tty): '$)
READ(5,16)INAME16 FORMAT(A30)
IF (INAME .EQ. ' ') GOTO 99OPEN(UNIT=63,FILE=INAME,STATUS-'OLD•)I INS 3
CC Get the pole number, the date of inoculation and the section date C99 WRITE(6,30)30 FORMAT(/' Pole number: ‘,$)
READ(IIN,31)POLNUM31 FORMAT(A10)
write(unit=6 ,fmt='('' Total incubation period: ,,,$)')read(unit=iin,fmt=’(a25)')INCUBP
CC This loop processes each level within the poleC
DO LEVEL-5,-5,-1if(level.eq.O .or. abs(level).eq.2 )then
L-LEVEL+64IF (LEVEL .NE. 0) GOTO 102 IPLUS=* ’L=48
102 IF (LEVEL .GE. 0) GOTO 101IPLUS— 1 - 1 L=64-LEVEL
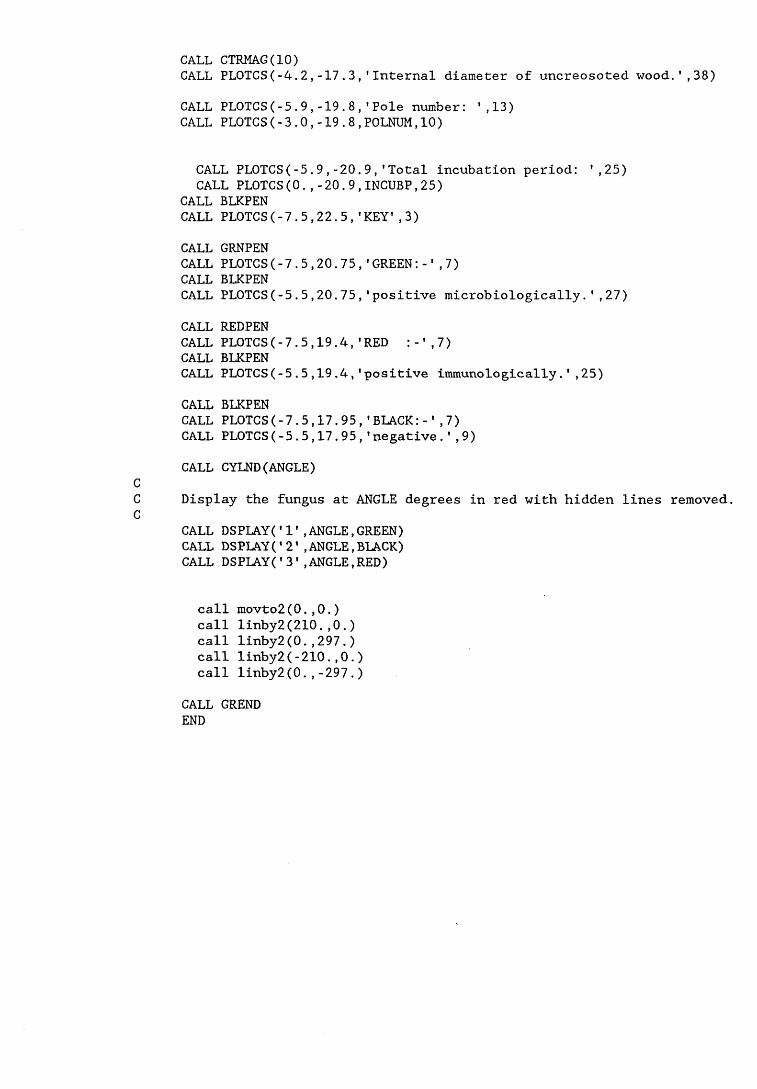
CALL CTRMAG(IO)CALL PLOTCS(-4.2,-17.3,'Internal diameter of uncreosoted wood.’,38)CALL PLOTCS(-5.9,-19.8,'Pole number: *,13)CALL PLOTCS(- 3.0,-19.8,POLNUM,10)
CALL PLOTCS(-5.9,-20.9,'Total incubation period: ',25) CALL PLOTCS(0.,-20.9,INCUBP,25)
CALL BLKPENCALL PLOTCS(-7.5,22.5,'KEY',3)CALL GRNPENCALL PLOTCS(-7.5,20.75,'GREEN:,7)CALL BLKPENCALL PLOTCS(-5.5,20.75, 1 positive microbiologically.* ,27) CALL REDPENCALL PLOTCS(-7.5,19.4, 'RED :-',7)CALL BLKPENCALL PLOTCS(-5.5,19.4positive immunologically.',25) CALL BLKPENCALL PLOTCS(-7.5,17.95,'BLACK:-',7)CALL PLOTCS(-5.5,17.95,'negative.',9)CALL CYLND(ANGLE)Display the fungus at ANGLE degrees in red with hidden lines removed.CALL DSPLAY('1',ANGLE,GREEN)CALL DSPLAY('2’,ANGLE,BLACK)CALL DSPLAY('3',ANGLE,RED)
call movto2 (0 .,0 .) call linby2 (2 1 0 .,0 .) call linby2(0.,297.) call linby2 (-2 1 0 .,0 .) call linby2(0.,-297.)
CALL GREND END
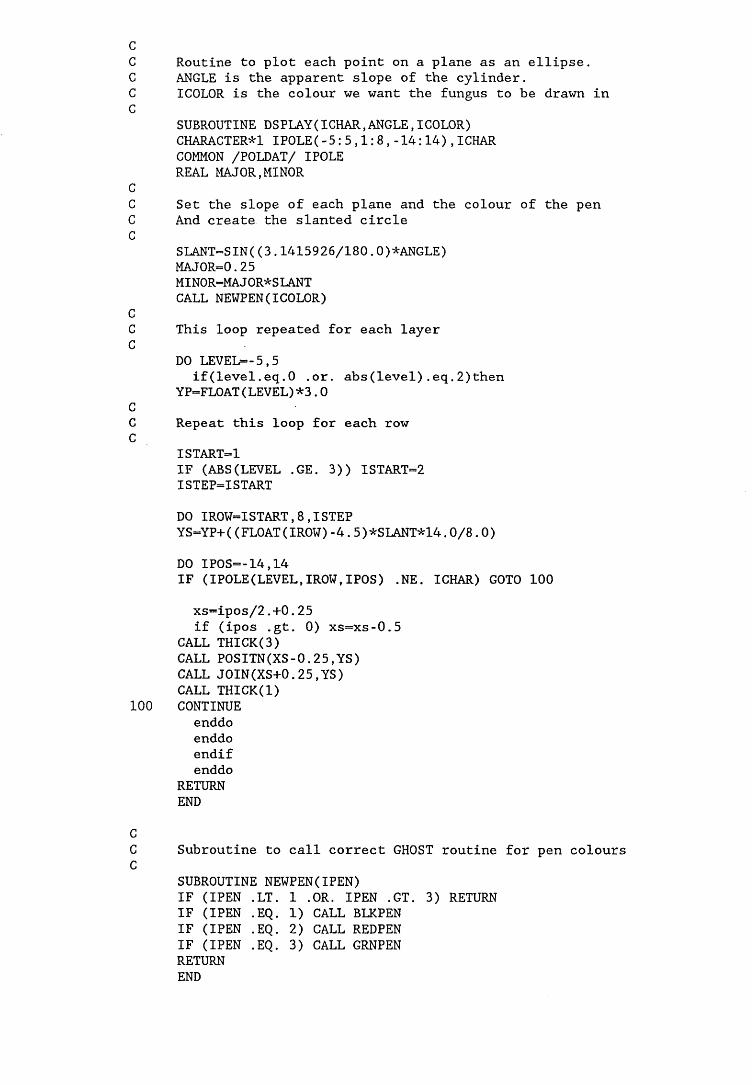
no
n
i-*
o
o
o
CC Routine to plot each point on a plane as an ellipse.C ANGLE is the apparent slope of the cylinder.C ICOLOR is the colour we want the fungus to be drawn inC
SUBROUTINE DSPLAY(ICHAR,ANGLE,ICOLOR)CHARACTER*1 IPOLE(-5:5,1:8,-14:14),ICHAR COMMON /POLDAT/ IPOLE REAL MAJOR,MINOR
CC Set the slope of each plane and the colour of the pen C And create the slanted circle C
SLANT=SIN((3.1415926/180.0)*ANGLE)MAJOR=0.25 MIN0R=MAJ OR*SLANT CALL NEWPEN(ICOLOR)
CC This loop repeated for each layer C
DO LEVE3>=-5,5if(level.eq. 0 .or. abs(level).eq.2 )then
YP=FL0AT(LEVEL)*3.0Repeat this loop for each rowISTART=1IF (ABS(LEVEL .GE. 3)) ISTART-2 ISTEP=ISTARTDO IR0W=ISTART,8 ,ISTEPYS=YP+((FLOAT(IROW)-4.5)*SLANT*14.0/8.0)DO IP0S=-14,14IF (IPOLE(LEVEL,IROW,IPOS) .NE. ICHAR) GOTO 100xs=ipos/2.+0.25 if (ipos .gt. 0 ) xs=xs-0.5
CALL THICK(3)CALL POSITN(XS-0.25,YS)CALL J0IN(XS+0.25,YS)CALL THICK(l)CONTINUE
enddoenddoendifenddo
RETURNEND
Subroutine to call correct GHOST routine for pen coloursSUBROUTINE NEWPEN(IPEN)IF (IPEN .LT. 1 .OR. IPEN .GT. 3) RETURNIF (IPEN .EQ. 1) CALL BLKPENIF (IPEN .EQ. 2) CALL REDPENIF (IPEN .EQ. 3) CALL GRNPENRETURNEND
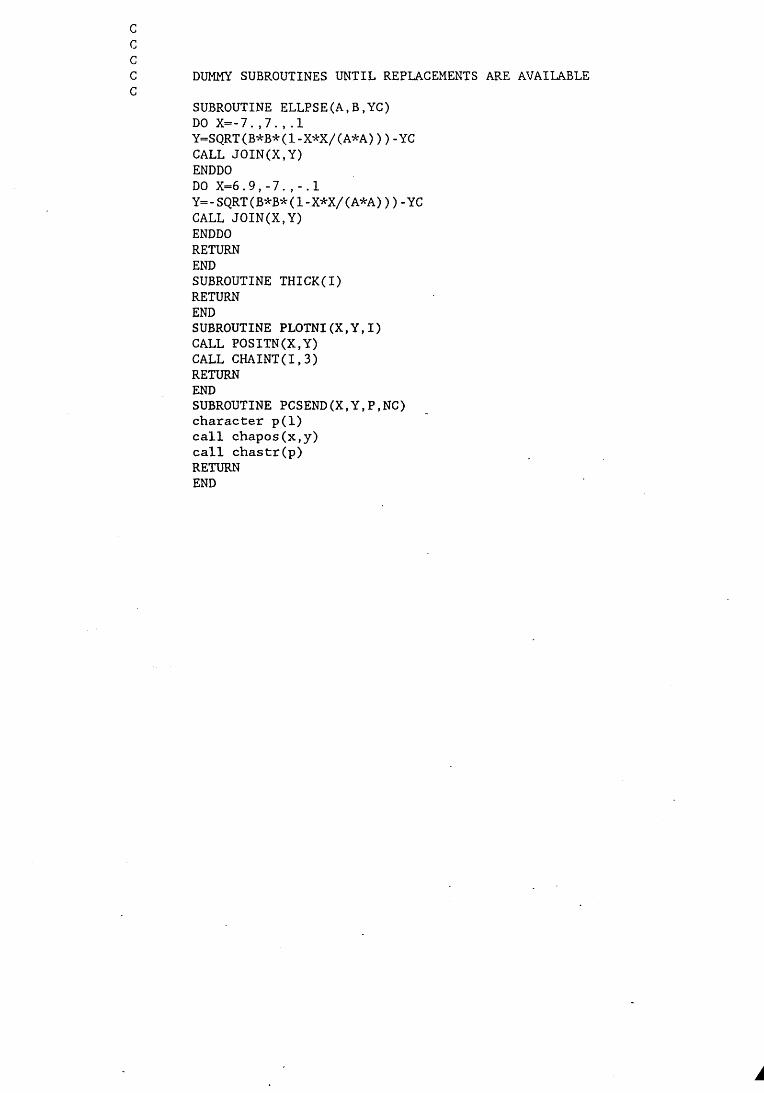
cccC DUMMY SUBROUTINES UNTIL REPLACEMENTS ARE AVAILABLEC
SUBROUTINE ELLPSE(A,B,YC)DO X— 7. ,7. , .1Y=SQRT(B*B*(1-X*X/(A*A)))-YC CALL JOIN(X.Y)ENDDODO X=6 .9,-7.,-. 1Y=-SQRT(B*B*(1-X*X/(A*A))) - YCCALL JOIN(X,Y)ENDDORETURNENDSUBROUTINE THICK(I)RETURNENDSUBROUTINE PLOTNI(X,Y ,I)CALL POSITN(X,Y)CALL CHAINT(I,3)RETURNENDSUBROUTINE PCSEND(X,Y,P,NC) character p(l) call chapos(x,y) call chastr(p)RETURNEND

Appendix C. Computer maps showing the distribution of immunologically positive and microbiologically positive samples within field trial distribution pole stubs (1-9).
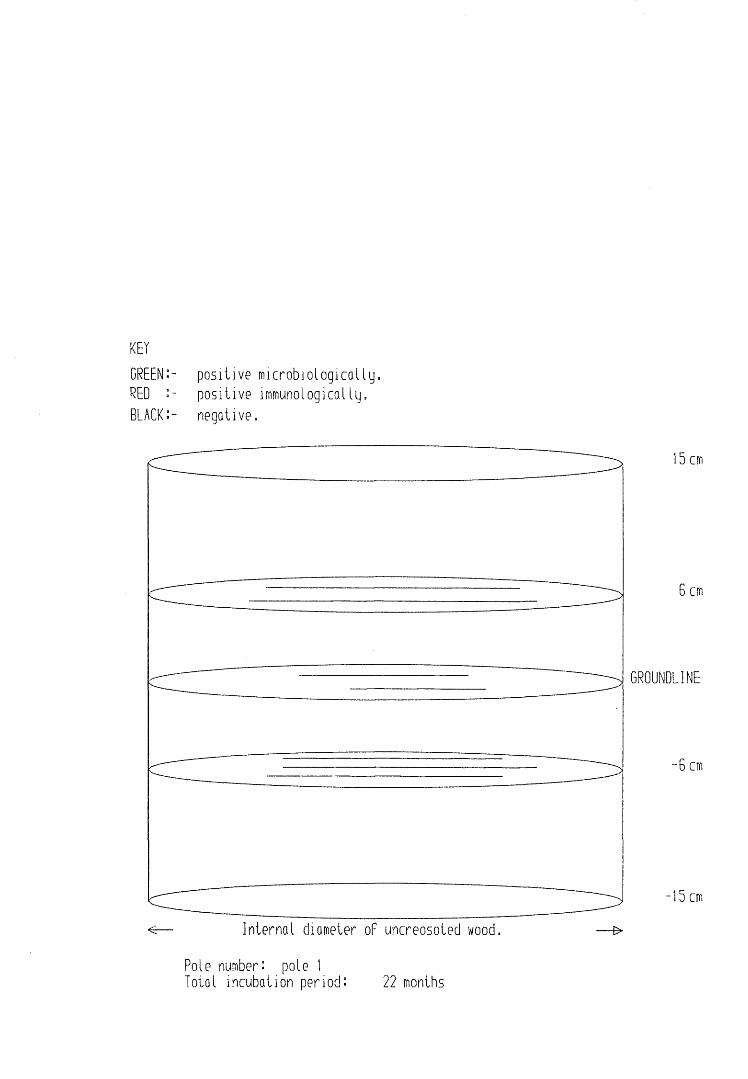
KEYGREEN:- positive microbiologically.RED positive immunologically.BLACK:- negative.
15 cm
6 cm
GROUNDLINE
-6 cm
-15 cm
Pole number: pole 1Total incubation period: 22 months
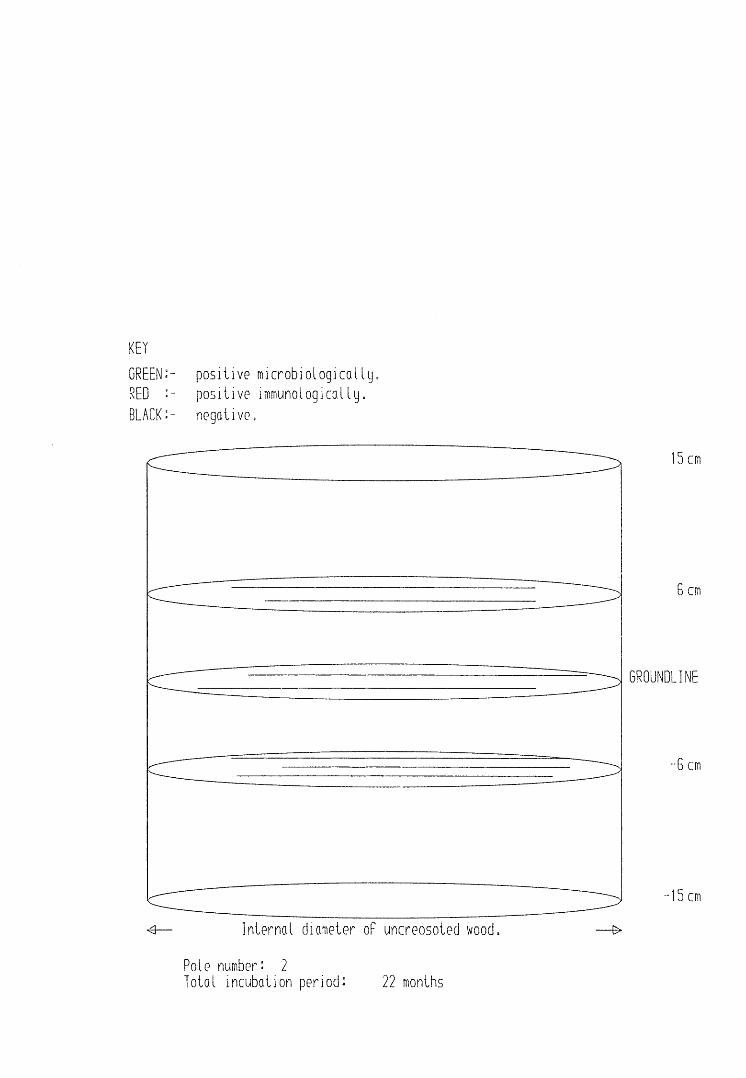
KEYGREEN:- positive microbiologically.RED positive immunologically.BLACK:- negative.
Pole number: 2Total incubation period: 22 months
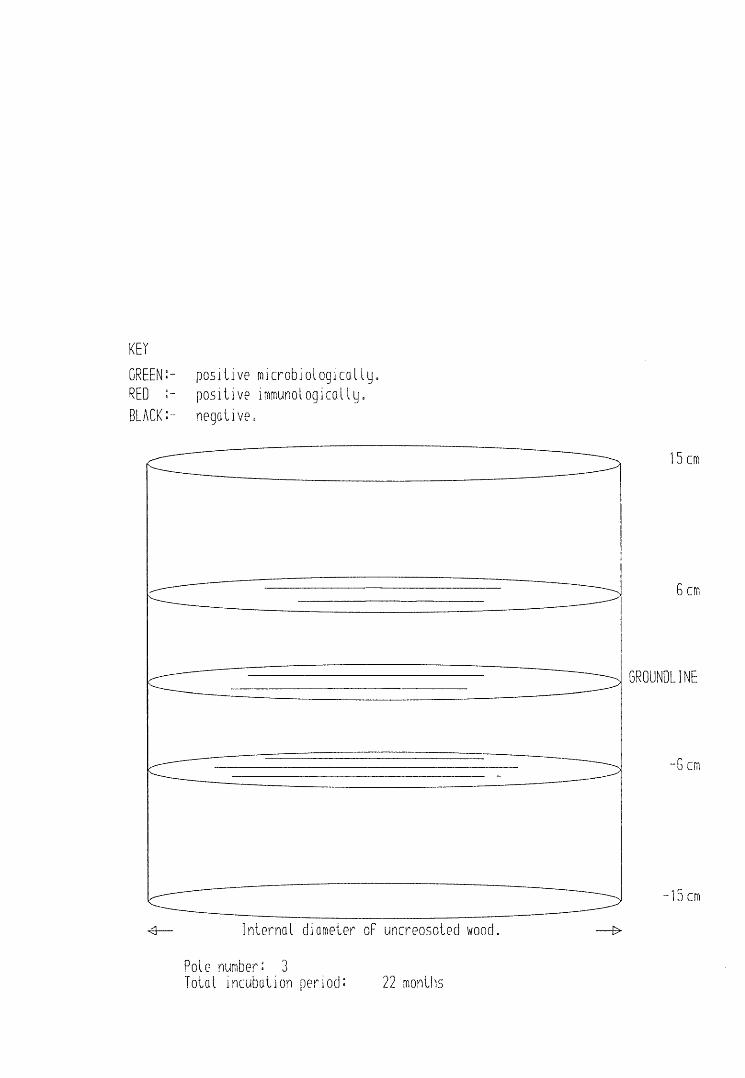
KEYGREEN:- positive microbiologically.RED :- positive immunologically.BLACK:- negative.
15 cm
G cm
GROUNDLINE
-6 cm
-15 cm
Pole number: 3Total incubation period: 22 months
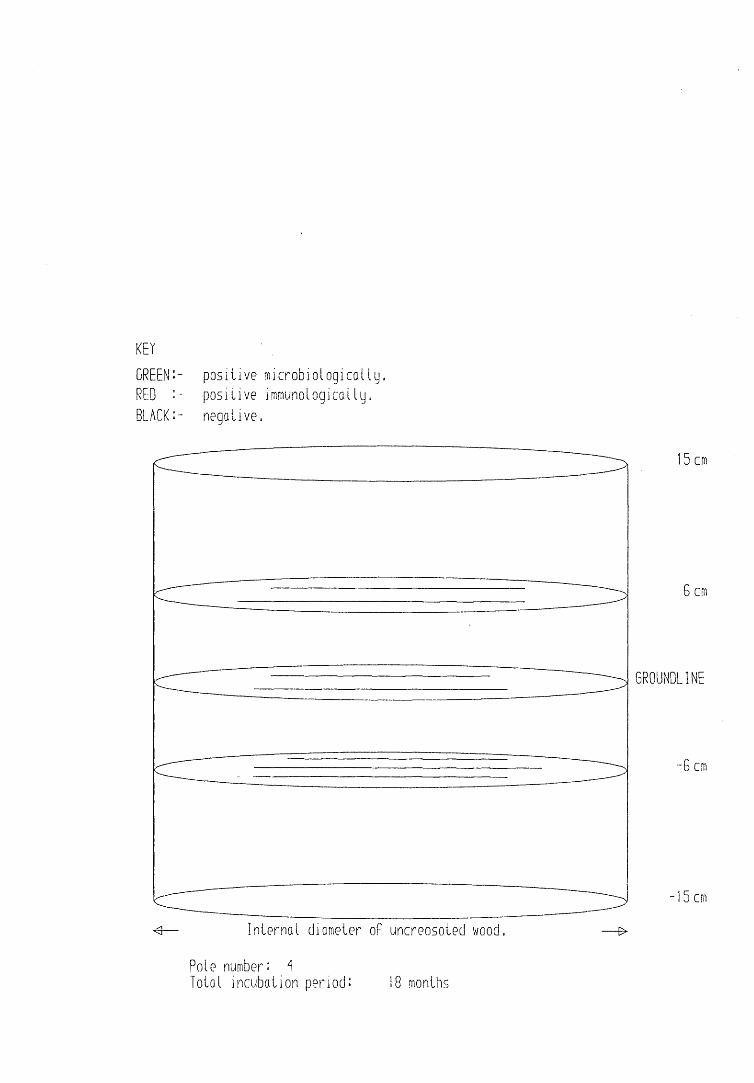
KEYGREEN:- positive microbiologically.RED :- positive immunologically.BLACK:- negative.
15 cm
6 cm
GROUNDLINE
-8 cm
-15 cm
Pole number: 1Total incubation period: 18 months
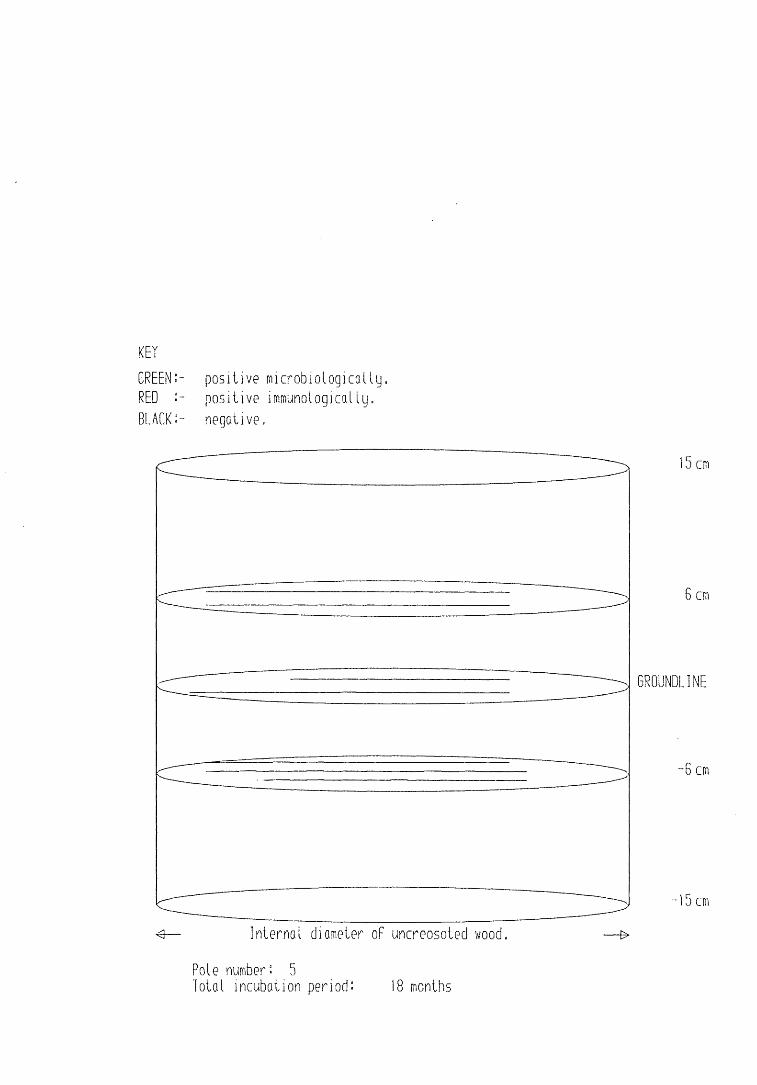
KEYGREEN;- positive microbiologically.RED positive immunologically.BLACK;- negative.
15 cm
6 cm
GROUNDLINE
-6 cm
-15 cm
Pole number; 5Total incubation period; 18 months
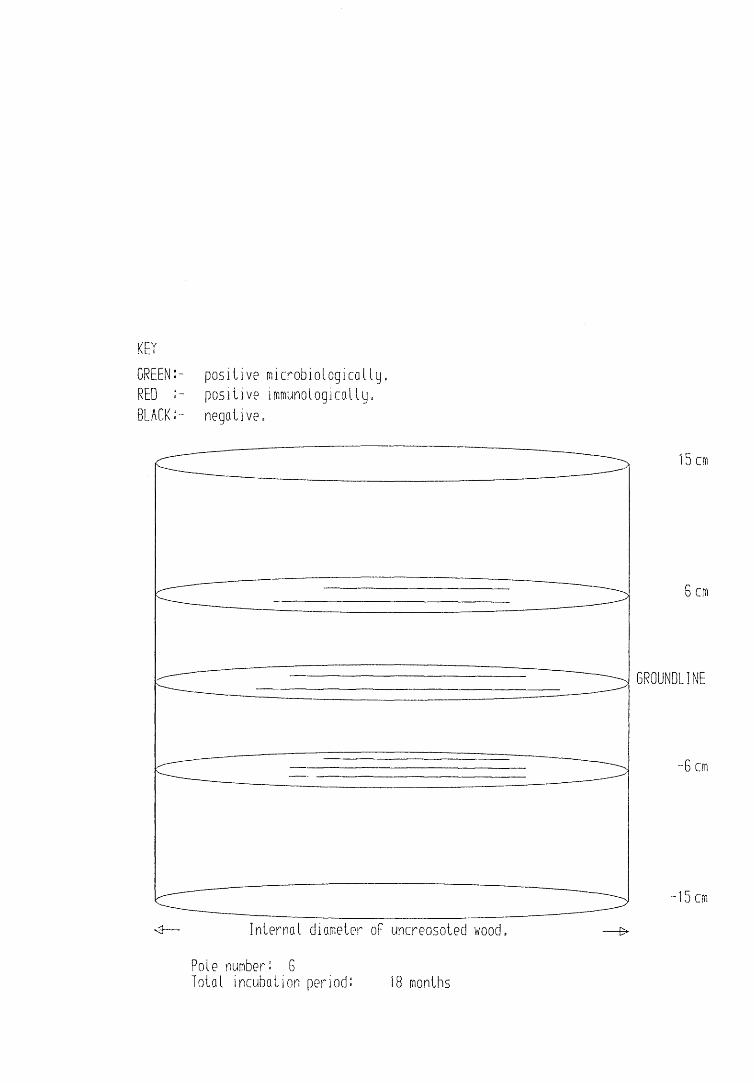
KEYG R E E N S positive microbiologically.RED s - positive 1mmunologically.BLACKS- negative.
15 cm
6 cm
GROUNDLINE
-6 cm
-15 cm
Pole numbers GTotal incubation periods 18 months

KEYGREEN;- positive microbiologicalty„RED :- positive immunologically.BLACK;- negative.
15 cm
6 cm
-6 cm
15 cm
Pole number; 7Total incubation period; G months
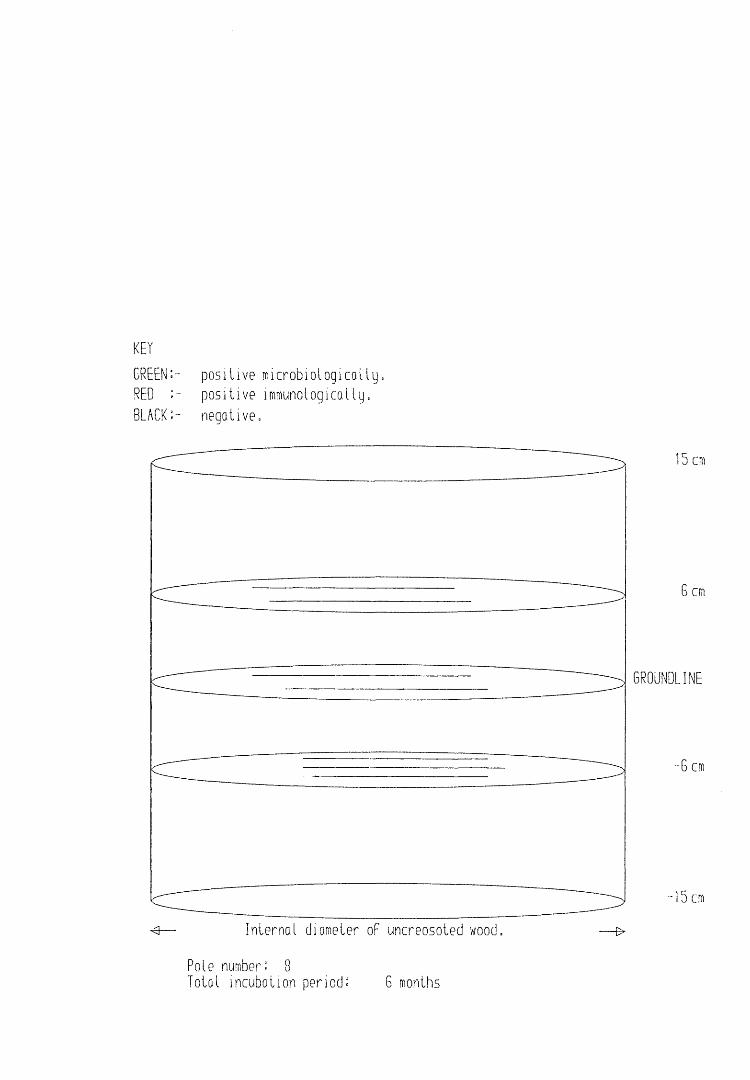
KEYGREEN'-- positive microbiologicatly.RED positive immunologicaliy.BLACK:- negative.
15 cm
8 cm
GROUNDLINE
-6 cm
-15 cm
Pole number: 8Total incubation period: G months
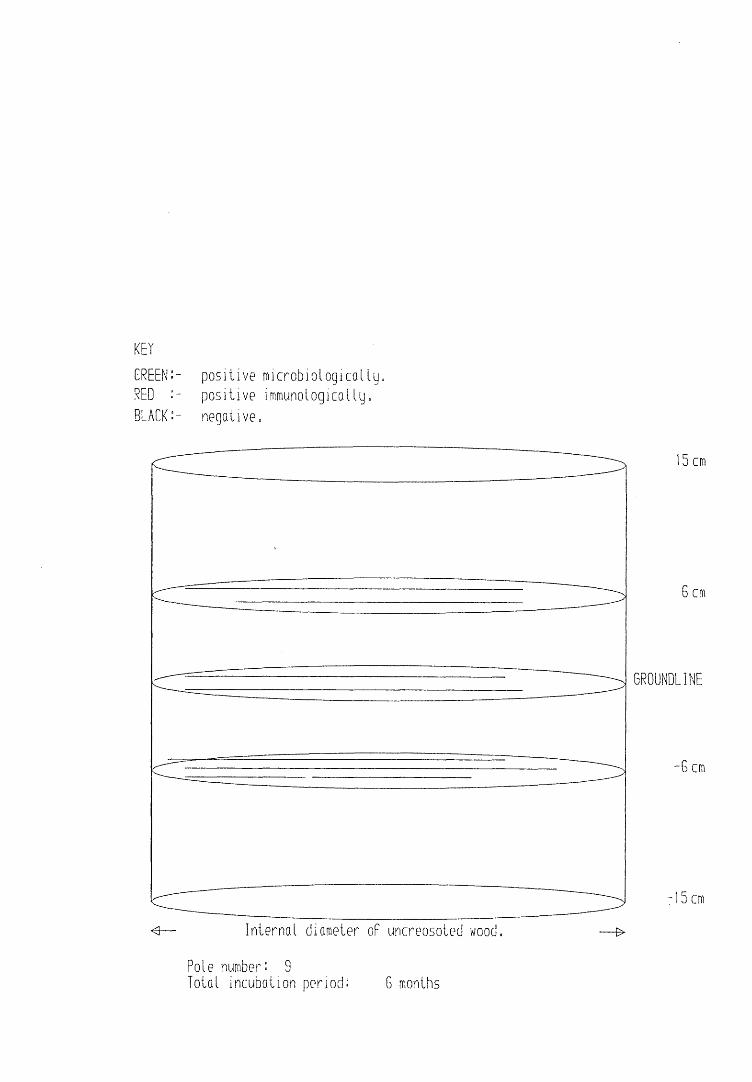
KEYGREEN:- positive microbiologically.RED :- positive immunologically.BLACK:- negative.
15 cm
6 cm
GROUNDLINE
-6 cm
-15 cm
Pole number: 9Total incubation period: 6 months
PUBLICATIONS.
Publications.1. GLANCY.H., PALFREYMAN, J . W ., BUTTON,D., BRUCE,A. and VIGROW,A.
(1988) .An immunological analysis of Lentinus lepideus.Presented at the British Society for Immunology Summer meeting,July 20th-22nd, 1988. University of Strathclyde, (abstract).
2. GLANCY,H., BRUCE,A., BUTTON,D., PALFREYMAN,J .W . and KING,B.(1989) .Application of immunological methods to the analysis anddetection of Lentinus lepideus. Fr.Internat. Res. Group Wood Pres., Doc. No. IRG/WP/1422.
3. GLANCY,H., PALFREYMAN,J .W ., BUTTON,D., BRUCE,A. and KING,B.(1990) .Use of an immunological method for the detection of Lentinuslepideus in distribution poles.J. Inst. Wood Sci. 12.(1) :59-64.
4. PALFREYMAN,J.W., BRUCE,A., BUTTON,D., GLANCY,H., VIGR0W,A.and KING,B. (1987).Immunological methods for the detection and characterisation ofwood decay basidiomycetes.In Biodeterioration 7. (eds. D.R. Houghton, R.N. Smith andH.O.W. Eggins). pp709-713. Elsevier, London.
5. PALFREYMAN,J.W., VIGR0W,A., BUTTON,D. and GLANCY,H. (1988).Simple method for scanning immunoblots.J. Immunol. Meths. 109 :199-201.
6 . PALFREYMAN,J.W., GLANCY,H., BUTTON,D., BRUCE,A., VIGROW.A., SCORE,A. and KING,B. (1988).Use of immunoblotting for the analysis of wood decay basidiomycetes.Internat. Res. Group Wood Pres., Doc. No. IRG/WP/2307.
7. PALFREYMAN,J.W., BUTTON,D., GLANCY,H., KING,B., NICOLL,G., SMITH,G.M. and VIGROW,A. (1989).The detection and destruction of basidiomycetes in the timberof artefacts of historical or archaeological interest.In Proc. of the European Symposium on "Science, Technology andEuropean Cultural Heritage", (in press).
The full text of the following two published papers has been removed from the e-thesis due to copyright restrictions:
Glancy,H., Palfreyman,J .W ., Button,D., Bruce,A. and King,B. (1990) . Use of an immunological method for the detection of Lentinus lepideus in distribution poles. J. Inst. Wood Sci. 12.(1) :59-64.
Palfreyman,J.W., Vigrow,A., Button,D. and Glancy,H. (1988). Simple method for scanning immunoblots. J. Immunol. Meths. 109 :199-201.

AN IMMUNOLOGICAL ANALYSIS OF LENTINUS LEPIDEUS.
H. Glancy, J.W. Palfreyman, D. Button, A. Bruce and E.A. Vigrow. Wood Research Group, Dept. Molecular and Life Sciences, Dundee Institute of Technology, Bell Street, Dundee. DD1 1HG.
Presented at the British Society for Immunology Summer Meeting, July 20th-22nd, 1988. University of Srathclyde.
Abstract.
The basidiomycete fungus Lentinus lepideus causes the destruction of creosote-treated distribution poles. To study the decay process initiated by this organism and to aid in the identification of decay fungi in wood, antisera have been raised in rabbits to both agar and wood grown cultures of L. lepideus. Cross-reactivity of the antisera is essentially confined to other basidiomycete fungi, particularly brown rots. Deuteromycete fungi show very little cross-reactivity.
The antigenic nature of L. lepideus in both ager and wood culture has been investigated in a variety of immunological systems including immunodiffusion, ELISA, RIA, dot-blotting and western blotting. The sensitivity and specificity of these different assay procedures will be compared and an analysis, by western blotting, of the chemical nature of the fungal antigensdiscussed.
Document No: IRG/WP/1^22
THE INTERNATIONAL RESEARCH GROUP ON WOOD PRESERVATION
Working Group la Biological Problems (Flora)
Application of immunological methods to the analysis and detection of Lentinus lepideus. Fr.
by
Heather Glancy, Alan Bruce, David Button, John W Palfreymanand Bernard King
Department of Molecular Life Sciences Dundee Institute of Technology Bell Street, Dundee, Scotland
United Kingdom
Paper prepared for the 20th Annual Meeting Congress Centre, Lappeenranta, Finland
22 - 26 May 1989
IRG Secretariat Box 5 6 0 7S - 114 86 Stockholm Sweden
22 May 1989
1
Application of immunological methods to the analysis and detection ofLentinus lepideus Fr.Heather Glancy, Alan Bruce, David Button, John. W. Palfreyman and Bernard King.SUMMARY.Polyclonal antisera have been raised against the brown rot fungus Lentinus lepideus, a major cause of rot induced pole failure in the UK. Specificity studies have indicated that the antisera cross-react with a number of basidiomycetes but to much lesser extent with other fungi.The antigenicity of L. lepideus and hence its molecular composition shows some alteration with culture age and change of substrate. Wood block decay experiments have indicated that dot-immunobinding assays based on the antisera can detect the presence of L. lepideus in conditions of minimal weight loss, an initial field trial has indicated that cross-reacting antigens can be detected in artificially inoculated distribution pole stubs. These and other aspects of the antigenicity and immunodetection of L. lepideus are discussed in this paper.Keywords : Lentinus lepideus, immunodiffusion, immunoassay, western
blotting, wood blocks, field trial.INTRODUCTION.The principal fungal organism causing the decay of creosote treated timber, in particular distribution poles, is the brown rot basidiomycete Lentinus lepideus (Cartwright and Findlay, 1958). In the early stages of colonisation and decay there are few visible signs , but in the advanced stage the wood darkens and breaks up by cracking along and across the grain. However, the presence of the decay-resistant creosote band can cause even those poles with advanced internal decay to appear superficially sound.Detection of incipient decay (the early stages of colonisation/decay prior to any loss in strength of and/or structural degradation within the wood) in poles is required for both safety and financial reasons. Kennedy (1958) has shown that losses of up to 50% can occur in the tensile strength of wood even at these very early stages of decay.Poles affected in this way may represent a serious public safety hazard. In addition, pole replacement programmes are expensive and prolonging the in-service life of poles is therefore highly desirable. There are a variety of commercially available remedial preservative treatments which can be applied to decaying poles. A combination of a reliable system for detecting incipient decay and an effective remedial preservative treatment would permit the extension of the service lives of poles with potential safety and financial advantages.Although a variety of detection systems exist, and are variously employed, they all have drawbacks which render them unsuitable for the routine detection of incipient fungal decay. Biologically-based detection methods are potentially the most effective systems since they involve the direct measurement of fungal activity and/or presence. Such systems have the potential to detect the fungus at the early stages of colonisation before the fungus begins to degrade the wood substrate.
2
One such system is the immunoassay which uses the specific interaction of antigen with antibody to provide information about the concentration of antigen (or antibody) in samples (Edwards, 1985). Immunoassays are highly adaptable and easily modified to suit a specific purpose.Although not widely used at present in general biodeterioration studies the use of immunological techniques to study wood decay fungi is a rapidly growing area of research. Several fungi, including representatives of the Basidiomycotina, which can colonise and/or decay wood have been studied immunologically. Immunodiffusion and immunoelectrophoresis techniques have been used to study the taxonomic relationships between Fusarium species (Hornock, 1980), Fomes species (syn. Heterobasidion) (Madhosingh and Ginns, 1974) and Gloeophyllum species (Madhosingh and Ginns, 1975). In addition, Goodell and Jellison(1986) have developed an ELISA system to detect Poria placenta within wood, whilst Palfreyman et al (1987, 1988a) have studied the wood decay fungi Coriolus versicolor and Serpula lacrymans using immunodot-blot and immunocytocheraical techniques. Further studies employing direct immunological staining of fungi within wood sections have also been reported (Benhamou et al, 1986, Goodell et al, 1988).A variety of immunological techniques have been used to study the serological relationship of L. lepideus to other fungi, to develop a diagnostic test for the organism, and in preliminary studies of the antigenic nature of the fungus. The results of this work are presented in this paper.MATERIALS AND METHODS.Fungal cultures.Fungi were isolated from in-service creosote treated distribution poles or obtained from the culture collection at the Building Research Establishment, Garston, U.K. The fungi studied can be divided into four representative groups, (a) L. lepideus FPRL 7F, isolates from poles infected with L. lepideus FPRL 7F and other L. lepideus strains, (b) other Lentinus species, (c) other basidiomycete fungi, and (d) deuteromycete fungi. Stock cultures were maintained on 3% (w/v) malt extract agar (Oxoid, No CM59) slopes in the dark at +4°C. Fungal mycelia for antigen/immunogen preparation were grown in static liquid cultures in petri-dishes (3% malt extract, Oxoid No CM57, with added benomyl (4ppm) in basidiomycete cultures). Fungal isolates were grown until the colony diameter was equivalent to an eight day old culture of L. lepideus FPRL 7F. Fungal mats were harvested by filtration through Whatman No 1 filter paper, washed with distilled water until the filtrate ran clear and freeze-dried.Preparation of Antigens.
Each individual antigen suspension was prepared by grinding lyophilised mycelium in a mortar and pestle and mixing it with phosphate-buffered saline (PBS, 0.01M, pH 7.4) to form a slurry.
3
Production of Antisera.Antisera were raised in New Zealand White rabbits against a whole cell antigen preparation of L. lepideus FPRL 7F. For immunisation, mycelial preparations were used at a concentration of 5mg per ml of PBS. One and a half mis of mycelial slurry were mixed with an equal volume of Freund's complete adjuvant (Gibco Laboratories) to give an emulsion which was then inoculated subcutaneously at six dorsal sites. Booster injections of the same antigen preparation mixed with Freund's incomplete adjuvant were given two weeks later. Rabbits were bled from the marginal ear vein ten days after the booster injection. Subsequently, rabbits were repeatedly given booster injections followed by three bleeds at fortnightly intervals. Blood was allowed to clot overnight, the serum was separated from the blood cells by centrifugation and stored in either 1ml or lOOul aliquots at -20°C. A stock of pre-immune control serum was obtained by bleeding rabbits prior to inoculation with fungal antigens.Immunodiffusion.Immunodiffusion was carried out in tissue culture petri-dishes filled to a depth of 5mra with molten agarose (1% w/v agarose, Biorad electrophoresis grade) containing PEG 8000 (Sigma) and sodium azide (final concentration 2% and 0.02% respectively). After setting, five wells were cut from the gel with a 2.0mm diameter corer. The resulting wells (one central and four peripheral) were filled with antigen suspension (outer wells) or antiserum (central well) and incubated in a humid chamber at +4 C for 48 hours. Whole cell antigen suspensions were prepared at a concentration of 50mg mycelium per ml of PBS. L. lepideus FPRL 7F suspension was used to fill two opposite outer wells whilst two test fungal antigen preparations were placed in the remaining outer wells for comparison (Figure 1). The antiserum was used undiluted. After immunodiffusion the gels were deproteinised by repeated press-drying with Whatman No 1 filter paper and washing in0.1M NaCl. The gels were then stained using the horse-radish peroxidase (HRP) amplification method (Kjaervig Broe and Ingild, 1983). Briefly this involves blocking the gels with 5% normal donkey serum in PBS to prevent non-specific binding then reacting the gels with HRP-labelled anti-rabbit IgG which binds to the antigen-antibody complexes. These complexes are visualised by addition of H202 and3-amino-9-ethylcarbazole. The precipitation arcs appear red against a pale pink background.Dot-immunobinding assays.Whole cell antigen suspensions in PBS (25mg per ml) were prepared as described in 'antigen preparation'. Uninfected control and L. lepideus infected lime (Tilia vulgaris.Hayne) wood blocks were prepared as described in 'wood blocks' and used in the dot-immunobinding assay at a concentration of 50mg per ml PBS. After centrifugation 2ul aliquots of supernatants were 'dotted' on to nitrocellulose membranes (NC, Biorad Trans-Blot Transfer Medium). Free binding sites were blocked with PBS /0.5% Tween 20 / 5% newborn calf serum (NCS,Gibco Laboratories) for 1 hour. Subsequently the NC membranes were incubated with test antiserum diluted 1:500 in PBS / 0.05% Tween 20 / 5% NCS (PBS-T-NCS) for 1 hour.
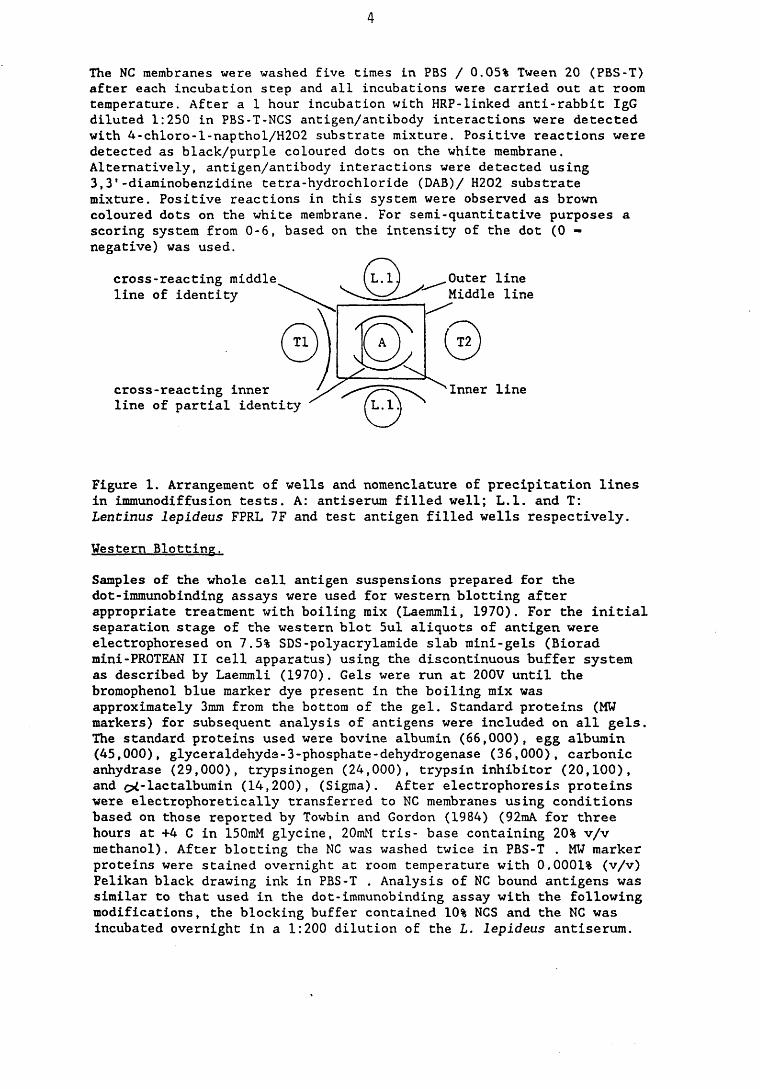
4
The NC membranes were washed five times in PBS / 0.05% Tween 20 (PBS-T) after each incubation step and all incubations were carried out at room temperature. After a 1 hour incubation with HRP-linked anti-rabbit IgG diluted 1:250 in PBS-T-NCS antigen/antibody interactions were detected with 4-chloro-l-napthol/H202 substrate mixture. Positive reactions were detected as black/purple coloured dots on the white membrane. Alternatively, antigen/antibody interactions were detected using 3,3'-diaminobenzidine tetra-hydrochloride (DAB)/ H202 substrate mixture. Positive reactions in this system were observed as brown coloured dots on the white membrane. For semi-quantitative purposes a scoring system from 0-6, based on the intensity of the dot (0 - negative) was used.
Figure 1. Arrangement of wells and nomenclature of precipitation lines in immunodiffusion tests. A: antiserum filled well; L.l. and T:Lentinus lepideus FPRL 7F and test antigen filled wells respectively.Western Blotting.Samples of the whole cell antigen suspensions prepared for the dot-immunobinding assays were used for western blotting after appropriate treatment with boiling mix (Laemmli, 1970). For the initial separation stage of the western blot 5ul aliquots of antigen were electrophoresed on 7.5% SDS-polyacrylamide slab mini-gels (Biorad mini-PROTEAN II cell apparatus) using the discontinuous buffer system as described by Laemmli (1970). Gels were run at 200V until the bromophenol blue marker dye present in the boiling mix was approximately 3mm from the bottom of the gel. Standard proteins (MW markers) for subsequent analysis of antigens were included on all gels. The standard proteins used were bovine albumin (66,000), egg albumin (45,000), glyceraldehyda-3-phosphate-dehydrogenase (36,000), carbonic anhydrase (29,000), trypsinogen (24,000), trypsin inhibitor (20,100), and /pi-lactalbumin (14,200), (Sigma). After electrophoresis proteins were electrophoretically transferred to NC membranes using conditions based on those reported by Towbin and Gordon (1984) (92mA for three hours at +4 C in 150mM glycine, 20mM tris- base containing 20% v/v methanol). After blotting the NC was washed twice in PBS-T . MW marker proteins were stained overnight at room temperature with 0.0001% (v/v) Pelikan black drawing ink in PBS-T . Analysis of NC bound antigens was similar to that used in the dot-immunobinding assay with the following modifications, the blocking buffer contained 10% NCS and the NC was incubated overnight in a 1:200 dilution of the L. lepideus antiserum.
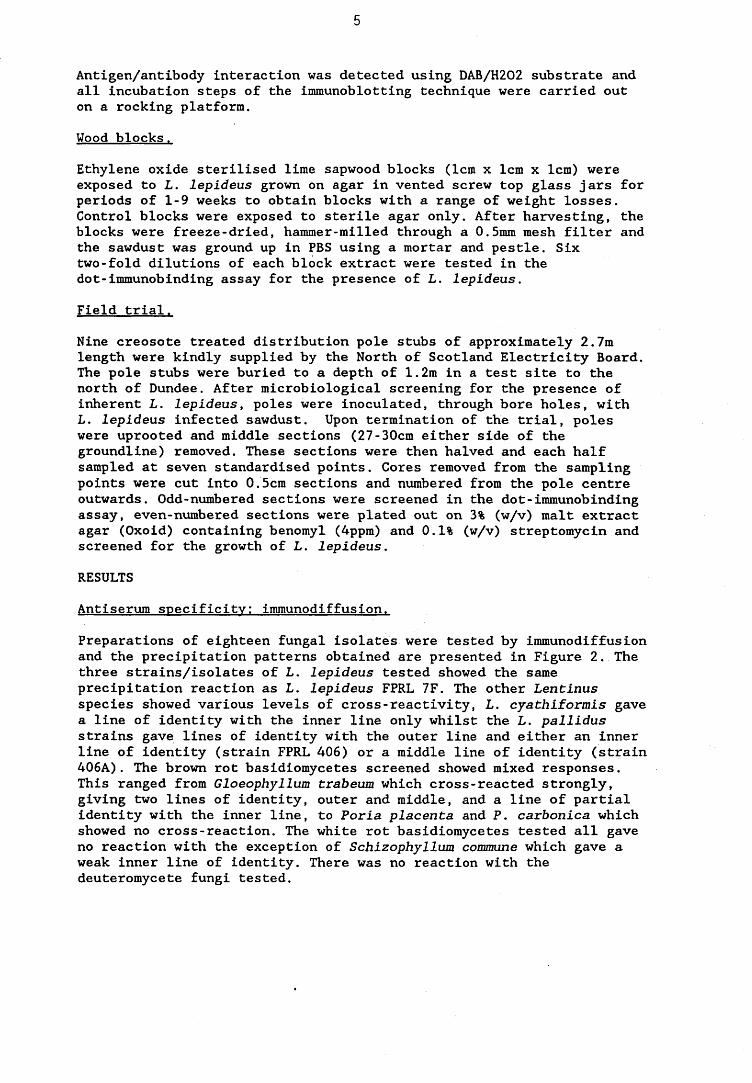
5
Wood blocks.Ethylene oxide sterilised lime sapwood blocks (1cm x 1cm x 1cm) were exposed to L. lepideus grown on agar in vented screw top glass jars for periods of 1-9 weeks to obtain blocks with a range of weight losses. Control blocks were exposed to sterile agar only. After harvesting, the blocks were freeze-dried, hammer-milled through a 0.5mm mesh filter and the sawdust was ground up in PBS using a mortar and pestle. Six two-fold dilutions of each block extract were tested in the dot-immunobinding assay for the presence of L. lepideus.Field trial.Nine creosote treated distribution pole stubs of approximately 2.7m length were kindly supplied by the North of Scotland Electricity Board. The pole stubs were buried to a depth of 1.2m in a test site to the north of Dundee. After microbiological screening for the presence of inherent L. lepideus, poles were inoculated, through bore holes, with L. lepideus infected sawdust. Upon termination of the trial, poles were uprooted and middle sections (27-30cm either side of the groundline) removed. These sections were then halved and each half sampled at seven standardised points. Cores removed from the sampling points were cut into 0.5cm sections and numbered from the pole centre outwards. Odd-numbered sections were screened in the dot-immunobinding assay, even-numbered sections were plated out on 3% (w/v) malt extract agar (Oxoid) containing benomyl (4ppm) and 0.1% (w/v) streptomycin and screened for the growth of L. lepideus.RESULTSAntiserum specificity: immunodiffusion.Preparations of eighteen fungal isolates were tested by immunodiffusion and the precipitation patterns obtained are presented in Figure 2. The three strains/isolates of L. lepideus tested showed the same precipitation reaction as L. lepideus FPRL 7F. The other Lentinus species showed various levels of cross-reactivity, L. cyathiformis gave a line of identity with the inner line only whilst the L. pallidus strains gave lines of identity with the outer line and either an inner line of identity (strain FPRL 406) or a middle line of identity (strain 406A). The brown rot basidiomycetes screened showed mixed responses. This ranged from Gloeophyllum trabeum which cross-reacted strongly, giving two lines of identity, outer and middle, and a line of partial identity with the inner line, to Poria placenta and P. carbonica which showed no cross-reaction. The white rot basidiomycetes tested all gave no reaction with the exception of Schizophyllum commune which gave a weak inner line of identity. There was no reaction with the deuteromycete fungi tested.
Antigen/antibody interaction was detected using DAB/H202 substrate andall incubation steps of the immunoblotting technique were carried outon a rocking platform.
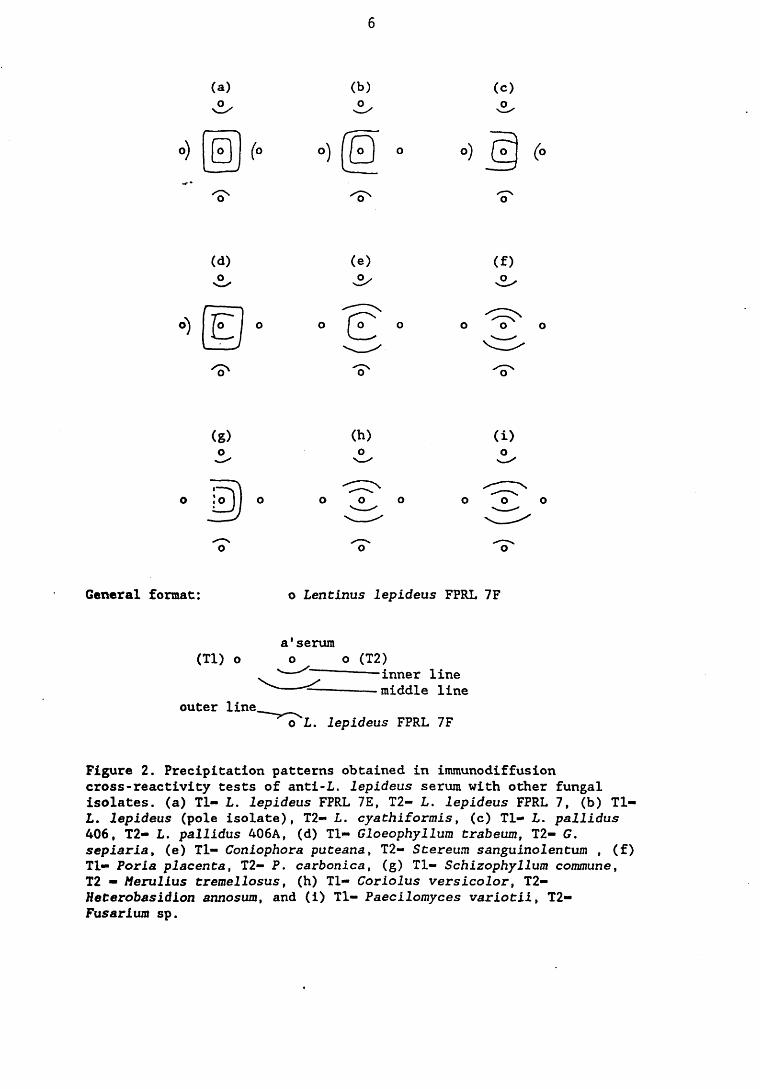
6
(a) (b) (c)
°) (° (°
(d) (f)
°) o o o o
o
(S) (i)
o
o o
o
o
General format: o Lentinus lepideus FPRL 7F
a*serum o o (T2)
inner line middle line
o L. lepideus FPRL 7F
Figure 2. Precipitation patterns obtained in immunodiffusion cross-reactivity tests of anti-L. lepideus serum with other fungal isolates, (a) Tl- L. lepideus FPRL 7E, T2- L. lepideus FPRL 7, (b) Tl- L. lepideus (pole isolate), T2- L. cyathiformis, (c) Tl- L. pallidus 406, T2- L. pallidus 406A, (d) Tl- Gloeophyllum trabeum, T2- G. sepiaria, (e) Tl- Coniophora puteana, T2- Stereum sanguinolentum , (f) Tl— Poria placenta, T2- P. carbonica, (g) Tl- Schizophyllum commune,T2 - Merulius tremellosus, (h) Tl- Coriolus versicolor, T2- Heterobasidion annosum, and (i) Tl- Paecilomyces variotii, T2- Fusariua sp.
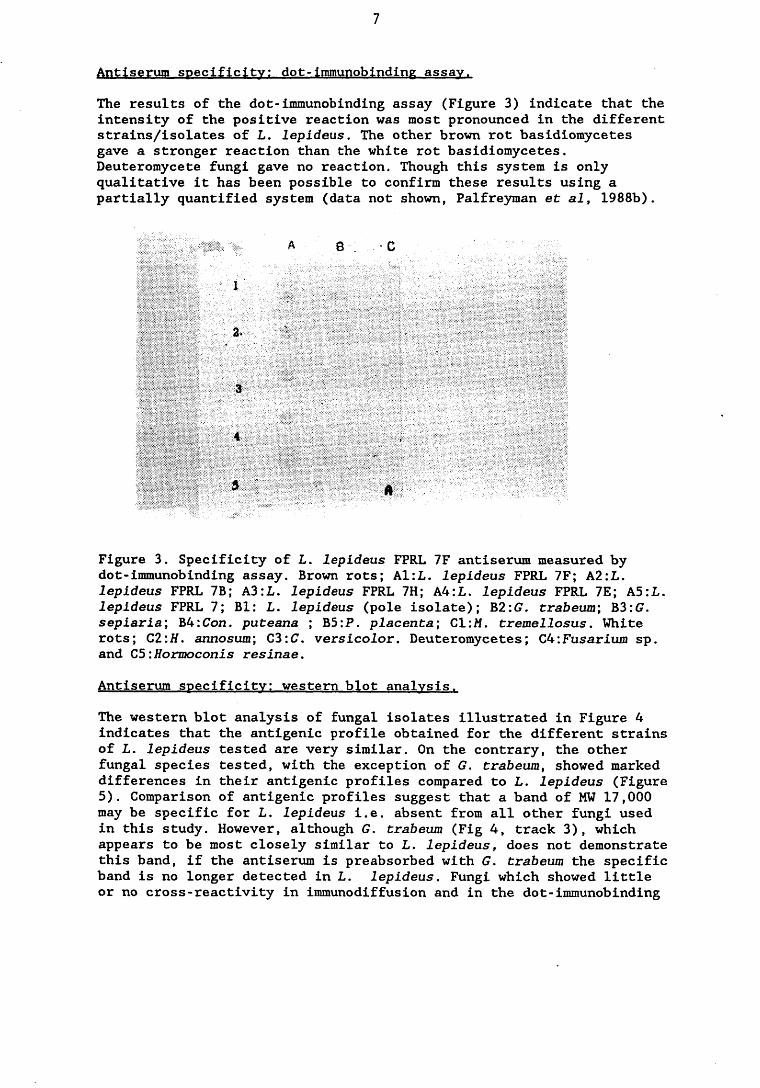
7
Antiserum specificity: dot-immunobinding assay.The results of the dot-immunobinding assay (Figure 3) indicate that the intensity of the positive reaction was most pronounced in the different strains/isolates of L. lepideus. The other brown rot basidiomycetes gave a stronger reaction than the white rot basidiomycetes. Deuteromycete fungi gave no reaction. Though this system is only qualitative it has been possible to confirm these results using a partially quantified system (data not shown, Palfreyman et al, 1988b).
A 8 • C
lS i! ll! |I S i
Figure 3. Specificity of L. lepideus FPRL 7F antiserum measured by dot-immunobinding assay. Brown rots; A1:L. lepideus FPRL 7F; A2:L. lepideus FPRL 7B; A3:L. lepideus FPRL 7H; A4:L. lepideus FPRL 7E; A5:L. lepideus FPRL 7; Bl: L. lepideus (pole isolate); B2:G. trabeum; B3:G. sepiaria; B4:Con. puteana ; B5:P. placenta; Cl:M. tremellosus. White rots; C2:H. annosum; C3:C. versicolor. Deuteromycetes; C4:Fusarium sp. and C5:Hormoconis resinae.Antiserum specificity: western blot analysis.The western blot analysis of fungal isolates illustrated in Figure 4 indicates that the antigenic profile obtained for the different strains of L. lepideus tested are very similar. On the contrary, the other fungal species tested, with the exception of G. trabeum, showed marked differences in their antigenic profiles compared to L. lepideus (Figure 5). Comparison of antigenic profiles suggest that a band of MW 17,000 may be specific for L. lepideus i.e. absent from all other fungi used in this study. However, although G. trabeum (Fig 4, track 3), which appears to be most closely similar to L. lepideus, does not demonstrate this band, if the antiserum is preabsorbed with G. trabeum the specific band is no longer detected in L. lepideus. Fungi which showed little or no cross-reactivity in immunodiffusion and in the dot-immunobinding

8
assay, (particularly white rot basidiomycetes), were shown to possessseveral antigenic determinants which cross-react with the testantiserum (Figure 5).
■ ifclii
1M 1M I
3 4
Figure 4. Western blot of different L. lepideus strains and G. trabeum 1:L. lepideus 7H; 2:L. lepideus 7B; 3: £7. trabeum and 4 :L. lepideus 7F (specific band dotted).
Figure 5. Western blot of basidiomycete fungi lrPeniophora gigantea\2:Stereum sanguinolentum; 3:Fibroporia vaillantii; 4 :P. placenta; 5:P.annosum; 6:C. versicolor and L:L. lepideus IF.
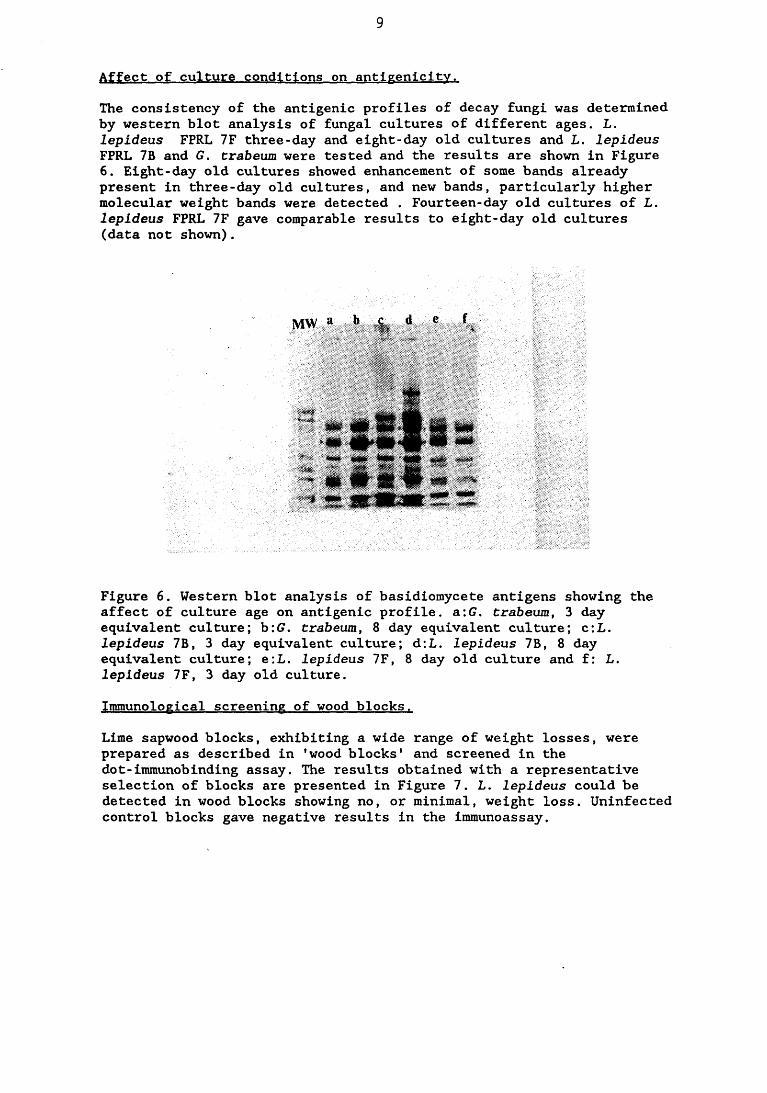
9
Affect of culture conditions on antigenicity.The consistency of the antigenic profiles of decay fungi was determined by western blot analysis of fungal cultures of different ages. L. lepideus FPRL 7F three-day and eight-day old cultures and L. lepideus FPRL 7B and G. trabeum were tested and the results are shown in Figure6. Eight-day old cultures showed enhancement of some bands already present in three-day old cultures, and new bands, particularly higher molecular weight bands were detected . Fourteen-day old cultures of L. lepideus FPRL 7F gave comparable results to eight-day old cultures (data not shown).
Figure 6. Western blot analysis of basidiomycete antigens showing the affect of culture age on antigenic profile, a:G. trabeum, 3 day equivalent culture; b:G. trabeum, 8 day equivalent culture; c:L. lepideus 7B, 3 day equivalent culture; d:L. lepideus 7B, 8 day equivalent culture; e:L. lepideus IF, 8 day old culture and f: L. lepideus IF, 3 day old culture.Immunological screening of wood blocks.Lime sapwood blocks, exhibiting a wide range of weight losses, were prepared as described in 'wood blocks' and screened in the dot-immunobinding assay. The results obtained with a representative selection of blocks are presented in Figure 7. L. lepideus could be detected in wood blocks showing no, or minimal, weight loss. Uninfected control blocks gave negative results in the immunoassay.

10
n n n > H y>JLt l 41 a li*
^ If * % li Z% l H 2* i* *f+h &' " l i p ? : .. . ':""'' '
Figure 7. Dot-immunobinding assay analysis of I. lepideus infected lime sapwood blocks. A series of six two-fold dilutions of each extract from infected blocks are shown (top to bottom), twelve two-fold dilutions of L. lepideus extracts represent a standard curve. Block 33, uninfected control block, 14, 0% weight loss, 11, 0.45% weight loss, 7, 0.88% weight loss, 38, 1.61% weight loss, 35, 1.93% weight loss, 28, 3.24% weight loss, 3, 4.5% weight loss, 21, 6.94% weight loss, 29, 8.4% weight loss, 15, 18.1% weight loss, and L. lepideus standard curves.Field trial.The dot-immunobinding assay system identified many more positive samples than the microbiological culturing technique (227 compared to 31). Statistical analysis of the results (Z-test) showed a significant level of association (p - 0.0016) between positive microbiological isolations of L. lepideus and immunologically positive samples. Those organisms most commonly isolated from the sections, viz Aspergillus niger, Hormoconis resinae, Penicillium spp., Gliocladium spp. and bacterial isolates, showed no significant association with immunological positives. In addition, results were analysed (Mann-Whitney U test and one-tailed Z-test) to test for association between higher mean scores in the immunoassay and microbiologically positive samples compared to microbiologically negative samples. A significant level of association between higher scores in the immunoassay and positive microbiological isolations of L. lepideus was found. No such association was found with the organisms detailed above (Table 1). Non-specific reaction with rabbit serum was also eliminated as a possible interfering factor in the assay (data not shown).
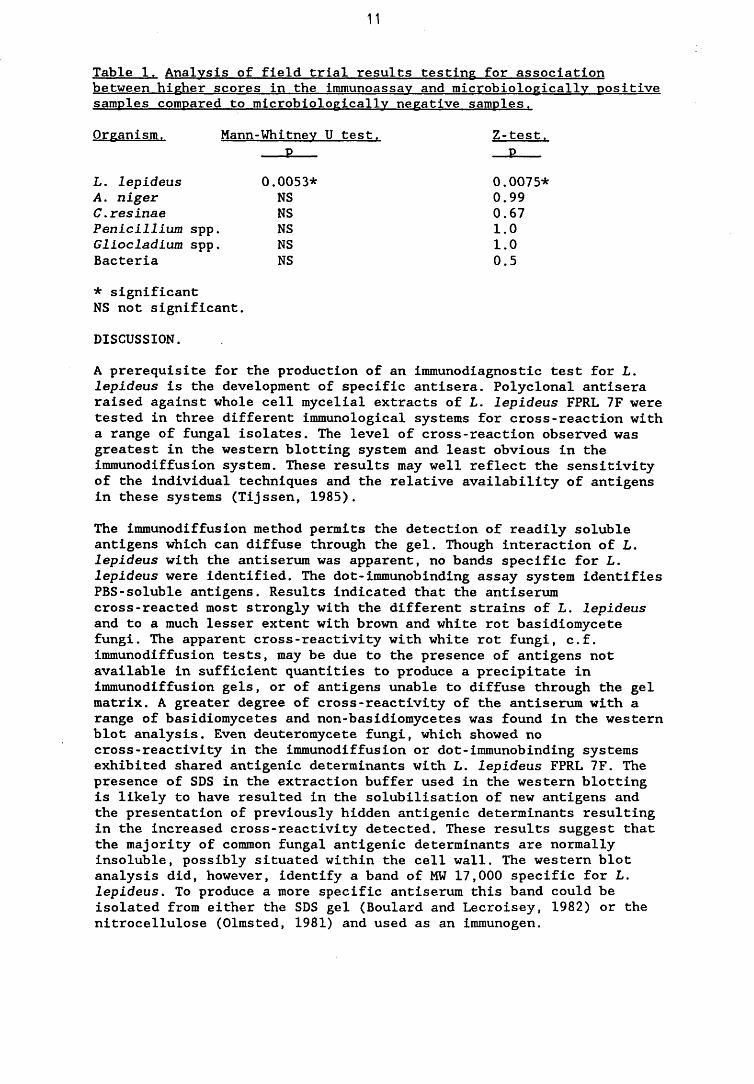
11
Table 1. Analysis of field trial results testing for association between higher scores in the immunoassay and microbiologicallv positive samples compared to microbiologicallv negative samples.Organism. Mann-Whitnev U test. Z-test.
___E___ __E___L. lepideus 0.0053* 0.0075*A . niger NS 0.99C.resinae NS 0.67Penicillium spp. NS 1.0Gliocladium spp. NS 1.0Bacteria NS 0.5* significant NS not significant.DISCUSSION.A prerequisite for the production of an immunodiagnostic test for L. lepideus is the development of specific antisera. Polyclonal antisera raised against whole cell mycelial extracts of L. lepideus FPRL 7F were tested in three different immunological systems for cross-reaction with a range of fungal isolates. The level of cross-reaction observed was greatest in the western blotting system and least obvious in the immunodiffusion system. These results may well reflect the sensitivity of the individual techniques and the relative availability of antigens in these systems (Tijssen, 1985).
The immunodiffusion method permits the detection of readily soluble antigens which can diffuse through the gel. Though interaction of L. lepideus with the antiserum was apparent, no bands specific for L. lepideus were identified. The dot-immunobinding assay system identifies PBS-soluble antigens. Results indicated that the antiserum cross-reacted most strongly with the different strains of L. lepideus and to a much lesser extent with brown and white rot basidiomycete fungi. The apparent cross-reactivity with white rot fungi, c.f. immunodiffusion tests, may be due to the presence of antigens not available in sufficient quantities to produce a precipitate in immunodiffusion gels, or of antigens unable to diffuse through the gel matrix. A greater degree of cross-reactivity of the antiserum with a range of basidiomycetes and non-basidiomycetes was found in the western blot analysis. Even deuteromycete fungi, which showed no cross-reactivity in the immunodiffusion or dot-immunobinding systems exhibited shared antigenic determinants with L. lepideus FPRL 7F. The presence of SDS in the extraction buffer used in the western blotting is likely to have resulted in the solubilisation of new antigens and the presentation of previously hidden antigenic determinants resulting in the increased cross-reactivity detected. These results suggest that the majority of common fungal antigenic determinants are normally insoluble, possibly situated within the cell wall. The western blot analysis did, however, identify a band of MW 17,000 specific for L. lepideus. To produce a more specific antiserum this band could be isolated from either the SDS gel (Boulard and Lecroisey, 1982) or the nitrocellulose (Olmsted, 1981) and used as an immunogen.
12
Hansen et al (1986) have reported that protein electrophoresis was the most sensitive method of determining the taxonomic relationships between various isolates of Phytophthora megasperma. This similarity of protein profiles in gels may well be mirrored in the western blots although not all proteins visualised in the gels will be antigenic and thus not detected in the western blot system. Therefore, the more closely related two fungi, the more alike their antigenic profile is likely to be and the similarity of profiles obtained for the different strains of L. lepideus exemplifies this. The similarities in the antigenic profiles of L. lepideus and G. trabeum suggest that these fungi, while showing distinct morphological differences in culture, may be closely related taxonomically. The failure to detect in western blots, the band specific for L. lepideus after preabsorption of the antiserum with G. trabeum mycelium, may be due to the presence of similar antigenic determinants which are carried on molecules of different size i.e. which have different molecular weights. Though the use of western blotting to determine taxonomic relationships between fungal isolates is feasible there are certain provisos as various factors such as culture age, substrate and incubation temperature have been shown to affect the antigenic profile (see Figure 6, also Burrell et al, 1966, Chard, 1981). For example, fungi grown in medium containing benomyl produced a limited number of bands, growth of the same fungi in medium without benomyl resulted in the detection of a number of new bands. Similarly, the profile obtained for the same fungi grown on wood substrate was altered (data not shown). Caution must therefore be applied when interpreting western blot data and standardisation of antigen preparation is recommended.
The application of the immunoassay in a field trial has demonstrated that the dot-immunobinding assay could be an effective detection system for L. lepideus-induced incipient decay within distribution poles. Furthermore this method, in conjunction with direct immunological staining methods could be used to map the distribution of the fungus within poles, permitting the acquisition of at least semi-quantitative data to supplement the qualitative data obtained using immunological staining techniques. The results indicate that the immunodetection system is much more sensitive than the standard microbiological culturing technique, which is routinely used to confirm the presence of fungal decay in distribution poles diagnosed suspect by hammer-sounding (Inwards and Graham, 1980). Statistical analysis of the results show the high numbers of immunologically positive samples are not due to cross-reaction of the antiserum with other fungal isolates present in the poles. Development of simpler sample extraction methods and full quantification of the system would permit the use of the immunoassay as a routine detection system for incipient fungal decay.
In conclusion, the results show that immunological methods can be applied to the analysis and detection of L. lepideus. The antiserum produced has been shown to possess a measure of specificity for L. lepideus and its application in a dot-immunobinding assay has permitted the identification of the fungus within wood blocks before any deleterious effects have occurred. The assay has been validated in a small field trial.
13
REFERENCES.
Benhamou,N., Quellette,G.B., Gardiner,R.B. and Day,A.W. (1986). Immunocytochemical localisation of antigen-binding sites in the cell surface of two ascomycete fungi using antibodies produced against fimbriae from Ustilago violacea and Rhodotorula rubra. Can.J. Microbiol. 32, 871-883.
Boulard.Ch. and Lecroisey,A. (1982). Specific antisera produced by direct immunisation with slices of polyacrylamide gel containing small amounts of protein. J. Immunol. Meths. 50, 221-226.
Burrell,R.G., Clayton,C.W., Gallegly.M.E. and Lilly,V.G. (1966). Factors affecting the antigenicity of the mycelium of three species of Phytophthora. Phytopathology £6, 422-426.Cartwright,K.St.G. and Findlay.W.P.K. (1958). Decay of timber and its prevention. HMSO. London. 332pp.
Chard,J.M. (1981). Development of an immunofluorescence technique for studying the ecology of Hycena galopus (Pers.ex.Fr.) Kummer.PhD Thesis, University of Essex, 225pp.
Edwards,R. (1985). Immunoassay. An introduction. William Heinemann Medical Books, London.
Goodell.B.S. and Jellison.J. (1986). Detection of a brown-rot fungus using serological assays. Internat. Res. Gp. Wood Pres. Document number IRG/WP/1305.
Goodell,B., Daniel,G., Jellison.J. and Nilsson,T. (1988). Immunolocalisation of extracellular metabolites from Poria placenta. Internat. Res. Gp. Wood Pres. Document number IRG/WP/1361.
Hansen,E.M., Brasier,C.M., Shaw,D.S. and Hamm,P.B. (1986). The taxonomic structure of Phytophthora megasperma : evidence for emerging biological species groups. Trans. Br. Mycol. Soc. 87 (4), 557-573.
Hearn,V.M. and Mackenzie,D.W.R. (1979). The preparation and chemical composition of fractions from Aspergillus fumigatus wall and protoplasts possessing antigenic activity. J. Gen. Micro. 112. 35-44.
Hornock,L. (1980). Serotaxonomy of Fusarium species of the sections Gibbosum ans Discolor. Trans. Br. Mycol. Soc. 74 (1), 73-78.
Inwards,R.D. and Graham,R.D. (1980). Comparing methods for inspecting Douglas-Fir poles in service. Am. Wood Pres. Assoc. 76. 283-289.
Kennedy,R.W. (1958). Strength retention in wood decayed to small weight losses. Forest Prod. J. 8, 308-314.
14
Kjaervig-Broe,M. and IngildfA. (1983). Amplification of immunoprecipitates in agarose gels by horseradish peroxidase- labelled antibody. Scand. J. Immunol. 12 Suppl. 10, 255-258.
Laemmli,U.K. (1970). Cleavage of structural proteins during the assembly of the head of bacteriophage T4. Nature 227. 680-685.
Madhosingh,C. and Ginns,J. (1974). Serological relationships between Fomes fraxinophilus and F. ellisianus. Can. J. Micro. 20, 1399-1401.
Madhosingh,C. and Ginns,J. (1975). Serological relationships between Gloeophyllum trabeum and G. sepiarium. Can. J. Micro. 21, 412-414.
Olmsted,J.B. (1981). Affinity purification of antibodies from diazotized paper blots of heterogeneous protein samples. J. Biol. Chem. 253, 11,955-11,957.
Palfreyman,J.W., Bruce,A., Button,D., Glancy,H., Vigrow.A. and King.B. (1987). Immunological methods for the detection and characterisation od wood decay basidiomycetes. in Biodeterioration (D.R. Houghton, R.N. Smith and H.O.W. Eggins, eds) volume 7, Elsevier, London.
Palfreyman,J.W., Glancy,H., Button,D., Vigrow,A., Score,A. and King,B. (1988a). Use of immunoblotting for analysis of wood decay basidiomycetes. Internat. Res. Gp. Wood Pres. Document number IRG/WP/2307.
Palfreyman,J.W., Vigrow,A., Button,D. and Glancy.H. (1988b)Simple method for scanning immunoblots. J. Immunol. Meths. 109. 199-201.
Tijssen,P. (1985). Practice and theory of enzyme immunoassays in Laboratory techniques in biochemistry and molecular biology (R.H. Burdon and P.H. van Knippenberg, eds) vol. 15, 549pp. Elsevier, Amsterdam.
Towbin.H. and Gordon,J. (1984). Immunoblotting and dot-immunobinding - current status and outlook. J. Immunol. Meths. 22, 313-340.
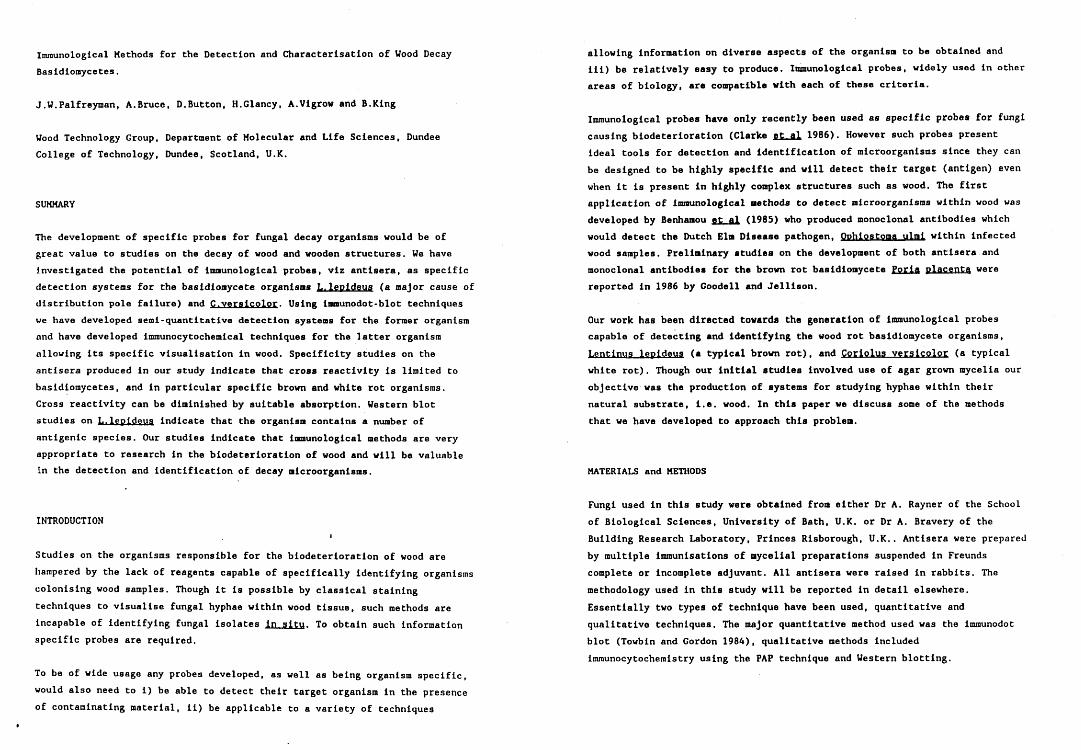
Immunological Methods for the Detection and Characterisation of Wood Decay Basldiomycetes.
J.W.Palfreyman, A.Bruce, D.Button, H.Glancy, A.Vigrow and B.Klng
Wood Technology Group, Department of Molecular and Life Sciences, Dundee College of Technology, Dundee, Scotland, U.K.
SUMMARY
The development of specific probes for fungal decay organisms would be of great value to studies on the decay of wood and wooden structures. We have investigated the potential of immunological probes, viz antisera, as specific detection systems for the basidiomycete organisms L.lepideus (a major cause of distribution pole failure) and C.versicolor. Using immunodot-blot techniques we have developed semi-quantitative detection systems for the former organism and have developed immunocytochemical techniques for the latter organism allowing its specific visualisation in wood. Specificity studies on the antisera produced in our study indicate that cross reactivity is limited to basidiomycetes, and in particular specific brown and white rot organisms.Cross reactivity can be diminished by suitable absorption. Western blot studies on L.lepideus indicate that the organism contains a number of antigenic species. Our studies indicate that immunological methods are very appropriate to research in the biodeterioration of wood and will be valuable in the detection and identification of decay microorganisms.
INTRODUCTIONi
Studies on the organisms responsible for the biodeterioration of wood are hampered by the lack of reagents capable of specifically identifying organisms colonising wood samples. Though it is possible by classical staining techniques to visualise fungal hyphae within wood tissue, such methods are incapable of identifying fungal isolates in situ. To obtain such information specific probes are required.
To be of wide usage any probes developed, as well as being organism specific, would also need to i) be able to detect their target organism in the presence of contaminating material, ii) be applicable to a variety of techniques
allowing information on diverse aspects of the organism to be obtained and iii) be relatively easy to produce. Immunological probes, widely used in other areas of biology, are compatible with each of these criteria.
Immunological probes have only recently been used as specific probes for fungi causing biodeterioration (Clarke et al 1986). However such probes present ideal tools for detection and identification of microorganisms since they can be designed to be highly specific and will detect their target (antigen) even when it is present in highly complex structures such as wood. The first application of immunological methods to detect microorganisms within wood was developed by Berthamou et al (1985) who produced monoclonal antibodies which would detect the Dutch Elm Disease pathogen, Qphlostoma ulral within infected wood samples. Preliminary studies on the development of both antisera and monoclonal antibodies for the brown rot basidiomycete Porla placenta were reported in 1986 by Goodell and Jellison.
Our work has been directed towards the generation of immunological probes capable of detecting and identifying the wood rot basidiomycete organisms, Lentinus lepideus (a typical brown rot), and Corlolus versicolor (a typical white rot). Though our initial studies involved use of agar grown mycelia our objective was the production of systems for studying hyphae within their natural substrate, i.e. wood. In this paper we discuss some of the methods that we have developed to approach this problem.
MATERIALS and METHODS
Fungi used in this study were obtained from either Dr A. Rayner of the School of Biological Sciences, University of Bath, U.K. or Dr A. Bravery of the Building Research Laboratory, Princes Rlsborough, U.K.. Antisera were prepared by multiple Immunisations of mycelial preparations suspended in Freunds complete or Incomplete adjuvant. All antisera were raised in rabbits. The methodology used in this study will be reported in detail elsewhere. Essentially two types of technique have been used, quantitative and qualitative techniques. The major quantitative method used was the immunodot blot (Towbin and Gordon 1984), qualitative methods included imraunocytochemistry using the PAP technique and Western blotting.
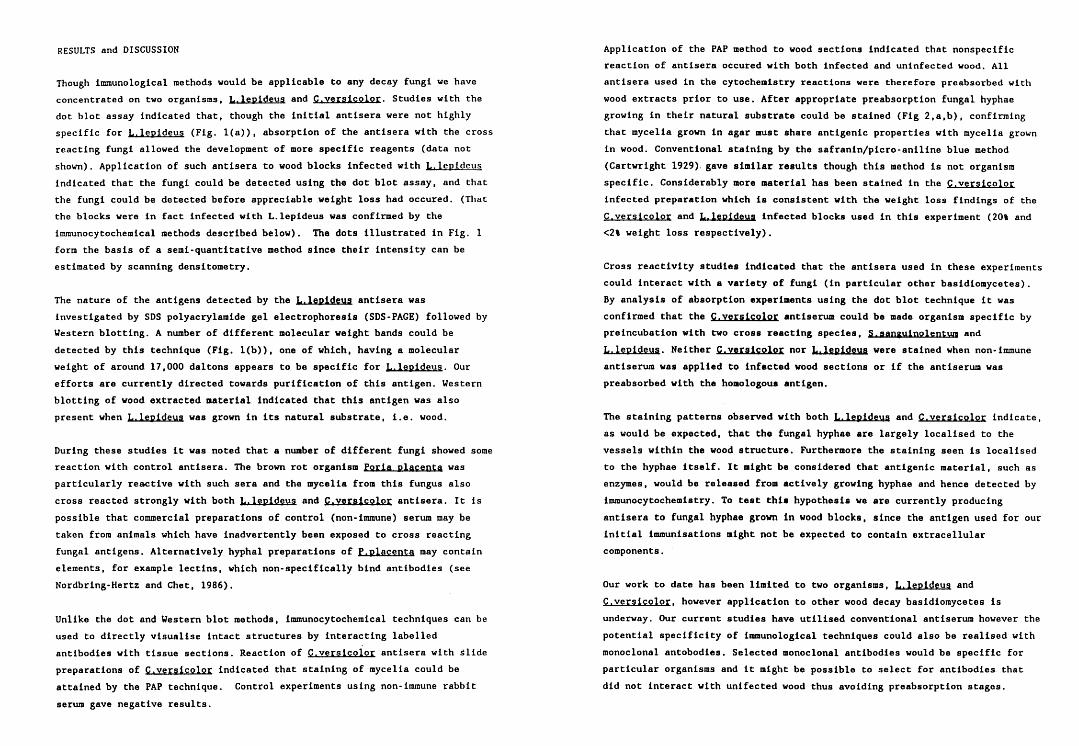
RESULTS and DISCUSSION
Though Immunological methods would be applicable to any decay fungi we have concentrated on two organisms, L.leoldeus and C.versicolor. Studies with the dot blot assay Indicated that, though the initial antisera were not highly specific for L.lepldeus (Fig. 1(a)), absorption of the antisera with the cross reacting fungi allowed the development of more specific reagents (data not shown). Application of such antisera to wood blocks infected with L.lepldeus indicated that the fungi could be detected using the dot blot assay, and that the fungi could be detected before appreciable weight loss had occured. (That the blocks were in fact infected with L.lepideus was confirmed by the immunocytochemical methods described below). The dots illustrated in Fig. 1 form the basis of a semi'quantitative method since their intensity can be estimated by scanning densitometry.
The nature of the antigens detected by the L. lepldeus antisera was investigated by SDS polyacrylamide gel electrophoresis (SDS-PAGE) followed by Western blotting. A number of different molecular weight bands could be detected by this technique (Fig. 1(b)), one of which, having a molecular weight of around 17,000 daltons appears to be specific for L.leoideus. Our efforts are currently directed towards purification of this antigen. Western blotting of wood extracted material indicated that this antigen was also present when L.lepldeus was grown in its natural substrate, i.e. wood.
During these studies it was noted that a number of different fungi showed some reaction with control antisera. The brown rot organism Porla placenta was particularly reactive with such sera and the mycelia from this fungus also cross reacted strongly with both L.lepldeus and C.versicolor antisera. It is possible that commercial preparations of control (non-immune) serum may be taken from animals which have inadvertently been exposed to cross reacting fungal antigens. Alternatively hyphal preparations of P.placenta may contain elements, for example lectins, which non-speciflcally bind antibodies (see Nordbring-Hertz and Chet, 1986).
Unlike the dot and Western blot methods, immunocytochemical techniques can be used to directly visualise intact structures by interacting labelled antibodies with tissue sections. Reaction of C.versicolor antisera with Slide preparations of C.versicolor indicated that staining of mycelia could be attained by the PAP technique. Control experiments using non-immune rabbit serum gave negative results.
Application of the PAP method to wood sections indicated that nonspecific reaction of antisera occured with both infected and uninfected wood. All antisera used in the cytochemistry reactions were therefore preabsorbed with wood extracts prior to use. After appropriate preabsorption fungal hyphae growing in their natural substrate could be stained (Fig 2,a,b), confirming that mycelia grown in agar must share antigenic properties with mycelia grown in wood. Conventional staining by the safranin/plcro-aniline blue method (Cartwright 1929) gave similar results though this method is not organism specific. Considerably more material has been stained in the C.versicolor infected preparation which is consistent with the weight loss findings of the C.versicolor and L.leoldeus infected blocks used in this experiment (20% and <2% weight loss respectively).
Cross reactivity studies indicated that the antisera used in these experiments could interact with a variety of fungi (in particular other basidlomycetes).By analysis of absorption experiments using the dot blot technique it was confirmed that the C.versicolor antiserum could be made organism specific by preincubation with two cross reacting species, S.sanguinolentura and L.lepideus. Neither C.versicolor nor L.lepideus were stained when non-immune antiserum was applied to infected wood sections or if the antiserum was preabsorbed with the homologous antigen.
The staining patterns observed with both L.leoideus and C.versicolor indicate, as would be expected, that the fungal hyphae are largely localised to the vessels within the wood structure. Furthermore the staining seen is localised to the hyphae itself. It might be considered that antigenic material, such as enzymes, would be released from actively growing hyphae and hence detected by immunocytochemistry. To test this hypothesis we are currently producing antisera to fungal hyphae grown In wood blocks, since the antigen used for our initial immunisations might not be expected to contain extracellular components.
Our work to date has been limited to two organisms, L.lepldeus and C.versicolor. however application to other wood decay basidiomycetes is underway. Our current studies have utilised conventional antiserum however the potential specificity of immunological techniques could also be realised with monoclonal antobodies. Selected monoclonal antibodies would be specific for particular organisms and it might be possible to select for antibodies that did not interact with unifected wood thus avoiding preabsorption stages.

Alternatively individual monoclonal antibodies could be modified to prevent them from non-specifically interacting with wood.
Our studies have demonstrated that immunological probes can be used to detect and identify wood decay basidlomycetes growing in their natural substrate. Given the large contribution that such reagents have made to other fields of biological research we would suggest that the use of Immunological probes and techniques should be more widely applied to the study of decay organisms and the decay process.
/
REFERENCES
Benhamou.N. Ouellette,G.B., Lafontaine,J.G. and Joly.J.R. (1985). Use of monoclonal antibodies to detect a phytotoxic glycopeptide produced by Ophlostoma ulml. the Dutch elm disease pathogen. Can. J. Bot. £2, 1177-1184
Cartwright,K.St.G. (1929). A satisfactory method of staining fungal mycelium in wood sections. Ann. Bot. £2. 412-413.
Clarke,J.H., MacNicoll,A.D. and Norman,J.A. (1986). Immunological detection fungi in plants, including stored cereals. International Biodeterioration Supp. 21, 123-130. r ■ ;
Goodell.B.S. and Jellison.J. (1986). Detection of a brown rot fungus using serological assays. International Research Group on Uood Preservation, Document No. IRG/WP/1305.
Nordbring-Hertz,B. and Chet,I. (1986). Fungal lectins and agglutinins. In ’Microbial Lectins and Agglutinins’ , Ed. Mirelman,D., pp 393-408, Wiley Interscience, New York.
i
Towbin, H. and Gordon,J. (1984). Immunoblotting and dot blotting - current status and outlook. J.Immunol. Methods 22, 313-340.
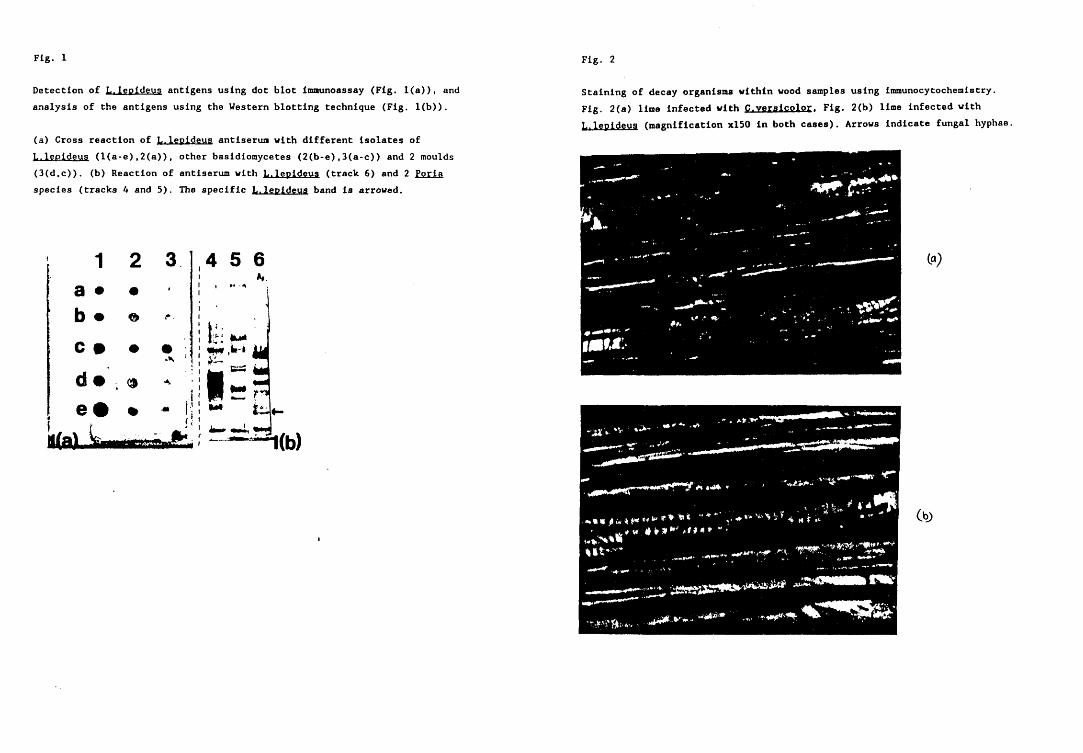
F i g . 1
Detection of L.lepldeus antigens using dot blot immunoassay (Fig. 1(a)), and analysis of the antigens using the Uestern blotting technique (Fig. 1(b)).
(a) Cross reaction of L.leoldeus antiserum with different Isolates of L.leoldeus (l(a-e),2(a)), other basidiomycetes (2(b-e),3(a-c)) and 2 moulds (3(d,c)). (b) Reaction of antiserum with L.lepldeus (track 6) and 2 Poria species (tracks 4 and 5). The specific L.lepideus band is arrowed.
1 2 3a • b •c 9dm
. e l
t i a L k
©
-*s
A
4 5 6h.
F i g . 2
Staining of decay organisms within wood samples using immunocytochemistry. Fig. 2(a) lime infected with C.versicolor. Fig. 2(b) lime infected with L.leoldeus (magnification xl50 in both cases). Arrows Indicate fungal hyphae.
Document No: IRG/WP/2307.THE INTERNATIONAL RESEARCH GROUP ON WOOD PRESERVATION.
Working Group II Fundamentals of Testing
Use of immunoblotting for the analysis of wood decay Basidiomycetes.
by
J.W. Palfreyman, H. Glancy, D. Button, A. Vigrow, A. Score & B. King.
Department of Molecular Life Sciences, Dundee Institute of Technology,Bell Street,Dundee.Scotland.UK.
Paper prepared for the 19th Annual Meeting Hotel Convencion, Madrid, Spain.
24-29 April 1988.
IRG Secretariat.Drottning Kristinas vag 47c S - 114 28 Stockholm Sweden
26th February 1988
Use of immunoblotting for the analysis of wood decay basidiomycetes
J.W.Palfreyraan, H.Glancy, D.Button, A.Bruce, A.Vigrow, A.Score andB.King
Department of Molecular and Life Sciences, Dundee College of Technology, Bell Street, Dundee, Scotland, U.K.
Summary
Immunoblotting methods, in particular dot and Western blotting have been used to investigate features of a variety of wood decay organisms, in particular C.versicolor. L.lepideus and S.lacrvmans. Antisera to each of these decay organisms has been produced by immunisation of rabbits with liquid culture grown hyphae. These antisera, after appropriate preabsorption with sawdust have been used to detect decay organisms grown in their natural substrate, i.e. wood.
Production of a semi-quantitative assay for C.versicolor allowed the relationship of antigen content to weight loss to be investigated in wood block experiments. Uninfected blocks contained no detectable antigen. In infected blocks antigen could be detected, however antigen content appeared to be higher in extracts from blocks with low levels of weight loss compared to extracts from blocks with high weight loss.
Western blotting, designed to identify the antigenic species present in different cultures of C.versicolor, indicated that the antigenic nature of the organism depends upon its substrate and that during the decay process the nature of antigens produced by C.versicolor changed,i.e. antigens of different molecular weights were detected, antigens.
Application of the Western blotting technique to two strains ofS.lacrvmans indicated that they could easily be distinguished by their antigenic nature and this technique may have implications for fungal classification.
These investigations indicate that immunological methods have considerable potential for the detection of decay organisms and for the study of the decay process itself.
Key Words
Immunoblotting, wood decay basidiomycetes, antigenicity
IntroductionRapid methods for the immunological detection and identification of wood decay basidiomycetes greatly enhance the range of studies which can be undertaken. Whilst it is currently possible to detect organisms by classical cultural studies such methods are time consuming and do not give an adequate representation of the microbial distribution within a wood sample.
A possible method for overcoming such limitations of is the use of immunologically based probes. The development of immunological probes relies upon the ability of higher animals to produce specific antibodies against foreign materials (antigens) encountered by their immune systems. These antibodies, present in serum and constituting the active component of an antiserum, will react with antigen both in the animal and in in vitro tests. By labelling, or tagging the antibody in some way, for example with an enzyme or a fluorescent dye, it is possible to visualise the reaction of an antibody with its antigen in an in vitro test. Such tests, which form the basis of the set of techniques termed 'Immunotechnology', can be used to assay an antigen or the organism from which it comes, to detect antigen microscopically (at the light or electron microscope level), to analyse the molecular nature of an antigen, to study its development and metabolism, or a wide range of other features of a specific antigen. Whilst antibodies are usually produced against animal pathogens almost any molecule can be induced to produce an antibodies (and hence an antiserum) within an experimental animal given suitable protocols.
Despite the wide use of immunotechnology in various fields of biology its application to the study of wood decay basidiomycetes has only recently been investigated (Goodell and Jellison 1986, Jellison and Goodell 1986, Palfreyman et al 1987). However the large range of available techniques indicate the potential that this technology has in the study of both the wood decay basidiomycetes and the wood decay process itself.
This paper summarises the initial results of studies made with antisera to a variety of decay organisms, in particular C.versicolor. L. lepideus and S.lacrvmans. Two types of immunological technique have been utilised in this present study, viz. immuno-dot blotting and Western blotting. Both of these techniques utilise the ability of nitrocellulose membranes to bind antigens and the subsequent ability of antibodies to detect bound antigens. In the dot blotting technique simple presence or absence of ah antibody/ antigen reaction is detected, in the Western blot antigens are separated electrophoretically prior to blotting and the relative molecular weights of antigens can be estimated.
Materials and MethodsThe organisms used in this study, Coriolus versicolor (L ex Fr) Quelet (FPRL 28A) , Stereum sanguinolentum (Alb & Schwein ex Fr) Fr (FPRL 27D), Lentinus lepideus (Fr ex Fr) Fr (FPRL 7F), Gloeophvllum trabeum (BAM(EDW)109), G.sepiarium (Wulfen ex Fr) Karsten (FPRL 10D), Schizophvllum commune Fr (FPRL 9), and Serpula lacrvmans (Schumacher ex Fr) Gray CMI 79 125 (FPRL 12C) and CMI 152 233, were supplied by DrA.Bravery of the Building Research Laboratory, Princes Risborough,U.K.
All antigens used in this study were prepared from liquid culture grown organisms, harvested and washed briefly in deionised water, freeze dried and stored at -20oC until use. Such preparations were ground up in phosphate buffered saline (PBS) and a supernatants prepared for dot blot assay and sodium dodecyl sulphate (SDS) extracts for Western blotting. Antisera used in these studies were raised in rabbits by multiple subcutaneous injections PBS extracts emulsified in Freunds complete adjuvant. Approximately 2ml of immunogen was injected into each animal corresponding to lOmg of antigen. After booster immunisations with antigen in incomplete adjuvant animals were bled regularly at approximately fortnightly intervals.
Antisera development and the detection of antigens using these antisera were by the immuno-dot blot method which will be described in detail elsewhere (Glancy et al manuscript in preparation). Briefly, antigens from the appropriate organism, viz. either an organism against which antiserum had been raised or an one which was being tested for cross reactivity, were extracted as described above in PBS and then absorbed onto deionised water washed nitrocellulose strips followed by air drying. After blocking of excess antigen binding sites by incubation of the strips in PBS containing 0.5% Tween, 5% newborn calf serum for 60 min at room temperature, the strips were incubated with appropriately diluted (in PBS containing 0.05% Tween, 5% newborn calf serum) antiserum at room temperature for 60 min. After 6 washes with PBS containing 0.05% Tween the strips were incubated with diluted peroxidase linked antirabbit serum (from the Scottish Antibody Production Unit, Carluke, Lanarkshire, U.K.) for a further 60 min at room temperature then washed and incubated with the peroxidase substrate diamino- benzidine and hydrogen peroxide.
Western blotting was essentially by the method of Towbin and Gordon (1984) with modifications which will be described in detail elsewhere (Glancy et al manuscript in preparation). Briefly samples were extracted into boiling mix (Towbin and Gordon 1984), electrophoresed on 7.5% SDS polyacrylamide gels, electroblotted onto nitrocellulose then detected using appropriately diluted antiserum followed by peroxidase linked antirabbit serum. Antibody binding was again visualised by diamino-benzidine.
When assaying wood samples for antigen, blocks were ground up to a fine sawdust and antigens extracted into PBS. All antisera used for detecting wood grown hyphae were preincubated with sawdust (2mg/ml)
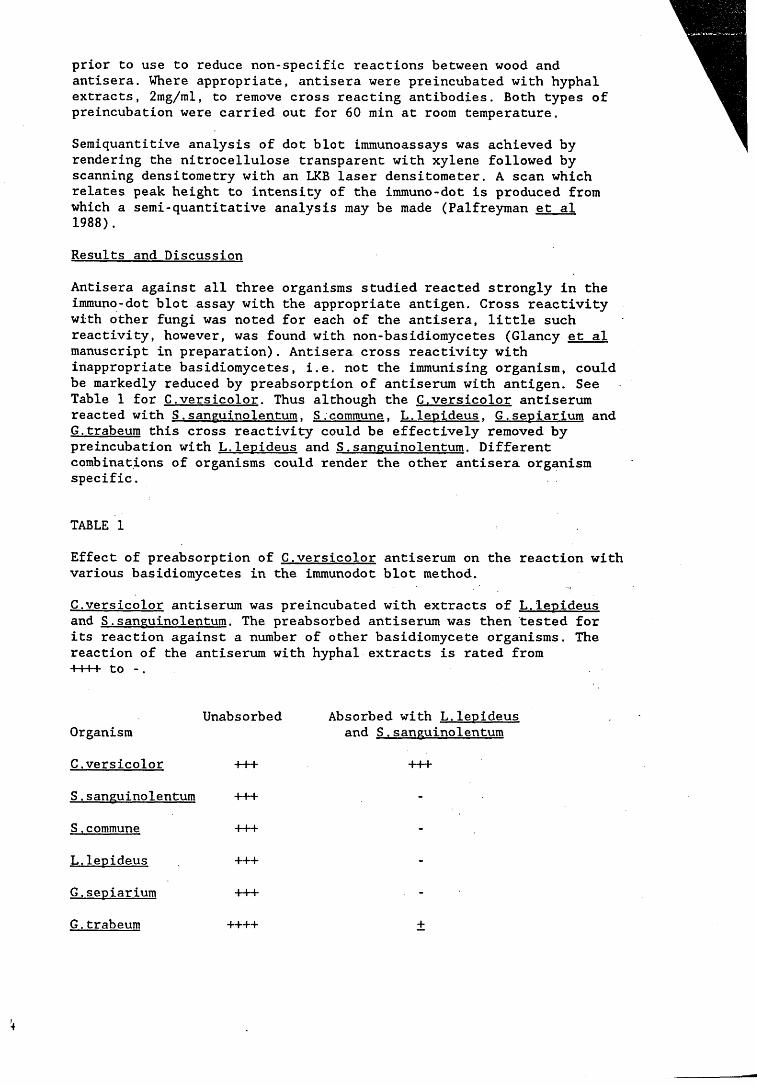
prior to use to reduce non-specific reactions between wood and antisera. Where appropriate, antisera were preincubated with hyphal extracts, 2mg/ml, to remove cross reacting antibodies. Both types of preincubation were carried out for 60 min at room temperature.
Seraiquantitive analysis of dot blot immunoassays was achieved by rendering the nitrocellulose transparent with xylene followed by scanning densitometry with an LKB laser densitometer. A scan which relates peak height to intensity of the immuno-dot is produced from which a semi-quantitative analysis may be made (Palfreyman et al 1988).
Results and Discussion
Antisera against all three organisms studied reacted strongly in the imrauno-dot blot assay with the appropriate antigen. Cross reactivity with other fungi was noted for each of the antisera, little such reactivity, however, was found with non-basidiomycetes (Glancy et al manuscript in preparation). Antisera cross reactivity with inappropriate basidiomycetes, i.e. not the immunising organism, could be markedly reduced by preabsorption of antiserum with antigen. See Table 1 for C.versicolor. Thus although the C.versicolor antiserum reacted with S .sanguinolentum. S .commune. L.lepideus. G .sepiarium and G . trabeum this cross reactivity could be effectively removed by preincubation with L.lepideus and S.sanguinolentum. Different combinations of organisms could render the other antisera organism specific.
TABLE 1
Effect of preabsorption of C.versicolor antiserum on the reaction with various basidiomycetes in the immunodot blot method.
C.versicolor antiserum was preincubated with extracts of L.lepideus and S.sanguinolentum. The preabsorbed antiserum was then tested for its reaction against a number of other basidiomycete organisms. The reaction of the antiserum with hyphal extracts is rated from ++++ to - .
UnabsorbedOrganism
C.versicolor +++
S .sanguinolentum +++
S .commune +++
L.lepideus +++
G.sepiarium +++
G . trabeum
Absorbed with L.lepideus and S .sanguinolentum
+++
++++ +
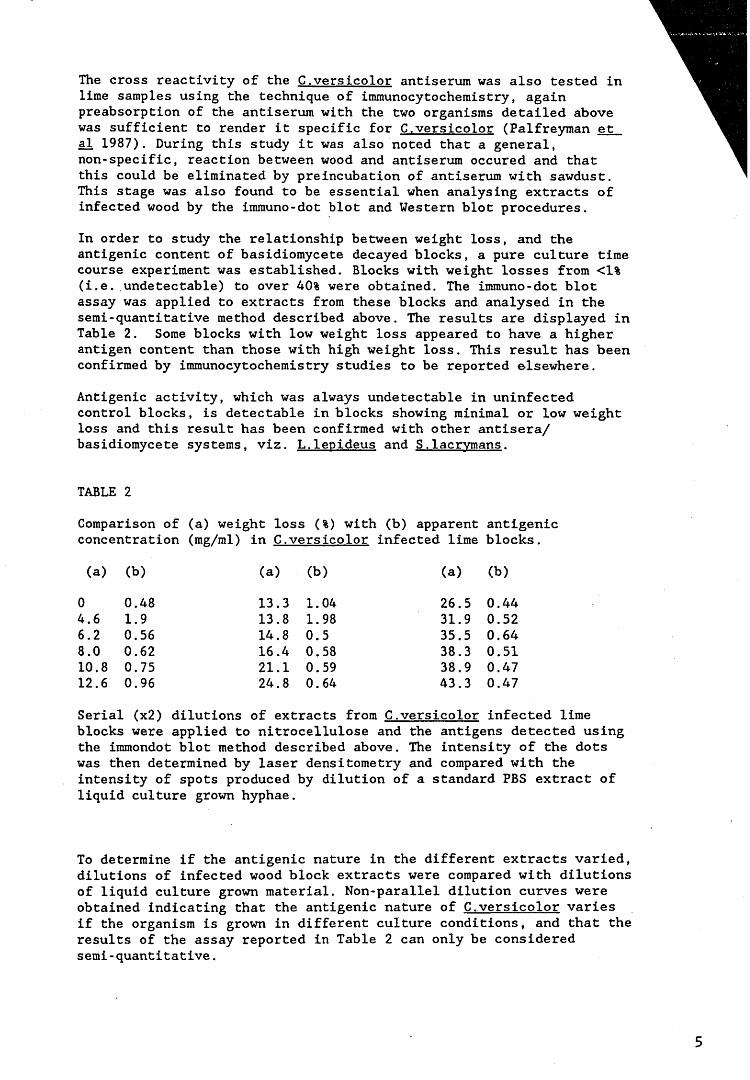
The cross reactivity of the C.versicolor antiserum was also tested in lime samples using the technique of immunocytocheraistry, again preabsorption of the antiserum with the two organisms detailed above was sufficient to render it specific for C.versicolor (Palfreyman et al 1987). During this study it was also noted that a general, non-specific, reaction between wood and antiserum occured and that this could be eliminated by preincubation of antiserum with sawdust. This stage was also found to be essential when analysing extracts of infected wood by the immuno-dot blot and Western blot procedures.
In order to study the relationship between weight loss, and the antigenic content of basidiomycete decayed blocks, a pure culture time course experiment was established. Blocks with weight losses from <1% (i.e. undetectable) to over 40% were obtained. The immuno-dot blot assay was applied to extracts from these blocks and analysed in the serai-quantitative method described above. The results are displayed in Table 2. Some blocks with low weight loss appeared to have a higher antigen content than those with high weight loss. This result has been confirmed by immunocytochemistry studies to be reported elsewhere.
Antigenic activity, which was always undetectable in uninfected control blocks, is detectable in blocks showing minimal or low weight loss and this result has been confirmed with other antisera/ basidiomycete systems, viz. L.lepideus and S.lacrvmans.
TABLE 2
Comparison of (a) weight loss (%) with (b) apparent antigenic concentration (mg/ml) in C.versicolor infected lime blocks.
(a) (b) (a) (b) (a) (b)
0 0.48 13.3 1.04 26.5 0.444.6 1.9 13.8 1.98 31.9 0.526.2 0.56 14.8 0.5 35.5 0.648.0 0.62 16.4 0.58 38.3 0.5110.8 0.75 21.1 0.59 38.9 0.4712.6 0.96 24.8 0.64 43.3 0.47
Serial (x2) dilutions of extracts from C.versicolor infected lime blocks were applied to nitrocellulose and the antigens detected using the immondot blot method described above. The intensity of the dots was then determined by laser densitometry and compared with the intensity of spots produced by dilution of a standard PBS extract of liquid culture grown hyphae.
To determine if the antigenic nature in the different extracts varied, dilutions of infected wood block extracts were compared with dilutions of liquid culture grown material. Non-parallel dilution curves were obtained indicating that the antigenic nature of C.versicolor varies if the organism is grown in different culture conditions, and that the results of the assay reported in Table 2 can only be considered semi-quant i tat ive.
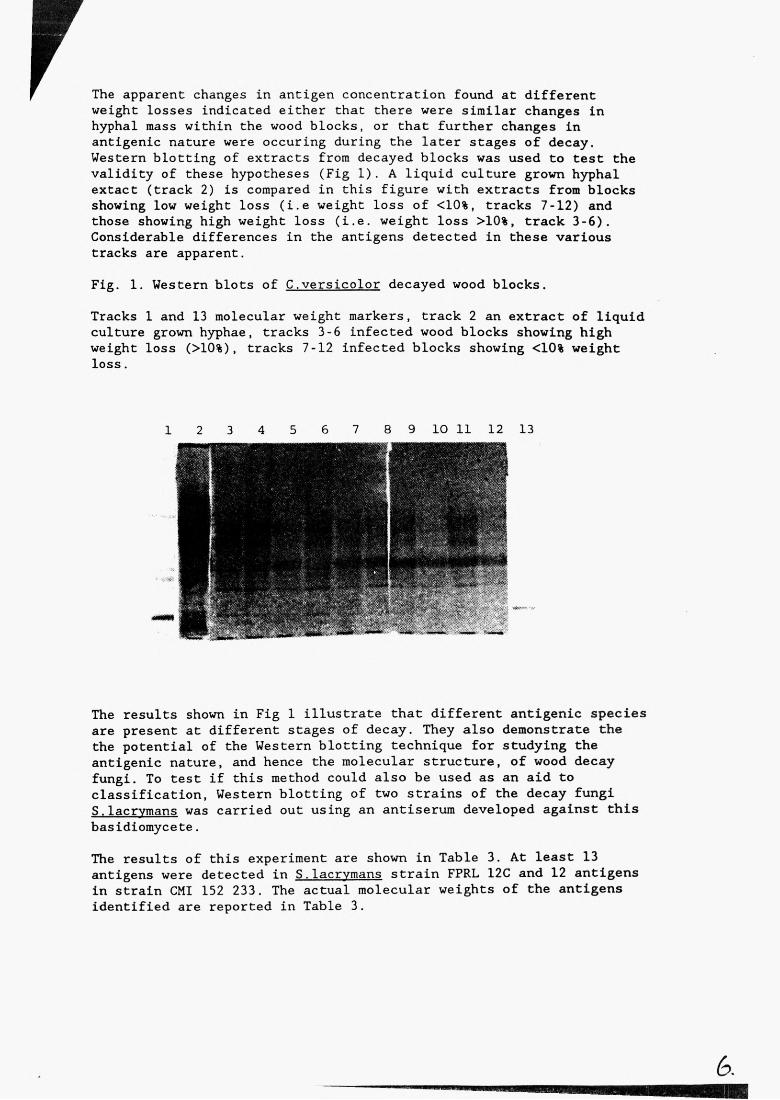
apparent: changes in antigen concentration found at different weight losses indicated either that there were similar changes in hyphal mass within the wood blocks, or that further changes in antigenic nature were occuring during the later stages of decay. Western blotting of extracts from decayed blocks was used to test the validity of these hypotheses (Fig 1) . A liquid culture grown hyphal extact (track 2) is compared in this figure with extracts from blocks showing low weight loss (i.e weight loss of <10%, tracks 7-12) and those showing high weight loss (i.e. weight loss >10%, track 3-6). Considerable differences in the antigens detected in these various tracks are apparent.Fig. 1. Western blots of C.versicolor decayed wood blocks.Tracks 1 and 13 molecular weight markers, track 2 an extract of liquid culture grown hyphae, tracks 3-6 infected wood blocks showing high weight loss (>10%), tracks 7-12 infected blocks showing <10% weight loss.
The results shown in Fig 1 illustrate that different antigenic species are present at different stages of decay. They also demonstrate the the potential of the Western blotting technique for studying the antigenic nature, and hence the molecular structure, of wood decay fungi. To test if this method could also be used as an aid to classification, Western blotting of two strains of the decay fungi S.lacrvmans was carried out using an antiserum developed against this basidiomycete.The results of this experiment are shown in Table 3. At least 13 antigens were detected in S. lacrvmans strain FPRL 12C and 12 antigens in strain CMI 152 233. The actual molecular weights of the antigens identified are reported in Table 3.
m6 .
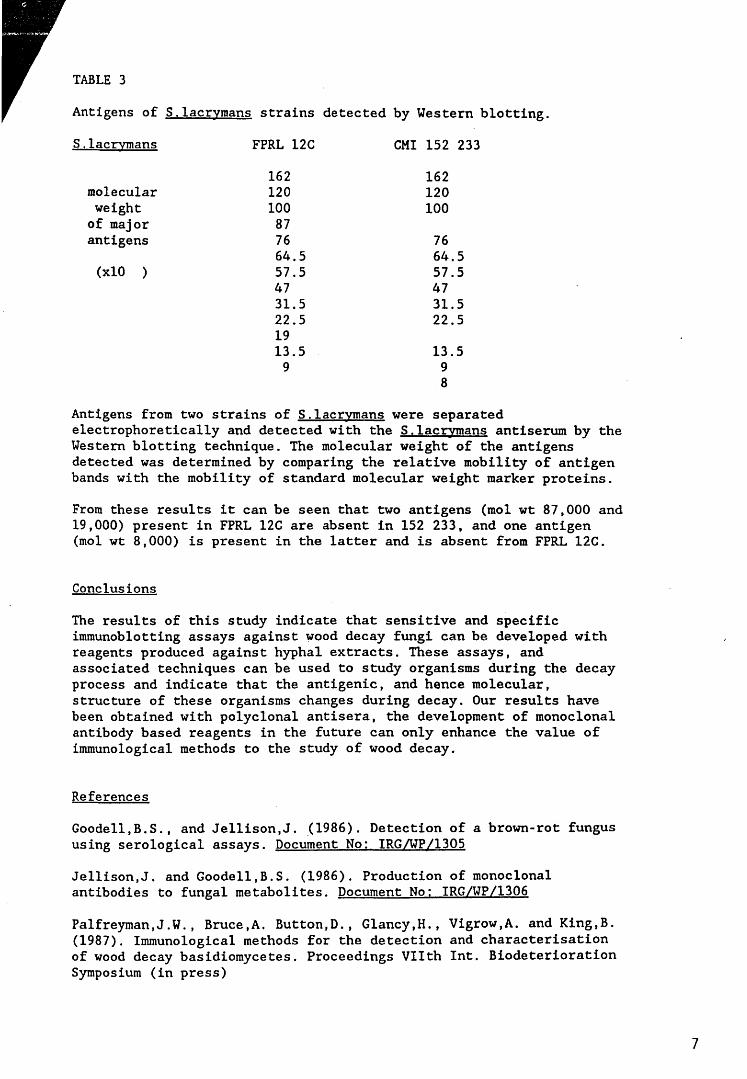
TABLE 3
Antigens of S.lacrvraans strains detected by Western blotting.
S ,lacrvmans FPRL 12C CMI 152 233
molecular weight of major antigens
1621201008776
162120100
76
(xlO )64.557.5
64.557.5 4747
31.5 31.522.522.5
1913.5 9
13.598
Antigens from two strains of S .lacrvmans were separated electrophoretically and detected with the S.lacrvmans antiserum by the Western blotting technique. The molecular weight of the antigens detected was determined by comparing the relative mobility of antigen bands with the mobility of standard molecular weight marker proteins.
From these results it can be seen that two antigens (mol wt 87,000 and 19,000) present in FPRL 12C are absent in 152 233, and one antigen (mol wt 8,000) is present in the latter and is absent from FPRL 12C.
Conclusions
The results of this study indicate that sensitive and specific immunoblotting assays against wood decay fungi can be developed with reagents produced against hyphal extracts. These assays, and associated techniques can be used to study organisms during the decay process and indicate that the antigenic, and hence molecular, structure of these organisms changes during decay. Our results have been obtained with polyclonal antisera, the development of monoclonal antibody based reagents in the future can only enhance the value of immunological methods to the study of wood decay.
References
Goodell.B.S., and Jellison,J. (1986). Detection of a brown-rot fungus using serological assays. Document No: IRG/WP/1305
Jellison.J. and Goodell.B.S. (1986). Production of monoclonal antibodies to fungal metabolites. Document No: IRG/WP/1306
Palfreyman,J.W. , Bruce,A. Button,D., Glancy,H., Vigrow,A. and King,B.(1987). Immunological methods for the detection and characterisation of wood decay basidiomycetes. Proceedings Vllth Int. Biodeterioration Symposium (in press)
Palfreyman,J.W., Vigrow.A., Button,D. and Glancy.H. (1988) A simple method for scanning immunoblots. J.Immunol. Methods (in press)
Towbin.H. and Gordon,J. (1984). Immunoblotting and dot blotting - current status and outlook. J.Immunol. Methods 22, 313-340
8
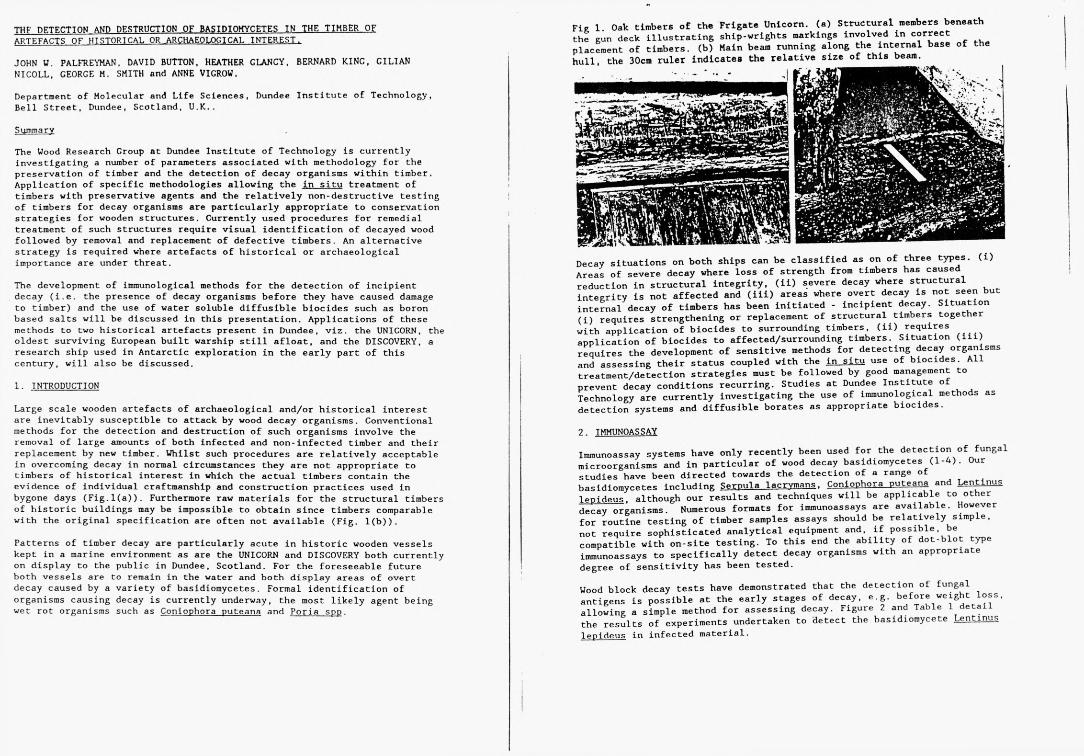
THE' DETECTION AND DESTRUCTION OF BASIDIOMYCETES IN THE TIMBER OF ARTEFACTS OF HISTORICAL OR ARCHAEOLOGICAL INTEREST.
JOHN W. PALFREYMAN, DAVID BUTTON, HEATHER CLANCY, BERNARD KING, CILIAN NICOLL, GEORGE M. SMITH and ANNE VIGROW.
Department of Molecular and Life Sciences, Dundee Institute of Technology, Bell Street, Dundee, Scotland, U.K..
Summary
The Wood Research Group at Dundee Institute of Technology is currently investigating a number of parameters associated with methodology for the preservation of timber and the detection of decay organisms within timber. Application of specific methodologies allowing the in situ treatment of timbers with preservative agents and the relatively non-destructive testing of timbers for decay organisms are particularly appropriate to conservation strategies for wooden structures. Currently used procedures for remedial treatment of such structures require visual identification of decayed wood followed by removal and replacement of defective timbers. An alternative strategy is required where artefacts of historical or archaeological importance are under threat.
The development of immunological methods for the detection of incipient decay (i.e. the presence of decay organisms before they have caused damage to timber) and the use of water soluble diffusible biocides such as boron based salts will be discussed in this presentation. Applications of these methods to two historical artefacts present in Dundee, viz. the UNICORN, the oldest surviving European built warship still afloat, and the DISCOVERY, a research ship used in Antarctic exploration in the early part of this century, will also be discussed.
1. INTRODUCTION
Large scale wooden artefacts of archaeological and/or historical interest are inevitably susceptible to attack by wood decay organisms. Conventional methods for the detection and destruction of such organisms involve the removal of large amounts of both infected and non-infected timber and their replacement by new timber. Whilst such procedures are relatively acceptable in overcoming decay in normal circumstances they are not appropriate to timbers of historical interest in which the actual timbers contain the evidence of individual craftmanship and construction practices used in bygone days (Fig.1(a)). Furthermore raw materials for the structural timbers of historic buildings may be impossible to obtain since timbers comparable with the original specification are often not available (Fig. 1(b)).
Patterns of timber decay are particularly acute in historic wooden vessels kept in a marine environment as are the UNICORN and DISCOVERY both currently on display to the public in Dundee, Scotland. For the foreseeable future both vessels are to remain in the water and both display areas of overt decay caused by a variety of basidiomycetes. Formal identification of organisms causing decay is currently underway, the most likely agent being wet rot organisms such as Coniophora puteana and Poria spp.
Fig 1. Oak timbers of the Frigate Unicorn, (a) Structural members beneath the gun deck illustrating ship-wrights markings involved in correct placement of timbers, (b) Main beam running along the internal base of the hull, the 30cm ruler indicates the relative size of this beam.
Decay situations on both ships can be classified as on of three types, (i) Areas of severe decay where loss of strength from timbers has caused reduction in structural integrity, (ii) severe decay where structural integrity is not affected and (iii) areas where overt decay is not seen but internal decay of timbers has been initiated - incipient decay. Situation (i) requires strengthening or replacement of structural timbers together with application of biocides to surrounding timbers, (ii) requires application of biocides to affected/surrounding timbers. Situation (iii) requires the development of sensitive methods for detecting decay organisms and assessing their status coupled with the in situ use of biocides. All treatment/detection strategies must be followed by good management to prevent decay conditions recurring. Studies at Dundee Institute of Technology are currently investigating the use of immunological methods as detection systems and diffusible borates as appropriate biocides.
2. IMMUNOASSAYImmunoassay systems have only recently been used for the detection of fungal microorganisms and in particular of wood decay basidiomycetes (1-4). Our studies have been directed towards the detection of a range of basidioraycetes including Serpula lacrvmans. Coniophora puteana and Lentinus lepideus. although our results and techniques will be applicable to other decay organisms. Numerous formats for immunoassays are available. However for routine testing of timber samples assays should be relatively simple, not require sophisticated analytical equipment and, if possible, be compatible with on-site testing. To this end the ability of dot-blot type immunoassays to specifically detect decay organisms with an appropriate degree of sensitivity has been tested.
Wood block decay tests have demonstrated that the detection of fungal antigens is possible at the early stages of decay, e.g. before weight loss, allowing a simple method for assessing decay. Figure 2 and Table 1 detail the results of experiments undertaken to detect the basidiomycete Lentinus lepideus in infected material.
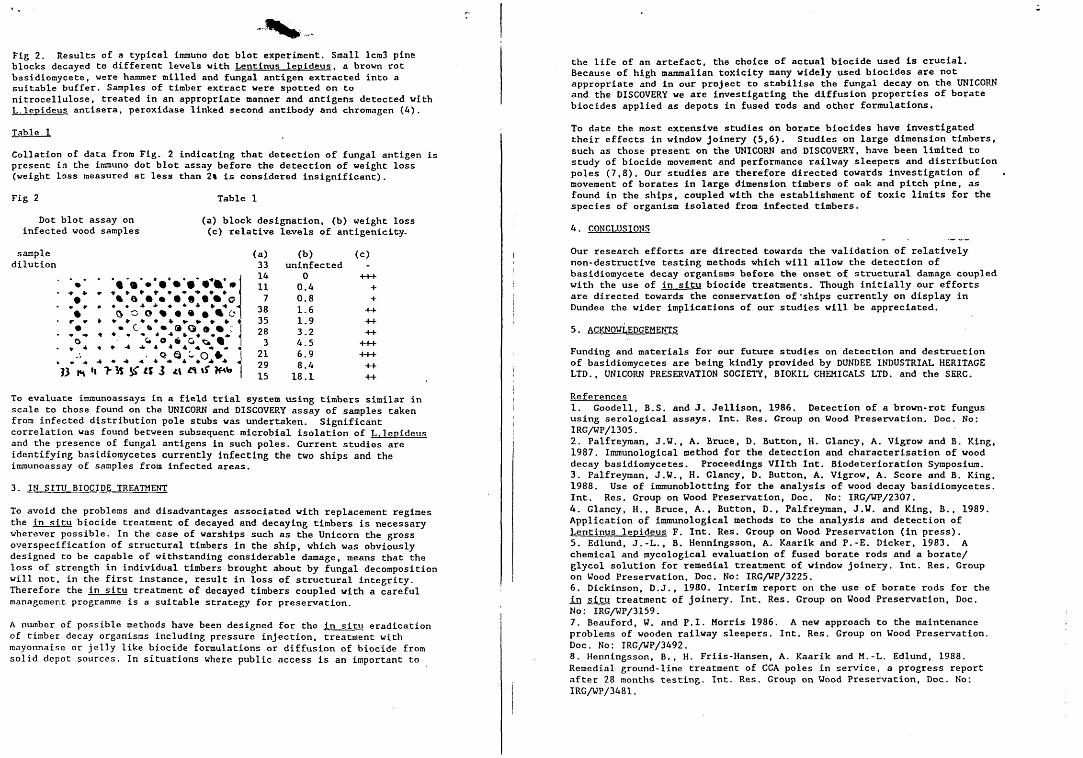
Fig 2. Results of a typical imrauno dot blot experiment. Small lcm3 pine blocks decayed to different levels with Lentinus leoideus. a brown rot basidiomycete, were hammer milled and fungal antigen extracted into a suitable buffer. Samples of timber extract were spotted on to nitrocellulose, treated in an appropriate manner and antigens detected with L. lenideus antisera, peroxidase linked second antibody and chromagen (4).
Table 1Collation of data from Fig. 2 indicating that detection of fungal antigen is present in the immuno dot blot assay before the detection of weight loss (weight loss measured at less than 2% is considered insignificant).Fig 2 Table 1
Dot blot assay on infected wood samples
(a) block designation, (b) weight loss (c) relative levels of antigenicity-
sampledilution
O
r ♦ » t t ♦ *% • <?*0*0 o %*• « • % o• c • • ® Q 9 %* - • * * ■* . * 4 •o a & %
(a) (b) (c)33 uninfected -14 0 +4-+11 0.4 +7 0.8 +
38 1.6 ++35 1.9 ++28 3.2 ++3 4.5 +++
21 6.9 +++29 8.4 ++15 18.1 ++
system using timbers sii
• Q Q « O V I, . 4 4 * 4 4 « * i ♦ * * W?3 IH H y ^ X « 3 I
scale to those found on the UNICORN and DISCOVERY assay of samples taken from infected distribution pole stubs was undertaken. Significant correlation was found between subsequent microbial isolation of L.lenideus and the presence of fungal antigens in such poles. Current studies are identifying basidioraycetes currently infecting the two ships and the immunoassay of samples from infected areas.3. IN SITU BIOCIDE TREATMENT
To avoid the problems and disadvantages associated with replacement regimes the in situ biocide treatment of decayed and decaying timbers is necessary wherever possible. In the case of warships such as the Unicorn the gross overspecification of structural timbers in the ship, which was obviously designed to be capable of withstanding considerable damage, means that the loss of strength in individual timbers brought about by fungal decomposition will not, in the first instance, result in loss of structural integrity. Therefore the in situ treatment of decayed timbers coupled with a careful management programme is a suitable strategy for preservation.
A number of possible methods have been designed for the in situ eradication of timber decay organisms including pressure injection, treatment with mayonnaise or jelly like biocide formulations or diffusion of biocide from solid depot sources. In situations where public access is an important to
the life of an artefact, the choice of actual biocide used is crucial. Because of high mammalian toxicity many widely used biocides are not appropriate and in our project to stabilise the fungal decay on the UNICORN and the DISCOVERY we are investigating the diffusion properties of borate biocides applied as depots in fused rods and other formulations.To date the most extensive studies on borate biocides have investigated their effects in window joinery (5,6). Studies on large dimension timbers, such as those present on the UNICORN and DISCOVERY, have been limited to study of biocide movement and performance railway sleepers and distribution poles (7,8). Our studies are therefore directed towards investigation of movement of borates in large dimension timbers of oak and pitch pine, as found in the ships, coupled with the establishment of toxic limits for the species of organism isolated from infected timbers.A. CONCLUSIONS
Our research efforts are directed towards the validation of relatively non-destructive testing methods which will allow the detection of basidiomycete decay organisms before the onset of structural damage coupled with the use of in situ biocide treatments. Though initially our efforts are directed towards the conservation of‘ships currently on display in Dundee the wider implications of our studies will be appreciated.5. ACKNOWLEDGEMENTSFunding and materials for our future studies on detection and destruction of basidiomycetes are being kindly provided by DUNDEE INDUSTRIAL HERITAGE LTD., UNICORN PRESERVATION SOCIETY, BIOKIL CHEMICALS LTD. and the SERC.
References1. Goodell, B.S. and J. Jellison, 1986. Detection of a brown-rot fungus using serological assays. Int. Res. Group on Wood Preservation. Doc. No: IRG/WP/1305.2. Palfreyman, J.W., A. Bruce, D. Button, H. Glancy, A. Vigrow and B. King,1987. Immunological method for the detection and characterisation of wood decay basidiomycetes. Proceedings Vllth Int. Biodeterioration Symposium.3. Palfreyman, J.W., H. Glancy, D. Button, A. Vigrow, A. Score and B. King,1988. Use of immunoblotting for the analysis of wood decay basidiomycetes. Int. Res. Group on Wood Preservation, Doc. No: IRG/WP/2307.4. Glancy, H., Bruce, A., Button, D., Palfreyman, J.W. and King, B., 1989. Application of immunological methods to the analysis and detection of Lentinus leoideus F. Int. Res. Group on Wood Preservation (in press).5. Edlund, J.-L., B. Henningsson, A. Kaarik and P.-E. Dicker, 1983. A chemical and mycological evaluation of fused borate rods and a borate/ glycol solution for remedial treatment of window joinery. Int. Res. Group on Wood Preservation, Doc. No: IRG/WP/3225.6. Dickinson, D.J., 1980. Interim report on the use of borate rods for the in situ treatment of joinery. Int. Res. Group on Wood Preservation, Doc.No: IRG/WP/3159.7. Beauford, W. and P.I. Morris 1986. A new approach to the maintenance problems of wooden railway sleepers. Int. Res. Group on Wood Preservation. Doc. No: IRG/WP/3492.8. Henningsson, B., H. Friis-Hansen, A. Kaarik and M.-L. Edlund, 1988. Remedial ground-line treatment of CCA poles in service, a progress report after 28 months testing. Int. Res. Group on Wood Preservation, Doc. No: IRG/WP/3481.