The Narrow Pulse Approximation and Long Length Scale Determination in Xenon Gas Diffusion NMR...
27
1 Accepted for publication in Journal of Magnetic Resonance March 20 2002 The Narrow Pulse Approximation and Long Length Scale Determination in Xenon Gas Diffusion NMR Studies of Model Porous Media R. W. Mair* ✝ , P. N. Sen ✝ ‡ , M. D. Hürlimann ‡ , S. Patz § , D. G. Cory ✝ , R. L. Walsworth* * Harvard-Smithsonian Center for Astrophysics, Cambridge, MA 02138, USA. ✝ Dept. of Nuclear Engineering, Massachusetts Institute of Technology, Cambridge, MA 02139, USA ‡ Schlumberger-Doll Research, Ridgefield, CT 06877, USA. § Dept. of Radiology, Brigham and Women’s Hospital, Boston, MA 02115, USA Running Title: Narrow Pulse Effects in Xenon Gas Diffusion Corresponding Author: Ross Mair Email: [email protected]
-
Upload
independent -
Category
Documents
-
view
0 -
download
0
Transcript of The Narrow Pulse Approximation and Long Length Scale Determination in Xenon Gas Diffusion NMR...
1
Accepted for publication in Journal of Magnetic Resonance March 20 2002
The Narrow Pulse Approximation and Long LengthScale Determination in Xenon Gas Diffusion
NMR Studies of Model Porous Media
R. W. Mair*✝ , P. N. Sen✝ ‡, M. D. Hürlimann‡, S. Patz§, D. G. Cory✝ , R. L. Walsworth*
* Harvard-Smithsonian Center for Astrophysics, Cambridge, MA 02138, USA.✝ Dept. of Nuclear Engineering, Massachusetts Institute of Technology, Cambridge, MA 02139, USA
‡ Schlumberger-Doll Research, Ridgefield, CT 06877, USA.
§ Dept. of Radiology, Brigham and Women’s Hospital, Boston, MA 02115, USA
Running Title: Narrow Pulse Effects in Xenon Gas Diffusion
Corresponding Author:
Ross Mair
Email: [email protected]
2
ABSTRACT
We report a systematic study of xenon gas diffusion NMR in simple model porous media: random
packs of mono-sized glass beads, and focus on three specific areas peculiar to gas-phase diffusion.
These topics are: (i) diffusion of spins on the order of the pore dimensions during the application of the
diffusion encoding gradient pulses in a PGSE experiment (breakdown of the 'narrow pulse
approximation' and imperfect background gradient cancellation), (ii) the ability to derive long-length
scale structural information, and (iii) effects of finite sample size. We find that the time-dependent
diffusion coefficient, D(t), of the imbibed xenon gas at short diffusion times in small beads is
significantly affected by the gas pressure. In particular, as expected, we find smaller deviations
between measured D(t) and theoretical predictions as the gas pressure is increased, resulting from
reduced diffusion during the application of the gradient pulse. The deviations are then completely
removed when water D(t) is observed in the same samples. The use of gas also allows us to probe D(t)
over a wide range of length scales, and observe the long-time asymptotic limit which is proportional to
the inverse tortuosity of the sample, as well as the diffusion distance where this limit takes effect (~ 1 -
1.5 bead diameters). The Pade′ approximation can be used as a reference for expected xenon D(t) data
between the short and long time limits, allowing us to explore deviations from the expected behaviour
at intermediate times as a result of finite sample size effects. Finally, the application of the Pade′
interpolation between the long and short time asymptotic limits yields a fitted length scale (the "Pade′
length"), which is found to be ~ 0.13b for all bead packs, where b is the bead diameter.
Keywords: xenon, diffusion, PGSE, tortuosity, porous media
3
INTRODUCTION
NMR is a commonly used, non-invasive probe of liquid-saturated porous materials. The 1H signal
obtained from water-saturated rocks and model porous systems can provide a wealth of information
including the pore surface-area-to-volume ratio (S/Vp) (1,2), the average pore size in model systems
(3,4,5), the eccentricity of non-spherical pores (6), and visualizations of fluid transport under flow (7).
The restricted diffusion of water molecules is commonly studied, and the Pulsed Gradient Spin Echo
(PGSE) technique has become a powerful tool for this purpose (8,9). However, this approach is
usually limited to probing length scales < 20 µm, because spin relaxation quenches the NMR signal
before molecules can diffuse across longer distances. For this reason, liquid phase NMR has been
unable to yield measurements of long-range properties for most porous media; e.g., heterogeneous
length scales and tortuosity in reservoir rock samples (2,10). Tortuosity is an important parameter that
characterizes pore connectivity and fluid transport properties in porous media such as electrical
conductivity, fluid flow, diffusion, and velocity of sound (11).
We have recently shown that gas diffusion NMR can be a powerful probe of porous media (12,13).
The spin 1/2 noble gases (3He and 129Xe) are particularly well suited for such studies, given their rapid
diffusion, inert nature, low surface interactions which reduce surface T1 effects, and the ability to tailor
the diffusion coefficient by altering the gas pressure in the sample. For example, 129Xe gas has an
unrestricted diffusion coefficient, D0 = 5.7 × 10⁻⁶ m2 s-1 at 1 bar pressure (12), which is ~ 3 orders of
magnitude higher than that of water. We have used 129Xe gas diffusion NMR to extend the length
scales that can be probed in porous media by more than an order of magnitude. In particular, we have
shown that pore length scales on the order of millimeters, rather than tens of micrometers, can be
probed; and that gas diffusion NMR can be used to measure the tortuosity of random bead packs and
reservoir rocks (13).
In this paper, we address three key issues that arise from gas-phase NMR diffusion measurements in
porous media, regardless of whether the gas signal results from thermal equilibration in the applied
magnetic field, or the increasingly popular laser-polarization process (14). The first of these issues is
the effect of diffusion during the application of the diffusion-encoding gradient pulse (15-18). While
the large gas diffusion coefficient is the essential property that permits the probing of long length
scales, it also implies that gas spins can diffuse significantly across the enclosing pore space during the
4
application of the diffusion-encoding gradient pulses. Such a phenomenon violates a common
assumption in the PGSE experiment, i.e., the narrow pulse approximation which assumes the gradient
pulse is infinitely narrow so that the spins do not diffuse significantly during its application (9). While
the impact of a breakdown of the narrow pulse approximation has previously been studied theoretically
(15-18), it is only with gas-phase diffusion that the phenomenon is readily observed, and at times,
unavoidable. Such significant diffusion during the application of the gradient pulses also implies that
the cancellation of background gradients resulting from susceptibility differences in the sample may
not be effective. This cancellation is achieved by using a modified PGSE sequence that employs bi-
polar gradient pulse pairs separated by a 180° RF pulse rather than a single diffusion encoding pulse,
and relies on the spins being in the same background gradient during the application of the two bi-polar
pulses (19,20). Our past experiments show deviations in normalized time-dependent gas diffusion
coefficients, D(t)/D0, from values expected from the known pore surface-area-to-volume ratio (S/Vp) of
model packed bead samples (13), which we have attributed to a breakdown of the narrow pulse
approximation. In this paper, we report systematic measurements of D(t)/D0 as a function of diffusion
length during the gradient pulse over a wide range of bead sizes, and show that a reduced free diffusion
coefficient, D0, either by increased gas pressure or changing the observation spin to water, can indeed
reduce or eliminate the previously observed deviations of D(t)/D0 from the expected values.
The other two issues we address are the ability to derive intermediate and long-length scale structural
information from the time-dependent diffusion coefficient, D(t), and the effect of finite sample size. In
gas-phase D(t) experiments, the tortuosity limit is easily observed, allowing not only accurate
determination of the tortuosity of a sample, but the length-scale at which the pore-structure becomes
homogeneous. In previous water D(t) studies in small beads, it has been shown that all D(t)/D0 data
could be well described by a Pade′ approximation which interpolates between the short and long time
limits (1,2). In this paper, we therefore use the Pade′ form as convenient reference to assess factors
influencing the observed gas D(t)/D0 data in the intermediate time range. In particular, we observed
that intermediate-time D(t)/D0 data deviated from the Pade′ approximation when the sample size was
within an order of magnitude of the bead size, while in a larger sample cell these deviations were
eliminated. Use of the Pade′ interpolation method also involves fitting an adjustable length scale
parameter which we refer to as the Pade′-length, and which we found to be a constant fraction of the
bead diameter for all samples.
5
THEORY
The NMR echo signal observed in a PGSE experiment has a Fourier relationship to the probability of
spin motion – the so-called displacement propagator, which can be thought of as a spectrum of motion.
The echo signal, E, obtained in a PGSE experiment for a system with uniform initial polarization, and
when the narrow pulse approximation is valid, can thus be written as (9):
E t P t i d dsq r r r q r r r r, | ' , exp ' '( ) = ( ) ( ) × ⋅ −( )[ ]∫ ∫ρ , [1]
where ρ(r) is the spin density at position r, and Ps(r|r', t) is the displacement propagator, or the
probability of a spin having a displacement r' – r during the 'diffusion time' t (often referred to as ∆ in
the literature). However, in these experiments, the propagator Ps(r|r', t) depends both on the initial and
final positions, not just the displacement vector (r' – r), as the samples are not translationally invariant,
due to their finite size. Therefore, it is not possible in this case for the propagator to represent an
average over all similar displacements r' – r. q is the wavevector of the magnetization modulation
induced on the spins by a field gradient pulse of strength g and pulse duration δ. The magnitude of q is
given by q = γδg, where γ is the spin gyro-magnetic ratio in rad/s T. In the limit of small q, the echo
will be attenuated by a factor exp(-q2D(t) t) (9), where D t t( ) [ ' ]= −r r 2 6 is the time-dependent
diffusion coefficient describing incoherent random motion of the spins in the pore space. D(t) can vary
as a function of t, with more spins encountering barriers to their motion as t is increased.
For short diffusion times (i.e., small t), the fraction of spins whose motion is restricted by pore
boundaries is given by the ratio of the volume of a boundary layer to the total pore volume, i.e., ~
(S/Vp) D t0 , where S/Vp is the pore surface-area-to-volume ratio and D t0 is the characteristic free-
spin-diffusion length for a diffusion time t. Using this basic physical picture, Sen and co-workers have
calculated, for small t (21,22):
D t
D
S
VD t D t
p
( )O( )
00 01
49
= − +π
. [2]
This relation has been verified experimentally (1) with NMR of liquids imbibed in model porous media
consisting of random packs of mono-sized spherical beads, where S/Vp = 6(1-φ)/(φb), φ is the sample’s
porosity (the fraction of void space in the total volume of the sample), and b is the bead diameter. We
have shown this relation also holds for gas diffusion in samples with large pores (> 1 mm) (12,13). In
this paper, we address short time deviations from the above description, due to a breakdown of the
narrow pulse approximation for gas diffusion NMR on samples with small pores.
6
In addition to short-time effects, we report in this paper studies of long length-scale properties of
porous media that are only observable with NMR by using gas diffusion. In particular, the tortuosity,
α, is a fundamental geometrical parameter that controls macroscopic fluid transport in porous media
(23). In simple, idealized systems, α can be calculated: e.g., in dense random packs of spherical beads,
1/α ~ φ ~ 0.62 (24). However, in most systems such as reservoir rocks and lung tissue, α must be
determined by measurement. In cases where surface electrical conductivity is negligible, the tortuosity
of a porous medium can be determined by conductivity measurements of salt-water infused in the pore
space; gas diffusion NMR is the only other static method for measuring tortuosity for systems with
pore sizes > 20 µm (13). In addition, gas diffusion NMR permits one to determine how far the spins
must diffuse in order to reach the tortuosity limit, which corresponds to the largest structural length
scale in the pore geometry (Lmacro). No other method for tortuosity determination provides this
additional information.
Ignoring the effects of spin relaxation at pore boundaries (a good approximation for noble gas NMR in
many systems), D(t)/D0 asymptotically approaches 1/α in the long time limit according to (25):
D t
D
L
D ttmacro( )
0
2
0
3 21= + − ( )−
αβ
Ο , [3]
where β is a length independent geometrical factor; implying for D t0 >> Lmacro, D(t)/D0 → 1/α.
Some water diffusion NMR measurements in reservoir rocks have been consistent with D(t) ~ 1/t in the
intermediate time regime (i.e., before the tortuosity limit is reached) (2). However, such measurements
have not provided an accurate determination of α and Lmacro. As a result, in analyzing diffusion in
reservoir rocks and model porous media, it has been common to use the Pade′ approximation to
interpolate between the short time (S/Vp) limit (Eq. [2]) and the long time (1/α) asymptotic limit
provided by electrical conductivity or calculation (2). This method uses an adjustable fitting parameter,
θ, which has units of time and is expected to scale with the square of the pore size (1). The Pade′
approximation can be used to estimate D(t) in the intermediate t regime, according to (1):
D t
D
D t S V D t D
D t S V D t Dp
p
( )( )
( )( ) ( )( )
( ) ( )( ) ( )( )0
0 0 0
0 0 0
1 11 4 9 1 1
1 1 4 9 1 1= − − ×
+ −
− + + −α
π α θ
α π α θ. [4]
This method has provided an excellent fit to water D(t)/D0 data in the intermediate-t regime in model
porous media consisting of small glass bead packs, with the fit parameter (the Pade′ length) yielding
D0θ ~ 0.14b, where b is the bead diameter (1). In this paper, we use gas diffusion NMR to test the
7
accuracy of the Pade′ approximation (Eq. [4]) for D(t) data ranging from the short to the long time
limits and with both S/Vp and α determined by NMR.
EXPERIMENTAL
We prepared samples of randomly packed spherical glass beads for thermally polarized xenon NMR
experiments. Cylindrical glass chambers of volume ~ 50 cm3 held the bead-packs. Each sample
contained beads of a single size, with bead diameters in different samples ranging from 0.1 mm to 4
mm. Also, one larger chamber cell of ~ 150 cm3 was used for additional experiments with 4 mm beads
to study finite sample cell effects. In addition to the chamber for beads, all these sample cells had a
second chamber of volume ~ 25 cm3, which was connected to the larger bead chamber via glass tubing
obstructed by a 50 µm porosity sintered glass frit. This design allowed the gases to fill both chambers
with a uniform partial pressure for the gas mixture, while the beads were confined to one chamber. We
filled the samples with gas by freezing appropriate amounts of xenon (isotopically enriched to 90%
129Xe) and oxygen inside the cells at liquid nitrogen temperature. We then sealed each glass sample
cell and warmed it to room temperature, establishing the desired gas partial pressures, typically ~ 6 -
6.5 bar xenon and ~ 1.5 bar oxygen. Paramagnetic oxygen was included with the xenon in order to
reduce the 129Xe T1 from tens of seconds to ~ 1.5 s, thereby enabling efficient signal averaging which
is essential due to the low NMR signal expected with thermally polarized 129Xe gas.
The two-chamber design of the sample cells allowed the smaller, free-gas chamber to be inserted in the
RF coil separately from the bead-filled chamber. Simple characterization experiments on the free gas
chamber yielded the 129Xe T1 time and the xenon free gas diffusion coefficient, D0, for the gas mixture.
We employed standard inversion-recovery (26) and PGSE (8) methods, respectively, for these
measurements. A linear regression of measurements of 129Xe T1 in the presence of O2 in various
carefully prepared standard free-gas samples of 129Xe at pressures of ~ 1 - 4 bar was performed
previously (see Fig. 1). We obtained a simple empirical relation between the 129Xe T1 value and the O2
content (pO2) in the gas mixture, valid for 129Xe pressures of a few bar near room temperature in an
applied field of 4.7 T. We found (129Xe T1)-1 = 0.0333 + 0.348 × pO2, with T1 in seconds and pO2 in
bar, and an R2 = 0.999. This result compares well with the proportionality constant of 0.388 for 129Xe
T1 at 4.7 T as a function of oxygen density at STP, as determined previously by Jameson et. al. in their
detailed analysis of intermolecular dipolar coupling in the gas phase (27). We used our relationship to
8
determine the pO2 in each filled bead cell. We then determined pXe, the xenon gas partial pressure,
from simple addition of gas partial pressures and their diffusion coefficients (28):1
0 0
2
0 2D
p
D
p
D= +
XeXe
OO( ) ( )
[5]
where D0(Xe) = 5.71 × 10⁻⁶ m2 s-1 (12) is the Xe diffusion coefficient at 1 bar pressure and room
temperature and D0(O2) = 13.5 × 10⁻⁶ m2 s-1 (28) is the xenon diffusion coefficient at infinite dilution in
O2 at 1 bar pressure and room temperature. We measured D0 from each sample cell's free gas chamber
and used it to normalize the Xe D(t) measurements from the bead chamber of the corresponding cell.
Water D(t) data was obtained from single chamber cells of 50 cm3, similar to those used for most of the
Xe D(t) measurements. We filled the cells with either 4 or 0.5 mm beads, and then saturated them with
de-ionized water under vacuum conditions to ensure the removal of air bubbles. The 1 mm beads were
held in a 4 cm ID plastic cylinder, which was also water saturated in the same manner. In all cases the
beads were the same as those used in the Xe gas experiments. We measured the water T1 time using
the inversion recovery method, and found it to be ~ 1.5 - 2 s without needing to add a doping agent.
No free diffusion coefficient (D0) measurement was made on these cells. Instead, we determined the
water D0 by extrapolation to t = 0 of the very linear plot of D(t) vs D t0 .
In practice, the very short spin coherence time (T2) of fluid (water or gas) spins in a porous sample, and
the high background magnetic field gradients that at high applied fields result from susceptibility
contrast between the solid grains and the imbibed fluid (29) make the standard pulsed gradient spin
echo (PGSE) technique unsuitable for measuring D(t). Instead, we used a modified stimulated echo
sequence (PGSTE-bp) incorporating alternating bi-polar diffusion-encoding gradient pulses which
cancel out the effect of the background gradients on the diffusion measurement (19,20). The sequence
is illustrated in Fig. 2, where the timing parameters shown correspond to the description in the previous
section or are described in the figure caption. The additional 180° RF pulses around each bi-polar
gradient pulse pair provide refocusing to overcome fast inhomogeneous signal loss; while the crusher
gradients, applied on an orthogonal axis, remove spurious signal resulting from imperfect 180° RF
pulse calibration and B1 inhomogeneity. The gradient pulses are half-sine shaped in order to minimize
their temporal length (δ) while maintaining a reproducible gradient shape, and to reduce eddy current
ring-down after the application of the gradient pulses. We determined D(t) by fitting the natural log of
the measured echo attenuation to a modified form of the Stejskal-Tanner equation (20):
9
ln(E(g,t)/E(0,t)) = –g2γ2δ2(2/π)2D(t)(t - δ/8 - T/6) [6]
where we have re-expressed the echo signal, E, in terms of the gradient pulse strength, g, and time, δ,
and the (2/π)2 factor accounts for the half-sine shape of the gradient pulses. T and t are defined in Fig.
2. This equation is only applicable in the limit of q = γδg > 1/L, where L is the sample length (2). As a
result, we omitted data from very low strength gradient pulses from all fits. However, we ensured the
gradient pulse strengths were not so high as to leave the Gaussian, low-q limit for which measured
ln(E(g,t)/E(0,t)) values are proportional to g2 . Deviations from this Gaussian limit usually occurred
around a maximum signal attenuation of ~ 20%, as has been previously noted (2).
We implemented the PGSTE-bp technique on two commercial NMR spectrometers. For most Xe
experiments, we used a GE Omega/CSI spectrometer (GE NMR Instruments, Fremont, CA), interfaced
to a 4.7 T magnet with clear bore of 20 cm. Experiments were performed at 55.35 MHz for 129Xe
using a tuned home-made solenoid RF coil. Applied magnetic field gradients up to 7 G/cm in strength
were available on this system. For xenon experiments on the 4 mm beads in the larger chamber cell,
and all water experiments, we used a Bruker AMX2 - based spectrometer (Bruker Instruments Inc.,
Billerica, MA) interfaced to a 4.7 T magnet. This system is equipped with a 12 cm ID gradient insert
(Bruker) capable of delivering gradient pulses of up to 26 G/cm. We employed Alderman-Grant-style
RF coils, tuned to 200.4 MHz for 1H and 55.35 MHz for 129Xe (both supplied by Nova Medical Inc.,
Wakefield, MA). All experiments were performed at room temperature.
For the PGSTE-bp measurements of Xe D(t) on both instruments, we set δ to 750 µs, the minimum
possible time without distortion of the gradient shape on the GE system. We varied the diffusion time,
t, from a minimum of 25 ms to a maximum of 3 s. We chose gradient strengths, g, to produce
significant attenuation of the 129Xe NMR signal while remaining between the high and low q regimes
described earlier. The combined timing parameters resulted in a diffusion encoding time T ~ 4 ms in
all experiments. We employed 12 different g values and a repetition time of ~ 7-8 s, while the number
of signal averaging scans ranged from 16 - 256, depending on signal linewidth, signal strength, and
diffusion time t. For water D(t) measurements, we set δ to 1 ms, and varied the diffusion time, t, from
30 ms to 4 s. We chose 16 gradient strengths, a repetition rate of ~ 8 - 12 s, and acquired 8 - 32 signal
averaging scans. The diffusion encoding time T ~ 8 - 18 ms.

10
RESULTS
Fig. 3 provides an overview of the Xe D(t) data at ~ 6 bar Xe pressure, from six different samples each
with a different bead size. The data is plotted in terms of the reduced diffusion coefficient, D(t)/D0, as
a function of normalized diffusion length, b–1 D t0 , where D0 is the free gas diffusion coefficient and b
is the bead diameter. Using this method of display, it is expected that the D(t)/ D0 data from all random
bead packs should collapse onto a single "universal" trend (1). The data is shown on two separate plots
(Figs. 3a and 3b) due to the wide range of bead sizes, and hence normalized diffusion lengths, which
vary by a factor of 40. Fig. 3a covers the larger bead sizes, 1 to 4 mm, where smaller normalized
diffusion distances are possible, and the short-time S/Vp regime can be probed carefully. Fig. 3b shows
the data for the smaller beads, 0.1 to 1 mm, where it is possible to monitor Xe diffusion over many
bead diameters, and the asymptotic value of D(t) at the tortuosity limit is easily observed. The
expected universal S/Vp and tortuosity limits for D(t) in random bead packs are shown on the figures in
dashed and solid straight lines respectively. The large bead data agree well with the short-time S/Vp
limit; whereas for smaller beads, the short-time data deviates from the calculated S/Vp line, as seen
previously (13). Conversely, the measurements for all bead sizes agree with the calculated long-time
limit to ~ 5%, where deviations likely arise from variations in packing, and hence porosity, from
sample to sample. Deviations are particularly evident in the small bead samples in Fig. 3b, where the
observed inverse tortuosity 1/α ~ 0.66 corresponds to ~ 10% greater porosity, which may arise from
non-optimum packing or static-charge-enabled clumping.
Fig. 4 shows the Xe D(t) measurements in more detail. The 6 bar Xe pressure D(t)/D0 data from each
sample is plotted separately in Fig. 4 a-f, along with the corresponding D(t)/D0 data obtained from
similar samples filled with 3 bar Xe - these data points are reproduced from ref. (30). Note that the 6
bar Xe data has better SNR than the previously acquired 3 bar Xe data because of the higher Xe
pressures, the use of isotopically enriched 129Xe, and longer signal averaging. Also included in the
plots for 0.1, 0.5, 1 and 4 mm beads is water D(t)/D0 data we acquired (0.5, 1, 4 mm) or reproduced
from ref (1) (0.1 mm). These plots show the potential for combined water and gas phase D(t)
measurements to provide complementary information over a range of length scales, from the short-t
S/Vp regime, for which the gas phase D(t) method fails with very small pores, to the long-t tortuosity
regime, which cannot generally be probed with the water D(t) measurements.

11
Each plot in Fig. 4 shows the observed tortuosity limit derived for the 6 bar Xe data, and is seen to
differ for each sample. For samples with 3 mm beads or smaller, where the 1/α limit is clearly
observed, we used the knowledge that 1/α ~ φ for random bead packs, where φ is the porosity, to
calculate a unique short-t S/Vp line for each sample using S/Vp = 6(1-φ)/(φb) (1). This provided an
indication of the short-time S/Vp limit in the small beads, where it is not necessarily observed.
However, for the 4 mm beads, the observed D(t)/D0 at both pressures lies exactly on the expected S/Vp
line at short diffusion times, while it is not clear that the correct tortuosity limit has been reached since
the data asymptotes at significantly shorter diffusion lengths than for smaller bead samples. Hence for
the 4 mm beads we estimated the inverse tortuosity, 1/α, from the observed S/Vp line and the value of φ
this yielded, rather than using the observed 1/α to estimate S/Vp as was done for all other data sets. In
addition, we used the Pade′ approximation, Eq. [4], to interpolate between the long and short t limits
for each sample (1). Because one goal of this study is to compare the Pade′ approximation to
intermediate-t D(t)/D0 measurements, we adjusted the Pade′ length, D0θ , for each sample to provide
the best fit with the short-t and long-t limits, i.e., the dashed and solid lines in each plot in Fig. 4. In
other words, we interpolated the limiting behavior at short and long times using Eq. [4], rather than
attempting to fit the intermediate-t experimental data itself. The Pade′ approximation for interpolating
between the short-t and long-t limits provides a theoretical basis for determining unknown (or using
known) structural parameters. We do not attempt to fit lines through all our observed data in all
circumstances if the fitting procedure does not yield useful structural information. Table 1 summarizes
the information about bead pack structure which we determined from the 6 bar Xe data, along with that
obtained for smaller beads from previous water D(t) NMR measurements (1).
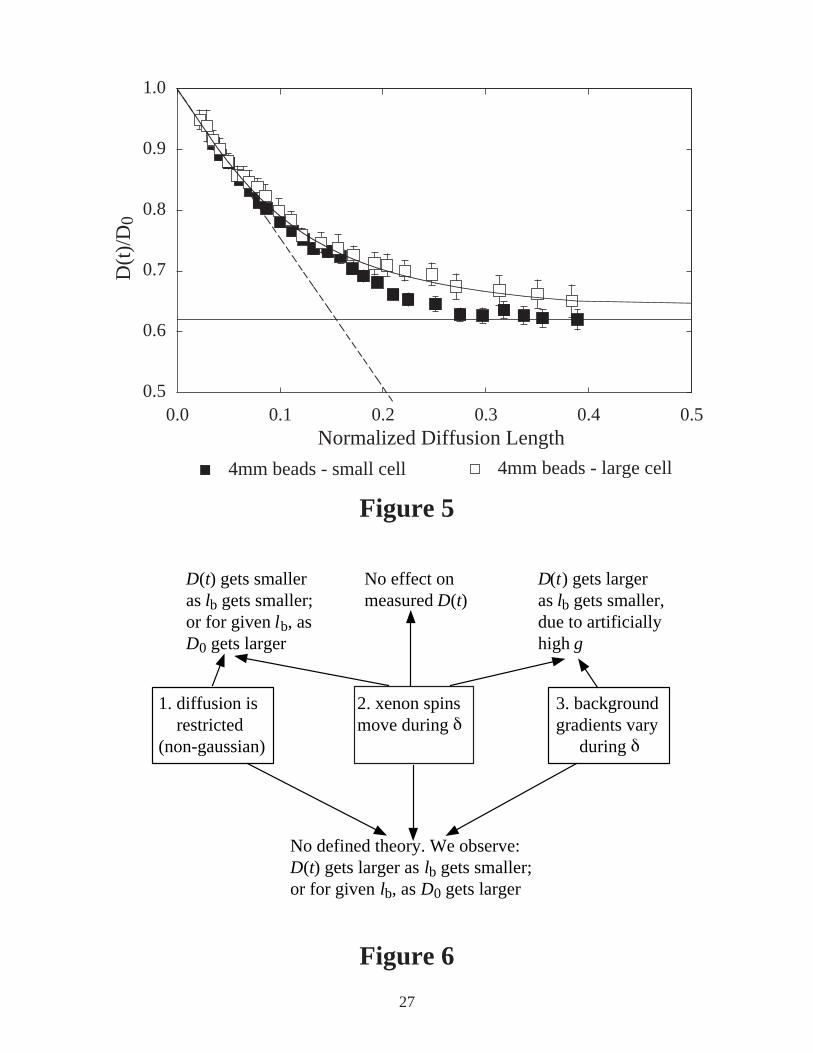
Finally, Fig. 5 shows additional Xe D(t)/D0 data from a 4 mm bead sample acquired in a larger (~ 150
cm3) sample holder. The data is contrasted to that obtained from the ~ 50 cm3 sample cell (Fig. 4a),
showing the effect of finite sample size on D(t)/D0: in smaller samples the tortuosity limit is reached
earlier, Lmacro is systematically underestimated, and deviations from the Pade′ line are observed.
DISCUSSION
The experiments reported in this paper address three key issues in gas diffusion NMR: (i) atomic
motion during the application of diffusion-encoding gradient pulses, particularly breakdown of the
12
narrow pulse approximation; (ii) the determination of intermediate and long length scale structural
information; and (iii) finite sample size effects. Here, we summarize conclusions about these issues
that can be drawn from our studies of xenon gas diffusion NMR in random packs of mono-sized beads.
The 1D Xe diffusion distance during the application of the gradient pulse is = 2 0D δ . Taking the
measured free gas diffusion coefficient, D0 = 1.36 × 10⁻⁶ m2 s-1 (12), for the xenon-oxygen mixture
used for the 3 bar Xe experiments, the 1D diffusion distance ~ 45 µm during the spectrometer’s
minimum gradient pulse time of δ = 750 µs. Additionally, the characteristic length scale of the pore
space between packed beads is approximately 1/4 the bead diameter. Therefore, during the diffusion
encoding gradient pulse, xenon atoms at 3 bar pressure traverse ~ 36% of the pore in a 0.5 mm bead
pack and ~ 18% of a pore in a 1 mm bead pack. Fukushima and co-workers have suggested (31) that
the narrow pulse approximation fails when the diffusion distance during the gradient pulse is greater
than about 14% of the pore size. Thus it is no surprise that we encountered a failure of the narrow
pulse approximation which is manifested as the D(t)/D0 data deviating from theoretical predictions for
3 bar xenon pressure in samples with beads of 1 mm diameter or smaller (see Fig. 4d-f). The narrower
necks that run off the pores between the beads may also induce similar but less dramatic effects in
larger beads (i.e., 3 bar xenon in 2 mm beads, Fig. 4c)
Increasing the xenon pressure to ~ 6.5 bar reduced D0 to ~ 0.80 × 10⁻⁶ m2 s-1 and thereby reduced the
diffusion distance during the gradient pulse. We observed a clear effect of the higher gas pressure in
the D(t)/D0 values measured at short times for both the 1 and 0.5 mm beads (Fig. 4d-e): the D(t)/D0 data
moves down and closer to the Pade′ and S/Vp lines, indicating a less severe breakdown of the narrow
pulse approximation. Hence it is clear that diffusion during the gradient pulse on a length scale
approaching that of the characteristic pore length is a significant contributor to deviations in short-time
D(t)/D0 measurements. Note also that water diffusion NMR provides an accurate measure of S/Vp.
This technique is thus complimentary to gas diffusion NMR for systems with pore sizes < 200 µm, for
which elimination of significant diffusion during the gradient pulse through increased gas pressure is
impractical (see Fig. 4d - 4f). The short-time discrepancy between the water and xenon D(t)/D0 data
seen in Figs. 4d and 4e are consistent with previous water and gas-phase D(t)/D0 measurements in
reservoir rocks (13).
Another important systematic effect of significant atomic motion during the diffusion-encoding

13
gradient pulses is a reduced effectiveness of the bi-polar stimulated echo (PGSTE-bp) sequence to
cancel background gradients. Nominally, this sequence cancels susceptibility-induced background
gradients by the application of two gradient pulses of opposite sign, separated by a 180° RF pulse,
which results in cumulative addition of the dephasing effect of the gradient pulses and subtraction of
the (assumed constant) background gradient (19,20). This cancellation relies on each spin experiencing
the same background gradient during the application of both pulses in a bi-polar pair. In the small
beads, D0δ → pore size, hence there is a high probability that the spins experience different
background gradients during the two gradient pulses. In addition, for beads of different sizes but made
with the same materials so they have identical magnetic properties, the susceptibility-induced
background gradients are inversely proportional to the bead size. Therefore, as the background
gradient at any place in the pore is a function of the distance from the pore surface, in the small beads
there is a greater chance that the variation in background gradient experienced by a spin during the
application of the bi-polar pulses will be significant. These two effects - significant diffusion across
the pore space and larger background gradients - reduce the effectiveness of the PGSTE-bp sequence in
canceling background gradients in small bead samples. This reduced effective cancellation of
background gradients causes the xenon spins to experience a larger effective applied gradient, which
results in greater signal attenuation and hence an artificially large observed D(t), as is seen in small
beads in the short time limit. In general then, as D0 (and thus D0δ ) increases, the deviation in D(t)/D0
for a given diffusion distance increases, with such deviation being greater for smaller beads.
The fact that increasing D0δ results in increased values of D(t)/D0 for a given diffusion distance is an
interesting observation, and is the opposite of what can be concluded from theoretical predictions for
E(q) vs q as a function of D0δ in the case of restricted diffusion (15-17). It has been shown by
simulation that for PGSE experiments on spins in restricted environments, the observed echo
attenuation minima (and 'diffusive diffraction' peaks (3) ) on a plot of ln(E(q)/E(0)) vs q move to higher
values of q as D0δ → the pore size, thus giving the potential for misleading pore or cell sizes to be
read from the 1/q value of the minimum. D(t) is determined from the initial slope of ln(E(q)/E(0)) vs q2
before the signal decays one order of magnitude. In the simulations, this slope, and thus D(t), decrease
as D0δ increases. By contrast, our data in Fig. 4 shows that D(t)/D0 increases as D0δ is increased.
This discrepancy arises, we believe because these theoretical studies consider a different problem - i.e.
they only consider diffusion of the spins during δ, but not that the background gradients experienced by
the spins may be changing at this time.

14
With the aim of making these different but similar, and related scenarios clearer, we have outlined three
phenomena (potential systematic effects) in a flow-chart in Fig. 6, and note the consequences for
D(t)/D0 measurements as a result of each. The three phenomena are: 1) restricted (non-Gaussian)
diffusion; 2) motion of Xe spins during δ; and 3) spins experiencing background gradients which vary
during δ . It is well known that phenomenon 2 alone has no effect on diffusion coefficient
determination if the diffusion is Gaussian (9). The prior theory discussed above (15-17) deals with the
combined effect of phenomena 1 and 2, while our explanation above outlines the case for the results
seen for phenomena 1 and 3. However, we believe the present experiment is one of the studies of the
effects of all three phenomena in a system in which all three may be significant. We conclude that the
dominant effect on the observed D(t)/D0 in our restricted gas-phase system is the varying background
gradients during δ. Thus, D(t)/D0 increases as D0δ is increased because the effect of the background
gradients varying during δ is felt by all spins within a characteristic length of the pore wall. The
restricted diffusion effects, which would result in D(t) decreasing as D0δ increases, according to (15-
17), is minor in comparison, as such effects are only realized when spins actually collide with the pore
wall, an event of much lower probability than moving near the wall.
Clearly, the power of noble gas diffusion NMR is the ability to probe very long distance sample
heterogeneity with insignificant spin depolarization, thereby permitting an accurate measurement of
tortuosity, an important parameter which cannot be measured with diffusion NMR of liquid-saturated
porous media with pores > 20 µm (2,10). It should be noted that for random bead packs, the tortuosity
(α) should be independent of bead size; however, Fig. 4 shows fine variations in tortuosity from sample
to sample. We believe these variations in α shown in Fig. 4 result from irregularities in the dense
random packing structure of the different bead packs, which were observed visually to become more
random and less dense as the bead size was reduced. In addition, as expected the observed tortuosity
does not change for a particular sample of beads as a function of the pressure of xenon gas used, except
for the 0.1 mm beads. The variation in α with gas pressure in the 0.1 mm beads may be due to
imperfect D0 calibration in the 3 bar xenon D(t) measurements, where D0 was not measured
independently (30).
It was recently suggested (32) that the observed long-time limit for D(t)/D0 (i.e. 1/α) in a given sample
geometry would be reduced with increased background gradients and imperfect cancellation of these
15
gradients by the bi-polar gradient pulses in the PGSTE-bp sequence. Our data, however, shows
incremental increases in 1/α as the bead size gets smaller (and hence the background gradients as well
as significant diffusion during the gradient pulse increase). In addition, the contention in (32) that
increased imperfect cancellation of background gradients reduces the observed long-t D(t)/D0 limit
implies that a lower 1/α should be observed for each sample with ~ 3 bar Xe pressure as compared to ~
6 bar Xe pressure. However, the plots in Fig. 4 show that the determination of tortuosity is not affected
by these changes in gas pressure (except for the 0.1 mm beads, for which a greater 1/α is found at
lower pressure). This independence of the determination of 1/α on moderate changes in gas pressure
implies that low pressure gases, or rapidly diffusing gases such as laser-polarized 3He, may be suitable
for tortuosity measurements at long diffusion times in a variety of samples. Such a capability would be
important in more complex porous media than bead packs (e.g., reservoir rocks and lung tissue) which
can have very long length-scale heterogeneity.
At intermediate diffusion times, except in the case of the 4 mm beads, the D(t)/D0 data generally lie
close to the expected Pade′ approximation line. Despite the variations in packing, which effect the
porosity, tortuosity and S/Vp from sample to sample, the normalized Pade′ length, b D−10θ , is quite
similar for the different bead packs (see Table I), with an average value of 0.132 ± 0.005. This result is
consistent with theory (1). (Note that the value of b D−10θ ~ 0.145 given in (1) for water-infused
glass beads was determined using an estimated and uncertain value for the tortuosity.)
Finally, a subtle effect is also notable in gas diffusion NMR of the larger beads: the intermediate-t
D(t)/D0 data drops below the calculated Pade′ line and reaches the tortuosity limit earlier than predicted
by the interpolation routine (see Fig. 4a). We believe this deviation from the Pade′ approximation is
due to the finite size of the sample relative to the bead size, which can invalidate the assumption of an
infinite sample used to derive Eq. [2-4] above. This finite-size hypothesis is supported by the
agreement of the D(t)/D0 data with the Pade approximation in the intermediate-t regime for a 4 mm
bead pack in a large sample container (see Fig. 5). Due to the larger volume of this additional cell and
variations in the geometrical configurations between the Bruker and GE spectrometers, the sample
length, L, along the direction of diffusion encoding was ~ 3 times longer for experiments on the large
cell than for the small cell. In the small cell, L ~ 8b while L ~ 25b in the large cell, evidently the latter
condition satisfies the condition L >> b. Footnote 1
16
CONCLUSION
Gas diffusion NMR is a powerful probe of porous media. In the current work, we have used thermally
polarized xenon imbibed in random packs of mono-sized glass beads to study three key issues of this
technique: breakdown of the narrow pulse approximation, the determination of long length scale
structural information, and finite sample size effects.
The large gas diffusion coefficient, which permits the probing of long length scales, also causes rapid
diffusion during the application of the diffusion-encoding gradient pulses. When this diffusion distance
approaches the pore size, the narrow-pulse approximation is violated and background gradient
cancellation by the PGSTE-bp technique may not be optimal. For samples containing an NMR
observable gas and pore sizes of a few hundred microns, such violations can easily occur, leading to
systematic errors in the determination of the pore surface-area-to-volume ratio, S/Vp. We have shown
that such systematic errors can be ameliorated by increasing xenon gas pressure, which in turn
decreases the unrestricted diffusion coefficient, D0, and hence reduces the diffusion distance D0δ
during a gradient pulse of time δ. The deviations are removed entirely when water is used as the NMR-
detectable medium, due to the much slower diffusion of water molecules. Breakdown of the narrow
pulse approximation in gas diffusion NMR will be particularly significant when probing structures in
samples where limited gas pressures are required: e.g., 1 bar pressure in lung tissue. Conversely, we
found that at long diffusion times, moderate changes in gas pressure, and hence D0δ , had no effect
on the observed value of D(t)/D0 in most samples. The diffusion distance at which the long-distance
(i.e., tortuosity) asymptote was reached was generally observed to be D t0 ~ 1 - 1.5 bead diameters for
all samples.
We also studied the approach of D(t)/D0 to the tortuosity asymptote. We used the Pade′ approximation
to interpolate between the short and long diffusion time limits, and found reasonable agreement with
experimental data in the intermediate t regime. The Pade′ fitting method also yielded a single fitted
parameter, θ, which for mono-sized bead packs is simply related to the bead diameter. Across a range
of bead sizes of more than an order of magnitude, we found that the Pade′ length, D0θ ~ 0.132b,
where b is the bead diameter. This value is similar to but slightly lower than the Pade′ length of 0.145b
previously determined using water D(t)/D0 measurements in very small bead packs. A challenge in
future work will be to relate D0θ to structural length scales in heterogeneous systems. Finally, we
17
found that the measured xenon D(t)/D0 reached the long-time, tortuosity limit at smaller normalized
diffusion distances for samples with larger beads, when the sample cell size was kept constant. We
confirmed that this effect resulted from the finite sample size when the experiments were carried out in
a larger sample cell.
ACKNOWLEDGEMENTS
This work was supported by the NSF, NASA, and the Smithsonian Institution.
FOOTNOTE
We note also that for the standard sized (smaller) sample container used to acquire all the data in Fig. 4,
the deviation of D(t)/D0 below the Pade′ line at intermediate times decreases and disappears as the bead
size reduces below 4 mm. However, there is still evidence of a small deviation in the 2 mm bead
sample at intermediate times that is not observed in the 3 mm beads. It is likely that such minor
deviations result from physical properties that vary from sample to sample. This may include the glass
composition and inherent paramagnetic impurity level for each type of bead - factors that will add to
variability in background gradients experienced during the measurements. In addition, variations in
packing geometry due to non-uniformity in grain size, shape defects and tilt can induce effects similar
to those manifested by finite-sample size effects.
18
REFERENCES
1. L. L. Latour, P. P. Mitra, R. L. Kleinberg and C. H. Sotak, Time-Dependent Diffusion Coefficient
of Fluids in Porous Media as a Probe of Surface-to-Volume Ratio, J. Magn. Reson. Series A 101,
342-346 (1993).
2. M. D. Hürlimann, K. G. Helmer, L. L. Latour and C. H. Sotak, Restricted Diffusion in Sedimentary
Rocks. Determination of Surface-Area-to-Volume Ratio and Surface Relaxivity J. Magn. Reson.
Series A 111, 169-178 (1994).
3. P. T. Callaghan, A. Coy, D. MacGowan, K. J. Packer, F. O. Zeyla, Diffraction-like effects in NMR
diffusion studies of fluids in porous solids, Nature 351, 467-469 (1991).
4. Y.-Q. Song, S. Ryu and P. N. Sen, Determining multiple length scales in rocks, Nature 406, 178-
181 (2000).
5. D. G. Cory and A. N. Garroway, Measurement of translational displacement probabilities by NMR:
an indicator of compartmentation, Magn. Reson. Med. 14, 435-444 (1990).
6. Y. Cheng and D. G. Cory, Multiple Scattering by NMR, J. Am. Chem. Soc. 121, 7935-7936 (1999).
7. S. Stapf, K. J. Packer, R. G. Graham, J.-F. Thovert and P. M. Adler, Spatial correlations and
dispersion for fluid transport through packed glass beads studied by pulsed field-gradient NMR,
Phys. Rev. E. 58, 6206-6221 (1998).
8. E. O. Stejskal and J. E. Tanner, Spin diffusion measurements: Spin echoes in the presence or a
time-dependent field gradient, J. Chem. Phys. 42, 288-292 (1965).
9. P. T. Callaghan, "Principles of Nuclear Magnetic Resonance Microscopy," Oxford University
Press, Oxford (1991).
10. L. L. Latour, R. L. Kleinberg, P. P. Mitra and C. H. Sotak, Pore-Size Distributions and Tortuosity
in Heterogeneous Porous Media, J. Magn. Reson. Series A 112, 83-91 (1995).
11. D. L. Johnson and P. N. Sen, Dependence of the conductivity of a porous medium on the electrolyte
conductivity, Phys. Rev. B. 37, 3502-3510 (1988).
12. R. W. Mair, D. G. Cory, S. Peled, C.-H. Tseng, S. Patz and R. L. Walsworth, Pulsed-field-gradient
measurements of time-dependent gas diffusion. J. Magn. Reson. 135, 478-486 (1998).
13. R. W. Mair, G. P. Wong, D. Hoffmann, M. D. Hürlimann, S. Patz, L. M. Schwartz and R. L.
Walsworth, Probing porous media with gas-diffusion NMR, Phys. Rev. Lett. 83, 3324-3327 (1999).
14. T. G. Walker and W. Happer, Spin-exchange optical pumping of noble-gas nuclei, Rev. Mod. Phys.
69, 629-642 (1997).
19
15. A. Coy and P. T. Callaghan, Pulsed gradient spin echo nuclear magnetic resonance for molecules
diffusing between partially reflecting rectangular barriers, J. Chem. Phys. 101, 4599-4609 (1994).
16. M. H. Blees, The Effect of Finite Duration of Gradient Pulses on the Pulsed-Field-Gradient NMR
Method for Studying Restricted Diffusion, J. Magn. Reson. Series A 109, 203-209 (1994).
17. P. P. Mitra and B. I. Halperin, Effects of finite gradient-pulse widths in pulsed-field-gradient
diffusion measurements, J. Magn. Reson. Series A 113, 94-101 (1995).
18. P. T. Callaghan, A Simple Matrix Formalism for Analysis of Restricted Diffusion under
Generalized Gradient Waveforms, J. Magn. Reson. 129, 74-84 (1997).
19. R. M. Cotts, M. J. R. Hoch, T. Sun and J. T. Markert, Pulsed Field Gradient Stimulated Echo
Methods for Improved NMR Diffusion Measurements in Heterogeneous Systems, J. Magn. Reson.
83, 252-266 (1989).
20. L. L. Latour, L. Li and C. H. Sotak, Improved PFG stimulated-echo method for the measurment of
diffusion in inhomogeneous fields, J. Magn. Reson. Series B 101, 72-77 (1993).
21. P. P. Mitra, P. N. Sen, L. M. Schwartz and P. L. Doussal, Diffusion Propagator as a Probe of the
Structure of Porous Media, Phys. Rev. Lett. 68, 3555-3558 (1992).
22. P. P. Mitra, P. N. Sen and L. M. Schwartz, Short-time behavior of the diffusion coefficient as a
geometrical probe of porous media, Phys. Rev. B. 47, 8565-8574 (1993).
23. J. Bear, "Dynamics of Fluids in Porous Media," Elsevier Inc., New York (1972).
24. P. N. Sen, L. M. Schwartz, P. P. Mitra and B. I. Halperin, Surface relaxation and the long-time
diffusion coefficient in porous media: Periodic geometries, Phys. Rev. B. 49, 215-225 (1994).
25. T. M. De Swiet and P. N. Sen. Time dependent diffusion coefficient in a disordered medium, J.
Chem. Phys. 104, 206-219 (1996).
26. R. L. Vold, J. S. Waugh, M. P. Klein and D. E. Phelps, Measurement of spin relaxation in complex
systems, J. Chem. Phys. 48, 3831-3832 (1968).
27. C. J. Jameson, A. K. Jameson and J. K. Hwang, Nuclear spin relaxation by intermolecular dipole
coupling in the gas phase. 129Xe in oxygen, J. Chem. Phys., 89, 4074-4081 (1988).
28. R. W. Mair, D. Hoffmann, S. Sheth, G. P. Wong, J. P. Butler, S. Patz, G. Topulos and R. L.
Walsworth, Reduced Xenon Diffusion for Quantitative Lung Study - The Role of SF6, NMR in
Biomedicine 13, 229-233 (2000).
29. M. D. Hürlimann, Effective Gradients in Porous Media Due to Susceptibility Differences, J. Magn.
Reson. 131, 232-240 (1998).
20
30. R. W. Mair, M. D. Hürlimann, P. N. Sen, L. M. Schwartz, S. Patz and R.L. Walsworth, Tortuosity
Measurement and the Effects of Finite Pulse Widths on Xenon Gas Diffusion NMR Studies of
Porous Media, Magn. Reson. Imaging, 19, 345-351 (2001).
31. L. Z. Wang, A. Caprihan and E. Fukushima, The narrow-pulse criterion for pulsed-gradient spin-
echo diffusion measurements, J. Magn. Reson. Series A 117, 209-219 (1995).
32. J. G. Seland, G. H. Humborstad, K. Zick and B. Hafskjold, Diffusion Measurements at Long
Observations Times in the Presence of Spatially Variable Internal Magnetic Field Gradients, J.
Magn. Reson.146, 14-19 (2000).

21
FIGURE CAPTIONS
Table 1. Summary of porosity, φ, inverse tortuosity, 1/α, pore surface area-to-volume ratio, S/Vp, Pade′
fitting parameter, θ, free diffusion coefficient, D0, and normalized Pade′ length, b D−10θ derived from
Xe gas D(t) data at ~ 6 bar pressure in all samples. Similar data for water D(t) experiments in small
beads is reproduced from Ref. (1).
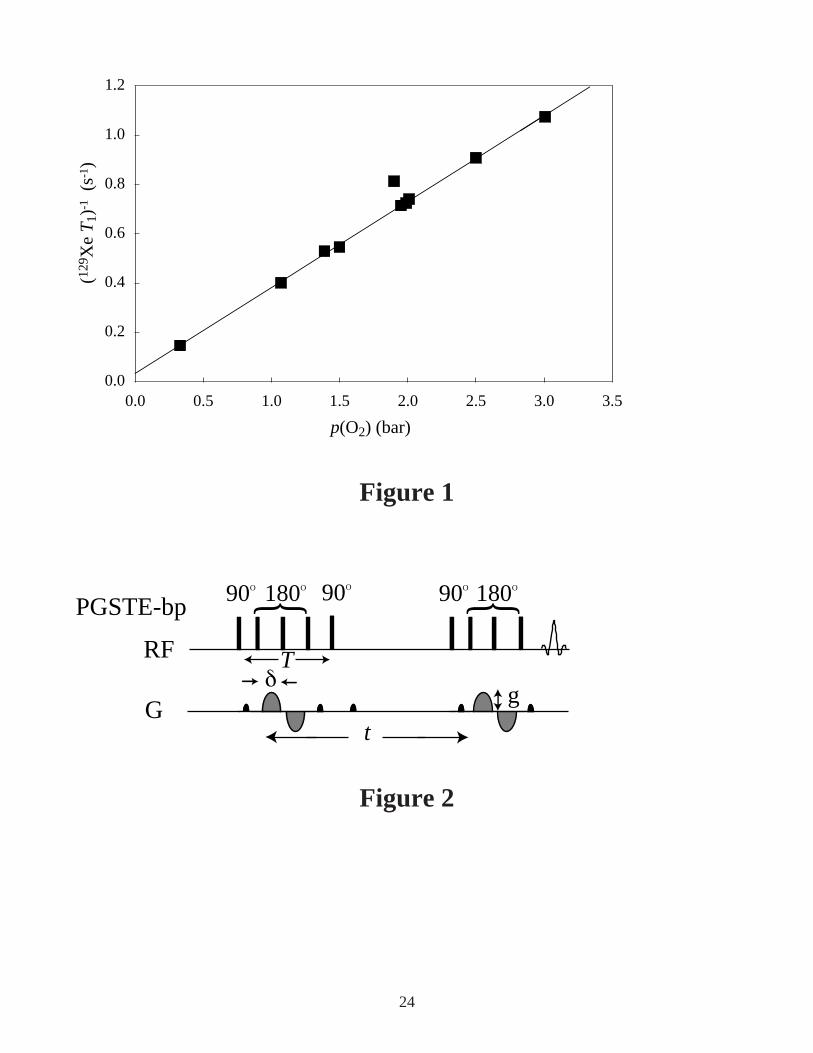
Fig. 1. Measured 129Xe T1-1 as a function of O2 partial pressure for samples of a few bar of Xe and O2.
The fitted line is a regression analysis omitting the one outlying point, and was used to derive the
empirical relation between 129Xe T1 and pO2. Error bars are the same size or smaller than the data
symbols.
Fig. 2. Pulse sequence diagram for the Pulsed Gradient Stimulated Echo (PGSTE-bp) with alternating
bi-polar gradient pulses, as used in this work. The diffusion encoding gradient pulses, of length δ and
strength g, are shown in gray, while crusher gradients are shown in black. The diffusion time is
denoted t and the total diffusion encoding time is T. See text for further description.
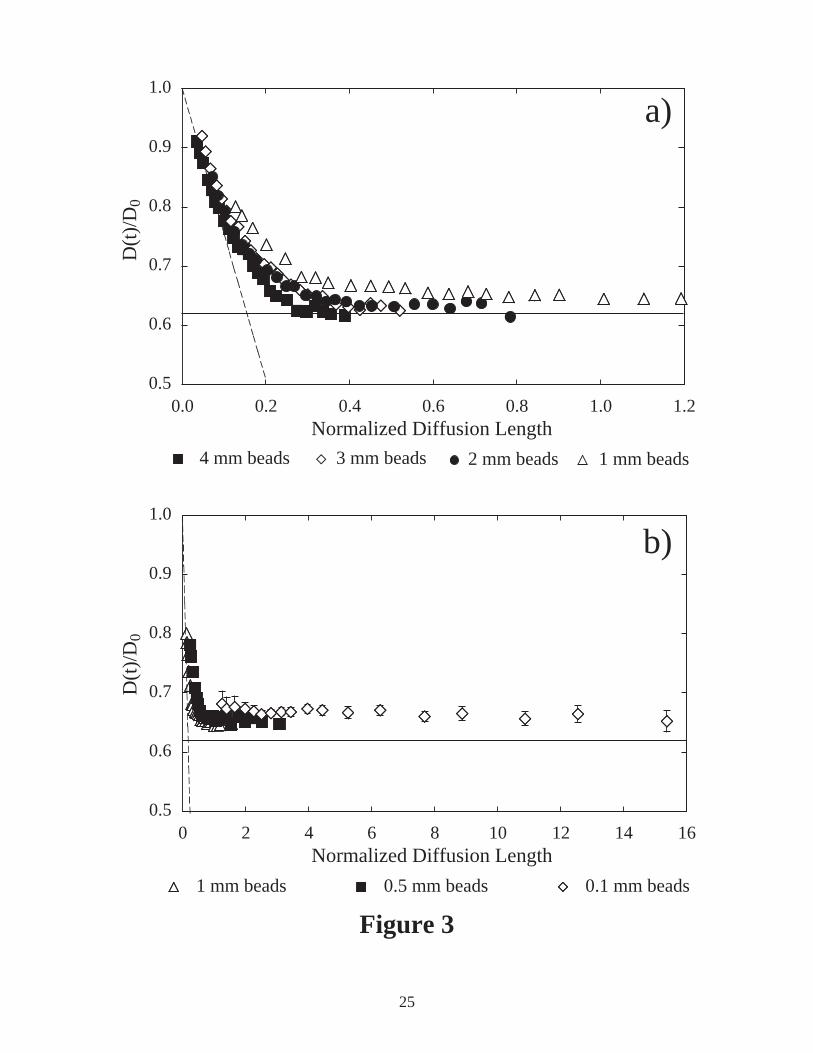
Fig. 3. Time-dependent diffusion measurements for thermally polarized xenon gas at ~ 6 bar pressure
imbibed in randomly packed spherical glass bead samples. Each sample contains beads of a uniform
diameter. The 129Xe time-dependent diffusion coefficient is normalized to the free gas diffusion
coefficient, D0, and plotted versus normalized diffusion length in units of bead diameters, b–1 D t0 ,
where b is the bead diameter. The calculated limits at short-t (S/Vp) and long-t (tortuosity) are shown
by the dashed and solid lines respectively, for an idealized sample of porosity φ = 0.38, 1/α = φ =
0.62, S/Vp = 6(1-φ)/(φb) = 9.79/b. (a) Xenon diffusion in packs of 1, 2, 3 and 4 mm beads. (b) Xenon
diffusion in packs of 0.1, 0.5 and 1 mm beads, showing diffusion over distances exceeding many bead
diameters. Example error bars for all samples are shown only for the 0.1 mm beads data series.
Fig. 4. 129Xe time-dependent diffusion measurements, D(t), for two different xenon gas pressures in
samples of randomly packed spherical glass beads. D(t) was measured at imbibed Xe gas pressures of
~ 6 bar (black squares) and 3 bar (white squares). The 3 bar pressure data is reproduced from ref. (30).
For 0.1, 0.5, 1 and 4 mm bead samples, water D(t) data is also shown (white circles). The water data
for 0.1 mm beads is reproduced from ref. (1), but otherwise was measured for this work. As in Fig. 3,
22
D(t)/D0 is plotted against b–1 D t0 , in bead diameters. The short-t and long-t limits for D(t)/D0 are
derived from the 6 bar Xe data, and are shown by the dashed and solid lines respectively. For each
sample, the tortuosity is derived from the measured D(t)/D0 asymptote, and then related to the porosity
(1/α ~ φ ), from which the expected S/Vp is derived in order to plot the dashed line. Additionally for
each plot, the Pade′ approximation, shown by a curved line, has been evaluated (Eq. [4]) using the
value of D0θ that extrapolates to the long and short-t limits over the longest diffusion distance. Error
bars are shown on the ~ 6 bar data only when they significantly exceed the size of the data symbols.
(a) 4 mm bead sample. (b) 3 mm bead sample. (c) 2 mm bead sample. (d) 1 mm bead sample. (e) 0.5
mm bead sample. (f) 0.1 mm bead sample.
Fig. 5. Exploration of finite sample size effects in 129Xe time-dependent diffusion measurements, D(t).
Randomly packed spherical 4 mm diameter glass beads were held in two different sample containers: a
small cell of ~ 50 cm3 (black squares) and a large cell of ~ 150 cm3 (white squares). For both samples,
D(t) was measured at imbibed Xe gas pressures of ~ 6.5 bar. Once again, D(t)/D0 is plotted against
b–1 D t0 , in bead diameters. The data from the small cell, the short-t and long-t limits for D(t)/D0 , as
well as the Pade′ approximation, are the same as that shown in Fig. 4a) for 6.41 bar of Xe. In the larger
sample cell the Xe D(t)/D0 data agrees well with the Pade′ approximation approach to the tortuosity
limit. However, in the smaller cell, a significant deviation from the Pade′ line can be seen: the
tortuosity limit is reached earlier. Thus finite sample size effects can induce a systematic underestimate
of Lmacro, the largest structural length scale in the pore geometry.
Fig. 6. Hypothesized three phenomena that can effect the measurement of D(t)/D0 using the PGStE-bp
NMR technique. The effect of spin movement during δ (phenomenon 2) in the measurement of free
diffusion, and in the case or restricted diffusion (phenomena 1 and 2 combined) is well known. Our
current study presents a sample in which all three phenomena occur. lb refers to the characteristic
length scale of the bead, which could be taken as either the bead diameter or pore size between beads.

23
bead diameter(mm) φ 1/α b (S/Vp) θ (s) D0 (m2s-1) b D−10θ
Xenon gas
b = 4 0.38 0.62 9.79 0.34 8.08×10⁻⁷ 0.131
b = 3 0.38 0.62 9.79 0.18 8.12×10⁻⁷ 0.127
b = 2 0.39 0.63 9.19 0.085 8.20×10⁻⁷ 0.132
b = 1 0.41 0.64 8.42 0.022 8.13×10⁻⁷ 0.134
b = 0.5 0.42 0.65 8.22 0.006 7.92×10⁻⁷ 0.138
b = 0.1 0.44 0.66 7.57 0.00022 7.88×10⁻⁷ 0.132
Water
b = 0.1 0.41 0.64 8.65 0.12 1.76×10⁻⁹ 0.145
b = 0.05 0.41 0.64 8.65 0.03 1.77×10⁻⁹ 0.146
Table 1
24
0.0
0.2
0.4
0.6
0.8
1.0
1.2
0.0 0.5 1.0 1.5 2.0 2.5 3.0 3.5
p(O2) (bar)
(129
Xe
T1)
-1 (
s-1)
Figure 1
RF
Gg
δ
90O 90O90O 180O 180O
PGSTE-bp } }
t
T
Figure 2
25
0.5
0.6
0.7
0.8
0.9
1.0
0.0 0.2 0.4 0.6 0.8 1.0 1.2Normalized Diffusion Length
D(t
)/D
0
4 mm beads 3 mm beads 2 mm beads 1 mm beads
a)
0.5
0.6
0.7
0.8
0.9
1.0
0 2 4 6 8 10 12 14 16Normalized Diffusion Length
D(t
)/D
0
1 mm beads 0.5 mm beads 0.1 mm beads
b)
Figure 3

26
0.5
0.6
0.7
0.8
0.9
1.0
0.0 0.1 0.2 0.3 0.4 0.5Normalized Diffusion Length
D(t
)/D
0
4mm - 6.41 bar Xe 4mm - 3 bar Xe 4mm - water
a)
0.5
0.6
0.7
0.8
0.9
1.0
0.0 0.2 0.4 0.6 0.8Normalized Diffusion Length
D(t
)/D
0
2mm - 6.24 bar Xe 2mm - 3 bar Xe
c)
0.5
0.6
0.7
0.8
0.9
1.0
0.0 0.2 0.4 0.6Normalized Diffusion Length
D(t
)/D
0
3mm - 6.41 bar Xe 3mm - 3 bar Xe
b)
0.5
0.6
0.7
0.8
0.9
1.0
0 2 4 6 8 10 12 14 16Normalized Diffusion Length
D(t
)/D
0
0.1 mm - 6.60 bar Xe 0.1mm - 3 bar Xe 0.1 mm - water
f)
d)
0.5
0.6
0.7
0.8
0.9
1.0
0.0 0.4 0.8 1.2 1.6Normalized Diffusion Length
D(t
)/D
0
1mm - 6.38 bar Xe 1mm - 3 bar Xe 1mm - water
e)
0.5
0.6
0.7
0.8
0.9
1.0
0.0 0.4 0.8 1.2 1.6 2.0 2.4 2.8 3.2Normalized Diffusion Length
D(t
)/D
0
0.5 mm - 6.58 bar Xe 0.5mm - 3 bar Xe 0.5mm - water
Figure 4
27
0.5
0.6
0.7
0.8
0.9
1.0
0.0 0.1 0.2 0.3 0.4 0.5Normalized Diffusion Length
D(t
)/D
0
4mm beads - small cell 4mm beads - large cell
Figure 5
3. backgroundgradients vary
during δ
2. xenon spinsmove during δ
1. diffusion is restricted(non-gaussian)
No effect onmeasured D(t)
D(t) gets largeras lb gets smaller,due to artificiallyhigh g
D(t) gets smalleras lb gets smaller;or for given lb, asD0 gets larger
No defined theory. We observe:D(t) gets larger as lb gets smaller;or for given lb, as D0 gets larger
Figure 6