The Monkey game: A computerized verbal working memory task for self-reliant administration in...
16
The Monkey game: A computerized verbal working memory task for self-reliant administration in primary school children Eva Van de Weijer-Bergsma 1 & Evelyn H. Kroesbergen 1 & Shahab Jolani 2 & Johannes E. H. Van Luit 1 # The Author(s) 2015. This article is published with open access at Springerlink.com Abstract In two studies, the psychometric properties of an online self-reliant verbal working memory task (the Monkey game) for primary school children (6–12 years of age) were examined. In Study 1, children (n = 5,203) from 31 primary schools participated. The participants completed computer- ized verbal and visual–spatial working memory tasks (i.e., the Monkey game and the Lion game) and a paper-and- pencil version of Raven’ s Standard Progressive Matrices. Reading comprehension and math achievement test scores were obtained from the schools. First, the internal consistency of the Monkey game was examined. Second, multilevel modeling was used to examine the effects of classroom mem- bership. Multilevel multivariate regression analysis was used to examine the Monkey game’ s concurrent relationship with the Lion game and its predictive relationships with reading comprehension and math achievement. Also, age-related dif- ferences in performance were examined. In Study 2, the con- current relationships between the Monkey game and two tester-led computerized working memory tasks were further examined (n = 140). Also, the 1- and 2-year stability of the Monkey game was investigated. The Monkey game showed excellent internal consistency, good concurrent relationships with the other working memory measures, and significant age differences in performance. Performance on the Monkey game was also predictive of subsequent reading comprehen- sion and mathematics performance, even after controlling for individual differences in intelligence. Performance on the Monkey game was influenced by classroom membership. The Monkey game is a reliable and suitable instrument for the online computerized and self-reliant assessment of verbal working memory in primary school children. Keywords Verbal working memory . Psychometric properties . Children . Computerized assessment Working memory is the ability to temporarily store and ma- nipulate information simultaneously and is considered an im- portant predictor for academic performance in areas such as reading (De Weerdt, Desoete, & Roeyers, 2013; Gathercole, Alloway, Willis, & Adams, 2006; Swanson, Xinhua, & Jerman, 2009) and mathematics (Bull, Espy, & Wiebe, 2008; Friso-van den Bos, Van der Ven, Kroesbergen, & Van Luit, 2013; Geary, Hoard, Byrd-Craven, Nugent, & Numtee, 2007; Swanson, 2006; Swanson, Jerman, & Zheng, 2008; Toll, Van der Ven, Kroesbergen, & Van Luit, 2011). Children who are better able to hold relevant information in mind and manipu- late this information have an advantage in integrating infor- mation from different passages while reading a written text, as well as an advantage in choosing and carrying out strategies while solving math problems. Working memory in children is usually assessed with computer- or paper-and-pencil tests in a one-to-one testing situation led by a test assistant, which is very time-consuming and costly. Computerized (online) working memory tests that can be administered self-reliantly or in groups could be of great value for studying working memory in large-sample studies. The aim of this study was to investigate the psychometric properties of a verbal working memory task for self-reliant (group) administration in primary school children. * Eva Van de Weijer-Bergsma [email protected] 1 Department of Pedagogical and Educational Sciences, Utrecht University, P.O. Box 80140, 3508 TC Utrecht, The Netherlands 2 Department of Methodology and Statistics, Utrecht University, Utrecht, The Netherlands Behav Res DOI 10.3758/s13428-015-0607-y
-
Upload
independent -
Category
Documents
-
view
0 -
download
0
Transcript of The Monkey game: A computerized verbal working memory task for self-reliant administration in...

The Monkey game: A computerized verbal working memory taskfor self-reliant administration in primary school children
Eva Van de Weijer-Bergsma1 & Evelyn H. Kroesbergen1&
Shahab Jolani2 & Johannes E. H. Van Luit1
# The Author(s) 2015. This article is published with open access at Springerlink.com
Abstract In two studies, the psychometric properties of anonline self-reliant verbal working memory task (the Monkeygame) for primary school children (6–12 years of age) wereexamined. In Study 1, children (n = 5,203) from 31 primaryschools participated. The participants completed computer-ized verbal and visual–spatial working memory tasks (i.e.,the Monkey game and the Lion game) and a paper-and-pencil version of Raven’s Standard Progressive Matrices.Reading comprehension and math achievement test scoreswere obtained from the schools. First, the internal consistencyof the Monkey game was examined. Second, multilevelmodeling was used to examine the effects of classroom mem-bership. Multilevel multivariate regression analysis was usedto examine the Monkey game’s concurrent relationship withthe Lion game and its predictive relationships with readingcomprehension and math achievement. Also, age-related dif-ferences in performance were examined. In Study 2, the con-current relationships between the Monkey game and twotester-led computerized working memory tasks were furtherexamined (n = 140). Also, the 1- and 2-year stability of theMonkey game was investigated. The Monkey game showedexcellent internal consistency, good concurrent relationshipswith the other working memory measures, and significant agedifferences in performance. Performance on the Monkeygame was also predictive of subsequent reading comprehen-sion and mathematics performance, even after controlling for
individual differences in intelligence. Performance on theMonkey game was influenced by classroom membership.The Monkey game is a reliable and suitable instrument forthe online computerized and self-reliant assessment of verbalworking memory in primary school children.
Keywords Verbal workingmemory . Psychometricproperties . Children . Computerized assessment
Working memory is the ability to temporarily store and ma-nipulate information simultaneously and is considered an im-portant predictor for academic performance in areas such asreading (De Weerdt, Desoete, & Roeyers, 2013; Gathercole,Alloway, Willis, & Adams, 2006; Swanson, Xinhua, &Jerman, 2009) and mathematics (Bull, Espy, & Wiebe, 2008;Friso-van den Bos, Van der Ven, Kroesbergen, & Van Luit,2013; Geary, Hoard, Byrd-Craven, Nugent, & Numtee, 2007;Swanson, 2006; Swanson, Jerman, & Zheng, 2008; Toll, Vander Ven, Kroesbergen, & Van Luit, 2011). Children who arebetter able to hold relevant information in mind and manipu-late this information have an advantage in integrating infor-mation from different passages while reading a written text, aswell as an advantage in choosing and carrying out strategieswhile solving math problems. Working memory in children isusually assessed with computer- or paper-and-pencil tests in aone-to-one testing situation led by a test assistant, which isvery time-consuming and costly. Computerized (online)working memory tests that can be administered self-reliantlyor in groups could be of great value for studying workingmemory in large-sample studies. The aim of this study wasto investigate the psychometric properties of a verbal workingmemory task for self-reliant (group) administration in primaryschool children.
* Eva Van de [email protected]
1 Department of Pedagogical and Educational Sciences, UtrechtUniversity, P.O. Box 80140, 3508 TC Utrecht, The Netherlands
2 Department of Methodology and Statistics, Utrecht University,Utrecht, The Netherlands
Behav ResDOI 10.3758/s13428-015-0607-y
Working memory is generally viewed as a multicompo-nent system, in which domain-specific storage and rehearsalcomponents or processes interact with a domain-general at-tentional control component (Baddeley, 2000; Baddeley &Hitch, 1974; Engle, 2002; Engle, Tuholski, Laughlin, &Conway, 1999; Kane, Hambrick, Tuholski, Wilhelm, Payne,& Engle, 2004). Baddeley’s model of working memory, forexample—which is the most frequently referred-to model—includes the central executive, phonological loop, visuospa-tial sketchpad, and episodic buffer (Baddeley, 2000;Baddeley & Hitch, 1974). The central executive is adomain-general attentional control system involved in sever-al processes, such as the selection and execution of strate-gies, monitoring of input, retrieval of information from long-term memory, storing and processing of information, andcoordination of the other components of the working mem-ory system. The two domain-specific slave systems, the pho-nological loop and the visuospatial sketchpad, involve thetemporary storage and rehearsal of phonological and audito-ry information and visual and spatial information, respec-tively. The episodic buffer—a temporary storage system thatis responsible for the integration of information from a va-riety of sources—is the third slave system (Baddeley, 2000).The functioning of the phonological loop and the visuospa-tial sketchpad is typically measured using simple span tasks,in which increasingly longer strings of information are im-mediately recalled without further processing. The function-ing of the central executive is usually measured with com-plex span tasks, requiring the storage as well as the process-ing or manipulation of information (Kail & Hall, 2001). Inother words, working memory can be distinguished fromshort-term memory, which only involves the temporary stor-age of information by the slave systems, whereas workingmemory involves the storage as well as processing of infor-mation. Although the central executive is a domain-generalcomponent of working memory, the tasks used to assess itsfunctioning also tap into one (or both) of the domain-specific slave systems. According to Engle and colleagues(Engle, 2002; Engle et al., 1999; Kane et al., 2004), workingmemory capacity is mainly determined by the domain-general executive component. Using a latent-variable ap-proach with an adult sample, Kane et al. (2004) found thata two-factor working memory model with separable verbaland spatial factors provided the best fit. However, the largeproportion of variance shared between the two factors(70 %) indicated that performance on working memory tasksis primarily determined by a domain-general mechanism.So, even though the domain-specific storage componentsalso play roles, the shared variance between measures ofworking memory primarily reflects the contribution of thedomain-general executive component according to this view.Nevertheless, the multicomponent nature of these workingmemory models allows researchers to examine whether the
contributions of different subcomponents vary as a functionof, for example, age or the academic domain investigated.
Although the central executive component of workingmem-ory is domain-general, reading comprehension seems to bemore strongly related to verbal than to visual–spatial workingmemory tasks (Seigneuric, Ehrlich, Oakhill, & Yuill, 2000). Inorder to comprehend a written text as a coherent whole, chil-dren have to integrate neighboring passages and need to makeinferences about different events, actions, and states. Verbalworking memory allows children to hold the most recently readpropositions in mind while establishing coherence, and alsoallows children to retrieve information (e.g., from the text orprior knowledge) from long-term memory for integration withthe current text (Cain, Oakhill, & Bryant, 2004). Although vi-sual–spatial working memory tasks also have been found to berelated to reading, Savage, Lavers, and Pillay (2007) argued intheir review of the literature that previous findings of visual–spatial working memory deficits in reading problems are prob-ably the result of sampling issues (e.g., the comorbidity of read-ing difficulties and other learning difficulties; Savage et al.,2007). Indeed, a recent meta-analysis indicated that deficits inthe phonological loop and central executive most prominentlyunderlie reading difficulties in children with average intelli-gence (Swanson et al., 2009). Mathematics performance andlearning, on the other hand, has been shown to be related toperformance on both visual–spatial and verbal working mem-ory tasks (De Smedt, Janssen, Bouwens, Verschaffel, Boets, &Ghesquière, 2009; Friso-van den Bos et al., 2013; Imbo &Vandierendonck, 2007; Swanson, 2006; Toll et al., 2011; Vander Ven, Van der Maas, Straatemeier, & Jansen, 2013). Solvingmathematical problems may elicit visual–spatial as well as ver-bal representations and strategies, which vary with age and thetype of math test that is used (Friso-van den Bos et al., 2013;Raghubar, Barnes, & Hecht, 2010). In sum, whereas perfor-mance on visual–spatial working memory tasks is mainly relat-ed to mathematics achievement, performance on verbal work-ing memory tasks seems to be related to both mathematicsachievement and reading comprehension (Geary, 2011).
A domain-general ability that is strongly related to workingmemory and also influences academic achievement is intelli-gence (Geary, 2011). Despite the finding that working mem-ory measures and measures of intelligence share substantialvariance, they are considered distinct constructs (Conway,Cowan, Bunting, Therriault, & Minkoff, 2002; Engle et al.,1999; Kane et al., 2004).
Online working memory assessment
Although working memory can be assessed with a wide vari-ety of measures, standardized performance-based tests (e.g.,paper-and-pencil or computerized) give a more objective rep-resentation of the differences between individuals than do
Behav Res
behavioral ratings (Alloway, Gathercole, Kirkwood, & Elliott,2009; Mahone et al., 2002; Mangeot, Armstrong, Colvin,Yeates, & Taylor, 2002; Toplak, Bucciarelli, Jain, & Tannock,2008; Vriezen & Pigott, 2002). Since standardizedperformance-based test assessment in a one-to-one testing sit-uation is very time-consuming and costly, a growing numberof computerized (online) workingmemory tests can be admin-istered self-reliantly or in groups. Although researchers haveless control over behavioral assessment when using self-reliant online assessment, online assessment also provides re-searchers the possibility to collect data in much larger samplesthan in more controlled settings (Van de Weijer-Bergsma,Kroesbergen, Prast, & Van Luit, 2014; Van der Ven et al.,2013). The feasibility of computerized or online self-reliantworking memory tasks has been shown in adults (De Neys,d’Ydewalle, Schaeken, & Vos, 2002; Pardo-Vázquez &Fernández-Rey, 2008), as well as in primary school children(Van de Weijer-Bergsma et al., 2014; Van der Ven et al.,2013). To the best of our knowledge, previous studies withprimary school children have focused on visual–spatial work-ing memory tasks (Van de Weijer-Bergsma et al., 2014; Vander Ven et al., 2013), whereas self-reliant assessment of verbalworking memory tasks has not yet been examined.
Assessment of verbal working memory in children
Verbal working memory in children is usually assessed usingcomplex span tasks (e.g., reading span, counting recall, listen-ing recall), n-back tasks (e.g., letter memory), or backwardspan tasks (e.g., digit span backward, word span backward).
In complex span tasks, participants have to perform a task—for example, reading sentences and verifying their logical accu-racy while remembering the last word from each sentence with-in a set, or counting objects and remembering the total in eachset of objects. After the set of items (e.g., sentences or counts)within one trial is finished, recall of the remembered words ortotal counts is prompted. The task difficulty is increased byincreasing the number of items within one set. Obviously, be-cause young children are only starting to learn how to read fromthe beginning of primary school, sentence-reading tasks are notvery suitable for children in early primary school.
In n-back tasks, participants are presented with a varyingnumber of stimuli (e.g., letters, words) and are asked to rec-ognize whether the last stimulus was the same as the onepresented n stimuli previously (where n is usually 1, 2, or 3),or are asked to recall the last n (e.g., 4) words of the list after alist has ended. Such tasks require participants to update the lastn stimuli, since the participants do not know when a set willend. It should be noted that the concurrent validity of n-backtasks using recognition with other working memory measureshas not been shown in adults (Jaeggi, Buschkuehl, Perrig, &Meier, 2010; Kane, Conway, Miura, & Colflesh, 2007), and is
therefore questioned. N-back tasks using recall have beenfound to show stronger associations with complex span tasks(Shelton, Elliott, Matthews, Hill, & Gouvier, 2010; Shelton,Metzger, & Elliott, 2007).
Backward span tasks generally begin with a short list ofverbal items to remember, with the number of items increasingover successive trials in order to increase working memoryload. After the items within a given set are presented, the par-ticipant is prompted to recall the items in a backward fashion.Although some studies with adult samples have suggested thatbackward span tasks are measures of short-termmemory, ratherthan working memory, since they only require a mental trans-formation of the order of the verbal materials (Cantor, Engle, &Hamilton, 1991; Engle et al., 1999), others have found thatmere sequence transformation could be sufficient to tap intoworking memory (Oberauer, Süß, Schulze, Wilhelm, &Wittmann, 2000). Moreover, in children, even simple spantasks may require more executive processing, since sequencingthe order of items may be less proceduralized in children(Hutton&Towse, 2001). Several studies have shown that back-ward span tasks require executive processing in children, andcan therefore be considered a measure of working memoryduring childhood (Alloway, Gathercole, & Pickering, 2006;Gathercole, Brown, & Pickering, 2003).
Development and characteristics of the Monkeygame
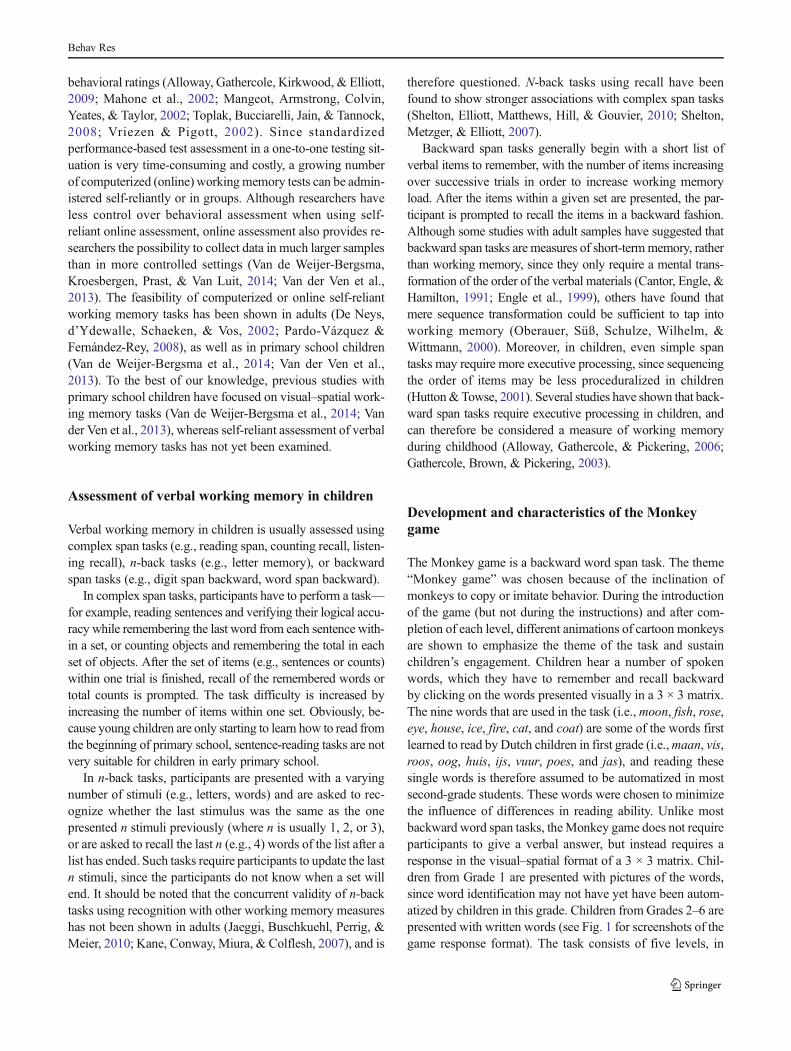
The Monkey game is a backward word span task. The theme“Monkey game” was chosen because of the inclination ofmonkeys to copy or imitate behavior. During the introductionof the game (but not during the instructions) and after com-pletion of each level, different animations of cartoon monkeysare shown to emphasize the theme of the task and sustainchildren’s engagement. Children hear a number of spokenwords, which they have to remember and recall backwardby clicking on the words presented visually in a 3 × 3 matrix.The nine words that are used in the task (i.e.,moon, fish, rose,eye, house, ice, fire, cat, and coat) are some of the words firstlearned to read by Dutch children in first grade (i.e.,maan, vis,roos, oog, huis, ijs, vuur, poes, and jas), and reading thesesingle words is therefore assumed to be automatized in mostsecond-grade students. These words were chosen to minimizethe influence of differences in reading ability. Unlike mostbackward word span tasks, theMonkey game does not requireparticipants to give a verbal answer, but instead requires aresponse in the visual–spatial format of a 3 × 3 matrix. Chil-dren from Grade 1 are presented with pictures of the words,since word identification may not have yet have been autom-atized by children in this grade. Children from Grades 2–6 arepresented with written words (see Fig. 1 for screenshots of thegame response format). The task consists of five levels, in
Behav Res
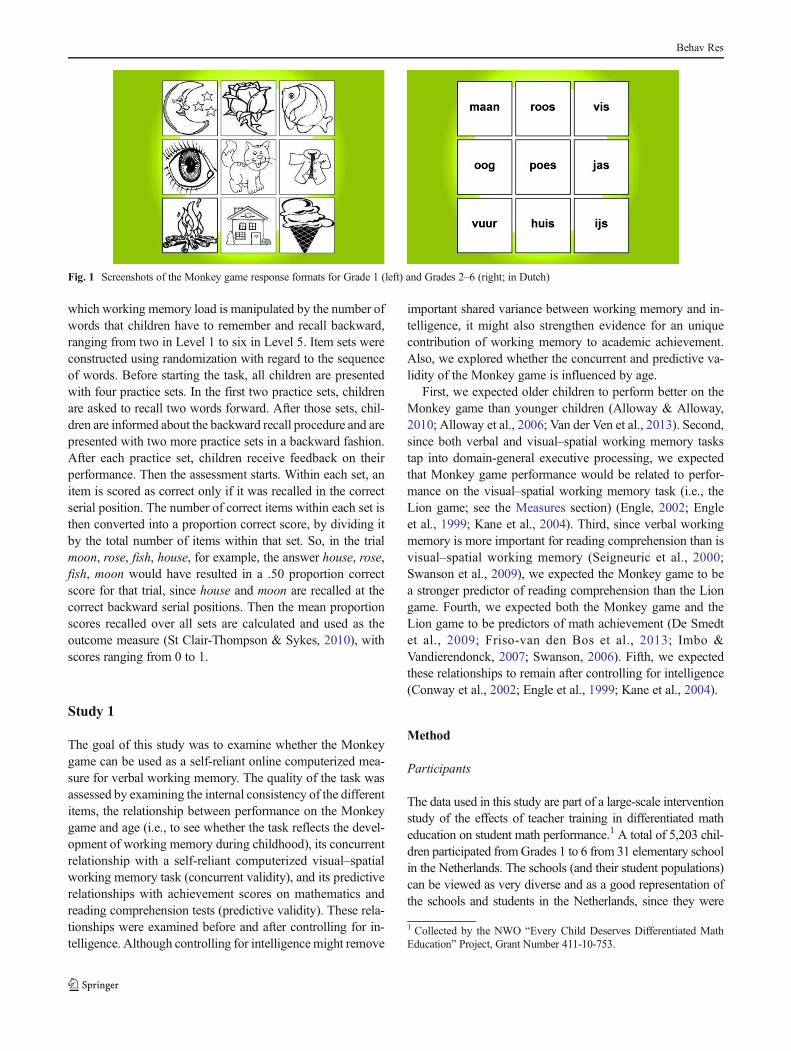
which working memory load is manipulated by the number ofwords that children have to remember and recall backward,ranging from two in Level 1 to six in Level 5. Item sets wereconstructed using randomization with regard to the sequenceof words. Before starting the task, all children are presentedwith four practice sets. In the first two practice sets, childrenare asked to recall two words forward. After those sets, chil-dren are informed about the backward recall procedure and arepresented with two more practice sets in a backward fashion.After each practice set, children receive feedback on theirperformance. Then the assessment starts. Within each set, anitem is scored as correct only if it was recalled in the correctserial position. The number of correct items within each set isthen converted into a proportion correct score, by dividing itby the total number of items within that set. So, in the trialmoon, rose, fish, house, for example, the answer house, rose,fish, moon would have resulted in a .50 proportion correctscore for that trial, since house and moon are recalled at thecorrect backward serial positions. Then the mean proportionscores recalled over all sets are calculated and used as theoutcome measure (St Clair-Thompson & Sykes, 2010), withscores ranging from 0 to 1.
Study 1
The goal of this study was to examine whether the Monkeygame can be used as a self-reliant online computerized mea-sure for verbal working memory. The quality of the task wasassessed by examining the internal consistency of the differentitems, the relationship between performance on the Monkeygame and age (i.e., to see whether the task reflects the devel-opment of working memory during childhood), its concurrentrelationship with a self-reliant computerized visual–spatialworking memory task (concurrent validity), and its predictiverelationships with achievement scores on mathematics andreading comprehension tests (predictive validity). These rela-tionships were examined before and after controlling for in-telligence. Although controlling for intelligencemight remove
important shared variance between working memory and in-telligence, it might also strengthen evidence for an uniquecontribution of working memory to academic achievement.Also, we explored whether the concurrent and predictive va-lidity of the Monkey game is influenced by age.
First, we expected older children to perform better on theMonkey game than younger children (Alloway & Alloway,2010; Alloway et al., 2006; Van der Ven et al., 2013). Second,since both verbal and visual–spatial working memory taskstap into domain-general executive processing, we expectedthat Monkey game performance would be related to perfor-mance on the visual–spatial working memory task (i.e., theLion game; see the Measures section) (Engle, 2002; Engleet al., 1999; Kane et al., 2004). Third, since verbal workingmemory is more important for reading comprehension than isvisual–spatial working memory (Seigneuric et al., 2000;Swanson et al., 2009), we expected the Monkey game to bea stronger predictor of reading comprehension than the Liongame. Fourth, we expected both the Monkey game and theLion game to be predictors of math achievement (De Smedtet al., 2009; Friso-van den Bos et al., 2013; Imbo &Vandierendonck, 2007; Swanson, 2006). Fifth, we expectedthese relationships to remain after controlling for intelligence(Conway et al., 2002; Engle et al., 1999; Kane et al., 2004).
Method
Participants
The data used in this study are part of a large-scale interventionstudy of the effects of teacher training in differentiated matheducation on student math performance.1 A total of 5,203 chil-dren participated fromGrades 1 to 6 from 31 elementary schoolin the Netherlands. The schools (and their student populations)can be viewed as very diverse and as a good representation ofthe schools and students in the Netherlands, since they were
Fig. 1 Screenshots of the Monkey game response formats for Grade 1 (left) and Grades 2–6 (right; in Dutch)
1 Collected by the NWO “Every Child Deserves Differentiated MathEducation” Project, Grant Number 411-10-753.
Behav Res
located in different parts of the country (e.g., rural as well asurban areas) and in different neighborhoods (e.g., lower- as wellas middle-class neighborhoods), and had different school sizes(ranging from 52 to 550 students). The parents of all childrenreceived written information about the study and a passive in-formed consent procedure was used in which parents informedtheir child’s teacher or a designated contact person at theirschool if they did not want their child to participate. The studywas approved by the ethics committee of the Faculty of Socialand Behavioral Science, Utrecht University.
Measures
Working memory Two online computerized working mem-ory tasks were administered, the Monkey game and the Liongame. For a description of the Monkey game, see the Devel-opment and Characteristics of the Monkey Game section.
The Lion game is a visual–spatial complex span task, inwhich children have to search for colored lions (Van deWeijer-Bergsma et al., 2014). Children are presented with a4 × 4 matrix containing 16 bushes. In each set, eight lions ofdifferent colors (red, blue, green, yellow, and purple) are con-secutively presented at different locations in the matrix for 2,000 ms each. Children have to remember the last locationwhere a lion of a certain color (e.g., red) appeared and usethe mouse button to click on that location after the sequencehas ended. The task consists of five levels in which workingmemory load is manipulated by the number of colors—hence,the number of locations—that children have to remember andupdate.Within each set, an itemwas scored as correct only if itwas recalled in the correct serial position. The number ofcorrect items within each set was then converted into a pro-portion correct score by dividing it by the total number ofitems within that set. Then the mean proportion scores recalledover all sets were calculated and used as an outcome measure(St Clair-Thompson& Sykes, 2010), with scores ranging from0 to 1. The Lion game has shown excellent internal consisten-cy (α ranges from .86 to .90), satisfactory 6-week test–retestreliability, and good concurrent relationships with individuallyadministered (tester-led) working memory tasks, and it is pre-dictive of subsequent mathematics performance (Van deWeijer-Bergsma et al., 2014).
Intelligence The Raven Standard Progressive Matrices(SPM) were used (Raven, Court, & Raven, 1996) as a mea-sure of nonverbal intelligence. The Raven SPM consists offive series (A to E) of 12 diagrams or designs with one partmissing. Children are asked to select the correct part to com-plete the designs from among six (series A and B) or eight(series C to E) answer options printed beneath. Children haveto decide which of the alternatives given logically completesthe design. The test starts relatively easy but increases in dif-ficulty, and answers are scored as incorrect (0) or correct (1).
The minimum score is 0 and the maximum score is 60. Inter-nal consistency was α = .92 in this study.
Reading comprehension Reading comprehension was mea-sured using the criterion-based Cito Reading ComprehensionTests (Feenstra, Kamphuis, Kleintjes, & Krom, 2010;Weekers, Groenen, Kleintjes, & Feenstra, 2011). The readingcomprehension tests are national Dutch tests used to monitorthe progress of primary school children. For Grades 1–6, sev-en tests are used, normed for different periods within grades(B = beginning of the school year, M = mid-school-year, E =end of school year): E1, M2, E2, M3, M4, M5, B6, and M6.The test consists of three modules that allow for differentiatedtesting. All children start with the Start module, and on thebasis of their performance, children finish the module Sequel1 (for lower-performing students) or Sequel 2 (for higher-performing students). The tests consist of different readingpassages, followed by a total of 50 (Grades 1–4) or 55 (Grades5 and 6) multiple-choice questions. The raw scores are con-verted into ability scores that increase throughout primaryschool, enabling comparison of the results from different ver-sions. Ability scores vary from –87 (lowest in Grade 1) to 147(highest in Grade 6). Validity and reliability have been report-ed as satisfactory (Cronbach α ranges from .84 to .93;Feenstra et al., 2010).
Mathematics performance Similar to the reading comprehen-sion tests, the criterion-based Cito Mathematics Tests are na-tional Dutch tests used to monitor the progress of primaryschool children (Janssen, Scheltens, & Kraemer, 2005). Thesetests primarily consist of contextual math problems. There aretwo different versions for each grade, one to be administered atmid-school-year (M) and one at the end of the school year (E),except for Grade 6, which has a test at the beginning of theschool year (B6) and one at mid-school-year (M6). In each test,five main domains are covered: (a) numbers and number rela-tions; (b) addition and subtraction; (c) multiplication and divi-sion; (d) complex math applications, often involving multiplemathematical manipulations; and (e) measuring (e.g., weightand length). From M2 through M6, several domains are addedsuccessively: (f) estimation, (g) time, (h) money, (i) proportions,(j) division, and (k) percentages. The raw test scores are con-verted to ability scores that increase throughout primary school,enabling comparison of the results from different tests on thesame scale (Janssen et al., 2005). Ability scores vary between 0(lowest in Grade 1) and 169 (highest in Grade 6). The reliabilitycoefficients of the different versions range from .91 to .97(Janssen, Verhelst, Engelen, & Scheltens, 2010).
Procedure
Measurements took place on two occasions during the schoolyear of 2012–2013, in September–October 2012 (T1) and
Behav Res
January–February 2013 (T2). At T1, visual–spatial workingmemory was assessed using the Lion game. Teachers receivedan e-mail containing login information for their class of childrenand were asked to let all students within their class finish thetask within a period of 3 weeks. Also at T1, a paper-and-pencilversion of Raven’s SPM was administered in classrooms byresearch assistants as a group test. Assessment was stoppedafter 60 min, even if some of the children did not finish the test.At T2, verbal working memory was assessed with the Monkeygame, using a procedure identical to that for the Lion game.Mathematics performance and reading comprehension testswere administered as part of the regular school testing proce-dure, and the results were requested from the mid-school-yearresults (January–February 2013, around T2).
Data analysis
In large samples, a few outliers are to be expected (Tabachnick& Fidell, 2007). Five univariate outliers were detected (Zscores > 3.29) in the reading comprehension scores. Thesewere high but realistic scores in Grades 5 and 6, and weretherefore not removed. Fifteen potential multivariate outlierswere detected on the basis of Mahalanobis distances [χ2(3) =16.27]. However, the influence of these outliers was negligible(Cook’s distance < 0.13). Therefore, the values were not de-leted or transformed. The normality of the distributions ofvariables was examined by calculating the standardized skew-ness and kurtosis indices (statistic divided by standard error).The skewness index was found to be higher than 3 for theRaven SPM (–10.51), whereas both the skewness and kurtosisindices were found to be higher than 3 for the Monkey game(–17.82 and 4.49, respectively), the Lion game (–23.24 and3.88, respectively), mathematics performance (–8.17 and –10.28, respectively), and reading comprehension (9.64 and7.05, respectively), indicating that the distributions differedsignificantly from normality. Nonnormality was therefore tak-en into account in all statistical analyses.
The reliability of the Monkey game was determined by cal-culating the internal consistency of the items in two differentways for the whole sample and for the different grades separate-ly. First, we calculated the sum of the proportion correct scoresfor the first trials of the different levels (i.e., Trial 1 of Level 1,Trial 1 of Level 2, etc.) and calculated the same for the second,third, and fourth trials of different levels. ThenCronbach’s alphawas calculated between these scores (Engle et al., 1999). Sec-ond, Cronbach’s alpha was calculated for the proportion correctscores on each individual trial (Kane et al., 2004).
To examine whether classroom membership influencesperformance on the Monkey game, we analyzed the ratio ofvariance between classes in Monkey game performance tovariance within those classes, using grade as a control vari-able. The intraclass correlation (ICC) was analyzed using amultilevel analysis with a two-level structure (Level 1,
individual children; Level 2, class) with Mplus version 7.0(Muthén & Muthén, 2006). ICC values of .05, .10, and .15were considered to be small, medium, and large, respectively(Hox, 2002). Also, a design effect was calculated as 1 + (av-erage cluster size – 1) × ICC (Muthén & Satorra, 1995). Adesign effect greater than 2 would indicate that clustering inthe data needed to be taken into account during the estimation.
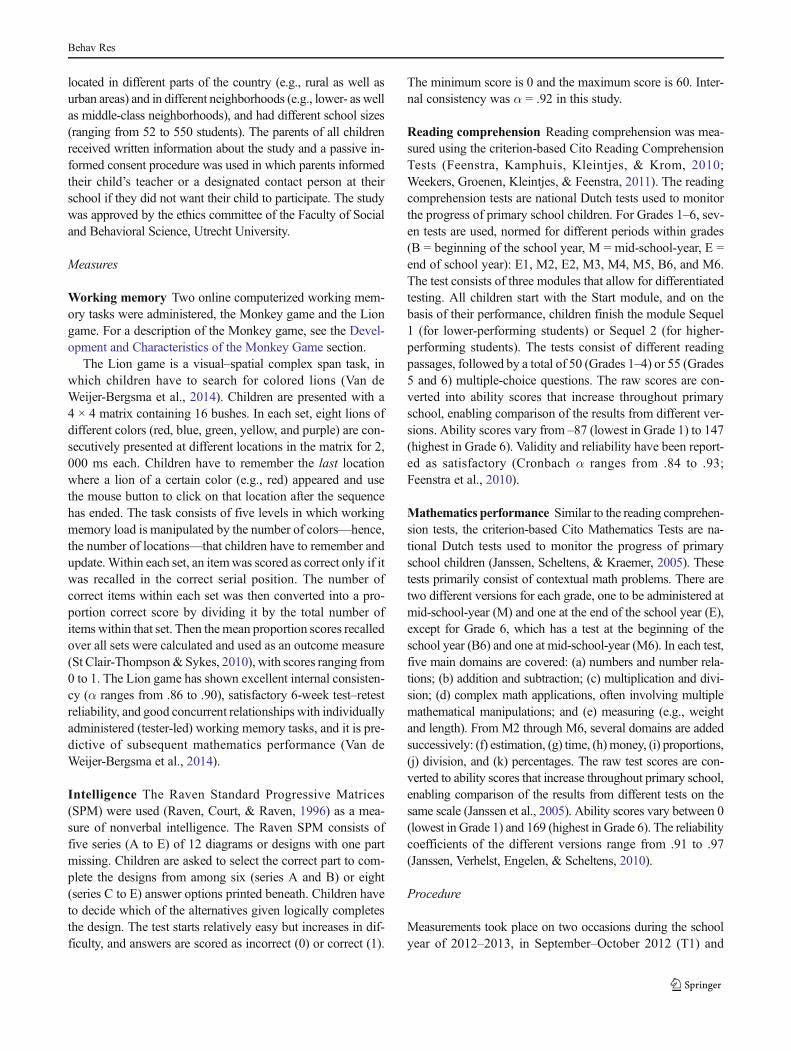
To examine the concurrent and predictive validities of theMonkey game, multilevel multivariate regression analysiswas conducted with multiple predictors and two dependentvariables, in several steps. A full estimation maximum likeli-hood (MLR) method was used inMplus version 7.0, since it isrobust to nonnormality and can handlemissing data. Althoughno attempt was made to explain variance at the classroomlevel, in all models the standard errors were corrected for thenested structure by using an automatic multilevel modelingsetup (Stapleton, 2006). That is, applying the Mplus statement“type is complex” ensures that part of the model variance isattributed to between-class variance (i.e., variance in theachievement outcomes existing between classrooms), ratherthan only to within-classroom variance. First, reading compre-hension and mathematics achievement were regressed on theMonkey game and the Lion game. Reading comprehensionand mathematics achievement were allowed to covary, aswere the two working memory tasks. All variables were con-trolled for grade. This model is referred to asModel 1. Second,Raven’s SPM scores were added to the model, to examinewhether the predictive value of the Monkey game was main-tained after controlling for intelligence. This model is referredto as Model 2. Models 1 and 2 are presented in Fig. 2. Sincethe aim of this study was not to search for the best-fittingmodel but to examine the strengths of the relationships be-tween variables, both models are saturated models withperfect-fit indices (CFI = 1.000, TLI = 1.000, RMSEA =.000). Third, grade was removed as a control variable, butadded as a grouping factor, to explore age-related differencesin the concurrent and predictive validities. Steiger’s Z (ZH)was used to test whether differences within grades in the de-pendent standardized estimates (visual–spatial vs. verbalworking memory) were statistically significant (Hoerger,2013; Steiger, 1980), taking into account the covariance be-tween the two working memory tasks. To test whether differ-ences in the independent standardized estimates and covari-ances between the lowest and highest grades were statisticallysignificant, the Fisher r-to-z transformation was used (Lowry,2013; Steiger, 1980). When multiple comparisons were made,Holm’s correction was applied to ensure that the chance for aType I error did not exceed the .05 level. In Holm’s procedure,first the p values of the relevant test outcomes are ranked fromthe smallest to the largest. The smallest outcome p value needsto be smaller or equal to α/k (where α = .05 and k is thenumber of tests). The second-smallest p value is then com-pared to α/(k – 1). This sequence is followed until a corrected
Behav Res
p value becomes larger than .05. For example, when threecomparisons are made, testing at the .05 level, in order to beable to speak of a significant difference, the smallest initial pvaluewould need to be ≤.017, the second-smallest would needto be ≤.025, and the final one would need to be ≤.05 (Holm,1979).
Missing data and multiple imputation
Of the 5,203 children in the data set, 36 children (0.7 %) hadmissing values for all variables. These children probablychanged schools before the start of the school year and wereremoved from the analysis. For the remaining 5,167 children(see Table 1 for the sample characteristics), data at the unitlevel were missing for n = 991 (19 %) on the Monkey game,for n = 581 (11 %) on the Lion game, for n = 595 (11 %)children on mathematics performance, for n = 824 (19 %) onreading comprehension, and for n = 310 (7 %) on the Raven’sSPM. In total, n = 2,954 (57%) children had complete data forall variables. Additionally, at the item level of the Raven’s
SPM, data were missing for n = 862 (16 %) children onone or more items, due to skipping of items, and for n =69 children (1 %) on one or more items, due to failing tofinish the test within the time constraints. The large scaleof the study made it unfeasible to keep track of reasonsfor missingness. However, several reasons were identifiedas being highly probable. Missing data for the Monkeygame, the Lion game, and Raven’s SPM (at the unit level)were most probably due to absence from school duringthe time of testing. Reading comprehension data weremissing in all children from Grade 1, due to the unavail-ability of the test at mid-school-year. Also, policies differbetween schools with regard to whether or not they ad-minister the reading comprehension test in all grades.When reading comprehension or mathematics perfor-mance data were missing for individual children, thiswas most likely because the children changed schoolsduring the study. In general, we expected that the reasonsfor missing data were mainly due to the absence of chil-dren from school (e.g., due to sickness, a dentist visit, orattendance at an official family event) or to a test beingunavailable for a certain grade. Thus, it would be plausi-ble to assume that the data were missing at random(Schafer & Graham, 2002). In addition, the pattern ofmissing data was nonmonotone, and therefore multipleimputation was an appropriate approach to deal withmissing data.
To impute the missing data, we constructed the imputationmodel as follows: All variables from the statistical model(see Fig. 2) were included in the imputation model. Addition-ally, background variables such as gender, as well as grade andmathematics ability scores from the previous school year,were added to the imputation model. Finally, the reason formissingness [i.e., skipped item(s), failed to finish test and
Table 1 Sample characteristics
Study 1 Study 2
n % Boys n % Boys
Grade 1 862 51.6 20 65.0
Grade 2 840 53.9 34 47.1
Grade 3 847 51.2 33 57.6
Grade 4 854 48.6 16 68.8
Grade 5 850 49.9 16 56.3
Grade 6 914 49.8 21 42.9
Total 5,167 50.8 140 55.0
Fig. 2 Model 1 (continuous linesonly) andModel 2 (also includinginterrupted lines), either aftercontrolling for grade or whenusing grade as a grouping factor.WM = working memory
Behav Res
absence during test] was added to the imputation model onlyfor the Raven items. Through the latter procedure, we aimedto strengthen the assumption of data being missing at random.The data had a multilevel structure (students within schools),so this hierarchy should be taken into account while drawingimputations. This ensured congeniality between the imputa-tion and statistical models (Meng, 1994). Congeniality canlead to biased results if the statistical model is more complexthan the imputation model and the imputation model ignoresimportant relationships presented in the original data. Wetherefore included class IDs (as dummy variables) into theimputation model to account for the hierarchical structure ofthe data (Graham, 2012, p. 135). Five imputed data sets weregenerated using the MICE package (Van Buuren, 2012; VanBuuren & Groothuis-Oudshoorn, 2011) in R 3.0.2, after in-vestigating the convergence of the MICE algorithm by meansof several diagnostic tools such as trace plots. The imputeddata set was then analyzed in Mplus (version 7.0), and theparameter estimates and their standard errors were pooledusing Rubin’s rules (Rubin, 1987). For comparison, we alsoperformed the analysis on the incomplete data, which impliesthat about 57 % of the data were used. The distribution ofgender in this data set (51.1 % boys) was highly similar to thatin the imputed data set.
Results
Descriptive statistics are presented in Table 2.Cronbach’s alpha for the sum of the first, second, third, and
fourth instances within the different levels of the Monkeygame was α = .89 for the whole sample, ranging from .81 to.88 in the different grades separately. The proportion correctscores for each individual item revealed an internal consisten-cy of α = .87 for the whole sample, ranging from .78 to .85 inthe different grades separately.
ICCs
An ICC of .07 was found for the Monkey game proportioncorrect scores after controlling for grade at the time of mea-surement, which indicates that a small proportion of variancewas explained by class membership. The design effect forMonkey game scores [1 + (23.69 – 1) × .07 = 2.66] wasgreater than 2, indicating that clustering needed to be takeninto account in the analysis. For the Lion game, reading com-prehension, math performance, and intelligence scores, theICCs were .07, .04, .05, and .07, respectively.
Multilevel multivariate regression results
Table 3 presents the standardized estimates of the models test-ed before (Model 1) and after (Model 2) controlling for intel-ligence. Analysis with the complete data rendered the sameresults for both models as the analysis with imputed data. Thepooled results from the imputed data sets are reported here.
First, standardized estimates in Model 1 showed that chil-dren from higher grades performed significantly better on theMonkey game than did children from lower grades, as well ason the Lion game.
Second, performance on the Monkey game was signifi-cantly related to performance on the Lion game after control-ling for grade. That is, children with higher scores for verbalworking memory also received higher scores for visual–spa-tial working memory.
Third, performance on the Monkey game was a significantpositive predictor of reading comprehension. Performance onthe Lion game was also a significant positive predictor ofreading comprehension. Comparison of the standardized esti-mates, however, showed that the predictive value of the Mon-key game was stronger that the predictive value of the Liongame for reading comprehension, ZH = 6.2, p < .001 (Holm’scorrection applied).
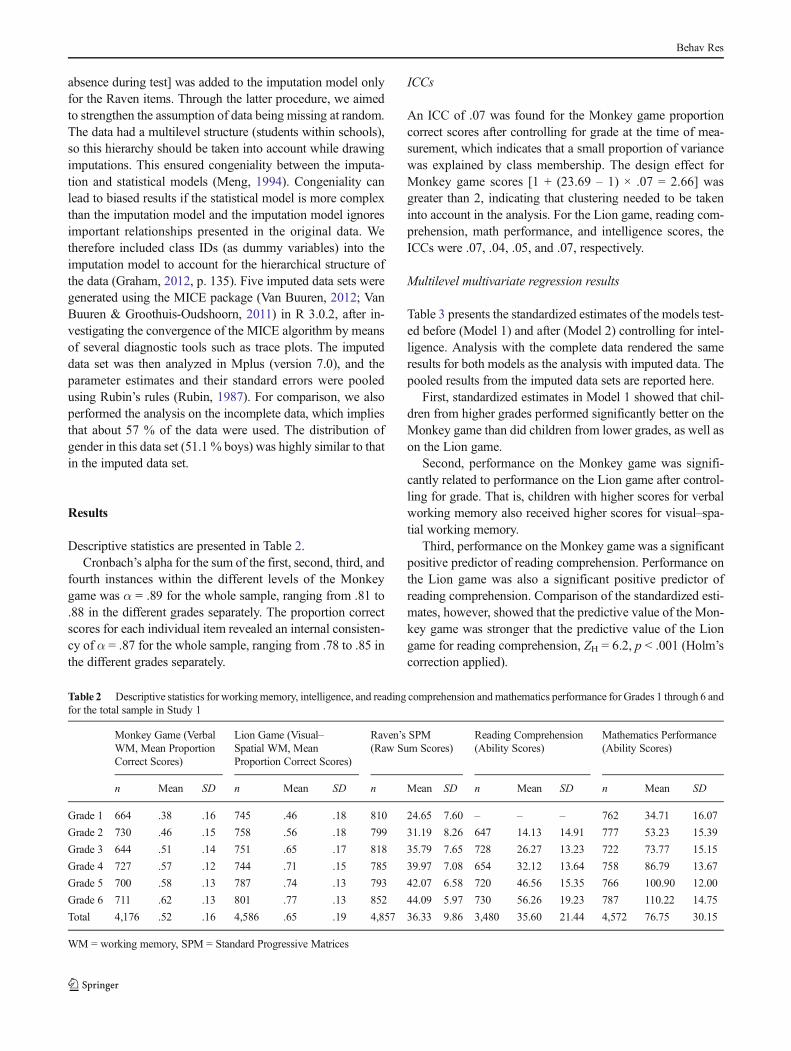
Table 2 Descriptive statistics for workingmemory, intelligence, and reading comprehension andmathematics performance for Grades 1 through 6 andfor the total sample in Study 1
Monkey Game (VerbalWM, Mean ProportionCorrect Scores)
Lion Game (Visual–Spatial WM, MeanProportion Correct Scores)
Raven’s SPM(Raw Sum Scores)
Reading Comprehension(Ability Scores)
Mathematics Performance(Ability Scores)
n Mean SD n Mean SD n Mean SD n Mean SD n Mean SD
Grade 1 664 .38 .16 745 .46 .18 810 24.65 7.60 – – – 762 34.71 16.07
Grade 2 730 .46 .15 758 .56 .18 799 31.19 8.26 647 14.13 14.91 777 53.23 15.39
Grade 3 644 .51 .14 751 .65 .17 818 35.79 7.65 728 26.27 13.23 722 73.77 15.15
Grade 4 727 .57 .12 744 .71 .15 785 39.97 7.08 654 32.12 13.64 758 86.79 13.67
Grade 5 700 .58 .13 787 .74 .13 793 42.07 6.58 720 46.56 15.35 766 100.90 12.00
Grade 6 711 .62 .13 801 .77 .13 852 44.09 5.97 730 56.26 19.23 787 110.22 14.75
Total 4,176 .52 .16 4,586 .65 .19 4,857 36.33 9.86 3,480 35.60 21.44 4,572 76.75 30.15
WM = working memory, SPM = Standard Progressive Matrices
Behav Res
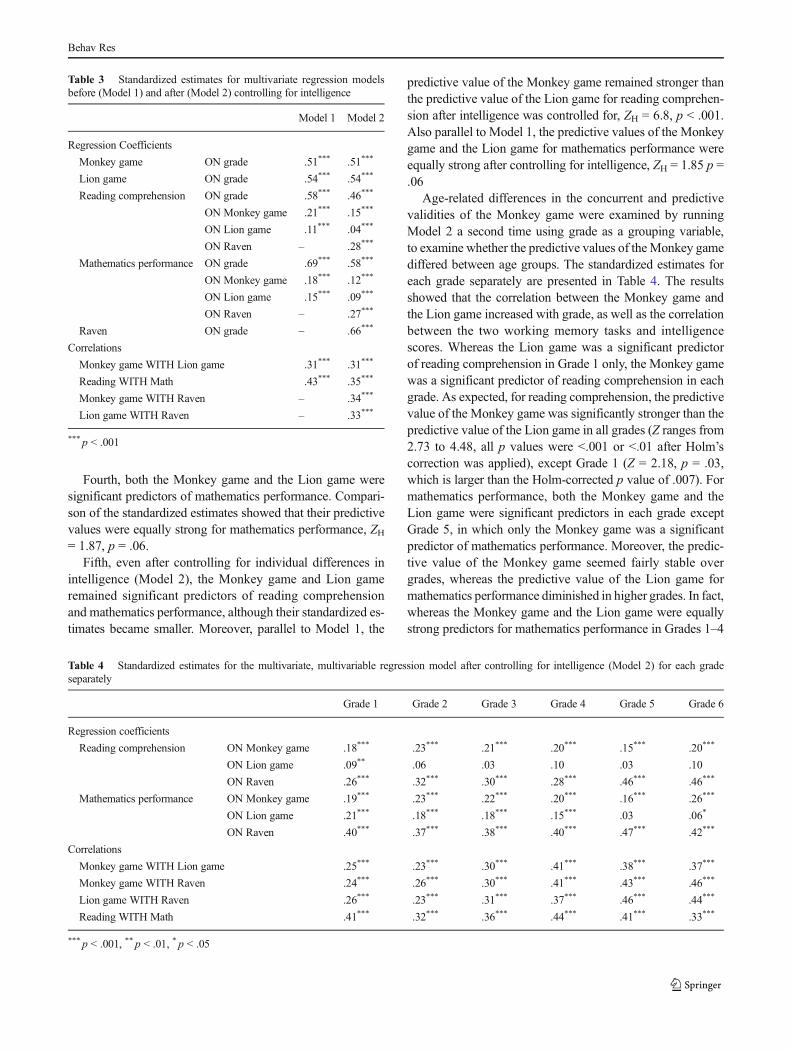
Fourth, both the Monkey game and the Lion game weresignificant predictors of mathematics performance. Compari-son of the standardized estimates showed that their predictivevalues were equally strong for mathematics performance, ZH= 1.87, p = .06.
Fifth, even after controlling for individual differences inintelligence (Model 2), the Monkey game and Lion gameremained significant predictors of reading comprehensionand mathematics performance, although their standardized es-timates became smaller. Moreover, parallel to Model 1, the
predictive value of the Monkey game remained stronger thanthe predictive value of the Lion game for reading comprehen-sion after intelligence was controlled for, ZH = 6.8, p < .001.Also parallel to Model 1, the predictive values of the Monkeygame and the Lion game for mathematics performance wereequally strong after controlling for intelligence, ZH = 1.85 p =.06
Age-related differences in the concurrent and predictivevalidities of the Monkey game were examined by runningModel 2 a second time using grade as a grouping variable,to examine whether the predictive values of theMonkey gamediffered between age groups. The standardized estimates foreach grade separately are presented in Table 4. The resultsshowed that the correlation between the Monkey game andthe Lion game increased with grade, as well as the correlationbetween the two working memory tasks and intelligencescores. Whereas the Lion game was a significant predictorof reading comprehension in Grade 1 only, the Monkey gamewas a significant predictor of reading comprehension in eachgrade. As expected, for reading comprehension, the predictivevalue of the Monkey game was significantly stronger than thepredictive value of the Lion game in all grades (Z ranges from2.73 to 4.48, all p values were <.001 or <.01 after Holm’scorrection was applied), except Grade 1 (Z = 2.18, p = .03,which is larger than the Holm-corrected p value of .007). Formathematics performance, both the Monkey game and theLion game were significant predictors in each grade exceptGrade 5, in which only the Monkey game was a significantpredictor of mathematics performance. Moreover, the predic-tive value of the Monkey game seemed fairly stable overgrades, whereas the predictive value of the Lion game formathematics performance diminished in higher grades. In fact,whereas the Monkey game and the Lion game were equallystrong predictors for mathematics performance in Grades 1–4
Table 3 Standardized estimates for multivariate regression modelsbefore (Model 1) and after (Model 2) controlling for intelligence
Model 1 Model 2
Regression Coefficients
Monkey game ON grade .51*** .51***
Lion game ON grade .54*** .54***
Reading comprehension ON grade .58*** .46***
ON Monkey game .21*** .15***
ON Lion game .11*** .04***
ON Raven – .28***
Mathematics performance ON grade .69*** .58***
ON Monkey game .18*** .12***
ON Lion game .15*** .09***
ON Raven – .27***
Raven ON grade – .66***
Correlations
Monkey game WITH Lion game .31*** .31***
Reading WITH Math .43*** .35***
Monkey game WITH Raven – .34***
Lion game WITH Raven – .33***
*** p < .001
Table 4 Standardized estimates for the multivariate, multivariable regression model after controlling for intelligence (Model 2) for each gradeseparately
Grade 1 Grade 2 Grade 3 Grade 4 Grade 5 Grade 6
Regression coefficients
Reading comprehension ON Monkey game .18*** .23*** .21*** .20*** .15*** .20***
ON Lion game .09** .06 .03 .10 .03 .10
ON Raven .26*** .32*** .30*** .28*** .46*** .46***
Mathematics performance ON Monkey game .19*** .23*** .22*** .20*** .16*** .26***
ON Lion game .21*** .18*** .18*** .15*** .03 .06*
ON Raven .40*** .37*** .38*** .40*** .47*** .42***
Correlations
Monkey game WITH Lion game .25*** .23*** .30*** .41*** .38*** .37***
Monkey game WITH Raven .24*** .26*** .30*** .41*** .43*** .46***
Lion game WITH Raven .26*** .23*** .31*** .37*** .46*** .44***
Reading WITH Math .41*** .32*** .36*** .44*** .41*** .33***
*** p < .001, ** p < .01, * p < .05
Behav Res
(Z ranges from –.49 to 1.37, p ranges from .17 to .62), theMonkey game was a stronger predictor than the Lion game inGrades 5 (Z = 3.42, p < .001) and 6 (Z = 5.49, p < .001).
Study 2
The goal of this study was to further examine the concurrentrelationship of the Monkey game with individually adminis-tered tester-led working memory tasks. We sought to relateperformance on the Monkey game to performance on theself-reliant Lion game, a tester-led verbal working memorytask, and a tester-led visual-spatial working memory task. Inaddition, since the majority of children in Study 2 had alsocompleted the Monkey game in Study 1 (either 1 or 2 yearsearlier), the stability of performance on theMonkey game wasexamined.
Since all working memory tasks tap into the domain-general executive component, we expected performance onthe Monkey game to be positively related to performance onall three other working memory tasks (Engle, 2002; Engleet al., 1999; Kane et al., 2004). On the basis of the contribu-tions of domain-specific components, we expected the Mon-key game to be more strongly related to the verbal tester-ledtask than the Lion game, whereas we expected the Lion gameto be more strongly related to the visual–spatial tester-led task.
Method
Participants
Four of the schools from the large-scale study described underStudy 1 participated. The parents of all children received writ-ten information about the study, and an active informed con-sent procedure was used. A total of 140 children receivedparental consent for participation. The sample characteristicsare presented in Table 1.
Of the 140 children, 79 children (58.2 % boys) had alsocompleted the Monkey game 2 years earlier (January–Febru-ary 2013). In addition, 32 children (46.9 % boys) had com-pleted the Monkey game 1 year earlier, after they had enteredfirst grade (January–February 2014).
Measures
Working memory The Monkey game and the Lion gamewere administered self-reliantly in classrooms. For a descrip-tion of these games, see the Development and Characteristicsof the Monkey Game and Measures sections of Study 1.
In addition, two tester-led computerized working memorytasks from a Dutch version of the Automated Working Mem-ory Assessment battery (AWMA; Alloway, 2007) were indi-vidually administered: Word Recall Backward and Odd One
Out. Both are computerized tasks in which assessment is ledby an assistant in a one-to-one testing situation. In the WordRecall Backward task, a recorded voice names a set of one-syllable words, after which the child is asked to repeat thewords verbally in the reverse order. The number of words toremember increases, starting with sets of two words and build-ing up to sets of seven words, after a child correctly recallsfour strings of words from the same set in the correct order.When a child incorrectly recalls three strings of words fromthe same series, task administration is discontinued. The num-ber of correctly recalled words was used for sets in which allstimuli were recalled correctly. The observed scores rangedfrom 4 to 17.
In the Odd-One-Out task, children are presented with a rowof three boxes containing three geometrical shapes on a com-puter screen. The children are asked to point out the odd shapeand to remember its location. Then three new boxes withshapes appear. At the end of each set of items, three emptyboxes appear, and the children are asked to point to the con-secutive locations of the odd shapes in the correct order. Thetest starts with sets of one item; after three correct answers ofthe same length, the sequence is increased by one. When threemistakes are made on sets of the same length, the task isdiscontinued. The maximum number of items within a set isseven. The numbers of correctly recalled locations were usedfrom sets in which all items were recalled correctly. The ob-served scores ranged from 3 to 17.
Procedure
The measurements took place in January 2015. Children com-pleted the self-reliant Monkey and Lion games, for whichteachers received an e-mail containing login information.The tester-ledWord Recall Backward and Odd-One-Out taskswere administered individually in a quiet room during schoolvisits by research assistants.
The data from the Monkey game assessments in 2013 and2014 were extracted from the Study 1 data files.
Data analysis
One univariate outlier inWord Recall Backward was found (Zscore = 3.38) and was removed from the analysis. No multi-variate outliers were identified using Mahalanobis distances[χ2(3) = 16.27]. The normality of the distributions of variableswas examined by calculating the standardized skewness andkurtosis indices (statistic divided by standard error). Theskewness indices were found to be higher than 3 for the Liongame (–3.44) and the Word Recall Backward task (3.56); theindices for the Monkey game and the Odd-One-Out task werebelow 3; and the indices for the Monkey game data from 2013and 2014 were higher than 3 (–3.48 and –3.58, respectively).
Behav Res
The kurtosis indices were smaller than 3 for all of the outcomemeasures.
First, the internal consistency of the scores was calculatedin SPSS 22.0 in two different ways, following the methodsused by Engle and coworkers (Engle et al., 1999; Kane et al.,2004). More details about these analytic procedures can befound in Study 1.
Second, the associations between the four different work-ingmemory tasks were calculated, while controlling for grade.The full-estimation maximum likelihood (MLR) method wasused in Mplus version 7.0, since it is robust to nonnormalityand can handle missing data. The number of classes in thestudy was too small to take clustering of the data into account.Since the aim of this study was not to search for the best-fittingmodel but to examine the strengths of the relationships be-tween variables, a saturated model was used, with perfect-fitindices (CFI = 1.000, TLI = 1.000, RMSEA = .000). Steiger’sZ (ZH) was used to test whether differences in the standardizedestimates were statistically significant (Hoerger, 2013; Steiger,1980).
Finally, the 1- and 2-year stabilities of the Monkey gamewere examined by calculating the associations between theMonkey game scores at different time points (between 2013and 2015, and between 2014 and 2015) using MLR inMplus.Controlling for grade was only necessary for the first associ-ation, since all children in the second analysis were from thesame grade (i.e., first grade).
Missing data
Three of the 140 students were absent due to illness at theplanned time of testing, and therefore they had data missingfor the tester-led Odd-One-Out and Word Recall Backwardtasks. One student had missing data for the Odd-One-Out taskonly, due to a technical problem at the time of assessment.Four students had missing data for the Lion game, whereasthree students had missing data for the Monkey game. Thereasons for missingness for these seven students were
unknown but possibly resulted from technical problems(e.g., network problems hampering server connection, and asa result, the functioning of the games).
Results
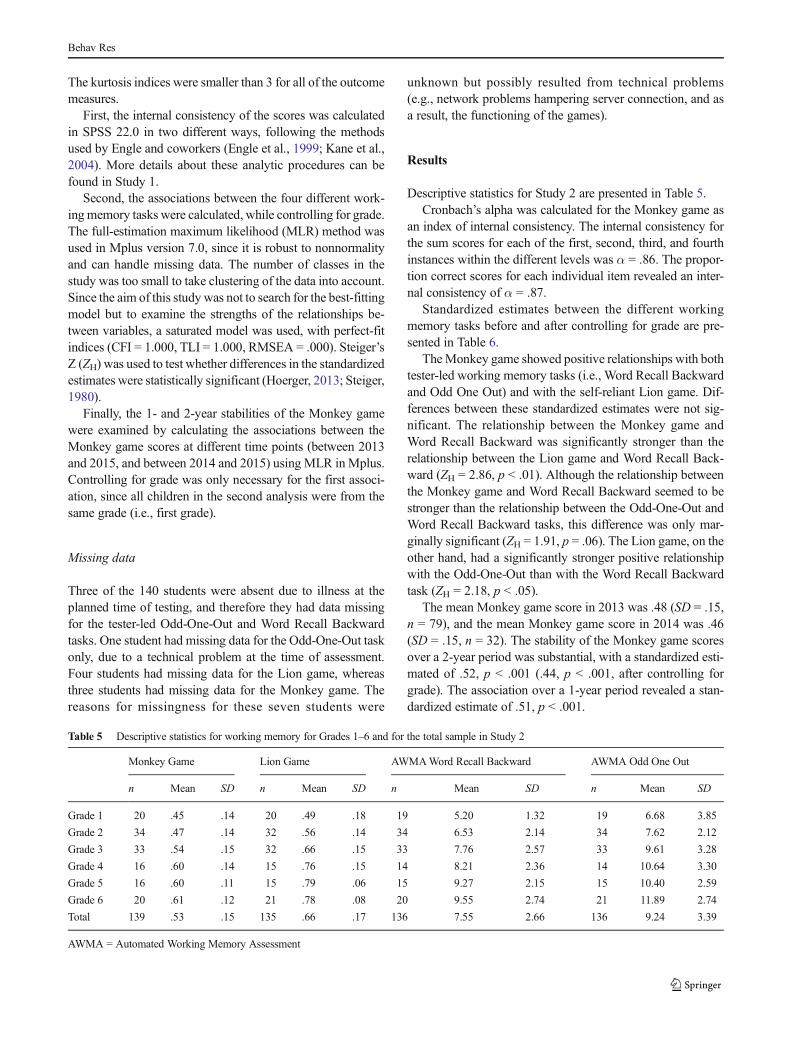
Descriptive statistics for Study 2 are presented in Table 5.Cronbach’s alpha was calculated for the Monkey game as
an index of internal consistency. The internal consistency forthe sum scores for each of the first, second, third, and fourthinstances within the different levels was α = .86. The propor-tion correct scores for each individual item revealed an inter-nal consistency of α = .87.
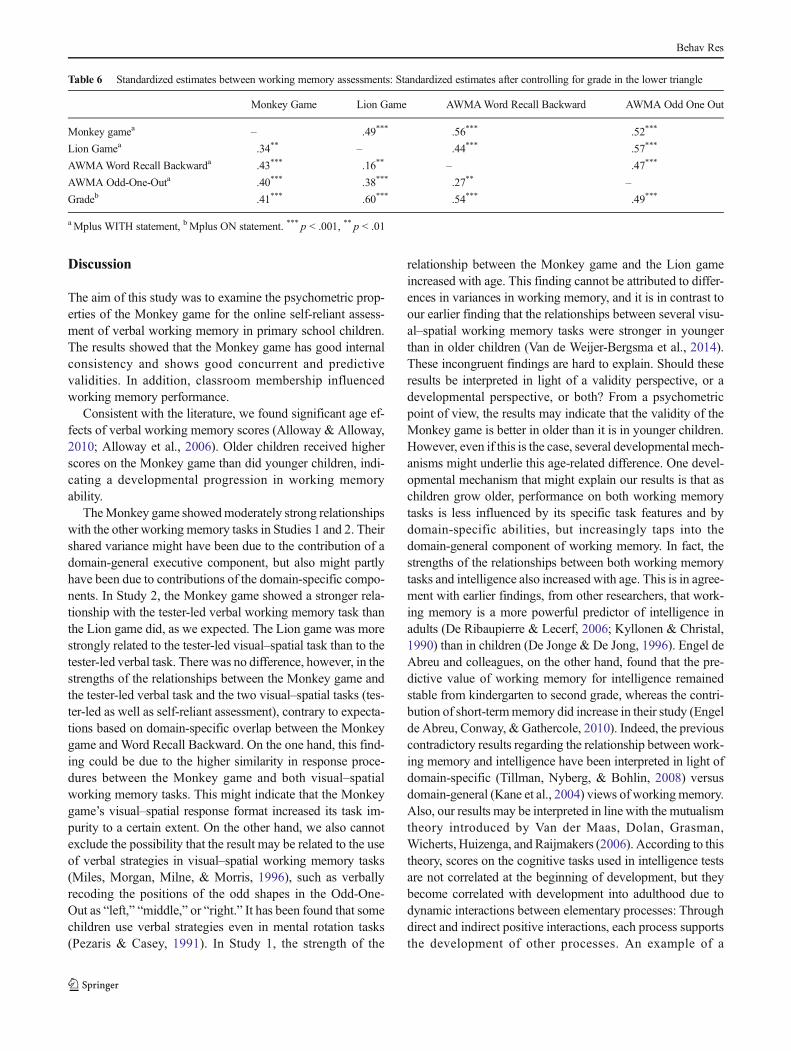
Standardized estimates between the different workingmemory tasks before and after controlling for grade are pre-sented in Table 6.
TheMonkey game showed positive relationships with bothtester-led working memory tasks (i.e., Word Recall Backwardand Odd One Out) and with the self-reliant Lion game. Dif-ferences between these standardized estimates were not sig-nificant. The relationship between the Monkey game andWord Recall Backward was significantly stronger than therelationship between the Lion game and Word Recall Back-ward (ZH = 2.86, p < .01). Although the relationship betweenthe Monkey game and Word Recall Backward seemed to bestronger than the relationship between the Odd-One-Out andWord Recall Backward tasks, this difference was only mar-ginally significant (ZH = 1.91, p = .06). The Lion game, on theother hand, had a significantly stronger positive relationshipwith the Odd-One-Out than with the Word Recall Backwardtask (ZH = 2.18, p < .05).
The mean Monkey game score in 2013 was .48 (SD = .15,n = 79), and the mean Monkey game score in 2014 was .46(SD = .15, n = 32). The stability of the Monkey game scoresover a 2-year period was substantial, with a standardized esti-mated of .52, p < .001 (.44, p < .001, after controlling forgrade). The association over a 1-year period revealed a stan-dardized estimate of .51, p < .001.
Table 5 Descriptive statistics for working memory for Grades 1–6 and for the total sample in Study 2
Monkey Game Lion Game AWMAWord Recall Backward AWMA Odd One Out
n Mean SD n Mean SD n Mean SD n Mean SD
Grade 1 20 .45 .14 20 .49 .18 19 5.20 1.32 19 6.68 3.85
Grade 2 34 .47 .14 32 .56 .14 34 6.53 2.14 34 7.62 2.12
Grade 3 33 .54 .15 32 .66 .15 33 7.76 2.57 33 9.61 3.28
Grade 4 16 .60 .14 15 .76 .15 14 8.21 2.36 14 10.64 3.30
Grade 5 16 .60 .11 15 .79 .06 15 9.27 2.15 15 10.40 2.59
Grade 6 20 .61 .12 21 .78 .08 20 9.55 2.74 21 11.89 2.74
Total 139 .53 .15 135 .66 .17 136 7.55 2.66 136 9.24 3.39
AWMA = Automated Working Memory Assessment
Behav Res
Discussion
The aim of this study was to examine the psychometric prop-erties of the Monkey game for the online self-reliant assess-ment of verbal working memory in primary school children.The results showed that the Monkey game has good internalconsistency and shows good concurrent and predictivevalidities. In addition, classroom membership influencedworking memory performance.
Consistent with the literature, we found significant age ef-fects of verbal working memory scores (Alloway & Alloway,2010; Alloway et al., 2006). Older children received higherscores on the Monkey game than did younger children, indi-cating a developmental progression in working memoryability.
TheMonkey game showedmoderately strong relationshipswith the other working memory tasks in Studies 1 and 2. Theirshared variance might have been due to the contribution of adomain-general executive component, but also might partlyhave been due to contributions of the domain-specific compo-nents. In Study 2, the Monkey game showed a stronger rela-tionship with the tester-led verbal working memory task thanthe Lion game did, as we expected. The Lion game was morestrongly related to the tester-led visual–spatial task than to thetester-led verbal task. There was no difference, however, in thestrengths of the relationships between the Monkey game andthe tester-led verbal task and the two visual–spatial tasks (tes-ter-led as well as self-reliant assessment), contrary to expecta-tions based on domain-specific overlap between the Monkeygame and Word Recall Backward. On the one hand, this find-ing could be due to the higher similarity in response proce-dures between the Monkey game and both visual–spatialworking memory tasks. This might indicate that the Monkeygame’s visual–spatial response format increased its task im-purity to a certain extent. On the other hand, we also cannotexclude the possibility that the result may be related to the useof verbal strategies in visual–spatial working memory tasks(Miles, Morgan, Milne, & Morris, 1996), such as verballyrecoding the positions of the odd shapes in the Odd-One-Out as “left,” “middle,” or “right.” It has been found that somechildren use verbal strategies even in mental rotation tasks(Pezaris & Casey, 1991). In Study 1, the strength of the
relationship between the Monkey game and the Lion gameincreased with age. This finding cannot be attributed to differ-ences in variances in working memory, and it is in contrast toour earlier finding that the relationships between several visu-al–spatial working memory tasks were stronger in youngerthan in older children (Van de Weijer-Bergsma et al., 2014).These incongruent findings are hard to explain. Should theseresults be interpreted in light of a validity perspective, or adevelopmental perspective, or both? From a psychometricpoint of view, the results may indicate that the validity of theMonkey game is better in older than it is in younger children.However, even if this is the case, several developmental mech-anisms might underlie this age-related difference. One devel-opmental mechanism that might explain our results is that aschildren grow older, performance on both working memorytasks is less influenced by its specific task features and bydomain-specific abilities, but increasingly taps into thedomain-general component of working memory. In fact, thestrengths of the relationships between both working memorytasks and intelligence also increased with age. This is in agree-ment with earlier findings, from other researchers, that work-ing memory is a more powerful predictor of intelligence inadults (De Ribaupierre & Lecerf, 2006; Kyllonen & Christal,1990) than in children (De Jonge & De Jong, 1996). Engel deAbreu and colleagues, on the other hand, found that the pre-dictive value of working memory for intelligence remainedstable from kindergarten to second grade, whereas the contri-bution of short-termmemory did increase in their study (Engelde Abreu, Conway, & Gathercole, 2010). Indeed, the previouscontradictory results regarding the relationship between work-ing memory and intelligence have been interpreted in light ofdomain-specific (Tillman, Nyberg, & Bohlin, 2008) versusdomain-general (Kane et al., 2004) views of workingmemory.Also, our results may be interpreted in line with the mutualismtheory introduced by Van der Maas, Dolan, Grasman,Wicherts, Huizenga, and Raijmakers (2006). According to thistheory, scores on the cognitive tasks used in intelligence testsare not correlated at the beginning of development, but theybecome correlated with development into adulthood due todynamic interactions between elementary processes: Throughdirect and indirect positive interactions, each process supportsthe development of other processes. An example of a
Table 6 Standardized estimates between working memory assessments: Standardized estimates after controlling for grade in the lower triangle
Monkey Game Lion Game AWMAWord Recall Backward AWMA Odd One Out
Monkey gamea – .49*** .56*** .52***
Lion Gamea .34** – .44*** .57***
AWMAWord Recall Backwarda .43*** .16** – .47***
AWMA Odd-One-Outa .40*** .38*** .27** –
Gradeb .41*** .60*** .54*** .49***
aMplus WITH statement, bMplus ON statement. *** p < .001, ** p < .01
Behav Res
reciprocal influence given by Van der Maas et al. was thefinding that better short-term memory helps the developmentof better cognitive strategies, and better strategies make itpossible to increase short-term memory efficiency.
Performance on the Monkey showed considerable stabilityover 1-year and 2-year periods. The stability of the Monkeygame seems to be higher than was reported in a longitudinalstudy by Seigneuric and Ehrlich (2005), for example. Theyreported correlations between .32 and .33 for the stability ofperformance on a listening span task over a 1-year period anda 2-year period. Although we have no data available on sta-bility over a shorter period of time (i.e., test–retest reliabilityover a time period of a number of weeks), these results indi-cate that the Monkey game provides a reliable measure ofverbal working memory over time. Even when children com-pleted the version with a picture response format the first time(i.e., the version for first graders) and the version with a wordresponse format the second time (i.e., the version for second tosixth graders), stability was substantial.
Regarding the predictive value of the Monkey game, wefound that verbal working memory scores were predictive oflater math achievement as well as of later reading compre-hension, which is consistent with the previous literature(Bull et al., 2008; Cain et al., 2004; De Weerdt et al.,2013; Gathercole et al., 2006; Raghubar et al., 2010; Savageet al., 2007; Swanson et al., 2009). The strength of thepredictive value of the Monkey game was quite stable overthe different grades, which counters the suggestion that theMonkey game may be a more valid measure of workingmemory in older than in younger children. Consistent withour expectations and the previous literature (Savage et al.,2007), the predictive value of the verbal Monkey game forreading comprehension was stronger than the predictive val-ue of the visual–spatial Lion game. Moreover, the predictivevalue of the Monkey game for mathematics achievementincreased with age. This finding is consistent with previousstudies that have indicated that as children grow older, visu-al–spatial strategies for solving math problems are replacedwith verbal strategies and verbal retrieval (De Smedt et al.,2009; Geary, Hoard, Byrd-Craven, & DeSoto, 2004; Holmes& Adams, 2006; Van der Ven et al., 2013). Since intelli-gence scores were included in the analyses, we can concludethat the predictive value of the Monkey game lasts aboveand beyond that of intelligence (De Weerdt et al., 2013;Swanson & Beebe-Frankenberger, 2004). As one might ex-pect, the strength of the relationship between working mem-ory measures and academic achievement decreased aftercontrolling for intelligence. However, since working memo-ry and intelligence measures share a large portion of vari-ance, including intelligence in the analysis may have re-moved important variance, and consequently may have re-sulted in an underestimation of the strength of the predictivevalue of working memory.
Some of the task features of the Monkey game need furtherconsideration. First, with regard to the response format, be-cause the same nine words are used repeatedly and are shownin a 3 × 3 matrix, this could provide an advantage or enhancedlearning effect for children who have better encoding skills.On the other hand, this task feature may also increase thedifficulty of the task as children advance through it, sinceprevious trials may cause interference with later trials. Also,because children have to translate their response to a visual–spatial format, it is possible that this places greater demandson executive resources than do other backward word spantasks, and it may also increase task impurity (as we discussedearlier). Furthermore, the highly similar results for the Mon-key game in Grade 1 and in Grades 2–6, as well as the stabilityof scores when children from Grade 1 finished the pictureversion first and the word version 1 year later, indicate thatthe difference in response formats (pictures vs. words) doesnot influence the reliability or validity of the task. Second,even in adults, the extent to which a specific task will triggerexecutive processing is dependent on whether the participantis a novice or an expert in the domain-specific ability that isbeing targeted (Conway, Kane, Bunting, Hambrick, Wilhelm,& Engle, 2005). Thus, even though we tried to minimize theinfluence of reading ability in the task, it is possible that indi-vidual differences in reading ability influenced performanceon the Monkey game. Third, no cutoff rules were applied,indicating that all children finished all trials. Although thismight have produced frustration for children who performedpoorly on the task, it also increased the sensitivity of the taskto individual differences, since information for all trials wasincluded (Conway et al., 2005). Fourth, the verbal instructionsin the Monkey game were kept as straightforward as possible.
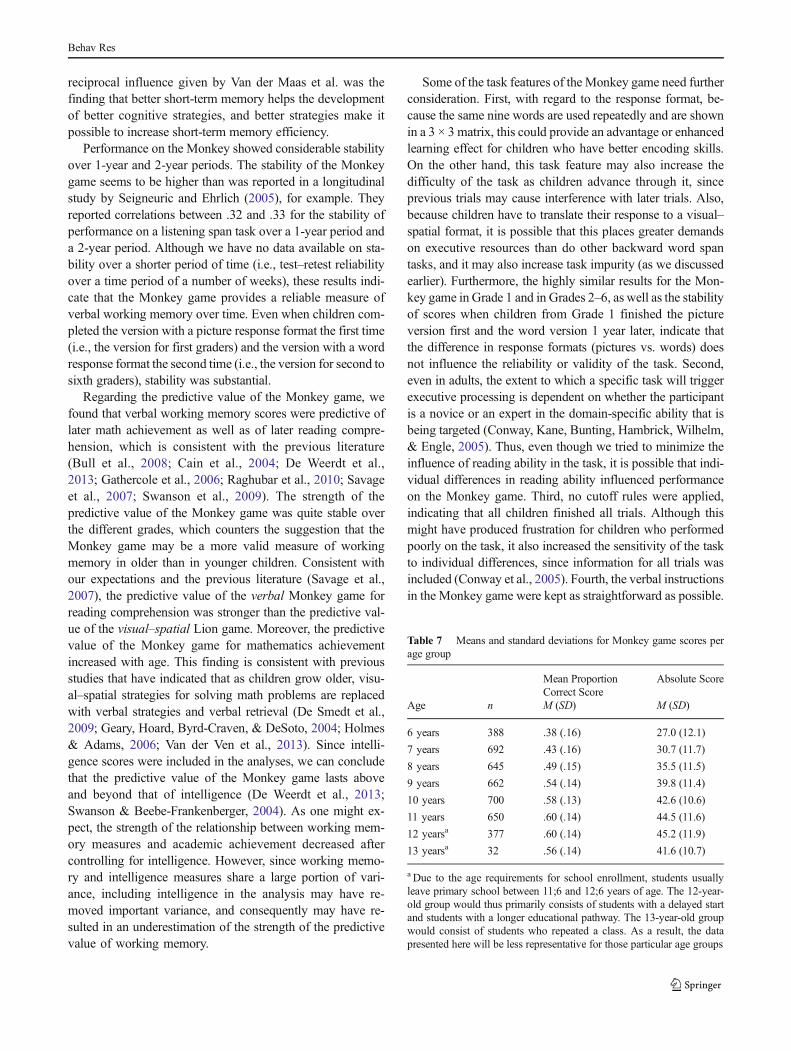
Table 7 Means and standard deviations for Monkey game scores perage group
Mean ProportionCorrect Score
Absolute Score
Age n M (SD) M (SD)
6 years 388 .38 (.16) 27.0 (12.1)
7 years 692 .43 (.16) 30.7 (11.7)
8 years 645 .49 (.15) 35.5 (11.5)
9 years 662 .54 (.14) 39.8 (11.4)
10 years 700 .58 (.13) 42.6 (10.6)
11 years 650 .60 (.14) 44.5 (11.6)
12 yearsa 377 .60 (.14) 45.2 (11.9)
13 yearsa 32 .56 (.14) 41.6 (10.7)
a Due to the age requirements for school enrollment, students usuallyleave primary school between 11;6 and 12;6 years of age. The 12-year-old group would thus primarily consists of students with a delayed startand students with a longer educational pathway. The 13-year-old groupwould consist of students who repeated a class. As a result, the datapresented here will be less representative for those particular age groups
Behav Res

Nevertheless, it is possible that children with less verbal skillshad more difficulty understanding the task. It is currently un-known whether such child characteristics (e.g., computer ex-perience or verbal abilities) may confound task performance.In our previous study with the Lion game, however, observa-tions by testing assistants and self-report by children indicatedthat even children in the youngest age group were able tounderstand the instructions and play such games self-reliantly (Van de Weijer-Bergsma et al., 2014). Indeed, in theMonkey game, the vast majority of children answered thebackward recall practice trials correctly (ranging from93.3 % in Grade 1 to 99.0 % in Grade 6), indicating that theyunderstood the instructions. In fact, this may actually be anunderrepresentation of the number of children who under-stood the instruction, since there were probably also childrenwho comprehended what they were asked to do but wereunable to respond correctly because of working memorydifficulties.
To summarize, this study showed that the Monkey gamecan be used to assess verbal working memory self-reliantly inchildren within a classroom setting. The Monkey game is alow-cost measure, enabling the inclusion of working memoryas a control or predictor variable in large-sample studies. Boththe Monkey game and the Lion game can be easily translatedinto other languages, making cross-cultural comparisons pos-sible without difficulty.2 The descriptive statistics of the datafrom the Monkey game per age group are included in Table 7for use by other researchers.
Author Note The data in this study were collected as part of the project“Every Child Deserves Differentiated Math Education,” which is fi-nanced by the Netherlands Organisation for Scientific Research(NWO), Grant Number 411-10-753. We thank Levent Serbesatik forprogramming the Monkey game for Web-based administration.
Open Access This article is distributed under the terms of the CreativeCommons At t r ibut ion 4 .0 In te rna t ional License (h t tp : / /creativecommons.org/licenses/by/4.0/), which permits unrestricted use,distribution, and reproduction in any medium, provided you give appro-priate credit to the original author(s) and the source, provide a link to theCreative Commons license, and indicate if changes were made.
References
Alloway, T. P. (2007). Automated working memory assessment. London,UK: Pearson Assessment.
Alloway, T. P., &Alloway, R. G. (2010). Investigating the predictive rolesof working memory and IQ in academic attainment. Journal ofExperimental Child Psychology, 106, 20–29. doi:10.1016/j.jecp.2009.11.003
Alloway, T. P., Gathercole, S. E., Kirkwood, H., & Elliott, J. (2009). Theworkingmemory rating scale: A classroom-based behavioral assess-ment of working memory. Learning and Individual Differences, 19,242–245. doi:10.1016/j.lindif.2008.10.003
Alloway, T. P., Gathercole, S. E., & Pickering, S. J. (2006). Verbal andvisuospatial short-term and working memory in children: Are theyseparable? Child Development, 77, 1698–1716. doi:10.1111/j.1467-8624.2006.00968.x
Baddeley, A. (2000). The episodic buffer: A new component of workingmemory? Trends in Cognitive Sciences, 4, 417–423. doi:10.1016/S1364-6613(00)01538-2
Baddeley, A., & Hitch, G. (1974). Working memory. In G. A. Bower(Ed.), The psychology of learning and motivation (pp. 47–90).New York, NY: Academic Press.
Bull, R., Espy, K. A., & Wiebe, S. A. (2008). Short-term memory, work-ing memory, and executive functioning in preschoolers:Longitudinal predictors of mathematical achievement at age 7 years.Developmental Neuropsychology, 33, 205–228. doi:10.1080/87565640801982312
Cain, K., Oakhill, J., & Bryant, P. (2004). Children’s reading comprehen-sion ability: Concurrent prediction by working memory, verbal abil-ity, and component skills. Journal of Educational Psychology, 96,31–42. doi:10.1037/0022-0663.96.1.31
Cantor, J., Engle, R. W., & Hamilton, G. (1991). Short-term memory,working memory, and verbal abilities: How do they relate?Intelligence, 15(10.1016/0160-2896(91)90032-9), 229–246.
Conway, A. R. A., Cowan, N., Bunting, M. F., Therriault, D. J., &Minkoff, S. R. B. (2002). A latent variable analysis of workingmemory capacity, short-term memory capacity, processing speed,and general fluid intelligence. Intelligence, 30, 163–183. doi:10.1016/S0160-2896(01)00096-4
Conway, A. R. A., Kane, M. J., Bunting, M., Hambrick, D. Z., Wilhelm,O., & Engle, R. W. (2005). Working memory span tasks: A meth-odological review and user’s guide. Psychonomic Bulletin &Review, 12, 769–786. doi:10.3758/BF03196772
De Jonge, P., & De Jong, P. F. (1996). Working memory, intelligence andreading ability in children. Personality and Individual Differences,21, 1007–1020. doi:10.1016/S0191-8869(96)00161-4
De Neys, W., d’Ydewalle, G., Schaeken, W., & Vos, G. (2002). A Dutch,computerized, and group administrable adaptation of the operationspan test. Psychologica Belgica, 42, 177–190.
De Ribaupierre, A., & Lecerf, T. (2006). Relationships between workingmemory and intelligence from a developmental perspective:Convergent evidence from a neo-Piagetian and a psychometric ap-proach. European Journal of Cognitive Psychology, 18, 109–137.doi:10.1080/09541440500216127
De Smedt, B., Janssen, R., Bouwens, K., Verschaffel, L., Boets, B., &Ghesquière, P. (2009). Working memory and individual differencesin mathematics achievement: A longitudinal study from first gradeto second grade. Journal of Experimental Child Psychology, 103,186–201. doi:10.1016/j.jecp.2009.01.004
De Weerdt, F., Desoete, A., & Roeyers, H. (2013). Working memory inchildren with reading disabilities and/or mathematical disabilities.Journal of Learning Disabilities, 46, 461–472. doi:10.1177/0022219412455238
Engel de Abreu, P. M. J., Conway, A. R. A., & Gathercole, S. E. (2010).Working memory and fluid intelligence in young children.Intelligence, 38, 552–561. doi:10.1016/j.intell.2010.07.003
Engle, R. W. (2002). Working memory capacity as executive attention.Current Directions in Psychological Science, 11, 19–23. doi:10.1111/1467-8721.00160
Engle, R. W., Tuholski, S. W., Laughlin, J. E., & Conway, A. R. A.(1999). Working memory, short-term memory, and general fluidintelligence: A latent-variable approach. Journal of ExperimentalPsychology: General, 128, 309–331. doi:10.1037/0096-3445.128.3.309
2 Dutch and German versions of the Monkey game and Lion game areavailable for use by other researchers. Other-language versions of thetasks may also be developed in consultation with the first author. Formore information, please contact [email protected].
Behav Res
Feenstra, H., Kamphuis, F., Kleintjes, F., & Krom, R. (2010).Wetenschappelijke verantwoording Begrijpend lezen voor groep 3tot en met 6 [Scientific justification of reading comprehension testsfor grades 1 through 4]. Arnhem, The Netherlands: Cito.
Friso-van den Bos, I., Van der Ven, S. H. G., Kroesbergen, E. H., & VanLuit, J. E. H. (2013). Working memory and mathematics in primaryschool children: A meta-analysis. Educational Research Review, 10,29–44. doi:10.1016/j.edurev.2013.05.003
Gathercole, S. E., Alloway, T. P., Willis, C., & Adams, A. (2006).Working memory in children with reading disabilities. Journal ofExperimental Child Psychology, 93, 265–281. doi:10.1016/j.jecp.2005.08.003
Gathercole, S. E., Brown, L., & Pickering, S. J. (2003). Workingmemoryassessments at school entry as longitudinal predictors of NationalCurriculum attainment levels. Educational and Child Psychology,20, 109–122.
Geary, D. C. (2011). Cognitive predictors of achievement growth inmath-ematics: A 5-year longitudinal study. Developmental Psychology,47, 1539–1552. doi:10.1037/a0025510
Geary, D. C., Hoard, M. K., Byrd-Craven, J., Nugent, L., & Numtee, C.(2007). Cognitive mechanisms underlying achievement deficits inchildren with mathematical learning disability. Child Development,78, 1343–1359. doi:10.1111/j.1467-8624.2007.01069.x
Geary, D. C., Hoard, M. K., Byrd-Craven, J., & Catherine DeSoto, M. C.(2004). Strategy choices in simple and complex addition:Contributions of workingmemory and counting knowledge for chil-dren with mathematical disability. Journal of Experimental ChildPsychology, 88, 121–151. doi:10.1016/j.jecp.2004.03.002
Graham, J.W. (2012).Missing data: Analysis and design. NewYork, NY:Springer. doi:10.1007/978-1-4614-4018-5_1
Hoerger, M. (2013). ZH: An updated version of Steiger’s Z and web-basedcalculator for testing the statistical significance of the differencebetween dependent correlations. Retrieved March 11, 2014, fromwww.psychmike.com/dependent_correlations.php
Holm, S. (1979). A simple sequentially rejective multiple test procedure.Scandinavian Journal of Statistics, 6, 65–70. Retrieved from www.jstor.org/stable/4615733
Holmes, J., & Adams, J. W. (2006). Working memory and children’smathematical skills: Implications for mathematical developmentand mathematics curricula. Educational Psychology, 26, 339–366.doi:10.1080/01443410500341056
Hox, J. (2002). Multilevel analysis: Techniques and applications.Mahwah, NJ: Erlbaum.
Hutton, U. M. Z., & Towse, J. N. (2001). Short-term memory and work-ing memory as indices of children’s cognitive skills. Memory, 9,383–394. doi:10.1080/09658210042000058
Imbo, I., & Vandierendonck, A. (2007). The development of strategy usein elementary school children: Working memory and individual dif-ferences. Journal of Experimental Child Psychology, 96, 284–309.doi:10.1016/j.jecp.2006.09.001
Jaeggi, S. M., Buschkuehl, M., Perrig, W. J., & Meier, B. (2010). Theconcurrent validity of the N-back task as a working memory mea-sure. Memory, 18, 394–412. doi:10.1080/09658211003702171
Janssen, J., Scheltens, F., & Kraemer, J. M. (2005). Leerling- enonderwijsvolgsysteem rekenen-wiskunde [Student monitoring sys-tem mathematics]. Arnhem, The Netherlands: Cito.
Janssen, J., Verhelst, N., Engelen, R., & Scheltens, F. (2010).Wetenschappelijke verantwoording van de toetsen LOVS rekenen-wiskunde voor groep 3 tot en met 8 [Scientific justification of themathematics test for grade 1 until grade 6] . Arnhem,The Netherlands: Cito.
Kail, R., & Hall, L. (2001). Distinguishing short-term memory fromworking memory. Memory & Cognition, 29, 1–9. doi:10.3758/BF03195735
Kane, M. J., Conway, A. R. A., Miura, T. K., & Colflesh, G. J. H. (2007).Working memory, attention control, and the n-back task: A question
of construct validity. Journal of Experimental Psychology.Learning, Memory, and Cognition, 33, 615–622. doi:10.1037/0278-7393.33.3.615
Kane,M. J., Hambrick, D. Z., Tuholski, S.W.,Wilhelm, O., Payne, T.W.,& Engle, R.W. (2004). The generality of working memory capacity:A latent-variable approach to verbal and visuospatial memory spanand reasoning. Journal of Experimental Psychology: General, 133,189–217. doi:10.1037/0096-3445.133.2.189
Kyllonen, P. C., & Christal, R. E. (1990). Reasoning ability is (little morethan) working-memory capacity?! Intelligence, 14, 389–433. doi:10.1016/S0160-2896(05)80012-1
Lowry, R. (2013). Significance of the difference between two correlationcoefficients. Retrieved March 11, 2014, from http://vassarstats.net/rdiff.html
Mahone, E. M., Cirino, P. T., Cutting, L. E., Cerrone, P. M., Hagelthorn,K. M., Hiemenz, J. R., … Denckla, M. B. (2002). Validity of thebehavior rating inventory of executive function in children withADHD and/or Tourette syndrome. Archives of ClinicalNeuropsychology, 17, 643–662. doi:10.1016/S0887-6177(01)00168-8
Mangeot, S., Armstrong, K., Colvin, A. N., Yeates, K. O., & Taylor, H. G.(2002). Long-term executive function deficits in children with trau-matic brain injuries: Assessment using the Behavior RatingI nv en t o r y o f Exe cu t i v e Func t i o n (BRIEF ) . Ch i l dNeuropsychology, 8, 271–284. doi:10.1076/chin.8.4.271.13503
Meng, X. (1994). Multiple-imputation inferences with uncongenialsources of input. Statistical Science, 9, 538–558.
Miles, C., Morgan, M. J., Milne, A. B., & Morris, E. D. M. (1996).Developmental and individual differences in visual memory span.Current Psychology, 15, 53–67. doi:10.1007/BF02686934
Muthén, L. K., & Muthén, B. O. (2006). Mplus. Los Angeles, CA:Muthén & Muthén.
Muthén, B. O., & Satorra, A. (1995). Complex sample data in structuralequation modeling. Sociological Methodology, 25, 267–316.
Oberauer, K., Süß, H., Schulze, R., Wilhelm, O., & Wittmann, W. W.(2000). Working memory capacity. Facets of a cognitive abilityconstruct. Personality and Individual Differences, 29, 1017–1045.doi:10.1016/S0191-8869(99)00251-2
Pardo-Vázquez, J., & Fernández-Rey, J. (2008). External validation of thecomputerized, group administrable adaptation of the “operationspan task.”. Behavior Research Methods, 40, 46–54. doi:10.3758/BRM.40.1.46
Pezaris, E., & Casey, M. B. (1991). Girls who use “masculine” problem-solving strategies on a spatial task: Proposed genetic and environ-mental factors. Brain and Cognition, 17, 1–22. doi:10.1016/0278-2626(91)90062-D
Raghubar, K. P., Barnes, M. A., & Hecht, S. A. (2010). Working memoryand mathematics: A review of developmental, individual difference,and cognitive approaches. Learning and Individual Differences, 20,110–122. doi:10.1016/j.lindif.2009.10.005
Raven, J. C., Court, J. H., & Raven, J. (1996). Manual for Raven’sStandard Progressive Matrices and vocabulary scales. Oxford,UK: Oxford Psychologists Press.
Rubin, D. B. (1987). Multiple imputation for non-response in surveys.New York, NY: Wiley.
Savage, R., Lavers, N., & Pillay, V. (2007). Working memory and readingdifficulties: What we know and what we don’t know about therelationship. Educational Psychology Review, 19, 185–221. doi:10.1007/s10648-006-9024-1
Schafer, J. L., & Graham, J. W. (2002). Missing data: Our view of thestate of the art. Psychological Methods, 7, 147–177. doi:10.1037/1082-989X.7.2.147
Seigneuric, A., & Ehrlich,M. F. (2005). Contribution of workingmemorycapacity to children’s reading comprehension: A longitudinal inves-tigation. Reading and Writing, 18, 617–656. doi:10.1007/s11145-005-2038-0
Behav Res

Seigneuric, A., Ehrlich, M., Oakhill, J., & Yuill, N. (2000). Workingmemory resources and children’s reading comprehension. Readingand Writing, 13, 81–103. doi:10.1023/A:1008088230941
Shelton, J. T., Elliott, E. M., Matthews, R. A., Hill, B. D., & Gouvier, W.D. (2010). The relationships of working memory, secondary mem-ory, and general fluid intelligence: Working memory is special.Journal of Experimental Psychology: Learning, Memory, andCognition, 36, 813–820. doi:10.1037/a0019046
Shelton, J. T., Metzger, R. L., & Elliott, E. M. (2007). A group-administered lag task as a measure of working memory.Behavior Research Methods, 39, 482–493. doi:10.3758/BF03193017
St Clair-Thompson, H. L., & Sykes, S. (2010). Scoring methods and thepredictive ability of working memory tasks. Behavior ResearchMethods, 42, 969–975. doi:10.3758/BRM.42.4.969
Stapleton, M. L. (2006). Using multilevel structural equation modelingtechniques with complex sample data. In G. R. Hancock & R. O.Mueller (Eds.), Structural equation modeling: A second course (pp.345–383). Charlotte, NC: Information Age.
Steiger, J. H. (1980). Tests for comparing elements of a correlationmatrix.Psychological Bulletin, 87, 245–251. doi:10.1037/0033-2909.87.2.245
Swanson, H. L. (2006). Cross-sectional and incremental changes in work-ing memory and mathematical problem solving. Journal ofEducational Psychology, 98, 265–281. doi:10.1037/0022-0663.98.2.265
Swanson, H. L., & Beebe-Frankenberger, M. (2004). The relationshipbetween working memory and mathematical problem solving inchildren at risk and not at risk for serious math difficulties.Journal of Educational Psychology, 96, 471–491. doi:10.1037/0022-0663.96.3.471
Swanson, H. L., Jerman, O., & Zheng, X. (2008). Growth in workingmemory and mathematical problem solving in children at risk andnot at risk for serious math difficulties. Journal of EducationalPsychology, 100, 343–379. doi:10.1037/0022-0663.100.2.343
Swanson, H. L., Xinhua, Z., & Jerman, O. (2009). Working memory,short-term memory, and reading disabilities: A selective meta-analysis of the literature. Journal of Learning Disabilities, 42,260–287. doi:10.1177/0022219409331958
Tabachnick, B. G., & Fidell, L. S. (2007). Using multivariate statistics(5th ed.). Boston, MA: Pearson Education.
Tillman, C. M., Nyberg, L., & Bohlin, G. (2008). Working memorycomponents and intelligence in children. Intelligence, 36, 394–402. doi:10.1016/j.intell.2007.10.001
Toll, S. W. M., Van der Ven, S. H. G., Kroesbergen, E. H., & Van Luit, J.E. H. (2011). Executive functions as predictors of math learningdisabilities. Journal of Learning Disabilities, 44, 521–532. doi:10.1177/0022219410387302
Toplak, M. E., Bucciarelli, S. M., Jain, U., & Tannock, R. (2008).Executive functions: Performance-based measures and theBehavior Rating Inventory of Executive Function (BRIEF) in ado-lescents with Attention Deficit/Hyperactivity Disorder (ADHD).Ch i l d Neu rop s y cho l og y, 15 , 53–72 . d o i : 10 . 1 080 /09297040802070929
Van Buuren, S. (2012). Flexible imputation of missing data. Boca Raton,FL: CRC Press.
Van Buuren, S., & Groothuis-Oudshoorn, K. (2011). Mice: Multivariateimputation by chained equations in R. Journal of StatisticalSoftware, 45, 1–67.
Van de Weijer-Bergsma, E., Kroesbergen, E. H., Prast, E. J., & Van Luit,J. E. H. (2014). Validity and reliability of an online visual–spatialworking memory task for self-reliant administration in school-agedchildren. Behavior Research Methods. doi:10.3758/s13428-014-0469-8. Advance online publication.
Van der Maas, H. L. J., Dolan, C. V., Grasman, R. P. P. P.,Wicherts, J. M.,Huizenga, H. M., & Raijmakers, M. E. J. (2006). A dynamicalmodel of general intelligence: The positive manifold of intelligenceby mutualism. Psychological Review, 113, 842–861. doi:10.1037/0033-295X.113.4.842
Van der Ven, S. H. G., Van der Maas, H. L. J., Straatemeier, M., & Jansen,B. R. J. (2013). Visuospatial working memory and mathematicalability at different ages throughout primary school. Learning andIndividual Differences, 27, 182–192. doi:10.1016/j.lindif.2013.09.003
Vriezen, E. R., & Pigott, S. E. (2002). The relationship between parentalreport on the BRIEF and performance-based measures of executivefunction in children with moderate to severe traumatic brain injury.Child Neuropsychology, 8, 296–303. doi:10.1076/chin.8.4.296.13505
Weekers, A., Groenen, I., Kleintjes, F., & Feenstra, H. (2011).Wetenschappelijke verantwoording papieren toetsen BegrijpendLezen voor groep 7 en 8 [Scientific justification of reading compre-hension tests for Grades 5 and 6]. Arnhem, The Netherlands: Cito.
Behav Res