The Modeling and Simulation of Tight Gas Reservoirs Incorporating Desorption Phenomena
15
This article was downloaded by: [Mr Emad Jamshidi] On: 01 February 2014, At: 11:39 Publisher: Taylor & Francis Informa Ltd Registered in England and Wales Registered Number: 1072954 Registered office: Mortimer House, 37-41 Mortimer Street, London W1T 3JH, UK Energy Sources, Part A: Recovery, Utilization, and Environmental Effects Publication details, including instructions for authors and subscription information: http://www.tandfonline.com/loi/ueso20 The Modeling and Simulation of Tight Gas Reservoirs Incorporating Desorption Phenomena M. A. Ekramzadeh a , S. Gerami b , R. Arabjamaloei c & E. Jamshidi d e a Petroleum Engineering Department , University of Calgary , Calgary , Alberta , Canada b National Iranian Oil Company , Tehran , Iran c Department of Petroleum Engineering , Islamic Azad University, Omidiyeh Branch , Omidiyeh , Khuzestan , Iran d Curtin University of Technology , Bentley , Australia e Petroleum University of Technology , Tehran , Iran Published online: 20 Aug 2012. To cite this article: M. A. Ekramzadeh , S. Gerami , R. Arabjamaloei & E. Jamshidi (2012) The Modeling and Simulation of Tight Gas Reservoirs Incorporating Desorption Phenomena, Energy Sources, Part A: Recovery, Utilization, and Environmental Effects, 34:20, 1855-1867, DOI: 10.1080/15567031003753561 To link to this article: http://dx.doi.org/10.1080/15567031003753561 PLEASE SCROLL DOWN FOR ARTICLE Taylor & Francis makes every effort to ensure the accuracy of all the information (the “Content”) contained in the publications on our platform. However, Taylor & Francis, our agents, and our licensors make no representations or warranties whatsoever as to the accuracy, completeness, or suitability for any purpose of the Content. Any opinions and views expressed in this publication are the opinions and views of the authors, and are not the views of or endorsed by Taylor & Francis. The accuracy of the Content should not be relied upon and should be independently verified with primary sources of information. Taylor and Francis shall not be liable for any losses, actions, claims, proceedings, demands, costs, expenses, damages, and other liabilities whatsoever or howsoever caused arising directly or indirectly in connection with, in relation to or arising out of the use of the Content. This article may be used for research, teaching, and private study purposes. Any substantial or systematic reproduction, redistribution, reselling, loan, sub-licensing,
-
Upload
independent -
Category
Documents
-
view
0 -
download
0
Transcript of The Modeling and Simulation of Tight Gas Reservoirs Incorporating Desorption Phenomena

This article was downloaded by: [Mr Emad Jamshidi]On: 01 February 2014, At: 11:39Publisher: Taylor & FrancisInforma Ltd Registered in England and Wales Registered Number: 1072954 Registeredoffice: Mortimer House, 37-41 Mortimer Street, London W1T 3JH, UK
Energy Sources, Part A: Recovery,Utilization, and Environmental EffectsPublication details, including instructions for authors andsubscription information:http://www.tandfonline.com/loi/ueso20
The Modeling and Simulation of TightGas Reservoirs Incorporating DesorptionPhenomenaM. A. Ekramzadeh a , S. Gerami b , R. Arabjamaloei c & E. Jamshidi de
a Petroleum Engineering Department , University of Calgary ,Calgary , Alberta , Canadab National Iranian Oil Company , Tehran , Iranc Department of Petroleum Engineering , Islamic Azad University,Omidiyeh Branch , Omidiyeh , Khuzestan , Irand Curtin University of Technology , Bentley , Australiae Petroleum University of Technology , Tehran , IranPublished online: 20 Aug 2012.
To cite this article: M. A. Ekramzadeh , S. Gerami , R. Arabjamaloei & E. Jamshidi (2012) TheModeling and Simulation of Tight Gas Reservoirs Incorporating Desorption Phenomena, EnergySources, Part A: Recovery, Utilization, and Environmental Effects, 34:20, 1855-1867, DOI:10.1080/15567031003753561
To link to this article: http://dx.doi.org/10.1080/15567031003753561
PLEASE SCROLL DOWN FOR ARTICLE
Taylor & Francis makes every effort to ensure the accuracy of all the information (the“Content”) contained in the publications on our platform. However, Taylor & Francis,our agents, and our licensors make no representations or warranties whatsoever as tothe accuracy, completeness, or suitability for any purpose of the Content. Any opinionsand views expressed in this publication are the opinions and views of the authors,and are not the views of or endorsed by Taylor & Francis. The accuracy of the Contentshould not be relied upon and should be independently verified with primary sourcesof information. Taylor and Francis shall not be liable for any losses, actions, claims,proceedings, demands, costs, expenses, damages, and other liabilities whatsoever orhowsoever caused arising directly or indirectly in connection with, in relation to or arisingout of the use of the Content.
This article may be used for research, teaching, and private study purposes. Anysubstantial or systematic reproduction, redistribution, reselling, loan, sub-licensing,

systematic supply, or distribution in any form to anyone is expressly forbidden. Terms &Conditions of access and use can be found at http://www.tandfonline.com/page/terms-and-conditions
Dow
nloa
ded
by [
Mr
Em
ad J
amsh
idi]
at 1
1:39
01
Febr
uary
201
4

Energy Sources, Part A, 34:1855–1867, 2012
Copyright © Taylor & Francis Group, LLC
ISSN: 1556-7036 print/1556-7230 online
DOI: 10.1080/15567031003753561
The Modeling and Simulation of Tight Gas
Reservoirs Incorporating Desorption Phenomena
M. A. EKRAMZADEH,1 S. GERAMI,2 R. ARABJAMALOEI,3
and E. JAMSHIDI4;5
1Petroleum Engineering Department, University of Calgary, Calgary, Alberta,
Canada2National Iranian Oil Company, Tehran, Iran3Department of Petroleum Engineering, Islamic Azad University, Omidiyeh
Branch, Omidiyeh, Khuzestan, Iran4Curtin University of Technology, Bentley, Australia5Petroleum University of Technology, Tehran, Iran
Abstract Tight gas reservoirs are categorized as unconventional gas reservoirs. One
of the main characteristics of a tight gas reservoir is the adsorption of gas on therock surface due to high specific surface area. Desorption is the process of adsorbing
gas by the reservoir rock on its surface that is dependent on factors, such as reservoir
pressure, reservoir rock type, and temperature. Therefore, analysis of production datausing conventional methods is expected to be problematic. In this study, there was
an endeavor to model and simulate the desorption phenomena in tight formationsto investigate its effect on different properties and to study related reservoirs. The
purpose of this work is to model the single-phase radial gas flow in tight gas reservoirsincluding equilibrium desorption phenomena on the rock surface and Darcy flow in
a reservoir. Considering a control volume, the gas desorption rate as a function oftime and space is incorporated into the radial continuity equation as a source term.
Using a Langmuir-type sorption isotherm, the gas desorption rate is determined atany radius of the reservoir. The resulting governing equation is solved numerically
using a finite difference approach. The simulator is used to model a tight reservoirto identify how important parameters affect the performance of a tight gas reservoir.
The results suggest that the development of tight gas reservoirs with significant gasdesorption can lead to higher production rates and improve the productivity of the gas
reservoir. The model developed here can be used as an engineering tool for evaluatingthe role of adsorbed gases in improving the productivity and extending the life of tight
gas reservoirs.
Keywords desorption phenomenon, gas-rock interaction, numerical simulation, reser-voir modeling, tight gas reservoir
1. Introduction
The increased demand for new gas reserves validate the need for an accurate estimate of
the reservoirs characteristics, such as gas in place estimation in the early life of a well
that leads to evaluating the offset development or infill drilling, well spacing, and design
of wellhead facilities.
Address correspondence to Mohammad Ekramzadeh, Petroleum Engineering Department,University of Calgary, Calgary, Canada. E-mail: [email protected]
1855
Dow
nloa
ded
by [
Mr
Em
ad J
amsh
idi]
at 1
1:39
01
Febr
uary
201
4
1856 M. Ekramzadeh et al.
What makes a significant difference between the production mechanisms of tight gas
reservoirs and conventional reservoirs is the intrinsic behavior of tight reservoirs for their
very low permeability. Most gas reservoirs deliver needed data for primary evaluation
within 24 to 72 h, depending on the reservoir characteristics. But this time cannot be kept
up with, since this time is so little for a tight formation to produce as much to extract
the inquired data.
All of the above features stimulate people to derive new methods of production
processes for tight gas formations. Bennett and Forgerson (1975) made an effort to
make new ways for reserve prediction using limited performance data. Gochnour and
Slater (1977) established ways for well test analysis of tight gas formations (Bennett and
Forgerson, 1975), while Crafton et al. (1982) described the producing well evaluation in
tight gas reservoirs.
Tight gas reservoirs lack a unique definition. Law and Curtis (mentioned in Gochnour
and Slater, 1977) define the low permeability reservoirs as having permeability less than
0.1 millidarcies (Gochnour and Slater, 1977; Naik).
DGMK, the German Society for Petroleum and Coal Science and Technology,
declared a definition for tight gas reservoirs as reservoirs with the effective permeability
of less than 0.6 millidarcies.
As in the definition of tight gas reservoirs, the matrix medium is poorly enabled to
transmit thefluid through theporespaces.Thiswill be intensified when weknowthat thehuge
amount of gas reserve should be extracted. People decided to make ways for the underlying
fluid, so hydraulic fracturing of tight gas formations appeared as the accepted method
fulfilling this goal. Hydraulically fractured horizontal wells, in particular, are the proven
technology to produce gas from tight formations. Hydraulic fractures reduce well drawdown,
increase productivity of horizontal wells by increasing the surface area in contact with
formation, and provide high conductivity paths to wellbore (Shahamat and Gerami, 2009).
Tight gas reservoirs support an outstanding supply of gas that is derived from un-
conventional gas reservoirs. They are different in the production amount and mechanism
since a large portion of the gas phase in the formation is adsorbed on the surface of the
low permeable matrix with the sorption mechanism, which is controlled by pressure. As
the pressure declines, this adsorbed amount of gas will release gradually in the form of
free gas and starts to flow towards the wellbore. If the reservoir is considered as a naturally
fractured reservoir, this flow will fill the fracture medium and start to move towards the
wellbore using the fracture wideness. Therefore, adsorbed gas has an important role in
long-term production scenarios, while it also causes the production forecasts to be more
realistic (Satik et al., 1995).
The volume of gas adsorbed as a function of pressure is considered as the adsorption
isotherm. Among all the adsorption isotherms, the Langmuir isotherm is the most popular
one, which is described in the following equation (Gao and John Lee, 1994):
VE DVLPg
PL C Pg
; (1)
where PL is the Langmuir pressure at which the total gas volume is adsorbed, VE is
equal to one half of the Langmuir volume, VE is total volume of gas adsorbed per unit
volume of the reservoir in equilibrium at pressure Pg , and VL is the Langmuir volume,
which is the maximum capacity of sorption for the rock type.
There also exists some other types of adsorption isotherms that are included as
Freundlich isotherm and Henry’s law.
Dow
nloa
ded
by [
Mr
Em
ad J
amsh
idi]
at 1
1:39
01
Febr
uary
201
4

Tight Gas Reservoirs 1857
The Freundlich isotherm is as follows:
Veq D VF P NFg ; (2)
where NF is the integer number of multiple boreholes and VF is the amount of gas
adsorbed per unit volume of the reservoir (Gao and John Lee, 1994).
Henry’s law is also indicating a kind of adsorption isotherm, which is highly depen-
dent on the pressure. It is described as:
Veq D VH Pg ; (3)
where VH is Henry’s law volume constant (Gao and John Lee, 1994).
The Langmuir isotherm is generally used to describe the mono player adsorption be-
cause with increasing pressure, the amount of adsorbed gas asymptotically approaches its
final possible amount of adsorbed gas volume (Fathi and Akkutlu, 2009). Since Freundlich
isotherm assumes no end for the adsorption capacity of the rock reservoir in any pressure,
it is widely used in multi layer reservoirs with adsorption phenomenon (Fathi and Akkutlu,
2009). Both Langmuir and Freundlich isotherms are finally collapsed on Henry’s law.
Fathi and Akkutlu (2009) studied the upscaling approach to investigate the effect
of small scale heterogeneities in matrix porosity on Darcy flow in the existence of
adsorption. The study had some malfunctions which were cured by their next paper
with the consideration of nonlinear sorption kinetics and a transport mechanism for the
adsorbed phase (Fathi and Akkutlu, 2009). Also, the unsteady state nature of sorption
phenomenon was studied with the diffusion actions of the reservoir in 1990 by Kolesar
et al. (Fathi and Akkutlu, 2009; Stotts et al., 2007).
The modeling of unconventional gas recovery was then investigated in 1991 by
King and Ertekin, who tried to compare the mechanism of desorption in coalbed and
tight formations (King and Ertekin, 1991a, 1991b). They also considered several fea-
tures that were distinguished, such as various gas transport mechanisms and allowance
for composite conventional and unconventional formations (Fathi and Akkutlu, 2009).
Langmuir and Freundlich were the desorption isotherms included.
2. Approach
As mentioned in the previous section, desorption process may be treated in two ways:
pseudo steady state and unsteady state mechanism. Dealing with the tight gas reservoirs,
the governing equations should account for the desorption phenomenon. Thus, it will be
seen that the governing equations are derived as nonlinear ones.
Two ways of processing these nonlinear equations exists:
1. Making simplified assumptions to transfer nonlinear equations into linear ones to
solve analytical form;
2. Treating the solution through a numerical approach.
What is expected in this endeavor is to verify whether desorption is influential on the
production of tight formations or not. So, it is clear that the analytical solution may not
be necessary. Then the numerical approach remains.
2.1. Methodology
The methodology is the step-by-step process of solving the nonlinear equation:
Dow
nloa
ded
by [
Mr
Em
ad J
amsh
idi]
at 1
1:39
01
Febr
uary
201
4

1858 M. Ekramzadeh et al.
1. Description of the physical model (single well, cylindrical reservoir);
2. Simplifying assumptions;
3. Mathematical model:
a. Mass balance equation;
b. Momentum equation (Darcy’s flow);
c. Equation of State;
d. Initial and Boundary Condition;
4. Numerical Solution;
5. Sensitivity study on important reservoir and rock parameters.
2.2. Physical Model
The reservoir is considered to be a cylindrical reservoir with the external radius of re and
the reservoir thickness of h. The well is also considered to be well located at the center
of the reservoir. There is not any conception of wellbore storage for simplicity.
The reservoir fluid flow is considered to be single phase flow of the gaseous phase.
All the required reservoir characteristics are assumed, in a way, to simplify the problem.
2.3. Mathematical Model
In order to derive the governing equation in the tight gas formations, the physical model
should be transferred into mathematical form to make ways to solve it.
In the first order, the usual gas reservoir is developed that gains no sign of the
adsorption process. The only factor that may change the usual derivation of the gov-
erning equation is the tight gas reservoirs characterization of having low permeability
values. Once the tight formations are evaluated by deriving the governing equation, then
desorption phenomenon should be inserted to account for it. This is the overlooked
procedure of mathematical modeling.
The whole procedure may be summarized as follows:
1. Derivation of continuity equation for gas reservoirs;
2. Accounting for the adsorption equation in the governing the equation;
3. Derivation of the final governing equation;
4. Determining the initial and boundary conditions;
5. Numerical simulation development.
2.4. Continuity Equation
In order to derive the continuity equation, the basis should be designed. It is usual to
start with the linear flow.
Rate of mass in � rate of mass out C net rate of mass generation D rate of mass
accumulation:
�r�u D@
@t.��/ C Oq; (4)
VE DVLPg
PL C Pg
; (5)
�r�u D@
@t.��/ C
@
@t.�gVE/: (6)
Dow
nloa
ded
by [
Mr
Em
ad J
amsh
idi]
at 1
1:39
01
Febr
uary
201
4
Tight Gas Reservoirs 1859
2.5. Initial and Boundary Conditions
The diffusivity equation of tight gas reservoir considering desorption phenomena is a
partial differential equation that is formulated upon two parameters of time and direction,
i.e., time and direction for solving these sorts of partial differential equations, there should
exist some assumptions, such as initial and boundary conditions.
In this investigation, boundary conditions are considered to be a constant rate at the
inner boundary and no flow boundary at the outer boundary. Also, the time boundaries
known in the case of conventional gas reservoirs are treated the same.
2.6. Numerical Simulation
The radial single phase compressible fluid reservoir with desorption is investigated with
the following equations as the final governing equation:
1
r
@
@r
�
rP
z
k
�
@P
@r
�
D@
@t
�
P
z�
�
C@
@t.�gVE /
1
r
@
@r
�
rk
�z
@P 2
@r
�
D
�
�C
zC VL
�
C
z.PL C P /P C
1
z
P
.PL C P /2
��
@P 2
@t;
Di Fi� 1
2
P 2nC1
i�1 � Di
�
Fi� 1
2
C FiC 1
2
C1
Di
�
P 2nC1
i C Di FiC 1
2
P 2nC1
iC1 D �P 2n
i
(7)
where
Fi D
�
1:127
5:615
rk
�z�r
�
i
Di D�t
ri �ri
�
�C
zC VL
�
C
z.PL C P /P C
PL
z.PL C P /2
�� :(8)
2.7. Running the Simulator
Once the simulator is developed, a base case was introduced to test the simulator. It is
important to remind that the aim of this simulator is to investigate the effects of desorption
process in the production and performance of the tight gas reservoirs.
A tight formation with the sequential characteristics is modeled and then simulated
to get the reservoir behavior as follows. The tight formation is considered not to have
any sign of desorption.
Figure 1 is illustrating a tight gas reservoir, which definitely has small characteristic
values of permeabilities of tight formations. The reservoir is considered to be divided
into 1,000 grid blocks with the outer radius of 1,000 ft. Once the desorption term is
inserted, Figure 2 is derived to get the first start of comparing the two conditions with
and without desorption tight formations.
What first appears in the first analysis is a sign of separation between two graphs, in
which the only reason taken into consideration is the desorption action of tight formation.
It is important to note here the point that desorption starts to release the adsorbed gas
from the rock surface while the pressure is declining. Figure 3 shows the two different
behaviors. The investigation shows that desorption seems to be very effective in the early
Dow
nloa
ded
by [
Mr
Em
ad J
amsh
idi]
at 1
1:39
01
Febr
uary
201
4

1860 M. Ekramzadeh et al.
Figure 1. Tight gas reservoirs without desorption. (color figure available online)
steps of production. Figure 4 is demonstrating that desorption is helping the pressure not
to decline as much as in the non-adsorptive case. Table 1 contains the base case data for
running the base case scenario.
3. Sensitivity Analysis
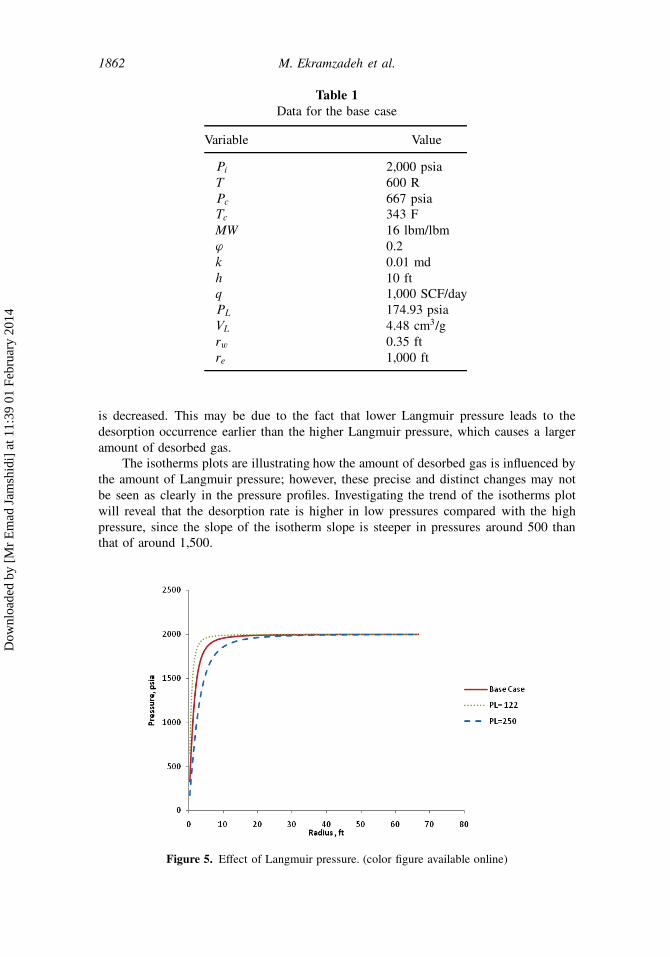
3.1. Effect of Langmuir Pressure in the Reservoir Performance
Langmuir pressure is described as the pressure at which the amount of desorbed gas is
equal to one half of the total amount of desorbed gas, VL. As the definition describes, this
Figure 2. Difference of desorption tight gas reservoirs and normal tight gas reservoirs. (color figure
available online)
Dow
nloa
ded
by [
Mr
Em
ad J
amsh
idi]
at 1
1:39
01
Febr
uary
201
4

Tight Gas Reservoirs 1861
Figure 3. Comparisons of tight gas reservoirs with desorption and without desorption. (color figure
available online)
parameter may not have any physical interpretation and is used as the auxiliary factor.
Figure 5 is describing a prototype of change in the Langmuir pressure. The time of
production is assumed to be 1 month. Figure 6 illustrates the same trend in a semilog plot.
The analysis of the effect of Langmuir pressure on the pressure distribution in a
desorption-dominant tight reservoir may be more accurate if the desorption isotherms are
investigated. Figures 7 and 8 are demonstrating the behavior of a Langmuir desorption
isotherm regarding the changes in the Langmuir pressure. It is easily indicated that,
with any increase in the amount of Langmuir pressure, the amount of desorbed gas
Figure 4. Effect of desorption in the early stages of production, after 15 days. (color figure avail-
able online)
Dow
nloa
ded
by [
Mr
Em
ad J
amsh
idi]
at 1
1:39
01
Febr
uary
201
4
1862 M. Ekramzadeh et al.
Table 1
Data for the base case
Variable Value
Pi 2,000 psia
T 600 R
Pc 667 psia
Tc 343 F
MW 16 lbm/lbm
' 0.2
k 0.01 md
h 10 ft
q 1,000 SCF/day
PL 174.93 psia
VL 4.48 cm3/g
rw 0.35 ft
re 1,000 ft
is decreased. This may be due to the fact that lower Langmuir pressure leads to the
desorption occurrence earlier than the higher Langmuir pressure, which causes a larger
amount of desorbed gas.
The isotherms plots are illustrating how the amount of desorbed gas is influenced by
the amount of Langmuir pressure; however, these precise and distinct changes may not
be seen as clearly in the pressure profiles. Investigating the trend of the isotherms plot
will reveal that the desorption rate is higher in low pressures compared with the high
pressure, since the slope of the isotherm slope is steeper in pressures around 500 than
that of around 1,500.
Figure 5. Effect of Langmuir pressure. (color figure available online)
Dow
nloa
ded
by [
Mr
Em
ad J
amsh
idi]
at 1
1:39
01
Febr
uary
201
4

Tight Gas Reservoirs 1863
Figure 6. Semilog plot of Langmuir pressure change on the desorption action. (color figure avail-
able online)
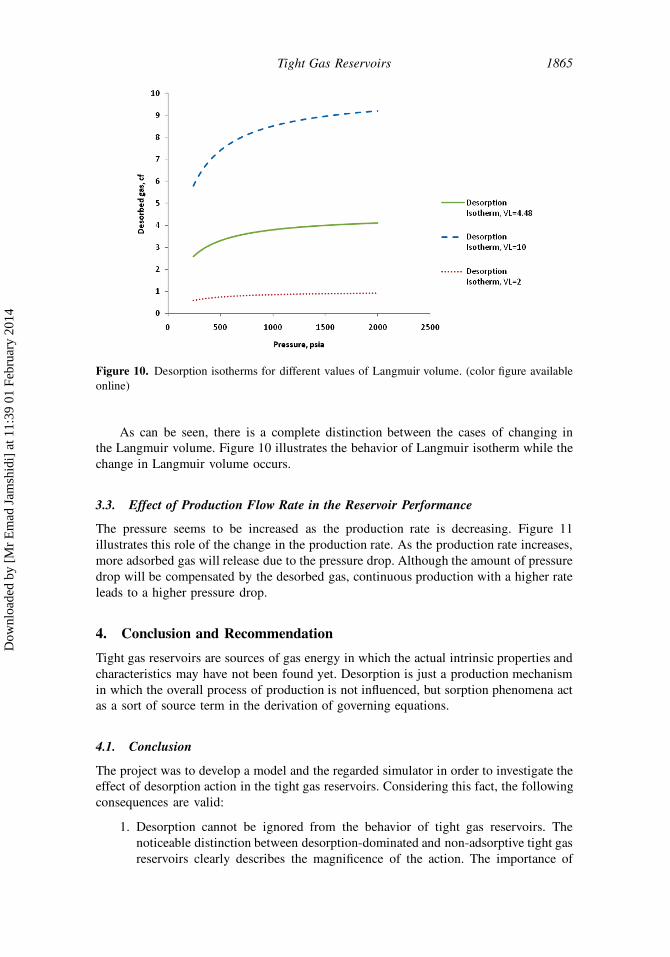
3.2. Effect of Langmuir Volume in the Reservoir Performance
Langmuir volume is the maximum capacity of rock to adsorb gas on its surface. Langmuir
volume represents a sort of rock characteristic, hence, the reservoir characteristic. The
sensitivity analysis of Langmuir volume reveals that this factor has great influence on
the reservoir performance and on the amount of gas desorbed as the pressure declines.
Figure 7. Plot of desorption isotherms for different values of Langmuir pressure. (color figure
available online)
Dow
nloa
ded
by [
Mr
Em
ad J
amsh
idi]
at 1
1:39
01
Febr
uary
201
4

1864 M. Ekramzadeh et al.
Figure 8. Semi-log plot of desorption isotherms for different values Langmuir pressure. (color
figure available online)
Any small change in Langmuir volume is clear in the small changes of the desorption
results. This trend shows that lowering the Langmuir volume will lead to lower amounts
of desorption. In this way, the pressure distribution will rise in a lower amount regarding
the base case in comparison to the tight gas formation without desorption. In Figure 9
the time of production is assumed to be 1 month.
Figure 9. Effect of change in Langmuir volume. (color figure available online)
Dow
nloa
ded
by [
Mr
Em
ad J
amsh
idi]
at 1
1:39
01
Febr
uary
201
4
Tight Gas Reservoirs 1865
Figure 10. Desorption isotherms for different values of Langmuir volume. (color figure available
online)
As can be seen, there is a complete distinction between the cases of changing in
the Langmuir volume. Figure 10 illustrates the behavior of Langmuir isotherm while the
change in Langmuir volume occurs.
3.3. Effect of Production Flow Rate in the Reservoir Performance
The pressure seems to be increased as the production rate is decreasing. Figure 11
illustrates this role of the change in the production rate. As the production rate increases,
more adsorbed gas will release due to the pressure drop. Although the amount of pressure
drop will be compensated by the desorbed gas, continuous production with a higher rate
leads to a higher pressure drop.
4. Conclusion and Recommendation
Tight gas reservoirs are sources of gas energy in which the actual intrinsic properties and
characteristics may have not been found yet. Desorption is just a production mechanism
in which the overall process of production is not influenced, but sorption phenomena act
as a sort of source term in the derivation of governing equations.
4.1. Conclusion
The project was to develop a model and the regarded simulator in order to investigate the
effect of desorption action in the tight gas reservoirs. Considering this fact, the following
consequences are valid:
1. Desorption cannot be ignored from the behavior of tight gas reservoirs. The
noticeable distinction between desorption-dominated and non-adsorptive tight gas
reservoirs clearly describes the magnificence of the action. The importance of
Dow
nloa
ded
by [
Mr
Em
ad J
amsh
idi]
at 1
1:39
01
Febr
uary
201
4

1866 M. Ekramzadeh et al.
Figure 11. Effect of production rate change. (color figure available online)
desorption action may be to show its importance once the reservoir different
characteristics, such as reserve estimation, well testing, history matching, etc.,
are to be evaluated.
2. The sensitivity analysis is performed to investigate the effects of changes in
Langmuir pressure, Langmuir volume, and production rate. Each effect in the
Langmuir properties were considered using the desorption isotherms regarding
the specified characteristics. It was shown that desorption amount will decrease
with the increase in the Langmuir pressure, while the value of Langmuir plays
the reverse behavior. In other words, desorption amount will increase with the
increase in the value of Langmuir volume.
4.2. Recommendation
In this study, there was an endeavor to model and simulate the desorption action of tight
gas reservoirs.
In order to perform this, there were some assumptions to simplify the problem. It
is recommended that whole assumptions are investigated precisely to prevent any source
of error. The recommendations are listed below:
1. Modify the assumptions in order to achieve realistic simulation.
2. Since tight gas reservoirs are mostly treated as naturally fractured reservoirs, it is
highly recommend that the whole process be done considering the tight formation
as double porosity-double permeability reservoir.
3. Insert the terms of diffusion and investigate the proportion of each mechanism in
the production.
4. Investigate the effect of near wellbore hydraulic fracturing in the mechanism and
process of desorption.
Dow
nloa
ded
by [
Mr
Em
ad J
amsh
idi]
at 1
1:39
01
Febr
uary
201
4

Tight Gas Reservoirs 1867
5. Investigate the other desorption isotherms in order to make it clear which isotherm
is suitable enough for the reservoirs of early production time.
6. Perform the whole process for constant pressure conditions in the wellbore bound-
ary.
References
Bennett, E. N., and Forgerson, C. D. 1975. Predicting reserves and forecasting flow rates of
relatively tight gas wells using limited performance data. SPE Paper No. 5058.
Crafton, J. W., Poundstone, D. J., and Brown, C. A. 1982. A practical model for evaluating a
well producing from a tight gas formation. SPE Unconventional Gas Recovery Symposium,
Pittsburgh, PA, May 16–18.
Fathi, E., and Akkutlu, I. Y. 2009. Nonlinear sorption kinetics and surface diffusion effects on gas
transport in low-permeability formations. SPE Paper No. 124478.
Gao, Ch., and John Lee, W. 1994. Modeling multilayer gas reservoirs including sorption effects.
SPE Paper No. 29173.
Gochnour, J. R., and Slater, G. E. 1977. Well test analysis in tight gas reservoirs. SPE Paper No.
6842.
King, G. R., and Ertekin, T. 1991a. State-of-the-art modeling for unconventional gas recovery. SPE
Formation Evaluation, SPE Paper No. 18947.
King, G. R., and Ertekin, T. 1991b. Supplement to SPE 18947: State-of-the-art modeling for
unconventional gas recovery. SPE Formation Evaluation, SPE Paper No. 22285.
Kolesar, J. E., Ertekin, T., and Obut, S. T. 1990. The unsteady state nature of sorption and diffusion
phenomena in the micropore structure of coal: Part 1—Theory and mathematical formulation.
SPE Formation Evaluation.
Naik, G. C. Tight gas reservoirs—An unconventional natural energy source for the future. Available
at: http://www.pinedaleonline.com/socioeconomic/pdfs/tight_gas.pdf
Satik, C., Home, R. N., and Yortsos, Y. C. 1995. A study of adsorption of gases in tight reservoir
rocks. SPE Paper No. 30732.
Shahamat, M. S., and Gerami, Sh. 2009. Tight gas reservoirs: Opportunities, characteristics and
challenges. First International Petroleum Conference & Exhibition, Shiraz, Iran.
Stotts, G. W. J., Anderson, D. M., and Mattar, D. M. 2007. Evaluating and developing tight gas
reservoirs—Best practices. SPE Paper No. 108183.
Nomenclature
C gas compressibility, psi�1
D desorption coefficient
F transmissibility coefficient
k permeability, md
PL Langmuir pressure, psi
Pg reservoir gas pressure, psi
r radius, ft
u reservoir fluid velocity, bblf t2 day
VE desorbed volume,Vdesorbedgas
VReservoir
VL Langmuir volume, ft3/lbm
Z compressibility factor
� gas density, lbm/ft3
' porosity
� viscosity, cp
Dow
nloa
ded
by [
Mr
Em
ad J
amsh
idi]
at 1
1:39
01
Febr
uary
201
4