Subtilisin-cleaved actin: polymerization and interaction with myosin subfragment 1
Upload
independentCategory
view
1download
0
tjp˙011 TJP-xml.cls December 22, 1904 11:38
J Physiol 554.2 pp 335–352 335
The mechanism of the force response to stretch in humanskinned muscle fibres with different myosin isoforms
Marco Linari1, Roberto Bottinelli2, Maria Antonietta Pellegrino2, Massimo Reconditi1,Carlo Reggiani3 and Vincenzo Lombardi1
1Laboratorio di Fisiologia, Dipartimento di Biologia Animale e Genetica, Universita di Firenze, e Istituto Nazionale di Fisica della Materia, Firenze,2Dipartimento di Medicina Sperimentale, Sezione Fisiologia Umana, Via Forlanini, 6-27100 Pavia3Dipartimento di Anatomia e Fisiologia Umana, Via Marzolo, 3-35131 Padova, Italy
Force enhancement during lengthening of an active muscle, a condition that normally occursduring locomotion in vivo, is attributed to recruitment of myosin heads that exhibit fastattachment to and detachment from actin in a cycle that does not imply ATP splitting. Weinvestigated the kinetic and mechanical features of this cycle in Ca2+ activated single skinnedfibres from human skeletal muscles containing different myosin heavy chain (MHC) isoforms,identified with single-fibre gel electrophoresis. Fibres were activated by using a new set-up thatallows development of most of the tension following a temperature jump from 0–1◦C to thetest temperature (∼12◦C). In this way we could prevent the development of sarcomere non-uniformity and record sarcomere length changes with a striation follower in any phase of themechanical protocol. We found that: (i) fibres with fast MHC isoforms develop 40–70% largerisometric forces than those with slow isoforms, as a result of both a larger fraction of force-generating myosin heads and a higher force per head; (ii) in both slow and fast fibres, forceenhancement by stretch is due to recruitment of myosin head attachments, without increasein strain per head above the value generated by the isometric heads; and (iii) the extent ofrecruitment is larger in slow fibres than in fast fibres, so that the steady force and power outputelicited by lengthening become similar, indicating that mechanical and kinetic properties of theactin–myosin interactions under stretch become independent of the MHC isoform.
(Received 21 July 2003; accepted after revision 9 October 2003; first published online 10 October 2003)Corresponding author V. Lombardi: Laboratorio di Fisiologia, Viale GB Morgagni, 63-50134 Firenze, Italy.Email: [email protected]
When a muscle is stretched during an active contraction, acondition that normally occurs during locomotion in vivo,the increase in force is much higher than that expected onthe basis of a smooth continuation of the force-shorteningvelocity curve (Katz, 1939), a feature that makes the musclean efficient braking system under stretch. It is known thatduring stretch the ATP consumption decreases below theisometric level (Infante et al. 1964; Curtin & Davies, 1973;Linari et al. 2003), but at the same time there is evidencethat force enhancement by stretch is due to an increase inthe number of myosin heads attached to actin (Linari et al.2000). These results have been explained assuming thatduring lengthening the actin–myosin interaction exhibitsa different kinetics with respect to the isometric conditionor during shortening: the attached myosin head understrain is prevented from completing the conventional cycle(Lymn & Taylor, 1971) and detaches from actin through astep that does not involve ATP splitting (Piazzesi et al. 1992;
Huxley, 1998). Myosin heads detached in this way reattachwith a rate much higher than the rate of attachmentin the isometric condition or during shortening, sothat, even during fast lengthening, attachment doesnot become the rate-limiting step and the number ofattached heads remains high (Lombardi & Piazzesi,1990).
In vertebrates and mammalian muscles the performanceof a muscle fibre contracting in isometric conditions oractively shortening exhibits a large variability: parameterssuch as unloaded shortening velocity, maximum poweroutput and ATPase activity, which are expressions ofthe myosin–actin interaction kinetics, vary from onemuscle fibre to the other in relation to their myosinheavy chain (MHC) isoform composition (see for reviewsSchiaffino & Reggiani, 1996; Bottinelli & Reggiani, 2000).Are the kinetic and mechanical features of myosinheads cycling during steady lengthening different in
C© The Physiological Society 2003 DOI: 10.1113/jphysiol.2003.051748
tjp˙011 TJP-xml.cls December 22, 1904 11:38
336 M. Linari and others J Physiol 554.2 pp 335–352
muscle fibres containing different MHC isoforms? Weinvestigated this question in Ca2+ activated single skinnedfibres dissected from human muscles and containingdifferent MHC isoforms, identified with single-fibre gelelectrophoresis. Fibres were activated by using a set-up that allows development of most of the tensionfollowing a temperature jump between a low-temperatureactivating solution (0–1◦C) and the test temperatureactivating solution (∼12◦C). This method, first used byPate et al. (1994), prevents the development of sarcomerenon-uniformities, due to the diffusion-limited time ofactivation across the fibre, and allows us to recordsarcomere length changes by a striation follower (Huxleyet al. 1981) in any phase of the mechanical protocol.We found that force enhancement by stretch is due torecruitment of myosin head attachments, without anincrease in strain per head above the value generated bythe isometric heads. The extent of recruitment is largerin slow fibres, where the isometric force is smaller thanin fast fibres, so that steady forces and power outputelicited by lengthening are similar in slow and fast fibresindependently of the MHC isoform.
Methods
Muscle biopsy and fibre preparation
The muscle fibres used in this study were obtainedfrom the vastus lateralis of five young healthy subjects(20–40 years old) in the Hospital of Pavia (Italy). Thestudy was approved by the ethical committee of theUniversity of Pavia and conformed to the standardsset by the Declaration of Helsinki (last modified in2000). After the subjects were fully informed of thegoal of the experiments and of the risks involved inthe biopsy procedure, written informed consent wasobtained.
The biopsy samples were immersed in ice-cold skinningsolution (Bottinelli et al. 1996; Stienen et al. 1996),separated into small bundles (70–150 fibres, ∼10 mmlong) and stored in skinning solution, containing 50%glycerol, at –20◦C for 3–4 weeks. For the experiments, abundle of fibres was transferred to a Petri dish with a Silgard(Dow Corning Limited, UK) covered base and kept at 4–6◦C. Single fibres were dissected under a stereomicroscopeand pinned down on the Silgard surface at both ends. Fibreswere treated with relaxing solution (Table 1) containingTriton X-100 (1%, v/v) for 30–40 min at 2–4◦C to ensurecomplete removal of the sarcolemma and sarcoplasmicreticulum. A segment 5–6 mm long was cut from the
fibre and T-shaped aluminium clips were mounted at itsextremities for attachment to transducers.
Experimental set-up
The fibre segment was mounted in a drop of relaxingsolution between the lever arms of a loudspeaker motor(Lombardi & Piazzesi, 1990) and a force transducer. Theforce transducers used were either strain gauge forcetransducers (AE 801 SensorNor, Horten, Norway, resonantfrequency 2.0–2.3 kHz and sensitivity 100–200 V N−1) orcapacitance force transducers (resonant frequency 40–50kHz, sensitivity 80–200 V N−1, Huxley & Lombardi, 1980).A rapid solution exchange system driven by a steppermotor (speed 15 mm s−1), similar to that previouslydescribed by Linari et al. (1993), allowed continuousrecording by a striation follower (Huxley et al. 1981)from a selected population of sarcomeres (800–1000).Before starting the experiment the fibre was transferredfrom relaxing solution to rigor solution (0–1◦C), then thefibre ends were first fixed with a rigor solution containingglutaraldehyde (5%, v/v) and then glued to the aluminiumclips with shellac dissolved in ethanol (for more details seeLinari et al. 1998).
The system used in these experiments was modifiedfrom the previous one (Linari et al. 1998) to allowrapid change of temperature of the bathing solution.The volume of the drops (∼70 µl) was delimited by topand bottom coverglass pieces of size 8 × 3 mm, andseparated by 3 mm. The pedestals carrying the coverglasspieces were placed on two aluminium plates that could bemaintained at two different temperatures by means of twoseparated servocontrolled thermoelectric modules. Eachplate carried two pedestals. The pedestals of the first platewere used to transfer the fibre from preactivating solutionto activating solution at the same low temperature. Thetransition from low-temperature to high-temperatureactivating solution occured by moving the fibre fromthe second drop carried by the low-temperature plate tothe first drop carried by the high-temperature plate.Since the stepper motor moved to transfer the fibre tothe next drop, the sarcomere length could be measuredby the striation follower as soon as the optic axis passedbeyond the end of the pedestal made by aluminium(shadow zone) and entered the part of the pedestal madeby coverglass. This occured ∼30 ms after the fibre hadentered into the next drop. Thus, following the transfer tothe high-temperature activating solution, the sarcomerelength could be monitored by the striation follower formost of the force development (see Fig. 2, later).
C© The Physiological Society 2003
tjp˙011 TJP-xml.cls December 22, 1904 11:38
J Physiol 554.2 pp 335–352 The force response to stretch by different myosin isoforms 337
Table 1. Composition of solutions used for human skinned muscle fibres
Solution TES Na2ATP MgCl2 EGTA HDTA CaEGTA Na2CP GLH(mM) (mM) (mM) (mM) (mM) (mM) (mM) (mM)
Relaxing 100 5.4 7.7 25 – – 19.1 10Pre-activating 100 5.5 6.9 0.1 24.9 – 19.5 10Activating 100 5.5 6.8 – – 25 19.5 10
TES, N-tris[hydroxymethyl]methyl-2-aminoethanesulphonic acid; ATP, adenosine 5′-triphosphate; EGTA, ethylene glycol-bis-(β-aminoethyl ether)-N,N,N′,N′-tetraacetic acid;HDTA, 1,6 diaminohexane-N,N,N′,N′-tetraacetic acid; CP, N-[Imino(phosphonoamino)methyl]-N-methylglycine; GLH, glutathione. 1 mg ml−1 creatine phosphokinase, 10-µM trans-epoxysuccinyl-L-leucylamido-(4-guanidino)butane (E-64) and 20 µg ml−1 leupeptin were added to all solutions.pH of all solutions, 7.10 at 12◦C (adjusted with KOH, 2–12 × 10−3 M). Ionic strength: 200 mM.HDTA was obtained from Fluka (Buchs, Switzerland). All other chemicals were obtained fromSigma.
Experimental protocol
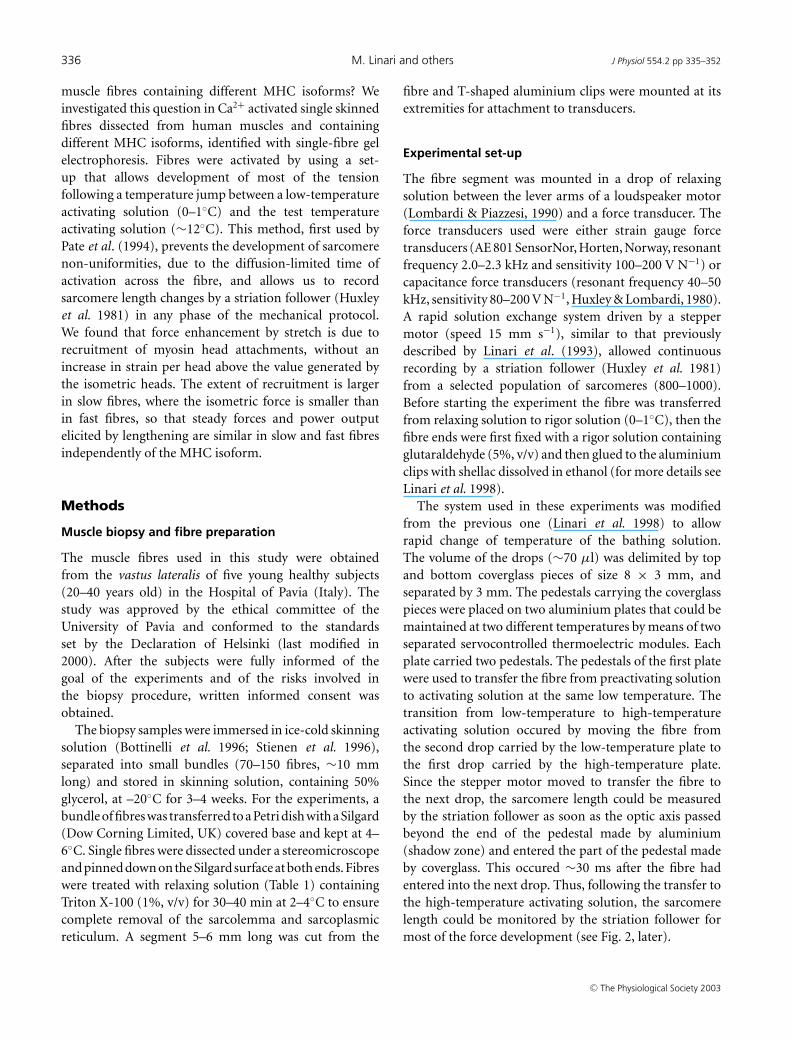
The sarcomere length, width (w) and height (h) in thecentral 2–4 mm segment of the fibre were measured at0.5-mm intervals with a 40× dry objective (NA 0.60,Zeiss) and an 8× or 25× eyepiece while the fibre wasin relaxing solution. The sarcomere length in the relaxedfibre was set to 2.40–2.65 µm. The cross-sectional area(CSA) was determined assuming the fibre cross-sectionto be elliptical (CSA = whπ /4). The fibre was transferredfrom relaxing solution at 12◦C to preactivating solution at1◦C and then to activating solution at 1◦C. At saturatingpCa, force rose to a steady value of 1/4–1/5 the isometricforce developed at the test (12◦C) temperature (Fig. 1).Then the fibre was transferred to activating solution at thetest temperature. This procedure allows the developmentof tension at the test temperature when Ca2+ is alreadyuniformly distributed around the myofilaments. In thisway it is possible to prevent the development of sarcomerelength inhomogeneity across the fibre which occurs whenthe fibre is directly activated at the test temperature. Oncethe force attained the plateau value, a ramp shorteningor lengthening (<8% of the fibre length or <100 nmper half-sarcomere, hs) was imposed by the motor. Thelengthening velocities used were always <1 µm s−1
hs−1 in order to minimize the possibility of inducinginhomogeneous responses to stretch from the sarcomeresalong the fibre (Lombardi & Piazzesi, 1990). The fibrewas kept in the activating solution at the test temperaturefor 4–8 s, and then transferred to relaxing solutionat the test temperature. With our temperature jump(T-jump) activation procedure, at 12◦C the striationpattern remained homogeneous for several (12–15)activation–relaxation cycles. The experiment ended whenthe signal from the striation follower became unreliable orwhen the force response started to exhibit a continuous rise
even beyond the extent of lengthening necessary to attainthe peak or angle of force (Edman et al. 1978; Colomo et al.1988; Lombardi & Piazzesi, 1990). Attempts to performthe experiments at a higher temperature (24◦C, closer tophysiological conditions) were frustrated by the reducednumber of activations during which the striation patternremained ordered.
Figure 1. Slow-time-base record from a fast fibre to show theexperimental protocolUpper trace, force; lower trace, motor position. The dashed lines markthe time when the solution was changed; the dotted line marks thetime of transition from low temperature (LT) to test temperature (TT).Arrows indicate the time during which a ramp lengthening (8% offibre length) at a velocity of 0.09 µm s−1 hs−1 was imposed on thefibre before returning to relaxing solution. A large release (10% offibre length) is imposed on the fibre to measure the force baseline (notresolved in the force record since the trace is from the chart recorder).Fibre length, 3.03 mm; average sarcomere length, 2.53 µm; CSA,8900 µm2. Low temperature (LT), 1.0◦C; test temperature (TT),11.5◦C. Fibre characterization indicates that the MHC isoform is2A/2X type.
C© The Physiological Society 2003

tjp˙011 TJP-xml.cls December 22, 1904 11:38
338 M. Linari and others J Physiol 554.2 pp 335–352
At the end of the experiment the fibre was cutfree from clips and placed in a capillary glass tubecontaining sample buffer (Laemmli, 1970) for subsequentelectrophoretic determination of myosin isoformcomposition.
To record the isometric force development or the forceresponse to ramp shortening or lengthening, the straingauge force transducer was used. In stiffness experiments,small step length changes complete in about 110 µs(range from +3 to –3 nm hs−1) were imposed on theactivated fibre both in isometric conditions and duringthe steady-state force response to ramp lengthening.The stiffness was calculated from the ratio between theforce change and the hs length change, as measured bythe striation follower. In these experiments the 50-kHzcapacitance force transducer was used to attain adequatetime resolution. This transducer is intrinsically sensitiveto changes in temperature but at the time when the stepwas imposed, 3–5 s after the fibre was transferred to thetest-temperature solution, the thermal drift was negligible.To determine the baseline tension at this time, a large
A
time (sec)
0.0 0.5 1.0 1.5 2.0 2.5 3.0
leng
th c
hang
e (n
m h
s-1)
-40
-20
0
20
40
time (sec)
0.0 0.5 1.0 1.5 2.0 2.5 3.0
forc
e (k
Pa)
0
50
100
150
time (sec)
0.0 0.5 1.0 1.5 2.0 2.5 3.0
leng
th c
hang
e (n
m h
s-1)
-40
-20
0
20
40
time (sec)
0.0 0.5 1.0 1.5 2.0 2.5 3.0
forc
e (k
Pa)
0
50
100
150
B
MHC-2X MHC-2A
MHC-1
a b c
Figure 2. Force development following aT-jump (from 1 to 12◦C) in slow (leftcolumn) and fast (right column) fibresand identification of fibre typesA, traces indicate segment length change(upper panel), force response and zero force(lower panel). The artefact before thestriation follower signal is due to the fibretravelling in air and within the shadow zone.Slow fibre (type 1 isoform): fibre length,2.10 mm; segment length under the striationfollower, 1.00 mm; average segmentsarcomere length, 2.58 µm; CSA, 5200 µm2.Fast fibre (type 2A/2X isoform): fibre length,2.45 mm; segment length under the striationfollower, 0.87 mm; average segmentsarcomere length, 2.52 µm; CSA, 9000 µm2.B, MHC isoform identification in single fibresby SDS-PAGE. The areas of migration ofMHC-1, MHC-2A and MHC-2X are indicatedon the left. Lane a: a single fibre containingMHC-2A and MHC-2X, i.e. a fast, type 2AX,fibre; lane b: a sample from vastus lateralismuscle containing all three adult MHCisoforms; lane c: a single fibre containingMHC-1, i.e. a slow, type 1, fibre.
step release was applied 200 ms after the small step lengthchange.
All experimental determinations were carried outduring activations at saturating pCa (4.50), with theexception of a series of experiments where steady force andstiffness were measured at different pCa (ranging between6.00 and 4.50) to determine the dependence of stiffnesson isometric force and thus estimate the contribution ofmyofilaments to hs compliance (Blange et al. 1985; Junget al. 1992; Martyn et al. 2002).
Data recording and analysis
Force, motor position and sarcomere length signals wererecorded with a sampling interval of 0.5 ms via an A/Dcard (Computerscope EGAA, RC Electronics) on a 386/33MHz PC. In experiments where stiffness was measured, thesame signals were also recorded on a digital oscilloscope(Nicolet ProSystem 20) with a sampling interval of 5–10 µs. The responses were measured directly on the PCwith the EGAA software and on the digital oscilloscopewith its internal reading system. Force and motor position
C© The Physiological Society 2003

tjp˙011 TJP-xml.cls December 22, 1904 11:38
J Physiol 554.2 pp 335–352 The force response to stretch by different myosin isoforms 339
were continuously monitored also on a chart recorder(Multitrace 2 Recorders 5022, Lectromed). The data areexpressed as mean ± s.e.m.
Myosin isoform identification
The fibre type was defined on the basis of MHCisoforms used as molecular markers. The MHC isoformcomposition of each fibre was determined by means of6% polyacrylamide gel electrophoresis after denaturationin sodium dodecyl sulphate (SDS-PAGE, Fig. 2B). Theelectrophoretic method used is described in detail byBottinelli et al. (1996). Three major bands in the regionof MHC isoforms, corresponding to MHC-1, MHC-2Aand MHC-2X, were separated. According to this analysis,46% of the 35 fibres used in this work contain the MHC-1isoform, 17% contain MHC-2A and 37% contain MHC-2A/2X. We will refer to fibres containing MHC-1 as slow
0.10
60 n
m12
0 kP
a
0.72
0.11
F
D
B
0.63
0.10
0.08
A
C
E
Figure 3. Force response to steadyshortening (A and B) and lengthening(C–F) imposed on activated fast fibresLeft column: 2A type; right column: 2A/2Xtype. Figures close to the records indicate thevelocity (µm s−1 hs−1) during thesteady-state force response. In each row,force responses obtained at similar velocitiesare compared. In each frame, from top tobottom, traces indicate: sarcomere lengthchange, force response and zero force. Thetime-scale is 400 ms (A–D) or 100 ms (E–F).2A fibre: fibre length, 2.25 mm; segmentlength, 0.98 mm; average sarcomere lengthin the segment, 2.71 µm; CSA, 6700 µm2,temperature, 11.8◦C. 2A/2X fibre: fibrelength, 3.03 mm; segment length, 0.85 mm;average sarcomere length in the segment,2.52 µm; CSA, 8900 µm2, temperature,11.5◦C. The two fibres are from vastuslateralis muscle of two different subjects.
fibres and to fibres containing MHC-2A and MHC-2A/2Xas fast fibres.
As shown in the results, the characteristics of theforce response to either shortening or lengtheningsuggested a further distinction within slow fibres,even if we could not find any difference with gelelectrophoresis. Therefore in the section concerning forcevelocity experiments slow fibres appear separated intotwo categories: slow fibres 1 (sf-1) and slow fibres 2(sf-2).
Myosin light chain (MLC) separation was performedas previously described (Bottinelli et al. 1994) on 10–20%linear polyacrylamide gradient slab gels. Two regulatoryMLC isoforms, the slow isoform MLC-2s and the fastisoform MLC-2f, and three alkali MLC isoforms, the slowMLC-1s and the two fast isoforms MLC-1f and MLC-3f,could be separated.
C© The Physiological Society 2003

tjp˙011 TJP-xml.cls December 22, 1904 11:38
340 M. Linari and others J Physiol 554.2 pp 335–352
Solutions
The composition of the solutions, reported in Table 1, wascalculated with a computer program kindly provided byPhilip Brandt (see Brandt et al. 1972). The concentrationsof multivalent ionic species were calculated after solvingthe equilibria of two metals (Ca and Mg) and two ligands(EGTA and ATP). According to a suggestion by M.Kellermayer (University of Pecs, Hungary), two inhibitorsof proteases were added to all solutions to preserve latticeproteins and thus sarcomere homogeneity: 10-µm trans-epoxysuccinyl-L-leucylamido-(4-guanidino) butane(E-64, Sigma), a cysteine protease inhibitor, and 20 µgml−1 leupeptin (Sigma), a serine and cysteine proteaseinhibitor.
A
F
D
B
C
E
0.06
0.72
0.08
60 n
m12
0 kP
a
0.62
0.05
0.15
Figure 4. Force response to steadyshortening (A and B) and lengthening(C–F) imposed on activated slow fibres.Left column: sf-1 type; right column: sf-2typeFigures close to the records indicate thevelocity (µm s−1 hs−1) at the steady state offorce response. In each row, force responsesobtained for similar velocities are compared.In each frame, from top to bottom, tracesindicate: sarcomere length change, forceresponse and zero force. The time-scale is400 ms (A–D) or 100 ms (E–F). sf-1 fibre:fibre length, 1.96 mm; segment length, 1.05mm; average sarcomere length in thesegment, 2.51 µm; CSA, 7000 µm2,temperature, 11.8◦C. sf-2 fibre: fibre length,2.10 mm; segment length, 1.0 mm; averagesarcomere length in the segment, 2.58 µm;CSA, 5200 µm2, temperature, 11.8◦C. Thetwo fibres are from vastus lateralis muscle ofthe same subject.
Results
Force development following T-jump to 12◦C
When the fibre was transferred from the preactivatingsolution to the low-temperature activating solution, forcerose to a steady state value of 1/4–1/5 the force developed inthe test-temperature activating solution (Fig. 1). The forcedevelopment at low temperature was slower in slow fibresthan in fast fibres; the half-time of force development (t1/2)was 5.8 ± 0.7 s in slow fibres (n = 6) and 2.1 ± 0.3 s in fastfibres (n=8). The plateau force at low temperature, relativeto the force developed at the test temperature (T0), was 0.18± 0.06 in slow fibres and 0.22 ± 0.09 in fast fibres. Oncethe plateau value was attained, the fibre was transferred
C© The Physiological Society 2003

tjp˙011 TJP-xml.cls December 22, 1904 11:38
J Physiol 554.2 pp 335–352 The force response to stretch by different myosin isoforms 341
to the activating solution at the test temperature. Figure2A shows force and sarcomere length changes with theT-jump activation protocol applied to a slow fibre (leftcolumn) and to a fast fibre (right column). There wasno change in force during the ∼100 ms while the fibreremained in air after leaving the low-temperature drop (seealso Fig. 1). Then, as soon as the fibre went into the drop ofactivating solution at the test temperature, the force startedto increase abruptly. t1/2 was 580 ± 20 ms in the slow fibres(n = 7), 235 ± 12 ms in the fast fibres containing MHC-2A isoform (2A fibres, n = 5) and 150 ± 22 ms in the fastfibres containing MHC-2A/2X isoform (2A/2X fibres, n =5). The shortening per hs during force development was15.5 ± 0.6 nm in the slow fibres, 16.9 ± 6.1 nm in the 2Afibres and 20.8 ± 8.3 nm in the 2A/2X fibres. Thus in theseexperiments the end compliance was consistently about2% of fibre length per T0. T0 was 66 ± 4 kPa (CSA 6500 ±1700 µm2, mean ± s.d.) in the slow fibres, 84 ± 10 kPa(CSA 5200 ± 1600 µm2) in the fast 2A fibres and 118 ±13 kPa (CSA 10 780 ± 5100 µm2) in the fast 2A/2X fibres.These values agree with those determined previously withsimilar bathing solutions, taking into account the differenttemperature: Stienen et al. (1996) at 20◦C found 115 kPa(slow fibres), 135 kPa (type 2A fibres) and 167 kPa (type2A/2X fibres).
Force responses to steady shorteningand lengthening
Force responses to steady sarcomere shortening andlengthening are shown in Fig. 3 for two fast fibres andin Fig. 4 for two slow fibres. In fast fibres, the shorteningspeed necessary to reduce the force to ∼0.5T0 was 0.08 µms−1 hs−1 in 2A fibres and 0.11 µm s−1 hs−1 in 2A/2X fibres(Fig. 3A and B). In slow fibres, similar shortening speedsreduced the force to <0.1T0. Actually, slow fibres showed alarge variability in their shortening speed which, togetherwith a difference in the transitory response to stretchshown below, suggested a separation into two groups, evenif no differences have been found by gel electrophoresisin their MHC and MLC isoforms. In five out of thethirteen slow fibres, defined as sf-1, a shortening velocityof 0.08 µm s−1 hs−1 reduced the force to ∼0.05T0. In theremaining eight slow fibres, defined as sf-2, the same valueof steady force was obtained with twice the shorteningvelocity (Fig. 4A and B). During lengthening, force roseand settled to an almost steady-state value that dependedon the lengthening velocity in the same way for both slowand fast fibres. At low lengthening velocity (<0.1 µm s−1
hs−1, C and D in Figs 3 and 4), force rose monotonicallyup to a constant value. At lengthening velocities >0.1 µm
s−1 hs−1 in fast 2A/2X fibres and in slow sf-2 fibres (Figs 3Fand 4F), but not in fast 2A fibres (Fig. 3E) and in slowsf-1 fibres (Fig. 4E), force attained a peak before settlingto a steady value. This is a phenomenon already describedboth in intact frog fibres (Edman et al. 1978; Lombardi& Piazzesi, 1990) and in skinned rabbit psoas fibres
Force (T/T0)
0.5 1.0 1.5 2.0 2.5
Vel
ocity
(µm
s-1
hs-1
)
-0.5
0.0
0.5
Force (T/T0)
0.5 1.0 1.5Vel
ocity
(µm
s-1
hs-1
)
-1.0
-0.5
0.0
0.5
1.0
1.5
2.0
A
B
Figure 5. Force–velocity relations in two slow fibres (A) and intwo fast fibres (B). Negative velocity refers to lengtheningOpen symbols, steady force; filled circles, peak of force duringlengthening. A, triangles (sf-1) and circles (sf-2) refer to the same slowfibres as in Fig. 4. B, triangles: 2A fast fibre (same fibre as in Fig. 3);circles: 2A/2X fast fibre (fibre length, 3.40 mm; segment length underthe striation follower, 1.20 mm; average segment sarcomere length,2.64 µm; CSA, 12 400 µm2; temperature, 11.6◦C; isometric force,170 kPa). Filled circles show the relation between the peak of forceand the lengthening velocity during the corresponding phase of forceresponse for the sf-2 and 2A/2X fibres.
C© The Physiological Society 2003
tjp˙011 TJP-xml.cls December 22, 1904 11:38
342 M. Linari and others J Physiol 554.2 pp 335–352
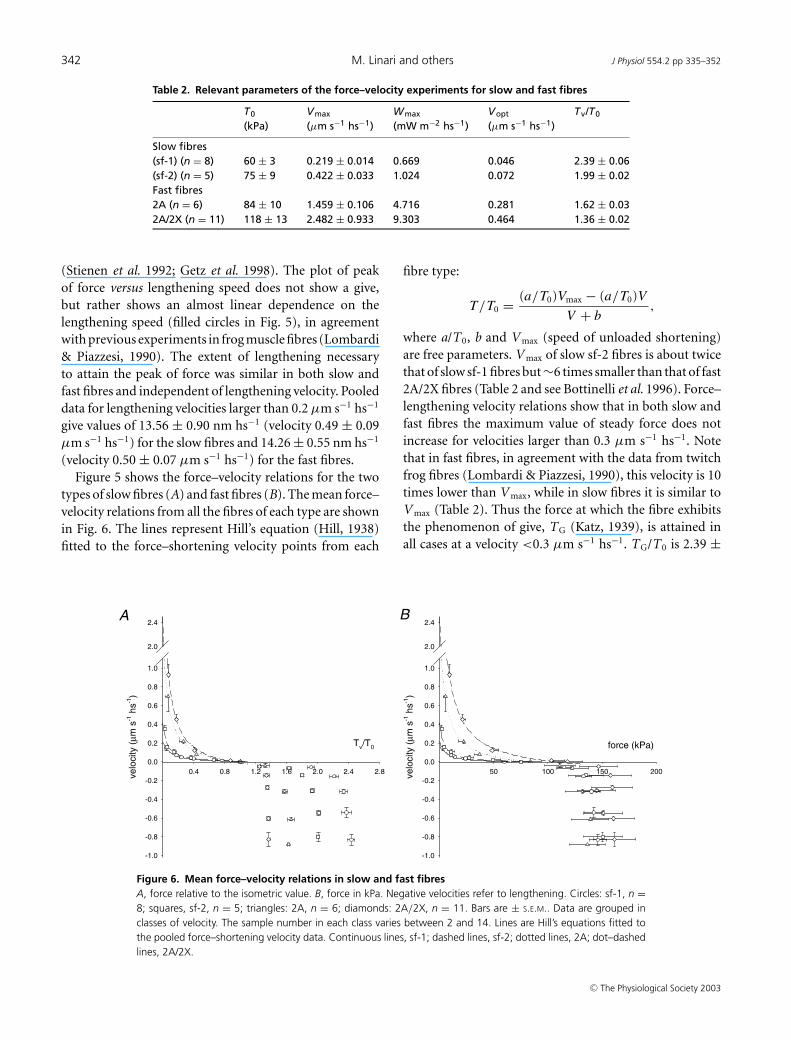
Table 2. Relevant parameters of the force–velocity experiments for slow and fast fibres
T0 Vmax Wmax Vopt Tv/T0
(kPa) (µm s−1 hs−1) (mW m−2 hs−1) (µm s−1 hs−1)
Slow fibres(sf-1) (n = 8) 60 ± 3 0.219 ± 0.014 0.669 0.046 2.39 ± 0.06(sf-2) (n = 5) 75 ± 9 0.422 ± 0.033 1.024 0.072 1.99 ± 0.02Fast fibres2A (n = 6) 84 ± 10 1.459 ± 0.106 4.716 0.281 1.62 ± 0.032A/2X (n = 11) 118 ± 13 2.482 ± 0.933 9.303 0.464 1.36 ± 0.02
(Stienen et al. 1992; Getz et al. 1998). The plot of peakof force versus lengthening speed does not show a give,but rather shows an almost linear dependence on thelengthening speed (filled circles in Fig. 5), in agreementwith previous experiments in frog muscle fibres (Lombardi& Piazzesi, 1990). The extent of lengthening necessaryto attain the peak of force was similar in both slow andfast fibres and independent of lengthening velocity. Pooleddata for lengthening velocities larger than 0.2 µm s−1 hs−1
give values of 13.56 ± 0.90 nm hs−1 (velocity 0.49 ± 0.09µm s−1 hs−1) for the slow fibres and 14.26 ± 0.55 nm hs−1
(velocity 0.50 ± 0.07 µm s−1 hs−1) for the fast fibres.Figure 5 shows the force–velocity relations for the two
types of slow fibres (A) and fast fibres (B). The mean force–velocity relations from all the fibres of each type are shownin Fig. 6. The lines represent Hill’s equation (Hill, 1938)fitted to the force–shortening velocity points from each
Tv/T0
0.4 0.8 1.2 1.6 2.0 2.4 2.8velo
city
(µm
s-1
hs-1
)
-1.0
-0.8
-0.6
-0.4
-0.2
0.0
0.2
0.4
0.6
0.8
1.0
2.0
2.4
force (kPa)
50 100 150 200velo
city
(µm
s-1
hs-1
)
-1.0
-0.8
-0.6
-0.4
-0.2
0.0
0.2
0.4
0.6
0.8
1.0
2.0
2.4A B
Figure 6. Mean force–velocity relations in slow and fast fibresA, force relative to the isometric value. B, force in kPa. Negative velocities refer to lengthening. Circles: sf-1, n =8; squares, sf-2, n = 5; triangles: 2A, n = 6; diamonds: 2A/2X, n = 11. Bars are ± S.E.M.. Data are grouped inclasses of velocity. The sample number in each class varies between 2 and 14. Lines are Hill’s equations fitted tothe pooled force–shortening velocity data. Continuous lines, sf-1; dashed lines, sf-2; dotted lines, 2A; dot–dashedlines, 2A/2X.
fibre type:
T/T0 = (a/T0)Vmax − (a/T0)V
V + b,
where a/T0, b and V max (speed of unloaded shortening)are free parameters. V max of slow sf-2 fibres is about twicethat of slow sf-1 fibres but∼6 times smaller than that of fast2A/2X fibres (Table 2 and see Bottinelli et al. 1996). Force–lengthening velocity relations show that in both slow andfast fibres the maximum value of steady force does notincrease for velocities larger than 0.3 µm s−1 hs−1. Notethat in fast fibres, in agreement with the data from twitchfrog fibres (Lombardi & Piazzesi, 1990), this velocity is 10times lower than V max, while in slow fibres it is similar toV max (Table 2). Thus the force at which the fibre exhibitsthe phenomenon of give, TG (Katz, 1939), is attained inall cases at a velocity <0.3 µm s−1 hs−1. TG/T0 is 2.39 ±
C© The Physiological Society 2003
tjp˙011 TJP-xml.cls December 22, 1904 11:38
J Physiol 554.2 pp 335–352 The force response to stretch by different myosin isoforms 343
BA
velocity (µm s-1 hs-1)
0.0 0.4 0.8 1.2 1.6 2.0 2.4
pow
er (
mW
m-2
hs-1
)
0
2
4
6
8
10
12
14
sf-1sf-22A2A/2X
velocity (µm s-1 hs-1)
-1.0 -0.8 -0.6 -0.4 -0.2 0.0
pow
er (
mW
m-2
hs-1
)
-180
-160
-140
-120
-100
-80
-60
-40
-20
0
sf-1sf-22A2A/2X
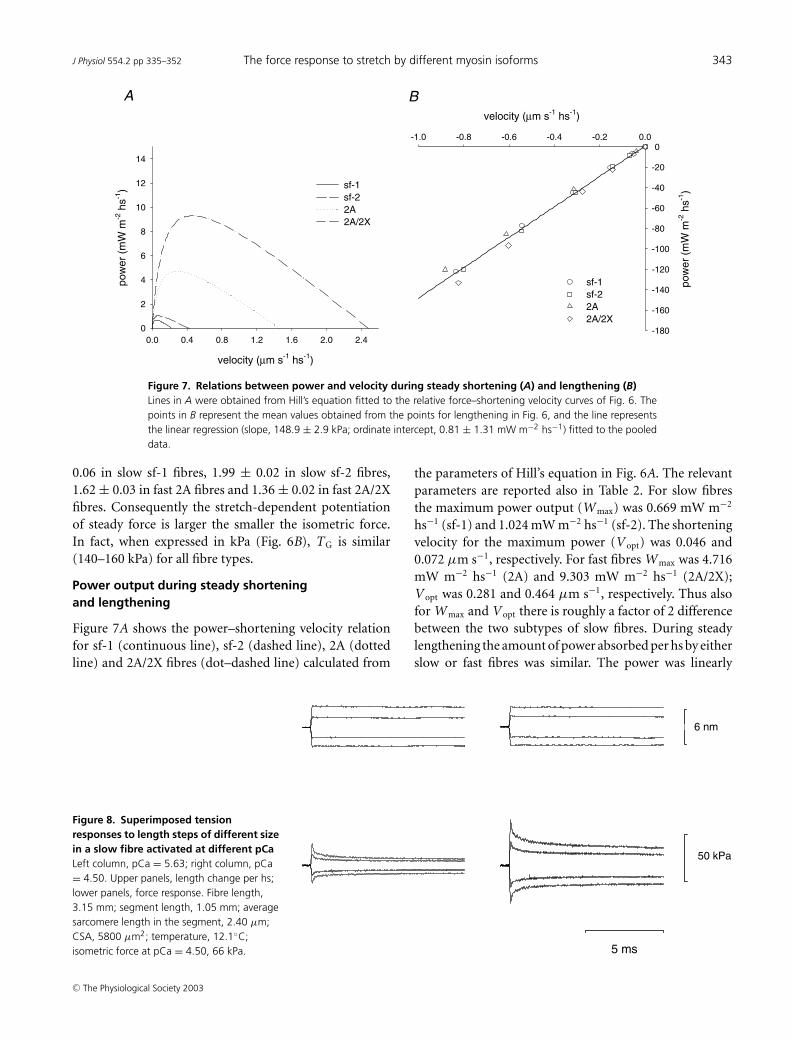
Figure 7. Relations between power and velocity during steady shortening (A) and lengthening (B)Lines in A were obtained from Hill’s equation fitted to the relative force–shortening velocity curves of Fig. 6. Thepoints in B represent the mean values obtained from the points for lengthening in Fig. 6, and the line representsthe linear regression (slope, 148.9 ± 2.9 kPa; ordinate intercept, 0.81 ± 1.31 mW m−2 hs−1) fitted to the pooleddata.
0.06 in slow sf-1 fibres, 1.99 ± 0.02 in slow sf-2 fibres,1.62 ± 0.03 in fast 2A fibres and 1.36 ± 0.02 in fast 2A/2Xfibres. Consequently the stretch-dependent potentiationof steady force is larger the smaller the isometric force.In fact, when expressed in kPa (Fig. 6B), TG is similar(140–160 kPa) for all fibre types.
Power output during steady shorteningand lengthening
Figure 7A shows the power–shortening velocity relationfor sf-1 (continuous line), sf-2 (dashed line), 2A (dottedline) and 2A/2X fibres (dot–dashed line) calculated from
5 ms
50 kPa
6 nm
Figure 8. Superimposed tensionresponses to length steps of different sizein a slow fibre activated at different pCaLeft column, pCa = 5.63; right column, pCa= 4.50. Upper panels, length change per hs;lower panels, force response. Fibre length,3.15 mm; segment length, 1.05 mm; averagesarcomere length in the segment, 2.40 µm;CSA, 5800 µm2; temperature, 12.1◦C;isometric force at pCa = 4.50, 66 kPa.
the parameters of Hill’s equation in Fig. 6A. The relevantparameters are reported also in Table 2. For slow fibresthe maximum power output (W max) was 0.669 mW m−2
hs−1 (sf-1) and 1.024 mW m−2 hs−1 (sf-2). The shorteningvelocity for the maximum power (V opt) was 0.046 and0.072 µm s−1, respectively. For fast fibres W max was 4.716mW m−2 hs−1 (2A) and 9.303 mW m−2 hs−1 (2A/2X);V opt was 0.281 and 0.464 µm s−1, respectively. Thus alsofor W max and V opt there is roughly a factor of 2 differencebetween the two subtypes of slow fibres. During steadylengthening the amount of power absorbed per hs by eitherslow or fast fibres was similar. The power was linearly
C© The Physiological Society 2003

tjp˙011 TJP-xml.cls December 22, 1904 11:38
344 M. Linari and others J Physiol 554.2 pp 335–352
related to the velocity (Fig. 7B) as a consequence of theconstant value of steady force response in the range ofvelocity used. The linear regression equation fitted to thepooled data indicates a slope of about 150 kPa.
Stiffness during isometric contraction of fibresactivated with different pCa
Force response to stretch can be accounted for by anincrease in either strain or number of attached myosin
C
Step length change per half-sarcomere (nm)
-8 -6 -4 -2 0 2 4 6
T1/T0, 4.50
0.4
0.8
1.2
1.6
2.0
5.84
5.63
5.49
4.50
4.50
Step length change per half-sarcomere (nm)
-8 -6 -4 -2 0 2 4 6
T1/T0, 4.50
0.4
0.8
1.2
1.6
2.0
5.30
5.49
5.63
5.84
BA
n = 3.21pK = 5.67
pCa
4.44.85.25.66.06.4
T0/
T0,
4.5
0
0.0
0.2
0.4
0.6
0.8
1.0
n = 2.34pK = 5.60
pCa
4.44.85.25.66.06.4
T0/
T0,
4.5
0
0.0
0.2
0.4
0.6
0.8
1.0
D
Figure 9. Isometric force–pCa relation (A and B) and T1 relations at different pCa (C and D) in a slowfibre (A and C) and a fast fibre (B and D)The continuous lines in A and B are calculated from Hill’s equation: T 0/T 0,4.50 = 1/[1 + 10n(pK–pCa)], where n, theHill coefficient, expresses the slope and pK is pCa at which T 0 = 0.5T 0,4.50. The best-fitting parameters, obtainedwith the nonlinear least-squares method (SigmaPlot, Jandel Scientific), are listed in the figure close to the graphs.T1 curves in C and D are obtained by plotting the extreme tension attained at the end of the length step (T1, relativeto T0 at pCa = 4.50, T0,S) against the step amplitude. Different symbols refer to different pCa as indicated by thefigure close to the corresponding relation. Circles refer to full activation before (open circles) and after (filled circles)the series at larger pCa. The lines represent the linear regressions fitted to the experimental points at each pCa. Aand C, same fibre as in Fig. 8. B and D, fast (2A/2X) fibre: fibre length, 3.51 mm; segment length, 1.03 mm; averagesarcomere length in the segment, 2.45 µm; CSA, 9500 µm2; temperature, 12.1◦C; T0,S, 109 kPa. Mean values(± S.E.M.) of the isometric force (T0) and stiffness (e0) at full activation are as follows. Slow fibres (3 fibres): T 0 =72 ± 5 kPa; e0 = 13.97 ± 2.36 kPa nm−1; fast fibres (2 fibres): T 0 = 106 ± 4 kPa; e0 = 16.15 ± 0.93 kPa nm−1.
heads or by a combination of the two mechanisms. Whichmechanism it is can be established by determining thechanges in fibre stiffness during stretch, if the fractionalcontribution of the various structures (myofilaments andattached myosin heads) to hs compliance is known. For thiswe used the method of Blange et al. (1985) (see also Martynet al. 2002) by determining the change in stiffness with thesteady isometric force induced by different concentrationsof Ca2+ in the activating solution (Figs 8 and 9). Tomeasure the stiffness, small steps (range +3 to –3 nm
C© The Physiological Society 2003
tjp˙011 TJP-xml.cls December 22, 1904 11:38
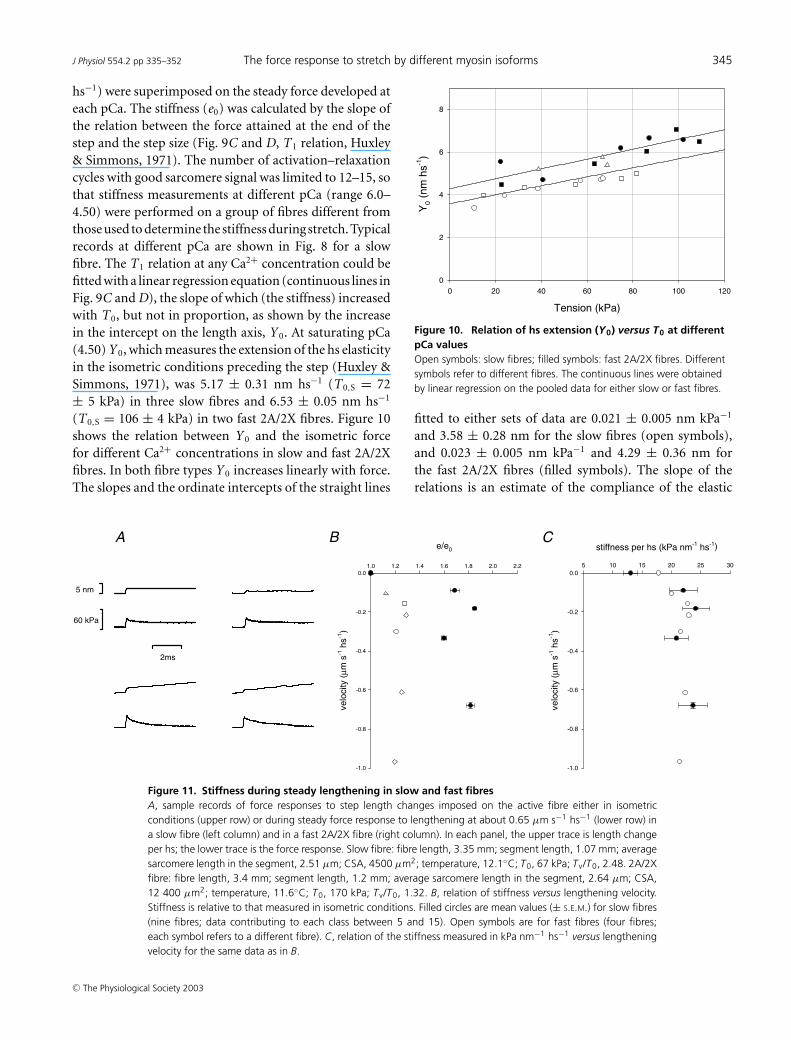
J Physiol 554.2 pp 335–352 The force response to stretch by different myosin isoforms 345
hs−1) were superimposed on the steady force developed ateach pCa. The stiffness (e0) was calculated by the slope ofthe relation between the force attained at the end of thestep and the step size (Fig. 9C and D, T1 relation, Huxley& Simmons, 1971). The number of activation–relaxationcycles with good sarcomere signal was limited to 12–15, sothat stiffness measurements at different pCa (range 6.0–4.50) were performed on a group of fibres different fromthose used to determine the stiffness during stretch. Typicalrecords at different pCa are shown in Fig. 8 for a slowfibre. The T1 relation at any Ca2+ concentration could befitted with a linear regression equation (continuous lines inFig. 9C and D), the slope of which (the stiffness) increasedwith T0, but not in proportion, as shown by the increasein the intercept on the length axis, Y 0. At saturating pCa(4.50) Y 0, which measures the extension of the hs elasticityin the isometric conditions preceding the step (Huxley &Simmons, 1971), was 5.17 ± 0.31 nm hs−1 (T0,S = 72± 5 kPa) in three slow fibres and 6.53 ± 0.05 nm hs−1
(T0,S = 106 ± 4 kPa) in two fast 2A/2X fibres. Figure 10shows the relation between Y 0 and the isometric forcefor different Ca2+ concentrations in slow and fast 2A/2Xfibres. In both fibre types Y 0 increases linearly with force.The slopes and the ordinate intercepts of the straight lines
A
5 nm
2ms
60 kPa
e/e0
1.0 1.2 1.4 1.6 1.8 2.0 2.2
velo
city
(µm
s-1
hs-1
)
-1.0
-0.8
-0.6
-0.4
-0.2
0.0
stiffness per hs (kPa nm-1 hs-1)
5 10 15 20 25 30
velo
city
(µm
s-1
hs-1
)
-1.0
-0.8
-0.6
-0.4
-0.2
0.0
B C
Figure 11. Stiffness during steady lengthening in slow and fast fibresA, sample records of force responses to step length changes imposed on the active fibre either in isometricconditions (upper row) or during steady force response to lengthening at about 0.65 µm s−1 hs−1 (lower row) ina slow fibre (left column) and in a fast 2A/2X fibre (right column). In each panel, the upper trace is length changeper hs; the lower trace is the force response. Slow fibre: fibre length, 3.35 mm; segment length, 1.07 mm; averagesarcomere length in the segment, 2.51 µm; CSA, 4500 µm2; temperature, 12.1◦C; T0, 67 kPa; Tv/T0, 2.48. 2A/2Xfibre: fibre length, 3.4 mm; segment length, 1.2 mm; average sarcomere length in the segment, 2.64 µm; CSA,12 400 µm2; temperature, 11.6◦C; T0, 170 kPa; Tv/T0, 1.32. B, relation of stiffness versus lengthening velocity.Stiffness is relative to that measured in isometric conditions. Filled circles are mean values (± S.E.M.) for slow fibres(nine fibres; data contributing to each class between 5 and 15). Open symbols are for fast fibres (four fibres;each symbol refers to a different fibre). C, relation of the stiffness measured in kPa nm−1 hs−1 versus lengtheningvelocity for the same data as in B.
Tension (kPa)
0 20 40 60 80 100 120
Y0
(nm
hs-1
)
0
2
4
6
8
Figure 10. Relation of hs extension (Y0) versus T0 at differentpCa valuesOpen symbols: slow fibres; filled symbols: fast 2A/2X fibres. Differentsymbols refer to different fibres. The continuous lines were obtainedby linear regression on the pooled data for either slow or fast fibres.
fitted to either sets of data are 0.021 ± 0.005 nm kPa−1
and 3.58 ± 0.28 nm for the slow fibres (open symbols),and 0.023 ± 0.005 nm kPa−1 and 4.29 ± 0.36 nm forthe fast 2A/2X fibres (filled symbols). The slope of therelations is an estimate of the compliance of the elastic
C© The Physiological Society 2003

tjp˙011 TJP-xml.cls December 22, 1904 11:38
346 M. Linari and others J Physiol 554.2 pp 335–352
Table 3. Mean values (± S.E.M.) of isometric force (T0), isometric stiffness (e0), force (Tv) andstiffness (ev) during steady lengthening in different fibre types
T0 e0 Tv ev
(kPa) (kPa nm−1) (kPa) (kPa nm−1)
Slow fibres (n = 9) 68 ± 7 13.04 ± 1.13 148 ± 16 21.77 ± 2.08Fast 2A/2X fibres (n = 4) 120 ± 28 17.85 ± 3.64 166 ± 38 21.78 ± 4.46
component in series to the force generators, due mainly tothe elasticity of actin and myosin filaments (Huxley et al.1994; Wakabayashi et al. 1994; Dobbie et al. 1998). Thefinding that, independently of the fibre type, the slopesof the two relations are practically the same (0.022 nmkPa−1) is in turn a strong support for the idea that thiscontribution to hs compliance is due to passive elasticcomponents, like the actin and myosin filaments, that areexpected to have identical mechanical properties in eitherfibre type. Under these conditions the ordinate interceptsrepresent an estimate of the strain in the isometric forcegenerators, the myosin heads, which appears 20% largerin fast fibres than in slow fibres. Considering that T0,S is∼50% larger in fast fibres (see Fig. 9 legend), it is evidentthat the strength of the attachment is only one of the factorsresponsible for the difference in isometric force betweenslow and fast fibres.
Change in stiffness during lengthening
Changes in stiffness induced on maximally activated fibresby steady lengthening are summarized in Fig. 11 andTable 3. Data were obtained from four fast (2A/2X) fibres,and nine slow fibres (including both sf-1 and sf-2 fibres)activated at saturating pCa. Steps were imposed at theplateau of either the isometric force or the steady forceresponse to lengthening (Fig. 11A). In both fibre types thestiffness during steady lengthening (ev) is larger than inthe corresponding isometric contraction (e0). In fast fibreswith an isometric force ∼75% larger than in slow fibres,e0 is ∼35% larger. As shown in Fig. 11B, the increase instiffness is independent of lengthening velocity (Lombardi& Piazzesi, 1990) and is much larger in slow fibres (∼65%,filled circles) than in 2A/2X fibres (∼20%, open symbols).Since the isometric force in fast fibres is 75% greater thanin slow fibres, during lengthening the stiffness per hs inkPa nm−1 is the same independently of fibre type (Table 3and Fig. 11C).
Discussion
The experiments reported in this paper show that differenttypes of human skeletal muscle fibres respond to forcible
lengthening, during maximal Ca2+ activation, producingthe same force and stiffness and absorbing the samepower. The diversity determined by the presence ofdistinct MHC isoforms, which is detectable during anisometric contraction (tension, ATPase activity) andactive shortening (V max and maximum power output),cannot be observed during steady-state lengthening. Theexperiments furthermore provide an explanation of thedifference of isometric force in different fibre types,by estimating the difference in the strain of attachedmyosin heads. These results are obtained by applyingfor the first time high-resolution mechanics to the studyof permeabilized human muscle fibres with identifiedcomposition in myosin isoforms. The implementation ofa new protocol for fibre activation at low temperaturehas been instrumental for preservation of the sarcomerepattern so that sarcomere length changes could be recordedby a striation follower during shortening or lengtheningmanoeuvres.
The isometric force in slow and fast fibres
As shown in Table 4, which collects data from force–pCaexperiments and force–velocity experiments, at 12◦C theisometric tension is larger in fast fibres than in slow fibresby 47–76%. Similarly, the stiffness is 15–37% larger in fastfibres. A greater isometric tension of human fast fibrescompared with slow has already been reported in previousstudies (Stienen et al. 1996; He et al. 2000). The differencecan find a quantitative explanation in terms of either thefraction of attached heads or the force per attached head,as reported below. Among fast fibres only 2A/2X fibres areconsidered, since this is the type of fast fibres for whichthe contribution of the myofilaments and the attachedmyosin heads to the hs compliance has been determined byforce– and stiffness–pCa relations. Figure 10 shows that thecompliance of the passive structures in series with force-generating myosin heads is ∼0.022 nm kPa−1. This valuecan be used to determine the compliance of the myosincross-bridges, from the compliance of the hs, according toeqns (A10) of Ford et al. (1981) and (A1) of Linari et al.(1998). At full overlap and assuming that the complianceof the Z line is zero and the compliance in series to myosin
C© The Physiological Society 2003

tjp˙011 TJP-xml.cls December 22, 1904 11:38
J Physiol 554.2 pp 335–352 The force response to stretch by different myosin isoforms 347
Table 4. Summary of relevant mechanical parameters (mean values) from the two kinds of experiments (force–pCa experiments andforce–velocity experiments) in slow and fast 2A/2X fibres
Force–velocity experiments
Force–pCa experiments Isometric Steady lengthening
Y0 F0/e0 βe0 T0 e0 Y0 F0/e0 βe0 Tv ev Yv Tv/βve0 βve0 T0 e0
(nm) (nm) (kPa nm−1) (kPa) (kPa nm−1) (nm) (nm) (kPa nm−1) (kPa) (kPa nm−1) (nm) (nm) (kPa nm−1) (kPa) (kPa nm−1)
Slow5.17 3.58 20.11 68 13.04 5.21 3.71 18.33 148 21.77 6.80 3.54 41.80 106 16.15Fast72 13.97 6.53 4.29 24.71 120 17.85 6.72 4.08 29.41 166 21.78 7.62 3.97 41.81
The parameters are: force in isometric conditions, T0, and during steady lengthening, Tv; stiffness in isometric conditions, e0, andduring steady lengthening, ev; hs strain in isometric conditions, Y0, and during steady lengthening, Yv; average strain per cross-bridgein isometric conditions, F0/ε0, and during steady lengthening, Tv/βvε0; stiffness of the cross-bridges in isometric conditions, βε0, andduring steady lengthening, βvε0.
cross-bridges is due to actin and myosin filaments, theseequations can be reduced to
C = Cf + 1
βε0, (1)
where C is the hs compliance, C f is the myofilamentequivalent compliance and βε0, the reciprocal of thecompliance of the cross-bridges, is the cross-bridgestiffness, given by the product of the stiffness of myosinheads if all heads are attached (ε0) and the fraction ofattached myosin heads (β).
According to the results in Fig. 10 and to previous resultsin the literature (Kraft & Brenner, 1997; Jung et al. 1992;Martyn et al. 2002), pCa influences the fraction of myosinheads in the strong bound force generating state. Thusfor either slow or fast fibres the strain per head remainsconstant independently of pCa and is estimated by theordinate intercept of the relation between the hs strain,Y 0( = CT0), and the isometric force (T0). Under theseconditions and using eqn (1), the linear equation fitted tothe data in Fig. 10 can be rewritten as
Y0 = CfT0 + T0/(βε0). (2)
If the strain and thus the force per myosin head is constantand independent of pCa,
T0 = F0β (3)
where F0 is the isometric force exerted by the hs if allthe heads are attached. Using this definition, eqn (2)becomes
Y0 = Cf F0β + F0/ε0, (4)
where F0/ε0 is the ordinate intercept of the relations inFig. 10 and represents the average strain per attachedmyosin head. Assuming that, for an equal number ofattached heads, the compliance of the heads (1/ε0) is the
same in both fibre types, the larger strain of fast fibre headsreflects an increase in F0, that is, an increase in the forceexerted by each myosin head. Note that, using the valueof C f estimated from the Y 0:T0 relations in force–pCaexperiments, F0/ε0 can be calculated also for the data fromforce–velocity experiments (Table 4). F0/ε0 is 20% (force–pCa experiments) to 10% (force–velocity experiments)larger in fast than in slow fibres (Table 4), and this explainsonly a part of the larger T0 of fast fibres at saturating pCa(47–76%). A substantial contribution to the increase inT0 must be attributed to the different fraction of attachedforce-generating heads, β (= T0/F0). β is 22% (force–pCa experiments) to 60% (force–velocity experiments)larger in fast than in slow fibres. The conclusion that thefraction of interacting heads is higher in fast than in slowfibres is in agreement with our previous observations (Heet al. 2000), based on comparison of the ATPase activity–tension relations determined in slow and fast fibres duringramp shortening. It is worth noting that also a smallerdensity of myofibrils in slow fibres would produce aparallel reduction of both force and stiffness. However,this possibility is not sustained by structural evidence(Eisenberg, 1983 and references therein) and, in any case,is contradicted by the finding that the stiffness becomessimilar in both fibre types during constant-velocity stretch(Fig. 11C and Table 3).
The large variability of F0/ε0 and βε0 for the same classof fibres in the two experiments (Table 4) reflects thevariability of T0 and Y 0. The reliability of the estimateof filament compliance can be tested by comparisonwith current estimates of the compliances of actin andmyosin filaments obtained with much better resolutionfrom frog intact muscle fibres. For the comparison itmust be considered that the force per CSA in this work isunderestimated by a factor of 1.44 because of the increasein fibre diameter by 20% produced by skinning (Godt
C© The Physiological Society 2003

tjp˙011 TJP-xml.cls December 22, 1904 11:38
348 M. Linari and others J Physiol 554.2 pp 335–352
& Maughan, 1981; Metzger & Moss, 1987; Linari et al.1998), and a ratio 3 : 1 of actin over myosin filamentcompliance must be assumed (Wakabayashi et al. 1994;Huxley et al. 1994; Dobbie et al. 1998; Piazzesi et al. 2003).Equations described by Linari et al. (1998) allow us tocalculate the average strain of actin and myosin filamentsfrom their compliances, and the values obtained (0.26%T−1
0 for the actin filament and 0.17% T−10 for the myosin
filament) are in agreement with the values estimatedin frog muscle from mechanical and X-ray diffractionexperiments (Wakabayashi et al. 1994; Huxley et al. 1994;Dobbie et al. 1998).
The nature of force response to lengthening
Forcible lengthening of maximally activated fibresproduces increases in steady force and stiffness that aremuch larger in slow than in fast fibres. The force increaseis ∼120% in slow fibres and ∼40% in fast fibres, while thestiffness increase is ∼65% in slow fibres and ∼20% in fastfibres (Table 3). Two clear and important features derivefrom these results: the first is that during lengthening bothforce and stiffness of slow and fast fibres become similar;the second is that in either fibre type the stretch-dependentincrease in force is twice the stretch-dependent increase instiffness.
The finding that the stretch-dependent increase in forceis larger in slow (less isometric force-generating) fibres isin agreement with all the work in frog and mammalianmuscle, showing that the stretch-dependent increase inforce is larger when the isometric force is depressed bydifferent interventions like hypertonicity (Mansson, 1994;Piazzesi et al. 1994), fatigue (Curtin & Edman, 1994),increase in phosphate concentration (Dantzig et al. 1990;Stienen et al. 1992) and decrease in temperature (Piazzesiet al. 2003). Recently a larger increase in force by stretchwhen isometric force is depressed by fatigue and byreduction in temperature has been demonstrated also inhuman skeletal muscle in situ (De Ruiter & De Haan, 2001).All these data are consistent with the idea, developed fromthe theory of Huxley & Simmons (1971), that cross-bridgesunder strain are prevented from going through the force-generating transition and accumulate in an early stronglybound state (Lombardi & Piazzesi, 1990; Piazzesi et al.1992). The farther from the initial low force-generatingstate is the equilibrium distribution in the isometriccondition (the higher the isometric force), the largerwill be the strain-dependent backward redistribution thatpartially neutralizes the force increase due to the imposedstrain (and thus the smaller the steady force enhancementby stretch).
Among the factors responsible for the forceenhancement during lengthening, the increase instrain of an elastic component in parallel to cross-bridges,like titin, is likely to be not relevant under the conditionsof our experiments. In fact virtually no resting tension isdeveloped at the starting sarcomere length (2.4–2.65 µm)with elongations below 100 nm hs−1. In the range ofsarcomere lengths and elongations utilized in this study,the response of titin-based parallel elasticity mightbecome evident only under conditions that favour thedevelopment of sarcomere inhomogeneity, when theweak sarcomeres yield and take all of the lengtheningimposed on the fibre, until the parallel elastic componentstress–strain relation equilibrates the force of strongersarcomeres in series (Morgan, 1990). The characteristicsof intrinsically inhomogeneous fibres are: (i) a reducedforce enhancement during the initial phase of the stretch;(ii) a continuous rise of force (creep) even beyond thebreak-point or angle of force increase; and (iii) a long-lasting force enhancement after the stretch ends (Edmanet al. 1978, 1982; Colomo et al. 1988; Edman & Tsuchiya,1996). This behaviour is favoured by conditions such aswhen the stretch is applied on tetani in the descendinglimb of the length–tension relation (Edman et al. 1982)or high-velocity lengthening is repeatedly imposed onsuccessive tetani (Lombardi & Piazzesi, 1990). Ourprotocol is specifically devised to minimize developmentof inhomogeneity between sarcomeres during stretch,by limiting the stretch speed to <1 µm s−1 hs−1 andalternating shortening and lengthening contractions. Inour experiments (see Figs 3 and 4) the creep of forceduring lengthening beyond the point of the peak orangle of force is absent or small, providing evidence forexcluding a significant contribution of a parallel elasticcomponent to the response to stretch. Eventually thelarger force enhancement of slow fibres with respect tofast fibres cannot be explained by a different contributionof a parallel elastic component like titin, since slow fibresare known to develop less passive tension in response toelongation (Wang et al. 1991; Horowits, 1992), a featurewhich might be related to the greater length of the titinisoform expressed in slow compared with fast fibres(Labeit & Kolmerer, 1995). A recent study in frog fibreselongated under special conditions like 2,3-butanedionemonoxime (BDM) depressed contraction (Bagni et al.2002) has revealed the contribution of a not yet identified,non cross-bridge related parallel elastic component ofthe order of 5% of the isometric tetanic force: a 5%contribution of this component to our responses cannotbe excluded.
C© The Physiological Society 2003
tjp˙011 TJP-xml.cls December 22, 1904 11:38
J Physiol 554.2 pp 335–352 The force response to stretch by different myosin isoforms 349
The factors that, under our conditions, are relevant forexplaining the force response to stretch and the differentresponses of slow and fast fibres have to be found in themechanical and kinetic properties of cross-bridges. Todetermine if there is a substantial contribution of changesin the fraction of attached myosin heads, it is necessary toanalyse the stretch-dependent changes in the hs stiffness interms of the fractional contribution of cross-bridges andmyofilaments.
Assuming that myofilament compliance behaves in alinear way also at forces larger than the active isometricforce (Linari et al. 2000), the cross-bridge strain can becalculated for the steady response to lengthening, by usingthe observed hs strain during steady lengthening (Y V, theabscissa intercept of the T1 relation during lengthening)and the myofilament compliance determined from force–pCa experiments (C f = 0.022 nm kPa−1). In fact, adaptingeqn (2) to the steady lengthening response,
YV = CfTV + TV/(βVε0), (5)
where βV is the fraction of myosin heads attached duringlengthening. From eqn (5) the average strain per cross-bridge during lengthening, TV/(βVε0), can be calculatedand is 3.54 nm for slow fibres and 3.97 nm for fast fibres(Table 4).These values are not very different from thecorresponding values during isometric contraction, 3.71and 4.08 nm, respectively. Consequently the stiffness ofcross-bridges during lengthening, βVε0, is increased byalmost the same amount as the force, ∼130% (slow fibres)and ∼40% (fast fibres), attaining a similar value in eitherfibre type (Table 4).
According to this analysis, the force enhancement bystretch is fully explained by the increase in the numberof attached heads, while their strain remains similar,although passive, to that actively generated in the isometriccontraction.
A requirement to make the response to stretch adequateto the task of resisting sudden increases in load beyondthe isometric force without a large strain in the attachedheads is that the recruitment of new attachments is veryrapid. Actually in intact fibres from the frog it has beenfound that the increase in stiffness following a step stretchis complete within 0.5 ms or so (Lucii et al. 2001a,b).The mechanism that could explain such a fast recruitmentcould be that even small increases in strain of the force-generating heads, as soon as the attached actin monomermoves away from the M line, favour the attachment ofthe second (partner) head of the same myosin moleculeon the next actin monomer closer to the M line (Linariet al. 2000). Alternatively, in isometric conditions therecould be a fraction of myosin heads in a weak binding
state and ready for the transition to strong binding assoon as the actin monomer, sharing the weak interaction,moves away from the M line (see also Getz et al. 1998). Theevidence, from these experiments, that the recruitment ofcross-bridges by lengthening can increase the fraction ofattached heads up to more than twice the isometric fraction(the case of slow fibres) supports the second hypothesis.This argument suggests in turn that slow fibres, whichexhibit a lower isometric force and have a smaller fractionof strongly attached force-generating heads with respectto fast fibres, have a larger fraction of myosin heads in theweak binding state, ready to be recruited by lengthening.
In conclusion, the MHC isoform determines theisometric force developed by the activated fibre bymodulating the force per head and the fraction of strongbound force-generating heads, but, at the same time,provides the fibre with the same resistance to stretch,irrespective of the fibre type, by exhibiting the same strongbond during lengthening for all the myosin heads that caninteract with actin.
In contrast to the mechanical properties duringsteady lengthening, different fibre types show differentcharacteristics during force rise at the beginning oflengthening. For lengthening speeds >0.1 µm s−1 hs−1 theforce rises smoothly to the steady value in the sf-1 subgroupof slow fibres and 2A fibres, while in the sf-2 subgroup ofslow fibres and 2A/2X fibres the force passes through a peaklarger than the steady-state value. Actually, also in the fibreswith a smooth transition to steady force, a transient peak inforce should be generated by a sufficiently high lengtheningspeed. The lack of evidence for a peak in the full range ofvelocities used (0.1–0.8 µm s−1 hs−1) could be due to thefact that, as the lengthening speed is increased, the degreeof inhomogeneity in the redistribution of lengtheningamong the sarcomeres increases to an extent sufficient toprevent the development of the transient peak (Colomoet al. 1988; Lombardi & Piazzesi, 1990). In any case,the presence/absence of the peak of force at velocitiesslightly greater than 0.1 µm s−1 hs−1 further supportsthe separation in subclasses within both slow and fastfibres.
The peak of force during high-speed lengthening hasbeen explained by the time taken by the attached headsresponsible for the isometric force before the start oflengthening to redistribute toward lower force-generatingstates (A2→A1 transition in Lombardi & Piazzesi, 1990).According to this idea there should be no peak of force ifthere is enough time for the state redistribution beforea great proportion of high force-generating A2 headscan be strained or, alternatively, the rate constant forthe reversal of the force-generating transition (k−2 in
C© The Physiological Society 2003

tjp˙011 TJP-xml.cls December 22, 1904 11:38
350 M. Linari and others J Physiol 554.2 pp 335–352
Lombardi & Piazzesi, 1990) is large enough to provide a fastre-equilibration during lengthening. The first argumentexplains the absence of the peak of force for lengtheningspeeds below 0.1 µm s−1 hs−1. The second argument couldexplain the absence of the peak in sf-1 fibres and 2A fibreseven at speeds >0.1 µm s−1 hs−1. In fact in these twofibre types T0 is lower than in the corresponding typesthat show the force peak (sf-2 and 2A/2X). In conclusion,a larger k−2could explain both the lower fraction of highforce-generating cross-bridges and the absence of a forcepeak during lengthening.
Molecular basis of the diversity of themechanical response
A large body of evidence supports the view that theenergetic parameters (ATP consumption rate, tensioncost) and the mechanical parameters (shortening velocity,power output) of the contractile response of skeletalmuscle fibres are primarily determined by MHC isoformcomposition with a contribution of the alkali MLC isoform(see for a review Schiaffino & Reggiani, 1996; Bottinelli& Reggiani, 2000). The results of this study show thatall MHC isoforms, when exposed to an external workpulling actin filaments away from the centre of thesarcomere, behave in the same way in spite of the structuraldiversity which is responsible for their specific kinetic andmechanical properties in isometric contraction and duringshortening. An interesting finding is the heterogeneityobserved inside the group of slow fibres (i.e. fibresexpressing MHC-1) without any obvious explanation interms of myosin isoform. Slow fibres have been dividedinto two subgroups, sf-1 and sf-2, on the basis of botha bimodal distribution of the force response to a rampshortening and the transitory response to lengthening. Thefibres identified as sf-2 exibit V max, W max and V opt largerby a factor of 2 and T0 larger by ∼25% with respect tosf-1 fibres (Table 2); they also show a transient peak beforethe force reaches a steady value during lengthening, andthe increase of relative force (T/T0) during lengtheningis lower in sf-2 than in sf-1. However, between sf-2 fibresand fast 2A fibres there are differences of factors of 4–6in V max, W max and V opt and of 10–20% in T0 (Table 2and Figs 6 and 7). A first element to take into accountto explain the difference is the presence in sf-2 fibres ofa small fraction of MHC-2A which might be undetectedby gel electrophoresis. The resolution of single-fibre gelelectrophoresis is about 1% (Bottinelli et al. 1994). Owingto the non linear interaction between a slow and a fastmyosin isoform as regards shortening capability (Harriset al. 1994), the effect of the slower isoform is predominant
and thus the presence of 1% of MHC-2A should not besufficient to increase the shortening velocity significantly.A contribution of MLC isoform composition can beexcluded, as both alkali and regulatory MLC isoformshave been found to be slow in all slow fibres examined.The presence of more than one slow MHC isoform inskeletal muscle fibres is matter of debate. Three slowMHC isoforms have been distinguished on the basis ofantibody reactivity in rat muscles (Hughes et al. 1993).In rabbit muscle a second MHC isoform was found ina sub-population of slow fibres and has been identifiedas MHC-alpha cardiac (Galler et al. 1997). Moreover, asecond MHC isoform has been separated from MHC-1in rat soleus muscle (Fauteck & Kandarian, 1995); suchextra MHC, which did not co-migrate with MHC-alphacardiac, was not identified further. None of the abovefindings has been confirmed in human skeletal muscle.Although a very recent study of mRNAs coding for MHCisoforms in human muscles following strength training hassuggested the up-regulation of MHC-alpha slow mRNA,such an isoform has not been identified at single-fibrelevel (Liu et al. 2003). The most likely explanation of thefunctional difference between fibres identified as type 1by gel electrophoresis is in our view represented by post-translational modifications, which have been shown tooccur under special conditions (ageing) in MHC-slow(Bottinelli, 2001; Hook et al. 1999), but might be morefrequent than until now suspected.
In conclusion, the results of the present studysignificantly contribute to the understanding of thediversity among myosin isoforms. The higher isometrictension developed by fast compared with slow fibres isexplained both by higher force and strain per myosin headand by a greater fraction of attached heads, reflecting botha shift of the balance towards strongly attached heads and ashift of strongly attached heads to higher force-generatingstates. Further studies are required to explain in molecularterms these two aspects, particularly the higher strain andforce in fast myosin during isometric contraction. Fromthe physiological point of view, the main finding is thatall myosin isoforms exhibit the same stress under strain,contributing in the most efficient way to generate the highresistance of muscle to forcible lengthening.
References
Bagni MA, Cecchi G, Colombini B & Colomo F (2002). Anon-cross-bridge stiffness in activated frog muscle fibers.Biophys J 82, 3118–3127.
Blange T, Stienen GJM & Treijtel BW (1985). Active stiffness infrog skinned muscle fibres at different Ca concentrations.J Physiol 366, 65P.
C© The Physiological Society 2003

tjp˙011 TJP-xml.cls December 22, 1904 11:38
J Physiol 554.2 pp 335–352 The force response to stretch by different myosin isoforms 351
Bottinelli R (2001). Functional heterogeneity of mammaliansingle muscle fibres: do myosin isoforms tell the whole story?Pflugers Arch 443, 6–17.
Bottinelli R, Betto R, Schiaffino S & Reggiani C (1994).Unloaded shortening velocity and myosin heavy chain andalkali light chain isoform composition in rat skeletal musclefibres. J Physiol 478, 341–349.
Bottinelli R, Canepari M, Pellegrino MA & Reggiani C (1996).Force-velocity properties of human skeletal muscle fibres:myosin heavy chain isoform and temperature dependence.J Physiol 495, 573–586.
Bottinelli R & Reggiani C (2000). Human skeletal muscle fibres:molecular and functional diversity. Prog Biophys Mol Biol 73,195–262.
Brandt PW, Reuben JP & Grundfest H (1972). Regulation oftension in the skinned crayfish muscle fiber. II. Role ofcalcium. J General Physiol 59, 305–317.
Colomo F, Lombardi V & Piazzesi G (1988). The mechanismsof force enhancement during constant velocity lengtheningin tetanized single fibres of frog muscle. Adv Exp Medical Biol226, 489–502.
Curtin NA & Davies RE (1973). Chemical and mechanicalchanges during stretching of activated frog skeletal muscle.Cold Spring Harbor Symp Quant Biol 37,619–626.
Curtin NA & Edman KAP (1994). Force-velocity relation forfrog muscle fibres: effects of moderate fatigue and ofintracellular acidification. J Physiol 475,483–494.
Dantzig JA, Goldman YE & Lombardi V (1990). Cross-bridgeviscoelasticity in rabbit psoas muscle fibres during steadylengthening and shortening in the presence and absence ofphosphate. J Physiol 426, 39P.
De Ruiter CJ & De Haan A (2001). Similar effects of coolingand fatigue on eccentric and concentric force-velocityrelationships in human muscle. J Appl Physiol 90,2109–2116.
Dobbie I, Linari M, Piazzesi G, Reconditi M, Koubassova N,Ferenczi MA, Lombardi V & Irving M (1998). Elasticbending and active tilting of myosin heads during musclecontraction. Nature 396, 383–387.
Edman KAP, Elzinga G & Noble MIM (1978). Enhancement ofmechanical performance by stretch during tetaniccontractions of vertebrate skeletal muscle fibres. J Physiol281, 139–155.
Edman KAP, Elzinga G & Noble MIM (1982). Residual forceenhancement after stretch of contracting frog single musclefibers. J General Physiol 80, 769–784.
Edman KAP & Tsuchiya T (1996). Strain of passive elementsduring force enhancement by stretch in frog muscle fibres.J Physiol 490, 191–205.
Eisenberg BR (1983). Quantitative ultrastructure ofmammalian skeletal muscle. In Handbook of Physiology,section 10, ed. Peachey LD & Adrian RH, pp. 73–112.American Physiological Society, Bethesda, MD.
Fauteck SP & Kandarian SC (1995). Sensitive detection ofmyosin heavy chain composition in skeletal muscle underdifferent loading conditions. Am J Physiol 268, C419–C424.
Ford LE, Huxley AF & Simmons RM (1981). The relationbetween stiffness and filament overlap in stimulated frogmuscle fibres. J Physiol 311, 219–249.
Galler S, Hilber K, Gohlsch B & Pette D (1997). Twofunctionally distinct myosin heavy chain isoforms in slowskeletal muscle fibres. FEBS Lett 410, 150–152.
Getz EB, Cooke R & Lehman SL (1998). Phase transition inforce during ramp stretches of skeletal muscle. Biophys J 75,2971–2983.
Godt RE & Maughan DW (1981). Influence of osmoticcompression on calcium activation and tension in skinnedmuscle fibers of the rabbit. Pflugers Arch 391, 334–347.
Harris DE, Work SS, Wright RK, Alpert NR & Warshaw DM(1994). Smooth, cardiac and skeletal muscle myosin forceand motion generation assessed by cross-bridge mechanicalinteractions in vitro. J Muscle Res Cell Motil 15, 11–19.
He ZH, Bottinelli R, Pellegrino MA, Ferenczi MA & Reggiani C(2000). ATP consumption and efficiency of human singlemuscle fibers with different myosin isoform composition.Biophys J 79, 945–961.
Hill AV (1938). The heat of shortening and the dynamicconstants of muscle. Proc R Soc B 126, 136–195.
Hook P, Li X, Sleep J, Hughes S & Larsson L (1999). In vitromotility speed of slow myosin extracted from single soleusfibres from young and old rats. J Physiol 520, 463–471.
Horowits R (1992). Passive force generation and titin isoformsin mammalian skeletal muscle. Biophys J 61, 392–398.
Hughes SM, Cho M, Karsch-Mizrachi I, Travis M, Silberstein L,Leinwand LA & Blau HM (1993). Three slow myosin heavychains sequentially expressed in developing mammalianskeletal muscle. Dev Biol 158, 183–199.
Huxley AF (1998). Biological motors: energy storage in myosinmolecules. Curr Biol 8, 485–488.
Huxley AF & Lombardi V (1980). A sensitive force transducerwith resonant frequency 50 kHz. J Physiol 305, 15–16.
Huxley AF, Lombardi V & Peachey D (1981). A system for fastrecording of longitudinal displacement of a striated musclefibre. J Physiol 317, 12–13.
Huxley AF & Simmons RM (1971). Proposed mechanism offorce generation in striated muscle. Nature 233, 533–538.
Huxley HE, Stewart A, Sosa H & Irving T (1994). X-raydiffraction measurements of the extensibility of actin andmyosin filaments in contracting muscle. Biophys J 67,2411–2421.
Infante AA, Klaupiks D & Davies RE (1964). Adenosinetriphosphate: Changes in muscle doing negative work.Science 144, 1577–1578.
Jung DW, Blange T, de Graaf H & Treijtel BW (1992).Cross-bridge stiffness in Ca2+ activated skinned singlemuscle fibres. Pflugers Arch 420, 434–445.
Katz B (1939). The relation between force and speed inmuscular contraction. J Physiol 96, 45–64.
C© The Physiological Society 2003
tjp˙011 TJP-xml.cls December 22, 1904 11:38
352 M. Linari and others J Physiol 554.2 pp 335–352
Kraft T & Brenner B (1997). Force enhancement withoutchanges in cross-bridge turnover kinetics: the effect of EMD57033. Biophys J 72, 272–281.
Labeit S & Kolmerer B (1995). Titins: giant proteins in chargeof muscle ultrastructure and elasticity. Science 270,293–296.
Laemmli UK (1970). Cleavage of structural proteins during theassembly of the head of bacteriophage T4. Nature 227,680–681.
Linari M, Aiazzi A, Dolfi M, Piazzasi G & Lombardi V (1993).A system for studying tension transients in segments ofskinned muscle fibres from rabbit psoas. J Physiol 473, 8P.
Linari M, Dobbie I, Reconditi M, Koubassova N, Irving M,Piazzesi G & Lombardi V (1998). The stiffness of skeletalmuscle in isometric contraction and rigor: the fraction ofmyosin heads bound to actin. Biophys J 74, 2459–2473.
Linari M, Lucii L, Reconditi M, Casoni ME, Amenitsch H,Bernstorff S, Piazzesi G & Lombardi V (2000). A combinedmechanical and X-ray diffraction study of stretchpotentiation in single frog muscle fibres. J Physiol 526,589–596.
Linari M, Woledge RC & Curtin NA (2003). Energy storageduring stretch of active single fibres from frog skeletalmuscle. J Physiol 548, 461–474.
Liu Y, Schlumberger A, Wirth K, Schmidtbleicher D &Steinacker JM (2003). Different effects on human skeletalmyosin heavy chain isoform expression: strength vs.combination training. J Appl Physiol 94, 2282–2288.
Lombardi V & Piazzesi G (1990). The contractile responseduring steady lengthening of stimulated frog muscle fibres.J Physiol 431, 141–171.
Lucii L, Piazzasi G & Lombardi V. (2001a). Mechanicalevidence for rapid cross-bridge recruitment during stretch ofcontracting single fibres of frog skeletal muscle. Pflugers Arch442, R22/56.
Lucii L, Vanzi F, Piazzesi G & Lombardi V (2001b). Rapidcross-bridge recruitment during stretch of active single fibersof frog skeletal muscle. Biophys J 80, 271a/1109–Pos.
Lymn RW & Taylor EW (1971). Mechanism of adenosinetriphosphate hydrolysis by actomyosin. Biochemistry 10,4617–4624.
Mansson A (1994). The tension response to stretch of intactskeletal muscle fibres of the frog at varied tonicity of theextracellular medium. J Muscle Res Cell Motil 15, 145–157.
Martyn DA, Chase PB, Regnier M & Gordon AM (2002). Asimple model with myofilament compliance predictsactivation-dependent crossbridge kinetics in skinned skeletalfibers. Biophys J 83, 3425–3434.
Metzger JM & Moss RL (1987). Shortening velocity in skinnedsingle muscle fibers. Influence of filament lattice spacing.Biophys J 52, 127–131.
Morgan DL (1990). New insights into the behavior of muscleduring active lengthening. Biophys J 57, 209–221.
Pate E, Wilson GJ, Bhimani M & Cooke R (1994). Temperaturedependence of the inhibitory effects of orthovanadate onshortening velocity in fast skeletal muscle. Biophys J 66,1554–1562.
Piazzesi G, Francini F, Linari M & Lombardi V (1992). Tensiontransients during steady lengthening of tetanized musclefibres of the frog. J Physiol 445, 659–711.
Piazzesi G, Linari M & Lombardi V (1994). The effect ofhypertonicity on force generation in tetanized single fibresfrom frog skeletal muscle. J Physiol 476, 531–546.
Piazzesi G, Reconditi M, Koubassova N, Decostre V, Linari M,Lucii L & Lombardi V (2003). Temperature dependence ofthe force-generating process in single fibres from frogskeletal muscle. J Physiol 549, 93–106.
Schiaffino S & Reggiani C (1996). Molecular diversity ofmyofibrillar proteins: gene regulation and functionalsignificance. Physiol Rev 76, 371–423.
Stienen GJ, Kiers JL, Bottinelli R & Reggiani C (1996).Myofibrillar ATPase activity in skinned human skeletalmuscle fibres: fibre type and temperature dependence.J Physiol 493, 299–307.
Stienen GJ, Versteeg PG, Papp Z & Elzinga G (1992).Mechanical properties of skinned rabbit psoas and soleusmuscle fibres during lengthening: effects of phosphate andCa2+. J Physiol 451, 503–523.
Wakabayashi K, Sugimoto Y, Tanaka H, Ueno Y, Takezawa Y &Amemiya Y (1994). X-ray diffraction evidence for theextensibility of actin and myosin filaments during musclecontraction. Biophys J 67, 2422–2435.
Wang K, McCarter R, Wright J, Beverly J & Ramirez-Mitchell R(1991). Regulation of skeletal muscle stiffness andelasticity by titin isoforms: a test of the segmental extensionmodel of resting tension. Proc Natl Acad Sci USA 88,7101–7105.
Acknowledgements
The authors thank Professor Philip Brandt for providing theprogram to calculate the composition of the solutions, ProfessorMiklos Kellermayer for his helpful advice on the use ofantiproteases, and Professor Gabriella Piazzesi for continuousdiscussion on the experimental work and helpful criticismson the manuscript. We also thank Mr Alessandro Aiazzi andMr Mario Dolfi for skilled technical assistance, and Mr AdrioVannucchi for preparation of some illustrations. The MIUR(Ministero dell’Istruzione dell’Universita e della Ricerca, COFIN2002) and the EU (HPRN-CT-2000-00091) supported thisresearch.
C© The Physiological Society 2003
Copyright © 2022 FDOKUMEN