The mechanical behaviour of synthetic, poorly consolidated granular rock under uniaxial compression
16
The mechanical behaviour of synthetic, poorly consolidated granular rock under uniaxial compression F. Saidi * , Y. Bernabe ´, T. Reuschle ´ Institut de Physique du Globe de Strasbourg, CNRS-Universite ´ Louis Pasteur, 5 rue Rene ´ Descartes, 67084 Strasbourg, France Accepted 31 March 2003 Abstract In order to isolate the effect of grain size and cementation on the mechanical behaviour of poorly consolidated granular rock, we prepared synthetic rock samples in which these two parameters were varied independently. Various proportions of sand, Portland cement and water were mixed and cast in a mold. The mixture was left pressure-free during curing, thus ensuring that the final material was poorly consolidated. We used two natural well-sorted sands with grain sizes of 0.22 and 0.8 mm. The samples were mechanically tested in a uniaxial press. Static Young’s modulus was measured during the tests by performing small stress excursions at discrete intervals along the stress– strain curves. All the samples exhibited nonlinear elasticity, i.e., Young’s modulus increased with stress. As expected, we found that the uniaxial compressive strength increased with increasing cement content. Furthermore, we observed a transition from grain size sensitivity of strength at cement content less than 20 – 30% to grain size independence above this value. The measured values of Young’s modulus are well explained by models based on rigid inclusions embedded in a soft matrix, at high cement content, and on cemented grain-to-grain contacts, at low cement content. Both models predict grain size independence in well-sorted cemented sands. The observed grain size sensitivity at low cement content is probably due to microstructural differences between fine- and coarse-grained materials caused by small differences in grain sorting quality. D 2003 Elsevier B.V. All rights reserved. Keywords: Strength; Elastic properties; Granular rocks; Cementation; Grain size 1. Introduction Poorly consolidated granular rocks are commonly encountered in oil reservoirs, and often linked to problems like earth surface subsidence, well–bore instability or sanding (e.g., Maury and Sauzay, 1987; Smart et al., 1991; Fredrich et al., 2000; Zhang et al., 2000). Better knowledge about the mechanical properties of these rocks is required in order to anticipate and minimise the technical difficulties men- tioned above (Schutjens et al., 1995). This is difficult to achieve, however, because of the near impossibility to collect and characterise well-preserved samples of poorly consolidated reservoir rock. An alternative approach is to prepare synthetic materials with the required specifications (e.g., Visser, 1988; Dass et al., 1993; Holt et al., 1993; Wang et al., 1997; David et al., 1998). Most importantly, this method allows 0040-1951/03/$ - see front matter D 2003 Elsevier B.V. All rights reserved. doi:10.1016/S0040-1951(03)00180-X * Corresponding author. Present address: Division de Me ´cani- que Applique ´e, Institut Franc ßais de Pe ´trole, 1 a ` 4 Avenue de Bois- Pre ´au, 92506 Rueil-Malmaison Cedex, France. E-mail address: [email protected] (F. Saidi). www.elsevier.com/locate/tecto Tectonophysics 370 (2003) 105– 120
-
Upload
independent -
Category
Documents
-
view
0 -
download
0
Transcript of The mechanical behaviour of synthetic, poorly consolidated granular rock under uniaxial compression

www.elsevier.com/locate/tecto
Tectonophysics 370 (2003) 105–120
The mechanical behaviour of synthetic, poorly consolidated
granular rock under uniaxial compression
F. Saidi*, Y. Bernabe, T. Reuschle
Institut de Physique du Globe de Strasbourg, CNRS-Universite Louis Pasteur, 5 rue Rene Descartes, 67084 Strasbourg, France
Accepted 31 March 2003
Abstract
In order to isolate the effect of grain size and cementation on the mechanical behaviour of poorly consolidated granular rock,
we prepared synthetic rock samples in which these two parameters were varied independently. Various proportions of sand,
Portland cement and water were mixed and cast in a mold. The mixture was left pressure-free during curing, thus ensuring that
the final material was poorly consolidated. We used two natural well-sorted sands with grain sizes of 0.22 and 0.8 mm. The
samples were mechanically tested in a uniaxial press. Static Young’s modulus was measured during the tests by performing
small stress excursions at discrete intervals along the stress–strain curves. All the samples exhibited nonlinear elasticity, i.e.,
Young’s modulus increased with stress. As expected, we found that the uniaxial compressive strength increased with increasing
cement content. Furthermore, we observed a transition from grain size sensitivity of strength at cement content less than 20–
30% to grain size independence above this value. The measured values of Young’s modulus are well explained by models based
on rigid inclusions embedded in a soft matrix, at high cement content, and on cemented grain-to-grain contacts, at low cement
content. Both models predict grain size independence in well-sorted cemented sands. The observed grain size sensitivity at low
cement content is probably due to microstructural differences between fine- and coarse-grained materials caused by small
differences in grain sorting quality.
D 2003 Elsevier B.V. All rights reserved.
Keywords: Strength; Elastic properties; Granular rocks; Cementation; Grain size
1. Introduction
Poorly consolidated granular rocks are commonly
encountered in oil reservoirs, and often linked to
problems like earth surface subsidence, well–bore
instability or sanding (e.g., Maury and Sauzay,
0040-1951/03/$ - see front matter D 2003 Elsevier B.V. All rights reserve
doi:10.1016/S0040-1951(03)00180-X
* Corresponding author. Present address: Division de Mecani-
que Appliquee, Institut Franc�ais de Petrole, 1 a 4 Avenue de Bois-
Preau, 92506 Rueil-Malmaison Cedex, France.
E-mail address: [email protected] (F. Saidi).
1987; Smart et al., 1991; Fredrich et al., 2000; Zhang
et al., 2000). Better knowledge about the mechanical
properties of these rocks is required in order to
anticipate and minimise the technical difficulties men-
tioned above (Schutjens et al., 1995). This is difficult
to achieve, however, because of the near impossibility
to collect and characterise well-preserved samples of
poorly consolidated reservoir rock. An alternative
approach is to prepare synthetic materials with the
required specifications (e.g., Visser, 1988; Dass et al.,
1993; Holt et al., 1993; Wang et al., 1997; David et
al., 1998). Most importantly, this method allows
d.
F. Saidi et al. / Tectonophysics 370 (2003) 105–120106
varying the relevant structural parameters independ-
ently and hence isolating their effect.
The mechanical behaviour of granular materials is
primarily controlled by cementation (e.g., Clough et
al., 1981; Chang et al., 1990; Bruno and Nelson, 1991;
Dvorkin et al., 1991, 1994; Bernabe et al., 1992; Zang
and Wong, 1995). In particular, it was observed that
very small amounts of cement, if deposited at grain-to-
grain contacts, strongly increase the stiffness and
strength of granular materials. The importance of
cement is also illustrated by a recent study that showed
that artificially induced cementation in situ can greatly
improve well–bore stability (Mamora et al., 2000).
Another important parameter is grain size. In the
ductile metals, an inverse relationship was established
between plastic yield stress and the square root of grain
size (Hall, 1951; Petch, 1953). Similar effects were ob-
served in rocks deformed in the brittle and semibrittle
fields (Handin and Hager, 1957; Skinner, 1959; Brace,
1961; Olsson, 1973). Fredrich et al. (1990) found that
in calcite aggregates, brittle strength, low temperature
yield stress and the brittle–ductile transition pressure
depended on the inverse of grain size. Zhang et al.
(1990) observed the same kind of scale effect in sand-
stones and attributed it to scaling with grain size of the
flaws responsible for grain fracturing. In poorly con-
solidated rock, we do not expect predominant grain
fracturing but rather rupture of cemented bonds. The
effect of grain size may therefore be quite different.
In this work, we prepared synthetic granular rock
samples in which cement content and grain size were
varied independently. The samples were tested in a
uniaxial press. The paper is organised as follows. In
Section 2, we describe the technique of fabrication of
the synthetic materials and the testing procedure. The
results of the mechanical tests are then reported in
Section 3.We present a detailedmicrostructure study of
the undeformed and deformed materials in Section 4.
Finally, the results are modelled and discussed in
Section 5.
2. Experimental procedure
2.1. Preparation of the synthetic granular rocks
The samples were prepared as follows: (1) Desired
amounts of dry sand and Portland cement were
weighed and thoroughly mixed. (2) Water was added
to produce complete curing. We used the smallest
possible amount of water in order to avoid gravity
segregation and/or flushing of the cement. (3) The
mixture was cast into a 4-cm-long rectangular pris-
matic mold with a square cross-section 2 cm in sides.
(4) The mixture was allowed to dry inside the mold
for 1 day. We finally removed the hardened sample
from the mold and completed the curing process by
leaving it in direct contact with the atmosphere for
six additional hours. In a previous series of experi-
ments, we assessed the influence of curing time on
the mechanical properties of the prepared materials
(Saidi, 2002) and verified that precisely following the
procedure above allowed us to obtain consistent
results (i.e., the properties of the various materials
can be meaningfully compared). Notice that no
pressure was applied to the samples during curing
in order to ensure that the final material was poorly
consolidated. Since the samples were very weak and
friable, we did not machine their faces to a precisely
flat surface.
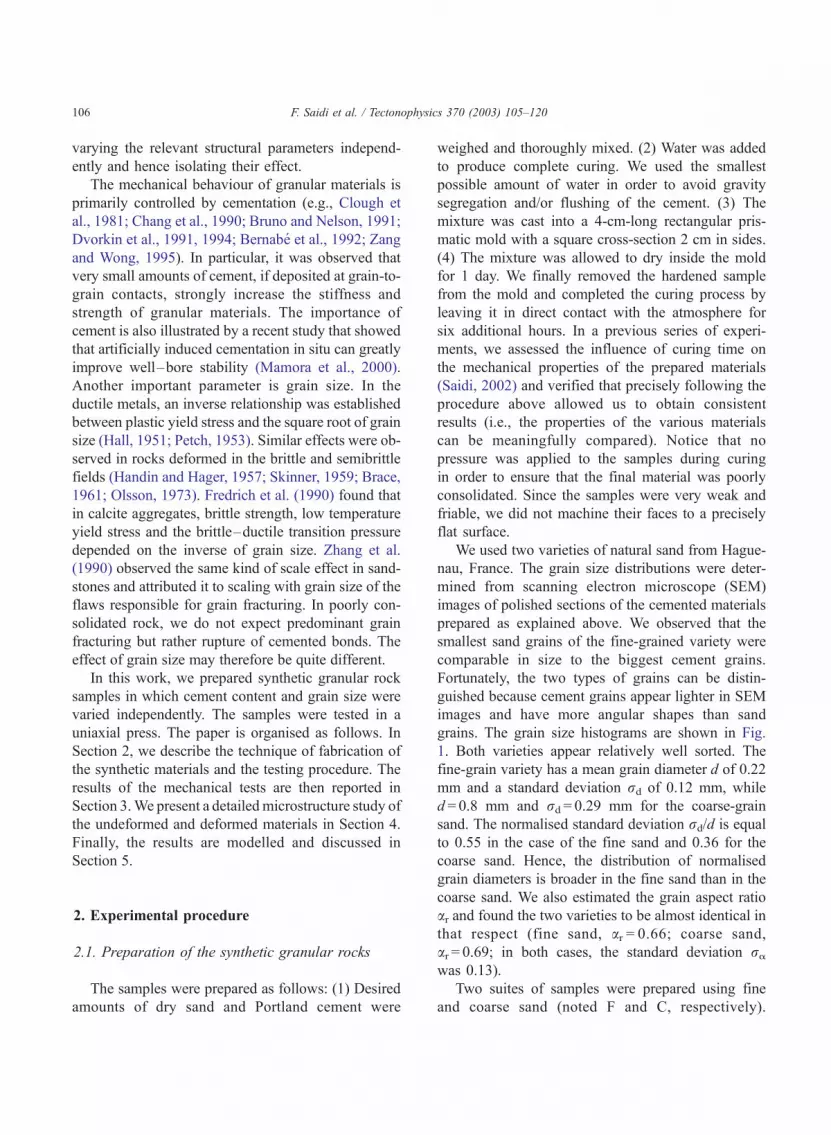
We used two varieties of natural sand from Hague-
nau, France. The grain size distributions were deter-
mined from scanning electron microscope (SEM)
images of polished sections of the cemented materials
prepared as explained above. We observed that the
smallest sand grains of the fine-grained variety were
comparable in size to the biggest cement grains.
Fortunately, the two types of grains can be distin-
guished because cement grains appear lighter in SEM
images and have more angular shapes than sand
grains. The grain size histograms are shown in Fig.
1. Both varieties appear relatively well sorted. The
fine-grain variety has a mean grain diameter d of 0.22
mm and a standard deviation rd of 0.12 mm, while
d = 0.8 mm and rd = 0.29 mm for the coarse-grain
sand. The normalised standard deviation rd/d is equal
to 0.55 in the case of the fine sand and 0.36 for the
coarse sand. Hence, the distribution of normalised
grain diameters is broader in the fine sand than in the
coarse sand. We also estimated the grain aspect ratio
ar and found the two varieties to be almost identical in
that respect (fine sand, ar = 0.66; coarse sand,
ar = 0.69; in both cases, the standard deviation ra
was 0.13).
Two suites of samples were prepared using fine
and coarse sand (noted F and C, respectively).
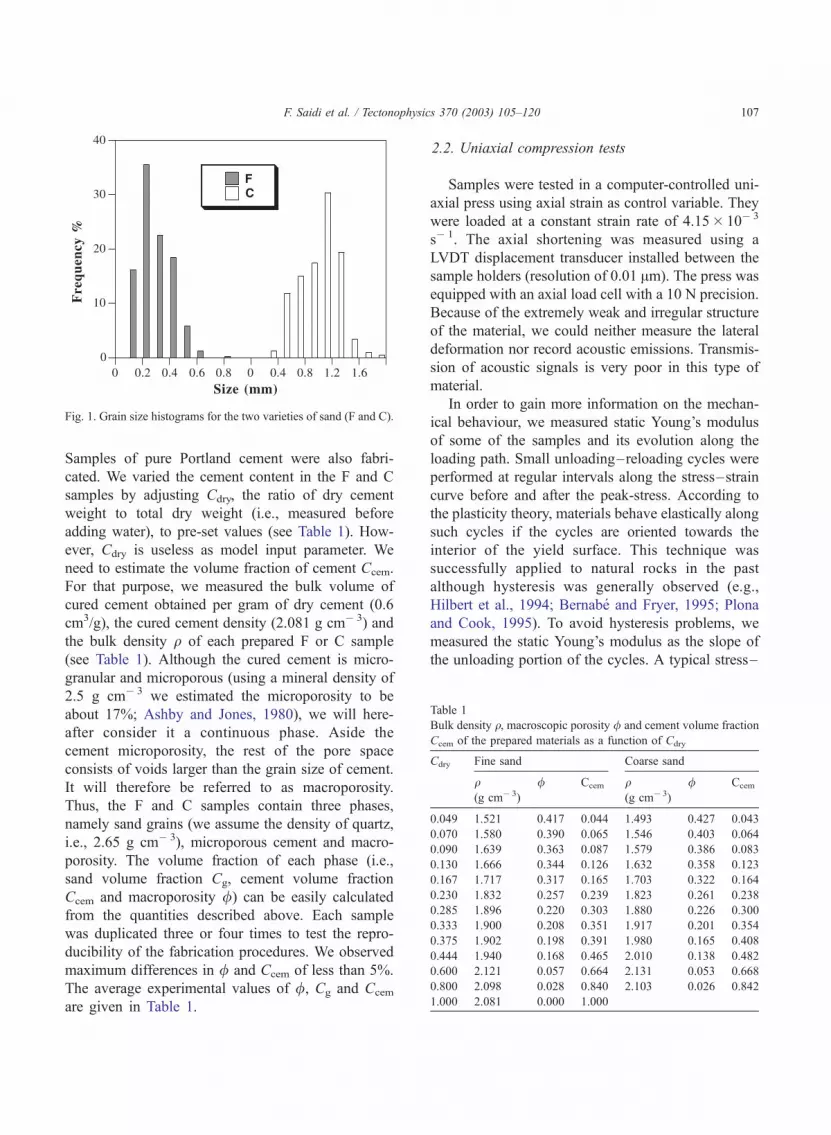
Table 1
Bulk density q, macroscopic porosity / and cement volume fraction
Ccem of the prepared materials as a function of Cdry
Cdry Fine sand Coarse sand
q(g cm� 3)
/ Ccem q(g cm� 3)
/ Ccem
0.049 1.521 0.417 0.044 1.493 0.427 0.043
0.070 1.580 0.390 0.065 1.546 0.403 0.064
0.090 1.639 0.363 0.087 1.579 0.386 0.083
0.130 1.666 0.344 0.126 1.632 0.358 0.123
0.167 1.717 0.317 0.165 1.703 0.322 0.164
0.230 1.832 0.257 0.239 1.823 0.261 0.238
0.285 1.896 0.220 0.303 1.880 0.226 0.300
0.333 1.900 0.208 0.351 1.917 0.201 0.354
0.375 1.902 0.198 0.391 1.980 0.165 0.408
0.444 1.940 0.168 0.465 2.010 0.138 0.482
0.600 2.121 0.057 0.664 2.131 0.053 0.668
0.800 2.098 0.028 0.840 2.103 0.026 0.842
1.000 2.081 0.000 1.000
Fig. 1. Grain size histograms for the two varieties of sand (F and C).
F. Saidi et al. / Tectonophysic
Samples of pure Portland cement were also fabri-
cated. We varied the cement content in the F and C
samples by adjusting Cdry, the ratio of dry cement
weight to total dry weight (i.e., measured before
adding water), to pre-set values (see Table 1). How-
ever, Cdry is useless as model input parameter. We
need to estimate the volume fraction of cement Ccem.
For that purpose, we measured the bulk volume of
cured cement obtained per gram of dry cement (0.6
cm3/g), the cured cement density (2.081 g cm� 3) and
the bulk density q of each prepared F or C sample
(see Table 1). Although the cured cement is micro-
granular and microporous (using a mineral density of
2.5 g cm� 3 we estimated the microporosity to be
about 17%; Ashby and Jones, 1980), we will here-
after consider it a continuous phase. Aside the
cement microporosity, the rest of the pore space
consists of voids larger than the grain size of cement.
It will therefore be referred to as macroporosity.
Thus, the F and C samples contain three phases,
namely sand grains (we assume the density of quartz,
i.e., 2.65 g cm� 3), microporous cement and macro-
porosity. The volume fraction of each phase (i.e.,
sand volume fraction Cg, cement volume fraction
Ccem and macroporosity /) can be easily calculated
from the quantities described above. Each sample
was duplicated three or four times to test the repro-
ducibility of the fabrication procedures. We observed
maximum differences in / and Ccem of less than 5%.
The average experimental values of /, Cg and Ccem
are given in Table 1.
2.2. Uniaxial compression tests
Samples were tested in a computer-controlled uni-
axial press using axial strain as control variable. They
were loaded at a constant strain rate of 4.15� 10� 3
s� 1. The axial shortening was measured using a
LVDT displacement transducer installed between the
sample holders (resolution of 0.01 Am). The press was
equipped with an axial load cell with a 10 N precision.
Because of the extremely weak and irregular structure
of the material, we could neither measure the lateral
deformation nor record acoustic emissions. Transmis-
sion of acoustic signals is very poor in this type of
material.
In order to gain more information on the mechan-
ical behaviour, we measured static Young’s modulus
of some of the samples and its evolution along the
loading path. Small unloading–reloading cycles were
performed at regular intervals along the stress–strain
curve before and after the peak-stress. According to
the plasticity theory, materials behave elastically along
such cycles if the cycles are oriented towards the
interior of the yield surface. This technique was
successfully applied to natural rocks in the past
although hysteresis was generally observed (e.g.,
Hilbert et al., 1994; Bernabe and Fryer, 1995; Plona
and Cook, 1995). To avoid hysteresis problems, we
measured the static Young’s modulus as the slope of
the unloading portion of the cycles. A typical stress–
s 370 (2003) 105–120 107

Fig. 2. (a) A typical stress–strain curve (Cdry = 28.5%). (b) The
corresponding evolution of Young’s modulus as a function of r1 inthe same sample.
F. Saidi et al. / Tectonophysics 370 (2003) 105–120108
strain curve with the unloading–reloading cycles is
shown in Fig. 2a. Notice that the initial portion of the
curve is nearly horizontal. This abnormally large
compressibility is related to irregularities of the end-
faces. As a consequence, it was difficult to determine
the point at which the loading piston first contacted
the sample and therefore the absolute values of the
axial strain are not accurately known.
3. Results
3.1. General observations
All the samples exhibited behaviours similar to that
shown in Fig. 2. Pre- and post-peak sections of the
stress–strain curve in Fig. 2a appear surprisingly
similar. Post-peak softening always proceeded regu-
larly down to stresses as low as we attempted to reach.
We never observed any instability (i.e., sudden stress
drop) after the peak stress, which suggests that dam-
age accumulation occurred progressively over the
entire post-peak domain (note that our testing machine
is only moderately stiff and therefore susceptible to
induce instability). Strain localisation was rarely
present at the sample scale. Only a few samples did
present visible axial fractures as is generally observed
in uniaxial compression experiments on harder rocks.
But we were not able to determine at which point on
the stress–strain curves these fractures formed. In Fig.
2a, we see that the small unloading–reloading cycles
did not coincide with the main stress–strain curves
even during the initial stages of deformation, implying
that the samples became nonelastic at very low
stresses. Fig. 2b shows the corresponding values of
Young’s modulus E as a function of axial stress r1. In
the pre-peak domain, E significantly increases with
r1, indicating nonlinear elastic behaviour. In the post-
peak domain, E decreases sharply as a result of
damage accumulation.
3.2. Effect of cementation and grain size on strength
Fig. 3 shows the uniaxial compression strength Su(i.e., peak-stress) of the F and C samples as a function
of cement content Ccem. The values plotted in Fig. 3
were obtained by averaging the results from three or
four experiments run in identical conditions. The
relative fluctuations were not larger than 20% (the
error bars in Fig. 3 represent plus or minus two stand-
ard deviations). Plotted on a linear scale in Fig. 3a the
curve of Su versus cement content has an S-shape with
an inflection point (i.e., maximum slope) at Ccemc20%. The observed sharp increase of Su at low cement
content is in a good agreement with recent theoretical
(Dvorkin et al., 1994; Bruno and Nelson, 1991) and
experimental work (Bernabe et al., 1992; Yin and
Dvorkin, 1994; David et al., 1998), which showed
that cement located at grain contacts is very effective
in strengthening granular materials. At high Ccem, Suincreases less dramatically because the additional
cement was deposited in less-effective locations.
One interesting observation is that the inflexion
point also corresponds to a transition from grain size
sensitivity of Su at Ccem < 20–30% to grain size inde-

Fig. 4. The evolution of Young’s modulus E with r1 in log– log
scale in two samples with different Cdry (symbols) and in pure
cement (thick line). The power law behaviour breakdowns at the
onset of damage accumulation (see text for more details).
Table 2
Average values of the pre-factor Eo and exponent n as function of
cement content
Cdry Fine sand Coarse sand
Eo
(GPa)
n Ccem Eo
(GPa)
n Ccem
0.090 2.29 0.70 0.087 2.05 0.76 0.083
0.130 2.34 0.77 0.126 2.09 0.75 0.123
0.167 3.19 0.59 0.165 2.29 0.73 0.164
0.230 3.13 0.73 0.239 3.17 0.65 0.238
0.285 2.71 0.73 0.303 2.57 0.74 0.300
0.375 3.28 0.69 0.391 3.08 0.80 0.408
0.600 3.78 0.61 0.664 4.06 0.59 0.668
0.800 2.92 0.74 0.840 3.41 0.68 0.842
1.000 2.59 0.62 1.000
Fig. 3. Uniaxial strength Su as a function of cement content Ccem in
a linear plot (a) and in a log– log plot (b). Variability is indicated by
the error bars (1 S.D.).
F. Saidi et al. / Tectonophysics 370 (2003) 105–120 109
pendence at Ccem>20–30%. This can be clearly seen in
log–log scale in Fig. 3b or by calculating the ratio of
the strength of fine-grain material (i.e., F samples) over
that of coarse-grain rock (i.e., C samples) qS = Su(F)/Su
(C).
For Ccem>20–30%, qS has a constant value near unity
indicating grain size independence, while it increases
up to about 2.5 for Ccem < 20–30%.
3.3. Effect of cementation and grain size on Young’s
modulus
It is impossible to represent all the Young’s mod-
ulus data for the complete set of F and C samples and
for all the stresses on a single plot. Fortunately, the
behaviour was similar in all the samples. Fig. 4 shows
log(E) versus log(r1), including the post-peak portion,
for C samples with Ccem equal to 60% and 9% (the data
for pure cement is also shown for comparison). We see
that, in the pre-peak domain, the log(E) versus log(r1)
curves are initially straight lines (i.e., power laws,
EcEo (r1/r0)n, where r0 = 1 MPa). As the peak-
stress is approached, the log(E) versus log(r1) curvesbecome more and more horizontal, eventually revers-
ing completely in the post-peak domain. Nonlinear
elasticity was recently recognised as an important
characteristic of rocks (e.g., Guyer et al., 1997; Ostrov-
sky et al., 2000). One possible cause of nonlinearity is
the presence of Hertzian contacts between grains,
leading to a power-law EcEo (r1/r0)n with n = 1/3.
The measured values of exponent n are listed in
Table 2. We see that n fluctuates between 0.6 and 0.8

F. Saidi et al. / Tectonophysics 370 (2003) 105–120110
independently of grain size. Given the scatter, n
remains quite close to 0.62, the value for pure cement,
independently of Ccem. As a consequence, it seems
reasonable to assume that the nonlinear elastic behav-
iour of the F and C materials is primarily caused by the
nonlinearity of the cement itself. Since n for pure
cement is much greater than 1/3, the nonlinearity of
cement cannot be explained by Hertzian contacts only.
The pre-factors Eo are also given in Table 2. Despite a
rather large scatter, we can observe that Eo first
increases when Ccem increases up to 60%, then
decreases to the value measured for pure cement (2.6
GPa). The grain size effect reported above for strength
is almost invisible in the scatter of the Young’s
modulus data. It merely appears that, for the F samples
with Ccem < 20–30%, Eo is higher than that of the C
samples by a rather moderate 1.2–1.4 factor.
If we assume that power-law behaviour is the
signature of intrinsic nonlinear elasticity in our materi-
als, then we must interpret the growing deviations from
the initial power law as reflecting damage accumula-
tion (other observations such as presence of hysteresis
support this interpretation; Saidi, 2002). Following
damage mechanics practice (Lemaitre, 1996), we can
define a damage parameterD from the elastic moduli of
the intact and damaged materials, D = 1�E(r1)/
[Eo(r1/r0)n] (D is equal to zero as long as E has the
undamaged power-law form and approaches 1 when E
becomes strongly degraded owing to damage accumu-
lation). Typical examples of D as a function of normal-
ised axial strain e1/e1(peak) are shown in Fig. 5 and
Fig. 5. The damage parameter D for samples with different Cdry
(symbols) and in pure cement (thick line) as a function of
normalised strain (see text for more details).
compared to D for pure cement. In Fig. 5, we see that
the onset of damage accumulation is early (i.e., around
e1(peak)/2) in high Ccem samples and is progressively
retarded as the cement content is lowered. Notice,
however, that we observed several exceptions to this
trend (see for example the 80% C sample as shown in
Fig. 5).
4. Microstructure
Selected intact and deformed samples were
impregnated with epoxy. Planar sections were cut
using a diamond saw and polished. Note that polish-
ing extended patches of cement turned out to be
impossible because epoxy did not penetrate the
cement microporosity. As a consequence, samples
with Ccem>40% were not used in the microstructure
study. In intact samples, the sections were cut perpen-
dicular to the sample axis whereas in deformed
samples, we used axial sections, i.e., parallel to r1.The sections were examined in the scanning electron
microscope (SEM) in backscattered electron mode. To
facilitate comparison, we used magnifications such
that micrographs of F and C materials showed a
similar number of sand grains. This is illustrated in
Fig. 6 showing examples of F and C samples with
identical high and low Cdry (37.5 and 9%). F and C
samples appear fairly similar. At low Ccem, the cement
forms distinct patches around grain-to-grain contacts.
As cementation increases, the cement begins to fill the
pore space between the grains. Note that due to the
different magnifications, the microgranular nature of
the cement is more apparent in the micrographs of F
material than in the C samples.
4.1. Intact materials
The SEM micrographs are images with grey levels
between 0 (black) and 255 (white). Pores appear in dark
shades. To evaluate porosity, we need to determine
which pixels belong to the solid phase and which to the
pores. Here we simply applied thresholding to the gray
images to render a binary image. However, choosing a
threshold is somewhat arbitrary. Here the grey level
histograms appeared always roughly bimodal and we
picked the mid-point between the two modes as thresh-
old. Since the micrographs of the F samples had amuch
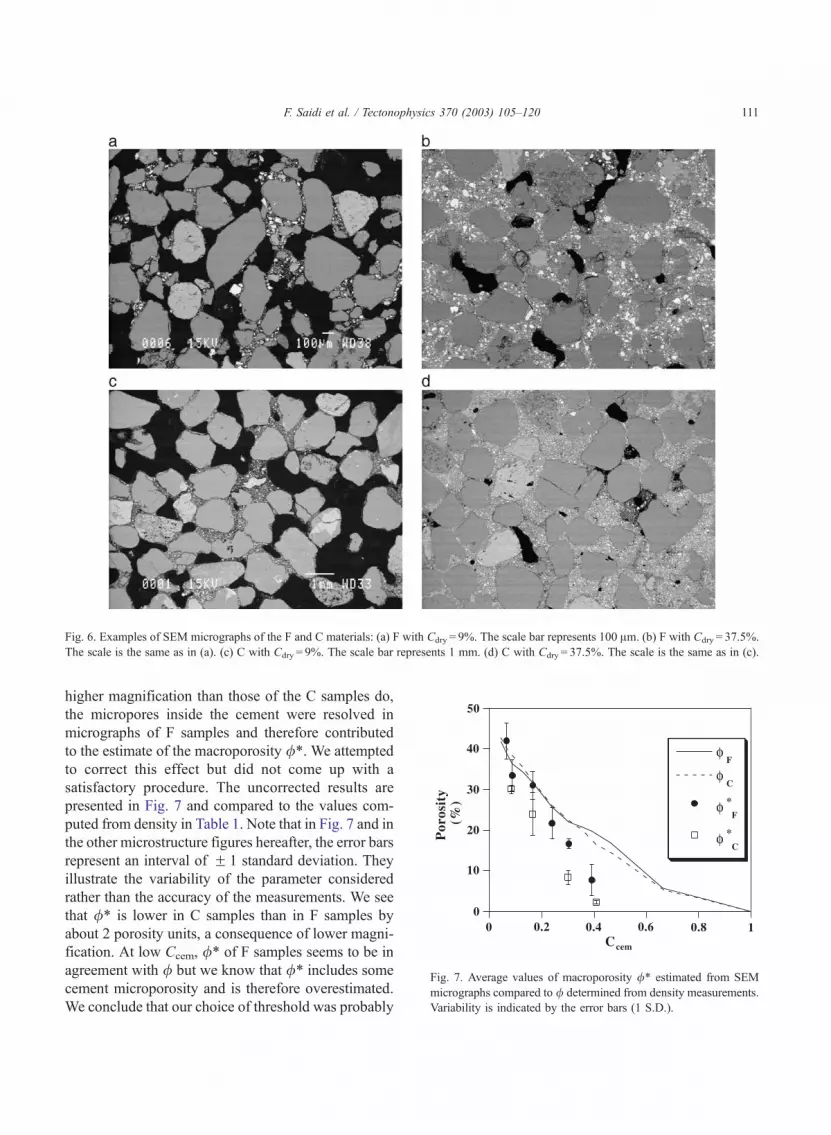
Fig. 7. Average values of macroporosity /* estimated from SEM
micrographs compared to / determined from density measurements.
Variability is indicated by the error bars (1 S.D.).
Fig. 6. Examples of SEM micrographs of the F and C materials: (a) F with Cdry = 9%. The scale bar represents 100 Am. (b) F with Cdry = 37.5%.
The scale is the same as in (a). (c) C with Cdry = 9%. The scale bar represents 1 mm. (d) C with Cdry = 37.5%. The scale is the same as in (c).
F. Saidi et al. / Tectonophysics 370 (2003) 105–120 111
higher magnification than those of the C samples do,
the micropores inside the cement were resolved in
micrographs of F samples and therefore contributed
to the estimate of the macroporosity /*. We attempted
to correct this effect but did not come up with a
satisfactory procedure. The uncorrected results are
presented in Fig. 7 and compared to the values com-
puted from density in Table 1. Note that in Fig. 7 and in
the other microstructure figures hereafter, the error bars
represent an interval of F 1 standard deviation. They
illustrate the variability of the parameter considered
rather than the accuracy of the measurements. We see
that /* is lower in C samples than in F samples by
about 2 porosity units, a consequence of lower magni-
fication. At low Ccem, /* of F samples seems to be in
agreement with / but we know that /* includes some
cement microporosity and is therefore overestimated.
We conclude that our choice of threshold was probably

Fig. 9. Average ratio n of length of grain/cement interface to grain
perimeter. Variability is indicated by the error bars (1 S.D.).
F. Saidi et al. / Tectonophysics 370 (2003) 105–120112
not optimal and lead to a general underestimation of
/*. At high Ccem, /* is much smaller than / in both F
and C samples. This effect is too strong to be caused by
incorrect thresholding. The most likely explanation is
that epoxy had not penetrated some nearly isolated
macropores inside the cement, making them indistin-
guishable from the poorly polished cement back-
ground. Hence, we failed to identify them. Overall,
the conclusion of this section is that the F and C
samples did not appear different with respect to poros-
ity.
The packing topology is usually characterised by
the packing coordination number, i.e., the average
number of grain-to-grain contacts per grain. Since
the samples were not compressed during preparation,
it is likely that a layer of cement is always present
separating nearly touching grains. In that sense, there
are probably no actual grain-to-grain contacts and we
define the coordination number as the number of
cemented bonds per grain. Unfortunately, this param-
eter cannot be determined from two-dimensional
images. Instead, we counted the average number N
of close neighbours per grain. We defined a close
neighbour as a grain having at least one point at a
distance less than a quarter of the radius of the grain
considered. This threshold distance is somewhat arbi-
trary. We settled on it because it visually appeared to
be a good compromise. For each value of Ccem, a
minimum of 300 grains were analysed. The results are
shown in Fig. 8. We can see that N has a range
Fig. 8. Average number N of closest neighbours per grain as a
function of Ccem. Variability is indicated by the error bars (1 S.D.).
roughly between 3 and 4, with a tendency to decrease
as Ccem increases. Also, N is in general lower for C
material than for F, which is consistent with the
strength results reported earlier. Lastly, it is important
to note the very large variability of N as illustrated by
the error bars in Fig. 8.
We also need to characterise the spatial distribution
of cement. We want to know if the cement is exclu-
sively located at the grain contacts (or near contacts)
or if it forms a continuous layer around the grains.
This distinction is particularly important at low
cement content but becomes less and less meaningful
as Ccem increases. For this purpose, we used classic
quantitative stereology techniques (Underwood, 1970)
and measured the ratio n of the cumulative length of
grain/cement interface by the sum of the grain perim-
eters. We counted the number of intersections of
grain/cement, grain/pore and cement/pore interfaces
(noted IGC, IGP and ICP, respectively) with a test line of
known length. Using quantitative stereology, it is easy
to see that n = IGC/(IGC + IGP). The results are shown inFig. 9. We observe that n is larger for C samples than
for F ones. As expected, the values in both cases tend
to increase with increasing Ccem. Indeed, at high Ccem,
there are no pores left and n should be close to 1. The
values at low Ccem are more interesting in that their
possible range is much wider (i.e., from 0.2–0.3 to 1).
We found 0.8 for C samples and 0.5 for F ones. For
comparison, we imagine a material in which cement is
deposited only at grain contacts. According to our
measurements of N, a section through a single grain of

F. Saidi et al. / Tectonophysics 370 (2003) 105–120 113
radius R would intersect four cemented bonds, each
one having a length 2a. We will see later that a/
R = 0.25 is a reasonable value. We therefore estimate nas 4(2a)/(2pR) = 0.3, a value significantly smaller than
the observed ones. We conclude that the cement is not
deposited exclusively at the grain-to-grain contacts
but coats a large portion of the free surface of the sand
grains. The cement coating appears to be more com-
plete in C material than in F.
4.2. Deformed samples
We also examined polished sections of deformed
samples. An example is shown in Fig. 10. We
observed essentially the same small number of intra-
granular microcracks as in the intact sand, indicating
that grain fracturing did not occur. This is not surpris-
ing since the F and C materials are too weak to allow
sufficiently high stresses to arise around grain con-
tacts. On the other hand, we observed intergranular
tensile microcracks at grain–cement interfaces. As
expected, the tensile microcracks were generally sub-
parallel to r1. Sometimes, these tensile fissures
extended through the cement itself. These observa-
tions suggest that cement debonding was an important
damage mechanism. This is in good agreement with
the results of Bruno and Nelson’s (1991) simulations.
However, other undetectable mechanisms may also
Fig. 10. Example of SEM micrograph of deformed sample (C with
Cdry = 16.7%). Debonding cracks at the grain/cement interfaces are
indicated by A while B highlights tensile cracks in the cement. The
direction of r1 is shown. The scale is the same as in Fig. 6c.
have been significant. In particular, shear fracturing in
the cement or grain boundary sliding are very hard to
identify because of the absence of offset markers. We
also noted fewer and smaller tensile debonding cracks
at high Ccem than at low cement content, suggesting
that other mechanisms were indeed active in this case.
5. Modelling and discussion
5.1. Young’s modulus
In modelling, the elastic properties, the greatest
difficulty we have to face is the nonlinear elasticity of
the cement phase. In fact, a rigorous treatment is out
of the scope of the present paper. Instead, we assume
that the classic methods valid for linear elastic media
can still be meaningfully used here. We consider two
end-members: (a) at high Ccem, the sand grains act as
rigid inclusions in a soft matrix of cement and macro-
pores, and (b) at low Ccem, the grains are cemented to
each other at grain contacts (Dvorkin et al., 1991,
1994). In both cases, one basic assumption is that the
cement acts as a homogeneous, continuous phase, and
its elastic behaviour is identical to that observed in
pure cement samples. Notice that the effect of macro-
porosity / is automatically taken into account in case
(b) but not in case (a). One way to handle this problem
is to homogenise cement and macropores together in
our treatment of end-member (a). In order to simplify
the analysis, we additionally assume that the sand
grains are monodispersed spheres. This is justified
since we saw earlier that, in both varieties, the grains
have a narrowly distributed radius R and an aspect
ratio of 0.6 (above 0.5, grains can safely be assimi-
lated to spheres; Huang and Hu, 1995).
It is convenient to start with end-member (a). We
follow the self-consistent analysis of Luo and Weng
(1987). A composite sphere consisting of a sand grain
of radius R and a concentric coat of a mixture of
cement and macroporosity is embedded in an infinite
volume of a material having the effective properties of
the sample considered (see Fig. 11a). The advantage
of this self-consistent approach is that it is not
restricted to dilute concentrations of sand grains, i.e.,
to Ccem near unity. Note that the weak cement/macro-
porosity matrix is the only connected phase in this
system, implying that the effective material should be
Fig. 11. The geometric arrangements corresponding to (a) the
effective medium inclusion model, and (b) the cemented bond
model (arrangement 1 and arrangement 2).
F. Saidi et al. / Tectonophysics 370 (2003) 105–120114
weak as well. The outer radius RV of the composite
sphere is R(1�Ccem�/)� 1/3. According to Luo and
Weng (1987), the effective bulk modulus Keff and
shear modulus Geff are:
Keff ¼ K* 1þ ð1� Ccem � /ÞðKQ � K*ÞðCcem þ /Þa*ðKQ � K*Þ þ K*
� �ð1Þ
Geff ¼ G* 1þ ð1� Ccem � /ÞðGQ � G*ÞðCcem þ /Þb*ðGQ � G*Þ þ G*
� �ð2Þ
where KQ and GQ are the bulk and shear modulus of
quartz (36.6 and 45 GPa, respectively), K* and G* are
the effective bulk and shear modulus of the cement/
macroporosity mixture, and, the two parameters a*and b* can be calculated in terms of KQ, GQ, K* and
G*. Luo and Weng (1987) demonstrated that
a* = 3K*/(3K* + 4G*), i.e., Eq. (1) is identical to the
classic Hashin–Shtrikman lower bound. Their results
also show that with the values of KQ, GQ, K* and G*
considered here, b* = 1.2(K* + 2G*)/(3K* + 4G*), i.e.,Hashin–Shtrikman lower bound for shear modulus, is
an excellent approximation. These definitions of a*and b* will be used here.
In order to evaluate K* and G*, we apply the same
approach to macropores embedded in a cement
matrix:
K* ¼ Kcem 1� /Ccem þ / � aCcem
� �ð3Þ
G* ¼ Gcem 1� // þ Ccem � bCcem
� �ð4Þ
where Kcem and Gcem are the cement bulk and
shear moduli, and, a = 3Kcem/(3Kcem + 4Gcem) and
b = 1.2(Kcem + 2Gcem)/(3Kcem + 4Gcem). Note that
Eqs. (3) and (4) are identical to Hashin–Shtrikman
higher bounds. In a previous uniaxial test on a pure
cement sample, we measured the Young’s modulus
Ecem and Poisson’s ratio mcem of cement. We found
that mcem was approximately equal to 0.2 independ-
ently on stress. We then have Kcem =Ecem/3(1�2mcem) and Gcem =Ecem/2(1 + mcem), which implies
that Kcem and Gcem have the same stress depend-
ence as Ecem (i.e., Ko(r1/r0)n and Go(r1/r0)
n, where
Ko =Eo/3(1� 2mcem) and Go =Eo/2(1 + mcem)).Concerning the nonlinear elasticity, the classic
treatment (Suquet, 1995) is to replace nonlinear
phases by linear materials with adequately chosen
properties, i.e., corresponding to the average stresses
and strains. Here we assume the average stress in the
cement to be nearly equal to the remotely applied
stress. This assumption may not be too bad because
of the rather weak stress dependence of the cement
(i.e., the exponent n is lower than 1). Accordingly,
we simply replace Kcem and Gcem in Eqs. (3) and (4)
by Ko(r1/r0)n and Go(r1/r0)
n, where Ko and Go are
the experimentally measured pre-factors for pure
cement and r1 is the remotely applied stress. We
can then evaluate the stress dependence of Keff, Geff
and Eeff = 9KeffGeff/(3Keff +Geff) by performing the
above calculations for the values of / and Ccem in
Table 1, using a broad range of r1 (i.e., 0.1–100
MPa). We found that the calculated Eeff very closely
obeyed a power law Eeff =Eo(r1/r0)n. In all cases,
the exponent n was only slightly lower than n for
pure cement (i.e., 0.55–0.58 instead of 0.62). Fig.
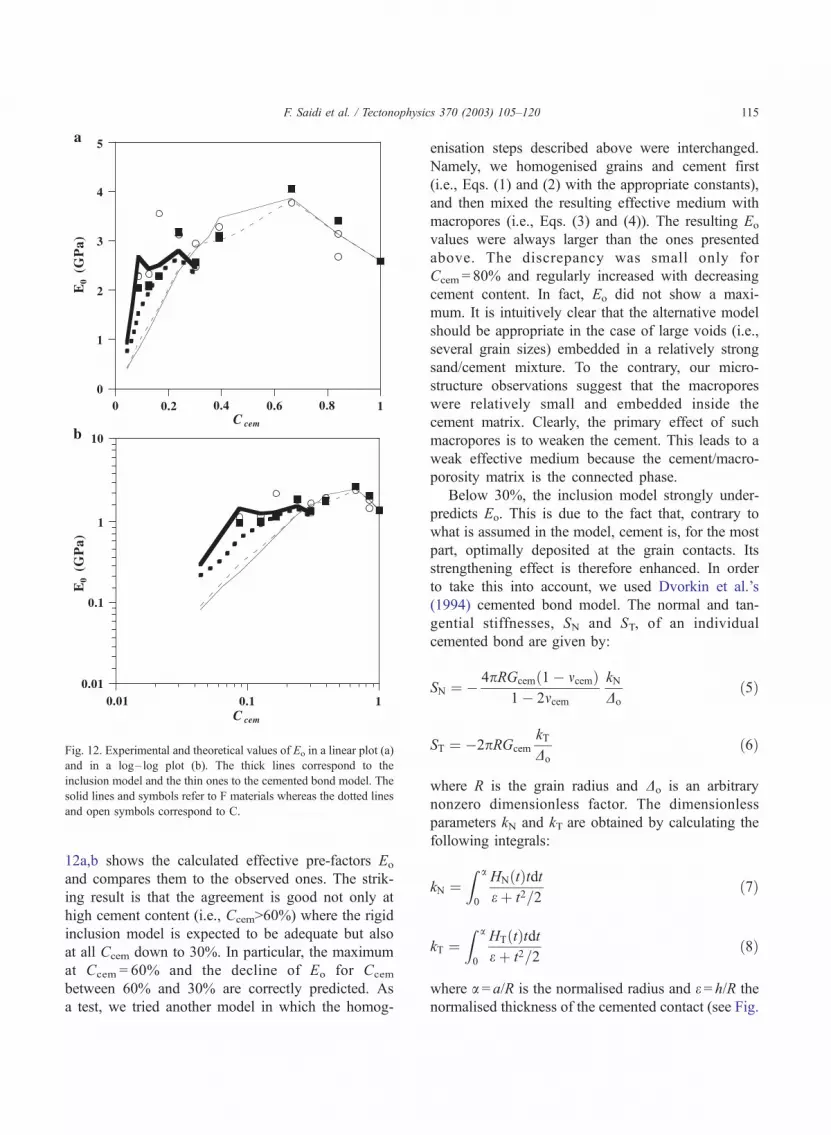
Fig. 12. Experimental and theoretical values of Eo in a linear plot (a)
and in a log– log plot (b). The thick lines correspond to the
inclusion model and the thin ones to the cemented bond model. The
solid lines and symbols refer to F materials whereas the dotted lines
and open symbols correspond to C.
F. Saidi et al. / Tectonophysics 370 (2003) 105–120 115
12a,b shows the calculated effective pre-factors Eo
and compares them to the observed ones. The strik-
ing result is that the agreement is good not only at
high cement content (i.e., Ccem>60%) where the rigid
inclusion model is expected to be adequate but also
at all Ccem down to 30%. In particular, the maximum
at Ccem = 60% and the decline of Eo for Ccem
between 60% and 30% are correctly predicted. As
a test, we tried another model in which the homog-
enisation steps described above were interchanged.
Namely, we homogenised grains and cement first
(i.e., Eqs. (1) and (2) with the appropriate constants),
and then mixed the resulting effective medium with
macropores (i.e., Eqs. (3) and (4)). The resulting Eo
values were always larger than the ones presented
above. The discrepancy was small only for
Ccem = 80% and regularly increased with decreasing
cement content. In fact, Eo did not show a maxi-
mum. It is intuitively clear that the alternative model
should be appropriate in the case of large voids (i.e.,
several grain sizes) embedded in a relatively strong
sand/cement mixture. To the contrary, our micro-
structure observations suggest that the macropores
were relatively small and embedded inside the
cement matrix. Clearly, the primary effect of such
macropores is to weaken the cement. This leads to a
weak effective medium because the cement/macro-
porosity matrix is the connected phase.
Below 30%, the inclusion model strongly under-
predicts Eo. This is due to the fact that, contrary to
what is assumed in the model, cement is, for the most
part, optimally deposited at the grain contacts. Its
strengthening effect is therefore enhanced. In order
to take this into account, we used Dvorkin et al.’s
(1994) cemented bond model. The normal and tan-
gential stiffnesses, SN and ST, of an individual
cemented bond are given by:
SN ¼ � 4pRGcemð1� mcemÞ1� 2mcem
kN
Do
ð5Þ
ST ¼ �2pRGcem
kT
Do
ð6Þ
where R is the grain radius and Do is an arbitrary
nonzero dimensionless factor. The dimensionless
parameters kN and kT are obtained by calculating the
following integrals:
kN ¼Z a
0
HNðtÞtdte þ t2=2
ð7Þ
kT ¼Z a
0
HTðtÞtdte þ t2=2
ð8Þ
where a = a/R is the normalised radius and e = h/R the
normalised thickness of the cemented contact (see Fig.

Table 3
Normalised grain separation e assuming hexagonal packing and
normalised cemented bond radius a1 and a2 using Dvorkin et al.’s
(1994) arrangements 1 and 2
Cdry Fine sand Coarse sand
e a1 a2 e a1 a2
0.049 0.078 0.408 0.091 0.397
0.070 0.070 0.466 0.083 0.085 0.456
0.090 0.064 0.512 0.198 0.089 0.492 0.104
0.130 0.090 0.558 0.254 0.104 0.548 0.218
0.167 0.106 0.598 0.320 0.111 0.595 0.311
0.230 0.126 0.660 0.443 0.129 0.659 0.438
0.285 0.163 0.700 0.524 0.170 0.696 0.510
0.333 0.221 0.721 0.560 0.214 0.724 0.572
0.375 0.276 0.739 0.589 0.246 0.752 0.648
0.444 0.363 0.775 0.674 0.335 0.785 0.732
0.600 0.589 0.585
0.800 1.321 1.318
F. Saidi et al. / Tectonophysics 370 (2003) 105–120116
11b). The dimensionless functions HN and HT are
solutions to the integral equations described in Appen-
dix A. The effective bulk and shear moduli are then
given by:
Keff ¼Ncð1� Ccem � /ÞSN
12pRð9Þ
Geff ¼Ncð1� Ccem � /Þ
20pRSN þ 3
2ST
� �ð10Þ
where Nc is the average contact coordination number,
i.e., the mean number of cemented bonds per grain.
The cemented bond model of Dvorkin et al.’s
(1994) is more complicated to use than the inclusion
model because we have to evaluate three additional
parameters, Nc, a and e. None of these parameters can
be obtained directly from the microstructure observa-
tions reported in Section 4. However, the microstruc-
ture study provides some useful information. We saw
that N, a two-dimensional equivalent of Nc, varied
between 3 and 4. In three dimensions, we assume that
2N gives a reasonable estimate of Nc, which would
thus range between 6 and 8. Although we know that
the actual sand packing was random, we need to
choose a regular sphere packing in order to proceed.
Nc = 6 corresponds to the simple cubic packing. We
must reject it because the maximum volume fraction
of the spheres (i.e., Cg) is p/6 = 0.524, a value smaller
than those yielded by the experimental data of Table 1
(between 0.551 and 0.529 for the first few F and C
samples). Assuming simple cubic packing in these
cases would imply that the sand grains penetrated
each other, which we know is impossible. Nc = 8
corresponds to hexagonal packing, i.e., two-dimen-
sional hexagonal layers of spheres, stacked on top of
each others. The maximum Cg is now p/3M3 = 0.605,
a value larger than any Cg calculated from the data of
Table 1. We can then calculate the normalised sepa-
ration e of the sand grains assuming hexagonal pack-
ing and using the values of Table 1. We simply have
to solve / +Ccem = 1� (1 + e/2)� 3p/3M3. The calcu-
lated values are given in Table 3. We lack sufficiently
detailed information on the spatial distribution of
cement to calculate the normalised radius a = a/R of
the cemented bonds directly. However, we know that
a must be bounded by a1 and a2, two values that we
can calculate using the two arrangements proposed by
Dvorkin et al. (1994) and illustrated in Fig. 11b.
Arrangement 1 assumes that the cement is all depos-
ited at the grain contacts, whereas, in arrangement 2,
the cement forms a continuous layer around the
grains. Tedious but simple volume calculations lead
to the following equations:
Ccem
Cg
¼ C
43a21 1þ e=2ð Þ � 2þ 2 1� a21
� �3=2h ið11Þ
Ccem
Cg
¼ ð1� C=2Þ½ð1þ e=2Þ2 þ a22�3=2 � 1
þ C
2ð1þ e=2Þ3 þ 3Ca22
4ð1þ e=2Þ ð12Þ
where a1 and a2 refer to arrangements 1 and 2,
respectively. These equations have at most one root
between 0 and 1. The results are given in Table 3. We
see that no solutions were found for a2 in the samples
with the lowest Ccem. Indeed, we verified that, in these
cases, the normalised thickness of the cement layer
was less than e/2, implying a2 = 0. Now, the simplest
is to take a equal to the mean of a1 and a2. Notice,however, that the cemented bonds overlap signifi-
cantly for a larger than about 0.65, implying that the
cemented bond model becomes inadequate in such
cases. Accordingly, only the cases with a< 0.65 were
considered in the following.
Finally, we proceeded with Dvorkin et al.’s (1994)
model as with the inclusion model: we replaced the

F. Saidi et al. / Tectonophysics 370 (2003) 105–120 117
nonlinear elastic cement by a linear material with
elastic properties chosen as before, i.e., corresponding
to the remotely applied stress. The calculated Eeff did
not display excellent power law behaviour (i.e.,
Eeff =Eo(r1/r0)n as before. Limiting r1 to the exper-
imental range 1–15 MPa, we obtained n between 0.42
and 0.50 (smaller than the pure cement exponent) and
values of Eo closer to the experimental data than the
results of the inclusion model (see Fig. 12a,b). How-
ever, the estimated Eo were still significantly smaller
than the experimental values, maybe owing to a
systematic underestimation of a or to nonlinear elas-
ticity effects (i.e., underestimation of stress concen-
tration in cemented bonds and, therefore, elastic
properties of cement). Interestingly we obtained 30–
50% smaller Eo in the C samples than in F (see Fig.
12b). We argue that this is probably a consequence of
our method of calculating e and a (the smaller
/ +Ccem, the smaller e and the larger a, finally leading
to a strong enhancement of Eo). If our goal was
merely to fit the experimental data, we could obvi-
ously obtain a much better match by defining a as an
adjustable linear combination of a1 and a2. But thiswould be quite arbitrary since we do not have any
independent constraint on a. We can nevertheless
confidently conclude that, at Ccem < 20–30%, the
cemented bond model is a clear improvement with
respect to the inclusion model.
5.2. Uniaxial strength
As explained above, damage was exclusively
located in the cement. Hence, it is clear that the
strength of the F and C materials is controlled by
the state of stress of the cemented regions between the
sand grains. The elastic models discussed above are
grain size independent, implying that the stress field
and therefore strength should also be insensitive to
grain size. This prediction agrees with the experimen-
tal results at Ccem>20–30% but not below this value.
We conclude that at least one important assumption
used in our implementation of Dvorkin et al.’s (1994)
cemented bond model was differently satisfied in the
F and C materials.
We saw in Section 2.1 that one important differ-
ence between the F and C sands was the width of their
grain size distributions as measured by rd/d. As a
consequence, N (i.e., a two-dimensional equivalent of
Nc) was 20% larger in F samples than in C (see
Section 4.1). A decrease of Nc implies a general
increase of the stress concentrations in the cemented
bonds and, hence, a decrease in strength. In addition,
the microstructure study showed that n (see Section
4.1) was larger in C materials by about 30%. An
increase of n indicates an increase of the amount of
cement inefficiently deposited away from the grain
contacts. This implies smaller a and, therefore,
smaller strength. Contrary to these observations, we
assumed in the cemented bond model that Nc was
equal to 8 and we used the same procedure to estimate
a in both F and C materials. Are these subtle differ-
ences in packing and cement distribution a plausible
explanation to the strength differences observed at
low cement content? If yes, why do they have a much
smaller effect on the elastic properties? Why does the
effect disappear at Ccem>30%?
The answer to the last question is easy. At high
Ccem, these differences in Nc and n tend to decrease
(the microstructure observations show the beginning
of this trend). Even if substantial differences re-
mained, at Ccem>30% the sand grains act as inclu-
sions. In this case, packing and cement distribution
become essentially irrelevant. As to the second ques-
tion, we can see readily that Nc appears linearly in the
cemented bond model. Hence, a 20% change in Nc
must produce a 20% change in the elastic properties.
We numerically verified that a similar change in ayielded a change in Young’s modulus of no more than
30%. Finally, in order to answer the first question, we
consider the strength S* of individual cemented bonds
and recognise that failure is not controlled by the
mean S* but by its minimum value, i.e., the weakest
link (see the numerical simulations of Reuschle, 1998;
Tang et al., 2000). A similar line of reasoning can be
followed using the magnitude of stress concentration
at individual cemented bonds. If all bonds are equally
resistant, failure is obviously controlled by the most
stressed ones. It is possible that, in our materials, a
small decrease in the mean value of Nc corresponded
to much greater fluctuations of the magnitude of stress
concentrations in cemented bonds. Likewise, a small
decrease of the average n may have induced much
larger fluctuations of S*. We conclude that the subtle
differences in packing and cement distribution
observed are indeed a plausible explanation to the
strength differences observed at low cement content.

F. Saidi et al. / Tectonophysics 370 (2003) 105–120118
As discussed above, there is a strong relationship
between the mechanical properties and the spatial
distribution of cement, which, of course, depends on
how the mixture was prepared, specifically, how the
water was introduced. The concentration of cement at
the grain contacts generally observed here suggests a
predominance of capillary forces. In this respect, our
fabrication procedure was similar to that of Holt et al.
(1993), who introduced the reactive fluid, CO2, using
two-phase flow conditions. In nature, analogues to our
materials might therefore be found in settings charac-
terised by unsaturated flow.
6. Conclusion
1. Poorly consolidated granular materials are signifi-
cantly strengthened by cementation. Uniaxial
strength strongly increased with increasing cement
content. The static Young’s modulus had a more
complex behaviour because the cement used in this
work was a weak, nonlinear elastic phase.
2. We observed a transition from grain size sensitivity
of strength at cement contents lower than 20–30%
to grain size independence above this value. To the
contrary, static Young’s modulus appeared rather
unaffected by grain size.
3. We were able to model the variations of static
Young’s modulus with cement content using two
very different approaches. At high Ccem, the sand
grains were treated as hard inclusions embedded in
a soft cement/macroporosity matrix. At low Ccem,
we used Dvorkin et al.’s (1994) cemented bonds
model. One striking result was that the inclusion
model remained valid in an unexpectedly wide
range of cement content, i.e., down to Ccem = 30%.
4. Because the sands used here are well sorted, the
models above predict that the elastic properties
should be unaffected by grain size. Theoretically,
this should be also true for strength. However, the
relative grain size distribution was narrower in F
sand than C, resulting in small differences in
packing and spatial distribution of cement. We
argue that strength is strongly affected by fluctua-
tions of the microstructural parameters while
elastic moduli are not. Consequently, it is plausible
that these subtle differences in packing and spatial
distribution of cement had a much greater impact
on strength than on the elastic properties of the F
and C materials.
Acknowledgements
We are grateful to A. Aydin and W. Olsson for
reviewing the manuscript. Their comments were very
helpful.
Appendix A
Here, we only need to concentrate on the integral
equation for HN:
Do þ HNðtÞ ¼ �KN
Z p
0
d/Z tcos/þ
ffiffiffiffiffiffiffiffiffiffiffiffiffiffiffiffia2�t2sin2/
p
0
� HNðffiffiffiffiffiffiffiffiffiffiffiffiffiffiffiffiffiffiffiffiffiffiffiffiffiffiffiffiffiffiffiffiffiffit2 þ s2 � 2tscos/
pÞ
e þ 1=2ðt2 þ s2 � 2tscos/Þ ds
ðA1Þ
where KN=(2Gcem/pGQ)(1 � mcem)(1 � mQ)/(1 �2mcem). Numerically solving this equation requires
using a sufficiently accurate numerical integration
method.
Consider the following integral I:
I ¼Z a
0
f ðsÞds ðA2Þ
I can be approximated by the following sum:
IcXNi¼0
a
Npifi ðA3Þ
where fi= f(ia/N) and pi are weights that depend on the
method used (in this work, we used the extended
Simpson’s rule; Press et al., 1987). Applying this
method twice, Eq. (A1) can be approximated by:
Do þ HN
kaM
� �¼ �KN
XMj¼0
ppjXMi¼0
abjkpi
� HNðxijka=MÞ
e þa2x2ijk2M 2
ðA4Þ

F. Saidi et al. / Tectonophysics 370 (2003) 105–120 119
where
bjk ¼k
Mcos
jpM
� �þ
ffiffiffiffiffiffiffiffiffiffiffiffiffiffiffiffiffiffiffiffiffiffiffiffiffiffiffiffiffiffiffiffiffiffiffiffi1� k2
M 2sin2
jpM
� �s
and
xijk ¼
ffiffiffiffiffiffiffiffiffiffiffiffiffiffiffiffiffiffiffiffiffiffiffiffiffiffiffiffiffiffiffiffiffiffiffiffiffiffiffiffiffiffiffiffiffiffiffiffiffiffiffiffiffiffik2 þ i2b2jk � 2kibjkcos
jpM
� �s:
By interpolation, we can express HN(xijka/M) as a
function of the HN(ka/M). We thus obtain an easily
solved system of M+ 1 linear equations with M + 1
unknowns, i.e., HN(ka/M). Notice that system (A4) is
singular for e = 0. In that case, a more sophisticated
method is necessary.
References
Ashby, M.F., Jones, D.R.M., 1980. Engineering Materials 1: An
Introduction to their Properties and Applications. Pergamon,
Oxford.
Bernabe, Y., Fryer, D.T., 1995. On the use of small stress excur-
sions to investigate the mechanical behaviour of porous rocks.
Int. J. Rock Mech. Min. Sci. Geomech. Abstr. 32, 93–99.
Bernabe, Y., Fryer, D.T., Hayes, J.A., 1992. The effect of cement
on the strength of granular rocks. Geophys. Res. Lett. 19,
1511–1514.
Brace, W.F., 1961. Dependence of fracture strength of rocks on grain
size. Bull. Miner. Ind. Exper. Stn. 76, 99–103 (Pennsylvania
State University).
Bruno, M.S., Nelson, R.B., 1991. Microstructural analysis of the
inelastic behaviour of sedimentary rock. Mech. Mater. 12,
95–118.
Chang, C.S., Misra, A., Sundaram, S.S., 1990. Micromechanical
modelling of cemented sands under low amplitude oscillations.
Geotechnique 40, 251–263.
Clough, G.W., Sitar, N., Bachus, R.C., Rad, N.S., 1981. Cemented
sands under static loading. J. Geotech. Eng. 107, 799–817.
Dass, R.N., Yen, S.C., Puri, V.K., Das, B.M., Wright, M.A., 1993.
Tensile stress– strain behavior of lightly cemented sand. Int. J.
Rock Mech. Min. Sci. Geomech. Abstr. 7, 711–714.
David, C., Menendez, B., Bernabe, Y., 1998. The mechanical be-
haviour of synthetic sandstone with varying brittle cement con-
tent. Int. J. Rock Mech. Min. Sci. Geomech. Abstr. 35, 759–770.
Dvorkin, J., Mavko, G., Nur, A., 1991. The effect of cementation
on the elastic properties of granular materials. Mech. Mater. 12,
207–217.
Dvorkin, J., Yin, J., Nur, A., 1994. Effective properties of cemented
granular materials. Mech. Mater. 18, 351–366.
Fredrich, J.T., Evans, B., Wong, T.-F., 1990. Effect of grain size on
brittle and semibrittle strength: implications for micromechani-
cal modelling of failure in compression. J. Geophys. Res. 95,
10907–10920.
Fredrich, J.T., Arguello, J.C., Deitrick, G.L., De Rouffignac, E.P.,
2000. Geomechanical modeling of reservoir compaction, sur-
face subsidence, and casing damage at the Belridge Diatomite
field. SPE Reserv. Evalu. Eng. 3, 348–359.
Guyer, R.A., McCall, K.R., Boitnott, G.N., Hilbert, L.B., Plona,
T.J., 1997. Quantitative implementation of Preisach–Mayer-
goyz space to find static and dynamic elastic moduli in rock.
J. Geophys. Res. 102, 5281–5293.
Hall, E.O., 1951. The deformation and aging of mild steel: III.
Discussion of results. Proc. Phys. Soc. Lond. 64B, 747–753.
Handin, J., Hager, R.V., 1957. Experimental deformation of sedi-
mentary rocks under confining pressure: tests at room temper-
ature on dry samples. Am. Assoc. Pet. Geol. Bull. 41, 1–50.
Hilbert, L.B., Hwong, T.K., Cook, N.G.W., Nihei, K.T., Myer,
L.R., 1994. Effects of strain amplitude on the static and
dynamic nonlinear deformation of Berea sandstone. In: Nel-
son, P.P., Laubach, S.E. (Eds.), Rock Mechanics. Balkema,
Rotterdam, pp. 487–504.
Holt, R.M., Unander, T.E., Kenter, C.J., 1993. Constitutive mechan-
ical behaviour of synthetic sandstone formed under stress. Int. J.
Rock Mech. Min. Sci. Geomech. Abstr. 30, 719–722.
Huang, Y., Hu, K.X., 1995. A generalized self-consistent mechanics
method for solids containing elliptical inclusions. J. Appl.
Mech. 62, 566–572.
Lemaitre, J., 1996. A Course on Damage Mechanics, 2nd ed.
Springer-Verlag, New York, p. 228.
Luo, H.A., Weng, G.J., 1987. On Eshelby’s inclusion problem in a
three-phase spherically concentric solid and a modification of
Mori-Tanaka’s method. Mech. Mater. 6, 347–361.
Mamora, D.D., Nilsen, K.A., Moreno, F.E., Guillemette, R., 2000.
Sand consolidation using high-temperature alkaline solution,
SPE paper 62943. Proc. Ann. Tech. Conf., Dallas.
Maury, V., Sauzay, J.M., 1987. Borehole stability: case histories,
rock mechanics approach and results, SPE paper 16051. Proc.
SPE/IADC Conf., New Orleans, 1987.
Olsson, W.A., 1973. Grain size dependence of yield stress in mar-
ble. J. Geophys. Res. 79, 4859–4862.
Ostrovsky, L.A., Johnson, P.A., Shankland, T.J., 2000. The mecha-
nism of strong nonlinear elasticity in Earth solids. In: Lauterborn,
W., Kurz, T. (Eds.), Nonlinear Acoustics at the Turn of the Mil-
lenium, ISNA 15. Am. Inst. Phys. Press, New York, pp. 75–84.
Petch, N.J., 1953. The cleavage strength of polycrystals. J. Iron
Steel Inst. 174, 25–28.
Plona, T.J., Cook, J.M., 1995. Effects of stress cycles on static and
dynamic Young’s moduli in Castlegate sandstone. In: Daemen,
J.K., Schultz, A. (Eds.), Proc. 35th U.S. Symp. Rock Mech.
Balkema, New York, pp. 155–160.
Press, W.H., Flannery, B.P., Teukolsky, S.A., Vetterling, W.T.,
1987. Numerical Recipes in C: The Art of Scientific Computing.
Cambridge Univ. Press, New York, p. 735.
Reuschle, T., 1998. A network approach to fracture: the effect of
heterogeneity and loading conditions. Pure Appl. Geophys. 152,
641–665.
Saidi, F., 2002. Micromecanique des roches granulaires faiblement

F. Saidi et al. / Tectonophysics 370 (2003) 105–120120
consolidees (in French), PhD Thesis, Universite Louis Pasteur,
Strasbourg, France.
Schutjens, P.M.T.M., Fens, T.W., Smits, R.M.M., 1995. Experimen-
tal observations of the uniaxial compaction of quartz-rich reser-
voir rock at stresses up to 80 MPa. In: Barends, F.B.J., Brouwer,
F.J.J., Schroder, F.H. (Eds.), Land Subsidence. Balkema, New
York.
Skinner, W.J., 1959. Experiments on the compressive strength of
anhydrite. Engineer 207, 255–259.
Smart, B.G.D., Somerville, J.M., MacGregor, K.J., 1991. The
prediction of yield zone development around a borehole
and its effect on drilling and production. In: Roegiers, J.C.
(Ed.), Proc. 32nd U.S. Symp. Rock Mech. Balkema, Rotter-
dam, pp. 961–969.
Suquet, P., 1995. Overall properties of non-linear composites: a
modified secant moduli theory and its link with Ponte Cas-
taneda’s non-linear variational procedure. C.R. Acad. Sci. 320
(ser. IIb), 563–571.
Tang, C.A., Liu, H., Lee, P.K.K., Tsui, Y., Tham, L.G., 2000. Nu-
merical studies of the influence of microstructure on rock failure
in uniaxial compression—Part I. Effect of heterogeneity. Int. J.
Rock Mech. Min. Sci. Geomech. Abstr. 37, 555–569.
Underwood, E.E., 1970. Quantitative Stereology. Addison-Wesley,
Reading, MA.
Visser, R., 1988. Acoustic Measurements on Real and Synthetic
Reservoir Rock, Proefschrift, Technische Universiteit Delft.
Wang, D.F., Yassir, N., Enever, J., Davies, P., 1997. Laboratory
investigation of core-based stress measurement using synthetic
sandstone, Paper No. 328. Int. J. Rock Mech. Min. Sci. Geo-
mech. Abstr. 34, 3–4.
Yin, H., Dvorkin, J., 1994. Strength of cemented grains. Geophys.
Res. Lett. 21, 903–906.
Zang, A., Wong, T.-F., 1995. Elastic stiffness and stress concentra-
tion in cemented granular materials. Int. J. Rock Mech. Min.
Sci. Geomech. Abstr. 32, 563–574.
Zhang, J., Wong, T.-F., Davis, D.M., 1990. Micromechanics of
pressure-induced grain crushing in porous rocks. J. Geophys.
Res. 95, 341–352.
Zhang, J.J., Rai, C.S., Sondergeld, C.H., 2000. Mechanical strength
of reservoir materials: key information for sand prediction. SPE
Reserv. Evalu. Eng. 3, 127–131.