
The magnetized steel and scintillator calorimeters of the MINOS experiment
91
arXiv:0805.3170v2 [physics.ins-det] 1 Aug 2008 Preprint submitted to Elsevier 1 August 2008
-
Upload
independent -
Category
Documents
-
view
0 -
download
0
Transcript of The magnetized steel and scintillator calorimeters of the MINOS experiment
arXiv:0805.3170v2 [physics.ins-det] 1 Aug 2008
Preprintsubm
ittedto
Elsevier
1A
ugust2008
The magnetized steel and scintillator calorimeters ofthe MINOS experiment
The MINOS Collaboration
D.G. Michaele,3, P. Adamsonk,u,ad, T. Alexopoulosak,4,W.W.M. Allison x, G.J. Alnerz, K. Andersonk, C. Andreopoulosz,b,
M. Andrewsk, R. Andrewsk, C. Arroyoac, S. Avvakumovac,D.S. Ayresa, B. Ballerk, B. Barishe, M.A. Barkerx, P.D.Barnes Jr.t,G. Barrx, W.L. Barrettah, E. Bealla,v,5, K. Bechtolai, B.R. Beckerv,
A. Beliasz, T. Bergfeldab,6, R.H. Bernsteink, D. Bhattacharyay,M. Bishaid, A. Blakef , V. Boceank, B. Bockw, G.J. Bockk,
J. Boehmℓ, D.J. Boehnleink, D. Bogertk, P.M. Borderv, C. Bowern,S. Boydy, E. Buckley-Geerk, A. Byon-Wagnerk, A. Cabrerax,7,
J.D. Chapmanf , T.R. Chasev, S.K. Chernichenkoo, S. Childressk,B.C. Choudharyk,e,8, J.H. Cobbx, S.J. Colemanai, J.D. Cossairtk,
H. Courantv, D.A. Cranea, A.J. Cullingf , D. Damianiai,J.W. Dawsona, J.K. de Jongm, D.M. DeMuthv,9, A. De Santox,10,
M. Dierckxsensd, M.V. Diwand, M. Dormanu,z, G. Drakea,R. Ducark,3, T. Durkinz, A.R. Erwinak, C.O. Escobarg,
J.J. Evansu,x, O.D. Facklert, E. Falk Harrisad, G.J. Feldmanℓ,N. Feltℓ, T.H. Fieldsa, R. Fordk, M.V. Frohnec,11,
H.R. Gallagherag,x,a,v, M. Gebhardn, A. Godleyab, J. Gogosv,M.C. Goodmana, Yu. Gornushkinr, P. Gouffonaa,
E.W. Grashornv,w, N. Grossmank, J.J. Grudzinskia, K. Grzelakaj,x,V. Guarinoa, A. Habigw,2, R. Halsallz, J. Hansone, D. Harrisk,
P.G. Harrisad, J. Hartnellad,z,x, E.P. Hartounit, R. Hatcherk,K. Hellerv, N. Hill a, Y. Ho j,12, C. Howcrofte,f , J. Hylenk,
M. Ignatenkor, D. Indurthyaf, G.M. Irwin ac, C. Jamesk, L. Jenneru,D. Jensenk, T. Joffe-Minora, T. Kafkaag, H.J. Kangac,S.M.S. Kasaharav, J. Kilmerk, H. Kim e, M.S. Kimy,13,
G. Koizumik, S. Koppaf, M. Kordoskyai,u,af, D.J. Koskinenu,w,
2

M. Kostinaf,14, S.K. Kotelnikovs, D.A. Krakauera,S. Kumaratungav, A.S. Ladrant, K. Langaf, C. Laughtonk,
A. Lebedevℓ, R. Leeℓ,15, W.Y. Leej,16, M.A. Libkind t, J. Liuaf,P.J. Litchfieldv,z, R.P. Litchfieldx, N.P. Longleyv, P. Lucask,
W. Luebkem, S. Madaniz, E. Maherv, V. Makeevk,o, W.A. Mannag,A. Marchionnik, A.D. Marinok, M.L. Marshakv, J.S. Marshallf ,J. McDonaldy, A.M. McGowana,v,17, J.R. Meierv, G.I. Merzons,M.D. Messiern,ℓ, R.H. Milburnag, J.L. Miller q,n,3, W.H. Miller v,
S.R. Mishraab,ℓ, P.S. Miyagawax, C.D. Moorek, J. Morfınk,R. Morsead, L. Mualeme,v, S. Mufsonn, S. Murgiaac,M.J. Murtaghd,3, J. Mussern, D. Naplesy, C. Nelsonk,
J.K. Nelsonai,k,v, H.B. Newmane, F. Nezrickk, R.J. Nicholu,T.C. Nichollsz, J.P. Ochoa-Ricouxe, J. Oliverℓ, W.P. Oliverag,
V.A. Onuchino, T. Osieckiaf , R. Ospanovaf , J. Paleyn, V. Paoloney,A. Parak, T. Patzaki,ag, Z. Pavlovic af, G.F. Pearcez, N. Pearsonv,
C. W. Pecke, C. Perryx, E.A. Petersonv, D.A. Petytv,z,x, H. Pingak,R. Piteirai, A. Pla-Dalmauk, R.K. Plunkettk,1, L.E. Pricea,M. Progaaf , D.R. Pushkak, D. Rahmanv, R.A. Rameikak,T.M. Rauferz,x, A.L. Readk, B. Rebelk,n, D.E. Reynaa,18,
C. Rosenfeldab, H.A. Rubinm, K. Ruddickv, V.A. Ryabovs,R. Saakyanu, M.C. Sancheza,ℓ,ag, N. Saoulidouk,b, J. Schnepsag,
P.V. Schoessowa,19, P. Schreinerc, R. Schwienhorstv,V.K. Semenovo, S. -M. Seunℓ, P. Shanahank, P.D. Shieldx,
R. Shivanev, W. Smartk, V. Smirnitskyp, C. Smithu,ad,e,P.N. Smithad, A. Sousax,ag, B. Speakmanv, P. Stamoulisb,
A. Stefanikk, P. Sullivanx, J.M. Swant, P.A. Symesad, N. Taggag,x,R.L. Talagaa, A. Terekhovs, E. Tetteh-Larteyae, J. Thomasu,x,k,J. Thompsony,3, M.A. Thomsonf , J.L. Throna,20, R. Trendlerk,
J. Trevore, I. Trostinp, V.A. Tsarevs, G. Tzanakosb, J. Urheimn,v,P. Vahleai,u,af , M. Vakili ae, K. Vaziri k, C. Velissarisak,
V. Verebryusovp, B. Virend, L. Wai ac, C.P. Wardf , D.R. Wardf ,M. Watabeae, A. Weberx,z, R.C. Webbae, A. Wehmannk, N. Westx,
C. Whitem, R.F. Whitead, S.G. Wojcickiac,1, D.M. Wright t,Q.K. Wuab, W.G. Yanh, T. Yangac, F.X. Yumicevaai,14, J.C. Yunk,
H. Zhenge, M. Zoisb, R. Zwaskak,af
3

aArgonne National Laboratory, Argonne, IL 60439, USAbDepartment of Physics, University of Athens, GR-15771 Athens, Greece
cPhysics Dept., Benedictine University, Lisle, IL 60532, USAdBrookhaven National Laboratory, Upton, NY 11973, USA
eLauritsen Lab, California Institute of Technology, Pasadena, CA 91125, USAfCavendish Laboratory, Univ. of Cambridge, Madingley Road,Cambridge CB3 0HE, UKgUniv. Estadual de Campinas, IF-UNICAMP, CP 6165, 13083-970, Campinas, SP, Brazil
hInst. of High Energy Physics, Chinese Academy of Sciences, Beijing 100039, ChinaiAPC – Universite Paris 7 Denis Diderot, F-75205 Paris Cedex 13, France
jPhysics Department, Columbia University, New York, NY 10027, USAkFermi National Accelerator Laboratory, Batavia, IL 60510,USA
ℓDepartment of Physics, Harvard University, Cambridge, MA 02138, USAmPhysics Division, Illinois Institute of Technology, Chicago, IL 60616, USA
nIndiana University, Bloomington, IN 47405, USAoInst. for High Energy Physics, Protvino, Moscow Region RU-140284, Russia
pHigh Energy Exp. Physics Dept., ITEP, 117218 Moscow, RussiaqPhysics Dept., James Madison University, Harrisonburg, VA22807, USA
rJoint Inst. for Nucl. Research, Dubna, Moscow Region, RU-141980, RussiasNuclear Physics Dept., Lebedev Physical Inst., 117924 Moscow, RussiatLawrence Livermore National Laboratory, Livermore, CA 94550, USA
uDept. of Physics and Astronomy, University College London,London WC1E 6BT, UKvUniversity of Minnesota, Minneapolis, MN 55455, USA
wDept. of Physics, Univ. of Minnesota – Duluth, Duluth, MN 55812, USAxSub-department of Particle Physics, Univ. of Oxford, Oxford OX1 3RH, UK
yDept. of Physics and Astronomy, Univ. of Pittsburgh, Pittsburgh, PA 15260, USAzRutherford Appleton Laboratory, Chilton, Didcot, Oxfordshire, OX11 0QX, UK
aaInst. de Fısica, Univ. de Sao Paulo, CP 66318, 05315-970, Sao Paulo, SP, BrazilabDept. of Physics and Astronomy, Univ. of South Carolina, Columbia, SC 29208, USA
acDepartment of Physics, Stanford University, Stanford, CA 94305, USAadDept. of Physics and Astronomy, University of Sussex, Falmer, Brighton BN1 9QH, UK
aePhysics Dept., Texas A&M Univ., College Station, TX 77843, USAafDept. of Physics, Univ. of Texas, 1 University Station, Austin, TX 78712, USA
agPhysics Dept., Tufts University, Medford, MA 02155, USAahPhysics Dept., Western Washington Univ., Bellingham, WA 98225, USA
aiDept. of Physics, College of William & Mary, Williamsburg, VA 23187, USAajFaculty of Physics, Warsaw University, Hoza 69, PL-00-681 Warsaw, Poland
4
akPhysics Dept., Univ. of Wisconsin, Madison, WI 53706, USA
Abstract
The Main Injector Neutrino Oscillation Search (MINOS) experiment uses an accelerator-produced neutrino beam to perform precision measurements of the neutrino oscillation pa-rameters in the “atmospheric neutrino” sector associated with muon neutrino disappear-ance. This long-baseline experiment measures neutrino interactions in Fermilab’s NuMIneutrino beam with a near detector at Fermilab and again 735 km downstream with a fardetector in the Soudan Underground Laboratory in northern Minnesota. The two detectorsare magnetized steel-scintillator tracking calorimeters. They are designed to be as similaras possible in order to ensure that differences in detector response have minimal impact onthe comparisons of event rates, energy spectra and topologies that are essential to MINOSmeasurements of oscillation parameters. The design, construction, calibration and perfor-mance of the far and near detectors are described in this paper.
Key words: detectors: neutrino, detectors: scintillator, calorimeters: tracking, extrudedplastic scintillatorPACS:29.40.Gx, 29.40.Mc, 29.40.Vj
5
1 Introduction
The Main Injector Neutrino Oscillation Search (MINOS) experiment is designedto perform precise measurements of neutrino oscillation parameters fromνµ dis-appearance using an accelerator-produced muon neutrino beam. MINOS uses twodetectors, called “near” and “far,” to measure the characteristics of an intense Fer-milab neutrino beam over a baseline distance of 735 km. The two detectors are de-signed to be as similar as possible so that many details of their responses will cancelin comparisons of neutrino event characteristics between the near and far ends ofthe baseline. The purpose of this paper is to describe the design, construction, cal-ibration and performance of the detector systems used in theMINOS experiment.Brief overviews of the neutrino beam and the detectors are given below, conclud-ing with an outline of the detector system presentations which constitute the coreof this paper.
MINOS utilizes 120 GeV protons from the Fermilab Main Injector to create thehigh-intensity NuMI (Neutrinos at the Main Injector) neutrino beam [1]. The beam-
1 Co-Spokesperson2 Corresponding author.Email address:[email protected] (A. Habig)3 Deceased4 Now at Dept. of Physics, National Tech. Univ. of Athens, GR-15780 Athens, Greece5 Now at Cleveland Clinic, Cleveland, OH 44195, USA6 Now at GE Healthcare, Florence SC 29501, USA7 Now at APC – Universite Paris 7 Denis Diderot, 10, rue Alice Domon et Leonie Duquet,F-75205 Paris Cedex 13, France8 Now at Dept. of Physics & Astrophysics, Univ. of Delhi, Delhi110007, India9 Now at Math, Science and Technology Dept., Univ. of Minnesota – Crookston, Crook-ston, MN 56716, USA10 Now at Physics Dept., Royal Holloway, Univ. of London, Egham, Surrey, TW20 0EX,UK11 Now at Holy Cross College, Notre Dame, IN 46556, USA12 Now at Dept. of Rad. Oncology, Beth Israel Med. Center, New York, NY 10003, USA13 Now at Centre for Particle Physics, Univ. of Alberta, Edmonton, Alberta T6G 2G7Canada14 Now at Fermi National Accelerator Laboratory, Batavia, IL 60510, USA15 Now at Lincoln Laboratory, Massachusetts Institute of Technology, Lexington, MA02420, USA16 Now at Physics Div., Lawrence Berkeley National Laboratory, Berkeley, CA 94720,USA17 Now at Physics Department, St. John Fisher College, Rochester, NY 14618, USA18 Now at Radiation and Nuclear Detection Systems, Sandia National Laboratories, Liver-more, CA 94551, USA19 Now at Euclid Techlabs LLC, Solon, OH 44139, USA20 Now at Nucl. Nonprolif. Div., Threat Reduc. Dir., Los AlamosNational Laboratory, LosAlamos, NM 87545, USA
6

line is precisely aimed in the direction of the Soudan Underground Laboratory innorthern Minnesota. The NuMI beam provides a high flux of neutrinos at the endof the decay volume in the energy range1 < Eν < 30 GeV, but the flux at Soudanis reduced by a factor of about106 due to the intrinsic divergence of the beam. Therelative rates of neutrino charged-current interactions in the MINOS near detectorat Fermilab are approximately 92.9%νµ, 5.8%νµ, 1.2%νe and 0.1%νe for thelow-energy beam configuration. With the parameters forνµ to ντ oscillations mea-sured by Super-Kamiokande [2] and other experiments (∆m2
32 ≃ 2.5 × 10⁻³ eV2
andsin2 2θ23 ≃ 1.0), the Fermilab-to-Soudan distance implies that the neutrino in-teractions of most interest will be in the1 < Eν < 5 GeV range. Details of thisexperiment’s measurements are published elsewhere [3,4].
The MINOS experiment uses two detectors to record the interactions of neutrinosin the NuMI beam. A third detector, called the calibration detector, was exposed toCERN test beams in order to determine detector response. Thenear detector at Fer-milab is used to characterize the neutrino beam and its interactions and is locatedabout 1 km from the primary proton beam target, the source of the neutrino par-ent particles. The far detector performs similar measurements 735 km downstream.The essence of the experiment is to compare the rates, energies and topologies ofevents at the far detector with those at the near detector, and from those compar-isons determine the relevant oscillation parameters. The energy spectra and ratesare determined separately forνµ and νe charged-current (CC) events and for neu-tral current (NC) events.
All three MINOS detectors are steel-scintillator samplingcalorimeters with track-ing, energy and topology measurement capabilities. This isachieved by alternateplanes of plastic scintillator strips and 2.54 cm thick steel plates. The near and fardetectors have magnetized steel planes. The calibration detector was not magne-tized as the particle momenta were selected a priori. The 1 cmthick by 4.1 cm wideextruded polystyrene scintillator strips are read out withwavelength-shifting fibersand multi-anode photomultiplier tubes. All detectors provide the same transverseand longitudinal sampling for fiducial beam-induced events.
The far detector, shown in Fig. 1, is located in Soudan, MN (47.8◦ N latitude, and92.2◦ W longitude), 735.3 km from the NuMI beam production target at Fermilab,in an inactive iron mine currently operated as a State Park bythe Department ofNatural Resources of the State of Minnesota. Much of the infrastructure used in themining days is still in service and is used to support the operation of the experi-ment. The detector is housed in a specially excavated cavern, 705 m underground(2070 meters-water-equivalent), 210 m below sea level. Thefar detector consists of486 octagonal steel planes, with edge to edge dimension of 8 m, interleaved withplanes of plastic scintillator strips. This 5,400 metric ton detector is constructed astwo “supermodules” axially separated by a 1.15 m gap. Each supermodule has itsown independently controlled magnet coil. The first (southernmost) supermodulecontains 249 planes and is 14.78 m in length while the second supermodule is com-
7
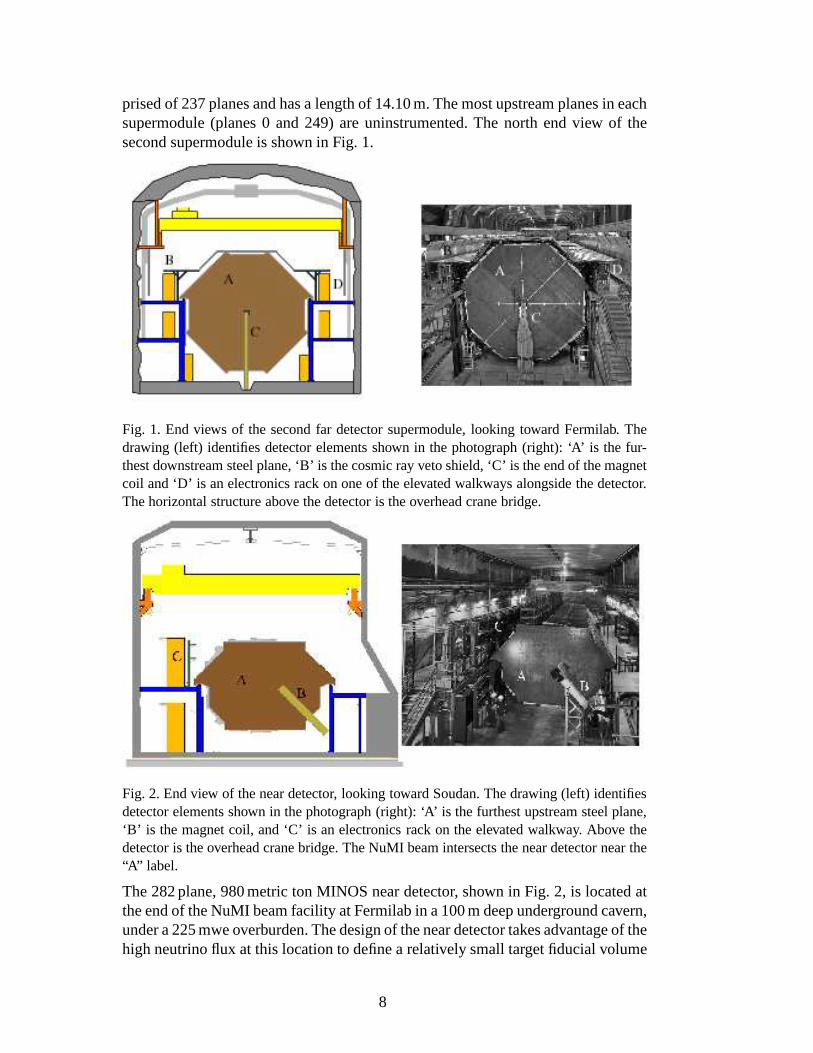
prised of 237 planes and has a length of 14.10 m. The most upstream planes in eachsupermodule (planes 0 and 249) are uninstrumented. The north end view of thesecond supermodule is shown in Fig. 1.
Fig. 1. End views of the second far detector supermodule, looking toward Fermilab. Thedrawing (left) identifies detector elements shown in the photograph (right): ‘A’ is the fur-thest downstream steel plane, ‘B’ is the cosmic ray veto shield, ‘C’ is the end of the magnetcoil and ‘D’ is an electronics rack on one of the elevated walkways alongside the detector.The horizontal structure above the detector is the overheadcrane bridge.
Fig. 2. End view of the near detector, looking toward Soudan.The drawing (left) identifiesdetector elements shown in the photograph (right): ‘A’ is the furthest upstream steel plane,‘B’ is the magnet coil, and ‘C’ is an electronics rack on the elevated walkway. Above thedetector is the overhead crane bridge. The NuMI beam intersects the near detector near the“A” label.
The 282 plane, 980 metric ton MINOS near detector, shown in Fig. 2, is located atthe end of the NuMI beam facility at Fermilab in a 100 m deep underground cavern,under a 225 mwe overburden. The design of the near detector takes advantage of thehigh neutrino flux at this location to define a relatively small target fiducial volume
8
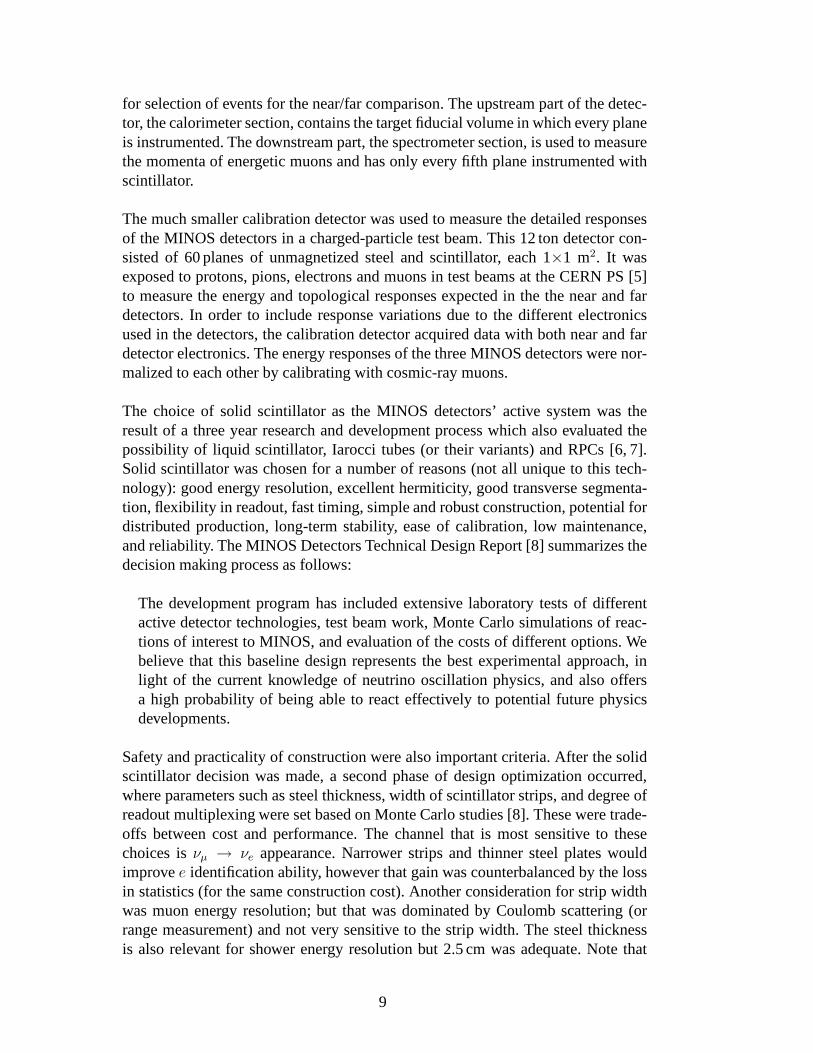
for selection of events for the near/far comparison. The upstream part of the detec-tor, the calorimeter section, contains the target fiducial volume in which every planeis instrumented. The downstream part, the spectrometer section, is used to measurethe momenta of energetic muons and has only every fifth plane instrumented withscintillator.
The much smaller calibration detector was used to measure the detailed responsesof the MINOS detectors in a charged-particle test beam. This12 ton detector con-sisted of 60 planes of unmagnetized steel and scintillator,each 1×1 m2. It wasexposed to protons, pions, electrons and muons in test beamsat the CERN PS [5]to measure the energy and topological responses expected inthe the near and fardetectors. In order to include response variations due to the different electronicsused in the detectors, the calibration detector acquired data with both near and fardetector electronics. The energy responses of the three MINOS detectors were nor-malized to each other by calibrating with cosmic-ray muons.
The choice of solid scintillator as the MINOS detectors’ active system was theresult of a three year research and development process which also evaluated thepossibility of liquid scintillator, Iarocci tubes (or their variants) and RPCs [6, 7].Solid scintillator was chosen for a number of reasons (not all unique to this tech-nology): good energy resolution, excellent hermiticity, good transverse segmenta-tion, flexibility in readout, fast timing, simple and robustconstruction, potential fordistributed production, long-term stability, ease of calibration, low maintenance,and reliability. The MINOS Detectors Technical Design Report [8] summarizes thedecision making process as follows:
The development program has included extensive laboratorytests of differentactive detector technologies, test beam work, Monte Carlo simulations of reac-tions of interest to MINOS, and evaluation of the costs of different options. Webelieve that this baseline design represents the best experimental approach, inlight of the current knowledge of neutrino oscillation physics, and also offersa high probability of being able to react effectively to potential future physicsdevelopments.
Safety and practicality of construction were also important criteria. After the solidscintillator decision was made, a second phase of design optimization occurred,where parameters such as steel thickness, width of scintillator strips, and degree ofreadout multiplexing were set based on Monte Carlo studies [8]. These were trade-offs between cost and performance. The channel that is most sensitive to thesechoices isνµ → νe appearance. Narrower strips and thinner steel plates wouldimprovee identification ability, however that gain was counterbalanced by the lossin statistics (for the same construction cost). Another consideration for strip widthwas muon energy resolution; but that was dominated by Coulomb scattering (orrange measurement) and not very sensitive to the strip width. The steel thicknessis also relevant for shower energy resolution but 2.5 cm was adequate. Note that
9

the ability to react to developments in the field was tested when the high∆m2
value hinted at by the original Kamiokande measurements [9]was superseded bythe current low∆m2 [10] after the civil construction had begun and these designdecisions had already been made.
The MINOS detectors required a significant scale-up in size from previous fine-grained scintillator sampling calorimeters, hence creative reductions in costs perunit of the scintillator and electronics systems resulted.The final design includesadvances in detector technology which will be of interest tofuture detector appli-cations requiring large areas of plastic scintillator.
The MINOS near and far detectors have now been been operatingfor several years,both with cosmic-ray events and with the accelerator neutrino beam. The far de-tector started commissioning data collection in September2002, and has been fullyoperational for cosmic-ray and atmospheric-neutrino datasince July 2003. The neardetector has been operating since January 2005. The NuMI beam started providingneutrinos to the MINOS experiment in March 2005.
This paper summarizes the considerations that have driven the detector designs,provides details of individual subsystems, describes the construction and installa-tion issues, and presents performance data from operational experience and frombench measurements of subsystems. It also provides a framework for more detailedpublications, either already in print or in preparation, which discuss specific detec-tor subsystems.
The remainder of this paper is organized as follows: Section2 describes the steeldetector planes, the magnetic coils, and the resulting detector magnetization. Sec-tion 3 contains a detailed description of the scintillator system that is the heart ofthe MINOS detectors. It includes the design and fabricationof the scintillator stripsand the characteristics of the wavelength-shifting fibers and photomultiplier tubesthat read them out. It describes the assembly of extruded plastic scintillator stripsinto modules and the performance of those modules. Section 4covers the elec-tronics and data acquisition systems for the near and far detectors; these requiredifferent front-end designs because of the very different counting rates at the twodetector locations. Section 5 gives detailed descriptionsof the calibrations of thetwo detectors and their electronic readout systems. Section 6 describes the facilitiesof the underground laboratories in which the near and far detectors are located. Italso covers the installation of the detectors and the surveytechniques used to de-termine the direction of the far detector from Fermilab as required for the preciseaiming of the neutrino beam. Section 7 documents the overallperformance of thedetector systems in the MINOS experiment and also includes abrief descriptionof the computer software used to measure performance and analyze MINOS data.Section 8 concludes with a brief summary of detector performance as observed indata-taking currently underway.
10
2 Steel Planes, Magnet Coils and Magnetic Fields
The MINOS near and far detectors are sampling calorimeters that utilize toroidallymagnetized, 2.54 cm thick steel planes [11] as the passive absorber material. Thedifferences in beam sizes and neutrino interaction rates atthe near and far detec-tor sites led to substantially different magnetic designs for the two detectors andallowed the near detector to be much smaller and less costly than the far detector.This section summarizes the specifications, designs, and performance of the steeland coils.
2.1 Magnet design
The MINOS magnets are designed to provide a measurement of muon momentumbased on curvature with resolution ofσP /P ∼12% for muons with energies greaterthan 2 GeV, and to facilitate the containment of negatively charged muons. The av-erage fields in the near and far detectors were required to have similar strengths tominimize systematic uncertainties arising from near/far detector differences. Thefield strength averaged over the fiducial volume in the near detector 1.28 T, com-pared to 1.42 T in the far detector. One of the design goals of the magnet system isthat the average magnetic field in each toroid be known to better than 3%. MonteCarlo studies indicate that uncertainties in the magnetic field strength at this levelresult in detector acceptance uncertainties of significantly less than 1% at all muonenergies of interest, and an average uncertainty in the energy of exiting tracks ofless than 2%. The magnetic calibration specifications require that stochastic vari-ations in field strength between different steel planes not significantly degrade theoverall momentum resolution. Monte Carlo studies of the effect of plane-to-planefield variations on momentum resolution provide a specification of stochastic resid-ual variations (after global calibration) of less than 15%.
2.2 Steel planes
2.2.1 Far detector configuration
The MINOS far detector has 486 steel planes, each one constructed of eight compo-nent plates. All detector components were moved underground through the existingmineshaft, which limited dimensions to 9×2×1 m3 and weights to 5.5 metric tonsor less. Each 8 m wide octagonal steel plane was constructed underground by plug-welding together eight 2 m wide, 1.27 cm thick plates. After attaching scintillator-strip modules to one side, the planes were mounted vertically with a 5.95 cm center-to-center spacing. The basic far detector steel plane construction is shown in Fig. 3.
11

Fig. 3. Arrangement of steel plates in the two layers of a far detector plane, showing theplate numbering scheme. A drawing of the bottom (downstream) layer is on the left andthe top (upstream) layer is on the right, both seen looking toward Fermilab. “Top” and“Bottom” refer to how they were stacked when being assembled. The dots indicate holesfor the plug welds or handling fixtures. Numbering is along the U (left) and V (right) axes.The installed planes are supported by the “ears” on plates 1,4, 5 and 8.
2.2.2 Steel plane construction
Each plane was assembled on a steel lift frame (called a “strongback”), which wasused to lift the completed plane onto the support structure.Each plate is identifiedby a part number specifying where it fits in the octagon, a “heat number” specifyingthe batch of steel from which it is made, and a serial number unique to that plate.
The construction of each of the 486 detector planes began with the placement andalignment of four steel sheets on a strongback to form the bottom of two layers.The top layer was then placed and aligned in the orthogonal direction. The plateswere placed to minimize gaps between sheets. The eight sheets of a complete planewere then welded together via seventy-two 2.5 cm diameter plug-weld holes in thetop set of sheets (Fig. 3). Surviving gaps of greater than 2 mmwere measured andrecorded. Most of these gaps were in the range of 2–4 mm and at most 9 mm. Fewerthan half of the seams had recordable gaps, typically located at the outer edge of theseam and about 30 cm to 50 cm long. Following the assembly of the steel planes,the scintillator detectors were mounted on the plane and thefull assembly liftedinto place.
The assembled planes are supported on two rails, one on each side of the detector.Each plane is bolted to the previously-installed plane with8 axial bolts aroundthe periphery and 8 additional bolts around the central coilhole. The steel planesare magnetically isolated from the steel support structureby 1 cm thick stainlesssteel strips between the plates and the support rails. Plumbness and plane to planealignment were obtained by checking each plane as it was installed using a lasersurvey device (Ref. [12] and Sec. 6.6), occasionally addingshims as needed whennew planes were bolted to a supermodule to maintain the specification of 6.4 mm
12
plumbness.
2.2.3 Steel characteristics
The steel plates were made from low-carbon (AISI 1006 designation) hot-rolledsteel. They were required to have flatness to better than 1.5 cm – half the ASTM A-6specification [13]. The carbon content was specified to be (0.04±0.01)%. Samplesfrom each of the 45 foundry runs (called “heats”) were testedto ensure that their ra-dioactivity was less than 0.15γ/kg/sec forγ-rays above 0.5 MeV. From block sam-ples of the various heats, the average steel density is foundto be 7.85±0.03 g/cm3.
As steel was delivered over the course of construction, eachplate was individuallyweighed using a scale with a least count of 0.9 kg, and this value was compared to anominal weight for that part number. The scale calibration was checked and verifiedto be stable during construction. An uncertainty of 1 kg in the plate masses impliesa plane-mass uncertainty of
√8 kg ≃ 3 kg. Deviations from the nominal weight
were found to be correlated with variations in the thicknessof the steel. The first190 (upstream) planes had an average mass of 10,831 kg and theremaining 296(downstream) planes had an average mass of 10,718 kg. The rmsmass variationwithin each group of planes is 0.35%, which grows to 0.62% if the detector isconsidered as a whole.
Requirements on the accuracy of the target mass and on muon range measurementsimposed the specification that the fiducial masses of the nearand far detectors beknown to 1%. The average thickness of the near detector planes was measured tobe 2.563±0.002 cm, compared to 2.558±0.005 cm for the far detector.
2.2.4 Near detector steel
The near detector was assembled from 282 steel planes, fabricated as single platesof 2.54 cm thickness from a subset of the same foundry heats used for the far detec-tor steel. The near detector target (fiducial) region was chosen to be 2 m in diameterto give a high rate of fully contained neutrino interaction events in the central re-gion of the beam. The magnet coil hole in the steel plates was located outside thisarea.
Plate thickness variations in the near detector planes werefound to be∼0.3% bysurveying with an ultrasound probe. No systematic difference in steel density wasfound between the two detectors. As was required for the far detector steel, theflatness specification for the near detector plates was set athalf of the ASTM A-6flatness standard, or 1.5 cm.
13
2.3 Magnet coils
The near and far detector steel geometries place somewhat different requirementson their respective magnet coil designs. The coil designs were optimized separately,taking into account differing detector geometry as well as differences in the labo-ratory infrastructures available at Fermilab and Soudan.
2.3.1 Far detector coil
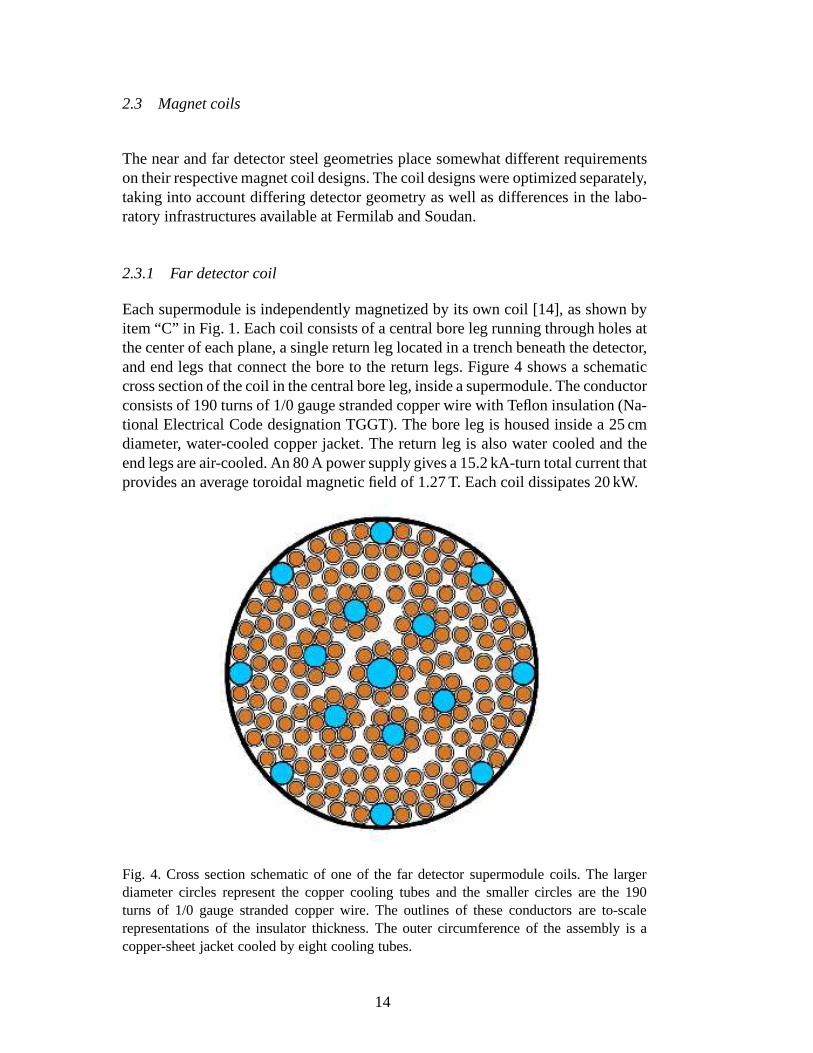
Each supermodule is independently magnetized by its own coil [14], as shown byitem “C” in Fig. 1. Each coil consists of a central bore leg running through holes atthe center of each plane, a single return leg located in a trench beneath the detector,and end legs that connect the bore to the return legs. Figure 4shows a schematiccross section of the coil in the central bore leg, inside a supermodule. The conductorconsists of 190 turns of 1/0 gauge stranded copper wire with Teflon insulation (Na-tional Electrical Code designation TGGT). The bore leg is housed inside a 25 cmdiameter, water-cooled copper jacket. The return leg is also water cooled and theend legs are air-cooled. An 80 A power supply gives a 15.2 kA-turn total current thatprovides an average toroidal magnetic field of 1.27 T. Each coil dissipates 20 kW.
Fig. 4. Cross section schematic of one of the far detector supermodule coils. The largerdiameter circles represent the copper cooling tubes and thesmaller circles are the 190turns of 1/0 gauge stranded copper wire. The outlines of these conductors are to-scalerepresentations of the insulator thickness. The outer circumference of the assembly is acopper-sheet jacket cooled by eight cooling tubes.
14
In order to minimize temperature induced aging of nearby scintillator, the outerjacket characteristics were designed to ensure a worst casemaximum temperatureof 150◦ C. Each coil’s cooling-water system carries 72 l/min and wasdesigned toremove up to 25 kW of heat per supermodule. A secondary heat-exchange systemremoves the heat from the underground laboratory. Fixturesalong the air-cooledend legs of the coil provide a 15 cm separation between the coil and the steel planesto allow air circulation and to reduce distortion of the fieldin supermodule endplanes by the current in the end-legs of the coil.
2.3.2 Near detector coil
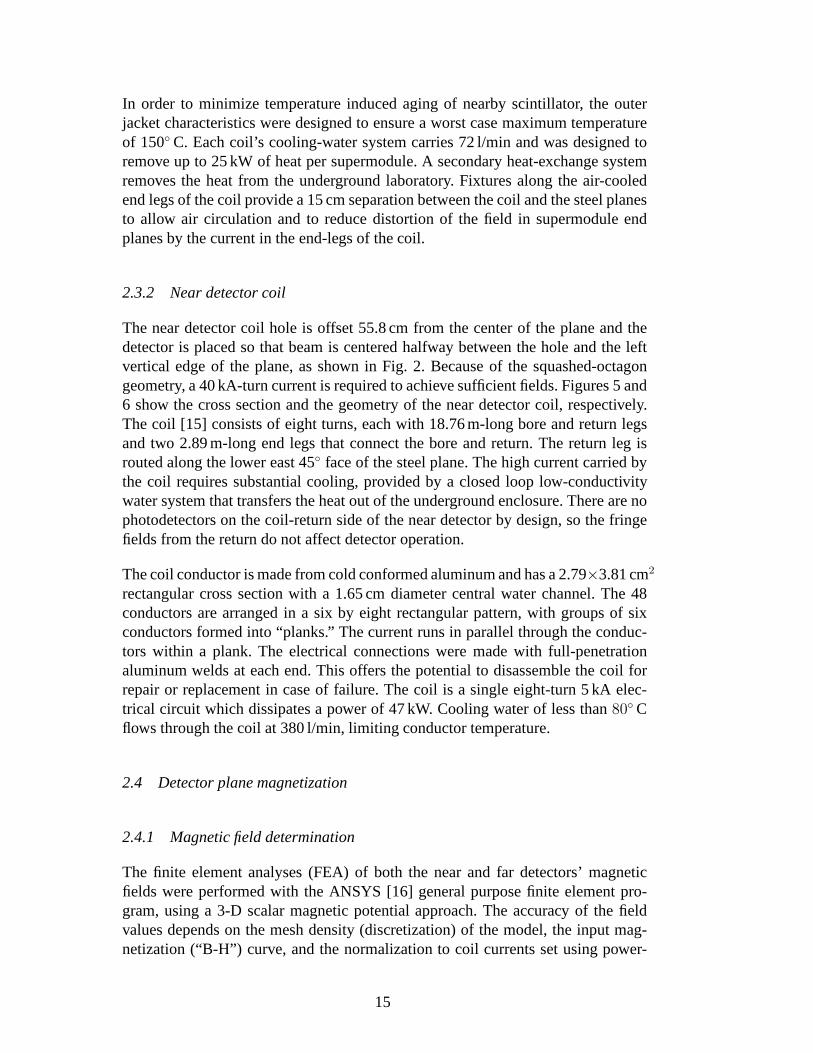
The near detector coil hole is offset 55.8 cm from the center of the plane and thedetector is placed so that beam is centered halfway between the hole and the leftvertical edge of the plane, as shown in Fig. 2. Because of the squashed-octagongeometry, a 40 kA-turn current is required to achieve sufficient fields. Figures 5 and6 show the cross section and the geometry of the near detectorcoil, respectively.The coil [15] consists of eight turns, each with 18.76 m-longbore and return legsand two 2.89 m-long end legs that connect the bore and return.The return leg isrouted along the lower east 45◦ face of the steel plane. The high current carried bythe coil requires substantial cooling, provided by a closedloop low-conductivitywater system that transfers the heat out of the underground enclosure. There are nophotodetectors on the coil-return side of the near detectorby design, so the fringefields from the return do not affect detector operation.
The coil conductor is made from cold conformed aluminum and has a 2.79×3.81 cm2
rectangular cross section with a 1.65 cm diameter central water channel. The 48conductors are arranged in a six by eight rectangular pattern, with groups of sixconductors formed into “planks.” The current runs in parallel through the conduc-tors within a plank. The electrical connections were made with full-penetrationaluminum welds at each end. This offers the potential to disassemble the coil forrepair or replacement in case of failure. The coil is a singleeight-turn 5 kA elec-trical circuit which dissipates a power of 47 kW. Cooling water of less than80◦ Cflows through the coil at 380 l/min, limiting conductor temperature.
2.4 Detector plane magnetization
2.4.1 Magnetic field determination
The finite element analyses (FEA) of both the near and far detectors’ magneticfields were performed with the ANSYS [16] general purpose finite element pro-gram, using a 3-D scalar magnetic potential approach. The accuracy of the fieldvalues depends on the mesh density (discretization) of the model, the input mag-netization (“B-H”) curve, and the normalization to coil currents set using power-
15
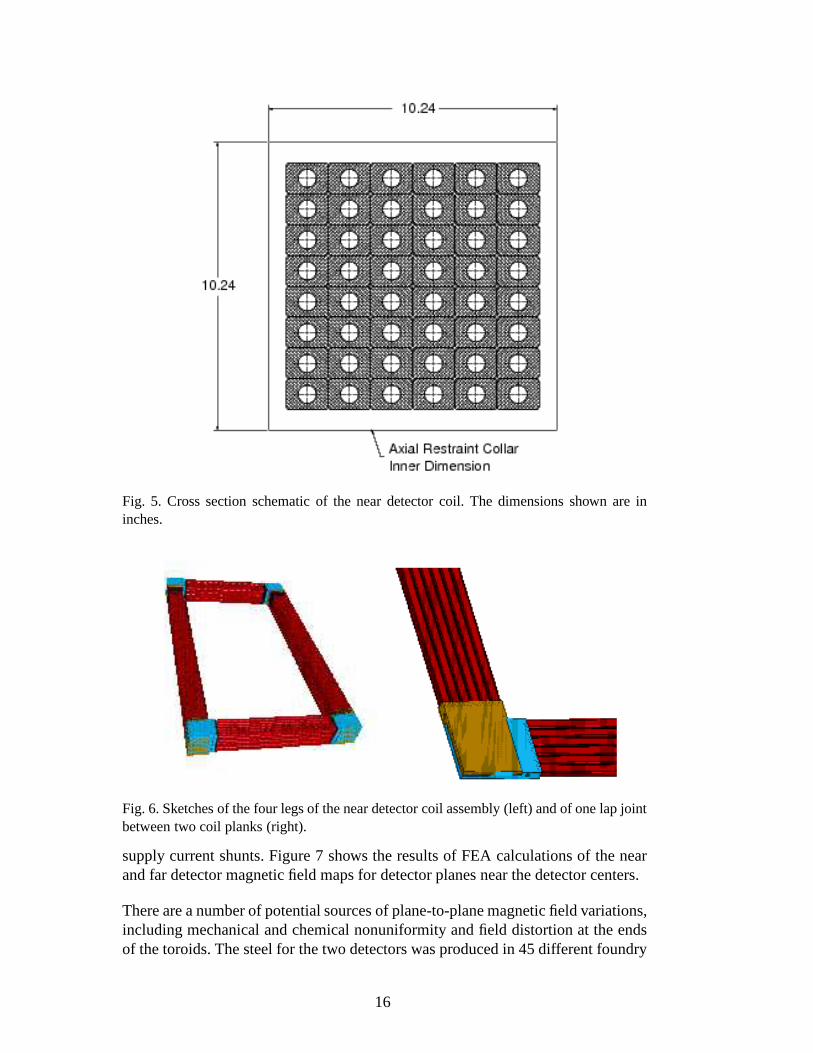
Fig. 5. Cross section schematic of the near detector coil. The dimensions shown are ininches.
Fig. 6. Sketches of the four legs of the near detector coil assembly (left) and of one lap jointbetween two coil planks (right).
supply current shunts. Figure 7 shows the results of FEA calculations of the nearand far detector magnetic field maps for detector planes nearthe detector centers.
There are a number of potential sources of plane-to-plane magnetic field variations,including mechanical and chemical nonuniformity and field distortion at the endsof the toroids. The steel for the two detectors was produced in 45 different foundry
16
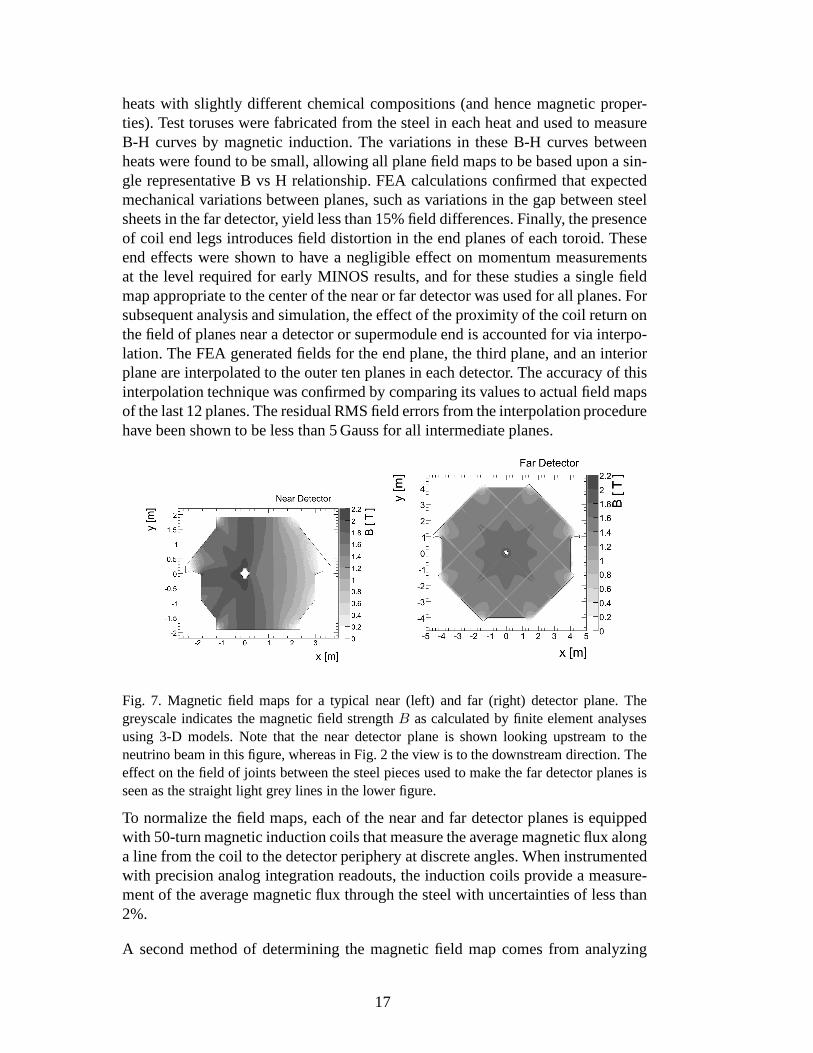
heats with slightly different chemical compositions (and hence magnetic proper-ties). Test toruses were fabricated from the steel in each heat and used to measureB-H curves by magnetic induction. The variations in these B-H curves betweenheats were found to be small, allowing all plane field maps to be based upon a sin-gle representative B vs H relationship. FEA calculations confirmed that expectedmechanical variations between planes, such as variations in the gap between steelsheets in the far detector, yield less than 15% field differences. Finally, the presenceof coil end legs introduces field distortion in the end planesof each toroid. Theseend effects were shown to have a negligible effect on momentum measurementsat the level required for early MINOS results, and for these studies a single fieldmap appropriate to the center of the near or far detector was used for all planes. Forsubsequent analysis and simulation, the effect of the proximity of the coil return onthe field of planes near a detector or supermodule end is accounted for via interpo-lation. The FEA generated fields for the end plane, the third plane, and an interiorplane are interpolated to the outer ten planes in each detector. The accuracy of thisinterpolation technique was confirmed by comparing its values to actual field mapsof the last 12 planes. The residual RMS field errors from the interpolation procedurehave been shown to be less than 5 Gauss for all intermediate planes.
Fig. 7. Magnetic field maps for a typical near (left) and far (right) detector plane. Thegreyscale indicates the magnetic field strengthB as calculated by finite element analysesusing 3-D models. Note that the near detector plane is shown looking upstream to theneutrino beam in this figure, whereas in Fig. 2 the view is to the downstream direction. Theeffect on the field of joints between the steel pieces used to make the far detector planes isseen as the straight light grey lines in the lower figure.
To normalize the field maps, each of the near and far detector planes is equippedwith 50-turn magnetic induction coils that measure the average magnetic flux alonga line from the coil to the detector periphery at discrete angles. When instrumentedwith precision analog integration readouts, the inductioncoils provide a measure-ment of the average magnetic flux through the steel with uncertainties of less than2%.
A second method of determining the magnetic field map comes from analyzing
17
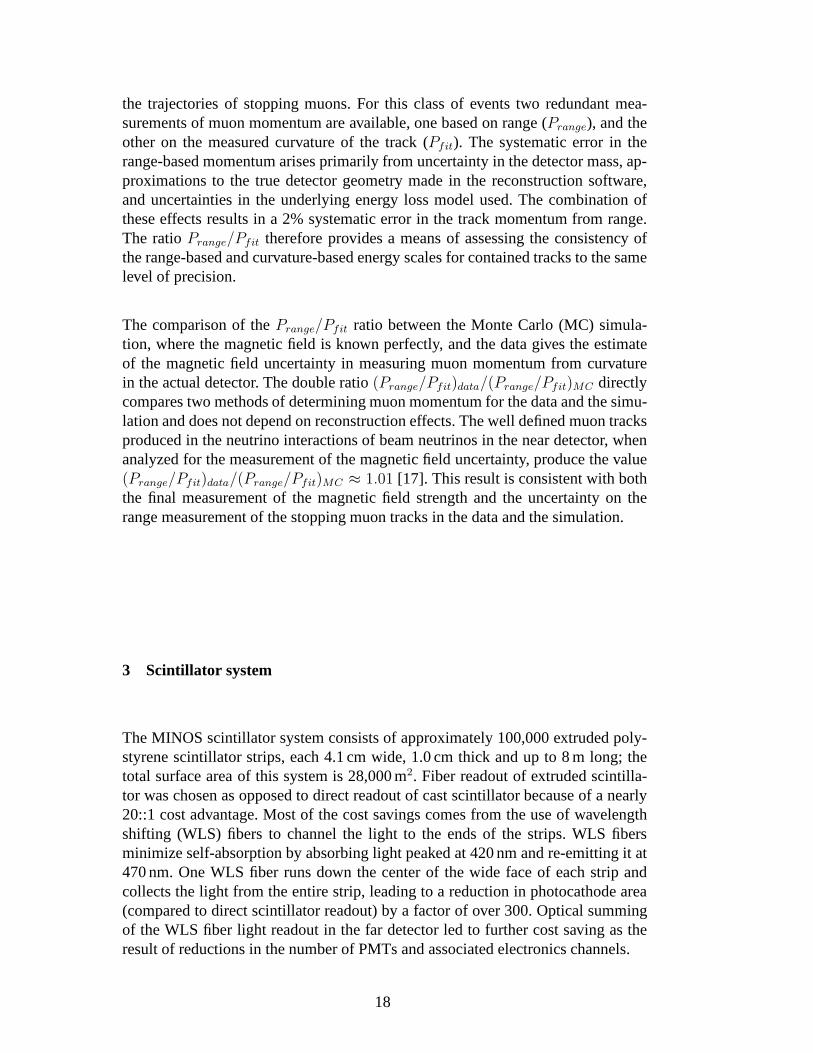
the trajectories of stopping muons. For this class of eventstwo redundant mea-surements of muon momentum are available, one based on range(Prange), and theother on the measured curvature of the track (Pfit). The systematic error in therange-based momentum arises primarily from uncertainty inthe detector mass, ap-proximations to the true detector geometry made in the reconstruction software,and uncertainties in the underlying energy loss model used.The combination ofthese effects results in a 2% systematic error in the track momentum from range.The ratioPrange/Pfit therefore provides a means of assessing the consistency ofthe range-based and curvature-based energy scales for contained tracks to the samelevel of precision.
The comparison of thePrange/Pfit ratio between the Monte Carlo (MC) simula-tion, where the magnetic field is known perfectly, and the data gives the estimateof the magnetic field uncertainty in measuring muon momentumfrom curvaturein the actual detector. The double ratio(Prange/Pfit)data/(Prange/Pfit)MC directlycompares two methods of determining muon momentum for the data and the simu-lation and does not depend on reconstruction effects. The well defined muon tracksproduced in the neutrino interactions of beam neutrinos in the near detector, whenanalyzed for the measurement of the magnetic field uncertainty, produce the value(Prange/Pfit)data/(Prange/Pfit)MC ≈ 1.01 [17]. This result is consistent with boththe final measurement of the magnetic field strength and the uncertainty on therange measurement of the stopping muon tracks in the data andthe simulation.
3 Scintillator system
The MINOS scintillator system consists of approximately 100,000 extruded poly-styrene scintillator strips, each 4.1 cm wide, 1.0 cm thick and up to 8 m long; thetotal surface area of this system is 28,000 m2. Fiber readout of extruded scintilla-tor was chosen as opposed to direct readout of cast scintillator because of a nearly20::1 cost advantage. Most of the cost savings comes from theuse of wavelengthshifting (WLS) fibers to channel the light to the ends of the strips. WLS fibersminimize self-absorption by absorbing light peaked at 420 nm and re-emitting it at470 nm. One WLS fiber runs down the center of the wide face of each strip andcollects the light from the entire strip, leading to a reduction in photocathode area(compared to direct scintillator readout) by a factor of over 300. Optical summingof the WLS fiber light readout in the far detector led to further cost saving as theresult of reductions in the number of PMTs and associated electronics channels.
18
3.1 General description of the scintillator system
We describe here the specifications that led to the design of the plastic scintillatorsystem. Because of its large size, the far detector drove thedesign features of thesystem and we describe it first, then describe how the near detector differs.
(i) Geometry: Each steel octagon (8 m across) is covered by a plane of scin-tillator. Each plane has one “view” of strips, with the next plane having theorthogonal view. The two views are at±45◦ relative to the vertical in orderto avoid having strip readout connections at the bottom of the detector. The4.1 cm strip width was the result of an optimization that included the responseof the detector to simulated neutrino interactions and costconsiderations.
(ii) Modularity: The planes were built from modules, each consisting of groupsof scintillator strips placed side-by-side and sandwichedbetween aluminumcovers. The strips were glued to one another and to the coversto make rigid,mechanically strong, light-tight modules. WLS fibers were routed throughmanifolds at both ends of the modules to bulk optical connectors. Continu-ous scintillator planes were formed by placing eight of these modules next toone another on a steel detector plane.
(iii) Routing of scintillator light: Light from the end of each WLS fiber is carriedby a clear fiber to a Hamamatsu R5900-00-M16 PMT, which has sixteen4 ×4 mm2 pixels. Eight fibers from non-neighboring scintillator strips are mappedonto one pixel, as described in Sec. 3.5.
(iv) Light output: In general, strips produce different amounts of light when ex-cited by a normally incident, minimum ionizing particle (MIP). Only eventsproducing a total of at least 4.7 photoelectrons summed overboth ends wereused in the later analyses. In addition, the average light output for a MIP cross-ing at the far end of a strip as seen from the other end should begreater than1.0 photoelectron.
(v) Uniformity: After a correction for fiber attenuation, the light output isuni-form over all the scintillator strips to within±30%. WLS fiber length is themost important cause of strip-to-strip differences in light output.
(vi) Calibration: The absolute response to hadronic energy deposition was cali-brated to 6%. In addition, the relative response of the near detector to the fardetector and between different locations within the far detector were calibratedto 3%.
(vii) Short-term stability: It was required that the average light output should varyby less than 1% per month of operation. This duration is determined by thetime required for a complete cosmic-ray muon calibration ofthe far detector.PMT gains which vary more rapidly than this can be corrected by equalizingthe response to hourly LED light injections, and cosmic ray muons are usedto correct for drifts on a daily basis.
(viii) Long-term stability: Decrease in light output due to the aging of variouscomponents is the main effect over the long term. The design goal was that
19

there should be no more than a 30% decrease in light output over a periodof ten years; this will not significantly degrade the detector’s physics perfor-mance.
(ix) Linearity: The response of the system depends linearly on hadronic energydeposition to within 5% up to 30 GeV.
(x) Time measurement:Time measurements are primarily useful for studies ofatmospheric neutrinos in the far detector because accuratetime-of-flight mea-surements can distinguish upward-going neutrino events from backgroundsinduced by downward-going cosmic-ray muons. The detector has a time res-olution of better than 5 ns for five observed photoelectrons (assuming that thisresolution scales as1/
√
Npe).
Figure 8 illustrates the light detection and collection forpart of one scintillatormodule. Clear fiber cables connect to the module and transmitlight from the edgesof the detector to centralized locations where the PMTs and readout electronics aremounted (Sec. 3.5.2). A light injection system illuminatesthe the WLS fibers neartheir ends with LED-generated UV light to perform the system’s primary calibra-tion (see Fig. 31 in Sec. 5.1).
The primary task of the far detector is the measurement of theproperties of neutri-nos initiated from the Fermilab beam. A secondary task is thedetection and char-acterization of atmospheric neutrinos. This second measurement, however, mustcontend with large backgrounds from high energy gammas and neutral hadrons pro-duced by cosmic-ray muon interactions in the rock surrounding the detector. Thesebackgrounds have been strongly reduced by deploying an active veto shield madeof MINOS scintillator modules. This anticoincidence layerdetects hadron showerremnants emerging from the rock above and beside the detector. The shield’s designand performance are described in Section 3.7.
The near detector is designed to have similar physics response to neutrino events asthe far detector. However, some differences are unavoidable because the neutrinoevent rate per unit mass is a factor of106 greater than that in the far detector. Thekey differences between the scintillator systems of the near detector and far detectorare:
(i) The near detector scintillator modules are much shorter, ranging from 2.5 mto 6 m in length.
(ii) The long WLS fibers of the far detector (and their corresponding∼5 m atten-uation lengths) required readout of both ends. In contrast only one end of eachnear detector WLS fiber is read out. With a mirrored far end, the near detectorWLS fiber gives approximately the same light yield as the dual-ended readoutin the far detector. Single-ended readout necessitates attaching each Hama-matsu R5900-00-M64 photomultiplier pixel to only one scintillator strip. ThisPMT has sixty-four 2×2 mm2 pixels but is otherwise very similar in construc-tion and response to the R5900-00-M16 PMTs used in the far detector.
20
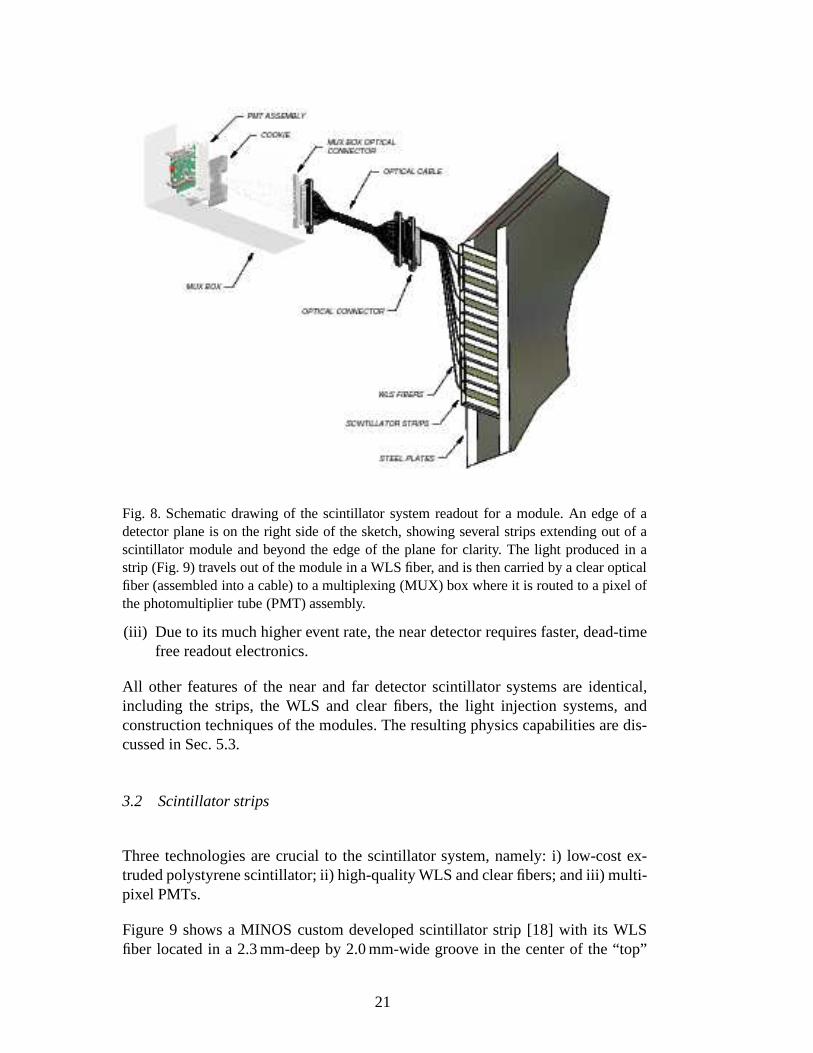
Fig. 8. Schematic drawing of the scintillator system readout for a module. An edge of adetector plane is on the right side of the sketch, showing several strips extending out of ascintillator module and beyond the edge of the plane for clarity. The light produced in astrip (Fig. 9) travels out of the module in a WLS fiber, and is then carried by a clear opticalfiber (assembled into a cable) to a multiplexing (MUX) box where it is routed to a pixel ofthe photomultiplier tube (PMT) assembly.
(iii) Due to its much higher event rate, the near detector requires faster, dead-timefree readout electronics.
All other features of the near and far detector scintillatorsystems are identical,including the strips, the WLS and clear fibers, the light injection systems, andconstruction techniques of the modules. The resulting physics capabilities are dis-cussed in Sec. 5.3.
3.2 Scintillator strips
Three technologies are crucial to the scintillator system,namely: i) low-cost ex-truded polystyrene scintillator; ii) high-quality WLS andclear fibers; and iii) multi-pixel PMTs.
Figure 9 shows a MINOS custom developed scintillator strip [18] with its WLSfiber located in a 2.3 mm-deep by 2.0 mm-wide groove in the center of the “top”
21

face. The fiber must be completely contained inside the groove to ensure efficientlight collection (Sec. 3.8.1). A specularly reflective strip of aluminized Mylar tapeis placed over the groove after the WLS fiber has been glued in place. The scintil-lator surface is covered by a thin (0.25 mm) co-extruded titanium-dioxide (TiO2)-loaded polystyrene layer that serves as a diffuse reflector.The scintillator and TiO2coating are co-extruded in a single process, a standard technique in the plasticsindustry. The TiO2 concentration was chosen to be as high as possible without pos-ing extruding problems. In R&D tests the highest concentration of TiO2 that did notaffect the quality of the extruded product was 12.5% by weight, which coincidedwith the concentration needed to maximize reflection of scintillator light. A 15%concentration was achieved for scintillator production, performed by a differentextruding manufacturer. The thickness of the TiO2 layer was as thin as could be re-liably co-extruded and thick enough that ultraviolet light(comparable to scintillatorlight) could not shine through. Bench tests of light reflection and propagation werewell-matched by models [19], with reflection angles following Lambert’s law. Ab-solute reflectivity measurements, known to 1%, were then tuned in the simulationbelow that level to match observations.
Fig. 9. Cutaway drawing of a single scintillator strip. Light produced by an ionizing particleis multiply reflected inside the strip by the 0.25 mm-thick outer reflective coating (shown inthe cross-section view). Light absorbed by a WLS fiber is re-emitted isotropically. Thoseresulting waveshifted photons whose directions fall within the total internal reflection conesare transported along the fiber to the edges of the detector, subsequently being routed to thephotodetectors (Fig. 8).
The procedure used to fabricate the scintillator strips wasas follows:
22

(i) Polystyrene pellets (Dow STYRON 663W) were placed in a nitrogen gas en-vironment to prevent reduction in light yield of the finishedproduct, whichwould otherwise result from exposure to atmospheric oxygenduring the melt-ing process.
(ii) Scintillator fluors PPO (2,5-diphenyloxazole, 1.0% byweight) and POPOP(1,4-bis(5-phenyloxazol-2-yl) benzene, 0.03% by weight)were mixed withpolystyrene pellets in a nitrogen gas environment.
(iii) The mixture was loaded into the primary extruding machine, where it wasmelted and pushed into the main port of the forming die.
(iv) At the same time a mixture of polystyrene pellets and TiO2 (concentration of15% TiO2 by weight) was loaded into a secondary extruding machine whereit was melted and pushed into an auxiliary port of the formingdie to producethe reflective coating. This material was distributed uniformly around the outersurface area of the strip except for the groove.
(v) A continuous strip, including its reflective coating, exited the die into a sizingand cooling line where its final shape was defined. The strips were then cut tolength by a traveling saw.
The diffuse reflector coating is a unique feature developed for MINOS [20]. Theco-extruded coating is in intimate contact with the inner clear scintillator; the twoare completely fused together, forming a single solid piece. Besides providing therequired reflective properties, the coating protects the inner reflective surfaces frommechanical damage, allowing the strips to be shipped with minimal attention topackaging and handling. Two other secondary features of thereflective coating arethe protection of the sensitive scintillator from environmental chemical attack andthe prevention of deleterious optical coupling by adjoining mechanical epoxies.Tests showed the reflectivity of the TiO2 loaded coating to be as good as or supe-rior to that of other, labor-intensive candidate reflectivematerials, such as highlypolished surfaces, Bicron TiO2 paint, or finished surfaces wrapped in Tyvek or My-lar.
Quality assurance feedback is a key component to successfulscintillator produc-tion. For example, the light output increased by about 20% compared to pre-prod-uction test runs when uniform quality-control processes and production extrusionconditions were established. This illustrates that large-scale production runs canhelp to assure consistent performance for this type of scintillator.
3.3 Wavelength shifting fibers
The WLS fiber is 1.20+0.02−0.01 mm diameter, double-clad polystyrene fiber with 175 ppm
of Y11 (K27) fluor produced by Kuraray, Inc. in Japan. The cladding consists ofan inner layer of acrylic and an outer layer of polyfluor. The fiber used in MINOSis “non-S” type, with a nominal S-factor of 25 compared to 75 for some “S-type”
23
fibers (in which the polystyrene chains are oriented along the fiber direction). Thepolystyrene core of non-S-type fiber is optically isotropicand more transparent thanthe core of S-type fiber, resulting in a 10% greater attenuation length. However,the transverse polystyrene chain orientation results in anincreased vulnerability tocracking from bending or rough handling.
The fiber was chosen following a series of measurements of light output versusvarious fiber properties. Fiber from an alternate manufacturer was tested but it didnot satisfy our requirements. The final composition of Kuraray fiber was selectedto give the highest light output from the far end of the longest scintillator strips (alength of about 9 m of WLS fiber coupled to 3 m of clear fiber). Hence, the longattenuation length properties of the fiber were of particular importance. The fiberdiameter was chosen to maximize the coverage of the 4×4 mm2 PMT pixel by eightfibers.
The fiber was flexible enough to allow delivery on spools of 1 kmeach, makingautomated use of the fiber particularly easy. Testing of the fiber was done usingblue LEDs in an apparatus that illuminated different pointsalong a fiber wrappedaround a cylinder. Production quality assurance tests weredone relative to a set of“reference fibers” which had been previously shown to satisfy our requirements.Two fiber samples from each spool, one from the beginning and the other fromthe end, were taken for testing. Kuraray made similar measurements prior to ship-ping. In addition, Kuraray provided data on the fiber diameter every 10 cm along itslength, automatically recorded during production. A spoolof fiber was consideredto be acceptable as long as both test fibers had light output ofat least 85% of thereference fiber at all locations along it and the spool had only a small (<10) num-ber of spots with diameter variations outside the nominal specifications. MINOSrejected only 3 km out of 730 km of WLS fiber, 0.4% of that delivered.
After installation in the detector, an unexpected level of single photoelectron spon-taneous light emission was observed in the WLS fiber. Bench tests [21] confirmedthe source of this light and also showed that clear fibers yield negligibly smallernoise rate. This WLS-induced light had an initial rate of several Hz/m (contributingabout 1/3 of the single-photoelectron noise rate in the detector) and has decayedexponentially with a time constant of several months.
3.4 Scintillator modules
Integrating scintillator strips into modules provides several advantages. The detailsof scintillator module design and construction are contained in the following twosections.
24
3.4.1 Scintillator module design
The packaging of scintillator strips into modules providesthe following function-alities:
(i) a mechanically strong structure that holds strips together and which is suffi-ciently robust for shipping and mounting to the steel plates,
(ii) a light-tight enclosure,(iii) a package that mitigates the risk of the polystyrene contributing fuel for a fire
in the vicinity of the detector,(iv) a means of connecting of the WLS fibers to clear fibers for transmission of the
light signal to the PMTs,(v) a unit that allowed much assembly work to be done away fromthe detector
sites and still fit into the vertical elevator shaft at the Soudan mine (Sec. 6.4).(The elevator shaft constraints ultimately determined both the length and widthof scintillator modules.)
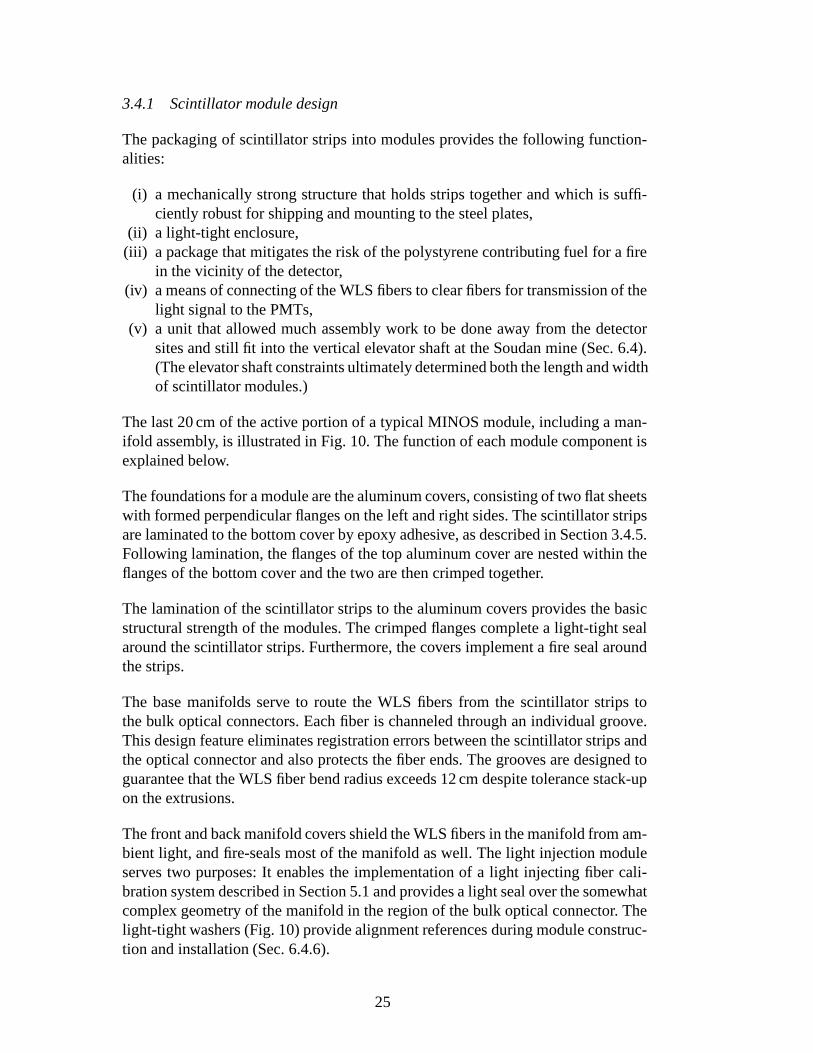
The last 20 cm of the active portion of a typical MINOS module,including a man-ifold assembly, is illustrated in Fig. 10. The function of each module component isexplained below.
The foundations for a module are the aluminum covers, consisting of two flat sheetswith formed perpendicular flanges on the left and right sides. The scintillator stripsare laminated to the bottom cover by epoxy adhesive, as described in Section 3.4.5.Following lamination, the flanges of the top aluminum cover are nested within theflanges of the bottom cover and the two are then crimped together.
The lamination of the scintillator strips to the aluminum covers provides the basicstructural strength of the modules. The crimped flanges complete a light-tight sealaround the scintillator strips. Furthermore, the covers implement a fire seal aroundthe strips.
The base manifolds serve to route the WLS fibers from the scintillator strips tothe bulk optical connectors. Each fiber is channeled throughan individual groove.This design feature eliminates registration errors between the scintillator strips andthe optical connector and also protects the fiber ends. The grooves are designed toguarantee that the WLS fiber bend radius exceeds 12 cm despitetolerance stack-upon the extrusions.
The front and back manifold covers shield the WLS fibers in themanifold from am-bient light, and fire-seals most of the manifold as well. The light injection moduleserves two purposes: It enables the implementation of a light injecting fiber cali-bration system described in Section 5.1 and provides a lightseal over the somewhatcomplex geometry of the manifold in the region of the bulk optical connector. Thelight-tight washers (Fig. 10) provide alignment references during module construc-tion and installation (Sec. 6.4.6).
25
(a) Exploded view.
(b) Assembled view.
Fig. 10. A typical MINOS module manifold assembly wherein WLS fibers from the scin-tillator strips are routed to bulk optical connectors (a) and enclosed by protective light tightaluminum covers (b).
The scintillator strips in each module are close-packed to minimize inactive zonesbetween strips. As a consequence the widths of the modules vary slightly, but byless than 0.5%. The aluminum covers are individually formedto exactly matchthe cumulative width of the extrusions which they enclose. The variable width sealserves to light seal the gap between the fixed-width manifoldparts and the variable-width aluminum covers.
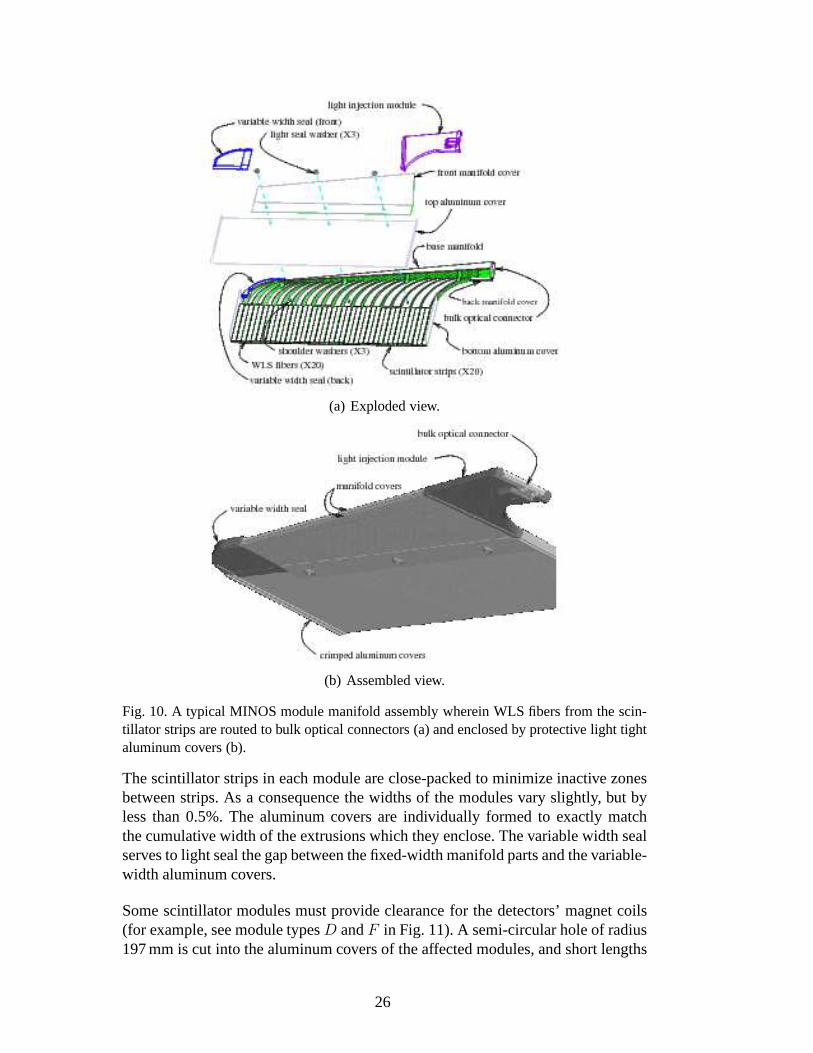
Some scintillator modules must provide clearance for the detectors’ magnet coils(for example, see module typesD andF in Fig. 11). A semi-circular hole of radius197 mm is cut into the aluminum covers of the affected modules, and short lengths
26
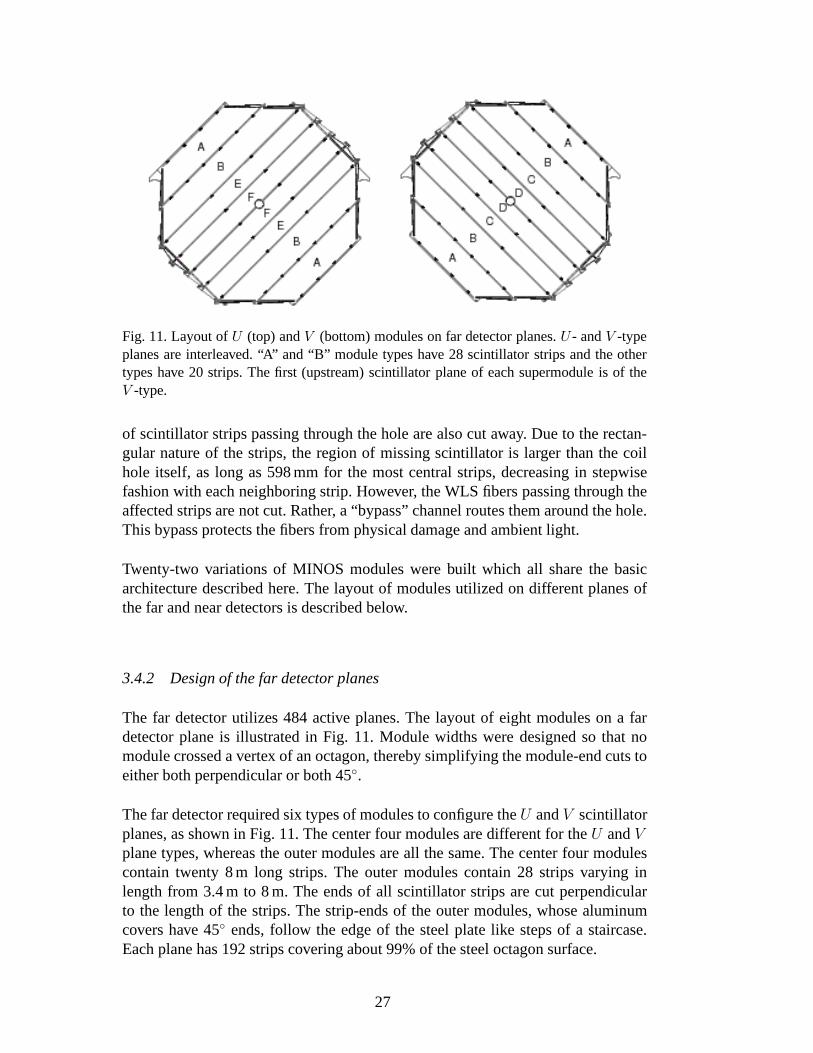
Fig. 11. Layout ofU (top) andV (bottom) modules on far detector planes.U - andV -typeplanes are interleaved. “A” and “B” module types have 28 scintillator strips and the othertypes have 20 strips. The first (upstream) scintillator plane of each supermodule is of theV -type.
of scintillator strips passing through the hole are also cutaway. Due to the rectan-gular nature of the strips, the region of missing scintillator is larger than the coilhole itself, as long as 598 mm for the most central strips, decreasing in stepwisefashion with each neighboring strip. However, the WLS fiberspassing through theaffected strips are not cut. Rather, a “bypass” channel routes them around the hole.This bypass protects the fibers from physical damage and ambient light.
Twenty-two variations of MINOS modules were built which allshare the basicarchitecture described here. The layout of modules utilized on different planes ofthe far and near detectors is described below.
3.4.2 Design of the far detector planes
The far detector utilizes 484 active planes. The layout of eight modules on a fardetector plane is illustrated in Fig. 11. Module widths weredesigned so that nomodule crossed a vertex of an octagon, thereby simplifying the module-end cuts toeither both perpendicular or both 45◦.
The far detector required six types of modules to configure theU andV scintillatorplanes, as shown in Fig. 11. The center four modules are different for theU andVplane types, whereas the outer modules are all the same. The center four modulescontain twenty 8 m long strips. The outer modules contain 28 strips varying inlength from 3.4 m to 8 m. The ends of all scintillator strips are cut perpendicularto the length of the strips. The strip-ends of the outer modules, whose aluminumcovers have 45◦ ends, follow the edge of the steel plate like steps of a staircase.Each plane has 192 strips covering about 99% of the steel octagon surface.
27
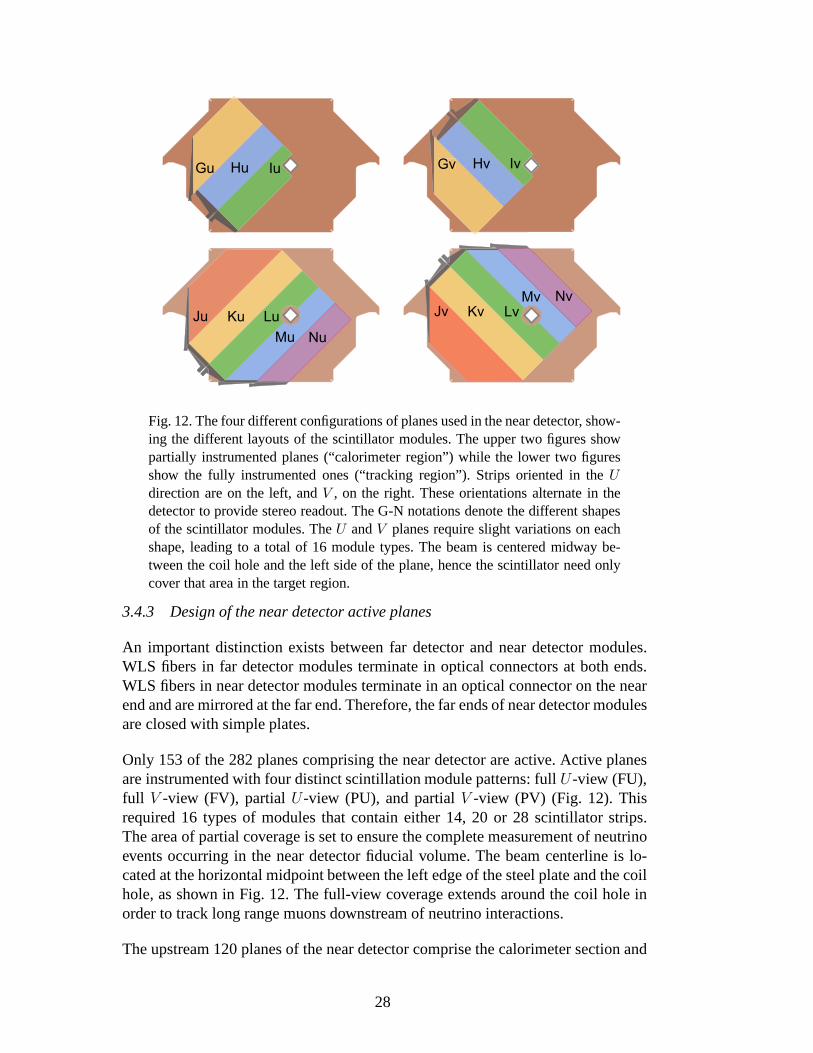
Fig. 12. The four different configurations of planes used in the near detector, show-ing the different layouts of the scintillator modules. The upper two figures showpartially instrumented planes (“calorimeter region”) while the lower two figuresshow the fully instrumented ones (“tracking region”). Strips oriented in theUdirection are on the left, andV , on the right. These orientations alternate in thedetector to provide stereo readout. The G-N notations denote the different shapesof the scintillator modules. TheU andV planes require slight variations on eachshape, leading to a total of 16 module types. The beam is centered midway be-tween the coil hole and the left side of the plane, hence the scintillator need onlycover that area in the target region.
3.4.3 Design of the near detector active planes
An important distinction exists between far detector and near detector modules.WLS fibers in far detector modules terminate in optical connectors at both ends.WLS fibers in near detector modules terminate in an optical connector on the nearend and are mirrored at the far end. Therefore, the far ends ofnear detector modulesare closed with simple plates.
Only 153 of the 282 planes comprising the near detector are active. Active planesare instrumented with four distinct scintillation module patterns: fullU-view (FU),full V -view (FV), partialU-view (PU), and partialV -view (PV) (Fig. 12). Thisrequired 16 types of modules that contain either 14, 20 or 28 scintillator strips.The area of partial coverage is set to ensure the complete measurement of neutrinoevents occurring in the near detector fiducial volume. The beam centerline is lo-cated at the horizontal midpoint between the left edge of thesteel plate and the coilhole, as shown in Fig. 12. The full-view coverage extends around the coil hole inorder to track long range muons downstream of neutrino interactions.
The upstream 120 planes of the near detector comprise the calorimeter section and
28
are all instrumented in order to yield a high resolution viewof the neutrino inter-actions. This section was assembled using a repetitive 10-plane pattern: FU-PV-PU-PV-PU-FV-PU-PV-PU-PV. For data analysis, the calorimeter section is dividedinto three longitudinal sections: planes 1-20 are the “veto” section, used to excludetracks that originate upstream of the detector; planes 21-60 represent the “target”region, as all neutrino-induced showers which occur here are contained within thelength of the detector; planes 61-120 complete the calorimeter section and are usedto contain and measure the hadronic showers of neutrino events in the target region.
The spectrometer section of the near detector, planes 121-281, uses the same 10-plane pattern but with partial-view scintillator modules removed. That is, a full-view plane is included in every fifth plane only. This downstream section is usedsolely to track muons from neutrino interactions.
3.4.4 Scintillator module assembly facilities
The construction of scintillator modules was the single largest production job inthe MINOS experiment. The modules were fabricated at three assembly facilitieslocated at collaborating institutions and operated by staff members of those insti-tutions. Twenty-strip wide rectangular modules, types C, D, E, and F in Fig. 11,were constructed at the California Institute of Technologywhile the 28 strip widetrapezoidal modules (types A and B in Fig. 11) were built at the University of Min-nesota, Twin Cities. Each factory produced about four modules per day and eachwas staffed by a crew of nine technicians working 40 hours perweek. Each factoryproduced a total of about 2,000 modules over a two-year period. At Caltech, the in-house staff was augmented by a number of temporary employeeswithout previousexperience building particle physics detectors. The Minnesota facility was mainlystaffed by part-time undergraduate workers.
The near detector factory was located at Argonne National Laboratory and wasstaffed by three Argonne technicians. It produced about 600modules at the rate ofabout eight modules per week over a two-year period.
Each module assembly facility was operated under a local manager with oversightby a local MINOS collaboration physicist. The local institution was responsiblefor worker health and safety but the MINOS construction project provided adviceand oversight with the help of Fermilab Environment, Safetyand Health (ES&H)professionals. The most significant health issue was the development of workersensitivity to epoxy vapors during the production start-upphase, apparently initi-ated by skin contact with liquid epoxy, particularly duringthe gluing of fibers instrips. It was easily mitigated by improved ventilation andthe use of gloves andother protective equipment to prevent skin contact with liquid.
The quality of modules produced by all three facilities was excellent. Only a verysmall number of constructed modules had to be discarded, most due to broken
29
fibers. After finished modules were delivered to the detectorsites, a small fractionwere found to have light leaks despite careful light tightness verification prior toshipping. Rapid feedback to the assembly facilities eliminated the causes of thisproblem, which were primarily transport related stresses at the long seam betweenthe light injection modules and the aluminum module skins. These light leaks wereremedied by applying a combination of tape, epoxy, and RTV atthe junctions.
3.4.5 Scintillator module construction steps
Module components were purchased commercially or fabricated at special purposefacilities operated by the collaboration. The assembly process required a period offour days to complete each scintillator module. Most of thistime was needed tocure structural and optical epoxies at different stages of the assembly process. Eachmodule was built on a dedicated assembly support panel whichwas moved fromone assembly station to another by means of roller tables. Assembly facilities weresupplied with the following materials to build scintillator modules.
(i) Aluminum covers. Rolls of aluminum sheets (0.5 mm thick) were purchasedcut to the proper nominal width for assembling the various types of modules.Aluminum sheets were unrolled and cut to length. Because theactual widthof every module varied from the nominal due to scintillator strip width toler-ances, the long edges of aluminum covers were trimmed with a slitting tooland then bent90◦ by hand-operated forming tools to accommodate the crimp-sealing procedure.
(ii) Scintillator strips. The extruder supplied 8.18 m long strips for rectangularmodule types C, D, E and F (Fig. 11). They were trimmed to 8.00 mat themodule factories. Precut 11.48 m long strips were supplied for the trapezoidalmodule types A and B. The strips were cut to length in a fixture designed tohold all 28 strips used in one module simultaneously. One endof the fixturehad a stop positioned at an angle of 26.57◦ (tan−1(0.5)) relative to the lengthdirection of a module. Positioning the ends of the stock extrusions against thisstop enabled cutting all 28 strips to their correct length with a single perpen-dicular cut. The 11.48 m length was chosen so that the unused portions of thestrips cut for a “B” module provided the raw stock for an “A” module, therebyminimizing scrap. Scintillator strips for the near detector were supplied inseveral lengths due to the larger number of near detector module types.
(iii) WLS fiber spools, described in Sec. 3.3.(iv) Manifold components, described in Sec. 3.4.1.(v) Bulk optical connectors, described in Sec. 3.6.
(vi) Adhesives. Structural:3M 2216 translucent two-part epoxy was used to lam-inate the aluminum skins to scintillator strips.Optical: Epon 815C resin withEpicure 3234 teta hardener (in a six to one ratio by weight, respectively) wasused to bond WLS fibers into scintillator strip grooves in allmodules and tobond the reflective-tape mirrors to the far ends of WLS fibers in near detector
30
modules.Manifolds: 3M DP 810 epoxy was used as the adhesive for the as-sembly of manifold components, while black GE RTV 103 was used to createlight seals at all joints.
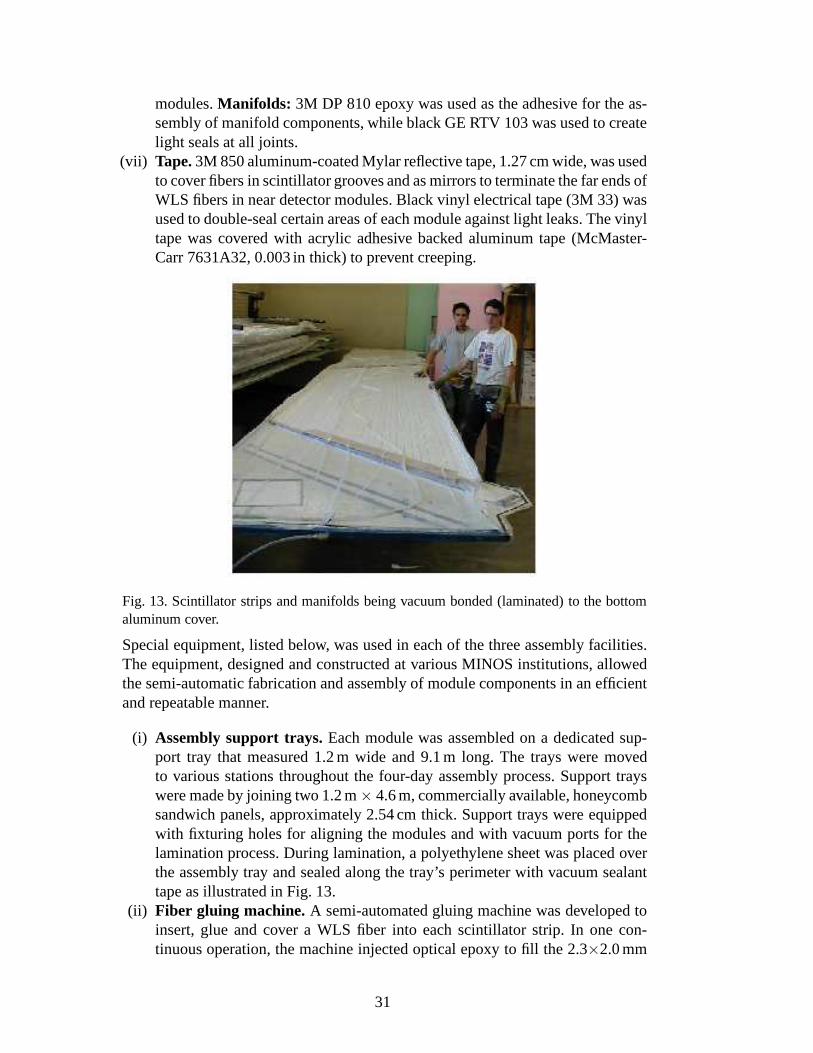
(vii) Tape.3M 850 aluminum-coated Mylar reflective tape, 1.27 cm wide, was usedto cover fibers in scintillator grooves and as mirrors to terminate the far ends ofWLS fibers in near detector modules. Black vinyl electrical tape (3M 33) wasused to double-seal certain areas of each module against light leaks. The vinyltape was covered with acrylic adhesive backed aluminum tape(McMaster-Carr 7631A32, 0.003 in thick) to prevent creeping.
Fig. 13. Scintillator strips and manifolds being vacuum bonded (laminated) to the bottomaluminum cover.
Special equipment, listed below, was used in each of the three assembly facilities.The equipment, designed and constructed at various MINOS institutions, allowedthe semi-automatic fabrication and assembly of module components in an efficientand repeatable manner.
(i) Assembly support trays.Each module was assembled on a dedicated sup-port tray that measured 1.2 m wide and 9.1 m long. The trays were movedto various stations throughout the four-day assembly process. Support trayswere made by joining two 1.2 m× 4.6 m, commercially available, honeycombsandwich panels, approximately 2.54 cm thick. Support trays were equippedwith fixturing holes for aligning the modules and with vacuumports for thelamination process. During lamination, a polyethylene sheet was placed overthe assembly tray and sealed along the tray’s perimeter withvacuum sealanttape as illustrated in Fig. 13.
(ii) Fiber gluing machine. A semi-automated gluing machine was developed toinsert, glue and cover a WLS fiber into each scintillator strip. In one con-tinuous operation, the machine injected optical epoxy to fill the 2.3×2.0 mm
31
groove, inserted the 1.2 mm diameter WLS fiber, pushed it to the bottom ofthe groove and applied reflective tape to cover the fiber and groove. The fibergluing machine (Fig. 14) consisted of a head that traversed the length of astationary table, upon which a partially assembled module was placed. Thehead carried a glue-mixing dispenser, a spool of WLS fiber anda roll of thereflective tape.
(iii) Storage rack.Assembly support trays were placed into storage racks duringthe (overnight) epoxy curing time. One storage rack could store five supportpanels, which were loaded by sliding the panels from an assembly stationsideways onto a storage shelf. The shelves were raised and lowered by electricmotors. The racks were mounted on casters that allowed them to be movedaround the assembly facility.
(iv) Crimping machine. A manually-operated machine was used to bind the longedges of the lower and upper aluminum covers together. The bent edge ofthe upper cover was nestled just inside the bent edge of the lower cover. Thecrimping machine’s roller system gradually folded both edges over each otherto form a seal as the head, containing 10 crimping stations, traversed the lengthof the table. The function of each crimping station is shown in Fig. 15.
(v) Fly cutter. A custom-built cutting/polishing machine was used to shavethesurface of the bulk optical connector and its embedded WLS fibers to pro-duce an optically smooth surface for good light transmission. The machineconsisted of an x-y table equipped with a rotating flywheel. The flywheel wasdriven by a motor with high-quality bearings. The cutting was done by a pairof diamond bits mounted to diametrically opposite sides of the flywheel. Mo-tion along the face of the connector was controlled by a pneumatic drive. Thedepth of cut was precisely set by manual operator control prior to each pass.A clear shield covering the flywheel protected the operator from getting tooclose to the sharp, spinning bits when the machine was operating. Figure 16shows the fly cutter without its clear protective shield.
(vi) Module mapper. An automated x-y scanning table was used to measure theresponse of each module to a 5 mCi137Cs source. The Cs source was encasedin a lead pig that was attached to a traveling x-y scanning carriage with arange of 1.3 m in width and 8 m in length. Optical fiber cables were connectedto the bulk optical connector(s) on every module and the transverse and longi-tudinal response of every scintillator strip was determined. This procedure isdescribed in detail in Sec. 3.8.1
Assembly of scintillator modules was carried out as follows:
Day 1: Cut scintillator strips to proper length; cut and formthe bottom aluminum cover;apply structural epoxy adhesive to the inside of aluminum cover. Install scin-tillator strips and fiber manifold(s) with optical connector(s) inside the epoxiedcover. (Figure 10 shows the end of one particular type of module illustrating thedetails of the scintillator-manifold interface.) Apply sealing compound to the pe-riphery of the assembly support tray and vacuum seal with a polyethylene sheet
32

Fig. 14. The WLS fiber gluing machine. The operator threads a fiber through the manifoldand into the optical connector while the head moves down the length of the module. Theinset shows the moving head which dispenses optical epoxy inthe U-shaped groove, insertsthe WLS fiber and covers the groove with reflective tape.
Fig. 15. The 10-station head of the crimping machine. The insets show the function of eachset of rollers to form a light-tight seam between the top and bottom aluminum covers ofeach module. All sharp edges are concealed following completion of the crimp.
33

Fig. 16. The fly-cutting machine, shown with its safety shield removed for clarity. Theflywheel with diamond bits can be seen behind an L-shaped clamping fixture used to holdthe optical connector at a precise location. Smooth transverse motion across the optical faceis provided by the pneumatic drive located at the lower rightin this photograph.
to provide uniform pressure for lamination. (This is shown in Fig. 13.) Move theassembly tray to a storage rack, maintain the vacuum four hours and allow tocure overnight.
Day 2: Move the assembly support tray from the storage rack tothe fiber-gluing ma-chine. Remove the polyethylene lamination sheet to preparethe assembly forgluing WLS fibers to the scintillator. Use the fiber gluing machine to apply op-tical epoxy into the groove, insert fiber to the bottom of the groove, and coverthe fiber with reflective aluminized Mylar tape. Extend the WLS fiber ends suf-ficiently beyond the scintillator strips to route fibers to the optical connectorthrough the guides in the manifold tray.
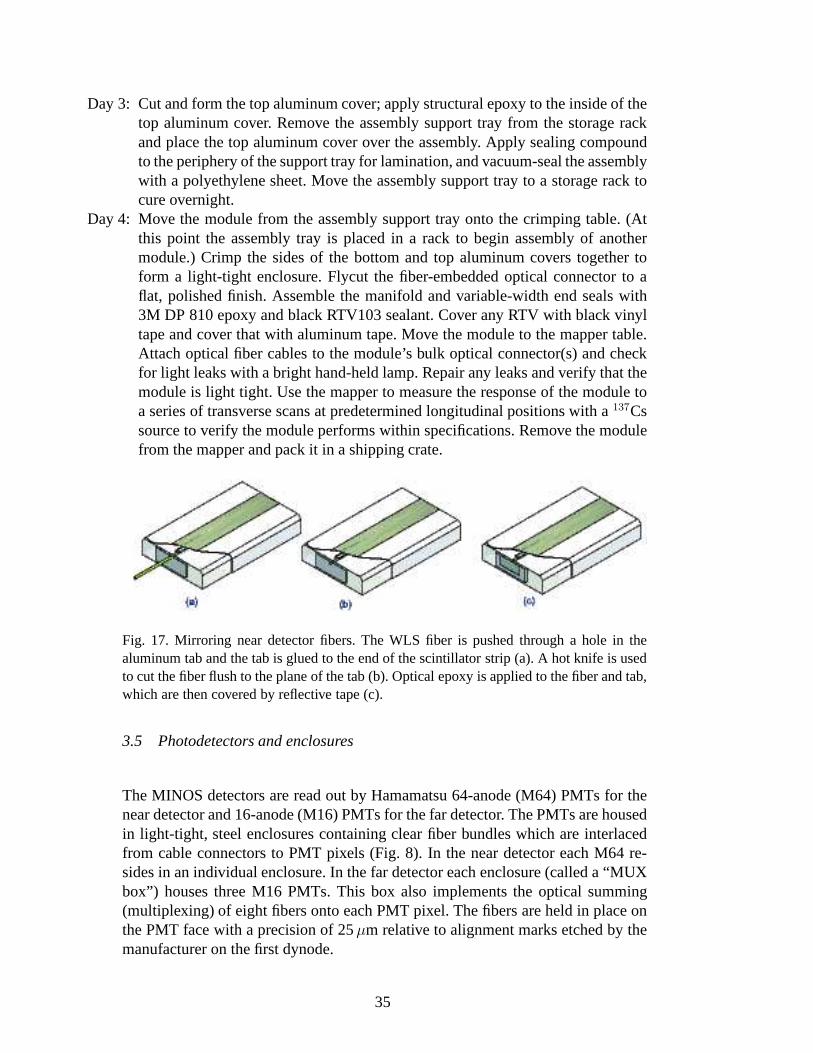
For near detector modules, apply the aluminum tab to the far end of the scin-tillator strip and pull WLS fiber through the hole in the tab. Cut the fiber flushagainst the tab with a heated knife edge. Apply optical epoxyover the cut-fiberend and tab. Place reflective tape across the tab and fiber and secure the tape untilepoxy cures. This process produced 1.71±0.02 times the light output of simplypolishing the cut end and covering it with a dab of optical grease and black paper.Figure 17 illustrates the mirroring process.
Remove the support tray from the fiber gluing machine and place it in a storagerack overnight to allow time for the epoxy to cure. At the end of each day, potthe fiber optic connectors with optical epoxy (Epon 815C with2% carbon blackadditive to prevent light transmission to the fibers).
34
Day 3: Cut and form the top aluminum cover; apply structural epoxy to the inside of thetop aluminum cover. Remove the assembly support tray from the storage rackand place the top aluminum cover over the assembly. Apply sealing compoundto the periphery of the support tray for lamination, and vacuum-seal the assemblywith a polyethylene sheet. Move the assembly support tray toa storage rack tocure overnight.
Day 4: Move the module from the assembly support tray onto thecrimping table. (Atthis point the assembly tray is placed in a rack to begin assembly of anothermodule.) Crimp the sides of the bottom and top aluminum covers together toform a light-tight enclosure. Flycut the fiber-embedded optical connector to aflat, polished finish. Assemble the manifold and variable-width end seals with3M DP 810 epoxy and black RTV103 sealant. Cover any RTV with black vinyltape and cover that with aluminum tape. Move the module to themapper table.Attach optical fiber cables to the module’s bulk optical connector(s) and checkfor light leaks with a bright hand-held lamp. Repair any leaks and verify that themodule is light tight. Use the mapper to measure the responseof the module toa series of transverse scans at predetermined longitudinalpositions with a137Cssource to verify the module performs within specifications.Remove the modulefrom the mapper and pack it in a shipping crate.
Fig. 17. Mirroring near detector fibers. The WLS fiber is pushed through a hole in thealuminum tab and the tab is glued to the end of the scintillator strip (a). A hot knife is usedto cut the fiber flush to the plane of the tab (b). Optical epoxy is applied to the fiber and tab,which are then covered by reflective tape (c).
3.5 Photodetectors and enclosures
The MINOS detectors are read out by Hamamatsu 64-anode (M64)PMTs for thenear detector and 16-anode (M16) PMTs for the far detector. The PMTs are housedin light-tight, steel enclosures containing clear fiber bundles which are interlacedfrom cable connectors to PMT pixels (Fig. 8). In the near detector each M64 re-sides in an individual enclosure. In the far detector each enclosure (called a “MUXbox”) houses three M16 PMTs. This box also implements the optical summing(multiplexing) of eight fibers onto each PMT pixel. The fibersare held in place onthe PMT face with a precision of 25µm relative to alignment marks etched by themanufacturer on the first dynode.
35
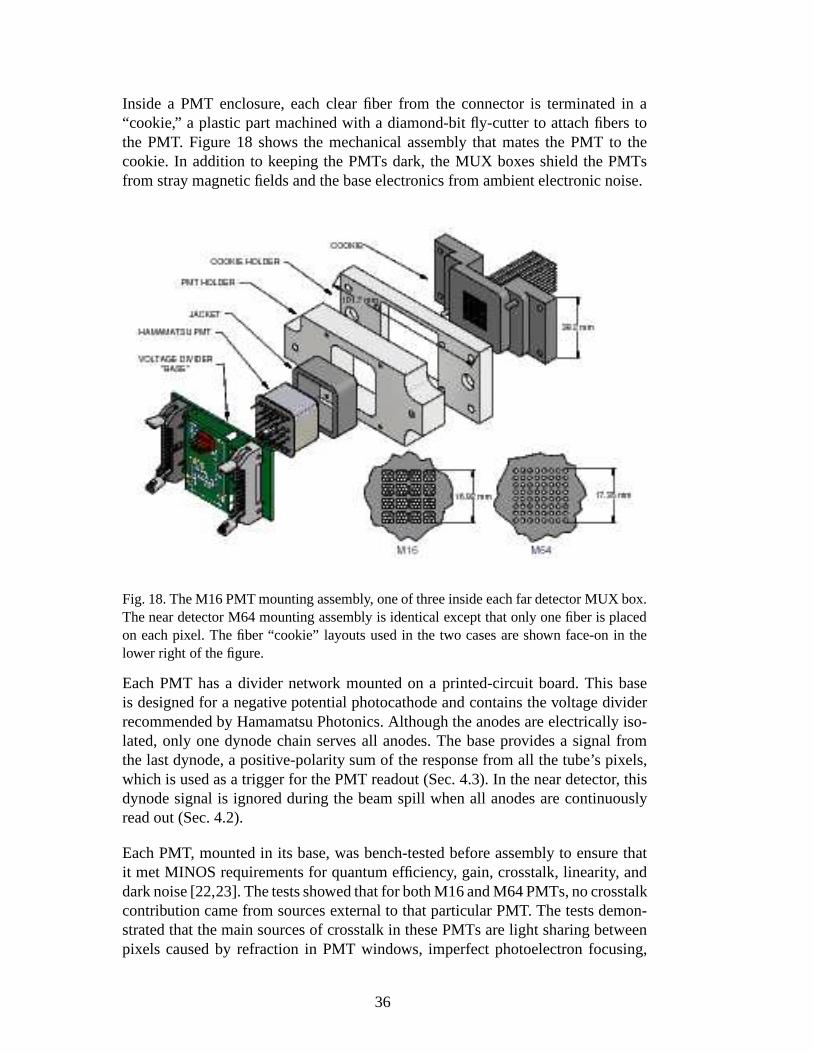
Inside a PMT enclosure, each clear fiber from the connector isterminated in a“cookie,” a plastic part machined with a diamond-bit fly-cutter to attach fibers tothe PMT. Figure 18 shows the mechanical assembly that mates the PMT to thecookie. In addition to keeping the PMTs dark, the MUX boxes shield the PMTsfrom stray magnetic fields and the base electronics from ambient electronic noise.
Fig. 18. The M16 PMT mounting assembly, one of three inside each far detector MUX box.The near detector M64 mounting assembly is identical exceptthat only one fiber is placedon each pixel. The fiber “cookie” layouts used in the two casesare shown face-on in thelower right of the figure.
Each PMT has a divider network mounted on a printed-circuit board. This baseis designed for a negative potential photocathode and contains the voltage dividerrecommended by Hamamatsu Photonics. Although the anodes are electrically iso-lated, only one dynode chain serves all anodes. The base provides a signal fromthe last dynode, a positive-polarity sum of the response from all the tube’s pixels,which is used as a trigger for the PMT readout (Sec. 4.3). In the near detector, thisdynode signal is ignored during the beam spill when all anodes are continuouslyread out (Sec. 4.2).
Each PMT, mounted in its base, was bench-tested before assembly to ensure thatit met MINOS requirements for quantum efficiency, gain, crosstalk, linearity, anddark noise [22,23]. The tests showed that for both M16 and M64PMTs, no crosstalkcontribution came from sources external to that particularPMT. The tests demon-strated that the main sources of crosstalk in these PMTs are light sharing betweenpixels caused by refraction in PMT windows, imperfect photoelectron focusing,
36

Feature M16 M64
Pixel GainVariation
Max/min pixel gain<3rms between pixels 23%
Max/min pixel gain<3rms between pixels 25%
QuantumEfficiency
>12% at 520 nm ∼12% at 520 nm
Dark Noise(1 p.e.)
∼ 25Hz per pixel ∼ 4Hz per pixel
Linearity (typicalat nominal gain)
< 5% below 100 p.e. < 5% below 50 p.e.
PE Crosstalk:(pixels)
nearest-neighbor 1.92% 2.58%
diagonal-neighbor
0.38% 0.47%
non-neighbor 0.90% 0.69%
total (all pixels) 3.20% 3.74%Table 1Main characteristics of the M16 PMTs used in the far detectorand M64 PMTs used in thenear detector. Further details can be found in Refs. [22,23].
and electromagnetic coupling of dynodes.
3.5.1 Near detector photodetection details
Strips in the upstream 120 scintillator planes of the near detector (the “calorimetersection”) are read out individually. In the downstream muonspectrometer section,sets of four anode pads are connected in parallel to reduce the number of front-end electronics channels. The four summed strips are about 1m apart so that muontracking is unambiguous. The near detector uses a total of 194 PMTs.
Pre-installation tests of the M64s established the operating high voltage for eachtube based upon the requirement of a gain of 0.8×10⁶ averaged over all pixels. Atypical PMT required∼800 V to reach this gain.
3.5.2 Far detector photodetection details
In the far detector, there are a total of 484 MUX boxes housingthe 1452 PMTs thatread out signals from both ends of each scintillator strip. An additional 64 PMTsare used in the cosmic-ray veto shield covering the far detector (Sec. 3.7).
Calibrations established the operating high voltage for each PMT. The requirementwas a gain of1 × 106 for the highest gain pixel on each M16. A typical value of
37

this setting was∼ 800 V.
During the detector design phase of MINOS an investigation showed that the uni-formity of response over the area of each pixel was sufficientto accommodate eightfibers in a close-packed arrangement and that fiber position shifts as large as200 µmfrom nominal could be tolerated. A pixel’s eight fibers come from scintillator planestrips separated by approximately 1 m. The fiber assignment on the opposite endof the strips was determined so as to provide an unambiguous 3-dimensional (“de-multiplexing”) reconstruction of charged particle tracksand showers.
The multiplexing pattern [24] is designed to minimize the effect of crosstalk in theM16s. The demultiplexing algorithm [24] is based on two assumptions: first, theapproximate position of a hit along a strip is a function of the ratio of the signalamplitudes at its two ends, and second, on any plane in the detector, the width of anevent spans 1 m or less. The algorithm uses information from neighboring planesto choose the overall best solution, including the effect ofcrosstalk.
3.6 Connectors and cables
Cables of clear fibers transport photons from the WLS fibers (Sec. 3.3) to the MUXboxes (Sec. 3.5.2). The clear fiber from Kuraray has attenuation lengths in the 11–15 m range for green LED light. Except for the 175 ppm fluor concentration inthe WLS fibers, the clear and WLS fibers are geometrically and compositionallyidentical. As a result, at the fiber-to-fiber interface the directions of signal photonsare preserved within the total internal reflection angle andnone should escape.However losses do arise from mismatching of refractive indices in the couplingmedium at the interface and from concentric misalignment offiber ends. By usingan optical couplant (Dow Corning Q2-3067), the transmission loss at each interfacewas improved from 10-15% to 5-10%.
A finished cable is made of four components, namely clear fiber, connectors, opaquecable conduit, and opaque shroud (injection molded clamshell) which allows con-duit to be joined to connector. The various pieces are shown in Fig. 19. The injection-molded Noryl connectors at the ends of cables mate with nearly identical connec-tors on the module manifolds and MUX boxes. The optical surface of a connectoris a linear array of 34 holes, starting and ending with pairs of holes for connect-ing screws and aligning dowel pins, with 30 fiber holes in between. The center-to-center alignment of fibers holes was measured on a few hundredconnector pairs andfound to be uniform to better than30 µm. The flexible corrugated black nylon con-duit used for light-tightness was a commercial product (Kabelschlepp PRF16/BL).Rare pinholes discovered in the checkout procedure were covered with black vinyltape. The shroud consists of identical mating custom injection molded clamshellpairs screwed together with the seams sealed with RTV103 (black) silicone rubber.
38
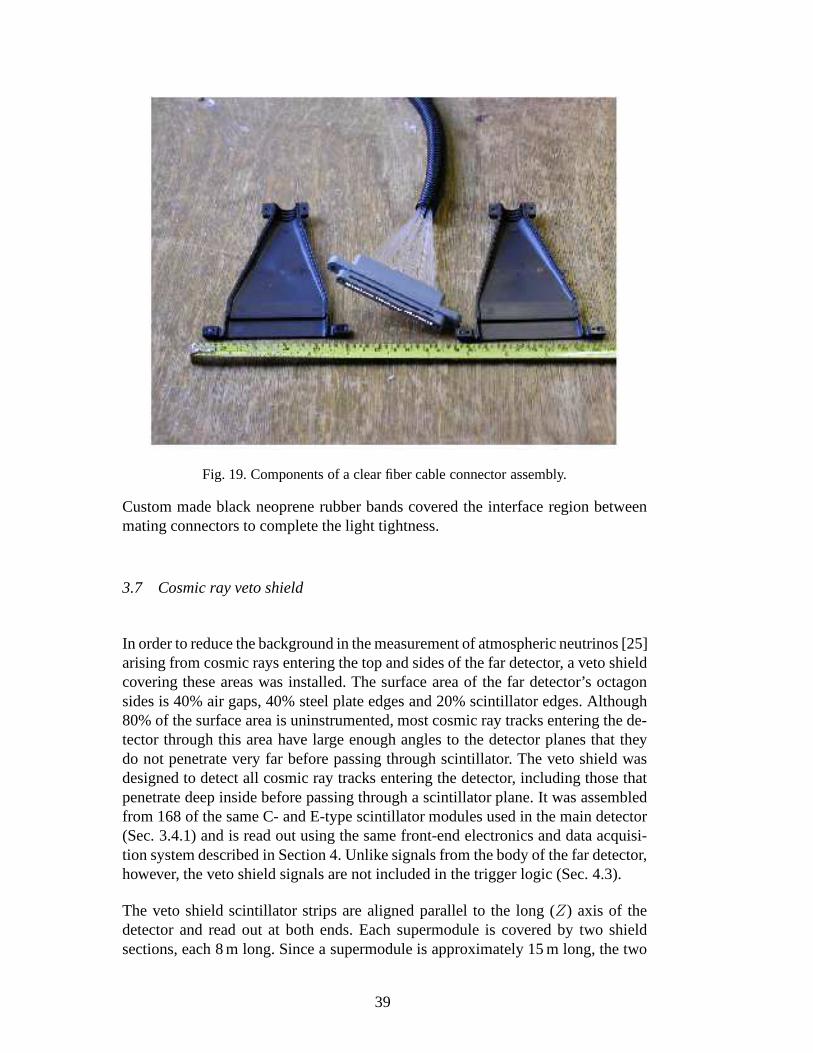
Fig. 19. Components of a clear fiber cable connector assembly.
Custom made black neoprene rubber bands covered the interface region betweenmating connectors to complete the light tightness.
3.7 Cosmic ray veto shield
In order to reduce the background in the measurement of atmospheric neutrinos [25]arising from cosmic rays entering the top and sides of the fardetector, a veto shieldcovering these areas was installed. The surface area of the far detector’s octagonsides is 40% air gaps, 40% steel plate edges and 20% scintillator edges. Although80% of the surface area is uninstrumented, most cosmic ray tracks entering the de-tector through this area have large enough angles to the detector planes that theydo not penetrate very far before passing through scintillator. The veto shield wasdesigned to detect all cosmic ray tracks entering the detector, including those thatpenetrate deep inside before passing through a scintillator plane. It was assembledfrom 168 of the same C- and E-type scintillator modules used in the main detector(Sec. 3.4.1) and is read out using the same front-end electronics and data acquisi-tion system described in Section 4. Unlike signals from the body of the far detector,however, the veto shield signals are not included in the trigger logic (Sec. 4.3).
The veto shield scintillator strips are aligned parallel tothe long (Z) axis of thedetector and read out at both ends. Each supermodule is covered by two shieldsections, each 8 m long. Since a supermodule is approximately 15 m long, the two
39

sections overlap by about a meter at the center of the supermodule. Figure 20 showsa vertical cross section through the shield (in theXY plane). The horizontal anddiagonal shield sections that cover the top of the detector have two layers of scin-tillator while the vertical shield modules along the east and west sides of the fardetector (known as “walls”) have just one. A Monte Carlo simulation [26] showsthat more than 99.9% of the cosmic ray muons that deposit energy in eight or morefar detector planes produce signals in the veto shield, excepting those which enterthrough the north and south faces where no veto shield is present.
The output signals from eight adjacent strips are summed together and read out bya single electronics channel on each end. The summing pattern is the same on bothends so it is not possible to demultiplex the hits in the shield in the same way as isdone for the body of the far detector. Therefore the transverse hit location resolutionof the shield is approximately 12 cm, as calculated by dividing the width of eight4.1 cm wide strips by
√
(12).
To reduce false cosmic ray muon tagging that could arise fromsingle photoelectronnoise, the dynode threshold is set between one and two photoelectrons. The singlesrate in the shield is predominately due to backgroundγ radiation from the cavernwalls and noise from the wavelength shifting fibers [21].
A cosmic ray muon entering the detector is identified by a shield signal in timecoincidence with an event observed in the main detector. Cosmic ray muons passingthrough the detector were used to measure the timing resolution of a single hit inthe shield to be (4.2±0.3) ns [26]. The inefficiency for tagging cosmic ray muonsis dominated by three factors: high singles rates in the shield causing readout dead-time, cosmic ray muons passing through small gaps in the shield, and muon signalsfalling below the 1–2 photoelectron threshold. The efficiency of the veto shield forcosmic ray muons that stop in the detector is measured to be 95-97%, dependingon the the algorithm used [26,27].
3.8 Scintillator performance
The performance of the scintillator system components was optimized during theR&D period and monitored during construction and operation. Section 3.8.1 de-scribes the measurement of strip response in every module prior to installation. Theeffects of aging in scintillator system components (Sec. 3.8.2) was also measuredduring the MINOS R&D program. Ongoing performance is monitored continu-ously during routine experiment operation using cosmic raymuon tracks (Sec. 3.8.3and 3.8.4).
40

WESTEAST
X
Y
Fig. 20. Schematic of the MINOS far detector veto shield in the XY plane (not to scale).Individual scintillator modules that comprise the shield are shown, including the doublelayer above the detector.
3.8.1 Module maps
A module mapper was used at each module production facility and at Soudan forquality control and calibration. The mapper used a well-defined γ beam from a5 mCi 137Cs source (γ energy 662 keV) to illuminate a 4×4 cm2 square on the scin-tillator module. A computer controlled x-y drive moved the source across the faceof the module. The PMT signal from each strip was integrated for 10 ms once ev-ery 40 ms and recorded. This duty cycle was due to the integration of the RABBITPMA card [28, 29] in current monitoring mode and the limit of reliable readout ofthe data through the Rabbit-CAMAC-GPIB system. Since the strip thickness is asmall fraction of theγ absorption length, the scintillator is fully illuminated.Thesemeasurements provided a detailed map of the response of eachscintillator mod-ule to ionizing radiation. Measurements were made every 8 cmalong the length ofeach strip with a precision and reproducibility of∼1%. Besides providing thesepulse height performance calibrations, the locations of the edges of the scintillatorstrips were determined to a precision of 1 mm by the response curve as the sourcewas scanned transversely across each strip.
Figure 21 shows the mapper’s response for a typical strip in aproduction module.The small variations in the light output from a smooth exponential behavior arereal and result from variations in scintillator, fiber depth, and gluing. Figure 22shows the map for a strip with imperfect fiber gluing (the fiberwas not completely
41
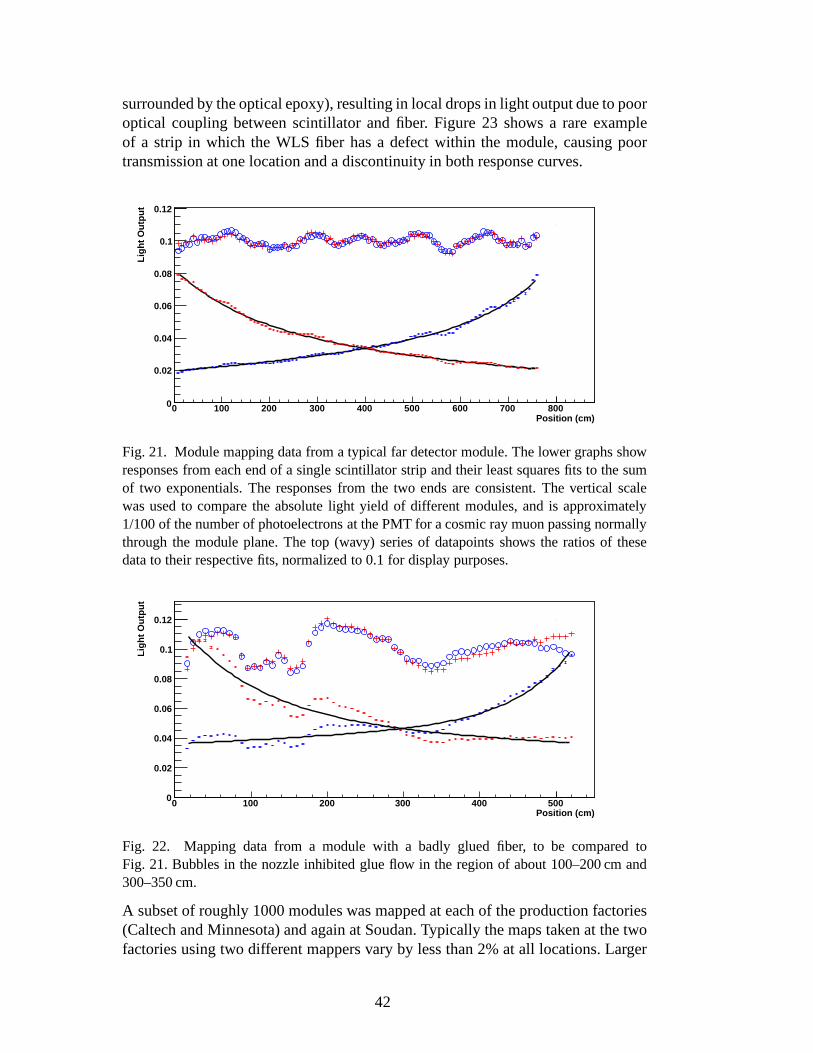
surrounded by the optical epoxy), resulting in local drops in light output due to pooroptical coupling between scintillator and fiber. Figure 23 shows a rare exampleof a strip in which the WLS fiber has a defect within the module,causing poortransmission at one location and a discontinuity in both response curves.
Position (cm)0 100 200 300 400 500 600 700 800
Lig
ht
Ou
tpu
t
0
0.02
0.04
0.06
0.08
0.1
0.12
Fig. 21. Module mapping data from a typical far detector module. The lower graphs showresponses from each end of a single scintillator strip and their least squares fits to the sumof two exponentials. The responses from the two ends are consistent. The vertical scalewas used to compare the absolute light yield of different modules, and is approximately1/100 of the number of photoelectrons at the PMT for a cosmic ray muon passing normallythrough the module plane. The top (wavy) series of datapoints shows the ratios of thesedata to their respective fits, normalized to 0.1 for display purposes.
Position (cm)0 100 200 300 400 500
Lig
ht
Ou
tpu
t
0
0.02
0.04
0.06
0.08
0.1
0.12
Fig. 22. Mapping data from a module with a badly glued fiber, tobe compared toFig. 21. Bubbles in the nozzle inhibited glue flow in the region of about 100–200 cm and300–350 cm.
A subset of roughly 1000 modules was mapped at each of the production factories(Caltech and Minnesota) and again at Soudan. Typically the maps taken at the twofactories using two different mappers vary by less than 2% atall locations. Larger
42
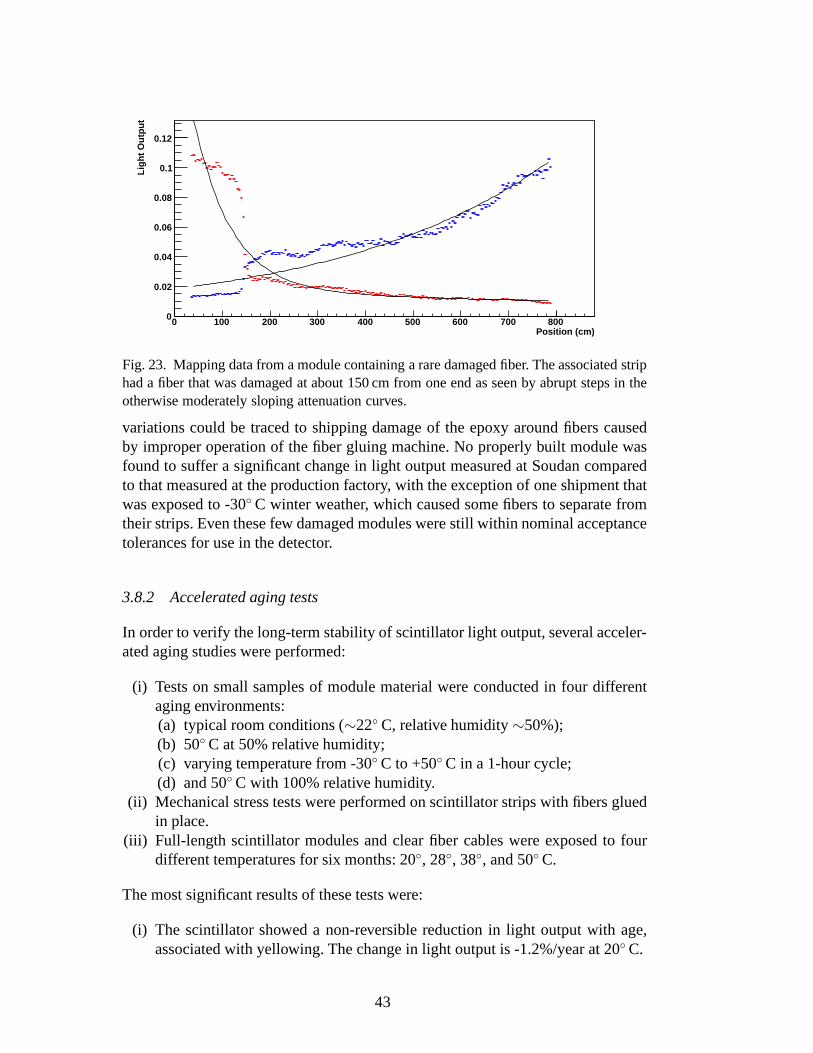
Position (cm)0 100 200 300 400 500 600 700 800
Lig
ht
Ou
tpu
t
0
0.02
0.04
0.06
0.08
0.1
0.12
Fig. 23. Mapping data from a module containing a rare damagedfiber. The associated striphad a fiber that was damaged at about 150 cm from one end as seen by abrupt steps in theotherwise moderately sloping attenuation curves.
variations could be traced to shipping damage of the epoxy around fibers causedby improper operation of the fiber gluing machine. No properly built module wasfound to suffer a significant change in light output measuredat Soudan comparedto that measured at the production factory, with the exception of one shipment thatwas exposed to -30◦ C winter weather, which caused some fibers to separate fromtheir strips. Even these few damaged modules were still within nominal acceptancetolerances for use in the detector.
3.8.2 Accelerated aging tests
In order to verify the long-term stability of scintillator light output, several acceler-ated aging studies were performed:
(i) Tests on small samples of module material were conductedin four differentaging environments:(a) typical room conditions (∼22◦ C, relative humidity∼50%);(b) 50◦ C at 50% relative humidity;(c) varying temperature from -30◦ C to +50◦ C in a 1-hour cycle;(d) and 50◦ C with 100% relative humidity.
(ii) Mechanical stress tests were performed on scintillator strips with fibers gluedin place.
(iii) Full-length scintillator modules and clear fiber cables were exposed to fourdifferent temperatures for six months: 20◦, 28◦, 38◦, and 50◦ C.
The most significant results of these tests were:
(i) The scintillator showed a non-reversible reduction in light output with age,associated with yellowing. The change in light output is -1.2%/year at 20◦ C.
43

(ii) Although optical epoxies typically become visibly yellow with age, the impacton light collection was found to be negligible because thereis only a thinepoxy layer between fiber and scintillator.
(iii) The scintillator showed a reversible loss in light output of -0.3%/◦ C as tem-perature was raised (but see item (v) below).
(iv) A non-reversible decrease in the attenuation length ofthe WLS fiber as a func-tion of time was measured. The change in light output at the end of an 8 mfiber was found to be -1.2%/year at 20◦ C.
(v) Increased temperature resulted in faster aging of the scintillator and WLSfiber. The rate of aging is parametrized exponentially with temperature asexp(∆T/τ) with τ = 10◦ C.
(vi) Temperature cycling (over>104 cycles) induced no measurable aging effectbeyond that caused by the part of the cycle that was above roomtemperature.
(vii) High humidity combined with high temperature accelerates aging.(viii) “Normal” mechanical stresses of production, assembly, shipping, and instal-
lation had no effect on light output. Extreme stresses can break fibers or stripsand exposed fibers are susceptible to cracking (which can significantly reducethe light transmission), but handling with normal industrial practice did notdamage fibers in any measurable way.
The overall conclusion is that after 10 years the light output of the MINOS scintil-lator system will be 65-75% of its initial value. One note of possible importance isthat the aging tests were performed on scintillator that hadbeen extruded about sixmonths prior to the aging measurements. Subsequently, other measurements havesuggested that the scintillator undergoes an initial drop in light output on the orderof 10-15% in the first few months before stabilizing to the behavior reported above.
3.8.3 Variation in light output from module to module
Differences in module light output result from a convolution of variations in severalcomponents and in the quality of the construction. Factors include the light outputfrom the scintillator strips, the quality of the WLS fiber, the quality of gluing theWLS fiber into the modules, damage to the fibers, and the quality of finishing thefibers at the connector ends. Figure 24 shows the variation inlight output at thecenter of all far detector scintillator modules as measuredby the module mappers.The Gaussian fit has a width of 11% and only 0.16% (317 out of 191,444) havelight output less than 50% of the average. Typically the fiberin these abnormalstrips had suffered damage during construction.
After correcting for known systematic effects, average photoelectron yields forminimum ionizing particles (MIPs) of installed modules also vary because of dif-ferences in transmission at the two connector interfaces, variation in transmissionat the PMT interface, and pixel to pixel quantum efficiency variations in the PMT.In addition, different gains of PMT pixels produce further variation in average MIP
44

Relative Light Output0 0.2 0.4 0.6 0.8 1 1.2 1.4 1.6 1.8 2
1
10
210
310
410
Entries 191444Sigma 11%
Fig. 24. Distribution of light output from all far detector strips for a 662 keVγ source at thestrip center as measured by the module mappers.
Distance from Strip Center (m)-4 -3 -2 -1 0 1 2 3 4
Str
ip R
esp
on
se (
Ph
oto
-ele
ctro
ns)
0
2
4
6
8
10
12 East strip end
West strip end
Sum of both ends
Fig. 25. Average light output from in-situ far detector strips as a function of distance-from–center for normally incident MIPs. The data are from stopping cosmic ray muons, for whichcontainment criteria cause lower statistical precision atthe ends of the strips.
45
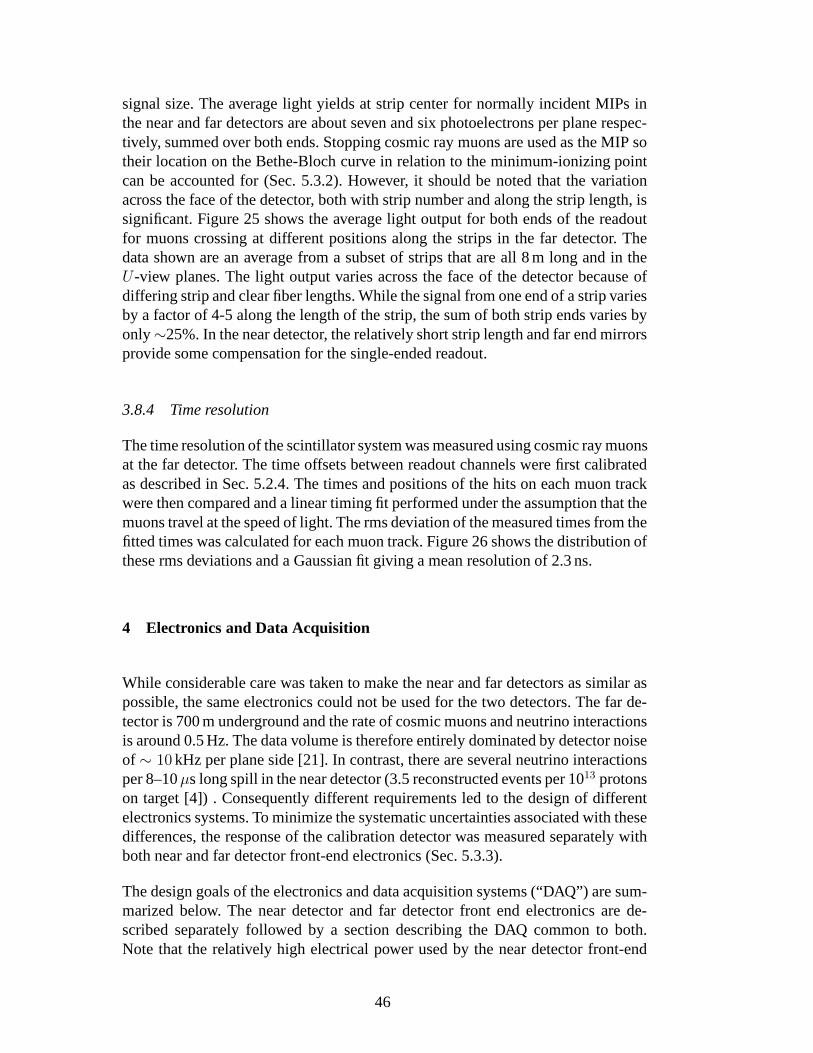
signal size. The average light yields at strip center for normally incident MIPs inthe near and far detectors are about seven and six photoelectrons per plane respec-tively, summed over both ends. Stopping cosmic ray muons areused as the MIP sotheir location on the Bethe-Bloch curve in relation to the minimum-ionizing pointcan be accounted for (Sec. 5.3.2). However, it should be noted that the variationacross the face of the detector, both with strip number and along the strip length, issignificant. Figure 25 shows the average light output for both ends of the readoutfor muons crossing at different positions along the strips in the far detector. Thedata shown are an average from a subset of strips that are all 8m long and in theU-view planes. The light output varies across the face of the detector because ofdiffering strip and clear fiber lengths. While the signal from one end of a strip variesby a factor of 4-5 along the length of the strip, the sum of bothstrip ends varies byonly∼25%. In the near detector, the relatively short strip lengthand far end mirrorsprovide some compensation for the single-ended readout.
3.8.4 Time resolution
The time resolution of the scintillator system was measuredusing cosmic ray muonsat the far detector. The time offsets between readout channels were first calibratedas described in Sec. 5.2.4. The times and positions of the hits on each muon trackwere then compared and a linear timing fit performed under theassumption that themuons travel at the speed of light. The rms deviation of the measured times from thefitted times was calculated for each muon track. Figure 26 shows the distribution ofthese rms deviations and a Gaussian fit giving a mean resolution of 2.3 ns.
4 Electronics and Data Acquisition
While considerable care was taken to make the near and far detectors as similar aspossible, the same electronics could not be used for the two detectors. The far de-tector is 700 m underground and the rate of cosmic muons and neutrino interactionsis around 0.5 Hz. The data volume is therefore entirely dominated by detector noiseof ∼ 10 kHz per plane side [21]. In contrast, there are several neutrino interactionsper 8–10µs long spill in the near detector (3.5 reconstructed events per 1013 protonson target [4]) . Consequently different requirements led tothe design of differentelectronics systems. To minimize the systematic uncertainties associated with thesedifferences, the response of the calibration detector was measured separately withboth near and far detector front-end electronics (Sec. 5.3.3).
The design goals of the electronics and data acquisition systems (“DAQ”) are sum-marized below. The near detector and far detector front end electronics are de-scribed separately followed by a section describing the DAQcommon to both.Note that the relatively high electrical power used by the near detector front-end
46
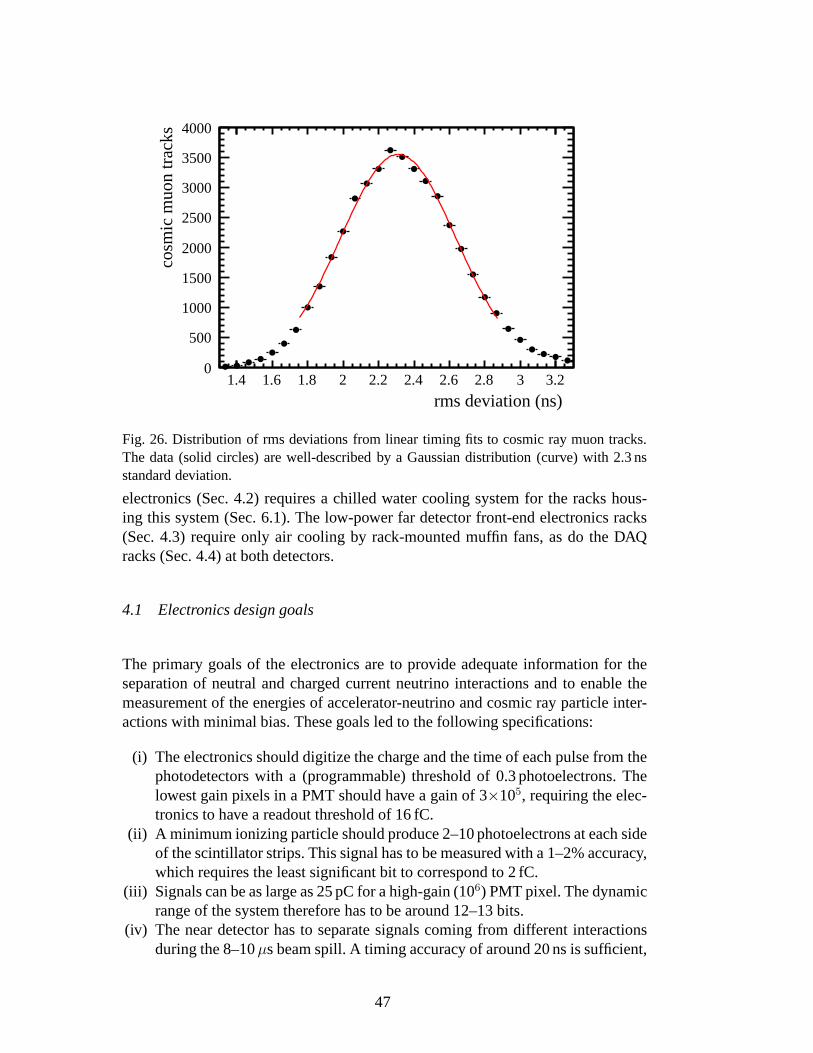
rms deviation (ns)1.4 1.6 1.8 2 2.2 2.4 2.6 2.8 3 3.2
cosm
ic m
uon
trac
ks
0
500
1000
1500
2000
2500
3000
3500
4000
Fig. 26. Distribution of rms deviations from linear timing fits to cosmic ray muon tracks.The data (solid circles) are well-described by a Gaussian distribution (curve) with 2.3 nsstandard deviation.
electronics (Sec. 4.2) requires a chilled water cooling system for the racks hous-ing this system (Sec. 6.1). The low-power far detector front-end electronics racks(Sec. 4.3) require only air cooling by rack-mounted muffin fans, as do the DAQracks (Sec. 4.4) at both detectors.
4.1 Electronics design goals
The primary goals of the electronics are to provide adequateinformation for theseparation of neutral and charged current neutrino interactions and to enable themeasurement of the energies of accelerator-neutrino and cosmic ray particle inter-actions with minimal bias. These goals led to the following specifications:
(i) The electronics should digitize the charge and the time of each pulse from thephotodetectors with a (programmable) threshold of 0.3 photoelectrons. Thelowest gain pixels in a PMT should have a gain of 3×10⁵, requiring the elec-tronics to have a readout threshold of 16 fC.
(ii) A minimum ionizing particle should produce 2–10 photoelectrons at each sideof the scintillator strips. This signal has to be measured with a 1–2% accuracy,which requires the least significant bit to correspond to 2 fC.
(iii) Signals can be as large as 25 pC for a high-gain (106) PMT pixel. The dynamicrange of the system therefore has to be around 12–13 bits.
(iv) The near detector has to separate signals coming from different interactionsduring the 8–10µs beam spill. A timing accuracy of around 20 ns is sufficient,
47

given the maximum instantaneous event rate of 20 events per spill, and is coin-cident with the 53.1 MHz RF structure of the beam. The far detector, however,is also used to study atmospheric neutrino interactions. A timing resolution onthe order of 3–5 ns is needed to separate upward from downwardgoing muonsor neutrinos.
(v) There should be negligible dead time during the neutrinospill and at least an80% live time out of spill to record atmospheric neutrino andcosmic ray muoninteractions.
4.2 Near detector front-end electronics
In the near detector front-end electronics [30], each PMT pixel is digitized contin-uously at the frequency of the beam RF structure of 53.103 MHz(18.83 ns). This isachieved with an individual front-end channel unit consisting of a small mezzanineprinted circuit board (PCB) called a “MENU”. The principal MENU componentsare an ASIC named theCharge Integration Encoder(abbreviated “QIE”) [31], acommercial flash analog-to-digital converter (“FADC”), and a data buffer. SixteenMENUs reside on a VME type-6U PCB (called a “MINDER”), with four MIN-DERs required for each fully used M64 PMT. An overview of the near detectorelectronics system is shown in Fig. 27.
The QIE input signal current,I, is split into eight binary-weighted “ranges” withvaluesI/2, I/4, I/8, . . ., and integrated onto a capacitor for each range. A biascurrent is added to ensure that the capacitor voltage on one and only one range iswithin the predetermined input limits of the FADC. The QIE selects that voltage foroutput to the FADC, and also outputs a 3-bit number representing the range value.Four independent copies of the current splitter, integration, and output circuits inthe QIE permit continuous dead-timeless operation. The combined information ofan 8-bit FADC value and 3-bit range value provide an effective dynamic rangeof sixteen bits. For the purpose of calibration, an additional 2-bit code allows theidentification of the current splitter and capacitor circuit (known as the “CapID”)used for each RF cycle.
Data are stored locally on each MENU during a trigger gate andsubsequently readout. A beam-spill gate of up to 1000 RF periods (18.83µs maximum, 13µs typ-ical) is formed from a signal provided by the Fermilab Accelerator Control Net-work (ACNET). Outside of beam spills, cosmic ray and PMT singles-rate data areacquired individually for each PMT for 8 RF periods (150 ns) whenever the chargeon the dynode exceeds the equivalent of approximately1
3of a photoelectron with a
10 ns shaping time. Charge injection calibration data are acquired using a calibra-tion trigger gate of 256 RF periods.
At the end of a trigger gate, data are transfered from the front-end to VME type-
48
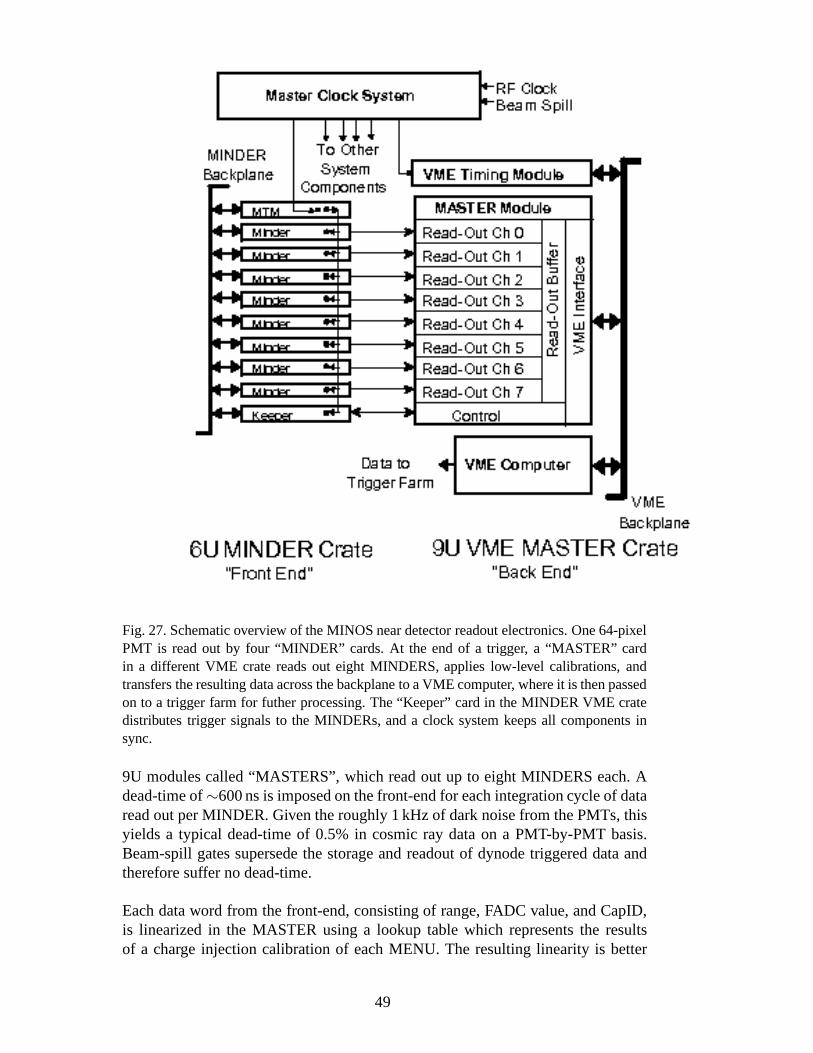
Fig. 27. Schematic overview of the MINOS near detector readout electronics. One 64-pixelPMT is read out by four “MINDER” cards. At the end of a trigger,a “MASTER” cardin a different VME crate reads out eight MINDERS, applies low-level calibrations, andtransfers the resulting data across the backplane to a VME computer, where it is then passedon to a trigger farm for futher processing. The “Keeper” cardin the MINDER VME cratedistributes trigger signals to the MINDERs, and a clock system keeps all components insync.
9U modules called “MASTERS”, which read out up to eight MINDERS each. Adead-time of∼600 ns is imposed on the front-end for each integration cycleof dataread out per MINDER. Given the roughly 1 kHz of dark noise fromthe PMTs, thisyields a typical dead-time of 0.5% in cosmic ray data on a PMT-by-PMT basis.Beam-spill gates supersede the storage and readout of dynode triggered data andtherefore suffer no dead-time.
Each data word from the front-end, consisting of range, FADCvalue, and CapID,is linearized in the MASTER using a lookup table which represents the resultsof a charge injection calibration of each MENU. The resulting linearity is better
49
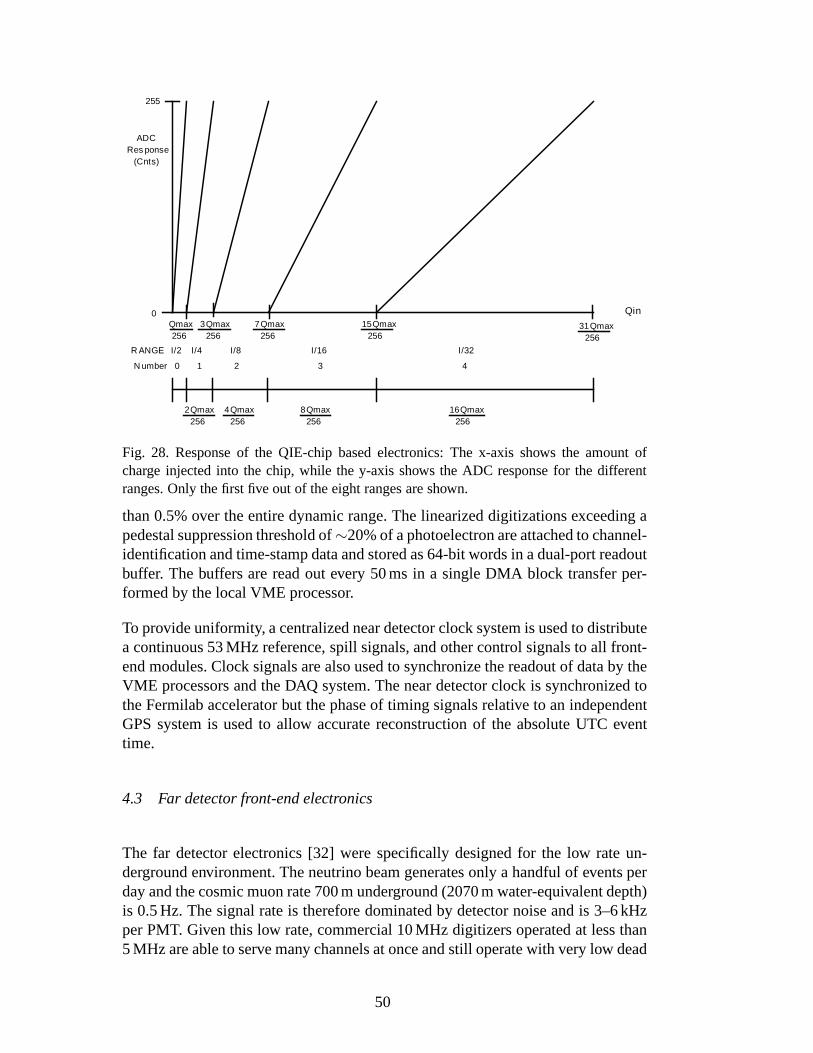
Qmax 256
3Qmax 256
7Qmax 256
15Qmax 256
31Qmax 256
2Qmax 256
4Qmax 256
8Qmax 256
16Qmax 256
0 1 2 3 4
255
0
ADCRes ponse (Cnts)
Qin
I/2 I/4 I/8 I/16 I/32R ANGE
N umber
Fig. 28. Response of the QIE-chip based electronics: The x-axis shows the amount ofcharge injected into the chip, while the y-axis shows the ADCresponse for the differentranges. Only the first five out of the eight ranges are shown.
than 0.5% over the entire dynamic range. The linearized digitizations exceeding apedestal suppression threshold of∼20% of a photoelectron are attached to channel-identification and time-stamp data and stored as 64-bit words in a dual-port readoutbuffer. The buffers are read out every 50 ms in a single DMA block transfer per-formed by the local VME processor.
To provide uniformity, a centralized near detector clock system is used to distributea continuous 53 MHz reference, spill signals, and other control signals to all front-end modules. Clock signals are also used to synchronize the readout of data by theVME processors and the DAQ system. The near detector clock issynchronized tothe Fermilab accelerator but the phase of timing signals relative to an independentGPS system is used to allow accurate reconstruction of the absolute UTC eventtime.
4.3 Far detector front-end electronics
The far detector electronics [32] were specifically designed for the low rate un-derground environment. The neutrino beam generates only a handful of events perday and the cosmic muon rate 700 m underground (2070 m water-equivalent depth)is 0.5 Hz. The signal rate is therefore dominated by detectornoise and is 3–6 kHzper PMT. Given this low rate, commercial 10 MHz digitizers operated at less than5 MHz are able to serve many channels at once and still operatewith very low dead
50

time. A block diagram of the readout structure is shown in Fig. 29.
VAVAVAPIN
PIN
PM
T
PM
T
PM
TVFB0
ASDLite
AD
C
VMM0
VAVAVAPIN
PIN
PM
T
PM
T
PM
T
VFB11ASDLite
AD
C
VMM5
VARCcoms
coms
VMEbus
Timing Signals
analog
analog
Fig. 29. Schematic overview of the MINOS far detector readout electronics. Three PMTsare connected with short flat ribbon cables to the VFB, which also houses two PIN diodesto monitor the light level of the light injection system. TheVA ASIC amplifies and holdsthe PMT signals, which are multiplexed via an analog link onto an ADC on the VARC. TheVFB is controlled through a digital link (coms) by the VARC.
The readout is based on the front-end ASIC VA32HDR11 (short VA chip), de-veloped in collaboration with the Norwegian company IDEA ASA [33]. Three VAchips are mounted onto the VA front-end board (VFB). There are 32 channels onthe chip of which only 17 are used, each channel consisting ofa charge sensitivepreamplifier, a shaper, a track and hold stage, and an output switch. The outputfrom a selected channel can be switched to a differential output buffer which drivesa∼6 m long cable to a remote ADC. There is a second multiplexer that can routecharge to a selected channel for test and calibration.
Three VA chips are mounted on the VFB, located on the outside of the PMT MUXbox (Sec. 3.5.2). The VFB provides support circuitry for power distribution andbiasing of the VA chips. It also houses the ASDLite [34] ASIC,which compares thedynode signals from the PMTs with a common programmable threshold to providea discriminated signal for time-stamping and readout initiation.
A serial slow control interface is provided to adjust VA biaslevels, enable criticalvoltage regulators, and monitor voltages and temperature.The VFB is operated in
51
slave mode and fully controlled by the VA readout controller(VARC) describedbelow.
The MINOS light injection system (Sec. 5.1) monitors the stability and linearityof the PMTs. The light injected into the detector is monitored by PIN (PositiveIntrinsic Negative) photodiodes mounted on the VFB. This signal undergoes a pre-amplification and shaping before being fed into a spare channel on the VA chip.The PIN diode signals are read out in coincidence with the PMTsignals.
The analog signals from the VA chip are multiplexed onto an ADC, which is locatedon a VA Mezzanine Module (VMM). Two VFBs are connected to eachVMM.The VARC houses 6 VMMs and controls the signal digitization,triggering, time-stamping and bias of the VA chips. Each VARC can thus service up to 36 PMTs of16 channels each.
The VARC is implemented as a 9U VME card. Three VARCs, a timingcard (seebelow), and a Motorola VME processor share a single VME crate. There are a totalof 16 VME crates to read out the 22,000 electronics channels of the detector. TheVARC receives the discriminated dynode signal of each PMT. It time-stamps thesesignals with an effective 640 MHz TDC, implemented in a Xilinx [35] 80 MHzfield programmable gate array, and then generates the hold signal for the VA ASIC.The delay time is programmable and is around 500 ns after the trigger signal isreceived. The signals held in the VA ASIC are then multiplexed to a commercial14-bit 10 MHz ADC [36], which is operated at 5×10⁶ samples/s. The resulting deadtime is 5µs per dynode trigger. The digitization sequence is started if the VARCreceives at least two discriminated dynode signals from different PMTs in a 400 nswindow. This so-called 2-out-of-36 trigger reduces the dead time due to dark noisein the PMTs and fiber noise in the scintillator, without compromising the recordingof physics events.
The system has been tuned such that 1 ADC count corresponds to2 fC. The elec-tronic noise in the fully installed system is typically around 2.5 ADC counts (5 fC)and changes less than one ADC count over 24 hours. The entire detector readout issynchronized by a 40 MHz optical timing distribution signalslaved to a GPS clockfrom TrueTime [37].
Once the data are digitized they are transmitted to a local FIFO and stored there forfurther processing. The pedestal is subtracted and data above an individually set-table sparsification threshold are written to an on-board VME memory. The VARCalso controls pedestal and charge injection calibration runs. This memory is readout by the DAQ system described in Sec. 4.4.
52
4.4 Data acquisition
The near and far detector data acquisition systems are functionally identical, withappropriate front-end software accommodating the differences of the front-endelectronics of the two detectors. The main requirements forthe DAQ systems are(i) to continuously read out the front-end electronics in an untriggered, dead timefree manner and (ii ) to transfer the data from all front-end modules to a small farmof PCs where software algorithms build and select events of interest and performmonitoring and calibration tasks. The DAQ system allows fordiagnostic and cal-ibration data taking runs and can be operated remotely and unmanned. Figure 30shows the layout of the DAQ system, using the far detector as an example. The sys-tem is constructed entirely from commercially available components. A detaileddescription of the DAQ system architecture and components can be found in [38].
The digitized data in the front-end electronics buffers (time blocks) are read outwith single block DMA transfer by a VME computer in each crate, the readout pro-cessor (ROP). The ROP is a PowerPC running VxWorks that encapsulates all thereadout specific software for the different front-end electronics systems of the de-tectors. There are 16 ROPs serving the far detector and 8 serving the near detector.The interrupt-driven readout of each ROP (typically 50 Hz) is synchronized by thetiming system through local timing system cards in each crate. Each ROP assem-bles consecutive time blocks in memory into convenient units, called time frames,which are nominally one second in length. The time frames areoverlapped by onetime block to circumvent processing problems at the time frame boundaries. Eachtime frame carries a header containing a full self description. Data blocks frommonitoring tasks or real-time electronics calibrations carried out in the ROPs areappended to the time frame as necessary.
The transfer of data from the multiple ROPs along the detector uses PCI VerticalInterconnection (PVIC) buses [39] which allow transfer rates of up to 40 MB/s.Groups of ROPs are interconnected with differential PVIC cables to form a chainwhich is connected by an optical PVIC cable to an off-detector DAQ PC, the BranchReadout Processor (BRP). The near detector is configured with four such chains(termedinput branches) and the far detector with six. All PCs in the MINOS DAQsystem are Intel Pentium-based and run the GNU/Linux operating system.
Time frames are buffered by the ROPs until requested by theirBRP. They are thentransferred into the memory of the BRP by DMA across the PVIC.One BRP actsas the master, coordinating the transfer of data by issuing transfer instructions tothe BRPs. Each BRP is also connected to an output branch, a differential PVIC buswhich connects the BRPs to a small farm of trigger processors(the TPs). When atime frame has been successfully transferred to the BRPs, the master BRP selects aTP and instructs each BRP to send (by DMA) its time frame to an address in the TPmemory via the PVIC output branch. In this way a full time frame of data from the
53

TP TP TP TP TP
TRC
FEE
FEE
FEE
ROP
TRC
FEE
FEE
FEE
ROP/PVIC T
RC
FEE
FEE
FEE
ROP/PVIC T
RC
FEE
FEE
FEE
ROP/PVIC
FEE
FEE
FEE
FEE
FEE
BRP(master)
BRP(slave)
BRP(slave)
BRP(slave)
TCU
TPC
GPS
TimingSystem
PVIC Input Branch
PVIC Output Branch
VME 64x9U Crate
Run Control &Monitoring
PVIC
100BaseT EthernetRemote
Run ControlClients
DCP
FPC
Light InjectionSystem
DDSOnline data consumers:
DBU, monitoring,event display
Data archival inFermilab tapestore
Fig. 30. The architecture of the MINOS DAQ system. The far detector front-end electronicsand clock system are shown as an example. For clarity, only one of the six PVIC inputbranches is completely illustrated, with three more shown in summary.
entire detector is available in a single TP for processing. The TPs, BRPs and ROPsare all able to buffer and queue multiple time frames. Typically, in a physics run theraw data rate into the trigger farm is 8 MB/s at the far detector and 5 MB/s at thenear detector. A farm of five 3.2 GHz Pentium4 PCs at each detector comfortablycopes with these rates.
After various data integrity checks the TP performs a numberof processing tasks onthe time frame data. Monitoring statistics, such as data flowrates, are accumulated.Data from the interspersed pulsing of the Light Injection (LI) system (Section 5.1)are identified as LI events and analyzed. Summaries of the detector response to thepulses are generated and output for offline detector calibration.
In parallel with the LI processing, the TP applies software triggering algorithms tothe time frame to locate events of physics interest. The primary triggers are sum-marized below. Since each of these triggers can, in principle, gather multiple events(notably the spill triggers), the output from the trigger istermed asnarl. The triggersfall into three categories: special triggers for debuggingand calibration, bias-freetriggers based on spill signals or spill times to gather beamevents, and triggersbased on the clustering of hits in the detector to gather out-of-spill events. In thislast case, a candidate snarl is first identified as a temporal cluster of hits boundedby 150 ns gaps of detector inactivity. The non-spill-based trigger algorithms areapplied to these candidates.
(i) Spill trigger: At the near detector, each digitization that occurs within thespill gate is tagged by the front-end electronics (Sec. 4.2). These are identified,extracted from the time frame and output as a single spill event with no further
54

selection.(ii) Remote spill trigger: At the far detector a direct spill signal is not available
so a remote spill trigger is applied. The near detector GPS system is used togenerate time-stamps of the spill signals. These are transmitted to the far de-tector over the internet where they are stored and served to the TPs on request.All readout within a configurable time window around each spill is extractedand written out as a spill-event. Since the DAQ has considerable bufferingcapability there is ample time to wait for spill informationto arrive.
(iii) Fake remote spill trigger: Fake spill times are generated randomly betweenspills to provide random sampling of detector activity.
(iv) Plane trigger: M detector planes in any set ofN contiguous planes mustcontain at least 1 hit. NominallyM=4, N=5.
(v) Energy trigger: M contiguous planes of the detector have a summed rawpulse height greater than E and a total of at leastN hits in those planes. Nom-inally M=4, E=1500 ADC counts,N=6. This trigger is not normally used atthe near detector.
(vi) Activity trigger: There must be activity in anyN planes of the detector. Nom-inally N=20.
(vii) Special triggers:A variety of special runs are available to perform detectorand electronics calibration or debugging.
The integrated trigger rates at the near and far detectors are typically 4 Hz and30 Hz, respectively, and are dominated by cosmic rays and noise. The output rateto disk from all sources, including LI and monitoring summaries, is approximately20 kB/s and 10 kB/s for the near and far detectors, respectively.
All data output by the TP are transmitted via TCP/IP to the Data Collection Processwhich collects and merges the output streams from all the TPs. The output stream isordered and formatted as a ROOT tree [40] before being written to disk. The activeoutput file is shared with a Data Distribution System (DDS) which serves the datato various online consumers such as online monitoring and event displays. A dataarchival task transfers completed data files to the Fermilabmass storage facility byKerberized FTP over the internet.
Overall control of the DAQ is provided by the Run Control system through a welldefined state model implemented by all DAQ components. The system employs aclient-server model with a single server controlling the DAQ. Multiple graphicaluser interface (GUI) clients are used to connect to the server over TCP/IP allowingremote operation. A system of control exchange avoids contention between clients.The GUI client is based on the ROOT framework. This displays the current stateand performance of the DAQ as well as allowing the operator tomodify the sys-tem configuration and control data taking. Automated run sequences are used tofacilitate unmanned operation.
55
4.5 Inter-detector timing
Each of the near and far detectors incorporates a GPS receiver [37] used as a clockfor the front-end electronics and DAQ computers. The GPS receivers are locatedunderground and connected by optical fiber to surface antennas. The worst-caseresolution of each receiver is approximately 200 ns during normal operation.
The near detector uses the GPS unit to record the time at whichMain Injector pro-tons arrive at the target. The far detector similarly records the GPS time of eachDAQ trigger. During offline data analysis, after correctingfor antenna delays, hard-ware offsets, and the 2.449 ms time of flight from FNAL to Soudan, these twoGPS measurements identify far detector events consistent with beam neutrino ar-rival times. There is a64 ns uncertainty on the time offset between the near and fardetectors due to uncertainties in hardware delays [41].
Because the far detector does not have a hardware trigger butinstead uses softwareto find events, a system was developed to use the timing information to promptlytag in-spill data. The beam spill is time-stamped at the neardetector. The time-stamp is transmitted via internet to Soudan, where this information is served to theevent-building software described in Sec. 4.4. A several second buffer of the fardetector data makes possible this efficient online time-stamping.
The prompt-time correlation allows for a relaxation of the usual event-building con-ditions, capturing very small energy events (∼300 MeV). During routine operationthe system works reliably to capture 99% of all spills. The dominant sources of in-efficiency are temporary network outages and transient network latencies betweenFermilab and Soudan.
4.6 Monitoring and control systems
The MINOS Detector Control System (DCS) monitors and controls the experimen-tal hardware and environment. There is a separate but similar DCS system at eachdetector, each composed of many smaller subsystems.
LeCroy 1440 high voltage mainframes are used to supply the PMTs (Sec. 3.5) withhigh voltage. Each PMT has its own voltage channel. These mainframes are con-trolled via a serial link using EDAS brand Ethernet to serialdevices, with detectoroperators using a menu-driven Linux program to manipulate the voltages. A mon-itoring program reads back both the supply and demand voltage for each channelevery 10 minutes and sets off alarms if channels are out of tolerance by more than10 V (1%).
The currents, voltages and imbalance voltages of the far detector magnet coils
56
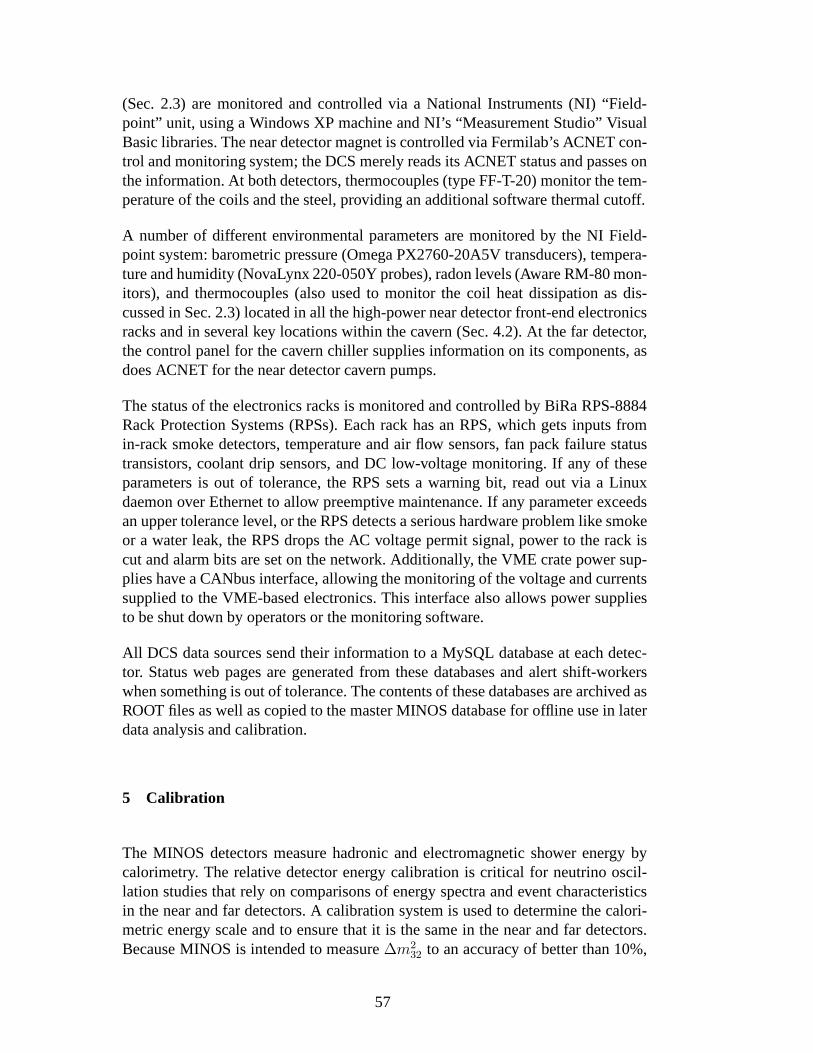
(Sec. 2.3) are monitored and controlled via a National Instruments (NI) “Field-point” unit, using a Windows XP machine and NI’s “Measurement Studio” VisualBasic libraries. The near detector magnet is controlled viaFermilab’s ACNET con-trol and monitoring system; the DCS merely reads its ACNET status and passes onthe information. At both detectors, thermocouples (type FF-T-20) monitor the tem-perature of the coils and the steel, providing an additionalsoftware thermal cutoff.
A number of different environmental parameters are monitored by the NI Field-point system: barometric pressure (Omega PX2760-20A5V transducers), tempera-ture and humidity (NovaLynx 220-050Y probes), radon levels(Aware RM-80 mon-itors), and thermocouples (also used to monitor the coil heat dissipation as dis-cussed in Sec. 2.3) located in all the high-power near detector front-end electronicsracks and in several key locations within the cavern (Sec. 4.2). At the far detector,the control panel for the cavern chiller supplies information on its components, asdoes ACNET for the near detector cavern pumps.
The status of the electronics racks is monitored and controlled by BiRa RPS-8884Rack Protection Systems (RPSs). Each rack has an RPS, which gets inputs fromin-rack smoke detectors, temperature and air flow sensors, fan pack failure statustransistors, coolant drip sensors, and DC low-voltage monitoring. If any of theseparameters is out of tolerance, the RPS sets a warning bit, read out via a Linuxdaemon over Ethernet to allow preemptive maintenance. If any parameter exceedsan upper tolerance level, or the RPS detects a serious hardware problem like smokeor a water leak, the RPS drops the AC voltage permit signal, power to the rack iscut and alarm bits are set on the network. Additionally, the VME crate power sup-plies have a CANbus interface, allowing the monitoring of the voltage and currentssupplied to the VME-based electronics. This interface alsoallows power suppliesto be shut down by operators or the monitoring software.
All DCS data sources send their information to a MySQL database at each detec-tor. Status web pages are generated from these databases andalert shift-workerswhen something is out of tolerance. The contents of these databases are archived asROOT files as well as copied to the master MINOS database for offline use in laterdata analysis and calibration.
5 Calibration
The MINOS detectors measure hadronic and electromagnetic shower energy bycalorimetry. The relative detector energy calibration is critical for neutrino oscil-lation studies that rely on comparisons of energy spectra and event characteristicsin the near and far detectors. A calibration system is used todetermine the calori-metric energy scale and to ensure that it is the same in the near and far detectors.Because MINOS is intended to measure∆m2
32 to an accuracy of better than 10%,
57

shower energy scale calibration goals were set at 2% relative systematic uncertaintyand 5% absolute uncertainty.
This section describes the calibration of the responses of the near, far and calibra-tion detectors. This calibration corrects for scintillator light output variations aswell as nonuniformities of light transmission and collection in the fibers, PMTs,and readout electronics. Section 5.1 details how the optical light-injection systemis used to measure the linearity and time variation of the readout response in allthree detectors. Section 5.2 outlines the use of cosmic ray muon tracks to measurescintillator strip light output variations with time and position, specifically to recordinterstrip and intrastrip nonuniformities. In addition, Sec. 5.2.4 describes the use ofcosmic ray muon data to measure the fast time response of far detector scintilla-tor strips, used to distinguish up-going from down-going cosmic ray muon tracks.Section 5.3 provides a detailed description of how the relative and absolute energyscales of the near and far detectors are determined using cosmic ray muons andcalibration-detector data from charged particle test beams.
The calibration uses both the optical light-injection system, which measures the be-havior of the readout instrumentation, and cosmic ray muon tracks, which measurethe response of the scintillator. This calibration is a multi-stage procedure that con-verts the raw pulse heightQraw(s, x, t, d) in strip s, positionx, time t and detectord into a fully-corrected signalQcorr. Each stage applies a multiplicative calibrationconstant:
Qcorr = Qraw × D(d, t) × L(d, s, Qraw) × S(d, s, t) × A(d, s, x) × M(d) (1)
where
D is the drift correction to account for PMT, electronics, andscintillator responsechanging with temperature and age.
L is the function that linearizes the response of each channelwith pulse-height.S is the strip-to-strip correction that removes differencesin response, strip-to-strip
and channel-to-channel.A is the attenuation correction, which describes the attenuation of light depending
on event position along each strip.M is an overall scale factor that converts corrected pulse height into the same
absolute energy unit for all detectors.
The data collected with the calibration detector at CERN [5]are used to determinethe absolute calibration of the detector energy response bycomparing the calibratedshower energy to the known energies of the particle beams.
Two additional calibrations are required. First, a strip-by-strip timing calibrationis performed on the far detector data, primarily to aid in reconstructing the direc-tionality of cosmic ray muons and atmospheric neutrino events. Second, the PMT
58
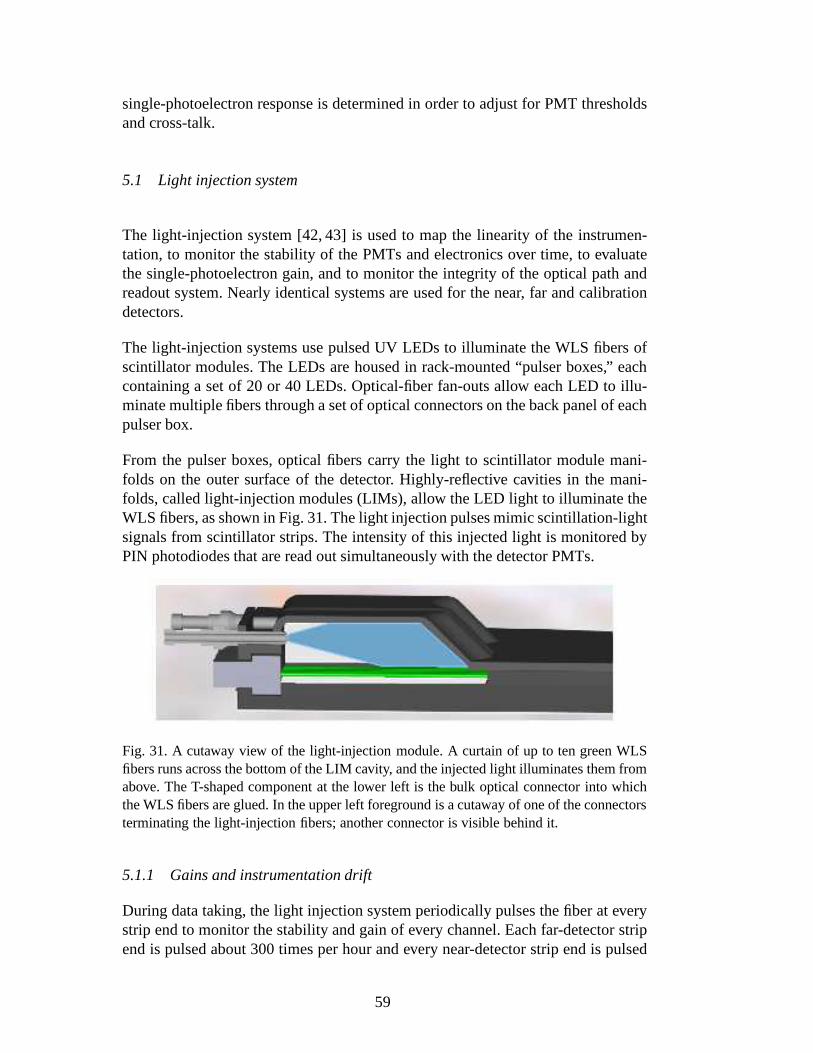
single-photoelectron response is determined in order to adjust for PMT thresholdsand cross-talk.
5.1 Light injection system
The light-injection system [42, 43] is used to map the linearity of the instrumen-tation, to monitor the stability of the PMTs and electronicsover time, to evaluatethe single-photoelectron gain, and to monitor the integrity of the optical path andreadout system. Nearly identical systems are used for the near, far and calibrationdetectors.
The light-injection systems use pulsed UV LEDs to illuminate the WLS fibers ofscintillator modules. The LEDs are housed in rack-mounted “pulser boxes,” eachcontaining a set of 20 or 40 LEDs. Optical-fiber fan-outs allow each LED to illu-minate multiple fibers through a set of optical connectors onthe back panel of eachpulser box.
From the pulser boxes, optical fibers carry the light to scintillator module mani-folds on the outer surface of the detector. Highly-reflective cavities in the mani-folds, called light-injection modules (LIMs), allow the LED light to illuminate theWLS fibers, as shown in Fig. 31. The light injection pulses mimic scintillation-lightsignals from scintillator strips. The intensity of this injected light is monitored byPIN photodiodes that are read out simultaneously with the detector PMTs.
Fig. 31. A cutaway view of the light-injection module. A curtain of up to ten green WLSfibers runs across the bottom of the LIM cavity, and the injected light illuminates them fromabove. The T-shaped component at the lower left is the bulk optical connector into whichthe WLS fibers are glued. In the upper left foreground is a cutaway of one of the connectorsterminating the light-injection fibers; another connectoris visible behind it.
5.1.1 Gains and instrumentation drift
During data taking, the light injection system periodically pulses the fiber at everystrip end to monitor the stability and gain of every channel.Each far-detector stripend is pulsed about 300 times per hour and every near-detector strip end is pulsed
59
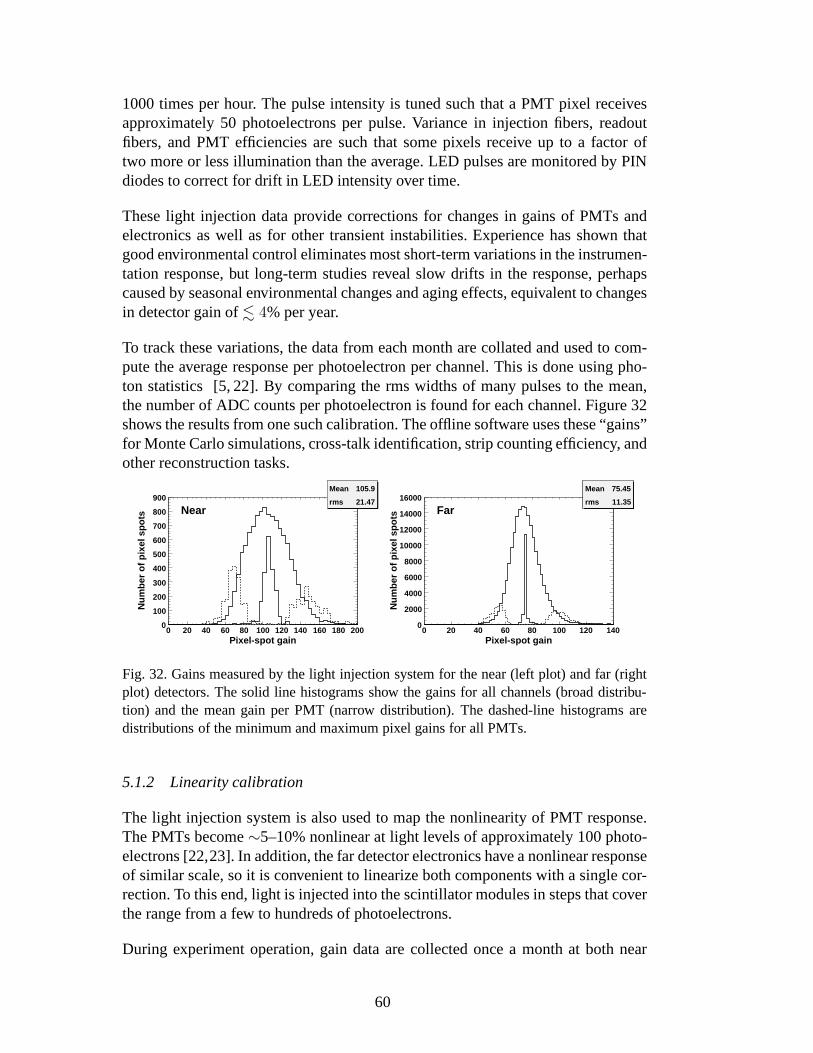
1000 times per hour. The pulse intensity is tuned such that a PMT pixel receivesapproximately 50 photoelectrons per pulse. Variance in injection fibers, readoutfibers, and PMT efficiencies are such that some pixels receiveup to a factor oftwo more or less illumination than the average. LED pulses are monitored by PINdiodes to correct for drift in LED intensity over time.
These light injection data provide corrections for changesin gains of PMTs andelectronics as well as for other transient instabilities. Experience has shown thatgood environmental control eliminates most short-term variations in the instrumen-tation response, but long-term studies reveal slow drifts in the response, perhapscaused by seasonal environmental changes and aging effects, equivalent to changesin detector gain of. 4% per year.
To track these variations, the data from each month are collated and used to com-pute the average response per photoelectron per channel. This is done using pho-ton statistics [5, 22]. By comparing the rms widths of many pulses to the mean,the number of ADC counts per photoelectron is found for each channel. Figure 32shows the results from one such calibration. The offline software uses these “gains”for Monte Carlo simulations, cross-talk identification, strip counting efficiency, andother reconstruction tasks.
Mean 105.9
rms 21.47
Pixel-spot gain0 20 40 60 80 100 120 140 160 180 200
Nu
mb
er o
f p
ixel
sp
ots
0
100
200
300
400
500
600
700
800
900Mean 105.9
rms 21.47Near
Mean 75.45
rms 11.35
Pixel-spot gain0 20 40 60 80 100 120 140
Nu
mb
er o
f p
ixel
sp
ots
0
2000
4000
6000
8000
10000
12000
14000
16000Mean 75.45
rms 11.35Far
Fig. 32. Gains measured by the light injection system for thenear (left plot) and far (rightplot) detectors. The solid line histograms show the gains for all channels (broad distribu-tion) and the mean gain per PMT (narrow distribution). The dashed-line histograms aredistributions of the minimum and maximum pixel gains for allPMTs.
5.1.2 Linearity calibration
The light injection system is also used to map the nonlinearity of PMT response.The PMTs become∼5–10% nonlinear at light levels of approximately 100 photo-electrons [22,23]. In addition, the far detector electronics have a nonlinear responseof similar scale, so it is convenient to linearize both components with a single cor-rection. To this end, light is injected into the scintillator modules in steps that coverthe range from a few to hundreds of photoelectrons.
During experiment operation, gain data are collected once amonth at both near
60
and far detectors, interspersed with normal physics data taking. Each scintillatorstrip-end fiber is pulsed 1000 times at many different light levels. The pulse heightsettings for each LED are tuned so that the average response of the strips connectedto it covers the full dynamic range of interest. Two PIN diodes, one amplified withhigh gain and one with low gain, monitor the stability of the light output of eachLED. Low-gain PIN diodes are better suited for large light levels where saturationof the PIN readout electronics might occur. At lower light levels, the high-gain PINdiodes provide a better signal. Extensive test stand studies have shown the responseof the PIN diodes used in MINOS to be linear to 1% [42] over a dynamic rangeroughly corresponding to 5-100 PMT photoelectrons.
These data are used to parametrize PMT response as a functionof true illumina-tion. The linearity correction, applied offline, is determined by extrapolating PMTresponse in the linear region to the nonlinear region. This is accomplished by map-ping PMT response as a function of either of two PIN diodes or acombination ofboth. For the far detector, both ends of each strip are read out, but light is injectedinto only one end at a time. Light on the distant end is substantially attenuated andtherefore in the linear region of the response curve, givingan independent measure-ment of the true illumination.
Although the PIN diodes themselves are measured to be quite linear, it is difficultto verify the linearity of the PIN diode readout electronics. Nonlinearities on the or-der of 1-2% are apparent in the data from both detectors. In the near detector, noisefrom the PIN amplifier was exacerbated by the characteristics of the sampling read-out. In the far detector, problems were suspected in the analog electronics wherecross-talk from PMT signals may have contaminated the PIN signals.
Figure 33 shows the results of the nonlinearity calibration. The far detector nonlin-earity is measured with the distant-end technique, while the near detector nonlin-earity is measured by the PIN diodes. The near detector PMTs become nonlinearat low pulse height, while the far detector readout electronics saturate at high pulseheight. Low pulse-height data from the near detector (not shown) are unreliable dueto PIN readout difficulties.
The flexibility of the system provides additional information for detector debug-ging. High- and low-gain PIN diodes have independent light paths to the LED andare used to diagnose problems related to the LED. The near andfar strip-end read-outs at the far detector provide an independent way to identify problems with thePMT and front-end electronics.
5.2 Cosmic ray muon calibrations
Cosmic ray muons are used at each detector to measure scintillator related quan-tities. Throughgoing cosmic ray muons have an average energy of ∼200 GeV at
61
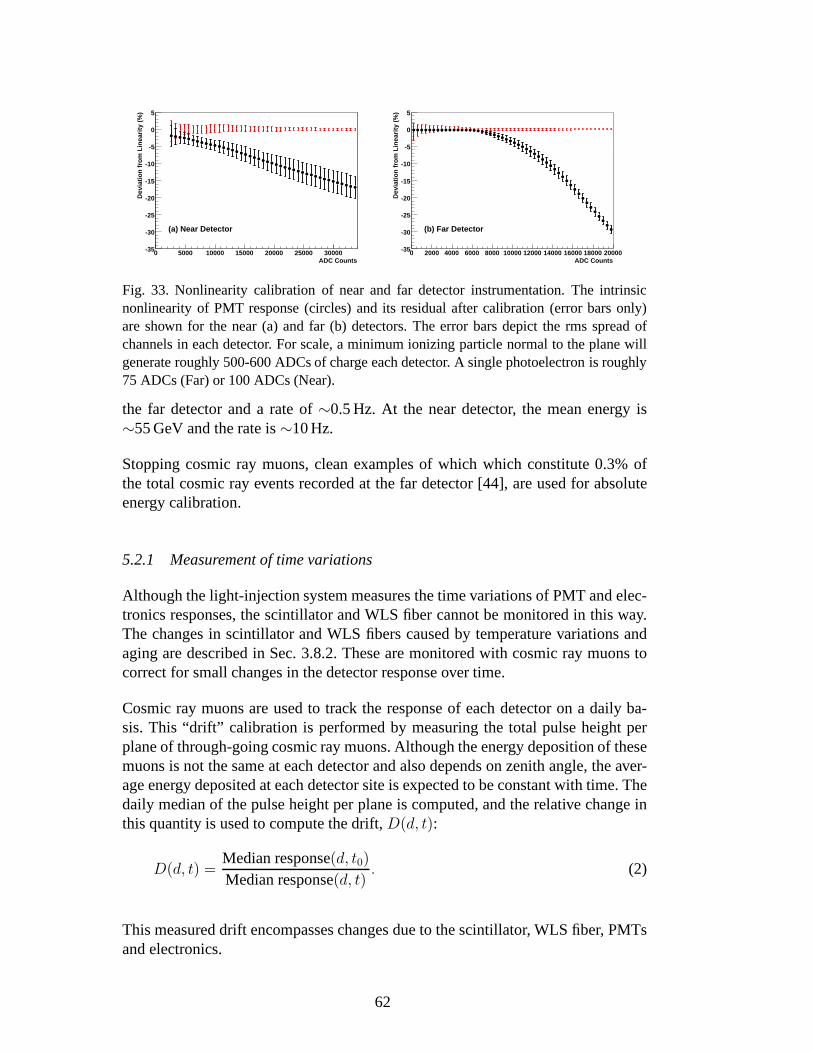
ADC Counts0 5000 10000 15000 20000 25000 30000
Dev
iati
on
fro
m L
inea
rity
(%
)
-35
-30
-25
-20
-15
-10
-5
0
5
(a) Near Detector
ADC Counts0 2000 4000 6000 8000 10000 12000 14000 16000 18000 20000
Dev
iati
on
fro
m L
inea
rity
(%
)
-35
-30
-25
-20
-15
-10
-5
0
5
(b) Far Detector
Fig. 33. Nonlinearity calibration of near and far detector instrumentation. The intrinsicnonlinearity of PMT response (circles) and its residual after calibration (error bars only)are shown for the near (a) and far (b) detectors. The error bars depict the rms spread ofchannels in each detector. For scale, a minimum ionizing particle normal to the plane willgenerate roughly 500-600 ADCs of charge each detector. A single photoelectron is roughly75 ADCs (Far) or 100 ADCs (Near).
the far detector and a rate of∼0.5 Hz. At the near detector, the mean energy is∼55 GeV and the rate is∼10 Hz.
Stopping cosmic ray muons, clean examples of which which constitute 0.3% ofthe total cosmic ray events recorded at the far detector [44], are used for absoluteenergy calibration.
5.2.1 Measurement of time variations
Although the light-injection system measures the time variations of PMT and elec-tronics responses, the scintillator and WLS fiber cannot be monitored in this way.The changes in scintillator and WLS fibers caused by temperature variations andaging are described in Sec. 3.8.2. These are monitored with cosmic ray muons tocorrect for small changes in the detector response over time.
Cosmic ray muons are used to track the response of each detector on a daily ba-sis. This “drift” calibration is performed by measuring thetotal pulse height perplane of through-going cosmic ray muons. Although the energy deposition of thesemuons is not the same at each detector and also depends on zenith angle, the aver-age energy deposited at each detector site is expected to be constant with time. Thedaily median of the pulse height per plane is computed, and the relative change inthis quantity is used to compute the drift,D(d, t):
D(d, t) =Median response(d, t0)
Median response(d, t). (2)
This measured drift encompasses changes due to the scintillator, WLS fiber, PMTsand electronics.
62
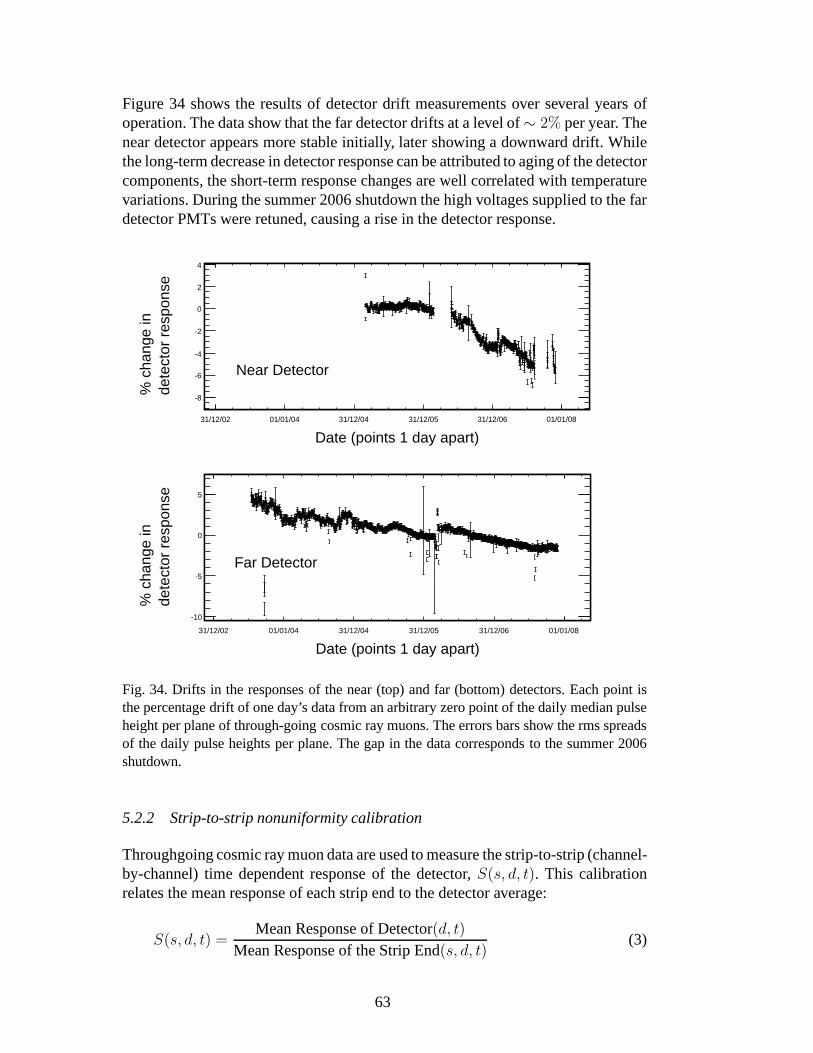
Figure 34 shows the results of detector drift measurements over several years ofoperation. The data show that the far detector drifts at a level of∼ 2% per year. Thenear detector appears more stable initially, later showinga downward drift. Whilethe long-term decrease in detector response can be attributed to aging of the detectorcomponents, the short-term response changes are well correlated with temperaturevariations. During the summer 2006 shutdown the high voltages supplied to the fardetector PMTs were retuned, causing a rise in the detector response.
Date (points 1 day apart)31/12/02 01/01/04 31/12/04 31/12/05 31/12/06 01/01/08
dete
ctor
res
pons
e%
cha
nge
in
-8
-6
-4
-2
0
2
4
Near Detector
Date (points 1 day apart)31/12/02 01/01/04 31/12/04 31/12/05 31/12/06 01/01/08
dete
ctor
res
pons
e%
cha
nge
in
-10
-5
0
5
Far Detector
Fig. 34. Drifts in the responses of the near (top) and far (bottom) detectors. Each point isthe percentage drift of one day’s data from an arbitrary zeropoint of the daily median pulseheight per plane of through-going cosmic ray muons. The errors bars show the rms spreadsof the daily pulse heights per plane. The gap in the data corresponds to the summer 2006shutdown.
5.2.2 Strip-to-strip nonuniformity calibration
Throughgoing cosmic ray muon data are used to measure the strip-to-strip (channel-by-channel) time dependent response of the detector,S(s, d, t). This calibrationrelates the mean response of each strip end to the detector average:
S(s, d, t) =Mean Response of Detector(d, t)
Mean Response of the Strip End(s, d, t)(3)
63
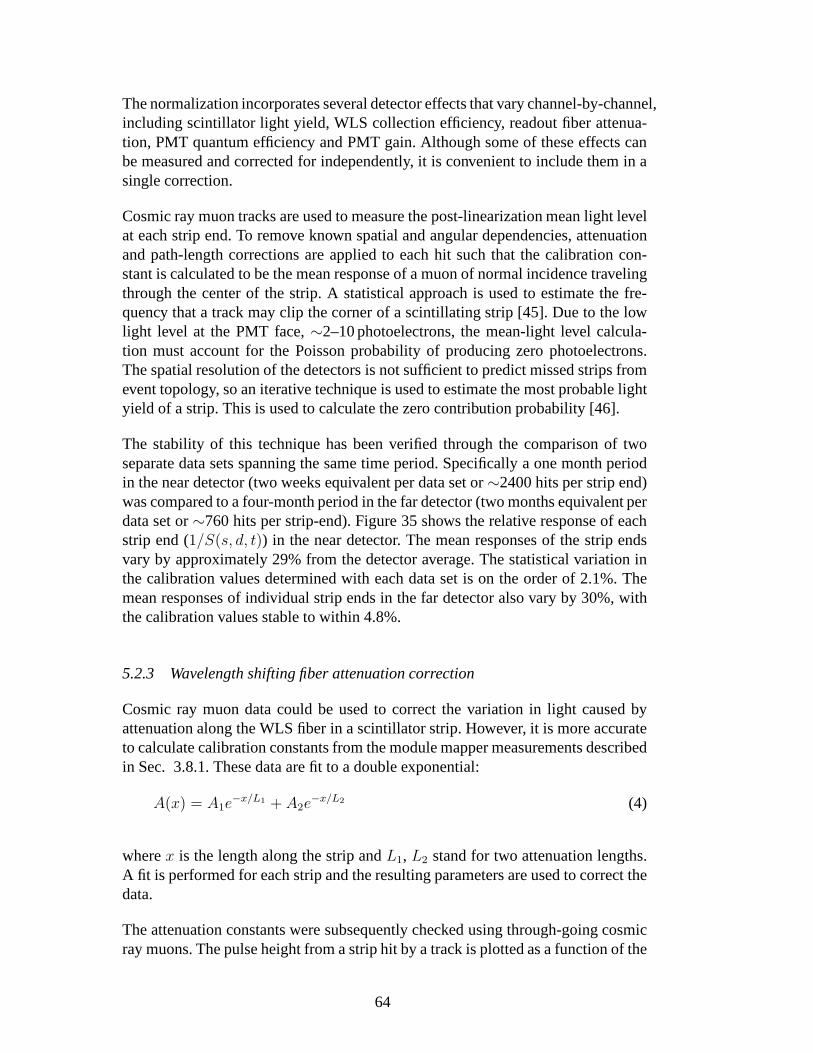
The normalization incorporates several detector effects that vary channel-by-channel,including scintillator light yield, WLS collection efficiency, readout fiber attenua-tion, PMT quantum efficiency and PMT gain. Although some of these effects canbe measured and corrected for independently, it is convenient to include them in asingle correction.
Cosmic ray muon tracks are used to measure the post-linearization mean light levelat each strip end. To remove known spatial and angular dependencies, attenuationand path-length corrections are applied to each hit such that the calibration con-stant is calculated to be the mean response of a muon of normalincidence travelingthrough the center of the strip. A statistical approach is used to estimate the fre-quency that a track may clip the corner of a scintillating strip [45]. Due to the lowlight level at the PMT face,∼2–10 photoelectrons, the mean-light level calcula-tion must account for the Poisson probability of producing zero photoelectrons.The spatial resolution of the detectors is not sufficient to predict missed strips fromevent topology, so an iterative technique is used to estimate the most probable lightyield of a strip. This is used to calculate the zero contribution probability [46].
The stability of this technique has been verified through thecomparison of twoseparate data sets spanning the same time period. Specifically a one month periodin the near detector (two weeks equivalent per data set or∼2400 hits per strip end)was compared to a four-month period in the far detector (two months equivalent perdata set or∼760 hits per strip-end). Figure 35 shows the relative response of eachstrip end (1/S(s, d, t)) in the near detector. The mean responses of the strip endsvary by approximately 29% from the detector average. The statistical variation inthe calibration values determined with each data set is on the order of 2.1%. Themean responses of individual strip ends in the far detector also vary by 30%, withthe calibration values stable to within 4.8%.
5.2.3 Wavelength shifting fiber attenuation correction
Cosmic ray muon data could be used to correct the variation inlight caused byattenuation along the WLS fiber in a scintillator strip. However, it is more accurateto calculate calibration constants from the module mapper measurements describedin Sec. 3.8.1. These data are fit to a double exponential:
A(x) = A1e−x/L1 + A2e
−x/L2 (4)
wherex is the length along the strip andL1, L2 stand for two attenuation lengths.A fit is performed for each strip and the resulting parametersare used to correct thedata.
The attenuation constants were subsequently checked usingthrough-going cosmicray muons. The pulse height from a strip hit by a track is plotted as a function of the
64
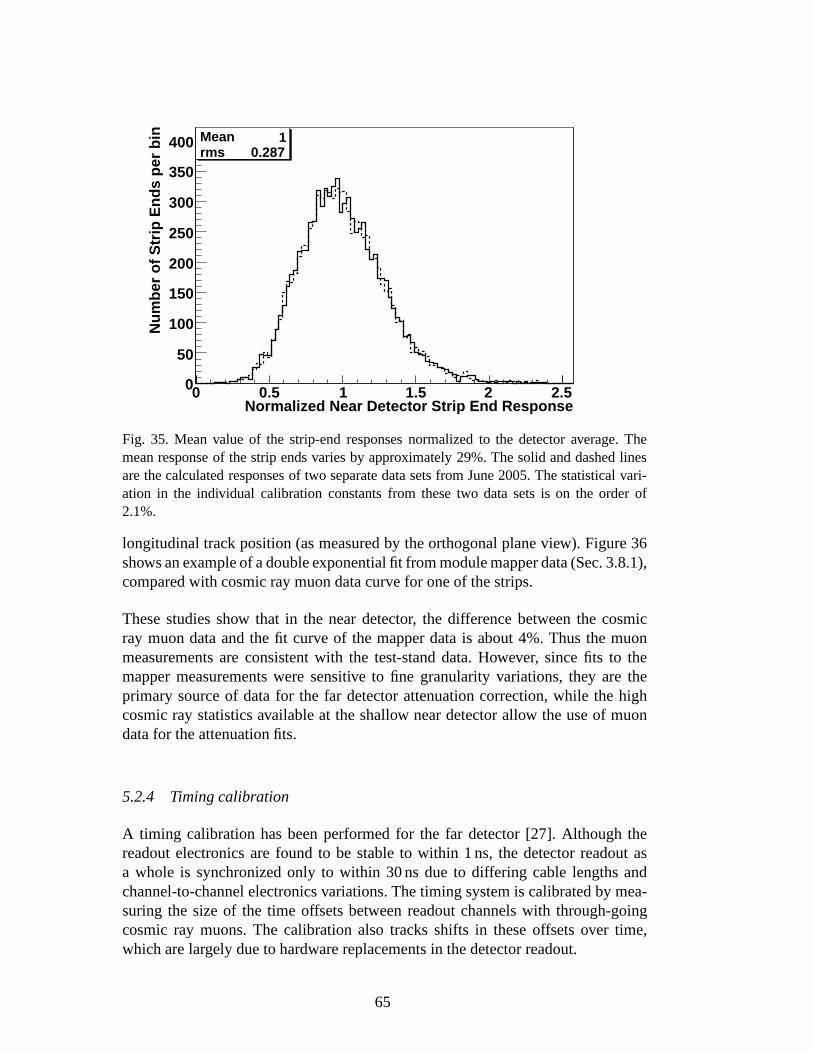
Mean 1rms 0.287
Normalized Near Detector Strip End Response0 0.5 1 1.5 2 2.5
Nu
mb
er o
f S
trip
En
ds
per
bin
0
50
100
150
200
250
300
350
400 Mean 1rms 0.287
Fig. 35. Mean value of the strip-end responses normalized tothe detector average. Themean response of the strip ends varies by approximately 29%.The solid and dashed linesare the calculated responses of two separate data sets from June 2005. The statistical vari-ation in the individual calibration constants from these two data sets is on the order of2.1%.
longitudinal track position (as measured by the orthogonalplane view). Figure 36shows an example of a double exponential fit from module mapper data (Sec. 3.8.1),compared with cosmic ray muon data curve for one of the strips.
These studies show that in the near detector, the differencebetween the cosmicray muon data and the fit curve of the mapper data is about 4%. Thus the muonmeasurements are consistent with the test-stand data. However, since fits to themapper measurements were sensitive to fine granularity variations, they are theprimary source of data for the far detector attenuation correction, while the highcosmic ray statistics available at the shallow near detector allow the use of muondata for the attenuation fits.
5.2.4 Timing calibration
A timing calibration has been performed for the far detector[27]. Although thereadout electronics are found to be stable to within 1 ns, thedetector readout asa whole is synchronized only to within 30 ns due to differing cable lengths andchannel-to-channel electronics variations. The timing system is calibrated by mea-suring the size of the time offsets between readout channelswith through-goingcosmic ray muons. The calibration also tracks shifts in these offsets over time,which are largely due to hardware replacements in the detector readout.
65
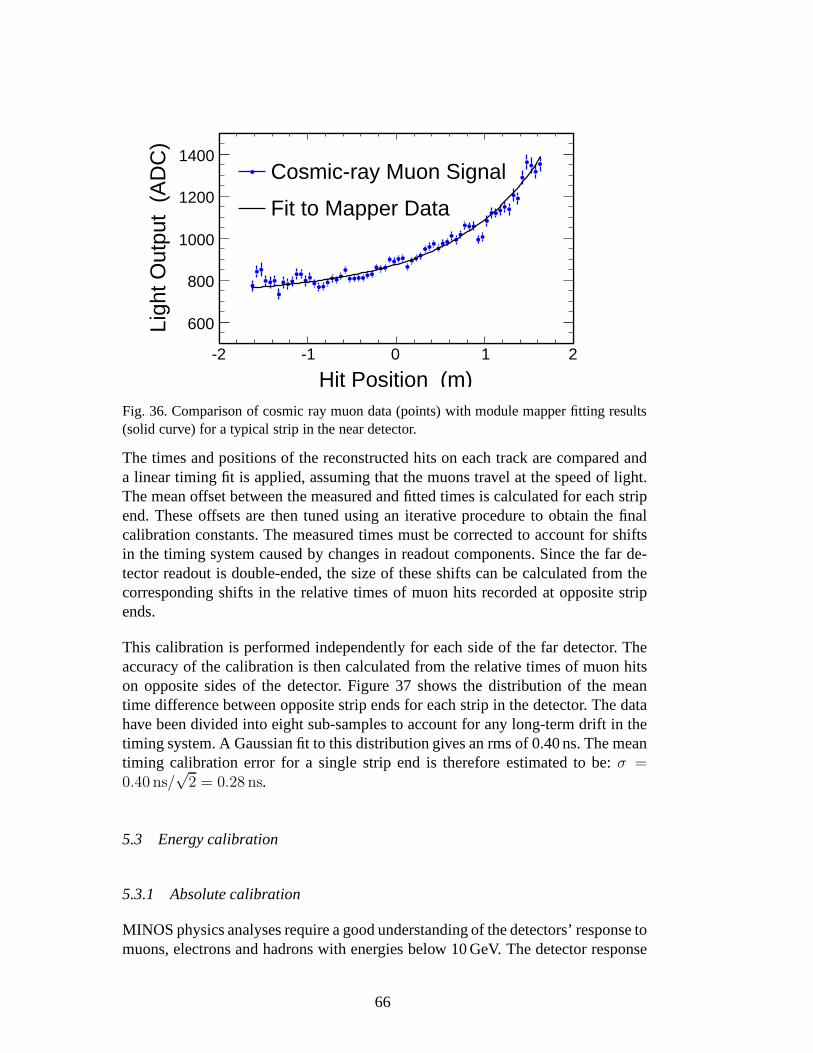
Hit Position (m)-2 -1 0 1 2
Ligh
t Out
put
(AD
C)
600
800
1000
1200
1400Cosmic-ray Muon Signal
Fit to Mapper Data
Fig. 36. Comparison of cosmic ray muon data (points) with module mapper fitting results(solid curve) for a typical strip in the near detector.
The times and positions of the reconstructed hits on each track are compared anda linear timing fit is applied, assuming that the muons travelat the speed of light.The mean offset between the measured and fitted times is calculated for each stripend. These offsets are then tuned using an iterative procedure to obtain the finalcalibration constants. The measured times must be corrected to account for shiftsin the timing system caused by changes in readout components. Since the far de-tector readout is double-ended, the size of these shifts canbe calculated from thecorresponding shifts in the relative times of muon hits recorded at opposite stripends.
This calibration is performed independently for each side of the far detector. Theaccuracy of the calibration is then calculated from the relative times of muon hitson opposite sides of the detector. Figure 37 shows the distribution of the meantime difference between opposite strip ends for each strip in the detector. The datahave been divided into eight sub-samples to account for any long-term drift in thetiming system. A Gaussian fit to this distribution gives an rms of 0.40 ns. The meantiming calibration error for a single strip end is thereforeestimated to be:σ =0.40 ns/
√2 = 0.28 ns.
5.3 Energy calibration
5.3.1 Absolute calibration
MINOS physics analyses require a good understanding of the detectors’ response tomuons, electrons and hadrons with energies below 10 GeV. Thedetector response
66
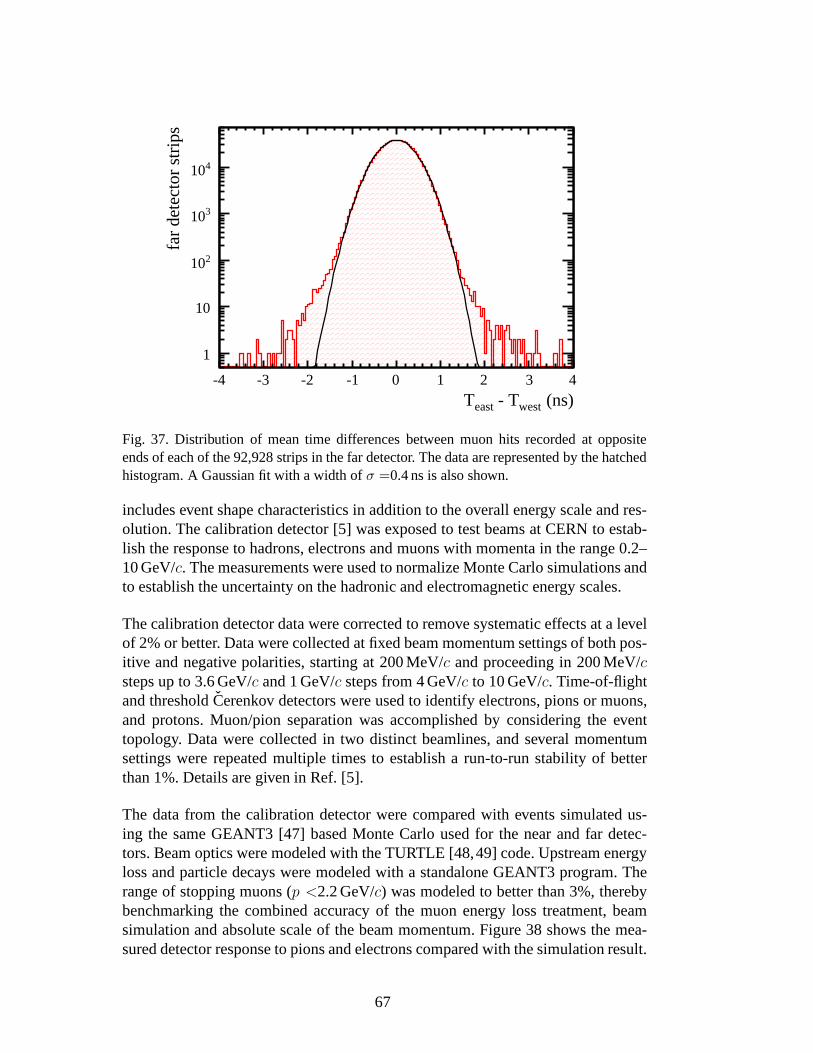
(ns)west - TeastT-4 -3 -2 -1 0 1 2 3 4
far
dete
ctor
str
ips
1
10
210
310
410
Fig. 37. Distribution of mean time differences between muonhits recorded at oppositeends of each of the 92,928 strips in the far detector. The dataare represented by the hatchedhistogram. A Gaussian fit with a width ofσ =0.4 ns is also shown.
includes event shape characteristics in addition to the overall energy scale and res-olution. The calibration detector [5] was exposed to test beams at CERN to estab-lish the response to hadrons, electrons and muons with momenta in the range 0.2–10 GeV/c. The measurements were used to normalize Monte Carlo simulations andto establish the uncertainty on the hadronic and electromagnetic energy scales.
The calibration detector data were corrected to remove systematic effects at a levelof 2% or better. Data were collected at fixed beam momentum settings of both pos-itive and negative polarities, starting at 200 MeV/c and proceeding in 200 MeV/csteps up to 3.6 GeV/c and 1 GeV/c steps from 4 GeV/c to 10 GeV/c. Time-of-flightand thresholdCerenkov detectors were used to identify electrons, pions or muons,and protons. Muon/pion separation was accomplished by considering the eventtopology. Data were collected in two distinct beamlines, and several momentumsettings were repeated multiple times to establish a run-to-run stability of betterthan 1%. Details are given in Ref. [5].
The data from the calibration detector were compared with events simulated us-ing the same GEANT3 [47] based Monte Carlo used for the near and far detec-tors. Beam optics were modeled with the TURTLE [48,49] code.Upstream energyloss and particle decays were modeled with a standalone GEANT3 program. Therange of stopping muons (p <2.2 GeV/c) was modeled to better than 3%, therebybenchmarking the combined accuracy of the muon energy loss treatment, beamsimulation and absolute scale of the beam momentum. Figure 38 shows the mea-sured detector response to pions and electrons compared with the simulation result.
67

0
5
10 data 0.6 GeV/c
data 1.6 GeV/c
data 3.0 GeV/c
MC
π
0 100 200
0
5
10
15
e
calorimeter signal (a.u.)
% e
vent
s / b
in
Fig. 38. MINOS calorimetric response to pions and electronsat three momenta. Thecalorimeter-signal scale is in arbitrary units. The data (open symbols), obtained from thecalibration detector exposure to CERN test beams, are compared to distributions fromMonte Carlo simulations.
The simulated detector response to electrons agreed with the data to better than2% [50]. Pion and proton induced showers were compared with events simulatedusing the GHEISHA, GEANT-FLUKA [51] and GCALOR [52] shower codes. TheGCALOR-based simulation was in best agreement with the dataand was adopted asthe default shower code. The Monte Carlo reproduces the response to pion and pro-ton induced showers to better than 6% at all momentum settings [53]. The energyresolution was adequately reproduced by the simulation andmay be parametrizedas56%/
√E⊕2% for hadron showers and21.4%/
√E⊕4%/E for electrons, where
E is expressed in GeV.
68

5.3.2 Inter-detector calibration
The 6% accuracy of the calibration detector hadronic energymeasurement ap-proaches the experiment’s design goal of establishing the absolute energy scaleto within 5%. The purpose of this section is to describe the transfer of this absoluteenergy scale calibration to the near and far detectors.
The calibration procedures outlined in Sections 5.1 and 5.2are designed to producetemporally and spatially uniform detector responses. A relative calibration is thennecessary to normalize the energy scales at the near, far andcalibration detectors tobe the same to within the 2% goal. Stopping muons are used for this task becausethey are abundant enough at all detectors and their energy depositions in each planecan be accurately determined from range measurements.
The energy loss of a muon by ionization is described by the Bethe-Bloch equa-tion, which determines changes with muon momentum as shown in Fig. 39. Tomeasure the responses of the detectors it is necessary to know the momentum ofthe muons used in the calibration. The momentum-range relations provide the sim-plest and most accurate technique to determine the momentumof stopping muons,with momentum from muon curvature in the detectors’ magnetic fields serving asa secondary measurement (see Sec. 2.4.1).
Muon momentum (GeV/c)0 0.2 0.4 0.6 0.8 1 1.2 1.4 1.6 1.8 2
/g)
2S
top
pin
g p
ow
er (
MeV
cm
1.9
1.95
2
2.05
2.1
2.15
2.2
2.25
2.3
Bethe-Bloch
Monte Carlo
Data
Fig. 39. Stopping power for muons. The gray line shows the Bethe-Bloch calculation ofthe stopping power for muons in polystyrene scintillator. The solid circles and open trian-gles show the response of stopping muons in the far detector data and GEANT3 MonteCarlo simulations respectively. Both data and Monte Carlo points have been normalized tothe Bethe-Bloch calculation to give the expected stopping power at the minimum ionizingpoint.
69
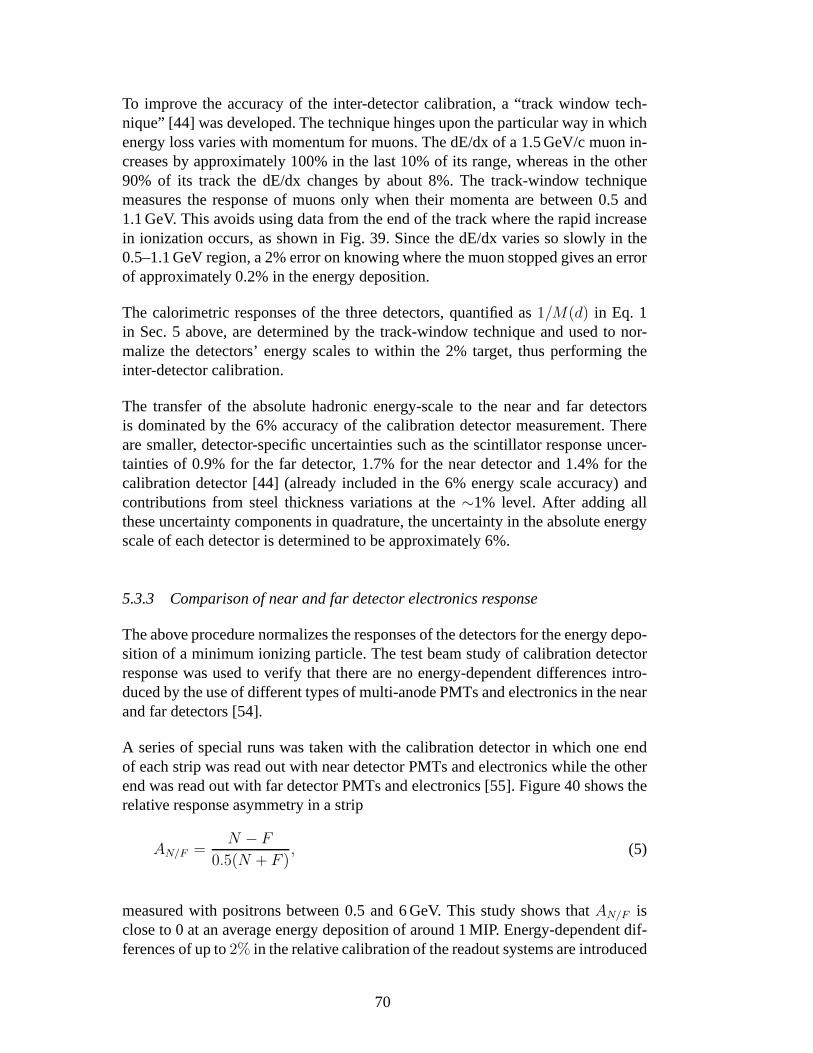
To improve the accuracy of the inter-detector calibration,a “track window tech-nique” [44] was developed. The technique hinges upon the particular way in whichenergy loss varies with momentum for muons. The dE/dx of a 1.5GeV/c muon in-creases by approximately 100% in the last 10% of its range, whereas in the other90% of its track the dE/dx changes by about 8%. The track-window techniquemeasures the response of muons only when their momenta are between 0.5 and1.1 GeV. This avoids using data from the end of the track wherethe rapid increasein ionization occurs, as shown in Fig. 39. Since the dE/dx varies so slowly in the0.5–1.1 GeV region, a 2% error on knowing where the muon stopped gives an errorof approximately 0.2% in the energy deposition.
The calorimetric responses of the three detectors, quantified as1/M(d) in Eq. 1in Sec. 5 above, are determined by the track-window technique and used to nor-malize the detectors’ energy scales to within the 2% target,thus performing theinter-detector calibration.
The transfer of the absolute hadronic energy-scale to the near and far detectorsis dominated by the 6% accuracy of the calibration detector measurement. Thereare smaller, detector-specific uncertainties such as the scintillator response uncer-tainties of 0.9% for the far detector, 1.7% for the near detector and 1.4% for thecalibration detector [44] (already included in the 6% energy scale accuracy) andcontributions from steel thickness variations at the∼1% level. After adding allthese uncertainty components in quadrature, the uncertainty in the absolute energyscale of each detector is determined to be approximately 6%.
5.3.3 Comparison of near and far detector electronics response
The above procedure normalizes the responses of the detectors for the energy depo-sition of a minimum ionizing particle. The test beam study ofcalibration detectorresponse was used to verify that there are no energy-dependent differences intro-duced by the use of different types of multi-anode PMTs and electronics in the nearand far detectors [54].
A series of special runs was taken with the calibration detector in which one endof each strip was read out with near detector PMTs and electronics while the otherend was read out with far detector PMTs and electronics [55].Figure 40 shows therelative response asymmetry in a strip
AN/F =N − F
0.5(N + F ), (5)
measured with positrons between 0.5 and 6 GeV. This study shows thatAN/F isclose to 0 at an average energy deposition of around 1 MIP. Energy-dependent dif-ferences of up to2% in the relative calibration of the readout systems are introduced
70
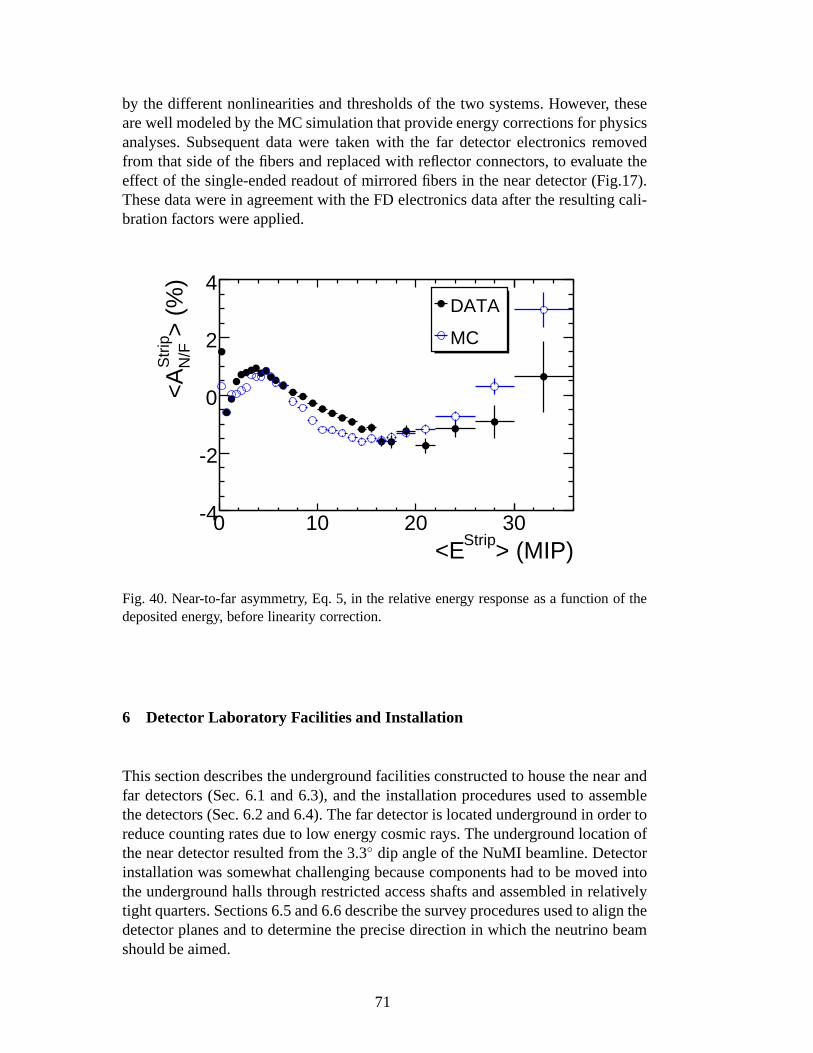
by the different nonlinearities and thresholds of the two systems. However, theseare well modeled by the MC simulation that provide energy corrections for physicsanalyses. Subsequent data were taken with the far detector electronics removedfrom that side of the fibers and replaced with reflector connectors, to evaluate theeffect of the single-ended readout of mirrored fibers in the near detector (Fig.17).These data were in agreement with the FD electronics data after the resulting cali-bration factors were applied.
> (MIP)Strip<E0 10 20 30
> (
%)
Str
ipN
/F<
A
-4
-2
0
2
4DATA
MC
Fig. 40. Near-to-far asymmetry, Eq. 5, in the relative energy response as a function of thedeposited energy, before linearity correction.
6 Detector Laboratory Facilities and Installation
This section describes the underground facilities constructed to house the near andfar detectors (Sec. 6.1 and 6.3), and the installation procedures used to assemblethe detectors (Sec. 6.2 and 6.4). The far detector is locatedunderground in order toreduce counting rates due to low energy cosmic rays. The underground location ofthe near detector resulted from the 3.3◦ dip angle of the NuMI beamline. Detectorinstallation was somewhat challenging because componentshad to be moved intothe underground halls through restricted access shafts andassembled in relativelytight quarters. Sections 6.5 and 6.6 describe the survey procedures used to align thedetector planes and to determine the precise direction in which the neutrino beamshould be aimed.
71
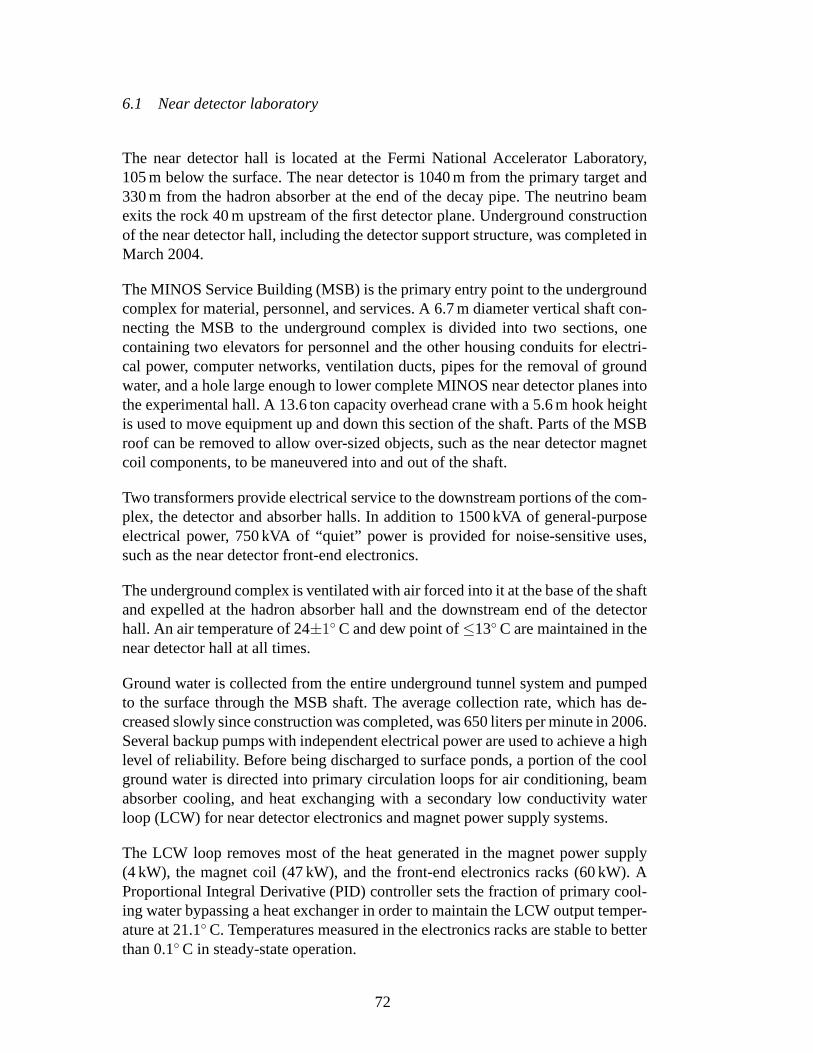
6.1 Near detector laboratory
The near detector hall is located at the Fermi National Accelerator Laboratory,105 m below the surface. The near detector is 1040 m from the primary target and330 m from the hadron absorber at the end of the decay pipe. Theneutrino beamexits the rock 40 m upstream of the first detector plane. Underground constructionof the near detector hall, including the detector support structure, was completed inMarch 2004.
The MINOS Service Building (MSB) is the primary entry point to the undergroundcomplex for material, personnel, and services. A 6.7 m diameter vertical shaft con-necting the MSB to the underground complex is divided into two sections, onecontaining two elevators for personnel and the other housing conduits for electri-cal power, computer networks, ventilation ducts, pipes forthe removal of groundwater, and a hole large enough to lower complete MINOS near detector planes intothe experimental hall. A 13.6 ton capacity overhead crane with a 5.6 m hook heightis used to move equipment up and down this section of the shaft. Parts of the MSBroof can be removed to allow over-sized objects, such as the near detector magnetcoil components, to be maneuvered into and out of the shaft.
Two transformers provide electrical service to the downstream portions of the com-plex, the detector and absorber halls. In addition to 1500 kVA of general-purposeelectrical power, 750 kVA of “quiet” power is provided for noise-sensitive uses,such as the near detector front-end electronics.
The underground complex is ventilated with air forced into it at the base of the shaftand expelled at the hadron absorber hall and the downstream end of the detectorhall. An air temperature of 24±1◦ C and dew point of≤13◦ C are maintained in thenear detector hall at all times.
Ground water is collected from the entire underground tunnel system and pumpedto the surface through the MSB shaft. The average collectionrate, which has de-creased slowly since construction was completed, was 650 liters per minute in 2006.Several backup pumps with independent electrical power areused to achieve a highlevel of reliability. Before being discharged to surface ponds, a portion of the coolground water is directed into primary circulation loops forair conditioning, beamabsorber cooling, and heat exchanging with a secondary low conductivity waterloop (LCW) for near detector electronics and magnet power supply systems.
The LCW loop removes most of the heat generated in the magnet power supply(4 kW), the magnet coil (47 kW), and the front-end electronics racks (60 kW). AProportional Integral Derivative (PID) controller sets the fraction of primary cool-ing water bypassing a heat exchanger in order to maintain theLCW output temper-ature at 21.1◦ C. Temperatures measured in the electronics racks are stable to betterthan 0.1◦ C in steady-state operation.
72
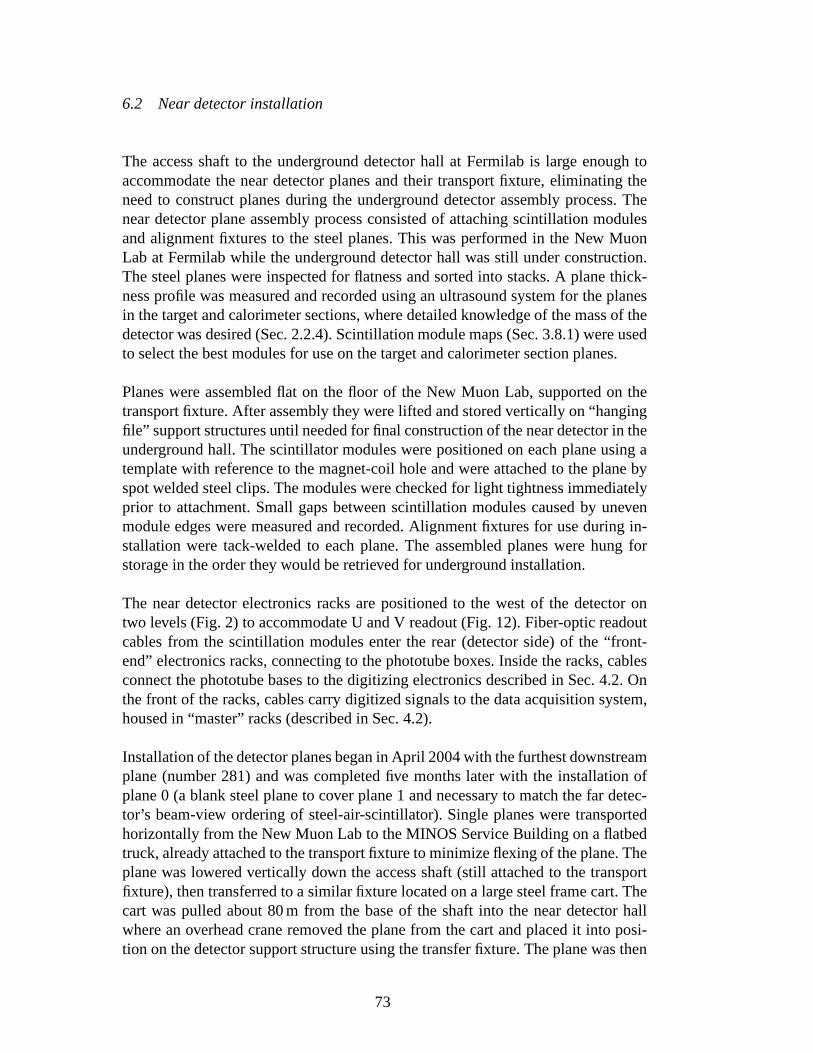
6.2 Near detector installation
The access shaft to the underground detector hall at Fermilab is large enough toaccommodate the near detector planes and their transport fixture, eliminating theneed to construct planes during the underground detector assembly process. Thenear detector plane assembly process consisted of attaching scintillation modulesand alignment fixtures to the steel planes. This was performed in the New MuonLab at Fermilab while the underground detector hall was still under construction.The steel planes were inspected for flatness and sorted into stacks. A plane thick-ness profile was measured and recorded using an ultrasound system for the planesin the target and calorimeter sections, where detailed knowledge of the mass of thedetector was desired (Sec. 2.2.4). Scintillation module maps (Sec. 3.8.1) were usedto select the best modules for use on the target and calorimeter section planes.
Planes were assembled flat on the floor of the New Muon Lab, supported on thetransport fixture. After assembly they were lifted and stored vertically on “hangingfile” support structures until needed for final constructionof the near detector in theunderground hall. The scintillator modules were positioned on each plane using atemplate with reference to the magnet-coil hole and were attached to the plane byspot welded steel clips. The modules were checked for light tightness immediatelyprior to attachment. Small gaps between scintillation modules caused by unevenmodule edges were measured and recorded. Alignment fixturesfor use during in-stallation were tack-welded to each plane. The assembled planes were hung forstorage in the order they would be retrieved for undergroundinstallation.
The near detector electronics racks are positioned to the west of the detector ontwo levels (Fig. 2) to accommodate U and V readout (Fig. 12). Fiber-optic readoutcables from the scintillation modules enter the rear (detector side) of the “front-end” electronics racks, connecting to the phototube boxes.Inside the racks, cablesconnect the phototube bases to the digitizing electronics described in Sec. 4.2. Onthe front of the racks, cables carry digitized signals to thedata acquisition system,housed in “master” racks (described in Sec. 4.2).
Installation of the detector planes began in April 2004 withthe furthest downstreamplane (number 281) and was completed five months later with the installation ofplane 0 (a blank steel plane to cover plane 1 and necessary to match the far detec-tor’s beam-view ordering of steel-air-scintillator). Single planes were transportedhorizontally from the New Muon Lab to the MINOS Service Building on a flatbedtruck, already attached to the transport fixture to minimizeflexing of the plane. Theplane was lowered vertically down the access shaft (still attached to the transportfixture), then transferred to a similar fixture located on a large steel frame cart. Thecart was pulled about 80 m from the base of the shaft into the near detector hallwhere an overhead crane removed the plane from the cart and placed it into posi-tion on the detector support structure using the transfer fixture. The plane was then
73
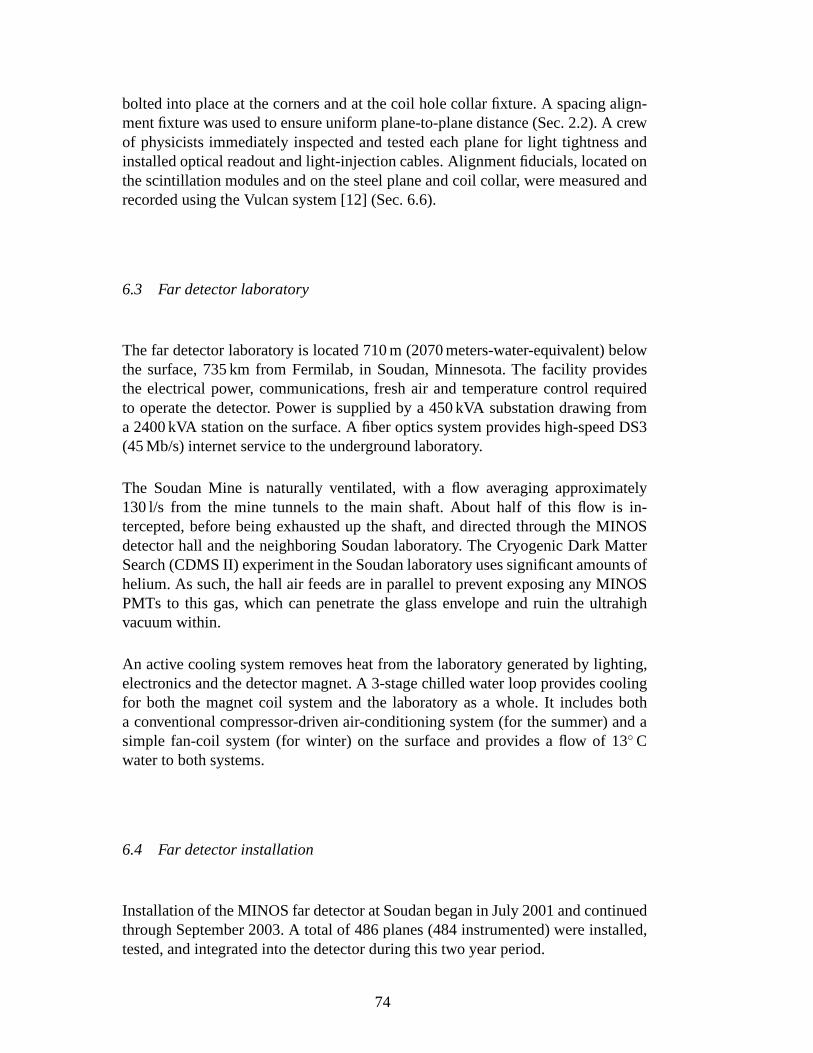
bolted into place at the corners and at the coil hole collar fixture. A spacing align-ment fixture was used to ensure uniform plane-to-plane distance (Sec. 2.2). A crewof physicists immediately inspected and tested each plane for light tightness andinstalled optical readout and light-injection cables. Alignment fiducials, located onthe scintillation modules and on the steel plane and coil collar, were measured andrecorded using the Vulcan system [12] (Sec. 6.6).
6.3 Far detector laboratory
The far detector laboratory is located 710 m (2070 meters-water-equivalent) belowthe surface, 735 km from Fermilab, in Soudan, Minnesota. Thefacility providesthe electrical power, communications, fresh air and temperature control requiredto operate the detector. Power is supplied by a 450 kVA substation drawing froma 2400 kVA station on the surface. A fiber optics system provides high-speed DS3(45 Mb/s) internet service to the underground laboratory.
The Soudan Mine is naturally ventilated, with a flow averaging approximately130 l/s from the mine tunnels to the main shaft. About half of this flow is in-tercepted, before being exhausted up the shaft, and directed through the MINOSdetector hall and the neighboring Soudan laboratory. The Cryogenic Dark MatterSearch (CDMS II) experiment in the Soudan laboratory uses significant amounts ofhelium. As such, the hall air feeds are in parallel to preventexposing any MINOSPMTs to this gas, which can penetrate the glass envelope and ruin the ultrahighvacuum within.
An active cooling system removes heat from the laboratory generated by lighting,electronics and the detector magnet. A 3-stage chilled water loop provides coolingfor both the magnet coil system and the laboratory as a whole.It includes botha conventional compressor-driven air-conditioning system (for the summer) and asimple fan-coil system (for winter) on the surface and provides a flow of 13◦ Cwater to both systems.
6.4 Far detector installation
Installation of the MINOS far detector at Soudan began in July 2001 and continuedthrough September 2003. A total of 486 planes (484 instrumented) were installed,tested, and integrated into the detector during this two year period.
74

6.4.1 Logistics
The logistics of bringing equipment, personnel and materials to build the MINOSdetector to the underground detector hall at Soudan presented a significant chal-lenge. It was especially important to mesh the delivery schedules of the steel and thescintillator modules, as these materials comprise the bulkof the detector and pre-sented most stringent demands for storage and handling. Generally, about 55 planesworth of these materials could be stored in a facility on the surface at Soudan. Ev-erything going into the Soudan Underground Laboratory mustbe transported downa relatively small shaft dating to the days of iron mining. Equipment and personnelare transported in cages that run on rails down the mine shaft, which is inclinedby 12◦ with respect to the vertical. The length of objects that can be moved un-derground is limited by the size of the cages and by the dimensions of the shaftstations on the surface and underground. The shaft size limits transverse dimen-sions to slightly over 2 m, while the lift capacity of the hoist system limits cageloads to no more than 5.5 metric tons.
Steel was lowered in bundles of four plates. Each bundle was 8m long and con-tained all the pieces for either a top or bottom layer of a double layer single plane.Upon reaching the shaft bottom, the steel bundle was transferred to a monorailfor transport to storage racks adjacent to the plane assembly area. The scintillatormodules, still housed in their 9 m long shipping crates (the length limit of the hoistsystem), were transported down the shaft in a manner similarto the steel. Onceunderground the crates were transferred to specially-designed carts and movedto a storage area near the module mapping table. In total, thedetector comprises5,400 metric tons of steel and 4,040 scintillator modules.
6.4.2 Scintillator module tests
Although the modules were tested and mapped with a radioactive source at thefactory, additional tests were done at Soudan to ensure thatthey had incurred nodamage in shipping, e.g. light leaks or broken fibers. The modules were foundto be very robust. In the initial stages of detector construction, all modules weretested for light leaks and re-mapped (Sec. 3.8.1) at Soudan.As very few modulesshowed any significant change in response from their factorymapping, eventuallyshipments were checked by re-mapping only a few randomly-selected modules. Anexception to this shortened testing occurred when there wasreason to believe thatdamage may have been incurred. Before being installed on a plane, each modulewas checked for light tightness and repaired in the rare event of light leaks beingfound.
75
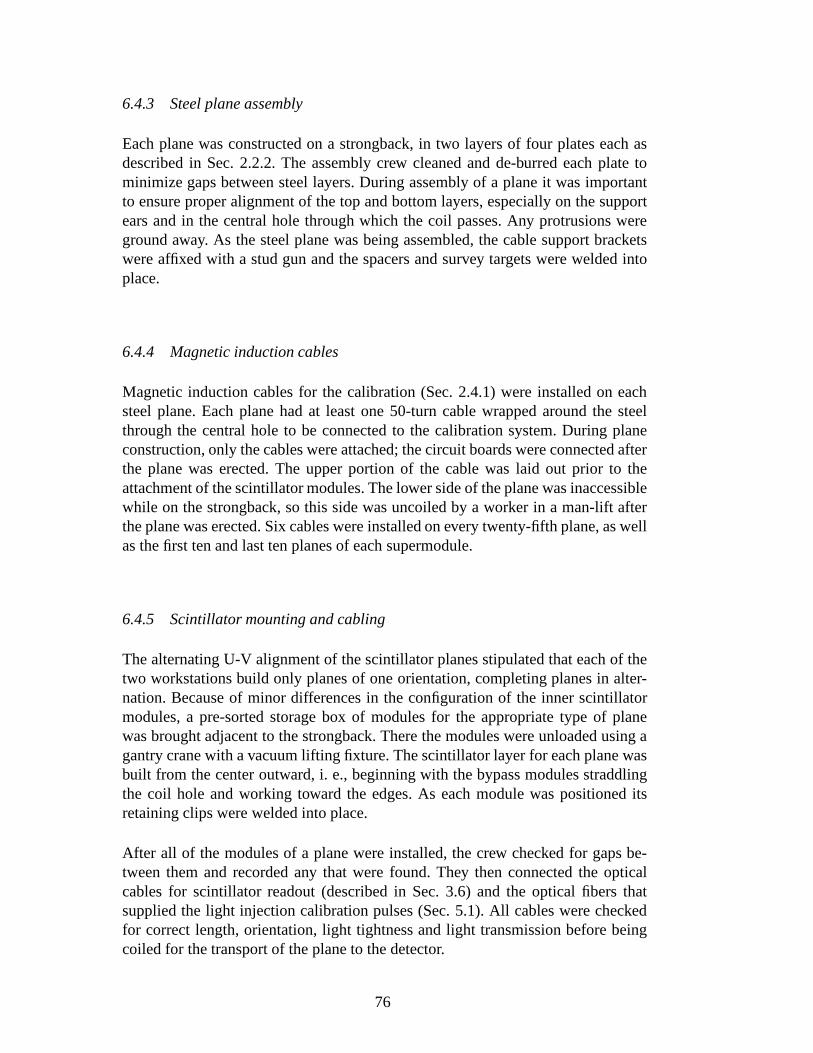
6.4.3 Steel plane assembly
Each plane was constructed on a strongback, in two layers of four plates each asdescribed in Sec. 2.2.2. The assembly crew cleaned and de-burred each plate tominimize gaps between steel layers. During assembly of a plane it was importantto ensure proper alignment of the top and bottom layers, especially on the supportears and in the central hole through which the coil passes. Any protrusions wereground away. As the steel plane was being assembled, the cable support bracketswere affixed with a stud gun and the spacers and survey targetswere welded intoplace.
6.4.4 Magnetic induction cables
Magnetic induction cables for the calibration (Sec. 2.4.1)were installed on eachsteel plane. Each plane had at least one 50-turn cable wrapped around the steelthrough the central hole to be connected to the calibration system. During planeconstruction, only the cables were attached; the circuit boards were connected afterthe plane was erected. The upper portion of the cable was laidout prior to theattachment of the scintillator modules. The lower side of the plane was inaccessiblewhile on the strongback, so this side was uncoiled by a workerin a man-lift afterthe plane was erected. Six cables were installed on every twenty-fifth plane, as wellas the first ten and last ten planes of each supermodule.
6.4.5 Scintillator mounting and cabling
The alternating U-V alignment of the scintillator planes stipulated that each of thetwo workstations build only planes of one orientation, completing planes in alter-nation. Because of minor differences in the configuration ofthe inner scintillatormodules, a pre-sorted storage box of modules for the appropriate type of planewas brought adjacent to the strongback. There the modules were unloaded using agantry crane with a vacuum lifting fixture. The scintillatorlayer for each plane wasbuilt from the center outward, i. e., beginning with the bypass modules straddlingthe coil hole and working toward the edges. As each module waspositioned itsretaining clips were welded into place.
After all of the modules of a plane were installed, the crew checked for gaps be-tween them and recorded any that were found. They then connected the opticalcables for scintillator readout (described in Sec. 3.6) andthe optical fibers thatsupplied the light injection calibration pulses (Sec. 5.1). All cables were checkedfor correct length, orientation, light tightness and lighttransmission before beingcoiled for the transport of the plane to the detector.
76
6.4.6 Plane installation and survey
After a plane was assembled and tested it was ready to be rigged for lifting andtransport to the detector support rails. The strongback clamps were engaged and aspreader bar attached to the strongback. For safety, the assembly area and the areathrough which the plane would travel were cleared of all personnel. The plane andstrongback were lifted with an overhead bridge crane and transported to the faceof the detector. There the crew positioned it and balanced the strongback with leadbricks to ensure that both ears sat down on the rails at the same time. Although aset of steel spacers was welded to the ears of the plane, it wasimportant to avoidjolting the scintillator face into the detector as the planewas eased into position.Once the plane was resting on the rails, 6 of the 8 axial rod bolts were installedand the plane was shimmed if necessary. Then the strongback was released andreturned to the assembly area. With the strongback out of theway, the crew useda man-lift to install the remaining axial bolts, unroll and affix the “bottom-side”magnetic induction cable, install the collar, and survey the installation (Sec. 6.6).
6.4.7 Optical connections and testing
Cabling for the newly-installed plane included connectingthe readout cables tothe MUX boxes (Sec. 3.5.2), routing the light-injection fibers to their distributionbox, and connecting the circuit board(s) to the magnetic induction cable(s). Theelectronics installation proceeded in phase with the planeinstallation. This timelycommissioning led to cosmic-ray data being routinely used for plane diagnosticpurposes within a few days of plane installation. In no case was a scintillator mod-ule damaged during installation, although occasional light leaks were found and re-paired. All 92,928 WLS fibers in the completed detector are inoperation, althougha very small number have only single-ended readout.
6.5 Far detector location
The success of the MINOS experiment depends on the accurate aiming of the neu-trino beam at the far detector. The origin of the detector coordinate system is theupstream edge of the far detector. This lies 15.631 m upstream from the midpointbetween the detector’s two supermodules. That midpoint wassurveyed and deter-mined to be located at latitude 47.820267 degrees north, longitude 92.241412 degreeswest, and ellipsoid height -248.4 m in North American Datum 1983 (NAD 83). Thissurvey point is 705 m below the surface and 735.3380 km from the upstream endof the first horn of the neutrino beamline, which is very closeto the (variable)target longitudinal position. The physics of the MINOS experiment requires thatthe transverse position of the neutrino beam center at the far detector be knownto within 100 m. Over a dozen possible misalignments of neutrino beam elements
77
(e.g., target, focusing horns, decay pipe) must be contained within this tolerance,including the transverse position of the far detector relative to the line of sight fromFermilab. The alignment goal of 12 m was established for thisportion of the totaltolerance; most of this tolerance window comes from the uncertainty in specifyingthe angles of the neutrino beam leaving Fermilab.
The relative positions of Fermilab and Soudan on the surfaceare determined bymaking simultaneous measurements using the GPS satellites. Simultaneous GPSdata at both Fermilab and Soudan were recorded for a total of 26 hours in April 1999.These data plus data from several Continuously Observed Reference Station (CORS)positions were analyzed by Fermilab personnel and independently by the NationalGeodetic Survey (NGS) [56, 57]. The agreement between the NGS result and twomethods of analysis at Fermilab was excellent. The Fermilabto Soudan vector,averaged over the period of the observations used, is known to better than 1 cmhorizontally and 6 cm vertically at 95% confidence level, well within requirements.The differential earth tide effect between Fermilab and Soudan is approximatelythe same as this uncertainty.
The position of the far detector on the 27th level at the bottom of the Soudan Mine,relative to the surface, was determined using inertial survey by the University ofCalgary in April 1999. The inertial survey unit used (Honeywell Laseref III IMU)contains a triad of accelerometers and optical gyroscopes to measure force and an-gular velocity. The accelerometers are double-integratedto yield position changealong each of the three axes [58]. Independent calibration measurements with theinertial survey unit and the internal consistency of several inertial survey runs in-dicated a precision of 0.7 m per coordinate for the surface tobottom of the minemeasurement, only a small part of the 12 m goal. Interestingly, these measurementsagreed to better than 4 m per coordinate with the miners’ 1962(and thought to beless precise) values for the 27th level relative to the surface.
A partial check of the critical beam angles at Fermilab was made during commis-sioning before the target was installed [59]. The proton beam was sent 723 m pastthe target position and measured to be within 0.02 m transverse of the specifiedbeam axis at the downstream end of the decay pipe. This check depends on opticalsurvey measurements. At 735.3379 km, this beam line would then be within 20 mtransverse of the far detector, confirming that the beam pointing was within a fac-tor of two of the desired precision of 12 m and considerably less than the 100 mrequirement.
The far detector and cavern axes are level and at an azimuth of333.4452◦ (26.5548◦
west of true north). These angles were measured with opticallevels (better than5 microradian accuracy) and a gyro-theodolite (15 microradians accuracy). The lat-ter is a precision theodolite combined with an accurate gyrocompass. The neutrinobeam axis at the far detector is at an azimuth of 333.2870◦ and is sloped up at anangle of 3.2765◦ above the horizontal as the beam travels approximately NNW.
78
6.6 Detector alignment
The large size of the far detector planes and the potential for mechanical instabilitymade its survey particularly important. The alignment of the collars on every planewas also essential to allow the insertion of the magnet coil sleeve, a copper tubewhich passes through 249 (237) planes in the first (second) supermodule. The mea-surements on each plane had to be made quickly so as not to delay installation of thenext plane. Furthermore, the retention of a professional survey crew in the Soudanunderground mine would have been cost-prohibitive. These criteria motivated theselection of the Vulcan Spatial Measurement System [12], which was capable ofmillimeter-level precision. The system allowed an experienced technician to sur-vey an entire plane within 30 minutes and could be operated effectively with onlya few hours training. Under these field conditions, the Vulcan system achieved aspatial measurement accuracy of about 3 mm.
During construction, after every plane was installed but before the installation of thenext plane, Vulcan measurements were made on its eight axialbolts and eight collarbolts. In addition, on every fifth plane, similar survey measurements were made onthe eight steel lugs welded to points on the perimeter of the plane. These lugsare visible after the erection of subsequent planes. These measurements helped toprevent “creeping” of the detector plane positions and alsoestablished the averageplane-to-plane pitch of 5.95 cm with a standard deviation of0.35 cm.
The scintillator modules were also surveyed, using built inalignment pins as ref-erence points. The Vulcan measurements for scintillator modules over the full su-permodule showed that, to within the resolution of the Vulcan, the modules werealigned with each other and with the trueU and V axes within approximately1 mrad. This translates to a deviation of the end of the modulefrom the true axis of2–3 mm, eliminating the need for software rotation corrections during event analy-sis.
The far detector coil comprises loops of cable running through a copper sleeve in-serted through a series of circular collars, so any rotationof the collar from plane toplane does not matter. The near detector, however, employs an aluminum coil com-prising rectangular “planks,” which are inserted through aseries of square collars.The square shape of the near detector collars places limits not only on the allow-able plane-to-plane translation of the collar, but on the rotation as well. While theVulcan was employed for measurements of scintillator modules and axial bolts, itdid not have sufficient precision for the collar alignment. For this task, a team ofFermilab surveyors set up a laser tracker in the near detector hall. Final laser trackermeasurements showed the transverse alignment of collars along the entire length ofthe detector to be within 3 mm, which was sufficient for coil insertion.
The near detector plane spacing was set to the same 5.95 cm pitch as in the far de-
79
tector, using an alignment fixture that was attached to each plane during the instal-lation process. Survey measurements during plane installation found the averageplane-to-plane pitch to be 5.97 cm with a standard deviationof 0.37 cm.
Cosmic-ray muons were used to determine the precise alignment of the far detectorscintillator modules along theU and V axes [60]. This was a one-dimensionalsoftware alignment procedure in which the positions of theU- andV -modules wereadjusted along theV andU axes, respectively. At the underground location of thefar detector, the cosmic-ray flux is insufficient to do a strip-by-strip alignment ina reasonable time. Instead, the relative strip positions are taken from the modulemapper data (Sec. 3.8.1) and combined with the aligned module position to put thestrip positions into the software geometry. A straight lineis fitted to a muon trackusing all the hits except those in the module to be aligned. The difference betweenthat module’s hit position and the projected position from the fit is the residual. Thealignment program then adjusts the position and proceeds tothe next module inthe track. After multiple iterations, the residuals are minimized and those positionsare the accepted ones for the modules. The final far detector alignment fits hadresiduals of 0.75–0.85 mm. The near detector modules were aligned using a similarprocedure, which resulted in residuals of approximately 0.3 mm for the modulesand 1.0 mm for the strips [61].
7 Detector Operation and Performance
As the result of several years of routine data-taking, extensive operational experi-ence has been obtained with the MINOS detector systems. Representative obser-vations are presented here. Section 7.1 summarizes detector performance and reli-ability information. Section 7.2 describes the systems andprocedures used to en-sure data quality and to monitor detector system performance in real time. Finally,Sec. 7.3 gives an overview of the offline software used for detector performancemeasurements and data analysis.
Since the NuMI beam and near detector are located at Fermilabwhile the far de-tector is 735 km north in Soudan, MN, the coordination of experimental operationsis non-trivial. This challenge has been addressed by makingas much of the ex-periment as possible controllable remotely over computer networks. Physicist shiftworkers are present 24 hours/day, 7 days/week in the main MINOS control roomon the 12th floor of Wilson Hall at Fermilab, where both near and far detectors aremonitored and controlled. In addition, the NuMI beam is monitored by the MINOSshift workers but is controlled from the Fermilab accelerator control room. Week-days between the hours of 7:30 and 17:30 US Central Time, fourto five full-timetechnicians are present in the MINOS cavern of the Soudan Underground Labo-ratory, monitoring and controlling the far detector, and, as needed, repairing thedetector subsystems. Both sites have technical support on call for after-hours in-
80

tervention when necessary. Close coordination among the three control rooms hasprovided high detector live times for periods when the beam is in operation (seeSec. 7.1.2).
7.1 Detector reliability and live-time fractions
7.1.1 Near detector
The near detector was commissioned in January 2005. Since then the detector hasbeen kept in an operational state except during extended periods when the beamwas not in operation. The near detector data taking is usually organized into anapproximately 24 hour run sequence, consisting of 210 seconds of calibration runsfollowed by a 24 hour physics run. Excluding periods when thebeam has beenoff, the fraction of time during which the near detector has been in physics datataking mode has averaged above 98.5%. Typically more than 99.95% of the detectorchannels are operational. The small fraction of the lost beam time is due to the dailycalibration runs and infrequent detector maintenance.
Most downtime with beam on is due to maintenance, usually forthe replacementof failed front-end electronics cards. A mean number of 3.5 cards (out of 9,360 to-tal) failed per week before a mass replacement of unreliableon-board fuses wasdone in the summer of 2007. After that, the failure rate dropped to less than a boardper week. The typical intervention to replace a few front-end cards requires ap-proximately one hour of downtime, including the calibration of the replacementchannels.
7.1.2 Far detector
The far detector installation was completed in July 2003 andthe detector has beenrecording cosmic ray and atmospheric-neutrino data since then. By the time thebeam arrived in the spring of 2005, reliable detector operation had become routine.Similar to near detector data taking, a 24 hour run sequence for physics data andcalibrations is also the operational mode at the far detector. The overall live-timefraction in 2005 was 96.7% and has risen to the high 90%’s since. Typically allchannels in the detector are functional, with isolated failures being fixed duringbeam downtime, usually within hours to days of the appearance of the problem.
After the neutrino beam turned on in March 2005 the importantmetric for evaluat-ing experimental performance was the fraction of protons-on-target (“POT”) whilethe far detector was taking good data. The MINOS experiment’s sensitivity is drivenby the statistics of neutrinos observed at the far detector,making it crucial to keepthe far detector operating as much as possible. Since the endof beam commis-sioning in March 2005, the detector has run very smoothly, taking physics data for
81
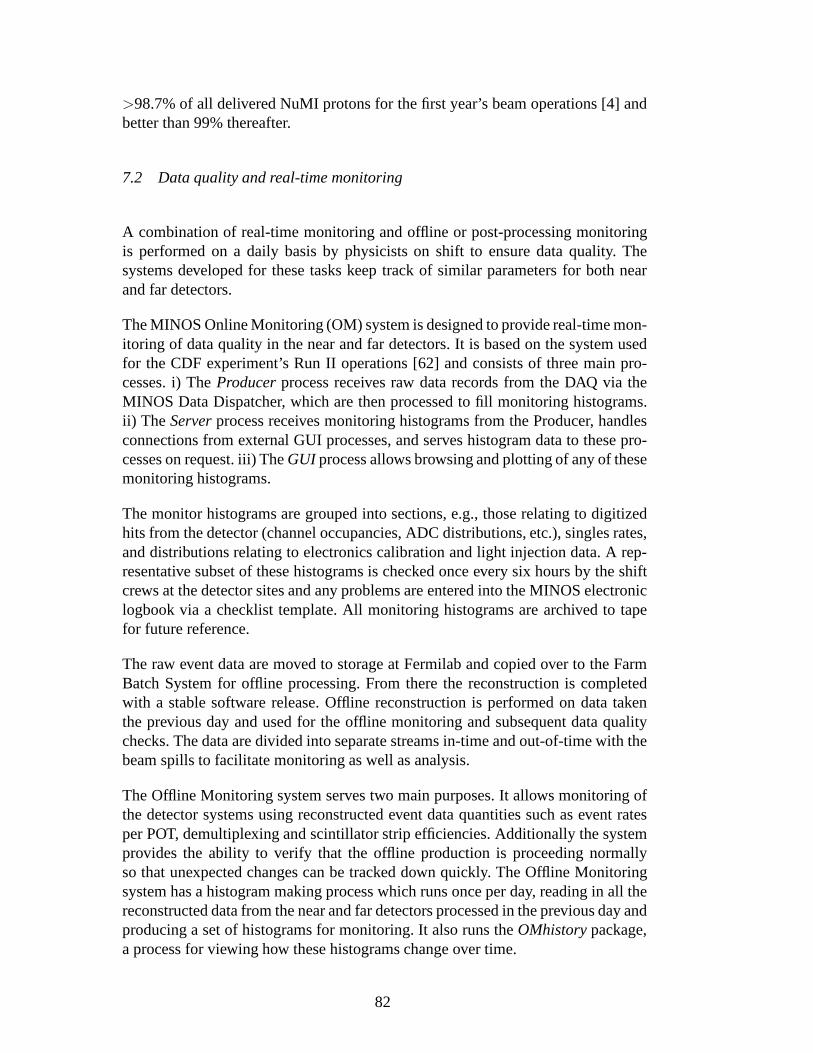
>98.7% of all delivered NuMI protons for the first year’s beam operations [4] andbetter than 99% thereafter.
7.2 Data quality and real-time monitoring
A combination of real-time monitoring and offline or post-processing monitoringis performed on a daily basis by physicists on shift to ensuredata quality. Thesystems developed for these tasks keep track of similar parameters for both nearand far detectors.
The MINOS Online Monitoring (OM) system is designed to provide real-time mon-itoring of data quality in the near and far detectors. It is based on the system usedfor the CDF experiment’s Run II operations [62] and consistsof three main pro-cesses. i) TheProducerprocess receives raw data records from the DAQ via theMINOS Data Dispatcher, which are then processed to fill monitoring histograms.ii) The Serverprocess receives monitoring histograms from the Producer,handlesconnections from external GUI processes, and serves histogram data to these pro-cesses on request. iii) TheGUI process allows browsing and plotting of any of thesemonitoring histograms.
The monitor histograms are grouped into sections, e.g., those relating to digitizedhits from the detector (channel occupancies, ADC distributions, etc.), singles rates,and distributions relating to electronics calibration andlight injection data. A rep-resentative subset of these histograms is checked once every six hours by the shiftcrews at the detector sites and any problems are entered intothe MINOS electroniclogbook via a checklist template. All monitoring histograms are archived to tapefor future reference.
The raw event data are moved to storage at Fermilab and copiedover to the FarmBatch System for offline processing. From there the reconstruction is completedwith a stable software release. Offline reconstruction is performed on data takenthe previous day and used for the offline monitoring and subsequent data qualitychecks. The data are divided into separate streams in-time and out-of-time with thebeam spills to facilitate monitoring as well as analysis.
The Offline Monitoring system serves two main purposes. It allows monitoring ofthe detector systems using reconstructed event data quantities such as event ratesper POT, demultiplexing and scintillator strip efficiencies. Additionally the systemprovides the ability to verify that the offline production isproceeding normallyso that unexpected changes can be tracked down quickly. The Offline Monitoringsystem has a histogram making process which runs once per day, reading in all thereconstructed data from the near and far detectors processed in the previous day andproducing a set of histograms for monitoring. It also runs the OMhistorypackage,a process for viewing how these histograms change over time.
82
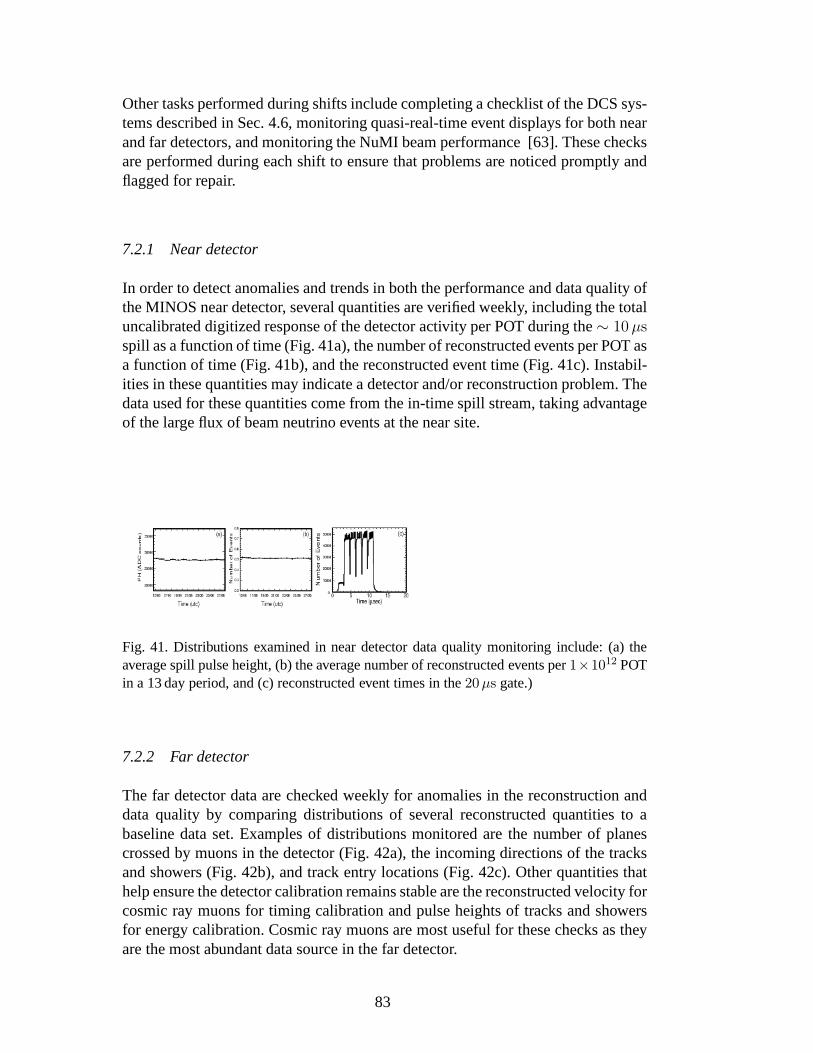
Other tasks performed during shifts include completing a checklist of the DCS sys-tems described in Sec. 4.6, monitoring quasi-real-time event displays for both nearand far detectors, and monitoring the NuMI beam performance[63]. These checksare performed during each shift to ensure that problems are noticed promptly andflagged for repair.
7.2.1 Near detector
In order to detect anomalies and trends in both the performance and data quality ofthe MINOS near detector, several quantities are verified weekly, including the totaluncalibrated digitized response of the detector activity per POT during the∼ 10 µsspill as a function of time (Fig. 41a), the number of reconstructed events per POT asa function of time (Fig. 41b), and the reconstructed event time (Fig. 41c). Instabil-ities in these quantities may indicate a detector and/or reconstruction problem. Thedata used for these quantities come from the in-time spill stream, taking advantageof the large flux of beam neutrino events at the near site.
Fig. 41. Distributions examined in near detector data quality monitoring include: (a) theaverage spill pulse height, (b) the average number of reconstructed events per1×1012 POTin a 13 day period, and (c) reconstructed event times in the20µs gate.)
7.2.2 Far detector
The far detector data are checked weekly for anomalies in thereconstruction anddata quality by comparing distributions of several reconstructed quantities to abaseline data set. Examples of distributions monitored arethe number of planescrossed by muons in the detector (Fig. 42a), the incoming directions of the tracksand showers (Fig. 42b), and track entry locations (Fig. 42c). Other quantities thathelp ensure the detector calibration remains stable are thereconstructed velocity forcosmic ray muons for timing calibration and pulse heights oftracks and showersfor energy calibration. Cosmic ray muons are most useful forthese checks as theyare the most abundant data source in the far detector.
83
Planes Crossed in Track0 100 200 300 400 500
Eve
nts/
1 P
lane
1
10
210
310
410(a)
dz/ds-1 -0.5 0 0.5 1
Eve
nts/
0.02
1
10
210
310
410(b)
(m)vertexTrack z0 5 10 15 20 25 30
Eve
nts/
0.4
m
410
510 (c)
Fig. 42. Distributions examined during far detector data quality monitoring include: (a) thenumber of planes crossed by cosmic ray muon tracks, (b) the incoming direction of thecosmic ray muons with respect to the beam direction and (c) the entry location for cosmicray muons along the length of the detector.
7.3 Offline software overview
Although MINOS comprises three detectors (the near, far andcalibration detectors)at different depths and latitudes and with different sizes,physical configurations,beam characteristics and electronic readout schemes, the simplicity of the activedetector technology has allowed a single framework of offline analysis software tobe constructed for all detectors. The object oriented characteristics of the C++ lan-guage [64] have enabled the modularity required for this task. MINOS software ismade available to collaborators using the Concurrent Versioning System (CVS)21
embedded in the SLAC-Fermilab Software Release Tools (SRT)code managementsystem22 . The system uses software libraries from the CERN ROOT project [40],including ROOT tools for I/O, graphical display, analysis,geometric detector rep-resentation, database access and networking.
Raw data from different data acquisition processes at the MINOS detectors arewritten to disk as separate ROOT TTree “streams.” These include physics eventdata, pulser calibration data, beam monitoring data and detector control data. Thisinformation immediately becomes available for monitoring, calibration and eventdisplay processes through an online data “dispatcher” service. This utility can ac-cess the online ROOT files while they are still open for writing by the MINOSDAQ systems. Subsequent offline processing produces additional TTree streamsfor event reconstruction results and analysis ntuples.
The need to correlate these streams of MINOS data with each other has motivateda key element in the MINOS software strategy calledVldContext(“Validity Con-text”). VldContext is a C++ class that encapsulates information needed to locatea data record in time and space. Separate streams of data fromdifferent sourcescan be synchronized by comparing their VldContext objects.When MINOS offline
21 http://www.nongnu.org/cvs/22 http://www.fnal.gov/docs/products/srt/
84

software opens files containing these streams, it indexes each stream accordingto the VldContext of each record. The indexing information can then be used toput VldContext-matched records into computer memory simultaneously. The GPStimestamps attached to raw data records enable this matching for far and near de-tector data in the same offline job. These features are illustrated in Fig. 43.
All MINOS record types derive from a common record base classwith a headerthat derives from a common header base class. The minimum data content of therecord header is the VldContext, used to associate records on input. The smallrecord header is stored on a separate ROOT TTree Branch from the much largerdata blocks. A MINOS stream is an ordered sequence of recordsstored in a ROOTTTree containing objects of a single record type extending over one or more se-quential files. On input, records stored in different streams are associated with eachother by VldContext and not by Tree index. The default mode isthat records of acommon VldContext form an input record set. Alternative input sequencing modesby VldContext are also supported.������
������� �� �������� ������������ �������� � � ��������������� �� �
!���������""" """"""
#$%&'( )#$%&'( *#$%&'( +,-.. /,-.. 0111111 ,-.. 2345& 6345& 711189: ; 89: <89: =
>>> 111???@&AB%C #&$DEFGH.- D.IJKHL-MIL.:NLMO9.PEQRJKSLJ-Fig. 43. MINOS data structure. The schematic on the left shows a MINOS record typederivation and header structure. The schematic on the rightshows a MINOS stream as anordered sequence of records stored in a ROOT TTree. On input,records stored in differentstreams are associated with each other by VldContext and notby Tree index.
The MINOS offline database contains calibration and survey data, including com-ponent locations and connection maps from the constructionphase of the detector.These relational tables are keyed with a notion of “ValidityRange” or scope of Vld-Context values to which a database record applies. For physics data of a particularVldContext, the offline database interface enables retrieval of matching databaserecords whose Validity Ranges encompass the VldContext of the physics data inquestion.
The offline software accesses the offline database through a low-level ROOT [40]
85
interface, which allows data to be saved to and retrieved from compliant databaseproducts. The central database warehouse is served by MySQL23 and is about100 GB in size. Local distributed databases are in MySQL installations and can besubstantially smaller depending on the local needs. Data inthe distributed MySQLservers are automatically synchronized with the MySQL warehouse through a multiple-master replication scheme.
8 Conclusions
The MINOS far detector has been in continuous operation since July 2003 andthe near detector has been operating since January 2005. Both detectors and theirmagnet coils routinely operate nearly 99% of the time when the neutrino beam ison, with close to 100% of their readout channels working properly.
Cosmic ray muons are used to calibrate the MINOS detectors, correcting for driftsover time, for variation of response over position within a detector, and for differ-ences between detectors. The light injection system monitors the PMT nonlinear-ities and gains. Together, these calibration methods have established the relativenear-far shower energy scale to 2%. The calibration detector test-beam measure-ments have established the shower energy scale to a precision of 6%. With units ofE expressed in GeV, the measured calorimetric energy resolutions of21.4%/
√E⊕
4%/E for electromagnetic showers and56%/√
E ⊕ 2% for hadronic showers arein excellent agreement with predictions.
The far detector time resolution of 2.3 ns is sufficient to give useful time-of-flightinformation for cosmic-ray events, and allows a clean sample of upward-goingmuons (from atmospheric-neutrino interactions in the rockbeneath the detector)to be identified. The near detector time resolution of approximately 5 ns providesa clean separation of neutrino events from different RF buckets within the same8–10µs Main Injector spill. The experiment routinely transmits spill-time infor-mation over the internet from Fermilab to Soudan, allowing areal-time spill gateto be applied (in the trigger software) to far detector neutrino beam data with anuncertainty of< 1 µs.
As of early 2008, the far detector has measured neutrino oscillation parametersfrom atmospheric-neutrino events recorded during its firsttwo years of data tak-ing [25] and higher-energy upward-going muons [65] as charge-seperated samples.The experiment has also accumulated data from more than4 × 1020 Main Injectorprotons on target, less than half of its total expected data sample, and has made itsfirst measurements of∆m2 andsin2 2θ [3, 4]. Thus it has been demonstrated thatthe performance and calibrations of the near and far detectors provide a suitable
23 http://www.mysql.com/
86
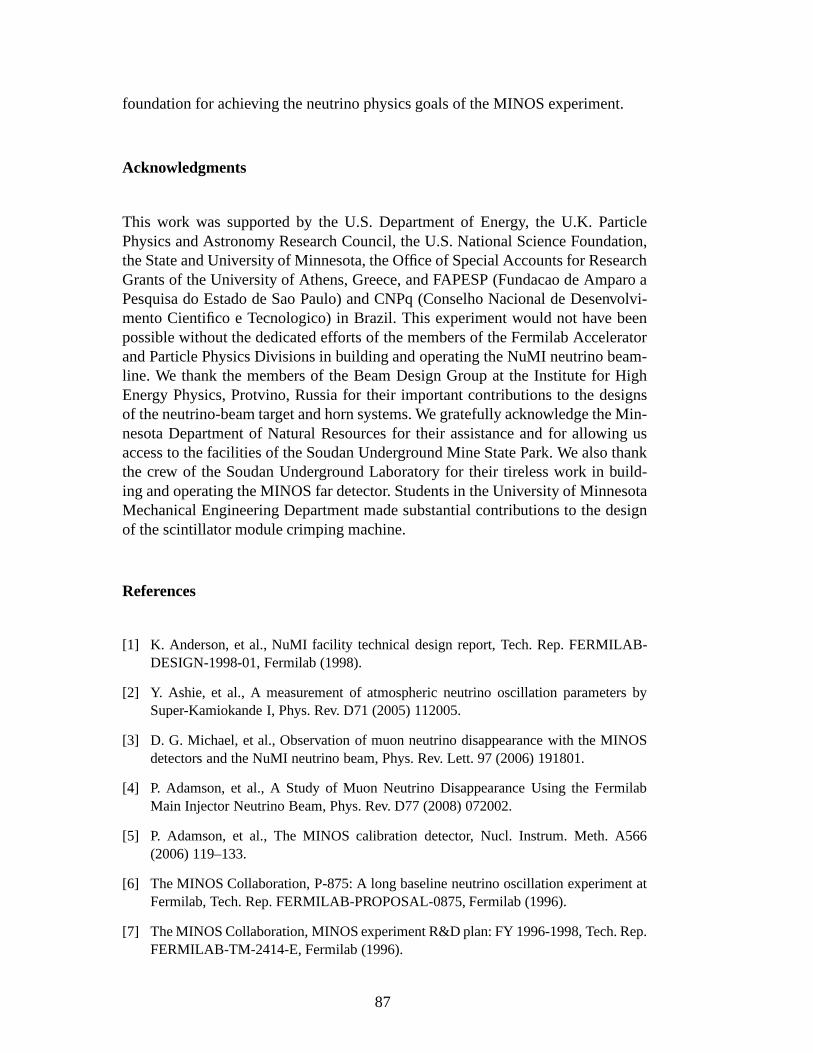
foundation for achieving the neutrino physics goals of the MINOS experiment.
Acknowledgments
This work was supported by the U.S. Department of Energy, theU.K. ParticlePhysics and Astronomy Research Council, the U.S. National Science Foundation,the State and University of Minnesota, the Office of Special Accounts for ResearchGrants of the University of Athens, Greece, and FAPESP (Fundacao de Amparo aPesquisa do Estado de Sao Paulo) and CNPq (Conselho Nacionalde Desenvolvi-mento Cientifico e Tecnologico) in Brazil. This experiment would not have beenpossible without the dedicated efforts of the members of theFermilab Acceleratorand Particle Physics Divisions in building and operating the NuMI neutrino beam-line. We thank the members of the Beam Design Group at the Institute for HighEnergy Physics, Protvino, Russia for their important contributions to the designsof the neutrino-beam target and horn systems. We gratefullyacknowledge the Min-nesota Department of Natural Resources for their assistance and for allowing usaccess to the facilities of the Soudan Underground Mine State Park. We also thankthe crew of the Soudan Underground Laboratory for their tireless work in build-ing and operating the MINOS far detector. Students in the University of MinnesotaMechanical Engineering Department made substantial contributions to the designof the scintillator module crimping machine.
References
[1] K. Anderson, et al., NuMI facility technical design report, Tech. Rep. FERMILAB-DESIGN-1998-01, Fermilab (1998).
[2] Y. Ashie, et al., A measurement of atmospheric neutrino oscillation parameters bySuper-Kamiokande I, Phys. Rev. D71 (2005) 112005.
[3] D. G. Michael, et al., Observation of muon neutrino disappearance with the MINOSdetectors and the NuMI neutrino beam, Phys. Rev. Lett. 97 (2006) 191801.
[4] P. Adamson, et al., A Study of Muon Neutrino Disappearance Using the FermilabMain Injector Neutrino Beam, Phys. Rev. D77 (2008) 072002.
[5] P. Adamson, et al., The MINOS calibration detector, Nucl. Instrum. Meth. A566(2006) 119–133.
[6] The MINOS Collaboration, P-875: A long baseline neutrino oscillation experiment atFermilab, Tech. Rep. FERMILAB-PROPOSAL-0875, Fermilab (1996).
[7] The MINOS Collaboration, MINOS experiment R&D plan: FY 1996-1998, Tech. Rep.FERMILAB-TM-2414-E, Fermilab (1996).
87
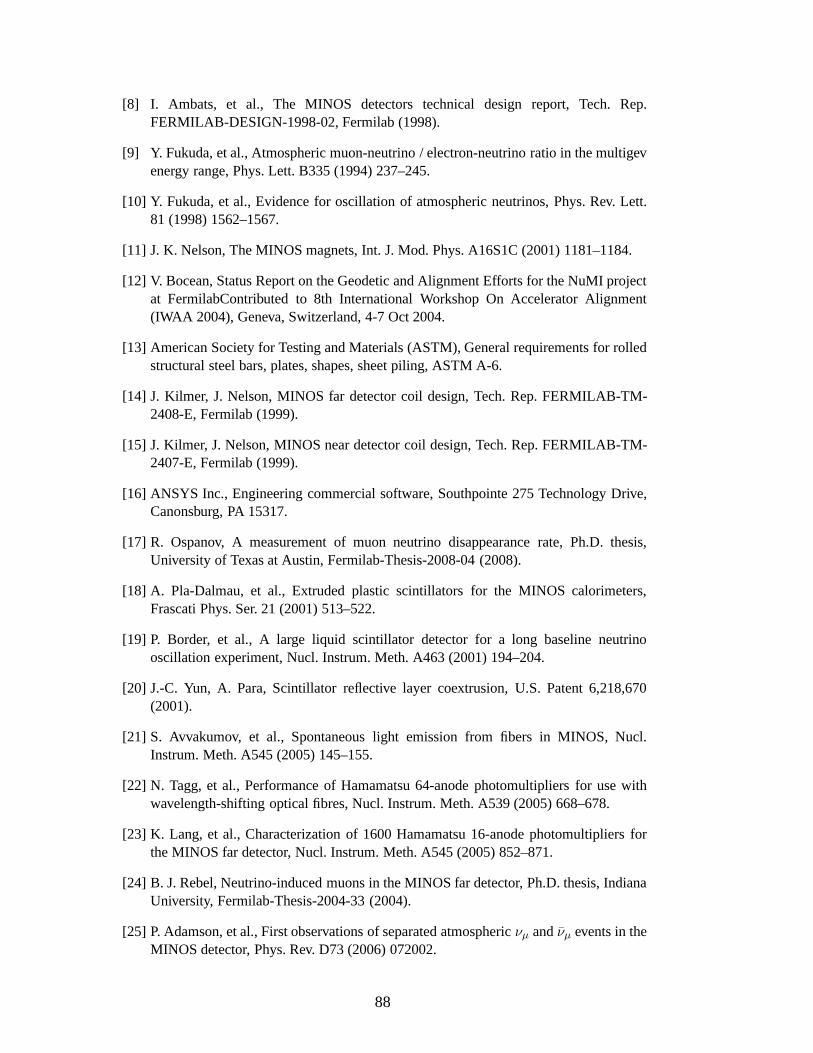
[8] I. Ambats, et al., The MINOS detectors technical design report, Tech. Rep.FERMILAB-DESIGN-1998-02, Fermilab (1998).
[9] Y. Fukuda, et al., Atmospheric muon-neutrino / electron-neutrino ratio in the multigevenergy range, Phys. Lett. B335 (1994) 237–245.
[10] Y. Fukuda, et al., Evidence for oscillation of atmospheric neutrinos, Phys. Rev. Lett.81 (1998) 1562–1567.
[11] J. K. Nelson, The MINOS magnets, Int. J. Mod. Phys. A16S1C (2001) 1181–1184.
[12] V. Bocean, Status Report on the Geodetic and Alignment Efforts for the NuMI projectat FermilabContributed to 8th International Workshop On Accelerator Alignment(IWAA 2004), Geneva, Switzerland, 4-7 Oct 2004.
[13] American Society for Testing and Materials (ASTM), General requirements for rolledstructural steel bars, plates, shapes, sheet piling, ASTM A-6.
[14] J. Kilmer, J. Nelson, MINOS far detector coil design, Tech. Rep. FERMILAB-TM-2408-E, Fermilab (1999).
[15] J. Kilmer, J. Nelson, MINOS near detector coil design, Tech. Rep. FERMILAB-TM-2407-E, Fermilab (1999).
[16] ANSYS Inc., Engineering commercial software, Southpointe 275 Technology Drive,Canonsburg, PA 15317.
[17] R. Ospanov, A measurement of muon neutrino disappearance rate, Ph.D. thesis,University of Texas at Austin, Fermilab-Thesis-2008-04 (2008).
[18] A. Pla-Dalmau, et al., Extruded plastic scintillatorsfor the MINOS calorimeters,Frascati Phys. Ser. 21 (2001) 513–522.
[19] P. Border, et al., A large liquid scintillator detectorfor a long baseline neutrinooscillation experiment, Nucl. Instrum. Meth. A463 (2001) 194–204.
[20] J.-C. Yun, A. Para, Scintillator reflective layer coextrusion, U.S. Patent 6,218,670(2001).
[21] S. Avvakumov, et al., Spontaneous light emission from fibers in MINOS, Nucl.Instrum. Meth. A545 (2005) 145–155.
[22] N. Tagg, et al., Performance of Hamamatsu 64-anode photomultipliers for use withwavelength-shifting optical fibres, Nucl. Instrum. Meth. A539 (2005) 668–678.
[23] K. Lang, et al., Characterization of 1600 Hamamatsu 16-anode photomultipliers forthe MINOS far detector, Nucl. Instrum. Meth. A545 (2005) 852–871.
[24] B. J. Rebel, Neutrino-induced muons in the MINOS far detector, Ph.D. thesis, IndianaUniversity, Fermilab-Thesis-2004-33 (2004).
[25] P. Adamson, et al., First observations of separated atmosphericνµ andνµ events in theMINOS detector, Phys. Rev. D73 (2006) 072002.
88
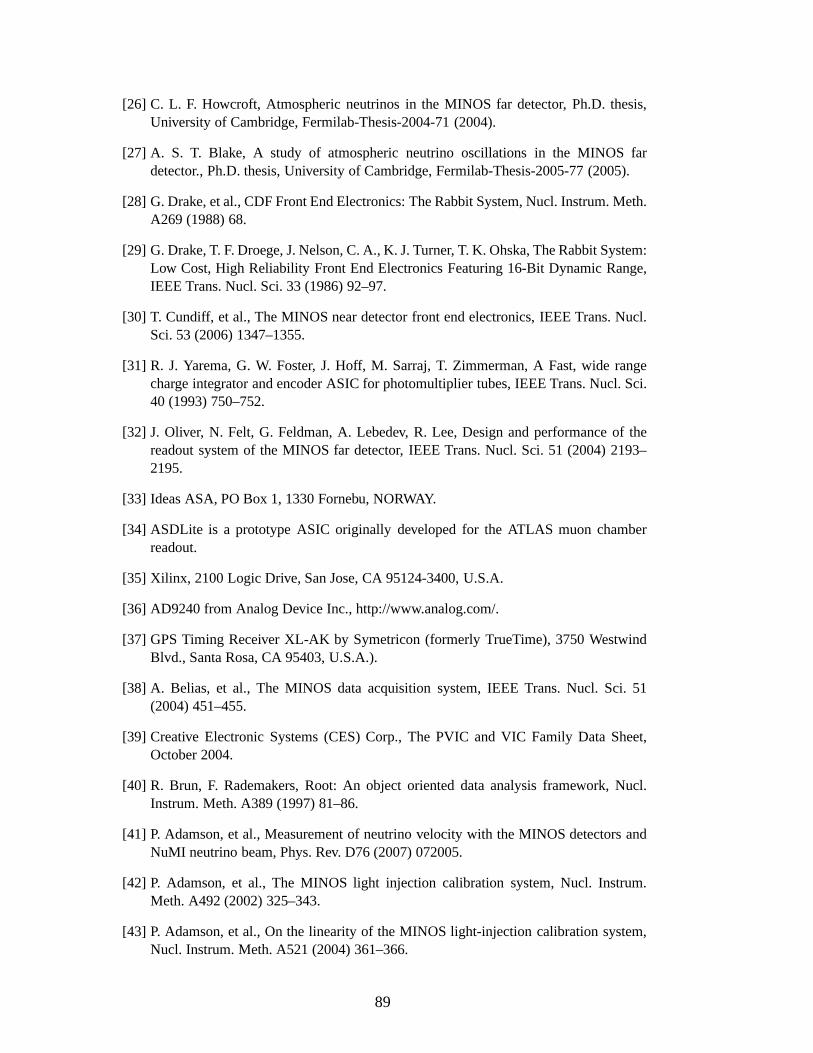
[26] C. L. F. Howcroft, Atmospheric neutrinos in the MINOS far detector, Ph.D. thesis,University of Cambridge, Fermilab-Thesis-2004-71 (2004).
[27] A. S. T. Blake, A study of atmospheric neutrino oscillations in the MINOS fardetector., Ph.D. thesis, University of Cambridge, Fermilab-Thesis-2005-77 (2005).
[28] G. Drake, et al., CDF Front End Electronics: The Rabbit System, Nucl. Instrum. Meth.A269 (1988) 68.
[29] G. Drake, T. F. Droege, J. Nelson, C. A., K. J. Turner, T. K. Ohska, The Rabbit System:Low Cost, High Reliability Front End Electronics Featuring16-Bit Dynamic Range,IEEE Trans. Nucl. Sci. 33 (1986) 92–97.
[30] T. Cundiff, et al., The MINOS near detector front end electronics, IEEE Trans. Nucl.Sci. 53 (2006) 1347–1355.
[31] R. J. Yarema, G. W. Foster, J. Hoff, M. Sarraj, T. Zimmerman, A Fast, wide rangecharge integrator and encoder ASIC for photomultiplier tubes, IEEE Trans. Nucl. Sci.40 (1993) 750–752.
[32] J. Oliver, N. Felt, G. Feldman, A. Lebedev, R. Lee, Design and performance of thereadout system of the MINOS far detector, IEEE Trans. Nucl. Sci. 51 (2004) 2193–2195.
[33] Ideas ASA, PO Box 1, 1330 Fornebu, NORWAY.
[34] ASDLite is a prototype ASIC originally developed for the ATLAS muon chamberreadout.
[35] Xilinx, 2100 Logic Drive, San Jose, CA 95124-3400, U.S.A.
[36] AD9240 from Analog Device Inc., http://www.analog.com/.
[37] GPS Timing Receiver XL-AK by Symetricon (formerly TrueTime), 3750 WestwindBlvd., Santa Rosa, CA 95403, U.S.A.).
[38] A. Belias, et al., The MINOS data acquisition system, IEEE Trans. Nucl. Sci. 51(2004) 451–455.
[39] Creative Electronic Systems (CES) Corp., The PVIC and VIC Family Data Sheet,October 2004.
[40] R. Brun, F. Rademakers, Root: An object oriented data analysis framework, Nucl.Instrum. Meth. A389 (1997) 81–86.
[41] P. Adamson, et al., Measurement of neutrino velocity with the MINOS detectors andNuMI neutrino beam, Phys. Rev. D76 (2007) 072005.
[42] P. Adamson, et al., The MINOS light injection calibration system, Nucl. Instrum.Meth. A492 (2002) 325–343.
[43] P. Adamson, et al., On the linearity of the MINOS light-injection calibration system,Nucl. Instrum. Meth. A521 (2004) 361–366.
89
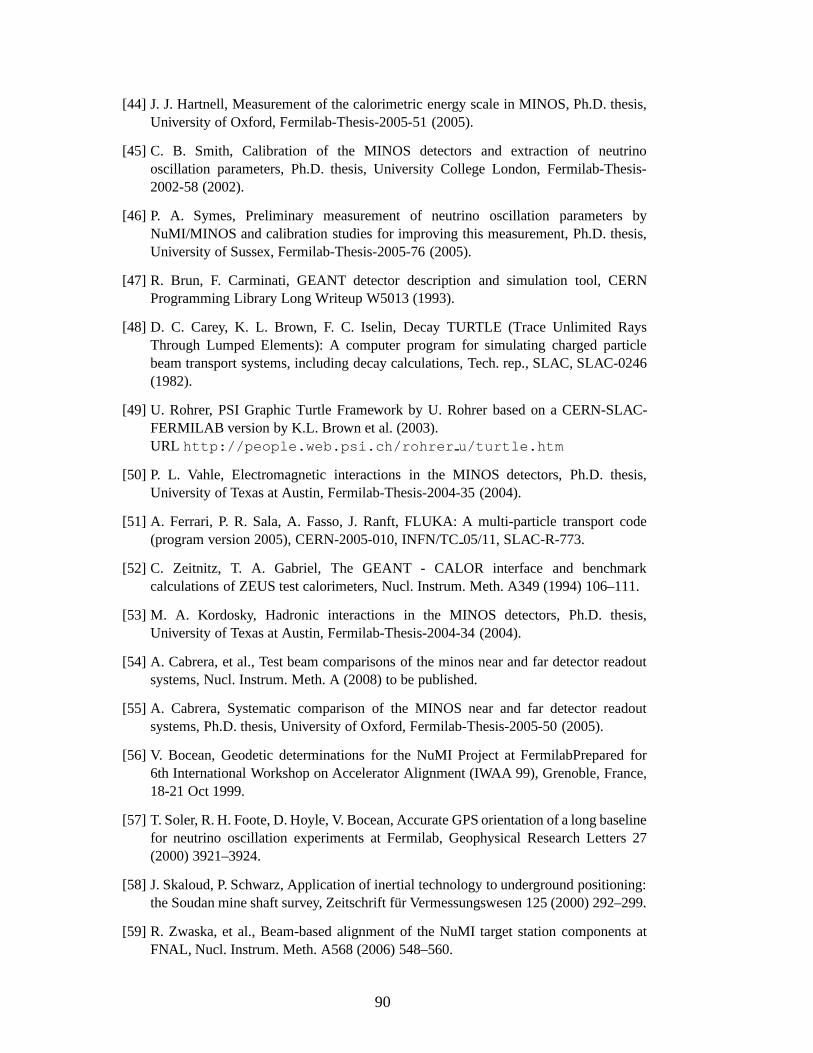
[44] J. J. Hartnell, Measurement of the calorimetric energyscale in MINOS, Ph.D. thesis,University of Oxford, Fermilab-Thesis-2005-51 (2005).
[45] C. B. Smith, Calibration of the MINOS detectors and extraction of neutrinooscillation parameters, Ph.D. thesis, University CollegeLondon, Fermilab-Thesis-2002-58 (2002).
[46] P. A. Symes, Preliminary measurement of neutrino oscillation parameters byNuMI/MINOS and calibration studies for improving this measurement, Ph.D. thesis,University of Sussex, Fermilab-Thesis-2005-76 (2005).
[47] R. Brun, F. Carminati, GEANT detector description and simulation tool, CERNProgramming Library Long Writeup W5013 (1993).
[48] D. C. Carey, K. L. Brown, F. C. Iselin, Decay TURTLE (Trace Unlimited RaysThrough Lumped Elements): A computer program for simulating charged particlebeam transport systems, including decay calculations, Tech. rep., SLAC, SLAC-0246(1982).
[49] U. Rohrer, PSI Graphic Turtle Framework by U. Rohrer based on a CERN-SLAC-FERMILAB version by K.L. Brown et al. (2003).URL http://people.web.psi.ch/rohrer u/turtle.htm
[50] P. L. Vahle, Electromagnetic interactions in the MINOSdetectors, Ph.D. thesis,University of Texas at Austin, Fermilab-Thesis-2004-35 (2004).
[51] A. Ferrari, P. R. Sala, A. Fasso, J. Ranft, FLUKA: A multi-particle transport code(program version 2005), CERN-2005-010, INFN/TC05/11, SLAC-R-773.
[52] C. Zeitnitz, T. A. Gabriel, The GEANT - CALOR interface and benchmarkcalculations of ZEUS test calorimeters, Nucl. Instrum. Meth. A349 (1994) 106–111.
[53] M. A. Kordosky, Hadronic interactions in the MINOS detectors, Ph.D. thesis,University of Texas at Austin, Fermilab-Thesis-2004-34 (2004).
[54] A. Cabrera, et al., Test beam comparisons of the minos near and far detector readoutsystems, Nucl. Instrum. Meth. A (2008) to be published.
[55] A. Cabrera, Systematic comparison of the MINOS near andfar detector readoutsystems, Ph.D. thesis, University of Oxford, Fermilab-Thesis-2005-50 (2005).
[56] V. Bocean, Geodetic determinations for the NuMI Project at FermilabPrepared for6th International Workshop on Accelerator Alignment (IWAA99), Grenoble, France,18-21 Oct 1999.
[57] T. Soler, R. H. Foote, D. Hoyle, V. Bocean, Accurate GPS orientation of a long baselinefor neutrino oscillation experiments at Fermilab, Geophysical Research Letters 27(2000) 3921–3924.
[58] J. Skaloud, P. Schwarz, Application of inertial technology to underground positioning:the Soudan mine shaft survey, Zeitschrift fur Vermessungswesen 125 (2000) 292–299.
[59] R. Zwaska, et al., Beam-based alignment of the NuMI target station components atFNAL, Nucl. Instrum. Meth. A568 (2006) 548–560.
90

[60] B. Becker, D. Boehnlein, Alignment of the MINOS far detector, Tech. Rep.FERMILAB-TM-2410-E, Fermilab (2004).
[61] R. Ospanov, K. Lang, Alignment of the near detector scintillator modules using cosmicray muons, Tech. Rep. FERMILAB-TM-2411-E, Fermilab (2005).
[62] W. Wagner, et al., Online monitoring in the CDF II experiment, Prepared forInternational Europhysics Conference on High-Energy Physics (HEP 2001), Budapest,Hungary, 12-18 Jul 2001.
[63] S. Kopp, et al., Secondary beam monitors for the NuMI facility at FNAL, Nucl.Instrum. Meth. A568 (2006) 503–519.
[64] B. Stroustrup, The C++ Programming Language, 3rd Edition, Addison-Wesley, 1997.
[65] P. Adamson, et al., Charge-separated atmospheric neutrino-induced muons in theMINOS far detector, Phys. Rev. D75 (2007) 092003.
91