An analytical model of nonproportional scintillator light yield in terms of recombination rates
55
eScholarship provides open access, scholarly publishing services to the University of California and delivers a dynamic research platform to scholars worldwide. Lawrence Berkeley National Laboratory Title: An analytical model of nonproportional scintillator light yield in terms of recombination rates Author: Bizarri, Gregory Publication Date: 10-15-2009 Publication Info: Lawrence Berkeley National Laboratory Permalink: http://escholarship.org/uc/item/49q391gh
Transcript of An analytical model of nonproportional scintillator light yield in terms of recombination rates

eScholarship provides open access, scholarly publishingservices to the University of California and delivers a dynamicresearch platform to scholars worldwide.
Lawrence Berkeley National Laboratory
Title:An analytical model of nonproportional scintillator light yield in terms of recombination rates
Author:Bizarri, Gregory
Publication Date:10-15-2009
Publication Info:Lawrence Berkeley National Laboratory
Permalink:http://escholarship.org/uc/item/49q391gh
1
An analytical model of nonproportional scintillator light yield in terms of recombination rates
G. Bizarria, W.W. Mosesa, J. Singhb , A.N. Vasil’evc, and R.T. Williamsd
a Lawrence Berkeley Lab., Berkeley, CA 94720-8119, USA b School of Engineering and IT, Charles Darwin University, Darwin, NT 0909, Australia
c Institute of Nuclear Physics, Moscow State University, Moscow 119991, Russia d Department of Physics, Wake Forest University, Winston-Salem, NC 27109, USA
Abstract Analytical expressions for the local light yield as a function of the local deposited energy
(-dE/dx) and total scintillation yield integrated over the track of an electron of initial energy E are
derived from radiative and/or nonradiative rates of first through third order in density of electronic
excitations. The model is formulated in terms of rate constants, some of which can be determined
independently from time-resolved spectroscopy and others estimated from measured light yield
efficiency as a constraint assumed to apply in each kinetic order. The rates and parameters are used
in the theory to calculate scintillation yield versus primary electron energy for comparison to
published experimental results on four scintillators. Influence of the track radius on the yield is
also discussed. Results are found to be qualitatively consistent with the observed scintillation light
yield. The theory can be applied to any scintillator if the rates of the radiative and non-radiative
processes are known.
2
1. Introduction The light yield of scintillators has attracted research interest for decades [1] because of their
applications in medical imaging [2], homeland security detectors [3], radiation detectors [4], etc.
The scintillation yield (Y) is defined as the total energy of emitted photons (Ep ) per unit energy (E)
deposited by the incident particle or gamma-ray in a scintillator material, i.e. Y = Ep/E [5]. The
experimentally observed scintillation yield is found not to be a constant but to vary with E, a
phenomenon known as non-proportionality [1] in the scintillator response . A constant light yield
implies that the scintillator is “proportional” and that means the amount of scintillation light
generated is proportional to the amount of energy deposited into the scintillator. Although
scintillators have been known for many decades, it is not yet clearly understood what causes the
non-proportionality. In fact, the issue has been addressed in so many ways that it has even created
some confusion in the literature [1,5].
The emission of photons from a scintillator occurs because the incident radiation first creates a pair
of a very high energy excited electron and hole, which then lose energy in a cascade that produces a
track of generally high density excited electron-hole (e-h) pairs. Some of these excitations finally
recombine radiatively and generate photons which can be detected and constitute the “scintillator
response”. If the excited e-h pairs recombine only radiatively without going through any other
processes of losing their energy, then one can expect a “proportional” scintillator response.
However, the creation of high density excitations in scintillators involves various other types of
radiative and non-radiative processes among the excitations and the light yield becomes a
complicated function of the rates of all these processes. As the rates of these processes may be
expected to vary from one material to another, different materials may exhibit different forms of
non-proportionality, as indeed it has been observed [6]. In order to understand the non-
3
proportionality in scintillators it is therefore important to study various processes of interaction
occurring in a high excitation density situation in a scintillating crystal when it is subjected to a
high energy incident radiation (particle) that can create high density excitations along its trajectory.
In insulators and semiconductors, an incident energy larger than the band gap energy (but smaller
than the threshold of multiplication of electronic excitations) excites an e-h pair, which loses the
excess energy above the band gap non-radiatively to lattice vibrations, usually in the pico-second or
even shorter time range. In semiconductors some of these relaxed e-h pairs, but not all, may
recombine radiatively by emitting a photon, whose energy is equal to the band gap energy. Some of
the free e-h pairs may form excitons due to their Coulomb interaction and get bound in hydrogen-
like energy states and the excess energy equal to the binding energy is again lost to the lattice non-
radiatively. These excitons are called free excitons (FE) and can recombine radiatively by emitting
a photon of energy less than the band gap energy, called FE photoluminescence (PL). Free exciton
PL and direct radiative electron-hole recombination is usually observed in crystals with little to
very small charge carrier-lattice interaction. Such crystals are usually known to be quite rigid in
their structure. For scintillators, the crystals used are ionic and organic solids, which have strong
charge carrier-lattice interaction and hence not as rigid. In such crystals, the excited e-h pairs can
undergo further non-radiative relaxation due to the lattice interaction and form what are called self-
trapped excitons (STE). STE can then recombine radiatively by emiting photons, called STE
photoluminescence, which occurs at an energy less than FE PL. In some crystals, usually organics,
both FE and STE have been observed to co-exist [7]. These three radiative processes and
associated non-radiative processes are known to be linear and if these are the only processes that
occur in a scintillator, which may be possible at a very low excitation density, then it may be
expected to give a proportional response.
4
In this paper, a phenomenological approach is presented to study the scintillator response of a
scintillator by including the rates of linear, binary and ternary (Auger) processes in the rate
equations. It is considered that initially one creates a number of excitations, some of which form
excitons before their radiative recombination and some remain e-h pairs. The exchange between e-h
pairs and excitons is also possible and considered. First the general theory is developed and
approximate expressions for the local light yield (YL) and total light yield (Y) are derived as
functions of different rates of recombination. Then the results are applied to calculate the
scintillator response, both local and total light yields in four scintillating crystals, NaI:Tl, BaF2,
Gd2SiO5:Ce (GSO) and LaCl3:Ce. As these four scintillators have been widely studied
experimentally and used as scintillators, results obtained here can easily be compared with
experiments. Rates of recombination are extracted from experiments where possible, and in other
cases by estimation as discussed. When it was necessary to estimate rates or other parameters, we
tried to impose the estimated values as constants across all four materials, to avoid using estimated
parameters as fitting variables. The dependence of the light yield on different recombination rates
and track radius is investigated. A qualitative agreement is found with the experimental yields. The
theory is general and if the rates are known the light yield can be calculated for any scintillator.
The paper is organized as follows: In section 2, the general theory is developed and approximate
expressions for the local (YL) and total (Y) light yields are derived. In section 3, the theory is used to
calculate the light yields in four scintillators, NaI:Tl, BaF2, GSO and LaCl3:CE, representing
different importance of first and second order recombination processes. A description on how
various rates are obtained is also presented in section 3. A discussion of the theory developed is
presented in section 4, which contains two subsections 4.2 and 4.3 presenting discussions on the
validity of track structure model (namely the radial and axial distribution of excitations within the
track region) used for our analytical estimations.
5
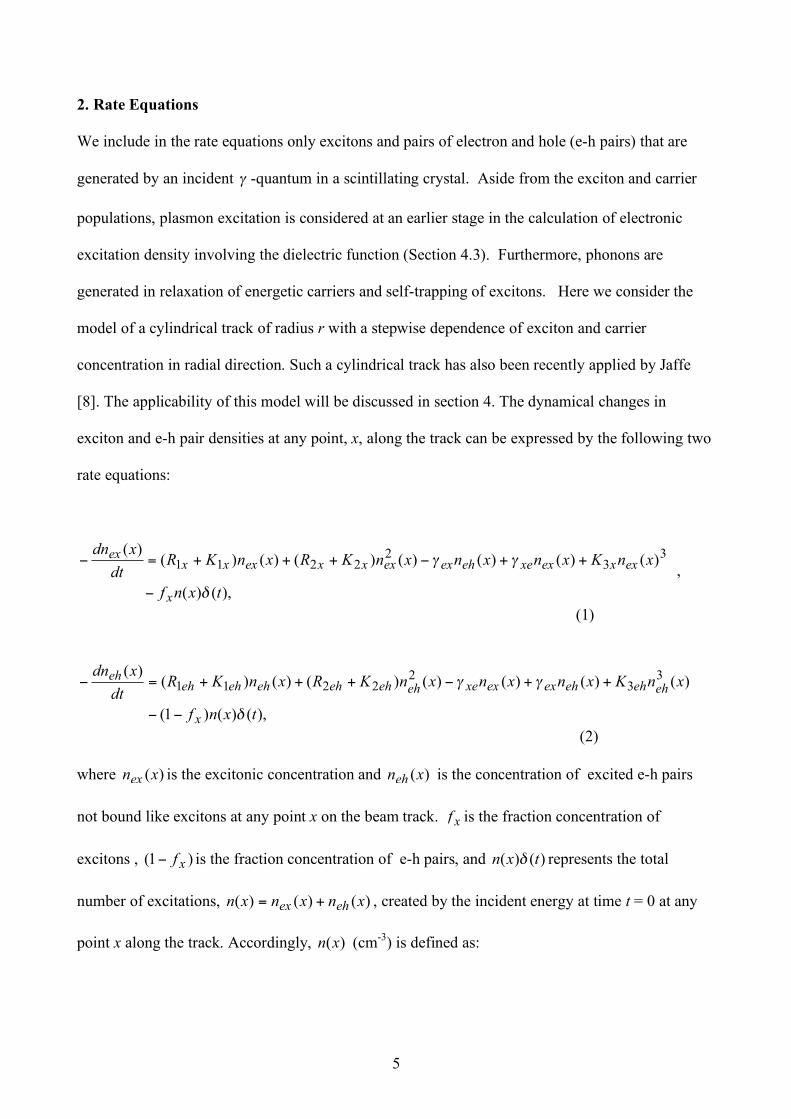
2. Rate Equations We include in the rate equations only excitons and pairs of electron and hole (e-h pairs) that are
generated by an incident ! -quantum in a scintillating crystal. Aside from the exciton and carrier
populations, plasmon excitation is considered at an earlier stage in the calculation of electronic
excitation density involving the dielectric function (Section 4.3). Furthermore, phonons are
generated in relaxation of energetic carriers and self-trapping of excitons. Here we consider the
model of a cylindrical track of radius r with a stepwise dependence of exciton and carrier
concentration in radial direction. Such a cylindrical track has also been recently applied by Jaffe
[8]. The applicability of this model will be discussed in section 4. The dynamical changes in
exciton and e-h pair densities at any point, x, along the track can be expressed by the following two
rate equations:
),()(
)()()()()()()()( 3
32
2211
txnf
xnKxnxnxnKRxnKRdt
xdn
x
exxexxeehexexxxexxxex
!
""
#
++#+++=# ,
(1)
),()()1(
)()()()()()()()( 3
32
2211
txnf
xnKxnxnxnKRxnKRdt
xdn
x
ehehehexexxeeheheheheheheh
!
""
##
++#+++=#
(2) where )(xnex is the excitonic concentration and )(xneh is the concentration of excited e-h pairs
not bound like excitons at any point x on the beam track. xf is the fraction concentration of
excitons , )1( xf! is the fraction concentration of e-h pairs, and )()( txn ! represents the total
number of excitations, )()()( xnxnxn ehex += , created by the incident energy at time t = 0 at any
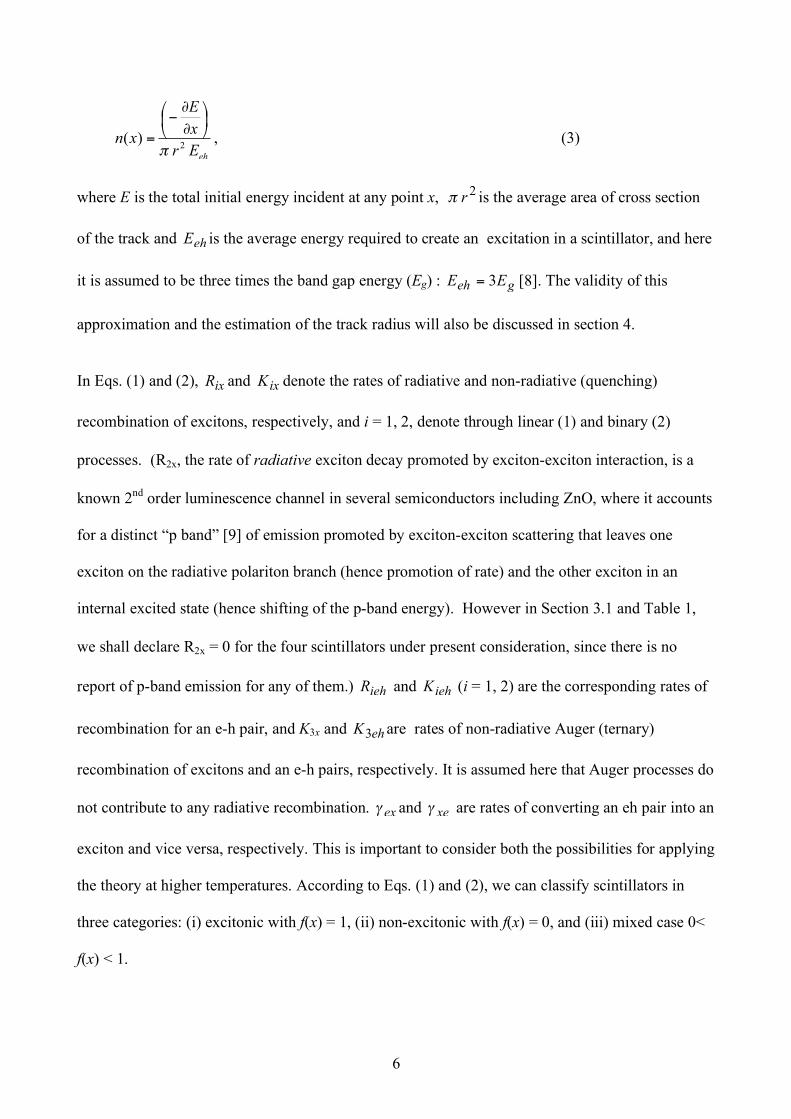
point x along the track. Accordingly, )(xn (cm-3) is defined as:
6
ehEr
x
E
xn2
)(!
"#
$%&
'
(
()
= , (3)
where E is the total initial energy incident at any point x, 2
r! is the average area of cross section
of the track and ehE is the average energy required to create an excitation in a scintillator, and here
it is assumed to be three times the band gap energy (Eg) : geh EE 3= [8]. The validity of this
approximation and the estimation of the track radius will also be discussed in section 4.
In Eqs. (1) and (2), ixR and ixK denote the rates of radiative and non-radiative (quenching)
recombination of excitons, respectively, and i = 1, 2, denote through linear (1) and binary (2)
processes. (R2x, the rate of radiative exciton decay promoted by exciton-exciton interaction, is a
known 2nd order luminescence channel in several semiconductors including ZnO, where it accounts
for a distinct “p band” [9] of emission promoted by exciton-exciton scattering that leaves one
exciton on the radiative polariton branch (hence promotion of rate) and the other exciton in an
internal excited state (hence shifting of the p-band energy). However in Section 3.1 and Table 1,
we shall declare R2x = 0 for the four scintillators under present consideration, since there is no
report of p-band emission for any of them.) iehR and iehK (i = 1, 2) are the corresponding rates of
recombination for an e-h pair, and K3x and ehK3 are rates of non-radiative Auger (ternary)
recombination of excitons and an e-h pairs, respectively. It is assumed here that Auger processes do
not contribute to any radiative recombination. ex! and xe! are rates of converting an eh pair into an
exciton and vice versa, respectively. This is important to consider both the possibilities for applying
the theory at higher temperatures. According to Eqs. (1) and (2), we can classify scintillators in
three categories: (i) excitonic with f(x) = 1, (ii) non-excitonic with f(x) = 0, and (iii) mixed case 0<
f(x) < 1.
7
It may also be important to note that the rate of any order in Eqs. (1) and (2) represents the sum
of all the rates in that order. For example, xR1 represents the sum of the first order excitonic rates
of radiative recombination of all possible channels, including recombination through doped
impurities. ad
x
STE
xxRRR111
+= , where STE
xR1
and ad
xR1
are rates of recombination of an intrinsic self-
trapped excitons (STE) and through an activator impurity atom, respectively. Both processes
contribute to the scintillation light yield.
2.1 Local Light Yield (YL) If one integrates Eqs. (1) and (2) over time, one gets:
)(
)()()()()()()(0 33
22211
xnf
xnKxnxnxnKRxnKR
x
exxexxeehexexxxexxx
!
><+><+><!><++><+= ""
, (4)
)()1(
)()()()()()()(0 33
22211
xnf
xnKxnxnxnKRxnKR
x
ehehehexexxeeheheheheheh
!!
><+><+><!><++><+= ""
(5) where >< )(xn represents the integrated value of )(xn over time, and
0)()()(
0||
0
=!=" !#
#
!
xnxndtdt
xdn is used in arriving at Eqs. (4) and (5). It is obvious that Eqs.
(4) and (5) have similar forms as Eqs. (1) and (2) in the steady-state but with unintegrated
concentrations.
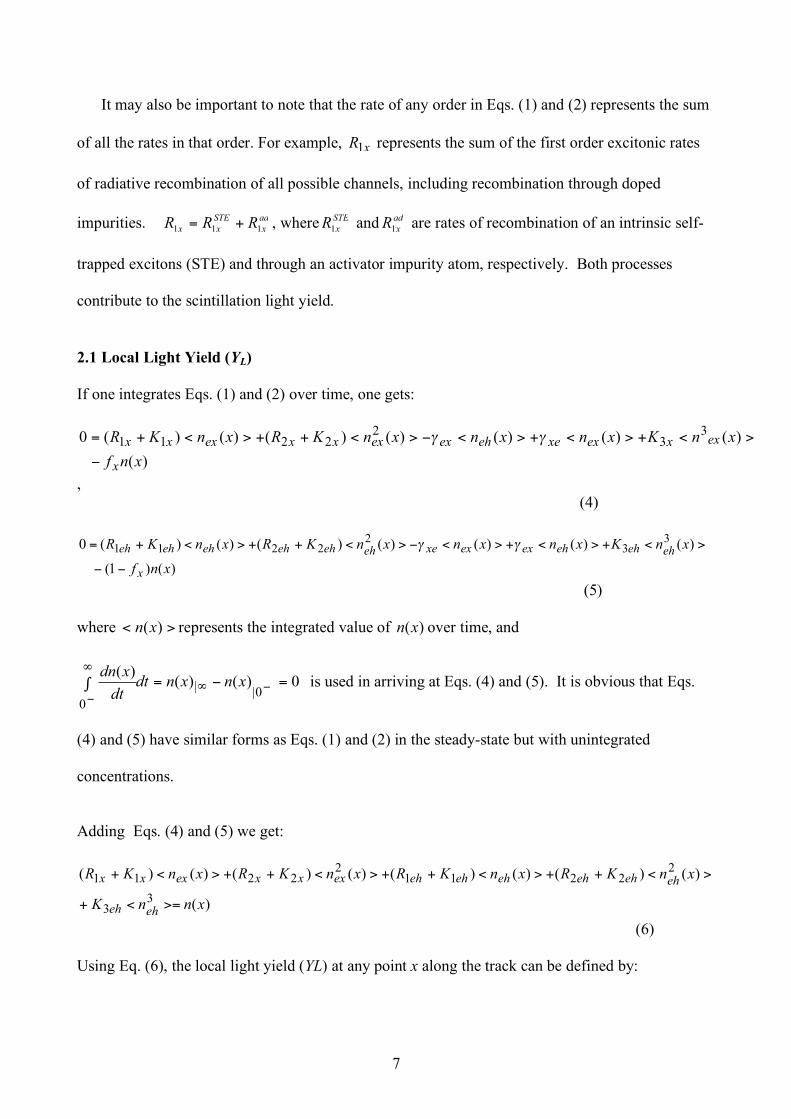
Adding Eqs. (4) and (5) we get:
)(
)()()()()()()()(
33
22211
22211
xnnK
xnKRxnKRxnKRxnKR
eheh
ehehehehehehexxxexxx
>=<+
><++><++><++><+
(6) Using Eq. (6), the local light yield (YL) at any point x along the track can be defined by:
8
)(
)()()()( 221
221
xn
xnRxnRxnRxnRY
ehehehehexxexx
L
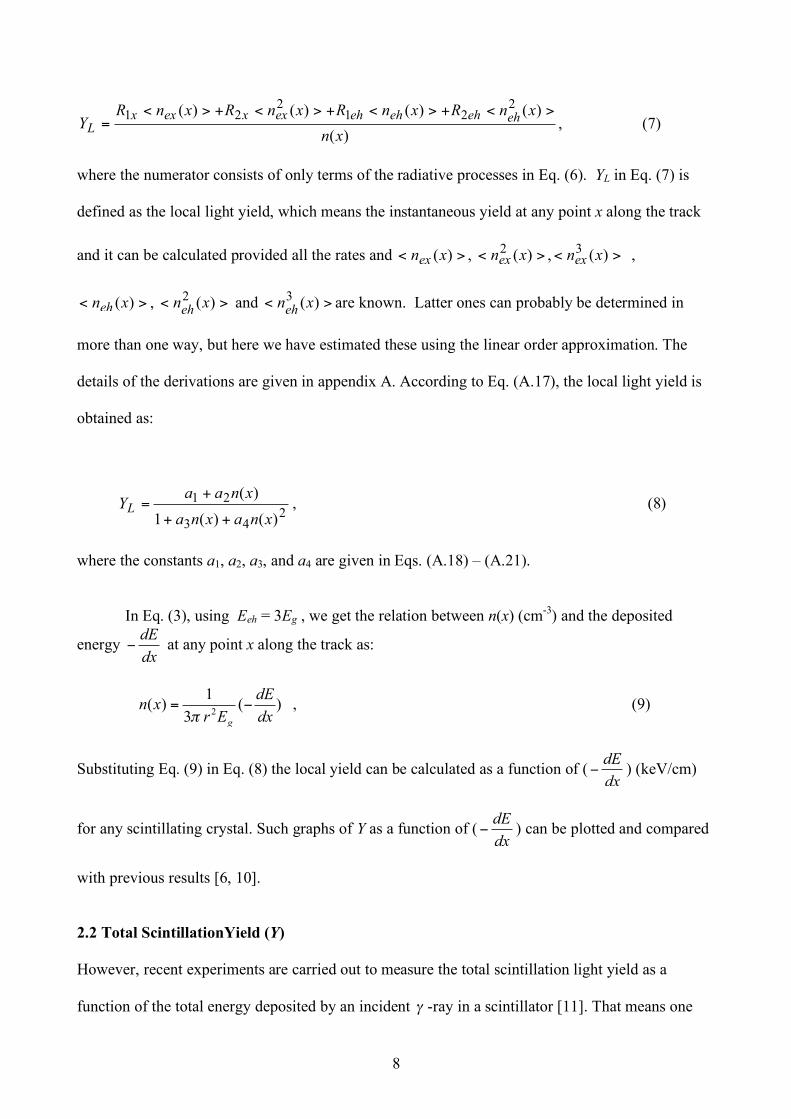
><+><+><+><= , (7)
where the numerator consists of only terms of the radiative processes in Eq. (6). YL in Eq. (7) is
defined as the local light yield, which means the instantaneous yield at any point x along the track
and it can be calculated provided all the rates and >< )(xnex , >< )(2 xnex , >< )(3 xnex ,
>< )(xneh , >< )(2 xneh
and >< )(3 xneh
are known. Latter ones can probably be determined in
more than one way, but here we have estimated these using the linear order approximation. The
details of the derivations are given in appendix A. According to Eq. (A.17), the local light yield is
obtained as:
2
43
21
)()(1
)(
xnaxna
xnaaYL
++
+= , (8)
where the constants a1, a2, a3, and a4 are given in Eqs. (A.18) – (A.21). In Eq. (3), using Eeh = 3Eg , we get the relation between n(x) (cm-3) and the deposited
energy dx
dE! at any point x along the track as:
)(3
1)(
2 dx
dE
Erxn
g
!="
, (9)
Substituting Eq. (9) in Eq. (8) the local yield can be calculated as a function of (dx
dE! ) (keV/cm)
for any scintillating crystal. Such graphs of Y as a function of (dx
dE! ) can be plotted and compared
with previous results [6, 10].
2.2 Total ScintillationYield (Y) However, recent experiments are carried out to measure the total scintillation light yield as a
function of the total energy deposited by an incident ! -ray in a scintillator [11]. That means one
9
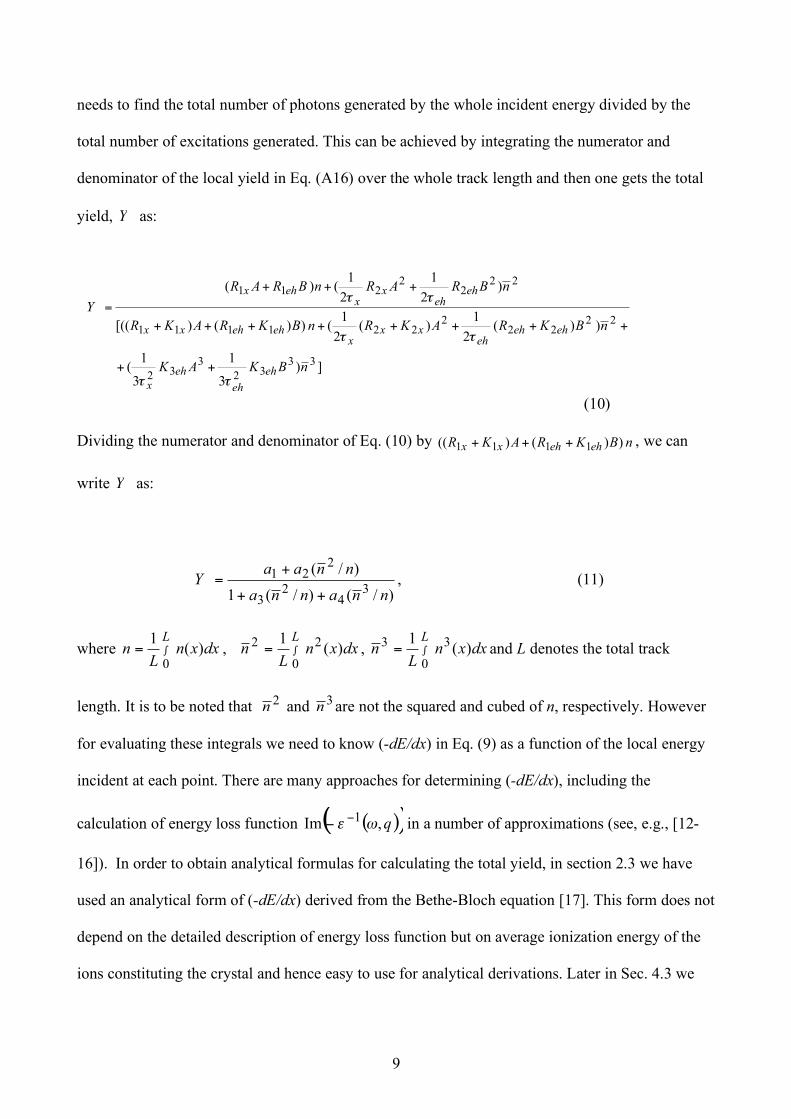
needs to find the total number of photons generated by the whole incident energy divided by the
total number of excitations generated. This can be achieved by integrating the numerator and
denominator of the local yield in Eq. (A16) over the whole track length and then one gets the total
yield, Y as:
])3
1
3
1(
))(2
1)(
2
1())()[((
)2
1
2
1()(
3332
332
2222
2221111
222
2211
nBKAK
nBKRAKRnBKRAKR
nBRARnBRAR
Y
eh
eh
eh
x
eheh
eh
xx
x
ehehxx
eh
eh
x
x
ehx
!!
!!
!!
++
++++++++
+++
=
(10) Dividing the numerator and denominator of Eq. (10) by nBKRAKR ehehxx ))()(( 1111 +++ , we can
write Y as:
)/()/(1
)/(
34
23
221
nnanna
nnaaY
++
+= , (11)
where dxxnL
nL
)(1
0!= , dxxn
Ln
L
)(1 2
0
2!= , dxxn
Ln
L
)(1 3
0
3!= and L denotes the total track
length. It is to be noted that 2n and 3
n are not the squared and cubed of n, respectively. However
for evaluating these integrals we need to know (-dE/dx) in Eq. (9) as a function of the local energy
incident at each point. There are many approaches for determining (-dE/dx), including the
calculation of energy loss function ( )( )q,Im1 !" ## in a number of approximations (see, e.g., [12-
16]). In order to obtain analytical formulas for calculating the total yield, in section 2.3 we have
used an analytical form of (-dE/dx) derived from the Bethe-Bloch equation [17]. This form does not
depend on the detailed description of energy loss function but on average ionization energy of the
ions constituting the crystal and hence easy to use for analytical derivations. Later in Sec. 4.3 we
10
have discussed the more detailed evaluation of (-dE/dx) based on the numerical calculations of
energy loss function.
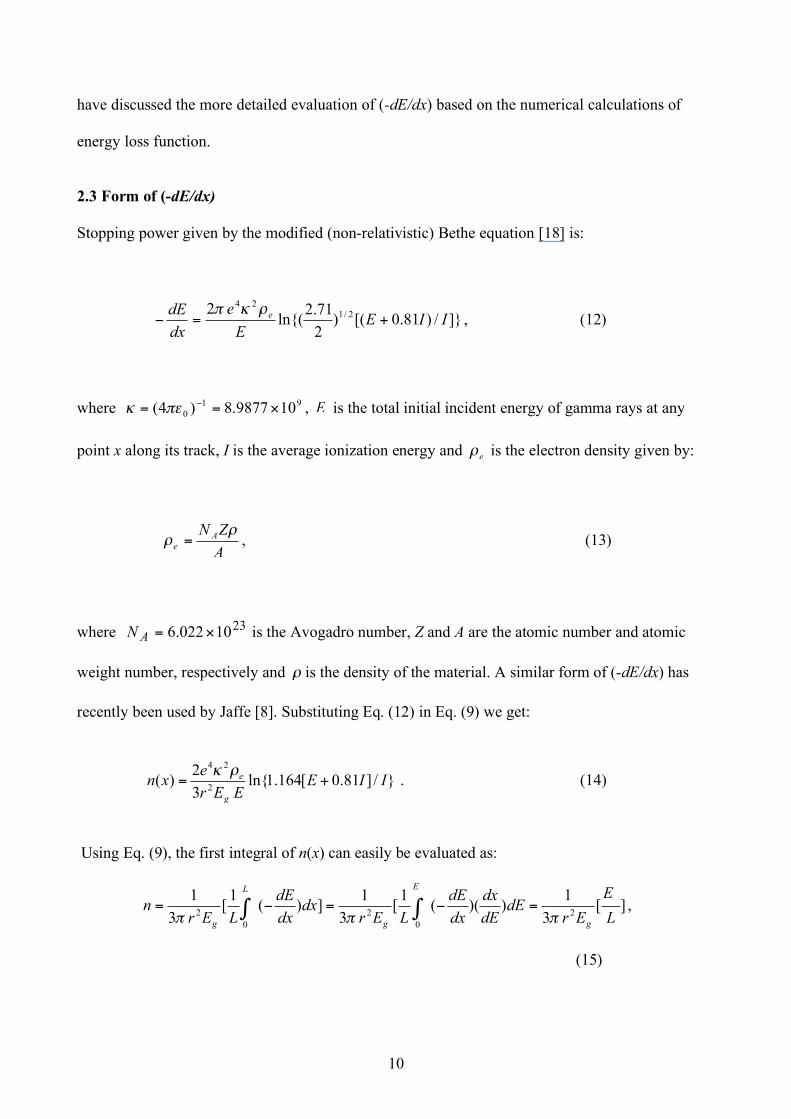
2.3 Form of (-dE/dx) Stopping power given by the modified (non-relativistic) Bethe equation [18] is:
]}/)81.0[()2
71.2ln{(
2 2/124
IIEE
e
dx
dEe +=!
"#$, (12)
where 91
0 109877.8)4( !=="#$% , E is the total initial incident energy of gamma rays at any
point x along its track, I is the average ionization energy and e
! is the electron density given by:
A
ZNA
e
!! = , (13)
where 2310022.6 !=AN is the Avogadro number, Z and A are the atomic number and atomic
weight number, respectively and ! is the density of the material. A similar form of (-dE/dx) has
recently been used by Jaffe [8]. Substituting Eq. (12) in Eq. (9) we get:
}/]81.0[164.1ln{3
2)(
2
24
IIEEEr
exn
g
e +=!" . (14)
Using Eq. (9), the first integral of n(x) can easily be evaluated as:
][3
1))((
1[
3
1])(
1[
3
12
0
2
0
2 L
E
ErdE
dE
dx
dx
dE
LErdx
dx
dE
LErn
g
E
g
L
g !!!="="= ## ,
(15)
11
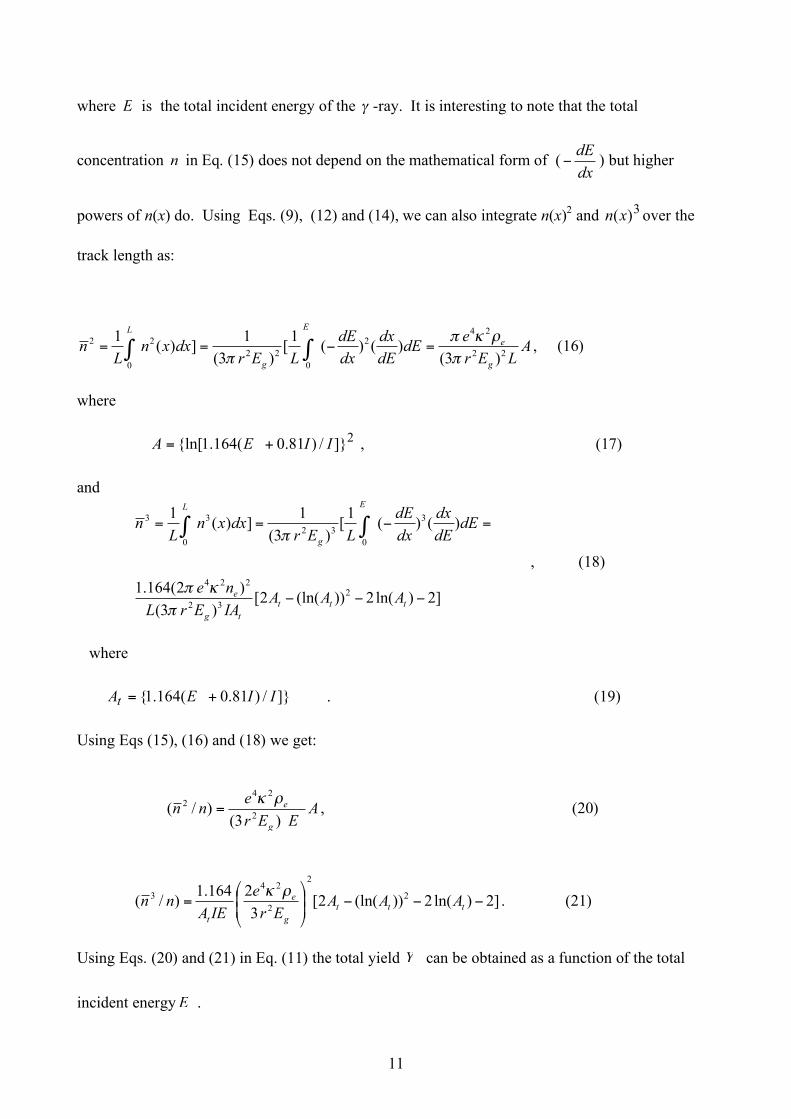
where E is the total incident energy of the ! -ray. It is interesting to note that the total
concentration n in Eq. (15) does not depend on the mathematical form of (dx
dE! ) but higher
powers of n(x) do. Using Eqs. (9), (12) and (14), we can also integrate n(x)2 and 3)(xn over the
track length as:
ALEr
edE
dE
dx
dx
dE
LErdxxn
Ln
g
e
E
g
L
22
242
0
22
2
0
2
)3()()(
1[
)3(
1])(
1
!
"#!
!=$== %% , (16)
where 2]}/)81.0(164.1{ln[ IIEA += , (17) and
]2)ln(2))(ln(2[)3(
)2(164.1
)()(1[
)3(
1])(
1
2
32
224
3
0
32
3
0
3
!!!
=!== ""
ttt
tg
e
E
g
L
AAAIAErL
ne
dEdE
dx
dx
dE
LErdxxn
Ln
#
$#
#
, (18)
where ]}/)81.0(164.1{ IIEAt += . (19) Using Eqs (15), (16) and (18) we get:
AEEr
enn
g
e
)3()/(
2
242 !"
= , (20)
]2)ln(2))(ln(2[3
2164.1)/( 2
2
2
243 !!!
""
#
$
%%
&
'= ttt
g
e
t
AAAEr
e
IEAnn
() . (21)
Using Eqs. (20) and (21) in Eq. (11) the total yield Y can be obtained as a function of the total
incident energyE .
12
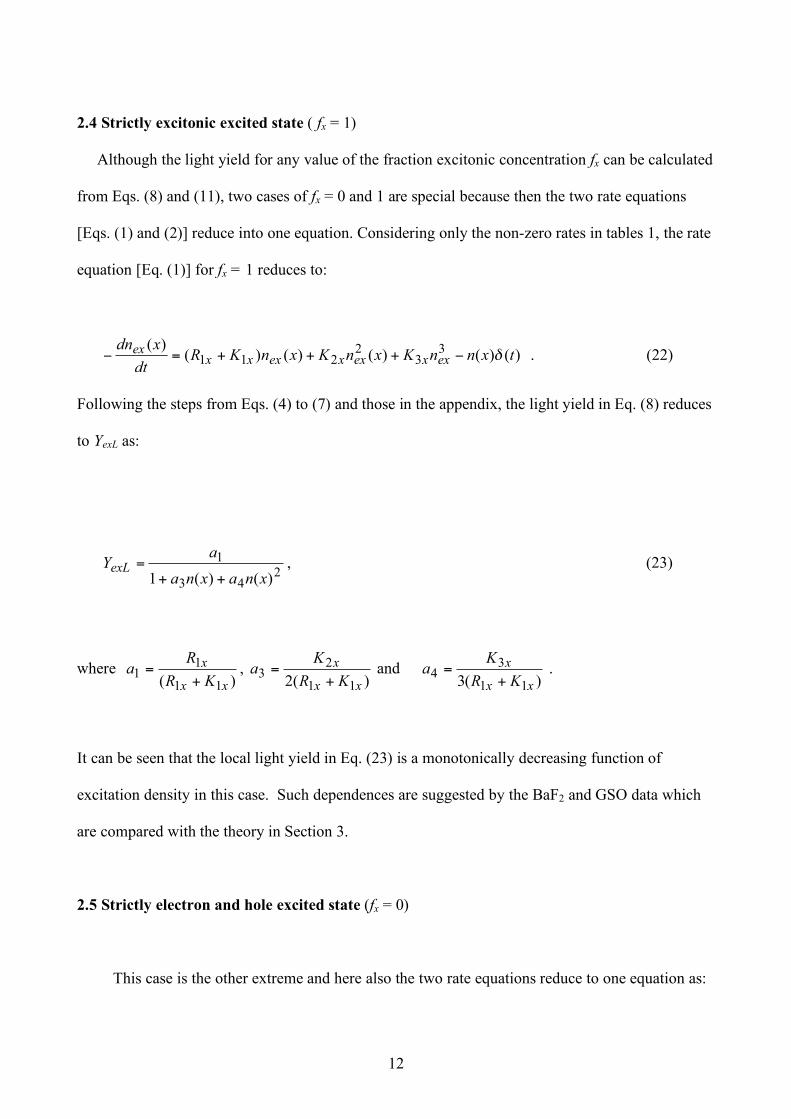
2.4 Strictly excitonic excited state ( fx = 1) Although the light yield for any value of the fraction excitonic concentration fx can be calculated
from Eqs. (8) and (11), two cases of fx = 0 and 1 are special because then the two rate equations
[Eqs. (1) and (2)] reduce into one equation. Considering only the non-zero rates in tables 1, the rate
equation [Eq. (1)] for fx = 1 reduces to:
)()()()()()( 3
32
211 txnnKxnKxnKRdt
xdn
exxexxexxxex !"+++=" . (22)
Following the steps from Eqs. (4) to (7) and those in the appendix, the light yield in Eq. (8) reduces
to YexL as:
2
43
1
)()(1 xnaxna
aYexL
++= , (23)
where )( 11
11
xx
x
KR
Ra
+= ,
)(2 11
23
xx
x
KR
Ka
+= and
)(3 11
34
xx
x
KR
Ka
+= .
It can be seen that the local light yield in Eq. (23) is a monotonically decreasing function of
excitation density in this case. Such dependences are suggested by the BaF2 and GSO data which
are compared with the theory in Section 3.
2.5 Strictly electron and hole excited state (fx = 0)
This case is the other extreme and here also the two rate equations reduce to one equation as:
13
),()()()()()( 3
32
21 txnxnKxnRxnKdt
xdn
eheheheheheheh !"++=" (24)
where again only the non-zero rates in table 1 are considered. In this case the light yield in Eq. (8)
becomes YehL as:
2
43
2
)()(1
)(
xnaxna
xnaYehL
++= , (25)
where
eh
eh
K
Raa
1
232
2== , and
eh
eh
K
Ka
1
34
3= . (26)
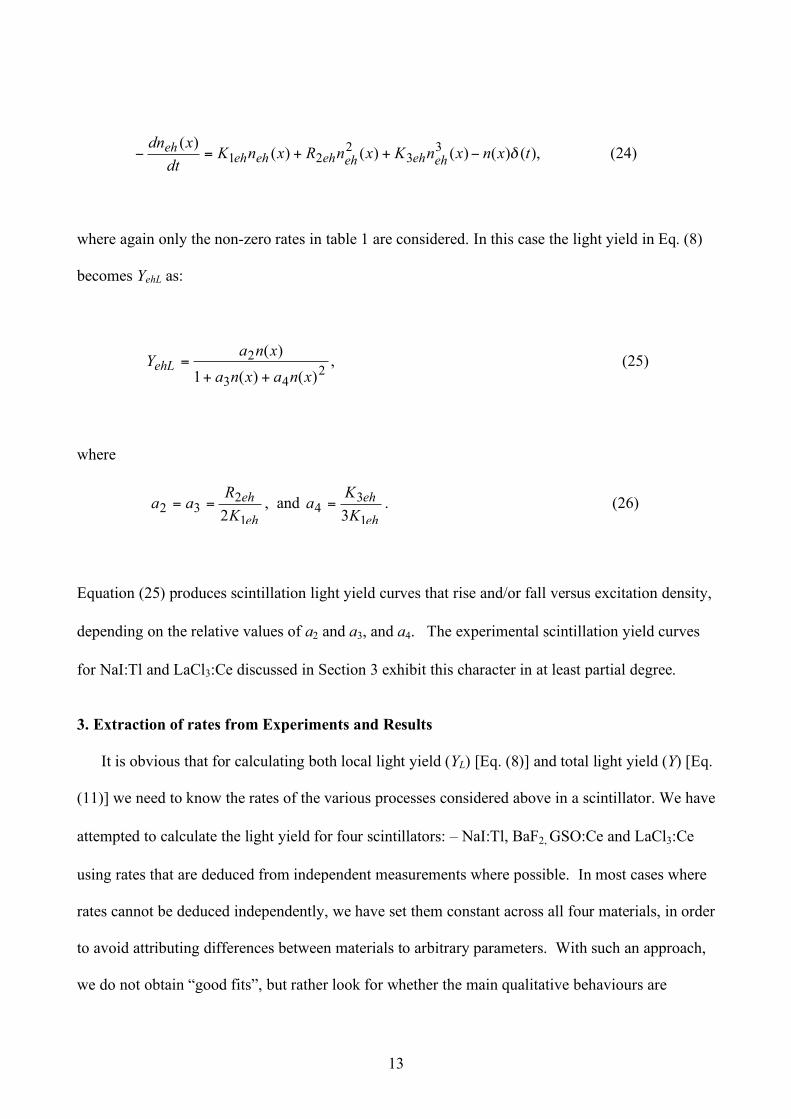
Equation (25) produces scintillation light yield curves that rise and/or fall versus excitation density,
depending on the relative values of a2 and a3, and a4. The experimental scintillation yield curves
for NaI:Tl and LaCl3:Ce discussed in Section 3 exhibit this character in at least partial degree.
3. Extraction of rates from Experiments and Results It is obvious that for calculating both local light yield (YL) [Eq. (8)] and total light yield (Y) [Eq.
(11)] we need to know the rates of the various processes considered above in a scintillator. We have
attempted to calculate the light yield for four scintillators: – NaI:Tl, BaF2, GSO:Ce and LaCl3:Ce
using rates that are deduced from independent measurements where possible. In most cases where
rates cannot be deduced independently, we have set them constant across all four materials, in order
to avoid attributing differences between materials to arbitrary parameters. With such an approach,
we do not obtain “good fits”, but rather look for whether the main qualitative behaviours are
14
attributable to known rates and parameters. Although there are apparently a great many
parameters in this model, from the discussion to follow, it turns out that only a few of the
parameters are sensitive controllers of the shapes and the placement along the energy scale.
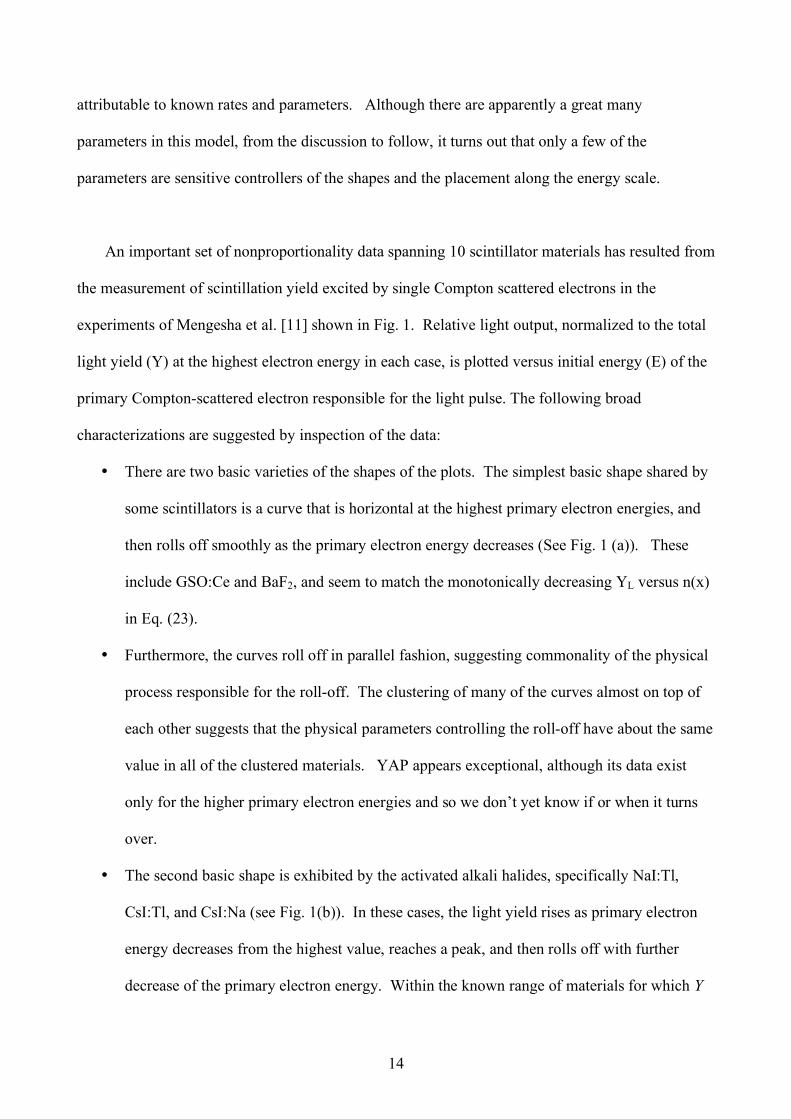
An important set of nonproportionality data spanning 10 scintillator materials has resulted from
the measurement of scintillation yield excited by single Compton scattered electrons in the
experiments of Mengesha et al. [11] shown in Fig. 1. Relative light output, normalized to the total
light yield (Y) at the highest electron energy in each case, is plotted versus initial energy (E) of the
primary Compton-scattered electron responsible for the light pulse. The following broad
characterizations are suggested by inspection of the data:
• There are two basic varieties of the shapes of the plots. The simplest basic shape shared by
some scintillators is a curve that is horizontal at the highest primary electron energies, and
then rolls off smoothly as the primary electron energy decreases (See Fig. 1 (a)). These
include GSO:Ce and BaF2, and seem to match the monotonically decreasing YL versus n(x)
in Eq. (23).
• Furthermore, the curves roll off in parallel fashion, suggesting commonality of the physical
process responsible for the roll-off. The clustering of many of the curves almost on top of
each other suggests that the physical parameters controlling the roll-off have about the same
value in all of the clustered materials. YAP appears exceptional, although its data exist
only for the higher primary electron energies and so we don’t yet know if or when it turns
over.
• The second basic shape is exhibited by the activated alkali halides, specifically NaI:Tl,
CsI:Tl, and CsI:Na (see Fig. 1(b)). In these cases, the light yield rises as primary electron
energy decreases from the highest value, reaches a peak, and then rolls off with further
decrease of the primary electron energy. Within the known range of materials for which Y
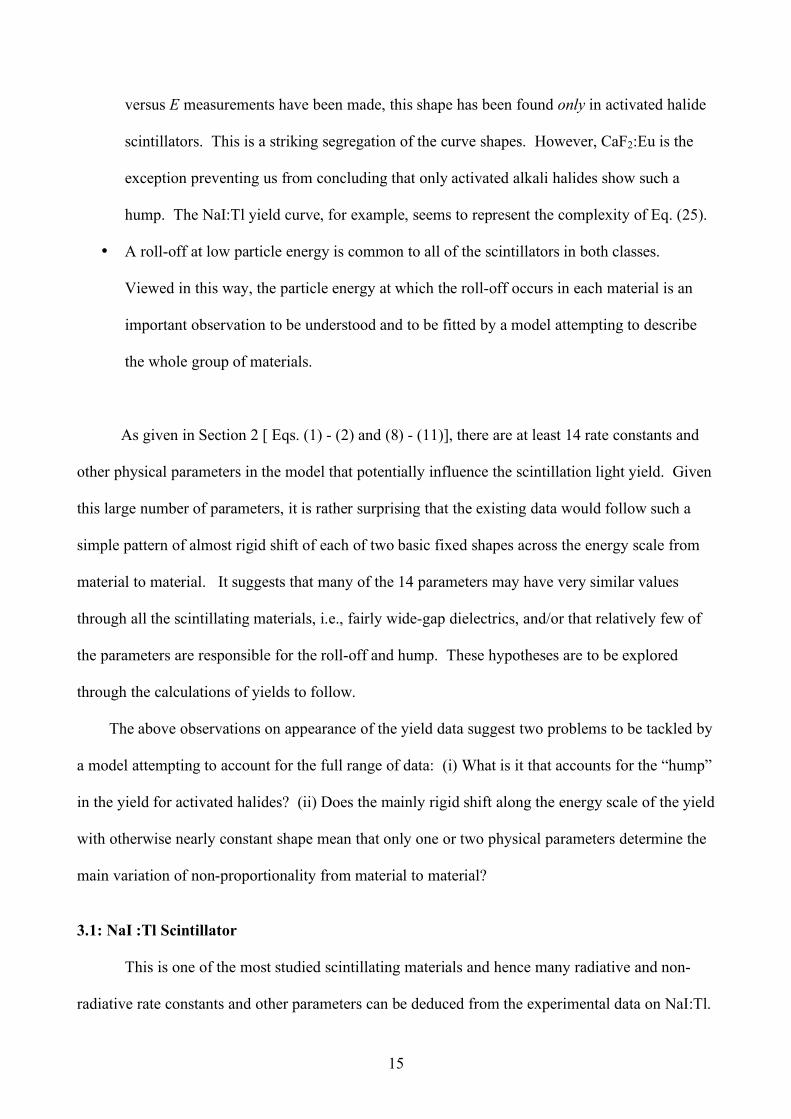
15
versus E measurements have been made, this shape has been found only in activated halide
scintillators. This is a striking segregation of the curve shapes. However, CaF2:Eu is the
exception preventing us from concluding that only activated alkali halides show such a
hump. The NaI:Tl yield curve, for example, seems to represent the complexity of Eq. (25).
• A roll-off at low particle energy is common to all of the scintillators in both classes.
Viewed in this way, the particle energy at which the roll-off occurs in each material is an
important observation to be understood and to be fitted by a model attempting to describe
the whole group of materials.
As given in Section 2 [ Eqs. (1) - (2) and (8) - (11)], there are at least 14 rate constants and
other physical parameters in the model that potentially influence the scintillation light yield. Given
this large number of parameters, it is rather surprising that the existing data would follow such a
simple pattern of almost rigid shift of each of two basic fixed shapes across the energy scale from
material to material. It suggests that many of the 14 parameters may have very similar values
through all the scintillating materials, i.e., fairly wide-gap dielectrics, and/or that relatively few of
the parameters are responsible for the roll-off and hump. These hypotheses are to be explored
through the calculations of yields to follow.
The above observations on appearance of the yield data suggest two problems to be tackled by
a model attempting to account for the full range of data: (i) What is it that accounts for the “hump”
in the yield for activated halides? (ii) Does the mainly rigid shift along the energy scale of the yield
with otherwise nearly constant shape mean that only one or two physical parameters determine the
main variation of non-proportionality from material to material?
3.1: NaI :Tl Scintillator This is one of the most studied scintillating materials and hence many radiative and non-
radiative rate constants and other parameters can be deduced from the experimental data on NaI:Tl.
16
These rates are considered first to calculate the local yield as a function of -dE/dx and total yield as
a function of the particle’s initial energy. These two types of calculated yields can be compared
with the corresponding experimental yields plotted by Murray and Meyer [6] and Mengesha et al.
[11] (see Fig. 1(b)), respectively.
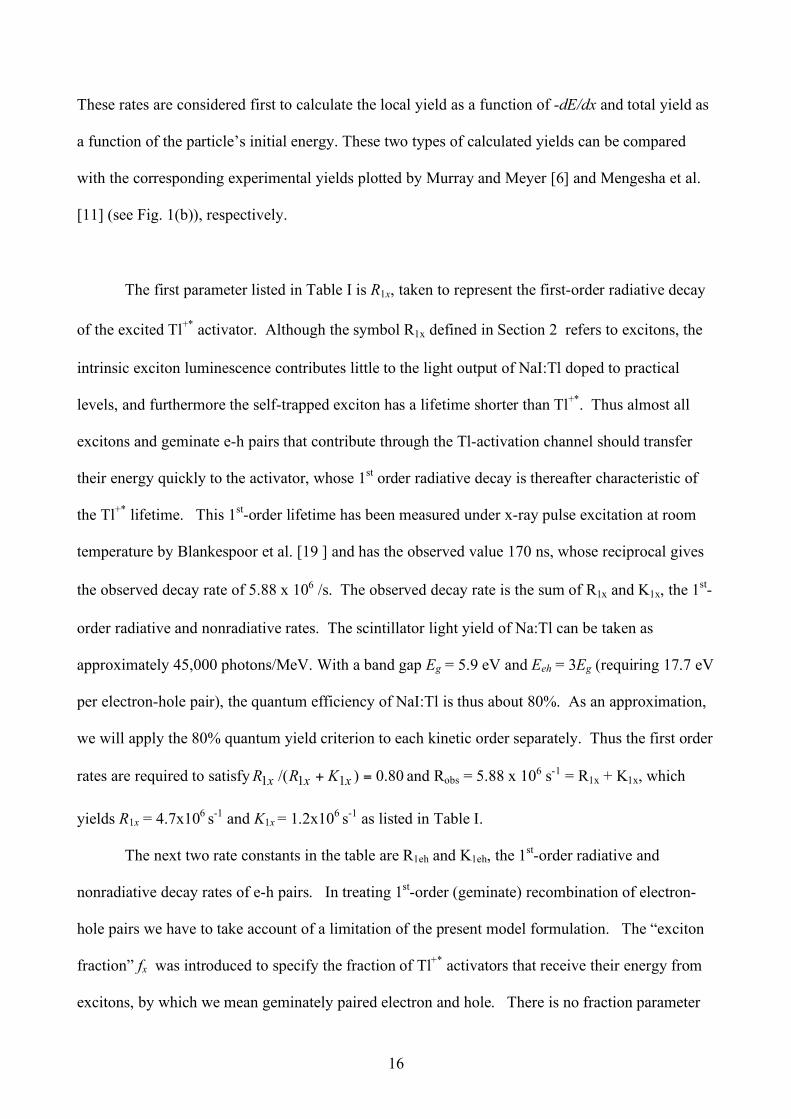
The first parameter listed in Table I is R1x, taken to represent the first-order radiative decay
of the excited Tl+* activator. Although the symbol R1x defined in Section 2 refers to excitons, the
intrinsic exciton luminescence contributes little to the light output of NaI:Tl doped to practical
levels, and furthermore the self-trapped exciton has a lifetime shorter than Tl+*. Thus almost all
excitons and geminate e-h pairs that contribute through the Tl-activation channel should transfer
their energy quickly to the activator, whose 1st order radiative decay is thereafter characteristic of
the Tl+* lifetime. This 1st-order lifetime has been measured under x-ray pulse excitation at room
temperature by Blankespoor et al. [19 ] and has the observed value 170 ns, whose reciprocal gives
the observed decay rate of 5.88 x 10⁶ /s. The observed decay rate is the sum of R1x and K1x, the 1st-
order radiative and nonradiative rates. The scintillator light yield of Na:Tl can be taken as
approximately 45,000 photons/MeV. With a band gap Eg = 5.9 eV and Eeh = 3Eg (requiring 17.7 eV
per electron-hole pair), the quantum efficiency of NaI:Tl is thus about 80%. As an approximation,
we will apply the 80% quantum yield criterion to each kinetic order separately. Thus the first order
rates are required to satisfy 80.0)/( 111 =+ xxx KRR and Robs = 5.88 x 10⁶ s-1 = R1x + K1x, which
yields R1x = 4.7x10⁶ s-1 and K1x = 1.2x10⁶ s-1 as listed in Table I.
The next two rate constants in the table are R1eh and K1eh, the 1st-order radiative and
nonradiative decay rates of e-h pairs. In treating 1st-order (geminate) recombination of electron-
hole pairs we have to take account of a limitation of the present model formulation. The “exciton
fraction” fx was introduced to specify the fraction of Tl+* activators that receive their energy from
excitons, by which we mean geminately paired electron and hole. There is no fraction parameter
17
in the present model formulation to specify a limited subset of e-h pairs that decays geminately,
apart from the population already designated as excitons. To associate a nonzero 1st-order radiative
decay rate R1eh with e-h pair decay in this model necessarily would mean that all e-h pairs decay
with a 1st order rate. The data of Dietrich et al [20 ] shows that scintillation in NaI:Tl is dominantly
a 2nd-order process of binary electron and hole capture on Tl+ ions. In order to utilize the exciton
fraction fx to specify that only a limited subset of e-h pairs recombines geminately, we lump all
geminate e-h radiative decay together with the 1st-order exciton term at the rate R1x already
discussed, and so formally set R1eh = 0 to express that there is no 1st-order geminate radiative
recombination outside the so-called exciton channel that is governed by the exciton fraction fx.
We do not set K1eh = 0 because the capture of either sign of charge carrier in deep traps
represents a first-order removal process that can take carriers out of the electron-hole population
during the detection gate width. We choose a somewhat arbitrary rate K1eh = 3 x 10⁶ s-1
comparable to the value of R1x. Since this is an arbitrary parameter, it will be held constant at the
above value for all the four materials.
The time-dependence of NaI:Tl luminescence at room temperature following 420 keV
electron pulse irradiation was measured over 6 decades of luminescence decay by Dietrich et al.
[20]. The excitation density was 1 x 10¹⁷ e-h pairs/cm3, determined by glass-block dosimetry and
electron penetration depth at this energy. The data are fitted by a straight line of slope –2 on the
plot of log luminescence versus log time scales. From the second order decay curve of this
measurement, we can deduce R2eh = 3 x 10-11 cm3/s for the 2nd order radiative rate constant of non-
geminate electron-hole recombination luminescence via Tl+ activator ions.
To set an estimate of the nonradiative 2nd –order rate K2eh, we go back to the 80% efficiency
of total light yield from NaI:Tl, and again make the approximation of applying it separately in each
kinetic order. Taking the 2nd and 3rd order losses together into account, a reasonable estimate of
K2eh consistent with the light yield considerations above is K2eh = 3 x 10-12 cm3/s.
18
There is no known process in a doped scintillator like NaI:Tl that transfers energy to the
activator through interaction of two excitons. Therefore the value of the 2nd order rate constant of
“exciton” radiative decay can be set to zero, R2x = 0. As noted earlier, in semiconductors where
free exciton luminescence is dominant, exciton-exciton radiative collision processes (so-called p-
band of luminescence) can accelerate radiative decay, but this is not typical of NaI:Tl or the other
scintillators presently considered.
In contrast, exciton-exciton collisions and resonant interactions of close excitations even if
immobilized on activator ions are well-known to be quenching mechanisms. One excitation can
make a transition to the ground state while exciting a nearby exciton to a high-lying state which
decays non-radiatively back to the lowest excited state or to the ground state. Its value is assigned
as K2x = 2 x 10-11 cm3/s for NaI:Tl, which is close to the observed rates in semiconductors [21]. The
bimolecular radiative recombination of this order of magnitude is also found in organic materials
used for light-emitting diodes [22]
There is guidance on the free-carrier Auger recombination rate K3eh from literature on
various semiconductors. A value around K3eh = 1 x 10-29 cm6/s is typical. [23] Although in line
with typical experimental values, the 3rd-order rate is only an estimate, so it is set to a single value
constant for all the four materials considered here.
The exciton 3rd-order nonradiative rate K3x is not considered to be very relevant in view of
existence of the 2nd order nonradiative rate K2x. We have therefore assigned it the same value as
that of K3eh and held it constant for all the four materials, i.e., K3x = 1 x 10-29 cm6/s.
The interchange rate of excitons converting into e-h pairs, may be given by:
)/exp( kTEexxe !"= ## , (27)
19
where the activation energy in NaI is taken to be eVE 06.0=! [24]. In this study we have
considered three values of 0=! xeh" , 105s-1 and 710 s-1 for NaI:Tl which from Eq. (27) give
0=xe! and 9.86x10³ s-1 and 9.86x10⁵, respectively, at 300 K. This is only to study the influence
of xeh!" on the yield in NaI:Tl. Otherwise, for the other three scintillators, we have chosen
0== !! ehxxeh "" . It may be noted that with the choice of rates given in table I, the temperature
dependence appears in the yield only through the exchange rate xe! .
The track radius can be estimated to be about 4 nm (see the discussion in Sec. 4.3). This
parameter has the simple effect of sliding a given curve left or right on the dE/dx scale, and
approximately a similar effect of sliding the integrated light yield across the particle energy scale.
A small track area means that a given dE/dx produces inversely proportionately higher excitation
density n(x), which is the independent variable of this formalism. As noted above, the
experimental data are quite remarkable in experiencing mainly a horizontal shift along the energy
scale of curves that otherwise are mostly rigid in shape among two basic classes. NaI:Tl has its
roll-off at the lowest energy (highest dE/dx), and so it should have the largest track radius. BaF2
(core-valence) scintillation has its roll-off at the highest energy (lowest dE/dx), and there is good
reason to expect that core holes will have negligible diffusion expanding the track. Thus we have
considered the following track radii: NaI:Tl, r = 6 nm, BaF2 (core/valence luminescence) r = 2 nm,
GSO and LaCl3 :Ce r = 4 nm as given in Table I.
In addition to the above parameters, we also need the average ionization energy, I, and electron
density e
! [Eq. (13)] for each material. For NaI, I is found to be 452.0 eV [25] and
231087.9 !=e" cm- 3 from Eq. (13). Using the rates from Table 1 and 1st-order lifetimes defined
20
earlier as xxex KR 111
+=!" and eheheh
KR 111
+=!" one can calculate the coefficients a1, a2, a3 and
a4 (from Eqs. (A.18) to A(21)) required for calculating the yield from Eqs. (8) and Eq. (11). The
yields thus calculated and plotted are shown in Fig. 2(curve (1)) (local yield) and 3 (curve (1))(total
yield) for NaI with fx = 0.1. Results of Fig. (1) agree with the main qualitative shapes and
placement on the energy axis of the experimental results of local [6] and total [11] (see Fig. 1(b))
yields for NaI:Tl.
For the other three materials considered, the parameters that we know differ significantly from
NaI:Tl are the 1st order decay rate R1x, and the corresponding nonradiative K1x that can be deduced
reasonably well from knowledge of the measured lifetime and absolute light yield efficiency All of
the other 10 rates in Table I will be held at the same value for all the four materials.
3.2: BaF2 (core-valence) Scintillator The 1st - order rates can be estimated from the lifetime and total light yield of core-valence
luminescence in BaF2 [26] as R1x = 1.6x10⁹ s-1 and K1x = 4.0 x 10⁸ s-1. The fast BaF2 scintillator
luminescence occurs due to core-valence transitions, where a Ba 5p shallow core hole is filled by
an electron from the fluorine valence band. Because the valence electron concentration is so large,
this rate depends only on the core hole concentration, i.e., is 1st order in excitation density. Hence
we have set fx = 1. Using the rates in table 2, 241020.1 !=e" cm- 3, I = 180.4 eV[25] and track
radius of 2nm, the calculated local and total yields for BaF2 are shown in Figs. 2(curve (2)) and 3
(curve (2)), respectively. These results reproduce the main qualitative features of the yield on the
energy axis as seen in the experimental data [11] (see Fig. 1(a)).
3.3: Gd2SiO5:Ce (GSO) and LaCl3 :Ce Scintillators The 1st-order radiative rate R1x in cerium-doped materials GSO:Ce and LaCl3:Ce is taken as 1/(30
ns). [27] These two scintillators have nearly identical luminescent properties and luminescence is
21
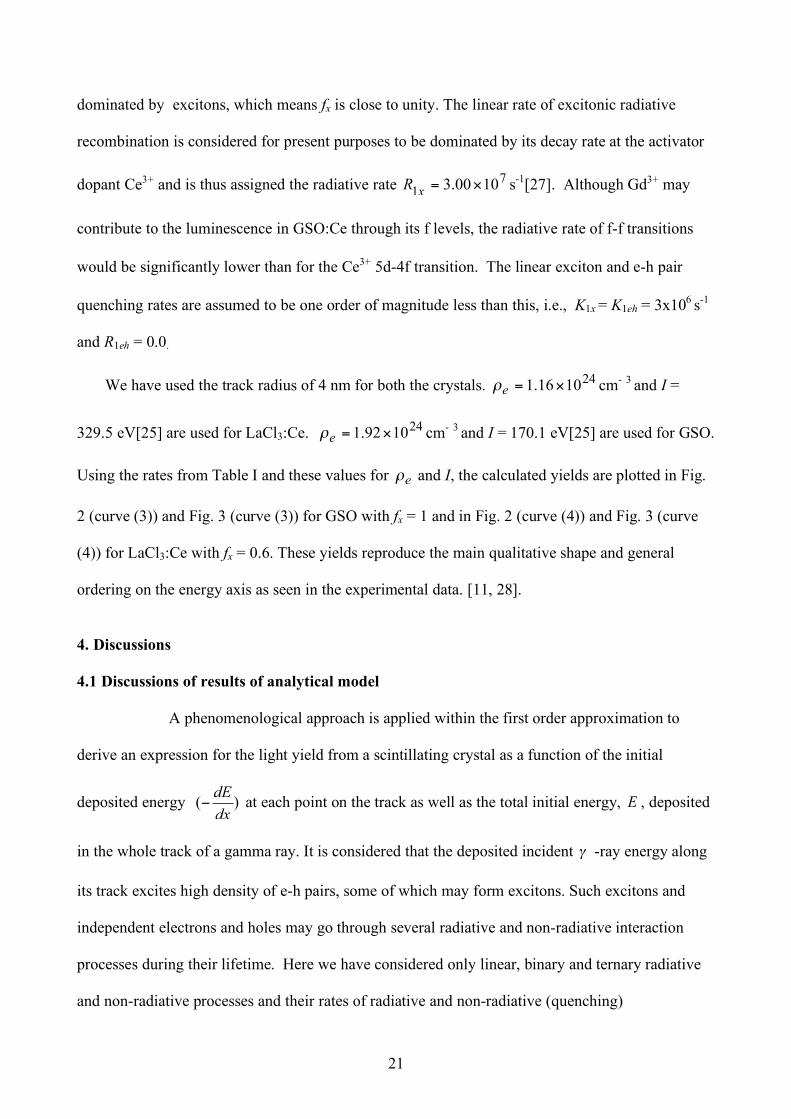
dominated by excitons, which means fx is close to unity. The linear rate of excitonic radiative
recombination is considered for present purposes to be dominated by its decay rate at the activator
dopant Ce3+ and is thus assigned the radiative rate 7
11000.3 !=
xR s-1[27]. Although Gd3+ may
contribute to the luminescence in GSO:Ce through its f levels, the radiative rate of f-f transitions
would be significantly lower than for the Ce3+ 5d-4f transition. The linear exciton and e-h pair
quenching rates are assumed to be one order of magnitude less than this, i.e., K1x = K1eh = 3x10⁶ s-1
and R1eh = 0.0.
We have used the track radius of 4 nm for both the crystals. 241016.1 !=e" cm- 3 and I =
329.5 eV[25] are used for LaCl3:Ce. 241092.1 !=e" cm- 3 and I = 170.1 eV[25] are used for GSO.
Using the rates from Table I and these values for e! and I, the calculated yields are plotted in Fig.
2 (curve (3)) and Fig. 3 (curve (3)) for GSO with fx = 1 and in Fig. 2 (curve (4)) and Fig. 3 (curve
(4)) for LaCl3:Ce with fx = 0.6. These yields reproduce the main qualitative shape and general
ordering on the energy axis as seen in the experimental data. [11, 28].
4. Discussions 4.1 Discussions of results of analytical model A phenomenological approach is applied within the first order approximation to
derive an expression for the light yield from a scintillating crystal as a function of the initial
deposited energy )(dx
dE! at each point on the track as well as the total initial energy, E , deposited
in the whole track of a gamma ray. It is considered that the deposited incident ! -ray energy along
its track excites high density of e-h pairs, some of which may form excitons. Such excitons and
independent electrons and holes may go through several radiative and non-radiative interaction
processes during their lifetime. Here we have considered only linear, binary and ternary radiative
and non-radiative processes and their rates of radiative and non-radiative (quenching)
22
recombinations are taken into account in the rate equations (1) and (2). Accordingly the
approximate expressions for the local and scintillation light yields derived in Eqs.(8) and (11) are
functions of all these three types of rates of recombination. It is assumed that the ternary (Auger)
recombination can only occur non-radiatively.
For the calculation of yields in these scintillators, the relevant rates are taken into account and the
estimation of their magnitudes is based on the experimental results. In estimating the binary and
ternary rates, guidance from the experimental results in semiconductors is also taken. The
calculated local yield rises first to a maximum and then starts decreasing at higher locally deposited
energies for materials that have mixed or dominantly e-h excited pairs, for example NaI:Tl with fx =
0.1 shown in Figs. 2(curve (1)) and 3 (curve (1)) and LaCl3:Ce with fx = 0.6 in Figs. 2(curve (4))
and 3 (curve (4)). Scintillators operating dominantly on excitonic luminescence ( fx = 1) do not
exhibit such a rise in the local yield see, for example, BaF2 and GSO shown in Figs. 2 and 3 (curves
(2) and (3)) . Also LaCl3:Ce becomes dominantly excitonic for fx > 0.6 and then the hump
disappears. The behaviour of the total yield has the opposite character because of the reciprocal
relationship between the local energy -dE/dx and total energy E as given in Eq. (12). Such a
dependence of the total yield on total energy agrees reasonably well with the experimental results
of Mengesha et al. [11] (see Fig. 1).
From the calculated yield, shown in Figs. 2 - 3 for NaI:Tl, BaF2, GSO and LaCl3:Ce , it is found
that the rates of linear processes ( R1 and K1) play a dominant role initially at low values of
)(dx
dE! . In the middle range values of )(
dx
dE! , the rates of binary process (R2 and K2) play
important roles and K3 becomes important only in the very high energy range. This is obviously
what one would expect because at the lower deposited energy the excitation density is low and
interactions among excitons and e-h pairs will be weak so only linear processes will be dominantly
23
effective. As the deposited energy increases, the excitation density increases and interactions
among excitations (excitons and binary e & h) become stronger and stronger and therefore the
binary rates become important in the middle to high energy range and ternary rate becomes
significant at very high deposited energies when the excitation density becomes largest. A similar
dependence on different rates can be interpreted from the total yield (Eq. (11)) plotted as a function
of E . The yield dependence on the total gamma ray energy, E , depends theoretically on the form
of (-dE/dx) chosen for the relation between these two quantities because the Bethe equation [Eq.
(12)] appears in the literature in a few different forms [8, 29]. The form used here given in Eq. (12)
requires two material dependent parameters, ionization energy I and electron density e! . However,
as the range of energy is quite high the reciprocal relationship between local and total yield
dominates [8].
The effect of the interchange rates ex! and xe! on the local and total yields are shown for NaI:Tl in
Fig. 4 (a) and (b), respectively, for ex! = 105 s-1 ( xe! = 9.86x10³ s-1) and 107 s-1 (9.86x10⁵ s-1).
These values are chosen due to the fact that according to Eqs. (A.6) and (A.7) if, on one hand, ex!
is less than 104s-1, i.e., much less than R1x+ K1x and R1eh+K1eh, it has negligible effect on both local
and total yields. On the other hand if ex! is much larger than R1x + K1x and R1eh+K1eh then the
material shows dominantly only the excitonic character (see the dotted yields in Figs. 4(a) and (b)).
It may be noted that the initial excitation density at position x along the track, n(x) [Eq. (3)]
is the independent variable in the local yield [Eq. (8)] in this model. After the constants a1 – a4 are
determined, the shape of the light yield curve versus n(x) is entirely determined. However,
comparisons to available experiments are represented either in the form of the local yield versus -
dE/dx [6], or more directly as total yield versus initial electron energy [8, 11, 30], but not as the
24
light yield versus n(x). According to Eq. (3), -dE/dx is related to n(x) as the square of the track
radius during light emission. This factor produces a rigid shift of the local light yield curve along
the horizontal axis without changing its shape. To obtain the comparison with the total yield
versus initial electron energy, we have integrated the local light yield versus -dE/dx along the whole
track. Because of this step, the integrated light yield curves will not be perfectly rigid in shifting
with changing track area, but since all of the component curves versus -dE/dx shift rigidly, the
integrated light yield can be expected to qualitatively resemble a rigid shift along the horizontal
(energy) axis as the track area changes. With at least 14 parameters contributing in principle to the
light yield curves in this model, it seems unlikely that they would change in an orchestrated way so
as to produce a rigid shift along the energy axis from material to material. Of all those 14
parameters, track radius is the one having the most obvious tendency to produce a nearly rigid shift
along the energy axis.
One of the important points in determining the shape of the light yield is also the fractional
excitonic concentration, fx. As stated in section 3, if the excitonic concentration is
dominant, 1!xf , the hump in the yield disappears as it is found in the case of LaCl3:Ce for fx >
0.6. It may therefore be important to understand how in some materials there are more excitons,
e.g., BaF2 and GSO, and in others there are more e-h pairs. This depends on how both carriers
diffuse along the track radius after the initial excitations. To discuss this point further, the case of
NaI:Tl is discussed below.
4.2 Estimation of track radius: Consideration of carrier diffusion in NaI:Tl Without yet considering any internal electric fields, the mean distance that an electron or
hole can travel from its point of origin within a time t is Dtr = [31] where the electron (hole)
diffusion coefficient D is related to the electron (hole) mobility µ by the Einstein formula,Tk
eD
B
=µ .
25
The conduction electron mobility has been measured in KI as µe = 20 cm2/Vs at room temperature
[32]. The mobility becomes much larger at low temperature and depends on sample purity. In CsI,
Aduev et al [33] have measured µe = 8 cm2/Vs at room temperature by electron pulse-induced
conductivity. Since NaI:Tl has rather high Tl doping, it’s electron mobility will not be expected to
be as high 20 cm2/Vs. If it is near 8 cm2/Vs, then at room temperature, D = 0.21 cm2/s and
considering only the electrons, the mean displacement would be about 4.6 nm in 1 ps, and 145nm
in 1 ns. Based on their effective mass, the free holes may be expected to have roughly 1/8 the
mobility of electrons (1 cm2/Vs) before self-trapping.. Furthermore, the time of free hole diffusion
in the valence band before self-trapping is about 1 ps. So the corresponding mean displacement
due to diffusion of free holes before self-trapping would be about 1.6 nm from the origin
established in the initial distribution. Were we to demand a zero internal electric field, the slower
hole diffusion and eventual self-trapping of holes would confine the distribution of both electrons
and holes at the smaller displacement value.
Now compare this situation to diffusion of conduction electrons from an n-type
semiconductor into an intrinsic region or a p-type region. In the central track of the scintillator, and
on a time scale shorter than completion of recombination luminescence (<< 1 µs) it is useful to
identify a pseudo-Fermi level for the dense population of conduction electrons excited. On the
nonequilibrium time scale which is comparable to the time for radiative recombination of electrons
and holes across the gap, the relatively immobile holes can be viewed in the electrostatic role of
ionized donors in our semiconductor analogy. That is, if some electrons diffuse across the
cylindrical boundary of the initially excited track core into the surrounding unexcited crystal, the
holes left behind will set up a charge depletion region whose electrostatic potential will eventually
limit further diffusion of electrons into the unexcited region. The highest yield in NaI:Tl is
observed at an energy of 10 keV[see Fig. 1(b)] . Using this in eq. (14) for a 6 nm track radius we
get n(x) = 1018 excitations/cm3. Using then Fick’s law, )(NDJN
!"= , we get a diffusion current
26
so large that the field-balanced electron distribution should be established within some tens of
picoseconds at most.
At that point in time the electrons will have diffused out ahead of the holes to a mean radius
determined by the internal electric field. We presume that the holes are self-trapped and are thus
essentially immobile on the time scale longer than a picosecond. Since the NaI scintillator is Tl-
doped to typically 0.3%, we can further presume that the electrons after fast diffusion will have
become trapped at their forward positions on Tl+ ions to form Tl0. This is slightly different from
the p-n junction analog, in which the electrons having diffused into the p-type region as minority
carriers are in equilibrium with the acceptors [31], but the analogy remains good in the following
way that identifies what the “built-in potential” that limits further diffusion should be. Within the
excited central 2-nm track core during the nonequilibrium condition, the pseudo Fermi level
(applying to conduction electrons only) should be very close to the conduction band edge at an
electron density of n(x) = 1018 excitations/cm3 (electron = hole = excitation density). In the initially
unexcited crystal outside the central core, the Fermi level for electrons captured on Tl0 states of
activators should be at about the energy of the Tl0 charge state, i.e. approximately 0.3 eV below the
conduction band edge [20]. The built-in potential difference at the boundary between the two
depletion regions (inside and outside the initially excited core) should therefore also be about 0.3
eV.
The electron diffusion will finally be balanced by the built-in depletion layer field (in the
radial geometry of the track), within a time we have assumed to be tens of picoseconds, but the
scintillation light output occurs on the hundreds of nanoseconds up to a microsecond time scale. It
has already been shown in various publications [20, 34-35] that hopping transport of self-trapped
holes occurs on the time scale of the scintillation light pulse. Thus our outlined process would be
completed when the self-trapped holes hop outward from the track core to recombine radiatively
27
with Tl0 at the periphery and/or to be trapped as Tl++ and recombined with an electron thermally
released from Tl0.
A very good model for the electrostatics of this situation is the cylindrical capacitor. The
initially excited core with possible limited diffusion of holes before self-trapping is modelled as the
inner cylinder of the capacitor having a radius of 6 nm and carrying a total positive charge density
corresponding to an unbalanced hole concentration of 1018 holes/cm3. We consider that these
holes remain stationary but that the electrons of equal number initially occupying the same cylinder
volume move outward to occupy an outer cylindrical shell of radius b. The interior radius already
assigned as 6 nm may be denoted as a. The linear charge density of both the positively and
negatively charged shells described above is: λ = (1018 holes/cm3) (π r2) = 2 x 10-11 Coul/m.
A cylindrical capacitor of inner radius a, outer radius b, and the linear +/- charge densities λ ,
has a voltage difference V between the inner and outer cylinders a
bV ln
2 0!"!
#= [36]. In NaI, ε =
6.6. Assuming that the outer radius is ten times larger than the inner radius, we find 125.0=V V
for the outer shell (electrons) of radius b = 60 nm. This is smaller than the built-in potential of 0.3
V described above. Therefore we may conclude that 60 nm is not a large distance for the diffusing
electrons to run ahead of the more immobile holes. This creates an initial charge separation which
prevents initial exciton formation in NaI:Tl and promotes eventual diffusive recombination of
separated electrons (trapped on Tl0) and holes (either self-trapped or on Tl++). This diffusive stage
may be sensitive to other crystal impurities and defects, and should be examined with respect to
observed impurity and defect effects on the light yield curves.
28
Thus, diffusion forces the mobile electrons to move very quickly out beyond the relatively
immobile holes, discouraging formation of excitons. This rapid diffusion stage sets up two
separated charge reservoirs (holes near the core, electrons farther out), which necessarily must
recombine as independent electrons and holes (generally with one or both trapped on thallium by
the time of recombination). Finally, the self-trapping of holes may make itself felt in determining
“hump or no hump” in the plot of scintillation yield vs E (Fig. 1), and also the ability of Tl to trap
both charges independently plays a role. If it were not for self-trapping of the holes, they would
tend to diffuse out pretty far along with the electrons, and furthermore if the electrons were not
trapped by the Tl+ to form Tl0, those holes would catch up to free electrons and form excitons.
From then on, the kinetics would be first order and will give rise to no hump. Thus, the above
discussions for NaI:Tl provide insight of why excitonic radiative recombination may be relatively
unimportant in this material and justifies the assumption of low excitonic fraction fx = 0.1.
In contrast, the case of the shallow core holes in BaF2 gives rise to core-valence
luminescence. The core hole mobility should be very small, and the electrons recombining with
the core holes are in this case plentiful valence electrons for which diffusion plays no significant
role in the kinetics. Thus, BaF2 may be assigned with the negligible diffusion effect and hence the
track radius is chosen to be 2 nm (Table I). The core hole decay rate is 1st order because the
recombination partners are dense valence electrons, and hence fx = 1 is chosen for this material and
the calculated yield agrees reasonably well with the observed yield. The cases of GSO and LaCl3
may be considered to be midway between BaF2 and NaI:Tl and hence the track radius is assumed to
be 4 nm. In both of these cases the excitonic radiative recombination is assumed to be significant.
For GSO:Ce, the calculated scintillation yield agrees reasonably well with the experimental yield vs
E for fx = 1 without any hump. However, for LaCl3:Ce the calculated light yield curve represents
the experimental one quite well with fx = 0.6. The hump disappears at fx > 0.6. It is not possible to
29
analyse the results of BaF2, GSO and LaCl3 beyond these qualitative trends in shape of the yield
curve at this stage without more supporting experimental works on the rate constants.
One may wonder why the response of a scintillator like YAP, which shows a proportional light
yield (see Fig. 1(a)), has not been considered in this paper? In view of the influences of various
orders of rates of radiative and non-radiative processes presented here, the case of YAP may be
considered as a special case of being pure excitonic (fx = 1) presented in section 2.4 with higher
order rates being negligibly small , i.e. Rnx , Knx << R1x, K1x ( n > 1). In this case the light yield
becomes nearly constant !a1 (see Eqs. (8), (11) and (23)).
4.3 Additional comments on the axial and radial distribution of excitations in the track region
In this section we will try to justify our model of the cylindrical track and make some
estimations of the radial and axial distribution of electronic excitations based on the detailed
discussion of elementary scattering processes for high-energy charge carriers.
The spatial distribution of excitons, electrons and holes (electronic excitations, EEs) after
the interaction of the primary electron with matter is formed during all stages of the
creation/relaxation processes. In the Born approximation these processes can be regarded as
sequential scattering events with emission and absorption of real and virtual photons and phonons.
At each scattering event the primary electron loses an energy !h and momentum qh . The energy
losses can be described in the polarization approximation and non-relativistic limit as:
( )( ) ( )!!
+
"
##$
%&&'
(
"""="
q
q
E
B qcqqq
dqd
mvadx
dE222
0
2,
2
,
1Im
2
))*)*))
+hh , (28)
where +qh and !qh are maximal and minimal momentum transfers, respectively,
( )!hh "±=± EEmq 2 , E is the electron kinetic energy, v is its velocity, and aB is the Bohr
radius. The first term in brackets in Eq. (28) corresponds to emission of virtual longitudinal
photons, which are instantly absorbed by the media. In insulators the energy loss function
30
( )( )q,Im1 !" #
# is non-zero in two regions: (1) if !h is greater than the minimal energy of the
creation of an electronic excitation (band gap energy gE or free exciton energy exE ), then the
absorption of the virtual photon by the media results in the creation of additional electronic
excitations. (2) when !h is about equal to the lattice phonon frequencies; the corresponding
scattering process describes the elementary act of the cooling of an electron without creation of
additional electronic excitations, i.e., the thermalization of electronic excitations. For !"h TkB
(T is the crystal temperature) Eq. (28) needs to be modified in order to account for the processes of
stimulated phonon emission and absorption. The second term in brackets in Eq. (28) corresponds to
emission of real transverse photons (e.g., bremsstrahlung).
In order to obtain the electron stopping power dxdE! in this section, we use a modified
form [29, 30], which helps us to estimate the stopping power in a wide energy range from several
eV to 1 MeV. We discuss here the structure of the energy loss function in the fundamental
absorption region considering NaI crystal as an example. The calculation of the energy loss
function ( )( )q,Im1 !" #
# can be performed by following the steps described below:
(1) First we calculate ( )( )0,Im1 !" #
# . Here ( )0,!" is calculated using the Evaluated Photon
Data Library (EPDL97) data bases [37] developed at the Lawrence Livermore National Laboratory.
For the case of ionic crystals, this requires the following corrections: (i) Modify the ionization
energies of elements using the rigid shift of core level positions in order to obtain the correct
ionization energies of shallow shells (a kind of the account for Madelung crystal potential), and (ii)
change the population of the outer shells (e.g. for NaI we use the pure ionic model Na+I– with 6
electrons at 5p iodine valence shell and zero electrons at 3s sodium shell). The partial photon
absorption cross-sections obtained from EPDL97 library are summed in order to obtain the
imaginary part of dielectric permittivity ( )0,2!" .
31
(2) The real part ( )0,1!" of ( )0,!" is reconstructed using the Kramers-Krönig procedure.
Then both ( )0,2!" and ( )( )0,Im
1 !" ## functions are checked using the sum rules for the total
number of electrons per unit crystal cell and for the value of low-frequency dielectric permittivity.
Thus, we check that the resulting energy loss function shows the plasmon peak at the correct
energy, and its intensity is also realistic.
(3) Then we extrapolate the energy loss function for the case of non-zero q. This method is
equivalent to using the Generalized Oscillator Strength (GOS) approximation instead of Optical
Oscillator Strength (OOS) approximation [12-13]. We use the procedure based on the plane wave
approximation of the final electron state. The results thus obtained for NaI are presented in Fig. 5.
Let us discuss the details of this electron loss function. First of all we introduce the variable
mqEq 222
h= instead of q. In this case the limits of integration over this variable becomes
( )2!h"± EE . The maximal value of the upper integration limit +
qE equals to E4 (for
0=!h ). From simple kinematics considerations this case corresponds to the back scattering of the
primary electron from the massive scattering center at pq 2!= , and in this case the scattering angle
is ! . When !qE E, the mean scattering angle for primary electron is about 2! . The scattering
angle is small if EEq << .
For high electron energies E > 1 keV, most scattering events occur for small qE due to two
reasons: (1) the factor q1 in the integrand makes q small and therefore small qE is more
preferable for scattering and (2) Fig. 5 (lower panel) shows that the energy loss function rapidly
decreases with increasing qE . Therefore the primary electron trajectory deviates slightly at each
scattering. The occurrence of scatterings with higher angular deviations of the trajectory is
relatively rare. The Bethe ridge (see, e.g., [12]) of the energy loss function plays an important role
32
in these rare scattering events. The Bethe ridge is the peak in the energy loss function near the line
qE=!h . It is clearly shown in the bottom panel of Fig. 5 and describes the Rutherford scattering
(or Mott scattering, if the exchange is taken into account) of the primary electron by quasi-free
electrons. This scattering is the main reason of the creation of so-called ! -rays. An additional
reason for the creation of ! -rays is the creation of high-energy Auger electrons followed after the
ionization of K- and L-shells of heavy ions. This is again rather a rare process, as it can be seen
from the energy loss function presented in Fig. 5. These K- and L-shells can be filled also with the
X-ray fluorescent photon emission, and the absorption of these photons creates high-energy
electrons far enough from the main track. The creations of both deep core holes and ! -rays are
relatively rare effects, therefore the main part of energy is deposited in the crystal in the form of
sequential low-angle scattering of the primary electron.
The scattering of electrons with energies below 100 eV is mainly a large-angle scattering,
and these electrons produce a ‘cluster’ of excitations sometimes called ‘spurs’, see, e.g., [38].
For the relativistic case, the following modifications should be made in Eq. (28). The factor
22
mv , which is equal to kinetic energy E in non-relativistic case should be replaced by
( )22
22
12
2
2 mcE
mcEE
mv
+
+= and then the limits of the integration are changed to:
( ) ( ) ( ) ( )
( ) ( )( ).2222
4222142221
mcEEmcEE
cmmcEccmmcEcEpEpq
+!!±+=
!+!±!+=!±= !!
±
""
""
hh
hhh (29)
The exchange of indistinguishable electrons is not included in this form of the stopping power.
However this effect modifies the stopping power only when the energies of the secondary electrons
and scattered primary electrons are about the same, i.e., the exchange modifies mainly the low-
energy part (below the mean ionization energy) of the stopping power and the decrease is no more
than by a factor of two.
33
For the first step, as an approximation, when the q-dependence of dielectric permittivity is
neglected we get: ( )( ) ( )( )0,Im,Im11 !"!" ##
#$# q . In this case we neglect the effects connected
with the Bethe ridge (see, e.g., [12]), i.e., neglect the large-angle scattering on quasi-free electrons,
which is expected to overestimate the stopping power slightly. The stopping power is then
calculated using:
( )( )
( )
!!
!!
!"!!
#
hh
hh
hh
$+$$+
$+$++%
&&'
())*
+$
+
+=$ ,
22
22
0
2
22
22
22ln
0,
1Im
2
121
mcEEmcEE
mcEEmcEE
dmcE
mcE
Eadx
dEE
B . (30)
The electron stopping power calculated with this technique for sodium iodide (NaI) is
shown in the top panel of Fig. 6 (left y-axis). Electrons with energy below 80 eV are scattered with
production of electronic excitations mainly from the valence band, whereas electrons with higher
energy create holes in iodine 4d core level (ionization energy is about 60 eV) and deeper levels.
The mean free path for electron-electron scattering and mean energy losses per a scattering
versus electron energy are shown in the bottom panel of Fig 6. The mean energy per one scattering
is about 70 eV for primary electron energy in the range 100 keV to 1 MeV. Therefore most
scatterings produce secondary excitations originating from the valence I 5p, Na 2p and I 4d bands.
Assuming that the mean energy for production of an electronic excitation Eeh can be estimated as 2
to 3 times the band gap energy Eg (5.9 eV for NaI), one can estimate that in the high-energy part of
the track, individual scatterings produce clusters (‘spurs’) of relaxed tertiary electronic excitations.
The number of electronic excitations in these clusters is about 3 to 5.
The mean radius of these clusters is determined mainly by the thermalization length. Since
the main channel for thermalization of electrons and holes in ionic crystals is the scattering on LO
and short-wavelength LA phonons, the mean radius of the cluster can be estimated as rth = 3 nm.
This value is too hard to be estimated accurately, since the main role in the thermalization process
34
is played by the short-wavelength LA phonons with wavevectors near the boundary of the Brillouin
zone. This interaction is especially strong and therefore the thermalization length is shorter in
binary crystals with high ionic degree, and in crystals with ferroelectric features.
For estimating the radius of these clusters, we have to take into account not only the
thermalization length, but also the diffusion length for thermalized excitations before their capture
by traps or self-trapping. As stated in section 4.2, the hole mobility for alkali halides is about
1 cm2/V·s, which gives a diffusion coefficient D = 2.6·10–2 cm2/s at T = 300K (see section 4.2). As
described above, the mean distance which a charge carrier can go away during time t from the place
of its creation is DtrD= , which gives rD = 6 nm in 1 ps and 50 nm in 1 ns. Assuming that the
self-trapping or capturing occurs in few picoseconds, we get the mean distance of the travelling
before the capture equal to 3 nm in 4 ps. Therefore the total mean distance from the creation to
trapping of a hole can be estimated as nm422!+= Dth
rrr . The trapping on impurities depends on
their concentration and therefore r can be different in the same matrices with different dopant
concentrations.
The value of r can hardly be measured directly. Nevertheless, the analysis of decay curve
profile of BaF2 cross-luminescence excited under 20 to 100 eV photons [39] gives the indication
that the radius of the ‘clusters’ is about several nanometers [40].
According to the mean free path plot shown in the bottom panel of Fig. 6, these clusters are
separated by the mean distance of about 50 nm at the high-energy part of the track and overlap at
the low-energy end of the track below 10 eV. This structure of the track is rather complicated, and
for simplicity we propose a model which replaces the real distribution of electronic excitations by a
Gaussian distribution in the transversal direction with mean radius r and peak concentration at the
track axis equal to ( ) ( ) ( ) ( ) ( )geh ErdxdEErdxdExn 22
max3!! "#"= as given in Eq. (9) and:
35
( ) ( ) ( ) ( )22
max exp0,,0, rxnxnn ññr !=" , where r!! "0 . (31)
Since nmax is proportional to dxdE! , it can be estimated as shown in the top panel of Fig. 6 (right
y-axis).
In the previous sections we have used the model of the cylindrical track with the stepwise
radial distribution of electronic excitations. The estimation presented in this section justifies the
applicability of the cylindrical track model and the values of track radius given in Table I which
have been used in Sec. 3 for the analytical calculation of the non-proportionality effect.
5. Conclusion A phenomenological approach is applied to derive an approximate expression for the light yield in
scintillators as a function of the rates of linear, binary and ternary radiative and non-radiative
interaction processes. The dependence of the light yield on the initial energy deposited at any point
along the ! - ray track ( -dE/dx) and the total energy ( E ) deposited in the whole track is studied.
The calculated yield is found to be in reasonable agreement with the yield observed in scintillators.
The energy and radial dependences on the excitation concentration along the track are also
discussed. It is expected that the results of this paper may enhance understanding of the dependence
of the light yield on different rates of radiative and non-radiative interaction processes occurring in
scintillators.
Acknowledgements This work was supported by the National Nuclear Security Administration, Office of Defense
Nuclear Nonproliferation, Office of Nuclear Nonproliferation Research and Engineering (NA-22)
of the U.S. Department of Energy under Contract No. DE-AC02-05CH11231, grant number NNSA
LB06-316-PD05 / NN2001000. We gratefully acknowledge the technical assistance from Ms
Francesca Morlino in preparing the manuscript. We would like to thank Steve Payne of Lawrence
36
Livermore National Laboratory for sharing his own comprehensive framework prior to publication
in terms of describing nonproportionality of scintillators.
Appendix A: Derivation of the excitation population
As an approximation, we consider only the linear processes in Eqs. (4) and (5) and then these
equations become:
)()()()()( 11 xnfxnxnxnKR xehexexxeexxx +><>=<+><+ !! , (A.1)
)()1()()()()( 11 xnfxnxnxnKR xexxeehexeheheh !+><>=<+><+ "" , (A.2)
Adding (A.1) and (A.2), we get:
)()()()()( 1111 xnxnKRxnKRehehehexxx >=<++><+ , (A.3)
Solving the linear Eqs (A.1) and (A.2) using Eq. (A.3), we get :
)()( xAnxnex >=< and )()( xBnxneh
>=< , (A.4)
where
)()())((
])([
11111111
11
ehehxexxexehehxx
xehehex
KRKRKRKR
fKRA
++++++
++=
!!
! , (A.6)
and
37
)()())((
]))(1[(
11111111
11
ehehxexxexehehxx
xexxx
KRKRKRKR
KRfB
++++++
++!=
""
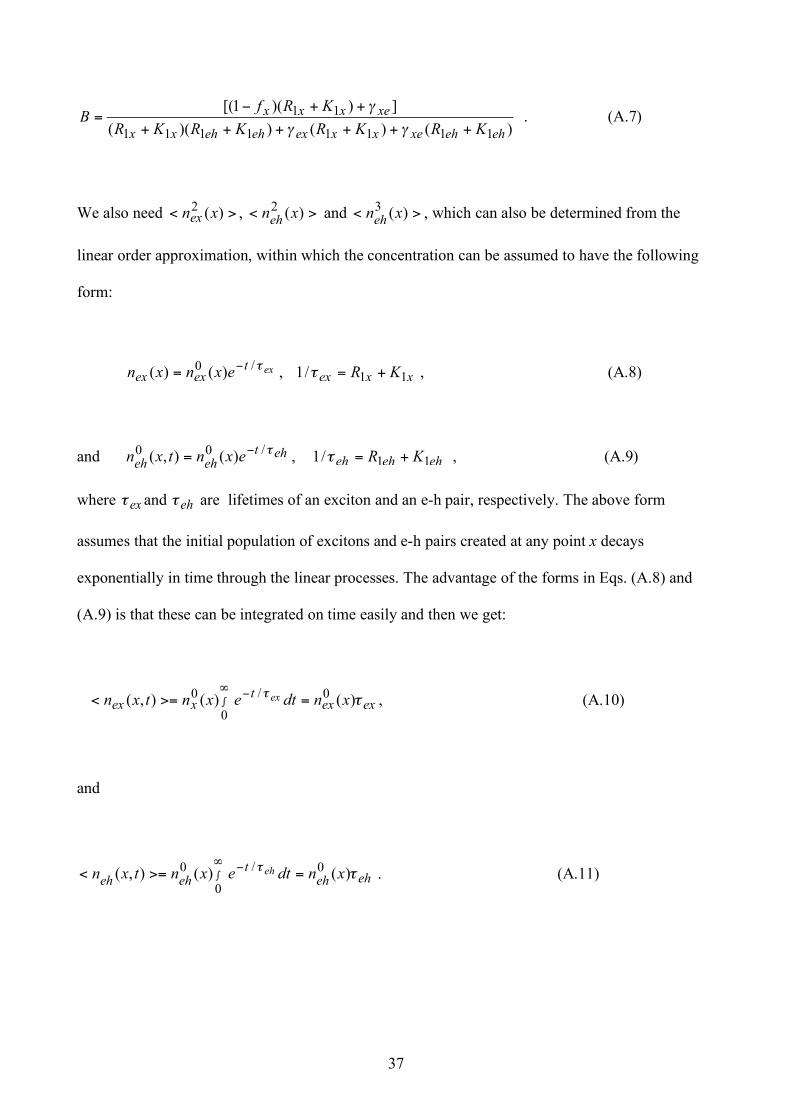
" . (A.7)
We also need >< )(2 xnex , >< )(2 xneh
and >< )(3 xneh
, which can also be determined from the
linear order approximation, within which the concentration can be assumed to have the following
form:
ext
exex exnxn!/0 )()(
"= , xxex KR 11/1 +=! , (A.8)
and eht
ehehexntxn
!/00 )(),("
= , eheheh KR 11/1 +=! , (A.9)
where ex! and eh! are lifetimes of an exciton and an e-h pair, respectively. The above form
assumes that the initial population of excitons and e-h pairs created at any point x decays
exponentially in time through the linear processes. The advantage of the forms in Eqs. (A.8) and
(A.9) is that these can be integrated on time easily and then we get:
exext
xex xndtexntxn ex !!)()(),( 0/
0
0=>=<
"#$ , (A.10)
and
eheh
t
ehehxndtexntxn eh !!)()(),( 0/
0
0=>=<
"#$ . (A.11)
38
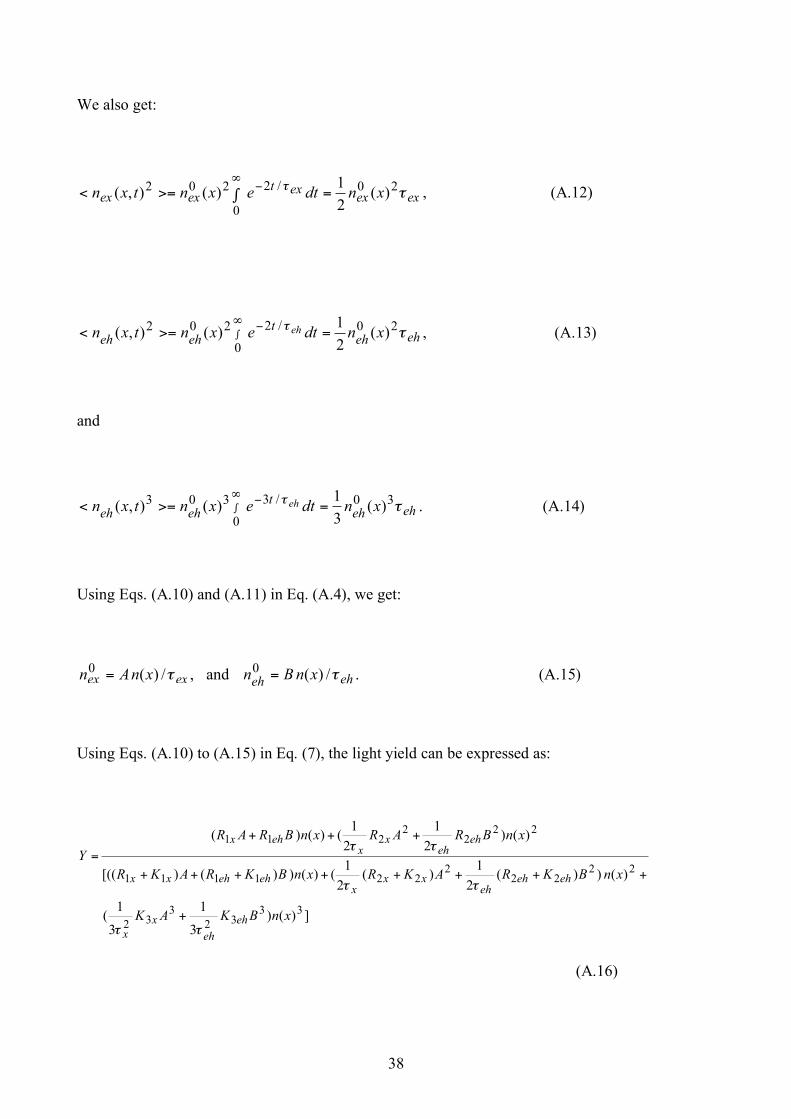
We also get:
exexext
exex xndtexntxn !! 20/2
0
202 )(2
1)(),( =">=<
#$
, (A.12)
eheh
t
ehehxndtexntxn eh !! 20/2
0
202 )(2
1)(),( =>=<
"#$ , (A.13)
and
eheh
t
ehehxndtexntxn eh !! 30/3
0
303 )(3
1)(),( =>=<
"#$ . (A.14)
Using Eqs. (A.10) and (A.11) in Eq. (A.4), we get:
exex xnAn !/)(0= , and eheh
xnBn !/)(0= . (A.15)
Using Eqs. (A.10) to (A.15) in Eq. (7), the light yield can be expressed as:
])()3
1
3
1(
)())(2
1)(
2
1()())()[((
)()2
1
2
1()()(
3332
332
2222
2221111
222
2211
xnBKAK
xnBKRAKRxnBKRAKR
xnBRARxnBRAR
Y
eh
eh
x
x
eheh
eh
xx
x
ehehxx
eh
eh
x
x
ehx
!!
!!
!!
+
++++++++
+++
=
(A.16)
39
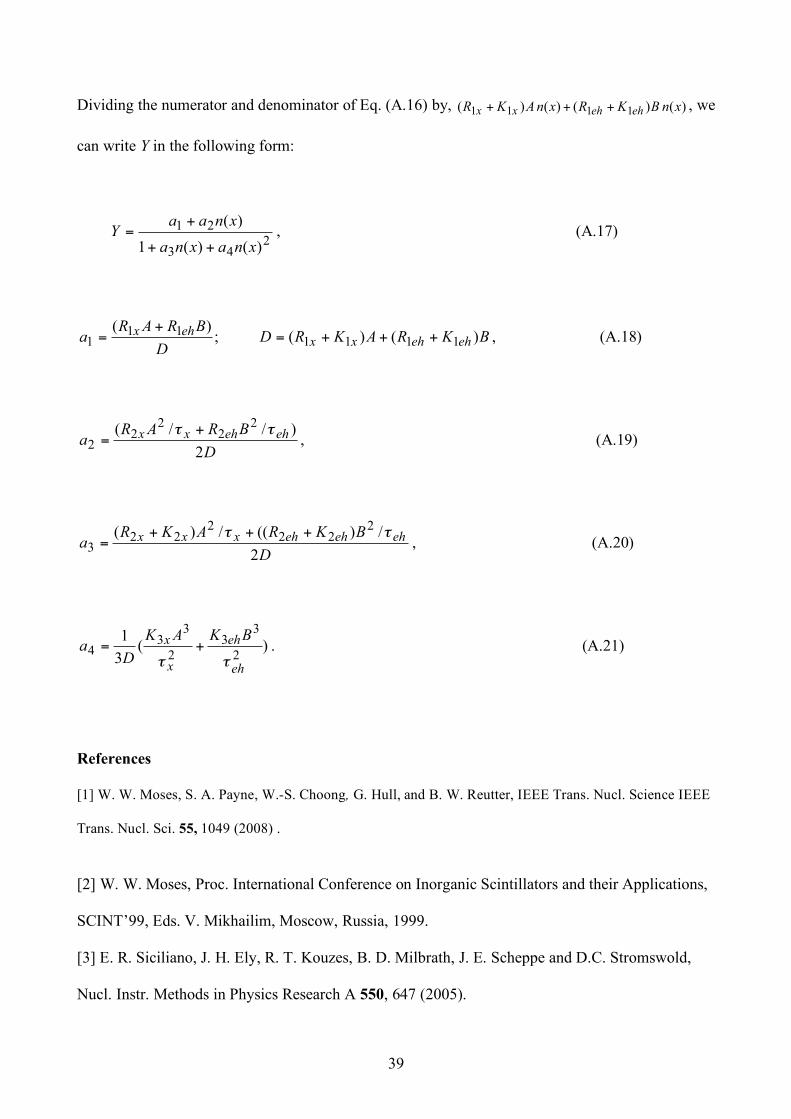
Dividing the numerator and denominator of Eq. (A.16) by, )()()()( 1111 xnBKRxnAKR ehehxx +++ , we
can write Y in the following form:
2
43
21
)()(1
)(
xnaxna
xnaaY
++
+= , (A.17)
BKRAKRDD
BRARa ehehxx
ehx )()(;)(
111111
1 +++=+
= , (A.18)
D
BRARa
ehehxx
2
)//( 22
22
2!! +
= , (A.19)
D
BKRAKRa
ehehehxxx
2
/)((/)( 222
222
3!! +++
= , (A.20)
)(3
1
2
33
2
33
4
eh
eh
x
x BKAK
Da
!!+= . (A.21)
References [1] W. W. Moses, S. A. Payne, W.-S. Choong, G. Hull, and B. W. Reutter, IEEE Trans. Nucl. Science IEEE
Trans. Nucl. Sci. 55, 1049 (2008) .
[2] W. W. Moses, Proc. International Conference on Inorganic Scintillators and their Applications,
SCINT’99, Eds. V. Mikhailim, Moscow, Russia, 1999.
[3] E. R. Siciliano, J. H. Ely, R. T. Kouzes, B. D. Milbrath, J. E. Scheppe and D.C. Stromswold,
Nucl. Instr. Methods in Physics Research A 550, 647 (2005).
40
[4] M. Globus, B. Grinyov and J. K. Kim, Inorganic Scintillators for Modern and Traditional
Applications (Institute for Single Crystals, Kharkov, Ukraine, 2005)
[5] See, e.g., J.D. Valentine, B.D. Rooney and P. Dorenbos, IEEE Trans. Nucl. Science 45, 1750
(1998).
[6] R.B.Murray and A. Meyer, Phys. Rev. 112, 815 (1961).
[7] J. Singh, Excitation Energy Transfer Processes in Condensed Matter (Plenum, N.Y., 1994).
[8] J.E. Jaffe, Nucl. Instr. and Methods in Phys. Res. A580, 1378 (2007); D.J. Robbins, J.
Electrochem. Soc.: Solid-State Sci. Tech. 127, 2694 (1980).
[9] C. Klingshirn, Phys. Status Solidi (b) 71, 547 (1975).
[10] G. Bizarri, W.W. Moses, J. Singh, A.N. Vasil’ev and R.T. Williams, Phys. Status. Solidi (c)
(2008) in press.
[11] W. Mengesha, T. Taulbee, B. Rooney and J. Valentine, IEEE Trans Nucl. Sci. 45, 456 (1998).
[12] M. Inokuti, Rev. Mod. Phys. 43 (1971) 297.
[13] R. Mayol and F. Salvat, J. Phys. B: At. Mol. Opt. Phys. 23 (1990) 2117.
[14] J. C. Ashley, J. Electron Spectrosc. Relat. Phenom. 28 (1982) 177.
[15] J. C. Ashley, J. Electron Spectrosc. Relat. Phenom. 46 (1988) 199.
[16] D. R. Penn, Phys. Rev. B 35 (1987) 482.
[17] H. Bethe, Ann. Physik. 5, 325 (1930).
[18] G.F. Knoll, Radiation Detection and Measurement, 3rd Ed. (John Wiley and Sons, New York,
N.Y., 2005) p. 31.
[19] S. C. Blankespoor, S. E. Derenzo, W. W. Moses, and C. S. Rossington, IEEE Trans. Nucl. Sci.
NS-41, 698 (1994)
[20] H.B. Dietrich, A.E. Purdy, R.B. Murray and R.T. Williams, Phys.Rev. B12, 5894 (1973).
[21] G. Bourdon, I. Robert, I. Sagnes, and I. Abram, J. Appl. Phys. 92, 6595 (2002).
41
[22] G. Garcia-Belmonte, J. M. Montero, E. M. Barea and J. Bisquert, J. Appl. Phys. 101, 114506
(2007
[23] A. Haug, J. Phys. C. Solid State Phys. 16, 4159 (1983).
[24]W.L. Emkey, A.B.Romberger, and W.J. Van Sciver, Phys.Rev. B20, 5326(1979).
[25] http://physics.nist.gov/PhysRefData/Star/Text/ESTAR-u.html
[26] P. Dorenbos, R. Visser, C. W. E. van Eijk, J. Valbis, and N. M. Khaidukov, IEEE Trans.
Nucl. Sci. 39, 506 (1992).
[27] S. Shimizu, H. Ishibashi, A. Ejiri, and S. Kubota, Nucl. Inst. Meth. in Phys. Res. A 486, 490
(2002).
[28] G. Bizarri and P. Dorembos, Phys. Rev. B75, 184302 (2007).
[29] A. N. Vasil’ev, IEEE Trans. Nucl. Sci. 55, 1054 (2008).
[30] G. Bizarri, N. J. Cherepy, W.-S. Choong, G. Hull, W. W. Moses, S. A. Payne, J. Singh, J.
D. Valentine, A. N. Vasil’ev, and R. T. Williams, IEEE Trans. Nucl. Sci., submitted for
publication.
[31] e.g., S.M. Sze and K. K. Ng, Physics of Semiconductor Devices, 3rd Ed. (John Wiley & Sons,
N.J., 2007).
[32] R. K. Ahrenkiel and F. C. Brown, Phys.Rev. A136, 223 (1964)].
[33]B. P. Aduev, E. D. Aluker, G. M. Belokurov, and V. N. Shvayko, phys. stat. sol. (b) 208, 137
(1998)]
[34] R. T. Williams and A. K. Song, Self-trapping of Excitons (Springer, Berlin, 1993).
[35] P. A. Rodnyi, Physical Processes in Inorganic Scintillators (Boca Raton, CRC Publisher,
2007).
[36] http://hyperphysics.phy-astr.gsu.edu/hbase/electric/capcyl.html
42
[37] D. E. Cullen, J. H. Hubbell, and L. Kissel, EPDL97: the Evaluated Photon Data Library, '97
Version, Lawrence Livermore National Laboratory, UCRL--50400, Vol. 6, Rev. 5, September
1997.
[38] D. I. Vaisburd and K. E. Evdokimov, phys. stat. sol. (c) 2 (2005) 216.
[39] M.A.Terekhin, A.N.Vasil’ev, M.Kamada, E. Nakamura, S.Kubota, Phys. Rev. B52 (1995)
3117.
[40] Glukhov R.A., Kamada M., Kubota S., Nakamura E., Ohara S., Terekhin M. A., Vasil’ev A.
N., Proc. Int. Conf. on Inorganic Scintillators and Their Applications, SCINT95, Delft University
Press, The Netherlands, 1996, p. 204.
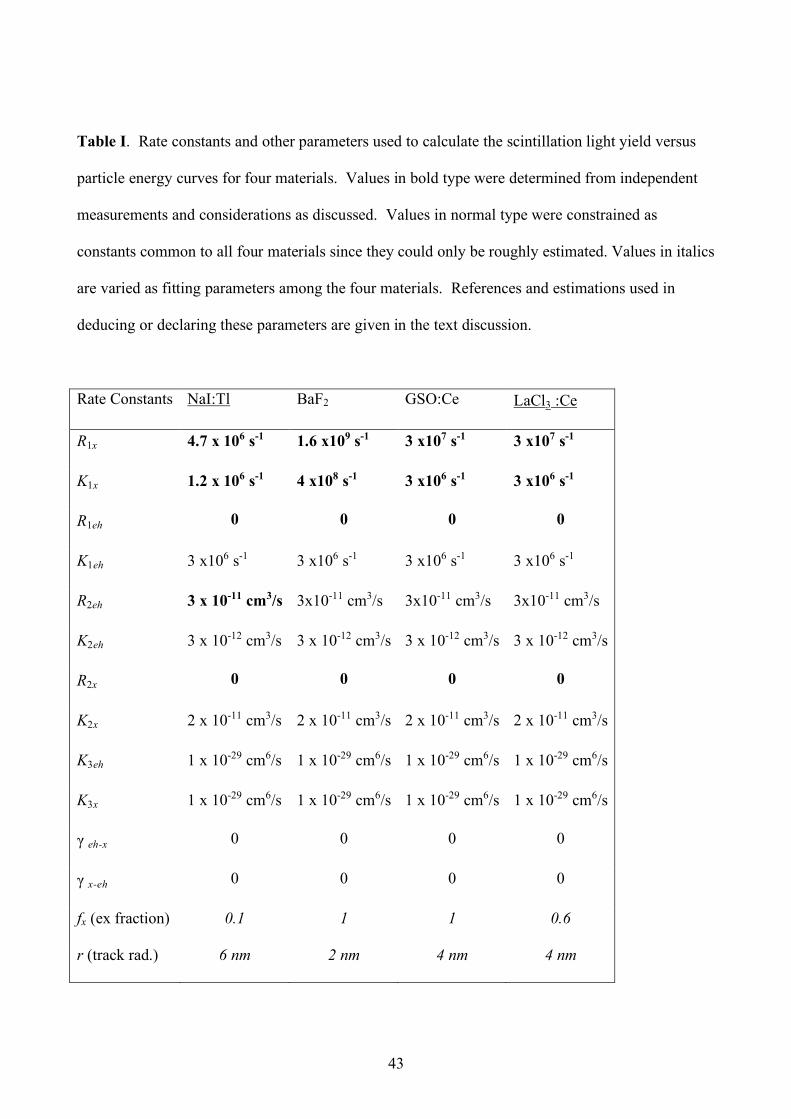
43
Table I. Rate constants and other parameters used to calculate the scintillation light yield versus
particle energy curves for four materials. Values in bold type were determined from independent
measurements and considerations as discussed. Values in normal type were constrained as
constants common to all four materials since they could only be roughly estimated. Values in italics
are varied as fitting parameters among the four materials. References and estimations used in
deducing or declaring these parameters are given in the text discussion.
Rate Constants NaI:Tl BaF2 GSO:Ce LaCl3 :Ce
R1x 4.7 x 106 s-1 1.6 x10⁹ s-1 3 x10⁷ s-1 3 x10⁷ s-1
K1x 1.2 x 106 s-1 4 x10⁸ s-1 3 x10⁶ s-1 3 x10⁶ s-1
R1eh 0 0 0 0
K1eh 3 x10⁶ s-1 3 x10⁶ s-1 3 x10⁶ s-1 3 x10⁶ s-1
R2eh 3 x 10-11 cm3/s 3x10-11 cm3/s 3x10-11 cm3/s 3x10-11 cm3/s
K2eh 3 x 10-12 cm3/s 3 x 10-12 cm3/s 3 x 10-12 cm3/s 3 x 10-12 cm3/s
R2x 0 0 0 0
K2x 2 x 10-11 cm3/s 2 x 10-11 cm3/s 2 x 10-11 cm3/s 2 x 10-11 cm3/s
K3eh 1 x 10-29 cm6/s 1 x 10-29 cm6/s 1 x 10-29 cm6/s 1 x 10-29 cm6/s
K3x 1 x 10-29 cm6/s 1 x 10-29 cm6/s 1 x 10-29 cm6/s 1 x 10-29 cm6/s
γ eh-x 0 0 0 0
γ x-eh 0 0 0 0
fx (ex fraction) 0.1 1 1 0.6
r (track rad.) 6 nm 2 nm 4 nm 4 nm
44
Figure Captions Fig. 1: The relative light output (total light yield) versus incident energy measured by Mengesha et
al. [11]. (a) for seven materials, CaF2:Eu, LSO, YAP, BGO, GSO, BaF2, LaCl3:Ce which show no
hump in the yield and (b) for three materials, NaI:Tl, CsI:Tl and CsI:Na which show a hump in the
yield. (© [1998] IEEE)
Fig. 2(a) The local light yield (YL) plotted as a function of (-dE/dx) (keV/cm) from Eq. (8) for:
NaI:Tl (1), BaF2: Ce (2), GSO:Ce (3) and LaCl3:Ce (4). Rates used for different materials are
given in Table I.
Fig. 3: The total light yield (Y) plotted as a function of the total energy(E) (keV) from Eq. (11) for
NaI:Tl (1), BaF2: Ce (2), GSO:Ce (3) and LaCl3:Ce (4). Rates used for different materials are
given in Table I.
Fig. 4 : (a) The local light yield plotted as a function of (-dE/dx ) calculated using Eq.(8) and (b)
total light yield as a function of the total energy calculated using Eq. (11) for NaI:Tl scintillating
crystals with fx = 0.1, average track radius 6 nm and using rates from Table I. The dotted line curve
corresponds to ex! =107 s-1 ( xe! =9.86x10⁵ s-1) and solid line corresponds to ex! =105 s-1
( xe! =9.86x10³ s-1).
Fig. 5. Energy loss function ( )( )q,Im
1 !" ## multiplied by the energy loss !h versus energy loss
!h for different values of q ( mqEq 222
h= ).Upper panel is for E ! 1keV and lower panel is for E
! 1keV.
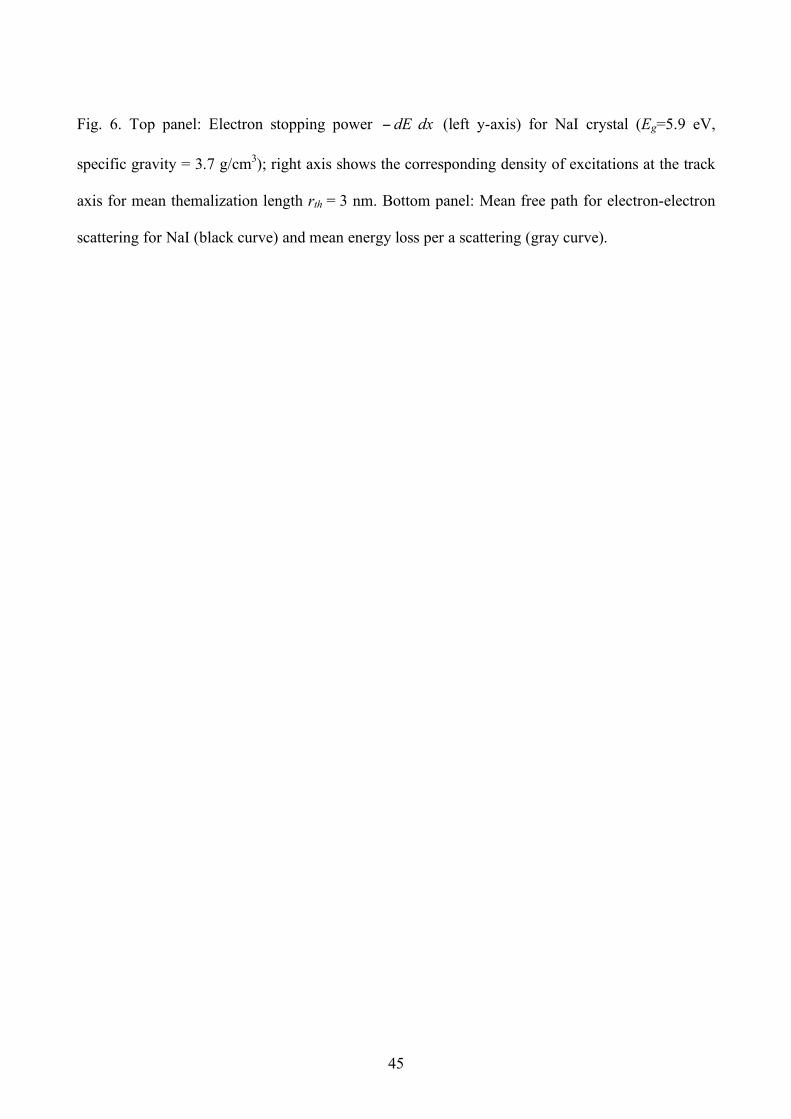
45
Fig. 6. Top panel: Electron stopping power dxdE! (left y-axis) for NaI crystal (Eg=5.9 eV,
specific gravity = 3.7 g/cm3); right axis shows the corresponding density of excitations at the track
axis for mean themalization length rth = 3 nm. Bottom panel: Mean free path for electron-electron
scattering for NaI (black curve) and mean energy loss per a scattering (gray curve).

46
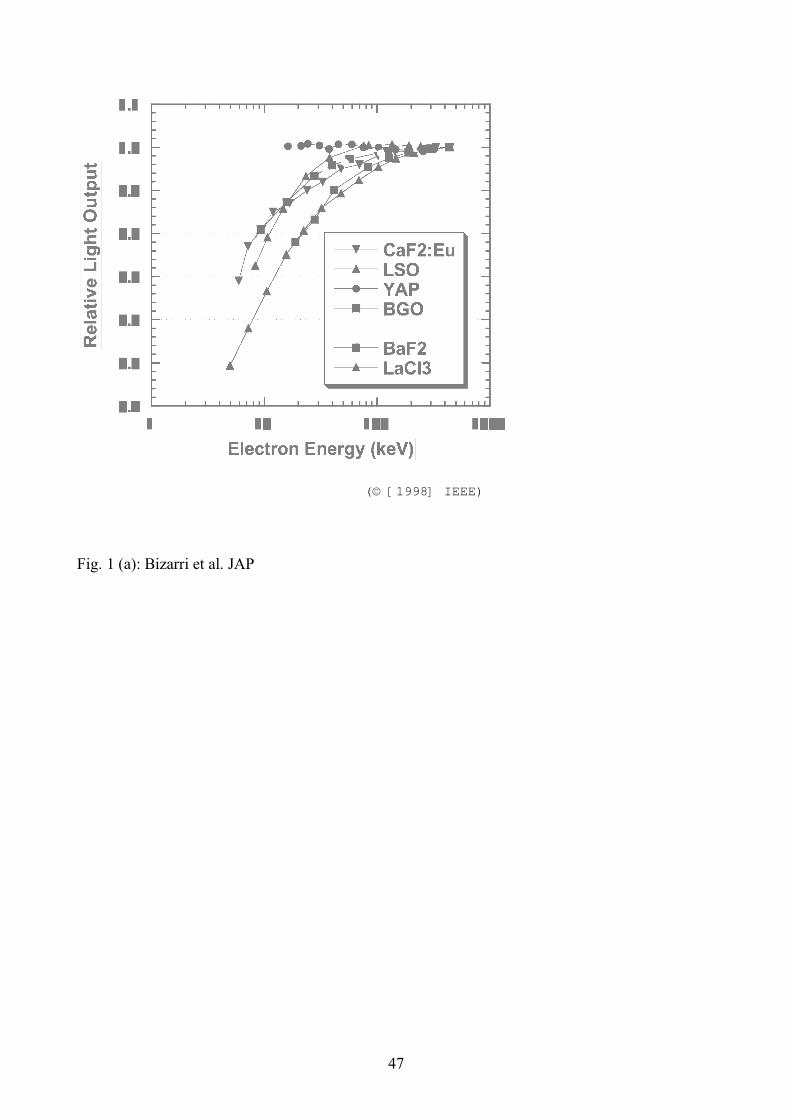
47
(© [1998] IEEE)
Fig. 1 (a): Bizarri et al. JAP
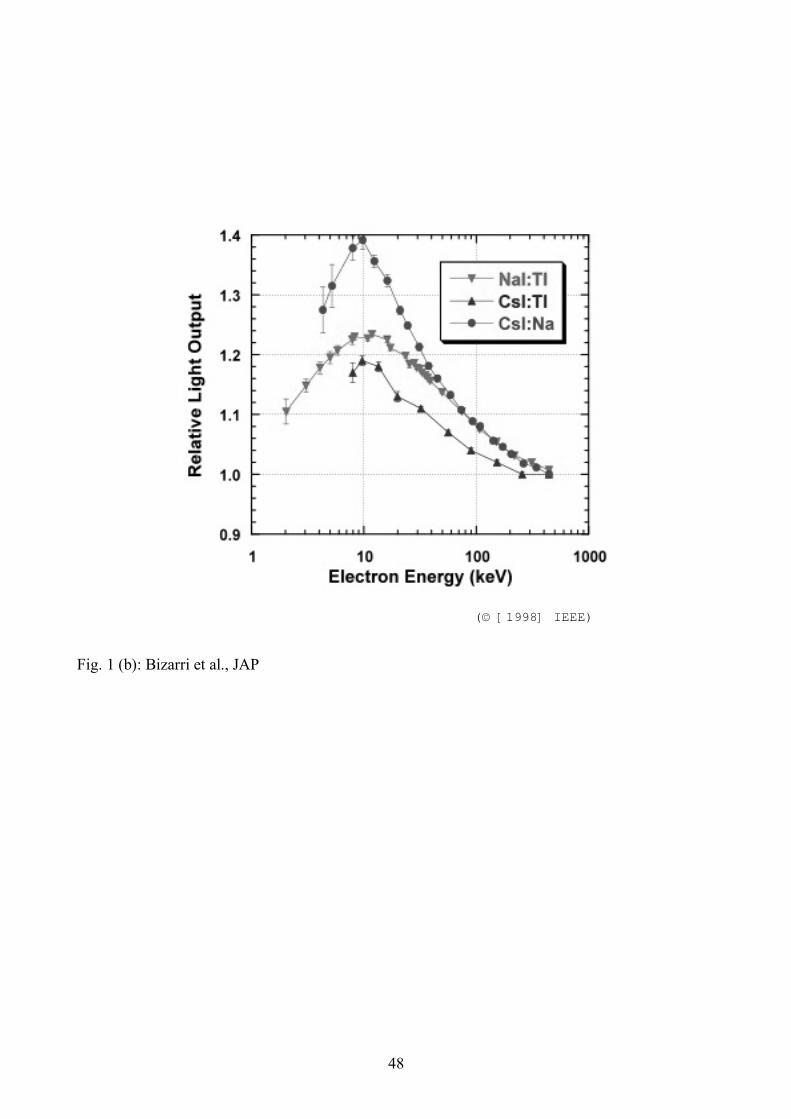
48
(© [1998] IEEE)
Fig. 1 (b): Bizarri et al., JAP
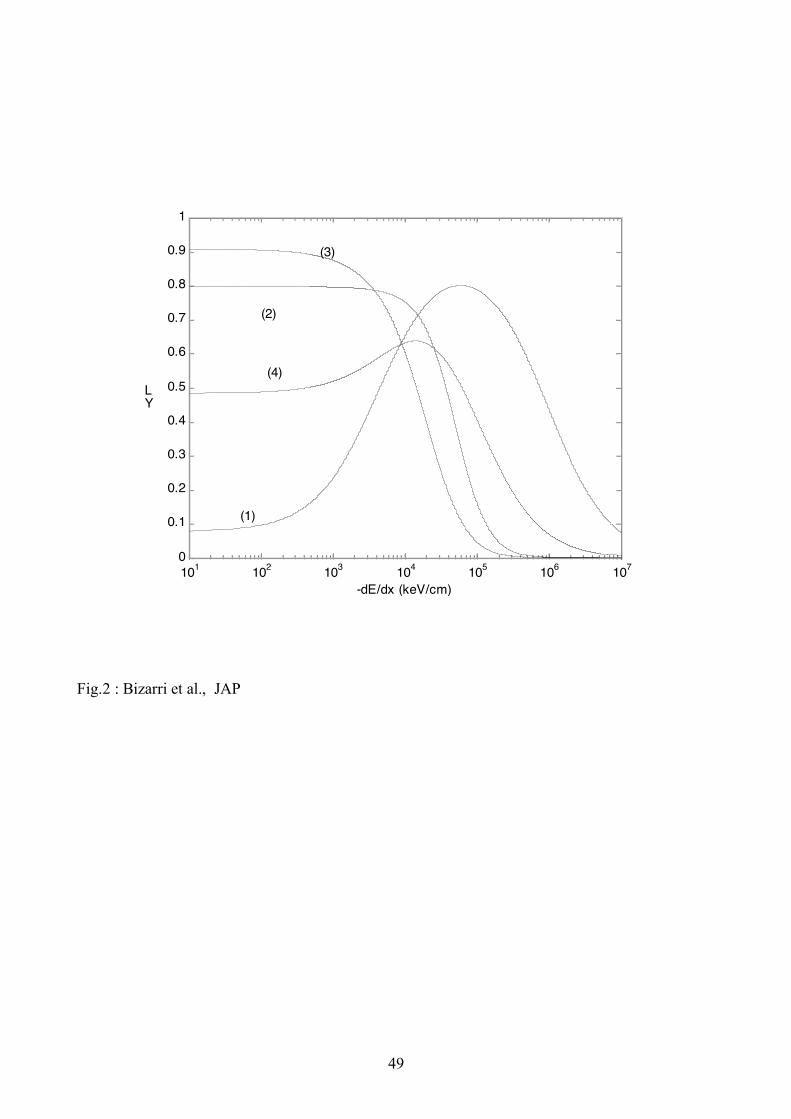
49
101
102
103
104
105
106
107
0
0.1
0.2
0.3
0.4
0.5
0.6
0.7
0.8
0.9
1
-dE/dx (keV/cm)
YL
(1)
(2)
(3)
(4)
Fig.2 : Bizarri et al., JAP
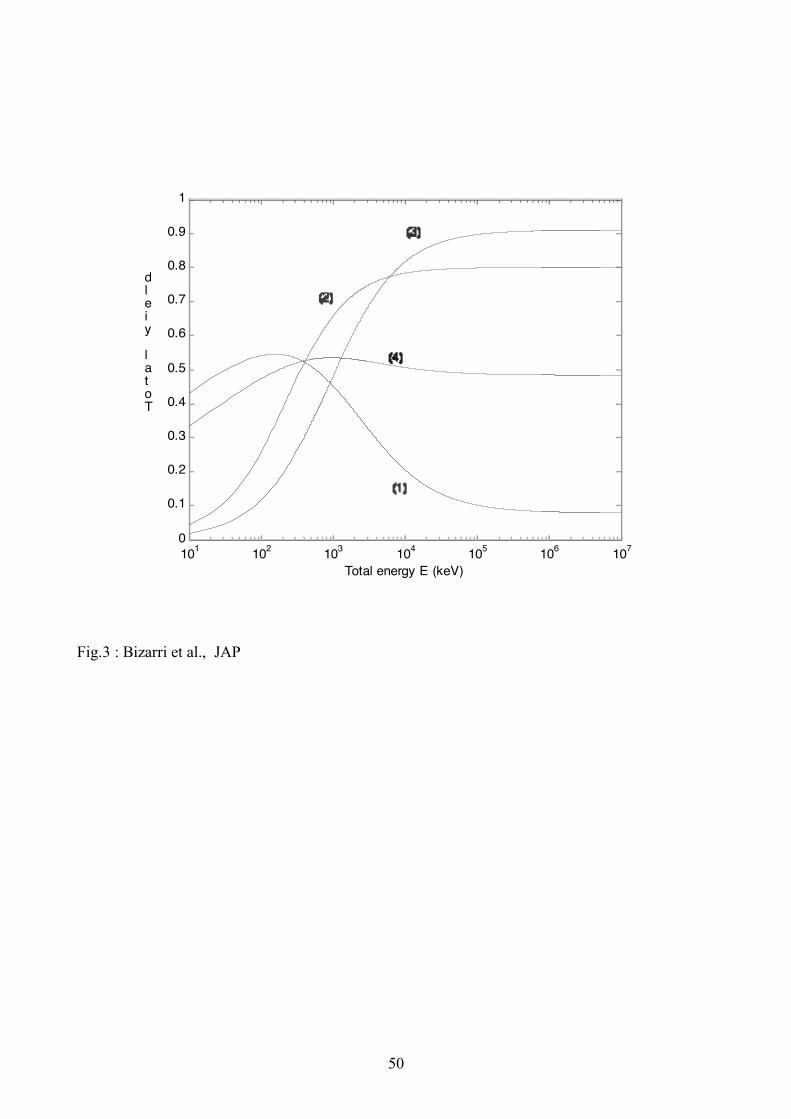
50
101
102
103
104
105
106
107
0
0.1
0.2
0.3
0.4
0.5
0.6
0.7
0.8
0.9
1
Total energy E (keV)
Total yield
Fig.3 : Bizarri et al., JAP
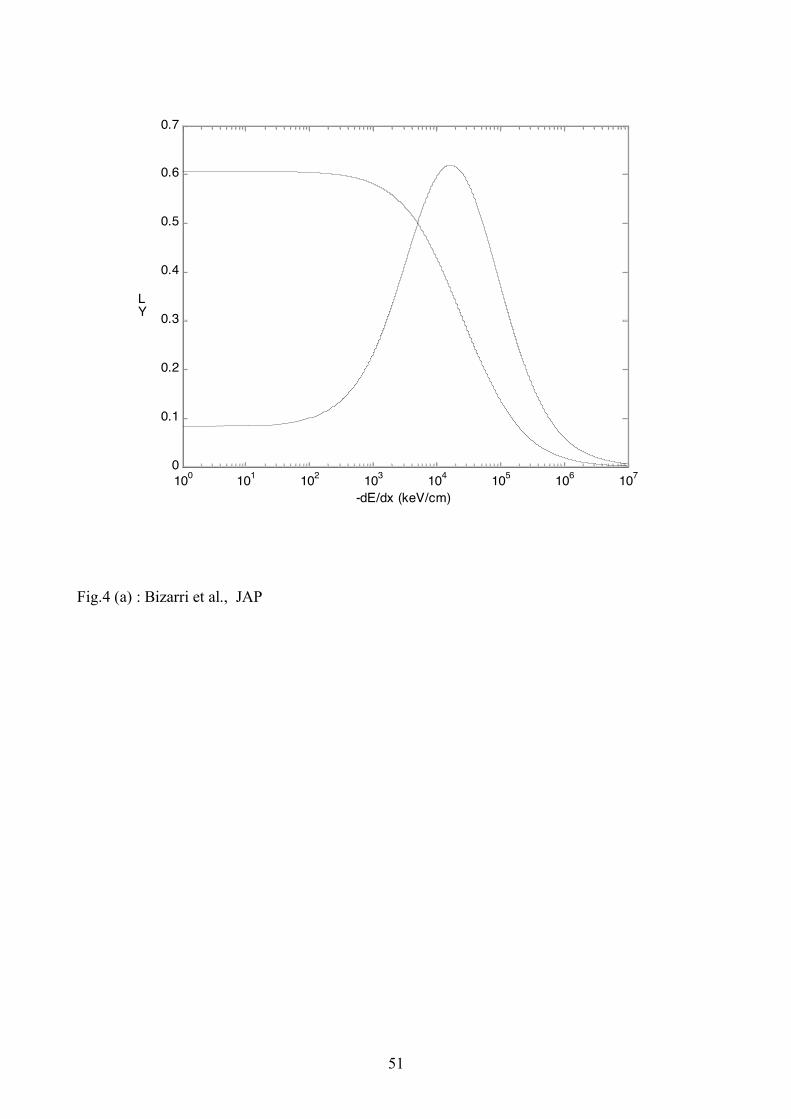
51
100
101
102
103
104
105
106
107
0
0.1
0.2
0.3
0.4
0.5
0.6
0.7
-dE/dx (keV/cm)
YL
Fig.4 (a) : Bizarri et al., JAP
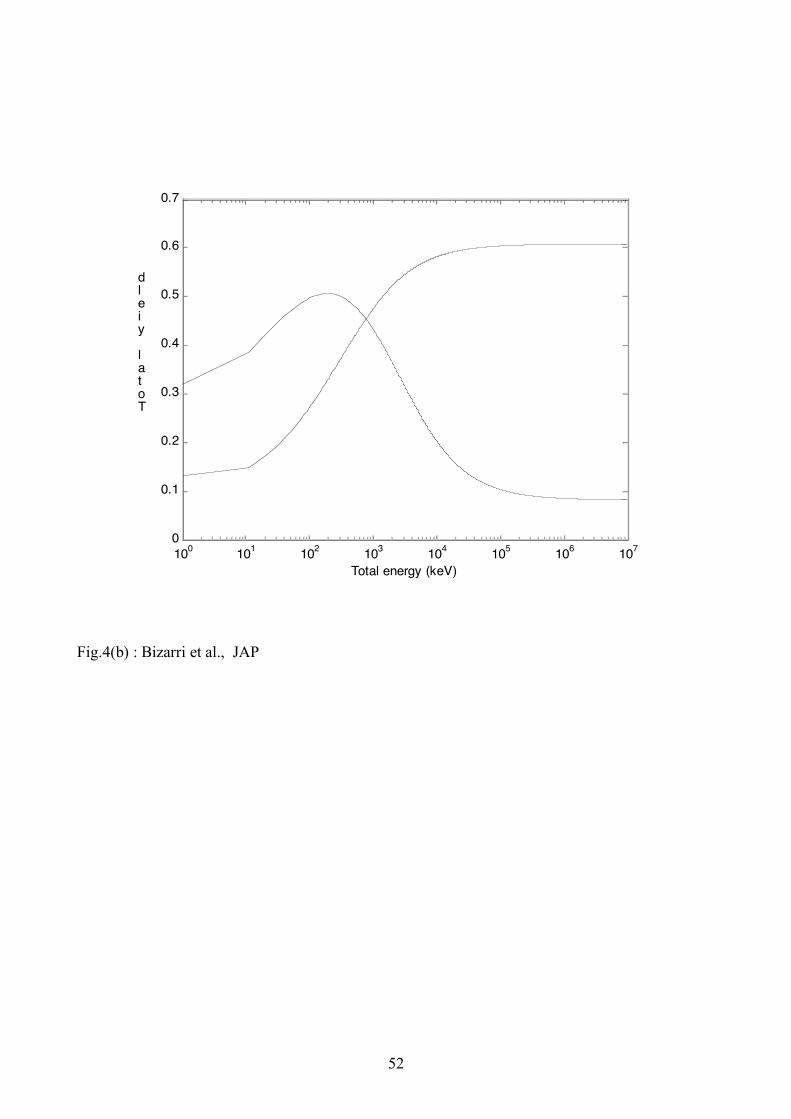
52
100
101
102
103
104
105
106
107
0
0.1
0.2
0.3
0.4
0.5
0.6
0.7
Total energy (keV)
Total yield
Fig.4(b) : Bizarri et al., JAP
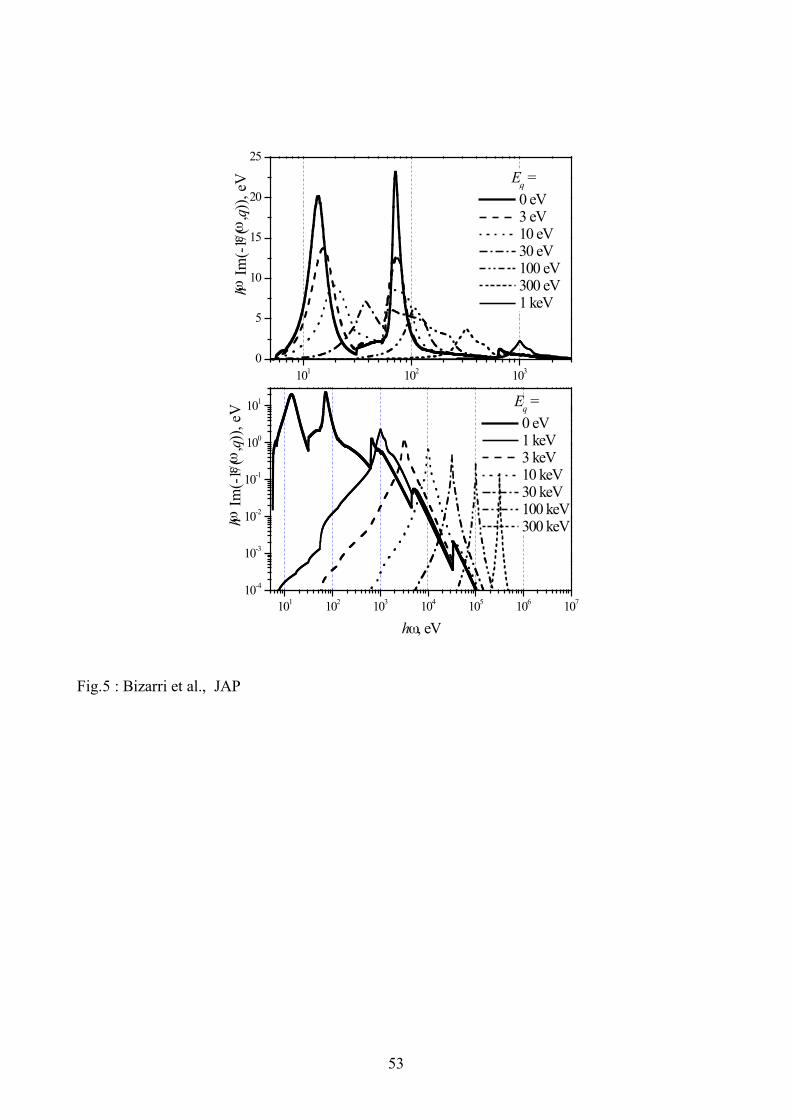
53
101
102
103
0
5
10
15
20
25
101
102
103
104
105
106
107
10-4
10-3
10-2
10-1
100
101
Eq =
0 eV 3 eV 10 eV 30 eV 100 eV 300 eV 1 keV
h! I
m(-
1/"(!
,q))
, eV
Eq =
0 eV 1 keV 3 keV 10 keV 30 keV 100 keV 300 keV
h! I
m(-
1/"(!
,q))
, eV
h!, eV
Fig.5 : Bizarri et al., JAP
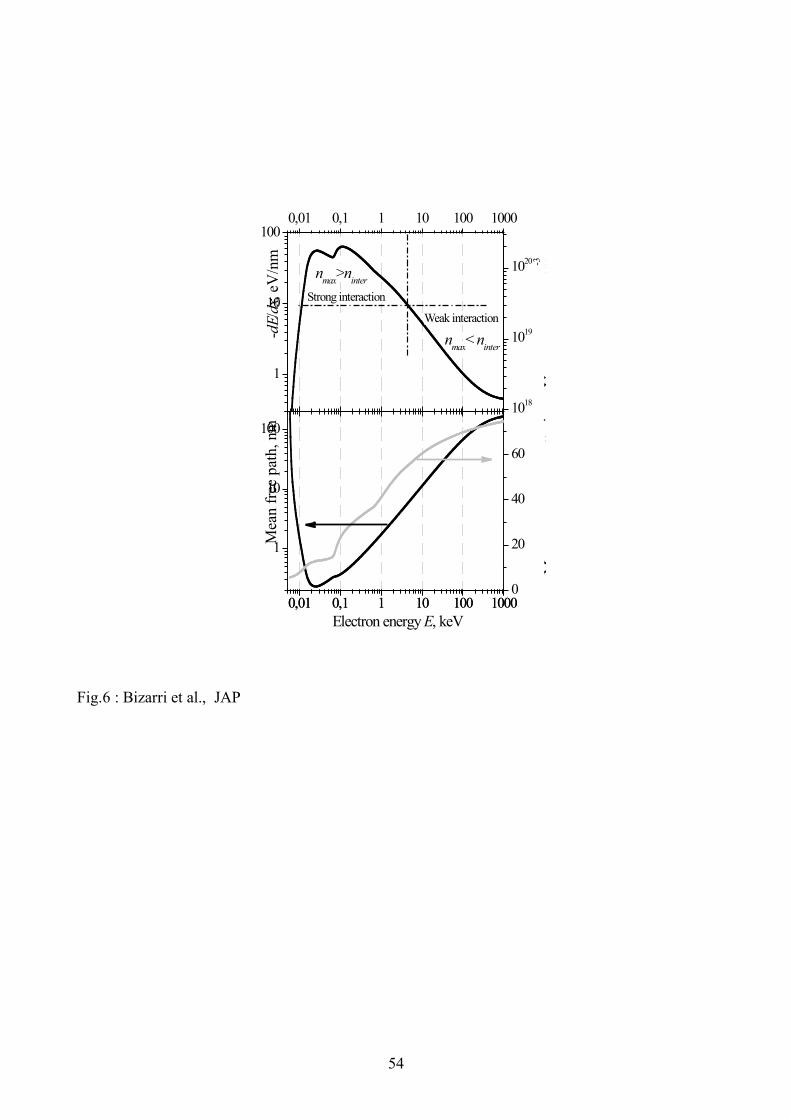
54
1
10
1000,01 0,1 1 10 100 1000
1018
1019
1020
0,01 0,1 1 10 100 1000
1
10
100
0,01 0,1 1 10 100 10000
20
40
60
Weak interaction
nmax
>ninter
-dE
/dx,
eV
/nm
nmax
< ninter
Strong interaction
nmax
, cm
-3
Mea
n f
ree
pat
h, nm
Electron energy E, keV
Mea
n e
ner
gy p
er s
catt
erin
g, eV
Fig.6 : Bizarri et al., JAP