
The longitudinal, chronological case study research strategy
36
Page 1 of 36 The longitudinal, chronological case study research strategy: a definition, and an example from IBM Hursley Park Austen Rainer School of Computer Science University of Hertfordshire College Lane Campus Hatfield Hertfordshire AL10 9AB U.K. [email protected] Context: There is surprisingly little empirical software engineering research (ESER) that has analysed and reported the rich, fine-grained behaviour of phenomena over time using qualitative and quantitative data. The ESER community also increasingly recognises the need to develop theories of software engineering phenomena e.g. theories of the actual behaviour of software projects at the level of the project and over time. Objective: To examine the use of the longitudinal, chronological case study (LCCS) as a research strategy for investigating the rich, fine-grained behaviour of phenomena over time using qualitative and quantitative data. Method: Review the methodological literature on longitudinal case study. Define the LCCS and demonstrate the development and application of the LCCS research strategy to the investigation of Project C, a software development project at IBM Hursley Park. Use the study to consider prospects for LCCSs, and to make progress on a theory of software project behaviour. Results: LCCSs appear to provide insights that are hard to achieve using existing research strategies, such as the survey study. The LCCS strategy has basic requirements that data is time-indexed, relatively fine-grained and collected contemporaneous to the events to which the data refer. Preliminary progress is made on a theory of software project behaviour. Conclusion: LCCS appears well suited to analysing and reporting rich, fine-grained behaviour of phenomena over time. Keywords: software project, deadline effect, schedule pressure, longitudinal case study, chronology, qualitative data, theory development 1 Introduction Projects are the software industry‘s de facto approach to developing software. Projects are also a focus for assessing the state of the software industry (e.g. The Standish Group‘s CHAOS Reports on successful and unsuccessful projects [66-70]; the Standish Group reports have been criticised by for example [21, 31]). While there has been considerable research interest into the success and failure of software projects (see [16, 31] for two reviews), the critical success factors for software project success (e.g. [7, 9, 10, 44, 45, 72]), and the estimation of effort, cost and duration of projects (see [30, 32] for two reviews), there is surprisingly little
-
Upload
khangminh22 -
Category
Documents
-
view
1 -
download
0
Transcript of The longitudinal, chronological case study research strategy
Page 1 of 36
The longitudinal, chronological case study research strategy: a
definition, and an example from IBM Hursley Park
Austen Rainer
School of Computer Science
University of Hertfordshire
College Lane Campus
Hatfield
Hertfordshire AL10 9AB
U.K.
Context: There is surprisingly little empirical software engineering research (ESER) that has analysed and
reported the rich, fine-grained behaviour of phenomena over time using qualitative and quantitative data.
The ESER community also increasingly recognises the need to develop theories of software engineering
phenomena e.g. theories of the actual behaviour of software projects at the level of the project and over time.
Objective: To examine the use of the longitudinal, chronological case study (LCCS) as a research strategy
for investigating the rich, fine-grained behaviour of phenomena over time using qualitative and quantitative
data.
Method: Review the methodological literature on longitudinal case study. Define the LCCS and demonstrate
the development and application of the LCCS research strategy to the investigation of Project C, a software
development project at IBM Hursley Park. Use the study to consider prospects for LCCSs, and to make
progress on a theory of software project behaviour.
Results: LCCSs appear to provide insights that are hard to achieve using existing research strategies, such as
the survey study. The LCCS strategy has basic requirements that data is time-indexed, relatively fine-grained
and collected contemporaneous to the events to which the data refer. Preliminary progress is made on a
theory of software project behaviour.
Conclusion: LCCS appears well suited to analysing and reporting rich, fine-grained behaviour of phenomena
over time.
Keywords: software project, deadline effect, schedule pressure, longitudinal case study, chronology,
qualitative data, theory development
1 Introduction
Projects are the software industry‘s de facto approach to developing software. Projects are also a focus for
assessing the state of the software industry (e.g. The Standish Group‘s CHAOS Reports on successful and
unsuccessful projects [66-70]; the Standish Group reports have been criticised by for example [21, 31]). While
there has been considerable research interest into the success and failure of software projects (see [16, 31] for
two reviews), the critical success factors for software project success (e.g. [7, 9, 10, 44, 45, 72]), and the
estimation of effort, cost and duration of projects (see [30, 32] for two reviews), there is surprisingly little
Page 2 of 36
research into the behaviour over time of a software project as it progresses [47]. The lack of study of behaviour
over time means that the research community lacks an empirically-based understanding (as opposed to, for
example, an anecdotal understanding) of what really happens on software projects. One implication from this
lack of understanding is that we do not fully appreciate the context within which sub-project activities (a classic
research example is the code inspection) affect or are affected by the wider software project. A second
implication is that the research community may not properly appreciate the real project environment into which
research often propose interventions. In Glass‘ words, there is a need for researchers to have ―... a description of
what they are prescribing for.‖ ([20], p. 20).
Longitudinal case studies would seem to be a natural research strategy for investigating behaviour over time,
however whilst there are guidelines [56, 73] emerging in the empirical software engineering research
community on the design, conduct and reporting of case studies, there is very little attention directed in these
guidelines at longitudinal studies [47], and in particular directed at the analysis and reporting of data, and
primarily qualitative data, as temporal information. Two clarifications are required. First, there are numerous
studies of quantitative time series. But longitudinal studies of phenomena like software projects would depend
on large volumes of qualitative data. Second, quantitative time series have tended to focus on phenomena were
there are relatively large samples (e.g. [2, 8, 17, 42]) for which one can perform statistical analysis. Our focus
here is on longitudinal studies of phenomena where there are often a relatively small number of cases, with a
small number of data points relative to the number of attributes of interest, where much of the data collected is
qualitative in nature, where the data is collected over time for phenomena that occur over time, and where the
data is collected as close in time (i.e. contemporaneously) to the events to which those data refer. To emphasise
the importance placed on the fine-grained collection and analysis of events and change, we refer to longitudinal,
chronological case studies, and discuss this in more depth in section 2. Software projects are a good example of
phenomena that meets these criteria.
In a separate development, there has been growing interest and advocacy in the research community for the
development of theories of empirical software engineering [61, 63]. Theories that seek to explain, and in
particular that seek to provide causal explanation, are fundamentally built on temporal information e.g. that
event A occurred before event B as a necessary although not sufficient criterion for demonstrating that event A
causes event B. The study of project behaviour over time provides an opportunity to gather that temporal
information as a necessary step toward theory development of project-related behaviours. For example, in a
study of the reasons that practitioners adopt or do not adopt software inspections, Jedlitschka and Ciolkowski
[29] found that the reasons an (admittedly small) practitioner sample gave for not adopting these technologies
was that the technologies were too time consuming and thus not applicable under time pressure. A risk arising
from the delays and schedule pressure that frequently occur with projects as they progress toward their planned
deadlines is that proven software development activities such as reviews may be abandoned during those
projects with consequences for, as an example, software quality. As a methodology, longitudinal, chronological
case study appears suited to the study of behaviour as it changes over time, as well as supporting the
development of theory.
Page 3 of 36
In related work, we have made progress on methodology by developing a technique for modelling behaviour of
time, the multi-dimensional timelines (MDT) [47], and by providing a conceptual framework for that technique
[48].
The current paper makes two contributions. The primary contribution is the preliminary development of the
longitudinal, chronological case study (LCCS) research strategy. The second contribution is an example of the
application of the LCCS research strategy to software project behaviour, providing insights on project behaviour
and also on the application of the LCCS research strategy.
The remainder of the paper is organised as follows: section 2 examines the methodological status of longitudinal
case studies in software engineering and goes on to define the longitudinal, chronological case study; section 3
describes the design of the particular LCCS reported here; section 4 provides an overview to Project C; section 5
uses qualitative and structured qualitative data to describe the socio-technical context of the project; section 6
describes and explores the behaviour of the project over time using multi-dimensional timelines (MDTs);
section 7 comments on the practical aspects and challenges of conducting LCCSs, and on the contribution that
LCCSs can make; finally, section 8 considers the prospects of a theory of project behaviour and avenues for
further research.
2 The contribution of longitudinal case studies to the study of software
projects
2.1 The methodological status of longitudinal studies in software engineering
Yin‘s [77] book Case Study Research is established as a standard reference text for case study research in
empirical software engineering. In that book Yin proposed several structures for reporting case studies, of which
one was the chronological structure. Yin briefly discussed chronologies, stating that:
1. The arraying of events into a chronology is not just a descriptive device. The procedure can have an
important analytic purpose, to investigate presumed causal events because the basic sequence of a cause
and its effect cannot be temporally inverted.
2. The chronology is likely to cover many different types of variable and not be limited to a single
independent or dependent variable. The chronology can therefore be richer and more insightful than
general time-series.
3. Without any hypotheses or causal propositions, chronologies become chronicles, but these are still
valuable descriptive renditions of events.
In referring to chronological structures, Yin implies a distinction between more general longitudinal studies and
more specific chronological studies; a distinction we explicitly recognise in the research strategy proposed here.
We make a distinction between a longitudinal case study that looks at phenomena over a period of time, and
chronological studies that investigate phenomena using a relatively fine-grained contiguous temporal structure.
A quantitative time-series could be understood as a kind of narrowly focused longitudinal, chronological study
although it is unlikely to be a longitudinal, chronological case study as we intend to use the term here.
Page 4 of 36
In another well-referenced text, Real World Research, Robson [54] states: ―When the main interest is in
describing or assessing the change or development over time, some form of LONGITUDINAL RESEARCH is
the method of choice... A survey is often the main approach... but there is no reason in principle why
experiments or case studies could not be chosen.‖ ([54], p. 50; capitalisation in original). Whilst Robson
recognises a longitudinal research design he does not consider longitudinal research in any particular detail.
A series of fairly recent publications by researchers from the empirical software engineering research (ESER)
community have considered research methodology and in particular case study methodology; but again there is
very little attention directed at the longitudinal case study. Consider:
1. In a recent paper, Runeson and Höst [56] present guidelines for conducting and reporting case study
research in software engineering. Their guidelines are derived from an extensive review of literature from
within, but also beyond, the field of empirical software engineering. In their review, Runeson and Höst
refer to Yin‘s variety of alternative structures for reporting case studies including the chronological
structure. Besides the recognition of the chronological structure for reporting the results of a case study,
Runeson and Höst direct little attention at structuring temporally the analysis in the study, or the
reporting of study findings.
2. Kitchenham, Pickard and Pfleeger [35] also present guidelines for organizing and analysing case studies,
in particular on case studies that evaluate software methods and tools. Their paper appears to provide no
discussion of historical, longitudinal or chronological aspects of the case being studied. The authors do
recognise that case studies sometimes need to be conducted for longer periods of time. Their main focus
on time however concerns the time and effort required to properly undertake the case study.
3. Around the same time as Kitchenham et al.‘s paper, Fenton, Pfleeger and Glass [18] challenged the
software engineering research and practice communities to build together a firmer scientific foundation
for improving software development and maintenance. Two of the areas they identified for improving
research were to focus on realistic rather than ‗toy‘ situations, and to take a long-term view of software
development, both of which suggest the need to model time. But their paper did not explicitly consider
the need to, for example, report behaviour as it changes over time.
4. More recently, Kitchenham et al. [34] present preliminary guidelines for reporting empirical studies.
Kitchenham et al. classify longitudinal study as a type of observational study, and further recognise the
historical cohort study. Again there is little attention directed explicitly at reporting behaviour over time.
5. Seaman [59] presents a number of qualitative methods for data collection and analysis and describes how
they might be used in empirical studies of software engineering. Seaman states that ―Historical
qualitative information can also be gained by examining documentation‖ ([59]; p. 558). But other than
recognising historical information, Seaman‘s article does not explicitly address the analysis or reporting
of behaviour over time.
6. Holt [26] reports a systematic review of case studies in software engineering, to our knowledge the only
publically available review of its kind. For her review, Holt randomly selected 50 case studies from the
Page 5 of 36
5,453 articles scanned and analyzed by Sjøberg et al. in their survey of controlled experiments [64]. Holt
found that only 38% of the case studies she reviewed reported the period of time over which data was
collected and only 18% (9) of the case studies report when the project being studied actually occurred.
(The data collection need not have occurred entirely concurrently with the project being studied.) These
percentages are an indication of the limited attention that software engineering researchers have directed
at the collection and analysis of time-related data.
Previous methodological work in the ESER community has therefore tended to overlook certain fundamental
properties of software engineering phenomena; properties that are explicitly considered by LCCS e.g. the
importance of collecting data over time for phenomena that change over time, the importance of the fine-grained
contiguous collection of quantitative and qualitative data, and the importance of collecting data as temporally
close to the events of interest as feasible.
The large and growing body of work investigating open source software (e.g. [11, 36]) tends to be based on data
primarily automatically collected by tools such as version control systems. Such studies do consider some types
of phenomena that change over time (e.g. source code, and bugs and their tracking) and also collect fine-grained
data that is temporally close to the events of interest. These studies tend to focus on very large volumes of data
drawn either from a small number of systems over time (e.g. [27]), or from a large number of systems (e.g. [49,
50, 74]. Analysis of these large volumes of data depend on automated analytical approaches which inevitably
require a focus on more structured and quantitative data, as well as the kinds of data naturally collected by tools
such as version control systems. Many of the software engineering phenomena we allude to in this paper (see
sections 5 and 6) are therefore not easily collectable using the tools often employed in studies of open source
software.
There is relevant methodological work being undertaken in research disciplines related to empirical software
engineering. Within the field of Human Computer Interaction (HCI) research, Schneiderman and Plaisant [60]
have proposed multi-dimensional, in-depth, long-term case studies (MILCs). The MILC research strategy is
directed at the evaluation of tools, particularly information visualisation tools, in contrast to our focus on the
study of software engineering behaviour at a variety of levels of abstraction (e.g. project, activity, business). For
MILCs, the term multi-dimensional refers to a range of sources of data (e.g. observations, surveys, interviews)
whereas for LCCSs the term multi-dimensional refers to a range of concepts (e.g. features, waiting, schedule,
defects etc.). Also, for MILCs the term in-depth refers to the closeness with which the researcher engages with
(expert) users of the tool. By contrast, for LCCSs, closeness of engagement with the phenomenon of interest is
subsumed within the intent and design of a case study.
As other brief examples of relevant work:
Gerken et al. [19] consider longitudinal research methods in HCI and visual analytics.
Salo and Abrahamsson have elaborated on the controlled case study approach [57] and also investigated
software process improvement and agile development using longitudinal case study [58].
De Souza, Redmiles and colleagues [13, 14] have undertaken field studies, drawing on ethnography, of
software changes and dependencies. These studies include a researcher spending 11 weeks at the field
site.
MacDonell and Shepperd [40] have investigated a project over time by using data collected from earlier
in a project to estimate effort at later stages of the same project.
Page 6 of 36
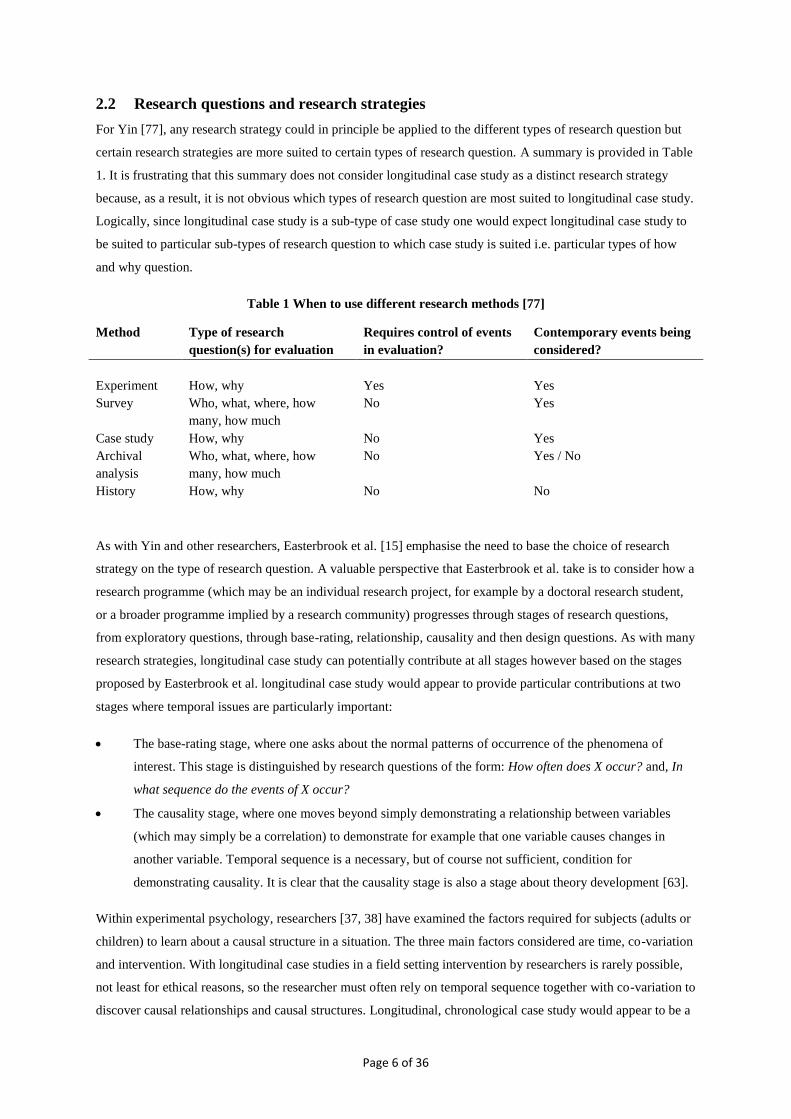
2.2 Research questions and research strategies
For Yin [77], any research strategy could in principle be applied to the different types of research question but
certain research strategies are more suited to certain types of research question. A summary is provided in Table
1. It is frustrating that this summary does not consider longitudinal case study as a distinct research strategy
because, as a result, it is not obvious which types of research question are most suited to longitudinal case study.
Logically, since longitudinal case study is a sub-type of case study one would expect longitudinal case study to
be suited to particular sub-types of research question to which case study is suited i.e. particular types of how
and why question.
Table 1 When to use different research methods [77]
Method Type of research
question(s) for evaluation
Requires control of events
in evaluation?
Contemporary events being
considered?
Experiment How, why Yes Yes
Survey Who, what, where, how
many, how much
No Yes
Case study How, why No Yes
Archival
analysis
Who, what, where, how
many, how much
No Yes / No
History How, why No No
As with Yin and other researchers, Easterbrook et al. [15] emphasise the need to base the choice of research
strategy on the type of research question. A valuable perspective that Easterbrook et al. take is to consider how a
research programme (which may be an individual research project, for example by a doctoral research student,
or a broader programme implied by a research community) progresses through stages of research questions,
from exploratory questions, through base-rating, relationship, causality and then design questions. As with many
research strategies, longitudinal case study can potentially contribute at all stages however based on the stages
proposed by Easterbrook et al. longitudinal case study would appear to provide particular contributions at two
stages where temporal issues are particularly important:
The base-rating stage, where one asks about the normal patterns of occurrence of the phenomena of
interest. This stage is distinguished by research questions of the form: How often does X occur? and, In
what sequence do the events of X occur?
The causality stage, where one moves beyond simply demonstrating a relationship between variables
(which may simply be a correlation) to demonstrate for example that one variable causes changes in
another variable. Temporal sequence is a necessary, but of course not sufficient, condition for
demonstrating causality. It is clear that the causality stage is also a stage about theory development [63].
Within experimental psychology, researchers [37, 38] have examined the factors required for subjects (adults or
children) to learn about a causal structure in a situation. The three main factors considered are time, co-variation
and intervention. With longitudinal case studies in a field setting intervention by researchers is rarely possible,
not least for ethical reasons, so the researcher must often rely on temporal sequence together with co-variation to
discover causal relationships and causal structures. Longitudinal, chronological case study would appear to be a
Page 7 of 36
natural research strategy for collecting and analysing information on temporal sequence, particularly where
there are a complex set of events, and where many of these events cannot easily be measured quantitatively.
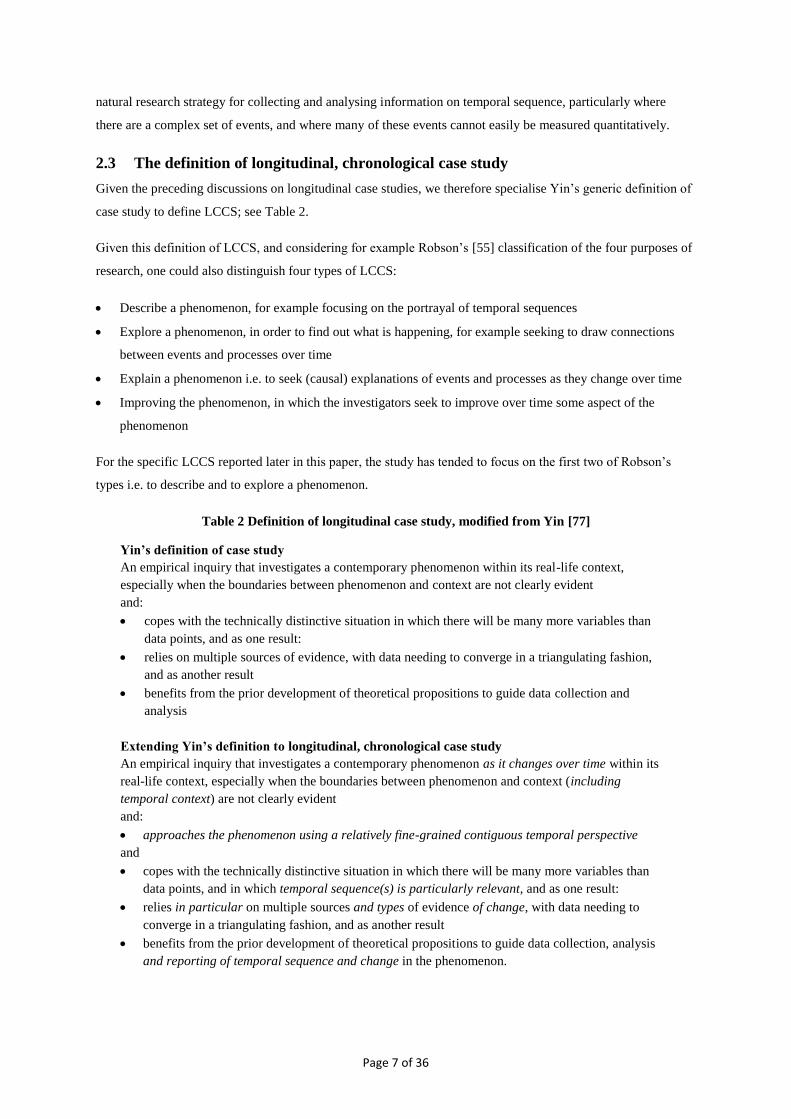
2.3 The definition of longitudinal, chronological case study
Given the preceding discussions on longitudinal case studies, we therefore specialise Yin‘s generic definition of
case study to define LCCS; see Table 2.
Given this definition of LCCS, and considering for example Robson‘s [55] classification of the four purposes of
research, one could also distinguish four types of LCCS:
Describe a phenomenon, for example focusing on the portrayal of temporal sequences
Explore a phenomenon, in order to find out what is happening, for example seeking to draw connections
between events and processes over time
Explain a phenomenon i.e. to seek (causal) explanations of events and processes as they change over time
Improving the phenomenon, in which the investigators seek to improve over time some aspect of the
phenomenon
For the specific LCCS reported later in this paper, the study has tended to focus on the first two of Robson‘s
types i.e. to describe and to explore a phenomenon.
Table 2 Definition of longitudinal case study, modified from Yin [77]
Yin’s definition of case study
An empirical inquiry that investigates a contemporary phenomenon within its real-life context,
especially when the boundaries between phenomenon and context are not clearly evident
and:
copes with the technically distinctive situation in which there will be many more variables than
data points, and as one result:
relies on multiple sources of evidence, with data needing to converge in a triangulating fashion,
and as another result
benefits from the prior development of theoretical propositions to guide data collection and
analysis
Extending Yin’s definition to longitudinal, chronological case study
An empirical inquiry that investigates a contemporary phenomenon as it changes over time within its
real-life context, especially when the boundaries between phenomenon and context (including
temporal context) are not clearly evident
and:
approaches the phenomenon using a relatively fine-grained contiguous temporal perspective
and
copes with the technically distinctive situation in which there will be many more variables than
data points, and in which temporal sequence(s) is particularly relevant, and as one result:
relies in particular on multiple sources and types of evidence of change, with data needing to
converge in a triangulating fashion, and as another result
benefits from the prior development of theoretical propositions to guide data collection, analysis
and reporting of temporal sequence and change in the phenomenon.
Page 8 of 36
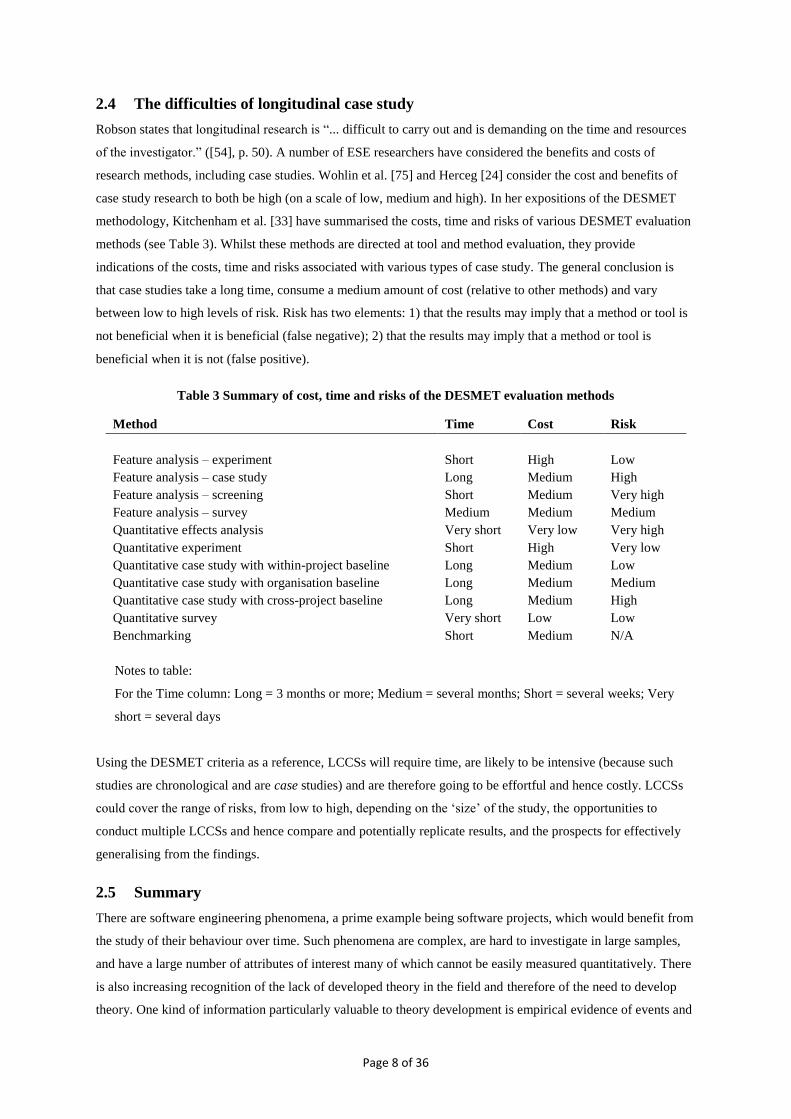
2.4 The difficulties of longitudinal case study
Robson states that longitudinal research is ―... difficult to carry out and is demanding on the time and resources
of the investigator.‖ ([54], p. 50). A number of ESE researchers have considered the benefits and costs of
research methods, including case studies. Wohlin et al. [75] and Herceg [24] consider the cost and benefits of
case study research to both be high (on a scale of low, medium and high). In her expositions of the DESMET
methodology, Kitchenham et al. [33] have summarised the costs, time and risks of various DESMET evaluation
methods (see Table 3). Whilst these methods are directed at tool and method evaluation, they provide
indications of the costs, time and risks associated with various types of case study. The general conclusion is
that case studies take a long time, consume a medium amount of cost (relative to other methods) and vary
between low to high levels of risk. Risk has two elements: 1) that the results may imply that a method or tool is
not beneficial when it is beneficial (false negative); 2) that the results may imply that a method or tool is
beneficial when it is not (false positive).
Table 3 Summary of cost, time and risks of the DESMET evaluation methods
Method Time Cost Risk
Feature analysis – experiment Short High Low
Feature analysis – case study Long Medium High
Feature analysis – screening Short Medium Very high
Feature analysis – survey Medium Medium Medium
Quantitative effects analysis Very short Very low Very high
Quantitative experiment Short High Very low
Quantitative case study with within-project baseline Long Medium Low
Quantitative case study with organisation baseline Long Medium Medium
Quantitative case study with cross-project baseline Long Medium High
Quantitative survey Very short Low Low
Benchmarking Short Medium N/A
Notes to table:
For the Time column: Long = 3 months or more; Medium = several months; Short = several weeks; Very
short = several days
Using the DESMET criteria as a reference, LCCSs will require time, are likely to be intensive (because such
studies are chronological and are case studies) and are therefore going to be effortful and hence costly. LCCSs
could cover the range of risks, from low to high, depending on the ‗size‘ of the study, the opportunities to
conduct multiple LCCSs and hence compare and potentially replicate results, and the prospects for effectively
generalising from the findings.
2.5 Summary
There are software engineering phenomena, a prime example being software projects, which would benefit from
the study of their behaviour over time. Such phenomena are complex, are hard to investigate in large samples,
and have a large number of attributes of interest many of which cannot be easily measured quantitatively. There
is also increasing recognition of the lack of developed theory in the field and therefore of the need to develop
theory. One kind of information particularly valuable to theory development is empirical evidence of events and
Page 9 of 36
processes over time. LCCS is a research strategy ideally suited to the investigation of temporal sequences in
phenomena that are complex and for which there are small samples etc. LCCS would therefore appear to be a
valuable research strategy for supporting theory development. There is however limited methodological support
in the ESE community for the conduct of LCCS that collect, analyse and report changes over time. In the
preceding subsections we have reviewed the state of methodological guidance on case studies in the field,
proposed a definition of LCCS, and briefly considered the costs and benefits of this type of study. In the
subsequent sections to this paper we present ad then discuss the LCCS of Project C, a software project at IBM
Hursley Park.
3 Study design
3.1 Objectives and research questions
The overall objective of this investigation was to better understand the behaviour of software projects at the
level of the project and as the project progressed over time. The case study research strategy is most suited to
such an investigation because a case study investigates a contemporary phenomenon within its real-life setting,
especially when the boundaries between the phenomenon and its context are not clearly evident [77]. A
longitudinal case study of this kind provides a rare opportunity to describe and explore project behaviour, rather
than ‗only‘ seeking to test a priori hypotheses (there is scope to test particular hypotheses and we intend to
report such tests in future papers). In Lonchamp‘s [39] terminology, for this investigation we take a descriptive
attitude to software processes, an attitude which has been present in empirical software engineering research for
some time e.g. [12, 25, 43, 52, 62, 76]. We began with two broad and open research questions allowing a
flexible, discovery-oriented approach:
RQ1 What happens, at the level of a software project, as that project progresses over time?
RQ2 What project behaviour can be related to the software project‘s planned and actual schedule?
3.2 Definition of the case and units of analysis
Yin [77], amongst others (e.g. [56]) recommend that the scope of the case and units of analyses are defined. In
modelling terminology [28], the two research questions provide respectively a statement of the scope and a
statement of the resolution of the investigation. The first research question therefore provides a statement of the
boundary of the case. As the study progressed we identified several units of analyses, some embedded within
others. The relevant unit of analysis for this paper is implied within the second research question i.e. the
longitudinal case study is looking for project behaviour relating to the software project‘s planned and actual
schedule e.g. events concerning planning and re-planning meetings, and activities relating to schedule pressure.
For the second research question, we are not (initially at least) seeking specific causal relationships but instead
we want to identify phenomena that relate to the project‘s schedule. The anticipation is that in time these
phenomena would reveal causal factors and structures.
Page 10 of 36
3.3 Case selection
For pragmatic reasons, our main criterion for selecting a project was that the project was planned to complete
within approximately 12 months and in order to know when a project was planned to complete, the project must
be close to completing its initial requirements analysis and planning phases. This means that our investigations
focused on the progress of the project after the initial project plan was established. In addition, we were also
constrained not just by the projects that were being undertaken at IBM Hursley Park at the time (which were
therefore available for study) but also by the projects that were accessible, for example projects for which there
were no insurmountable logistical challenges or, as another example, projects for which there were no
particularly sensitive ‗political‘ issues. Given that each project is, at an appropriately detailed level of
granularity, unique there are inevitable biases to Project C. Section 5 describes the socio-technical context to the
project and this description gives some indication of the potential biases in the project e.g. the lower strategic
value of the project, and the fact that the project is porting a product to a new platform rather than developing a
new product.
Four projects were selected for case studies from a candidate set of projects, all taken from IBM Hursley Park.
As the case studies progressed, it became increasingly clear that it would be impractical to maintain four case
studies (because of the demands of collecting and analysing evidence from four cases), so the number of cases
was further reduced to two, which we have consistently referred to in publications (e.g. [47]) as Project B and
Project C. The case study design described here applies to both projects however we focus on the detailed
behaviour of Project C and intend to report on Project B in a future paper.
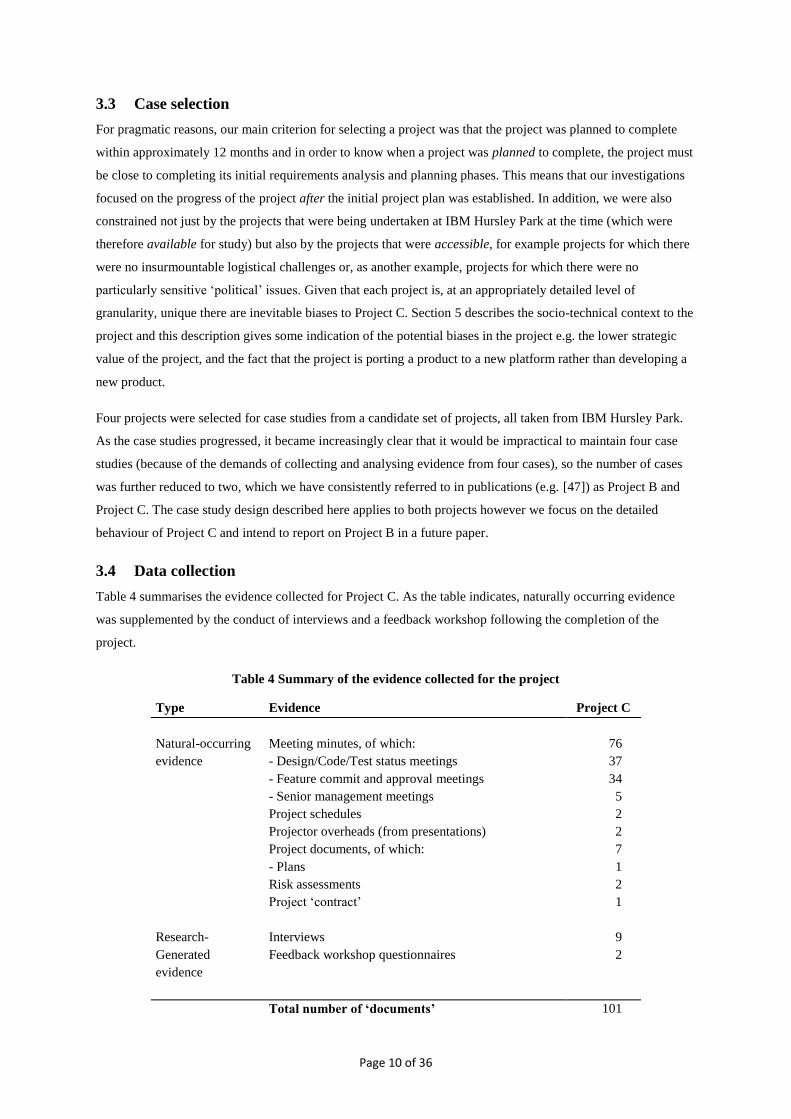
3.4 Data collection
Table 4 summarises the evidence collected for Project C. As the table indicates, naturally occurring evidence
was supplemented by the conduct of interviews and a feedback workshop following the completion of the
project.
Table 4 Summary of the evidence collected for the project
Type Evidence Project C
Natural-occurring
evidence
Meeting minutes, of which:
- Design/Code/Test status meetings
- Feature commit and approval meetings
- Senior management meetings
76
37
34
5
Project schedules 2
Projector overheads (from presentations) 2
Project documents, of which:
- Plans
7
1
Risk assessments 2
Project ‗contract‘ 1
Research- Interviews 9
Generated Feedback workshop questionnaires 2
evidence
Total number of ‘documents’ 101

Page 11 of 36
There were no formal project status meetings, the equivalent was the Design/Code/Test status meeting, and
these were used as the primary source of evidence. These meetings were the highest-level meetings within the
project, occurred regularly (typically weekly or fortnightly), were typically attended by representatives from
functional areas important to the given project, and are a naturally occurring phenomena (so that the researcher
is not intruding on the project).
Overall, the status minutes provide a broad view of the project over the duration of the project. Naturally,
minutes do not record all that was discussed at a meeting, or even necessarily the most important issues (e.g. for
political reasons, a discussion at the meeting may not be reported in the minutes), and such meetings are
unlikely to discuss all the issues occurring within the project at the time of the meeting. Despite these
simplifications, the minutes provide a large volume of ‗rich‘ information about the project over the duration of
the project, and this information appears rich enough to provide substantive, longitudinal insights into progress
in software development. Furthermore, the minutes provide detail that is unlikely to be collected from other
sources of data, and can also indicate simple causal connections between events. Taking an economic
perspective, meeting minutes would appear to provide a better cost/benefit ratio compared to for example an
equivalent number of interviews: in broad terms, consider the amount of effort required to collect and analysis
data from meeting minutes compared to interviews; the range of issues referred to in meeting minutes compared
to interviews; the range of roles present at a meetings compared to those present at a set of interviews; the
frequency with which meeting minutes can be collected compared to the conduct of interviews; and the
likelihood that status meetings, and hence their minutes, occur relatively close to activities compared to the
conduct of an equivalent number of interviews. For these kinds of reasons, meeting minutes were chosen as the
primary source of data for the study.
3.5 Data analysis
Case study researchers (e.g. [3, 59]) recognise that case studies are intensive, iterative and intuitive in nature,
and dependent on the ―integrative powers‖ ([3], p. 374) of the investigator. Consequently, it is extremely
difficult to document in a repeatable way the detailed data collection and analyses activities that took place
during this case study. It is therefore extremely hard to show a clear chain of evidence from the raw data
collection to the overall findings of the study. We do however comment on the challenges further in section 7.1
and provide a worked example of our detailed analysis in section 7.3.

Page 12 of 36
Table 5 Constructs emerging during the data collection and analysis
Constructs Level of project Evidence
Socio-technical contexts.
Tactics of management.
Actual progress:
Workload
Resource-levels
Schedule
Indicators of project activity
Re-plans
Events
Status information.
Project Status meeting minutes
Interviews
Project schedule(s)
Project contract(s)
Other meeting minutes
Feedback workshop(s)
Frequencies, types of, and relationships
within:
Waiting
Progress of work
Outstanding work
Process area Status meeting minutes
Interviews
As with Robinson et al. [53] we use principles to ensure the validity and quality of our investigation. As
indicated in Table 4 we used multiple sources of evidence and sought to triangulate our findings across these
sources. We searched and researched the data (manually and using search functions in text editors) and
reworked our classifications. Over time, several constructs emerged, with the relevant constructs for this paper
summarised in Table 5.
We used interviews to clarify the behaviour of the project and sometimes proposed alternative interpretations of
events as a way of challenging the conceptions and perceptions of the interviewees. We also used a formal
feedback session (discussed in section 3.7) as another method of challenging our conclusions. We also
compared our emerging findings with findings from published research.
3.6 Definitions
3.6.1 Project workload
Workload is defined terms of features and design changes. Broadly, both features and design changes are sets of
market requirements of a piece of software which ―... typically involve changes and additions to multiple
[software] subsystems‖ ([65]; p. 840). In principle, features refer to new functionality and design changes refer
to modifications to existing functionality, but in practice there are no clear distinctions between a feature and a
design change: in terms of code size, a design change may be larger than a feature. At the feedback workshop
for Project B (another project studied at IBM Hursley Park; see [51]) the Project Leader provided more
information on features and design changes, information which applies across project at Hursley Park at the
time:
1. Features are the work that is planned at the beginning of the project.
2. Changes in workload, once the project starts, are managed as design changes.
Page 13 of 36
3. Some of the design changes accepted on to a project can actually be features (which, for example, had been
prepared for another related project in the product line).This indicates how features and design changes are not
effective measures of process size or product size, and therefore how they are not appropriate for productivity
measures.
4. There are two types of design changes: design changes that add function and design changes that remove
function. Both types increase workload on the project.
3.6.2 Project capability
Project capability is broadly defined as the ability to complete project workload at a given time in the project.
The concept of capability incorporates concepts of productivity and resource, and we use the term capability
rather than effort to imply that a project‘s ability to complete work is not just a function of the number of staff
on a project, or the amount of effort available. For measurement purposes, capability is represented in the
figures in section 6 in terms of weekly resource levels. The concept of project capability used here is distinct
from the concept in, for example, the Capability Maturity Model and its derivatives.
3.7 Validation of our analysis through a feedback workshop
One feedback session was conducted approximately one year after the completion of the project. The Project
Leader and Project Assistant were present at the session(s). The sessions took the form of exploring the study‘s
findings with the Project Leader and the Assistant, so as to validate and clarify the findings. Van Genuchten [71]
adopted a similar approach in his study of software project schedules. Conducting the sessions some time after
the project completed was advantageous because project members are likely to have a more objective
perspective of their project. Also, with the product in the market for about a year, the project members were able
to assess the success of the product. Against these advantages, project members were unable to remember
certain information, which meant that certain questions asked during the sessions could not be answered.
3.8 Reporting the behaviour over time
Yin [77] suggests six structures for reporting case studies; considers the chronological structure to be relevant to
explanatory, descriptive or exploratory research; recognises that case studies generally cover events over time
([77]); and recognises that chronological structures are important because presumed causal sequences must
occur linearly over time ([77]). We report many of the findings from the longitudinal case study in terms of
multi-dimensional timelines (MDTs; see [47]), a particular kind of chronological structure we developed as part
of this research.
3.9 Threats to validity
Our research questions focus on identifying the constructs present in the project that affect in particular the
project‘s schedule. Our main sources of data are interviews and the analyses of archival data, but we also used a
feedback workshop. In terms of construct validity and internal validity, the study is therefore highly dependent
on the data that is naturally generated by the project, and much of that data has been generated with the purpose
of managing a software project rather than investigating project schedules. The volume of data, as well as the
diversity of types of data and sources of data, together with triangulation, feedback and references to
Page 14 of 36
independent literature should collectively ensure that we have identified and analysed appropriate constructs
although it is unlikely that we have identified all constructs relevant to project schedules.
In terms of reliability, we have recognised in section 3.5 that we cannot describe in detail the data collection and
analysis activities we went through. To increase reliability we have, like others, relied on principles of
qualitative data analysis. Other researchers adopting similar principles may undertake detailed data collection
and analysis in a different way, but should arrive at similar overall conclusions. We discuss external validity in
section 7 where we reflect on the study and its findings.
4 An overview to the project
Product C is a ‗local‘, cross-platform, middleware transaction processing system that is used primarily in the
‗front office‘ of banks. Product C runs on the DOS, OS/2 and AIX platforms and Project C is an investment to
protect the product. The Project Leader, ‗CP‘, explained: ―What we're trying to propose is the right level of
investment that maximises the revenue, and keeps the product going as long as possible.‖ [Interview C.001.CP]
The objective of Project C was to port the existing product to run on a new operating system (which is
developed and maintained by another organisation), and to provide some additional functionality for the DOS
and OS/2 versions.
Overall, the Project Leader considered Project C to be a success. This was despite the fact that the actual
duration of the project was 11 weeks (20%) longer than the originally planned duration, and that some of the
functionality was delivered via the World Wide Web rather than with the product.
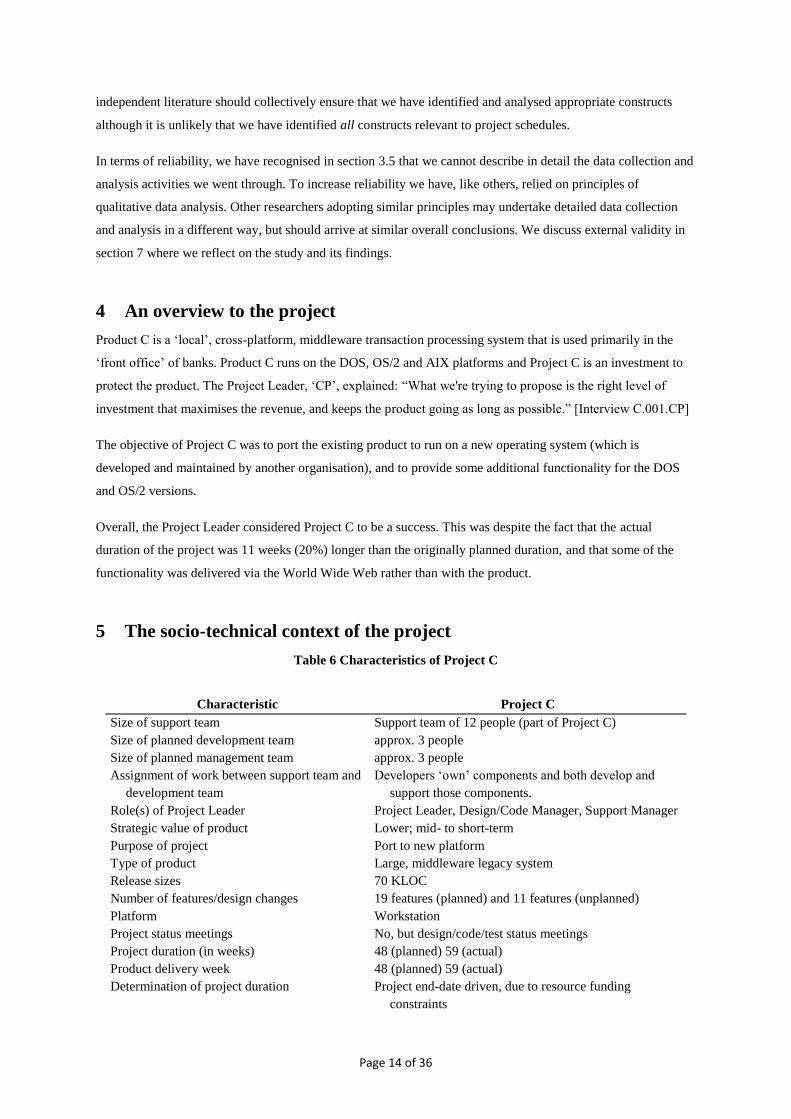
5 The socio-technical context of the project
Table 6 Characteristics of Project C
Characteristic Project C
Size of support team Support team of 12 people (part of Project C)
Size of planned development team approx. 3 people
Size of planned management team approx. 3 people
Assignment of work between support team and
development team
Developers ‗own‘ components and both develop and
support those components.
Role(s) of Project Leader Project Leader, Design/Code Manager, Support Manager
Strategic value of product Lower; mid- to short-term
Purpose of project Port to new platform
Type of product Large, middleware legacy system
Release sizes 70 KLOC
Number of features/design changes 19 features (planned) and 11 features (unplanned)
Platform Workstation
Project status meetings No, but design/code/test status meetings
Project duration (in weeks) 48 (planned) 59 (actual)
Product delivery week 48 (planned) 59 (actual)
Determination of project duration Project end-date driven, due to resource funding
constraints

Page 15 of 36
Table 6 present a number of characteristics of Project C. Three entries in the table warrant clarification. First,
the strategic value of the product is relative to other products developed in other projects. Although Product C
has a lower strategic value this is not to say that the product is not valued by the organisation (if the product had
a low value to the organisation it is unlikely it would be maintained). Second, although design changes and
additional features are unplanned, this is not to say that such work is unexpected. Experienced Project Leaders
recognise that the workload for a project will probably increase. Third, the KLOC sizes of the project can give
misleading impressions on productivity as much of the code for Product C is being ported from an existing
version of the product. The difference between Project C and other projects is recognised by Project C‘s Project
Leader:
―There are some [features]... but it may be artificial to compare these with [features of other projects],
because of the magnitude of [features], and what‘s involved.‖ [Interview C.001.CP]
Project C appears to be constrained by manpower and schedule:
―I would have to say that the planning has been done somewhat backwards here, as we have the schedule
and man-power constraints, and we‘ve been trying to fit the work into that, rather than asking people how
long it will take them, and building the schedule from that.‖ [Interview C.001.CP]
The Project Leader explained how the workload looked very challenging given the planned schedule, but he
justified how that work could be done:
―And it‘s actually frightening if you look at... [the workload]... in terms of the productivity that‘s needed to
get this product out of the door. However, the counter argument is that there is very little new function. If
you look at the lines of code for... [the new product]... it‘s something like 55 KLOC, and I‘m trying to do
that with three person years, which looks impossible. However, that is reusing code, its porting code. Where
we‘re writing new code it‘s usually with existing design, where the architecture is already there. I can justify
it to myself that it‘s do-able... It‘s not writing new code, it‘s not using old code without change, its
somewhere between those two.‖ [Interview C.001.CP]
The resource constraints affect the organisation of the new development and support teams. Project C has a
combined development and support team. The Project Leader explained:
―In an ideal world, one would have... separate... [support]... and development teams, but this would probably
be inefficient... You have to remember we‘ve got 19 people here and we‘re trying to support three products,
not one product, and we‘re trying to develop a new product. And we‘re actually trying to do an awful lot
with very little resource.‖ [Interview C.001.CP]
The constraints also affect the composition of the testing team. The Project Leader explained some of the
implications for Project C:
―A major constraint is actually can we get them [the features] tested, rather than can we develop them. It all
boils down to can we get the right skills.‖ [Interview C.001.CP]
Page 16 of 36
6 The behaviour of Project C over time
6.1 Changes to the project’s schedule, workload and capability
Figure 1 presents information over time on the schedule, workload and capability of Project C, including
differences between actual and planned schedule. Table 7 summarises opinions of project personnel at the
feedback workshop on the effect of events on the actual schedule, workload and capability of the project. The
table also shows the question template used to gather opinions from the participants. The majority of events
shown in the table relate to events shown in the figure. To clarify: the focus of the workload-related questions is
not on whether events increase or decrease the quality, functionality and performance of the product but whether
the events increase or decrease the workload required to deliver quality, functionality and performance. The
table indicates that in general there was an increase in workload, a decrease in capability and an increase in
schedule. (The scores of 8.5 and 1.5 for the schedule column reflect participants‘ uncertainty over the effect of
the key designer stating their intention to leave.)
The phases of the project are all originally planned to progress in a sequential manner, but they all actually
progress concurrently. It is clear that the project does not complete when originally planned and actually
completes 11 weeks later. This is a slippage of about 20%. A recent structured review of surveys of project
performance found that projects overrun their schedule by on average 33% [31]. The three main phases of the
project (i.e. plan, design/code, and test) all complete later than planned. The design/code and test phases each
continue for approximately 80% longer than planned, and on this basis it is remarkable that the project overall
‗only‘ slips by 20%. The manufacturing phase actually compresses, from seven weeks down to four. In addition
to the extension to the project duration, the project also delivers some features via the World Wide Web at the
same time that the product is available. This approach gives the project more time to work on the respective
features because the work is not constrained by the manufacturing deadline.
Table 7 shows that in almost all cases the events of the project affect the project‘s schedule. The Project Leader
explained (although this not shown in the table) that individually these events could be contained within the
original plan, but as a group they could not be.
Figure 1 indicates than the actual workload increases from 19 features to 30. (Gaps in the recording of features
are due to status meetings typically occurring fortnightly, and some status meetings not recording the progress
of the features. From week 33 until the end of the project the progress of features is not recorded in the minutes
of meetings.) This is an increase of almost 50% in the number of features but this does not imply a near-50%
increase in workload. For example, the Project Leader explained that some initial features are subsequently
separated into two features in order to help manage the workload. The figure also indicates that it is not until
week 24, half way through the original duration of the project, that the first feature is recorded as being
completed; and by week 33, approximately three-quarters of the way through the original duration of the
project, only two features are recorded as being completed. Three possible reasons for the apparent late
completion of features have been identified:
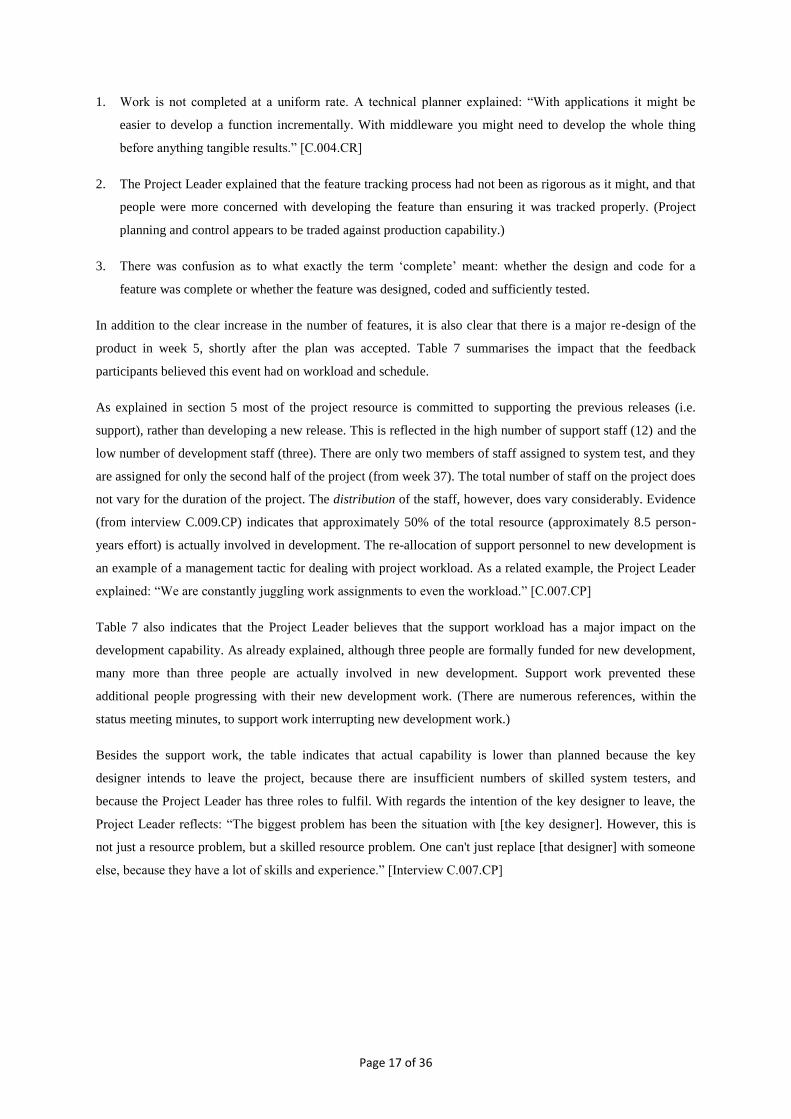
Page 17 of 36
1. Work is not completed at a uniform rate. A technical planner explained: ―With applications it might be
easier to develop a function incrementally. With middleware you might need to develop the whole thing
before anything tangible results.‖ [C.004.CR]
2. The Project Leader explained that the feature tracking process had not been as rigorous as it might, and that
people were more concerned with developing the feature than ensuring it was tracked properly. (Project
planning and control appears to be traded against production capability.)
3. There was confusion as to what exactly the term ‗complete‘ meant: whether the design and code for a
feature was complete or whether the feature was designed, coded and sufficiently tested.
In addition to the clear increase in the number of features, it is also clear that there is a major re-design of the
product in week 5, shortly after the plan was accepted. Table 7 summarises the impact that the feedback
participants believed this event had on workload and schedule.
As explained in section 5 most of the project resource is committed to supporting the previous releases (i.e.
support), rather than developing a new release. This is reflected in the high number of support staff (12) and the
low number of development staff (three). There are only two members of staff assigned to system test, and they
are assigned for only the second half of the project (from week 37). The total number of staff on the project does
not vary for the duration of the project. The distribution of the staff, however, does vary considerably. Evidence
(from interview C.009.CP) indicates that approximately 50% of the total resource (approximately 8.5 person-
years effort) is actually involved in development. The re-allocation of support personnel to new development is
an example of a management tactic for dealing with project workload. As a related example, the Project Leader
explained: ―We are constantly juggling work assignments to even the workload.‖ [C.007.CP]
Table 7 also indicates that the Project Leader believes that the support workload has a major impact on the
development capability. As already explained, although three people are formally funded for new development,
many more than three people are actually involved in new development. Support work prevented these
additional people progressing with their new development work. (There are numerous references, within the
status meeting minutes, to support work interrupting new development work.)
Besides the support work, the table indicates that actual capability is lower than planned because the key
designer intends to leave the project, because there are insufficient numbers of skilled system testers, and
because the Project Leader has three roles to fulfil. With regards the intention of the key designer to leave, the
Project Leader reflects: ―The biggest problem has been the situation with [the key designer]. However, this is
not just a resource problem, but a skilled resource problem. One can't just replace [that designer] with someone
else, because they have a lot of skills and experience.‖ [Interview C.007.CP]
Page 18 of 36
Figure 1 Project-level schedule, workload and capability for Project C
-1 2 4 6 8
10
12
14
16
18
20
22
24
26
28
30
32
34
36
38
40
42
44
46
48
50
52
54
56
58
Project week
0
5
10
15
20
250
5
10
15
20
25
30
Total
Complete
No. of
featu
res
Total
Support
Design
Information developmentTest
No. of
staff
Workload & capability
P lan
Schedule (planned)
DesignTestManufacturing
Schedule (actual)P lan
Manufacturing
Design ?Test ?
Events
ST manager
examining possibility
of extra resource
Redesign of P roduct
C: big piece of work
Key designer
considering leaving
P erformance impact
on ported product
Headcount for ST: 2 persons.
Manager concerned whether
this will be adequate
Many secondary
changes outstanding Y2K feature raised
P erformance of F1950 < 50%
of ‘ source’ feature
Two features to be
delivered by a WebServer
Additional resource
assigned to system test
P roduct C dispatched to
manufacturing

Page 19 of 36
Table 7 The effect of certain events on development workload, capability and schedule for Project C
Development workload Development Development
Event Quality Functionality Performance capability schedule Comments
Major re-design Increase Major increase No change No change Increase Additional requirements as
to how the product runs on
the new operating system
Key designer stating their intention to leave No change No change No change Decrease Increase or
No change
Impact on team motivation /
morale
Performance ‗problems‘ emerging No change No change No change No change No change
System Test
Headcount Increase No change No change Decrease Increase
Skills Increase No change No change Decrease Increase
Vacation during System Test phase No change No change No change Decrease Increase
New year-2000 requirements Increase Increase No change No change Increase
Project Leader: one person doing three jobs Increase Increase Increase Decrease Increase
Many secondary changes Increase Increase No change No change Increase Requirements ‗creep‘
Support work No change No change No change Major decrease Increase
Count of
Increase or Major increase 6 4 1 0 8.5
No change 4 6 9 4 1.5
Decreases or Major decrease 0 0 0 6 0
Question template: “Did the event increase/decrease... Responses were restricted to:
the development and test workload required to deliver a quality product Major increase
the development and test workload required to deliver functionality Increase
the development and test workload required to deliver performance No change
the development and test capability Decrease
the development and test schedule‖ Major decrease
Don‘t know

Page 20 of 36
6.2 Re-plans and project urgency
Figure 2 shows the re-plans and the indicators of urgency for Project C. Project C has one external re-plan
in which the plan is formally re-negotiated with senior management. This formal re-plan occurs in week 39
and results in an extension to the completion of the project, from week 48 to week 59. The formal re-plan is
caused by the introduction of new Year-2000 requirements earlier in the project, resulting in the
introduction of a new feature in week 35. The two plans toward the beginning of the project, both labelled
‗1st Plan‘, are due to the fact that a second Plan Decision Checkpoint was required (in week 8); the second
plan addressing revenue issues rather than schedule issues.
In the first proper re-plan at week 22 the project team believe that the schedule can be held (see the
corresponding event for that week). Two weeks later, the frequency of the status meetings change from
fortnightly to weekly, suggesting an increase in project activity. One possible explanation is that the project
team believe that while the schedule is still attainable they will need to be more ‗focused‘ in their work.
The increase in the number of integrate builds (week 28) might be because the test phase is starting, or
because the design phase and test phase are proceeding concurrently (where it is important to quickly
transfer completed design work over to test). The original plan consists of sequential phases rather than
concurrent phases.
The comment on schedule movement (in week 51) refers to a schedule movement in the start of the
manufacturing phase. The test phase is still incomplete (with outstanding defects and test cases), and the
manufacturing phase is compressed to provide more time for test. The resource re-assigned to test in week
54, from elsewhere in the project, appears to be a response to the outstanding test issues.

Page 21 of 36
Figure 2 Re-plans and indicators of project activity for Project C
-1 2 4 6 8
10
12
14
16
18
20
22
24
26
28
30
32
34
36
38
40
42
44
46
48
50
52
54
56
58
Project week
Events
(Re)plans
1st re-plan 2nd re-plan
(Formal re-plan)
3rd re-plan 4th re-plan1st plan1st plan
Schedule (actual)P lan
Manufacturing
Design ?
Test ?
Schedule (planned)
Design
Test
Manufacturing
P lan
Indicators of urgency
In view of the increased project
activity, P roject C status meetings
will take place weekly.
... this coincides with probably the
busiest time of Development ...
Action: any volunteers with available
resource cycles to form a queue outside
A1210. JRG to assign.
There would now be 2 Integrate
Builds each week.
Many secondary
changes outstanding Y2K feature raised
Two features to be
delivered by a WebServer
Additional resource
assigned to system test
P roduct C dispatched to
manufacturingWith the delivery content now firmed, it was felt that the
‘ project contract’ could still be held from a schedule and
cost viewpoint. Checkpoint was sucessfully exited.
Schedule movement will provide a much
needed window to enable the defect
backlog to be worked, to address many of
the earlier concerns on Quality, and for
some of the outstanding testing to be
progressed

Page 22 of 36
6.3 The changing project schedule
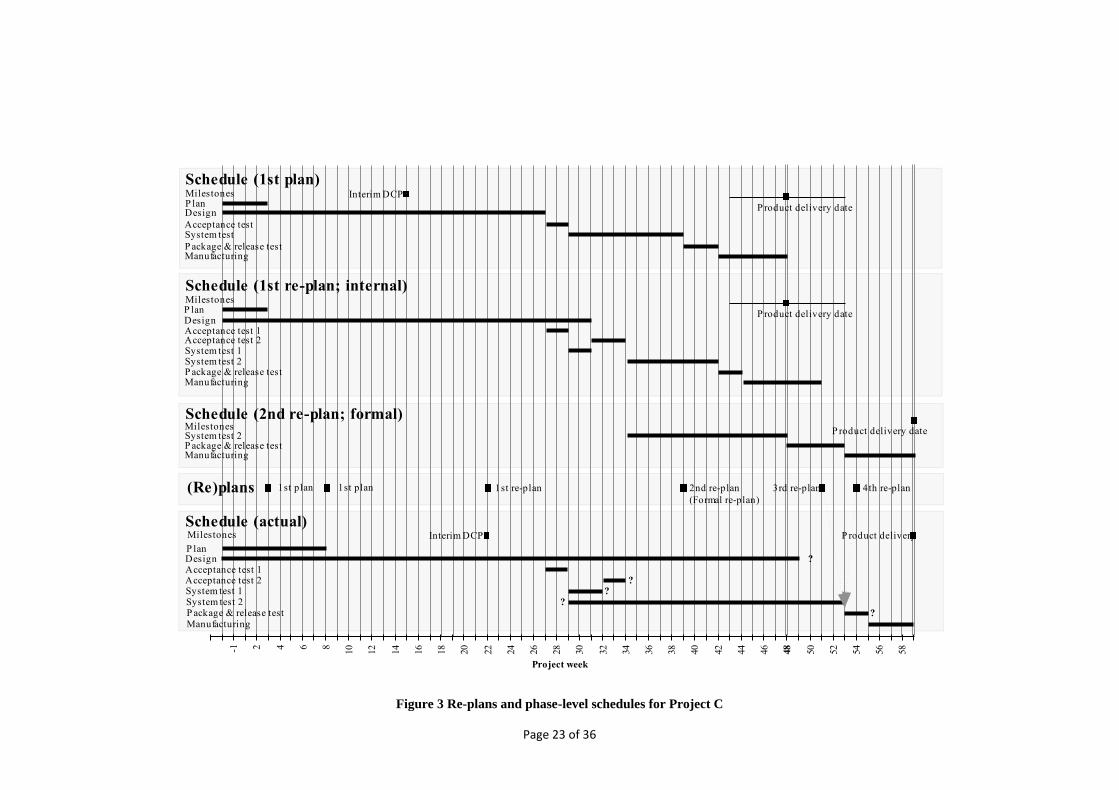
Figure 3 provides detailed information on the re-plans and their effect on the phases of the project. The first
re-plan appears as a response to the delay in completing the design phase. The schedule is adjusted in an
attempt to cause minimal disruption to the system test and manufacturing phases. In the period between
weeks 27 and 31, the design and acceptance test phases are planned to proceed concurrently. From week
32, at which time the design phase is expected to complete, the sequential order of phases is planned to
return. This first re-plan consists of re-organising the project work into two groups. The first group of work
consists of the OS/2 and DOS work. The fact that test (acceptance test and system test) will address this
work first suggests that this work is progressing well through the design phase (or at least is believed to be
progressing well), and that it will progress well through the test phases.
The second group of work is pushed back in the test schedule suggesting that this work is more
troublesome in the design phase and may be more troublesome in the test phases.
As already explained in section 6.2, the formal re-plan at week 39 extends the project duration by 11
weeks. Around the time of this re-plan, the Project Leader believes that the project can be completed by
week 48, as originally planned, if the new Year-2000 requirements were not introduced. During the
feedback workshops, the Project Leader reflects that the introduction of year-2000 requirements (imposed
by the organisation on the project) was a fortuitous event for the project because it provided much needed
additional schedule.
Page 23 of 36
Figure 3 Re-plans and phase-level schedules for Project C
-1 2 4 6 8
10
12
14
16
18
20
22
24
26
28
30
32
34
36
38
40
42
44
46
48
50
52
54
56
58
Project week
Schedule (1st plan)
P lanDesign
Acceptance testSystem test
P ackage & release testManufacturing
Milestones Interim DCP
P roduct delivery date
Schedule (actual)
P lan
Acceptance test 1
Manufacturing
Acceptance test 2 ?System test 1 ?System test 2 ?
Design ?
P ackage & release test ?
Milestones Interim DCP P roduct delivery
(Re)plans 1st re-plan 2nd re-plan
(Formal re-plan)
3rd re-plan 4th re-plan1st plan1st plan
Schedule (1st re-plan; internal)
P lanDesignAcceptance test 1
System test 1
P ackage & release testManufacturing
Milestones
P roduct delivery date
System test 2
Acceptance test 2
MilestonesP roduct delivery date
Schedule (2nd re-plan; formal)
P ackage & release testManufacturing
System test 2
Page 24 of 36
7 Further comments on the longitudinal, chronological case study
research strategy
7.1 Practical application of the research strategy
To be most effective, a longitudinal, chronological case study benefits from data that is collected close to the
time at which the respective event or change occurred. In other words, data collection is contemporaneous with
event occurrence. Version control systems are an excellent example for the contemporaneous collection of
quantifiable data however contemporaneous data collection is much harder for a wide range of other kinds of
data about other kinds of events and changes e.g. project management decisions and software design decisions.
There is also a scaling issue: as the number of actors and activities increase in the phenomenon of interest (such
as a software project) so it becomes increasingly hard to maintain contemporaneous data collection. (As an
illustrative counter-example, Guindon [22, 23] was able to observe two programmers individually undertaking a
design activity over a two-hour period. This kind of observation would be very hard to scale up to a project.)
The use of evidence naturally generated by the actors and activities (e.g. emails, calendar appointments, minutes
of meetings, project plans) therefore becomes increasingly valuable to the researcher. Minute meetings were
used as a key source of evidence in the Project C case study because they provide a near-contemporaneous data
collection opportunity across a wide range of project-related activities and actors (although, inevitably, the
minutes provide only a summary of those activities and actors). Two distinctions (amongst others) of LCCS
over the more general case study are that the time at which the data is collected and also the time at which the
event occurred are both recorded during data collection, and that ideally these two times should be very close to
each other. Taking the meeting minutes as an example, the date of the meeting provides an index for when the
data was collected, whilst the content of the meeting might provide an index as to when the respective event(s)
occurred. When an index of when the event occurred is not available, one can often assume that the event
occurred within a time period preceding the meeting e.g. for weekly meetings, events typically occurred in the
preceding week. Some common time unit needs to be established so that all data can be indexed for analysis and
reporting according to that time unit e.g. Project C had a weekly index. An added complication for Project C
however was that project status meetings initially occurred every two weeks and then changed to every week.
As a consequence there is a finer granularity of data collection, and hence analysis, later in the project.
Interestingly, the decision to meet weekly instead of fortnightly suggests something about the project
management‘s need to gather data on the project too more frequently. This decision is itself potentially valuable
to an LCCS.
The full range of qualitative and quantitative analytic techniques used in case studies appear to be applicable to
the more specific longitudinal, chronological case study however there is the additional requirement on the
analysis similar to the requirement on data collection: wherever possible, the time at which the data is collected
and also the time at which the event occurred are retained during the analysis. As one progresses to the later
stages of analysis, the time at which the data was collected may no longer need to be considered. For a LCCS
Page 25 of 36
however it is essential where feasible to retain the temporal dimension and not abstract it out prematurely during
analysis.
We have developed MDTs to report the findings of LCCSs. Decisions on the design of MDTs (e.g. the number
of MDTs, the number and content of sections on an MDT, the data to be reported on MDTs) are dependent on
the objectives of the research, the amount and complexity of analysed data and of course on the specific research
questions. The MDTs presented in this paper are concerned with various project-level attributes, as well as other
interesting project-related issues, because this is relevant to the general objective and research questions asked
in the case study.
7.2 Challenges to the application of the research strategy
We believe that LCCSs can make unique contributions to our understanding of software engineering phenomena
however we are also conscious that all of these contributions are not necessarily demonstrated effectively with
the current case study, Project C. Some of the challenges with using Project C to demonstrate the potential
contribution of LCCSs are:
1. Software projects are large and complex and are therefore inherently hard to study.
2. There was a large volume of qualitative and quantitative data collected. This volume and diversity of data
is beneficial and desirable but is also hard to organise, analyse and report concisely and effectively. (The
development of specific tools may help with this issue.)
3. There was at the time of the study (and remains) a lack of appropriate theoretical structures (e.g. limited
theory of project behaviour) and conceptual frameworks (i.e. limited frameworks for organising
temporally-related qualitative and quantitative data) to support the study design, data collection, analysis
and reporting. The lack of appropriate theoretical frameworks also makes it difficult to use analytic
generalisation to generalise the findings of the case study to a broader class of projects. It is therefore
harder to demonstrate the specific contribution that the findings of Project C can make to our
understanding of software projects in general. Nevertheless, we attempt to do so in section 7.4.
4. The formalisation of the LCCS research strategy, and the MDT technique, have emerged after the study
of Project C (and also of Project B; see [51]) and are only being explicitly articulated with this and
related papers e.g. [47]. As noted in section 2.3, the study reported here has tended to focus on the first
two of Robson‘s four types of case study i.e. the description and exploration of software project
behaviour. This reflects the theoretical and methodological status of the study of Project C.
7.3 A detailed example of data analysis
To complement the general comments made above about the practical application and challenges of the strategy,
as well as the general remarks made on study design in section 3, we present a detailed example of the data
analysis undertaken using data collected from the project meeting minutes.
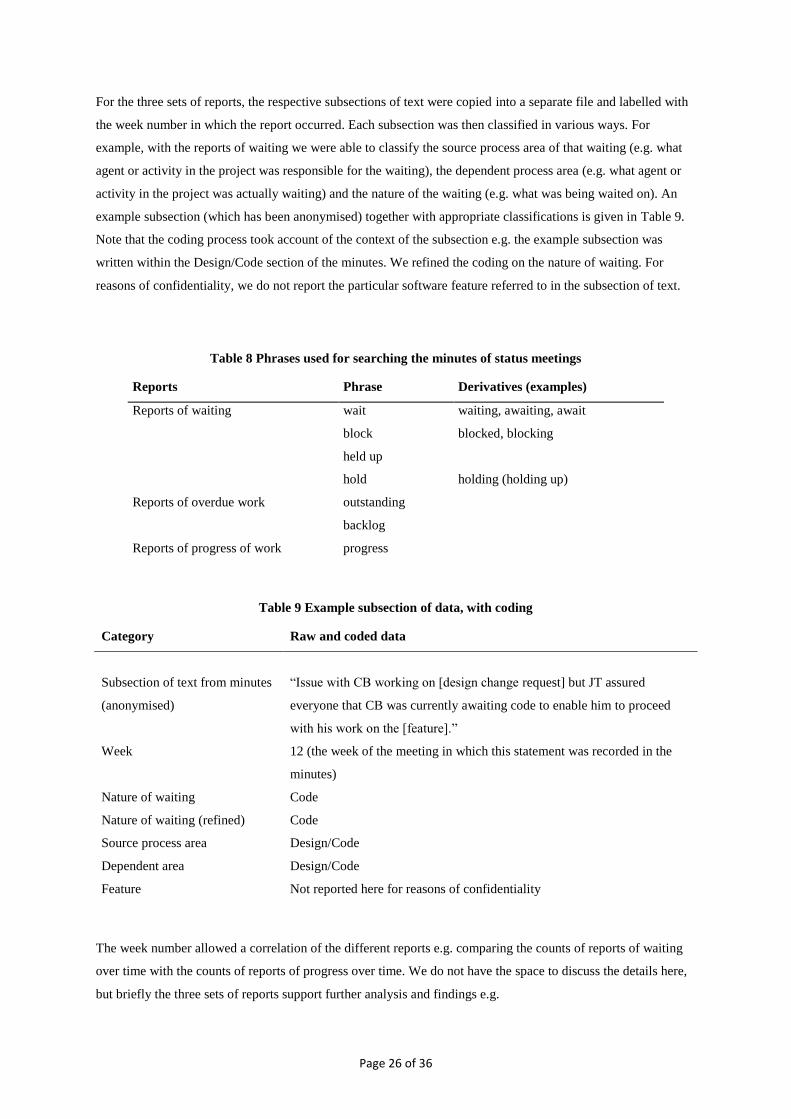
Using a combination of systematic manual review of each set of project meeting minutes, together with
automated searches (using text editors and wildcard search terms) for phrases across all sets of minutes, we
identified subsections of the minutes that report the occurrence of waiting, overdue work, and the progress of
work on the project. In the original study this was done to follow up on the findings of Bradac et al. [4, 5]. Table
8 summarises the phrases used for the automated searches, including derivatives of a phrase when using
wildcards.
Page 26 of 36
For the three sets of reports, the respective subsections of text were copied into a separate file and labelled with
the week number in which the report occurred. Each subsection was then classified in various ways. For
example, with the reports of waiting we were able to classify the source process area of that waiting (e.g. what
agent or activity in the project was responsible for the waiting), the dependent process area (e.g. what agent or
activity in the project was actually waiting) and the nature of the waiting (e.g. what was being waited on). An
example subsection (which has been anonymised) together with appropriate classifications is given in Table 9.
Note that the coding process took account of the context of the subsection e.g. the example subsection was
written within the Design/Code section of the minutes. We refined the coding on the nature of waiting. For
reasons of confidentiality, we do not report the particular software feature referred to in the subsection of text.
Table 8 Phrases used for searching the minutes of status meetings
Reports Phrase Derivatives (examples)
Reports of waiting wait waiting, awaiting, await
block blocked, blocking
held up
hold holding (holding up)
Reports of overdue work outstanding
backlog
Reports of progress of work progress
Table 9 Example subsection of data, with coding
Category Raw and coded data
Subsection of text from minutes
(anonymised)
―Issue with CB working on [design change request] but JT assured
everyone that CB was currently awaiting code to enable him to proceed
with his work on the [feature].‖
Week 12 (the week of the meeting in which this statement was recorded in the
minutes)
Nature of waiting Code
Nature of waiting (refined) Code
Source process area Design/Code
Dependent area Design/Code
Feature Not reported here for reasons of confidentiality
The week number allowed a correlation of the different reports e.g. comparing the counts of reports of waiting
over time with the counts of reports of progress over time. We do not have the space to discuss the details here,
but briefly the three sets of reports support further analysis and findings e.g.

Page 27 of 36
1. The coded data allows the investigation of a potential causal relationship i.e. waiting leads to poor
progress that then leads to overdue work. This relationship can be examined over time, and placed within
the context of the planned or actual schedule, as we indicate in the multi-dimensional timeline presented
in Figure 4. (For illustration, the figure shows a subset of the reports of progress, those reports
specifically referring to poor progress.) One could expect some kind of time delay in this causal
relationship e.g. waiting reported during week t might lead to reports of overdue work in weeks
subsequent to week t. Digressing briefly, Figure 4 also shows that we have taken complex, rich
qualitative data and converted that into three single-variable quantitative time-series which have then
been combined with event and phase information.
2. The coded data allows us to investigate the dependencies between agents and activities in the project. For
this project, there are a small number of agents or activities that seem to be responsible for the majority
of the waiting, progress issues and overdue work, and these agents and activities also relate to the main
phases of the project i.e. design/code and testing. A longitudinal, chronological case study is able to
examine how these dependencies evolve during the course of the project. Further details are reported in
[51].
3. Once the reports of waiting, progress and overdue work were coded, the coded data could then be treated
as quantitative data and hypotheses on waiting, progress and overdue work could be tested using non-
parametric tests. Details of these tests are reported in [51].
4. The combination of quantitative time-series, events and phases (from projects plans and the project
minutes), and other events identified in the project minutes (e.g. indicators of project urgency) allow us
to examine the onset and evolution of The Deadline Effect as the project approaches its planned
completion (see for example Figure 2). This data can then be combined with data drawn from the
interviews to examine the project leader‘s attitude to maintaining the existing project schedule and not re-
scheduling the delivery data. Further information on the interviews and on the interview comments
relating to schedule slippage are reported in [51].

Page 28 of 36
Figure 4 A multi-dimensional timeline of waiting, poor progress, overdue work and other ‘events’ for
Project C
The figure plots all data against the project week number. The top ‗quarter‘ of the figure plots various
events and project phases. The remaining three ‗quarters‘ of the figure plot reports of waiting, poor
progress and outstanding work respectively. Where there is a frequency of zero for some weeks, this may
be due to ‗missing values‘ i.e. a project meeting did not occur during that week.
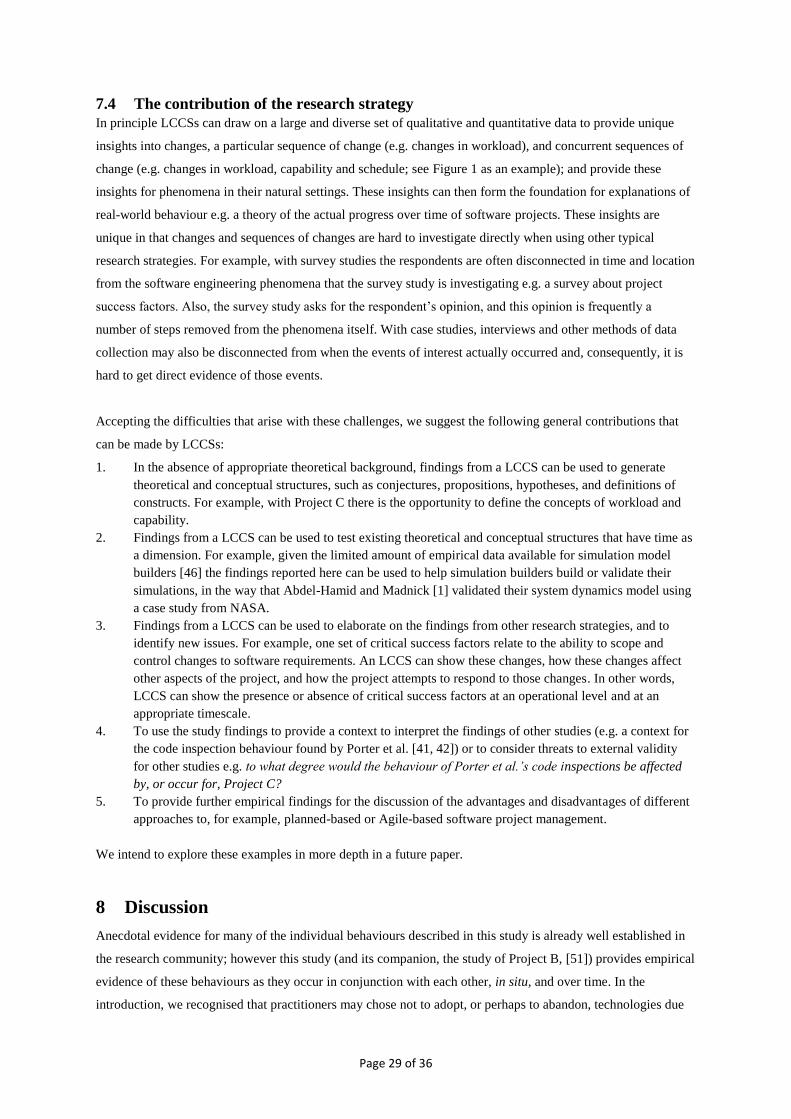
Page 29 of 36
7.4 The contribution of the research strategy
In principle LCCSs can draw on a large and diverse set of qualitative and quantitative data to provide unique
insights into changes, a particular sequence of change (e.g. changes in workload), and concurrent sequences of
change (e.g. changes in workload, capability and schedule; see Figure 1 as an example); and provide these
insights for phenomena in their natural settings. These insights can then form the foundation for explanations of
real-world behaviour e.g. a theory of the actual progress over time of software projects. These insights are
unique in that changes and sequences of changes are hard to investigate directly when using other typical
research strategies. For example, with survey studies the respondents are often disconnected in time and location
from the software engineering phenomena that the survey study is investigating e.g. a survey about project
success factors. Also, the survey study asks for the respondent‘s opinion, and this opinion is frequently a
number of steps removed from the phenomena itself. With case studies, interviews and other methods of data
collection may also be disconnected from when the events of interest actually occurred and, consequently, it is
hard to get direct evidence of those events.
Accepting the difficulties that arise with these challenges, we suggest the following general contributions that
can be made by LCCSs:
1. In the absence of appropriate theoretical background, findings from a LCCS can be used to generate
theoretical and conceptual structures, such as conjectures, propositions, hypotheses, and definitions of
constructs. For example, with Project C there is the opportunity to define the concepts of workload and
capability.
2. Findings from a LCCS can be used to test existing theoretical and conceptual structures that have time as
a dimension. For example, given the limited amount of empirical data available for simulation model
builders [46] the findings reported here can be used to help simulation builders build or validate their
simulations, in the way that Abdel-Hamid and Madnick [1] validated their system dynamics model using
a case study from NASA.
3. Findings from a LCCS can be used to elaborate on the findings from other research strategies, and to
identify new issues. For example, one set of critical success factors relate to the ability to scope and
control changes to software requirements. An LCCS can show these changes, how these changes affect
other aspects of the project, and how the project attempts to respond to those changes. In other words,
LCCS can show the presence or absence of critical success factors at an operational level and at an
appropriate timescale.
4. To use the study findings to provide a context to interpret the findings of other studies (e.g. a context for
the code inspection behaviour found by Porter et al. [41, 42]) or to consider threats to external validity
for other studies e.g. to what degree would the behaviour of Porter et al.’s code inspections be affected
by, or occur for, Project C?
5. To provide further empirical findings for the discussion of the advantages and disadvantages of different
approaches to, for example, planned-based or Agile-based software project management.
We intend to explore these examples in more depth in a future paper.
8 Discussion
Anecdotal evidence for many of the individual behaviours described in this study is already well established in
the research community; however this study (and its companion, the study of Project B, [51]) provides empirical
evidence of these behaviours as they occur in conjunction with each other, in situ, and over time. In the
introduction, we recognised that practitioners may chose not to adopt, or perhaps to abandon, technologies due

Page 30 of 36
to time pressures. This study reports a case that describes a situation in which such abandonment might occur.
More generally, the case provides a rich description of how a project is constrained by cost, becomes pressured
by schedule, and struggles to attain or retain appropriate levels of quality. The chronological structures reported
here show not only that re-plans occurred but also show the chain of events over time that lead up to these re-
plans (e.g. recurring design problems with particular features, a steady increase in workload) as well as actions
besides re-plans to tackle problems on the project (e.g. shifting people between development, test and support).
More generally, the descriptions show how important it is to follow a phenomenon for a sufficiently long period
of time, and with a sufficiently fine-grained unit of time, in order to properly describe and its true behaviour (cf.
[18]).
8.1 Preparations for a theory of project behaviour
We do not propose an explicit theory here, but the behaviour represented in sections 5 and 6 can be used to
prepare for a theory. One kind of preparation is the development of what Ziman calls conceptual scaffolding
[78]. Ziman used the term conceptual scaffolding as a metaphorical device: just as scaffolding may be first
constructed to then support the creation or maintenance of a civil structure, so conceptual scaffolding may be
first constructed in order to then support the subsequent creation or maintenance of theory. As a metaphor,
conceptual scaffolding illustrates a useful distinction between a theory and other conceptual frameworks to
support a theory. In our discussion below, we seek to develop conceptual scaffolding, but in so doing, we also
start to develop theory and at this stage it is not easy to distinguish the two. (To extend Ziman‘s metaphor,
perhaps scaffolding and the construction being created sometimes ascend together.)
For Project C, the project completion date actually slipped by 11 weeks (about 20%). In a theory about project
schedule and duration, planned project completion dates, duration, and whether that completion slipped are
likely to be outcomes that the theory is seeking to predict or explain. In experimental terms they might be
treated as dependent variables.
There are a range of behaviours in Project C that suggest independent or moderator variables, and a particularly
interesting set of variables relate to practitioners‘ perceptions and their reactions to those perceptions. Re-plans
provide an excellent example of this type of variable. There were four re-plans in the project of which the
second was a formal re-plan requiring senior management involvement, and resulting in a revised completion
date for the project. Formal and informal re-planning activities constitute practitioners‘ reactions to a perceived
situation, or to changes in a perceived situation, i.e. that the schedule is slipping and by implication that the
planned completion date is becoming increasingly unlikely to be achieved. Outputs from re-planning activities,
such as revised project plans, provide tangible evidence that a re-planning activity occurred. Such outputs also
provide tangible evidence that practitioners believe that the schedule is now at significant risk. (What constitutes
significant is a subjective assessment.)
By using information relating to practitioners‘ perceptions and their reactions to those perceptions we are
exploiting a fundamental element of human activity systems (e.g. [6]) i.e. that people intentionally change their
behaviour in reaction to the perceived situation. Phrased more figuratively, re-planning activities show people
attempting to ‗buck‘ the laws of software engineering (cf. [17]); in other words attempting to avoid, ‗resist‘,
Page 31 of 36
prevent or in other ways change an increasingly expected but undesirable outcome. Besides re-planning, the
indicators of project urgency provide another set of information about practitioner perceptions and reactions.
As a project schedule is an abstract concept for which there is no direct, physical manifestation (although there
are representations in the form of a plan) the question becomes: what is occurring in a project to encourage the
project participants to believe that the project schedule (duration) is becoming significantly risky? Again, the
evidence reported in sections 5 and 6 (and derived from interviews, minutes and the feedback workshop)
suggests two preliminary answers:
1. There are changes over time in the amount of remaining workload. As a project progresses the project
stakeholders seek ideally a reduction in remaining workload, but in fact there can be increases in workload
(as new features are added) or a slower-than-planned reduction in workload (as work takes longer to
complete than planned).
2. There is insufficient capability to complete the work
From the above discussion, the following process emerges:
Changes over time in workload and capability lead to an increased perception that the project schedule is
risky i.e. that the project will not be able to complete when planned. At some tipping point, the project
reacts to this perception by formally or informally re-planning (which provides evidence that the
stakeholders believe the project is at significant risk), and by taking other actions to counteract the changes
in workload and capability.
This process may unfold within a fairly stable context, crudely represented by the socio-technical characteristics
presented in section 5. One consequence of this process is that recognised by Jedlitschka and Ciolkowski [29]
i.e. that practitioners abandon some of the projects‘ ‗standard‘ processes and technologies because they are
perceived to take more time than is available to the project.
8.2 Further research
An important avenue for future research is clearly the further development, application and evaluation of
longitudinal, chronological case studies. As demonstrated with Project C, one particular area to apply LCCs is
the study of software project behaviour. There is also the need to develop theories of software engineering
phenomena with, again, one obvious area being theories of software project behaviour.
8.3 Conclusion
Projects are an industry standard approach to organising the production of software, and the success and failure
of projects is used as an indicator of the state of the software industry. There is surprisingly little empirical
software engineering research that has analysed and reported project behaviour at the level of the project and
over time. There is also an increasing awareness in the research community for the development of theory.
Given the limited methodological advice available specifically on longitudinal case studies, we have in this
paper proposed the longitudinal, chronological case study (LCCS) research strategy. Also, using a combination
of qualitative and quantitative data together with a particular kind of chronological structure (multi-dimensional
timelines) we described aspects of the behaviour of a software project as that project progresses over time. The

Page 32 of 36
LCCS of the project concentrated in particular on those phenomena that relate to the project‘s planned and
actual schedule. From those descriptions we have begun to prepare a theory of software project schedule
behaviour, together with some conceptual support for that theory. There is however much work that remains
incomplete for such a theory.
We hope this study will: encourage methodological development on longitudinal, chronological case study;
encourage the conduct of longitudinal case studies that report behaviour over time; and lead to theoretical
development of explanations of software engineering phenomena.
Acknowledgements
I thank IBM Hursley Park and all of the project members of Project C for allowing me to study the project and
report the results of that study. In particular, I thank Paul Gibson and John Allan for their continual support at
IBM Hursley Park. I also thank Professor Martin Shepperd for supervising my doctoral studies, which form the
basis for the case study reported here. Completion of this paper was facilitated by a short research visit to Lund
University, partly funded by a Royal Academy of Engineering International Travel Grant (ITG10-279). I thank
Professor Per Runeson for his support in preparation for and during the visit to Lund University. Finally, I thank
the editor and reviewers for their constructive comments on earlier drafts of this paper.
References
1. Abdel-Hamid, T.K. and S.E. Madnick, Lessons learned from modeling the dynamics of software development.
Communications of the ACM, 1989. 32(12): p. 1426-1438.
2. Andersson, C. and P. Runeson, A replicated quantitative analysis of fault distributions in complex software systems.
IEEE Transactions on Software Engineering, 2007.
3. Benbasat, I., D.K. Goldstein, and M. Mead, The case research strategy in studies of information systems. MIS
Quarterly, 1987. 11(3): p. 369-386.
4. Bradac, M.G., D.E. Perry, and L.G. Votta. Prototyping A Process Monitoring Experiment. in 15th International
Conference on Software Engineering. 1993: IEEE Computer Society Press.
5. Bradac, M.G., D.E. Perry, and L.G. Votta, Prototyping A Process Monitoring Experiment. IEEE Transactions on
Software Engineering, 1994. 20(10): p. 774-784.
6. Checkland, P., Systems Thinking, Systems Practice. 1981, Chichester.: John Wiley & Sons.
7. Chow, T. and D.-B. Cao, A survey study of critical success factors in agile software projects Journal of Systems and
Software, 2008. 81(6): p. 961-971.
8. Cook, J.E., L.G. Votta, and A.L. Wolf, Cost-Effective Analysis Of In-Place Software Processes. IEEE Transactions on
Software Engineering, 1998. 24(8): p. 650-663.
9. Crowston, K., H. Annabi, and J. Howison. Defining open source software project success. in 24th International
Conference on Information Systems (ICIS 2003). 2003. Seattle, WA.
10. Crowston, K., et al. Towards a portfolio of FLOSS project success measures. in Collaboration, Conflict and Control:
The 4th Workshop on Open Source Software Engineering, International Conference on Software Enginnering (ICSE
2004). 2004. Edinburgh, Scotland.
11. Crowston, K., J. Howison, and H. Annabi, Information Systems Success in Free and Open Source Software
Development: Theory and Measures. Software Process: Improvement and Practice (Special Issue on Free/Open
Source Software Processes.), 2006. 11(2): p. 123-148.
12. Curtis, B., H. Krasner, and N. Iscoe, A field study of the software design process for large systems. Communications of
the ACM, 1988. 31(11): p. 1268-1287.
13. de Souza, C.R.B. and D.F. Redmiles. An Empirical Study of Software Developers‘ Management of Dependencies and
Changes. in 2008 International Conference on Software Engineering (ICSE’08). 2008. May 10–18, 2008, Leipzig,
Germany.
14. de Souza, C.R.B., et al. Sometimes You Need to See Through Walls — A Field Study of Application Programming
Interfaces. in 2004 ACM Conference on Computer Supported Cooperative Work (CSCW’04). 2004. November 6–10,
2004, Chicago, Illinois, USA.
15. Easterbrook, S., et al., Selecting Empirical Methods for Software Engineering Research, in Guide to Advanced
Software Engineering, F. Shull, J. Singer, and D.I. Sjøberg, Editors. 2008, Springer-Verlag: London.

Page 33 of 36
16. El Emam, K. and A. Günes Koru, A Replicated Survey of IT Software Project Failures. IEEE Software, 2008. 25(5): p.
84-90.
17. Fenton, N. and N. Ohlsson, Quantitative Analysis of Faults and Failures in a Complex Software System. IEEE
Transactions on Software Engineering, 2000. 26(8): p. 797 - 814.
18. Fenton, N., S.L. Pfleeger, and R.L. Glass, Science and substance: a challenge to software engineers. IEEE Software,
1994. 11(4): p. 86-95.
19. Gerken, J., P. Bak, and H. Reiterer. Longitudinal Evaluation Methods in Human-Computer Studies and Visual
Analytics. in Visualization 2007: Workshop on Metrics for the Evaluation of Visual Analytics (InfoVis 2007). 2007.
Sacramento, CA, USA.
20. Glass, R.L., The state of the practice of software engineering (guest editor's introduction). IEEE Software, 2003. 20(6):
p. 20 - 21.
21. Glass, R.L., IT Failure Rates--70% or 10-15%? Software, IEEE, 2005. 22(3): p. 112-111.
22. Guindon, R., Designing the design process: Exploiting opportunistic thought. Human-Computer Interaction, 1990.
5(2-3): p. 305-344.
23. Guindon, R., Knowledge exploited by experts during software system design. International Journal of Man-Machine
Studies, 1990. 33(3): p. 279-304.
24. Herceg, P., Defining Useful Technology Evaluations, MTR070061R1, 2007, MITRE Corporation.
25. Hesse, W. Theory And Practice Of The Software Process - A Field Study And Its Implications for Project
Management. in 5th European Workshop On Software Process Technology. 1996.
26. Holt, N.E., A Systematic Review of Case Studies in Software Engineering, Master of Science, Department of
Informatics, University of Oslo, 2006
27. Israeli, A. and D.G. Feitelson, The Linux kernel as a case study in software evolution. Journal of Systems and
Software, 2010. 83(3): p. 485-501.
28. Jackson, M., Software requirements & specification. 1995: Addison-Wesley.
29. Jedlitschka, A. and M. Ciolkowski. Relevant information sources for successful technology transfer: a survey using
inspections as an example. in First International Symposium on Empirical Software Engineering and Measurement
(ESEM2007). 2007. Madrid, Spain, September 2007.
30. Jørgensen, M., A review of studies on expert estimation of software development effort. Journal of Systems and
Software, 2004. 70(1-2): p. 37-60.
31. Jørgensen, M. and K. Moløkken, How large are software cost overruns? A review of the 1994 CHAOS report.
Information and Software Technology, 2006. 48(4): p. 297–301.
32. Jørgensen, M. and M.J. Shepperd, A Systematic Review of Software Development Cost Estimation Studies. IEEE
Transactions on Software Engineering, 2007. 33(1): p. 33 - 53.
33. Kitchenham, B., DESMET: a method for evaluating software engineering methods and tools, TR96-09, 1996, Keele
University, UK. p. 120-126.
34. Kitchenham, B., et al., Preliminary guidelines for empirical research in software engineering. IEEE Transactions on
Software Engineering, 2002. 28(8): p. 721-734.
35. Kitchenham, B., L. Pickard, and S.L. Pfleeger, Case studies for method and tool evaluation. IEEE Software, 1995.
12(4): p. 52-62.
36. Koch, S., Software evolution in open source projects—a large-scale investigation. Journal of software maintenance
and evolution, 2007. 19(6): p. 361-382.
37. Lagnado, D.A. and S. Sloman, The advantage of timely intervention. Journal of Experimental Psychology, 2004.
30(4): p. 856-876.
38. Lagnado, D.A. and S. Sloman, Time as a guide to cause. Journal of Experimental Psychology, 2006. 32(3): p. 451-460.
39. Lonchamp, J. A Structured Conceptual And Terminological Framework For Software Process Engineering. in Second
International Conference on Software Process: Continuous Software Process Improvement. 1993. Berlin, Germany:
IEEE Computer Society Press.
40. Macdonell, S.G. and M.J. Shepperd, Combining techniques to optimize effort predictions in software project
management. Journal of Systems and Software, 2003. 66(1): p. 91-98.
41. Porter, A.A., et al., Understanding the sources of variation in software inspections. ACM Transactions on Software
Engineering and Methodology, 1998. 7(1): p. 41-79.
42. Porter, A.A., et al., An Experiment To Asess The Cost-Benefits Of Code Inspections In Large Scale Software
Development. IEEE Transactions on Software Engineering, 1997. 23(6): p. 329-346.
43. Prechelt, L., S. Jekutsch, and P. Johnson, Actual Process: A Research Program, TR-B-06-02, 2006, Institut f.
Informatik, Freie Universität Berlin.
44. Procaccino, J.D., et al., Case study: factors for early prediction of software project success. Information and Software
Technology, 2002. 44(1): p. 53-62.
45. Procaccino, J.D., et al., What do software practitioners really think about project success: an exploratory study.
Journal of Systems and Software, 2005. 78(2): p. 194-203.
46. Raffo, D.M. and M.I. Kellner, Empirical analysis in software process simulation modeling. Journal of Systems and
Software, 2000. 53(1 ): p. 31-41.
47. Rainer, A., Representing the behaviour of software projects using multi-dimensional timelines. Information and
Software Technology, 2010. 52(11): p. 1217 - 1228.
48. Rainer, A., A framework and modelling technique for the longitudinal study of software project situations. Submitted.
49. Rainer, A. and S. Gale. Evaluating the Quality and Quantity of Data on Open Source Software Projects. in First
International Conference on Open Source Systems. 2005. Genova, Italy, July 11 - 15, 2005.

Page 34 of 36
50. Rainer, A. and S. Gale. Sampling open source projects from portals: some preliminary investigations. in 11th IEEE
International Software Metrics Symposium. 2005. Como, Italy, 19-22 September, 2005.
51. Rainer, A.W., An Empirical Investigation of Software Project Schedule Behaviour, Doctoral thesis, Department of
Computing, Bournemouth University, 1999
52. Robinson, H., J. Segal, and H. Sharp. The case for empirical studies of the practice of software development. in The
Future of Empirical Studies in Software Engineering. Workshop Series on Empirical Software Engineering. 2004.
Stuttgart, Germany: Fraunhofer IRB Verlag,.
53. Robinson, H., J. Segal, and H. Sharp, Ethnographically-informed empirical studies of software practice. Information
and Software Technology, 2007. 49(6): p. 540–551.
54. Robson, C., Real World Research: A Resource For Social Scientists and Practitioner-Researchers. 1993, Oxford UK:
Blackwell.
55. Robson, C., Real World Research: A Resource For Social Scientists and Practitioner-Researchers. 2nd edition ed.
2002, Oxford UK: Blackwell.
56. Runeson, P. and M. Höst, Guidelines for conducting and reporting case study research in software engineering.
Empirical Software Engineering, 2009. 14(2): p. 131–164.
57. Salo, O. and P. Abrahamsson, Empirical Evaluation of Agile Software Development: The Controlled Case Study
Approach in Product Focused Software Process Improvement, F. Bomarius and H. Iida, Editors. 2004, Springer-
Verlag Berlin Heidelberg. p. 408-423.
58. Salo, O. and P. Abrahamsson. Integrating agile software development and software process improvement: a
longitudinal case study. in International Symposium on Empirical Software Engineering. 2005. 17-18 Nov. 2005
59. Seaman, C.B., Qualitative Methods In Empirical Studies Of Software Engineering. IEEE Transactions on Software
Engineering, 1999. 25(4): p. 557-572.
60. Shneiderman, B. and C. Plaisant. Strategies for Evaluating Information Visualization Tools: Multi-dimensional In-
depth Long-term Case Studies. in Beyond time and errors: novel evauation methods for Information Visualization
(BELIV 2006). 2006. May 23rd, 2006, Venice, Italy.
61. Shull, F. and R.L. Feldman, Building Theories from Multiple Evidence Sources, F. Shull, J. Singer, and D.I. Sjøberg,
Editors. 2008, Springer-Verlag London.
62. Singer, J. and T. Lethbridge. Studying Work Practices To Assist Tool Design In Software Engineering. in
International Workshop on Program Comprehension. 1998.
63. Sjøberg, D.I., et al., Building theories in software engineering, in Guide to Advanced Empirical Software Engineering,
F. Shull, J. Singer, and D.I. Sjøberg, Editors. 2008, Springer-Verlag: Londong.
64. Sjøberg, D.I., et al., A Survey of Controlled Experiments in Software Engineering. IEEE Transactions on Software
Engineering, 2005.
65. Taff, L.M., J.W. Borchering, and W.R. Hudgins Jr., Estimeetings: Development estimates and a front-end process for a
large project. IEEE Transactions on Software Engineering, 1991. 17(8): p. 839-849.
66. The Standish Group, Chaos Report. 1994.
67. The Standish Group, Chaos: A Recipe for Success. 1999.
68. The Standish Group, Extreme Chaos. 2001.
69. The Standish Group, Latest Standish Group Chaos Report Shows Project Success Rates Have Improved by 50%, 2003.
70. The Standish Group, 2004 Third Quarter Research Report, 2004.
71. van Genuchten, M., Why is software late? An empirical study of reasons for delay in software development. IEEE
Transactions on Software Engineering, 1991. 17(6): p. 582-590.
72. Verner, J., W.M. Evanco, and N. Cerpa, State of the practice: An exploratory analysis of schedule estimation and
software project success prediction Information and Software Technology, 2007. 49(2): p. 181-193.
73. Verner, J.M., et al. Guidelines for Industrially-Based Multiple Case Studies in Software Engineering. in Third
International Conference on Research Challenges in Information Science (RCIS2009). 2009. Fez, Morocco, 22-24
April 2009
74. Weiss, D., A Large Crawl and Quantitative Analysis of Open Source Projects Hosted on SourceForge, Technical
report number: RA-001/05, 2005, Institute of Computing Science, Poznan University of Technology: Poznan, Poland.
p. 50.
75. Wohlin, C., et al. A Framework for Technology Introduction in Software Organizations. in Software Process
Improvement Conference (SPI'96). 1996. Brighton, UK, 1996.
76. Wolf, A.L. and D.S. Rosenblum. A Study In Software Process Data Capture And Analysis. in 2nd International
Conference on the Software Process. 1993. Berlin, Germany, February 25-26.
77. Yin, R.K., Case Study Research: Design and Methods. 3rd edition ed. 2003: SAGE Publications.
78. Ziman, J., Reliable Knowledge: An Exploration of the Grounds for Belief in Science. 1978/1991: Cambridge
University Press.

Page 35 of 36
Appendix A Multi-Dimensional Timelines
A multi-dimensional timeline (MDT) is intended to visualise multiple sets of data over time with each set of
data being of a particular type e.g. a quantitative time-series, a schedule of phases, a sequence of events, or some
qualitative data. MDTs require data that can be represented in time and that can be represented using the simple
geometrical structures of points, lines and planes.
Broadly speaking an MDT is structured into one or more sections in the visual display. Each section provides a
graphical space to represent a set of data. A set of data is positioned in that space in a way that is sensible for
that type of data. For example, a quantitative time series could be positioned in the space as a histogram whereas
a set of decisions may be positioned as a sequence of events. The MDTs in section 6 further illustrate how types
of data are positioned in the sections/spaces. Whilst each section possesses its own y-axis (with the meaning of
that y-axis specific to the type of data), all sections share a common x-axis (time) that is needed in order to
represent data as events in time, and to synchronise different information on the MDT.
Figure 5 Simple, annotated example of a multi-dimensional timeline (MDT)
Figure 5 presents a simple, annotated example of an MDT. As already explained, the MDT is organised into
sections with all sections on the diagram ordered by a common x-axis shown at the foot of the diagram. For all
the MDTs in this paper, the respective x-axes are ordered in weekly units, these units being appropriate to the
project bring studied. Other MDTs could use other units of time such as seconds, days, months, or years. Each
section has a title and a border, although the border is not shown.

Page 36 of 36
The MDTs for this paper were created manually using Microsoft Excel to generate the quantitative time-series,
and Microsoft PowerPoint to prepare the visual displays. As a result, quantitative time-series have been
presented in the lowest section of an MDT, but this was solely for convenience because it was easier to
manually align other non-quantitative information (such as phases and events) with the quantitative time-series,
rather than the other way around. Where a section presents multiple quantitative time-series, the y-axis for that
section can be used to represent more than one metric, as we show with the workload and capability data in the
MDT presented in Figure 1. Often, objects in the diagram are accompanied by descriptive labels. Uncertainty
over the start or completion of an interval of time or the occurrence of an event are typically illustrated with
question mark (i.e. ‗?‘) or a thinner line preceding or succeeding a thicker line. Events are represented by filled
squares or unfilled circles. Shaded thick lines also indicate overrun.