Using Generalized Estimating Equations for Longitudinal Data ...
Upload
khangminh22Category
view
0download
0
Digital Learning Framework (DLF) national longitudinal evaluation:One year on – Wave 1 reportEmmet Feerick, Jude Cosgrove and Eva Moran
Educational Research Centre June 2021

Digital Learning Framework (DLF) national longitudinal evaluation: One year on – Wave 1 report Emmet Feerick, Jude Cosgrove, and Eva Moran Educational Research Centre June 2021

Feerick, Emmet Digital Learning Framework (DLF) national evaluation – one year on: Wave 1 report / Emmet Feerick, Jude Cosgrove, and Eva Moran. Dublin: Educational Research Centre. ISBN: 978-1-911678-00-7 (pdf) 1. Digital Learning Framework – Evaluation. 2. Education – Digital technology – Ireland. 3. Education – Information technology – Ireland. 4. Digital technology – Primary schools – Ireland. 5. Digital technology – Post primary schools – Ireland. 2021 I Title II Feerick, Emmet III Cosgrove, Jude IV Moran, Eva 371.334--dc23
i
DLF evaluation project ERC oversight Jude Cosgrove – DLF evaluation lead Emmet Feerick, Eva Moran – DLF evaluation team members Anne Comey, Patricia Gaffney, Imelda Pluck – administrative support Website: www.erc.ie/dlf Contact: [email protected]
Acknowledgements Our thanks to the support of the Department of Education (DE) Teacher Education Policy (Digital) Unit, which asked the ERC to conduct this national evaluation. The evaluation follows from a baseline phase, also supported by the DE Teacher Education Policy (Digital) Unit, during 2018 and 2019 (http://www.erc.ie/programme-of-work/dlf/).
We are grateful for the support, advice and guidance from the DLF advisory group on the survey design and reporting on the Wave 1 phase of the Digital Learning Framework (DLF) evaluation. Aside from the ERC, the DLF advisory group comprises Chris Kelly, Betty Regan, Tony Shine (DE Teacher Education Policy (Digital) Unit), Séamus Knox and Tony Weir (DE Inspectorate), and Anthony Kilcoyne (PDST Technology in Education (TiE)). The group will continue to advise on the evaluation of the DLF as it progresses into Wave 2 of the longitudinal phase in 2021.
Thanks also to Professor Deirdre Butler (School of STEM Education, Innovation & Global Studies, DCU) for her review of the draft report.
We acknowledge and appreciate the collaboration with all of the PDST Technology in Education team, led by Michael McNamara. The collaboration permitted the ERC to administer the baseline survey during the PDST Technology in Education DLF seminars, which has resulted in a rich baseline survey dataset. This dataset provided a starting point for the longitudinal analysis outlined in the present report.
Thanks to Anne Comey, Patricia Gaffney and Imelda Pluck for administrative guidance and support on the DLF evaluation study.
Finally, our sincere thanks to the school leaders and teachers who completed the Wave 1 surveys and provided us with their views and insights. Their responses provide key findings, and will assist us in identifying and better understanding specific issues as the longitudinal phase of the evaluation progresses in 2021.

ii
List of acronyms and abbreviations CPD Continuing Professional Development DEIS Delivering Equality of opportunity In Schools DE Department of Education DES Department of Education and Skills DL Digital Learning DLF Digital Learning Framework DLP Digital Learning Plan (of schools, to implement the DLF) DLT Digital Learning Team (in the school) DT Digital Technology/Technologies ELC Early Learning and Care (pre-primary settings) ERC Educational Research Centre ETB Education and Training Board ICT Information and Communication Technologies IT Information Technologies LAOS Looking at Our Schools Framework (for School Self-Evaluation) NAMER National Assessment of Mathematics and English Reading NCCA National Council for Curriculum and Assessment OECD Organisation for Economic Co-operation and Development PDST Professional Development Service for Teachers PIRLS Progress in International Reading Literacy Study PISA Programme for International Student Assessment SEN Special Educational Needs SSE School Self-Evaluation STEM Science, Technology, Engineering and Maths TiE Technology in Education (a team of the PDST responsible for resources
and supports to enable schools to implement the DLF) TLA Teaching, learning, and assessment TIMSS Trends in International Mathematics and Science Study UNESCO United Nations Educational Scientific and Cultural Organisation

iii
Table of contents DLF evaluation project ERC oversight ........................................................................................................................... i Acknowledgements .............................................................................................................................................................. i List of acronyms and abbreviations ................................................................................................................................. ii Executive summary ............................................................................................................................................................ 1
E.1 Background .............................................................................................................................................................. 1 E.2 The Digital Learning Framework (DLF) ............................................................................................................ 2 E.3 Objective and design of the DLF evaluation ..................................................................................................... 2 E.4 Digital Learning Team (DLT) leader (or Principal) perspectives ................................................................... 3 E.5 Teachers’ perspectives ........................................................................................................................................... 6 E.6 Differences in DLT leader (Principal) and teacher perspectives .................................................................... 9 E.7 Changes, progress and challenges since baseline ............................................................................................. 10 E.8 Themes emerging from DLT leaders' (Principals’) and teachers' text responses ....................................... 11 E.9 Implications ........................................................................................................................................................... 13
Chapter 1: Background, aims and design ...................................................................................................................... 15 1.1 Background............................................................................................................................................................. 15
1.1.1 Digital Learning Framework and Digital Strategy for Schools .............................................................. 15 1.1.2 Structure and purpose of the Digital Learning Framework ................................................................... 20
1.2 Objective and aims of the Digital Learning Framework evaluation ............................................................. 22 1.3 Oversight of the DLF evaluation ........................................................................................................................ 24 1.4 Design of the DLF evaluation ............................................................................................................................. 24
1.4.1 Wave 1 surveys .............................................................................................................................................. 24 1.4.2 Sample and respondents ............................................................................................................................... 26 1.4.3 Sampling weights used in the analyses ....................................................................................................... 30
1.5 Recent national and international research findings ........................................................................................ 31 1.5.1. DLF longitudinal evaluation baseline study findings ............................................................................. 32 1.5.2. Inspectorate report on digital learning findings ...................................................................................... 35 1.5.3. Other national and international findings ................................................................................................ 37
1.6 Guidelines for interpreting the DLF Wave 1 results ....................................................................................... 38 1.6.1 Caveats ............................................................................................................................................................ 38 1.6.2 Construction of questionnaire indices ....................................................................................................... 38
1.7 Content of this report ........................................................................................................................................... 39 Chapter 2: Key findings from the DLF Wave 1 Digital Learning Team Leader (or Principal) questionnaire .. 40
2.1 Chapter overview ................................................................................................................................................... 40 2.2 Description of respondents and schools ........................................................................................................... 42
2.2.1 Characteristics of DLT leader (or Principal) respondents ...................................................................... 42 2.2.2 Characteristics of schools and schools’ Digital Learning Teams ........................................................... 43
2.3 Overview of the DLF in primary and post-primary schools .......................................................................... 44 2.3.1 DLF Dimension and Domain of focus ..................................................................................................... 44 2.3.2 School policies relating to digital technologies ......................................................................................... 46 2.3.3 Implementation of and supports for the Digital Learning Plan ............................................................ 47 2.3.4 Role of Digital Learning Framework in School Self Evaluation ........................................................... 51 2.3.5 Use of digital technologies in standardised testing .................................................................................. 51
iv
2.4 Key findings from the DLT Leader (or Principal) questionnaire .................................................................. 52 2.4.1 Attitudes to and familiarity with digital technologies .............................................................................. 52 2.4.2 Participation in professional learning and initiatives relevant to DLF implementation .................... 54 2.4.3. Self-assessment of current level of embedding digital technologies in teaching, learning and assessment ................................................................................................................................................................ 57 2.4.4 Digital technology infrastructure and technical support ......................................................................... 61 2.4.5. DLT leaders’ attitudes and beliefs ............................................................................................................. 69 2.4.6 Impacts and challenges associated with implementing the DLF ........................................................... 72
2.5 Inter-relationships between scales ...................................................................................................................... 77 2.6 Key points from Chapter 2 .................................................................................................................................. 78
Chapter 3: Key findings from the DLF Wave 1 teacher questionnaires .................................................................. 82 3.1 Chapter overview ................................................................................................................................................... 82 3.2 Description of respondents ................................................................................................................................. 84 3.3 Key findings from the Teacher questionnaire .................................................................................................. 84
3.3.1 Digital technology characteristics of participants’ schools ..................................................................... 84 3.3.2 School policies relating to digital technologies ......................................................................................... 85 3.3.3 Implementation of and supports for digital learning ............................................................................... 85 3.3.4 Participation in professional learning relevant to DLF implementation .............................................. 86 3.3.5 Collaborative practices.................................................................................................................................. 89 3.3.6 Self-assessment of current level of embedding digital technologies in teaching, learning and assessment ................................................................................................................................................................ 89 3.3.7 Digital technologies infrastructure and technical support ...................................................................... 90 3.3.8 Teachers’ use of digital technologies and tools for teaching, learning and assessment ..................... 96 3.3.9 Teachers’ attitudes to and familiarity with digital technologies ............................................................. 98 3.3.10 Teachers’ general beliefs about teaching and learning .......................................................................... 99 3.3.11 Impacts and challenges associated with implementing the DLF ...................................................... 103 3.3.12 Inter-relationships between scales .......................................................................................................... 106
3.4 Overlaps and divergence in teachers’ and Digital Learning Team leaders’ (or Principals’) perspectives....................................................................................................................................................................................... 108
3.4.1 DLF embedding .......................................................................................................................................... 108 3.4.2 Constructivist beliefs................................................................................................................................... 109 3.4.3 Ease with digital devices ............................................................................................................................. 109 3.4.4 Teacher and pupil engagement ................................................................................................................. 109 3.4.5 Impact of DLF ............................................................................................................................................ 110 3.4.6 Implementation challenges ........................................................................................................................ 110
3.5 Key points from Chapter 3 ................................................................................................................................ 110 Chapter 4: Changes, progress and challenges since baseline ................................................................................... 114
4.1. Chapter overview ................................................................................................................................................ 114 4.2. Approach taken in the analysis ......................................................................................................................... 114 4.3. A description of changes since baseline .......................................................................................................... 116
4.3.1. Level of embedding digital technologies in teaching, learning and assessment ............................... 116 4.3.2. Level of engagement with digital technologies ...................................................................................... 117 4.3.3. Connectivity and infrastructure ................................................................................................................ 117 4.3.4. Technical support effectiveness ............................................................................................................... 117

v
4.4. Results of regression models: Primary ............................................................................................................ 118 4.5. Results of regression models: Post-primary ................................................................................................... 121 4.6. Key points from Chapter 4 ............................................................................................................................... 124
Chapter 5: Digital Learning Team leaders’ (or Principals’) and teachers’ perspectives on what works ............ 126 5.1 Chapter overview ................................................................................................................................................. 126 5.2 Digital Learning Team Leaders’ perspectives on what works ...................................................................... 127
5.2.1 Views on the dimension chosen for the Digital Learning Framework – Teaching and Learning dimension ............................................................................................................................................................... 127 5.2.2 Views on the dimension chosen for the Digital Learning Framework – Leadership and Management dimension ....................................................................................................................................... 130 5.2.3 General views on embedding digital technologies in teaching, learning and assessment ................ 131 5.2.4 Views on resources for implementing the Digital Learning Framework/Plan ................................. 135 5.2.5 Views on professional learning supports for implementing the Digital Learning Framework/Plan.................................................................................................................................................................................. 136 5.2.6 Views on enablers of the Digital Learning Framework/Plan implementation ................................. 139 5.2.7 Descriptions of how schools’ current level of practice was identified ............................................... 141
5.3 Teachers’ perspectives on what works ............................................................................................................. 142 5.3.1 General view on embedding digital technologies in teaching, learning and assessment ................. 142 5.3.2. Views on resources for implementing the Digital Learning Plan ....................................................... 145 5.3.3. Views on professional learning supports for implementing the Digital Learning Plan .................. 147 5.3.4 Views on enablers of the Digital Learning Plan implementation ........................................................ 150
5.4 Key points from Chapter 5 ................................................................................................................................ 153 Chapter 6: Conclusions and implications .................................................................................................................... 157
6.1 Successes ............................................................................................................................................................... 157 6.2 Challenges ............................................................................................................................................................. 158 6.3 Implications .......................................................................................................................................................... 161
6.3.1 With respect to recent national research ................................................................................................. 161 6.3.2 In light of other national policies / initiatives ........................................................................................ 162 6.3.3 For measurement and monitoring ............................................................................................................ 162 6.3.4 In light of COVID-19 ................................................................................................................................ 164 6.3.5 For Wave 2 of the DLF longitudinal evaluation .................................................................................... 166
References ........................................................................................................................................................................ 168 Appendix 1: Additional data tables for Chapter 1 ..................................................................................................... 172
Special schools ............................................................................................................................................................ 172 Primary schools .......................................................................................................................................................... 174 Post-primary schools ................................................................................................................................................. 176
Appendix 2 ....................................................................................................................................................................... 181 Appendix 3 ....................................................................................................................................................................... 208
1
Executive summary E.1 Background This Wave 1 report on the Digital Learning Framework (DLF) national longitudinal evaluation follows from the baseline report published in late 2019 (Cosgrove et al., 2019). Wave 2 data collection will commence in autumn 2021, allowing a three-year view of schools' progress in implementing the DLF. Prior to the full national evaluation, a trial was conducted in 20 post-primary and 28 primary and special schools in 2017-2018 (Cosgrove et al., 2018a, b). Note that the survey data on which this report is based was collected during autumn 2019 to spring 2020, just prior to the onset of the COVID-19 pandemic in Ireland. The DLF is a resource to guide schools on how to use digital technologies effectively to transform their teaching, learning and assessment practices. It is intended to be used in tandem with the Looking at Our Schools school self-evaluation framework (Department of Education and Skills [DES]1, 2016), and supports the Digital Strategy for Schools 2015-2020 (DES, 2015a). Grounded in constructivist principles, the Digital Strategy for Schools and the DLF promote the embedding of digital technologies into a wide range of teaching, learning and assessment activities. The Digital Strategy is guided by findings from the 2013 ICT Census of Schools (Cosgrove et al., 2014a, b) and builds on previous strategies, including Investing Effectively in Information and Communications Technology in Schools, 2008-2013 (DES, 2008) and Building Towards a Learning Society: A National Digital Strategy for Schools (Butler et al., 2013). To help support the implementation of the 2015-2020 Digital Strategy, a 210-million euro investment in ICT infrastructure grants for primary and post-primary schools was announced in January 2017. All funding has now issued to schools in the form of a lump sum plus per capita allocation, with the final instalment of 50 million euro issued in December 2020. The relevant Department of Education Circular (CL0077/2020)2 notes that schools must have a Digital Learning Plan (DLP) updated at least annually in place to be eligible to receive the ICT grant. Consistent with previous years, the grant may be used to purchase various digital technologies infrastructure and equipment. However, technical support and maintenance services are not covered in the list of items that may be purchased using the Grant. Detailed plans for further funding and supports following the completed allocation of the ICT Infrastructure grant will be clarified with the development of a new Digital Strategy was announced by the Department of Education in April 20212. Under Project Ireland 2040, the ongoing embedding of the use of digital technologies in teaching, learning and assessment through the Digital Strategy for Schools will be
1 The Department of Education and Skills was renamed the Department of Education in October 2020. In this report we refer to Department of Education and Skills for publications prior to this time, otherwise we use the term Department of Education. 2 https://www.education.ie/en/Press-Events/Press-Releases/2021-press-releases/PR21-04-05.html

2
supported through a further investment, under the current National Development Plan, of some 200 million euro up to 2027. In addition to the ICT grant, the Department funds the provision of broadband connectivity to schools under the Schools Broadband Programme at an annual cost of approximately 13 million euro, and some 98% of schools avail of this programme3. Currently, all post-primary schools have high speed connectivity (mostly at 200 MB/s or higher). Around 900 primary schools have 100 MB/s or higher connectivity under the Schools Broadband Plan, while about 680 are in the National Broadband Plan Intervention Area (for connection by end 2022). A new Broadband Enhancement Project for Primary Schools has been commenced, with the aim of having 100 MB/s or higher broadband connectivity in all primary schools by 2022/20234. E.2 The Digital Learning Framework (DLF) The notion of ‘embedding’ is core to the implementation of the DLF. The Framework (DES, 2017a, b, p. 15) defines embedding digital technology as ‘Moving beyond ICT integration, where digital technology is seamlessly used in all aspects of teaching, learning and assessment to enhance the learning experiences of all students.’ The DLF is organised along two dimensions and eight domains, consistent with the School Self-Evaluation (SSE) framework, Looking At Our School (DES, 2016a, b):
• Teaching and Learning Dimension (consisting of the four domains of learner outcomes; learner experiences; teachers' individual practice; and teachers' collective/collaborative practice).
• Leadership and Management Dimension (consisting of the four domains of leading learning and teaching; managing the organisation; leading school development; and developing leadership capacity).
Within each of the eight domains of the DLF, there is a set of standards, accompanied by statements of effective and highly effective practice. In addition to providing professional learning workshops and seminars and follow-up supports to schools for implementing the DLF, the PDST Technology in Education (TiE) team has developed an integrated suite of resources at www.DLPlanning.ie. There is also www.webwise.ie, an Internet safety initiative managed by the PDST, which promotes awareness of online safety issues and good practice among students, their parents and teachers. E.3 Objective and design of the DLF evaluation The objective of the DLF evaluation is to evaluate the implementation of the Digital Learning Framework from the multiple perspectives of school Principals, Digital Learning Team leaders, teachers and learners over a three-year period (2019-2022). The design of the evaluation is longitudinal and mixed-method, involving a baseline phase and two longitudinal data collection phases.
3 https://www.education.ie/en/Press-Events/Press-Releases/2021-press-releases/PR21-04-05.html 4 Department of Education, personal communication, April 28 2021.
3
The sample is designed to be nationally representative of both schools and teachers. The Wave 1 school sample of 150 primary schools, 100 post-primary schools and 32 special schools is drawn from the baseline school participants (1,524 primary schools, 320 post-primary schools, and 64 special schools). Within each sampled school, the Digital Learning Team Leader or Principal is invited to complete a school survey, and each teacher is invited to complete a teacher survey. This same sample will be followed through to Wave 2, allowing a three-year perspective on the implementation and impacts of the DLF. The Wave 1 samples are broadly representative of their respective populations and sampling weights are applied in all quantitative analyses. Throughout the report, the term ‘DLT leader’ is used as shorthand to refer to DLT leaders or Principals. The evaluation of the DLF is overseen by an advisory committee group of representatives from the Department of Education's Teacher Education (Digital) Policy Unit, the Inspectorate, the PDST and the ERC. The advisory group provides guidance and advice on all key stages of the DLF evaluation, particularly survey content and reporting. Wave 1 questionnaires for Digital Learning Team (DLT) leaders and teachers were developed by the ERC (in both Irish and English). Question types were both closed (tick box) and open (text response). Various questionnaire indices or scale (summary scores based on sets of thematically linked questionnaire items) were derived from the survey responses. All index scores range from 0-100 and so may be directly compared. Higher index scores are indicative of a more positive outcome. The text responses, meanwhile, were submitted to thematic analysis. Due to low survey response rates at the last quarter of 2019, the survey window was extended into spring 2020. This resulted in sufficient response rates to deem the DLT leader survey nationally representative. However response rates from teachers were lower than desired across all three school types. Therefore, although the sample was designed to be nationally representative, the low teacher response rates mean that the DLF wave 1 teacher survey data cannot be considered nationally representative. Also, primary and special schools have been combined into a single group for analysis due to the small number of respondents in the special schools group. Therefore, when the term ‘primary schools’ is used in this report, it should be understood to mean ‘primary and special schools’. E.4 Digital Learning Team (DLT) leader (or Principal) perspectives DLT leader surveys were received from 60 out of 100 post-primary schools and from 109 out of 182 primary and special schools. At post-primary level, a large majority of respondents were Principals (52%) or Assistant/Deputy Principals (35%). At primary level, 58% of respondents were Principals, 23% were Assistant/Deputy Principals. (Other respondents indicated that they were class teachers or SETs.) Asked about the composition of their school’s Digital Learning Teams, DLT leaders reported that DLTs tended to consist of staff members who volunteer – and hence are likely to already be ‘digitally savvy’. Around nine in ten schools were focused on the Teaching and Learning dimension of the DLF, which is to be expected, given that the focus for school self-evaluation (SSE) from 2016 to 2022 is the

4
dimension of Teaching and Learning. Post-primary schools were more likely (93%) than primary schools (73%) to have incorporated their Digital Learning Plan (DLP) into SSE activities. Over 90% of schools at both primary and post-primary levels had either begun or completed their DLPs. At both primary and post-primary, DLT leaders reported that teaching staff were consulted with extensively about the development of the DLP; however, school management boards were consulted more frequently at post-primary than at primary level. At both primary and post-primary levels, parents were consulted relatively extensively on the DLP, in contrast to students, who were extensively consulted in fewer than 10% of schools. This latter finding indicates that the students have not been widely consulted in informing schools’ DLPs. Very high levels of implementation of digital technology-related policies and guidelines were reported by DLT leaders at both primary and post-primary level. Over 90% of respondents reported having policies or guidelines on acceptable use of technology in school, acceptable use of the internet in school, and online safety. There is also evidence of extensive consultation with teachers and school management boards on these policies and guidelines, though less consultation with parents and students. A majority of DLT leaders (about 80% at primary and 90% at post-primary) had visited the PDST’s DLPlanning.ie website, although website visits were not very frequent. However, of those who had visited the DLPlanning.ie website, they reported having visited all sections at some point, suggesting that all sections had some relevance for a majority of respondents. DLT leaders’ levels of comfort and familiarity with DTs5 were moderate to high, particularly at post-primary level (with scale means of 65 for primary schools and 74 for post-primary schools). Similarly, participants expressed a very positive view of DTs for supporting learning6 (with scale means of 75 at primary and 76 at post-primary; see Figure E1.1). Respondents’ participation in CPD or professional learning in the area of DTs was high. For example, in the two years prior to the survey, at primary level, 78% of DLT leaders had attended a relevant summer course and at post-primary level, 83% had participated in relevant workshops. Two in five (40%) primary respondents and 69% of respondents at post-primary reported availing of in-school PDST support. A majority of respondents (75% at primary level and 69% at post-primary level) indicated that their school was partly at, mostly at or all at the level of effective practice as described in the DLF (across all statements). Just 6% or post-primary and 7% of primary respondents indicated that they were mostly or all at levels of highly effective practice, while 11% of primary respondents and 9% of post-primary respondents indicated that their school was all or mostly below the statements of effective practice.
5 As measured by levels of agreement with statements such as ‘I feel comfortable using digital devices that I am less familiar with’; ‘If I need new software, I install it by myself’. 6 For example, 80% or more of respondents at both primary and post-primary levels agreed or strongly agreed that ‘DTs enable students to access better sources of information’, and that ‘DTs help students develop greater interest in learning’.

5
DLT leaders’ views on the level at which their school was at in terms of embedding DTs into teaching, learning and assessment were measured on a scale ranging from ‘Emerging’ to ‘Highly Advanced’. Post-primary respondents rated their schools as being at a higher level of embedding than primary schools: 78% of post-primary respondents described the level of embedding as intermediate to highly advanced, compared to 44% of primary schools. Respondents’ ratings of their schools’ use of DTs on these two measures (level of practice and level of embedding) were generally quite closely aligned to one another. DLT leaders reported that teachers’ access to school-owned computing devices was high – around 90% at both primary and post-primary levels. A little over half of DLT leaders (55% at both primary and post-primary) indicated that all pupils in the school had regular access to a school-owned computing device. The type of devices available for students differed across primary (with more common use of iPads) and post-primary (with more common use of desktops). Rates of home access for pupils to their own computing device were lower, particularly at primary level. Technical support and maintenance was most commonly provided by a mixture of internal and external sources (as opposed to being all external or all internal). Technical support was rated by DLT leaders as being more effective at post-primary than primary level, with scale means of 71 and 54, respectively. Responses on this scale varied substantially across schools. At post-primary level technical support effectiveness was not statistically significantly associated with enrolment size or mode of technical support and maintenance provision (i.e. internal, external, or a mixture). At primary level, smaller schools reported internal technical support and maintenance more frequently than larger schools, which in turn reported external technical support more frequently than smaller schools. Although not statistically significant, the least effective technical support was reported in smaller primary schools (with 120 or fewer pupils enrolled). On a scale measuring DLT leaders’ views on their school’s level of DT infrastructure and connectivity required for teaching, learning and assessment, primary (47) and post-primary schools (53) had scores in the moderate range. A large majority of both primary and post-primary schools rated the availability of computing devices for teaching, learning and assessment as good, very good or excellent. For many of the other items, such as age and condition of computing devices, availability of suitable software and awareness of suitable software there was considerable variation across schools at both primary and post-primary levels. Primary and post-primary schools also obtained scale means in the moderate range (50) on a scale measuring teacher and student engagement in DTs. There is a strong relationship between scores on the infrastructure and connectivity scale and the DT engagement scale (r=.55 at primary and .51 at post-primary). On a scale measuring the impact of having implemented the DLF since baseline, post-primary DLT leaders reported a higher mean score than primary school DLT leaders (57 and 47, respectively). Interestingly, the area of highest perceived impact at both primary and post-primary related to decisions relating to DT infrastructure. Moderate levels of impact in teaching and learning practices and collaborative practices were found at both levels, with the latter being higher at post-primary

6
level. Notably, perceived impact on assessment was low at both levels: 65% of primary respondents and 45% of post-primary respondents reported no change or a minor change in this area. Implementation challenges covered a range of areas. According to DLT leaders, dedicated time for implementation, DT infrastructure, provision of leadership by school management, sharing learning across staff, and staff competency levels in using DTs for TLA, represent significant challenges in many schools. The various DT scale means associated with DLT leader responses (see Figure E1.1) did not differ significantly across schools of different enrolment size, DEIS status, or (in the case of post-primary schools) sector. This could be interpreted to mean that schools do not differ to one another with respect to these scales when it comes to their implementation of the DLF. It should be noted that these indices are subjective perceptual measures rather than objective empirical ones. Figure E1.1. Wave 1 survey scale means and standard deviations for primary and post-primary schools: DLT leaders
Note. Red bars display the standard deviations. These indicate, approximately, the interval within which the scale scores of two-thirds of respondents lie. E.5 Teachers’ perspectives In total, 443 teachers from 71 post-primary schools completed a survey, and 495 teachers from 117 primary and special schools completed a survey. Among primary respondents, 17% of respondents were DLT leaders, 41% reported being on the DLT, and 42% reported not being on the DLT. These figures were 25%, 24% and 51% respectively, among post-primary respondents. This indicates a
7
wider involvement in the DLT among staff in primary schools, which could be related to the lower average enrolment sizes at primary level. Respondents generally reported a low level of usage of the DLPlanning.ie website, with approximately 40% of primary teachers and 52% of post-primary teachers never having used the website. These levels are lower than those reported by DLT leaders (see Section E.3). Teachers who did use the website tended to use many parts of it, suggesting that many aspects of the website were found to be useful, provided the website is visited in the first place. In terms of teacher professional learning relating to DTs, summer courses (39%) and in-school PDST support (27%) were attended most frequently by primary school respondents. At post-primary, the most frequently attended professional learning activities over the last two years were in-school PDST support (49%) and workshops (38%). By far the most popular method of DT knowledge sharing reported by teachers at both primary and post-primary was informal, occurring throughout the school day. However, the results indicated a divergence between primary and post-primary respondents regarding how widespread more formal and organised methods of DT knowledge sharing are. While exactly half of primary respondents reported using cloud document storage or shared folders to share DT learning and resources, four in five (81%) post-primary respondents did this. These differences in using cloud storage or shared folders may be related to the systems infrastructure associated with larger schools. Post-primary respondents were also more likely than primary respondents to use formal peer mentoring (46% vs 31%), and email, messaging, or social media to share DT knowledge (80% vs 62%). Regarding the level of embedding of DTs in teaching, learning and assessment (TLA), post-primary teachers were more likely than primary teachers to indicate that they were at an Advanced/Highly advanced level (6% primary vs 25% post-primary). This difference is significant, and it may be due in part to different expectations between primary and post-primary respondents regarding what constitutes a high level of embedding. In any event, it is planned to follow up on this finding during Wave 2 of the study. Mean scores on the DT infrastructure and connectivity scale were almost identical across primary and post-primary level (see Figure E.2). However, there were some differences between primary and post-primary schools with regard to which specific aspects of DT infrastructure and connectivity were most highly rated. For example, one-quarter of primary schools rated the availability of digital devices as Excellent, compared to 13% of post-primary schools. Conversely, while broadband speed was rated as Excellent by one quarter (24%) of post-primary respondents, just one-tenth of primary respondents gave it this rating. The age and condition of computing devices ranked prominently as an infrastructural issue for respondents at both levels: 36% of respondents at primary and 34% at post-primary rated this as Fair or Poor. The mean score on the technical support effectiveness scale at post-primary (63) was higher than at primary (55). At primary level, schools with a very small enrolment (≤60) scored significantly lower on this scale than schools with medium and large enrolment sizes. Many respondents signalled the importance of technical support, with about three in ten agreeing or strongly agreeing with the
8
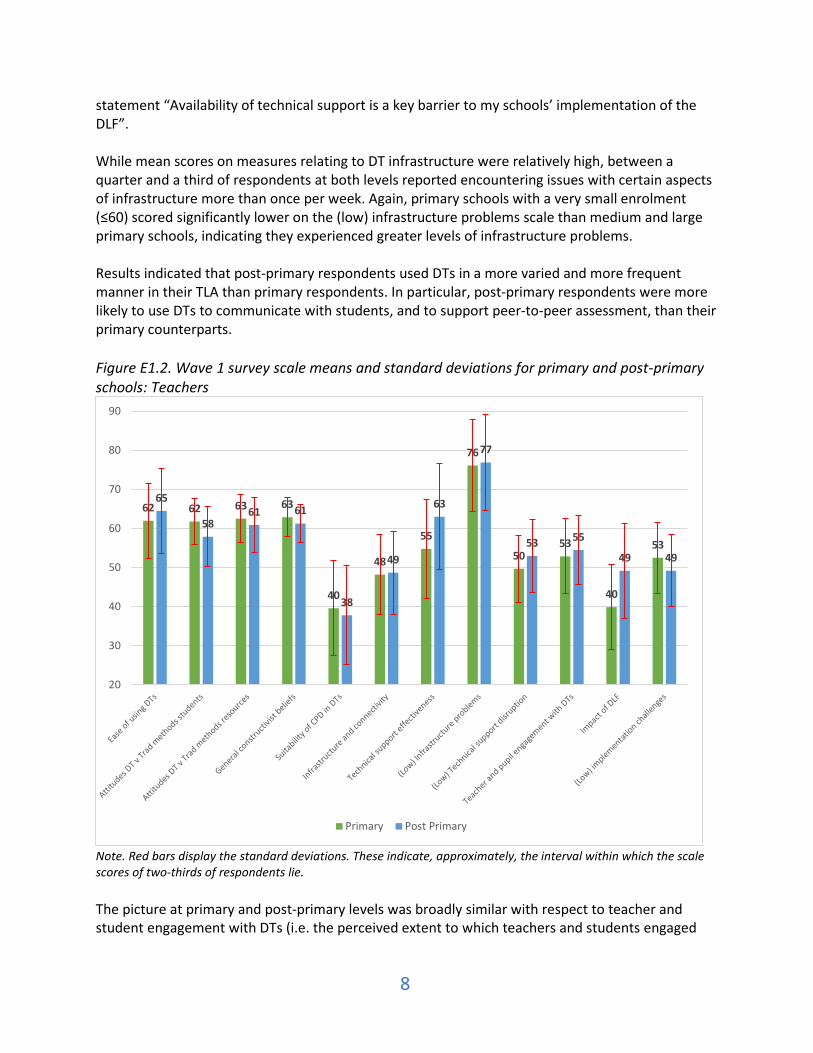
statement “Availability of technical support is a key barrier to my schools’ implementation of the DLF”. While mean scores on measures relating to DT infrastructure were relatively high, between a quarter and a third of respondents at both levels reported encountering issues with certain aspects of infrastructure more than once per week. Again, primary schools with a very small enrolment (≤60) scored significantly lower on the (low) infrastructure problems scale than medium and large primary schools, indicating they experienced greater levels of infrastructure problems. Results indicated that post-primary respondents used DTs in a more varied and more frequent manner in their TLA than primary respondents. In particular, post-primary respondents were more likely to use DTs to communicate with students, and to support peer-to-peer assessment, than their primary counterparts. Figure E1.2. Wave 1 survey scale means and standard deviations for primary and post-primary schools: Teachers
Note. Red bars display the standard deviations. These indicate, approximately, the interval within which the scale scores of two-thirds of respondents lie. The picture at primary and post-primary levels was broadly similar with respect to teacher and student engagement with DTs (i.e. the perceived extent to which teachers and students engaged
62 62 63 63
40
48
55
76
5053
40
53
65
5861 61
38
49
63
77
53 55
49 49
20
30
40
50
60
70
80
90
Primary Post Primary
9
generally with digital technologies on a set of items with responses ranging from excellent to poor). Additionally, at post-primary level, non-DEIS schools had higher average scores than DEIS schools on the teacher and student engagement with DTs scale (56 vs 49). Teachers reported largely positive views about the use of DTs for TLA. A majority of respondents at both levels believed that using DTs enables students to better engage in collaborative learning (72% primary; 69% post-primary); helps students work at a level appropriate to their needs (78% primary; 78% post-primary); and enables students to access better sources of information (89% primary; 85% post-primary). However, most post-primary respondents (68%) Agreed or Agreed strongly that DTs encourage copying material from published internet sources, reflecting a specific concern at post-primary level in relation to the use of DTs for student learning. Also, despite widespread endorsement of the use of DTs for TLA, 47% of primary respondents reported that they found the large number of apps to choose from confusing. Encouragingly, majorities of post-primary teacher respondents indicated that due to their work on the DLF, there was Moderate change or Significant change in the following areas: sharing of documents or resources among teachers; collaborative practices among teachers; and students’ interest and engagement in learning activities, among others. Less change was reported by primary respondents overall compared with post-primary respondents; however, a majority of primary respondents indicated that there was moderate or significant change in Decisions relating to enhancing DT infrastructure, and Emphasis on the use of DTs in school policies or guidelines. Both primary and post-primary respondents reported experiencing significant challenges in implementing the DLF in a few key areas, in particular, relating to DT infrastructure, time for staff to implement the DLP, and issues concerning the fit between the aims of the DLF and the structure of the standardised assessments. E.6 Differences in DLT leader (Principal) and teacher perspectives At both primary and post-primary levels, DLT leaders had higher scores on a scale measuring constructivist beliefs compared to teachers, and the difference was more pronounced at post-primary (18 scale points) than primary level (7 points). Post-primary DLT leaders also had a particularly high score on the DT ease with digital devices scale, compared with post-primary teachers, as well as primary teachers and DLT leaders, whose scores were similar to one another. At both primary and post-primary levels, teachers had higher scores on the DT student and teacher engagement scale than DLT leaders. In contrast, DLT leaders at both levels were more likely to have a higher score on the DLF impact scale than teachers, indicating a higher perceived impact of DLF implementation among DLT leaders than among teachers. Similarly, DLT leaders at both primary and post-primary levels reported higher perceived suitability of CPD in DTs than did teachers, though there was a lot of variation in teacher reports (as indicated by the standard deviation). Also at both levels, DLT leaders reported lower levels of challenges in implementation than teachers.

10
At least some of the differences observed between DLT leaders and teachers are plausibly related to their different roles in the implementation of the DLF in their schools, while some of the differences observed across primary and post-primary levels can be attributed to curricular, structural, or infrastructural differences between the two levels. E.7 Changes, progress and challenges since baseline Wave 1 included a longitudinal analysis by comparing baseline and Wave 1 survey responses. Only a year separates the baseline and Wave 1 data collection phases, so substantial and widespread change was not generally expected. Changes in four indicators (measures) were assessed – the first two indicators, level of embedding DTs in teaching, learning and assessment, and level of engagement of teachers and students with DTs, may be interpreted as DLF impact measures, while the second two, schools' DT infrastructure and connectivity, and schools' adequacy of technical support, may be interpreted as (some) enablers of DLF implementation. At primary level, no change was observed in the level of embedding at baseline and at Wave 1; in contrast, at post-primary level, an overall increasing trend was observed, with post-primary ratings tending to move from 'developing' to 'intermediate' levels. However, at primary level, there was a significant increase in the mean level of engagement with DTs by teachers and pupils from baseline (43) to Wave 1 (50); rates of engagement at post-primary were around the same at Wave 1 (49) as they were at baseline (47). Measures of DT infrastructure and connectivity, and of technical support effectiveness, did not change between baseline and Wave 1 at either primary or post-primary. Three sets of regression models were carried out at each of primary and post-primary levels. This permitted a multivariate analysis of change in three DLF-related outcomes over time, i.e. student and teacher engagement with DTs, level of impact of DLF implementation on TLA, and level of practice with respect to embedding DTs in TLA. The models were built in three stages: school characteristics (e.g. enrolment size, DEIS status) were entered as controls; next, Wave 1 covariates were entered; and finally, baseline inputs were included. Results confirmed that different factors are at play in predicting successful DLF implementation at primary and post-primary levels. This is not surprising since primary and post-primary schools differ significantly in terms of average enrolment size, curricular, teacher and assessment characteristics. However, across both primary and post-primary, DT infrastructure/connectivity and consultative approaches emerged as significant enablers of successful implementation of the DLF. At primary level, the regression models indicate that more successful implementation of the DLF is associated with, and hence may need to be enabled by, multiple factors, including the school's infrastructure and connectivity, consultative leadership (consultation on the DLP), presence or
11
absence of DLF implementation challenges, and the extent to which the DLT leader felt that CPD on the DLF was constructivist and targeted to the goals of the DLF. At post-primary level the regression results suggest that attitudes and beliefs of the DLT leader have a significant and substantive bearing on successful implementation of the DLF, along with a consultative approach to the development of the DLP, and the presence of infrastructural and connectivity supports. E.8 Themes emerging from DLT leaders' (Principals’) and teachers' text responses In analysing reasons provided by respondents for having (largely) chosen the Teaching and Learning dimension of the DLF, the commentary indicates that the promotion of teacher collaboration and shared practice is a high priority for post-primary schools, while at primary level, improving learner outcomes is seen as a key priority. This is consistent with findings reported in Sections E.5 and E.6, above. It also emerged that schools are using multiple and largely informal means to establish their school's level of effective practice – a key outcome of DLF implementation. While it is clear that schools are implementing many good practices to identify and monitor levels of effective practice, it would appear that further guidance would be of benefit, in order to promote a more uniform understanding of levels of effective and highly effective practice for assessment and monitoring purposes. The DLF baseline report identified differences in the understanding of “DT embedding” across schools and between teachers as a potential challenge in monitoring progress in DLF implementation. These differences in understanding became clearer in the responses to the question asking what it meant to “embed” DTs in teaching, learning, and assessment. While many primary and post-primary respondents described embedding in a manner consistent with that of the DLF (see Section E.2), it was also common for respondents’ comments to reflect a more functional approach, particularly at post-primary level. At post-primary, the most common response to this question mentioned that embedding simply meant using DTs in TLA. This could be related to the highly structured curriculum and State examinations at post-primary level, which in turn may work against a more flexible, constructivist approach to TLA embodied in the DLF. At both levels, and across teachers and DLT leaders, the DLPlanning.ie website was widely praised as a useful resource (though perhaps not very widely used by teachers). Respondents particularly liked the videos of effective and highly effective practice, the DL planning guidelines document and DL planning templates. DLT leaders were asked what changes to DLF documents and other supporting materials would better enable them to implement the DLF in their school. At primary level, the most common response was that more DLP or lesson plan samples would be helpful, with over one in four respondents mentioning this (28%). A fifth of responses fell into the “other” category. These responses were varied, and no common themes could be found among them. This reflects an overarching theme of specificity – schools and teachers have very different needs, and that the supports they need are highly dependent on their particular situation. A number of DLT leaders at post-primary level expressed a desire for an online interactive DLP document, since it was felt that the ability to change and interact with the DLP plan document online would enable schools to
12
continuously improve and adapt their DLP to their needs as they progressed with their DLP implementation. Respondents were asked to name up to three things which would best enable them and their school to implement the DLF. Two themes occurred particularly often among primary DLT leader respondents. These were Well-maintained DT infrastructure and devices, and Appropriate and practical CPD/training/demonstrations. The former of these was present in almost half of responses (45%) at primary level and this theme indicates a need for both infrastructural improvements as well as supports to maintain them. In a number of responses, this was the only theme present, suggesting the primacy of well-maintained infrastructure and devices in the process of embedding DTs in TLA. It is notable that both infrastructure and needs-specific training are seen by primary teachers as key enablers of successful DLP implementation. This finding is corroborated by the regression analyses described in the previous section. A broadly similar pattern was observed at post-primary, with Continued/More support and training, and More/better/newer devices being the two most common themes. An interesting difference between primary and post-primary levels is the frequency with which the theme of Purchasing help and funding featured in the responses. At primary level, this was the third most common theme, and was present in about a quarter of all comments (24%). At post-primary level, however, this theme occurred in only 11% of comments. This suggests that some schools, particularly at primary level, may not be sufficiently aware of, or supported in, the purchase of DT resources. Many respondents at both levels held positive attitudes towards the use of DTs in teaching and learning. A key enabler of this, according to the respondents, included “digital champions” within schools, who were seen as very helpful in advancing the schools’ use of DTs. Many respondents, especially at primary level, expressed positive sentiments about the potential of DTs to enable student-centred learning and collaboration between students. Reliable broadband and equipment which teachers could rely on were other key enablers of positive attitudes towards the use of DTs, with some teachers commenting that morale was impacted in schools where staff had learned not to rely on faulty or unreliable equipment. Asked about the kinds of CPD supports that would enable successful continued implementation of the DLF (DLP), both DLT leaders and teachers commented that professional development (frequently referred to as ‘training’) which is specific to subjects, class levels, and teacher knowledge level in DTs was preferred. Demonstrations of particular apps and software were also frequently referenced. Many respondents stressed the need for ongoing professional development, rather than sporadic workshops or in-service days. Some respondents attributed this lack of a consistent approach to poor planning and leadership at the school level or a lack of buy-in among some staff, whereas others noted that progress in the DLF was not possible until issues around unreliable WiFi or insufficient access to enough up-to-date devices were remedied.

13
E.9 Implications The Wave 1 findings are highly consistent with recent national research, including the DLF baseline evaluation, an Inspectorate report on the use of DTs in TLA (Department of Education, 2020), and recent research that has examined the impact of the Covid-19 pandemic on schooling at primary and post-primary levels (Burke & Dempsey, 2020; Devitt et al., 2020; INTO, 2020; Mohan et al., 2020). A recent OECD country note for Ireland confirms that comparatively, schools in Ireland were relatively under-prepared for ICT-based learning prior to the onset of the Covid-19 pandemic (OECD, 2020c, Figure 2). With respect to the forthcoming new Digital Strategy for Schools, the current Department policy to achieve cross-policy alignment is noted and welcomed7. Two particular policies/initiatives seem worth highlighting with a view to strategic alignment in light of the DLF Wave 1 findings:
• The forthcoming new Literacy and Numeracy Strategy and supports for its implementation could represent an important opportunity for the Department of Education to further align policies, funding and CPD supports relating to curriculum, teaching, learning, assessment and DTs into a coherent set.
• It would seem important to establish early and strategic links between any forthcoming Digital Strategy for Schools (announced April 5, 20218) and changes or reforms arising from the Senior Cycle review, in particular relating to assessment or examination reforms. The OECD (2020a, p. 10) has noted that "any changes made to senior cycle will have limited possibilities to succeed if the current assessment approaches are not reviewed accordingly".
• The forthcoming Digital Strategy for Schools should also prioritise the key enablers identified in this study, i.e. adequate levels of infrastructure and connectivity; effective technical support; consultative and collaborative leadership; high levels of collaboration among teachers; active promotion of and advocacy for the DLP in the school; and CPD that is sustained and tailored to local need.
With respect to measurement and monitoring:
• A Finnish Innovative Digital School Model (Ilomäki & Lakkala, 2018) is proposed as a potentially useful guiding structure for the analysis of the DLF Wave 2 results. This model fits well with existing DT policy and strategy in Ireland, is founded on extensive research on school improvement and change relating to DTs, and has practical applications at the system, school and policy levels.
• There is a need to further research to explore and validate measures of levels of effective/highly effective practice associated with the DLF during Wave 2, perhaps in a collaboration between the ERC and Inspectorate and/or PDST.
In light of Covid-19, the Wave 1 findings, and other national research, three DT-related priorities emerge for the Department of Education to consider: 7 The Digital Strategy will also link into wider Government policies such as the National Digital Strategy/skills strategies; Further & Higher Education Literacy, Numeracy & Digital Literacy Strategy; National Broadband Strategy (Department of Education, personal communication, June 1, 2021). 8 https://www.education.ie/en/Press-Events/Press-Releases/2021-press-releases/PR21-04-05.html

14
• The development and implementation of appropriate DT funding (and funding supports), technical support and maintenance, and CPD plans.
• Raising awareness at system level of various information and resources already available particularly as they related to procurement/purchase and CPD, both national and international. The OECD has a range of country case studies, toolkits and other resources that may be useful at system and school level.
• A focus on equity, prioritising supports for smaller, rural schools, schools with high concentrations of educational disadvantage, children with special educational needs, and children with a first language other than English or Irish.
The following are proposed as some of the priorities for the second and final longitudinal data collection wave of the DLF national evaluation:
• Gathering the views of young people on using digital technologies in teaching, learning and assessment
• Establishing the key longer-term changes that have occurred in schools in using digital technologies in teaching, learning and assessment in response to COVID-19
• Gathering information on how DTs are being used to support priority groups of students (children in educationally disadvantaged homes and communities, children with special educational needs)
• Investigating barriers and enablers to DT-based assessment in more depth • Identifying practices that promote the use of DTs in knowledge creation and collaborative
teaching and learning • In the context of the DLF, explore the decision-making processes guiding schools’ DT-related
spending • Gathering school views on what supports should be prioritised in order to maintain and
build on the initial successes of DLF implementation • In the context of the DLF, establishing the needs and priorities of schools with poor levels of
infrastructure, connectivity and technical support • Further examining how schools are interpreting the DLF’s effective/highly effective levels of
practice, potentially through a validation study in collaboration with the PDST or the Inspectorate, in order to enhance assessment and monitoring at system and school levels into the future.
15
Chapter 1: Background, aims and design 1.1 Background This Wave 1 report on the Digital Learning Framework (DLF) national longitudinal evaluation follows from the baseline report published in late 2019 (Cosgrove et al., 2019). Prior to that, a trial was conducted in 20 post-primary and 28 primary and special schools in 2017-2018 and the findings (Cosgrove et al., 2018a, b) informed the design and focus of the full national evaluation of the DLF. At the time of writing this report (Spring 2021), Ireland is one year into its experiences of the COVID-19 pandemic, which has resulted in a range of significant challenges and disruptions to all aspects of daily life, society, employment, health, and education. The survey data on which this report is based was collected just prior to the onset of the pandemic (Autumn 2019 to Spring 2020), and should be interpreted in this light. Further data will be gathered in autumn 2021 in the final phase ('Wave 2') of this longitudinal study. This will offer an opportunity to consider how schools and students have responded and adapted to the challenges of COVID-19 in the context of the implementation of the DLF and use of digital technologies in teaching, learning and assessment. This introductory chapter situates the present report in the broader context of Ireland's Digital Strategy for Schools and explains the purpose and design of the DLF. The oversight, aims and design of the longitudinal evaluation are described, before providing an overview more specifically of the survey design, sample design and analyses of the Wave 1 phase of the evaluation. The chapter then provides a brief update to the national and international research provided in the introductory chapter to the baseline report (Cosgrove et al., 2019). In the concluding chapter of this report (Chapter 6), we consider the implications of the findings in terms of DLF implementation, recent research emerging in the context of COVID-19 and the collection of information in Wave 2. Chapter 6 also reflects on implications that the findings have more broadly for school leaders' and teachers' professional development, resources for digital technologies, and other national policies and initiatives. 1.1.1 Digital Learning Framework and Digital Strategy for Schools The DLF is a resource to guide schools on how best to effectively use digital technologies to transform their teaching, learning and assessment practices. It supports the Digital Strategy for Schools 2015-2020 (DES9, 2015a) and other Department policies in a number of areas including curriculum reform and implementation, skills development, teacher education and improved
9 DES, or Department of Education and Skills, was re-named and somewhat restructured following the General Election in mid-2020. It is now the Department of Education. In this report, we refer to 'DES' for previously-published reports, initiatives, etc., but to the Department of Education (DE) in present tense to reflect its current title.

16
learner outcomes. This section provides an overview of Ireland’s national Digital Strategy for Schools 2015-2020 and describes how the DLF is linked to that strategy as well as other national initiatives. In September, 2017, the Digital Learning Framework (DLF) for primary and post-primary schools was published by the Department of Education and Skills (DES, 2017a, b). This was followed by Digital Planning Guidelines and a Planning Template, published in December 201710. The DLF is a tool to help schools manage the transformation of teaching and learning as a result of embedding digital technologies into practice, and has been developed to enable schools to engage with and implement elements of Ireland’s national Digital Strategy for Schools 2015-2020 (DES, 2015a). Grounded in constructivist principles, the Digital Strategy for Schools and the DLF promote embedding digital technologies into a wide range of teaching and learning activities. The Digital Strategy (2015a, p. 5) states that:
“The Department’s vision for ICT integration in Irish schools is to realise the potential of digital technologies to enhance teaching, learning and assessment so that Ireland’s young people become engaged thinkers, active learners, knowledge constructors and global citizens to participate fully in society and the economy”.
The notion of ‘embedding’ is core to the implementation of the DLF. The Framework (DES, 2017a, b, p. 15) defines embedding digital technology as ‘Moving beyond ICT integration, where digital technology is seamlessly used in all aspects of teaching, learning and assessment to enhance the learning experiences of all students.’ The Digital Strategy is guided by findings from the 2013 ICT Census of Schools (Cosgrove et al., 2014a, b) and builds on previous strategies, including Investing Effectively in Information and Communications Technology in Schools, 2008-2013 (DES, 2008) and Building Towards a Learning Society: A National Digital Strategy for Schools (Butler et al., 2013). The embedding of digital technologies into teaching, learning and assessment is complex, and associated with a range of challenges. For example, in the summary report on the 2013 ICT Census of Schools, Cosgrove et al. (2014a, p. 8, italics added) note:
“The linking of investments in ICT to improvements in student outcomes is a challenge faced by all countries investing in the use of ICT in education. The present review pointed to the complexity of developing a Digital Strategy for Schools. Such a strategy must consider infrastructural issues but also how digital technologies are to be used in curriculum and assessment. Teachers’ pedagogical orientations are pivotal in how the
10 http://www.pdsttechnologyineducation.ie/en/Planning/Digital-Learning-Framework-and-Planning-Resources-Primary/ and http://www.pdsttechnologyineducation.ie/en/Planning/Digital-Learning-Framework-and-Planning-Resources-Post-Primary/; video exemplars are also available.

17
digital technologies are used. Although digital technologies can make things possible, it is people that make change possible.”
The report on the 2013 ICT Census of Schools discusses a range of policy priorities, organised under four main themes:
• Theme 1: Teaching, learning and assessment using ICT • Theme 2: Teacher professional learning • Theme 3: Leadership, research and policy • Theme 4: ICT infrastructure.
These four themes also underpin the Digital Strategy, which specifies a set of actions under each theme. Of particular relevance to the DLF and the work of schools is Theme 1 (teaching, learning and assessment using ICT), under which the DES (2015a, p. 6) states:
“The Strategy will adapt the UNESCO ICT Competency Framework for Teachers so that schools will have greater clarity around the concept of ICT integration. … [this] will allow the Department’s support services and others to provide more appropriate support materials and services to Principals and teachers on embedding ICT into their practice. This will be a central focus of the Strategy and it will be reviewed at various intervals and levels between 2015 and 2020”.
The UNESCO framework referred to above is one of the frameworks informing the DLF, and the involvement of the Professional Development Service for Teachers Technology in Education (PDST-TiE) team is one example of the provision of supports to enable the embedding of the DLF into teaching and learning. Under Theme 2 (teacher professional learning), the DES (p. 7) states that: “The Strategy will provide schools with guidance and examples of good practice on the effective, critical, and ethical use of ICT for teaching, learning and assessment. These examples will reflect real classroom practice in action”. One way in which this element of the strategy is being realised is through the availability of exemplar videos on the PDST TiE11, www.DLPlanning.ie, and are also embedded in online and face-to-face courses. Under Theme 3 (leadership, research and policy), the DES notes the need for distributed leadership across school managers and other stakeholders, and emphasises how the Strategy links with other practices: “…the Strategy will facilitate schools to create linkages with existing school policies, for example School Self Evaluation, so that ICT is embedded deeply within the school” (p. 7). To achieve this linkage, the structure of the DLF is aligned to the Looking At Our
11 http://pdsttechnologyineducation.ie/en/Good-Practice/Videos/; http://www.pdsttechnologyineducation.ie/en/Planning/Digital-Learning-Framework-and-Planning-Resources-Primary/; http://www.pdsttechnologyineducation.ie/en/Planning/Digital-Learning-Framework-and-Planning-Resources-Post-Primary/

18
School framework (DES, 2016a, b), which is designed to underpin both school self-evaluation and school inspections (the structure of the DLF is described in the next section). Under Theme 4 (ICT infrastructure), it may be noted that the Schools Broadband Access Programme provides for the supply of broadband connectivity in all primary and post-primary schools. Around 98% of schools are included in this Programme. All post-primary and some 58 special schools are on high-speed broadband connections of in excess of 100Mbp/s symmetrical upload and download speeds. Under the primary school programme, approximately 1,600 primary schools have download speeds of 30Mb/s or higher (generally accepted as the minimum speed for reliable Internet connection), which represents about 50% of all primary schools. Although data are not yet available, it was previously estimated that by the end of 2020, an additional 200 primary schools would be provided with improved broadband. Also, about 700 primary schools are located in the National Broadband Plan intervention area. Currently (mainly during the first half of 2021) there are network builds in five locations (covering parts of Cavan, Clare, Cork, Galway, Limerick and Roscommon) with network build surveys underway in a further 19 areas (https://nbi.ie/rollout-plan/). Broadband capacity varies by geographical location and local infrastructure. On a fixed network, for example, factors affecting the speed and quality of Internet connectivity include the data transfer technology (with faster connections via fibre-optic and cable than via xDSL); distance between the device and the network centraliser (the further a school from the broadband operator’s centraliser, the slower the connection); and the number of devices in a school attempting to connect to the Internet. The Department of Education acknowledges the increasing importance of cloud computing and commits to evaluating a number of technical support options to identify the best solutions for schools. Guidance for schools on these and other issues is available on the PDST-TiE website12. To help support the implementation of the Digital Strategy, a 210 million euro investment in ICT infrastructure grants for primary and post-primary schools was announced in January 201713. All funding has now issued to schools in the form of a lump sum plus per capita allocation, with slightly higher weightings to DEIS and special schools and special classes in 'mainstream' schools, and with the final instalment of 50 million euro issued in December 2020. Of this 50 million euro,
• 40 million euro was issued to all eligible schools in line with previous years, to support the embedding of the use of digital technologies in teaching and learning
• 10 million euro was issued to cover measures to provide for the continuity of teaching and learning using digital technology (in response to COVID-19).
12 http://pdsttechnologyineducation.ie/en/Technology/ 13 See press release dated January 3, 2017, at www.education.ie; rates payable are 2,000 euro per school plus 22.20 euro per mainstream pupil in primary schools, with additional per capita payments for pupils in DEIS schools, Special Classes and Special Schools. At post-primary, the rates payable are 2,000 euro per school plus 31.90 euro per student, with an additional per capita payment for students in DEIS schools.

19
The relevant Circular (CL0077/2020)14 notes that schools must have a Digital Learning Plan updated at least annually in place to be eligible to receive the grant. Consistent with previous years, the grant may be used to purchase the following types of infrastructure and equipment:
• Teaching computers (desktop PCs, tablets, laptops or hybrid devices) • Shared student computers (desktop PCs, tablets, laptops or hybrid devices) • Projectors (short throw or ultra-short throw, long throw, interactive, or interactive flat
screens) • Networking equipment (e.g. fixed and wireless networking, including cabling, switches
and installation) • Cloud based tools and applications to support learning • Learning platforms (applications used to support the teaching and learning process) • Local software or 'apps' to support learning • Other ICT equipment, including relevant digital items to support teaching, learning and
assessment (e.g. audio visual equipment and other equipment including mobile laptop/tablet trollies, printers and school server).
Circular (CL0077/2020) contains a range of references and links to various resources, including, for example guidance on procurement of ICT equipment/materials. Of note is that technical support and maintenance services are not covered in the above list. Plans for further funding and supports following the completed allocation of the ICT Infrastructure Grant will be established with the development of a new Digital Strategy was announced by the Department of Education in April 2021. Under Project Ireland 2040, the ongoing embedding of the use of digital technologies in teaching, learning and assessment through the Digital Strategy for Schools will be supported through a further investment, under the current National Development Plan, of 200 million euro up to 2027. Under the Schools Broadband Programme the Department of Education funds the provision of broadband connectivity to schools at an annual cost of around 13 million euro and some 98% of schools avail of this programme15. Currently, all post-primary schools have high speed connectivity (mostly at 200 MB/s or higher). Around 900 primary schools have 100 MB/s or higher connectivity under the Schools Broadband Plan while about 680 are in the National Broadband Plan Intervention Area (for connection by end 2022). A new Broadband Enhancement Project for Primary Schools has been commenced, with the aim of having 100 MB/s or higher broadband connectivity in all primary schools by 2022/202316. The DLF is firmly embedded in the Department’s Statement of Strategy 2019-2021 and its Action Plan for Education for 2019 (DES, 2019)17. Under Goal 1 (We will shape a responsive education and training system that meets the needs and raises the aspirations of all learners),
14 https://www.gov.ie/en/circular/c85b5-grant-scheme-for-ict-infrastructure-20202021-school/ 15 https://www.education.ie/en/Press-Events/Press-Releases/2021-press-releases/PR21-04-05.html 16 Department of Education, personal communication, April 28 2021. 17 No Action Plan was published in 2020.

20
implementation of the Digital Strategy for Schools 2015-2020 is listed as Action 10, the first sub-action of which is the commencement of the longitudinal study on the Digital Learning Framework and its implementation in schools. Under Goal 3 (We will equip education and training providers with the skills and support to provide a quality learning experience), links between the DLF and School Self-Evaluation and school inspections are evident. Under Action 31 of Goal 3, for example (management of a programme of SSE visits to primary and post-primary schools), Sub-Action 31.1 states that the DES will ‘publish SSE updates for primary and post-primary schools in order to promote the embedding of SSE in schools and to support the implementation of strategies such as STEM, Modern Foreign Languages and Digital Learning’. Under Action 32 of Goal 3 (planned programme of inspection and advisory visits in schools and alternative education settings), Sub-Action 32.6 states that the DES will implement ‘a thematic inspection report on Digital Learning in primary and post-primary schools and early years settings in order to provide both evaluative information and guidance on digital learning’. This report has now been published (Department of Education, 2020) and is reviewed in Section 1.5, below. The DLF links with and complements other recent and current DE activities, including planned changes to curricula and Certificate examinations. For example, a new mathematics curriculum at primary level (due for publication in Autumn 2021)18 is planned to incorporate aspects of computational thinking. At post-primary level, Coding and Digital Media Literacy are two among the 10 courses available at Junior Cycle19; at Senior Cycle, Phase 1 of Computer Science was introduced as a new Leaving Certificate subject20 in 40 schools in September 2018. In addition to this, digital technologies are embedded in all new subject specifications, regardless of whether these subjects are explicitly computer-related.
The use of digital technologies as an integral part of teaching, learning and assessment is not a new policy area. It has been endorsed in a range of educational policies and initiatives over the past decade. For example, the National Strategy to Improve Literacy and Numeracy among Children and Young People (2011-2020) (DES, 2011a), the Key Skills Framework (NCCA, 2009), and the Framework for the Junior Cycle (DES, 2015b) all assert that digital technologies should be used as a part of pupil/student learning. 1.1.2 Structure and purpose of the Digital Learning Framework The DLF is organised along two dimensions and eight domains, consistent with the School Self-Evaluation (SSE) framework, Looking At Our School (DES, 2016a, b):
• Teaching and Learning Dimension o Domain 1 Learner Outcomes o Domain 2 Learner Experiences o Domain 3 Teachers' Individual Practice
18 https://www.ncca.ie/en/primary/primary-developments/maths-curriculum 19 https://www.curriculumonline.ie/Junior-cycle/Short-Courses 20 https://www.curriculumonline.ie/Senior-cycle/Senior-Cycle-Subjects/Computer-Science/
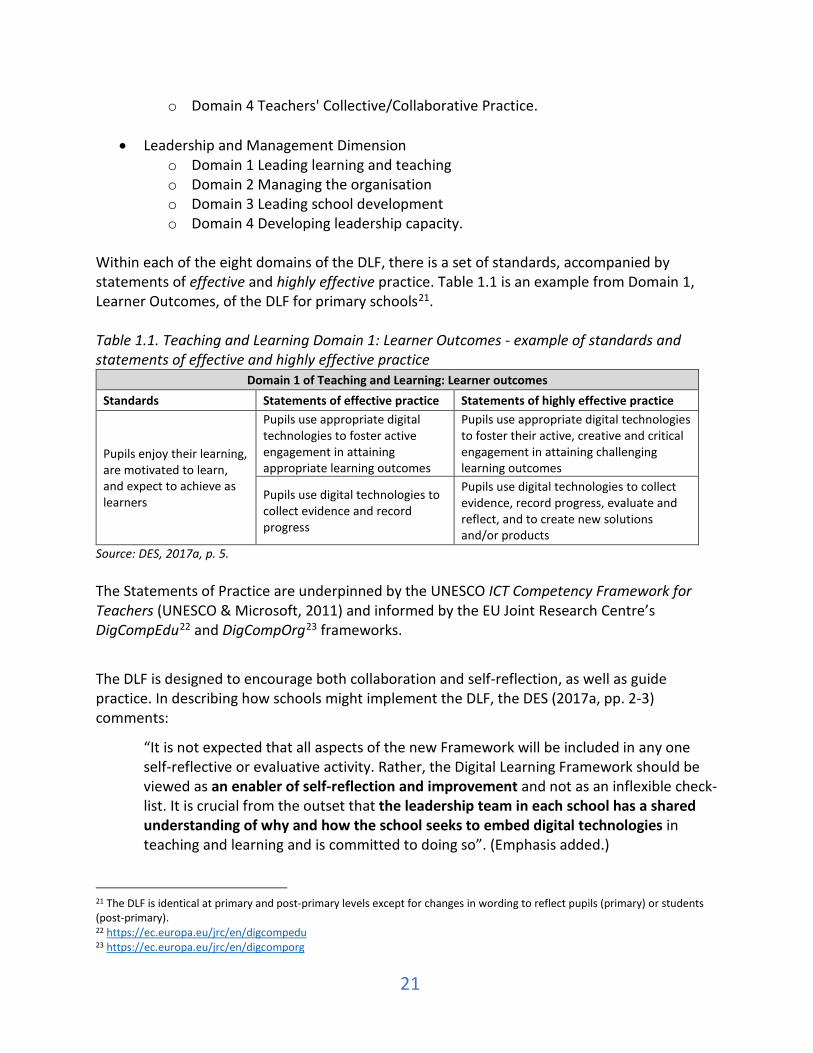
21
o Domain 4 Teachers' Collective/Collaborative Practice.
• Leadership and Management Dimension o Domain 1 Leading learning and teaching o Domain 2 Managing the organisation o Domain 3 Leading school development o Domain 4 Developing leadership capacity.
Within each of the eight domains of the DLF, there is a set of standards, accompanied by statements of effective and highly effective practice. Table 1.1 is an example from Domain 1, Learner Outcomes, of the DLF for primary schools21. Table 1.1. Teaching and Learning Domain 1: Learner Outcomes - example of standards and statements of effective and highly effective practice
Domain 1 of Teaching and Learning: Learner outcomes Standards Statements of effective practice Statements of highly effective practice
Pupils enjoy their learning, are motivated to learn, and expect to achieve as learners
Pupils use appropriate digital technologies to foster active engagement in attaining appropriate learning outcomes
Pupils use appropriate digital technologies to foster their active, creative and critical engagement in attaining challenging learning outcomes
Pupils use digital technologies to collect evidence and record progress
Pupils use digital technologies to collect evidence, record progress, evaluate and reflect, and to create new solutions and/or products
Source: DES, 2017a, p. 5. The Statements of Practice are underpinned by the UNESCO ICT Competency Framework for Teachers (UNESCO & Microsoft, 2011) and informed by the EU Joint Research Centre’s DigCompEdu22 and DigCompOrg23 frameworks.
The DLF is designed to encourage both collaboration and self-reflection, as well as guide practice. In describing how schools might implement the DLF, the DES (2017a, pp. 2-3) comments:
“It is not expected that all aspects of the new Framework will be included in any one self-reflective or evaluative activity. Rather, the Digital Learning Framework should be viewed as an enabler of self-reflection and improvement and not as an inflexible check-list. It is crucial from the outset that the leadership team in each school has a shared understanding of why and how the school seeks to embed digital technologies in teaching and learning and is committed to doing so”. (Emphasis added.)
21 The DLF is identical at primary and post-primary levels except for changes in wording to reflect pupils (primary) or students (post-primary). 22 https://ec.europa.eu/jrc/en/digcompedu 23 https://ec.europa.eu/jrc/en/digcomporg

22
As noted above, the PDST Technology in Education (TiE) team has developed an integrated suite of resources at www.DLPlanning.ie. The content and design of the website have taken feedback and concerns expressed by schools during the DLF Field Trial into account (see Cosgrove et al., 2019). For example, additional exemplar videos have been mapped to the DLF and new exemplar videos have been produced to support the leadership and management dimension in particular, and the structured presentation of the six-step process with concrete tools and examples facilitates schools’ breaking down of the DLF implementation into discrete, manageable tasks. Online safety is another important aspect of digital technologies within the overall context of the DLF. In addition to the resources and supports available through the DLPlanning website, www.webwise.ie, an Internet safety initiative managed by the PDST, promotes awareness of online safety issues and good practice among students, their parents and teachers. Webwise promotes the autonomous, effective and safe use of the Internet by young people through a sustained information and awareness strategy targeting school leaders, parents and children themselves, using consistent and relevant messages. 1.2 Objective and aims of the Digital Learning Framework evaluation Based on Terms of Reference agreed between the ERC and DES, the objective of the DLF evaluation is to evaluate the implementation of the Digital Learning Framework from the multiple perspectives of school Principals, Digital Learning Team leaders, teachers and learners over a three-year period (2019-2022). There are 11 specific aims. Those marked with a single asterisk (*) are evaluated in the current phase of the study (Wave 1) while those marked with a double asterisk (**) come into focus during Wave 2. Aim 5 will emerge from secondary analysis of large-scale assessments overseen by the ERC, including the 2018 cycle of the Programme for International Student Assessment (PISA 2018), the 2019 cycle of the Trends in International Mathematics and Science Study (TIMSS 2019), and the 2021 National Assessment of Mathematics and English Reading (NAMER 2021). It should be noted that NAMER was originally scheduled to take place in 2020 but was postponed by one year due to COVID-19, and at the time of writing (Spring 2021), is proceeding, but in an uncertain context.
1. *Identify any changes to teaching, learning and assessment practices in participating schools that may be linked to implementing the DLF.
2. **Determine if teachers have become more favourably disposed to the use of digital technologies in their practice as a result of implementing the DLF.
3. *Elicit the views of participating teachers on if, and how, the DLF and related resources have impacted or influenced their practice, for example with regard to promoting a constructivist pedagogical approach and enabling self-reflection.
4. **Capture the views of learners on the use of digital technologies in classrooms. 5. Determine learners’ attitudes to and usage of digital technologies for learning using data
collected in large-scale national and international assessments (e.g. PISA 2018, DLF evaluation data collections).
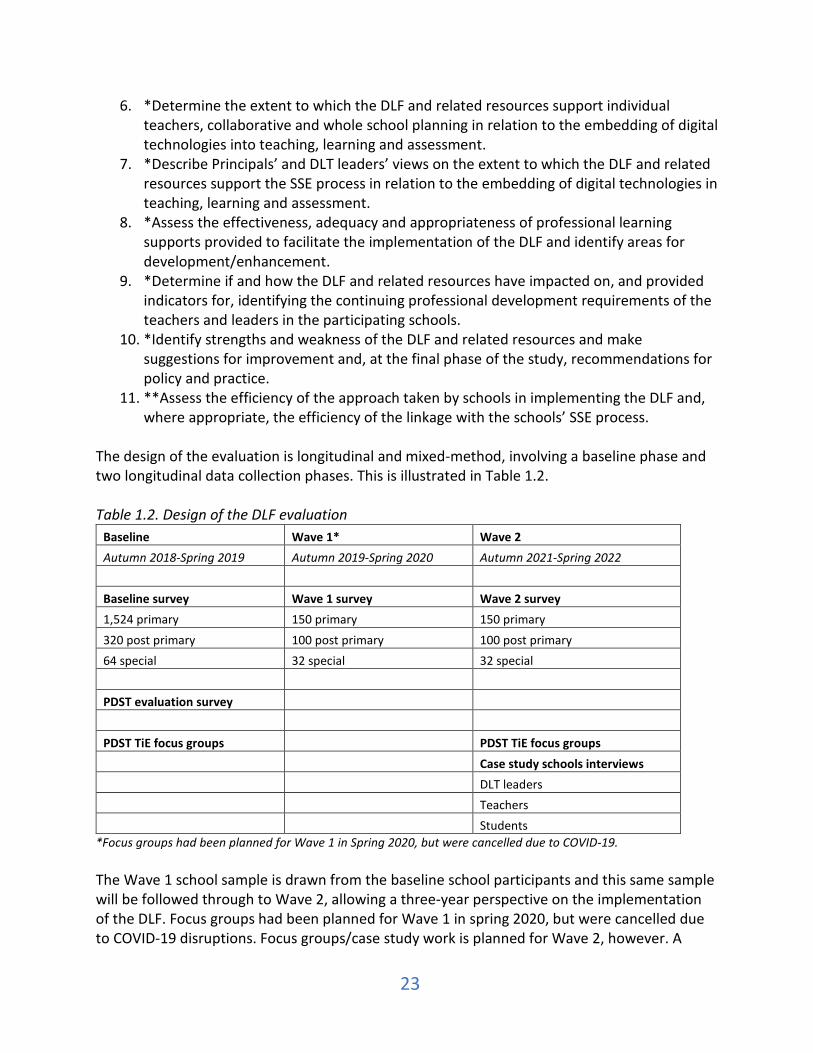
23
6. *Determine the extent to which the DLF and related resources support individual teachers, collaborative and whole school planning in relation to the embedding of digital technologies into teaching, learning and assessment.
7. *Describe Principals’ and DLT leaders’ views on the extent to which the DLF and related resources support the SSE process in relation to the embedding of digital technologies in teaching, learning and assessment.
8. *Assess the effectiveness, adequacy and appropriateness of professional learning supports provided to facilitate the implementation of the DLF and identify areas for development/enhancement.
9. *Determine if and how the DLF and related resources have impacted on, and provided indicators for, identifying the continuing professional development requirements of the teachers and leaders in the participating schools.
10. *Identify strengths and weakness of the DLF and related resources and make suggestions for improvement and, at the final phase of the study, recommendations for policy and practice.
11. **Assess the efficiency of the approach taken by schools in implementing the DLF and, where appropriate, the efficiency of the linkage with the schools’ SSE process.
The design of the evaluation is longitudinal and mixed-method, involving a baseline phase and two longitudinal data collection phases. This is illustrated in Table 1.2. Table 1.2. Design of the DLF evaluation
Baseline Wave 1* Wave 2 Autumn 2018-Spring 2019 Autumn 2019-Spring 2020 Autumn 2021-Spring 2022 Baseline survey Wave 1 survey Wave 2 survey 1,524 primary 150 primary 150 primary 320 post primary 100 post primary 100 post primary 64 special 32 special 32 special
PDST evaluation survey PDST TiE focus groups PDST TiE focus groups
Case study schools interviews
DLT leaders
Teachers
Students *Focus groups had been planned for Wave 1 in Spring 2020, but were cancelled due to COVID-19. The Wave 1 school sample is drawn from the baseline school participants and this same sample will be followed through to Wave 2, allowing a three-year perspective on the implementation of the DLF. Focus groups had been planned for Wave 1 in spring 2020, but were cancelled due to COVID-19 disruptions. Focus groups/case study work is planned for Wave 2, however. A

24
priority for Wave 2 is to gather information on the perspectives of young people. The completion of this Wave 1 report will be followed by a Wave 2 report and a final synthesis report of all phases of the study, to be completed in 2022. 1.3 Oversight of the DLF evaluation The evaluation of the DLF is overseen by an advisory committee group of representatives from the DES’ ICT Policy Unit, the Inspectorate, the PDST and the ERC. The advisory group provides guidance and advice on all key stages of the DLF evaluation, and in particular the content of the surveys and published reports. The DLF advisory group consists of:
• Chris Kelly, DE Teacher Education Policy (Digital) Unit • Anthony Kilcoyne, PDST Technology in Education • Séamus Knox, DE Inspectorate • Betty Regan, DE Teacher Education Policy (Digital) Unit • Tony Shine, DE Teacher Education Policy (Digital) Unit • Anne Sinclair, DE Teacher Education Policy (Digital) Unit • Tony Weir, DE Inspectorate • Jude Cosgrove, ERC • Emmet Feerick, ERC • Eva Moran, ERC.
In terms of implementation, the ERC’s role is to design and administer survey instruments, analyse and report on these surveys, and design and report on focus groups with the PDST Technology in Education team, school staff and pupils/students. The PDST Technology in Education’s role is to design and deliver a suite of professional development supports (for teachers) to enable schools to implement the DLF. 1.4 Design of the DLF evaluation 1.4.1 Wave 1 surveys Wave 1 questionnaires for Digital Learning Team (DLT) Leaders and teachers were developed by the ERC in both Irish and English, and reviewed and approved by the DLF advisory group (see Section 1.3). The survey was delivered online on SurveyHero™. The collection of individually identifiable data was avoided (that is, IP addresses and other individually identifying information were not collected). The purpose of the surveys with assurances of confidentiality and data security were communicated to respondents in cover letters and the introductory section of the surveys (in accordance with the GDPR). Question types were both closed (tick box) and open (text response). In this report, the closed or numeric questionnaire data are described in Chapters 2, 3 and 4, while the text data analyses are described in Chapter 5. PDF copies of the full surveys may be accessed at https://www.erc.ie/programme-of-work/dlf/.
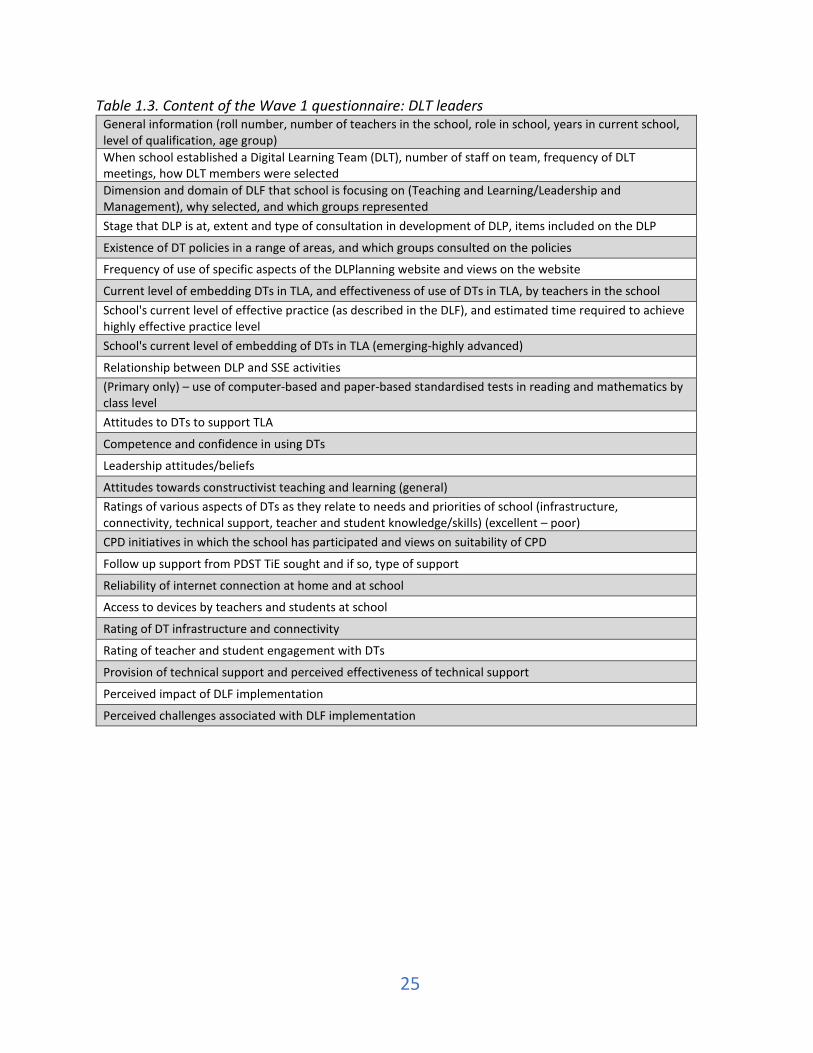
25
Table 1.3. Content of the Wave 1 questionnaire: DLT leaders General information (roll number, number of teachers in the school, role in school, years in current school, level of qualification, age group) When school established a Digital Learning Team (DLT), number of staff on team, frequency of DLT meetings, how DLT members were selected Dimension and domain of DLF that school is focusing on (Teaching and Learning/Leadership and Management), why selected, and which groups represented Stage that DLP is at, extent and type of consultation in development of DLP, items included on the DLP
Existence of DT policies in a range of areas, and which groups consulted on the policies
Frequency of use of specific aspects of the DLPlanning website and views on the website
Current level of embedding DTs in TLA, and effectiveness of use of DTs in TLA, by teachers in the school School's current level of effective practice (as described in the DLF), and estimated time required to achieve highly effective practice level School's current level of embedding of DTs in TLA (emerging-highly advanced)
Relationship between DLP and SSE activities (Primary only) – use of computer-based and paper-based standardised tests in reading and mathematics by class level Attitudes to DTs to support TLA
Competence and confidence in using DTs
Leadership attitudes/beliefs
Attitudes towards constructivist teaching and learning (general) Ratings of various aspects of DTs as they relate to needs and priorities of school (infrastructure, connectivity, technical support, teacher and student knowledge/skills) (excellent – poor) CPD initiatives in which the school has participated and views on suitability of CPD
Follow up support from PDST TiE sought and if so, type of support
Reliability of internet connection at home and at school
Access to devices by teachers and students at school
Rating of DT infrastructure and connectivity
Rating of teacher and student engagement with DTs
Provision of technical support and perceived effectiveness of technical support
Perceived impact of DLF implementation
Perceived challenges associated with DLF implementation
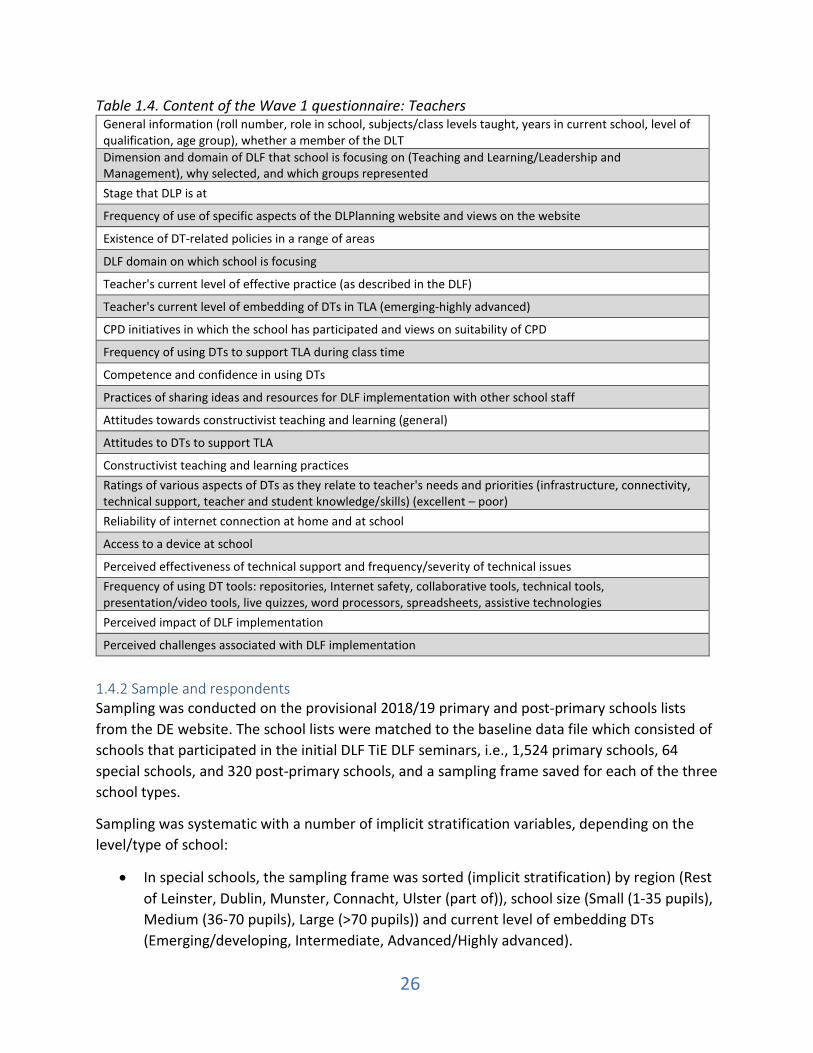
26
Table 1.4. Content of the Wave 1 questionnaire: Teachers General information (roll number, role in school, subjects/class levels taught, years in current school, level of qualification, age group), whether a member of the DLT Dimension and domain of DLF that school is focusing on (Teaching and Learning/Leadership and Management), why selected, and which groups represented Stage that DLP is at
Frequency of use of specific aspects of the DLPlanning website and views on the website
Existence of DT-related policies in a range of areas
DLF domain on which school is focusing
Teacher's current level of effective practice (as described in the DLF)
Teacher's current level of embedding of DTs in TLA (emerging-highly advanced)
CPD initiatives in which the school has participated and views on suitability of CPD
Frequency of using DTs to support TLA during class time
Competence and confidence in using DTs
Practices of sharing ideas and resources for DLF implementation with other school staff
Attitudes towards constructivist teaching and learning (general)
Attitudes to DTs to support TLA
Constructivist teaching and learning practices Ratings of various aspects of DTs as they relate to teacher's needs and priorities (infrastructure, connectivity, technical support, teacher and student knowledge/skills) (excellent – poor) Reliability of internet connection at home and at school
Access to a device at school
Perceived effectiveness of technical support and frequency/severity of technical issues Frequency of using DT tools: repositories, Internet safety, collaborative tools, technical tools, presentation/video tools, live quizzes, word processors, spreadsheets, assistive technologies Perceived impact of DLF implementation
Perceived challenges associated with DLF implementation
1.4.2 Sample and respondents Sampling was conducted on the provisional 2018/19 primary and post-primary schools lists from the DE website. The school lists were matched to the baseline data file which consisted of schools that participated in the initial DLF TiE DLF seminars, i.e., 1,524 primary schools, 64 special schools, and 320 post-primary schools, and a sampling frame saved for each of the three school types.
Sampling was systematic with a number of implicit stratification variables, depending on the level/type of school:
• In special schools, the sampling frame was sorted (implicit stratification) by region (Rest of Leinster, Dublin, Munster, Connacht, Ulster (part of)), school size (Small (1-35 pupils), Medium (36-70 pupils), Large (>70 pupils)) and current level of embedding DTs (Emerging/developing, Intermediate, Advanced/Highly advanced).

27
• In primary schools the implicit stratification variables were region (Rest of Leinster, Dublin, Munster, Connacht, Ulster (part of)), DEIS status (No, Yes), school size (Small (1-80 pupils), Medium (81-200 pupils), Large (>200 pupils)) and current level of embedding DTs.
• In post-primary schools the implicit stratification variables were region (Rest of Leinster, Dublin, Munster, Connacht, Ulster (part of)), school type (Community, Comprehensive, Secondary, Vocational), DEIS status (No, Yes), school size (Small (1-350 students), Medium (351-600 students), Large (>600 students)) and current level of embedding DTs.
The inclusion of current level of embedding of DTs at baseline as a sampling variable is important since it provides some assurance that the longitudinal sample includes the full range of levels of embedding DTs into teaching, learning and assessment. Probability proportional to size (PPS) sampling (e.g. Brewer & Hanif, 1983) was not used as the primary focus was at school level. However, as indicated above, school size was taken account of as one of the implicit stratification variables. In all, 32 special schools were selected, 150 primary schools, and 100 post-primary schools were selected as the longitudinal sample. Appendix 1, Tables A1.1-A1.17 provide comparisons between the population of schools, DLF baseline schools, and Wave 1 schools for each of the stratification variables. Generally, Tables A1.1-A1.17 the Wave 1 sample provides a good match to the population on these variables, i.e. that the samples are broadly representative by region, school size, level of embedding of DTs, and where applicable, DEIS status (primary and post-primary) and sector (post-primary). Due to low response rate during the last quarter of 2019, the survey window was extended, and the DE and ERC worked together to engage with schools to increase the response rates. This yielded satisfactory DLT response rates, but lower than desired response rates from teachers across all three school types. Post-primary respondents Of 100 schools in the longitudinal sample, 61 DLT surveys were received. Teacher surveys were received from 72 of the 100 schools (yielding a total of 502 responses). The pattern of school and teacher responses for post-primary schools is shown in Table 1.5. It shows that in 19% of schools, no DLT or teacher survey was returned, while in 52% of schools, the DLT survey as well as one or more teacher surveys were returned, and in the remaining 29% of schools, either DLT survey or one or more teacher surveys were returned.

28
Table 1.5. Pattern of returns – post primary (N = 100)
Teacher Q
Total No Yes
DLT Q No 19 20 39
Yes 9 52 61
Total 28 72 100 Following the removal of records with less than 10% of responses completed, the final post-primary dataset consisted of 60 DLT leader responses and 443 teacher responses (from 71 schools). The distributions of responding and non-responding schools do not differ significantly across enrolment size, sector/gender composition, DEIS status or level of embedding digital technologies at baseline stage (in all cases, chi-square tests were well in excess of p = .05) (Table 1.6) with the exception of DEIS status in which non-DEIS schools were significantly likely to have teacher questionnaires returned than DEIS schools (p = .026). The weights correct for differential response rates across enrolment size, DEIS status and DT embedding at baseline. Procedures used for the weights are described in Section 1.4.3 below. Table 1.6. Distribution of DLT and teacher questionnaire responses across key school-level characteristics: Post primary schools
Characteristic Category DLT questionnaire Teacher questionnaire
No Yes No Yes
Enrolment Small 28.2 29.5 25.0 30.6 Medium 41.0 21.3 39.3 25.0 Large 30.9 49.2 35.7 44.4
Gender and sector
Sec boys 12.8 13.1 3.6 16.7 Sec girls 20.5 18.0 14.3 20.8 Sec mixed 23.1 26.2 32.2 22.2 ETB / voc 28.2 26.2 28.6 26.4 Comm/comp 15.4 16.4 21.4 13.9
DEIS No 66.7 82.0 60.7 81.9 Yes 33.3 18.0 39.3 18.1
DT embedding (at baseline)
Low 48.6 41.0 50.0 40.3 Medium 43.2 49.2 35.7 52.8 High 8.1 9.8 14.3 6.9
Within-school teacher response rates ranged from 2% to 100%, with just 20% of schools having teacher response rates at or in excess of 25%. It is not possible to accurately assess the extent
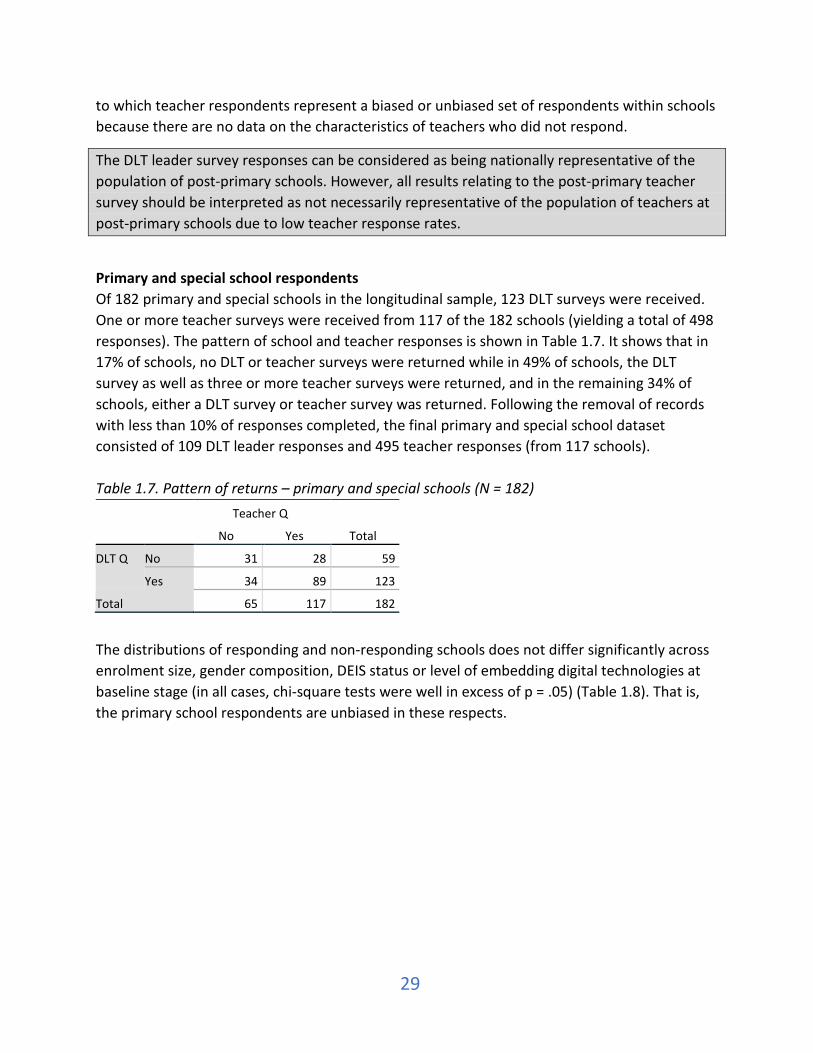
29
to which teacher respondents represent a biased or unbiased set of respondents within schools because there are no data on the characteristics of teachers who did not respond.
The DLT leader survey responses can be considered as being nationally representative of the population of post-primary schools. However, all results relating to the post-primary teacher survey should be interpreted as not necessarily representative of the population of teachers at post-primary schools due to low teacher response rates.
Primary and special school respondents Of 182 primary and special schools in the longitudinal sample, 123 DLT surveys were received. One or more teacher surveys were received from 117 of the 182 schools (yielding a total of 498 responses). The pattern of school and teacher responses is shown in Table 1.7. It shows that in 17% of schools, no DLT or teacher surveys were returned while in 49% of schools, the DLT survey as well as three or more teacher surveys were returned, and in the remaining 34% of schools, either a DLT survey or teacher survey was returned. Following the removal of records with less than 10% of responses completed, the final primary and special school dataset consisted of 109 DLT leader responses and 495 teacher responses (from 117 schools). Table 1.7. Pattern of returns – primary and special schools (N = 182)
Teacher Q
Total No Yes
DLT Q No 31 28 59
Yes 34 89 123
Total 65 117 182
The distributions of responding and non-responding schools does not differ significantly across enrolment size, gender composition, DEIS status or level of embedding digital technologies at baseline stage (in all cases, chi-square tests were well in excess of p = .05) (Table 1.8). That is, the primary school respondents are unbiased in these respects.
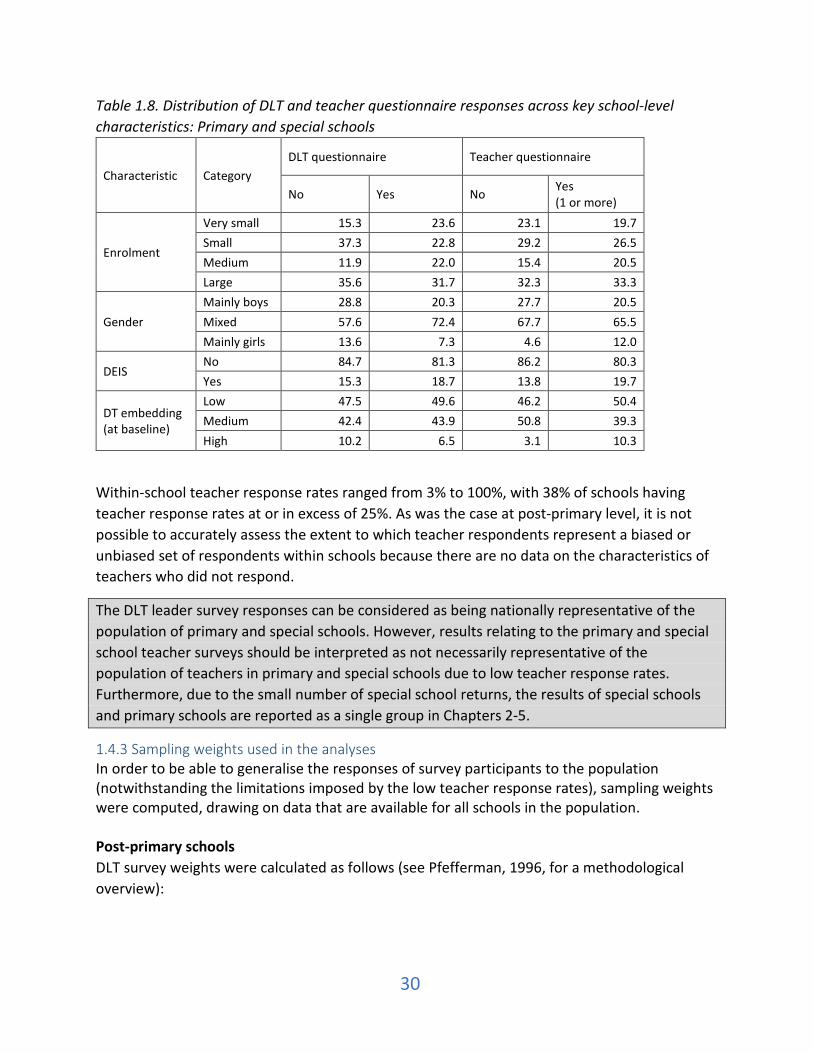
30
Table 1.8. Distribution of DLT and teacher questionnaire responses across key school-level characteristics: Primary and special schools
Characteristic Category DLT questionnaire Teacher questionnaire
No Yes No Yes (1 or more)
Enrolment
Very small 15.3 23.6 23.1 19.7 Small 37.3 22.8 29.2 26.5 Medium 11.9 22.0 15.4 20.5 Large 35.6 31.7 32.3 33.3
Gender Mainly boys 28.8 20.3 27.7 20.5 Mixed 57.6 72.4 67.7 65.5 Mainly girls 13.6 7.3 4.6 12.0
DEIS No 84.7 81.3 86.2 80.3 Yes 15.3 18.7 13.8 19.7
DT embedding (at baseline)
Low 47.5 49.6 46.2 50.4 Medium 42.4 43.9 50.8 39.3 High 10.2 6.5 3.1 10.3
Within-school teacher response rates ranged from 3% to 100%, with 38% of schools having teacher response rates at or in excess of 25%. As was the case at post-primary level, it is not possible to accurately assess the extent to which teacher respondents represent a biased or unbiased set of respondents within schools because there are no data on the characteristics of teachers who did not respond.
The DLT leader survey responses can be considered as being nationally representative of the population of primary and special schools. However, results relating to the primary and special school teacher surveys should be interpreted as not necessarily representative of the population of teachers in primary and special schools due to low teacher response rates. Furthermore, due to the small number of special school returns, the results of special schools and primary schools are reported as a single group in Chapters 2-5.
1.4.3 Sampling weights used in the analyses In order to be able to generalise the responses of survey participants to the population (notwithstanding the limitations imposed by the low teacher response rates), sampling weights were computed, drawing on data that are available for all schools in the population. Post-primary schools DLT survey weights were calculated as follows (see Pfefferman, 1996, for a methodological overview):

31
• School – non-response adjustments to match with characteristics of the sample on the basis of DEIS status, enrolment size (small, medium and large) and digital technology embedding at baseline (low, medium/high).
• Teacher – non-response adjustments as above, multiplied by a teacher adjustment factor which results in each school receiving an equal weight (set to 10) such that no school is over- or under-represented in analyses.
Primary and special schools DLT survey weights were calculated as follows:
• School – non-response adjustments to match with characteristics of the sample on the basis of DEIS status, enrolment size (very small, small, medium and large) and digital technology embedding at baseline (low, medium/high).
• Teacher – non-response adjustments as above, multiplied by a teacher adjustment factor which results in each school receiving an equal weight (set to 10) such that no school is over- or under-represented in analyses.
For analysis purposes the weights were standardised or normalised (divided by the mean of the weights) so that the N would not be artificially inflated, thereby increasing the risk of a Type I error (inferring that a difference is statistically significant when, in fact, the difference is not significant) (see Hahs-Vaughn, 2005). All analyses of the Wave 1 surveys with the exception of the text responses in Chapter 5 have been weighted using these weights. The DLT leader survey responses are generalisable to the entire populations of primary, post-primary and special schools, at least on the basis of the characteristics used in the computation of the sampling weights. However as noted above, it is not possible to quantify the nature or extent of non-response bias in the teacher survey datasets, so teacher responses are not generalisable to the population of teachers. 1.5 Recent national and international research findings This section presents a selective summary of recent national and international research findings. Readers are also referred to Chapter 1 (Sections 1.1.3 and 1.1.5) of the baseline report (Cosgrove et al., 2019), which considers key findings of the DLF field trial phase and international study findings. In that report, it was noted that data from international comparative assessments consistently show that, relative to other countries, Ireland has low DT usage in schools, while broad measures of school DT infrastructure tend to be slightly better in Ireland than international averages. However, Cosgrove et al. (2019) also noted that the international comparative studies tend to rely on broad indicators (e.g. rates of connectivity, numbers of devices) rather than providing measures of the quality of DT usage to support teaching, learning and assessment. Indeed, the relationship between DT and learning outcomes is not straightforward (e.g. Archer et al., 2014; Chaia et al., 2017; OECD, 2015).
32
In May 2021, the OECD (2021) published analyses of PISA 2018 ICT-related data24, which essentially confirms that relative to other countries, Ireland has low DT rates of usage in post-primary schools. For example, students in Ireland reported an average of four hours per week on the internet at school, which is half of the OECD average of 8 hours. However, the Irish average of four hours represents an increase of two hours since 2012 and three hours since 2015. Students were also asked whether, during their entire school experience, they were taught various digital skills. Students in Ireland were less likely than on average across the OECD to be taught how to use keywords when using a search engine (IRL: 44%; OECD: 56%), how to decide whether to trust information from the internet (IRL: 58%; OECD: 69%), how to compare different web pages and decide what information in more relevant for school work (IRL: 46%; OECD: 63%), how to use the short description below the links in the list of search results (IRL: 35%; OECD: 49%), and how to detect phishing or spam (IRL: 28%; OECD: 41%). On the other hand, students in Ireland were more likely to be taught to understand the consequences of making information publicly available on social media (IRL: 83%; OECD: 76%) and how to detect whether information is subjective or biased (IRL: 59%; OECD: 55%). 1.5.1. DLF longitudinal evaluation baseline study findings During the DLF evaluation baseline stage, survey data were gathered from school staff attending the PDST Technology in Education (TiE) DLF seminars between October 2018 and April 2019. In all, 1,524 baseline survey responses were received from primary schools, 320 from post-primary schools, and 64 from special schools. Data were weighted to provide nationally representative estimates for primary, post-primary and special schools. The findings of the baseline survey are reported in detail in Cosgrove et al. (2019), along with the results of focus groups with the PDST TiE team, and PDST DLF seminar evaluation surveys. Key findings may be summarised as follows:
• Participants’ experience of the PDST Technology in Education seminars was extremely positive, with large majorities of attendees from primary, post-primary and special schools expressing positive views about seminar content, the practical approach taken, time given to planning, and the opportunity to network or collaborate with staff from other schools. Participants’ self-rated levels of knowledge about the DLF, digital learning, constructivism, the six-step planning process, and monitoring and evaluating implementation, were all markedly higher after having attended the seminar in a large majority of respondents than they had been before attendance, and in particular, among respondents who had lower initial levels of familiarity. However, slightly higher levels of confidence in implementing the DLF were reported by respondents in post-primary than in primary and special schools.
• Some seminar participants and the PDST TiE noted communication difficulties concerning the organisation of the seminars and suggested that centralised communication from the Department of Education on CPD activities such as the DLF CPD would be helpful (where funding is contingent on schools having a Digital Learning
24 With thanks to Rachel Perkins, ERC, for summarising the main findings of this report.
33
Plan in place), supported by a central CPD booking system (possibly within the PDST itself).
• The baseline survey data showed that post-primary schools were, on average, a little further along than primary or special schools in their initial planning. Schools overwhelmingly chose to focus on the Teaching and Learning dimension of the DLF, rather than the Leadership and Management dimension. This was because the former is the current focus of SSE (2016-2020). PDST advisors noted, however, that schools did not always integrate their DLP and SSE processes for a variety of reasons, even though both follow the same structure. Many schools already had oral language as their SSE focus; some schools were not clear about how steps 1 and 2 of the 6-step planning process related to SSE; and DEIS schools may have encountered challenges in incorporating the DLP into their SSE due to the additional DEIS planning process. The publication in December 2018 of guidance on how the DLF and SSE could be linked may have arrived too late since this was received a few months into the SSE planning phase.
• Top priorities identified by schools in implementing the DLF, such as developing a whole-school approach; developing teachers’ skills in using specific apps or software; using digital technologies to improve learning outcomes; and making improvements to the sharing of documents or resources, confirm that schools' priorities were in line with key objectives of the DLF.
• Implementation strategies differed across primary, special and post-primary schools. Primary and special schools were most likely to implement the DLF using dedicated time allocated to DLF during Croke Park hours, dedicated time allocated to DLF during staff meetings, and professional development delivered by an external provider to school staff. Post-primary schools, in contrast, were most likely to use professional development delivered by some school staff (e.g. Digital Learning Team members), mentoring (e.g. digital champions in the school provide support to other school staff), and dedicated time allocated to DLF during staff meetings.
• At both primary and post-primary levels there was a lot of variation across schools in perceived levels of adequacy of infrastructure, connectivity, and technical support. Perceived adequacy of infrastructure and connectivity, and technical support were significantly and substantially higher in post-primary than primary and special schools. At primary level, smaller schools and rural DEIS schools had the lowest ratings on infrastructure and connectivity. At post-primary level, ETB schools had higher ratings on infrastructure and connectivity than community/comprehensive and secondary schools. Observations made by the PDST TiE team confirmed that these infrastructural, connectivity and technical support issues hampered DLF implementation in some schools, and the TiE team underlined the need for structured, regional technical support for schools.
• At primary level, variations in DLF implementation activities was associated with school enrolment size. For example, team teaching or mentoring were more commonly mentioned as implementation strategies in larger than in smaller primary schools. At post-primary, implementation plans did not vary quite so much; nonetheless some differences by DEIS status and sector were identified. For example, respondents in DEIS
34
schools reported that they were less likely to integrate their Digital Learning Plans with the school’s overall Planning Processes than non-DEIS schools.
• PDST advisors also flagged the need for sufficient continued support to schools after the DLF seminar. This support needed, in the advisors’ view, to be both technical and pedagogical, and they felt that these two essential roles should be separate.
Five sets of implications were identified in the baseline report:
1. Opportunities for collaboration and shared learning: DLF seminar attendees placed a high value placed on the opportunities to network and collaborate. The baseline report suggested that it would be worth further exploring and developing ways for staff to collaborate and network with one another to share their experiences and learning as they implement the DLF, both in online and face-to-face settings. It was noted that the PDST TiE had planned to support the DLF in its second year through online (blended) communities of practice.
2. Technical support: In the baseline report, as well as during the trial phase of the DLF evaluation, lack of technical support was identified by school staff and PDST advisers as a significant obstacle to DLF implementation in many schools. The baseline report suggested that the work of the Department of Education's Technical Support Working Group should be supported and prioritised. It was noted that many schools in the baseline study expressed a willingness to work with other neighbouring schools to establish technical support solutions, and suggested exploring the clustered provision of technical support further.
3. Connectivity: To support the implementation of the DLF in primary schools that do not have adequate or reliable Internet connectivity, it was suggested that tailored, offline tools and resources are needed. As the DLF evaluation continues, the baseline report noted that it would be of interest to monitor the rollout of the National Broadband Plan.
4. Communicating about and organising CPD: In the baseline report, some difficulties in DLF seminar bookings and communications occurred, and it was suggested to review and enhance the booking and communications processes between education centres and schools for CPD and other events. It was further suggested that there is a need to identify and implement ways to increase system-level awareness of high-priority CPD initiatives and where applicable, any linkages with funding, for example through a Department of Education Circular.
5. Understandings of ‘embedding’: The baseline report noted that while the DLF includes a definition of embedding digital technologies into teaching, learning and assessment, the understanding of this concept appears to vary across primary, post-primary and special schools, as well as across individual members of school staff. It was noted that these differences could, in turn, give rise to variations in how schools view levels of effective and highly effective practice. It was suggested that the Wave 1 surveys should ask school staff about their understanding of embedding to gain a better understanding of this issue.

35
1.5.2. Inspectorate report on digital learning findings In June of 2020 the Department of Education (DE) published a report entitled Digital Learning 2020: Reporting on practice in Early Learning and Care, Primary and Post-Primary Contexts. This report presented findings of an evaluation carried out by the Inspectorate of digital learning in early learning and care (ELC) settings, primary schools and post-primary schools, between January and December 2019. Inspectors developed a number of specific digital learning evaluation criteria which they incorporated into their inspection instruments. They used two main methods in the course of inspections to gather information related to these criteria:
• Observation of teaching and learning in lessons. In all, 445 observations were carried out: 39 in ELC settings, 212 in Primary settings, and 194 in Post-primary settings.
• Discussions with ELC practitioners and school leaders. Inspectors asked whether DTs were part of CPD, whether the school had a digital learning plan (DLP), and whether this contained clear actions to improve digital learning, among other questions. Inspectors also reviewed schools’ Digital Learning Plans (DLPs) to see how the Digital Learning Framework was being used to plan digital teaching, learning.
Inspectors then assigned quality ratings using the Inspectorate’s quality continuum for primary and post-primary schools (a five category rating – very good, good, satisfactory, fair, and weak). These ratings were then aggregated into two ratings: Satisfactory or better, and Less than satisfactory. How effectively are digital technologies (DTs) integrated into teaching, learning and assessment (TLA) in primary and post-primary schools? Inspectors found that digital learning was part of the lesson in 55% of lessons observed in primary schools and 62% in post-primary schools. In lessons where DTs were not involved in learning, inspectors considered that in 34% of primary lessons, learning would have been better had DTs been used, compared with 25% of post-primary lessons. When judging whether lessons creatively engaged learners, inspectors gave the rating Satisfactory or better to the vast majority of primary and post-primary lessons (86% and 81% respectively) where DTs were used. Some inspectors noted however that in some lessons, DTs were only used by teachers and not by learners. Inspectors also examined whether lessons were satisfactory or better in the active and collaborative use of DTs during lessons at primary and post-primary level. Both primary and post-primary lessons fared better in the active use of DTs than in the collaborative use, with approximately two-thirds of lessons achieving the Satisfactory or better rating. However, collaborative use of DTs was significantly lower in primary lessons, where just 41% of lessons received this rating (Figure 1.1).

36
Figure 1.1. Inspectors’ ratings of percentage of lessons achieving “Satisfactory or better” rating regarding active and collaborative use of DTs in primary and post-primary schools.
Source: Department of Education (2020).
The Digital Strategy for Schools emphasises the importance of providing opportunities for learners to use digital technologies to create new knowledge, content and artefacts25. The use of DTs in this way is a higher-order skill, and facilitates deeper learning. On this topic, Inspectors observed that the creation of new knowledge and digital artefacts were not well-established practices in lessons at either primary or post-primary level. Just about half of lessons received a rating of Satisfactory or better in this regard (44% at primary and 52% at post-primary level). Discussions with teachers and school leaders revealed that they are finding this to be a challenging aspect of digital teaching and learning to implement.
In a similar vein, collaboration between learners using DTs was also found to be lacking in schools, especially at primary level. The inspectorate found that 68% of post-primary lessons involved DT-related collaboration between learners at a satisfactory or better level, compared to just 41% at primary level. While the DLF evaluation data alone leaves open the possibility that these differences between primary and post-primary are intrinsic to the teaching and learning needs of the different levels, when triangulated with the Inspectorate satisfaction ratings at primary and post-primary levels, the implication is that DT-related collaboration is lower than desired and particularly at primary level. Regarding the use of DTs as part of assessment, inspectors found that this practice was more widespread at post-primary than primary level. They rated the use of DTs to support assessment as Satisfactory or better in just under 80% of post-primary schools, compared to just under 60% of primary schools. Additionally, inspectors found many examples of practitioners in ELC settings using DTs to support the assessment process.
25 Digital Strategy for Schools, p. 20
62
72
41
68
0
10
20
30
40
50
60
70
80
Active use of DTs inprimary lessons
Active use of DTs in post-primary lessons
Collaborative use of DTsin primary lessons
Collaborative use of DTsin post-primary lessons

37
How well are schools and early learning and care settings planning the use of digital technologies? In the schools surveyed by inspectors, 73% of primary schools and 81% of post-primary schools had developed a digital learning plan (DLP) at the time of the evaluation. Of those who had developed a DLP, the quality of the plan was rated by inspectors as Satisfactory or better in most (83%-100%) cases. Many primary and post-primary schools reported finding the six-step SSE process very useful for improving digital learning in a manageable and incremental way. Some schools were making meaningful links between digital learning and the priority areas that they had identified for school improvement using the SSE process. Additional key themes
• Regarding ELC settings, managers and practitioners reported that they were unsure as to how to approach digital learning in an age-appropriate way.
• Inspectors found that many primary and post-primary teachers were not aware of the DLF documents or of the good practice videos available through the PDST at DLPLanning.ie.
• Schools which reported experience success in their efforts to implement the DLF reported that the CPD and training they participated in was focused on their particular needs. Other schools were often unaware of supports such as Scoilnet, and were unsure of how to access external CPD.
• School Principals, teachers, and ELC practitioners alike reported that infrastructure and access to reliable high-speed internet was an important factor in the embedding of DTs. Many primary schools reported not having access to good quality broadband.
o Where practice was well-developed, it was reported to inspectors that high speed and dependable broadband was a key supporting factor.
o Where connectivity problems existed, leaders, teachers, and practitioners reported that they were reluctant to use DTs as they often proved frustrating for learners, and diminished teachers’ and practitioners’ confidence with DTs.
1.5.3. Other national and international findings The first national and international reports on TIMSS 2019 were published in December 2020 (Perkins & Clerkin, 2020). TIMSS (Trends in International Mathematics and Science Study) is an international assessment of students in Grades 4 and 8 (Fourth Class and Second Year). Detailed national analysis of use of DTs are planned for later in 2021, but the international report on TIMSS 2019 provides some initial findings. For example, In Ireland, 66% of Fourth Class pupils and 62% of Second Year students were in classes in which computers were never or almost never used to support mathematics learning activities26. The ERC will report on the theme of digital technologies which draws on the PISA 2018 and TIMSS 2019 results later in 2021. 26 https://timssandpirls.bc.edu/timss2019/international-results/classroom-contexts/#classroom-technology-in

38
The National Assessment of Mathematics and English Reading (NAMER) is an assessment of reading and mathematics of second and sixth class pupils, and provides information on DT usage by teachers and pupils. NAMER had been due to be implemented in Spring 2020, but has been postponed to May 2021. Also, The Progress in International Reading Literacy Study (PIRLS), an assessment of fourth class pupils, will provide some comparative data on technology use. Results from both of these studies can be expected towards the end of 2022. 1.6 Guidelines for interpreting the DLF Wave 1 results 1.6.1 Caveats Some features of the study impose limitations and caveats for interpretation. First, as noted in Section 1.4, the teacher response rates do not permit teacher results to be generalised to the population of teachers. It may be the case that 'digitally engaged' teachers were more likely to respond to the survey, but we have no means to assess this empirically. Second, this report uses both numeric and qualitative information. The qualitative data has been subject to thematic analysis to provide a concise description of key themes emerging (Chapter 5). It is possible that another research team might identify and prioritise somewhat different sets of themes. That is, we recognise that it is not possible to have a fully impartial analysis of qualitative data of this nature. Third, many of the analyses include comparisons across primary, post-primary and special schools. These are intended to be interpreted in a broad way. The sectors have important structural differences (e.g. regarding curriculum, assessment, timetabling, and management) and these should be borne in mind when interpreting these comparisons. Fourth, due to school closures and disruptions during Wave 1, we were unable to conduct case study interviews and the report does not include students’ perspectives. During Wave 2, however, case study interviews with students planned. 1.6.2 Construction of questionnaire indices In Chapters 2, 3 and 4, various questionnaire indices or scales are reported. These are summary scores based on sets of thematically linked questionnaire items. To validate and construct these scales, we followed three steps:
1. An exploratory factor analysis was undertaken to confirm the factor structure (number of empirically distinguishable constructs) for each item set.
2. Scale reliability (internal consistency) was checked by computing Cronbach's alpha. This provides an indication as to the extent to which the individual scale items cluster together in a reliable manner and is calculated using the following formula:
39
Where N = the number of items, c ̄= average covariance between item-pairs, and v ̄= average variance.
Generally, Cronbach's alpha at or above 0.8 is considered very good to excellent, 0.7-0.8 is acceptable to good, 0.6-0.7 is fair and below 0.6 is poor to unacceptable (Tavakol & Dennick, 2011). The Appendices to Chapters 2 and 3 show the scale reliabilities for all DLT and teacher scales described in this report.
3. An index score for each respondent was computed by recoding the raw item response (R) to (R-1), summing the recoded response values, dividing by the number of response categories minus 1 and multiplying this value by 100. This approach was used to create index scores which range from 0-100, thereby allowing direct comparisons across scales regardless of the number of response options associated with the items making up a particular index. Descriptions of these scales are provided at the beginning of Chapters 2 and 3, and the Appendices to these chapters provide the index descriptives for each scale by school type/level, along with comparisons of mean index scores across important sub-groups such as enrolment size and DEIS status. Generally, higher index scores are indicative of a more positive outcome. There are, however, a small number of 'negative' scales for which a higher score indicates a more negative or less favourable outcome. In these instances, those scales are clearly noted in the relevant parts of Chapters 2, 3 and 4.
1.7 Content of this report Chapters 2 and 3 describe the quantitative findings from the DLT leader and teacher surveys, respectively, and include some comparisons across school type (primary/special and post-primary) as well as within type (e.g. DEIS status, enrolment size). Chapter 4 considers the results longitudinally, matching the Wave 1 DLT leader questionnaire data with the baseline data and describing change in two indicators of DLF implementation and two indicators of enablers of implementation. Chapter 4 also presents the results of three sets of multiple regression models which have Wave 1 DLF implementation outcomes as the independent variable (i.e. level of DT engagement by teachers and students; level of DLF impact; and level of effective practice at Wave 1) and baseline inputs and Wave 1 covariates as explanatory variables. Chapter 5 provides a thematic analysis of the DLT and teacher survey text responses. Finally, Chapter 6 establishes some conclusions in terms of successes and challenges, and considers implications with respect to: recent/current research; in light of other national policies and initiatives; for monitoring progress in DLF implementation; in light of COVID-19; and in terms of evaluation design for Wave 2.
40
Chapter 2: Key findings from the DLF Wave 1 Digital Learning Team Leader (or Principal) questionnaire 2.1 Chapter overview This chapter describes the findings from the DLF Wave 1 questionnaire for DLT leaders at primary and post-primary level. We use the term ‘DLT leaders’ to refer to DLT leaders (or Principals) throughout this chapter. Notwithstanding the significant structural, curricular, assessment etc. differences between post-primary and primary schools, the chapter draws comparisons between the two levels where appropriate, particularly where common patterns of results emerge. It should be noted that special schools are combined with primary schools for reporting purposes. Results are weighted (see Chapter 1) in order to be generalisable to the populations of primary, special and post-primary schools in the country27. Findings are presented in four sections, with supplementary tables and figures in Appendix 2:
• Description of respondents and schools • Overview of the DLF in primary and post-primary schools • Key findings from the DLT Leader questionnaire - primary and post-primary schools • Chapter summary and conclusions.
The results are all based on the survey questions, and some of these questions have been combined to form scales. See Chapter 1, Section 1.4.1, for a full description of the survey content, and Chapter 1, Section 1.6.2, for a description of how these scales were constructed. Appendix 2 provides information on the reliabilities of these scales, as well as the relationships between the scores on these scales (the intercorrelations) (see Appendix 2, Tables A2.1a, A2.1b, A2.2a and A2.2b). For all scales, higher scores indicate a more positive outcome. All of the scales range from 0-100 so that they can be directly compared to one another. Table 2.1 provides a short description of the scales that are reported in this chapter. When we describe the results of these scales, we illustrate what each scale measures by showing the individual item responses. We also compare scale means across primary and post-primary levels and, within level, we describe whether or not the scale means vary significantly by key school characteristics, such as DEIS status and enrolment size. A large majority of scales are common across primary and post-primary levels, though some are unique to one or other level, due to the different measurement properties across levels as shown in the last column in Table 2.1.
27 The sample is generalisable to the general population of schools on the basis of the characteristics that are in the weights - enrolment size, DEIS status, sector, and gender composition. However, the sample may not be representative on other relevant characteristics such as overall quality of digital technology infrastructure.

41
Table 2.1 Description of the questionnaire scales reported in Chapter 2
Scale Name Description
Primary/ Post-
primary/ Both
(High) DLT attitudes to DTs for student learning
Attitudes towards using DTs: preference to support constructivist learning over traditional methods
Both
(Low) DLT attitudes to DTs-impediments to learning
Attitudes towards using DTs: view of DTs as impediments to teaching and learning
Both
(High) DLT ease with digital devices
Level of familiarity with and confidence in using digital technologies Both
(High) DLT leadership style – idealised influence
School leadership: extent to which leadership style inspires trust and pride
Both
(High) DLT leadership style –intellectual stimulation
School leadership: extent to which leadership style enables intellectual stimulation (creativity and problem solving)
Both
(High) DLT leadership style –individual consideration
School leadership: extent to which respondents know each of their staff individually, and listen to any concerns or needs that their team members have, working to develop, empower and inspire them to achieve more
Post-primary
(Low) DLT leadership style –laissez faire
School leadership: extent to which respondents avoid providing visions or directions to other staff, delegating tasks and avoiding decision-making
Post-primary
(High) DLT constructivist beliefs
Positive attitude to constructivist approaches to teaching and learning in general
Both
(High) DLT professional learning suitability
Extent to which digital technology-related CPD has included a focus on a range of relevant elements (curriculum materials, content knowledge, teaching and learning practices, participation with other teachers in the school)
Both
(High) DT infrastructure and connectivity
Perceived adequacy of school's DT infrastructure and connectivity to meet teaching, learning and assessment needs
Both
(High) DT teacher and student engagement
Perceived overall level of teachers' and students' levels of knowledge, skills and engagement with DTs for teaching and learning.
Both
(High) DLT technical support effectiveness
Perceived extent to which technical support is effective in keeping computing and other devices in good repair and up to date, and for maintaining connectivity
Both
(High) DLT impact of DLF
Perceived overall level of impact of the school's implementation of the DLF on teaching, learning and assessment activities, student engagement, collaborative practices, and policy and decision making relating to school's DT
Both
(Low) DLT implementation challenges
Ongoing challenges related to DLF embedding, including the Overall timeline for implementation of the DLP, DT infrastructure, DLT Leaders' own perception of the value of using DTs, and Leadership from school management
Both
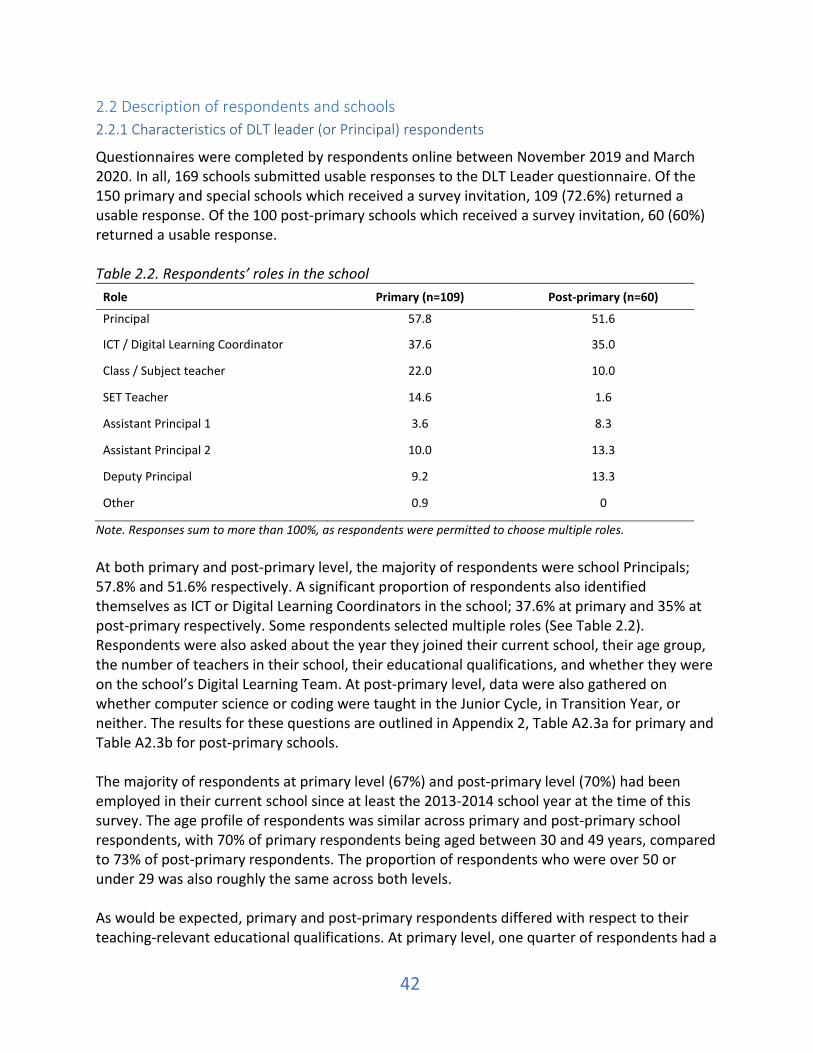
42
2.2 Description of respondents and schools 2.2.1 Characteristics of DLT leader (or Principal) respondents
Questionnaires were completed by respondents online between November 2019 and March 2020. In all, 169 schools submitted usable responses to the DLT Leader questionnaire. Of the 150 primary and special schools which received a survey invitation, 109 (72.6%) returned a usable response. Of the 100 post-primary schools which received a survey invitation, 60 (60%) returned a usable response. Table 2.2. Respondents’ roles in the school
Role Primary (n=109) Post-primary (n=60)
Principal 57.8 51.6
ICT / Digital Learning Coordinator 37.6 35.0
Class / Subject teacher 22.0 10.0
SET Teacher 14.6 1.6
Assistant Principal 1 3.6 8.3
Assistant Principal 2 10.0 13.3
Deputy Principal 9.2 13.3
Other 0.9 0
Note. Responses sum to more than 100%, as respondents were permitted to choose multiple roles. At both primary and post-primary level, the majority of respondents were school Principals; 57.8% and 51.6% respectively. A significant proportion of respondents also identified themselves as ICT or Digital Learning Coordinators in the school; 37.6% at primary and 35% at post-primary respectively. Some respondents selected multiple roles (See Table 2.2). Respondents were also asked about the year they joined their current school, their age group, the number of teachers in their school, their educational qualifications, and whether they were on the school’s Digital Learning Team. At post-primary level, data were also gathered on whether computer science or coding were taught in the Junior Cycle, in Transition Year, or neither. The results for these questions are outlined in Appendix 2, Table A2.3a for primary and Table A2.3b for post-primary schools. The majority of respondents at primary level (67%) and post-primary level (70%) had been employed in their current school since at least the 2013-2014 school year at the time of this survey. The age profile of respondents was similar across primary and post-primary school respondents, with 70% of primary respondents being aged between 30 and 49 years, compared to 73% of post-primary respondents. The proportion of respondents who were over 50 or under 29 was also roughly the same across both levels. As would be expected, primary and post-primary respondents differed with respect to their teaching-relevant educational qualifications. At primary level, one quarter of respondents had a
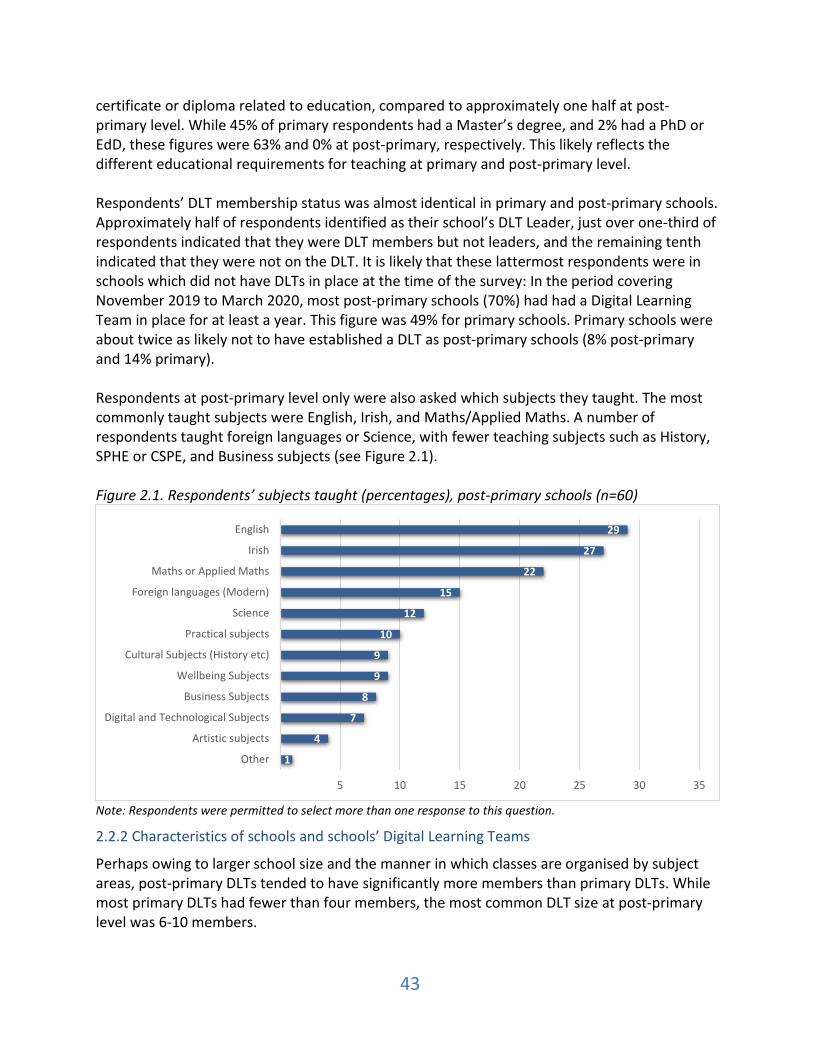
43
certificate or diploma related to education, compared to approximately one half at post-primary level. While 45% of primary respondents had a Master’s degree, and 2% had a PhD or EdD, these figures were 63% and 0% at post-primary, respectively. This likely reflects the different educational requirements for teaching at primary and post-primary level. Respondents’ DLT membership status was almost identical in primary and post-primary schools. Approximately half of respondents identified as their school’s DLT Leader, just over one-third of respondents indicated that they were DLT members but not leaders, and the remaining tenth indicated that they were not on the DLT. It is likely that these lattermost respondents were in schools which did not have DLTs in place at the time of the survey: In the period covering November 2019 to March 2020, most post-primary schools (70%) had had a Digital Learning Team in place for at least a year. This figure was 49% for primary schools. Primary schools were about twice as likely not to have established a DLT as post-primary schools (8% post-primary and 14% primary). Respondents at post-primary level only were also asked which subjects they taught. The most commonly taught subjects were English, Irish, and Maths/Applied Maths. A number of respondents taught foreign languages or Science, with fewer teaching subjects such as History, SPHE or CSPE, and Business subjects (see Figure 2.1). Figure 2.1. Respondents’ subjects taught (percentages), post-primary schools (n=60)
Note: Respondents were permitted to select more than one response to this question.
2.2.2 Characteristics of schools and schools’ Digital Learning Teams
Perhaps owing to larger school size and the manner in which classes are organised by subject areas, post-primary DLTs tended to have significantly more members than primary DLTs. While most primary DLTs had fewer than four members, the most common DLT size at post-primary level was 6-10 members.
1
4
7
8
9
9
10
12
15
22
27
29
5 10 15 20 25 30 35
Other
Artistic subjects
Digital and Technological Subjects
Business Subjects
Wellbeing Subjects
Cultural Subjects (History etc)
Practical subjects
Science
Foreign languages (Modern)
Maths or Applied Maths
Irish
English

44
In both primary and post-primary schools, the most common group to be included in the DLT were teachers, with 92% of primary schools and 100% of post-primary schools having teachers on the DLT. Approximately one-third of primary schools had representatives from the school management board on the DLT, compared with about one-half of post-primary schools. Just a small minority of DLTs included parents (5% at primary; 3% at post-primary) or students (9% at primary; 7% at post-primary) (see Figure 2.2). Figure 2.2. Members of school’s Digital Learning Team
The most common way by which DLT membership was decided was through volunteering by interested staff (65% at primary, 80% at post-primary level). In approximately one-fifth of schools at both primary and post-primary levels, staff were selected across year levels or departments, while some schools used other (unspecified) methods of selection. The majority of schools’ DLTs met less often than once per month (62% of primary schools and 65% of post-primary schools). A minority of schools’ DLTs met at least fortnightly, 12% at post-primary and 4% at primary level. 2.3 Overview of the DLF in primary and post-primary schools 2.3.1 DLF Dimension and Domain of focus
It will be recalled from Chapter 1 that the Digital Learning Framework follows the same structure as the Looking at Our Schools 2016 Quality Framework used in school self-evaluation underpinned by a six-stage planning process. The DLF framework, as with the Quality (SSE) framework, specifies two overarching dimensions, and within each dimension, there are four ‘domains’, each associated with statements of effective and highly effective practice (see Chapter 1, Section 1.1.2). DLT leaders were asked to specify which dimension and domain had been chosen as their focus. At both primary and post-primary level, schools overwhelmingly chose the Teaching and Learning dimension of the DLF as their focus (90% at primary and 89% at post-primary level).
8
92
32
5
9
7
100
51
3
7
10 20 30 40 50 60 70 80 90 100
Other
Teaching staff
School management board
Parents
Students
Post Primary (n=51) Primary (n=98)
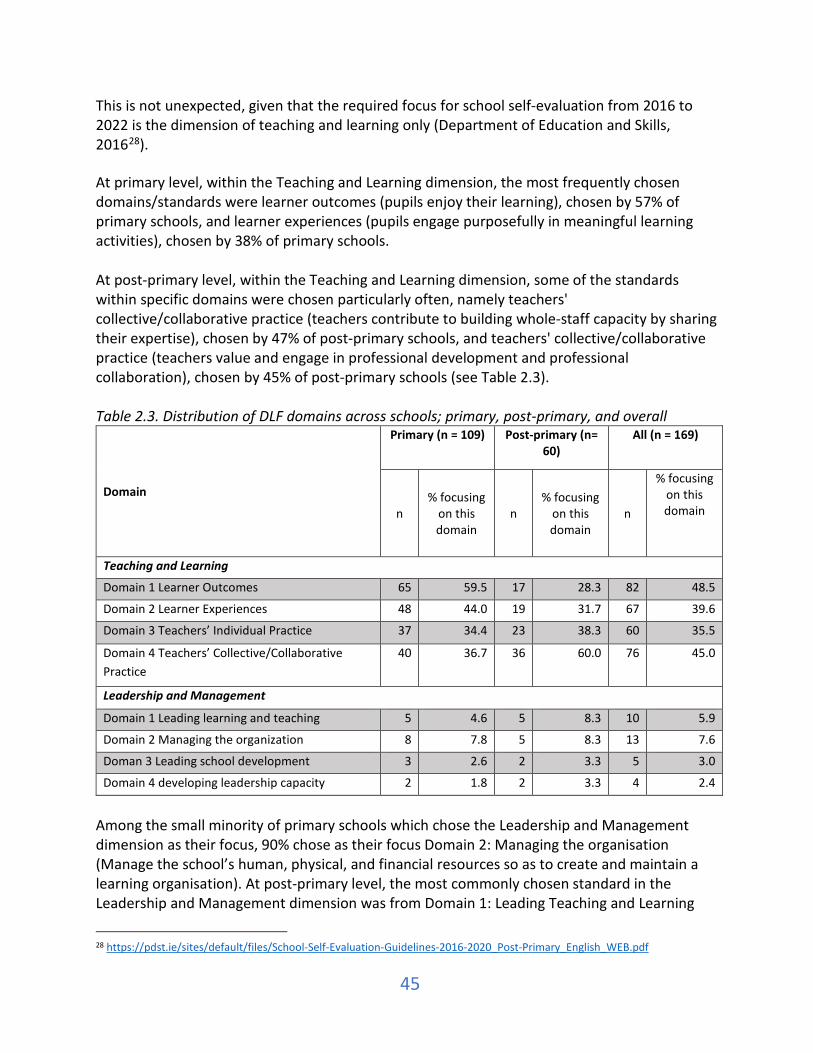
45
This is not unexpected, given that the required focus for school self-evaluation from 2016 to 2022 is the dimension of teaching and learning only (Department of Education and Skills, 201628). At primary level, within the Teaching and Learning dimension, the most frequently chosen domains/standards were learner outcomes (pupils enjoy their learning), chosen by 57% of primary schools, and learner experiences (pupils engage purposefully in meaningful learning activities), chosen by 38% of primary schools. At post-primary level, within the Teaching and Learning dimension, some of the standards within specific domains were chosen particularly often, namely teachers' collective/collaborative practice (teachers contribute to building whole-staff capacity by sharing their expertise), chosen by 47% of post-primary schools, and teachers' collective/collaborative practice (teachers value and engage in professional development and professional collaboration), chosen by 45% of post-primary schools (see Table 2.3). Table 2.3. Distribution of DLF domains across schools; primary, post-primary, and overall
Domain
Primary (n = 109) Post-primary (n= 60)
All (n = 169)
n % focusing
on this domain
n % focusing
on this domain
n
% focusing on this domain
Teaching and Learning
Domain 1 Learner Outcomes 65 59.5 17 28.3 82 48.5
Domain 2 Learner Experiences 48 44.0 19 31.7 67 39.6
Domain 3 Teachers’ Individual Practice 37 34.4 23 38.3 60 35.5
Domain 4 Teachers’ Collective/Collaborative Practice
40 36.7 36 60.0 76 45.0
Leadership and Management
Domain 1 Leading learning and teaching 5 4.6 5 8.3 10 5.9
Domain 2 Managing the organization 8 7.8 5 8.3 13 7.6
Doman 3 Leading school development 3 2.6 2 3.3 5 3.0
Domain 4 developing leadership capacity 2 1.8 2 3.3 4 2.4
Among the small minority of primary schools which chose the Leadership and Management dimension as their focus, 90% chose as their focus Domain 2: Managing the organisation (Manage the school’s human, physical, and financial resources so as to create and maintain a learning organisation). At post-primary level, the most commonly chosen standard in the Leadership and Management dimension was from Domain 1: Leading Teaching and Learning
28 https://pdst.ie/sites/default/files/School-Self-Evaluation-Guidelines-2016-2020_Post-Primary_English_WEB.pdf

46
(Foster teacher professional development that enriches teachers’ and pupils’ learning), chosen by 67% of those who chose Leadership and Management. 2.3.2 School policies relating to digital technologies
In relation to the elements included in schools’ DT policies and guidelines, a similar picture emerged at both primary and post-primary level. In each case, policies on acceptable use of technology in school, acceptable use of the internet in school, and online safety were very frequently included, i.e. generally in 90% or more of schools. As might be expected, primary and post-primary schools differed in their likelihood to have included policies or guidelines on students’ use of their own devices in school, with post-primary schools having included this element in their DT policies or guidelines more often (87% vs 71%). Exactly half of primary schools surveyed reported that they had policies or guidelines for assistive technology for students with SEN; this was the case for 60% of post-primary schools (see Figure 2.3). Figure 2.3. Percentage of schools with policies and guidelines on various aspects of digital technology, primary and post-primary
Mirroring the membership of the DLT described in Section 2.1.2, the groups which had most input into the development of primary schools’ DT policies and guidelines were the teaching staff and the school management board. In two-thirds (65%) of primary schools, teaching staff were extensively consulted in the creation of these policies, while a further 31% of schools reported that there was some consultation with teachers. The school management board was extensively consulted in 33% of cases at primary level, and had some consultation in 61% of schools. Parents were more likely than
48
50
71
85
95
95
46
60
87
93
99
100
0 20 40 60 80 100
Teachers' own device use in school
Assisitive technology for students with SEN
Students' own device use in school
Online safety
Acceptable use of technology in school
Acceptable use of the internet in school
Post-primary (n=54) Primary (n=107)
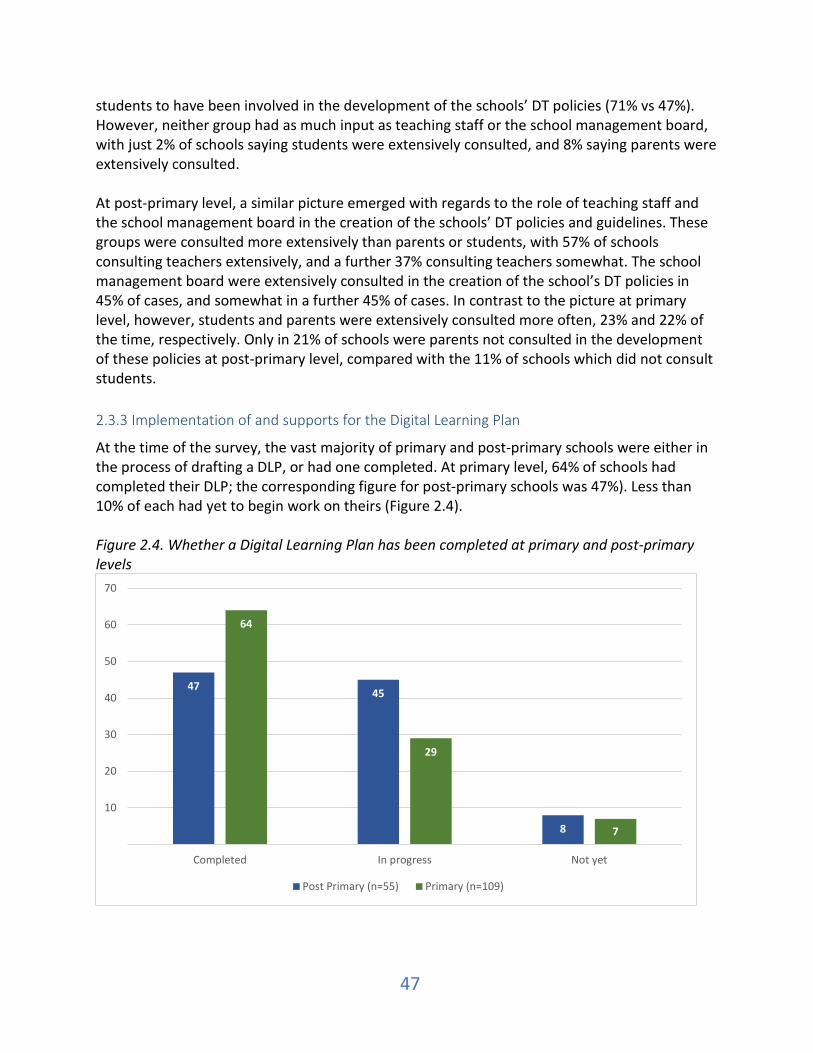
47
students to have been involved in the development of the schools’ DT policies (71% vs 47%). However, neither group had as much input as teaching staff or the school management board, with just 2% of schools saying students were extensively consulted, and 8% saying parents were extensively consulted. At post-primary level, a similar picture emerged with regards to the role of teaching staff and the school management board in the creation of the schools’ DT policies and guidelines. These groups were consulted more extensively than parents or students, with 57% of schools consulting teachers extensively, and a further 37% consulting teachers somewhat. The school management board were extensively consulted in the creation of the school’s DT policies in 45% of cases, and somewhat in a further 45% of cases. In contrast to the picture at primary level, however, students and parents were extensively consulted more often, 23% and 22% of the time, respectively. Only in 21% of schools were parents not consulted in the development of these policies at post-primary level, compared with the 11% of schools which did not consult students. 2.3.3 Implementation of and supports for the Digital Learning Plan
At the time of the survey, the vast majority of primary and post-primary schools were either in the process of drafting a DLP, or had one completed. At primary level, 64% of schools had completed their DLP; the corresponding figure for post-primary schools was 47%). Less than 10% of each had yet to begin work on theirs (Figure 2.4). Figure 2.4. Whether a Digital Learning Plan has been completed at primary and post-primary levels
47 45
8
64
29
7
10
20
30
40
50
60
70
Completed In progress Not yet
Post Primary (n=55) Primary (n=109)

48
When it came to the development of their DLP, primary schools mainly consulted the teaching staff. In 67% of primary schools, teachers were extensively consulted in the development of the DLP. Only in 5% of schools were teachers not consulted at all. While only a minority of schools extensively consulted students (7%) or the school management board (9%), approximately two-thirds of schools consulted these groups at least somewhat. The only group which in most cases was not consulted, was parents, with 58% of schools not consulting them in the development of the schools’ DLP. In 23% of cases, other groups such as the PDST, Occupational Therapists, ICT advisors, and SNAs, were consulted. The picture at primary level was largely mirrored by that at post-primary, with 63% of schools consulting teachers extensively in the development of the DLP, and just 5% not consulting teachers at all. However, at post-primary level, the school management board was consulted in 83% of cases, of 18% were classed as extensive. Parents were more likely to have been consulted at post-primary level, though only slightly so (55%). Students were consulted in the development of the DLP in 72% of schools, though extensively so at just 3%. In one-quarter of post-primary schools, other groups were consulted. These groups included the PDST, the schools’ ICT maintenance company, ETB, the PDST (‘DLF training team’), and SNAs. When DLT leaders were further asked to list other groups/individuals who were involved in the consultation process for the schools’ development of its DLP, both primary and post-primary respondents commented that IT support/coordinators and the PDST were most commonly consulted. Respondents were asked to indicate which among a list of elements (drawn from the Digital Learning Planning Guidelines and associated PDST resources29) were included in their DLP (see Figure 2.5). While most of these elements, such as School Vision, Standards of focus, Targets, and DLP timeframe, were included in a majority of schools’ DLPs, three in particular were chosen less frequently. These were Summary of strengths with regards to digital learning (included by 62% of primary, 68% of post-primary schools), Evaluation procedures (59% and 55%), and Specific plans/goals/procedures for SEN students (23% and 22%). Comparison of primary and post-primary levels reveals that post-primary schools were more likely to have reviewed or updated various aspects of their DLP since first making it. The part of the DLP most likely to have been reviewed or updated at both levels was Use of digital technologies in the school to date, with 63% of post-primary schools having reviewed or updated this, compared to 45% of primary schools. The areas least likely to have been reviewed or updated by primary schools were School Vision (13%), Summary of strengths with regards to Digital Learning (15%), and Evaluation procedures (17%). A similar pattern was found at post-primary level; Evaluation procedures (18%), Criteria for success (19%), and School vision (27%) were the least selected areas here.
29 https://www.pdsttechnologyineducation.ie/en/Planning/; www.dlplanning.ie

49
Figure 2.5. Elements included in DLP at primary and post-primary levels
Areas of wide divergence between primary and post-primary levels may also be of note. While 32% of post-primary respondents indicated that their school had reviewed or updated the DLP section Summary of strengths with regards to digital learning, this figure was just 15% for primary school respondents. A similar disparity was found for Persons or groups responsible; 46% vs 26% respectively. See Figure 2.6 for more detail. Asked how often they used the PDST’s DLPlanning.ie website, about one-fifth of primary schools and one-tenth of post-primary respondents indicated that they had never visited the site. Despite being more likely not to have visited the website, primary school respondents were slightly more likely than post-primary school respondents to have visited the website five or more times (21% vs 16% respectively). The majority of respondents at both levels reported
22
55
68
82
73
90
84
86
94
78
86
88
97
89
23
59
62
79
74
81
81
81
84
77
84
90
88
88
10 20 30 40 50 60 70 80 90 100
Specific plans/goals/procedures for Special EducationNeeds students
Evaluation procedures
Summary of strengths with regards to digital learning
Resources needed
Criteria for success
Persons / Groups responsible
DLP Timeframe
DLP Actions
Targets
The statements of effective and/or highly effectivepractice
The standard(s) we focus on within these domains
The domain(s) of focus for our Digital Learning ActionPlan
Use of digital technologies in the school to date
School Vision
Primary (n=101) Post Primary (n=51)

50
that they had visited the website between one and four times (60% of primary schools and 72% of post-primary schools). Those who visited the website tended not to do so on a regular basis, with no section of the website being visited more often than once per month by a majority of respondents at either primary or post-primary level. However, all sections had been visited at least once at some point, suggesting that all sections had at least some relevance for a majority of respondents. One difference between primary and post-primary level was the proportion of respondents reporting that they visited certain sections of the website frequently - at least once every two weeks. This proportion was higher at post-primary, often more than double, for sections such as DL Plan Template document (8% vs 3%), the DL framework document (14% vs 5%), the Digital Learning planning guidelines document (8% vs 4%), and Statements of effective and highly effective practice (16% vs 8%). Figure 2.6. Elements of DLP reviewed or updated since first made at primary and post-primary levels
18
32
48
19
46
42
45
49
30
35
37
63
27
17
15
42
20
26
36
42
33
26
27
30
45
13
10 20 30 40 50 60 70
Evaluation procedures
Summary of strengths with regards to digitallearning
Resources needed
Criteria for success
Persons or Groups responsible
Digital Learning Plan Timeframe
Digital Learning Plan Actions
Targets
The statements of effective and or highly effectivepractice
The standard(s) we focus on within these domains
The domain(s) of focus for our Digital LearningAction Plan
Use of digital technologies in the school to date
School Vision
Primary (n=98) Post Primary (n=49)

51
2.3.4 Role of Digital Learning Framework in School Self Evaluation
Respondents were asked to indicate the extent to which their DLF plans were included in their school self-evaluation. Over one quarter (27%) of primary schools indicated that they kept their DLF planning completely separate from their SSE; the corresponding figure for post-primary was 7%. However, at the other end of the scale, approximately one tenth of primary schools indicated that they had made the DLF the main part of their SSE activities; 5% of post-primary DLT leaders indicated that this was the case See Figure 2.7 for more details. Figure 2.7. Relationship between DLF and School Self-Evaluation at primary and post-primary levels
2.3.5 Use of digital technologies in standardised testing
Primary schools only were asked about the administration of standardised tests in paper-based and online formats. (Post-primary schools were not asked this question because standardised testing is mandatory only at primary level). At all class levels, primary schools overwhelmingly (>90%) administered standardised tests via pencil and paper. Standardised tests of reading were slightly more likely to have been administered on computer than standardised tests of mathematics (e.g. 5% vs. 3% in third and fourth class). The most frequent use of computers for standardised tests was in sixth class tests of reading, which 8% of schools administered via computer. Note that at the time of the survey, to the best knowledge of the authors, no online versions of DES-mandated standardised tests were available at first or second class levels. See Table 2.4 for details.
5
27
61
7
11
32
31
27
10 20 30 40 50 60 70
Forms main part of SSE activities
Forms subset of SSE activities
Complements SSE, implemented in parallel
Completely separate from SSE
Primary (n=105) Post Primary (n=50)
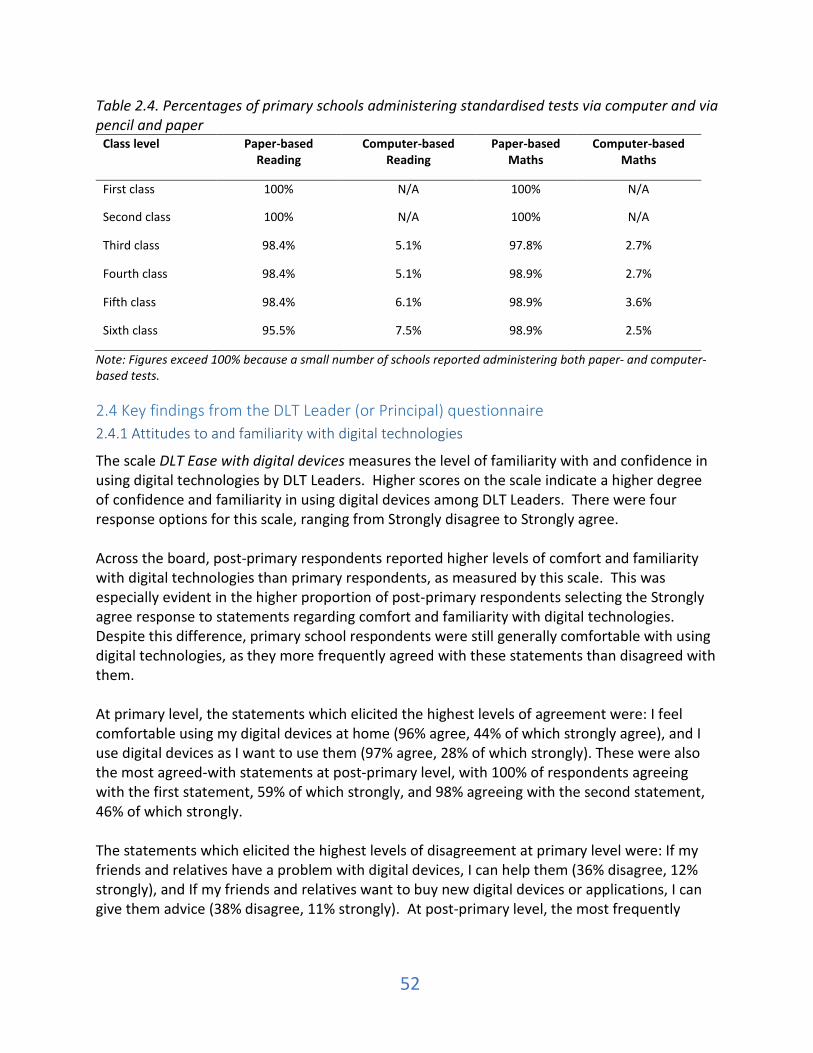
52
Table 2.4. Percentages of primary schools administering standardised tests via computer and via pencil and paper
Class level Paper-based Reading
Computer-based Reading
Paper-based Maths
Computer-based Maths
First class 100% N/A 100% N/A
Second class 100% N/A 100% N/A
Third class 98.4% 5.1% 97.8% 2.7%
Fourth class 98.4% 5.1% 98.9% 2.7%
Fifth class 98.4% 6.1% 98.9% 3.6%
Sixth class 95.5% 7.5% 98.9% 2.5%
Note: Figures exceed 100% because a small number of schools reported administering both paper- and computer-based tests.
2.4 Key findings from the DLT Leader (or Principal) questionnaire 2.4.1 Attitudes to and familiarity with digital technologies
The scale DLT Ease with digital devices measures the level of familiarity with and confidence in using digital technologies by DLT Leaders. Higher scores on the scale indicate a higher degree of confidence and familiarity in using digital devices among DLT Leaders. There were four response options for this scale, ranging from Strongly disagree to Strongly agree. Across the board, post-primary respondents reported higher levels of comfort and familiarity with digital technologies than primary respondents, as measured by this scale. This was especially evident in the higher proportion of post-primary respondents selecting the Strongly agree response to statements regarding comfort and familiarity with digital technologies. Despite this difference, primary school respondents were still generally comfortable with using digital technologies, as they more frequently agreed with these statements than disagreed with them. At primary level, the statements which elicited the highest levels of agreement were: I feel comfortable using my digital devices at home (96% agree, 44% of which strongly agree), and I use digital devices as I want to use them (97% agree, 28% of which strongly). These were also the most agreed-with statements at post-primary level, with 100% of respondents agreeing with the first statement, 59% of which strongly, and 98% agreeing with the second statement, 46% of which strongly. The statements which elicited the highest levels of disagreement at primary level were: If my friends and relatives have a problem with digital devices, I can help them (36% disagree, 12% strongly), and If my friends and relatives want to buy new digital devices or applications, I can give them advice (38% disagree, 11% strongly). At post-primary level, the most frequently

53
disagreed-with statements were: If I need new software, I install it by myself (31% disagree), and If I need a new application, I choose it myself (24% disagree, 6% of which strongly so). The mean score for the scale DLT Ease with digital devices was significantly higher at post-primary level than the mean score for primary (mean post-primary 74.3 (SD 19.9) compared with mean primary 65.3 (SD 21.1); p<0.05). This indicates that post-primary DLT leaders had a higher level of confidence and familiarity with using digital devices than primary DLT leaders. Scores on this scale did not differ at primary or post-primary level, either by enrolment size and DEIS status (primary and post-primary), or by sector (post-primary only). However, there were several positive moderate correlations with other scales at both primary and post primary level. See Appendix 2, Tables A2.1 and A2.2, and Tables A2.3 and A2.4. The scale DLT attitudes to DTs for student learning assessed the attitudes of DLT leaders in using DTs for student learning and their preference to support constructivist learning over traditional methods. Respondents selected from five response options for this scale, ranging from Strongly disagree to Strongly agree. Higher scores on this scale correspond to a greater preference by DLT leaders for constructivist approaches to learning over more traditional methods. At both primary and post-primary level, a majority of items elicited high rates (80% or more) of agreement. In particular, primary respondents expressed high levels of agreement with the statement that using DTs enables students to access better sources of information (94% agree, 39% of which strongly), and helps students develop greater interest in learning (89% agree, 42% of which strongly). These were also the most agreed-with statements at post-primary level, with 92% of respondents agreeing that using DTs enables students to access better sources of information (55% strongly agree), and 89% agreeing that using DTs helps students develop greater interest in learning (37% strongly). At both primary and post-primary level, the least agreed-with statement was that using DTs improves the academic performance of students. While less than 5% of respondents at either level disagreed with this statement, just 55% agreed with it at primary level (10% strongly), and 46% at post-primary level (10% strongly). This lower level of agreement reflects the mixed research evidence in the relationships between DT usage and achievement (see Chapter 1 (Sections 1.1.3 and 1.1.5) of the DLF baseline report; Cosgrove et al., 2019). The mean scores for DLT respondents for the scale DLT attitudes to DTs for student learning were high. However, there was no significant difference between the mean score of primary schools on this scale in comparison with the mean score of post-primary schools (mean primary 75.2 (SD 12.51) and mean post-primary 76.6, (SD 13.81); p=.537). Scores on this scale did not differ at primary or post-primary level, either by enrolment size and DEIS status (primary and post-primary), or by sector (post-primary only). At primary level, there were several positive moderate correlations with other scales (see Appendix 2, Table A2.2 for more detail). At post-primary level, higher scores on this scale were not significantly associated with scores on any other scales.
54
The scale DLT attitudes to DTs for impediments to learning assessed the extent to which DLT leaders believed that using DTs impedes learning. Respondents were required to select one of five response options, from Strongly disagree to Strongly agree. The items in this scale have been reverse-scored, therefore, higher scores on this scale indicate less impediments to learning as a result of DTs. At primary level, the most agreed-with statements on this scale were that using DTs introduces organisational problems for schools (48% agree, 9% of which strongly), and that using DTs encourages copying material from published internet sources (48% agree, 5% of which strongly). At post-primary level, these were also the most agreed-with statements, with 45% agreeing that using DTs introduces organisational problems for schools (12% of which strongly agree), and 54% agreeing that using DTs encourages copying from published internet sources (7% of which strongly agree). There was no significant difference between the mean scores on this scale between primary and post-primary levels (mean primary 51.9 (SD 13.92) and mean post-primary 52.4 (SD 19.69); p=.853). Furthermore, scores on this scale did not differ at primary or post-primary level either by enrolment size and DEIS status (primary and post-primary) or by sector (post-primary only). At primary level, there were several positive moderate correlations with other scales. At post-primary level, higher scores on this scale were not significantly associated with scores on any other scales (see Appendix 2, Tables A2.2a and A2.2b for more detail). 2.4.2 Participation in professional learning and initiatives relevant to DLF implementation
Respondents were asked to indicate whether they had participated in any digital technology related professional learning in the last two years. Summer courses (78%) and DLF seminars (74%) were attended most frequently by primary school DLT respondents in the previous two years. Online courses were the least frequented by primary respondents. At post-primary level, the most frequently attended professional learning activities over the last two years were workshops (83%) and in-school PDST support (69%), whereas face-to-face summer courses were the least frequented by post-primary respondents. See Table 2.5 for more detail.
Respondents were also asked to indicate whether they had participated in any digital technology related initiatives or events in recent years. The following initiatives/events were attended by a majority of primary level respondents: Tech space (99%), Trinity Access 21 (98%), School Excellence Fund Digital Initiative (88%), and EU Code Week (86%). At post-primary level, DT-related events were attended by fewer respondents. The most frequently attended events were PDST/GAA Future leaders’ transition year programme (57%) and Coding Ireland (34%). See Table 2.6 for more detail.
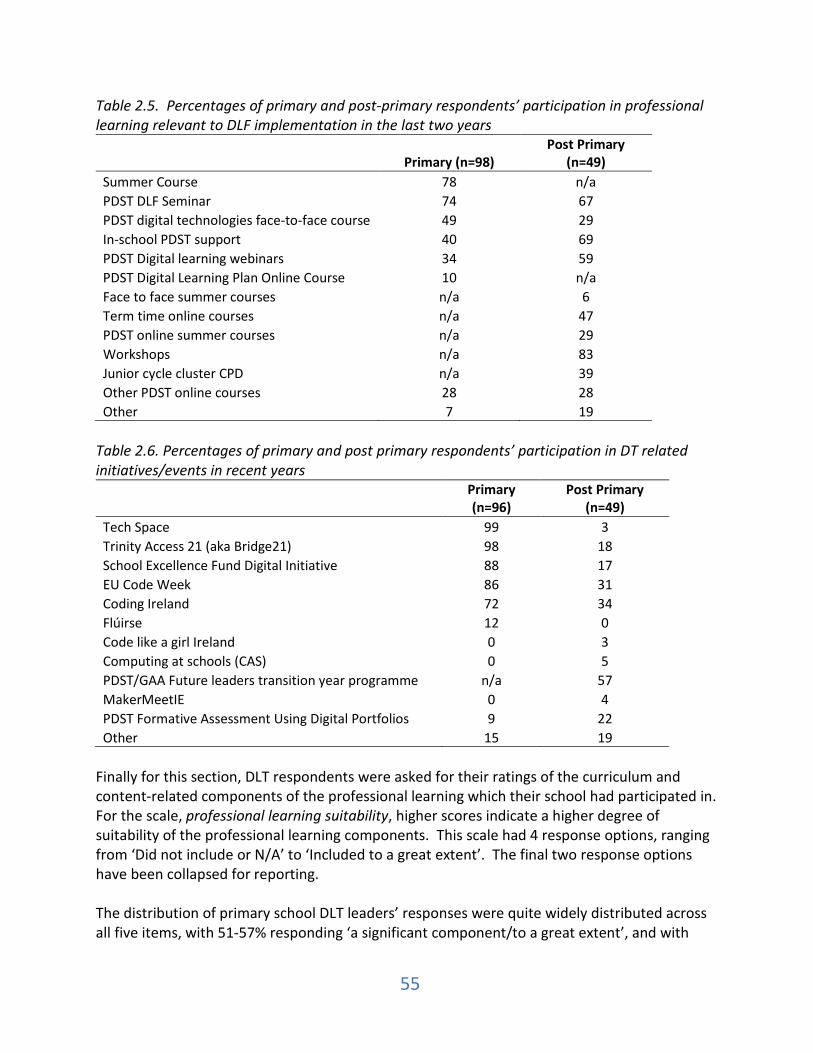
55
Table 2.5. Percentages of primary and post-primary respondents’ participation in professional learning relevant to DLF implementation in the last two years
Primary (n=98) Post Primary
(n=49) Summer Course 78 n/a PDST DLF Seminar 74 67 PDST digital technologies face-to-face course 49 29 In-school PDST support 40 69 PDST Digital learning webinars 34 59 PDST Digital Learning Plan Online Course 10 n/a Face to face summer courses n/a 6 Term time online courses n/a 47 PDST online summer courses n/a 29 Workshops n/a 83 Junior cycle cluster CPD n/a 39 Other PDST online courses 28 28 Other 7 19
Table 2.6. Percentages of primary and post primary respondents’ participation in DT related initiatives/events in recent years
Primary (n=96)
Post Primary (n=49)
Tech Space 99 3 Trinity Access 21 (aka Bridge21) 98 18 School Excellence Fund Digital Initiative 88 17 EU Code Week 86 31 Coding Ireland 72 34 Flúirse 12 0 Code like a girl Ireland 0 3 Computing at schools (CAS) 0 5 PDST/GAA Future leaders transition year programme n/a 57 MakerMeetIE 0 4 PDST Formative Assessment Using Digital Portfolios 9 22 Other 15 19
Finally for this section, DLT respondents were asked for their ratings of the curriculum and content-related components of the professional learning which their school had participated in. For the scale, professional learning suitability, higher scores indicate a higher degree of suitability of the professional learning components. This scale had 4 response options, ranging from ‘Did not include or N/A’ to ‘Included to a great extent’. The final two response options have been collapsed for reporting. The distribution of primary school DLT leaders’ responses were quite widely distributed across all five items, with 51-57% responding ‘a significant component/to a great extent’, and with
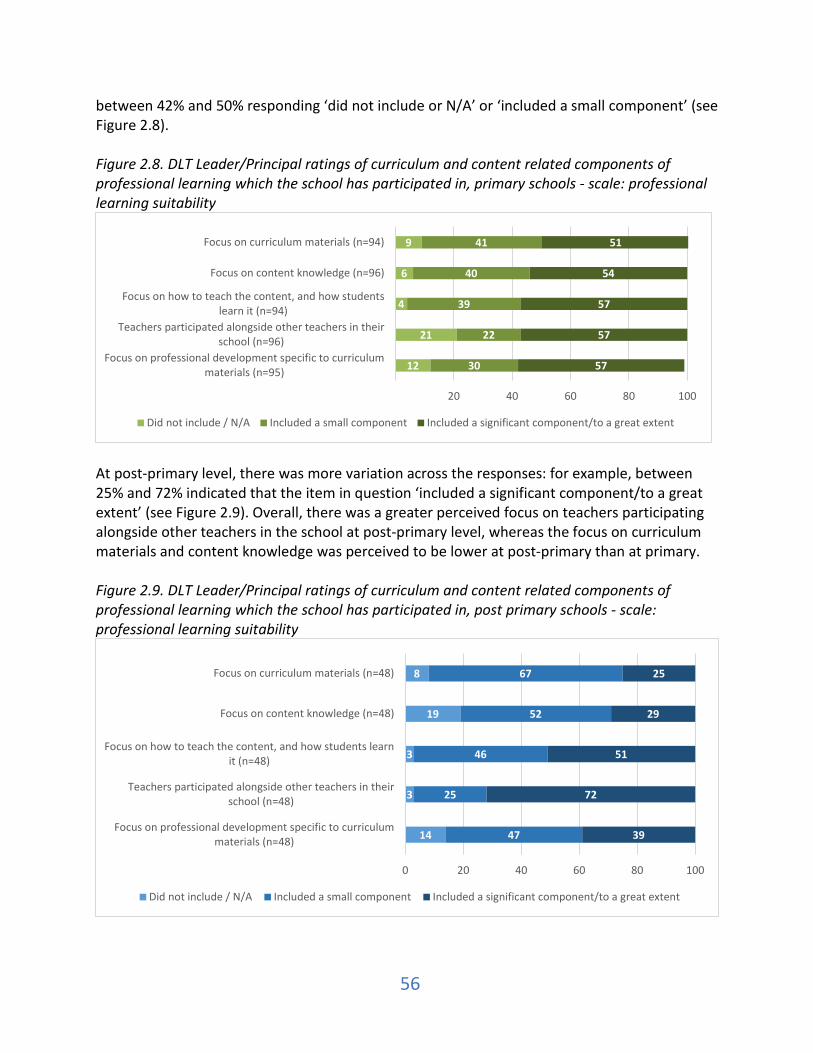
56
between 42% and 50% responding ‘did not include or N/A’ or ‘included a small component’ (see Figure 2.8). Figure 2.8. DLT Leader/Principal ratings of curriculum and content related components of professional learning which the school has participated in, primary schools - scale: professional learning suitability
At post-primary level, there was more variation across the responses: for example, between 25% and 72% indicated that the item in question ‘included a significant component/to a great extent’ (see Figure 2.9). Overall, there was a greater perceived focus on teachers participating alongside other teachers in the school at post-primary level, whereas the focus on curriculum materials and content knowledge was perceived to be lower at post-primary than at primary. Figure 2.9. DLT Leader/Principal ratings of curriculum and content related components of professional learning which the school has participated in, post primary schools - scale: professional learning suitability
12
21
4
6
9
30
22
39
40
41
57
57
57
54
51
20 40 60 80 100
Focus on professional development specific to curriculummaterials (n=95)
Teachers participated alongside other teachers in theirschool (n=96)
Focus on how to teach the content, and how studentslearn it (n=94)
Focus on content knowledge (n=96)
Focus on curriculum materials (n=94)
Did not include / N/A Included a small component Included a significant component/to a great extent
14
3
3
19
8
47
25
46
52
67
39
72
51
29
25
0 20 40 60 80 100
Focus on professional development specific to curriculummaterials (n=48)
Teachers participated alongside other teachers in theirschool (n=48)
Focus on how to teach the content, and how students learnit (n=48)
Focus on content knowledge (n=48)
Focus on curriculum materials (n=48)
Did not include / N/A Included a small component Included a significant component/to a great extent
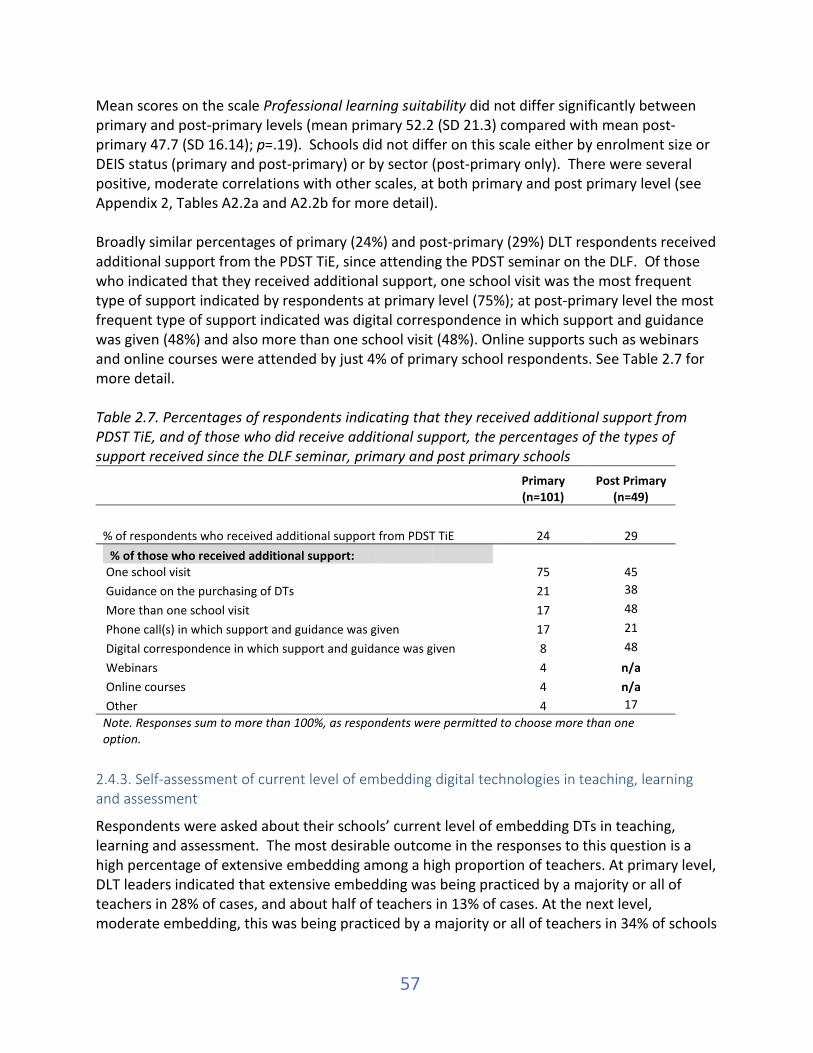
57
Mean scores on the scale Professional learning suitability did not differ significantly between primary and post-primary levels (mean primary 52.2 (SD 21.3) compared with mean post-primary 47.7 (SD 16.14); p=.19). Schools did not differ on this scale either by enrolment size or DEIS status (primary and post-primary) or by sector (post-primary only). There were several positive, moderate correlations with other scales, at both primary and post primary level (see Appendix 2, Tables A2.2a and A2.2b for more detail). Broadly similar percentages of primary (24%) and post-primary (29%) DLT respondents received additional support from the PDST TiE, since attending the PDST seminar on the DLF. Of those who indicated that they received additional support, one school visit was the most frequent type of support indicated by respondents at primary level (75%); at post-primary level the most frequent type of support indicated was digital correspondence in which support and guidance was given (48%) and also more than one school visit (48%). Online supports such as webinars and online courses were attended by just 4% of primary school respondents. See Table 2.7 for more detail. Table 2.7. Percentages of respondents indicating that they received additional support from PDST TiE, and of those who did receive additional support, the percentages of the types of support received since the DLF seminar, primary and post primary schools
Primary (n=101)
Post Primary (n=49)
% of respondents who received additional support from PDST TiE 24 29 % of those who received additional support:
One school visit 75 45 Guidance on the purchasing of DTs 21 38 More than one school visit 17 48 Phone call(s) in which support and guidance was given 17 21 Digital correspondence in which support and guidance was given 8 48 Webinars 4 n/a Online courses 4 n/a Other 4 17 Note. Responses sum to more than 100%, as respondents were permitted to choose more than one option.
2.4.3. Self-assessment of current level of embedding digital technologies in teaching, learning and assessment
Respondents were asked about their schools’ current level of embedding DTs in teaching, learning and assessment. The most desirable outcome in the responses to this question is a high percentage of extensive embedding among a high proportion of teachers. At primary level, DLT leaders indicated that extensive embedding was being practiced by a majority or all of teachers in 28% of cases, and about half of teachers in 13% of cases. At the next level, moderate embedding, this was being practiced by a majority or all of teachers in 34% of schools
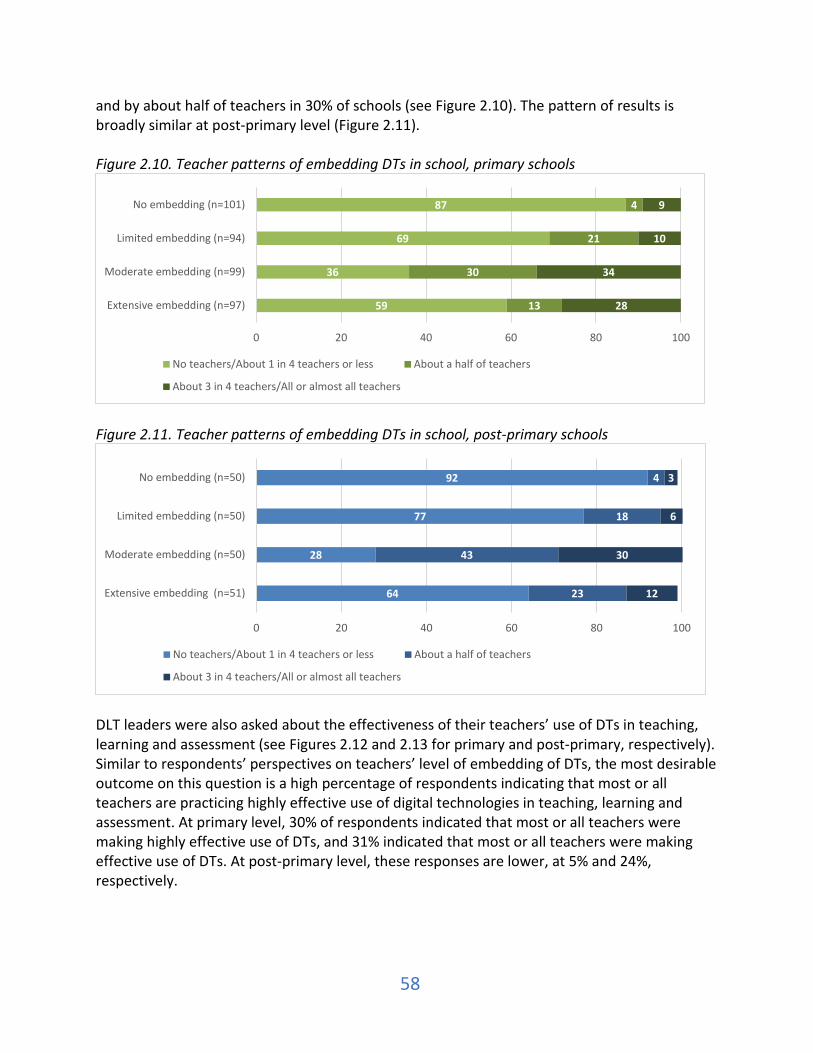
58
and by about half of teachers in 30% of schools (see Figure 2.10). The pattern of results is broadly similar at post-primary level (Figure 2.11). Figure 2.10. Teacher patterns of embedding DTs in school, primary schools
Figure 2.11. Teacher patterns of embedding DTs in school, post-primary schools
DLT leaders were also asked about the effectiveness of their teachers’ use of DTs in teaching, learning and assessment (see Figures 2.12 and 2.13 for primary and post-primary, respectively). Similar to respondents’ perspectives on teachers’ level of embedding of DTs, the most desirable outcome on this question is a high percentage of respondents indicating that most or all teachers are practicing highly effective use of digital technologies in teaching, learning and assessment. At primary level, 30% of respondents indicated that most or all teachers were making highly effective use of DTs, and 31% indicated that most or all teachers were making effective use of DTs. At post-primary level, these responses are lower, at 5% and 24%, respectively.
59
36
69
87
13
30
21
4
28
34
10
9
0 20 40 60 80 100
Extensive embedding (n=97)
Moderate embedding (n=99)
Limited embedding (n=94)
No embedding (n=101)
No teachers/About 1 in 4 teachers or less About a half of teachers
About 3 in 4 teachers/All or almost all teachers
64
28
77
92
23
43
18
4
12
30
6
3
0 20 40 60 80 100
Extensive embedding (n=51)
Moderate embedding (n=50)
Limited embedding (n=50)
No embedding (n=50)
No teachers/About 1 in 4 teachers or less About a half of teachers
About 3 in 4 teachers/All or almost all teachers
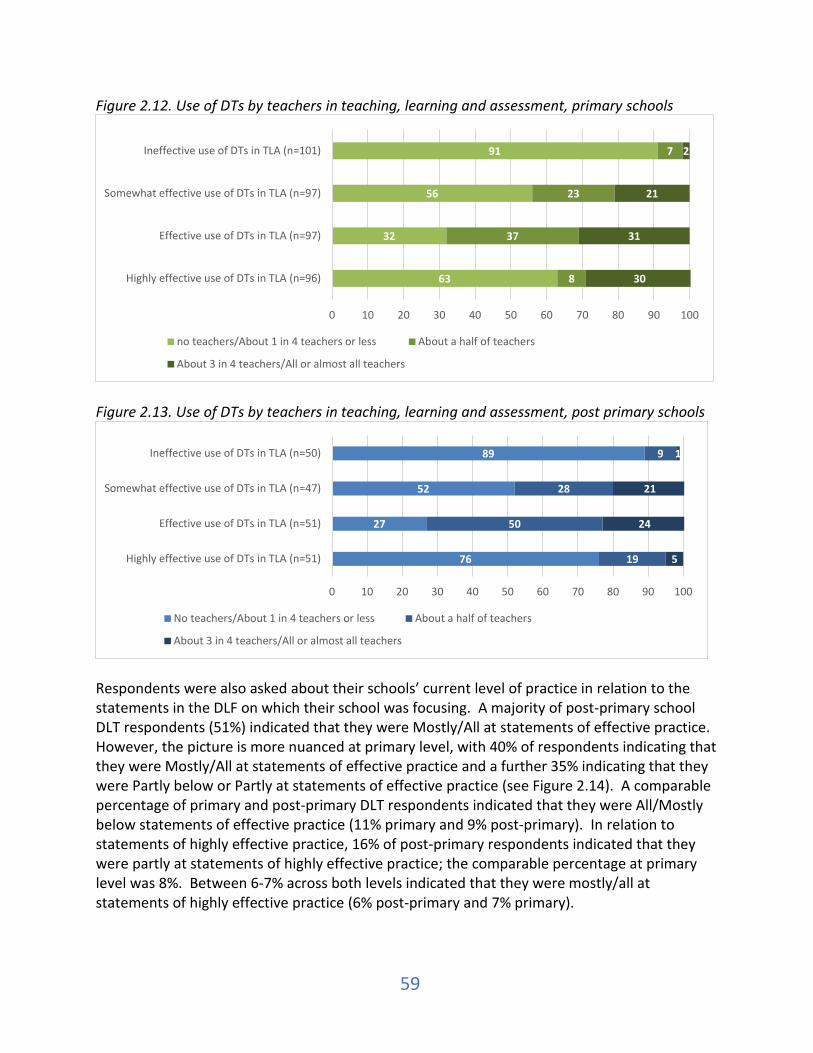
59
Figure 2.12. Use of DTs by teachers in teaching, learning and assessment, primary schools
Figure 2.13. Use of DTs by teachers in teaching, learning and assessment, post primary schools
Respondents were also asked about their schools’ current level of practice in relation to the statements in the DLF on which their school was focusing. A majority of post-primary school DLT respondents (51%) indicated that they were Mostly/All at statements of effective practice. However, the picture is more nuanced at primary level, with 40% of respondents indicating that they were Mostly/All at statements of effective practice and a further 35% indicating that they were Partly below or Partly at statements of effective practice (see Figure 2.14). A comparable percentage of primary and post-primary DLT respondents indicated that they were All/Mostly below statements of effective practice (11% primary and 9% post-primary). In relation to statements of highly effective practice, 16% of post-primary respondents indicated that they were partly at statements of highly effective practice; the comparable percentage at primary level was 8%. Between 6-7% across both levels indicated that they were mostly/all at statements of highly effective practice (6% post-primary and 7% primary).
63
32
56
91
8
37
23
7
30
31
21
2
0 10 20 30 40 50 60 70 80 90 100
Highly effective use of DTs in TLA (n=96)
Effective use of DTs in TLA (n=97)
Somewhat effective use of DTs in TLA (n=97)
Ineffective use of DTs in TLA (n=101)
no teachers/About 1 in 4 teachers or less About a half of teachers
About 3 in 4 teachers/All or almost all teachers
76
27
52
89
19
50
28
9
5
24
21
1
0 10 20 30 40 50 60 70 80 90 100
Highly effective use of DTs in TLA (n=51)
Effective use of DTs in TLA (n=51)
Somewhat effective use of DTs in TLA (n=47)
Ineffective use of DTs in TLA (n=50)
No teachers/About 1 in 4 teachers or less About a half of teachers
About 3 in 4 teachers/All or almost all teachers
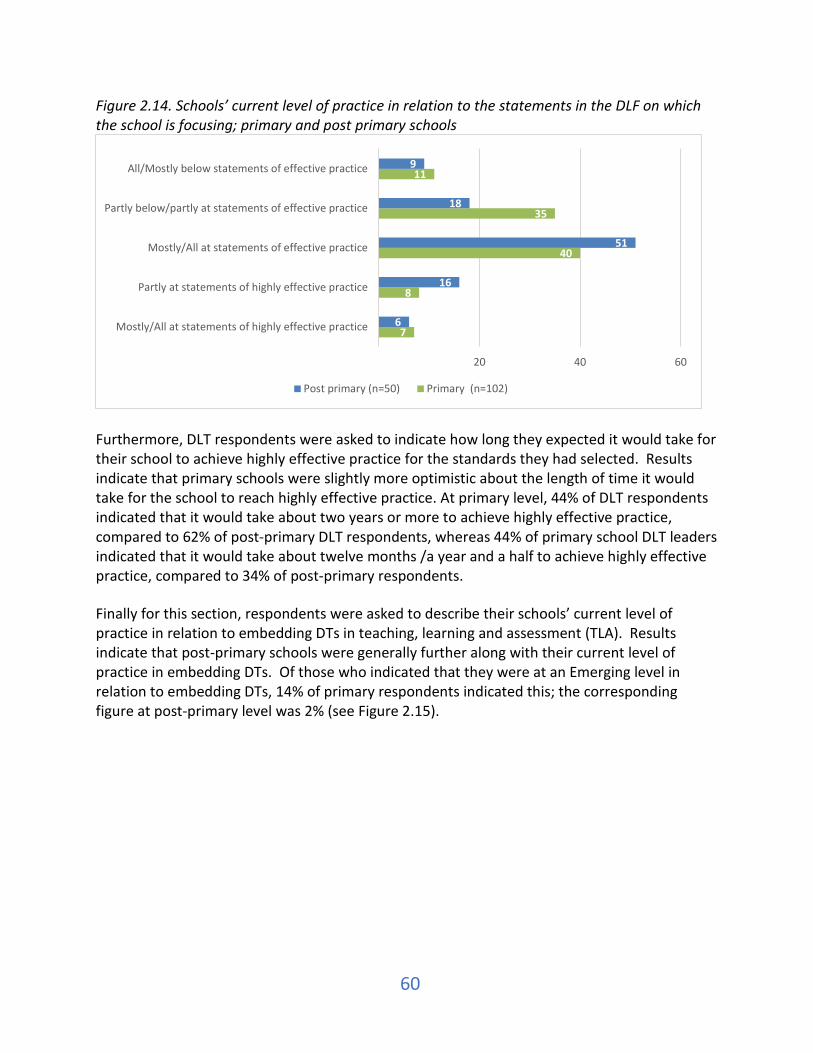
60
Figure 2.14. Schools’ current level of practice in relation to the statements in the DLF on which the school is focusing; primary and post primary schools
Furthermore, DLT respondents were asked to indicate how long they expected it would take for their school to achieve highly effective practice for the standards they had selected. Results indicate that primary schools were slightly more optimistic about the length of time it would take for the school to reach highly effective practice. At primary level, 44% of DLT respondents indicated that it would take about two years or more to achieve highly effective practice, compared to 62% of post-primary DLT respondents, whereas 44% of primary school DLT leaders indicated that it would take about twelve months /a year and a half to achieve highly effective practice, compared to 34% of post-primary respondents. Finally for this section, respondents were asked to describe their schools’ current level of practice in relation to embedding DTs in teaching, learning and assessment (TLA). Results indicate that post-primary schools were generally further along with their current level of practice in embedding DTs. Of those who indicated that they were at an Emerging level in relation to embedding DTs, 14% of primary respondents indicated this; the corresponding figure at post-primary level was 2% (see Figure 2.15).
7
8
40
35
11
6
16
51
18
9
20 40 60
Mostly/All at statements of highly effective practice
Partly at statements of highly effective practice
Mostly/All at statements of effective practice
Partly below/partly at statements of effective practice
All/Mostly below statements of effective practice
Post primary (n=50) Primary (n=102)
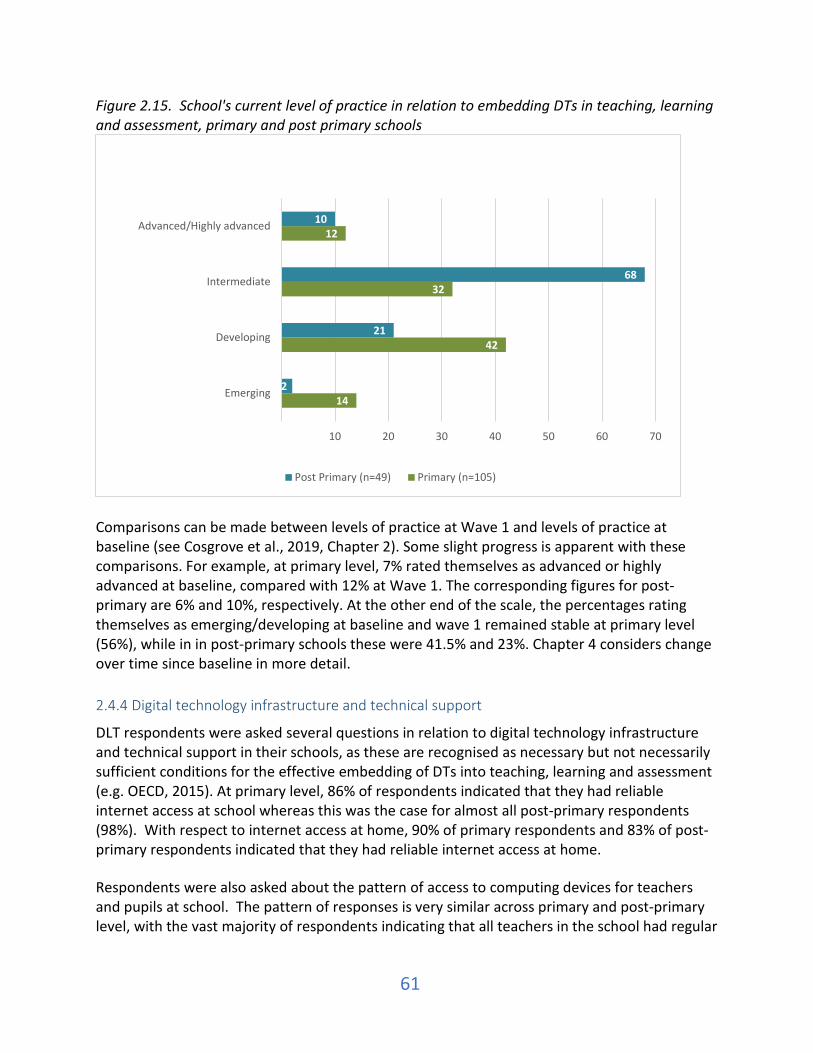
61
Figure 2.15. School's current level of practice in relation to embedding DTs in teaching, learning and assessment, primary and post primary schools
Comparisons can be made between levels of practice at Wave 1 and levels of practice at baseline (see Cosgrove et al., 2019, Chapter 2). Some slight progress is apparent with these comparisons. For example, at primary level, 7% rated themselves as advanced or highly advanced at baseline, compared with 12% at Wave 1. The corresponding figures for post-primary are 6% and 10%, respectively. At the other end of the scale, the percentages rating themselves as emerging/developing at baseline and wave 1 remained stable at primary level (56%), while in in post-primary schools these were 41.5% and 23%. Chapter 4 considers change over time since baseline in more detail. 2.4.4 Digital technology infrastructure and technical support
DLT respondents were asked several questions in relation to digital technology infrastructure and technical support in their schools, as these are recognised as necessary but not necessarily sufficient conditions for the effective embedding of DTs into teaching, learning and assessment (e.g. OECD, 2015). At primary level, 86% of respondents indicated that they had reliable internet access at school whereas this was the case for almost all post-primary respondents (98%). With respect to internet access at home, 90% of primary respondents and 83% of post-primary respondents indicated that they had reliable internet access at home. Respondents were also asked about the pattern of access to computing devices for teachers and pupils at school. The pattern of responses is very similar across primary and post-primary level, with the vast majority of respondents indicating that all teachers in the school had regular
14
42
32
12
2
21
68
10
10 20 30 40 50 60 70
Emerging
Developing
Intermediate
Advanced/Highly advanced
Post Primary (n=49) Primary (n=105)

62
access to a school-owned computing device, e.g. laptop, tablet, PC (91% primary and 90% post-primary) (see Figures 2.16 and 2.17). Also at both levels, more than 50% of respondents indicated that all teachers in the school had regular access to their own computing devices, e.g. mobile phone, laptop (58% primary and 53% post-primary). Figure 2.16. Teacher and pupil access to computing devices; primary schools
Furthermore, over 50% of respondents indicated that all pupils in the school had regular access to a school-owned computing device, e.g. laptop, tablet, PC (55% primary and 54% post-primary). However, access for pupils to their own computing device at home was a bit lower (e.g. mobile phone, tablet), particularly at primary level. The majority of primary level respondents (86%) indicated that either none or just some of the pupils in the school had regular access to their own computing device, and this figure was 52% at post-primary level.
12
2
53
2
13
23
33
7
18
20
7
91
58
55
7
20 40 60 80 100
Teachers in this school have regular access to a school-owned computing device (n=101)
Teachers in this school have regular access to their owncomputing devices (n=99)
Pupils in this school have regular access to a school-ownedcomputing device (n=100)
Pupils in this school have regular access to their owncomputing devices (n=99)
None Some Most All
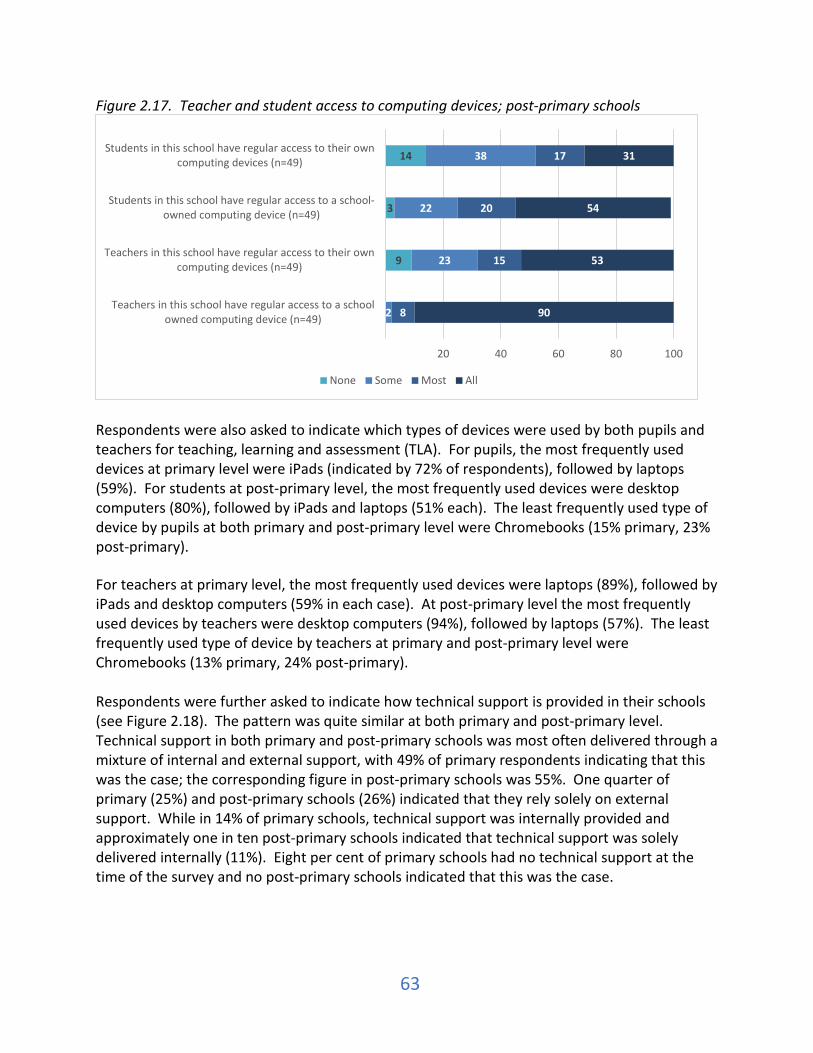
63
Figure 2.17. Teacher and student access to computing devices; post-primary schools
Respondents were also asked to indicate which types of devices were used by both pupils and teachers for teaching, learning and assessment (TLA). For pupils, the most frequently used devices at primary level were iPads (indicated by 72% of respondents), followed by laptops (59%). For students at post-primary level, the most frequently used devices were desktop computers (80%), followed by iPads and laptops (51% each). The least frequently used type of device by pupils at both primary and post-primary level were Chromebooks (15% primary, 23% post-primary). For teachers at primary level, the most frequently used devices were laptops (89%), followed by iPads and desktop computers (59% in each case). At post-primary level the most frequently used devices by teachers were desktop computers (94%), followed by laptops (57%). The least frequently used type of device by teachers at primary and post-primary level were Chromebooks (13% primary, 24% post-primary). Respondents were further asked to indicate how technical support is provided in their schools (see Figure 2.18). The pattern was quite similar at both primary and post-primary level. Technical support in both primary and post-primary schools was most often delivered through a mixture of internal and external support, with 49% of primary respondents indicating that this was the case; the corresponding figure in post-primary schools was 55%. One quarter of primary (25%) and post-primary schools (26%) indicated that they rely solely on external support. While in 14% of primary schools, technical support was internally provided and approximately one in ten post-primary schools indicated that technical support was solely delivered internally (11%). Eight per cent of primary schools had no technical support at the time of the survey and no post-primary schools indicated that this was the case.
9
3
14
2
23
22
38
8
15
20
17
90
53
54
31
20 40 60 80 100
Teachers in this school have regular access to a schoolowned computing device (n=49)
Teachers in this school have regular access to their owncomputing devices (n=49)
Students in this school have regular access to a school-owned computing device (n=49)
Students in this school have regular access to their owncomputing devices (n=49)
None Some Most All
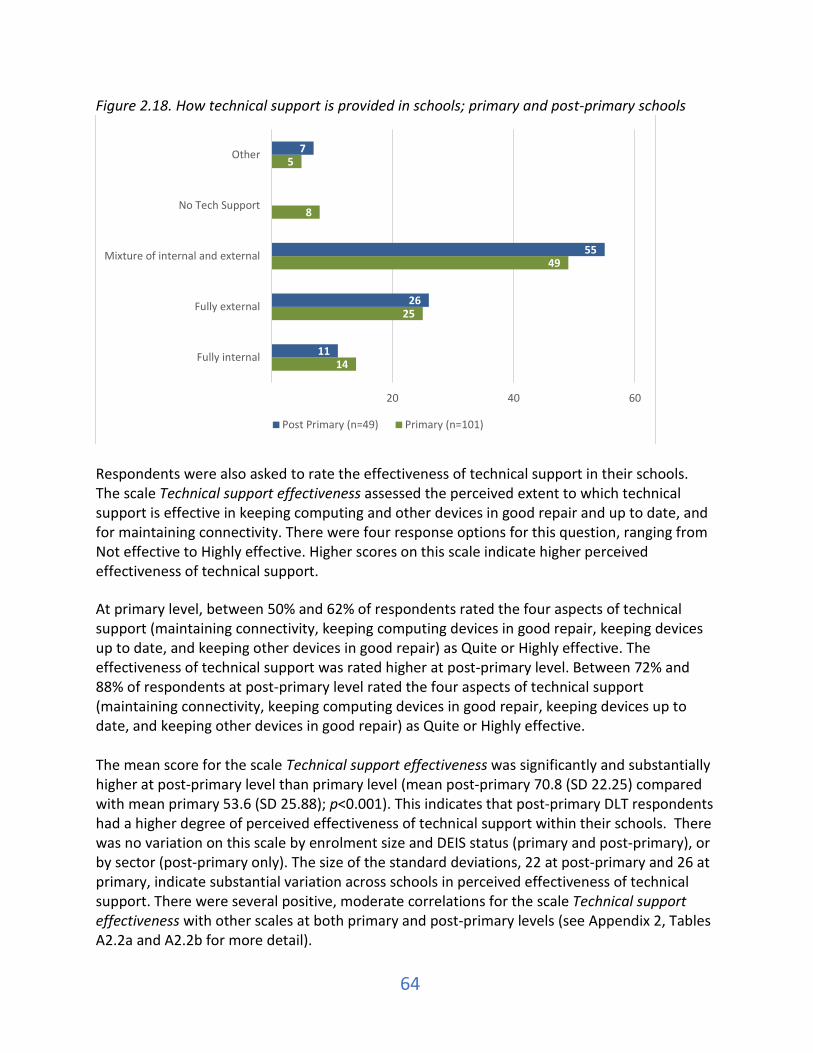
64
Figure 2.18. How technical support is provided in schools; primary and post-primary schools
Respondents were also asked to rate the effectiveness of technical support in their schools. The scale Technical support effectiveness assessed the perceived extent to which technical support is effective in keeping computing and other devices in good repair and up to date, and for maintaining connectivity. There were four response options for this question, ranging from Not effective to Highly effective. Higher scores on this scale indicate higher perceived effectiveness of technical support. At primary level, between 50% and 62% of respondents rated the four aspects of technical support (maintaining connectivity, keeping computing devices in good repair, keeping devices up to date, and keeping other devices in good repair) as Quite or Highly effective. The effectiveness of technical support was rated higher at post-primary level. Between 72% and 88% of respondents at post-primary level rated the four aspects of technical support (maintaining connectivity, keeping computing devices in good repair, keeping devices up to date, and keeping other devices in good repair) as Quite or Highly effective. The mean score for the scale Technical support effectiveness was significantly and substantially higher at post-primary level than primary level (mean post-primary 70.8 (SD 22.25) compared with mean primary 53.6 (SD 25.88); p<0.001). This indicates that post-primary DLT respondents had a higher degree of perceived effectiveness of technical support within their schools. There was no variation on this scale by enrolment size and DEIS status (primary and post-primary), or by sector (post-primary only). The size of the standard deviations, 22 at post-primary and 26 at primary, indicate substantial variation across schools in perceived effectiveness of technical support. There were several positive, moderate correlations for the scale Technical support effectiveness with other scales at both primary and post-primary levels (see Appendix 2, Tables A2.2a and A2.2b for more detail).
14
25
49
8
5
11
26
55
7
20 40 60
Fully internal
Fully external
Mixture of internal and external
No Tech Support
Other
Post Primary (n=49) Primary (n=101)
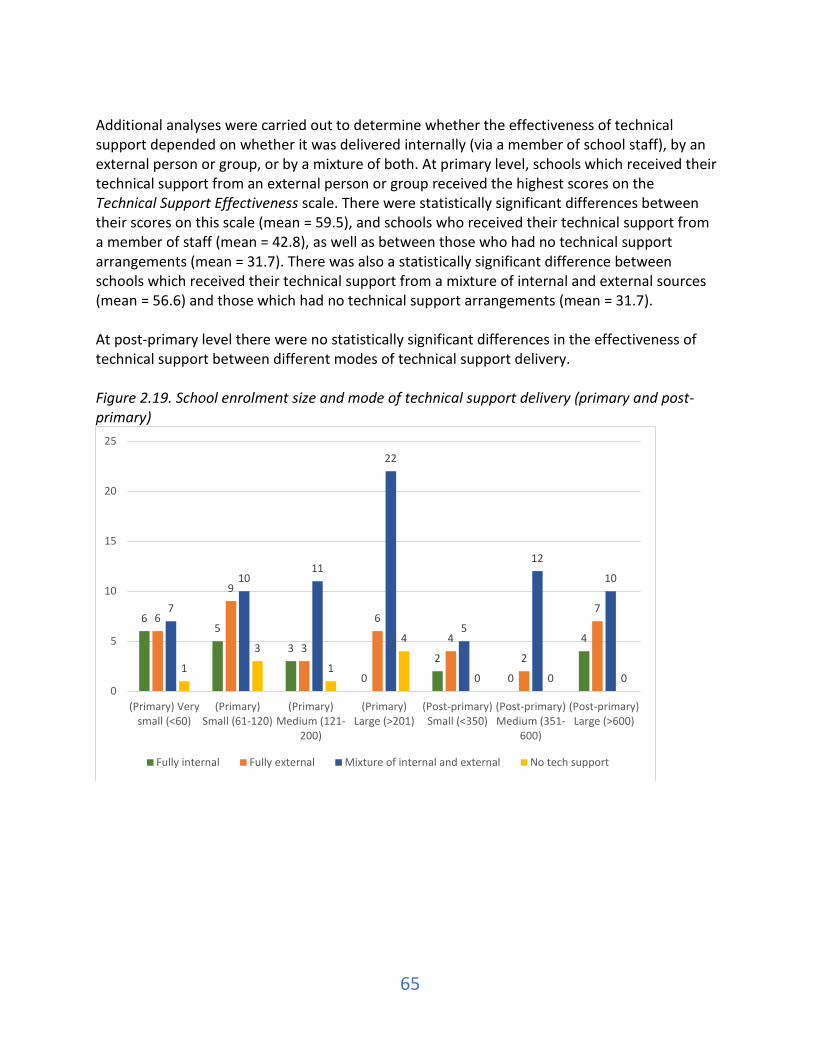
65
Additional analyses were carried out to determine whether the effectiveness of technical support depended on whether it was delivered internally (via a member of school staff), by an external person or group, or by a mixture of both. At primary level, schools which received their technical support from an external person or group received the highest scores on the Technical Support Effectiveness scale. There were statistically significant differences between their scores on this scale (mean = 59.5), and schools who received their technical support from a member of staff (mean = 42.8), as well as between those who had no technical support arrangements (mean = 31.7). There was also a statistically significant difference between schools which received their technical support from a mixture of internal and external sources (mean = 56.6) and those which had no technical support arrangements (mean = 31.7). At post-primary level there were no statistically significant differences in the effectiveness of technical support between different modes of technical support delivery. Figure 2.19. School enrolment size and mode of technical support delivery (primary and post-primary)
65
3
0
2
0
4
6
9
3
6
4
2
77
1011
22
5
12
10
1
3
1
4
0 0 00
5
10
15
20
25
(Primary) Verysmall (<60)
(Primary)Small (61-120)
(Primary)Medium (121-
200)
(Primary)Large (>201)
(Post-primary)Small (<350)
(Post-primary)Medium (351-
600)
(Post-primary)Large (>600)
Fully internal Fully external Mixture of internal and external No tech support

66
Box 2.1. Relationships between mode of technical support, school enrolment size, and effectiveness of technical support Further analyses examined the associations between mode of technical support (internal, external, a mixture), school enrolment size, and perceived effectiveness of technical support. While the analyses did not yield any statistically significant results other than an association between enrolment size and technical support delivery mode at primary level, some trends in the data are worth noting. These non-significant trends, at primary level, point to lower effectiveness of fully internal technical support, and more effective technical support in schools with an enrolment size in excess of 120. Does mode of technical support differ across schools of different enrolment size? At primary level, there was a statistically significant association between school enrolment size and mode of technical support (chi-square = 14.585, df = 6, p = .024). Broadly speaking, the results indicate that all external and mixed modes of technical support are more common in schools with larger enrolment sizes, whereas smaller schools tended to have either all internal or mixed modes of technical support. At post-primary level, was no statistically significant association between school enrolment size categories with respect to the mode of technical support (chi-square = 6.552, df = 4, p = .162). There was a tendency among all school sizes for having a mixture of internal and external technical support. This tendency was most pronounced among schools of medium enrolment size (351-600), where 12 of the 14 schools reported opting for a mixture of internal and external support (see Figure 2.19). Does technical support effectiveness vary according to the mode of technical support? There were no statistically significant differences in the mean technical support effectiveness scores by mode of technical support (internal, external, a mixture) (F (primary) = 2.138, p = .124; F (post-primary) = 0.135, p = .874). However, at primary level there was nonetheless a substantial difference in the mean Technical support effectiveness score of schools whose technical support was fully internal (43), and those whose technical support was delivered by externally (59.5), or by a mixture of internal and external sources (57). Does technical support effectiveness vary according to school enrolment size? There were no statistically significant differences in scores on the Technical support effectiveness scale between schools of different enrolment sizes at either primary or post-primary level (F (primary) = 2.015, p = .118; F (post-primary) = 0.674, p = .515). However, at primary level, the mean Technical support effectiveness scores were notably higher for schools where the enrolment was greater than 120 pupils (specifically, 63 in schools with 121-200 pupils and 61 in schools with more than 200 pupils). Schools smaller than this had a mean score below 50 (48 in schools with 60 or fewer pupils, and 49 in schools with 61-120 pupils). This suggests that a school enrolment size of approximately 120 represents a critical mass, above which technical support arrangements are more effective. This may also go towards explaining the higher scores achieved by post-primary schools on this scale, as they tend to be larger, on average, than primary schools.
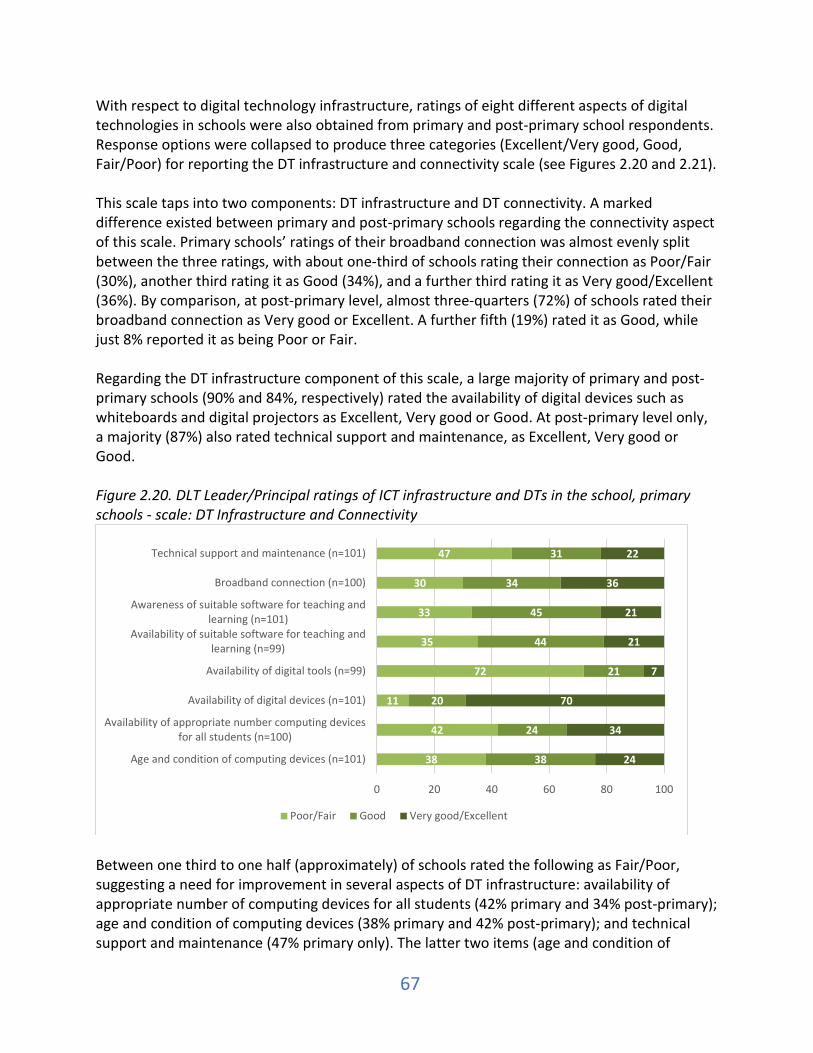
67
With respect to digital technology infrastructure, ratings of eight different aspects of digital technologies in schools were also obtained from primary and post-primary school respondents. Response options were collapsed to produce three categories (Excellent/Very good, Good, Fair/Poor) for reporting the DT infrastructure and connectivity scale (see Figures 2.20 and 2.21). This scale taps into two components: DT infrastructure and DT connectivity. A marked difference existed between primary and post-primary schools regarding the connectivity aspect of this scale. Primary schools’ ratings of their broadband connection was almost evenly split between the three ratings, with about one-third of schools rating their connection as Poor/Fair (30%), another third rating it as Good (34%), and a further third rating it as Very good/Excellent (36%). By comparison, at post-primary level, almost three-quarters (72%) of schools rated their broadband connection as Very good or Excellent. A further fifth (19%) rated it as Good, while just 8% reported it as being Poor or Fair. Regarding the DT infrastructure component of this scale, a large majority of primary and post-primary schools (90% and 84%, respectively) rated the availability of digital devices such as whiteboards and digital projectors as Excellent, Very good or Good. At post-primary level only, a majority (87%) also rated technical support and maintenance, as Excellent, Very good or Good. Figure 2.20. DLT Leader/Principal ratings of ICT infrastructure and DTs in the school, primary schools - scale: DT Infrastructure and Connectivity
Between one third to one half (approximately) of schools rated the following as Fair/Poor, suggesting a need for improvement in several aspects of DT infrastructure: availability of appropriate number of computing devices for all students (42% primary and 34% post-primary); age and condition of computing devices (38% primary and 42% post-primary); and technical support and maintenance (47% primary only). The latter two items (age and condition of
38
42
11
72
35
33
30
47
38
24
20
21
44
45
34
31
24
34
70
7
21
21
36
22
0 20 40 60 80 100
Age and condition of computing devices (n=101)
Availability of appropriate number computing devicesfor all students (n=100)
Availability of digital devices (n=101)
Availability of digital tools (n=99)
Availability of suitable software for teaching andlearning (n=99)
Awareness of suitable software for teaching andlearning (n=101)
Broadband connection (n=100)
Technical support and maintenance (n=101)
Poor/Fair Good Very good/Excellent

68
devices; technical support and maintenance) reflect difficulties faced by many schools in managing and optimising the DT infrastructure through appropriate technical support and maintenance. Approximately three-quarters of primary and post-primary schools (72% and 77% respectively) indicated that the availability of digital tools such as data sensors, cameras and assistive devices were Fair/Poor. These results could suggest a need for improvement in both the understanding of the uses of these peripheral devices, as well as their deployment, in teaching, learning and assessment. Figure 2.21. DLT Leader/Principal ratings of ICT infrastructure and DTs in the school, post primary schools - scale: DT Infrastructure and Connectivity
These eight items were combined in a scale for analysis. The scale DT Infrastructure and Connectivity assessed the perceived adequacy of school's DT infrastructure and connectivity to meet teaching, learning and assessment needs. Higher scores on this scale indicate a higher level of perceived adequacy of school’s DT infrastructure and connectivity. The mean score on the scale at post-primary level was significantly and substantially higher than the mean score at primary (mean post-primary 53.7 (SD 17.58) compared with mean primary 46.5 (SD 16.93); p<0.05), though it should also be noted that the mean scores at both primary and post-primary levels are in the moderate range (since the scores may range from 0-100). This difference indicates that post-primary DLT leaders had a higher perceived level of the adequacy of their schools’ DT infrastructure and connectivity than DLT leaders in primary schools. No differences were observed for the scale DT Infrastructure and Connectivity either by enrolment size or DEIS status (at primary and post-primary level) or by sector (post-primary
42
34
17
77
27
28
8
14
19
23
27
16
49
39
19
32
39
44
57
7
24
34
72
55
0 20 40 60 80 100
Age and condition of computing devices (n=49)
Availability of appropriate number computing devices forall students (n=49)
Availability of digital devices (n=49)
Availability of digital tools (n=49)
Availability of suitable software for teaching and learning(n=48)
Awareness of suitable software for teaching and learning(n=47)
Broadband connection/speed (n=49)
Technical support and maintenance (n=49)
Poor/Fair Good Very good/Excellent

69
only). At primary and post-primary level, there were positive, moderate correlations with other scales (see Appendix 2, Tables A2.2a and A2.2b). Teacher and pupil digital technology engagement was also examined. The scale DT Teacher and pupil engagement assessed the perceived overall level of teachers' and students' knowledge, skills and engagement with DTs for teaching and learning. There were five response options to this scale, ranging from Poor to Excellent, with response options collapsed to three for reporting. Higher scores on the scale indicate a higher perceived level of teacher and pupil DT engagement for teaching and learning. At primary level, approximately three quarters of schools rated the following items as Excellent, Very good or Good: pupils’ overall engagement with DTs as part of teaching and learning (73%), pupils’ overall level of knowledge and skills in using DTs for learning (74%), teachers’ overall level of use of DTs for teaching and learning (79%), and teachers’ overall level of knowledge and skills in using DTs for teaching and learning (75%). At post-primary level, all four items received high ratings by DLT respondents. The vast majority (90%) rated teachers’ overall level of knowledge and skills in using DTs for teaching and learning as Very good or Good. Approximately 80% or more of respondents rated the following as Very good or Good: teachers’ overall level of use of DTs for teaching and learning (86%); students’ overall engagement with DTs as part of teaching and learning (81%). With respect to the final item, students’ overall level of knowledge and skills in using DTs for learning, 70% of respondents rated this item as Very good or Good; however, approximately one third (31%) rated this item as Fair/Poor. It should be noted that no post-primary respondents rated any of these four items as Excellent. No significant difference was observed between the mean scores for the scale DT Teacher and pupil engagement for both primary and post-primary schools (mean primary 49.7 (SD 17.7) compared with mean post-primary 49.7 (SD 13.9); p=.999), with both scores in the moderate range. No differences were observed at primary and post-primary level for this scale either by enrolment size and DEIS status (primary and post-primary), or by sector (post-primary only). There were several moderate and strong correlations at primary level, and one strong positive correlation at post-primary level, for the scale DT Teacher and pupil engagement with other scales (see Appendix 2, Tables A2.2a and A2.2b).
2.4.5. DLT leaders’ attitudes and beliefs
DLT leaders were asked several questions relating to their leadership style. At primary level, the following leadership subscales reached acceptable reliability and were thus included for analysis: Idealised influence and Intellectual stimulation. The scale Idealised influence assessed the extent to which DLT leaders’ leadership style inspires trust and pride, while Intellectual stimulation assessed the extent to which DLT leaders’ leadership style enables intellectual stimulation (creativity and problem solving).
70
At post-primary level, the following subscales reached acceptable reliability and were thus included for analysis: Idealised influence, Intellectual stimulation, Individual consideration, and Laissez-faire leadership. The scale Individual consideration assessed the self-rated extent to which DLT leaders know each of their staff individually, and listen to any concerns or needs that their team members have, working to develop, empower and inspire them to achieve more. The scale Laissez-faire leadership assessed the self-rated extent to which DLT leaders avoid providing visions or directions to other staff, delegating tasks and avoiding decision-making. There was no significant difference between the mean scores for primary and post-primary levels on the scale Idealised influence (p=.987). However, the mean score on the scale Intellectual stimulation was significantly higher at post-primary level than at primary (mean post-primary 65.6 (SD 15.47) compared with mean primary 58.1 (SD 17.66); p<0.05). This suggests that post-primary DLT leaders were more likely to display a leadership style which enables intellectual stimulation. None of these leadership subscale means varied across schools, either by enrolment size and DEIS status (primary and post-primary), or by sector (post-primary only). There were several moderate, positive correlations for the leadership scales at primary and post-primary level – see Appendix 2, Tables A2.2a and A2.2b. DLT leaders were also asked several questions about their pedagogical beliefs. The scale Constructivist Beliefs, assessed the extent to which DLT leaders hold positive attitudes to constructivist approaches to teaching and learning in general. There were four response options for this scale, ranging from Strongly disagree to Strongly agree. Higher scores on the scale indicate more positive attitudes towards constructivist approaches to teaching and learning. As evident from Figures 2.22 and 2.23, large majorities of primary and post-primary school respondents assigned a rating of Agree or Strongly agree to the following items: thinking and reasoning processes are more important than specific curriculum content (84% primary and 88% post-primary); students learn best by finding solutions to problems on their own (87% primary and 95% post-primary); my role as a teacher is to facilitate students own inquiry (95% primary and 97% post-primary); students should be made aware of how what they are learning relates to real life (99% primary and 97% post-primary).

71
Figure 2.22. DLT Leader/Principal ratings of their pedagogical beliefs, primary schools – scale: Constructivist Beliefs
* Item has been reverse scored for analysis Figure 2.23. DLT Leader/Principal ratings of their pedagogical beliefs, post primary schools – scale: Constructivist Beliefs
* Item has been reverse scored for analysis
The mean score for the scale Constructivist Beliefs was significantly higher at post-primary level than at primary (mean post-primary 78.8 (SD 13.63) compared with mean primary 69.8 (SD 12.27); p<0.001). This suggests that post-primary DLT leaders were more likely hold positive attitudes to constructivist approaches to teaching and learning. There were no statistically significant variations between schools on this scale either by enrolment size and DEIS status (primary and post-primary) or by sector (post-primary only). There was one moderate positive correlation with this scale at primary level, and there were no significant correlations for this scale with other scales at post-primary level (see Appendix 2, Tables A2.2a and A2.2b).
2
1
5
13
16
45
50
67
51
61
51
49
28
36
23
2
0 20 40 60 80 100
Students should be made aware of how what they arelearning relates to real life (n=99)
My role as a teacher is to facilitate students own inquiry(n=99)
Students learn best by finding solutions to problems ontheir own (n=99)
Thinking and reasoning processes are more importantthan specific curriculum content (n=98)
The teacher should be the one who decides how long isspent on a learning activity (n=98) RS*
Strongly disagree Disagree Agree Strongly agree
2
2
4
55
2
12
34
37
48
53
70
9
60
49
42
18
2
20 40 60 80 100
Students should be made aware of how what they arelearning relates to real life (n=49)
My role as a teacher is to facilitate students own inquiry(n=49)
Students learn best by finding solutions to problems ontheir own (n=49)
Thinking and reasoning processes are more important thanspecific curriculum content (n=49)
Students should not learn about the practical utility oftheir learning (n=49) (RS)*
Strongly disagree Disagree Agree Strongly agree

72
2.4.6 Impacts and challenges associated with implementing the DLF
DLT leaders’ ratings of the impacts and challenges associated with implementing the DLF are described in this section. Firstly, DLT leaders were asked to rate several aspects of digital technology, along with aspects of teaching, learning and assessment practices, and the associated impact of the DLF on these aspects. Ratings were on a scale ranging from No change to Significant change. The 10 items assessing impact were combined in a scale for analysis. The scale DLT Impact of DLF assessed the perceived overall level of impact of the school's implementation of the DLF on teaching, learning and assessment activities, student engagement, collaborative practices, and policy and decision making relating to school's DT. Higher scores on the scale indicate a higher degree of change for outcomes related to DLF Impact. There were a couple of patterns evident from the data (see Figures 2.24 and 2.25). At primary level, first, between 52% and 77% of respondents indicated that there was No change or a Minor change for the following outcomes: emphasis on use of DTs in school policies or guidelines (52%); decisions relating to enhancing broadband/wifi connectivity or reliability (56%); teachers’ assessment practices (65%); decisions relating to enhancing technical support or maintenance (65%); and students’ homework or study activities (77%). Second, between 54% and 70% of respondents at primary level indicated that there was a Moderate or Significant change for the following outcomes: decisions relating to enhancing DT infrastructure (70%); students’ interest and engagement in learning activities (58%); teaching and learning activities during class time (56%); collaborative practices among teachers (57%); and sharing of documents or resources among teachers (54%). This gives a strong indication that the focus of change in primary schools is consistent with the overall focus on the Teaching and Learning dimension of the DLF, whilst at the same time focusing on infrastructural enhancements in order to enable these changes to occur. At post-primary level, a majority of DLT respondents indicated that there was Significant or Moderate change on all ten outcome measures (see Figure 2.25). There was, however, variation across some of the items. For example, approximately two-fifths of respondents indicated that there was No change or Minor change in respect of the following items: students’ homework or study activities (40%); decisions relating to enhancing technical support or maintenance (41%); students’ interest and engagement in learning activities (43%); teachers assessment practices (45%); decisions relating to enhancing broadband/wifi connectivity or reliability (45%). The mean score for the scale DLT Impact of DLF was significantly and substantially higher at post-primary level compared with primary (mean post-primary 56.3 (SD 16.97) compared with mean primary 46.7 (SD 19.54); p<0.005). This finding suggests that post-primary schools in the sample have experienced a higher degree of change in outcomes related to the impact of the DLF. No significant differences were observed for this scale between schools, either by enrolment size or DEIS status (primary and post-primary) or by sector (post-primary only).

73
There were a couple of strong positive correlations with this scale at primary level, and there were a couple of significant correlations for this scale with other scales at post-primary level (see Appendix 2, Tables A2.2a and A2.2b). Figure 2.24. DLT Leader/Principal ratings of the impact of the DLF in the school to date, primary schools – scale: DLT Impact of DLF
96
77
65
65
56
52
46
44
44
41
30
3
22
30
31
29
36
31
39
49
50
45
1
1
5
4
15
12
23
18
7
8
25
0 10 20 30 40 50 60 70 80 90 100
Other area (n=99)
Students homework or study activities (n=101)
Decisions relating to enhancing technical support ormaintenance (n=98)
Teachers assessment practices (n=99)
Decisions relating to enhancing broadband connectivity(n=99)
Emphasis on use of DTs in school policies or guidelines(n=100)
Sharing of documents or resources among teachers (n=98)
Collaborative practices among teachers (n=98)
Teaching and learning activities during class time (n=101)
Students interest and engagement in learning activities(n=101)
Decisions relating to enhancing DT infrastructure (n=98)
No change/Minor change Moderate change Significant change

74
Figure 2.25. DLT Leader/Principal ratings of the impact of the DLF in the school to date, post primary schools – scale: DLT Impact of DLF
Finally, for this section, respondents were asked to rate 10 school-level challenges in relation to the implementation of the DLF. The scale DLF Implementation Challenges assessed the ongoing challenges related to DLF embedding, including the overall timeline for implementation of the DLP, DT infrastructure, DLT Leaders' own perception of the value of using DTs, and leadership from school management. Results for individual items in the scale have been collapsed to 4 categories for reporting (Highly/Moderately challenging, Somewhat challenging, Not challenging, Does not apply/did not occur). Higher scores on the scale DLF Implementation Challenges indicate fewer implementation challenges for schools. Results for primary schools are displayed in Figure 2.26 and post-primary school results are displayed in Figure 2.27.
86
45
45
43
41
40
26
17
15
13
10
14
33
54
52
49
51
57
59
45
35
58
23
2
5
10
9
17
23
40
52
32
0 10 20 30 40 50 60 70 80 90 100
Other area (n=48)
Decisions relating to enhancing broadband connectivity/wificonnectivity or reliability (n=48)
Teachers assessment practices (n=49)
Students interest and engagement in learning activities(n=49)
Decisions relating to enhancing tech. support or maintenance(n=48)
Students homework or study activities (n=49)
Teaching and learning activities during class time (n=49)
Emphasis on use of DTs in school policies or guidelines (n=48)
Collaborative practices among teachers (n=48)
Sharing of documents or resources among teachers (n=49)
Decisions relating to enhancing DT infrastructure (n=49)
No change/Minor change Moderate change Significant change

75
Figure 2.26. DLT Leader/Principal ratings of the challenges in implementing the DLF in the school to date, primary schools - scale: DLF Implementation Challenges
A couple of key findings are evident from the primary level results. First, around half or more rated the following aspects as Highly/Moderately challenging: gathering evidence to support the work of the programme (49%); DT infrastructure (54%); and dedicated time for staff to implement the steps involved in the DLF (69%), while about two in four respondents rated connectivity and provision of overall leadership as highly challenging. Second, most other items were rated by a majority as Highly/Moderately or Somewhat challenging. Such results indicate that implementation difficulties represent a significant challenge for most primary schools at the time of the survey, in particular issues relating to time to implement the programme as well as DT infrastructure.
69
54
49
44
41
39
30
30
29
16
22
30
29
38
40
35
49
33
46
42
5
15
15
15
17
23
20
10
26
34
3
7
2
2
3
2
27
9
0 10 20 30 40 50 60 70 80 90 100
Dedicated time for staff to implement the steps involvedin the DLF (n=98)
DT infrastructure (n=96)
Gathering evidence to support the work of theprogramme (n=97)
The overall timeline for implementation (n=99)
Providing overall leadership for the programme on thepart of school management (n=97)
Broadband connectivity/wifi connection or reliability(n=97)
Staff level of competency in managing and using DTs inteaching and learning (n=100)
Fit between the aims of the DLF and the structure of thestandardised assessments (n=99)
Sharing the learning of the DLT across all staff in theschool (n=97)
Staff culture and attitudes towards DTs leading todifficulty in 'buy in' (n=100)
Highly/Moderately challenging Somewhat challenging Not challenging/ Does not apply/did not occur
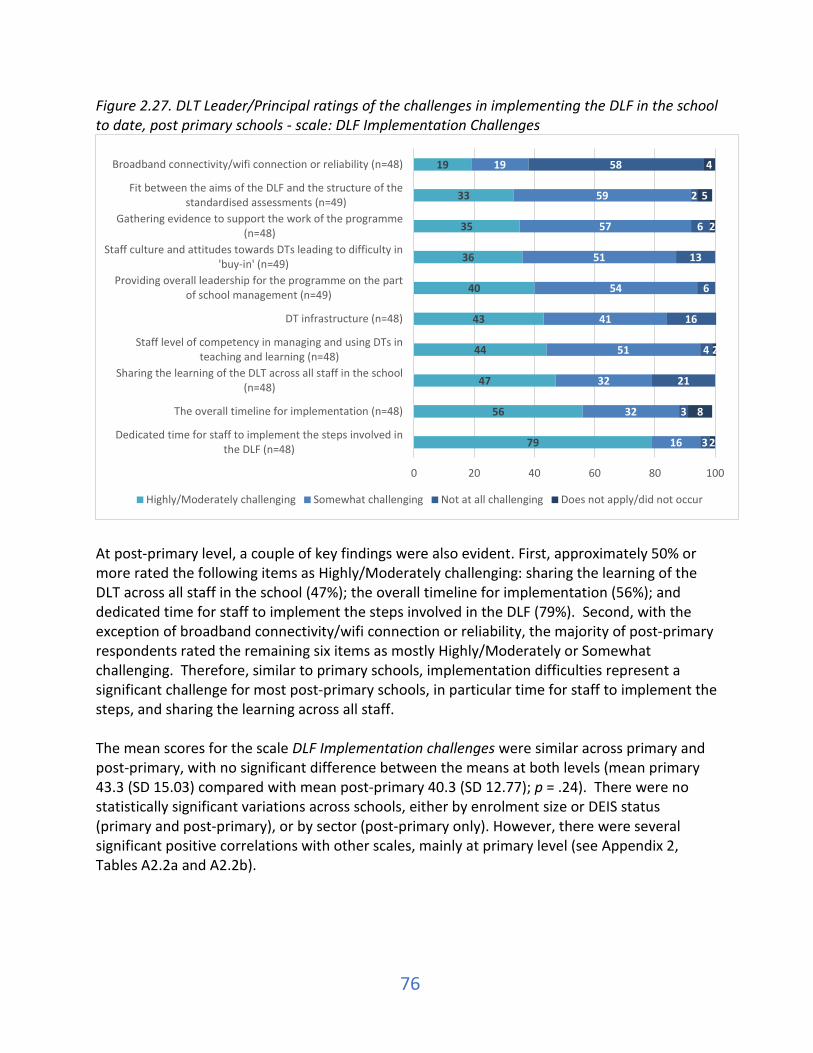
76
Figure 2.27. DLT Leader/Principal ratings of the challenges in implementing the DLF in the school to date, post primary schools - scale: DLF Implementation Challenges
At post-primary level, a couple of key findings were also evident. First, approximately 50% or more rated the following items as Highly/Moderately challenging: sharing the learning of the DLT across all staff in the school (47%); the overall timeline for implementation (56%); and dedicated time for staff to implement the steps involved in the DLF (79%). Second, with the exception of broadband connectivity/wifi connection or reliability, the majority of post-primary respondents rated the remaining six items as mostly Highly/Moderately or Somewhat challenging. Therefore, similar to primary schools, implementation difficulties represent a significant challenge for most post-primary schools, in particular time for staff to implement the steps, and sharing the learning across all staff. The mean scores for the scale DLF Implementation challenges were similar across primary and post-primary, with no significant difference between the means at both levels (mean primary 43.3 (SD 15.03) compared with mean post-primary 40.3 (SD 12.77); p = .24). There were no statistically significant variations across schools, either by enrolment size or DEIS status (primary and post-primary), or by sector (post-primary only). However, there were several significant positive correlations with other scales, mainly at primary level (see Appendix 2, Tables A2.2a and A2.2b).
79
56
47
44
43
40
36
35
33
19
16
32
32
51
41
54
51
57
59
19
3
3
21
4
16
6
13
6
2
58
2
8
2
2
5
4
0 20 40 60 80 100
Dedicated time for staff to implement the steps involved inthe DLF (n=48)
The overall timeline for implementation (n=48)
Sharing the learning of the DLT across all staff in the school(n=48)
Staff level of competency in managing and using DTs inteaching and learning (n=48)
DT infrastructure (n=48)
Providing overall leadership for the programme on the partof school management (n=49)
Staff culture and attitudes towards DTs leading to difficulty in'buy-in' (n=49)
Gathering evidence to support the work of the programme(n=48)
Fit between the aims of the DLF and the structure of thestandardised assessments (n=49)
Broadband connectivity/wifi connection or reliability (n=48)
Highly/Moderately challenging Somewhat challenging Not at all challenging Does not apply/did not occur

77
2.5 Inter-relationships between scales In Chapter 4, we take a more in-depth look at three key outcomes of the implementation of the DLF: perceived impact, DT engagement by teachers and students, and changes in the level of embedding of DTs between baseline and wave 1. This section focuses on the intercorrelations (inter-relationships between two of these three outcomes, since they are measured as scales. The third outcome is measured by a difference). The two scales of focus in this section are: DLT Impact of DLF and DT teacher and pupil engagement. Firstly, the scale DLT Impact of DLF assessed the perceived overall level of impact of the school's implementation of the DLF on teaching, learning and assessment activities, student engagement, collaborative practices, and policy and decision making relating to school's DT. For the scale DLT Impact of DLF, correlations in excess of 0.3 were found with the following scales at primary level:
• Constructivist beliefs (r=.31) • Ease with digital devices (r=.33) • DT infrastructure and connectivity (r=.44) • DT Teacher and pupil engagement (r=.50) • Attitudes to DTs for pupil learning (r=.52).
At post-primary level, a correlation in excess of 0.3 was found for the scale DLT Impact of DLF with the scale DT teacher and student engagement (r=.50). At primary level, there were a few moderate, and two strong correlations, for the scale DLT Impact of DLF, and there was one strong correlation at post-primary level. Findings suggest that, at primary level, perceived higher levels of impact associated with the implementation of the DLF was associated with: more positive attitudes to constructivist approaches to teaching and learning in general; was associated with a higher level of familiarity with and confidence in using digital technologies; and also was associated with higher perceived adequacy of the school’s DT infrastructure and connectivity. At primary level also, higher levels of impact associated with the implementation of the DLF was strongly associated with more positive attitudes to the use of digital technologies for pupil learning. At both primary and post-primary levels, DLT Impact of DLF was strongly associated with a higher degree of teacher and pupil engagement with DTs, as rated by DLT respondents. For the second scale in question for this section, DT teacher and pupil engagement assessed the perceived overall level of teachers' and pupils’ levels of knowledge, skills and engagement with DTs for teaching and learning. Correlations in excess of 0.3 were found for the scale DT teacher and pupil engagement with the following scales at primary level:

78
• Attitudes to DTs for pupil learning (r=.37) • Professional learning suitability (r=.38) • DLT ease with digital devices (r=.45) • DT infrastructure and connectivity (r=.55).
At post-primary level, the scale DT teacher and student engagement was correlated with the scale DT infrastructure and connectivity (r=.51) (see Appendix 2, Tables A2.2a and A2.2b for all intercorrelations at primary and post-primary level). At primary level there were a few moderate, and one strong correlation, for the scale DT teacher and pupil engagement, and there was one strong correlation at post-primary level. Findings suggest that, at primary level, higher degrees of teacher and pupil engagement with DTs was associated with more positive attitudes to the use of digital technologies for pupil learning; was associated with a higher degree of suitability of the professional learning components which DLT leaders engaged in; and was also associated with a higher level of familiarity with and confidence in using digital technologies. At both primary and post-primary levels, higher degrees of teacher and pupil engagement with DTs was strongly associated with higher perceived levels of adequacy of the school’s DT infrastructure and connectivity. 2.6 Key points from Chapter 2 In all, 169 schools submitted responses to the DLT Leader (or Principal) questionnaire between November 2019 and March 2020. Of these, 109 were from primary schools, and 60 were from post-primary schools. At both primary and post-primary level, slightly more than half of responses were from school Principals (58% at primary, and 52% at post-primary). More than a third of respondents identified themselves as being ICT or Digital Learning Coordinators (38% at primary and 35% at post-primary). DLT leaders reported that DLTs tended to consist of staff members who volunteer – and hence are likely to already be ‘digitally savvy’. While this represents an advantage to the work of the DLT, it could also bring challenges, for example in terms of level of awareness of the issues faced by less ‘digitally savvy’ staff and sharing the learning across all staff (and indeed this was identified as one of the key challenges at post-primary level). Around nine in ten schools were focused on the Teaching and Learning dimension of the DLF. This is not surprising, given that the required focus for school self-evaluation from 2016 to 2020 is the dimension of teaching and learning only. It will be of interest to see whether the focus of schools shifts to Leadership and Management as time progresses, though it should also be noted that a majority of respondents indicated that they expected that it would take at least 1-2 years to achieve highly effective levels of practice in the areas selected for focus in their DLPs. There is evidence of high levels of implementation of digital technology related policies and guidelines at both primary and post-primary levels, and this is a very positive finding. Over 90% of respondents reported having policies or guidelines on acceptable use of technology in school, acceptable use of the internet in school, and online safety. As might be expected,

79
policies/guidelines on students’ own device usage was somewhat more common at post-primary level. There is evidence of extensive consultation on these policies and guidelines, with teachers and schools’ management boards, with less consultation with parents and students. This is consistent with the finding that just 7-9% of schools’ DLTs included students, and 3-5% included parents. Turning specifically to the DLP, over 90% of schools at both primary and post-primary levels had either begun or completed their DLPs. At both primary and post-primary, teaching staff were consulted extensively about the DLP; however, school management boards were consulted more frequently at post-primary than at primary level. At both primary and post-primary levels, parents was consulted relatively extensively on the DLP, in contrast to students, who were consulted with extensively in fewer than 10% of schools. Hence, the student voice is not evidence in the development of the DLP in a majority of schools. In a quarter or so of schools, other groups such as IT support, the PDST and/or school SNAs were consulted on the development of the DLP. A majority of respondents (about 80% at primary and 90% at post-primary) had visited the PDST’s DLPlanning.ie website, and website visits were not very frequent. However, all sections had been visited at least once at some point, suggesting that all sections had at least some relevance for a majority of respondents. A large majority of post-primary schools (93%) incorporated their DLP into the school’s overall school self-evaluation in some manner (in a complementary parallel manner, as a subset of SSE, or as the main focus of SSE); the corresponding figure for primary schools was 74%. Broadly speaking, DLT leaders’ levels of comfort and familiarity with DTs in general were moderate to high among respondents, particularly at post-primary level (with scale means of 65 for primary schools and 74 for post-primary schools). Similarly, participants expressed a very positive view of DTs for supporting learning, as evidenced in high scale means (75 at primary and 76 at post-primary). Respondents’ participation in CPD or professional learning in the area of DTs was high. For example, in the two years prior to the survey, at primary level, 78% of respondents had attended a relevant summer course at post-primary level, 83% had participated in relevant workshops. Also, a very high percentage of respondents had participated in one or more of various DT-related initiatives or events in the two years preceding the survey, most commonly Tech space, Trinity Access 21, School Excellence Fund Digital Initiative, and EU Code Week. These findings indicate that DLT leaders are a highly engaged group of professionals, clearly aware of the need for professional learning and participation in DT and relevant initiatives or events. Asked about their current levels of practice in terms of the standards of the DLF, about half of respondents at both levels indicated that their school was mostly or all at the level of

80
effective practice. Just 6% or post-primary and 7% of primary DLT respondents indicated that they were mostly or all at highly effective practice. DLT leaders’ views on the level at which their school was at in terms of the level of embedding of DTs for teaching, learning and assessment was measured on a scale ranging from ‘Emerging’ to ‘Highly Advanced’. Post-primary respondents rated their schools as being at a higher level of embedding: 78% of post-primary respondents described the level of embedding as intermediate to highly advanced, the corresponding figure for primary schools was 44%. At the baseline survey, 58.5% of post-primary respondents described their level of embedding as intermediate to highly advanced; this figure was 43% for primary schools. Ratings of level of embedding and level of effective practice tended to align quite closely to one another. Teachers’ access to school-owned computing devices was high – around 90% at both primary and post-primary levels. About 55% of respondents indicated that all pupils in the school had regular access to a school-owned computing device, with desktops more common in post-primary schools, and iPads more common in primary schools. However, access for pupils to their own computing device at home was a bit lower, particularly at primary level. Desktop computers and laptops were the most common types of device used by teachers at post-primary level. In contrast, at primary level, iPads and laptops were the most common types of devices used by pupils. Technical support and maintenance was most commonly provided by a mixture of internal and external sources. The effectiveness of technical support was rated significantly and substantially higher at post-primary than primary level, with scale means of 71 and 54, respectively. Technical support effectiveness was unrelated to enrolment size and mode of support (internal, external or a mixture) at post-primary level. At primary level, internal technical support was more common in smaller schools, while external technical support was more common in larger schools. Although not statistically significant, lower levels of technical support effectiveness were found in smaller primary schools and primary schools with internal (rather than external or mixed internal/external) technical support. On a scale measuring DLT leaders’ views on the level of DT infrastructure and connectivity required for teaching, learning and assessment, primary (47) and post-primary schools (54) had scores in the moderate range. An examination of the individual questions making up this scale indicates some important variations. A large majority of both primary and post-primary schools rated the availability of computing devices for teaching, learning and assessment as good, very good or excellent. For many of the other items, such as age and condition of computing devices, availability of suitable software and awareness of suitable software there was considerable variation across schools at both primary and post-primary levels. The availability of digital tools (peripherals) was rated as fair or poor in more than 70% of primary and post-primary schools. Variations in schools’ perspectives on DT infrastructure and connectivity as well as the low ratings for peripheral device infrastructure pose significant challenges for some schools in DLF implementation.

81
Primary and post-primary schools also obtained scale means in the moderate range (50 in both cases) on a scale measuring teacher and student engagement in DTs. There is a strong relationship between scores on the infrastructure and connectivity scale and the DT engagement scale (r=.55 at primary and r=.51 at post-primary). On a scale measuring the impact of having implemented the DLF since baseline, post-primary schools reported a substantially and significantly higher mean score than primary schools, suggesting a higher impact at post-primary (56 and 47, respectively). The pattern of results suggests a greater focus at primary on teaching and learning activities, and a greater focus at post-primary on whole school approaches. Both primary and post-primary schools reported a high level of change in their focus on DT infrastructure. Results also indicate a need for schools to focus more on embedding DTs specifically in assessment going forward. At primary level, four items were rated as having undergone a moderate or significant change by around 55-70% of respondents: decisions relating to enhancing DT infrastructure; students’ interest and engagement; teaching and learning activities; and collaborative practices among teachers. In contrast, between 65% and 77% of respondents reported no change in teachers’ assessment practices, homework or study activities, and decisions regarding the enhancement of technical support/maintenance. At post-primary level, around three-quarters to nine-tenths of respondents reported moderate or significant change in decisions relating to enhancing DT infrastructure; sharing of documents/resources; collaborative practices among teachers; and emphasis on DTs in school policies/guidelines. In contrast, lower levels of change (with 45% reporting no change) were found for assessment practices and decisions relating to broadband/wifi. DLT leaders were also asked about implementation challenges, ranging across issues such as dedicated time for implementation, providing leadership, sharing learning across the school, staff DT competency levels, achieving ‘buy in’, and DT infrastructure. Results indicate that implementation difficulties in a range of areas, ranging from time for implementation to infrastructure/connectivity and leadership, represent a significant challenge for most schools which in turn suggests the need for multiple solutions/approaches to these challenges. Finally, no variations were found in the scores on any of the various questionnaire scales between schools of different enrolment size, DEIS status, or (in the case of post-primary schools) sector. This could be interpreted to mean that schools do not differ to one another with respect to these scales when it comes to their implementation of the DLF. One important caveat about this interpretation, however, is that the measures are self-reports are, for the most part, are not explicitly linked to standards or benchmarks. An exception to this is the DLT leaders’ assessment of the level of effective or highly effective practice, since this is tied directly to the DLF, though it is reasonable to suppose that the meaning of effective or highly effective will vary depending on local context and needs. The perspectives giving rise to these self-reports are likely calibrated not with reference to objective national standards, but to the respondents’ experience in their current school or local community. An independent objective assessment of schools’ level of embedding of DTs and/or levels of practice across schools, perhaps by the Inspectorate, would provide a complementary set of results.

82
Chapter 3: Key findings from the DLF Wave 1 teacher questionnaires 3.1 Chapter overview This chapter details the findings from the DLF Wave 1 questionnaire for teachers at primary and post-primary level. As with Chapter 2, notwithstanding the significant structural, curricular, assessment etc. differences between post-primary and primary schools, the chapter draws comparisons between the two levels where appropriate, particularly where common patterns of results emerge. It should be noted that special schools are combined with primary schools for reporting purposes. Findings are presented in four sections, with supplementary tables and figures in Appendix 3:
• Description of respondents and schools • Key findings from the Teacher questionnaire - primary and post-primary schools • Overlaps and divergence in teachers’ and Digital Learning Team Leaders’ perspectives • Chapter summary and conclusions.
The results are all based on the survey questions, and some of these questions have been combined to form scales. See Chapter 1, Section 1.4.1, for a description of the survey content, and Chapter 1, Section 1.6.2, for a description of how these scales were constructed. Appendix 3, Table A3.1 and Table A3.2 provide information on the reliabilities of these scales, descriptives, and comparisons by school size, DEIS status, and sector (post-primary only). The relationships between the scores on these scales (the intercorrelations) are shown in Table A3.3 and Table A3.4 for primary and post-primary respondents, respectively. For all scales, higher scores indicate a more positive outcome. All of the scales range from 0-100 so that they can be directly compared to one another. Item-level statistics for any scales which are mentioned in this chapter but whose results are not described at the item level can be found in Appendix 3. Table 3.1 provides a description of the scales that are reported in this chapter. When we describe the results of these scales, we illustrate what each scale measures by showing the individual item responses. We also compare scale means across primary and post-primary respondents and, within level, we describe whether or not the scale means vary significantly by key school characteristics, such as DEIS status and enrolment size. One caveat for the interpretation of numbers in this chapter concerns the low teacher response rates overall, as noted in Chapter 1. The teacher weight used in the analyses presented in this chapter accounts for this variation in teacher respondents within schools. The results, however, should not be interpreted as being representative of the population of teachers. Although the teacher sample was designed to be nationally representative, the low response rates from teachers mean that the results cannot be generalised to the population of teachers.

83
Table 3.1. Teacher scale names and descriptions: Primary and post-primary Scale name Description (High) Teacher usage of DLP website
Frequency of use of different parts of the DLPlanning.ie website by teachers (e.g. DL Plan template document, DL framework document, Sample videos of best practice, Statements of effective and highly effective practice)
(High) Teacher DT usage frequency
Teacher use of digital technologies for variety of TLA purposes (e.g. to present information of give class instruction to students, to publish students' work online, or to use social networks in teaching and learning)
(High) Teacher ease with digital devices
Level of familiarity with and confidence in using digital technologies
(High) Teacher professional learning suitability
Extent to which digital technology-related CPD attended has included a focus on relevant elements (e.g. curriculum materials, content knowledge, teaching and learning practices, participation with other teachers)
Positive teacher attitudes to DT v Traditional methods for students
Teacher attitudes towards using DT versus traditional methods for TLA as it relates to their students (e.g. whether DTs distract students from learning, or whether they result in poorer writing skills among students)
Positive teacher attitudes to DT v Traditional methods for resources
Teacher attitudes towards using DT versus traditional methods for TLA as it relates to their resources (e.g. whether using DTs gives them less time to cover the curriculum, or whether the existing digital tools and resources fit their TLA needs)
(High) Teacher constructivist beliefs
Teacher level of endorsement of statements of constructivist learning (e.g. That students learn best by finding solutions to problems on their own).
(High) Student engagement
Teacher-rated level of student engagement in learning (not specific to digital learning), including the extent to which they prefer to learn by rote and repetition, and their interest in developing their own understanding of the material covered
(High) DT infrastructure and connectivity
Perceived adequacy of school's DT infrastructure and connectivity to meet teaching, learning and assessment needs
(High) DT teacher and student engagement
Perceived overall level of teachers' and students' levels of knowledge, skills and engagement with DTs for teaching and learning
(High) Technical support effectiveness
Perceived extent to which tech support is effective in keeping computing and other devices in good repair and up to date, and for maintaining connectivity
(Low) Infrastructure problems
The frequency with which various problems with DT infrastructure impede TLA (e.g. Problems with internet safety, Problems with connectivity or speed, or Problems with software). Higher scores correspond to fewer problems
(Low) technical support disruption
The level of disruption caused by inadequate technical support (e.g. Availability of technical support, Speed with which technical issues are fixed). Higher scores correspond to less disruption due to inadequate technical support.
(High) DLF Impact Perceived overall level of impact of the school's implementation of the DLF on teaching, learning and assessment activities, student engagement, collaborative practices, and policy and decision making relating to school's DT
(Low) DLF implementation challenges
Ongoing challenges related to DLF embedding, including the Overall timeline for implementation of the DLP, DT infrastructure, Leadership from school management, teachers' perception of the value of using DTs. Higher scores mean fewer challenges
* See Appendix 3, Table A3.1-A3.4, for scale reliabilities and intercorrelations.

84
3.2 Description of respondents Questionnaires were completed online between November 2019 and March 2020, with almost all responses received prior to the onset of the COVID 19 pandemic. At primary level, 495 usable teacher responses were submitted from 117 schools. At post-primary level, 443 usable teacher responses were received from 71 schools. Respondents were asked about the year they joined their current school, their age group, the number of teachers in their school, their educational qualifications, whether their school had established a Digital Learning Team (DLT), and whether they were on the school’s DLT. The majority of respondents at both primary (58%) and post-primary level (63%) began employment at their current school on or before the 2013-2014 school year. The age profile of respondents was roughly similar between the two levels, though post-primary respondents tended to be slightly older (46% of primary school respondents were aged 40 or over, vs 58% of post-primary respondents). The educational qualifications of primary and post-primary respondents differed as well, perhaps as a result of the different educational requirements for primary and post-primary teachers. At primary level, 25% of respondents had a Cert or Diploma (34% at post-primary), while 37% had a Master’s or Higher Diploma (58% at post-primary). Approximately half of respondents at primary level were school Principals (46%), compared with 5% of respondents at post-primary. A further 23% of primary respondents were deputy Principals, compared with 5% of post-primary respondents. The most commonly held position for post-primary respondents was class or subject teacher (65%, vs 10% for primary respondents). Therefore, while reference to “teacher respondents” will be made throughout this chapter, it should be kept in mind that not all respondents who answered the teacher questionnaire were solely in a teaching role. 3.3 Key findings from the Teacher questionnaire 3.3.1 Digital technology characteristics of participants’ schools About four-fifths of respondents (79% at primary; 81% at post-primary) indicated that their school had established a Digital Learning Team (DLT) at the time of the survey. Some respondents were unsure as to whether their school had established a DLT (11% at primary; 15% at post-primary). Asked about their DLT membership, 17% of primary respondents reported being their school’s DLT leader, compared to 25% of post-primary respondents. At primary level, 41% of respondents reported being on the DLT (but not the DLT leader), while 42% reported not being on the DLT. These figures were 24% and 51% for post-primary respondents, respectively. At the time of the survey, 57% of primary respondents reported that their school had completed their Digital Learning Plan (DLP), compared with 37% of post-primary respondents. An equal proportion of primary and post-primary schools had not yet developed their DLP (7% in each case). The remaining third (35%) of primary respondents’ schools and just over half (57%) of post-primary respondents’ schools had DLPs which were “in progress” (see Figure 3.1).
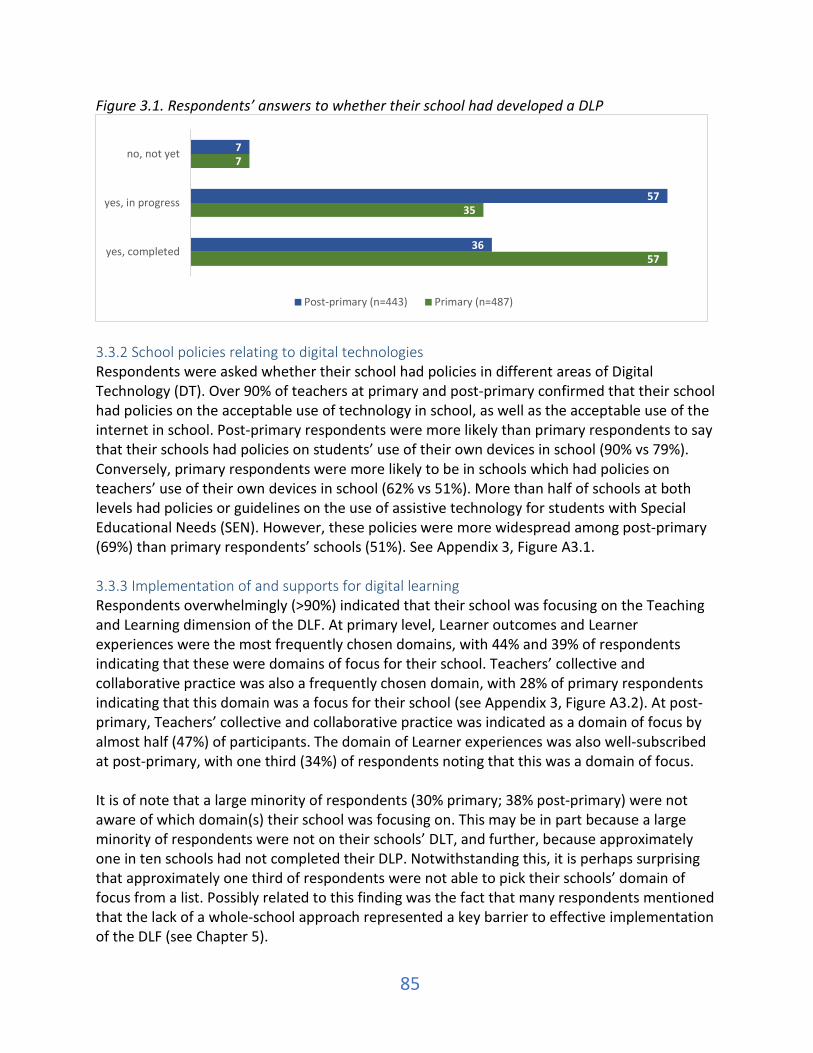
85
Figure 3.1. Respondents’ answers to whether their school had developed a DLP
3.3.2 School policies relating to digital technologies Respondents were asked whether their school had policies in different areas of Digital Technology (DT). Over 90% of teachers at primary and post-primary confirmed that their school had policies on the acceptable use of technology in school, as well as the acceptable use of the internet in school. Post-primary respondents were more likely than primary respondents to say that their schools had policies on students’ use of their own devices in school (90% vs 79%). Conversely, primary respondents were more likely to be in schools which had policies on teachers’ use of their own devices in school (62% vs 51%). More than half of schools at both levels had policies or guidelines on the use of assistive technology for students with Special Educational Needs (SEN). However, these policies were more widespread among post-primary (69%) than primary respondents’ schools (51%). See Appendix 3, Figure A3.1. 3.3.3 Implementation of and supports for digital learning Respondents overwhelmingly (>90%) indicated that their school was focusing on the Teaching and Learning dimension of the DLF. At primary level, Learner outcomes and Learner experiences were the most frequently chosen domains, with 44% and 39% of respondents indicating that these were domains of focus for their school. Teachers’ collective and collaborative practice was also a frequently chosen domain, with 28% of primary respondents indicating that this domain was a focus for their school (see Appendix 3, Figure A3.2). At post-primary, Teachers’ collective and collaborative practice was indicated as a domain of focus by almost half (47%) of participants. The domain of Learner experiences was also well-subscribed at post-primary, with one third (34%) of respondents noting that this was a domain of focus. It is of note that a large minority of respondents (30% primary; 38% post-primary) were not aware of which domain(s) their school was focusing on. This may be in part because a large minority of respondents were not on their schools’ DLT, and further, because approximately one in ten schools had not completed their DLP. Notwithstanding this, it is perhaps surprising that approximately one third of respondents were not able to pick their schools’ domain of focus from a list. Possibly related to this finding was the fact that many respondents mentioned that the lack of a whole-school approach represented a key barrier to effective implementation of the DLF (see Chapter 5).
57
35
7
36
57
7
yes, completed
yes, in progress
no, not yet
Post-primary (n=443) Primary (n=487)

86
Answers to a question about how often respondents visited the DLPlanning.ie website suggest that while post-primary respondents were more likely than primary respondents to have visited the site on many occasions, they were also more likely not to have visited it at all. Post-primary respondents were more likely than primary respondents (12% vs 7%) to have visited the site five or more times. However, about half of post-primary respondents (52%) had not visited the site at all, compared to 40% of primary respondents. Responses to these questionnaire items were combined in a scale for analysis, the Teacher usage of DLP website scale. Higher scores indicate more frequent and extensive use of the DLPlanning.ie website (see Figure A3.3). The mean level of usage was comparable for primary and post-primary (12.9 vs 11.3). The high reliability of this scale (>.95) indicates that respondents who used one part of the website were more likely to use other parts of the website. That is, that participants either used various part of the website, or did not use it at all. Primary respondents from a school with a large enrolment (≥201) were more likely not to use the website than those in schools with a very small enrolment (≤60) (mean 8.7 vs 15.3). Variation by enrolment size was not present at post-primary. However, at post-primary, non-DEIS respondents were more likely to have used the website than DEIS respondents (mean 12.4 vs 7.8). Additionally, secondary schools reported lower levels of website use than community or vocational schools (mean 9.6, 11.6, and 13.7). It is of note that while these differences exist, overall usage of the website remained very low across all types of school. One reason even among those who had used it at some point may be that many of the resources available on it are downloadable, and as such do not necessitate multiple site visits. In addition to this, respondents were asked to indicate the frequency with which they used different parts of the DLPlanning.ie website. There were five response options in total: Never, About once per month or less, About once every two weeks, About once per week, or More than once per week. At both primary and post-primary, the most common response was “Never” for all parts of the DLPlanning.ie website, suggesting that a majority of respondents were not using the website at all. In particular, the sample downloadable questionnaire and other documents were accessed infrequently – 64% of primary and 71% of post-primary respondents indicated that they had never used them. Less than 10% of respondents at either level reported using any part of the website more than once fortnightly (See Appendix 3, Figure A3.4 and Figure A3.5). 3.3.4 Participation in professional learning relevant to DLF implementation Respondents were asked to indicate whether they had participated in any digital technology-related professional learning in the last two years. Note that primary school respondents were asked about summer courses and post-primary school respondents were asked about workshops, as these better reflect the kinds of professional learning at these two levels of the education system. Summer courses (39%) and In-school Professional Development Service for Teachers (PDST) support (27%) were attended most frequently by primary school respondents

87
in the last two years. Digital Learning Plan Online courses were the least frequently attended by primary respondents. At post-primary, the most frequently attended professional learning activities over the last two years were In-school PDST support (49%) and Workshops (38%). In contrast, other PDST online courses were the least frequented by post-primary respondents (see Table 3.2). Table 3.2. Percentages of primary and post-primary teachers’ participation in professional learning relevant to DLF implementation in the last two years
Primary (n=423)
Post Primary (n=380)
In-school PDST support 27 49 Workshops n/a 38 PDST digital technologies face-to-face course 17 20 Summer Course 39 n/a DLF seminar 23 17 Digital Learning Plan Online Course 4 12 DLF webinars 8 12 Other PDST online course 9 10 Other 12 17
Teachers were asked about features of the professional learning in which they participated, such as participation alongside other teachers in the school, focus on how to teach content and how students learn it, and focus on content knowledge (see Figures 3.2 and 3.3). At both primary and post-primary, the picture was similar. Primary school teacher responses were widely distributed across all five items, with 29-41% responding ‘A significant component/To a great extent’, and 59-71% responding ‘Did not include/N/A’ or ‘Included a small component’ (see Figure 3.2). At post-primary, 29-45% indicated that the item in question ‘Included a significant component/To a great extent’ and 56-71% responding ‘Did not include/N/A’ or ‘Included a small component’ (see Figure 3.3). Comparisons across primary and post-primary on these items indicate that there was a greater perceived focus on teachers participating alongside other teachers at post-primary compared with primary, while focus on content knowledge and curriculum materials was perceived to be lower at post-primary than at primary level.

88
Figure 3.2. Teacher ratings of curriculum and content related components of professional learning they have participated in, primary schools - scale: professional learning suitability
Figure 3.3. Teacher ratings of curriculum and content related components of professional learning they have participated in, post-primary schools - scale: professional learning suitability
The responses to the items shown in Figures 3.2 and 3.3 were combined to form a scale measuring Teacher professional learning suitability, which assesses the extent to which teachers’ professional learning in DTs contained elements of constructivism and pedagogical content knowledge. Higher scores indicate a higher degree of suitability of the professional learning components in terms of the approaches underpinning the DLF. This scale has four response options, ranging from ‘Did not include/N/A’ to ‘Included to a great extent’. The higher two response options have been collapsed for reporting. The mean score for primary schools on the scale was 39.6 (SD 24.3), vs 37.8 for post-primary (SD 25.4). Schools did not differ on the scale, by enrolment size or DEIS status. However, a difference was observed at post-primary by sector. Community and comprehensive schools had a much lower mean score (mean 30.1) on the Professional learning suitability scale than secondary (mean 48.6) and vocational schools (mean 45.5).
20
21
20
23
33
39
39
40
46
38
41
40
40
32
29
0 20 40 60 80 100
Focus on content knowledge (n=405)
Focus on curriculum materials (n=400)
Focus on both professional development specific tocurriculum materials (n=404)
Focus on how to teach the content, and how studentslearn it (n=406)
Teachers participated alongside other teachers in theirschool (n=404)
did not include/NA included a small component included a significant component/to a great extent
29
29
28
32
25
42
40
39
37
31
29
31
33
30
45
0 20 40 60 80 100
Focus on content knowledge (n=346)
Focus on curriculum materials (n=352)
Focus on both professional development specific tocurriculum materials (n=350)
Focus on how to teach the content, and how studentslearn it (n=346)
Teachers participated alongside other teachers in theirschool (n=355)
did not include/NA included a small component included a significant component/to a great extent
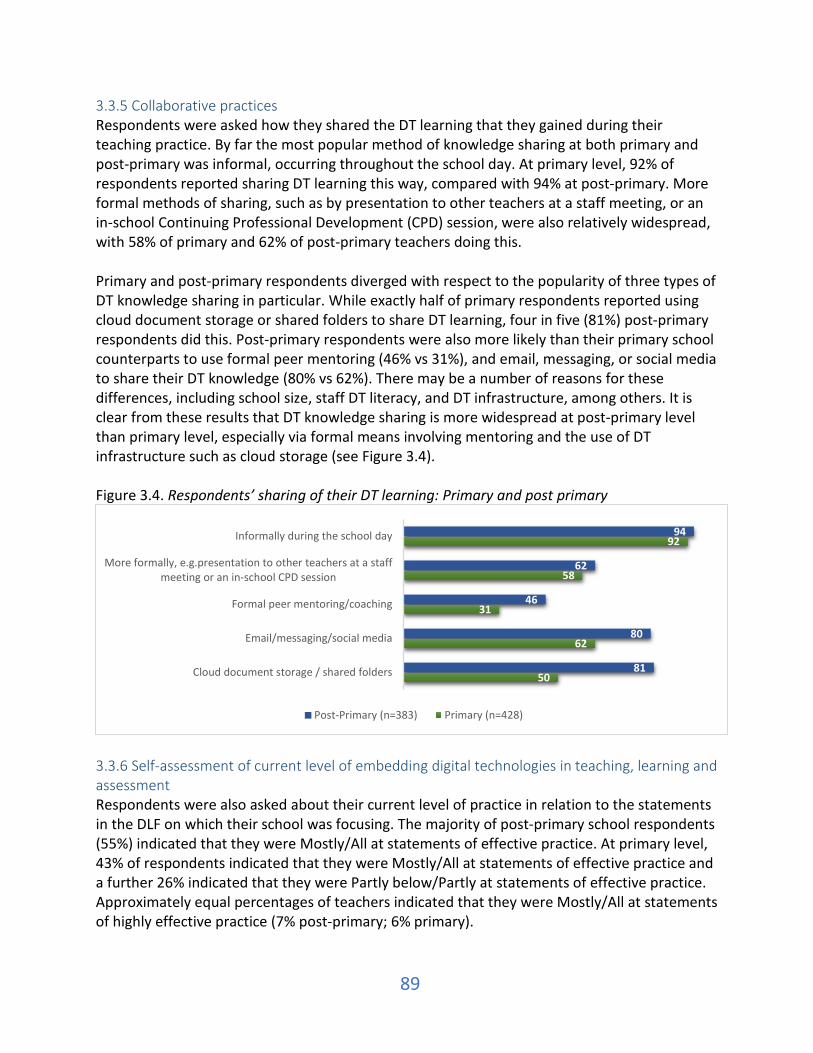
89
3.3.5 Collaborative practices Respondents were asked how they shared the DT learning that they gained during their teaching practice. By far the most popular method of knowledge sharing at both primary and post-primary was informal, occurring throughout the school day. At primary level, 92% of respondents reported sharing DT learning this way, compared with 94% at post-primary. More formal methods of sharing, such as by presentation to other teachers at a staff meeting, or an in-school Continuing Professional Development (CPD) session, were also relatively widespread, with 58% of primary and 62% of post-primary teachers doing this. Primary and post-primary respondents diverged with respect to the popularity of three types of DT knowledge sharing in particular. While exactly half of primary respondents reported using cloud document storage or shared folders to share DT learning, four in five (81%) post-primary respondents did this. Post-primary respondents were also more likely than their primary school counterparts to use formal peer mentoring (46% vs 31%), and email, messaging, or social media to share their DT knowledge (80% vs 62%). There may be a number of reasons for these differences, including school size, staff DT literacy, and DT infrastructure, among others. It is clear from these results that DT knowledge sharing is more widespread at post-primary level than primary level, especially via formal means involving mentoring and the use of DT infrastructure such as cloud storage (see Figure 3.4). Figure 3.4. Respondents’ sharing of their DT learning: Primary and post primary
3.3.6 Self-assessment of current level of embedding digital technologies in teaching, learning and assessment Respondents were also asked about their current level of practice in relation to the statements in the DLF on which their school was focusing. The majority of post-primary school respondents (55%) indicated that they were Mostly/All at statements of effective practice. At primary level, 43% of respondents indicated that they were Mostly/All at statements of effective practice and a further 26% indicated that they were Partly below/Partly at statements of effective practice. Approximately equal percentages of teachers indicated that they were Mostly/All at statements of highly effective practice (7% post-primary; 6% primary).
50
62
31
58
92
81
80
46
62
94
Cloud document storage / shared folders
Email/messaging/social media
Formal peer mentoring/coaching
More formally, e.g.presentation to other teachers at a staffmeeting or an in-school CPD session
Informally during the school day
Post-Primary (n=383) Primary (n=428)
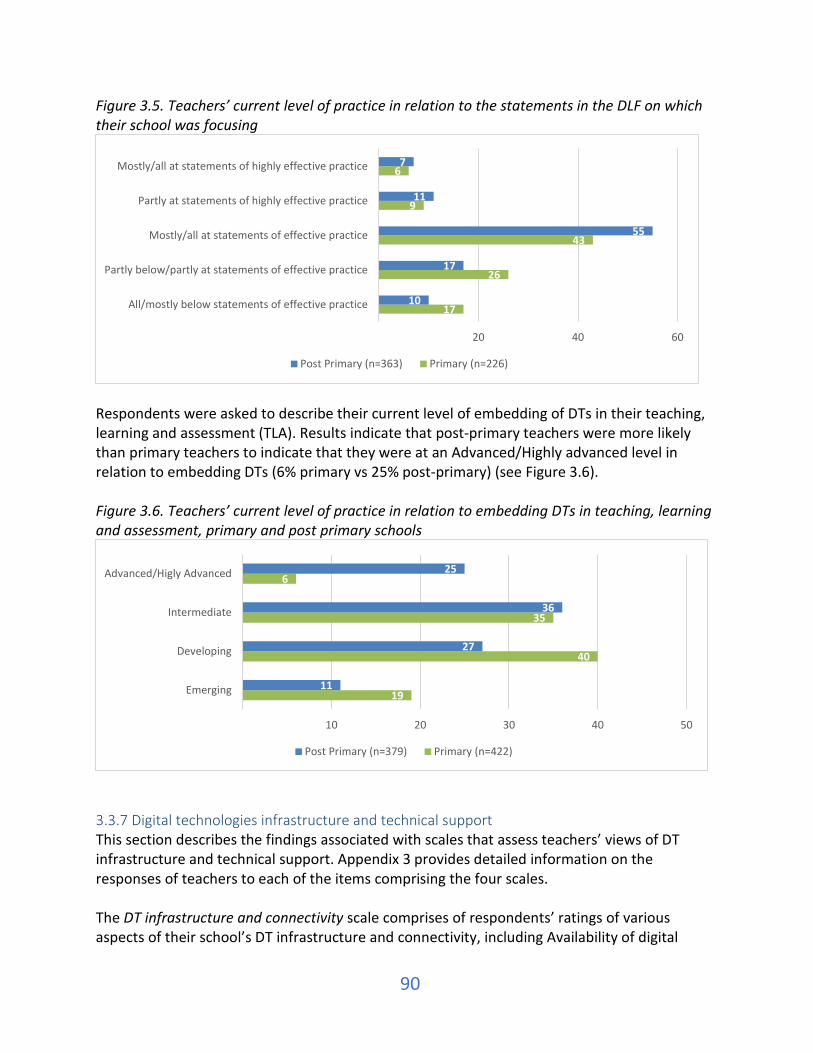
90
Figure 3.5. Teachers’ current level of practice in relation to the statements in the DLF on which their school was focusing
Respondents were asked to describe their current level of embedding of DTs in their teaching, learning and assessment (TLA). Results indicate that post-primary teachers were more likely than primary teachers to indicate that they were at an Advanced/Highly advanced level in relation to embedding DTs (6% primary vs 25% post-primary) (see Figure 3.6). Figure 3.6. Teachers’ current level of practice in relation to embedding DTs in teaching, learning and assessment, primary and post primary schools
3.3.7 Digital technologies infrastructure and technical support This section describes the findings associated with scales that assess teachers’ views of DT infrastructure and technical support. Appendix 3 provides detailed information on the responses of teachers to each of the items comprising the four scales. The DT infrastructure and connectivity scale comprises of respondents’ ratings of various aspects of their school’s DT infrastructure and connectivity, including Availability of digital
17
26
43
9
6
10
17
55
11
7
20 40 60
All/mostly below statements of effective practice
Partly below/partly at statements of effective practice
Mostly/all at statements of effective practice
Partly at statements of highly effective practice
Mostly/all at statements of highly effective practice
Post Primary (n=363) Primary (n=226)
19
40
35
6
11
27
36
25
10 20 30 40 50
Emerging
Developing
Intermediate
Advanced/Higly Advanced
Post Primary (n=379) Primary (n=422)
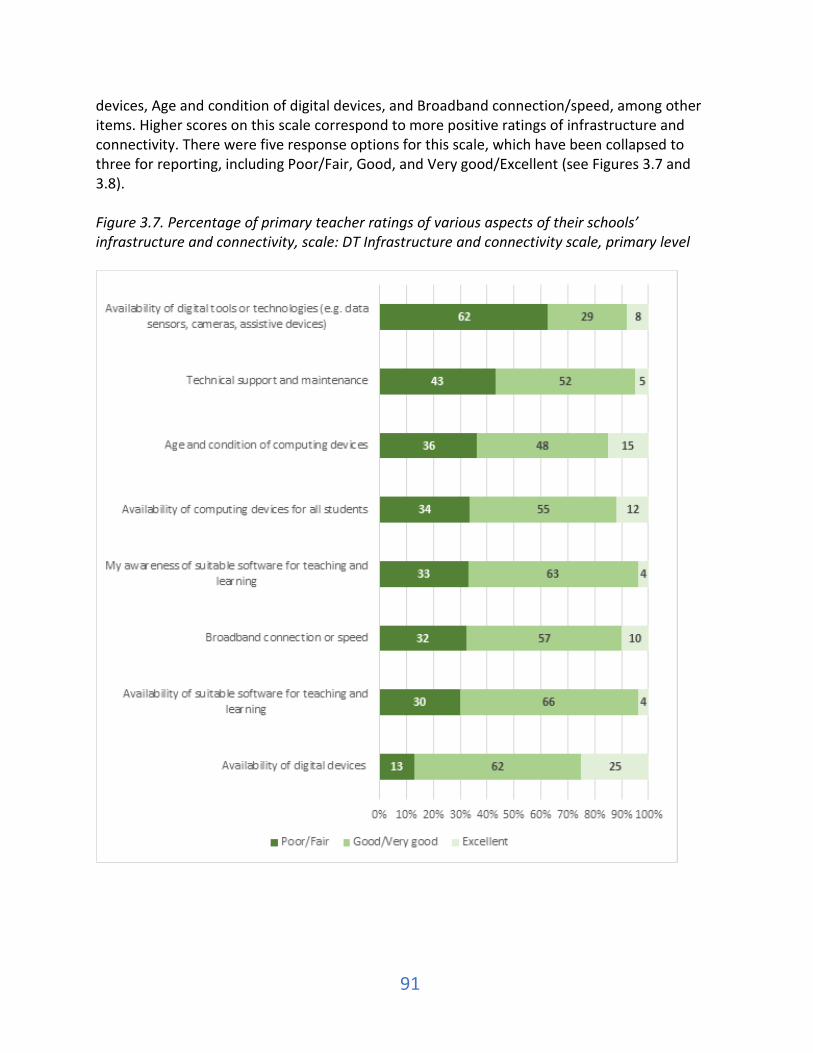
91
devices, Age and condition of digital devices, and Broadband connection/speed, among other items. Higher scores on this scale correspond to more positive ratings of infrastructure and connectivity. There were five response options for this scale, which have been collapsed to three for reporting, including Poor/Fair, Good, and Very good/Excellent (see Figures 3.7 and 3.8). Figure 3.7. Percentage of primary teacher ratings of various aspects of their schools’ infrastructure and connectivity, scale: DT Infrastructure and connectivity scale, primary level
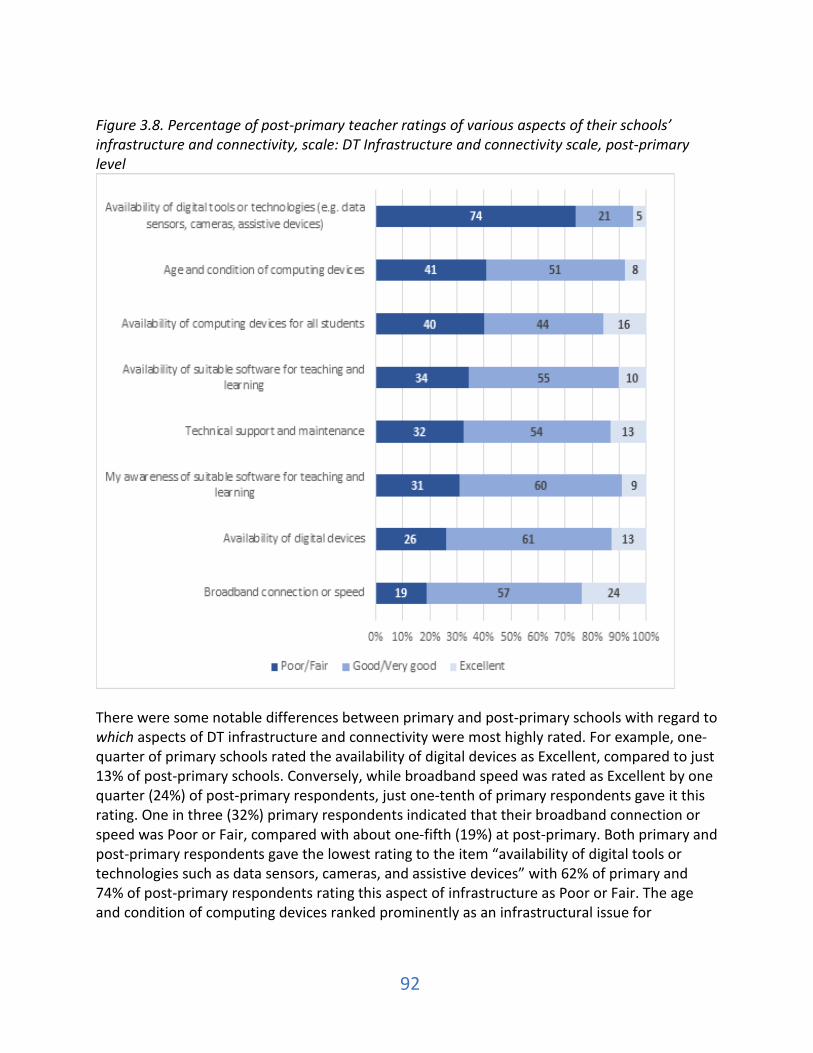
92
Figure 3.8. Percentage of post-primary teacher ratings of various aspects of their schools’ infrastructure and connectivity, scale: DT Infrastructure and connectivity scale, post-primary level
There were some notable differences between primary and post-primary schools with regard to which aspects of DT infrastructure and connectivity were most highly rated. For example, one-quarter of primary schools rated the availability of digital devices as Excellent, compared to just 13% of post-primary schools. Conversely, while broadband speed was rated as Excellent by one quarter (24%) of post-primary respondents, just one-tenth of primary respondents gave it this rating. One in three (32%) primary respondents indicated that their broadband connection or speed was Poor or Fair, compared with about one-fifth (19%) at post-primary. Both primary and post-primary respondents gave the lowest rating to the item “availability of digital tools or technologies such as data sensors, cameras, and assistive devices” with 62% of primary and 74% of post-primary respondents rating this aspect of infrastructure as Poor or Fair. The age and condition of computing devices ranked prominently as an infrastructural issue for

93
respondents at both levels. Over one-third of respondents (36% at primary; 34% at post-primary), rated this as Poor or Fair. The mean score on the DT infrastructure and connectivity scale at primary level was 48.2 (SD 20.6), compared to an almost identical mean of 48.7 (SD 21.2) at post-primary level. These results, combined with the item-specific results discussed above, suggest that while primary and post-primary schools do not differ by a great amount with respect to their overall DT infrastructure and connectivity, there are strengths and challenges specific to each level along with clear room for improvement, as the scores (which can range from 0-100) are in the moderate range. At primary level, results on this scale did not differ with respect to enrolment size or DEIS status. At post-primary level however, both schools with a medium (351-600) and large enrolment size (≥601) had significantly higher scores than schools with a small enrolment size (≤350). While schools with a medium enrolment had a mean score of 51.3, and schools with a large enrolment had a mean score of 50.7, the mean for schools with a small enrolment was 42.7. This indicates that at post-primary level, schools with a small enrolment have significantly lower levels of DT infrastructure and connectivity, and may need special attention in this regard. Community schools also scored significantly lower on this scale than Secondary and Vocational schools, with a mean score of 44.4, compared to 53 and 57.1 respectively (see Appendix 3, Table A3.1 and A3.2). One caveat in interpreting the results of this scale is that while the state of a school’s infrastructure and connectivity is an objective attribute of that school, respondents’ perceptions of infrastructure and connectivity are not. As such, respondents’ expectations about what constitutes “Excellent” and “Poor” DT infrastructure and connectivity may influence scores on this scale. This makes comparisons between teachers and schools difficult. Complementing this scale is the Technical support effectiveness scale. This measures the perceived extent to which technical support is effective in keeping computing and other devices in good repair, and for maintaining connectivity. It consists of four items, which respondents rated on a four-point scale from Not effective to Highly effective. These items were “keeping computing devices in good repair”, “keeping devices up to date with software and virus scans”, “keeping other devices in good repair”, and “for maintaining connectivity”. At both primary and post-primary, no single aspect of technical support stood out as being particularly effective or ineffective. However, scores at post-primary (mean 63.0, SD 27.1) were higher than those at primary (mean 54.8, SD 25.4), indicating that their technical support is perceived as being more effective (see Appendix 3, Figures A3.6 and A3.7). The very large standard deviation at both primary and post-primary levels indicate large variation across schools in perceived technical support effectiveness: While 16% of primary respondents reported that the technical support they received was “highly effective” for keeping computing devices in good repair, this figure was 29% at post-primary level. At the other end of the scale, 12% of primary respondents indicated that their technical support was

94
“not effective” for keeping devices up to date with software and virus scans, compared to just 7% at post-primary. It is notable that at both primary and post-primary levels, a significant portion of respondents gave each of the four aspects of technical support one of the lower two ratings, either “not effective” or “somewhat effective”. At primary, even the least negatively-viewed aspect of technical support – “Keeping other devices in good repair” – received one of these lower ratings from over a third of respondents (38%). At post-primary, even the least negatively-viewed item, “Maintaining connectivity”, received one of the lower two ratings from over one-quarter (27%) of respondents. These results indicate that while all aspects of technical support are rated as “highly effective” in some schools, there are widespread issues with the effectiveness of technical support in a substantial percentage of schools at both primary and post-primary level. At primary level, mean scores on this scale differed significantly by enrolment size but not by DEIS status. Schools with a very small enrolment (≤60) scored significantly and substantially lower (mean 40.5) for Technical support effectiveness than schools with a small enrolment (61-120) (mean 57.4), schools with a medium enrolment (121-200) (mean 62.8), and schools with a large enrolment size (≥201) (mean 59.2). This pattern was not found at post-primary, where schools differed only by sector. At post-primary, community schools scored significantly lower (mean 57.1) on this scale than secondary schools (mean 71.9). Vocational schools (mean 67) did not differ significantly from either of these groups. The Infrastructure problems scale measures the frequency with which various problems with DT infrastructure impede teaching, learning and assessment (TLA), such as problems with software, or problems with internet connectivity or speed. The scale consists of five items, for which respondents can choose three response options to indicate how often they experience these issues: Once per week or more, between once per week and once per month, and less often than once per month. Higher scores on this scale indicate fewer and less frequent infrastructure problems. The infrastructure problems which most frequently affected TLA were the same at both primary and post-primary levels, except when it came to the most frequent issue. At primary level, respondents indicated that their TLA activities were most frequently disrupted by problems with internet connectivity or speed. Almost a third (30%) of primary respondents reported that this became an issue at least once per week, while a further third (35%) reported that these issues occurred between once per week and once per month. At post-primary level, the infrastructure problem most frequently affecting TLA was problems with hardware. About a quarter (27%) of post-primary respondents indicated that problems with hardware interrupted TLA once per week or more, while a further 38% reported that they experienced these issues between once per week and once per month. At primary level, problems with hardware was the second most frequently occurring issue. About one fifth (19%) of respondents indicated that this caused disruption to TLA more than once per week, while a further fifth (21%) reported that this was an issue between once per week and once per month. At post-primary level, problems with internet connectivity or speed

95
were the second most frequent issue. One fifth of post-primary respondents reported that this disrupted TLA more than once per week, while a further third (30%) reported that this was an issue between once per week and once per month (see Appendix 3, Figure A3.8 & Figure A3.9). The responses at both primary and post-primary levels are of concern as they indicate substantial and widespread infrastructural issues which are symptomatic of ineffective or lack of technical support and maintenance. Overall, primary and post-primary did not differ significantly in their mean scores on the Infrastructure problems scale. The mean primary score was 76.1, while the mean post-primary score was 76.9. These relatively high scores indicate that for most respondents, infrastructural problems are not substantial. However, there are some key areas where a sizable minority of teachers at both levels experience infrastructure problems quite frequently. These are problems with hardware, and problems with internet connectivity or speed. The standard deviation of these mean scores at primary (SD 23.3) and post-primary levels (SD 24.6) indicates that there is a wide variation in respondents’ experiences with the reliability of DT infrastructure. Indeed, between a quarter and a third of respondents at both levels reported encountering issues with certain aspects of infrastructure more than once per week. This underlines the need for ongoing technical support, as well as for increased digital literacy among school staff to solve day-to-day problems. At primary level, there were no differences in mean score on this scale between DEIS schools and non-DEIS schools (see Appendix 3, Table A3.1, Table A3.2). However, schools with a very small enrolment (≤60) scored significantly and substantially lower on this scale (mean 68.5) than schools with a small enrolment (61-120) (mean 78.5) and schools with a large enrolment (≥201) (mean 80). In other words, infrastructural problems were less widespread in larger primary schools This pattern was not present at post-primary, where there were no differences between schools of different enrolment sizes. This suggests that very small primary schools have markedly less reliable DT infrastructure, and thus require additional technical support for infrastructural problems. At post-primary, there was no difference in scores on this scale by sector. However, non-DEIS schools scored significantly higher (had significantly less frequent infrastructure problems) than DEIS schools (mean 79.5 vs 68.7). Scores on this scale were correlated with a number of other scales at both primary and post-primary levels (see Appendix 3, Table A3.3 and A3.4). The Technical support disruption scale measures respondents’ perception of the level of disruption to TLA caused by inadequate technical support. Poor availability of technical support, and slow resolution of technical problems, are two aspects which this scale taps into. Respondents answered six items, selecting from five response options for each, ranging from Strongly Agree to Strongly Disagree. These were collapsed into three response categories for reporting. As with all scales, positive scores correspond to more positive outcomes – in this case, to fewer levels of disruption caused by inadequate technical support. At both primary and post-primary, the most strongly endorsed item was “This school would benefit greatly from additional professional (external) technical support”. This statement
96
received agreement or strong agreement from 68% of primary and 73% of post-primary respondents. Complementing this sentiment was another strongly endorsed item: “Availability of technical support is a key barrier to my schools’ implementation of the DLF”. This statement was agreed with or strongly agreed with by about one in three respondents (31% at primary; 29% at post-primary). An interesting difference between primary and post-primary respondents’ answers to items on this scale were their answers to the item “my level of knowledge about DTs restricts my capacity to solve some of the technical problems which have arisen in class”. While almost two-fifths (39%) of primary respondents agreed or Strongly agreed with this statement, this figure was just 27% for post-primary respondents. This indicates that especially at primary level, respondents may benefit from additional professional learning in DTs. Only a small minority of respondents at either level agreed with the statement that “embedding DTs into my TLA is currently more trouble than it is worth, due to inadequate technical support”: just 15% of primary respondents and 14% of post-primary respondents agreed with this statement. This suggests that despite technical difficulties experienced, teachers are still largely motivated to invest effort in embedding DTs in TLA (see Appendix 3, Figure A3.10 and A3.11). Mean scores on the Technical support disruption scale were comparable between primary and post-primary levels (primary mean 50.3 and SD 17.2; post-primary mean 53.3 and SD 18.8). At primary level there was no significant difference between DEIS and non-DEIS schools with respect to scores on this scale (see Appendix 3, Table A3.1 and Table A3.2). However, primary schools with a very small enrolment (≤60) scored significantly and substantially lower on this scale (mean 45.1) than primary schools with a small enrolment (61-120) (mean 54.0), suggesting that they experience greater disruption due to inadequate technical support. At post-primary, respondents from DEIS schools reported significantly higher levels of disruption due to inadequate technical support (indicated by their lower scores on this scale) than those from non-DEIS schools (mean 49.5 vs 55.5). A number of other scales were correlated with scores on the technical support disruption scale; see Appendix 3, Table A3.3, and Table A3.4. 3.3.8 Teachers’ use of digital technologies and tools for teaching, learning and assessment The Teacher DT usage frequency scale measures teachers’ use of digital technologies for a variety of TLA purposes, including to present information or give class instruction to students, to publish students' work online, or to use social networks in teaching and learning. Respondents selected from four response options for each of the 14 items, indicating how often they use DTs for each item. Responses range from “A quarter of lessons or less” to “Three quarters or more of lessons”. Higher scores on this scale correspond to greater frequency and variety of DTs in TLA. At both primary and post-primary, one of the most frequent uses of DTs was to use online resources for lesson preparation. At primary level, 44% of respondents indicated that they did this for at least half of their lessons vs 54% among post-primary respondents. Another frequent use of DTs was for presenting information or giving class instruction to students. About two-fifths (42%) of primary respondents reported using DTs for this purpose, compared to 60% of

97
post-primary respondents (see Appendix 3, Figure A3.12 and Figure A3.13). Mean scores on this scale differed between primary and post-primary (21.4 vs 32.6 respectively). This indicates that post-primary respondents used a greater variety of DTs in their TLA, and used them with greater frequency than primary respondents. In particular, post-primary respondents were more likely than primary respondents to use DTs to communicate with students, and to support peer-to-peer assessment. It should be noted that while these mean scores may appear low in comparison to other scales, this is largely due to the fact that it is neither feasible nor desirable to, for example, use DTs to communicate with students “in most lessons”, or to publish all of students’ work online. Thus, while higher scores do signify greater embedding of the DTs, we should not expect a score of 100 on this scale. At primary level, mean scores on this scale did not differ by school enrolment size or DEIS status. At post-primary, respondents in non-DEIS schools scored significantly higher on this scale, with a mean score of 34.9, compared to 25.2 for respondents in DEIS schools. Community schools and vocational schools also scored significantly higher on this scale than secondary schools, with means of 34.6, 37, and 26.9 respectively (see Appendix 3, Table A3.1 and Table A3.2). A key outcome measure of DLF implementation is the DT teacher and student engagement scale. This scale measures the overall extent to which teachers and students engage with and are skilled and knowledgeable in the use of DTs for teaching, learning, and assessment. It consists of four items, each with five response options, ranging from Poor to Excellent (collapsed into four for reporting). The picture at primary and post-primary levels was broadly similar with respect to teacher and student engagement with DTs. Mean scores on this scale were comparable between primary and post primary (52.9 at primary; 54.5 at post-primary). The most common rating at both levels was “Good”, which was the middle item on the 5-point scale. Primary respondents were more likely than post-primary respondents to give high ratings to the statement “Pupils overall engagement with digital technologies as part of teaching and learning” (41% Very good/Excellent, compared to 30% at post-primary). No item received a rating of “Excellent” from more than 10% of respondents at either level (see Figure 3.9. and Figure 3.10.) These scores suggest that from the perspective of teachers, there is still room for improvement at both levels, particularly among the large minority of participants who rated their engagement with DTs as “Poor” or “Fair”. At primary level, there were no differences in scores on this scale by DEIS status or enrolment size. At post-primary level, non-DEIS schools had higher average scores than DEIS schools (56.2 vs 49.0). This suggests that respondents and students in non-DEIS post-primary schools have greater levels of engagement with and skills in using DTs in TLA (see Appendix 3, Table A3.1 and Table A3.2). At both primary and post-primary level, this scale was correlated with a number of other important measures (see Appendix 3, Table A3.3 and A3.4).

98
Figure 3.9. Primary respondents’ ratings of their and their students’ overall engagement and skill in using DTs for TLA. Scale: DT teacher and student engagement
Figure 3.10. Post-primary respondents’ ratings of their and their students’ overall engagement and skill in using DTs for TLA. Scale: DT teacher and student engagement
3.3.9 Teachers’ attitudes to and familiarity with digital technologies Asked about which devices they personally owned, an overwhelming majority of respondents indicated that they owned a smartphone (96% at primary; 97% at post-primary). A majority also owned a tablet, though tablet ownership was higher among primary than post-primary respondents (90% vs 69%). Conversely, for laptop ownership, 90% of post-primary respondents reported that they owned a laptop, compared to 67% of primary respondents. It is interesting to note that approximately half of post-primary respondents (53%) reported owning a Bluetooth device, compared to about one-fifth of primary respondents (18%). Almost every respondent reported owning a smartphone, and most reported owning a tablet or a laptop computer, all of which are Bluetooth devices. Therefore, it may be inferred that most respondents who indicated that they do not own a Bluetooth device were mistaken, or that the item wording may have been clearer if expressed as a device with Bluetooth capability and respondents asked to indicate if they used the Bluetooth capability on their devices. The
23
24
23
16
43
43
47
42
27
27
27
32
6
5
3
9
0% 10% 20% 30% 40% 50% 60% 70% 80% 90% 100%
My overall level of knowledge and skills in using DTs forteaching and learning (n=410)
My overall level of use of DTs for teaching and learning(n=410)
Pupils' overall level of knowledge and skills in using DTsfor learning (n=407)
Pupils' overall engagement with DTs as part of teachingand learning (n=410)
Poor/Fair Good Very good Excellent
23
22
17
19
47
54
40
39
26
20
33
34
4
3
9
8
0% 10% 20% 30% 40% 50% 60% 70% 80% 90% 100%
Pupils overall engagement with digital technologies aspart of teaching and learning (n=344)
Pupils overall level of knowledge and skills in usingdigital technologies for learning (n=344)
My overall level of use of DTs for teaching and learning(n=342)
My overall level of knowledge and skills in using DTs forteaching and learning (n=338)
poor/fair good very good excellent

99
difference between primary and post-primary responses here (53% vs 18%) may suggest a gap in digital literacy or familiarity between primary and post-primary respondents, with post-primary respondents being the more digitally literate of the two. As described in Section 3.1, the Teacher ease with digital devices scale measures respondents’ level of familiarity with and confidence in using digital technologies. Results on this scale indicated that primary and post-primary respondents were broadly similar with respect to which aspects of digital devices they were more and less comfortable with. The items receiving strongest agreement from both primary and post-primary levels were “I feel comfortable using my digital devices at home” (86% Agree or Strongly Agree at primary, 94% at post-primary), and “I use digital devices as I want to use them” (97% Agree or Strongly Agree at primary, 94% at post-primary). The items which received the highest percentage of ‘Disagree’ responses at primary level were “If my friends and relatives have a problem with digital devices, I can help them” (44% Disagree, 9% of which Strongly), and “If my friends and relatives want to buy new digital devices or applications, I can give them advice” (49% Disagree, 12% of which Strongly). At post-primary, these same items received the highest levels of disagreement. For the statement “If my friends and relatives have a problem with digital devices, I can help them”, 37% disagreed, 12% of which Strongly. For “If my friends and relatives want to buy new digital devices or applications, I can give them advice” 40% disagreed, 9% of which Strongly (see Appendix 3, Figure A3.14 & Figure A3.15). Primary and post-primary respondents did not differ significantly in their mean scores on this scale, with post-primary schools receiving a mean score of 64.5 (SD 21.8) on the ease with digital devices scale, compared to 62.0 (SD 19.2) at primary. Overall familiarity and confidence with DTs was moderate to high across primary and post-primary, with most items being agreed with by at least two-thirds of respondents. At primary, there were no differences in the mean scores on this scale with respect to school enrolment size or DEIS status (see Appendix 3, Table 3.1 and Table 3.2). At post-primary, respondents in DEIS schools had higher scores than respondents in non-DEIS schools (65.9 vs 60.0). Additionally, community (66.4) and vocational (68.3) schools scored significantly higher on this scale than secondary schools (59.2). 3.3.10 Teachers’ general beliefs about teaching and learning Teacher respondents were asked several questions about their pedagogical beliefs. The scale Teacher constructivist beliefs assessed the extent to which teachers held positive views towards constructivist practices in teaching and learning. There were four response categories for the items in this scale, ranging from Strongly Disagree to Strongly Agree. At primary and post-primary, large majorities of Teacher respondents assigned a rating of Agree or Strongly Agree to the following four items: thinking and reasoning processes are more important than specific curriculum content (85% primary; 73% post-primary); students learn
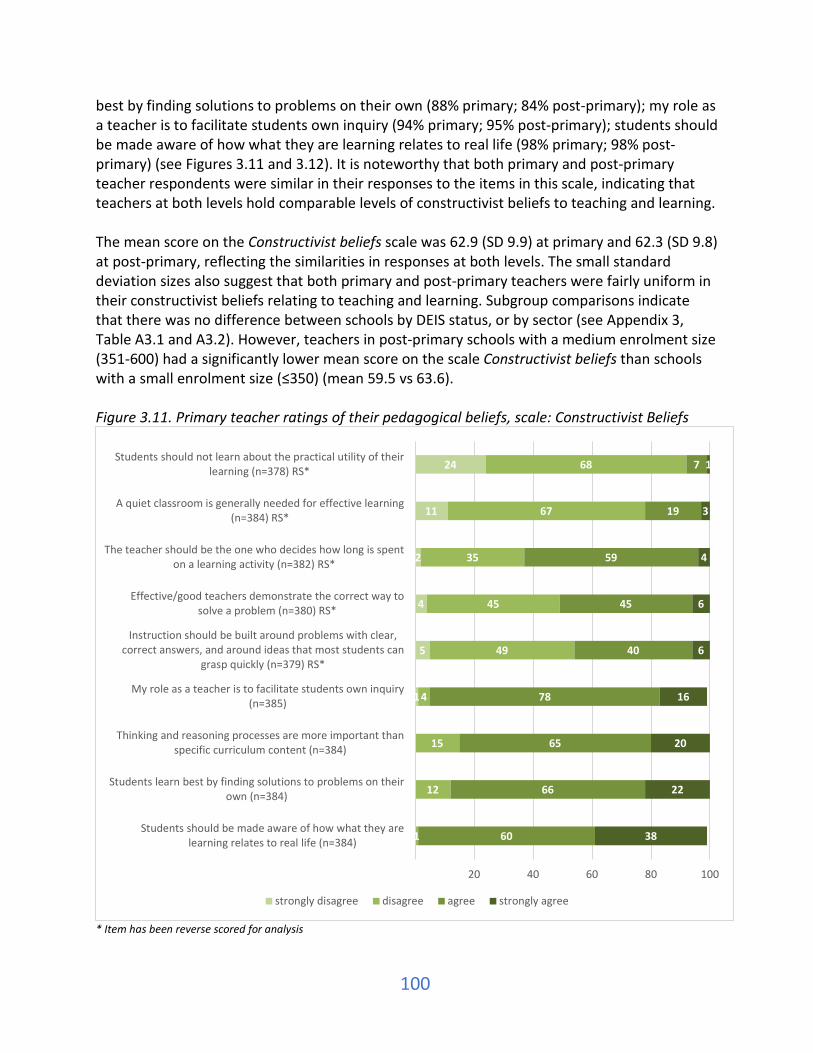
100
best by finding solutions to problems on their own (88% primary; 84% post-primary); my role as a teacher is to facilitate students own inquiry (94% primary; 95% post-primary); students should be made aware of how what they are learning relates to real life (98% primary; 98% post-primary) (see Figures 3.11 and 3.12). It is noteworthy that both primary and post-primary teacher respondents were similar in their responses to the items in this scale, indicating that teachers at both levels hold comparable levels of constructivist beliefs to teaching and learning. The mean score on the Constructivist beliefs scale was 62.9 (SD 9.9) at primary and 62.3 (SD 9.8) at post-primary, reflecting the similarities in responses at both levels. The small standard deviation sizes also suggest that both primary and post-primary teachers were fairly uniform in their constructivist beliefs relating to teaching and learning. Subgroup comparisons indicate that there was no difference between schools by DEIS status, or by sector (see Appendix 3, Table A3.1 and A3.2). However, teachers in post-primary schools with a medium enrolment size (351-600) had a significantly lower mean score on the scale Constructivist beliefs than schools with a small enrolment size (≤350) (mean 59.5 vs 63.6). Figure 3.11. Primary teacher ratings of their pedagogical beliefs, scale: Constructivist Beliefs
* Item has been reverse scored for analysis
1
5
4
2
11
24
1
12
15
4
49
45
35
67
68
60
66
65
78
40
45
59
19
7
38
22
20
16
6
6
4
3
1
20 40 60 80 100
Students should be made aware of how what they arelearning relates to real life (n=384)
Students learn best by finding solutions to problems on theirown (n=384)
Thinking and reasoning processes are more important thanspecific curriculum content (n=384)
My role as a teacher is to facilitate students own inquiry(n=385)
Instruction should be built around problems with clear,correct answers, and around ideas that most students can
grasp quickly (n=379) RS*
Effective/good teachers demonstrate the correct way tosolve a problem (n=380) RS*
The teacher should be the one who decides how long is spenton a learning activity (n=382) RS*
A quiet classroom is generally needed for effective learning(n=384) RS*
Students should not learn about the practical utility of theirlearning (n=378) RS*
strongly disagree disagree agree strongly agree

101
Figure 3.12. Post-primary teacher ratings of their pedagogical beliefs, scale: Constructivist Beliefs
* Item has been reverse scored for analysis The scale Student engagement assessed the extent to which students engage with learning and their level of constructivist learning as rated by their teachers. There were five response categories for the items in this scale, ranging from ‘Very few or none’ to ‘All or almost all’. Response options have been collapsed from five to three for reporting. At primary, the statements which elicited the highest ratings by teachers were: my students are invested in what they are learning (58% Most/All or almost all students); my students learn by collaboration and discussion (59% Most/All or almost all students); and my students try hard to understand the material we cover in class (74% Most/All or almost all students). At post-primary, the statements which elicited the highest ratings by teachers were: my students are invested in what they are learning (57% Most/All or almost all students); and my students try hard to understand the material we cover in class (67% Most/All or almost all students. This last statement was the highest rated statement by both primary and post-primary respondents (see Appendix 3, Figure A3.16 and Figure A3.17).
3
2
2
18
2
34
1
16
6
24
32
38
58
49
56
62
65
79
61
58
53
22
47
9
36
19
16
12
9
7
2
2
1
20 40 60 80 100
Students should be made aware of how what they are learningrelates to real life (n=320)
Students learn best by finding solutions to problems on theirown (n=318)
My role as a teacher is to facilitate students own inquiry(n=321)
Thinking and reasoning processes are more important thanspecific curriculum content (n=314)
Instruction should be built around problems with clear, correctanswers, and around ideas that most students can grasp quickly
(n=314) RS*
Effective/good teachers demonstrate the correct way to solve aproblem (n=314) RS*
A quiet classroom is generally needed for effective learning(n=315) RS*
The teacher should be the one who decides how long is spenton a learning activity (n=319) RS*
Students should not learn about the practical utility of theirlearning (n=315) RS*
strongly disagree disagree agree strongly agree
102
The mean score on the scale Student engagement was 62.3 (SD 14.3) at primary and 59.4 (SD 13.1) at post-primary. Subgroup comparisons indicate that there was no difference between schools by enrolment size, either at primary or post-primary. However, there was a significant difference at primary by DEIS status. The mean score on the scale Student engagement was higher in DEIS than non-DEIS schools (67.2 vs 61.1). At post-primary, there was also a significant difference by DEIS status. However, on this occasion, non-DEIS schools had a significantly higher mean score on the scale Student engagement than DEIS schools (61.3 vs 53.7). There was a difference at post-primary by sector: the mean score of community schools was significantly higher than the mean score of secondary schools (61.2 vs 56.5). There was no significant difference in mean scores between community schools and vocational schools (see Appendix 3, Table A3.1 and Table A3.2). Teacher respondents were also asked several items in relation to their attitudes to using DTs for teaching, learning and assessment. The scale Teacher attitudes to DTs versus traditional methods for students assessed the extent to which teachers held positive attitudes towards the use of DTs for teaching, learning and assessment versus the use of traditional methods for students. There were five response categories for the items in this scale, ranging from Strongly Disagree to Strongly Agree. Response options have been collapsed to three for reporting. At primary and post-primary level, the majority of teacher respondents assigned a rating of Agree or Strongly agree to the following items: enables students to better engage in collaborative learning (72% primary; 69% post-primary); helps students to consolidate and process information more effectively (76% primary; 64% post-primary); helps students work at a level appropriate to their needs (78% primary; 78% post-primary); enables students to access better sources of information (89% primary; 85% post-primary); and helps students develop greater interest in learning (90% primary; 77% post-primary). A majority of post-primary respondents also indicated that they Agree or Agree strongly that DTs encourage copying material from published internet sources (68%), reflecting a specific concern at post-primary level in relation to the use of DTs for student learning (see Appendix 3, Figure A3.18 & Figure A3.19). The mean score on the scale Teacher attitudes to DTs versus traditional methods for students was 61.8 (SD 11.6) at primary and 57.9 (SD 15.3) at post-primary. Subgroup comparisons indicate that there was no difference between schools by enrolment size, either at primary or post-primary level. However, there was a significant difference at primary level by DEIS status. Primary DEIS schools had a significantly higher mean score than non-DEIS primary schools (mean 65.6 vs 60.9), indicating that primary DEIS teachers held more positive attitudes towards the use of DTs for teaching, learning and assessment than their non-DEIS teacher counterparts. No difference was observed at post-primary level by DEIS status. However, post-primary schools did vary by sector: community post-primary schools had a significantly higher mean score on this scale than secondary post-primary schools (mean 59.4 vs 54.8). There was no difference in mean scores on this scale between community and vocational schools (see Appendix 3, Table A3.1 and A3.2).
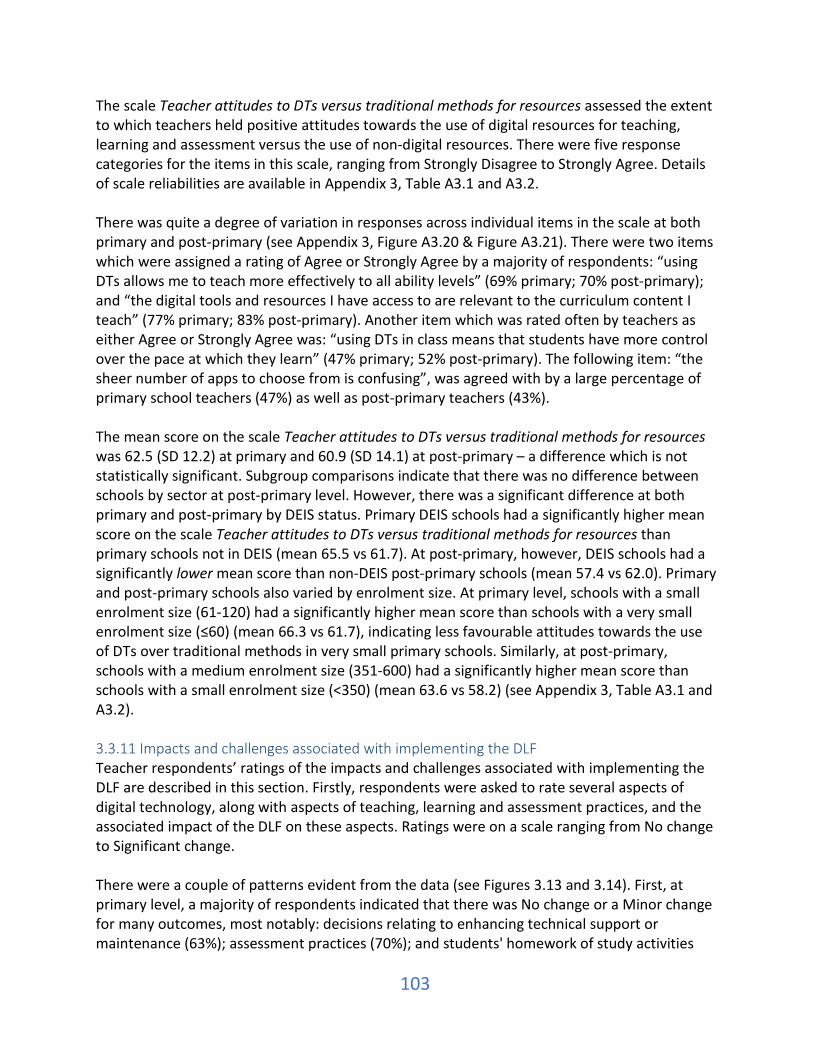
103
The scale Teacher attitudes to DTs versus traditional methods for resources assessed the extent to which teachers held positive attitudes towards the use of digital resources for teaching, learning and assessment versus the use of non-digital resources. There were five response categories for the items in this scale, ranging from Strongly Disagree to Strongly Agree. Details of scale reliabilities are available in Appendix 3, Table A3.1 and A3.2. There was quite a degree of variation in responses across individual items in the scale at both primary and post-primary (see Appendix 3, Figure A3.20 & Figure A3.21). There were two items which were assigned a rating of Agree or Strongly Agree by a majority of respondents: “using DTs allows me to teach more effectively to all ability levels” (69% primary; 70% post-primary); and “the digital tools and resources I have access to are relevant to the curriculum content I teach” (77% primary; 83% post-primary). Another item which was rated often by teachers as either Agree or Strongly Agree was: “using DTs in class means that students have more control over the pace at which they learn” (47% primary; 52% post-primary). The following item: “the sheer number of apps to choose from is confusing”, was agreed with by a large percentage of primary school teachers (47%) as well as post-primary teachers (43%). The mean score on the scale Teacher attitudes to DTs versus traditional methods for resources was 62.5 (SD 12.2) at primary and 60.9 (SD 14.1) at post-primary – a difference which is not statistically significant. Subgroup comparisons indicate that there was no difference between schools by sector at post-primary level. However, there was a significant difference at both primary and post-primary by DEIS status. Primary DEIS schools had a significantly higher mean score on the scale Teacher attitudes to DTs versus traditional methods for resources than primary schools not in DEIS (mean 65.5 vs 61.7). At post-primary, however, DEIS schools had a significantly lower mean score than non-DEIS post-primary schools (mean 57.4 vs 62.0). Primary and post-primary schools also varied by enrolment size. At primary level, schools with a small enrolment size (61-120) had a significantly higher mean score than schools with a very small enrolment size (≤60) (mean 66.3 vs 61.7), indicating less favourable attitudes towards the use of DTs over traditional methods in very small primary schools. Similarly, at post-primary, schools with a medium enrolment size (351-600) had a significantly higher mean score than schools with a small enrolment size (<350) (mean 63.6 vs 58.2) (see Appendix 3, Table A3.1 and A3.2). 3.3.11 Impacts and challenges associated with implementing the DLF Teacher respondents’ ratings of the impacts and challenges associated with implementing the DLF are described in this section. Firstly, respondents were asked to rate several aspects of digital technology, along with aspects of teaching, learning and assessment practices, and the associated impact of the DLF on these aspects. Ratings were on a scale ranging from No change to Significant change. There were a couple of patterns evident from the data (see Figures 3.13 and 3.14). First, at primary level, a majority of respondents indicated that there was No change or a Minor change for many outcomes, most notably: decisions relating to enhancing technical support or maintenance (63%); assessment practices (70%); and students' homework of study activities
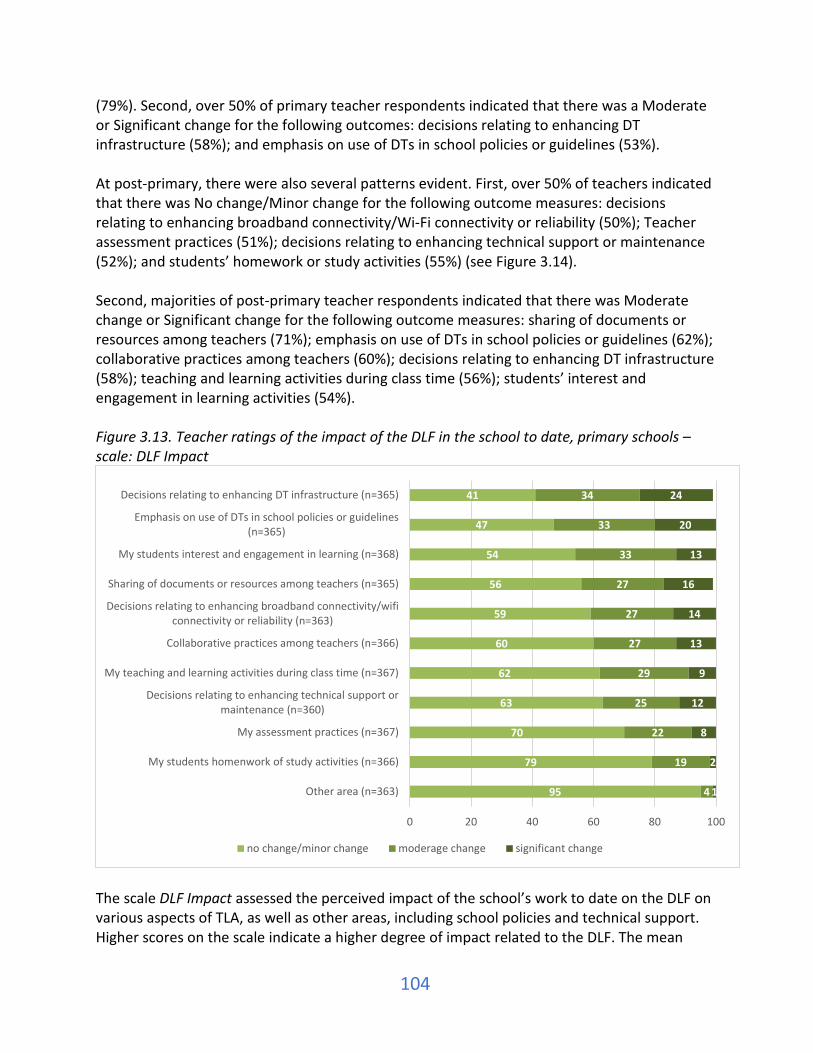
104
(79%). Second, over 50% of primary teacher respondents indicated that there was a Moderate or Significant change for the following outcomes: decisions relating to enhancing DT infrastructure (58%); and emphasis on use of DTs in school policies or guidelines (53%). At post-primary, there were also several patterns evident. First, over 50% of teachers indicated that there was No change/Minor change for the following outcome measures: decisions relating to enhancing broadband connectivity/Wi-Fi connectivity or reliability (50%); Teacher assessment practices (51%); decisions relating to enhancing technical support or maintenance (52%); and students’ homework or study activities (55%) (see Figure 3.14). Second, majorities of post-primary teacher respondents indicated that there was Moderate change or Significant change for the following outcome measures: sharing of documents or resources among teachers (71%); emphasis on use of DTs in school policies or guidelines (62%); collaborative practices among teachers (60%); decisions relating to enhancing DT infrastructure (58%); teaching and learning activities during class time (56%); students’ interest and engagement in learning activities (54%). Figure 3.13. Teacher ratings of the impact of the DLF in the school to date, primary schools – scale: DLF Impact
The scale DLF Impact assessed the perceived impact of the school’s work to date on the DLF on various aspects of TLA, as well as other areas, including school policies and technical support. Higher scores on the scale indicate a higher degree of impact related to the DLF. The mean
95
79
70
63
62
60
59
56
54
47
41
4
19
22
25
29
27
27
27
33
33
34
1
2
8
12
9
13
14
16
13
20
24
0 20 40 60 80 100
Other area (n=363)
My students homenwork of study activities (n=366)
My assessment practices (n=367)
Decisions relating to enhancing technical support ormaintenance (n=360)
My teaching and learning activities during class time (n=367)
Collaborative practices among teachers (n=366)
Decisions relating to enhancing broadband connectivity/wificonnectivity or reliability (n=363)
Sharing of documents or resources among teachers (n=365)
My students interest and engagement in learning (n=368)
Emphasis on use of DTs in school policies or guidelines(n=365)
Decisions relating to enhancing DT infrastructure (n=365)
no change/minor change moderage change significant change
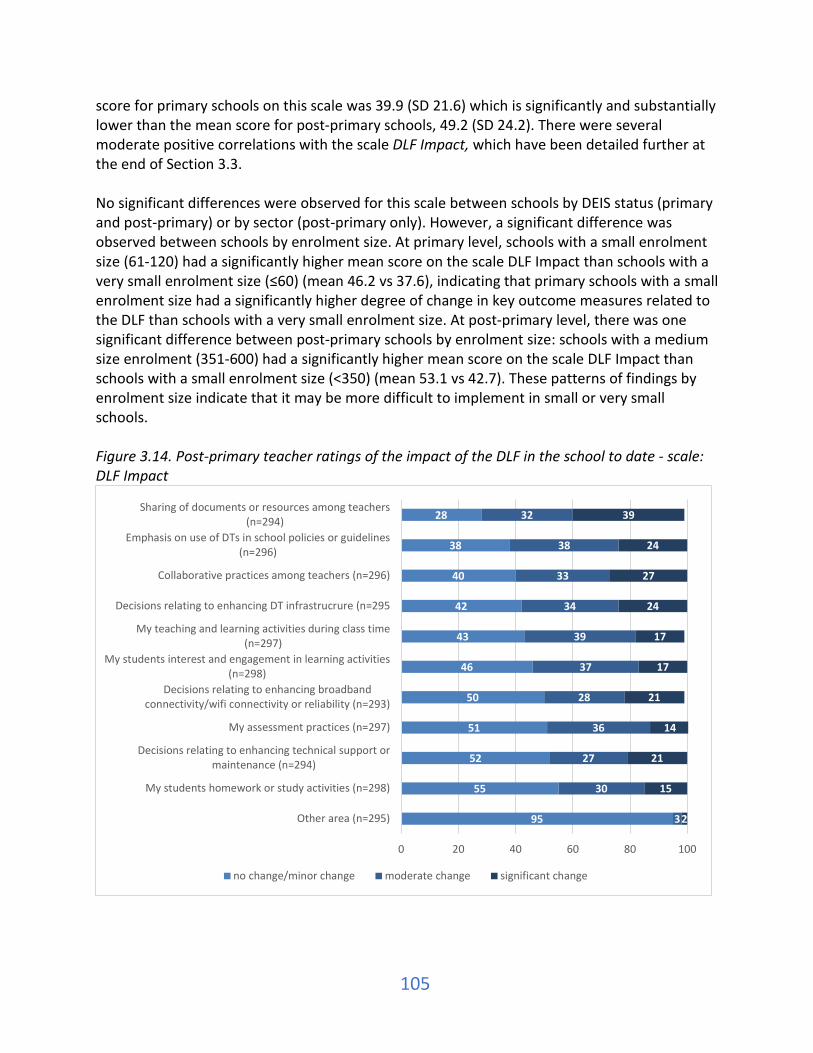
105
score for primary schools on this scale was 39.9 (SD 21.6) which is significantly and substantially lower than the mean score for post-primary schools, 49.2 (SD 24.2). There were several moderate positive correlations with the scale DLF Impact, which have been detailed further at the end of Section 3.3. No significant differences were observed for this scale between schools by DEIS status (primary and post-primary) or by sector (post-primary only). However, a significant difference was observed between schools by enrolment size. At primary level, schools with a small enrolment size (61-120) had a significantly higher mean score on the scale DLF Impact than schools with a very small enrolment size (≤60) (mean 46.2 vs 37.6), indicating that primary schools with a small enrolment size had a significantly higher degree of change in key outcome measures related to the DLF than schools with a very small enrolment size. At post-primary level, there was one significant difference between post-primary schools by enrolment size: schools with a medium size enrolment (351-600) had a significantly higher mean score on the scale DLF Impact than schools with a small enrolment size (<350) (mean 53.1 vs 42.7). These patterns of findings by enrolment size indicate that it may be more difficult to implement in small or very small schools. Figure 3.14. Post-primary teacher ratings of the impact of the DLF in the school to date - scale: DLF Impact
95
55
52
51
50
46
43
42
40
38
28
3
30
27
36
28
37
39
34
33
38
32
2
15
21
14
21
17
17
24
27
24
39
0 20 40 60 80 100
Other area (n=295)
My students homework or study activities (n=298)
Decisions relating to enhancing technical support ormaintenance (n=294)
My assessment practices (n=297)
Decisions relating to enhancing broadbandconnectivity/wifi connectivity or reliability (n=293)
My students interest and engagement in learning activities(n=298)
My teaching and learning activities during class time(n=297)
Decisions relating to enhancing DT infrastrucrure (n=295
Collaborative practices among teachers (n=296)
Emphasis on use of DTs in school policies or guidelines(n=296)
Sharing of documents or resources among teachers(n=294)
no change/minor change moderate change significant change
106
Finally, respondents were asked to rate eight teacher and school-level challenges in relation to the implementation of the DLF. Results have been collapsed to four categories for reporting (Highly/Moderately challenging, Somewhat challenging, Not challenging, Does not apply/did not occur), to create the scale Implementation challenges. A couple of key findings are evident from the primary level results. First, the majority of Teachers rated the following aspects as Highly/Moderately, or Somewhat challenging: broadband connectivity/Wi-Fi connection or reliability (62%); my own level of competency in managing and using DTs in teaching and learning (64%); the fit between the aims of the DLF and the structure of the standardised assessments (70%); the overall timeline for implementation (72%); DT infrastructure (75%); and dedicated time for me to implement the steps involved in the DLF (82%). Second, the remaining two items were rated mostly as Not at all challenging or Does not apply/Did not occur (my perception that not much value is added by embedding DTs into TLA (53% received this rating) and leadership from school management to support the DLP (58% received this rating)). Such results indicate that a range of implementation difficulties relating to, for example, time for implementation, infrastructure and connectivity, DT competence, and assessment, represent significant challenges for most primary school teachers at the time of the survey. This issue is examined further in Chapter 5. At post-primary, the following key findings were also evident. First, the majority of Teachers rated almost all items as Highly/Moderately challenging, or Somewhat challenging: broadband connectivity/Wi-Fi connection or reliability (50%); my own level of competency in managing and using DTs in teaching and learning (56%); my perception that not much value is added by embedding DTs into TLA (59%); DT infrastructure (75%); the fit between the aims of the DLF and the structure of the standardised assessments (80%); the overall timeline for implementation (80%); and dedicated time for me to implement the steps involved in the DLF (86%). The only item which was not rated by a majority of teachers as being a challenge was: leadership from school management to support the DLP. Therefore, similar to primary schools, implementation difficulties in a range of areas represent a significant challenge for most post-primary schools (see Appendix 3, Figure A3.22 & Figure A3.23). The mean score on the scale DLF Implementation challenges was 52.5 (SD 18.1) at primary and 49.2 (SD 18.3) at post-primary. Higher scores on the scale indicate fewer challenges. Subgroup comparisons indicate that there was no difference between schools by DEIS status or by enrolment, either at primary or at post-primary. However, there was a significant difference at post-primary by sector. Community schools had a significantly lower mean score (and therefore significantly more challenges) (45.6) than both secondary (mean 53.1) and vocational post-primary schools (mean 55.9). 3.3.12 Inter-relationships between scales This section outlines the relationships between two key outcome scales – DLF Impact and DT teacher and student engagement – and other measures in the survey. These two outcomes are examined in more detail using data from the DLF leader questionnaire in Chapter 4. Examining

107
the inter-relationships between these two scales and others is helpful as it can highlight the factors which are most strongly associated with change due to DLF implementation. The full details of these correlations can be found in Appendix 3, Table A3.3 and Table A3.4. The scale DLF Impact measures teachers’ perceived overall level of impact of the school's implementation of the DLF on teaching, learning and assessment activities, student engagement, collaborative practices, and DT policy and decision making within the school. Higher scores correspond to greater levels of change in these outcomes as a result of DLF implementation. At primary level, intercorrelations with the scale DLF Impact revealed that higher levels of DLF-related impact was associated with higher scores on the following scales:
• usage of the DLP Website (r=.35) • DT usage by teachers (r=.43) • level of embedding DTs at wave 1 (r=.33) • degree of suitability of teacher professional learning (r=.35) • teacher attitudes to DT vs Traditional methods for students (r=.35) • teacher attitudes to DT vs Traditional methods for resources (r=.37) • teacher and student DT engagement (r=.37), and • DT infrastructure and connectivity (r=.45).
These correlations are moderate in strength, and suggest a range of features of the schools’ practices, infrastructure and CPD supports are relevant to understanding what enables the DLF to be implemented. However, it should be noted that these correlations are bivariate: they consider the relationships between DLF impact and one other characteristic at a time. At post-primary level, higher DLF impact scores were associated with higher scores on the following scales:
• teacher attitudes to DT vs traditional methods for students (r=.32) • teacher attitudes to DT vs traditional methods for resources (r=.39) • DT infrastructure and connectivity (r=.41) • DT teacher and student engagement (r=.41), and • teacher professional learning suitability (r=.41).
The DT teacher and student engagement measures teachers’ self-perceived level of knowledge, skills and engagement with DTs for teaching and learning, as well as that of their students. Higher scores on this scale correspond to greater levels of knowledge, skill, and engagement with DTs in TLA. At primary level, moderate to strong positive relationships were found between this scale and the following scales, among others:

108
• teacher current level of embedding (r=.56) • teacher DT usage frequency (r=.48) • teacher attitudes to DT v Traditional methods for resources (r=.38), and • teacher ease with digital devices (r=.36).
At post-primary level, correlations reveal a moderate to strong positive relationships between scores on the DT teacher and student engagement scale and scores on the following scales:
• DT infrastructure and connectivity (r=.64) • teacher current level of embedding (r=.42) • DLF Impact (r=.41) • teacher ease with digital devices (r=.39), and • teacher attitudes to DT v Traditional methods for resources (r=.37).
At both primary and post-primary level, therefore, these correlations reveal a relatively high level of association between teacher and student engagement with DTs and teacher attitudes, DT competence, and DT infrastructure and connectivity. 3.4 Overlaps and divergence in teachers’ and Digital Learning Team leaders’ (or Principals’) perspectives With respect to DLF implementation, there were a number of areas of overlap and divergence between the perspectives of DLT leaders and teachers. This section considers the key patterns of commonality and difference between these two groups of respondents. 3.4.1 DLF embedding DLT leaders were asked about the extent to which teachers in their school had embedded DTs in their TLA, while teachers were asked about the extent to which they personally had embedded DTs in their TLA practices. Ratings were on a four-point scale from Emerging to Advanced/Highly advanced. At primary level, there was broad overlap between the perspectives of teachers and DLT leaders, with no noticeable divergences. However, at post-primary level, teachers were far more likely than DLT leaders to give more extreme ratings, at both the higher and lower ends of the scale, to their level of DT embedding, compared to intermediate ratings. That is, while 25% post-primary teachers rated their level of embedding as Advanced or Highly advanced, just 10% post-primary DLT leaders gave their school this rating. Conversely, 39% of teachers rated their level of embedding as Developing or Emerging (the two lowest ratings), compared with 22% of DLT Leaders. Post-primary DLT leaders were far more likely than teachers to rate their schools’ level of practice as Intermediate (68% vs 36%). One possible reason for this disparity is that the post-primary teachers who chose to respond to the questionnaire may have been those most interested in embedding DTs in their practice to begin with. This means that while DLT leaders may have been referring to the overall level of
109
embedding within the school, the teacher responses may have come from the subset of teachers who were most involved in embedding DTs. 3.4.2 Constructivist beliefs At primary level, DLT leaders had higher scores on average than teachers on the constructivist beliefs scale (69.8 vs 62.9). This difference was even more pronounced at post-primary level, where DLT leaders received an average score of 78.8, compared to 61.3 among teachers. This suggests that at post-primary level, DLT leaders tend to hold more positive views towards constructivist methods in teaching, learning, and assessment, than do teachers. This difference was evident in the proportion of respondents indicating strong agreement with statements of constructivist beliefs. For example, 36% of post-primary teacher respondents strongly agreed with the statement “Students should be made aware of how what they are learning relates to real life”, compared to 60% of post-primary DLT respondents. Similarly, while 19% of teacher respondents at post primary strongly agreed that “Students learn best by finding solutions to problems on their own”, this figure was 42% among DLT Leaders at post-primary. 3.4.3 Ease with digital devices At primary level, DLT leaders and teachers had similar levels of familiarity with and confidence in the use of DTs for TLA, as indicated by the DT ease with digital devices scale (mean scores 65.3 and 62.0, respectively). However, again, an interesting difference emerged at post-primary level, with DLT leaders scoring significantly higher on this scale than teachers (74.3 vs 64.5). This suggests that DLT leaders at post-primary level are particularly comfortable with using DTs, while other staff are somewhat less so, on average. 3.4.4 Teacher and pupil engagement A key outcome measure for this survey is the level of engagement teachers and students show in their use of DTs for TLA. This is measured by the scale DT teacher and student engagement, which contains items measuring the pupils’ overall engagement with DTs as part of teaching and learning, pupils’ overall level of knowledge and skills in using DTs for learning, teachers’ overall level of use of DTs for teaching and learning, and teachers’ overall level of knowledge and skills in using DTs for teaching and learning. At both primary and post-primary levels, a similar pattern emerged, whereby teachers had slightly higher ratings on this scale than DLT leaders. There are a number of possible reasons for this, including that teachers are often better placed to determine their own and their students’ level of engagement with DTs than DLT leaders (commonly, Principals, deputy or assistant Principals, and ICT coordinators). Moreover, it could be the case, as already noted above in Section 3.4.1, that ‘DT engaged’ teachers were more likely to respond to the teacher Wave 1 teacher questionnaire.

110
Overall, though, the difference between DLT and teacher scores is relatively small, suggesting that generally, teachers and DLT leaders are in accordance regarding their assessment of the degree of teacher and student engagement with DTs. 3.4.5 Impact of DLF Another key measure of the effectiveness of DLF implementation is the DLF Impact scale. This asks respondents to rate the impact of their school’s work to date on the DLF on various aspects of TLA, and also on school policies and technical support. An interesting difference emerged here in the perspectives of teachers and DLT leaders. DLT leaders at both primary and post-primary level were more likely than teachers to indicate that the DLF had had a larger impact on various aspects of TLA. The difference in mean scores was substantial, with primary DLT leaders scoring 46.7 on average, compared to 39.9 for primary teachers. At post-primary level, these scores were 56.3 for DLT leaders, and 49.2 for teachers. These results suggest that changes that occur as a result of DLF implementation may be more visible to DLT leaders than to teachers. There is also a possibility that DLT leaders, who by definition are on the DLT, are more involved in the implementation of the DLF than teachers, many of whom are not on the DLT. Thus, the greater level of change they report may be more reflective of their own experience than of the school’s overall implementation of the DLF. This underlines the value of sampling a wide range of perspectives in the school, as this provides a more holistic picture of the school-wide implementation of the DLF. 3.4.6 Implementation challenges Comparison of DLT leader and teacher respondents’ scores on the Implementation challenges scale reveals some stark differences at both levels. DLT leaders reported significantly higher levels of challenge (lower scores) than teachers when it came to implementing the DLF (mean teacher score 52.5 vs 43.3 for DLT at primary; 49.2 vs 40.3 at post-primary). This was particularly evident on items on this scale which referred to DT infrastructure, dedicated time for staff to implement the steps involved in the DLP, and staff level of competency in managing and using DTs in teaching and learning. Given their position overlooking the implementation of the DLF in their school, DLT leaders’ experience of the challenges involved in DLF implementation may be more reflective of the overall picture at the school level. 3.5 Key points from Chapter 3 In all, 938 responses to this survey were received from 188 schools between November 2019 and March 2020. At primary level, 495 usable teacher responses were submitted from 117 schools. At post-primary level, 443 usable teacher responses were received from 71 schools. Approximately half of respondents at primary level were school Principals (46%), compared with 5% of post-primary respondents. Among post-primary respondents, the most commonly held position was subject teacher (65%). Teacher responses are not generalisable to the population. Among primary respondents, 17% were DLT leaders, 41% reported being on the DLT, while 42% reported not being on the DLT. These figures were 24%, 24% and 51% respectively, among post-primary respondents. This indicates a wider involvement in the DLT among staff in primary schools. Additionally, over half of post-primary respondents reported

111
that their school had completed their DLP (57%), compared with just over a third of primary respondents (37%). However, at least 9 in 10 respondents at each level reported that their school had at least started developing a DLP. Respondents generally reported a low level of usage of the DLPlanning.ie website, with approximately 40% of primary teachers and 52% of post-primary teachers never having used the website. This is in contrast with results from DLT leaders, over four-fifths of whom had accessed the website at least once. Teachers who did use the website tended to use many parts of it, suggesting that many aspects of the website are found to be useful, provided they are visited in the first place. In terms of teacher professional learning, summer courses (39%) and In-school PDST support (27%) were attended most frequently by primary school respondents. At post-primary, the most frequently attended professional learning activities over the last two years were In-school PDST support (49%) and Workshops (38%). By far the most popular method of DT knowledge sharing at both primary and post-primary was informal, occurring throughout the school day. At primary level, 92% of respondents reported sharing DT learning this way, compared with 94% at post-primary. However, the results indicated a clear divergence between primary and post-primary respondents regarding how widespread more formal and organised methods of DT knowledge sharing are. While exactly half of primary respondents reported using cloud document storage or shared folders to share DT learning, four in five (81%) post-primary respondents did this. Note that cloud-based systems may be more common in larger schools. Post-primary respondents were also more likely to use formal peer mentoring (46% vs 31%), and email, messaging, or social media to share their DT knowledge (80% vs 62%). Regarding the level of embedding of DTs in TLA, post-primary teachers were more likely than primary teachers to indicate that they were at an Advanced/Highly advanced level in relation to embedding DTs (6% primary vs 25% post-primary). This difference is significant, and it may be due in part to different expectations between primary and post-primary respondents regarding what constitutes a high level of embedding. There were some notable differences between primary and post-primary schools with regard to which aspects of DT infrastructure and connectivity were most highly rated. One-quarter of primary schools rated the availability of digital devices as Excellent, compared to just 13% of post-primary schools. Conversely, while broadband speed was rated as Excellent by one quarter (24%) of post-primary respondents, just one-tenth of primary respondents gave it this rating. Despite these differences, the mean scores on the DT infrastructure and connectivity scale were almost identical between primary and post-primary level. This suggests that while primary and post-primary schools do not differ by a great amount with respect to their overall DT infrastructure and connectivity, there are strengths and challenges specific to both levels. The age and condition of computing devices ranked prominently as an infrastructural issue for

112
respondents at both levels. Over one-third of respondents (36% at primary; 34% at post-primary), rated this as Poor or Fair. Primary and post-primary respondents also differed with respect to their perception of the effectiveness of technical support. Scores on the Technical support effectiveness scale at post-primary (mean 63) were higher than those at primary (mean 54.8). Importantly, at primary level, schools with a very small enrolment (≤60) scored significantly lower (mean 40.5) for Technical support effectiveness than schools with a small enrolment (61-120) (mean 57.4), schools with a medium enrolment (121-200) (mean 62.8), and schools with a large enrolment size (≥201) (mean 59.2). Many respondents signalled the importance of technical support, with about one-in-three (31% at primary; 29% at post-primary) agreeing or strongly agreeing with the statement “Availability of technical support is a key barrier to my schools’ implementation of the DLF”. Between a quarter and a third of respondents at both levels reported encountering issues with certain aspects of infrastructure more than once per week. This underlines the need for ongoing technical support, along with increased digital literacy among school staff to solve day-to-day problems. Again, primary schools with a very small enrolment (≤60) scored significantly lower on the Infrastructure problems scale (mean 68.5) than schools with a small enrolment (61-120) (mean 78.5) and schools with a large enrolment (≥201) (mean 80). This pattern was not present at post-primary, where there were no differences between schools of different enrolment sizes. This suggests that very small primary schools have markedly less reliable DT infrastructure, and thus require additional technical support for infrastructural problems. Results indicate that post-primary respondents used a greater variety of DTs in their TLA, and used them with greater frequency than primary respondents. In particular, post-primary respondents were more likely to use DTs to communicate with students, and to support peer-to-peer assessment. The picture at primary and post-primary levels was broadly similar with respect to teacher and student engagement with DTs. However, primary respondents were more likely than post-primary respondents to give high ratings to the statement “Pupils overall engagement with digital technologies as part of teaching and learning” (39% Very good/Excellent, compared to 30% at post-primary). While average scores on the pupil and teacher engagement scale were high, there is still room for improvement, as most items on this scale were rated as poor or fair by between one fifth and one quarter of respondents. Additionally, at post-primary level, non-DEIS schools had higher average scores than DEIS schools (56.2 vs 49). This suggests that respondents and students in non-DEIS post-primary schools have greater levels of engagement with and skills in using DTs in TLA. Teachers held largely positive views about the use of DTs for TLA. A majority of respondents at both levels believed that using DTs enables students to better engage in collaborative learning (72% primary; 69% post-primary); helps students work at a level appropriate to their needs (78% primary; 78% post-primary); and enables students to access better sources of information
113
(89% primary; 85% post-primary). However, most post-primary respondents (68%) also indicated that they Agree or Agree strongly that DTs encourage copying material from published internet sources, reflecting a specific concern at post-primary level in relation to the use of DTs for student learning. However, despite widespread endorsement of the use of DTs for TLA, 47% of primary respondents reported that they found the large number of apps to choose from confusing. This suggests that at primary level, more guidance is needed on where to find appropriate software. Encouragingly, majorities of post-primary teacher respondents indicated that due to their work on the DLF, there was Moderate or Significant change in: sharing of documents or resources among teachers (71%); collaborative practices among teachers (60%); and students’ interest and engagement in learning activities (54%), among others. Less change was reported by primary respondents, however, a majority of primary respondents indicated that there was moderate or significant change in Decisions relating to enhancing DT infrastructure (58%), and Emphasis on the use of DTs in school policies or guidelines (53%). Both primary and post-primary respondents saw significant challenges in implementing the DLF in due to a few key areas. In particular, DT infrastructure, time for staff to implement the DLP, and issues around the fit between the aims of the DLF and the structure of the standardised assessments were seen as significant barriers. Post-primary teachers tended to rate their own level of embedding of DTs at the extremes of the scale than post-primary DLT leaders: while a quarter of teachers rated their level of embedding as Advanced or Highly advanced, just 10% post-primary DLT Leaders did so. Conversely, two-fifths of teachers rated their level of embedding as Developing or Emerging, compared with 22% of DLT Leaders. In contrast, primary teachers’ and DLT leaders’ ratings on level of embedding of DTs were quite similar to one another. At both primary and post-primary levels, DLT leaders had higher scores on a scale measuring constructivist beliefs compared to teachers, and the difference was more pronounced at post-primary than primary level. Post-primary DLT leaders also had a particularly high score on the DT ease with digital devices scale, compared with post-primary teachers, as well as primary teachers and DLT leaders, whose scores were similar to one another. At both primary and post-primary levels, teachers had higher scores on the DT student and teacher engagement scale than DLT leaders. In contrast, DLT leaders at both levels were more likely to have a higher score on the DLF impact scale than teachers, indicating a higher perceived impact of DLF implementation among DLT leaders than among teachers. Also at both levels, DLT leaders had higher implementation challenges score than teachers. At least some of the differences observed between DLT leaders and teachers are plausibly related to their different roles in the implementation of the DLF in their schools, while some of the differences observed across primary and post-primary levels can be attributed to curricular, structural, infrastructural differences between the two levels.
114
The intercorrelations between two scales which can be interpreted as indicators of successful DLF implementation and others confirm the relevance of a range of factors for successful implementation at both primary and post-primary levels, including infrastructure, attitudes/beliefs, DT confidence/competency and appropriateness of CPD.
Chapter 4: Changes, progress and challenges since baseline 4.1. Chapter overview Chapter 2 and 3 provided an account of findings from the Digital Learning Team (DLT) Leader (or Principal) and Teacher questionnaires at Wave 1. This chapter builds on those findings by identifying and describing changes relating to the implementation of the Digital Learning Framework (DLF) since the baseline survey, which was administered around one year prior to the Wave 1 surveys (Cosgrove et al., 2019). It should be noted that the baseline phase did not include a teacher questionnaire, so the analyses in this chapter present findings relating to comparisons at the school level only. This chapter provides a brief, non-technical overview of the approach taken in the analysis (including the framework developed for the analysis). Next, it presents the results, starting with descriptive comparisons of change over time. In these analyses, changes in four indicators (measures) are the focus – the first two indicators, level of embedding DTs in teaching, learning and assessment, and level of engagement of teachers and students with DTs, may be interpreted as DLF impact measures, while the second two, schools' DT infrastructure and connectivity, and schools' adequacy of technical support, may be interpreted as (some) enablers of DLF implementation. It then considers the results of two sets of regression models – one set for primary and special schools and the other for post-primary schools – which examine three Wave 1 outcomes (level of engagement of teachers and students with DTs, perceived level of impact of DLF implementation, and level of embedding DTs in teaching, learning and assessment) and their relationships to other characteristics. The chapter concludes with a concise summary of the key findings. 4.2. Approach taken in the analysis A key strength of the evaluation of the DLF is that it has a longitudinal design, allowing us to understand progress with the implementation of DLF over time in a nationally representative sample of schools. Analyses were carried out by merging the school-level survey datafiles from baseline and Wave 1. Chapter 1 (Sections 1.2.2 and 1.2.3) describes the sample design and response rates for Wave 1. Readers are reminded that, although the response rates for Wave 1 are acceptable, and the data are weighted to provide nationally representative estimates, the numbers of respondents are nonetheless on the low side. Therefore results presented here are somewhat less robust (precise) than would be the case had a higher number of schools returned a Wave 1 survey. The first part of the results describes the extent to which change has occurred on four key characteristics associated with implementation of the DLF (level of embedding DTs in teaching,
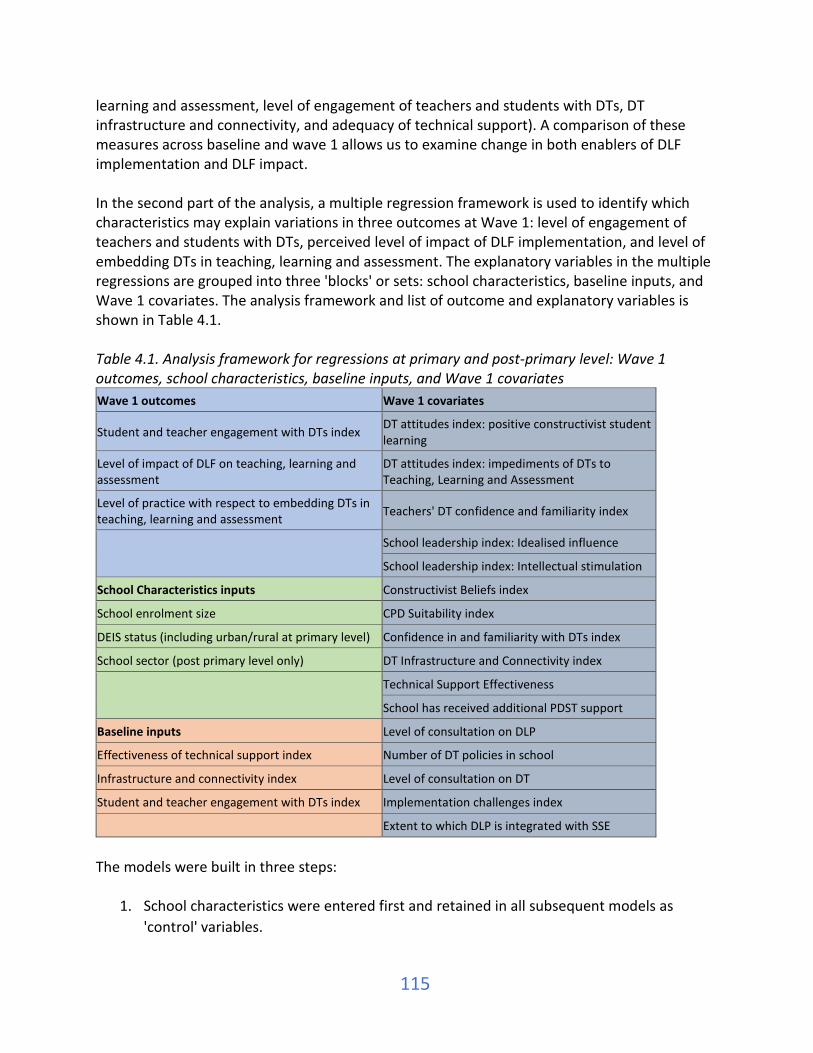
115
learning and assessment, level of engagement of teachers and students with DTs, DT infrastructure and connectivity, and adequacy of technical support). A comparison of these measures across baseline and wave 1 allows us to examine change in both enablers of DLF implementation and DLF impact. In the second part of the analysis, a multiple regression framework is used to identify which characteristics may explain variations in three outcomes at Wave 1: level of engagement of teachers and students with DTs, perceived level of impact of DLF implementation, and level of embedding DTs in teaching, learning and assessment. The explanatory variables in the multiple regressions are grouped into three 'blocks' or sets: school characteristics, baseline inputs, and Wave 1 covariates. The analysis framework and list of outcome and explanatory variables is shown in Table 4.1. Table 4.1. Analysis framework for regressions at primary and post-primary level: Wave 1 outcomes, school characteristics, baseline inputs, and Wave 1 covariates Wave 1 outcomes Wave 1 covariates
Student and teacher engagement with DTs index DT attitudes index: positive constructivist student learning
Level of impact of DLF on teaching, learning and assessment
DT attitudes index: impediments of DTs to Teaching, Learning and Assessment
Level of practice with respect to embedding DTs in teaching, learning and assessment Teachers' DT confidence and familiarity index
School leadership index: Idealised influence
School leadership index: Intellectual stimulation
School Characteristics inputs Constructivist Beliefs index
School enrolment size CPD Suitability index
DEIS status (including urban/rural at primary level) Confidence in and familiarity with DTs index
School sector (post primary level only) DT Infrastructure and Connectivity index
Technical Support Effectiveness
School has received additional PDST support
Baseline inputs Level of consultation on DLP
Effectiveness of technical support index Number of DT policies in school
Infrastructure and connectivity index Level of consultation on DT
Student and teacher engagement with DTs index Implementation challenges index
Extent to which DLP is integrated with SSE
The models were built in three steps:
1. School characteristics were entered first and retained in all subsequent models as 'control' variables.

116
2. Next, all Wave 1 covariates were entered using forward regression, removing any non-significant variables before proceeding.
3. Finally, baseline inputs were entered using forward regression, removing any non-significant variables before finalising the model.
Two of the outcome measures (engagement with DTs and impact of DLF) are continuous scales, so multiple linear regression was applied, while the third (level of embedding DTs) was a binary measure (low/medium versus high level of practice), so logistic regression was used. Specifically with respect to the binary measure, DLT leaders were asked: with regard to the statements in the DLF on which your school is focusing, which of the following statements best describes your current level of practice? with eight response options recoded as follows: all below statements of effective practice, mostly below statements of effective practice, partly below/partly at statements of effective practice, mostly at statements of effective practice = 0; partly at statements of highly effective practice, mostly at statements of highly effective practice, all at statements of highly effective practice = 1. 4.3. A description of changes since baseline 4.3.1. Level of embedding digital technologies in teaching, learning and assessment Figure 4.1 shows schools’ ratings of their level of embedding of digital technologies in teaching, learning and assessment at baseline and Wave 1. The question asked was: which one of the following best describes your school's current level of practice in relation to embedding digital technologies in teaching, learning and assessment? Figure 4.1. Level of embedding of DTs in teaching, learning and assessment at baseline and wave 1: Primary/special and post-primary schools
At primary level, not much change is evident (comparing the light and dark green bars) but at post-primary level a shift from ‘developing’ to ‘intermediate’ is evident (light and dark blue bars). Looking in more detail of changes in levels of embedding over time in individual schools,
8.6
40.044.2
7.313.7
42.1
32.2
12.05.1
35.9
50.1
8.9
1.5
21.0
67.6
9.9
0.0
10.0
20.0
30.0
40.0
50.0
60.0
70.0
Emerging Developing Intermediate Advanced/Highlyadvanced
Baseline (primary) Wave 1 (primary) Baseline (post prim) Wave 1 (post prim)
117
it was found that, in primary schools, 26.8% recorded a decline in level of embedding, 46.9% recorded no change, and 26.4% recorded an improvement. At post-primary level, 19.6% of schools recorded a decline, 47.6% recorded no change, and 32.8% recorded an improvement. 4.3.2. Level of engagement with digital technologies At both baseline and Wave 1, DLT leaders/Principals were asked to rate four aspects of digital technologies in their school specifically as they related to teacher and student engagement on a five-point scale (excellent / very good / good / fair / poor) and these responses were combined to create an index of teacher and student engagement with DTs at baseline and at Wave 1. See Chapter 1, Section 1.6.2, for more detail on the construction of indices. Chapter 2 provides more descriptive information on this and other Wave 1 DLT leader survey indices.
• At primary level, mean DT engagement was 43.3 at baseline and 50.0 at Wave 1, and the increase of 6.7 index points is statistically significant (t = 3.751, p < .001).
• At post-primary, mean DT engagement was 47.3 at baseline and 49.1 at Wave 1, and the slight increase of 1.8 index points is not statistically significant (t = 1.121, p = .268).
4.3.3. Connectivity and infrastructure At both baseline and Wave 1, DLT leaders/Principals were asked to rate eight aspects of infrastructure and connectivity in their school on a five-point scale (excellent / very good / good / fair / poor) and these responses were combined to create an index of DT connectivity and infrastructure at baseline and at Wave 1. (As noted in Section 4.3.2, Chapter 1, Section 1.6.2, provides more detail on the construction of indices and Chapter 2 provides more descriptive information on this and other Wave 1 DLT leader survey indices.)
• At primary level, mean DT connectivity and infrastructure was 44.4 at baseline and 46.7 at Wave 1, and the small increase of 2.3 index points is not statistically significant (t = 1.159, p = .249).
• At post-primary level, mean DT connectivity and infrastructure was 53.7 at baseline and 52.2 at Wave 1, and the small decrease of 1.5 index points is not statistically significant (t = 0.676, p = .502).
4.3.4. Technical support effectiveness At both baseline and Wave 1, DLT leaders/Principals were asked to rate the effectiveness of four aspects of the technical support in their school (e.g. keeping computing devices in good repair, maintaining connectivity) on a four-point scale (highly effective / quite effective / somewhat effective / not effective) and these responses were combined to create an index of technical support effectiveness at baseline and at Wave 1. (Again, Chapter 1, Section 1.6.2, provides more detail on the construction of indices and Chapter 2 provides more descriptive information on the results of this scale for Wave 1.)

118
• At primary level, mean technical support effectiveness was 59.4 at baseline and 54.1 at Wave 1, and the decrease of 5.3 index points is close to statistically significant at the .05 level (t = -1.832, p = .070).
• At post-primary level, mean technical support effectiveness was 72.0 at baseline and 70.2 at Wave 1, and the small decrease of 1.8 index points is not statistically significant (t = 0.478, p = .635).
4.4. Results of regression models: Primary Table 4.2 provides a summary of the three sets of regression analyses conducted for primary schools. Table 4.2. Summary of results of regression models: Primary
Explanatory variable groups and variables
Outcome variables and model results DT
engagement DLF Impact Level of
practice (High) School features DEIS Enrolment size Wave 1 covariates DT attitudes: positive constructivist student learning DT attitudes: impediments to TLA Teacher DT confidence and familiarity School leadership: Idealised influence School leadership: Intellectual stimulation Constructivist beliefs CPD suitability Confidence in and familiarity with DTs DT infrastructure and connectivity Tech support effectiveness Additional PDST support Consultation on DLP Number of DT policies in school Consultation on DT Implementation challenges Integration with SSE Baseline inputs DT engagement DT infrastructure and connectivity scale Tech support effectiveness R2 of final model .517 .355 .541* Not significant p > .05 Significant p < .05 *This is the Nagelkerke pseudo r-square value which is not a true measure of variance explained by the model.
119
Table 4.2 allows a side-by-side comparison of which variables were and were not significant in each model. It is important to note that the variables that are statistically significant are significant in the presence of each other. For example, in the case of the DLF impact model, we can say that level of consultation on the DLP is significantly associated with DLF impact at Wave 1 after adjusting for, or in the presence of, positive attitudes towards DTs to support constructivist learning, and DT infrastructure and connectivity. This feature of multiple regression allows for a much richer interpretation of the various factors relating to the outcomes, since, when variables are examined one at a time in their relationship to an outcome, spurious bivariate (‘one-at-a-time’) relationships may emerge. The results show that school DEIS status (Band 1, Band 2, rural, non-DEIS) and enrolment size were not significantly associated with any of the three Wave 1 outcomes (engagement with DT, DLF impact and level of practice). It can also be seen that a majority of the covariates at Wave 1 were not related to any of the three outcomes, and the only baseline measure associated with any of the three outcomes at was engagement with DTs, which was positively associated with levels of engagement at Wave 1. Four Wave 1 covariates were statistically significant in two of the three models:
• DT infrastructure and connectivity • Level of consultation on DLP • (Fewer) Implementation challenges • Suitability of CPD.
A further two Wave 1 covariates and one baseline measure were statistically significant in one of the three models:
• Positive constructivist orientation to DT • Level of consultation on DT policies (generally) • Level of teacher and pupil engagement with DT at baseline.
The R2 values at the bottom of Table 4.2 provide an indication of the ‘explanatory power’ of each model. In the case of engagement with DTs, the model explains 51.7% of variation (R2 = .517) which indicates quite strong explanatory power. In other words, the five variables in the model explain a little over half of the variation in student and teacher engagement in DTs. It is worth noting that, over and above levels of engagement with DTs at baseline, four factors at Wave 1 contributed significantly to increased engagement with DTs: the suitability of technology-related CPD in which the school participated; DT infrastructure and connectivity; level of consultation on DTs (in general); and (low) implementation challenges. Table 4.4 shows the detailed output associated with the engagement with DTs model. The ‘PE’ (parameter estimate) column shows the expected change in the outcome associated with a one standard deviation increase in each explanatory variable. All continuous variables have been standardised to have a mean of 0 and standard deviation of 1 for ease of interpretation. For example, a primary school with a DT infrastructure and connectivity score that is one standard deviation above the mean has an expected increase in the DT engagement index of around
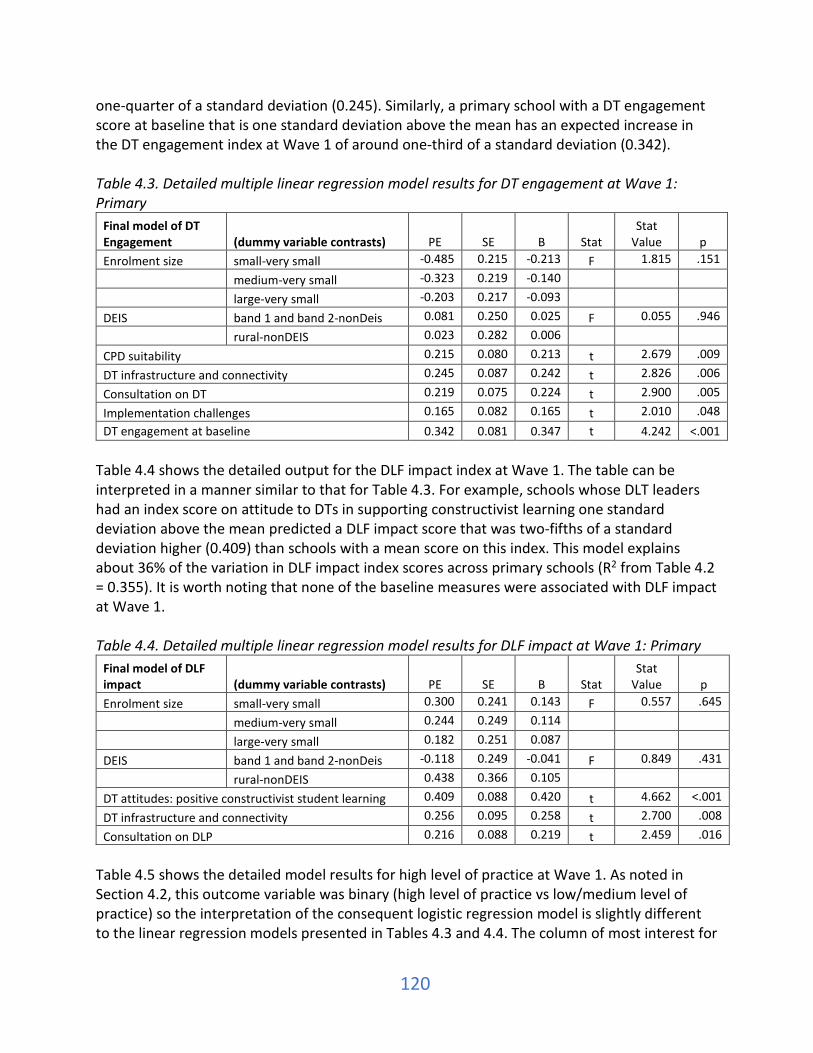
120
one-quarter of a standard deviation (0.245). Similarly, a primary school with a DT engagement score at baseline that is one standard deviation above the mean has an expected increase in the DT engagement index at Wave 1 of around one-third of a standard deviation (0.342). Table 4.3. Detailed multiple linear regression model results for DT engagement at Wave 1: Primary
Final model of DT Engagement (dummy variable contrasts) PE SE B Stat
Stat Value p
Enrolment size small-very small -0.485 0.215 -0.213 F 1.815 .151
medium-very small -0.323 0.219 -0.140 large-very small -0.203 0.217 -0.093 DEIS band 1 and band 2-nonDeis 0.081 0.250 0.025 F 0.055 .946
rural-nonDEIS 0.023 0.282 0.006 CPD suitability 0.215 0.080 0.213 t 2.679 .009
DT infrastructure and connectivity 0.245 0.087 0.242 t 2.826 .006
Consultation on DT 0.219 0.075 0.224 t 2.900 .005
Implementation challenges 0.165 0.082 0.165 t 2.010 .048 DT engagement at baseline 0.342 0.081 0.347 t 4.242 <.001
Table 4.4 shows the detailed output for the DLF impact index at Wave 1. The table can be interpreted in a manner similar to that for Table 4.3. For example, schools whose DLT leaders had an index score on attitude to DTs in supporting constructivist learning one standard deviation above the mean predicted a DLF impact score that was two-fifths of a standard deviation higher (0.409) than schools with a mean score on this index. This model explains about 36% of the variation in DLF impact index scores across primary schools (R2 from Table 4.2 = 0.355). It is worth noting that none of the baseline measures were associated with DLF impact at Wave 1. Table 4.4. Detailed multiple linear regression model results for DLF impact at Wave 1: Primary
Final model of DLF impact (dummy variable contrasts) PE SE B Stat
Stat Value p
Enrolment size small-very small 0.300 0.241 0.143 F 0.557 .645
medium-very small 0.244 0.249 0.114 large-very small 0.182 0.251 0.087 DEIS band 1 and band 2-nonDeis -0.118 0.249 -0.041 F 0.849 .431
rural-nonDEIS 0.438 0.366 0.105 DT attitudes: positive constructivist student learning 0.409 0.088 0.420 t 4.662 <.001
DT infrastructure and connectivity 0.256 0.095 0.258 t 2.700 .008
Consultation on DLP 0.216 0.088 0.219 t 2.459 .016
Table 4.5 shows the detailed model results for high level of practice at Wave 1. As noted in Section 4.2, this outcome variable was binary (high level of practice vs low/medium level of practice) so the interpretation of the consequent logistic regression model is slightly different to the linear regression models presented in Tables 4.3 and 4.4. The column of most interest for

121
interpreting the results is the ‘Odds ratio’: this value describes the odds of being in the ‘high level of practice’ group with a one-standard deviation increase in the explanatory variable. For example, primary schools reporting consultation on the DLP one standard deviation above the average level were about three times more likely to be in the ‘high level of practice’ group (Odds Ratio = 3.080) than those at the average level. The R2 associated with this model cannot be interpreted in the same way as for the models in Tables 4.3 and 4.4 since this is a binary outcome – so should not be used to compare the explanatory power of this model with the others. Table 4.5. Detailed binary logistic regression model results for (high) level of practice at Wave 1: Primary
Final model of high level of embedding DTs (dummy variable contrasts) B SE
Odds ratio Stat
Stat Value p
Enrolment size small-very small -0.104 1.303 0.902 chi-
square 4.674 .197
medium-very small 0.978 1.507 2.660 large-very small -1.912 1.150 0.148
DEIS band 1 and band 2-nonDeis -2.172 1.345 0.114 chi-
square 0.410 .815
rural-nonDEIS -0.693 1.098 0.500 CPD suitability 1.199 0.529 3.315 Wald 5.132 .023
Consultation on DLP 1.125 0.495 3.080 Wald 5.175 .023
Implementation challenges 1.652 0.563 5.215 Wald 8.602 .003
4.5. Results of regression models: Post-primary Table 4.6 provides a summary of the three sets of regression analyses conducted for post-primary schools to give a side-by-side comparison of which variables were and were not significant in each model. As noted in Section 4.4, the results should be interpreted with respect to the fact that each variable is significant in the presence of the other significant variables. Compared with the primary level models, the post-primary models for each of the three outcomes are quite different insofar as there is almost no overlap between them in the explanatory variables that are statistically significant. With respect to DT engagement, four variables are significant (two of these at the .10 level of significance): DEIS status, attitude to DTs as a support for constructivist learning, DT infrastructure and connectivity, and DT engagement at baseline. These four variables explain 43% of the variation in DT engagement in post-primary schools at Wave 1 (R2 = 0.429). Just two variables were significantly associated with DLF impact at Wave 1: enrolment size and consultation on the DLP. These two variables explained 22% of the variation in DLF impact (R2 = 0.222). Interestingly, three of the four significant variables in the model of high level of effective practice were attitudinal: attitude to DTs as a support for constructivist learning; attitude to DTs

122
as an impediment to teaching, learning and assessment; and (general) constructivist beliefs. The fourth variable in the model of high level of effective practice was technical support effectiveness at baseline. Table 4.6. Summary of results of regression models: Post-primary
Explanatory variable groups and variables
Outcome variables and model results
DT engagement DLF Impact
Level of practice (High)
School features DEIS Enrolment size Sector Wave 1 covariates DT attitudes: positive constructivist student learning DT attitudes: impediments to TLA Teacher DT confidence and familiarity School leadership: Idealised influence School leadership: Intellectual stimulation Constructivist beliefs CPD suitability Confidence in and familiarity with DTs DT infrastructure and connectivity Tech support effectiveness Additional PDST support Consultation on DLP Number of DT policies in school Consultation on DT Implementation challenges Integration with SSE Baseline inputs DT engagement DT infrastructure and connectivity scale Tech support effectiveness R2 of final model .429 .222 .572* Not significant p > .10 Borderline significant p < .10 and > .05 Significant p < .05 *This is the Nagelkerke pseudo r-square value which is not a true measure of variance explained by the model.
Table 4.7 shows the detailed output associated with the engagement with DTs model. The ‘PE’ or parameter estimate column shows the expected change in the outcome associated with a one standard deviation increase in each explanatory variable. As with the primary models in the previous section, all continuous variables have been standardised to have a mean of 0 and

123
standard deviation of 1 for ease of interpretation. For example, a post-primary school with a DT infrastructure and connectivity score that is one standard deviation above the mean has an expected increase in the DT engagement index of around half of a standard deviation (0.496). Similarly, a post-primary school with a DT engagement score at baseline that is one standard deviation above the mean has an expected increase in the DT engagement index at Wave 1 of around two-fifths of a standard deviation (0.394). The model also shows that the DT engagement score is about three-fifths of a standard deviation lower in non-DEIS schools compared to DEIS schools, and this difference is almost significant at the .05 level (p = .063). Differences in DT engagement across enrolment size and sector are not significant after accounting for the other variables in the model. Table 4.7. Detailed multiple linear regression model results for DT engagement at Wave 1: Post-primary
Final model of DT Engagement
(dummy variable contrasts) PE SE B Stat
Stat Value p
Enrolment size medium-small -0.567 0.288 -0.259 F 1.937 .157
large-small -0.378 0.283 -0.189 DEIS no-yes -0.613 0.320 -0.268 t -1.195 .063
Sector comm/comp-secondary 0.553 0.312 0.258 F 2.274 .116 ETB-secondary 0.152 0.301 0.060 DT attitudes: positive constructivist student learning
0.214 0.123 0.214 t
1.747 .088
DT infrastructure and connectivity 0.496 0.113 0.496 t 4.404 <.001
DT engagement at baseline 0.394 0.124 0.359 t 3.171 .003
Table 4.8 shows the detailed output for the DLF impact index at Wave 1. The table can be interpreted in a manner similar to that for Table 4.7. The results show that schools with an index score on consultation on the DLP one standard deviation above the mean had a predicted a DLF impact score that was three-tenths of a standard deviation higher (0.281) than schools with a mean score on this index. Principals in schools with larger enrolment sizes reported a DLF impact score half a standard deviation higher than those in small schools (p = .075). DEIS status and sector were not significantly associated with DLF impact at Wave 1. Table 4.8. Detailed multiple linear regression model results for DLF impact at Wave 1: Post-primary
Final model of DLF impact
(dummy variable contrasts) PE SE B Stat
Stat Value p
Enrolment size medium-small -0.225 0.336 -0.111 F 2.781 .075
large-small 0.499 0.322 0.268 DEIS no-yes -0.424 0.346 -0.205 t -1.225 .228
Sector comm/comp-secondary -0.166 0.346 -0.084 F 1.314 .281 ETB-secondary -0.563 0.348 -0.248 Consultation on DLP 0.281 0.129 0.314 t 2.189 .035
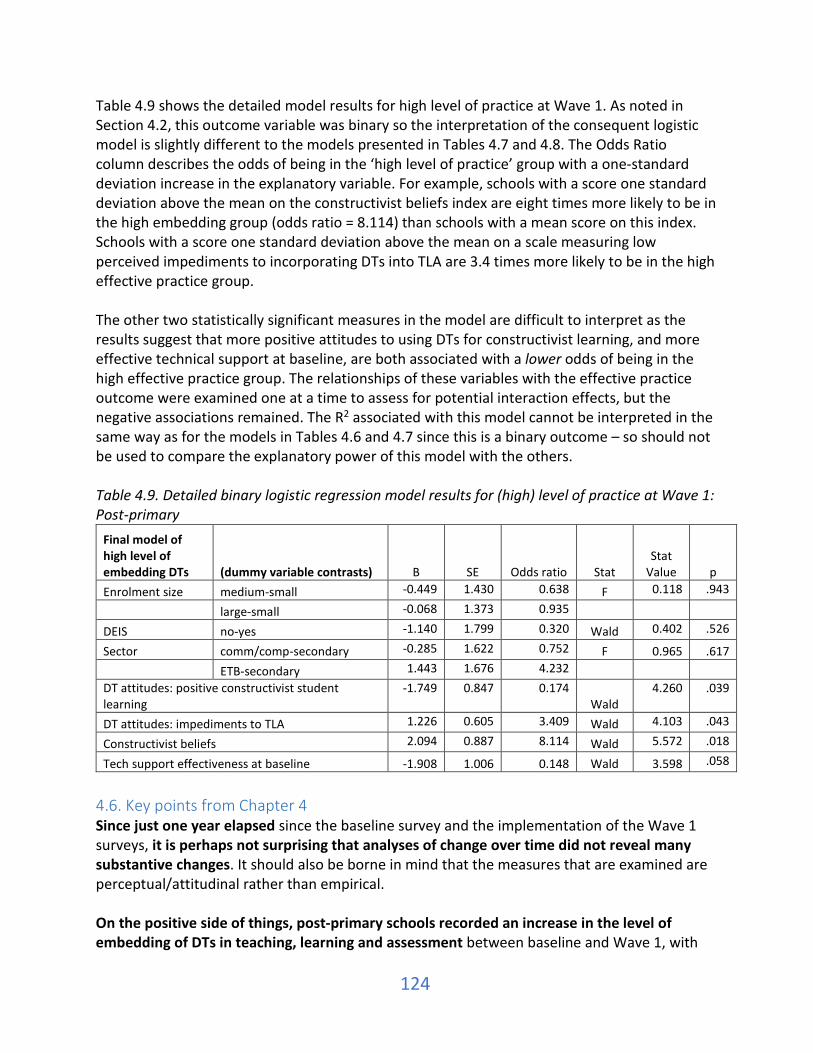
124
Table 4.9 shows the detailed model results for high level of practice at Wave 1. As noted in Section 4.2, this outcome variable was binary so the interpretation of the consequent logistic model is slightly different to the models presented in Tables 4.7 and 4.8. The Odds Ratio column describes the odds of being in the ‘high level of practice’ group with a one-standard deviation increase in the explanatory variable. For example, schools with a score one standard deviation above the mean on the constructivist beliefs index are eight times more likely to be in the high embedding group (odds ratio = 8.114) than schools with a mean score on this index. Schools with a score one standard deviation above the mean on a scale measuring low perceived impediments to incorporating DTs into TLA are 3.4 times more likely to be in the high effective practice group. The other two statistically significant measures in the model are difficult to interpret as the results suggest that more positive attitudes to using DTs for constructivist learning, and more effective technical support at baseline, are both associated with a lower odds of being in the high effective practice group. The relationships of these variables with the effective practice outcome were examined one at a time to assess for potential interaction effects, but the negative associations remained. The R2 associated with this model cannot be interpreted in the same way as for the models in Tables 4.6 and 4.7 since this is a binary outcome – so should not be used to compare the explanatory power of this model with the others. Table 4.9. Detailed binary logistic regression model results for (high) level of practice at Wave 1: Post-primary
Final model of high level of embedding DTs (dummy variable contrasts) B SE Odds ratio Stat
Stat Value p
Enrolment size medium-small -0.449 1.430 0.638 F 0.118 .943
large-small -0.068 1.373 0.935 DEIS no-yes -1.140 1.799 0.320 Wald 0.402 .526
Sector comm/comp-secondary -0.285 1.622 0.752 F 0.965 .617 ETB-secondary 1.443 1.676 4.232 DT attitudes: positive constructivist student learning
-1.749 0.847 0.174 Wald
4.260 .039
DT attitudes: impediments to TLA 1.226 0.605 3.409 Wald 4.103 .043
Constructivist beliefs 2.094 0.887 8.114 Wald 5.572 .018
Tech support effectiveness at baseline -1.908 1.006 0.148 Wald 3.598 .058
4.6. Key points from Chapter 4 Since just one year elapsed since the baseline survey and the implementation of the Wave 1 surveys, it is perhaps not surprising that analyses of change over time did not reveal many substantive changes. It should also be borne in mind that the measures that are examined are perceptual/attitudinal rather than empirical. On the positive side of things, post-primary schools recorded an increase in the level of embedding of DTs in teaching, learning and assessment between baseline and Wave 1, with
125
the increase tending to manifest in fewer schools at the ‘developing’ level and more schools at the ‘intermediate’ level of embedding at Wave 1 compared to baseline. Primary schools did not record a similar increase, however, with levels of embedding tending to remain similar at baseline and Wave 1. In contrast, primary schools (but not post-primary schools) recorded a significant increase in the reported levels of engagement of teachers and students with digital technologies. Meanwhile, there was no change in the levels of DT infrastructure, or of the perceived effectiveness of technical support, between baseline and Wave 1 at either primary or post-primary. At primary level, the regression models indicate that better outcomes on digital technologies i.e. indicative of a more successful implementation of the DLF, are associated with, and hence may need to be enabled by, multiple factors, including the school's infrastructure and connectivity, consultative leadership (consultation on the DLP), presence or absence of challenges, and the extent to which the DLT leader felt that CPD on the DLF was constructivist and targeted to the goals of the DLF. There is also evidence of an association between successful implementation at primary level and the DLT's own attitude or disposition towards DTs in TLA. Interestingly, general measures of leadership and constructivist beliefs were not associated with successful DLF implementation at primary level, nor were perceptions of technical support effectiveness, additional support from the PDST, or the extent to which the DLP was integrated with SSE more generally. Measures at baseline around a year prior (infrastructure/connectivity and technical support effectiveness) were not associated with successful implementation at Wave 1 in primary schools. At post-primary level, there was much less of an overlap in the regression models in terms of the explanatory variables. Taking the three post-primary models together, it appears that attitudes and beliefs of the DLT leader have a significant and substantive bearing on successful implementation of the DLF, along with a consultative approach to the development of the DLP, and the presence of infrastructural and connectivity supports. In the model of (high) effective practice, negative relationships associated with attitudes to using DTs for constructivist learning, and effective technical support are unexpected: this could point to the limitations of the small post-primary sample size or potential unreliability of the outcome measure. Whatever the reason for these findings, it will be important to follow up on them at Wave 2. Across both primary and post-primary, DT infrastructure/connectivity emerged as a significant enabler of successful implementation of the DLF; otherwise, the variables significantly associated with the three DLF implementation outcomes (DT engagement, DLF impact, and (high) level of effective practice) differed across primary and post-primary levels. This in a sense is not surprising since primary and post-primary schools differ significantly in terms of average enrolment size, curricular, teacher and assessment characteristics.

126
Chapter 5: Digital Learning Team leaders’ (or Principals’) and teachers’ perspectives on what works 5.1 Chapter overview As part of the surveys, teachers and DLT Leaders (or Principals) were invited to answer some questions in open-ended text format. These questions covered a number of areas, including the kinds of professional supports they desired in order to best implement the DLF, the resources they found useful when implementing their schools’ DLP, the factors which enabled their implementation of the DLF, and the parts of the DLPlanning.ie website which they found particularly useful, among others. These responses were subjected to thematic analysis, which drew out common themes in the respondents’ answers. From this emerged a broad and rich overview of the needs and experiences of teachers and DLT Leaders. These findings are presented in several sections, with DLT leaders’ and teachers’ responses considered together, as appropriate:
• Views on the dimension chosen for the Digital Learning Framework (DLT Leaders only) • Groups involved with development of the Digital Learning Plan (DLT Leaders only) • General views on embedding digital technologies in teaching, learning and assessment • Views on resources for implementing the Digital Learning Framework/Plan • Views on professional learning supports for implementing the Digital Learning
Framework/Plan • Views on enablers of the Digital Learning Framework/Plan implementation • Views on how schools’ current level of practice was identified (DLT Leaders only) • A summary and conclusions are presented at the end of the chapter.
The most commonly occurring themes for each question are discussed in some level of detail in this chapter. Frequency charts are also provided. These contain all of the themes which emerged for each topic, which facilitates comparison of the frequency of occurrence of different themes, and provides a broad overview of the kinds of themes uncovered. Where relevant, differences and similarities between primary and post-primary levels are discussed. As was the case in Chapters 2, 3 and 4, special schools are combined with primary schools for reporting purposes. Likewise, in other areas, issues specific to DEIS schools are highlighted. Owing to the different types of questions asked in this part of the survey, a wide range of themes and issues emerged from the teacher and DLT leader responses at both primary and post-primary level. However, even given this variety, two overarching themes can be seen connecting much of these responses. These were the related themes of specificity and practicality. Respondents often focused on themes which related to their particular context – whether at their class level, or their subject, or, when talking about training, their own ability level. Similarly, they wanted supports to be practical – they wanted demonstrations of apps and software, and workshops which showed practical use cases for DTs. This desire that supports

127
for the implementation of the DLF be practical and specific to the needs of the schools and teachers was found across the dataset. Reference to these overarching themes is made throughout this chapter where appropriate.
5.2 Digital Learning Team Leaders’ perspectives on what works 5.2.1 Views on the dimension chosen for the Digital Learning Framework – Teaching and Learning dimension DLT leaders were asked to describe why the Teaching and Learning dimension was chosen as the dimension of focus by their school. At primary level, there were a total of 70 comments with an average of 1.2 themes per comment. At post-primary level, there were a total of 40 comments, with an average of 1.48 themes per comment. This means that most comments contained between one and two themes. Results of the thematic analysis for this item are displayed in Figures 5.1 and 5.2. There were mostly differing themes across primary and post-primary levels. However, one theme was common to both levels: both primary and post-primary respondents commented that they chose the Teaching and Learning dimension as DTs are appropriate for TLA. This was the third most commonly occurring theme at both levels, with one fifth of comments at both levels relating to this theme (21% primary; 20% post-primary). Relating to this theme, at primary level comments mostly indicated that DTs should be used for teaching, learning and assessment across the curriculum and to enhance the overall teaching and learning experience for pupils. For example, one respondent commented that a focus on the Teaching and Learning dimension would: “create opportunities for...pupils to experience ICT in a meaningful way in the classroom”. At post-primary level, respondents echoed the comments of their primary counterparts, noting that the availability and use of DTs enhances the teaching and learning experience of the students in the school. One respondent, for example, commented on the differentiation that the use of DTs would enable, that increasing the use of DTs would successively: “vary the teaching and assessment methodologies that teachers were using to address the different learning styles and levels of abilities of the students within the classroom”. Post-primary respondents also described how a focus on the Teaching and Learning dimension enhances teachers’ capacity to collaborate digitally, becoming increasingly confident using the available DTs in school, which in turn results in improved teaching and learning outcomes for students. The two most common themes to occur at primary level in relation to the choice of the Teaching and Learning dimension were DTs improve learner outcomes and that DT was the Area identified following school review/consultation. Approximately one quarter of comments were relating to each of these themes (23% in each case). In relation to the first theme, DTs improve learner outcomes, DLT primary leaders mentioned that they chose the Teaching and Learning dimension as the use of DTs ensures better learner outcomes for all pupils. Specifically, it was commented that the use of DTs improves “digital competence” and helps pupils to “become fully ICT literate”. The use of DTs in the classroom helps pupils become “accustomed to using

128
new technologies”, improving pupils’ skills for secondary school and readiness for work in adulthood. One respondent commented: “Individual teachers have varying degrees of experience and therefore it was felt that if we focused on Teaching and Learning ... that it would ensure better learning outcomes for all without being overwhelming.” For the next theme at primary level, Area identified following school review/consultation, DLT leaders indicated that some of the following review and consultative activities served to prioritise the Teaching and Learning dimension for the school:
• review of equipment and software for pupils; • dimension identified based on results of survey of staff/parents/pupils; • area identified following consultation and feedback/discussion/staff meetings with
teachers; • school’s current needs identified from first phase of the project.
Other themes relating to the Teaching and Learning dimension which were mentioned with less frequency at primary level are listed in Figure 5.1. At post-primary level, by far the two most frequently occurring themes to emerge from the data were: DTs promote teacher collaboration, shared practice; and Complement SSE process/SIP/school goals. Post-primary DLT leaders commented that they chose the Teaching and Learning dimension as DTs promote teacher collaboration and shared practice. Almost two fifths of comments (38%) were relating to this theme. In general, the Teaching and Learning dimension was chosen by post-primary respondents as digital technologies have been reported to enhance the sharing of practices and resources amongst teachers, improving their capacity to collaborate professionally to improve teaching and learning outcomes for students. Post-primary respondents described how their staff are being actively encouraged to collaborate and share resources. For example, it was commented that digital technologies encourage staff collaboration between different subject departments, through the use of software such as Microsoft teams, Google classroom, and Google drive. DTs are viewed as a positive resource in post-primary schools in this regard. For example, one post-primary respondent noted: “There is a positive attitude among the staff towards digital technology and an eagerness to embrace new software and teaching approaches.” Furthermore, another post-primary respondent described the “digital champions” they have within the school, who are “willing to share their skills and knowledge with other staff members”. The second most frequently occurring theme at post-primary level was that the Teaching and Learning dimension was chosen as it Complements SSE process/SIP/school goals. Approximately one third (35%) of the comments at this level were relating to this theme. Respondents reported choosing this domain to work in tandem with their School Self-Evaluation (SSE) process. It also complements the School Improvement Plan (SIP) and general school goals in some cases. Other themes relating to the Teaching and Learning dimension which were mentioned with less frequency at post-primary level are listed in Figure 5.2.

129
Figure 5.1. Themes emerging from primary DLT leader respondents’ answers to the question “Please describe why the Teaching and Learning dimension was chosen by your school, and why the domain(s) you have selected was/were chosen as the focus”. Figures represent percentage of comments containing each theme (n=70)
Figure 5.2. Themes emerging from post-primary DLT leader respondents’ answers to the question “Please describe why the Teaching and Learning dimension was chosen by your school, and why the domain(s) you have selected was/were chosen as the focus” Figures represent percentage of comments containing each theme (n=40)
3
4
4
9
14
19
21
23
23
0 5 10 15 20 25
Dimension key to pupil-staff relationship
Dimension reflects age, abilities and goals of pupils
Dimension reflects existing use of DTs in school
Improves teachers' professional practice
Aligns with school's plan/targets /goals/ DEIS plan
Fosters pupil/staff familiarity with the DLF and DTresources
DTs appropriate for TLA
Area identified following school review/consultation
DTs improve learner outcomes
5
5
6
8
10
10
13
20
35
38
0 5 10 15 20 25 30 35 40
Encourages students use of DTs
Encourages more focused approach/whole school…
Other
Enhances student engagement/promotes active learning
Develops teacher confidence with DTs
Most relevant to school context
Domain selected based on available evidence (e.g.…
DTs appropriate for TLA
Complements SSE process/SIP/school goals
DTs promote teacher collaboration, shared practice
130
5.2.2 Views on the dimension chosen for the Digital Learning Framework – Leadership and Management dimension DLT leaders were asked to describe why the Leadership and Management dimension was chosen as the focus for the school. It is worth noting that there were very few comments in relation to this item as so few schools had focused on Leadership and Management, with a total of 8 comments at primary level, and a total of 6 comments at post-primary level. There was on average 1.0 themes per comment at primary and an average of 1.5 themes per comment at post-primary level. Results of the thematic analysis for this question are displayed in Figures 5.3 and 5.4. Due to the paucity of responses, only the most frequently occurring theme is described here. Themes were different between primary and pot-primary levels. At primary level, the most frequent theme was Integration of DTs into teaching and learning, with one quarter (25%) of comments relating to this theme. Primary DLT leaders chose the Leadership and Management dimension as it was mentioned a couple of times that schools were at the beginning of their journey with respect to the Integration DTs into teaching and learning, resulting in the choice of this particular dimension. All of the other themes were mentioned just once (refer to Figure 5.3 for more detail). At post-primary level, the two most frequently occurring themes to emerge from the data were as follows: Invest/implement changes in DT infrastructure and resources (50%); and Complements SSE (33%). Half of the comments were relating to the theme Invest/implement changes in DT infrastructure and resources. A few schools mentioned that they chose the Leadership and Management dimension as investment and the implementation of changes in digital technology hardware (for teachers and students) and DT infrastructure was a priority in order to further embed DTs into learning and teaching. The second most mentioned theme was Complements SSE, which was mentioned in one third of comments. A couple of schools commented that the Leadership and Management dimension linked in well with the schools’ SSE. Themes which were mentioned with lesser frequency are outlined in Figure 5.4.

131
Figure 5.3. Themes emerging from primary DLT leader respondents’ answers to the question “Please describe why the Leadership and Management dimension was chosen by your school, and why the domain(s) you have selected was/were chosen as the focus” Figures represent percentage of comments containing each theme (n=8)
Figure 5.4. Themes emerging from post-primary DLT leader respondents’ answers to the question “Please describe why the Leadership and Management dimension was chosen by your school, and why the domain(s) you have selected was/were chosen as the focus” Figures represent percentage of comments containing each theme (n=6)
5.2.3 General views on embedding digital technologies in teaching, learning and assessment DLT leaders were asked to indicate what the phrase embedding digital technologies in teaching, learning and assessment means to them. This is of key interest since the DLF document makes 17 references to the notion of embedding digital technologies, and the
13
13
13
13
13
13
25
0 5 10 15 20 25 30
Standardise school planning
Review and investment in resources
General, negative
Focus on teaching and learning previously
Progressing with DL strategy from 'top down'
Did not choose, part of pilot scheme
Integration of DTs into teaching and learning
17
17
17
17
33
50
0 10 20 30 40 50 60
Consultation with PDST advisor
Facilitate teachers integrate DTs into TLA
Facilitate collaboration between subject depts
Maximise the use of school IT funds/grants
Complements SSE
Invest/implement changes in DT infrastructure andresources
132
statements of effective and highly effective practice rely on a shared understanding of what this means. The Glossary of Terms at the back of the DLF document defines embedding digital technology as ‘Moving beyond ICT integration, where digital technology is seamlessly used in all aspects of teaching, learning and assessment to enhance the learning experiences of all students’ (Department of Education and Skills, 2017a, b). Results of the thematic analysis for this question are displayed in Figures 5.5 and 5.6. At primary level, there were a total of 67 comments, with an average of 1.4 themes per comment. At post-primary level, there were a total of 42 comments, with an average of 1.2 themes per comment. At primary level, the three most frequently occurring themes to emerge from the data were: Student engagement with DTs/supports student learning; Seamless integration of DTs in curriculum; DTs support/tool for TLA. There were fewer prominent themes to emerge at post-primary level compared with primary. However, the most frequent theme to emerge at post-primary level was similar to one of the prominent themes at primary level: Integral part of TLA/seamless/habitual/widespread/the norm. With respect to the first theme at primary level, Student engagement with DTs/supports student learning, almost two fifths (37%) of the comments were relating to this theme. Respondents indicated that embedding digital technologies in teaching, learning and assessment means that digital technologies are used as a tool to support and enhance pupil learning, with pupils becoming accustomed to their use. It was commented that pupils “engage with technology as a means towards learning and responding to work”. Also mentioned was that DTs benefit pupils as an aid to their “full potential”, whilst facilitating “active learning and collaboration”, and promoting digital literacy. It was also commented that DTs inspire pupils to “learn through inquiry” and serve as an aid to pupils developing their abilities to participate in society. One respondent commented: “The phrase embedding digital technologies in teaching, learning and assessment means enabling children ... to engage with and access the curriculum while using digital technologies in a deep, child-centred and creative way. It means helping children to become active learners and knowledge constructors...” For the second most frequent theme at primary level, Seamless integration of DTs in the curriculum, approximately one third (34%) of the comments were related to this theme. At post-primary level, approximately three in ten comments (28%) were related to the similar theme Integral part of TLA/seamless/widespread/the norm. At primary level, DLT leaders commented that embedding digital technologies in teaching, learning and assessment means a seamless integration of DTs in the curriculum. The use of digital technologies is an integral means of teaching effectively and as such, digital technologies are used naturally, practically and seamlessly within the school day by both teachers and pupils. It was mentioned that embedding DTs means that they are used regularly to enhance lessons. One respondent commented: “Embedding digital learning technologies means using digital resources as part of every learning experience right across the curriculum, from mathematics to literacy, science, art and music”.

133
Similarly at post-primary level, many DLT leaders commented that embedding digital technologies in teaching, learning and assessment means that the use of digital technologies becomes the normal way of engaging students in their learning and assessment, and that digital technologies can be used seamlessly in activities relating to teaching, learning and assessment. Echoing the finding at primary level, one respondent commented that DTs become an “integral part of lessons”. Another commented: “...that the use of digital technologies in TLA becomes standard practice and a routine habit across our school.” According to another post-primary respondent, a culture is created within the school where the use of DTs is accepted and used on a widespread basis. The widespread use of DTs across the school was reflected in many comments, with one respondent commenting that there should be access to DTs for all within the school. One respondent succinctly noted that embedding means to them: “Having digital technology blended seamlessly into teaching and learning and all members of the school community being open to the opportunities offered to us by digital technology.” For the third most frequent theme at primary level, DTs support/tool for TLA, three in ten (30%) comments were related to this theme. Respondents noted that embedding digital technologies means to them that DTs support teaching, learning and assessment across all subject areas of the curriculum. When used as an integrated part of teaching, learning and assessment within the classroom and school, digital technologies improve the teaching and learning experiences of the pupils, consolidating learning and assessment. It was also commented that the embedding of DTs assists in providing more accurate assessment tools for teachers. One respondent commented about the use of DTs: “It will be an enabler, facilitator to access areas of their [pupils’] learning.” Other themes which were mentioned with less frequency are shown in Figures 5.5 and 5.6.
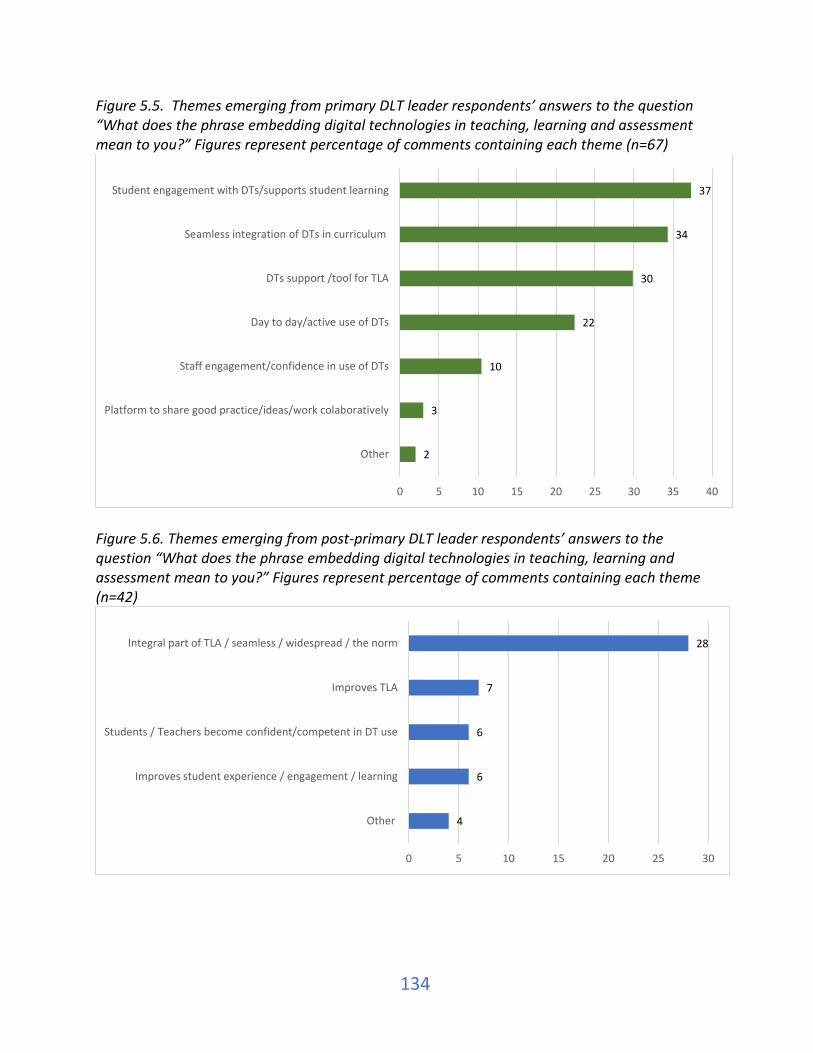
134
Figure 5.5. Themes emerging from primary DLT leader respondents’ answers to the question “What does the phrase embedding digital technologies in teaching, learning and assessment mean to you?” Figures represent percentage of comments containing each theme (n=67)
Figure 5.6. Themes emerging from post-primary DLT leader respondents’ answers to the question “What does the phrase embedding digital technologies in teaching, learning and assessment mean to you?” Figures represent percentage of comments containing each theme (n=42)
2
3
10
22
30
34
37
0 5 10 15 20 25 30 35 40
Other
Platform to share good practice/ideas/work colaboratively
Staff engagement/confidence in use of DTs
Day to day/active use of DTs
DTs support /tool for TLA
Seamless integration of DTs in curriculum
Student engagement with DTs/supports student learning
4
6
6
7
28
0 5 10 15 20 25 30
Other
Improves student experience / engagement / learning
Students / Teachers become confident/competent in DT use
Improves TLA
Integral part of TLA / seamless / widespread / the norm
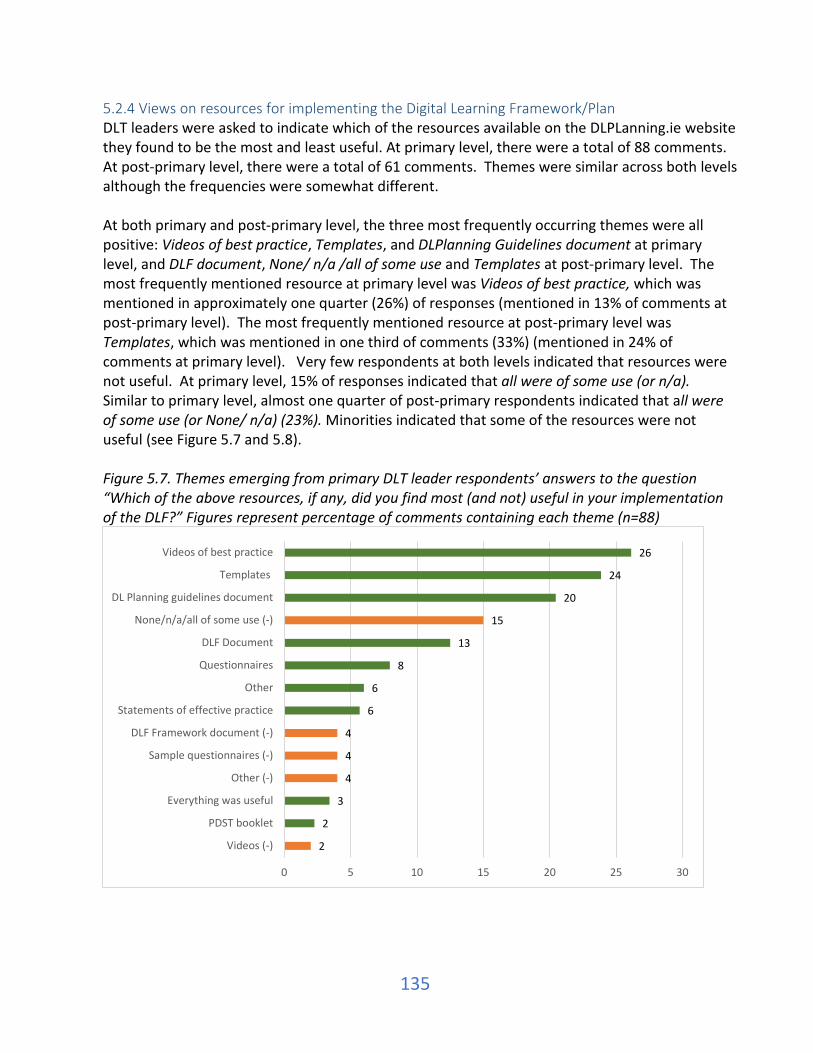
135
5.2.4 Views on resources for implementing the Digital Learning Framework/Plan DLT leaders were asked to indicate which of the resources available on the DLPLanning.ie website they found to be the most and least useful. At primary level, there were a total of 88 comments. At post-primary level, there were a total of 61 comments. Themes were similar across both levels although the frequencies were somewhat different. At both primary and post-primary level, the three most frequently occurring themes were all positive: Videos of best practice, Templates, and DLPlanning Guidelines document at primary level, and DLF document, None/ n/a /all of some use and Templates at post-primary level. The most frequently mentioned resource at primary level was Videos of best practice, which was mentioned in approximately one quarter (26%) of responses (mentioned in 13% of comments at post-primary level). The most frequently mentioned resource at post-primary level was Templates, which was mentioned in one third of comments (33%) (mentioned in 24% of comments at primary level). Very few respondents at both levels indicated that resources were not useful. At primary level, 15% of responses indicated that all were of some use (or n/a). Similar to primary level, almost one quarter of post-primary respondents indicated that all were of some use (or None/ n/a) (23%). Minorities indicated that some of the resources were not useful (see Figure 5.7 and 5.8). Figure 5.7. Themes emerging from primary DLT leader respondents’ answers to the question “Which of the above resources, if any, did you find most (and not) useful in your implementation of the DLF?” Figures represent percentage of comments containing each theme (n=88)
2
2
3
4
4
4
6
6
8
13
15
20
24
26
0 5 10 15 20 25 30
Videos (-)
PDST booklet
Everything was useful
Other (-)
Sample questionnaires (-)
DLF Framework document (-)
Statements of effective practice
Other
Questionnaires
DLF Document
None/n/a/all of some use (-)
DL Planning guidelines document
Templates
Videos of best practice
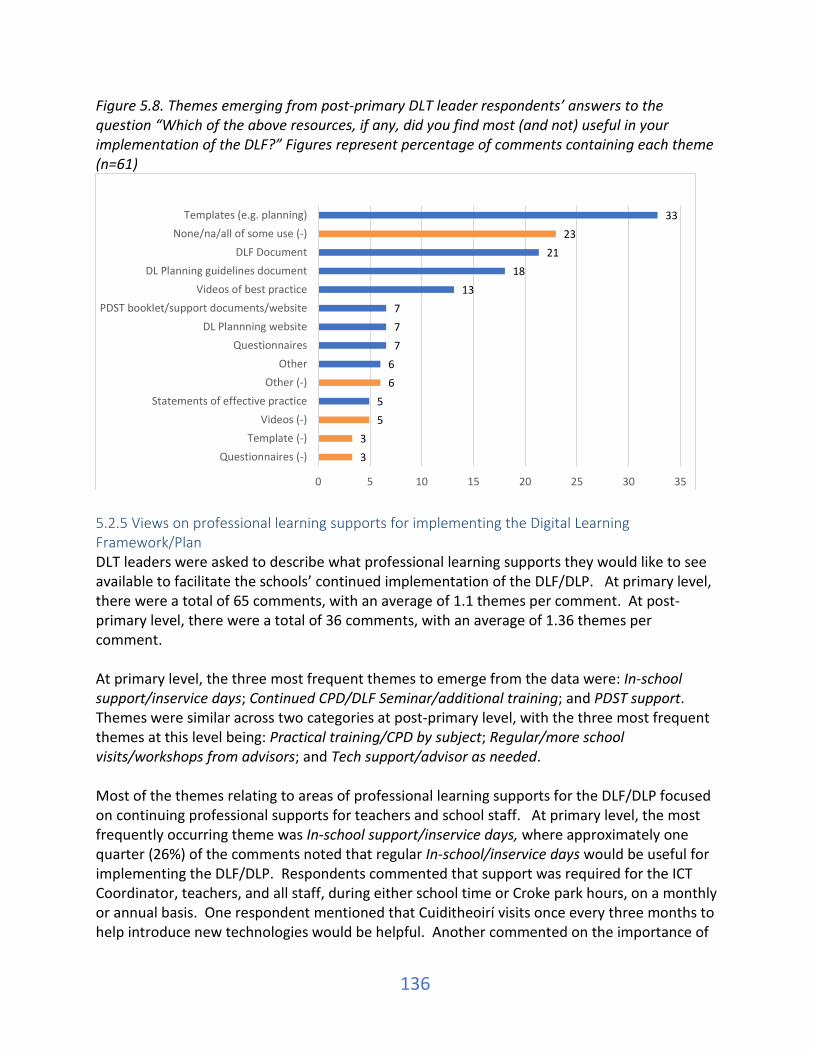
136
Figure 5.8. Themes emerging from post-primary DLT leader respondents’ answers to the question “Which of the above resources, if any, did you find most (and not) useful in your implementation of the DLF?” Figures represent percentage of comments containing each theme (n=61)
5.2.5 Views on professional learning supports for implementing the Digital Learning Framework/Plan DLT leaders were asked to describe what professional learning supports they would like to see available to facilitate the schools’ continued implementation of the DLF/DLP. At primary level, there were a total of 65 comments, with an average of 1.1 themes per comment. At post-primary level, there were a total of 36 comments, with an average of 1.36 themes per comment. At primary level, the three most frequent themes to emerge from the data were: In-school support/inservice days; Continued CPD/DLF Seminar/additional training; and PDST support. Themes were similar across two categories at post-primary level, with the three most frequent themes at this level being: Practical training/CPD by subject; Regular/more school visits/workshops from advisors; and Tech support/advisor as needed. Most of the themes relating to areas of professional learning supports for the DLF/DLP focused on continuing professional supports for teachers and school staff. At primary level, the most frequently occurring theme was In-school support/inservice days, where approximately one quarter (26%) of the comments noted that regular In-school/inservice days would be useful for implementing the DLF/DLP. Respondents commented that support was required for the ICT Coordinator, teachers, and all staff, during either school time or Croke park hours, on a monthly or annual basis. One respondent mentioned that Cuiditheoirí visits once every three months to help introduce new technologies would be helpful. Another commented on the importance of
33
55
66
777
1318
2123
33
0 5 10 15 20 25 30 35
Questionnaires (-)Template (-)
Videos (-)Statements of effective practice
Other (-)Other
QuestionnairesDL Plannning website
PDST booklet/support documents/websiteVideos of best practice
DL Planning guidelines documentDLF Document
None/na/all of some use (-)Templates (e.g. planning)

137
in-school support and regular feedback: “More focused/specific face to face inschool [sic] support. Also, regular feedback about what is working well in schools and what is not working well to encourage sharing of practice between schools.” Similarly themed at post-primary level, approximately one third (31%) of comments were related to Regular/more school visits/workshops from advisors. Respondents mentioned that the following activities would be helpful professional learning supports for the DLF/DLP:
• drop-in clinics with DLF advisor for individual subject departments; • more in-school training e.g., with PDST TiE; • facilitators/advisors to meet with DLT; • regular visits from PDST with more seminars and presentations for teachers and school
leaders; • PDST advisors to aid with the demonstration and embedding of approaches.
At primary level, almost one quarter (23%) of DLT leaders commented that Continued CPD/DLF Seminar/additional training would be a helpful professional learning support for all staff and one fifth (20%) commented that continued PDST support would be useful. Likewise, at post-primary level one third (33%) of the comments were relating to the theme Practical training/CPD. Some of the professional learning supports suggested by post-primary DLT leaders include:
• the use of instructional videos on particular apps for use in the classroom; • teacher training in the use of effective DTs; • technical support training; • more CPD for teachers; • training programmes for individual subject departments; • webinars on the use of DTs for assessment.
Finally, at post-primary level, approximately one fifth (22%) of comments were relating to the theme Tech support/advisor as needed. Generally post-primary respondents expressed the desire to have an experienced IT advisor or technical support available to the school, or for advanced ICT training to be made available. This theme was also present at primary level, however with lesser frequency. Other professional learning supports which were mentioned with less frequency are presented in Figures 5.9 and 5.10.
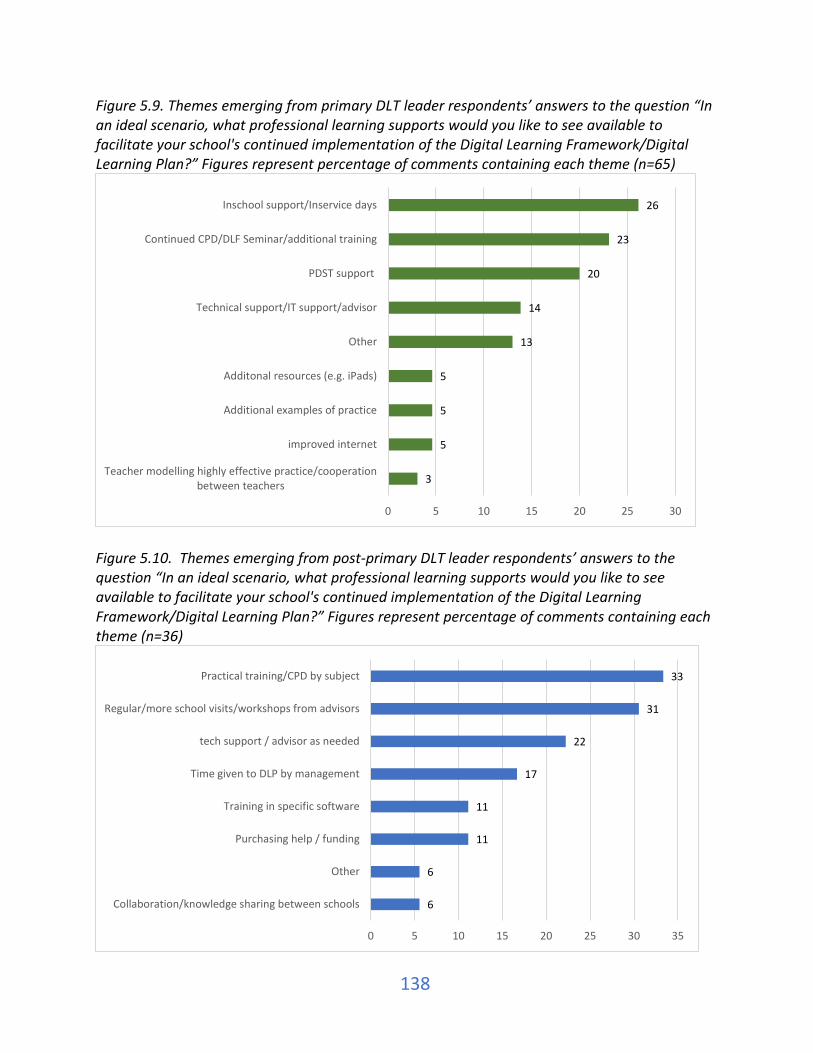
138
Figure 5.9. Themes emerging from primary DLT leader respondents’ answers to the question “In an ideal scenario, what professional learning supports would you like to see available to facilitate your school's continued implementation of the Digital Learning Framework/Digital Learning Plan?” Figures represent percentage of comments containing each theme (n=65)
Figure 5.10. Themes emerging from post-primary DLT leader respondents’ answers to the question “In an ideal scenario, what professional learning supports would you like to see available to facilitate your school's continued implementation of the Digital Learning Framework/Digital Learning Plan?” Figures represent percentage of comments containing each theme (n=36)
3
5
5
5
13
14
20
23
26
0 5 10 15 20 25 30
Teacher modelling highly effective practice/cooperationbetween teachers
improved internet
Additional examples of practice
Additonal resources (e.g. iPads)
Other
Technical support/IT support/advisor
PDST support
Continued CPD/DLF Seminar/additional training
Inschool support/Inservice days
6
6
11
11
17
22
31
33
0 5 10 15 20 25 30 35
Collaboration/knowledge sharing between schools
Other
Purchasing help / funding
Training in specific software
Time given to DLP by management
tech support / advisor as needed
Regular/more school visits/workshops from advisors
Practical training/CPD by subject

139
5.2.6 Views on enablers of the Digital Learning Framework/Plan implementation DLT leaders were asked to describe what changes to the DLF documents and other supporting materials would better enable them to implement the DLF in their school/classroom. At primary level, there were a total of 40 comments with an average of 1.3 themes per comment. At post-primary level, there were a total of 22 comments, with an average of 1.0 themes per comment. Across primary and post-primary levels, a couple of similar themes emerged from the data, however, there were differences in the frequency of occurrence. At primary level, one quarter (25%) of respondents indicated that No changes were required to the DLF documents and other materials; this was also a theme at post-primary level. The corresponding percentage at post-primary level was approximately one fifth (18%). At primary level one DLT leader commented: “I felt that the DLF documents were very straight forward and self-explanatory”. Another similar theme to emerge at both levels was Improve communication of DLF/clearer guidelines (at primary) and Clearer/more user friendly documents (at post-primary). At primary level, 15% of comments by DLT leaders indicated that a change they would like to see was Improve communication of DLF/clearer guidelines. Similarly, at post-primary almost one fifth (18%) of comments indicated that they would like Clearer/more user friendly documents. The most frequently occurring theme to emerge from the data at primary level was: More DLP/lesson plan samples. Approximately three in ten comments (28%) were related to this theme. It was commented that more sample digital learning plans were required and would be useful for schools to “use and adapt”. It was also mentioned that a longer time was required for the plan (e.g. formulate a 3-year plan). Suggested also was a “DLP building tool”, and more detailed templates of the DLP. It was mentioned a few times also that more sample lesson plans/ideas would be useful. The most frequent theme to emerge at post-primary level was Other. Approximately one third (32%) of the comments were related to this theme. Given the low number of responses for this question at post-primary level, and due to the variety of answers received, there were few common themes throughout. The variety of responses highlights the variation in what schools think would enable them to better implement the DLF. Within this theme, there were various subthemes, some of which mentioned that the following would be useful: clearer step by step approach, longer training time for DLF team leaders, collaboration between an ETB and PDST, additional time to bring the DLT team together and ensure that targets are implemented, and also clarity on the role of the ETB in relation to documentation and funding. At primary level also, one fifth (20%) of the comments came under the Other category. Some of the subthemes presented in this category were: more equipment, more examples of evaluation procedures, more online information/advice on good practice, and improved templates. The second most frequent theme at post-primary level was Online interactive DLP document, with approximately one quarter of the comments relating to this theme. Generally, respondents commented that they would like an online DLP. Specifically, it was mentioned that it would be useful if the online DLP was “more interactive” and would take into consideration
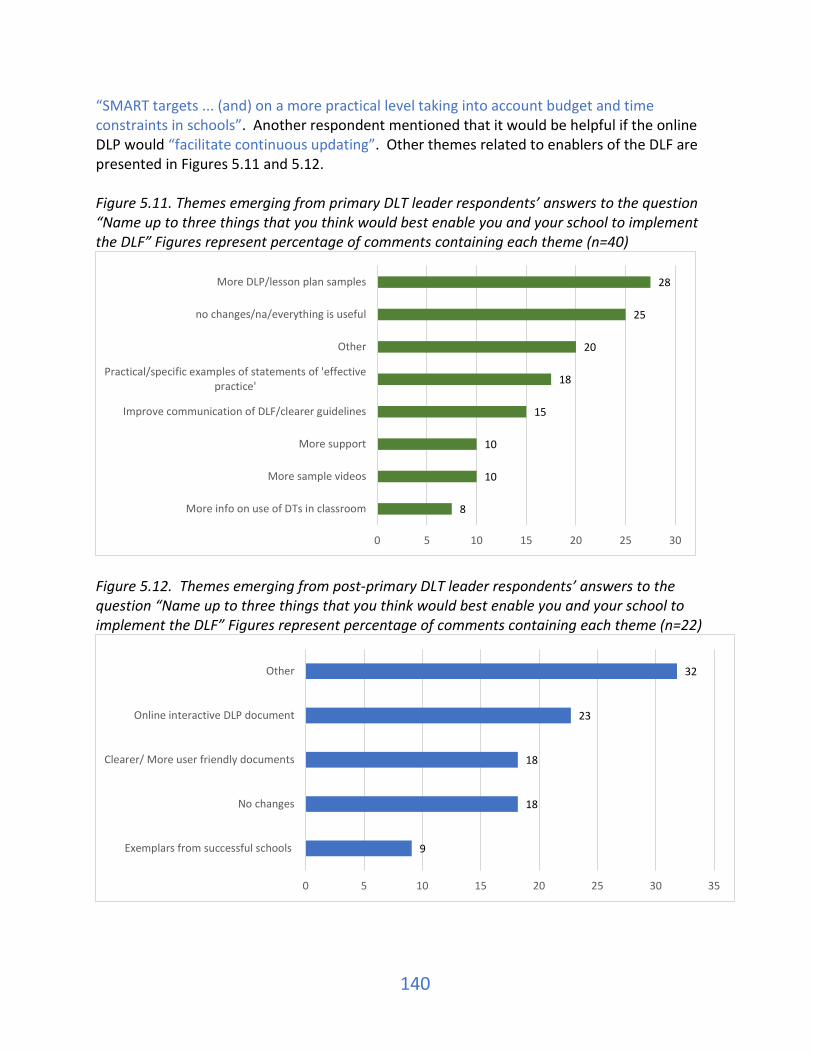
140
“SMART targets ... (and) on a more practical level taking into account budget and time constraints in schools”. Another respondent mentioned that it would be helpful if the online DLP would “facilitate continuous updating”. Other themes related to enablers of the DLF are presented in Figures 5.11 and 5.12. Figure 5.11. Themes emerging from primary DLT leader respondents’ answers to the question “Name up to three things that you think would best enable you and your school to implement the DLF” Figures represent percentage of comments containing each theme (n=40)
Figure 5.12. Themes emerging from post-primary DLT leader respondents’ answers to the question “Name up to three things that you think would best enable you and your school to implement the DLF” Figures represent percentage of comments containing each theme (n=22)
8
10
10
15
18
20
25
28
0 5 10 15 20 25 30
More info on use of DTs in classroom
More sample videos
More support
Improve communication of DLF/clearer guidelines
Practical/specific examples of statements of 'effectivepractice'
Other
no changes/na/everything is useful
More DLP/lesson plan samples
9
18
18
23
32
0 5 10 15 20 25 30 35
Exemplars from successful schools
No changes
Clearer/ More user friendly documents
Online interactive DLP document
Other
141
5.2.7 Descriptions of how schools’ current level of practice was identified DLT leaders were also asked to outline how their schools’ current level of practice was identified. This question is of particular interest since it has direct implications for the assessment and monitoring of effective practice. At primary level, there were a total of 40 comments, with an average of 1.4 themes per comment. At post-primary level, there were a total of 39 comments with an average of 1.6 themes per comment. Themes at primary level were similar to those at post-primary level, however the frequencies in their occurrence were different and themes were somewhat more refined at post-primary level. The three most frequently occurring themes at primary level were Discussion at staff meetings/feedback/consultation; Survey/evaluation/focus groups; and Reflection/observation/current knowledge. The three most frequent themes at post-primary level were Staff survey/feedback (62%); Staff discussion (38%); Observation (26%). At primary level, almost one half of the comments mentioned that Discussion at staff meetings/feedback/consultation (46%) served to identify the school’s current level of practice. Feedback and consultation was reported to have been sought mainly from staff, though feedback from pupils was mentioned a couple of times also. Staff discussion was also the second most frequent theme at post-primary level, with almost two fifths (38%) of comments relating to this theme. DLT respondents mentioned that schools’ current level of practice was identified through formal and informal staff discussion and consultation, e.g., at staff meetings, and also within the Digital Learning Team. At primary level, the second most frequent theme was Survey/evaluation/focus groups with one quarter (25%) of comments focused on this theme. It was reported by primary DLT leaders that these activities could involve either staff, parents or pupils in order to identify schools’ current level of practice. At post-primary level, approximately two thirds of the comments (62%) were related to the theme Staff survey/feedback. Many post-primary DLT respondents mentioned that they undertook surveys of teachers to assess skills, some on a once off basis (e.g., undertake a digital technology survey with all teaching staff). Other surveys were undertaken more regularly. For example, one respondent commented: “We regularly survey staff in relation to their ICT skills development needs and priorities.” Another mentioned that they undertook surveys of staff “at different stages of the implementation of the DLP”. It was also mentioned that teacher feedback was obtained in order to identify schools’ current level of practice. Surveys of students were also undertaken by some schools in order to assess their needs. The third most frequent theme at primary level was Reflection/observation/current knowledge, with just over one fifth (21%) of comments relating to this area. DLT respondents described how staff reflection and observation of teachers and the DLT, as well as current knowledge from the classroom, contributed to identifying the schools’ current level of practice. The theme of Observation was also the third most frequent theme at post-primary level, with approximately one quarter (26%) of comments referring to this theme. Other themes which were mentioned with less frequency are listed in Figures 5.13 and 5.14.

142
Figure 5.13. Themes emerging from primary DLT leader respondents’ answers to the question “Please outline how you identified your school’s current level of practice” Figures represent percentage of comments containing each theme (n=40)
Figure 5.14. Themes emerging from post-primary DLT leader respondents’ answers to the question “Please outline how you identified your school’s current level of practice” Figures represent percentage of comments containing each theme (n=39)
5.3 Teachers’ perspectives on what works 5.3.1 General view on embedding digital technologies in teaching, learning and assessment Teachers were asked what they understood the word “embedding” to mean in the context of embedding digital technology in teaching, learning and assessment. There were 311 responses
7
8
8
8
12
21
25
46
0 5 10 15 20 25 30 35 40 45 50
General, negative
General, positive
Use of targets/gathering evidence
Review resources and plan/comparison with other time/other schools
Other
Reflection/observation/current knowledge
Survey/evaluation/ focus groups
Discussion at staff meetings/feedback/consultation
8
13
15
26
38
62
0 5 10 15 20 25 30 35 40 45 50 55 60 65
Student discussion
Other
Student survey / feedback
Observation
Staff discussion
Staff survey / feedback
143
to this question at primary level, with an average of 1.39 themes per comment. At post-primary level, there were 281 responses to this question, with an average of 1.21 themes per comment. This means that most comments contained between one and two themes. As noted in Section 5.2.4, responses to this question are of key interest and should be interpreted with reference to the definition of embedding digital technologies in the Glossary of Terms in the Digital Learning Framework (Department of Education and Skills, 2017a, b). Similar themes emerged from primary and post-primary levels, however, there were differences in the frequency of their occurrence. At primary level, by far the most commonly occurring theme was that embedding meant Making DTs an integral part of the curriculum and/or of TLA. This theme was present in about two-fifths of responses (39%). One respondent said that embedding means that “the use of digital technologies are intertwined into lesson planning, teaching and assessment”. Another commented that it meant “using IT as part of everyday life, not as an add-on”. This idea of DTs not being used as an “add-on” appeared frequently as part of this theme. This hints at a feeling among teachers that embedding is not complete if it merely involves more use of DTs, rather than a fitting of the DT practices to the TLA needs of the school and the particular lessons. This is in contrast to the most frequently occurring theme at post-primary level, which was that embedding meant simply the use of DTs in TLA. This theme occurred in about a quarter (24%) of post-primary teacher responses, however, it only occurred in about one-tenth of primary responses (11%). This suggests that primary respondents have a more holistic understanding of what it means to embed DTs in TLA – one that is more likely to include the consequences of effective DT use. Apart from this significant difference in the most common theme, the other frequently occurring themes were the same between levels. At both primary and post-primary level, the second most common theme emerging from these responses was that embedding meant that DTs became second-nature, habitual, or were a seamless part of the teacher’s practice. This theme was present in almost a quarter of responses to this question (24%) at primary level, and about a fifth of responses at post-primary (22%). One teacher commented that “For me, it means making the use of digital technologies as natural part of the educational process as the "chalk and talk" method was to previous generations of Irish pupils”. Another said that it meant “Creating a culture where digital technology is second nature to staff”. This second comment reflects a desire that this second-nature aspect of DT use comes from the school culture, rather than just from the teachers’ own training or familiarity with DTs. Interestingly, the third most common theme at both levels, present in 16% of comments at primary, and 19% of comments at post-primary, was that embedding Enhances lessons and assessment techniques. This is distinct from the previous two themes in that it represents an outcome of embedding, rather than a description of what embedding means. One respondent commented that embedding meant “utilising digital technology to improve the quality of the teacher and learning in the modern-day classroom”. Another said that embedding meant using

144
DTs to enhance a lesson, and said that when designing a lesson, they should ask “what additional benefit will it bring to my lesson?”. Some teachers took this notion of enhancement quite far, with one post-primary teacher commenting that it meant “Using digital platforms to enhance the learning of your students which will give an opportunity for all to learn and become more independent and inquisitive learners”. This emphasis on students becoming independent and inquisitive learners suggests that the teacher sees DT embedding as enabling the fostering of a constructivist learning environment. This teacher took their answer further still to include the benefits to the school of embedding DTs: “Furthermore to enhance the collaborative process among subject departments which will extend to whole school over time which ultimately achieves our schools mission statement”. This deep and comprehensive concept of what it means to embed DTs in TLA is further reflected in some of the other themes for this question, such as Students are more engaged in their learning, and that they understand more deeply and engage more critically with the material. This featured prominently at both levels, and suggests that many teachers conceive of embedding as something which can have profound effects on the learning experience for students which extend into other aspects of their lives. Figure 5.15. Themes emerging from primary teacher respondents’ answers to the question “What does the phrase embedding digital technologies in teaching, learning and assessment mean to you?” Figures represent percentage of comments containing each theme (n=311)
1
4
5
5
6
6
7
11
15
16
24
39
0 5 10 15 20 25 30 35 40 45
Improves curriculum accessibility for SEN students
Variety of digital tools used
Own-pace, student-centered learning
Enhances student learning
Give students IT skills / transfer from school to life
Frequent DT use
Teachers confident in their DT ability
Simply: Using DTs in TLA
Students are more engaged in learning /better learning
Enhances lessons & assessment techniques
DTs are second-nature / habit / natural / seamless
Integral part of curriculum/TLA
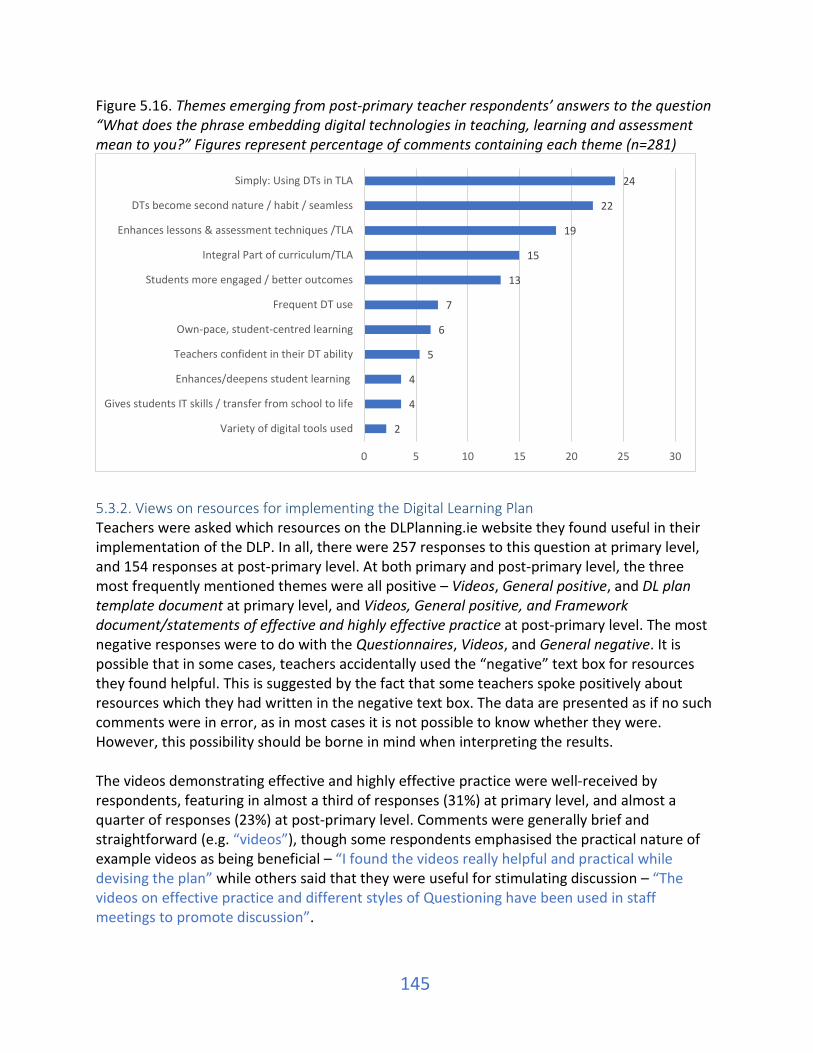
145
Figure 5.16. Themes emerging from post-primary teacher respondents’ answers to the question “What does the phrase embedding digital technologies in teaching, learning and assessment mean to you?” Figures represent percentage of comments containing each theme (n=281)
5.3.2. Views on resources for implementing the Digital Learning Plan Teachers were asked which resources on the DLPlanning.ie website they found useful in their implementation of the DLP. In all, there were 257 responses to this question at primary level, and 154 responses at post-primary level. At both primary and post-primary level, the three most frequently mentioned themes were all positive – Videos, General positive, and DL plan template document at primary level, and Videos, General positive, and Framework document/statements of effective and highly effective practice at post-primary level. The most negative responses were to do with the Questionnaires, Videos, and General negative. It is possible that in some cases, teachers accidentally used the “negative” text box for resources they found helpful. This is suggested by the fact that some teachers spoke positively about resources which they had written in the negative text box. The data are presented as if no such comments were in error, as in most cases it is not possible to know whether they were. However, this possibility should be borne in mind when interpreting the results. The videos demonstrating effective and highly effective practice were well-received by respondents, featuring in almost a third of responses (31%) at primary level, and almost a quarter of responses (23%) at post-primary level. Comments were generally brief and straightforward (e.g. “videos”), though some respondents emphasised the practical nature of example videos as being beneficial – “I found the videos really helpful and practical while devising the plan” while others said that they were useful for stimulating discussion – “The videos on effective practice and different styles of Questioning have been used in staff meetings to promote discussion”.
2
4
4
5
6
7
13
15
19
22
24
0 5 10 15 20 25 30
Variety of digital tools used
Gives students IT skills / transfer from school to life
Enhances/deepens student learning
Teachers confident in their DT ability
Own-pace, student-centred learning
Frequent DT use
Students more engaged / better outcomes
Integral Part of curriculum/TLA
Enhances lessons & assessment techniques /TLA
DTs become second nature / habit / seamless
Simply: Using DTs in TLA
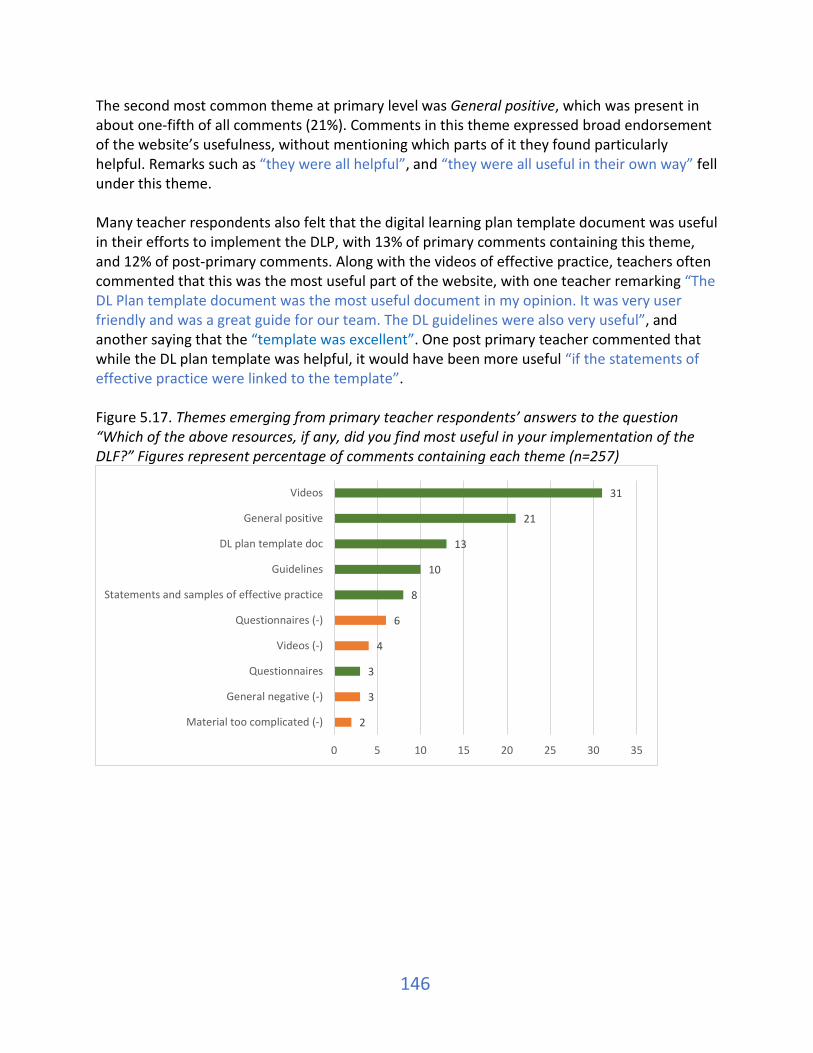
146
The second most common theme at primary level was General positive, which was present in about one-fifth of all comments (21%). Comments in this theme expressed broad endorsement of the website’s usefulness, without mentioning which parts of it they found particularly helpful. Remarks such as “they were all helpful”, and “they were all useful in their own way” fell under this theme. Many teacher respondents also felt that the digital learning plan template document was useful in their efforts to implement the DLP, with 13% of primary comments containing this theme, and 12% of post-primary comments. Along with the videos of effective practice, teachers often commented that this was the most useful part of the website, with one teacher remarking “The DL Plan template document was the most useful document in my opinion. It was very user friendly and was a great guide for our team. The DL guidelines were also very useful”, and another saying that the “template was excellent”. One post primary teacher commented that while the DL plan template was helpful, it would have been more useful “if the statements of effective practice were linked to the template”. Figure 5.17. Themes emerging from primary teacher respondents’ answers to the question “Which of the above resources, if any, did you find most useful in your implementation of the DLF?” Figures represent percentage of comments containing each theme (n=257)
2
3
3
4
6
8
10
13
21
31
0 5 10 15 20 25 30 35
Material too complicated (-)
General negative (-)
Questionnaires
Videos (-)
Questionnaires (-)
Statements and samples of effective practice
Guidelines
DL plan template doc
General positive
Videos
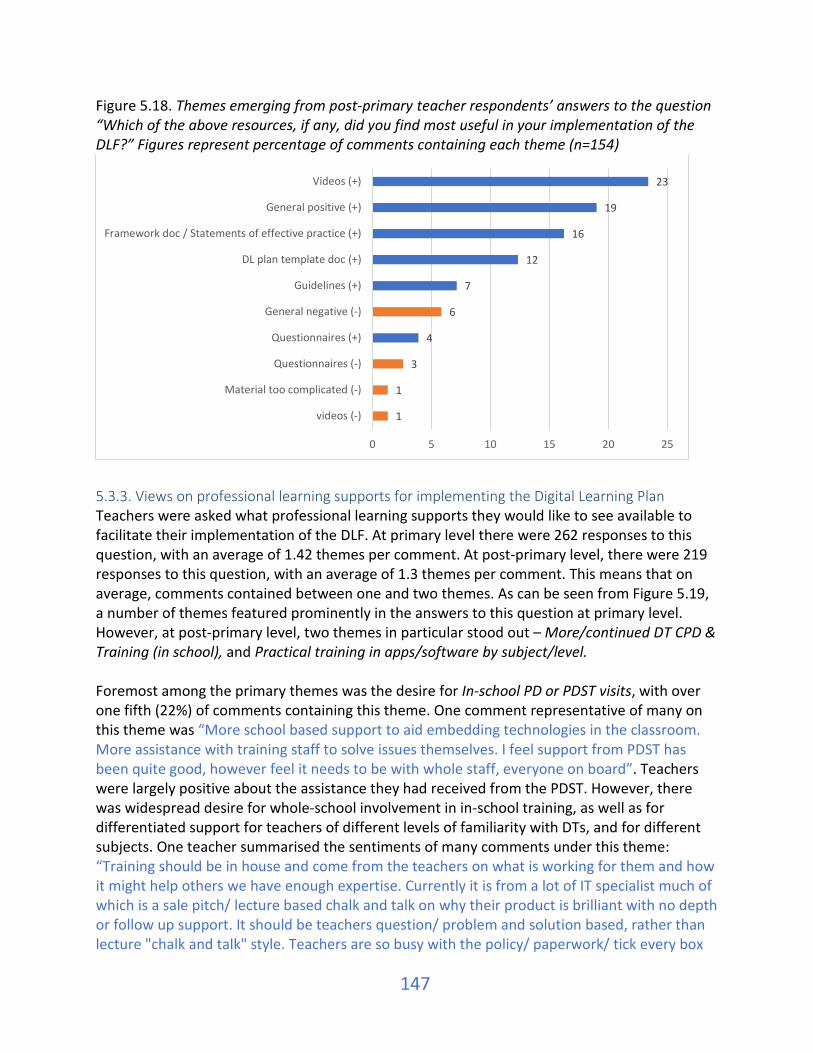
147
Figure 5.18. Themes emerging from post-primary teacher respondents’ answers to the question “Which of the above resources, if any, did you find most useful in your implementation of the DLF?” Figures represent percentage of comments containing each theme (n=154)
5.3.3. Views on professional learning supports for implementing the Digital Learning Plan Teachers were asked what professional learning supports they would like to see available to facilitate their implementation of the DLF. At primary level there were 262 responses to this question, with an average of 1.42 themes per comment. At post-primary level, there were 219 responses to this question, with an average of 1.3 themes per comment. This means that on average, comments contained between one and two themes. As can be seen from Figure 5.19, a number of themes featured prominently in the answers to this question at primary level. However, at post-primary level, two themes in particular stood out – More/continued DT CPD & Training (in school), and Practical training in apps/software by subject/level. Foremost among the primary themes was the desire for In-school PD or PDST visits, with over one fifth (22%) of comments containing this theme. One comment representative of many on this theme was “More school based support to aid embedding technologies in the classroom. More assistance with training staff to solve issues themselves. I feel support from PDST has been quite good, however feel it needs to be with whole staff, everyone on board”. Teachers were largely positive about the assistance they had received from the PDST. However, there was widespread desire for whole-school involvement in in-school training, as well as for differentiated support for teachers of different levels of familiarity with DTs, and for different subjects. One teacher summarised the sentiments of many comments under this theme: “Training should be in house and come from the teachers on what is working for them and how it might help others we have enough expertise. Currently it is from a lot of IT specialist much of which is a sale pitch/ lecture based chalk and talk on why their product is brilliant with no depth or follow up support. It should be teachers question/ problem and solution based, rather than lecture "chalk and talk" style. Teachers are so busy with the policy/ paperwork/ tick every box
1
1
3
4
6
7
12
16
19
23
0 5 10 15 20 25
videos (-)
Material too complicated (-)
Questionnaires (-)
Questionnaires (+)
General negative (-)
Guidelines (+)
DL plan template doc (+)
Framework doc / Statements of effective practice (+)
General positive (+)
Videos (+)

148
exercise mentality that is taking over in the school from the practical problem solving and improvement based changes that should happen organically”. This is reflected in the large number of comments containing the theme of Practical PD / demonstrations, which was present in 21% of responses to this question. Fundamentally, this theme reflects teachers’ desire for their PD to be relevant to their TLA practices. Many teachers wanted DT training to be less abstract and general, and more applicable to their setting. Teachers commented that “I'd love PDST to come in and see if the apps we have are good and how to use some apps”, and that they would benefit from “Hands on help in classroom to implement plan and help it to become embedded in lessons in a seamless way”. Many teachers wanted this practical element of PD to involve training in the use of devices, as well as advice on when it would be most appropriate to use them – “I would like to see training in schools with practical use of the digital devices to be shown how to use them and when. I think when you physically use them it will impact upon your teaching much more than being told about them.” Further reflecting a broader theme across the dataset about the need for specificity of training, a teacher in a special school stated that in terms of PD support, they needed “Reasonably frequent in-service during the school year in practical ways of implementing digital technologies in Special Education.” At post-primary level, the most commonly-occurring theme was More/Continued DT CPD & training (in school), with 35% of comments containing this theme. This reflected, above all, a feeling among post-primary teachers that they needed more training, and ongoing training in order to properly implement the DLF and DLP. One teacher expressed this broadly-held sentiment like this: “The support we received from PDST through our facilitator was invaluable so I would really like to see that support to continue. Every school needs that kind of individual support to get the right solutions”. Another teacher put it more simply: “If they don’t know it they can’t use it”. Comments like these make it clear that when teachers receive PD support in CPDs, they find it extremely useful. It is notable that at post-primary level, in response to a question about what professional learning supports teachers wanted, the most common theme was not about a particular type of support, or method of support delivery, but merely that more support be delivered. The kind of supports desired at post-primary were found in the second most commonly occurring theme – Practical training in apps/software by subject/level. Teachers wanted the training they received to be practical, and to be readily applicable to their particular context. One teacher stressed the need for “Having access to better subject resources”. Another said that they wanted “A customised course that looks at the technology available in our school and shows us the potential for that technology inside curriculum specific settings”. A teacher in a special school commented that “Further training on assistive technology to fully help students with AEN” would be helpful. That this theme should rate so highly suggests that at present, knowledge and training in DTs is more general than teachers would like. Training which is
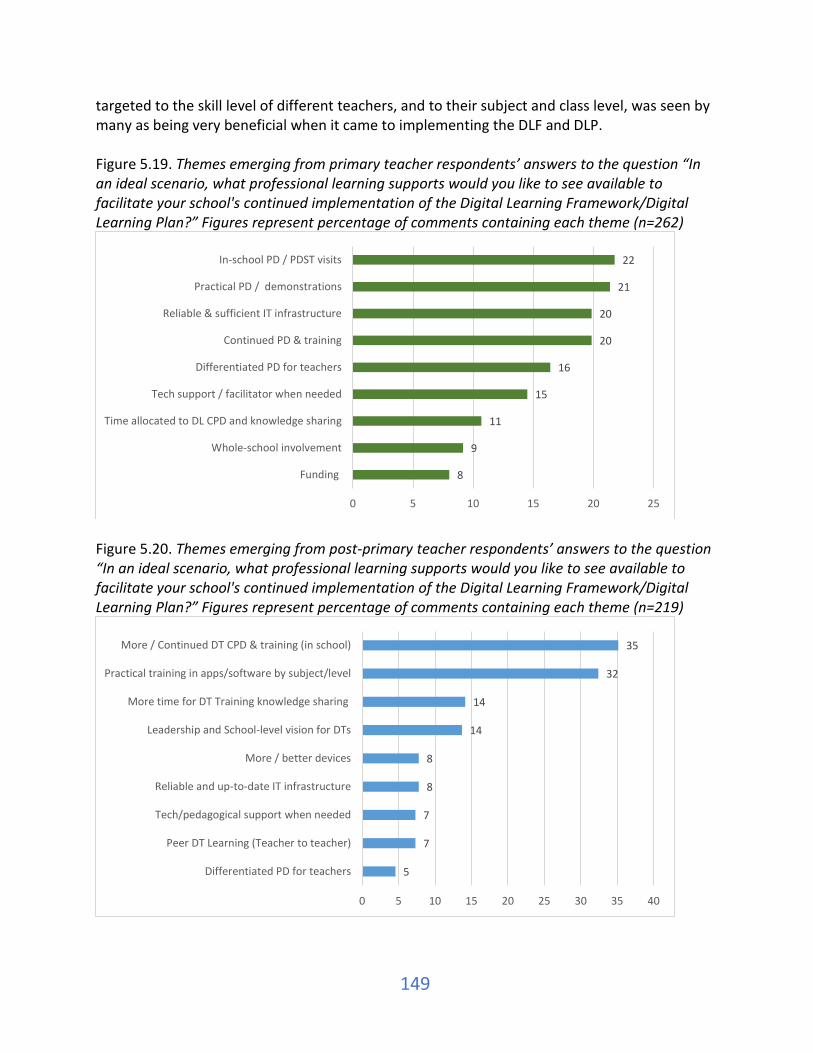
149
targeted to the skill level of different teachers, and to their subject and class level, was seen by many as being very beneficial when it came to implementing the DLF and DLP. Figure 5.19. Themes emerging from primary teacher respondents’ answers to the question “In an ideal scenario, what professional learning supports would you like to see available to facilitate your school's continued implementation of the Digital Learning Framework/Digital Learning Plan?” Figures represent percentage of comments containing each theme (n=262)
Figure 5.20. Themes emerging from post-primary teacher respondents’ answers to the question “In an ideal scenario, what professional learning supports would you like to see available to facilitate your school's continued implementation of the Digital Learning Framework/Digital Learning Plan?” Figures represent percentage of comments containing each theme (n=219)
8
9
11
15
16
20
20
21
22
0 5 10 15 20 25
Funding
Whole-school involvement
Time allocated to DL CPD and knowledge sharing
Tech support / facilitator when needed
Differentiated PD for teachers
Continued PD & training
Reliable & sufficient IT infrastructure
Practical PD / demonstrations
In-school PD / PDST visits
5
7
7
8
8
14
14
32
35
0 5 10 15 20 25 30 35 40
Differentiated PD for teachers
Peer DT Learning (Teacher to teacher)
Tech/pedagogical support when needed
Reliable and up-to-date IT infrastructure
More / better devices
Leadership and School-level vision for DTs
More time for DT Training knowledge sharing
Practical training in apps/software by subject/level
More / Continued DT CPD & training (in school)

150
5.3.4 Views on enablers of the Digital Learning Plan implementation Teachers were asked what they thought would enable them to better implement the DLF and DLP in their teaching, learning and assessment. There were 213 responses to this question at primary level (Figure 5.21), and an average of 2.02 themes per comment. At post-primary level, there were 166 responses to this question (Figure 5.22), with an average of 2.22 themes per comment. This means that most comments contained about two themes. Notably, two themes occurred particularly often among primary respondents. These were Well-maintained DT infrastructure and devices, and Appropriate and practical CPD/training/demonstrations. The same pattern occurred at post-primary, with Continued/More support and training, and More/better/newer devices being the two most common themes. The former of these was present in almost half of responses (45%) at primary level. In a number of responses, this was the only theme present, suggesting its primacy in a process of embedding DTs in TLA. One teacher simply responded “Tablets in School. More reliable internet. Faster Internet”. Another said that “More hardware” and “Better connectivity” were needed. Fast and reliable Wi-Fi was a frequent comment in this theme, as was new and well-maintained devices, particularly tablets and computers. Many of these comments suggest a need for technical support and maintenance. It was also common for teachers to say that more hardware was needed, not just that existing hardware be functional: “Having more tablets, laptops etc. Rather than having one set for the school, each class or year group could have a set to use”. The second-most frequently occurring theme at primary level was that of appropriate and practical CPD and training, including demonstrations. About two-fifths of responses (41%) contained this theme. One teacher commented that they wanted “Teacher relief time for ICT person so she can show us how to best use digital technology”, and “A training day for ALL staff on digital technology but relevant to their school needs”. This “relevant to their school needs” comment occurred frequently in various forms throughout the answers to this question. Teachers took care to indicate that the needs of each school were particular to that school, and that further the needs of each teacher and each subject within each school differed. Thus, it was important that there be “More training with practical examples graded by classes”, and “good educational apps online that would suit certain subjects”, as well as “Training on apps suitable for different age groups”. These themes are explored further in the next section on teachers’ views of the professional learning supports required for implementing the DLP. It is notable, however, that both infrastructure and needs-specific training are seen by primary teachers as key enablers of successful DLF & DLP implementation.

151
Figure 5.21. Themes emerging from primary teacher respondents’ answers to the question “Name up to three things that you think would best enable you and your school to implement the DLF” Figures represent percentage of comments containing each theme (n=213)
Figure 5.22. Themes emerging from post-primary teacher respondents’ answers to the question “Name up to three things that you think would best enable you and your school to implement the DLF” Figures represent percentage of comments containing each theme (n=166)
An interesting difference between primary and post-primary levels is the frequency with which the theme of Purchasing help and funding featured in the responses. It may be recalled from Chapter 1 that a substantial amount of funding has been made available to schools for the purchase of DT equipment and software. Circular 0077/2020 advises schools to consult with www.spu.ie and www.pdsttechnologyineducation.ie but the comments under this theme could
22
23
23
23
25
41
45
0 5 10 15 20 25 30 35 40 45 50
Technical support + maintenance
Time for all of above
Within-school communication & leadership
Continued support & training/facilitators
Purchasing help & funding for all of above
Appropriate and PracticalCPD/training/demonstrations
Well-maintained DT infrastructure & devices
7
11
11
18
19
19
19
27
42
49
0 10 20 30 40 50 60
Better awareness of resource libraries
Purchasing help & funding for all of above
Teacher to teacher training and knowl. Sharing
Well-maintained DT infrastructure & connectivity
Within-school communication & leadership
Subject specific / curriculum-appropriate training
Fast & effective technical support + IT person in school
Time for all of above, inlcuding planning time
More / Better / Newer devices
Continued / More support & training
152
suggest that schools are not sufficiently aware of or supported by these resources, and that some schools feel they need further resources, for digital technologies. At primary level, purchasing help and funding was the third most common theme, and was present in about a quarter of all comments (24%). At post-primary level, however, this was the ninth most common theme, occurring in just 11% of comments. This difference may in part be due to differences in the perceived adequacy of funding or number of devices between the two levels. Many primary respondents stated that more funding was needed so that they could secure adequate numbers of devices for their students. This appeared to be less of an issue at post-primary level. Regarding help with purchasing decisions, it is possible that because post-primary schools are generally larger than primary schools, there is more likely to be somebody who is knowledgeable enough about DTs to help make purchasing decisions. A slightly different ordering of priorities emerged at post-primary level, with Continued / more support and training featuring more prominently than infrastructural issues, being present in about half of all 166 comments (49%). Teachers stressed the need for support to be delivered on an ongoing basis – “Further Training, Reoccurring upskilling”. Other teachers said that “More workshops, PDST events based on practical application of apps in class” would be beneficial, as well as “Teacher Training regularly on devices”. Another teacher suggested that a professional development incentive be offered to teachers for completion of courses to do with digital technology – “Credits towards a qualification for every course completed”. Post-primary teachers said that to enable their implementation of the DLF, they needed “individual upskilling on basic use of digital technologies”. One teacher commented that “when receiving training in new junior and senior cycle, teachers should receive more concrete templates for lessons in specific subjects with digital technologies embedded within”. The desire for subject- or cycle-specific training in DTs was widespread among post-primary respondents, with many asking for “differentiated digital resources”, and “Subject specific training (ie maths applets and programmes for maths teachers provided by a maths teacher)”. For some teachers, this demand for differentiated PD was focused on teachers, rather than on subjects, with the aim of fostering whole-school involvement in the DLP – “CPD targeted at 100% of the staff, Less resistance from staff and greater engagement”. Many also stressed their desire for this training to be delivered in school, rather than externally. The main reasons for this appeared to be so that there would be a greater involvement among staff, and so that teachers could be trained in the use of devices and software which they have in the school – “More workshops, PDST events based on practical application of apps in class”. This again reflects the overarching theme that support and training be specific to the needs of individual schools, teachers, subjects, and class levels. Despite this apparent difference in priorities between primary and post-primary teacher respondents (which can at least in part be traced to differences in DT infrastructure and connectivity which were evident at the baseline phase, with primary schools reporting less favourable infrastructure and connectivity than post-primary schools), a large proportion of comments at post-primary (42%) contained the theme More / better / newer devices. This is

153
comparable to the proportion of comments at primary level which contained the theme Well-maintained DT infrastructure and devices (44%). This suggests that basic infrastructural and technical support/maintenance needs such as having an adequate number of up-to-date devices are not currently being met for a large number of both primary and post-primary schools. The third most common theme at post-primary level was Time, including planning time, which was present in 27% of comments. One teacher said that they needed “More time for communication, training and collaboration as there is not currently time with Croke Park and full timetables”. Many of the comments in this theme had to do with planning time, and time for knowledge sharing between teachers. There was widespread sentiment that the aims of the DLP were not possible to achieve given the time currently allocated for staff to focus on it. In many cases this perhaps falls under a broader theme of leadership, with some teachers explicitly indicating this – “Management more engaged in digital learning plan and see its importance. Time allocated from Croke Park to allow teachers to engage in training to upskill-as they want to!”. 5.4 Key points from Chapter 5 Thematic analysis of the qualitative survey data provided a chance to elicit and better understand themes whose importance may otherwise have been underappreciated. This rich source of data has enabled us to develop a more fine-grained understanding of the successes, needs and challenges of teachers and DLT Leaders as they implement the DLF. Schools at both levels overwhelmingly chose to focus on the Teaching and Learning dimension of the DLF. While this was likely the case because it aligned with their SSE, the answers from this section revealed other potential reasons for its being chosen. Namely, the main reason primary schools reported choosing the Teaching and Learning dimension was that “DTs improve learner outcomes”. Respondents also made frequent mention that this dimension was chosen following school review/consultation, and that DTs are appropriate for TLA. Interestingly, among post-primary respondents, slightly different reasons for choosing the Teaching and Learning dimension emerged. Foremost among these was that it promotes teacher collaboration and shared practice. The second most frequent reason was that it complements SEE process/SIP/school goals, and third, that DTs are appropriate for TLA. The differences in the reasoning behind the choice of the Teaching and Learning dimension between primary and post-primary schools may give some insight into the differences in priorities between the two levels. The promotion of teacher collaboration and shared practice is a high priority for post-primary schools, while at primary level, improving learner outcomes is seen as a key priority. DLT leaders were also asked to outline how their schools’ current level of practice was identified. The three most frequently occurring themes at primary level were Discussion at staff meetings/feedback/consultation (46%); Survey/evaluation/focus groups (25%); and
154
Reflection/observation/current knowledge (21%). The three most frequent themes at post-primary level were Staff survey/feedback (62%); Staff discussion (38%); Observation (26%). While it is clear that schools are implementing many good practices to identify and monitor levels of effective practice, it would appear that further guidance would be of benefit, in order to promote a more uniform understanding of assessing and monitoring levels of effective and highly effective practice. The DLF Baseline report identified differences in the understanding of “DT embedding” across schools and between teachers as a potential barrier to measurement of progress in DLF implementation. These differences in understanding became clear in the responses to the question asking what it meant to “embed” DTs in teaching, learning, and assessment. While many primary and post-primary respondents described embedding in a manner consistent with that of the DLF (Department of Education, 2017a, b), it was also common for respondents’ comments to reflect a more functional approach, particularly at post-primary level. These responses tended to focus more ICT integration (into the curriculum and teaching practices), rather than seamless and deep use of new methodologies made possible by DTs. At post-primary, the most common response to this question mentioned that embedding simply meant using DTs in TLA. This could be related to the highly structured curriculum and state examinations at post-primary level, which in turn may work against a more flexible, constructivist approach to TLA embodied in the DLF. A significant number of responses also mentioned potential outcomes of embedding, such as improved learner experiences, or that teachers and students became confident in the use of DTs. Some respondents noted the potential for DTs to facilitate constructivist-style learning, where students learn at their own pace, produce digital artefacts, and collaborate with other students in both learning and assessment. At both levels, and between teachers and DLT Leaders, the DLPlanning.ie website was widely praised as a useful resource. Among Primary DLT Leaders and teachers, the part of the website most frequently cited as useful was the videos of effective and highly effective practice. Both DLT Leaders and teachers at primary level also ranked highly the DL Planning guidelines document, and the DL planning templates. At post-primary level, DLT Leaders most frequently mentioned the DL planning templates as being the most useful resources, while the DLF document and DL planning guidelines document came second and third respectively. Among primary school DLT Leaders, the most desired PD supports to implement the DLF/DLP were in-school support or in-service days, continued CPD, and PDST support. Among post-primary DLT Leaders, practical training or CPD by subject was the most often mentioned support, with regular school visits or workshops from advisors coming in second. Similar themes emerged from analysis of the teacher data, with in-school PD or PDST visits being the most desired among primary teachers, followed by practical PD or demonstrations. Among post-primary teachers, more CPD and continued CPD in school were the most frequently cited supports needed for DLP/DLF implementation, followed closely by practical training in apps or software by subject and class level. The PD supports question elicited a great

155
number of responses which fit into the overarching themes of practicality and specificity. It is clear from these data that teachers and DLT Leaders want training which is specific to subjects, class levels, and teacher knowledge level in DTs. Demonstrations of particular apps and software are also frequently mentioned as being useful. DLT Leaders were asked what changes to DLF documents and other supporting materials would better enable them to implement the DLF in their school. At primary level, the most common response was that more DLP or lesson plan samples would be helpful, with over one in four respondents mentioning this (28%). A further quarter said that no changes to the documentation were required, while a fifth of responses fell into the “other” category. These responses were varied, and no common themes could be found between them. This again reflects the overarching theme of specificity – that schools and teachers have very different needs, and that the supports they need are highly dependent on their particular situation. This was especially true at post-primary level, where the most common theme for DLT Leaders was “other”, followed by a desire for an online interactive DLP document. On this latter point, it was thought that the ability to change and interact with the DLP plan document online would enable schools to continuously improve and adapt their DLP to their needs as they progressed with their DLP implementation. Teachers were asked to name up to three things which would best enable them and their school to implement the DLF. Notably, two themes occurred particularly often among primary respondents. These were Well-maintained DT infrastructure and devices, and Appropriate and practical CPD/training/demonstrations. The same pattern occurred at post-primary, with Continued/More support and training, and More/better/newer devices being the two most common themes. The former of these was present in almost half of responses (45%) at primary level and this theme indicates a need for both infrastructural improvements as well as supports to maintain them. In a number of responses, this was the only theme present, suggesting its primacy in a process of embedding DTs in TLA. It is notable, however, that both infrastructure and needs-specific training are seen by primary teachers as key enablers of successful DLF and DLP implementation. This finding is corroborated by the regression analyses described in Chapter 4 of this report. An interesting difference between primary and post-primary levels is the frequency with which the theme of Purchasing help and funding featured in the teacher responses. At primary level, this was the third most common theme, and was present in about a quarter of all comments (24%). Many of these respondents wanted support when deciding which tools and resources to purchase to best facilitate DLF implementation, noting in some cases that they received little guidance in this regard. At post-primary level, however, this was the ninth most common theme, occurring in just 11% of comments, perhaps reflecting the delegation of this duty to the DLT Leader or Principal, or better awareness at post-primary level of which DT tools were needed. It is noteworthy that Circular 0076/2020 provides guidance to schools on the purchase of DT resources: the comments, particularly from primary schools, suggest that schools may not be sufficiently aware of, or supported in, the purchase of DT resources.

156
Many respondents at both levels held positive attitudes towards the use of DTs in teaching and learning - “There is a positive attitude among the staff towards digital technology and an eagerness to embrace new software and teaching approaches.” While lack of buy-in and whole-school involvement was an issue in some schools, there were higher levels of support for the use of DTs in schools which were further along in their DT journey. A key enabler of this included “digital champions” within schools, who were very helpful in advancing the schools’ use of DTs with their “willingness to share their skills and knowledge with other staff members”. Many respondents, especially at primary level, expressed positive sentiments about the potential of DTs to enable student-centred learning and creative collaboration between students. This, they said, would allow them to reach their “full potential”, whilst facilitating “active learning and collaboration”, and promoting digital literacy. It was also commented that DTs inspire pupils to “learn through inquiry” and serve as an aid to pupils developing their abilities to participate in society. Reliable broadband and equipment which teachers could rely on were another key enabler of positive attitudes towards the use of DTs, with some teachers commenting that morale was impacted in schools where staff had learned not to rely on faulty or unreliable equipment. A wide range of themes and issues emerged from the teacher and DLT Leader responses at both primary and post-primary level. However, two overarching themes can be seen throughout this chapter. These were the related themes of specificity and practicality. Respondents often focused on themes which related to their particular context – whether at their class level, or their subject, or, when talking about training, their own ability level. Similarly, they wanted supports to be practical – whether it meant that training in apps and software be delivered via demonstrations, or that DL planning templates be simple and interactive. Many respondents stressed the need for continued professional development, rather than sporadic workshops or in-service days. Some respondents attributed this lack of a consistent approach to poor planning and leadership at the school level or a lack of buy-in among some staff, whereas others noted that progress in the DLF was not possible until issues around unreliable WiFi or insufficient access to enough up-to-date devices were remedied. Overall, the thematic analysis in this chapter confirms that multiple factors, ranging from infrastructure/connectivity/technical support, to school leadership and sustained professional development/supports are likely to be required for successful implementation of the DLF.

157
Chapter 6: Conclusions and implications This chapter draws the findings from Chapters 2-5 together to describe key successes and challenges associated with the implementation of the DLF arising from the Wave 1 findings. The chapter concludes with a set of implications relating to: recent national research; other current national policies and initiatives; resources and supports; the COVID-19 pandemic; and the focus and design of the Wave 2 data collection. This chapter does not provide a summary of the findings. Readers are referred to the Executive Summary and the key points at the end of each chapter for these summaries. 6.1 Successes The respondents to the Wave 1 survey are clearly highly engaged with DTs in a variety of ways. For example, we noted very positive attitudes towards using DTs in teaching, learning and assessment; moderate to high levels of comfort and familiarity with DT usage; and high levels of participation in CPD relating to DTs. Another successful outcome of the implementation of the DLF to date is the very positive views of the PDST's DLPlanning.ie website, though perhaps fewer teachers than might have been hoped for had visited the website. Respondents particularly liked the videos, planning guidelines and planning templates. Furthermore, over 90% of schools have completed their Digital Learning Plans (DLPs) or are in the process of doing so, again with quite extensive consultation with teachers, parents and boards of management. Also, almost all schools have consulted teachers, boards of management and parents quite extensively in the creation of policies and guidelines on acceptable use and online safety, and over 90% of primary and post-primary schools have these policies in place. However, students have not been widely consulted in the development of schools’ DLPs. About three-fifths of schools rated themselves as being mostly or all at levels of effective practice or higher on their chosen domain and dimension(s) of the DLF, while four in five post-primary schools, and 44% of primary schools, described their level of embedding of DTs in TLA as intermediate, advanced or highly advanced. Respondents also reported high rates (90% or more) of staff with regular access to school-owned devices in schools (though reported rates of student-level access were lower). Asked about the impact of DLF implementation in their school, about a quarter of DLT leaders (or Principals) at primary level recorded a significant change in two specific areas: decisions relating to DT infrastructure, and in the sharing of documents or resources among teachers. Moderate impact was also recorded in a majority of primary schools in three other areas: students' interest and engagement, teaching and learning activities, and collaborative practices among teachers.

158
Levels of perceived impact among DLT leaders at post-primary level were even higher than at primary level, with between about a quarter and half of DLT leaders reporting a significant impact in five areas: sharing of documents and resources; collaborative practices among teachers; decisions relating to ICT infrastructure; decisions relating to enhancing broadband connectivity; and emphasis on the use of DTs in school policies or guidelines. Comparisons between the baseline data and Wave 1 data (Chapter 4) indicated some early signs of improvement and impact relating to DLF implementation. We identified a significant increase in levels of teacher and student engagement with DTs at primary level, and an increase in the reported level of embedding DTs in teaching, learning and assessment at post-primary level. These improvements stand in contrast to reported levels of infrastructure and connectivity, and perceived effectiveness of technical support, which were the same in Wave 1 as they were at baseline, at both primary and post-primary. The Wave 1 findings (Chapters 4 and 5) also allowed for the identification of key enablers of successful DLF implementation, which may be summarised as:
• adequate levels of infrastructure and connectivity; • effective technical support; • consultative and collaborative leadership; • high levels of collaboration among teachers; • the active promotion of and advocacy for the DLP in the school; and • CPD that is sustained and tailored to the particular needs of the school.
It will be important for the new Digital Strategy for Schools to incorporate ways to prioritise these key enablers. 6.2 Challenges When we consider respondents' levels of engagement with and attitudes towards DTs on the one hand, and reported levels of infrastructure, connectivity and technical support effectiveness on the other, a misalignment is apparent. As noted in the previous section, the Wave 1 survey participants are generally very positively disposed towards DTs and support their use for teaching learning and assessment; however there also exists a low level of awareness of existing supports and resources among some school staff. Perceived levels of infrastructure, connectivity and technical support are on average in the moderate range, with a lot of variation between schools on these latter measures, with some schools dealing with poor/mediocre levels of DT infrastructure. It is possible that a morale issue among staff due to low DT infrastructure may be one cause of this apparent misalignment. This finding indicates that the two necessary conditions and corollary identified by Ilomäki and Lakkala (2018; see also OECD, 2010; 2011; 2014; 2015) in order to use digital technologies for innovation and change are not met in many of the DLF Wave 1 schools:
• teachers and students must have the opportunity to learn to use digital technology, and
• teachers and students must have meaningful and necessary resources to use it;

159
• and as a corollary to these preconditions, teachers’ digital competence and pedagogical understanding of using technology in education is the cornerstone of supporting students’ digital competence.
The results of the regression analyses (Chapter 4) and the thematic analyses of text responses (Chapter 5) as well as the DLF baseline report (Cosgrove et al., 2019) together provide consistent and robust evidence that successful implementation of the DLF is enabled by multiple factors which must include adequate infrastructure and connectivity, and a means to maintain these through effective technical maintenance and support. The evidence in the Wave 1 survey results is entirely consistent with the baseline results in terms of highlighting challenges associated with sub-optimal technical support and maintenance, infrastructure and connectivity, particularly at primary level. It would seem critically important to identify and implement effective technical support and maintenance for schools, since some of the evidence in the Wave 1 surveys points to sub-optimal use of available resources due to lack of technical support and maintenance. Findings also suggest that the use of digital technologies in assessment is an area in need of further development. This is noteworthy given that assessment is intrinsic to good teaching and learning practice (Khan, 2012; Dann, 2017). Further, the move towards online assessment in international large-scale studies such as PIRLS, PISA and TIMSS and the widespread use of online assessment in national testing programmes in other countries such as Australia, Canada, Denmark and the Slovak Republic (OECD, 2019) suggests that a shift in approach is needed to keep pace with these changes. There are likely to be a number of reasons for the lower-than-ideal use of DTs for assessment, and reasons may differ across primary and post-primary levels. At primary level, infrastructure and connectivity levels are significantly lower than at post-primary level, and there is, arguably, an over-emphasis on standardised summative tests, which has been associated with a range of negative consequences (O'Leary et al., 2019). Moreover, the Wave 1 survey results confirmed that, despite the almost universal administration of standardised tests of reading and mathematics at primary level (where this is mandatory at second, fourth and sixth classes30), uptake of online (as opposed to paper) tests by primary schools was very low, despite the advantages offered by online standardised testing, such as immediate access to reports of the results, and higher levels of engagement with the test on the part of pupils. Insights could be gleaned from other countries in this regard. For example, in Wales, a formative online adaptive assessment approach has been adopted at primary level with a high level of success31. Wave 2 will provide an opportunity to better understand barriers and enablers of embedding DTs into assessment practices. At post-primary level, the Wave 1 results provide indirect evidence that assessment practices may be constrained as a result of the structured curriculum and examination system, particularly the Leaving Certificate assessment design. Following calls from the UN-CRC (2016) and the OECD (2020a) for revisions to the Leaving Certificate (with the latter 30 See Circular 56/2011 https://www.education.ie/en/Circulars-and-Forms/Active-Circulars/cl0056_2011.pdf 31 https://www.penyrenglynprimary.com/welsh-government-national-tests-for-years-2-to-yea/

160
review forming part of the senior cycle review and consultation; NCCA, 2018), the senior cycle review and any assessment reforms arising from it seem particularly timely and urgent. The findings of the Wave 1 report can usefully be considered under the dual themes of diversity and specificity. There is wide variation between schools on many of the DT-related scales that were explored in this report. Primary schools, particularly small ones, need specific attention regarding infrastructure, connectivity, technical support and maintenance. This is a key challenge that naturally emerges from a single framework applied across the system, and suggests that tailored supports are needed for these schools to enable equitable teaching, learning and assessment experiences that embed DTs for all teachers and students. In Chapter 5, it was noted that DLT leaders and teachers alike expressed a desire to have access to ongoing professional learning/training to support the embedding of DTs in TLA, with in-school training and supports preferred over other modes. The themes of diversity and specificity are strongly in evidence here also. At primary level, DLT leaders most frequently mentioned specific CPD by subject, specific practical training, and technical support and advice as needed. Similarly at post-primary level, DLT leaders frequently mentioned training in particular apps or software, training in specific subjects, technical support training, and training in assessment approaches. The forthcoming move from the Teaching and Learning to the Leadership and Management dimension of Looking at Our School comes at a critical time in the system with the onset of the pandemic, and this move, ideally, would be supported by leadership and management at the system level. At baseline, DLF evaluation respondents expressed a desire for guidance at system level regarding CPD priorities, along with alignment and synergy in CPD which cuts across linked initiatives and reforms (Cosgrove et al., 2019). Coherence and alignment of CPD with other national policies and initiatives appears to be an issue more generally (Rawdon et al., 2020). At the school level, the importance of consultative and collaborative leadership in DLF implementation was also confirmed in the Wave 1 findings, as it has elsewhere (e.g. OECD, 2020b; Ilomäki & Lakkala, 2018), suggesting the strong potential of this approach and the merits of facilitating CPD on this specific area into the leadership and management strand of SSE. Furthermore, there is evidence that some schools, particularly at primary level, are not sufficiently aware of existing resources, or are inadequately supported for, procurement and purchase of equipment and infrastructure. This is another area which could be a focus of any CPD and/or system-level communication or awareness-raising that is planned as part of the forthcoming Digital Strategy for Schools. It was noted in Section 6.1 that primary and post-primary schools differed in terms of the perceived level of embedding DTs into TLA. In the report on the pilot of the DLF evaluation, it was found that ratings of schools and PDST TiE advisors on this measure differed, and there was a systematic pattern to these differences: advisors tended to assign lower ratings than schools (Cosgrove et al., 2018b). The Wave 1 findings (Chapter 2) indicated that schools are using largely informal approaches to assess level of embedding and standards of

161
effective practice. Establishing a reliable and valid way to measure and monitor level of practice is another area in need of development as the implementation of the DLF continues, as this is a key measure of impact. Challenges associated with achieving a shared understanding and measurement of practices/competencies in DTs are not unique to Ireland (e.g. Olofsson, 2019). Finally, it was noted in Chapter 1 that the full 210 million euro of the ICT infrastructure grant has been disbursed, yet many schools, particularly at primary, appear to be struggling with infrastructure, connectivity and technical support, while also expressing a desire for ongoing CPD in specific areas, both practical and pedagogical. It is envisaged that, under Project Ireland 2040, some 200 million euro will be available to the school system to continue to support the use of DT. How this funding will be used will form part of the planning for the new Digital Strategy for Schools. It will be of interest at Wave 2 to explore what additional resources are most urgently needed and the decision-making processes of schools in this respect. 6.3 Implications 6.3.1 With respect to recent national research As noted in Section 6.2, many of the findings reported in the Wave 1 survey results are highly consistent with the DLF baseline survey results discussed in Chapter 1; for example, the very positive views about the PDST TiE team and the DLPlanning.ie website; challenges relating to infrastructure, connectivity and technical support which disproportionately affect smaller, rural primary schools; the perceived need for ongoing tailored training and support; and the significant shift towards collaborative practices in schools. However, the Wave 1 report, particularly Chapters 4 and 5, has added to our understanding of how multiple enablers (and barriers) operate to facilitate (or impede) DLF implementation. Many of the findings in the recent Inspectorate report discussed in Chapter 1 (Department of Education, 2020) are consistent with both the DLF baseline and Wave 1 survey findings. While the Inspectorate report presents a fairly positive picture of using DTs in TLA (as indeed the Wave 1 surveys recorded several positive findings), it also highlights some areas in need of further development and improvement. For example, the Inspectorate report noted better usage of DTs in post-primary lessons observed compared with primary, notably in the collaborative use of DTs. Similarly, in the Wave 1 DLF survey, it was found that at primary level, just 13% of teachers reported that their students used DTs to collaborate with each other in at least half of lessons, compared to 32% of post-primary teachers. The Inspectorate report rated the use of DTs to support assessment as satisfactory or better in about four in five post-primary schools, compared to about three in five primary schools. An examination of the DLF data to explore why this might be the case indicates that while 34% of primary school DLT leaders and 40% of post-primary school DLT leaders indicated that the availability of digital devices for all students was ‘Fair’ or ‘Poor’ (indicating potential for improvement at both levels), there were systematic differences in the types of devices most commonly used. Notably, desktop computers were more widely used in post-primary (80%) than in primary (45%) schools, while iPads were more common in primary (72%) than post-primary (51%) schools. Smaller tablet devices may not be suitable for certain digital

162
activities, including assessments, so this difference in device type could partly explain this particular finding in the Inspectorate report. Also similar to the present study which reported lower than desired use of DLPlanning.ie among teachers, and lower than desired awareness of resources and supports to guide procurement and purchase of DT equipment, particularly at primary level, the Inspectorate report noted a low level of awareness of the DLPlanning.ie websites and other resources relevant to DTs, such as Scoilnet and how to access CPD. One finding in the Inspectorate report, i.e. the low level of satisfaction in using DTs for knowledge creation at both primary and post-primary levels, merits follow-up in Wave 2 of the DLF evaluation. 6.3.2 In light of other national policies / initiatives With respect to the forthcoming new Digital Strategy for Schools, the current Department policy to achieve cross-policy alignment is noted and welcomed32. Two particular policies/initiatives seem worth highlighting with a view to strategic alignment in light of the DLF Wave 1 findings:
• The forthcoming new Literacy and Numeracy Strategy and supports for its implementation could represent an important opportunity for the Department of Education to align policies, funding and CPD supports relating to curriculum, teaching, learning, assessment and DTs into a coherent set.
• It would seem important to establish early and strategic links between any forthcoming Digital Strategy for Schools and changes or reforms arising from the Senior Cycle review, in particular relating to assessment or examination reforms. The OECD (2020a, p. 10) has noted that "any changes made to senior cycle will have limited possibilities to succeed if the current assessment approaches are not reviewed accordingly".
• The forthcoming Digital Strategy for Schools should also prioritise the key enablers identified in this study, i.e. adequate levels of infrastructure and connectivity; effective technical support; consultative and collaborative leadership; high levels of collaboration among teachers; the active promotion of and advocacy for the DLP in the school; and CPD that is sustained and tailored to local need.
6.3.3 For measurement and monitoring A Finnish Innovative Digital School Model (Ilomäki & Lakkala, 2018) is proposed as a potentially useful guiding structure for the analysis of the DLF Wave 2 results. This model fits well with existing DT policy and strategy in Ireland, is founded on extensive research on school improvement and change relating to DTs, and has practical applications at the system, school and policy levels. It is strongly grounded in existing theory and research, and validated in fieldwork in Finland. It also has practical applications at various levels of the system. Ilomäki and Lakkala's (2018) paper is based on the premise that
32 The Digital Strategy will also link into wider Government policies such as the National Digital Strategy/skills strategies; Further & Higher Education Literacy, Numeracy & Digital Literacy Strategy; National Broadband Strategy (Department of Education, personal communication, June 1, 2021).
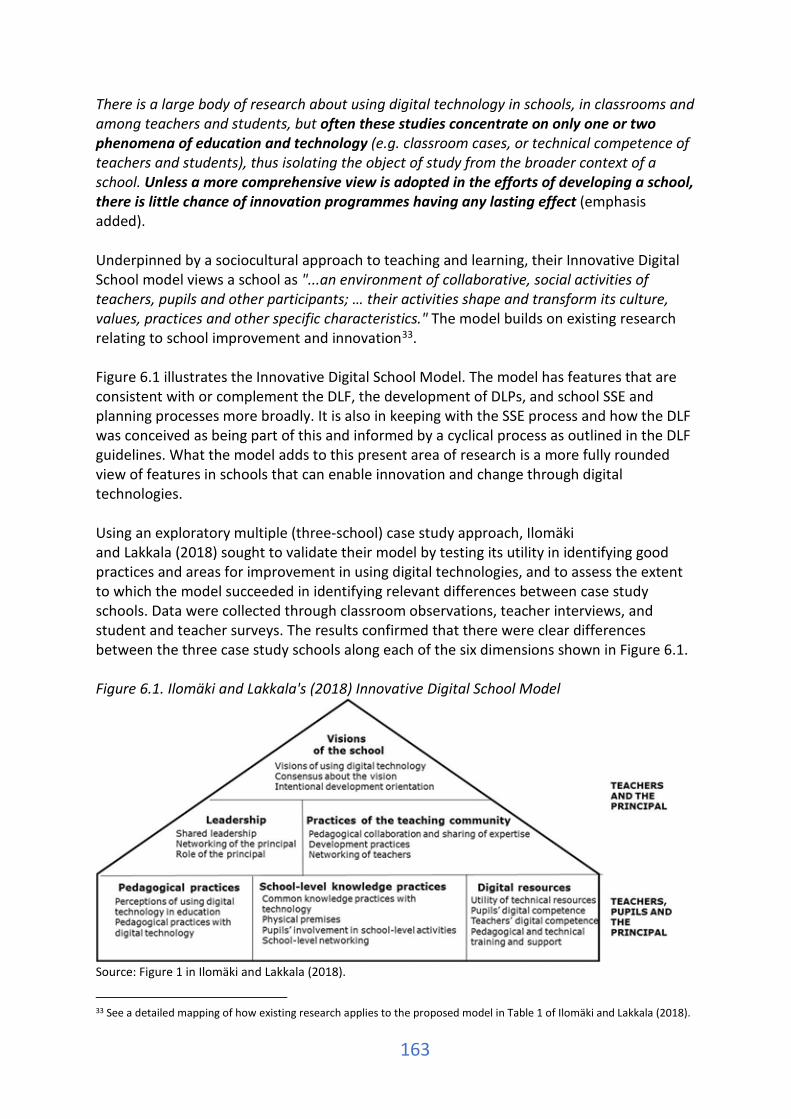
163
There is a large body of research about using digital technology in schools, in classrooms and among teachers and students, but often these studies concentrate on only one or two phenomena of education and technology (e.g. classroom cases, or technical competence of teachers and students), thus isolating the object of study from the broader context of a school. Unless a more comprehensive view is adopted in the efforts of developing a school, there is little chance of innovation programmes having any lasting effect (emphasis added). Underpinned by a sociocultural approach to teaching and learning, their Innovative Digital School model views a school as "...an environment of collaborative, social activities of teachers, pupils and other participants; … their activities shape and transform its culture, values, practices and other specific characteristics." The model builds on existing research relating to school improvement and innovation33. Figure 6.1 illustrates the Innovative Digital School Model. The model has features that are consistent with or complement the DLF, the development of DLPs, and school SSE and planning processes more broadly. It is also in keeping with the SSE process and how the DLF was conceived as being part of this and informed by a cyclical process as outlined in the DLF guidelines. What the model adds to this present area of research is a more fully rounded view of features in schools that can enable innovation and change through digital technologies. Using an exploratory multiple (three-school) case study approach, Ilomäki and Lakkala (2018) sought to validate their model by testing its utility in identifying good practices and areas for improvement in using digital technologies, and to assess the extent to which the model succeeded in identifying relevant differences between case study schools. Data were collected through classroom observations, teacher interviews, and student and teacher surveys. The results confirmed that there were clear differences between the three case study schools along each of the six dimensions shown in Figure 6.1. Figure 6.1. Ilomäki and Lakkala's (2018) Innovative Digital School Model
Source: Figure 1 in Ilomäki and Lakkala (2018).
33 See a detailed mapping of how existing research applies to the proposed model in Table 1 of Ilomäki and Lakkala (2018).

164
Ilomäki and Lakkala (2018) concluded that their model worked particularly well for elements that are focused on school leadership, whereas findings were not as consistent when it came to comparisons of teacher and pupil reports. It was also found that survey-based teacher measures of digital technologies interest and practices painted a somewhat less favourable picture than the classroom observations and interviews. They suggest three levels of application of the model:
• as a shared conceptual framework for schools, to enable collective reflection, discussion and strategy planning
• as a system level tool, to evaluate the status of DT use in schools • as a policy or CPD tool, to increase the quality of DT-related pedagogical and
knowledge practices. 6.3.4 In light of COVID-19 A number of national surveys at primary and post-primary level were conducted in 2020 to gain an understanding of schools' responses to the pandemic. Reports on these surveys provide additional evidence that is consistent with what has been found in the DLF Wave 1 survey results and this further confirms the robustness of many of the DLF Wave 1 findings. This section provides a selective summary of four of these recent surveys. The commentary is focused on findings that have implications more broadly for DLF implementation (as opposed to being related specifically to the context of temporary school closures). Mohan et al. (2020) reported on a survey on the impact of Covid-19 on post-primary schools implemented in May 2020, in which 33% of post-primary school Principals participated. The authors show that difficulties relating to the use of DTs for teaching and learning were more prevalent in post-primary schools with lower broadband coverage and higher rates of educational disadvantage, describing this as a two-dimensional problem, as well as being indicative of an urban rural divide. Respondents in their survey called for more funding for DTs and better broadband availability, and respondents also noted the unsustainability of current technical support arrangements. In June 2020, Devitt et al. (2020) surveyed teachers of post-primary schools. The survey sample covered 3% of the post-primary teacher population with over-representation of teachers in DEIS schools, so results are not generalisable to the population of post-primary teachers. Nonetheless, findings confirm the importance of school leadership and a whole-school approach in enabling the successful transition to online learning. Other enablers identified were DT-relevant technical and pedagogical know-how of teachers, presence of a dedicated school email or IT system, use of a virtual learning environment (VLE) platform such as Google Classroom or Microsoft Teams, reliable broadband, and home access to devices for both teachers and students. Devitt et al.'s survey also recorded some positive findings. For example, about one in three participants had taken part in CPD relating to technology since schools had closed in March 2020, which in and of itself demonstrates a clear commitment on the part of teachers to respond to the challenging situation; and, although some noted significant increases in their DT skills, many of the respondents highlighted a need for further training in this area. In particular, the following areas were highlighted in the findings: meaningful embedding of
165
technology in teaching and learning; promotion of student autonomy; and promotion of student reflection and peer feedback. Another positive finding was an increase in the level of collaboration among teachers in their school. Burke and Dempsey (2020) reported on the findings of a survey of about 2,800 primary and special school leaders conducted in March 2020. Similar to issues raised by the respondents in the surveys reported on by Mohan et al. (20201) and Devitt et al. (2020), as well as by the INTO (2020, discussed below), Burke and Dempsey highlighted the presence and impact of the digital divide during the school closures period, which was noted in all four of these reports as having a disproportionately negative effect on children in educationally disadvantaged homes and communities, as well as children with special educational needs and with a first language other than English or Irish. Burke and Dempsey comment: "The survey results highlighted a clear digital divide (hardware, software, & technological skills) that exists across schools in Ireland, reinforcing the social inequalities of our society. This may add to already gaping social divide between the better-resourced schools/families and the schools/families who just make ends meet" (p. 12). Of concern here is that while 39% of school leaders confirmed the presence of a digital divide in their local catchment area, 45% did not know whether one existed or not. Also of concern is that one third of respondents indicated that broadband access was available at home for 60% or fewer of pupils, and 30% did not know how many pupils had access to broadband. In contrast, 61% of Principals reported that broadband access was available for 80% or more of staff (with 14% reporting broadband access for 60% or less of teachers). While home access to broadband is perhaps not thought to be key to school-based implementation of the DLF, it is nonetheless highly relevant to the ability of students to embed DTs into their homework and study practices. Burke and Dempsey noted some positive outcomes of the sudden closures. For example, similar to Devitt et al.'s (2020) survey respondents, some of their respondents viewed this as an opportunity to embrace digital learning. Burke and Dempsey underline the complexity and importance of distributed and collaborative leadership as an enabler of the effective use of digital technologies during the school closures, while at the same time noting a high level of need among respondents for DT training and technical support. Burke and Dempsey’s (2020) survey provided some information on the kinds of digital resources being used by schools. The main digital resources reported by respondents were Twinkl (used by 90%), Scoilnet (71%), PowerPoint (49%), SeomraRanga (48.5%), and SeeSaw (29.5%). Textbook publisher websites and PDST resources were also used by about two-thirds of schools. Close to two-fifths of schools were posting hardcopy materials to pupils' homes and just one in four schools interacted with pupils for peer learning using online platforms. A similar percentage (one in four) reported using video conferencing for interacting with other members of staff. WhatsApp and email were much more widely used. In some of these tools/applications, there is clear evidence of an urban-rural/school size divide. For example, video conferencing among teachers was reported by 39% of large schools compared with 9% of small schools.
166
The fourth and final report reviewed here was conducted by the INTO (2020), which undertook a survey of its members: of the 950 or so respondents, approximately one in six were Principals, and five in six were teachers. This represents a response rate of about 24% of INTO's members. A significant finding in this survey from the point of view of embedding DTs into TLA was that one in five schools set up online platforms for the first time to allow teachers and pupils to connect in response to the pandemic, with just 11% using existing platforms. In 27% of schools, hardcopies of materials were used to connect with pupils, and email (22%) and text messaging (13%) were also commonly used. Three-fifths of teachers used their personal device during the closures, while two-fifths used a school-owned device. There was wide variation in the level of confidence reported by respondents in supporting pupils' learning through DTs, with 31% apprehensive or very apprehensive, 30% hopeful, and 38% reasonably or very confident. There is also variation in the CPD priorities identified by respondents. One in four wanted training in preparing content for use on a digital platform; 23% wanted to learn more about digital assessment strategies; 20% wanted to learn pedagogical approaches for digital teaching and learning; and 31% wanted guidance on selecting a suitable digital platform or operating a digital platform. A very positive finding from the INTO survey is that 75% of respondents confirmed that an effective DLP was in place in their schools; almost half reported that the DLP had been amended in light of the pandemic. On the basis of the Wave 1 data and other relevant research cited in Chapters 1 and 6, three priorities for the Department of Education to consider, in order to enable schools to build on progress made to date in DLF implementation emerge:
• The development and implementation of appropriate DT funding (and funding supports/guidance), technical support and maintenance, and CPD plans.
• Raising awareness at system level of various information and resources already available particularly as they relate to procurement/purchase and CPD, both national and international. For example, the OECD has a range of country case studies, toolkits and other resources that may be useful at system and school level.
• A focus on equity, prioritising supports for smaller, rural schools, schools with high concentrations of educational disadvantage, children with special educational needs, and children with a first language other than English or Irish.
6.3.5 For Wave 2 of the DLF longitudinal evaluation Wave 2 will include surveys of DLT leaders and teachers; case studies of schools with varying levels of DLF implementation success; and interviews with students. It may also include a validation study on the measurement of levels of effective and highly effective practice (as described in the DLF), possibly in collaboration with the Inspectorate and/or PDST TiE team. The Innovative Digital School Model will be used as a guiding framework (see Section 6.3.3). Based on the aims of the DLF evaluation, the findings of the Wave 1 survey, and other research reviewed in Chapters 1 and 6 of this report, the following are proposed as some of the priorities for the second and final longitudinal data collection wave of the evaluation:

167
• Gathering the views of young people on using digital technologies in teaching, learning
and assessment • Establishing the key longer-term changes that have occurred in schools in using digital
technologies in teaching, learning and assessment in response to COVID-19 • Gathering information on how DTs are being used to support priority groups of students
(children in educationally disadvantaged homes and communities, children with special educational needs)
• Investigating barriers and enablers to DT-based assessment in more depth • Identifying practices that promote the use of DTs in knowledge creation and
collaborative teaching and learning • In the context of the DLF, explore the decision-making processes guiding schools’ DT-
related spending • Gathering school views on what supports should be prioritised in order to maintain and
build on the initial successes of DLF implementation • In the context of the DLF, establishing the needs and priorities of schools with poor
levels of infrastructure, connectivity and technical support • Further examining how schools are interpreting the DLF’s effective/highly effective
levels of practice, potentially through a validation study in collaboration with the PDST or the Inspectorate, in order to enhance assessment and monitoring at system and school levels into the future.
168
References Archer, K., Savage, R., Sanghera-Sidhu, S., Wood, E., Gottardo, A., & Chen, V. (2014).
Examining the effectiveness of technology use in classrooms: A tertiary meta-analysis. Computers & Education, 78, 140-149.
Brewer, K.R.W., & Hanif, M. (1983). Sampling with unequal probabilities. New York: Springer.
Burke, J., & Dempsey, M. (2020). Covid-19 practice in primary schools in Ireland report. Kildare: NUI Maynooth. https://www.maynoothuniversity.ie/sites/default/files/assets/document/Covid-19%20Practice%20in%20Primary%20Schools%20Report_0.pdf
Butler, D., Leahy, M, Shiel, G., & Cosgrove, J. (2013). Building towards a Learning Society: A National Digital Strategy for Schools. Dublin: St Patrick’s College and Educational Research Centre. https://www.education.ie/en/Schools-Colleges/Information/Information-Communications-Technology-ICT-in-Schools/Digital-Strategy-for-Schools/Building-Towards-a-Learning-Society-A-National-Digital-Strategy-for-Schools-Consultative-Paper.pdf
Chaia, A., Child, F., Dorn, E., Frank, M., Krawitz, M., & Mourshed, M. (2017). Drivers of student performance: Latin America insights. https://www.mckinsey.com/~/media/mckinsey/industries/social%20sector/our%20insights/what%20drives%20student%20performance%20in%20latin%20america/drivers-of-student-performance.ashx
Cosgrove, J., Butler, D., Leahy, M., Shiel, G., Kavanagh, L., & Creaven, A-M. (2014a). The 2013 ICT census in schools – summary report. Dublin: Educational Research Centre/St Patrick’s College. http://www.erc.ie/documents/ict_cencus2013_summaryreport.pdf
Cosgrove, J., Butler, D., Leahy, M., Shiel, G., Kavanagh, L., & Creaven, A-M. (2014b). The 2013 ICT census in schools – main report. Dublin: Educational Research Centre/St Patrick’s College. http://www.erc.ie/documents/ict_cencus2013_mainreport.pdf
Cosgrove, J., Ní Chobhthaigh, S., Shiel, G., & Leahy, M. (2018a). Digital Learning Framework Trial evaluation: baseline report. Dublin: Educational Research Centre. http://www.erc.ie/wp-content/uploads/2018/05/DLF-Trial-Evaluation-Interim-Report-May-2018.pdf
Cosgrove, J., Duggan, A., Shiel, G., & Leahy, M. (2018b). Digital Learning Framework Trial evaluation: final report. Dublin: Educational Research Centre. http://www.erc.ie/wp-content/uploads/2018/10/DLF-Trial-Evaluation-Final-Report-Oct-18.pdf
Cosgrove, J., Moran, E., Feerick, E., & Duggan, A. (2019). Digital Learning Framework (DLF) national evaluation – starting off: Baseline report. Dublin: Educational Research Centre. http://www.erc.ie/wp-content/uploads/2020/01/DLF-national-evaluation-baseline-report.pdf
Dann, R. (2017). Developing feedback for pupil learning. London: Routledge. Department of Education and Skills (2008). Investing Effectively in Information and
Communications Technology in Schools, 2008-2013. Dublin: Author. https://www.education.ie/en/Publications/Policy-Reports/Investing-Effectively-in-Information-and-Communication-Technology-in-Schools-2008-2013.pdf
Department of Education (2020). Digital Learning 2020: Reporting on practice in Early Learning and Care, Primary and Post-Primary Contexts. Dublin: Author.
169
https://www.gov.ie/en/publication/c0053-digital-learning-2020-reporting-on-practice-in-early-learning-and-care-primary-and-post-primary-contexts/
Department of Education and Skills (2011a). The National Strategy to Improve Literacy and Numeracy among Children and Young People (2011-2020). Dublin: Author. https://www.education.ie/en/Publications/Policy-Reports/lit_num_strategy_full.pdf
Department of Education and Skills (2015a). Digital Strategy for Schools 2015-2020: Enhancing teaching, learning and assessment. Dublin: Author. https://www.education.ie/en/Publications/Policy-Reports/Digital-Strategy-for-Schools-2015-2020.pdf
Department of Education and Skills (2015b). Framework for Junior Cycle 2015. Dublin: Author. https://www.education.ie/en/Publications/Policy-Reports/Framework-for-Junior-Cycle-2015.pdf
Department of Education and Skills (2016a). Looking At Our School 2016: A quality framework for primary schools. https://www.education.ie/en/Publications/Inspection-Reports-Publications/Evaluation-Reports-Guidelines/Looking-at-Our-School-2016-A-Quality-Framework-for-Primary-schools.pdf
Department of Education and Skills (2016b). Looking At Our School 2016: A quality framework for post-primary schools. https://www.education.ie/en/Publications/Inspection-Reports-Publications/Evaluation-Reports-Guidelines/Looking-at-Our-School-2016-A-Quality-Framework-for-Post-Primary-schools.pdf
Department of Education and Skills (2017a). Digital Learning Framework for primary schools. Dublin: Author. https://www.education.ie/en/Schools-Colleges/Information/Information-Communications-Technology-ICT-in-Schools/digital-learning-framework-primary.pdf
Department of Education and Skills (2017b). Digital Learning Framework for post-primary schools. Dublin: Author. https://www.education.ie/en/Schools-Colleges/Information/Information-Communications-Technology-ICT-in-Schools/digital-learning-framework-post-primary.pdf
Department of Education and Skills (2019). Action plan for education 2019. Dublin: Author. https://www.education.ie/en/Publications/Corporate-Reports/Strategy-Statement/action-plan-for-education-2019.pdf
Devitt, A., Bray, A., Banks, J., & Ni Chorcora, E. (2020). Teaching and learning during school closures: Lessons learned. Dublin: Trinity College, Dublin. https://www.tcd.ie/Education/research/covid-19/teaching-and-learning-resources/Teaching-and-Learning-during-COVID-shutdown-Post-Primary-Teacher-Perspectives-Report_July_USE_web.pdf
Hahs-Vaughn, D.L. (2005). A primer for using and understanding weights with national datasets. The Journal of Experimental Education, 73(3), 221-248. https://www.juanbattle.com/files/2012/04/Hahs-Vaughn_2005_Using-weights-with-national-datasets.pdf
Ilomäki, L., Lakkala, M. (2018) Digital technology and practices for school improvement: Innovative digital school model. Research and Practice in Technology Enhanced Learning 13, 25. https://telrp.springeropen.com/articles/10.1186/s41039-018-0094-8

170
INTO (2020, November). Digital learning and the primary school – Draft background paper. Dublin: Author. https://www.into.ie/app/uploads/2020/11/Digital-learning-and-the-primary-school_Background-paper.pdf
Khan, B. (2012). Relationship between assessment and students’ learning. International Journal of Social Sciences and Education, 2(1), 576-588.
Mohan, G., McCoy, S., Carroll, E., Mihut, G., Lyons, S., & MacDomhnaill, C. (2020). Learning for all? Second-level education in Ireland during COVID-19. Dublin: ESRI. https://www.esri.ie/system/files/publications/SUSTAT92_3.pdf
National Council for Curriculum and Assessment (NCCA) (2009). Senior Cycle Key Skills Framework. Dublin: Author. https://www.curriculumonline.ie/getmedia/161b0ee4-706c-4a7a-9f5e-7c95669c629f/KS_Framework.pdf
National Council for Curriculum and Assessment (NCCA) (2018). Senior Cycle review: what is purpose of Senior Cycle education in Ireland? Dublin: Author. https://ncca.ie/media/3878/ncca_sc_single_pages_en.pdf
O’Leary, M., Lysaght, Z., Nic Craith, D., and Scully, D. (2019). Standardised testing in English reading and mathematics in the Irish primary school: A survey of Irish primary teachers. Dublin: DCU – CARPE and INTO. https://www.dcu.ie/sites/default/files/carpe/carpeinto_standardised_testing_survey_web.pdf
Organisation for Co-operation and Development (OECD) (2010). Inspired by technology, driven by pedagogy. A systemic approach to technology-based school innovations. Paris: Author. https://doi.org/10.1787/9789264094437-en
Organisation for Co-operation and Development (OECD) (2011). PISA 2009 results: students on line: digital technologies and performance (volume VI). Paris: Author. https://doi.org/10.1787/9789264112995-en
Organisation for Co-operation and Development (OECD) (2014). PISA 2012 Results: creative problem solving: students’ skills in tackling real-life problems (volume V). Paris: Author. https://doi.org/10.1787/9789264208070-en
Organisation for Co-operation and Development (OECD) (2015). Students, computers and learning: Making the connection. Paris: Author. http://www.oecd.org/education/students-computers-and-learning-9789264239555-en.htm
Organisation for Co-operation and Development (OECD) (2019). Education Policy Outlooks 2019: Working Together to Help Students Achieve Their Potential. Paris: Author.
Organisation for Co-operation and Development (OECD) (2020a). Education in Ireland: An OECD assessment of the Senior Cycle Review. Paris: Author.
Organisation for Co-operation and Development (OECD) (2020b). An implementation framework for effective change in schools. Paris: Author.
Organisation for Co-operation and Development (OECD) (2021). 21st-Century readers: Developing literacy skills in a digital world. Paris: Author. https://www.oecd.org/pisa/publications/21st-century-readers-a83d84cb-en.htm
Perkins, R., & Clerkin, A. (2020). TIMSS 2019: Ireland's results in mathematics and science. Dublin: Educational Research Centre. https://www.erc.ie/wp-content/uploads/2020/12/03-ERC-TIMSS-2019-Report_A4_Online.pdf
Pfefferman D. (1996). The use of sampling weights for survey data analysis. Statistical Methods in Medical Research, 5(3), 239-261. DOI: https://doi.org/10.1177%2F096228029600500303
171
Rawdon, C., Sampson, K., Gilleece, L., & Cosgrove, J. (2020). Developing an evaluation framework for teachers’ professional learning in Ireland: Phase 1 – desk-based reasearch. Dublin: Educational Research Centre. https://www.erc.ie/wp-content/uploads/2020/11/ERC-TPL-Wellbeing-Literature-Review-Report_Final.pdf
UN-CRC (United Nations Convention on the Rights of the Child) (2016). Concluding observations on the combined third and fourth periodic reports of Ireland (CRC/C/IRL/CO/3-4).
UNESCO and Microsoft (2011). UNESCO ICT competency framework for teachers. Paris: UNESCO. http://unesdoc.unesco.org/images/0021/002134/213475e.pdf

172
Appendix 1: Additional data tables for Chapter 1 Special schools Table A1.1: Number and percentage of schools and pupils in the population, the baseline group and Wave 1 sample by school size
Population DLF
baseline schools DLF Wave 1 sample
Schools Pupils Schools Pupils Schools Pupils Enrolment n % n % n % n % n % n %
Small, 1-35 pupils 45 33.6 929 11.3 14 21.9 280 6.4 6 18.8 147 6.5
Medium, 36-70 pupils 43 32.1 2299 27.9 24 37.5 1,311 30.1 12 37.5 646 28.6 Large, >70 pupils 46 34.3 5013 60.8 26 40.6 2,765 63.5 14 43.8 1,463 64.8 Total 134 100 8241 100 64 100 4,356 100 32 100 2,256 100
Table A1.2: Number and percentage of schools and pupils in the population, the baseline group and Wave 1 sample by school gender mix
Population DLF
baseline schools DLF Wave 1 sample Schools Pupils Schools Pupils Schools Pupils Gender mix n % n % n % n % n % n %
Mixed 128 95.5 8,175 99.2 64 100 4,356 100 32 100 2,256 100 Boys 5 3.7 65 0.8 Girls 1 0.7 1 0.0 Total 134 100 8,241 100 64 100 4,356 100 32 100 2,256 100

173
Table A1.3: Number and percentage of schools and pupils in the population, the baseline group and Wave 1 sample by region
Population DLF
baseline schools DLF Wave 1 sample Schools Pupils Schools Pupils Schools Pupils Region n % n % n % n % n % n %
Rest of Leinster 31 23.1 2,113 25.6 18 28.1 1,272 29.2 9 28.1 606 26.9 Dublin 50 37.3 2,788 33.8 16 25.0 1,290 29.6 8 25.0 679 30.1 Munster 35 26.1 2,474 30.0 20 31.3 1,249 28.7 10 31.3 629 27.9 Connacht 15 11.2 537 6.5 9 14.1 376 8.6 4 12.5 173 7.7
Ulster (part of) 3 2.2 329 4.0 1 1.6 169 3.9 1 3.1 169 7.5 Total 134 100 8,241 100 64 100 4,356 100 32 100 2,256 100
TableA1.4: Number and percentage of schools and pupils in the population, the baseline group and Wave 1 sample by current level of embedding DTs
Population DLF
baseline schools DLF Wave 1 sample Schools Pupils Schools Pupils Schools Pupils Level of embedding n % n % n % n % n % n %
emerging/developing 31 48.4 1,769 40.6 15 46.9 990 43.9 intermediate 28 43.8 2,163 49.7 14 43.8 982 43.5 advanced/highly advanced 4 6.3 356 8.2 3 9.4 284 12.6
Missing 1 1.6 68 1.6 Total 64 100 4,356 100 32 100 2,256 100

174
Primary schools Table A1.5: Number and percentage of schools and pupils in the population, the baseline group and Wave 1 sample by school size
Population DLF
baseline schools DLF Wave 1 sample Schools Pupils Schools Pupils Schools Pupils Enrolment n % n % n % n % n % n %
Small, 1-80 pupils 958 30.8 42,012 7.5 430 28.0 19,364 6.7 37 24.7 1,725 5.7 Medium, 81-200 pupils 1,040 33.5 131,863 23.6 514 33.5 66,283 22.9 53 35.3 6,978 23.0 Large, >200 pupils 1,108 35.7 385,694 68.9 590 38.5 203,665 70.4 60 40.0 21,696 71.4 Total 3,106 100 559,569 100 1,534 100 289,312 100 150 100 30,399 100
TableA1.6: Number and percentage of schools and pupils in the population, the baseline group and Wave 1 sample by DEIS status
Population DLF
baseline schools DLF Wave 1 sample Schools Pupils Schools Pupils Schools Pupils
DEIS status n % n % n % n % n % n %
Non-DEIS 2,409 77.6 448,660 80.2 1,248 81.4 243,766 84.3 118 78.7 24,009 79.0 DEIS 697 22.4 110,909 19.8 286 18.6 45,546 15.7 32 21.3 6,390 21.0
Total 3,106 100 559,569 100 1,534 100 289,312 100 150 100 30,399 100

175
Table A1.7: Number and percentage of schools and pupils in the population, the baseline group and Wave 1 sample by school gender mix
Population DLF
baseline schools DLF Wave 1 sample
Schools Pupils Schools Pupils Schools Pupils Gender mix n % n % n % n % n % n %
Mixed 2840 91.4 491,690 87.9 1,403 91.5 254,339 88.0 137 91.3 26,456 87.0
Boys 170 5.5 39,980 7.1 81 5.3 20,887 7.2 6 4.0 1,478 4.9 Girls 96 3.1 27,899 5.0 50 3.3 14,086 4.9 7 4.7 2,465 8.1 Total 3106 100 559,569 100 1,534 100 289,312 100 150 100 30,399 100
Table A1.8: Number and percentage of schools and pupils in the population, the baseline group and Wave 1 sample by region
Population DLF
baseline schools DLF Wave 1 sample Schools Pupils Schools Pupils Schools Pupils Region n % n % n % n % n % n %
Rest of Leinster 820 26.4 167,413 29.9 403 26.3 85,533 29.6 38 25.3 9,124 30.0 Dublin 447 14.4 141,869 25.4 170 11.1 57,708 19.9 18 12.0 6,335 20.8 Munster 947 30.5 149,413 26.7 473 30.8 82,581 28.5 46 30.7 8,770 28.8 Connacht 581 18.7 64,108 11.5 290 18.9 39,062 13.5 28 18.7 3,585 11.8
Ulster (part of) 311 10 36,766 6.6 198 12.9 24,428 8.4 20 13.3 2,585 8.5 Total 3,106 100 559,569 100 1534 100 289,312 100 150 100 30,399 100
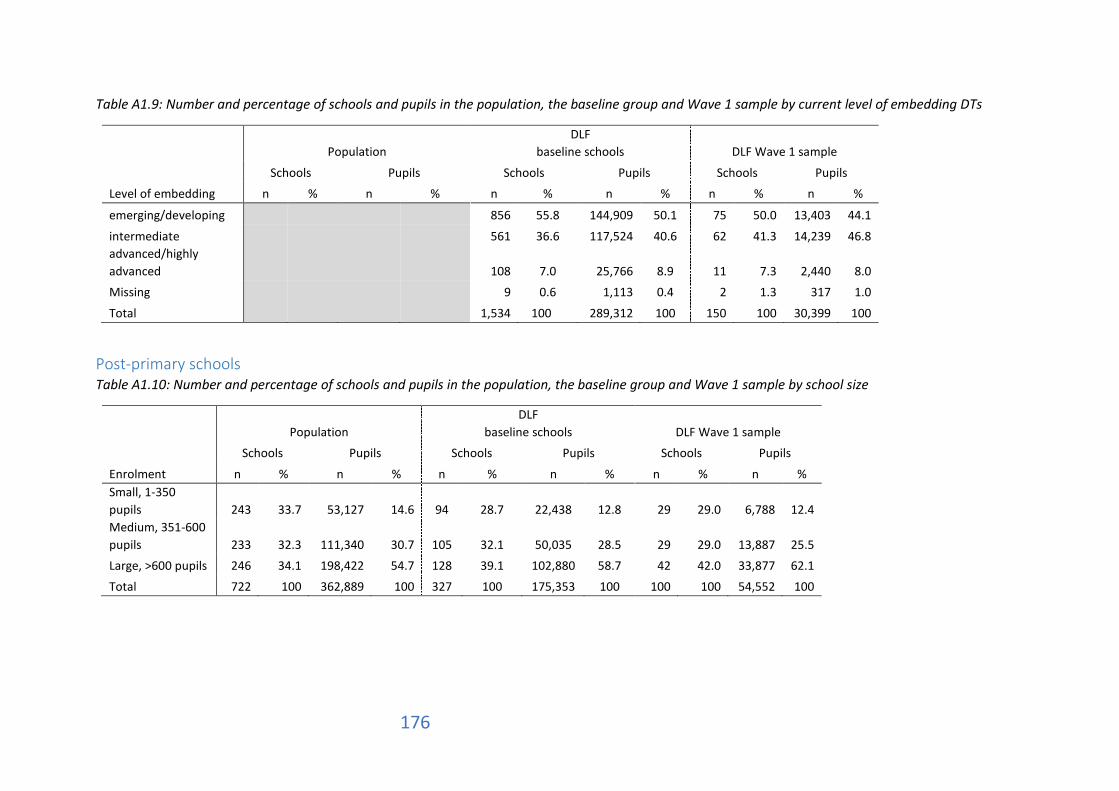
176
Table A1.9: Number and percentage of schools and pupils in the population, the baseline group and Wave 1 sample by current level of embedding DTs
Population DLF
baseline schools DLF Wave 1 sample
Schools Pupils Schools Pupils Schools Pupils Level of embedding n % n % n % n % n % n %
emerging/developing 856 55.8 144,909 50.1 75 50.0 13,403 44.1
intermediate 561 36.6 117,524 40.6 62 41.3 14,239 46.8 advanced/highly advanced 108 7.0 25,766 8.9 11 7.3 2,440 8.0 Missing 9 0.6 1,113 0.4 2 1.3 317 1.0
Total 1,534 100 289,312 100 150 100 30,399 100
Post-primary schools Table A1.10: Number and percentage of schools and pupils in the population, the baseline group and Wave 1 sample by school size
Population DLF
baseline schools DLF Wave 1 sample Schools Pupils Schools Pupils Schools Pupils
Enrolment n % n % n % n % n % n % Small, 1-350 pupils 243 33.7 53,127 14.6 94 28.7 22,438 12.8 29 29.0 6,788 12.4 Medium, 351-600 pupils 233 32.3 111,340 30.7 105 32.1 50,035 28.5 29 29.0 13,887 25.5 Large, >600 pupils 246 34.1 198,422 54.7 128 39.1 102,880 58.7 42 42.0 33,877 62.1 Total 722 100 362,889 100 327 100 175,353 100 100 100 54,552 100

177
Table A1.11: Number and percentage of schools and pupils in the population, the baseline group and Wave 1 sample by school sector
Population DLF
baseline schools DLF Wave 1 sample
Schools Pupils Schools Pupils Schools Pupils Sector n % n % n % n % n % n %
Community 82 11.4 52,842 14.6 47 14.4 31,027 17.7 16 16.0 10,703 19.6
Comprehensive 14 1.9 7,718 2.1 5 1.5 2,559 1.5 Secondary 378 52.4 198,828 54.8 184 56.3 100,448 57.3 57 57.0 31,979 58.6 Vocational (ETB) 248 34.3 103,501 28.5 91 27.8 41,319 23.6 27 27.0 11,870 21.8 Total 722 100 362,889 100 327 100 175,353 100 100 100 54,552 100
Table A1.12: Number and percentage of schools and pupils in the population, the baseline group and Wave 1 sample by DEIS status
Population DLF
baseline schools DLF Wave 1 sample Schools Pupils Schools Pupils Schools Pupils
DEIS status n % n % n % n % n % n %
Non-DEIS 524 72.6 288,758 79.6 246 75.2 140,740 80.3 76 76.0 44,054 80.8 DEIS 198 27.4 74,131 20.4 81 24.8 34,613 19.7 24 24.0 10,498 19.2 Total 722 100 362,889 100 327 100 175,353 100 100 100 54,552 100
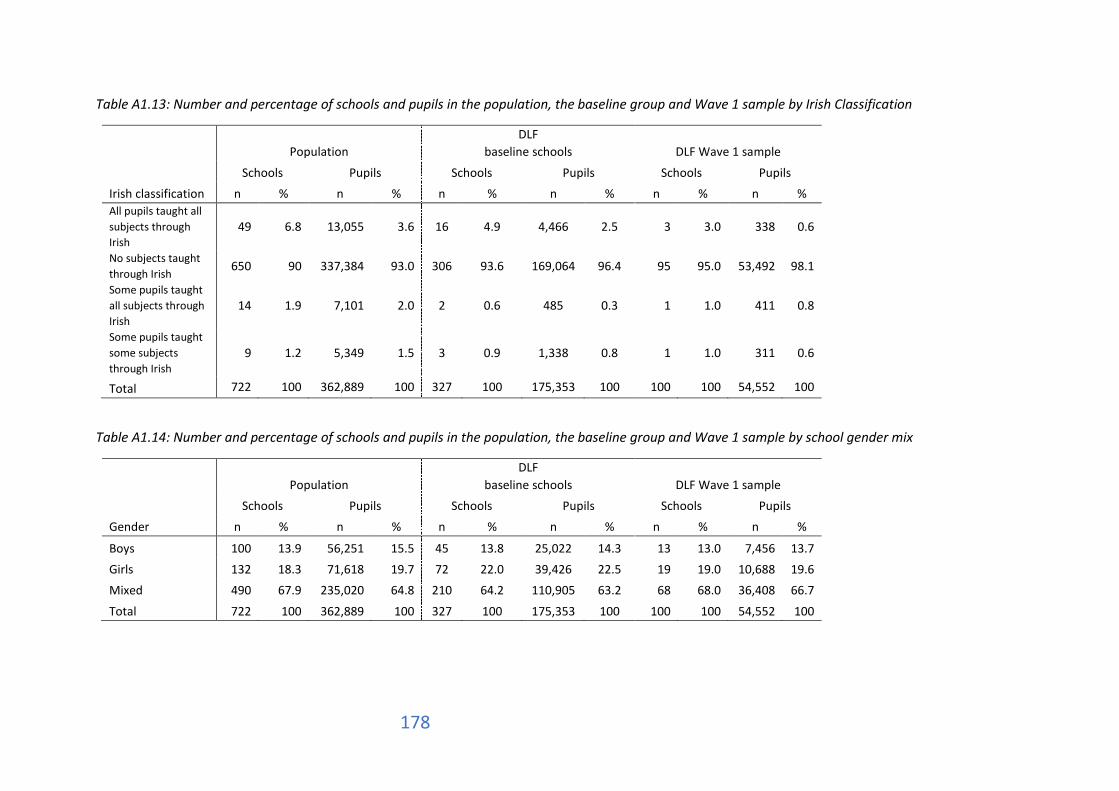
178
Table A1.13: Number and percentage of schools and pupils in the population, the baseline group and Wave 1 sample by Irish Classification
Population DLF
baseline schools DLF Wave 1 sample
Schools Pupils Schools Pupils Schools Pupils Irish classification n % n % n % n % n % n % All pupils taught all subjects through Irish
49 6.8 13,055 3.6 16 4.9 4,466 2.5 3 3.0 338 0.6
No subjects taught through Irish 650 90 337,384 93.0 306 93.6 169,064 96.4 95 95.0 53,492 98.1
Some pupils taught all subjects through Irish
14 1.9 7,101 2.0 2 0.6 485 0.3 1 1.0 411 0.8
Some pupils taught some subjects through Irish
9 1.2 5,349 1.5 3 0.9 1,338 0.8 1 1.0 311 0.6
Total 722 100 362,889 100 327 100 175,353 100 100 100 54,552 100
Table A1.14: Number and percentage of schools and pupils in the population, the baseline group and Wave 1 sample by school gender mix
Population DLF
baseline schools DLF Wave 1 sample Schools Pupils Schools Pupils Schools Pupils Gender n % n % n % n % n % n %
Boys 100 13.9 56,251 15.5 45 13.8 25,022 14.3 13 13.0 7,456 13.7 Girls 132 18.3 71,618 19.7 72 22.0 39,426 22.5 19 19.0 10,688 19.6 Mixed 490 67.9 235,020 64.8 210 64.2 110,905 63.2 68 68.0 36,408 66.7
Total 722 100 362,889 100 327 100 175,353 100 100 100 54,552 100

179
Table A1.15: Number and percentage of schools and pupils in the population, the baseline group and Wave 1 sample by fee-paying status
Population DLF
baseline schools DLF Wave 1 sample
Schools Pupils Schools Pupils Schools Pupils Fee-pay status n % n % n % n % n % n %
Non fee-pay 664 92 336,019 92.6 304 93.0 165,342 94.3 93 93.0 51,379 94.2
Unspecified 6 0.8 1,265 0.3 1 0.3 338 0.2 Fee-pay 52 7.2 25,605 7.1 22 6.7 9,673 5.5 7 7.0 3,173 5.8 Total 722 100 362,889 100 327 100 175,353 100 100 100 54,552 100
Table A1.16: Number and percentage of schools and pupils in the population, the baseline group and Wave 1 sample by region
Population DLF
baseline schools DLF Wave 1 sample Schools Pupils Schools Pupils Schools Pupils Region n % n % n % n % n % n %
Rest of Leinster 182 25.2 108,292 29.8 86 26.3 55,133 31.4 25 25.0 16,488 30.2 Dublin 185 25.6 90,214 24.9 69 21.1 37,439 21.4 21 21.0 11,383 20.9 Munster 204 28.3 99,140 27.3 85 26.0 42,881 24.5 26 26.0 12,986 23.8 Connacht 101 14 41,396 11.4 52 15.9 20,751 11.8 16 16.0 6,185 11.3
Ulster (part of) 50 6.9 23,847 6.6 35 10.7 19,149 10.9 12 12.0 7,510 13.8 Total 722 100 362,889 100 327 100 175,353 100 100 100 54,552 100
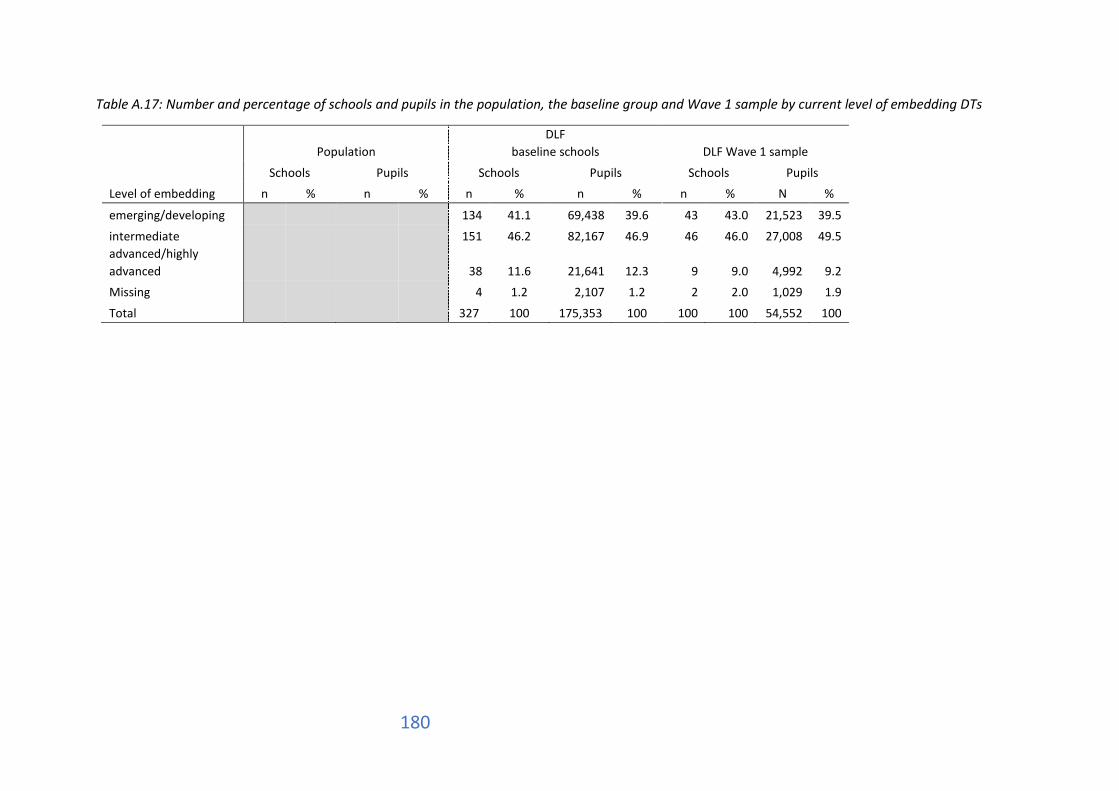
180
Table A.17: Number and percentage of schools and pupils in the population, the baseline group and Wave 1 sample by current level of embedding DTs
Population DLF
baseline schools DLF Wave 1 sample
Schools Pupils Schools Pupils Schools Pupils Level of embedding n % n % n % n % n % N %
emerging/developing 134 41.1 69,438 39.6 43 43.0 21,523 39.5
intermediate 151 46.2 82,167 46.9 46 46.0 27,008 49.5 advanced/highly advanced 38 11.6 21,641 12.3 9 9.0 4,992 9.2 Missing 4 1.2 2,107 1.2 2 2.0 1,029 1.9
Total 327 100 175,353 100 100 100 54,552 100
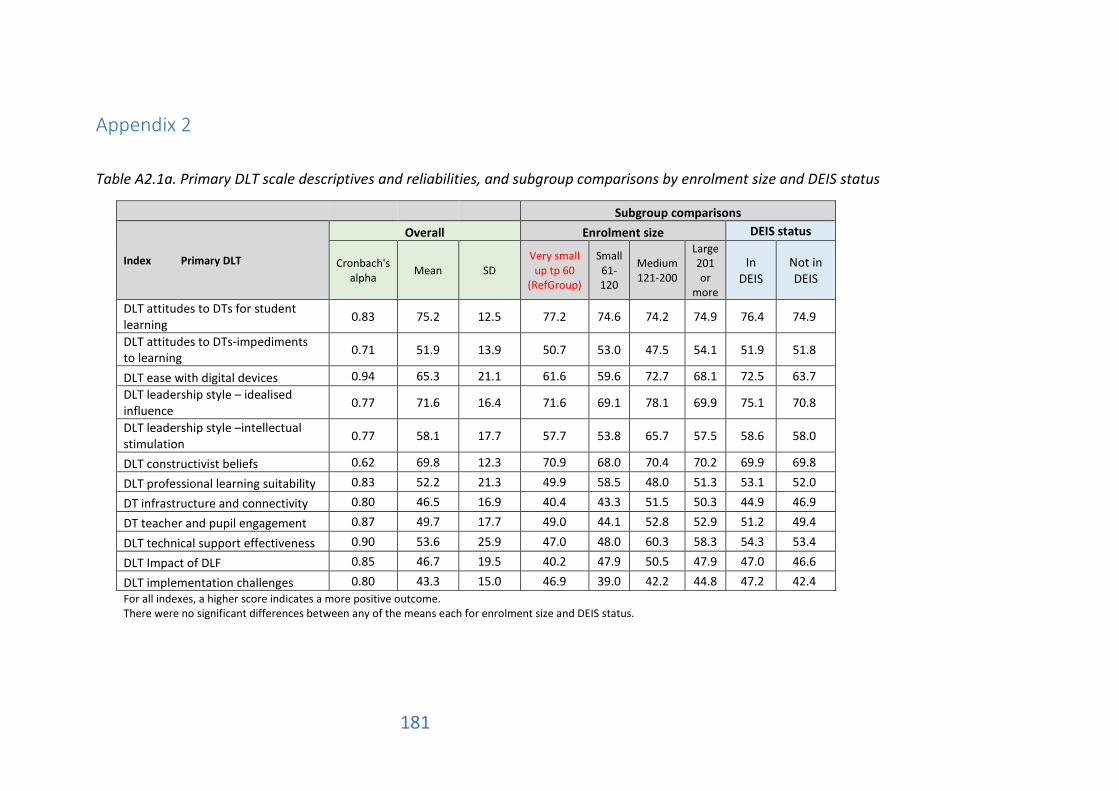
181
Appendix 2
Table A2.1a. Primary DLT scale descriptives and reliabilities, and subgroup comparisons by enrolment size and DEIS status
Subgroup comparisons
Index Primary DLT
Overall Enrolment size DEIS status
Cronbach's alpha Mean SD
Very small up tp 60
(RefGroup)
Small 61-120
Medium 121-200
Large 201 or
more
In DEIS
Not in DEIS
DLT attitudes to DTs for student learning 0.83 75.2 12.5 77.2 74.6 74.2 74.9 76.4 74.9
DLT attitudes to DTs-impediments to learning 0.71 51.9 13.9 50.7 53.0 47.5 54.1 51.9 51.8
DLT ease with digital devices 0.94 65.3 21.1 61.6 59.6 72.7 68.1 72.5 63.7 DLT leadership style – idealised influence 0.77 71.6 16.4 71.6 69.1 78.1 69.9 75.1 70.8
DLT leadership style –intellectual stimulation 0.77 58.1 17.7 57.7 53.8 65.7 57.5 58.6 58.0
DLT constructivist beliefs 0.62 69.8 12.3 70.9 68.0 70.4 70.2 69.9 69.8
DLT professional learning suitability 0.83 52.2 21.3 49.9 58.5 48.0 51.3 53.1 52.0
DT infrastructure and connectivity 0.80 46.5 16.9 40.4 43.3 51.5 50.3 44.9 46.9
DT teacher and pupil engagement 0.87 49.7 17.7 49.0 44.1 52.8 52.9 51.2 49.4
DLT technical support effectiveness 0.90 53.6 25.9 47.0 48.0 60.3 58.3 54.3 53.4
DLT Impact of DLF 0.85 46.7 19.5 40.2 47.9 50.5 47.9 47.0 46.6
DLT implementation challenges 0.80 43.3 15.0 46.9 39.0 42.2 44.8 47.2 42.4 For all indexes, a higher score indicates a more positive outcome. There were no significant differences between any of the means each for enrolment size and DEIS status.
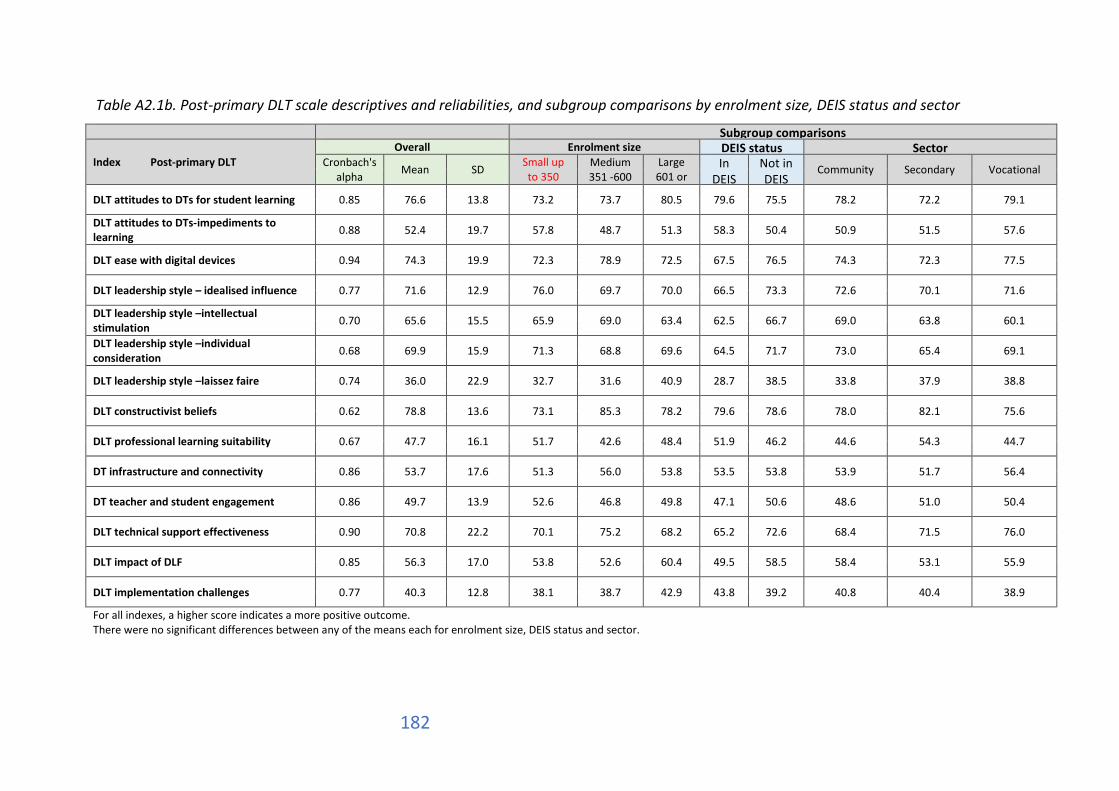
182
Table A2.1b. Post-primary DLT scale descriptives and reliabilities, and subgroup comparisons by enrolment size, DEIS status and sector
Subgroup comparisons
Index Post-primary DLT Overall Enrolment size DEIS status Sector
Cronbach's alpha Mean SD Small up
to 350
Medium 351 -600
Large 601 or
In DEIS
Not in DEIS
Community Secondary Vocational
DLT attitudes to DTs for student learning 0.85 76.6 13.8 73.2 73.7 80.5 79.6 75.5 78.2 72.2 79.1
DLT attitudes to DTs-impediments to learning 0.88 52.4 19.7 57.8 48.7 51.3 58.3 50.4 50.9 51.5 57.6
DLT ease with digital devices 0.94 74.3 19.9 72.3 78.9 72.5 67.5 76.5 74.3 72.3 77.5
DLT leadership style – idealised influence 0.77 71.6 12.9 76.0 69.7 70.0 66.5 73.3 72.6 70.1 71.6
DLT leadership style –intellectual stimulation 0.70 65.6 15.5 65.9 69.0 63.4 62.5 66.7 69.0 63.8 60.1
DLT leadership style –individual consideration 0.68 69.9 15.9 71.3 68.8 69.6 64.5 71.7 73.0 65.4 69.1
DLT leadership style –laissez faire 0.74 36.0 22.9 32.7 31.6 40.9 28.7 38.5 33.8 37.9 38.8
DLT constructivist beliefs 0.62 78.8 13.6 73.1 85.3 78.2 79.6 78.6 78.0 82.1 75.6
DLT professional learning suitability 0.67 47.7 16.1 51.7 42.6 48.4 51.9 46.2 44.6 54.3 44.7
DT infrastructure and connectivity 0.86 53.7 17.6 51.3 56.0 53.8 53.5 53.8 53.9 51.7 56.4
DT teacher and student engagement 0.86 49.7 13.9 52.6 46.8 49.8 47.1 50.6 48.6 51.0 50.4
DLT technical support effectiveness 0.90 70.8 22.2 70.1 75.2 68.2 65.2 72.6 68.4 71.5 76.0
DLT impact of DLF 0.85 56.3 17.0 53.8 52.6 60.4 49.5 58.5 58.4 53.1 55.9
DLT implementation challenges 0.77 40.3 12.8 38.1 38.7 42.9 43.8 39.2 40.8 40.4 38.9
For all indexes, a higher score indicates a more positive outcome. There were no significant differences between any of the means each for enrolment size, DEIS status and sector.
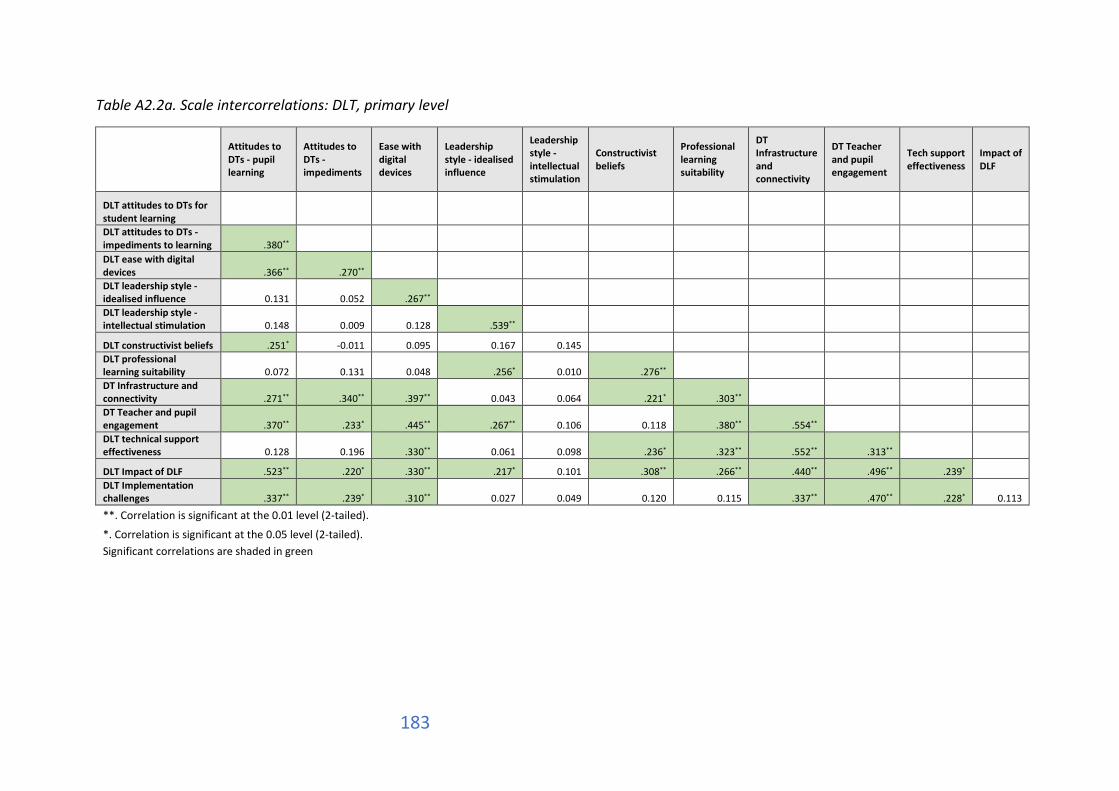
183
Table A2.2a. Scale intercorrelations: DLT, primary level
Attitudes to DTs - pupil learning
Attitudes to DTs - impediments
Ease with digital devices
Leadership style - idealised influence
Leadership style - intellectual stimulation
Constructivist beliefs
Professional learning suitability
DT Infrastructure and connectivity
DT Teacher and pupil engagement
Tech support effectiveness
Impact of DLF
DLT attitudes to DTs for student learning DLT attitudes to DTs - impediments to learning .380** DLT ease with digital devices .366** .270** DLT leadership style - idealised influence 0.131 0.052 .267** DLT leadership style - intellectual stimulation 0.148 0.009 0.128 .539** DLT constructivist beliefs .251* -0.011 0.095 0.167 0.145 DLT professional learning suitability 0.072 0.131 0.048 .256* 0.010 .276** DT Infrastructure and connectivity .271** .340** .397** 0.043 0.064 .221* .303** DT Teacher and pupil engagement .370** .233* .445** .267** 0.106 0.118 .380** .554** DLT technical support effectiveness 0.128 0.196 .330** 0.061 0.098 .236* .323** .552** .313** DLT Impact of DLF .523** .220* .330** .217* 0.101 .308** .266** .440** .496** .239* DLT Implementation challenges .337** .239* .310** 0.027 0.049 0.120 0.115 .337** .470** .228* 0.113 **. Correlation is significant at the 0.01 level (2-tailed).
*. Correlation is significant at the 0.05 level (2-tailed). Significant correlations are shaded in green
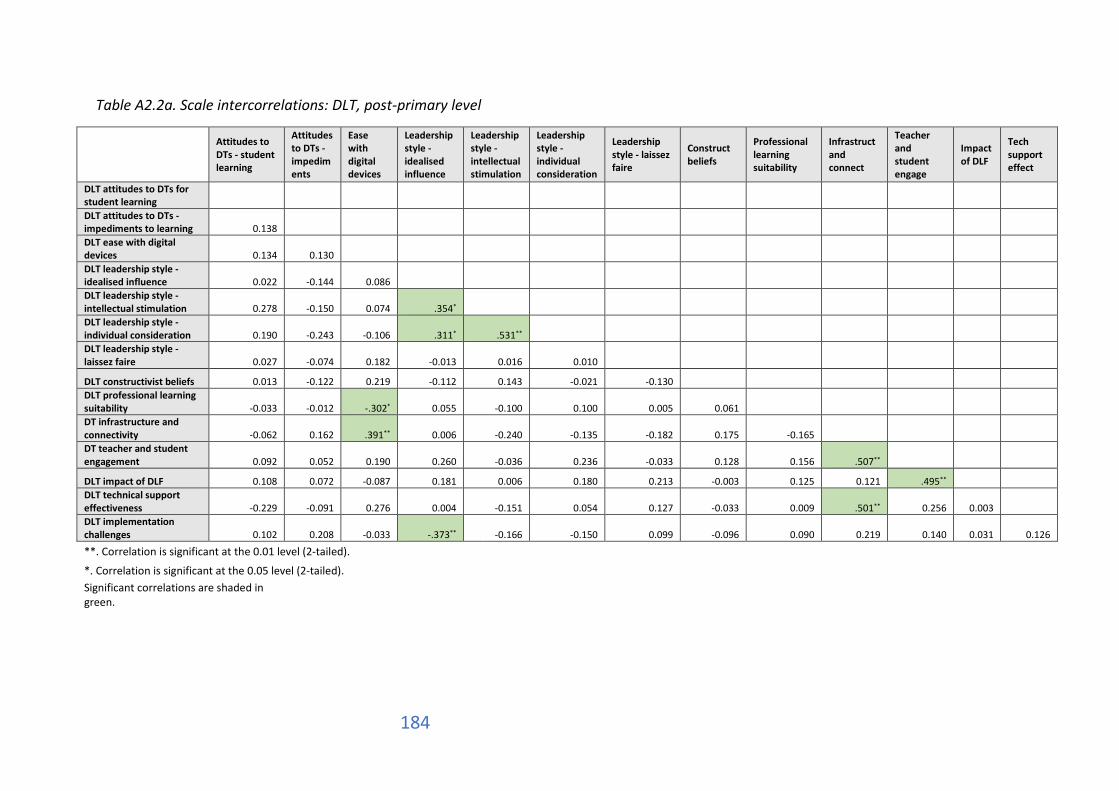
184
Table A2.2a. Scale intercorrelations: DLT, post-primary level
Attitudes to DTs - student learning
Attitudes to DTs - impediments
Ease with digital devices
Leadership style - idealised influence
Leadership style - intellectual stimulation
Leadership style - individual consideration
Leadership style - laissez faire
Construct beliefs
Professional learning suitability
Infrastruct and connect
Teacher and student engage
Impact of DLF
Tech support effect
DLT attitudes to DTs for student learning
DLT attitudes to DTs - impediments to learning 0.138 DLT ease with digital devices 0.134 0.130 DLT leadership style - idealised influence 0.022 -0.144 0.086 DLT leadership style - intellectual stimulation 0.278 -0.150 0.074 .354* DLT leadership style - individual consideration 0.190 -0.243 -0.106 .311* .531** DLT leadership style - laissez faire 0.027 -0.074 0.182 -0.013 0.016 0.010 DLT constructivist beliefs 0.013 -0.122 0.219 -0.112 0.143 -0.021 -0.130 DLT professional learning suitability -0.033 -0.012 -.302* 0.055 -0.100 0.100 0.005 0.061 DT infrastructure and connectivity -0.062 0.162 .391** 0.006 -0.240 -0.135 -0.182 0.175 -0.165 DT teacher and student engagement 0.092 0.052 0.190 0.260 -0.036 0.236 -0.033 0.128 0.156 .507** DLT impact of DLF 0.108 0.072 -0.087 0.181 0.006 0.180 0.213 -0.003 0.125 0.121 .495** DLT technical support effectiveness -0.229 -0.091 0.276 0.004 -0.151 0.054 0.127 -0.033 0.009 .501** 0.256 0.003 DLT implementation challenges 0.102 0.208 -0.033 -.373** -0.166 -0.150 0.099 -0.096 0.090 0.219 0.140 0.031 0.126 **. Correlation is significant at the 0.01 level (2-tailed).
*. Correlation is significant at the 0.05 level (2-tailed). Significant correlations are shaded in green.
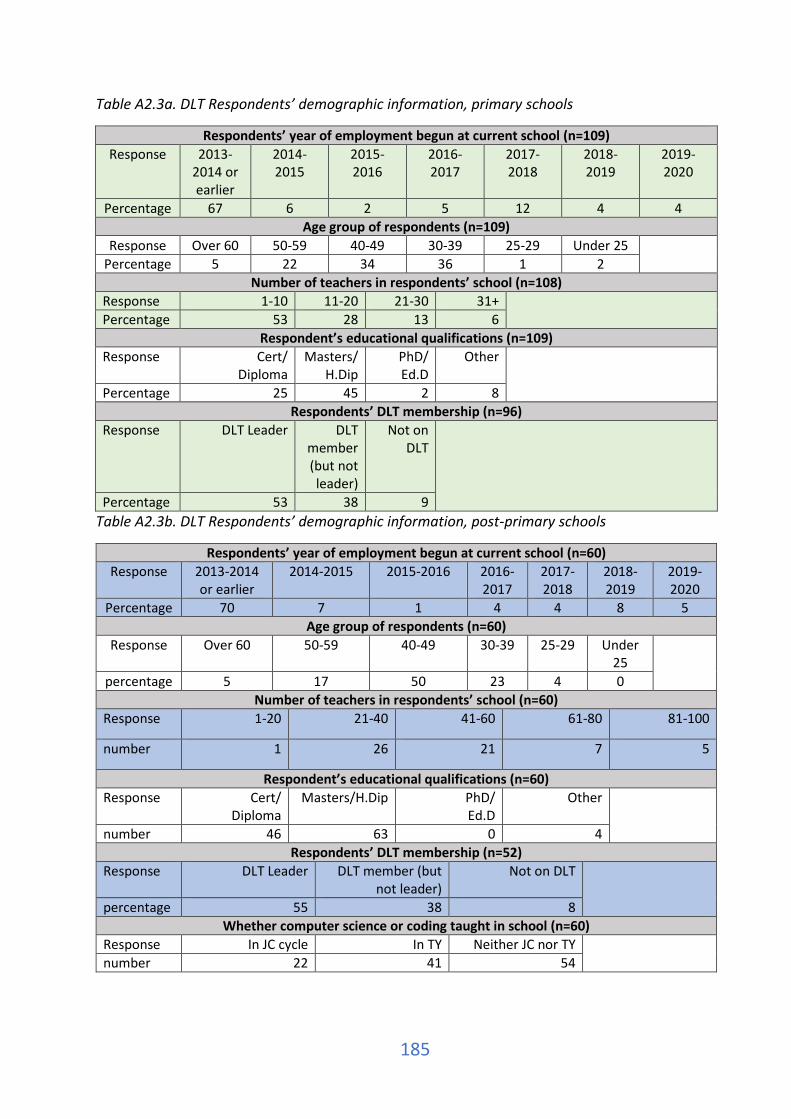
185
Table A2.3a. DLT Respondents’ demographic information, primary schools
Respondents’ year of employment begun at current school (n=109) Response 2013-
2014 or earlier
2014-2015
2015-2016
2016-2017
2017-2018
2018-2019
2019-2020
Percentage 67 6 2 5 12 4 4 Age group of respondents (n=109)
Response Over 60 50-59 40-49 30-39 25-29 Under 25 Percentage 5 22 34 36 1 2
Number of teachers in respondents’ school (n=108) Response 1-10 11-20 21-30 31+ Percentage 53 28 13 6
Respondent’s educational qualifications (n=109) Response Cert/
Diploma Masters/
H.Dip PhD/ Ed.D
Other
Percentage 25 45 2 8 Respondents’ DLT membership (n=96)
Response DLT Leader DLT member (but not leader)
Not on DLT
Percentage 53 38 9 Table A2.3b. DLT Respondents’ demographic information, post-primary schools
Respondents’ year of employment begun at current school (n=60) Response 2013-2014
or earlier 2014-2015 2015-2016 2016-
2017 2017-2018
2018-2019
2019-2020
Percentage 70 7 1 4 4 8 5 Age group of respondents (n=60)
Response Over 60 50-59 40-49 30-39 25-29 Under 25
percentage 5 17 50 23 4 0 Number of teachers in respondents’ school (n=60)
Response 1-20 21-40 41-60 61-80 81-100
number 1 26 21 7 5
Respondent’s educational qualifications (n=60) Response Cert/
Diploma Masters/H.Dip PhD/
Ed.D Other
number 46 63 0 4 Respondents’ DLT membership (n=52)
Response DLT Leader DLT member (but not leader)
Not on DLT
percentage 55 38 8 Whether computer science or coding taught in school (n=60)
Response In JC cycle In TY Neither JC nor TY number 22 41 54

186
Figure A2.1. When Schools’ Digital Learning Team was established, primary and post-primary schools
Figure A2.2a. Number of people on school’s Digital Learning Team, primary schools (n=96)
14
25
12
49
8
12
10
70
10 20 30 40 50 60 70 80
Not yet established
About six months ago or less
About nine months ago
About a year ago or more
Post Primary (n=60) Primary (n=109)
58
34
5
0 10 20 30 40 50 60 70
1-3
4-6
7-10

187
Figure A2.2b. Number of people on school’s Digital Learning Team, post-primary schools (n=54)
Figure A2.3a. How DLT membership was decided, primary schools (n=108)
21
25
8
1
5 10 15 20 25 30
1-5
6-10
11-15
16-20
19
17
65
0 10 20 30 40 50 60 70
Other
Staff were selected across year levels or departments
Interested staff volunteered

188
Figure A2.3b. How DLT membership was decided, post-primary schools (n=55)
Figure A2.4a. Frequency of Digital Learning Team meetings, primary schools (n=95)
13
21
80
0 10 20 30 40 50 60 70 80 90
Other
Staff were selected across year levels or departments
Interested staff volunteered
62
34
3
1
10 20 30 40 50 60 70
Less than once per month
About once per month
About once per fortnight
About once per week or more

189
Figure A2.4b. Frequency of Digital Learning Team meetings, post-primary schools (n=55)
Figure A2.5. Schools’ chosen dimension of focus, primary and post-primary schools
65
23
8
4
10 20 30 40 50 60 70
Less than once per month
About once per month
About once per fortnight
About once per week or more
89
11
90
10
20 40 60 80 100
Teaching and Learning
Leadership and Management
Primary (n=109) Post Primary (n=60)

190
Figure A2.6a. Schools’ chosen domains of focus within Teaching and Learning Dimension, primary schools (n=99)
83
95
84
77
90
83
86
83
81
86
86
62
91
82
85
43
17
5
16
23
10
17
14
17
19
14
14
38
9
18
15
57
0% 10% 20% 30% 40% 50% 60% 70% 80% 90% 100%
Domain 4: Teachers collective/collaborative practice -Teachers contribute to building whole-staff capacity by
sharing their expertise
Domain 4: Teachers collective/collaborative practice -Teachers collectively develop and implement consistent anddependable formative and summative assessment practices
Domain 4: Teachers collective/collaborative practice -Teachers work together to devise learning opportunities for
pupils across and beyond the curriculum
Domain 4: Teachers collective/collaborative practice -Teachers value and engage in professional development and
professional collaboration
Domain 3: Teachers individual practice - The teacherresponds to individual learning needs and differentiates
teaching and learning activities as necessary
Domain 3: Teachers individual practice - The teacher selects and uses teaching approaches appropriate to the learning
objective and to pupils’ learning needs
Domain 3: Teachers individual practice - The teacher selectsand uses planning, preparationand assessment practices
that progress pupils learning
Domain 3: Teachers individual practice - The teacher hasthe requisite subject knowledge, pedagogical knowledge
and classroom management skills
Domain 2: Learner experiences - Pupils experienceopportunities to develop the skills and attitudes necessary
for lifelong learning
Domain 2: Learner experiences - Pupils reflect on theirprogress as learners and develop a sense of ownership of
and responsibility for their learning
Domain 2: Learner experiences - Pupils grow as learnersthrough respectful interactions and experiences that are
challenging and supportive
Domain 2: Learner experiences - Pupils engage purposefullyin meaningful learning activities
Domain 1: Learner outcomes - Pupils achieve the statedlearning objectives for the term and year
Domain 1: Learner outcomes - Pupils demonstrate theknowledge, skills and understanding required by the
curriculum
Domain 1: Learner outcomes - Pupils have the necessaryknowledge, skills and attitudes required to understand
themselves and their relationships
Domain 1: Learner outcomes - Pupils enjoy their learning,are motivated to learn and expect to achieve as learners
No Yes

191
Figure A2.6b. Schools’ chosen domains of focus within Teaching and Learning Dimension, post-primary schools (n=54)
53
81
84
55
85
75
79
88
90
85
88
73
95
89
83
77
47
19
16
45
15
25
21
12
10
15
12
27
5
11
17
23
0% 10% 20% 30% 40% 50% 60% 70% 80% 90% 100%
Domain 4: Teachers collective & collaborative practice -Teachers contribute to building whole-staff capacity by
sharing their expertise
Domain 4: Teachers collective & collaborative practice -Teachers collectively develop and implement consistentand dependable formative and summative assessment…
Domain 4: Teachers collective & collaborative practice -Teachers work together to devise learning opportunities
for pupils across and beyond the curriculum
Domain 4: Teachers collective & collaborative practice -Teachers value and engage in professional development
and professional collaboration
Domain 3: Teachers individual practice - The teacherresponds to individual learning needs and differentiates
teaching and learning activities as necessary
Domain 3: Teachers individual practice - The teacherselects and uses teaching approaches appropriate to the
learning objective and to pupils learning needs
Domain 3: Teachers individual practice - The teacherselects and uses planning, preparation and assessment
practices that progress pupils learning
Domain 3: Teachers individual practice - The teacher hasthe requisite subject knowledge, pedagogical knowledge
and classroom management skills
Domain 2: Learner experiences - Pupils experienceopportunities to develop the skills and attitudes necessary
for lifelong learning
Domain 2: Learner experiences - Pupils reflect on theirprogress as learners and develop a sense of ownership of
and responsibility for their learning
Domain 2: Learner experiences - Pupils grow as learnersthrough respectful interactions and experiences that are
challenging and supportive
Domain 2: Learner experiences - Pupils engagepurposefully in meaningful learning activities
Domain 1: Learner outcomes - Pupils achieve the statedlearning objectives for the term and year
Domain 1: Learner outcomes - Pupils demonstrate theknowledge, skills and understanding required by the
curriculum
Domain 1: Learner outcomes - Pupils have the necessaryknowledge, skills and attitudes required to understand
themselves and their relationships
Domain 1: Learner outcomes - Pupils enjoy their learning,are motivated to learn and expect to achieve as learners
No Yes
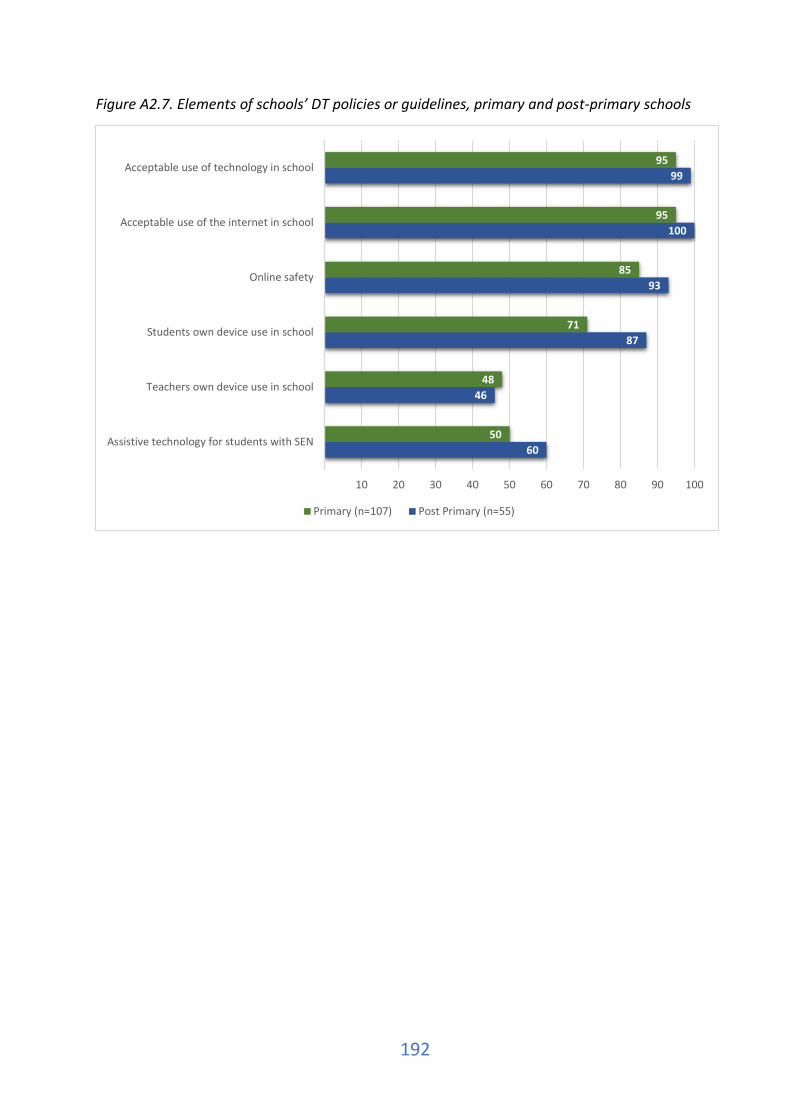
192
Figure A2.7. Elements of schools’ DT policies or guidelines, primary and post-primary schools
60
46
87
93
100
99
50
48
71
85
95
95
10 20 30 40 50 60 70 80 90 100
Assistive technology for students with SEN
Teachers own device use in school
Students own device use in school
Online safety
Acceptable use of the internet in school
Acceptable use of technology in school
Primary (n=107) Post Primary (n=55)
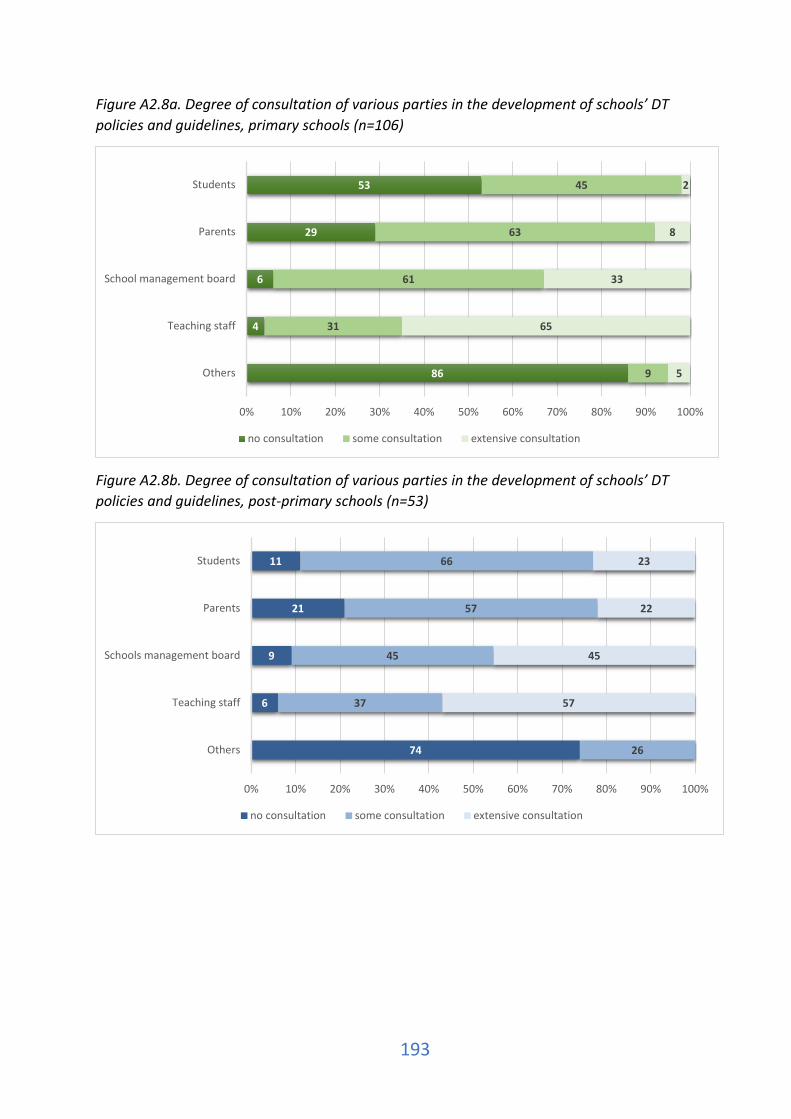
193
Figure A2.8a. Degree of consultation of various parties in the development of schools’ DT policies and guidelines, primary schools (n=106)
Figure A2.8b. Degree of consultation of various parties in the development of schools’ DT policies and guidelines, post-primary schools (n=53)
86
4
6
29
53
9
31
61
63
45
5
65
33
8
2
0% 10% 20% 30% 40% 50% 60% 70% 80% 90% 100%
Others
Teaching staff
School management board
Parents
Students
no consultation some consultation extensive consultation
74
6
9
21
11
26
37
45
57
66
57
45
22
23
0% 10% 20% 30% 40% 50% 60% 70% 80% 90% 100%
Others
Teaching staff
Schools management board
Parents
Students
no consultation some consultation extensive consultation
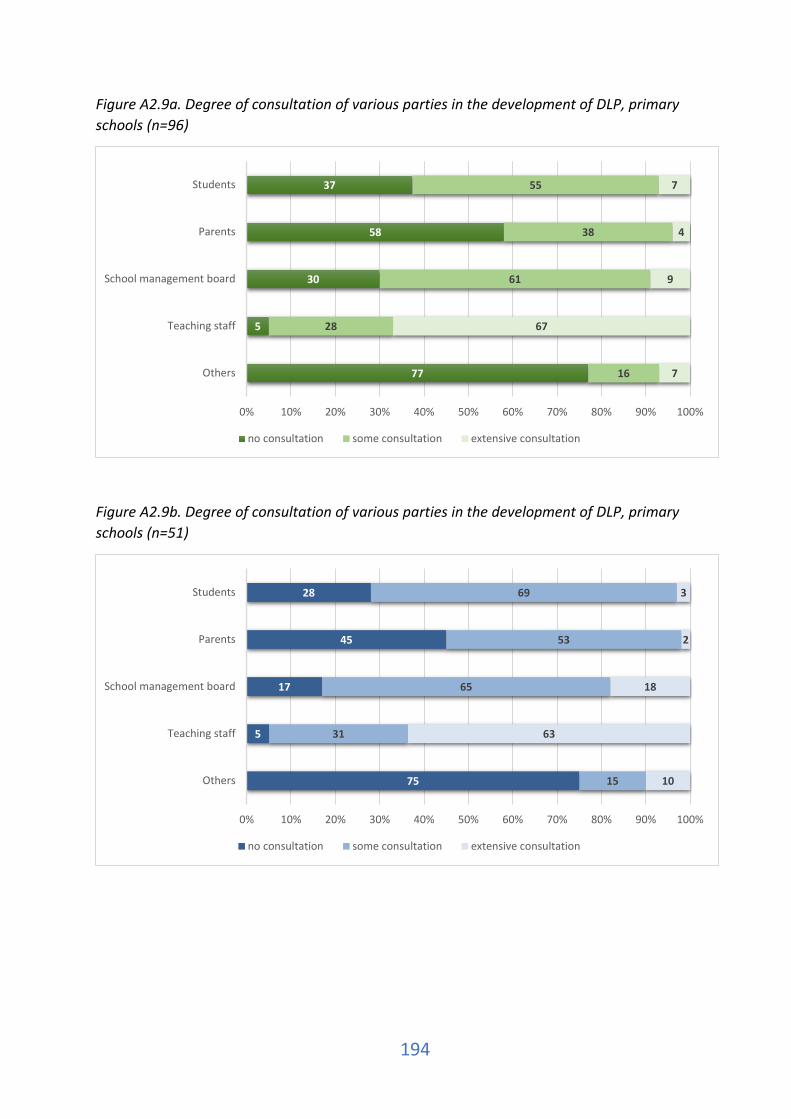
194
Figure A2.9a. Degree of consultation of various parties in the development of DLP, primary schools (n=96)
Figure A2.9b. Degree of consultation of various parties in the development of DLP, primary schools (n=51)
77
5
30
58
37
16
28
61
38
55
7
67
9
4
7
0% 10% 20% 30% 40% 50% 60% 70% 80% 90% 100%
Others
Teaching staff
School management board
Parents
Students
no consultation some consultation extensive consultation
75
5
17
45
28
15
31
65
53
69
10
63
18
2
3
0% 10% 20% 30% 40% 50% 60% 70% 80% 90% 100%
Others
Teaching staff
School management board
Parents
Students
no consultation some consultation extensive consultation
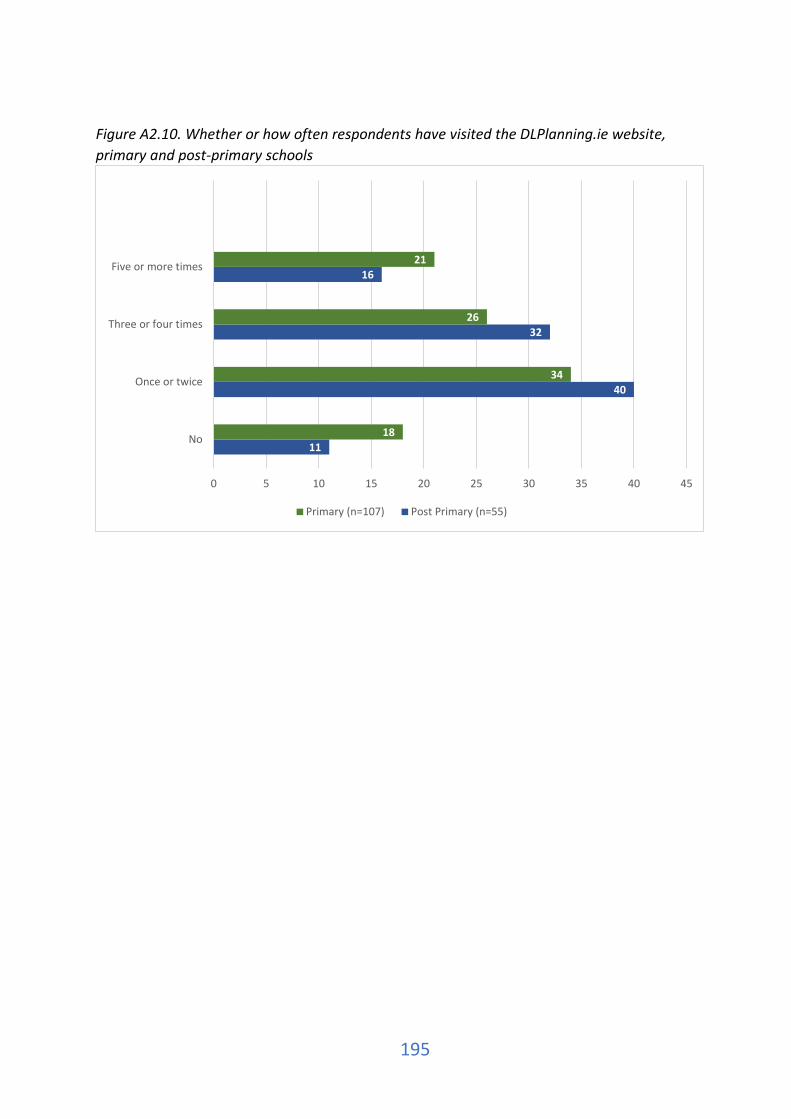
195
Figure A2.10. Whether or how often respondents have visited the DLPlanning.ie website, primary and post-primary schools
11
40
32
16
18
34
26
21
0 5 10 15 20 25 30 35 40 45
No
Once or twice
Three or four times
Five or more times
Primary (n=107) Post Primary (n=55)
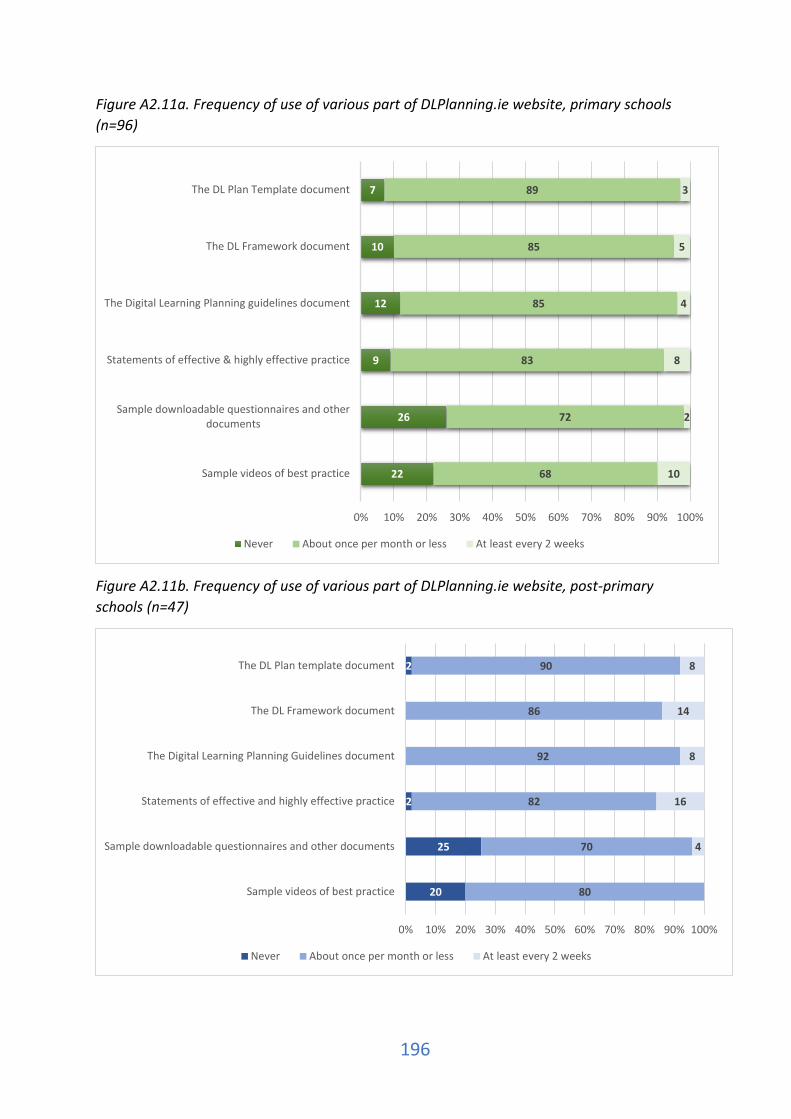
196
Figure A2.11a. Frequency of use of various part of DLPlanning.ie website, primary schools (n=96)
Figure A2.11b. Frequency of use of various part of DLPlanning.ie website, post-primary schools (n=47)
22
26
9
12
10
7
68
72
83
85
85
89
10
2
8
4
5
3
0% 10% 20% 30% 40% 50% 60% 70% 80% 90% 100%
Sample videos of best practice
Sample downloadable questionnaires and otherdocuments
Statements of effective & highly effective practice
The Digital Learning Planning guidelines document
The DL Framework document
The DL Plan Template document
Never About once per month or less At least every 2 weeks
20
25
2
2
80
70
82
92
86
90
4
16
8
14
8
0% 10% 20% 30% 40% 50% 60% 70% 80% 90% 100%
Sample videos of best practice
Sample downloadable questionnaires and other documents
Statements of effective and highly effective practice
The Digital Learning Planning Guidelines document
The DL Framework document
The DL Plan template document
Never About once per month or less At least every 2 weeks

197
Figure A2.12a.DLT respondents’ self-rated degree of comfort and familiarity with using digital technologies, scale: Ease with digital devices, primary schools (n=104)
5
3
1
5
6
12
6
11
2
24
20
2
21
18
24
23
4
27
32
52
51
69
56
49
43
49
52
43
42
19
27
28
18
26
22
23
44
20
24
0% 10% 20% 30% 40% 50% 60% 70% 80% 90% 100%
If I need a new application, I choose it by myself
If I have a problem with digital devices I start to solve it onmy own
I use digital devices as I want to use them
I read information about digital devices to be independent
If I need new software, I install it by myself
If my friends and relatives have a problem with digitaldevices, I can help them
When I come across problems with digital devices, I think Ican solve them
I feel comfortable using my digital devices at home
If my friends and relatives want to buy new digital devicesor applications, I can give them advice
I feel comfortable using digital devices that I am lessfamiliar with
Strongly disagree Disagree Agree Strongly agree

198
Figure A2.12b. DLT respondents’ self-rated degree of comfort and familiarity with using digital technologies, scale: Ease with digital devices, post-primary schools (n=49)
6
5
6
18
13
2
22
31
15
19
9
11
43
45
53
48
30
42
42
41
51
47
33
42
46
30
39
39
38
59
34
42
0% 10% 20% 30% 40% 50% 60% 70% 80% 90% 100%
If I need a new application, I choose it by myself
If I have a problem with digital devices I start to solve it onmy own
I use digital devices as I want to use them
I read information about digital devices to be independent
If I need new software, I install it by myself
If my friends and relatives have a problem with digitaldevices, I can help them
When I come across problems with digital devices, I think Ican solve them
I feel comfortable using my digital devices at home
If my friends and relatives want to buy new digital devicesor applications, I can give them advice
I feel comfortable using digital devices that I am lessfamiliar with
Strongly disagree Disagree Agree Strongly agree
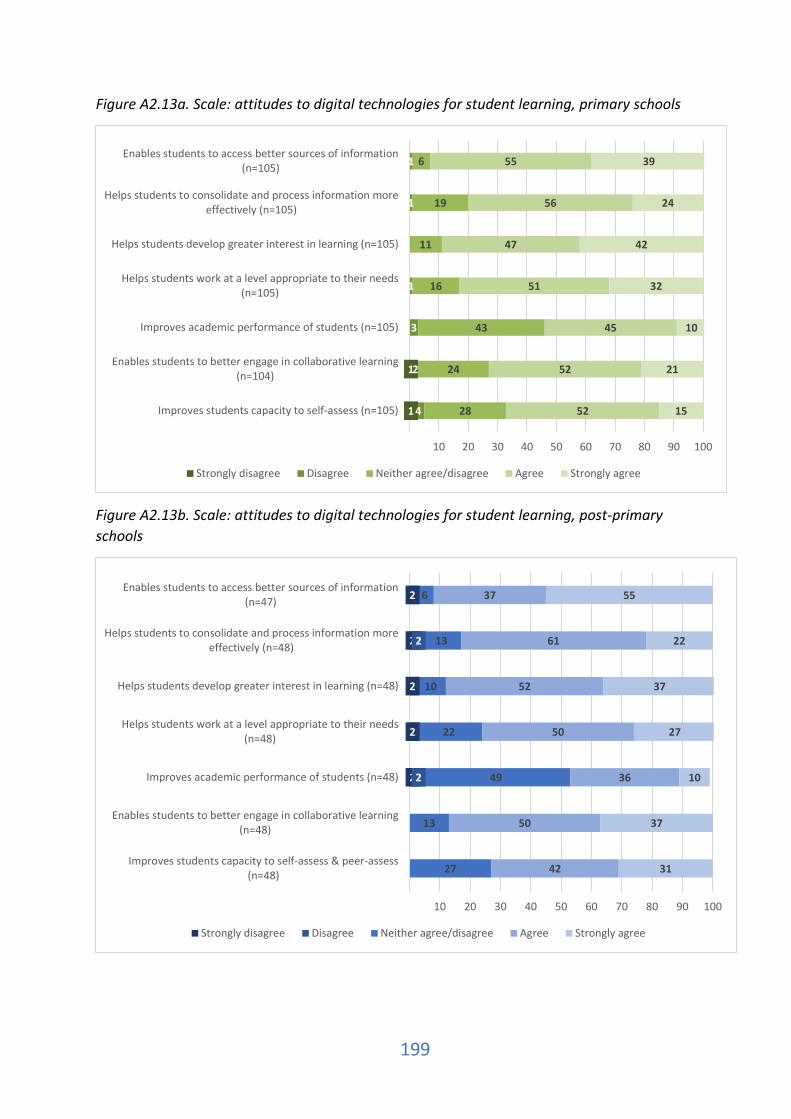
199
Figure A2.13a. Scale: attitudes to digital technologies for student learning, primary schools
Figure A2.13b. Scale: attitudes to digital technologies for student learning, post-primary schools
1
1
4
2
3
1
1
1
28
24
43
16
11
19
6
52
52
45
51
47
56
55
15
21
10
32
42
24
39
10 20 30 40 50 60 70 80 90 100
Improves students capacity to self-assess (n=105)
Enables students to better engage in collaborative learning(n=104)
Improves academic performance of students (n=105)
Helps students work at a level appropriate to their needs(n=105)
Helps students develop greater interest in learning (n=105)
Helps students to consolidate and process information moreeffectively (n=105)
Enables students to access better sources of information(n=105)
Strongly disagree Disagree Neither agree/disagree Agree Strongly agree
2
2
2
2
2
2
2
27
13
49
22
10
13
6
42
50
36
50
52
61
37
31
37
10
27
37
22
55
10 20 30 40 50 60 70 80 90 100
Improves students capacity to self-assess & peer-assess(n=48)
Enables students to better engage in collaborative learning(n=48)
Improves academic performance of students (n=48)
Helps students work at a level appropriate to their needs(n=48)
Helps students develop greater interest in learning (n=48)
Helps students to consolidate and process information moreeffectively (n=48)
Enables students to access better sources of information(n=47)
Strongly disagree Disagree Neither agree/disagree Agree Strongly agree
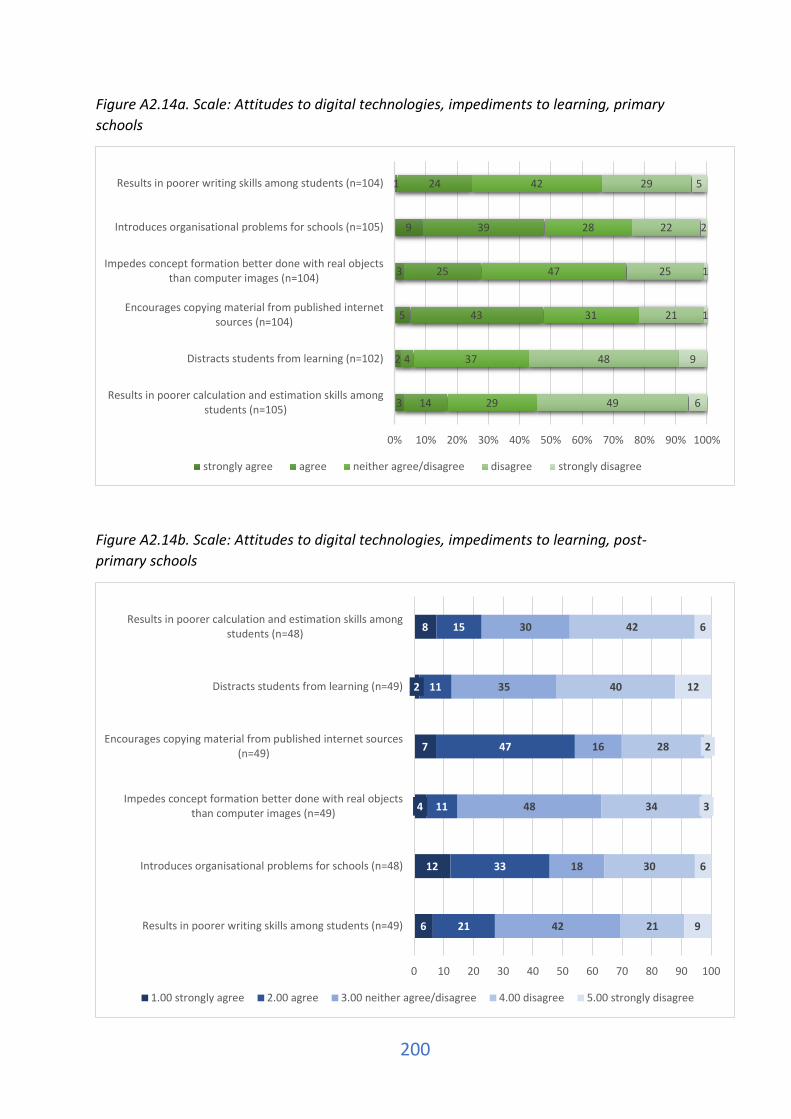
200
Figure A2.14a. Scale: Attitudes to digital technologies, impediments to learning, primary schools
Figure A2.14b. Scale: Attitudes to digital technologies, impediments to learning, post-primary schools
3
2
5
3
9
1
14
4
43
25
39
24
29
37
31
47
28
42
49
48
21
25
22
29
6
9
1
1
2
5
0% 10% 20% 30% 40% 50% 60% 70% 80% 90% 100%
Results in poorer calculation and estimation skills amongstudents (n=105)
Distracts students from learning (n=102)
Encourages copying material from published internetsources (n=104)
Impedes concept formation better done with real objectsthan computer images (n=104)
Introduces organisational problems for schools (n=105)
Results in poorer writing skills among students (n=104)
strongly agree agree neither agree/disagree disagree strongly disagree
6
12
4
7
2
8
21
33
11
47
11
15
42
18
48
16
35
30
21
30
34
28
40
42
9
6
3
2
12
6
0 10 20 30 40 50 60 70 80 90 100
Results in poorer writing skills among students (n=49)
Introduces organisational problems for schools (n=48)
Impedes concept formation better done with real objectsthan computer images (n=49)
Encourages copying material from published internet sources(n=49)
Distracts students from learning (n=49)
Results in poorer calculation and estimation skills amongstudents (n=48)
1.00 strongly agree 2.00 agree 3.00 neither agree/disagree 4.00 disagree 5.00 strongly disagree
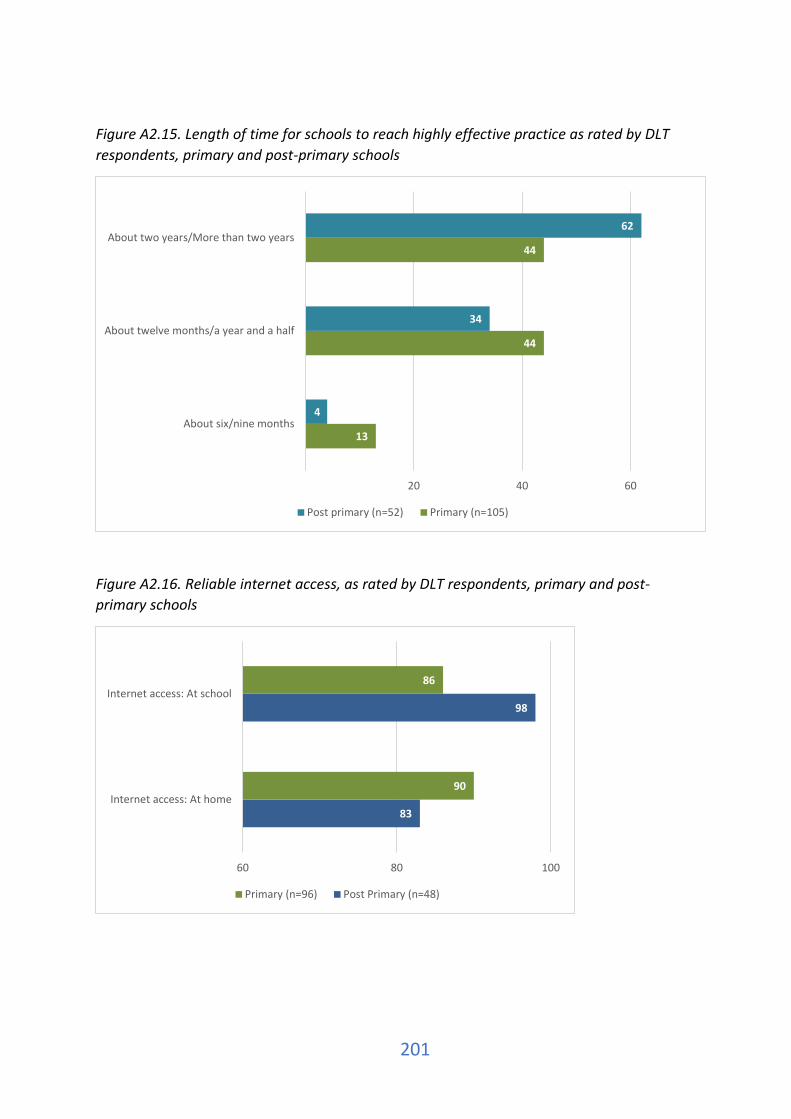
201
Figure A2.15. Length of time for schools to reach highly effective practice as rated by DLT respondents, primary and post-primary schools
Figure A2.16. Reliable internet access, as rated by DLT respondents, primary and post-primary schools
13
44
44
4
34
62
20 40 60
About six/nine months
About twelve months/a year and a half
About two years/More than two years
Post primary (n=52) Primary (n=105)
83
98
90
86
60 80 100
Internet access: At home
Internet access: At school
Primary (n=96) Post Primary (n=48)

202
Figure A2.17a. Devices used by pupils/students, primary and post-primary schools
Figure A2.17b. Devices used by teachers, primary and post-primary schools
45
72
30
59
15
80
51
24
51
23
20 40 60 80 100
Desktop computers
iPads
Tablets
Laptops
Chromebooks
Post Primary (n=49) Primary (n=101)
59
59
21
89
13
94
36
41
57
24
20 40 60 80 100
Desktop computers
iPads
Tablets
Laptops
Chromebooks
Post Primary (n=49) Primary (n=101)
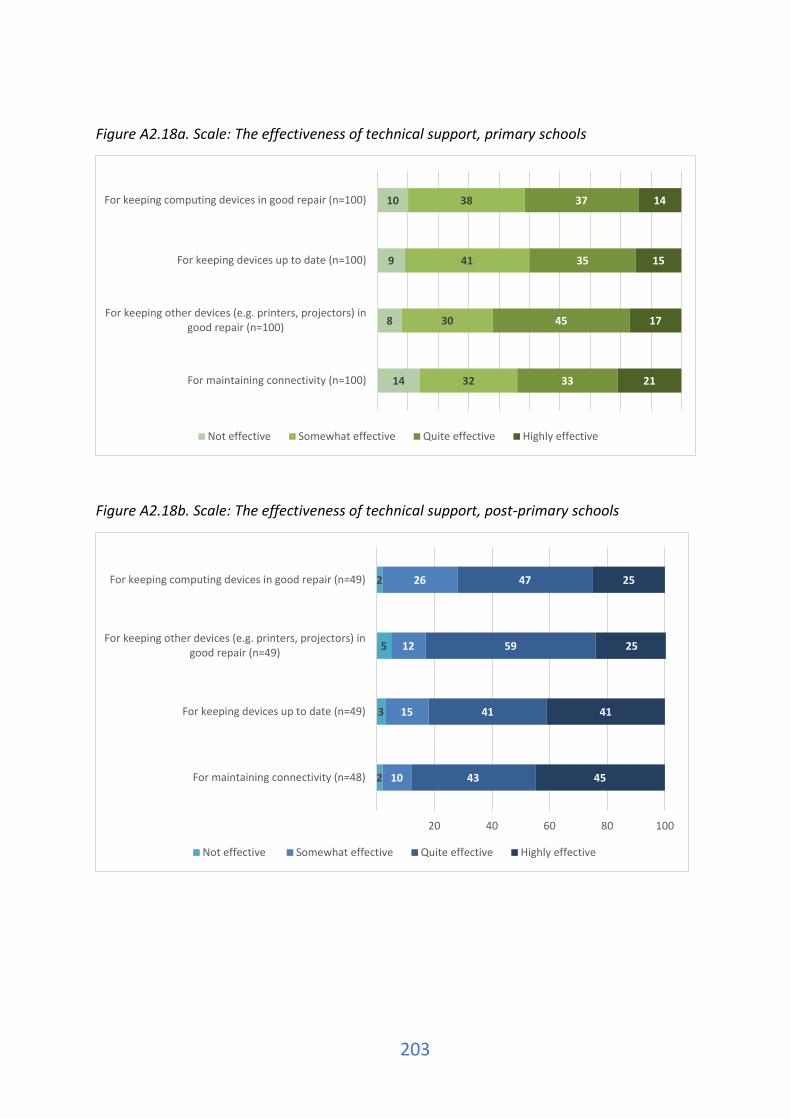
203
Figure A2.18a. Scale: The effectiveness of technical support, primary schools
Figure A2.18b. Scale: The effectiveness of technical support, post-primary schools
14
8
9
10
32
30
41
38
33
45
35
37
21
17
15
14
For maintaining connectivity (n=100)
For keeping other devices (e.g. printers, projectors) ingood repair (n=100)
For keeping devices up to date (n=100)
For keeping computing devices in good repair (n=100)
Not effective Somewhat effective Quite effective Highly effective
2
3
5
2
10
15
12
26
43
41
59
47
45
41
25
25
20 40 60 80 100
For maintaining connectivity (n=48)
For keeping devices up to date (n=49)
For keeping other devices (e.g. printers, projectors) ingood repair (n=49)
For keeping computing devices in good repair (n=49)
Not effective Somewhat effective Quite effective Highly effective
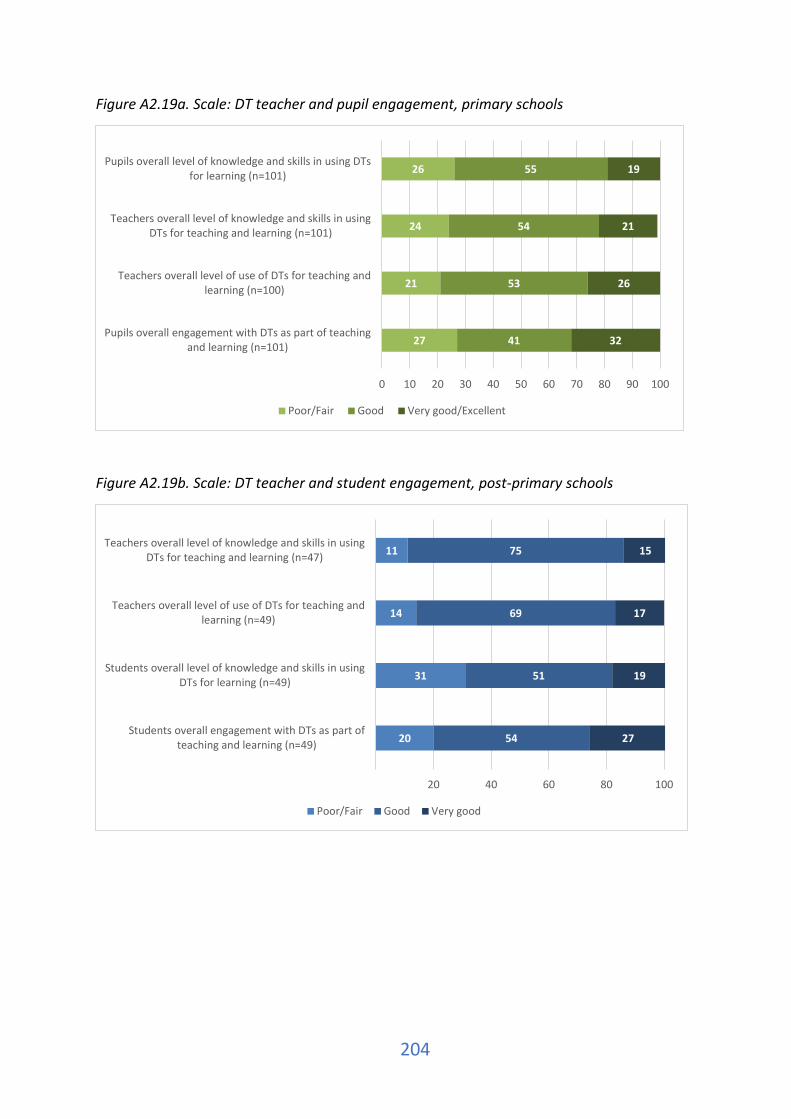
204
Figure A2.19a. Scale: DT teacher and pupil engagement, primary schools
Figure A2.19b. Scale: DT teacher and student engagement, post-primary schools
27
21
24
26
41
53
54
55
32
26
21
19
0 10 20 30 40 50 60 70 80 90 100
Pupils overall engagement with DTs as part of teachingand learning (n=101)
Teachers overall level of use of DTs for teaching andlearning (n=100)
Teachers overall level of knowledge and skills in usingDTs for teaching and learning (n=101)
Pupils overall level of knowledge and skills in using DTsfor learning (n=101)
Poor/Fair Good Very good/Excellent
20
31
14
11
54
51
69
75
27
19
17
15
20 40 60 80 100
Students overall engagement with DTs as part ofteaching and learning (n=49)
Students overall level of knowledge and skills in usingDTs for learning (n=49)
Teachers overall level of use of DTs for teaching andlearning (n=49)
Teachers overall level of knowledge and skills in usingDTs for teaching and learning (n=47)
Poor/Fair Good Very good
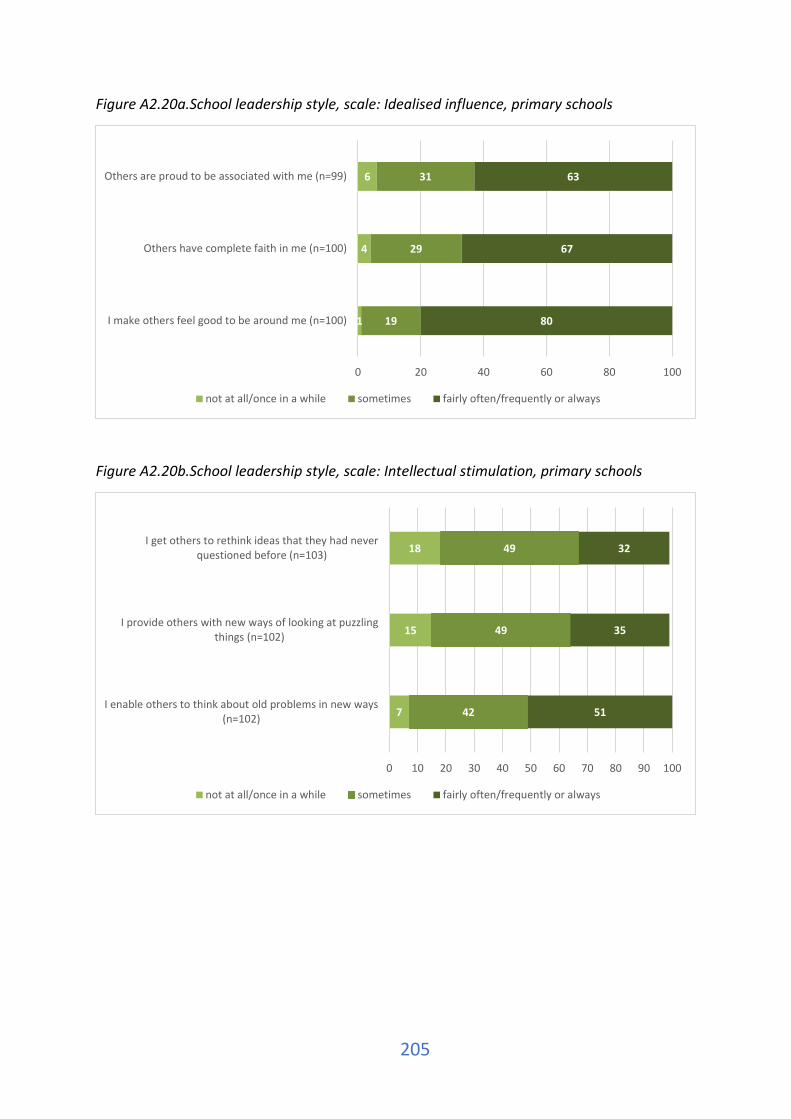
205
Figure A2.20a.School leadership style, scale: Idealised influence, primary schools
Figure A2.20b.School leadership style, scale: Intellectual stimulation, primary schools
1
4
6
19
29
31
80
67
63
0 20 40 60 80 100
I make others feel good to be around me (n=100)
Others have complete faith in me (n=100)
Others are proud to be associated with me (n=99)
not at all/once in a while sometimes fairly often/frequently or always
7
15
18
42
49
49
51
35
32
0 10 20 30 40 50 60 70 80 90 100
I enable others to think about old problems in new ways(n=102)
I provide others with new ways of looking at puzzlingthings (n=102)
I get others to rethink ideas that they had neverquestioned before (n=103)
not at all/once in a while sometimes fairly often/frequently or always

206
Figure A2.20c. School leadership style, scale: Idealised influence, post-primary schools
Figure A2.20d.School leadership style, scale: Intellectual stimulation, post-primary schools
4
3
6
32
29
74
54
60
20
10
9
20 40 60 80 100
I make others feel good to be around me (n=48)
Others have complete faith in me (n=48)
Others are proud to be associated with me (n=47)
Once in a while Sometimes Fairly often Frequently/always
8
7
9
25
37
36
50
45
50
17
11
6
20 40 60 80 100
I enable others to think about old problems in new ways(n=48)
I provide others with new ways of looking at puzzlingthings (n=48)
I get others to rethink ideas that they had neverquestioned before (n=48)
Once in a while Sometimes Fairly often Frequently/always
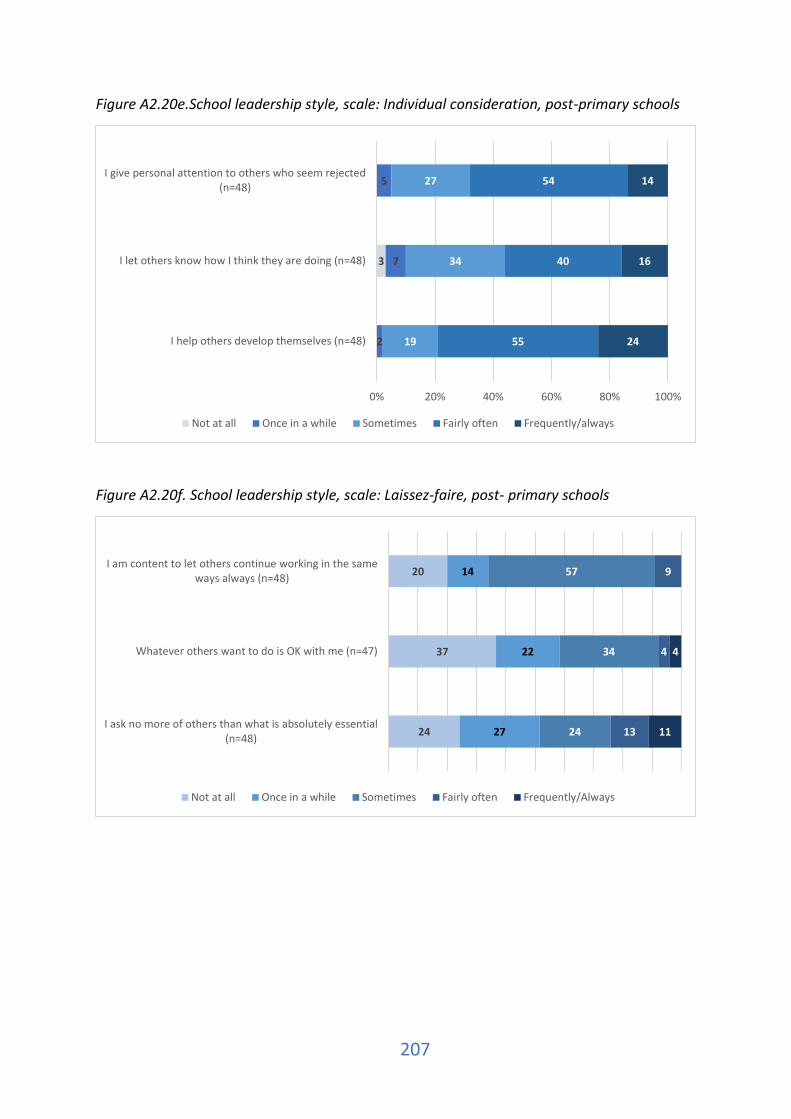
207
Figure A2.20e.School leadership style, scale: Individual consideration, post-primary schools
Figure A2.20f. School leadership style, scale: Laissez-faire, post- primary schools
3
2
7
5
19
34
27
55
40
54
24
16
14
0% 20% 40% 60% 80% 100%
I help others develop themselves (n=48)
I let others know how I think they are doing (n=48)
I give personal attention to others who seem rejected(n=48)
Not at all Once in a while Sometimes Fairly often Frequently/always
24
37
20
27
22
14
24
34
57
13
4
9
11
4
I ask no more of others than what is absolutely essential(n=48)
Whatever others want to do is OK with me (n=47)
I am content to let others continue working in the sameways always (n=48)
Not at all Once in a while Sometimes Fairly often Frequently/Always

208
Appendix 3 Table A3.1. Primary teacher scale descriptives and reliabilities, and subgroup comparisons by enrolment size and DEIS status
Subgroup comparisons
Index Primary Teacher
Overall Enrolment size DEIS status
Cronbach's alpha Mean SD
Very small up to 60
(RefGroup)
Small 61 - 120
Medium 121 - 200
Large 201 or more
In DEIS Not in DEIS
Teacher usage of DLP Website 0.95 12.9 14.5 15.3 16.8 11.5 8.7 12.9 12.8
Teacher DT usage frequency 0.89 21.4 17.4 20.0 24.2 19.2 21.3 23.6 20.9
Teacher ease with digital devices 0.93 62.0 19.2 61.3 61.9 66.3 60.1 63.1 61.7
Teacher professional learning suitability 0.91 39.6 24.3 37.6 43.1 40.6 37.4 44.1 38.6
Teacher attitudes to DT v Traditional methods for students 0.83 61.8 11.6 63.0 62.9 59.3 61.2 65.6 60.9
Teacher attitudes to DT v Traditional methods for resources 0.77 62.5 12.2 61.7 66.3 59.6 61.4 65.5 61.7
Teacher constructivist beliefs 0.63 62.9 9.9 63.6 62.2 61.3 63.7 63.6 62.7
Pupil engagement 0.76 62.3 14.3 60.7 64.6 60.9 62.4 67.2 61.1
DT infrastructure and connectivity 0.87 48.2 20.6 45.4 49.7 51.2 47.3 47.7 48.3
DT teacher and pupil engagement 0.82 52.9 19.2 55.7 52.4 51.7 51.7 52.7 52.9
Technical support effectiveness 0.92 54.8 25.4 40.5 57.4 62.8 59.2 58.5 53.9
Infrastructure problems 0.82 76.1 23.3 68.5 78.5 75.8 80.0 72.7 76.9
Technical support disruption 0.75 50.3 17.2 45.1 54 50.8 50.7 51.7 49.9
DLF Impact 0.90 39.9 21.6 37.6 46.2 40.3 35.5 44.2 38.8
Implementation challenges 0.83 52.5 18.1 50.7 52.5 51.3 54.7 52.2 52.6 For all indexes, a higher score indicates a more positive outcome. Cells in grey with numbers in bold show groups whose mean is statistically significantly different from that of the reference group (marked in red font).
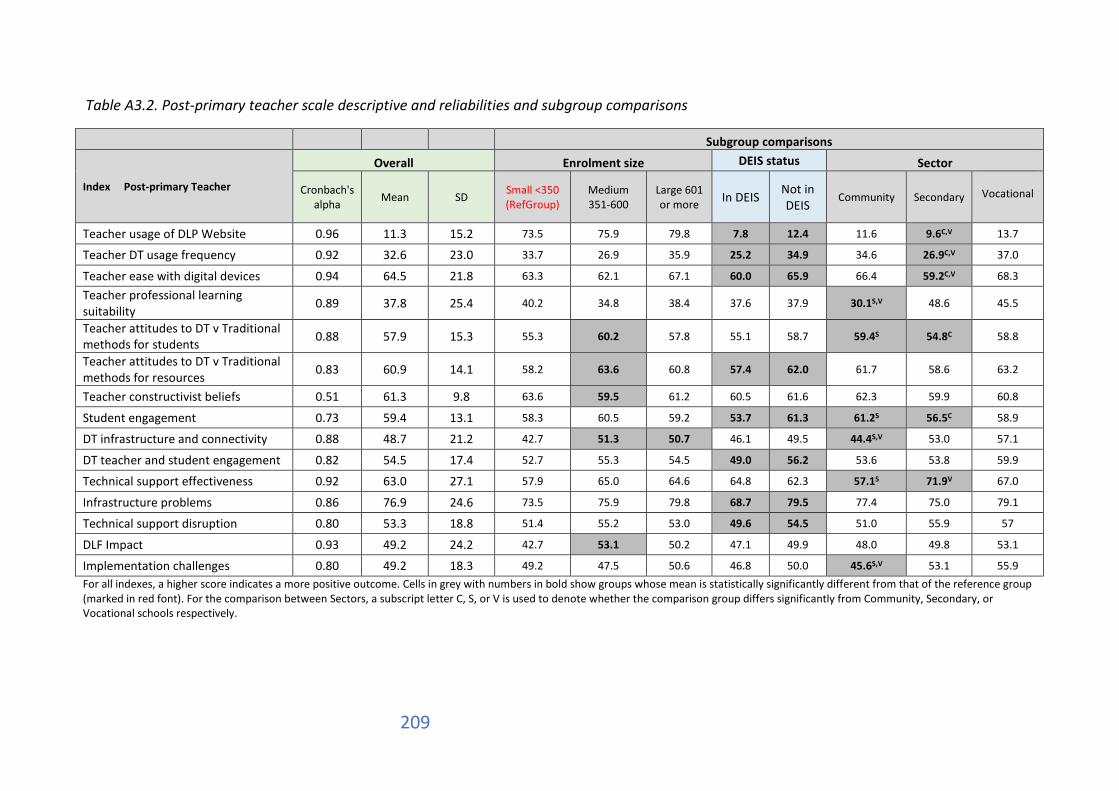
209
Table A3.2. Post-primary teacher scale descriptive and reliabilities and subgroup comparisons
Subgroup comparisons
Index Post-primary Teacher
Overall Enrolment size DEIS status Sector
Cronbach's alpha Mean SD Small <350
(RefGroup) Medium 351-600
Large 601 or more In DEIS Not in
DEIS Community Secondary
Vocational
Teacher usage of DLP Website 0.96 11.3 15.2 73.5 75.9 79.8 7.8 12.4 11.6 9.6C,V 13.7
Teacher DT usage frequency 0.92 32.6 23.0 33.7 26.9 35.9 25.2 34.9 34.6 26.9C,V 37.0
Teacher ease with digital devices 0.94 64.5 21.8 63.3 62.1 67.1 60.0 65.9 66.4 59.2C,V 68.3
Teacher professional learning suitability 0.89 37.8 25.4 40.2 34.8 38.4 37.6 37.9 30.1S,V 48.6 45.5
Teacher attitudes to DT v Traditional methods for students 0.88 57.9 15.3 55.3 60.2 57.8 55.1 58.7 59.4S 54.8C 58.8
Teacher attitudes to DT v Traditional methods for resources 0.83 60.9 14.1 58.2 63.6 60.8 57.4 62.0 61.7 58.6 63.2
Teacher constructivist beliefs 0.51 61.3 9.8 63.6 59.5 61.2 60.5 61.6 62.3 59.9 60.8
Student engagement 0.73 59.4 13.1 58.3 60.5 59.2 53.7 61.3 61.2S 56.5C 58.9
DT infrastructure and connectivity 0.88 48.7 21.2 42.7 51.3 50.7 46.1 49.5 44.4S,V 53.0 57.1
DT teacher and student engagement 0.82 54.5 17.4 52.7 55.3 54.5 49.0 56.2 53.6 53.8 59.9
Technical support effectiveness 0.92 63.0 27.1 57.9 65.0 64.6 64.8 62.3 57.1S 71.9V 67.0
Infrastructure problems 0.86 76.9 24.6 73.5 75.9 79.8 68.7 79.5 77.4 75.0 79.1
Technical support disruption 0.80 53.3 18.8 51.4 55.2 53.0 49.6 54.5 51.0 55.9 57
DLF Impact 0.93 49.2 24.2 42.7 53.1 50.2 47.1 49.9 48.0 49.8 53.1
Implementation challenges 0.80 49.2 18.3 49.2 47.5 50.6 46.8 50.0 45.6S,V 53.1 55.9 For all indexes, a higher score indicates a more positive outcome. Cells in grey with numbers in bold show groups whose mean is statistically significantly different from that of the reference group (marked in red font). For the comparison between Sectors, a subscript letter C, S, or V is used to denote whether the comparison group differs significantly from Community, Secondary, or Vocational schools respectively.

210
Table A3.3. Primary teacher scale intercorrelations Website DT
policies DT usage
Current Practice
Current embed
DT ease
CPD suitability
DT vs Trad atts
DT vs Trad atts
Const beliefs Student engage
Teach & student engage
DT infra
Tech supp effective
Infra probs
Tech supp disrupt
DLF impact
Number of DT policies
.135**
Teacher DT usage frequency
.326** .145**
Teacher current level of practice
.200** -0.022 .271**
Teacher current level of embedding
.310** .224** .547** .338**
Teacher ease with digital devices
.242** 0.016 .279** 0.010 .226**
Teacher professional learning suitability
.229** .193** .338** .253** .301** .143**
Teacher attitudes to DT v Traditional methods for students
.166** -0.001 .273** .340** .258** .162** .246**
Teacher attitudes to DT v Traditional methods for resources
.145** 0.030 .436** .248** .371** .211** .229** .616**
Teacher constructivist beliefs -0.066 -.341** -0.083 -0.064 -.124* 0.035 -0.066 .165** .102* Student engagement .130* 0.085 .124* 0.056 .189** 0.036 0.076 .357** .321** .252** DT teacher and student engagement .352** .208** .476** .263** .562** .361** .296** .312** .383** -.146** .201** DT infrastructure and connectivity .270** .228** .223** .200** .344** .143** .300** .253** .280** -0.099 .148** .583** Technical support effectiveness 0.081 .166** .175** 0.056 0.079 0.073 .114* .194** .194** 0.004 .250** .231** .512** Infrastructure problems -.132** 0.021 0.073 .141* 0.088 -0.024 -0.052 .212** .293** 0.071 .148** 0.053 .197** .301** Technical support disruption 0.087 0.083 .191** .271** .265** .211** .175** .330** .384** -0.042 .235** .384** .543** .582** .455** Impact of DLF .348** .135** .427** .250** .331** .130* .352** .348** .370** -0.069 .204** .368** .447** .288** 0.041 .266** Implementation challenges -0.078 0.002 .103* .238** .205** 0.029 -0.096 .173** .316** -0.037 0.070 .146** .142** 0.081 .292** .308** 0.008
**. Correlation is significant at the 0.01 level (2-tailed). *. Correlation is significant at the 0.05 level (2-tailed). Significant correlations are shaded in green

211
Table A3.4. Post-primary teacher scale intercorrelations DT
policies Current practice
DT usage
Current embed
DT ease
DT vs Trad attitude stu
DT vs Trad attitude res
Constructivist beliefs
Student engage
DT infra
Teacher & student engage
Tech supp effective
Infra probs
Tech supp disrupt
Implement challenge
Website CPD suitability
Teacher current level of practice
-0.062
Teacher DT usage frequency
.140** .319**
Teacher current level of embedding
0.081 .311** .453**
Teacher ease with digital devices
-0.024 .243** .380** .385**
Teacher attitudes to DT v Traditional methods for students
0.034 0.035 .267** .386** .415**
Teacher attitudes to DT v Traditional methods for resources
-0.065 .169* .226** .357** .438** .691**
Teacher constructivist beliefs
-.141* 0.141 .146** .204** .180** .380** .402**
Student engagement -0.011 0.090 .259** .168** .155** .443** .480** .382**
DT infrastructure and connectivity .120* 0.109 0.103 .250** .311** .253** .393** 0.051 0.104 DT teacher and student engagement .152** 0.121 .404** .420** .388** .345** .370** 0.048 .231** .635** Technical support effectiveness 0.077 0.016 -.126* 0.051 0.083 .131* .237** 0.051 .120* .651** .284** Infrastructure problems -0.096 .191** 0.034 .126* .198** .227** .397** .165** .297** .245** 0.023 .393** Technical support disruption 0.051 .195** -0.005 .193** .249** .301** .552** .122* .314** .444** .253** .565** .534** Implementation challenges 0.074 .369** .151** .313** .160** .161** .344** 0.084 .297** .239** .181** .217** .397** .518** DLP website use frequency 0.007 0.077 .246** .301** .396** .334** .392** .153** .188** .320** .259** .143* .227** .216** 0.079 Teacher professional learning suitability .226** 0.063 .123* .289** .162** .173** .257** 0.050 .153** .425** .317** .317** .122* .305** .212** .296** Impact of DLF implementation .207** 0.077 .231** .184** 0.103 .320** .387** .148* .274** .408** .405** .226** 0.104 .243** -0.069 .253** .406**
**. Correlation is significant at the 0.01 level (2-tailed). *. Correlation is significant at the 0.05 level (2-tailed). Significant correlations are shaded in green
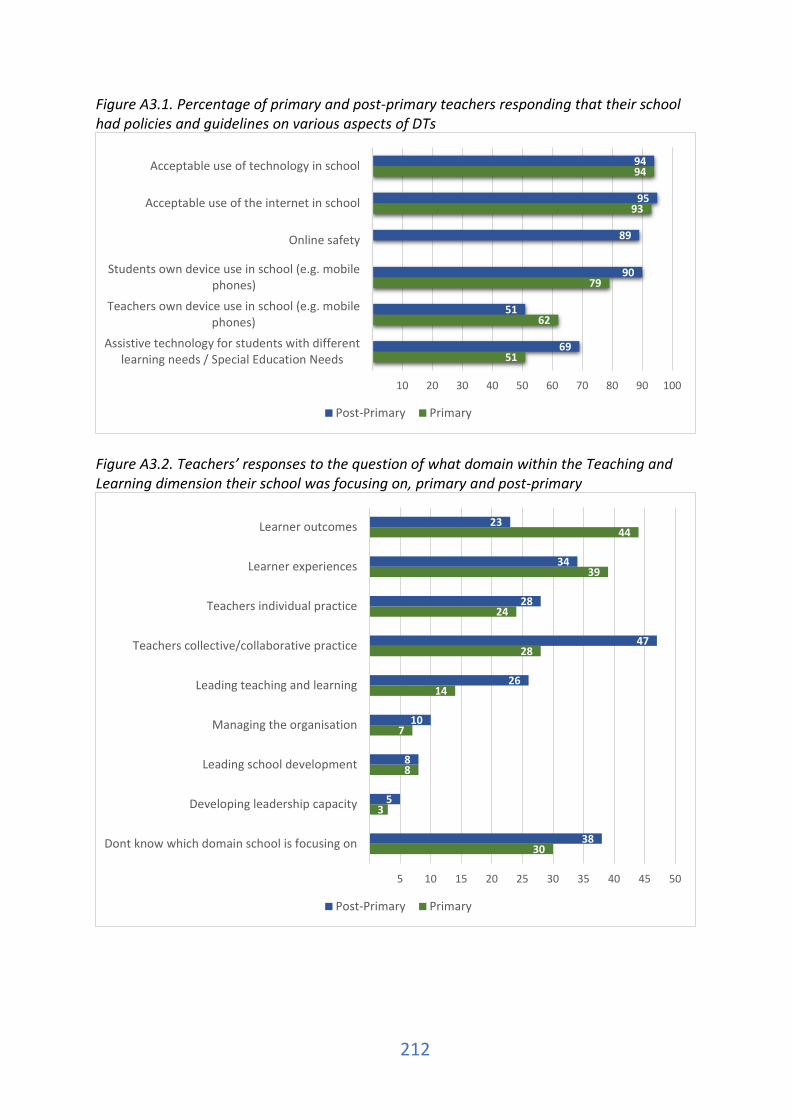
212
Figure A3.1. Percentage of primary and post-primary teachers responding that their school had policies and guidelines on various aspects of DTs
Figure A3.2. Teachers’ responses to the question of what domain within the Teaching and Learning dimension their school was focusing on, primary and post-primary
51
62
79
93
94
69
51
90
89
95
94
10 20 30 40 50 60 70 80 90 100
Assistive technology for students with differentlearning needs / Special Education Needs
Teachers own device use in school (e.g. mobilephones)
Students own device use in school (e.g. mobilephones)
Online safety
Acceptable use of the internet in school
Acceptable use of technology in school
Post-Primary Primary
30
3
8
7
14
28
24
39
44
38
5
8
10
26
47
28
34
23
5 10 15 20 25 30 35 40 45 50
Dont know which domain school is focusing on
Developing leadership capacity
Leading school development
Managing the organisation
Leading teaching and learning
Teachers collective/collaborative practice
Teachers individual practice
Learner experiences
Learner outcomes
Post-Primary Primary

213
Figure A3.3. Percentage of primary and post-primary teachers who had visited the DLPlanning.ie website with various levels of frequency, scale: Teacher usage of DLP website
Figure A3.4. Percentage of primary teachers who had visited various parts of the DLPlanning.ie website.
40
42
11
7
52
28
7
12
10 20 30 40 50 60
no
yes, once or twice
yes, three or four times
yes, five or more times
Post-Primary Primary
57
64
54
52
53
57
35
32
38
43
39
37
8
4
8
4
7
6
Sample videos of effective andoror highly effectivepractice
Sample downloadable questionniare and otherdocuments
Statements of effective andoror highly effective practice
Digital Learning Planning Guidelines document
DL Framework document
DL Plan template document
never about once per month or less At least once every two weeks
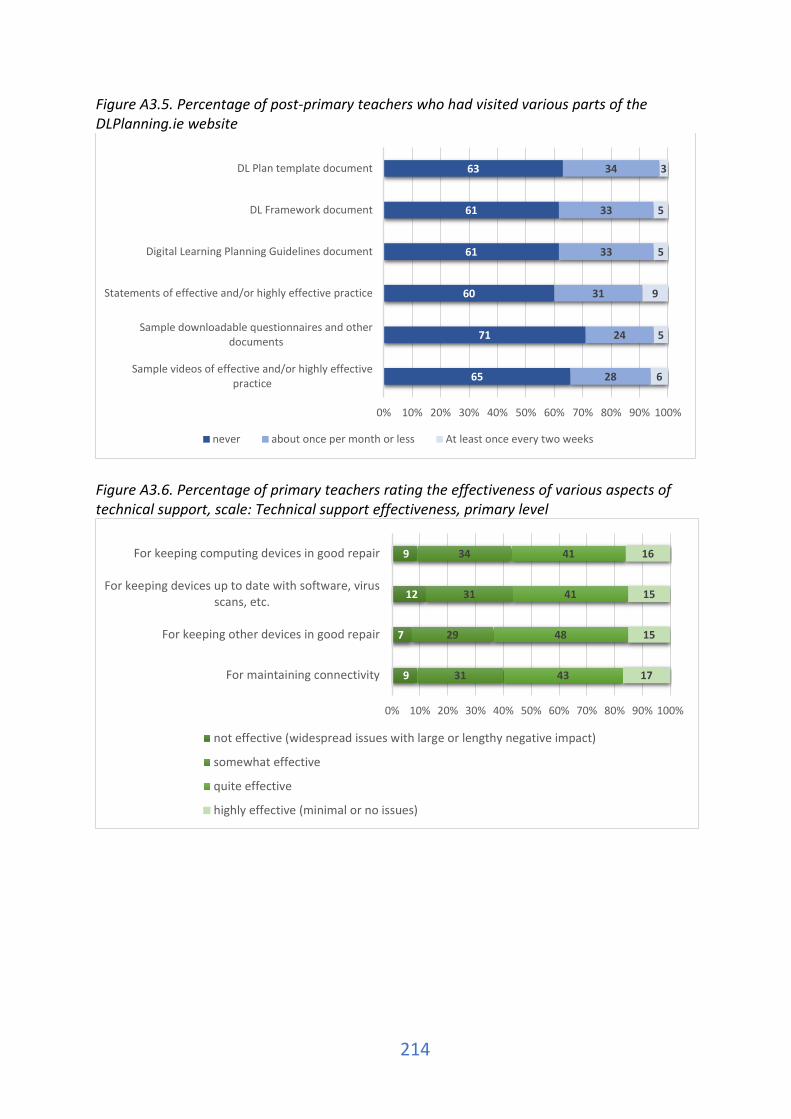
214
Figure A3.5. Percentage of post-primary teachers who had visited various parts of the DLPlanning.ie website
Figure A3.6. Percentage of primary teachers rating the effectiveness of various aspects of technical support, scale: Technical support effectiveness, primary level
65
71
60
61
61
63
28
24
31
33
33
34
6
5
9
5
5
3
0% 10% 20% 30% 40% 50% 60% 70% 80% 90% 100%
Sample videos of effective and/or highly effectivepractice
Sample downloadable questionnaires and otherdocuments
Statements of effective and/or highly effective practice
Digital Learning Planning Guidelines document
DL Framework document
DL Plan template document
never about once per month or less At least once every two weeks
9
7
12
9
31
29
31
34
43
48
41
41
17
15
15
16
0% 10% 20% 30% 40% 50% 60% 70% 80% 90% 100%
For maintaining connectivity
For keeping other devices in good repair
For keeping devices up to date with software, virusscans, etc.
For keeping computing devices in good repair
not effective (widespread issues with large or lengthy negative impact)
somewhat effective
quite effective
highly effective (minimal or no issues)
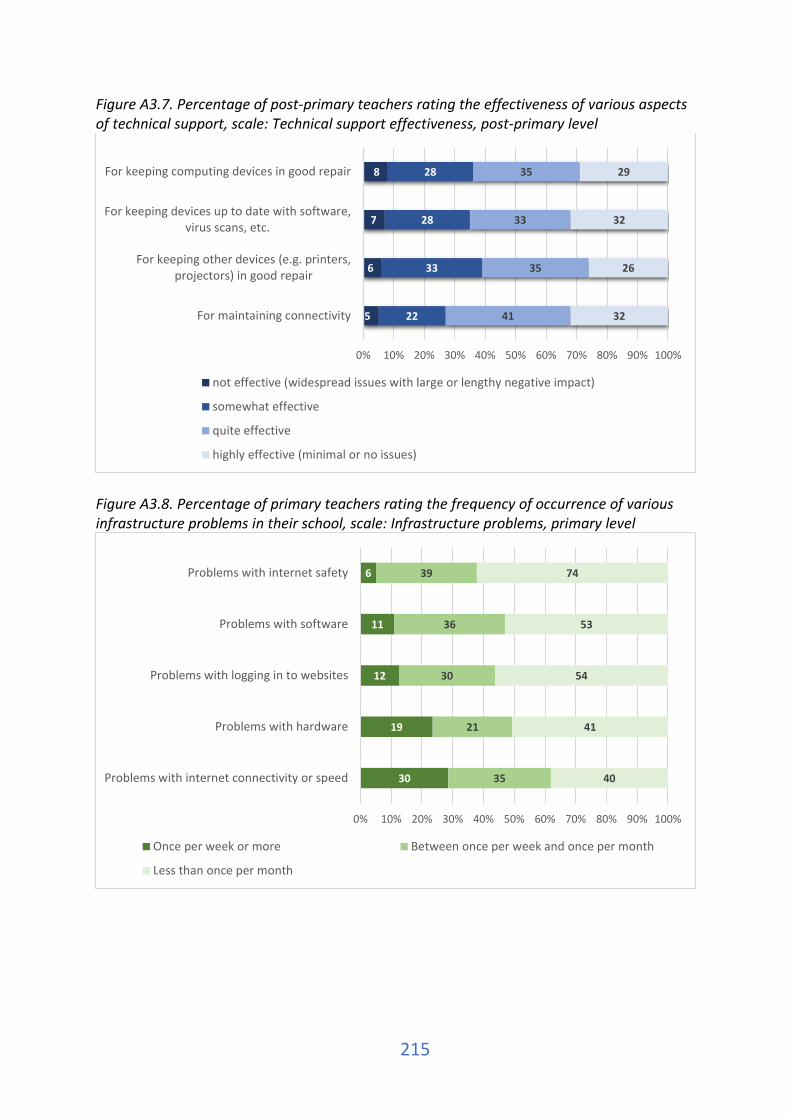
215
Figure A3.7. Percentage of post-primary teachers rating the effectiveness of various aspects of technical support, scale: Technical support effectiveness, post-primary level
Figure A3.8. Percentage of primary teachers rating the frequency of occurrence of various infrastructure problems in their school, scale: Infrastructure problems, primary level
5
6
7
8
22
33
28
28
41
35
33
35
32
26
32
29
0% 10% 20% 30% 40% 50% 60% 70% 80% 90% 100%
For maintaining connectivity
For keeping other devices (e.g. printers,projectors) in good repair
For keeping devices up to date with software,virus scans, etc.
For keeping computing devices in good repair
not effective (widespread issues with large or lengthy negative impact)
somewhat effective
quite effective
highly effective (minimal or no issues)
30
19
12
11
6
35
21
30
36
39
40
41
54
53
74
0% 10% 20% 30% 40% 50% 60% 70% 80% 90% 100%
Problems with internet connectivity or speed
Problems with hardware
Problems with logging in to websites
Problems with software
Problems with internet safety
Once per week or more Between once per week and once per month
Less than once per month
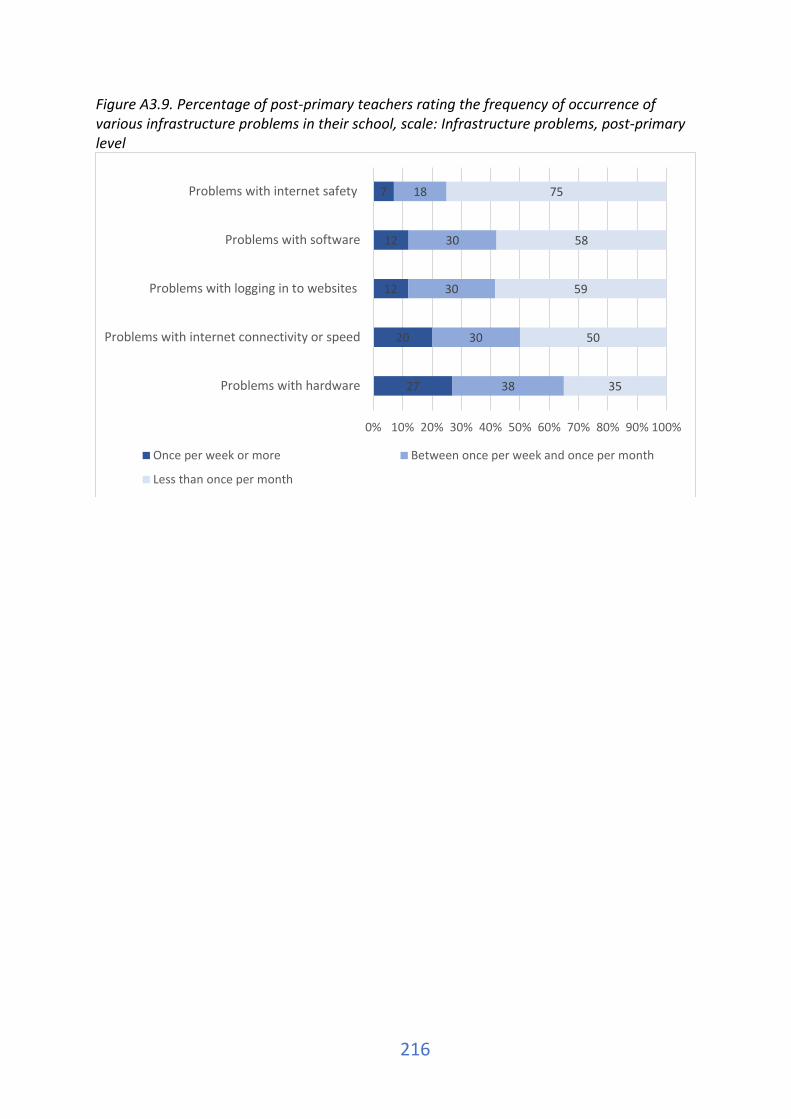
216
Figure A3.9. Percentage of post-primary teachers rating the frequency of occurrence of various infrastructure problems in their school, scale: Infrastructure problems, post-primary level
27
20
12
12
7
38
30
30
30
18
35
50
59
58
75
0% 10% 20% 30% 40% 50% 60% 70% 80% 90% 100%
Problems with hardware
Problems with internet connectivity or speed
Problems with logging in to websites
Problems with software
Problems with internet safety
Once per week or more Between once per week and once per month
Less than once per month
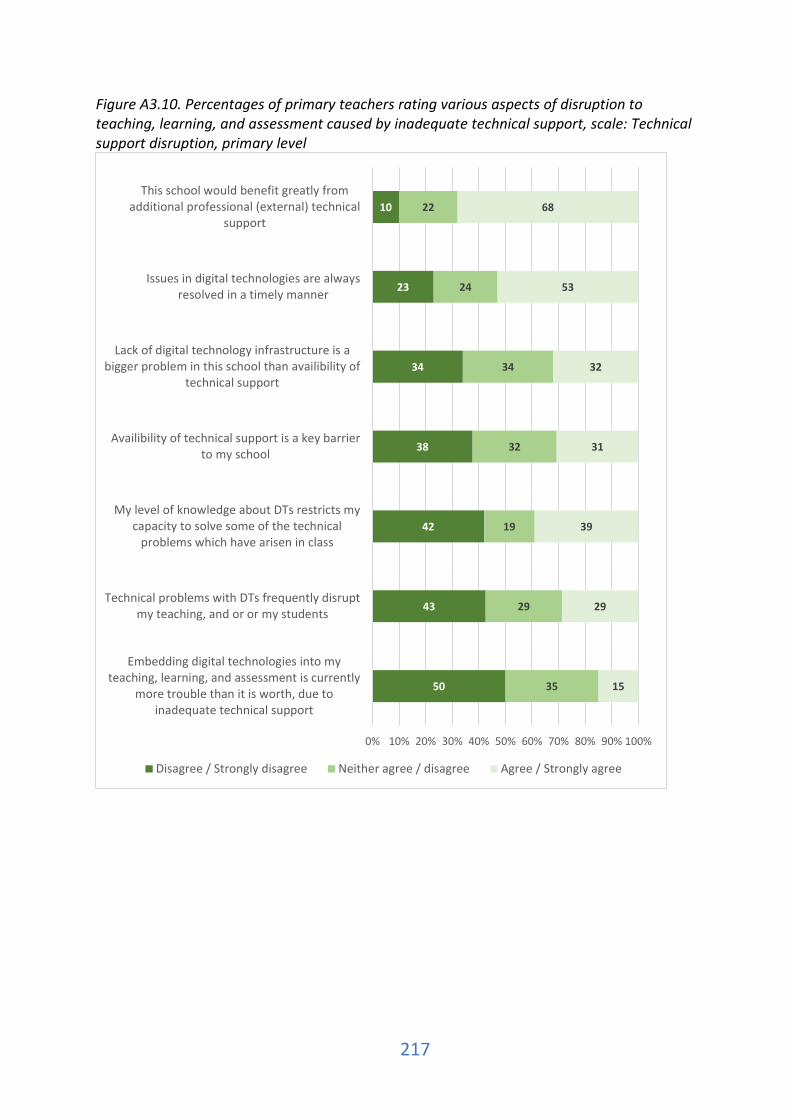
217
Figure A3.10. Percentages of primary teachers rating various aspects of disruption to teaching, learning, and assessment caused by inadequate technical support, scale: Technical support disruption, primary level
50
43
42
38
34
23
10
35
29
19
32
34
24
22
15
29
39
31
32
53
68
0% 10% 20% 30% 40% 50% 60% 70% 80% 90% 100%
Embedding digital technologies into myteaching, learning, and assessment is currently
more trouble than it is worth, due toinadequate technical support
Technical problems with DTs frequently disruptmy teaching, and or or my students
My level of knowledge about DTs restricts mycapacity to solve some of the technical
problems which have arisen in class
Availibility of technical support is a key barrierto my school
Lack of digital technology infrastructure is abigger problem in this school than availibility of
technical support
Issues in digital technologies are alwaysresolved in a timely manner
This school would benefit greatly fromadditional professional (external) technical
support
Disagree / Strongly disagree Neither agree / disagree Agree / Strongly agree
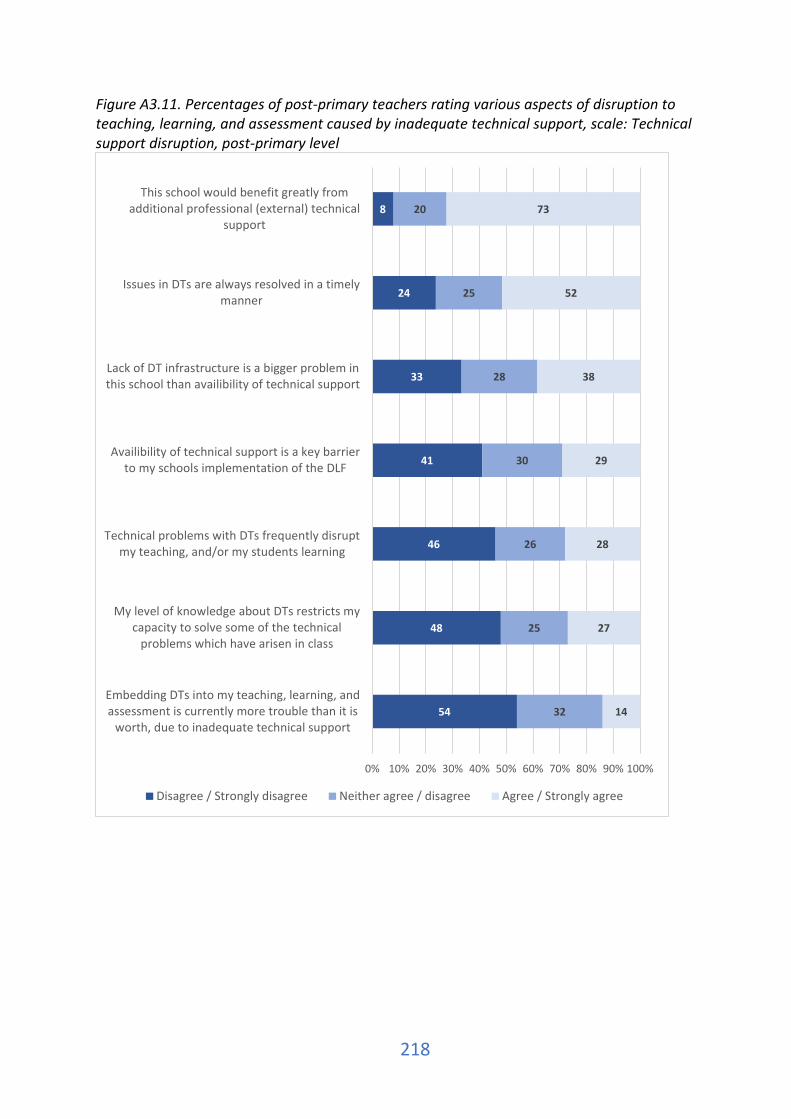
218
Figure A3.11. Percentages of post-primary teachers rating various aspects of disruption to teaching, learning, and assessment caused by inadequate technical support, scale: Technical support disruption, post-primary level
54
48
46
41
33
24
8
32
25
26
30
28
25
20
14
27
28
29
38
52
73
0% 10% 20% 30% 40% 50% 60% 70% 80% 90% 100%
Embedding DTs into my teaching, learning, andassessment is currently more trouble than it is
worth, due to inadequate technical support
My level of knowledge about DTs restricts mycapacity to solve some of the technical
problems which have arisen in class
Technical problems with DTs frequently disruptmy teaching, and/or my students learning
Availibility of technical support is a key barrierto my schools implementation of the DLF
Lack of DT infrastructure is a bigger problem inthis school than availibility of technical support
Issues in DTs are always resolved in a timelymanner
This school would benefit greatly fromadditional professional (external) technical
support
Disagree / Strongly disagree Neither agree / disagree Agree / Strongly agree

219
Figure A3.12. Percentages of primary teachers using DTs for a variety of teaching, learning and assessment purposes, scale: Teacher DT usage frequency, primary level
27
29
40
44
48
50
58
61
64
66
79
83
87
90
28
29
30
34
32
27
31
28
23
23
15
9
8
6
27
27
17
16
16
15
8
8
9
10
5
5
4
3
17
15
14
7
5
7
2
3
4
2
1
2
1
1
0% 10% 20% 30% 40% 50% 60% 70% 80% 90% 100%
Use curriculum-relevant online resources forlesson preparation
Present information or give class instruction tostudents
Support the learning of students with specialeducational needs
Provide differentiated learning or own-pacelearning for literacy and numeracy
Support the deleopment of higher-order thinkingin students
Conduct classroom demonstrations
Support assessment of learning (summativeaqssessment)
Support assessment for learning (formativeassessment)
Support collaboration between students forlearning
Support students to reflect on their own learning
Support student peer-to-peer assessment
Publish students work online
Use social networks in teaching and learning
Communicate with students
a quarter of lessons or less between a quarter and a half of lessons
between half and three quarters of lessons three quarters or more of lessons

220
Figure A3.13. Percentages of post-primary teachers using DTs for a variety of teaching, learning and assessment purposes, scale: Teacher DT usage frequency, post-primary level
23
24
34
39
40
42
43
44
44
46
49
54
70
84
17
22
23
23
26
24
26
27
24
25
22
23
16
7
23
29
26
27
27
23
23
21
19
13
20
16
9
5
37
25
17
12
7
12
9
8
13
15
8
6
4
5
0% 10% 20% 30% 40% 50% 60% 70% 80% 90% 100%
Present information or give class instruction tostudents
Use curriculum-relevant online resources forlesson preparation
Support the deleopment of higher-order thinkingin students
Support the learning of students with specialeducational needs
Provide differentiated learning or own-pacelearning to support the development of literacy…
Support assessment for learning (formativeassessment)
Support collaboration between students forlearning
Support assessment of learning (summativeaqssessment)
Conduct classroom demonstrations (e.g.computer-based simulations, virtual labs)
Communicate with students (e.g. email)
Support students to reflect on their own learning
Support student peer-to-peer assessment
Use social networks in teaching and learning
Publish students work online
a quarter of lessons or less between a quarter and a half of lessons
between half and three quarters of lessons three quarters or more of lessons

221
Figure A3.14. Percentages of primary teachers reporting their level of confidence and familiarity with various uses of DTs, scale: Teacher ease with digital devices, primary level
12
9
4
4
7
5
4
8
1
1
37
35
37
29
26
16
20
14
2
3
40
43
47
52
51
62
57
55
69
64
11
13
13
15
16
18
19
22
28
32
0% 10% 20% 30% 40% 50% 60% 70% 80% 90% 100%
If my friends and relatives want to buy new digitaldevices or applications, I can give them advice
If my friends and relatives have a problem withdigital devices, I can help them
I feel comfortable using digital devices that I amless familiar with
When I come across problems with digital devices,I think I can solve them
I read information about digital devices to beindependent
If I have a problem with digital devices I start tosolve it on my own
If I need a new application, I choose it by myself
If I need new software, I install it by myself
I use digital devices as I want to use them
I feel comfortable using my digital devices at home
strongly disagree disagree agree strongly agree
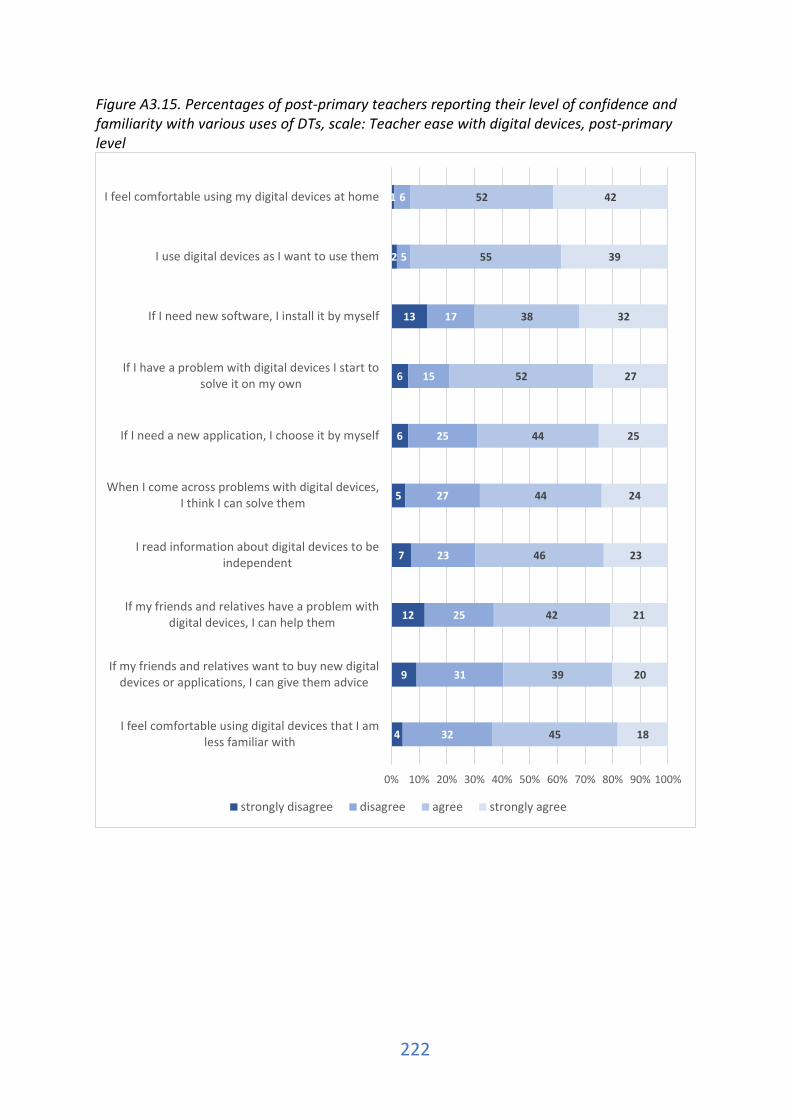
222
Figure A3.15. Percentages of post-primary teachers reporting their level of confidence and familiarity with various uses of DTs, scale: Teacher ease with digital devices, post-primary level
4
9
12
7
5
6
6
13
2
1
32
31
25
23
27
25
15
17
5
6
45
39
42
46
44
44
52
38
55
52
18
20
21
23
24
25
27
32
39
42
0% 10% 20% 30% 40% 50% 60% 70% 80% 90% 100%
I feel comfortable using digital devices that I amless familiar with
If my friends and relatives want to buy new digitaldevices or applications, I can give them advice
If my friends and relatives have a problem withdigital devices, I can help them
I read information about digital devices to beindependent
When I come across problems with digital devices,I think I can solve them
If I need a new application, I choose it by myself
If I have a problem with digital devices I start tosolve it on my own
If I need new software, I install it by myself
I use digital devices as I want to use them
I feel comfortable using my digital devices at home
strongly disagree disagree agree strongly agree
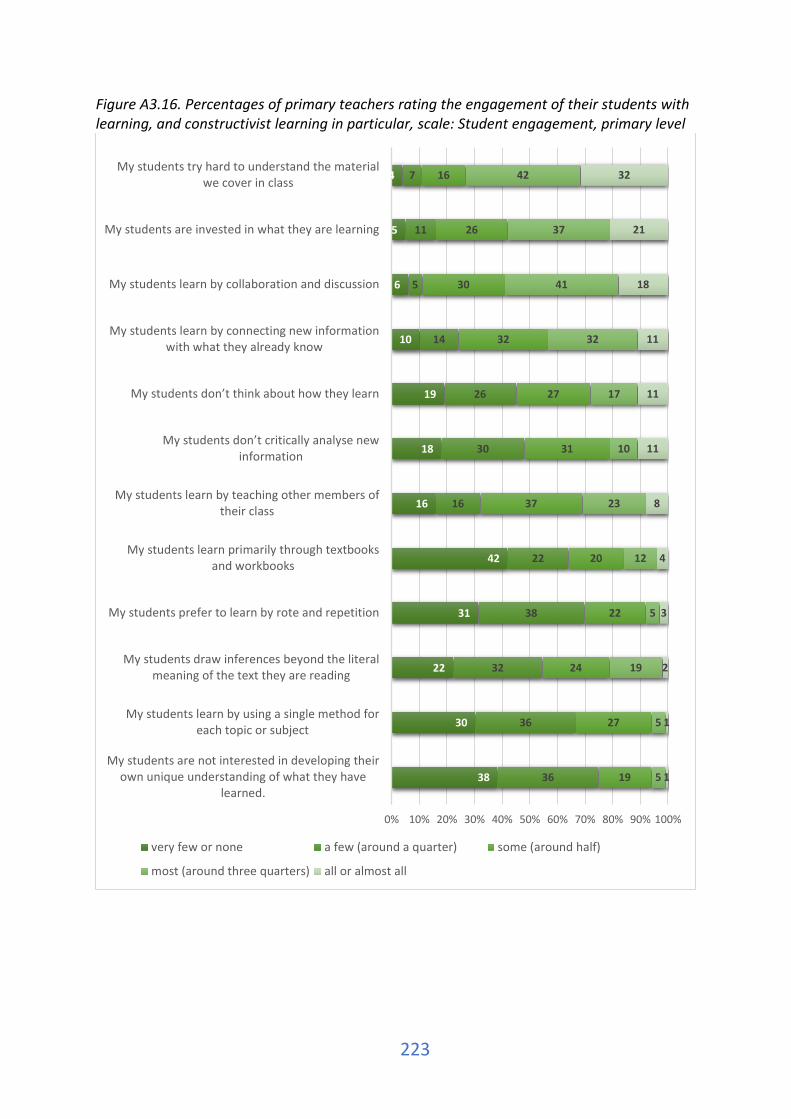
223
Figure A3.16. Percentages of primary teachers rating the engagement of their students with learning, and constructivist learning in particular, scale: Student engagement, primary level
38
30
22
31
42
16
18
19
10
6
5
4
36
36
32
38
22
16
30
26
14
5
11
7
19
27
24
22
20
37
31
27
32
30
26
16
5
5
19
5
12
23
10
17
32
41
37
42
1
1
2
3
4
8
11
11
11
18
21
32
0% 10% 20% 30% 40% 50% 60% 70% 80% 90% 100%
My students are not interested in developing theirown unique understanding of what they have
learned.
My students learn by using a single method foreach topic or subject
My students draw inferences beyond the literalmeaning of the text they are reading
My students prefer to learn by rote and repetition
My students learn primarily through textbooksand workbooks
My students learn by teaching other members oftheir class
My students don’t critically analyse new information
My students don’t think about how they learn
My students learn by connecting new informationwith what they already know
My students learn by collaboration and discussion
My students are invested in what they are learning
My students try hard to understand the materialwe cover in class
very few or none a few (around a quarter) some (around half)
most (around three quarters) all or almost all
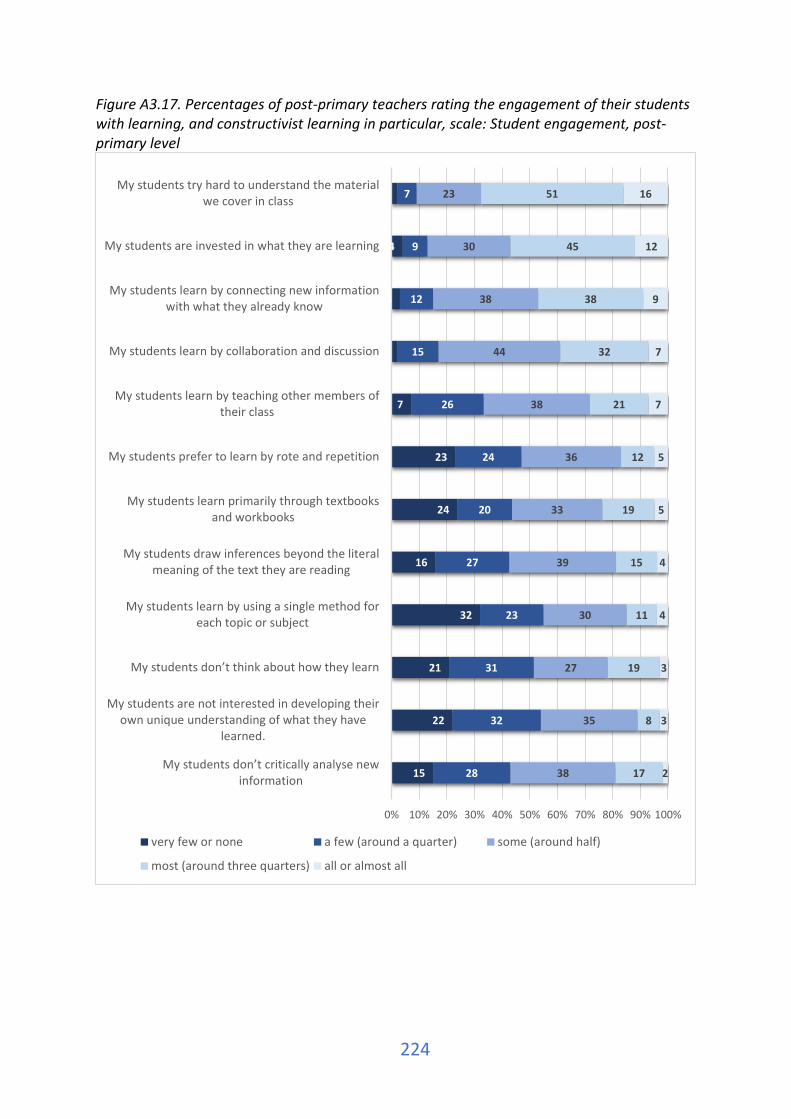
224
Figure A3.17. Percentages of post-primary teachers rating the engagement of their students with learning, and constructivist learning in particular, scale: Student engagement, post-primary level
15
22
21
32
16
24
23
7
2
3
4
2
28
32
31
23
27
20
24
26
15
12
9
7
38
35
27
30
39
33
36
38
44
38
30
23
17
8
19
11
15
19
12
21
32
38
45
51
2
3
3
4
4
5
5
7
7
9
12
16
0% 10% 20% 30% 40% 50% 60% 70% 80% 90% 100%
My students don’t critically analyse new information
My students are not interested in developing theirown unique understanding of what they have
learned.
My students don’t think about how they learn
My students learn by using a single method foreach topic or subject
My students draw inferences beyond the literalmeaning of the text they are reading
My students learn primarily through textbooksand workbooks
My students prefer to learn by rote and repetition
My students learn by teaching other members oftheir class
My students learn by collaboration and discussion
My students learn by connecting new informationwith what they already know
My students are invested in what they are learning
My students try hard to understand the materialwe cover in class
very few or none a few (around a quarter) some (around half)
most (around three quarters) all or almost all
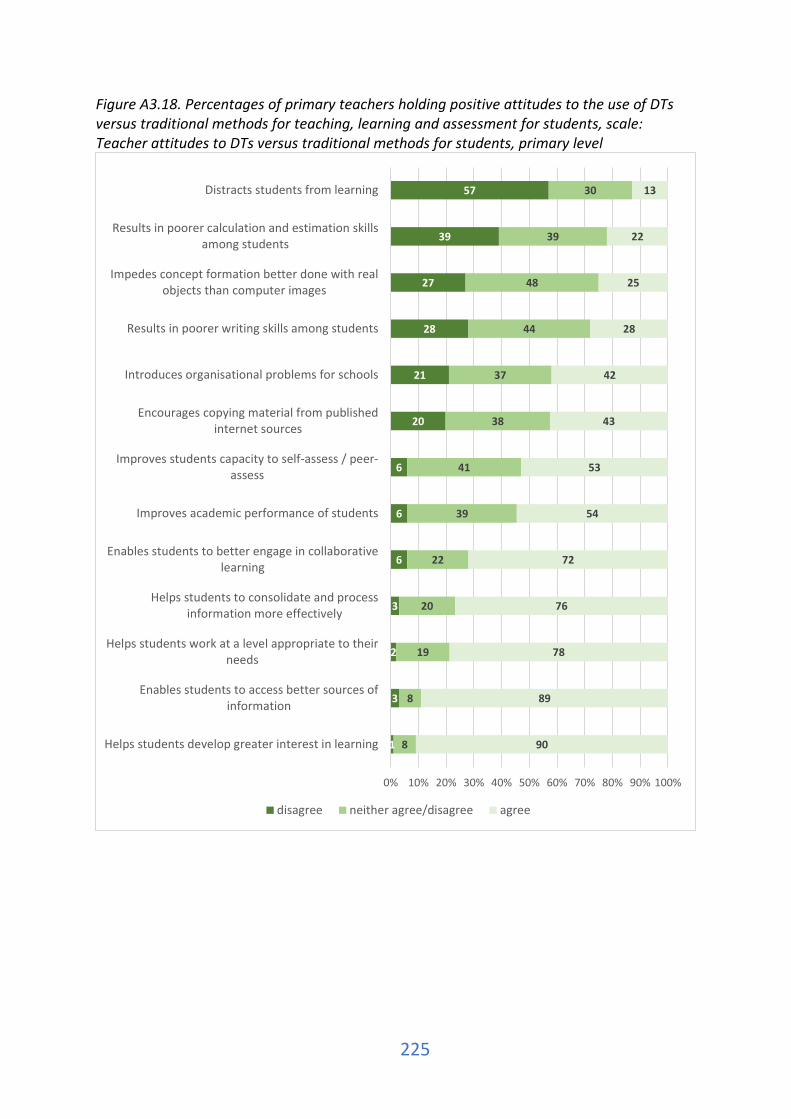
225
Figure A3.18. Percentages of primary teachers holding positive attitudes to the use of DTs versus traditional methods for teaching, learning and assessment for students, scale: Teacher attitudes to DTs versus traditional methods for students, primary level
1
3
2
3
6
6
6
20
21
28
27
39
57
8
8
19
20
22
39
41
38
37
44
48
39
30
90
89
78
76
72
54
53
43
42
28
25
22
13
0% 10% 20% 30% 40% 50% 60% 70% 80% 90% 100%
Helps students develop greater interest in learning
Enables students to access better sources ofinformation
Helps students work at a level appropriate to theirneeds
Helps students to consolidate and processinformation more effectively
Enables students to better engage in collaborativelearning
Improves academic performance of students
Improves students capacity to self-assess / peer-assess
Encourages copying material from publishedinternet sources
Introduces organisational problems for schools
Results in poorer writing skills among students
Impedes concept formation better done with realobjects than computer images
Results in poorer calculation and estimation skillsamong students
Distracts students from learning
disagree neither agree/disagree agree

226
Figure A3.19. Percentages of post-primary teachers holding positive attitudes to the use of DTs versus traditional methods for teaching, learning and assessment for students, scale: Teacher attitudes to DTs versus traditional methods for students, post-primary level
6
3
4
3
12
8
6
18
9
19
29
38
26
9
19
19
28
20
28
40
30
43
37
35
27
40
85
78
77
69
68
64
53
52
49
45
36
36
35
0% 10% 20% 30% 40% 50% 60% 70% 80% 90% 100%
Enables students to access better sources ofinformation
Helps students work at a level appropriate to theirneeds
Helps students develop greater interest in learning
Enables students to better engage in collaborativelearning
Encourages copying material from publishedinternet sources
Helps students to consolidate and processinformation more effectively
Improves students capacity to self-assess / peer-assess
Introduces organisational problems for schools
Improves academic performance of students
Results in poorer writing skills among students
Results in poorer calculation and estimation skillsamong students
Distracts students from learning
Impedes concept formation better done with realobjects than computer images
Disagree Neither agree/disagree Agree
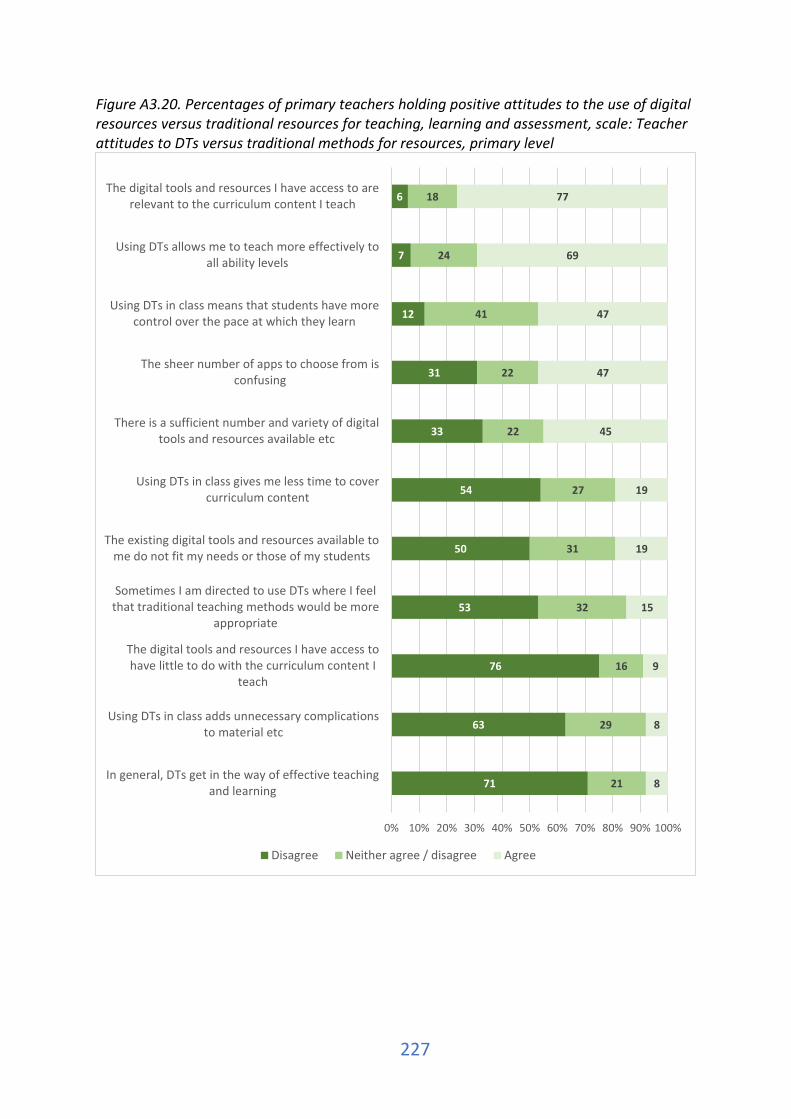
227
Figure A3.20. Percentages of primary teachers holding positive attitudes to the use of digital resources versus traditional resources for teaching, learning and assessment, scale: Teacher attitudes to DTs versus traditional methods for resources, primary level
71
63
76
53
50
54
33
31
12
7
6
21
29
16
32
31
27
22
22
41
24
18
8
8
9
15
19
19
45
47
47
69
77
0% 10% 20% 30% 40% 50% 60% 70% 80% 90% 100%
In general, DTs get in the way of effective teachingand learning
Using DTs in class adds unnecessary complicationsto material etc
The digital tools and resources I have access tohave little to do with the curriculum content I
teach
Sometimes I am directed to use DTs where I feelthat traditional teaching methods would be more
appropriate
The existing digital tools and resources available tome do not fit my needs or those of my students
Using DTs in class gives me less time to covercurriculum content
There is a sufficient number and variety of digitaltools and resources available etc
The sheer number of apps to choose from isconfusing
Using DTs in class means that students have morecontrol over the pace at which they learn
Using DTs allows me to teach more effectively toall ability levels
The digital tools and resources I have access to arerelevant to the curriculum content I teach
Disagree Neither agree / disagree Agree
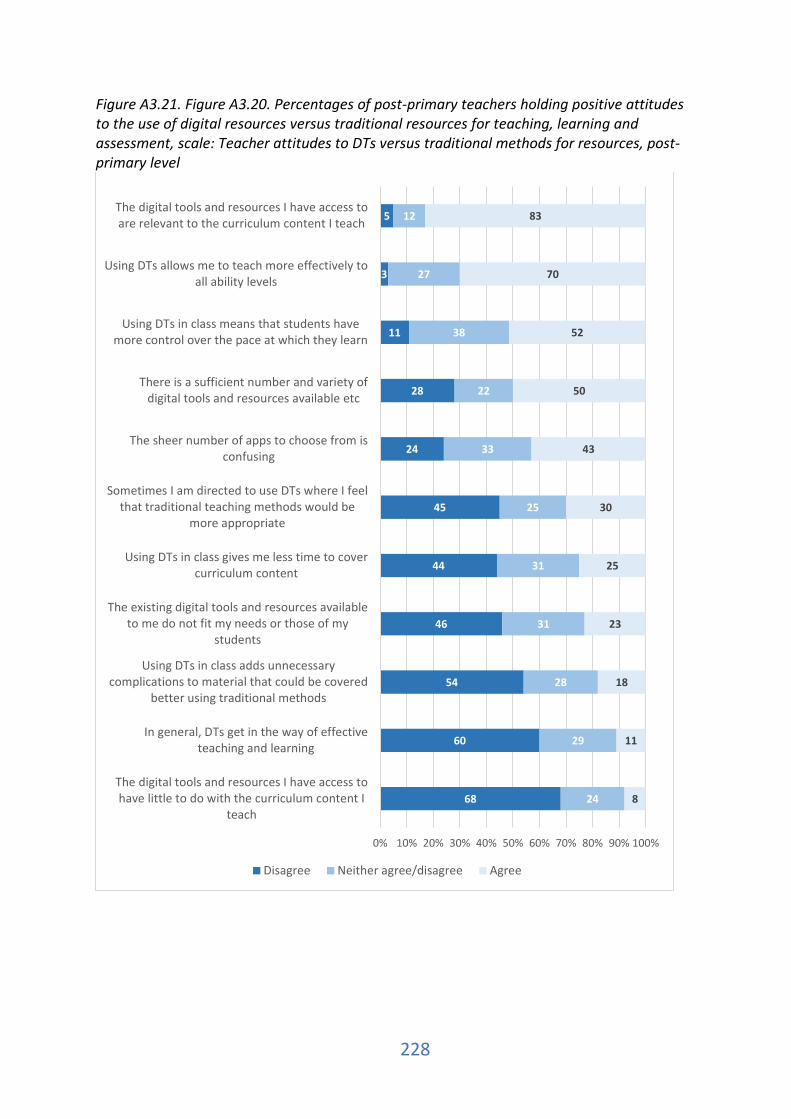
228
Figure A3.21. Figure A3.20. Percentages of post-primary teachers holding positive attitudes to the use of digital resources versus traditional resources for teaching, learning and assessment, scale: Teacher attitudes to DTs versus traditional methods for resources, post-primary level
68
60
54
46
44
45
24
28
11
3
5
24
29
28
31
31
25
33
22
38
27
12
8
11
18
23
25
30
43
50
52
70
83
0% 10% 20% 30% 40% 50% 60% 70% 80% 90% 100%
The digital tools and resources I have access tohave little to do with the curriculum content I
teach
In general, DTs get in the way of effectiveteaching and learning
Using DTs in class adds unnecessarycomplications to material that could be covered
better using traditional methods
The existing digital tools and resources availableto me do not fit my needs or those of my
students
Using DTs in class gives me less time to covercurriculum content
Sometimes I am directed to use DTs where I feelthat traditional teaching methods would be
more appropriate
The sheer number of apps to choose from isconfusing
There is a sufficient number and variety ofdigital tools and resources available etc
Using DTs in class means that students havemore control over the pace at which they learn
Using DTs allows me to teach more effectively toall ability levels
The digital tools and resources I have access toare relevant to the curriculum content I teach
Disagree Neither agree/disagree Agree

229
Figure A3.22. Percentages of primary teachers rating the level of challenge of various aspects of DLF implementation, scale: Implementation challenges, primary level
1
2
4
8
13
14
16
23
14
7
10
16
17
17
25
20
49
39
26
46
42
31
34
39
28
31
49
13
22
30
20
9
7
22
9
16
6
8
5
9
0% 10% 20% 30% 40% 50% 60% 70% 80% 90% 100%
My own level of competency in managing andusing digital technologies in teaching and learning
My perception that not much value is added byembedding digital technologies into teaching,
learning and assessment
Leadership from school management to supportthe Digital Learning Plan
The fit between the aims of the DLF and thestructure of the standardised assessments
The overall timeline for implementation
Broadband connectivity or wifi connection orreliability
Digital technology infrastructure
Dedicated time for me to implement the stepsinvolved in the DLF
highly challenging moderately challenging somewhat challenging
not at all challenging does not apply/did not occur
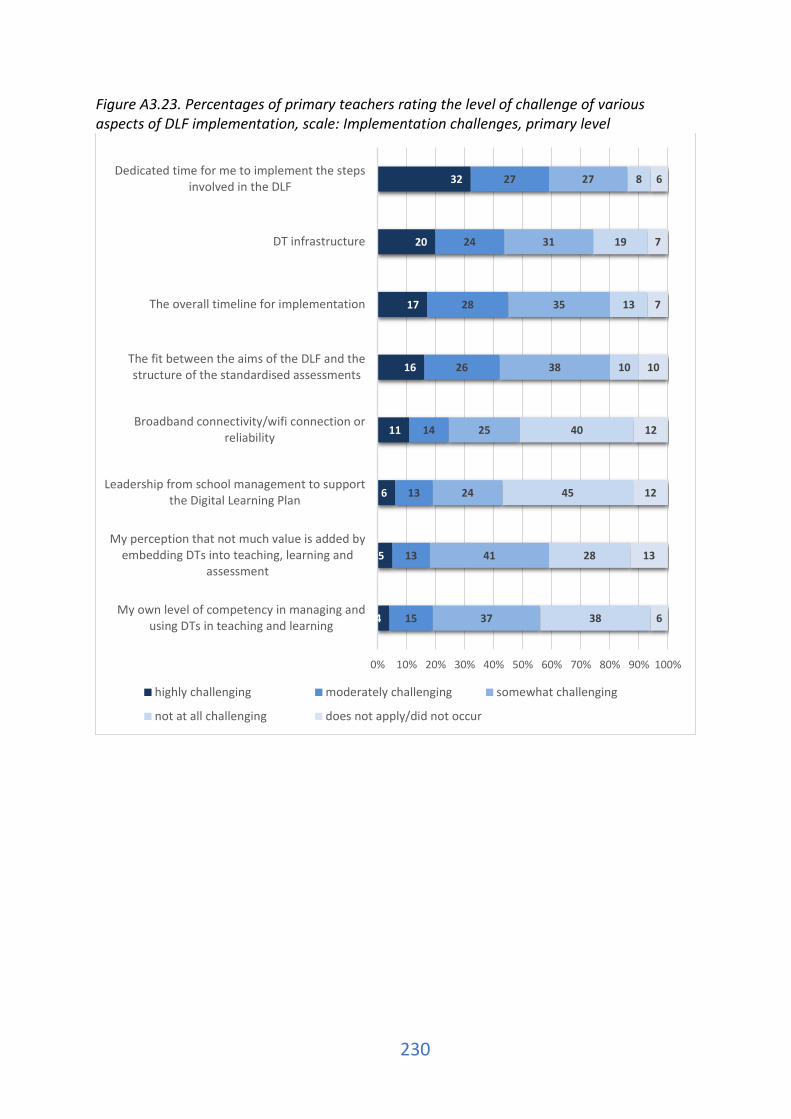
230
Figure A3.23. Percentages of primary teachers rating the level of challenge of various aspects of DLF implementation, scale: Implementation challenges, primary level
4
5
6
11
16
17
20
32
15
13
13
14
26
28
24
27
37
41
24
25
38
35
31
27
38
28
45
40
10
13
19
8
6
13
12
12
10
7
7
6
0% 10% 20% 30% 40% 50% 60% 70% 80% 90% 100%
My own level of competency in managing andusing DTs in teaching and learning
My perception that not much value is added byembedding DTs into teaching, learning and
assessment
Leadership from school management to supportthe Digital Learning Plan
Broadband connectivity/wifi connection orreliability
The fit between the aims of the DLF and thestructure of the standardised assessments
The overall timeline for implementation
DT infrastructure
Dedicated time for me to implement the stepsinvolved in the DLF
highly challenging moderately challenging somewhat challenging
not at all challenging does not apply/did not occur

ISBN: 978-1-911678-00-7 (pdf)
www.erc.ie/dlf
Copyright © 2022 FDOKUMEN