The Latency Budget: How to Save and What to Buy - DukeSpace
177
The Latency Budget: How to Save and What to Buy by Waqar Aqeel Department of Department of Computer Science Duke University Date: Approved: Bruce M. Maggs, Supervisor Jeffrey S. Chase Vincent Conitzer Philip Brighten Godfrey Dissertation submitted in partial fulfillment of the requirements for the degree of Doctor of Philosophy in the Department of Department of Computer Science in the Graduate School of Duke University 2021
-
Upload
khangminh22 -
Category
Documents
-
view
0 -
download
0
Transcript of The Latency Budget: How to Save and What to Buy - DukeSpace

The Latency Budget: How to Save and What to Buy
by
Waqar Aqeel
Department of Department of Computer ScienceDuke University
Date:Approved:
Bruce M. Maggs, Supervisor
Jeffrey S. Chase
Vincent Conitzer
Philip Brighten Godfrey
Dissertation submitted in partial fulfillment of therequirements for the degree of Doctor of Philosophy
in the Department of Department of Computer Sciencein the Graduate School of
Duke University
2021

ABSTRACT
The Latency Budget: How to Save and What to Buy
by
Waqar Aqeel
Department of Department of Computer ScienceDuke University
Date:Approved:
Bruce M. Maggs, Supervisor
Jeffrey S. Chase
Vincent Conitzer
Philip Brighten Godfrey
An abstract of a dissertation submitted in partial fulfillment of therequirements for the degree of Doctor of Philosophy
in the Department of Department of Computer Sciencein the Graduate School of
Duke University
2021

Abstract
Novel applications have driven innovation in the Internet over decades. Electronic
mail and file sharing drove research for communication and congestion control pro-
tocols. Hypertext documents then created the web and put the web browser at the
center. Online advertisement commercialized the web and accelerated development in
web technologies such as JavaScript along with content delivery and caching. Video
streaming then demanded higher bandwidth both in the data center and the home
network. The web is now headed towards increased interactivity and immersion.
With high bandwidth available to many subscribers, end-to-end network latency is
likely to be the bottleneck for interactive applications in the future. While some
applications have very stringent latency requirements, many have a “good enough”
latency floor, beyond which further speed-up is imperceptible to humans. In the
latter case, time saved from reduced network latency can be used to improve other
aspects of user experience. For example, most private information retrieval protocols
require more computation or multiple roundtrips, and reduced network latency can
allow clients to use such protocols to protect user privacy while also delivering good
quality of experience. The latency budget is then set by the “good enough” latency
floor (which may vary over applications). We can save by reducing network latency,
and then spend to improve various aspects of the web ecosystem. This thesis (a)
addresses a widespread pitfall in measuring latency on the web, and highlights that
(b) there is ample potential to reduce infrastructural, long-distance latency, and (c)
the saved latency enables improvements in the web ranging from increased publisher
revenues for online ads to improved user privacy for DNS queries.
iii

To my brother, Kashif
iv

Contents
Abstract iii
List of Figures ix
List of Tables xiii
Acknowledgements xiv
1 Introduction 1
1.1 Life of an HTTP request . . . . . . . . . . . . . . . . . . . . . . . . . 2
1.2 Organization . . . . . . . . . . . . . . . . . . . . . . . . . . . . . . . 7
1.3 Limitations . . . . . . . . . . . . . . . . . . . . . . . . . . . . . . . . 9
2 Infrastructure Options for Saving Latency 11
2.1 Acknowledgements . . . . . . . . . . . . . . . . . . . . . . . . . . . . 11
2.2 Low-Latency Microwave Networking . . . . . . . . . . . . . . . . . . 12
2.2.1 Active measurements . . . . . . . . . . . . . . . . . . . . . . . 13
2.2.2 Trading data analysis . . . . . . . . . . . . . . . . . . . . . . . 16
2.3 Potential of In-Flight Aircraft . . . . . . . . . . . . . . . . . . . . . . 19
2.4 Related Work . . . . . . . . . . . . . . . . . . . . . . . . . . . . . . . 21
2.5 Summary . . . . . . . . . . . . . . . . . . . . . . . . . . . . . . . . . 22
3 Internal Pages in Web Measurement 24
3.1 Acknowledgements . . . . . . . . . . . . . . . . . . . . . . . . . . . . 26
3.2 Impact on Previous Studies . . . . . . . . . . . . . . . . . . . . . . . 27
3.3 The Hispar Top List . . . . . . . . . . . . . . . . . . . . . . . . . . . 29
3.3.1 The H1K, Ht30, Ht100, and Hb100 Lists . . . . . . . . . . . . . . 34
v

3.4 Overview of Differences . . . . . . . . . . . . . . . . . . . . . . . . . . 36
3.5 Content and Delivery . . . . . . . . . . . . . . . . . . . . . . . . . . . 40
3.5.1 Cacheability . . . . . . . . . . . . . . . . . . . . . . . . . . . . 40
3.5.2 Content Mix . . . . . . . . . . . . . . . . . . . . . . . . . . . . 42
3.5.3 Multi-Origin Content . . . . . . . . . . . . . . . . . . . . . . . 44
3.5.4 Inter-Object Dependencies . . . . . . . . . . . . . . . . . . . . 46
3.5.5 Resource Hints . . . . . . . . . . . . . . . . . . . . . . . . . . 47
3.5.6 Roundtrip and Turnaround times . . . . . . . . . . . . . . . . 48
3.6 Security and Privacy . . . . . . . . . . . . . . . . . . . . . . . . . . . 51
3.6.1 HTTP and Mixed Content . . . . . . . . . . . . . . . . . . . . 52
3.6.2 Third-Party Dependencies . . . . . . . . . . . . . . . . . . . . 53
3.6.3 Ads and Trackers . . . . . . . . . . . . . . . . . . . . . . . . . 54
3.7 On Selecting Internal Pages . . . . . . . . . . . . . . . . . . . . . . . 56
3.8 Related Work . . . . . . . . . . . . . . . . . . . . . . . . . . . . . . . 57
3.9 Summary . . . . . . . . . . . . . . . . . . . . . . . . . . . . . . . . . 58
4 Privacy and Latency in DNS Queries 59
4.1 Acknowledgements . . . . . . . . . . . . . . . . . . . . . . . . . . . . 61
4.2 Comments on the Status Quo . . . . . . . . . . . . . . . . . . . . . . 61
4.3 Stub Resolver on Steroids . . . . . . . . . . . . . . . . . . . . . . . . 63
4.3.1 Web Performance . . . . . . . . . . . . . . . . . . . . . . . . . 68
4.3.2 Encryption . . . . . . . . . . . . . . . . . . . . . . . . . . . . 70
4.3.3 Scalability . . . . . . . . . . . . . . . . . . . . . . . . . . . . . 72
4.3.4 Adoption . . . . . . . . . . . . . . . . . . . . . . . . . . . . . 74
4.4 Related . . . . . . . . . . . . . . . . . . . . . . . . . . . . . . . . . . 75
vi

4.5 Summary . . . . . . . . . . . . . . . . . . . . . . . . . . . . . . . . . 76
5 Revenue and Latency in Online Ads 77
5.1 Introduction . . . . . . . . . . . . . . . . . . . . . . . . . . . . . . . . 77
5.2 A Brief History of Programmatic Advertising . . . . . . . . . . . . . . 80
5.3 Real User Measurements . . . . . . . . . . . . . . . . . . . . . . . . . 82
5.3.1 Privacy & Ethics . . . . . . . . . . . . . . . . . . . . . . . . . 83
5.4 Ad Exchanges, CPM, and Ad Revenue . . . . . . . . . . . . . . . . . 85
5.5 Auction Duration & Implications . . . . . . . . . . . . . . . . . . . . 86
5.6 Sources of Latency in HB Auctions . . . . . . . . . . . . . . . . . . . 89
5.6.1 Persistent vs. non-persistent connections . . . . . . . . . . . . 91
5.6.2 Ad Infrastructure Deployments . . . . . . . . . . . . . . . . . 92
5.7 Client-side TFO adoption . . . . . . . . . . . . . . . . . . . . . . . . 93
5.8 NA & EU Users: GDPR, ad-worthiness and latencies . . . . . . . . . 95
5.9 Popularity Correlations . . . . . . . . . . . . . . . . . . . . . . . . . . 96
5.10 Related Work . . . . . . . . . . . . . . . . . . . . . . . . . . . . . . . 97
5.11 Concluding Remarks . . . . . . . . . . . . . . . . . . . . . . . . . . . 98
6 Programmable TLS Certificates 100
6.1 Acknowledgements . . . . . . . . . . . . . . . . . . . . . . . . . . . . 102
6.2 Assertion-Carrying Certs . . . . . . . . . . . . . . . . . . . . . . . . . 102
6.2.1 ACC Programs Are Logic Programs . . . . . . . . . . . . . . . 104
6.2.2 ACC Programs Reference “Facts” . . . . . . . . . . . . . . . . 105
6.2.3 ACC Programs Define Rules . . . . . . . . . . . . . . . . . . . 106
6.2.4 ACCs Are Evaluated by Clients . . . . . . . . . . . . . . . . . 106
6.3 Example ACCs . . . . . . . . . . . . . . . . . . . . . . . . . . . . . . 107
vii

6.4 Implementation & Evaluation . . . . . . . . . . . . . . . . . . . . . . 112
6.5 Related work . . . . . . . . . . . . . . . . . . . . . . . . . . . . . . . 115
6.6 Concluding Discussion . . . . . . . . . . . . . . . . . . . . . . . . . . 116
7 Conclusion 119
Bibliography 121
Biography 162
viii

List of Figures
1.1 Stages in the life of an HTTP request. . . . . . . . . . . . . . . . . . 2
1.2 Client and server messages in TCP and TLS 1.2 handshakes. 3 roundtripsare required to complete the handshakes before any payload can be de-livered. . . . . . . . . . . . . . . . . . . . . . . . . . . . . . . . . . . . 4
2.1 Analyzing trading data: (a) Heat map of order book events at delay be-tween Chicago and New Jersey. Response delay never exceeds 4.3 ms;(b) A coarse weather signal (max wind speed + max rainfall) is corre-lated with the observed transmission delay. . . . . . . . . . . . . . . . 12
2.2 (a) Predicting loss rate of 396 byte packets from observed loss rates of1,499 byte packets on Feb 15th, 2020. (b) Corruptions observed in theUDP fast set. . . . . . . . . . . . . . . . . . . . . . . . . . . . . . . . 17
2.3 Using in-flight aircraft as network hops. This snapshot from July 11,13:49 UTC shows 11,082 in-flight aircraft as well as the paths betweena few major cities through them. . . . . . . . . . . . . . . . . . . . . . 18
3.1 Nearly two-thirds of the web-perf. studies that use a top list and werepublished between 2015 and 2019 at 5 top-tier networking venues wouldrequire some revision for them to apply to internal pages. . . . . . . . 27
3.2 Overview of differences between landing (L) and internal (I) pages: Forweb sites in H1K (Ht30), (a) 65% (54%) have landing pages that arelarger than the median size of their internal pages; (b) landing pagesof 68% (57%) have more objects. . . . . . . . . . . . . . . . . . . . . 33
3.3 (a) For web sites in H1K (Ht30), page-load times of landing pages aresmaller for 56% (77%); (b) Content on landing pages displays, in themedian, 14% faster than that on internal pages (D=0.01). . . . . . . 33
3.4 Limited exhaustive crawls of five web sites, Wikipedia (WP), Twitter(TW), New York Times (NY), HowStuffWorks (HS) and an academicweb site (AC), show that internal pages differ from landing pages andfrom each other in (b) number objects and (c) page size. . . . . . . . . 36
ix

3.5 For web sites in H1K: (a) 66% have landing (L) pages with more non-cacheable objects than their internal (I) pages (40% more in the me-dian); and (b) landing pages of 57% have a higher fraction of bytesdelivered via CDNs (13% more in the median). . . . . . . . . . . . . . 39
3.6 (a) For web sites in H1K, 67% have landing pages that fetch contentfrom more origins (29% more in the median); (b) internal pages have,in the median, 10% more JS bytes as a fraction of total bytes, 36%less image bytes, and 22% more HTML/CSS bytes than landing pages(D � 0.00001 for HTML/CSS, image, and JS bytes). . . . . . . . . 45
3.7 (a) 69% of landing pages use at least one HTML5 resource hint, whereas45% of internal pages have no hints (D � 0.00001). In the median,(b) landing pages perform 25% more handshakes than internal pagesdo (D � 0.00001) . . . . . . . . . . . . . . . . . . . . . . . . . . . . . 46
3.8 (a) Landing pages have more objects at each level of depth than internalpages do. In the median, landing pages have 38% more objects at depth2. (b) Objects on internal pages spend 20% more time in wait thanthose on landing pages (D � 0.00001). . . . . . . . . . . . . . . . . . 50
3.9 For web sites in H1K, (a) 170 have secure landing pages but at least onenon-secure internal page, 36 have 10 or more; (c) at the 80th percentile,landing pages make 40% more tracking requests (D � 0.00001). . . . 51
4.1 Cloudflare and Google recursive resolvers provide cache hit rates of(a) roughly 45% and 25% respectively for the domains in UmbrellaTop 100K (Ut100K), and (b) less than 2% each for those in Alexa Tail2K (Ab2K). . . . . . . . . . . . . . . . . . . . . . . . . . . . . . . . . 61
4.2 Current DNS model with recursive resolver at the center in both tradi-tional UDP-based DNS and newer DNS over HTTPS. . . . . . . . . . 64
4.3 Our proposal where the client does the heavy lifting. DNS Push Server,and k-query obfuscation provide efficiency and privacy respectively. . . 65
4.4 DNS query and response packets with the modified DNSCurve scheme. 66
4.5 (a) For A1M, 50% of NS and 5% of A records have a TTL of oneday or longer. (b) 25% of the NS records in A1M are covered by 2providers, while 40 providers cover 50%. . . . . . . . . . . . . . . . . 67
x
4.6 (a) Authoritative nameservers provide query times comparable to sharedresolvers for Ut100K and lower for Ab2K. (b) The increase in PLT whendelay to TRR is increased from 10 ms to 50 ms is statistically insignif-icant. . . . . . . . . . . . . . . . . . . . . . . . . . . . . . . . . . . . . 68
5.1 Interactions between different elements in client-side header bidding . 81
5.2 A summary of the Rum data set . . . . . . . . . . . . . . . . . . . . . 82
5.3 (a) In the median, auctions involve only two ad exchanges and websites (publishers) connect with only three ad exchanges. (b) Auctionduration increases with the number of ad exchanges contacted. . . . . 84
5.4 (a) Bid prices show significant variation, with approximately 30% ofbids having at least $1 CPM. (b) The median CPM or ad revenueincreases with number of ad exchanges contacted. . . . . . . . . . . . 85
5.5 (a) Auctions last for 600 ms in the median, and some 10% of auctionslast more than µs2. (b) Auctions, however, do not seem to affect thepage load times: Most bids arrive much later than when the onLoad
event fires. . . . . . . . . . . . . . . . . . . . . . . . . . . . . . . . . . 87
5.6 (a) Ad exchanges typically are quite far from end users. (b) “High-CPM” ad exchanges are not any faster in responding with bids than“low-CPM” ad exchanges. . . . . . . . . . . . . . . . . . . . . . . . . 88
5.7 (a) 87% of the bids and (b) 90% of the ad revenue, estimated throughCPMs, arrive within µs1 of the start of the auction. . . . . . . . . . 89
5.8 (a) The gap between the “in-browser” and “on-the-wire” bid request du-rations suggests room for improving HB implementations. (b) Break-down of time spent by requests over non-persistent connections intokey contributing factors. . . . . . . . . . . . . . . . . . . . . . . . . . 90
5.9 (a) TCP/TLS handshakes account for a significant fraction of an adrequest’s duration. (b) Ad exchanges can quite effectively lower auctiondurations by optimizing the exchange-side auctions, and lowering theTTFB values. . . . . . . . . . . . . . . . . . . . . . . . . . . . . . . . 93
5.10 Impact of a user’s location on (a) the number of exchanges contacted,and (b) the mean CPM obtained per web page. . . . . . . . . . . . . . 94
xi

5.11 Impact of a user’s location on (a) bid-request duration, and (b) auctionduration. . . . . . . . . . . . . . . . . . . . . . . . . . . . . . . . . . . 94
5.12 Impact of a web site’s ranking on (a) mean CPM and (b) number ofexchanges contacted. . . . . . . . . . . . . . . . . . . . . . . . . . . . 96
6.1 Overview ACC-enabled chain validation. 1 Certificate fields are trans-lated into Datalog facts. 2 Constraints are extracted from each ACC.3 Environment information (e.g., the current time) are transcribedas Datalog facts. 4 The ACC engine evaluates each certificate’s con-straints over the entire chain and all accumulated facts. The certifi-cate is rejected if any ACC constraints are violated or if the browser’scanonical validation—shown on the left—fails. . . . . . . . . . . . . . 103
xii

List of Tables
2.1 Availability and average latency between several major cities usingin-flight aircraft over a 2-day period. . . . . . . . . . . . . . . . . . . 21
6.1 Size (bytes) of ACC use cases proposed in §6.3. For comparison, weshow the median and max leaf certificate size across 10M certificatessampled from CT logs. . . . . . . . . . . . . . . . . . . . . . . . . . . 113
6.2 A non-exhaustive list of environment facts and “standard library” rulesmade available to ACCs. . . . . . . . . . . . . . . . . . . . . . . . . . 118
xiii

Acknowledgements
I cannot believe that I have had the privilege of pursuing a PhD at Duke, and actually
finishing it. I have too many people to thank for it who supported me both before and
during the program.
Most of all, I am thankful to my advisor, Prof. Bruce Maggs. I learned everything
I know about research from Bruce. I also got the opportunity to work with amazing
researchers, visit beautiful places, and meet wonderful people because of him. Even more
than research, he showed me how to be generous and kind. He showed me how to have fun
while meaning business. I wish to emulate his qualities my whole life.
I am grateful to my committee members Jeffrey S. Chase, Vincent Conitzer, and P.
Brighten Godfrey. They provided critical feedback and advice which shaped this thesis.
Jeff and Vince also shaped my experience as a graduate student at Duke.
I would like to thank Balakrishnan Chandrasekaran and Ilker Nadi Bozkurt for their
brotherly advice in research and otherwise throughout the program. Bala also made possible
and hosted me in Germany for the most wonderful summer of my program. I also have
to thank Anja Feldmann for making me feel at home at MPI. I am grateful to and for
my long-term collaborators Balakrishnan Chandrasekaran, Brighten Godfrey, Debopam
Bhattacherjee, James Larisch, Gregory Laughlin, Christo Wilson, Anja Feldmann, Ankit
Singla, Elaine Shi, Dave Levin, Bryan Parno, Alan Mislove and Tijay Chung. This work
would not have been possible without their invaluable inputs. I have been exceedingly lucky
to have found the best collaborators and to have learnt so much from them.
My friends at Duke, Sahiti Bommareddy, Siddhartha Nalluri, and Trung Tran, were
pillars of support and helped me whenever I needed it. Naman Jain, Srihari Radhakrishnan,
Sudarshan Balaji, Alina Barnett and many others made the grad school struggles easier. I
cannot thank Marilyn Butler enough for her support and kind words. She knows how to
solve every problem!
I thank my mentors Fareed Zaffar and Aamir Shafi for their counsel leading up to my
xiv

PhD. Fareed showed faith in me when I didn’t have it in myself.
I learned hard work and perseverance from my parents. But it was my brother, Kashif,
who set me on the path to scientific inquiry. I will be forever grateful to the undeserved
love and affection all my siblings have given me. Lastly, I thank my wife, Aimen. She
deserves as much credit for this PhD as I do. She has given me a lot of love and support
through this difficult journey.
xv

Chapter 1
Introduction
Latency, the time delay between two events, manifests on the Internet in various forms.
End-to-end network latency is usually measured as the roundtrip time of a small network
packet from point A to point B and back to A. This measurement can include, in addition
to network transmission delay, processing delays at servers on either point, and on network
routers and switches in the path. Time consuming computation, disk seek, and waiting in
queues can all cause processing delays. Higher layer tasks, such as establishing a reliable,
encrypted communication channel between points A and B incur further latency costs by
requiring multiple roundtrips between the two points. For a normal user, however, all
underlying factors combine to produce a perceived latency, that is, the time it takes to
finish a user task such as loading a web page.
User experience in many interactive network applications depends crucially on achieving
low latency. Even seemingly small increases in latency can negatively impact user experi-
ence, and subsequently, revenue for service providers. The “Milliseconds Make Millions”
study reports that only 100ms reduction in page load time results in an increase in con-
version rate of 10% for travel sites, and 8% for retail [369]. Google reports that when an
additional 400ms of processing latency is introduced at the server side, it results in 0.7%
fewer searches per user [96]. Similarly, Bing reports a 1.2% decrease in revenue per user if
processing latency is increased by 500ms. VPN services targeted at gamers charge end users
as much as 13 USD per month for providing low-latency connections to popular gaming
servers [509]. Indeed, content delivery networks (CDNs) present latency reduction and its
associated increase in conversion rates as one of the key value propositions of their services,
citing, e.g., a 1% loss in sales per 100ms of latency for Amazon [17]. Popularization of vir-
tual and augmented reality, such as through Facebook’s Metaverse initiative, will require
low-latency connectivity to make the interactions realistic and immersive [322].
1

DNS Connect TLSBlocked Send Wait Receive
Request is queued
Domain name resolved
TCP handshake done
TLS handshake done
Request sent
Response received
Figure 1.1: Stages in the life of an HTTP request.
Users have different latency expectations for various applications. When it comes to
gaming, reducing delay by 25 to 30ms offers a competitive advantage to the player in first-
person shooting (FPS) or real-time strategy (RTS) games [290]. For DNS, we have observed
that query resolution times of up to 30ms do not significantly slow down the page load (see
chapter 4). Page load time itself, when measured as first contentful paint 1, is considered
good when it is under 1.8 seconds [208]. For video-on-demand, users may be willing to
tolerate delays of multiple seconds before the video starts. These user expectations set
budgets for latency: as long as the application stays within the budget, it can spend time
on, for example, computation to deliver better results or improved privacy.
The physical lower bound for latency between two points along the surface of the Earth
is determined by their geodesic distance divided by the speed of light, c. Latencies over
the Internet, however, are usually much larger than this minimal “c-latency”: recent mea-
surement work found that fetching even small amounts of data over the Internet typically
takes 37× longer than the c-latency, and often, more than 100× longer [84]. This delay can
come from a variety of sources. We will discuss these sources of latency by following the
events that take place when the browser initiates an HTTP request.
1.1 Life of an HTTP request
A web page load consists of a number of HTTP requests. Encrypted HTTP is called
HTTPS, but since most requests on the Internet are now encrypted [233], we will use the
two terms interchangeably. Moreover, we consider HTTP over TCP and TLS rather than
1Time from when the page starts loading to when any part of the page’s content is rendered on the screen.
2

QUIC, as QUIC has not seen wide adoption yet [519]. As Fig. 1.1 shows, we divide the life
of an HTTP request into seven stages:
1. Blocked. In this stage, the browser is busy executing other tasks and the request is
just waiting in a queue for the browser to pick it up. The time spent in this stage
depends on the resources on the user’s machine and how busy the CPU is.
2. Domain Name System (DNS). This is the first network request that is made to
start processing the HTTP request. The browser resolves the domain name in the
URL of the HTTP request to an IP address so that a connection can be made. In
many cases, DNS also happens to be the first step in request routing to serve a web
resource that is deployed in a geo-distributed fashion. The DNS request goes to an
authoritative name server, which then selects the best edge cache to serve the request
based on the DNS resolver’s IP address or the EDNS Client Subnet field [121]. If
the optimal, in terms of network proximity to the user, edge cache happens to be far
from the user, a large latency penalty may have to be paid. If a suboptimal edge
cache is selected, it will further increase latency. Additionally, the requested resource
may be a cache miss at the selected edge, and must be fetched from another cache
or from an origin server, which will also incur latency.
IP Anycast is also at times used for edge cache selection. In this case, the task of
selecting the optimal edge cache is pushed down from the DNS layer to the IP layer,
but all the issues of suboptimal edge cache selection and cache misses still apply [105].
3. Connect. Once the browser knows the IP address of the destination server, it
initiates a TCP three-way handshake to the server by sending a TCP SYN packet.
The server responds with a SYN ACK packet, after which the client sends an ACK
packet along with request content. Thus the handshake costs one extra roundtrip
before the request may be sent.
Since HTTP/1.1, TCP connections are kept alive, meaning that they can be reused to
fetch multiple resources from the same server. HTTP/2 also allows multiplexing the
3

Client Server
SYN
SYN ACK
ACK
ClientHelloServerHello Certificate
ServerHelloDoneClientKeyExchange ChangeCipherSpec
FinishedChangeCipherSpec
Finished
1
2
3
Figure 1.2: Client and server messages in TCP and TLS 1.2 handshakes. 3
roundtrips are required to complete the handshakes before any payload can be deliv-
ered.
same TCP connection to fetch multiple resources in parallel. Server push in HTTP/2
allows the server to send additional objects that the server predicts the client will
request to save latency [66]. TCP Fast Open allows resumption of a TCP connection
after it has been closed without requiring an extra roundtrip [123]. However, TCP
Fast Open faces major issues towards adoption [50].
4. Transport Layer Security (TLS). To encrypt the channel between the client and
the server, a TLS handshake is required after the TCP connection is established. The
client initiates the handshake by sending a CLIENT HELLO message. The server’s
TLS certificate chain is sent to the client, and a session key is securely exchanged
between the parties in this process2. As Fig. 1.2 shows, the TLS handshake costs two
more roundtrips before the actual HTTP request payload may be sent.
TLS 1.3 eliminates one roundtrip, thus requiring only one instead of two roundtrips
to establish the encrypted channel [441]. TLS 1.3 also supports 0-RTT resumption,
2See https://www.cloudflare.com/learning/ssl/what-happens-in-a-tls-handshake/ for more detail.
4

which means a closed TLS connection can be resumed without requiring any ex-
tra roundtrips. However, 0-RTT resumption has potential security and server-side
performance issues [59].
5. Send. Send is the time between the first byte of the request being sent and the last
byte of the request being sent. An HTTP request sent from a client is small, typically
around 700 to 800 bytes [489], unless it is a file upload. In case of file upload, upload
bandwidth of the client may become the bottleneck and increase latency.
6. Wait. Wait is the time between the last byte of the request being sent and the first
byte of the response being received. This stage consists of one network roundtrip time
and the turnaround time at the server. The turnaround time may be inflated due to
a cache miss at the edge cache, the server being busy with other requests, the request
requiring the server to do excessive computation, fetch data from a database, initiate
other requests for subtasks and a wide variety of other reasons. The client, however,
is typically oblivious to the reasons behind the delay and spends time waiting for the
response.
7. Receive. Receive is time between the first byte of the response being received and the
last byte of the response being received. HTTP responses are typically larger than
requests [272], and may require a TCP congestion window adjustment depending
on the initial window size and throughput. It may take multiple roundtrips for the
congestion window to ramp up to its “stable” size. After the congestion window ramp
up, throughput becomes the bottleneck for transmission of the HTTP response.
The time a request spends in the DNS, Connect and TLS stages depends almost entirely
on network latency between the client and the server. To get total latency, the network
roundtrip time between client and server is multiplied by the number of roundtrips required.
In today’s Internet, a network roundtrip itself takes 3-4× longer than the c-latency in the
median [84]. Combined with inefficiencies in request routing, caching and extra roundtrips,
the median latency of an HTTP response in today’s Internet is 37× its theoretical lower
5

bound [84].
Wide-area network latency is often the bottleneck, as Facebook’s analysis of over a mil-
lion requests found [125]. when bandwidth is not the main bottleneck, eliminating inflation
in Internet RTTs can potentially translate to up to 3-4× speedup, even without any pro-
tocol changes. Further, as protocol stack improvements get closer to their ideal efficiency
of one RTT for small amounts of data, the RTT becomes the singular network bottleneck.
Similarly, for well-designed applications dependent on persistent connectivity between two
fixed locations, such as gaming, nothing other than resolving this 3-4× “infrastructural in-
efficiency” can improve latency substantially. In addition to worsening user experience and
having revenue implications, high infrastructural latency also makes some improvements
to the web ecosystem impractical. For example, the Private Information Retrieval (PIR)
scheme from Shi et al. requires O(√n) computation to complete a query where n is the
database size [468]. If the infrastructural latency is low, computation time would be within
the latency budget, and this protocol could be used to make DNS queries private. However,
the high infrastructural latency in today’s Internet make this protocol impractical for the
DNS application.
There is a rich body of literature on optimizing nearly every aspect of web content de-
livery including but not limited to caching [426], content pushing [66] and prefetching [386],
and web proxies in the cloud [12]. To correctly identify the sources of slowdown and devise
the most effective optimization techniques, measurements of the web must be performed
accurately and should represent real user experience to the extent possible. However, re-
searchers face a variety of issues towards conducting reproducible and representative web
measurements. Firstly, researchers rely on top lists such as Alexa Top 1 Million [40] to
get web sites that users visit the most. Each top list comes with its own biases and also
changes considerably from one day to another [456]. Secondly, top lists provide only web
sites and not web pages, so researchers typically just measure the home page of a web site
and not its internal pages (see chapter 3). Lastly, there can be considerable variation across
measurements of the same web page [190].
6

In this thesis, we show that infrastructural inefficiencies in the current Internet can
be bypassed. We evaluate the feasibility of two low-latency and low-bandwidth channels
and show that these channels can be used to augment the current fiber infrastructure of
the Internet. We show that, in the past, web measurement research has largely ignored
internal pages of web sites resulting in potentially biased results. We also provide a way
for researchers to easily include internal pages in future research. Finally, we show that
latency can be traded off as a resource to provide better user privacy for the domain name
system, and for online advertising.
1.2 Organization
The rest of this thesis is organized as follows:
• In chapter 2, we explore a few ways to bypass the infrastructural latency inflation
in optical fiber. We assess the feasibility of microwave towers and in-flight aircraft
as low-latency alternatives to optical fiber. We assess using real flight data whether
there are enough aircraft in the air at any instant to provide line of sight connectivity
between major urban centers across the globe. We conduct active measurements
over a low-latency microwave network that the high-frequency trading industry uses,
accompanied by a passive analysis of trading data across two markets to assess the
impact of bad weather on connectivity.
• Chapter 3 discusses how most research on web measurement focuses on landing pages
and ignores internal pages of web sites. We characterize the differences between
landing and internal (i.e., non-root) pages of 1000 web sites to demonstrate that
the structure and content of internal pages differ substantially from those of landing
pages, as well as from one another. We review more than a hundred studies published
at top-tier networking conferences between 2015 and 2019, and highlight how, in light
of these differences, the insights and claims of nearly two-thirds of the relevant studies
7

would need to be revised for them to apply to internal pages. We also develop a new
top list that provides landing as well as internal pages.
• Chapter 4 discusses work on improving domain name system (DNS) privacy through
full client-side resolution. Almost all end-user activities on the Internet rely on the
DNS to resolve human-friendly names to IP addresses. Despite its ubiquitous use,
DNS does not provide confidentiality. DNS queries and responses leak sensitive pri-
vate information about users’ browsing behavior to recursive resolvers, and when sent
in cleartext, to anyone on the network path who cares to observe. A broad range of
solutions have been proposed to mitigate this problem, but most of them require that
end users trust some third-party to protect them. This chapter proposes redesigning
the stub resolvers running on client machines to improve the privacy of DNS. By
focusing on the component closest to, and within control of end users, we empower
the end users to have maximum control over their privacy. We show that our solu-
tion is readily deployable, simplifies the DNS architecture, and does not impair web
performance, and suggest ways to overcome potential scalability issues.
• Chapter 5 discusses our exploration of how latency plays a key role in online ad
auctions on the client-side. Header bidding (HB) is a relatively new online advertising
technology that allows a content publisher to conduct a client-side (i.e., from within
the end-user’s browser), real-time auction for selling ad slots on a web page. We
developed a new browser extension for Chrome and Firefox to observe this in-browser
auction process from the user’s perspective. We use real end-user measurements from
393,400 HB auctions to (a) quantify the ad revenue from HB auctions, (b) estimate
latency overheads when integrating with ad exchanges and discuss their implications
for ad revenue, and (c) break down the time spent in soliciting bids from ad exchanges
into various factors and highlight areas for improvement. For the users in our study,
we find that HB increases ad revenue for web sites by 28% compared to that in real-
time bidding as reported in a prior work. We also find that the latency overheads
in HB can be reduced or eliminated and outline a few solutions, and pitch the HB
8

platform as an opportunity for privacy-preserving advertising.
• Chapter 6 proposes Assertion-Carrying Certificates (ACCs). ACCs are TLS certifi-
cates that carry small programs in a meta-extension that add further validity con-
ditions to the browser’s existing conditions. Certificate Authorities, trusted entities
that sign TLS certificates, can use ACCs to enforce transitive constraints—constraints
that apply not only to certificates they directly sign but to all descendants—over all
certificate fields and the entire validation context. This allows certificate owners to
programmatically enforce stricter security requirements than existing browsers. We
present a high-level design of an ACC-enabled Public Key Infrastructure in which
constraints are expressed as Datalog programs, a prototype client implementation,
and preliminary evaluation results, before discussing the tradeoffs and challenges
involved in deploying ACCs.
• In Chapter 7, we summarize our findings and conclude with a brief discussion on the
role of latency on the web.
1.3 Limitations
In this work, we do not attempt to reduce the number of roundtrips required for protocol
tasks such as a TCP three-way handshake. While that line of work is critical, it is orthogonal
to efforts for reducing the time it takes to make one roundtrip. We limit our focus to long-
distance network latency. Large last mile latencies, arising potentially from coaxial cable,
WiFi, 4G etc., are a well-known problem that we do not discuss. The fiber Infrastructure
of the Internet is not being used optimally. While we explore alternatives to fiber, we do
not investigate the causes behind suboptimal use of existing fiber.
Single-page web applications, in contrast to web pages, use client-side rendering3. Typ-
ically, the server delivers code governing the application’s interface and client-side func-
tionality once, and the application then accesses web APIs to fetch content and perform
3See https://developers.google.com/web/updates/2019/02/rendering-on-the-web for detail.
9

user actions. User interactions in this case do not result in new page loads. Rather, one
or more API requests complete a user action. Web applications are similar to smartphone
applications in their interactions with the server’s API. In this work, we do not address
measuring the impact of latency on user experience in web and smartphone applications.
10

Chapter 2
Infrastructure Options for Saving Latency
Beyond the networking research community’s focus on protocol efficiency, reducing the
Internet infrastructure’s latency inflation is the next frontier in research on latency. While
academic research has typically treated infrastructural latency inflation as an unresolvable
given, we argue that this is a high-value opportunity, and is more tractable than may be
evident at first.
What are the root causes of the Internet’s infrastructural inefficiency, and how do we
ameliorate them? Large latencies are partly explained by poor use of existing fiber infras-
tructure: two communicating sites often use a longer, indirect route because their service
providers do not peer over the shortest fiber connectivity between their locations. We find,
nevertheless, that even latency-optimal use of all known fiber conduits, computed via short-
est paths in the InterTubes dataset [177], would leave us 1.98× away from c-latency [86].
This gap stems from the speed of light in fiber being ∼23c, and the unavoidable circuitous-
ness of fiber routes due to topographic and economic constraints of buried conduits.
We thus explore, in this chapter, some alternatives to fiber for long-haul connectivity.
We explore the viability of wireless electromagnetic transmission through microwave point-
to-point antennas for providing low-latency and low-bandwidth long-distance connectivity.
We also briefly discuss the potential of in-flight aircraft for providing ultra-low latency
connectivity between major population centers.
2.1 Acknowledgements
This chapter contains plots and discussion from joint work with Debopam Bhattacherjee,
Sangeetha Abdu Jyothi, Ilker Nadi Bozkurt, William Sentosa, Muhammad Tirmazi, An-
thony Aguirre, Balakrishnan Chandrasekaran, P. Brighten Godfrey, Gregory P. Laughlin,
11

day
delay (ms)
0
5
10
15
3 4 5 6 7
0 5 10 15 20
Orders / µs
fiber
late
ncy
main responseinitial response
c-la
tency
(a)
day
wind + rain (m/s + mm/hr)
delay - 4000 (µs)
delay 0
5
10
15
0 5 10 15 20
0 10 20 30 40 50
(b)
Figure 2.1: Analyzing trading data: (a) Heat map of order book events at delay
between Chicago and New Jersey. Response delay never exceeds 4.3 ms; (b) A coarse
weather signal (max wind speed + max rainfall) is correlated with the observed trans-
mission delay.
Bruce M. Maggs, and Ankit Singla. Parts of the work were published at the ACM Work-
shop on Hot Topics in Networks, 2018 [70], and the USENIX Networked Systems Design
and Implementation, 2022 [71].
2.2 Low-Latency Microwave Networking
To evaluate the characteristics of long-haul microwave links, we have conducted experiments
over one of the most popular nearly-speed-of-light networks deployed in the high-frequency
trading corridor between Chicago and New Jersey. We describe these experiments and their
results below. The HFT niche is partially characterized by a “winner-takes-all” dynamic
which requires these networks to operate at the bleeding edge of low latency. Hence, it is
important to quantify the usefulness of these networks in serving more generic low-latency
12

applications on the Internet, which have less-strict latency requirements than HFT, but
higher availability and lower packet loss demands.
2.2.1 Active measurements
We conducted active measurements over the microwave link between the Chicago Mercantile
Exchange (CME) data center and the Equinix data center in Secaucus, New Jersey, operated
by one of the fastest MW networks in the corridor. On weekdays, when the Chicago and
New York markets are open, the link carries financial information critical to high-frequency
trading that triggers trades worth billions of dollars. The networks are optimized for low
latency, with microseconds of advantage [72] providing a significant edge to customers.
We ran experiments for ∼7 hours every Saturday for 11 weeks between Nov. 2019, and
Oct. 2020 from one host each located in the CME and Equinix data centers. The microwave
link was provided to us without any Forward Error Correction (FEC), thus being exposed
to all errors and bit flips expected in radio transmission. We observe that the link behavior
tends to be in one of two states: losses are either very low (normal) or very high (degraded).
Out of a total of 72 hours of measurements, there are 12 hours during which the link is
degraded due to weather, and 4 hours during which it is down due to maintenance or other
issues. Note that because there is no FEC at all, very small bit error rates (BER) degrade
the link. Also, in our trading data analysis (§2.2.2), we see that microwave networks stay
up in worse weather conditions than these 12 hours. FEC is needed in packet headers to
correct for bit errors, which we could not implement as we did not have access to routers
on the network.
RTT and bandwidth
The geodesic distance between the CME and Equinix data centers is 1139.5 km. The c-
latency for a roundtrip, then, is 7.6 ms. In our experiments over 11 weeks, we always observe
a roundtrip time of 7.7 ms for 32-byte packets, i.e., within 1.5% of c-latency. The RTT
goes up to 7.9 ms for 1,499-byte packets because of the limited bandwidth available on the
13

link (or more specifically, the slice of it provided to us).
The 0.1 ms increase in transmission delay as packet size increases by 1,467 bytes gives
a bandwidth estimate of 120 Mbps. Our UDP measurements and TCP measurements,
in the best case, also give us a bandwidth of 120 Mbps. It is hard for TCP to sustain
throughput at this rate in the absence of any FEC because of transmission losses. While
the operator did not divulge the exact link capacity, it is likely that our network access
was capacity-capped. Hence, these measurements only provide a lower bound on the link
bandwidth.
Loss and FEC
In plain TCP (iperf) and ICMP (ping) probes, we observe high loss rates: typically around
3% to 5% for 32-byte packets. The packet loss rate increases sharply as packet size increases
because more bits can potentially be corrupted in transmission. Without FEC, a link with
loss rate this high is clearly unsuitable for web traffic [565]. Whether FEC can bring the loss
rate down to an acceptable level (say, 0.1%) at reasonable latency and bandwidth overhead
depends on two factors: 1. the Bit Error Rate (BER), and 2. the typical length of error
bursts, i.e., how many consecutive bits are corrupted in an error burst. We elaborate on
these factors below.
First, we derive the underlying BER from observed ping packet loss. For a ping packet
of s bytes, a successful response is observed when both the echo request and reply packets
are delivered to the respective hosts without any errors. To estimate the BER berr, we first
assume that bit errors are uniform and random. Then, for packet loss rate ploss, we get:
berr = 1− (1− ploss)1/(2×8×s)
For initial validation of this model, with the possibly unjustified assumption of random
and uniform errors, we calculate berr from observed ploss for s = 1,499 for the 7 hours of
measurements on Feb. 15th, 2020. Then, we use the calculated berr to predict ploss for
s = 396 on the same day. We compare the predicted and observed values in Fig. 2.2a.
14

While the observed and predicted loss rates for s = 396 largely agree, there are some
disagreements, e.g., at 12:30, which can be explained by the fact that the observations for
s = 1,499 and s = 396 are separated in time by 60 seconds. The underlying BER might
change during this interval. For Feb. 15th, the median, 95th percentile, and maximum BER
we calculate are 3.6× 10⁻⁵, 8.2× 10⁻⁵, and 3.6× 10⁻⁴ respectively.
For a target packet loss rate of 0.1% for packets of size 1,500 bytes, the BER needs to
be 4.17 × 10⁻⁸ or lower. Extremely lightweight FEC codes, such as Reed-Solomon (255,
239) can correct from BER of 10−4 to 10−12 with a bit rate overhead of only 7% [451]. If
performed over 255 byte blocks, a 1,500 byte packet can be encoded in 7 blocks with a total
redundancy overhead of 112 bytes. At 120 Mbps bandwidth, this incurs a latency penalty
of only 7.5 µs. This FEC scheme would break down, however, if errors occurred in bursts of
around 8 bytes or more. Now we discuss the earlier assumption of error bursts being short
and uniformly distributed.
To analyze bit errors, we sent two sets of UDP probes over the link: the first set
consists of 60 byte packets sent at 35 packets per second (slow), and the second consists
of 60 byte packets sent at 200,000 packets per second (fast). The slow set characterizes
link behavior with no congestion/bandwidth related losses, whereas the fast set provides
statistical significance to rare bit flip events. In contrast to ping losses, losses in this
experiment are observed through packet captures rather than at the application layer, so a
corruption of, e.g., the UDP destination port would not register a loss. For the slow set, we
observe a packet loss rate of 0.8%, whereas for the fast set we observe a loss rate of 2.04%.
In the UDP fast set a packet has 4 bytes of payload, 8 bytes of UDP header, 20 bytes
of IP header, 14 bytes of Ethernet header, and 14 bytes of padding. A total of 1.6 billion
packets were sent, out of which 2.66 million were received on the other end with at least
one of the following fields corrupted: source port, destination port, UDP header length
field, and payload. We calculate the Hamming distance between the received value and the
expected value of the corrupted fields. As Table. 2.2b shows, there appears to be a linear
relationship between field size and number of corruptions, and over 99% of all corruptions
15

consist of 2 bit flips or less. Also, if we extrapolate the errors we observe in these 4 fields
to the rest of the 60 byte packet, the expected loss rate due to corruptions in the Ethernet
and IP headers and padding matches that observed in the UDP slow set. The other 1.24%
packets lost can thus be explained by congestion/bandwidth issues.
2.2.2 Trading data analysis
To characterize the latency and up-time of the full range of microwave links deployed in
the Chicago-New Jersey corridor, we analyze trading data from the Chicago Mercantile
Exchange (CME) in Chicago, Illinois, and the CBOE Options Exchange in Secaucus, New
Jersey. Information about trades happening at the CME travels over microwave paths
and triggers activity at the CBOE [72]. The time difference between stimulus events at
the CME and the response at the CBOE represents the network latency between the two
exchanges. Laughlin et al. have also used this methodology to estimate latency between
financial markets [315].
We obtained tick data from CME and CBOE for three weeks of Mar. 2019. The tick
data consists of microsecond precision timestamps for events at both ends. Both markets
are open simultaneously for 6.5 hours every weekday, which means that we have 97.5 hours
of relevant tick data. For each trade executed at the CME at timestamp t, we count the
number of order book events at the CBOE at timestamps t + i where i ∈ [3000, 7000] µs.
Fig. 2.1a plots a heat map of the number of orders per µs for each 10 µs bin in the tick
data. The y-axis time is in intervals of 15 minutes. Analysis of the data shows that the
main response delay, which reflects the network latency between CME and CBOE, does
not exceed 4.3 ms for any 15-minute interval. The lowest fiber latency between the two
exchanges is 6.65 ms [350]. This shows that some microwave networks were up through
every 15-minute interval over the 3-week period.
In addition to the main response at 4.2 ms, Fig. 2.1a has a smaller initial response at
4.0 ms. The CME tick data reveals that internal trading algorithms and strategies produce
a second stimulus at CME 200 µs after the initial stimulus. The main response in Fig. 2.1a
16

is triggered by that second stimulus.
0
25
50
75
10:00 12:00 14:00 16:00
Lo
ss (
%)
Time (hr)
1499 obs396 obs
396 pred
(a)
Field #corrupt #bits 1 flip 2 flips
src port 873,165 16 84% 15%
dst port 864,955 16 82% 17%
length 914,528 16 85% 14%
payload 1,734,539 32 84% 15%
(b)
Figure 2.2: (a) Predicting loss rate of 396 byte packets from observed loss rates of
1,499 byte packets on Feb 15th, 2020. (b) Corruptions observed in the UDP fast set.
We consider the delay between the second stimulus at CME and the main response at
CBOE as transmission delay. We calculate the transmission delay for every 1-hour interval
in the tick data. Fig. 2.1b plots the moving average of transmission delay over 2 hours. We
use the hourly wind speed estimate [154] and rainfall data [130] in the regions through which
the MW corridor passes as a coarse weather signal. For each hour, we pick the maximum
wind speed and maximum rainfall observed at a granularity of ∼ 10 km along the geodesic
between the end points. Fig. 2.1b plots wind speed + rainfall /2, and shows that there
is some correlation. The Pearson correlation coefficient between wind and delay is 0.24,
while that between rain and delay is 0.16. Sources of noise in this correlation include the
noise inherent in the trading data itself, and issues that may affect transmission delay, such
as infrastructure damage or operational downtime. Note that days 3 and 14 have more
severe rain and wind than the 12 hours during which the link was degraded in our active
measurements (§2.2.1).
Conclusions: From the active measurements, we conclude that for our MW path,
17
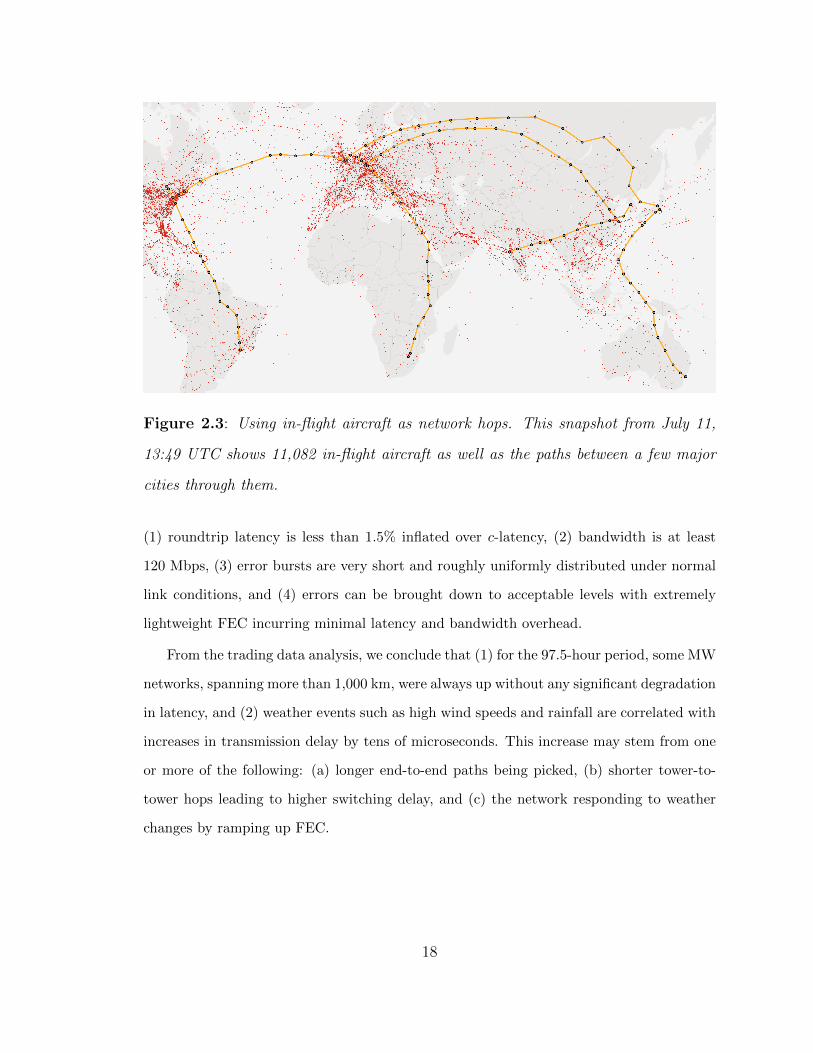
Figure 2.3: Using in-flight aircraft as network hops. This snapshot from July 11,
13:49 UTC shows 11,082 in-flight aircraft as well as the paths between a few major
cities through them.
(1) roundtrip latency is less than 1.5% inflated over c-latency, (2) bandwidth is at least
120 Mbps, (3) error bursts are very short and roughly uniformly distributed under normal
link conditions, and (4) errors can be brought down to acceptable levels with extremely
lightweight FEC incurring minimal latency and bandwidth overhead.
From the trading data analysis, we conclude that (1) for the 97.5-hour period, some MW
networks, spanning more than 1,000 km, were always up without any significant degradation
in latency, and (2) weather events such as high wind speeds and rainfall are correlated with
increases in transmission delay by tens of microseconds. This increase may stem from one
or more of the following: (a) longer end-to-end paths being picked, (b) shorter tower-to-
tower hops leading to higher switching delay, and (c) the network responding to weather
changes by ramping up FEC.
18

2.3 Potential of In-Flight Aircraft
A new space race is imminent, with several industry players working towards satellite-
based Internet connectivity. While satellite networks are not themselves new, these recent
proposals are aimed at orders of magnitude higher bandwidth and much lower latency,
with constellations planned to comprise thousands of satellites. These are not merely far
future plans — the first satellite launches have already commenced, and substantial planned
capacity has already been sold. It is thus critical that networking researchers engage actively
with this research space, instead of missing what may be one of the most significant modern
developments in networking.
In our first steps in this direction, we find that this new breed of satellite networks could
potentially compete with today’s ISPs in many settings, and in fact offer lower latencies
than present fiber infrastructure over long distances. We thus elucidate some of the unique
challenges these networks present at virtually all layers, from topology design and ISP
economics, to routing and congestion control.
Recent work [16] proposed an opportunistic, delay-tolerant network to extend Internet
coverage to remote areas using existing commercial flights. We examine the potential of
this approach in a different context, i.e., reducing latency; and contrast its capabilities with
LEO satellite networking.
Given the low bandwidth and ultra-low latency requirements of the HFT industry, we
also considered the idea of using aircraft in flight to connect major exchanges around the
world. Wi-Fly [16] proposes a commercial air transport based opportunistic network to
provide coverage to remote areas. We use a similar idea, albeit in a different context, to
reduce global latencies.
We used the FlightAware API [5] to get the positions of all airborne aircraft at any
time. We collected such snapshots every 15 minutes for two days. Considering that flights
follow similar daily patterns, we believe this data to be representative. We removed all
updates that were older than 15 minutes, or for which the altitude was reported to be less
than 50 meters. We removed all aircraft with reported altitude lower than 50 meters. We
19

then evaluate instantaneous connectivity between desired pairs of ground locations through
a series of aircraft in the sky at that moment, assuming microwave radio communication
as the medium. We repeat this exercise every 15 minutes for two days to observe how this
connectivity evolves over time.
To evaluate instantaneous connectivity, we use an A* heuristic search to find a path
composed of in-flight aircraft as hops between the target ground locations. The A* search
heuristic we use is the straight line distance from each airplane to the destination. Aircraft
are treated as neighbors if they have line-of-sight visibility. This is determined by calculating
the distance each plane can see ahead on the earth’s surface based on its altitude, and if
the sum of these distances for any two planes is less than their distance from each other,
they are visible to each other. This method does not account for atmospheric refraction,
which increases visibility, so it is somewhat conservative. We also assume that the planes
communicate at frequencies low enough for haze and clouds to not disrupt communication.
For this brief analysis, we ignore other obstructions and terrain (which should be minor
factors given most aircraft in air are at around 10 km.)
The performance of this approach for several large city pairs as the end points is sum-
marized in Tab. 2.1, and also visualized in one snapshot in Fig. 2.3. We find that for some
city pairs, 100% availability of connectivity is not achievable, but when connectivity exists,
it is often low latency, with average inflation over geodesic distance being small for most
city pairs tested. This is because this method avoids most of the altitude overhead that
LEO satellites incur.
This approach is thus unlikely to be suitable for global Internet connectivity, with
LEO satellites being a more suitable choice. However, for niche industries like HFT, this
approach could be promising. In particular, using aircraft to connect several of the ”$1
Trillion Club” of stock exchanges (to which the cities in Table 2.1 belong) could be feasible.
Although widely geographically separated exchanges, like the Johannesburg Stock Ex-
change in South Africa only show intermittent connectivity, exchanges in NYC, London,
Tokyo, Shanghai, Mumbai, Frankfurt etc. show 100% connectivity. Table 2.1 shows avail-
20

Table 2.1: Availability and average latency between several major cities using in-
flight aircraft over a 2-day period.
Link Availability Inflation Hops
NYC-London 100.00% 0.99% 13.48
London-Tokyo 100.00% 5.71% 21.07
Shanghai-Frankfurt 100.00% 0.63% 19.22
Mumbai-Seoul 100.00% 2.65% 13.56
Toronto-Sao Paulo 98.97% 10.49% 19.55
Sydney-Tokyo 96.41% 21.63% 19.82
Amsterdam-Johannesburg 35.38% 15.69% 22.94
ability and stretch for different pairs of exchanges. Figure 2.3 shows these links at a point
in time where all exchanges have available paths.
2.4 Related Work
Networking research has made significant progress in measuring latency, as well as improv-
ing it through transport, routing, and application-layer changes. However, the underlying
infrastructural latency has received little attention and has been assumed to be a given.
This chapter explored some options for reducing infrastructural latency demonstrating that
improvements are indeed possible.
There are several ongoing Internet infrastructure efforts, including X moonshot fac-
tory’s project Taara [564], Facebook connectivity’s Magma [196], Rural Access [197], Ter-
ragraph [198], and the satellite Internet push by Starlink [488], Kuiper [307], Telesat [507],
and others. Project Taara consists of networks under deployment in India and Africa, based
on free-space optics, and described as “Expanding global access to fast, affordable internet
with beams of light”. While Facebook’s Magma and Rural Access aim to extend connectiv-
21

ity to rural areas by offering a software, hardware, business model, and policy framework,
Terragraph aims to extend last-mile connectivity to poorly connected urban and suburbans
areas by leveraging short millimeter-wave hops. Free-space networks of this type will likely
become more commonplace in the future, and these works are further evidence that many
of the concerns with line-of-sight networking can indeed be addressed with careful planning.
Further, cISP’s design approach is flexible enough to incorporate a variety of media (fiber,
MW, MMW, free-space optics, etc.) as the technology landscape changes.
“New Space” satellite networks: While low-Earth orbit (LEO) satellite networks can
reduce long-distance latency [70, 243, 294], current deployments are more targeted at last-
mile connectivity than long haul [75]. Starlink recently claimed to offer last-mile roundtrip
latency of 31 ms [491], more than 3.8× the latency estimated in prior simulations [70],
showing that the service is not yet latency optimized.
To the best of our knowledge, the only efforts primarily focused on wide-area latency
reduction through infrastructural improvements are in niches, such as the point-to-point
links for financial markets [315], and isolated submarine cable projects aimed at shortening
specific Internet routes [385,390].
2.5 Summary
Low-latency Internet not only promises significant benefits for present-day applications,
but also opens the door to new possibilities, such as eliminating the perception of wait
time in our interactions over the Internet [84]. Our experiments show that augmenting
the Internet’s fiber infrastructure with line-of-sight wireless networking could provide a
low-latency and low-bandwidth channel.
The enabling technology of low-latency multi-hop microwave networks was spurred on
by HFT only within the last 10 years, and even then it has not been a priori obvious that
the challenges of relatively high loss and low bandwidth could be overcome to leverage such
links for an Internet backbone. More importantly, the Internet has become increasingly
22

latency-limited due to increasing bandwidths and greater use of interactive applications.
Thus, we believe we have reached an exciting point in time when greatly reducing the
Internet’s infrastructural latency is not only tractable, but surprisingly cost-effective and
impactful for applications.
23
Chapter 3
Internal Pages in Web Measurement
Any attempt to quantify a characteristic of a web site raises the following question: What
page or pages of the site should be used for the quantification? A cursory review of a
decade’s worth of literature on web performance measurement and optimization (abbrevi-
ated, henceforth, as web-perf.) reveals that, until now, the implicit answer to that question
has been the landing page. The landing page (i.e., root document, “/”) of a web site is
quite important. It serves as the primary gateway through which users discover content on
the site. But internal pages (i.e., non-root documents) are often equally important. For
example, the content consumed by users (e.g., articles on news web sites and posts from
friends on social media platforms) are typically served on internal pages. This importance
is also reflected, for instance, in the attention paid to internal pages in search engine opti-
mization, which helps publishers in monetizing their content by driving traffic to their web
sites from search engines [211]. Why, then, is it the case that almost all prior web-perf.
studies ignore the internal pages and focus only on the landing pages of web sites?
Prior work implicitly assumes that the performance measures and optimizations of land-
ing pages generalize to most, if not all, internal pages. We use the term “web performance
study,” to refer loosely to a broad range of efforts: characterizing one or more aspects of
web pages (e.g., distribution of different types of objects, prevalence of ads and trackers,
and adoption of specific security features), estimating and improving the load and display
times of pages, and evaluating novel optimizations to reduce the page-load times. To mea-
sure or optimize web page performance, studies typically use one or more rank-ordered lists
or top lists of web sites, e.g., Alexa [31] and Quantcast [430]. The top lists provide only the
domain name of a web site, such as nytimes.com or www.wikipedia.org. After choosing
a web site from a top list, researchers typically use the landing page of that site in their
experiments. Every aspect of these web-perf. studies—metrics, optimizations, evaluation
24

techniques, and even characteristics of top lists—has faced extensive scrutiny [343,412,456],
except one: the exclusion of internal pages.
The exclusion of internal pages might have been intentional. The rationale might be that
the differences between landing and internal pages, if any, are random—a simple statistical
problem remedied by measuring a large number of landing pages. It may also be that the
page-type differences are common knowledge and the studies are page-type agnostic. This
chapter casts doubt on both rationales.
We compare the landing page of a web site with several internal pages of that site and
repeat the analyses for 20,000 pages from around 1000 web sites. We show that internal
pages differ substantially in content and performance from landing pages; internal pages
also vary significantly from one another. The differences between the two page types also
vary based on the popularity rankings of web sites. We manually review more than a
hundred web-perf. studies published at top-tier networking venues and demonstrate that
a significant fraction of them are affected by the exclusion of internal pages: to apply to
internal pages, more than two-thirds of the relevant studies would have to revise their
claims to avoid over-generalized insights or assertions. Hence we urge that all future web-
perf. work analyze both landing pages and internal pages.
While there is no ambiguity in choosing landing pages, since there is only one per web
site, the recommendation that all web-perf. studies should include internal pages poses a
non-trivial challenge: How can we select a set of “representative” pages from the available
internal pages of a web site? To address this challenge, we exploit the key objective behind
web perf. studies—improving users’ browsing experience. Given this intent, it is only
logical to select internal pages visited by real users. Thus, we use search engines to find
“popular,” or frequently visited internal pages of web sites; we assume that these pages
are representative of the typical internal pages that users visit at these sites. To this end,
we created Hispar (dσ), a new top list that includes landing as well as internal pages of
different web sites. Unlike current top lists, which provide only the domain names of web
sites, Hispar comprises complete URLs of both landing pages and a subset of internal web
25

pages. We use Hispar to characterize the differences between landing and internal pages of
web sites and ascertain their impact on prior work.
We summarize our contributions as follows.
? We create Hispar with around 1000 highest-ranked web sites (H1K) from the Alexa
Top 1M, selecting for each the landing page and at most 19 frequently visited internal pages.
Hispar uses search engine results for discovering internal pages. Our experiments against
H1K reveal that internal pages of a web site not only differ substantially from the landing
page, but also from one another. We release our data set for use by other researchers [252].
? We describe the page-type differences in detail and highlight the implications of each
for prior work. For the latter, we review more than a hundred web-perf. measurement
and optimization studies published at five premier networking conferences over the past
five years, from 2015 to 2019, and show that two-thirds of the relevant publications would
require some revision for the results to apply to internal pages.
? We expand H1K to generate a much larger list, H2K, that includes about 2000 web
sites, with one landing and at most 49 internal web page URLs for each web site. We release
H2K and the tools for recreating or customizing Hispar as open source artifacts [252]. We
discuss the stability of Hispar, present the economic feasibility of our approach, and outline
alternative approaches for creating the list.
We hope that our findings and recommendations serve as a “call to arms” to the net-
working community to include internal pages when measuring and optimizing the web.
3.1 Acknowledgements
This chapter contains plots and discussion from joint work with Balakrishnan Chandrasekaran,
Bruce Maggs, and Anja Feldmann. The work was published at the ACM Internet Mea-
surement Conference, 2020 [51].
26

Figure 3.1: Nearly two-thirds of the web-perf. studies that use a top list and were
published between 2015 and 2019 at 5 top-tier networking venues would require some
revision for them to apply to internal pages.
Venue Pubs.#using Revision Score
top list Maj. Min. No
IMC 214 56 9 23 24
PAM 117 27 7 10 10
NSDI 222 11 6 4 1
SIGCOMM 187 9 1 6 2
CoNEXT 180 16 7 5 4
3.2 Impact on Previous Studies
We conducted a brief survey of research on web performance measurement and optimization
published at top-tier conferences and focused on answering two questions: (a) How prevalent
is the use of internal pages in such prior studies? (b) For studies that focus only on landing
pages, would the inclusion of internal pages impact their claims or insights?
We reviewed papers published from 2015 to 2019 at five premier networking venues,
namely ACM Internet Measurement Conference (IMC), Passive and Active Measurement
Conference (PAM), USENIX Symposium on Networked Systems Design and Implementa-
tion (NSDI), ACM Special Interest Group on Data Communications (SIGCOMM), and
ACM Conference on emerging Networking EXperiments and Technologies (CoNEXT). We
collected 920 papers in total and programmatically searched the PDF-versions of these pa-
pers for terms related to the five widely used top lists in the literature, viz., Alexa [30],
Majestic [354], Umbrella [516], Quantcast [431], and Tranco [412]. We then manually in-
spected the papers with one or more matching terms to weed out false positives, e.g., papers
that mention “Alexa” Dot and have nothing to do with the “Alexa” top list, and those that
27

mention a top list only when discussing prior work. After eliminating these false positives,
we were left with 119 papers that used at least one of the top lists.
We manually reviewed each of these 119 papers to determine whether they used internal
pages. We found that only 15 (12.6%) of the papers implicitly or explicitly use internal
pages in their experiments. Seven papers, for example, analyzed web-browsing traces of
users, and we assume that the URLs in these traces include both landing and internal
pages of different web sites. Another set of eight papers, involving active measurements,
took measures to include internal pages, either by recursively crawling a web site or monkey
testing (e.g., randomly clicking buttons and links, and typing text to trigger navigation).
The remaining 104 (87.4%) papers ignored internal pages in their studies.
We evaluated the remaining 104 papers to ascertain how their claims and insights might
change had they included internal pages in their experiments. We captured the extent of
this change via a revision score (refer Tab. 3.1) that takes one of three values, viz., No
revision, Minor revision, and Major revision, on an ordinal scale.
No revision implies that the differences between page types are irrelevant for the
study. We assign this label to a study if, for example, it is a trace-based study and uses a
top list only to rank the web sites in the trace [37] or uses landing pages from a top list,
but mixes in data from other sources to compose their data set [221].
Minor revision implies that although a given study uses a top list, its insights are not
based solely on landing pages. Berger et al. [69], for example, uses landing pages to evaluate
their system, but they also conduct three other types of evaluation that are independent
of or agnostic to page types. Similarly, one of the evaluation methods in [467] uses only
landing pages from a top list to measure the performance overhead of their system.
Major revision implies that a given research work focuses chiefly on web page per-
formance but excludes internal pages, or uses only landing pages to evaluate their pro-
posals. Netravali et al., for instance, propose a web page delivery optimization and use
only landing pages to measure the improvement in page-load times brought about by the
optimization [386]. Snyder et al. report on the usage of JavaScript features by the Alexa
28

Top 10K web sites, but only measure the landing pages of these web sites to detect feature
usage [478].
From the 119 publications we review, we label 41 (34.5%) papers as requiring no revision,
48 (40.3%) as requiring a minor revision, and 30 (25.2%) papers as requiring a major
revision. In short, the claims and insights of nearly two-thirds of all web-perf. publications
published in the last five years in these five venues would need at least a minor revision
in order to apply to internal pages. We also find that most papers do not comment on
whether results derived from the analysis of landing pages also apply to internal pages.
Caveats. Our survey is limited to five venues, but these are top-tier conferences with a
high bar for research quality. Although the majority of web-perf. studies published at these
venues ignored internal pages in their experiments, it is hard to generalize our findings to
other venues without further investigation. Lastly, while the revision scores are coarse and
subjective, they are instructive for understanding the ramifications of this work.
3.3 The Hispar Top List
To determine whether landing and internal pages of web sites differ significantly, ascertain
how they differ, and investigate any implications for web performance measurement and
optimization, we created a new top list, called Hispar (dσ). Unlike typical top lists, Hispar
consists of a list of URL sets, one for each web site. The URL set for a site comprises the
landing page as well as a subset of the site’s internal pages.
We bootstrap Hispar from a top-ranked subset of the Alexa Top 1 million [30] list
(A1M) by replacing each domain in the latter with the landing page as well as a set of
internal pages from the corresponding web site. While obtaining the landing-page URL
for each web site in A1M is straightforward, retrieving the internal-pages’ URLs introduces
several challenges. It is infeasible to exhaustively crawl all internal pages of all web sites.
Performing an exhaustive crawl even on a small scale may be unethical. It may introduce
fake page visits or ad impressions, distort the statistics that the web site collects, increase
29

the load on the web server, and cost the web site money by creating bandwidth costs. We
limit, hence, the set of internal pages per web site to at most N pages.
In the absence of a content provider’s support in selecting a set of representative internal
pages from their web site, we turn to search engines. Specifically, we use the Google Search
Engine API [232] to discover a set of at most N internal pages for each web site. We
opted for search-engine results as they are biased towards what people search for and click
on [361]. The measurements conducted and optimizations tested on such internal pages
are, hence, likely to reflect and improve the browsing experience of real users. Prior work
has used search-engine queries with satisfactory results [389], and this method allows us to
avoid exhaustive crawls.
Starting with the most popular site listed in A1M, we examine the sites one-by-one until
Hispar has enough pages. For each web site ω, we used the Google Search Engine API for
the term “site:ω.” We fix the user’s location for the search queries to the United States,
and limit the search results to pages in the English language. We restrict our searches to
web page URLs and filter out files such as PDF and Word documents. We drop any ω for
which there are fewer than 10 results, which is typically the case with international web
sites that have very few pages in English. We collect the top N unique web-page URLs
(including the landing page) from the search results for each ω.
Using the above methodology, we generated Hispar containing 100,000 web page URLs.
Referred to as H2K, the list contains at least 2000 URL sets of size N = 50, one for each
web site. Each URL set contains one landing and at most 49 internal pages. We refresh
H2K once every week, and make the lists publicly available for researchers. The size and
refresh rate are limited to reduce the cost of publishing this (free) list. We release the tools
and artifacts required for regenerating or customizing the lists [252].
We think the list size is sufficient as 93% of studies that received a major revision score
in our survey (in §3.2), i.e. studies that would benefit most from this list, measured 100,000
or fewer pages. We refresh H2K every Thursday at 11AM UTC. We avoid weekends, since
weekly patterns in Internet traffic affect the A1M list [456], which we use for bootstrapping
30

H2K. We also do not randomize the day of the week to keep the frequency of updates static.
Why “Alexa” and not others? The choice of using the Alexa top list to bootstrap Hispar
is somewhat arbitrary. Alternatives include Cisco Umbrella [516], Majestic million [354],
Quantcast [431], and Tranco [412]. Cisco Umbrella ranks web sites based on the volume of
DNS queries issued for the domains as well as the number of unique client IP addresses re-
questing a domain’s resolution [264]. The fully qualified domain names (FQDNs) in the list,
as a consequence, do not necessarily reflect end-user browsing behavior: on 2019-06-15,
4 of the top 5 entries, for instance, were Netflix domains. Majestic ranks web sites by
the number of unique IP subnets hosting servers that serve pages containing links to a
domain, which is more of a measure of quality than traffic [353]. Tranco combines four lists
including Umbrella and Majestic [412], which we did not want to use. Between Alexa and
Quantcast, we chose Alexa because of its popularity: only 10 (or 8.4%) out of 119 papers
in our survey (§3.2) use a top list other than Alexa. The justification notwithstanding, our
study is agnostic to which top list is used for bootstrapping Hispar, since none of the top
lists include internal pages.
Why use search engine results? Alternative ways of discovering a web site’s internal
pages include, for instance, exhaustively crawling the web site, collecting links posted on
blogs and/or social media, and gathering frequently visited internal pages from site-traffic
metrics maintained by web sites or reported by browsers. We preferred search engine
results as they combine all three of the above approaches: Search engines routinely crawl
web sites exhaustively (except pages disallowed via robots.txt [302]), collect links posted
on other web sites to rank results (e.g., Google’s PageRank [446]), and track internal pages
frequently searched and visited by users [361]. Also, more than two-thirds of “trackable”
web traffic comes from search engines [88], where trackable implies that the user reached
the concerned web page from another web site (as opposed to entering the page’s URL
directly in the browser or clicking a bookmark). Additionally, search engine results have
empirically proven to be fairly stable, and stability is a desirable property of a top list [343].
31

On the stability of H2K
H2K is different from existing top lists in that it has a two-level structure: web sites at the
top and the web pages (or URL sets) of those sites at the bottom. The top level will inherit,
naturally, the stability (or churn) of the top list used for bootstrapping—A1M in this case.
We observe, for instance, a 20% mean weekly change in the web sites that appear in H2K.
This change is directly inherited from the Alexa top 5K list, a subset of A1M, that was used
to bootstrap H2K. Prior work also observes that the Alexa Top 5K list experiences about
10% daily change [456].
Additionally, H2K may also experience a churn at the bottom level: The set of N
(internal-page) URLs, selected from search results, in each URL set at the bottom level
may change over time. We estimate the weekly churn as the fraction of (internal-page)
URLs present in the list on week i, but not on week i + 1 for web sites present on both
weeks. In computing this churn, we assume no ordering among the pages at the bottom
level; although the search results are ranked, we advise against assigning any meaning to
the ordering of the URLs in a URL set.1 We use this weekly churn to characterize the
stability of H2K.
Across a 10-week period starting in February 2020, H2K experiences a 30% weekly churn
in the internal pages at the bottom level. It is not surprising that inclusion of internal pages
introduces additional churn: nytimes.com consistently remains a popular web site, but its
news headlines change multiple times in a day. Perhaps the churn in internal pages is even
desired as the list should ideally reflect the changing internal states of the web sites it is
representing. By comparison, a subset of A1M of the same size as H2K, Alexa top 100K,
experiences a mean weekly change of 41% in web sites over the same period. The higher
churn in A1M has not been a hindrance to using it in web-perf. studies. If the churn in
internal pages in H2K is deemed too high, we can improve the list’s stability by using the
same techniques that are used to improve the stability of top lists—averaging the results
over longer periods of time as Pochat et al. suggest [412].
1Search engines do not reveal the exact metric by which the search results are rank ordered.
32

0
0.2
0.4
0.6
0.8
1
-6 -4 -2 0 2 4 6
CD
F
L.size – I.size (MB)
H1KHt30
(a)
0
0.2
0.4
0.6
0.8
1
-400 -200 0 200 400
CD
F
L.#objects – I.#objects
H1KHt30
(b)
Figure 3.2: Overview of differences between landing (L) and internal (I) pages: For
web sites in H1K (Ht30), (a) 65% (54%) have landing pages that are larger than the
median size of their internal pages; (b) landing pages of 68% (57%) have more objects.
0
0.2
0.4
0.6
0.8
1
-4 -2 0 2 4
CD
F
L.PLT – I.PLT (s)
H1KHt30
(a)
0
0.2
0.4
0.6
0.8
1
0 1 2 3 4 5
CD
F
Speed Index (s)
InternalLanding
(b)
Figure 3.3: (a) For web sites in H1K (Ht30), page-load times of landing pages are
smaller for 56% (77%); (b) Content on landing pages displays, in the median, 14%
faster than that on internal pages (D=0.01).
33

3.3.1 The H1K, Ht30, Ht100, and Hb100 Lists
For the purposes of this study, we created a smaller version of Hispar, namely H1K, with
1000 web sites. We bootstrapped H1K using the A1M list downloaded on March 12, 2020.
The URL set for each web site in H1K consists of one landing page and at most 19 internal
pages, comprising 20,000 web pages in aggregate; if the search for internal pages on a site
revealed less than 5 results, we dropped that site. In addition to making the measurements
more tractable, the smaller top list makes our experiments similar to that of studies that
received a “major” revision score in our survey: 60% of such studies use 1000 or fewer web
sites, and 77% use 20,000 or fewer web pages. To demonstrate how the differences between
the landing and internal pages change based on the popularity ranking of web sites, we
also use three different subsets of H1K: The lists Ht30 and Ht100 consist of the URL sets
of the top 30 and 100 web sites, respectively, of H1K, while the Hb100 contains those of the
bottom 100 web sites of H1K.
We fetched web pages in H1K by automating the Mozilla Firefox browser (version 74.0),
using the tools from Enghardt et al. [190]. We performed the page fetches from an Ubuntu
18.04 server with an Intel 8-core i7 processor and 32 GB of RAM. We shuffled the set of all
landing pages, iterated over this set 10 times, and fetched each page with an empty cache
and new user profile. We then shuffled and fetched the internal pages in a similar manner,
except we fetched the internal pages for each web site only once.2
After each web-page visit using the automated browser, we collected the HTTP Archive
(HAR) files [534] from the browser and data from the Navigation Timing (NT) API [535].
The HAR files provide various details (e.g., response size and time) about resources fetched
when loading a page, while the NT data provides performance measures of the web page
fetch and load. To compare and contrast different characteristic features of internal pages
with those of landing pages, we typically compute the cumulative distribution function
(CDF) of each such feature for each of the two page types and compare these CDFs. The
2Our intent is to compare the observations in two categories—landing and internal pages. The number of individual
samples in the latter suffices to capture the variance in observations, making it unnecessary to repeat the fetches.
34

“landing” CDF is computed over 10,000 values, while the “internal” CDF is computed
over 19,000 values. For each such comparison, we also present the p-values (D) from a
two-sample Kolmogorov-Smirnov test [413], with the null hypothesis of the test being that
the CDFs are not significantly different (i.e., they have both been drawn from the same
underlying distribution). A low D value, hence, indicates a high statistical significance, i.e.,
it is less likely that the samples were drawn from the same distribution.
Ethical considerations. Our measurements do not involve real users or include any person-
ally identifiable information. When gathering these measurements, we avoided exhaustive
crawls of web sites to induce minimal load on the web servers and infrastructure. Mea-
surements over H1K involve 30 page fetches per web site, spread over 5 days. For the
limited-exhaustive-crawl experiments in §3.4, we fetched 500 pages each for 5 web sites.
These fetches were also spread out such that there was at least a 5-second gap between
consecutive page fetches. In the unlikely scenario where our web-page fetches impose undue
load on a web server, we took measures to facilitate web-site owners or administrators to
opt out of our experiments. To this end, we modified the HTTP User-Agent header of our
automated browser to include a URL pointing to our project web page. The project web
page describes who we are, the intent behind the crawl, and a procedure to opt out of the
crawls. We did not, however, receive any opt-out requests, presumably because our crawl
volumes were negligible for an Alexa-ranked web site.
Limitations. First, our methodology has a sample bias of selecting the top roughly 2000
web sites from the A1M list. We also note that the magnitude of the differences we observe
may not generalize well to less popular web sites. Second, we do not measure internal pages
that are behind a user log-in, such as the Facebook news feed. Such pages may drastically
differ from the landing page as well as other internal pages. Third, we measure all pages
with a “cold” browser cache, which means that objects fetched while loading the landing
page of a web site do not affect the loading times of internal pages that may also host a
subset of these objects. Lastly, whether most users navigate to internal pages through the
landing page, or through direct links on search engine results and other web sites, remains
35

0
100
200
300
400
WP TW NY HS AC
#objects
Internal Landing
(a)
0
2
4
6
8
10
WP TW NY HS AC
size
(M
B)
Internal Landing
(b)
Figure 3.4: Limited exhaustive crawls of five web sites, Wikipedia (WP), Twitter
(TW), New York Times (NY), HowStuffWorks (HS) and an academic web site (AC),
show that internal pages differ from landing pages and from each other in (b) number
objects and (c) page size.
unknown to us.
3.4 Overview of Differences
While two arbitrary web pages from the same web site may share some common objects
and resources, they may have also significant differences in structure, size, and content. In
this section, we present the high-level differences between landing and internal pages that
we discovered.
Differences in size and object count
We begin with a focus on two questions: (a) Are landing and internal pages similar in size,
on average? and (b) Do landing and internal pages have similar structure, on average?
We defined the size of a web page as the aggregate size of the constituent objects (i.e.,
the sum of sizes of all entries in the corresponding HAR file) comprising that page. For each
web site ω in H1K, we measured the difference in size between the landing page (i.e., the
36

median size observed across 10 page loads) and the median size of the internal pages. The
CDF of these differences, in Fig. 3.2a, indicates that for 35% of the sites, the landing pages
are smaller in size (the shaded region) than the internal pages. For 5% of the web sites,
the median sizes of internal pages are at least 2 MB larger than the landing pages, while for
another 20% they are at least 2 MB smaller than the landing pages. The geometric mean
of the ratios of page sizes of landing to internal pages reveals that landing pages are, on
average, 34% larger than internal pages. The size differences also vary substantially with
the rank of web sites.
We used the number of objects in a web page (i.e., the number of entries in the cor-
responding HAR file) as a crude approximation of its structure. Then, to estimate the
structural differences between the two page types, we computed the difference between the
number of objects on the landing page and the median number of objects across internal
pages for each web site in H1K. Fig. 3.2b shows the CDF of these differences, indicating
that the two page types are significantly different from one another. For 32% of the sites,
landing pages have fewer objects (the shaded region) than internal pages. Comparing the
shaded region of this plot with that of Fig. 3.2a reveals that for 5% of the web sites, the
landing pages, despite having fewer objects, are larger than their corresponding internal
pages. The geometric mean of the ratios of object counts of landing to internal pages in-
dicates that landing pages have 24% more objects, on average, than internal pages. The
differences in object count, as with size, vary with web site rank: In Ht30, 57% of web sites
have landing pages with higher object count than internal pages, but that number jumps
to 68% in Hb100.
Differences in page load and render times
Now, we turn our attention to two widely used performance metrics and ask, “Is the time
to load and render a page, on average, similar between landing and internal pages?”
We define the page-load time (PLT) of a web page as the time elapsed between when
the browser begins navigation (i.e., when the navigationStart event fires) and when it
37

renders the first pixel (i.e., when the firstPaint event fires). Then, we estimated the
performance difference between the two page types, for each web site in H1K, using the
difference between the PLT of the landing page and the median PLT of the internal pages.
Landing pages in H1K are heavier (Fig. 3.2a) and have more objects (Fig. 3.2b). Since
these parameters have implications for PLT [100], we expect landing pages to have higher
PLTs than internal pages. We observe, nevertheless, the opposite: Landing pages load
faster than internal pages for 56% of the web sites (Fig. 3.3a). These differences also vary
significantly based on the web site rank: 77% of web sites in Ht30 have faster landing pages
than internal pages, but that percentage drops to 59% in Hb100. One reason that landing
pages load faster than internal pages could be that resources in landing pages are more likely
to be cached at a CDN (see §3.5.1), since they are also likely to be relatively more popular
(i.e., more frequently requested by users). It could also be that web developers optimize
the landing-page design more meticulously than the internal pages, to avoid frustrating or
distracting end users with a slowly loading landing page. We explore these questions in
§3.5.
To address the well-known shortcomings in PLT [159, 190], we also measured the
SpeedIndex (SI) scores [231, 548] of the two page types using Google’s PageSpeed Insights
API [229]. The SI score measures how quickly the content on a web page is visually popu-
lated [548]. A low SI score indicates that the page loads quickly. For each web site in Ht30,
we computed the median SI scores of the page types as follows. We derived the SI scores
ten times for the landing page and computed the median. For internal pages, we derived
the score once for each of the 19 pages, and computed the median of all pages. Fig. 3.3b
shows that content on internal pages visually loads 14% more slowly than that on landing
pages in the median.
Limited exhaustive crawl
We supplemented the above experiments with an exhaustive crawl of five web sites. We
selected wikipedia.org (WP), twitter.com (TW), nytimes.com (NY), howstuffworks.com (HS),
38

and csail.mit.edu (AC), with Alexa ranks 13, 36, 67, 2014, and “unranked” respectively. We
crawled the landing page of each web site and followed links to internal pages recursively
until we obtained at least 5000 unique URLs for each domain. We fetched the landing pages
ten times and computed the medians of relevant metrics. We randomly sampled 500 URLs
from the discovered internal pages, and fetched them once. The internal pages of these
web sites show a large variation in object counts (Fig. 3.4a) and page sizes (Fig. 3.4b). Per
these figures, internal pages differ substantially not only from landing pages, but also from
one another. The distribution of object counts and page sizes shows that our inferences
would not change significantly for a random subset of 19 internal pages; as such a random
selection would likely not change the median values. Analyzing only 19 internal pages and
using the median values of object counts, page sizes, and PLTs, only limits the magnitude
of these differences.
0
100
200
300
-100 -50 0 50 100
#w
eb
sit
es
L.#noncacheables - I.#noncacheables
(a)
0
100
200
300
-1 -0.5 0 0.5 1
#w
eb
sit
es
L.CDNbytes - I.CDNbytes
(b)
Figure 3.5: For web sites in H1K: (a) 66% have landing (L) pages with more non-
cacheable objects than their internal (I) pages (40% more in the median); and (b)
landing pages of 57% have a higher fraction of bytes delivered via CDNs (13% more
in the median).
In summary, the differences between landing and internal pages of a web site are not
random. Averaging the results of an analysis over a large number of landing pages is
unlikely to eliminate the inherent bias in the differences; besides, these differences vary
across popularity ranks. These differences narrow the scope of studies that rely only on
39
landing pages; virtually all such studies would have to revise their claims and insights to
generalize to all web pages and not just landing pages. We delve deeper into the differences
between the landing and internal pages and highlight how they affect prior web-perf. studies
in §3.5 and §3.6.
3.5 Content and Delivery
In this section, we analyze the differences between landing and internal pages in content
and in optimizations used for delivering content quickly. When discussing these differences
we also highlight the implications for select prior web-perf. studies.
3.5.1 Cacheability
Caching is the most commonly used technique to improve web page performance. Rather
than serving content to users from origin (i.e., publisher’s) servers, caching attempts to
serve them from servers in close proximity to the users. The roundtrip time (RTTs) of the
network path between the end points in case of the latter is typically shorter than that of
the former. The majority of web content today is delivered via content delivery networks
(CDNs) [137], which often act as intermediate caches along the path between users and
origin servers. The number of cacheable objects constituting a web page and the volume
of data delivered through a CDN, hence, have a large impact on web page performance.
To count the cacheable objects in landing as well as internal pages we analyzed the
HAR files generated after fetching a given web page. We used the HTTP request method
and response code to check whether an object is cacheable [362]. While we cleared the
web-browser cache prior to every page fetch, the state of intermediate caches (i.e., along the
cache hierarchy between the browser and the server of the content provider) could change
depending on the cacheability of objects. Where the objects of a web page are served
from—the content provider or an intermediate cache—does not, however, affect the count
of (non-)cacheable objects.
40

Fig. 3.5a plots the CDF of the number of non-cacheable objects: Landing pages in H1K
have, in the median, 40% more non-cacheable objects than internal pages. If we measure
cacheability, however, as the fraction of cacheable bytes to the total bytes in the page, both
landing and internal pages have similar cacheability. Landing pages, hence, have more
(non-)cacheable objects by virtue of simply having more objects in general. The lower
PLTs of landing pages compared to internal pages (refer Fig. 3.3a), therefore, are not due
to the former having more cacheable content than the latter. This differential between
landing and internal page cacheability also implies that the effectiveness of a performance
optimization such as caching cannot be generalized to all pages; internal pages might not
benefit as much from caching (or CDNs) as landing pages.
To determine whether a particular HTTP request was served through a CDN, we used
multiple heuristics (e.g., domain-name patterns, HTTP headers, DNS CNAMEs, and reverse
DNS lookup). We obtained these heuristics from [515]. Although these heuristics are
neither exhaustive nor necessarily accurate, simply ascertaining whether the object was
delivered by a well-known CDN suffices for this study. In the web-page-fetch experiments
with H1K, we identified more than 40 different CDNs using these heuristics. Then, we
measured the ratio of bytes delivered by CDNs to the total size of the page.
We observe that in the median, the fraction of bytes delivered via CDNs for internal
pages is 13% lower than for landing pages. Whether a given object (request) experienced a
cache “hit” or “miss” at the CDN does not have any implications for the above observation,
but it affects the performance (or load times) of the pages. We suspect that landing pages
have more “popular” (i.e., frequently requested by users) objects, which might lead to a
higher cache hit ratio at the CDN. Measuring whether an object request experienced a
cache hit presents, unfortunately, several challenges: Our measurements are not spread
over a long time period; We only measure from a single vantage point, so our visibility is
limited to the CDN site closest to the vantage point at the time of measurement; and, lastly,
the mechanism through which CDNs report a cache hit or miss is not standardized. We
used, nevertheless, the HTTP X-Cache header (used by at least two major CDNs [23,201]),
41

to identify whether a request experienced a cache hit or miss. For web sites in H1K, we
found that cache hits for landing-page objects are 16% higher than those for internal-page
objects, suggesting that internal pages do not benefit as much from CDNs as landing pages.
Implications for prior work. Vesuna et al. showed that PLTs of web pages on mobile de-
vices do not benefit as much from improvements to cache hit ratios as desktop devices [528].
Using 400 landing pages selected uniformly at random from the Alexa Top 2K list, they
show that a perfect cache hit ratio, compared to no caching, would reduce PLT by 34% for
desktop devices, but only 13% for mobile devices. We find that landing pages of sites in
H1K have more non-cacheable objects than internal pages; the differences are also not uni-
form over the popularity ranks of web sites in H1K. Depending upon the particular random
subset of 400 landing pages selected, Vesuna et al. could underestimate to various degrees
the effect of caching on PLT for those web sites. Similarly, Narayanan et al. evaluate a new
cache-placement algorithm for CDNs using only the landing pages of 83 randomly chosen
web sites from the Alexa Top 1K (40%) and Alexa Top 1M (60%) lists [426]. They report
that their algorithm can reduce PLT by 100 ms or more for 30% of the web pages. Per
Fig. 3.5b, internal pages have 13% less content delivered via CDNs than landing pages, and
such content will, naturally, draw no benefits from Narayanan et al.’s placement algorithm.
They perhaps overestimate the PLT decrease, since they did not consider internal pages in
their evaluation.
3.5.2 Content Mix
The discussion on cacheable objects leads to a broader and a more general question: Do the
landing and internal pages differ substantially in terms of the distribution of the different
types of objects they comprise?
To estimate the distribution of different types of objects constituting the web pages
in H1K, we gathered the MIME types [537] of objects from the HAR files. We collapsed
them into nine categories (audio, data, font, HTML/CSS, image, JavaScript, JSON, video,
and unkown) to simplify the analyses. We then measured, for each web site, the relative
42

size of content (i.e., as a fraction of total page size) in each category. Fig. 3.6b shows
the distribution of the relative size of content in three different categories. The other six
categories combined only contribute 6% (7%) of the bytes for landing (internal) pages, and,
hence, we omitted them for clarity.
Landing and internal pages of web sites in H1K, per Fig. 3.6b, differ substantially
in terms of HTML and Cascading Style Sheets (HTM/CSS), JavaScript (JS), and image
(IMG) contents. Internal pages, in the median, have 50% JS content (“I: JS”) while landing
pages have 45%—a 10% change. Landing pages also have 22% less HTML/CSS content than
internal pages as a fraction of total bytes. Conversely, landing pages’ fraction of image bytes
(“I: IMG”) is 36% higher than that of internal pages. These differences could partly be due
to landing pages typically having a few large images (e.g., banners) or many small images
(e.g., thumbnails of photos related to various stories on a news web site). The smaller JS
content of landing pages could be due to web-designers intending to keep them simpler (i.e.,
fewer computations to be processed by the browser), thereby helping them load faster than
internal pages. Internal pages, in contrast, by virtue of containing more JavaScript might
load slower than landing pages, even if they each have the same number of objects and page
size as the corresponding landing page. The significant differences in contents between
landing and internal pages highlight, once again, that techniques for optimizing landing
pages (which were the focus of virtually all prior work on web performance optimization)
might not be effective, or even feasible, for internal pages.
Implications for prior work. Butkiewicz et al. conducted a large-scale measurement study
to analyze the complexity of web pages and investigate the implications for performance
measurement [100]. They tested the landing pages of 2000 web sites randomly selected
from the Alexa Top 20K list, and reported that, in the median, JavaScript constituted 25%
of the page size. We find (in Fig. 3.6b) that JavaScript contributes, in the median, to 45%
of a landing page’s size,3 but that contribution increases to 50% in internal pages. There-
fore, ignoring internal pages in measurement studies such as [100] would underestimate the
3The increase is roughly in line with the increase in JavaScript bytes that HTTP Archive reports since 2011 [261].
43

amount of JavaScript on the web and overestimate the amount of multimedia (e.g., images,
audio, and video) content. Performance optimization efforts that rely on such measurement
studies could in turn propose misleading guidelines for performance improvements.
3.5.3 Multi-Origin Content
We refer to the content on a web page served from two or more domains as
multi-origin content. The landing page of www.nytimes.com uses, for instance,
the domain static01.nyt.com for serving images, cdnjs.cloudflare.com for ob-
jects delivered by the Cloudflare CDN, use.typekit.net and fonts.gstatic.com
for fonts, ad.doubleclick.net for placing ads via Google DoubleClick, and
www.google-analytics.com for serving scripts for analytics, to name a few. The request
to load such a page will, if the browser’s DNS cache is empty, result in the browser issu-
ing many DNS queries, one for each unique domain. Discrepancies in the prevalence of
multi-origin content between landing and internal pages may have implications for their
performance (e.g., PLTs).
We estimated the prevalence of multi-origin content in web pages in H1K by counting,
for each page fetch, the number of unique domains encountered across all requests issued by
the browser to load that page’s contents. Multi-origin content is more prevalent in landing
pages in H1K than in internal pages (Fig. 3.6a): The former has 29% more unique domain
names, in the median, than the latter. The magnitude of these differences also varies over
web site popularity ranks.
The difference in the number of DNS queries issued between landing and internal pages,
owing to the discrepancies in the prevalence of multi-origin content, might, however, be
masked by the local resolver if the DNS responses for the domains queried are usually
found in the local resolver’s cache. Therefore we estimated the “hit” rate of a resolver’s
cache as follows. We picked the top 5K most popular (i.e., most frequently observed)
domains from the Cisco Umbrella list [264], and issued two consecutive queries to our local
(ISP’s) resolver as well as to Google’s public DNS resolver. For each resolver, if the response
44

0
100
200
300
-100 -50 0 50 100
#w
eb
sit
es
L.#domains - I.#domains
(a)
0
0.2
0.4
0.6
0.8
1
0 0.2 0.4 0.6 0.8 1
CD
F
Fraction of total bytes
I: HTM/CSSL: HTM/CSS
I: IMGL: IMG
I: JSL: JS
(b)
Figure 3.6: (a) For web sites in H1K, 67% have landing pages that fetch content
from more origins (29% more in the median); (b) internal pages have, in the median,
10% more JS bytes as a fraction of total bytes, 36% less image bytes, and 22% more
HTML/CSS bytes than landing pages (D � 0.00001 for HTML/CSS, image, and JS
bytes).
time for the second query was significantly lower than the first, we label the first as a cache
“miss” at that resolver; otherwise, we mark the first response as a cache “hit.” For the
most popular 5K domains on the Internet, we observed a hit rate of only about 30% at
our local resolver and about 20% at Google’s public resolver. The low cache hit rates we
observe are in line with previous studies [14, 29], and are mostly explained by the practice
of setting low time-to-live values for request routing [375] and cache fragmentation at the
Google resolver [234]. Caching at DNS resolvers, hence, does not completely mask the
performance impact of multi-origin content.
Implications for prior work. Bottger et al. explored the performance cost of using DNS
over HTTPS (DoH) [254] for web browsing [81]. They crawled the landing pages of Alexa
Top 100K web sites, recorded the number of DNS requests required to fetch each page,
measured the overhead incurred by DoH with respect to the traditional DNS over UDP,
and measured the difference in PLT resulting from those overheads. They observe, in the
median, 20 DNS requests per landing page for web sites in the Alexa Top 100K. We observe,
however, that for most sites in H1K landing pages fetch content from more origins than
45

0.2
0.4
0.6
0.8
1
0 10 20 30
CD
F
Count of resource hints used
InternalLanding
(a)
0
0.2
0.4
0.6
0.8
1
0 20 40 60 80 100 120
CD
F
#handshakes
InternalLanding
(b)
Figure 3.7: (a) 69% of landing pages use at least one HTML5 resource hint, whereas
45% of internal pages have no hints (D � 0.00001). In the median, (b) landing pages
perform 25% more handshakes than internal pages do (D � 0.00001)
.
internal pages. This difference also varies over web site popularity ranks. If Bottger et al.’s
study was generalized to internal pages, it would overestimate the count of DNS requests
per page, and consequently miscalculate the cost of switching over to DoH.
3.5.4 Inter-Object Dependencies
Downloading and rendering the objects on a web page often requires the web browser to
handle complex dependencies between the objects. A browser might have to fetch, for
instance, two objects—say, a JavaScript and a CSS file—and parse them before fetching a
third object (say, an image). Such relationships between objects are encoded typically in a
data structure called the dependency graph [334,386,543]. Nodes in the graph represent the
objects and the directed edges encode the dependencies between them. We define the depth
of an object as the shortest path from the root document to that object. Every internal
node on this path is another object, which must be downloaded before the download of the
concerned object begins, slowing down the page load process. On any given page, there
is only one object at depth 0—the root HTML. All object fetches that the root HTML
triggers lie at depth 1. Below, we analyze objects at depths 2 and greater. (There are far
46

more objects at depth 1 than at any other depth.)
To analyze the differential between internal- and landing-page object depths, we fetched
the web pages of web sites in Ht100 and Hb100, and generated the dependency graph of each
page using the tool from [110]. This tool uses the Chrome DevTools Protocol [126] to
track which object triggers which other object fetches (via the initiator parameter in the
requestWillBeSent event) and build the graph. We measured the depths of all objects,
and compared the number of objects on landing and internal pages at each depth. Fig. 3.8a
shows that landing pages have consistently (i.e., in the 50th, 75th, and 90th percentiles) more
objects than internal pages at depths 2 and 3; at depths 4 and beyond, even if the medians
are 0, the former has more objects than the latter in the tail (90th/95th percentile). Landing
pages, by this metric, have a more complex page structure than internal pages.
Implications for prior work. There exists a rich body of prior work that employs one or
more variants of the dependency graph to determine how to improve page-load times [101,
386, 447, 544]. These optimizations generally work by delivering objects at greater depths
of the dependency graph earlier than the browser would normally fetch them. Complex
dependency graphs present the most opportunities for these optimization efforts [386]. For
evaluation, these works use only the landing pages from some subset of the Alexa Top 1M,
and ignore internal pages. We used a rudimentary approach to building dependency graphs
as the tools used in these studies were not available. Our measurements nevertheless suggest
that landing pages have more complex dependency graphs than internal pages. By ignoring
internal pages, the aforementioned efforts, hence, may have overestimated the impact of
their optimizations.
3.5.5 Resource Hints
The interdependencies between objects (§3.5.4) and the fact that web pages often serve
objects from many different domains make it hard for a web browser to determine how
to optimize the fetch process and load pages quickly. HTML5 resource hints are a recent
attempt to remedy this problem. Resource hints are primitives that provide hints to the web
47

browser such as which domains it should connect to (via the dns-prefetch and preconnect
primitives), which resources it should fetch (via prefetch), and which ones to preprocess
(via prerender) in parallel [539]. These web-developer-provided hints can, if used correctly,
result in significant web page performance improvements.
We inspected the HTML DOM of the web pages in Ht100 and Hb100 and counted the
number of resource hints used in each page. Fig. 3.7a shows the CDF of the counts of
resource hints used in internal as well as landing pages. For the web sites measured, we
find that the use of resource hints is more prevalent in landing pages than internal pages:
69% of landing pages use at least one resource hint, whereas 45% of internal pages have no
hints. This discrepancy in resource-hint use is even larger for web sites in Ht100: 52% of
internal pages in Ht100 don’t use any hints.
Implications for prior work. We did not find any large-scale study of the implications of
resource hints for page performance, but there exists anecdotal evidence on how the use of
HTML5 resource hints reduces PLT [400]. Evidently, if a study is conducted in the future,
it would overestimate the prevalence and performance of these hints if it only considered
landing pages. The discrepancy in resource-hint use also suggests that web developers are
optimizing landing pages more carefully. Since internal pages of more than 90% of web
sites in H1K host or serve content on more than one domain, web developers must at the
very least consider using the dns-prefetch hint for internal pages. Future work can use
our publicly available lists to carefully evaluate which hints could help internal pages, and
to what extent.
3.5.6 Roundtrip and Turnaround times
The number of objects on a web page correlates with its page-load time (PLT) [100],
because the browser must fetch over the network each object that is not already in its
cache. Ideally, the browser would fetch all of these objects in parallel, and the PLT would
ultimately depend only on the time it takes to download the largest object, or simply on
bandwidth. Web pages have, however, objects with complex inter-dependencies (see §3.5.4)
48

and latency directly affects their PLT [127]: The browser downloads and parses an object,
discovers other objects that depend on it, and only then starts to fetch them. HTTP/2
Server Push [66] and QUIC [311] are among the recent efforts towards increasing parallelism
in fetching objects and reducing the number of roundtrips required to fetch objects, and
thus decreasing PLTs. Since the landing and internal pages of a web site significantly differ
in structure and contents, the efficacy of these optimizations will also vary between the two
page types.
We used the HAR files from our page-fetch experiments to analyze the time spent in
downloading the different objects on each page in H1K. The HAR file breaks down the time
spent in downloading each object into seven steps: (1) blocked, (2) dns, (3) connect, (4),
ssl, (5) send, (6) wait, and (7) receive.4 We treat the combined times of connect and
ssl as the total time spent in TCP and TLS handshakes, and wait as server processing
time. Since the browser typically fetches many objects in parallel, the sum of handshake
times for all objects is only an approximation of the effect of handshakes on PLT.
We observe that on average, the browser spends the same amount of time in handshakes
prior to downloading an object regardless of page type. Also, the fraction of objects fetched
over new connections, which require a handshake, is nearly the same on landing and internal
pages. However, landing pages typically have more objects (cf. §3.4) and multi-origin
content (see §3.5.3) than landing pages. As a consequence, landing pages in H1K spend
28% more time, in the median, performing handshakes than do internal pages. They
also perform, in the median, 25% more handshakes than internal pages do (Fig. 3.7b).
Per these observations, internal pages would benefit less than landing pages from efforts
that reduce the number of roundtrips involved in a handshake, such as QUIC [311], TCP
Fast Open [432], and TLS 1.3 [441]. Ignoring internal pages in the evaluation of such
optimizations could exaggerate their benefits.
In our experiments, about half of the time it takes to download an object is, on average,
spent in the wait step. A browser’s request to fetch an object might have to spend time in
4We refer the reader to [534] for a detailed description of these steps.
49

0
20
40
60
80
2 3 4 5+
#ob
ject
s
object depth
InternalLanding
(a)
0
0.2
0.4
0.6
0.8
1
0 40 80 120 160 200
CD
F
Time spent in wait (ms)
InternalLanding
(b)
Figure 3.8: (a) Landing pages have more objects at each level of depth than internal
pages do. In the median, landing pages have 38% more objects at depth 2. (b)
Objects on internal pages spend 20% more time in wait than those on landing pages
(D � 0.00001).
wait for several reasons, e.g., stalls or processing delays at the server, and queuing delays
along the route. We find that objects in internal pages spend 20% more time, in the median,
than those in landing pages (Fig. 3.8b). This finding combined with the earlier observation
that internal-page fetches result in more cache “misses” at the CDN (cf. §3.5.1) suggests
that the larger wait times are perhaps due to the turnaround or processing times at the
CDN servers. CDNs have a complex hierarchy of servers acting as a multi-level cache to
quickly and efficiently serve objects to users. Since most objects on a web page are rather
small [311] and the connections between different CDN servers as well as those between
the CDN and origin (or content-providers’) servers are typically persistent [475], the time
to download an object is dominated by the roundtrip time between the CDN servers or
between the CDN server and the origin server. These findings suggest that internal pages
induce more back-office web traffic than landing pages at the CDN, and are, thus, affected
more by the latency experienced in the CDN backhaul.
Implications for prior work. Research efforts over the past few years have renewed the
networking community’s interests in understanding and improving latency in the Internet
backbone [70, 85, 472]. There have also been other efforts that focus on minimizing the
50

0
20
40
60
0 5 10 15 20
Web
-sit
es
count
Count of insecure internal pages
(a)
0.2
0.4
0.6
0.8
1
1 10 100
CD
F
Number of trackers
InternalLanding
(b)
Figure 3.9: For web sites in H1K, (a) 170 have secure landing pages but at least
one non-secure internal page, 36 have 10 or more; (c) at the 80th percentile, landing
pages make 40% more tracking requests (D � 0.00001).
number of roundtrips in the upper layers of the network-protocol stack [66, 311, 432, 441].
None of these efforts, however, point out how landing pages are already significantly faster
than internal pages despite the former being heavier than the latter. They do not examine
how physical-layer latency improvements or protocol optimizations would help in speeding
up the slowest parts of the web, comprising the internal pages of web sites. Recent follow
ups on measuring the performance impact of QUIC and other protocols [554, 559] also
ignore internal pages. Having both the design and the evaluation parts of web performance
optimization efforts completely ignore internal pages can be dangerously misleading to
research as well as practice.
3.6 Security and Privacy
Below, we discuss how including the internal pages of web sites could affect analyses pertain-
ing to security and privacy of the web. As in prior sections, we follow up our observations
with implications for relevant prior work.
51
3.6.1 HTTP and Mixed Content
The use of (cleartext) HTTP for serving web sites has well-known security pitfalls, e.g.,
session hijacking and man-in-the-middle attacks. Owing to a concerted effort from devel-
opers, content providers, and web browsers, the majority of web content today is served
over (secure) HTTPS [233]. There are numerous ongoing efforts to further improve the
users’ security and privacy through technologies like Certificate Transparency (CT) [317]
and HTTP Strict Transport Security (HSTS) [253]. In this section, we simply ask whether
the security attributes of landing pages are similar to those of internal pages.
We found only 36 of the 1000 web sites in H1K to serve their landing pages over HTTP;
the rest redirected to HTTPS versions. Among the web sites with secure landing pages,
we discovered that 170 web sites had at least one HTTP internal page (Fig. 3.9a). In
most cases, the same domain was hosting the non-secure internal page (e.g., http://www.
fedex.com/us/international/) while in others, a seemingly secure internal page was
found redirecting to a non-secure page on a different domain (e.g., https://www.amazon.
com/birminghamjobs redirected to a plaintext page on amazon.jobs, which has now moved
to HTTPS.) We regret such poor practices, particularly in well-known web sites such as
amazon.com, ebay.com, and adobe.com.
We also analyzed the web sites in H1K for pages hosting mixed content. A web page
served over HTTPS is called a mixed-content page if it includes content fetched using
(cleartext) HTTP. The presence of mixed content could undermine the security of a web
page. Mixed content may, for instance, leak information about a user’s browsing behavior,
and expose content to man-in-the-middle attackers. Some web browsers flag such pages
by showing a visible warning to the user and some simply refuse to load the page. We
searched for only “passive” mixed content (i.e., when images and other static resources are
served using HTTP on an HTTPS page), since “active” mixed content (e.g., JavaScript)
is blocked by default on most browsers [107]. We found that while only 35 web sites in
H1K have landing pages with (passive) mixed content, 194 have at least one mixed-content
internal page. Since we fetched only 19 internal pages per web site in H1K, our estimates of
52

the prevalence of (cleartext) HTTP and mixed content are probably only the lower bounds.
Implications for prior work. There have been numerous studies on HTTPS adoption using
various data sources such as top lists [304], DNS zone files [38], Certificate Transparency
logs [525], port scans [179], and real user traces [205]. Unfortunately, all these data sources
except for the real user traces exclude internal pages of a web site. Felt et al. studied
HTTPS adoption, using real traces as well as other data sources, among popular web sites
using top lists [205]. Paracha et al. recently studied the prevalence of non-secure internal
pages in web sites with secure landing pages, and content differences between HTTP and
HTTPS versions [406]. We did not find any prior work on the prevalence of HTTPS pages
redirecting to HTTP pages.
3.6.2 Third-Party Dependencies
Modern web pages depend on a large number of third-party content including, but not
limited to, static content served from a CDN, analytics, and advertising. Such dependencies
offer a lucrative attack vector for malicious actors to, for example, take down a large portion
of the web by compromising one entity. A web page on domain a could access third-party
content on domain b, which in turn could depend on other third-party content on domain
c. These third-party dependencies can be encoded in the dependency chain a → b → c.
Below, we investigate if the landing page sufficiently represents the dependency chains for
a web site.
The domain in the URL of an object on a page is considered a third-party domain if
it does not belong to the same second-level domain (SLD) as the page being fetched. For
example, for a web page on www.guardian.com, cdn.akamai.com is a third-party domain,
but images.guardian.com is not. We take public (domain) suffixes into consideration
to ensure that, for instance, tesco.co.uk will be a third-party domain for bbc.co.uk.
Our method is prone to false positives in case of the same organization owning different
domains: microsoft.com is counted as a third-party on skype.com. Such false positives
should, however, be similar for both page types, and thus would not introduce a systemic
53

bias.
For this study, we focused only on the unique third-parties involved and ignore the
dependency relationships among them. We counted, hence, the number of unique third-
party domains observed on at least one internal page but never on the landing page. We find
that, in the median, internal pages collectively fetch content from 18 third-party domains
that are not used in the corresponding landing pages. Also, for 10% of the web sites in H1K,
internal pages fetch content from 80 or more third-party domains that are not observed on
the landing pages.
Implications for prior work. Ikram et al. fetched the landing pages of web sites in Alexa
Top 200K and built dependency chains of resources for each web site [273]. They used an
antivirus aggregator tool and reported that 1.2% of the third-party domains are malicious.
Similarly, Yue et al. measured the amount of third-party JavaScript on web sites using a
data set comprising 6805 landing pages [569]. We find that collectively, internal pages of
a web site fetch content from a much larger number of third-parties than landing pages.
The aforementioned prior work, hence, would underestimate the dependency structure for
a web site as a whole. Urban et al. have recently studied the differences in third-party
dependencies of landing and internal pages, and their results largely agree with ours [518].
There are also a few other studies that address similar problems but include internal pages
in their analyses [308,389,496].
3.6.3 Ads and Trackers
While advertisements help content providers monetize content, the pervasive tracking, mon-
itoring, and profiling of users purportedly for targeted ad placements and customization
has faced strong criticism from both industry and end users [149, 158, 377]. The advent of
GDPR, furthermore, has led to significant changes in the use of trackers as well as end-
user-data collection practices. With significant differences in content across landing and
internal pages, we simply ask, in this section, if the use (or the lack thereof) of ads and
trackers is consistent across the two types of pages.
54

To detect advertisement and tracking related requests, we used the Brave Browser
Adblock library [93] coupled with Easylist [183]. Easylist is a list of over 73,000 URL
patterns associated with online ads and tracking. Popular ad blockers, such as AdBlock
Plus, and uBlock Origin use this list. We counted all HTTP requests on a web page that
would have been blocked by Brave Adblock. We label all such blocked requests as those
corresponding to trackers for ease of exposition. The CDFs of the number of trackers
per page (in Fig. 3.9b) reveal that at the 80th percentile, internal pages have 20 tracking
requests while landing pages have 28. Furthermore, in about 10% of the web sites in H1K,
internal pages have no trackers while the corresponding landing pages do.
Header bidding (HB) is a new online advertising technology that initiates ad auctions
from the browser instead of relying on an ad server (see [50] for detail). We used the open
source tools from [50] to analyze HB ads in Ht100 and Hb100. Out of the 200 web sites, we
find that 17 have HB ads on landing pages. An additional 12 web sites have such ads on
internal pages, but not on the landing page. We also find that among web sites that have
HB ads, internal pages have 7 ad slots in the 80th percentile whereas landing pages have
9. The differing use of advertisements and trackers between landing and internal pages has
implications especially for studies measuring compliance to GDPR and privacy leakage.
Implications for prior work. Pachilakis et al. crawled the landing pages of the top 35K
web sites, and detected 5000 that have header bidding ads [401]. Then, they crawled these
web sites daily for 34 days and report on the number of ad slots and many other metrics.
Owing to the exclusion of internal pages, this study will miss web sites that have HB ads
only on internal pages. Lerner et al. present a seminal study of user tracking from 1996
to 2016 [329]. They use the Wayback Machine [277] to crawl the Alexa Top 500 web sites,
and report extensive historical trends on the trackers, techniques, and prevalence found on
these web sites. Based on our observations, this study will overestimate tracker activity on
the web, since it considers only landing pages.
55

3.7 On Selecting Internal Pages
Selecting a “representative” set of internal pages from a web site without any traffic mea-
surements is hard. In addressing this problem and creating Hispar, we used search engine
results. Retrieving search results using a search-engine API, however, is not free. Google
(Bing) charges, for instance, $5 ($3) per 1000 queries [232,367], although Bing is effectively
cheaper because it returns more results per query. However, we encountered some bugs in
Bing’s API and instead opted for Google. Generating a list of 100,000 URLs using Google
would require at least 10,000 queries, and under standard pricing, would cost $50. Many
queries return, however, less than 10 unique URLs; hence our cost has consistently been
around $70 per list. About half of the studies that received a “major” revision score in
our review (§3.2) used 500 or fewer web sites. Including up to 50 internal pages per web
site for these studies would cost less than $20. We provide, nevertheless, the weekly H2K
lists of 100,000 URLs free of charge for the community’s convenience, and to spur future
web-perf. studies to include internal pages. We now discuss other approaches to selecting
internal pages.
Involve publishers. Web page performance is of paramount importance to publishers
since poor performance often translates to a significant loss in revenue [19, 97]. Hence,
publishers are most likely to be interested in determining whether a given optimization
(e.g., using a specific CDN to reduce page-load times) is representative, i.e., whether it
generalizes to the majority of the site’s pages. Publishers can either select a set of internal
pages or even construct a set of synthetic internal pages that serve as a good representation
of the internal pages on their site. These samples can be published at a Well-Known
URI [391] or through extension of mechanisms like robots.txt [302]. This approach is
similar in purpose to web-standards compliance and browser-performance benchmarks (e.g.,
Acid3 [513], Kraken [289], and JetStream2 [94]), albeit implemented in a more distributed
way: Each publisher specifies a benchmark—the representative internal page(s)—that we
must use for any performance measurement or optimization on their web site. Ensuring
that this set of internal pages does not go stale as the site contents change, however, is a
56

challenging task.
Nudge web-browser vendors. Major web-browser vendors such as Mozilla and Google
already collect anonymous user data (e.g., URLs of web pages visited by the end users)
via projects such as Telemetry [376] and CrUX [230], respectively. Such data can also
be gathered from Google Analytics and other user-tracking platforms that a majority of
the Alexa Top 1M web sites already use [99]. Web-perf. efforts will immensely benefit
if such projects make their anonymous data sets publicly available. Indeed, Alexa and
other top-list providers may leverage their existing vantage points to help select internal
pages in different web sites. Although web content may significantly differ based on query
parameters, session data, cookies, location, and time, publishing at least the most popular
URLs from such data sets will be the first step towards improving web-perf. measurement.
Sharing this aggregated data does not violate the privacy of end users.
Learn web page characteristics. We could also use machine-learning tools to learn the
structure and characteristics of different web pages. Augmented with other parameters such
as the end-user’s bandwidth and last-mile latency, the learned model can help in evaluating
how a given optimization will perform under various scenarios, each representing a page
with a distinct set of characteristics.
3.8 Related Work
There is an extensive body of literature on web performance measurement and optimization,
dating all the way back to when the web came into existence [225]. Several useful guidelines
on conducting sound Internet measurements have also been published [33, 36, 181, 408].
Nearly every aspect of web-perf. studies has also faced extensive scrutiny [76, 98, 190,
231, 297, 343, 387, 412, 456]. Our work is orthogonal to these studies and shines light on a
heretofore neglected aspect: the exclusion of internal pages in web-perf. studies.
Recently, Scheitle et al. showed that the choice of top lists such as Alexa and Quantcast
has implications for web-perf. studies because of a lower than expected overlap among these
57

lists [456]; they also show that there is considerable churn within a given list. Pochat et al.
provide a new top list that averages four different lists over 30 days [412]. However, these
efforts do not address the problem that such top lists can only be directly used for landing
pages.
Kaizer and Gupta’s work on how the privacy-related behavior of web sites differs based
on whether the user is logged in or not is most similar to our work. [292] To the best of our
knowledge, our work is the first one to highlight the intrinsic differences between landing
and internal pages of web sites and their impact on past research.
3.9 Summary
We compared the landing page with a set of internal pages for 1000 web sites, constituting
Hispar H1K, and discovered that landing pages differ substantially from internal pages.
These differences have implications for virtually all web-perf. studies that examined simply
the landing pages. We manually reviewed more than a hundred different web-perf. studies
published at top-tier conferences and found that about two-thirds of the studies would have
to be revised if they were to apply to internal pages.
We released our measurements data set and analyses scripts for use of other researchers.
We also made Hispar, including all its weekly updates, and tools required for customizing
or regenerating the list publicly available [252].
Armed with the insights and tools from this study, we hope that future work on web
performance measurement and optimization will start including the larger, slower, and
neglected part of the web for more sound measurements, optimizations, and evaluations.
While we provide several suggestion on selecting internal pages, we hope that our study
paves the way for a discussion concerning the selection and curation of internal pages, and
eliciting support from content providers, search engines, and browser vendors to generate
a rich and scalable version of Hispar, or an even better alternative.
58

Chapter 4
Privacy and Latency in DNS Queries
Virtually every request from an end user to access a resource over the Internet starts with
the translation of a human-friendly mnemonic to an IP address through a domain name
system (DNS) lookup. The request or response messages involved in the DNS lookup reveal
both the identity of the end user, via source IP address in the request or destination IP
address in the response, and the domain queried, via the QNAME field. Despite the ubiquitous
use and the sensitive nature of DNS, virtually all requests and responses are transmitted in
plaintext. Any observer on the network path can, hence, amass a wealth of sensitive data
on end users through the DNS requests or responses [87, 237, 249]. This chapter attempts
to address such risks to end-user’s privacy in DNS by simply extending the functionality of
stub resolvers—an often neglected component in the DNS ecosystem.
The privacy issues stemming from the use of DNS are well known [78], and there is a
wealth of prior work focused on providing confidentiality for DNS transactions. DNSCurve,
for instance, encrypts messages between resolvers and authoritative name servers [168].
DNSCrypt uses similar cryptographic techniques to encrypt the DNS messages between
the end user and the resolver [172]. DNSCurve and DNSCrypt require support at both
the client (or resolver) and the name server, and neither are widely deployed. DNS over
DTLS (DNSoD) [440] and DNS over TLS (DoT) [262] add confidentiality by using a secure
transport protocol—DTLS (in case of DNSoD) and TLS (in case of DoT). DNSoD was never
widely deployed, but many client-platforms and public resolvers support DoT. DNS over
HTTPS (DoH) encrypts DNS messages and uses HTTP or HTTP/2, thereby camouflaging
DNS traffic within other HTTPS traffic [254]. On the server side, Google and Cloudflare
and many others support DoH, and on the client side, major web browsers, including
Firefox and Chrome, have added support for DoH. All prior work, nevertheless, require the
end users to trust the (the local or third-party) resolvers: Users must trust that although
59

the resolvers observe which user is looking up what domain they would act responsibly to
protect their users’ privacy.
Stub resolvers (or “stubs,” in short) have, unfortunately, only a marginal role in prior
work: They assist in delegating the task of providing confidentiality or guaranteeing end-
user privacy to recursive resolvers and name servers. We propose, however, making the
stub resolvers do all the “heavy lifting” and obviate the need to trust third-party recursive
resolvers or servers. The DNS protocol does not prevent stub resolvers from directly con-
tacting authoritative name servers. Indeed, stubs used to send DNS requests directly to
authoritative name servers until some large networks started funneling such requests to a
local resolver, and creating a shared cache in the process [161]. We show that the perfor-
mance benefits of a shared resolver or a shared cache are often exaggerated. Schomp et al.
also show that we can eliminate recursive resolvers, but the authors focus on performance
and do not address the privacy concerns [459].
Perhaps the implicit rationale for marginalizing the role of stubs is rooted in the fact
that when a stub contacts an authoritative server it immediately reveals the identity of the
end user (i.e., via its IP address). We dispel this concern by sketching a lookup algorithm
that exploits the inherent complexity in the DNS infrastructure to provide nearly as much
privacy as a shared resolver. To this end, we turn to one of the oldest tricks in information-
theoretic security: Dump the entire (DNS) database, making it impossible for an observer
or adversary to learn which DNS record the end user resolved. Rather than downloading
the entire DNS database on every lookup, which is impractical, we devise a new lookup
algorithm that eventually fetches the entire database over time.
The rest of this chapter is organized as follows. §4.2 argues why DNS-over-HTTPS is
not the final solution to DNS privacy, and motivates direct client resolution, our model
for client resolution, and its performance and scalability implications are presented in §4.3,
§4.4 summaries related past work, and §4.5 concludes.
60

0
0.2
0.4
0.6
0.8
1
10 100 1000
CCDF
Query time (ms)
Cloudfare1Cloudfare2
Google1Google2
(a)
0
0.2
0.4
0.6
0.8
1
10 100 1000
CCDF
Query time (ms)
Cloudfare1Cloudfare2
Google1Google2
(b)
Figure 4.1: Cloudflare and Google recursive resolvers provide cache hit rates of (a)
roughly 45% and 25% respectively for the domains in Umbrella Top 100K (Ut100K),
and (b) less than 2% each for those in Alexa Tail 2K (Ab2K).
4.1 Acknowledgements
This chapter contains plots and discussion from joint work with Elaine Shi, Shivani Singh,
Balakrishnan Chandrasekaran, Bruce M. Maggs, and Anja Feldmann. Some parts of the
work were published at the Annual International Cryptology Conference, 2021 [468].
4.2 Comments on the Status Quo
It is well known that DNS over UDP (or DoU) has serious privacy implications for end
users. We highlight, however, that even recent approaches such as as DoH do not address
this problem. Although our focus for the rest of the discussion rests solely on DoH, the
comments and observations apply broadly to other approaches that encrypt the channel
between the user and the (shared) recursive resolver for protecting end-user privacy (e.g.,
DoT and DNSCurve).
1○ There is scant evidence that resolvers act “responsibly” to protect users’ privacy.
Thousands of open DNS resolvers were, for instance, found to manipulate answers for self-
ish objectives (e.g., injecting ads) or even malicious purposes (e.g., censorship and phish-
61

ing) [306]. Chung et al. showed that resolvers also significantly undermine DNSSEC that
can thwart such manipulation: 88% of resolvers do not validate DNSSEC records [133].
Trusting that for-profit organizations (e.g., Cloudflare and Google) will operate an exten-
sive DNS infrastructure for free without attempting to monetize the privacy-sensitive data
requires a monumental “leap of faith.” Supercharging stub resolvers, in contrast, would
allow users to get DNS responses directly from “the horse’s mouth”, i.e. from authoritative
name servers, and obviates the reliance on third-party resolvers.
2○ Third-party resolvers, especially in case of DoH, may significantly impair web per-
formance. Content delivery networks (CDNs), which deliver most of the Internet content
today [137], often use DNS-based redirection to serve the content from servers in close
proximity to end users [394]. CDNs estimate the proximity based on the (IP address of
the) local recursive resolver, or local domain name server (LDNS), and an ISP-provided
local resolver is indeed deployed close, i.e., in the last mile or eyeball network, to the ISP’s
users. Use of third-party resolvers, which are not typically in close proximity to users,
however, significantly impacts the web performance [121]. EDNS Client Subnet remedies
this problem by having resolvers send the client IP subnet (at some coarse granularity) to
the authoritative name server [150], but resolver adoption has been lacking, with some even
refusing to implement it citing privacy reasons [145]. Use of anycast instead of DNS-based
redirection for mapping end users to “closest” servers does not mitigate these issues; due
to the vagaries of Internet routing a DNS request from an end user may be routed to a dis-
tant anycast site or replica [332]. Stubs contacting the authoritative name servers directly
solves the mapping problem, while caching at home (or on device) addresses the problem
of latency to the resolver.
3○ Recursive resolvers reduce the robustness of the infrastructure. They introduce new
points of failure in addition to the authoritative name servers, making them attractive
targets for DoS attacks, and leaving users vulnerable to outages like [310]. These shared
caches are also attractive for cache poisoning attacks as a successful poisoning could impact
thousands, potentially millions of users. Resolvers can also act as central repositories of
62

user browsing history, and collude with nation states or other agencies and invade user
privacy [216]. Stub resolvers running on client machines are clearly immune to such threats.
4○ Performance benefits of a shared recursive resolver or DNS cache are exaggerated.
Today, there are numerous domains (or hostnames), following a heavy-tailed popularity
distribution, with short time-to-live (TTL) values that caching benefits only for a small
fraction of the most popular domain names. In a data set of 200 million DNS queries
observed over a 14-month period, Callahan et al. find that 63% of domains are queried
only once over the entire period and less than 0.01% of domains trigger more than 10K
queries, averaging at about 1 query per hour [106]. They also observe that 70% of the DNS
responses have TTL values of at most 1 hour. Similarly, Schomp et al. find in a different
data set that 77% of all observed domains are only ever queried by a single client [461]. It
would be better if these clients fetched and cached those hostnames themselves instead of
impacting the entire shared infrastructure.
Regardless of their shortcomings, recursive provide one key benefit for end users: Since
they act as a proxy for a large number of users, it is hard for a third-party observer to trace
the DNS requests made by the recursive resolver to a specific end user, assuming that the
DNS messages between the users and the recursive resolvers are encrypted. This benefit
perhaps explains why virtually all prior solutions focus on extending recursive resolvers. In
this chapter, we simply ask the following. To what extent can a stub resolver protect the
privacy of the end users, and what are the challenges and tradeoffs in relying only on stub
resolvers? What are the performance implications, both for the end users and the DNS
infrastructure, of this stub-centric approach?
4.3 Stub Resolver on Steroids
Having clients perform full DNS resolution instead of going to resolvers is trivial—tools
like dig are capable of doing that today. The challenge lies in providing anonymity and
privacy to clients performing full resolution. In this section, we define our threat model,
63

Shared Resolver
Usermachine
AuthoritativeNS for com
Authoritative NSfor google.com
Root NS
7. (A) www.google.com
3. (NS) .com(A) a.gtld-servers.net
6. (A) www.google.com?
2. (NS) .com?
4. (NS) google.com?
5. (NS) google.com(A) ns1.google.com
1. (A) www.google.com?
8. (A) www.google.com
Figure 4.2: Current DNS model with recursive resolver at the center in both tradi-
tional UDP-based DNS and newer DNS over HTTPS.
and outline our solution.
DNS is organized in a hierarchical manner. Root authNS provide answers for top-level
domains (TLD), TLD authNS provide answers for second-level domains (SLD), and so
on. We proceed with the assumption that QNAME minimization [79] is in use, so that for
example, only .com is sent as a question to the root name server when attempting to resolve
google.com. Since a client would be fully traversing the authNS hierarchy in this scenario,
we tackle each level in order.
There are 13 root authNS, run by a small number of organizations, and geographically
distributed using anycast. With QNAME minimization, these nameservers present little pri-
vacy risk: revealing that a user is interested in some hostname in the .net zone does not
say much about that user’s browsing behavior. Nevertheless, we note that the entire root
zone file contained 22000 records in 2019, and had a total file size of 1.1 MB in compressed
form [35]. This is a trivial amount of data in the current Internet, and could be pushed to
all clients with incremental updates as [35] proposes. To push this, and other out-of-band
DNS information to clients, we introduce a “DNS Push Server” in our design as Fig. 4.3
64

User machine
DNS PushServer
AuthoritativeNS for com
1. (NS) unpopular.com?2. (NS) unpopular.com(A) ns1.unpopular.com
Authoritative NSfor google.com
(A) www.google.com
(A) www.google.com?
K-1 queries
K-1 answers
Authoritative NSfor unpopular.com
3. (A) www.unpopular.com?
4. (A) www.unpopular.com
Out-of-banddata
Figure 4.3: Our proposal where the client does the heavy lifting. DNS Push Server,
and k-query obfuscation provide efficiency and privacy respectively.
shows. We note that the DNS Push Server is not a trusted third-party—answers it provides
come with the appropriate DNSSEC RRsig records guaranteeing authenticity, and clients
do not poll it or reveal any information about the hostnames in which they are interested.
There are currently about 1500 TLDs in the Internet, some containing as few as 11
domains [271]. For a TLD this small, the user could download its entire zone file at little
cost and reveal nothing more than the fact they were interested in one of the domains in
that TLD, which is impossible to hide from any third-party anyway.
To provide privacy when accessing the nameservers of a larger TLD to, for example,
query the NS record for sensitive.com, we observe that novel techniques such as those
based on Private Information Retrieval [572], and hardware-based Trusted Execution En-
vironment [379] require drastic changes to authNS, and may not be feasible for years to
come. Instead, we suggest the simple method of querying k domains whenever 1 domain is
needed. The k − 1 extra questions obfuscate the name that the user actually desires. [461]
finds that a single user queries, in the median, about 150 unique SLDs in one day. With
k = 10, and clever selection of the k − 1 extra queries, an average user would touch 15000
65

client public key
#additional
answers
server-selected Nonce
Response
Flags
#answer
ID
#questions
#authority
Server ZSK
ID Flags
#questions #answer
#authority #additional
questions
client DNSCurve public key
this packet's Nonce
query zone name
Server ASK
Query
Figure 4.4: DNS query and response packets with the modified DNSCurve scheme.
domains over a period of 10 days. This may seem like a small subset considering that the
.com TLD alone has about 146 million domains, but note that SLD popularity has a strong
power law distribution, and [213] finds that the top 10000 SLDs cover about 90% of DNS
traffic (minus NXDOMAIN etc.). The problem of ascertaining the population from which
k − 1 should be picked could be addressed by finding relevant domains in the Alexa Top
1M [30], or a one-time download of the TLD zone file provided by the DNS Push Server.
The exact algorithm for picking k − 1 names is beyond our scope.
At the SLD and lower levels, DNS has the potential to be fully distributed with each
domain managing its own name server. However, most domains utilize third-party ser-
vices. To measure the extent of centralization in nameservers, we leverage the OpenIN-
TEL dataset [523] to get the NS records for the Alexa Top 1M (A1M) on 2020-01-01.
Less than 20 NS records contain IP addresses, which we drop. The rest contain host-
names. We identify the DNS service provider by the SLD in each hostname, e.g. azuredns
for ns1.azuredns.co.uk, taking public suffixes into account. We don’t use IP addresses
and AS names because a domain could independently run its own name server on cloud
infrastructure. We also identify and group together patterns in SLD names, such as
awsdns-16.com, by manually inspecting the top 1000 providers.
66

00.20.40.60.81
1min 5min 1hr 4hr 1day
CDF
TTL (s)
A records NS records
(a)
0
25
50
75
100
100 101 102 103 104 105
domains
cov
ered
(%
)
#authoritative NS
(b)
Figure 4.5: (a) For A1M, 50% of NS and 5% of A records have a TTL of one day
or longer. (b) 25% of the NS records in A1M are covered by 2 providers, while 40
providers cover 50%.
As Fig. 4.5b shows, we find significant centralization in the SLD name server providers:
the top 3 (Cloudflare, GoDaddy, and AWS) covering 30% of the domains, and the top 700
covering 75%. Without any special privacy measures, these providers would find the IP
addresses of clients visiting domains for which they are authoritative. However, this is still
significantly better than one DoH provider logging 100% of a client’s DNS traffic. We also
note that in the Alexa Top 1000, 68% of domains that use Cloudflare, Amazon, Google,
Azure, or Akamai services for DNS also use the same for CDN services. These providers
are authoritative for 24% of the A1M domains. The CDN provider would find out user
identities through subsequent web requests anyway, so there is no extra information leaked
through DNS in those cases.
These DNS requests should be encrypted to protect from on-path observers. Even so,
if the destination IP address of a packet reveals the domain to which it belongs, our model
cannot prevent it. Thankfully, this is no longer the case for most IP addresses . We now
discuss performance, encryption, and scalability aspects of the proposed model.
67

0
0.2
0.4
0.6
0.8
1
10 100 1000
CCDF
Query time (ms)
Ut100KAb2K
(a)
0
1
2
3
10 20 30 50 100 200 300 500
PLT (s)
delay to TRR (ms)
(b)
Figure 4.6: (a) Authoritative nameservers provide query times comparable to shared
resolvers for Ut100K and lower for Ab2K. (b) The increase in PLT when delay to TRR
is increased from 10 ms to 50 ms is statistically insignificant.
4.3.1 Web Performance
Some applications of DNS, like e-mail, software updates, and other background services
are not sensitive to latency. In fact, web browsing is the only DNS application sensitive
to latency at the millisecond scale. This is because modern web pages fetch content from
multiple hostnames (about 20 in the median [81]), and each hostnames, assuming an empty
local cache, must be resolved to an IP address through DNS before the request can proceed.
However, due to the large number of objects in these pages that are mostly fetched in
parallel, it is unclear how much DNS query times affect the overall page load time (PLT). In
this section, we explore query times as experienced through two popular recursive resolvers,
and attempt to quantify the effect of DNS delays on PLT.
Query times: We measured DNS query times by looking up hostnames against 8.8.8.8
(Google), and 1.1.1.1 (Cloudflare), two of the most popular public resolvers. We used
the top 100K hostnames (FQDN) from the Cisco Umbrella Top 1M (Ut100K) [516], and
the bottom 2000 domains from the Alexa Top 1M (Ab2K). The Ut100K list represents
the hundred thousand most popular names on the Internet as Cisco Umbrella Top 1M
is compiled from DNS requests at the OpenDNS resolver, while Ab2K represents a set of
68

relatively unpopular hostnames. From a machine on the US East Coast that provided an
11 ms RTT to both resolvers, we issued two queries for each hostname, two seconds apart.
The first query serves to prime the cache and the second one should then result in a cache
hit.
As can be seen in Fig. 4.1a, Cloudflare provides a hit rate of about 45% for Ut100K,
while Google provides 25%. It is interesting that priming the cache with the first query has
little effect on query time for the second one on Google’s resolver. Cache framgentation
at the Google resolver could cause this [234]. For the relatively unpopular names in Ab2K,
both Google and Cloudflare provide hit rates below 2% (Fig. 4.1b).
We also measured the query times for hostnames in these lists by directly contacting
the authNS for each zone. Fig. 4.6a shows that authNS provide query times comparable
to those measured against the resolvers for popular hostnames, and actually lower for
unpopular ones. This assumes that the IP address of the authNS is already known or
cached. If it is not cached, one extra trip to the authNS of the higher zone is required.
However, this extra trip should be rare since we find, from the OpenINTEL dataset for
A1M, that NS records and IP addresses of authNS have much longer TTL values than
other A records. Fig. 4.5a shows that 50% NS records have TTL values of 1 day or more,
while about 50% of A records have TTL values of 5 minutes or less.
Effect on PLT: To measure the effect of DNS query times on page load time, we picked
the top 20 websites from the Alexa US Top List. We fetched the home pages of these
websites using Google Chrome on an Intel Core-i7 machine with 4 processing cores and
32GB RAM running Ubuntu 18.04. This machine is connected by Ethernet to a university
network on the US East Coast. It provides a stable Roundtrip Time (RTT) of 10 ms to the
closest Google recursive resolver (8.8.8.8), and very low last mile latency. To measure the
impact of DNS queries on PLT, we used the Linux tc command to delay traffic on port 53
and IP address 8.8.8.8, the DNS resolver used. This has the effect of simulating high DNS
query times while bandwidth and latency for other traffic remains unchanged. We varied
the RTT to the DNS resolver at eight different values between 10 ms and 500 ms as shown
69

in Fig. 4.6b. At each such value, we fetched the 20 webpages 10 times each, every time
using an empty browser and DNS cache. We only control the RTT between our machine
and the recursive resolver, not the time the resolver takes to respond to a given query. For
each RTT value, we observe that the median query time exceeds it by about 4 ms.
Increasing the RTT from 10 ms to 50 ms, we observe the median PLT increase by 15%.
However, this increase is not statistically significant for 200 page fetches as the t-test gives
us a p-value of 20%, i.e., if the means for these populations were not different at all, there
is a 20% chance that we would still see the samples we do. The increase in PLT becomes
significant when we increase the RTT from 10 ms to 100 ms: 43% with a p-value of 0.1%.
Hence, we conclude that DNS query times can increase by up to a factor of 3 without
any significant changes in PLT, and that query times stay within that factor when clients
contact authNS instead of recursive resolvers. We argue that these results translate well to
a machine that is poorly connected. For such a machine, the RTT to the authNS may be
high, but so will the delays to web servers, which will mask the effect of DNS as they are
doing in the well-connected case.
At first glance, this result may seem contrary to those reported by Sundaresan et al in
[499], but a closer look reveals that it is not so. The authors of [499] report a decrease of
7% in the mean PLT when DNS is cached at the home router, but observe that caching
at the home router reduces the query time to 0 ms. They report minimum DNS query
time at 15 ms, and don’t report on the mean or median query times. Moreover, they don’t
comment on the statistical significance of the differences they observe. Hence [499] is not
a result on how PLT increases as DNS query time is increased.
4.3.2 Encryption
Encryption is necessary to protect the client from on-path observers. Such an observer
could easily infer which of the k answers a client is interested in by simply observing which
IP address, from among the answers it receives, the client connects to. A diverse collection
of DNS encryption techniques have been developed recently, which include DNSCrypt [172],
70

DNSCurve [168], DNS over TLS (DoT) [262], DNS over QUIC [267], and DNS over HTTPS
(DoH) [254], roughly in that chronological order. However, most of these techniques have
been designed for a DNS architecture that involves client stub resolver communicating with
a single recursive resolver. Hence, DNSCrypt, DoT, and DoH are connection-oriented,
i.e., an exchange of keys or certificates is required before a query can be sent which adds
significant latency if a client resolver is communicating with many auth-NSes. Since the
communication between a specific client and auth-NS pair is usually scarce, connection-
oriented encryption may not be suitable.
To our knowledge, DNSCurve is the only relatively well-supported [138] scheme that
provides connectionless, per-packet encryption for DNS. It has the added advantage of using
elliptic curve by default, which can provide better security with shorter keys [497]. However,
DNSCurve uses an ad-hoc method for public key distribution, and does not specify how
a single nameserver can be authoritative for multiple zones that use different public keys.
Here, we outline a modification of the DNSCurve scheme that addresses these problems.
For public key distribution, we suggest using the already established [133] DNSSEC PKI.
One advantage of DNSSEC being an authentication-only protocol is that nameservers that
answer queries do not need to store private keys, only those that sign the records do. If the
same PKI is used for encryption, then every server will need to store a copy of the private
key. However, DNSSEC already provides a remedy to this problem. The protocol specifies
two separate key pairs: a Zone-Signing Key (ZSK), and a longer-lived Key-Signing Key
(KSK). Thus the ZSK could be used as the key-pair for DNSCurve encryption. This would
require domains to move from using RSA for DNSSEC to ECDSA (elliptic curve), which is
already strongly encouraged [146, 524] considering the computational and size advantages
ECDSA provides.
If a given DNS server is authoritative for more than one zone, it would not know
which ZSK to use to decrypt an incoming query. This problem is very similar in nature to
the multi-tenancy problem with TLS: if the same IP address is hosting multiple HTTPS
websites, how would it know which server certificate to send during a TLS handshake? This
71

problem was solved using the Server Name Indication (SNI) [182] extension, which includes
the website name in plaintext in the TLS Client Hello message. Since we are trying to hide
the zone name itself, we cannot take the same approach and put zone name in plain text.
We instead suggest using the approach that Encrypted SNI [442] takes, and introduce a
new key, which we call Authoritative Server Key (ASK). A nameserver that is authoritative
for multiple zones must use a single ASK such that DNSCurve queries for any zone can be
enclosed in a box encrypted with that ASK.
Fig 4.4 shows a simplified sketch of what DNS queries and responses encrypted with
this modified DNSCurve would look like. The traditional DNS query is first encrypted
using a combination of the client DNSCurve public key, a per-query nonce, and the server’s
ZSK, which is discovered from a DS record in the parent zone. Then, this ‘cryptographic
box‘ is appended to the the client’s public key, nonce, and zone name. This bundle is
then encrypted using the server’s ASK, again discovered through the parent zone. After
unwrapping this bundle, the server encrypts the answer using a combination of the client
public key, a server-generated nonce, and the ZSK. We refer the reader to [168] for more
details on the encryption mechanism. This scheme does not require any extra round trips
between the client and the authoritative name server, or connection state information.
We note that this encryption scheme, which requires changes to authNS, is only an
optimization and not a prerequisite for our proposal. Clients can opt for existing, relatively
popular encryption methods such as DNS over TLS.
4.3.3 Scalability
The proposal to have clients directly contact authNS, and send k−1 extra queries for every
legitimate query raises the question of how authNS and the DNS infrastructure in general
will support the increased load. Previous work [459] shows promising results. They examine
a dataset from 1 ISP with 100 residences for four months, and find that if recursive resolvers
are removed, peak load does not increase for 99% of authNS. This is because access to
these nameserver is sparse and their answers are rarely present in the shared cache anyway.
72

However, the most popular TLD (.com) authNS experience a load increase of 3.4 times on
average and 1.1 times at peak over 10-second bins. If we send k − 1 extra queries, this
translates to a peak load increase of 11 times for k = 10. We note that this does not
indicate an 11 times increase in number of DNS packets or traffic volume, those can be
reduced by embedding multiple questions and responses within single packets, and using
DNS compression techniques [373]. However, these techniques do not reduce the number of
queries that the server has to answer. Below, we discuss some opportunities in the current
DNS system that our model can exploit to accomodate for increased load.
Recursive Resolvers: Past work found 32 million open recursive resolvers in the Inter-
net in 2013 [460]. This number decreased to 3 million in 2019 [407]. This doesn’t mean that
the number of recursive resolvers has decreased, just that they are now better protected
against simple IPv4 scans. Thus, tens of millions is a lower bound on the actual number
of resolvers operational in the Internet. Having clients directly contact authNS will free up
all the recursive resolver infrastructure to be put to other use.
Client caching and TTL: As discussed in §4.2 and §4.3.1, shared caching leads to
sparse hits at the recursive resolver caches even for the most popular hostnames. This
follows from the observation in [461] that over a 10 day period, 77% of all hostnames
resolved from more than 1000 clients are only ever looked up by a single client. However,
since authNS are operating with the assumption that a single answer could affect hundreds
or even thousands of individual users, they set very low TTL values on their answers to
facilitate DNS-based redirection. We observe half of the A records in the Alexa Top 1
Million domains setting a TTL value of 5 minutes or less (4.5a). If authNS were answering
to single clients, they would probably set higher TTL values [375]. Combined with the
observation that the set of names a single client looks up is fairly consistent over days [461],
DNS caching at the client and higher TTL values will lead to a significant reduction in
DNS traffic.
DNSSEC: DNSSEC is known to have severe size overhead since each resource record
(RR) must be accompanied by an RRSig record. The size overhead can be as large as a
73

factor of 6 for valid authoritative answers. The increase in response size causes problems
stemming from IP fragmentation of the DNS packets [335]. In our proposed model, the
ability of a server to decrypt the query packet implies that it has access to the ZSK private
key, and obviates the need to send signatures generated using the same key. Along with
response size savings, this could also save processing power because authNS would only
have to encrypt the entire packet once instead of computing signatures over all the records
on-the-fly as some do [146].
DNS Push Server: The popularity distribution of DNS names is known to be heavily-
tailed [291]. In fact, [461] finds that in their trace, the 100 most popular hostnames make up
28% of all DNS traffic. A The DNS Push Server introduced in §4.3 can also be used to notify
the clients for answers to the most popular names so clients don’t individually traverse the
lookup hierarchy. This suggestion is very similar to the DNS Push Notification [425] except
that clients can subscribe to sets of names instead of zones. There still remains the problem
of selecting which domains to push through this service. Although it is hard to build an
optimal set, popular TLDs (.com, .net, .org), relevant cc-TLDs (.de, .co.uk), Alexa top
lists for countries, and the Umbrella list seem like good starting points.
4.3.4 Adoption
Ease of adoption is a key goal for us as we aim to provide a turn-key solution to end-user
DNS privacy. We observe that full client resolution, and k-query obfuscation suggested in
our model require no changes to the DNS infrastructure. These can be implemented today
by just running a piece of resolver software on end-user machines or home routers. The
optional optimization of DNS push service requires a third-party, but any organization can
start providing this service independently. Users may be willing to pay for such a service
to obtain performant privacy, like they are in case of paid VPN services. In fact, there
already are paid services that provide DNS data, albeit for different purposes [574].
The modified DNSCurve encryption scheme requires changes in the DNS infrastructure,
but it is incrementally deployable. Any zone or domain can implement this scheme without
74
requiring changes to zones above it in the hierarchy. Support at the root or TLD levels is
not necessary.
4.4 Related
A large body of work on DNS has been produced over the past two decades ranging from
security and infrastructure optimizations to novel DNS architectures [35, 54, 245, 262, 429,
452]. Here, we focus on work related to DNS privacy. Zhao et al in [572] and Castillo-
Perez et al in [116] propose preserving user privacy through obfuscation by sending dummy
queries to the resolver. However, they don’t point out that this method, when applied to
shared resolvers, would reduce their cache hit rates exponentially. We apply this technique
to authNS. In [571], Zhao et al propose a two-server Private Information Retrieval (PIR)
scheme for guaranteeing privacy. This scheme is not applicable to resolvers because resolvers
don’t have the entire DNS database. They don’t elaborate on how it would apply to every
single authNS that a client might contact in case of direct resolution.
Yoshimichi et al in [379] design a promising scheme to protect user privacy at the
resolver by using Trusted Execution Environments to guarantee that query names never
leave trusted enclaves. This is orthogonal to our work in that we propose to eliminate
resolvers entirely. Lu et al [349] protect privacy through a new DNS architecture based
on distributed hash tables and a new naming scheme. We aim to minimize changes to
the existing DNS architecture. [250, 457] propose to preserve user privacy by introducing
another layer of redirection in DNS resolution. We instead take out a layer.
Most similar to our work are [258,459]. Schomp et al [459] propose that clients contact
authNS directly, but they don’t tackle privacy issues that arise from this. Hounsel [258] pro-
pose that clients contact multiple resolvers to de-centralize DNS and provide opportunistic
privacy. We provide better privacy by having clients contact authNS directly.
75
4.5 Summary
The DNS protocol was designed in an age when the Internet had less than 2000 nodes [345],
and all of them were trusted. Hence, DNS did not provide any authentication or confiden-
tiality. DNSSEC [13] was introduced to provide authentication for DNS responses, while
the confidentiality problem remains largely unsolved.
Much innovation has happened in the DNS privacy space over the past few years.
Unfortunately, most work treats the client stub resolvers as dumb/thin clients that must
trust a third-party to resolve names for them, perhaps out of performance and scalability
concerns. In this chapter, we show that shared recursive resolvers and caches are not
essential to the DNS architecture, no longer provide many of the benefits they are often
assumed to provide, and client resolution can provide good enough performance and better
privacy to end users. Through this attempt, we hope to unlock innovation that leverages
the client stub resolvers, and deploys smart DNS management to optimize performance and
privacy at end user machines.
76

Chapter 5
Revenue and Latency in Online Ads
Header bidding (HB) is a relatively new online advertising technology that allows a content
publisher to conduct a client-side (i.e., from within the end-user’s browser), real-time auc-
tion for selling ad slots on a web page. We developed a new browser extension for Chrome
and Firefox to observe this in-browser auction process from the user’s perspective. We
use real end-user measurements from 393,400 HB auctions to (a) quantify the ad revenue
from HB auctions, (b) estimate latency overheads when integrating with ad exchanges and
discuss their implications for ad revenue, and (c) break down the time spent in soliciting
bids from ad exchanges into various factors and highlight areas for improvement. For the
users in our study, we find that HB increases ad revenue for web sites by 28% compared
to that in real-time bidding as reported in a prior work. We also find that the latency
overheads in HB can be easily reduced or eliminated and outline a few solutions, and pitch
the HB platform as an opportunity for privacy-preserving advertising.
5.1 Introduction
Online advertising is a multi-billion dollar industry, with estimated global revenues of more
than 300 billion dollars (USD) in 2019 [188]. Revenues from advertising platforms exhibited
a consistent positive growth rate over the last nine quarters [365], and are projected to
reach 0.5 trillion USD within the next four years [188]. Programmatic advertising, which
includes both real-time bidding (RTB) and header bidding (HB), dominates the online
advertising space today: It accounts for 62% of the total advertising spend [365]. In this
chapter, we offer insights into the design and performance of HB auctions using real end-
user measurements, which have not been available before.
77
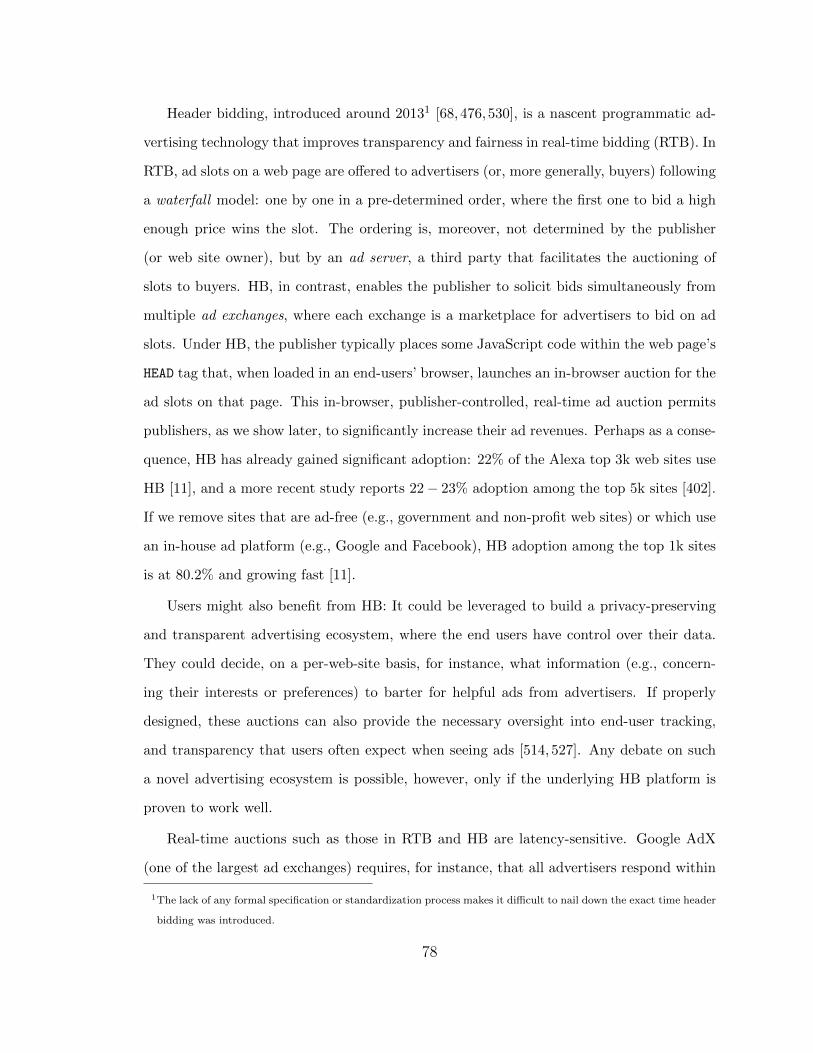
Header bidding, introduced around 20131 [68, 476, 530], is a nascent programmatic ad-
vertising technology that improves transparency and fairness in real-time bidding (RTB). In
RTB, ad slots on a web page are offered to advertisers (or, more generally, buyers) following
a waterfall model: one by one in a pre-determined order, where the first one to bid a high
enough price wins the slot. The ordering is, moreover, not determined by the publisher
(or web site owner), but by an ad server, a third party that facilitates the auctioning of
slots to buyers. HB, in contrast, enables the publisher to solicit bids simultaneously from
multiple ad exchanges, where each exchange is a marketplace for advertisers to bid on ad
slots. Under HB, the publisher typically places some JavaScript code within the web page’s
HEAD tag that, when loaded in an end-users’ browser, launches an in-browser auction for the
ad slots on that page. This in-browser, publisher-controlled, real-time ad auction permits
publishers, as we show later, to significantly increase their ad revenues. Perhaps as a conse-
quence, HB has already gained significant adoption: 22% of the Alexa top 3k web sites use
HB [11], and a more recent study reports 22− 23% adoption among the top 5k sites [402].
If we remove sites that are ad-free (e.g., government and non-profit web sites) or which use
an in-house ad platform (e.g., Google and Facebook), HB adoption among the top 1k sites
is at 80.2% and growing fast [11].
Users might also benefit from HB: It could be leveraged to build a privacy-preserving
and transparent advertising ecosystem, where the end users have control over their data.
They could decide, on a per-web-site basis, for instance, what information (e.g., concern-
ing their interests or preferences) to barter for helpful ads from advertisers. If properly
designed, these auctions can also provide the necessary oversight into end-user tracking,
and transparency that users often expect when seeing ads [514, 527]. Any debate on such
a novel advertising ecosystem is possible, however, only if the underlying HB platform is
proven to work well.
Real-time auctions such as those in RTB and HB are latency-sensitive. Google AdX
(one of the largest ad exchanges) requires, for instance, that all advertisers respond within
1The lack of any formal specification or standardization process makes it difficult to nail down the exact time header
bidding was introduced.
78

120 ms of the bid request being sent [226]. Setting aside a recommended room of 20 ms for
unexpected delays, and 40 ms for bid computations and data fetches, leaves only 60 ms for
the round trip between an advertiser and Google AdX [403]. Given the state of latency
in the Internet [85], it is not surprising that Google AdX recommends that advertisers
peer directly or co-locate with AdX to minimize latency. Ensuring low latency for bid
requests and responses is even more challenging in HB, since users’ browsers cannot be co-
located with exchanges. Publishers thus set very long deadlines (from 500 ms to 3000 ms) to
ensure that all ad exchanges in an HB auction have a chance to bid. These long deadlines
are consistent with the widespread belief that the in-browser auction held in HB imposes
significant latency overhead [163, 402]. The central theme of this chapter is that these
concerns may be overblown. In particular, we identify the sources of overhead and outline
several avenues for lowering it. We summarize our contributions as follows.
? We developed a web browser extension, for both the Google Chrome and Mozilla
Firefox browsers, to dissect in-browser HB auctions. We released the source code of the
extension as open source software [49].
? Prior work on header bidding [402] relied on regularly crawling websites from a single
vantage point. Crawling is valid for some of the analyses they do, such as how many ads are
on a web page, and which exchanges are involved, but it cannot provide any useful insights
into networking timing for real users. Revenue measurements will also be inaccurate as
advertisers bid only token amounts for synthetic user profiles. We gathered measurements
of in-browser HB auctions from about 400 real users, who volunteered to install and use
the extension for a period of 8 months. We also made the data set constituting these
measurements publicly available [49]. We call this data set Rum.
? Using the Rum data set, we demonstrate that ad revenue (estimated using the median
of bids from ad exchanges) from HB is significantly higher (28%) than that reported for
RTB in other studies. We also estimate the publishers’ latency overheads when integrating
with ad exchanges and discuss their implications for publishers’ ad revenue.
? We break down the time spent in soliciting bids from ad exchanges into its contribut-
79
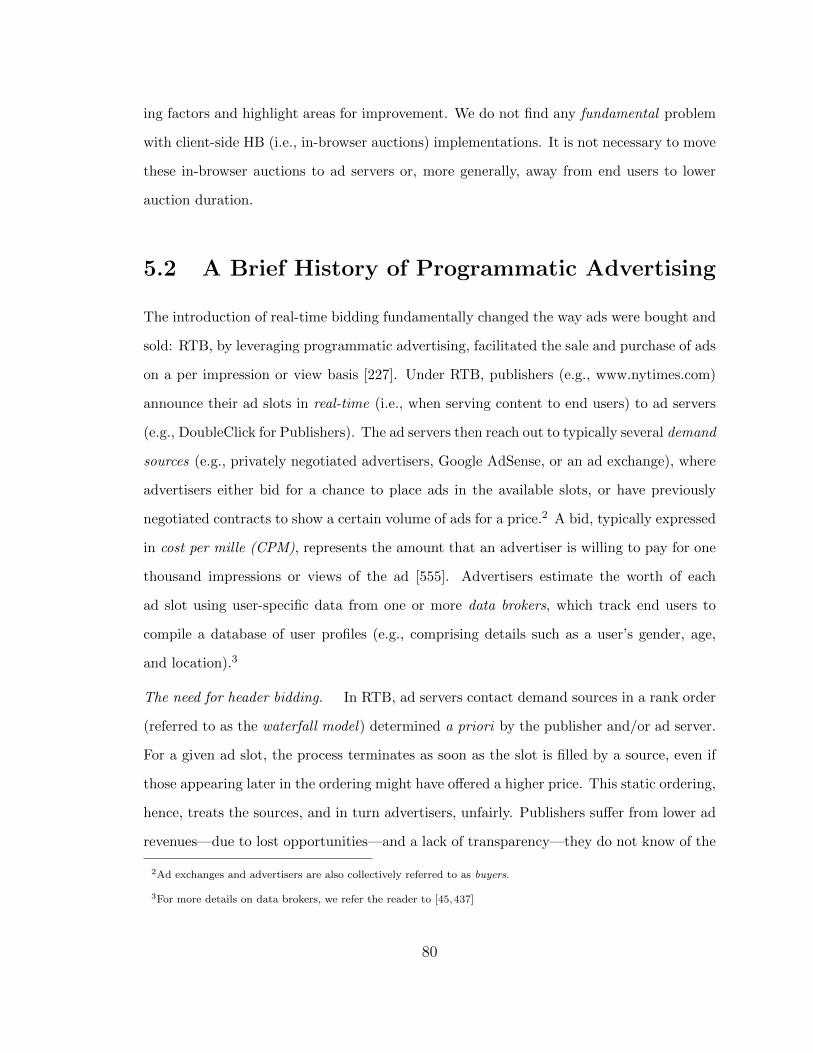
ing factors and highlight areas for improvement. We do not find any fundamental problem
with client-side HB (i.e., in-browser auctions) implementations. It is not necessary to move
these in-browser auctions to ad servers or, more generally, away from end users to lower
auction duration.
5.2 A Brief History of Programmatic Advertising
The introduction of real-time bidding fundamentally changed the way ads were bought and
sold: RTB, by leveraging programmatic advertising, facilitated the sale and purchase of ads
on a per impression or view basis [227]. Under RTB, publishers (e.g., www.nytimes.com)
announce their ad slots in real-time (i.e., when serving content to end users) to ad servers
(e.g., DoubleClick for Publishers). The ad servers then reach out to typically several demand
sources (e.g., privately negotiated advertisers, Google AdSense, or an ad exchange), where
advertisers either bid for a chance to place ads in the available slots, or have previously
negotiated contracts to show a certain volume of ads for a price.2 A bid, typically expressed
in cost per mille (CPM), represents the amount that an advertiser is willing to pay for one
thousand impressions or views of the ad [555]. Advertisers estimate the worth of each
ad slot using user-specific data from one or more data brokers, which track end users to
compile a database of user profiles (e.g., comprising details such as a user’s gender, age,
and location).3
The need for header bidding. In RTB, ad servers contact demand sources in a rank order
(referred to as the waterfall model) determined a priori by the publisher and/or ad server.
For a given ad slot, the process terminates as soon as the slot is filled by a source, even if
those appearing later in the ordering might have offered a higher price. This static ordering,
hence, treats the sources, and in turn advertisers, unfairly. Publishers suffer from lower ad
revenues—due to lost opportunities—and a lack of transparency—they do not know of the
2Ad exchanges and advertisers are also collectively referred to as buyers.
3For more details on data brokers, we refer the reader to [45,437]
80
Figure 5.1: Interactions between different elements in client-side header bidding
demands across different sources, especially ad exchanges, to inform a better ordering.
Leveling the playing field. Header bidding was introduced sometime around 2013 or
2014 [68,414,476,530], to address RTB’s shortcomings. HB allows the publisher to contact
different advertisers and ad exchanges concurrently. Then, these bids are sent to the ad
server so they can be compared to other demand sources. With this model, ad exchanges
have a fair chance to bid for the slots, and publishers can monitor the demand across
different exchanges. Over time, three different kinds of header bidding implementations
have emerged: client-side, server-side, and hybrid (see [402]), although client-side is the
original and still dominant implementation. For the rest of this chapter, we focus our
attention on client-side HB.
Client-side HB. The publisher adds JavaScript in the web page’s header, i.e., content
enclosed by the HEAD HTML-tag that when processed by an end-user’s browser, kick-starts
an in-browser auction (illustrated in Fig. 5.1). The auction concurrently solicits bids from
different exchanges for the ad slots on that page. The bids received until the end of the
auction are then sent to the ad server to compare with those retrieved via the waterfall-
model auctions in the ad server. Finally, the ad server chooses the highest bid, i.e., with
the highest CPM, and returns the winning bid to the browser. The browser then contacts
(not shown in the illustration) the winning bidder to retrieve the ad and display it.
81

Attribute(s) Value
Users ≈ 400
Duration 8 months
Cities; countries 356; 51
web sites 5362
Ad exchanges 255
Page visits 103,821
Auctions 393,400
Bids 462,075
Figure 5.2: A summary of the Rum data set
5.3 Real User Measurements
Our objective is to passively observe the in-browser auctions of the client-side header bid-
ding process. To this end, we developed a browser extension, released it to public, and, from
real end users who used the extension for 8 months, obtained measurements pertaining to
HB auctions.
The browser extension utilizes the Prebid library [415], for it is the most widely used
HB JavaScript library, with 63.7% of the publishers using it as of August 2019 [11]. The
extension, MyAdPrice, is available on both the Google Chrome web store and Firefox Add-
ons web site. It uses the JavaScript APIs for WebExtensions [364] to access the document-
object-model (DOM) tree [363]. Via the DOM, it learns of (a) the ad slots on the Web
page, (b) the name and IP addresses of the ad exchanges that were contacted to fill up those
slots, (c) the bids received from different exchanges, and (d) which bids, if any, won the
auctions and for which ad slots. The extension also uses the Web Performance Timing API
(WPT) [538] to capture the time spent in each step of the request such as DNS resolution,
performing TCP/TLS handshakes, soliciting bids from exchanges (i.e., transferring the data
82

carrying the requests to the exchange’s servers) for various ad slots, and receiving bids (i.e.,
retrieving the response data from the exchange’s servers) from the exchanges. Outgoing ad
server requests are also checked for query parameters.
In addition to releasing the source code for the extension as open source software,
we announced it on university mailing lists and public forums to increase adoption. We
recruited approximately 400 volunteers from diverse locations, with nearly 50% of the users
from the US. The rest were mostly from European countries including Bulgaria, the United
Kingdom, France, Norway, Germany, and the Netherlands, and a small, but significant
fraction, also from Canada and India. Tab. 5.2 presents the high-level characteristics of the
Rum data set, comprising real user measurements over a period of 8 months. The end users
visited about 5k web sites, for a total of about 100k web page fetches. The users’ browsing
activity resulted in about 400k auctions involving about 500k bids from 255 ad exchanges.
In total, we observed 916,447 requests issued by the users’ browsers to ad exchanges and
servers; 247,869 (27%) of these were to ad servers, while the remaining 668,578 were to
ad exchanges. Our browser extension recorded the timestamp of each request using the
browser’s Navigation Timing API [536]. Using these timestamped requests, we estimated
the duration of auctions and investigated the factors that affect an auction’s duration.
5.3.1 Privacy & Ethics
Our extension, by default, sends no data from the user’s browser. The extension uses the
browser’s local storage to store data pertaining to ad slots in different pages and the bids
received for each. The extension uses this data to compute the “ad-worthiness” of the
user—the money that advertisers intend to make off of the user, and allows the user to
view this locally-stored information. Users may opt in to share data including domain
names of web pages they visit, i.e., only those that use header bidding, ad slots on the
pages, exchanges contacted for ads, bids received, timing information on various phases
of the in-browser auction, and, lastly, their geographical location at city level. The data
shared does not have any information to uniquely identify a user. This opt-in data from real
83

0
0.2
0.4
0.6
0.8
1
1 0 1 4 1 8 1 12 1 16 1 20
CDF
Num. 1 of1 ad 1 exchanges
per1 auctionper1 website
(a) (b)
Figure 5.3: (a) In the median, auctions involve only two ad exchanges and web sites
(publishers) connect with only three ad exchanges. (b) Auction duration increases
with the number of ad exchanges contacted.
end users constitutes the Rum data set. When we consulted our institutional review board,
they declared that we do not require an approval since we do not gather any personally
identifiable information.
The strict privacy standards we set for ourselves also mean that our dataset has lim-
itations. Since we don’t upload any data by default, not all installations result in data
collection. Also, since we don’t identify users, we cannot tell how many unique users up-
loaded data to our servers. We also cannot track users across different websites, and cannot
profile based on age, income etc.
We refrained from conducting any experiment that would harm end users or publishers
or even the advertisers. The extension is merely a passive observer of the in-browser
auctions. We did not crawl web sites, since that would generate synthetic ad impressions
for which advertisers might have to pay the publishers. Crawling activities may also lead
to exchanges flagging the publisher for suspicious activity. We did not craft synthetic user
profiles for similar reasons.
84

0
0.2
0.4
0.6
0.8
1
1 0.01 1 0.1 1 1 1 10 1 100
CDF
CPM1 (USD)
allwinning
(a)
0
0.4
0.8
1.2
1 0 1 4 1 8 1 12 1 16 1 20
CPM
1
(USD
)
Num. 1 of1 ad 1 exchanges
(b)
Figure 5.4: (a) Bid prices show significant variation, with approximately 30% of bids
having at least $1 CPM. (b) The median CPM or ad revenue increases with number
of ad exchanges contacted.
5.4 Ad Exchanges, CPM, and Ad Revenue
The large number of ad exchanges observed in the Rum data set (in Tab. 5.2) suggests that
publishers leverage HB to integrate with many buyers in order to maximize their ad revenue.
To investigate further, we computed the number of ad exchanges contacted, derived from
the count of distinct ad exchanges from which bids were received by the browser, per auction
as well as per web site. The CDF of the number of ad exchanges contacted (Fig. 5.3a),
across all auctions and web sites, reveals that most web sites (60%) use at most four ad
exchanges, and 10% use at least twice as many. Per this figure more than a third (35%) of
all auctions involve only one exchange and a fifth use at least four exchanges. Publishers
seem conservative in connecting with many ad exchanges, even if HB libraries make it easy
to establish such direct integrations. Prebid, the most widely used JavaScript HB library,
for instance, offers more than 250 integration modules or “adapters” [418]; to integrate with
an ad exchange, publishers simply have to enable or include the corresponding adapter.
The CDF of CPMs across all auctions, in Fig. 5.4a, shows a significant variation in bid
values. While 20% of bids have at most $0.10 CPM, nearly 30% of the bids have at least
$1 CPM. We also observed 2 bids with CPM between $500− $1000 and 3 with more than
85

$1000 CPM. We find that ad revenue in HB (for our volunteers) is not lower than that of
RTB reported in other studies. For example, the median winning CPM that we observe
($1.15) is 28% higher than the RTB median of $0.90 reported in [405]. Furthermore, we
grouped together ad slots based on the number of ad exchanges from which they solicited
bids and computed the median value of bids in each group (Fig. 5.4b). The median value of
bids increases significantly with the number of ad exchanges. It is indeed in the publishers’
best interests to connect with many ad exchanges—at least more than the current number
of ad exchanges (Fig. 5.3a) they are using.
Publishers could be contacting fewer exchanges for performance reasons. We investigate
the implications of integrating with more ad exchanges for auction duration in the next
section.
5.5 Auction Duration & Implications
The Prebid Javascript library does not provide explicit timestamps for auction start, and
end. As an approximation, we use the first bid request from the browser to an ad exchange
to signal an auction’s start. A call to the ad server marks the end of an auction (step 8
in Fig. 5.1). Hence we approximate the auction duration as the time between the first bid
request, and the ad server call. The CDF of these estimates, in blue in Fig. 5.5a, shows
that auctions last for 600 ms in the median and some 10% of auctions last longer than µs2.
Despite the publishers integrating with a small number of ad exchanges, auction durations
are fairly high.4
The CDF of the elapsed time between when the user arrives at a given web page and
the end of the auction (“since visit” line in Fig. 5.5a) reveals that the browsers spend a
large amount of time prior to launching HB auctions. Perhaps web browsers spend this
time prioritizing content over ads. Web pages may also refresh ads based on user activity,
e.g., scrolling down or reactivating an inactive tab, triggering some auctions much later
4Appendix 5.9 presents additional results on factors that may influence the number of exchanges contacted by a
publisher.
86

0
0.2
0.4
0.6
0.8
1
1 0 1 2 1 4 1 6 1 8 1 10
CDF
Time1 to1 call1 ad 1 server 1 (s)
since 1 visitsince 1 f rst 1 bid
(a)
0
0.2
0.4
0.6
0.8
1
-4 -2 1 0 1 2 1 4 1 6 1 8 1 10
CDF
Bid1 arrival1 – 1 onLoad 1 (s)
(b)
Figure 5.5: (a) Auctions last for 600 ms in the median, and some 10% of auctions
last more than µs2. (b) Auctions, however, do not seem to affect the page load times:
Most bids arrive much later than when the onLoad event fires.
than when the user arrived at the web page. These are separate auctions that are triggered
in response to these events.
To ascertain the implications of auction duration for end users, we focus on the page-
load time (PLT), and measure the time it takes for the browser to fire the onLoad event
after the user navigates to the web page. We subtract the onLoad time of a web page from
the bid-arrival times associated with the ad slots or auctions on that page, and plot the
CDF of the resulting values in Fig. 5.5b. Only a small fraction of bids (18%) arrive before
the page load is complete; 82% of the bids arrive after the onLoad event is fired. Although
the shortcomings of the PLT metric in reflecting end-users’ experiences is well-known, it is
still the most widely used metric [160], and according to this metric auction duration does
not significantly impact end-user experiences.
Longer ad auctions could, however, affect publishers and advertisers. The negative
effect of latency on e-commerce sales is well-known [18], and [63] concludes that increased
response latency decreases click-through rates for search results. Delay in showing ads
likely has the same effect, since a longer duration implies a longer time to display the ad
and engage the user. Furthermore, the display of an ad might alter the visual elements or
rendering of the web page. Auction duration also increases with the number of ad exchanges
87

0
0.2
0.4
0.6
0.8
1
1 0 1 1000 1 2000 1 3000 1 4000 1 5000
CDF
Distance 1 to1 user 1 (km)
INDRUBAOLCRT
(a) (b)
Figure 5.6: (a) Ad exchanges typically are quite far from end users. (b) “High-
CPM” ad exchanges are not any faster in responding with bids than “low-CPM” ad
exchanges.
contacted by the browser, as the linear fit in Fig. 5.3b shows. While publishers can limit
the auction duration, a smaller timeout could lead to lost revenues, since a higher bid
may arrive after the timeout is triggered. Clearly, publishers have to manage the trade-off
between maximizing revenue and minimizing auction duration.
A simple approach to managing the trade-off is to cherry-pick ad exchanges that deliver
high-value bids. We thus rank-order ad exchanges by median CPM of bids sent across all
web sites and users. Fig. 5.6b shows, however, no correlation between ad-exchange CPM
and the median latency of its bid responses.
Rather than limit the number of exchanges, which is clearly not efficient, publishers
could perhaps specify an early timeout. Fig. 5.7a shows the CDF of bid-response arrivals
with respect to auction start (i.e., the timestamp of the first bid request). 87% of the bids
arrive within µs1 of the start of the auction. Also, the CDF of CPMs of bids as a function
of the time they were received since auction start, in Fig. 5.7b, indicates that 90% of the
total CPM is received within the same time span. This observation is in stark contrast
with the estimates of auction duration in Fig. 5.5a (“since first bid” line). More concretely,
per Fig.5.5a, 30% of the auctions take longer than µs1, suggesting that publishers are
conservative in setting auction timeouts or deadlines: A lot of time is, hence, unnecessarily
88

0
0.2
0.4
0.6
0.8
1
1 10 1 100 1 1000 1 10000
CDF
Bid1 delay1 since 1 auction 1 start 1 (ms)
(a)
0
0.2
0.4
0.6
0.8
1
1 10 1 100 1 1000 1 10000Frac
tion1
of
1
CPM
1
rece
ived
Time1 since 1 auction 1 start 1 (ms)
(b)
Figure 5.7: (a) 87% of the bids and (b) 90% of the ad revenue, estimated through
CPMs, arrive within µs1 of the start of the auction.
wasted on waiting for bids that will likely have no significant effect on the auction.
5.6 Sources of Latency in HB Auctions
In this section we delve into the factors that fundamentally determine the duration of
the in-browser HB auctions. To this end, we dissect the latency of a bid request into
its contributing factors and identify, wherever possible, avenues for mitigating the latency
overheads.
We define bid duration as the time between the start of the bid request being sent out
and the end of the bid response being received. We can measure bid duration from two data
sources—from within the Prebid JavaScript library (in-browser) and through the WPT
API [538] (on-the-wire). in-browser measures the difference between the timestamps
that Prebid records when it has prepared the bid request to be sent through the browser,
and when it has finished parsing the bid response. on-the-wire is just the duration between
the bid request and response as provided by the WPT API.
The CDF of bid durations calculated separately from these two sources, in Fig 5.8a,
shows, surprisingly, a difference of 174 ms in the median, which is fairly large. This dif-
ference is suggestive of poor implementation practices or bugs in HB libraries, specifically
89

0
0.2
0.4
0.6
0.8
1
1 0 1 500 1 1000 1 1500
CDF
Bid1 duration 1 (ms)
on-the-wirein-browser
(a)
0
500
1000
1500
0 500 1000 1500
Time1
(ms)
Bid1 duration 1 (ms)
ResponseTTFB
TLSTCP
DNS
(b)
Figure 5.8: (a) The gap between the “in-browser” and “on-the-wire” bid request
durations suggests room for improving HB implementations. (b) Breakdown of time
spent by requests over non-persistent connections into key contributing factors.
in the logic implemented in the adapters developed for integrating the publisher with an
ad exchange or advertiser [416]; it could also be that publishers are using adapters incor-
rectly. Consider the scenario in which a publisher’s web site contacts exchanges A and
B. Suppose that bid duration for exchanges A and B are 250 ms and 300 ms, respectively.
In the ideal case, the adapters for A and B should be making concurrent, asynchronous
requests. Suppose that B has a bug in its adapter: it makes a synchronous request. If the
publisher integrated HB so that B is contacted before A, given that B makes a synchronous
call, the call to A will get delayed until the request to B completes. The auction now lasts
for 550 ms instead of only 300 ms (in case of a correct implementation). Such pitfalls are
detailed in [170] and [417].
The WPT API allows us to break down the bid duration into the various steps involved.
We specifically gather the following measures: (a) the amount of time the bid request
was waiting in the browser’s queue (“Stall”), due to several factors such as preemption
by requests with higher priority, exhaustion of the allowed number of simultaneous TCP
connections (particularly with HTTP/1.0 and HTTP/1.1), and allocation of disk space for
caching; (b) time spent in resolving the domain name (“DNS”); (c) time spent in TCP
handshake; (d) time spent in TLS handshake; (d) time spent in waiting for the first byte
90
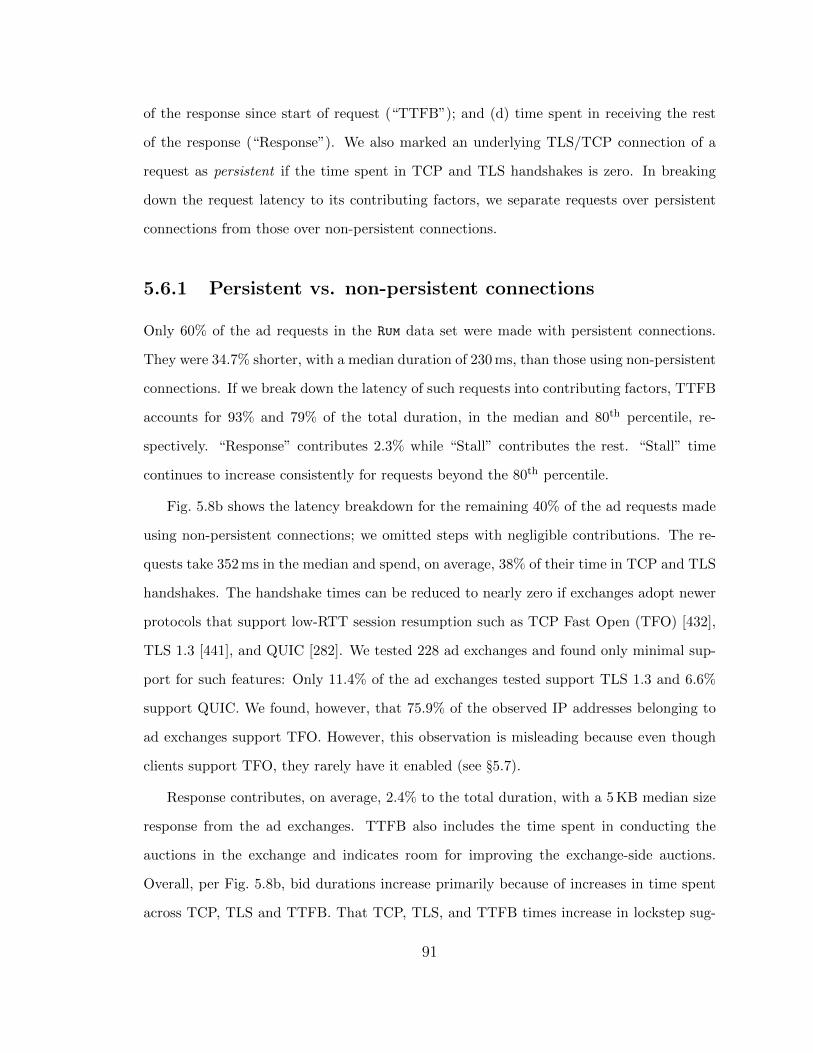
of the response since start of request (“TTFB”); and (d) time spent in receiving the rest
of the response (“Response”). We also marked an underlying TLS/TCP connection of a
request as persistent if the time spent in TCP and TLS handshakes is zero. In breaking
down the request latency to its contributing factors, we separate requests over persistent
connections from those over non-persistent connections.
5.6.1 Persistent vs. non-persistent connections
Only 60% of the ad requests in the Rum data set were made with persistent connections.
They were 34.7% shorter, with a median duration of 230 ms, than those using non-persistent
connections. If we break down the latency of such requests into contributing factors, TTFB
accounts for 93% and 79% of the total duration, in the median and 80th percentile, re-
spectively. “Response” contributes 2.3% while “Stall” contributes the rest. “Stall” time
continues to increase consistently for requests beyond the 80th percentile.
Fig. 5.8b shows the latency breakdown for the remaining 40% of the ad requests made
using non-persistent connections; we omitted steps with negligible contributions. The re-
quests take 352 ms in the median and spend, on average, 38% of their time in TCP and TLS
handshakes. The handshake times can be reduced to nearly zero if exchanges adopt newer
protocols that support low-RTT session resumption such as TCP Fast Open (TFO) [432],
TLS 1.3 [441], and QUIC [282]. We tested 228 ad exchanges and found only minimal sup-
port for such features: Only 11.4% of the ad exchanges tested support TLS 1.3 and 6.6%
support QUIC. We found, however, that 75.9% of the observed IP addresses belonging to
ad exchanges support TFO. However, this observation is misleading because even though
clients support TFO, they rarely have it enabled (see §5.7).
Response contributes, on average, 2.4% to the total duration, with a 5 KB median size
response from the ad exchanges. TTFB also includes the time spent in conducting the
auctions in the exchange and indicates room for improving the exchange-side auctions.
Overall, per Fig. 5.8b, bid durations increase primarily because of increases in time spent
across TCP, TLS and TTFB. That TCP, TLS, and TTFB times increase in lockstep sug-
91

gests RTTs between users and ad exchanges as a key contributor to latency.
5.6.2 Ad Infrastructure Deployments
Using a commercial geolocation service, we calculated the geodesic [556] between the end
users and the ad exchange servers.5 Fig 5.6a plots the CDF of these distances for four of the
eight most popular exchanges; we omitted the rest, which had similar results, for clarity.
Index Exchange’s servers (IND), deployed at 88 different locations are the closest to end
users: in the median, the servers are about 180 km away from the users. The remaining
exchanges each have servers in only 20 locations and are quite far away from end users—
median distances for Rubicon Project (RUB), AOL, and Criteo (CRT) are approximately
520 km, 910 km, and 2410 km, respectively. Criteo seems to be directing almost all North
American users to a single US West Coast location. (Appendix 5.8 presents other inferences
derived from the locations of the users and ad exchanges.)
Index Exchange’s geographically widespread deployments help in ensuring a low hand-
shake time, as shown in Fig. 5.9a. The handshake times to servers of Criteo and AOL,
despite the exchanges’ comparatively poor deployment, are surprisingly low. We found
that Criteo supports TLS 1.3, while Index Exchange does not. This can result in a drastic
improvement in handshake latency as TLS 1.3 saves one complete roundtrip in the hand-
shake. Another reason that Index Exchange is not seeing even lower latency is that perhaps
most of the latency is in the last mile. Since 60% of the bid requests use persistent connec-
tions, TTFB, and not handshake time, accounts for most of the request duration. Fig. 5.9b
shows that Criteo does an exceptionally good job, especially compared to Index Exchange,
in keeping the TTFB low: The server-side auctions at Criteo are perhaps better optimized
than those at Index Exchange.
5We geolocate the end-user’s IP address when the extension reports the opt-in data.
92

0
0.2
0.4
0.6
0.8
1
1 0 1 100 1 200 1 300 1 400 1 500
CDF
Handshake 1 time1 (ms)
INDRUBAOLCRT
(a)
0
0.2
0.4
0.6
0.8
1
1 0 1 100 1 200 1 300 1 400 1 500
CDF
TTFB1 to1 user 1 (ms)
INDRUBAOLCRT
(b)
Figure 5.9: (a) TCP/TLS handshakes account for a significant fraction of an ad
request’s duration. (b) Ad exchanges can quite effectively lower auction durations by
optimizing the exchange-side auctions, and lowering the TTFB values.
5.7 Client-side TFO adoption
In this appendix, we complement the observations on server-side TFO adoption (in §5.6.1)
with some comments on adoption on the client side. Measuring TFO adoption on the client
side is challenging. The Linux kernel disables TFO globally if it sees 3 consecutive TCP
timeouts, before or after the handshake, for any destination [122]. The rationale is to avoid
the extra cost of TFO failure or client blacklisting in case of middlebox interference [251].
macOS implements a similar backoff strategy and disables TFO [46], although it is a bit less
conservative. Windows implements an even more conservative backoff strategy [62]. Even
if the operating system has TFO enabled, the browser usually does not. The Chromium
project, on which Google Chrome and some other browsers are based, has removed TFO
from all platforms [128], while Firefox supports TFO, but keeps it disabled by default.
93
0
0.2
0.4
0.6
0.8
1
1 2 1 4 1 6 1 8 1 10 1 12 1 14
CDF
Exchanges 1 contacted
NAEUASOC
(a)
0
0.2
0.4
0.6
0.8
1
1 0.01 1 0.1 1 1 1 10 1 100 1 1000
CDF
Avg1 CPM1 for1 domain
NAEUASOC
(b)
Figure 5.10: Impact of a user’s location on (a) the number of exchanges contacted,
and (b) the mean CPM obtained per web page.
0
0.2
0.4
0.6
0.8
1
1 0 1 500 1 1000 1 1500
CDF
Bid1 request 1 duration 1 (ms)
NAEUASOC
(a)
0
0.2
0.4
0.6
0.8
1
1 0 1 1 1 2 1 3 1 4
CDF
Auction 1 duration 1 (s)
NAEUASOC
(b)
Figure 5.11: Impact of a user’s location on (a) bid-request duration, and (b) auction
duration.
94

5.8 NA & EU Users: GDPR, ad-worthiness and
latencies
In this appendix, we examine the role that user location plays in HB. We coarsely divided
our users into regions of North America (NA), Europe (EU), Asia (AS), and Oceania (OC),
we observe that web sites contact more ad exchanges in North America: 13% of web sites,
when visited by users in North America, contact 8 or more ad exchanges, but in case of EU
users 99% web sites contact at most 7 (Fig. 5.10a). Perhaps this effect can be attributed
to the strict privacy requirements of GDPR. The difference between European and North
American users is even more pronounced when it comes to bid amounts (or CPMs). Web
sites generate 4 times more CPM through a visit from a North American user than they
do from a European user as shown in Fig. 5.10b. It is hard to conclusively determine
the reason for this large difference as there are a multitude of factors that determine the
“ad-worthiness” of a user.
The CDF of on-the-wire bid durations for users in different regions (Fig. 5.11a) shows
that, in the 80th percentile, European (EU) users observe 12% higher bid durations than
North American (NA) users. The auction durations for NA users are, however, 27% longer
than that of their EU counterparts in the 80th percentile (Fig. 5.11b). These observations
can perhaps be attributed to NA users contacting more exchanges, and that, as we have
seen earlier in Fig. 5.3b, increases auction duration. Bid durations for Oceania (OC) users
are alarmingly high: 23% of bids take longer than µs1 (Fig. 5.11a), which precipitates
in long auctions for OC users (Fig. 5.11b). Only 7% auctions of OC users take, however,
longer than µs2.5 compared to 10% of auctions in case of NA users. For a large fraction of
OC users, even though bids arrive late, the JavaScript perhaps times out and terminates
the auction, potentially introducing some loss of ad revenue for publishers.
95

(a) (b)
Figure 5.12: Impact of a web site’s ranking on (a) mean CPM and (b) number of
exchanges contacted.
5.9 Popularity Correlations
We investigate, in this appendix, how the popularity ranking of a web site affects its HB
implementation and the CPM it receives on its ad slots. For popularity rankings, we used
the Tranco list [412], a stable top list hardened against manipulation. We used the relative
ranks of second-level domains observed in our measurements and filtered out web sites that
have fewer than 10 data points.
Fig. 5.12a shows the mean CPM per web-page visit, of a given web site, as a function
of that site’s relative Tranco rank. The linear fit, with a slope of 0.008, reveals a weak
correlation, suggesting that web-site popularity is not a strong indicator of “high-value”
audience for advertisers. For instance, imgur.com (rank 51), an image-sharing web site
outranks wsj.com (rank 152), a major business-focused publication.
Increasing the number of ad exchanges contacted increases the auction duration, which
may have implications for end-users’ browsing experiences (refer §5.5). Fig 5.12b shows,
however, no correlation between the rank of a web site (based on Tranco) and the number of
ad exchanges it contacts: Popular web sites do not contact fewer exchanges than unpopular
ones to improve user experience.
96

We also repeated these analyses with the Majestic Million top list6 instead of Tranco.
Majestic Million ranks web sites by the number of subnets linking to them, which is more
of a quality measure than raw traffic. Regardless, we did not observe any significant change
in the results and inferences presented above.
5.10 Related Work
Header bidding, being a nascent technology, has received little attention in the literature.
In [285], Jauvion et al. discuss how to optimize a buyer’s bidding strategy in HB, while [428]
presents a stochastic optimization model for optimizing ad-exchange revenues. Cook et al.
use machine learning models to identify relationships between data brokers and advertis-
ers [152]. In [402], Pachilakis et al. present a measurement study of the HB platform. They
focus on market aspects such as the most popular ad exchanges, number of ad slots found
on web pages, and their sizes. They crawl web sites with blank user profiles from a single
vantage point, so their revenue and network timing data does not reflect real users and
network conditions. They also cannot identify the causes of HB latency. In contrast, our
study uses real user measurements to study latency and its ad-revenue implications.
Orthogonal to header bidding, there is a rich body of work on online advertising, end-
user tracking, and privacy that show how users attach monetary value to their personally
identifiable information (e.g., [113, 490]) and how to uncover advertising and tracking ser-
vices by analyzing network traffic data (e.g., [438]). Venkatadri et al. propose a novel
mechanism that enforces transparency on online advertising platforms [527]. Guha et al.
and Toubiana et al. have presented designs for privacy preserving advertising that puts
the client at the center [236,514]. These techniques, however, require sweeping changes for
real-world deployments, and we argue that they can be ported over to the HB platform
that is already enjoying widespread adoption.
6https://majestic.com/reports/majestic-million
97

5.11 Concluding Remarks
Within a span of roughly six years since its introduction, header bidding has gained a strong
adoption: Among the top 1k web sites that use third-party ad platforms, 80% use HB. It
decreases publishers’ dependence on large advertising-market players, e.g., Google, and
also improves publisher revenue [482]. Although there are widespread concerns that HB’s
in-browser auctions introduce significant latency overheads and affect end-users’ browsing
experiences [163] ( [402] mentions high delays seen from one vantage point, and paints
a gloomy picture without any analysis on what is causing the delay), our real-end-user
measurements lessen these concerns. We showed that more than half of these overheads
can be eliminated by adopting more modern protocols and also, perhaps, by fixing bugs
in the JavaScript-based HB implementations. Since HB is widely adopted by publishers,
shows promise in significantly increasing the publishers’ ad revenues (e.g., see §5.4), and
has implementation overheads that are addressable with minimal engineering efforts, we
propose that client-side HB be seen as an opportunity for privacy-preserving advertising.
The pervasive and commonplace tracking of users to improve targeted ads is unsustain-
able in the long term. Recent privacy violations and scandals [149, 220, 477] have raised
users’ awareness and lowered their tolerances: A recent study found 22% of surveyed users
to be using Adblock Plus, the most popular ad-blocking browser extension [422], and, fu-
eled by users’ demands, Firefox ships bundled with a collection of privacy extensions (e.g.,
tracker and third-party cookie blocker) [377]. Such aggressive measures to block ads and
trackers, nevertheless, is fundamentally at odds with the publishers’ business model. Major
news web sites have resorted to putting up paywalls [512], and asking for donations [547].
There is, unfortunately, an inherent flaw in today’s approach to blocking ads and track-
ers: ads and trackers are treated equally. While users are sensitive about privacy, most do
not mind seeing non-intrusive ads; users would be willing to share more if they had control
over what is shared and with whom, and what kind of ads they would like to see [119]. Users
also think that ad targeting based on tracking is often inaccurate: they see ads related to
common stereotypes about their identity, or related to searches they made over a month
98

ago [119].
The client-side HB platform gives us an opportunity to address these concerns: Since
the browser has control over the in-browser auction, it can essentially control the entire
ad-fetch process. Browsers must continue to block tracking mechanisms such as host fin-
gerprinting [566] and third-party cookies [191], but could allow HB-based ad requests. They
could even append such requests with user-profile data, obviating the exchanges’ need for
data brokers. The user-profile data could be based on a limited form of profiling or could
consist of manually entered preferences as in Privad [236]. Regardless of the approach,
the user has complete control and visibility into this data. Privacy-preserving designs for
online advertising (e.g., [236, 514]) are not novel, but they require sweeping changes for
deployment in practice. Given HB’s widespread adoption, porting over these techniques to
work on top of the HB platform might mitigate the deployment issues.
When implemented correctly, these solutions will limit users’ exposure to essentially
IP-address-based tracking, which can be alleviated by tunneling the ad requests through
a forward proxy operated by neutral or non-profit entities such as Mozilla or Brave; since
these ad requests are encrypted, we do not need to trust the proxy operator. Such public
proxies have been operated by Google [12] and Opera [399], albeit for other purposes. We
could also incentivize such proxies by devising a revenue-sharing mechanism between the
end user, publisher, and the proxy operator using an in-browser cryptocurrency wallet (e.g.,
MetaMask [324]).
A detailed investigation of such mechanisms will constitute future work. For now, we
have shown that HB is already popular and generating higher revenues for publishers, and
the perceived latency limitations are addressable, and not fundamental to the protocol. We
hope that our insights will encourage both academia and the industry to take a deeper look
into header bidding.
99

Chapter 6
Programmable TLS Certificates
The importance of the Transport Layer Security (TLS) Public Key Infrastructure (PKI) to
the success of the Internet cannot be overstated—it secures HTTPS, email (IMAP), voice-
over-IP, mobile application APIs, and more. One critical component of the TLS PKI is
certificate validation, in which TLS clients determine whether an X.509 certificate presented
by a host they are communicating with should be trusted.
Today, TLS clients such as web browsers are the sole arbiters of whether a certificate
is valid, based on a mix of prescribed constraints drawn from RFCs, Certificate Author-
ity/Browser (CA/B) forum Baseline Requirements (BR), and bespoke client policy choices.
This leaves virtually no room for certificates to further restrict the circumstances under
which they or their descendants (in the case of CAs) should be considered valid.
In this chapter, we propose an X.509 meta-extension that enables CAs and leaf owners
to inject their own additional constraints into the certificate validation process. To facilitate
this, we propose that TLS clients implement a mechanism for processing generic assertions
included in the meta-extension. These assertions specify certificate validity constraints
on top of those already specified by the client, i.e., they are guaranteed to never weaken
existing certificate validation policies. We refer to certificates with this meta-extension as
Assertion-Carrying Certificates (ACCs).
ACCs allow certificates to impose transitive constraints on descendant certificates. In
particular, a CA can include constraints in its meta-extension preventing sub-CAs from
issuing non-compliant certificates. Such transitive constraints are possible but extremely
limited today—using the path length constraint, a CA can limit the maximum depth that
any valid chain can be. Another example is the X.509 name constraints extension, which
enables CAs to permit and exclude the names (e.g., domain names) that sub-CAs and end-
100

entities in the same chain may be issued for. Unfortunately despite being drafted in 1996, it
took many years for all major browsers to support the name constraints extension—Chrome
and Safari had incorrect and insecure name constraints implementations until 2017 [270].
Furthermore, name constraints only transitively restrict the values of one extension: Subject
Alternative Names (SAN).
Transitive, programmatically-enforced constraints can improve the security and flexi-
bility of the PKI in the following ways:
Stricter Security Requirements. Certificate issuers may wish to enforce more
restrictive validation constraints on their subscribers’ certificates for security reasons. For
instance, an ACC could impose a stricter revocation policy than existing browsers by re-
quiring a valid, unrevoked OCSP response (both Chrome and Firefox treat failed OCSP
requests the same way they treat a valid, unrevoked response [339]). Another example is
the signature algorithm field: a CA ACC could ensure that all descendant certificates use
an RSA key length of at least 4096 bits.
Smoothing Over Client Differences. Because TLS clients often have different
validation criteria, a CA may issue a certificate that works in one client but not in another.
For instance, at the time of writing, Chrome enforces a maximum leaf certificate lifetime of
398 days [129], while Firefox does not. For each possible constraint, an ACC could include
the behavior of the “strictest” client in an effort to ensure that their certificate will be
equivalently valid or invalid across all clients.
New Validation Criteria. Finally, ACCs enable new, ambitious validation criteria
not currently implemented or standardized. For example, the current PKI does not allow
domain owners to restrict the network infrastructure over which their leaf certificate may
be served. A leaf ACC could instruct TLS clients to only consider it valid when served
from a particular IP subnet.
In this chapter, we make four primary contributions:
1. In §6.2, we describe ACCs: certificates that express additional validation constraints
101

as small programs housed in the aforementioned meta-extension. Because certificate
validation is fundamentally a set of rules defined over input data, a.k.a. facts (the
X.509 field values of all certificates in a chain, revocation information, the current
time, and so on), we propose that a logic programming language should be used to
express ACC constraints. We adopt Datalog for our prototype implementation.
2. In §6.3, we present seven example ACCs and demonstrate how they improve the
consistency, security, and/or flexibility of the modern PKI.
3. We describe the changes required for modern TLS clients to support ACCs, namely a
Datalog engine and a standard way of translating X.509 fields and environment data
into Datalog facts. In §6.4, we perform a preliminary evaluation, demonstrating that
evaluating ACC constraints is feasible in practice.
4. In §6.6, we discuss the benefits and challenges of deploying ACCs for the major
stakeholders in the modern PKI.
6.1 Acknowledgements
This chapter contains plots and discussion from joint work with Waqar Aqeel, James Lar-
isch, Taejoong Chung, Dave Levin, Bruce Maggs, Alan Mislove, Bryan Parno, and Christo
Wilson. Some parts of the work were published at the Workshop on Foundations of Com-
puter Security, 2020 [52].
6.2 Assertion-Carrying Certs
In this work, we seek to develop a mechanism that enables CAs to programmatically and
transitively impose constraints on all descendants of the certificates they issue. Such a
mechanism would also enable leaf certificate owners to programmatically enforce constraints
on their own certificates. In this mechanism, say CA1 imposes constraints on CA2, and
CA2 imposes additional constraints on CA3. These constraints are transitive and compose
102

Figure 6.1: Overview ACC-enabled chain validation. 1 Certificate fields are trans-
lated into Datalog facts. 2 Constraints are extracted from each ACC. 3 Environment
information (e.g., the current time) are transcribed as Datalog facts. 4 The ACC
engine evaluates each certificate’s constraints over the entire chain and all accumu-
lated facts. The certificate is rejected if any ACC constraints are violated or if the
browser’s canonical validation—shown on the left—fails.
103

monotonically, i.e., children cannot relax constraints imposed by their parents (we define
this property in §6.2.3). Leaf certificates are only valid if they conform to all of their and
their parents’ constraints, in addition to passing all of the existing validity checks imposed
by TLS clients.
We call our proposed mechanism Assertion-Carrying Certificates (ACCs). An ACC is
a standard X.509 certificate that includes an additional meta-extension—an extension that
allows the certificate to further constrain the conditions under which it (and potentially
its descendant certificates) should be considered valid. TLS clients that support ACCs
construct certificate chains and validate them using their own validation logic (as they
already do today), then perform a single additional step: they verify that each certificate’s
custom constraints are satisfied. If any are not satisfied, validation fails. This process,
described in detail below, is shown in Figure 6.1.
6.2.1 ACC Programs Are Logic Programs
The meta-extension in an ACC contains a logic program, specifically a Datalog program.
Datalog is a popular choice for deductive database queries, among other applications [67,
263, 288, 330, 344, 458, 551]. A Datalog programmer writes a set of rules.1 For example, an
ACC programmer might specify the rule “if the OCSP response signature is valid and the
status is revoked, the certificate has been revoked”. The Datalog engine evaluates these
rules over a database of facts such as “OCSP response signature is valid” to determine
whether a programmer-specified query (“has the certificate been revoked?”) is derivable
from the given facts and rules. The simplest Datalog engine derives new facts until either
the query is satisfied or it reaches a fixed point. If the number of initial facts and rules is
finite, termination is guaranteed.
Although ACCs are not tied to any particular language, Datalog is attractive for ex-
pressing ACC constraints because it is:
1. Expressive. Datalog is sufficiently powerful to express a wide range of useful vali-
1See http://datalog.sourceforge.net/datalog.html#Syntax for a quick primer on Datalog syntax.
104

dation constraints, as we demonstrate in §6.3.
2. Declarative. Datalog code mirrors the declarative nature of certificate validation
(policies over facts). In contrast, the C and C++ source code of existing TLS clients
can obfuscate the policies they implement.
3. Computationally Limited. Datalog is non-Turing complete, termination is guar-
anteed, and “pure” implementations prohibit I/O. This helps minimize the threat
presented to TLS clients from evaluating ACC constraints from third-parties.
6.2.2 ACC Programs Reference “Facts”
X.509 certificate validation fits naturally into the fact/rule/query decomposition of Datalog
programs. Facts describe the certificates and environment, rules define certificate validation
policies, and the query is simple: “does this certificate chain satisfy the policies?” This
makes Datalog a natural fit for certificate-specified constraints.
Datalog programs in ACCs have access to relevant TLS information, encoded as facts
and divided into two types. The first, called X.509 facts, are simply the fields of every
X.509 certificate included in the candidate chain encoded as Datalog facts. For instance,
notBefore(root45, ‘‘2018-05-01 00:00:00’’) would be the notBefore date of the 45th
root certificate in the root store encoded as a Datalog fact. The X.509 facts also include
signature information, although Datalog performs no cryptographic validation itself. For
instance, signs(root45, cert1) signifies that the 45th root signed the first intermediate.
ACC programs may also need to reference information that is not found in certifi-
cates but is still relevant for validation, such as the current time, the server’s hostname, the
server’s IP address, and the status of an OCSP response. This second class of facts are called
environment facts. For instance, the current time may be encoded as currentTime(‘‘2021-06-01
00:00:00’’).
105

6.2.3 ACC Programs Define Rules
Each ACC specifies its constraints by defining the required “main” rule verified(Chain)
where Chain is the candidate certificate chain being validated. The Datalog query verified(Chain)?
determines whether the ACC’s constraints have been satisfied. If verified(Chain)? re-
turns false for any ACC in the candidate chain, the candidate chain is invalid. The main
rule verified(Chain) is a standard Datalog rule, which may reference X.509 facts, envi-
ronment facts, and other rules defined either by that ACC or by the TLS client.
It is critical that an ACC program cannot relax the constraints imposed by other ACC
programs in the chain. We call this property monotonic composability. We achieve mono-
tonic composability by evaluating each ACC’s constraints independently in a logically iso-
lated Datalog namespace. This means that an ACC cannot view or modify the constraints
of other ACCs in the same chain.
With this property, a CA Foo can issue an intermediate ACC Bar and be certain that
constraints included in Foo will apply not only to Bar but also to descendants of Bar,
regardless of the ACC constraints in Bar or in the rest of the chain. This general form of
transitive constraints is not supported in today’s PKI.
6.2.4 ACCs Are Evaluated by Clients
To enable ACCs, TLS clients augment their existing certificate chain validation routine
with ACC constraint evaluation and enforcement. To be ACC-compatible, TLS clients
require three modifications:
1. While constructing a certificate chain, a TLS client must collect and translate each
X.509 field of each certificate into its corresponding Datalog X.509 fact. Additionally,
the Datalog code from each ACC’s meta-extension must be collected.
2. A TLS client must collect relevant environment information during chain validation
and produce corresponding Datalog environment facts. Critically, TLS clients already
collect environment information—revocation status, the current time, etc.—and need
106

only express each in Datalog form.
3. A TLS client must pass all X.509 facts, environment facts, and ACC rules into the
ACC Engine, which performs the verified(Chain)? query for each ACC in a sep-
arate Datalog namespace and returns a boolean result. If the ACC engine returns
false, the TLS client must consider the chain invalid. Although Figure 6.1 visually
separates the TLS client and ACC engine, in practice we expect the engine to execute
in tandem with the client process (either within or alongside).
6.3 Example ACCs
In this section we present case studies demonstrating the power of ACCs to express novel
ways in which leaf certificate owners or CAs can restrict how the certificates they own
or sign can be used. Without ACCs, each use case would individually require significant
coordination and deployment effort.
Transitive Constraints. The name constraints extension allows transitive con-
straints on the set of Subject Alternative Names a CA’s descendants may include [153].
Implementing name constraints as an ACC is simple, as shown in Listing 6.1.
% --------------- ACC code in CA --------------- %
permittedSubtree(".example.com").
permittedSubtree(".example2.com").
nameAllowed(Name):-
permittedSubtree(Suffix),
endsWith(Name, Suffix).
% Does a descendant violate name constraints?
chainViolatesNameConstraint(Chain):-
descendant(Cert, Chain),
subjectAlternativeName(Cert, Name),
\+nameAllowed(Name).
verified(Chain):-
107

% There is no descendant violating the name constraint
\+chainViolatesNameConstraint(Chain).
Listing 6.1: ACC implementation of name constraints.
But ACCs allow CAs to transitively constrain any X.509 field. For example, Let’s
Encrypt requires that all leaf certificates be valid for at most 90 days [278]. Using ACCs,
if Let’s Encrypt signed an intermediate, third-party CA certificate, they could require that
all leaves signed by the delegated third-party may also only be valid for at most 90 days
(despite having no direct control over the third party’s signing power). Listing 6.3 shows
this constraint encoded as an ACC.
In addition, consider that as encryption algorithms or key sizes are deemed too weak,
the community has struggled to upgrade all certificates that use weak cryptography (e.g.,
SHA-1 [368]). Using ACCs, as shown in Listing 6.2, a CA can force an upgrade on its own
subtree.
% --------------- ACC code in CA --------------- %
% List of signature algorithms that CA deems strong
strongSignAlgo("1.2.840.10045.4.3.1"). % ecdsa-with-SHA224
strongSignAlgo("1.2.840.10045.4.3.2"). % ecdsa-with-SHA256
strongSignAlgo("1.2.840.10045.4.3.3"). % ecdsa-with-SHA384
strongSignAlgo("1.2.840.10045.4.3.4"). % ecdsa-with-SHA512
chainHasWeakAlgo(Chain):-
descendant(Cert, Chain),
signatureAlgorithm(Cert, Algo),
\+strongSignAlgo(Algo).
verified(Chain):-
% No descendant with a weak signature algorithm
\+chainHasWeakAlgo(Chain).
Listing 6.2: Restricting signature algorithms for descendants.
% ------------ ACC code in root CA cert ------------- %
108

maxLifetime(7776000). % 90 days in seconds
verified(Chain):-
maxLifetime(MaxDuration),
% get the leaf certificate
getLeaf(Leaf, Chain),
% get X.509 facts about leaf
notBefore(Leaf, NotBeforeTime),
notAfter(Leaf, NotAfterTime),
% leaf validity duration must be less than or equal to 90 days
subtract(Duration, NotAfterTime, NotBeforeTime),
lessThan(Duration, MaxDuration).
Listing 6.3: Limit the maximum lifetime of certificates.
% ------------ ACC code in leaf cert -------------- %
sixMonths(15779999). % Six months in seconds - 1 sec
% Leaf must be less than six months old
verified(Chain):-
currentTime(Now),
sixMonths(SixMonths),
getLeaf(Leaf, Chain),
% get X.509 facts about Leaf
notBefore(Leaf, NotBeforeTime),
% Leaf age less than six months
subtract(Age, Now, NotBeforeTime),
lessThan(Age, SixMonths).
% Or a correct stapled OCSP response must be received
verified(Chain):-
getLeaf(Leaf, Chain),
stapledOcspResponseValid(Leaf, true),
stapledOcspResponseVerified(Leaf, true),
stapledOcspResponseExpired(Leaf, false),
stapledOcspResponseStatus(Leaf, ok).
Listing 6.4: ACC implementation of must-staple-if-old.
109

Environmental Constraints. In addition to X.509 fields, constraints in ACCs may
also be placed on the environmental context. This context may include, among other things,
revocation and network information. For example, a leaf certificate owner may stipulate
that its certificate is only valid when served from trusted infrastructure, e.g., a specific set
or range of IP addresses (see Listing 6.5).
% ------------- Environment facts -------------- %
serverIPAddr("192.168.1.2"). % server IP address
% -------------- ACC code in leaf -------------- %
verified(Chain):-
% server IP address must be in the expected IP subnet
serverIPAddr(A),
iPAddrInSubnet(A, "192.168.1.0/24").
Listing 6.5: Leaf certificate must be served from a specific IP subnet.
The ACC language also allows certificate owners to express more nuanced constraints
combining multiple X.509 and environmental facts. For example, Listing 6.4 shows a leaf
certificate requiring that a stapled OCSP response be present if more than six months have
passed since the certificate’s notBefore date.
When a valid certificate is committed to a Certificate Transparency (CT) log, the
log returns a Signed Certificate Timestamp (SCT) [318]. The server then presents the
SCT along with its certificate as proof that the certificate was committed to a CT log.
Independent of whether the client requires an SCT, a CA or leaf certificate could require
one using ACCs as shown in Listing 6.6.
% ------------- Environment facts -------------- %
% X.509 SCT extension (OID 1.3.6.1.4.1.11129.2.4.2)
extensionExists(cert1, "SignedCertificateTimestamp", true).
% TLS SCT extension "signed_certificate_timestamp"
sctReceivedTLS(cert1).
% OCSP SCT extension (OID 1.3.6.1.4.1.11129.2.4.5)
sctReceivedOCSP(cert1).
110
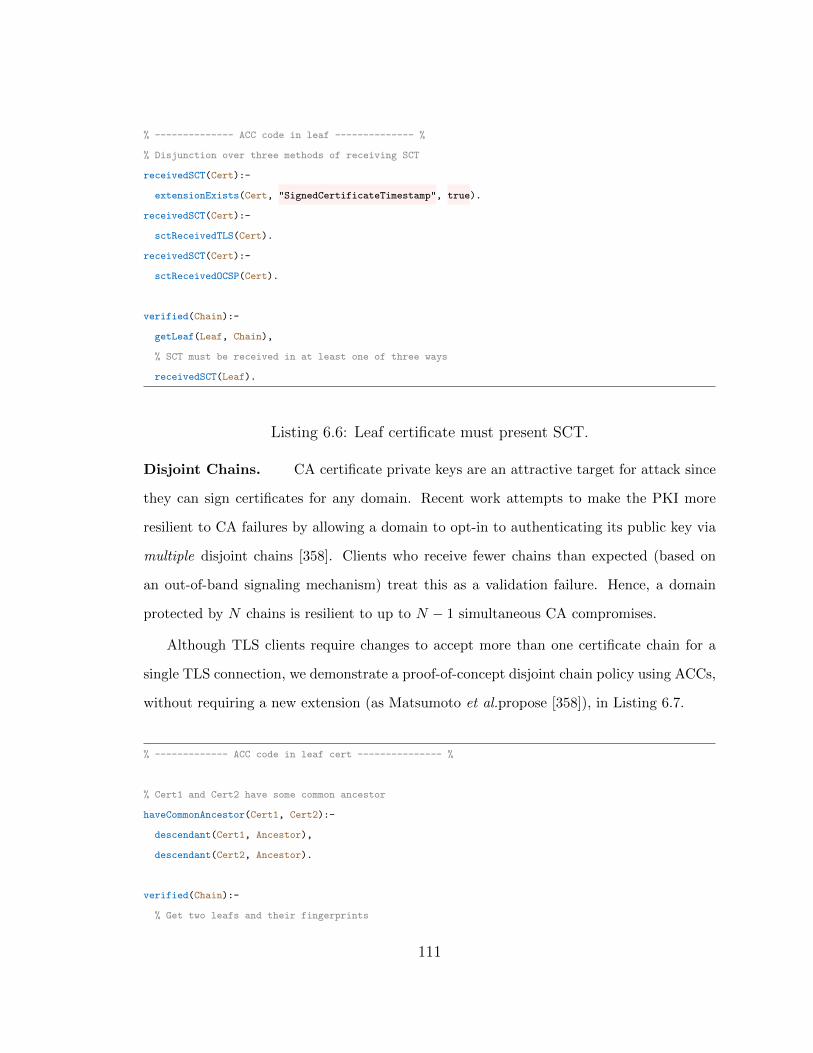
% -------------- ACC code in leaf -------------- %
% Disjunction over three methods of receiving SCT
receivedSCT(Cert):-
extensionExists(Cert, "SignedCertificateTimestamp", true).
receivedSCT(Cert):-
sctReceivedTLS(Cert).
receivedSCT(Cert):-
sctReceivedOCSP(Cert).
verified(Chain):-
getLeaf(Leaf, Chain),
% SCT must be received in at least one of three ways
receivedSCT(Leaf).
Listing 6.6: Leaf certificate must present SCT.
Disjoint Chains. CA certificate private keys are an attractive target for attack since
they can sign certificates for any domain. Recent work attempts to make the PKI more
resilient to CA failures by allowing a domain to opt-in to authenticating its public key via
multiple disjoint chains [358]. Clients who receive fewer chains than expected (based on
an out-of-band signaling mechanism) treat this as a validation failure. Hence, a domain
protected by N chains is resilient to up to N − 1 simultaneous CA compromises.
Although TLS clients require changes to accept more than one certificate chain for a
single TLS connection, we demonstrate a proof-of-concept disjoint chain policy using ACCs,
without requiring a new extension (as Matsumoto et al.propose [358]), in Listing 6.7.
% ------------- ACC code in leaf cert --------------- %
% Cert1 and Cert2 have some common ancestor
haveCommonAncestor(Cert1, Cert2):-
descendant(Cert1, Ancestor),
descendant(Cert2, Ancestor).
verified(Chain):-
% Get two leafs and their fingerprints
111

getLeaf(Leaf1, Chain),
fingerprint(Leaf1, F1),
getLeaf(Leaf2, Chain),
fingerprint(Leaf2, F2),
% Leafs must not have the same fingerprint
unequal(F1, F2),
% Chains of Leaf1 and Leaf2 must be disjoint
\+haveCommonAncestor(Leaf1, Leaf2),
% Leaf2 must be deemed valid by the browser for this domain
browser:verified(Leaf2).
Listing 6.7: ACC implementation of disjoint chains. Note that \+ is the negation
operator in Datalog.
OCSP Hot Patching. So far, we have discussed assertions contained only in certifi-
cates themselves. Assertions could also be integrated with real-time systems such as OCSP.
OCSP responses could carry ACC “hot patches” that upgrade the existing constraints of
the ACC in question, in light of new vulnerabilities or updates in the PKI. For example,
a CA ACC that limits the maximum lifetime of descendant certificates to 298 days could,
using an OCSP hot patch, reduce that enforced validity to 198 days without reissuing the
certificate.
6.4 Implementation & Evaluation
We now demonstrate the feasibility of an ACC-enabled PKI by constructing both prototype
ACCs and an ACC-compatible TLS client. To construct an ACC, we “stuff” a Datalog
program into an unused extension (OID 1.3.3.7) of a new certificate before signing the
certificate with the issuer’s key.
Our ACC-compatible TLS client simulates the certificate chain validation component of
web browsers. The TLS client takes as input a chain of certificates, a root store (we use the
Mozilla Root Store), and a URL signifying the hostname being “visited” by the user. Our
client follows the procedure described in §6.2.4. It constructs a candidate chain by starting
112

ACC Size Compressed Size
Name Constraints 279 195
Limited Lifetime 237 166
Stronger Crypto 240 153
Network Constraints 133 131
Signed Certificate Timestamp 334 177
OCSP Must Staple If Old 362 208
Disjoint Chains 286 178
Live Certificates (Median) 2026 –
Live Certificates (Max) 32000 –
Table 6.1: Size (bytes) of ACC use cases proposed in §6.3. For comparison, we
show the median and max leaf certificate size across 10M certificates sampled from
CT logs.
from the leaf and ending with a root, recursively verifying the issuer signatures along
the way. Once it has constructed a candidate chain, parsed each certificate into Datalog
X.509 facts, produced all Datalog environment facts, and parsed the 1.3.3.7 extension of
each ACC in the chain, it sends all of this data to a Datalog interpreter and performs the
verified(Chain)? query for each ACC. If any query returns false, the certificate is deemed
invalid. Our TLS client also supports stapled OCSP responses and live OCSP requests,
and can thus execute ACC programs that reference the corresponding environment facts.
Our prototype consists of about 1,200 lines of Rust and 400 lines of Lua. It uses the Rust
X.509 and DER parsing libraries from the Rusticata project [448,449] for certificate parsing
and uses the Rust OpenSSL bindings for signature verification. We use a simple Datalog
interpreter designed by MITRE [371] written in Lua, and augment it with a stratified
negation capability and a simple form of namespaces.
The MITRE Datalog interpreter does not implement the string and arithmetic opera-
tions required for many ACCs, though it allows the definition of custom, non-Datalog rules
in Lua. We implement some “standard library” functions such as greaterThan in Lua.
Table 6.2 lists some anticipated environment facts and standard library rules. We discuss
113
the standardization of these facts and rules in §6.6.
Validation Time. We stuff each of the name constraints, limited lifetime, stronger
crypto, network constraints, and must-staple-if-old constraints presented in §6.3 into exist-
ing leaf certificates issued by Let’s Encrypt. Then, we validate each newly minted ACC
with our prototype TLS client. We measure the time taken by each stage of our implemen-
tation on an Ubuntu 20.04 virtual machine with two virtual cores and 4GB of memory. We
validate each ACC 50 times and find that mean Datalog execution times (i.e., the time it
takes to execute the verified query over the ACC program and facts) range from 5.68ms
to 6.2ms. Translating X.509 certificates to Datalog took roughly an additional 1ms on av-
erage. We did not include the time taken to perform canonical validation, since this must
be performed by all TLS clients.
We repeat the above experiment using the SWI-Prolog interpreter [553] instead of our
unoptimized Lua-based Datalog interpreter. With SWI-Prolog, the mean validation time
of any of the above constraints does not exceed 2ms. We believe our experiments demon-
strate the feasibility of validating ACCs in TLS clients such as browsers, without incurring
significant latency overhead.
Certificate Size Overhead Adding ACC policy code to certificates increases their
size and thus increases network overhead. To compare ACC sizes to real world leaf certifi-
cates that do not have ACC policy code, we collected ≈10M certificates from nine public
CT logs [455] (Pilot, Rocketeer, Skydiver, Argon2022, Argon2021, Argon2020, Xenon2022,
Xenon2021, and Xenon2020). We consider only non-expired certificates and exclude pre-
certificates. In Table 6.1 we compare the median and max certificate sizes from our CT
log dataset to the size of the ACC programs described in §6.3. We also measure the size of
these ACC programs after zlib [169] compression.
We find that the example ACC sizes range from 6–18% of the median leaf size, while
compressed ACC sizes range from 6–10% of the median (uncompressed) leaf size. Even
uncompressed, these ACC programs are much smaller than the maximum leaf size we
found in the wild. Note that our ACC programs are not minified, which would lead to
114

further reduction in size. Furthermore, even if a client loaded a web page with twenty
distinct certificates, each with a median sized certificate (2 KB) plus a complex (5 KB
uncompressed, 1 KB compressed) ACC, the extra network overhead caused by ACCs would
be 100 KB uncompressed, 20 KB compressed. For comparison, the average web page is
2 MB [207].
6.5 Related work
Given its critical importance, there are many studies that measured various aspects of the
PKI. This includes studies from the network perspective [185,256], of root stores [409,522],
of certificates in-the-wild [131, 180, 526], the management of certificates [109, 309, 336], the
costs of HTTPS [384], the deployment of related security protocols [39, 305, 410, 454], and
the impact of severe security incidents [178,567,570].
There has also been extensive work examining the TLS certificate validation code im-
plemented by non-browser software and mobile applications [95, 120, 199, 200, 222]. These
efforts have demonstrated that many implementations silently accept invalid certificates.
Similarly, Liu et al. discovered several bugs and omissions when major browsers and oper-
ating systems attempted to validate revoked certificates [339].
Once TLS clients correctly support the evaluation of ACC programs and expose stan-
dardized facts, certificate issuers can use ACCs to smooth over browser implementation
bugs, omissions, and differences by specifying browser-independent validation constraints.
ACCs also allow issuers to add to the minimum security requirements of existing validation
logic (e.g., Listing 6.4) to better prepare for unpredictable events such as Heartbleed.
In 1999, when the current centralized hierarchical PKI model did not exist, SPKI/SDSI
(Simple Public Key Infrastructure and Simple Distributed Security Infrastructure) [186]
was proposed to provide decentralized trust management. It re-designs a certificate using
a LISP-like language that can contain statements such as names, keys, and signatures.
However, its main focus was to provide access control in a distributed manner, not to
115

attest the legitimate binding of a name to a public key. Thus, it allowed an identity to
choose an arbitrary name and let anyone “certify” its key through a bottom-up approach,
which is not feasible in the current web-PKI ecosystem.
Besides SPKI/SDSI, researchers have proposed other systems to supplant or replace
the current CA-based PKI [64,151,167,323]. DNS-based Authentication of Named Entities
(DANE) [255] is actually deployed, however, recent studies [319, 320] found many DANE-
supporting SMTP clients showing inconsistent validation behaviors and SMTP servers suf-
fering from mismanagement. These findings motivate our ACC proposal.
Techniques have also been suggested to improve the existing TLS ecosystem [300, 314,
359,420,498,501]. For example, Ryan proposed to extend certificate transparency to support
end-to-end encrypted mail [450].
Compared to these prior proposals, our proposal of ACCs is relatively modest in terms
of deployment: it requires updates to TLS clients, but no additional deployment infrastruc-
ture.
6.6 Concluding Discussion
In this chapter, we introduced Assertion-Carrying Certificates (ACCs), a mechanism for
enabling extensibility and flexibility in the PKI. Conceptually, ACCs enable CAs and leaf
certificate owners to define logical assertions for their own (and their descendants’) cer-
tificates that constrain their validity. ACC assertions are expressed as logic programs (in
Datalog, in our prototype) that operate over X.509 and environmental facts. TLS clients
consider a certificate chain to be valid if (1) the signatures are cryptographically valid,
(2) canonical client validation succeeds over the chain, and (3) the assertions within the
certificates evaluate to true. ACC constraints have the desirable properties of being tran-
sitive and programmatically-enforceable by TLS clients.
We argue that by deploying such validation policies as ACCs, rather than as univer-
sal client policies, certificate owners and issuers are free to more rapidly add features to
116

certificates without explicit TLS client approval or development. As a proof-of-concept,
we demonstrated that our ACC language can declaratively express non-trivial, useful, and
novel validation policies (§6.3). We also showed that, even unoptimized, the execution time
for ACC programs is modest and their size is small (§6.4).
In the long run, if ACCs (or a similarly flexible meta-extension) are adopted into the
PKI, this may provide a path for the PKI to incrementally move away from legacy for-
mats (DER encoded ASN.1 structures) and towards a more flexible encoding scheme for
certificates that also includes executable policies.
Our current ACC prototype parses X.509 fields and translates them into Datalog facts.
This means that our prototype inherits all of the challenges of robustly and securely parsing
binary format ASN.1 structures [95, 480]. The obvious simplification is for the ACC to
include more of the required Datalog facts so the translation step can be skipped.
As certificate fields and extensions are successively subsumed by the ACC extension, an
X.509 certificate eventually becomes a cryptographically signed collection of standardized
Datalog facts and, optionally, a program. So long as key fact names are standardized,
all information necessary for certificate validation, either by the TLS client or by custom
assertions in the ACC, can be expressed in a uniform, straightforward, executable format.
117

Environment Facts Comments
hostname(Hostname) Hostname denotes the domain being accessed by the user in the
browser.
currentTime(Timestamp) Timestamp is the current system time in seconds since UNIX
epoch.
serverIPAddr(Addr) The current certificate chain was received from a server with IPv4
or IPv6 address Addr.
tlsVersion(Ver) Connection with the remote server was established using TLS
version Ver.
sctReceivedTLS(Cert) Valid SCT for Cert received via TLS extension
signed certificate timestamp.
sctReceivedOCSP(Cert) Valid SCT for Cert received via OCSP extension OID
1.3.6.1.4.1.11129.2.4.5.
stapledOcspResponseValid(Cert, IsValid) IsValid is true if a valid OCSP response is received for Cert.
false otherwise.
publicSuffix(Suffix) Suffix is a public suffix such as "co.uk".
Standard Library Rules Comments
getLeaf(Leaf, Chain) Unifies Leaf with the leaf certificate in the presented Chain.
descendant(X, Y) True if certificate X follows certificate Y in the signature chain.
equal(A, B) True if A = B. A and B must be constant strings, atoms or num-
bers.
unequal(A, B) True if A 6= B. A and B must be constant strings, atoms or num-
bers.
lessThan(A, B) True if A < B. A and B must be constant numbers.
greaterThan(A, B) True if A > B. A and B must be constant numbers.
add(C, A, B) Unifies A, B, or C such that C = A + B. At least two terms must
be constant numbers.
subtract(C, A, B) Unifies A, B, or C such that C = A - B. At least two terms must
be constant numbers.
startsWith(P, Q) True if string Q is a prefix of P. P and Q must be constant strings.
endsWith(P, Q) True if string Q is a suffix of P. P and Q must be constant strings.
stringMatch(P, Q) True if P matches Q (which may contain wildcards; not full reg-
ular expressions). P and Q must be constant strings.
stringConcat(R, P, Q) Unifies P, Q, or R such that concatenating P and Q results in R.
At least two terms must be constant strings.
iPAddrInSubnet(Addr, Subnet) True if IP address Addr falls in subnet Subnet. Both terms must
be constant strings in IPv4 or IPv6 format.
Table 6.2: A non-exhaustive list of environment facts and “standard library” rules
made available to ACCs.118

Chapter 7
Conclusion
Latency on the Internet is important for all applications ranging from gaming and web
browsing to interactive augmented and virtual reality. Latency inflation results in de-
graded user experience which then causes revenue loss to online businesses. Causes of this
inflation include, but are not limited to, a) infrastructural latency inflation that makes
a single roundtrip between two nodes take much longer than it should, b) protocol inef-
ficiencies that require multiple roundtrips for small amounts of information transfer, c)
suboptimal structuring of information that create complex dependency graphs in modern
web pages, and d) suboptimal delivery of content that lead to inefficient request routing or
caching. In this work, we target the infrastructural causes of latency inflation which have
a multiplicative impact on higher network layers.
To reduce infrastructural latency, we assess the feasibility of two alternatives to optical
fiber: Microwave towers and in-flight aircraft. For microwave, we run active measurements
on one of the fastest networks on Earth that the High Frequency Trading industry uses.
We also analyze trading data from financial markets at both ends of the New York to
Chicago HFT corridor. Our experiments and analysis show that microwave towers provide
ultra-low latency, within 1.5% of the theoretical lower bound, and can provide, with some
error correction, decent bandwidth even in bad weather. We also find that in-flight aircraft
can provide low-latency intermittent connectivity to the most populous urban centers.
To study latency in web browsing, it is important to measure the web correctly. From
a survey of all papers published at 5 top networking venues between 2014 and 2019, we
find that almost all web studies measure the landing pages of websites and ignore internal
pages. We also observe major differences between size, page load time, content types and
other characteristics of landing and internal pages. From these differences, we infer that
119

about two-thirds of web measurement papers that we surveyed would need some revision
for their results to apply to internal pages. We also compile and publish Hispar, a new
top list that includes internal pages so researchers can easily include those pages in future
work.
We explore latency tradeoffs in DNS and online advertising for web browsing. For
DNS, we find that because modern web pages are fairly complex, DNS query time is not
the bottleneck and some increase in query time can be tolerated without any significant
slowdown in page load time. We present full recursive DNS resolution at the client as
a viable alternative to shared resolver caches and show that private DNS queries can be
supported. For online advertising, we conduct a real user measurement study of header
bidding through our browser extension. We find that while header bidding requires one or
more extra roundtrips to fetch bids and display ads to the user, it increases revenue for
website owners, and can be used to deliver private ads.
Latency management is critical in modern web application design. The Google search
team, for example, works with a “fixed latency budget” to pick and choose which features
get deployed. If a great new feature causes search queries to exceed the budget, the slow-
down must be offset somewhere else or the great feature doesn’t make it [511]. Developers,
network operators, and researchers alike need to make better use of available infrastructure,
and explore new infrastructure options to reduce latency. Besides improving user experi-
ence of interactive applications, low network latency will make new applications and new
user protection features more viable.
120

Bibliography
[1] Selenium - Web Browser Automation. http://www.seleniumhq.org.
[2] Workshop on Reducing Internet Latency, 2013. http://goo.gl/kQpBCt.
[3] Issue 572734: Support for OCSP Must-staple, December 2015. https://bugs.
chromium.org/p/chromium/issues/detail?id=572734.
[4] Feature request: OCSP Must Staple (RFC 7633), March 2016. https://groups.
google.com/a/chromium.org/g/security-dev/c/-pB8IFNu5tw.
[5] Flightaware API. https://tinyurl.com/zsgd7fq, 2018.
[6] GPS: The Global Positioning System. https://www.gps.gov/, 2018.
[7] Iridium NEXT. https://www.iridiumnext.com/, 2018.
[8] Iridium Satellite Communications. https://www.iridium.com/, 2018.
[9] AAA Internet Publishing, Inc. WTFast. https://www.wtfast.com/en/. [On-line; accessed 11-March-2021].
[10] Abiteboul, S., Hull, R., and Vianu, V. Foundations of databases. 1994.
[11] Adzerk. Ad Tech Insights - August ’19 Report. https://adzerk.com/assets/
reports/AdTechInsights_Aug2019.pdf, August 2019.
[12] Agababov, V., Buettner, M., Chudnovsky, V., Cogan, M., Greenstein,B., McDaniel, S., Piatek, M., Scott, C., Welsh, M., and Yin, B. Flywheel:Google’s Data Compression Proxy for the Mobile Web. In NSDI (2015).
[13] Ager, B., Dreger, H., and Feldmann, A. Predicting the dnssec overhead usingdns traces. In 2006 40th Annual Conference on Information Sciences and Systems(2006), pp. 1484–1489.
[14] Ager, B., Muhlbauer, W., Smaragdakis, G., and Uhlig, S. Comparing DNSResolvers in the Wild. In Proceedings of the 10th ACM SIGCOMM Conference onInternet Measurement (New York, NY, USA, 2010), IMC ’10, Association for Com-puting Machinery, pp. 15–21.
[15] Aggarwal, A., Savage, S., and Anderson, T. Understanding the Performanceof TCP Pacing. IEEE INFOCOM (2000).
[16] Ahmad, T., Chandra, R., Kapoor, A., Daum, M., and Horvitz, E. Wi-Fly:Widespread Opportunistic Connectivity via Commercial Air Transport. In ACMHotNets (2017).
[17] Akamai. Akamai “10for10”. https://www.akamai.com/us/en/multimedia/
documents/brochure/akamai-10for10-brochure.pdf, July 2015. [Online; ac-cessed 11-March-2021].
121

[18] Akamai. Akamai “10For10”. https://www.akamai.com/us/en/multimedia/
documents/brochure/akamai-10for10-brochure.pdf, July 2015.
[19] Akamai. Akamai “10For10”. https://www.akamai.com/us/en/multimedia/
documents/brochure/akamai-10for10-brochure.pdf, July 2015.
[20] Akamai. Using Akamai Pragma headers to Investigate or Troubleshoot Akamai Con-tent Delivery. https://community.akamai.com/customers/s/article/Using-
Akamai-Pragma-headers-to-investigate-or-troubleshoot-Akamai-content-
delivery?language=en_US, 2015. [Online; accessed 11-March-2021].
[21] Akamai. SureRoute. https://developer.akamai.com/learn/Optimization/
SureRoute.html, 2017. [Online; accessed 11-March-2021].
[22] Akamai. The State of Online Retail Performance. https://www.akamai.
com/uk/en/multimedia/documents/report/akamai-state-of-online-retail-
performance-spring-2017.pdf, 2017. [Online; accessed 11-March-2021].
[23] Akamai. Using Akamai Pragma headers to investigate or troubleshoot Akamaicontent delivery. https://community.akamai.com/customers/s/article/Using-
Akamai-Pragma-headers-to-investigate-or-troubleshoot-Akamai-content-
delivery, 2018. [Last accessed on May 12, 2020].
[24] Akella, A., Maggs, B., Seshan, S., and Shaikh, A. On the performancebenefits of multihoming route control. IEEE/ACM TON (2008).
[25] Akella, A., Maggs, B., Seshan, S., Shaikh, A., and Sitaraman, R. Ameasurement-based analysis of multihoming. ACM SIGCOMM (2003).
[26] Akella, A., Seshan, S., and Shaikh, A. Multihoming Performance Benefits: AnExperimental Evaluation of Practical Enterprise Strategies. In USENIX ATC (2004).
[27] Akyildiz, I. F., Ekici, E., and Bender, M. D. MLSR: a novel routing algorithmfor multilayered satellite IP networks. IEEE/ACM TON (2002).
[28] Akyildiz, I. F., Morabito, G., and Palazzo, S. TCP-Peach: a new congestioncontrol scheme for satellite IP networks. IEEE/ACM TON (2001).
[29] Al-Dalky, R., and Rabinovich, M. Revisiting comparative performance of dnsresolvers in the ipv6 and ecs era, 2020.
[30] alexa.com. Alexa—Top sites. https://www.alexa.com/topsites, 2019. [Lastaccessed on November 30, 2019].
[31] alexa.com. Alexa — About Us. https://www.alexa.com/about, 2019. [Lastaccessed on December 13, 2019].
[32] Allen, N. Elon Musk announces ’space Internet’ plan. http://www.telegraph.
co.uk/news/worldnews/northamerica/usa/11353782/Elon-Musk-announces-
space-Internet-plan.html, January 2015.
122

[33] Allman, M. On Changing the Culture of Empirical Internet Assessment. SIG-COMM Comput. Commun. Rev. 43, 3 (July 2013), 78–83.
[34] Allman, M. Comments on DNS Robustness. In Proceedings of the Internet Mea-surement Conference 2018 (New York, NY, USA, 2018), IMC ’18, Association forComputing Machinery, pp. 84–90.
[35] Allman, M. On Eliminating Root Nameservers from the DNS. In Proceedings ofthe 18th ACM Workshop on Hot Topics in Networks (New York, NY, USA, 2019),HotNets ’19, Association for Computing Machinery, pp. 1–8.
[36] Allman, M., Beverly, R., and Trammell, B. Principles for Measurability inProtocol Design. SIGCOMM Comput. Commun. Rev. 47, 2 (May 2017), 2–12.
[37] Alrizah, M., Zhu, S., Xing, X., and Wang, G. Errors, Misunderstandings,and Attacks: Analyzing the Crowdsourcing Process of Ad-Blocking Systems. InProceedings of the Internet Measurement Conference (New York, NY, USA, 2019),IMC ’19, Association for Computing Machinery, pp. 230–244.
[38] Amann, J., Gasser, O., Scheitle, Q., Brent, L., Carle, G., and Holz,R. Mission Accomplished?: HTTPS Security After Diginotar. In Proceedings of the2017 Internet Measurement Conference (New York, NY, USA, 2017), IMC ’17, ACM,pp. 325–340.
[39] Amann, J., Gasser, O., Scheitle, Q., Brent, L., Carle, G., and Holz, R.Mission accomplished? HTTPS security after DigiNotar. In Proc. of IMC (2017).
[40] Amazon Web Services, Inc. Alexa Top Sites. https://aws.amazon.com/alexa-top-sites/, 2018. [Online; accessed 07-March-2017].
[41] amazon.com. ASUS VG248QE Gaming Monitor. https://goo.gl/gnFnPv, 2018.[Online; accessed 11-March-2021].
[42] American Tower Global Wireless Solutions. https://www.americantower.com/us/, 2004. [Online; accessed 11-March-2021].
[43] Andersen, D., Balakrishnan, H., Kaashoek, F., and Morris, R. Resilientoverlay networks. ACM SIGCOMM CCR 32, 1 (2002), 66–66.
[44] Anova Technologies. Laser wireless connectivity. http://anova-tech.com/
sample-page/laser-wireless-connectivity/.
[45] Anthes, G. Data Brokers Are Watching You. Commun. ACM 58, 1 (Dec. 2014).
[46] Apple Open Source. tcp cache.c. https://github.com/opensource-apple/
xnu/blob/master/bsd/netinet/tcp_cache.c, September 2017.
[47] AppNexus. About. https://www.appnexus.com/about, last accessed on October14, 2019.
123

[48] AppNexus. prebid/header-bidder-expert. https://github.com/prebid/header-
bidder-expert/blob/master/src/js/definitions/calls.js, January 2018.
[49] Aqeel, W. MyAdPrice: An ad-tracking extension for Chrome and Firefox. https://myadprice.github.io/, January 2020.
[50] Aqeel, W., Bhattacherjee, D., Chandrasekaran, B., Godfrey, P. B.,Laughlin, G., Maggs, B., and Singla, A. Untangling header bidding lore: Somemyths, some truths, and some hope. In Passive and Active Measurement (2020).
[51] Aqeel, W., Chandrasekaran, B., Maggs, B., and Feldmann, A. On landingand internal pages: The strange case of Jekyll and Hyde in Internet measurement.In ACM IMC (2020).
[52] Aqeel, W., Hanif, Z., Larisch, J., Omolola, O., Chung, T., Levin, D.,Maggs, B., Mislove, A., Parno, B., and Wilson, C. Assertion-carrying cer-tificates. In Foundations of Computer Security (2020).
[53] Arends, R., Austein, R., Larson, M., Massey, D., and Rose, S. Dns securityintroduction and requirements. RFC 4033, RFC Editor, March 2005. http://www.
rfc-editor.org/rfc/rfc4033.txt.
[54] Ariyapperuma, S., and Mitchell, C. J. Security vulnerabilities in DNS andDNSSEC. In Availability, Reliability and Security, 2007. ARES 2007. The SecondInternational Conference on (April 2007), pp. 335–342.
[55] Arun, V., and Balakrishnan, H. Copa: Congestion Control Combining Objec-tive Optimization with Window Adjustments. In USENIX NSDI (2018).
[56] Asoni, D. E., Hitz, S., and Perrig, A. A Paged Domain Name System for QueryPrivacy. In Cryptology and Network Security (Cham, 2018), S. Capkun and S. S. M.Chow, Eds., Springer International Publishing, pp. 250–273.
[57] AT & T. Project AirGig Nears First Field Trials for Ultra-Fast Wireless BroadbandOver Power Lines. http://goo.gl/k9MeQj.
[58] AT & T Corporation. AT & T Long Lines Routes March 1960. http://long-
lines.net/places-routes/maps/MW6003.html, 2003. [Online; accessed 11-March-2021].
[59] Aviram, N., Gellert, K., and Jager, T. Session resumption protocols andefficient forward security for tls 1.3 0-rtt. Journal of Cryptology 34, 3 (2021), 1–57.
[60] Awan, M. F., Ahmad, T., Qaisar, S., Feamster, N., and Sundaresan, S.Measuring broadband access network performance in Pakistan: A comparative study.In LCN Workshops (2015), IEEE.
[61] Bai, J., Lu, X., Lu, Z., and Peng, W. A distributed hierarchical routing protocolfor non-GEO satellite networks. In IEEE ICPP Workshops (2004).
124

[62] Balasubramanian, P. Updates on Windows TCP. https://datatracker.ietf.
org/meeting/100/materials/slides-100-tcpm-updates-on-windows-tcp-00,July 2017.
[63] Barreda-Angeles, M., Arapakis, I., Bai, X., Cambazoglu, B. B., andPereda-Banos, A. Unconscious Physiological Effects of Search Latency on Usersand Their Click Behaviour. In Proceedings of the 38th International ACM SIGIRConference on Research and Development in Information Retrieval (2015), SIGIR’15.
[64] Bates, A., Pletcher, J., Nichols, T., Hollembaek, B., and Butler, K. R.Forced Perspectives: Evaluating An SSL Trust Enhancement At Scale. In ACMInternet Measurement Conference (November 2014).
[65] Battleping. Info on our lower ping service. http://www.battleping.com/info.
php, 2010. [Online; accessed 11-March-2021].
[66] Belshe, M., Peon, R., and Thomson, M. Hypertext Transfer Protocol Version2 (HTTP/2). RFC 7540, May 2015.
[67] Bembenek, A., Greenberg, M., and Chong, S. Formulog: Datalog for smt-based static analysis. Proceedings of the ACM on Programming Languages 4, OOP-SLA (2020), 1–31.
[68] Benes, R. ’An ad tech urban legend’: An oral history of how header bidding be-came digital advertising’s hottest buzzword. https://digiday.com/media/header-bidding-oral-history/, June 2017.
[69] Berger, D. S., Sitaraman, R. K., and Harchol-Balter, M. AdaptSize: Or-chestrating the Hot Object Memory Cache in a Content Delivery Network. In 14thUSENIX Symposium on Networked Systems Design and Implementation (NSDI 17)(Boston, MA, Mar. 2017), USENIX Association, pp. 483–498.
[70] Bhattacherjee, D., Aqeel, W., Bozkurt, I. N., Aguirre, A., Chan-drasekaran, B., Godfrey, P. B., Laughlin, G., Maggs, B., and Singla,A. Gearing up for the 21st century space race. In Proceedings of the 17th ACMWorkshop on Hot Topics in Networks (New York, NY, USA, 2018), HotNets ’18,ACM, p. 113–119.
[71] Bhattacherjee, D., Aqeel, W., Jyothi, S. A., Bozkurt, I. N., Sentosa, W.,Tirmazi, M., Aguirre, A., Chandrasekaran, B., Godfrey, P. B., Laughlin,G. P., Maggs, B. M., and Singla, A. cisp: A speed-of-light internet serviceprovider, 2022.
[72] Bhattacherjee, D., Aqeel, W., Laughlin, G., Maggs, B. M., and Singla,A. A bird’s eye view of the world’s fastest networks. In ACM IMC (2020).
[73] Bischof, Z. S., Bustamante, F. E., and Stanojevic, R. The Utility Argument- Making a Case for Broadband SLAs. In PAM (2017).
125

[74] Bloomberg. Zayo closes acquisition of Spread Networks, 2018. https://www.
bloomberg.com/press-releases/2018-02-28/zayo-closes-acquisition-of-
spread-networks [Online; accessed 11-March-2021].
[75] Bloomberg. Musk targets telecom for next disruption with Starlink Internet.https://tinyurl.com/wejrv37c, 2021. [Online; accessed 11-March-2021].
[76] Bocchi, E., De Cicco, L., and Rossi, D. Measuring the Quality of Experi-ence of Web Users. In Proceedings of the 2016 Workshop on QoE-based Analysisand Management of Data Communication Networks (New York, NY, USA, 2016),Internet-QoE ’16, ACM, pp. 37–42.
[77] Bonner, A. J. Hypothetical datalog: Complexity and expressibility. TheoreticalComputer Science 76, 1 (1990), 3–51.
[78] Bortzmeyer, S. DNS Privacy Considerations. RFC 7626, Aug. 2015.
[79] Bortzmeyer, S. Dns query name minimisation to improve privacy. RFC 7816,RFC Editor, March 2016.
[80] Bortzmeyer, S. DNS Query Name Minimisation to Improve Privacy. RFC 7816,Mar. 2016.
[81] Bottger, T., Cuadrado, F., Antichi, G., Fernandes, E. L. a., Tyson, G.,Castro, I., and Uhlig, S. An Empirical Study of the Cost of DNS-over-HTTPS.In Proceedings of the Internet Measurement Conference (New York, NY, USA, 2019),IMC ’19, Association for Computing Machinery, pp. 15–21.
[82] Boudreau, B. Global Bandwidth & IP Pricing Trends. https://tinyurl.com/
y9up793k, 2017.
[83] Bowman, J. Why It’s So Hard to Make a Profit in E-Commerce. https://goo.gl/EAUDuy, 2016. [Online; accessed 11-March-2021].
[84] Bozkurt, I. N., Aguirre, A., Chandrasekaran, B., Godfrey, B., Laughlin,G., Maggs, B. M., and Singla, A. Why Is the Internet so Slow?! In PAM (2017).
[85] Bozkurt, I. N., Aguirre, A., Chandrasekaran, B., Godfrey, P. B., Laugh-lin, G., Maggs, B., and Singla, A. Why is the internet so slow?! In Passiveand Active Measurement: 18th International Conference, PAM 2017, Sydney, NSW,Australia, March 30-31, 2017, Proceedings (Cham, 2017), M. A. Kaafar, S. Uhlig,and J. Amann, Eds., Springer International Publishing, pp. 173–187.
[86] Bozkurt, I. N., Aqeel, W., Bhattacherjee, D., Chandrasekaran, B., God-frey, P. B., Laughlin, G., Maggs, B. M., and Singla, A. Dissecting latencyin the Internet’s fiber infrastructure, 2018. arXiv:1811.10737.
[87] Bradshaw, S., and DeNardis, L. Privacy by Infrastructure: The UnresolvedCase of the Domain Name System. Policy & Internet 11, 1 (2019), 16–36.
126
[88] BrightEdge. BrightEdge Channel Report. https://www.brightedge.com/
resources/research-reports/channel_share, 2019.
[89] Brodkin, J. FCC approves SpaceX plan to launch 4,425 broadband satellites.https://tinyurl.com/ybbkgxwp, 2018.
[90] Brodkin, J. SpaceX hits two milestones in plan for low-latency satellite broadband.https://tinyurl.com/yb9t5cf6, 2018.
[91] Brown, N. Control Groups Series, July 7, 2014. Linux Weekly News. https:
//lwn.net/Articles/604609/.
[92] Brownlee, N., Claffy, K. C., and Nemeth, E. DNS measurements at aroot server. In GLOBECOM’01. IEEE Global Telecommunications Conference (Cat.No.01CH37270) (2001), vol. 3, pp. 1672–1676 vol.3.
[93] Browser, B. Brave Ad Block. https://github.com/brave/ad-block, 2019. [Lastaccessed on January 25, 2020].
[94] Browser Benchmarks. JetStream2. https://browserbench.org/JetStream/
in-depth.html, 2019.
[95] Brubaker, C., Jana, S., Ray, B., Khurshid, S., and Shmatikov, V. Us-ing Frankencerts For Automated Adversarial Testing Of Certificate Validation InSSL/TLS Implementations. In IEEE Symposium on Security and Privacy (May2014).
[96] Brutlag, J. Speed Matters for Google Web Search. http://goo.gl/vJq1lx, 2009.[Online; accessed 11-March-2021].
[97] Brutlag, J. Speed Matters for Google Web Search. http://goo.gl/t7qGN8, June2009.
[98] Brutlag, J., Abrams, Z., and Meenan, P. Above the fold time: Measuringweb page performance visually, March 2011. https://conferences.oreilly.com/
velocity/velocity-mar2011/public/schedule/detail/18692.
[99] Builtwith. Google Analytics Usage Statistics. https://trends.builtwith.com/
analytics/Google-Analytics, 2020.
[100] Butkiewicz, M., Madhyastha, H. V., and Sekar, V. Understanding WebsiteComplexity: Measurements, Metrics, and Implications. In Proceedings of the 2011ACM SIGCOMM Conference on Internet Measurement Conference (New York, NY,USA, 2011), IMC ’11, ACM, pp. 313–328.
[101] Butkiewicz, M., Wang, D., Wu, Z., Madhyastha, H. V., and Sekar, V.Klotski: Reprioritizing Web Content to Improve User Experience on Mobile De-vices. In 12th USENIX Symposium on Networked Systems Design and Implementa-tion (NSDI 15) (Oakland, CA, May 2015), USENIX Association, pp. 439–453.
127

[102] Bylaws of the CA/Browser Forum, Version 2.3. https://cabforum.org/wp-
content/uploads/CA-Browser-Forum-Bylaws-v2.3.pdf.
[103] CA/Browser Forum. Ballot SC22 – Reduce Certificate Lifetimes (v2).https://cabforum.org/2019/09/10/ballot-sc22-reduce-certificate-lifetimes-v2/, 2019.
[104] Cai, C. X., Le, F., Sun, X., Xie, G. G., Jamjoom, H., and Campbell, R. H.Cronets: Cloud-routed overlay networks. In 2016 IEEE 36th International Confer-ence on Distributed Computing Systems (ICDCS) (June 2016), pp. 67–77.
[105] Calder, M., Flavel, A., Katz-Bassett, E., Mahajan, R., and Padhye, J.Analyzing the performance of an anycast cdn. In Proceedings of the 2015 InternetMeasurement Conference (2015), pp. 531–537.
[106] Callahan, T., Allman, M., and Rabinovich, M. On modern dns behavior andproperties. ACM SIGCOMM Computer Communication Review 43, 3 (2013), 7–15.
[107] Calzavara, S., Rabitti, A., and Bugliesi, M. Content Security Problems?Evaluating the Effectiveness of Content Security Policy in the Wild. In Proceed-ings of the 2016 ACM SIGSAC Conference on Computer and Communications Se-curity (New York, NY, USA, 2016), CCS ’16, Association for Computing Machinery,pp. 1365–1375.
[108] Camillo, A. The Current and the Future States of DNS security(2019). https://medium.com/@andrecamillo/the-current-state-and-the-
future-of-dns-security-2019-4a9590296d26, August 2019.
[109] Cangialosi, F., Chung, T., Choffnes, D., Levin, D., Maggs, B. M., Mis-love, A., and Wilson, C. Measurement and Analysis of Private Key Sharingin the HTTPS Ecosystem. In ACM Conference on Computer and CommunicationsSecurity (October 2016).
[110] Cardaci, A. Chrome Page Graph. https://github.com/cyrus-and/chrome-
page-graph/, 2019. [Last accessed on January 25, 2020].
[111] Cardwell, N., Cheng, Y., Gunn, C. S., Yeganeh, S. H., and Jacobson, V.BBR: Congestion-based congestion control. Queue 14, 5 (2016), 50.
[112] Carneiro, G., Fortuna, P., and Ricardo, M. FlowMonitor: A Network Moni-toring Framework for the Network Simulator 3 (NS-3). In Proceedings of the FourthInternational ICST Conference on Performance Evaluation Methodologies and Tools(2009), VALUETOOLS ’09.
[113] Carrascal, J. P., Riederer, C., Erramilli, V., Cherubini, M., andde Oliveira, R. Your Browsing Behavior for a Big Mac: Economics of PersonalInformation Online. In WWW (2013).
[114] Casetti, C., Gerla, M., Mascolo, S., Sanadidi, M. Y., and Wang, R. TCPWestwood: end-to-end congestion control for wired/wireless networks. Wireless Net-works 8, 5 (2002), 467–479.
128

[115] CASIS. ISSRDC 2015 - A Conversation with Elon Musk. https://tinyurl.com/
plnon58, 2015.
[116] Castillo-Perez, S., and Garcia-Alfaro, J. Anonymous resolution of dnsqueries. In OTM Confederated International Conferences” On the Move to Mean-ingful Internet Systems” (2008), Springer, pp. 987–1000.
[117] Castro, S., Wessels, D., Fomenkov, M., and Claffy, K. A Day at the Rootof the Internet. SIGCOMM Comput. Commun. Rev. 38, 5 (Sept. 2008), 41–46.
[118] Center for International Earth Science Information Network(CIESIN), Columbia University; United Nations Food and AgricultureProgramme (FAO); and Centro Internacional de Agricultura Tropi-cal (CIAT). Gridded Population of the World: Future Estimates (GPWFE).http://sedac.ciesin.columbia.edu/gpw, 2005. [Online; accessed 11-March-2021].
[119] Chanchary, F., and Chiasson, S. User Perceptions of Sharing, Advertising, andTracking. In Eleventh Symposium On Usable Privacy and Security (SOUPS) (July2015).
[120] Chau, S. Y., Chowdhury, O., Hoque, E., Ge, H., Kate, A., Nita-Rotaru,C., and Li, N. SymCerts: Practical Symbolic Execution For Exposing Noncompli-ance in X.509 Certificate Validation Implementations. In Proc. of IEEE Symposiumon Security and Privacy (2017).
[121] Chen, F., Sitaraman, R. K., and Torres, M. End-user mapping: Next gener-ation request routing for content delivery. ACM SIGCOMM Computer Communica-tion Review 45, 4 (2015), 167–181.
[122] Cheng, Y. pause Fast Open globally after third consecutive timeout. https://
patchwork.ozlabs.org/patch/847640/, last accessed on October 16, 2019.
[123] Cheng, Y., Chu, J., Radhakrishnan, S., and Jain, A. TCP Fast Open. RFC7413, 2014.
[124] Chiu, Y.-C., Schlinker, B., Radhakrishnan, A. B., Katz-Bassett, E., andGovindan, R. Are we one hop away from a better Internet? In ACM IMC (2015).
[125] Chow, M., Meisner, D., Flinn, J., Peek, D., and Wenisch, T. F. Themystery machine: End-to-end performance analysis of large-scale internet services.In USENIX OSDI (2014).
[126] Chrome. Chrome DevTools Protocol. https://chromedevtools.github.io/
devtools-protocol/tot/Network/, 2020. [Last accessed on January 25, 2020].
[127] Chromium Blog. A QUIC update on Google’s experimental trans-port. https://blog.chromium.org/2015/04/a-quic-update-on-googles-
experimental.html, 2015.
129

[128] Chromium Bugs. TCP fast open not supported on Windows 10 build 1607. https://bugs.chromium.org/p/chromium/issues/detail?id=635080, last accessed onOctober 16, 2019.
[129] Certificate Lifetimes. https://chromium.googlesource.com/chromium/src/+/
master/net/docs/certificate_lifetimes.md.
[130] CHRS at UC Irvine. PERSIANN-CCS. https://chrsdata.eng.uci.edu/, 2017.[Online; accessed 11-March-2021].
[131] Chung, T., Liu, Y., Choffnes, D., Levin, D., Maggs, B., Mislove, A., andWilson, C. Measuring and Applying Invalid SSL Certificates: The Silent Majority.In ACM Internet Measurement Conference (November 2016).
[132] Chung, T., Lok, J., Chandrasekaran, B., Choffnes, D., Levin, D., Maggs,B., Mislove, A., Rula, J., Sullivan, N., and Wilson, C. Is the Web Readyfor OCSP Must Staple? In Proc. of IMC (2018).
[133] Chung, T., van Rijswijk-Deij, R., Chandrasekaran, B., Choffnes, D.,Levin, D., Maggs, B. M., Mislove, A., and Wilson, C. A Longitudinal,End-to-End View of the DNSSEC Ecosystem. In 26th USENIX Security Symposium(USENIX Security 17) (August 2017).
[134] Cisco. Cisco Visual Networking Index: Forecast and Methodology.https://www.reinvention.be/webhdfs/v1/docs/complete-white-paper-c11-
481360.pdf, 2017. [Online; accessed 11-March-2021].
[135] Cisco. Cisco Visual Networking Index: Forecast and Methodology.https://www.reinvention.be/webhdfs/v1/docs/complete-white-paper-c11-
481360.pdf, 2017. [Online; accessed 11-March-2021].
[136] cisco. The Zettabyte Era: Trends and Analysis. https://tinyurl.com/ycr9wqxp,2017.
[137] Cisco. Visual Networking Index: Forecast and Trends, 2017-2022 White Pa-per. https://www.cisco.com/c/en/us/solutions/collateral/service-
provider/visual-networking-index-vni/white-paper-c11-741490.html,February 2019.
[138] Cisco Umbrella. OpenDNS adopts DNSCurve. https://umbrella.cisco.com/
blog/opendns-dnscurve, March 2010.
[139] cISP authors. MW path refining. https://goo.gl/LwYB5Z. [Online; accessed11-March-2021].
[140] cISP authors. Impact of rainfall on cISP for a period of 1 year. https://tinyurl.com/a8szcukz, 2021. [Online; accessed 11-March-2021].
[141] cISP authors. The MW+fiber hybrid network evolves with budget. https://
tinyurl.com/3vakxccm, 2021. [Online; accessed 11-March-2021].
130

[142] Claypool, M., Finkel, D., Grant, A., and Solano, M. Thin to win? networkperformance analysis of the onlive thin client game system. In IEEE NetGames(2012).
[143] Claypool, M., LaPoint, D., and Winslow, J. Network analysis of Counter-Strike and Starcraft. In IEEE Performance, Computing, and Communications Con-ference (2003).
[144] Cloudflare. Crate quiche. https://docs.quic.tech/quiche/, last accessed onOctober 12, 2019.
[145] Cloudflare. The Nitty Gritty. https://developers.cloudflare.com/1.1.1.1/nitty-gritty-details, June 2019.
[146] Cloudflare. ECDSA: The missing piece of DNSSEC. https://www.cloudflare.com/dns/dnssec/ecdsa-and-dnssec/, October 2020.
[147] Commission, F. C. Universal Licensing System. http://wireless2.fcc.gov/
UlsApp/UlsSearch/searchLicense.jsp. [Online; accessed 11-March-2021].
[148] CommScope. HSX8-107-D3A. https://objects.eanixter.com/PD354739.PDF,2012. [Online; accessed 28-July-2021].
[149] Confessore, N. Cambridge Analytica and Facebook: The Scandal and the FalloutSo Far. The New York Times (April 2018).
[150] Contavalli, C., van der Gaast, W., Lawrence, D., and Kumari, W. Clientsubnet in dns queries. RFC 7871, RFC Editor, May 2016.
[151] Convergence. http://convergence.io.
[152] Cook, J., Nithyanand, R., and Shafiq, Z. Inferring Tracker-Advertiser Re-lationships in the Online Advertising Ecosystem using Header Bidding. CoRRabs/1907.07275 (2019).
[153] Cooper, D., Santesson, S., Farrell, S., Boeyen, S., Housley, R., andPolk, W. Internet X.509 Public Key Infrastructure Certificate And CertificateRevocation List (CRL) Profile. RFC 5280, May 2008.
[154] Copernicus by ECMWF. ERA5 hourly data on single levels from 1979 topresent. https://cds.climate.copernicus.eu/cdsapp#!/dataset/reanalysis-
era5-single-levels?tab=overview, 2018. [Online; accessed 11-March-2021].
[155] Costello, C., Fournet, C., Howell, J., Kohlweiss, M., Kreuter, B.,Naehrig, M., Parno, B., and and, S. Z. Geppetto: Versatile verifiable com-putation. In Proc. of IEEE Symposium on Security and Privacy (2015).
[156] Council, C. S. Casc Heartbleed Response, 2014. https://casecurity.org/2014/05/08/casc-heartbleed-response.
131
[157] CTC Technology & Energy. Dark Fiber Lease Considerations. http://www.
ctcnet.us/DarkFiberLease.pdf. Last accessed: January 26,2017.
[158] Cyphers, B., and Gebhart, G. Behind the One-Way Mirror: A Deep Dive Intothe Technology of Corporate Surveillance. Tech. rep., Electronic Frontier Foundation,December 2019.
[159] da Hora, D. N., Asrese, A. S., Christophides, V., Teixeira, R., and Rossi,D. Narrowing the Gap Between QoS Metrics and Web QoE Using Above-the-foldMetrics. In Passive and Active Measurement (Cham, 2018), R. Beverly, G. Smarag-dakis, and A. Feldmann, Eds., Springer International Publishing, pp. 31–43.
[160] da Hora, D. N., Asrese, A. S., Christophides, V., Teixeira, R., and Rossi,D. Narrowing the Gap Between QoS Metrics and Web QoE Using Above-the-foldMetrics. In PAM (2018).
[161] Danzig, P. B., Obraczka, K., and Kumar, A. An analysis of wide-area nameserver traffic: a study of the internet domain name system. In Conference proceedingson Communications architectures & protocols (1992), pp. 281–292.
[162] DARPA. Novel Hollow-Core Optical Fiber to Enable High-Power Military Sen-sors. http://www.darpa.mil/news-events/2013-07-17, 2013. [Online; accessed11-March-2021].
[163] Davies, J. Beware of page latency: The side effects to header bidding. https:
//digiday.com/uk/beware-page-latency-side-effects-header-bidding/, Sep2016.
[164] Deahl, D. FCC grants OneWeb approval to launch over 700 satellites for ‘spaceInternet’. https://tinyurl.com/yb8fstr9, 2018.
[165] DeBord, M. Connected cars are almost here. https://tinyurl.com/y7e9db9k,2015.
[166] Deckelmann, S. Firefox continues push to bring DNS over HTTPS by default forUS users . https://blog.mozilla.org/blog/2020/02/25/firefox-continues-
push-to-bring-dns-over-https-by-default-for-us-users/, February 2020.
[167] Delignat-Lavaud, A., Fournet, C., Kohlweiss, M., and Parno, B. Cin-derella: Turning Shabby X.509 Certificates into Elegant Anonymous Credentials withthe Magic of Verifiable Computation. In IEEE Symposium on Security and Privacy(May 2016).
[168] Dempsky, M. Dnscurve: Link-level security for the domain name system. Internet-Draft draft-dempsky-dnscurve-01, IETF Secretariat, February 2010. http://www.
ietf.org/internet-drafts/draft-dempsky-dnscurve-01.txt.
[169] Deutsch, P., and Gailly, J.-L. Zlib compressed data format specification version3.3. Tech. rep., RFC 1950, May, 1996.
132

[170] DeWitt, G. Improperly implemented header bidding tags cause page slowdown anddecreased revenue for publishers. https://www.indexexchange.com/improperly-
implemented-header-bidding-tags-cause-page-slowdown-and-decreased-
revenue-for-publishers/, May 2017.
[171] Digital Commerce 360. US ecommerce grows 44.0% in 2020. https://
www.digitalcommerce360.com/article/us-ecommerce-sales/, 2021. [Online; ac-cessed 28-July-2021].
[172] DNSCrypt. DNSCrypt version 2 protocol specification. https://dnscrypt.info/
protocol, March 2019.
[173] Dong, M., Li, Q., Zarchy, D., Godfrey, P. B., and Schapira, M. PCC:Re-architecting Congestion Control for Consistent High Performance. In USENIXNSDI (2015).
[174] Dong, M., Meng, T., Zarchy, D., Arslan, E., Gilad, Y., Godfrey, B.,and Schapira, M. PCC Vivace: Online-Learning Congestion Control. In USENIXNSDI (2018).
[175] DragonWave-X. Services & Support / Pre Deployment / Line of Sight. https:
//www.dragonwavex.com/services/pre-deployment/line-sight, 2021. [Online;accessed 11-March-2021].
[176] Dukkipati, N., Refice, T., Cheng, Y., Chu, J., Herbert, T., Agarwal, A.,Jain, A., and Sutin, N. An Argument for Increasing TCP’s Initial CongestionWindow. SIGCOMM Comput. Commun. Rev. 40, 3 (June 2010), 26–33.
[177] Durairajan, R., Barford, P., Sommers, J., and Willinger, W. InterTubes:A study of the US long-haul fiber-optic infrastructure. In ACM SIGCOMM (2015).
[178] Durumeric, Z., Kasten, J., Adrian, D., Halderman, J. A., Bailey, M., Li,F., Weaver, N., Amann, J., Beekman, J., Payer, M., and Paxson, V. TheMatter Of Heartbleed. In ACM Internet Measurement Conference (November 2014).
[179] Durumeric, Z., Kasten, J., Bailey, M., and Halderman, J. A. Analysis ofthe HTTPS Certificate Ecosystem. In Proceedings of the 2013 Conference on InternetMeasurement Conference (New York, NY, USA, 2013), IMC ’13, ACM, pp. 291–304.
[180] Durumeric, Z., Kasten, J., Bailey, M., and Halderman, J. A. AnalysisOf The HTTPS Certificate Ecosystem. In ACM Internet Measurement Conference(October 2013).
[181] Durumeric, Z., Wustrow, E., and Halderman, J. A. ZMap: Fast Internet-wide Scanning and Its Security Applications. In Presented as part of the 22ndUSENIX Security Symposium (USENIX Security 13) (Washington, D.C., 2013),USENIX, pp. 605–620.
[182] Eastlake, D. Transport layer security (tls) extensions: Extension definitions. RFC6066, RFC Editor, January 2011. http://www.rfc-editor.org/rfc/rfc6066.txt.
133

[183] EasyList. Easylist filter list project. https://easylist.to, August 2019.
[184] Econoday. Econoday. http://mam.econoday.com/, 2018.
[185] EFF SSL Observatory. https://www.eff.org/observatory.
[186] Ellison, C., Frantz, B., Lampson, B., Rivest, R., Thomas, B., and Ylonen,T. SPKI Certificate Theory. RFC 2693, Sept. 1999.
[187] Elon Musk. https://tinyurl.com/o765qmc, 2015.
[188] Enberg, J. Global Digital Ad Spending 2019. https://www.emarketer.com/
content/global-digital-ad-spending-2019, March 2019.
[189] Engebretson, J. Broadband Data Usage Report: Internet-only Homes UseAlmost Twice as Much Data as Bundled Homes. https://www.telecompetitor.
com/broadband-data-usage-report-internet-only-homes-use-almost-twice-
as-much-data-as-bundled-homes/, 2019. [Online; accessed 11-March-2021].
[190] Enghardt, T., Zinner, T., and Feldmann, A. Web Performance Pitfalls. InPassive and Active Measurement (Cham, 2019), D. Choffnes and M. Barcellos, Eds.,Springer International Publishing, pp. 286–303.
[191] Englehardt, S., Reisman, D., Eubank, C., Zimmerman, P., Mayer, J.,Narayanan, A., and Felten, E. W. Cookies That Give You Away: The Surveil-lance Implications of Web Tracking. In WWW (2015).
[192] Erkmen, B. Exploring a new approach to connectivity. https://goo.gl/vHycHi,2017.
[193] European Commission. Galileo. https://tinyurl.com/ydbcrgjh, 2018.
[194] European Securities and Markets Authority. MIFID II. https://tinyurl.com/ycmufhr8, 2018.
[195] Facebook. Facebook demonstrates record-breaking data-rate using millimeter-wavetechnology. https://code.facebook.com/posts/1197678800270377/facebook-
demonstrates-record-breaking-data-rate-using-millimeter-wave-
technology.
[196] Facebook connectivity. Magma. https://connectivity.fb.com/magma/,2021. [Online; accessed 11-March-2021].
[197] Facebook connectivity. Rural Access. https://connectivity.fb.com/rural-
access/, 2021. [Online; accessed 11-March-2021].
[198] Facebook connectivity. Terragraph. https://connectivity.fb.com/
terragraph/, 2021. [Online; accessed 11-March-2021].
134

[199] Fahl, S., Harbach, M., Muders, T., Baumgartner, L., Freisleben, B.,and Smith, M. Why Eve And Mallory Love Android: An Analysis Of AndroidSSL (in)security. In ACM Conference on Computer and Communications Security(Raleigh, North Carolina, USA, October 2012).
[200] Fahl, S., Harbach, M., Perl, H., Koetter, M., and Smith, M. RethinkingSSL Development in an Appified World. In ACM Conference on Computer andCommunications Security (Berlin, Germany, November 2013).
[201] Fastly. Understanding cache HIT and MISS headers with shielded ser-vices. https://docs.fastly.com/en/guides/understanding-cache-hit-and-
miss-headers-with-shielded-services, 2019. [Last accessed on May 12, 2020].
[202] FCC. Memorandum opinion, order and authorization, FCC 18-38. https://
tinyurl.com/y95bk6n9, 2018.
[203] Federal Communications Commission. Antenna Structure RegistrationDatabase. https://www.fcc.gov/antenna-structure-registration, 2018. [On-line; accessed 11-March-2021].
[204] Federrath, H., Fuchs, K.-P., Herrmann, D., and Piosecny, C. Privacy-Preserving DNS: Analysis of Broadcast, Range Queries and Mix-Based Protec-tion Methods. In Computer Security – ESORICS 2011 (Berlin, Heidelberg, 2011),V. Atluri and C. Diaz, Eds., Springer Berlin Heidelberg, pp. 665–683.
[205] Felt, A. P., Barnes, R., King, A., Palmer, C., Bentzel, C., and Tabriz,P. Measuring HTTPS Adoption on the Web. In 26th USENIX Security Symposium(USENIX Security 17) (Vancouver, BC, 2017), USENIX Association, pp. 1323–1338.
[206] Fibre Atlantic. GTT Express. http://www.fiberatlantic.com/system/J6Qmo,2015.
[207] Finley, K. The Average Webpage Is Now the Size of the Original Doom, April 2016.https://www.wired.com/2016/04/average-webpage-now-size-original-doom/.
[208] First Contentful Paints. https://web.dev/fcp/.
[209] Fischer, S., Kammenhuber, N., and Feldmann, A. Replex: Dynamic trafficengineering based on wardrop routing policies. In ACM CoNEXT (2006).
[210] Fisher, D. Final report on diginotar hack shows total compromise ofca servers. https://threatpost.com/final-report-diginotar-hack-shows-
total-compromise-ca-servers-103112/77170/.
[211] Fishkin, R., and Høgenhaven, T. Inbound marketing and SEO: Insights from theMoz Blog. John Wiley & Sons, Hoboken, NJ, USA, 2013.
[212] Flach, T., Dukkipati, N., Terzis, A., Raghavan, B., Cardwell, N., Cheng,Y., Jain, A., Hao, S., Katz-Bassett, E., and Govindan, R. Reducing WebLatency: The Virtue of Gentle Aggression. In Proceedings of the ACM SIGCOMM
135

2013 Conference on SIGCOMM (New York, NY, USA, August 2013), SIGCOMM’13, ACM, pp. 159–170.
[213] Foremski, P., Gasser, O., and Moura, G. C. Dns observatory: The big pictureof the dns. In Proceedings of the Internet Measurement Conference (2019), pp. 87–100.
[214] French gov used fake google certificate to read its workers’ traffic. https://www.
theregister.co.uk/2013/12/10/french_gov_dodgy_ssl_cert_reprimand/.
[215] Gallager, R. A minimum delay routing algorithm using distributed computation.IEEE Transactions on Communications 25, 1 (1977), 73–85.
[216] Gallagher, R., and Moltke, H. THE WIRETAP ROOMS: The NSA’s Hid-den Spy Hubs in Eight U.S. Cities. ”https://theintercept.com/2018/06/25/att-internet-nsa-spy-hubs/”, June 2018.
[217] Games, R. Fixing the Internet for real-time applications. https://goo.gl/SEoxW2,2016. [Online; accessed 11-March-2021].
[218] Gao, L., and Wang, F. The Extent of AS Path Inflation by Routing Policies. InGlobal Telecommunications Conference, 2002. GLOBECOM ’02. IEEE (Nov 2002),vol. 3, pp. 2180–2184 vol.3.
[219] Garey, M. R., and Johnson, D. S. The rectilinear Steiner tree problem is NP-complete. SIAM Journal on Applied Mathematics 32, 4 (1977), 826–834.
[220] Gartenberg, C. Seized documents reveal that Facebook knew about Russian dataharvesting as early as 2014. The Verge (November 2018).
[221] Gasser, O., Hof, B., Helm, M., Korczynski, M., Holz, R., and Carle, G.In Log We Trust: Revealing Poor Security Practices with Certificate TransparencyLogs and Internet Measurements. In Passive and Active Network Measurement: 19thInternational Conference, PAM 2018, Berlin, Germany, ,March 26-27, 2018. Pro-ceedings (Cham, 2018), R. Beverly, G. Smaragdakis, and A. Feldmann, Eds., SpringerInternational Publishing, pp. 173–18.
[222] Georgiev, M., Iyengar, S., Jana, S., Anubhai, R., Boneh, D., andShmatikov, V. The Most Dangerous Code In The World: Validating SSL Cer-tificates In Non-browser Software. In ACM Conference on Computer and Communi-cations Security (October 2012).
[223] Geuss, M. Satellite Internet: meet the hip new investment for Richard Branson,Elon Musk. https://tinyurl.com/jaqulst, January 2015.
[224] Gill, P., Arlitt, M., Li, Z., and Mahanti, A. The flattening internet topology:natural evolution, unsightly barnacles or contrived collapse? In PAM (2008).
[225] Glassman, S. A Caching Relay for the World Wide Web. In Selected Papersof the First Conference on World-Wide Web (Amsterdam, The Netherlands, TheNetherlands, 1994), Elsevier Science Publishers B. V., pp. 165–173.
136

[226] Google. Latency Restrictions and Peering. https://developers.google.com/ad-exchange/rtb/peer-guide, last accessed on October 12, 2019.
[227] Google. The Arrival of Real-Time Bidding. https://www.rtbchina.com/wp-
content/uploads/2012/03/Google-White-Paper-The-Arrival-of-Real-Time-
Bidding-July-2011.pdf, June 2011.
[228] Google. Chrome V8: Google’s high performance, open source, JavaScript engine,2018. https://developers.google.com/v8/.
[229] Google. About PageSpeed Insights. https://developers.google.com/speed/
docs/insights/v5/about, 2019.
[230] Google. Chrome User Experience Report. https://developers.google.com/
web/tools/chrome-user-experience-report, 2019.
[231] Google. Speed Index. https://web.dev/speed-index/, 2019.
[232] Google. Google Custom Search. https://developers.google.com/custom-
search/docs/overview, 2020. [Last accessed on April 26, 2020].
[233] Google. HTTPS encryption on the web. https://transparencyreport.google.
com/https/overview, 2020.
[234] Google Public DNS. Performance Benefits. https://developers.google.com/
speed/public-dns/docs/performance.
[235] Google warns of fake digital certificates issued for its domains and potentiallyothers. https://venturebeat.com/2015/03/23/google-security-temporarily-
compromised-by-fake-digital-certificates/.
[236] Guha, S., Cheng, B., and Francis, P. Privad: Practical privacy in online adver-tising. In NSDI (2011).
[237] Guha, S., and Francis, P. Identity Trail: Covert Surveillance Using DNS. InPrivacy Enhancing Technologies (Berlin, Heidelberg, 2007), N. Borisov and P. Golle,Eds., Springer Berlin Heidelberg, pp. 153–166.
[238] Gunter’s Space Page. MicroSat 2a, 2b (Tintin A, B). https://tinyurl.com/
yd5bpp9r, 2018.
[239] Gurobi Optimization, I. Gurobi optimizer reference manual, 2016.
[240] Gvozdiev, N., Vissicchio, S., Karp, B., and Handley, M. Low-latency routingon mesh-like backbones. ACM HotNets (2017).
[241] Habib, M. A., and Abrams, M. Analysis of Sources of Latency in DownloadingWeb Pages. In Proceedings of WebNet 2000 - World Conference on the WWW andInternet, San Antonio, Texas, USA, October 30 - November 4, 2000 (2000), pp. 227–232.
137

[242] Hallam-Baker, P. X.509v3 Transport Layer Security (TLS) Feature Extension.RFC 7633, October 2015.
[243] Handley, M. Delay is not an option: Low latency routing in space. In ACMHotNets (2018).
[244] Handley, M. Delay is Not an Option: Low Latency Routing in Space. In ACMHotNets (2018).
[245] Handley, M., and Greenhalgh, A. The Case for Pushing DNS. In Proceedings ofthe 4th ACM Workshop on Hot Topics in Networks (2005), HotNets ’04, Associationfor Computing Machinery.
[246] Hansryd, J., and Edstam, J. Microwave capacity evolution. Ericsson review 1(2011), 22–27.
[247] Hardawar, D. Samsung proves why 5G is necessary with a robot arm. https:
//goo.gl/3gZTn8, 2016. [Online; accessed 11-March-2021].
[248] Henry, C. OneWeb asks FCC to authorize 1,200 more satellites. https://tinyurl.com/y9ncb5my, 2018.
[249] Herrmann, D., Banse, C., and Federrath, H. Behavior-Based Tracking: Ex-ploiting Characteristic Patterns in DNS Traffic. Comput. Secur. 39 (Nov. 2013),17–33.
[250] Herrmann, D., Fuchs, K.-P., Lindemann, J., and Federrath, H. Encdns: Alightweight privacy-preserving name resolution service. In European Symposium onResearch in Computer Security (2014), Springer, pp. 37–55.
[251] Hesmans, B., Duchene, F., Paasch, C., Detal, G., and Bonaventure, O.Are TCP Extensions Middlebox-proof? In HotMiddlebox (2013).
[252] Hispar Project. Pagetypes data set, Hispar list tools and archives. https://
hispar.cs.duke.edu/, 2020.
[253] Hodges, J., Jackson, C., and Barth, A. HTTP Strict Transport Security(HSTS). RFC 6797, Nov. 2012.
[254] Hoffman, P., and McManus, P. Dns queries over https (doh). RFC 8484, RFCEditor, October 2018.
[255] Hoffman, P., and Schlyter, J. The DNS-based Authentication Of Named En-tities (DANE) Transport Layer Security (TLS) Protocol: TLSA. RFC 6698, August2012.
[256] Holz, R., Braun, L., Kammenhuber, N., and Carle, G. The SSL Landscape– a Thorough Analysis Of The X.509 PKI Using Active And Passive Measurements.In ACM Internet Measurement Conference (November 2011).
138
[257] Hong, C., Kandula, S., Mahajan, R., Zhang, M., Gill, V., Nanduri, M.,and Wattenhofer, R. Achieving high utilization with software-driven WAN. InACM SIGCOMM (2013).
[258] Hounsel, A., Borgolte, K., Schmitt, P., and Feamster, N. D-DNS: TowardsRe-Decentralizing the DNS, 2020.
[259] Houser, R., Li, Z., Cotton, C., and Wang, H. An Investigation on InformationLeakage of DNS over TLS. In Proceedings of the 15th International Conference onEmerging Networking Experiments And Technologies (New York, NY, USA, 2019),CoNEXT ’19, Association for Computing Machinery, pp. 123–137.
[260] Housley, R., Ford, D. W. S., and Solo, D. Internet Public Key Infrastructure.Part I: X.509 Certificate and CRL Profile. RFC 2459, June 1996.
[261] HTTP Archive. State of JavaScript. https://httparchive.org/reports/
state-of-javascript#bytesJs, 2019. [Last accessed on December 5, 2019].
[262] Hu, Z., Zhu, L., Heidemann, J., Mankin, A., Wessels, D., and Hoffman,P. E. Specification for DNS over Transport Layer Security (TLS). RFC 7858, May2016.
[263] Huang, S. S., Green, T. J., and Loo, B. T. Datalog and emerging applications:an interactive tutorial. In Proceedings of the 2011 ACM SIGMOD InternationalConference on Management of Data (2011), pp. 1213–1216.
[264] Hubbard, D. Cisco Umbrella 1 Million. https://umbrella.cisco.com/blog/
2016/12/14/cisco-umbrella-1-million/, December 2016.
[265] Hughes, J. Tesla Could Use SpaceX Starlink Network to Manage Data Uplinks.https://tinyurl.com/ycdsvsap, 2018.
[266] HughesNet. HughesNet: America’s #1 Choice for Satellite Internet. https://
www.hughesnet.com/, 2018.
[267] Huitema, C., Mankin, A., and Dickinson, S. Specification of dns over dedi-cated quic connections. Internet-Draft draft-huitema-dprive-dnsoquic-00, IETF Sec-retariat, March 2020. http://www.ietf.org/internet-drafts/draft-huitema-
dprive-dnsoquic-00.txt.
[268] IAB Tech Lab. OpenRTB API Specification Version 2.3.1. https:
//www.iab.com/wp-content/uploads/2015/05/OpenRTB_API_Specification_
Version_2_3_1.pdf, June 2015.
[269] IAC. GLONASS. https://www.glonass-iac.ru/en/, 2018.
[270] Ian Haken. https://netflixtechblog.com/bettertls-c9915cd255c0.
[271] IANA. Top-Level Domains. https://data.iana.org/TLD/tlds-alpha-by-
domain.txt, June 2020.
139

[272] Ihm, S., and Pai, V. S. Towards understanding modern web traffic. In Proceedingsof the 2011 ACM SIGCOMM conference on Internet Measurement Conference (2011),pp. 295–312.
[273] Ikram, M., Masood, R., Tyson, G., Kaafar, M. A., Loizon, N., and En-safi, R. The chain of implicit trust: An analysis of the web third-party resourcesloading. In The World Wide Web Conference (New York, NY, USA, 2019), WWW’19, Association for Computing Machinery, pp. 2851–2857.
[274] International Telecommunication Union. Attenuation by atmospheric gases.https://www.itu.int/rec/R-REC-P.676/en.
[275] International Telecommunication Union. Specific attenuation model for rainfor use in prediction methods. https://www.itu.int/rec/R-REC-P.838/en.
[276] International Telecommunications Union. ITU-T Recommendation X.509:The Directory: Authentication Framework. Technical Report X.509, Nov. 1988.
[277] Internet Archive. Wayback Machine. https://archive.org, 2019. [Last ac-cessed on December 5, 2019].
[278] Internet Security Research Group (ISRG). Certification Practice Statement,January 2020. https://letsencrypt.org/documents/isrg-cps-v2.7/#dv-ssl-
end-entity-certificate.
[279] Internet Society. Workshop on Reducing Internet Latency, 2013 —Report. https://www.internetsociety.org/sites/default/files/Workshop%
20on%20Reducing%20Internet%20Latency-1.2.pdf, September 2013.
[280] ITU. Specific attenuation model for rain for use in prediction methods. http://www.itu.int/dms_pubrec/itu-r/rec/p/R-REC-P.838-3-200503-I!!PDF-E.pdf, 2005.[Online; accessed 11-March-2021].
[281] Ixia. Measuring Latency in Equity Transactions. http://ixia.cabanday.com/
products/_content/wp-measuring-latency.pdf, 2012. [Online; accessed 11-March-2021].
[282] Iyengar, J., and Thomson, M. QUIC: A UDP-Based Multiplexed and SecureTransport. Internet-draft, Internet Engineering Task Force, Sept. 2019.
[283] Jacobson, V., and Karels, M. J. Congestion Avoidance and Control. In SIG-COMM (1988), ACM.
[284] Jain, S., Kumar, A., Mandal, S., Ong, J., Poutievski, L., Singh, A.,Venkata, S., Wanderer, J., Zhou, J., Zhu, M., Zolla, J., Holzle, U., Stu-art, S., and Vahdat, A. B4: experience with a globally-deployed software definedwan. In ACM SIGCOMM (2013).
[285] Jauvion, G., Grislain, N., Dkengne Sielenou, P., Garivier, A., andGerchinovitz, S. Optimization of a SSP’s Header Bidding Strategy Using Thomp-son Sampling. In KDD (2018).
140
[286] Jianjun, B., Xicheng, L., Zexin, L., and Wei, P. Compact explicit multi-pathrouting for LEO satellite networks. In IEEE HPSR (2005).
[287] John Graham-Cumming. Details of the Cloudflare outage on July 2,2019. ”https://blog.cloudflare.com/details-of-the-cloudflare-outage-on-july-2-2019/”, July 2019.
[288] Jordan, H., Scholz, B., and Subotic, P. Souffle: On synthesis of program ana-lyzers. In International Conference on Computer Aided Verification (2016), pp. 422–430.
[289] Jostedt, E. Release the Kraken. https://blog.mozilla.org/blog/2010/09/14/release-the-kraken-2/, 2010.
[290] Jota, R., Ng, A., Dietz, P., and Wigdor, D. How fast is fast enough? a studyof the effects of latency in direct-touch pointing tasks. In Proceedings of the sigchiconference on human factors in computing systems (2013), pp. 2291–2300.
[291] Jung, J., Sit, E., Balakrishnan, H., and Morris, R. Dns performance andthe effectiveness of caching. IEEE/ACM Transactions on networking 10, 5 (2002),589–603.
[292] Kaizer, A. J., and Gupta, M. Characterizing Website Behaviors Across Logged-inand Not-Logged-in Users. In Proceedings of the 2016 Internet Measurement Confer-ence (New York, NY, USA, 2016), IMC ’16, Association for Computing Machinery,pp. 111–117.
[293] Kandula, S., Katabi, D., Davie, B., and Charny, A. Walking the tightrope:Responsive yet stable traffic engineering. In ACM SIGCOMM (2005).
[294] Kassing, S., Bhattacherjee, D., Aguas, A. B., Saethre, J. E., and Singla,A. Exploring the “Internet from space” with Hypatia. In ACM IMC (2020).
[295] Kelly, E. SpaceX’s Shotwell: Starlink internet will cost about $10 billion and’change the world’. https://goo.gl/A1NyNq, 2018.
[296] Kelly, K. How much does one search cost? http://kk.org/thetechnium/how-
much-does-o/, 2007. [Online; accessed 11-March-2021].
[297] Kelton, C., Ryoo, J., Balasubramanian, A., and Das, S. R. Improving UserPerceived Page Load Times Using Gaze. In 14th USENIX Symposium on NetworkedSystems Design and Implementation (NSDI 17) (Boston, MA, Mar. 2017), USENIXAssociation, pp. 545–559.
[298] Kent, S. Privacy Enhancement for Internet Electronic Mail: Part II: Certificate-Based Key Management. RFC 1422, Feb. 1993.
[299] Khalidi, Y. The network is a living organism. https://tinyurl.com/lybpwab,2017.
141

[300] Kim, T. H.-J., Huang, L.-S., Perrig, A., Jackson, C., and Gligor, V. Ac-countable Key Infrastructure (AKI): A Proposal for a Public-key Validation Infras-tructure. In International World Wide Web Conference (May 2013).
[301] Klenze, T., Giuliari, G., Pappas, C., Perrig, A., and Basin, D. Networking,in Heaven as on Earth. In ACM HotNets (2018).
[302] Koster, M. A Standard for Robot Exclusion. https://www.robotstxt.org/orig.html, 1994.
[303] Kotronis, V., Kloti, R., Rost, M., Georgopoulos, P., Ager, B., Schmid,S., and Dimitropoulos, X. Stitching inter-domain paths over ixps. In Proceedingsof the Symposium on SDN Research (2016), SOSR ’16, pp. 17:1–17:12.
[304] Kranch, M., and Bonneau, J. Upgrading HTTPS in Mid-Air: An EmpiricalStudy of Strict Transport Security and Key Pinning, February 2015.
[305] Kranch, M., and Bonneau, J. Upgrading https in mid-air: An empirical studyof strict transport security and key pinning.
[306] Kuhrer, M., Hupperich, T., Bushart, J., Rossow, C., and Holz, T. Goingwild: Large-scale classification of open dns resolvers. In Proceedings of the 2015Internet Measurement Conference (New York, NY, USA, 2015), IMC ’15, Associationfor Computing Machinery, pp. 355–368.
[307] Kuiper Systems LLC. Application of Kuiper Systems LLC for Authority toLaunch and Operate a Non-Geostationary Satellite Orbit System in Ka-band Fre-quencies. https://licensing.fcc.gov/myibfs/download.do?attachment_key=
1773885, 2019.
[308] Kumar, D., Ma, Z., Durumeric, Z., Mirian, A., Mason, J., Halderman,J. A., and Bailey, M. Security Challenges in an Increasingly Tangled Web. InProceedings of the 26th International Conference on World Wide Web (Republicand Canton of Geneva, CHE, 2017), WWW ’17, International World Wide WebConferences Steering Committee, pp. 677–684.
[309] Kumar, D., Wang, Z., Hyder, M., Dickinson, J., Beck, G., Adrian, D.,Mason, J., Durumeric, Z., Halderman, J. A., and Bailey, M. TrackingCertificate Misissuance in the Wild. In Proc. of IEEE Symposium on Security andPrivacy (2018).
[310] Kumar, P. Analyzing the Impact of a Public DNS Resolver Out-age. https://blog.catchpoint.com/2018/06/14/analyzing-impact-public-
dns-resolver-outage, June 2018.
[311] Langley, A., Riddoch, A., Wilk, A., Vicente, A., Krasic, C., Zhang, D.,Yang, F., Kouranov, F., Swett, I., Iyengar, J., Bailey, J., Dorfman, J.,Roskind, J., Kulik, J., Westin, P., Tenneti, R., Shade, R., Hamilton, R.,Vasiliev, V., Chang, W.-T., and Shi, Z. The QUIC Transport Protocol: Design
142

and Internet-Scale Deployment. In Proceedings of the Conference of the ACM SpecialInterest Group on Data Communication (New York, NY, USA, 2017), SIGCOMM’17, ACM, pp. 183–196.
[312] Langley, R. B. World’s smallest GPS chip makes wearables more wearable. https://tinyurl.com/y9bfafl2, 2014.
[313] Lapowsky, I. Facebook Lays Out Its Roadmap for Creating Internet-ConnectedDrones. http://www.wired.com/2014/09/facebook-drones-2/, September 2014.
[314] Larisch, J., Choffnes, D., Levin, D., Maggs, B. M., Mislove, A., andWilson, C. CRLite: A Scalable System for Pushing all TLS Revocations to AllBrowsers. In Proc. of IEEE Symposium on Security and Privacy (2017).
[315] Laughlin, G., Aguirre, A., and Grundfest, J. Information transmission be-tween financial markets in Chicago and New York. Financial Review (2014).
[316] Laughlin, G., Aguirre, A., and Grundfest, J. Information transmission be-tween financial markets in Chicago and New York. Financial Review (2014).
[317] Laurie, B., Langley, A., and Kasper, E. Certificate Transparency. RFC 6962,June 2013.
[318] Laurie, B., Langley, A., and Kasper, E. Certificate Transparency. RFC 6962,June 2013.
[319] Lee, H., Ashiq, M. I., Muller, M., van Rijswijk-Deij, R., Kwon, T., andChung, T. Under the hood of dane mismanagement in smtp (to appear).
[320] Lee, H., Girish, A., van Rijswijk-Deij, R., Kwon, T. T., and Chung, T. Alongitudinal and comprehensive study of the dane ecosystem in email.
[321] Lee, K., Chu, D., Cuervo, E., Kopf, J., Degtyarev, Y., Grizan, S., Wol-man, A., and Flinn, J. Outatime: Using speculation to enable low-latency contin-uous interaction for mobile cloud gaming. In ACM MobiSys (2015).
[322] Lee, L.-H., Braud, T., Zhou, P., Wang, L., Xu, D., Lin, Z., Kumar, A.,Bermejo, C., and Hui, P. All one needs to know about metaverse: A completesurvey on technological singularity, virtual ecosystem, and research agenda. arXivpreprint arXiv:2110.05352 (2021).
[323] Lee, T., Pappas, C., Szalachowski, P., and Perrig, A. Towards SustainableEvolution for the TLS Public-Key Infrastructure. In Proc. of AsiaCCS (2018).
[324] Lee, W.-M. Using the MetaMask Chrome Extension. Apress, 2019, pp. 93–126.
[325] Lentz, M., Levin, D., Castonguay, J., Spring, N., and Bhattacharjee, B.D-mystifying the D-root Address Change. In Proceedings of the 2013 Conferenceon Internet Measurement Conference (New York, NY, USA, 2013), IMC ’13, ACM,pp. 57–62.
143

[326] LeoSat. FCC filing. https://tinyurl.com/yda6ce2q.
[327] LeoSat. http://leosat.com/, 2018.
[328] LeoSat. FAQ. http://leosat.com/faq/, 2018.
[329] Lerner, A., Simpson, A. K., Kohno, T., and Roesner, F. Internet Jones andthe Raiders of the Lost Trackers: An Archaeological Study of Web Tracking from1996 to 2016. In 25th USENIX Security Symposium (USENIX Security 16) (Austin,TX, Aug. 2016), USENIX Association, pp. 997–1014.
[330] Li, N., Grosof, B. N., and Feigenbaum, J. Delegation logic: A logic-based ap-proach to distributed authorization. ACM Transactions on Information and SystemSecurity 6, 1 (2003), 128–171.
[331] Li, Q., Dong, M., and Godfrey, P. B. Halfback: Running Short Flows Quicklyand Safely. In Proceedings of the 11th ACM Conference on Emerging NetworkingExperiments and Technologies (New York, NY, USA, 2015), CoNEXT ’15, ACM,pp. 22:1–22:13.
[332] Li, Z., Levin, D., Spring, N., and Bhattacharjee, B. Internet anycast: Per-formance, problems, & potential. In Proceedings of the 2018 Conference of the ACMSpecial Interest Group on Data Communication (New York, NY, USA, 2018), SIG-COMM ’18, Association for Computing Machinery.
[333] Li, Z., Levin, D., Spring, N., and Bhattacharjee, B. Internet Anycast: Per-formance, Problems, & Potential. In SIGCOMM (2018).
[334] Li, Z., Zhang, M., Zhu, Z., Chen, Y., Greenberg, A., and Wang, Y.-M.WebProphet: Automating Performance Prediction for Web Services. In 7th USENIXSymposium on Networked Systems Design and Implementation (NSDI 10) (San Jose,CA, Apr. 2010), USENIX Association, pp. 143–158.
[335] Lian, W., Rescorla, E., Shacham, H., and Savage, S. Measuring the practicalimpact of DNSSEC deployment. In 22nd USENIX Security Symposium (USENIXSecurity 13) (Washington, D.C., Aug. 2013), USENIX Association, pp. 573–588.
[336] Liang, J., Jiang, J., Duan, H., Li, K., Wan, T., and Wu, J. When HTTPSMeets CDN: A Case of Authentication in Delegated Service. In IEEE Symposium onSecurity and Privacy (May 2014).
[337] Linden, G. Make Data Useful. https://slideplayer.com/slide/4203392/, 2006.[Online; accessed 11-March-2021].
[338] Liu, D., Allman, M., Jin, S., and Wang, L. Congestion Control Without aStartup Phase. In PFLDnet (2007).
[339] Liu, Y., Tome, W., Zhang, L., Choffnes, D., Levin, D., Maggs, B., Mis-love, A., Schulman, A., and Wilson, C. An End-to-end Measurement Of Cer-tificate Revocation In The Web’s PKI. In ACM Internet Measurement Conference(October 2015).
144

[340] Liu, Y. A., and Stoller, S. D. From Datalog Rules to Efficient Programs withTime and Space Guarantees. ACM Trans. Program. Lang. Syst. 31, 6 (2009).
[341] LLC, M. B. Quincy Extreme Data Latencies. http://www.quincy-data.com/
product-page/#latencies, 2017. [Online; accessed 11-March-2021].
[342] Lloyd, J. W. Foundations of logic programming. 1984.
[343] Lo, B. W., and Sedhain, R. S. How Reliable are Website Rankings? Implicationsfor E-Business Advertising and Search. Issues in Information Systems VII, 2 (2006),233–238.
[344] Loo, B. T., Condie, T., Garofalakis, M., Hellerstein, J. M., Maniatis,P., Ramakrishnan, R., Roscoe, T., and Stoica, I. Declarative networking:language, execution and optimization. In Proceedings of the 2006 ACM SIGMODinternational conference on Management of data (2006), pp. 97–108.
[345] Lottor, M. Internet growth (1981-1991). RFC 1296, RFC Editor, January 1992.
[346] Lottor, M. Internet growth (1981-1991). RFC 1296, RFC Editor, January 1992.
[347] Louis, B. Trading Fortunes Depend on a Mysterious Antenna in an Empty Field.https://goo.gl/82kzXd, 2017. [Online; accessed 11-March-2021].
[348] Louis, B., Baker, N., and McCormick, J. Hft traders dust off century-old toolin search of market edge. https://tinyurl.com/ycl8m3yg, 2018.
[349] Lu, Y., and Tsudik, G. Towards plugging privacy leaks in the domain namesystem. In 2010 IEEE Tenth International Conference on Peer-to-Peer Computing(P2P) (2010), pp. 1–10.
[350] MacKenzie, D. Trading at the Speed of Light: How Ultrafast Algorithms Are Trans-forming Financial Markets. Princeton University Press, 2021.
[351] Macrotrends LLC. Amazon Net Profit Margin 2006-2021. https://www.
macrotrends.net/stocks/charts/AMZN/amazon/net-profit-margin, 2021. [On-line; accessed 28-July-2021].
[352] Maguire, Y. Facebook and Airbus Working Together to Advance High AltitudeConnectivity. https://tinyurl.com/y76yvl7a, 2017.
[353] majestic.com. Majestic Help Centre — Frequently Asked Questions. https://
majestic.com/help/faq, 2019. [Last accessed on November 30, 2019].
[354] majestic.com. The Majestic Million. https://majestic.com/reports/
majestic-million, 2019. [Last accessed on November 30, 2019].
[355] Manning, T. Microwave Radio Transmission Design Guide. Artech House, 2009.
[356] Marrison, C. Understanding the threats to dns and how to secure it. Netw. Secur.2015, 10 (Oct. 2015), 8–10.
145

[357] Marvin, G. Report: Google earns 78% of $36.7B US search ad revenues, soon to be80%. https://goo.gl/kp4L5X, 2017. [Online; accessed 11-March-2021].
[358] Matsumoto, S., Bosamiya, J., Dai, Y., van Oorschot, P., and Parno, B.CAPS: Smoothly transitioning to a more resilient web PKI. In Proc. of the ACSAAnnual Computer Security Applications Conference (ACSAC) (Dec. 2020).
[359] Matsumoto, S., Szalachowski, P., and Perrig, A. Deployment Challenges inLog-based PKI Enhancements. In European Workshop on Systems Security (Bor-deaux, France, April 2015).
[360] Mauger, R., and Rosenberg, C. QoS guarantees for multimedia services on aTDMA-based satellite network. IEEE Communications 35, 7 (1997).
[361] McDonald, K. Minimizing Answer Defects. https://blogs.bing.com/search-
quality-insights/2012/08/20/minimizing-answer-defects, 2012. [Last ac-cessed on January 25, 2020].
[362] MDN web docs. Cacheable. https://developer.mozilla.org/en-US/docs/
Glossary/cacheable, March 2019.
[363] MDN web docs. Introduction to the DOM. https://developer.mozilla.org/
en-US/docs/Web/API/Document_Object_Model/Introduction, May 2019.
[364] MDN web docs. JavaScript APIs for WebExtensions. https://developer.
mozilla.org/en-US/docs/Mozilla/Add-ons/WebExtensions/API, March 2019.
[365] Meeker, M. Internet Trends 2019. https://www.bondcap.com/pdf/Internet_
Trends_2019.pdf, June 2019.
[366] Microsoft Azure. Content Delivery Network pricing. https://azure.
microsoft.com/en-us/pricing/details/cdn/, 2018. [Online; accessed 11-March-2021].
[367] Microsoft Azure. Bing Web Search. https://azure.microsoft.com/en-us/
services/cognitive-services/bing-web-search-api/, 2019. [Last accessed onDecember 5, 2019].
[368] Microsoft finally bans SHA-1 certificates in Internet Explorer and Edge.https://www.pcworld.com/article/3195921/microsoft-finally-bans-sha-1-
certificates-in-internet-explorer-and-edge.html.
[369] Milliseconds make Millions: A study on how improvements in mobile site speed pos-itively affect a brand’s bottom line. https://www2.deloitte.com/content/dam/
Deloitte/ie/Documents/Consulting/Milliseconds_Make_Millions_report.
pdf.
[370] Misissued/suspicious symantec certificates. https://groups.google.com/forum/
#!msg/mozilla.dev.security.policy/fyJ3EK2YOP8/yvjS5leYCAAJ.
[371] MITRE Datalog. http://datalog.sourceforge.net/datalog.html.
146

[372] Mockapetris, P. DOMAIN NAMES - CONCEPTS AND FACILITIES. RFC1034, Internet Request for Comments, 1034 (November 1987).
[373] Mockapetris, P. Domain names - implementation and specification. STD 13, RFCEditor, November 1987. http://www.rfc-editor.org/rfc/rfc1035.txt.
[374] Molla, R. Amazon could be responsible for nearly half of U.S. e-commerce sales in2017. https://goo.gl/QqAYCv, 2017. [Online; accessed 11-March-2021].
[375] Moura, G. C. M., Heidemann, J., de O. Schmidt, R., and Hardaker, W.Cache Me If You Can: Effects of DNS Time-to-Live (extended). In Proceedings of theACM Internet Measurement Conference (Amsterdam, the Netherlands, Oct. 2019),ACM, p. 101–115.
[376] Mozilla. Telemetry. https://wiki.mozilla.org/Telemetry, 2017.
[377] Mozilla Firefox. Content blocking. https://support.mozilla.org/en-US/kb/
content-blocking, 2019. [Last accessed on October 16, 2019].
[378] Muhlbauer, W., Uhlig, S., Feldmann, A., Maennel, O., Quoitin, B., andFu, B. Impact of routing parameters on route diversity and path inflation. ComputerNetworks 54, 14 (2010), 2506 – 2518.
[379] Nakatsuka, Y., Paverd, A., and Tsudik, G. Pdot: Private dns-over-tls with teesupport. In Proceedings of the 35th Annual Computer Security Applications Confer-ence (New York, NY, USA, 2019), ACSAC ’19, Association for Computing Machinery.
[380] NASA. GMAT tool. https://software.nasa.gov/software/GSC-17177-1.
[381] NASA. Space Debris and Human Spacecraft. https://tinyurl.com/zl9gfx8,2013.
[382] NASA. Precipitation Processing System Data Ordering Interface for TRMM andGPM (STORM). https://storm.pps.eosdis.nasa.gov/storm/, 2015. [Online;accessed 11-March-2021].
[383] NASA Jet Propulsion Laboratory. U.S. Releases Enhanced Shuttle Land El-evation Data. https://www2.jpl.nasa.gov/srtm/, 2015. [Online; accessed 11-March-2021].
[384] Naylor, D., Finamore, A., Leontiadis, I., Grunenberger, Y., Mellia, M.,Munafo, M., Papagiannaki, K., and Steenkiste, P. The Cost of the “S” inHTTPS. In Proc. of ACM CoNEXT (2014).
[385] NEC. SEA-US: Global Consortium to Build Cable System Connecting Indonesia,the Philippines, and the United States. https://tinyurl.com/ybj9nhp3, August2014. [Online; accessed 11-March-2021].
[386] Netravali, R., Goyal, A., Mickens, J., and Balakrishnan, H. Polaris: FasterPage Loads Using Fine-grained Dependency Tracking. In 13th USENIX Symposiumon Networked Systems Design and Implementation (NSDI 16) (Santa Clara, CA,Mar. 2016), USENIX Association, pp. 123–136.
147

[387] Netravali, R., Nathan, V., Mickens, J., and Balakrishnan, H. Vesper:Measuring Time-to-Interactivity for Web Pages. In 15th USENIX Symposium onNetworked Systems Design and Implementation (NSDI 18) (Renton, WA, Apr. 2018),USENIX Association, pp. 217–231.
[388] Netravali, R., Sivaraman, A., Das, S., Goyal, A., Winstein, K., Mickens,J., and Balakrishnan, H. Mahimahi: Accurate record-and-replay for http. InUSENIX ATC (2015).
[389] Nikiforakis, N., Invernizzi, L., Kapravelos, A., Van Acker, S., Joosen,W., Kruegel, C., Piessens, F., and Vigna, G. You Are What You Include:Large-Scale Evaluation of Remote Javascript Inclusions. In Proceedings of the 2012ACM Conference on Computer and Communications Security (New York, NY, USA,2012), CCS ’12, Association for Computing Machinery, pp. 736–747.
[390] Nordrum, A. Fiber optics for the far north [news]. IEEE Spectrum 52, 1 (January2015), 11–13.
[391] Nottingham, M. Well-Known Uniform Resource Identifiers (URIs). RFC 8615,May 2019.
[392] ns-3 community. Network simulator ns-3. https://www.nsnam.org, 2011. [Online;accessed 11-March-2021].
[393] Nygren, E. Architectural Paths for Evolving the DNS. https://blogs.akamai.
com/2018/10/architectural-paths-for-evolving-the-dns.html, October 2018.
[394] Nygren, E., Sitaraman, R. K., and Sun, J. The Akamai Network: A Platformfor High-performance Internet Applications. SIGOPS Oper. Syst. Rev. 44, 3 (Aug.2010), 2–19.
[395] O3b Networks and Sofrecom. Why Latency Matters to Mobile Backhaul.https://tinyurl.com/yc4vor3e, 2017.
[396] Odvarko, J. Har 1.2 spec. http://www.softwareishard.com/blog/har-12-spec,2007. [Online; accessed 11-March-2021].
[397] OneWeb. FIRST ROUND INVESTORS. http://www.oneweb.net/#need, 2016.
[398] OneWeb. http://www.oneweb.world/, 2018.
[399] Opera. Data savings and turbo mode. https://www.opera.com/turbo, last ac-cessed on October 16, 2019.
[400] Osmani, A. Preload, Prefetch And Priorities in Chrome. https://medium.com/
reloading/preload-prefetch-and-priorities-in-chrome-776165961bbf, 2017.[Last accessed on January 25, 2020].
[401] Pachilakis, M., Papadopoulos, P., Markatos, E. P., and Kourtellis, N.No More Chasing Waterfalls: A Measurement Study of the Header Bidding Ad-Ecosystem. In Proceedings of the 2017 Internet Measurement Conference (New York,NY, USA, 2019), IMC ’19, ACM, pp. 280–293.
148

[402] Pachilakis, M., Papadopoulos, P., Markatos, E. P., and Kourtellis, N.No More Chasing Waterfalls: A Measurement Study of the Header Bidding Ad-Ecosystem. In IMC (2019).
[403] Pandey, P., and Muthukumar, P. Real-Time Ad Impression Bids UsingDynamoDB. https://aws.amazon.com/blogs/aws/real-time-ad-impression-
bids-using-dynamodb/, April 2013.
[404] Pantel, L., and Wolf, L. C. On the impact of delay on real-time multiplayergames. In NOSSDAV (2002), ACM.
[405] Papadopoulos, P., Kourtellis, N., and Markatos, E. P. The Cost of DigitalAdvertisement: Comparing User and Advertiser Views. In WWW (2018).
[406] Paracha, M. T., Chandrasekaran, B., Choffnes, D., and Levin, D. ADeeper Look at Web Content Availability and Consistency over HTTP/S, 2020.
[407] Park, J., Mohaisen, M., and Mohaisen, A. Investigating dns manipulation byopen dns resolvers. In Proceedings of the 15th International Conference on emergingNetworking EXperiments and Technologies (2019), pp. 45–46.
[408] Paxson, V. Strategies for Sound Internet Measurement. In Proceedings of the 4thACM SIGCOMM Conference on Internet Measurement (New York, NY, USA, 2004),IMC ’04, Association for Computing Machinery, pp. 263–271.
[409] Perl, H., Fahl, S., and Smith, M. You Won’t Be Needing These Any More: OnRemoving Unused Certificates From Trust Stores. In Financial Cryptography andData Security (March 2014).
[410] Petrov, I., Peskov, D., Coard, G., Chung, T., Choffnes, D., Levin, D.,Maggs, B. M., Mislove, A., and Wilson, C. Measuring the rapid growth ofhsts and hpkp deployments, 2017. http://www.cs.umd.edu/content/measuring-
rapid-growth-hsts-and-hpkp-deployments.
[411] Pingzapper. Pingzapper Pricing. https://pingzapper.com/plans, 2018. [Online;accessed 11-March-2021].
[412] Pochat, V. L., Goethem, T. V., Tajalizadehkhoob, S., Korczynski, M.,and Joosen, W. Tranco: A research-oriented top sites ranking hardened againstmanipulation, 2019.
[413] Pratt, J. W., and Gibbons, J. D. Kolmogorov-Smirnov Two-Sample Tests.Springer New York, New York, NY, 1981, pp. 318–344.
[414] Prebid. A brief history of header bidding. http://prebid.org/overview/intro.
html#a-brief-history-of-header-bidding, last accessed on October 9, 2019.
[415] Prebid. Header Bidding Made Easy. http://prebid.org/index.html, last ac-cessed on October 10, 2019.
149

[416] Prebid. How to Add a New Bidder Adapter. http://prebid.org/dev-docs/
bidder-adaptor.html, last accessed on October 14, 2019.
[417] Prebid. How to reduce the latency of header bidding with Prebid.js. http://
prebid.org/overview/how-to-reduce-latency-of-header-bidding.html, lastaccessed on October 12, 2019.
[418] Prebid. Prebid.org members. http://prebid.org/partners/partners.html, lastaccessed on October 15, 2019.
[419] Prince, M. The Hidden Costs Of Heartbleed. CloudFlare, 2014. http://blog.
cloudflare.com/the-hard-costs-of-heartbleed.
[420] Prince, M. Encrypting sni: Fixing one of the core internet bugs, 2018. https:
//blog.cloudflare.com/esni/.
[421] PTCL. PTCL. https://www.ptcl.com.pk/, 2018.
[422] Pujol, E., Hohlfeld, O., and Feldmann, A. Annoyed Users: Ads and Ad-BlockUsage in the Wild. In IMC (2015).
[423] Pujol, E., Richter, P., Chandrasekaran, B., Smaragdakis, G., Feldmann,A., Maggs, B. M., and Ng, K.-C. Back-office web traffic on the Internet. In ACMIMC (2014).
[424] Pultarova, T. OneWeb weighing 2,000 more satellites. https://tinyurl.com/
ycqam3vb, 2017.
[425] Pusateri, T., and Cheshire, S. Dns push notifications. Internet-Draft draft-ietf-dnssd-push-25, IETF Secretariat, October 2019. http://www.ietf.org/internet-
drafts/draft-ietf-dnssd-push-25.txt.
[426] Puzhavakath Narayanan, S., Nam, Y. S., Sivakumar, A., Chandrasekaran,B., Maggs, B., and Rao, S. Reducing Latency Through Page-aware Managementof Web Objects by Content Delivery Networks. In Proceedings of the 2016 ACMSIGMETRICS International Conference on Measurement and Modeling of ComputerScience (New York, NY, USA, 2016), SIGMETRICS ’16, ACM, pp. 89–100.
[427] Puzhavakath Narayanan, S., Nam, Y. S., Sivakumar, A., Chandrasekaran,B., Maggs, B., and Rao, S. Reducing latency through page-aware management ofweb objects by content delivery networks. ACM SIGMETRICS Performance Evalu-ation Review 44, 1 (2016), 89–100.
[428] Qin, R., Yuan, Y., and Wang, F. Optimizing the revenue for ad exchangesin header bidding advertising markets. In 2017 IEEE International Conference onSystems, Man, and Cybernetics (SMC) (Oct 2017).
[429] Qin, Z., Xiao, C., Wang, Q., Jin, Y., and Kuzmanovic, A. A cdn-baseddomain name system. Computer Communications 45 (2014).
150

[430] Quantcast. The World’s largest Audience Behavior Platform for the Open Internet.https://www.quantcast.com/about-us/, 2020. Last accessed on January 4, 2020.
[431] quantcast.com. Quantcast—Top sites. https://www.quantcast.com/top-
sites/, 2019. [Last accessed on November 30, 2019].
[432] Radhakrishnan, S., Cheng, Y., Chu, J., Jain, A., and Raghavan, B. TCPFast Open. In Proceedings of the Seventh COnference on emerging Networking EX-periments and Technologies (New York, NY, USA, December 2011), CoNEXT ’11,ACM, pp. 21:1–21:12.
[433] Radio Amateur Satellite Corporation. Keplerian Elements Tutorial. https://tinyurl.com/y98e9msp, 2018.
[434] radiowaves. SHPD8-1011. https://www.radiowaves.com/getmedia/b1a7277f-
fde0-4c05-a5fc-7c22c29c5b3a/HPD8-1011.aspx, 2018. [Online; accessed 28-July-2021].
[435] radiowaves. SPD8-11. https://www.radiowaves.com/getmedia/f942ec58-
9999-4607-a165-fd4db4deef60/SPD8-11.aspx, 2018. [Online; accessed 28-July-2021].
[436] Raj, K. S., Thanudas, B., Radhika, N., and Smitha, V. Satellite-TCP: A flowcontrol algorithm for satellite network. Indian Journal of Science and Technology 8,17 (2015).
[437] Ramirez, E., Brill, J., Ohlhausen, M. K., Wright, J. D., and McSweeney,T. Data Brokers: A Call for Transparency and Accountability. Tech. rep., UnitedStates Federal Trade Commission, May 2014.
[438] Razaghpanah, A., Nithyanand, R., Vallina-Rodriguez, N., Sundaresan,S., Allman, M., Kreibich, C., and Gill, P. Apps, trackers, privacy, and regu-lators: A global study of the mobile tracking ecosystem. In NDSS (2018).
[439] Rebatta, A. 295 Tbps: Internet Traffic and Capacity in 2017. https://tinyurl.
com/y73pq8u4, 2017.
[440] Reddy.K, T., Wing, D., and Patil, P. DNS over Datagram Transport LayerSecurity (DTLS). RFC 8094, Feb. 2017.
[441] Rescorla, E., and Dierks, T. The Transport Layer Security (TLS) protocolversion 1.3. RFC 8446, 2018.
[442] Rescorla, E., Oku, K., Sullivan, N., and Wood, C. Encrypted server nameindication for tls 1.3. Internet-Draft draft-ietf-tls-esni-06, IETF Secretariat, March2020.
[443] Rescorla, E., Oku, K., Sullivan, N., and Wood, C. A. Encrypted server nameindication for tls 1.3. IETF draft. Available at: https://tools. ietf. org/html/draft-ietf-tls-esni-02 (Accessed December 14th 2018) (2018).
151

[444] Rhian, J. Iridium NEXT Flight Seven readied for launch atop SpaceX Falcon 9.https://tinyurl.com/ybln7kfz, 2018.
[445] Rhodes, B. C. PyEphem. http://rhodesmill.org/pyephem/, 2008.
[446] Rogers, I. Understanding Google Page Rank. http://ianrogers.uk/google-
page-rank/, Aug. 2002.
[447] Ruamviboonsuk, V., Netravali, R., Uluyol, M., and Madhyastha, H. V.Vroom: Accelerating the Mobile Web with Server-Aided Dependency Resolution. InProceedings of the Conference of the ACM Special Interest Group on Data Commu-nication (New York, NY, USA, 2017), SIGCOMM ’17, Association for ComputingMachinery, pp. 390–403.
[448] Rusticata DER Parser. https://github.com/rusticata/der-parser.
[449] Rusticata X.509 Parser. https://github.com/rusticata/x509-parser.
[450] Ryan, M. D. Enhanced Certificate Transparency And End-to-end Encrypted Mail.In Network and Distributed System Security Symposium (San Diego, California, USA,February 2014).
[451] Sackinger, E. Analysis and Design of Transimpedance Amplifiers for Optical Re-ceivers. John Wiley & Sons, 2017.
[452] Sankararaman, S., Chen, J., Subramanian, L., and Ramasubramanian, V.Trickledns: Bootstrapping dns security using social trust. In 2012 Fourth Inter-national Conference on Communication Systems and Networks (COMSNETS 2012)(2012), pp. 1–10.
[453] Savage, S., Anderson, T., Aggarwal, A., Becker, D., Cardwell, N.,Collins, A., Hoffman, E., Snell, J., Vahdat, A., Voelker, G., et al. De-tour: Informed Internet routing and transport. IEEE Micro (1999).
[454] Scheitle, Q., Chung, T., Hiller, J., Gasser, O., Naab, J., van Rijswijk-Deij, R., Hohlfeld, O., Holz, R., Choffnes, D., Mislove, A., and Carle,G. A first look at certification authority authorization (caa). ACM Computer Com-munication Review 48, 2 (Apr. 2018).
[455] Scheitle, Q., Gasser, O., Nolte, T., Amann, J., Brent, L., Carle, G.,Holz, R., Schmidt, T. C., and Wahlisch, M. The Rise of Certificate Trans-parency and Its Implications on the Internet Ecosystem. In Proc. of IMC (2018).
[456] Scheitle, Q., Hohlfeld, O., Gamba, J., Jelten, J., Zimmermann, T.,Strowes, S. D., and Vallina-Rodriguez, N. A Long Way to the Top: Sig-nificance, Structure, and Stability of Internet Top Lists. In Proceedings of the In-ternet Measurement Conference 2018 (New York, NY, USA, 2018), IMC ’18, ACM,pp. 478–493.
152

[457] Schmitt, P., Edmundson, A., Mankin, A., and Feamster, N. Oblivious DNS:Practical Privacy for DNS Queries. In Proceedings of the Applied Networking ResearchWorkshop (New York, NY, USA, 2019), ANRW ’19, Association for Computing Ma-chinery, pp. 17–19.
[458] Scholz, B., Jordan, H., Subotic, P., and Westmann, T. On fast large-scaleprogram analysis in datalog. In Proceedings of the 25th International Conference onCompiler Construction (2016), pp. 196–206.
[459] Schomp, K., Allman, M., and Rabinovich, M. DNS Resolvers ConsideredHarmful. In Proceedings of the 13th ACM Workshop on Hot Topics in Networks(New York, NY, USA, 2014), HotNets-XIII, ACM, pp. 16:1–16:7.
[460] Schomp, K., Callahan, T., Rabinovich, M., and Allman, M. On measuringthe client-side dns infrastructure. In Proceedings of the 2013 conference on Internetmeasurement conference (2013), pp. 77–90.
[461] Schomp, K., Rabinovich, M., and Allman, M. Towards a model of dns clientbehavior. In International Conference on Passive and Active Network Measurement(2016), Springer, pp. 263–275.
[462] Sentosa, W., Chandrasekaran, B., Godfrey, P. B., Hassanieh, H., Maggs,B., and Singla, A. Accelerating mobile applications with parallel high-bandwidthand low-latency channels. In ACM HotMobile (2021).
[463] ServerBid. Header Bidding Industry Index (HBIX). https://www.serverbid.
com/hbix/, last accessed on October 12, 2019.
[464] SES. https://www.ses.com/networks/, 2018.
[465] Shamah, D. Smaller and Smaller: The Evolution of the GPS Receiver. https:
//tinyurl.com/ydxaekz8, 2000.
[466] Sheetz, M. SpaceX prices Starlink satellite internet service at $99 per month,according to e-mail. https://www.cnbc.com/2020/10/27/spacex-starlink-
service-priced-at-99-a-month-public-beta-test-begins.html, 2020. [On-line; accessed 11-March-2021].
[467] Sherry, J., Lan, C., Popa, R. A., and Ratnasamy, S. BlindBox: Deep PacketInspection over Encrypted Traffic. In Proceedings of the 2015 ACM Conference onSpecial Interest Group on Data Communication (New York, NY, USA, 2015), SIG-COMM ’15, Association for Computing Machinery, pp. 213–226.
[468] Shi, E., Aqeel, W., Chandrasekaran, B., and Maggs, B. Puncturable pseu-dorandom sets and private information retrieval with near-optimal online bandwidthand time. In Advances in Cryptology – CRYPTO 2021 (Cham, 2021), T. Malkin andC. Peikert, Eds., Springer International Publishing, pp. 641–669.
[469] Shields, T., and Hull, D. SpaceX’s Broadband-From-Space Plan Gets Final FCCApproval. https://tinyurl.com/y9exr9n5, 2018.
153

[470] Shkilko, A. and Sokolov, K. Every Cloud Has a Silver Lining: Fast Trading,Microwave Connectivity and Trading Costs. https://ssrn.com/abstract=2848562,2016. [Online; accessed 11-March-2021].
[471] SimilarWeb. Overview: amazon.com. https://www.similarweb.com/website/
amazon.com/#overview, 2021. [Online; accessed 28-July-2021].
[472] Singla, A., Chandrasekaran, B., Godfrey, P. B., and Maggs, B. TheInternet at the Speed of Light. In Proceedings of the 13th ACM Workshop on HotTopics in Networks (New York, NY, USA, 2014), HotNets-XIII, ACM, pp. 1:1–1:7.
[473] Singla, A., Chandrasekaran, B., Godfrey, P. B., and Maggs, B. TheInternet at the Speed of Light. In Proceedings of the 13th ACM Workshop on HotTopics in Networks (New York, NY, USA, 2014), HotNets-XIII, ACM, pp. 1:1–1:7.
[474] Singla, A., Chandrasekaran, B., Godfrey, P. B., and Maggs, B. TheInternet at the Speed of Light. In ACM HotNets (2014).
[475] Sitaraman, R. K., Kasbekar, M., Lichtenstein, W., and Jain, M. OverlayNetworks: An Akamai Perspective. John Wiley & Sons, Inc., Hoboken, NJ, USA,October 2014, ch. 16, pp. 305–328.
[476] Sluis, S. The Rise Of ’Header Bidding’ And The End Of The Publisher Wa-terfall. https://adexchanger.com/publishers/the-rise-of-header-bidding-
and-the-end-of-the-publisher-waterfall/, June 2015.
[477] Snowden, E. J. Permanent record. Metropolitan Books, 2019.
[478] Snyder, P., Ansari, L., Taylor, C., and Kanich, C. Browser feature usage onthe modern web. In Proceedings of the 2016 Internet Measurement Conference (NewYork, NY, USA, 2016), IMC ’16, ACM, pp. 97–110.
[479] SoftBank Group. ONEWEB announces $1.2 billion in funded capital from SOFT-BANK GROUP and other investors. https://tinyurl.com/y7pcxhyl, 2016.
[480] Somorovsky, J. Systematic Fuzzing and Testing of TLS Libraries.
[481] Song, G., Chao, M., Yang, B., and Zheng, Y. TLR: A traffic-light-basedintelligent routing strategy for NGEO satellite IP networks. IEEE Transactions onWireless Communications 13, 6 (2014), 3380–3393.
[482] Sovrn. The Past, Present, and Future of Header Bidding. https://www.sovrn.
com/blog/header-bidding-grows-up/, February 2017.
[483] Space Race Authors. Time-varying paths between DC and Frankfurt over a polarLEO satellite constellation. https://youtu.be/4Bg4ZzZzoHI, 2018.
[484] SpaceX. http://www.spacex.com/, 2018.
[485] SpaceX. FALCON 9. http://www.spacex.com/falcon9, 2018.
154

[486] SpaceX FCC filing. Application for approval for orbital deployment and operatingauthority for the spacex ngso satellite system. https://tinyurl.com/y7mvpdvz,2016.
[487] SpaceX FCC filing. SpaceX V-band non-geostationary satellite system. https:
//tinyurl.com/kkskns4, 2017.
[488] SpaceX Starlink. https://www.spacex.com/webcast, 2017. [Online; accessed11-March-2021].
[489] SPDY: An experimental protocol for a faster web. http://dev.chromium.org/spdy/spdy-whitepaper.
[490] Staiano, J., Oliver, N., Lepri, B., de Oliveira, R., Caraviello, M., andSebe, N. Money Walks: A Human-centric Study on the Economics of PersonalMobile Data. In Proceedings of the 2014 ACM International Joint Conference onPervasive and Ubiquitous Computing (2014), UbiComp ’14.
[491] Starlink Services. Petition of Starlink Services, LLC for designation as an eligibletelecommunications carrier. https://ecfsapi.fcc.gov/file/1020316268311/
Starlink%20Services%20LLC%20Application%20for%20ETC%20Designation.pdf,2021. [Online; accessed 11-March-2021].
[492] statista. Online gaming - statistics & facts. https://www.statista.com/topics/1551/online-gaming/, 2021. [Online; accessed 28-July-2021].
[493] Stats, I. L. Google Search Statistics. https://www.internetlivestats.com/
google-search-statistics/. [Online; accessed 11-March-2021].
[494] Steam. Steam & game stats, 2017. http://store.steampowered.com/stats/ [On-line; accessed 11-March-2021].
[495] Stewart, L., and Branch, P. SONG: Quake 3 Network Traffic Trace Files. Tech.rep., Swinburne University of Technology, Melbourne, 2006.
[496] Stock, B., Johns, M., Steffens, M., and Backes, M. How the Web TangledItself: Uncovering the History of Client-Side Web (In)Security. In 26th USENIXSecurity Symposium (USENIX Security 17) (Vancouver, BC, Aug. 2017), USENIXAssociation, pp. 971–987.
[497] Sullivan, N. A (Relatively Easy To Understand) Primer on Elliptic Curve Cryp-tography. https://blog.cloudflare.com/a-relatively-easy-to-understand-
primer-on-elliptic-curve-cryptography/, October 2013.
[498] Sullivan, N. High-reliability ocsp stapling and why it matters. CloudFlare, 2017.https://blog.cloudflare.com/high-reliability-ocsp-stapling/.
[499] Sundaresan, S., Feamster, N., Teixeira, R., and Magharei, N. Measuringand Mitigating Web Performance Bottlenecks in Broadband Access Networks. InProceedings of the 2013 Conference on Internet Measurement Conference (New York,NY, USA, 2013), IMC ’13, ACM, pp. 213–226.
155

[500] Sy, E., Burkert, C., Federrath, H., and Fischer, M. Tracking Users Acrossthe Web via TLS Session Resumption. In Proceedings of the 34th Annual ComputerSecurity Applications Conference (2018), ACSAC ’18.
[501] Szalachowski, P., Matsumoto, S., and Perrig, A. PoliCert: Secure and flex-ible TLS certificate management. In ACM Conference on Computer and Communi-cations Security (November 2014).
[502] Taht, D. On Reducing Latencies Below the Perceptible. Workshop on ReducingInternet Latency (2013).
[503] Taleb, T., Mashimo, D., Jamalipour, A., Kato, N., and Nemoto, Y. Explicitload balancing technique for NGEO satellite IP networks with on-board processingcapabilities. IEEE/ACM TON (2009).
[504] Tavakolifard, M., and Almeroth, K. C. Social computing: an intersection ofrecommender systems, trust/reputation systems, and social networks. IEEE Network26 (July 2012).
[505] TeleGeography. 100G: Are the Potential Savings Worth the Investment? goo.
gl/fi9lDH. Last accessed: January 26,2017.
[506] TeleGeography. TeleGeography Workshop: International Market Trends. goo.
gl/iFY51M. Last accessed: January 26,2017.
[507] Telesat. Telesat: Global Satellite Operators. https://www.telesat.com/, 2020.[Online; accessed 11-March-2021].
[508] Tesla. Tesla: Electric Cars, Solar Panels & Clean Energy Storage. https://www.
tesla.com/, 2018.
[509] The best VPN for gaming in 2021. https://www.pcgamer.com/best-vpn-for-pc-
gaming/.
[510] The Chromium Projects. QUIC, a multiplexed stream transport over UDP.http://www.chromium.org/quic, 2015.
[511] The Google Gospel of Speed. https://www.thinkwithgoogle.com/future-
of-marketing/digital-transformation/the-google-gospel-of-speed-urs-
hoelzle/.
[512] The Times Open Team. We Re-Launched The New York Times Paywall and NoOne Noticed. Times Open (August 2019).
[513] The Web Standards Project. Acid3 Browser Test. https://www.
webstandards.org/action/acid3/, 2008.
[514] Toubiana, V., Narayanan, A., Boneh, D., Nissenbaum, H., and Barocas,S. Adnostic: Privacy Preserving Targeted Advertising. In NDSS (2010).
156

[515] TurboBytes. cdnfinder. https://github.com/turbobytes/cdnfinder, 2019.[Last accessed on December 5, 2019].
[516] umbrella.com. Umbrella Popularity List—Top Million Domains. https://
docs.umbrella.com/investigate-api/docs/top-million-domains, 2019. [Lastaccessed on November 30, 2019].
[517] Unwired Labs. OpenCelliD Tower Database. https://opencellid.org/, 2018.[Online; accessed 11-March-2021].
[518] Urban, T., Degeling, M., Holz, T., and Pohlmann, N. Beyond the FrontPage:Measuring Third Party Dynamics in the Field. In Proceedings of The WebConference 2020 (New York, NY, USA, 2020), WWW ’20, Association for ComputingMachinery, pp. 1275–1286.
[519] Usage statistics of QUIC for websites. https://w3techs.com/technologies/
details/ce-quic.
[520] USGS. National Elevation Dataset (NED). https://www.usgs.gov/core-
science-systems/national-geospatial-program/national-map. [Online; ac-cessed 11-March-2021].
[521] Valancius, V., Ravi, B., Feamster, N., and Snoeren, A. C. Quantifying thebenefits of joint content and network routing. In SIGMETRICS (2013).
[522] Vallina-Rodriguez, N., Amann, J., Kreibich, C., Weaver, N., and Paxson,V. A Tangled Mass: The Android Root Certificate Stores. In International Confer-ence on Emerging Networking Experiments and Technologies (December 2014).
[523] van Rijswijk-Deij, R., Jonker, M., Sperotto, A., and Pras, A. A high-performance, scalable infrastructure for large-scale active dns measurements. IEEEJournal on Selected Areas in Communications 34, 6 (2016), 1877–1888.
[524] van Rijswijk-Deij, R., Sperotto, A., and Pras, A. Making the case for ellipticcurves in dnssec. ACM SIGCOMM computer communication review 45, 5 (2015),13–19.
[525] VanderSloot, B., Amann, J., Bernhard, M., Durumeric, Z., Bailey, M.,and Halderman, J. A. Towards a Complete View of the Certificate Ecosystem.In Proceedings of the 2016 Internet Measurement Conference (New York, NY, USA,2016), IMC ’16, ACM, pp. 543–549.
[526] VanderSloot, B., Amann, J., Bernhard, M., Durumeric, Z., Bailey, M.,and Halderman, J. A. Towards a Complete View of the Certificate Ecosystem. InACM Internet Measurement Conference (November 2016).
[527] Venkatadri, G., Mislove, A., and Gummadi, K. P. Treads: Transparency-Enhancing Ads. In HotNets (2018).
157
[528] Vesuna, J., Scott, C., Buettner, M., Piatek, M., Krishnamurthy, A., andShenker, S. Caching Doesn’t Improve Mobile Web Performance (Much). In 2016USENIX Annual Technical Conference (USENIX ATC 16) (Denver, CO, June 2016),USENIX Association, pp. 159–165.
[529] Viasat Inc. Viasat. https://www.viasat.com/, 2018.
[530] Videology Knowledge Lab. Header Bidding: A byte-sized overview.https://www.iab.com/wp-content/uploads/2015/10/VidLab-HeaderBidding-
3.27.17V10.pdf, October 2015.
[531] VIRGINIA TECH TRANSPORTATION INSTITUTE. VIRGINIA SMARTROAD. https://tinyurl.com/ycb6zybo, 2018.
[532] Vulimiri, A., Godfrey, P. B., Mittal, R., Sherry, J., Ratnasamy, S., andShenker, S. Low Latency via Redundancy. In Proceedings of the Ninth ACMConference on Emerging Networking Experiments and Technologies (New York, NY,USA, 2013), CoNEXT ’13, ACM, pp. 283–294.
[533] Vutukury, S., and Garcia-Luna-Aceves, J. J. A simple approximation tominimum-delay routing. In Proceedings of the Conference on Applications, Technolo-gies, Architectures, and Protocols for Computer Communication (1999), SIGCOMM’99, pp. 227–238.
[534] W3C. HTTP Archive (HAR) format. https://w3c.github.io/web-performance/specs/HAR/Overview.html, August 2012.
[535] W3C. Navigation Timing. https://www.w3.org/TR/navigation-timing/, Decem-ber 2012.
[536] W3C. Navigation Timing. https://www.w3.org/TR/navigation-timing/, Decem-ber 2012.
[537] W3C. WebIntents/MIME Types. https://www.w3.org/wiki/WebIntents/MIME_
Types, September 2012.
[538] W3C. A Primer for Web Performance Timing APIs. https://w3c.github.io/
perf-timing-primer/, April 2019.
[539] W3C. Resource Hints. https://www.w3.org/TR/resource-hints/, December2019.
[540] Wall, M. SpaceX’s Prototype Internet Satellites Are Up and Running. https:
//tinyurl.com/ydz534ok, 2018.
[541] Wang, H., Xie, H., Qiu, L., Yang, Y. R., Zhang, Y., and Greenberg, A.Cope: Traffic engineering in dynamic networks. SIGCOMM Comput. Commun. Rev.36, 4 (Aug. 2006), 99–110.
158

[542] Wang, J., Jiang, C., Zhang, H., Ren, Y., and Leung, V. C. Aggressive con-gestion control mechanism for space systems. IEEE aerospace and electronic systemsmagazine 31, 3 (2016), 28–33.
[543] Wang, X. S., Balasubramanian, A., Krishnamurthy, A., and Wetherall,D. Demystifying Page Load Performance with WProf. In Presented as part of the10th USENIX Symposium on Networked Systems Design and Implementation (NSDI13) (Lombard, IL, 2013), USENIX, pp. 473–485.
[544] Wang, X. S., Krishnamurthy, A., and Wetherall, D. Speeding up Web PageLoads with Shandian. In 13th USENIX Symposium on Networked Systems Designand Implementation (NSDI 16) (Santa Clara, CA, Mar. 2016), USENIX Association,pp. 109–122.
[545] Wang, Z. Speeding Up Mobile Browsers without Infrastructure Support. Master’sthesis, Duke University, 2012.
[546] Wardrop, J. G. Some theoretical aspects of road traffic research. Proceedings ofthe Institution of Civil Engineers 1, 3 (1952), 325–362.
[547] Waterson, Jim. More than a million readers contribute financially to the Guardian.The Guardian (November 2018).
[548] WebPagetest. Speed Index - WebPagetest Documentation. https://sites.
google.com/a/webpagetest.org/docs/using-webpagetest/metrics/speed-
index, 2012. [Last accessed on December 4, 2019].
[549] Werner, M. A dynamic routing concept for ATM-based satellite personal commu-nication networks. IEEE JSAC (1997).
[550] Wessels, D., and Fomenkov, M. Wow, That’s a lot of packets. In Passive andActive Network Measurement Workshop (PAM) (San Diego, CA, Apr 2003), PAM.
[551] Whaley, J., Avots, D., Carbin, M., and Lam, M. S. Using datalog with binarydecision diagrams for program analysis. In APLAS’05 Proceedings of the Third Asianconference on Programming Languages and Systems (2005), pp. 97–118.
[552] WhistleOut. AT&T Internet 100. https://tinyurl.com/y8p2vx89, 2018.
[553] Wielemaker, J., Schrijvers, T., Triska, M., and Lager, T. SWI-Prolog.Theory and Practice of Logic Programming - Prolog Systems archive 12, 1 (2012),67–96.
[554] Wijnants, M., Marx, R., Quax, P., and Lamotte, W. HTTP/2 Prioritizationand Its Impact on Web Performance. In Proceedings of the 2018 World Wide WebConference (Republic and Canton of Geneva, CHE, 2018), WWW ’18, InternationalWorld Wide Web Conferences Steering Committee, pp. 1755–1764.
[555] Wikipedia. Cost per mille. https://en.wikipedia.org/wiki/Cost_per_mille,last accessed on October 9, 2019.
159

[556] Wikipedia. Geodesic. https://en.wikipedia.org/wiki/Geodesic, last accessedon October 29, 2019.
[557] Winters, J. H., Salz, J., and Gitlin, R. D. The impact of antenna diversity onthe capacity of wireless communication systems. IEEE Transactions on Communi-cations 42, 2/3/4 (Feb/Mar/Apr 1994), 1740–1751.
[558] Wlosik, M. Client-Side vs. Server-Side Header Bidding: Pros and Cons. https:
//clearcode.cc/blog/pros-cons-client-side-server-side-header-bidding/,April 2019.
[559] Wolsing, K., Ruth, J., Wehrle, K., and Hohlfeld, O. A Performance Per-spective on Web Optimized Protocol Stacks: TCP+TLS+HTTP/2 vs. QUIC. InProceedings of the Applied Networking Research Workshop (New York, NY, USA,2019), ANRW ’19, Association for Computing Machinery, pp. 1–7.
[560] WonderNetwork. Global Ping Statistics. https://wondernetwork.com/pings.
[561] Wood, L. Internetworking with satellite constellations. PhD thesis, University ofSurrey, 2001.
[562] X Development LLC. Project Loon. https://www.solveforx.com/loon/, 2017.
[563] X DEVELOPMENT LLC. Loon: Expanding Internet connectivity with strato-spheric balloons. https://x.company/projects/loon/, 2018.
[564] X, the moonshot factory. Taara – Expanding global access to fast, affordableinternet with beams of light. https://x.company/projects/taara/, 2018. [Online;accessed 11-March-2021].
[565] Xie, X., Zhang, X., and Zhu, S. Accelerating mobile web loading using cellularlink information. In ACM MobiSys (2017).
[566] Yen, T.-F., Xie, Y., Yu, F., Yu, R. P., and Abadi, M. Host Fingerprinting andTracking on the Web:Privacy and Security Implications. Proceedings of the Networkand Distributed System Security Symposium (NDSS) 2012 (February 2012).
[567] Yilek, S., Rescorla, E., Shacham, H., Enright, B., and Savage, S. WhenPrivate Keys Are Public: Results From The 2008 Debian OpenSSL Vulnerability. InACM Internet Measurement Conference (November 2009).
[568] Yuan, S., Wang, J., and Zhao, X. Real-time Bidding for Online Advertising:Measurement and Analysis. In Proceedings of the Seventh International Workshopon Data Mining for Online Advertising (2013), ADKDD ’13.
[569] Yue, C., and Wang, H. Characterizing Insecure Javascript Practices on the Web.In Proceedings of the 18th International Conference on World Wide Web (New York,NY, USA, 2009), WWW ’09, Association for Computing Machinery, pp. 961–970.
160

[570] Zhang, L., Choffnes, D., Dumitras, T., Levin, D., Mislove, A., Schulman,A., and Wilson, C. Analysis Of SSL Certificate Reissues And Revocations In TheWake Of Heartbleed. In ACM Internet Measurement Conference (November 2014).
[571] Zhao, F., Hori, Y., and Sakurai, K. Analysis of privacy disclosure in dnsquery. In 2007 International Conference on Multimedia and Ubiquitous Engineer-ing (MUE’07) (2007), IEEE, pp. 952–957.
[572] Zhao, F., Hori, Y., and Sakurai, K. Two-servers pir based dns query schemewith privacy-preserving. In The 2007 International Conference on Intelligent Perva-sive Computing (IPC 2007) (2007).
[573] Zhou, W., Li, Q., Caesar, M., and Godfrey, P. B. ASAP: A Low-LatencyTransport Layer. In Proceedings of the Seventh COnference on emerging NetworkingEXperiments and Technologies (New York, NY, USA, December 2011), CoNEXT ’11,ACM, pp. 20:1–20:12.
[574] ZoneFiles. Domain lists & domain API. https://zonefiles.io/, 2020.
161

Biography
Waqar Aqeel is from Orangi Town, Pakistan. Waqar obtained his undergraduate degree
in Software Engineering from the National University of Science and Technology (NUST),
Islamabad in 2014. He then worked at Arbisoft, a software company in Lahore for two
years. At Arbisoft, Waqar worked on Insurify, an insurance aggregator in Cambridge, Mas-
sachusets. In 2017, Waqar started graduate school as a Computer Science PhD student at
Duke University, Durham, North Carolina. With Prof. Bruce Maggs as his advisor, Waqar
was able to publish research at top networking venues such as the USENIX Networked
Systems Design and Implementation (NSDI), and the ACM Internet Measurement Confer-
ence (IMC). His work also won awards at IMC and the Passive and Active Measurement
Conference. He completed his doctorate in 2021. Waqar loves his dog Gigi, and his cats
Sheru and Bebo. He likes sufi music, fiction, and hiking trips.
162