A Next - DukeSpace - Duke University
207
A NextGeneration Approach to Systematics in the Classic Reticulate Polypodium vulgare Species Complex (Polypodiaceae) by Erin Mackey Sigel Department of Biology Duke University Date:_______________________ Approved: ___________________________ Kathleen M. Pryer, Supervisor ___________________________ Paul S. Manos ___________________________ A. Jonathan Shaw ___________________________ John Willis ___________________________ Michael D. Windham Dissertation submitted in partial fulfillment of the requirements for the degree of Doctor of Philosophy in the Department of Biology in the Graduate School of Duke University 2014
-
Upload
khangminh22 -
Category
Documents
-
view
4 -
download
0
Transcript of A Next - DukeSpace - Duke University

A Next-‐‑Generation Approach to Systematics
in the Classic Reticulate Polypodium vulgare Species Complex (Polypodiaceae)
by
Erin Mackey Sigel
Department of Biology Duke University
Date:_______________________ Approved:
___________________________ Kathleen M. Pryer, Supervisor
___________________________
Paul S. Manos
___________________________ A. Jonathan Shaw
___________________________
John Willis
___________________________ Michael D. Windham
Dissertation submitted in partial fulfillment of the requirements for the degree of Doctor
of Philosophy in the Department of Biology in the Graduate School
of Duke University
2014

ABSTRACT
A Next-‐‑Generation Approach to Systematics
in the Classic Reticulate Polypodium vulgare Species Complex (Polypodiaceae)
by
Erin Mackey Sigel
Department of Biology Duke University
Date:_______________________
Approved:
___________________________ Kathleen M. Pryer, Supervisor
___________________________
Paul S. Manos
___________________________ A. Jonathan Shaw
___________________________
John Willis
___________________________ Michael D. Windham
An abstract of a dissertation submitted in partial fulfillment of the requirements for the degree of Doctor of Philosophy in the Department of
Biology in the Graduate School of Duke University
2014

Copyright by Erin Mackey Sigel
2014

iv
ABSTRACT
The Polypodium vulgare complex (Polypodiaceae) comprises a well-‐‑studied group
of fern taxa whose members are cryptically differentiated morphologically and have
generated a confusing and highly reticulate species cluster. Once considered a single
species spanning much of northern Eurasia and North America, P. vulgare has been
segregated into approximately 17 diploid and polyploid taxa as a result of
cytotaxonomic work, hybridization experiments, and isozyme studies conducted during
the 20th century. Despite considerable effort, however, the evolutionary relationships
among the diploid members of the P. vulgare complex remain poorly resolved, and
several taxa, particularly allopolyploids and their diploid progenitors, remain
challenging to delineate morphologically due to a dearth of stable diagnostic characters.
Furthermore, compared to many well-‐‑studied angiosperm reticulate complexes,
relatively little is known about the number of independently-‐‑derived lineages,
distribution, and evolutionary significance of the allopolyploid species that have formed
recurrently. This dissertation is an attempt to advance systematic knowledge of the
Polypodium vulgare complex and establish it as a “model” system for investigating the
evolutionary consequences of allopolyploidy in ferns.
Chapter I presents a diploids-‐‑only phylogeny of the P. vulgare complex and
related species to test previous hypotheses concerning relationships within Polypodium

v
sensu stricto. Analyses of sequence data from four plastid loci (atpA, rbcL, matK, and
trnG-‐‑trnR) recovered a monophyletic P. vulgare complex comprising four well-‐‑supported
clades. The P. vulgare complex is resolved as sister to the Neotropical P. plesiosorum
group and these, in turn, are sister to the Asian endemic Pleurosoriopsis makinoi.
Divergence time analyses incorporating previously derived age constraints and fossil
data provide support for an early Miocene origin for the P. vulgare complex and a late
Miocene-‐‑Pliocene origin for the four major diploid lineages of the complex, with the
majority of extant diploid species diversifying from the late Miocene through the
Pleistocene. Finally, node age estimates are used to reassess previous hypotheses, and to
propose new hypotheses, about the historical events that shaped the diversity and
current geographic distribution of the diploid species of the P. vulgare complex.
Chapter II addresses reported discrepancies regarding the occurrence of
Polypodium calirhiza in Mexico. The original paper describing this taxon cited collections
from Mexico, but the species was omitted from the recent Pteridophytes of Mexico.
Originally treated as a tetraploid cytotype of P. californicum, P. calirhiza now is
hypothesized to have arisen through hybridization between P. glycyrrhiza and P.
californicum. The allotetraploid can be difficult to distinguish from either of its putative
parents, but especially so from P. californicum. These analyses show that a combination
of spore length and abaxial rachis scale morphology consistently distinguishes P.
calirhiza from P. californicum and confirm that both species occur in Mexico. Although

vi
occasionally found growing together in the United States, the two species are strongly
allopatric in Mexico, where P. californicum is restricted to coastal regions of the Baja
California peninsula and neighboring Pacific islands and P. calirhiza grows at high
elevations in central and southern Mexico. The occurrence of P. calirhiza in Oaxaca,
Mexico, marks the southernmost extent of the P. vulgare complex in the Western
Hemisphere.
Chapter III examines a case of reciprocal allopolyploid origins in the fern
Polypodium hesperium and presents it as a natural model system for investigating the
evolutionary potential of duplicated genomes. In allopolyploids, reciprocal crosses
between the same progenitor species can yield lineages with different uniparentally
inherited plastid genomes. While likely common, there are few well-‐‑documented
examples of such reciprocal origins. Using a combination of uniparentally inherited
plastid and biparentally inherited nuclear sequence data, we investigated the
distributions and relative ages of reciprocally formed lineages in Polypodium hesperium,
an allotetraploid fern that is broadly distributed in western North America. The
reciprocally-‐‑derived plastid haplotypes of Polypodium hesperium are allopatric, with
populations north and south of 42˚ N latitude having different plastid genomes.
Biogeographic information and previously estimated ages for the diversification of its
diploid progenitors, lends support for middle to late Pleistocene origins of P. hesperium.
Several features of Polypodium hesperium make it a particularly promising system for

vii
investigating the evolutionary consequences of allopolyploidy. These include
reciprocally derived lineages with disjunct geographic distributions, recent time of
origin, and extant diploid progenitor lineages.
This dissertation concludes by demonstrating the utility of the allotetraploid
Polypodium hesperium for understanding how ferns utilize the genetic diversity imparted
by allopolyploidy and recurrent origins. Chapter IV details the use of high-‐‑throughput
sequencing technologies to generate a reference transcriptome for Polypodium, a genus
without preexisting genomic resources, and compare patterns of total and homoeolog-‐‑
specific gene expression in leaf tissue of reciprocally formed lineages of P. hesperium.
Genome-‐‑wide expression patterns of total gene expression and homoeolog expression
ratios are strikingly similar between the lineages—total gene expression levels mirror
those of the diploid progenitor P. amorphum and homoeologs derived from P. amorphum
are preferentially expressed. The unprecedented levels of unbalanced expression level
dominance and unbalanced homoeolog expression bias found in P. hesperium supports
the hypothesis that these phenomena are pervasive consequences of allopolyploidy in
plants.

viii
For my parents, Mary and Milton, and my husband, Brian.

ix
TABLE OF CONTENTS Abstract…………………………………………..………………………………………………iv List of Tables………………………………………………………………………………..…….x List of Figures………………………………………………………………………………...…xii Acknowledgements…………………………………………………………………………....xiv Introduction………………………………………………………………………………………1 Chapter I: Phylogeny, divergence time estimates, and phylogeography of the diploid species of the Polypodium vulgare complex……………..……………………………………...8 Chapter II: Rediscovery of Polypodium calirhiza (Polypodiaceae) in Mexico………..…….49 Chapter III: Evidence for reciprocal origins in Polypodium hesperium (Polypodiaceae): a natural fern model system for investigating how multiple origins shape allopolyploid genomes……………………………….…………………….……………………………….......67 Chapter IV: Expression level dominance and homoeolog expression bias in reciprocal origins of the allopolyploid fern Polypodium hesperium……………………………..……...93 Chapter V: Additional insights into the evolution, diversification, and biogeography of ferns.……...……...…...………………………………………………………………………...133 Appendix A: Supplementary information for Chapter I………………………...……......136 Appendix B: Supplementary information for Chapter III…………..……………........….141 Appendix C: Supplementary information for Chapter IV…………..……………….....…144 References…………...……………………………………………………………………….....166 Biography…………...……………………………………………………………………….....189

x
LIST OF TABLES
Table 1. Statistics for Chapter I plastid datasets and phylogenies..……………………......42 Table 2. Specimens of Polypodium used in Chapter II………………………………….........61 Table 3. Specimens of Polypodium and Pleurosoriopsis used in Chapter III………………..86 Table 4. Tree statistics for the plastid and nuclear sequence datasets analyzed in Chapter III…..……………………………………………………………………………………………...89 Table 5. Terms related to gene expression in allopolyploid organisms as described in Rapp et al. (2009) and Grover et al. (2012)………..…………………………………………124 Table 6. Synopsis of Polypodium specimens used in Chapter IV………………………….125 Table A.1. Voucher table of specimens included in Chapter I.…………………………...136 Table A. 2. Node age constraints obtained from Schuettpelz and Pryer (2009) for nodes in Fig. 5 of Chapter I…………………………………………………………………………..138 Table A.3. Divergence time estimates in MYA for nodes in Fig. 5 of Chapter I.………..139 Table B.1. Voucher table of specimens of Pleurosoriopsis and Polypodium included in Chapter III…………………………………………………………………………………...…141 Table C.1. Estimate of genetic distance between the diploid species Polypodium amorphum and Polypodium glycyrrhiza based on coding regions of 24 single copy nuclear loci………………………………………………………………………………………………144 Table C.2. Summary of the number of Illumina 100 base paired-‐‑end reads for each Polypodium specimen………………………………………………………………………….146 Table C.3. Summary statistics for the Polypodium reference transcriptome……………..148 Table C.4. Synopsis of gene ontology (GO) cellular components represented in the Polypodium reference transcriptome…………………………………….……….…………..150

xi
Table C.5. Synopsis of gene ontology (GO) biological processes categories represented in the Polypodium reference transcriptome.…….……….……………………………………..152 Table C.6. Synopsis of gene ontology (GO) molecular functions represented in the Polypodium reference transcriptome.…….……….………………………………...………..157

xii
LIST OF FIGURES
Figure 1. Polypodium vulgare L….……………………………………….………………………6
Figure 2. Phyloreticulogram depicting relationships within the Polypodium vulgare reticulate complex…………..……………………………………………………………………7
Figure 3. Consensus topology of previously published relationships for diploid species of the Polypodium vulgare complex and members of the neotropical Polypodium plesiosorum group……………………………………………………………………………….43
Figure 4. The best maximum likelihood phylogram from the combined analysis of atpA, rbcL, matK, and trnG-‐‑R sequence data for ten diploid taxa of the Polypodium vulgare complex, five taxa belonging to the P. plesiosorum complex, and eight outgroup taxa…………………………………………………………………………...…………..………45
Figure 5. The maximum clade credibility chronogram for ten diploid taxa of the Polypodium vulgare complex, five taxa belonging to the P. plesiosorum complex, and eight outgroup taxa from divergence dating analysis 2…………………………………………...47
Figure 6. Average spore lengths for specimens listed in Chapter II…………………….....64
Figure 7. Images of abaxial rachis scales for specimens of Polypodium calirhiza and P. californicum……………………………………………………………………………………....65
Figure 8. Map of Mexico showing the localities for the Mexican specimens of Polypodium calirhiza and P. californicum………………………………………………………………...…..66
Figure 9. Summary of relationships among the diploid and allopolyploid taxa of the Polypodium vulgare complex as reconstructed by a phylogenetic analysis of a four loci plastid sequence dataset and analysis of isozyme banding patterns…………………...…90
Figure 10. Summary of the evolutionary relationships and geographic distributions of independently derived lineages of the allotetraploid species Polypodium hesperium.....…91
Figure 11. Patterns of differential gene expression in the maternal lineages of P. hesperium…………………………….……………………………………………………….....126 Figure 12. Number of genes belonging to 12 possible classes of differential expression in the maternal lineages of P. hesperium.……………………………………………….………128

xiii
Figure 13. Relative expression of P. amorphum-‐‑derived homoeologs in the maternal lineages of Polypodium hesperium.……………………………………………………………129 Figure 14. Difference in the relative expression of Polypodium amorphum-‐‑derived
homoeologs between P. hesperium Ha and P. hesperium Hg for 2111 genes………….......130 Figure 15. Comparison of the relative expression of P. amorphum-‐‑derived homoeologs
between P. hesperium Ha and P. hesperium Hg for 1861 genes..………...………………….131 Figure C.1. Synopsis of the number of isoforms (Trinity subcomponents) assigned to each gene (Trinity component) in the final Polypodium reference transcriptome……….149 Figure C.2. The number of genes differentially expressed in each contrast between the allotetraploid Polypodium hesperium and diploid progenitors, P. amorphum and P. glycyrrhiza.……………………………………………………………….……………………..163 Figure C.3. The number of genes belonging to 12 possible classes of differential expression among the allotetraploid Polypodium hesperium and its diploid progenitors, P. amorphum and P. glycyrrhiza………………………………………………………………….165

xiv
ACKNOWLEDGEMENTS
As with all major accomplishments, this dissertation could not have been
completed without the contributions of many people. First and foremost I must
acknowledge my advisor, Kathleen Pryer, for her extraordinary guidance and her
commitment to helping me achieve my academic goals. I am hugely indebted to the
extended members of the Pryer lab—James Beck, Amanda Grusz, Layne Huiet, Anne
Johnson, Tzu-‐‑Tong Kao, Fay-‐‑Wei Li, Kathryn Picard, Carl Rothfels, Eric Schuettpelz, and
Michael Windham—for their help in developing this thesis and being my academic
family. My committee members—Paul Manos, Jon Shaw, John Willis, and Michael
Windham—have given me much support, encouragement, and guidance.
I am particularly grateful to those who collected specimens specifically for this
work, namely, Robert Dyer, Atushi Ebihara, Libor Ekrt, Layne Huiet, Anders Larsson,
Fay-‐‑Wei Li, Lisa Pokorny, Carl Rothfels, Amanda Vernon, and Sarah Zylinksi. The
curatorial staff of the ALA, DUKE, F, HUH, IND, JEPS, MICH, MO, NY, RSA, UC, US,
and UT herbaria provided access to valuable material and allowed destructive sampling
for DNA extraction and spore studies. Special thanks go to Layne Huiet at DUKE for
managing my herbaria loans. UCBG and RBGE kindly provided plant material from
their live collections. Anne Johnson, Fay-‐‑Wei Li, Monique McHenry, Brian Miles, Carl
Rothfels, Paul Rothfels, and Michael Windham served as skilled field assistants and

xv
delightful travel companions on several collection trips.
I am indebted to Josh Der, Claude dePamphilis, Nico Devos, Lex Flagel, Ed
Iverson, Josh Puzey, Paula Ralph, Jon Shaw, and the Duke University Genome
Sequencing Center for their help with project design, library preparation, and analysis
for the transcriptomics portion of this dissertation. Endless thanks go to Brian Miles for
his in-‐‑house (quite literally) computer expertise and programming advice.
I would be remiss for not acknowledging the support of the greater fern
systematics community, especially David Barrington, Josh Der, Chris Haufler, Monique
McHenry, Cathy Paris, Alan Smith, George Yatskievych, and Paul Wolf.
This work was funded by a NSF Doctoral Dissertation Improvement Grant (DEB-‐‑
1110775), a Sigma Xi Grant-‐‑in-‐‑Aid of Research, an American Society of Plant
Taxonomists Graduate Student Research Grant, and four Grants-‐‑in-‐‑Aid from the Duke
University Biology Department. Collection permits were provided by Glacier National
Park (GLAC-‐‑210-‐‑SCI-‐‑0180), Zion National Park (ZION-‐‑2011-‐‑SCI-‐‑0007), National Forest
Service Region 1 (NFS R1 permits 2010-‐‑4 and 2011-‐‑7), and National Forest Service
Region 6 (NFS R6 permit 2010-‐‑7).

xvi
“The prospect before one attempting to bring anything like order out of the substantial aggregate known as Polypodium vulgare is far from encouraging.”
William R. Maxon, 1900

1
INTRODUCTION
Few groups of ferns are as well-‐‑studied and have as rich a taxonomic history as
the primarily northern temperate members of the Polypodium vulgare reticulate species
complex. The complex comprises approximately ten diploid, six allotetraploid, and one
allohexaploid species, as well as numerous sterile hybrids, all of which have glabrous,
pinnatifid leaves, evident round sori, and creeping rhizomes (Figs. 1 and 2). Native to
Europe, Asia, North America, Macaronesia, Hawaii, and South Africa, they are usually
found as epiphytes on living or dead trees or in dense epipetric colonies (hence the
North American common name “rock-‐‑cap” polypody; Valentine 1964; Haufler et al.
1993; Iwatsuki et al. 1995; Shugang and Haufler 2013). While readily identifiable as
belonging to the P. vulgare complex, distinguishing among species is significantly more
challenging and requires careful observation of cryptic morphological characters. Since
even before Carl Linneaus, who named Polypodium vulgare L. in his Species Plantarum
(1753), taxonomists were besieged by the overwhelming intergradation of
morphological variants and seemed to endlessly disagree about specific divisions within
Polypodium (summarized in Fernald 1922, Christensen 1928, and Haufler et al. 1995b). As
a result, P. vulgare came to be widely considered a single, circumtemperate species
comprising populations that exhibited subtle variations in leaf shape, rhizome flavor,
indument, and the presence of paraphyses (sterile hairs) among the sporangia. Since the
mid-‐‑20th century, fern systematists have been quick to adopt new methodologies to

2
address the problem of P. vulgare, and, in many ways, study of the P. vulgare complex
charts the progress of modern pteridology.
Irene Manton, employing extensive hybridization experiments and cytological
techniques, began to elucidate that the rampant morphological variation observed in P.
vulgare reflected an intricate history of hybridization among closely related diploid
species, in combination with chromosome doubling (Manton 1947, 1950, 1951). Manton’s
work, which is detailed in her perennially influential book “Problems of Cytology and
Evolution in Pteridophyta” (1950), provided the foundation for understanding the
significance of polyploidization and reticulation in fern evolution, and introduced
several, now iconic, polyploid species complexes (in addition to the P. vulgare complex,
these include the Dryopteris filix-‐‑mas group and the Cystopteris fragilis complex). It was
Manton’s student Molly Shivas, who assigned specific status to the three sexually-‐‑
reproducing European cytotypes of P. vulgare, and restricted the name P. vulgare sensu
stricto to the North European and Asian allotetraploid taxon derived from the diploid
progenitors P. glycyrrhiza D.C. Eaton and P. sibiricum Sipliv. (Shivas 1961a, 1961b, 1962).
In North America, Frank Lloyd and Robert Lang synthesized their own
cytological, ecological, and biogeographic data with the work of previous researchers, to
assign nine additional taxa to the P. vulgare complex and designate two major clades
based on the absence or presence of sporangiasters (modified, sterile sporangia; Lloyd

3
1963; Taylor and Lang 1963; Lloyd and Lang 1964; Lang 1969, 1971). One generation
later, Christopher Haufler and his students utilized newly-‐‑developed techniques such as
isozyme electrophoresis, chloroplast restriction site analyses, and rbcL sequence data to
determine the genetic identify among species, develop a parsimony-‐‑based phylogeny of
the group, and test previous hypotheses about the parentage of the allopolyploid taxa
(Haufler and Zhongren 1991; Haufler and Windham 1991; Haufler and Ranker 1995;
Haufler et al. 1995a, 1995b, 2000). Among their most significant findings was the
realization that several allopolyploid species formed repeatedly through distinct
hybridization events, some with reciprocal maternity.
Since Haufler’s flurry of contributions in the 1990s, investigation into the P.
vulgare complex was largely halted, with greater emphasis being placed on discerning
generic relationships within Polypodiaceae, and the segregation of genera from
Polypodium sensu lato (for example, Schneider et al. 2004; Smith et al. 2006, and Otto et
al. 2009). As a result, numerous key phylogenetic questions about the complex have yet
to be resolved. Most pressing, and perhaps most surprising, is conflicting evidence from
molecular analyses for the monophyly of the P. vulgare complex and its sister
relationship with the Neotropical Polypodium plesiosorum complex (Haufler and Ranker
1995; Haufler et al. 1995a, 2000; Otto et al. 2009). In addition, several taxa, particularly
allopolyploids and their diploids progenitors, remain challenging to delineate
morphologically due to a dearth of stable diagnostic characters. This problem is often

4
compounded by conflicting information about the geographic distribution of species.
Furthermore, compared to many well-‐‑studied angiosperm reticulate complexes,
relatively little is known about the number of independently-‐‑derived lineages,
distribution, and evolutionary significance of the allopolyploid species that have formed
recurrently (Haufler 1995b).
My dissertation is an attempt to advance systematic knowledge of the Polypodium
vulgare complex and establish it as a “model” system for investigating the evolutionary
consequences of allopolyploidy in ferns. Chapters I-‐‑III comprise three systematic studies
that have been published or are currently in review. In Chapter I, I provide a well-‐‑
supported phylogenetic framework for a monophyletic P. vulgare complex, further
clarify relationships among the diploid taxa, and assess the timing of diversification
within Polypodium sensu stricto (Sigel et al., Systematic Botany, in press). In Chapter II, I
address the geographic distribution of the North American allotetraploid Polypodium
calirhiza S.A. Whitmore & A.R. Sm. relative to its diploid progenitor Polypodium
californicum Kaulf., and establish a suite of rachis scale and spore size characters useful
for distinguishing the two species (Sigel et al., Brittonia, 2014). In Chapter III, I
investigate the two independently derived lineages of Polypodium hesperium Maxon,
demonstrating reciprocal origins with a striking association between plastid haplotypes
and geography (Sigel et al., American Journal of Botany, in review). In Chapter IV, I

5
deviate from traditional systematic inquires, and begin to investigate how ferns utilize
the genetic diversity imparted by allopolyploidy and recurrent origins. By investigating
total and homoeolog-‐‑specific gene expression between the reciprocal origins of P.
hesperium, I identify strong patterns of expression level dominance and homoeolog-‐‑
expression bias favoring the diploid progenitor species, Polypodium amorphum Suksd.
These patterns are consistent between the reciprocal origins of P. hesperium, and add to
the growing body of evidence that expression level dominance and homoeolog-‐‑
expression bias are common, perhaps pervasive, properties of allopolyploid species.
This manuscript is being prepared for submission to New Phytologist.
This body of work, while conceived, largely executed, and written by me,
contains significant contributions from other researchers. Kathleen Pryer and Michael
Windham heavily influenced the study design of Chapters I-‐‑IV, and Michael Windham
provided chromosome counts and morphological analyses for Chapter II. Alan Smith,
Robert Dyer, and Christopher Haufler provided key specimens and guidance for
Chapters I and II. Joshua Der and Claude dePamphilis provided significant guidance on
the study design for Chapter IV, generated the Illumina RNA-‐‑Seq libraries, and
annotated the Polypodium reference transcriptome.

6
Figure 1. Polypodium vulgare L. 1. Sporophyte with creeping rhizome and phyllopodia (jointed leaf bases). 2. Dessicated leaf. 3. Abaxial leaf surface with round, exindusiate sori. 4. Sporangium releasing spores. 5. Gametophyte. Illustration by Carl Axel Magnus Lindman from Bilder ur Nordens Flora (1905). This image is in the public domain of the United States of America and is free of copyright restrictions

7
Figure 2. Phyloreticulogram depicting relationships within the Polypodium vulgare reticulate complex. The bolded cladogram represents relationships among the diploid species as determined by a consensus of morphological, isozyme, chloroplast restriction site, and plastid sequence data (Haufler and Ranker 19955; Haufler et al. 1995a, 1995b). Arrows connect polyploids with their progenitors, with dashed arrows indicating unconfirmed parentage (Rothmaler and Schneider 1962; Haufler and Wang 1991; Haufler et al. 1995b; Cusick 2002; Hildebrand et al. 2002; Schmakov 2004; Windham and Yatskievych 2005). Shapes indicate each taxon’s ploidy (see inset legend). Black text and shapes indicate sexual species, whereas gray text and shapes indicate sterile hydrids.
P. amorphumP. sibiricum
P. “okiense”
P. fauriei
P. virginianum
P. appalachianum P. cambricum
P. vulgare
P. interjectum
P. californicum
P. calirhiza
P. glycyrrhiza
P. hesperium
P. scouleri P. pellucidumP. macaronesicum
P. ×incognitum
P. sibiricum × virginianum
P. scouleri × calirhiza
P. ×viane
diploid
triploid
tetraploid
hexaploid
pentaploid
P. ×takuhinum
P. ×mantoniae P. ×shivasiae
P. ×font-queri
P. ×aztecum
P. saximontanum

8
CHAPTER I
PHYLOGENY, DIVERGENCE TIME ESTIMATES, AND PHYLOGEOGRAPHY OF THE DIPLOID SPECIES OF
THE POLYPODIUM VULGARE COMPLEX
Introduction
Members of the Polypodium vulgare L. complex (Polypodiaceae) are among the
best-‐‑studied examples of ferns that combine cryptic morphology with complex patterns
of reticulate evolution. For much of the 19th and 20th centuries, taxonomists considered P.
vulgare, the type species of Polypodium L., to be a single species spanning much of
northern Eurasia and North America. Subtle variations in morphology, including
differences in leaf shape, indument type, rhizome scale shape and coloration, spore size
and ornamentation, and rhizome flavor, were either dismissed or treated as taxonomic
varieties. As these cryptic characters (summarized by Shivas 1961a and Hennipman et
al. 1990) were examined in greater detail and their strong correlations with geography
were demonstrated, researchers began to split P. vulgare into segregate species. Using
cytotaxonomic studies and hybridization experiments, Manton (1950) and Shivas (1961a,
1961b) were the first to implicate a history of reticulation as one source of the taxonomic
confusion. Based on these studies, they assigned specific status to each of the three
sexually reproducing European cytotypes of P. vulgare (Manton 1947, 1950, 1951; Shivas
1961a, 1961b). Subsequent investigations have led to the recognition of about ten

9
diploid, six allotetraploid, and one allohexaploid species, as well as numerous sterile
hybrids, that constitute the P. vulgare complex worldwide (Lloyd 1963; Taylor and Lang
1963; Valentine 1964; Lloyd and Lang 1964; Lang 1969, 1971; Whitmore and Smith 1990;
Haufler and Zhongren 1991; Haufler and Windham 1991; Haufler et al. 1993; Haufler et
al. 1995b; Schmakov 2001). Today, the name P. vulgare sensu stricto (s.s.) is applied only
to the northern European and Asian allotetraploid taxon derived from the diploid
progenitors P. glycyrrhiza D.C. Eaton and P. sibiricum Sipliv. (Shivas 1961b; Haufler et al.
1995b).
Despite progress in resolving the reticulate relationships and the origins of the
polyploid members of the P. vulgare complex (Manton 1947, 1950; Shivas 1961a; Lloyd
and Lang 1964; Lang 1971; Haufler et al. 1995a, 1995b), the monophyly of the complex
and phylogenetic relationships among its diploid taxa are not fully resolved. A synthesis
of previous studies provides support for three major clades of diploid taxa, each united
by a shared morphological character (Fig. 3; Manton 1950; Lloyd and Lang 1964; Lang
1971; Roberts 1980; Haufler and Ranker 1995; Haufler et al. 1995a, 1995b, 2000; Schneider
et al. 2004; Otto et al. 2009). Two of these (clade A: P. appalachianum Haufler & Windham
+ P. amorphum Suksd. + P. sibiricum and clade G: P glycyrrhiza + P. californicum Kaulf. + P.
fauriei Christ) are predominantly North American but extend to eastern Asia, and the
third (clade C: P. cambricum L. + P. macaronesicum A.E. Bobrov) is European, primarily
found in the Mediterranean region and Macaronesia. Members of the P. appalachianum

10
clade (A) all have sporangiasters (see Fig. 3 i and ii; Martens 1943; Peterson and Kott
1974), which are sterile, often glandular structures within sori that are homologous to
sporangia. In contrast, the P. glycyrrhiza clade (G) is devoid of sporangiasters, but has
hairs on the adaxial surface of the leaf midrib. The P. cambricum clade (C) has branching,
hair-‐‑like paraphyses distributed among the sporangia (Fig. 3 iii and iv; Martens 1943,
1950; Wagner 1964). Relationships among and within these three clades were not well
resolved by previous studies (Fig. 3 a–f), as was the placement of the Hawaiian endemic
P. pellucidum Kaulf. Perhaps the most contentious relationship among diploids is that of
P. scouleri Hook. & Grev., a western North American coastal endemic; some molecular
studies suggest it is sister to P. glycyrrhiza (Fig. 3 d, e; Haufler and Ranker 1995; Haufler
et al. 2000), whereas others show it as sister to the Hawaiian endemic P. pellucidum (Fig.
3 f; Otto et al. 2009).
On morphological grounds, the Polypodium vulgare complex has been considered
closely related to the Neotropical P. plesiosorum Kunze group (Christensen 1928; Tryon
and Tryon 1982; Haufler et al. 1995a, 1995b). While recent phylogenetic work reveals the
need for a recircumscription of P. plesiosorum group (Otto et al. 2009), it comprises an
estimated 20 diploid and polyploid species (A. R. Smith, pers. comm.; Tejero-‐‑Diaz and
Pacheco 2004; Luna-‐‑Vega et al. 2012). Whereas some molecular analyses support a sister
relationship between the P. vulgare and P. plesiosorum groups (Haufler et al. 1995a, Otto
et al. 2009), others suggest that the P. plesiosorum group may be nested within the P.

11
vulgare complex (Haufler and Ranker 1995; Haufler et al. 2000; Otto et al. 2009). Thus,
even the monophyly of the P. vulgare complex has been called into question (Fig. 3).
Here we adopt a “diploids first” approach (Beck et al. 2010; Govindarajulu et al.
2011) to investigate relationships within Polypodium s.s. with a particular focus on the P.
vulgare complex. Using DNA sequence data from four plastid loci (atpA, matK, rbcL, and
trnG-‐‑trnR intergenic spacer) and sampling that includes ten diploid species assigned to
the P. vulgare complex, we infer a molecular phylogeny of these iconic ferns. In addition,
we use established calibrated divergence dates for the Polypodiaceae (Schuettpelz and
Pryer 2009), together with a recently described Polypodium fossil (Kvaček 2001), to date
the divergence of Polypodium s.s. and the P. vulgare complex. Our goals are to: 1) assess
the monophyly of the P. vulgare complex and its hypothesized sister relationship with
the P. plesiosorum group; 2) infer evolutionary relationships among the diploid taxa of
the P. vulgare complex; 3) provide temporal and biogeographic context for the origin of
the diploid species; and 4) lay the foundation for ongoing studies detailing the reticulate
history and timing of allopolyploid formation within the P. vulgare complex.
Materials and Methods
Taxon Sampling—We sampled 34 Polypodium specimens representing ten
recognized diploid taxa in the P. vulgare complex and five species belonging to the P.
plesiosorum group (Appendix A, Table A.1). These include two taxa formerly assigned to
the P. dulce Poir. or P. subpetiolatum Hook. groups, but subsequently shown to be related

12
to P. plesiosorum (Tryon and Tryon 1982; Moran 1995; Mickel and Smith 2004; Otto et al.
2009). Representatives of the P. plesiosorum group were selected without regard to ploidy
because of a lack of cytogenetic data for these taxa. Pleurosoriopsis makinoi (Maxim.)
Fomin was included in the analyses based on its position in recent molecular studies as
the closest relative to a clade including the Polypodium vulgare + P. plesiosorum complexes
(Schneider et al. 2004; Otto et al. 2009). Seven other outgroup taxa were selected to
represent a diversity of major clades in the Polypodiaceae (Appendix A, Table A.1),
including Polypodium sanctae-‐‑rosae (Maxon) C. Chr., a species closely allied with the
scaly-‐‑leaved genus Pleopeltis Humboldt & Bonpland ex Willdenow, but has yet to
transferred to that genus (Mickel and Smith 2004; Otto et al. 2009). Analyses were rooted
with Platycerium Desv., the outgroup taxon most distantly related to Polypodium s.s.
according to recent studies (Schneider et al. 2004; Otto et al. 2009).
DNA Extraction and Plastid Sequencing—For each individual sampled, total
genomic DNA was isolated from herbarium, silica-‐‑dried, or fresh material using the
DNeasy Plant Mini Kit (Qiagen, Valencia, California) following the manufacturer’s
protocol. One to four plastid regions, atpA, matK, rbcL, and trnG-‐‑trnR intergenic spacer
(henceforth trnG-‐‑R), were entirely or partially amplified and sequenced for each of the
samples (Appendix A, Table A.1). Primers used for amplification and sequencing, as
well as amplification and sequencing protocols were based on previous studies (atpA:

13
ESATPA412F, ESATPA535F, ESATPA557R, and ESTRNR46F from Schuettpelz et al.
2006; matK: fEDR and rGLR from Kuo et al. 2011; rbcL: ESRBCL1F, ESRBCL628F,
ESRBCL654R, and RBCL1361R from Schuettpelz and Pryer 2007; trnG-‐‑R: TRNG1F,
TRNG43F1, TRNG63R, and TRNR22R from Nagalingum et al. 2007). Plastid data sets
were supplemented with sequences from GenBank. The 115 newly generated sequences
are available in GenBank (Appendix A, Table A.1).
Sequence Alignment and Data Sets—DNA sequence chromatograms were
manually edited and assembled using Sequencher 4.8 (Gene Codes Corporation 2005).
Sequences for each locus were manually aligned with MacClade 4.05 (Maddison and
Maddison 2005). Unsequenced portions of each locus were coded as missing data. Indels
(present only in trnG-‐‑R) were coded as present or absent for each individual using the
method of Simmons and Ochoterena (2000), as implemented in gapcode.py v. 2.1 (Ree
2008). These binary characters were appended to the alignment, and the corresponding
indels were excluded from analysis. Five datasets were compiled: four single-‐‑locus
datasets and one combined four-‐‑locus dataset. Sequences from multiple specimens of P.
plesiosorum, P. rhodopleuron Kunze, Drymotaenium miyoshianum Makino, Microsorum Link
(M. varians (Mett.) Hennipman & Hett. and M. fortunei (T.Moore) Ching), Platycerium (P.
stemaria (Beauv.) Desv. and P. superbum de Jonch. & Hennipman), and Prosaptia contigua
C. Presl. were concatenated in the combined four-‐‑locus dataset (Appendix A, Table A.1).

14
Phylogenetic Analyses—Separate phylogenetic analyses were conducted for
each of the single-‐‑locus datasets using maximum likelihood (ML) as implemented in
Garli 2.0 on the CIPRES computing cluster (Zwickl 2006; Miller et al. 2010). Single-‐‑locus
data sets for atpA, matK, and rbcL were analyzed using the best model as determined by
the Akaike Information Criterion (AIC; Table 1) in PartitionFinder (Lanfear et al. 2012).
The trnG-‐‑R single-‐‑locus dataset was divided into two partitions for analysis: a partition
of sequence data with the best model as determined above, and a partition of binary-‐‑
coded indel data with a Mkv model (Table 1; Lewis 2001). Each analysis was run for two
independent searches with ten replicates each, resulting in 20 optimal maximum
likelihood trees. The single “best” ML tree was identified as having the largest -‐‑ln score
(tree statistics summarized in Table 1). For each dataset, tree searches were performed
on 1,000 bootstrap pseudoreplicate datasets. The bootstrap majority-‐‑rule consensus tree
for each dataset was compiled using PAUP* v. 4.0a123 (Swofford 2002) and compared
for well supported (≥ 70% bootstrap support) incompatible clades (Mason-‐‑Gamer and
Kellogg 1996). No significant incongruences were detected, allowing us to concatenate
the four single-‐‑locus datasets into a single combined dataset. This combined dataset
(with five data partitions: one partition for each of the four sequence loci and one
partition for the trnG-‐‑R binary-‐‑coded indel data) was analyzed using the ML approach
described above for the single-‐‑locus analyses.

15
The combined dataset was also analyzed using Bayesian inference as
implemented in MrBayes v 3.1.2 on the CIPRES computing cluster (Ronquist and
Huelsenbeck 2003; Miller et al. 2010). Parameters were unlinked among the five
partitions. In order to accommodate the range of models accepted by MrBayes, the best-‐‑
fitting models for atpA, rbcL and trnG-‐‑R sequence partitions were implemented with the
nst = 6, statefreqpr = dirichlet(1,1,1,1) and rates = gamma settings. The best-‐‑fitting model
for the matk partition was implemented with the nst = mixed, statefreqpr =
dirichlet(1,1,1,1) and rates = gamma settings. The Mkv model for the trnG-‐‑R indel
partition was implemented with the nst = 1, rates = equal, and coding = variable. The
average rates for each partition were allowed to be different (ratepr = variable) and all
other priors were left at their default values. Four analyses were run with four chains
(one cold, three heated), for 10 million generations with a sample taken every 1,000
generations. The sample parameter traces were visualized in Tracer v. 1.5 (Rambaut and
Drummond 2007). The four runs each converged around one million generations, but to
be conservative, we excluded the first two million generations of each run as burn-‐‑in,
resulting in a final pool of 32,000 samples. A majority-‐‑rule consensus tree was generated
using PAUP* v. 4.0a123 (Swofford 2002). The combined dataset and consensus trees are
deposited in TreeBase (http://treebase.org; study 15263).
Divergence Time Estimation—Divergences times were estimated from the
combined dataset using Bayesian inference as implemented in Beast v. 1.7.4 (Drummond

16
et al. 2012) on the Duke Shared Cluster Resource
(https://wiki.duke.edu/display/SCSC/DSCR). Sequence data for each locus was assigned
to a separate data partition (four partitions in total) with parameters corresponding to
the best nucleotide substitution model as determined by PartitionFinder (Table 1;
Lanfear et al. 2012). The four data partitions were assigned a linked lognormal relaxed
clock model with estimated parameters and a linked tree. Coded indels (present only for
trnG-‐‑R) were excluded from the divergence time analyses because Beast v. 1.7.4 is
unable to employ a Mkv model that is appropriate for standard ordered variable data
(Lewis 2001).
Four analyses were run, each employing a unique combination of tree model
priors and calibration points. Because sampling for this study included both interspecific
variation (sampling across species) and intraspecific variation (multiple individuals of a
single species), separate analyses were run with either a birth-‐‑death speciation prior or a
constant population size coalescence prior. All analyses incorporated five previously
derived age constraints (calibration points A-‐‑D, F; Appendix A, Table A.2). These
calibration points are best-‐‑age estimates obtained from Schuettpelz and Pryer (2009) for
the Polypodiaceae. To compensate for uncertainty surrounding these estimates, each
calibration point was assigned a normal distribution, with a mean equal to the best-‐‑age
estimate and one standard deviation equal to ten percent of the best-‐‑age estimate
(Rothfels et al. 2012). Two of the four analyses included an additional age constraint

17
from a Polypodiaceae fossil from the Oligocene (Kvaček 2001), with a minimum age of
26.8 ± 1.2 million years ago (mya; calibration point E). Kvaček (2001) presents strong, but
inconclusive, evidence that the fossilized frond fragment with visible venation, intact
sporangia, and observable spores belongs to the genus Polypodium. This calibration point
was assigned an exponential distribution with a mean of 5 and an offset of 25.6 mya,
resulting in a 95% confidence interval between 25.73 and 44.03 mya. These settings
closely approximate the minimum age estimate for the fossil (25.6 mya) and allow for
uncertainty in the upper age estimate. In summary, the four analyses were: (1) birth-‐‑
death speciation prior and calibration points A-‐‑F; (2) birth-‐‑death speciation prior and
calibration points A-‐‑D, F; (3) constant population size coalescence and calibration points
A-‐‑F; and (4) constant population size coalescence and calibration points A-‐‑D, F.
Each analysis was run four times for 10,000,000 generations, with parameters
sampled every 1,000 generations. Tracer v. 1.5 (Rambaut and Drummond 2007) was
used to assess the posterior distribution of all parameters, and mixing was considered
sufficient when the effective sample size of each parameter exceeded 200. The first 2,000
(20%) trees of each run were discarded as burn-‐‑in. The program TreeAnnotator v. 1.5.4
(Drummond et al. 2012) was used to combine the 32,000 trees (8,000 trees/run for four
runs) and produce a maximum clade credibility (MCC) chronogram with mean
divergence time estimates and 95% highest posterior density (HPD) intervals.

18
Results
Phylogenetic Analyses—Of the 125 DNA sequences used in this study, 115 were
newly generated and all are available in GenBank (Appendix A, Table A.1). The best ML
tree for the combined dataset and the Bayesian inference consensus tree yielded
phylogenetic hypotheses of identical topology and comparable support (see Table 1 for
tree statistics). Nodes were considered well supported if maximum likelihood bootstrap
support (MLBS) ≥ 70% and Bayesian inference posterior probabilities (BIPP) ≥ 0.95. In
Fig. 4, we present the best ML phylogram showing evolutionary relationships within
Polypodium and the associated MLBS and BIPP support values.
Our phylogeny (Fig. 4) provides robust support (MLBS = 88%, BIPP = 0.95) for
the monophyly of Polypodium s.s. encompassing two well-‐‑supported species complexes:
the P. vulgare complex (MLBS = 97%, BIPP = 1.0) and the P. plesiosorum group (MLBS =
100%, BIPP = 1.0). The P. vulgare complex comprises four well-‐‑supported clades: the P.
appalachianum clade, the P. glycyrrhiza clade, the P. cambricum clade, and the P. scouleri
clade (henceforth referred to as clades A, G, C, and S, respectively; Fig. 4). Relationships
among these clades are poorly resolved, but weak support for the union of clades A + G
(MLBS = 60%, BIPP = 0.72) and moderate support for the union of clades C + S (MLBS =
75%, BIPP = 0.91) hints at potential relationships among clades A, G, C, and S.
Clade A (MLBS = 100%, BIPP = 1.0) includes all samples of P. amorphum, P.
appalachianum, and P. sibiricum, though there is no support for differentiating among the

19
species. Within Clade G (MLBS = 97%, BIPP = 1.0), there is strong support for P. fauriei as
sister to P. californicum + P. glycyrrhiza (MLBS = 100%, BIPP = 1.0). Both accessions of P.
californicum are united in a well-‐‑supported clade (MLBS = 94%, BIPP = 1.0), whereas all
accessions of P. glycyrrhiza are united in a clade with weak support (MLBS = 80%, BIPP =
0.58). Clade C unites P. cambricum and P. macaronesicum as sister species (MLBS = 100%,
BIPP = 1.0), with the two accessions of P. cambricum unambiguously sister to one
another. Clade S provides maximal support (MLBS = 100%, BIPP = 1.0) for P. pellucidum
being sister to two accessions of P. scouleri (MLBS = 100%, BIPP = 1.0).
Among members of the monophyletic P. plesiosorum group (Fig. 4), P.
subpetiolatum is well supported as sister to the other four species (MLBS = 92%, BIPP =
1.0). Within the latter clade, P. martensii Mett. is sister to a well-‐‑supported and highly
differentiated clade of P. colpodes Kunze + P. rhodopleuron + P. plesiosorum (MLBS = 100%,
BIPP = 1.0), with P. plesiosorum sister to P. colpodes + P. rhodopleuron (MLBS = 95%, BIPP =
1.0). Our analyses position Pleurosoriopsis makinoi as closest sister to Polypodium s.s. with
strong support (MLBS = 87%, BIPP = 1.0). In our inferred phylogeny, there is good
support (MLBS = 88%, BIPP = 0.97) for a larger clade consisting of Polypodium s.s. +
Pleurosoriopsis makinoi, Prosaptia contigua, and Phlebodium decumanum J.Sm. + Pleopeltis
polypodioides (L.) E.G. Andrews & Windham + Polypodium sanctae-‐‑rosea (the latter with
MLBS = 70%, BIPP = 0.95). The relationships among these three groups are unsupported.

20
Divergence Time Estimations—Age estimates from our four divergence time
analyses produced nearly identical maximum clade credibility (MCC) topologies and
similar divergence time estimates (mean node ages and 95% highest posterior
distribution (HPD) for all four analyses are presented in Appendix A, Table A.3). This
suggests that estimations of topological and divergence times employed by Beast v. 1.7.4
(Drummond et al. 2012) were relatively insensitive to the choice of tree model prior
(birth-‐‑death speciation or constant population size coalescence) or to the absence of the
fossil constraint (calibration point E). Topological differences among the analyses were
primarily confined to branch tips and did not affect the comparison of divergence times
of interspecific taxa across the four analyses. Figure 3 depicts the chronogram derived
from analysis 2 (node estimates for all the analyses can be found in Appendix A, Table
A.3). For the majority of the nodes uniting interspecific taxa (nodes 1–20, 22, 23, 25, 28,
31, 33, 35, 39), differences in mean node divergence time (mean node height) and 95%
HPD were less than two million years. For most nodes uniting intraspecific individuals
(nodes 21, 24, 26, 27, 29, 30, 32, 34, 36–38, 40–41), differences in mean node divergence
time and 95% HPD were less than 0.2 million years.
A few nodes showed greater variation in divergence times across the analyses,
most notably node 1, the designated root node of the chronogram. In this instance, mean
age estimates range from 78.57 mya (analysis 2) to 99.33 mya (analysis 3). We suspect
this variation results from not placing an age constraint on the root node, but it does not

21
affect our conclusions regarding relationships and divergence dates within Polypodium
s.s. Greater variation was also seen for node 7, the most recent common ancestor of
Polypodium s. s. and Pleurosoriopsis makinoi. Mean divergence time estimates
incorporating a fossil age constraint for that node ranged from 27.64 to 27.80 mya
(analyses 1 and 3 respectively), whereas those not incorporating the fossil age constraint
ranged between 24.65 and 24.77 mya (analyses 2 and 4). Thus, it appears that the older
estimated divergence times for analyses 1 and 3 reflect the minimum age constraint
imposed on that node by the Oligocene fossil dated at 26.80 ± 1.2 mya (Kvaček 2001).
Nevertheless, all analyses indicate a mean divergence for node 7 in the late Oligocene,
with substantial overlap in the 95% HPD estimates among all four analyses.
Based on analysis 2 (Fig. 5), we infer that Polypodium s.s. and Pleurosoriopsis
makinoi diverged approximately 24.77 mya (95% HPD: 16.72–32.74 mya; node 7).
Cladogenetic events within Polypodium began approximately 20.59 mya (95% HPD:
14.01–27.06 mya; node 8), leading to the formation of the reciprocally monophyletic P.
vulgare complex and P. plesiosorum group. Within the P. plesiosorum group,
diversification is estimated to have started 11.38 mya (95% HPD: 6.90–16.57; node 13).
Within the P. vulgare complex, divergence into the major clades A, G, C, and S occurred
between approximately 13.60 mya (95% HPD: 8.98–18.67 mya; node 10) and 11.91mya
(95% HPD: 7.45–16.76 mya; node 12). Diversification within clades A, G, C, and S is
estimated at about 2.18 mya (95% HPD: 0.86–3.85 mya; node 20), 8.81 mya (95% HPD:

22
5.06–13.08 mya; node 14), 3.72 mya (95% HPD: 1.53–6.24 mya; node 17) and 5.50 mya
(95% HPD: 2.46–8.93 mya; node 16), respectively.
Discussion
The taxonomy of Polypodium has a long and complicated history. As originally
described by Linnaeus (1753), the genus encompassed most leptosporangiate ferns with
discrete, non-‐‑marginal, round sori. This circumscription has narrowed significantly over
the years (see de la Sota 1973 and Hennipman et al. 1990), and many late 20th century
authors limit application of the generic name Polypodium to a group of approximately
100–150 primarily New World species (Tryon and Tryon 1982; Moran 1995; Haufler et al.
1995b; Mickel and Smith 2004). Schneider et al. (2004, 2006) and Otto et al. (2009)
provided compelling molecular evidence for the polyphyly of even this narrowed
circumscription of Polypodium, supporting the recognition of a series of segregate genera
such as Pecluma Price, Phlebodium (R. Br.) J. Sm., Serpocaulon A. R. Sm., and Synammia C.
Presl (Haufler et al. 1993; Schneider et al. 2006; Smith et al. 2006).
Our phylogenetic analyses of sequence data from four plastid loci (Fig. 4)
strongly support the monophyly of the primarily north-‐‑temperate Polypodium vulgare
complex and its sister relationship with the Neotropical P. plesiosorum group
(Christensen 1928; Tryon and Tryon 1982; Haufler et al. 1995 a, b). As in previous
molecular studies (Schneider et al. 2004; Otto et al. 2009), the enigmatic Asian taxon

23
Pleurosoriopsis makinoi is inferred to be sister to these two groups of Polypodium. This
remains a surprising result because the diminutive, highly divided leaves (Fig. 4),
sporangia following the veins, and chlorophyllous spores (Kurita and Ikebe 1977;
Iwatsuki et al. 1995; Shugang and Haufler 2013) of Pleurosoriopsis are so different from
those of typical Polypodium. However, it does provide for a convenient and unequivocal
demarcation of Polypodium s.s., which can be defined as the monophyletic clade sister to
Pleurosoriopsis makinoi.
Phylogenetic Relationships Among Diploid Members of the Polypodium
vulgare Complex—Our analyses provide strong support for four clades of diploid
species belonging to the P. vulgare complex (Figs. 2, 3; clades A, G, C. and S). Here we
discuss the inferred relationships among these species in light of hypotheses proposed
by previous researchers.
POLYPODIUM APPALACHIANUM CLADE (A)—This clade encompasses all samples
assigned to three, primarily North American taxa: P. appalachianum, P. amorphum, and P.
sibiricum (Fig. 4). These taxa correspond to the diploid members of Lloyd and Lang’s
(1964) “Polypodium virginianum L. group”, as expanded by subsequent taxonomic
revisions (Lang 1969, 1971; Siplivinski 1974; Haufler and Windham 1991). Strong
support for this clade has been recovered in all previous molecular studies (Haufler and
Ranker 1995; Haufler et al. 1995 a, 1995b; Otto et al. 2009), and the presence of

24
sporangiasters (Fig. 3 i and ii) provides an unambiguous morphological synapomorphy
for the group.
Despite strong support for the monophyly of clade A, our best maximum
likelihood topology for the combined dataset recovers no support (< 50 % MLBS and <
70 BIPP) for the monophyly of individual species (Fig. 4). All included specimens of P.
appalachianum, P. amorphum, and P. sibiricum form a polytomy with little sequence
differentiation. This lack of resolution is consistent across topologies derived from
individual locus datasets, with the exception of matK which unites the three sampled
individuals of P. appalachianum (MLBS = 87%) and provides weak support (MLBS = 62%)
for a combined clade of P. appalachianum + P. amorphum sister to one individual of P.
sibiricum (matK topology not shown). This lack of interspecific resolution is surprising in
light of earlier isozyme electrophoresis studies of the group. Haufler et al. (1995b)
reported that genetic identity values within these taxa were much higher than those
between taxa (average of 0.96 vs. 0.46), suggesting that each is genetically distinct from
its close relatives. This discrepancy might be explained by differential rates of evolution
between the nuclear (coding the isozyme loci) and plastid genomes (Wolfe et al.1987).
Despite the inability of plastid sequence data to resolve relationships among taxa
in clade A, we do not advocate collapsing P. appalachianum, P. amorphum, and P. sibiricum
into a single broadly circumscribed species. Each taxon has a unique suite of stable, if

25
somewhat cryptic, morphological features and a distinct geographic distribution
(Haufler and Windham 1991; Haufler et al. 1993; Haufler et al. 1995a, 1995b). Polypodium
appalachianum has relatively long, narrow pinnae with acute apices, abundant glandular
sporangiasters, and spores <52 µm long; its range extends from the southern
Appalachians to eastern Canada. Polypodium amorphum has short, obtuse pinnae,
relatively few (but still glandular) sporangiasters, and spores >52 µm long; it is confined
to the northern Cascade Mountains of Oregon, Washington, and British Columbia.
Polypodium sibiricum is distinguished from both of these by its eglandular sporangiasters
and an arctic/boreal distribution. Further molecular studies incorporating nuclear
sequence data may resolve these species relationships and allow for inferences of
morphological evolution within this clade.
POLYPODIUM GLYCYRRHIZA CLADE (G)—This clade encompasses all samples of
three species occupying the Pacific Rim of western North America and eastern Asia: P.
glycyrrhiza, P. californicum, and P. fauriei (Fig. 2). Lloyd and Lang (1964) hypothesized a
close relationship between P. californicum and P. glycyrrhiza because they have hairs on
their adaxial leaf surfaces, lack sporangiasters, and are largely confined to coastal
habitats in western North America. Based on isozyme studies indicating high levels of
genetic identity with P. glycyrrhiza and P. californicum, Haufler et al. (1995a)
hypothesized that the Asian species P. fauriei was also a member of this group.

26
However, relationships among these species remained unresolved (Fig. 3 a, b).
Similarities in isozyme electrophoresis banding profiles suggested that P. fauriei might
be sister to P. californicum, whereas biogeographic distributions supported P. fauriei and
P. glycyrrhiza as sister (P. fauriei is exclusively Asian and P. glycyrrhiza extends into the
Kamchatka Peninsula; Haulfer et al. 1995b). A subsequent study utilizing trnL-‐‑trnF
plastid sequence data provided weak support (> 50% maximum parsimony BS) for P.
fauriei being sister to a clade including P. glycyrrhiza, P. californicum, and P. scouleri (Fig. 3
e; Haufler et al. 2000). All other studies addressing relationships within the P. vulgare
complex included no more than two of the three diploid species belonging to this group,
limiting the ability to infer sister relationships (Haufler and Ranker 1995; Haufler et al.
1995a; Otto et al. 2009).
Our study provides strong support for the monophyly of the diploid members of
the “P. glycyrrhiza group” and novel, unequivocal support for the sister relationship of P.
californicum and P. glycyrrhiza (Fig. 4 clade G). These three species are morphologically
united by the presence of multicellular hairs on the adaxial surface of the leaves
(Christensen 1928; Haufler et al. 1993; Iwatsuki et al. 1995), a trait not found in other
diploid members of the P. vulgare complex. Branch lengths indicate that P. fauriei is
strongly differentiated from P. glycyrrhiza + P. californicum (Fig. 4), a pattern reflected in
its unique morphology. Unlike other diploid members of the P. vulgare complex, P.

27
fauriei has a distinctive curved frond when dried and long, gray adaxial rachis hairs
(Christensen 1928; Iwatsuki et al. 1995). In contrast, the rachises of P. glycyrrhiza and P.
californicum are puberulent (Haufler et al. 1993). The two sampled individuals of P.
californicum form a well-‐‑supported clade, whereas P. glycyrrhiza is only weakly-‐‑
supported as monophyletic (Fig 2., MLBS = 80% and BIPP = 0.58). This could be due to
greater molecular variation in P. glycyrrhiza across a larger geographic range (as
reflected in the sampling for this study), compared to P. californicum whose geographic
range is largely limited to central and southern California (Haufler et al. 1993; Baldwin
et al. 2012; Sigel et al. 2014).
POLYPODIUM CAMBRICUM CLADE (C)—Our analysis unites the two accessions of P.
cambricum and our only sample of P. macaronesicum (Fig. 4 clade C) into a well-‐‑
supported clade characterized by having branched paraphyses (distinctive receptacular
hairs; see Fig. 3 iii and iv; Martens 1950; Wagner 1964) scattered among the sporangia. It
has long been hypothesized that these two taxa are closely allied, with some authors
treating P. macaronesicum as a synonym of P. cambricum, or as a subspecies restricted to
the Macaronesian Islands (summarized in Rumsey et al. 2014). Alternatively, some
authors recognize populations of P. macaronesicum on the Azore Islands as P.
macaronesicum subsp. azoricum (Vasc.) F.J. Rumsey, Carine & Robba or as a distinct
species, P. azoricum (Vasc.) Ros. Fernandes (Haufler et al. 2000; Schäfer 2005; Rumsey et

28
al. 2014). Roberts (1980) documented differences in lamina serration, paraphysis
structure and abundance, and rhizome scale shape that support the recognition of P.
cambricum and P. macaronesicum as distinct species. Our study reinforces previous
phylogenetic analyses that showed significant genetic divergence between these two
taxa (Haufler and Ranker 1995; Otto et al. 2009; Rumsey et al. 2014). We also are able to
confirm the monophyly of P. cambricum from the southern and northern portions of its
range (Appendix A, Table A.1; Fig. 4; Spain and England, respectively), which further
supports the segregation of P. macaronesicum from P. cambricum.
POLYPODIUM SCOULERI CLADE (S)—Two species are included in this well-‐‑
supported clade, P. scouleri and P. pellucidum (Fig. 4 clade S). Despite having rarely been
associated with one another, they are similar in the thick, leathery texture of their leaves
and their sister relationship was recovered by Otto et al. (2009; Fig. 3 f). Polypodium
scouleri has obscure, strongly anastomosing veins and is restricted to coastal habitats in
western North America (Haufler et al. 1993; Mickel and Smith 2004; Baldwin et al. 2012).
Polypodium pellucidum has transparent (pellucid) free veins and is endemic to Hawaii
(Hillebrand 1888; Li 1997; Li and Haufler 1999; Palmer 2003).
The taxonomic placement of P. scouleri has been a matter of much historical
debate. Christensen (1928) suggested that this species, with its strongly anastomosing
venation, belonged with the Neotropical goniophlebioid species of Polypodium, many of

29
which have been recently segregated into Serpocaulon (Smith et al. 2006). This idea was
dispelled, in part, by Lellinger (1981), who pointed to widespread homoplasy of
anastomosing venation across Polypodium s. l. Nevertheless, P. scouleri was excluded
from several phylogenetic studies of the P. vulgare complex because it was thought to
have played little or no part in reticulate speciation (Lloyd and Lang 1964; Haufler et
al.1995 a, 1995b).
Haufler and Ranker (1995) included both P. scouleri and P. pellucidum in the first
rbcL phylogeny of Polypodium, and were surprised to resolve P. scouleri as sister to P.
glycyrrhiza (Fig. 3 d). A later study using trnL-‐‑trnF plastid sequence data recovered P.
scouleri and P. glycyrrhiza united in a polytomy with P. californicum (Fig. 3 e; Haufler et
al. 2000). The discrepancy between our results and those of earlier studies may be
explained by the subsequent recognition of a triploid hybrid between P. scouleri and the
allotetraploid P. calirhiza (derived from P. californicum and P. glycyrrhiza; Whitmore and
Smith 1990) from Pt. Reyes and Tank Hill, California (Manton 1951; Hildebrand et al.
2002). The individuals of P. scouleri included in the earlier molecular studies were
collected in Marin County and Pt. Reyes specifically, and it is possible that they, despite
resembling P. scouleri, were actually triploid hybrids with maternally inherited plastid
genomes from either P. californicum or P. glycyrrhiza (Gastony and Yatskievych 1998;
Vogel et al. 1998; Guillon and Raquin 2000). Such a scenario would explain why

30
previous studies resolved P. scouleri as sister to P. glycyrrhiza, rather than P. pellucidum.
RELATIONSHIPS AMONG CLADES A, G, C, AND S—Our inferred phylogeny of the P.
vulgare complex hints at, but provides low support for, relationships among the four
diploid clades. Clades A and G, both predominantly North American, are united with
weak support (Fig. 4; MLBS = 60% and BIPP = 0.72). Somewhat better supported (Fig 4;
MLBS = 75% and BIPP = 0.91) is the sister relationship between clade C and clade S.
Despite their broad geographic separation (clade C is European/Macaronesia, whereas
clade S is Pacific Basin in distribution), some previous authors have suggested affinities
among the taxa belonging to these two clades. In describing P. macaronesicum, Bobrov
(1964) noted that its rhizome scales were most similar to those of P. scouleri, and that
these two species and P. cambricum are all found in persistently unglaciated regions with
oceanic climates. Li (1997) also suggested an affinity between the members of clade C
and P. pellucidum based on hybridization experiments and morphological observations.
He demonstrated a higher percentage of successful crosses between P. pellucidum and P.
macaronesicum (5.95%) relative to crosses between P. pellucidum and other diploid
congeners (0–0.79%). In addition, Li (1997) noted the presence of deciduous branched
paraphyses in the developing sori of P. pellucidum, which are similar to those found in P.
cambricum and P. macaronesicum.
Divergence Time Estimates and Phylogeography Among Diploid Members of

31
the Polypodium vulgare Complex—Our phylogeny provides a new framework for
addressing the historical events that have shaped the evolutionary relationships and
geographic distributions of the diploid members of the P. vulgare group. To date,
phylogeographic hypotheses regarding the P. vulgare complex have focused on the
origins of the allotetraploid taxa (Haufler and Zhongren 1991; Haufler et al. 1995b;
Windham and Yatskievych 2005). By their very existence, allopolyploid species indicate
that diploid species, which may be allopatric at present, had geographic contact in the
past. Major geographic and climatic changes, such as the Pleistocene glaciation, have
been invoked to explain these distributional changes. Less attention has been accorded
the historical events that may have precipitated cladogenesis and speciation of the
diploid taxa (Haufler et al. 2000). By calculating divergence date estimates on our
“diploids-‐‑only” phylogeny, we are able to provide new perspective on the origin of the
diploids.
Polypodium sensu stricto—The present day geographic distribution of the two
large monophyletic clades in Polypodium s. s. are largely non-‐‑overlapping. Members of
the P. plesiosorum group (including species formerly assigned to the P. dulce and P.
subpetiolatum groups) occur solely in the Neotropics, mainly south of the Tropic of
Cancer, from Mexico through Central America, northern and central South America, and
Hispañola (Luna-‐‑Vega et al. 2012). In contrast, members of the P. vulgare complex occur,

32
with few exceptions, in the northern temperate regions of Europe, Asia, and North
America (Valentine 1964; Haufler et al. 1993; Shugang and Haufler 2013). Our
divergence time analysis provides support for a late Oligocene/early Miocene origin of
Polypodium s.s. (Fig. 5 node 7; 24.77mya, 95% HPD (16.72–33.52 mya), and the
subsequent divergence of the P. vulgare complex (V) and P. plesiosorum group (P) during
the early Miocene (Fig. 5 node 8; 20.6 mya, 95% HPD: 14.00–27.06 mya). These estimates
for the divergence of the mostly epiphytic P. plesiosorum group and the largely terrestrial
P. vulgare complex roughly correspond to the mid-‐‑Cenozoic radiation of epiphytic ferns
that followed the rise of modern tropical rain forests (Schuettpelz and Pryer 2009).
Polypodium vulgare complex—Within the Polypodium vulgare complex (V), an
initial diversification occurred during the mid-‐‑Miocene, with all four major extant clades
(Fig. 5 clades A, G, C, and S) diverging within a span of approximately two million
years. These divergences show a topological pattern characteristic of ancient rapid
radiations (Whitfield and Lockhardt 2007; Whitfield and Kjer 2008). Although the
specifics are unclear, this burst of diversification most likely was driven by changing
environmental conditions that provided novel ecological opportunities (Rundell and
Price 2009). Subsequent diversification of extant species within each of the four major
clades did not begin until the late Miocene-‐‑Pliocene, with the majority of the North
American taxa diversifying near the Pliocene-‐‑Pleistocene boundary. Two geographic

33
patterns emerge among the resulting clades: 1) both clades A and G are composed of a
taxon occurring in Asia together with North American taxa; 2) both clades C and S have
only two species, one with a primarily maritime or Mediterranean mainland
distribution, and one endemic to volcanic islands.
POLYPODIUM APPALACHIANUM CLADE (A)—The three diploid species in clade A
inhabit rocky outcrops in the temperate forests of North America and eastern Asia, each
with its own distinct geographic range. Polypodium sibiricum has a wide boreal
distribution in central and western Canada, northern Japan, China, and Siberia (Haufler
et al. 1993; Shugang and Haufler 2013). Polypodium appalachianum and P. amorphum have
more limited and southern distributions. Polypodium amorphum is confined to southern
British Columbia, the Cascade and Olympic Mountains in Washington, and northern
Oregon along the Columbia River Valley (Lang 1969; Haufler et al. 1993). Polypodium
appalachianum is found in eastern North America extending from Newfoundland along
the Appalachian Mountains south to Alabama (Haufler and Windham 1991; Haufler et
al. 1993). Their geographic distributions prompted Haufler et al. (2000) to hypothesize
that these diploid taxa resulted from allopatric speciation precipitated by glaciation
events in North America. Our study lends credence to this hypothesis by showing little
divergence at the plastid loci analyzed and providing a relatively recent estimated
divergence date for the crown group of clade A (Fig 5. node 20; 2.18 mya, 95% HPD:

34
0.86–3.85 mya). This corresponds closely to the Pliocene-‐‑Pleistocene boundary, the
beginning of repeated cycles of glaciation (Walker and Geissman 2009).
Most of the present day range of Polypodium sibiricum in North America is above
40°N latitude which marks the southern edge of the Laurentide Ice Sheet during the last
glacial maximum (LGM), 21 to 18 thousand years ago (Dyke and Prest 1987; Pielou 1991;
Haufler et al. 2000). We hypothesize that the common ancestor of P. sibiricum, P.
appalachianum, and P. amorphum was broadly distributed across boreal Canada prior to
the Pleistocene, but its range shifted south and became restricted to montane or coastal
refugia during glacial advances. The Appalachian Mountains in the east and the
Olympic Peninsula and Columbia River Valley in the west are well known Pleistocene
refugia for many plant and animal species (Deitling 1958; Soltis et al. 1997; Steele and
Storfer 2006; Soltis et al. 2006; Barrington and Paris 2007; Zeisset and Beebee 2008;
Walker et al. 2009) and are likely locations for the allopatric speciation of P.
appalachianum and P. amorphum, respectively. Geographic isolation in multiple
Pleistocene refugia has been invoked as a mechanism of speciation in numerous other
plant and animal lineages (Avise and Walker 1998; Comes and Kadereit 1998; Willis and
Whitaker 2000; Knowles 2001; Hewitt 2004). As the glaciers retreated, P. sibiricum likely
expanded into its present range by dispersal from Asia, Beringia, and/or southern
refugia. While it is impossible to rule out the speciation of P. appalachianum and P.

35
amorphum occurring just prior to the beginning of the Pleistocene glaciation (as early as
3.8 mya; Fig. 5 node 20), it is evident that cycles of glaciation shaped their current
distribution in North America and, likely, reinforced genetic differentiation among these
three taxa (Hewitt 1996, 2001).
POLYPODIUM GLYCYRRHIZA CLADE (G)—The three members of clade G are
distributed in a nearly continuous arc along the Pacific Rim from Japan to Baja
California (Whitmore and Smith 1991; Haufler et al. 1993; Iwatsuki et al. 1995).
Polypodium fauriei occurs on Cheju Island of Korea, all major islands of Japan except
Okinawa, and the Kuril Islands of Russia (Iwatsuki et al. 1995). The Kamchatka
Peninsula, situated just northeast of the Kuril Islands, marks the western extent of P.
glycyrrhiza. This species arcs across the Aleutian Islands, then continues south along the
coast of mainland Alaska, British Columbia, and the Pacific Northwest of the United
States (Haufler et al. 1993). The San Francisco Bay area marks the southern limit of P.
glycyrrhiza and the northern limit of P. californicum, which extends south along the coast
into the Baja California peninsula (Haufler et al. 1993; Baldwin et al. 2012; Sigel et al.
2014).
Polypodium fauriei diverged from P. glycyrrhiza + P. californicum in the Late
Miocene (Fig. 5 node 14; 8.81 mya, 95% HPD: 5.06–13.08 mya). This divergence time
marks the establishment of distinct Asian and North American lineages, and

36
corresponds to when the Bering Land Bridge was submerged and boreal forests with
dissimilar species compositions were forming in northeastern Asia and northwestern
North America (Hultén 1968). Similar to the species in clade A, the estimated Pliocene-‐‑
Pleistocene divergence between P. glycyrrhiza and P. californicum (Fig. 5 node 18; 2.52
mya, 95% HPD: 1.14–4.12 mya), together with their geographic distributions, suggest a
history of allopatric speciation that was precipitated and reinforced by the climatic
cycles of the Pleistocene. The current geographic range of P. glycyrrhiza encompasses
numerous Pleistocene coastal refugia, including Vancouver Island, the Queen Charlotte
Islands, and the Columbia River Valley (Pielou 1991; Soltis et al. 1997). The present
range of P. californicum includes the Pacific coast of the Baja California peninsula and
Guadalupe Island (Mickel and Smith 2004; Sigel et al. 2014), areas also thought to harbor
northern species during the Pleistocene glacial advances (Lindsay 1981; Arbogast et al.
2001; Maldonado et al. 2001; Oberbauer 2005). We hypothesize that prior to the
Pleistocene, the common ancestor of P. glycyrrhiza and P. californicum spanned a coastal
range from Alaska through the Pacific Northwest. Isolation in separate northern and
southern refugia during repeated cycles of glaciation may have triggered and reinforced
the allopatric speciation of P. glycyrrhiza and P. californicum (Hewitt 1996, 2001, 2004).
Following the Last Glacial Maximum, these species likely expanded into their present
ranges, coming into secondary contact in the San Francisco coastal basin (Baldwin et al.
2012).

37
POLYPODIUM CAMBRICUM CLADE (C)—Polypodium cambricum and P. macaronesicum
are the only diploid members of the P. vulgare complex to have a European-‐‑
Macaronesian distribution. Polypodium cambricum is most abundant on calcareous rocks
near the Mediterranean, but it ranges as far north as the British Isles (Valentine 1964;
Page 1997). Polypodium macaronesicum is endemic to Macaronesia where it is a common
epiphyte in Madeira, the Azores, and the Canary Islands (Press and Short 1994; Schäfer
2005; Vanderpoorten et al. 2007).
Polypodium cambricum and P. macaronesicum conform to a well-‐‑established
Mediterranean-‐‑Atlantic floristic distribution pattern, whereby approximately 75% of
Macaronesian plant species have a sister group found in the Mediterranean (Carine et al.
2004; Carine 2006). The dominant vegetation type of the Macaronesian islands, the laurel
forest (laurisilva), is a relic of the humid, subtropical evergreen forests that were most
extensive and diverse in southern Europe and northwestern Africa during the Tertiary
(2.6–65.5 mya; Walker and Geissman 2009; Rodríguez-‐‑Sánchez and Arroyo 2011). Clade
C is estimated to have diverged during the middle to late Miocene (Fig. 5 node 12; 11.92
mya, 98% HPD: 7.45–16.76 mya), suggesting that the most recent common ancestor of P.
cambricum and P. macaronesicum may have evolved in and was broadly distributed
within the Tertiary laurisilva. The divergence of these two species in the Pliocene (Fig. 5
node 17; 3.72 mya, 95% HPD: 1.53–6.24 mya) corresponds to a time of greatly

38
diminished laurisilva on continental Europe, with isolated patches persisting in only the
Mediterranean and Black Sea Basins (Sunding 1979; Mai 1987; Emerson 2002; Rodríguez-‐‑
Sánchez and Arroyo 2011). Thus, both allopatric (insular) divergence and fragmentation
of the ancestral laurisilva habitat may have contributed to the evolution of P.
macaronesicum and P. cambricum.
Alternatively, it is possible that P. macaronesicum evolved on Macaronesia
following a long distance dispersal event from North America, with subsequent
dispersal to Europe or North Africa. If true, Polypodium cambricum would have likely
evolved in the Mediterranean and then expanded northward. Such a scenario is
consistent with a previously proposed hypothesis that the Macaronesian archipelagos
acted as a stepping-‐‑stone for the spread of American taxa eastward (Sim-‐‑Sim et al. 2005),
and would help explain the apparent sister relationship between clades C and S (Figs. 4
and 5). Numerous Macaronesian bryophytes, lycophytes, and ferns are phylogenetically
nested within Neotropical and temperate North American lineages (summarized in
Vanderporten et al. 2007).
POLYPODIUM SCOULERI CLADE (S)—Much like clade C, clade S is composed of taxa
primarily found in temperate oceanic or foggy forest habitats. Polypodium scouleri is
endemic to western North America, growing on rocks or as an epiphyte on the branches
and trunks of coniferous trees (Sillett and Bailey 2003). It is restricted to the salt-‐‑spray

39
coastal zones and high rainfall coastal ranges from southern British Columbia to the San
Francisco Bay area, with a disjunct population reported from high elevation sites on
Guadalupe Island west of Baja California (Oberbauer 2005; Haufler et al. 1993; Baldwin
et al. 2012). The other species of clade S is P. pellucidum, a Hawaiian endemic with four
described morphological varieties occupying distinct habitats (Li 1997; Li and Haufler
1999; Palmer 2003). Polypodium pellucidum var. pellucidum occurs almost exclusively as an
epiphyte living on tree trunks in rainforests. In contrast, P. pellucidum var. vulcanicum is
terrestrial and inhabits barren lava flows and cinder (Li and Haufler 1999; Palmer 2003).
Using genetic distance estimates derived from isozyme electrophoresis, Li (1997)
hypothesized a single introduction of an epiphytic ancestor to Hawaii, followed by
subsequent adaptations to volcanic habitats (Li and Haufler 1999). However, the
geographic provenance of this ancestor was not established.
Our phylogeny shows a well-‐‑supported sister relationship between P. scouleri
and P. pellucidum, suggesting the possibility of a North American origin for the ancestor
of P. pellucidum. Because the Hawaiian Islands are of volcanic origin (approximately 80–
0.5 mya; Clague and Dalrymple 1994; Geiger et al. 2007) and have never been connected
to a larger landmass, all non-‐‑endemic biota must have immigrated by long-‐‑distance
dispersal via wind or water. The estimated divergence time between P. pellucidum and P.
scouleri (Fig. 5 node 16; 5.50 mya, 95% HPD 2.46–8.93 mya) closely corresponds to the

40
emergence of Kauai, the oldest of the current eight main Hawaiian Islands (Price and
Clague 2002). We hypothesize that P. pellucidum originated from a single, long distance
dispersal of a common ancestor with P. scouleri from the Pacific Coast of North America
during the late Miocene, followed by subsequent dispersal events to all of the eight main
Hawaiian Islands. The shared epiphytic habit of P. scouleri and P. pellucidum var.
pellucidum, as well as evidence for the North American origins of several endemic
Hawaiian ferns and angiosperms lends support to this hypothesis (Barrington 1993;
Ranker et al. 2003; Geiger et al. 2007; Nagalingum et al. 2007; Baldwin and Wagner 2010;
Vernon and Ranker 2013). Alternatively, we cannot exclude the possibility that the
common ancestor P. pellucidum and P. scouleri is of Hawaiian origin, perhaps following
dispersal from Mediterranean Europe or Macaronesia. Under this scenario, the common
ancestor would have dispersed from Hawaii to the Pacific coast of North America, likely
aided by the jetstream from tropical latitudes in the Pacific to the west coast of North
America (Gillespie and Clark 2011).
The results of this study contradict a previous hypothesis that P. scouleri evolved
from a maritime-‐‑adapted population of P. glycyrrhiza (Haufler and Ranker 1995), but
they do not readily evoke an alternative hypothesis to explain the origin, unique
morphology, or distribution of P. scouleri. As with clades A and clade G, the present day
geographic distribution of P. scouleri in North America could very well reflect a history

41
involving Pleistocene refugia. Polypodium scouleri is part of an assemblage of
northwestern plant species with disjunct distributions in the coastal islands west of
California and the Baja California peninsula (Raven 1965). It is possible that the
relatively cool, foggy northern highlands of Guadalupe Island served as a refugium
during the southward displacement of the flora during Pleistocene glacial advances
(Oberbauer 2005). However, it is equally possible that P. scouleri persisted in unglaciated
coastal areas of the Pacific Northwest, and that its distribution was relatively unaffected
by the LGM. Additional population genetic data will be required to address this and
other biogeographic hypotheses presented herein.

42
Table 1. Statistics for Chapter I plastid datasets and phylogenies. Missing data includes both uncertain bases (?, N) and gaps (-‐‑). Sequence data and binary coded indels data for trnG-‐‑trnR were united into a single maximum likelihood (ML) analysis. MLBS: maximum likelihood bootstrap support; BIPP: Bayesian inference posterior probability; * The combined dataset was analyzed under a partition model, with each locus given its own best-‐‑fitting model.
MLBS BIPP
Locus
Number of
Sequences Included Sites
Variable Sites
% Missing Data
Best-‐‑Fitting Model Mean
% Partitions ≥ 70% Mean
% Partitions ≥ 0.95
atpA 34 1524 231 5.9 TrN+G 76 81 -‐‑ -‐‑
matK 24 624 232 2.7 TVM+G 79 56 -‐‑ -‐‑
rbcL 41 1309 227 8.5 GTR+G 90 81 -‐‑ -‐‑
trnG-‐‑trnR 29 964 230 1.0 K81uf+G
83 64
-‐‑ -‐‑
trnG-‐‑trnR indels
29 31 31 0 Mkv -‐‑ -‐‑
combined 42 4452 951 24.6 -‐‑* 92 75 0.89 76

43
Figure 3: Consensus topology of previously published relationships for diploid species of the Polypodium vulgare complex and members of the Neotropical Polypodium plesiosorum group. Thick black lines represent the consensus topology inferred from morphological, isozyme, chloroplast restriction site, and plastid sequence data by Haufler et al. (1995a, 1995b) and Haufler and Ranker (1995). Small text under each taxon name indicates the generalized geographic distribution for that species. Three commonly recovered clades are marked as A (P. appalachianum clade), G (P. glycyrrhiza clade), and C (P. cambricum clade). Grey dashed lines and lowercase letters depict topological differences recovered by specific studies: a. Haufler et al. (1995b), based on biogeographic patterns and morphological synapomorphies; b. Haufler et al. (1995b), derived from genetic analysis of isozyme data; c. Haufler et al. (1995a), nodes with ≥70% bootstrap support in a parsimony analysis of chloroplast restriction site data; d. Haufler and Ranker (1995), nodes with ≥70% bootstrap support in a parsimony analysis of rbcL plastid sequence data; e. Haufler et al. (2000), relationships based on a

44
strict consensus of 180 most parsimonious trees derived from trnL-‐‑trnF plastid sequence data; f. Otto et al. (2009), nodes with = 1.0 posterior probability support in a Bayesian inference analysis of trnL-‐‑F, rbcL, and rps4 plastid sequence data. Only Haufler et al. (2000) had complete sampling of the ten diploid species included in this study. Inset images are modified from Martens (1943) as follows: i. sporangiasters with glandular trichomes found in P. amorphum and P. appalachianum; ii. sporangiasters without glandular trichomes found in P. sibiricum; iii. soral paraphyses found in P. macaronesicum; iv. soral paraphyses found in P. cambricum. Horizontal lines next to inset images represent 100 µμm.

45
0.005 substitutions/site
MLBS = 100% & BIPP = 1.0 0/%6�!������%,33�������0/%6�!������%,33�������
*
V
P
Polypodium sensu stricto
G
A
C
S
P. glycyrrhiza
P. californicum
P. fauriei
P. appalachianum
P. amorphum
P. sibiricum
P. macaronesciumP. cambricum
P. pellucidium P. scouleri
P. plesiosorum
Pleurosoriopsis makinoi
Polypodium amorphum ����Polypodium amorphum 7771Polypodium amorphum 7773Polypodium amorphum ����Polypodium amorphum ����Polypodium appalachianum ����Polypodium appalachianum 7630Polypodium appalachianum ����
Polypodium appalachianum ����Polypodium sibiricum ����Polypodium sibiricum ����Polypodium sibiricum ����
Polypodium sibiricum ����
Polypodium californicum ����Polypodium californicum ����Polypodium glycyrrhiza ����Polypodium glycyrrhiza ����Polypodium glycyrrhiza ����Polypodium glycyrrhiza ����Polypodium glycyrrhiza ����Polypodium glycyrrhiza ����Polypodium glycyrrhiza ����Polypodium fauriei
Polypodium cambricum ����Polypodium cambricum ����
Polypodium macaronesicum
Polypodium pellucidum
Polypodium scouleri ����Polypodium scouleri ����
Polypodium colpodesPolypodium rhodopleuron
Polypodium plesiosorumPolypodium martensii
Polypodium subpetiolatum
Pleurosoriopsis makinoi
Phlebodium decumanumPleopeltis polypodioidesPolypodium sanctae-rosea (Pleopeltis)
Prosaptia contiguaDrymotaenium miyoshianum
Microsorum spp.Platycerium spp.
*
60/����
*
���1.0
�������
97/1.0
������
���0.91
**
99/1.0���
����
*
*���1.0
���1.0
������
70/����
*
��������
*
*
�������

46
Figure 4. The best maximum likelihood phylogram from the combined analysis of atpA, rbcL, matK, and trnG-‐‑R sequence data for ten diploid taxa of the Polypodium vulgare complex, five taxa belonging to the P. plesiosorum complex, and eight outgroup taxa (Appendix A, Table A.1). See Table 1 for tree statistics. The tree is rooted with Platycerium, the outgroup taxon most distantly related to the P. vulgare complex according to Schneider et al. (2004). ML bootstrap support values (MLBS) and Bayesian inference posterior probabilities (BIPP) are mostly given above nodes and indicated with thickened branches (see inset legend). The bolded V and P identify the monophyletic P. vulgare complex and monophyletic P. plesiosorum complex, respectively. Bolded letters A, G, C, and S indicate the major subclades of diploid species within the P. vulgare complex, the P. appalachianum clade, the P. glycyrrhiza clade, the P. cambricum clade, and the P. scouleri clade, respectively. Thumbnail silhouettes of members of the P. vulgare complex, P. plesiosorum, and Pleurosoriopsis makinoi were obtained by modifying scanned images of herbarium vouchers used in this study. Scale bars next to each silhouette represent 2.54 cm.

47
A
B
C
D
F
E
Polypodium sensu stricto
P
VG
A
C
S
1
2
3
4
5
6
7
8
9
11
12
13
14
15
10
16
17
18
19
20
21
22
23
24
25
26
27
28
29
30
31
32
33
34
35
36
37
38
39
40
41
TertiaryCretaceous Qu
Late Cretaceous Paleocene Eocene Oligocene Miocene Pl P
CenozoicMesozoic
0 Mya1020304050607080
P. plesiosorum
P. rhodopleuron
P. colpodes
P. martensii
P. subpetiolatum
Pleurosoriopsis makinoi
Phlebodium
Polypodium sanctae-rosea(Pleopeltis)
Pleopeltis polypodioides
Prosaptia contigua
Drymotaenium miyoshianum
Microsorum spp.
Platycerium spp.
P. pellucidum
P. scouleri 7216
P. scouleri 7251
P. macaronesicum
P. cambricum 8786
P. sibiricum 9145
P. sibiricum 8039
P. sibiricum 8008
P. appalachianum 7533
P. appalachianum 7630
P. appalachianum 8029
P. appalachianum 8045
P. amorphum 6951
P. amorphum 7771
P. amorphum 8210
P. amorphum 8499
P. californicum 3829
P. californicum 7249
P. fauriei
P. glycyrrhiza 8161
P. glycyrrhiza 8523
P. glycyrrhiza 8009
P. glycyrrhiza 7783
P. glycyrrhiza 7781
P. amorphum 7773
P. sibiricum 8010
P. glycyrrhiza 7537
P. glycyrrhiza 7768
P. cambricum 8787

48
Figure 5. The maximum clade credibility chronogram for ten diploid taxa of the Polypodium vulgare complex, five taxa belonging to the P. plesiosorum complex, and eight outgroup taxa from divergence dating analysis 2. Clades P, V, A, G, C, and S are as indicated in Fig. 4. Black circles with letters indicate the six calibration points used in this study: points A-‐‑D and F were obtained from Schuettpelz and Pryer (2009) and point E refers to a fossil reported by Kvaček (2001; Appendix A, Table A.2). Small numbers above nodes indicate mean node age estimates from oldest (node 1) to youngest (node 41). Statistics corresponding to each node are reported in Appendix A, Table A.3. Mean age and 95% HPD are indicated for each node by the grey bars. The lower limit of the 95% HPD for node 1 is truncated. Dates for geologic periods and epochs as represented in the bottom bar correspond to Walker and Geissman (2009).

49
CHAPTER II
REDISCOVERY OF POLYPODIUM CALIRHIZA (POLYPODIACEAE) IN MEXICO
Introduction
The Polypodium vulgare L. (Polypodiaceae) complex is an iconic group of ferns
with a primarily north-‐‑temperate distribution. In North America, this complex is
represented by six diploid species, four allotetraploids, and various sterile hybrids
(Haufler et al. 1993, 1995a, 1995b). One of the more recently described allotetraploids is
P. calirhiza S.A. Whitmore & A.R. Sm., hypothesized to have arisen through
hybridization between the diploid species P. glycyrrhiza Maxon and P. californicum Kaulf.
(Whitmore and Smith 1991). Although formerly treated as a tetraploid cytotype of P.
californicum (Manton 1951; Lloyd 1963; Lloyd and Lang 1964), P. calirhiza shows
additivity of isozyme bands (Haufler et al. 1995a) and a morphology that is subtly
intermediate between the hypothesized parental species (Whitmore and Smith 1991).
Polypodium calirhiza can be difficult to distinguish from its putative parents, and
the situation is exacerbated by morphological variation in the allotetraploid that may be
the genetic legacy of multiple, independent hybridization events (Haufler et al. 1995a,
1995b). Although P. calirhiza is not known to form triploid backcrosses with P.
californicum as it does with P. glycyrrhiza (Haufler et al. 1993), it is more difficult to
separate morphologically from P. californicum. Previous authors (Whitmore and Smith

50
1991; Haufler et al. 1993) have proffered a number of characteristics that, taken together,
appear to distinguish P. calirhiza from P. californicum. These include: spore length (> 58
μm in P. calirhiza vs. < 58 μm in P. californicum); leaf blade shape (widest above the base
in P. calirhiza vs. widest near the base in P. californicum); and degree of reticulation
among leaf veins (areoles rare in P. calirhiza vs. common in P. californicum).
Geography also plays a useful role in distinguishing P. calirhiza and its putative
parents in the region covered by the Flora of North America (Haufler et al. 1993). The three
species inhabit the Pacific Rim of North America, usually in close proximity to the coast
but with inland populations of P. calirhiza occurring in the Sierra Nevada of California
(Whitmore and Smith 1991). The range of P. glycyrrhiza extends from central California
north to Alaska, with additional localities reported for the Kamchatka Peninsula
(Haufler et al. 1993). Polypodium californicum ranges from central California south to Baja
California, with some authors (i.e., Mickel and Beitel 1988; Mickel and Smith 2004)
reporting its occurrence in southern Mexico. The allotetraploid P. calirhiza is distributed
from central Oregon south to the Southern Coastal Ranges and High Sierra Nevada
Region of California (Haufler et al. 1993; Baldwin et al. 2012). Notably, Whitmore and
Smith (1991) reported disjunct occurrences of P. calirhiza in the Mexican states of Mexico
and Oaxaca, yet Mickel and Smith (2004) subsequently treated these specimens as P.
californicum.

51
A recent survey of Polypodium specimens at the DUKE herbarium conducted
during a phylogenetic study of the P. vulgare complex (Sigel et al. in press) identified a
potential new record of P. californicum from the western Mexican state of Jalisco (R. Dyer
51; Table 2). Upon microscopic examination, however, this specimen proved more
similar to P. calirhiza than to P. californicum, and molecular analysis of the nuclear locus
gapCp-‐‑short revealed that the collection was nearly identical to a P. calirhiza specimen
from Oregon (Sigel unpublished). This led to the discovery of another specimen of P.
calirhiza (J. Mickel 7426; Table 2), identified by Whitmore and Smith (1991) as this species
but referred to as P. californicum in The Pteridophytes of Mexico (Mickel and Smith 2004).
The result of the latter identification was to exclude P. calirhiza from the Mexican flora.
This discrepancy provided the impetus to revisit the distinctions between P.
californicum and P. calirhiza and reassess the reported occurrence of the latter species in
Mexico. Here, we use spore length measurements derived from chromosome vouchers
to calibrate spore-‐‑based ploidy estimates for a series of Mexican Polypodium specimens
previously identified as P. californicum. These data are combined with observations of
abaxial rachis scale morphology and geographic/ecological distribution to ascertain
whether some of the specimens assigned to P. californicum in The Pteridophytes of Mexico
(Mickel and Smith 2004) actually represented P. calirhiza.

52
Material and Methods
Seventeen accessions of Polypodium calirhiza and P. californicum from Oregon,
California, and Mexico were examined for this study (Table 2). Special effort was made
to obtain specimens examined by Whitmore and Smith (1991) and/or cited in The
Pteridophytes of Mexico (Mickel and Smith 2004). Two of these (Smith 836 and Lemieux
s.n.) were voucher specimens for published chromosome counts (Whitmore and Smith
1991), and two others (Windham 706 and 835a) provided new cytogenetic data. For the
latter, leaves undergoing meiosis were fixed in the field using Farmer’s solution (3 parts
ethanol: 1 part glacial acetic acid). Protocols for the preparation of chromosome squashes
followed Windham and Yatskievych (2003).
Average spore length was determined for all seventeen accessions included in
Table 2. Because spore size varies with maturity in Polypodium, sampling was limited to
specimens with sporangia producing fully mature, yellow spores. To obtain spore size
data, 10–50 spores (obtained from one to five sporangia) from each specimen were
placed in a drop of glycerol and photographed at 100× magnification using a Leica MZ
12.5 dissecting microscope and a Canon EOS Rebel XSi camera. Spore length was
measured using ImageJ version 1.38 (Abramoff et al. 2004) calibrated with a slide
micrometer. Mean spore length and standard deviation were calculated for each
specimen. Spore length measurements for the aforementioned chromosome vouchers
were used to correlate spore size with ploidy level. A Mann-‐‑Whitney U test was

53
performed in R (R Development Core Team, 2008) to determine whether mean spore
lengths of specimens representing different ploidy levels were significantly different.
Summary statistics were calculated using Excel v. 14.1 (Microsoft 2011).
All 17 accessions were visually inspected to determine leaf blade shape and
degree of reticulation among leaf veins. The leaves of each were assigned to one of two
categories as circumscribed in the Flora of North America treatment of the genus
Polypodium (Haufler et al. 1993): 1) widest above the base (proximal 1-‐‑3 pinnae shorter
than more distal pinnae) or 2) widest near the base (proximal 1-‐‑3 pinnae equal to or
longer than more distal pinnae). In order to determine the prevalence of vein
reticulation, five to ten pinnae per specimen were inspected under 10× magnification to
estimate the number of areoles/pinna. In addition, all plants included in the study were
examined at 10× magnification for the presence of small scales on the abaxial leaf rachis.
These scales, which are nearly ubiquitous in the Polypodium vulgare complex but
deciduous with age, were observed on fifteen of the seventeen specimens. For each plant
with rachis scales, two to four scales were removed, placed on a slide in a drop of soapy
water under a cover slip, and photographed at 50× magnification with the same
microscope and camera used to document spore sizes. Rachis scales for each specimen
were categorized according to their width (≤ 3 cells wide, 3 to 6 cells wide, or > 6 cells
wide) and shape (linear, linear-‐‑lancolate, or lanceolate-‐‑caudate).

54
Results
A new meiotic chromosome count of n = 37 was obtained for Polypodium
californicum 3 (Table 2; Fig. 6; M. D. Windham 706), and a new count of n = 74 was
obtained for P. calirhiza 15 (Table 2; Fig. 6; M. D. Windham 835a). Figure 6 illustrates the
average spore length and standard deviations for the 17 specimens included in these
analyses (see Table 2 for actual measurements). Spore measurements formed two
statistically distinct groups (p-‐‑value < 0.0001; Mann-‐‑Whitney U test): specimens 1 – 9
formed one group with an average spore length of 57.72 µm ± 0.32 µm (standard error of
the mean), while specimens 10 – 17 formed a second group with an average spore length
of 68.92 µm ± 0.34 µm (standard error of the mean).
Although the spore differences between tetraploid P. calirhiza and diploid P.
californicum were striking, this study failed to detect clear differences in leaf blade shape
and vein reticulation. Leaf blades that were widest above the base and leaf blades widest
near the base were encountered in both taxa, with some individual plants exhibiting
both leaf shapes. Leaf venation presented a different sort of problem when applied to
herbarium specimens. This character could not be scored without clearing leaves in
nearly half the accessions included this study due to the thickness of the leaf blades
and/or abundance of sporangia. Among the specimens with visible venation, we
observed individuals of both small-‐‑ and large-‐‑spored specimens with no or few areoles

55
per pinnae (one to two). Just two of the small-‐‑spored accessions (Table 2, P. californicum
1 and 5) had pinnae with numerous areoles (five to 14).
In contrast to leaf blade shape and venation, there does appear to be a strong
correlation between abaxial rachis scale morphology and spore length (Table 2). Large-‐‑
spored specimens exhibited linear to linear-‐‑lanceolate scales up to 6 cells wide, usually
with at least some scales (often the majority) ≤ 3 cells wide (Fig. 7). In contrast, the small-‐‑
spored specimens that retained their abaxial rachis scales consistently exhibited some
lanceolate-‐‑caudate scales > 6 cells wide (Fig. 7), as well as linear-‐‑lanceolate scales 3 to 6
cells wide, but narrower scales were absent.
Discussion
A strong correlation between spore size and sporophyte ploidy level has been
documented in many fern lineages (Wagner 1974; Kott and Britton 1982; Pryer and
Britton 1983; Barrington et al. 1986; Grusz et al. 2009; Beck et al. 2010; Sigel et al. 2011; Li
et al. 2012). As a general rule, diploid species produce smaller spores than closely
related, congeneric polyploid species. Previous work on the Polypodium californicum
complex (see Barrington et al. 1986; Whitmore and Smith 1991) suggested that this
correlation might provide one of the best ways to separate P. calirhiza from P.
californicum, and spore length was one of three morphological characters used in the
Flora of North America to distinguish these taxa. In that work, the tetraploid P. calirhiza

56
was characterized as having “spores usually more than 58 µm” whereas diploid P.
californicum had “spores usually less than 58 µm” (Haufler et al. 1993: page 317).
By comparing the mean spore length of specimens of unknown ploidy to similar
data derived from chromosome voucher specimens, this study demonstrates that spore
size can be used to differentiate Polypodium californicum from P. calirhiza. The new
mitotic chromosome counts for P. californicum 3 (M. D. Windham 706; Table 2; Fig. 6) and
P. calirhiza 15 (M. D. Windham 835a) are consistent with previously reported counts for
each species (Whitmore and Smith 1991) and demonstrate that these specimens are
diploid and tetraploid, respectively. The calibrated spore length data (Fig. 6) reveal two
statistically distinct groups for which the group means are separated by approximately
11 µm and with no overlap in their standard deviations. The midpoint between these
two distinct groups is approximately 63 µm. In this case, the small-‐‑spored (P.
californicum) and large-‐‑spored (P. calirhiza) groups are amply distinct from one another,
more so than many other diploid-‐‑tetraploid pairs of ferns (Whittier and Wagner 1971;
Kott and Britton 1982; Pryer and Britton 1983; Barrington et al. 1986).
Spore lengths observed among the specimens sampled for this study differ
somewhat from those reported in the Flora of North America, which states that the spores
of tetraploid P. calirhiza are “usually more than 58 µm” whereas those of diploid P.
californicum are “usually less than 58 µm” (Haufler et al. 1993: page 317). These data
indicate that accessions of P. calirhiza from the United States have average spore lengths

57
ranging from approximately 68 µm to 70 µm, with some individual lengths in excess of
73 µm (P. calirhiza 11 and 17; Table 2, Fig. 6). Though these are higher than the values
reported by Haufler et al. (1993), they do not contribute to specimen misidentification
because they are above the stated threshold of 58 µm. In this case the problem is P.
californicum, which these data indicate can exhibit average spore lengths as high as 59
µm and individual lengths exceeding 61 µm (e.g., P. californicum 9; Table 2; Fig. 6). These
discrepancies may be due to expanded geographic sampling or slightly different
measurement methodologies. However, given that these results closely match those of
Whitmore and Smith (1991), it appears that the dividing line between P. californicum and
P. calirhiza in terms of spore length should be 63 µm rather than the lower value of 58
suggested by Haufler et al. (1993).
In contrast to the clear separation provided by spore size, the differences in leaf
blade shape and venation reported by Whitmore and Smith (1991) and Haufler et al.
(1993) are not always effective for clearly distinguishing P. californicum from P. calirhiza.
Leaf blade shape is highly variable and difficult to quantify, and the two supposed
character states (leaves widest near the base vs. widest above the base) occasionally
occur on leaves from the same plant. Though potentially a more valuable character, the
widespread use of leaf venation as a distinguishing feature is inhibited by the thick leaf
tissue and abundant sporangia of many specimens. While some specimens of P.

58
californicum did exhibit a high degree of reticulation among veins, others exhibited few
areoles and could not be differentiated from P. calirhiza based on this character alone.
Besides spore length, this study demonstrates the utility of abaxial rachis scale
morphology for differentiating P. calirhiza from P. californicum. Diagnostic scale types for
each taxon were identified by observing the abaxial rachis scales of previously
annotated specimens from California and Oregon. (Table 2; Fig. 7). While both species
have linear-‐‑lanceolate scales that are 3–6 cells wide, only P. calirhiza has hair-‐‑like linear
scales ≤ 3 cells wide. At the other end of the continuum, P. californicum always has at
least some lanceolate-‐‑acuminate scales > 6 wide, a scale type that was not found in P.
calirhiza. These abaxial rachis scale types are consistent with those described in
treatments of P. calirhiza and P. californicum (Whitmore and Smith 1991; Haufler et al.
1993), but previously have not been emphasized as a valuable character for
distinguishing between the two taxa.
The strong correlation between ploidy level and spore size documented in this
study provides evidence that both diploids and tetraploids are present among the
Mexican specimens assigned to P. californicum by Mickel and Smith (2004). Differences
in rachis scales mirror those observed between P. californicum and P. calirhiza in
California, prompting the reevaluation of species identifications for all included
accessions (Table 2). Four specimens of Polypodium calirhiza from Mexico were identified
(Table 2; P. calirhiza 10, 12, 14, and 16), including two specimens (P. calirhiza 10 and 14)

59
cited as P. californicum in The Pteridophytes of Mexico (Mickel and Smith 2004). These
results, combined with preliminary molecular analyses (Sigel unpublished) justify the
inclusion of P. calirhiza in the flora of Mexico.
During the course of this study, the highly allopatric geographic distributions of
Polypodium californicum and P. calirhiza in Mexico became apparent. Polypodium
californicum seems to be restricted to the western coast of the Baja California peninsula
and outlying Pacific islands (Fig. 8). It reaches the southern and eastern limits of its
range in the Sierra de la Laguna Mountains at the tip of Baja California Sur (Table 2, P.
californicum 8). Its restriction to low elevations in the Pacific coastal region mirrors its
distribution in California (100-‐‑600 m; Mickel and Smith 2004). This is likely due to
ecological similarities, as the California Floristic Province extends to Baja California and
Guadalupe Island (Raven and Axelrod 1978; Hugo and Exequiel 2007; Baldwin et al.
2012). The one Mexican specimen of P. californicum from Baja California Sur was
collected in a low-‐‑elevation coastal area of the Cape Region (de la Luz et al. 2000).
In sharp contrast, the Mexican collections now identified as Polypodium calirhiza
appear to be restricted to the central and southern mountains (Fig. 8) in the states of
Jalisco, Mexico, Oaxaca, and Veracruz (Table 2). Available collection data suggest that
the species may be confined to high elevation sites in this region; the specimen from
Oaxaca (Table 2, P. calirhiza 14) was collected at approximately 3100 m, and the
specimen from Mexico (Table 2; P. calirhiza 10) was collected on the Nevado de Toluca

60
volcano, the base of which is about 2500 m elevation. Although P. calirhiza often is found
at higher elevations than P. californicum in the United States, it is not known to occur
above 1500 m elevation in its North American range (Haufler et al. 1993). These high
elevation sites in Mexico represent a remarkable disjunction of nearly 2500 km from the
known southernmost populations of P. calirhiza in California. It appears that the
Oaxacan specimen, cited above and now confidently assigned to P. calirhiza, marks the
southernmost limit of the P. vulgare complex in the Western Hemisphere.

61
Table 2. Specimens of Polypodium used in Chapter II. Taxon names are as confirmed or redetermined during this study. Numbers under taxon names are unique specimen identifiers, and superscripts indicate chromosome vouchers and specimens included in previous publications. Average spore length and rachis scale width/shape are given for each specimen, with some specimens exhibiting two types of scales. “NA” indicates that no rachis scales were observed. Superscripts indicate the following: a chromosome voucher (chromosome counts indicated in Fig. 6); b specimen formerly identified as P. californicum; c specimen identified as P. calirhiza by Whitmore and Smith (1991); d specimen identified as P. californicum in The Pteridophytes of Mexico (Mickel and Smith 2004).
Taxon
Voucher Information
Average Spore Length ± One Standard Deviation in µμm (Number of Spores Measured)
Rachis Scale Width (Cell Number) / Shape
Polypodium californicum Kaulf.
1d Mexico: Baja California, Guadalupe Island, J. N. Rose 16015 (NY) 56.27±2.45 (30) >6 / lanceolate-‐‑caudate
2 Mexico: Baja California, Guadalupe Island, G. B. Newcomb 170 (UC) 56.64±3.67 (10) NA
3a USA: California, Orange County, M. D. Windham 706 (DUKE) 57.08±3.95 (50) 3–6 / linear-‐‑lanceolate ≥6 / lanceolate-‐‑caudate
4d Mexico: Baja California, Coronado Islands, A. W. Anthony s.n. (UC) 57.25±3.95 (32) NA
5 Mexico: Baja California, San Quentin Bay, E. Palmer 703 (NY) 58.18±1.54 (20) 3–6 / linear-‐‑lanceolate >6 / lanceolate-‐‑caudate
6 Mexico: Baja California, Guadalupe Island, A. W. Anthony 256 (UC) 58.32±1.87 (15) 3–6 / linear-‐‑lanceolate >6 / lanceolate-‐‑caudate

62
Taxon
Voucher Information
Average Spore Length ± One Standard Deviation in µμm (Number of Spores Measured)
Rachis Scale Width (Cell Number) / Shape
7 USA: California, Orange County, J. Metzgar 176 (DUKE) 58.32±2.92 (30) 3–6 / linear-‐‑lanceolate >6 / lanceolate-‐‑caudate
8 Mexico: Baja California Sur, Todos Santos, T. S. Brandegee s.n. (UC) 58.40±2.84(12) 3–6 / linear-‐‑lanceolate >6 / lanceolate-‐‑caudate
9 USA: California, San Mateo County, L. Huiet 138 (DUKE) 59.09±2.19 (30) 3–6 / linear-‐‑lanceolate >6 / lanceolate-‐‑caudate
Polypodium calirhiza S.A. Whitmore & A.R. Sm.
10bd Mexico: Mexico, Nevado de Toluca, J. N. Rose & J. H. Painter 7946 (NY)
67.55±2.85 (30) ≤ 3 / linear 3–6 / linear-‐‑lanceolate
11ac USA: California, Marin County, A. R. Smith 836 (UC) 67.69±2.04 (10) 3–6 / linear-‐‑lanceolate
12abc USA: California, Mendocino County, T. Lemieux s.n. (UC) 68.71±3.31 (36) ≤ 3 / linear 3–6 / linear-‐‑lanceolate
13b Mexico: Veracruz, Xalapa, Hahn s.n. (UC) 68.92±2.88 (20) ≤ 3 / linear 3–6 / linear-‐‑lanceolate
14bd Mexico: Oaxaca, Distrito Ixtlán, J. T. Mickel 7426 (UC) 69.09±2.26 (30) ≤ 3 / linear 3–6 / linear-‐‑lanceolate

63
Taxon
Voucher Information
Average Spore Length ± One Standard Deviation in µμm (Number of Spores Measured)
Rachis Scale Width (Cell Number) / Shape
15a USA: Oregon, Lane County, M. D. Windham 835a (DUKE) 69.26±3.22 (40) ≤ 3 / linear 3–6 / linear-‐‑lanceolate
16b Mexico: Jalisco, Volcán Nevado de Colima, R. Dyer 51 (DUKE) 69.86±5.44 (40) ≤ 3 / linear 3–6 / linear-‐‑lanceolate
17 USA: Oregon, Curry County, R. Halse 7580 (NY) 70.29±2.85 (40) ≤ 3 / linear 3–6 / linear-‐‑lanceolate

64
Figure 6. Average spore lengths for specimens listed in Chapter II. Numbers on symbols correspond to specific specimens in Table 2. Error bars indicate one standard deviation. Specimens originating from Mexico are indicated in black, and those from the United States of America in gray; round symbols are diploids, square symbols are tetraploids. Chromosome counts are provided for the four chromosome voucher specimens listed in Table 2.

65
Figure 7. Images of abaxial rachis scales for specimens of Polypodium calirhiza and P. californicum. a*. P. calirhiza 14, J. T. Mickel 7426 ; b*. P. calirhiza 10, J. N. Rose & J. H. Painter 7946; c. P. calirhiza 12, T. Lemieux s.n.; d–e. P. calirhiza 17, R. Halse 7580; f. P. calirhiza 11, A. R. Smith 836; g*. P. californicum 5, E. Palmer 703; h*. P. californicum 1, J. N. Rose 16015; i*. P. californicum 8, T. S. Brandegee s.n.; j–k. P. californicum 9, R. L. Huiet 138; l. P. californicum 7, J. Metzgar 176. * indicates Mexican specimens. All photographs were taken at 50x magnification, cropped, and converted from RGB to 8-‐‑bit grayscale. Scale bars represent 100 µm.

66
Figure 8. Map of Mexico showing the localities for the Mexican specimens of Polypodium calirhiza and P. californicum. Symbol shape corresponds to species (see legend on figure), and numbers shown in symbols refer to specific specimens in Table 2. Best estimates of collection localities were obtained from herbarium labels, some with limited geographic information.

67
CHAPTER III
EVIDENCE FOR RECIPROCAL ORIGINS IN POLYPODIUM HESPERIUM (POLYPODIACEAE):
A NATURAL FERN MODEL SYSTEM FOR INVESTIGATING HOW MULTIPLE ORIGINS SHAPE
ALLOPOLYPLOID GENOMES
Introduction
Polyploidy, or whole genome duplication, played a critical role in the evolution
of entire lineages, from fungi to insects and even vertebrates (Otto and Whitton 2000;
Mable 2004; Albertin and Marullo 2012). This is particularly true among plants, where it
is thought that increases in ploidy level have been involved in ca. 15% and 31% of
angiosperm and fern speciation events, respectively (Wood et al. 2009), and that all
vascular plants have experienced one or more ancient polyploidization events (Cui et al.
2006; Otto 2007; Jiao et al. 2011). One particularly intriguing aspect of polyploid species
is that many form recurrently, resulting in species composed of multiple, independently
derived lineages (henceforth IDLs; Soltis and Soltis 1993, 1999). In the case of
allopolyploid species—polyploids resulting from hybridization between two or more
distinct species—IDLs represent the repeated union of divergent genomes (Werth et al.
1985). It has been hypothesized that the increased genetic variation imparted by
multiple origins increases the ecological amplitude, geographic range, and evolutionary
success of allopolyploid lineages (Meimberg et al. 2009; Madlung 2013).

68
Recurrent origins of allopolyploids can result from reciprocal crosses between
the same progenitor species, resulting in IDLs with different maternal parents. Although
multiple origins are common among polyploid species, there are relatively few, well-‐‑
documented cases of reciprocal origins (Soltis and Soltis 1993). The list is growing,
however, with examples now known in Tragopogon L. (Soltis and Soltis 1989, 2004),
Polypodium L. (Haufler et al. 1995b), Platanthera Rich. (Wallace 2003), Senecio L. (Kadereit
et al. 2006), Aegilops L. (Meimberg et al. 2009), Androsace L. (Dixon et al. 2009), Asplenium
L. (Perrie et al. 2010; Chang et al. 2013), Astrolepis D.M. Benham & Windham (Beck et al.
2012), Pteris L. (Chao et al. 2012), and Nephrolepis Schott (Kao et al. 2014). Among the
cases documented so far, one of the most intriguing is that involving the western North
American sexual allotetraploid Polypodium hesperium Maxon, a member of the well-‐‑
studied and morphologically cryptic P. vulgare reticulate complex (Fig. 9; summarized in
Haufler et al. 1995b; Sigel et al. in press). This species has a broad, but disjunct, montane
distribution extending from southern British Columbia to the northern Baja Peninsula,
east to Montana, the Four Corners states, and Chihuahua, Mexico (Maxon 1900; Haufler
et al. 1993; Mickel and Smith 2006; Yatskievych and Windham 2009).
Based on morphological and cytological data, Lang (1971) hypothesized that P.
hesperium is an allotetraploid derived from hybridization between the sexual diploids P.
amorphum Suksd. and P. glycyrrhiza D.C. Eaton. The latter two species belong to distinct

69
lineages within the P. vulgare complex (Fig. 9, clades A and G, respectively) that
diverged approximately 12 million years ago (mya; Sigel et al. in press), and their
present ranges overlap with that of P. hesperium only in a limited area of the Pacific
Northwest (Haufler et al. 1993). Lang’s (1971) original hypothesis was supported by an
analysis of biparentally-‐‑inherited nuclear isozyme markers (Haufler et al. 1995b), and a
complementary study utilizing restriction-‐‑site mapping of the uniparentally-‐‑inherited
chloroplast genome demonstrated that two specimens of P. hesperium, one from eastern
Washington and one from Utah, had reciprocal origins (Haufler et al. 1995a). Presuming
maternal inheritance of plastid genomes in ferns [initially demonstrated by Gastony and
Yatskievych (1992) and subsequently shown by Vogel et al. (1998) and Guillon et al.
(2000)], Haufler et al. (1995a) hypothesized that the maternal parent of the eastern
Washington specimen was P. amorphum, whereas the maternal parent of the Utah
specimen was P. glycyrrhiza. Variations in isozyme banding patterns and cryptic
morphological characters were proposed as evidence for additional IDLs within P.
hesperium (Haufler et al. 1995b). Recent divergence date estimates for the P. vulgare
complex (Sigel et al. in press) suggest that P. amorphum and P. glycyrrhiza both arose
during the middle to late Pleistocene and, as such, all IDLs of P. hesperium likely formed
during the last one million years.

70
In this study we utilize nuclear and plastid sequence data to revisit the IDLs of
Polypodium hesperium. Our goals are to: (1) document the geographic distribution of
plastid haplotypes within P. hesperium, (2) assess the number and relative ages of IDLs
within P. hesperium, and (3) introduce P. hesperium as a natural model system for
investigating the evolutionary consequences of allopolyploidy in ferns.
Materials and Methods
Taxon Sampling—We sampled 100 specimens of Polypodium representing 51
individuals of P. hesperium, ten diploid taxa of the P. vulgare complex, and five species
belonging to the more distantly related P. plesiosorum group (Table 3; Appendix B, Table
B.1). The latter is sister to the to the P. vulgare complex (Sigel et al. in press), and its
representatives were selected without regard to ploidy because of a lack of cytogenetic
data for most members of this lineage. Pleurosoriopsis makinoi (Maxim.) Fomin, an
uncommon east Asian taxon reported as both triploid and tetraploid (Kurita and Ikebe
1977; Iwatsuki et al. 1995), was used as the outgroup based on its position as the closest
relative to a clade including the Polypodium vulgare complex + P. plesiosorum group in
recent molecular studies (Schneider et al. 2004; Otto et al. 2009; Sigel et al. in press).
DNA Extraction, PCR Amplification, Cloning, and Sequencing—For each
individual sampled, total genomic DNA was isolated from herbarium, silica-‐‑dried, or
fresh material using the DNeasy Plant Mini Kit (Qiagen, Valencia, California, U.S.A.)
following the manufacturer’s protocol. The trnG-‐‑trnR intergenic spacer (hereafter trnG-‐‑

71
R) was entirely or partially amplified from the plastid genome and sequenced for each
specimen included in this study (Table 3; Appendix B, Table B.1). Universal trnG-‐‑R fern
primers (TRNG1F, TRNG43F1, TRNG63R, and TRNR22R) and protocols used for
amplification and sequencing followed Nagalingum et al. (2007). A trnG-‐‑R sequence was
assembled from chromatograms for each specimen using the program Sequencher 4.8
(Gene Codes Corp., Ann Arbor, Michigan, U.S.A.).
A portion of the low-‐‑copy nuclear locus gapCp was amplified, cloned, and
sequenced for a subset of 36 specimens included in this study (Table 3; Appendix B,
Table B.1). Sequences for the outgroup taxon, Pleurosoriopsis makinoi, were amplified
using previously published universal gapCp primers, ESGAPCP8F1 and ESGAPCP11R1,
and protocols (Schuettpelz et al. 2008). Two copies of gapCp are recovered in
Polypodiaceae—one ~900-‐‑bp copy and one ~600-‐‑bp copy (Rothfels et al. 2013); only the
~600-‐‑bp copy was sequenced. The need to efficiently separate the two copies of gapCp
prompted the development of a Polypodium specific gapCp “short” forward primer,
EMGAPF1 (5’– GGTGCTGCTAAGGTACAAC – 3’). When used with ESGAPCP11RI,
this new forward primer amplified only gapCp “short” (hereafter gapCp). Amplification,
cloning, and sequencing of gapCp followed the protocols in Schuettpelz et al. (2008) with
the following exceptions: cloning was performed using pGEM-‐‑T cloning kits (Promega,
Madison, Wisconsin, U.S.A.), and two to three separate amplifications per individual
were pooled prior to ligation. This was done to mitigate PCR bias occurring in any

72
single amplification (Polz and Cavanaugh 1998; Beck et al. 2010). A minimum of 16
colonies was amplified for each individual and sequences were obtained for eight to 14
colonies for each specimen sampled.
To minimize variation due to PCR error in the gapCp sequences, we filtered the
raw data for genetic variants (putative alleles) using the approach described by Grusz et
al. (2009). First, a contig sequence was assembled for each clone from chromatograms
using Sequencher 4.8 (Gene Codes Corp., Ann Arbor, Michigan, U.S.A.). Then, all clone
sequences obtained from a given individual were combined into a single alignment
using Sequencher 4.8. Each alignment was visually inspected and obvious chimeric
sequences were removed. A maximum parsimony (MP) tree of each alignment was
constructed using PAUP v. 4.0 (Swofford 2002). The resulting tree was used to
determine the alleles present in an individual by identifying groups of clones united by
two or more polymorphisms. A consensus sequence of each group of clones was
constructed in Sequencher 4.8 (Gene Codes Corp., Ann Arbor, Michigan, U.S.A.), with
the resulting consensus sequences representing alleles belonging to a given individual.
Sequence Alignment and Data Sets—Separate alignments for trnG-‐‑R and gapCp
were manually generated using MacClade 4.05 (Maddison and Maddison 2005).
Unsequenced portions of each locus were coded as missing data, and portions of the 5’
and 3’ regions with large amounts of missing data were excluded. Indels due to
insertion or deletion events (present in both trnG-‐‑R and gapCp) were coded as present or

73
absent for each individual using the method of Simmons and Ochoterena (2000), as
implemented in gapcode.py v. 2.1 (Ree 2008). The resulting binary characters were
appended to the alignment, and the corresponding indels were excluded.
Phylogenetic Analyses—Separate phylogenetic analyses were conducted for the
trnG-‐‑R and gapCp datasets using maximum likelihood (ML) as implemented in Garli 2.0
(Zwickl 2006) on the Duke Shared Computing Resources Cluster (DSCR;
https://wiki.duke.edu/display/SCSC/DSCR). The best model for each dataset was
determined by the Akaike Information Criterion (AIC; Table 4) using PartitionFinder
(Lanfear et al. 2012). For both the trnG-‐‑R and gapCp datasets, the binary-‐‑coded indel data
were assigned a Mkv model (Table 4; Lewis 2001). Each analysis was run for four
independent searches with four replicates each, resulting in 16 optimal maximum
likelihood trees. The single most-‐‑likely ML tree was identified by having the largest -‐‑ln
score (tree statistics summarized in Table 4). For each dataset, clade support was
assessed using 1000 bootstrap pseudoreplicate datasets. The bootstrap majority-‐‑rule
consensus tree for each dataset was compiled using PAUP* v. 4.0a123 (Swofford 2002).
The trnG-‐‑R and gapCp datasets also were analyzed separately using Bayesian
inference as implemented in MrBayes v. 3.1.2 (Ronquist and Huelsenbeck 2003) on the
DSCR computing cluster. To accommodate the range of models accepted by MrBayes,
the best-‐‑fitting model for trnG-‐‑R was implemented with the nst = (0 1 2 2 1 0), statefreqpr
= estimate and rates = gamma settings. The best-‐‑fitting model for gapCp was

74
implemented with the nst = 2, statefreqpr = equal and rates = gamma settings. The Mkv
model for the both the trnG-‐‑R and gapCp binary-‐‑coded indel data was implemented with
the nst = 1, rates = equal, and coding = variable; the average rates for the sequence data
partition and binary-‐‑coded indel partition were allowed to differ (ratepr = variable). All
other priors were left at their default values. Four analyses were run with four chains
(one cold, three heated) for 10 million generations with a sample taken every 1000
generations. The sample parameter traces were visualized in Tracer v. 1.5 (Rambaut and
Drummond 2007). For each analysis, the four runs converged around one million
generations. To be conservative, we excluded the first two million generations of each
run as burn-‐‑in, resulting in a final pool of 32,000 samples. A majority-‐‑rule consensus tree
was generated using PAUP* v. 4.0a123 (Swofford 2002). Both the trnG-‐‑R and gapCp
alignments and consensus trees are deposited in Dryad (treebase.org; study: 15737).
Results
Plastid phylogeny (Fig. 10A)—Of the 101 trnG-‐‑R sequences used in this study,
75 were newly generated and deposited in Genbank (Appendix B, Table B.1). The best
ML tree and Bayesian inference consensus tree yielded similar topologies and
comparable support values (see Table 4 for tree statistics). Figure 10A shows the best
plastid ML tree as an unrooted phylogram in which well supported nodes are identified
by Bayesian inference posterior probabilities (BIPP) ≥ 0.95 and maximum likelihood

75
bootstrap support (MLBS) ≥ 70%.
Our trnG-‐‑R phylogeny (Fig. 10A) shows strong support for the reciprocal
monophyly of the P. vulgare complex (BIPP = 1.0, MLBS = 71%) and the P. plesiosorum
group (BIPP = 1.0, MLBS = 98%). In agreement with Sigel et al. (in press; findings
summarized in Fig. 9), the P. vulgare complex consists of four well-‐‑supported clades—
the P. cambricum clade (clade C; BIPP = 1.0, MLBS = 100%), the P. scouleri clade (clade S;
BIPP = 1.0, MLBS = 99%), the P. appalachianum clade (clade A; BIPP = 1.0, MLBS = 92%),
and the P. glycyrrhiza clade (clade G; BIPP = 1.0, MLBS = 92%), However, relationships
among the four clades comprising the P. vulgare complex are largely unresolved by the
plastid data (Fig. 10A).
Within the P. vulgare complex, clade C unequivocally unites the diploid taxa P.
cambricum L. and P. macaronesicum A.E. Bobrov (BIPP = 1.0, MLBS = 100%), and the two
samples of P. cambricum are united with strong support (BIPP = 1.0, MLBS = 74%). Clade
S comprises P. pellucidum Kaulf. and P. scouleri Hook. & Grev. (BIPP = 1.0, MLBS = 99%),
with the two samples of P. scouleri united in a well-‐‑supported clade (BIPP = 1.0, MLBS =
83%). Clade A comprises all samples of the diploid taxa P. amorphum, P. appalachianum
Haufler & Windham, P. sibiricum Sipliv., as well as 22 samples of P. hesperium. The
plastid data provide no support for the monophyly of any species in clade A, and
relationships among all samples are essentially unresolved (Fig. 10A). Clade G includes

76
all samples of the diploid taxa P. fauriei Christ, P. californicum Kaulf., and P. glycyrrhiza,
as well as 29 samples of P. hesperium. Polypodium fauriei is resolved as sister to all other
members of clade G with strong support (BIPP = 1.0, MLBS = 99%). Relationships among
other samples in clade G are unresolved, with no support for the monophyly of the
remaining taxa.
Within the P. plesiosorum group (clade P), P. rhodopleuron Kunze and P. colpodes
Kunze are united in a well-‐‑supported clade (BIPP = 1.0, MLBS = 96%), which is sister to
P. plesiosorum (BIPP = 1.0, MLBS = 100%). Relationships among P. rhodopleuron + P.
colpodes + P. plesiosorum Kunze, P. subpetiolatum Hook., and P. martensii Mett. are
unresolved (Fig. 10A).
Nuclear sequence variation and phylogeny (Fig. 10B)—Cloning and
amplification of the nuclear locus gapCp resulted in 380 clones, representing 63
consensus sequences (putative alleles) for 36 samples (Table 3; Appendix B, Table B.1).
All gapCp sequences were newly generated for this study, and consensus allele
sequences are deposited in Genbank. Figure 10B depicts the most-‐‑likely tree (see Table 3
for tree statistics) resulting from ML analysis and is rooted with Pleurosoriopsis makinoi.
Unlike the trnG-‐‑R plastid ML tree (Fig. 10B), the gapCp ML phylogeny does not
explicitly support monophyly of the P. vulgare complex. In the nuclear phylogeny, the P.
plesiosorum group (clade P) forms a polytomy with two clades representing the P. vulgare
complex—one uniting the diploid species of clades C, S, and A with mixed BIPP (= 1.0)

77
and MLBS (= 65%) support and the other comprising the diploid taxa belonging to clade
G (BIPP = 1.0, MLBS = 98%). The 28 alleles obtained from the 12 included specimens of P.
hesperium are divided between these two clades, with each specimen of P. hesperium
having at least one allele derived from each clade (Fig. 10B).
Our gapCp phylogeny (Fig. 10B) also provides no support for the monophyly of
clades C, S, or A. The relationship between P. cambricum and P. macaronesicum (the two
members of clade C) is unresolved. Similarly, the relationship between the two clade S
species, P. scouleri and P. pellucidum, is unclear, though the two specimens of P. scouleri
are supported (BIPP = 0.99, MLBS = 71%) as sister to one another. Alleles from P.
appalachianum and P. sibiricum (both members of clade A) form a well supported (BIPP =
1.0, MLBS = 89%), yet unresolved clade. All alleles from the remaining clade A diploid,
P. amorphum, form a clade showing mixed support (BIPP = 0.96, MLBS < 50%) with 14
alleles obtained from 12 specimens of P. hesperium. Though the relationship among the
P. amorphum and P. hesperium alleles is largely unresolved, five alleles obtained from
three specimens of P. hesperium (all from the northern portion of its geographic range)
form a strongly supported clade (BIPP = 1.0, MLBS = 84%).
Within clade G, P. fauriei is weakly supported (BIPP = 1.0, MLBS = 62%) as sister
to the other taxa, and P. californicum appears sister to a robustly supported (BIPP = 1.0,
MLBS = 98%) clade consisting of all P. glycyrrhiza samples and 14 alleles obtained from
12 specimens of P. hesperium. The relationship among the P. glycyrrhiza and P. hesperium

78
alleles is largely unresolved, but eight alleles obtained from eight specimens of P.
hesperium (all from the southern portion of its geographic range) are united in a clade
with mixed BIPP (= 0.96) and MLBS (= 51%) support.
As with the trnG-‐‑R ML tree (Fig. 10B), the gapCp phylogeny (Fig. 10C) provides
unequivocal support for the monophyly of the P. plesiosorum group (BIPP = 1.0, MLBS =
1.0%). Within the P. plesiosorum group, P. plesiosorum is sister to all other taxa (BIPP = 1.0,
MLBS = 88%). Two alleles obtained from P. subpetiolatum are united with robust support
(BIPP = 1.0, MLBS = 100%). Two alleles from P. rhodopleuron and two alleles from P.
colpodes are united with strong support (BIPP = 1.0, MLBS = 97%), with the two alleles
from P. colpodes sister to each other (BIPP = 1.0, MLBS = 97%). The three alleles obtained
from the outgroup taxon, Pleurosoriopsis makinoi, form an unequivocally supported clade
(BIPP = 1.0, MLBS = 100%), with two alleles robustly supported as sister to the third
allele (BIPP = 1.0, MLBS = 100%).
Geographic distribution of plastid haplotypes (Fig. 10C)—Our phylogenetic
analysis of trnG-‐‑R plastid sequence data reveals a striking correspondence between the
geographic locality of a P. hesperium individual and its plastid haplotype. As shown in
Figure 10C, all specimens of P. hesperium sampled from the north––Washington, Oregon,
Idaho, and Montana––have plastid genomes contributed by a diploid taxon from the P.
appalachianum clade (clade A). On the other hand, all specimens from the south––Utah,

79
Colorado, New Mexico, Arizona, and Baja California––have plastid genomes
contributed by a diploid taxon from the P. glycyrrhiza clade (clade G).
Discussion
Using a combination of uniparentally-‐‑inherited plastid (trnG-‐‑R) and
biparentally-‐‑inherited nuclear (gapCp) sequence data, we were able to corroborate earlier
hypotheses based on morphological, cytological, and isozyme data (Lang 1971; Haufler
et al. 1995b) that: 1) P. hesperium is an allotetraploid derived from hybridization between
the diploid species P. amorphum and P. glycyrrhiza, and 2) that P. hesperium encompasses
distinct IDLs with reciprocal plastid donors. Chloroplast and mitochondrial plastid
genomes are predominantly inherited from a single parent (Bock 2007), and, while never
tested specifically for Polypodium, several ferns have been shown to have maternal
inheritance of plastids (Pellaea Link., Gastony and Yatskievych 1992; Asplenium, Vogel et
al. 1998; Equisetum L., Guillon and Raquin 2000). Assuming maternal inheritance of
plastids in Polypodium, Haufler et al. (1995a) used chloroplast restriction site data to
propose reciprocal hybrid origins in P. hesperium. In their study, one specimen of P.
hesperium from Utah had P. glycyrrhiza as the putative maternal progenitor, whereas
another specimen of P. hesperium from eastern Washington had P. amorphum (or a closely
related diploid) as the maternal progenitor. By expanding the geographic sampling of P.
hesperium, we have discovered a broader geographic trend that reinforces the initial
findings of Haufler et al. (1995a). All specimens of P. hesperium that we sampled from the

80
north––Washington, Oregon, Idaho, and Montana––have plastid genomes contributed
by a diploid taxon from the P. appalachianum clade (clade A), whereas all specimens from
the south––Utah, Colorado, New Mexico, Arizona, and Baja California––have plastid
genomes contributed by a diploid taxon from the P. glycyrrhiza clade (clade G; Figs. 10A,
C; Sigel et al. in press). Our analysis of biparentally-‐‑inherited gapCp sequence data
further clarifies the plastid donors, providing support for P. amorphum (clade A) and P.
glycyrrhiza (clade G), specifically, as the diploid progenitors of P. hesperium (Fig. 10C).
Based on these findings, we propose that P. hesperium individuals north of 42˚N belong
to one or more IDLs that have P. amorphum as their maternal progenitor, whereas those
south of 42˚N belong to one or more IDLs that have P. glycyrrhiza as their maternal
progenitor (Fig. 10C). Additional sampling of populations in British Columbia,
California, and Chihuahua may further corroborate or provide interesting
counterexamples to this pattern.
To the best of our knowledge, no other allopolyploid species with reciprocal
origins has such a striking association between plastid haplotypes and geography. What
might account for the pattern observed in Polypodium hesperium? It is possible that it was
simply a matter of chance that P. glycyrrhiza was the maternal parent during a southern
hybridization event, whereas P. amorphum was the maternal parent during a northern
hybridization event. This scenario seems most probable if there is equal likelihood (e.g.,
no biological barriers) for reciprocal hybridization, and P. hesperium is composed of only

81
two IDLs, one in the northern portion and one in the southern portion of its range. A
second possibility is that plastids inherited from different parents confer selective
advantages in different portions of the range of P. hesperium. While never explicitly
analyzed, it likely that there are significant environmental and ecological differences
between P. hesperium habitats in the northern vs. southern portions of its range
(Windham 1985). Under this scenario, it is possible that multiple IDLs of P. hesperium
were formed in both the northern and southern portions of its range, but only those
having the more advantageous plastid haplotype—P. amorphum in the north and P.
glycyrrhiza in the south—remain extant.
Relative ages of northern and southern IDLs of Polypodium hesperium—
Because P. amorphum and P. glycyrrhiza both diverged from their closest relatives during
the early to middle Pleistocene (approximately 1.2 mya and 2.5 mya, respectively; Sigel
et al. in press), all IDLs of P. hesperium were likely formed within the last one million
years. The present-‐‑day distributions of P. amorphum and P. glycyrrhiza are characteristic
of species whose evolutionary histories have been shaped by cycles of glacial advances
and retreats during the Pleistocene (Pielou 1991; Soltis et al. 1997; Haufler et al. 2000;
Sigel et al. in press). Polypodium amorphum is primarily found in the Cascade and
Olympic Mountains of the Pacific Northwest, whereas P. glycyrrhiza grows near the
Pacific coast from the Kamchatka Peninsula to central California (Haufler et al. 1993;
Douglas et al. 2000). The geographic ranges of P. hesperium and its progenitors currently

82
overlap in a narrow band extending from the Columbia River gorge on the
Oregon/Washington border to the Frasier River gorge in southern British Columbia
(Lang 1971). During glacial advances, the ranges of P. glycyrrhiza and P. amorphum likely
extended south and overlapped more extensively to form one (or more) southern IDLs
of P. hesperium. During glacial retreats, the ranges of P. glycyrrhiza and P. amorphum
likely contracted northward and formed at least one northern IDL of P. hesperium. The
northernmost distribution of P. hesperium was glaciated or under permafrost during the
last glacial maxima (approximately 20 000–19 000 years ago; Pielou 1991; Taberlet 1998;
Clark and Mix 2002; Clark et al. 2009), and sediment cores from Fraser River Canyon
reveal the appearance of Polypodium spores approximately 11 000 years ago (Mathewes
and Rouse 1975). We hypothesize that the northern IDL(s) of P. hesperium may have
formed during the last 20 000 years and is potentially younger that the southern IDL(s).
Our hypothesis about the relative ages of the northern and southern IDLs of P.
hesperium challenges an earlier hypothesis by Haulfer et al. (1995a) that populations
from western Montana were of older origin than other northern or southern
populations. Because specimens from western Montana and eastern Washington exhibit
nuclear-‐‑encoded hexohinase (HK) isozyme alleles and spore ornamentation patterns
resembling those of P. sibiricum, a diploid species closely allied to P. amorphum (Fig. 9,
clade A), Haufler et al. (1995b) proposed that P. hesperium in western Montana and
eastern Washington may have resulted from an ancient hybridization event between P.

83
glycyrrhiza and the common ancestor of P. amorphum and P. sibiricum. However, neither
our trnG-‐‑R nor gapCp datasets provide evidence that specimens from western Montana
belong to a distinct, ancient IDL; the presence of P. sibiricum characters might be
explained by introgression instead. Polypodium saximontanum Windham, an
allotetraploid derived from P. amorphum and P. sibiricum (Fig. 9), recently has been
found in Ravalli County, Montana where it overlaps with P. hesperium (Sigel et al.
2014a). It is feasible that these two allopolyploid species may have hybridized,
providing a mechanism for the introgression of P. sibiricum genes into the P. hesperium
population (Rieseberg 1995; Hegarty and Hiscock 2005).
Are there additional IDLs of Polypodium hesperium?—While our trnG-‐‑R plastid
phylogeny (Fig. 10B) strongly supports reciprocal origins of P. hesperium, it is possible
that the northern and southern populations of P. hesperium do, in fact, include multiple,
“cryptic” IDLs that share a plastid haplotype. This has been shown for several natural
allopolyploids, including species of Platanthera (Wallace 2003), Aegilops (Meimberg et al.
2009), and Androsace (Dixon et al. 2009). The most extensively studied example involves
the allopolyploid angiosperm Tragopogon miscellus Ownbey (Asteracaeae; Soltis at al.
1991, 1995, 2004). In addition to having well documented reciprocal IDLs, different
populations of T. miscellus with identical plastid haplotypes exhibit significant variation
in random amplified polymorphic DNA (RAPD) markers (Cook et al. 1998). Because T.
miscellus is of very recent origin (~ 80 years ago), this variation has been attributed to

84
repeated allopolyploid formation among genetically variable diploid populations, not
subsequent genetic evolution.
In the case of P. hesperium, our nuclear gapCp data support the distinction
between northern and southern populations suggested by the plastid data (Fig. 10B).
Specimens from northern populations (highlighted in red) have P. amorphum-‐‑derived
alleles that form a well-‐‑supported (BIPP = 1.0; MLBS = 89%) clade not represented
among the sampled diploids of that species. On the other hand, the P. amorphum-‐‑derived
alleles observed in the southern populations of P. hesperium are identical (or very
similar) to one of the two alleles recovered from P. amorphum 7773 (Fig. 10B). With
regard to the P. glycyrrhiza-‐‑derived alleles found in P. hesperium, the northern (red) and
southern (blue) populations do not share alleles with each other, and none are identical
to alleles recovered from the three samples of diploid P. glycyrrhiza. The lack of
resolution among alleles within the northern and southern populations of P. hesperium
seems to argue against additional IDLs of P. hesperium. The southern populations in
particular show minimal variation in gapCp, and the majority of specimens have
identical alleles (Fig. 10C). While the gapCp data do not provide compelling evidence for
additional IDLs in P. hesperium, the possibility of their existence cannot be dismissed. It
is possible, even likely, that gapCp is insufficiently variable to allow detection of cryptic
IDLs, and additional nuclear markers (such as the RAPDs used in Tragopogon miscellus)
will be necessary to address this question.

85
Polypodium hesperium: a natural fern model system for investigating how
reciprocal origins shape allopolyploids—With few exceptions, research on polyploid
plants has been dominated by studies of angiosperms—particularly crops, synthesized
polyploids, and model organisms (Buggs 2008). It remains unclear whether conclusions
drawn from these particular taxa may be extended to broadly-‐‑divergent evolutionary
lineages. Here, we propose P. hesperium as a natural fern model system for studying the
effects of gene duplication and hybridization on adaptation and evolution at the
phenotypic, genetic, and genomic scales. Several features of Polypodium hesperium make
it a particularly promising study system, including reciprocal IDLs with disjunct
geographic distributions, recent (Pleistocene) time of origin, divergent nuclear genomes
with homoeologous gene copies that can be phylogenetically distinguished from one
other, extant diploid progenitors, and possible evidence for introgression with a closely
related species. In addition, P. hesperium, as well as P. glycyrrhiza and P. amorphum,
survive well when transplanted from the field into controlled growth conditions, can be
asexually propagated, and have spores that readily germinate into gametophytes in
standard media (Hoshizaki 1975; Sigel, personal observation). At present, no other
allopolyploid fern is better suited to improving our understanding of the role
polyploidy and hybridization in plant evolution.

86
Table 3. Specimens of Polypodium and Pleurosoriopsis used in Chapter III. Numbers following locality information are unique identifiers that correspond to accession numbers in the Fern Lab Database (http://fernlab.biology.duke.edu). All specimens listed are included in the plastid trnG-‐‑R dataset. Superscript letters indicate the plastid origin of specific P. hesperium specimens as determined by phylogenetic analysis of the trnG-‐‑R dataset: a = P. appalachianum clade; g = P. glycyrrhiza clade. Unique identifiers in italics indicate specimens included in the nuclear gapCp dataset.
Polypodium vulgare complex
Polypodium amorphum Suksd. Canada, British Columbia, Greater Vancouver District: 6951 U.S.A., Oregon, Multnomah Co.: 7556, 7772, 7773, 7778 U.S.A., Washington, King Co.: 7771, 7779; Kittitas Co.: 6952; Mason Co.: 6953;
Snohomish Co.: 7770, 7777
Polypodium appalachianum Haufler & Windham Canada, Nova Scotia: 8029 U.S.A., New York, Hamilton Co.: 8045 U.S.A., North Carolina, Ashe Co.: 7533 U.S.A., Virginia, Augusta Co.: 7632; Rockingham Co.: 7630 Polypodium californicum Kaulf. U.S.A., California, Orange Co.: 3829; Riverside Co.: 5909; San Mateo Co.: 7249 Polypodium cambricum L. England: 8786 Spain, Valencia: 8787 Polypodium fauriei Christ Japan, Fukui, Nyū-‐‑gun: 8722 Polypodium glycyrrhiza D.C. Eaton U.S.A., Alaska, Lake and Peninsula Co.: 8009, 8161 U.S.A., Oregon, Lincoln Co.: 7559; Multnomah Co.: 7545, 7546, 7768, 7769 U.S.A., Washington, King Co.: 7218, 7781; Lewis Co.: 7780, 7783; Snohomish Co.: 7766,
7782

87
Polypodium hesperium Maxon Mexico, Baja California, Ensenada Municipality: 7539 g U.S.A., Arizona, Coconino Co.: 3127g, 8171g, 8174g, 8175g, 8176g ; Gila Co.: 8172g, 8177g,
8178g; Graham Co.: 7217g, 8179 g , 8180g, 8181g , 8182g ; Pima Co.: 7793g U.S.A., Colorado, La Plata Co.: 8184g; Ouray Co.: 8185g, 8186g, 8187g, 8188g U.S.A., Idaho, Clearwater Co.: 7785a, 7786a ; Shoshone Co.: 8288a U.S.A., Montana, Flathead Co.: 8277a; Glacier Co.: 8278a; Lake Co.: 8279a, 8280a, 8281a,
8282a; Lincoln Co.: 7791a, 8268a, 8269a, 8270a, 8271a, 8272a, 8273a, 8274a, 8276a; Sanders Co.: 8290a
U.S.A., New Mexico, Rio Arriba Co.: 8183g U.S.A., Oregon, Multnomah Co.: 7763a U.S.A., Utah, Beaver Co.: 8166g; Salt Lake Co.: 7792g, 8159g, 8164 g, 8165g ; Washington
Co.: 8167g, 8168 g , 8169g U.S.A., Washington, Chelan Co.: 7571a; Snohomish Co.: 8206a Polypodium macaronesicum A.E. Bobrov Spain, Canary Islands, Tenerife: 8688 Polypodium pellucidum Kaulf. U.S.A., Hawaii, Kauai Co.: 8778 Polypodium scouleri Hook. & Grev. U.S.A., California, San Francisco Co.: 7251 U.S.A., Washington, Jefferson Co.: 7216
Polypodium sibiricum Sipliv. Canada, Ontario, Kenora District: 8039 U.S.A., Alaska, Northwest Arctic Co.: 8008; Southeast Fairbanks Co.: 7215 Russia, Siberia: 8779 Polypodium plesiosorum group Polypodium colpodes Kunze Mexico, Chiapas: 7254 Polypodium martensii Mett. Mexico, Querétaro, Landa de Matamoros Municipality: 7540 Polypodium plesiosorum Kunze Mexico, Jalisco, Zapopan Municipality: 7160

88
Polypodium rhodopleuron Kunze Mexico, Veracruz: 7255 Polypodium subpetiolatum Hook. Mexico, Hidalgo, Nicolás Flores Municipality: 6485 Pleurosoriopsis makinoi (Maxim.) Fomin Japan, Fukui, Fukui-‐‑shi: 8723

89
Table 4. Tree statistics for the plastid and nuclear sequence datasets analyzed in Chapter III. Missing data includes both uncertain bases (?, N, R, Y, etc.) and gaps (-‐‑); MLBS: maximum likelihood bootstrap support. BIPP: Bayesian inference posterior probability.
Locus Taxon
Sampling Included Sites
Variable Sites
% Missing Data
Best-‐‑Fitting Model ML Score
% Partitions MLBS ≥ 70%
% Partitions BIPP ≥ 0.95
trnG-‐‑R 100
986 123 0.39 K81uf+G -‐‑2881.7743 29.73 32.43
trnG-‐‑R indels 38 38 1.77 Mkv
gapCp
36 (63
consensus alleles)
552 144 11.14 K80+G -‐‑2234.9338 51.85 70.37
gapCp indels
25 25 3.81 Mkv

90
Figure 9. Summary of relationships among the diploid and allopolyploid taxa of the Polypodium vulgare complex as reconstructed by a phylogenetic analysis of a four loci plastid sequence dataset and analysis of isozyme banding patterns (Haufler et al. 1995a; Sigel et al. in press). The monophyletic P. vulgare complex comprises four clades of diploid species: the P. appalachianum clade (A), the P. glycyrrhiza clade (G), the P. cambricum clade (C), and the P. scouleri clade (S). Bolded branches and * indicate Bayesian inference posterior probability (BIPP) and maximum likelihood bootstrap support (MLBS) values (see inset legend). Dashed lines connect allopolyploid taxa to their progenitor diploid species. Bolded taxon names and dashed lines highlight P. amorphum (clade A) and P. glycyrrhiza (clade G), the diploid progenitors of the allotetraploid species P. hesperium. Numbers in parentheses indicate the ploidy of the polyploid species.
P. amorphum
P. glycyrrhiza
P. californicum
P. fauriei
P. cambricum
P. macaronesicum
P. scouleri
P. pellucidum
P. appalachianum
P. sibiricum
P. californicum
P. fauriei
P. cambricum
P. macaronesicum
P. scouleri
P. pellucidum
G
A
C
S %,33���������0/%6�����
*
*
*
* *%,33� ������0/%6� ���
P. hesperium (4x)
P. vulgare (4x)
P. virginianum (4x)
P. calirhiza (4x)
P. saximontanum (4x)
P. interjectum (6x)
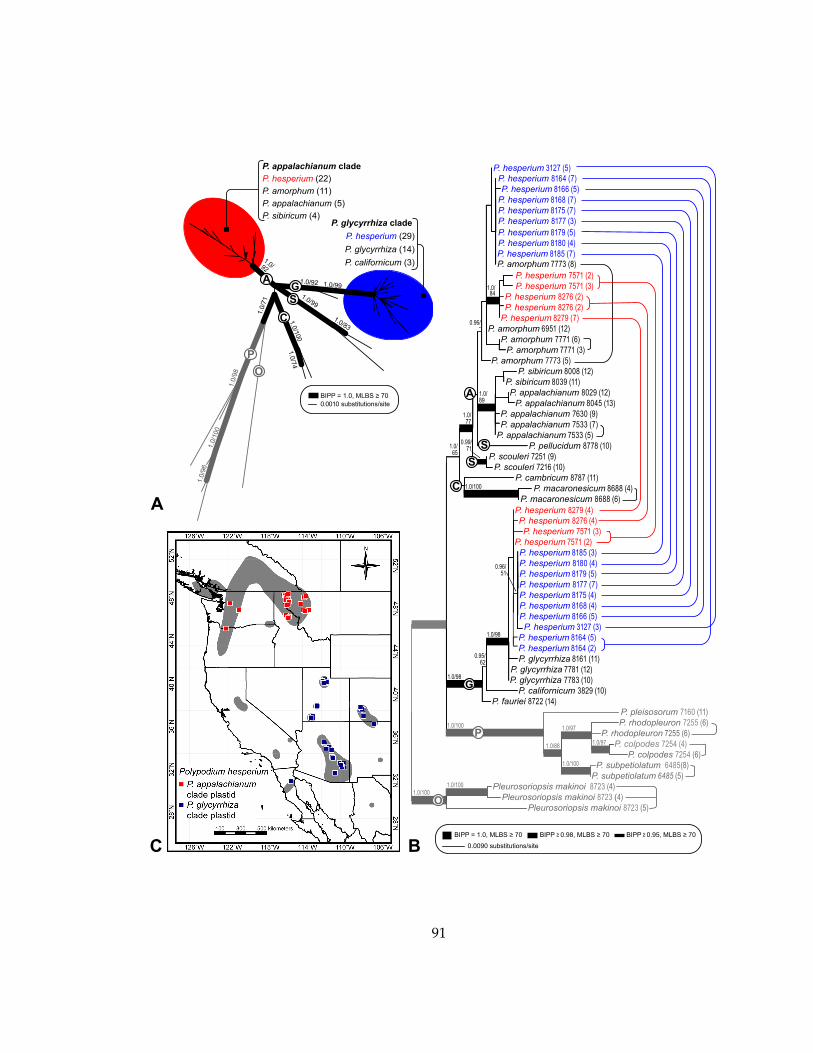
91
0.0010 substitutions/site %,33� ������0/%6�����
BC
A
1.0/92
1.0/92 1.0/991.0/99
1.0/100������
������
1.0/83
1.0/
98
1.0/
100
1.0/
96
AG
C
S
P
O
P. appalachianum clade
P. hesperium (22) P. amorphum (11)P. appalachianum (5)P. sibiricum ���
P. glycyrrhiza clade P. hesperium (29)P. glycyrrhiza ����P. californicum (3)
P. hesperium ��������
P. hesperium���������
P. hesperium 8166 (5)P. hesperium���������
P. hesperium���������
P. hesperium���������P. hesperium���������
P. hesperium ��������
P. hesperium���������
P. amorphum��������� P. hesperium �������� P. hesperium ��������
P. hesperium ��������P. hesperium ��������
P. hesperium���������P. amorphum 6951 (12)
P. amorphum ��������P. amorphum���������
P. amorphum ��������P. sibiricum 8008 (12)
P. sibiricum 8039 (11)
P. appalachianum ��������
P. appalachianum����������P. appalachianum 8029 (12)
P. appalachianum���������
P. appalachianum ��������
P. pellucidum ���� (10)P. scouleri ��������
P. scouleri ���������P. cambricum ���� (11)
P. macaronesicum 8688 ���P. macaronesicum 8688 (6)
P. hesperium ��������P. hesperium ��������
P. hesperium �������� P. hesperium ��������
P. hesperium���������
P. hesperium ��������
P. hesperium ��������
P. hesperium 8185 (3)
P. hesperium ��������P. hesperium ��������
P. hesperium ��������P. hesperium 8166 (5)
P. hesperium ��������P. hesperium ��������
P. glycyrrhiza 8161 (11)P. glycyrrhiza ���������P. glycyrrhiza ���������
P. californicum 3829 (10)P. fauriei ���������
P. pleisosorum ���� (11)P. rhodopleuron ������6)
P. rhodopleuron ���������P. colpodes ���� ���
P. colpodes ���� (6)P. subpetiolatum ����(8)
P. subpetiolatum 6485 (5)Pleurosoriopsis makinoi ��������
Pleurosoriopsis makinoi �����(��Pleurosoriopsis makinoi �����(5)
0.0090 substitutions/site
1.0/98
1.0/100
1.0/88
������
1.0/100
������
1.0/100
1.0/98
0.95/62
0.96/51
1.0/65
1.0/100
0.99/��
1.0/��
1.0/89
0.96/-
1.0/��
1.0/100
BIPP = 1.0,�0/%6����� BIPP ��0.98��0/%6����� BIPP���0.95��0/%6�����
A
S
S
C
G
O
P

92
Figure 10. Summary of the evolutionary relationships and geographic distributions of independently derived lineages of the allotetraploid species Polypodium hesperium. (A) Best unrooted phylogram recovered by ML analysis of the plastid trnG-‐‑R dataset. Lettered clades correspond to those in Fig. 9. Black branches show relationships within the P. vulgare complex (clades A, G, C, and S), whereas gray branches indicate the P. plesiosorum group (clade P) and Pleurosoriopsis makinoi (O). Red and blue circles highlight members of the P. appalachianum clade (A) and P. glycyrrhiza clade (G), respectively, with the number of individuals of each species noted in parentheses. Bolded branches display Bayesian inference posterior probability (BIPP) and maximum likelihood bootstrap (MLBS) support values (see inset legend). (B) Best phylogram recovered by ML analysis of the nuclear gapCp dataset. Lettered clades and branch colors are as specified in Figs. 9 and 10A. Bolded branches display BIPP and MLBS support values (see inset legend). Four-‐‑digit numbers following taxon names are unique specimen identifiers, and numbers in parentheses indicate the number of clones compiled to determine the corresponding consensus allele sequence (see Table 3 and Appendix B, Table B.1). Red font indicates consensus allele sequences derived from P. hesperium specimens with a P. appalachianum clade (A) plastid donor, whereas blue font indicates consensus allele sequences derived from P. hesperium specimens with a P. glycyrrhiza clade (G) plastid donor. Curved lines join consensus allele sequences recovered from the same specimen. (C) Geographic distribution of P. hesperium and specific collection localities of P. hesperium specimens included in this study. Gray patches represent the known geographic range of P. hesperium as interpreted from voucher coordinate information from the Global Biodiversity Informatics Facility (www.gbif.com; Edwards et al. 2000), the Intermountain Region Herbarium Network (http://intermountainbiota.org), and the Consortium of California Herbaria (http://ucjeps.berkeley.edu/consortium). Squares indicate the collection localities of particular specimens used in this study (see Table 3 and Appendix B, Table B.1 for locality information and coordinates). Square color corresponds to the plastid (presumably maternal) donor as determined by phylogenetic analysis of the trnG-‐‑R dataset: red indicates P. hesperium specimens with plastids inherited from a member of the P. appalachianum clade (A), whereas blue indicates P. hesperium specimens with plastids inherited from a member of the P. glycyrrhiza clade (G).

93
CHAPTER IV
EXPRESSION LEVEL DOMINANCE AND HOMOEOLOG EXPRESSION BIAS IN RECIPROCAL
ORIGINS OF THE ALLOPOLYPLOID FERN POLYPODIUM HESPERIUM
Introduction
Once considered an evolutionary dead end, polyploidy is now widely accepted
as an evolutionary force with the potential to influence the fate of entire lineages, from
plants to fungi and animals, and even protozoans (Stebbins 1950; Wolfe & Shields 1997;
Gallardo et al. 1999; Sémon and Wolfe 2007). This is particularly true among vascular
plants, where all lineages are known to have experienced one or more ancient
polyploidization events (Jiao et al. 2011). An increase in ploidy has co-‐‑occurred with an
estimated 15% and 31% of speciation events in angiosperms and ferns, respectively
(Wood et al. 2009). Such a high prevalence of polyploids suggests that genome
duplication may be a primary facilitator of evolutionary change, allowing these
organisms to adapt to, and persist in, varying environmental conditions (Soltis and
Soltis 2000; Comai 2005; Otto 2007; Ramsey 2011; Meimberg et al. 2009; Madlung 2012).
Allopolyploids are especially intriguing because they result from hybridization
accompanied by chromosome doubling, and they begin their evolutionary journey with
full sets of chromosomes from each progenitor. The union of divergent, or

94
homoeologous, genomes is often associated with major genetic and regulatory changes,
such as epigenetic modifications (Salmon et al. 2005; Lukens et al. 2006), activation of
retroelements (Kashkush et al. 2003; Senerchia et al. 2014), interchromosomal
rearrangements (Levy and Feldman 2004; Jones and Thomas 2009; Chester et al. 2012),
homoeologous recombination (Gaeta and Pires 2009; Salmon et al. 2010), and gene loss
(Thomas et al. 2005; Schnable et al. 2011; Buggs et al. 2012; Moghe et al. 2014). These
genomic changes, in turn, can result in altered gene expression patterns and phenotypes
(Comai 2005; Coate et al. 2012; Madlung 2013).
While patterns of gene expression in allopolyploids can vary significantly among
genes and tissues, as well as among individuals and allopolyploid species, two
transcriptional phenomena have been widely observed. The first phenomenon, referred
to as expression level dominance, occurs when the total gene expression of an
allopolyploid for a given gene matches the expression level of only one of its parent
species (see Table 5 for a summary of terminology; Rapp et al. 2009; Flagel and Wendel
2010; Bardil 2011; Yoo et al. 2013; Cox et al. 2014). The second phenomenon, referred to
as homoeolog expression bias, is the preferential expression of homoeologs, or gene
copies, from one parent for a given gene in an allopolyploid (Chaudhary et al. 2009; Koh
et al. 2010; Combes et al. 2013; Grønvold 2013; Yoo et al. 2013; Akama et al. 2014; Cox et
al. 2014). Patterns of expression level dominance and homoeolog expression bias across
the transcriptome can mirror or contradict the expression of individual genes, often with

95
both phenomena co-‐‑occuring. For example, Yoo et al. (2013) found that 25% of genes
surveyed in the natural allotetraploid Gossypium hirsutum exhibited expression level
dominance in the direction of its G. arboretum (A-‐‑genome) parent. Most of the genes that
exhibited A-‐‑genome dominance, however, exhibited near equal expression of
homoeologs derived from both G. arboretum (A-‐‑genome) parent and the second parental
species, G. raimondii (D-‐‑genome).
Increasingly, it is recognized that many, if not most, allopolyploid species form
recurrently from distinct hybridization events among different populations of the same
progenitor species (Soltis and Soltis 1993, 1998) and comprise multiple, independently
derived lineages (IDLs). In some cases, allopolyploid species form reciprocally, with
IDLs having reciprocal maternal progenitors and, consequently, different maternally-‐‑
inherited plastid genomes (most plants exhibit maternal inheritance of plastids; Reboud
and Zeyl 1994; Birky 1995). At the time of formation, IDLs contribute to the genetic
diversity of an allopolyploid species by incorporating different parental genotypes
(Soltis and Soltis 1999), but the influence of recurrent origins on genetic and phenotypic
variation in subsequent generations is less apparent. Studies on a handful of natural,
recurrently formed allopolyploid angiosperms, namely Tragopogon miscellus and T.
mirus, suggest that IDLs undergo similar patterns homoeolog evolution, resulting in
similar patterns of gene expression (Tate et al 2006, 2009; Koh et al. 2010; Buggs et al.
2009, 2012). For example, plants belonging to IDLs of T. miscellus, exhibited unbalanced

96
homoeolog-‐‑expression bias, with preferential loss of expression of homoeologs derived
from their T. dubius parent (in many cases due to convergent homoeolog loss; Tate et al
2006, 2009; Buggs et al. 2010). Additional studies of recurrently formed allopolyploids,
preferably with broad taxonomic representation, are needed to understand the
predictability of homoeolog evolution and expression.
As the second largest lineage of vascular plants, ferns have a complex history of
ancient polyploidization events and are replete with reticulate species complexes
(Barrington et al. 1989). One especially promising candidate for investigating the
evolutionary consequences of recurrent allopolyploidy in ferns is the allotetraploid
species Polypodium hesperium Maxon, a member of the well-‐‑studied Polypodium vulgare
complex. Native to western North America, P. hesperium is known to have formed
reciprocally between two diploid species, P. amorphum Suksd. and P. glycyrrhiza D.C.
Eaton, that belong to genetically and morphologically distinct clades in the P. vulgare
complex (diverged approximately 12 mya, Sigel et al. in press; average genetic
divergence of 2%, Appendix C, Table C.1). Polypodium hesperium comprises at least two
independently derived lineages (IDLs) with reciprocal maternally-‐‑inherited plastid
haplotypes (henceforth referred to as maternal lineages)—populations north of 42˚N
have plastids inherited from P. amorphum, whereas those south of 42˚N have plastids
inherited from P. glycyrrhiza (referred to as P. hesperium Ha and P. hesperium Hg,
respectively; Sigel et al. in review). Geographic data and estimates of divergence times

97
between P. amorphum, P. glycyrrhiza, and their respective sister taxa, suggest that the
maternal lineages of P. hesperium likely originated within the last one million years (Sigel
et al. in press, in review).
With the ultimate goal of understanding how ferns utilize the genetic diversity
imparted by allopolyploidy and recurrent origins, we assess patterns of gene expression
between the two maternal lineages of Polypodium hesperium. By adopting high
throughput RNA-‐‑sequencing (RNA-‐‑Seq), we construct a well-‐‑annotated reference
transcriptome for Polypodium and identify a suite of SNP markers between P. amorphum
and P. glycyrrhiza. By mapping sequencing reads back to the reference transcriptome, we
are able to compare total gene expression among P. hesperium and its diploid
progenitors, and assess patterns of homoeolog-‐‑specific expression in P. hesperium.
Specifically, we ask the following questions: (1) Do each of the maternal lineages of P.
hesperium exhibit similar patterns of total gene expression relative to their diploid
progenitors? (2) Do each of the maternal lineages of P. hesperium exhibit similar patterns
of homoeolog-‐‑specific gene expression? (3) Because this is the first study to focus on
gene expression patterns in ferns, do we find that P. hesperium exhibits expression level
dominance and homoeolog-‐‑bias that is comparable to what is being found in other (non-‐‑
fern) allopolyploid lineages?
Material and Methods

98
Plant material—For this study we used a total of 12 Polypodium specimens—
three individuals of P. amorphum, three individuals of P. glycyrrhiza, three individuals of
P. hesperium with a P. amorphum-‐‑derived plastid genome, and three individuals of P.
hesperium with a P. glycyrrhiza-‐‑derived plastid genome (Table 6). All specimens of P.
hesperium were included in an earlier study investigating the reciprocal origins of P.
hesperium, in which the plastid haplotypes were determined by sequencing the plastid
trnG-‐‑trnR intergenic spacer (henceforth trnG-‐‑R; Sigel et al. in review). All plants were
collected from wild populations between August 2010 and August 2011, and
transported live to the Duke University Greenhouses. Each plant was cleaned with
water to remove soil from the roots and rhizomes and repotted in Farfard Mix 2 (Sun
Gro Horticulture Canada Ltd., U.S.A.). Plants were maintained in a randomly arranged
block under common greenhouse conditions (18 hour/day photoperiod with luminosity
of 200-‐‑400 Umol/sec/cm2; 27-‐‑67% humidity; daytime temperature: 18.3-‐‑21.1°C; nighttime
temperature: 17.8-‐‑20.6°C) for a minimum of 18 months before leaf material was
harvested for RNA extraction. Newly emerged croziers were loosely tagged at the
petiole base with colored wire, and monitored daily as the leaves unrolled. Lamina
tissue from a single leaf was sampled for each specimen, 21 days after the young leaf
had fully unrolled. After collection, leaf material was flash frozen in liquid nitrogen and
maintained at -‐‑80°C until RNA extraction. Material for all specimens was collected
between February 28 and March 5, 2013, and always between 10:00 -‐‑ 11:00 am EST.

99
RNA extraction, library construction, and Illumina sequencing—Total RNA
was extracted from 70 to 100 milligrams of leaf material per Polypodium specimen,
depending on the amount of available tissue. Extraction protocols followed the
Spectrum Plant Total RNA kit (Sigma-‐‑Aldrich, U.S.A.) without modification. The
Aglient DNA 2100 Bioanalyzer with Agilent RNA 6000 Nanochip and reagents (Aglient
Technologies, U.S.A.) were used to assess the quality and concentration of each RNA
extraction.
A total of 12 cDNA libraries, one for each Polypodium specimen, were constructed
using the TruSeq RNA Sample Prep Kit (Illumina, U.S.A). The standard library
preparation protocol was modified to produce indexed (bar-‐‑coded), strand-‐‑specific,
paired-‐‑end libraries following Borodina et al. (2011). Equimolar amounts of the 12
libraries were pooled into a single sample and submitted to the Duke University
Genome Sequencing and Analysis Core (www.genome.duke.edu). Sequencing of 100
base paired-‐‑end reads was performed on four lanes of the Illumina HiSeq 2000
(Illumina, U.S.A.).
Processing of raw sequencing reads—Reads from each library were sorted by
index, and the number and quality of reads of each sample were evaluated with FastQC
v. 3-‐‑5-‐‑2012 (http://www.bioinformatics.bbsrc.ac.uk/projects/fastqc). Adapter sequences
and low quality reads were removed using Trimmomatic v. 0.30 (Bolger et al. 2014). All

100
read pairs for which both the forward and reverse reads passed quality filtering were
used in subsequent analyses.
Confirming the plastid haplotypes of P. hesperium—The plastid haplotypes
were confirmed by generating a transcriptome assembly for each P. hesperium specimen
using Bowtie v. 1.0.1 (Langmead et al. 2009) as implemented in Trinity v. r20140413
(Grabherr et al. 2011), and extracting the rbcL plastid sequences using blastn (e-‐‑value =
1e-‐‑20; Altschul et al. 1990) with the corresponding Adiantum capillus-‐‑veneris sequence as
the query (acquired from chloroplast genome AY178864.1 on Genbank). The extracted
rbcL sequences were then manually aligned to previously published rbcL sequences of P.
amorphum and P. glycyrrhiza (Sigel et al. in press, in review). A parsimony tree was
generated for the rbcL alignment in PAUP* v. 4.0a134 (Swofford 2002) using default
settings. Polypodium hesperium specimens with sequences united in a clade with
sequences from P. amorphum were determined to have P. amorphum-‐‑derived plastid
genomes; P. hesperium specimens with sequences united in a clade with sequences from
P. glycyrrhiza were determined to have P. glycyrrhiza-‐‑derived plastid genomes.
Generating a Polypodium reference transcriptome and transcript annotation—
A lack of preexisting genomic resources for Polypodium or closely related genera
required us to generate a de novo reference transcriptome as a prerequisite for assessing
gene expression patterns. To minimize read mapping related technical bias, an initial
reference transcriptome was generated using all filtered reads from the three specimens

101
of P. amorphum and the three specimens of P. glycyrrhiza using Trinity v. r20140413
(Grabherr et al. 2011). All P. amorphum and P. glycyrrhiza reads were then mapped back
to the initial reference transcriptome using Bowtie v. 1.0.1 (Langmead et al. 2009) and
quantified with RSEM v. 1.2.14 (Li and Dewey 2011). Any transcripts with less than
three reads mapped back to it were considered artifacts of the transcriptome assembly
algorithm (Grabherr et al. 2011) and removed from the reference transcriptome.
To remove non-‐‑plant contaminant sequences and restrict subsequent analyses to
nuclear genes, we annotated the initial reference transcriptome by querying all
transcripts against the orthologous gene classification (i.e. narrowly-‐‑defined gene
lineages; henceforth, orthogroups) used by the Amborella Genome Project (Amborella
Genome Project 2013). The 53,136 orthogroups in this classification were constructed
with OrthoMCL (Li et al. 2003), using the predicted proteins from 22 sequenced land
plant genomes. Candidate orthogroups for each Polypodium transcript were first
identified using a low stringency blastp search (e-‐‑value = 10; Altschul et al. 1990).
Transcripts were then queried against profile hidden markov models (HMMs) for all
orthogroups containing a postitive blastp hit and were then assigned to the orthogroup
with the best scoring HMM match. Functional information for each orthogroup was
collected by querying each protein from the 22 genomes against the protein domain
HMMs in the PFAM database (e-‐‑value cutoff = 1e-‐‑10; pfam.xfam.org) and retrieving the
gene ontology (GO) terms associated with each PFAM domain. Custom scripts were

102
used to cross reference orthogroup information with GO categories. All transcripts
without hits to the orthogroup classification were excluded from the Polypodium
reference transcriptome and not used in subsequent analyses.
Read mapping, quantification, and differential expression—For each of the 12
Polypodium specimens, filtered reads were mapped to the Polypodium reference
transcriptome using Bowtie v. 1.0.1 (Langmead et al. 2009) as implemented through the
Trinity package v. r20140413 (Grabherr et al. 2011), using parameters specifically for
paired-‐‑end strand specific reads (as described in Haas et al. 2013). Maximum likelihood
(ML) read abundances were calculated for each gene using RSEM v. 1.2.13 (as described
in Haas et al. 2013; Li and Dewey 2011), and the Trinity package script
abundance_estimates_to_matrix.pl was used to generate a combined matrix of read
abundances of all genes for all samples. Prior to differential expression analyses, the
combined read abundance matrix was filtered to remove genes that were not expressed
consistently (i.e. expressed in all three biological replicates) by either P. amorphum and/or
P. glycyrrhiza. Additive, or midparent, expression (Table 5) between P. amorphum and P.
glycyrrhiza for each gene was generated in silico by taking a weighted average of the
expression levels of the six diploid accessions.
Differential expression analyses were performed using the edgeR release 2.14 in
R v. 3.1.0 (R Development Core Team 2008) with the TMM (trimmed mean of M values)
method to normalize read counts within and across specimens (Robinson and Oshlack

103
2010; Dillies et al. 2013). Using the filtered combined reads abundance matrix,
differential expression analyses were performed in one of two ways: (1) for the three
biological replicates of each IDL of P. hesperium and (2) for each of the six specimens of
P. hesperium. For both types of analyses, differential expression of a gene was assessed
by comparing the total expression levels among P. hesperium, P. amorphum, P. glycyrrhiza,
and the in silico midparent using Fisher’s exact test. The BH method was used to a adjust
p-‐‑values to account for false discovery of differentially expressed genes (Benjamini and
Hochberg 1995; Robinson and Oshlack 2010). The number of genes exhibiting
statistically significant differential expression among P. hesperium, P. amorphum, P.
glycyrrhiza, and the in silico midparent was calculated using custom scripts. Significant
differences in the number of differentially expressed genes between the reciprocal
lineages of P. hesperium and their diploid progenitors were determined with Fisher’s
exact test, α = 0.01, as implemented in R (R Foundation for Statistical Computing 2008).
Analyses of expression level dominance—Each gene identified as differentially
expressed among P. hesperium, P. amorphum, and P. glycyrrhiza was assigned to one of 12
expression classes in accordance with Rapp et al. (2012), using custom scripts. These 12
classes comprise all possible patterns of differential expression of P. hesperium relative to
its diploid progenitors (Table 5; Fig. 12) and include multiple categories of additivity
(classes I and XII), expression level dominance (classes II, IV, IX, and XI), and
transgressive regulation (classes III, V, VI, VII, VIII, and X). Significant differences in the

104
number of genes belonging to the different expression categories within and between
the maternal lineages of P. hesperium were determined with Fisher’s exact test, α = 0.01,
as implemented in R (R Foundation for Statistical Computing 2008).
Estimation of homoeologous gene expression—One method for assessing
subgenomic contributions to total gene expression in allopolyploids involves using fixed
single nucleotide polymorphisms (SNPs) between progenitor species to identify
homoeologous gene copies in the allopolyploid. SNPs between progenitor species at the
time of hybridization are vertically transmitted to the derived allopolyploid. Even after
substantial evolutionary time, some SNPs will remain fixed between the diploid species
and can be used to identify homoeologous gene copies in the allopolyploid (Adams
2007; Flagel and Wendel 2009). Encouraged by numerous recent, successful applications
of this technique to model and non-‐‑model allopolyploids (e.g. Buggs et al. 2010; Combes
et al. 2012; Salmon et al. 2012; Akama et al. 2013; Grønvold 2013; Krasileva et al. 2013;
Mathani et al. 2013; Nagy et al. 2013; Page et al. 2013; Cox et al. 2014), we developed a
bioinformatics pipeline to identify putative interspecific SNPs between the diploid
species P. amorphum and P. glycyrrhiza, and to estimate homoeolog-‐‑specific contributions
to gene expression in the maternal lineages of P. hesperium.
We used GATK Unified Genotyper in combination with the previously
generated bam read alignment files (see section on read mapping, quantification, and
differential expression) to simultaneously identify SNPs between the Polypodium

105
reference transcriptome and each of the 12 Polypodium specimens (McKenna et al. 2010;
DePristo et al. 2011; Van der Auwera 2013). The -‐‑stand\_call\_conf and -‐‑
stand\_emit\_conf parameters were set to 30 and 10, respectively, to identify low
quality variant calls. The –ploidy parameter was set to 2 for each specimen, regardless of
whether it was diploid or allopolyploid. This was done to reduce the complexity of
variant calls and limit subsequent analyses to intergenomic homoeologous SNPs in P.
hesperium rather than intragenomic variation (i.e. between homologs). GATK Unified
Genotyper output a single variant call format (VCF) file containing the estimated
genotype at each SNP site for each Polypodium specimen and the read depth of each
allele.
Custom scripts were used to remove low quality SNP calls, identify putative
fixed SNPs between the diploid progenitors, and calculate homoeolog expression ratios
for each individual of P. hesperium. Briefly, SNPs were filtered to exclude sites with low
mapping quality (Phred scaled probability score < 30) and genotype calls based on a low
number of reads (< 4 reads). Putative fixed SNPs between P. amorphum and P. glycyrrhiza
were identified as having reciprocal homozygous genotypes among all replicates of each
species (i.e. P. amorphum genotype = 0/0 and P. glycyrrhiza genotype = 1/1, or P.
amorphum genotype = 1/1 and P. glycyrrhiza genotype = 0/0). The homoeolog expression
ratio for a particular gene for each individual of P. hesperium was estimated by
calculating the weighted mean of the number of P. amorphum-‐‑derived reads / total

106
number of reads for all SNPs assigned to that gene. A homoeolog expression ratio of 1.0
(100%) indicates that total gene expression for a given gene is solely comprised of
homoeologs derived from P. amorphum, whereas a homoeolog expression ratio of 0.0
(0%) indicates that total gene expression for a given gene is solely comprised of
homoeologs derived from P. glycyrrhiza. Intermediate homoeolog expression ratios
indicate that total gene expression is comprised of homoeologs derived from both P.
amorphum and P. glycyrrhiza. For each gene expressed in all six individuals of P.
hesperium, we calculated the weighted mean homoeolog expression ratio for both P.
hesperium Ha and P. hesperium Hg. The Mann-‐‑Whitney U test, α = 0.10, as implemented
in the scipy v. 0.13.1 python library (Jones et al. 2001), was used to identify genes with
significant differences in homoeolog expression between the reiprocal P. hesperium
maternal lineages.
Results
Illumina sequencing reads—Approximately 46-‐‑68 million 100-‐‑bp paired-‐‑end
reads were generated from each of the 12 Polypodium specimens. After removing adapter
sequences and filtering out low quality reads, 87.9-‐‑89.7% of read pairs were retained, as
were 4.9-‐‑6.2% of forward only reads and 1.9-‐‑2.1% of reverse only reads (Appendix C,
Table C.2).
Confirmation of plastid haplotypes of P. hesperium—RbcL plastid sequences
were successfully extracted from the transcriptomes of all six P. hesperium accessions. As

107
expected based on earlier phylogenetic analyses of plastid trnG-‐‑R sequence data (Sigel et
al, in review), P. hesperium 8179, 8276, and 8280 have rbcL sequences closely allied to
those of P. amorphum, whereas P. hesperium 8175, 8177, and 8288 have rbcL sequences
closely allied to those of P. glycyrrhiza (maximum parsimony tree not shown). This
confirms that P. amorphum contributed its plastid genome to the former three specimens
of P. hesperium (henceforth referred to as P. hesperium Ha) and that P. glycyrrhiza
contributed its plastid genome to the latter three specimens of P. hesperium (henceforth
referred to as P. hesperium Hg).
Polypodium reference transcriptome—The initial Polypodium transcriptome
comprised 420542 transcripts (e.g. unigenes) corresponding to 192418 genes (e.g. Trinity
components) with an average transcript length of 814.64 bases. Filtering to remove
potential transcript artifacts and any transcripts without hits to the 22 plant genome
database, reduced the transcriptome to 82855 transcripts corresponding to 25769 genes
and increased the average transcript length to 1756.44 bases (see Appendix C, Table C.3,
and Fig. C.1 for basic reference transcriptome statistics and a summary of number of
transcripts per gene). General information about Gene Ontogeny (GO) annotations for
the final Polypodium reference transcriptome is provided in Appendix C, Tables C.4-‐‑C.6.
Differential expression—Of the 25769 genes in the Polypodium reference
transcriptome, 19194 were consistently expressed (i.e. expressed in all three biological

108
replicates) by either P. amorphum and/or P. glycyrrhiza and used for analyses of
differential expression. A pairwise comparison of gene expression in P. amorphum and P.
glycyrrhiza revealed that 4371 genes (22.8%) were differentially expressed between the
two diploid species (Fig. 11), with significantly more genes up-‐‑regulated in P. glycyrrhiza
(3083 genes, 16.1%) than were up-‐‑regulated in P. amorphum (1288 genes, 6.7%; p-‐‑value <
0.0001, Fisher’s exact test).
Figure 11 summarizes total gene expression (the combined expression of all
homoelogs) in P. hesperium Ha and P. hesperium Hg relative to P. amorphum and P.
glycyrrhiza. For the vast majority of genes surveyed, no significant difference in
expression was detected between either lineage of P. hesperium and its diploid
progenitors [Ha vs. P. amorphum: 18468 genes (96.2%); Ha vs. P. glycyrrhiza: 16480 genes
(85.9%); Hg vs. P. amorphum: 19164 genes (99.8%); Hg vs. P. glycyrrhiza: 16541 genes
(86.2%); p-‐‑values > 0.01, Fisher’s exact test]. Significantly more genes were differentially
expressed between P. hesperium and P. glycyrrhiza (Ha: 2714 gene, 14.1%; Hg: 2653 genes,
13.8%), than between P. hesperium and P. amorphum (Ha: 726 genes, 3.8%; Hg: 30 genes,
0.16%; p-‐‑value < 0.0001) or between P. hesperium and the in silico midparent (Ha: 996
genes, 5.2%; Hg: 554 genes, 2.9%; p-‐‑value < 0.0001). Of those genes that were
differentially expressed between P. glycyrrhiza and P. hesperium, significantly more genes

109
were highly expressed in P. glycyrrhiza (Ha: 1783 genes, 9.3%; Hg: 2031 genes, 10.6%)
than were highly expressed in P. hesperium (Ha: 931 genes, 4.9%; Hg: 622 genes, 3.2%; p-‐‑
value < 0.001). In contrast, of the genes that were differentially expressed between, P.
amorphum and P. hesperium, significantly more genes were highly expressed in P.
hesperium (Ha: 673 genes, 3.5%; Hg: 22 genes, 0.11%) than were highly expressed in P.
amorphum (Ha: 53 genes, 0.28%; Hg: 8 genes, < 0.04%; p-‐‑value < 0.001).
One striking difference between the maternal lineages of P. hesperium is the
number of differently expressed genes relative to P. amorphum. Polypodium hesperium Ha
exhibited significantly more differentially expressed genes with P. amorphum [Ha: 726
genes (3.8%) vs. Hg: 30 genes (0.16%); p-‐‑value < 0.0001]. This pattern is not consistently
recovered in the differential expression analyses of individual P. hesperium accessions;
(refer to Appendix C, and Fig. C.2 for comparison of gene expression in individual
accessions of P. hesperium relative to P. amorphum and P. glycyrrhiza).
Expression level dominance—Following the scheme of Rapp et al. (2009),
differentially expressed genes were binned into 12 classes reflecting the expression level
in P. hesperium relative to its diploid progenitors (Fig. 12; Appendix C, Fig. C.3). The
IDLs maternal lineages of P. hesperium showed similar numbers of genes across the 12
classes, with the vast majority of genes exhibiting equal levels of expression among P.

110
hesperium, P. glycyrrhiza, and P. amorphum [Fig. 12, “No Change”; Ha: 14327 genes
(83.9%); Hg: 14596 genes (85.6%)]. Of the genes exhibiting differential expression relative
to P. amorphum and/or P. glycyrrhiza, most exhibited expression level dominance [classes
II, IV, IX, and XI; Ha: 2537 genes (19.6%); Hg: 3449 genes (20.2%)]. Expression level
dominance in both maternal lineages of P. hesperium was significantly biased towards P.
amorphum [classes IV and IX; Ha: 2063 genes (12.1%), p-‐‑value < 0.001; 12.1%; Hg: 2423
genes (14.2%), p-‐‑value < 0.001] with most genes reflecting low expression of P. amorphum
relative to P. glycyrrhiza [(class IX; Ha: 1434 genes (8.4%); Hg: 1940 genes (11.4%)]. Both P.
hesperium Ha and P. hesperium Hg had relatively few numbers of genes exhibiting
additive expression [classes I and XII; Ha: 187 genes (1.0%); Hg: 1 gene (< 0.01%)] and
transgressive regulation (classes III, V, VI, VII, VIII, and X; Ha: 27 genes, 0.16%); Hg: 4
genes 0.02%)].
Between the maternal lineages of P. hesperium, P. hesperium Hg exhibited
significantly more genes with P. amorphum-‐‑expression level bias than P. hesperium Ha
[Ha: 2063 genes (12.1%) vs. Hg: 2423 genes (14.2%); p-‐‑value < 0.001]. In contrast, P.
hesperium Ha exhibited significantly more genes with P. glycyrrhiza-‐‑expression level

111
dominance [Ha: 474 genes (2.8%) vs. Hg: 26 genes 0.15%); p-‐‑value < 0.001], additivity
[Ha: 187 genes (1.1 %) vs. Hg: 1 gene (< 0.01%); p-‐‑value < 0.001], and transgressive
regulation [classes III, V, VI, VII, VIII, and X; Ha: 27 genes, (0.16%) vs. Hg: 4 genes
(0.02%); p-‐‑value < 0.0001].
Estimation of relative homoeolog expression—A total of 935205 SNPs were
detected among the 12 Polypodium samples. After removing low quality SNPs, we were
able to identify 5564 putatively fixed SNPs (i.e. those with reciprocal homozygous
genotypes) between the diploid species. By combining genotype and read depth
information for all SNPs assigned to a single gene, we able to estimate the homoeolog
expression ratio for P. hesperium Ha and P. hesperium Hg for 2111 and 2114 genes,
respectively (Fig. 13). For a majority of these genes, both P. hesperium Ha and P.
hesperium Hg exhibited strong expression bias favoring P. amorphum-‐‑derived
homoeologs [Ha: 1704 genes (80.7%); Hg: 1219 genes (57.7%); 70-‐‑100% P. amorphum-‐‑
derived homelogs]. Only P. amorphum-‐‑derived homoeologs were expressed for 196 and
102 genes by P. hesperium Ha and P. hesperium Hg exhibited, respectively. For both
maternal lineages of P. hesperium, significantly less genes exhibited strong bias in favor
of P. glycyrrhiza derived homoeologs [Ha: 68 genes (3.2%); Hg: 172 genes (8.1%); 0-‐‑30% P.

112
amorphum-‐‑derived homelogs]. Only P. glycyrrhiza-‐‑derived homoeologs were expressed
for 2 and 7 genes by P. hesperium Ha and P. hesperium Hg, respectively.
Compring homoeolog expression ratios between maternal lineages, P. hesperium
Ha had significantly more genes exhibiting strong bias in favor of P. amorphum-‐‑derived
homoeologs than P. hesperium Hg [70-‐‑100% P. amorphum-‐‑derived homelogs; Ha: 1704
genes (80.7%) vs. Hg: 1219 genes (57.7%); p-‐‑value < 0.001, Fisher’s exact test]. In contrast,
P. hesperium Hg had significantly more genes exhibiting low bias or strong bias in favor
of P. glycyrrhiza-‐‑derived homoeologs that P. hesperium Ha [<70% P. amorphum-‐‑derived
homelogs; Ha: 407 genes (19.3%) vs. Hg: 715 genes (42.3%); p-‐‑value < 0.001].
When comparing homoeolog expression ratios between the maternal lineages of
P. hesperium at the level of individual genes, we found that the majority of genes
exhibited little to no difference in the percentage of P. amorphum-‐‑derived homoeologs
expressed in P. hesperium Ha verses P. hesperium Hg [Fig. 14; < 20% difference: 1685 genes
(79.8%)]. Few genes exhibited vastly different percentages of P. amorphum-‐‑derived
homoeologs expressed in P. hesperium Ha verses P. hesperium Hg [Fig. 14; > 80 %
difference: 51 genes (2.4%)].

113
By further filtering the dataset, we were able to identify a suite of 1861 genes that
were expressed by all six individuals of P. hesperium (Fig. 15a, b) and with which we
could test for lineage specific effects of homoeolog expression bias. Using the Mann-‐‑
Whitney U test, we were able to identify 163 genes with a 20% or greater significant
difference (p-‐‑value < 0.10) in homoeolog expression ratios between P. hesperium Ha and
P. hesperium Hg (Fig. 15b, orange data points).
Discussion
Allopolyploid species are prevalent in both flowering plants and ferns (Wood et
al. 2009), but studies investigating the evolutionary importance and fate of duplicated
genes of have been limited to a suite angiosperms with significant preexisting genomic
resources or have been restricted to a handful of markers. Here we attempt to “level the
playing field” by adopting RNA-‐‑seq to conduct the first genome-‐‑wide expression study
of leaf tissue in a fern, the allotetraploid Polypodium hesperium. Like many allopolyploids,
P. hesperium has formed recurrently, and it comprises reciprocally formed maternal
lineages. Recurrent origins increase the genetic diversity of an allopolyploid species by
integrating variation from different progenitor populations (Werth 1992; Soltis and Soltis
1999), but little is know about how recurrent origins contribute to variation in the
transcriptome. We were surprised to find that both maternal lineages of P. hesperium
exhibit remarkably consistent genome-‐‑wide patterns of total gene expression (e.g. the

114
sum of expression of all homoeologs of a gene) and homoeolog expression ratios. In
addition, we demonstrate unprecedented levels of unbalanced expression level
dominance and unbalanced homoeolog expression bias, supporting the notion that these
phenomena are pervasive consequences of allopolyploidy in plants.
Differential expression between diploids progenitors—In order to assess
differential expression between P. hesperium and its diploid progenitors, it is helpful to
understand the extent of differential expression between P. amorphum and P. glycyrrhiza.
Approximately 22% of the genes surveyed were differentially expressed between the
diploid species. This percentage is less than that recovered from comparable studies of
natural allopolyploid angiosperm complexes with similar levels of sequence divergence
(2-‐‑3% divergence). For example, diploid progenitors of Gossypium and Coffea
allopolyploids exhibit differential expression in 42-‐‑53% and 36-‐‑55% of genes,
respectively (Rapp et al. 2009, Yoo et al. 2013; Bardil et al. 2011). Furthermore, unlike
Gossypium and Coffea, differential expression between P. amorphum and P. glycyrrhiza is
unbalanced (Rapp et al. 2009, Yoo et al. 2013; Bardil et al. 2011)—approximately 2.4×
more genes are up-‐‑regulated in P. glycyrrhiza than in P. amorphum (Fig. 11).
Differential expression between P. hesperium and its diploid progenitors—
When compared to their diploid progenitors, both maternal lineages of P. hesperium
exhibit similar patterns of differential expression. Overall, the vast majority of genes
expressed in P. hesperium Ha (94.8%) and P. hesperium Hg (97.1%) exhibit midparent

115
expression values (Fig. 11a, b), similar to what is reported for reported in Gossypium
(Rapp et al. 2009) and Arabidopsis (Wang et al. 2006) allopolyploids. Among those genes
that are differentially expressed between P. hesperium and its diploid progenitors, both
maternal lineages of P. hesperium exhibit significantly more differentially expressed
genes when compared to P. glycyrrhiza than when compared to P. amorphum (Fig. 11a, b).
Put differentially, both P. hesperium Ha and P. hesperium Hg have gene expression
patterns more like that of P. amorphum, indicating that P. amorphum is the ‘dominant’
progenitor dictating gene expression in P. hesperium (Rapp et al 2009; Grover et al. 2012;
Buggs et al. 2014). These results suggest that at the broad, genomic level, gene
expression patterns in P. hesperium are consistent between the reciprocal origins.
Similarity in gene expression at the genomic level, however, mask significant
variation between P. hesperium Ha and P. hesperium Hg at the level of individual
specimens and individual genes. Careful comparison reveals a striking and significant
difference in the number of differently expressed genes between P. amorphum and each
lineage of P. hesperium (Fig. 11 a, b)—very few genes are differentially expressed
between P. amorphum and P. hesperium Hg (Fig. 11 a). This initially led us to infer that
gene expression in P. hesperium Hg is essentially identical to that of P. amorphum.
Analysis of the expression patterns of the six individual specimens of P. hesperium
reveals a more nuanced situation (Appendix C, Fig. C.2). Individual specimens of P.

116
hesperium Hg, have between 4.2% and 12.7% of genes differentially expressed when
compared to P. amorphum, a range that is not dramatically different from that seen in P.
hesperium Ha (7.7%-‐‑12.3%). What does dramatically differ is the number of specific genes
that are commonly expressed among the three accessions of P. hesperium Ha verses the
number of specific genes that are commonly expressed among the three accessions of P.
hesperium Hg. Of the 19194 genes surveyed, 5.5% (1052 genes) were differently expressed
in all three specimens of P. hesperium Ha relative to P. amorphum, whereas less than 1%
(169 genes) were differently expressed in all three specimens of P. hesperium Hg
(Appendix C, Fig. C.2). The low number of specific genes differently expressed in all
three specimens of P. hesperium Hg contributes to the low number of genes recovered in
the joint analysis of the three biological replicates of P. hesperium Hg (Fig. 11 b), and
suggests that P. hesperium Hg has less fidelity (i.e. or more within maternal lineage
variability) in the expression of individual genes, especially when compared to gene
expression in P. amorphum.
In the same way that variation in the expression of individual genes occurs
among P. hesperium specimens belonging to the same maternal lineage, expression of
individual genes can also vary between maternal lineages. Figure 11c summarizes the

117
number of specific genes exhibiting differential expression in both P. hesperium Ha and P.
hesperium Hg. For each comparison, between 1% and 60% of specific genes are
differentially expressed in both maternal lineages of P. hesperium. These results indicate
that while a large proportion of genes exhibit consistent expression levels in P. hesperium
regardless of maternal lineage, an equal or greater proportion vary between maternal
lineages. These results lead us to conclude that while patterns of gene expression are
relatively consistent at the genomic level, the maternal lineages of P. hesperium
experience significant variation at the level of individual genes.
Expression level dominance in P. hesperium Ha and P. hesperium Hg—As
defined by Rapp et al. (2009), gene expression between an allopolyploid and its diploid
progenitors can be assigned to one of 12 categories encompassing all possible
permutations of additivity, trangressive regulation, and expression level dominance
(Table 1; Fig. 12; Appendix C, Fig. C.3). Notably, of those genes that are differentially
expressed in P. hesperium when compared to either progenitor, very few exhibit
additivity or transgressive regulation (Ha: 7.8%; Hg: 0.2%). The vast majority exhibits
expression level dominance (Ha: 92.2%; Hg: 99.8%), and both maternal lineages of P.
hesperium demonstrating unbalanced expression level dominance at the genomic level.
The largest class of differentially expressed genes in both P. hesperium Haand P.

118
hesperium Hg is that mirroring the down-‐‑regulation in P. amorphum relative to P.
glycyrrhiza (Fig. 12; class IX).
While both maternal lineages of P. hesperium show similar patterns of unbalanced
expression level dominance favoring P. amorphum, substantial variation exists in the
composition of genes displaying this pattern. For example, only 51% and 66% of class IV
genes in P. hesperium Ha and P. hesperium Hg, respectively, are common to both lineages
(Fig. 12, Ha & Hg). This reinforces our conclusion that genomic level patterns of gene
expression are relatively consistent between the maternal lineages of P. hesperium, but
significant variation occurs at the level of individual genes.
The extent of expression level dominance reported here is unprecedented. We
can find no other examples in which the proportion of differentially expressed genes
exhibiting expression level dominance exceeds 25% and no other examples with so few
occurrences of additivity and transgressive regulation (Rapp et al. 2009; Chagué et al.
2010; Chelaifa et al. 2010; Flagel and Wendel 2010; Bardil et al. 2011; Yoo et al. 2013; Cox
et al. 2014). Surprised by these findings and impeded by the general lack of knowledge
about genome evolution and regulation of gene expression in ferns, we are at a loss to
explain why P. hesperium has such extreme expression level dominance relative to other
allopolyploids. Polypodium hesperium, and perhaps ferns in general, may simply exhibit

119
extreme manifestations of the factors thought to promote expression level dominance in
angiosperms (see discussion below).
While the degree of expression level dominance reported here is exciting, we feel
it is necessary to include one important caveat when interpreting these results. Here we
report total gene expression per individual as normalized across Illumina libraries
(Robinson and Oshlack 2010). This method has become standard for studies using RNA-‐‑
seq to explore gene expression in allopolyploids relative to their diploid progenitors (e.g.
Higgins et al. 2012; Shi et al. 2012; Combes et al. 2013; Page et al. 2013; Yoo et al. 2013;
Cox et al. 2014; Xu et al. 2014), but it ignores absolute levels of transcription per cell. In
certain circumstances, if the number of transcripts per cell differs between an
allopolyploid and its diploid progenitors, a gene that appears additive using RNA-‐‑Seq
normalized data, may demonstrate non-‐‑additive expression at the level of the individual
cells (Coate and Doyle 2010; Gianinetti 2013; Buggs et al 2014). Without direct
quantification, it is impossible to estimate transcription per cell. In Glycine transcription
of a gene in an allotetraploid is, on average, 1.4x that of its diploid progenitors (Coate
and Doyle, 2010). Hence, doubling of ploidy does not necessarily lead to a doubling of
transcription, and relative number of transcripts per cell may very widely among
genera. While we are confident the results of this study are directly comparable to other
studies utilizing library-‐‑normalized RNA-‐‑Seq data, we stress that the results of all these
studies must be approached cautiously. In the case of P. hesperium, the number of genes

120
exhibiting mid-‐‑parent expression levels and expression level dominance may be
inflated.
Homoeolog expression bias in P. hesperium Ha and P. hesperium Hg —To
determine how gene copies derived from different progenitors contribute to total gene
expression in P. hesperium, we examined homoeolog-‐‑specific expression for
approximately 2100 genes in both maternal lineages of P. hesperium. Utilizing SNPs that
are putatively fixed between P. amorphum and P. glycyrrhiza, we were able to infer the
parental origin of homoeologs in P. hesperium and simultaneously calculate their relative
expression. Just as we discovered unbalanced expression level dominance with P.
amorphum as the dominant parent (see discussion above), we recovered unbalanced
homoeolog expression bias whereby a disproportionate number of genes favor
expression of P. amorphum-‐‑derived homoeologs. For both P. hesperium Ha and P.
hesperium Hg, total expression of most genes is composed of greater than 50% P.
amorphum-‐‑derived homoeologs, with the largest category of genes expressing greater
than 90% P. amorphum-‐‑derived homoeologs (Ha: 59% of genes, Hg: 41% of genes; Fig.
13). It is important to note that there are significant differences in the degree and
direction of homoeolog expression bias between the maternal lineages. For example, P.
hesperium Ha has significantly more genes with > 90% expression of P. amorphum-‐‑derived

121
homoeologs, whereas P. hesperium Hg has significantly more genes with < 90%
expression of P. amorphum-‐‑derived homoeologs (Fig. 13). It appears, however, that all
individuals of P. hesperium, regardless of maternal lineage, exhibit a strong bias for the
expression of P. amorphum-‐‑derived homoeologs at the genomic level. Although we are
uncertain of its cause, this phenomenon is undoubtedly linked to the striking degree of
expression level dominance described above.
At the level of individual genes, we recovered a high degree of fidelity in
homoeolog expression bias between P. hesperium Ha and P. hesperium Hg (Figs. 14, 15 a).
Of the genes expressed by both maternal lineages, 69% exhibited identical or near
identical biases (0-‐‑10% difference in expression of P. amorphum-‐‑derived homoeologs;
Figs. 14, 15a). Less than 1% of genes exhibited complete or near complete differences in
expression bias, indicating that very few genes experience reciprocal silencing of
homoeologs between P. hesperium Ha and P. hesperium Hg. We were able to identify 163
genes with statistically significant differences in homoeolog expression bias of greater
than 20% (Fig. 15b, orange data points), suggesting that homoeolog expression in these
genes may be dictated by lineage-‐‑specific factors. Forthcoming gene ontology
enrichment analyses may illuminate whether these genes belong to specific functional
categories, or are closely associated with plastid loci (Ashburner et al. 2000; Coate and
Doyle 2013).

122
Preferential expression of homoeologs derived from a particular progenitor is
commonly observed in other allopolyploids (Arabidopsis: Wang et al. 2006; Coffea:
Combes et al. 2013; Glycine: Coate et al. 2014; Gossypium: Chaudary et al. 2009, Flagel et
al. 2009, Rapp et al. 2009, Flagel and Wendel 2010; Tragopogon: Tate et al. 2006; Buggs et
al. 2010; Koh et al. 2010; Zea: Schnable and Freeling 2011, Schnable et al. 2011), and
appears to be a prevasive consequence of allopolyploidization. Once again, though, the
proportion of genes exhibiting extreme homoeolog expression bias in P. hesperium (Fig.
3, 0-‐‑10% and 90-‐‑100% expression of P. amorphum-‐‑derived homoeologs) is greater than in
other allopolyploids and evades obvious explanation.
To our knowledge, Tragopogon miscellus and T. mirus are the only other
allopolyploids of recurrent and reciprocal origin for which homoeolog-‐‑specific
expression has been investigated. As in P. hesperium, all independently derived lineages
of both T. miscellus and T. mirus preferentially express homoeolog derived from the same
progenitor (Tate et al. 2006; Koh et al. 2010, Buggs et al. 2010). These findings suggest
that recurrent origins of natural allopolyploids, regardless of maternity, consistently
yield similar genome-‐‑wide patterns of homoeolog expression.
Possible mechanisms for expression level dominance and homoeolog
expression bias in P. hesperium—Both expression level dominance and homoeolog
expression bias are broadly observed phenomena, prompting interest in the underlying
genomic and regulatory mechanisms. While little is known about gene regulation and

123
genome evolution in ferns, mechanisms revealed in angiosperm allopolyploids may
help explain patterns seen in Polypodium hesperium. In general, gene expression in
allopolyploids is thought to reflect the progression of genetic diploidization, the
regulatory process by which redundant genes assume diploid-‐‑like expression (Ma and
Gustafson 2005; Feldman 2012). It is increasingly recognized that genetic diploidization
is modulated by epigenetic modifications of genes, which may be inherited from diploid
progenitors (Lui and Wendel 2003; Ma and Gustafson 2005; Jablonski and Raz 2009;
Woodhouse 2014). Furthermore, some recurrently formed synthetic allopolyploids,
exhibit similar patterns of epigenetic modification (Lukens et al. 2006). It seems
reasonable that multiple lineages of a natural allopolyploid, if formed in close temporal
proximity from similar progenitor populations, they could inherit similar patterns of
gene expression that reflect the genomic dominance of one progenitor. This seems most
plausible for very recently formed allopolyploids such as Tragopogon mirus and P.
miscellus (less than 100 years; Soltis et al. 2004), but it is debatable whether this is likely
for older allopolyploids like Polypodium hesperium that formed within the last one million
years (Sigel et al. in review). Without additional data, we are cautious to speculate
further as to why genome-‐‑wide patterns of gene expression are so similar between the
maternal lineages of P. hesperium. Additional transcriptomic studies investigating
expression in multiple tissues, F1 hybrids, or other closely related Polypodium
allopolyploid taxa may prove illuminating.

124
Table 5. Terms related to gene expression in allopolyploid organisms as described in Rapp et al. (2009) and Grover et al. (2012). additivity – For a single gene of a suite of genes; total expression level in an allopolyploid is
intermediate to that of its progenitors differential expression – For a single gene or suite of genes; differential expression is a statistically
significant difference in the total expression level of two individuals expression level dominance – For a single gene; total expression level in an allopolyploid is
statistically identical to only one of its progenitors balanced expression level dominance – For a suite of genes; an approximately equal
number of genes in an allopolyploid exhibit expression level dominance in the direction of each progenitor
unbalanced expression level dominance – For a suite of genes; more genes in an
allopolyploid exhibit expression level dominance in the direction of one progenitor
homoeologs – For a single gene or a suite of genes; gene copies in an allopolyploid that are each
derived from different progenitor species homoeolog expression bias – For a single gene; a homoeolog expression ratio that deviates from
50/50 expression levels balanced homoeolog expression – For a suite of genes; an approximately equal number of
genes in an allopolyploid exhibit homoeolog expression bias in the direction of each progenitor
unbalanced homoeolog expression – For a suite of genes; more genes in an allopolyploid
exhibit homoeolog expression bias in the direction of one progenitor trangressive regulation – For a single gene or a suite of genes; total gene expression level in an
allopolyploid is outside the expression range of either progenitor transgressive up-‐‑regulation – For a single gene or a suite of genes; total gene
expression level in an allopolyploid exceeds that of both progenitors transgressive down-‐‑regulation – For a single gene or a suite of genes; total gene
expression level in an allopolyploid is less than that of both progenitors

125
Table 6. Synopsis of Polypodium specimens used in Chapter IV. DB numbers refer to unique specimen identifiers as designated in the Duke Fern Lab Database (http://fernlab.biology.duke.edu). Ha = plastid genome derived from Polypodium
amorphum; Hg = plastid genome derived from Polypodium glycyrrhiza. Ploidy for each species is as indicated in Haufler et al. (1993), each with a base chromosome number of x = 37.
Taxon (ploidy) DB
number Voucher Information Polypodium amorphum Suksd. (2x)
P. amorphum 8521 Canada, British Columbia, Squamish-‐‑Lillooet Regional District, Rothfels 4084 (DUKE)
P. amorphum 7773 U.S.A., Oregon, Multnomah County, Sigel 2010-‐‑104 (DUKE)
P. amorphum 7771 U.S.A., Washington, King County, Sigel 2010-‐‑125 (DUKE)
Polypodium glycyrrhiza D.C. Eaton
(2x)
P. glycyrrhiza 8493 Canada, British Columbia, Squamish-‐‑Lillooet Regional District, Rothfels 4059 (DUKE)
P. glycyrrhiza 7767 U.S.A., Washington, Snohomish, County, Sigel 2010-‐‑81 (DUKE)
P. glycyrrhiza 7559 U.S.A, Oregon, Lincoln County, Rothfels 3875 (DUKE)
Polypodium hesperium Maxon (4x)
P. hesperium Ha 8179 U.S.A., Idaho, Shoshone County, Sigel 2011-‐‑46 (DUKE)
P. hesperium Ha 8276 U.S.A., Montana, Lincoln County, Sigel 2011-‐‑31c (DUKE)
P. hesperium Ha 8280 U.S.A., Montana, Lake County, Sigel 2011-‐‑37 (DUKE)
P. hesperium Hg 8175 U.S.A., Arizona, Coconino County, Sigel 2011-‐‑08A (DUKE)
P. hesperium Hg 8177 U.S.A., Arizona, Gila County, Sigel 2011-‐‑09A (DUKE)
P. hesperium Hg 8288 U.S.A., Arizona, Graham County, Sigel 2011-‐‑10 (DUKE)

126
Figure 11. Patterns of differential gene expression in the maternal lineages of P. hesperium. a. Number of genes differentially expressed between P. hesperium Ha and each of its diploid progenitors. Bolded values indicate the total number and proportion of genes differentially expressed between two species. Values that are not bolded indicate the number of genes that are more highly expressed in a particular species. For example, of the 19194 genes evaluated, 4371 (22.8%) genes are differentially expressed between P. amorphum and P. glycyrrhiza, with 1288 (6.7%) up-‐‑regulated in P. amorphum
a. b.
P. amorphum2x
P. glycyrrhiza2x
P. hesperium Ha 4x
midparent
(in silico)
4371 22.8%
308316.1%
1288 6.7%
1783 9.3%
271414.1%
931 4.9%
7263.8%
6733.5%
530.03%
9565.0%
400.21%
9965.2%
P. amorphum2x
P. glycyrrhiza2x
midparent
(in silico)
4371 22.8%
308316.1%
1288 6.7%
203110.6%
265313.8%
622 3.2%
300.16%
220.11%
8 0.04%
5042.6%
500.03%
5542.9%
C.
P. amorphum2x
P. hesperium Ha & Hg
4x
midparent
(in silico)
4371 22.8%
308316.1%
1288 6.7%
20.01%
90.05%
70.04%
3681.9%
15968.3%
12266.4%
40.02%
2791.5%
2631.4%
P. hesperium Hg
4x
P. glycyrrhiza2x

127
and 3083 (16.1%) up-‐‑regulated in P. glycyrrhiza. b. Number of genes differentially
expressed between P. hesperium Hg and each of its diploid progenitors. c. Summary of the number and proportion of specific genes that are differentially expressed genes by both maternal lineages of P. hesperium relative to their diploid progenitors. For example, 1596 specific genes (8.3% of the total genes surveyed) are differentially expressed in P.
hesperium Ha and P. hesperium Hg relative to P. glycyrrhiza.

128
Figure 12. Number of genes belonging to 12 possible classes of differential expression in the maternal lineages of P. hesperium. Roman numerals correspond to the class designations given in Rapp et al. (2009), and figures illustrate the expression level of P. hesperium (H) relative to P. amorphum (A) and P. glycyrrhiza (G). “No Change” refers to genes without a statistically significant change in gene expression between all three
species. The bottom row (Ha & Hg) shows the number of specific genes exhibiting pattern of expression in both maternal lineages.
Ha & Hg0 1 319 61040 00 00 00 0 14156 -
Hg
Ha
I XII VVIIXIIXIV II III X VIIIVI
No
Change Total
Additivity
P. amorphum-expression
level
dominance
P. glycyrrhiza-expression
level
dominance
Transgressive
down-regulation
Transgressive
up-regulation
A GH A GH A GH A GH A GH A GH A GH A GH A GH A GH A GH A GH
172
0
15
1 483
31443
20
1434
1940
629 00
16 1
1
0 0
31
0
22
2 14596
14327 17078
17050

129
Figure 13. Relative expression of P. amorphum-‐‑derived homoeologs in the maternal
lineages of Polypodium hesperium (P. hesperium Ha = grey; P. hesperium Hg = black). Genes are classified according to the percentage of total expression attributed to P. amorphum-‐‑derived homoeologs. Gene counts are indicated at the top of the columns. Gene counts in parentheses indicate the number of gene with 0% or 100% total expression attributed to P. amorphum-‐‑derived homoeologs. 2111 genes were surveyed
for P. hesperium Ha and 2114 genes were surveyed for P. hesperium Hg. * indicates
statistically significant differences between Ha and Hg.
0
10
20
30
40
50
60
70
Ha Hg Ha Hg Ha Hg Ha Hg Ha Hg Ha Hg Ha Hg Ha Hg Ha Hg Ha Hg
0-10 10-20 20-30 30-40 40-50 50-60 60-70 70-80 80-90 90-100
Pe
rce
nta
ge
of
ge
ne
s (
%)
% P. amorphum-derived homoeologs
13
(2
)
55
(7
)
25 6
0
30 57
61 90
78 1
26
92
15
3
10
8 17
4
15
9 20
0
30
2
33
2
12
43
(1
96
)
86
7 (
10
2)
** *
* * *
*

130
Figure 14. Difference in the relative expression of Polypodium amorphum-‐‑derived homoeologs between P. hesperium Ha and P. hesperium Hg for 2111 genes. The horizontal axis describes the percentage change in expression of P. amorphum-‐‑derived homoeologs, regardless of the direction of variation. Gene counts are given at the top of the columns, with numbers in parentheses indicating the number of genes with 0% or 100% difference in the relative expression of P. amorphum-‐‑derived homoeologs between P. hesperium Ha and P. hesperium Hg.
10
20
30
40
50
60
0-10 10-20 20-30 30-40 40-50 50-60 60-70 70-80 80-90 91-100
0
Difference in % P. amorphum-derived homoeologs between Ha and Hg
Perc
enta
ge o
f genes (
%)
80
70 1448 (
53)
237
62931
33
40
22 24
20 31 (
3)

131

132
Figure 15. Comparison of the relative expression of P. amorphum-‐‑derived homoeologs
between P. hesperium Haand P. hesperium Hg for 1861 genes. a. Colors of data points reflect the degree of difference in the expression of P. amorphum-‐‑derived homoeologs
between P. hesperium Ha and P. hesperium Hg regardless of the direction of variation (see legend). b. Orange data points indicate genes that exhibit a statistically significant difference of ≥ 20% in the expression P. amorphum-‐‑derived alleles between P. hesperium Ha and P. hesperium Hg (Mann-‐‑Whitney U test).

133
CHAPTER V
ADDITIONAL INSIGHTS INTO THE EVOLUTION, DIVERSIFICATION, AND BIOGEOGRAPHY OF FERNS
Other Contributions
During my graduate studies at Duke University, I have been tempted to purse
additional projects and have enjoyed fruitful collaborations with other researchers, both
within the Biology Department and at other institutions. As a result, I have made
substantial contributions to five additional publications that supplement the four
publications (three published, one in preparation) represented in Chapters I-‐‑IV of this
dissertation. While the focal taxa and objectives of these additional publications vary, all
reflect my interest in the evolution, diversification, and biogeography of ferns.
Sigel et al. (2011) provided the first comprehensive phylogeny of the strictly
New World cheilanthoid fern genus Argyrochosma. Using ancestral character state
reconstruction, we investigated the evolution of farina (distinctive powdery leaf
deposits) and demonstrated that Argyrochosma comprises two major monophyletic
groups: one exclusively non-‐‑farinose and the other primarily farinose. Our phylogenetic
hypothesis, in combination with spore data and chromosome counts, provided critical
context for addressing the prevalence of polyploidy and apomixis within the genus and
indicated the presence of several previously undetected taxa.

134
Rothfels et al. (2012) documented two new fern records for the flora of North
Carolina. Cheilanthes feei T. Moore was discovered during a search of specimens at
DUKE herbarium, and Dryopteris erythrosora (D.C. Eaton) Kunze was first observed in a
residential area adjacent to Duke University’s West Campus.
Rothfels et al. (2013) presented 20 single-‐‑copy nuclear markers for phylogenetic
studies in ferns. Using unpublished transcriptome data provided by the 1000 Plant
Transcriptomes Initiative (onekp.com), we developed universal primers to amplify these
regions across the Polypodiales, effectively tripling the number of single-‐‑copy nuclear
regions available for use in ferns. These new markers are important and much-‐‑needed
tools for investigating fern evolution, including reassessing plastid-‐‑derived phylogenetic
hypotheses and unraveling reticulate species complexes.
Li et al. (2014) used phylogenetic analyses to elucidate the horizontal gene
transfer (HGT) of neochrome, a chimeric photoreceptor, from hornworts to ferns.
Divergence dating provided further support for this hypothesis by demonstrating that
fern and hornwort neochromes diverged approximately 200 million years after the
divergence of the hornwort and fern lineages. In addition to documenting the first
known HGT between a bryophyte and a fern, this study suggests that neochrome may
have been pivotal for the diversification of modern ferns.
Sigel et al. (2014) documents the first record of the allotetraploid fern Polypodium
saximontanum Windham for the flora of Montana. Previously known from only a

135
handful of locations in northern New Mexico, Colorado, eastern Wyoming, and western
South Dakota, the discovery P. saximontanum in the Bitterroot Mountains of Montana
greatly expands the known geographic range of this uncommon species.

136
APPENDIX A
SUPPLEMENTAL INFORMATION FOR CHAPTER I
Table A.1. Voucher table included of specimens included in Chapter I. Taxon name Fern Database accession number (http://fernlab.biology.duke.edu): collector and collection number (herbarium); collection locality; GenBank accessions in the order; atpA, matK, rbcL, and trnG-‐‑R. -‐‑ = data not available. Nomenclatural authorities are given for the first specimen of each taxon.
Drymotaenium miyoshianum (Makino) Makino 4879: E. Schuettpelz 1136A (DUKE); Hualien Co., Taiwan; KF909068, KF909023, -‐‑, -‐‑. Drymotaenium miyoshianum -‐‑: C. C. Liu DB06104 (PE); Sichuan, China; -‐‑, -‐‑, GQ256255.1, -‐‑. Microsorum fortune (T.Moore) Ching 4817: E. Schuettpelz 1074A (DUKE); Nantou Co., Taiwan; -‐‑, KF909024, KF909054, -‐‑. Microsorum varians (Mett.) Hennipman & Hett. 3475: H. Schneider s. n. (GOET); In cultivation, Alter Botanischer Garten Goettingen; EF463832.1, -‐‑, -‐‑, -‐‑. Phlebodium decumanum (Willd.) J. Sm. 2384: E. Schuettpelz 216 (DUKE); Napo, Ecuador; EF463836.1, -‐‑, EF463256.1, -‐‑. Platycerium stemaria (Beauv.) Desv. 3544: H.-‐‑P. Krier s. n. (GOET); In cultivation, Alter Botanischer Garten Goettingen; EF463837, KF909025, EF463256, -‐‑. Platycerium superbum de Jonch.& Hennipman -‐‑: E. B. Sessa s. n. (WIS); -‐‑; -‐‑, -‐‑, -‐‑, JN189024. Pleopeltis polypodioides (Weath.) E.G. Andrews & Windham 6489: C. J. Rothfels 3031 (DUKE); Jalisco, Mexico; KF909086, KF909027, KF909056, KF909115. Pleurosoriopsis makinoi (Makim.) Fomin 8723: A. Ebihara 2972 (DUKE); Fukui, Japan; -‐‑, KF909028, KF909057, KF909116. Polypodium amorphum Sudsk. 6951: M. D. Windham 3404 (DUKE); British Columbia, Canada; KF909071, KF909009, KF909034, KF909094. Polypodium amorphum 7771: E. M. Sigel 2010-‐‑125 (DUKE); Washington, U. S. A.; KF909072, -‐‑, KF909032, KF909095. Polypodium amorphum 7773: E. M. Sigel 2010-‐‑104 (DUKE); Oregon, U. S. A.; KF909073, KF909010, KF909033, KF909096. Polypodium amorphum 8210: E. M. Sigel 2010-‐‑75 (DUKE); Washington, U. S. A.; KF909069, KF909007, -‐‑, -‐‑. Polypodium amorphum 8499: C. J. Rothfels 4065 (DUKE); British Columbia, Canada; KF909070, KF909008, KF909031, -‐‑. Polypodium appalachianum Haufler & Windham 7533: E. M. Sigel 2010-‐‑61 (DUKE); North Carolina, U. S. A.; KF909074, KF909011, KF909035, KF909097. Polypodium appalachianum 7630: C. J. Rothfels 3905 (DUKE); Virginia, U. S. A.; KF909075, KF909012, KF909036, KF909098. Polypodium appalachianum 8029: M. J. Oldham 38496 (DUKE); Nova Scotia, Canada; KF909076, KF909013, KF909037, KF909099. Polypodium appalachianum 8045: M. J. Oldham 27283 (DUKE); New York, U. S. A.; -‐‑, -‐‑, KF909038, KF909100. Polypodium californicum Kaulf. 3829: J. Metzgar 176 (DUKE); California, U. S. A.; KF909082, KF909014, KF909039, -‐‑.

137
Polypodium californicum 7249: L. Huiet 138 (DUKE); California, U. S. A.; KF909083, -‐‑, KF909040, KF909101. Polypodium cambricum L. 8786: H. S. McHaffie s. n. (E); England; KF909065, -‐‑, KF909041, KF909102. Polypodium cambricum 8787: Patrick James Blyth Collection Number: 8-‐‑61 (E); Valencia, Spain; KF909066, KF909015, KF909042, KF909103. Polypodium colpodes Kunze 7254: L. Huiet 144 (DUKE); Chiapas, Mexico; KF909067, -‐‑, KF909044, KF909104. Polypodium fauriei Christ 8722: A. Ebhiara 2973 (DUKE); Fukui, Japan; KF909077, KF909016, KF909045, KF909106. Polypodium glycyrrhiza D.C. Eaton 7537: D. Toren 9399 (UC); California, U. S. A.; -‐‑, -‐‑, KF909046, -‐‑. Polypodium glycyrrhiza 7768: E. M. Sigel 2010-‐‑89 (DUKE); Oregon, U. S. A.; KF909080, KF909021, KF909047, KF909107. Polypodium glycyrrhiza 7781: E. M. Sigel 2010-‐‑101 (DUKE); Washington, U. S. A.; KF909078, -‐‑, KF909048, KF909108. Polypodium glycyrrhiza 7783: E. M. Sigel 2010-‐‑85 (DUKE); Washington, U. S. A.; KF909079, KF909018, KF909049, KF909109. Polypodium glycyrrhiza 8009: M. H. Barker BG04-‐‑129 (ALA); Alaska, U. S. A.; -‐‑, KF909019, KF909050, KF909110. Polypodium glycyrrhiza 8161: R. Lipkin 04-‐‑286 (ALA); Alaska, U. S. A.; -‐‑, KF909020, KF909051, KF909111. Polypodium glycyrrhiza 8523: C. J. Rothfels 4046 (DUKE); British Columbia, Canada; KF909081, KF909017, KF909052, -‐‑. Polypodium macaronesicum A.E.Bobrov 8688: A. Larsson 47 (DUKE); Canary Islands, Spain; KF909084, KF909022, KF909043, KF909112. Polypodium martensii Mett. 7540: J. Rzedowski 53471 (UC); Querétaro, Mexico; -‐‑, -‐‑, KF909053, KF909113. Polypodium pellucidum Kaulf. 8778: A. L. Vernon s. n. (DUKE); Hawaii, U. S. A.; KF909085, -‐‑, KF909055, KF909114. Polypodium plesiosorum Kunze 7160: J. B. Beck 1160 (DUKE); Jalisco, Mexico; KF909087-‐‑, -‐‑, -‐‑. P. plesiosorum -‐‑: J. Lautner 01-‐‑39 (GOET); Mexico; -‐‑, -‐‑, FJ825696.1, -‐‑. Polypodium rhodopleuron Kunze 610: C. H. Haufler 926 (KANU); Vera Cruz, Mexico; -‐‑, -‐‑, U21145.1, -‐‑. Polypodium rhodopleuron 7255: L. Huiet 145 (DUKE); Vera Cruz, Mexico; KF909088, -‐‑, -‐‑, KF909105. Polypodium sanctae-‐‑rosea (Maxon) C. Chr. 3580: E. Schuettpelz 525 (GOET); In cultivation, Alter Botanischer Garten Goettingen, originally from Mexico; EF463840, KF909026, EF463258, -‐‑. Polypodium scouleri Hook. & Grev 7216: M. D. Windham 94-‐‑115 (DUKE); Washington, U. S. A.; KF909089, -‐‑, KF909058, KF909117. Polypodium scouleri 7251: L. Huiet 141 (DUKE); California, U. S. A.; KF909090, KF909029, KF909059, KF909118. Polypodium sibiricum Sipliv. 8008: C. L. Parker 9347 (ALA); Alaska, U. S. A.; KF909091, -‐‑, KF909063, KF909119. Polypodium sibiricum 8010: P. Caswell 98-‐‑109 (ALA); Alaska, U. S. A.; -‐‑, -‐‑, KF909061, -‐‑. Polypodium sibiricum 8039: S. R. Brinker 1708 (DUKE); Ontario, Canada; -‐‑, KF909030, KF909062, KF909120. Polypodium sibiricum 9145: C. H. Haufler s. n. (DUKE); Japan; KF909092, -‐‑, KF909060, -‐‑. Polypodium subpetiolatum Hook. 6485: C. J. Rothfels 3026 (DUKE); Hidalgo, Mexico; KF909093, -‐‑, KF909064, KF909121. Prosaptia contigua C.Presl 293: W. L. Chiou 97-‐‑09-‐‑12-‐‑05 (TAIF); Taiwan; -‐‑, -‐‑, AY362345.1, -‐‑. Prosaptia contigua 4204: E. Schuettpelz 786 (DUKE); Pahang, Malaysia; EF463842, -‐‑, -‐‑, -‐‑.

138
Table A. 2. Node age constraints obtained from Schuettpelz and Pryer (2009) for nodes in Fig. 5 of Chapter I. Age constraint: node number in Fig. 5; corresponding node number from Schuettpelz and Pryer (2009, Fig. S1); best age estimate from Schuettpelz and Pryer (2009) ± one standard deviation.
A: node 3; node 357; 43.00 ± 4.30 mya. B: node 4; node 358; 39.20 ± 3.92 mya C: node 5; node 359; 37.00 ± 3.70 mya. D: node 6; node 352; 30.00 ± 3.00 mya. F: node 9; node 361; 14.20 ± 1.42 mya.

139
Table A.3. Divergence time estimates in MYA for nodes in Fig. 5 of Chapter I. Node number: Analysis1 mean node age (95% HPD); Analysis 2 mean node age (95% HPD); Analysis 3 analysis mean node age (95% HPD); Analysis 4 analysis mean node age (95% HPD). NA = Node not recovered. Node 1: 80.9093 (49.8643-‐‑116.7018); 78.5680 (48.3207-‐‑113.3601); 99.3296 (56.7785-‐‑148.1528); 94.2568391 (51.9024427-‐‑144.3365683). Node 2: 59.0926 (47.5398-‐‑73.5632); 58.1556 (46.6538-‐‑71.3184); 61.5822 (48.2060-‐‑77.2235); 60.8147904 (47.6548397-‐‑77.0995208). Node 3: 43.2737 (39.5811-‐‑47.0155); 43.2360 (39.3988-‐‑46.8713); 43.3403 (39.5048-‐‑47.0098); 43.284612 (39.4220265-‐‑46.9229102). Node 4: 39.1587 (36.2754-‐‑41.9505); 39.0101 (36.1520-‐‑41.9606); 39.2372 (36.3638-‐‑42.0730); 39.0308866 (36.0497452-‐‑41.9501179). Node 5: 36.0998 (33.0286-‐‑39.2506); 36.0304 (32.8590-‐‑39.1146); 36.1174 (32.9915-‐‑39.2393); 36.0076033 (32.8910391-‐‑39.154408). Node 6: 29.7660 (25.9940-‐‑33.5855); 29.6928 (25.8864-‐‑33.5223); 29.7374 (25.8946-‐‑33.4966); 29.6668509 (25.856626-‐‑33.4618959). Node 7: 27.8021 (25.6005-‐‑31.4888); 24.7731 (16.7244-‐‑32.7388); 27.6381 (25.5001-‐‑31.2645); 24.6547965 (17.1705195-‐‑32.3178474). Node 8: 22.2375 (16.5627-‐‑27.5515); 20.5928 (14.0057-‐‑27.0553); 22.0444 (16.7382-‐‑27.2800); 20.4979249 (14.6166243-‐‑26.8414717). Node 9: 14.6571 (11.2182-‐‑18.0584); 14.5090 (11.1799-‐‑18.0744); 14.6256 (11.2866-‐‑18.1274); 14.5497633 (11.0786795-‐‑17.97002). Node 10: 14.4076 (9.9477-‐‑19.3999); 13.5960 (8.9830-‐‑18.6721); 14.4694 (10.3315-‐‑19.2985); 13.6208218 (9.8967262-‐‑10.098109). Node 11: 13.4419 (9.0761-‐‑18.4595); 12.6786 (8.1951-‐‑17.6302); 13.4673 (9.2312-‐‑18.0843); 12.6441798 (8.489163-‐‑17.1542618). Node 12: 12.6070 (8.0990-‐‑17.1256); 11.9199 (7.4503-‐‑16.7618); 12.6647 (8.5236-‐‑17.1183); 11.8900939 (7.7775471-‐‑16.2409955). Node 13: 12.2370 (7.5440-‐‑17.4243); 11.3832 (6.8946-‐‑16.5744); 9.3523 (5.5573-‐‑13.4450); 11.3841674 (6.845854-‐‑16.1018793). Node 14: 9.3332 (5.3521-‐‑13.4785); 8.8067 (5.0561-‐‑13.0767); 9.2201 (5.4489-‐‑13.4990); 8.8091156 (5.1362716-‐‑12.8036577). Node 15: 9.3008 (5.2464-‐‑13.8106); 8.7273 (4.7765-‐‑13.0323); 5.8812 (2.8599-‐‑9.2974); 8.7155285 (4.8365912-‐‑12.8247527). Node 16: 5.7479 (2.4742-‐‑9.1701); 5.4933 (2.4591-‐‑8.9299); 4.0109 (1.7563-‐‑6.4851); 5.5721493 (2.5218709-‐‑9.076938). Node 17: 3.9132 (1.5731-‐‑6.5035); 3.7170 (1.5281-‐‑6.2363); 2.7677 (1.3417-‐‑4.4725); 3.8198199 (1.6698643-‐‑6.4611226). Node 18: 2.6588 (1.2852-‐‑4.3195); 2.5169 (1.1450-‐‑4.1212); 2.6264 (1.0553-‐‑4.4121); 2.6533937 (1.2691906-‐‑4.2842092). Node 19: 2.5202 (0.9812-‐‑4.2770); 2.3787 (0.9421-‐‑4.1207); 2.4402 (1.0302-‐‑4.2018); 2.491035 (0.9935786-‐‑4.2383673). Node 20: 2.2995 (0.9574-‐‑4.0619); 2.1815 (0.8579-‐‑3.8495); 1.4515 (0.6213-‐‑2.4462); 2.3593704 (0.9464934-‐‑4.084822). Node 21: 1.3733 (0.6031-‐‑2.3371); 1.2912 (0.5162-‐‑2.1958); 1.4353 (0.6289-‐‑2.3351); 1.3994 (0.6166255-‐‑2.3069672). Node 22: 1.3384 (0.5642-‐‑2.1744); 1.2661 (0.5335-‐‑2.1206); 1.3546 (0.5990-‐‑2.2961); 1.3897871 (0.5851661-‐‑2.3502674). Node 23: 1.2622 (0.4176-‐‑2.2920); 1.1960 (0.3919-‐‑2.2016); 1.3331 (0.4292-‐‑2.3980); 1.2580641 (0.3823619-‐‑2.3047871). Node 24: 1.2200 (0.3471-‐‑2.2985); 1.1538 (0.2884-‐‑2.1737); 1.3046

140
(0.2998-‐‑2.3730); 1.2503524 (0.2954099-‐‑2.3214561). Node 25: 1.1598 (0.4983-‐‑1.8718); 1.1152 (0.4810-‐‑1.8584); 1.2080 (7.7165-‐‑16.9081); 1.1977087 (0.519568-‐‑1.9518167). Node 26: 1.1057 (0.4685-‐‑1.8332); 1.0339 (0.4333-‐‑1.7530); 1.1774 (0.4971-‐‑1.9486); 1.1294496 (0.4548203-‐‑1.8930163). Node 27: 0.9822 (0.4331-‐‑1.6731); 0.7914 (0.2565-‐‑1.3793); -‐‑; -‐‑. Node 28: 0.7304 (0.1427-‐‑1.3746); 0.7586 (0.1806-‐‑1.3963); 0.8214 (0.2796-‐‑1.5034); 0.7808707 (0.202273-‐‑1.468254). Node 29: 0.6885 (0.0406-‐‑1.6038); 0.6668 (0.0498-‐‑1.5583); 0.7821 (0.2437-‐‑1.4460); 0.7665087 (0.122964-‐‑1.4402922). Node 30: 0.6818 (0.0350-‐‑1.5430); 0.6425 (0.0428-‐‑1.4611); 0.7303 (0.0470-‐‑1.6873); 0.7077625 (0.1580288-‐‑1.3681133). Node 31: -‐‑; 0.5845 (0.1547-‐‑1.1289); -‐‑; 0.7018873 (0.0393405-‐‑1.6279652). Node 32: 0.6314 (0.1576-‐‑1.2059); 0.5465 (0.1052-‐‑1.1135); -‐‑; 0.6913805 (0.044884-‐‑1.5962671). Node 33: 0.6120 (0.0770-‐‑1.3073); 0.5105 (0.1347-‐‑1.0108); 0.6801 (0.1325-‐‑1.3343); 0.6384346 (0.1611844-‐‑1.2026506). Node 34: 0.5883 (0.1066-‐‑1.1952); 0.4497 (0.0904-‐‑0.9022); -‐‑; 0.5976591 (0.0971099-‐‑1.2048526). Node 35: -‐‑; 0.4024 (0.0131-‐‑0.9512); 0.5012 (0.1174-‐‑1.0147); 0.4863264 (0.0987683-‐‑0.9673032). Node 36: -‐‑; 0.3992 (0.0165-‐‑0.8916); -‐‑; 0.4373267 (0.0102414-‐‑1.0037977). Node 37: -‐‑; 0.3428 (0.0000-‐‑0.9362); -‐‑; -‐‑. Node 38: 0.2690 (0.0065-‐‑0.6118); 0.3085 (0.0000-‐‑0.9507); 0.3028 (0.0002-‐‑0.7849); 0.3333279 (0.0000075-‐‑1.0251555). Node 39: -‐‑; 0.2737 (0.0000-‐‑0.8115); -‐‑; -‐‑. Node 40: 0.2301 (0.0000-‐‑0.6688); 0.2202 (0.0001-‐‑0.6561); -‐‑; 0.2150414 (0.0000212-‐‑0.6317393). Node 41: 0.1551 (0.0000-‐‑0.4443); 0.1473 (0.0000-‐‑0.4155); 0.1634 (0.0000-‐‑0.4753); 0.1590446 (0.0000142-‐‑0.4614606).

141
APPENDIX B
SUPPLEMENTARY INFORMATION FOR CHAPTER III
Table B.1. Voucher table of specimens of Pleurosoriopsis and Polypodium included in Chapter III. Taxon name—Fern Lab Database accession number (http://fernlab.biology.duke.edu): voucher information (herbarium); trnG-‐‑R: GenBank accession; gapCp: GenBank accession (number of clones in consensus allele sequence) [repeated for multiple gapCp consensus alleles]; latitude and longitude coordinates [for Polypodium hesperium only]. -‐‑ = data not available. Pleurosoriopsis makinoi—8723: A. Ebihara 2971 (DUKE); trnG-‐‑R: KF909116; gapCp: KJ748276 (5), KJ748277 (4), KJ748278 (4). Polypodium amorphum—6951: M. D. Windham 3404 (DUKE); trnG-‐‑R: KF909094; gapCp: KJ748225 (12). 6952: M. D. Windham 3629 (DUKE); trnG-‐‑R: KJ748290; gapCp: -‐‑. 6953: M. D. Windham 3619 (DUKE); trnG-‐‑R: KJ748291; gapCp: -‐‑. 7556: C. J. Rothfels 3872 (DUKE); trnG-‐‑R: KJ748300; gapCp: -‐‑. 7770: E. M. Sigel 2010-‐‑73 (DUKE); trnG-‐‑R: KJ748309; gapCp: -‐‑. 7771: E. M. Sigel 2010-‐‑125 (DUKE); trnG-‐‑R: KF909095; gapCp: KJ748226 (6), KJ748227 (3). 7772: E. M. Sigel 2010-‐‑101 (DUKE); trnG-‐‑R: KJ748310; gapCp: -‐‑. 7773: E. M. Sigel 2010-‐‑104 (DUKE); trnG-‐‑R: KF909096; gapCp: KJ748224 (8), KJ748228 (5). 7777: E. M. Sigel 2010-‐‑74 (DUKE); trnG-‐‑R: KJ748311; gapCp: -‐‑. 7778: E. M. Sigel 2010-‐‑102 (DUKE); trnG-‐‑R: KJ748312; gapCp: -‐‑. 7779: E. M. Sigel 2010-‐‑126 (DUKE); trnG-‐‑R: KJ748313; gapCp: -‐‑. Polypodium appalachianum—7533: E. M. Sigel 2010-‐‑61 (DUKE); trnG-‐‑R: KF909097; gapCp: KJ748229 (7), KJ748230 (5). 7630: C. J. Rothfels 3905 (DUKE); trnG-‐‑R: KF909098; gapCp: KJ748231 (9). 7632: C. J. Rothfels 3907 (DUKE); trnG-‐‑R: KJ748304; gapCp: -‐‑. 8029: M. J. Oldham 38496 (DUKE); trnG-‐‑R: KF909099; gapCp: KJ748232 (12). 8045: M. J. Oldham 27283 (DUKE); trnG-‐‑R: KF909100; gapCp: KJ748233 (13). Polypodium californicum—3829: J. Metzgar 176 (DUKE); trnG-‐‑R: KJ748234; gapCp: KJ748288 (10). 5909: E. Schuettpelz 1272A (DUKE); trnG-‐‑R: KJ748289; gapCp: -‐‑. 7249: L. Huiet 138 (DUKE); trnG-‐‑R: KJ748296; gapCp: -‐‑. Polypodium cambricum—8786: H. S. McHaffie s.n. (E); trnG-‐‑R: KF909102; gapCp: -‐‑. 8787: Patrick James Blyth Collection Number: 8-‐‑61 (E); trnG-‐‑R: KF909103; gapCp: KJ748235 (11). Polypodium colpodes—7254: L. Huiet 144 (DUKE); trnG-‐‑R: KF909104; gapCp: KJ748236 (6), KJ748237 (4). Polypodium fauriei—8722: A. Ebihara 2973 (DUKE); trnG-‐‑R: KF909106; gapCp: KJ748238 (14). Polypodium glycyrrhiza—7218: M. D. Windham 3618 (DUKE); trnG-‐‑R: KJ748295; gapCp: -‐‑. 7545: C. J. Rothfels 3854 (DUKE); trnG-‐‑R: KJ748298; gapCp: -‐‑. 7546: C. J. Rothfels 3855 (DUKE); trnG-‐‑R: KJ748299; gapCp: -‐‑. 7559: C. J. Rothfels 3875 (DUKE); trnG-‐‑R: KJ748301; gapCp: -‐‑. 7766: E. M. Sigel 2010-‐‑77A (DUKE); trnG-‐‑R: KJ748307; gapCp: -‐‑. 7768: E. M. Sigel 2010-‐‑89 (DUKE); trnG-‐‑R: KF909107; gapCp: -‐‑. 7769: E. M. Sigel 2010-‐‑95 (DUKE); trnG-‐‑R: KJ748308;

142
gapCp: -‐‑. 7780: E. M. Sigel 2010-‐‑83 (DUKE); trnG-‐‑R: KJ748314; gapCp: -‐‑. 7781: E. M. Sigel 2010-‐‑12 (DUKE); trnG-‐‑R: KF909108; gapCp: KJ748239 (12). 7782: E. M. Sigel 2010-‐‑68 (DUKE); trnG-‐‑R: KJ748315; gapCp: -‐‑. 7783: E. M. Sigel 2010-‐‑85 (DUKE); trnG-‐‑R: KF909109; gapCp: KJ748240 (10). 8009: M. H. Barker BG04-‐‑129 (ALA); trnG-‐‑R: KF909110; gapCp: -‐‑. 8161: R. Lipkin 04-‐‑286 (ALA); trnG-‐‑R: KF909111; gapCp: KJ748241 (11). Polypodium hesperium—3127: E. Schuettpelz 420 (DUKE); trnG-‐‑R: KJ748287; gapCp: KJ748244 (5), KJ748245 (3); estimated 35.02443 -‐‑111.74215. 7217: M. D. Windham 90-‐‑385 (DUKE); trnG-‐‑R: KJ748294; gapCp: -‐‑; estimated 32.63160 -‐‑109.82160. 7539: S. Boyd 2714 (US); trnG-‐‑R: KJ748297; gapCp: -‐‑; estimated 31.43402 -‐‑115.05132. 7571: C. J. Rothfels 3889 (DUKE); trnG-‐‑R: KJ748302; gapCp: KJ748246 (3), KJ748247 (3), KJ748248 (2), KJ748249 (2); estimated 47.47893 -‐‑120.79845. 7763: E. M. Sigel 2010-‐‑107 (DUKE); trnG-‐‑R: KJ748305; gapCp: -‐‑; 45.58992 -‐‑122.07300. 7785: E. M. Sigel 2010-‐‑120 (DUKE); trnG-‐‑R: KJ748316; gapCp: -‐‑; 46.85236 -‐‑125.63183. 7786: E. M. Sigel 2010-‐‑111 (DUKE); trnG-‐‑R: KJ748317; gapCp: -‐‑; 46.81736 -‐‑125.54936. 7791: C. Haufler s.n. (DUKE); trnG-‐‑R: KJ748318; gapCp: -‐‑; estimated 48.44447 -‐‑115.67622. 7792: M. D. Windham 89-‐‑05 (DUKE); trnG-‐‑R: KJ748319; gapCp: -‐‑; 40.63626 -‐‑111.71162. 7793: J .E. Bowers R1218 (DUKE); trnG-‐‑R: KJ748320; gapCp: -‐‑; 32.21309 -‐‑110.56263. 8159: E. M. Sigel 2011-‐‑01A (DUKE); trnG-‐‑R: KJ748321; gapCp: -‐‑; 40.63626 -‐‑111.71162. 8164: E. M. Sigel 2011-‐‑01B (DUKE); trnG-‐‑R: KJ748322; gapCp: KJ748250 (7), KJ748251 (5), KJ748252 (2); 40.63626 -‐‑111.71162. 8165: E. M. Sigel 2011-‐‑01C (DUKE); trnG-‐‑R: KJ748323; gapCp: -‐‑; 40.63626 -‐‑111.71162. 8166: E. M. Sigel 2011-‐‑02 (DUKE); trnG-‐‑R: KJ748324; gapCp: KJ748253 (5), KJ748254 (5); 38.37306 -‐‑112.49611. 8167: E. M. Sigel 2011-‐‑03A (DUKE); trnG-‐‑R: KJ748325; gapCp: -‐‑; 37.26667 -‐‑112.93333. 8168: E. M. Sigel 2011-‐‑03B (DUKE); trnG-‐‑R: KJ748326; gapCp: KJ748255 (7), KJ748256 (4); 37.26667 -‐‑112.93333. 8169: E. M. Sigel 2011-‐‑03C (DUKE); trnG-‐‑R: KJ748327; gapCp: -‐‑; 37.26667 -‐‑112.93333. 8171: E. M. Sigel 2011-‐‑04B (DUKE); trnG-‐‑R: KJ748328; gapCp: -‐‑; 35.02443 -‐‑111.74215. 8172: E. M. Sigel 2011-‐‑05 (DUKE); trnG-‐‑R: KJ748329; gapCp: -‐‑; 34.45270 -‐‑111.47913. 8174: E. M. Sigel 2011-‐‑07 (DUKE); trnG-‐‑R: KJ748330; gapCp: -‐‑; 34.46718 -‐‑111.14944. 8175: E. M. Sigel 2011-‐‑08A (DUKE); trnG-‐‑R: KJ748331; gapCp: KJ748257 (7), KJ748258 (4); 34.32830 -‐‑110.93815. 8176: E. M. Sigel 2011-‐‑08B (DUKE); trnG-‐‑R: KJ748332; gapCp: -‐‑; 34.32830 -‐‑110.93815. 8177: E. M. Sigel 2011-‐‑09A (DUKE); trnG-‐‑R: KJ748333; gapCp: KJ748259 (7), KJ748260 (3); 33.80528 -‐‑110.88949. 8178: E. M. Sigel 2011-‐‑09B (DUKE); trnG-‐‑R: KJ748334; gapCp: -‐‑; 33.80528 -‐‑110.88949. 8179: E. M. Sigel 2011-‐‑10 (DUKE); trnG-‐‑R: KJ748335; gapCp: KJ748242 (5), KJ748243 (5); 32.65807 -‐‑109.85813. 8180: E. M. Sigel 2011-‐‑11 (DUKE); trnG-‐‑R: KJ748336; gapCp: KJ748262 (4), KJ748263 (4); 32.65807 -‐‑109.85813. 8181: E. M. Sigel 2011-‐‑12 (DUKE); trnG-‐‑R: KJ748337; gapCp: -‐‑; 32.65807 -‐‑109.85813. 8182: E. M. Sigel 2011-‐‑13 (DUKE); trnG-‐‑R: KJ748338; gapCp: -‐‑; 32.65807 -‐‑109.85813. 8183: E. M. Sigel 2011-‐‑14 (DUKE); trnG-‐‑R: KJ748339; gapCp: -‐‑; 36.73839 -‐‑106.41589. 8184: E. M. Sigel 2011-‐‑16 (DUKE); trnG-‐‑R: KJ748340; gapCp: -‐‑; 37.47863 -‐‑107.54394. 8185: E. M. Sigel 2011-‐‑17A (DUKE); trnG-‐‑R: KJ748341; gapCp:

143
KJ748264 (7), KJ748265 (3); 38.00353 -‐‑107.66137. 8186: E. M. Sigel 2011-‐‑17B (DUKE); trnG-‐‑R: KJ748342; gapCp: -‐‑; 38.00353 -‐‑107.66137. 8187: E. M. Sigel 2011-‐‑19A (DUKE); trnG-‐‑R: KJ748343; gapCp: -‐‑; 38.01798 -‐‑107.67814. 8188: E. M. Sigel 2011-‐‑19B (DUKE); trnG-‐‑R: KJ748344; gapCp: -‐‑; 38.01798 -‐‑107.67814. 8206: E. M. Sigel 2010-‐‑78 (DUKE); trnG-‐‑R: KJ748345; gapCp: -‐‑; -‐‑48.9745833 -‐‑121.48016. 8268: E. M. Sigel 2011-‐‑23 (DUKE); trnG-‐‑R: KJ748346; gapCp: -‐‑; 48.64772 -‐‑115.88533. 8269: E. M. Sigel 2011-‐‑25 (DUKE); trnG-‐‑R: KJ748347; gapCp: -‐‑; 48.64772 -‐‑115.88533. 8270: E. M. Sigel 2011-‐‑26 (DUKE); trnG-‐‑R: KJ748348; gapCp: -‐‑; 48.45308 -‐‑115.77125. 8271: E. M. Sigel 2011-‐‑27 (DUKE); trnG-‐‑R: KJ748349; gapCp: -‐‑; 48.45308 -‐‑115.77125. 8272: E. M. Sigel 2011-‐‑28 (DUKE); trnG-‐‑R: KJ748350; gapCp: -‐‑; 48.45458 -‐‑115.76397. 8273: E. M. Sigel 2011-‐‑29 (DUKE); trnG-‐‑R: KJ748351; gapCp: -‐‑; 48.44464 -‐‑115.67608. 8274: E. M. Sigel 2011-‐‑31a (DUKE); trnG-‐‑R: KJ748352; gapCp: -‐‑; 48.44447 -‐‑115.67622. 8276: E. M. Sigel 2011-‐‑31c (DUKE); trnG-‐‑R: KJ748353; gapCp: KJ748267 (4), KJ748268 (2), KJ748269 (2); 48.44447 -‐‑115.67622. 8277: E. M. Sigel 2011-‐‑33 (DUKE); trnG-‐‑R: KJ748354; gapCp: -‐‑; 48.47042 -‐‑113.85553. 8278: E. M. Sigel 2011-‐‑34 (DUKE); trnG-‐‑R: KJ748355; gapCp: -‐‑; 48.45128 -‐‑113.67861. 8279: E. M. Sigel 2011-‐‑35 (DUKE); trnG-‐‑R: KJ748356; gapCp: KJ748270 (7), KJ748271 (4); 47.95586 -‐‑114.03294. 8280: E. M. Sigel 2011-‐‑37 (DUKE); trnG-‐‑R: KJ748357; gapCp: -‐‑; 47.32644 -‐‑113.25539. 8281: E. M. Sigel 2011-‐‑38 (DUKE); trnG-‐‑R: KJ748358; gapCp: -‐‑; 47.32589 -‐‑113.97172. 8282: E. M. Sigel 2011-‐‑40 (DUKE); trnG-‐‑R: KJ748359; gapCp: -‐‑; 47.32400 -‐‑113.97458. 8288: E. M. Sigel 2011-‐‑46 (DUKE); trnG-‐‑R: KJ748306; gapCp: -‐‑; 46.85236 -‐‑125.63183. 8290: E. M. Sigel 2011-‐‑48 (DUKE); trnG-‐‑R: KJ748360; gapCp: -‐‑; 48.00467 -‐‑115.82144. Polypodium macaronesicum—8688: A. Larsson 47 (DUKE); trnG-‐‑R: KF909112; gapCp: KJ748272 (6), KJ748273 (4). Polypodium martensii—7540: Rzedowski 53471 (UC); trnG-‐‑R: KF909113; gapCp: -‐‑. Polypodium pellucidum—8778: A. L. Vernon s.n. (DUKE); trnG-‐‑R: KF909114; gapCp: KJ748274 (10). Polypodium plesiosorum—7160: J. Beck 1160 (DUKE); trnG-‐‑R: KJ748292; gapCp: KJ748275 (11). Polypodium rhodopleuron—7255: L. Huiet 145 (DUKE); trnG-‐‑R: KF909105; gapCp: KJ748279 (6), KJ748280 (6). Polypodium scouleri—7216: M. D. Windham 94-‐‑115 (DUKE); trnG-‐‑R: KF909117; gapCp: KJ748282 (10). 7251: L. Huiet 141 (DUKE); trnG-‐‑R: KF909118; gapCp: KJ748281 (9). Polypodium sibiricum—7215: J. R. Grant 90-‐‑1235 (DUKE); trnG-‐‑R: KJ748293; gapCp: -‐‑. 8008: C. L Parker 9347 (ALA); trnG-‐‑R: KF909119; gapCp: KJ748283 (12). 8039: S. R. Brinker 1708 (DUKE); trnG-‐‑R: KF909120; gapCp: KJ748284 (11). 8779: Krasnoborov 3753 (MO); trnG-‐‑R: KJ748361; gapCp: -‐‑. Polypodium subpetiolatum—6485: C. J. Rothfels 3026 (DUKE); trnG-‐‑R: KF909121; gapCp: KJ748285 (8), KJ748286 (5).

144
APPENDIX C
SUPPLEMENTAL INFORMATION FOR CHAPTER IV
Table C.1. Estimate of genetic distance between the diploid species Polypodium amorphum and Polypodium glycyrrhiza based on coding regions of 24 single copy nuclear loci. Sequence data was obtained from P. amorphum and P. glycyrrhiza transcriptomes generated by the 1000 Plants Initiative (onekp.com). Sequence data that was previously published in Rothfels et al. (2013) is indicated with *. Uncorrected p-‐‑distances and Jukes-‐‑Cantor distances were calculated in PAUP* v 4.0a134 (Swofford 2002).
Included sites Pairwise distance Locus Total Variable uncorrected p Jukes-‐‑Cantor ApPEFP_C* 912 18 0.0192 0.0200 AT1G49140 239 3 0.0126 0.0127 AT1G75980 259 1 0.0034 0.0039 AT5G10780 516 7 0.0136 0.0137 AT5G17840 348 18 0.0517 0.0536 COP9 645 8 0.0124 0.0125 CRY1 1430 25 0.0175 0.0177 CRY2* 1545 46 0.0298 0.0304 CRY3 1990 35 0.0176 0.0178 CRY4* 2100 37 0.0176 0.0178 CRY5 636 17 0.0267 0.0271 det1* 1149 16 0.0139 0.0141 gapC 1017 31 0.0305 0.0311 gapCp long 935 12 0.0128 0.0130 gapCp short* 1085 17 0.0157 0.0158 Hemera 1113 27 0.0243 0.0247 IBR3* 2412 39 0.0162 0.0164 IGPD 780 26 0.0333 0.0341 MCD1 944 12 0.0127 0.0128 pgiC* 1688 20 0.0119 0.0119 SEF 493 8 0.0162 0.0164 SQD1* 1002 34 0.0339 0.0347

145
Included sites Pairwise distance Locus Total Variable uncorrected p Jukes-‐‑Cantor TPLATE* 2456 24 0.0114 0.0115 Transducin* 2605 42 0.0163 0.0163 average 0.0196 0.0200

146
Table C.2. Summary of the number of Illumina 100 base paired-‐‑end reads for each Polypodium specimen. “Raw read pairs” refers to the number of reads before any quality control filtering. Raw reads were filtered using Trimmomatic (Bolger et al. 2014) to remove low quality reads and adapter sequences using the following parameters: PE -‐‑phred33 ILLUMINACLIP:TruSeq3-‐‑PE.fa:2:30:10:8:true HEADCROP:10 TRAILING:20 SLIDINGWINDOW:10:30 MINLEN:30. “Forward only” and “reverse only” refers to read pairs in which only the forward or reverse sequence in a read pair passed filtering.
Polypodium specimen Raw read pairs Filtered read pairs
P. amorphum 7771 46469538 read pairs: 40775861 (87.9%) forward only: 2807028 (6.2%) reverse only: 937150 (2.0%)
P. amorphum 7773 54361763 read pairs: 48055949 (87.9%) forward only: 3239533 (6.0%) reverse only: 1050025 (1.9%)
P. amorphum 8521 68239527 read pairs: 61285556 (89.9%) forward only: 3258970 (4.8%) reverse only: 1398881 (2.0%)
P. glycyrrhiza 7767 54397819 read pairs: 48734820 (89.1%) forward only: 2714555 (5.2%) reverse only: 1190460 (2.0%)
P. glycyrrhiza 8493 59726125 read pairs: 53355900 (89.3%) forward only: 3099800 (5.2%) reverse only: 1190460 (2.0%)
P. glycyrrhiza 7557 54290379 read pairs: 48383244 (89.1%) forward only: 2832566 (5.2%) reverse only: 1148381 (2.1%)
P. hesperium 8179 (Ha) 61102106 read pairs: 54227741 (88.8%) forward only: 3453901 (5.7%) reverse only: 1194554 (1.96%)
P. hesperium 8276 (Ha) 52396406 read pairs: 46931013 (89.6%) forward only: 2613892 (5.0%) reverse only: 1051250 (2.0%)

147
Polypodium specimen Raw read pairs Filtered read pairs
P. hesperium 8280 (Ha) 53544501 read pairs: 48056895 (89.8%) forward only: 2622626 (4.9%) reverse only: 1054477 (2.0%)
P. hesperium 8175 (Hg) 57760074 read pairs: 51813719 (89.7%) forward only: 2801653 (4.9%) reverse only: 1173320 (2.0%)
P. hesperium 8177 (Hg) 52671424 read pairs: 46513232 (88.3%) forward only: 3015565 (5.7%) reverse only: 1123514 (2.1%)
P. hesperium 8288 (Hg) 47247157 read pairs: 42092327 (88.1%) forward only: 2504258 (5.3%) reverse only: 968192 (2.1%)

148
Table C.3. Summary statistics for the Polypodium reference transcriptome. The “initial” transcriptome was generated with filtered reads from the six specimens of Polypodium amorphum and P. glycyrrhiza using Trinity v. r20140413 (Grabherr et al. 2011) with parameters for strand-‐‑specific paired-‐‑end reads (-‐‑-‐‑SS_lib_type RF). The “final” transcriptome, which was used in subsequent analyses, was created by filtering the initial transcriptome to remove assembly artifact and transcripts without a query hit in the PlantTribes 22 plant genome database (Wall et al. 2008). Initial
Polypodium reference transcriptome
Final Polypodium reference
transcriptome
Total number of transcripts 420542 82893
Number of genes 223955 25749
Number of isoforms 420542 82893
Percent G/C content 44.31 45.42
Contig N50 (bases) 1560 2300
Median contig length (bases) 401 1559
Average contig length (bases) 814.64 1756.44
Total assembled bases 342589259 145596568

149
Figure C.1. Synopsis of the number of isoforms (Trinity subcomponents) assigned to each gene (Trinity component) in the final Polypodium reference transcriptome.
11337 4780 5433
2886 1151
141
20
1
10
100
1000
10000
100000
1 2 3-5 6-10 11-20 21-30 31+
Num
ber o
f gen
es
Number of isoforms per gene

150
Table C.4. Synopsis of gene ontology (GO) cellular components represented in the Polypodium reference transcriptome. Cellular components are grouped by the number of genes representing each component, with some genes representing multiple components. Because each gene was assigned to the most specific cellular component possible, this summary includes multiple hierarchical levels of classification.

151
Represented by > 500 Genes: 6 Represented by > 10 Genes cont.cytoplasm (GO:0005737) SAGA-type complex (GO:0070461)integral to membrane (GO:0016021) septin ring (GO:0005940)intracellular (GO:0005622) small-subunit processome (GO:0032040)membrane (GO:0016020) spindle pole (GO:0000922)nucleus (GO:0005634) spliceosomal complex (GO:0005681)ribosome (GO:0005840) thylakoid (GO:0009579)Represented by > 100 Genes: 9 transcription factor complex (GO:0005667)cell wall (GO:0005618) transcription factor TFIIA complex (GO:0005672)chloroplast (GO:0009507) transcription factor TFIID complex (GO:0005669)chromosome (GO:0005694) viral envelope (GO:0019031)endoplasmic reticulum (GO:0005783) voltage-gated potassium channel complex (GO:0008076)endoplasmic reticulum membrane (GO:0005789) Represented by > 1 Gene: 52nuclear chromosome (GO:0000228) acetyl-CoA carboxylase complex (GO:0009317)photosystem II (GO:0009523) actin cytoskeleton (GO:0015629)protein complex (GO:0043234) ATP-binding cassette (ABC) transporter complex (GO:0043190)ubiquitin ligase complex (GO:0000151) beta-galactosidase complex (GO:0009341)Represented by > 50 Genes: 23 cell cortex (GO:0005938)1,3-beta-D-glucan synthase complex (GO:0000148) cell junction (GO:0030054)cullin-RING ubiquitin ligase complex (GO:0031461) chromatin remodeling complex (GO:0016585)DNA replication factor C complex (GO:0005663) cis-Golgi network (GO:0005801)dynein complex (GO:0030286) COPI vesicle coat (GO:0030126)exocyst (GO:0000145) DNA polymerase III complex (GO:0009360)extrinsic to membrane (GO:0019898) DNA-directed RNA polymerase III complex (GO:0005666)Golgi-associated vesicle (GO:0005798) Elongator holoenzyme complex (GO:0033588)intrinsic to endoplasmic reticulum membrane (GO:0031227) endoplasmic reticulum lumen (GO:0005788)large ribosomal subunit (GO:0015934) eukaryotic translation elongation factor 1 complex (GO:0005853)mitochondrial intermembrane space protein transporter complex (GO:0042719) extracellular matrix (GO:0031012)mitochondrial outer membrane (GO:0005741) F-actin capping protein complex (GO:0008290)mitochondrial proton-transporting ATP synthase complex, coupling factor F(o) (GO:0000276)
glycine cleavage complex (GO:0005960)
myosin complex (GO:0016459) Golgi stack (GO:0005795)nuclear pore (GO:0005643) Golgi transport complex (GO:0017119)nucleosome (GO:0000786) GPI-anchor transamidase complex (GO:0042765)outer membrane-bounded periplasmic space (GO:0030288) integral to mitochondrial inner membrane (GO:0031305)oxygen evolving complex (GO:0009654) integral to nuclear inner membrane (GO:0005639)peptidoglycan-based cell wall (GO:0009274) integral to peroxisomal membrane (GO:0005779)peroxisome (GO:0005777) integral to thylakoid membrane (GO:0031361)photosystem I (GO:0009522) intracellular membrane-bounded organelle (GO:0043231)prefoldin complex (GO:0016272) microtubule (GO:0005874)proteinaceous extracellular matrix (GO:0005578) mitochondrial intermembrane space (GO:0005758)proton-transporting two-sector ATPase complex (GO:0016469) mitochondrial matrix (GO:0005759)Represented by > 10 Genes: 49 mitochondrial outer membrane translocase complex (GO:0005742)6-phosphofructokinase complex (GO:0005945) mitochondrial proton-transporting ATP synthase complex, catalytic core F(1) (GO:0000275)apoplast (GO:0048046) mitochondrial ribosome (GO:0005761)chromosome, centromeric region (GO:0000775) molybdopterin synthase complex (GO:0019008)clathrin adaptor complex (GO:0030131) monolayer-surrounded lipid storage body (GO:0012511)clathrin coat of coated pit (GO:0030132) nuclear chromosome, telomeric region (GO:0000784)clathrin coat of trans-Golgi network vesicle (GO:0030130) nucleolus (GO:0005730)COPII vesicle coat (GO:0030127) PCNA complex (GO:0043626)core TFIIH complex (GO:0000439) photosystem (GO:0009521)cytochrome b6f complex (GO:0009512) plasma membrane (GO:0005886)cytoskeleton (GO:0005856) pore complex (GO:0046930)extracellular region (GO:0005576) proteasome core complex, alpha-subunit complex (GO:0019773)Golgi membrane (GO:0000139) protein kinase CK2 complex (GO:0005956)integral to Golgi membrane (GO:0030173) proton-transporting V-type ATPase, V0 domain (GO:0033179)mediator complex (GO:0016592) proton-transporting V-type ATPase, V1 domain (GO:0033180)membrane coat (GO:0030117) riboflavin synthase complex (GO:0009349)microtubule associated complex (GO:0005875) ribonuclease MRP complex (GO:0000172)microtubule organizing center (GO:0005815) ribonuclease P complex (GO:0030677)mitochondrial envelope (GO:0005740) signal peptidase complex (GO:0005787)mitochondrial inner membrane (GO:0005743) signal recognition particle (GO:0048500)mitochondrial inner membrane presequence translocase complex (GO:0005744) signal recognition particle, endoplasmic reticulum targeting (GO:0005786)mitochondrion (GO:0005739) thylakoid membrane (GO:0042651)nuclear origin of replication recognition complex (GO:0005664) transcription factor TFIIF complex (GO:0005674)outer membrane (GO:0019867) vacuolar proton-transporting V-type ATPase, V1 domain (GO:0000221)peroxisomal membrane (GO:0005778) Represented by 1 Gene: 14phosphatidylinositol 3-kinase complex (GO:0005942) centrosome (GO:0005813)phosphopyruvate hydratase complex (GO:0000015) DNA-directed RNA polymerase II, core complex (GO:0005665)photosystem I reaction center (GO:0009538) eukaryotic translation initiation factor 3 complex (GO:0005852)photosystem II reaction center (GO:0009539) extrachromosomal circular DNA (GO:0005727)plastid (GO:0009536) Golgi apparatus (GO:0005794)preribosome, small subunit precursor (GO:0030688) H4/H2A histone acetyltransferase complex (GO:0043189)proteasome core complex (GO:0005839) integral to endoplasmic reticulum membrane (GO:0030176)protein phosphatase type 2A complex (GO:0000159) mitochondrial respiratory chain (GO:0005746)proton-transporting ATP synthase complex, catalytic core F(1) (GO:0045261) mitochondrial respiratory chain complex IV (GO:0005751)proton-transporting ATP synthase complex, coupling factor F(o) (GO:0045263) oligosaccharyltransferase complex (GO:0008250)proton-transporting two-sector ATPase complex, catalytic domain (GO:0033178) origin recognition complex (GO:0000808)proton-transporting two-sector ATPase complex, proton-transporting domain (GO:0033177) signal recognition particle receptor complex (GO:0005785)retromer complex (GO:0030904) vacuolar proton-transporting V-type ATPase complex (GO:0016471)ribonucleoside-diphosphate reductase complex (GO:0005971) viral capsid (GO:0019028)
GO Cellular Component Categories: 153

152
Table C.5. Synopsis of gene ontology (GO) biological processes represented in the Polypodium reference transcriptome. Biological processes are grouped by the number of genes representing each process, with some genes representing multiple processes. Because each gene was assigned to the most specific biological process possible, this summary includes multiple hierarchical levels of classification.

153
Represented by > 500 Genes: 14 Represented by > 50 Genes cont.biosynthetic process (GO:0009058) ATP hydrolysis coupled proton transport (GO:0015991)carbohydrate metabolic process (GO:0005975) ATP metabolic process (GO:0046034)DNA integration (GO:0015074) base-excision repair (GO:0006284)lipid metabolic process (GO:0006629) cell wall modification (GO:0042545)metabolic process (GO:0008152) cellular amino acid biosynthetic process (GO:0008652)oxidation-reduction process (GO:0055114) cellular amino acid metabolic process (GO:0006520)protein phosphorylation (GO:0006468) cellular protein metabolic process (GO:0044267)proteolysis (GO:0006508) chloride transport (GO:0006821)
regulation of transcription, DNA-dependent (GO:0006355) citrate transport (GO:0015746)
RNA-dependent DNA replication (GO:0006278) defense response (GO:0006952)signal transduction (GO:0007165) DNA methylation (GO:0006306)translation (GO:0006412) DNA recombination (GO:0006310)transmembrane transport (GO:0055085) DNA topological change (GO:0006265)transport (GO:0006810) exocytosis (GO:0006887)Represented by > 100 Genes: 49 fatty acid beta-oxidation (GO:0006635)ATP synthesis coupled proton transport (GO:0015986) GTP catabolic process (GO:0006184)cation transport (GO:0006812) histidine biosynthetic process (GO:0000105)cell redox homeostasis (GO:0045454) intracellular signal transduction (GO:0035556)cell wall macromolecule catabolic process (GO:0016998) lipid biosynthetic process (GO:0008610)cellular metabolic process (GO:0044237) mismatch repair (GO:0006298)cellulose biosynthetic process (GO:0030244) Mo-molybdopterin cofactor biosynthetic process (GO:0006777)DNA repair (GO:0006281) multicellular organismal development (GO:0007275)DNA replication (GO:0006260) negative regulation of catalytic activity (GO:0043086)drug transmembrane transport (GO:0006855) nitrogen compound metabolic process (GO:0006807)fatty acid biosynthetic process (GO:0006633) nuclear mRNA splicing, via spliceosome (GO:0000398)glycolysis (GO:0006096) nucleoside metabolic process (GO:0009116)GPI anchor biosynthetic process (GO:0006506) nucleosome assembly (GO:0006334)histone lysine methylation (GO:0034968) nucleotide-excision repair (GO:0006289)intracellular protein transport (GO:0006886) pentose-phosphate shunt (GO:0006098)metal ion transport (GO:0030001) peptidoglycan biosynthetic process (GO:0009252)microtubule-based movement (GO:0007018) phosphatidylinositol phosphorylation (GO:0046854)mRNA processing (GO:0006397) polysaccharide catabolic process (GO:0000272)nucleobase-containing compound metabolic process (GO:0006139) protein import into mitochondrial inner membrane (GO:0045039)oligopeptide transport (GO:0006857) protein metabolic process (GO:0019538)photosynthesis (GO:0015979) protein modification process (GO:0006464)potassium ion transmembrane transport (GO:0071805) protein retention in ER lumen (GO:0006621)protein dephosphorylation (GO:0006470) protein targeting to mitochondrion (GO:0006626)protein folding (GO:0006457) proton transport (GO:0015992)protein glycosylation (GO:0006486) purine base biosynthetic process (GO:0009113)protein polymerization (GO:0051258) response to light stimulus (GO:0009416)protein transport (GO:0015031) ribosome biogenesis (GO:0042254)protein ubiquitination (GO:0016567) rRNA processing (GO:0006364)pseudouridine synthesis (GO:0001522) steroid biosynthetic process (GO:0006694)pyridoxal phosphate biosynthetic process (GO:0042823) tetrapyrrole biosynthetic process (GO:0033014)recognition of pollen (GO:0048544) transcription initiation from RNA polymerase II promoter (GO:0006367)regulation of Rab GTPase activity (GO:0032313) translational termination (GO:0006415)response to aluminum ion (GO:0010044) trehalose biosynthetic process (GO:0005992)response to hormone stimulus (GO:0009725) Represented by > 10 Genes: 142response to oxidative stress (GO:0006979) amine metabolic process (GO:0009308)response to stress (GO:0006950) arginine biosynthetic process (GO:0006526)RNA modification (GO:0009451) asparagine biosynthetic process (GO:0006529)RNA processing (GO:0006396) ATP synthesis coupled electron transport (GO:0042773)small GTPase mediated signal transduction (GO:0007264) autophagy (GO:0006914)sucrose metabolic process (GO:0005985) carbon fixation (GO:0015977)transcription initiation, DNA-dependent (GO:0006352) carboxylic acid metabolic process (GO:0019752)transcription, DNA-dependent (GO:0006351) carotenoid biosynthetic process (GO:0016117)translational elongation (GO:0006414) cell communication (GO:0007154)translational initiation (GO:0006413) cell cycle (GO:0007049)tRNA aminoacylation for protein translation (GO:0006418) cell cycle arrest (GO:0007050)tRNA processing (GO:0008033) cell death (GO:0008219)two-component signal transduction system (phosphorelay) (GO:0000160) cell division (GO:0051301)ubiquitin-dependent protein catabolic process (GO:0006511) cell morphogenesis (GO:0000902)vesicle-mediated transport (GO:0016192) cellular carbohydrate metabolic process (GO:0044262)Represented by > 50 Genes: 50 cellular glucan metabolic process (GO:0006073)(1->3)-beta-D-glucan biosynthetic process (GO:0006075) cellular iron ion homeostasis (GO:0006879)activation of protein kinase C activity by G-protein coupled receptor protein signaling pathway (GO:0007205)
cellular modified amino acid biosynthetic process (GO:0042398)
anion transport (GO:0006820) cellular process (GO:0009987)
GO Biological Processes Categories: 445

154
Represented by > 10 Genes: cont. Represented by > 10 Genes cont.chitin catabolic process (GO:0006032) phospholipid biosynthetic process (GO:0008654)chromosome organization (GO:0051276) phosphorylation (GO:0016310)chromosome segregation (GO:0007059) photosynthesis, light reaction (GO:0019684)coenzyme A biosynthetic process (GO:0015937) photosystem II stabilization (GO:0042549)CTP biosynthetic process (GO:0006241) porphyrin-containing compound biosynthetic process (GO:0006779)cyclic nucleotide biosynthetic process (GO:0009190) potassium ion transport (GO:0006813)cysteine biosynthetic process from serine (GO:0006535) prenylcysteine catabolic process (GO:0030328)cytoskeleton organization (GO:0007010) protein ADP-ribosylation (GO:0006471)D-amino acid catabolic process (GO:0019478) protein complex assembly (GO:0006461)DNA metabolic process (GO:0006259) protein deacetylation (GO:0006476)electron transport chain (GO:0022900) protein import (GO:0017038)ER to Golgi vesicle-mediated transport (GO:0006888) protein methylation (GO:0006479)fatty acid metabolic process (GO:0006631) protein processing (GO:0016485)female sex differentiation (GO:0046660) protein-phycocyanobilin linkage (GO:0017009)ferrous iron transport (GO:0015684) proteolysis involved in cellular protein catabolic process (GO:0051603)folic acid-containing compound biosynthetic process (GO:0009396) purine nucleotide biosynthetic process (GO:0006164)fructose metabolic process (GO:0006000) queuosine biosynthetic process (GO:0008616)gene silencing (GO:0016458) regulation of anion transport (GO:0044070)gluconeogenesis (GO:0006094) regulation of ARF GTPase activity (GO:0032312)glucose catabolic process (GO:0006007) regulation of cell cycle (GO:0051726)glucose metabolic process (GO:0006006) regulation of cyclin-dependent protein kinase activity (GO:0000079)glutamate biosynthetic process (GO:0006537) regulation of transcription from RNA polymerase II promoter (GO:0006357)glutamine biosynthetic process (GO:0006542) respiratory gaseous exchange (GO:0007585)glutamine metabolic process (GO:0006541) response to biotic stimulus (GO:0009607)glutathione biosynthetic process (GO:0006750) response to water (GO:0009415)glycerol metabolic process (GO:0006071) riboflavin biosynthetic process (GO:0009231)glycerol-3-phosphate catabolic process (GO:0046168) RNA metabolic process (GO:0016070)glycine catabolic process (GO:0006546) RNA polyadenylation (GO:0043631)glycine metabolic process (GO:0006544) rRNA modification (GO:0000154)glyoxylate cycle (GO:0006097) sensory perception of smell (GO:0007608)Golgi vesicle transport (GO:0048193) septin ring assembly (GO:0000921)GPI anchor metabolic process (GO:0006505) sodium ion transport (GO:0006814)GTP biosynthetic process (GO:0006183) spermidine biosynthetic process (GO:0008295)heme a biosynthetic process (GO:0006784) spermine biosynthetic process (GO:0006597)histone modification (GO:0016570) sphingolipid metabolic process (GO:0006665)IMP biosynthetic process (GO:0006188) SRP-dependent cotranslational protein targeting to membrane (GO:0006614)inositol trisphosphate metabolic process (GO:0032957) sulfate assimilation (GO:0000103)ion transport (GO:0006811) superoxide metabolic process (GO:0006801)iron ion transmembrane transport (GO:0034755) tetrahydrobiopterin biosynthetic process (GO:0006729)iron-sulfur cluster assembly (GO:0016226) thiamine biosynthetic process (GO:0009228)isoprenoid biosynthetic process (GO:0008299) thiamine diphosphate biosynthetic process (GO:0009229)L-arabinose metabolic process (GO:0046373) transcription termination, DNA-dependent (GO:0006353)L-phenylalanine biosynthetic process (GO:0009094) trehalose metabolic process (GO:0005991)L-serine metabolic process (GO:0006563) tricarboxylic acid cycle (GO:0006099)leukotriene biosynthetic process (GO:0019370) tRNA aminoacylation (GO:0043039)lipid A biosynthetic process (GO:0009245) tRNA modification (GO:0006400)lipid glycosylation (GO:0030259) tRNA splicing, via endonucleolytic cleavage and ligation (GO:0006388)lysine biosynthetic process via diaminopimelate (GO:0009089) tryptophan metabolic process (GO:0006568)mannose metabolic process (GO:0006013) tyrosine biosynthetic process (GO:0006571)methionine biosynthetic process (GO:0009086) UTP biosynthetic process (GO:0006228)methylation (GO:0032259) vacuolar transport (GO:0007034)microtubule cytoskeleton organization (GO:0000226) vesicle docking (GO:0048278)microtubule-based process (GO:0007017) vesicle docking involved in exocytosis (GO:0006904)mitosis (GO:0007067) vesicle fusion with Golgi apparatus (GO:0048280)NAD biosynthetic process (GO:0009435) viral envelope fusion with host membrane (GO:0019064)nucleobase transport (GO:0015851) viral genome replication (GO:0019079)nucleoside diphosphate phosphorylation (GO:0006165) Represented by > 1 Gene: 174penicillin biosynthetic process (GO:0042318) actin cytoskeleton organization (GO:0030036)pentose-phosphate shunt, non-oxidative branch (GO:0009052) actin filament polymerization (GO:0030041)peptidoglycan catabolic process (GO:0009253) acyl-CoA metabolic process (GO:0006637)peptidoglycan-based cell wall biogenesis (GO:0009273) aerobic respiration (GO:0009060)peroxisome organization (GO:0007031) alanyl-tRNA aminoacylation (GO:0006419)phagocytosis (GO:0006909) arginyl-tRNA aminoacylation (GO:0006420)phosphate ion transport (GO:0006817) aromatic amino acid family biosynthetic process (GO:0009073)phosphate-containing compound metabolic process (GO:0006796) aromatic amino acid family metabolic process (GO:0009072)phosphatidylinositol metabolic process (GO:0046488) aromatic compound catabolic process (GO:0019439)phosphatidylinositol-mediated signaling (GO:0048015) ATP biosynthetic process (GO:0006754)
GO Biological Processes Categories cont.

155
Represented by > 1 Gene cont Represented by > 1 Gene contATP-dependent chromatin remodeling (GO:0043044) mitochondrial electron transport, ubiquinol to cytochrome c (GO:0006122)
autophagic vacuole assembly (GO:0000045)mitochondrial proton-transporting ATP synthase complex assembly (GO:0033615)
C-terminal protein methylation (GO:0006481) molybdopterin cofactor biosynthetic process (GO:0032324)carbohydrate transport (GO:0008643) mRNA capping (GO:0006370)cell adhesion (GO:0007155) mRNA cleavage (GO:0006379)cell differentiation (GO:0030154) negative regulation of nucleotide metabolic process (GO:0045980)cell volume homeostasis (GO:0006884) negative regulation of transcription, DNA-dependent (GO:0045892)cell wall biogenesis (GO:0042546) negative regulation of translational elongation (GO:0045900)cellular aromatic compound metabolic process (GO:0006725) nicotianamine biosynthetic process (GO:0030418)cellular cell wall organization (GO:0007047) nodule morphogenesis (GO:0009878)
ceramide metabolic process (GO:0006672)nuclear-transcribed mRNA catabolic process, nonsense-mediated decay (GO:0000184)
chlorophyll biosynthetic process (GO:0015995) nucleotide biosynthetic process (GO:0009165)chlorophyll catabolic process (GO:0015996) nucleotide metabolic process (GO:0009117)chromatin assembly or disassembly (GO:0006333) oligosaccharide metabolic process (GO:0009311)chromatin modification (GO:0016568) one-carbon metabolic process (GO:0006730)chromatin remodeling (GO:0006338) pantothenate biosynthetic process (GO:0015940)cobalamin biosynthetic process (GO:0009236) pathogenesis (GO:0009405)coenzyme A metabolic process (GO:0015936) peptide biosynthetic process (GO:0043043)coenzyme M biosynthetic process (GO:0019295) peptidoglycan turnover (GO:0009254)
cofactor metabolic process (GO:0051186)peptidyl-diphthamide biosynthetic process from peptidyl-histidine (GO:0017183)
copper ion transmembrane transport (GO:0035434) peptidyl-lysine modification to hypusine (GO:0008612)copper ion transport (GO:0006825) phenylalanyl-tRNA aminoacylation (GO:0006432)cortical protein anchoring (GO:0032065) phosphatidylserine biosynthetic process (GO:0006659)cyanate metabolic process (GO:0009439) phospholipid metabolic process (GO:0006644)cytochrome complex assembly (GO:0017004) photosynthetic electron transport chain (GO:0009767)cytokinin metabolic process (GO:0009690) photosynthetic electron transport in photosystem II (GO:0009772)defense response to bacterium (GO:0042742) phytochromobilin biosynthetic process (GO:0010024)defense response to fungus (GO:0050832) plant-type cell wall organization (GO:0009664)deoxyribonucleoside diphosphate metabolic process (GO:0009186) poly(A)+ mRNA export from nucleus (GO:0016973)detection of visible light (GO:0009584) pore complex assembly (GO:0046931)dicarboxylic acid transport (GO:0006835) positive regulation of autophagy (GO:0010508)DNA catabolic process (GO:0006308) positive regulation of catalytic activity (GO:0043085)
DNA replication, synthesis of RNA primer (GO:0006269)positive regulation of transcription elongation from RNA polymerase II promoter (GO:0032968)
DNA-dependent DNA replication initiation (GO:0006270) positive regulation of transcription, DNA-dependent (GO:0045893)double-strand break repair (GO:0006302) positive regulation of translational elongation (GO:0045901)double-strand break repair via homologous recombination (GO:0000724) positive regulation of translational termination (GO:0045905)double-strand break repair via nonhomologous end joining (GO:0006303) proline catabolic process (GO:0006562)dTDP biosynthetic process (GO:0006233) prolyl-tRNA aminoacylation (GO:0006433)dTMP biosynthetic process (GO:0006231) proteasomal ubiquitin-dependent protein catabolic process (GO:0043161)embryo development (GO:0009790) protein arginylation (GO:0016598)endocytosis (GO:0006897) protein catabolic process (GO:0030163)extracellular polysaccharide biosynthetic process (GO:0045226) protein import into mitochondrial outer membrane (GO:0045040)fruiting body development (GO:0030582) protein import into nucleus (GO:0006606)G-protein coupled receptor signaling pathway (GO:0007186) protein insertion into membrane (GO:0051205)galactose metabolic process (GO:0006012) protein localization (GO:0008104)glutaminyl-tRNA aminoacylation (GO:0006425) protein N-linked glycosylation (GO:0006487)glycine biosynthetic process (GO:0006545) protein N-linked glycosylation via asparagine (GO:0018279)glycolipid biosynthetic process (GO:0009247) protein prenylation (GO:0018342)glycolipid transport (GO:0046836) protein stabilization (GO:0050821)glycyl-tRNA aminoacylation (GO:0006426) protein targeting (GO:0006605)GMP biosynthetic process (GO:0006177) protein targeting to Golgi (GO:0000042)guanosine tetraphosphate metabolic process (GO:0015969) protein thiol-disulfide exchange (GO:0006467)heme biosynthetic process (GO:0006783) protein-chromophore linkage (GO:0018298)heme oxidation (GO:0006788) pteridine-containing compound metabolic process (GO:0042558)hemolysis by symbiont of host erythrocytes (GO:0019836) purine ribonucleoside monophosphate biosynthetic process (GO:0009168)hemolysis in other organism involved in symbiotic interaction (GO:0052331) regulation of actin filament polymerization (GO:0030833)inositol biosynthetic process (GO:0006021) regulation of barrier septum assembly (GO:0032955)inositol catabolic process (GO:0019310) regulation of DNA repair (GO:0006282)intra-Golgi vesicle-mediated transport (GO:0006891) regulation of DNA replication (GO:0006275)intracellular transport (GO:0046907) regulation of phosphoprotein phosphatase activity (GO:0043666)iron ion transport (GO:0006826) regulation of S phase of mitotic cell cycle (GO:0007090)
L-phenylalanine catabolic process (GO:0006559)regulation of sequence-specific DNA binding transcription factor activity (GO:0051090)
leucine biosynthetic process (GO:0009098) regulation of signal transduction (GO:0009966)lipid catabolic process (GO:0016042) regulation of translational fidelity (GO:0006450)lipid transport (GO:0006869) respiratory chain complex IV assembly (GO:0008535)macromolecule biosynthetic process (GO:0009059) respiratory electron transport chain (GO:0022904)mannose biosynthetic process (GO:0019307) response to antibiotic (GO:0046677)mature ribosome assembly (GO:0042256) response to DNA damage stimulus (GO:0006974)methionine metabolic process (GO:0006555) response to metal ion (GO:0010038)
retrograde vesicle-mediated transport, Golgi to ER (GO:0006890)
GO Biological Processes Categories cont.

156
Represented by > 1 Gene cont Represented by 1 Gene: 16RNA capping (GO:0009452) allantoin catabolic process (GO:0000256)RNA methylation (GO:0001510) arginine catabolic process (GO:0006527)RNA splicing (GO:0008380) branched chain family amino acid biosynthetic process (GO:0009082)rRNA methylation (GO:0031167) 'de novo' pyrimidine base biosynthetic process (GO:0006207)seryl-tRNA aminoacylation (GO:0006434) dUTP metabolic process (GO:0046080)signal peptide processing (GO:0006465) ergosterol biosynthetic process (GO:0006696)snRNA pseudouridine synthesis (GO:0031120) folic acid-containing compound metabolic process (GO:0006760)sterol metabolic process (GO:0016125) isoleucine biosynthetic process (GO:0009097)sucrose biosynthetic process (GO:0005986) isopentenyl diphosphate biosynthetic process, mevalonate-independent
pathway (GO:0019288)telomere maintenance (GO:0000723) lipopolysaccharide biosynthetic process (GO:0009103)terpenoid biosynthetic process (GO:0016114) lipopolysaccharide core region biosynthetic process (GO:0009244)thylakoid membrane organization (GO:0010027) meiotic chromosome segregation (GO:0045132)transcription from RNA polymerase II promoter (GO:0006366) microtubule anchoring (GO:0034453)transcription from RNA polymerase III promoter (GO:0006383) oligosaccharide biosynthetic process (GO:0009312)translational frameshifting (GO:0006452) phytochelatin biosynthetic process (GO:0046938)transposition, DNA-mediated (GO:0006313) primary metabolic process (GO:0044238)tRNA 5'-leader removal (GO:0001682) proton-transporting ATP synthase complex assembly (GO:0043461)tRNA methylation (GO:0030488) pyrimidine nucleotide biosynthetic process (GO:0006221)tRNA thio-modification (GO:0034227) regulation of nitrogen utilization (GO:0006808)tubulin complex assembly (GO:0007021) replication fork protection (GO:0048478)tyrosine metabolic process (GO:0006570)ubiquinone biosynthetic process (GO:0006744)UMP biosynthetic process (GO:0006222)urea metabolic process (GO:0019627)
GO Biological Processes Categories cont.

157
Table C.6. Synopsis of gene ontology (GO) molecular functions represented in the Polypodium reference transcriptome. Molecular functions are grouped by the number of genes representing each function, with some genes representing multiple functions. Because each gene was assigned to the most specific molecular function possible, this summary includes multiple hierarchical levels of classification.

158
Represented by > 500 Genes: 29 Represented by > 100 Genes cont.ADP binding (GO:0043531) nucleotidyltransferase activity (GO:0016779)ATP binding (GO:0005524) oxidoreductase activity, acting on paired donors, with incorporation or
reduction of molecular oxygen, 2-oxoglutarate as one donor, and incorporation of one atom each of oxygen into both donors (GO:0016706)
ATP-dependent helicase activity (GO:0008026) oxidoreductase activity, acting on single donors with incorporation of molecular oxygen, incorporation of two atoms of oxygen (GO:0016702)
ATPase activity (GO:0016887) oxidoreductase activity, acting on the aldehyde or oxo group of donors, disulfide as acceptor (GO:0016624)
catalytic activity (GO:0003824) oxidoreductase activity, acting on the CH-CH group of donors (GO:0016627)DNA binding (GO:0003677) oxidoreductase activity, acting on the CH-OH group of donors, NAD or NADP
as acceptor (GO:0016616)electron carrier activity (GO:0009055) pectinesterase activity (GO:0030599)GTP binding (GO:0005525) peptidyl-prolyl cis-trans isomerase activity (GO:0003755)helicase activity (GO:0004386) peroxidase activity (GO:0004601)heme binding (GO:0020037) phosphotransferase activity, alcohol group as acceptor (GO:0016773)hydrolase activity (GO:0016787) potassium ion transmembrane transporter activity (GO:0015079)hydrolase activity, hydrolyzing O-glycosyl compounds (GO:0004553) protein disulfide oxidoreductase activity (GO:0015035)iron ion binding (GO:0005506) protein histidine kinase activity (GO:0004673)metal ion binding (GO:0046872) protein tyrosine/serine/threonine phosphatase activity (GO:0008138)nucleic acid binding (GO:0003676) proton-transporting ATPase activity, rotational mechanism (GO:0046961)nucleotide binding (GO:0000166) pseudouridine synthase activity (GO:0009982)oxidoreductase activity (GO:0016491) pyridoxal phosphate binding (GO:0030170)oxidoreductase activity, acting on paired donors, with incorporation or reduction of molecular oxygen (GO:0016705)
Rab GTPase activator activity (GO:0005097)
protein binding (GO:0005515) ribonuclease H activity (GO:0004523)protein dimerization activity (GO:0046983) serine-type carboxypeptidase activity (GO:0004185)protein kinase activity (GO:0004672) serine-type endopeptidase activity (GO:0004252)RNA binding (GO:0003723) signal transducer activity (GO:0004871)RNA-directed DNA polymerase activity (GO:0003964) solute:hydrogen antiporter activity (GO:0015299)sequence-specific DNA binding (GO:0043565) strictosidine synthase activity (GO:0016844)sequence-specific DNA binding transcription factor activity (GO:0003700) structural molecule activity (GO:0005198)structural constituent of ribosome (GO:0003735) sugar binding (GO:0005529)transferase activity, transferring hexosyl groups (GO:0016758) sulfotransferase activity (GO:0008146)transporter activity (GO:0005215) transferase activity (GO:0016740)zinc ion binding (GO:0008270) transferase activity, transferring acyl groups (GO:0016746)Represented by > 100 Genes: 78 transferase activity, transferring acyl groups other than amino-acyl groups
(GO:0016747)acid-amino acid ligase activity (GO:0016881) transferase activity, transferring glycosyl groups (GO:0016757)acyl-CoA dehydrogenase activity (GO:0003995) translation initiation factor activity (GO:0003743)amino acid binding (GO:0016597) transmembrane transporter activity (GO:0022857)aminoacyl-tRNA ligase activity (GO:0004812) triglyceride lipase activity (GO:0004806)antiporter activity (GO:0015297) two-component response regulator activity (GO:0000156)aspartic-type endopeptidase activity (GO:0004190) two-component sensor activity (GO:0000155)ATP-dependent DNA helicase activity (GO:0004003) ubiquitin thiolesterase activity (GO:0004221)calcium ion binding (GO:0005509) ubiquitin-protein ligase activity (GO:0004842)cellulose synthase (UDP-forming) activity (GO:0016760) unfolded protein binding (GO:0051082)coenzyme binding (GO:0050662) Represented by > 50 Genes: 73cofactor binding (GO:0048037) 1,3-beta-D-glucan synthase activity (GO:0003843)copper ion binding (GO:0005507) 2 iron, 2 sulfur cluster binding (GO:0051537)cysteine-type peptidase activity (GO:0008234) 3-beta-hydroxy-delta5-steroid dehydrogenase activity (GO:0003854)DNA photolyase activity (GO:0003913) 3'-5' exonuclease activity (GO:0008408)DNA-directed DNA polymerase activity (GO:0003887) acyl-CoA oxidase activity (GO:0003997)DNA-directed RNA polymerase activity (GO:0003899) antioxidant activity (GO:0016209)drug transmembrane transporter activity (GO:0015238) ATPase activity, coupled to transmembrane movement of substances
(GO:0042626)endonuclease activity (GO:0004519) beta-amylase activity (GO:0016161)flavin adenine dinucleotide binding (GO:0050660) binding (GO:0005488)flavin-containing monooxygenase activity (GO:0004499) calmodulin binding (GO:0005516)GTPase activity (GO:0003924) carbon-nitrogen ligase activity, with glutamine as amido-N-donor
(GO:0016884)heat shock protein binding (GO:0031072) catechol oxidase activity (GO:0004097)histone-lysine N-methyltransferase activity (GO:0018024) cation binding (GO:0043169)hydrogen ion transporting ATP synthase activity, rotational mechanism (GO:0046933)
cation transmembrane transporter activity (GO:0008324)
hydrolase activity, acting on acid anhydrides (GO:0016817) chlorophyllide a oxygenase [overall] activity (GO:0010277)hydrolase activity, acting on ester bonds (GO:0016788) citrate transmembrane transporter activity (GO:0015137)identical protein binding (GO:0042802) damaged DNA binding (GO:0003684)iron-sulfur cluster binding (GO:0051536) diacylglycerol kinase activity (GO:0004143)kinase activity (GO:0016301) DNA clamp loader activity (GO:0003689)magnesium ion binding (GO:0000287) DNA ligase (ATP) activity (GO:0003910)metal ion transmembrane transporter activity (GO:0046873) DNA topoisomerase (ATP-hydrolyzing) activity (GO:0003918)metalloendopeptidase activity (GO:0004222) double-stranded RNA binding (GO:0003725)methyltransferase activity (GO:0008168) enzyme inhibitor activity (GO:0004857)microtubule motor activity (GO:0003777) ER retention sequence binding (GO:0046923)N-acetyltransferase activity (GO:0008080) extracellular-glutamate-gated ion channel activity (GO:0005234)NAD binding (GO:0051287) FMN binding (GO:0010181)NADP binding (GO:0050661) galactosyltransferase activity (GO:0008378)nuclease activity (GO:0004518) histone binding (GO:0042393)nucleobase-containing compound kinase activity (GO:0019205) hydrogen ion transmembrane transporter activity (GO:0015078)
GO Molecular Functions Categories: 519

159
Represented by > 50 Genes cont. Represented by > 10 Genes cont.hydrolase activity, acting on acid anhydrides, in phosphorus-containing anhydrides (GO:0016818)
aminoacyl-tRNA hydrolase activity (GO:0004045)
hydroxymethyl-, formyl- and related transferase activity (GO:0016742) aminomethyltransferase activity (GO:0004047)inorganic diphosphatase activity (GO:0004427) aminopeptidase activity (GO:0004177)ionotropic glutamate receptor activity (GO:0004970) ammonia-lyase activity (GO:0016841)isomerase activity (GO:0016853) ARF GTPase activator activity (GO:0008060)ligase activity (GO:0016874) asparagine synthase (glutamine-hydrolyzing) activity (GO:0004066)lyase activity (GO:0016829) ATP phosphoribosyltransferase activity (GO:0003879)mannosyl-oligosaccharide 1,2-alpha-mannosidase activity (GO:0004571) ATP-dependent 3'-5' DNA helicase activity (GO:0043140)mismatched DNA binding (GO:0030983) ATP-dependent peptidase activity (GO:0004176)motor activity (GO:0003774) ATP:ADP antiporter activity (GO:0005471)NADH dehydrogenase (ubiquinone) activity (GO:0008137) beta-N-acetylhexosaminidase activity (GO:0004563)nutrient reservoir activity (GO:0045735) bile acid:sodium symporter activity (GO:0008508)O-acyltransferase activity (GO:0008374) calcium-dependent phospholipid binding (GO:0005544)O-methyltransferase activity (GO:0008171) carbohydrate binding (GO:0030246)oxidoreductase activity, acting on CH-OH group of donors (GO:0016614) carbon-sulfur lyase activity (GO:0016846)oxidoreductase activity, acting on the aldehyde or oxo group of donors, NAD or NADP as acceptor (GO:0016620)
carboxy-lyase activity (GO:0016831)
P-P-bond-hydrolysis-driven protein transmembrane transporter activity (GO:0015450)
carboxyl- or carbamoyltransferase activity (GO:0016743)
peptidase activity (GO:0008233) catalase activity (GO:0004096)phosphatase activity (GO:0016791) chaperone binding (GO:0051087)phosphogluconate dehydrogenase (decarboxylating) activity (GO:0004616) chitin binding (GO:0008061)phospholipid binding (GO:0005543) chitinase activity (GO:0004568)phosphoribosylamine-glycine ligase activity (GO:0004637) coproporphyrinogen oxidase activity (GO:0004109)phosphoric diester hydrolase activity (GO:0008081) cyclin-dependent protein kinase inhibitor activity (GO:0004861)phosphoric ester hydrolase activity (GO:0042578) cysteine-type endopeptidase activity (GO:0004197)polygalacturonase activity (GO:0004650) cytochrome-c oxidase activity (GO:0004129)polynucleotide adenylyltransferase activity (GO:0004652) D-arabinono-1,4-lactone oxidase activity (GO:0003885)protein serine/threonine kinase activity (GO:0004674) dephospho-CoA kinase activity (GO:0004140)protein transporter activity (GO:0008565) dihydrodipicolinate reductase activity (GO:0008839)protein-disulfide reductase activity (GO:0047134) dimethylallyltranstransferase activity (GO:0004161)quinone binding (GO:0048038) DNA helicase activity (GO:0003678)ribonuclease activity (GO:0004540) DNA topoisomerase activity (GO:0003916)ribonuclease III activity (GO:0004525) DNA topoisomerase type I activity (GO:0003917)serine-type peptidase activity (GO:0008236) endo-1,3(4)-beta-glucanase activity (GO:0033903)single-stranded DNA binding (GO:0003697) endodeoxyribonuclease activity, producing 5'-phosphomonoesters
(GO:0016888)starch binding (GO:2001070) endopeptidase inhibitor activity (GO:0004866)thiopurine S-methyltransferase activity (GO:0008119) endoribonuclease activity, producing 5'-phosphomonoesters (GO:0016891)transferase activity, transferring nitrogenous groups (GO:0016769) fatty-acyl-CoA binding (GO:0000062)transferase activity, transferring phosphorus-containing groups (GO:0016772) ferric iron binding (GO:0008199)translation release factor activity (GO:0003747) ferrous iron transmembrane transporter activity (GO:0015093)translation release factor activity, codon specific (GO:0016149) folic acid binding (GO:0005542)ubiquitin protein ligase binding (GO:0031625) fructose-bisphosphate aldolase activity (GO:0004332)UDP-N-acetylmuramate dehydrogenase activity (GO:0008762) galactosylgalactosylxylosylprotein 3-beta-glucuronosyltransferase activity
(GO:0015018)uroporphyrinogen-III synthase activity (GO:0004852) gamma-glutamyltransferase activity (GO:0003840)voltage-gated chloride channel activity (GO:0005247) glucose-6-phosphate dehydrogenase activity (GO:0004345)Represented by > 10 Genes: 197 glucosylceramidase activity (GO:0004348)1-phosphatidylinositol-3-kinase activity (GO:0016303) glutamate N-acetyltransferase activity (GO:0004358)2-isopropylmalate synthase activity (GO:0003852) glutamate synthase activity (GO:0015930)3'-5'-exoribonuclease activity (GO:0000175) glutamate-ammonia ligase activity (GO:0004356)3',5'-cyclic-nucleotide phosphodiesterase activity (GO:0004114) glutamate-cysteine ligase activity (GO:0004357)4 iron, 4 sulfur cluster binding (GO:0051539) glutathione peroxidase activity (GO:0004602)4-alpha-glucanotransferase activity (GO:0004134) glycerophosphodiester phosphodiesterase activity (GO:0008889)4-alpha-hydroxytetrahydrobiopterin dehydratase activity (GO:0008124) glycine hydroxymethyltransferase activity (GO:0004372)5-formyltetrahydrofolate cyclo-ligase activity (GO:0030272) hedgehog receptor activity (GO:0008158)5-methyltetrahydropteroyltriglutamate-homocysteine S-methyltransferase activity (GO:0003871)
histone acetyltransferase activity (GO:0004402)
5S rRNA binding (GO:0008097) homocysteine S-methyltransferase activity (GO:0008898)6-phosphofructo-2-kinase activity (GO:0003873) hydrogen-translocating pyrophosphatase activity (GO:0009678)6-phosphofructokinase activity (GO:0003872) hydrolase activity, acting on acid anhydrides, catalyzing transmembrane
movement of substances (GO:0016820)acetylglucosaminyltransferase activity (GO:0008375) hydrolase activity, acting on carbon-nitrogen (but not peptide) bonds
(GO:0016810)acid phosphatase activity (GO:0003993) hydrolase activity, acting on carbon-nitrogen (but not peptide) bonds, in linear
amides (GO:0016811)acireductone dioxygenase [iron(II)-requiring] activity (GO:0010309) hydrolase activity, acting on glycosyl bonds (GO:0016798)actin binding (GO:0003779) inorganic phosphate transmembrane transporter activity (GO:0005315)actin filament binding (GO:0051015) inositol tetrakisphosphate 1-kinase activity (GO:0047325)acyl-[acyl-carrier-protein] desaturase activity (GO:0045300) inositol-1,3,4-trisphosphate 5-kinase activity (GO:0052726)adenosine deaminase activity (GO:0004000) inositol-1,3,4-trisphosphate 6-kinase activity (GO:0052725)adenosylmethionine decarboxylase activity (GO:0004014) intramolecular lyase activity (GO:0016872)alpha-amylase activity (GO:0004556) intramolecular transferase activity, phosphotransferases (GO:0016868)alpha-mannosidase activity (GO:0004559) ion channel activity (GO:0005216)alpha-N-arabinofuranosidase activity (GO:0046556) iron ion transmembrane transporter activity (GO:0005381)alpha,alpha-trehalase activity (GO:0004555) ligase activity, forming aminoacyl-tRNA and related compounds
(GO:0016876)
GO Molecular Functions Categories cont.

160
Represented by > 10 Genes cont. Represented by > 10 Genes cont.lipid-A-disaccharide synthase activity (GO:0008915) rRNA (adenine-N6,N6-)-dimethyltransferase activity (GO:0000179)malate synthase activity (GO:0004474) rRNA binding (GO:0019843)malonyl-CoA decarboxylase activity (GO:0050080) rRNA methyltransferase activity (GO:0008649)manganese ion binding (GO:0030145) serine O-acetyltransferase activity (GO:0009001)mannose-6-phosphate isomerase activity (GO:0004476) shikimate kinase activity (GO:0004765)mannosidase activity (GO:0015923) sialyltransferase activity (GO:0008373)metallocarboxypeptidase activity (GO:0004181) sigma factor activity (GO:0016987)metallopeptidase activity (GO:0008237) squalene monooxygenase activity (GO:0004506)methionine adenosyltransferase activity (GO:0004478) superoxide dismutase activity (GO:0004784)molybdenum ion binding (GO:0030151) terpene synthase activity (GO:0010333)N-acetyl-gamma-glutamyl-phosphate reductase activity (GO:0003942) tetraacyldisaccharide 4'-kinase activity (GO:0009029)N-acetylmuramoyl-L-alanine amidase activity (GO:0008745) thiamine diphosphokinase activity (GO:0004788)N6-(1,2-dicarboxyethyl)AMP AMP-lyase (fumarate-forming) activity (GO:0004018)
thiamine pyrophosphate binding (GO:0030976)
NAD+ ADP-ribosyltransferase activity (GO:0003950) thiolester hydrolase activity (GO:0016790)NAD+ binding (GO:0070403) threonine-type endopeptidase activity (GO:0004298)NAD+ kinase activity (GO:0003951) transaminase activity (GO:0008483)nickel ion binding (GO:0016151) transcription coactivator activity (GO:0003713)nucleobase transmembrane transporter activity (GO:0015205) transcription cofactor activity (GO:0003712)nucleoside diphosphate kinase activity (GO:0004550) transferase activity, transferring acyl groups, acyl groups converted into alkyl
on transfer (GO:0046912)odorant binding (GO:0005549) transferase activity, transferring alkyl or aryl (other than methyl) groups
(GO:0016765)olfactory receptor activity (GO:0004984) transferase activity, transferring pentosyl groups (GO:0016763)oxidoreductase activity, acting on a sulfur group of donors, disulfide as acceptor (GO:0016671)
translation elongation factor activity (GO:0003746)
oxidoreductase activity, acting on a sulfur group of donors, oxygen as acceptor (GO:0016670)
tRNA (guanine-N2-)-methyltransferase activity (GO:0004809)
oxidoreductase activity, acting on NADH or NADPH (GO:0016651) tRNA (guanine-N7-)-methyltransferase activity (GO:0008176)oxidoreductase activity, acting on NADH or NADPH, oxygen as acceptor (GO:0050664)
tRNA binding (GO:0000049)
oxidoreductase activity, acting on NADH or NADPH, quinone or similar compound as acceptor (GO:0016655)
tRNA dihydrouridine synthase activity (GO:0017150)
oxidoreductase activity, acting on paired donors, with oxidation of a pair of donors resulting in the reduction of molecular oxygen to two molecules of water (GO:0016717)
tubulin-tyrosine ligase activity (GO:0004835)
oxidoreductase activity, acting on the CH-NH2 group of donors (GO:0016638) ubiquinol-cytochrome-c reductase activity (GO:0008121)oxo-acid-lyase activity (GO:0016833) UDP-3-O-[3-hydroxymyristoyl] N-acetylglucosamine deacetylase activity
(GO:0008759)pectate lyase activity (GO:0030570) voltage-gated anion channel activity (GO:0008308)penicillin binding (GO:0008658) voltage-gated potassium channel activity (GO:0005249)peroxiredoxin activity (GO:0051920) xyloglucan:xyloglucosyl transferase activity (GO:0016762)phosphatidylinositol 3-kinase activity (GO:0035004) Represented by > 1 Gene: 191phosphatidylinositol binding (GO:0035091) 2-amino-4-hydroxy-6-hydroxymethyldihydropteridine diphosphokinase activity
(GO:0003848)phosphatidylinositol N-acetylglucosaminyltransferase activity (GO:0017176) 2-C-methyl-D-erythritol 2,4-cyclodiphosphate synthase activity (GO:0008685)phosphatidylinositol phosphate kinase activity (GO:0016307) 3-dehydroquinate dehydratase activity (GO:0003855)phosphatidylinositol phospholipase C activity (GO:0004435) 3-deoxy-7-phosphoheptulonate synthase activity (GO:0003849)phospho-N-acetylmuramoyl-pentapeptide-transferase activity (GO:0008963) 3-hydroxyacyl-CoA dehydrogenase activity (GO:0003857)phosphoenolpyruvate carboxykinase (ATP) activity (GO:0004612) 3-methyl-2-oxobutanoate hydroxymethyltransferase activity (GO:0003864)phosphoenolpyruvate carboxylase activity (GO:0008964) 3-oxoacyl-[acyl-carrier-protein] synthase activity (GO:0004315)phosphoglycerate kinase activity (GO:0004618) 3,4-dihydroxy-2-butanone-4-phosphate synthase activity (GO:0008686)phosphoglycerate mutase activity (GO:0004619) 5-amino-6-(5-phosphoribosylamino)uracil reductase activity (GO:0008703)phospholipase C activity (GO:0004629) 5'-3' exonuclease activity (GO:0008409)phosphopyruvate hydratase activity (GO:0004634) 5'-nucleotidase activity (GO:0008253)phosphoribosylanthranilate isomerase activity (GO:0004640) 7S RNA binding (GO:0008312)phosphorus-oxygen lyase activity (GO:0016849) acetyl-CoA carboxylase activity (GO:0003989)phosphorylase activity (GO:0004645) acyl-CoA hydrolase activity (GO:0047617)phosphotransferase activity, for other substituted phosphate groups (GO:0016780)
adenosylhomocysteinase activity (GO:0004013)
poly(ADP-ribose) glycohydrolase activity (GO:0004649) adenyl-nucleotide exchange factor activity (GO:0000774)potassium ion binding (GO:0030955) adenylosuccinate synthase activity (GO:0004019)prenyltransferase activity (GO:0004659) alanine-tRNA ligase activity (GO:0004813)prephenate dehydratase activity (GO:0004664) aldehyde-lyase activity (GO:0016832)prephenate dehydrogenase (NADP+) activity (GO:0004665) alkylbase DNA N-glycosylase activity (GO:0003905)prephenate dehydrogenase activity (GO:0008977) alpha-1,3-mannosylglycoprotein 2-beta-N-acetylglucosaminyltransferase
activity (GO:0003827)primary amine oxidase activity (GO:0008131) alpha-L-fucosidase activity (GO:0004560)protein binding, bridging (GO:0030674) arginine-tRNA ligase activity (GO:0004814)protein kinase binding (GO:0019901) argininosuccinate synthase activity (GO:0004055)protein methyltransferase activity (GO:0008276) arginyltransferase activity (GO:0004057)protein phosphatase type 2A regulator activity (GO:0008601) ATPase activator activity (GO:0001671)pyridoxamine-phosphate oxidase activity (GO:0004733) beta-galactosidase activity (GO:0004565)pyruvate kinase activity (GO:0004743) calcium-activated potassium channel activity (GO:0015269)queuine tRNA-ribosyltransferase activity (GO:0008479) carbon-carbon lyase activity (GO:0016830)reduced folate carrier activity (GO:0008518) carbonate dehydratase activity (GO:0004089)Rho guanyl-nucleotide exchange factor activity (GO:0005089) carboxylesterase activity (GO:0004091)riboflavin kinase activity (GO:0008531) channel activity (GO:0015267)ribonuclease T2 activity (GO:0033897) chlorophyll binding (GO:0016168)ribonucleoside-diphosphate reductase activity (GO:0004748) chlorophyllase activity (GO:0047746)ribose-5-phosphate isomerase activity (GO:0004751) cholestenol delta-isomerase activity (GO:0047750)RNA methyltransferase activity (GO:0008173) chorismate synthase activity (GO:0004107)RNA polymerase II transcription cofactor activity (GO:0001104) cobalt ion binding (GO:0050897)RNA-directed RNA polymerase activity (GO:0003968) copper chaperone activity (GO:0016531)
GO Molecular Functions Categories cont.

161
Represented by > 1 Gene cont. Represented by > 1 Gene cont.cyclic-nucleotide phosphodiesterase activity (GO:0004112) methylenetetrahydrofolate reductase (NADPH) activity (GO:0004489)cyclin-dependent protein kinase regulator activity (GO:0016538) microtubule binding (GO:0008017)cysteamine dioxygenase activity (GO:0047800) mRNA guanylyltransferase activity (GO:0004484)cysteine-type endopeptidase inhibitor activity (GO:0004869) N-methyltransferase activity (GO:0008170)cytokinin dehydrogenase activity (GO:0019139) NADH dehydrogenase activity (GO:0003954)deaminase activity (GO:0019239) NADPH binding (GO:0070402)diacylglycerol O-acyltransferase activity (GO:0004144) nicotianamine synthase activity (GO:0030410)dihydrofolate reductase activity (GO:0004146) nicotinate phosphoribosyltransferase activity (GO:0004516)dihydroorotate dehydrogenase activity (GO:0004152) nicotinate-nucleotide diphosphorylase (carboxylating) activity (GO:0004514)dipeptidyl-peptidase activity (GO:0008239) nitronate monooxygenase activity (GO:0018580)DNA polymerase processivity factor activity (GO:0030337) nucleoside binding (GO:0001882)DNA primase activity (GO:0003896) nucleoside transmembrane transporter activity (GO:0005337)DNA-(apurinic or apyrimidinic site) lyase activity (GO:0003906) nucleosome binding (GO:0031491)DNA-3-methyladenine glycosylase activity (GO:0008725) nucleotide phosphatase activity (GO:0019204)DNA-dependent protein kinase activity (GO:0004677) omega peptidase activity (GO:0008242)dolichyl-diphosphooligosaccharide-protein glycotransferase activity (GO:0004579)
oxidoreductase activity, acting on paired donors, with incorporation or reduction of molecular oxygen, NADH or NADPH as one donor, and incorporation of two atoms of oxygen into one donor (GO:0016708)
dTDP-4-dehydrorhamnose reductase activity (GO:0008831) oxidoreductase activity, acting on the CH-CH group of donors, iron-sulfur protein as acceptor (GO:0016636)
electron transporter, transferring electrons within the cyclic electron transport pathway of photosynthesis activity (GO:0045156)
oxidoreductase activity, acting on the CH-OH group of donors, quinone or similar compound as acceptor (GO:0016901)
electron-transferring-flavoprotein dehydrogenase activity (GO:0004174) palmitoyl-(protein) hydrolase activity (GO:0008474)endopeptidase activity (GO:0004175) pantoate-beta-alanine ligase activity (GO:0004592)endoplasmic reticulum signal peptide binding (GO:0030942) pantothenate kinase activity (GO:0004594)exodeoxyribonuclease III activity (GO:0008853) peptide-methionine-(S)-S-oxide reductase activity (GO:0008113)exonuclease activity (GO:0004527) phenylalanine-tRNA ligase activity (GO:0004826)ferredoxin-NAD(P) reductase activity (GO:0008937) phosphatase activator activity (GO:0019211)ferrochelatase activity (GO:0004325) phosphate ion binding (GO:0042301)flavin reductase activity (GO:0042602) phosphatidylserine decarboxylase activity (GO:0004609)FMN adenylyltransferase activity (GO:0003919) phospholipase A2 activity (GO:0004623)formate-tetrahydrofolate ligase activity (GO:0004329) phosphomannomutase activity (GO:0004615)four-way junction helicase activity (GO:0009378) phosphoprotein phosphatase activity (GO:0004721)fucosyltransferase activity (GO:0008417) phosphoribosyl-AMP cyclohydrolase activity (GO:0004635)fumarylacetoacetase activity (GO:0004334) phosphoribosylaminoimidazolecarboxamide formyltransferase activity
(GO:0004643)G-protein coupled photoreceptor activity (GO:0008020) phosphoribosylaminoimidazolesuccinocarboxamide synthase activity
(GO:0004639)galactoside 2-alpha-L-fucosyltransferase activity (GO:0008107) phosphotransferase activity, carboxyl group as acceptor (GO:0016774)glucose-6-phosphate isomerase activity (GO:0004347) proline dehydrogenase activity (GO:0004657)glucosidase activity (GO:0015926) proline-tRNA ligase activity (GO:0004827)glutamine-tRNA ligase activity (GO:0004819) protein C-terminal S-isoprenylcysteine carboxyl O-methyltransferase activity
(GO:0004671)glutamyl-tRNA reductase activity (GO:0008883) protein homodimerization activity (GO:0042803)glutathione synthase activity (GO:0004363) protein kinase regulator activity (GO:0019887)glycerone kinase activity (GO:0004371) protein phosphatase inhibitor activity (GO:0004864)glycine dehydrogenase (decarboxylating) activity (GO:0004375) protein prenyltransferase activity (GO:0008318)glycine-tRNA ligase activity (GO:0004820) protein tyrosine phosphatase activity (GO:0004725)glycogenin glucosyltransferase activity (GO:0008466) protein-L-isoaspartate (D-aspartate) O-methyltransferase activity
(GO:0004719)glycolipid binding (GO:0051861) pyrophosphatase activity (GO:0016462)glycolipid transporter activity (GO:0017089) quinolinate synthetase A activity (GO:0008987)glycylpeptide N-tetradecanoyltransferase activity (GO:0004379) receptor activity (GO:0004872)GMP synthase (glutamine-hydrolyzing) activity (GO:0003922) Rho GDP-dissociation inhibitor activity (GO:0005094)GTP cyclohydrolase II activity (GO:0003935) riboflavin synthase activity (GO:0004746)GTPase binding (GO:0051020) ribonuclease P activity (GO:0004526)guanyl nucleotide binding (GO:0019001) ribosome binding (GO:0043022)guanyl-nucleotide exchange factor activity (GO:0005085) ribulose-bisphosphate carboxylase activity (GO:0016984)heme oxygenase (decyclizing) activity (GO:0004392) ribulose-phosphate 3-epimerase activity (GO:0004750)histidinol dehydrogenase activity (GO:0004399) RNA ligase (ATP) activity (GO:0003972)holo-[acyl-carrier-protein] synthase activity (GO:0008897) selenium binding (GO:0008430)homogentisate 1,2-dioxygenase activity (GO:0004411) serine-tRNA ligase activity (GO:0004828)hydrolase activity, hydrolyzing N-glycosyl compounds (GO:0016799) shikimate 3-dehydrogenase (NADP+) activity (GO:0004764)hydroxymethylglutaryl-CoA reductase (NADPH) activity (GO:0004420) small GTPase regulator activity (GO:0005083)hydroxymethylglutaryl-CoA synthase activity (GO:0004421) small protein activating enzyme activity (GO:0008641)IMP cyclohydrolase activity (GO:0003937) snoRNA binding (GO:0030515)indole-3-glycerol-phosphate synthase activity (GO:0004425) sodium:dicarboxylate symporter activity (GO:0017153)inositol oxygenase activity (GO:0050113) sterol binding (GO:0032934)inositol pentakisphosphate 2-kinase activity (GO:0035299) structural constituent of cell wall (GO:0005199)inositol-1,4,5-trisphosphate 3-kinase activity (GO:0008440) structural constituent of nuclear pore (GO:0017056)inositol-3-phosphate synthase activity (GO:0004512) sucrose-phosphate phosphatase activity (GO:0050307)lipid binding (GO:0008289) sugar:hydrogen symporter activity (GO:0005351)lipid transporter activity (GO:0005319) sulfate adenylyltransferase (ATP) activity (GO:0004781)magnesium chelatase activity (GO:0016851) sulfuric ester hydrolase activity (GO:0008484)magnesium protoporphyrin IX methyltransferase activity (GO:0046406) thiamine-phosphate diphosphorylase activity (GO:0004789)mannosyl-glycoprotein endo-beta-N-acetylglucosaminidase activity (GO:0033925)
thiol oxidase activity (GO:0016972)
mannosyl-oligosaccharide glucosidase activity (GO:0004573) thymidine kinase activity (GO:0004797)methylenetetrahydrofolate dehydrogenase (NADP+) activity (GO:0004488) thymidylate kinase activity (GO:0004798)
GO Molecular Functions Categories cont.

162
Represented by > 1 Gene cont. Represented by 1 Gene cont.thymidylate synthase activity (GO:0004799) cytidine deaminase activity (GO:0004126)transposase activity (GO:0004803) diaminopimelate epimerase activity (GO:0008837)triose-phosphate isomerase activity (GO:0004807) dihydroneopterin aldolase activity (GO:0004150)tRNA (adenine-N1-)-methyltransferase activity (GO:0016429) electron transporter, transferring electrons within cytochrome b6/f complex of
photosystem II activity (GO:0045158)tRNA-intron endonuclease activity (GO:0000213) enzyme regulator activity (GO:0030234)tryptophan synthase activity (GO:0004834) ferrous iron binding (GO:0008198)tubulin N-acetyltransferase activity (GO:0019799) glutathione gamma-glutamylcysteinyltransferase activity (GO:0016756)UDP-glucose:hexose-1-phosphate uridylyltransferase activity (GO:0008108) heme-copper terminal oxidase activity (GO:0015002)urease activity (GO:0009039) hydroxyethylthiazole kinase activity (GO:0004417)uroporphyrinogen decarboxylase activity (GO:0004853) imidazoleglycerol-phosphate dehydratase activity (GO:0004424)violaxanthin de-epoxidase activity (GO:0046422) ketol-acid reductoisomerase activity (GO:0004455)Represented by 1 Gene: 24 L-threonine ammonia-lyase activity (GO:0004794)4-hydroxy-3-methylbut-2-en-1-yl diphosphate synthase activity (GO:0046429) orotidine-5'-phosphate decarboxylase activity (GO:0004590)alpha-1,6-mannosylglycoprotein 2-beta-N-acetylglucosaminyltransferase activity (GO:0008455)
oxidized purine base lesion DNA N-glycosylase activity (GO:0008534)
arginine decarboxylase activity (GO:0008792) porphobilinogen synthase activity (GO:0004655)C-8 sterol isomerase activity (GO:0000247) protein binding involved in protein folding (GO:0044183)cAMP-dependent protein kinase regulator activity (GO:0008603) signal recognition particle binding (GO:0005047)CTP synthase activity (GO:0003883) ureidoglycolate hydrolase activity (GO:0004848)
GO Molecular Functions Categories cont.

163
P. amorphum2x
P. glycyrrhiza2x
P. hesperium Ha 8179, 4x
midparent
(in silico)
4371 22.8%
308316.1%
1288 6.7%
1772 9.2%
264613.8%
874 4.6%
236412.3%
16358.5%
7293.8%
7954.1%
410.2%
8364.3%
P. amorphum2x
P. glycyrrhiza2x
P. hesperium Ha 8276, 4x
midparent
(in silico)
4371 22.8%
308316.1%
1288 6.7%
2152 11.2%
316816.5%
1016 5.3%
14877.8%
10485.5%
4392.3%
5863.1%
300.2%
6163.3%
P. amorphum2x
P. glycyrrhiza2x
P. hesperium Ha
8280, 4x
midparent
(in silico)
4371 22.8%
308316.1%
1288 6.7%
1876 9.8%
271914.2%
843 4.4%
18069.4%
12646.6%
5422.8%
6073.2%
360.2%
6433.4%
a.
b.
d.
g.c.
f.
h.
e.
P. amorphum2x
P. glycyrrhiza2x
P. hesperium Hg
8175, 4x
midparent
(in silico)
4371 22.8%
308316.1%
1288 6.7%
18459.6%
293815.3%
1093 5.7%
244612.7%
1735 9.0%
7113.7%
9004.7%
350.2%
9354.9%
P. amorphum2x
P. glycyrrhiza2x
P. hesperium Hg
8177, 4x
midparent
(in silico)
4371 22.8%
308316.1%
1288 6.7%
320316.7%
480025.0%
1597 8.3%
10165.3%
632 3.3%
3842.0%
6253.3%
2321.2%
8574.5%
P. amorphum2x
P. glycyrrhiza2x
P. hesperium Hg
8288, 4x
midparent
(in silico)
4371 22.8%
308316.1%
1288 6.7%
290915.2%
407121.3%
1162 6.1%
8034.2%
473 2.5%
3301.7%
4132.2%
720.4%
4852.5%
P. amorphum2x
P. glycyrrhiza2x
P. hesperium Ha
4x
midparent
(in silico)
P. amorphum2x
P. glycyrrhiza2x
P. hesperium Hg
4x
midparent
(in silico)
10525.5%
1350.70%
7734.0%
16188.4%
11436.0%
4622.4%
3241.7%
3161.6%
40.02%
1690.9%
1130.6%
290.2%
15908.3%
4532.4%
11295.9%
1447.5%
20.01%
1336.9%

164
Figure C.2. The number of genes differentially expressed in each contrast between the allotetraploid Polypodium hesperium and diploid progenitors, P. amorphum and P. glycyrrhiza. a-‐‑c, e-‐‑g. For each of the three specimens of P. hesperium Ha and the three
specimens of P. hesperium Hg. Four digit numbers are unique specimen identifiers that correspond to Table 6. Bolded values indicate the total number and proportion of genes differentially expressed in each contrast. Values that are not bolded indicate the number of genes that are more highly expressed in a particular species for each contrast. For example, of the 19194 genes evaluated, 4371 (22.8%) genes are differentially expressed between P. amorphum and P. glycyrrhiza, with 1288 genes (6.7%) more highly expressed in P. amorphum and 3083 genes (16.1%) more highly expressed in P. glycyrrhiza. d& h. Summary of the number of genes differentially expressed genes in each contrast with
the three specimens of P. hesperium Ha and the three specimens of P. hesperium Hg, respectively. The number in the middle of each Venn diagram indicates the number of genes common to the three corresponding contrasts.

165
Figure C.3. The number of genes belonging to 12 possible classes of differential expression among the allotetraploid Polypodium hesperium and its diploid progenitors, P. amorphum and P. glycyrrhiza. Roman numerals correspond to the class designations given in Rapp et al. (2009), and figures illustrate the expression level of P. hesperium (H) relative to P. amorphum (A) and P. glycyrrhiza. (G). “No Change” refers to genes without a statistically significant change in gene expression among all three species. Each row describes expression patterns for a particular individual of P.
hesperium, with Ha and Ha designating the lineage and the four-‐‑digit number as a unique specimen identifier (Table 6).
Hg
8175
I XII VVIIXIIXIV II III X VIIIVI
No
Change Total
Additivity
P. amorphum-expression
level
dominance
P. glycyrrhiza-expression
level
dominance
Transgressive
down-regulation
Transgressive
up-regulation
A GH A GH A GH A GH A GH A GH A GH A GH A GH A GH A GH A GH
278
295
68
37 481
1087403
514
250
164
964 00
01504 0
33
29 11
717
1
124
113 13684
13455 16686
16833
322
324
47
42 916
1260398
408
230
321
634 11
21132 2
36
7 19
125
5
115
220 13271
13760 16821
16699
86 32 2277667 89212 33 101 338 176 12949 16636
Ha
8276
Ha
8179
Ha
8280
Hg
8177
Hg
8288120 27 2250628 94162 11 61 110 92 13597 17044

166
REFERENCES
Abramoff, M. D., P. J. Magelhaes, and S. J. Ram. 2004. Image processing with ImageJ. Biophotonics International 7: 36–42.
Adams, K. L. 2007. Evolution of duplicate gene expression in polyploid and hybrid plants. Journal of Heredity 98: 136–141.
Akama, S., R. Shimizu-‐‑Inatsugi, K. K. Shimizu, and J. Sese. 2014. Genome-‐‑wide quantification of homoeolog expression ratio revealed nonstochastic gene regulation in synthetic allopolyploid Arabidopsis. Nucleic Acids Research 42: gkt1376.
Albertin W. and P. Marullo. 2012. Polyploidy in fungi: evolution after whole-‐‑genome duplication. Proceedings of the Royal Society B: Biological Sciences 279: 2487–2509.
Altschul S.F., W. Gish, W. Miller, E. W. Myers, and D. J. Lipman. 1990. Basic local alignment search tool. Journal of Molecular Biology 215: 403–410.
Amborella Genome Project. 2013. The Amborella genome and the evolution of flowering plants. Science 342: 1241089.
Arbogast, B. S., R. A. Browne, and P. D. Weigel. 2001. Evolutionary genetics and Pleistocene biogeography of North American tree squirrels. Journal of Mammalogy 82: 302–319.
Ashburner, M., C. A. Ball, J. A. Blake, D. Botstein, H. Butler, J. M. Cherry, A.P. Davis, et al. 2000. Gene Ontology: tool for the unification of biology. Nature Genetics 25: 25–29.
Avise, J. C. and D. Walker. 1998. Phylogeographic effects on avian populations and the speciation process. Proceedings of the Royal Society B 265: 457–463.
Baldwin, B. G. and W. L. Wagner. 2010. Hawaiian angiosperm radiations of North American origin. Annals of Botany 105: 849–879.
Baldwin, B. G., D. H. Goldman, D. J. Keil, R. Patterson, T. J. Rosatti, and D. H. Wilken, editors. 2012. The Jepson manual: Vascular plants of California. Ed. 2. Berkeley: University of California Press.

167
Bardil, A., J. Dantas de Almeida, M.-‐‑C. Combes, P. Lashermes, and B. Bertrand. 2011. Genomic expression dominance in the natural allopolyploid Coffea arabica is massively affected by growth temperature. New Phytologist 192: 760–774.
Barrington, D. S. 1993. Ecological and historical factors in fern biogeography. Journal of Biogeography 20: 275–279.
Barrington, D. S. and C. A. Paris. 2007. Refugia and migration in the Quaternary history of the New England flora. Rhodora 109: 369–386.
Barrington, D. S., C. H. Haufler, and C. R. Werth. 1989. Hybridization, reticulation, and species concepts in the ferns. American Fern Journal 79: 55–64.
Barrington, D. S., C. A. Paris, and T. A. Ranker. 1986. Systematic inferences from spore and stomate size in the ferns. American Fern Journal 76: 149–159.
Beck, J. B., M. D. Windham, G. Yatskievych, and K. M. Pryer. 2010. A diploids-‐‑first approach to species delimitation and interpreting polyploid evolution in the fern genus Astrolepis (Pteridaceae). Systematic Botany 35: 223–234.
Benjamini Y. and Y. Hochberg. 1995. Controlling the false discovery rate: a practical and powerful approach to multiple testing. Journal of the Royal Statistical Society: Series B 57: 289–300.
Birky, C. W. 1995. Uniparental inheritance of mitochondrial and chloroplast genes: mechanisms and evolution. Proceedings of the National Academy of Sciences, U.S.A. 92: 11331–11338.
Bobrov, A. E. 1964. A comparative morphological and taxonomic study of the species of Polypodium L. of the flora of the U.S.S.R. Botanicheskii Zhurnal (Moscow and Leningrad) 49: 534–545.
Bock, R. 2007. Structure, function, and inheritance of plastid genomes. In Cell and molecular biology of plastids, pp. 29–63. New York: Springer Berlin Heidelberg.
Bolger, A. M., M. Lohse, and B. Usadel. 2014. Trimmomatic: a flexible trimmer for Illumina sequence data. Bioinformatics: btu170.
Buggs, R. J. A. 2008. Towards natural polyploid model organisms. Molecular Ecology 17: 1875–1876.

168
Buggs, R. J., J. F, Wendel, J. J. Doyle, D. E. Soltis, P. S. Soltis, and J. E. Coate. 2014. The legacy of diploid progenitors in allopolyploid gene expression patterns. Philosophical Transactions of the Royal Society B 369: 20130354.
Buggs, R. J. A., S. Chamala, W. Wu, J. A. Tate, P. S. Schnable, D. E. Soltis, P. S. Soltis, and W. B. Barbazuk. 2012. Rapid, repeated, and clustered loss of duplicate genes in allopolyploid plant populations of independent origin. Current Biology 22: 248–252.
Buggs, R. J. A., A. N. Doust, J. A. Tate, J. Koh, K. Soltis, F. A. Feltus, A. H. Paterson, P. S. Soltis, and D. E. Soltis. 2009. Gene loss and silencing in Tragopogon miscellus (Asteraceae): comparison of natural and synthetic allotetraploids. Heredity 103: 73–81.
Buggs, R. J. A., S. Chamala, W. Wu, L. Gao, G. D. May, P. S. Schnable, D. E. Soltis, P. S. Soltis, and W. B. Barbazuk. 2010. Characterization of duplicate gene evolution in the recent natural allopolyploid Tragopogon miscellus by next-‐‑generation sequencing and Sequenom iPLEX MassARRAY genotyping. Molecular Ecology 19: 132–146.
Carine, A. M. 2006. Spatio-‐‑temporal relationships of the Macaronesian endemic flora: a relictual series or window of opportunity? Taxon 54: 895–903.
Carine, A. M., S. J. Russell, A. Santos-‐‑Guerra, and J. Francisco-‐‑Ortega. 2004. Relationships of the Macaronesian and Mediterranean floras: molecular evidence for multiple colonizations into Macaronesia and back-‐‑colonization of the continent in Convolvulus (Convolvulaceae). American Journal of Botany 91: 1070–1085.
Chagué, V., J. Just, I. Mestiri, S. Balzergue, A.‐M. Tanguy, C. Huneau, V. Huteau, et al. 2010. Genome‐wide gene expression changes in genetically stable synthetic and natural wheat allohexaploids. New Phytologist 187: 1181–1194.
Chang, Y., J. Li, S. Lu, and H. Schneider. 2013. Species diversity and reticulate evolution in the Asplenium normale complex (Aspleniaceae) in China and adjacent areas. Taxon 62: 673–687.
Chao, Y.-‐‑S., S.-‐‑Y. Dong, Y.-‐‑C. Chiang, H.-‐‑Y. Liu, and W.-‐‑L. Chiou. 2012. Extreme multiple reticulate origins of the Pteris cadieri complex (Pteridaceae). International Journal of Molecular Science 13: 4523–4544.

169
Chaudhary, B., L. Flagel, R. M. Stupar, J. A. Udall, N. Verma, N. M. Springer, and J. F. Wendel. 2009. Reciprocal silencing, transcriptional bias and functional divergence of homoeologs in polyploid cotton (Gossypium). Genetics 182: 503–517.
Chelaifa, H., A. Monnier, and M. Ainouche. 2010. Transcriptomic changes following recent natural hybridization and allopolyploidy in the salt marsh species Spartina × townsendii and Spartina anglica (Poaceae). New Phytologist 186: 161–174.
Chester, M., J. P. Gallagher, V. Vaughan Symonds, A. V. Cruz da Silva, E. V. Mavrodiev, A. R. Leitch, P. S. Soltis, and D. E. Soltis. 2012. Extensive chromosomal variation in a recently formed natural allopolyploid species, Tragopogon miscellus (Asteraceae). Proceedings of the National Academy of Sciences, U.S.A. 109: 1176–1181.
Christensen, C. 1928. On the systematic position of Polypodium. Udgivet Af Dansk Botanisk Forening 22: 1–10.
Clague, D. A. and G. B. Dalrymple. 1994. Tectonics, geochronology, and origin of the Hawaiian-‐‑Emperor Volcanic Chain. Pp. 5–40 in A natural history of the Hawaiian Islands. Selected readings II, ed. E. A. Kay. Honolulu: University of Hawai‘i Press.
Clark, P. U., and A. C. Mix. 2002. Ice sheets and sea level of the Last Glacial Maximum. Quaternary Science Reviews 21: 1–7.
Clark, P. U., A. S. Dyke, J. D. Shakun, A. E. Carlson, J. Clark, B. Wohlfarth, J. X. Mitrovica, et al. 2009. The Last Glacial Maximum. Science 325: 710–714.
Coate, J. E. and J. J. Doyle. 2010. Quantifying whole transcriptome size, a prerequisite for understanding transcriptome evolution across species: an example from a plant allopolyploid. Genome Biology and Evolution 2: 534–546.
Coate, J. E., H. Bar, and J. J. Doyle. 2014. Extensive translational regulation of gene expression in an allopolyploid (Glycine dolichocarpa). The Plant Cell 26: 136–150.
Coate, J. E., A. K. Luciano, V. Seralathan, K. J. Minchew, T. G. Owens, and J. J. Doyle. 2012. Anatomical, biochemical, and photosynthetic responses to recent allopolyploidy in Glycine dolichocarpa (Fabaceae). American Journal of Botany 99: 55–67.
Comai, L. 2005. The advantages and disadvantages of being polyploid. Nature Reviews Genetics 6: 836–]846.

170
Combes, M.-‐‑C., A. Dereeper, D. Severac, B. Bertrand, and P. Lashmeres. 2013. Contribution of subgenomes to the transcriptome and their intertwined regulation in the allopolyploid Coffea arabica grown at contrasted temperatures. New Phytologist 200: 251–260.
Comes, H. P. and J. W. Kadereit. 1998. The effect of Quaternary climatic changes on plant distribution and evolution. Trends in Plant Science 3: 432–438.
Cook, L. M., P. S. Soltis, S. J. Brunsfeld, and D. E. Soltis. 1998. Multiple independent formations of Tragopogon tetraploids (Asteraceae): evidence from RAPD markers. Molecular Ecology 7: 1293–1302.
Cox, M. P., T. Dong, G. Shen, Y. Davi, D. B. Scott, and A. R. D. Ganley. An interspecific fungal hybrid reveals cross-‐‑kingdom rules for allopolyploid gene expression patterns. PLOS Genetics 10: e1004180.
Cui, L., P. K. Wall, J. H. Leebens-‐‑Mack, B. G. Lindsay, D. E. Soltis, J. J. Doyle, P. S. Soltis, et al. 2006. Widespread genome duplications throughout the history of flowering plants. Genome Research 16: 738–749.
de la Luz, L., J. Luis, P. Navarro, J. Juan, and A. Breceda. 2000. A transitional xerophytic tropical plant community of the Cape Region, Baja California. Journal of Vegetative Science 11: 555–564.
De la Sota, E. R. 1973. On the classification and phylogeny of the Polypodiaceae. Pp. 229–244 in The phylogeny and classification of the ferns, eds. A. C. Jermy, J. A. Crabbe, and B. A. Thomas. London: Academic Press.
DePristo, M., E. Banks, R. Poplin, K. Garimella, J. Maguire, C. Hartl. A. Philippakis, G. del Angel, M. A. Rivas, M. Hanna, A. McKenna, T. Fennell, A. Kernytsky, A. Sivachenko, K. Cibulskis, S. Gabriel, D. Altshuler, and M. Daly. 2011. A framework for variation discovery and genotyping using next-‐‑generation DNA sequencing data. Nature Genetics 43:491–498.
Detling, L. E. 1958. Peculiarities of the Columbia River Gorge flora. Madroño 14: 160–172.
Dillies, M.-‐‑A., A. Rau, J. Aubert, C. Hennequet-‐‑Antier, M. Jeanmougin, N. Servant, C. Keime, et al. 2013. A comprehensive evaluation of normalization methods for Illumina high-‐‑throughput RNA sequencing data analysis. Briefings in Bioinformatics 14.6: 671–683.

171
Dixon, J. D., P. Schönswetter, J. Suda, M. M.Wiederamnn, and G. M. Schneeweiss. 2009. Reciprocal Pleistocene origin and postglacial range formation of an allopolyploid and its sympatric ancestors (Androsace adfinis group, Primulaceae). Molecular Phylogenetics and Evolution 50: 74–83.
Douglas, G.W., D.V. Meidinger, and J. Pojar [eds]. 2000. Illustrated Flora of British Columbia. Volume 5: Dicotyledons (Salicaceae Through Zygophyllaceae) And Pteridophytes. B.C. Ministry of Environment, Lands & Parks and B.C. Ministry of Forests,Victoria, British Columbia, Canada.
Drummond A. J., M. A. Suchard, D. Xie, and A. Rambaut. 2012. Bayesian phylogenetics with BEAUti and the BEAST 1.7. Molecular Biology and Evolution 29: 1969–1973.
Dyke, A. S. and V. K. Prest. 1987. Late Wisconsinan and Holocene history of the Laurentide Ice Sheet. Géographie physique et Quaternaire 41: 237–263.
Edwards, J. L., M. A. Lane, and E. S. Nielsen. 2000. Interoperability of biodiversity databases: biodiversity information on every desktop. Science 289: 2312–2314.
Emerson, B. C. 2002. Evolution on oceanic islands: Molecular phylogenetic approaches to understanding pattern and process. Molecular Evolution 11: 951–966.
Fernald, M. L. 1922. Polypodium virginianum and P. vulgare. Contributions from the Gray Herbarium of Harvard University 24:125–142.
Flagel, L. E. and J. F. Wendel. 2009. Gene duplication and evolutionary novelty in plants. New Phytologist 183: 557–564.
Flagel, L. E. and J. F. Wendel. 2010. Evolutionary rate variation, genomic dominance and duplicate gene expression evolution during allotetraploid cotton speciation. New Phytologist 186: 184–193.
Gaeta, R. T. and J. C. Pires. 2009. Homoeologous recombination in allopolyploids: the polyploid ratchet. New Phytologist 186: 18–28.
Gallard, M. H., G. Kausel, A. Jiménez, C. Bacquet, C. González, J. Figueroa, N. Köhler, and R. Ojeda. 2004. Whole-‐‑genome duplications in South American desert rodents (Octodontidae). Biological Journal of the Linnean Society 82: 443–451.

172
Gastony, G. J. and G. Yatskievych. 1989. Maternal inheritance of the chloroplast and mitochondrial genomes in cheilanthoid ferns. American Journal of Botany 79: 716–722.
Geiger, J. M. O., T. A. Ranker, J. M. Ramp Neale, and S. T. Klimas. 2007. Molecular biogeography and origins of the Hawaiian fern flora. Brittonia 59: 142–158.
Gene Codes Corporation. 2005. Sequencher version 4.8 sequence analysis software. Ann Arbor, Michigan, U. S. A. http://www.genecodes.com.
Gianinetti, A. 2013. A criticism of the value of midparent in polyploidization. Journal of Experimental Botany 64: 4119–4129.
Gillespie, A. and D. H. Clark. 2011. Glaciations of the Sierra Nevada, California, USA. Pp. 447–462 in Developments in Quaternary Science, vol 15, Quaternary Glaciations: Extent and Chronology: A Closer Look. St. Louis: Elsevier.
Govindarajulu, R., C. E. Hughes, and C. D. Bailey. 2011. Phylogenetic and population genetic analyses of diploid Leucaena (Leguminosae; Mimosoideae) reveal cryptic species diversity and patterns of divergent allopatric speciation. American Journal of Botany 98: 2049–2063.
Grabherr, M. G., B. J. Haas, M. Yassour, J. Z. Levin, D. A. Thompson, I. Amit, X. Adiconis , et al. 2011. Full-‐‑length transcriptome assembly from RNA-‐‑seq data without a reference genome. Nature Biotechnology 29: 644–652.
Grønvold, L. 2013. Analysis of homoeolog specific transcription in hexaploid wheat. Master'ʹs Thesis. Ås, Norway: Norwegian University of Life Sciences.
Grover, C. E., J. P. Gallagher, E. P. Szadkowski, M. J. Yoo, L. E. Flagel, and J. F. Wendel. 2012. Homoeolog expresssion bias an expression level dominance in allopolyploids. New Phytologist 196: 966–971.
Grusz, A.L., M.D. Windham, and K.M. Pryer. 2009. Deciphering the origins of apomictic polyploids in the Cheilanthes yavapensis complex (Pteridaceae). American Journal of Botany 96: 1636–1645.
Guillon, J.–M. and C. Raquin. 2000. Maternal inheritance of chloroplasts in the horsetail Equisetum variegatum (Schleich.). Current Genetics 37: 53–56.

173
Haas B. J., A. Papanicolaou, M. Yassour, M. Grabherr, P. D. Blood, J. Bowden, M. B. Couger, et al. 2013. De novo transcript sequence reconstruction from RNA-‐‑seq using the Trinity platform for reference generation and analysis. Nature Protocols 8: 1494-‐‑512.
Haufler, C. H. and T. A. Ranker. 1995. RbcL sequences provide phylogenetic insights among sister species of the fern genus Polypodium. American Fern Journal 85: 361–374.
Haufler, C. H. and M. D. Windham. 1991. New species of North American Cystopteris and Polypodium, with comments on their reticulate relationships. American Fern Journal 81: 7–23.
Haufler, C. H. and W. Zhongren. 1991. Chromosomal analyses and the origin of allopolyploid Polypodium virginianum (Polypodiaceae). American Journal of Botany 78: 624–629.
Haufler, C. H., E. A. Hooper, and J. P. Therrien. 2000. Mode and mechanisms of speciation in pteridophytes: Implications of contrasting patterns in ferns representing temperate and tropical habitats. Plant Species Biology 15: 223–236.
Haufler, C. H., D. E. Soltis, and P. S. Soltis. 1995a. Phylogeny of the Polypodium vulgare complex: Insights from chloroplast DNA restriction site data. Systematic Botany 20: 110–119.
Haufler, C. H., M. D. Windham, and E. W. Rabe. 1995b. Reticulate evolution in the Polypodium vulgare complex. Systematic Botany 20: 89–109.
Haufler, C. H., M. D. Windham, F. A. Lang, and S. A. Whitmore. 1993. Polypodium. Pp. 356–357 in Flora of North America north of Mexico vol. 2, ed. Flora of North America Editorial Committee. New York and Oxford: Oxford University Press.
Hegarty, M. J., and S. J. Hiscock. 2005. Hybrid Speciation in Plants: New Insights from Molecular Studies. New Phytologist 165: 411-‐‑423.
Hennipman, E., Veldhoen, P., Kramer, K.U., and M. G. Price. 1990. Polypodiaceae. Pp. 203–230 in The families and genera of vascular plants vol. 1, ed. K. Kubitzki. Berlin: Springer-‐‑Verlag.
Hewitt, G. M. 1996. Some genetic consequences of ice ages, and their role in divergence and speciation. Biological Journal of the Linnean Society 58: 247–276.

174
Hewitt, G. M. 2001. Speciation, hybrid zones and phylogeography—or seeing genes in space and time. Molecular Ecology 10: 537–549.
Hewitt, G. M. 2004. Genetic consequences of climatic oscillations in the Quaternary. Philosophical Transactions of the Royal Society of London B 349: 183–195.
Higgins, J., A. Magusin, M. Trick, F. Fraser, and I. Bancroft. 2012. Use of mRNA-‐‑seq to discriminate contributions to the transcriptome from the constituent genomes of the polyploid crop species Brassica napus. BMC Genomics 13: 247–260.
Hildebrand, T. J., C. H. Haufler, J. P. Therrien, and C. Walters. 2002. A new hybrid Polypodium provides insights concerning the systematics of Polypodium scouleri and its sympatric congeners. American Fern Journal 92: 214–228.
Hillebrand, W. 1888. Flora of the Hawaiian Islands: A description of their phanerogams and vascular cryptogams. London: Williams and Norgate.
Hoshizaki, B. J. 1975. Fern growers manual. New York, New York: Alfred A. Knopf.
Hugo, R. and E. Exequiel. 2007. Endemic regions of the vascular flora of the peninsula of Baja California, Mexico. Journal of Vegetative Science 18: 327–336.
Hultén, E. 1968. Flora of Alaska and neighboring territories: A manual of the vascular plants. Stanford: Stanford University Press.
Iwatsuki, K., T. Yamazaki, D. E. Boufford, and H. Ohba. 1995. Flora of Japan. Vol I. Pteridophyta and Gymnospermae. Tokyo: Kodansha Ltd.
Jablonka, E. and G. Raz. 2009. Transgenerational epigenetic inheritance: prevalence, mechanisms, and implications for the study of heredity and evolution. The Quarterly Review of Biology 84: 131–176.
Jiao, Y., N. J. Wickett, S. Ayyampalayam, A. S. Chanderbali, L. Landherr, P. E. Ralph, L. P. Tomsho, et al. 2011. Ancestral polyploidy in seed plants and angiosperms. Nature 473: 97–100.
Jones, R. N. and H. Thomas.2009. Genome restructuring in hybrids: marriages of inconvenience. Genetyka i genomika w doskonaleniu roślin uprawnych: 11–28.
Jones, E., T. Oliphant, and P. Peterson. 2001. SciPy: Open source scientific tools for Python. Available at http://www. scipy. org.

175
Kadereit, J. W., S. Uribe-‐‑Convers, E. Westberg, and H. P. Comes. 2006. Reciprocal hybridization at different times between Senecio flavus and Senecio glaucus gave rise to two polyploid species in north Africa and south-‐‑west Asia. New Phytologist 169: 431–441.
Kao, T. T., W. L. Chiou, S. Y. Hsu, C.-‐‑M.Chen, Y.-‐‑S. Chao, and Y. M. Huang. 2014. Hybrid origins of Nephrolepis xhippocrepicis Miyam. (Nephrolepidaceae). International Journal of Plant Reproductive Biology 6: 1–14.
Kashkush, K., M. Feldman, and A. A. Levy. 2002. Gene loss, silencing and activation in a newly synthesized wheat allotetraploid. Genetics 160: 1651–1659.
Knowles, L. L. 2001. Did the Pleistocene glaciations promote divergence? Tests of explicit refugial models in montane grasshoppers. Molecular Ecology 10: 691–701.
Koh, J. P. S. Solitis, and D. E. Soltis. 2010. Homoeolog loss and expression changes in natural populations of the recently and repeatedly formed allotetraploid Tragopogon mirus (Asteraceae). BMC Genomics 11: 97–121.
Kott, L. S. and D. M. Britton. 1982. A comparative study of sporophyte morphology of the three cytotypes of Polypodium virginianum in Ontario. Canadian Journal of Botany 60: 1360–1370.
Krasileva, K. V., V. Buffalo, P. Bailey, S.Pearce, S. Ayling, F. Tabbita, M. Soria, S. Wang, IWGS Consortium, E. Akhunov, C. Uauy, and J. Dubcovsky. 2013. Separating homoeologs by phasing in the tetraploid wheat transcriptome. Genome Biology 14: R66.
Kurita, S. and C. Ikebe. 1977. On the systematic position of Pleurosoriopsis makinoi (Maxim.) Fomin. Journal of Japanese Botany 52: 39–49.
Kvaček, Z. 2001. A new fossil species of Polypodium (Polypodiaceae) from the Oligocene of northern Bohemia (Czech Republic). Feddes Repertorium 112: 159–177.
Lanfear R., B. Calcott, S. Y. W. Ho, and S. Guindon. 2012. PartitionFinder: combined selection of partitioning schemes and substitution models for phylogenetic analyses. Molecular Biology and Evolution 29: 1695–1701.
Lang, F. A. 1969. A new name for a species of Polypodium from northwestern North America. Madroño 20: 53–60.

176
Lang, F. A. 1971. The Polypodium vulgare complex in the Pacific Northwest. Madroño 21: 235–254.
Langmead B., C. Trapnell, M. Pop, and S. L. Salzberg. 2009. Ultrafast and memory-‐‑efficient alignment of short DNA sequences to the human genome. Genome Biology 10: R25.
Lellinger, D. B. 1981. Notes on North American ferns. American Fern Journal 71: 90–94.
Levy, A. A. and M. Feldman. 2004. Genetic and epigenetic reprogramming of the wheat genome upon allopolyploidization. Biological Journal of the Linnean Society 82: 607–613.
Lewis, P. O. 2001. A likelihood approach to estimating phylogeny from discrete morphological character data. Systematic Biology 50: 913–925.
Li, J. 1997. Biosystematic analyses of the Hawaiian endemic fern species Polypodium pellucidum (Polypodiaceae) and related congenerics. Ph. D. thesis. Lawrence, Kansas: University of Kansas.
Li, B. and C. N. Dewey. 2011. RSEM: accurate transcript quantification from RNA-‐‑Seq data with or without a reference genome. BMC Bioinformatics 12: 323–338.
Li, J. and C. H. Haufler. 1999. Genetic variation, breeding systems, and patterns of diversification in Hawaiian Polypodium (Polypodiaceae). Systematic Botany 24: 339–355.
Li, F.-‐‑W., K. M. Pryer, and M. D. Windham. 2012. Gaga, a new genus segregated from Cheilanthes (Pteridaceae). Systematic Botany 37: 845–860.
Li, L., C. J. Stoeckert, and D. S. Roos. D. S. OrthoMCL: identification of ortholog groups for eukaryotic genomes. Genome Research 13: 2178–2189.
Li, F.-‐‑W., J. C. Villarreal, S. Kelly, C. J. Rothfels, M. Melkonian, E. Frangedakis, M. Ruhsam, E. M. Sigel, et al. 2014. Horizontal transfer of an adaptive chimeric photoreceptor from bryophytes to ferns. Proceedings of the National Academy of Sciences of the United States of America DOI 10.1073/pnas.1319929111.
Lindman, C. A. M. 1918. Bilder ur nordens flora: Andra och tredje upplagorna, vol. 1. Stockholm: Wahlström & Widstrand.

177
Lindsay, S. L. 1981. Taxonomic and biogeographic relationships of Baja California chickarees (Tamiasciurus). Journal of Mammalogy 62: 673–683.
Linneaus, C. 1753. Species Plantarum. Holmiae: Imprensis Laurentii Salvii.
Liu, B. and J. F. Wendel. 2003. Epigenetic phenomena and the evolution of plant allopolyploids. Molecular Phylogenetics and Evolution 29: 365–379.
Lloyd, R. M. 1963. New chromosome numbers in Polypodium L. American Fern Journal 53: 99–101.
Lloyd, R. M. and F. A. Lang. 1964. The Polypodium vulgare complex in North America. British Fern Gazette 9: 168–177.
Lukens, L., J. Pires, E. Leon, and R. Vogelzang. 2006. Patterns of sequence loss and cytosine methylation within a population of newly resynthesized Brassica napus allopolyploids. Plant Physiology 140: 336–348.
Luna–Vega, I., J. D. Tejero-‐‑Dìez, R. Contreras-‐‑Medina, M. Heads, and G. Rivas. 2012. Biogeographical analysis of two Polypodium species complexes (Polypodiaceae) in Mexico and Central America. Biological Journal of the Linnean Society 106: 940–955.
Ma, X.-‐‑F. and J. P. Gustafson. 2005. Genome evolution of allopolyploids: a process of cytological and genetic diploidization. Cytogenetic and Genome Research 109: 236–249.
Mable, B. K. 2004. Why polyploidy is rarer in animals than in plants: myths and mechanisms. Biological Journal of the Linnean Society 82: 453–466.
Maddison, D. R. and W. P. Maddison. 2005. McClade 4: Analysis of phylogeny and character evolution. v. 4.08. Sunderland: Sinauer Associates.
Madlung, A. 2013. Polyploidy and its effect on evolutionary success: old questions revisited with new tools. Heredity 110: 99–104.
Mai, D. H. 1987. Development and regional differentiation of the European vegetation during the Tertiary. Plant Systematics and Evolution 161: 79–91.
Maldonado, J. E., C. Vilà, and R. K. Wayne. 2001. Tripartite genetic subdivisions in the ornate shrew (Sorex ornatus). Molecular Ecology 10: 127–147.

178
Manton, I. 1947. Polyploidy in Polypodium vulgare. Nature 159: 136.
Manton, I. 1950. Problems of cytology and evolution in the Pteridophyta. Cambridge: Cambridge University Press.
Manton, I. 1951. Cytology of Polypodium in America. Nature 167: 37.
Martens, P. 1943. Les organes glanduleux de Polypodium virginianum (P. vulgare var. virginianum) I. Valeur systématique et répartition géographique. Bulletin du Jardin botanique de l'ʹÉtat a Bruxelles 17: 1–14.
Martens, P. 1950. Les paraphyses de Polypodium vulgare et la sous-‐‑espèce serratum. Bulletin de la Sociètè Royale de Botanique de Belgique 82: 225–262.
Mason-‐‑Gamer, R. J. and E. A. Kellogg. 1996. Testing for phylogenetic conflict among molecular datasets in the tribe Triticeae (Gramineae). Systematic Biology 45: 524–545.
Mathewes, R. W. and G. E. Rouse. 1975. Palynology and paleoecology of postglacial sediments from the lower Fraser River Canyon of British Columbia. Canadian Journal of Earth Sciences 12: 745–756.
Maxon, W. R. 1900. Polypodium hesperium, a new fern from western North America. Proceedings of the Biological Society of Washington 13: 199–200.
McKenna, A., M. Hanna, E. Banks, A. Sivachenko, K. Cibulskis, A. Kernytsky, K. Garimella, D. Altshuler, S. Gabriel, M. Daly, and M. A. DePristo. 2010. The Genome Analysis Toolkit: a MapReduce framework for analyzing next-‐‑generation DNA sequencing data. Genome Research 20: 1297–303.
Meimberg, H., K. J. Rice, N. F. Milan, C. C. Njoku, and J. K. McKay. 2009. Multiple origins promote the ecological amplitude of allopolyploid Aegilops (Poaceae). American Journal of Botany 96: 1262–1273.
Mickel, J. T. and A. R. Smith. 2004. The Pteridophytes of Mexico. New York: The New York Botanical Garden Press.
Mickel, J. T. and J. M. Beitel. 1988. Pteridophyte flora of Oaxaca, Mexico. Memoirs of the New York Botanical Garden 46: 1–568.
179
Microsoft. 2011. Microsoft Excel v. 14.1. Redmond, Washington: Microsoft, Computer Software.
Miller, M.A., W. Pfeiffer, and T. Schwartz. 2010. Creating the CIPRES Science Gateway for inference of large phylogenetic trees. Pp. 1–8 in Proceedings of the Gateway Computing Environments Workshop (GCE). New Orleans, Louisiana.
Mithani, A., E. J. Belfield, C. Brown, C. Jiang, L. J. Leach, and N. P. Harberd. 2013. HANDS: a tool for genome-‐‑wide discovery of subgenome-‐‑specific base-‐‑identity in polyploids. BMC Genomics 14: 653–660.
Moghe, G. D., D. E. Hufnagel, H. Tang, Y. Xiao, I. Dworkin, C. D. Town, J. K. Conner, and S. H. Shiu. 2014. Consequences of whole-‐‑genome triplication as revealed by comparative genomic analyses of the wild radish Raphanus raphanistrum and three other Brassicaceae species. The Plant Cell tpc.114: tpc.114.124297.
Moran, R. C. 1995. Polypodium L. Pp. 349–365 in Flora Mesoamericana vol. 1, eds. M. Sousa Sanchez, S. Knapp, G. Davidse, R. C. Moran, and R. Riba. St. Louis: Missouri Botanical Garden.
Nagalingum, N. S., H. Schneider, and K. M. Pryer. 2007. Molecular phylogenetic relationships and morphological evolution in the heterosporous fern genus Marsilea. Systematic Botany 32: 16–25.
Nagy I., S. Barth, J. Mehenni-‐‑Ciz, M. T. Abberton, and D. Milbourne. 2013. A hybrid next generation transcript sequencing-‐‑based approach to identify allelic and homoeolog-‐‑specific single nucleotide polymorphisms in allotetraploid white clover. BMC Genomics 14: 100–118.
Oberbauer, T. 2005. A comparison of estimated historic and current vegetation community structure of Guadalupe Island, Mexico. Proceedings of the Sixth California Islands Symposium 6: 143–153.
Otto, S. P. 2007. The evolutionary consequences of polyploidy. Cell 131: 452–462.
Otto, S. P., and J. Whitton. 2000. Polyploid incidence and evolution. Annual review of genetics 34: 401–437.
Otto, E. M., T. Janβen, H.–P. Kreier, and H. Schneider. 2009. New insights into the phylogeny of Pleopeltis and related Neotropical genera (Polypodiaceae, Polypodiopsida). Molecular Phylogenetics and Evolution 53: 190–201.

180
Page, C. N. 1997. The ferns of Britain and Ireland. Cambridge: Cambridge University Press.
Page, J. T., A. R. Gingle, and J. A. Udall. 2013. PolyCat: a resource for genome categorization of sequencing reads from allopolyploid organisms. G3 3: 517–525.
Palmer, D. 2003. Hawai‘i'ʹs ferns and fern allies. Honolulu: University of Hawai‘i Press.
Perrie, L. R., L. D. Shepherd, P. J. de Lange, and P. J. Brownsey. 2010. Parallel polyploid speciation: distinct sympatric gene-‐‑pools of recurrently derived allo-‐‑octoploid Asplenium ferns. Molecular Ecology 19: 2916–2932.
Peterson, R. L. and L. S. Kott. 1974. The sorus of Polypodium virginianum: some aspects of the development and structure of paraphyses and sporangia. Canadian Journal of Botany 52: 2283–2288.
Pielou, C. E. 1991. After the ice age: the return of life to glaciated North America. Chicago: University of Chicago Press.
Polz, M. F. and C. M. Cavanaugh. 1998. Bias in template-‐‑to-‐‑product ratios in multitemplate PCR. Applied and Environmental Microbiology 64: 3724–3730.
Press, J. R. and M. J. Short. 1994. Flora of Madeira. London: The Natural History Museum.
Price, J. P. and D. A. Clague. 2002. How old is the Hawaiian biota? Geology and phylogeny suggest recent divergence. Proceedings of the Royal Society B 269: 2429–2435.
Pryer, K. M. and D. M. Britton. 1983. Spore studies in the genus Gymnocarpium. Canadian Journal of Botany 61: 377–388.
R Development Core Team. 2008. R: A language and environment for statistical computing. R Foundation for Statistical Computing, Vienna, Austria. ISBN 3-‐‑900051-‐‑07-‐‑0, URL http://www.R-‐‑project.org.
Rambaut, A. and A. J. Drummond. 2007. Tracer v1.4. Available from http://beast.bio.ed.ac.uk/Tracer.
Ramsey, J. 2011. Polyploidy and ecological adaptation in wild yarrow. Proceedings of the National Academy of Sciences, U.S.A. 108: 7096–7101.

181
Ranker, T. A., J. M. O. Geiger, S. C. Kennedy, A. R. Smith, C. H. Haufler, and B. S. Parris. 2003. Molecular phylogenetics and evolution of the endemic Hawaiian genus Adenophorus (Grammitidaceae). Molecular Phylogenetics and Evolution 26: 337–347.
Rapp, R. A., J. A. Udall, and J. F. Wendel. 2009. Genomic expression dominance in allopolyploids. BMC Biology 7: 18.
Raven, P. H. 1965. The floristics of the California islands. Pp. 57–67 in Proceedings of the symposium on the biology of the California Islands, ed. R. N. Philbrick. Santa Barbara: Santa Barbara Botanical Garden.
Raven, P. H. and D. I. Axelrod. 1978. Origin and relationships of the California flora. University of California Publications in Botany 72: 1–134.
Reboul, X. and C. Zeyl. 1994. Organelle inheritance in plants. Heredity 72: 132–140.
Ree, R. 2008. gapcode.py. Available form http://www.bioinformatics.org/~rick/software.html.
Rieseberg, L. H. 1995. The role of hybridization in evolution: old wine in new skins. American Journal of Botany 82: 944–953.
Roberts, R. H. 1980. Polypodium macaronesicum and P. australe: a morphological comparison. Fern Gazette 12: 69–74.
Robinson, M. D. and A. Oshlack. 2010. A scaling normalization method for differential expression analysis of RNA-‐‑Seq data. Genome Biology 11: R25.
Rodríguez-‐‑Sánchez, F. and J. Arroyo. 2011. Cenozoic climate changes and the demise of Tethyan laurel forests: lessons for the future from an integrative reconstruction of the past. Pp. 280–303 in Climate change, ecology and systematics, eds. T. R. Hodkinson, M. B. Jones, S. Waldern, and J. A. N. Parnell. Cambridge: Cambridge University Press.
Rothfels, C. R., E. M. Sigel, and M. D. Windham. Cheilanthes feei T. Moore (Pteridaceae) and Dryopteris erythrosora (D.C. Eaton) Kunze (Dryopteridaceae) new for the flora of North Carolina. 2012. American Fern Journal 102: 184–186.
Ronquist, F. and J. P. Huelsenbeck. 2003. MrBayes 3: Bayesian phylogenetic inference under mixed models. Bioinformatics 19:1572–1574.

182
Rothfels, C. J., A. Larson, L.–Y. Kuo, P. Korall, W.-‐‑L. Chiou, and K. M. Pryer. 2012. Overcoming deep roots, fast rates, and short internodes to resolve the ancient rapid radiation of eupolypod II ferns. Systematic Biology 61: 490–509.
Rothfels C. J., A. Larsson, F.-‐‑W. Li, E. M. Sigel, L. Huiet, D. O. Burge, M. Ruhsam, et al. 2013. Transcriptome-‐‑mining for single-‐‑copy nuclear markers in ferns. PLoS ONE 8(10): e76957.
Rumsey, F. J., L. Robba, H. Schneider, and M. A. Carine. 2014. Taxonomic uncertainty and a continental conundrum: Polypodium macaronesicum reassessed. Botanical Journal of the Linnean Society 174: 449–460.
Rundell, R. J. and T. D. Price. 2009. Adaptive, radiation, nonadaptive, radiation, ecological speciation, and nonecological speciation. Trends in Ecology and Evolution 24: 394–399.
Salmon, A., M. L. Ainouche, and J. F. Wendel. 2005. Genetic and epigenetic consequences of recent hybridization and polyploidy in Spartina (Poaceae). Molecular Ecology 14: 1163–1175.
Salmon, A., L. Flagel, B. Ying, J. A. Udall, and J.F. Wendel. 2010. Homoeologous nonreciprocal recombination in polyploid cotton. New Phytologist 186: 123–134.
Sankoff, D., C. Zheng, and B. Wang B. 2012. A model for biased fractionation after whole genome duplication. BMC Genomics 13: S8.
Schäfer, H. 2005. Flora of the Azores: A field guide. Weikersheim: Margraf Publishers.
Schmakov, A. 2001. A new Polypodium from Altai. Turczaninowia 7: 5–7.
Schnable, J. C., M. Freeling, and E. Lyons. 2012. Genome-‐‑wide analysis of syntenic gene deletion in the grasses. Genome Biology and Evolution 4: 265–277.
Schnable, J. C., N. M. Springer, and M. Freeling. 2011. Differentiation of the maize subgenomes by genome dominance and both ancient and ongoing gene loss. Proceedings of the National Academy of Sciences, U.S.A. 108: 4069–4074.
Schneider, H., H.-‐‑P. Kreier, R. Wilson, and A. R. Smith. 2006. The Synammia enigma: Evidence for a temperate lineage of polygrammoid ferns (Polypodiaceae, Polypodiidae) in southern South America. Systematic Botany 31: 31–41.

183
Schneider, H., A. R. Smith, R. Cranfill, T. J. Hildebrand, C. H. Haufler, and T. A. Ranker. 2004. Unraveling the phylogeny of polygrammoid ferns (Polypodiaceae and Grammitidaceae): exploring aspects of the diversification of epiphytic plants. Molecular Phylogenetics and Evolution 31: 1041–1063.
Schuettpelz, E. and K. M. Pryer. 2007. Fern phylogeny inferred from 400 leptosporangiate species and three plastid genes. Taxon 56: 1037–1050.
Schuettpelz, E. and K. M. Pryer. 2009. Evidence for a Cenozoic radiation of ferns in an angiosperm–dominated canopy. Proceedings of the National Academy of Sciences USA 106: 11200–11025.
Schuettpelz, E., P. Korall, and K. M. Pryer. 2006. Plastid atpA data provide improved support for deep relationships among ferns. Taxon 55: 897–906.
Schuettpelz, E., A. L. Grusz, M. D. Windham, and K. M. Pryer. 2008. The utility of nuclear gapCp in resolving polyploid fern origins. Systematic Botany 33: 621–629.
Shivas, M. G. 1962. The Polypodium vulgare complex. British Fern Gazette 9: 65–70.
Senerchia, N., F. Felber, and C. Parisod. 2014. Contrasting evolutionary trajectories of multiple retrotransposons following independent allopolyploidy in wild wheats. New Phytologist 202: 975–985.
Sémon, M. and K. H. Wolfe. 2007. Consequences of genome consequences. Current in Genetics and Development 17: 505–512.
Shi, X., D. W. K. Ng, C. Zhang, L. Comai, W. Ye, and Z. J.Chen. 2012. Cis-‐‑and trans-‐‑regulatory divergence between progenitor species determines gene-‐‑expression novelty in Arabidopsis allopolyploids. Nature Communications 3: 950.
Shivas, M. G. and I. Manton. 1961a. Contributions to the cytology and taxonomy of species of Polypodium in Europe and America: I. cytology. Botanical Journal of the Linnean Society 58: 13–25.
Shivas, M. G. and I. Manton. 1961b. Contributions to the cytology and taxonomy of species of Polypodium in Europe and America: II. taxonomy. Botanical Journal of the Linnean Society 58: 27–38.
Shugang, L. and C. Haufler. 2013. Polypodium. Pp. 838–839 in Flora of China, vols. 2–3, ed. Flora of China Editorial Committee. St. Louis: Missouri Botanical Garden Press.

184
Sigel, E. M., A. K. Johnson, and C. H. Haufler. 2014. A first record of Polypodium saximontanum for the flora of Montana. American Fern Journal 104: 22–23.
Sigel, E. M., M. D. Windham, C. Haufler, and K. M. Pryer. In press. Phylogeny, divergence time estimates, and phylogeography of the diploid species of the Polypodium vulgare complex. Systematic Botany.
Sigel, E. M., M. D. Windham, L. Huiet, G. Yatskievych, and K. M. Pryer. 2011. Species relationships and farina evolution in the cheilanthoid fern genus Argyrochosma (Pteridaceae). Systematic Botany 36: 554–564.
Sigel, E. M., M. D. Windham, A. R. Smith, R. J. Dyer, and K. M. Pryer. 2014. Rediscovery of Polypodium calirhiza (Polypodiaceae) in Mexico. Brittonia, DOI 10.1007/s12228-‐‑014-‐‑9332-‐‑6.
Sillett, S. C. and M. G. Bailey. 2003. Effects of the crown structure on biomass of the epiphytic fern Polypodium scouleri (Polypodiaceae) in redwood forests. American Journal of Botany 90: 255–261.
Sim-‐‑Sim, M., M. G. Esquivel, S. Fontinha, and M. Stech. 2005. The genus Plagiochila (Dumort.) Dumort. (Plagiochilaceae, Hepaticophytina) in Madeira Archipelago—molecular relationships, ecology, and biogeographic affinities. Nova Hedwigia 81: 449–461.
Simmons, M. P. and H. Ochoterena. 2000. Gaps as characters in sequence based phylogenetic analyses. Systematic Biology 49: 369–381.
Siplivinski, V. 1974. Notulae de Flora Baicalensi, II. Novosti Sistematiki vysshikh rastenii 11: 327–337.
Smith, A. R., H.-‐‑P. Kreier, C. H. Haufler, T. A. Ranker, and H. Schneider. 2006. Serpocaulon (Polypodiaceae), a new genus segregated from Polypodium. Taxon 55: 919–930.
Soltis, D. E. and P. S. Soltis. 1989. Allopolyploid speciation in Tragopogon: Insights from chloroplast DNA. American Journal of Botany 76: 1119–1124.
Soltis, D. E. and P. S. Soltis. 1993. Molecular data and the dynamic nature of polyploidy. Critical Reviews in Plant Sciences 12: 243–273.

185
Soltis, D. E. and P. S. Soltis. 1999. Polyploidy: recurrent formation and genome evolution. Trends in Ecology and Evolution 14: 348–351.
Soltis, P. S. and D. E. Soltis. 2000. The roles of genetic and genomic attributes in success of polyploids. Proceedings of the National Academy of Sciences, U.S.A. 97: 7051–7057.
Soltis, D. E., M. A. Gitzendanner, D. D. Strenge, and P. S. Soltis. 1997. Chloroplast DNA intraspecific phylogeography of plants from the Pacific Northwest of North America. Plant Systematics and Evolution 206: 353–373.
Soltis, D. E., A. B. Morris, J. S. McLachlan, P. S. Manos, and P. S. Soltis. 2006. Comparative phylogeography of unglaciated eastern North America. Molecular Ecology 15: 4261–4293.
Soltis, D. E., P. S. Soltis, J. C. Pires, A. Kovarik, J. A. Tate, and E. Mavrodiev. 2004. Recent and recurrent polyploidy in Tragopogon (Asteraceae): cytogenetic, genomic and genetic comparisons. Biological Journal of the Linnean Society 82: 485–501.
Stebbins, G. L. 1950. Variant and Evolution in Plants. New York: Columbia University Press.
Steele, C. A. and A. Storfer. 2006. Coalescent-‐‑based hypothesis testing supports multiple Pleistocene refugia in the Pacific Northwest for the Pacific giant salamander (Dicamptodon tenebrosus). Molecular Ecology 15: 2477–2487.
Sunding, P. 1979. Origins of the Macaronesian flora. Pp. 13–40 in Plants and islands, ed. D. Bramwell. London: Academic Press.
Swofford, D. L. 2002. PAUP* Phylogenetic analysis using parsimony (*and other methods), v. 4.0 beta 10. Sunderland: Sinauer Associates.
Taberlet, P. 1998; Biodiversity at the intraspecific level: the comparative phylogeographic approach. Journal of Biotechnology 64: 91–100.
Tate, J. A., P. Joshi, K. A. Soltis, P. S. Soltis, and D. E. Soltis. 2009. On the road to diploidization? Homoeolog loss in independently formed populations of the allopolyploid Tragopogon miscellus (Asteraceae). BMC Plant Biology 9: 80–89.
Tate, J. A., Z. Ni, A. C. Scheen, J. Koh, C.A, Gilbert, D. Lefkowitz, Z. J. Chen, P. S. Soltis, and D. E. Soltis. 2006. Evolution and expression of homoeologous loci in

186
Tragopogon miscellus (Asteraceae), a recent and reciprocally formed allopolyploid. Genetics 173: 1599–1611.
Taylor, T. M. C. and F. Lang. 1963. Chromosome counts in some British Columbia ferns. American Fern Journal 53: 123–126.
Tejero-‐‑Dìez, J. D. and L. Pacheco. 2004. Taxa nuevos, nomenclatura, redefinición y distribución de las especies relacionadas con Polypodium colpodes Kunze (Polypodiaceae, Pteridophyta). Acta Botanica Mexicana 67: 75–115.
Thomas, B. C., B. Pedersen, and M. Freeling. 2006. Following tetraploidy in an Arabidopsis ancestor genes were removed preferentially from one homoeolog leaving clusters enriched in dose-‐‑sensitive genes. Genome Research 16: 934–946.
Tryon, R. M. and A. F. Tryon. 1982. Ferns and allied plants with special reference to tropical America. New York: Springer.
Valentine, D. H. 1964. Polypodium. Pp. 15–16 in Flora Europaea vol.1, eds. T. G. Tutin, N. A. Burges, A. O. Charter, J. R. Edmonson, V. H. Heywood, D. M. Moore, D. H. Valentine, S. M. Walters, and D. A. Webb. Cambridge: Cambridge University Press.
Van der Auwera, G. A., M. Carneiro, C. Hartl, R. Poplin, G. del Angel, A. Levy-‐‑Moonshine, T. Jordan, K. Shakir, D. Roazen, J. Thibault, E. Banks, K. Garimella , D. Altshuler, S. Gabriel, and M. DePristo. 2013. From fastq data to high-‐‑confidence variant calls: the Genome Analysis Toolkit best practices pipeline. Current Protocols in Bioinformatics 43: 11.10.1-‐‑11.10.33.
Vanderpoorten, A., F. J. Rumsey, and M. A. Carine. 2007. Does Macaronesia exist? Conflicting signal in the bryophyte and pteridophyte floras. American Journal of Botany 94: 625–638.
Vernon, A. L. and T. A. Ranker. 2013. Current status of the ferns and lycophytes of the Hawaiian Islands. American Fern Journal 103: 59–112.
Vogel, J. C., S. J. Russell, F. J. Rumsey, J. A. Barrett, and M. Gibby. 1998. Evidence for maternal transmission of chloroplast DNA in the genus Asplenium (Aspleniaceae, Pteridophyta). Botanica Acta 111: 247–249.
Wagner, W. H. 1964. Paraphyses: Filicineae. Taxon 13: 56–64.

187
Wagner, W. H. 1974. Structure of spores in relation to fern phylogeny. Annals of the Missouri Botanical Garden 61: 332–353.
Walker, J. D. and J. W. Geissman. 2009. 2009 GSA Geologic Time Scale. GSA Today 19: 60–61.
Walker, J. M., A. K. Stockman, P. E. Marek, and J. E. Bond. 2009. Pleistocene glacial refugia across the Appalachian Mountains and coastal plain in the millipede genus Narceus: Evidence from population genetic, phylogeographic, and paleoclimatic data. BMC Evolutionary Biology 9: 25–36.
Wallace, L. E. 2003. Molecular evidence for allopolyploid speciation and recurrent origins in Platanthera huronensis (Orchidaceae). International Journal of Plant Sciences 164: 907–916.
Wang, J., L. Tian, H.-‐‑S. Lee, M. E. Wei, H. Jiang, B. Watson, A. Madlung, T. C. Osborn, R. W. Doerge, L. Comai, and Z. J. Chen. 2006. Genomewide nonadditive gene regulation in Arabidopsis allotetraploids. Genetics 172: 507–517.
Werth, C. R. 1992. Origins of genetic variability in allopolyploid ferns. Pp. 167-‐‑181 in Fern Horticulture: Past, Present, and Future. International Symposium on the Cultivation and Propagation of Pteridophytes. London: Intercept.
Werth, C. R., S. I. Guttman, and W. H. Eshbaugh. 1985. Recurring origins of allopolyploid species in Asplenium. Science 228: 731–733.
Whitfield, J. B. and K. M. Kjer. 2008. Ancient rapid radiations of insects: challenges for phylogenetic analysis. Annual Review of Entomology 53: 449–472.
Whitfield, J. B. and P. J. Lockhart. 2007. Deciphering ancient rapid radiations. Trends in Ecology and Evolution 22: 258–265.
Whitmore, S. A. and A. R. Smith. 1991. Recognition of the tetraploid Polypodium calirhiza (Polypodiaceae) in western North America. Madroño 38: 233–248.
Whittier, P. and W. H. Wagner Jr. 1971. The variation in spore size and germination in Dryopteris taxa. American Fern Journal 61: 123–127.
Willis, K. L. and R. J. Whittaker. 2000. The refugial debate. Science 287: 1406–1407.

188
Windham, M. D. 1985. A biosystematic study of Polypodium subgenus Polypodium in the southern Rocky Mountain region. M. S. thesis. Flagstaff, AZ: Northern Arizona University.
Windham, M. D. and G. Yatskievych. 2003. Chromosome studies of cheilanthoid ferns (Pteridaceae: Cheilanthoideae) from the western United States and Mexico. American Journal of Botany 90: 1788–1800.
Windham, M. D. and G. Yatskievych. 2005. A novel hybrid Polypodium (Polypodiaceae) from Arizona. American Fern Journal 95: 57–67.
Wolfe, K. H. and D. C. Shields. 1997. Molecular evidence for an ancient duplication of the entire yeast genome. Nature 387: 708–712.
Wolfe, K. H., W.-‐‑H. Li, and P. M. Sharp. 1987. Rates of nucleotide substitution vary greatly among plant mitochondrial, chloroplast, and nuclear DNAs. Proceedings of the National Academy of Sciences USA 84: 9054–9058.
Woodhouse, M. R., F. Cheng, J. C. Pires, D. Lisch, M. Freeling, and X. Wang. 2014. Origin, inheritance, and gene regulatory consequences of genome dominance in polyploids. Proceedings of the National Academy of Sciences USA 111: 5283–5288.
Xu, C., Y. Bai, X. Lin, N. Zhao, L. Hu, Z. Gong, J. F. Wendel, and B. Liu. 2014. Genome-‐‑wide disruption of gene expression in allopolyploids but not hybrids of rice subspecies. Molecular biology and evolution 31: 1066–1076.
Yatskievych, G. and M. D. Windham. 2009. Vascular Plants of Arizona: Polypodiaceae. Canotia 5: 34–38.
Yoo, M.-‐‑J., E. Szadkowski, and J. F. Wendel. 2013. Homoeolog expression bias and expression level dominance in allopolyploid cotton. Heredity 110: 171–180.
Zeisset, I. and T. J. C. Beebee. 2008. Amphibian phylogeography: a model for understanding historical aspects of species distributions. Heredity 101: 109–119.
Zwickl, D. J. 2006. GARLI, vers. 0.951. Genetic algorithm approaches for the phylogenetic analysis of large biological sequence datasets under the maximum likelihood criterion. Ph.D. dissertation. Austin, TX: University of Texas.

189
BIOGRAPHY
Erin Sigel was born on 30 July 1980 in St. Louis Park, Minnesota, U.S.A. Her
childhood was spent alternating between school years in Newtown, Pennsylvania and
summer adventures on the lakes of Minnesota. For her undergraduate studies, she
attended the University of New Hampshire, Durham, New Hampshire and completed a
B.S. in Environment Sciences, summa cum laude, in May 2003. After holding several
diverse jobs, including park ranger and bookstore clerk, Erin returned to school to purse
a M.S. in Plant Biology at the University of Vermont, Burlington, Vermont. In August
2008, she completed my M.S. thesis entitled “Polyphyly of polyploid species: an inquiry
into the origin of Dryopteris campyloptera and Dryopteris dilatata (Dryopteridaceae)”
under the supervision of Dr. David S. Barrington. Erin began her doctoral dissertation in
Biology at Duke University in September 2008. Her peer-‐‑reviewed publications to date
are:
8. Sigel, E. M., M. D. Windham, and K. M. Pryer. In review. Polypodium hesperium (Polypodiaceae): A natural model system for investigating how reciprocal origins shape allopolyploid genomes. American Journal of Botany. 7. Sigel, E. M., M. D. Windham, C. Haufler, and K. M. Pryer. In press. Phylogeny, divergence time estimates, and phylogeography for the diploid species of the Polypodium vulgare complex (Polypodiaceae). Systematic Botany. 6. Sigel, E. M., A. K. Johnson, and C. H. Haufler. 2014. A first record of Polypodium saximontanum for the flora of Montana. American Fern Journal 104: 22–23. 5. Li, F.W., J.C. Villarreal, S. Kelly, C.J. Rothfels, M. Melkonian, E. Frangedakis,

190
M. Ruhsam, E. M. Sigel, J.P. Der, J. Pittermann, D.O. Burge, L. Pokorny, A. Larsson, T. Chen, S. Weststrand, P. Thomas, E. Carpenter, Y. Zhang, Z. Tian, L. Chen, Z. Yan, Y. Zhu, X. Sun, J. Wang, D.W. Stevenson, B.J. Crandall-‐‑Stotler, A.J. Shaw, M.K. Deyholos, D.E. Soltis, S.W. Graham, M.D. Windham, J.A. Langdale, G. K.S.Wong, S. Mathews, and K.M. Pryer. 2014. Horizontal transfer of an adaptive chimeric photoreceptor from bryophytes to ferns. Proceedings of the National Academy of Sciences of the United States of America 111.18: 6672–6677. 4. Sigel, E. M., M. D. Windham, A. R. Smith, R. J. Dyer, and K. M. Pryer. 2014. Rediscovery of Polypodium calirhiza (Polypodiaceae) in Mexico. Brittonia 66: 10.1007/s12228-‐‑014-‐‑9332-‐‑6. 3. Rothfels, C. J., A. Larsson, F. W. Li, E. M. Sigel, L. Huiet, D. O. Burge, M. Ruhsam, S. Graham, D. Stevenson, G. K. S. Wong, P. Korall, and K. M. Pryer. 2013. Transcriptome-‐‑mining for fern single-‐‑copy nuclear regions. PLoS One 8.10: e76957. 2. Rothfels, C. R., E. M. Sigel, and M. D. Windham. Cheilanthes feei T. Moore (Pteridaceae) and Dryopteris erythrosora (D.C. Eaton) Kunze (Dryopteridaceae) new for the flora of North Carolina. 2012. American Fern Journal 102: 184–186. 1. Sigel, E. M., M. D. Windham, L. Huiet, G. Yatskievych, and K. M. Pryer. 2011. Species relationships and farina evolution in the cheilanthoid fern genus Argyrochosma (Pteridaceae). Systematic Botany 36: 554–564.
Erin has been fortunate to receive numerous research grants, fellowships, and
awards during her graduate education. These include: Department of Biology Semester
Fellowship, Duke University (2014); Department of Biology Grant-‐‑in-‐‑Aid of Research,
Duke University (4 times, 2009-‐‑2013); Conference Travel Awards, Graduate School,
Duke University (2 times; 2012-‐‑2013); Natural Sciences Summer Research Fellowship,
Graduate School, Duke University (2012); American Society of Plant Taxonomists
Graduate Student Research Grant (2012); National Science Foundation Doctoral

191
Dissertation Improvement Grant, co-‐‑PI with K. M. Pryer (2011); Sigma Xi Grant-‐‑in-‐‑Aid
of Research (2011); American Fern Society Conference Travel Award (2009); HATCH
Research Semester Fellowship, Department of Plant Biology, University of Vermont
(2007); Vermont Botanical and Bird Club Student Scholarship (2007).