THE KENYA NUTRITION ACTION PLAN (KNAP)
176
MINISTRY OF HEALTH THE KENYA NUTRITION ACTION PLAN (KNAP) 2 018 -2022 Optimal Nutrition For All December 2018
-
Upload
khangminh22 -
Category
Documents
-
view
0 -
download
0
Transcript of THE KENYA NUTRITION ACTION PLAN (KNAP)

MINISTRY OF HEALTH
THE KENYA NUTRITION ACTION PLAN (KNAP)
2018 -2022Optimal Nutrition For All
December 2018


THE KENYA NUTRITION ACTION PLAN (KNAP) | 2018 – 2022 Improved Nutrition For All
iii
The Kenya Nutrition Action Plan (KNAP) 2018 – 2022
Improved Nutrition For All
Suggested citation: Government of Kenya, Ministry of Health (2018): The Kenya Nutrition Action Plan (KNAP), 2018 –2022
December 2018
TABLE OF CONTENTS
TABLE OF CONTENTS iv
MINISTRY OF HEALTH

THE KENYA NUTRITION ACTION PLAN (KNAP) | 2018 – 2022 Improved Nutrition For All
iv
List of Tables.................................................................................................................................................. viList of Figures............................................................................................................................................... viiList of Abbreviations and Acronyms........................................................................................................... viiiForeword....................................................................................................................................................... xiiPreface........................................................................................................................................................... xiiiNutrition Commitments.............................................................................................................................. xivAcknowledgements.................................................................................................................................... xviiiExecutive Summary.................................................................................................................................... xix
Chapter 1: Introduction................................................................................................................................ 11.1. Background........................................................................................................................................ 21.2. Policy Context.................................................................................................................................... 21.3 National Policy and Legal Frameworks.............................................................................................. 41.4. Kenya Nutrition Action Plan Development Process........................................................................... 71.4.1. Review of the NNAP 2012-2017.....................................................................................................71.4.2. Challenges in implementation of NNAP 2012-2017........................................................................71.4.3. Recommendations of NNAP 2012-2017.........................................................................................71.4.4. Development of KNAP 2018-2022..................................................................................................91.5. Target audience for the KNAP............................................................................................................9
Chapter 2: Kenya Nutrition Situation Analysis...........................................................................................102.1. Introduction........................................................................................................................................ 112.2. The global context.............................................................................................................................. 112.3. Regional Trends ................................................................................................................................. 122.4. Trends of malnutrition in Kenya......................................................................................................... 122.4.1 Trends in undernutrition................................................................................................................... 122.4.2 Trends in overweight, Obesity and diet related non-communicable diseases (DRNCDs)............... 152.4.3 Trends in Micronutrients deficiencies.............................................................................................. 152.4.4 Trends in feeding practices (Children 6-23 months and Adults)...................................................... 162.4.5 Mortality Trends............................................................................................................................... 162.4.6 Morbidity Trends.............................................................................................................................. 172.5. Trends in access to food, care and health services........................................................................... 182.6. Nutrition actions in the national development context...................................................................... 192.7. Conceptual framework for addressing malnutrition in all its forms................................................... 19
Chapter 3: The Kenya Nutrition Action Plan Design Framework............................................................... 213.1 Rationale............................................................................................................................................. 223.2 Theory of Change................................................................................................................................233.3 Vision, Mission and Guiding Principles............................................................................................... 253.4 Objective of the KNAP........................................................................................................................ 263.5 Key strategies..................................................................................................................................... 26
Chapter 4: Key Result Areas (KRAs), Strategies and Interventions.......................................................... 274.1 Introduction........................................................................................................................................ 284.2 Key result areas with corresponding Outcomes, Outputs, Strategies and Activities........................ 29
KRA 1: Maternal, Newborn, Infant and Young Child Nutrition (MIYCN) Scaled-Up........................ 29 KRA 2: Nutrition of Older Children and Adolescents Promoted........................................................ 31
CONTENTS

THE KENYA NUTRITION ACTION PLAN (KNAP) | 2018 – 2022 Improved Nutrition For All
v
KRA 3: Nutrition Status of Adults and Older Persons promoted....................................................... 33 KRA 4: Prevention, Control and Management of Micronutrient Deficiencies Scaled-Up.................. 35 KRA 5: Prevention, Control and Management of Diet Related Risk Factors for Non-Communicable Diseases scaled up........................................................................................... 36 KRA 6: Prevention and Integrated Management of Acute Malnutrition (IMAM) Strengthened........ 38 KRA 7: Nutrition in Emergencies Strengthened................................................................................ 40 KRA 8: Nutrition in HIV and TB promoted......................................................................................... 42 KRA 9: Clinical Nutrition and Dietetics in Disease Management Strengthened................................ 44 KRA 10: Nutrition in Agriculture and Food Security Scaled up.......................................................... 46 KRA 11: Nutrition in the Health Sector Strengthened....................................................................... 47 KRA 12: Nutrition in the Education Sector Strengthened.................................................................. 48 KRA 13: Nutrition in Water, Sanitation and Hygiene (WASH) Sector Promoted............................... 49 KRA 14: Nutrition in social protection programmes promoted.......................................................... 50 KRA 15: Sectoral and Multi-Sectoral Nutrition Governance (MNG) Including Coordination and Legal/Regulatory Framework Strengthened...................................................................................... 52 KRA 16: Sectoral and Multi-sectoral Nutrition Information Systems, Learning and Research Strengthened..................................................................................................................................... 54 KRA 17: Advocacy, Communication and Social Mobilization (ACSM) Strengthened......................... 57 KRA 18: Capacity for Nutrition Developed......................................................................................... 58 KRA 19: Supply Chain Management for Nutrition Commodities and Equipment Strengthened....... 59
Chapter 5: Costed Action Plans of The KNAP.............................................................................................. 625.1 Context .............................................................................................................................................. 635.2 Costing Approach............................................................................................................................... 635.3 Resource needs for Implementing Kenya Nutrition Action Plan........................................................ 635.4 Funding opportunities and sustainability plan for the KNAP.............................................................. 64
Chapter 6: KNAP Monitoring, Evaluation, Accountability and Learning (MEAL).................................. 656.1. Introduction........................................................................................................................................ 666.2. Common Results and Accountability Framework (CRAF).................................................................. 666.3 KNAP Monitoring process..................................................................................................................696.3.1 Data Review and Performance monitoring processes.................................................................... 696.4 KNAP Evaluations.............................................................................................................................. 716.5 KNAP Learning................................................................................................................................... 716.6 Financial tracking and budget analysis for nutrition........................................................................... 726.7 Institutional arrangement for M&E.................................................................................................... 726.8 Data management for Nutrition M&E................................................................................................ 736.9 Research............................................................................................................................................ 736.10 Cost of MEAL................................................................................................................................... 73
Chapter 7: Legal And Institutional Frameworks for The KNAP)................................................................ 747.1 Introduction........................................................................................................................................ 757.2 Legal Framework............................................................................................................................... 757.3 Institutional Frameworks................................................................................................................... 767.4 Elements of sector-wide partnership................................................................................................. 767.5 Coordination Arrangements............................................................................................................... 77
Chapter 8: Risk Assessment, Analysis and Mitigation............................................................................... 798.1 Risk identification, assessment and prioritization............................................................................... 798.2 Risk Analysis Frameworks.................................................................................................................. 80

THE KENYA NUTRITION ACTION PLAN (KNAP) | 2018 – 2022 Improved Nutrition For All
vi
8.2.1 SWOT Analysis in managing risk..................................................................................................... 808.2.2 PESTLE Analysis in managing risk................................................................................................... 818.3 Risk Mitigation Measures................................................................................................................... 818.4 Combined risk Analysis, evaluation, prioritization and mitigation measures matrix............................ 81
Appendixes................................................................................................................................................... 84Appendix 1: Detailed financial resources requirement and implementation plan for KNAP per KRA......84Appendix 2: Matrix of Common Results and Accountability Framework (CRAF) for results-based performance monitoring (KNAP 2018-2022).............................................................................................117Appendix 3: HIV Prevalence by County.................................................................................................. 144Appendix 4: Tuberculosis........................................................................................................................ 147Appendix 5: Evaluation questions........................................................................................................... 148Appendix 6: List of participants in developing the KNAP........................................................................ 150
Table 1: KNAP estimated annual budget 2018/19 - 2022/23.......................................................................... xxTable 2: Summary of key trends in malnutrition in Kenya <5 children (KDHS 2008/09 & 2014).................... 13Table 3: The cost-benefit of various nutrition programs................................................................................. 22Table 4: List of the KNAP Key Result Areas (KRAs)....................................................................................... 28Table 5: Coverage estimates form the SQUEAC surveys 2017/2018............................................................ 38Table 6: Summary of financial resource needs for the KNAP 2018-2022/23................................................. 63Table 7: MEAL explained)............................................................................................................................... 66Table 8: Kenya nutrition targets for 2022/23................................................................................................... 67Table 9: The risk analysis framework............................................................................................................. 79Table 10: Risk assessment prioritization matrix.............................................................................................. 80Table 11: Risk analysis, mitigation and accountability table for the KNAP...................................................... 82Table 12: Financial resource requirements and implementation plan for KRA 1............................................ 84Table 13: Financial resource requirements for KRA 2.................................................................................... 86Table 14: Financial resource requirements for KRA 3.................................................................................... 88Table 15: Financial resource requirements for KRA 4.................................................................................... 90Table 16: Financial resource requirements for KRA 5.................................................................................... 92Table 17: Financial resources requirements for KRA 6................................................................................... 93Table 18: Financial resource requirements for KRA 7.................................................................................... 95Table 19: Financial resource requirements for KRA 8.................................................................................... 97Table 20: Financial resource requirements for KRA 9.................................................................................... 100Table 21:Financial resources requirement for KRA 10.................................................................................. 101Table 22: Financial resource requirements for KRA 11.................................................................................. 103Table 23: Financial resource requirements for KRA 12.................................................................................. 104Table 24: Financial resource requirements for KRA 13.................................................................................. 105Table 25: Financial resource requirements for KRA 14.................................................................................. 106Table 26:Financial resource requirements for KRA 15................................................................................... 107Table 27:Financial resource requirements for KRA 16................................................................................... 109Table 28:Financial resource requirements for KRA 17................................................................................... 112Table 29: Financial resource requirements for KRA 18...................................................................................114Table 30: Financial resource requirements for KRA 19...................................................................................115
LIST OF TABLES

THE KENYA NUTRITION ACTION PLAN (KNAP) | 2018 – 2022 Improved Nutrition For All
vii
Table 31:KNAP Common Results and Accountability Framework (CRAF)..................................................... 117Table 32: County Adults (15-49) HIV Estimates.............................................................................................. 144
Table 33: HIV burden by County .................................................................................................................... 145
Figure 1: SDGs related to Nutrition (Source: Global Nutrition Report 2017).................................................. 3Figure 2: A Snapshot of the key milestones during the development of the KNAP 2018-2022)................... 8Figure 3: Trends in Stunting, Underweight and Wasting 1998-2014)............................................................ 12Figure 4: Regional disparities between counties for Underweight)............................................................... 13Figure 5: Map of the distribution of Stunting (1) and Wasting (2) in Kenya (KDHS 2014).............................. 14Figure 6: Trends in overweight/obesity in Kenyan children under-five years 1988-2014 (KDHS 2014)......... 15Figure 7: Childhood mortality trends in Kenya, 2003-2014)........................................................................... 16Figure 8: Main Causes of Death in Kenya 2017 (Source: KNBS (2018), Economic Survey)........................... 17Figure 9: KNAP Conceptual framework for the triple burden of malnutrition................................................ 18Figure 10: The triple A cyclic process of Assessment, Analysis, and Action................................................. 20Figure 11: Results Logical Pyramid of the KNAP............................................................................................ 24Figure 12: MIYCN Trends (Source: KDHS 2014)......................................................................................... 29Figure 13: M&E Logical Framework.............................................................................................................. 69Figure 14: KNAP monitoring and evaluation process..................................................................................... 70Figure 15: KNAP learning cycle...................................................................................................................... 72Figure 16 Elements of sector wide partnership............................................................................................. 77Figure 17: National Food and Nutrition Security Policy Implementation Coordination Structure................... 77Figure 18: Schematic representation of the existing Nutrition Sector Coordination Mechanism.................. 78
Figure 19: SUN Coordination Structures........................................................................................................ 78
Figure 20: SWOT analysis for the KNAP........................................................................................................ 80
LIST OF FIGURES

THE KENYA NUTRITION ACTION PLAN (KNAP) | 2018 – 2022 Improved Nutrition For All
viii
APHRC African Population and Health Research Center
ARNS African Regional Nutrition Strategy
ARR Annual Reduction Rate
ASALs Arid and Semi-Arid Lands
AU African Union
AWP Annual Work Plan
BFCI Baby-Friendly Community initiative
BFHI Baby-Friendly Hospital Initiative
BMI Body Mass Index
BMS Breast Milk Substitute
CHIS Community Health Information System
CHMT Community Health Management Team
CHV Community Health Volunteers
CIDPS County Integrated Development Plans
CIMES County Integrated Monitoring Evaluation System
CNAP County Nutrition Action Plan
CoG Council of Governors
COTU Central Organization of Trade Union
CRAF Common Results and Accountability Framework
CSO Civil Society Organization
DHIS District Health Information System
DQA Data Quality Audit
DRNCDs Diet-Related Non-Communicable Diseases
EECD Education and Early Childhood Development
EMMS Essential Medicines & Medical Supplies
ENAC Emergency Nutrition Advisory Committee
ETR End-Term Review
FBO Faith-Based Organization
FEWSNET Famine Early Warning Systems Network
FNSP Food and Nutrition Security Policy
FY Financial Year
GAIN Global Alliance for Improved Nutrition
GBD Global Burden of Diseases
GDP Gross Domestic Product
GNR Global Nutrition Report
HINI High-Impact Nutrition Interventions
HIS Health Information System
HIV Human Immunodeficiency Virus
AIDS Acquired Immune Deficiency Syndrome
HMB Human Milk Banks
HMIS Health Management Information System
ICC Inter-Agency Coordinating Committee
LIST OF ABBREVIATIONS AND ACRONYMS

THE KENYA NUTRITION ACTION PLAN (KNAP) | 2018 – 2022 Improved Nutrition For All
ix
ICN2 Second International Conference on Nutrition
ICS Investing in Children and their Societies
ICT Information and Communication Technology
IDD Iodine Deficiency Disorders
IEC Information, Education and Communication
IFAS Iron and Folic Acid Supplementation
IHRIS Integrated Human Resource Management System
IMAM Integrated Management of Acute Malnutrition
IPC Integrated Phase Classification
IQ Intelligence Quotient
IYCF-e Infant and Young Child Feeding in Emergency
IYCN Infant and Young Child Nutrition
KDHS Kenya Demographic and Health Survey
KEBS Kenya Bureau of Standards
CPHR Centre for Public Health Research
KEMRI Kenya Medical Research Institute
KEMSA Kenya Medical Supply Agency
KEPH Kenya Essential Package for Health
KES Kenya Shilling
KFSM Kenya Food Security Meeting
KFSSG Kenya Food Security Steering Group
KHP Kenya Health Policy
KHSSP Kenya Health Sector Strategic Plan
KNAP Kenya Nutrition Action Plan
KNCDF Kenya Nutrition Capacity Development Framework
KNFFA Kenya National Food Fortification Alliance
KNMS Kenya National Micronutrient Survey
KRA Key Result Area
KRCS Kenya Red Cross Society
LBW Low Birthweight
LMIS Logistics Management Information System
M&E Monitoring and Evaluation
MAM Moderate Acute Malnutrition
MDD Minimum Dietary Diversity
MDG Millennium Development Goals
MEAL Monitoring, Evaluation, Accountability and Learning
MICS Multiple Indicator Cluster Survey
MNDCC Micronutrient Deficiency Control Council
MNG Multisectoral Nutrition Governance
MIYCN Maternal, Newborn, Infant and Young Child Nutrition
MoALF&I Ministry of Agriculture, Livestock, Fisheries and Irrigation
MOE Ministry of Education
MOH Ministry of Health
MTEF Medium-Term Expenditure Framework
MTP Medium-Term Plan

THE KENYA NUTRITION ACTION PLAN (KNAP) | 2018 – 2022 Improved Nutrition For All
x
MTR Midterm Review
NACS Nutrition Assessment, Counselling and Support
NNAP National Nutrition Action Plan
NASEP National Agricultural Sector Extension Policy
NCD Non-Communicable Disease
NDMA National Drought Management Authority
NDU Nutrition and Dietetics Unit
NFNSP National Food and Nutrition Security Policy
NFNSP-IF National Food and Nutrition Security Policy Implementation Framework
NGO Non-Governmental Organization
NHIF National Hospital Insurance Fund
NI Nutrition International
NICC Nutrition Inter-Agency Coordinating Committee
NIMES National Integrated Monitoring and Evaluation Systems
NIPN Nutrition Information Platform
NITWG Nutrition Information Technical Working Group
NTD Neural Tube Defects
OJT On-Job Training
ORS Oral Rehydration Salts
OTP Outpatient Therapeutic Programme
PESTLE Political, Economic, Sociological, Technological, Legal and Environmental
PHC Primary Health Care
PLWHIV People Living With HIV
PPP Public–Private Partnership
PTA Parents–Teacher Association
RNTWG Research in Nutrition Technical Working Group
SAM Severe Acute Malnutrition
SBCC Social and Behaviour Change Communication
SCHMTS Sub Community Health Management Team
SDGs Sustainable Development Goals
SDP Service Delivery Points
SFP Supplementary Feeding Programme
SOPS Standard Operating Procedures
SQUEAC Semi-Quantitative Evaluation of Access and Coverage
SUN Scaling Up Nutrition Movement
SWOT Strengths, Weaknesses, Opportunities and Threats
TB Tuberculosis
TWGS Technical Working Groups
U5MR Under-Five Mortality Rate
UDHR Universal Declaration of Human Rights
UHC Universal Health Coverage
UN United Nations
UNICEF United Nations Childrens’ Fund
THE KENYA NUTRITION ACTION PLAN (KNAP) | 2018 – 2022 Improved Nutrition For All
xi
MTR Midterm Review
NACS Nutrition Assessment, Counselling and Support
NNAP National Nutrition Action Plan
NASEP National Agricultural Sector Extension Policy
NCD Non-Communicable Disease
NDMA National Drought Management Authority
NDU Nutrition and Dietetics Unit
NFNSP National Food and Nutrition Security Policy
NFNSP-IF National Food and Nutrition Security Policy Implementation Framework
NGO Non-Governmental Organization
NHIF National Hospital Insurance Fund
NI Nutrition International
NICC Nutrition Inter-Agency Coordinating Committee
NIMES National Integrated Monitoring and Evaluation Systems
NIPN Nutrition Information Platform
NITWG Nutrition Information Technical Working Group
NTD Neural Tube Defects
OJT On-Job Training
ORS Oral Rehydration Salts
OTP Outpatient Therapeutic Programme
PESTLE Political, Economic, Sociological, Technological, Legal and Environmental
PHC Primary Health Care
PLWHIV People Living With HIV
PPP Public–Private Partnership
PTA Parents–Teacher Association
RNTWG Research in Nutrition Technical Working Group
SAM Severe Acute Malnutrition
SBCC Social and Behaviour Change Communication
SCHMTS Sub Community Health Management Team
SDGs Sustainable Development Goals
SDP Service Delivery Points
SFP Supplementary Feeding Programme
SOPS Standard Operating Procedures
SQUEAC Semi-Quantitative Evaluation of Access and Coverage
SUN Scaling Up Nutrition Movement
SWOT Strengths, Weaknesses, Opportunities and Threats
TB Tuberculosis
TWGS Technical Working Groups
U5MR Under-Five Mortality Rate
UDHR Universal Declaration of Human Rights
UHC Universal Health Coverage
UN United Nations
UNICEF United Nations Childrens’ Fund
USD US Dollar
USI Universal Salt Iodization
VAD Vitamin A Deficiency
VAS Vitamin A Supplementation
WASH Water, Sanitation and Hygiene
WFP World Food Programme
WHA World Health Assembly
WHO World Health Organization
WVI World Vision International

THE KENYA NUTRITION ACTION PLAN (KNAP) | 2018 – 2022 Improved Nutrition For All
xii
Kenya is a signatory to several nutrition-related global agreements and mechanisms including the Scaling Up Nutrition (SUN) movement, the World Health Assembly (WHA) 2025 nutrition targets, the Sustainable Development Goals (SDGs), the United Nations (UN) Decade of Action on Nutrition (2016–2025), and the ICN2 Declaration and Plan of Action. The agreements lay down the foundation for addressing the immediate, underlying and basic causes of malnutrition including expanding the political, economic, social and technological space for nutrition actions.
The Constitution of Kenya article 43 (1) gives every person the right to: the highest attainable standard of health, freedom from hunger and access to adequate food of acceptable quality. The government is committed to creating an enabling environment for citizens to realize these rights as evidenced in the Vision 2030, Kenya Health Policy (2014–2030) and the National Food and Nutrition Security Policy, 2012.
The Kenya Health Policy (KHP) and the National Food and Nutrition Security Policy (NFNSP) outline some of the key measures the government will put in place for realization of the Vision 2030. This is to be achieved through supporting the provision of equitable, affordable and quality health and related services at the highest attainable standards to all Kenyans. The government commitment to providing a high quality of life to all its citizens was further affirmed by the declaration of His Excellency President Uhuru Kenyatta’s Big Four Agenda in 2017 in which universal health coverage (UHC) by the year 2022 is prioritized.
Furthermore, several pieces of legislation covering key aspects of nutrition interventions have been enacted; for example, in addressing micronutrient deficiencies salt iodization and mandatory fortification of vegetable fats and oils and packaged wheat and maize flours. Additionally, the Breast Milk Substitutes (Regulation and Control Act) 2012 and Article 71 and 72 of the Health Act 2017 provide for promotion, protection and support of breastfeeding.
Following the launch of the NFNSP in 2012, the Ministry of Health led the development of the National Nutrition Action Plan (NNAP) 2012–2017 to coordinate nutrition and dietetics intervention by government and nutrition stakeholders at all levels. The 2014 Kenya Demographic and Health Survey reported improvements in the prevalence of stunting, wasting and underweight from 35 per cent, 7 per cent and 16 per cent in 2009 to 26 per cent, 4 per cent and 11 per cent in 2014 respectively. The improvement was attributed to the coordinated implementation of nutrition intervention as guided by the NNAP.
The Kenya Nutrition Action Plan (KNAP) 2018–2022 is cognisant of lessons learnt in the implementation of the NNAP 2012–2017 and global and regional targets on nutrition. The main objective of the KNAP is to accelerate and scale up efforts towards the elimination of malnutrition as a problem of public health significance in Kenya by 2030, focusing on specific achievements by 2022. The KNAP focuses on three areas of intervention, namely nutrition-specific; nutrition-sensitive; and enabling environment, putting emphasis on the need for strengthening multisectoral collaboration in addressing malnutrition. We believe this five-year plan will contribute to achieving the Kenyan Development Agenda.
.......................................Sicily Kariuki (Mrs), EGHCABINET SECRETARY
FOREWORD

THE KENYA NUTRITION ACTION PLAN (KNAP) | 2018 – 2022 Improved Nutrition For All
xiii
Quality health care forms the foundation for a nation’s accelerated overall national development agenda. Vision 2030 envisages Kenya as a globally competitive middle-income country by 2030. To realize this dream, the health sector must institutionalize its planning processes in order to operate efficiently and cohesively. To this effect, the President in November 2017 made a declaration to include the provision of quality and affordable health care as part of the government’s ‘Big Four’ agenda for the 2017–2022 medium-term plan (MTP) period. The Ministry of Health is taking the lead in implementing the President’s action plan on universal health coverage and food and nutrition security.
Nutrition is a vital building block in the foundation of human health and development. Nutrition has a direct relationship with child survival, physical and mental growth, learning capacity, adult productivity and overall social and economic development. Unacceptably high levels of malnutrition remain a public health concern and a hindrance to achieving the country’s developmental agenda, with an emerging triple burden of malnutrition, where undernutrition (underweight, stunting and wasting), overweight and obesity and micronutrient deficiencies are on the increase in addition to the burden of Non-Communicable Diseases (NCDs) (Kenya Demographic and Health Survey (KDHS), 2014).
The Kenya Nutrition Action Plan (KNAP) 2018–2022 is the second action plan that follows the implementation of the first National Nutrition Action Plan (NNAP) 2012–2017 and builds on the success, limitations and opportunities of the previous five years. The KNAP 2018–2022 applies a multisectoral approach and promotes cross sectoral collaboration to address the social determinants of malnutrition sustainably with an overall aim of ensuring ‘Optimal Nutrition for All Kenyans’ by ensuring that the roles and responsibilities of different sectors are clear and each carries out its action in cognisance that addressing the triple burden of malnutrition requires multisectoral and multi-disciplinary approaches.
The process of development of the KNAP 2018–2022 was driven by Government, through a sector-wide approach that involved broad-ranging consultations within and across the sector. Critical to note is the engagement of counties in the development and anticipated adoption of the KNAP to county nutrition action plans (CNAPs). A series of dedicated meetings were held with counties and their leadership during the entire development process. Further, the process brought together a broad range of actors that included the UN agencies, academia, the private sector, civil society, regulatory bodies, government line ministries and other semi-autonomous government agencies such as the Kenya Medical Supply Authority (KEMSA) and the Kenya Nutrition Institute of Nutritionists and Dietitians.
Considering the devolved system of governance, KNAP will provide an umbrella framework and guidance to counties as they develop CNAPs. The KNAP will provide a critical catalyst for enhancing accountability, multisectoral collaboration and coordination, linking national and county actions, and tracking progress of both the KNAP and the CNAPs results. The KNAP is aligned to the government’s medium-term plans (MTPs) to facilitate mainstreaming of nutrition budgeting.
Key priorities to be implemented during the five years from 2018 to 2022 have been identified. It is my expectation that in working together, the overall objectives of the KNAP will be achieved.
.......................................Susan Mochache, CBS PRINCIPAL SECRETARY
PREFACE

THE KENYA NUTRITION ACTION PLAN (KNAP) | 2018 – 2022 Improved Nutrition For All
xiv
KENYA NUTRITION ACTION PLAN 2018-2022 COMMITMENTS
We, the leadership in the Ministries implementing Food and Nutrition Security interventions, support having a common nutrition guiding document for Kenya, the Kenya Nutrition Action Plan (KNAP 2018-2022);
EMPHASIZING that the KNAP is a multisectoral document with an overall aim of ensuring Optimal Nutrition for All Kenyans;
COGNIZANT of the fact that the development of the KNAP takes place against the background of His Excellency the President’s declaration of the Big 4 Agenda, that prioritizes Food and Nutrition Security and Universal Health Coverage;
AWARE that The Big 4 Agenda will see dedicated resources, energy and time by the various sectors to transform the lives of Kenyans thereby guaranteeing a healthy and productive nation;Having discussed the pivotal role of food and nutrition in realization of the Big 4 Agenda and the Vision 2030 and taken stock of the achievements made by the past Nutrition Action Plan (2012-2017);
ACKNOWLEDGING the emerging triple burden of malnutrition characterized by the (i) coexistence of undernutrition as manifested by stunting1, wasting2, underweight3, low birthweight4 (ii) micronutrient deficiencies5; (iii) overweight and obesity6 and diet-related noncommunicable diseases (DRNCD)7 and low physical activity needs an evidence-based strategic action plan and that such an Action Plan cannot be actualized without involvement of various sectors that address malnutrition in Kenya in all its forms and for all ages.
RECOGNIZING that The Constitution of Kenya, in Article 43(a) provides for every person the right to the highest attainable standards of health, which includes the right to health care services including reproductive health; Article 43 (1)(c) provides for every Kenyan freedom from hunger and a right to adequate food of acceptable quality; and Article 53 (l)(c) provides for every child the right to basic nutrition, shelter and health care;
RESTATING that Kenya, as a part of the global community has committed itself to the goals and aspirations of the Global Sustainable Development Goals (SDGs) and the World Health Assembly (WHA) nutrition targets, and that Kenya remains fully committed to the realization of these goals;
NOTING that devolution continues to provide an opportunity for increased accountability to citizens and for implementation of the various strategies outlined in the policy documents;
STRESSING that implementation within different government ministries, development agencies and donors’ bodies, calls for a coordinated approach to implementation of strategies and actions; adequate sensitization and ownership of each sector; coordinated monitoring, evaluation and research; and time and budget allocation;
RECOGNIZING the need to mobilize political will and support that places food and nutrition security at a strategic position;
ACKNOWLEDGING that the risk factors for malnutrition are multisectoral and multifactorial, and that malnutrition occurs in households and communities; therefore, interventions proposed must be multisectoral, address the multiple causative factors and focus at the county level to have the required community-level impact;
AWARE that the KNAP has been guided by a number of national policies, legal framework and other grounded nutrition related frameworks, among others:
• Health Act 2017• The Nutritionist and Dieticians Act, 18, 2017• Breast Milk Substitute (Regulation and Control) Act 2012 • National Food and Nutrition Security Policy, 2012• National Food and Nutrition Security Policy Implementation Framework 2017 to 2022• Kenya Health Policy 2012-2030• The National Agricultural Sector Extension Policy (NASEP) 2012
NUTRITION COMMITMENTS

THE KENYA NUTRITION ACTION PLAN (KNAP) | 2018 – 2022 Improved Nutrition For All
xv
• National Land Policy• National Irrigation Policy 2015 • National Environmental Policy, 2013• National Livestock Policy, 2008• National Oceans & Fisheries Policy, 2008• Kenya ASAL policy, 2012 • Kenya Policy Framework for Education, 2012• National Nutrition Action plan (2012-2017)• Kenya Health Sector Strategic Plan (KHSSP 2014-2018)• Kenya National Strategy for Prevention & Control of NCDs (2015-2020)• Republic of Kenya National School Health Strategy Implementation Plan (2011-2015)• Kenya Rural Development Strategy (2012-2017)• Economic Recovery Strategy for Wealth and Employment Creation (2003-2007)• Kenya Poverty Reduction Strategy Paper, 2013• Strategy for Revitalizing Agriculture (2004-2014)• The Constitution of Kenya, 2010
RECOGNIZING that Kenya made various achievements during the past National Nutrition Action Plan (NNAP) including: -
• Reduction of prevalence of stunting, underweight and wasting in children • Improvement in the micronutrient’s status within the Kenyan population • Improvement in capacity development. • Increased financing for nutrition interventions both at national and county levels.• Enhanced government leadership, improved coordination of stakeholders. • Improved collaboration of stakeholders including government ministries and departments, private
sector, civil society, academia, and development partners. • Improved delivery of nutrition messages to improve knowledge, attitudes and practices.
ACKNOWLEDGING that despite the progress made, more effort is still required in the following areas: • Prevention and management of all forms of malnutrition• Sustainable access to a package of high impact nutrition interventions including in hard to reach areas
and urban informal settlements • Multisector collaboration for nutrition programming• Strengthening regulatory environment for marketing and promotion of healthy foods • Sustainable financing and investment on nutrition • Performance management, monitoring and evaluation systems for nutrition across sectors • Advocacy and communication for nutrition prioritization • Social mobilization for improved uptake of nutrition promoting services• Research and evidence generation for nutrition • Capacity development of human resources and the nutrition systems, with low coverage of certain
specialties and inadequate resources: e.g. clinical nutrition and dietetics• Governance, leadership, coordination and regulation.
WE THEREFORE, pledge to undertake to implement a wide range of specific commitments and prioritize and fast track the sectoral and multisectoral nutrition actions contained in this KNAP and be accountable for their implementation as follows: -
1Stunting also called chronic malnutrition is defined as low height-for-age (H/A) that is below minus 2 standard deviation (SD) against internationally agreed WHO standards.2Wasting also called acute malnutrition is defined as low weight-for-height (W/H) that is below minus 2 standard deviation (SD) against internationally agreed WHO standards.3Underweight is defined as low weight-for-age (W/A) that is below minus 2 standard deviation (SD) against internationally agreed WHO standards. It is a combined measure of stunting and wasting.4Low birthweight (LBW) is defined as a birth weight of 2.5kg and below. When the birth is appropriate for gestational age, the cause of LBW may be intrauterine growth retardation caused by maternal malnutrition. Premature births also result in LBW babies.5Most prevalent micronutrient deficiencies in Kenya are of: vitamin A leading to Vitamin A Deficiency (VAD); iodine leading to iodine deficiency disorders (IDD); iron, folic acid and vitamin B12 deficiency leading to nutritional anaemias; and zinc deficiency. 6Overweight and obesity in adults are defined as excessive weight in relation to the height as measured by the Body Mass Index (BMI), calculated as weight (W) in kg divided by the square of the height (H) in metres (W/H2). A BMI of <18.5 is defined as underweight for women; <20 is underweight for men; 20-<25 is normal for both sexes; 25-<30 is overweight and 30 and above is defined as obese for both sexes. The BMI of mothers can be used as a measure of household food security since mothers will always prioritize children when food is scarce.7DRNCDs include type 2 diabetes, hypertension, cardiovascular diseases, osteoporosis, dental diseases and several forms of cancers.

THE KENYA NUTRITION ACTION PLAN (KNAP) | 2018 – 2022 Improved Nutrition For All
xvi
1. Ministry of Health
• Mainstream nutrition in all policy, planning and strategy documents.• Develop capacity of the health workforce to deliver integrated services including nutrition.• Joint planning on nutrition with nutrition sensitive sectors.• Joint monitoring and evaluation and performance review on nutrition indicators.• Promote social and political accountability on nutrition such as the use of nutrition scorecards and
nutrition mainstreaming in performance contracts.• Participate in the development and implementation of a resource mobilization strategy for nutrition
covering all aspects of resources - financial, human and organizational.• Strengthen and utilize established nutrition forums at national and county levels to enhance collaboration
and learning for improved nutrition.• Develop a system for reporting nutrition information and learning.• Harmonize and align nutrition coordinating committees and technical working groups.• Leverage on Public Private Partnerships to mobilize resources for nutrition
2. Ministry of Agriculture, Livestock, Fisheries and Irrigation• Ensure access to adequate nutritious and safe food along the food value chain.• Joint planning on nutrition with nutrition sensitive sectors• Joint monitoring and evaluation and performance review on nutrition sensitive indicators through the
developed system for reporting nutrition information.• Promote social and political accountability on nutrition such as the use of nutrition scorecards and
nutrition mainstreaming in performance contracts• Promote consumption of safe, diverse, nutritious foods• Contribute to strengthening of agri-nutrition capacities and coordination at national and county levels• Coordinate with other sectors for policy, legal and regulation and for program implementation.• Participate in activities that strengthen and diversify partnerships in nutrition• Participate in the development, and thereafter implementation of a resource mobilization strategy for
nutrition covering all aspects of resources - financial, human and organizational.• Utilize established nutrition forums at national and county levels to enhance collaboration and learning
for improved nutrition.• Harmonize and align nutrition coordinating committees and Technical Working Groups (TWGs).
3. Ministry of Education• Review school curriculum to reinforce and promote nutrition and physical activity, and document and
share best practices• Promote food, nutrition and physical activity in schools and colleges.• Promote nutrition assessments in schools.• Involve stakeholders including communities and parents, in school nutrition activities.• Promote access to nutritious and safe food along the food value chain.• Joint planning on nutrition, with nutrition sensitive sectors.• Joint monitoring and evaluation, and performance review of nutrition indicators through the developed
system for reporting nutrition information.• Promote social and political accountability on nutrition such as the use of nutrition scorecards and
nutrition mainstreaming in performance contracts• Participate in the development and implement a resource mobilization strategy for nutrition covering
all aspects of resources - financial, human and organizational.• Utilize established nutrition forums at national and county levels to enhance collaboration and learning
for improved nutrition.• Harmonize and align nutrition coordinating committees and technical working groups.
4. Ministry of Labor and Social Protection
• Target the nutritionally vulnerable e.g. women in reproductive age, children during the first 1,000 days (from pregnancy to their second birthday), poor households, older persons.
• Incorporate explicit nutrition objectives and indicators in policies and strategies to enhance the positive impact of social protection interventions on nutrition.
• Mobilize resources for social protection that address nutrition needs of the vulnerable groups.• Empower women and make them the recipients of social protection benefits, focusing on increasing

THE KENYA NUTRITION ACTION PLAN (KNAP) | 2018 – 2022 Improved Nutrition For All
xvii
women’s access to education, assets and resources; consider women’s work burden and time constraints.
• Engage men when addressing gender issues to strengthen the positive impact of social protection on nutrition.
• Promote strategies that enable households to diversify their diets and livelihoods. • Scale up safety nets in times of crises/shocks.• Strengthen linkages of social protection programs with health and nutrition programs.• Integrate nutrition education and promotion into social protection interventions.• Joint planning on nutrition with nutrition sensitive sectors.• Joint monitoring and evaluation and performance review on nutrition indicators.• Promote social and political accountability on nutrition such as the use of nutrition scorecards and
nutrition mainstreaming in performance contracts.• Participate in the development and implementation of a resource mobilization strategy for nutrition
covering all aspects of resources - financial, human and organizational.• Utilize established nutrition forums at national and county levels to enhance collaboration and learning
for improved nutrition.
5. The Ministry of Devolution and ASALS • Support in capacity building and technical assistance to County Governments in the areas related to
Food and Nutrition security.• Support in fostering intergovernmental relations across ministries that contribute to food and nutrition
security.• Promote socio-economic development that is geared towards improving the nutrition status of the
Kenyan population.• Contribute to and support food relief management when applicable to ensure no deterioration in
nutrition status.
6. The Council of Governors • Support in providing a mechanism for consultation on nutrition matters amongst County Governments • Provide support in the development and implementation of the County Nutrition Action Plans.• Contribute in sharing information on nutrition performance for counties. • Strategic planning and resource allocation to ensure effective and equitable allocation of public funds
in line with national and county government priorities towards food and nutrition security as key areas. • Support short-term planning perspective in addressing nutrition in emergency situations
We the undersigned, representing the Government of Kenya, fully recognize each ministry’s mandate and pledge our commitment to support the achievement of the targets laid out in this Kenya Nutrition Action Plan 2018-2022. We will strive towards equitable and sustainable multisectoral actions to realize optimal nutritional status for all Kenyans.We shall work through enhanced coordination and partnerships to prioritize the elimination of malnutrition from Kenya.
...............................................................Name: Sicily K. Kariuki (Mrs), EGH
Cabinet Secretary,Ministry of Health
...............................................................Name: Hon. Mwangi Kiunjuri, EGH
Cabinet Secretary, Ministry of Agriculture, Livestock and Fisheries
...............................................................Name: Hon. Eugene Wamalwa, EGG
Cabinet Secretary,Ministry of Devolution & ASALs
...............................................................Name: H.E. Hon. F.C.P.A Wycliffe Ambetsa Oparanya, EGH, CGJ
Chairman, Council of Governors
...............................................................Name: Prof. George Magoha
Cabinet Secretary,Ministry of Education
...............................................................Name: Simon Chelugui, EGH
Cabinet Secretary,Ministry of Labour and Social Protection

THE KENYA NUTRITION ACTION PLAN (KNAP) | 2018 – 2022 Improved Nutrition For All
xviii
The Ministry of Health takes this opportunity to thank everyone who participated in the development of the Kenya National Nutrition Action Plan (KNAP) 2018–2022. The KNAP could not have been finalized without the valuable contributions and full commitment of the technical committee members of different working groups drawn from both the government and partner organizations. The support from the Government of Kenya through the Ministry of Health is highly appreciated.
Special thanks goes to the United Nations Children’s Fund (UNICEF) Kenya for the immense technical leadership and financial support in the entire process of developing the KNAP 2018 to 2022. Further, we express our sincere gratitude and indebtedness to Nutrition International (NI), World Food Programme (WFP), World Vision International (WVI), NHP Plus, Concern Worldwide, World Health Organization (WHO), Action Against Hunger (ACF), Kenya Red Cross Society (KRCS), Save the Children, and Global Alliance for Improved Nutrition (GAIN) for technical and financial support in developing this nutrition action plan. In addition, we acknowledge the technical contribution from the following partners and institutions namely African Population and Health Research Center (APHRC), Action Aid, Path, ICS Africa, Central Organization of Trade Unions (COTU), Kenya Human Rights Commission, Consumer Information Network and Kenya Network for Women with Aids.
The contributions of the following ministries in providing overall leadership and technical inputs to the KNAP is also highly appreciated: Health; Education; Water and Sanitation; Labour and Social Protection; Ministry of Devolution and ASAL; Ministry of Public Service, Gender and Youth Affairs; Ministry of Industrialization and Enterprise development; Agriculture, Livestock, Fisheries & Irrigation and the National Treasury and Planning. The contribution of the Counties through the Council of Governors (CoG) and all the 47 Counties through their County Executive Committee Members (CECMs), Directors and County Nutrition Coordinators (CNCs) during the development and/or validation of the KNAP is gratefully acknowledged.
We gratefully acknowledge the inputs of the following institutions, government and Semi-Autonomous Government Agencies: University of Nairobi, Kenyatta University, Jomo Kenyatta University of Agriculture and Technology, Kenya Methodist University, Moi University and Mount Kenya University, Kenya Medical Research Institute, Kenyatta National Hospital, Kenya Bureau of Standards, National Council for Children’s Services, Kenya Medical Training College, Nutrition Association of Kenya and Kenya Nutritionists & Dieticians Institute. The inputs of the private sector in the validation of the KNAP is gratefully appreciated.
The following persons are specially thanked for final editing of the action plan: Betty Samburu, Florence Mugo, and John Mwai from the Nutrition and Dietetics Unit, Joy Kiruntimi from Nutrition International; Sicily Matu, Victoria Mwenda and Lucy Maina-Gathigi from UNICEF. We appreciate the overall coordination of the entire process provided by the KNAP secretariat through the leadership of Betty Samburu and Sicily Matu. Further, the contribution and support of the following agency’s heads of nutrition namely Patrick Codjia from UNICEF; Martha Nyagaya from Nutrition International and Joyce Owigar from World Food Programme to the overall KNAP development process is gratefully acknowledged.
We acknowledge the review work on Nutrition Action Plan (NNAP) 2012–2017 that was undertaken by Ms. Rhodah Njuguna and Dr. Zipporah Bukania, which formed the basis of the development of this plan by providing the strengths, weakness and opportunities for nutrition in Kenya. The team leads and members of different task forces who participated in the preliminary work and provided guidance on different key result areas throughout the process and during the stakeholder’s workshop are highly appreciated.
Lastly, the Nutrition and Dietetics Unit greatly appreciates the technical support from the consulting team; Dr. Festo Kavishe (lead consultant), Dr. Daniel Mwai (costing, resource mobilization legal and institutional environment), David Njuguna (policy, costing, financial tracking and resource mobilization), Dr. Wangia Elizabeth (M&E and accountability plan) and Terry Wefwafwa (nutrition expert) for providing the technical support throughout the whole development process.
.......................................Veronica KirogoHEAD, NUTRITION AND DIETETICS SERVICES,
ACKNOWLEDGEMENTS

THE KENYA NUTRITION ACTION PLAN (KNAP) | 2018 – 2022 Improved Nutrition For All
xix
The Kenya Nutrition Action Plan (KNAP) 2018–2022 is an evidence-based five-year strategic action plan that seeks to address malnutrition in Kenya in all its forms and for all ages. It is the second National Nutrition Action Plan for the implementation of the Kenya Food and Nutrition Security Policy (FNSP) and follows implementation of the first National Nutrition Action Plan 2012–2017, building on the success, limitations and opportunities of the previous five years. The Kenya Vision 2030, implemented in five-year midterm plans and the Big Four Agenda, together with the overall global health and nutrition agenda and within the framework of the constitution and legal framework, form the over-arching guidance for the development of KNAP. The plan applies a life-course approach and promotes cross-sectoral collaboration to address the social determinants of malnutrition sustainably. The overall expected result of the KNAP is Kenyans achieving optimal nutrition for a healthier and better-quality life and improved productivity for the country’s accelerated social and economic growth. The pathway of change for the KNAP is defined using the theory of change. The theory of change was used to develop a set of key result areas so that if certain inputs were in place, and certain activities implemented, then a set of results would be realized and, if at scale, contribute to improved nutritional status of all Kenyans.
The KNAP development process was driven by government through the Nutrition and Dietetics Unit, Ministry of Health. The process involved wide consultation with all key stakeholders including: line ministries, county governments, development partners and donor agencies, civil society organizations, research and academic institutions and the private sector. The process was evidence-informed and recognized successes, challenges and lessons learnt from the implementation of the 2012–2017 NNAP.
A review of the implementation of the 2012–2017 NNAP indicated substantial achievements during the period of implementation, such as a reduction in the prevalence of malnutrition among children under five years, improved breastfeeding practices, improved policy environment and capacity to deliver nutrition services, and improved collaboration among key stakeholders driven by government leadership. However, the review also noted key challenges encountered during implementation of the NNAP, including: a delay in the establishment of coordination mechanisms as stipulated in the Food and Nutrition Security Policy (FSNP), weak linkage with other sectors, inadequate monitoring and evaluation of the NNAP implementation, limited funds allocation from the government and inadequate funding for research to generate evidence.
The main audience for the KNAP will be policy makers, planners, nutrition managers and officers at all levels, academia, development partners, donors, Non Government Organizations (NGOs), civil society organizations (CSOs), faith-based organizations (FBOs) and the private sector. The document will also help the public at large to understand what the government is doing to ensure optimal nutrition for all Kenyans, and what they can do individually to contribute to improved nutrition. This KNAP has been organized into eight chapters as follows: Chapter 1, the introduction, discusses the global, regional and national frameworks under which the KNAP is anchored, the 2018–2022 KNAP development process including the review of the 2012–2017 NNAP, and the main users/audience for the NNAP. A comprehensive nutrition situation trend analysis is presented in Chapter 2, while Chapter 3 presents the KNAP design framework including rationale, theory of change and the objectives of KNAP. Chapter 4 presents the key results areas, key strategies, interventions/activities, expected outputs and outcomes. Chapters 5 and 6 present the resource needs of the KNAP and the Monitoring, Evaluation, Accountability and Learning (MEAL) Framework respectively. Chapter 7 discusses institutional and legal frameworks for the KNAP while Chapter 8 deals with risk assessment, analysis and mitigation.
Further, the KNAP is organized into three categories of result areas with corresponding interventions. These include nutrition-specific, nutrition-sensitive and enabling environment as listed below:
Nutrition specific Key Result Areas (KRAs)KRA 1: Maternal Infant and Young Child Nutrition (MIYCN) scaled-upKRA 2: Nutrition of older children and adolescents promotedKRA 3: Nutrition of adults and older persons promotedKRA 4: Prevention, control and management of micronutrient deficiencies scaled-upKRA 5: Prevention, control and management of Diet Related Non-Communicable Diseases (DRNCDs) scaled-upKRA 6: Integrated Management of Acute Malnutrition (IMAM) strengthenedKRA 7: Nutrition in emergencies strengthenedKRA 8: Nutrition in Tuberculosis (TB) and HIV strengthenedKRA 9: Clinical Nutrition and Dietetics in Disease Management Strengthened
EXECUTIVE SUMMARY

THE KENYA NUTRITION ACTION PLAN (KNAP) | 2018 – 2022 Improved Nutrition For All
xx
Multi-sectoral nutrition sensitive KRAsKRA 10: Nutrition in agriculture and food security scaled-upKRA 11: Nutrition in the health sector strengthenedKRA 12: Nutrition in Education and Early Childhood Development (EECD) promotedKRA 13: Nutrition in Water, Sanitation and Hygiene (WASH) promotedKRA 14: Nutrition in social protection promoted
Enabling environment (Cross-cutting) KRAsKRA 15: Sectoral and multi-sectoral nutrition governance including coordination and legal/regulatory frameworks strengthened KRA 16: Sectoral and multi-sectoral nutrition information systems, learning and research strengthenedKRA 17: Advocacy, Communication and Social Mobilization (ACSM) strengthenedKRA 18: Capacity for nutrition developed KRA 19: Supply chain management for nutrition commodities and equipment strengthened
The total cost to achieve the 19 key results over the next five years will be KES 38.4 billion (US$ 379.9 million) with KRA 19 on nutrition commodities accounting for more than half (57.6%) of the total resource needs for the KNAP. Table 1 presents annual estimated budget requirements.
The MEAL framework will facilitate tracking and evaluation of performance of set targets, as well as serve as an accountability and learning framework for the various nutrition stakeholders. In addition to supporting results and financial tracking, the MEAL framework will also provide a mechanism for county, national and where relevant global and regional reporting; thereby aligning partners at county, country, regional and global levels around a common approach to reporting. The evidence generated will inform planning, resource allocation, decision making and adaptive management as well as real time monitoring of the nutrition actions. The MEAL framework further provides a summary of select results and indicators that will be mutually tracked and reported on by all sectors responsible for the implementation of KNAP. The summary is referred as Common Result Accountability Framework (CRAF).
There will be four key instants for tracking progress and learning where information will be presented, discussed, lessons learnt, and strategic decisions made in respect to adjustments in strategy or activities. These will include: quarterly or six-monthly reports from routine data collection, like the Health Information System (HIS), nutrition score card, and feedback from coordinating structures, which will provide opportunities for adjustments of activities. Annual multi-sectoral and multi-stakeholder nutrition reviews will need to be established, to review overall progress including functionality of the CRAF and multistakeholder coordination and collaboration. A Mid-Term Review (MTR) will be done in 2020 to review progress made in the two years of implementation and recommend adjustments in strategy or review of expected targets where necessary. An End-Term Review (ETR) in 2022 will evaluate the overall performance of the KNAP and use lessons learnt to develop the subsequent KNAP.
Key elements that will support implementation of the KNAP include a vibrant and functional regulatory environment supported by robust legal frameworks which provides for revision of existing legislation and formulating new laws and regulations and guidelines to ensure availability and accessibility of adequate, safe, and quality food and adherence to internationally recognized standards and nutritional guidelines. Optimization of coordination structures to facilitate and drive service delivery, capacity strengthening, evidence generation and utilization, advocacy and resource mobilization, resource tracking and social accountability. Sector wide partnerships are critical in the execution of the KNAP and for driving the vision of nutrition in the country. The Three Ones principle; ONE agreed comprehensive plan, ONE coordinating authority and ONE Monitoring and Evaluation framework. This KNAP, therefore, promotes stronger institutional coherence and linkages between sectors. An important component of the KNAP is risk assessment, analysis and mitigation to identify and manage risks that may affect its smooth implementation.
KNAP Estimated Annual Budget (Ksh. millions) Total cost
Financial year 2018/2019 2019/2020 2020/2021 2021/2022 2022/2023 Ksh. (billion) USD (millions)
Estimated budget
6,928.43 7,897.34 7,677.18 7,771.66 8,093.22 38,367.83 379.88
Table 1: KNAP estimated annual budget 2018/19 - 2022/23
THE KENYA NUTRITION ACTION PLAN (KNAP) | 2018 – 2022 Improved Nutrition For All
1
01
15
Take IFA supplements with meals to reduce chances of experiencing nausea.

THE KENYA NUTRITION ACTION PLAN (KNAP) | 2018 – 2022 Improved Nutrition For All
2
1.1. BACKGROUND
The over-arching direction for nutrition sector planning in Kenya is guided by Vision 20308, which is the long-term development plan for the country, aiming at creating “a globally competitive and prosperous country with a high quality of life by the year 2030”; and the overall global health and nutrition agenda. These are entrenched within the Constitution of Kenya 2010 under the Bill of rights as follows: -
1. Article 43 (1) (c) - the right of every Kenyan to be free from hunger and a right to adequate food of acceptable quality;
2. Article 53 (l) (c) - the right of every child to basic nutrition, shelter and health care; and 3. Article 21 - establishes the progressive realization of social and economic rights and obligates the State to
“observe, respect, protect, promote, and fulfil the rights and fundamental freedoms in the Bill of Rights.”
Another high-level policy directive is the Big Four Agenda, which is the focus of the government for the next five years, where Universal Health Coverage (UHC), Food, and Nutrition Security form part of the four pillars. Nutrition related actions in the UHC (2018-2022) include: investing in preventive and promotive services; increased budgetary allocation to public health programs and nutrition; supervision and monitoring of rational use of commodities; and commitment to work with enabler Ministries for nutrition.
Kenya is a state party to several nutrition related global agreements and mechanisms including the Scaling Up Nutrition (SUN) Movement, the World Health Assembly (WHA) 2025 nutrition targets, the Sustainable Development Goals (SDGs)9, as seen in the figure one, the United Nations (UN) International Decade on Food and Nutrition, and the ICN2 Declaration and Plan of Action. These frameworks lay down the foundation for addressing the immediate, underlying and basic causes of malnutrition including expanding the political, economic, social and technological space for nutrition actions.
1.2. POLICY CONTEXT
Kenya is a signatory of key global and regional initiatives to address malnutrition in all its forms and is committed to their realization and implementation through sector specific action plans. Key global frameworks include: The six World Health Assembly (WHA) 2025 nutrition targets endorsed by WHO Member States in 2012 for improving Maternal, Infant and Young Child Nutrition (IYCN) with its Comprehensive Implementation Plan (CIP) and its tracking tools; Establishment of the Scaling Up Nutrition (SUN) Movement in 2012, which revamped the global response to malnutrition. The SUN’s second Strategy and Roadmap (2016-2020) presents a practical vision of how we can all work together, toward our vision of a world without malnutrition by 2030. As a SUN member early riser since 2012, Kenya subscribes to the Movement’s vision of a world without hunger and malnutrition and its 10 principles of engagement which guide actors as they work in a multi-sectoral and multi-stakeholder space to effectively working together to end malnutrition, in all its forms. These principles ensure that the Movement is flexible while maintaining a common purpose and mutual accountability.
On an annual basis countries with support from the Global SUN Secretariat in Geneva conduct an annual assessment to review progress against the targets. In 2017, Kenya scored overall 58% of the SUN annual joint assessment measures of progress across four processes: (a) bringing people together (69%), (b) coherent policy and legal framework (54%), (c) aligning programs around a common results framework (56%) and (d)
8Government of Kenya, 2007. Vision 2030: A globally competitive and prosperous Kenya9The 17 SDGs by 2030 are: Goal 1 – No poverty; Goal 2 – No hunger; Goal 3- Good health; Goal 4 – Quality education; Goal 5 – Gender equality; Goal 6 – Clean water and sanitation; Goal 7 – Renewable energy; Goal 8 – Good jobs and economic activity; Goal 9 – Innovation and infrastructure; Goal 10 – Reduced inequalities; Goal 11 – Sustainable cities and communities; Goal 12 – Responsible consumption; Goal 13: Climate action; Goal 14 – Life below water; Goal 15 – Life on land; Goal 16: Peace and Justice; Goal 17 – Partnership for the goals.
01 INTRODUCTION

THE KENYA NUTRITION ACTION PLAN (KNAP) | 2018 – 2022 Improved Nutrition For All
3
financial tracking and resource mobilization (59%). The implementation of this KNAP will ensure that these processes continue to be followed and monitored.
KNAP adopts three targets of the 9 Voluntary Global NCD 2025 Targets (with 2010 as baseline year) and Global NCD Action Plan by WHA adopted in 2013 - target 3 on physical activity, 4 on salt/sodium intake and 7 on diabetes and obesity – efforts will continue to be made through health and other strategies and plans to promote progress towards the achievement of all targets.
The 2030 global agenda on Sustainable Development Goals (SDGs) adopted in September 2015 has 17 Goals. Goal 2 is specific on nutrition: End hunger, achieve food security and improve nutrition and promote sustainable agriculture, with target 2.2 calling for ending all forms of malnutrition. This includes achieving the internationally agreed targets on stunting and wasting in children under five years of age, and address the nutritional needs of adolescent girls, pregnant and lactating women and older persons by 2025. The SDGs aim to transform the world through an integrated approach towards achievement of the set-out goals. Integration emphasizes on all the goals being achieved in an indivisible way by all relevant sectors, thus the importance of multisectoral collaboration and coordination. In the SDGs and Agenda 2030, Nutrition is taken both as a direct goal and foundation and an enabler of all the other SDGs.
The 2017 Global Nutrition Report key finding was that improving nutrition has a powerful multiplier effect across the SDGs, submitting that it will be difficult to achieve any SDG without addressing nutrition, and listing five areas of greatest impact as follows: -
1. Good nutrition can drive greater environmental sustainability.2. Good nutrition is key for economic development. 3. Good nutrition means less burden on health systems.4. Good nutrition supports equity and inclusion.5. Good nutrition and improved food security enhance peace and stability.
Africa Union Agenda 2063 - ‘The Africa We Want’ of the African Union (AU), member states. This framework prioritized the goal of a healthy and well-nourished citizenry with the strategy of reducing maternal and child malnutrition within the first ten years (2015-2025). As a follow up, the African Union launched its Nutrition Policy in Addis Ababa in 2015 and its accompanying African Regional Nutrition Strategy (ARNS) 2015-2025. The ARNS recognizes the paradigm shift in the approach towards food and nutrition security with a renewed focus on the 1,000 days nutritional status of women and children and multisectoral approaches. The ARNS also recognizes nutrition as a national development issue and the need for new policies and commitments.
Other regional frameworks with specific inclusion for prioritization of food and nutrition for vulnerable groups include the AU Policy Framework and Plan of Action on Ageing (2002) with its three key recommendations on food and nutrition for older persons, i.e. ensuring that older people’s rights to adequate food and nutrition are
Figure 1: SDGs related to Nutrition (Source: Global Nutrition Report 2017)

THE KENYA NUTRITION ACTION PLAN (KNAP) | 2018 – 2022 Improved Nutrition For All
4
legally constituted and guaranteed; ensuring that older people have access to adequate food and nutrition; and ensuring that older people have equal access to means of food production and marketing.
The ARNS adopts the WHA 2025 nutrition targets, emphasizes the need to implement strategies that address the triple burden of malnutrition, and adopts 4 strategic outcome areas, which have also been adopted by this KNAP: -
• Outcome 1: Guides the development of policies and frameworks for adoption by AU Member States to Scale-up both direct (nutrition specific) and indirect (nutrition sensitive) nutrition interventions and ensure multi-sectoral approach to nutrition.
• Outcome 2: Facilitates consensus on “One voice” on nutrition, advocates for collaboration within and among sectors and agencies and promotes generation of evidence and sharing of lessons.
• Outcome 3: Advocates and promotes implementation of the ARNS, sustain commitment and increase resources for nutrition and facilitate alignment of nutrition policies.
• Outcome 4: Advocates to establish a decision-making architecture on implementation of the ARNS, ensure capacity and skills exist and enhance accountability.
Ouagadougou Declaration on Primary Health Care and Health (PHC) Systems – a re-iteration of the principles of the PHC approach, within the context of an overall health system strengthening approach
Abuja Declaration – to support improvements of health systems in the country by domesticating the provisions through national legislation, the country committed in the Abuja Declaration that calls for allocation of 15% of the government budget for health
1.3 NATIONAL POLICY AND LEGAL FRAMEWORKS
Localizing Health and Sustainable Development Goals and Agenda 2063
The Third MTP builds on gains made so far in key sectors of the economy including completing projects initiated during the Second MTP. The MTP III plan will place greater emphasis on structural transformation of the economy in terms of increasing the share of manufacturing and productive sectors and increasing the share of exports to GDP. Further, the plan will prioritize the development of infrastructure and create an enabling environment to develop the country’s oil, gas and other mineral resources sector. It will put in place measures to facilitate development of the “Blue Economy”, mainstream Sustainable Development Goals (SDGs), Africa’s Agenda 2063 and climate change among other regional and international development agenda and cooperation frameworks.
The country has a huge responsibility of ensuring the communities have access to good quality health care and live a healthy life. The country will enroll poor households to the insurance scheme in order to access health care. In addition, it will establish various programmes and projects geared towards improvement of health care services. These programs and projects are captured through the 7 health investment areas namely; health service delivery, health workforce, health care commodities and vaccines, health infrastructure, health information system, health care financing, leadership, Governance and research & Development.
To achieve the aspirations of the Constitution and Vision 2030, Kenya has given legislative force to some key aspects of nutrition interventions. These include prevention and control of iodine deficiency disorders through mandatory salt iodization, and control of other micronutrient deficiencies by mandatory food fortification of cooking fats and oils and cereal flours, through the Food Drugs and Chemical Substances Act. The benefits of breastfeeding are protected through the Breast Milk Substitutes (Regulation and Control Act) 2012. The Food, Drugs and Chemical Substances Act (food labelling, additives, and standard (amendment) regulation 2015 on trans fats) is also key legislation central to the control of DRNCDs. Additionally, the Nutritionists and Dieticians Act 2007 (Cap 253b) has been set up to determine and set up a framework for the professional practice of nutritionists and dieticians; set and enforce standards of professional practice and ethics on nutrition and dietetics; enforce a programme of quality assurance for the nutrition and dietetic profession; research into and provide public education on nutrition and dietetics; and design programmes and methods for sensitization on suitable dietary and nutritional habits through capacity-building, competency oriented trainings and specialization in nutrition service delivery. Monitoring compliance is even more critical in the light of devolution. Counties’ ability to implement and monitor the regulations is crucial, and hence is considered within the KNAP. Further, the KNAP identifies areas where the development of legislation is still necessary.

THE KENYA NUTRITION ACTION PLAN (KNAP) | 2018 – 2022 Improved Nutrition For All
5
The nutrition policy environment in Kenya is highly favourable, with various nutrition-specific and sensitive policies developed with implementation ongoing; a clear demonstration of government commitment. Coherence and alignment between different spheres of policy making is important. The KNAP (2018–2022) adds to a series of strategic national policy actions that Kenya has developed over the past decade to improve the food and nutrition security of all Kenyans. The KNAP is the second National Nutrition Action Plan for the implementation of the National Food and Nutrition Security Policy (NFNSP) 2012 and its implementation framework the National Food and Nutrition Security Implementation Framework (NFNSP-IF) 2017–2022. The NFNSP’s main objective is that ‘all Kenyans, throughout their life-cycle enjoy at all times safe food in sufficient quantity and quality to satisfy their nutritional needs for optimal health’. Using the life-course approach, the policy identifies key nutrition interventions for each age cohort and provides the linkages of nutrition to food production and other relevant sectors that impact on nutrition. However, there are still unacceptably high levels of malnutrition in Kenya, with an emerging triple burden of malnutrition, where undernutrition is declining, but overweight, obesity and non-communicable diseases (NCDs) and other diseases are increasing at a fast pace.10 In the 2018 global nutrition report, Kenya is clustered under countries having triple burden of malnutrition.
This Kenya Nutrition Action Plan (KNAP) 2018–2022 seeks to address malnutrition in Kenya in all its forms and for all ages. It is anticipated that when fully implemented it will contribute to an improvement in nutritional status for the population of Kenya. The Kenya National Nutrition Action Plan 2018–2022 applies a multisectoral approach and promotes cross-sectoral collaboration to address the social determinants of malnutrition sustainably.
In the light of devolution and the functions ascribed to the two levels of government, the Kenya Nutrition Action Plan (KNAP) 2018–2022 will provide an umbrella framework and guidance to counties, which will develop their own County Nutrition Action Plans (CNAPs) to align with the KNAP’s strategic framework. The KNAP will also define the national government roles relating to the provision of technical support, advocacy, guidance and development of capacity for nutrition for the county governments, so the counties can concentrate on implementation. The KNAP will provide a critical catalyst for enhancing accountability, multisectoral collaboration and coordination, linking national and county actions, and tracking progress of both the KNAP and the CNAPs’ results. This is more so in relation to the principle of ONE plan, ONE coordinating mechanism, and ONE monitoring, evaluation and accountability and learning framework (MEAL) through a CRAF.
Malnutrition is a multisectoral problem and needs concerted efforts from all sectors to address it. Key policies and strategic plans linked to nutrition in given line ministries are outlined below.
Ministry of Health - the Kenya Health Policy (2014–2030) is aimed at guiding and directing health sector investments with six policy objectives, three of which are directly linked to nutrition. It demonstrates the health sector’s commitment, under the government’s stewardship, to ensuring that the country attains the highest possible standards of health in a manner responsive to the needs of the population. The Kenya National Strategy for Prevention & Control of NCDs (2015–2020) also touches on nutrition for management and control of NCDs.
Ministries of Agriculture, Livestock, Fisheries and Irrigation, through the National Agricultural Sector Extension Policy (NASEP), Livestock Policy and the Strategy for Revitalizing Agriculture (SRA) in 2004, define the modalities for effective agricultural extension management and organization in a pluralistic system where both public and private service providers are active participants. It also provides a point of reference for service providers and other stakeholders on matters of standards, ethics and approaches, and guides all players on how to strengthen coordination, partnership and collaboration. The National Food and Nutrition Security Policy 2012 and the National Food and Nutrition Security Policy Implementation Framework 2017–2022 provides the framework and strategies for addressing nutrition and food security by addressing the supply side factor which affect food production in the country and the . The NASEP policy also contributes towards the improved transfer of technology and management for higher agricultural sector productivity, a key prerequisite for poverty reduction and enhanced nutrition and food security.
Ministries of Education, through the Policy Framework for Education 2012 and the National School Health Implementation plan (2013/14–2017/2018) provide linkages between education, training and social pillars. The policy endeavours to incorporate basic preventive and promotive health in the curriculum at the basic levels and continued capacity development in human resources for health and nutrition. The policy also aims at enhancing knowledge and skills to improve management of social systems, attitude change towards nurturing
10KenyaNational Bureau of Statistics, KDHS 2014, Nairobi, 2015

THE KENYA NUTRITION ACTION PLAN (KNAP) | 2018 – 2022 Improved Nutrition For All
6
a cohesive and knowledge society with a culture of tolerance, equity, nationalism, respect and value for life and basic human rights.
The National Treasury and Planning, through the Strategy for Public Financial Management Reforms 2013–2018, provides implementation guidance on macro-economic management and resource mobilization in line with macro-economic and fiscal policies on strategic planning and resource allocation. The strategy aims to ensure effective and equitable allocation of public funds in line with national and county government priorities including for food and nutrition security and universal health coverage.
The Ministry of Devolution & Arid and Semi-Arid Lands (ASAL), through the strategic plan 2013/14–2017/2018, addresses the priority of strengthening the weak linkages in a systematic manner between policy formulations, Vision 2030, the Medium Term Expenditure Framework (MTEF) three-year cycle and annual budget. The strategy has highlighted the development challenges facing Kenya. This Ministry is also in charge of coordinating activities with the Council of Governors (CoG) whose strategic plan 2017–2022 has agriculture and food security as a key area.
Ministry of Industry, Trade & Cooperatives through the National Industrialization Policy Framework 2012–2030 addresses agro-processing and value addition, milk and dairy products, meat and meat products, fish and fishery products and biotechnology. The economic pillar of the policy addresses financial services, agriculture, wholesale and trade, business process outsourcing, and an enabling business environment through efficiency and competitiveness. The market access pillar addresses the ‘supply side’ and ‘demand side’ constraints through promoting the consumption of locally manufactured goods, improved quality and measures to curb the influx of substandard goods.
Ministry of Sports, Culture & Heritage, through the National Policy on Culture and Heritage 2012, provides a framework that encourages government collaboration with the private sector on the use and consumption, development and popularization of inter-ethnic traditional dishes and drinks. It encourages the growing of traditional foods crops, their preservation and presentation, with the aim of meeting communities’ nutritional needs through diversity and acceptability.
Ministry of Water and Sanitation, through the Poverty Oriented Irrigation Policy 2012 provides a framework and strategies for addressing food security through irrigation and changing attitudes from depending on rain-fed agriculture. This has a positive impact on food security status, income, gender equality and health and nutrition outcomes.
Ministry of Transport, Infrastructure, Housing, Urban Development and Public Works, through the Integrated National Transport Policy, provides a framework that aims at reducing the rural and urban transport burden and travel time with the view of increasing economic efficiency through widespread forms of transport including non-motor forms. This addresses the statement ‘Food insecurity is a problem of distribution rather than production’.
Ministry of Public Service Youth and Gender, tthrough the National Policy on Gender and Development, incorporates gender and social concerns that have an impact on livelihoods, economic risks and nutrition outcomes. They include gender mainstreaming, human capital, education and health for all, opportunities through access to labour markets, employment and productive resources. It promotes women entrepreneurship, and vulnerabilities especially orphans and vulnerable children and victims of domestic violence.
Ministry of Environment & Forestry, through the National Environmental Policy 2013, provides a framework and strategic guidelines on the management of ecosystems and sustainable use of natural resources that constitute the biological basis of food security and support for livelihoods. It promotes environmental stewardship that addresses consumption and production patterns, industrialization, infrastructure, human settlement, climate change, invasive and alien species and gender vulnerability. Environmental quality and health addresses food safety, environmental diseases, water and sanitation, environment and HIV and waste management.
The actual implementation of these policies requires synergy, coordination and commitments from different sectors, donor bodies and development agencies. It also calls for adequate sensitization for ownership by each sector/ intervention, coordinated research, education, monitoring and governance, and time and budget allocation.
Given the commitment demonstrated by the Kenya Government to nutrition, it is likely that by tackling malnutrition and related development challenges, the KNAP can act as a catalyst to yield multiple benefits across the SDGs.

THE KENYA NUTRITION ACTION PLAN (KNAP) | 2018 – 2022 Improved Nutrition For All
7
1.4. KENYA NUTRITION ACTION PLAN DEVELOPMENT PROCESS
The KNAP 2018–2022 is the second action plan that follows the implementation of the first National Nutrition Action Plan 2012–2017 and builds on the success, limitations and opportunities of the past five years. The development was comprised of a comprehensive review of the previous NNAP 2012-2017 and a further consolidation of findings conducted through participatory and consultative writing workshops.
1.4.1. REVIEW OF THE NNAP 2012-2017
Implementation of the first NNAP 2012–2017 was associated with significant progress in addressing the problem of malnutrition. At that time the country was focused on achieving the Millennium Development Goals (2015), whose nutrition goal was to halve the prevalence of underweight in children under the age of five years. Kenya’s MDG nutrition target was to reduce the prevalence of underweight from 22 per cent to 11 per cent, a goal that was achieved. Although no formal evaluation of the NNAP was carried out, a formal review11 was done in May–December 2017. This review indicated a good enabling environment, which was critical in the improvement in nutrition indicators over the period. Improvements were noted in the form of stunting reduction, improved rates of exclusive breastfeeding (EBF) and a general improvement in micronutrient status for children 6–59 months. The NNAP 2012–2017 was also credited with providing an enabling environment for capacity development, coordination and collaboration; and increased financing for nutrition interventions both at national and county levels, coupled with notable support from donors, UN agencies and implementing partners. Scaling up nutrition messages to improve knowledge, attitudes and practices was also a key highlight over the period.
1.4.2. CHALLENGES IN IMPLEMENTATION OF NNAP 2012-2017
Technical capacity gaps: this was in relation to number and skills mix of nutrition staff especially in specialized areas such as clinical nutrition and dietetics, as well as Information and Communication Technology (ICT) limitations and connectivity.
Structural capacity gaps: related to distance and access to services, community health strategy not well developed, poor archiving of data and information, programmes not at scale.
Financing gaps: high cost of nutrition commodities and equipment, inadequate long-term financing with more emergency-oriented funding from government for short-term actions.
Coordination and Leadership gaps: low involvement of other sectors and limited linkages; for example, regulatory environmental challenges, advertisements for unhealthy foods.
1.4.3. RECOMMENDATIONS OF NNAP 2012-2017
The review in summary recommended a strong focus for the new KNAP on key issues that include:
• Strengthen policy coherence across sectors. • Strengthen financing for nutrition. • Multisectoral coordination and collaboration: including strengthening governance and leadership for
nutrition across sectors. • Enhance advocacy, communication and social mobilization for nutrition at all levels. • Enhance and scale up monitoring and evaluation systems for nutrition at national and county levels. • Strengthen capacity development initiatives including infrastructure, products and technologies,
commodities, HR management, internships, technical trainings including specialization.• Strengthen partnerships and collaboration with private sector. • Enhance systems for evidence generation, knowledge management and utilization. • Enhance and scale up population-level nutrition awareness initiatives (ensuring life-course approach is
implemented). • Enhance and strengthen regulatory and compliance monitoring for nutrition commodities and allied
products.
11Government of Kenya, Nutrition International and UNICEF (2017): , National Nutrition Action Plan (NNAP) 2012–2017. Implementation Review Report. December 2017

THE KENYA NUTRITION ACTION PLAN (KNAP) | 2018 – 2022 Improved Nutrition For All
8
J A N – A P R I L
- Editing and Proof reading of KNAP- Designing of KNAP- Developing of KNAP Popular Version- Development and Dissemination of CNAPs Operational Guidelines - Sensitization of Principal Secretaries and Directors in relevant sectors
2019
M A Y – J U N E
2018Road map developed; Thematic groups constituted, Secretariat formed; TORs defined; Consultancy areas identified; TORs for consultants developed and adverts sent out. KNAP is part of GoK/MoH RRI; Groups meeting and thematic areas identified. County Matrices developed
F E B – A P R I L
2018
Review of NNAP 2012-2017 commissioned
D E C
2016
J U N E - D E C
2018
J A N
2018
M A Y – D E C
2017
KNAP drafts developed; KNAP draft reviewed by various multi-stake-holder consultative fora which included: sector ministries, counties, Donors, NGOs, CSOs and private sector. KNAP validated and finalized.
KNAP – Consultative Forum with Counties and County matrices
developed. Development of a listing and links for key KNAP
resource documents
Review of NNAP done identifying lessons for new KNAP
Development of KNAP 2018-2022 commissioned
Figure 2: A Snapshot of the key milestones during the development of the KNAP 2018-2022

THE KENYA NUTRITION ACTION PLAN (KNAP) | 2018 – 2022 Improved Nutrition For All
9
1.4.4. DEVELOPMENT OF KNAP 2018-2022
The process was driven by government, specifically the Nutrition and Dietetics Unit (NDU) of the Ministry of Health, and was widely consultative, involving all key nutrition stakeholders through a multisectoral process that was open, inclusive and built on existing and emerging alliances, institutions and initiatives. At the national level key nutrition-sensitive sectors, development partners, civil society organizations, NGOs and the private sector participated in the process. At the sub-national level, all counties were involved. The process ensured that the plan is evidence-informed and recognized successes, challenges and lessons learnt from the implementation of the 2012–2017 NNAP. The process also ensured that the KNAP is results-based and provides for a common results and accountability framework for performance-based M&E. Evidence was gathered through desk reviews of relevant documents and information from key sectors.
1.5. TARGET AUDIENCE FOR THE KNAP
While many constituencies will benefit from the KNAP, the target audience includes health care planners and policy makers at both national and county level, global and national decision makers, nutrition-sensitive sectors, nutrition officers and managers at all levels, donors, development partners, NGOs, civil society organizations, faith-based organizations, the private sector, academia, research institutions, the media and the Kenyan public at large. This will enable them to understand what the government is doing to ensure optimal nutrition for all Kenyans and what they can do individually to contribute to the effort.

THE KENYA NUTRITION ACTION PLAN (KNAP) | 2018 – 2022 Improved Nutrition For All
10
02 Source: MOH

THE KENYA NUTRITION ACTION PLAN (KNAP) | 2018 – 2022 Improved Nutrition For All
11
2.1. INTRODUCTION
The KNAP addresses the triple burden of malnutrition in Kenya, characterized by the coexistence of undernutrition as manifested by stunting,12 wasting,13 underweight,14 micronutrient deficiencies,15 and overweight and obesity16 including diet-related non-communicable diseases (DRNCD).17 All three forms of malnutrition occur within individuals, households and populations throughout the life course – pregnant women, children, adolescents, adults and older persons – throughout the country at different levels of public health significance. Undernutrition, including micronutrient deficiencies, affects mainly children and women especially during the first 1,000 days of life due to their high nutrient requirement, while obesity and DRNCDs affect mainly women of reproductive age and adults in general. Because of the ageing of body organs and systems, older persons too are at a very high risk of malnutrition.
2.2. THE GLOBAL CONTEXT
Globally, at least one in three people is experiencing malnutrition in some form or another. Almost every country in the world is facing a serious nutrition-related challenge – in the form of undernutrition, micronutrient deficiencies or overweight/obesity and DRNCDs, or a triple burden of all forms. The 2018 Global Nutrition Report (GNR)18 estimates that 150.8 million children under the age of five (22.2 per cent) are stunted; 50.5 million children (7.4 per cent) are wasted. The anaemia prevalence in girls and women of reproductive age remains high at 32.8 per cent, having increased from 31.6 in 2000. Slightly over two billion adults are overweight, of whom 678 million are obese; and 38.3 million children are overweight. 3.62 per cent of children under five (15.95 million children) are both stunted and wasted, while 1.87 per cent of under-fives globally (8.23 million children) experience both stunting and overweight. Countries are struggling with multiple forms of malnutrition. Of the 141 countries analysed, 88 per cent (124 countries) experience more than one form of malnutrition, with 29 per cent (41 countries) having high levels of all three forms of malnutrition. None of the countries featured in the report is on track to achieve obesity and anaemia global targets. It is estimated that the total cost of malnutrition is about USD 3.5 trillion per year.19
12Stunting, also called chronic malnutrition, is defined as low height-for-age (H/A); that is, below minus 2 standard deviation (SD) against internationally agreed WHO standards.13Wasting, also called acute malnutrition is defined as low weight-for-height (W/H) that is below minus 2 standard deviation (SD) against internationally agreed WHO standards.14Underweight is defined as low weight-for-age (W/A); that is, below minus 2 standard deviation (SD) against internationally agreed WHO standards. It is a combined measure of stunting and wasting.15This includes the prevalence of deficiencies for given micronutrients including vitamin A deficiency (VAD); iodine deficiency disorders (IDD); anaemia and zinc deficiency. 16Overweight and obesity in adults are defined as excessive weight in relation to the height as measured by the body mass index (BMI), calculated as weight (W) in kg divided by the square of the height (H) in metres (W/H2). A BMI of <18.5 is defined as underweight for women; <20 is underweight for men; 20-<25 is normal for both sexes; 25-<30 is overweight and 30 and above is defined as obese for both sexes. The BMI of mothers can be used as a measure of household food security since mothers will always prioritize children when food is scarce.17DRNCDs include type 2 diabetes, hypertension, cardiovascular diseases, osteoporosis, dental diseases and several forms of cancers.18Global Nutrition Report, 2018, https://globalnutritionreport.org/reports/global-nutrition-report-2018/19Global Panel on Agriculture and Food Systems for Nutrition; 2016
02 KENYA NUTRITION SITUATION ANALYSIS
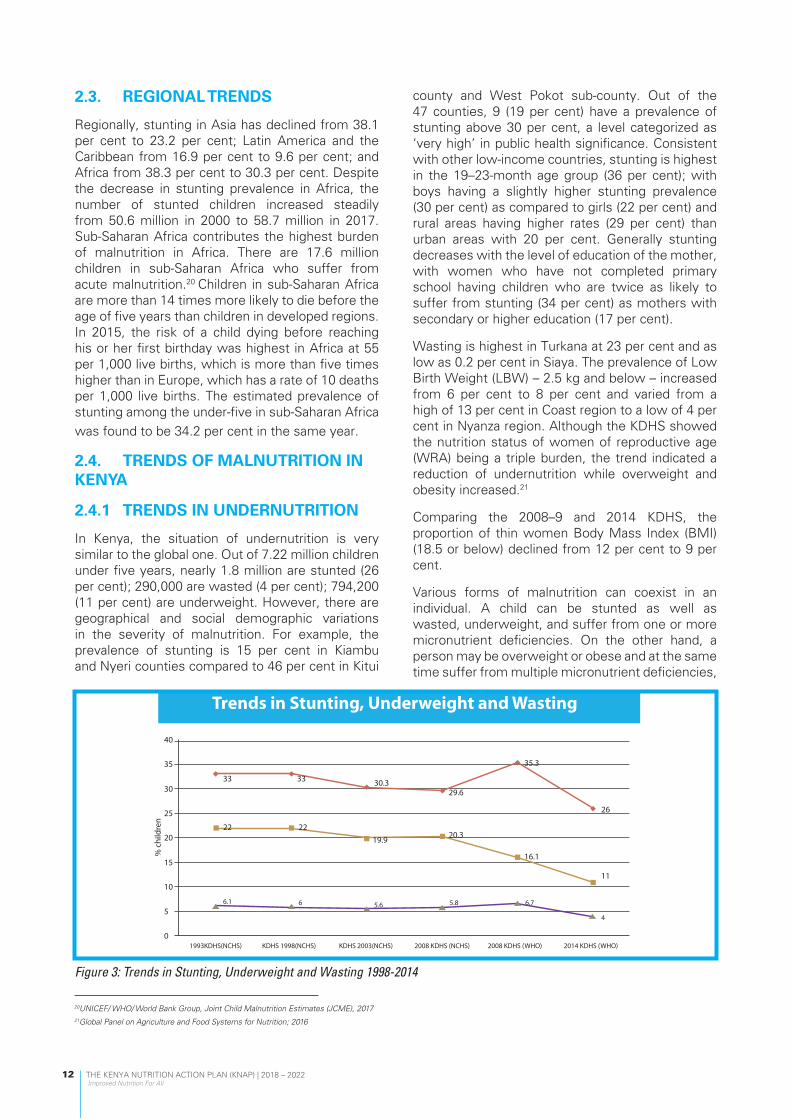
THE KENYA NUTRITION ACTION PLAN (KNAP) | 2018 – 2022 Improved Nutrition For All
12
2.3. REGIONAL TRENDS
Regionally, stunting in Asia has declined from 38.1 per cent to 23.2 per cent; Latin America and the Caribbean from 16.9 per cent to 9.6 per cent; and Africa from 38.3 per cent to 30.3 per cent. Despite the decrease in stunting prevalence in Africa, the number of stunted children increased steadily from 50.6 million in 2000 to 58.7 million in 2017. Sub-Saharan Africa contributes the highest burden of malnutrition in Africa. There are 17.6 million children in sub-Saharan Africa who suffer from acute malnutrition.20 Children in sub-Saharan Africa are more than 14 times more likely to die before the age of five years than children in developed regions. In 2015, the risk of a child dying before reaching his or her first birthday was highest in Africa at 55 per 1,000 live births, which is more than five times higher than in Europe, which has a rate of 10 deaths per 1,000 live births. The estimated prevalence of stunting among the under-five in sub-Saharan Africa was found to be 34.2 per cent in the same year.
2.4. TRENDS OF MALNUTRITION IN KENYA
2.4.1 TRENDS IN UNDERNUTRITION
In Kenya, the situation of undernutrition is very similar to the global one. Out of 7.22 million children under five years, nearly 1.8 million are stunted (26 per cent); 290,000 are wasted (4 per cent); 794,200 (11 per cent) are underweight. However, there are geographical and social demographic variations in the severity of malnutrition. For example, the prevalence of stunting is 15 per cent in Kiambu and Nyeri counties compared to 46 per cent in Kitui
county and West Pokot sub-county. Out of the 47 counties, 9 (19 per cent) have a prevalence of stunting above 30 per cent, a level categorized as ‘very high’ in public health significance. Consistent with other low-income countries, stunting is highest in the 19–23-month age group (36 per cent); with boys having a slightly higher stunting prevalence (30 per cent) as compared to girls (22 per cent) and rural areas having higher rates (29 per cent) than urban areas with 20 per cent. Generally stunting decreases with the level of education of the mother, with women who have not completed primary school having children who are twice as likely to suffer from stunting (34 per cent) as mothers with secondary or higher education (17 per cent).
Wasting is highest in Turkana at 23 per cent and as low as 0.2 per cent in Siaya. The prevalence of Low Birth Weight (LBW) – 2.5 kg and below – increased from 6 per cent to 8 per cent and varied from a high of 13 per cent in Coast region to a low of 4 per cent in Nyanza region. Although the KDHS showed the nutrition status of women of reproductive age (WRA) being a triple burden, the trend indicated a reduction of undernutrition while overweight and obesity increased.21
Comparing the 2008–9 and 2014 KDHS, the proportion of thin women Body Mass Index (BMI) (18.5 or below) declined from 12 per cent to 9 per cent.
Various forms of malnutrition can coexist in an individual. A child can be stunted as well as wasted, underweight, and suffer from one or more micronutrient deficiencies. On the other hand, a person may be overweight or obese and at the same time suffer from multiple micronutrient deficiencies,
Figure 3: Trends in Stunting, Underweight and Wasting 1998-2014
20UNICEF/ WHO/ World Bank Group, Joint Child Malnutrition Estimates (JCME), 2017 21Global Panel on Agriculture and Food Systems for Nutrition; 2016
40
35
% c
hild
ren
30
25
20
15
10
56.1 6 5.6 5.8 6.7
4
11
16.1
20.3
33 30.329.6
35.3
26
01993KDHS(NCHS) KDHS 1998(NCHS) KDHS 2003(NCHS) 2008 KDHS (NCHS)
Stunting
Trends in Stunting, Underweight and Wasting
Underweight Wasting
2008 KDHS (WHO) 2014 KDHS (WHO)
2219.9
22
33

THE KENYA NUTRITION ACTION PLAN (KNAP) | 2018 – 2022 Improved Nutrition For All
13
for example iron, iodine, zinc or folic acid.
Figure 4: Regional disparities between counties for Underweight
Table 2: Summary of key trends in malnutrition in Kenya <5 children (KDHS 2008/09 & 2014)
Stunting (chronic malnutrition) 1. Decreased by 9 per cent, from 35 per cent to 26 per cent, which is an annual reduction rate (ARR)
of 1.8 per cent. NNAP 2012-2017 target of 16 per cent was not met.2. Severe stunting (<3SD) decreased from 14 per cent to 8 per cent, a reduction of 6 percentage
points, which is an AAR of 1.2 per cent. 3. The peak level of stunting is found in children in the 18–23 months age group (36 per cent) and
boys are more affected (30 per cent) than girls (22 per cent).
Wasting (acute malnutrition) 1. Decreased by 3 per cent from 7 per cent to 4 per cent. Severe acute malnutrition declined from 2
per cent to 1 per cent. Thus, acute malnutrition declined overall by half.2. The current level of 4 per cent wasting means Kenya has achieved the WHA 2025 target of 5 per
cent and below. 3. Acute malnutrition was higher (9 per cent) among children of thin mothers (BMI of 18.5 or below)
than among other children with mothers of higher BMI. 4. Acute malnutrition tends to be concentrated in the ASAL counties, though it exists at lower levels
in all counties.
Underweight1. Declined by 5 percentage points from 16 per cent to 11 per cent. This level indicates Kenya met
the MDG target of halving the prevalence from the early 1990s of 22 per cent.
2. Peak level of underweight is in children older than 12 months.
3. Boys are slightly more affected by underweight (12 per cent) than girls (10 per cent).
4. The prevalence of underweight is higher among children with thin mothers (24 per cent) than children with mothers with a higher BMI (11 per cent).
45
24.9
30.1
38.5
5.6 5.12.5
Prev
alen
ce (%
)
40
35
30
25
20
Mandera
Proportion of Children <5 years Underweight
Marsabit West Pokot Muranga Kiambu Nyeri24.9Series 1 30.1 38.5 5.6 5.1 2.5
15
10
5
0

THE KENYA NUTRITION ACTION PLAN (KNAP) | 2018 – 2022 Improved Nutrition For All
14
1 2
Low birth weight1. The prevalence of low birthweight (LBW) of 2.5kg and below increased from 6 per cent to 8 per
cent and varied from a high of 13 per cent in Coast region to a low of 4 per cent in Nyanza region. 2. Children who were born with low birthweight (reported by mothers as very small) had a higher
prevalence of stunting (43 per cent) than among those who were larger at birth (24 per cent).
Drivers of nutrition trendsThere are multiple drivers of the positive trends for stunting, wasting and underweight. They include:
1. Scaling up of a package of high impact interventions within the health system;2. Scaling up nutrition sensitive interventions3. Renewed focus on community-based programming for behavioural change; 4. Improved environment for nutrition including better policies and strategies, better nutrition
governance, Gross Domestic Product (GDP) growth, and resilience programming, among others.5. However, note disparities in relation to geography, urban/rural, education level, household wealth
and gender (boys are slightly more affected by all forms of malnutrition than girls).
(KDHS 2008/09 & 2014)
Figure 5: Map of the distribution of Stunting (1) and Wasting (2) in Kenya (KDHS 2014)

THE KENYA NUTRITION ACTION PLAN (KNAP) | 2018 – 2022 Improved Nutrition For All
15
2.4.2 TRENDS IN OVERWEIGHT, OBESITY AND DIET-RELATED NON-COMMUNICABLE DISEASES (DRNCDS)
The Kenya 2015 STEPwise Survey22 confirmed an increasing rate of overweight/obesity and diet-related non-communicable diseases (DRNCDs) in adults. A total of 28 per cent of adults aged 18–69 years were either overweight or obese, with the prevalence in women being 38.5 per cent and men 17.5 per cent. Similar trends are seen when comparing the 2008–2014 KDHS. The proportion of women who were overweight or obese increased from 25 per cent to 33 per cent and those who were obese increased from 7 per cent to 10 per cent. The prevalence of overweight or obesity is higher in urban areas (43 per cent) than in rural areas (26 per cent); in women with higher education (38 per cent) than with low education (18 per cent); and higher in women in the highest wealth quintile (50 per cent) compared with those in the lowest wealth quintile (12 per cent). Areas with high prevalence of overweight/obesity were Nyeri, Kirinyaga and Mombasa, where almost half of the women of reproductive age (WRA) were affected.
2.4.3 TRENDS IN MICRONUTRIENT DEFICIENCIES
According to the Kenya National Micronutrient Survey of 201123 significant progress is being made in reducing the prevalence of micronutrient deficiencies, except for zinc deficiency. The prevalence of anaemia was highest in pregnant women (41.6 per cent), followed by children 6–59 months (26.3 per cent), school–age children (5–14
years) at 16.5 per cent. The prevalence of iron deficiency was 21.8 per cent, 9.4 per cent and 36.1 per cent in the same groups respectively. The prevalence of other types of nutritional anaemia, such as folic acid and vitamin B12 deficiency, was at 31.5 per cent and 47.7 per cent respectively among non-pregnant women aged 15–19 years. The prevalence of vitamin A deficiency among children 6–59 months was 9.2 per cent. Iodine deficiency disorders (IDD) are the most common cause of brain damage, which can easily be prevented by Universal Salt Iodization (USI) programmes. The prevalence of iodine deficiency in pre-school and non-pregnant women was 22.1 per cent and 25.6 per cent respectively24.
However, the prevalence of zinc deficiency was high across the population, averaging at about 70 per cent, with pre-school children being 81.6 per cent, school-age children 79.0 per cent, pregnant women 67.9 per cent and non-pregnant women 79.9 per cent. Zinc is a vital trace element with many health benefits.25 Deficiency in children can lead to growth impediments and an increased risk of infection. There are other micronutrients of public health concern demonstrated by disease conditions that have been observed; these include calcium, vitamin D, vitamin B12 and omega 3, especially for older persons and the general population.
About 12 per cent of adolescent girls (15–19 years) are overweight or obese (BMI >25) and close to 17 per cent are underweight (BMI <18.5).26 Eighteen per cent of adolescent girls (15–19 years) get pregnant, leading to a further increase in demand for nutrients during this period.
22Ministry of Health, Kenya, STEPwise Survey for Non-communicable Diseases Risk Factors, Nairobi, 201523Ministry of Health; Kenya National Micronutrient Survey ; 201124Ministry of Health, Kenya National Micronutrient Survey, Nairobi, 2011 25Joseph Nordqvist (2017): What are the health benefits of zinc? NEWSLETTER Medical News Today. https://www.medicalnewstoday.com/articles/263176.php 26Kenya National Bureau of Statistics, KDHS 2014, Nairobi, 2015
0
1
2
3
4
5
66 6
5
4
7
Proportion of Children Overweight
Overweight
1998 KDHS 2003 KDHS 2008-09 KDHS 2014 KDHS
Figure 6: Trends in overweight/obesity in Kenyan children under-five years 1998-2014 (KDHS 2014)

THE KENYA NUTRITION ACTION PLAN (KNAP) | 2018 – 2022 Improved Nutrition For All
16
2.4.4 TRENDS IN FEEDING PRACTICES AMONG CHILDREN AND ADULTS
Exclusive breastfeeding is recommended during the first six months of life because breast milk contains all the nutrients required for development, growth and child survival. Exclusive breastfeeding rates in Kenya have markedly improved from 32 per cent in 2008–9 to 61 per cent in 2014.27 It is recommended that infants be initiated to breastfeeding within one hour after delivery. According to the Lancet 2016 this can save 22 per cent and 16 per cent of neonatal deaths within the first hour of birth and 48 hours respectively. In Kenya, trends in early initiation of breastfeeding show an increase from 58 per cent in 2008–9 to 62 per cent in 2014.28
Timely, adequate and safe introduction of complementary foods is critical at six months when breast milk alone is no longer sufficient to meet the nutritional requirements of infants and young children. The 2014 KDHS found that 81 per cent of breastfed children aged 6–9 months received complementary foods in addition to breastfeeding, indicating timely complementary feeding. However, only 22 per cent of children aged 6 to 23 months consume a minimum acceptable diet, indicating a dire nutritional situation in this age group. Furthermore, 49 per cent of children aged 6 to 23 months do not consume the minimum required number of meals per day, while 59 per cent do not consume an adequately diversified diet indicating restriction in access to quality diets.29
According to the 2015 STEPwise Survey, 95 per cent of adults aged 18–69 years did not consume
the WHO daily recommended five servings of fruits and/or vegetables; fruits were consumed on average about 2.4 days in a week, and vegetables were consumed five days in a week.30 Approximately 20 per cent of adults in this group add salt or salty sauce to their food before eating; 3.7 per cent consume processed foods high in salt; 83.5 per cent often add sugar when cooking or preparing beverages at home; and 28 per cent always add sugar to beverages. The proportion of Kenyans who use oil is higher (59.1 per cent) than that of those who use vegetable fat (38.5 per cent). About 6.5 per cent do not engage in the WHO recommended level of physical activity.31
2.4.5 MORTALITY TRENDS
Nutrition is an underlying cause of mortality and it contributes to one third of child deaths. All childhood mortality rates declined between 2003 and 2014 KDHS surveys, with neonatal mortality rates (NMR) exhibiting the slowest rate of decline. The 2014 infant mortality rate (IMR) of 39 deaths per 1,000 live births, and Under-Five Mortality Rate (U5MR) of 52 deaths per 1,000 live births, means that about one in every 26 Kenyan children dies before reaching their first birthday, and about one in every 19 does not survive to their fifth birthday. The highest U5MR is seen in Nyanza (82/1,000 live births) and Nairobi (72/1,000 livebirths) and lowest in the Central region (42/1,000 live births). The high levels of maternal deaths in Kenya are also related to nutrition. The 2014 KDHS calculated the maternal mortality ratio (MMR) for Kenya to be 362 deaths per 100,000 live births, having fallen from 520 deaths per 100,000 live births since the 2008/09
33 31 22
115
77
52
74
52
39
KDHS 2003 KDHS 2008-09
KDHS YEARS
NMR IMR U5MR
KDHS 2014
Figure 7: Childhood mortality trends in Kenya, 2003-2014
27Kenya National Bureau of Statistics, KDHS 2014, Nairobi, 201528Kenya National Bureau of Statistics, KDHS 2014, Nairobi, 201529Ibid.30Ministry of Health, Kenya, STEPwise Survey for Non-communicable Diseases Risk Factors, Nairobi, 201531WHO, Global Recommendations for Physical Activity for Health, 2010

THE KENYA NUTRITION ACTION PLAN (KNAP) | 2018 – 2022 Improved Nutrition For All
17
KDHS. While hypertension and haemorrhage are the common direct causes of death among pregnant women, HIV and complications of unsafe abortion are common indirect causes of death. These problems are exacerbated by poor health infrastructure, low rates of skilled birth attendance, low access to family planning services, high rates of adolescent pregnancy and nutrition-related risk factors like anaemia and childhood stunting causing obstructed labour.
2.4.6 MORBIDITY TRENDS
There has been progress in addressing communicable diseases, which precipitate undernutrition. Progress in immunization and towards controlling and managing malaria, diarrhea, acute respiratory diseases, pneumonia and worms are particularly noteworthy given their major direct impact on undernutrition and micronutrient deficiencies. However, major challenges remain leading to an epidemiological and nutrition transition that is characterized by the coexistence of declining levels of communicable diseases and undernutrition, while the problem of non-communicable diseases and over nutrition are increasing. The KDHS 2014 shows 15 percent of children under five had episodes of
diarrhea, while 9 percent recorded incidences of Acute Respiratory Infections.
Despite the progress, the country continues to register a high burden of disease with an average daily outpatient attendance of 151,223 people, which is a monthly average of 4,536,690 people seeking medical care in government facilities alone. Non-communicable diseases account for more than 50 percent of bed occupancy in hospitals and are responsible for 27 percent of total deaths. The country also still faces a significant burden of communicable diseases such as malaria, TB and HIV and AIDS. Malaria account for 18 percent of outpatient and 6 percent of admissions District Health Information System (DHIS).
The burden of HIV in Kenya has been on a modest decline since 2010 with the adult HIV prevalence rate estimated at 4.9 per cent (women 5.2 per cent and men 4.5 per cent) in 2017. Annual HIV incidences number approximately 52,800; 44,800 among adults aged 15+ years and 8,000 among children aged <14 years. HIV prevalence varies geographically, ranging from a prevalence of 21.0 per cent in Siaya County to approximately 0.1 per cent in Wajir County.
Causes of Deaths (Number)
Pneumonia
Malaria
Cancer
Tuberclosis
HIV/AIDS
Anaemia
Heart disease
Other accidents
Road traffic accidents
Menengitis
0 5,000 10,000 15,000 20,000 25,000
Of the estimated total new infections (52,800) in 2017, Nairobi contributed 7,159 new infections, Homa Bay 4,558, Kisumu 4,012, Siaya 4,039 and Migori 2,814 (see Appendix 3). Together these counties contributed about 43 per cent of the estimated total new infections and 38.0 per cent of the new infections among children in 2017. The number of adults aged 15+ in of need of ART is estimated at 1,338,200, while the ART needs among children (0–14) stands at 105,200. The number of HIV-positive pregnant women in need of PMTCT services declined from 73,800 in 2010 to approximately 69,500 in 2017. The decrease in the number of HIV-positive pregnant women is likely to be a function of several factors; reduced transmission (incidence) in young women leading to an ageing of the HIV-infected population into lower-fertility age groups and perhaps increased knowledge of status leading to better fertility choices.
Therapeutic nutrition interventions in disease, comorbidities and related conditions have been shown to reduce the hospital length of stay, overall medical costs, and avert preventable morbidities and mortalities. They
Figure 8: Main Causes of Death in Kenya 2017 (Source: KNBS (2018), Economic Survey)

THE KENYA NUTRITION ACTION PLAN (KNAP) | 2018 – 2022 Improved Nutrition For All
18
also improve the quality of life and better health outcomes in disease treatment. High incidence of both communicable and non-communicable diseases increases the individual and population needs for nutrients and are a major cause of malnutrition. Figure 8 shows the main causes of death in Kenya.
2.5. TRENDS IN ACCESS TO FOOD, CARE AND HEALTH SERVICES
Kenya experiences a 20–30 per cent deficit in staple food every year and is increasingly dependent on food imports (30–40 per cent) to bridge the national deficit.32 Although trends in household food security (availability, accessibility and stability) have generally improved over the last three decades, and economic growth has been generally positive, food insecurity persists due to the stagnation of agricultural production, low use of agricultural technology, high food prices, frequent disasters and the effects of climate change on the mainly rain-fed agriculture and an overreliance on pastoral livelihoods, especially in the Northern frontier counties. The food security situation is further affected by seasonality, with rapid deterioration during drought years resulting in emergency levels of acute malnutrition. Kenya has also been facing challenges related to crop infestation, as seen with the fall army worm outbreak of 2016/2017 and maize
lethal necrosis affecting major bread baskets in the country. Market access has shown variation across the country to be due to several issues such as poor security, poor coverage of infrastructure, trade and fiscal policies, and emergency events, among other things. The KDHS 201433 shows that 95 per cent of households had access to salt, of which 99.5 per cent was iodated. The proportion of households consuming iodized salt was over 95 per cent in all counties except Lamu, which was at 89 per cent. Thus, Kenya has achieved universal salt iodization (USI) where the coverage cut-off point is 90 per cent and above. Sustaining the momentum on iodization remains critical for the country.
The KDHS 2014 indicated that only 44.5 per cent of households treated their water using an appropriate treatment method, however 54 per cent of households did not treat their water before consumption. Approximately two thirds of Kenyans (66 per cent) normally use non-improved toilet facilities. A handwashing station with soap and water was observed in only 49.5 per cent of households.
The government has put in place initiatives to accelerate the provision of health care. These include free maternity services (over one million mothers get free services when delivering), and removal of user fees where about 45 million outpatient services are provided annually. The health insurance subsidy
Figure 9: KNAP Conceptual framework for the triple burden of malnutrition
32National Food and Nutrition Security Policy Implementation Framework 2017–202233Kenya National Bureau of Statistics, KDHS 2014, Nairobi, 2015
Figure 9: KNAP Conceptual framework for the triple burden of malnutrition
32National Food and Nutrition Security Policy Implementation Framework 2017–202233Kenya National Bureau of Statistics, KDHS 2014, Nairobi, 2015

34Kenya National Bureau of Statistics, KDHS 2014, Nairobi, 2015
THE KENYA NUTRITION ACTION PLAN (KNAP) | 2018 – 2022 Improved Nutrition For All
19
programme and medical support for the elderly and people with severe disability have benefited about 181,000 households and 42,000 people respectively. Moreover, eight hospitals have been equipped with diagnostic equipment. According to the 2014 KDHS,34 57.6 per cent of women attended at least four antenatal care (ANC) services and 31.3 per cent took deworming medication. With regard to micronutrient supplementation, 72 per cent of children aged 6–59 months received vitamin A and 8 per cent of pregnant women received iron and folic acid supplementation for 90 days or more. Hospital delivery remains a challenge as 39 per cent of women still do not deliver in health facilities. Hospital delivery in urban areas is significantly higher (50.5 per cent) than in rural areas (17.9 per cent). Only 74 per cent of children aged 12–23 months are fully immunized, falling short of the 80 per cent required to achieve ‘herd immunity’.
2.6. NUTRITION ACTIONS IN THE NATIONAL DEVELOPMENT CONTEXT
The government has put efforts to build self-reliance to reduce chronic food insecurity. Due to the multisectoral nature of nutrition, coordination structures were set up through the Nutrition Interagency Coordinating Committee (NICC) and programme based technical working groups. This has ensured nutrition actions and efforts are anchored in various legal and policy documents. In addition, Kenya has enacted legislations that include mandatory fortification of wheat flour, maize flour, edible oil and fats with essential micronutrients.
Wheat and maize flour are fortified with Iron (Fe), Zinc (Zn), Folic acid, Vitamin A, B1, B2, B3, B6 and B12, while edible oils/fats are fortified with vitamin A to improve their nutritional quality and to provide a public health benefit with minimal risk to health. To protect and promote breastfeeding, Kenya enacted the Breastmilk Substitutes (Regulation and Control) Act 2012, which regulates the marketing and promotion of breast milk substitutes and designated products.
2.7. CONCEPTUAL FRAMEWORK FOR ADDRESSING MALNUTRITION IN ALL ITS FORMS
The KNAP adopts a conceptual framework that addresses the immediate, underlying and basic determinants of malnutrition. The immediate determinants are food intake and diseases, and the underlying determinants are food, health and care practices. The underlying causes are themselves determined by more structural basic or root causes which can be categorized as political, economic, social, cultural and technological. In general, nutrition-specific interventions address the manifestation and immediate causes; nutrition-sensitive interventions address the underlying causes; and enabling environment interventions address the basic or root causes of malnutrition. Nutrition is not a domain of one ministry or discipline but a multisectoral and multi-disciplinary issue that has many ramifications from the individual, household, community and national levels to global levels.

THE KENYA NUTRITION ACTION PLAN (KNAP) | 2018 – 2022 Improved Nutrition For All
20
The KNAP also addresses a strategy that ensures the problem of malnutrition is adequately assessed in its extent and nature, its determinants are analysed as to their contribution in terms of their depth and relationship, and possible solutions are developed. Actions are taken based on the analysis and monitoring and evaluation (M&E) is done throughout the process to ensure that actions are tracked and adjustments made where required, resulting in a cyclic process of assessment, analysis and action (triple A process). Key enablers throughout the process include advocacy, leadership and results-based management. and action (triple A process). Key enablers throughout the process include advocacy, leadership and results-based management.
Figure 10: The triple A cyclic process of Assessment, Analysis, and ActionFigure 10: The triple A cyclic process of Assessment, Analysis, and Action

THE KENYA NUTRITION ACTION PLAN (KNAP) | 2018 – 2022 Improved Nutrition For All
21
03

THE KENYA NUTRITION ACTION PLAN (KNAP) | 2018 – 2022 Improved Nutrition For All
22
3.1 RATIONALE
The second Kenya National Nutrition Action Plan was developed to further accelerate and scale up efforts towards the elimination of malnutrition as a problem of public health significance in Kenya by 2030, focusing on specific achievements by 2022. The three basic rationales for the action plan are: (a) the health consequences – improved nutrition status leads to a healthier population and enhanced quality of life; (b) economic consequences – improved nutrition and health is the foundation for rapid economic growth; and (c) the ethical argument – optimal nutrition is a human right.
There is overwhelming evidence that improving nutrition contributes to economic productivity and development and poverty reduction by improving physical work capacity, mental capacity and school performance. Improving nutrition is tremendous value for money as it reduces the costs related to lost productivity and health care expenditures. Globally, it is estimated that each dollar spent on nutrition delivers between USD 8 and USD 138, which is a cost–benefit ratio of around 1:17, similar to that of infrastructure development like roads, railways and electricity. Table 3 shows the cost–benefit ratios of different nutrition intervention programmes.
35Eberwein, Julia Dayton; Kakietek, Jakub; de Beni, Davide; Moloney, Grainne; Pereira, Audrey; Akuoku, Jonathan Kweku; Volege, Marjorie; Matu, Sicily; Shekar, Meera (2016). An Investment Framework for Nutrition in Kenya: Reducing Stunting and Other Forms of Child Malnutrition. Health, Nutrition and Population Discussion Paper. World Bank, Washington, DC. © World Bank. https://openknowledge.worldbank.org/handle/10986/26282
03 THE KENYA NUTRITION ACTION PLAN DESIGN FRAMEWORK
Table 3: The cost-benefit of various nutrition programsNutrition intervention programs Cost-benefit (US$) Cost-benefit ratio
Breastfeeding promotion in health facilities
5 - 67 1:13
Integrated child care programs 9 - 16 1:1.8
Iodine supplementation (women) 15 - 520 1:35
Vitamin A supplementation (children <6 years)
4 - 43 1:11
Iron fortification (per capita) 176 - 200 1:1.4
Iron supplementation (per pregnant woman)
6 - 14 1:2.3
Source: World Bank, Why invest in nutrition?, 2016
A cost–benefit analysis conducted in Kenya in 2016 by UNICEF, the World Bank and Ministry of Health35 reported that every USD1 invested in scaling up high-impact nutrition interventions has the potential return of USD22, higher than the global estimates of USD16–18. The study was done to help guide the selection of the most cost-effective interventions as well as strategies for scaling up a package of interventions tailored to Kenya’s specific needs, as done in this KNAP. The study considered high-impact nutrition-specific interventions that largely rely on typical health sector delivery mechanisms. There are 11 high-impact interventions that have been prioritized in the KNAP. It is estimated that the costs and benefits of implementing these 11 critical nutrition-specific interventions36 will avert more than 455,000 disability adjusted life years (DALYs) annually, save over 5,000 lives, and avert more than 700,000 cases of stunting among children under five.

THE KENYA NUTRITION ACTION PLAN (KNAP) | 2018 – 2022 Improved Nutrition For All
23
37Stunting also called chronic malnutrition is defined as low height-for-age (H/A) that is below minus 2 standard deviation (SD) against internationally agreed WHO standards.38Wasting also called acute malnutrition is defined as low weight-for-height (W/H) that is below minus 2 standard deviation (SD) against internationally agreed WHO standards.39Underweight is defined as low weight-for-age (W/A) that is below minus 2 standard deviation (SD) against internationally agreed WHO standards. It is a combined measure of stunting and wasting.40Low birthweight (LBW) is defined as a birth weight of 2.5kg and below. When the birth is appropriate for gestational age, the cause of LBW may be intrauterine growth retardation caused by maternal malnutrition. Premature births also result in LBW babies.41This includes the prevalence of deficiencies for given micronutrients including vitamin A deficiency (VAD); iodine deficiency disorders (IDD); anaemia and zinc deficiency.42Overweight and obesity in adults are defined as excessive weight in relation to the height as measured by the Body Mass Index (BMI), calculated as weight (W) in kg divided by the square of the height (H) in metres (W/H2). A BMI of <18.5 is defined as underweight for women; <20 is underweight for men; 20-<25 is normal for both sexes; 25-<30 is overweight and 30 and above is defined as obese for both sexes. The BMI of mothers can be used as a measure of household food security since mothers will always prioritize children when food is scarce.43DRNCD include type 2 diabetes, hypertension, cardiovascular diseases, osteoporosis, dental diseases and several forms of cancers.44WHO: Double-duty actions for nutrition. Policy Brief WHO/NMH/NHD/17.2
The 11 High-Impact Nutrition Interventions (HINI) were: (i) Promotion of good infant and young child nutrition and hygiene practices, (ii) vitamin A supplementation, (iii) therapeutic zinc supplementation with Oral Rehydration Salts (ORS), (iv) Multiple micronutrient powders for children, (v) deworming, (vi) iron-folic acid supplementation during pregnancy, (vii) iron fortification of staple foods, (viii) salt iodization, (ix) public provision of complementary food for the prevention of moderate acute malnutrition, (x) management of moderate acute malnutrition and (xi) treatment of severe acute malnutrition.
The KNAP addresses the triple burden of malnutrition in Kenya, characterized by (i) the coexistence of undernutrition as manifested by stunting,37
wasting,38 underweight39 and low birthweight40; (ii) micronutrient deficiencies41; and (iii) overweight and obesity42 and diet-related non-communicable diseases (DRNCD)43 and low physical activity. All three forms of malnutrition occur within individuals, households and populations throughout the life course – during pregnancy, and among children, adolescents, adults and older persons throughout the country at different levels of public health significance. Addressing all forms of malnutrition at all three levels of causation (immediate, underlying and basic) and simultaneously will increase the effectiveness and efficiency of investments of time, energy and resources to improve nutrition. Triple-duty actions have the potential to improve nutrition outcomes across the spectrum of malnutrition, through integrated initiatives, policies and programmes.44 The potential for triple-duty actions emerges from the shared drivers behind different forms of malnutrition, and from shared platforms that can be used to address these various forms. Examples of shared platforms for delivering triple-
duty actions include health systems, agriculture and food security systems, education systems, social protection systems, WASH systems and nutrition-sensitive policies, strategies and programmes.
3.2 THEORY OF CHANGE
Figure 11 depicts the results logic pyramid of the KNAP combining the theory of change and logic framework approaches. The results pyramid framework ensures results-based planning, budgeting, and implementation and performance M&E, and facilitates results-based management of the KNAP. The pathway of change for the KNAP is best defined using the theory of change. The ‘theory of change’ (ToC) is a specific type of methodology for planning, participation, and evaluation that is used to promote social change – in this case nutrition improvement.
To achieve the ultimate success of improved health and socio-economic development in Kenya, there are key assumptions and parameters that will be put in place in the KNAP. The theory of change was used to develop a set of result areas such that if certain inputs were in place, and certain activities implemented then a set of results would be realized and, if carried out at scale, contribute to improved nutritional status of all Kenyans.

Family planning/Child spacingCard
10
THE KENYA NUTRITION ACTION PLAN (KNAP) | 2018 – 2022 Improved Nutrition For All
25
3.3 VISION, MISSION AND GUIDING PRINCIPLES
CORE VALUES AND GUIDING PRINCIPLES• Professionalism• Integrity• Accountability • Partnership • Teamwork, collaboration• Innovativeness
• Ethics• Equity • Efficiency and effectiveness • Quality • Risk management • Sustainability and ownership
MissionTo reduce all forms of
malnutrition in Kenya using well-coordinated multisectoral and
community-centred approaches for optimal health of all Kenyans
and the country’s economic growth.
Vision A malnutrition free Kenya.
THE KENYA NUTRITION ACTION PLAN (KNAP) | 2018 – 2022 Improved Nutrition For All
24
Figure 11: Results Logical Pyramid of the KNAP
THE KENYA NUTRITION ACTION PLAN (KNAP) | 2018 – 2022 Improved Nutrition For All
24
Figure 11: Results Logical Pyramid of the KNAP

Family planning/Child spacingCard
10
THE KENYA NUTRITION ACTION PLAN (KNAP) | 2018 – 2022 Improved Nutrition For All
25
3.3 VISION, MISSION AND GUIDING PRINCIPLES
CORE VALUES AND GUIDING PRINCIPLES• Professionalism• Integrity• Accountability • Partnership • Teamwork, collaboration• Innovativeness
• Ethics• Equity • Efficiency and effectiveness • Quality • Risk management • Sustainability and ownership
MissionTo reduce all forms of
malnutrition in Kenya using well-coordinated multisectoral and
community-centred approaches for optimal health of all Kenyans
and the country’s economic growth.
Vision A malnutrition free Kenya.
THE KENYA NUTRITION ACTION PLAN (KNAP) | 2018 – 2022 Improved Nutrition For All
25
3.3 VISION, MISSION AND GUIDING PRINCIPLES
CORE VALUES AND GUIDING PRINCIPLES• Professionalism• Integrity• Accountability • Partnership • Teamwork, collaboration• Innovativeness
• Ethics• Equity • Efficiency and effectiveness • Quality • Risk management • Sustainability and ownership
MissionTo reduce all forms of
malnutrition in Kenya using well-coordinated multisectoral and
community-centred approaches for optimal health of all Kenyans
and the country’s economic growth.
Vision A malnutrition free Kenya.

THE KENYA NUTRITION ACTION PLAN (KNAP) | 2018 – 2022 Improved Nutrition For All
26
3.4 OBJECTIVE OF THE KNAP
The objective of the KNAP is to accelerate and scale up efforts towards the elimination of malnutrition in Kenya in line with Kenya’s Vision 2030 and sustainable development goals, focusing on specific achievements by 2022. The expected result or desired change for the KNAP is that ‘All Kenyans achieve optimal nutrition for a healthier and better quality of life and improved productivity for the country’s accelerated social and economic growth’.
3.5 KEY STRATEGIES
Key strategies that will be adopted for the implementation of the KNAP include:
• Life-course approach to nutrition programming: a holistic approach to nutrition issues for all population groups
• Coordination and partnerships: sectoral and multisectoral approaches to enhance programming across various levels and sectors, and within the SUN movement platforms
• Integration which takes into account the various platforms in place to deliver nutrition e.g. health centres and schools
• Capacity strengthening for implementation of nutrition services targeting service providers and related systems
• Advocacy, communication and social mobilization: acknowledging that nutrition improvements require political goodwill for increased investments and raising population-level awareness
• Equity and human rights • Resilience and risk-informed programming: focus on anticipating, planning and reducing disaster risks
to effectively protect persons, communities, livelihoods and health• Monitoring, evaluation, learning and accountability: promotion of use of the triple A (assessment,
analysis & action) cyclic process to provide feedback, learn lessons and adjust strategy as appropriate• Sustainability: empowerment for sustainability of results – the need to ensure predictable flow of
resources, develop technical and managerial capacity of implementers, motivate implementers, ensure vertical and horizontal linkages, and gradual exit when exiting an intervention.
The KNAP is further organized into three focus areas: Nutrition-specific, Nutrition-sensitive and Enabling environment. Within the three focus areas are a set of key results areas with corresponding outcomes, outputs, strategies, interventions and activities that are further costed and presented within an implementation matrix. A detailed monitoring, evaluation, accountability and learning framework (MEAL) is further developed and set targets put in place to measure the progress in implementation of the result areas over the five-year period over which the KNAP will be implemented. The MEAL framework further provides a summary of select results and indicators that will be mutually tracked and reported on by all sectors responsible for the implementation of the KNAP. The summary is referred to as the Common Results and Accountability Framework (CRAF). An institutional and legal framework for the KNAP and a risk mitigation plan are also included to strengthen governance for the KNAP over the period.

THE KENYA NUTRITION ACTION PLAN (KNAP) | 2018 – 2022 Improved Nutrition For All
27
04

THE KENYA NUTRITION ACTION PLAN (KNAP) | 2018 – 2022 Improved Nutrition For All
28
4.1 INTRODUCTION
The overall expected result or desired change for the KNAP is for all Kenyans to achieve optimal nutrition for a healthier and better quality life and improved productivity for the country’s accelerated social and economic growth. To achieve the expected result a total of 19 key result areas (KRAs) have been defined. The KRAs are categorized into three focus areas: (a) Nutrition-specific (b) Nutrition-sensitive and (c) Enabling environment. Within the three focus areas are a set of key result areas with corresponding outcomes, outputs, strategies, interventions and activities that are further costed and presented within an implementation matrix.
CATEGORY OF KRAs by focus area KEY RESULT AREAS (KRAs)
A. NUTRITION SPECIFIC RESULT AREAS 1. Maternal, Infant, Young Child Nutrition (MIYCN) scaled-up
2. Nutrition of older children and adolescents promoted
3. Nutrition of adults and older persons promoted
4. Prevention, control and management of micronutrient meficiencies scaled-up
5. Prevention, control and management of Diet Related Non-Communicable Diseases (DRNCDs) scaled-up
6. Integrated Management of Acute Malnutrition (IMAM) strengthened
7. Nutrition in emergencies strengthened
8. Nutrition in HIV and TB scaled up
9. Clinical nutrition and dietetics strengthened
B. NUTRITION SENSITIVE RESULT AREAS 10. Nutrition in agriculture and food security scaled-up
11. Nutrition in the Health sector strengthened
12. Nutrition in Education and Early Childhood Development promoted (EECD)
13. Nutrition in Water, Sanitation and Hygiene (WASH) promoted
14. Nutrition in social protection promoted
C. ENABLING ENVIRONMENT RESULT AREAS 15. Sectoral and multi-sectoral nutrition governance including coordination and legal/regulatory frameworks strengthened
16. Sectoral and multisectoral nutrition information systems, learning and research strengthened
17. Advocacy, Communication and Social Mobilization (ACSM) strengthened
18. Capacity for nutrition developed
19. Supply chain management for nutrition commodities and equipment’s strengthened
04 KEY RESULT AREAS (KRAS), STRATEGIES AND INTERVENTIONS
Table 4: List of the KNAP Key Result Areas (KRAs)
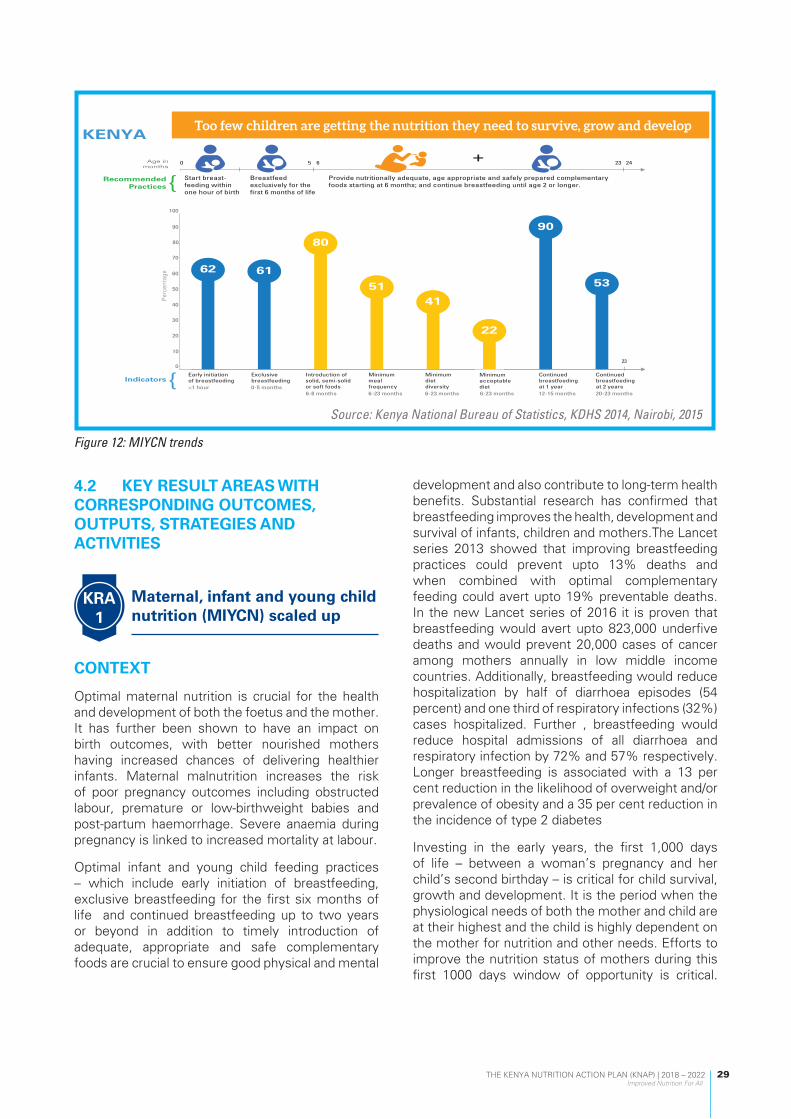
THE KENYA NUTRITION ACTION PLAN (KNAP) | 2018 – 2022 Improved Nutrition For All
29
4.2 KEY RESULT AREAS WITH CORRESPONDING OUTCOMES, OUTPUTS, STRATEGIES AND ACTIVITIES
CONTEXT
Optimal maternal nutrition is crucial for the health and development of both the foetus and the mother. It has further been shown to have an impact on birth outcomes, with better nourished mothers having increased chances of delivering healthier infants. Maternal malnutrition increases the risk of poor pregnancy outcomes including obstructed labour, premature or low-birthweight babies and post-partum haemorrhage. Severe anaemia during pregnancy is linked to increased mortality at labour.
Optimal infant and young child feeding practices – which include early initiation of breastfeeding, exclusive breastfeeding for the first six months of life and continued breastfeeding up to two years or beyond in addition to timely introduction of adequate, appropriate and safe complementary foods are crucial to ensure good physical and mental
development and also contribute to long-term health benefits. Substantial research has confirmed that breastfeeding improves the health, development and survival of infants, children and mothers.The Lancet series 2013 showed that improving breastfeeding practices could prevent upto 13% deaths and when combined with optimal complementary feeding could avert upto 19% preventable deaths. In the new Lancet series of 2016 it is proven that breastfeeding would avert upto 823,000 underfive deaths and would prevent 20,000 cases of cancer among mothers annually in low middle income countries. Additionally, breastfeeding would reduce hospitalization by half of diarrhoea episodes (54 percent) and one third of respiratory infections (32%) cases hospitalized. Further , breastfeeding would reduce hospital admissions of all diarrhoea and respiratory infection by 72% and 57% respectively. Longer breastfeeding is associated with a 13 per cent reduction in the likelihood of overweight and/or prevalence of obesity and a 35 per cent reduction in the incidence of type 2 diabetes
Investing in the early years, the first 1,000 days of life – between a woman’s pregnancy and her child’s second birthday – is critical for child survival, growth and development. It is the period when the physiological needs of both the mother and child are at their highest and the child is highly dependent on the mother for nutrition and other needs. Efforts to improve the nutrition status of mothers during this first 1000 days window of opportunity is critical.
0
10
20
30
40
50
60
70
80
90
100
62 61
80
5141
22
90
53
KENYA
Indicators
RecommendedPractices
Early initiation of breastfeeding
Exclusivebreastfeeding
Introduction of solid, semi-solid or soft foods
Continued breastfeeding at 1 year
Continued breastfeeding at 2 years
Minimum diet diversity
Minimum meal frequency
20-23 months12-15 months6-23 months6-23 months6-23 months6-8 months0-5 months<1 hour
Start breast-feeding within one hour of birth
Breastfeed exclusively for the first 6 months of life
Provide nutritionally adequate, age appropriate and safely prepared complementary foods starting at 6 months; and continue breastfeeding until age 2 or longer.
Per
cent
age
0 5 6 23 24+
23
{
{
Age in months
Minimum acceptable diet
Too few children are getting the nutrition they need to survive, grow and develop
Figure 12: MIYCN trends
Source: Kenya National Bureau of Statistics, KDHS 2014, Nairobi, 2015
Maternal, infant and young child nutrition (MIYCN) scaled up
KRA 1
Figure 12: MIYCN trends
Source: Kenya National Bureau of Statistics, KDHS 2014, Nairobi, 2015
Maternal, infant and young child nutrition (MIYCN) scaled up
KRA 1

THE KENYA NUTRITION ACTION PLAN (KNAP) | 2018 – 2022 Improved Nutrition For All
30
The current statistics shows poor complementary feeding with only 22 percent of children 6-23 months meeting minimum acceptable diets.
Key challenges experienced by mothers include employment and seeking livelihood opportunities. Workplace support for breastfeeding among female employees has emerged as a critical need for women. The KDHS 2014 indicated that rates of exclusive breastfeeding declined from the third month after the lapse of the maternity period. In addition protecting women from the inappropriate marketing of breast milk substitute is critical. Care of young children is compromised in urban informal settings and requires regulation of day centres and improvements in the environments where children reside in those areas. Other challenges include low levels of knowledge on the importance of MIYCN amongst communities, heavy workload for pregnant and lactating women and inadequate linkage of communities and facilities that still affects coverage of key health promotion interventions. To achieve the desired outcome a series of strategies and interventions with related outputs will be prioritized for implementation over the planned period.
Expected outcome:
Strengthened care practices and services for improved maternal, infant and young child nutrition (MIYCN)
Output 1.1 Increased proportion of women of reproductive age (15–49 years) and caregivers who practise optimal behaviours for improved nutrition
StrategyStrengthen delivery of MIYCN services
Interventions/Activities1) Scale-up Baby Friendly Community Initiative
(BFCI) in all communities
Output 1.2
Increased proportion of care givers who practice optimal behaviors for improved nutrition of young children under five years
StrategyStrengthen delivery of MIYCN services
Interventions/Activities1) Scale-up implementation of Baby Friendly
Hospital Initiative (BFHI) 2) Strengthen neo-natal nutrition care 3) Strengthen growth monitoring and promotion
for children under 5 years 4) Promote establishment of breastfeeding spaces
at work places.
5) Develop and disseminate complementary feeding recipe book & guide
6) Promote optimal nutrition care practices and support for children 6 –59 months including those in the formal and informal day-care centres and integrate agenda into multisectoral platforms between Ministry of Health and line ministries
7) Scale-up BFCI in all communities
StrategyScale up advocacy, communication, social mobilization and resource mobilization
Interventions/Activities1) Engage key influencers in MIYCN activities2) Establish mechanisms to collaborate with
print and electronic media to scale up MIYCN messaging.
3) Promote celebration of World Breastfeeding Week and other MIYCN global/national events (nutrition week, world premature day, malezi bora)
4) Advocacy for oversight, monitoring and enforcement of Breast Milk Substitute (BMS) Act, 2012
5) Advocate for adaptation of Health Act, 2017, Workplace support for breastfeeding at national and county level in both public and private workplaces
6) Advocate for incorporation of MIYCN data in nutrition information systems and use generated evidence for programming by: inclusion of MIYCN indicators in joint support supervision tools; review and inclusion of MIYCN indicators in the Community Health Information System (CHIS); Designation of data collection tools for BFCI with MOH numbers.
StrategyTechnical capacity development for delivery of quality MIYCN services
Interventions/Activities1) Advocacy for, procurement and distribution of
anthropometric and Information, Education and Communication (IEC) materials.
2) Sensitization of implementers, enforcers, Champions, Policy Makers County Health
Output 1.4 Enhanced capacity for implementation of MIYCN activities at all levels
Output 1.3
MIYCN advocated for at global, national and county levels

THE KENYA NUTRITION ACTION PLAN (KNAP) | 2018 – 2022 Improved Nutrition For All
31
Management Teams (CHMT) and Sub County Health Management Teams (SCHMT) on MIYCN
3) Develop capacity of Health Workers and Community Health Volunteers (CHVs) on MIYCN; integration of MIYCN interventions in youth friendly services; BFHI, BFCI, BMS Act, Workplace support for breastfeeding and WHO Growth Charts;
4) Organize/attend National and International Symposium, Conferences, Exchange visits and Best Practices
Strategies• Strengthen enabling policy, legal and regulatory
environment/framework for multisectoral response to MIYCN including monitoring and quality assurance.
Interventions/Activities1) Review of national MIYCN Policy2) Review of MIYCN Strategy3) Review of MIYCN Operational Guidelines,
development, printing and dissemination of Standard Operating Procedures (SOPs), Training materials and Sensitization packages
4) Support implementation of Health Act, 20175) Technical support to counties during
dissemination meetings6) Review of pre-service curricular for colleges and
universities7) Establish functional implementation
committees: BMS Monitoring and enforcement committees’/BFCI Committees; TWGs
8) Monitor and evaluate implementation of MIYCN activities including BFCI implementation; monitoring and enforcement of BMS Act
9) Disseminate MIYCN related findings10) Strengthen evidence-based programming
through information sharing on MIYCN research; participation in biannual data clinics; holding MIYCN information and programming review
CONTEXT
This KRA focuses on older children (those aged 5-9 years) and adolescents (those aged 10-19 years). These cohorts are faced with social and nutrition challenges. Children aged 5–9 years are very active. This stage is characterized by a slow, steady rate of physical growth, but a high rate of cognitive, social and emotional development. From the age of seven, a child’s weight and height begin to increase more quickly in preparation for adolescence. Adolescents have increased nutrient needs for their accelerated growth spurt, and for the emotional and social transition from childhood to adulthood.
Early adolescence is the first stage and occurs from ages 10 years to 14 years. In this stage, there are profound external changes beginning with the body growth spurt and followed by the development of the sex organs and secondary sexual characteristics. Rapid growth increases nutritional requirements for all nutrients.
Late adolescence encompasses the latter part of the teenage years, broadly between the ages of 15 years and 19 years. Girls in late adolescence tend to be at greater risk than boys of negative health outcomes, including teenage pregnancies and depression. Girls are particularly prone to eating disorders such as anorexia nervosa (obsessive dislike of food to reduce weight) and bulimia nervosa (obsessive overeating followed by unorthodox ways of getting rid of the eaten food like induced vomiting and use of laxatives).
Many adolescents between 14 and 19 years of age are in boarding schools and may not have control over the foods they are served. Therefore, collaboration with other stakeholders, including the Ministry of Education, is key when addressing the nutrition needs of this age group. In addition, they are vulnerable to peer pressure and media, especially in relation to body image and marketing of foods, which could result in consumption of foods with excess salt, sugar and/or fats. The age group is exposed to risky health behaviours such as anorexia nervosa, exposure to and engaging in habits such as smoking, drugs and alcohol use. Often adolescents adopt dietary behaviours and lifestyles that they will continue into adulthood and affect the health and nutrition of the families they will eventually have. Practising healthy eating behaviours at this age promotes growth, development and health, prevents micronutrient deficiencies and eating
Output 1.5 Improved MIYCN policy environment at national and county level
Nutrition of Older Children and Adolescents Promoted
KRA 2

THE KENYA NUTRITION ACTION PLAN (KNAP) | 2018 – 2022 Improved Nutrition For All
32
disorders, and lays the foundation for lifelong health, including reducing the risk of NCDs. The geographic settings (rural vs urban) also determine the eating habits and physical activity levels for this age group; for instance in urban areas street foods that are unhealthy are readily available to the children, which calls for context-specific solutions to challenges related to the nutrition needs of this cohort. To achieve the desired outcome a series of strategies and interventions with related outputs will be prioritized for implementation over the plan period.
Expected outcomeIncreased nutrition awareness and uptake of nutrition services for improved nutritional status of older children (5-9 years) and adolescents (10-19 years).
Strategies: • Formulate/review policies, develop guidelines
and advocate for the nutrition of older children and adolescents
• Facilitate participation of adolescents in policies, strategies and plans that affect them
Interventions/Activities(1) Develop and disseminate nutrition policies,
guidelines (food-based dietary guidelines; tuck shop guidelines; menu guidelines; sports nutrition guidelines; school garden guidelines), training packages (healthy diet and physical activity).
2) Monitor and evaluate adherence to policies and strategies; integrate play and nutrition activities in schools and identify research gaps.
3) Lobby for inclusion of nutrition for older children and adolescents in various nutrition-related documents in other sectors.
4) Advocate and sensitize key influencers, policy makers, role models, and nutrition champions on nutrition for older children and adolescents.
StrategiesCapacity-build stakeholders on healthy diets and physical activity, sensitize communities and increase diversity of food production in kitchen gardens.
Interventions (1) Train key stakeholders on healthy diets
and physical activity for older children and adolescents
2) Sensitization of older children, adolescents and communities on healthy diets and physical activity using context-specific communication channels in both rural and urban setups
3) Integrate messaging on healthy diets and physical activity in the school health programme
4) Collaborate with MoALF&I on establishment of diverse food production (crops, livestock, insects and fisheries)
Strategies Promote consumption and marketing of healthy foods for older children and adolescents
Interventions/Activities (1) Regulate the food environment to control
marketing of unhealthy foods for older children and adolescents
(2) Sensitization of school stakeholders on marketing and promotions within the school; sufficient safe and nutritious foods in school
Strategies Establish collaboration with stakeholders and sensitize them to promote good nutrition in older children and adolescents.
Interventions/Activities (1) Promote collaboration with other health sector
interventions to promote good nutrition of older child and adolescent (MoE, MOALF&I, MoH, Industry, Finance, Gender, Sports and social protection) and the private sector
2) Intersectoral sensitization on child care development
Output 2.1
Improved policy environment at national and county level for older children (5-9 years) and adolescents (10-19 years).
Output 2.2
Increased awareness on healthy diets among caregivers, social influencers, older children and adolescents themselves.
Output 2.3
Reduction of marketing of unhealthy foods among older children and adolescents
Output 2.4
Enhanced linkages and collaboration with relevant sectors to promote the health and nutrition of the older child and adolescents
THE KENYA NUTRITION ACTION PLAN (KNAP) | 2018 – 2022 Improved Nutrition For All
33
CONTEXT
In the life-course approach, adults comprise of men and women in the 20–59years age group while old age begins at 60 and above. The population aged 20–59 years constitute the economically productive workforce upon which the other groups depend to meet their requirements for livelihood and subsistence.
It is important to note that adults also face several nutritional challenges including inadequate energy and micronutrient intake due to poverty, inadequate dietary diversity, poor access to nutrition information, and poor lifestyles often adopted during adolescence. Poor nutritional and lifestyle practices range from overconsumption of fats, sugars and salt to smoking, excessive consumption of alcohol, and low physical activity – all of which increase the risk of diet-related NCDs; for example, diabetes, cardiovascular diseases, hypertension and cancers, often leading to premature death. Moreover, they also constitute the group most vulnerable to HIV and AIDS. Promotion of physical activity and the adoption of healthy lifestyles are critical in addressing the nutritional challenges faced by adults.
Within the adults’ group, older people have specific needs in relation to their general food intake, micronutrient requirements and palatability of food, which makes them particularly vulnerable to disruptions in nutrition and food security. Older people tend to adapt their diets in response to individual functional difficulties, often leading to monotonous food consumption and, as a consequence, to inadequate nutrient intakes. Dietary habits for this age group are also influenced by the type of foods available, and the geographic locations, with urban dwellers more likely to obtain their foods from the market compared to the rural dwellers. Physical activity in these age groups also has a major impact on their health and well-being, with urban dwellers less likely to be engaged in physical activities.
According to the latest WHO data published in 2018, life expectancy in Kenya is 64.4 years for men and 68.9 years women, total life expectancy for both sexes is 66.7 years. This emphasizes the need to fully incorporate the nutrition needs of older people into policy decisions. The number of older people in Kenya increased more than threefold from 587,983 in 1969 to about 1.9 million in 2009, and it is projected that by 2020 the older population will be approximately 2.6 million or about 5 per cent of
the projected population of 53.1 million. Given that most adult men can fend for themselves, and that population-based nutrition interventions like food fortification, and public health measures including awareness creation, are covered under KRA 4 on micronutrient deficiencies and KRA 5 on DRNCDs, this KRA focuses on adults and older persons (60 years and above). To achieve the desired outcome a series of strategies and interventions with related outputs will be prioritized for implementation over the plan period.
Expected outcome
Improved nutrition status of adults and older persons.
Expected outputs, strategies and interventions
StrategyDevelop/review relevant policies and guidelines to include nutrition of adults and older persons
Interventions1) Develop a geriatrics nutrition guideline for Kenya2) Develop and disseminate training manuals and
guidelines for formation of support groups3) Develop national guidelines for older people and
volunteer engagement in health and nutrition of older people in the community
StrategyEnhanced decision making using information and programme evidence
Activities /Interventions1) Create a centralized data bank of existing
research and programmes on nutrition related to adults and older persons
2) Advocate for establishment of a centralized automated inventory for older persons to inform planning and decision making
3) Mapping and assessment on nutritional and health needs for adults and older persons to inform policy and programming
4) Develop a nutrition monitoring and evaluation framework to inform policy and programme for for adults and older persons
Output 3.1
Legislations, policies and guidelines on nutrition of adults and older persons formulated
Output 3.2
Improved utilization of nutrition information, evidence and learning for program improvement and decision making
Nutrition Status of Adults and Older Persons promoted
KRA 3
THE KENYA NUTRITION ACTION PLAN (KNAP) | 2018 – 2022 Improved Nutrition For All
34
StrategyDevelop capacity for health workers to provide quality nutrition services targeting adults and older persons
Interventions/activities1) Develop capacity of health care provider to
provide quality health care and nutrition support for older people
2) Build the capacity of community health personnel to actively engage and empower older persons in solving problems related to their health and nutrition
3) Promote and support establishment of social support groups at both community and health facility to relay information and updates for continuum of care and linkage to social support structures
StrategyEnhanced service provision for adults and older persons
Interventions/Activities1) Establish technical working groups (TWGs)
on health and nutrition of the older persons at national level
2) Sensitize counties on formation of TWGs on health and nutrition of the older person at county level
3) Facilitate stakeholder meetings for the coordination of nutrition and health programmes for older persons managed by humanitarian and charity organizations at national level
4) Strengthen participation and inclusion of older persons in decision making for development of health and nutrition strategic policy documents and programmes
5) Advocate for integrated education in social protection package for older persons
Strategy Strengthened food security and nutrition systems for older persons
Interventions/ Activities:1) Assessment and linkage of food, nutrition
support and physical activity for adults and older persons
StrategyStrengthened financing and human resource capacity mechanisms for nutrition interventions for older persons.
Interventions/ Activities1) Mobilize human and financial resources to
address health and nutrition security needs for older persons in special circumstances not limited to (living with disabilities, primary caregivers, PLWHIV)
2) Advocate for participation of older persons in the national budgetary process
StrategyEnhanced participation of adults and older persons in physical activity, health and nutrition programme
Interventions/Activities1) Develop communication materials on health,
nutrition and physical activities of adults and older persons
2) Advocate for financial resources allocation for adults and older persons
3) Advocate for older person representation in development programmes
4) Advocate for incorporation of data on adults and older people in health surveys
Output 3.6
Improved financing and human resource for nutrition in adults and older persons
Output 3.7
Advocacy, communication and social mobilization of nutrition of adults and older persons strengthened and promoted.
Output 3.4
Strengthened coordination mechanism and systems for health and nutrition for adults and older persons.
Output 3.3
Access to quality, timely, affordable health care and nutrition support to adults and older persons promoted
Output 3.5
Improved food and nutrition security and physical activity for adults and older persons

THE KENYA NUTRITION ACTION PLAN (KNAP) | 2018 – 2022 Improved Nutrition For All
35
Strategy Establish a mechanism for assessment, research and monitoring of the nutrition of older persons.
Interventions/Activities1) Create a centralized data bank of existing
research and programmes on nutrition related to older persons
2) Create a centralized automated inventory for older persons to inform planning and decision making
3) Conduct a national assessment on nutritional and health needs of older persons to inform policy and programming
4) Develop a nutrition monitoring and evaluation framework to inform policy and programmes for older persons
5) Conduct a KAP survey on health and nutrition for older persons.
CONTEXT
Micronutrient deficiencies are of public health concern due to their devastating effect on the physical and mental well-being of the population. The most common deficiencies are of iron, folate, zinc, iodine and vitamin A. They are risk factors for increased morbidity and mortality among children under five years, pregnant and lactating women. Folic acid deficiency in pregnancy is a risk factor to Neural Tube Defects (NTD) in newborns and iodine deficiency during pregnancy is the commonest risk factor for preventable brain damage in the newborn.
The strategies applied in prevention, control and management of micronutrient deficiencies include; dietary diversification, food fortification, supplementation and public health measures such as parasitic control, WASH, malaria control, health education and counselling.
Periodic, high dose Vitamin A Supplementation (VAS) is a proven, low-cost intervention which has been shown to reduce all-cause mortality by 12 to 24 per cent, and is therefore an important programme
in support of efforts to reduce child mortality.The government has been implementing vitamin A supplementation programme with higher coverage in rural than in urban areas. Trends in population-based food fortification, which affects all population groups, shows that the number of industries taking part in mandatory fortification has been increasing steadily over the last decade.
Some of the main challenges in prevention, control and management of micronutrient deficiencies include low uptake of VAS services, especially for children aged 12–59 months. In the case of iron and
folic acid supplementation (IFAS) as well as micronutrient powder supplementation there is low coverage, poor compliance and inconsistencies in uptake. The challenges in mass food fortification include slow adoption of fortification by small- and medium-scale millers, poor compliance with standards, inadequate human capital and infrastructure and limited enforcement of the regulatory framework. To achieve the desired outcome a series of strategies and interventions with related outputs will be prioritized for implementation over the plan period.
Expected outcome
Improved micronutrient status for children, adolescents, women of reproductive age, men and older persons.
Expected outputs, strategies and interventions
Strategy Enhance systems for delivery of micronutrient supplementation.
Interventions/Activities 1) Train health workers and key stakeholders on
micronutrient supplementation and sensitize the general population
2) Promote uptake of micronutrient supplementation through context-specific social behaviour change communication strategies
3) Strengthen the documentation system for the monitoring and reporting of micronutrient supplementation.
Prevention, control and management of micronutrient deficiencies scaled-up
KRA 4
Output 4.1
Strengthened routine micronutrient supplementation (vitamin A, iron and folate and micronutrient powders) for targeted groups
Output 3.8
Mechanisms for research and surveillance on nutrition for older persons strengthened.

THE KENYA NUTRITION ACTION PLAN (KNAP) | 2018 – 2022 Improved Nutrition For All
36
StrategyEnhance uptake of diversified and bio-fortified foods
Interventions/Activities1. Promote increased production, preservation
and consumption of micronutrient-rich foods at household level
Strategy Promote compliance, production and consumption of fortified foods
Interventions/Activities 1) Increase production, demand and consumption
of adequately fortified foods2) Strengthen regulatory monitoring of fortified
foods at industry and market level to increase compliance with fortification standards
3) Strengthen routine monitoring and evaluation of food fortification programme
StrategyIntegrate micronutrient deficiency prevention and control measures within public health systems
Interventions/Activities 1) Scale up public health interventions that prevent
micronutrient deficiencies
Strategy: Provision of supportive policy environment for micronutrient supplementation
Interventions/Activities1) Develop and disseminate policies and
strategies on production and consumption of biofortified foods
2) Develop and disseminate guideline, SOPs,
training packages; communication strategies; standards on blending of flour; technical micronutrient deficiency and control guidelines; guidelines on MNDPC integration with public health interventions
3) Strengthen governance and coordination mechanisms for micronutrient programmes MNDCC and Kenya National Food Fortification Alliance (KNFFA))
CONTEXT
Noncommunicable diseases (NCDs)—mainly cardiovascular diseases, cancers, chronic respiratory diseases and diabetes—are the world’s biggest killers. Low- and middle-income countries already bear 86% of the burden of these premature deaths, resulting in cumulative economic losses of USD $7 trillion over the next 15 years and millions of people trapped in poverty.
Most of these premature deaths from NCDs are largely preventable by enabling health systems to respond more effectively and equitably to the health-care needs of people with NCDs, and influencing public policies in sectors outside health that tackle shared risk factors—namely tobacco use, unhealthy diet, physical inactivity, and the harmful use of alcohol. Diet and physical exercise is a powerful tool for prevention of NCDs. To reduce the preventable and avoidable burden of morbidity, mortality and disability due to noncommunicable diseases multisectoral collaboration is key.
Health care workers play a major role in the prevention and care of non-communicable diseases by educating their clients on the need to adopt healthy lifestyles.
To achieve the desired outcome a series of strategies and interventions with related outputs will be prioritized for implementation over the plan period.
Expected outcome
Prevention, management and control of DRNCD non-communicable diseases improved.
Output 4.4
Integrated public health interventions with micronutrient deficiencies prevention and control interventions.
Output 4.5
Improved policy, legislation, leadership and governance for micronutrient programme
Prevention, control and management of diet related non-communicable diseases scaled-up
KRA 5Output 4.3
Strengthened production, consumption, and compliance of fortified foods.
Output 4.2
Increased dietary diversity and Bio-fortification of food

Output 5.2
Established mechanisms to raise the priority accorded to nutrition therapy for prevention and management of NCDs at national and county levels.
THE KENYA NUTRITION ACTION PLAN (KNAP) | 2018 – 2022 Improved Nutrition For All
37
StrategyAdvocate for integration of nutrition therapy in prevention and control of NCDs into policies across all sectors
Interventions/Activities: 1) Develop/review existing standards and
regulations on healthy diets, NCDs and physical activities
2) Develop policies and guidelines on nutrition and NCDs
3) Develop legislations on advertising, packaging, labelling and marketing of foods and beverages
Strategy Integrate nutrition agenda for prevention and control of NCDs into relevant policies across all government and private sectors.
Interventions/Activities 1) Advocate for national and county fiscal budgets
and prioritization on financing prevention and control of NCDs.
2) Enhance participation of nutrition in NCDs Inter-Agency Coordinating Committee (ICC) consisting of representatives from all sectors, national, county governments and development partners.
Strategy Integrate nutrition services in NCDs programmes at national and county level.
Interventions/Activities1) Conduct capacity development on prevention
and control of NCD at national and county levels2) Promote screening of the public for early
detection, control, management and treatment of NCDs and integrate in community health services
Strategies• Advocate for inclusion of nutrition content in
both print and electronic media• Strengthen behaviour change communication
on the consumption of healthy diets among the populations
Interventions/Activities(1) Develop behavior change communication
strategy on nutrition and NCDs (2) Develop key messages, advocacy tool kits and
sensitize media, journalist and editors on NCDs(3) Create public demand for physical activity and
healthy diet at workplace, institutions and community
Strategy Enhanced integrated nutrition services for NCDs management.
Interventions/Activities1) Provision of nutrition services in NCDs clinics2) Advocate for the establishment of integrated
centres for NCDs management3) Advocate for procurement of nutrition supplies
and equipment for NCDs screening
Strategy Monitor trends of nutrition-related risk factors for NCDsInterventions/Activities: 1) Integrate indicators for monitoring of nutrition-
related risk factors for NCDs in relevant sectors and within routine MOH database
2) Conduct periodic surveys and operational research of nutrition-related risk factors for NCDs
Output 5.5
Quality and timely provision of nutrition therapy in management of NCDs
Output 5.3
Strengthened national and county capacity to accelerate nutrition response for prevention and control of NCDs
Output 5.4
Behaviour change communication strategies developed and implemented to promote primary and secondary prevention of diet-related risk factors for NCDs
Output 5.6
Improved monitoring and evaluation for diet-related NCDs
Output 5.1
Improved policy and legal environment for nutrition in NCDs

THE KENYA NUTRITION ACTION PLAN (KNAP) | 2018 – 2022 Improved Nutrition For All
38
CONTEXT
Acute malnutrition results from inadequate dietary intake and/or disease as the two immediate causes. A deadly vicious cycle is often created between acute malnutrition and infection, whereby acutely malnourished children are predisposed to infection, and vice versa. Children with acute malnutrition are at a five to nine times higher risk of death when compared to well-nourished children. Reducing child mortality and improving maternal health depend heavily on reducing malnutrition. While focusing on management of acute malnutrition, integrated management of acute malnutrition interventions should ensure continuum of care along the spectrum of nutritional status through strong linkages with programmes that focus on preventive and promotive services like supplementation, breastfeeding, complementary feeding, hygiene and food safety, among others.
In Kenya, there are large disparities in the prevalence of acute malnutrition, with several arid areas (Turkana, Mandera, North Horr, Samburu and East Pokot) reporting acute malnutrition levels that are persistently above emergency levels (Global Acute Malnutrition (GAM by WHZ ≥15 per cent based on WHO cut-offs) followed by several semi-arid areas reporting poor to serious levels of acute malnutrition. Programmes for the management of acute, severe and moderate malnutrition are implemented in the country albeit with significant challenges. Coverage of IMAM services, especially in arid and semi-arid counties, has remained relatively low mainly
due to distance from health facilities, programme challenges like erratic supplies, lack of staff who can offer the services, poor health-seeking behaviours by the community, prioritization of other competing activities over health seeking, migration of families leading to early defaulting from IMAM programme, and little or no IMAM programme awareness. Recurrent drought emergencies have recorded very high levels of acute malnutrition requiring emergency response to reach distant communities through approaches such as the integrated mobile health and nutrition outreaches to overcome some of the above barriers. The increasing number of newly constructed health facilities in ASAL counties have offered the opportunity for sustained increase in coverage through continued expansion of capacity to new facilities and newly recruited staff. In addition, studies are underway to enable community-level management of acute malnutrition through integration with integrated community case management (iCCM).
Although the prevalence of acute malnutrition is relatively low in urban settings and other densely populated areas, the burden of acute malnutrition remains very high due to the population density. For example, while Nairobi county has normal levels of prevalence of acute malnutrition, it hosts the second highest burden of acutely malnourished children in Kenya. There have been several years of investment by the MoH and partners in high prevalence areas of ASAL for justified reasons. On the other hand, urgent attention is required to increase coverage of access to treatment for acute malnutrition in high-burden non-ASAL counties. Most acutely malnourished children in these non-ASAL counties are identified late after developing complications because of major challenges such as low capacity of the health care providers to manage malnutrition, lack of commodities and low prioritization of acute malnutrition.
Table 5: Coverage estimates from the Semi Quantitative Evaluation of Access and Coverage (SQUEAC) surveys 2017/2018
County Single Coverage estimate_OTP % 95% CI
Single Coverage estimate_SFP % 95% CI
Baringo (East Pokot) County 29.7 (21.9 - 38.7) 45.9 (34.3 - 58.5)
Garissa County 62.7 (51.3- 72.7) 63.1 (52.1-72.7)
Tana River County 48.0 (36.0- 60.1) 50.5 (40.6 - 60.1)
Turkana West Sub-county 67.5 (55.4 – 77.0) 66.2 (57.7 – 73.7)
Turkana Central/Loima Sub-county 60.4 (48.3 – 71.6) 65.9 (55.6 – 74.8)
Turkana East Sub-county 59.6 (47.4 – 70.3) 61.0 (49.4 – 71.2)
Turkana South Sub-county 62.2 (50.3 – 72.6) 81.4 (73.9 – 87.3)
Turkana North Sub-county 71.9 (60.5 –80.9) 64.9 (53.7 –74.8)
Wajir North Sub-county 59.6 (48.0 - 70.1) 47.3 (34.9 - 60.2)
Mandera County 66.3 (56.8 - 74.4) 65.1 (53.6 - 75.1)
Integrated management of acute malnutrition (IMAM) strengthened
KRA 6

Output 6.2
Scaled-up access to delivering IMAM services in ASAL, urban and non-ASAL counties.
Output 6.1
Policy, standards and guidelines for the IMAM program developed/reviewed.
THE KENYA NUTRITION ACTION PLAN (KNAP) | 2018 – 2022 Improved Nutrition For All
39
The continuum of care within acute malnutrition is part of HINI (high-impact nutrition interventions) that span from early identification and ambulatory management of moderate acute malnutrition and uncomplicated severe acute malnutrition, constituting over 95 per cent of cases, to inpatient admission and close clinical follow-up of severely malnourished children with complications. While those requiring 24-hour care are relatively few, they are at very high risk of death unless managed correctly. Most cases of acute malnutrition are managed in the Supplementary Feeding Programme (SFP) and Outpatient Therapeutic Programme (OTP) while about 7 per cent of cases with severe acute malnutrition (with complications) receive inpatient care before being discharged for outpatient care programmes. Generally key programme performance indicators have met the sphere standards, with SFP/OTP coverage of over 50 per cent in most areas (Table 5).
To achieve the desired outcome a series of strategies and interventions with related outputs will be prioritized for implementation over the plan period.
Expected outcome
Increased coverage of integrated management of acute malnutrition (IMAM) services.
Expected outputs, strategies and interventions
StrategiesDevelop/review and disseminate IMAM policies, standards and guidelines
Interventions/Activities1) Develop/review guidelines, strategies,
treatment protocols and standard operating procedures (SOP) and disseminate at national and county levels
2) Review and disseminate IMAM training package for health workers
Strategy Develop a module for full coverage of IMAM services.Interventions/Activities1) Develop a costed scaled-up plan to expand
access to treatment in all counties
2) Integrate management of acutely malnourished children with other programmes in the health care system
3) Conduct capacity assessment for IMAM service delivery
Strategy Regularly monitor the performance and quality of services provided by the IMAM programme.
Interventions/Activities1) Monitor adherence to IMAM programme
SOPs, guidelines and protocols by health and nutrition workforce
2) Conduct IMAM programme performance reviews – cure, defaulter, death, coverage (linkage with M&E)
Strategy Link IMAM services with other programmes (WASH, livelihood, social protection, food security)
Interventions/Activities1) Use available mechanisms for coordination
of IMAM to link IMAM services with other programmes (WASH, livelihood, social protection and food security).
2) Advocate for Public Private Partnership in the implementation of IMAM.
Output 6.5
Advocacy, communication, social mobilization and resource mobilization for IMAM programme scaled up:
Strategy Advocate for a scaled-up IMAM strategy that is geographically rolled up for full coverage.
Interventions/Activities1) Advocate for increased resource allocation for
IMAM implementation including commodities, equipment, HR
2) Advocate for institutionalization of community health volunteer (CHV) motivation within county strategic documents.
3) Promote programmes to advocate for integrated
Output 6.4
Strengthened partnerships including public–private partnership (PPP) to improve access and coverage of IMAM services and linkages with other interventions .
Output 6.3
IMAM programme performance monitored and quality of services improved.

THE KENYA NUTRITION ACTION PLAN (KNAP) | 2018 – 2022 Improved Nutrition For All
40
treatment and prevention of malnutrition and strengthen nutritional care and support of affected individuals
4) Promote improved linkage with programmes on behavioural change awareness creation or for prevention strategies at community and household level including MIYCN, social protection and livelihood support strategies.
Output 6.6
Innovative approaches to improve IMAM quality and coverage implemented
StrategyEffectively use available approaches and, where appropriate, develop innovative approaches to improve quality and coverage of IMAM services.
Interventions/Activities:1) Utilize m-Health (data capturing, analysis,
reporting, dissemination and surveillance) for monitoring and reporting on IMAM
2) Effectively utilize IMAM surge.3) Promote operational research on IMAM.
Output 6.7
Enhanced early case identification through community mobilization and referral, including ICCM
Strategy Develop capacity for improved screening and referral of acute malnutrition at community and health facilities
Interventions/Activities1) Conduct nutrition screening/assessment for all
cohorts at community and facility level2) Improve follow up and referral systems for
IMAM across all levels
Output 6.8
Improved utilization of IMAM data for informed decision making
Strategy Use IMAM data to ensure evidence-based decision making regarding IMAM
Interventions/Activities1) Promote appropriate documentation of related
research, best practices and learning 2) Adopt key actions/recommendations from
research, assessments/surveys, lessons learnt, routine data, programme review meetings and feedback from field experiences
Output 6.9
Capacity enhanced for IMAM service delivery and programming.
Strategy Develop infrastructure and capacity of health workers for service delivery
Interventions/Activities1) Health worker classroom training, On-Job
Training (OJT), joint support supervision on IMAM
2) Link with pre-service and in-service training institutions for incorporation of IMAM into training curriculum
3) Support cross-learning between ASAL and non-ASAL counties on IMAM programming
4) Support the necessary training based on emerging evidence and continuous capacity-building on IMAM
CONTEXT
Kenya experiences frequent emergencies such as drought, floods and electoral violence, among others, that often causes disruption and affects the health and nutrition of the most vulnerable groups who include pregnant and lactating women, infants and young children, older persons as well as persons with disabilities. Efforts have been made at policy level to put mechanisms in place for disaster risk reduction / management as well as emergency response and recovery. The National Nutrition Action Plan 2012–2017 was considered risk-informed and had a strategic objective that included emergency preparedness and response which guided the sector over the five-year period. Emergency coordination was scaled up over the period and credited for improvements over the years in emergency preparedness, response and recovery efforts. National frameworks such as the Ending Drought Emergencies Framework 2018–2022 are in place and are guiding drought management efforts through the National Drought Management Authority.
Significant efforts have been made over the years to ensure that nutrition has an annual contingency plan, preparedness and response plan that is updated following regular seasonal assessments (Short and Long Rains Assessment) as well as
Nutrition in Emergencies Strengthened
KRA 7
THE KENYA NUTRITION ACTION PLAN (KNAP) | 2018 – 2022 Improved Nutrition For All
41
contingency plans for specific hazards. These plans have provided a coordinated framework for the sector to resource and implement preparedness and response actions. Government leadership has been lauded, as has been the collaboration and partnerships for response within the humanitarian sector.
It is also important to note the emergency coordination mechanisms that exist at national level, such as the Emergency Nutrition Advisory Committee (ENAC), Kenya Food Security Meeting (KFSM), Kenya Food Security Steering Group (KFSSG) and Cash Coordination Group, among others. While there has been notable progress, a lot more needs to be done to strengthen collaboration and joint programming, especially in the ASALs where chronic deprivation complicates recovery after cyclical droughts and flood events. High levels of poverty, low access to basic social services and infrastructure limitations complicate resilience-building efforts and continue to predispose women and children to both acute and chronic malnutrition. Some areas in the ASALs have what are considered to be endemic levels of acute malnutrition. Suffice it to note that the environmental challenges experienced in the ASALs further compound the nature and frequency of climate-related disasters.
That said, trends are changing and non-ASAL areas are also faced with emergencies that include disease outbreaks, as well as some areas becoming drier which is affecting traditional livelihoods like farming. Traditional fishing areas are seeing a steady decline in stocks and families are increasingly faced with food security challenges. Natural resource management challenges are being felt across the country. Moreover, the number of actors and range of actors implementing resilience programmes have increased.
The scope and integration of nutrition response remains a critical challenge. The drought of 2017 revealed the need for greater coordination among sectors and actors to improve the scale and scope of resilience programmes. Social protection programmes have grown in prominence and nutrition is gaining traction in the area. Similarly, innovative approaches are being implemented, such as the ‘surge approach’ to strengthen the ability of systems to anticipate and cope with increased caseloads of morbidity and acute malnutrition. The goal of the surge approach is to improve the resilience of health systems to better deliver services for treatment of acute malnutrition over time, particularly during periods of high demand when the need to save lives is greatest, without undermining the capacity and accountability of government and other health actors. It strengthens the capacity of
government health systems to effectively manage acute malnutrition before, during and after shocks while protecting and supporting ongoing health and nutrition system strengthening efforts.
Kenya also hosts over a quarter of a million refugees from other countries, exemplified by the Kakuma and Dadaab refugee camps, which has socio-economic, socio-cultural and political implications for the hosting communities. Durable solutions, therefore, will need to expand in range to cater for both populations. Urban vulnerability remains a major issue for the populations residing in major towns. With devolution, there is an increase in the number of urban centres where food production opportunities are limited, and populations increasingly affected by high food prices. Overall, the coherence of strategies across sectors remains critical, as does application of preparedness and risk reduction strategies to further reduce nutrition vulnerability of populations in Kenya. To achieve the desired outcome a series of strategies and interventions with related outputs will be prioritized for implementation over the plan period.
Expected outcome
Improved multi-level and multisectoral capacity for risk preparedness, reduction and mitigation against impact of disasters.
Expected outputs, strategies and interventions
Output 7.1
Strengthened coordination and partnerships for integrated preparedness and response initiatives
StrategyIntegrate risk reduction and mitigation in functions of coordinating structures.
Interventions/Activities 1) Map partners in preparedness and emergency
risk reduction 2) Establish functional emergency preparedness
and risk reduction committees
Output 7.2
Strengthened preparedness capacity for the nutrition sector
Strategies • Enhance risk analysis and articulation • Build capacity of systems and individuals to
undertake preparedness functions
Interventions/Activities1) Hold joint planning and implementation
THE KENYA NUTRITION ACTION PLAN (KNAP) | 2018 – 2022 Improved Nutrition For All
42
meetings with other sectors on integrated preparedness and risk reduction
2) Conduct joint resource mobilization activities with other sectors on integrated preparedness and risk reduction
3) Develop and implement of IMAM surge kit4) Review disaster preparedness and response
plan5) Train stakeholders on disaster risk reduction6) Put supply chain contingency systems in place 7) Conduct, review and disseminate early warning
surveys 8) Train stakeholders on needs assessment
during emergencies and conduct the needs assessment
9) Develop SOPs for emergency response; finalize guidelines on linkage of nutrition with livelihood programmes
Output 7.3
Improved access to timely multi-sectoral high-impact interventions to populations affected by emergencies to prevent deterioration of nutritional status and avert excess morbidity and mortality
Strategies• Roll out a package of high-impact interventions
to affected population• Strengthen utilization of data/ information to
enhance decision making
Interventions/Activities1) Activate emergency coordination for nutrition
response monitoring 2) Conduct nutrition needs assessment during
emergencies to adapt response to the context3) Optimize nutrition service delivery approaches
including outreach services in hard-to-reach areas, affected urban areas
4) Ensure access to high-impact nutrition interventions in emergencies
Output 7.4
Strengthened implementation of recovery interventions to enhance ‘build back better’ approaches
StrategyMainstreaming nutrition in resilience programmes.
Interventions/Activities1) Actively engage in the development of
livelihood and social protection programmes to enhance integration of nutrition
2) Participate in policy discussions related to post-disaster reviews to influence nutrition considerations
3) Strengthen participation in community-level dialogue and recovery initiatives
CONTEXT
The overall goals of medical management of HIV are to reduce HIV-related morbidity and mortality, improve the quality of life, restore and preserve immunological function, and maximize suppression of viral replication. Optimizing and extending the usefulness of currently available therapies and minimizing drug toxicity and managing side effects are important goals in both medical and nutritional management. Disease progression differs among individuals, and treatment decisions must be individualized. With viral load testing and combination ART, clinical and therapeutic management of HIV disease in adults is based on numerous considerations. Malnutrition is an important and complicated consequence of HIV infection. Problems leading to malnutrition may involve ingestion, absorption, digestion, metabolism, and use of nutrients. Without successful ART, protein-energy malnutrition (PEM) is a frequent complication of advanced HIV disease. Interactions between antiretroviral therapy (ART) and food and nutrition can affect medication efficacy, nutritional status, and adherence to drug regimens.
Nutrient deficiencies play important roles in the pathogenesis of HIV disease. Nutrition therapy with individualized counselling is critical in overall treatment. Whereas nutrition improves immunity, ARVs reduce the viral load. Therefore, the implementation of individualized nutrition interventions should consider the following factors: overall prevalence; absolute numbers, i.e., burden of disease; new infections; and HIV and TB related mortality.
To achieve the desired outcome a series of strategies and interventions with related outputs will be prioritized for implementation over the plan period.
Expected outcome
Reduced impact of HIV-related co-morbidities among people living with HIV through targeted nutrition therapy.
Nutrition in HIV and TB promoted
KRA 8

THE KENYA NUTRITION ACTION PLAN (KNAP) | 2018 – 2022 Improved Nutrition For All
43
Expected outputs, strategies and interventions
Output 8.1
Improved routine screening for nutrition related problems and referral for all PLHIV and TB patients
Strategies
• Build and maintain a skilled, competent and resourceful public and private health workforce to provide support activities for patient-focused nutrition therapies
• Address information gaps and systemic gaps in service delivery of HIV, TB Nutrition therapy
Interventions/Activities1) Develop standardized training guides for HIV/TB
patient-focused nutritional therapies for trainer of trainers, facilitator and health workers
2) Build capacity of health workers through online and in-person continuous professional development on integrated nutrition therapy for TB/HIV nutrition
3) Disseminate and make available new training guidelines and policies to the county, sub-county, facility, and community-level workforce
4) Develop and disseminate context-specific job aids for patient-focused nutrition therapy and interpersonal counselling
5) Develop regional capacity for ongoing training and mentorship on nutrition screening and assessment of PLHIV and TB patients
6) Scale up nutrition screening at HIV/TB service points while simultaneously strengthening facility referral linkages for HIV/TB patients
7) Conduct systematic engagement, capacity building, and empowerment of the service providers at facility level to provide comprehensive nutrition assessments
Output 8.2
Increased coverage for nutrition screening and referral of PLHIV and TB patients
Strategy Optimize nutrition assessment counselling and support for reduced viral load and improved quality of life in HIV/ TB patients
Interventions/Activities1) Broaden access points for comprehensive
nutrition assessment2) Develop capacity of health care workers to
provide patient-focused nutrition therapy for paediatric patients and adolescents infected
with HIV or TB 3) Build the capacity of health care workers
and CHVs on information related to nutrition screening and comprehensive nutrition assessment for HIV/TB patients
4) Invest in emerging technologies for nutrition assessment and diagnostics for optimal nutrition interventions and care of HIV/TB patients
5) Offer comprehensive nutrition assessments in all HIV, TB, MNCH service points to reduce missed opportunities and improve service uptake and retention into care
6) Adapt technologies in body composition analysis, lipid profile testing that improve nutrition diagnosis and optimize treatment options for HIV and TB patients
7) Invest in adaptive and innovative mechanisms that enhance delivery nutrition interventions for children and adolescents exposed or living with HIV/TB
8) Implement national- and county-level forecasting, quantification, and supply planning exercises through integrated operationalized county-level commodity security committees
9) Utilize routine supply chain monitoring, including electronic Logistic Management Information System (LMIS) systems, to minimize stock outs, avoid expiries, and over/under-stocking of HIV/TB nutrition commodities
10) Conduct periodic post-market surveillance for quality of nutrition commodities used in management of HIV/TB patients
Output 8.3
Strengthened integration of nutrition interventions for home-based care at community level for PLHIVs towards the 90.90.90
StrategyDevelop and disseminate context-specific interpersonal communication on nutrition management for PLHIV and TB patients
Interventions/Activities1) Develop a series of small doable actions that
enhance dietary diversity and physical exercises at household level for HIV and TB patients
2) Build capacity of CHVs and other community resource persons to promote healthy and sustainable lifestyles at household level
3) Disseminate key context-specific nutrition messages that promote positive lifestyles and behaviour for HIV /TB patients
45Ministry of Health, Kenya HIV Estimates Report 2018, Nairobi, October 2018

THE KENYA NUTRITION ACTION PLAN (KNAP) | 2018 – 2022 Improved Nutrition For All
44
4) Identification and engagement of existing community structures: ward health committees, village health committees, and mother to mother support groups
5) Strengthen outreach, referrals, and linkage systems to involve all community actors and optimize identification and linkage of PLHIV and TB patients with nutrition care and management.
Output 8.4
Enhanced use of implementation research to generate evidence for cost-effective nutrition TB and HIV programming.
Strategies • Utilization of nutrition TB and HIV strategic
information for monitoring evaluation and learning
• Strengthen the generation and use of Nutrition Assessment, Counselling and Support (NACS) data for surveillance and decision making towards achievement of key result area goals
• Strengthen capacity for use of implementation research to inform future NACS programming.
Interventions/Activities1) Implement routine participatory progress
monitoring platforms at all levels (national, county, sub-county and community) through scheduled data review meetings
2) Adapt and implement country NACS validation guidelines and tools including capacity-building of counties to county annual data validation
3) Conduct standard annual NACS data and service audits including partner mapping at sub-county level
4) Adopt use of county level scorecards for nutrition indicators including NACS
5) Scale up the generation and utilization of granulated NACS data for decision making down to the lowest level such as county, sub-county, ward, facility and community levels
6) Review and optimize integration of data systems from various nutrition service delivery points for HIV, TB clients across the NACS continuum of care. This shall include retention, treatment outcomes, and viral suppression for HIV/TB patients
7) Establish sentinel sites for NACS and dashboards at the facility, sub-county, county and national levels
8) Implement regular data quality assessments using work improvement teams’ activities at all levels
9) Develop capacity for use of m-Health systems to identify and follow up patients at community
level10) Conduct annual bottleneck assessments
specific to key programme areas in NACS to identity questions for implementation research
11) Develop an online inventory of bottlenecks related to specific NACS programme areas to inform investments and programming
12) Conduct regional learning workshops for NACS knowledge management and transfer on best practices
CONTEXT
Clinical nutrition practice has emerged as an important discipline in modern medicine. It entails the use of diets and nutrients in prevention of diseases and as an essential component of the medical treatment. An increase in the prevalence of diseases, co-morbidities and related conditions has increased the demand for clinical nutrition and dietetics services at all levels of health care including community-level services. Some of these conditions require specialized nutrition services and specific therapeutic nutrition interventions. Malnutrition as a result of disease is an area of concern worldwide, with global prevalence of hospital-based malnutrition nearly 50 per cent. Every 60 seconds, 10 hospitalized patients go undiagnosed with malnutrition. Malnutrition negatively affects patient health outcomes by increasing infection rates and poor wound healing, and contributing to longer lengths of hospital stay, higher frequency of readmission and increased health costs.
Optimal nutrition care should be the first line of nutrition intervention in disease management and should be integrated as a critical and important component of health care. Clinical nutrition and dietetics services given at health care institutions can be complemented through strengthening follow-up and linkages at the community level and including promotive, preventive and nutrition rehabilitative services.
Challenges
The performance of clinical nutrition and dietetics is hindered by inadequate financial resources, which results in a lack of nutrition tools, equipment and therapeutic feeds, supplements and other nutrition commodities; and a lack of guidelines and standards, as well as overworked human resources, which
Clinical Nutrition and Dietetics Strengthened
KRA 9

THE KENYA NUTRITION ACTION PLAN (KNAP) | 2018 – 2022 Improved Nutrition For All
45
compromises the quality of specialized nutrition care. Consequently, this weakens the individual and institutional monitoring and evaluation systems for clinical nutrition together with patient feeding systems and feedback mechanisms in hospitals. Capacity-building, formation of technical working groups and research/ evidence-based generation in clinical nutrition is of paramount importance.
The policy objectives to prevent malnutrition from confounding the effects of diseases will be through supporting the development, review and implementation of policies, guidelines and standards in clinical nutrition and dietetics while strengthening capacity development in diseases prevention, management and control using medical nutrition therapies. To achieve the desired outcome a series of strategies and interventions with related outputs will be prioritized for implementation over the plan period.
Expected outcomeImproved and scaled-up services and practices related to clinical nutrition and dietetics.
Output 9.1
Nutrition and dietetics guidelines, standards, screening and assessment tools developed and implemented
StrategyProvision of clinical and dietetics services to patients1) Develop and disseminate standard operating
procedures (SOP) for nutrition and dietetics: protocol on nutrition management in diseases and conditions; inpatient feeding protocol.
2) Develop and disseminate clinical nutrition tools: screening, inter-facility referral, patient feeding monitoring and service quality management tools.
3) Develop and disseminate basic training and patient safety package for clinical nutrition and dietetics.
4) Develop and disseminate guidelines, strategies and policies on clinical nutrition and dietetics: guidelines for nutritional management of patients in disease and illness; home-based care guidelines for nutrition; guidelines on therapeutic food production units.
Output 9.2
Nutrition screening, assessment and triage to all individuals seeking health care promoted.
Strategy Promote nutrition screening, assessment and triage to all individuals seeking health care.
Interventions/Activities1) Establish nutrition screening, assessment
and triage areas/stations in the outpatient and inpatient services.
Output 9.3
Improved referral services between facility to facility, community to facility and vice versa
StrategyStrengthened inter-facility referral system for clinical nutrition and dietetics services
Intervention/activity1) Conduct sensitization workshops on the use
of standard facility-community referral tool for counties
Output 9.4
Improved quality of clinical nutrition and dietetics care in management of diseases.
Strategy Improved technical capacity for clinical nutrition and dietetics in disease management
Interventions/Activities1) Sensitize counties on the national basic essential
clinical nutrition and dietetics care package in diseases
2) Build the capacity of the national and county health workers in clinical nutrition and dietetics care package.
Output 9.5
Improved food procurement, supply, hygiene and safety in health care institutions.
Strategy Strengthen the procurement system for food supplies
Interventions/Activities1) Strengthen procurement of nutrition
commodities for feeding and management of special medical conditions based on inpatient feeding protocols
2) Establish food safety inspection committees in the institutions
Output 9.6
Strengthen M&E for clinical nutrition and dietetics in disease management.
Strategy Strengthen quality management in clinical nutrition and dietetics

THE KENYA NUTRITION ACTION PLAN (KNAP) | 2018 – 2022 Improved Nutrition For All
46
1. Assess quality of nutrition care in facilities 2. Integrate clinical nutrition indicators in the DHIS
Output 9.7
Improved advocacy for nutrition and dietetics
StrategySustained advocacy for resource allocation
Interventions/Activities1) Advocate for increased resource allocation for
clinical nutrition and dietetics2) Advocate for integration of nutrition and dietetics
services at all levels of the health care system3) Development of IEC materials for nutrition
management in diseases and conditions
CONTEXT
The entire food system from production to consumption has an influence on the nutritional status of a population. Challenges in food production, storage, processing, marketing, consumer demand and preparation, consequently result in dietary inadequacy that leads to nutritional problems at household level. In Kenya, safe and adequate nutritious diets are not easily accessible and adequately utilized by most households. In KDHS 2014, about 14.5 million Kenyans are food poor, with 5.9 million being children; and only 22 per cent of children aged 6–23 months meet the minimum dietary diversity. Nationally the food security situation has seen significant improvement due to the long rains experienced in early 2018 National Drought Management Authority (NDMA, 2018).
Markets plays a critical role in increasing access to safe and nutritious foods. Challenges, however, exist in weak market structures and there are opportunities to improve the marketing channels to provide well-defined outlets and markets. Food quality and safety along the value chain is critical to good health and nutrition outcomes. In the recent past, for example, there have been cases of aflatoxin poisoning owing to poor storage of food including during post-harvest. Poor sanitation and handling of street food leads to increased diarrhoeal diseases. This is especially prevalent in urban areas. Improvements in food access, safety and quality control will lead to more diverse diets, improved consumer health and nutrition, and ultimately lead to enhanced food security and good nutrition among the population.
Opportunities exist in strengthening agri-nutrition capacity on policy, programming and community levels. Decision makers require knowledge and skills on how agriculture impacts on nutrition outcomes. Agriculture programmes need to integrate nutrition interventions at all stages of implementation. Household capacities on proper food preparation, storage and consumption need to be built to enhance the nutritional outcomes of the household members. Furthermore, diversification of diets will be promoted.
The Ministry of Health will collaborate with the Ministry of Agriculture, Livestock, Fisheries and Irrigation to support food systems to improve access to nutritious foods. To achieve the desired outcome a series of strategies and interventions with related outputs will be prioritized for implementation over the plan period.
Expected outcomeLinkages between nutrition, agriculture and food security strengthened
Expected outputs, strategies and interventions
Output 10.1
Strengthened sustainable and inclusive food systems that are diverse, productive and profitable for improved nutrition.
Strategy Advocate for joint planning with nutrition-sensitive sectors.
Intervention(s)/activities1) Advocate for joint strategic planning with MoH,
MoALF, MoW, MoE and other stakeholders for nutrition-sensitive agricultural production.
2) Support county training on early warning systems.
Output 10.2
Improved access to nutritious and safe foods along the food value chain
Strategy Promote increased access to nutritious and safe food along the food value chain pathways.
Interventions/activities1) Strengthen coordination and collaboration
with public and private sector actors – through capacity assessment of private sector
2) Promote uptake of food processing, preservation and storage technologies.
Nutrition in agriculture and food security scaled up
KRA 10

THE KENYA NUTRITION ACTION PLAN (KNAP) | 2018 – 2022 Improved Nutrition For All
47
Output 10.3
Consumption of safe, diverse, and nutritious foods promoted
Strategy Promote increased consumption of safe, diverse, nutritious foods.
Interventions/Activities1) Sensitize counties on diversified food production2) Support uptake and use of food composition
tables and recipes for decision making 3) Develop food safety regulations and
enforcement mechanisms 4) Support dissemination of the agri-nutrition
resource manual and dialogue cards and other related materials
5) Develop Social Behaviour Change and Communication (SBCC) strategy for increased consumption of nutritious foods and improved dietary diversity (including fortified foods)
6) Support flour blending initiatives-regulations and standards development.
Output 10.4
Strengthened agri-nutrition capacities and coordination at national and county levels.
StrategyContribute to strengthening of agri-nutrition capacities and coordination at national and county levels.
Interventions/Activities1) Support agri-nutrition coordination mechanisms
at national and county level and between private and public sectors
2) Participate in the agri-nutrition coordination working groups
3) Support agri-nutrition capacity development and integration initiatives
CONTEXT
The health sector remains a critical conduit through which nutrition services are provided to the population. Further, it is the largest formal employer for nutritionists and dieticians in the country at both national and county level, and hence remains one of the most crucial sectors for nutrition service delivery. The Division of Nutrition and Dietetics
(DND) is positioned in the Ministry of Health and is the custodian of the nutrition policy as assigned by the Government Executive Order of 2017.
The Kenya Health Policy 2014–2030 gives directions on how to ensure significant improvement in the overall status of health in Kenya and further aligns this to the 2010 Constitution of Kenya, the country’s long-term development agenda, Vision 2030 and global commitments. It demonstrates the health sector’s commitment, under the government’s stewardship, to ensuring that the country attains the highest possible standards of health, in a manner responsive to the needs of the population. Its action plan includes directions for addressing both undernutrition in children, women and to halt and reverse the increasing problem of DRNCDs.
Key opportunities including the renewed focus around primary health care and implementation approaches such as universal health care (UHC) are key for nutrition to leverage. The community health strategy is also a key platform for implementation of the UHC package and is a key opportunity that nutrition sector needs to benefit from in relation to the preventive and promotive package of services.
Key components of the health system including the DHIS, Integrated Human Resource Management System (IHRMS) and the Logistics Management Information System (LMIS) are in place and are critical for data, human resource and supply chain management processes. Regular updates to the monitoring and evaluation framework require engagement to ensure that nutrition indicators are also tracked and reported consistently.
Leveraging the health budgets at national and county level remains critical for nutrition in health. To achieve the desired outcome a series of strategies and interventions with related outputs will be prioritized for implementation over the plan period.
Expected outcomeNutrition mainstreamed in health policies, strategies and action plans
Expected outputs, strategies and interventionsEnhanced integration of nutrition within the health sector.
Output 11.1
Nutrition articulated in health policy documents and represented in health sector policy development forums
StrategyRaise nutrition profile in the health sector
Interventions/activities1) Include nutrition in Universal Health Care
Nutrition in the Health Sector Strengthened
KRA 11

THE KENYA NUTRITION ACTION PLAN (KNAP) | 2018 – 2022 Improved Nutrition For All
48
roadmap and implementation framework2) Include nutrition as an agenda in national,
regional and global health forums
Output 11.2
Enhanced integration of nutrition within the health sector
Strategy Mainstream nutrition in all policy, planning and strategy documents
Intervention(s)/activities 1) Use available mechanisms for joint planning and
coordination within health sector to integrate nutrition.
Output 11.3
Nutrition strengthened and integrated in health monitoring, evaluation, research, accountability and learning systems of the health sector
StrategyReview health sector M&E systems and the Health Management Information System (HMIS) to ensure inclusion of nutrition indicators.
Interventions/activities1) Integrate nutrition in health research agenda.
Output 11.4
Nutrition services incorporated in all health services delivery point at all levels of care.
StrategyInstitutionalize nutrition in health service delivery points (across all levels of care)
Interventions/Activities
1) Participate in joint health service delivery committee meetings
Output 11.5
Strengthened capacity of the health workforce to deliver integrated services to include nutrition.
Strategy Develop capacity of the health workforce to deliver integrated services including nutrition.
Interventions1) Support continuous education, learning, and
professional development of health workers through mentorship and supportive supervision.
2) Update pre-service curriculums with nutrition content.
3) Train specialities in nutrition and dietetics .
CONTEXT
Good nutrition is essential to realize the learning potential of children and maximize returns on educational investments. Good nutrition combined with child stimulation through play and physical activity promotes optimal brain development. Undernourished children in early childhood have lower performance in Intelligence Quotient (IQ) and other tests. In addition, poor child nutrition is associated with poor school enrolment, low attendance and high school dropout. Nutrition education in schools is known to foster healthy eating habits in the children themselves and in their families in the short and longer terms. School meals ensure children are well nourished and healthy and are able to learn. Home-grown school meals programmes are implemented in select counties in arid and semi-arid areas. However, not all schools offer school meals supported by the government, and there is inadequate integration of nutrition in the school curriculum – especially for adolescents.
It is evident that nutrition and health outcomes are directly related to the level of education of the mother.45 According to the 2014 KDHS, the nutritional status of children whose mothers have completed primary school was almost one and half times better than those who have no education or did not complete primary school. Mothers who have completed secondary education or more were three times less likely to have malnourished children. Although in Kenya there is about an equal enrolment of girls and boys in primary school, at an average of about 84 per cent, and a high survival of about 96 per cent to the last year of primary school, there is a wide gender gap in secondary education. In secondary school, 52 per cent of enrolled students are male and 48 per cent are female. UNICEF46 reports very low enrolment and completion rates among the poorest quintile group, starkly pronounced in the arid and semi-arid lands (ASAL) areas and informal urban settlements. A group of counties in the north and east (Mandera, Turkana, Garissa and Wajir) show clear indicators of poor education in terms of enrolment and completion, especially for girls. Wajir, for example, enrols only about 14 per cent of its girls. To achieve the desired outcome a series of strategies and interventions with related outputs will be prioritized for implementation over the plan period.
45Kenya National Bureau of Statistics, KDHS 2014, Nairobi, 201546UNICEF (2018): Situation Analysis of Children and Women in Kenya, 2017. UNICEF
Nairobi, Kenya.
Nutrition in the education sector strengthened
KRA 12

THE KENYA NUTRITION ACTION PLAN (KNAP) | 2018 – 2022 Improved Nutrition For All
49
Expected OutcomeNutrition mainstreamed in education sector policies, strategies and action plans.
Expected outputs, strategies and interventions
Output 12.1
Policies, strategies, standards and guidelines on nutrition and physical activity in schools and other learning institutions developed and promoted.
StrategiesImproved school curriculum to reinforce and promote nutrition and physical activityIntegrate nutrition and physical activity in curricular and co-curricular frameworks
Interventions1) Develop nutrition and physical activity content
for school curriculum.2) Advocate for inclusion of nutrition and physical
activity themes in co-curricular school activities (drama, music, talent shows, contests, symposia)
3) Advocate for comprehensive examination on nutrition and physical activity; and advocate for support from Ministry of Education (MOE) to monitor implementation of nutrition and physical activity in the curriculum
4) Advocate for technical support from MoALF to schools on establishment and improvement of existing school demonstration gardens, small animals and revive 4Kclubs.
5) Implementation of school meals guidelines.6) Documentation and implementation of best
practices and information sharing 7) Assessment of implementation of nutrition and
physical activity education and promotion in school
Output 12.2
Nutrition assessments in schools and other learning institutions conducted.
Strategy Promote capacity for nutrition assessment in schools and other learning institutions
Interventions 1) Develop tools and manuals for nutrition
assessment in schools2) Sensitize on nutrition assessments in schools 3) Procure nutrition assessment equipment4) Conduct periodic nutritional status assessments
in schools and other learning institutions5) Establish a referral system for health and
nutrition interventions for those assessed
Output 12.3
Healthy and safe food environment promoted in schools and other learning institutions.
Strategies Promote health and safe food environment in schools and other learning institutions.
Interventions 1) Sensitize stakeholders including, curriculum
support officers, food service providers and handlers, Parent–Teacher Associations (PTA) on healthy and safe food environment.
2) Advocate for improved access to safe and sufficient water, and adequate WASH services in schools and other learning institutions.
CONTEXT
Access to safe drinking water, sanitation and hygiene (WASH) services is a fundamental element of healthy communities and has an important positive impact on nutrition. Lack of access to WASH can affect a child’s nutritional status in many ways. Existing evidence supports at least three direct pathways: via diarrhoeal diseases, intestinal parasite infections and environmental enteropathy. Hand washing with soap and water has been shown to reduce the risk of diarrhoea in the general population by 42–44 per cent.47 In addition, the treatment and safe storage of drinking water in the household reduces the risk of diarrhoeal disease by 30–40 per cent48 and the safe disposal of faeces reduces the risk of diarrhoeal disease by 30 per cent or more.49
Kenya is committed to an upscale of WASH under SDG 6 on achieving universal and equitable access to safe and affordable drinking water, access to adequate and equitable sanitation and hygiene and an end to open defecation for all. The 2016 Water Act, the 2017 National Water Policy, the 2017 Sanitation Bill on Environmental Sanitation and Hygiene Policy and its 2016–2020 Action Plan, and the Open-Defecation Free campaign for 2016–2020 have been hampered by lack of capacity to implement and adoption to county integrated development and action plans. The National Food
47Fewtrell et al., Water, Sanitation, and Hygiene Interventions to Reduce Diarrhea in Less Developed Countries. A Systematic Review and Meta-Analysis. The Lancet Infectious Diseases 5(1), 2005, pp. 42–52.48Clasen et al., Interventions to Improve Water Quality for Preventing Diarrhoea (A Cochrane Review). In: The Cochrane Library, Issue 3, 2006. Oxford: Update Software49Fewtrell et al., Water, Sanitation, and Hygiene Interventions to Reduce Diarrhea in Less Developed Countries. A Systematic Review and Meta-Analysis. The Lancet Infectious Diseases 5(1), 2005, pp. 42–52.
Nutrition in water, sanitation and hygiene (WASH) sector promoted
KRA 13

THE KENYA NUTRITION ACTION PLAN (KNAP) | 2018 – 2022 Improved Nutrition For All
50
and Nutrition Security Policy (NFNSP) and National Food and Nutrition Security Policy Implementation Framework (NFNSP-IF, 2017-2022) mainstream WASH into their situational analysis and proposed thematic interventions in food security, schools and emergency response.
WASH situation
The proportion of households with access to an improved water source is 71 per cent50 while the proportion of households consistently treating their drinking water with appropriate household water treatment methods is 45.3 per cent (KDHS 2014).51
The proportion of households with handwashing stations in compound is 35 per cent52; with regard to sanitation facilities, the proportion of households using an improved sanitation facility is 61.1 per cent (KDHS 2014). To achieve the desired outcome, a series of strategies and interventions with related outputs will be prioritized for implementation over the plan period.
Expected outcome
Nutrition integrated into WASH policies, strategies, plans and programmes.
Expected outputs, strategies and interventions
Output 13.1
Improved access to safe and adequate WASH services.
Strategies Advocate with WASH sector to promote establishment of WASH facilities and provision of safe drinking water.
Interventions/Activities1) Advocate for the provision of adequate potable
water and safe storage within households, health facilities and schools
2) Advocate for protection of water sources and regular water treatment quality checks
3) Promote use of water treatment technologies at household and community levels
Output 13.2
Collaboration with relevant stakeholders on WASH strengthened.
Strategies Strengthen mechanisms for collaboration and
promote participation of stakeholders in WASH forums
Interventions/Activities1) Support the development of mechanisms that
strengthen coordination, linking nutrition to WASH
2) Support development and review of policies and strategies using participatory approaches to ensure universal access to adequate sanitation
3) Promote joint resource mobilization for integrated WASH and nutrition activities
Output 13.3
Optimal WASH practices promoted.
Strategies Advocate and promote adequate WASH in households and institutions.
Interventions/Activities1) Advocate for functional systems for WASH
service provision at institution and household level
2) Conduct sensitization on safe and hygienic practices during food preparation and storage
3) Integrate handwashing message and hygiene during nutrition sessions
4) Promote environmental hygiene at household level
5) Promote stakeholders’ partnerships in design, development and dissemination of IEC materials and messaging on hand washing, community and institutions led total sanitation and food hygiene.
CONTEXT
UNICEF defines social protection as a set of interventions whose objective is to reduce social and economic risk and vulnerability, and to alleviate extreme poverty and deprivation.53 A comprehensive social protection system will include four sets of interventions: -1. Protective programmes that offer relief
from economic and social deprivation; e.g. humanitarian relief in emergencies, and targeted
50Kenya National Bureau of Statistics, KDHS 2014, Nairobi, 201551Kenya National Bureau of Statistics, KDHS 2014, Nairobi, 201552Ibid.53UNICEF, Social Protection in Eastern and Southern Africa: A Framework and Strategy for UNICEF, 200854De Groot, R., Palermo, T., Handa, S., Ragno, L.P. and Peterman, A., Cash Transfers and Child Nutrition: What we know and what we need to know, Innocenti Working Paper No. 2015-07, UNICEF Office of Research, Florence, 2015
Nutrition in social protection programmes promoted
KRA 14

THE KENYA NUTRITION ACTION PLAN (KNAP) | 2018 – 2022 Improved Nutrition For All
51
cash transfer schemes, which increase available resources for household food security, health and care54.
2. Preventive programmes designed to avert deprivation or mitigate the impact of adverse shocks; e.g. health insurance, non-contributory pension schemes.
3. Promotive programmes that enhance assets, human capital and income-generating capacity among the poor and marginalized, such as skills training and nutrition programmes.
4. Transformative interventions that address power imbalances that create or sustain economic inequality and social exclusion; these include legal and judicial reform, budgetary analysis and reform, policy review and monitoring and social and behavioural change.
The Kenya National Social Protection Policy56 defines social protection as ‘policies and actions, including legislative measures, that enhance the capacity of, and opportunities for the poor and vulnerable to improve and sustain their lives, livelihoods, and welfare. It must also enable income-earners and their dependents to maintain a reasonable level of income through decent work, and ensure access to affordable health care, social security, and social assistance.’ The policy proposes three policy measures which have a bearing on nutrition: (i) social assistance, (ii) social security, and (iii) health insurance. It also adopts four approaches to social protection, which have implications for nutrition: (i) Provision, (ii) Prevention, (iii) Promotion, and (iv) Transformation. These fall into the four broad categories proposed by UNICEF. The policy and its implementation strategies do not clearly articulate linkage with nutrition, or the importance of using nutrition indicators in measuring impact, which are the main concerns of this KNAP.
Social protection policies and programmes hold immense potential for improving the nutrition situation of vulnerable populations. To ensure that these policies holistically combat malnutrition, a nutrition-sensitive approach needs to be employed in their design and implementation. Nutrition and social protection are linked by their relevance for building resilience and linking emergency and development approaches. Social protection can positively affect nutrition by: (a) improving dietary quality, (b) increasing income and (c) improving access to health services.
Safety net programmes in Kenya that have a direct bearing on nutrition include: cash transfers (e.g. orphans and vulnerable children cash transfers, older persons cash transfer, hunger safety net programme and urban food subsidy); food distribution (e.g. school
feeding, expanded school feeding, emergency relief); public works programmes (e.g., food for work); and grants – e.g., Njaa Marufuku (Hunger not allowed) and for people with severe disabilities, safe motherhood and health vouchers.
To achieve the desired outcome a series of strategies and interventions with related outputs will be prioritized for implementation over the plan period.
Expected outcome: Integration of nutrition in social protection programmes strengthened
Expected outputs, strategies and interventions
Output 14.1
Nutrition promoted and linkages enhanced in social protection programmes including in crisis
Strategies Incorporate explicit nutrition objectives, target criteria and indicators in policies and strategies to enhance the positive impact of social protection interventions on nutrition
Interventions/Activities1) Develop and disseminate targeting criteria for
nutrition in social protection programmes; cash transfers, hunger safety nets, and others
2) Mainstream nutrition in review of the Social Protection Policy and Strategy
3) Advocate for inclusion of nutrition indicators in the M&E of social protection interventions
4) Scale up social safety nets in times of crises5) Conduct stakeholder mapping of various players
in social protection6) Enhance participation of nutrition stakeholders
in social protection coordination mechanisms 7) Train stakeholders in social protection
programmes on good nutrition practices 8) Conduct a baseline survey/situation analysis on
status of nutrition and health for the vulnerable groups
Output 14.2
Resources for nutrition in social protection programmes mobilized
Strategies Mobilize resources for social protection that address the nutrition needs of vulnerable groups.
Interventions/Activities 1) Advocate for deployment in nutrition human
resource in social protection programmes 55Republic of Kenya Ministry of Gender, Children and Social Development: Kenya National Social Protection Policy, June 2011

THE KENYA NUTRITION ACTION PLAN (KNAP) | 2018 – 2022 Improved Nutrition For All
52
2) Mobilize financial resources for nutrition interventions in social protection programmes
Output 14.3
Strengthened advocacy, communication and social mobilization for social protection.
Strategy Integrate nutrition education and promotion into social protection interventions.
Interventions/Activities1) Advocate for governance and accountability for
nutrition and social protection for vulnerable groups
2) Advocate for harmonization of nutrition and social protection services for vulnerable groups
3) Advocate for the linkage of nutrition services and social protection for all vulnerable groups to National Hospital Insurance Fund (NHIF)
4) Advocate for high-level consultations for promotion of health and nutrition for vulnerable groups at National and County levels.
5) Sensitize (a) the public and b) management of institutions of vulnerable persons and correction facilities on health and nutrition.
6) Promote benchmarking/learning visits for policy makers and implementers in countries with best practices on health and nutrition for vulnerable groups
CONTEXT
Coordination in Kenya for nutrition has been credited as a key enabler of success in programming – a factor that is validated by the 2014 Kenya Demographic Health Survey, which showed a steady improvement in the nutritional status of Kenyan children. Efforts on coordination in Kenya have their roots in emergency programmes that require stakeholder alignment and coherence given the cyclical nature of climate disasters and resulting high levels of acute malnutrition in certain areas of the country. A shift was, however, deemed necessary as Kenya was also transitioning to more development-oriented programming in the mid-2000s – a factor that was instituted by the first National Nutrition Action Plan 2012–2017. The NNAP 2012–2017 provided the framework against which all sector efforts were coordinated against the
principles of ONE national coordinating authority; ONE agreed comprehensive national nutrition plan of action and ONE agreed country-level nutrition monitoring and evaluation framework. It is against this backdrop that coordination in Kenya is cited as largely being successful at sector level in supporting key processes around advocacy and resource mobilization, capacity strengthening, monitoring, evaluation and accountability, as well providing opportunities for engagement in strategic decision making processes.
Several technical working groups and committees that were in place pre-2012 have since expanded their mandates to cover not only emergency but also development programmes. This was further necessitated by the devolution process that required the national level to provide focused support to the counties that were and remain the primary implementation units. New nutrition structures were also instituted at the national level, to cater for emerging areas such as Research, Healthy Diets and Linkages. Kenya joined the Scaling Up Nutrition movement in 2012 and established requisite networks that would enhance and broaden the engagement of nutrition actors with the private sector, academia, donors, the United Nations and civil society. Increased collaboration and partnerships were required for nutrition, given the multiple interaction of causal factors leading to malnutrition. A greater recognition on the need to solidify and harness partnerships with other actors for improved nutrition is articulated in several frameworks including the National Food and Nutrition Security Policy 2012, Kenya Health Policy 2014–2030, School Health Policy 2018, Ending Drought Emergencies Framework 2017, and the National School Meals and Nutrition Strategy 2017–2022, among others.
Despite the success and progress, a lot more needs to be done to sustain the gains and strengthen coordination and collaboration with other sectors at national and county levels. The capacity to coordinate and provide leadership in nutrition remains critical in this KNAP. Similarly, the ability to monitor coordination efforts and processes is fundamental, as the number of stakeholders and forums increase/ diversify given the renewed focus on multisectoral action and collaboration. This will be key deliverables of this result area. Achieving nutrition outcomes requires a whole-system approach, with sectors implementing their actions and programmes through mechanisms that promote mutual accountability and ownership for results.
This KRA envisions stronger collaborations and strengthening public–private partnerships (PPP) that will also provide opportunities to leverage resources and widen coverage of interventions
Sectoral and Multisectoral Nutrition Governance (MNG) including coordination and legal/regulatory framework strengthened
KRA 15

THE KENYA NUTRITION ACTION PLAN (KNAP) | 2018 – 2022 Improved Nutrition For All
53
across the country. The private sector consultation done on 17 September 2018 as part of developing the KNAP reaffirmed private sector collaboration in providing support across all KRAs, focusing on areas of comparative advantage through market forces, product innovations, value addition, ICT solutions and engagement in coordination and partnership mechanisms. Product innovation could include a reduction of fats, sugars and salt in food products; fortification, including of flour, edible oil and iodation of salt in value addition; agro-processing; and creation of consumer awareness. The private sector also requested government support in accessing quality and affordable premixes, laboratory analysis/testing of products and invitation to relevant coordination meetings. Also requested was uniform enforcement of nutrition-relevant regulations, management of food safety, standardized labelling and the importance of bringing together all nutrition relevant laws, regulations and guidelines in one document for ease of reference.
Financing the current Kenya Nutrition Action Plan 2018–2022 will need robust resource mobilization strategies and innovative partnerships. With devolution in place, the capacity of counties to coordinate will be as important, given the core functions being undertaken at their level. Forums for sharing experiences will be critical in the new KNAP dispensation and will also provide opportunities for cross-learning and leadership. To achieve the desired outcome a series of strategies and interventions with related outputs will be prioritized for implementation over the plan period.
Expected outcomeEfficient and effective nutrition governance, coordination and legal frameworks in place.
Expected outputs, strategies and interventions
Output 15.1
Enhanced existing nutrition coordination and collaborating mechanisms and linkages between national and county governments
StrategiesStrengthen coordination mechanisms for programme implementation, knowledge sharing and learning at national and county levels
Interventions/Activities1) Map partners and stakeholders2) Hold periodic governance and accountability
meetings 3) Hold Nutrition Technical Forums at national and
county level and support sub-county level as per TORs
4) Support development, costing, review and
updating of sector-specific coordination annual plans
5) Support the establishment and functionality of the Food and Nutrition Security Council and all other structures as approved in the NFNSP-IF at national and county levels
6) Enhance representation of nutrition at other sectoral forums at county and national level
7) Conduct performance assessment reviews on coordination
8) Support annual National and County learning forums.
Output 15.2
Regional and global international cooperation on nutrition enhanced
Strategy
Sustained engagement in regional and global commitment for nutrition.
Interventions/activities1) Support the functioning and the rollout of the
SUN movement 2) Participate in regional and global international
meetings on nutrition
Output 15.3
Enhanced coordination in development and implementation of nutrition-relevant regulatory frameworks
StrategyStrengthen mechanisms for policy, legal and regulatory framework engagement and processes.
Interventions/activities1) Establish a coordination mechanism for
engagement in nutrition legal and regulatory process
2) Hold annual nutrition standards and regulation summit with relevant actors
Output 15.4
Strengthened partnerships and collaboration for nutrition
Strategy Strengthen and diversify partnerships in nutrition.
Interventions/Activities1) Develop a strategy and framework for enhancing
public–private partnerships2) Develop and update nutrition sector/
multisectoral partnership framework to guide collaboration at all levels

THE KENYA NUTRITION ACTION PLAN (KNAP) | 2018 – 2022 Improved Nutrition For All
54
Output 15.5
Nutrition resource mobilization and accountability tracked
StrategyDevelop and implement a resource mobilization strategy for nutrition covering all aspects of resources – financial, human and organizational.
Interventions/Activities1) Create coordinating mechanism for resource
mobilization at all levels2) Develop costed County Nutrition Action Plans
(CNAPs)3) Conduct annual donor group forums on nutrition4) Develop annual resource mobilization strategy5) Conduct nutrition resource tracking at county
and national level 6) Support participation and representation of
nutrition sector in citizen-participation forums at all levels.
CONTEXT
Monitoring and Evaluation (M&E) SystemsThe current nutrition M&E is built on the existing infrastructure that collects, collates and analyses surveillance and service delivery data from various Service Delivery Points (SDP). The nutrition M&E framework developed to define the performance indicators for tracking the 2012–2017 NNAP implementation has been a key enabler in strengthening the nutrition surveillance, monitoring and evaluation systems in the county.
Key milestones achieved include: - 1) Development of standards tools and guidelines
for nutrition information such as the nutrition coverage assessment guideline, the standard integrated nutrition SMART survey and MIYCN KAP tools and adoption of the Integrated Phase Classification (IPC) for acute malnutrition protocols
2) Improved capacity on nutrition information management at all levels
3) Strengthened continuity of Nutrition Information Technical Working Group (NITWG) partnership and linkage with stakeholders such as NDMA, KNBS, Famine Early Warning System Network (FEWSNET) and enhanced linkages with other
working groups within the nutrition sector4) Mainstreaming of nutrition indicators in the
national M&E systems and support to data quality improvement processes
5) Improved dissemination and presentation of nutrition information through the nutrition website, the population-based survey database, infographics and nutrition situation briefs among other platforms.
Collection of data for monitoring and evaluation (M&E) purposes should be an integral part of all aspects of implementation of nutrition intervention programmes. An M&E system is critical in tracking the progress and outcome of implementation, which plays a key role in informing programme improvement, adjustment and decisions for both government and other nutrition stakeholders. The current nutrition M&E is built on the existing infrastructure that collects, collates and analyses surveillance and service delivery data from various SDP in the country. M&E is integrated through the national platforms such as District Health Information software (DHIS2), NDMA early warning system, seasonal assessments and Kenya Demographic Health Surveys (KDHS). Routine data are collected monthly and reported in DHIS, while other nutrition outcome and impact indicators are monitored through the Kenya Demographic and Health Survey (KDHS), Multiple Indicator Cluster survey (MICS) and Kenya Household Income and Budget Survey (KHIBS). Other nutrition data are periodically collected for monitoring purposes through small-scale surveys such as integrated nutrition SMART surveys and MIYCN KAP assessments, sentinel surveillance, the Long Rains Assessment (LRA), and Short Rains Assessment (SRA). Coverage assessments are also conducted to assess nutrition programme coverage. These data are analysed, shared and used for decision making in planning appropriate interventions.
Though there has been significant improvement in the nutrition M&E systems, challenges still exist including:(1) Limited allocation of financial resources to
nutrition information (2) Stock outs of nutrition MoH tools in health
facilities(3) Poor documentation of nutrition data and
reporting (4) Limited capacity to analyse and utilize nutrition
data at sub-national level, especially for problematic indicators such as iron and folic acid supplementation from the DHIS
(5) Inadequate population-level data, especially in non-ASAL areas where surveys are not conducted regularly
Sectoral and multisectoral nutrition information systems, learning and research strengthened
KRA 16

THE KENYA NUTRITION ACTION PLAN (KNAP) | 2018 – 2022 Improved Nutrition For All
55
Addressing these challenges requires continued engagement, concerted efforts through multi-sectoral linkages and support at all levels.
ResearchResearch has gained a great momentum and recognition in the field of nutrition especially in informing policy formulation. However, institutions and individual researchers implement research with or without adequate coordination with the division of nutrition and dietetics. This affects the prioritization of research areas and the use of the research findings. Furthermore, key research indicators for national reporting need to be consistently collected at a national level to allow for consistent monitoring of the implementation of KNAP. Translation and dissemination of research findings is still limited and hampers the uptake of findings by target groups such as programme managers, policy makers and communities. In 2017, the division of nutrition and dietetics initiated a research programme to be coordinated by a manager and subsequently a technical working group was established. The group has terms of reference which will assist in improving the quality of research conducted, and in coordinating with Ministry of Health research groups and other research institutions. It is anticipated that with the technical working group in place, the unit will not only achieve coordination of and documentation of the nutrition research studies under implementation, but also provide guidance on conduct of nutrition research, and advocate for capacity-building for the conduct of research, the establishment of a nutrition research repository and open data access through policy documents and guidelines. The technical working group has members from the Ministry of Health, Kenya Medical Research Institute (KEMRI)-Centre for Public Health Research (CPHR), research institutions such as APHRC, donor and development organizations such as UNICEF, Nutrition International, various universities (private sector institutions), and implementing partners, among others who have an interest in nutrition and dietetics research. To achieve the desired outcome a series of strategies and interventions with related outputs will be prioritized for implementation over the plan period
Expected outcomeSectoral and multisectoral nutrition information systems, learning and research strengthened.
Expected outputs, strategies and interventions
Output 16.1
Nutrition sector plans progress reviewed
Strategy Monitor implementation of KNAP and M&E framework for nutrition sector and evaluate the impact of nutrition interventions in the country to inform program planning and adjustment.
Interventions/Activities1) Review and update the Kenya Nutrition M&E
framework2) Support development and progress review of
AWPs and other multi-year plans and policies3) Conduct annual, midterm and end term reviews/
evaluations and corrective actions and way forward
4) Develop and disseminate annual reports.
Output 16.2
Strengthened nutrition sector capacity in NIS and evidence-based decision-making
StrategyImprove capacity for quality nutrition data collection, analysis and dissemination.
Interventions/Activities1) Develop and use a nutrition multisectoral
nutrition scored card to monitor key KNAP indicators quarterly
2) Train officers on website Maintenance and management; qualitative research methodology; SMART Survey methodology; Integrated Phase Classification for acute malnutrition; Nutrition data elements and indicators; Sentinel Surveillance-Early Warning System
3) Routine Data review and feedback meetings with counties
4) Conduct M&E capacity needs assessment and action plan for findings
Output 16.3
Improved access to and use of nutrition information to inform program quality, adjustment and learning
StrategiesTimely generation, dissemination and utilization of nutrition situation updates to inform programme planning and response.
Interventions/Activities1) Conduct nutrition situation analysis, generate
information products, and disseminate to all levels for planning and response

THE KENYA NUTRITION ACTION PLAN (KNAP) | 2018 – 2022 Improved Nutrition For All
56
2) Upload nutrition products reports and bulletins in the nutrition website and population survey database and document best practices and lessons learnt in M&E/NIS
3) Support development and review of data protection sharing guidelines
4) Develop nutrition dashboards, scorecards, electronic data collection tools, etc.
5) Systematic utilization of nutrition information to inform program quality improvement
Output 16.4
Standardized and harmonized nutrition data collection methodologies, management, and reporting at all levels
StrategyStrengthen systems for managing nutrition information
Interventions/Activities1) Review/ Develop and disseminate guidelines
on nutrition M&E based on field learning experience and emerging global guidance: Nutrition Coverage Guideline; Data Quality Audit (DQA) Guideline for nutrition indicators; Sentinel Sites DQA Guidelines reviewed; MIYCN KAP
2) Review/develop Field Assessment Manual; Guidelines on CNAP Development; IYCF-e assessment tools and guidelines; Nutrition DHIS2 tools review; SMART Survey Questionnaire review; KAP Survey Questionnaire review;
3) Participate in the HMIS indicator manual review 4) Print, distribute and disseminate MoH Nutrition
M&E framework, tools, manuals, and guidelines
Output 16.5
Quality nutrition data generated for evidence-based programming
StrategyIntegrate data quality into the M&E framework
Interventions/Activities1) Conduct nutrition data clinics to reflect on NIS
processes, key emerging issues, lessons learnt from field implementation and tap into national, regional and global experts to improve NIS
2) Conduct Data Quality Audits for DHIS, LMIS and sentinel surveillance
3) Review and validate methodologies and results and quality monitoring during nutrition surveys-SMART, MIYCN KAP and Coverage surveys
4) Conduct Integrated Nutrition SMART Surveys, MIYCN KAP and coverage assessment
Output 16.6
Enhanced multisectoral linkages result in improved nutrition information efficiencies and cost-effectiveness
StrategyMainstream nutrition M&E in the relevant sector information systems and technical working groups.
Interventions/Activities1) Hold periodic multisectoral nutrition
collaboration TWG meetings and monitoring of TWG plan
2) Strengthen continuity of NITWG partnership with stakeholders such as NDMA, KNBS, FEWSNET, MoH HIS
3) Enhance linkages between NITWG and other working groups within the sectors
4) Plan/review TORs for M&E/NIS including monthly meetings and NITWG costed plan for resource mobilization
5) Support the multisectoral Nutrition Information Platform (NIPN) for improved multisectoral data analysis, dissemination and utilization
Output 16.7
Improved decision making through research evidence
StrategyEnhanced evidence-based decision making through research.
Interventions/activities1) Develop strategic partnerships and networks
in addressing national research agenda (county and national governments and departments, partners, private sector, etc.)
2) Advocate for research prioritization both at national and county levels
3) Advocate and strengthen formation and coordination of sub-committees for research for all counties
4) Develop capacity in research methodologies, knowledge translation and systematic review processes
5) Hold forums for dissemination of research findings and information sharing
6) Strengthen systematic review of nutrition-sensitive and nutrition-specific research
7) Promote knowledge sharing forums such as symposiums and conferences, workshops, meetings
8) Establish an effective mechanism for knowledge management and learning

THE KENYA NUTRITION ACTION PLAN (KNAP) | 2018 – 2022 Improved Nutrition For All
57
9) Promote knowledge sharing through publication10) Establish research repository for nutrition and
dietetics
CONTEXT
Advocacy is an important key result area if a good nutrition outcome is to be achieved in the country. The result area aims to ensure improved and strengthened governance, capacity to deliver, increased awareness, increased demand and adoption of nutrition services and practices at all levels within the country. This key results area aims to ensure that advocacy and communication is strengthened among the nutrition-specific and nutrition-sensitive actors to achieve the good nutrition outcome.
Several gains have been made in advocacy, and this has resulted in an increased visibility for nutrition in Kenya. Kenya is a signatory and a member of the Scaling Up Nutrition movement, it has unveiled a framework for ending drought emergencies and the government has recognized food and nutrition security as one of its key priority areas for the next five years. In addition, the country now has a nutrition financial tracking tool. With this tool, policy makers will become aware of where funding for nutrition is and using this information efforts can be made to advocate for targeted actions to have a positive impact on nutrition outcomes.
Despite the various gains on advocacy, gaps still exist. Human resource numbers and the capacity for advocacy has persistently been identified as a gap during capacity assessments at national and county level. Other identified gaps are weak community engagement, weak community participation and weak feedback mechanisms that result in poor or weak social accountability. National and county budget analysis indicates that nutrition is underfunded; therefore advocacy is required to lobby for nutrition positioning at national and county levels and increased financial allocation. Currently, a huge share of funding even for nutrition actions goes towards curative actions in nutrition. There is evidence that nutrition-sensitive actions have a big role to play if we are to improve the nutrition indicators. This requires advocacy actions to have line sectors mainstream nutrition in their policies and actions. The objectives and strategies of these key result area aim to address these gaps. To achieve
the desired outcome a series of strategies and interventions with related outputs will be prioritized for implementation over the plan period.
Expected outcomeEnhanced commitment and continued prioritization of nutrition in national and county agenda.
Expected outputs, strategies and interventions
Output 17.1
Political commitment and prioritization of nutrition at national and county level enhanced.
StrategyHigh level advocacy for national and county governments.
Interventions/Activities1) Hold high level sensitization fora targeting policy
makers on the value and impact of prioritizing nutrition.
2) Support counties to develop county advocacy, communication and social mobilization plans.
3) Engage nutrition champions to advocate for prioritization of nutrition at all levels.
Output 17.2
Enhanced and sustained multisectoral collaboration, social accountability and financial resources allocated across relevant sectors at national and county levels.1 Advocate for relevant sectors to support
establishment of multisectoral nutrition platforms
2) Advocate for adequate financial resources for sustained and quality nutrition services including domestic resource mobilization
3) Participate in national and county planning process ensuring nutrition representation and mainstreaming nutrition in the national and county plans.
Output 17.3
Increased and strengthened human capital and capacity for nutrition advocacy
Strategy Strengthen capacity for nutrition advocacy at national and county levels.
Interventions/Activities1) Strengthen capacity for nutrition advocacy2) Training nutrition professionals and influencers
on advocacy 3) Advocate for recruitment of nutritionists.
Advocacy, communication and social mobilization (ACSM) strengthened
KRA 17

THE KENYA NUTRITION ACTION PLAN (KNAP) | 2018 – 2022 Improved Nutrition For All
58
Output 17.4
Evidence-based nutrition advocacy and knowledge management promoted
Strategy Support effective knowledge management and strengthen evidence-based advocacy.
Interventions/Activities1) Document and disseminate best practices, case
studies, research findings and success stories 2) Development of a nutrition advocacy package at
national and county level.
Output 17.5
Effective engagements with media built and maintained.
Strategy Build and maintain stronger relationships with media houses and journalists.
Interventions/Activities:1) Develop a training package on nutrition for
journalists based on simplified messages and key information
2) Train media fraternity on nutrition for better coverage
3) Support training of nutrition professionals and other relevant stakeholders on communication and writing skills to help them better package information for media
4) Participate in mass media education programme on nutrition.
Output 17.6
Community engagement in nutrition strengthened.
Strategy Strengthen community engagement, participation and feedback mechanisms for nutrition services and decision making processes.
Interventions/Activities1) Support counties to promote community
participation in nutrition resilience building interventions and accountability mechanism.
CONTEXT
Capacity development is the process by which individuals, groups and organizations, institutions and countries develop, enhance and organize their systems, resources and knowledge. This is reflected in their ability at individual or collective level to perform functions and solve problems in order to achieve and sustain development objectives. Capacity development for nutrition is a critical element for achieving nutrition and health objectives.
The Kenya Nutrition Capacity Development Framework (KNCDF) categorizes capacity development in four broad categories: (1) Systemic capacity, which focuses on the
broader macro environment. This includes the policy environment, legal and regulatory capacity as well as social economic and cultural dynamics that influence nutrition outcomes.
(2) Organizational capacity, which looks at working arrangements, coordination framework, structures of key institutions and organizations such as learning and research institutions, regulatory bodies, nutrition-sensitive and nutrition-specific actors and the Ministry of Health at national and county level.
(3) Technical capacity, which looks at the presence of technical and human resource capacity of nutrition in relevant institutions to support and improve nutrition service delivery.
(4) Community Capacity, which looks at the ability of communities to access, demand and consume for nutrition services through increased nutrition service awareness.
Nutrition capacity assessment conducted in 16 counties by mid-2018 indicated critical gaps across the four capacity domains. At system levels gaps were noted in policy, leadership and management competencies of the workforce while at organizational level, gaps were noted in sub optimal coordination and weak systems for service delivery. Stock outs in essential commodities and equipment was noted and linked to inadequate knowledge to forecast and quantify the items. Similarly, the ability of the management to resource mobilize was limited as seen in very low budgetary allocation for nutrition in the assessed counties. At technical level, skills of staff at facility level were not optimal and did not match nutrition needs and services
Capacity for nutrition developedKRA 18

THE KENYA NUTRITION ACTION PLAN (KNAP) | 2018 – 2022 Improved Nutrition For All
59
required at the various levels of health care. There was inadequate number of nutrition personnel further noted in addition to very few of those in place being adequately trained. Opportunities for enhancing technical skills were further limited by weak linkages between the implementers and the training institutions. At community level, limited community units were noted with limited skills of the community health workforce further resulting in a weak referral system. To achieve the desired outcome a series of strategies and interventions with related outputs will be prioritized for implementation over the plan period.
Expected outcomeCapacity to deliver and demand for nutrition services enhanced.
Expected outputs, strategies and interventions
Output 18.1
Capacity for nutrition developed at national and county level
Strategy Conduct nutrition capacity assessment.
Interventions/Activities1) Conduct comprehensive national and county
capacity assessments2) Review the capacity development framework 3) Develop a costed action plan for capacity
strengthening4) Disseminate the capacity assessment findings
and action plan at national level5) Undertake policy dialogue to enhance capacity
for nutrition policy formulation and utilization 6) Development of course on leadership and
governance7) Conduct trainings on partnerships and
coordination management 8) Hold periodic capacity TWG meetings.
Output 18.2
Enhanced systems for skills and competency development for nutrition workforce.
Strategy Adopt competency-based approach in skill development
Interventions/Activities1) Review and disseminate of guidance on job
description and performance appraisal for nutrition
2) Develop and disseminate technical induction package
3) Conduct joint monitoring missions to review
progress of implementation 4) Prepare advocacy briefs and organize for forums
with stakeholders 5) Sensitize counties on IHRIS 6) Regularly monitor and analyse IHRIS update for
trainings 7) Review and disseminate standardized training
packages and guidelines 8) Dissemination meeting for internship guidelines
Output 18.3
Strengthened capacity for community level demand, generation and utilization of integrated services.
Strategy Optimize functioning of community structures to facilitate demand generation for uptake of nutrition services
Interventions/Activities 1) Empower the community’s own resource
persons to create demand for utilization of nutrition services through community structures
CONTEXT
Nutrition commodities and equipment are a key component for prevention and management of malnutrition and diseases specific conditions along the life course. The key objective is to ensure uninterrupted supply by facilitating integration into a single more effective and efficient Government led supply chain system with KEMSA as the key warehousing and distribution agency of nutrition commodities directly to the health facilities. The need for continuous supply of adequate and good quality nutrition commodities and equipment is paramount to the success of the treatment of these conditions and the success of UHC agenda. An increased scope of commodities is also necessary to support the reviewed Kenya Essential Package for Health (KEPH) that focuses on responsiveness to the population needs especially expanding to coverage for more non-communicable diseases. Advocacy for expansion of Essential Medicines & Medical Supplies (EMMS) lists to incorporate new commodities, e.g., nutrition commodities for chronic diseases such as cancer, is critical. An important aspect that determines the scale of procurement is the cyclical emergencies and disasters that increases the caseloads of children affected by malnutrition,
Supply Chain Management for Nutrition Commodities and Equipment Strengthened
KRA 19

THE KENYA NUTRITION ACTION PLAN (KNAP) | 2018 – 2022 Improved Nutrition For All
60
consequently increasing the requirements for key products necessary in treatment and management of malnutrition.
Procurement of nutrition commodities is predominantly done by the KEMSA which is a state corporation under the Ministry of Health established under the KEMSA Act 2013. There are, however, limitations in the full range and quality of commodities that KEMSA is currently able to stockpile. Similarly, the ability of counties to forecast, quantify and procure commodities from KEMSA is of great importance in maintaining the integrity of the supply chain. The mandate of the authority is to procure, warehouse and distribute nutrition commodities to facilities. The nutrition commodities steering committee was formed under the leadership of the director of medical services and hosted under the Nutrition and Dietetics Unit to coordinate nutrition commodity supply chain integration and management in collaboration with key supporting partners, MoH, UNICEF, World Bank, WFP, DFID, Global Fund, NHP, USAID, AMREF, GAIN, Nutrition International (NI) and KEMSA.
The key issues and challenges with regard to nutrition commodities are: -(1) Inadequate government funding and prioritization
of nutrition commodities and equipment for routine programme implementation across the various programmes leading to erratic supply and overreliance on partners for support
(2) Parallel/ uncoordinated supply chains across the nutrition programmes and cohorts, especially in the non-ASAL where integration has not taken root
(3) Inadequate capacity on commodity management, target setting, seasonal forecasting and quantification, quality and timely reporting affecting facility reporting rates and consistent availability of supplies
(4) Inadequate / poor storage facilities and space for nutrition commodities and equipment
(5) Insecurity with regard to commodities and quality
(6) Inaccessibility to some health facilities affecting effective nutrition commodity distribution
(7) Inadequate data collection and reporting tools mainly for the non-ASAL
(8) Difficulties with downstream warehousing and distribution chain
(9) Inadequate utilization of the Logistic Management Information System (LMIS)
To achieve the desired outcome a series of strategies and interventions with related outputs will be prioritized for implementation over the plan period.
Expected outcomeStrengthened integrated supply chain management system for nutrition commodities, equipment and allied tools.Expected outputs, strategies and interventions
Output 19.1
Increased government budget allocation for nutrition commodities and allied tools
Strategy Advocate for increased government budget allocation for nutrition commodities and allied tools.
Interventions/activities 1) Advocate for a standing budget line for nutrition
commodities and equipment and increased allocation for procurement and distribution of nutrition commodities at national and county level
2) Advocate for Expansion of Essential Medicines & Medical Supplies (EMMS) lists (to incorporate new commodities), e.g. nutrition commodities for chronic diseases such as cancer etc.
3) Advocate for increased supplier base for cost reduction of nutrition commodities and equipment
4) Ring-fence nutrition commodity funds at county level through review of the PFM Act 2012
5) Increase KEMSA capacity to warehouse and supply nutrition quality commodities in a timely and effective manner including commodity security insurance
6) Promote in-country nutrition product formulation and development (link with research).
Output 19.2
Strengthened coordination and management capacity of supply chain of nutrition commodities and equipment
Strategy Optimize functioning of national and county nutrition commodity steering committees
Interventions/activities 1) Hold quarterly meetings for nutrition commodity
steering committee at the national and county level
2) Conduct annual national forecasting and quantification exercise across the nutrition programs
3) Conduct training on LMIS including inventory management

THE KENYA NUTRITION ACTION PLAN (KNAP) | 2018 – 2022 Improved Nutrition For All
61
Output 19.3
Quality of all nutrition commodities and equipment ensured.
Strategy: Develop a mechanism to monitor quality of nutrition supplies.
Interventions/Activities: 1) Develop guidelines and SOPs for nutrition commodities and tools2) Collaborate with the food safety division and regulatory bodies to ensure good quality of nutrition
commodities and equipment3) Conduct nutrition commodity data quality audits and data review meetings4) Develop and provide tools for quality assurance including data collection and summary 5) Conduct joint support supervision and end user monitoring6) Monitor end-user of nutrition commodities on a regular basis.
Output 19.4
Improved availability of nutrition commodities, equipment, resources and management of supply chain.
Strategy: Advocacy and resource mobilization for nutrition supply chain
Interventions/Activities: 1) Procurement nutrition commodities

THE KENYA NUTRITION ACTION PLAN (KNAP) | 2018 – 2022 Improved Nutrition For All
62
05

THE KENYA NUTRITION ACTION PLAN (KNAP) | 2018 – 2022 Improved Nutrition For All
63
5.1. CONTEXTA good health system raises adequate revenue for service provision, enhances the efficiencies of management of resources and provides financial protection to the poor against catastrophic and impoverishing situations. Understanding how the health systems and services are financed, programmed and resourced is important in the strategic mobilization of resources, advocating for the financing of priority actions, and supporting populations to access available health services. Estimation of resources is a critical part of sustainable financing of nutrition interventions. This will help government and partners understand the scale of the financial requirements and decide prioritization of areas of resource allocation. To ensure sustainability and predictability of resources, it is hoped that government will increase its financial resources for nutrition without overly relying on donors.
5.2. COSTING APPROACH
Financial resources need for the KNAP was estimated by costing all the activities necessary to achieve each of the expected outputs in each key result area (KRA). The KNAP used result-based costing to estimate the total resource need to implement the action plan for the next five years. The costing logic springs from activity-based costing, with the
intuition that activities require inputs. These inputs are required in certain quantities, and with certain frequencies. The sum of all the input costs gives the activity cost. The activities are added up to arrive at the output cost, KRA cost, and eventually the total cost of achieving results outlined in the KNAP. This method is referred to as results-based costing and the emphasis is on results rather than spending.
5.3. RESOURCE NEEDS FOR IMPLEMENTING KENYA NUTRITION ACTION PLAN
The total cost to achieve the 19 key results areas outlined in the KNAP from 2018 to 2022/23 will be KES 38.4 billion (USD 379.9 million). There is variation in the financial need across various KRAs, with KRA 19 on nutrition commodities accounting for more than half (55.6 per cent) of the total resource needs for the KNAP. This is attributed to the high resources need for nutrition commodities. Other KRAs accounting for substantial proportion of the total resources include KRA 15 (8.2 per cent); KRA 6 (7.3 per cent); and KRA 1 (5.7 per cent). These four result areas account for 76.8 per cent of the total resource need for the KNAP for the five years of the plan. Table 6 presents a summary of total resources needs for implementing KNAP by KRA. Detailed financial resources requirement by each KRA by output and activity is provided in Appendix 1.
05 COSTED ACTION PLANS OF THE KNAP
CATEGORY OF ESTIMATED BUDGET (Ksh millions) TOTAL TOTAL
INTERVENTION KEY RESULT AREAS (KRAs) 2018/2019 2019/2020 2020/2021 2021/2022 2022/2023 KSH (MILLION)
USD (MILLIONS
NUTRITION SPECIFIC KRA 1 - Maternal, Infant and Young Child Nutrition (MIYCN) Scaled-Up
419.80 488.01 394.31 408.06 490.67 2,200.85 21.79
KRA 2: Nutrition of older children and adolescents promoted
63.92 158.42 145.19 120.64 101.58 589.74 5.84
KRA 3: Nutrition Status of Adults and Older Persons promoted
20.37
69.86
107.61
29.42
7.72
234.98
2.33
KRA 4: Prevention, Control and Management of Micronutrient Deficiencies Scaled-Up
85.36 308.54 114.63 131.57 129.03 769.12 7.62
Table 6: Summary of financial resource needs for the KNAP 2018–2022/23

THE KENYA NUTRITION ACTION PLAN (KNAP) | 2018 – 2022 Improved Nutrition For All
64
5.4. FUNDING OPPORTUNITIES AND SUSTAINABILITY PLAN FOR THE KNAP
While it is critical to mobilize domestic resources to fund full implementation of the KNAP, the role of donors and NGOs is very important. For the past several years, expenditure on nutrition has been relatively low. The total health expenditures for nutrition was KES 1 billion (USD11.9 million) and KES 1.2 billion (USD12.3 million) in the financial years 2012/13 and 2015/16 respectively. As a percentage of GDP nutrition expenditure was almost zero (0) per cent in the two periods. However, there was a 30 per cent increase in the government institutional units providing financing schemes for nutrition between
FY 2012/13 and FY 2015/16, mainly as a result of government devolution. This was also reflected in the revenue schemes for nutrition financing where in 2012/13 donors, at 52 per cent, constituted the largest sources of revenue of health care financing, but in FY 2015/16 government schemes as well as Non-Profit Institutions Serving Households (NPISH) financing schemes were the major pools for funds for nutritional care at 52 per cent, while for donors it was 48 per cent. In absolute values, the managing role by the MoH reduced by 9.6 per cent with the entry of counties, with funding control by the ministry reduced from KES 488 million in FY 2012/13 to KES 441 million in FY 2015/16 (see Figure 13).
KRA 5: Prevention, Control and Management of Diet Related Risk Factors For Non-Communicable Diseases scaled up
148.08 223.38 146.91 119.99 125.61 763.97 7.56
KRA 6: Integrated Management of Acute Malnutrition (IMAM) Strengthened
579.46 571.98 531.21 567.10 560.48 2,810.24 27.82
KRA 7: Nutrition in Emergencies Strengthened
128.72 160.33 112.85 100.60 148.64 651.13 6.45
KRA 8: Nutrition in HIV and TB Scaled Up
378.22 371.11 328.78 320.61 325.60 1,724.32 17.07
KRA 9: Clinical Nutrition and Dietetics Strengthened
15.51 75.37 100.54 47.94 40.08 279.44 2.77
NUTRITION SENSITIVE KRA 10: Nutrition in Agriculture and Food Security Scaled up
188.93 203.64 185.60 269.58 205.44 1,053.19 10.43
KRA 11: Nutrition in the Health Sector Strengthened
31.67 32.34 20.57 18.71 20.17 123.46 1.22
KRA 12: Nutrition in the Education Sector Strengthened
45.05 58.65 75.28 54.68 46.79 280.44 2.78
KRA 13: Nutrition in Water, Sanitation And Hygiene (WASH) Promoted
121.77 88.41 78.16 126.71 77.94 492.99 4.88
KRA 14: Nutrition in social protection programmes promoted
10.67 47.34 67.59 39.48 12.03 177.11 1.75
CROSS-CUTTING KRA 15: Sectoral and Multi-Sectoral Nutrition Governance (MNG) Including Coordination and Legal/Regulatory Framework Strengthened
615.36 646.22 610.63 609.45 659.59 3,141.26 31.10
KRA 16: Sectoral and Multi-sectoral Nutrition Information Systems, Learning and Research Strengthened
157.12 197.40 271.67 154.56 241.15 1,021.90 10.12
KRA 17: Advocacy, Communication and Social Mobilization (ACSM) Strengthened
110.75 108.46 84.28 57.91 56.62 418.00 4.14
KRA 18: Capacity for Nutrition Developed
58.97 76.70 34.79 61.79 61.79 294.05 2.91
KRA 19: Supply Chain Management for Nutrition Commodities and Equipment Strengthened
3,748.71 4,011.19 4,266.57 4,532.88 4,782.29 21,341.65 211.30
TOTAL 6,928.43 7,897.34 7,677.18 7,771.66 8,093.22 38,367.83 379.88

THE KENYA NUTRITION ACTION PLAN (KNAP) | 2018 – 2022 Improved Nutrition For All
65
06

The KNAP M&E system will therefore ensure: • Continued progress monitoring, reporting
through regular and systematic tracking of the progress of implementation of the KNAP.
• Alignment of stakeholders’ resources and actions to strengthen nutrition interventions.
• Evidence-based decision making through ensuring timely availability of good-quality evidence that is effectively disseminated.
• Constructive evidence-based policy dialogue to facilitate evidence-informed decision making.
• That operational research capacity is strengthened to generate evidence to inform decision making.
• Documentation of lessons learnt in KNAP implementation to promote learning, institutional memory and linking of nutrition programmes with research and training.
6.2. COMMON RESULTS AND ACCOUNTABILITY FRAMEWORK (CRAF)
KNAP has identified results expected upon full implementation of the action plan, together with indicators that will measure the progress of achievement of the strategies outlined. Important to note is a set of key indicators and targets that are referred to as the CRAF that have been agreed upon. The CRAF uses a logical results framework process at three levels (impacts, outcome and output results). Kenya has identified and selected 29 nutrition targets that constitute the CRAF and if achieved will contribute significantly to the desired change. Table 8 details the baseline data, and mid- and end-term target as well as the sources for these indicators. The largely impact targets are derived from three sources: the World Health Assembly (WHA) six targets for 2025; the global Non-Communicable Diseases (NCD) nine voluntary 2025 targets and the National Food and Nutrition Security Policy Implementation (NFNSP-IF) results matrix.
06 KNAP MONITORING, EVALUATION, ACCOUNTABILITY AND LEARNING (MEAL)
Table 7: MEAL explained
THE MEAL Definitions
Monitoring The routine monitoring of project resources, activities and results, and analysis of the information to guide project implementation.
Evaluation The periodic (midterm, final) assessment and analysis of an existing strategy/action plan
Accountability Transparency of processes: planning, execution, and reporting
Learning The process through which information is generated from M&E is reflected upon and intentionally used to continuously improve the ability of an action plan/strategy to achieve results
The monitoring, evaluation, accountability and learning (MEAL) framework will facilitate tracking and evaluation of performance of set targets, as well as serving as an accountability and learning framework for the various nutrition stakeholders. In addition to supporting results and financial tracking, the MEAL framework will also provide a mechanism for county, national and, where relevant, global and regional reporting; thereby aligning partners to a common approach to reporting. The KNAP elaborates required investments to strengthen
the nutrition system and scale up coverage of nutritional interventions, to attain set nutrition objectives. The MEAL framework further provides a summary of select results and indicators that will be mutually tracked and reported on by all sectors responsible for the implementation of KNAP. The summary is referred to as the Common Results and Accountability Framework (CRAF). Table 7 explains key MEAL terms.
6.1. INTRODUCTION
THE KENYA NUTRITION ACTION PLAN (KNAP) | 2018 – 2022 Improved Nutrition For All
66

THE KENYA NUTRITION ACTION PLAN (KNAP) | 2018 – 2022 Improved Nutrition For All
67
Table 8: Kenya nutrition targets for 2022/23
KNAP ADOPTED NUTRITION TARGETS BY 2022
S/N KNAP expected results (Global targets used where applicable)
Indicator Baseline 2018 Target 2022
Framework for targets
1 Reduce the prevalence of stunting among children under five years by 40%
Prevalence of stunting in children 0-59 months (%)
26 17 WHA target 1 NFNSP-IF
KDHS 2014
2 Reduce the prevalence of anaemia in women of reproductive age by 30%
Prevalence of anaemia in women 15-49 years (%) –
27 17 WHA target 2 NFNSP-IF
KDHS 2014
3 Reduce the prevalence of low birthweight by 30%
Prevalence of low birth weight of 2.5 kg and below (%)
8 5 WHA target 3
KDHS 2014
4 No increase in childhood overweight/obesity Prevalence of overweight/obesity (W/A >2SD) of children 0-59 months (%)
4 <4 WHA target 4 & NFNSP-IF
KDHS 2014
5 Increase the rate of exclusive breastfeeding in the first six months by 20% and above
Prevalence of exclusive breastfeeding in children 0-6 months (%)
61 75 WHA target 5 & NFNSP-IF
KDHS 2014
6 Maintain childhood wasting at less than 4% Prevalence of wasting (W/H <2SD) in children 0-59 months (%)
4 <4 WHA target 6 & NFNSP-IF
KDHS 2014
7 Reduce childhood underweight by 30% Prevalence of underweight (W/A <2SD) in children 0-59 months
11 7 NFNSP-IF
KDHS 2014
8 Maintain proportion of deaths at below 3% for MAM and 10% for SAM
Proportion (%) of discharges from treatment program who have died
0.2% for MAM <0.2% MAM
NFNSP-IF
(among acutely malnourished children for MAM and SAM)
1.7% for SAM <1.7 SAM
DHIS 2
9 Reduce anaemia in children 6-59 months by 30%
Prevalence of anaemia in children 0-59 months (%)
26 17 KNAP
10 Reduce anaemia in pregnant women by 40% or more
Prevalence of anaemia in pregnant women (%)
36 20 NFNSP-IF
KNMS
11 Reduce anaemia in adolescent girls by 30% Prevalence of anaemia in girls 15-19 years (%)
21 15 KNAP
KNMS
12 Reduce folic acid deficiency among non-pregnant women by 50%
Proportion of non-pregnant women with folic acid deficiency (%)
39 20 NFNSP-IF
KNMS
13 Reduce vitamin A deficiency in children by 50% Prevalence of VAD in children 0-59 months (%)
9 4 NFNSP-IF
KNMS
14 Reduce iodine deficiency among children <5 years by over 50%
Prevalence of iodine deficiency in children <5 years (%)
22 <10 NFNSP-IF
KNMS
15 Reduce iodine deficiency among non-pregnant women by over 50%
Prevalence of iodine deficiency in non-pregnant women (%)
26 <10 NFNSP-IF
KNMS
16 Reduce prevalence of zinc deficiency in pre-school children by 40%
Prevalence of zinc deficiency in children <5 years (%)
83 50 NFNSP-IF
KNMS

THE KENYA NUTRITION ACTION PLAN (KNAP) | 2018 – 2022 Improved Nutrition For All
68
17 Reduce prevalence of zinc deficiency among pregnant women by 40%
Prevalence of zinc deficiency among pregnant women (%)
60 36 NFNSP-IF
KNMS
18 A 10% relative reduction in prevalence of insufficient physical activity
Prevalence of insufficient physical activity in adults 18–64 years of age (%)
6.5 5 NCD target 3
Stepwise survey
19 Reduce proportion of population with raised blood pressure or currently on medication by 25%
Proportion of population with raised blood pressure or currently on medication (%)
24 18 NCD target 6
Stepwise survey NFNSP-IF
20 Reduce proportion of population with raised fasting blood sugar
Proportion of adults 18-69 years with raised fasting blood sugar (%)
1.9 1.5 NFNSP-IF
Stepwise survey
21 Increased proportion of men with normal waist: hip ratio
Proportion of men with normal waist: hip ratio (%)
73 78 NFNSP-IF
Stepwise survey
22 Increased proportion of women with normal waist: hip ratio
Proportion of women with normal waist: hip ratio (%)
64 75 NFNSP-IF
Stepwise survey
23 A 30% relative reduction in mean population intake of salt/sodium
Mean intake of sodium salt (g/day)
3 <3 NCD target 4
24 Halt and reverse the rise in obesity by 30% Prevalence of overweight/obesity in adults (18-69 years)
28 20 NCD target 7
NFNSP-IF
25 10% of Population accessing health care services screened and assessed for nutrition status
Proportion of population screened and assessed for nutrition status while accessing healthcare services
No Data 10% Clinical Nutrition target 2b
26 Increase access by the population to clinical nutrition and dietetics services
Proportion of population with access to clinical nutrition and dietetics services
No Data 10% Clinical Nutrition target 3
27 Increased budgetary allocation towards nutrition
Percentage of nutrition budget in national health budget
2% 8% Financing of nutrition
28 Increase coverage of nutrition assessment counselling and support for people living with HIV
Percentage of People Living with HIV (PLHIV) in care and treatment who were nutritionally assessed
< 50% NASCOP Quantification
2018
90% HIV Nutrition targets as indicated in quantification plan
29 Increase access to therapeutic and or supplemental food for clinically undernourished people living with HIV
Proportion of clinically undernourished PLHIV who received therapeutic or supplementary food
< 50% NASCOP Quantification
2018
90% HIV Nutrition targets as indicated in quantification plan
Monitoring of this progress will require the use of data from multiple data sources, strong multisectoral collaboration, stakeholder involvement and strong political support.
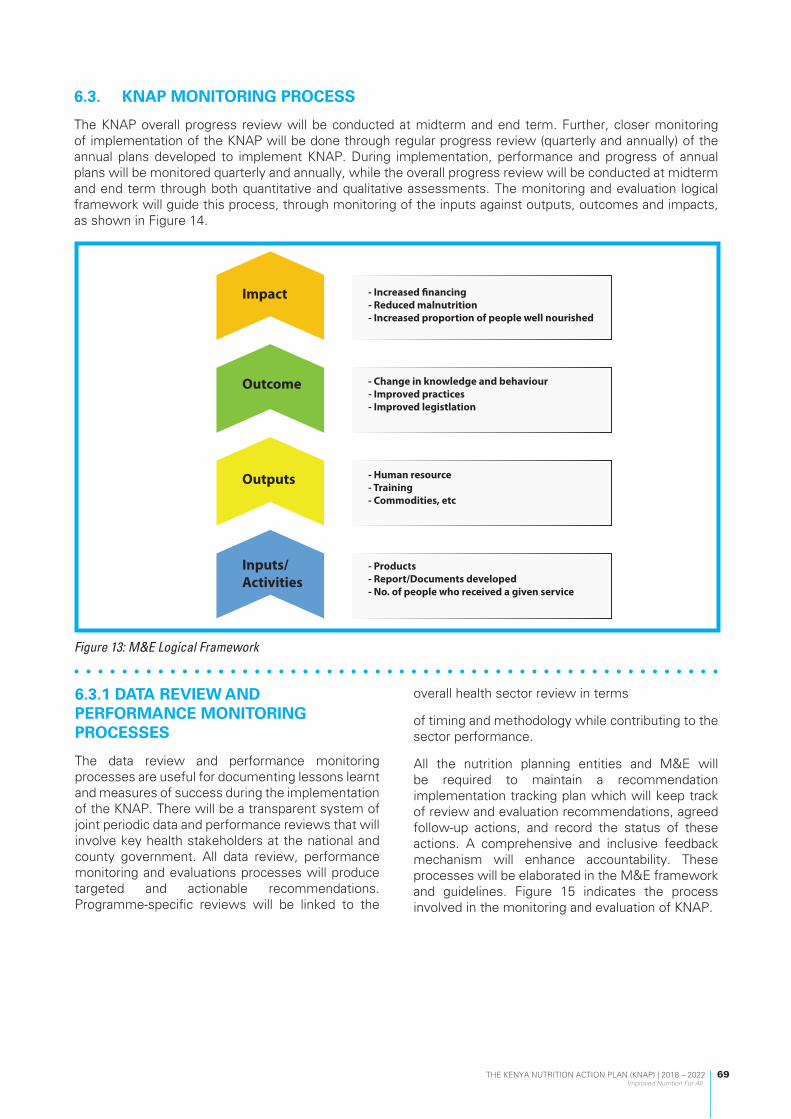
THE KENYA NUTRITION ACTION PLAN (KNAP) | 2018 – 2022 Improved Nutrition For All
69
6.3.1 DATA REVIEW AND PERFORMANCE MONITORING PROCESSES
The data review and performance monitoring processes are useful for documenting lessons learnt and measures of success during the implementation of the KNAP. There will be a transparent system of joint periodic data and performance reviews that will involve key health stakeholders at the national and county government. All data review, performance monitoring and evaluations processes will produce targeted and actionable recommendations. Programme-specific reviews will be linked to the
overall health sector review in terms
of timing and methodology while contributing to the sector performance.
All the nutrition planning entities and M&E will be required to maintain a recommendation implementation tracking plan which will keep track of review and evaluation recommendations, agreed follow-up actions, and record the status of these actions. A comprehensive and inclusive feedback mechanism will enhance accountability. These processes will be elaborated in the M&E framework and guidelines. Figure 15 indicates the process involved in the monitoring and evaluation of KNAP.
6.3. KNAP MONITORING PROCESS
The KNAP overall progress review will be conducted at midterm and end term. Further, closer monitoring of implementation of the KNAP will be done through regular progress review (quarterly and annually) of the annual plans developed to implement KNAP. During implementation, performance and progress of annual plans will be monitored quarterly and annually, while the overall progress review will be conducted at midterm and end term through both quantitative and qualitative assessments. The monitoring and evaluation logical framework will guide this process, through monitoring of the inputs against outputs, outcomes and impacts, as shown in Figure 14.
Impact - Increased financing- Reduced malnutrition- Increased proportion of people well nourished
- Change in knowledge and behaviour- Improved practices- Improved legistlation
- Human resource- Training- Commodities, etc
- Products- Report/Documents developed- No. of people who received a given service
Outcome
Outputs
Inputs/Activities
Figure 13: M&E Logical Framework

THE KENYA NUTRITION ACTION PLAN (KNAP) | 2018 – 2022 Improved Nutrition For All
70
Quarterly Reporting
Monitoring of annual work plans will be carried out through quarterly and biannual reporting from routine data collection, like the HIS, nutrition scorecard, and feedback from coordinating structures which provide opportunities for the adjustment of activities. These data will be presented in the performance review reports that will be prepared both at the county level and at national by the various sectors. These review reports will outline the performance against the targets set for the said period. Recommendations from previous reports will be discussed, together with prevailing implementation challenges, by the county health management teams together with the nutrition focal person, and stakeholders at county level. At national level, these reports will be discussed during the quarterly nutrition stakeholder meeting, with representation from the various ministries and stakeholders.
Annual Reporting
Annual multisectoral and multi-stakeholder nutrition reviews (AMNRs) will need to be established. The CRAF and financial tracking tools will be used to show stakeholders the progress made, the challenges faced and what still needs to be done. The AMNRs will make recommendations on how those challenges will be resolved, indicating timelines and who will be accountable. Progress on implementation of the recommendations will need to be tabled at the next annual multisectoral
nutrition review.
Key outputs of this annual process will be realized at national and county levels as follows:
• National Annual Nutrition Sector Report
The national report will be prepared through a consultative process by all the various ministries involved in nutrition, and nutrition stakeholders. This will document the progress made, challenges faced and recommendations for the following year. Best practices will also be documented and shared for mutual learning. This report will feed into the various ministries annual reports to be shared to senior management at national level for endorsement and use, and to the various stakeholders including county health management teams for feedback and use. The dissemination will be through meetings, workshops, emails and nutrition website.
• County Nutrition Sector Report
The report will be developed by the county nutrition stakeholders through a consultative process with all nutrition stakeholders and presented at a County Annual Health Review forum. This report will document the overall progress made by the counties against the targets set for the year. This will be collected from sub-county level and aggregated to the county level. It will include challenges encountered during the period under review, recommendations and priorities for the following year. Best practices will also be documented for shared learning.
SCALED UP AND IMPROVED KRA INTERVENTIONS
ANNUAL MULTISECTORAL NUTRITION REVIEWS (AMNRs)
QUARTELRY MULTISECTORAL NUTRITION SCORE-CARD
2018 2019 2020 2021 2022
BASELINE- BEFORE SITUATION
TARGETS -AFTER SITUATION
KNAPBASELINE
MID TERM REVIEW
(MTR)
END TERM REVIEW(ETR) &
DEVELOPMENTOF NEW KNAP
Figure 14: KNAP monitoring and evaluation processFigure 14: KNAP monitoring and evaluation process

THE KENYA NUTRITION ACTION PLAN (KNAP) | 2018 – 2022 Improved Nutrition For All
71
6.4. KNAP EVALUATIONS
Evaluating implementation of the KNAP is intended to determine whether or not the interventions suggested achieved the expected results. The evaluation will provide credible evidence on the performance of the KNAP and document what worked and did not work. Beyond answering the evaluation questions, it will test the effectiveness of the suggested interventions, against practices in the region with similar challenges.
A midterm review and an end evaluation will be undertaken to determine the extent to which the objectives of the action plan are met. Trends will be assessed, together with the results of the various assessments and surveys across the different indicator domains – inputs/processes; outputs; outcomes and expected results.
Mid -term review
A midterm review (MTR) will be done in 2020 that will review the progress made in the two years of implementation and recommend adjustments in strategy or review of expected targets when deemed necessary. This will assess progress made towards the realization of the KNAP objectives. The midterm review will coincide with the annual work plan review for year three. It will also be aligned to the health sector strategic plan midterm review. It will cover all the targets mentioned in the plan, including targets for outcome and impact indicators. The results will be used to adjust the KNAP strategies, priorities and targets.
End term evaluation
The end-term review (ETR) will be done in 2022 to evaluate the overall performance of the KNAP and use lessons learnt to develop the subsequent KNAP and review the final achievements of the sector against what had been planned. It will involve a comprehensive analysis of progress and performance for the whole period of the plan.
Evaluation Criteria
To carry out an effective evaluation, there is a need for clear evaluation questions, which answer/respond to the appropriate policy questions. To establish the type of questions, a theory of change has been developed, describing the results chain, for formulating hypotheses to be tested by the evaluation, and for selecting performance indicators.
Evaluation criteria will highlight the following aspects of the interventions:
1. Effectiveness 2. Efficiency 3. Sustainability 4. Relevance5. Impact6. Gender7. Human Rights
6.5. KNAP LEARNING
The learning process of the KNAP will follow an adaptive management cycle approach, which involves improving outcomes through learning. Assessment of the problems facing nutrition have been outlined in the situation analysis and strategies and interventions outlined to address the issues. This is followed by the actual implementation, and monitoring of the inputs, outputs, outcomes, achieved and evaluation against the expected results, adjusting accordingly. Figure 16 indicates the learning cycle involved.
Learning will involve assessing what works well or does not work well in a particular context, which aspects have more influence on the achievement of results, which strategies can be replicated, etc.
For the KNAP, the following initiatives will guide learning:i. Compare results across time to determine
which ones contribute to achieving the mission and expected results.
ii. Facilitation of both formal and informal learning and reflection meetings of all stakeholders, by sharing learning experiences (positive and negative) with partners, communities and other stakeholders, in response to their needs. This will strengthen accountability and transparency.
iii. Documentation of processes and reports (paper based, photos, videos, etc.); and appropriate storage (filing – electronic, paper based) of MEAL outputs to keep learning within the organization even when key staff leave.
iv. Mentoring of staff with a focus on specific issues or identified needs and helping individuals reflect and question existing practice.
v. Training courses in response to feedback. vi. Development of innovative tools for MEAL.

THE KENYA NUTRITION ACTION PLAN (KNAP) | 2018 – 2022 Improved Nutrition For All
72
Figure 15: KNAP learning cycle
EVALU
AT
E &
LE
ARN
DO
ADJUST
PLAN
Adjust management actions and
arrangements to enhance effectiveness
6.6. FINANCIAL TRACKING AND BUDGET ANALYSIS FOR NUTRITION
An important aspect in measuring the performance of the KNAP is to be able to track the nutrition investments made through the KNAP regularly and transparently. This will help in better use of finance data (allocations vs expenditures) to mobilize increased domestic and external resources for improved nutrition and for purposes of advocacy and better planning. Governments invest in nutrition through budgetary allocation to various sectors, e.g., health, agriculture, education, WASH and social protection, and the KNAP has incorporated nutrition targets in these sectors to ensure these budgets work harder for nutrition impact.
Since budgetary analysis through Public Expenditure Reviews for Nutrition (PER-N) can only be done every 3–4 years, the SUN movement has devised a three-step approach as a quick way to report on nutrition-relevant allocations in national budgets. Kenya has developed a nutrition financial tracking tool and process that follows a three-step approach:
(1) Step 1: Identify relevant budget-line items through a strategically created key word search. For Kenya, using the KNAP outcomes and actions would provide the relevant word search;
(2) Step 2: Assess whether or not the identified items are specific to nutrition and whether they fall into the categories nutrition-specific,
nutrition-sensitive, or enabling environment. Items not related to nutrition are excluded from the analysis after further consultations;
(3) Step 3: Weight or apply an attributable percentage of the allocated budget-line item to nutrition, based on the three categories in step two: nutrition-specific, nutrition sensitive and enabling environment.
6.7. INSTITUTIONAL ARRANGEMENT FOR M&E
Kenya is implementing National Integrated Monitoring and Evaluation Systems (NIMES) and County Integrated Monitoring Evaluation System (CIMES), which track all government programmes. The systems will also track the Kenya Vision 2030 through its medium-term plans (MTP) and County Integrated Development Plans (CIDPs), which will provide government with reliable policy implementation feedback to help it efficiently allocate resources over time.
At the national level, there is an established M&E unit within the MoH whose functions are to: 1) provide strategic direction for M&E in the health sector; 2) coordinate M&E activities as well as supporting programmes in their M&E needs; and 3) work with the Kenya National Bureau of Statistics (KNBS), Ministry of Planning to collect health information and vital statistics required for national development. At the county level, there are designated M&E focal persons and the division of
Periodically reviewoverall management
program
Report findings andrecommendations
of evaluation
Evaluatemanagementeffectiveness
Source: DPIPWE 2016 after Jones 2005, 2009
Implementstrategies and actionsto achieve objectives
Establish monitoring programs for selected
performance indicators
Develop managementstrategies and actions
Identify performanceindicators
Define key desiredoutcomes
Determine managementobjectives
THE KENYA NUTRITION ACTION PLAN (KNAP) | 2018 – 2022 Improved Nutrition For All
73
nutrition and dietetics has a nutrition information and management programme.
6.8. DATA MANAGEMENT FOR NUTRITION M&E
What data are to be collected, how and when, are key to the success of KNAP. The role of the health and nutrition information system is collection of health and nutrition data, collation, conveyance and management of the data to information for decision making. This information is only useful when it is reliable and timely. To support health and nutrition information systems strengthening, the MoH has developed various policy documents and guidelines.56
6.9. RESEARCH
The objective of implementation research is to promote the systematic uptake of research findings and other evidence-based practices into routine practice, and, hence, to improve the quality and effectiveness of chosen interventions. In the context of the KNAP, the structure of implementation (for example, the roles played by the government, non-governmental organizations, development partners, the private sector and citizens in general) can also
be subjected to implementation research.
Development of an overall research agenda to support the KNAP is important. Some key implementation research questions that the KNAP may want to be answered as part of implementation monitoring could include:1) How functional and effective are the coordinating
structures at the national and county levels?2) Have the different sectors and development
partners aligned their strategies and programmes with the KNAP?
3) What is the extent of public awareness on nutrition created by the KNAP?
4) Is the leadership and accountability mechanism of the KNAP working as envisaged?
5) Is the change in the nutrition situation (at midterm & end time) a result of the KNAP?
6.10. COST OF MEAL
MEAL should be allocated between 5 and 10 per cent of the KNAP budget. However, it is recommended that specific activities involved in MEAL should be costed, including assessments, baselines, routine monitoring, ongoing reflection and learning, and periodic evaluations.
56Revised HIS policy 2014-2030, HIS strategic plan 2014-2018, eHealth strategy, Health sector indicator’s manual, EMR standards and guidelines, Health guidelines and system interoperability guidelines, The National Nutrition Monitoring and Evaluation Framework
17
Eat daily consumption of fruits, vegetables, legumes, and whole grain cereals to promote healthy weight gain.

07
THE KENYA NUTRITION ACTION PLAN (KNAP) | 2018 – 2022 Improved Nutrition For All
74

THE KENYA NUTRITION ACTION PLAN (KNAP) | 2018 – 2022 Improved Nutrition For All
75
7.1. INTRODUCTION
The broad-ranging determinants of malnutrition as articulated in the key result areas will require strong coordination within the nutrition sector and between other sectors to catalyse collaboration which is critical for the successful implementation of this KNAP. Stronger integration and leveraging of the health sector structures for policy and programme implementation, resource mobilization and advocacy coordination are also critical factors for successful implementation of the high-impact nutrition interventions – most of which are provided through the health sector.
Key elements that will support implementation of the KNAP include a vibrant and functional regulatory environment that provides for the critical functions of compliance monitoring, standards and quality assurance as relates to food and nutrition products and allied commodities. With regard to risk reduction and emergency response, the nutrition sector will need to continue and strengthen representation across various key forums including those articulated in the National Drought Management Authority Act 2016 and the related Ending Drought in Emergencies framework 2018–2022. This chapter therefore sets out the legal and institutional frameworks of the Kenya Nutrition Action Plan 2018 to 2022.
7.2. LEGAL FRAMEWORK
Global Related Frameworks
• In 1948, The United Nations formally recognized the right to good food and nutrition as a human right with the Universal Declaration of Human Rights (UDHR) with Article 25, protecting the right for people to feed themselves in dignity.
• Further, at the UN World Food Summit of 1996, the Heads of States and Governments reaffirmed the right of everyone to have access to safe and nutritious food, consistent with the right to adequate food and the fundamental right of everyone to be free from hunger. They pledged their political will and commitment to achieving food security for all and eradicating poverty and hunger in all countries.
• In 1990, the United Nations set the Millennium Development Goal to halve the number of
people suffering from hunger by 2015. • In 2012 Scaling-Up Nutrition (SUN) movement
was launched • In 2012 Comprehensive Integrated Plan on
Infant and Young Child Nutrition (CIP-IYCN) and 6 Global Nutrition Targets by WHA was adopted
• In 2014, 2nd International Conference on Nutrition was held in Rome, and this led to the adoption of the 9 voluntary Global NCD Targets and Global NCD Action Plan by WHA
• On 25 September 2015, the UN General Assembly adopted the 2030 Agenda for Sustainable Development, among them the common goal to eradicate hunger - Kenya was among the 153 countries.
• The UN General Assembly proclaimed 2016-2025 as the Decade of Action on Nutrition
Kenya specific frameworks
• Nutrition is anchored in the Constitution of Kenya 2010: Article 43 (1) (c), Article 53 (l) (c), Article 21 and Article 27 guarantees the right to food and adequate nutrition and the universal right to food and nutritional health, and protection from discrimination.
• Vision 2030 and forms a key component of the Medium Term III (MTP III) flagship projects and as a key component of the other priority projects of the MTP III. It has been mainstreamed in some of the CIDPS.
• President’s Big Four Agenda on food and nutrition security pillar and universal health coverage recognizes consideration of food and nutrition as a developmental agenda.
• The Kenya Food and Nutrition Security Policy 2012 and its corresponding Implementation Framework 2017 to 2022.
• The implementation process of the KNAP will involve rollout of existing legislation, revision of existing legislation and formulating new laws, regulations and guidelines to ensure availability and access of adequate, safe and quality nutrition services; and adherence to internationally recognized standards and guidelines.
The Kenya Food and Nutrition Security Policy 2012 and its corresponding Food and Nutrition Security
07 LEGAL AND INSTITUTIONAL FRAMEWORKS FOR THE KNAP

THE KENYA NUTRITION ACTION PLAN (KNAP) | 2018 – 2022 Improved Nutrition For All
76
Policy Implementation Framework 2017 to 2022 further recognize nutrition as a key outcome to be achieved.
The implementation process of the KNAP will involve rollout of existing legislation, revision of existing legislation and formulating new laws, regulations and guidelines to ensure availability and access of adequate, safe and quality nutrition services; and adherence to internationally recognized standards and guidelines.
7.3. INSTITUTIONAL FRAMEWORKS
Governance and leadership are core to the successful engagement with various institutions within the provided legal framework. The leadership and governance result areas in this plan will focus broadly on: stewardship, advocacy, partnerships and effective governance structures. This will be even more critical given devolution and the need to have functional governance mechanisms at both national and county levels. Actions aimed at improving governance are core in strengthening accountability and transparency, and reducing wastage and duplication. The devolved system of government offers new opportunities to further enhance governance not only at sector level but down to the grassroots where citizen participation mechanisms are more elaborate and in place to facilitate and strengthen joint accountability for nutrition.
This is critical in fulfilling key objectives such as:• Facilitating powers of self-governance to
the people and enhancing their participation in making decisions on matters of nutrition affecting them;
• Recognizing the right of communities to manage their own nutrition affairs and to further their development;
• Protecting and promoting the nutrition interests and rights of minorities and marginalized communities, including informal settlements such as slum dwellers and underserved populations.
This action plan promotes stronger institutional coherence and linkages between sectors, including the optimization of coordination structures to facilitate and drive service delivery, capacity strengthening, evidence generation and utilization, advocacy and resource mobilization, resource tracking and social accountability. Within the Ministry of Health, coordination and governance for nutrition service delivery will be strengthened through existing structures such as health management teams, boards and committees at respective service delivery levels. Strategic partnerships will be
developed with independent institutions to support capacity-building, research, curriculum design, monitoring and evaluation.
In the light of risk reduction and mitigation measures, humanitarian activities will be mainstreamed within the humanitarian–development and peace nexus. This will require dedicated coordination and governance structures to ensure that the sector remains responsive towards ensuring that there is minimal loss of life during emergencies and that continued efforts are made in addressing underlying risks and causes of vulnerability to disasters, fragility and conflict (through both humanitarian and development work). Thus, the leadership/management structure, governance and stewardship mechanisms will be sensitive to both humanitarian and development issues aimed at mitigating excessive mortality and morbidity during public health emergencies and/or disasters, including cross-border response.
For the nutrition sector in Kenya, governance and coordination are essential as they bridge and strengthen devolution and partnerships by focusing deliberately on: • Ensuring functional strategic partnership and
coordination mechanisms: This will be premised on the five principles of aid effectiveness: Ownership, Alignment, Harmonization, Mutual Accountability, and Managing for Results
• Providing collaborative oversight for implementation of a functional and integrated nutrition programme
• Ensuring functional nutrition governance, management and coordination mechanisms
• Putting in place means for engaging with nutrition and allied actors
• Synchronizing development of operational and strategic plans and undertaking review processes
• Providing oversight to regulate and assess standards and quality of services
• Providing support to legal and regulatory framework implementation
All the above are facilitated through the adoption of the sector-wide approach, which provides for government-led stewardship in conjunction with other key actors in the sector.
7.4. ELEMENTS OF SECTOR-WIDE PARTNERSHIP
Sector-wide partnerships are critical in the execution of the Kenya Nutrition Action Plan both at national and county level. The key principles promoted under this approach include: ONE plan;

THE KENYA NUTRITION ACTION PLAN (KNAP) | 2018 – 2022 Improved Nutrition For All
77
ONE coordinating authority and ONE Monitoring and Evaluation framework. Critical for effective attainment of the Vision and Mission of this KNAP will be the Strategy for Public Financial Management Reforms 2013–2018, which provides implementation guidance on macro-economic management and resource mobilization in line with macro-economic and fiscal policies. Sector-wide partnerships are critical in ensuring effective and equitable allocation of funds in line with both the sector priorities and government fiscal policies. Key considerations in line with devolution will include fiscal decentralization and intergovernmental fiscal relations, legal and institutional frameworks and integrated financial management system (IFMIS) and other public finance management systems (PFM).
The implementation of nutrition interventions in Kenya has been addressed predominantly and directly by the Ministries of Health, Agriculture, Social Protection and Education; however, there are several ministries with policy measures and strategic plans in place that have an indirect impact on
Notes: The dotted lines indicate linkages exist between the National and County structures as per the mechanismsstipulated in the intergovernmental relations Act, 2012
NATIONAL FOOD AND NUTRITIONSECURITY COUNCIL
NATIONAL FOOD AND NUTRITIONSECURITY STEERING COMMITTEE
FoodAvailabilityand Access
Food inCrisis andEmergency
Food Safety andQuality
Nutritionimprovement
FoodAvailabilityand Access
Food inCrisis andEmergency
Food Safety andQuality
Nutritionimprovement
COUNTY FOOD AND NUTRITIONSECURITY STEERING COMMITTEES
COUNCIL OF GOVERNORS
STAKEHOLDER TECHNICAL COMMITTEES
STAKEHOLDER TECHNICAL COMMITTEES
NATIONAL FOOD AND NUTRITION SECURITY
SECRETARIAT
COUNTY FOOD AND NUTRITION SECURITY
SECRETARIATS
Figure 17: National Food and Nutrition Security Policy Implementation Coordination Structure
Figure 16 : Elements of sector wide partnership
food security and nutrition improvement. Harnessing the synergy therefore calls for greater stewardship and leadership from the nutrition sector as a collective.
7.5. COORDINATION ARRANGEMENTS
The KNAP is anchored on the Food and Nutrition Security Policy 2012 and the Food and Nutrition Security Policy Implementation Framework 2017–2022 that outlines a coordination structure for food and nutrition security at both national and county level. The stipulated structures aim to address the existing gaps and overlaps in dealing with the implementation of food and nutrition policies and programmes at both national and county levels. The structures are envisioned to strengthen linkages between national and county governments, development partners’ private sector, civil society, and local communities. The structures include a National Food and Nutrition Security Council, Government, Food and Nutrition Security Steering Committees and Secretariats; and Food and Nutrition Security Stakeholder Technical Committees. It is envisaged that the structures will further foster and enhance multisectoral engagement for nutrition.
Figure 18 shows the recommended National Food and Nutrition Security Policy implementation coordination structure described above.
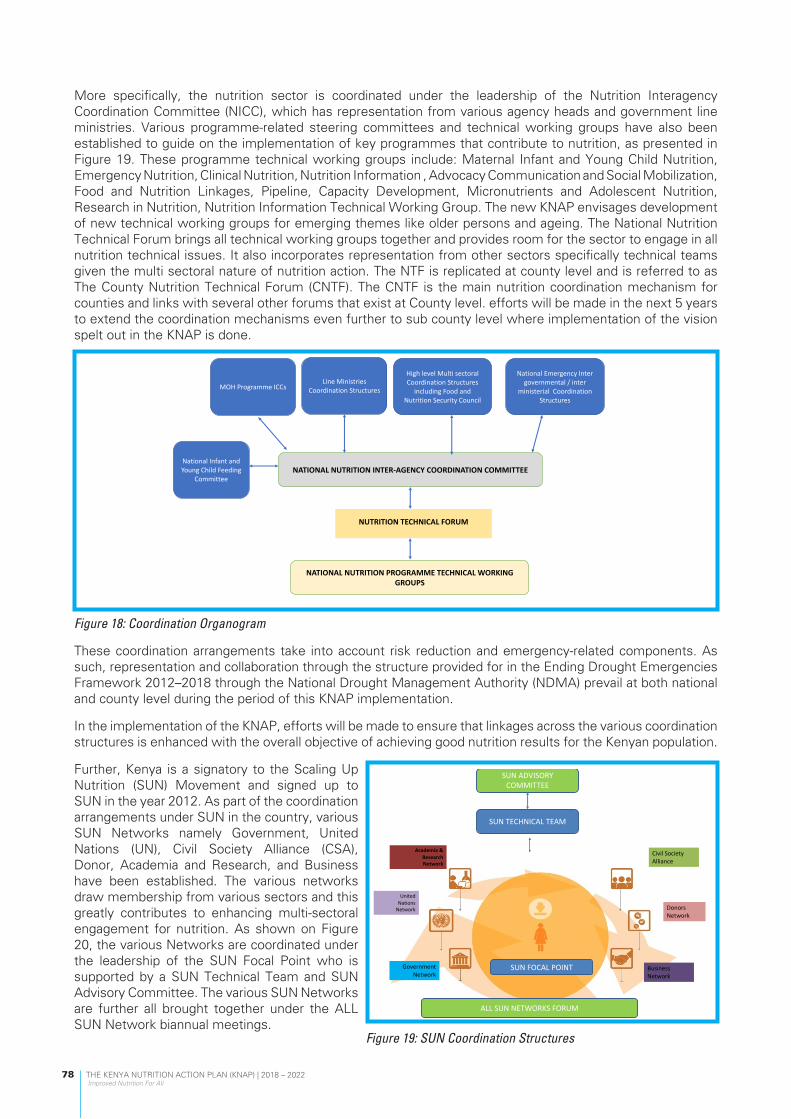
THE KENYA NUTRITION ACTION PLAN (KNAP) | 2018 – 2022 Improved Nutrition For All
78
More specifically, the nutrition sector is coordinated under the leadership of the Nutrition Interagency Coordination Committee (NICC), which has representation from various agency heads and government line ministries. Various programme-related steering committees and technical working groups have also been established to guide on the implementation of key programmes that contribute to nutrition, as presented in Figure 19. These programme technical working groups include: Maternal Infant and Young Child Nutrition, Emergency Nutrition, Clinical Nutrition, Nutrition Information , Advocacy Communication and Social Mobilization, Food and Nutrition Linkages, Pipeline, Capacity Development, Micronutrients and Adolescent Nutrition, Research in Nutrition, Nutrition Information Technical Working Group. The new KNAP envisages development of new technical working groups for emerging themes like older persons and ageing. The National Nutrition Technical Forum brings all technical working groups together and provides room for the sector to engage in all nutrition technical issues. It also incorporates representation from other sectors specifically technical teams given the multi sectoral nature of nutrition action. The NTF is replicated at county level and is referred to as The County Nutrition Technical Forum (CNTF). The CNTF is the main nutrition coordination mechanism for counties and links with several other forums that exist at County level. efforts will be made in the next 5 years to extend the coordination mechanisms even further to sub county level where implementation of the vision spelt out in the KNAP is done.
Figure 18: Coordination Organogram
These coordination arrangements take into account risk reduction and emergency-related components. As such, representation and collaboration through the structure provided for in the Ending Drought Emergencies Framework 2012–2018 through the National Drought Management Authority (NDMA) prevail at both national and county level during the period of this KNAP implementation.
In the implementation of the KNAP, efforts will be made to ensure that linkages across the various coordination structures is enhanced with the overall objective of achieving good nutrition results for the Kenyan population.
Further, Kenya is a signatory to the Scaling Up Nutrition (SUN) Movement and signed up to SUN in the year 2012. As part of the coordination arrangements under SUN in the country, various SUN Networks namely Government, United Nations (UN), Civil Society Alliance (CSA), Donor, Academia and Research, and Business have been established. The various networks draw membership from various sectors and this greatly contributes to enhancing multi-sectoral engagement for nutrition. As shown on Figure 20, the various Networks are coordinated under the leadership of the SUN Focal Point who is supported by a SUN Technical Team and SUN Advisory Committee. The various SUN Networks are further all brought together under the ALL SUN Network biannual meetings.
NATIONALNUTRITIONINTER-AGENCYCOORDINATIONCOMMITTEE
NUTRITIONTECHNICALFORUM
NATIONALNUTRITIONPROGRAMMETECHNICALWORKINGGROUPS
MOHProgrammeICCsLineMinistries
CoordinationStructures
HighlevelMultisectoralCoordinationStructures
includingFoodandNutritionSecurityCouncil
NationalInfantandYoungChildFeeding
Committee
NationalEmergencyIntergovernmental/inter
ministerialCoordinationStructures
Academia&ResearchNetwork
UnitedNationsNetwork
GovernmentNetwork
CivilSocietyAlliance
DonorsNetwork
BusinessNetwork
SUNADVISORYCOMMITTEE
SUNTECHNICALTEAM
ALLSUNNETWORKSFORUM
SUNFOCALPOINT
Figure 19: SUN Coordination Structures

THE KENYA NUTRITION ACTION PLAN (KNAP) | 2018 – 2022 Improved Nutrition For All
79
8.1 RISK IDENTIFICATION, ASSESSMENT AND PRIORITIZATION
Risk analysis and management is the systematic use of available information to determine the likelihood of specified events occurring, their magnitude and consequences and how to mitigate them. Risk analysis and management is one of the cornerstones of modern scientific and risk-based approach to planning; hence its inclusion in the development of the KNAP. The process facilitates developing options and actions to enhance opportunities and reduce threats to the achievement of objectives. It involves:
1) Risk identification – define risk events and their relationship 2) Risk impact assessment - assessing the probability (likelihood) of their occurrence and their consequences
(impact). Consequences may include cost, schedule, technical performance and impacts, as well as capability or functionality.
3) Risk prioritization analysis: identify risk events from most to least critical. 4) Risk mitigation: The ultimate purpose of risk identification and analysis is to prepare for risk mitigation.
Mitigation includes reduction of the likelihood that a risk event will occur and/or reduction of the effect of a risk event if it does occur.
The interpretation of risk is based on the likelihood of its occurrence and the level of its consequences/impact as shown in Table 9.
Table 9: The risk analysis framework
5 levels of likelihood of occurrence
5 levels of consequence/impact
5Catastrophic
4Critical
3Marginal
2Minor
1 Negligible
5Near certain
5High
5High
5High
3Medium
1Low
4Highly likely
5High
5High
4Medium
2Medium
1Low
3Likely
5High
4Medium
3Medium
1Low
1Low
2Unlikely
4Medium
3Medium
2Low
1Low
1Low
1Remote
3Low
2Low
1Low
1Low
1Low
The risk analysis framework presented in Table 9 can be further simplified into a 4x4 risk assessment matrix, which categorizes risk as simply high, medium or low as in Table 10 (this approach has been used within the NFNSP-IF).
This framework is used together with the Strength Weaknesses, Opportunities and Threats (SWOT) and Political, Economic, Sociological, Technological, Legal and Environmental (PESTLE) analysis frameworks to develop the risk analysis, evaluation and mitigation matrix for the KNAP (Table 11).
08 RISK ASSESSMENT, ANALYSIS AND MITIGATION

THE KENYA NUTRITION ACTION PLAN (KNAP) | 2018 – 2022 Improved Nutrition For All
80
Table 10: Risk assessment prioritization matrixLikelihood of occurrence Consequence/impact
High Medium Low
High 5 4 3
Medium 4 3 2
Low 3 2 1
8.2 RISK ANALYSIS FRAMEWORKS
8.2.1. SWOT ANALYSIS IN MANAGING RISK
The SWOT analysis in the risk assessment and analysis framework considers the strengths, opportunities, weaknesses and threats in relation to the KNAP implementation (see Figure 20). Some considerations using this approach would be as follows:
• Strengths – What advantages does the KNAP have in addressing malnutrition in Kenya? How can they be used effectively to assure good implementation?
• Weaknesses – Are there any internal disadvantages in the plan? What should be done to address them?• Opportunities – What are the current external trends which are waiting to be taken advantage of? How
should this be done?• Threats – Are there any external factors which may cause a problem and have a negative impact on the
plan?
Figure 20: SWOT analysis for the KNAP
Strengths
1. KNAP uses lesson learnt from previous NNAP2. Brings all nutrition strategic plans together
3. Plan developed on basis of stakeholder participation and consensus
4 Presence of agreed coordination structures at all levels
5. CRAF strengthens tracking of progress on results and finances at a strategic level
Opportunities
1. Political good will and Government committment (Big Four Agenda)
2. Improved national and global framework for nutrition actions
3. Existing package of high impact interventions4. Devolution structures available to implement
nutrition actions at all levels
Threats
1. Impact of climate change: seasonal droughts and floods
2. Inadequate resources for implementation3. Changing Political Climate
Weaknesses
1. Coordination and collaboration challenges in multisectoral approaches
2. Low human resources capacity3. Inadequate capacity to produce nutrition
commodities
SWOT ANALYSIS

THE KENYA NUTRITION ACTION PLAN (KNAP) | 2018 – 2022 Improved Nutrition For All
81
8.2.2. PESTLE ANALYSIS IN MANAGING RISK
The PESTLE analysis helps categorize the broad areas where the risk analysis can take place. This identification of broad areas is useful when developing a mitigation plan. The broad areas are categorized as follows:
• Political – national and global political issues which may have an effect on the KNAP, either immediately or in the future.
• Economic – GDP growth, financial allocations to nutrition, etc.
• Social – The changes in lifestyle and buying trends, media, major events, ethics, advertising and publicity factors.
• Technological – Innovations, access to technology, licensing and patents, manufacturing, research funding, global communications.
• Legal – Legislation, laws and regulations which have been passed or proposed and may come into effect and affect smooth implementation of the KNAP.
• Environmental – Environmental issues (e.g., climate change) either locally or globally, and their impact on nutrition.
8.3 RISK MITIGATION MEASURES
It is anticipated that during implementation of the KNAP various risks may occur which will ultimately hinder effective realization of the aspirations set out in the action plan. The sector will use a range of risk mitigation options and strategies as shown in Table 11. Risk mitigation handling options include:
1) Assume/accept: Acknowledge the existence of a risk and make a deliberate decision to accept it without engaging in special efforts to control it.
2) Avoid: Adjust programme requirements or constraints to eliminate or reduce the risk. This adjustment could be accommodated by a change in funding, schedule, or technical requirements.
3) Control: Implement actions to minimize the impact or likelihood of the risk.4) Transfer: Reassign organizational accountability, responsibility and authority to another stakeholder
willing to accept the risk.5) Watch/monitor: Monitor the environment for changes that affect the nature and/or the impact of the
risk and respond as appropriate.
8.4 COMBINED RISK ANALYSIS, EVALUATION, PRIORITIZATION AND MITIGATION MEASURES MATRIX
Table 11 synthesizes the different types of risk analysis frameworks into a single matrix. The PESTLE analysis used to categorize the type of risks; SWOT analysis is used to identify the risk events; and the risk analysis framework is used to describe the likelihood of occurrence, their consequences/impact and the risk priority. Finally the matrix uses the strength and opportunities components of SWOT and other information to propose mitigation strategies and determine who will be responsible for implementing them.

THE KENYA NUTRITION ACTION PLAN (KNAP) | 2018 – 2022 Improved Nutrition For All
82
Table 11: Risk analysis, mitigation and accountability table for the KNAPPESTLE categorization of risks
Identified risk event Risk consequence Likelihood of occurrence
Risk impact /consequence
Risk priority
Risk mitigation strategy Responsibility for mitigation
1. Political risks
1. Political risk • Affects implementation
High High 5 • Develop and implement risk reduction and emergency contingency plans including for elections
• Sustained National and County government engagement for Nutrition prioritization
• Advocate with partners to maintain implementation momentum
• Strengthen Citizen participation in demanding nutrition services
MOH (Nutrition Division)
FNS Council, NICC, Council of Governors (COG)
Development Partners (DPs)
Implementing Partners (IPs)
UN agencies,
CSOs ; CBOs
2. Economic risks
2. Inadequate funding • Some activities slowed or halted
• Linkages and relationships disrupted
High High 5 • Develop and implement a robust resource mobilization strategy
MOH (Nutrition Division); NICC, FNS Council, COG; FNS Secretariat, Development and Implementing Partners
3. In efficient mechanisms for Nutrition budgeting and expenditure monitoring across sectors and actors
• Lost opportunities to maximize programme coverage
• Implementation cost unknown
Medium High 3 • Strengthen nutrition sector engagement at National and County level in budgetary making processes
• Scale up financial tracking
MOH (Nutrition Division); NICC FNS Council, Development and Implementing Partners, COG
4. Weak adherence to financial pledges and agreements
• Ineffective and inefficient implementation
• Lowers credibility and accountability of FNS programs
Low Medium 3 • Develop and strengthen implementation of partnership frameworks for the nutrition sector
MOH (Nutrition Division); NICC FNS Council, Development and Implementing Partners, Line Ministries, COG

THE KENYA NUTRITION ACTION PLAN (KNAP) | 2018 – 2022 Improved Nutrition For All
83
PESTLE categorization of risks
Identified risk event Risk consequence Likelihood of occurrence
Risk impact /consequence
Risk priority
Risk mitigation strategy Responsibility for mitigation
3. Social risks 5. Weak collaboration by key stakeholders
• Fragmentation and duplication in implementation
Medium High 4 • Strengthen stakeholders’ coordination platforms
• Promote joint planning and prioritization, implementation and monitoring by all stakeholders
MOH (Nutrition Division); NICC FNS Council, FNS Secretariat, Development and Implementing Partners, target communities
4. Technological risks
6. Inadequate infrastructure and capacity to use ICT for M&E and for
advocacy
• Inability to achieve high programme efficiency
Medium Medium 3 • Advocacy for strategic investment for development and use of ICT for nutrition programming.
• Enhance capacity on use of technology for nutrition
MOH (Nutrition Division); Ministry of Information Communication and Technology, DPs and IPs.
5. Legal risks 7. Low enforcement of nutrition relevant laws (e.g. food fortification, food safety, marketing of BMS, maternity leave)
• Low compliance High High 4 • Monitor enforcement Enforcement institutions as provided for by the relevant acts/regulations
6. Environmental risks
8. Occurrence of natural disasters (e.g. floods, drought, earthquake) -ASAL areas.
• Disruption of services and access to populations
Medium High 5 • Monitor and develop contingency plans & funding
• Mainstream sector-wide response
FNS Council, FNS Secretariat, Development Partners, NGOs, CSO, CG

THE KENYA NUTRITION ACTION PLAN (KNAP) | 2018 – 2022 Improved Nutrition For All
84
APPENDIX 1: DETAILED FINANCIAL RESOURCES REQUIREMENT AND IMPLEMENTATION PLAN57 FOR KNAP PER KRA.
Table 12: Financial resource requirements and implementation plan for KRA 1KRA 1 - Maternal, Infant and Young Child Nutrition (MIYCN) Scaled-Up
Outputs Activities Budget in Ksh (millions)
2018 2019 2020 2021 2022 Total Ksh Total USD
Output 1.1: Increased proportion of women of reproductive age (15-49 years) and care givers who practice optimal behaviors for improved nutrition
36.38 36.38 36.38 36.38 36.38 181.89 $ 1.80
Activity 1.1.1: Scale-up BFCI in all communities 36.38 36.38 36.38 36.38 36.38 181.89 $ 1.80
Output 1.2: Increased proportion of care givers who practice optimal behaviors for improved nutrition of young children under five years
118.99 42.64 18.76 10.91 98.90 290.20 $ 2.87
Activity 1.2.1: Scale-up implementation of baby friendly hospital initiative (BFHI)
Output 1.5.4 and Output 1.5.6
Activity 1.2.2: Strengthen neo-natal nutrition care 10.03 16.44 12.70 6.29 6.29 51.75 $ 0.51
Activity 1.2.3: Strengthen growth monitoring and promotion for children under 5 years
31.43 - - - 31.43 62.86 $ 0.62
Activity 1.2.4: Promote establishment of breastfeeding spaces at work places.
Output 1.3.5 and Output 1.3.6
Activity 1.2.5: Develop and disseminate complementary feeding recipe book & guide
76.69 20.58 - - 56.11 153 $ 1.52
Activity 1.2.6: Promote optimal nutrition care practices and support for children 6 –59 months including those in the formal and informal day-care centres and integrate agenda into multisectoral platforms between MOH and line ministries
0.84 5.62 6.07 4.62 5.07 22 $ 0.22
Output 1.3: MIYCN advocated for at global, national and county levels 63.34 115.69 76.59 104.82 104.82 465.27 $ 4.61
57Implementation of activities is aligned to the year for which given costs are indicated. For example, if the cost is indicated in 2018 then the activity will be implemented in 2018.
APPENDIXES

THE KENYA NUTRITION ACTION PLAN (KNAP) | 2018 – 2022 Improved Nutrition For All
85
Activity 1.3.1: Engage key influencers in MIYCN activities - - - - - - $ -
Activity 1.3.2: Establish mechanisms to collaborate with print and electronic media to scale up MIYCN messaging
3.10 3.10 3.10 3.10 3.10 15.48 $ 0.15
Activity 1.3.3: Promote celebration of World Breastfeeding week and other MIYCN global/national events (nutrition week, world premature day, malezi bora)
22.24 22.24 22.24 22.24 22.24 111.18 $ 1.10
Activity 1.3.4: Advocate for oversight, monitoring and enforcement of BMS Act, 2012
3.76 5.08 - - - 8.84 $ 0.09
Activity 1.3.5: Advocate for adaptation of Health Act-Workplace support for breastfeeding at national, county level in both public and private workplaces
34.02 85.28 51.26 79.49 79.49 329.54 $ 3.26
Activity 1.3.6: Advocate for incorporation of MIYCN data in nutrition information systems and use generated evidence for programming by: inclusion of MIYCN indicators in joint support supervision tools; review and inclusion of MIYCN indicators in the CHIS; Designation of data collection tools for BFCI with MOH numbers
0.24 - - - - 0.24 $ 0.00
Output 1.4: Enhanced capacity for implementation of MIYCN activities at all levels
123.80 191.69 187.07 178.29 168.57 849.41 $ 8.41
Activity 1.4.1: Advocacy for, procurement and distribution of anthropometric and IEC materials; necessary to implement BFHI/BFCI
- 10.00 5.00 10.00 5.00 30.00 $ 0.30
Activity 1.4.2: Sensitize implementers, enforcers, Champions, Policy Makers (CHMT/SCHMTs/High Level decision makers) on MIYCN
2.00 18.36 15.91 15.91 15.91 68.09 $ 0.67
Activity 1.4.3: Develop capacity of Health Workers and CHVs on MIYCN/BFCI/Maternal continuum of care package; on integration of MIYCN interventions in youth friendly services; on BFHI, BFCI, BMS Act, Workplace support for breastfeeding; WHO Growth Charts;
95.59 132.40 132.40 121.45 121.45 603.29 $ 5.97
Activity 1.4.4: Organize/attend national and international symposium and conferences; exchange visits; best practices
26.21 30.93 33.76 30.93 26.21 148.03 $ 1.47
Output 1.5: Improved MIYCN policy environment at national and county level 77.29 101.61 75.51 77.66 82.01 414.09 $ 4.10
Activity 1.5.1: Review of national MIYCN Policy 3.56 8.48 - - - 12.04 $ 0.12
Activity 1.5.2: Review of MIYCN Strategy 4.83 10.40 - - - 15.23 $ 0.15

THE KENYA NUTRITION ACTION PLAN (KNAP) | 2018 – 2022 Improved Nutrition For All
86
Activity 1.5.3: Review of MIYCN Operational Guidelines, development, printing and dissemination of SOPs, Training materials and Sensitization packages
14.52 4.06 1.79 12.35 16.70 49.42 $ 0.49
Activity 1.5.4: Support implementation of Health Act, 2017 15.51 16.70 15.91 15.51 15.51 79.13 $ 0.78
Activity 1.5.5: Provide technical support to counties during dissemination
- 0.67 0.67 0.67 0.67 2.68 $ 0.03
Activity 1.5.6: Review of pre-service curricular 1.80 1.80 5.37 - - 8.97 $ 0.09
Activity 1.5.7: Establish functional implementation committees: BMS Monitoring and enforcement committees’/BFCI Committees; TWGs
10.53 21.85 16.70 14.06 14.06 77.19 $ 0.76
Activity 1.5.8: Monitor and evaluate implementation of MIYCN activities including BFCI implementation; monitoring and enforcement of BMS Act
22.15 33.26 30.69 30.69 30.69 147.48 $ 1.46
Activity 1.5.9: Disseminate of MIYCN related findings 1.25 1.25 1.25 1.25 1.25 6.27 $ 0.06
Activity 1.5.10: Strengthen evidence-based programming through: information sharing on MIYCN research; participation in biannual data clinics; holding MIYCN information and programming review
3.14 3.14 3.14 3.14 3.14 15.68 $ 0.16
Table 13: Financial resource requirements for KRA 2KRA 2: Nutrition of older children and adolescents promoted
Outputs Activities Budget in Ksh (millions)
2018 2019 2020 2021 2022 Total Ksh Total USD
Output 2.1: Improved policy environment at national and county level for older children (5-9 years) and adolescents (10-19 years).
41.35 112.09 97.74 79.00 59.94 390.11 $ 3.86
Activity 2.1.1: Develop and disseminate nutrition policies, guidelines (food based dietary guidelines; tuck shop guidelines; menu guidelines; school garden guidelines), training packages (Healthy diet and physical activity).
23.04 84.60 70.25 51.51 32.45 261.85 $ 2.59
Activity 2.1.2: Monitor and evaluate adherence to policies and strategies; integrate play and nutrition activities in schools and identify research gaps.
14.15 23.33 23.33 23.33 23.33 107.48 $ 1.06

THE KENYA NUTRITION ACTION PLAN (KNAP) | 2018 – 2022 Improved Nutrition For All
87
Activity 2.1.3: Lobby for inclusion of nutrition for older children and adolescents in various nutrition related documents in other sectors
0.80 0.80 0.80 0.80 0.80 4.00 $ 0.04
Activity 2.1.4: Advocate and sensitize key influencers, policy makers, role models, nutrition champions on nutrition of older children and adolescents.
3.36 3.36 3.36 3.36 3.36 16.78 $ 0.17
Output 2.2: Increased awareness on healthy diets among caregivers, social influencers, older children and adolescents themselves.
20.2 27.4 32.0 26.2 26.2 132.0 $ 1.31
Activity 2.2.1: Train key stakeholders on healthy diets and physical activity for older children and adolescents.
- 15.60 7.48 7.48 7.50 38.05 $ 0.38
Activity 2.2.2: Sensitization of older children, adolescents and communities on healthy diets and physical activity using context specific communication channels in both rural and urban set ups.
18.80 19.71 24.38 19.71 19.71 102.31 $ 1.01
Activity 2.2.3: Integrate messaging on healthy diets and physical activity in the school health program.
1.14 7.42 7.42 6.28 6.28 28.54 $ 0.28
Activity 2.2.4: Collaborate with MoALF&I on establishment of diverse food production (Crops, livestock, insects and fisheries).
0.24 0.24 0.24 0.24 0.24 1.20 $ 0.01
Output 2.3: Reduction of marketing of unhealthy foods among older children and adolescents
1.47 18.04 14.49 14.49 14.49 62.97 $ 0.62
Activity 2.3.1: Regulate the food environment to control marketing of unhealthy foods for older children and adolescents
0.73 0.74 0.74 0.74 0.74 3.68 $ 0.04
Activity 2.3.2: Sensitize of school stakeholders on marketing and promotions within the school; sufficient safe and nutritious foods in school
0.73 17.30 13.75 13.75 13.75 59.29 $ 0.59
Output 2.4: Enhanced linkages and collaboration with relevant sectors to promote the health and nutrition of the older child and adolescents
0.92 0.92 0.92 0.92 0.92 4.61 $ 0.05
Activity 2.4.1: Promote collaboration with other sector interventions to advocate for promotion of good nutrition of older child and adolescent (MOALF&I , MOH, Industry, Finance, Gender, Sports and social protection) and the private sector.
0.78 0.78 0.78 0.78 0.78 3.90 $ 0.04
Activity 2.4.2: Intersectoral sensitization on child care development
0.14 0.14 0.14 0.14 0.14 0.71 $ 0.01

THE KENYA NUTRITION ACTION PLAN (KNAP) | 2018 – 2022 Improved Nutrition For All
88
Table 14: Financial resource requirements for KRA 3KRA 3: Nutrition Status of Adults and Older Persons promoted
Outputs Activities Budget in Ksh (millions)
2018 2019 2020 2021 2022 Total Ksh Total USD
Output 3.1: Legislations, policies and guidelines, on nutrition of adults and older persons formulated
0.18 8.40 24.50 - - 33.08 $ 0.33
Activity 3.1.1: Develop a geriatrics nutrition guideline for Kenya 0.18 8.40 - - - 8.58 $ 0.08
Activity 3.1.2: Develop and disseminate training manuals and guidelines for formation of support groups
- - 6.41 - - 6.41 $ 0.06
Activity 3.1.3: Develop national guidelines for older persons and volunteer engagement in health and nutrition of older persons in the community
- - 18.08 - - 18.08 $ 0.18
Output 3.2: Improved utilization of nutrition information, evidence and learning for program improvement and decision making
0.01 20.01 10.61 1.50 0.40 32.53 $ 0.32
Activity 3.2.1: Create a centralized data bank of existing research and programs on nutrition related to the older persons
0.01 - 1.00 - - 1.01 $ 0.01
Activity 3.2.2: Advocate for establishment of a centralized automated inventory for older persons to inform planning and decision making.
- - 0.60 1.50 0.40 2.50 $ 0.02
Activity 3.2.3: Map and assess nutritional and health needs of the older persons to inform policy and programming.
- 20.01 2.32 - - 22.33 $ 0.22
Activity 3.2.4: Develop a nutrition monitoring and evaluation framework to inform policy and program for the older persons
- - 6.69 - - 6.69 $ 0.07
Output 3.3: Access to quality, timely, affordable health care and nutrition support to older persons promoted
0.69 20.12 6.82 - - 27.64 $ 0.27
Activity 3.3.1: Develop the capacity development of health care provider to provide quality health care and nutrition support for older people
- 18.32 6.32 - - 24.64 $ 0.24
Activity 3.3.2: Build the capacity of community health personnel to actively engage and empower the older persons in solving problems related to their health and nutrition
0.22 0.39 0.50 - - 1.12 $ 0.01
Activity 3.3.3: Promote and support establishment of social support groups at both community and health facility to relay information and updates for continuum of care and linkage to
social support structures
0.47 1.41 - - - 1.88 $ 0.02

THE KENYA NUTRITION ACTION PLAN (KNAP) | 2018 – 2022 Improved Nutrition For All
89
Output 3.4: Strengthened coordination mechanism and systems for health and nutrition of older persons
9.89 6.83 10.16 5.92 5.92 38.71 $ 0.38
Activity 3.4.1: Establish TWGs on health and nutrition of the older persons at national level
0.16 - 0.08 - - 0 $ 0.00
Activity 3.4.2: Sensitize counties on formation of TWGs on health and nutrition of the older person’s county level
5.64 5.64 5.64 5.64 5.64 28 $ 0.28
Activity 3.4.3: Facilitate stakeholder meetings for the coordination of nutrition and health programmes for the older persons managed by humanitarian and charity organizations at national level
0.56 0.28 0.28 0.28 0.28 2 $ 0.02
Activity 3.4.4: Strengthen participation and inclusion of older persons in decision making for development of health and nutrition strategic policy documents and programs
3.53 0.28 3.53 - - 7 $ 0.07
Activity 3.4.5: Advocate for integrated education in social protection package for older persons
- 0.63 0.63 - - 1 $ 0.01
Output 3.5: Improved food and nutrition security for older persons - - 10.02 18.15 - 28.17 $ 0.28
Activity 3.5.1: Assessment and linkage of food and nutrition support of older persons at risk of malnutrition
- - 10.02 18.15 - 28.17 $ 0.28
Output 3.6: Improved financing and human resource for nutrition in older persons
9.40 5.81 5.71 - - 20.93 $ 0.21
Activity 3.6.1: Mobilize human and financial resources to address health and nutrition security needs for older persons in special circumstances not limited to (living with disabilities, primary care givers, PLWHIV)
- 5.81 5.71 - - 11.53 $ 0.11
Activity 3.6.2: Advocate for participation of older persons in the national budgetary process
9.40 - - - - 9 $ 0.09
Output 3.7: Advocacy, communication and social mobilization of nutrition of older persons strengthened and promoted.
0 9 35 4 1 49 $ 0.49
Activity 3.7.1: Develop communication materials on the health and nutrition of the older persons
- 5.76 16.82 - - 22.58 $ 0.22
Activity 3.7.2: Advocate for financial resources allocation for older persons
- - 0.96 - - 0.96 $ 0.01
Activity 3.7.3: Advocate for older person representation in development programs
0.20 - - - - 0.20 $ 0.00
Activity 3.7.4: Advocate for Incorporation of older persons data in health surveys
- 2.92 17.25 3.85 1.40 25.42 $ 0.25

THE KENYA NUTRITION ACTION PLAN (KNAP) | 2018 – 2022 Improved Nutrition For All
90
Output 3.8: Advocacy, communication and social mobilization of nutrition of older persons strengthened and promoted.
14 17 15 5 22 72 $ 0.71
Activity 3.8.1: Create a centralized data bank of existing research and programs on nutrition related to the older persons.
5.50 - 3.00 - 3.00 11.50 $ 0.11
Activity 3.8.2: Create a centralized automated inventory for older persons to inform planning and decision making
4.00 - 3.00 - 2.00 9.00 $ 0.09
Activity 3.8.3: Conduct a national assessment on nutritional and health needs of the older persons to inform policy and programming.
- 12.00 - - 12.00 24.00 $ 0.24
Activity 3.8.4: Develop a nutrition monitoring and evaluation framework to inform policy and program for the older persons.
4.50 4.50 4.50 4.50 4.50 22.50 $ 0.22
Activity 3.8.5: Conduct a KAP survey on health and nutrition for older persons
- - 4.75 - - 4.75 $ 0.05
Table 15: Financial resource requirements for KRA 4KRA 4: Prevention, Control and Management of Micronutrient Deficiencies Scaled-Up
Outputs Activities Budget in Ksh (millions)
2018 2019 2020 2021 2022 Total Ksh Total USD
Output 4.1: Strengthened routine micronutrient supplementation (vitamin A, iron and folate and micronutrient powders) for targeted groups.
85.22 182.15 89.44 101.04 99.53 557.38 $ 5.52
Activity 4.1.1: Train health workers and other key stakeholders on micronutrient supplementation and sensitize general population
77.63 82.74 23.32 69.91 68.40 322.01 $ 3.19
Activity 4.1.2: Promote uptake of micronutrient supplementation through context specific social behavior change communication strategies
- 18.91 18.91 18.91 18.91 75.63 $ 0.75
Activity 4.1.3: Strengthen the documentation system on the monitoring and reporting of micronutrient supplementation
7.59 80.50 47.22 12.22 12.22 159.74 $ 1.58
Output 4.2: Increased dietary diversity and Bio-fortification of food - 16.80 0.00 - - 16.81 $ 0.17
Activity 4.2.1: Promote increased production, preservation and consumption of micronutrient-rich foods at household level
- 16.80 0.00 - - 16.81 $ 0.17
Output 4.3: Strengthened production, consumption, and compliance of fortified foods.
- 88.44 24.99 25.99 24.99 164.41 $ 1.63

THE KENYA NUTRITION ACTION PLAN (KNAP) | 2018 – 2022 Improved Nutrition For All
91
Activity 4.3.1: Increase production, demand and consumption of adequately fortified foods
- 8.32 2.84 3.84 2.84 17.84 $ 0.18
Activity 4.3.2: Strengthen regulatory monitoring of fortified foods at industry and market level to increase compliance to fortification standards
- 62.78 7.15 7.15 7.15 84.23 $ 0.83
Activity 4.3.3: Strengthen routine monitoring and evaluation of food fortification program.
- 17.34 15.00 15.00 15.00 62.34 $ 0.62
Output 4.4: Integrate public health interventions with micronutrient deficiencies prevention and control interventions.
- - - 4.37 4.37 8.73 $ 0.09
Activity 4.4.1: Scale up public health interventions that prevent micronutrient deficiencies
- - - 4.37 4.37 8.73 $ 0.09
Output 4.5: Improved policy, legislation, leadership and governance for micronutrient programme
0.14 21.14 0.20 0.18 0.14 21.80 $ 0.22
Activity 4.5.1: Develop and disseminate policies and strategies on production and consumption of biofortified foods; communication strategy;
- 14.30 - - - 14.30 $ 0.14
Activity 4.5.2: Develop and disseminate guideline, SOPs, training packages: Standards on blending of flour; technical micronutrient deficiency and control guidelines; guidelines on MNDPC integration with public health interventions
- 6.70 0.06 0.04 - 6.79 $ 0.07
Activity 4.5.3: Strengthen governance and coordination mechanisms for micronutrients programmes MNDCC, Kenya National Food Fortification Alliance (KNFFA).
0.14 0.14 0.14 0.14 0.14 0.70 $ 0.01

THE KENYA NUTRITION ACTION PLAN (KNAP) | 2018 – 2022 Improved Nutrition For All
92
Table 16: Financial resource requirements for KRA 5KRA 5: Prevention, Control and Management of Diet Related Non-Communicable Diseases scaled up
Outputs Activities Budget in Ksh (millions)
2018 2019 2020 2021 2022 Total Ksh Total USD
Output 5.1: Improved policy and legal environment for Nutrition in NCDs 8.70 42.28 21.13 1.73 1.73 75.55 $ 0.75
Activity 5.1.1: Develop, review existing standards and regulations on healthy diets, NCDs and Physical activities
- 12.46 12.02 - - 24.48 $ 0.24
Activity 5.1.2: Develop policies and guidelines on nutrition and NCDs
6.57 28.09 7.38 - - 42.05 $ 0.42
Activity 5.1.3: Develop legislations on advertising, packaging labelling and marketing of foods and beverages
2.13 1.73 1.73 1.73 1.73 9.03 $ 0.09
Output 5.2: Improved policy and legal environment for nutrition in NCDs 1.29 2.89 1.60 - - 5.78 $ 0.06
Activity 5.2.1: Advocate for national and county fiscal budgets and prioritization on financing prevention and control of NCDs through nutrition interventions.
- 1.60 1.60 - - 3.19 $ 0.03
Activity 5.1.2: Enhance participation of nutrition in NCDs Inter-Agency Coordinating Committee (ICC) consisting of representatives from all sectors, national and county governments and development partners in health.
1.29 1.29 - - - 2.59 $ 0.03
Output 5.3: Strengthened national and county capacity to accelerate nutrition response for prevention and control of NCDs
95.86 96.42 95.86 95.86 95.59 479.60 $ 4.75
Activity 5.3.1: Conduct capacity development on prevention and control of NCD at national and county levels
95.59 95.59 95.59 95.59 95.59 477.96 $ 4.73
Activity 5.3.2: Promote screening of the public for early detection, control, management and treatment of NCDs and integrate in community health services
0.27 0.83 0.27 0.27 - 1.64 $ 0.02
Output 5.4: Behavior Change Communication strategies developed and implemented to promote primary and secondary prevention of diet related risk factors for non-communicable diseases
- 32.86 9.11 3.20 9.09 54.26 $ 0.54
Activity 5.4.1: Develop behavior change communication strategy on nutrition and NCD
- - - - 7.59 7.59 $ 0.08
Activity 5.4.2: Develop key messages, advocacy tool kits and sensitize media, journalist and editors on NCDs
- 1.70 0.45 1.70 - 3.85 $ 0.04
Activity 5.4.3: Create public demand for physical activity and healthy diet at workplace, institutions and community
- 31.16 8.66 1.50 1.50 42.82 $ 0.42

THE KENYA NUTRITION ACTION PLAN (KNAP) | 2018 – 2022 Improved Nutrition For All
93
Output 5.5: Quality and timely provision of nutrition therapy in management of NCDs.
21.85 21.85 3.20 3.20 3.20 53.30 $ 0.53
Activity 5.5.1: Provision of nutrition services in NCDs clinics. 3.85 3.85 3.20 3.20 3.20 17.30 $ 0.17
Activity 5.5.2: Advocate for the establishment of integrated centers for NCDs management.
11.93 11.93 - - - 23.85 $ 0.24
Activity 5.5.3: Advocate for procurement of nutrition supplies and equipment for NCDs screening.
6.08 6.08 - - - 12.15 $ 0.12
Output 5.6: Improved monitoring and evaluation for diet related NCDs 20.37 27.09 16.01 16.01 16.01 95.48 $ 0.95
Activity 5.6.1: Integrate indicators for monitoring of nutrition related risk factors for NCDs in relevant sectors and within routine MOH database
- 6.71 - - - 6.71 $ 0.07
Activity 5.6.2: Conduct periodic surveys and operational research of nutrition related risk factors for NCDs
4.37 4.37 - - - 8.74 $ 0.09
Table 17: Financial resources requirements for KRA 6KRA 6: Prevention and Integrated Management of Acute Malnutrition (IMAM) Strengthened
Outputs Activities Budget in Ksh (millions)
2018 2019 2020 2021 2022 Total Ksh Total USD
Output 6.1: Policy, standards and guidelines for the IMAM program developed/reviewed.
11.03 5.38 5.68 - - 22.08 $ 0.22
Activity 6.1.1: Develop/review guidelines, strategies, treatment protocols and Standard Operating Procedures (SOP) and disseminate at national and county levels.
11.03 5.38 5.64 - - 22.04 $ 0.22
Activity 6.1.1: Review and disseminate IMAM training package for health workers.
- - 0.04 - - 0.04 $ 0.00
Output 6.2: Scaled-up access to delivering IMAM services in ASAL, urban and non-ASAL counties.
59.14 37.75 2.50 37.75 37.75 174.89 $ 1.73
Activity 6.2.1: Develop a costed scaled-up plan to expand access to treatment in all counties
21.39 - - - - 21.39 $ 0.21
Activity 6.2.2: Integrate management of acutely malnourished children with other programs in the health care system
2.50 2.50 2.50 2.50 2.50 12.50 $ 0.12
Activity 6.2.3: Conduct capacity assessment for IMAM service delivery
35.25 35.25 - 35.25 35.25 141.00 $ 1.40

THE KENYA NUTRITION ACTION PLAN (KNAP) | 2018 – 2022 Improved Nutrition For All
94
Output 6.3 IMAM program performance monitored, and quality of services improved
1.05 14.49 14.49 14.49 14.49 59.00 $ 0.58
Activity 6.3.1: Monitor adherence to IMAM program SOPs, guidelines and protocols by health and nutrition workforce
- $ -
Activity 6.3.2: Conduct IMAM program performance reviews - cure, defaulter, death, coverage (linkage with M&E
1.05 14.49 14.49 14.49 14.49 59.00 $ 0.58
Output 6.4: Strengthened partnerships including public private partnership (PPP) to improve access and coverage of IMAM services and linkages with other interventions.
4.69 4.69 4.69 4.69 4.69 23.46 $ 0.23
Activity 6.4.1: Use available mechanisms for coordination of IMAM to link IMAM services with other programs (WASH, livelihood, social protection, food security)
1.692 1.692 1.692 1.692 1.692 8.46 $ 0.08
Activity 6.4.2: Advocate for PPP in the implementation of IMAM 3 3 3 3 3 15.00 $ 0.15
Output 6.5: Scaled-up advocacy, communication, social mobilization and resource mobilization for IMAM program
35.02 35.02 35.02 35.02 35.02 175.09 $ 1.73
Activity 6.5.1: Advocate for increased resource allocation for IMAM implementation including commodities, equipment, HR
0.02 0.02 0.02 0.02 0.02 0.09 $ 0.00
Activity 6.5.2: Advocate for institutionalization of CHV motivation within county strategic documents.
- $ -
Activity 6.5.3: Promote programs to advocate for integrated treatment and prevention of malnutrition and strengthen nutritional care and support of affected individuals.
15 15 15 15 15 75.00 $ 0.74
Activity 6.5.4: Promote improved linkage with programs on behavioural change awareness creation on for prevention strategies at community and household level including MIYCN, social protection and livelihood support strategies.
20 20 20 20 20 100.00 $ 0.99
Output 6.6 Innovative approaches to improve IMAM quality and coverage implemented
397.35 397.35 397.35 397.35 397.35 1,986.76 $ 19.67
Activity 6.6.1: Utilize M-health (data capturing, analysis, reporting, dissemination and surveillance) for monitoring and reporting on IMAM.
- $ -
Activity 6.6.2: Effectively utilize IMAM surge 5.37 5.37 5.37 5.37 5.37 26.86 $ 0.27
Activity 6.6.3: Promote operational research on IMAM. 391.98 391.98 391.98 391.98 391.98 1,959.90 $ 19.40
Output 6.7 Enhanced early case identification through community mobilization and referral, including ICCM
12.20 12.20 12.50 12.69 12.20 61.79 $ 0.61

THE KENYA NUTRITION ACTION PLAN (KNAP) | 2018 – 2022 Improved Nutrition For All
95
Activity 6.7.1: Conduct nutrition screening/assessment for all cohorts at community and facility level
- - - 0.49 - 0.49 $ 0.00
Activity 6.7.2: Improve follow up and referral systems for IMAM across all levels
12.20 12.20 12.50 12.20 12.20 61.30 $ 0.61
Output 6.8: Improved utilization of IMAM data for informed decision making - 6.13 - 6.13 - 12.25 $ 0.12
Activity 6.8.1: Promote appropriate documentation of related research, best practices and learning
0.00 6.13 0.00 6.13 0.00 12.25 $ 0.12
Activity 6.8.2: Adopt key actions/recommendations from research, assessments/surveys, lessons learnt, routine data, program review meetings and feedback from field experiences.
0.00 0.00 0.00 0.00 0.00 - $ -
Output 6.9: Capacity enhanced for IMAM service delivery and programming. 58.98 58.98 58.98 58.98 58.98 294.92 $ 2.92
Activity 6.9.1: Health worker Class room training, OJT, Joint Support Supervision on IMAM.
31.78 31.78 31.78 31.78 31.78 158.92 $ 1.57
Activity 6.9.2: Link with pre-service and in-service training institutions for incorporation of IMAM into training curriculum
8.20 8.20 8.20 8.20 8.20 41.00 $ 0.41
Activity 6.9.3: Support cross-learning between ASAL and non-ASAL counties on IMAM programming
10.00 10.00 10.00 10.00 10.00 50.00 $ 0.50
Activity 6.9.4: Support the necessary training based on emerging evidence and continuous capacity building on IMAM
9.00 9.00 9.00 9.00 9.00 45.00 $ 0.45
Table 18: Financial resource requirements for KRA 7KRA 7: Nutrition in Emergencies Strengthened
Outputs Activities Budget in Ksh (millions)
2018 2019 2020 2021 2022 Total Ksh Total USD
Output 7.1: Strengthened coordination and partnerships for integrated preparedness and response initiatives
0.26 0.08 0.26 0.08 0.26 0.93 $ 0.01
Activity 7.1.1: Map partners in preparedness and emergency risk reduction
0.18 - 0.18 - 0.18 0.54 $ 0.01
Activity 7.1.1: Establish functional Emergency preparedness and risk reduction committees
0.08 0.08 0.08 0.08 0.08 0.39 $ 0.00
Output 7.2: Strengthened preparedness capacity for the nutrition sector 122.29 132.32 107.70 94.35 120.46 577.12 $ 5.71

THE KENYA NUTRITION ACTION PLAN (KNAP) | 2018 – 2022 Improved Nutrition For All
96
Activity 7.2.1: Hold joint planning and implementation meetings with other sectors on integrated preparedness and risk reduction
59.69 59.69 59.69 59.69 59.69 298.45 $ 2.95
Activity 7.2.2: Conduct joint resource mobilization activities with other sectors on integrated preparedness and risk reduction
0.42 - 0.42 - - 0.846 $ 0.01
Activity 7.2.3: Finalization and implementation of IMAM surge kit 14.59 11.87 - - - 26.46 $ 0.26
Activity 7.2.4: Review disaster preparedness and response plan 3.76 29.87 3.76 3.76 29.87 71.017 $ 0.70
Activity 7.2.5: Train stakeholders on disaster risk reduction 21.39 8.46 21.39 8.46 8.46 68.15 $ 0.67
Activity 7.2.6: Put supply chain contingency systems in place 5.03 5.03 5.03 5.03 5.03 25.145 $ 0.25
Activity 7.2.7: Conduct, review and disseminate early warning surveys
7.23 7.23 7.23 7.23 7.23 36.15 $ 0.36
Activity 7.2.8: Train stakeholders on needs assessment and conduct assessment during emergencies
7.99 7.99 7.99 7.99 7.99 39.95 $ 0.40
Activity 7.2.9: Develop SOPs for emergency response; finalize guidelines on linkage of nutrition with livelihood programs
2.19 2.19 2.19 2.19 2.19 10.9475 $ 0.11
Output 7.3: Improved access to timely multi- sectorial high impact interventions to populations affected by emergencies to prevent deterioration of nutritional status and avert excess morbidity and mortality
1.32 24.35 1.32 1.32 24.35 52.68 $ 0.52
Activity 7.3.1: Activate emergency coordination for nutrition response monitoring
1.16 1.16 1.16 1.16 1.16 5.79 $ 0.06
Activity 7.3.2: Conduct nutrition needs assessment during emergencies to adapt response to the context.
- 23.03 - - 23.03 46.06 $ 0.46
Activity 7.3.3: Optimize nutrition service delivery approaches including outreach services in hard to reach areas, affected urban areas
0.12 0.12 0.12 0.12 0.12 0.60 $ 0.01
Activity 7.3.4: Access to High impact nutrition interventions in emergencies
0.05 0.05 0.05 0.05 0.05 0.23 $ 0.00
Output 7.4: Strengthened Implementation of Recovery Interventions to Enhance “Build Back better” approaches
4.85 3.57 3.57 4.85 3.57 20.41 $ 0.20
Activity 7.4.1: Actively engage in development of livelihood and social protection programs to enhance integration of nutrition
0.05 0.05 0.05 0.05 0.05 0.25 $ 0.00
Activity 7.4.2: Participate in policy discussions related to post disaster reviews to influence nutrition considerations
1.28 - - 1.28 - 2.56 $ 0.03
Activity 7.4.3: Strengthen participation in community level dialogue and recovery initiatives
3.52 3.52 3.52 3.52 3.52 17.60 $ 0.17
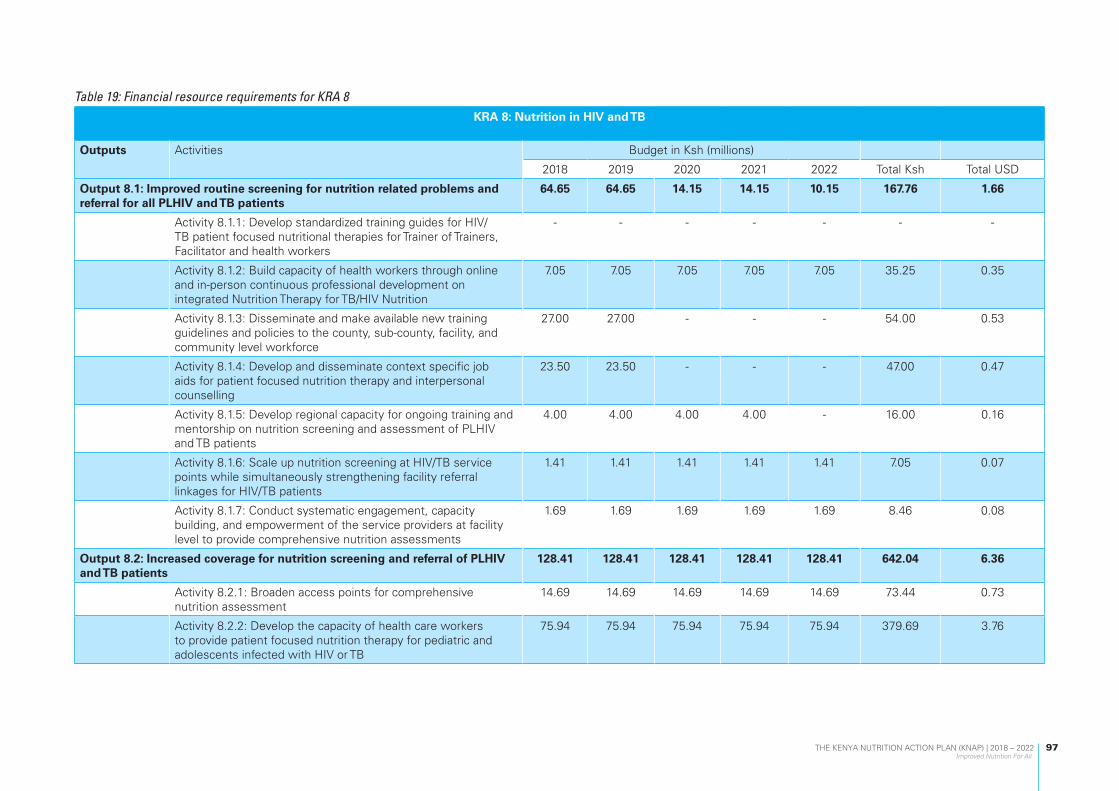
THE KENYA NUTRITION ACTION PLAN (KNAP) | 2018 – 2022 Improved Nutrition For All
97
Table 19: Financial resource requirements for KRA 8KRA 8: Nutrition in HIV and TB
Outputs Activities Budget in Ksh (millions)
2018 2019 2020 2021 2022 Total Ksh Total USD
Output 8.1: Improved routine screening for nutrition related problems and referral for all PLHIV and TB patients
64.65 64.65 14.15 14.15 10.15 167.76 1.66
Activity 8.1.1: Develop standardized training guides for HIV/TB patient focused nutritional therapies for Trainer of Trainers, Facilitator and health workers
- - - - - - -
Activity 8.1.2: Build capacity of health workers through online and in-person continuous professional development on integrated Nutrition Therapy for TB/HIV Nutrition
7.05 7.05 7.05 7.05 7.05 35.25 0.35
Activity 8.1.3: Disseminate and make available new training guidelines and policies to the county, sub-county, facility, and community level workforce
27.00 27.00 - - - 54.00 0.53
Activity 8.1.4: Develop and disseminate context specific job aids for patient focused nutrition therapy and interpersonal counselling
23.50 23.50 - - - 47.00 0.47
Activity 8.1.5: Develop regional capacity for ongoing training and mentorship on nutrition screening and assessment of PLHIV and TB patients
4.00 4.00 4.00 4.00 - 16.00 0.16
Activity 8.1.6: Scale up nutrition screening at HIV/TB service points while simultaneously strengthening facility referral linkages for HIV/TB patients
1.41 1.41 1.41 1.41 1.41 7.05 0.07
Activity 8.1.7: Conduct systematic engagement, capacity building, and empowerment of the service providers at facility level to provide comprehensive nutrition assessments
1.69 1.69 1.69 1.69 1.69 8.46 0.08
Output 8.2: Increased coverage for nutrition screening and referral of PLHIV and TB patients
128.41 128.41 128.41 128.41 128.41 642.04 6.36
Activity 8.2.1: Broaden access points for comprehensive nutrition assessment
14.69 14.69 14.69 14.69 14.69 73.44 0.73
Activity 8.2.2: Develop the capacity of health care workers to provide patient focused nutrition therapy for pediatric and adolescents infected with HIV or TB
75.94 75.94 75.94 75.94 75.94 379.69 3.76

THE KENYA NUTRITION ACTION PLAN (KNAP) | 2018 – 2022 Improved Nutrition For All
98
Activity 8.2.3: Build the capacity of health care workers and CHVs on information related to nutrition screening and comprehensive nutrition assessment for HIV/TB patients
4.69 4.69 4.69 4.69 4.69 23.44 0.23
Activity 8.2.4: Invest in emerging technologies for nutrition assessment and diagnostics for optimal nutrition interventions and care of HIV/TB patients
4.38 4.38 4.38 4.38 4.38 21.88 0.22
Activity 8.2.5: Offer comprehensive nutrition assessments in all HIV, TB, MNCH service points to reduce missed opportunities and improve service uptake and retention into care
4.69 4.69 4.69 4.69 4.69 23.44 0.23
Activity 8.2.6: Adapt technologies in body composition analysis, lipid profile testing that improve nutrition diagnosis and optimize treatment options for HIV, TB patients
4.69 4.69 4.69 4.69 4.69 23.44 0.23
Activity 8.2.7: invest in adaptive and innovative mechanisms that enhance delivery nutrition interventions for children and adolescents exposed or living with HIV/TB
1.41 1.41 1.41 1.41 1.41 7.05 0.07
Activity 8.2.8: Implement national and county level forecasting, quantification, and supply planning exercises through integrated operationalized county-level commodity security committees.
4.94 4.94 4.94 4.94 4.94 24.68 0.24
Activity 8.2.9: Utilize routine supply chain monitoring, including electronic LMIS systems, to minimize stock outs, avoid expiries, and over/under stocking of HIV/TB Nutrition commodities
9.00 9.00 9.00 9.00 9.00 45.00 0.45
Activity 8.2.10: Conduct periodic post-market surveillance for quality of nutrition commodities used in management of HIV/TB patients
4.00 4.00 4.00 4.00 4.00 20.00 0.20
Output 8.3: Strengthened integration of nutrition interventions for home-based care at community level for PLHIVs towards the 90.90.90
22.69 22.21 22.77 22.21 22.82 112.69 1.12
Activity 8.3.1: Develop a series of small doable actions that enhance dietary diversity and physical exercises at household level for HIV and TB patients
0.49 - 0.56 - 0.61 1.66 0.02
Activity 8.3.2: Build capacity of CHVs and other community resource persons to promote healthy and sustainable lifestyles at household level
6.11 6.11 6.11 6.11 6.11 30.55 0.30
Activity 8.3.3: Disseminate key context specific nutrition messages that promote positive lifestyles and behavior for HIV /TB patients
14.69 14.69 14.69 14.69 14.69 73.44 0.73

THE KENYA NUTRITION ACTION PLAN (KNAP) | 2018 – 2022 Improved Nutrition For All
99
Activity 8.3.4: Identification and engagement of existing community structures: ward Health committees, village health committees, and mother to mother support groups
0.71 0.71 0.71 0.71 0.71 3.53 0.03
Activity 8.3.5: Strengthen outreach, referrals, and linkage systems to involve all community actors and optimize identification and linkage of PLHIV and TB patients with nutrition care and management
0.71 0.71 0.71 0.71 0.71 3.53 0.03
Output 8.4: Enhanced use of implementation research to generate evidence for cost effective nutrition TB and HIV programing
162.22 155.84 163.18 155.84 163.91 801.00 7.93
Activity 8.4.1: Implement routine participatory progress monitoring platforms at all levels (national, county, sub-county and community) through schedule data review meetings
12.34 12.34 12.34 12.34 12.34 61.69 0.61
Activity 8.4.2: Adapt and implement country NACS validation guidelines and tools including capacity building of counties to county annual data validation
18.00 18.00 18.00 18.00 18.00 90.00 0.89
Activity 8.4.3: Conduct standard annual NACS data and service audits including partner mapping at sub county level
0.71 0.71 0.71 0.71 0.71 3.53 0.03
Activity 8.4.4: Adopt use of county level scorecards for nutrition indicators including NACS
12.34 12.34 12.34 12.34 12.34 61.69 0.61
Activity 8.4.5: Scale up the generation and utilization of granulated NACS data for decision making down to the lowest level such as county, sub-county, ward, facility and community levels
18.00 18.00 18.00 18.00 18.00 90.00 0.89
Activity 8.4.6: Review and optimize integration of data systems from various nutrition service delivery points for HIV, TB clients across the NACS continuum of care. This shall include retention, treatment outcomes, and viral suppression for HIV/TB patients
12.34 12.34 12.34 12.34 12.34 61.69 0.61
Activity 8.4.7: Establish sentinel sites for NACS and dashboards at the facility, sub-county, county and national levels
70.50 70.50 70.50 70.50 70.50 352.50 3.49
Activity 8.4.8: Implement regular data quality assessments using work improvement teams’ activities at all levels
5.63 5.63 5.63 5.63 5.63 28.13 0.28
Activity 8.4.9: Develop capacity for use of m-Health systems to identify and follow up patients at community level
6.00 6.00 6.00 6.00 6.00 30.00 0.30
Activity 8.4.10: Conduct annual bottleneck assessments specific to key program areas in NACS to identity questions for implementation research
2.88 - 3.31 - 3.64 9.84 0.10

THE KENYA NUTRITION ACTION PLAN (KNAP) | 2018 – 2022 Improved Nutrition For All
100
Activity 8.4.11: Develop an online inventory of bottlenecks related to specific NACS program areas to inform investments and programming
1.75 - 2.01 - 2.21 5.98 0.06
Activity 8.4.12: Conduct regional learning workshops for NACS knowledge management and transfer on best practices
1.75 - 2.01 - 2.21 5.98 0.06
Table 20: Financial resource requirements for KRA 9KRA 9: Clinical Nutrition and Dietetics in Disease Management Strengthened
Outputs Activities Budget in Ksh (millions)
2018 2019 2020 2021 2022 Total Ksh Total USD
Output 9.1: Nutrition and dietetics guidelines, standards, screening and assessment tools, developed and implemented
0.06 53.81 66.30 24.13 23.12 167.42 $ 1.66
Activity 9.1.1: Develop and disseminate standard operating procedures (SOP) for nutrition and dietetics: protocol on nutrition management in diseases and conditions; inpatient feeding protocol;
- 18.37 15.05 9.89 10.16 53.46 $ 0.53
Activity 9.1.2: Develop and disseminate clinical nutrition tools: screening, inter-facility referral, patient feeding monitoring and service quality management tools
0.02 21.67 19.64 3.03 2.75 47.12 $ 0.47
Activity 9.1.3: Develop and disseminate basic training and patient safety package for clinical nutrition and dietetics
0.04 9.94 17.72 0.25 - 27.94 $ 0.28
Activity 9.1.4: Develop and disseminate guidelines, strategies and policies on clinical nutrition and dietetics: guidelines for nutritional management of patients in disease and illness; home based care guidelines for nutrition; guidelines on therapeutic food production units.
- 3.83 13.89 10.95 10.21 38.89 $ 0.39
Output 9.2: Nutrition screening, assessment and triage to all individuals seeking healthcare promoted
- 0.06 6.30 6.30 - 12.66 $ 0.13
Activity 9.2.1: Establish nutrition screening, assessment and triage areas/stations in the outpatient and inpatient services
- 0.06 6.30 6.30 - 12.66 $ 0.13
Output 9.3: Improved referral services between facility to facility, community to facility and vice versa
- - - 2.02 - 2.02 $ 0.02
Activity 9.3.1: Conduct sensitization workshops on the use of standard facility-community referral tool for counties
- - - 2.02 - 2.02 $ 0.02

THE KENYA NUTRITION ACTION PLAN (KNAP) | 2018 – 2022 Improved Nutrition For All
101
Output 9.4: Improved quality of clinical nutrition and dietetics care in management of diseases.
15.41 - 13.73 5.49 5.49 40.11 $ 0.40
Activity 9.4.1: Sensitize counties on the national basic essential clinical nutrition and dietetics care package in diseases
- - 6.41 - - 6.41 $ 0.06
Activity 9.4.2: Build the capacity of the national and county health workers in clinical nutrition and dietetics care package.
15.41 - 7.31 5.49 5.49 33.70 $ 0.33
Output 9.5: Improved Food Procurement, Supply, Hygiene and Safety in healthcare institutions
- 20.00 10.00 10.00 10.00 50.00 $ 0.50
Activity 9.5.1: Strengthen Procurement of nutrition commodities for feeding and management of special medical conditions based on inpatient feeding protocols.
- 20.00 10.00 10.00 10.00 50.00 $ 0.50
Activity 9.5.2: Establish food safety inspection committees in the institutions
- - - - - - $ -
Output 9.6: Strengthen M&E for clinical nutrition and dietetics in disease management.
0.04 1.36 3.86 1.72 1.17 8.16 $ 0.08
Activity 9.6.1: Assessment of quality of nutrition care in facilities 0.04 0.51 3.01 0.87 0.32 4.75 $ 0.05
Activity 9.6.2: Integrate clinical nutrition indicators in the DHIS - 0.85 0.85 0.85 0.85 3.41 $ 0.03
Output 9.7 Improved advocacy for nutrition and dietetics - 0.14 0.35 0.30 0.30 1.09 $ 0.01
Activity 9.7.1: Advocate for increased resource allocation for clinical nutrition and dietetics
- 0.02 - - - 0.02 $ 0.00
Activity 9.7.2: Advocate for integration of nutrition and dietetics services at all levels of the healthcare system
- 0.12 0.13 0.13 0.13 0.52 $ 0.01
Activity 9.7.3: Develop IEC materials for nutrition management in diseases and conditions
- - 0.22 0.17 0.17 0.55 $ 0.01
Table 21:Financial resources requirement for KRA 10KRA 10: Nutrition in Agriculture and Food Security Scaled up
Outputs Activities Budget in Ksh (millions)
2018 2019 2020 2021 2022 Total Ksh Total USD
Output 10.1: Strengthened sustainable and inclusive food systems that are diverse, productive and profitable for improved nutrition.
50.08 41.13 51.21 37.17 47.47 227.06 $ 2.25

THE KENYA NUTRITION ACTION PLAN (KNAP) | 2018 – 2022 Improved Nutrition For All
102
Activity 10.1.1: Advocate for joint Strategic planning with MOH, MOALF&I, MoW, MOE, MLSP and other stakeholders for nutrition sensitive agricultural production
50.08 41.13 40.91 37.17 37.17 206.46 $ 2.04
Activity 10.1.2: Support county training on early warning systems - - 10.30 - 10.30 20.60 $ 0.20
Output 10.2: Improved access to nutritious and safe foods along the food value chain.
2.86 2.26 3.57 2.26 2.26 13.21 $ 0.13
Activity 10.2.1: Strengthen coordination and collaboration with public and private sector actors -through capacity assessment of private sector
0.60 - 1.31 - - 1.91 $ 0.02
Activity 10.2.2: Promote uptake of food processing, preservation and storage technologies.
2.26 2.26 2.26 2.26 2.26 11.30 $ 0.11
Output 10.3: Consumption of safe, diverse, and nutritious foods promoted 26.10 51.80 21.43 122.20 47.75 269.27 $ 2.67
Activity 10.3.1: Sensitize counties on diversified food production 17.50 17.50 17.50 17.50 17.50 87.48 $ 0.87
Activity 10.3.2: Support uptake and use of food composition tables and recipes for decision making
0.78 0.78 0.78 0.78 0.78 3.90 $ 0.04
Activity 10.3.3: Develop food safety regulations, and enforcement mechanisms
- 26.33 - - 26.33 52.65 $ 0.52
Activity 10.3.4: Support dissemination of the agrinutrition resource manual and dialogue cards and other related materials
0.63 - 0.63 - 0.63 1.89 $ 0.02
Activity 10.3.5: Develop SBCC strategy for increased consumption of nutritious foods and improved dietary diversity (Including fortified foods)
- - - 101.40 - 101.40 $ 1.00
Activity 10.3.6: Support flour blending initiatives-regulations and standards development
7.19 7.19 2.52 2.52 2.52 21.95 $ 0.22
Output 10.4: Strengthened agri-nutrition capacities and coordination at national and county levels
109.89 108.45 109.39 107.95 107.95 543.64 $ 5.38
Activity 10.4.1: Support agri-nutrition coordination mechanisms at national and county level and between private and public sectors
107.70 106.26 107.70 106.26 106.26 534.19 $ 5.29
Activity 10.4.2: Participate in the agri-nutrition coordination working groups.
1.69 1.69 1.69 1.69 1.69 8.46 $ 0.08
Activity 10.4.3: Support agri-nutrition capacity development and integration initiatives
0.50 0.50 - - - 1.00 $ 0.01

THE KENYA NUTRITION ACTION PLAN (KNAP) | 2018 – 2022 Improved Nutrition For All
103
Table 22: Financial resource requirements for KRA 11KRA 11: Nutrition in the Health Sector Strengthened
Outputs Activities Budget in Ksh (millions)
2018 2019 2020 2021 2022 Total Ksh Total USD
Output 11.1 Nutrition articulated in health policy documents and represented in health sector policy development forums
18.55 8.40 8.40 9.14 8.40 52.89 $ 0.52
Activity 11.1.1: Include nutrition in Universal Health Care (UHC)roadmap and implementation framework
10.15 - - 0.74 - 10.89 $ 0.11
Activity 11.1.2: Include nutrition as an agenda in national, regional and global health forums
8.40 8.40 8.40 8.40 8.40 42.00 $ 0.42
Output 11.2: Enhanced integration of nutrition within the health sector 8.45 8.45 8.45 8.45 8.45 42.24 $ 0.42
Activity 11.2.1: Use available mechanisms for joint planning and coordination within health sector to integrate nutrition.
8.45 8.45 8.45 8.45 8.45 42.24 $ 0.42
Output 11.3: Nutrition strengthened and integrated in health monitoring, evaluation, research, accountability and learning systems of the health sector
1.94 0.58 1.94 0.58 1.54 6.56 $ 0.06
Activity 11.3.1: Review health sector M&E systems and the HMIS to ensure inclusion of nutrition indicators
1.80 0.44 1.80 0.44 1.40 5.89 $ 0.06
Activity 11.3.2: Integrate nutrition in health research agenda 0.14 0.14 0.14 0.14 0.14 0.68 $ 0.01
Output 11.4: Nutrition services incorporated in all health services delivery point at all levels of care
0.54 0.54 0.54 0.54 0.54 2.72 $ 0.03
Activity 11.4.1: Participate in joint health service delivery committee meetings
0.54 0.54 0.54 0.54 0.54 2.72 $ 0.03
Output 11.5: Strengthened capacity of the health workforce to deliver integrated services to include nutrition
2.20 14.37 1.24 - 1.24 19.06 $ 0.19
Activity 11.5.1: Support continuous education, learning, and professional development of health workers through supportive supervision
1.24 - 1.24 - 1.24 3.73 $ 0.04
Activity 11.5.2: Update pre-service curriculums with nutrition content
0.95 - - - - 0.95 $ 0.01
Activity 11.5.3: Train specialists in nutrition and dietetics - 14.37 14.37 14.37 - 43.11 $ 0.43

THE KENYA NUTRITION ACTION PLAN (KNAP) | 2018 – 2022 Improved Nutrition For All
104
Table 23: Financial resource requirements for KRA 12KRA 12: Nutrition in the Education Sector Strengthened
Outputs Activities Budget in Ksh (millions)
2018 2019 2020 2021 2022 Total Ksh Total USD
Output 12.1: Policies, strategies, standards and guidelines on nutrition and physical activity in schools and other learning institutions developed and promoted
15.53 20.82 18.67 17.56 16.09 88.67 $ 0.88
Activity 12.1.1: Develop nutrition and physical activity content for school curriculum.
3.11 3.11 3.11 - - 9.33 $ 0.09
Activity 12.1.2: Advocate for inclusion of nutrition and physical activity themes in co-curricular school activities (drama, music, talent shows, contests, symposia)
1.14 7.42 7.42 6.28 6.28 28.54 $ 0.28
Activity 12.1.3: Advocate for comprehensive examination on nutrition and physical activity; and advocate for support from MOE to monitor implementation of nutrition and physical activity in the curriculum
- 0.48 0.94 - - 1.42 $ 0.01
Activity 12.1.4: Advocate for technical support from MoALF to schools on establishment and improvement of existing school demonstration gardens, small animals and revive 4Kclubs.
0.52 0.52 0.52 0.52 0.52 2.60 $ 0.03
Activity 12.1.5: Implement school meals guidelines. - - - - - - $ -
Activity 12.1.6: Document and implement best practices and information sharing
10.76 9.29 6.68 10.76 9.29 46.78 $ 0.46
Activity 12.1.7: Assess implementation of nutrition and physical activity education and promotion in school
- - - - - - $ -
Output 12.2: Nutrition assessments in schools and other learning institutions 25.27 27.05 45.83 30.07 23.65 151.87 $ 1.50
Activity 12.2.1: Develop tools and manuals for nutrition assessment in schools
- 3.40 - - - 3.40 $ 0.03
Activity 12.2.2: Sensitize schools on nutrition assessments in schools
- - 6.22 6.22 - 12.44 $ 0.12
Activity 12.2.3: Procure nutrition assessment equipment - - - - - - $ -
Activity 12.2.4: Conduct periodic nutritional status assessments in schools and other learning institutions
23.65 23.65 39.61 23.85 23.65 134.41 $ 1.33
Activity 12.2.5: Establish a referral system for health and nutrition interventions for those assessed
1.62 - - - - 1.62 $ 0.02

THE KENYA NUTRITION ACTION PLAN (KNAP) | 2018 – 2022 Improved Nutrition For All
105
Output 12.3: Healthy and safe food environment promoted in schools and other learning institutions
4.25 10.78 10.78 7.05 7.05 39.90 $ 0.40
Activity 12.3.1: Sensitize stakeholders including, curriculum support officers, food service providers and handlers, PTA (Parents-Teachers Associations) on healthy and safe food environment
3.89 10.42 10.42 6.69 6.69 38.10 $ 0.38
Activity 12.3.2: Advocate for improved access to safe and sufficient water, and adequate WASH services in schools and other learning institutions
0.36 0.36 0.36 0.36 0.36 1.80 $ 0.02
Table 24: Financial resource requirements for KRA 13KRA 13: Nutrition in Water, Sanitation And Hygiene (WASH) Sector Promoted
Outputs Activities Budget in Ksh (millions)
2018 2019 2020 2021 2022 Total Ksh Total USD
Output 13.1: Improved access to safe and adequate WASH services ensured in Kenya.
59.95 30.54 51.85 43.70 55.14 241.17 $ 2.39
Activity 13.1.1: Advocate for the provision of adequate portable water and safe storage within households, health facilities and schools.
32.99 7.14 39.00 21.24 27.25 127.62 $ 1.26
Activity 13.1.2: Advocate for protection of water sources and regular water treatment quality checks
4.78 15.32 4.78 0.28 19.82 44.99 $ 0.45
Activity 13.1.3: Promote use of water treatment technologies at household and community levels
22.17 8.07 8.07 22.17 8.07 68.56 $ 0.68
Output 13.2: Collaboration with relevant stakeholders on WASH strengthened.
8.52 1.65 1.60 8.52 1.44 21.73 $ 0.22
Activity 13.2.1: Support the development of mechanisms that strengthen coordination, linking nutrition to WASH.
0.96 1.17 0.96 0.96 0.96
5.01 $ 0.05
Activity 13.2.2: Support development and review of policies and strategies using participatory approaches to ensure universal access to adequate sanitation.
6.28 0.48 0.64 6.28 0.48 14.16 $ 0.14
Activity 13.2.3: Promote joint resource mobilization for integrated WASH and nutrition activities.
1.28 - - 1.28 - 2.56 $ 0.03
Output 13.3: Optimal WASH practices promoted 53.31 56.23 24.71 74.49 21.36 230.09 $ 2.28

THE KENYA NUTRITION ACTION PLAN (KNAP) | 2018 – 2022 Improved Nutrition For All
106
Activity 13.3.1: Advocate for functional systems for WASH service provision at institution and household level
19.82 39.93 19.82 19.82 20.10 119.50 $ 1.18
Activity 13.3.2: Sensitize all food handlers on safe and hygiene practices during food preparation and storage
15.36 1.26 1.26 1.26 1.26 20.40 $ 0.20
Activity 13.3.3: Integrate hand washing message and hygiene
during nutrition sessions 18.13 - 3.63 18.13 - 39.88 $ 0.39
Activity 13.3.4: Promote environmental hygiene at household level.
- - - 19.82 - 19.82 $ 0.20
Activity 13.3.5: Promote stakeholders’ partnerships in design, development and dissemination of IEC materials and messaging on hand washing, community and institutions led total sanitation and food hygiene
- 15.04 - 15.46 - 30.50 $ 0.30
Table 25: Financial resource requirements for KRA 14KRA 14: Nutrition in Social Protection Programmes promoted
Outputs Activities Budget in Ksh (millions)
2018 2019 2020 2021 2022 Total Ksh Total USD
Output 14.1: Nutrition promoted and linkages enhanced in Social Protection programs including in crisis
10.67 38.31 50.96 34.20 12.03 146.17 $ 1.45
Activity 14.1.1: Develop and disseminate targeting criteria for nutrition in social protection programmes e.g. cash transfers, hunger safety nets, others.
4.51 8.04 8.04 4.51 4.51 29.60 $ 0.29
Activity 14.1.2: Mainstream nutrition in review of the Social Protection Policy and Strategy
6.16 9.49 11.87 - - 27.52 $ 0.27
Activity 14.1.3: Advocate for inclusion of nutrition indicators in the M&E of social protection interventions
- 2.30 4.61 - - 6.91 $ 0.07
Activity 14.1.4: Scale up social safety nets in times of crises - 9.35 9.35 - - 18.70 $ 0.19
Activity 14.1.5: Conduct stakeholder mapping of various players in social protection
- 4.52 5.27 4.52 4.52 18.83 $ 0.19
Activity 14.1.6: Enhance participation of nutrition stakeholders in social protection coordination mechanisms
- - 0.18 0.18 - 0.36 $ 0.00
Activity 14.1.7: Train stakeholders in social protection programmes on good nutrition practices.
- - 1.40 1.40 - 2.80 $ 0.03

THE KENYA NUTRITION ACTION PLAN (KNAP) | 2018 – 2022 Improved Nutrition For All
107
Activity 14.1.8: Conduct a baseline survey/situation analysis on status of nutrition and health for the vulnerable groups.
- 4.62 10.25 23.59 3.00 41.45 $ 0.41
Output 14.2: Resources for nutrition in Social Protection programs mobilized - 1.50 1.50 - - 3.00 $ 0.03
Activity 14.2.1: Advocate for deployment of nutrition human resource in social protection programmes
- 1.20 1.20 - - 2.40 $ 0.02
Activity 14.2.2: Mobilize financial resources for nutrition interventions in social protection programmes
- 0.30 0.30 - - 0.60 $ 0.01
Output 14.3: Strengthened Advocacy, Communication and Social Mobilization for Social Protection
- 7.53 15.13 5.28 - 27.94 $ 0.28
Activity 14.3.1: Advocate for governance and accountability for nutrition and social protection for vulnerable groups
- 2.02 2.02 5.28 - 9.32 $ 0.09
Activity 14.3.2: Advocate for harmonization of nutrition and social protection services for vulnerable groups
- 0.40 0.40 - - 0.80 $ 0.01
Activity 14.3.3: Advocate for the linkage of nutrition services and social protection for all vulnerable groups to NHIF
- 0.16 0.16 - - 0.32 $ 0.00
Activity 14.3.4: Advocate for high level consultations for promotion of health and nutrition for vulnerable groups at National and County levels.
- 0.40 0.40 - - 0.80 $ 0.01
Activity 14.3.5: Sensitize (a) the public and b) management of institutions of vulnerable persons and correction facilities on health and nutrition.
- 4.35 4.35 - - 8.70 $ 0.09
Activity 14.3.6: Promote benchmarking/learning visits for policy makers and implementers in countries with best practices on health and nutrition for vulnerable groups
- 0.20 7.80 - - 8.00 $ 0.08
Table 26:Financial resource requirements for KRA 15KRA 15: Sectoral and Multi-Sectoral Nutrition Governance (MNG) Including Coordination and Legal/Regulatory Framework Strengthened
Outputs Activities Budget in Ksh (millions)
2018 2019 2020 2021 2022 Total Ksh Total USD
Output 15.1: Enhanced existing nutrition coordination and collaborating mechanisms and linkages between national and county Governments
55.79 53.77 50.85 50.85 50.85 262.11 $ 2.60
Activity 15.1.1: Map partners and stakeholders 1.19 - - - - 1.19 $ 0.01

THE KENYA NUTRITION ACTION PLAN (KNAP) | 2018 – 2022 Improved Nutrition For All
108
Activity 15.1.2: Hold periodic governance and accountability meetings
0.17 0.16 0.16 0.16 0.16 0.83 $ 0.01
Activity 15.1.3: Hold nutrition technical forums at National, County and support sub county level as per TORs
1.37 1.37 1.37 1.37 1.37 6.86 $ 0.07
Activity 15.1.4: Support development, costing, review and updating of sector specific coordination annual plans
13.83 13.83 13.83 13.83 13.83 69.15 $ 0.68
Activity 15.1.5: Support the establishment and functionality of the Food and Nutrition Security Council and all other structures as approved in the NFNSP-IF at national and county levels
13.07 12.25 12.25 12.25 12.25 62.07 $ 0.61
Activity 15.1.6: Enhance representation of nutrition at other sectorial forums at county and national level
3.36 3.36 0.45 0.45 0.45 8.08 $ 0.08
Activity 15.1.7: Conduct performance assessment reviews on coordination
21.42 21.42 21.42 21.42 21.42 107.08 $ 1.06
Activity 15.1.8: Support annual National and County learning fora 1.37 1.37 1.37 1.37 1.37 6.86 $ 0.07
Output 15.2: Regional and global international cooperation on nutrition enhanced
5.01 7.44 5.01 5.01 5.01 27.49 $ 0.27
Activity 15.2.1: Support SUN Network meetings and joint annual assessments
0.70 0.70 0.70 0.70 0.70 3.48 $ 0.03
Activity 15.2.2: Participate in regional and global international meetings on nutrition
4.32 6.75 4.32 4.32 4.32 24.01 $ 0.24
Output 15.3 Enhanced coordination in development and implementation of nutrition relevant regulatory frameworks
3.19 3.19 3.19 3.19 3.19 15.94 $ 0.16
Activity 15.3.1: Establish a coordination mechanism for engagement in nutrition legal and regulatory process engagement
0.36 0.36 0.36 0.36 0.36 1.80 $ 0.02
Activity 15.3.2: Hold annual nutrition standards and regulation summit with relevant actors
2.83 2.83 2.83 2.83 2.83 14.14 $ 0.14
Output 15.4 Strengthened partnerships and collaboration for nutrition 2.63 - - - - 2.63 $ 0.03
Activity 15.4.1: Develop a strategy and framework for enhancing public-private partnerships
1.72 - - - - 1.72 $ 0.02
Activity 15.4.2: Develop and update nutrition sector/multisectoral partnership framework to guide collaboration at all levels
0.92 - - - - 0.92 $ 0.01
Output 15.5 Nutrition Resource mobilization and accountability tracked 39.60 22.86 21.39 11.97 12.93 108.75 $ 1.08
Activity 15.5.1: Create coordinating mechanism for resource mobilization at all levels
0.68 0.54 0.54 0.54 0.54 2.84 $ 0.03

THE KENYA NUTRITION ACTION PLAN (KNAP) | 2018 – 2022 Improved Nutrition For All
109
Activity 15.5.2: Develop costed County Nutrition Action Plans (CNAPs)
15.65 - - - - 15.65 $ 0.15
Activity 15.5.3: Conduct annual donor group forums on nutrition 0.14 0.14 0.14 0.14 0.14 0.68 $ 0.01
Activity 15.5.4: Develop annual resource mobilization strategy - - - - - - $ -
Activity 15.5.5: Conduct Nutrition resource tracking at County and National level
15.70 14.74 16.42 7.01 7.96 61.82 $ 0.61
Activity 15.5.6: Support participation and representation of Nutrition sector in citizen- participation forums at all levels
7.44 7.44 4.29 4.29 4.29 27.76 $ 0.27
Table 27:Financial resource requirements for KRA 16KRA 16: Sectoral and Multi-sectoral Nutrition Information Systems, Learning and Research Strengthened
Outputs Activities Budget in Ksh (millions)
2018 2019 2020 2021 2022 Total Ksh Total USD
Output 16.1 Nutrition sector plans progress reviewed 18.49 16.12 23.76 2.89 58.25 119.50 $ 1.18
Activity 16.1.1: Review and update the Kenya Nutrition M&E framework
- 6.54 - - 6.54 13.08 $ 0.13
Activity 16.1.2: Support development and progress review of AWPs and other multi-year plans and policies
0.13 0.13 0.13 0.13 0.13 0.64 $ 0.01
Activity 16.1.3: Conduct quarterly, annual, mid-term and end term reviews/evaluations of the KNAP and take corrective
actions
15.83 6.92 21.10 0.23 49.05 93.11 $ 0.92
Activity 16.1.4: Develop and disseminate annual reports 2.54 2.54 2.54 2.54 2.54 12.68 $ 0.13
Output 16.2 Strengthened Nutrition sector capacity in NIS and evidence based decision making
7.08 27.55 15.98 27.60 33.79 112.00 $ 1.11
Activity 16.2.1: Develop and use multisectoral nutrition scored card to monitor key KNAP indicators quarterly
- - 1.51 13.66 13.66 28.82 $ 0.29
Activity 16.2.2: Train officers on website Maintenance and management; qualitative research methodology; SMART Survey methodology; Integrated Phase Classification for acute malnutrition; Nutrition data elements and indicators; Sentinel Surveillance-Early Warning System;
7.02 27.47 14.42 13.88 20.07 82.85 $ 0.82
Activity 16.2.3: Conduct routine data review and feedback meetings with counties
0.06 0.06 0.06 0.06 0.06 0.30 $ 0.00

THE KENYA NUTRITION ACTION PLAN (KNAP) | 2018 – 2022 Improved Nutrition For All
110
Activity 16.2.4: Conduct M&E capacity needs assessment and action plan for findings
- 0.02 - - - 0.02 $ 0.00
Output 16.3: Improved access to and use of nutrition information to inform program quality, adjustment and learning
41.85 41.79 36.15 36.15 36.15 192.09 $ 1.90
Activity 16.3.1: Conduct nutrition situation analysis, generate information products, and disseminate to all levels for planning and response
17.82 17.82 17.82 17.82 17.82 89.10 $ 0.88
Activity 16.3.2: Upload nutrition products reports and bulletins in the nutrition website and population survey database and document best practices and lessons learnt in M&E/NIS
0.09 0.09 0.09 0.09 0.09 0.45 $ 0.00
Activity 16.3.2: Support development and review of data protection sharing guidelines.
17.82 17.82 17.82 17.82 17.82 89.10 $ 0.88
Activity 16.3.2: Develop nutrition dashboards, scorecards, electronic data collection tools etc.
1.17 6.06 0.42 0.42 0.42 8.49 $ 0.08
Activity 16.3.2: Systematic utilization of nutrition information to inform program quality improvement
4.95 - - - - 4.95 $ 0.05
Output 16.4 Standardized and harmonized nutrition data collection methodologies, management, and reporting at all levels
0.88 2.27 1.02 - 0.63 4.79 $ 0.05
Activity 16.4.1: Review/ develop and disseminate guidelines on nutrition M&E based on field learning experience and emerging global guidance: Nutrition Coverage Guideline; DQA Guideline for nutrition indicators; Sentinel Sites DQA Guidelines; MIYCN KAPS Guidelines
0.50 0.38 - - - 0.88 $ 0.01
Activity 16.4.2: Review/develop field assessment manual; guidelines on cnap development; IYCF-e assessment tools and guidelines; Nutrition DHIS2 tools review; SMART Survey Questionnaire; KAP Survey Questionnaire;
0.38 1.56 0.36 - 0.60 2.90 $ 0.03
Activity 16.4.3: Participate in the HMIS indicator manual review - 0.03 - - 0.03 0.06 $ 0.00
Activity 16.4.4: Print, distribute and disseminate nutrition M&E framework, tools, manuals, and guidelines.
- 0.30 0.66 - - 0.96 $ 0.01
Output 16.5 Quality nutrition data generated for evidence-based programming
62.47 62.47 167.47 62.47 61.92 416.80 $ 4.13
Activity 16.5.1: Conduct nutrition data clinics to reflect on NIS processes, key emerging issues, lessons learnt from field implementation and tap into national, regional and global experts to improve NIS
0.66 0.66 0.66 0.66 0.66 3.28 $ 0.03

THE KENYA NUTRITION ACTION PLAN (KNAP) | 2018 – 2022 Improved Nutrition For All
111
Activity 16.5.2: Conduct Data Quality Audits for DHIS, LMIS and sentinel surveillance
1.67 1.67 1.67 1.67 1.11 7.77 $ 0.08
Activity 16.5.3 Review and validate methodologies and results and quality monitoring during nutrition surveys-SMART, MIYCN KAP and Coverage surveys
0.15 0.15 0.15 0.15 0.15 0.75 $ 0.01
Activity 16.5.4: Conduct integrated nutrition SMART Surveys, MIYCN KAP and coverage assessment
60.00 60.00 165.00 60.00 60.00 405.00 $ 4.01
Output 16.6 Enhanced multi-sectoral linkages result in improved nutrition information efficiencies and cost-effectiveness
11.43 37.85 11.54 11.43 37.76 110.01 $ 1.09
Activity 16.6.1: Hold periodic Multisectoral nutrition collaboration TWG meetings and monitoring of TWG Plan
0.64 0.64 0.64 0.64 0.64 3.19 $ 0.03
Activity 16.6.2: Strengthen continuity of NITWG partnership with stakeholders such as NDMA, KNBS, FEWSNET, MOH HIS.
- 0.09 0.11 - - 0.20 $ 0.00
Activity 16.6.3: Enhance linkages between NITWG and other working groups within the sectors.
10.55 10.55 10.55 10.55 10.55 52.77 $ 0.52
Activity 16.6.4: Plan/review TORs for M&E/NIS including monthly meetings and NITWG costed plan for resource mobilization.
- 26.33 - - 26.33 52.65 $ 0.52
Activity 16.6.5: Support the multi-sectoral Nutrition Information Platform (NIPN) for improved multi-sectoral data analysis, dissemination and utilization.
0.24 0.24 0.24 0.24 0.24 1.20 $ 0.01
Output 16.7 Enhanced evidence-based decision making through research 14.92 9.36 15.75 14.02 12.66 66.72 $ 0.66
Activity 16.7.1: Develop strategic partnerships and networks in addressing national research agenda
1.62 0.12 - - - 1.74 $ 0.02
Activity 16.7.2: Advocate for research prioritization at both
national and county levels 2.22 0.42 7.26 4.16 4.16 18.23 $ 0.18
Activity 16.7.3: Advocate and strengthen formation and coordination of sub committees for research for all counties
- - - - - - $ -
Activity 16.7.4: Develop capacity in research methodologies, knowledge translation and systemetic review processes
4.48 3.36 3.33 4.46 3.33 18.96 $ 0.19
Activity 16.7.5: Disseminate of research findings 3.14 2.90 2.90 3.14 2.90 14.97 $ 0.15
Activity 16.7.6: Strengthen systematic review of nutrition
sensitive and nutrition specific research - 0.30 - - - 0.30 $ 0.00
Activity 16.7.7: Promote knowledge sharing forums such as Symposiums and conferences, workshops, meetings
1.32 1.32 1.32 1.32 1.32 6.60 $ 0.07

THE KENYA NUTRITION ACTION PLAN (KNAP) | 2018 – 2022 Improved Nutrition For All
112
Activity 16.7.8: Establish an effective mechanism for knowledge management and learning
0.48 - - - - 0.48 $ 0.00
Activity 16.7.9: Promote knowledge sharing through publications 0.44 0.44 0.44 0.44 0.44 2.22 $ 0.02
Activity 16.7.10: Establish research repository on nutrition and dietetics
1.22 0.50 0.50 0.50 0.50 3.22 $ 0.03
Table 28:Financial resource requirements for KRA 17KRA 17: Advocacy, Communication and Social Mobilization (ACSM) Strengthened
Outputs Activities Budget in Ksh (millions)
2018 2019 2020 2021 2022 Total Ksh Total USD
Output 17.1 Political commitment and prioritization of nutrition at national and county level enhanced
33.18 32.98 32.98 32.98 32.98 165.09 $ 1.63
Activity 17.1.1: Hold high level sensitization fora targeting policy makers on the value and impact of prioritizing nutrition.
26.85 26.85 26.85 26.85 26.85 134.25 $ 1.33
Activity 17.1.2: Support counties to develop county advocacy, communication and social mobilization plans.
6.13 6.13 6.13 6.13 6.13 30.64 $ 0.30
Activity 17.1.3: Engage nutrition champions to advocate for prioritization of nutrition at all levels
0.20 - - - - 0.20 $ 0.00
Output 17.2 Enhanced and sustained multi-sectoral collaboration, social accountability and financial resources allocated across relevant sectors at national and county levels.
11.15 11.15 11.15 11.15 11.15 55.77 $ 0.55
Activity 17.2.1: Advocate for relevant sectors to support establishment of multisectoral nutrition platforms
10.55 10.55 10.55 10.55 10.55 52.77 $ 0.52
Activity 17.2.2: Advocate for adequate financial resources for sustained and quality nutrition services including domestic resource mobilization
0.30 0.30 0.30 0.30 0.30 1.50 $ 0.01
Activity 17.2.3: Participate in national and county planning process ensuring nutrition representation and mainstreaming nutrition in the national and county plans.
0.30 0.30 0.30 0.30 0.30 1.50 $ 0.01
Output 17.3: Increased and strengthened human capital and capacity for nutrition advocacy
34.18 32.49 32.89 6.52 5.23 111.31 $ 1.10
Activity 17.3.1: Strengthen capacity for nutrition advocacy. 27.26 27.26 27.26 - - 81.78 $ 0.81

THE KENYA NUTRITION ACTION PLAN (KNAP) | 2018 – 2022 Improved Nutrition For All
113
Activity 17.3.2: Training nutrition professionals and influencers on
advocacy 5.23 5.23 5.23 5.23 5.23 26.15 $ 0.26
Activity 17.3.3: Advocate for recruitment of nutritionists. 1.69 - 0.40 1.29 - 3.38 $ 0.03
Output 17.4 Evidence based Nutrition advocacy and knowledge management promoted
2.61 2.21 2.21 2.21 2.21 11.43 $ 0.11
Activity 17.4.1: Documentation and dissemination of best practices, case studies, research findings and success stories
0.48 0.48 0.48 0.48 0.48 2.40 $ 0.02
Activity 17.4.2: Development of a nutrition advocacy package at national and county level.
2.13 1.73 1.73 1.73 1.73 9.03 $ 0.09
Output 17.5 Effective engagements with media built and maintained. 26.11 26.11 1.53 1.53 1.53 56.81 $ 0.56
Activity 17.5.1: Develop a training package on nutrition for journalists based on simplified messages and key information
0.01 0.01 0.01 0.01 0.01 0.05 $ 0.00
Activity 17.5.2: Train media fraternity on nutrition for better coverage
1.48 1.48 1.48 1.48 1.48 7.40 $ 0.07
Activity 17.5.3: Support training of nutrition professionals and other relevant stakeholders on communication and writing skills to help them better package information for media
24.58 24.58 - - - 49.16 $ 0.49
Activity 17.5.4: Participate in media program mass media education program on Nutrition.
0.04 0.04 0.04 0.04 0.04 0.20 $ 0.00
Output 17.6 Community engagement in nutrition strengthened. 3.52 3.52 3.52 3.52 3.52 17.60 $ 0.17
Activity 17.6.1: Support counties to promote community participation in nutrition resilience building interventions and accountability mechanism
3.52 3.52 3.52 3.52 3.52 17.60 $ 0.17

THE KENYA NUTRITION ACTION PLAN (KNAP) | 2018 – 2022 Improved Nutrition For All
114
Table 29: Financial resource requirements for KRA 18KRA 18: Capacity for Nutrition Developed
Outputs Activities Budget in Ksh (millions)
2018 2019 2020 2021 2022 Total Ksh Total USD
Output 18.1 Capacity for nutrition developed at national and county level 43.53 61.19 19.27 46.36 46.36 216.70 $ 2.15
Activity 18.1.1: Conduct comprehensive national and county capacity assessments
35.25 35.25 - 35.25 35.25 141.00 $ 1.40
Activity 18.1.2: Review the capacity development framework - 4.53 - - - 4.53 $ 0.04
Activity 18.1.3: Develop a costed action plan for capacity strengthening
1.06 1.06 - 1.06 1.06 4.23 $ 0.04
Activity 18.1.4: Disseminate the capacity assessment findings and action plan at national level
1.08 1.08 - 1.08 1.08 4.32 $ 0.04
Activity 18.1.5: Undertake policy dialogue to enhance capacity for nutrition policy formulation and utilization
- 0.16 0.16 0.16 0.16 0.64 $ 0.01
Activity 18.1.6: Develop a course on leadership and governance - 12.97 12.97 2.67 2.67 31.26 $ 0.31
Activity 18.1.7: Conduct trainings on partnerships and coordination management
6.00 6.00 6.00 6.00 6.00 30.00 $ 0.30
Activity 18.1.8: Hold periodic capacity TWG meetings 0.14 0.14 0.14 0.14 0.14 0.72 $ 0.01
Output 18.2 Enhanced systems for skills and competency development for nutrition workforce.
14.64 14.72 14.72 14.64 14.64 73.36 $ 0.73
Activity 18.2.1: Review and disseminate guidance on job description and performance appraisal for nutrition
- - 0.04 - - 0.04 $ 0.00
Activity 18.2.2: Develop and disseminate technical induction package
- 0.04 - - - 0.04 $ 0.00
Activity 18.2.3: Conduct joint monitoring missions to review progress on skills and competence to implement nutrition
0.76 0.76 0.76 0.76 0.76 3.80 $ 0.04
Activity 18.2.4: Prepare advocacy briefs and organize for forums with stakeholders
7.52 7.52 7.52 7.52 7.52 37.60 $ 0.37
Activity 18.2.5: Sensitize counties on IHRIS 1.36 1.36 1.36 1.36 1.36 6.80 $ 0.07
Activity 18.2.6: Regularly monitor and analyze IHRIS update for trainings
5.00 5.00 5.00 5.00 5.00 25.00 $ 0.25
Activity 18.2.7: Review and disseminate standardized training packages
- 0.02 0.02 - - 0.04 $ 0.00

THE KENYA NUTRITION ACTION PLAN (KNAP) | 2018 – 2022 Improved Nutrition For All
115
Activity 18.2.8: Disseminate internship guidelines - 0.02 0.02 - - 0.04 $ 0.00
Output 18.3 Strengthened capacity for community level demand, generation and utilization of integrated services
0.80 0.80 0.80 0.80 0.80 3.99 $ 0.04
Activity 18.3.1: Empower the community’s own resource persons to create demand for utilization of nutrition services through community structures
0.80 0.80 0.80 0.80 0.80 3.99 $ 0.04
Table 30: Financial resource requirements for KRA 19KRA 19: Supply Chain Management for Nutrition Commodities and Equipment Strengthened
Outputs Activities Budget in Ksh (millions)
2018 2019 2020 2021 2022 Total Ksh Total USD
Output 19.1: Increased Government budget allocation for nutrition commodities and allied tools
1.23 6.79 2.87 2.06 2.05 15.00 $ 0.15
Activity 19.1.1: Advocate for a standing budget line for nutrition commodities and equipment and increased allocation for procurement and distribution of nutrition commodities at national and county level
0.01 4.54 - - - 4.54 $ 0.04
Activity 19.1.2: Advocate for EMMS lists (to incorporate new commodities) e.g. nutrition commodities for chronic diseases such as cancer etc.
0.13 0.14 0.13 0.13 0.13 0.64 $ 0.01
Activity 19.1.3: Advocate for increased supplier base for cost reduction of nutrition commodities and equipment
0.06 0.24 0.06 0.06 0.06 0.49 $ 0.00
Activity 19.1.4: Ring fence nutrition commodity funds through review of the PFM Act 2012
0.15 0.15 0.15 0.15 0.15 0.74 $ 0.01
Activity 19.1.5: Increase KEMSA capacity to warehouse and supply nutrition quality commodities in a timely and effective manner including commodity security insurance
0.89 1.72 2.54 1.72 1.72 8.58 $ 0.08
Activity 19.1.6: Promote in-country nutrition product formulation and development
- 0.01 - 0.01 - 0.01 $ 0.00
Output 19.2: Strengthened coordination and management capacity of supply chain of nutrition commodities and equipment
3.37 6.56 6.56 6.56 1.77 24.81 $ 0.25
Activity 19.2.1: Hold quarterly meetings for nutrition commodity steering committee - National and County level
0.57 0.57 0.57 0.57 0.57 2.86 $ 0.03
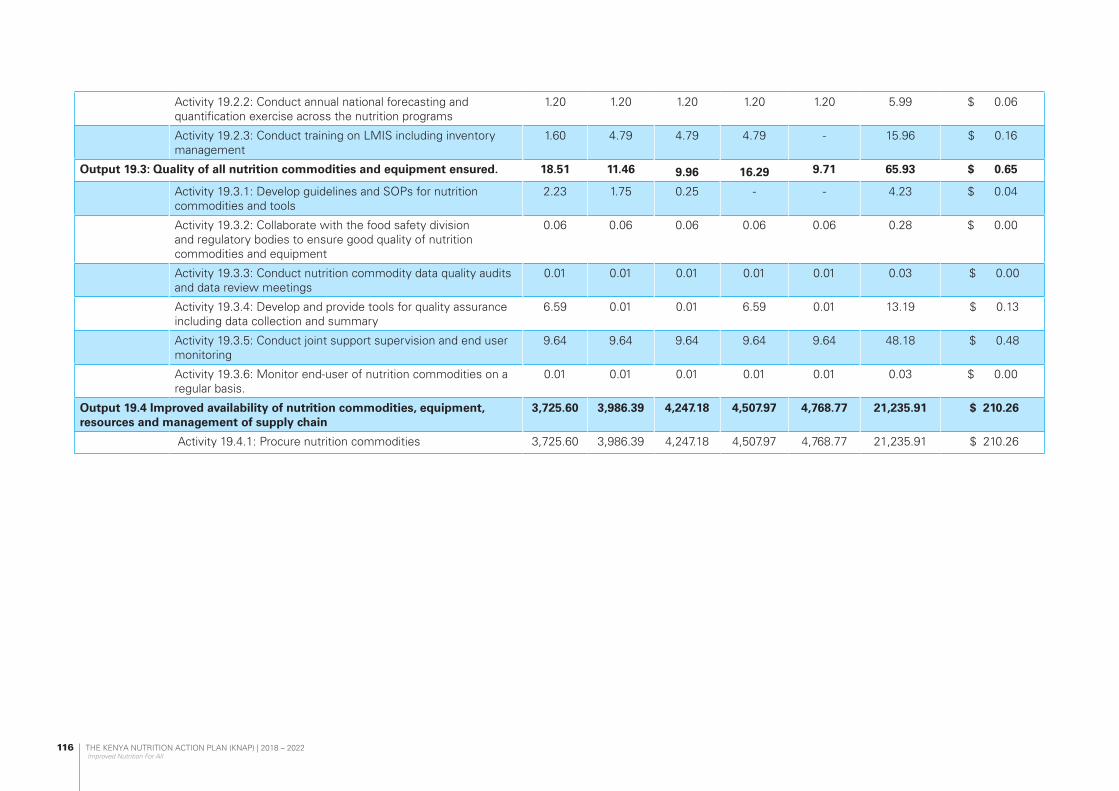
THE KENYA NUTRITION ACTION PLAN (KNAP) | 2018 – 2022 Improved Nutrition For All
116
Activity 19.2.2: Conduct annual national forecasting and quantification exercise across the nutrition programs
1.20 1.20 1.20 1.20 1.20 5.99 $ 0.06
Activity 19.2.3: Conduct training on LMIS including inventory management
1.60 4.79 4.79 4.79 - 15.96 $ 0.16
Output 19.3: Quality of all nutrition commodities and equipment ensured. 18.51 11.46 9.96 16.29 9.71 65.93 $ 0.65
Activity 19.3.1: Develop guidelines and SOPs for nutrition commodities and tools
2.23 1.75 0.25 - - 4.23 $ 0.04
Activity 19.3.2: Collaborate with the food safety division and regulatory bodies to ensure good quality of nutrition commodities and equipment
0.06 0.06 0.06 0.06 0.06 0.28 $ 0.00
Activity 19.3.3: Conduct nutrition commodity data quality audits and data review meetings
0.01 0.01 0.01 0.01 0.01 0.03 $ 0.00
Activity 19.3.4: Develop and provide tools for quality assurance including data collection and summary
6.59 0.01 0.01 6.59 0.01 13.19 $ 0.13
Activity 19.3.5: Conduct joint support supervision and end user monitoring
9.64 9.64 9.64 9.64 9.64 48.18 $ 0.48
Activity 19.3.6: Monitor end-user of nutrition commodities on a regular basis.
0.01 0.01 0.01 0.01 0.01 0.03 $ 0.00
Output 19.4 Improved availability of nutrition commodities, equipment, resources and management of supply chain
3,725.60 3,986.39 4,247.18 4,507.97 4,768.77 21,235.91 $ 210.26
Activity 19.4.1: Procure nutrition commodities 3,725.60 3,986.39 4,247.18 4,507.97 4,768.77 21,235.91 $ 210.26
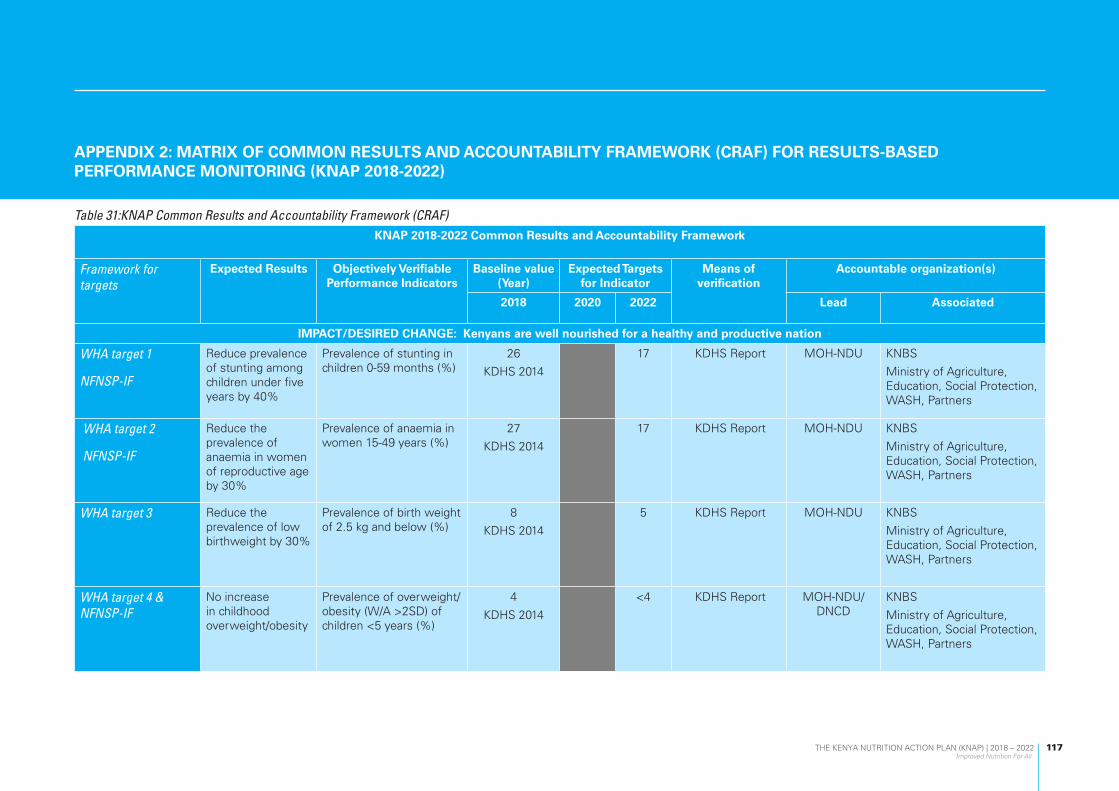
THE KENYA NUTRITION ACTION PLAN (KNAP) | 2018 – 2022 Improved Nutrition For All
117
APPENDIX 2: MATRIX OF COMMON RESULTS AND ACCOUNTABILITY FRAMEWORK (CRAF) FOR RESULTS-BASED PERFORMANCE MONITORING (KNAP 2018-2022)
Table 31:KNAP Common Results and Accountability Framework (CRAF)KNAP 2018-2022 Common Results and Accountability Framework
Framework for targets
Expected Results Objectively Verifiable Performance Indicators
Baseline value (Year)
Expected Targets for Indicator
Means of verification
Accountable organization(s)
2018 2020 2022 Lead Associated
IMPACT/DESIRED CHANGE: Kenyans are well nourished for a healthy and productive nation
WHA target 1
NFNSP-IF
Reduce prevalence of stunting among children under five years by 40%
Prevalence of stunting in children 0-59 months (%)
26
KDHS 2014
17 KDHS Report MOH-NDU KNBS
Ministry of Agriculture, Education, Social Protection, WASH, Partners
WHA target 2
NFNSP-IF
Reduce the prevalence of anaemia in women of reproductive age by 30%
Prevalence of anaemia in women 15-49 years (%)
27
KDHS 2014
17 KDHS Report MOH-NDU KNBS
Ministry of Agriculture, Education, Social Protection, WASH, Partners
WHA target 3 Reduce the prevalence of low birthweight by 30%
Prevalence of birth weight of 2.5 kg and below (%)
8
KDHS 2014
5 KDHS Report MOH-NDU KNBS
Ministry of Agriculture, Education, Social Protection, WASH, Partners
WHA target 4 & NFNSP-IF
No increase in childhood overweight/obesity
Prevalence of overweight/ obesity (W/A >2SD) of children <5 years (%)
4
KDHS 2014
<4 KDHS Report MOH-NDU/DNCD
KNBS
Ministry of Agriculture, Education, Social Protection, WASH, Partners

THE KENYA NUTRITION ACTION PLAN (KNAP) | 2018 – 2022 Improved Nutrition For All
118
KNAP 2018-2022 Common Results and Accountability Framework
Framework for targets
Expected Results Objectively Verifiable Performance Indicators
Baseline value (Year)
Expected Targets for Indicator
Means of verification
Accountable organization(s)
2018 2020 2022 Lead Associated
WHA target 5 & NFNSP-IF
Increase the rate of exclusive breastfeeding in the first six months by 20% and above
Prevalence of exclusive breastfeeding in children 0-6 months (%)
61 KDHS 2014 75 KDHS Report MOH-NDU KNBS
Ministry of Agriculture, Education, Social Protection, WASH, Partners
WHA target 6 & NFNSP-IF
Reduce and maintain childhood wasting to less than 5%
Prevalence of wasting (W/H >2SD) in children 0-59 months (%)
4 KDHS 2014 <4 KDHS Report MOH-NDU KNBS
Ministry of Agriculture, Education, Social Protection, WASH, Partners
NFNSP-IF Reduce and maintain childhood underweight to less than 10%
Prevalence of underweight (W/A <2SD) in children 0-59 months
11 KDHS 2014 7 KDHS Report MOH-NDU/DNCD
KNBS
Ministry of Agriculture, Education, Social Protection, WASH, Partners
NFNSP-IF Maintain mortality rates at below 3% for MAM and 10% for SAM
Proportion of deaths among acutely children (%)
0.2% for MAM
1.7% for SAM
Maintain SPHERE standards
KDHS Report MOH-NDU KNBS
Ministry of Agriculture, Education, Social Protection, WASH, Partners
KNAP Reduce anaemia in children 6-59 months by 30%
Prevalence of anaemia in children 0-59 months (%)
26
(KDHS 2014)
17 KDHS Report MOH-NDU KNBS
Ministry of Agriculture, Education, Social Protection, WASH, Partners

THE KENYA NUTRITION ACTION PLAN (KNAP) | 2018 – 2022 Improved Nutrition For All
119
KNAP 2018-2022 Common Results and Accountability Framework
Framework for targets
Expected Results Objectively Verifiable Performance Indicators
Baseline value (Year)
Expected Targets for Indicator
Means of verification
Accountable organization(s)
2018 2020 2022 Lead Associated
NFNSP-IF Reduce anaemia in pregnant women by 40% or more
Prevalence of anaemia in pregnant women (%)
36 KDHS 2014 20 KDHS Report MOH-NDU KNBS
Ministry of Agriculture, Education, Social Protection, WASH, Partners
KNAP Reduce anaemia in adolescent girls by 30%
Prevalence of anaemia in girls 15-19 years (%)
21 KNMS 15 KNMS Report MOH-NDU KNBS
Ministry of Agriculture, Education, Social Protection, WASH, Partners
NFNSP-IF Reduce folic acid deficiency among non-pregnant women by 50%
Proportion of non-pregnant women with folic acid deficiency (%)
39 KNMS 20 KNMS Report MOH-NDU KNBS
Ministry of Agriculture, Education, Social Protection, WASH, Partners
NFNSP-IF Reduce vitamin A deficiency in children by 50%
Prevalence of VAD in children 0-59 months (%)
9 KNMS 4 KNMS Report MOH-NDU KNBS
Ministry of Agriculture, Education, Social Protection, WASH, Partners
NFNSP-IF Reduce iodine deficiency among children <5 years by over 50%
Prevalence of iodine deficiency in children <5 years (%)
22 KNMS <10 KNMS Report MOH-NDU KNBS
Ministry of Agriculture, Education, Social Protection, WASH, Partners

THE KENYA NUTRITION ACTION PLAN (KNAP) | 2018 – 2022 Improved Nutrition For All
120
KNAP 2018-2022 Common Results and Accountability Framework
Framework for targets
Expected Results Objectively Verifiable Performance Indicators
Baseline value (Year)
Expected Targets for Indicator
Means of verification
Accountable organization(s)
2018 2020 2022 Lead Associated
NFNSP-IF Reduce iodine deficiency among non-pregnant women by over 50%
Prevalence of iodine deficiency in non-pregnant women (%)
26 KNMS <10 KNMS Report MOH-NDU KNBS
Ministry of Agriculture, Education, Social Protection, WASH, Partners
NFNSP-IF Reduce prevalence of zinc deficiency in pre-school children by 40%
Prevalence of zinc deficiency in children <5 years (%)
83 KNMS 50 KNMS Report MOH-NDU KNBS
Ministry of Agriculture, Education, Social Protection, WASH, Partners
NFNSP-IF Reduce prevalence of zinc deficiency among pregnant women by 10%
Prevalence of zinc deficiency among pregnant women (%)
60 KNMS 55 KNMS Report MOH-NDU/ DNCD
KNBS
Ministry of Agriculture, Education, Social Protection, WASH, Partners
NCD target 3 A 10% relative reduction in prevalence of insufficient physical activity
Prevalence of insufficient physical activity in adults (%)
6.5 5 Stepwise Survey Report
MOH-NDU/ DNCD
KNBS
Ministry of Agriculture, Education, Social Protection, WASH, Partners
NCD target 6
NFNSP-IF
Reduce proportion of population with raised blood pressure or currently on medication by 25%
Proportion of population with raised blood pressure or currently on medication (%)
24 Stepwise survey
18 Stepwise Survey Report
MOH-NDU/ DNCD
KNBS
Ministry of Agriculture, Education, Social Protection, WASH, Partners
NFNSP-IF Reduce proportion of population with raised fasting blood sugar
Proportion of adults 18-69 years with raised fasting blood sugar (%)
1.9
Stepwise survey
1.5 Stepwise Survey Report
MOH-NDU/ DNCD
KNBS
Ministry of Agriculture, Education, Social Protection, WASH, Partners

THE KENYA NUTRITION ACTION PLAN (KNAP) | 2018 – 2022 Improved Nutrition For All
121
KNAP 2018-2022 Common Results and Accountability Framework
Framework for targets
Expected Results Objectively Verifiable Performance Indicators
Baseline value (Year)
Expected Targets for Indicator
Means of verification
Accountable organization(s)
2018 2020 2022 Lead Associated
NFNSP-IF Increased proportion of men with normal waist: hip ratio
Proportion of men with normal waist: hip ratio (%)
73 Stepwise survey
78 Stepwise Survey Report
MOH-NDU/ DNCD
KNBS
Ministry of Agriculture, Education, Social Protection, WASH, Partners
NFNSP-IF Increased proportion of women with normal waist: hip ratio
Proportion of women with normal waist: hip ratio (%)
64 Stepwise survey
75 Stepwise Survey Report
MOH-NDU/DNCD
KNBS
Ministry of Agriculture, Education, Social Protection, WASH, Partners
NCD target 4 A 30% relative reduction in mean population intake of salt/sodium
Mean intake of sodium salt (g/day)
3
Stepwise survey
4 Stepwise Survey Report
MOH-NDU/DNCD
KNBS
Ministry of Agriculture, Education, Social Protection, WASH, Partners
NCD target 7
NFNSP-IF
Halt and reverse the rise in obesity by 30%
Prevalence of overweight/obesity in adults (18-69 years)
28
Stepwise
20 Stepwise Survey Report
MOH-NDU/DNCD
KNBS
Ministry of Agriculture, Education, Social Protection, WASH, Partners
KNAP Reduce mortality due to dietary risk factors by 20%
Mortality attributable to dietary risk factors
31 per 100,000 26 https://vizhub.healthdata.org/gbd-compare/
MOH-NDU/DNCD
KNBS
Ministry of Agriculture, Education, Social Protection, WASH, Partners
KNAP Reduce mortality due to child and maternal malnutrition by 30%
Mortality attributable to child and maternal malnutrition
75 per 100,000
GBD 2016
53 https://vizhub.healthdata.org/gbd-compare/
MOH-NDU KNBS
Ministry of Agriculture, Education, Social Protection, WASH, Partners

THE KENYA NUTRITION ACTION PLAN (KNAP) | 2018 – 2022 Improved Nutrition For All
122
KNAP 2018-2022 Common Results and Accountability Framework
Framework for targets
Expected Results Objectively Verifiable Performance Indicators
Baseline value (Year)
Expected Targets for Indicator
Means of verification
Accountable organization(s)
2018 2020 2022 Lead Associated
Clinical Nutrition target 2b
10% of population accessing health services screened and assessed for nutritional status
Proportion of population screened and assessed for nutrition status while accessing healthcare services
10% Hospital data MOH-NDU County department of health
Policy and Legal Improved national legal and policy environment for nutrition
Number of Nutrition laws, regulations, and policies developed, reviewed or enacted at national level
8 16 2858 Policy Documents
Ministry of Health,
Agriculture, Education,
Social Protection,
WASH
Financing of nutrition
Increased nutrition health budget
Percentage of nutrition budget as a percentage of the total national health budget
2% 5% 8% Budget Papers MOH Treasury
Nutrition Capacity strengthening
Capacity on nutrition enhanced
Proportion of health professionals who are trained in nutrition management
30% 65% Attendance sheets
Capacity assessment
report
MOH Ministry of Agriculture, Education, Social Protection, WASH, Partners, Nutrition Stakeholders
58Policy Documents to be developed are annexed

THE KENYA NUTRITION ACTION PLAN (KNAP) | 2018 – 2022 Improved Nutrition For All
123
Output Expected Results Indicator Baseline Mid Term End term
Means of verification
Lead Associated
KRA 1 - MIYCN OUTCOME 1: Strengthened care practices and services for improved maternal, infant and young child nutrition
Output 1.1 Increased proportion of mothers and care givers who practice optimal behaviors for improved nutrition of women of reproductive age (15-49 years)
Proportion of population with an acceptable household food consumption score (Minimum dietary diversity (MDD).
88.8%
(KDHS 2014)
92% 95%
(KDHS 2014)
KDHS Report MOH Partners
KNBS
Output 1.2 Increased proportion of care givers who practice optimal behaviors for improved nutrition of young children under five years
Percentage of children born in the last 24 months who were put to the breast within one hour of birth
62%
(KDHS 2014)
68% 70%
(KDHS 2014)
KDHS Report MOH Partners
KNBS
Proportion of infants 0–5 months of age who are fed exclusively with breast milk
61.4%
(KDHS 2014)
68% 75%
(KDHS 2014)
KDHS Report MOH Partners
KNBS
Proportion of children 20–23 months of age who are fed breast milk
53%
(KDHS 2014)
57% 60% (KDHS 2014)
KDHS Report MOH Partners
KNBS
Proportion of infants 6–8 months of age who receive solid, semi-solid or soft foods.
80%
(KDHS 2014)
83% 85% (KDHS 2014)
KDHS Report MOH Partners
KNBS
Proportion of children 6–23 months of age who receive foods from 4 or more food groups.
41%
(KDHS 2014)
49% 55% (KDHS 2014)
KDHS Report MOH Partners
KNBS

THE KENYA NUTRITION ACTION PLAN (KNAP) | 2018 – 2022 Improved Nutrition For All
124
Proportion of breastfed and non-breastfed children 6–23 months of age who receive solid, semi-solid, or soft foods (but also including milk feeds for non-breastfed children) the minimum number of times or more.
51%
(KDHS 2014)
59% 65% (KDHS 2014)
KDHS Report MOH Partners
KNBS
Proportion of children 6–23 months of age who receive a minimum acceptable diet (apart from breast milk).
21% (KDHS2014)
25% 30% (KDHS 2014)
KDHS Report MOH Partners
KNBS
Proportion of children 6–23 months of age who receive an iron-rich food or iron-fortified food that is specially designed for infants and young children, or that is fortified in the home.
33.3% (KDHS 2014)
36% 40% (KDHS 2014)
KDHS Report MOH Partners
KNBS
Proportion of children 0–23 months of age who are fed with a bottle.
22% (KDHS 2014)
17% 15% (KDHS 2014)
KDHS Report MOH Partners
KNBS
No of Human Milk Banks Established
1 2 3 NDU Report NDU Partners
KNBS
Output 1.3. MIYCN advocated for at global, national and county levels
Proportion of counties with initiatives for workplace support for breastfeeding at public and private work places
No Data 25% 50% NDU Report NDU County
Output 1.4 Enhanced capacity for implementation of MIYCN activities at all levels
No. of national nutrition conferences/symposium held
0 3 5 NDU Report NDU Partners and stakeholders
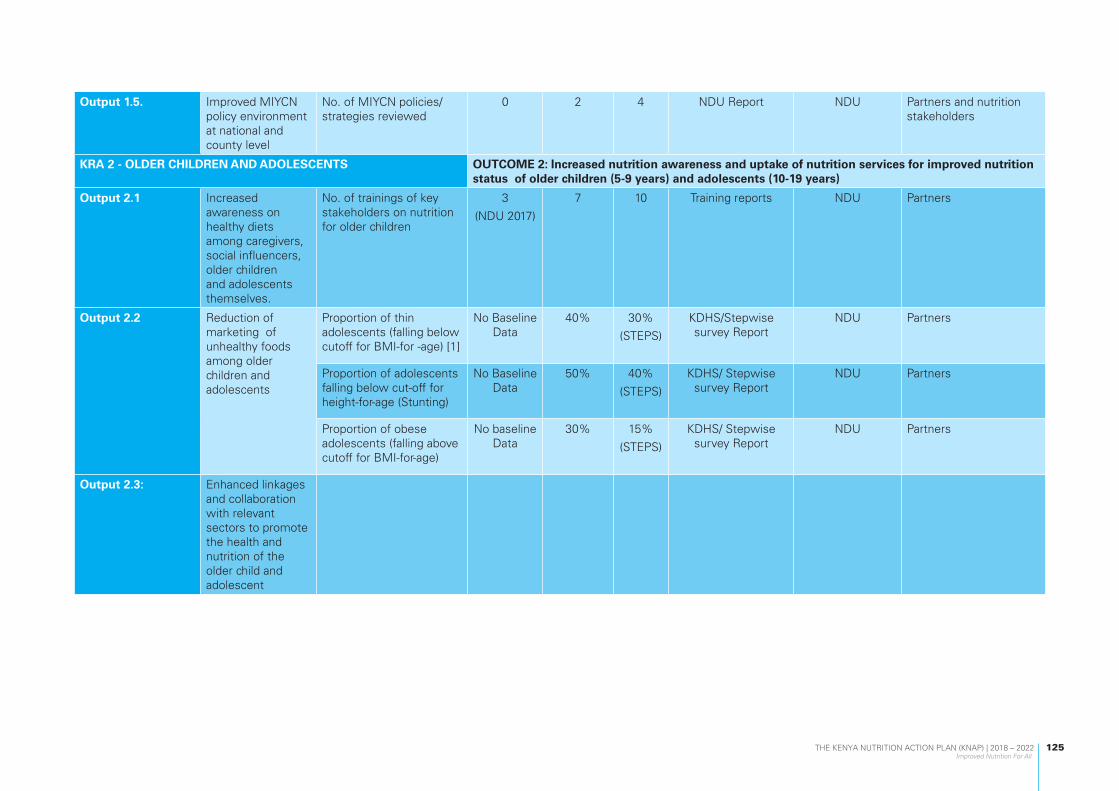
THE KENYA NUTRITION ACTION PLAN (KNAP) | 2018 – 2022 Improved Nutrition For All
125
Output 1.5. Improved MIYCN policy environment at national and county level
No. of MIYCN policies/strategies reviewed
0 2 4 NDU Report NDU Partners and nutrition stakeholders
KRA 2 - OLDER CHILDREN AND ADOLESCENTS OUTCOME 2: Increased nutrition awareness and uptake of nutrition services for improved nutrition status of older children (5-9 years) and adolescents (10-19 years)
Output 2.1 Increased awareness on healthy diets among caregivers, social influencers, older children and adolescents themselves.
No. of trainings of key stakeholders on nutrition for older children
3
(NDU 2017)
7 10 Training reports NDU Partners
Output 2.2 Reduction of marketing of unhealthy foods among older children and adolescents
Proportion of thin adolescents (falling below cutoff for BMI-for -age) [1]
No Baseline Data
40% 30%
(STEPS)
KDHS/Stepwise survey Report
NDU Partners
Proportion of adolescents falling below cut-off for height-for-age (Stunting)
No Baseline Data
50% 40%
(STEPS)
KDHS/ Stepwise survey Report
NDU Partners
Proportion of obese adolescents (falling above cutoff for BMI-for-age)
No baseline Data
30% 15%
(STEPS)
KDHS/ Stepwise survey Report
NDU Partners
Output 2.3: Enhanced linkages and collaboration with relevant sectors to promote the health and nutrition of the older child and adolescent

THE KENYA NUTRITION ACTION PLAN (KNAP) | 2018 – 2022 Improved Nutrition For All
126
KRA 3 – ADULTS AND OLDER PERSONS OUTCOME 3: Improved nutrition status of adults and older persons
Output 3.1 Improved utilization of nutrition information, evidence and learning for program improvement and decision making
Promotion of nutrition support for older persons
Proportion of counties with strategies on management of nutrition of the older persons in their CNAP
0
(NDU 2018)
0.32 0.64 County CNAP County Partners
Output 3.2 Strengthened food and nutrition security systems for older persons.
No. of mapping surveys on food and nutrition security conducted
0
(NDU 2018)
0 1 Mapping Report MOH Partners
Output 3.3 Advocacy, communication and social mobilization of nutrition of older persons strengthened and promoted
Proportion of population aware of geriatric nutrition
No data (2018)
10% 40% (MOH 2018)
KAP survey MOH Partners
Strengthened financing and human resource capacity mechanisms for nutrition interventions for older persons
Proportion of nutrition budget allocated to the older persons
0
(MOH 2018)
2% 2%
(MOH 2018)
Budget itemization MOH Partners
Number of counties including older persons, in their budgetary development process
0
(MOH 2018)
20% 48%
(MOH 2018)
Participant lists County Partners
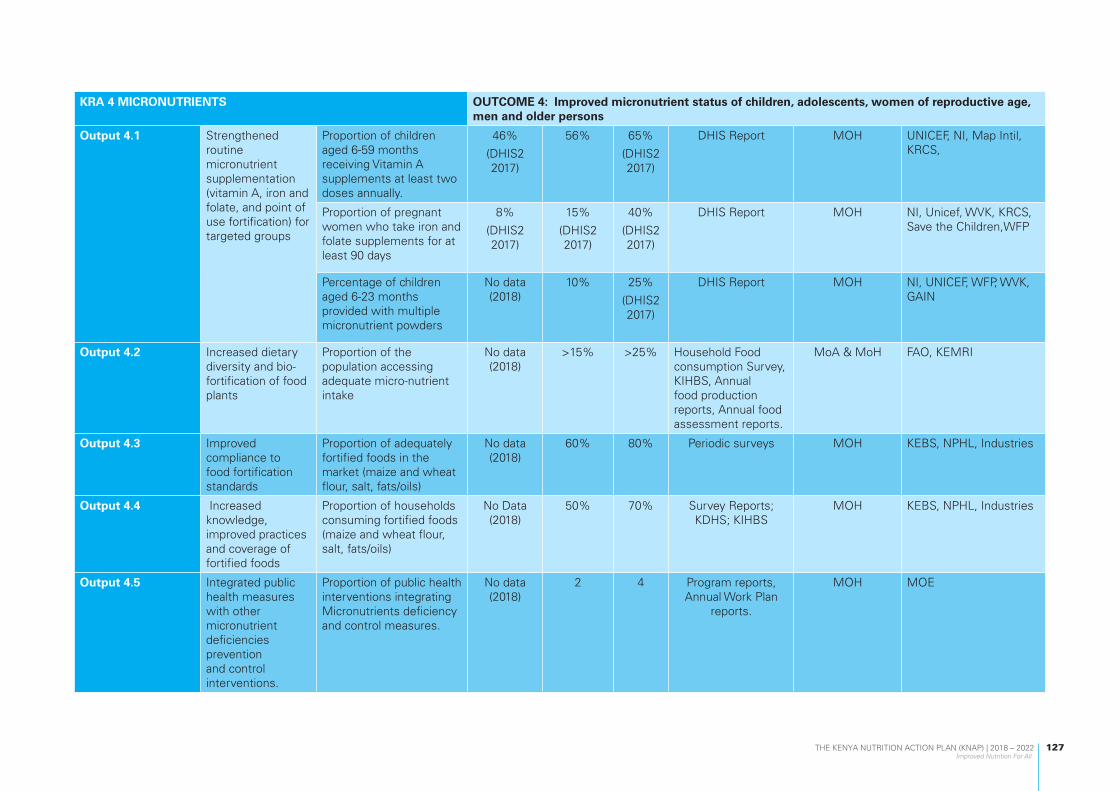
THE KENYA NUTRITION ACTION PLAN (KNAP) | 2018 – 2022 Improved Nutrition For All
127
KRA 4 MICRONUTRIENTS OUTCOME 4: Improved micronutrient status of children, adolescents, women of reproductive age, men and older persons
Output 4.1 Strengthened routine micronutrient supplementation (vitamin A, iron and folate, and point of use fortification) for targeted groups
Proportion of children aged 6-59 months receiving Vitamin A supplements at least two doses annually.
46%
(DHIS2 2017)
56% 65%
(DHIS2 2017)
DHIS Report MOH UNICEF, NI, Map Intil, KRCS,
Proportion of pregnant women who take iron and folate supplements for at least 90 days
8%
(DHIS2 2017)
15%
(DHIS2 2017)
40%
(DHIS2 2017)
DHIS Report MOH NI, Unicef, WVK, KRCS, Save the Children,WFP
Percentage of children aged 6-23 months provided with multiple micronutrient powders
No data (2018)
10% 25%
(DHIS2 2017)
DHIS Report MOH NI, UNICEF, WFP, WVK, GAIN
Output 4.2 Increased dietary diversity and bio-fortification of food plants
Proportion of the population accessing adequate micro-nutrient intake
No data (2018)
>15% >25% Household Food consumption Survey, KIHBS, Annual food production reports, Annual food assessment reports.
MoA & MoH FAO, KEMRI
Output 4.3 Improved compliance to food fortification standards
Proportion of adequately fortified foods in the market (maize and wheat flour, salt, fats/oils)
No data (2018)
60% 80% Periodic surveys MOH KEBS, NPHL, Industries
Output 4.4 Increased knowledge, improved practices and coverage of fortified foods
Proportion of households consuming fortified foods (maize and wheat flour, salt, fats/oils)
No Data (2018)
50% 70% Survey Reports; KDHS; KIHBS
MOH KEBS, NPHL, Industries
Output 4.5 Integrated public health measures with other micronutrient deficiencies prevention and control interventions.
Proportion of public health interventions integrating Micronutrients deficiency and control measures.
No data (2018)
2 4 Program reports, Annual Work Plan
reports.
MOH MOE
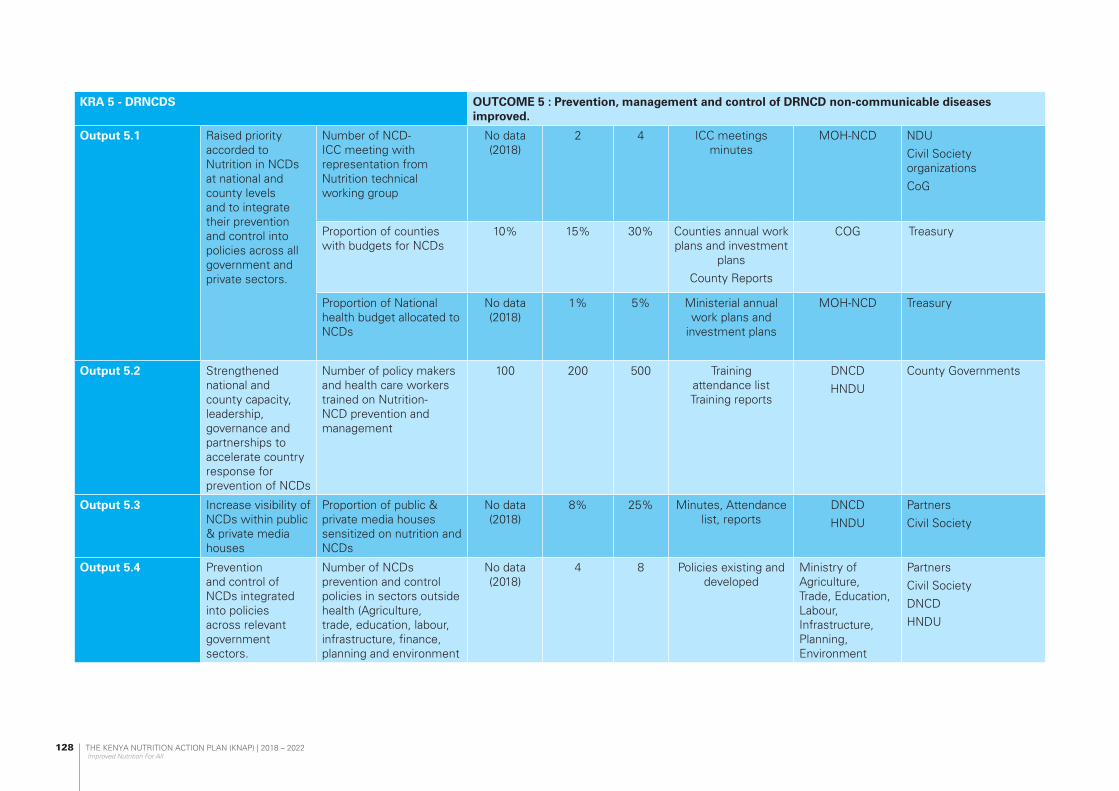
THE KENYA NUTRITION ACTION PLAN (KNAP) | 2018 – 2022 Improved Nutrition For All
128
KRA 5 - DRNCDS OUTCOME 5 : Prevention, management and control of DRNCD non-communicable diseases improved.
Output 5.1 Raised priority accorded to Nutrition in NCDs at national and county levels and to integrate their prevention and control into policies across all government and private sectors.
Number of NCD-ICC meeting with representation from Nutrition technical working group
No data (2018)
2 4 ICC meetings minutes
MOH-NCD NDU
Civil Society organizations
CoG
Proportion of counties with budgets for NCDs
10% 15% 30% Counties annual work plans and investment
plans
County Reports
COG Treasury
Proportion of National health budget allocated to NCDs
No data (2018)
1% 5% Ministerial annual work plans and
investment plans
MOH-NCD Treasury
Output 5.2 Strengthened national and county capacity, leadership, governance and partnerships to accelerate country response for prevention of NCDs
Number of policy makers and health care workers trained on Nutrition-NCD prevention and management
100 200 500 Training attendance list Training reports
DNCD
HNDU
County Governments
Output 5.3 Increase visibility of NCDs within public & private media houses
Proportion of public & private media houses sensitized on nutrition and NCDs
No data (2018)
8% 25% Minutes, Attendance list, reports
DNCD
HNDU
Partners
Civil Society
Output 5.4 Prevention and control of NCDs integrated into policies across relevant government sectors.
Number of NCDs prevention and control policies in sectors outside health (Agriculture, trade, education, labour, infrastructure, finance, planning and environment
No data (2018)
4 8 Policies existing and developed
Ministry of Agriculture, Trade, Education, Labour, Infrastructure, Planning, Environment
Partners
Civil Society
DNCD
HNDU

THE KENYA NUTRITION ACTION PLAN (KNAP) | 2018 – 2022 Improved Nutrition For All
129
Output 5.5 Healthy diets and lifestyles promoted to reduce the modifiable risk factors for NCDs
Proportion of population reading nutrient content in food products
No data (2018)
10% 30% Acts of parliament, household survey
reports
DNCD
HNDU
Civil Society
Partners
Output 5.6 Quality and timely treatment for NCDs is provided
a. Proportion of public hospitals with NCD and nutrition management centres
10% 30% 65% M&E Reports
DHIS reports
MOH- DNCD KNBS
Output 5.7 Improved monitoring and evaluation for diet related NCDs
Number of NCD indicators captured in DHIS and other data reporting platforms
4 12 20 Quarterly and annual reports in DHIS and
other platforms
MOH- DNCD, HIS HNDU
KRA 6 - IMAM OUTCOME 6: Increased coverage of integrated Management of Acute Malnutrition (IMAM)
Output 6.1 IMAM services across all cohorts reviewed and scale up
Number of health facilities with capacity for IMAM service delivery
1873 2100 2500 DHIS2 HNDU CoG
Proportion of children with acute malnutrition accessing IMAM services
No Baseline Data
75% 85%
(DHIS2)
DHIS2 (MOH713)
Seasonal Assessment Reports
HNDU CoG
Number of health facilities implementing IMAM services
1873 2100 2500 DHIS2 HNDU CoG
Output 6.2 Quality of IMAM services improved
Number of counties meeting sphere standards for IMAM
No Baseline Data
20 47 DHIS2 HNDU CoG
KRA 7 - EMERGENCIES OUTCOME 7: Improved multi-level, and multi-sectoral capacity for risk preparedness, reduction and mitigation against impact of disasters
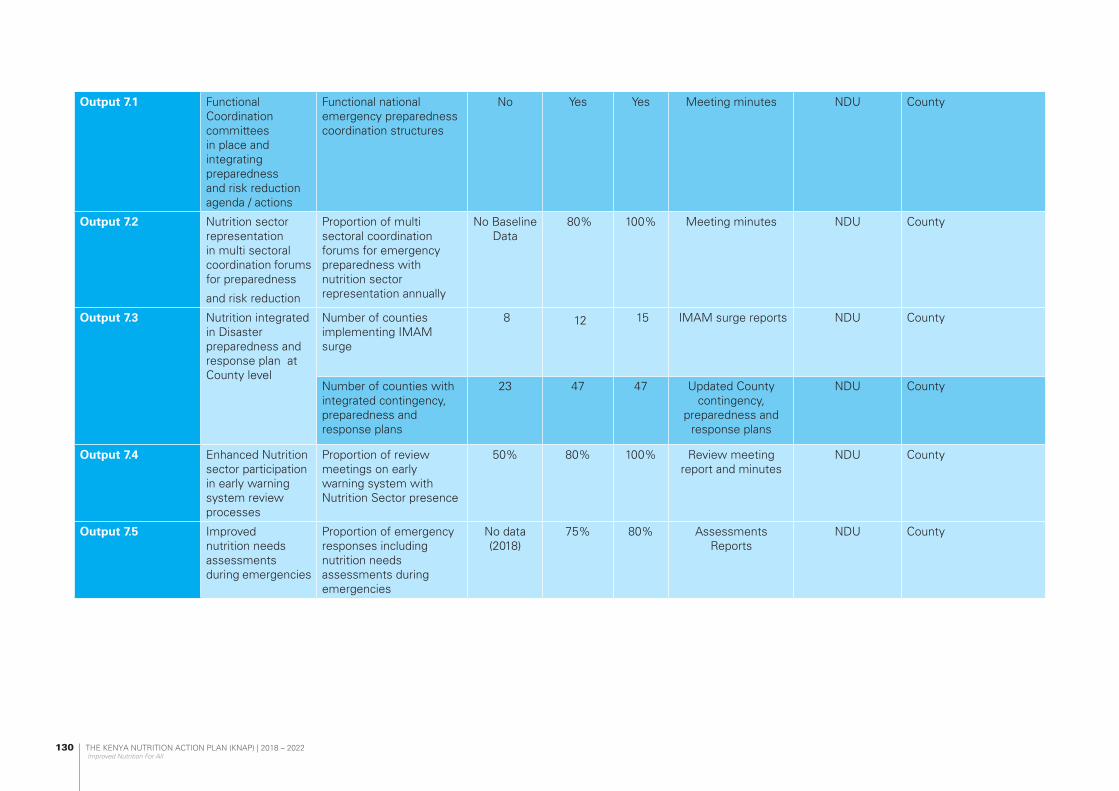
THE KENYA NUTRITION ACTION PLAN (KNAP) | 2018 – 2022 Improved Nutrition For All
130
Output 7.1 Functional Coordination committees in place and integrating preparedness and risk reduction agenda / actions
Functional national emergency preparedness coordination structures
No Yes Yes Meeting minutes NDU County
Output 7.2 Nutrition sector representation in multi sectoral coordination forums for preparedness
and risk reduction
Proportion of multi sectoral coordination forums for emergency preparedness with nutrition sector representation annually
No Baseline Data
80% 100% Meeting minutes NDU County
Output 7.3 Nutrition integrated in Disaster preparedness and response plan at County level
Number of counties implementing IMAM surge
8 12 15 IMAM surge reports NDU County
Number of counties with integrated contingency, preparedness and response plans
23 47 47 Updated County contingency,
preparedness and response plans
NDU County
Output 7.4 Enhanced Nutrition sector participation in early warning system review processes
Proportion of review meetings on early warning system with Nutrition Sector presence
50% 80% 100% Review meeting report and minutes
NDU County
Output 7.5 Improved nutrition needs assessments during emergencies
Proportion of emergency responses including nutrition needs assessments during emergencies
No data (2018)
75% 80% Assessments Reports
NDU County

THE KENYA NUTRITION ACTION PLAN (KNAP) | 2018 – 2022 Improved Nutrition For All
131
Output 7.6 Increased access to High impact Nutrition interventions as part of emergency response (MIYCN-E, IMAM, Micronutrient supplementation, Deworming, WASH interventions)
Proportion of emergency responses integrating comprehensive High Impact Nutrition interventions (IMAM, Micronutrient supplementation, Deworming, WASH interventions) during emergencies
No Baseline Data
75% 85% Routine Program reports
NDU County
KRA 8 – NUTRITION IN HIV AND TB OUTCOME 8: Reduced impact of HIV related co-morbidities among People Living with HIV through targeted nutrition therapy
Output 8.1 Improved routine screening for nutrition problems and referral for all TB and HIV patients
Proportion of patients screened and refered for nutrition problems
DHIS2 MOH – NASCOP Nutrition
County, Partners
Output 8.2 Increased coverage for nutrition screening and referral of PLHIV and TB Patients
No of facilities conducting nutrition screening for HIV and TB
No baseline data
Proportion of health facilities equipped with nutrition screening and assessment equipment
No baseline data
50% 65% Biannual Commodity support supervisor reportsCounty reportsFacility assessment reports
MoH, NASCOP Nutrition
County Governments
Output 8.3 Strengthened integration of nutrition interventions for home-based care at community level for PLHIVs towards the 90.90.90
Proportion of health facilities undertaking nutrition integration activities
12.7% 30% 50% Program reports MOH NASCOP Nutrition
Counties Partners

THE KENYA NUTRITION ACTION PLAN (KNAP) | 2018 – 2022 Improved Nutrition For All
132
Output 8.4 Enhanced use of implementation research to generate evidence for cost effective nutrition TB and HIV programing
Propotion of in country reseach results in use in the country in HIV nutrition programming
One research report every 2 yearsresearch report every 2 years
One research report every 2 years
In coutry Study reports available and
in use
MOH NASCOP Nutrition
County Partners
KRA 9 – CLINICAL NUTRITION AND DIETETICS OUTCOME 9: Improved and scaled up services and practices related to clinical nutrition and dietetics
Output 9.1 Nutrition screening, assessment and triage to all individuals seeking health care promoted
Proportion of population accessing health care services at the facilities screened and assessed for nutrition status
No baseline data
10% 20% DHIS2 MoH, NDU County Governments
Output 9.2 Enhanced nutrition screening and assessment at facility level
Proportion of health facilities implementing the national SOPs on nutrition screening, assessment and triage
No baseline data
40% 60% DHIS2 MoH, NDU County Governments
Proportion of health facilities equipped with nutrition screening and assessment equipment
No baseline data
50% 65% County reportsFacility assessment
reports
MoH, NDU County Governments
Output 9.3 Strengthened inter-facility referral system for nutrition services place
No. of counties sensitized on the use of standard inter-facility nutrition referral tool
No baseline data
25 47 Report MoH, NDU County Governments
Output 9.4 Improved quality of care in the nutrition management of diseases, co-morbidities and conditions
No. of counties sensitized on the use of on national basic essential nutrition care package in management of diseases, co-morbidities and conditions
No baseline data
25 47 Report MoH, NDU County Governments

THE KENYA NUTRITION ACTION PLAN (KNAP) | 2018 – 2022 Improved Nutrition For All
133
Output 9.5 Strengthened management of malnutrition in disease and illness
Proportion of hospitals with disease-specific therapeutic feeds and supplements for management of malnutrition in illness and disease
No baseline data
50% 65% County reportsFacility assessment
reports
MoH, NDU County Governments
Output 9.6 Clinical nutrition and disease management in the community
Proportion of counties sensitized on continuum of nutrition care in the community
No baseline 20% 40% Training ReportAttendance sheets
MoH, NDU County Governments
Output 9.7 Improved patient feeding in health care institutions
Proportion of hospitals offering inpatient feeding with standard therapeutic food production units
No baseline 5% 10% County reportsFacility assessment
reports
MoH, NDU County Governments
Number of counties sensitized on the use of monitoring tool for inpatient feeding
No baseline 10 35 Training ReportAttendance sheets
MoH, NDU County Governments
Output 9.8 Strengthened technical capacity for clinical nutrition and dietetics
Proportion of health care workers trained on clinical nutrition package
No baseline 20% 40% County Report MoH, NDU County Governments
KRA 10 - AGRICULTURE AND FOOD SECURITY OUTCOME 10: Linkages between nutrition, agriculture and food security strengthened
Output 10.1 Strengthened sustainable and inclusive food systems that are diverse, productive and profitable for improved nutrition.
Inclusion of nutrition in the development of agriculture and food security sector policy documents
No of joint strategic planning meeting held for nutrition sensitive agricultural production
Number of agriculture policy that are nutrition-sensitive by 2022
1(2018) 6 8 Policy/strategy/plan document
MoALF&I MOH-NDU, /MOE/COG/partners

THE KENYA NUTRITION ACTION PLAN (KNAP) | 2018 – 2022 Improved Nutrition For All
134
Output 10.2 Improved access to nutritious and safe foods
Proportion of farm HH producing food items from five food groups for subsistence
35(2018) 40 60 Reports on food items/Consumer info
reports
MoALF&I MOH, Culture Social protection, MODA, COG, MOE, partner etc.
Output 10.3 Promotion of consumption of safe, diverse, and nutritious foods
Number new and nutritious foods products availed in Kenyan market
1(2018) 3 5 Safety guidelines, New products briefs, Food safety reports, Food composition tables, Recipes,
MoH MoALF&I, MODA and partners
Output 10.4 Strengthened agri-nutrition capacities and coordination at national and county levels
No of counties where agri-nutrition technologies have been disseminated
1(2018) 10 25 Curriculum, Technology,
Attendance sheetsDissemination
reports
MoH MoALF&I and partners
KRA 11 - HEALTH SECTOR OUTCOME 11: Nutrition mainstreamed in health policies, strategies and action plans
Output 11.1 Nutrition integrated in health policy documents and represented in health sector policy development forums
Proportion of health sector policies with nutrition indicators included
0.05 0.26 0.4 Health sector policies MoH/NDU MoH
Output 11.2 Nutrition integrated in health sector coordination mechanisms
Proportion of coordination forums where nutrition is integrated
20% 40% 60% Annual reports MoH/NDU MoH
Output 11.3 Improved performance of nutrition within health sector
Number of nutrition indicators included in the Ministerial performance contracts
1 2 2 Health leadership Performance
contracts at National
MoH/NDU MoH
Output 11.4 Nutrition services incorporated in all health services delivery point at all levels of care

THE KENYA NUTRITION ACTION PLAN (KNAP) | 2018 – 2022 Improved Nutrition For All
135
Output 11.5 Strengthened capacity of the health workforce to deliver integrated services to include nutrition
KRA 12 – EDUCATION AND ECD OUTCOME 12: Nutrition mainstreamed in education sector policies, strategies and action plans
Output 12.1 Policies, strategies, standards and guidelines on nutrition and physical activity in schools and other learning institutions developed and promoted
Output 12.2 Healthy and safe food environment promoted to ensure that food to learners is available, sufficient, nutritious, accessible and safe
Proportion of schools offering safe and nutritious foods
No Baseline
Data
40% 60% Assessment Reports MOE MoH
Proportion of schools where nutrition assessment is done
No Baseline data
20% 35% Assessment Reports MOE MoH
KRA 13 - WASH OUTCOME 13: Nutrition integrated into WASH policies, strategies, plans and programs
Output 13.1 Reduced mortality due to consumption of water from unsafe water sources
Proportion of households using an improved sanitation facility
61.1
KDHS 2014
67 76 KDHS Report MoH-WASH Hub NDU
Proportion of deaths attributed to unsafe water sources
77.08 per 100,000
(GBD 2016)
65 60 https://vizhub.healthdata.org
MoH-WASH Hub NDU
Proportion of households with access to an improved water source
71 KDHS 2014
77 86 KDHS Report MoH-WASH Hub NDU

THE KENYA NUTRITION ACTION PLAN (KNAP) | 2018 – 2022 Improved Nutrition For All
136
Output 13.2 Nutrition integrated in policies, strategies and plans on universal access to adequate WASH services
Proportion of WASH policies with nutrition component
No Baseline Data
77 86 Policy documents and strategies
MOH-WASH Hub NDU
Output 13.3 Reduction of mortality due to poor access to handwashing facility
Proportion of households with handwashing station in compound
35 KDHS 2014
45 60 KDHS Report MOH-WASH Hub NDU
Proportion of deaths attributed to lack of access to handwashing facilities
53.6 per 100,000
(GBD 2016)
49.5 45 https://vizhub.healthdata.org
MOH-WASH Hub NDU
KRA 14 -SOCIAL PROTECTION OUTCOME 14: Integration of nutrition in social protection programs strengthened
Output 14.1 Inclusion of nutrition component in social protection
Proportion of social protection programs with a nutrition component
0 (2018) 30% 60% NIMES and CPIMS reports
MOH
ML&SP
Other line ministries
-Development partners
Output 14.2 Enhanced monitoring of nutrition in social protection
Number of nutrition indicators integrated on the information system for social protection programs
0 (2018) 1 2 NIMES and CPIMS report
MOH
ML&SP
Other line ministries
-Development partners
KRA 15 –MULTISECTORAL NUTRITION GOVERNANCE OUTCOME 15: Efficient and effective nutrition governance, coordination and legal frameworks in place
Output 15.1 Enhanced existing nutrition coordination and collaborating mechanisms and linkages between national and county Governments
Number of functional nutrition coordination committees’ meetings held
14 54 90 Meeting minutes MOH/COG MOH
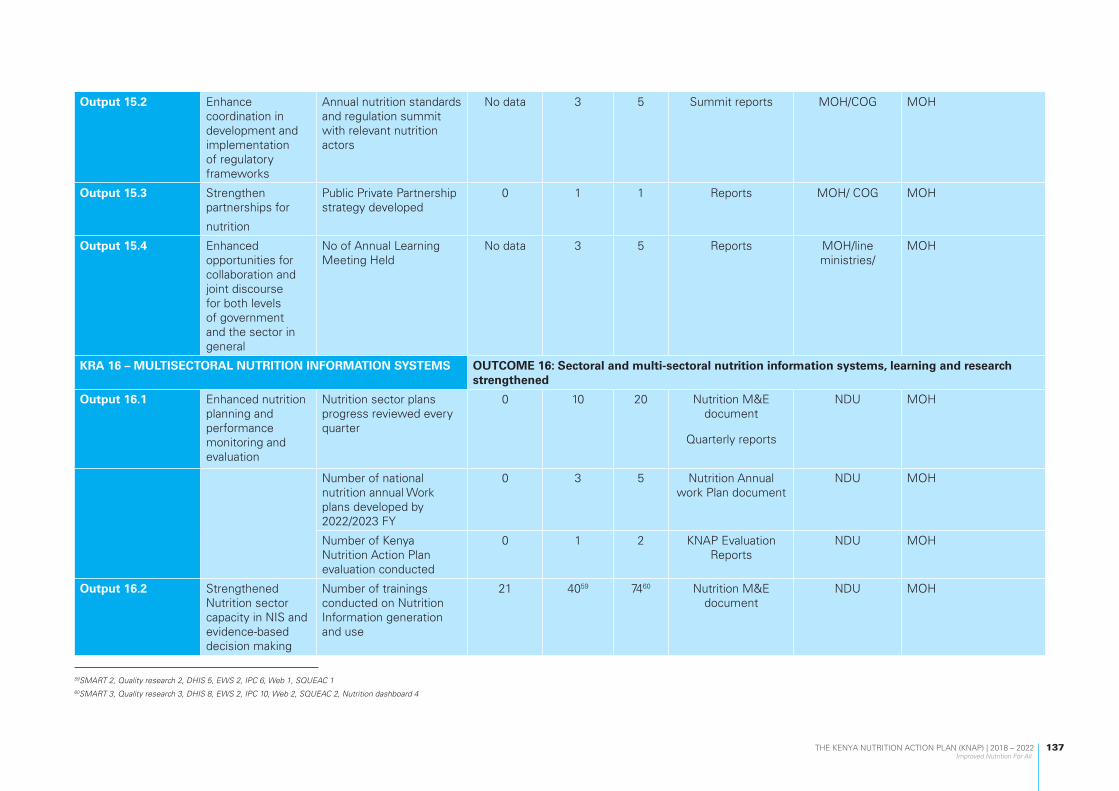
THE KENYA NUTRITION ACTION PLAN (KNAP) | 2018 – 2022 Improved Nutrition For All
137
59SMART 2, Quality research 2, DHIS 5, EWS 2, IPC 6, Web 1, SQUEAC 160SMART 3, Quality research 3, DHIS 8, EWS 2, IPC 10, Web 2, SQUEAC 2, Nutrition dashboard 4
Output 15.2 Enhance coordination in development and implementation of regulatory frameworks
Annual nutrition standards and regulation summit with relevant nutrition actors
No data 3 5 Summit reports MOH/COG MOH
Output 15.3 Strengthen partnerships for
nutrition
Public Private Partnership strategy developed
0 1 1 Reports MOH/ COG MOH
Output 15.4 Enhanced opportunities for collaboration and joint discourse for both levels of government and the sector in general
No of Annual Learning Meeting Held
No data 3 5 Reports MOH/line ministries/
MOH
KRA 16 – MULTISECTORAL NUTRITION INFORMATION SYSTEMS OUTCOME 16: Sectoral and multi-sectoral nutrition information systems, learning and research strengthened
Output 16.1 Enhanced nutrition planning and performance monitoring and evaluation
Nutrition sector plans progress reviewed every quarter
0 10 20 Nutrition M&E document
Quarterly reports
NDU MOH
Number of national nutrition annual Work plans developed by 2022/2023 FY
0 3 5 Nutrition Annual work Plan document
NDU MOH
Number of Kenya Nutrition Action Plan evaluation conducted
0 1 2 KNAP Evaluation Reports
NDU MOH
Output 16.2 Strengthened Nutrition sector capacity in NIS and evidence-based decision making
Number of trainings conducted on Nutrition Information generation and use
21 4059 7460 Nutrition M&E document
NDU MOH
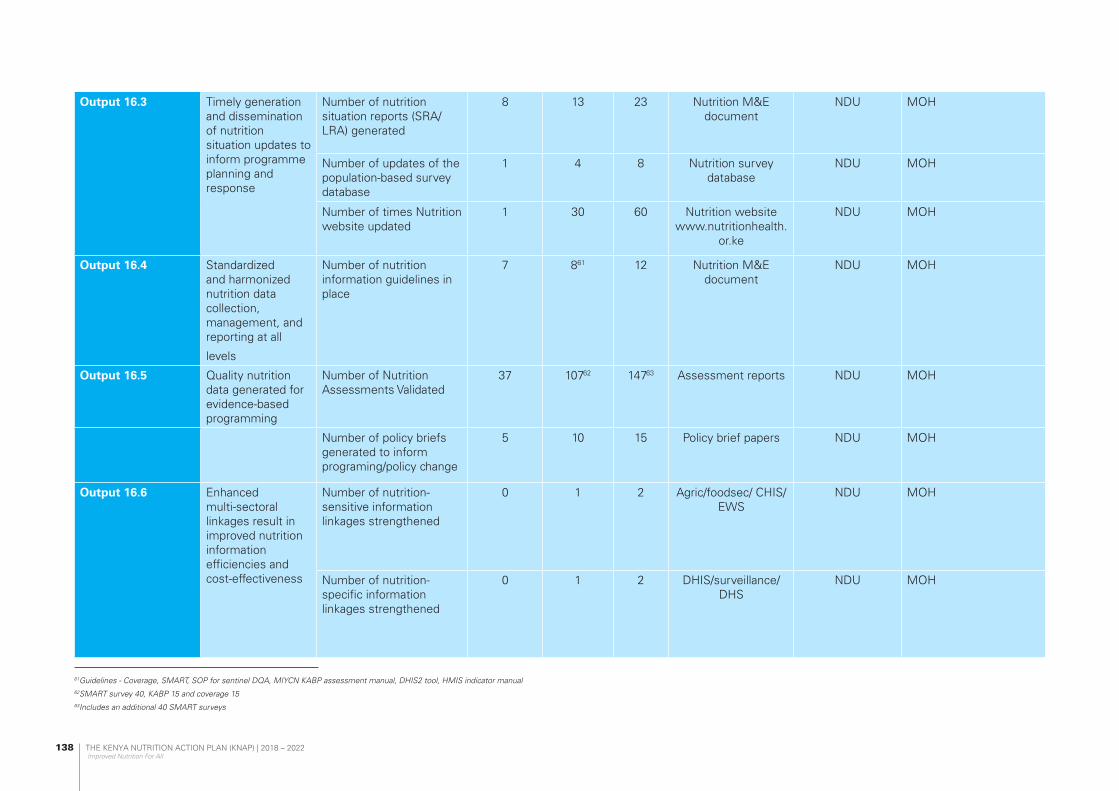
THE KENYA NUTRITION ACTION PLAN (KNAP) | 2018 – 2022 Improved Nutrition For All
138
Output 16.3 Timely generation and dissemination of nutrition situation updates to inform programme planning and response
Number of nutrition situation reports (SRA/LRA) generated
8 13 23 Nutrition M&E document
NDU MOH
Number of updates of the population-based survey database
1 4 8 Nutrition survey database
NDU MOH
Number of times Nutrition website updated
1 30 60 Nutrition website www.nutritionhealth.
or.ke
NDU MOH
Output 16.4 Standardized and harmonized nutrition data collection, management, and reporting at all
levels
Number of nutrition information guidelines in place
7 861 12 Nutrition M&E document
NDU MOH
Output 16.5 Quality nutrition data generated for evidence-based programming
Number of Nutrition Assessments Validated
37 10762 14763 Assessment reports NDU MOH
Number of policy briefs generated to inform programing/policy change
5 10 15 Policy brief papers NDU MOH
Output 16.6 Enhanced multi-sectoral linkages result in improved nutrition information efficiencies and cost-effectiveness
Number of nutrition-sensitive information linkages strengthened
0 1 2 Agric/foodsec/ CHIS/EWS
NDU MOH
Number of nutrition-specific information linkages strengthened
0 1 2 DHIS/surveillance/DHS
NDU MOH
61Guidelines - Coverage, SMART, SOP for sentinel DQA, MIYCN KABP assessment manual, DHIS2 tool, HMIS indicator manual62SMART survey 40, KABP 15 and coverage 1563Includes an additional 40 SMART surveys

THE KENYA NUTRITION ACTION PLAN (KNAP) | 2018 – 2022 Improved Nutrition For All
139
Output 16.7 Improved access to and use of nutrition information to inform programme quality improvement
Nutrition dashboard (within DHIS2) developed
0 1 1 DHIS2 Nutrition board
NDU MOH
Nutrition DHIS2 scorecard developed
0 1 1 Nutrition DHIS2 scorecard
NDU MOH
Output 16.8 Enhanced evidence-based decision making through research
No. of new strategic nutrition partnerships established including universities
1 3 5 MoU NDU MoH Research Unit/Partners
No. of new research priorities identified annually
3 5 8 Research in Nutrition Technical Working
Group (RTWG) minutes
NDU Partners
No of counties undertaking nutrition research
0 5 8 County research findings
NDU/CCNC Counties/Partners
No. of operational /implementational researches Initiated
8
(2018)
10 12 Research proposals validated
NDU-RTWG KEMRI/ Partners
Number of research fund formed
0 1 1 Research fund report NDU Partners
No of Research findings validated
0 4 8 Results reports/presentations
Partners NDU-RTWG
Number of symposiums/Conferences on nutrition
2 3 5 Symposiums NDU Partners

THE KENYA NUTRITION ACTION PLAN (KNAP) | 2018 – 2022 Improved Nutrition For All
140
KRA 17 – Advocacy, Communication and Social Mobilization (ACSM)
OUTCOME 17: Enhanced commitment and continued prioritization of nutrition in national and county agenda
Output 17.1 Implementation of National advocacy strategy on nutrition
Number of high-level nutrition meetings held
0 3 5 Report MOH/NDU CoG, Counties, Line Ministries, House committee on health
Number of counties with nutrition advocacy plans
0 27 47 Report MOH/NDU CoG, Counties, Line Ministries, House committee on health
Number of nutrition champions identified
1
(2015)
6 10 Report MOH/NDU Counties, National Govt, partners
Output 17.2 Increased and sustained multi-sectoral collaboration on advancing and integrating nutrition outcomes across relevant sectors at national and county
Number of functioning of Multisectoral platforms
1
(2018)
3 3 Report MOH/NDU CoG, Counties, Line Ministries, House committee on health
Output 17.3 Social accountability and financial tracking of nutrition resources at National and county Level
Number of relevant ministries and counties trained on nutrition financial tracking tool (47 counties and 13 Ministries)
16
(2018)
49 60 Report MOH/NDU CoG, Counties, Line Ministries, House committee on health
Number of National and County budgets tracked
16
(2017)
4 48 Report MOH/NDU Line Ministries, Counties
Output 17.4 Adequate financial resources mobilized for sustained and quality nutrition services including domestic resource mobilization
Number of relevant MDAs with nutrition budget lines
No data 5 15 Budget line MOH/NDU MDAs
Nutrition mainstreamed in Ministerial and County performance contract
0 1 2 PC MOH/NDU MDAs, Counties, CoG, Performance Management and Coordination office in Executive office of the President

THE KENYA NUTRITION ACTION PLAN (KNAP) | 2018 – 2022 Improved Nutrition For All
141
Output 17.5 Increased and strengthened human capital and capacity for nutrition advocacy
Number of nutrition professionals and influencers trained on advocacy
0 180 300 Report/certs MOH/NDU Line ministries, CoG
Number of nutritionists in post at national and county level
1200 1302 1360 Adverts/contracts
HR Report
MOH/NDU/County
governments
PSC, CoG, TNT, CPSB
Output 17.6 Evidence informed nutrition advocacy
Number of nutrition best practices documented and disseminated
0 15 25 Best practices/newsletters
MOH/NDU/County
governments
Stakeholders, CoG, Partners, National government
Number of sectors assisted in packaging their nutrition advocacy products
0 6 15 Reports MOH/NDU Stakeholders, MDAs
Output 17.7 Stronger relationships on nutrition with key media houses and journalists built and maintained
Number of media personnel trained (under influencers)
60 (2017) 120 120 Training reports /certificates
MOH/NDU Partners, Media houses
Number of nutrition documentaries held
0 12 20 Reports MOH/NDU Media, Partners, CoG, National Government
Output 17.8 Community engagement, participation and feedback mechanisms in nutrition services and decision-making processes strengthened to enhance social accountability
Number of counties with feedback mechanisms on community engagement
0 30 47 Reports MOH/NDU/County
governments
Counties, Stakeholders, Partners, CoG, National Government

THE KENYA NUTRITION ACTION PLAN (KNAP) | 2018 – 2022 Improved Nutrition For All
142
OUTCOME 18: KRA 18 – CAPACITY DEVELOPMENT Capacity to deliver and demand for nutrition services enhanced.
Output 18.1 Strengthened systemic and organizational capacity development on policy, governance, leadership, coordination and partnerships for nutrition at county and national level
Number of counties with comprehensive nutrition capacity assessments conducted
17 30 47 Capacity assessment reports and action
plans
Capacity working group
NDU and implementing partners
Number of counties implementing the Kenya nutrition leadership and governance programme
0 3 4 Annual reports Capacity working group
NDU and implementing partners
Output 18.2 Enhanced systems for skills and competency development for nutrition workforce
Number of counties achieving at least 60% of the prescribed human resource norms and standards for nutritionists
13 24 35 HRH reports, Capacity assessment
reports
Advocacy and communications, Capacity working
group
NDU and implementing partners
Number of counties with improved score card performance on nutrition
0 20 40 Score card reports, DHIS
M & E working group, HRIOs
NDU, Implementing partners
Number of counties where the Nutrition Internship and placement guide is disseminated
0 25 47 Annual reports Capacity working group, KNDI
NDU and implementing partners,
Output 18.3 Strengthened capacity for community level demand generation and utilization of integrated nutrition services
Proportion of CHVs trained on nutrition packages (module 8)
10% 40% 80% CHS reports and capacity assessment
reports
CHS focal point, capacity working
group
NDU, Implementing partners
OUTCOME 19: KRA 19 – SUPPLY CHAIN MANAGEMENT Strengthened integrated supply chain management system for nutrition commodities equipment and allied tools.
Output 19.1 Counties prioritizing procurement of nutrition commodities and equipment
Proportion of counties with a budget line for nutrition commodities and equipment
30% 40% 50% County Budgets NDU County

THE KENYA NUTRITION ACTION PLAN (KNAP) | 2018 – 2022 Improved Nutrition For All
143
Output 19.2 Inclusion of nutrition commodities in the EMMS
Number of nutrition commodities included in the EMMS
17 20 24 EMMS List NDU County
Output 19.3 Reduced cost for nutrition commodities and equipment
Number of new certified suppliers producing nutrition commodities and supplying equipment
5 8 12 List of prequalified suppliers
NDU County
Output 19.4 PFM Act reviewed with inclusion of nutrition commodities
Proportion of counties with drawing rights at KEMSA for nutrition commodities and equipment
No data (2018)
24 35 Procurement and distribution reports
from KEMSA
NDU County
KEMSA
Output 19.5 Expanded product base of locally produced nutrition commodities
No. of nutrition commodity coordination meetings held
1 10 20 Meeting Minutes NDU County
Output 19.6 Timely Quantification for Nutrition Commodities and equipment
Number of nutrition commodities quantification and forecasting reports generated
1 2 5 Quantification Reports
NDU County
Proportion of annual nutrition commodity needs met
50% 65% 80% Distribution reports NDU County
Output 19.7 Enhanced capacity for nutrition logistics and inventory management
Proportion of counties with Nutrition LMIS and Inventory Management training conducted
45% 55% 65% Training reports NDU County
Output 19.8 Safe and quality nutrition commodities and equipment at both national and county level
Proportion of Nutrition commodities and equipment meeting minimum quality and safety standards
70% 75% 80% Certificates of Analysis
NDU County

THE KENYA NUTRITION ACTION PLAN (KNAP) | 2018 – 2022 Improved Nutrition For All
144
APPENDIX 3: HIV PREVALENCE BY COUNTY
Table 32: County Adults (15-49) HIV EstimatesCounty Overall Prevalence Male Prevalence Female Prevalence Incidence (per 1000)
Siaya 21.00% 19.40% 22.40% 7.7
Homa Bay 20.70% 19.10% 22.10% 8.2
Kisumu 16.30% 15.00% 17.40% 6.3
Migori 13.30% 12.20% 14.20% 5
Busia 7.70% 5.70% 9.40% 3.1
Nairobi 6.10% 4.70% 7.50% 2.2
Vihiga 5.40% 4.00% 6.70% 2
Kakamega 4.50% 3.40% 5.60% 1.8
Kitui 4.50% 2.70% 6.10% 1.7
Kisii 4.40% 4.00% 4.70% 1.5
Trans Nzoia 4.30% 3.70% 6.10% 0.9
Makueni 4.20% 2.50% 5.70% 1.6
Murang’a 4.20% 2.20% 6.20% 2
Nyamira 4.20% 3.90% 4.50% 1.4
Mombasa 4.10% 2.50% 5.90% 1.9
Taita Taveta 4.10% 2.50% 5.80% 1.7
Kiambu 4.00% 2.10% 5.90% 2.2
Kajiado 3.90% 3.30% 5.50% 0.8
Uasin Gishu 3.90% 3.30% 5.50% 0.8
Kilifi 3.80% 2.30% 5.40% 1.6
Kwale 3.80% 2.30% 5.40% 1.6
Machakos 3.80% 2.20% 5.10% 1.4
Nyeri 3.70% 1.90% 5.50% 1.8
Nyandarua 3.50% 1.90% 5.20% 1.8
Nakuru 3.40% 2.90% 4.80% 0.7
Bungoma 3.20% 2.40% 3.90% 1.3
Isiolo 3.20% 1.90% 4.30% 1.3
Tharaka Nithi 3.20% 1.90% 4.40% 1.2
Turkana 3.20% 2.70% 4.50% 0.7
Kirinyaga 3.10% 1.70% 4.60% 1.6
Lamu 3.00% 1.80% 4.30% 1.3
Kericho 2.90% 2.40% 4.10% 0.6
Embu 2.80% 1.60% 3.80% 1.1
Laikipia 2.70% 2.30% 3.80% 0.5
Narok 2.70% 2.30% 3.90% 0.6
Meru 2.40% 1.40% 3.30% 0.9
Nandi 2.00% 1.70% 2.90% 0.4

THE KENYA NUTRITION ACTION PLAN (KNAP) | 2018 – 2022 Improved Nutrition For All
145
Bomet 1.90% 1.60% 2.70% 0.4
Samburu 1.80% 1.50% 2.50% 0.4
Elgeyo Marakwet 1.60% 1.40% 2.30% 0.3
West Pokot 1.60% 1.30% 2.20% 0.3
Marsabit 1.40% 0.80% 1.80% 0.5
Baringo 1.30% 1.10% 1.90% 0.3
Tana River 1.30% 0.80% 1.80% 0.5
Garissa 0.80% 0.30% 1.40% 0
Mandera 0.20% 0.10% 0.30% 0
Wajir 0.10% 0.03% 0.20% 0
Kenya 4.80% 4.50% 5.20% 1.8
Table 33: HIV burden by County County Overall Prevalence HIV+ New Infections HIV-related Deaths
Siaya 21.0% 123,107 4,039 2,062
Homa Bay 20.7% 138,921 4,558 2,326
Kisumu 16.3% 122,301 4,012 2,048
Migori 13.3% 85,765 2,814 1,436
Busia 7.7% 38,606 1,601 721
Nairobi 6.1% 190,993 7,159 2,612
Vihiga 5.4% 19,935 827 372
Kakamega 4.5% 52,976 2,197 989
Kitui 4.5% 28,661 1,146 600
Kisii 4.4% 37,874 1,243 634
Trans Nzoia 4.3% 28,962 693 733
Murang’a 4.2% 30,376 1,422 600
Makueni 4.2% 24,581 983 515
Nyamira 4.2% 19,004 623 318
Mombasa 4.1% 41,599 1,738 777
Taita Taveta 4.1% 10,211 427 191
Kiambu 4.0% 59,016 2,763 1,166
Uasin Gishu 3.9% 32,260 771 816
Kajiado 3.9% 24,869 595 629
Kilifi 3.8% 33,019 1,380 617
Machakos 3.8% 30,095 1,203 630
Kwale 3.8% 19,292 806 361
Nyeri 3.7% 21,428 1,003 424
Nyandarua 3.5% 16,005 749 316
Nakuru 3.4% 49,575 1,186 1,255
Bungoma 3.2% 30,044 1,246 561
Turkana 3.2% 23,230 556 588
Tharaka Nithi 3.2% 8,453 338 177
Isiolo 3.2% 3,139 126 66
Kirinyaga 3.1% 14,481 678 286
Lamu 3.0% 2,638 110 49
Kericho 2.9% 17,535 419 444
Embu 2.8% 10,721 429 225

THE KENYA NUTRITION ACTION PLAN (KNAP) | 2018 – 2022 Improved Nutrition For All
146
Narok 2.7% 18,296 438 463
Laikipia 2.7% 9,284 222 235
Meru 2.4% 24,005 960 503
Nandi 2.0% 12,748 305 323
Bomet 1.9% 10,624 254 269
Samburu 1.8% 3,069 73 78
West Pokot 1.6% 6,012 144 152
Elgeyo Marakwet 1.6% 4,789 115 121
Marsabit 1.4% 2,577 103 54
Baringo 1.3% 5,874 140 149
Tana River 1.3% 2,235 93 42
Garissa 0.8% 2,888 55 193
Mandera 0.2% 987 19 66
Wajir 0.1% 321 6 21
Kenya 4.8% 1,493,382 52,767 28,214

THE KENYA NUTRITION ACTION PLAN (KNAP) | 2018 – 2022 Improved Nutrition For All
147
APPENDIX 4: TUBERCULOSIS
According to 2016 global statistics, out of 10.4 million cases 1.9Million cases were attributed to under nutrition. 55.4% newly diagnosed drug susceptible and 59.9% of drug resistant TB patients were malnourished at the time of diagnosis. (Annual report 2017)
The risk of becoming infected with TB is associated with malnutrition, crowding, poor air circulation and poor sanitation. (TB cost survey).
NUTRITION SITUATION IN TB
• 47% of TB patients are malnourished at the time of diagnosis• 16% with Severe Acute Malnutrition• 31% with Moderate Acute Malnutrition• 90% of those malnourished are adults (36000)• 10% are children (4000)
TB case finding
85,188
DR TB case finding
577
Pediatric TB cases
7,711 9% of cases
notified

THE KENYA NUTRITION ACTION PLAN (KNAP) | 2018 – 2022 Improved Nutrition For All
148
APPENDIX 5 EVALUATION QUESTIONS
Evaluation Objectives
Over-arching Objective
To test the effect of KNAP interventions on the nutrition outcomes suggested, and to examine the implementation experience by the various key result areas, using a multisectoral approach.
Specific Objectives i. To assess effectiveness of the approaches
used by KNAP to achieve its overall objective.ii. To determine the extent of accessibility,
availability, and utilization of nutrition services and nutrition information across the various sectors.
iii. To assess the capacity of the health facilities and health workers to provide nutrition information and services.
iv. To assess demand and utilization of nutrition services.
v. To assess the efficiency of the approaches used by KNAP to achieve its overall objective
vi. To assess sustainability of interventions in the KNAP, for continued promotion of desired nutrition practices and services beyond the implementation period and make necessary recommendations
vii. To assess the relevance of KNAP in the prevailing country and global nutrition context and make necessary recommendations for future comparable planning.
viii. To assess the impact (planned and unplanned) on the various sectors that has resulted from the implementation of KNAP. In particular: Capacity building of the communities, counties, and other stakeholders to better address nutrition among populations in the implementation; and coordination of nutrition related interventions.
ix. To understand and document the challenges and best practices during implementation for mutual learning.
Evaluation Criteria
To carry out an effective evaluation, there is need for clear evaluation questions, which answer/respond to the appropriate policy questions. To establish the type of questions, a theory of change has been developed, describing the results chain, for formulating hypotheses to be tested by the evaluation, and selecting performance indicators.
Evaluation Criteria
1. Effectiveness i. Assessment of the community strategy
structures (Community Health Units) in improving utilization of and accessibility of nutrition services
ii. Assessment of facility-based health care providers in utilizing their skills to deliver nutrition services
iii. Assessment of existing capacity of selected health facilities, to meet nutrition needs of the community
iv. Assessment of the attitudes and behavior that have an effect on nutrition outcomes
v. Assessment of effectiveness of partnership with MDAs, communities and other stakeholders in achievement of the overall KNAP objective.
The following questions will guide the KNAP evaluation
i. Is the KNAP implementation by the various sectors and stakeholders in the country effective given the multisectoral approach?
ii. Did KNAP achieve its expected outcomes? Was KNAP effective in delivering desired/planned outcomes and outputs?
iii. What is the capacity of the KNAP to create demand for nutrition services.
iv. What is the Knowledge, Attitudes, Perceptions and Behavior (KAPB) regarding nutrition among communities in Kenya?
v. To what extent did the implementation of core KNAP interventions (By KRAs) contribute to achievement of the overall

THE KENYA NUTRITION ACTION PLAN (KNAP) | 2018 – 2022 Improved Nutrition For All
149
KNAP objective? vi. What is the capacity of the health care
workers to meet the nutrition specific needs of the community?- Carry out a rapid capacity assessment of the health care workers using existing tools and scorecards.
vii. How effective were the strategies and approaches used, in the implementation of KNAP?
viii. How effective has KNAP been in responding to the nutrition needs of the various populations using the life course approach, and what results were achieved?
ix. To what extent were the target groups reached (in particular, the adolescents and the older persons, who have been previously left out) by the various indicators?
x. What are the recommendations for future intervention strategies and issues?
xi. Who has benefited (women, men, girls, boys, adolescents, older persons, health worker, county) and in what ways?
xii. Have functional community units had a positive impact on nutrition indicators:- Carry out a rapid assessment of the functionality of Community Units using existing tools and scorecards
xiii. Has the KNAP provided a critical catalyst for ensuring accountability, multisectoral collaboration and coordination, linking national and county actions, and tracking progress of both the KNAP and the CNAPs.
2. Efficiency i. Was the process of achieving results
efficient? Specifically, did the actual or expected results justify the costs incurred? Were the resources efficiently utilized?
ii. Did KNAP activities overlap and duplicate other similar interventions.
iii. Are there more efficient ways and means of delivering more and better results with the available inputs?
iv. Could a different approach have produced better results?
v. How was KNAPs collaboration with various stakeholders (Various Ministries, Departments and Agencies (MDAs), Counties, Manufacturers, partners within the SUN Network and other relevant partners?)
vi. How efficient were the management and accountability structures of KNAP?
vii. How did the organizational financial management processes and procedures
affect implementation? viii. What are the strengths, weaknesses,
opportunities and threats of the KNAP implementation process?
3. Sustainability i. To what extent are the benefits of the KNAP
interventions, including innovations likely to be sustained after the implementation period?
ii. How effective are the exit strategies, and approaches?
iii. Is the country, through the various sectors, committed to the KNAP initiatives and likely to support continuation of the initiatives?
iv. What was the working relationship like, with the various MDAs, community and other stakeholders’ structures, in building their capacity to be able to sustain the gains made by KNAP initiatives?
v. Are there existing challenges that may hinder sustainability of the gains achieved so far?
4. Relevance i. How relevant was the KNAP strategies and
interventions to the needs of the various populations (using life course approach).
ii. Were the strategies realistic, appropriate and adequate to achieve the results?
iii. Are there alternative approaches, which have proved to be more relevant?
Evaluation framework
The evaluation is focused on the measurement of the impact of KNAP in the various sectors and their contributions in achieving a healthy and well-nourished nation. The overall evaluation will focus on qualitative and quantitative evidence generated from multi-sectoral sources around Health Systems strengthening, provision of quality health care to Kenyans, improved health lives and measurements that may drive the economic growth by 10% by 2022.

THE KENYA NUTRITION ACTION PLAN (KNAP) | 2018 – 2022 Improved Nutrition For All
150
Overall Coordination
Betty Samburu MOH/NDUDr. Mohammed A. Sheikh MOH/DFHMartha Nyagaya NIPatrick Codjia UNICEFSicily Matu UNICEFVeronica Kirogo MOH/NDU
KNAP Secretariat: Write-up, Editing and Validation
Betty Samburu MOH/NDUFlorence Mugo MOH/NDUJohn Mwai MOH/NDUJoy Kiruntumi NILucy Maina Gathigi UNICEFSicily Matu UNICEFVeronica Kirogo MOH/NDUVictoria Mwenda UNICEF
List of KNAP Thematic Areas Team Leads
Betty Samburu MOH/NDUCaroline Kathiari MOH/NDUCharity Tauta MOH/CHDDr. Muthoni Gichu MOH/NCDFlorence Mugo MOH/NDUGladys Mugambi MOH/NDUGrace Gichohi MOH/NDUImmaculate Nyaugo MOH/NDUJohn Maina Mwai MOH/NDUJulia Rotich MOH/NDULeila Akinyi MOH/NDULucy Kinyua MOH/NDULucy Wangari Maina MOH/NDUMary Nyaga MOH/TBRose Wambu MOH/NDURuth Musyoki MOH/NDUSamuel Murage MOH/NDUZachary Muriuki MOH/NCD
KNAP Consultants: Write-up, Editing and Validation
Dr. Festo Kavishe Lead ConsultantDr. Daniel Mwai Legal Policy & FinancingDavid Njuguna Costing and FinancingDr. Elizabeth Wangia Monitoring and Evaluation
APPENDIX 6: LIST OF PARTICIPANTS IN DEVELOPING THE KNAP

THE KENYA NUTRITION ACTION PLAN (KNAP) | 2018 – 2022 Improved Nutrition For All
151
Agatha Mugo ACFAggrey M. Machoka KNHAlbert Mulwa PLPOAngela Kimani FAOAnita Kamanda MOH-FSUAnn Muthoni Kiarie MITCAnn Wanjema ML&P- SPSSAnne Claire Otieno PATHAnne Njagi MOH-MNTRHAshley Okelo MOH-NDUAudrine Mikhala CBCC-AFRICABarnet Walema MOEBernice Arndi GAIN-KenyaBetty Samburu MOHBoniface A. Ouko MOEBrenda Asyago MOEBrian Njoroge NHP PLUSBrian Asande Feed the ChildrenCaroline Kathiari MOHCatherine Michobo NHP PLUSCatherine Mikia KANCOCharity Tauta MOHCharles Ndambo MODAChrisantos Okioma TNT & PlanningClementina Ngina NutritionistConsolata Musita CBCCDalmas Oyieko MOH/DFHDan Hashell GAINDaniel Muhinja WV-KenyaDavid Njuguna NIDenis Ndegwa KEMSADiana Rotich NIDouglas Manyara TNT &PDr .Festo Kavishe UNICEF/KICSDr .Muthoni Gichu MOH-DNCDDr. Alice Mwangi NHP PLUSDr. Catherine Macharia GAINDr. Colleta Kibassa KICSDr. Daniel Mwai NIDr. David Okeyo KNDIDr. Edwin Mbugua Concern Dr. Elizabeth Wangia NIDr. Emily Teshome YCFDr. Eunice Njogu APHRCDr. Gondi Joel MOH-HQsDr. Hellen Kiarie MOHDr. Joyce Luvussa WHODr. Judith Munga KUDr. Martin Chabi Joseph WHODr. Mohamed A. Sheikh Head, DFHDr. Oren Ombiro MOH-DNCDDr. Rose Opiyo UON-SPHDr. Sophie Ngala UON Dr. Susan Nyawade UON
Dr. Tadessa A Zerfu APHRCDr. Zipporah Bukania KEMRI-CPHREdgar Okoth ACFEdna Warentho KNHEdward Kutondo UNICEFElizabeth Owendi MOA-ASALEmiuana Mulandi Fhi 360 NHPErastus Maina Help AgeEsther Maina MLSTEsther Omosa ILRI-AVCDFarida Kyeki MOH-NDUFlorence Mugo MOH/NDUFlorence Mwangi We WorldFrancis Wambua UNICEFGachua Gotheche MOH HQGeorge Ndichu MOH-NakuruGladys Mugambi MOHGoaha Mogaka MOHGrace Gichohi MOHHarry Gioche Mwangi MOALF & IHarisson Muriuki MOEHenry Mdebwe AMTCKHenry Ngethe NAKImmaculate Nyaugo MOH/NDUIrene Kamau KNHIrene Nyaucho World VisionIrene Mugo FHKJackline Kerubo MTRHJacynter Achieng Omondi MOLSPJames Kaberi KEMSAJames Ngugi KEMSAJames Njiru ACFJane Kithuka NIJane Munuhe MOLSPJane W. Wanyoike MPSYGJane Wambugu MOAJanet Ntwiga UNICEFJared Owuor NDAKJohn Maina Mwai MOH/NDUJohn Njihia MOH-NPHLJoseph O.Anyango MAP INTERNATIONAL
Josephine Mwema WFPJoy Kiruntumi NIJoyce Muthuuri MOHJoyce N Kariuki NDU AttacheeJoyce Owigar WFPJudy Ndungu WFPJulia Rotich MOH/NDUKassim Lupao CONCERNKennedy Lenguro MOH HQKibet Chirchir NDU/UNICEFLaura Kiige UNICEFLeah Kaguara GAINLeila Akinyi MOH/NDU
Contributions to Write-up and Validation Processes Team
NAME ORGANIZATION NAME ORGANIZATION
THE KENYA NUTRITION ACTION PLAN (KNAP) | 2018 – 2022 Improved Nutrition For All
152
Lilian Odhiambo ENNLilian Ogutu NGECLillian Kaindi ACFLinnet Achieng KRCSLucy Magige MOH-NDULucy Maina Gathigi UNICEFLucy Kinyua MOH/NDULucy Maina Wangari MOH/NDULucy Muinde MOH/NSIRHLucy Murage NILucy Sembei KRCSMargaret Muli NASCOPMartin Koome NIMary Gathiru DMI CENTREMary Kimani ACF/MOHMary Nyagah MOH/NTLDMbogo Alexander KNHMildred Irungu USAIDMilka Njeri APHRCMurianki Ann Cirindi MOH/HRMusungu Benjamin COGNavneet Mittal SBNNancy Owola World ReliefNancy R. Mandiro MOHNganga Naftaly Ministry of PlanningNoah Ledaany UNICEFOlivia Agutu UNICEFOscar Kasingo MOAL&FIOwatto H. Oboo MOHPatricia Mukayagi AHNPeris Mbugua MOHPeter Ochieng MLSS
Peter Wathigo DSMPhares N. Nkari MOHPhillip Ndemwa KEMRIProf Judith Kimiywe Kenyatta UniversityProf. Kogi Makau UONPurity Kibe MOH-NDURachel Kavithe PATHRahab Mwaniki KANCORegina Mbochi SAVE THE CHILDRENRose Wambu MOH/NDURosemary Kamuyu TICKSHERRuth Akelola KNDIRuth Tiampati USAIDSalome Michieka NDU AttacheeSamuel Maina KMTCSamwel Mbugua Egerton UniversitySamuel Murage MOH/NDUSarah Blen TDHSarah Kihianyu NIScholastica Mwende MOH/NCDScholastica Omondo MOHShalini Guduri UNICEFSicily Matu UNICEFSimon Kinyanjui MOH-NDUStanley Mutua MOAS&LSylvia Kitamati KRCSTerry Wefwafwa Nutrition ExpertTewoldeberha Daniel UNICEFValerie Wambani KRCSVictoria Mwenda UNICEFWeldon Ngetich ConcernZachary Muriuki MOH/NCD
NAME ORGANIZATION NAME ORGANIZATION
NAME COUNTY DESIGNATIONMary Panga Baringo CECMZakayo Kimuge Baringo CNC (Former)Fancy Chepkoech Bomet CNC Philemon Rutoh Bomet COPHMicah Koech Bomet CDHDr. Antony Walela Bungoma CECMJuliet Walukana Bungoma CNCDr. Johnstone Akatu Bungoma CDH Scholastica Nabade Busia CNCJoyce Nabwire Busia CNC (Former)Dr Patrick Kosgei Elgeyo Marakwet CDHMr Kiprono Chepkok Elgeyo Marakwet CECMPriscilla Ngetich Elgeyo Marakwet CNCMary M. Kiringa Embu CNC representative
County Level - Consultatitive Engagements and Validation Meetings : CNC, CDH and CECM

THE KENYA NUTRITION ACTION PLAN (KNAP) | 2018 – 2022 Improved Nutrition For All
153
Dr. Stephen M. Kaniaru Embu CDHMercy Wawira Kithinji Embu CNCAbdimalik Ibrahim Garissa CNC representativeAhmed Nadhir Omar Garissa CECMMohamed Haret Lohos Garissa CDHMohamed Hassan Abdi Garissa CNC representativeDr. Gordon Odhiambo Okomo Homa Bay CDHHillary Otieno Oracha Homa Bay CNC Rep – SCNCHon. Mohamed Haji Isiolo CECMJoseph Ngiri Isiolo CDH Rep – DNOSaida Abdirahman Isiolo CNCEsther Somoire Kajiado CECMRuth Nansikoi Lenku Kajiado CNCSteve Ndung'u Kajiado CDH Rep - CHAOFlorence E.Amakobe Kakamega CNCDr.Misiani Ayub Wastara Kakamega Ag. CDH medical servicesFlorence Emali Amakobe Kakamega CNCJoseph K. Rutoh Kericho CNCDr. Koech Peter Kericho CDH RepresentativeDr.David Ndungu Kiambu COHFaith Munoru Kiambu CNC RepresentativeMary Kamau Kiambu CECMDr. Kellen Njeri Kiambu Director Public Health & SanitationRacheal Wanjugu Kiambu CNCRonald Mbunya Kilifi CNCGeorge N.Karoki Kirinyaga CDHJane Wambui Kabungo Kirinyaga CNCDr. Agnes Gachoki Kirinyanga CECMDennis Bosire Kisii CNC representativeDr. Geoffrey Otomu Kisii CDH representing CECMHon Sarah Omache Kisii CECM-HealthOnguso Samuel Kisii CNCDr. Rosemary Obara Kisumu CECMDr. Mary Obade Kisumu CDNMwando Wanyona Rael Kisumu CNCLidya Mbeti Mutie Kitui CNC representativeDr. Allan Owino Kitui CDHDr. Richard Muthoka Kitui CECMDr Hajara Elbusaid Kwale CECM RepresentiveDr. Aggrey Okumu Kwale CDHRachel Jumwa Kahindi Kwale CNCHannah Munyui Laikipia CNC representativeDr. Ohas Josephine Laikipia Director Public Health & SanitationPhoebe Mwangagi Laikipia CNCCharles Mjomba Mwashihadi Lamu CNCDr. Abubakar Badawy Lamu COH representing CECMDr. David Mulewa Lamu CDHDr. Ruth Musiva Muthama Machakos CDHMary Ndanu Makau Machakos CNC
THE KENYA NUTRITION ACTION PLAN (KNAP) | 2018 – 2022 Improved Nutrition For All
154
Dr. Andrew Mulwa Makueni CECMJoseph Wambua Makueni CNC representativeDr. Stephen Ndolo Kiio Makueni CDHRuth Ndinda Kaloki Makueni CNCDr. Mohamud Etha Mandera CECMHaret Sugow Hassan Mandera CNCMuktar Issac Kassim Mandera CDH RepImmaculate Mutua Marsabit CNCGeorge Taitumu Meru Director NursingHelen Ringera Meru CNCDr. Lilian Karoki Meru CDHFlorence Akeyo Migori CNCDr. Ogutu Meshack Owidi Migori Asst. Director Health ServicesAisha Abubakar Mombasa COH Public HealthEsha Bakari Mombasa CNCDr. Shem Onyango Patta Mombasa CDHDr. Winfred Wambui Kanyi Murang'a CDHNancy Waitherero Mwangi Murang'a CNCJoseph Mbai Murang’a CECDr. Lucina Koyio Nairobi CDHEsther K. Mogusu Nairobi CNCDr. Solomon Sirma Nakuru CECM representativeChrisitine Wangui Kihara Nakuru CNCDr. Benedict T.Osore Nakuru CDHAnjeline Korir Nandi CNCMathew Rotich Nandi CECM representativeDr. David Bungei Nandi CDHPaul .K. Lagat Nandi COH-Medical ServicesSilas Tumpeine Narok CNCVivian Sereti Narok CECMDouglas Bosire Nyamira CECMDr. Charles Ogachi Nyamira MOH Representing CECM HealthDr. Silas Ayunga Nyamira CDHRosemary A.Otiende Nyamira CNC Dr. Martha Wangu Mwathi Nyandarua CDHPaul Mutugi Migwi Nyandarua CNC Agnes Wangari Mwendia Nyeri CNCDr Rachel Kamau Nyeri CECMNancy M. Wangai Nyeri CECM representativeJane Wawira Gatimu Nyeri Health Promotion OfficerDelphina Kaaman Samburu CNCH.E Julius Leseeto Samburu Deputy GovernorAmos Odiwuor Siaya Representing CECMVeronica Akinyi Siaya CNC representativeDr. Kennedy O. Oruenjo Siaya CDHOscar Kambona Ayoma Siaya CNCDorothy Owino Siaya CECMMichael Nyambu Taita Taveta Nutritionist

THE KENYA NUTRITION ACTION PLAN (KNAP) | 2018 – 2022 Improved Nutrition For All
155
Dr. Felix Kimotho Taita Taveta CDH RepresentativePauline Mugo Taita Taveta CNCMwanajuma Hiribae Tana River CECM Makopa Omari Mwakanyenze Tana River CNCSimon Nyaga Tharaka Nithi CNCDr. Nthuraku Gichuyia Tharaka Nithi CECMJohn Murithi Mbogo Tharaka Nithi Ag CDH Eng. Charles Barasa Trans Nzoia CECM Lydia Kimani Trans- Nzoia CNCDr. Sowon Gilbert Trans-Nzoia CDHAlice Akalapatan Turkana DDFHElias Kamau Turkana CDHEsther Serem Uasin Gishu CDH Rep- NODr. Amos Kutwa Vihiga CECMDr. Arnold Mamadi Vihiga COH Medical ServicesEsther Asiko Odera Vihiga CNCAbdihakim Billow Wajir CECMMohamed Abdi Salat Wajir CDH Rep - Head M&EMohamed Hassan Wajir DD for CECMNuria Ibrahim Wajir CNCGeoffrey Lipale West Pokot CECMJane Limangura West Pokot CNCStephen K. Porriot West Pokot CDH Rep - Nursing Officer
Council of Governors - Consultatitive Engagements and Validation Meeting
Benjamin Musungu Programme OfficerCharles Mito Senior HIS AdvisorJemimah Kuta Monitoring and Evaluation - HealthKhalm Ah Programme OfficerKhatra Ali Programme OfficerMaureen Khaniri Technical support –HealthMeboh Abuor Programme OfficerMeshack Ndolo Senior Health AdvisorMohamed Abdinoor Monitoring and Evaluation- HealthNerrie Dammy Monitoring and Evaluation- HealthPaul Bartilol Project AssistantSheila Yoto Technical Support HealthTobias Outi Project Assistant
NAME DESIGNATION

MINISTRY OF HEALTH