The Journal of ACHSM & SHAPE
183
Volume 17 Issue 1 2022 The Journal of ACHSM & SHAPE
-
Upload
khangminh22 -
Category
Documents
-
view
6 -
download
0
Transcript of The Journal of ACHSM & SHAPE

Volume 17 Issue 1 2022 The Journal of ACHSM & SHAPE
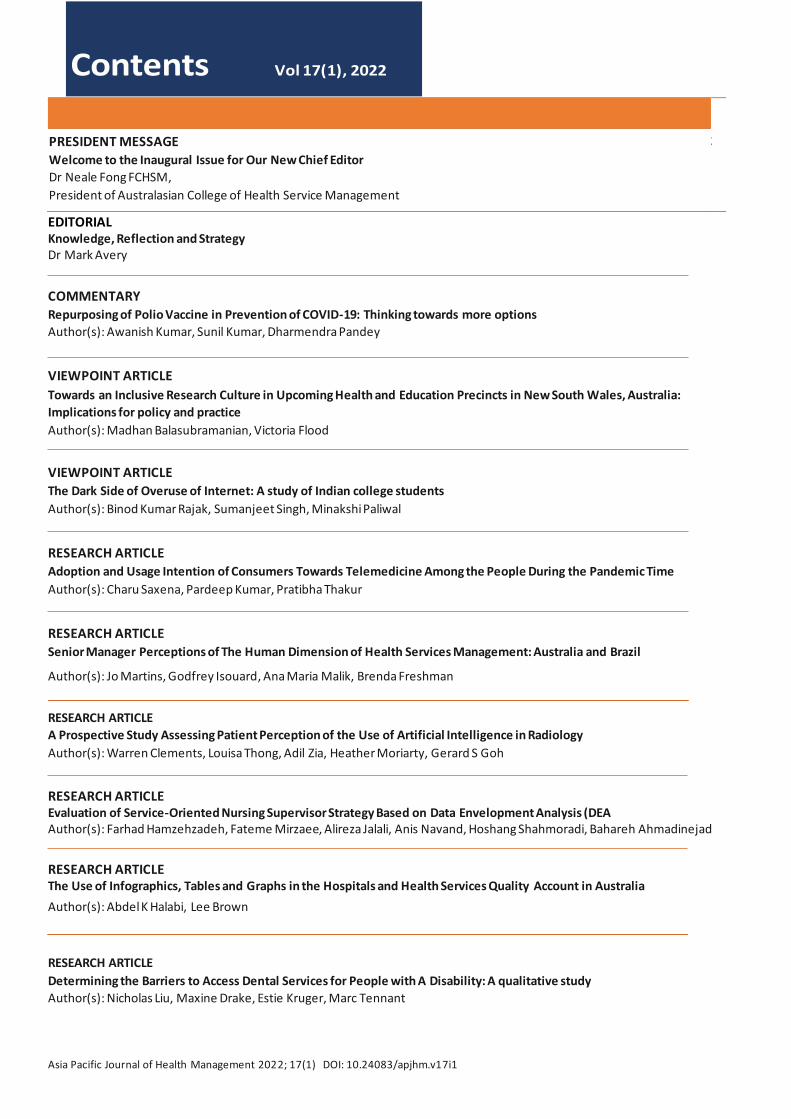
Asia Pacific Journal of Health Management 2022; 17(1) DOI: 10.24083/apjhm.v17i1
PRESIDENT MESSAGE
Welcome to the Inaugural Issue for Our New Chief Editor
Dr Neale Fong FCHSM,
President of Australasian College of Health Service Management
2
EDITORIAL Knowledge, Reflection and Strategy Dr Mark Avery
COMMENTARY Repurposing of Polio Vaccine in Prevention of COVID-19: Thinking towards more options
Author(s): Awanish Kumar, Sunil Kumar, Dharmendra Pandey
VIEWPOINT ARTICLE
Towards an Inclusive Research Culture in Upcoming Health and Education Precincts in New South Wales, Australia:
Implications for policy and practice
Author(s): Madhan Balasubramanian, Victoria Flood
VIEWPOINT ARTICLE
The Dark Side of Overuse of Internet: A study of Indian college students
Author(s): Binod Kumar Rajak, Sumanjeet Singh, Minakshi Paliwal
RESEARCH ARTICLE
Adoption and Usage Intention of Consumers Towards Telemedicine Among the People During the Pandemic Time
Author(s): Charu Saxena, Pardeep Kumar, Pratibha Thakur
RESEARCH ARTICLE
Senior Manager Perceptions of The Human Dimension of Health Services Management: Australia and Brazil
Author(s): Jo Martins, Godfrey Isouard, Ana Maria Malik, Brenda Freshman
RESEARCH ARTICLE
A Prospective Study Assessing Patient Perception of the Use of Artificial Intelligence in Radiology
Author(s): Warren Clements, Louisa Thong, Adil Zia, Heather Moriarty, Gerard S Goh
RESEARCH ARTICLE Evaluation of Service-Oriented Nursing Supervisor Strategy Based on Data Envelopment Analysis (DEA Author(s): Farhad Hamzehzadeh, Fateme Mirzaee, Alireza Jalali, Anis Navand, Hoshang Shahmoradi, Bahareh Ahmadinejad
RESEARCH ARTICLE The Use of Infographics, Tables and Graphs in the Hospitals and Health Services Quality Account in Australia
Author(s): Abdel K Halabi, Lee Brown
RESEARCH ARTICLE
Determining the Barriers to Access Dental Services for People with A Disability: A qualitative study
Author(s): Nicholas Liu, Maxine Drake, Estie Kruger, Marc Tennant

Asia Pacific Journal of Health Management 2022; 17(1) DOI: 10.24083/apjhm.v17i1
RESEARCH ARTICLE
The Importance of Environmental Sustainability for Healthy Ageing and The Incorporation of Systems Thinking in Education
for A Sustainable Environment
Author(s): Wang-Kin Chiu, Ben Y. F Fong, Wing Yi Ho
RESEARCH ARTICLE
Evaluating an Automated Temperature-Monitoring System in Medicine and Vaccine Storage Facilities of a Hospital Network
Author(s): Mazdak Zamani, Paul Wembridge
RESEARCH ARTICLE
Factors Associated with the Four-Visit ANC in Indonesia: A population-based study
Author(s): Helen Andriani, Valencia Natasha, Salma Dhiya Rachmadani, Adila Saptari
RESEARCH ARTICLE
Exploring the Challenges of Prehospital Emergency Personnel in COVID-19 Pandemic: A qualitative study
Author(s): Zohreh Sarchahi, Hasan Ghodsi, Rasool lakziyan, Razieh Froutan
RESEARCH ARTICLE
Impact of COVID-19 on Mental Health Issues in India: Understanding the factors of suicides due to pandemic
Author(s): Subhra Rajat Balabantaray, Deepak Bangwal, Upananda Pani
RESEARCH ARTICLE
Covid-19 Related Factors Associated with Antenatal Care in Rural Bangladesh: A qualitative study
Author(s): S. M. Mostafa Kamal, Dr. M Anisur Rahman, Dr. Sonia Singh
RESEARCH ARTICLE
Convergence of Comorbidity and COVID-19 Infection to Fatality: An investigation based on health assessment and
vaccination among older adults in Kerala, India
Author(s): Sindhu Joseph, Jijo Pulickiyil Ulahannan, Parvathy A J
RESEARCH ARTICLE
Awareness of Jordanian Surgical Patients about COVID 19 During Peak of Epidemic at JUH
Author(s): Abdelkarim Aloweidi, Sami Abu Halaweh, Mahmoud Al-Mustafa, Islam Massad, Ibrahim Qudaisat,
Ahmad El-Share, Mohammad Rwaidi, Mohammad Yousef, Mazen Al-Nouti, Isam Bsisu, Mohammad Aqel
RESEARCH ARTICLE
Public Awareness and Personal Hygienic Practices of Rural People in the COVID-19 Situation
Author(s): Prodip Kumar Baral, Umme Habiba, Md. Emdadul Islam, S. M. Woahid Murad
REVIEW ARTICLE
Ethical Conflicts Among the Leading Medical and Healthcare Leaders
Authors(s): Bindu Roy, Anuj Kumar, Dr. Arya Kumar, Dr. Kavitha R Gowda
REVIEW ARTICLE
Role of Social Distancing, Hand Hygiene and Wearing Mask in Controlling COVID-19 Pandemic: A review
Author(s): Santosh Kumar Swain, Pragnya Paramita Jena, Somadatta Das
1

PRESIDENT MESSAGE
WELCOME TO THE INAUGURAL ISSUE FOR OUR NEW CHIEF
EDITOR
Dr. Neale Fong FCHSM
President of Australasian College of Health Service Management
Welcome to the inaugural
issue of the College’s
flagship journal with our new
Editor-in-Chief, Dr Mark
Avery. On behalf of all
members, contributors and
readers we wish him and
the editorial team all the
best.
Firstly, I would like to thank all members and all those health
professionals across our regions for your dedicated service,
commitment and support of the community in the past two
years during the COVID-19 Pandemic. In Australia we have
also seen natural disasters add to workloads and from time
to time it really is important to take a moment to
acknowledge the fantastic job being done managing
through these crises. Thank you.
We now have some wonderful analysis from the vast
number of College members who have completed the self-
assessment against the ACHSM Master Health Service
Competency Framework. This report was generated in
October last year with 864 overall completions, 732 of those
from Australia. Thanks to The Screening Lab who provide
the platform for this self-assessment survey and have
generated this report from your feedback.
Respondents came from across the health leader and
manager spectrum with 10% identifying as emerging
leaders and the remainder evenly spread across middle
and executive leadership.
It appears education matters, with 66% of respondents
citing having a Masters as their highest qualification, 11%
with PhDs and 20% with Bachelor qualifications. This
commitment to education has carried through to our
Certification Program with our credentialled members
committing to a program of lifelong learning.
The final page of the report lists the fifteen competencies
that had the lowest rankings in the self-assessment data,
and this will assist the College in informing professional
development programs to support our current and future
leaders. It is worth noting that some of these competencies
are quite discrete and it may be that “manages supply
chain” for example, is a specialty skill that is not inherently
necessary for all health leaders and might be better
expressed for most as “understands supply chain issues.”
Others, however, such as “creates and controls budgets”
are more important to the success of senior leaders.
I encourage you to consider this report and if you are a
College member, to use your own personal report from this
free self-assessment service to generate a plan for your
individual development. This report will be available shortly
on the College website under the Resources tab. The
College Board believes this aggregated data should be a
freely available resource for the health sector and your
participation supports the future of leadership. Better
leadership. Healthier Communities. It is also an opportunity
to conduct research into leadership development and be
published in this journal.
It was also particularly good to see over 180 people attend
in person our first face-to-face conference for two years, in
Melbourne on March 18th. Themed as “The Health of our
1

Nations,” the calibre and scope of speakers and panelists
was outstanding. I look forward to seeing so many of you in
Perth at the Annual Congress 21-23 September this year.
Plan now to come!!
Domain 3 – Business Skills Q9.1 Manages supply chain
Domain 3 – Business Skills Q7.4 Understands insurance management
Domain 4 – Comms & Relationships Q2.5 Applies marketing tools and principles
Domain 3 – Business Skills Q9.3 Manages supply contracts
Domain 3 – Business Skills Q9.4 Manages facilities
Domain 2 – Health & Healthcare Environment Q3.3 Promotes the preferences of population groups
Domain 2 – Health & Healthcare Environment Q4.2 Uses data to control threats to health
Domain 3 – Business Skills Q2.3 Creates and controls budgets
Domain 3 – Business Skills Q3.1 Promotes cultural safety and Indigenous rights
Domain 3 – Business Skills Q5.4 Plans for business continuity
Domain 3 – Business Skills Q2.2 Uses financial principles
Domain 2 – Health & Healthcare Environment Q3.4 Responds to diverse health needs
Domain 3 – Business Skills Q6.4 Promotes digital literacy
Domain 4 – Comms & Relationships Q2.4 Demonstrates effective public relations skills
Domain 5 – Professional & Social Responsibility Q1.1 Demonstrate commitment to policy advocacy
and capacity
To access the full report please click here
2
EDITORIAL
KNOWLEDGE, REFLECTION AND STRATEGY
Dr Mark Avery
Editor-in-Chief, Asian Pacific Journal of Health Management
This first issue of the journal for 2022 brings a comprehensive
range of contributions from a number of authors.
Reflection is a critically important process and opportunity
that contributes to the development of strategy. Creating
future opportunity stems from reflection on the past and
engagement with issues of the current time. Research
provides granular understanding for this.
The World Economic Forum’s (International Organisation for
Public–Private Corporation) recent global risks report [1]
examines risk tensions relevant to health, aged and social
care. Climate, social cohesion, livelihoods and infectious
diseases present as some current and emerging serious
issues. The current pandemic in itself, highlights these
problems, as well as for mental health, migration and social
security issues.
Papers presented in this issue work to contribute to this
continuum of learning, reflection and future strategy.
Researchers and authors here are offering new knowledge
and perspectives. From this range of work that we publish,
some examples of these knowledge contributions may be
identified.
The engagement and development opportunities for
health professionals is an ongoing responsibility.
Balasubramanian and Flood report on the importance of
engaging clinicians in an inclusive research culture where
research and innovation structures enable opportunity.
Martins et al. present and discuss skills and competencies
for health managers, particularly at the opportunity of
postgraduate education.
Access and understanding by patient and client
stakeholders are assessed and presented. Liu et al. present
findings and opportunities in relation to service access for
people with disabilities. Andriani et al. have studied access
and opportunities for those needing and requiring
antenatal care. Clements et al. provide research results
regarding patient perceptions and their engagement in
relation to the use of artificial intelligence (AI) in diagnostic
imaging.
Evaluation approaches and methods are examined
through the practical examination of temperature
monitoring of refrigerated pharmaceutical products by
Zamani and Wembridge.
A series of papers presented by researchers and authors in
relation to the COVID-19 disease and pandemic across
several countries and communities highlights critical
learning about population awareness, understanding and
sense making; care and support delivery in response
preparations; prehospital emergency care; tele-medicine
and the potential for re-purposing of drugs.
Recognition and Thanks – Dr. David Briggs AM
In February Dr. David Briggs completed his long and
distinguished association with our journal as Editor-in-Chief.
David provided strong knowledge, experience and
leadership from health care academia, delivery and
system management.
A critical part of a profession is having a body of knowledge
from which members may operate. The College enables
this knowledge through its commitment to this journal that
provides for expansion, development, debate and
translation to practice of healthcare management
knowledge. David Briggs has been a critical part of this
3
process and has worked to expand contributions and the
impact of the journal both nationally and internationally.
In starting my time in this role with the journal, I look forward
to contributions from researchers and practitioners as well
as ideas and suggestions towards the sustained growth and
development of this publication. I am particularly grateful
to Mrs Yaping Liu who undertakes both roles as Managing
Editor for the journal and ACHSM Librarian. Yaping has
great skills on journal operations and direction and is an
enormous support to the journal, College members and the
health management profession.
Dr. Mark Avery
Editor-in-Chief
References
1. World Economic Forum. The Global Risks Report 2022.
Geneva, Switzerland; 2022. ISBN: 978-2-940631-09-4.
Accessed February 2022
https://www3.weforum.org/docs/WEF_The_Global_Ris
ks_Report_2022.pdf
4
COMMENTARY
REPURPOSING OF POLIO VACCINE IN PREVENTION OF
COVID-19: THINKING TOWARDS MORE OPTIONS
Sunil Kumar1, Dharmendra Pandey1, Awanish Kumar2*
1. Faculty of Biosciences, Institute of Biosciences and Technology, Shri Ramswaroop Memorial University, Barabanki, Uttar
Pradesh, India
2. Department of Biotechnology, National Institute of Technology, Raipur, Chhattisgarh, India
Correspondence: [email protected]
ABSTRACT
COVID-19 has created an unprecedented crisis worldwide in every sector. There currently is no approved drug available
against this disease. The development of a vaccine is also a complex and long process that is often completed in 10-15
years. Recently, several vaccines for COVID-19 have received emergency approval for use but few experts deem that
currently approved COVID-19 vaccines might provide a temporary boost to the immune system, but they are dubious for
their long-term effect and safety. This article sheds light on polio vaccine as a possibility on COVID-19 prophylaxis because
this vaccine was developed through a rigorous process of the various phases of development. The polio vaccine could
provide another option to combat COVID-19 and if we have more options, we can fight more effectively against the
pandemic. The polio vaccine is utilized globally with a highly satisfactory retort and very good immune responses. By
seeing a satisfactory cross-protective immune response, the polio vaccination could be repurposed and offered against
COVID-19 for an effective immuno-prophylaxis and protection. This article focusses on the repurposing of vaccines/drugs
for COVID-19 and discusses the scientific rationale behind the suggestive use of the polio vaccine against COVID-19
because the polio vaccine is FDA-approved less expensive, readily available, easy to administer, and highly safe.
KEYWORDS
COVID-19; Vaccine repurposing; Polio vaccine; Immuno-prophylaxis against SARS-CoV-2; More prophylactic option
INTRODUCTION
The COVID-19 (coronavirus disease-2019) pandemic has
impacted all aspects of our life for the past two years. The
severe acute respiratory syndrome coronavirus-2 (SARS-
CoV-2) is an etiologic agent of COVID-19 that has infected
millions of people globally and put unprecedented strain
on healthcare systems [1–4]. Co-infections are a common
consequence [3, 5], especially with longer hospital stays
[6]. This coronavirus illness is worldwide disseminated and
has predisposed a relatively high proportion of individuals
to acute respiratory distress syndrome. While the world waits
for a fully verified vaccine of COVID-19, some experts
believe that current vaccinations might provide a much-
needed temporary boost to the immune system in order to
prevent infection. It is still unclear if such an approach
would work, and some authorities are skeptical. Others,
including Israeli, Dutch, and Australian researchers, are
5

investigating that a TB vaccine may help jump-start the
immune system and make COVID-19 less dangerous,
however, the WHO strongly recommends against using it
until it has been shown effective against the COVID-19
disease.
COVID-19 has created a global healthcare emergency,
particularly for poor countries like India, which have
inadequate healthcare resources and a patchwork
healthcare infrastructure. Given that we are in a
pandemic, it is critical to investigate the potential of
repurposing existing vaccinations. A recent
epidemiological study reported that live-attenuated
vaccinations (LAV) such as the Bacillus Calmette-Guérin
(BCG) measles vaccine and oral polio vaccine (OPV) may
induce non-specific immune responses after single or
double doses and may protect against different viruses [7-
13]. Furthermore, Mayo Clinic retrospective research found
that those who have had previous OPV immunizations over
a 1-, 2-, or 5-year period have a reduced incidence of
SARS-CoV-2 infection than for people who have not been
vaccinated yet [14].
The return of COVID-19 in India and in some other countries
has resulted in an upsurge in the number of pediatric
COVID-19 patient hospitalizations [15]. It may be claimed
that because the majority of these individuals were
vaccinated with OPV and BCG as part of the National
Immunization Schedule, the predicted cross-protection
from OPV against SARS-CoV-2 may not occur. However,
anecdotal data suggests that the relative COVID-19
severity in pediatric instances is lower than in adult cases,
even in the second wave, and it's possible that innate
immune system activation plays a role in partial immunity
to severe COVID-19 in pediatric cases. The possible reason
behind this is there was extensive Polio vaccination done in
children globally that could have resulted in innate immune
responses [activated natural killer (NK) cells and induction
of interferons (IFNs)] which offer a natural immunity against
SARS-CoV-2 in children. So if the Polio vaccine is offered to
the adult population, it will surely confer cross-protection in
adults against SARS-CoV-2.
After entering its third phase, which includes all people over
the age of 18, the world is presently experiencing severe
shortages in order to carry out an ambitious universal
COVID-19 immunization push. In such cases, innate
immune system reactivation with a LAV like OPV could
hypothetically act as partial immunity against COVID-19
until available vaccines become widely available and can
boost the immune response subsequently with a
combination of OPV, or inactivated vaccine category of
the three COVID-19 vaccine candidates that OPV, LAV,
and an adenovirus vector-based. We attempt to spotlight
discussion on some available data and scientific reasons
for the potential use of Polio vaccination against COVID-19
in this paper.
CURRENT THERAPEUTIC STATUS AND
REPURPOSING OF VACCINE/DRUG FOR
COVID-19: IN BRIEF
Currently, there is no dedicated drug available for COVID-
19 treatment. The current research and development
(R&D) of drugs and their production timelines are not
conducive to give any quick responses to COVID-19
pandemic threats. Anti-COVID-19 drugs are in the
development phase and may take a few years to come
into the global market [16]. Since the process of research
and working on new content is time-consuming, expensive,
and needs regulatory approvals, therefore repurposing
could shorten the time and reduce the cost of the vaccine
and drug discovery [17]. Repurposing of vaccines and
drugs may give relief for the current pandemic because
repurposing of vaccines/drugs, represents an effective
strategy to use existing vaccines/drugs to combat the
unknown threat. Opinions of researchers have
demonstrated that some existing vaccines (like Polio and
BCG) may protect against other viral infections of the
respiratory tract. A Phase 3 randomized double-blind trial of
oral polio vaccine was completed, and its efficacy and
safety studies were also performed for COVID-19 [18]. The
trial of the BCG vaccine to check its efficacy against
COVID-19 has begun with the collaboration of four
countries Australia, Germany Netherlands, and United
Kingdom [19]. These steps could be useful because in the
present situation active research seeks to hasten and
strengthen vaccine development for COVID-19. After all,
significant vaccination is needed in society to achieve herd
immunity against COVID-19. Some vaccines for COVID-19
received emergency approval and some are under a
development phase. Polio and BCG vaccines may offer a
new potential tool in dealinf with COVID-19 because they
are safe and approved already.
Repurposing drugs would be another potent strategy to
treat common and rare diseases like COVID-19.
Repurposing of drugs is strongly advocated because it
offers the use of risk-addressed compounds that can be
developed in shorter timelines with lower costs.
6
Hydroxychloroquine (an analog of chloroquine) is a
popular and approved antimalarial drug which was found
to be efficient on nCOV and reported to be effective on
COVID-19 patients in China, USA, and other countries [20].
In the direction of repurposing, a recent powerful network-
based study was performed with some repurposed drugs
(e.g., sirolimus, mercaptopurine, and melatonin) for rapid
identification of a potential drug against COVID-19 [21]. A
trial of the antiviral drug Lopinavir–Ritonavir was undertaken
in adult hospitalized patients in China, but no significant
result was observed in severe COVID-19 patients [22].
However, repurposing/testing of some other antiviral
agents like Favipiravir, Remdesivir, and other classes of
drugs is warranted in the future to anticipate some good
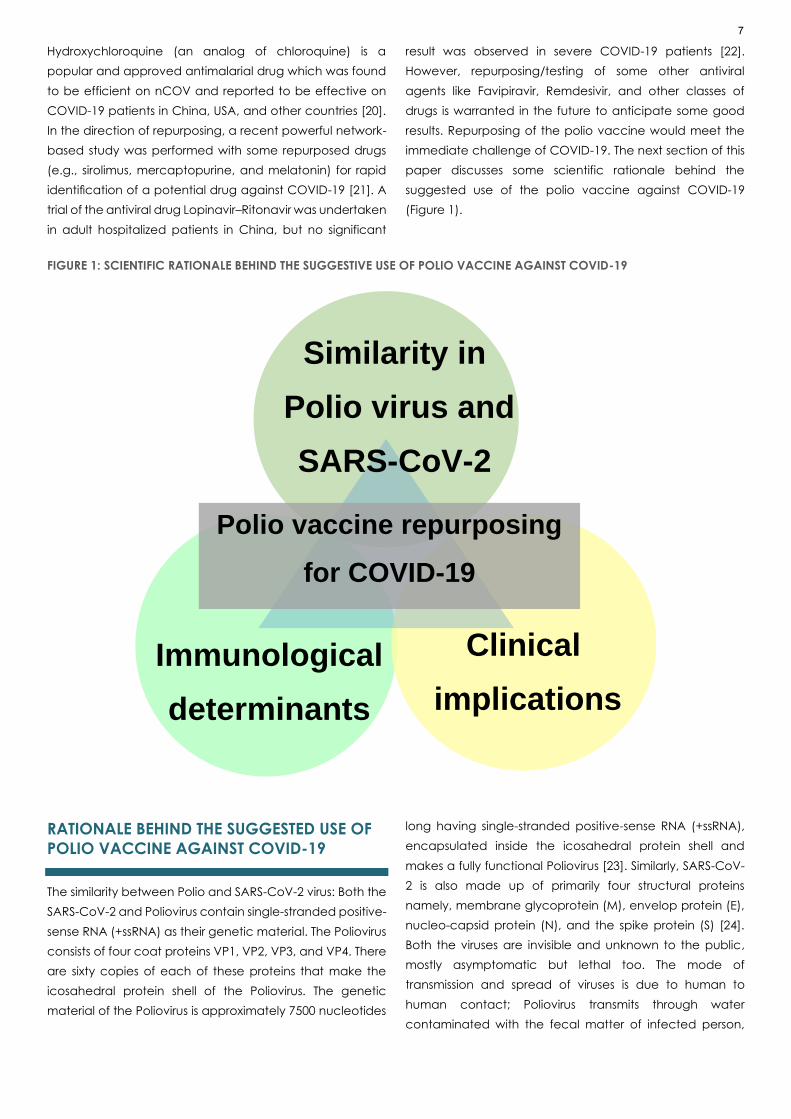
results. Repurposing of the polio vaccine would meet the
immediate challenge of COVID-19. The next section of this
paper discusses some scientific rationale behind the
suggested use of the polio vaccine against COVID-19
(Figure 1).
FIGURE 1: SCIENTIFIC RATIONALE BEHIND THE SUGGESTIVE USE OF POLIO VACCINE AGAINST COVID-19
RATIONALE BEHIND THE SUGGESTED USE OF
POLIO VACCINE AGAINST COVID-19
The similarity between Polio and SARS-CoV-2 virus: Both the
SARS-CoV-2 and Poliovirus contain single-stranded positive-
sense RNA (+ssRNA) as their genetic material. The Poliovirus
consists of four coat proteins VP1, VP2, VP3, and VP4. There
are sixty copies of each of these proteins that make the
icosahedral protein shell of the Poliovirus. The genetic
material of the Poliovirus is approximately 7500 nucleotides
long having single-stranded positive-sense RNA (+ssRNA),
encapsulated inside the icosahedral protein shell and
makes a fully functional Poliovirus [23]. Similarly, SARS-CoV-
2 is also made up of primarily four structural proteins
namely, membrane glycoprotein (M), envelop protein (E),
nucleo-capsid protein (N), and the spike protein (S) [24].
Both the viruses are invisible and unknown to the public,
mostly asymptomatic but lethal too. The mode of
transmission and spread of viruses is due to human to
human contact; Poliovirus transmits through water
contaminated with the fecal matter of infected person,
Similarity in
Polio virus and
SARS-CoV-2
Immunological
determinants
Clinical
implications
Polio vaccine repurposing
for COVID-19
7

while transmission of SARS-CoV-2 is thought to be primarily
by droplets [25].
Immunological determinants: A prompt and coordinated
innate and adaptive immune response works as a first line
of defense in SARS-CoV-2 infection. However, the excessive
and uncontrolled immune response of the host immune
system, such as cytokine storm, may be deleterious to the
COVID-19 patient. The severity of COVID-19 pathology can
be signified by a substantial surge in serum levels of pro-
inflammatory cytokines (e.g., IL-1β, IL-2, IL-6, IL-8, IL-17, G-
CSF, GM-CSF, IP-10, MCP-1, CCL3, and TNFα) as well as an
absolute decline of circulating CD4+, CD8+, B cells and
natural killer cells along with decreased levels of basophils,
eosinophils, and monocytes [26]. In the case of Poliovirus
infection, extraneural organ activation of IFNα/β in the
CD155 transgenic mice model has been observed.
Additionally, augmentation of cytokines and antigen
presentation, as well as inhibition of NF-κB, has also been
observed in post-poliovirus infection [27].
Several case studies at autopsy of the lung from people
who died due to COVID-19, shows infiltration in alveolar
immune cells. A post-mortem outcome from 38 patients
who died due to COVID-19 showed plenty of CD68 positive
macrophages present in the alveolar lumen and a few
CD45 positive lymphocytes were seen in the interstitial
space [26]. Another case study of histology of lung autopsy
of a COVID-19 patinets indicated a low amount of
polymorphonuclear neutrophils (PMN) and the moderate
number of macrophages was present in the alveolar
exudate, whereas infiltration of monocytes and T cells, but
not B cells, was seen in interstitial compartment [28].
Clinical implications: Recent studies show Poliovirus
vaccine can show cross-reactivity and thereby induce
adaptive immunity and prevent the infection from SARS-
CoV-2. Administration of Poliovirus vaccine generates
antibodies against RdRP (RNA dependent RNA
polymerases) protein, binds to RdRP of both Poliovirus as
well as SARS-CoV-2 [14]. Another study that explored the
effect of other available vaccines and their role in
preventing SARS-CoV-2 infection shows that people
administered with Polio vaccine show a lower rate of SARS-
CoV-2 infection [29]. However, several vaccines have been
developed for COVID-19, alternative therapeutical
approaches, in addition to the repurposing of old drugs (as
explained above), are needed to develop the potential
drug against SARS-CoV-2 to contain the viral infection.
Most recent COVID-19 vaccination has the strongest
nonspecific effects, therefore, we hypothesize that, even
though SARS-CoV-2 suppresses TLR signaling, the
prophylactic use of OPV or other LAV could activate innate
immunity before COVID-19 infection via TLRs, priming the
immune response/system for adaptive immunity if SARS-
CoV-2 infection occurs later. Despite the UNICEF and
WHO’s efforts to phase down OPV a year after wild
Poliovirus eradication, the potential advantages of OPV for
COVID-19 need prospective research to determine the
impact of OPV on COVID-19 illness and death globally.
High rates of morbidity and death associated with COVID-
19 have already seen globally [30], therefore, it is critical to
do these trials as soon as possible.
CONCLUDING REMARKS
Significant vaccination is needed in society to achieve
herd immunity against COVID-19. Some vaccines for
COVID-19 have recieved emergency approval for use and
some are under the development phase in different
countries of the world. There is a large overall population of
the world is to be vaccinated but many are hesitant with
the currently used COVID-19 vaccines. The use of FDA
approved Polio vaccine against COVID-19 is tested and
safe, therefore, it could be thought of as one more option.
Some common points are also associated between
Polioviruse and SARS-CoV viz, their primary replication and
possible cross-protective innate immunity offered by Polio
vaccine further suggested it’s repurposing for immune-
prophylaxis and prevention of COVID-19. It will surely save
time, resources, and lives of billions of people worldwide
and protect society which is currently facing the COVID-19
pandemic.
DECLARATIONS
Ethics approval and consent to participate:
This article does not contain any studies involving human
participants or animals performed by any of the authors.
Consent for publication:
Not applicable
Availability of data and material:
Not applicable
Competing interests:
None
Funding:
8

The authors have no financing to disclose.
Acknowledgements:
Authors are grateful to the National Institute of Technology,
Raipur (CG), India and Shri Ramswaroop Memorial
University (SRMU), Barabanki (UP), India for providing the
facility and space for this work.
All authors have read and approved the manuscript
References
1. Soltani S, Zakeri A, Zandi M, Kesheh MM, Tabibzadeh
A, Dastranj M, Faramarzi S, Didehdar M, Hafezi H,
Hosseini P. The role of bacterial and fungal human
respiratory microbiota in COVID-19 patients. BioMed
Research Intl. 2021;
https://doi.org/10.1155/2021/6670798
2. Talento AF, Hoenigl M. Fungal infections complicating
COVID-19: with the rain comes the spores. J. Fungi.
2020; 6:279.
3. Chowdhary A, Sharma A. Since January 2020 Elsevier
has created a COVID-19 resource centre with free
information in English and Mandarin on the novel
coronavirus COVID-19. The COVID-19 resource centre
is hosted on Elsevier Connect the company public
news and information. 2020.
4. Rawson TM, Wilson RC, Holmes A. Since January 2020
Elsevier has created a COVID-19 resource centre with
free information in English and Mandarin on the novel
coronavirus COVID- 19. The COVID-19 resource centre
is hosted on Elsevier Connect, the company ’ s public
news and information. 2020.
5. Arastehfar A, Carvalho A, Nguyen MH, Hedayati MT,
Netea MG, Perlin DS, Hoenigl M. COVID-19-associated
candidiasis (CAC): an underestimated complication in
the absence of immunological predispositions? J.
Fungi. 2020; 6:211-223.
6. Kubin CJ, McConville TH, Dietz D, Zucker J, May M,
Nelson B, Istorico E, Bartram L, Small-Saunders J,
Sobieszczyk ME. Characterization of bacterial and
fungal Infections in hospitalized patients with
Coronavirus Disease 2019 and factors associated with
health Care-Associated Infections. Open Forum Infect.
Dis. 2021; 8. https://doi.org/10.1093/ofid/ofab201
7. Blok BA, Arts RJ, van Crevel R, Benn CS, Netea MG.
Trained innate immunity as underlying mechanism for
the long‐term, nonspecific effects of vaccines. J
Leukoc Biol 2015; 98: 347-356.
8. De Bree LC, Koeken VA, Joosten LA, Aaby P, Benn CS,
van Crevel R. Non-specific effects of vaccines: Current
evidence and potential implications. Semin Immunol.
2018; 39: 35-43.
9. Higgins JP, Soares-Weiser K, Reingold A. Systematic
Review of the Non-specific Effects of BCG, DTP and
Measles Containing Vaccines. Geneva: World Health
Organization. 2014.
10. Jensen KJ, Benn CS, van Crevel R. Unravelling the
nature of non-specific effects of vaccines a challenge
for innate immunologists. Semin Immunol. 2016; 28:
377-383.
11. Aaby P, Benn CS. Beneficial nonspecific effects of oral
polio vaccine (OPV): Implications for the cessation of
OPV? Clin Infect Dis. 2017; 65: 420-421.
12. Higgins JP, Soares-Weiser K, Lopez-Lopez JA, Kakourou
A, Chaplin K, Christensen H. Association of BCG, DTP,
and measles containing vaccines with childhood
mortality: Systematic review. BMJ. 2016; 355:i5170. doi:
10.1136/bmj.i5170.
13. Upfill-Brown, A, Taniuchi M, Platts-Mills JA, Kirkpatrick B,
Burgess SL, Oberste MS. Nonspecific effects of oral
polio vaccine on diarrheal burden and etiology
among Bangladeshi infants. Clin Infect Dis. 2017; 65:
414-419.
14. Pawlowski C, Puranik A, Bandi H, Venkatakrishnan AJ,
Agarwal V, Kennedy R. Exploratory analysis of
immunization records highlights decreased SARS-CoV-
2 rates in individuals with recent non-COVID-19
vaccinations. Sci Rep. 2021; 11(1):4741. doi:
10.1038/s41598-021-83641-y.
15. Thevar S. More children COVID positive in second
wave. Hindustan Times. 2021; Available. https://www.
hindustantimes.com/cities/pune-news/more-children-
covid- positive-in-second-wave-101618657160956.html
16. Abd El-Aziz TM, Stockand JD. Recent progress and
challenges in drug development against COVID-19
coronavirus (SARS-CoV-2)-an update on the status.
Infect Genet Evol. 2020; 83:104327.
doi:10.1016/j.meegid.2020.104327.
17. Pushpakom S, Iorio F, Eyers P. Drug repurposing:
progress, challenges and recommendations. Nat Rev
Drug Discov. 2019; 18, 41–58.
18. Lloyd T. A Phase 3 randomized double blind efficacy
and safety study of oral Polio Vaccine and NA-831 for
Covid-19 (OPV-NA831). Available
9

<https://clinicaltrials.gov/ct2/show/NCT04540185>
(9/9/2022).
19. Sandhya R. 100-year-old TB vaccine now being tested
for Covid-19, India may conduct a trial too. 2020
Available <https://theprint.in/health/100-year-old-tb-
vaccine-now-being-tested-for-covid-19-india-may-
conduct-a-trial-too/387839/> (25/3/2020).
20. Gautret P. Hydroxychloroquine and azithromycin as a
treatment of COVID-19: results of an open-label non-
randomized clinical trial. Int J Antimicrob Agents. 2020;
20:105949.
21. Zhou Y. Network-based drug repurposing for novel
coronavirus 2019-nCoV/SARS-CoV-2. Cell Discov. 2020;
16; 6:14.
22. Cao B, Yeming W. et al. A Trial of Lopinavir Ritonavir in
adults hospitalized with severe COVID-19. N Engl J
Med. 2020; 382: 1787-1799.
23. Wein MW, Chow M, Hogle JM. Poliovirus: new insights
from an old paradigm. Structure 1996; 4:763-767.
24. Hu B, Guo H, Zhou P. et al. Characteristics of SARS-
CoV-2 and COVID-19. Nat Rev Microbiol. 2021; 19:
141-154.
25. Shurtleff D. Polio and COVID-19. 2020;
https://wcaap.org/polio-and-covid-19/ .
26. Catanzaro M, Fagiani F, Racchi M. Immune response
in COVID-19: addressing a pharmacological
challenge by targeting pathways triggered by SARS-
CoV-2. Sig Transduct Target Ther. 2020; 5, 84;
https://doi.org/10.1038/s41392-020-0191-1
27. Aguiar D, Lobrinus JA, Schibler M, Fracasso T, Lardi C.
Inside the lungs of COVID-19 disease. Int J Legal Med.
2020;134:1271-1274.
28. Carsana L, Sonzogni A, Nasr A, Rossi RS, Pellegrinelli A,
Zerbi P, Rech R, Colombo R, Antinori S, Corbellino M,
Galli M, Catena E, Tosoni A, Gianatti A, Nebuloni M.
Pulmonary post-mortem findings in a large series of
COVID-19 cases from Northern Italy. Lancet Infect Dis.
2020; 20:1135-1140.
29. Sun Y, Abriola L, Niederer RO, Pedersen SF, Alfajaro
MM, Monteiro VS, Wilen CB, Ho YC, Gilbert WV,
Surovtseva YV, Lindenbach BD, Guo JU. Restriction of
SARS-CoV-2 replication by targeting programmed −1
ribosomal frameshifting. Proc Natl Acad Sci USA 2021,
118(26):e2023051118.
30. Kumar, A. COVID-19 gripped the globe with some
unnoticed facts and too many questions. VirusDis.
2021; 32: 609–612.
10

VIEWPOINT ARTICLE
TOWARDS AN INCLUSIVE RESEARCH CULTURE IN UPCOMING
HEALTH AND EDUCATION PRECINCTS IN NEW SOUTH WALES,
AUSTRALIA: IMPLICATIONS FOR POLICY AND PRACTICE
Madhan Balasubramanian 1,2, Victoria Flood 3,4
1. Health Care Management, College of Business, Government and Law, Flinders University, Adelaide, Australia
2. Menzies Centre for Health Policy and Economics, School of Public Health, Faculty of Medicine and Health, The University of
Sydney, Australia
3. School of Health Sciences, Faculty of Medicine and Health, The University of Sydney, Australia
4. Western Sydney Local Health District, NSW Health, Westmead, Australia
Correspondence: [email protected]
ABSTRACT
An inclusive research culture is vital towards the maturity of Health and Education Precincts into an active innovation
ecosystem. To date, substantial investments have been made in 13 upcoming Health and Education Precincts in varying
stages of development in the Greater Sydney region, New South Wales. The political commitment to create an innovative
environment for teaching and a vibrant research culture is noticeable. However, it is unclear to what extent government
policy engages the breadth of clinical personnel in teaching and research-related activities and contributes towards
improving research culture. Based on a study conducted at the central river district of the Greater Sydney region, we
argue that better engagement of clinical personnel in teaching/research-related activities and inclusion of research-
related roles within the job description of clinical personnel can substantially drive a positive research culture and thereby
contribute towards the overall development of Health and Education Precincts. Opportunities for continued education
and training of clinical personnel and involvement in graduate research programs also substantially drives research
culture. We argue that future policy and practice solutions for upcoming Health and Education Precincts need to foster
an inclusive research culture and should be tailored to meet the needs of an i nnovative ecosystem. Future solutions will
need to contribute towards improving research culture as well as the health and wellbeing of people in the region.
KEYWORDS
health and education precincts; innovation; research culture; leadership
INTRODUCTION
The Greater Sydney Commission’s (hereon referred to as
‘the Commission’) vision for the future of Sydney proposes
an interconnected metropolis of three cities: western
parkland city (Penrith), central river city (Parramatta) and
eastern harbour city (Sydney).[1] The Commission’s vision
brings new thinking to livability, productivity and
sustainability so as to radically transform the region into an
innovative and high growth economy. [1, 2] Health and
education precincts are classified as strategic centres for
development by the Commission.
11

At the basic level, a health and education precinct
includes a University collaborating or co-located alongside
a major hospital or principal referral hospital.[1, 3] Maturity
pathways for such precincts include the development of
medical research institutions, commercialisation of
research, startup accelerators, venture capital firms,
multidisciplinary university settings, residential facilities and
enabling an active innovation ecosystem.[3] As precincts
evolve in nature, the economic productivity of the precinct
is also set to increase substantially.[4] The Commission
recognises 13 health and education precincts at various
stages of development in the Greater Sydney region.[1]
Box 1 provides the list of these precinct names along with
their location in the Greater Sydney region and key
stakeholders.
BOX 1: HEALTH AND EDUCATION INNOVATION PRECINCTS IN GREATER SYDNEY REGION, NSW
NO.
PRECINCT
NAME
GREATER SYDNEY
COMMISSION
REGION
MAIN INNOVATION PARTNERS†
1 Camperdown-
Ultimo
Eastern Harbour City
District
Sydney LHD; Royal Prince Alfred Hospital; Sydney Health Partners; TAFE
NSW; University of Sydney; University of Technology Sydney; University of
Notre Dame; George Institute of Global Health; Woolcock Institute of
Medical Research; Sydney City Council
2 Randwick Eastern Harbour City
District
South Eastern Sydney LHD; Prince of Wales Hospital; Sydney Children’s
Hospital; Royal Hospital for Women, University of New South Wales; TAFE
NSW Randwick; Randwick City Council
3 Rhodes East Eastern Harbour City
District
Sydney LHD; Concord Repatriation General Hospital; TAFE NSW; University
of Sydney; Canada Bay City Council
4 Westmead Central River City
District
Western Sydney LHD; Westmead Public Hospital; Westmead Private
Hospital; Sydney Children’s Hospital Network; The Westmead Institute of
Medical Research; Children’s Medical Research Institute; City of
Parramatta Council; Cumberland Council; Sydney Business Chamber
5 Blacktown Central Riven City
District
Western Sydney LHD; Blacktown Public Hospital; Western Sydney
University; TAFE NSW Blacktown; Blacktown City Council
6 Greater Penrith Western Garden
City District
Nepean Blue Mountains LHD; Nepean Public Hospital; Nepean Private
Hospital; Nepean Blue Mountains Primary Health Network; Wentworth
Healthcare; Nepean Blue Mountains Education and Medical Research
Council; Western Sydney University; University of Sydney; TAFE NSW;
Celestin; Penrith City Council
7 Liverpool Western Garden
City District
South Western Sydney LHD; Liverpool Hospital; South West Sydney Primary
Health Network; Western Sydney University; University of Wollongong;
University of New South Wales; TAFE NSW; Ingham Institute of Applied
Medical Research; Liverpool City Council
8 Campbelltown-
Macarthur
Western Garden
City District
South Western Sydney LHD; Western Sydney University; Ingham Institute of
Applied Medical Research; South Wes Sydney Primary Health Network;
University of Wollongong; University of New South Wales; TAFE NSW;
Campbelltown-Macarthur City Council
9 St Leonards North District Northern Sydney LHD; Sydney Royal North Shore Hospital; North Shore
Private Hospital; Ramsay Health Care; North Shore Radiology; Genesis
Care; TAFE NSW North Shore; North Sydney, Willoughby and Lane Cove
City Councils; NSW Health; Genesis Care
12

10 Frenchs Forest North District Northern Sydney LHD; Northern Beaches Hospital; NSW Health; Northern
Beaches Council
11 Macquarie Park North District Northern Sydney LHD; Macquarie University; Abbott; AMP Capital;
Australian Learning Hub, Cochlear; Johnson and Johnson; 3M Fujistsu;
Schneider Electric; Konica Minolta; National Bank of Australia; NSW
Government; Optus & Orix Australia; CSIRO; City of Ryde Council
12 Bankstown South District South Western Sydney LHD; Bankstown-Lidcombe Hospital, Western
Sydney University; TAFE NSW Bankstown; Bankstown-Cantebury Council;
13 Kogarah South District South Eastern Sydney LHD; St Georges Hospital; St Georges Private
Hospital; Western Sydney University; University of New South Wales; St
George & Sutherland Medical Research Foundation; Georges River
Council
Note: †List of main innovation partners is not exhaustive. LHD is a Health Local Health District – administrative zones of NSW Health.
The organisational philosophy of a health and education
precinct is to build a culture that strengthens collaboration
between clinical/health personnel and
academic/university personnel.[5] It is recognised that the
roles and responsibilities may vary - the main role of
academic personnel is teaching and research, while
clinical personnel are more engaged in patient care roles.
A few traditional measures for collaboration are already in
place through teaching and research programs offered by
universities within major public hospital settings. For
example, the University of Sydney has longstanding clinical
teaching and research units based at several public
referral hospitals (such as Royal Prince Alfred Hospital,
Concord Hospital, Westmead Hospital).[6] Both academic
personnel (employed through the University) and clinical
personnel (mainly employed by the public hospital and
holding a University affiliation) have been involved in
teaching and research activities. However, for a large
majority of clinical personnel, these activities fall outside the
purview of their main patient care roles.
While accommodating the Commission’s vision for the
future of Sydney, it is necessary to encourage collaboration
between health and education sectors and strengthen
evidence-based care provision in the upcoming precincts.
Building an inclusive research culture is the foundation of
evidence-based practice and sound decision making.[7] It
is well recognised that health settings that actively engage
in research show improved patient and health
outcomes.[8] The ability of all health personnel to engage
in research-related activities - such as reviewing, utilising,
conducting, evaluating and disseminating research
evidence - is vital.[9] Creating an inclusive research culture
also improves skill sets, job satisfaction and career
opportunities for health personnel.[10] Undoubtedly, a
positive and inclusive research culture is an essential aspect
for an innovative ecosystem, strengthening the global
reputation and contributing to the economic
development of the upcoming health and education
precincts.
LESSONS FROM A WESTERN SYDNEY STUDY
We conducted a study on research culture and capacity
of all health personnel (medical, nursing and allied health)
located at the central river city district1 of the Commission’s
region. [11] The study area included two upcoming health
and education innovation precincts at Westmead and
Blacktown [12], along with Auburn, Mt Druitt and
Cumberland hospitals and community health centres.
Together, they formed part of the Western Sydney Local
Health District, which is one of the 15 health administrative
districts of NSW Health.[13] Geographically, it also includes
four local government areas of Parramatta Council,
Blacktown Council, Cumberland Council and the Hills Shire.
Figure 1 provides an illustration of the study area; locating
the study area within the Greater Sydney Region and
identifying the upcoming health and education innovation
precincts.
_______________ 1 The Greater Sydney Commissions plan document classifies the region into five districts: eastern harbour city district, centra l river city district, western
parkland city district, north district and south district
13

FIGURE 1: A MAP OF GREATER SYDNEY REGION, WITH THE STUDY AREA MARKED IN BLUE
Note: This map has been modified using sources from the Greater Sydney Commission and Western Sydney Local Health District maps. Th e yellow dots are
the health and education precincts. Map not to scale
The Universities of Sydney and Western Sydney are the main
higher education universities in the study area and have
established bases in the region. Both Universities have
made considerable investments and envision the
upcoming health and education precincts at Westmead
and Blacktown as global centres for excellence and
multidisciplinary innovation[14].
Approximately 7150 clinical personnel (2079 medical; 4100
nursing and 968 allied health) were employed in the public
health sector (i.e. Western Sydney Local Health District) at
1 REDCap is being widely deployed in NSW Health and used by researchers
across the local health districts. The functionality is similar to other online
the time of the study. Overall, the public health sector
serves over one million people in the region. Over 43
percent of the population in the region were born
overseas, and about 45 percent speak a language other
than English at home.[15] The region is also the home to the
highest urban aboriginal population in NSW (about 13,400
aboriginal people based on 2016 census).[15]
All health personnel (medical, nursing and allied health)
employed at the study area were invited to participate in
a survey through an online questionnaire via a Research
Electronic Data Capture (REDCap) system1 . The survey was
surveys such as Qualtrics/Survey Monkey but provides secure storage
functions.
14

administered between November 2016 to January 2017. A
range of data items, including demographic, work status
and research biodata were collected. Research culture
(outcome variable) was assessed using a battery of 51
items, classified across three domains: individual level (14
items); team level (19 items) and organisational level (18
items). Health professionals (medical, nursing and allied
health); gender (male, female); age groups (less than 35
yrs, 35-45 yrs and 55+ yrs); educational qualification
(undergraduate, graduate, higher degree research); team
role (clinician, management, teaching/research);
experience years (5 yrs or less, 6 to 15 yrs, and 15+ yrs);
enrolled in a research program and having research in role
description - were used as covariates.
Respondents were asked to rank their level of skill/
confidence to each item/statement of the research
culture domains ranging from 1 to 10, with 1 being in least
agreement and 10 being in strong agreement to that
item/statement. Responses were later dichotomised into
two groups using mean scores of < 6 as cut-off point (scores
< 6 were considered to be a lower level of skill/confidence
in the concerned scale/domain and coded as 0; scores of
≥ 6 were considered have a higher level of skill/confidence
with the concerned scale/domain, and were coded as 1).
These dichotomised scales were first examined by sample
characteristics using chi-square tests, and a level of
significance set at p<0.05. Characteristics found significant
at any research culture domain were included as
covariates in the multivariate log-binomial regression
models. Adjusted odds ratios were generated. Ethics
approval for the study was obtained from an approved
Human Research Ethics Committee in Australia. In this
viewpoint, we have presented results of the logistic
regression analysis; a prior publication has examined the
descriptive nature of the findings from the study.[11]
Table 1 presents the findings from the regression analysis of
the dichotomised research culture domains with selected
sample characteristics. Adjusted log-binomial models are
presented for each domain. Respondents with a higher
degree by research qualification had a consistently higher
odds ratio of having a higher level of skill/confidence the
three research culture domains compared with
respondents with an undergraduate or graduate
qualification. Respondents engaged in teaching and
research, also had a higher odds ratio of identifying higher
skill level / confidence for the team and organisational
research culture domains, compared with respondents
mainly involved in clinical and management/executive
tasks. A further finding was respondents not having
research within their role description were less likely to
identify higher skills / confidence for each of the research
culture domains, and this was significant at the individual
and team domains.
TABLE 1: LOGISTIC REGRESSION ANALYSIS | WESTERN SYDNEY STUDY
INDIVIDUAL LEVEL TEAM LEVEL
ORGANISATIONAL
LEVEL
VARIABLE OR 95% CIS OR 95% CIS OR 95% CIS
Profession
Medical Ref.
Ref.
Ref.
Nursing 0.29 ** (0.13, 0,62) 0.4 * (0.17, 0.91) 0.87
(0.4, 1.91)
Allied health 0.57
(0.27, 1.18) 0.39 * (0.17, 0.86) 0.69
(0.4, 1.47)
Gender
Male Ref.
Ref.
Ref.
Female 1.03
(0.55, 1.95) 1.21
(0.58, 2.52) 0.99
(0.52, 1.9)
Age group
Less than 35 yrs Ref.
Ref.
Ref.
35 to 54 yrs 0.99
(0.45,2.21) 1.07
(0.38, 3.02) 1.25
(0.51, 3.06)
55+ yrs 1.17
(0.44,3.14) 0.65
(0.19, 2.21) 1.11
(0.38, 3.23)
Educational Qualification
Undergraduate level Ref.
Ref.
Ref.
15

Graduate level 1.59
(0.87,2.93) 1.23
(0.61, 2.48) 1.57
(0.82. 3.03)
HDR level 8.64 ** (3.79,19.72) 2.37 * (1.01, 5.58) 2.56 * (1.12, 5.85)
Enrolled in a study/research program
Yes Ref.
Ref.
Ref.
No 0.22 ** (0.12,0.42) 0.63
(0.31, 1.27) 0.81
(0.42, 1.58)
Team role
Clinician Ref.
Ref.
Ref.
Management/Executive 1.32
(0.66,2.64) 1.1
(0.49, 2.47) 1.95
(0.97, 3.9)
Teaching/Research 1.45
(0.77,2.71) 2.96 ** (1.53, 5.73) 1.99 * (1.05, 3.75)
Years of experience
5 yrs or less Ref.
Ref.
Ref.
6 to 15 yrs 0.8
(0.35,1.84) 0.36 * (0.13, 0.98) 0.18 ** (0.07, 0.44)
16+ yrs 1.33
(0.51,3.48) 1.18
(0.37, 3.74) 0.23 ** (0.08, 0.7)
Research in role description
Yes Ref.
Ref.
Ref.
No 0.49 ** (0.30,0.81) 0.38 ** (0.22, 0.67) 0.88
(0.53, 1.47)
*p<0.05. **p<0.01.
Ref is Reference Category; OR is Odds Ratio; CI is 95% Confidence Interval.
Multivariate log-binomial regression models; Adjusted odds ratios were generated; Models accommodated selected variables and
simultaneously adjusted for the outcome variable.
Only health personnel employed by the public health
system (Western Sydney Local Health District) were
surveyed. Private hospitals in the region were not included.
However, the public sector is the largest employer of health
personnel in the region. Further, the study did not evaluate
the research culture of the health and education precincts
per se, but chose to examine only an aspect of the
precincts - the health sector. This decision was conscious as
the purpose of the study was to build an inclusive research
culture for evidence-based practice among the health
professionals.
ON REFLECTION: POLICY AND PRACTICE
IMPLICATIONS
An inclusive research culture is vital towards the maturity of
health and education precincts into an active innovation
ecosystem. It is preferable to engage a wide variety of
clinical personnel as part of the process of establishing a
vibrant research culture. To date, substantial investments
have been made in Health and Education Precincts in the
Greater Sydney region. In the Westmead precinct alone,
over 3 billion has been committed by the government,
University and private sector for infrastructure and
development projects.[16] Amongst a new central acute
services building and a new pediatric services building, the
university infrastructure has also been strengthened via
conference facilities and dedicated university spaces (for
teaching and research) alongside the clinical facilities.[16]
While, the political intent to enable a collaborative
environment for teaching and research is visible, it is
unclear to what extent these changes will contribute to
improving the research culture for a large majority of
clinical personnel.
In this paper, we have provided insights into enabling
factors for improving research culture to drive an
innovative ecosystem in the Health and Education
Precincts. Our viewpoint, however, is based on findings
from two Health and Education Precincts. We recognize
that the underlying social determinants, geographic
location, population needs, health professionals and
universities will determine the inherit nature of upcoming
Health and Education Precincts. While our findings are
suggestive and should be viewed with some caution, there
are considerable implications across all the 13 Health and
Education Precincts in NSW. We argue that policy and
practice solutions will need to be tailored to meet the
emerging population needs in each region. To this end,
improving research culture and involving clinical staff in
research and teaching related activities will undoubtedly
create a vibrant innovative ecosystem.
16

References
1. Greater Sydney Commission, NSW Government.
Greater Sydney Region Plan: A Metropolis of Three
Cities. 2018; 1–192.
2. Clark G, Moonen T. International Case Studies of
Connected Cities: Advice to the Greater Sydney
Commission. Sydney, https://gsc-public-
1.s3.amazonaws.com/s3fs-
public/international_case_studies_of_connected_citie
s_-_clark_moonen_-_october_2017.pdf (2017).
3. Greater Sydney Commission. Growing and investing in
health and education precincts: Maturity pathways
for health and education precincts,
https://www.greater.sydney/north-district-
plan/productivity/jobs-and-skills-city/growing-and-
investing-health-and-education (2020, accessed 5
June 2020).
4. Yigitcanlar T, Velibeyoglu K, Martinez-Fernandez C.
Rising knowledge cities: The role of urban knowledge
precincts. J Knowl Manag 2008; 12: 8–20.
5. Harding K, Lynch L, Porter J, et al. Organisational
benefits of a strong research culture in a health
service: A systematic review. Aust Heal Rev 2017; 41:
45–53.
6. The University of Sydney. Clinical schools - Faculty of
Medicine and Health, The University of Sydney,
https://www.sydney.edu.au/medicine-
health/schools/clinical-schools.html (2020, accessed 5
June 2020).
7. Bennett CC. A healthier future for all Australians: an
overview of the final report of the National Health and
Hospitals Reform Commission. Med J Aust 2009; 191:
383–387.
8. NSW Ministry of Health. NSW Health and Medical
Research Strategic Review. Sydney,
https://www.medicalresearch.nsw.gov.au/wp-
content/uploads/2018/07/strategic-review-report-
2012.pdf (2012).
9. Boaz A, Baeza J, Fraser A. Effective implementation of
research into practice: an overview of systematic
reviews of the health literature. BMC Res Notes 2011; 4:
212.
10. Finch E, Cornwell P, Ward EC, et al. Factors influencing
research engagement: research interest, confidence
and experience in an Australian speech-language
pathology workforce. BMC Health Serv Res 2013; 13:
144,
11. Lee S, Byth K, Gifford J, et al. Assessment of Health
Research Capacity in Western Sydney Local Health
District (WSLHD): A Study on Medical, Nursing and
Allied Health Professionals. J Multidiscip Healthc 2020;
Volume 13: 153–163.
12. Greater Sydney Commission. Western City District Plan.
2018; 135.
13. NSW Health. Local health districts,
https://www.health.nsw.gov.au/lhd/Pages/default.as
px (2020, accessed 5 June 2020).
14. University of Sydney. University a partner in vision for
Western Sydney - The University of Sydney,
https://www.sydney.edu.au/news-
opinion/news/2016/07/19/university-a-partner-in-
vision-for-western-sydney-.html (2016, accessed 8
August 2020).
15. WSLHD, NSW Health. Western Sydey Local Health
District, https://www.wslhd.health.nsw.gov.au/ (2020,
accessed 5 June 2020).
16. Health N. Westmead Redevelopment,
http://www.westmeadproject.health.nsw.gov.au/new
s-and-publications/latest-news/july-2016/westmead-s-
exciting-future (2020, accessed 5 June 2020).
17
VIEWPOINT ARTICLE
THE DARK SIDE OF OVERUSE OF INTERNET: A STUDY OF INDIAN
COLLEGE STUDENTS
Binod Kumar Rajak*1, Sumanjeet Singh2, Minakshi Paliwal3
1. Department of Management Studies, Nalsar University of Law, Hyderabad, India
2. Department of Commerce, Ramjas College, University of Delhi, India
3. Department of Commerce, Daulat Ram College, University of Delhi, India.
Correspondence: [email protected]
ABSTRACT
INTRODUCTION
The extensive use of the internet and its effect on our lives can no longer be overlooked. While the internet is a result of
the rapid advancement of science and technology, its impact on students depends on how they use it. The present study
identifies Internet usage patterns, nature of use, and Internet Addiction (IA) among India's undergraduate and
postgraduate students and its consequences on their lives.
METHODS
This empirical examination uses the Multistage Sampling Method (MSM) and cross-sectional method. The structured
questionnaire distributed (N=1,200) to ungraduated college students. We included at least ten institutes of every state in
India and thirty participants from each institution in this study.
RESULTS
The study revealed that overuse of the internet is statistically significant with internet addiction concerning gender but no t
with age and education. Overuse of the internet strongly impacts IA. The study further investigates the relationship with
the consequences of overuse of the internet with age, gender and education and found that genders significantly differ
with the physical and psychological problem but not with a behavioural and relationship problem; level of education has
a significant difference with physical and behavioural problem but not with relationship and psychological problems.
CONCLUSION
Our investigation helps college, university or educational policymakers to frame good mental health policies or create
programmes to reduce or constrain the adverse effect of overuse of the internet. The results show a compelling need to
reduce the overuse of the internet (OI) by promoting psychological competence.
KEYWORDS
Internet Addiction, Overuse of Internet, Gender, Consequences, India, College and Students.
18

INTRODUCTION
As technological devices become prolific in our lives, they
are increasingly embedded and concealed in ourselves as
we gradually integrate with them. Extensive merging of
humanity and technology is inevitable and such
amalgamation is bound to have implications in all aspects
of our lives. Technology has tremendously changed lifestyle
within a short period, given that instant access to
information was unimaginable just a few decades ago.
The proliferation of technology in our personal and
professional lives has also changed how we interact with it
to the extent of becoming dependent on it. There are
ongoing debates and discussions on classifying behaviour
characterized by excessive non-work-related technology,
especially those related to the internet. Such excessive use
has been recognized as an addiction. Overindulgence in
Internet-based activities, i.e., gaming, blogging, surfing,
chat rooms, shopping and pornography, is now considered
an addiction disorder. The disorder has various names,
including Problematic Internet Use, Internet Addiction
Disorder (IA), Compulsive Internet Use and Impulse Control
Disorder. These disorders are akin to conventional
addictions such as pathological gambling, which may not
necessarily involve narcotic usage. The stark rise in the
figure of nternet users in India from 394 million in 2000 to 6
billion in the 4th quarter of 2020 – the second largest in the
world, indicates the country’s prevalence for digital
addiction disorders. [1] These disorders are associated with
depression, lack of concentration, high anxiety,
psychomotor agitation, salience, mood modification,
obsessive thoughts, and sleeplessness. The World Health
Organization has included “gaming disorders” into the
International Classification of Diseases, highlighting the
growing and severe problem of IA throughout the world.
Prominent researchers of internet addiction suggest that
internet addicts exhibit the same symptoms as those with
impulsive control disorder and drug or alcohol addicts. [2]
IA is believed and has proven to have wide-ranging
unpropitious outcomes that impact large domains of lives,
ranging across physical, emotional, psychological,
occupational and interpersonal. The negative impacts
have severely impacted young people who spend
excessive time online and neglect their family, professional
and social life and most importantly, their interests. [3]
Previous literature compares internet usage with cigarette
smoking and individual behaviour. [4] Internet usage
becomes so addictive that individuals start neglecting their
work which can cause many issues such as family conflict,
relationship conflict, boredom and low self-esteem. [5]
Whether we codify it within a clinical framework or not, the
alarming nature of IA is significant in recognizing the
potential negative impact of this problem. Studies have
been undertaken on internet addiction and the workplace
but there is less study on students' internet usage and
academic performance. There is an urgent need to attend
to the crisis of IA by academics, health experts, professional
institutions, society and government. [6] The current study
proposes the framework of how Overuse of Internet (OI)
becomes internet addiction and its further association with
gender, age and educational level.
RESEARCH BACKGROUND & HYPOTHESIS
DEVELOPMENT
There have been many studies on IA, as seen in an
extensive review by Mak & Young. [7] A seminal
introductory study of addiction with computers emerged
as early as 1989 in a book by Shotten, which reported the
enchantment of students in the UK by machines, to the
exclusion of their other activities. [8] Dr Kimberly Young first
introduced the notion of ‘IA’ in August 1996 at the
American Psychological Association [9] but this presented
many controversies. It was believed the term could only use
in substance addiction and abuse, such as in drug
addiction; thus, some studies have referred to the
overindulgence in internet activities as for IA. [10] Others
have called it terms such an IA Disorder [110], pathological
operation of internet [12] depression [13] and pathological
internet use. [14] Over time, researchers have propounded
the term and concept of IA to simplify the exploitation or
adverse Usage of Interenet (UOI) and the uncontrollable
use of Internet of Things (IoT). [15] Studies have also
recognized various disorders caused by IA, similar to drug
or alcohol addiction. [6, 16] On comparing internet addicts
to non-addicted users of the internet, the former reported
more harmful and adverse consequences significantly as a
result of excessive Internet use, such as the compulsive
need to go online when offline, along with mixed feelings
of guilt and anxiety about the amount of time spent on
Internet [17] and hiding the details of time spent on the
Internet to their peers. [18]
19

Earlier studies have identified specific negative
consequences of OI, such as time mismanagement, lack of
sleep, and missed meals [19], all of which could directly
affect on personal and professional fronts. [20] Studies have
recognised IA symptoms including psychomotor agitation
[21], changes in appetite [22], gloominess or depression,
lack of self-control [23], impairment of function [24], inability
to make decisions [25], disorganized eating habits [26], and
irresistible online surfing despite its detrimental effects on
personal welfare. [23] Studies revealed that hefty Internet
use for leisure is highly connected with decreased
Academic Performance because of synchronous chat
rooms. [14] Studies have also highlighted common
problems created by extensive Internet use like disrupted
marriages and marital issues. [27] Studies hitherto have
primarily focused on four factors, viz., personal, social,
academic and Internet-related to define and explain the
problems related to IA. Despite studies discussing and
studying IA's impact, few reports study the entire pathway
that includes therapy. Most of the studies focused only on
the adverse impact rather than the positive impacts of
Internet use. [28]
To the best of our knowledge, few studies have assessed
the adverse effect of the internet but there is no clarity how
internet usage becomes internet addiction. Recent studies
revealed that usage of internet vary with gender. [4] For
example, in terms of gender, some studies have shown that
men are more addicted to the Internet in developed and
high-tech economies. [4; 29] while other researchers have
shown no such differences between the genders in the
extent of UOI. [30] While many studies have tried to assess
and analyse the factor of addiction by measuring the
amount of time spent online, such studies are complicated
by the fact that students are connected to the Internet or
Wi-Fi all the time in modern times and rely strongly on the
Internet for academic’s purposes, acquiring news and
information and for communication and entertainment.
Thus, IA is now a multidimensional and
multifaceted concept that must be explored across a
broad perspective to understand the issue
comprehensively. The following hypotheses were proposed
to gain such understanding:
➢ Ho1 There is no significant difference in the overuse of
internet and Internet Addiction across the (a) gender,
(b) age and (c) education.
➢ Ho2 Overuse of internet has no significant impact on
Internet Addiction among students.
➢ Ho3 There is no significant difference with
consequences of Overuse of Internet across the (a)
gender, (b) age and (c) education.
METHODOLOGY
DATA, DEMOGRAPHIC, PROCEDURE AND INSTRUMENT
This empirical examination has used the Multistage
Sampling Method (MSM) [31] and the cross-sectional
method; [32]. MSM is viewed as reasonable to minimalise
and control for bias, which diminishes the study's expense
and time. The current survey examination has 39 items
(accumulative) scale, and previous research has
suggested that 5-10 response for one item is adequate for
the study. [32] So, the current study required (39*10) 390
responses, but we distributed the (N= 1200) structured
questionnaire to graduate and postgraduate college
students of Delhi and NCR, Haryana, Uttrakhand, Himachal
Pradesh and Uttar Pradesh states in India regardless of their
level, stream of study. We included at least ten institutes
from each state and thirty participants from each
institution. Previous studies suggests that structured
questionnaire surveys circulated through email or by hand
are generally more appropriate for social science fit in
sociology research. [33] Seven hundred and nineteen
responses were obtained, with a response rate of 47%
(online survey) and 79% (personal survey method). The final
study sample comprised 626 participants (61% male; 39%
female; M = 3.372, SD=0.794, with ninety-three rejected
because data was imprecise or nonresponsive. The
demographic of respondents can be seen in Table 1. The
IA Test, developed by Young [21], was used in this work. The
data obtained were organised, tabulated, and analysed
systematically using SPSS 25 software.
20
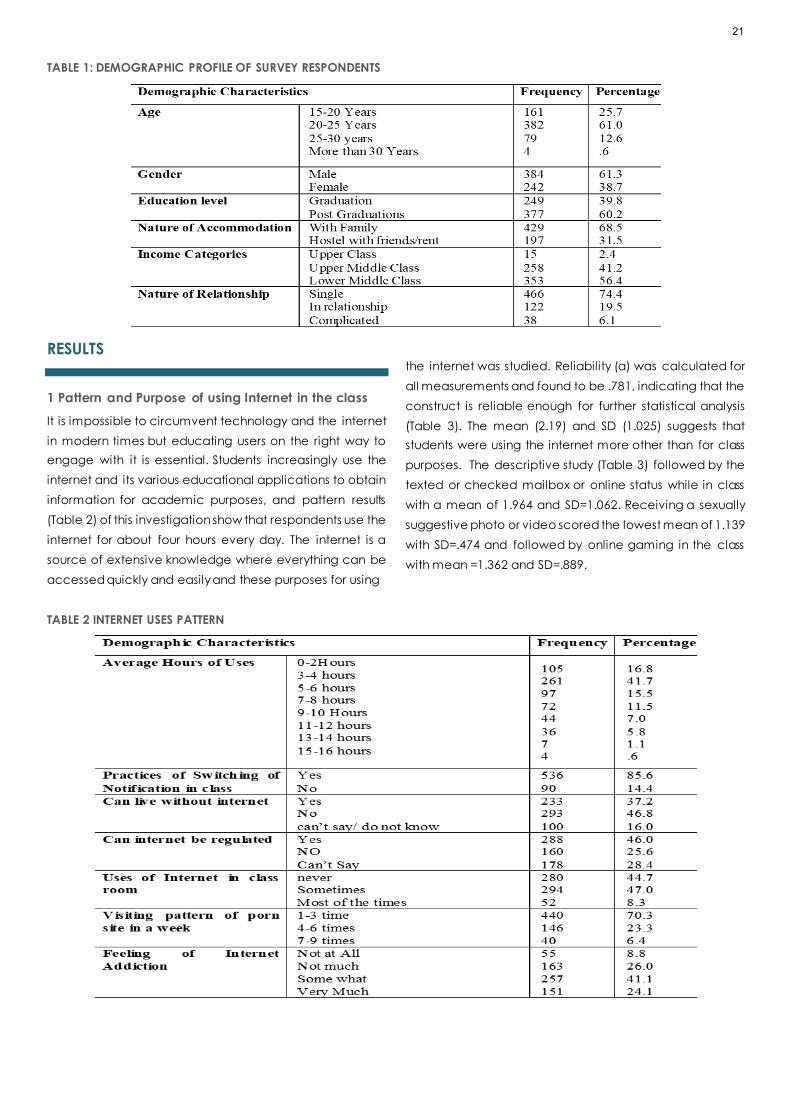
TABLE 1: DEMOGRAPHIC PROFILE OF SURVEY RESPONDENTS
RESULTS
1 Pattern and Purpose of using Internet in the class
It is impossible to circumvent technology and the internet
in modern times but educating users on the right way to
engage with it is essential. Students increasingly use the
internet and its various educational applications to obtain
information for academic purposes, and pattern results
(Table 2) of this investigation show that respondents use the
internet for about four hours every day. The internet is a
source of extensive knowledge where everything can be
accessed quickly and easily and these purposes for using
the internet was studied. Reliability (α) was calculated for
all measurements and found to be .781, indicating that the
construct is reliable enough for further statistical analysis
(Table 3). The mean (2.19) and SD (1.025) suggests that
students were using the internet more other than for class
purposes. The descriptive study (Table 3) followed by the
texted or checked mailbox or online status while in class
with a mean of 1.964 and SD=1.062. Receiving a sexually
suggestive photo or video scored the lowest mean of 1.139
with SD=.474 and followed by online gaming in the class
with mean =1.362 and SD=.889.
TABLE 2 INTERNET USES PATTERN
21

TABLE 3 DESCRIPTIVE ANALYSIS (CR, MEAN AND STANDARD VALUE OF CONSTRUCTS)
CONSTRUCTS CR MEAN SD
Using Internet 0.781 1.9649 1.06224
Internet Addiction 0.929 2.0815 0.71876
Causes of internet overuse 0.867 2.8315 0.7946
Physical Problems 0.917 2.2764 0.98478
Psychological Problems 0.938 2.18 1.01878
Behavioural Problems 0.907 2.1465 0.91039
Relationship Problems 0.936 1.7688 0.81293
1.1 Causes of Internet overuse
While the UOI in terms of information and entertainment
cannot underestimate, its overuse can cause depression,
obsession, anxiety, and even isolation, all of which are IA
symptoms. A literature survey identified various causes of
Internet Overuse (IO), and students were asked to rate on
intrenet use according to their preferences. Reliability (α)
(see table 1) was calculated for all the measurements and
found to be .867, indicating that the constructs were
reliable enough for further statistical analysis. Sexual
exploration was one of the fundamental reasons disclosed
by students with mean score 3.426 and SD=1.412, followed
by the statement “I want to escape harsh realities of life”
with a mean of 3.372 and SD of 1.230. Leisure time or Free
time scored the lowest mean of 2.126 and SD=1.054.
1.2 Consequences of overuse of Internet
A series of internet overuse consequenecs were identified
from the literare including physical problems, psychological
problems, behavioral problems and relationship problems
and in our survey, students were asked to rate these
consequences on a scale of 1 to 5. Reliability (α) (see Table
3) was calculated for all the constructs and found to be
between .907 to .938, indicating that the construct was
reliable for further statistical analysis. Descriptive statistics
showed that ‘Physical problem’ had the highest mean
(mean = 2.276) followed by ‘Psychological Problems’
(mean = 2.180), ‘Behavioral problem’ (mean = 2.146) and
‘Relationship problem’ (mean = 1.768). the attribute' Sleep
disturbance" scored highest with a mean of 2.580 and SD
of1.298 followed by dry eyes/eye strain, with a mean of
2.539 and SD of 1.245, and backaches had a mean value
of 2.492 and SD of 1.263.
For the different measurement variables of psychological
problems, "feelings of guilt" scored the highest mean of
2.596 and SD=1.362, followed by "Loss of interest" with a
mean of 2.427 and SD of 1.289. In regard to behavioral
problems, attributes like "Loss of interest in study/work"
scored the highest mean of 2.385 and SD=1.239, followed
by "Often losing to track of time when online" with mean
=2.379 and SD=1.182. Attributes such as "Displaying anger
due to time loss" had the lowest mean of 1.852 and
SD=1.071. Regarding relationship problems, attributes such
as "Decreased time spent with family and friends" had the
highest mean of 2.016 with SD=0.991, followed by attributes
like "Deceiving others about the amount of time spent on
the Internet" with mean =1.971 and SD=1.035. "Thoughts of
"getting online", or of sexual behaviour, seep into your mind
when you are not online or engaged in sexual behaviour
(i.e., work, with family)" scored the lowest mean of 1.499
and SD=0.824.
2 Hypothesis testing
The values calculated experimentally using the one-way
ANOVA; Table value of OI and IA (3.85) found is less than
the calculated value (F=5.188, p=.023, p>.05) of IA &
Internet overuses (F=5.540, p=.019). Hence, (Ho1) was
rejected, which shows that male and female students are
significantly different concerning OI and IA. [38; 12; 29]
However, the analysis has not found enough evidence to
say there is a difference between OI and IA with age and
educational levels. F value = 2151.630, p>.05 showed (H2)
Overuse of the Internet has a significant difference with
Internet Addiction. The pooled mean of all measurement
variables calculated for assessing IA; regression analysis
was carried out and was found to be moderately
significant (f=82521.042, P=.000b, t=287.265, p=.000) and
contributed 99.2% (R2 = 0.992) to the IA. IA=
(B=0.037+.979*), the results revealed that the beta values
for Internet overuse were 0. .979 and thus, it had a strong
effect on IA; hence it is concluded that Internet overuse is
22

a prime cause. OI, the f-value was found to be greater than
the table value (3.85) in the case of Physical Problems
(11.113) and Psychological Problem (14.15) as against to
behavioral problem (2.547) and relationship problem
(1.807) at 1 degree of freedom and 0.05 level of
significance. Therefore, (Ho3) was rejected; the mean
values of the physical problem and psychological problem
differed significantly between the genders. However, the
mean values of behavioral and relationship problems do
not differ significantly between men and women. The f
value of (Ho3) was more significant than the table value
(3.85) in the case of Physical Problems (5.320), Behavioral
Problem (4.065) as against Psychological Problem (3.622)
and relationship problem (.999) at 1 degree of freedom
and 0.05 level of significance. Therefore, it concludes that
the mean of the physical problem and behavioral problem
differs significantly across the respondents' level of
education but is accepted in psychological problems and
relationship problems. Thus, psychological and relationship
problems do not differ significantly across respondents'
levels of education.
TABLE 3 ONE WAY ANOVA OF MEAN OF INTERNET ADDICTION AND INTERNET OVERUSES ACROSS THE GENDER, AGE AND
EDUCATION
GENDER SUM OF
SQUARES DF
MEAN
SQUARE F SIG.
Internet
addiction
Between
Groups 3.141 1 3.141 5.188 0.023
Within Groups 377.739 624 0.605
Total 380.88 625
Internet
overuse
Between
Groups 3.473 1 3.473 5.54 0.019
Within Groups 391.141 624 0.627
Total 394.614 625
AGE SUM OF
SQUARES DF
MEAN
SQUARE F SIG.
Internet
addiction
Between
Groups 2.307 3 0.769 1.264 0.286
Within Groups 378.573 622 0.609
Total 380.88 625
Internet
overuse
Between
Groups 2.208 3 0.736 1.167 0.322
Within Groups 392.405 622 0.631
Total 394.614 625
EDUCATION SUM OF
SQUARES DF
MEAN
SQUARE F SIG.
Internet
addiction
Between
Groups 0.435 1 0.435 0.713 0.399
Within Groups 380.445 624 0.61
Total 380.88 625
Internet
overuse
Between
Groups 0.488 1 0.488 0.772 0.38
Within Groups 394.126 624 0.632
Total 394.614 625
23

TABLE 4: IMPACT OF INTERNET OVERUSE ON INTERNET ADDICTION: REGRESSION ANALYSIS
MODEL
UNSTANDARDIZED COEFFICIENTS
STANDARDIZED
COEFFICIENTS
T SIG. B Std. Error Beta
1 (Constant) .037 .010 3.722 .000
Internet overuse .979 .003 .996 287.265 .000
R= .996a R2 .992 F= 82521.042 P=.002b Std. Error of the Estimate=0.06768
a. Dependent Variable: Internetaddiction1
DISCUSSIONS AND CONCLUSION
Addiction generally refers to compulsive behaviour those
results in adverse effects. The amount of time an individual
spends on the internet is a critical factor in increasing IA risk.
The Study found that IA's sternness levels increase with an
OI. [39; 13] Thus, the risk of becoming IA becomes higher as
students spend on the Internet increases. This study
indicated that OI and IA are more significant among
female students than male students. An earlier study also
indicated significant differences in Internet overuse and IA
between gender categories, age of the students and the
students of UG and PG. [36] IA's prevalence is significant
with gender, age, and education. [40]
Our study results show that most tertiary level students use
the internet for more than 4 hours every day. From the
ANOVA results, it can seem that the mean OI differs
significantly. The present investigation also highlights the
consequences of OI on the internet, such as sleep
disturbance, interpersonal relationship issues, eyes strain,
backache. [37; 38] Further investigation suggests that OI
and IA harm sex life, family life, individual behaviour, loss of
interest, lack of concentration, and short temperament.
The current examinations also suggest that overuse of the
internet has a significant difference in physical and
psychological problems faced by each gender. A recent
study also suggests that females feel shyer in relation to the
internet in comparison to their male counterparts. That
could be the reason why males and females face different
problems. [4; 5] Male are more expressive, so they express
themselves, whereas females are shy (especially in India),
which could be a possible gender difference regarding
physical and psychological problems. [4; 39] This study also
reports that IA was associated with students' physical,
psychological, behavioural, and relationship issues. [40] The
present study revealed that students are unaware when
their usage becomes an addiction. So, institutions and
policymakers should come forward to make policies to
regularise the usage of the internet. Psychological distress
(PD) and addiction to the internet have been positively
linked as a predictor of IA. Students need to be tested for
PD and IA because there is a significant risk of coexisting
and escalating issues. [41; 42]
IMPLICATION, LIMITATION & FUTURE SCOPE
Although the internet is regarded as the most powerful tool
of modern times and people use it for various purposes, the
user needs to know how it starts to take over life and
impede other daily activities. IA in India appears to be a
significant emerging mental health disorder among
students at all UG and PG levels. Our investigation helps
college and university or educational policymakers frame
suitable policies or create a Programme to reduce or
aware the adverse effect of overuse of the internet. The
results of the compelling need to reduce the OI by
promoting psychological competence among students.
Without clarifying Internet use or abuse outcomes, it is
unjustifiable to consider it an issue; the current investigation
additionally endeavours this path. These activities would
help provide early referrals for diagnosis and care to
specialist centers. Thus, raising awareness among students
and faculty about IA and its risk factors would be an
excellent initial step towards safe Internet use. The study
carried out before the Covid pandemic, and Internet
usage increased during and after the pandemic due to the
online classes. So, future research will explore the
relationship between OI, IA and its consequences after the
pandemic, which gives more clarity. The cross-sectional
technique constrains the casualty, and participants are
limited to Delhi NCR College and universi ty, which bound
the results the future researcher can work on this and
generalize it for a large population. Since the study is limited
to quantitative methodology and a single methodology
has limitations in relation to when individual behaviour and
24
perception are involved, future research in this area can
have a mixed methods approach so as to present the
holistic model of OI, IA and their consequences.
CONFLICT OF INTEREST:
The authors declared no potential conflicts of interest with
this article.
References
1. Internet Top 20 Countries - Internet Users 2020 [Internet].
Internetworldstats.com. [cited 2021 Feb 24]. Available
from: https://www.Internetworldstats.com/top20.htm
2. Young KS. Internet addiction: A new clinical
phenomenon and its consequences. American
behavioral scientist. 2004 Dec;48(4):402-15.
3. Cheng C, Li AY. Internet addiction prevalence and
quality of (real) life: A meta-analysis of 31 nations across
seven world regions. Cyberpsychology, Behavior, and
Social Networking. 2014 Dec 1;17(12):755-60.
4. Nayak, J. K. (2018). Relationship among smartphone
usage, addiction, academic performance and the
moderating role of gender: A study of higher
education students in India. Computers & Education,
123, 164-173.
5. Roberts, J., Yaya, L., & Manolis, C. (2014). The invisible
addiction: Cell-phone activities and addiction among
male and female college students. Journal of
behavioral addictions, 3(4), 254–265.
http://dx.doi.org/10.1556/JBA.3.2014.015.
6. Schell BH. Online health and safety: From cyberbullying
to internet addiction: from cyberbullying to internet
addiction. ABC-CLIO; 2016 Feb 22.
7. Mak KK, Young KS. Development and Differential Item
Functioning of the Internet Addiction Test-Revised (IAT-
R): An Item Response Theory Approach.
Cyberpsychology, Behavior, and Social Networking.
2020 May 1;23(5):312-28.
8. Shotton MA. Computer Addiction Pb: A Study of
Computer Dependency. CRC Press; 1989 Oct 23.
9. Young KS. Psychology of computer use: XL. Addictive
use of the Internet: a case that breaks the stereotype.
Psychological reports. 1996 Dec;79(3):899-902.
10. Akın A. The relationships between Internet addiction,
subjective vitality, and subjective happiness.
Cyberpsychology, Behavior, and Social Networking.
2012 Aug 1;15(8):404-10.
11. Liu X, Bao Z, Wang Z. Internet use and Internet
addiction disorder among medical students: a case
from China. Asian Social Science. 2010 Jan 1;6(1):28-34.
12. Liang L, Zhou D, Yuan C, Shao A, Bian Y. Gender
differences in the relationship between internet
addiction and depression: A cross-lagged study in
Chinese adolescents. Computers in Human Behavior.
2016 Oct 1; 63:463-70.
13. Boonvisudhi T, Kuladee S. Association between Internet
addiction and depression in Thai medical students at
Faculty of Medicine, Ramathibodi Hospital. PloS one.
2017 Mar 20;12(3): e0174209.
14. Canbaz S, TEVFIK SA, Peksen Y, Canbaz MA.
Prevalence of the pathological Internet use in a
sample of Turkish school adolescents. Iranian Journal of
Clinical Infectious Diseases.2009; 3:1; 7–11.
15. Romano M, Osborne LA, Truzoli R, Reed P. Differential
psychological impact of internet exposure on internet
addicts. PloS one. 2013 Feb 7;8(2): e55162.
16. Krishnamurthy S, Chetlapalli SK. Internet addiction:
Prevalence and risk factors: A cross-sectional study
among college students in Bengaluru, the Silicon Valley
of India. Indian journal of public health. 2015 Apr
1;59(2):115.
17. Sherer K. College life on-line: Healthy and unhealthy
Internet use. Journal of College Student Development.
1997 Nov; 38:6; 655–665.
18. Kandell JJ. Internet addiction on campus: The
vulnerability of college students. Cyberpsychology &
behavior. 1998;1(1):11-7.
19. Brenner V. Psychology of computer use: XLVII.
Parameters of Internet use, abuse and addiction: the
first 90 days of the Internet Usage Survey. Psychological
reports. 1997 Jun;80(3):879-82.
20. Young KS. Internet addiction: The emergence of a new
clinical disorder. Cyberpsychology & behavior.
1998;1(3):237-44.
21. Young K. The evolution of internet addiction disorder.
Internet addiction. Psychology and Behavioral
Economics, 2017:3-18.
22. Davey S, Davey A, Singh JV. Emergence of
Problematic Internet use among Indian Adolescents: A
Multi Method study. Journal of Indian Association for
Child & Adolescent Mental Health. 2016 Jan 1;12(1).
23. Rao R. Powered by Leone, India becomes third largest
consumer of online porn [Internet]. 2020 [cited 2020
Spring 12]. Available from: www.zdnet.com
25

24. Charlton JP, Danforth ID. Distinguishing addiction and
high engagement in the context of online game
playing. Computers in human behavior. 2007 May
1;23(3):1531-48.
25. Oztürk O, Odabasıoglu G, Eraslan D, Genc Y, Kalyoncu
OA. Internet addiction: Clinical aspects and treatment
strategies. Journal of Dependence. 2007;8(1):36-41.
26. Tsukayama H. This Dark Side of the Internet is Costing
Young People Their Jobs and Social Lives. Washington
Post. 2016.
27. Lin MP, Wu JY, You J, Hu WH, Yen CF. Prevalence of
internet addiction and its risk and protective factors in
a representative sample of senior high school students
in Taiwan. Journal of Adolescence. 2018 Jan 1; 62:38-
46.
28. Lai CM, Mak KK, Watanabe H, Ang RP, Pang JS, Ho RC.
Psychometric properties of the internet addiction test
in Chinese adolescents. Journal of Pediatric
Psychology. 2013 Aug 1;38(7):794-807.
29. Yeh YC, Ko HC, Wu JY, Cheng CP. Gender differences
in relationships of actual and virtual social support to
Internet addiction mediated through depressive
symptoms among college students in Taiwan.
Cyberpsychology & behavior. 2008 Aug 1;11(4):485-7.
30. Tran BX, Hinh ND, Nguyen LH, Le BN, Nong VM, Thuc VT,
Tho TD, Latkin C, Zhang MW, Ho RC. A study on the
influence of internet addiction and online interpersonal
influences on health-related quality of life in young
Vietnamese. BMC public health. 2017 Dec;17(1):1-8.
31. Sedgwick P. Multistage sampling. Bmj. 2015 Jul 31;351.
doi: 10.1136/bmj.h4155
32. Rajak BK, Kunja SR, Singh P. Emotional labour, stress and
employee performance: a study of higher education
system. International Journal of Economic Policy in
Emerging Economies. 2021;14(3):306-18.
33. Chi X, Lin L, Zhang P. Internet addiction among college
students in China: Prevalence and psychosocial
correlates. Cyberpsychology, Behavior, and Social
Networking. 2016 Sep 1;19(9):567-73.
34. Goel D, Subramanyam A, Kamath R. A study on the
prevalence of internet addiction and its association
with psychopathology in Indian adolescents. Indian
Journal of Psychiatry. 2013 Apr;55(2):140.
35. Anand N, Jain PA, Prabhu S, Thomas C, Bhat A,
Prathyusha PV, Bhat SU, Young K, Cherian AV. Internet
use patterns, internet addiction, and psychological
distress among engineering university students: A study
from India. Indian journal of psychological medicine.
2018 Sep;40(5):458-67.
36. Sharma B, Ashok L, Chandrasekaran V, Monteiro A.
Internet addiction and its correlates among
undergraduate college students in Udupi Taluk,
Karnataka. Journal of Datta Meghe Institute of Medical
Sciences University. 2018 Apr 1;13(2):95.
37. Werner, G., & Eleanor, C. Developing and Using
Questionnaires. Program Evaluation and Methodology
Division, 1993 October, 242. [Cited on 2021, Feb 24]
Retrieved from
http://archive.gao.gov/t2pbat4/150366.pdf
38. Bernardi S, Pallanti S. Internet addiction: a descriptive
clinical study focusing on comorbidities and
dissociative symptoms. Comprehensive psychiatry.
2009 Nov 1;50(6):510-6.
39. Claes L, Müller A, Norré J, Van Assche L, Wonderlich S,
Mitchell JE. The relationship among compulsive buying,
compulsive internet use and temperament in a sample
of female patients with eating disorders. European
Eating Disorders Review. 2012 Mar;20(2):126-31.
40. Floros G, Siomos K, Stogiannidou A, Giouzepas I,
Garyfallos G. Comorbidity of psychiatric disorders with
Internet addiction in a clinical sample: The effect of
personality, defense style and psychopathology.
Addictive behaviors. 2014 Dec 1;39(12):1839-45.
41. Ko CH, Yen JY, Yen CF, Chen CS, Chen CC. The
association between Internet addiction and
psychiatric disorder: a review of the literature.
European Psychiatry. 2012 Jan;27(1):1-8.
42. Kraut R, Patterson M, Lundmark V, Kiesler S,
Mukophadhyay T, Scherlis W. Internet paradox: A social
technology that reduces social involvement and
psychological well-being? American psychologist.
1998 Sep;53(9):1017.
26

RESEARCH ARTICLE
ADOPTION AND USAGE INTENTION OF CONSUMERS
TOWARDS TELEMEDICINE AMONG PEOPLE DURING
PANDEMIC TIMES
Charu Saxena1, Pardeep Kumar1, Pratibha Thakur2
1. University School of Business, Chandigarh University, Mohali, Punjab, India.
2. Department of Management, Chandigarh Group of Colleges, Landran, Punjab, India.
Correspondence: [email protected]
ABSTRACT
OBJECTIVE:
As COVID-19 engulfed the world, people are shifting to a new way of life with social distancing and self isolation, especially
in developing countries. In such a scenario, online retailing has gone through a sea change with a new wave of increased
demand and where the healthcare sector has also adjusted with the augmented transition from physical shops to e-
commerce. The current study aims to assess the adoption and usage intention of consumers towards telemedicine among
people during pandemic times.
METHOD:
The adoption of telemedicine by consumers depends upon some factors such as reliability, affordability, convenience,
authenticity, offers and discount; which could enhance the intention to adopt and continual use by consumers. A
modified version of ‘Technology Acceptance Model’ is incorporated in this study to validate the concept of adoption of
telemedicine in cities of North India.
RESULTS:
The study has found the positive and significant relationship between the factors of adoption and the intention to adopt
telemedicine. Also, the ‘Effect of COVID-19’ plays a moderating role between the different factors of adoption and the
intention to adopt telemedicine.
CONCLUSION:
The adoption of telemedicine by people is significantly associated with different internal and external factors. The intention
to adopt telemedicine is the construct that strongly influences the actual usage of telemedicine in developing countries.
The scope of this study is restricted to the Northern region of India. A future study can be undertaken in relation to the
global perspective of consumers.
KEYWORDS
COVID-19, healthcare, e-commerce, telemedicine.
27
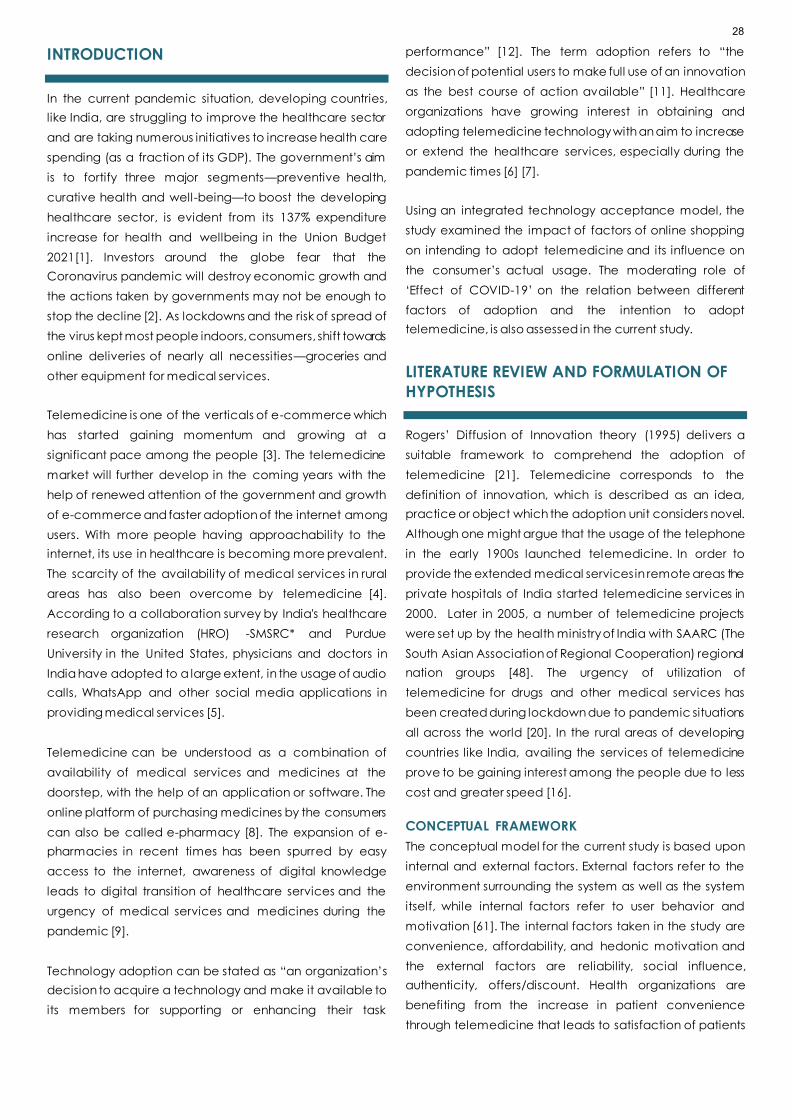
INTRODUCTION
In the current pandemic situation, developing countries,
like India, are struggling to improve the healthcare sector
and are taking numerous initiatives to increase health care
spending (as a fraction of its GDP). The government’s aim
is to fortify three major segments—preventive health,
curative health and well-being—to boost the developing
healthcare sector, is evident from its 137% expenditure
increase for health and wellbeing in the Union Budget
2021[1]. Investors around the globe fear that the
Coronavirus pandemic will destroy economic growth and
the actions taken by governments may not be enough to
stop the decline [2]. As lockdowns and the risk of spread of
the virus kept most people indoors, consumers, shift towards
online deliveries of nearly all necessities—groceries and
other equipment for medical services.
Telemedicine is one of the verticals of e-commerce which
has started gaining momentum and growing at a
significant pace among the people [3]. The telemedicine
market will further develop in the coming years with the
help of renewed attention of the government and growth
of e-commerce and faster adoption of the internet among
users. With more people having approachability to the
internet, its use in healthcare is becoming more prevalent.
The scarcity of the availability of medical services in rural
areas has also been overcome by telemedicine [4].
According to a collaboration survey by India's healthcare
research organization (HRO) -SMSRC* and Purdue
University in the United States, physicians and doctors in
India have adopted to a large extent, in the usage of audio
calls, WhatsApp and other social media applications in
providing medical services [5].
Telemedicine can be understood as a combination of
availability of medical services and medicines at the
doorstep, with the help of an application or software. The
online platform of purchasing medicines by the consumers
can also be called e-pharmacy [8]. The expansion of e-
pharmacies in recent times has been spurred by easy
access to the internet, awareness of digital knowledge
leads to digital transition of healthcare services and the
urgency of medical services and medicines during the
pandemic [9].
Technology adoption can be stated as “an organization’s
decision to acquire a technology and make it available to
its members for supporting or enhancing their task
performance” [12]. The term adoption refers to “the
decision of potential users to make full use of an innovation
as the best course of action available” [11]. Healthcare
organizations have growing interest in obtaining and
adopting telemedicine technology with an aim to increase
or extend the healthcare services, especially during the
pandemic times [6] [7].
Using an integrated technology acceptance model, the
study examined the impact of factors of online shopping
on intending to adopt telemedicine and its influence on
the consumer’s actual usage. The moderating role of
‘Effect of COVID-19’ on the relation between different
factors of adoption and the intention to adopt
telemedicine, is also assessed in the current study.
LITERATURE REVIEW AND FORMULATION OF
HYPOTHESIS
Rogers’ Diffusion of Innovation theory (1995) delivers a
suitable framework to comprehend the adoption of
telemedicine [21]. Telemedicine corresponds to the
definition of innovation, which is described as an idea,
practice or object which the adoption unit considers novel.
Although one might argue that the usage of the telephone
in the early 1900s launched telemedicine. In order to
provide the extended medical services in remote areas the
private hospitals of India started telemedicine services in
2000. Later in 2005, a number of telemedicine projects
were set up by the health ministry of India with SAARC (The
South Asian Association of Regional Cooperation) regional
nation groups [48]. The urgency of utilization of
telemedicine for drugs and other medical services has
been created during lockdown due to pandemic situations
all across the world [20]. In the rural areas of developing
countries like India, availing the services of telemedicine
prove to be gaining interest among the people due to less
cost and greater speed [16].
CONCEPTUAL FRAMEWORK
The conceptual model for the current study is based upon
internal and external factors. External factors refer to the
environment surrounding the system as well as the system
itself, while internal factors refer to user behavior and
motivation [61]. The internal factors taken in the study are
convenience, affordability, and hedonic motivation and
the external factors are reliability, social influence,
authenticity, offers/discount. Health organizations are
benefiting from the increase in patient convenience
through telemedicine that leads to satisfaction of patients
28

[15] [17]. Telemedicine can play a role in the reduction of
health care costs for the patient. As per the theory of
affordability, if the adoption of a new technology is
economically affordable for the people, they would
accept it and thus transition from potential users to
the actual usage [14]. In line with motivation theory,
hedonic motivation is pivotal in influencing technology
adoption among users, focused on seeking information
relative to the usefulness of the product or service with
respect to the technology or the product [17]. If the
potential user of technology-based service innovations
perceives that the new technology is unreliable and
believes that errors may occur, they are not likely to
embrace it [19]. Furthermore, in developing countries
where people give importance to others’ opinion,
especially the people belonging to their society, regarding
the usage of new technology and develop intention to
adopt the technology [19]. Moreover, with the use of
telemedicine enable the users to get authenticate
information in real time, which guarantee to provide secure
and trustworthy medical services [13]. In order to reinforce
the intention amongst people, many online telemedicine
vendors provide offers and discounts on their online
products and use other promotional strategies such as cash
back and free delivery. [10]. Based on a literature review
and previously published research work, the present
research has used actual usage of telemedicine as
dependent variable and intentions to adopt telemedicine
as a predictor variable of actual usage [2]. Intention to
adopt telemedicine further acts a a predictor for
examining the actual usage of telemedicine. Actual usage
has examined the usage behavior of the respondent
towards using telemedicine.
H1: There is a significant impact of reliability on intention to
adopt telemedicine.
H2: There is a significant impact of convenience on
intention to adopt telemedicine.
H3: There is a significant impact of affordability on
intention to adopt telemedicine.
H4: There is a significant impact of SI on intention to adopt
telemedicine.
H5: There is a significant impact of the HM on intention to
adopt telemedicine.
H6: There is a significant impact of authenticity on
intention to adopt telemedicine.
H7: There is a significant impact of offers/discounts on
intention to adopt telemedicine.
H8: There is a significant impact of intention to adopt
telemedicine and actual usage
MODERATING ROLE OF COVID-19
It is stated that telemedicine proposes interactive solutions
and helps in restructuring the healthcare by offering various
benefits related to cost and time [26]. The present global
COVID-19 pandemic offers a new dimension to the
literature on telemedicine and its applications. Following
the emergence of COVID-19, telemedicine has been
quickly and widely adopted [27].
H9: Effect of COVID moderates the relation among the
factors affecting the adoption of telemedicine and
intention to adopt telemedicine by people.
FIGURE 1. RESEARCH MODEL
29

METHOD
In this study, an integrated conceptual model has been
developed, using variables from the available theories of
TAM and past studies of e-pharmacy adoption, to
empirically authenticate the data for usage and intention
to adopt telemedicine and its impact on actual usage of
online mode of buying the medicines and other medical
services (shown in Figure 1).
The relationships hypothesized in the framework are tested
using SEM, to validate the measurement and structural
model, through a survey study that has included customers
of telemedicine in the smart cities of India. The random
purposive sampling technique is incorporated in data
collection, with a purposefully targeted population. The
sample size for conducting the survey taken in the present
research are 450 respondents (adequate sample size for
structural equation modeling, on the basis of effect size on
G* power, [18]), selected from the Northern region of India.
A structured questionnaire is used both in online and offline
modes, as the data collection tool to be used is to serve
the purpose and objectives of the study.
DATA ANALYSIS AND INTERPRETATION
SAMPLE DEMOGRAPHICS
This section discusses the findings of the study. The
demographic details of the participants of the survey are
presented in Table 1
The total number of the respondents in Table 1 328. In Table
1 it is seenthat 51.8% of participants are male and 48.2% are
female. The sample consists of 42.4% participants in the age
group 20-35 years, followed by the participants in the age
group 35-50 years (31.1%) and remaining 26.5% are in the
age group of more than 50 years respectively. Table 1 also
depicts that 55.5% of the participants have an e-shopping
experience of less than 2 years and 33.2% are having an
experience of 2-5 years. For 11.3% of the participants have
an online shopping experience of above 5 years
respectively.
RELIABILITY AND VALIDITY ANALYSIS:
The measurement model is examined for internal
consistency reliability [29] and the presence of necessary
convergent and discriminant validity in the scale. The results
of these statistical methods are reported and discussed
below. In order to validate construct validity and reliability
before analysing the interrelationship of the constructs in
the structural model, the PLS algorithm is applied to the
proposed model [25]. The final measurement model
indicates the diverse variables affecting the intention to
adopt the telemedicine by the consumers is shown in figure
1.
TABLE 1. DEMOGRAPHIC PROFILE OF THE PARTICIPANTS
Demographics Sub categories Frequency
(Percentage)
Gender Female 158 (48.2%)
Male 170 (51.8%)
Age group
Age between 20-35 139 (42.4%)
35-50 102 (31.1%)
Above 50 87 (26.5%)
E-shopping
experience
Less than 2 years 182 (55.5%)
Between 2-5 years 109 (33.2%)
Above 5 years 37 (11.3%)
30

TABLE 2: RELIABILITY, CONVERGENT VALIDITY AND DISCRIMINANT VALIDITY
Construct Indicator Variables
Standard Factor
Loading
Cronbach
Alpha
Composite
Reliability AVE
Affordability
AF1 0.791
0.868 0.91 0.717 AF2 0.834
AF3 0.863
AF4 0.896
Authenticity
AN1 0.912
0.899 0.937 0.832 AN2 0.918
AN3 0.906
Intention to
Adopt
Telemedicine
AT1 0.935
0.818 0.894 0.741 AT2 0.917
AT3 0.713
Convenience
CO1 0.893
0.869 0.919 0.792 CO2 0.92
CO3 0.856
Hedonic
Motivation
HM1 0.716
0.85 0.9 0.693 HM2 0.878
HM3 0.864
HM4 0.862
Actual Usage
IR1 0.847
0.723 0.844 0.644 IR2 0.728
IR3 0.827
Offers/
Discounts
OD1 0.909
0.893 0.933 0.823 OD2 0.89
OD3 0.923
Reliability
RL1 0.764
0.869 0.911 0.72 RL2 0.901
RL3 0.849
RL4 0.874
Social
Influence
SI1 0.862
0.846 0.906 0.763 SI2 0.875
SI3 0.883
Authors’ Calculation
31
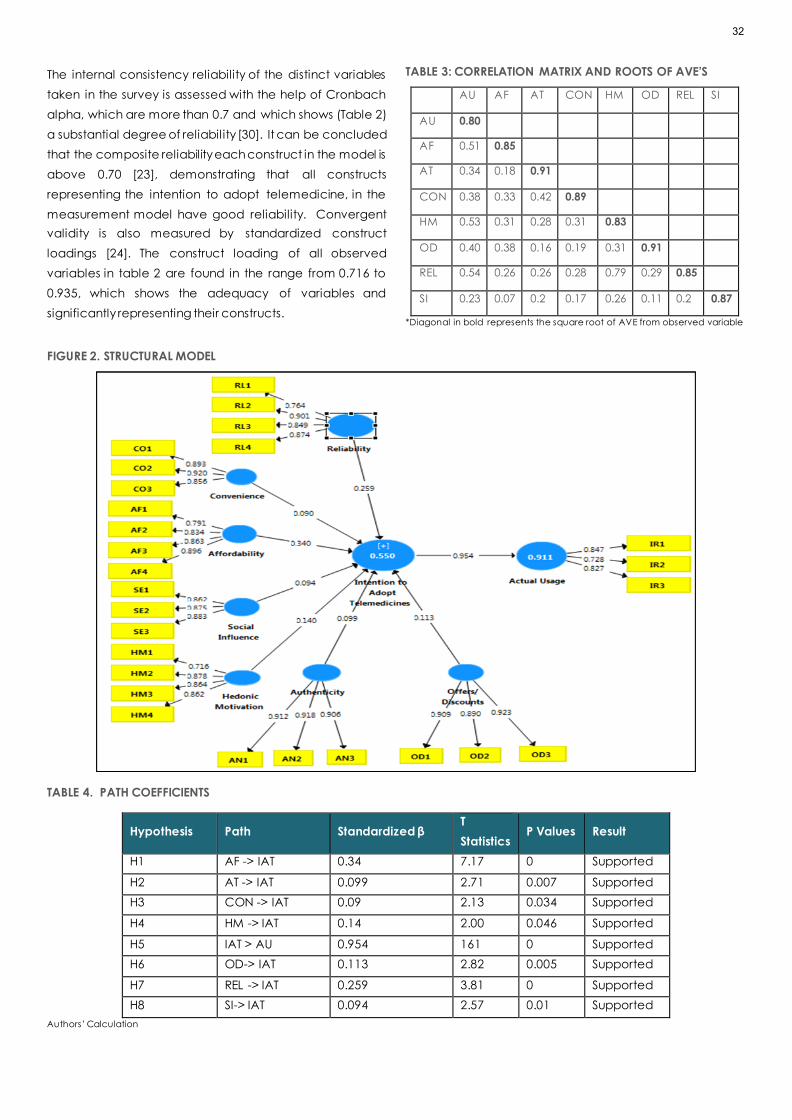
The internal consistency reliability of the distinct variables
taken in the survey is assessed with the help of Cronbach
alpha, which are more than 0.7 and which shows (Table 2)
a substantial degree of reliabil ity [30]. It can be concluded
that the composite reliability each construct in the model is
above 0.70 [23], demonstrating that all constructs
representing the intention to adopt telemedicine, in the
measurement model have good reliability. Convergent
validity is also measured by standardized construct
loadings [24]. The construct loading of all observed
variables in table 2 are found in the range from 0.716 to
0.935, which shows the adequacy of variables and
significantly representing their constructs.
TABLE 3: CORRELATION MATRIX AND ROOTS OF AVE’S
AU AF AT CON HM OD REL SI
AU 0.80
AF 0.51 0.85
AT 0.34 0.18 0.91
CON 0.38 0.33 0.42 0.89
HM 0.53 0.31 0.28 0.31 0.83
OD 0.40 0.38 0.16 0.19 0.31 0.91
REL 0.54 0.26 0.26 0.28 0.79 0.29 0.85
SI 0.23 0.07 0.2 0.17 0.26 0.11 0.2 0.87
*Diagonal in bold represents the square root of AVE from observed variable
FIGURE 2. STRUCTURAL MODEL
TABLE 4. PATH COEFFICIENTS
Hypothesis Path Standardized β T
Statistics P Values Result
H1 AF -> IAT 0.34 7.17 0 Supported
H2 AT -> IAT 0.099 2.71 0.007 Supported
H3 CON -> IAT 0.09 2.13 0.034 Supported
H4 HM -> IAT 0.14 2.00 0.046 Supported
H5 IAT > AU 0.954 161 0 Supported
H6 OD-> IAT 0.113 2.82 0.005 Supported
H7 REL -> IAT 0.259 3.81 0 Supported
H8 SI-> IAT 0.094 2.57 0.01 Supported
Authors’ Calculation
32
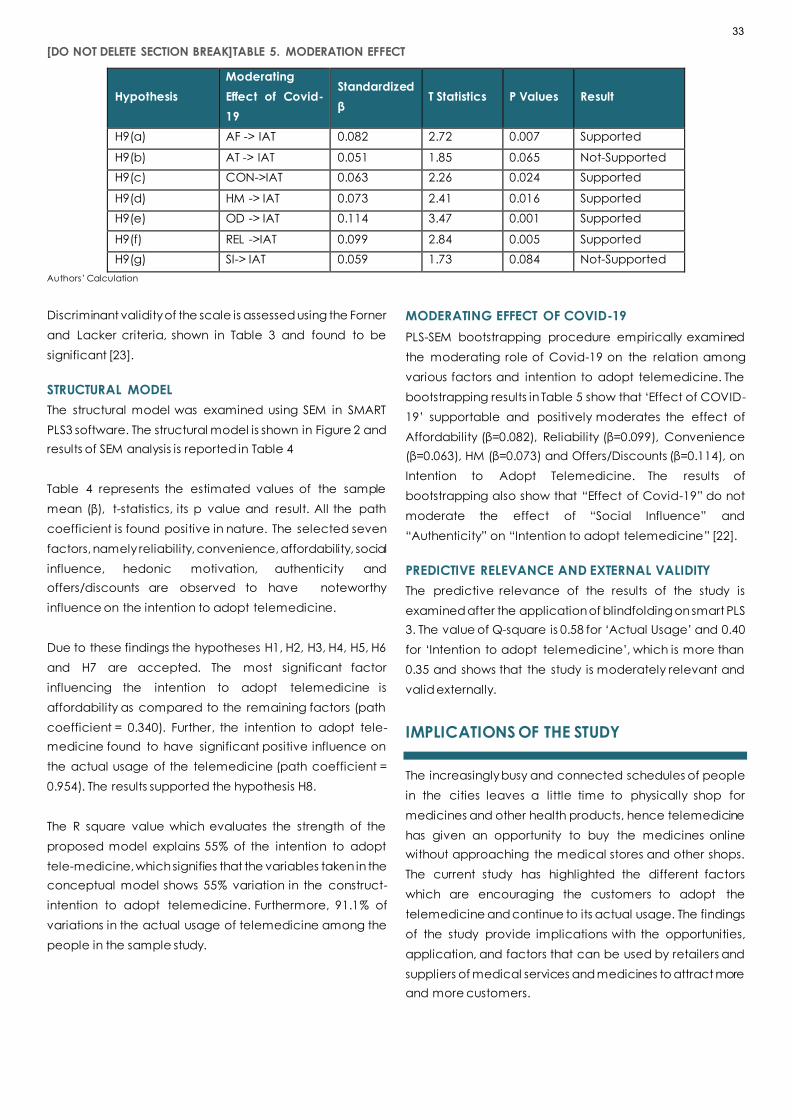
[DO NOT DELETE SECTION BREAK]TABLE 5. MODERATION EFFECT
Hypothesis
Moderating
Effect of Covid-
19
Standardized
β T Statistics P Values Result
H9(a) AF -> IAT 0.082 2.72 0.007 Supported
H9(b) AT -> IAT 0.051 1.85 0.065 Not-Supported
H9(c) CON->IAT 0.063 2.26 0.024 Supported
H9(d) HM -> IAT 0.073 2.41 0.016 Supported
H9(e) OD -> IAT 0.114 3.47 0.001 Supported
H9(f) REL ->IAT 0.099 2.84 0.005 Supported
H9(g) SI-> IAT 0.059 1.73 0.084 Not-Supported
Authors’ Calculation
Discriminant validity of the scale is assessed using the Forner
and Lacker criteria, shown in Table 3 and found to be
significant [23].
STRUCTURAL MODEL
The structural model was examined using SEM in SMART
PLS3 software. The structural model is shown in Figure 2 and
results of SEM analysis is reported in Table 4
Table 4 represents the estimated values of the sample
mean (β), t-statistics, its p value and result. All the path
coefficient is found positive in nature. The selected seven
factors, namely reliability, convenience, affordability, social
influence, hedonic motivation, authenticity and
offers/discounts are observed to have noteworthy
influence on the intention to adopt telemedicine.
Due to these findings the hypotheses H1, H2, H3, H4, H5, H6
and H7 are accepted. The most significant factor
influencing the intention to adopt telemedicine is
affordability as compared to the remaining factors (path
coefficient = 0.340). Further, the intention to adopt tele-
medicine found to have significant positive influence on
the actual usage of the telemedicine (path coefficient =
0.954). The results supported the hypothesis H8.
The R square value which evaluates the strength of the
proposed model explains 55% of the intention to adopt
tele-medicine, which signifies that the variables taken in the
conceptual model shows 55% variation in the construct-
intention to adopt telemedicine. Furthermore, 91.1% of
variations in the actual usage of telemedicine among the
people in the sample study.
MODERATING EFFECT OF COVID-19
PLS-SEM bootstrapping procedure empirically examined
the moderating role of Covid-19 on the relation among
various factors and intention to adopt telemedicine. The
bootstrapping results in Table 5 show that ‘Effect of COVID-
19’ supportable and positively moderates the effect of
Affordability (β=0.082), Reliability (β=0.099), Convenience
(β=0.063), HM (β=0.073) and Offers/Discounts (β=0.114), on
Intention to Adopt Telemedicine. The results of
bootstrapping also show that “Effect of Covid-19” do not
moderate the effect of “Social Influence” and
“Authenticity” on “Intention to adopt telemedicine” [22].
PREDICTIVE RELEVANCE AND EXTERNAL VALIDITY
The predictive relevance of the results of the study is
examined after the application of blindfolding on smart PLS
3. The value of Q-square is 0.58 for ‘Actual Usage’ and 0.40
for ‘Intention to adopt telemedicine’, which is more than
0.35 and shows that the study is moderately relevant and
valid externally.
IMPLICATIONS OF THE STUDY
The increasingly busy and connected schedules of people
in the cities leaves a little time to physically shop for
medicines and other health products, hence telemedicine
has given an opportunity to buy the medicines online
without approaching the medical stores and other shops.
The current study has highlighted the different factors
which are encouraging the customers to adopt the
telemedicine and continue to its actual usage. The findings
of the study provide implications with the opportunities,
application, and factors that can be used by retailers and
suppliers of medical services and medicines to attract more
and more customers.
33

CONCLUSION
COVID-19 outbreak forced the government of different
countries to undertake lockdown and instructed people to
maintain social distancing. It has become difficult for
people to approach markets and obtain medicines. During
the lockdown period, when people were compelled to
depend on e-shopping for their day-to-day basic needs,
these consumers also utilized the services of telemedicine.
Currentlyin the epidemic, this study has examoned distinct
influential variables of intention to adopt telemedicine by
the people. The intention to adopt telemedicine is the
construct that strongly influences the actual usage of
telemedicine in developing countries. The scope of the
study is restricted to the northern region of Indiatherefore
future studies can be conducted in relation a whole global
perspective of consumers.
References:
1. Union Budget 2021:137 percent increase in health
spending; key highlights for healthcare.
Timesnownews.com 2021 Available from:
https://www.timesnownews.com/health/article/union-
budget-2021-health-sector-rs-64180-cr-new-
aatmanirbhar-health-scheme-key-highlights-for-
healthcare/714369 [Last accessed on 2021 Feb 15]
2. Sidhu, G. S., Rai, J. S., Khaira, K. S. Kaur, S. The Impact of
COVID-19 Pandemic on Different Sectors of the Indian
Economy: A Descriptive Study. Int J Eco Fin Iss 2020;
10(5): 113-120.
3. Hertling, S., Hertling, D., Martin, D., Graul, I.
Acceptance, Use, and Barriers of Telemedicine in
Transgender Health Care in Times of SARS-CoV-2:
Nationwide Cross-sectional Survey. JMIR 2021; 7(12):
e30278.
4. Menachemi, N., Burke, D., & Ayers, D. (2005). Factors
Affecting the Adoption of Telemedicine—A Multiple
Adopter Perspective. Journal of Medical Systems, 28,
617–632.
https://doi.org/10.1023/B:JOMS.0000044964.49821.df
5. IANS. (2020, October 3). At least 81% doctors in
Northern India have adopted telemedicine: Report.
Business Standard India. https://www.business-
standard.com/article/current-affairs/at-least-81-
doctors-in-northern-india-have-adopted-
telemedicine-report-120100300645_1.html
6. Srivastava M, Raina M. Consumers’ usage and
adoption of e-pharmacy in India. Int J Pharm Healthc
Mark 2021; 15(2): 235-250.
7. Straub ET. Understanding technology adoption: Theory
and future directions for informal learning. Rev Educ
Res 2009; 79(2): 625-649.
8. Okereafor K, Adebola O, Djehaiche R. Exploring the
potentials of telemedicine and other noncontact
electronic health technologies in controlling the
spread of the novel coronavirus disease (covid-19) IJITE
2020; 8(4): 1-13.
9. Nicola M, Alsafi Z, Sohrabi C, Kerwan A, Al-Jabir A,
Iosifidis C, Agha M, Agha R. The socio-economic
implications of the coronavirus pandemic (COVID-19):
A review. Int J Surg 2020; 78:185-193.
10. Ministry of Chemicals & Fertilizers, Annual Report
2020-21.
Available:<https://pharmaceuticals.gov.in/sites/def
ault/files/english%20Annual%20Report%202020-
21.pdf> (Accessed 03/09/21)
11. Wani, T. A., & Ali, S. W. (n.d.). Innovation Difusion Theory.
19.
12. Chaturvedi AK, Singh UK, Kumar A. Online pharmacy:
An e-strategy for medication. Int J Pharm Front Res
2011; 1(1): 146-158.
13. Bokolo, A. Jnr. (2021). Exploring the adoption of
telemedicine and virtual software for care of
outpatients during and after COVID-19 pandemic. Irish
Journal of Medical Science (1971 -), 190(1), 1–10.
https://doi.org/10.1007/s11845-020-02299-z
14. Kichloo, A., Albosta, M., Dettloff, K., Wani, F., El -Amir, Z.,
Singh, J., Aljadah, M., Chakinala, R. C., Kanugula, A. K.,
Solanki, S., & Chugh, S. (2020). Telemedicine, the
current COVID-19 pandemic and the future: A
narrative review and perspectives moving forward in
the USA. Family Medicine and Community Health, 8(3),
e000530. https://doi.org/10.1136/fmch-2020-000530
15. Riew GJ, Lovecchio F, Samartzis D, Bernstein DN,
Underwood EY, Louie PK, Germscheid N, An HS,
Cheung JP, Chutkan N, Mallow GM. Spine surgeon
perceptions of the challenges and benefits of
telemedicine: an international study. Eur Spine J 2021;
16:1-9.
16. Almathami, H. K. Y., Win, K. T., & Vlahu-Gjorgievska, E.
(2020). Barriers and Facilitators That Influence
Telemedicine-Based, Real-Time, Online Consultation at
Patients’ Homes: Systematic Literature Review. Journal
of Medical Internet Research, 22(2), e16407.
https://doi.org/10.2196/16407
17. Rahi S, Khan MM, Alghizzawi M. Factors influencing the
adoption of telemedicine health services during
COVID-19 pandemic crisis: an integrative research
model. Enterp Inf Syst 2021; 15(6):769-793.
34

18. Faul, F., Erdfelder, E., Lang, A.-G., & Buchner, A. (2007).
G*Power 3: A flexible statistical power analysis program
for the social, behavioral, and biomedical sciences.
Behavior Research Methods, 39(2), 175–191.
https://doi.org/10.3758/BF03193146.
19. Kamal SA, Shafiq M, Kakria P. Investigating
acceptance of telemedicine services through an
extended technology acceptance model (TAM).
Technol Soc 2020; 60:101212.
20. Kronenfeld, J. P., & Penedo, F. J. (2021). Novel
Coronavirus (COVID-19): Telemedicine and remote
care delivery in a time of medical crisis,
implementation, and challenges. Translational
Behavioral Medicine, 11(2), 659–663.
https://doi.org/10.1093/tbm/ibaa105
21. Miller, R. L. (2015). Rogers’ Innovation Diffusion Theory
(1962, 1995) [Chapter]. Information Seeking Behavior
and Technology Adoption: Theories and Trends; IGI
Global. https://doi.org/10.4018/978-1-4666-8156-
9.ch016
22. Saxena C, Baber H, Kumar P. Examining the
moderating effect of perceived benefits of
maintaining social distance on e-learning quality
during COVID-19 pandemic. J Educ Technol Syst 2021;
49(4): 532-554.
23. Fornell C. Partial least squares. In: Advanced methods
of marketing research. Cambridge: Blackwell; 1994.
24. Hair Jr JF, Sarstedt M, Hopkins L, Kuppelwieser VG.
Partial least squares structural equation modeling (PLS-
SEM): An emerging tool in business research. Eur bus rev
2014; 31(1): 2-24.
25. Fornell C, Larcker DF. Structural equation models with
unobservable variables and measurement error:
Algebra and statistics. J Mark Res 1981; 18(3): 382-388.
26. Wen CL. Telemedicine, ehealth and remote care
systems. In: Global Health Informatics. Academic Press;
2017.
27. Mann DM, Chen J, Chunara R, Testa PA, Nov O.
COVID-19 transforms health care through
telemedicine: evidence from the field. JAMIA 2020;
27(7): 1132-1135.
28. Ali F, Rasoolimanesh SM, Sarstedt M, Ringle CM, Ryu K.
An assessment of the use of partial least squares
structural equation modeling (PLS-SEM) in hospitality
research. Int J Contemp Manag Res 2018; 30(1): 514-
538.
29. Sekaran U, Bougie R. Research methods for business: A
skill building approach (7th edition). John Willey and
Sons Limited, West Sussex, United Kingdom
35

RESEARCH ARTICLE
SENIOR MANAGER PERCEPTIONS OF THE HUMAN DIMENSION
OF HEALTH SERVICES MANAGEMENT: AUSTRALIA AND BRAZIL
Jo. M. Martins1, Godfrey Isouard2, Ana Maria Malik3, Brenda Freshman4
1. Adjunct Professor, International Medical University, Kuala Lumpur, Malaysia
2. Adjunct Professor, University of New England, Sydney, Australia
3. Professor, School of Business Administration, Sao Paulo, Brazil
4. Professor, Health Care Administration, California State University, Long Beach CA, USA
Correspondence: [email protected]
ABSTRACT
Practice and research show the importance of the human dimension of health service management and related
skills/competences. However, a review of curriculum content of postgraduate courses in Australia showed a lack of
content in this area. It was in this context, an enquiry was undertaken to assess the perceptions of senior health service
managers in Australia in this field. To provide a contrast with Australian perceptions, senior health service managers in
Brazil were also asked for their understandings. Findings from this enquiry in the two countries show similar but some
variance in nuance, possible due to differences in culture and corporate environment. The result of the enquiry points to
the importance given by these senior managers to skills/competences in this area, and perceptions of shortfalls, in contrast
with the lack of importance given to postgraduate training in this field.
KEYWORDS
Health management, human skills/competence, managers’ perceptions, curriculum lags.
INTRODUCTION
Health services outcomes are dependent on the
combined efforts of a large and varied range of people.
Therefore, the practice of health service management is
faced with the interaction among people often coming
from different backgrounds and professional cultures.
Further, research findings have shown the importance of
essential personal skills in the management of health
services, and that related training can result in improved
management and outcomes. This would lead to the
assumption that the content of postgraduate training in
health services management would include the practice
of relevant personal skills. Yet, a review of curricula of
postgraduate courses in health services management in
Australia showed that there is a lack of content in this area
[1] [2]. A relevant question is whether the lack of course
content reflects the perceptions of health services
managers regarding the importance of these skills and their
practice, thence lack of demand for related training. It was
in this context that the present enquiry was undertaken, to
ascertain whether the low importance given to
36

postgraduate health management training on these skills in
Australia reflected the perceptions of senior health
managers of their relative importance. In order, to provide
some contrast to the perceptions of Australian health
services managers on these skills, a similar enquiry was also
undertaken among some senior health service managers
in Brazil, in a different cultural and social environment. The
aim of this contrast was to ascertain whether the
perceptions of the relative importance of personal skills in
health services management were peculiar to Australian
health service managers or might have wider perceived
relevance. The responses from this enquiry need to be seen
more as qualitative in nature, as an input into the
assessment of the perceived need for training in personal
skills in health services management in Australia.
LITERATURE REVIEW
A brief review is now provided of the extensive literature,
with focus on salient features of concepts, their assessment,
association with performance, and effective training.
A review of systemic changes in the Australian health
services led to the identification of salient management
issues arising from them. In turn, these concerns led to the
identification of management competencies and/or skills
that would enhance related services management. This
pathway, based on real-world events documented
empirically, led to a framework of predisposing, enabling
and transforming competencies and/or skills of relevance
from the available inventory of health management
competencies and/or skills identified [3]. A direct link had
been established between the identified competencies to
enhance leadership and management effectiveness.
Among the salient management issues identified, a
number were related to personal motivation, reflection and
behaviour in relation to others in the work setting. These are
of importance in health services because of the
interdependence among a wide range of professionals
and practice that affects personal and organisational
outcomes and the effectiveness of services [4]. However,
there is evidence that current practices can stifle
motivation and result in a lack of satisfaction with work,
stress, burnout and even exit from the professions [5] [6]
The related literature shows there are three applicable
concepts that meet the four tests of validity, association
with performance, identifiable features capable of
measurement and possible training:
• work engagement
• emotional intelligence
• conflict resolution
The concept of personal engagement at work was
described by Kahn [7] as the simultaneous employment
and expression of a person’s ‘preferred self’ in task
behaviour that promote connections with work and others.
Emotional intelligence has been defined by Salovey &
Mayer [8] as the ability to monitor one’s own and others’
feelings and emotions to discriminate among them and use
this information to guide one’s thinking and actions. Rahim
[9] stated that conflict is an interactive process manifested
in incompatibility, disagreement, or dissonance within or
between social entities; and De Breu et al [10] saw its
resolution (management) as behaviour oriented towards
the intensification, reduction, and resolution of tension
caused by conflict. There are affective, cognitive and
behavioural dimensions in these three concepts. They
intercept with each other and notions of involvement and
satisfaction, organisational commitment, burnout,
personality traits and regulation of emotions, motivation,
cognitive intelligence and self-efficacy. Nevertheless, they
have been found valid and different constructs.
A review of the concept of personal engagement at work
by Schaufeli [11] pointed to four main perspectives
concerned with (1) needs satisfying, (2) burnout-antithesis,
(3) work satisfaction and engagement, and (4) a
multidimensional perspective. May et al [12] found
evidence of the linkage between personal engagement
and Khan’s three conditions of psychological
meaningfulness, safety, availability as antecedent
variables of expression of personal engagement in terms of
physical, emotional and cognitive engagement. The
burnout-antithesis perspective considers engagement at
one end of a continuum with burnout at the other end.
Another perspective relates engagement to involvement,
enthusiasm and satisfaction at work. The multidimensional
perspective relates engagement and role performance
[13]. Christian et al [14] in their meta-analysis of the concept
of personal work engagement found that although it shares
an association with job attitudes it is a unique concept that
had incremental validity in predicting job performance.
Kim et al [15] found that the association of work
engagement and performance applied to different
industries and occupations in Africa, Asia, Europe, Australia
and the US.
37
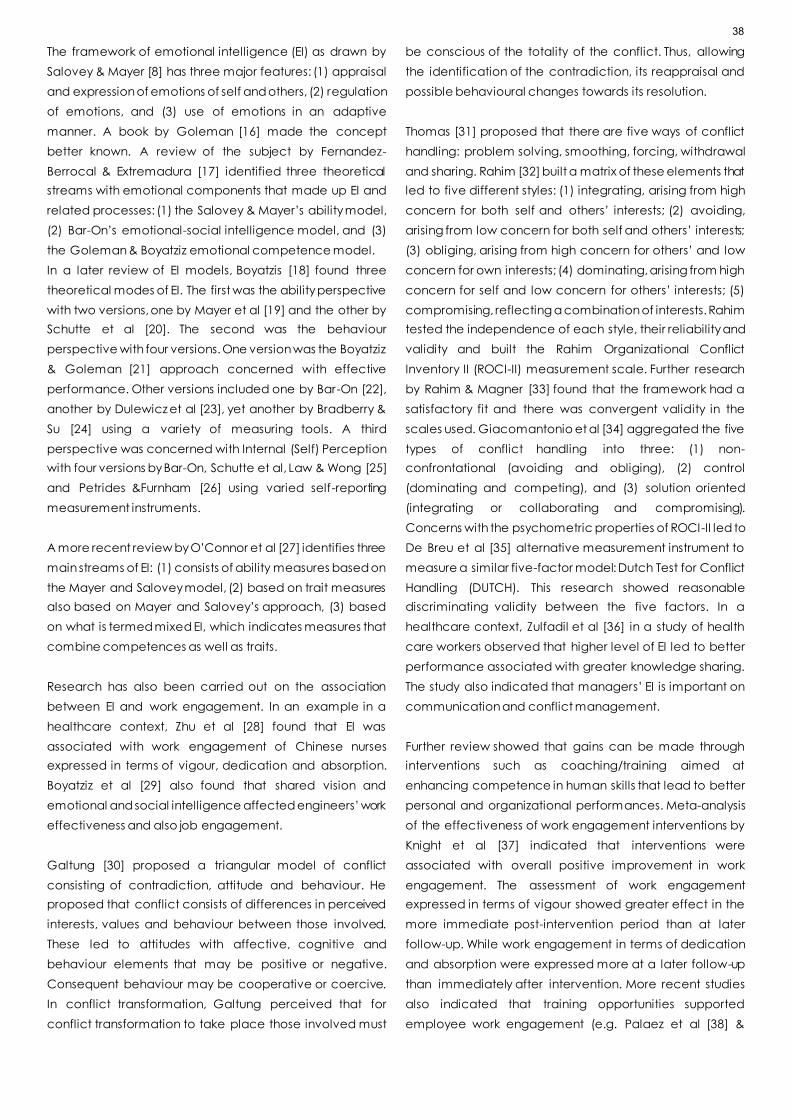
The framework of emotional intelligence (EI) as drawn by
Salovey & Mayer [8] has three major features: (1) appraisal
and expression of emotions of self and others, (2) regulation
of emotions, and (3) use of emotions in an adaptive
manner. A book by Goleman [16] made the concept
better known. A review of the subject by Fernandez-
Berrocal & Extremadura [17] identified three theoretical
streams with emotional components that made up EI and
related processes: (1) the Salovey & Mayer’s ability model,
(2) Bar-On’s emotional-social intelligence model, and (3)
the Goleman & Boyatziz emotional competence model.
In a later review of EI models, Boyatzis [18] found three
theoretical modes of EI. The first was the ability perspective
with two versions, one by Mayer et al [19] and the other by
Schutte et al [20]. The second was the behaviour
perspective with four versions. One version was the Boyatziz
& Goleman [21] approach concerned with effective
performance. Other versions included one by Bar-On [22],
another by Dulewicz et al [23], yet another by Bradberry &
Su [24] using a variety of measuring tools. A third
perspective was concerned with Internal (Self) Perception
with four versions by Bar-On, Schutte et al, Law & Wong [25]
and Petrides &Furnham [26] using varied self-reporting
measurement instruments.
A more recent review by O’Connor et al [27] identifies three
main streams of EI: (1) consists of ability measures based on
the Mayer and Salovey model, (2) based on trait measures
also based on Mayer and Salovey’s approach, (3) based
on what is termed mixed EI, which indicates measures that
combine competences as well as traits.
Research has also been carried out on the association
between EI and work engagement. In an example in a
healthcare context, Zhu et al [28] found that EI was
associated with work engagement of Chinese nurses
expressed in terms of vigour, dedication and absorption.
Boyatziz et al [29] also found that shared vision and
emotional and social intelligence affected engineers’ work
effectiveness and also job engagement.
Galtung [30] proposed a triangular model of conflict
consisting of contradiction, attitude and behaviour. He
proposed that conflict consists of differences in perceived
interests, values and behaviour between those involved.
These led to attitudes with affective, cognitive and
behaviour elements that may be positive or negative.
Consequent behaviour may be cooperative or coercive.
In conflict transformation, Galtung perceived that for
conflict transformation to take place those involved must
be conscious of the totality of the conflict. Thus, allowing
the identification of the contradiction, its reappraisal and
possible behavioural changes towards its resolution.
Thomas [31] proposed that there are five ways of conflict
handling: problem solving, smoothing, forcing, withdrawal
and sharing. Rahim [32] built a matrix of these elements that
led to five different styles: (1) integrating, arising from high
concern for both self and others’ interests; (2) avoiding,
arising from low concern for both self and others’ interests;
(3) obliging, arising from high concern for others’ and low
concern for own interests; (4) dominating, arising from high
concern for self and low concern for others’ interests; (5)
compromising, reflecting a combination of interests. Rahim
tested the independence of each style, their reliability and
validity and built the Rahim Organizational Conflict
Inventory II (ROCI-II) measurement scale. Further research
by Rahim & Magner [33] found that the framework had a
satisfactory fit and there was convergent validity in the
scales used. Giacomantonio et al [34] aggregated the five
types of conflict handling into three: (1) non-
confrontational (avoiding and obliging), (2) control
(dominating and competing), and (3) solution oriented
(integrating or collaborating and compromising).
Concerns with the psychometric properties of ROCI-II led to
De Breu et al [35] alternative measurement instrument to
measure a similar five-factor model: Dutch Test for Conflict
Handling (DUTCH). This research showed reasonable
discriminating validity between the five factors. In a
healthcare context, Zulfadil et al [36] in a study of health
care workers observed that higher level of EI led to better
performance associated with greater knowledge sharing.
The study also indicated that managers’ EI is important on
communication and conflict management.
Further review showed that gains can be made through
interventions such as coaching/training aimed at
enhancing competence in human skills that lead to better
personal and organizational performances. Meta-analysis
of the effectiveness of work engagement interventions by
Knight et al [37] indicated that interventions were
associated with overall positive improvement in work
engagement. The assessment of work engagement
expressed in terms of vigour showed greater effect in the
more immediate post-intervention period than at later
follow-up. While work engagement in terms of dedication
and absorption were expressed more at a later follow-up
than immediately after intervention. More recent studies
also indicated that training opportunities supported
employee work engagement (e.g. Palaez et al [38] &
38

Sawasdee et al [39]). A number of studies indicate that
coaching/training in EI can improve performance as well
as wellbeing of students, health workers and others (e.g.
Slaski & Cartwright [40]; Hen & Sharabi-Nov [41]; Choi et al
[42]; Gilar-Corbi et al [43]; Karimi et al [44]). Similarly, studies
have shown that coaching/training in conflict
management resulted in improved practice (e.g. Haraway
& Haraway [45]; Leon-Perez et al [46]; Wolfe et al [47]).
METHOD AND DATA
The enquiry was undertaken to assess perceptions of senior
managers regarding the relative importance of human skills
in health services management. The method used was that
of a qualitative nature of perceptions held rather than
tested actual situations. The enquiry used a questionnaire
developed to assess senior managers’ perceptions
regarding:
• adequacy of competence in human skills in
healthcare management
• obstacles to human skills enhancement in healthcare
management
• possible steps to enhance these skills
The enquiry relied on written answers to a questionnaire
(See Appendix). A draft questionnaire had been prepared
originally and reviewed for suitability by an experienced
senior manager. Consequently, some amendments were
made. The enquiry involved senior and busy health service
managers, and by its very nature relied on the willingness
of senior managers to take the time involved. Senior in this
context relates to the relative high position of the manager
rather their length of experience. The respondents to the
questionnaire worked in hospitals, aged-care residential
services (hostels and nursing homes), and in the
administration of health services. The answers to each open
question were reviewed independently by two of the
authors, both in the case of Australia and Brazil. The
itemised themes of the answers were then revised by the
two reviewers using relevant criteria, to resolve any
differences, to get agreed response items for each
question. The enquiry has a number of limitations. The
convenience samples used both in Australia and Brazil are
not random in nature, and, as stated, relied on the
willingness of senior managers to spend their usually busy
time in sharing their opinions. The sample sizes were
relatively small (14 in Australia and 18 in Brazil). Nevertheless,
the relative consistency in the responses provide
worthwhile insights about the perceived relevance of these
skills/competences by the responding senior managers of
health services in the two countries.
PERCEPTIONS OF SENIOR MANAGERS OF
HEALTHCARE IN AUSTRALIA AND BRAZIL
Following the outlined method, the analysis of responses
provides a qualitative measure of the opinion of the
responding senior managers regarding human skills in the
management of health services.
CONTRIBUTION OF COMPETENCE IN HUMAN SKILLS
In both countries, the importance of competence in
human skills was recognised by all respondents. They also
felt that they were essential in most cases but more so in
Brazil than Australia (57% in Australia and 67% in Brazil).
While Brazilian managers expressed their perspectives in
terms of commitment and communication, Australians did
so in terms of teamwork, efficiency and effectiveness
(Table 1).
TABLE 1 IMPORTANCE OF ESSENTIAL HUMAN SKILLS
IMPORTANCE
PERCENTAGE OF RESPONDENTS
AUSTRALIA BRAZIL
Working with and engagement with others
Essential/decisive/fundamental/basic
Conflict management
Efficiency/productivity/effectiveness
Commitment/engagement
Communication
Team work
100
57
36
50
…
…
64
100
67
39
33
39
17
…
39

ADEQUACY OF COMPETENCE IN HUMAN SKILLS
The responses to the question of the adequacy of
competence in human skills were expressed considerably
different in the two countries. It is possible that cultural
differences may account for some of the differences in the
expression of perceptions. About three quarters of
respondents in Australia (73%) expressed the opinion that
generally healthcare managers did not possess adequate
competence in human skills versus only 6% in Brazil.
However, half of Brazilian respondents (50%) felt that
competence was inconsistent or less than adequate.
Agreement was close on the proportion who felt that
managers had adequate skills in human relationships (13%
in Australia and 17% in Brazil) (Table 2).
LACKING ENHANCEMENT IN HUMAN SKILLS
Senior managers in both countries perceived that there
was need for greater skills in teamwork/collaboration (53%
and 50% in Australia and Brazil respectively), but also in
conflict management and listening and communication
with others (40% and 39% respectively in each case).
Australian managers placed greater emphasis on self-
awareness (27% in Australia and 17% in Brazil) and
emotional intelligence (same respectively), while Brazilian
managers placed some emphasis on the issue of critical
appraisal and problem identification (33%) (Table 3)
OBSTACLES TO HUMAN SKILL DEVELOPMENT AND
HOW TO ADDRESS THEM
In both countries, obstacles to the development of human
skills were perceived to be due to priority to technical
training and competence (27% and 28% in Australia and
Brazil respectively). Time and resource constraints were
found to be more important in Australia (33%) but they were
also found in Brazil (22%). Authoritarian/bureaucratic
structure and culture were seen as obstacles in Brazil by
more than a quarter of managers (28%), but in Australia
learned and rewarded negative behaviour was seen as an
obstacle by about a fifth (20%). Lack of awareness of the
value of human skills was seen as an obstacle by a third of
managers in Brazil (33%) but less so in Australia (13%) (Table
4).
TABLE 2 ADEQUACY OF COMPETENCE IN ESSENTIAL HUMAN SKILLS
ADEQUACY
PERCENTAGE OF RESPONDENTS
AUSTRALIA BRAZIL
Yes, but inconsistent/less than adequate
Managers have adequate skills in in human relationships
Few/exception
Generally, no
7
13
7
73
50
17
28
6
TABLE 3 LACKING ENHANCEMENT IN HUMAN SKILLS
LACK
PERCENTAGE OF RESPONDENTS
AUSTRALIA BRAZIL
Teamwork/collaboration
Conflict management/negotiation/conciliation
Communication/listening to others
Critical appraisal/problem identification
Self-awareness
Emotional intelligence
53
40
40
…
27
27
50
39
39
33
17
17
40
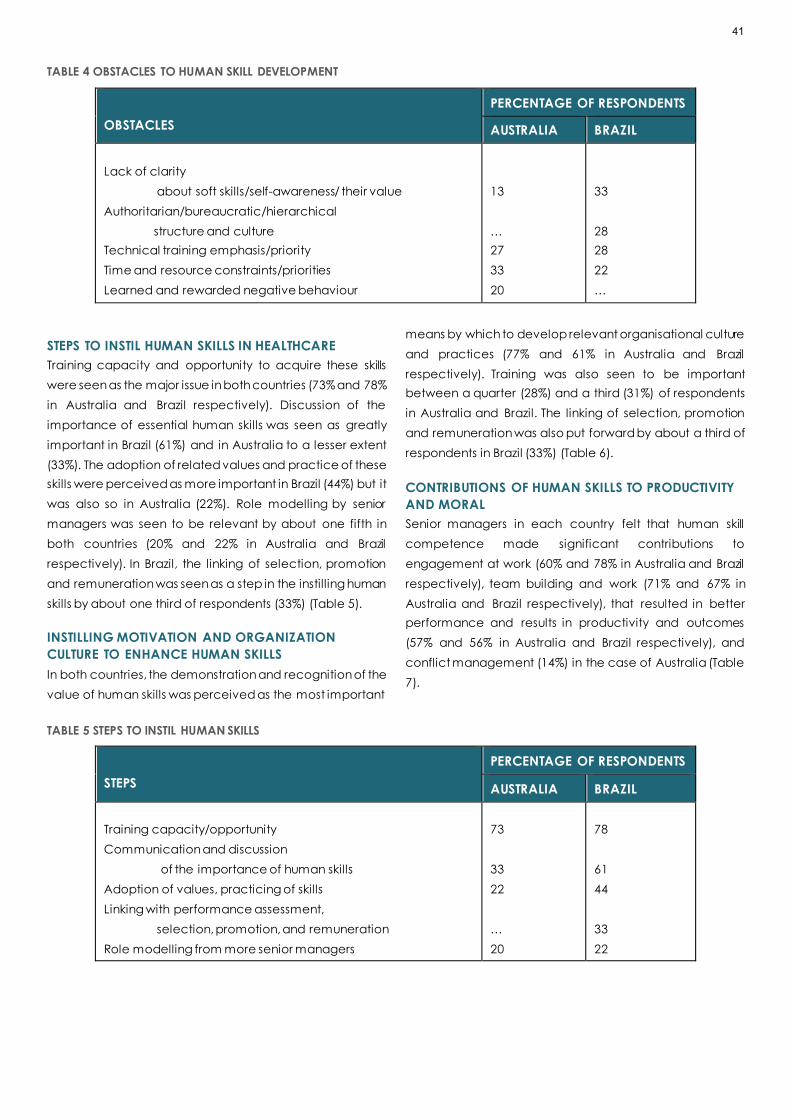
TABLE 4 OBSTACLES TO HUMAN SKILL DEVELOPMENT
OBSTACLES
PERCENTAGE OF RESPONDENTS
AUSTRALIA BRAZIL
Lack of clarity
about soft skills/self-awareness/ their value
Authoritarian/bureaucratic/hierarchical
structure and culture
Technical training emphasis/priority
Time and resource constraints/priorities
Learned and rewarded negative behaviour
13
…
27
33
20
33
28
28
22
…
STEPS TO INSTIL HUMAN SKILLS IN HEALTHCARE
Training capacity and opportunity to acquire these skills
were seen as the major issue in both countries (73% and 78%
in Australia and Brazil respectively). Discussion of the
importance of essential human skills was seen as greatly
important in Brazil (61%) and in Australia to a lesser extent
(33%). The adoption of related values and practice of these
skills were perceived as more important in Brazil (44%) but it
was also so in Australia (22%). Role modelling by senior
managers was seen to be relevant by about one fifth in
both countries (20% and 22% in Australia and Brazil
respectively). In Brazil, the linking of selection, promotion
and remuneration was seen as a step in the instilling human
skills by about one third of respondents (33%) (Table 5).
INSTILLING MOTIVATION AND ORGANIZATION
CULTURE TO ENHANCE HUMAN SKILLS
In both countries, the demonstration and recognition of the
value of human skills was perceived as the most important
means by which to develop relevant organisational culture
and practices (77% and 61% in Australia and Brazil
respectively). Training was also seen to be important
between a quarter (28%) and a third (31%) of respondents
in Australia and Brazil. The linking of selection, promotion
and remuneration was also put forward by about a third of
respondents in Brazil (33%) (Table 6).
CONTRIBUTIONS OF HUMAN SKILLS TO PRODUCTIVITY
AND MORAL
Senior managers in each country felt that human skill
competence made significant contributions to
engagement at work (60% and 78% in Australia and Brazil
respectively), team building and work (71% and 67% in
Australia and Brazil respectively), that resulted in better
performance and results in productivity and outcomes
(57% and 56% in Australia and Brazil respectively), and
conflict management (14%) in the case of Australia (Table
7).
TABLE 5 STEPS TO INSTIL HUMAN SKILLS
STEPS
PERCENTAGE OF RESPONDENTS
AUSTRALIA BRAZIL
Training capacity/opportunity
Communication and discussion
of the importance of human skills
Adoption of values, practicing of skills
Linking with performance assessment,
selection, promotion, and remuneration
Role modelling from more senior managers
73
33
22
…
20
78
61
44
33
22
41

TABLE 6 HOW TO DO IT
MEANS
PERCENTAGE OF RESPONDENTS
AUSTRALIA BRAZIL
Demonstration/discussion/recognition
of value of these skills
Linking with performance assessment,
selection, promotion, and remuneration
Training
Do not know
Self-assessment
and sharing of individual strengths and challenges
77
…
31
…
15
61
33
28
11
…
TABLE 7 CONTRIBUTIONS TO PRODUCTIVITY AND MORAL
CONTRIBUTIONS
PERCENTAGE OF RESPONDENTS
AUSTRALIA BRAZIL
Work engagement, feel valued, moral
Team building and work, relationships, communication
Better performance, results/outcomes, productivity
Conflict management
60
71
57
14
78
67
56
…
BETTER NAME FOR THESE SKILLS
There were a wide range of suggestions, especially in the
case of Brazil for a better name than soft skills. Nevertheless,
about a fifth of respondents in Australia (21%) and a lower
proportion in Brazil (6%) were happy with soft skills. In Brazil,
behaviour skills had the largest backing (22%), while
personal/interpersonal/people skills had the largest appeal
(28%) among Australian healthcare managers. A large
proportion of Australian respondents (43%) found that the
term soft skills is derogative and not indicative of the
importance of these skills.
DISCUSSION
The responses of Australian senior healthcare managers
indicated that they placed great importance to
competence in human skills in healthcare management
and most felt that they were essential or fundamental in
team work, and to the effectiveness of healthcare.
However, most observed that competence in these skills
was inadequate among healthcare managers. This was
associated with the lack of team work and collaboration.
A number of factors were seen as obstacles, such as time
and resource constraints, and lack of priority given to
training in these skills. Thus, most perceived training
capacity and greater opportunity to acquire these skills as
possible steps to instil human skills in healthcare managers.
They also saw the need for a greater discussion and
recognition of the importance of these skills. Further, most
saw the value of human skills in terms team building, work
engagement and related performance in productivity and
outcomes.
The responses by Brazilian senior healthcare managers
provided a test of the perception of the importance of
human skills in healthcare management, by the degree of
consistency, or lack of it, between the responses of
Australian and Brazilian senior managers. The responses of
Brazilian senior managers followed closely those of the
Australians. However, there were some differences in tone,
possibly reflecting cultural nuances. Accordingly, while
Australian managers mentioned the importance of
teamwork, Brazilian managers mentioned
communication/commitment and engagement. Similarly,
while only a minority of Australian and Brazilian managers
felt that managers had adequate skills in human
relationships, most Australian managers stated that they
42

were generally inadequate, while Brazilian managers
expressed their opinion in terms of less than adequate.
The enquiry showed that the interviewed senior managers
felt that human skills were essential/important to the
outcome of healthcare, and that competence in them to
be lacking, with need for training and competence in
them. Thus, their near absence in the curriculum of
postgraduate training in healthcare management [1]
diverge from their perceived value and seen need for
training in them. It is also in contrast with their demonstrated
value and successful available training programs (see
literature review).
CONUNDRUM:
SENIOR MANAGER PERCEPTIONS AND LACK OF
ACADEMIC RESPONSES
The results of this enquiry among senior managers in health
services showed that respondents felt that health services
are essentially a human enterprise, where personal
relationships are intrinsic to their effectiveness and
efficiency. These senior managers indicated that
competence in human management skills are
essential/basic yet lacking in practice, in spite of the
perception of its relevance to productivity and personal
relationships, and the availability of operational concepts
and training possibilities. It is also in contrasts to the lack of
import given in postgraduate training in healthcare
management documented [1]. This contrast presents a
challenge to all stakeholders of health services and
academic institutions concerned with postgraduate
training in healthcare management.
APPENDIX:
AN ENQUIRY INTO SENIOR MANAGER PERCEPTIONS
OF THE IMPORTANCE OF HUMAN SKILLS IN HEALTH
SERVICES
Questions
1. Soft skills are concerned with interpersonal relationships,
stimulation of engagement at work and conflict
management. What do these skills contribute to
healthcare management effectiveness?
2.In your experience, do managers in health services
demonstrate adequate skills in this area?
3. If you feel that greater attention should be given to
management training in these areas, what specific skills do
you feel are lacking in your workforce?
4. Do obstacles get in the way of this skill development? If
yes, what are they and how can these obstacles be
addressed?
5. What steps would you take to instil soft skills into your
healthcare workforce?
6. How can motivation to develop soft skills be inspired in
individual employees and throughout the organizational
culture?
7. How can soft skills contribute to team productivity and
morale?
8. Do you think there is a better term for this skill set and
why?
ACKNOWLEDGMENTS
The authors wish to express their gratitude to the busy senior
managers in health services who took the time to respond
and share their insights on the importance of human skills in
health service management. The authors would also like to
show their appreciation of the critical comments made by
anonymous peer reviewers, especially one, who gave
detailed comments on areas that needed clarification and
led to additional explanation of the objective and methods
used, as well as discussion of findings.
References
1. Martins JM, Isouard G, Freshman B. (2019). Human
dimension of health service management. Australian
Health Review; 43: 103-110. Doi:10.1071/AH17063.
2. Martins JM, Isouard G, Freshman B. Senior managers’
perceptions and curriculum content: The human
dimension. Paper presented at AUPHA (Association of
University Programs in Health Administration) National
Congress, June 2018. Philadelphia PA, USA.
3. Martins JM, Isouard G. (2015). An evidence-based
framework: competencies and skills for managers in
Australian health services. Asia Pacific Journal of Health
Management; 10: 8-23.
4. Mickan SM. (2005). Evaluating the effectiveness of
health care teams. Australian Health Review; 29: 211-
217. Doi:10.1071/AH050211.
43
5. Barret L, Yates P. (2002). Oncology/haematology
nurses: a study of job satisfaction, burnout, and
intention to leave the speciality. Australian Health
Review; 25: 109-121. doi: 10.1071/AH020109.
6. Joiner TA, Bartram T. (2004). How empowerment and
social support effect Australian nurses’ work stressors.
Australian Health Review; 28: 56-64.
Doi:10/1071/AH040056.
7. Kahn WA. (1990). Psychological conditions of personal
engagement and disengagement at work. Academy
of Management Journal; 33: 692-724.
doi:10.2307/256287.
8. Salovey P, Mayer JD. (1990). Emotional intelligence.
Imagination, Cognition and Personality ; 9: 185-
211.doi:10.2190/DUGG-P24E-52WK-CDG.
9. Rahim MA. (2002). Towards a theory of managing
organisational conflict. International Journal of Conflict
Management; 13 (3): 206-235. doi:10.1108/eb022874.
10. De Dreu CKW, Harinck F, Van Vianen AEM. (1999).
Conflict and performance in groups and organisations.
International Review of Industrial and Organisation
Psychology; 14: 376-405.
11. Schaufeli W. (2013). What is engagement? In Truss C,
Alfes K, Deldridge R, Shantz A, Soane E, editors.
Employee engagement in theory and practice.
London: Rutledge.
12. May DR, Gilson GL, Harter LM. (2004). The psychological
conditions of meaningful, safety and availability and
the engagement of the human spirit at work. Journal of
Occupational and Organizational Psychology ; 77:11-
37. doi:10.1348/096317904322915892.
13. Saks AM. (2006). Antecedents and consequences of
employee engagement. Journal of Managerial
Psychology; 21: 600-619.
doi:10.1108/02683940610690169.
14. Christian MS, Garza AS, Slaughter JE. (2011). Work
engagement: a quantitative review and tests of its
relations with task and contextual performance.
Personal Psychology; 64: 89-136. doi:10.1111/j.1744-
6570.2010.
15. Kim W, Kolb JA, Kim T. (2013). The relationship between
work engagement and performance: a review of the
empirical literature and proposed research agenda.
Human Resources Development Review; 12: 248-276.
doi:10.1177/1534484312461635.
16. Goleman D. (1995). Emotional intelligence – why it can
matter more than IQ. New York NY: Batam Books.
17. Fernandez-Berrocal P, Extremera N. (2006). Emotional
intelligence: a theoretical and empirical review of its
15-year history. Psicothema; 18 (Suppl): 7-12.
18. Boyatzis RE. (2009). Competencies as a behavioural
approach to emotional intelligence. Journal of
Management Development; 28: 749-770.
doi:10.1108/02621710910987647.
19. Mayer JD, Caruso DR, Salovey P. (1999). Emotional
intelligence meets traditional standards for an
intelligence. Intelligence; 27: 267-298. doi.10.1016/S160-
2896(99)00016-1.
20. Schutte NS, Malouf JM, Hall LE, Haggerty D, Cooper JT,
Golden CJ, Dornheim L. (1998). Development and
validation of a measure of emotional intelligence.
Personality and Individual Differences; 25: 167-177.
doi.10.1016/S0191-8869(98)00001-4.
21. Boyatziz RE & Goleman D. (1998). Emotional
Competence Inventory. Boston MA: The Hay Group.
22. Bar-On R. (2006). The Bar-On model of emotional-social
intelligence (ESI). Psicothema; 18 (Suppl.): 7-12.
23. Dulewicz V, Higgs M, Slaski M. (2003). Measuring
Emotional Intelligence: content, construct and
criterion-related validity. Journal of Management
Psychology; 18: 405-420.
doi:10.1108/02683940310484017.
24. Bradberry TR, Su LD. (2006). Ability-versus skill-based
assessment of emotional intelligence. Psicothema; 18
(Suppl.): 59-66.
25. Law KS, Wong C-S, Song LG. (2004). The construct and
criterion validity of emotional intelligence and its
potential utility for management studies. Journal of
Applied Psychology; 89: 483-496. doi:10.1037/0021-
9010.89.3.483.
26. Petrides KV, Furnham A. (2003). Trait emotional
intelligence: behavioural validation in two studies of
emotion recognition and reactivity to mood induction.
European Journal of Personality; 17: 39-57.
doi.10.1002.1002/per.466.
27. O’Conner PJ, Hill A, Kaya, M Martin B. (2019). The
measurement of emotional intelligence: a critical
review of the literature and recommendations for
researchers and practitioners. Frontiers in Psychology;
10:116. doi.10.3389/fpsyg.2019.01116.
28. Zhu Y, Liu C, Guo B, Zhao L, Lou F. (2015). The impact of
emotional intelligence on work engagement of
registered nurses: the mediating role of organisational
justice. Journal of Clinical Nursing; 24: 2115-2124.
doi:10.1111/jocn.12807.
29. Boyatzis R, Rochford K, Cavanagh KV. (2017).
Emotional intelligence competencies in engineer’s
effectiveness and engagement. Career Development
International, 22(1): 70-86. doi.10.1108/CDI-
08.2016.0136
44

30. Galtung J. (1969). Violence, peace and peace
research. Journal of Peace Research; 6: 167-191.
doi:10.1177/002234336900301.
31. Thomas KW. (1976). Conflict and conflict
management. In Dunnette, M D (ed) Handbook of
industrial and organizational psychology . Chicago:
Rand-McNally, 1976: 889-935.
32. Rahim, MA. (1983). A measure of styles of handling
interpersonal conflict. Academy of Management
Journal; 26: 368-376. doi.10.2397/255985.
33. Rahim MA & Magner NR. (1995). Confirmatory factor
analysis of the styles of handling interpersonal conflict:
first-order model and its invariance across groups.
Journal of Applied Psychology; 80: 122-
132.doi.10.1037/0021-9010.80.1.122.
34. Giacomantonio M, Pierro A, Kruglanski AW. (2011).
Leaders’ fairness and followers conflict handling style.
International Journal of Conflict Management; 22: 358-
372. doi:10.1108/10444061111171369.
35. De Dreu CKW, Evers A, Beersma B, Kluwer ES, Nauta A.
(2001). A throaty-based measure of conflict
management strategies in the work place. Journal of
Organizational Behaviour; 22: 645-
668.doi.10.1002/job.107.
36. Zulfadil, Hendriani S, Machasin. (2020). The influence of
emotional intelligence on team performance through
knowledge sharing, team conflict, and the structure
mechanism. Journal of Management Development;
39(3): 269-292. doi:10.1108/JMI/12.2018.0354.
37. Knight C, Patterson M, Dawson J. (2017). Building work
engagement: a systematic review and meta-analysis
investigating the effectiveness of work engagement
interventions. Journal of Organizational Behavior; 38:
792-812.
38. Palaez M J, Coo C, Salanova M. (2020). Facilitating
work engagement and performance through strength-
based micro-coaching: A controlled trail study. Journal
of Happiness Studies; 21: 1265-1284.
doi.org/10.1007/s10902-019-00127-5
39. Sawasdee A, Saengchai S, Jermsittiparset K. (2020). The
role of emotional demands, supervisor support and
training opportunities towards work engagement
among employees in pharmaceutical companies of
Thailand. Systematic Review Pharmacy; 11(3): 176-184.
40. Slaski M, Cartwright S. (2003). Emotional intelligence
training and its implications for stress, health and
performance. Stress and Health: Journal of the
International Society for the Investigation of Stress ;
19(4): 233-239.
41. Hen M, Sharabi-Nov A. (2014). Teaching teachers:
emotional intelligence for teachers. Teaching
Education; 25(4).
doi.org/10.1080/10476210.2014.908838.
42. Choi K, Vickers K, Tassone A. (2014). Trait emotional
intelligence, anxiety sensitivity, and experiential
avoidance in stress reactivity and their improvement
through psychological methods. Europe’s Journal of
Psychology; 10(2). doi.org/10.59464/ejop.v100iz.754.
43. Gilar-Corbi R, Pozi-Rico, Pertegal-Felices ML, Sanchez B.
(2018). Emotional intelligence training intervention
among trainee teachers: a quasi-experimental study.
Psicologia: Reflexao e Critica; 3(33).
prc.springeropen.com/articles/10.1186/s41155-018-
0112-1.
44. Karimi L, Leggat SG, Bartram T, Rada J. (2020). The
effects of emotional intelligence training on the job
performance of Australian aged care workers. Health
Care Management Review; 45(1): 41-51.
45. Haraway DL, Haraway WM. (2010). Analysis of the
effect of conflict-management and resolution training
on employee stress at a health care organization.
Hospital Topics; 83(4). doi:10.3200/HTPS.83.4.11-18.
46. Leon-Perez JM, Notelaers G, Leon-Rubio JM. (2015).
European Journal of Work and Organizational
Psychology; 25(1). doi:10.1080/1359432X.2015.1010520.
47. Wolfe, AD, Hoang KB, Denniston SF. (2018). Teaching
conflict resolution in medicine: lessons from business,
diplomacy, and theatre. AAMC Journal of Teaching
and Learning Resources; 14: 10672.
doi:10.15766/mep_2374-8265.10672.
45

RESEARCH ARTICLE
A PROSPECTIVE STUDY ASSESSING PATIENT PERCEPTION OF
THE USE OF ARTIFICIAL INTELLIGENCE IN RADIOLOGY
A/Prof Warren Clements 1,2,3, Dr Louisa P Thong 1, Mr Adil Zia 1, Dr Heather K Moriarty 1,2
A/Prof Gerard S Goh 1,2,3
1. Department of Radiology, Alfred Health, Melbourne, Australia
2. Department of Surgery, Monash University, Australia
3. National Trauma Research Institute, Central Clinical School, Monash University, Melbourne, Australia
Correspondence: [email protected]
ABSTRACT
OBJECTIVE
Radiology has been at the forefront of medical technology including the use of artificial intelligence (AI) and machine
learning. However, there remains scant literature on the perspective of patients regarding clinical use of this technology.
This study aimed to assess the opinion of radiology patients on the potential involvement of AI in the ir medical care.
DESIGN
A survey was given to ambulatory outpatients attending our hospital for medical imaging. The survey consisted of
questions concerning comfort with radiologist reports, comfort with entirely AI reports, comfort with in-part AI reports,
accuracy, data security, and medicolegal risk.
SETTING
Tertiary academic hospital in Melbourne, Australia.
MAIN OUTCOME MEASURES
Patients were surveyed for their overall comfort with the use of AI in their medical imaging using a Likert scale of 0 to 7.
RESULTS
283 patient surveys were included. Patients rated comfort in their imaging being reported by a radiologist at mean of 6.5
out of 7, compared with AI alone at mean 3.5 out of 7 (p<0.0001), or in-part AI at mean 5.4 out of 7 (p<0.0001). Patients
felt AI should have an accuracy of mean 91.4% to be able to be used in a clinical environment. Patients rated their current
comfort with data security at mean 5.5 out of 7 however comfort with data security using AI at mean 4.4 out of 7, p<0.0001.
CONCLUSIONS
Patients are trusting of the holistic role of a radiologist however, remain uncomfortable with clinical use of AI as a
standalone product including accuracy and data security. If AI technology is to evolve then it must do so with appropriate
involvement of stakeholders, of which patients are paramount.
KEYWORDS: Artificial intelligence; AI; survey; patient
46

INTRODUCTION
The clinical specialty of Radiology has always been
intimately associated with cutting edge medical
technology. As such, it has been no surprise to see artificial
intelligence (AI) and machine learning enter the territory of
diagnostic medical imaging [1]. This role has been
acknowledged by major imaging societies from North
America, Europe, and other countries [2,3]. A 2019 joint
consensus statement on ethics which included input from
the American College of Radiology and the Radiological
Society of North America, commented on the potential for
the advancing role of AI in medicine [2]. While AI was
initially used in a research capacity, advancements in
accuracy of image interpretation has now seen this take a
clinical role in hospitals. There is a complex interplay
between the technical, ethical, and medicolegal
obstacles required to implement such technology [2].
There are varying opinions from radiologists on the future of
AI in diagnostic imaging [4-7]. While there exists optimism
and excitement for new technology [4], there are also
those with scepticism and a fear of the potential for future
redundancy [7]. These concerns were highlighted in a 2019
survey from Collado-Mesa et al. which assessed
perceptions on training and the future role of radiologists
[8,9].
Despite these concerns, there is no doubt that AI will have
some role in diagnostic imaging moving forward [10,11]. A
nation-wide survey of Italian radiologists in 2021 suggested
that rather than believing the profession will be replaced,
radiologist concern was more towards the potential effects
on their professional reputation [7]. At early stages of
implementation, it is important to integrate this technology
in a manner which suits the ultimate reason for medical
practice – our patients. Human nature has arguably been
one of the most vital barriers to implementation of existing
autonomous technological aids using AI such as self-driving
cars and self-flying aircraft.
While literature to support accuracy and training of AI
technology is evolving rapidly, there remains little on the
perspective of patients in regard to clinical use of this
technology. A 2019 study from Haan et al. sought to
address this by interviewing 20 patients on the topic of AI in
radiology [12]. They identified 6 domains which were
important to consider: proof of technology, procedural
knowledge, competence, efficiency, personal interaction,
and accountability. The authors concluded that patients'
level of knowledge of AI is limited. In a 2020 follow-up study
the same group developed a questionnaire and
implemented this to 155 patients. They concluded that
patients remain pessimistic about AI performing the role of
radiologists, with patients valuing human interaction. The
authors also highlighted the importance placed by
patients on ethics and the legal framework for this
technology [13]. A 2022 scoping review assessed the
opinion of a range of different stakeholders on AI in
radiology, including 62 publications of which 4 were from
the perspective of the general public [14]. The authors
identify a similar framework suggesting radiologists are
unlikely to be replaced, but that there is a general lack of
understanding and knowledge of AI [14]. Issues of
accountability and medicolegal implications remain a
question for patients [14]. These views are held by most
stakeholders including non-radiologist clinicians [15]
This study aimed to assess the opinion of patients on the
potential involvement of AI in their medical care, by
seeking to identify whether patients would be happy for AI
technology to provide image interpretation for their studies
at our centre, comparing the existing radiologist model of
care with AI-alone, and a radiologist-AI hybrid model. This
study will add to the current very small pool of knowledge
on this topic and guide future directions of education
concerning AI implementation.
MATERIALS AND METHODS
ETHICS
Ethics approval was provided for this prospective study by
our institutional review board. Participation was voluntary
and implied informed consent.
SURVEY
The survey used is shown in Appendix 1 and included
questions relating to age, gender, education, confidence
with technology, knowledge of imaging interpretation,
opinion on AI, report accuracy, data security, and
medicolegal implications. Patient perspectives were
assessed using numerical ranges, Likert scale from 1 to 7 (7
being highest relevant to the question type), or yes/no
response as appropriate to the question type. The model of
AI integration was framed as AI alone, hybrid AI and
radiologist (e.g. decision support), or radiologist-alone. This
47

distinction was chosen as it reflects potential directions for
the use of this technology in the future based on previous
literature [16].
INCLUSION CRITERIA
The Hospital is a state-wide tertiary and teaching hospital
with a University. Patients were invited to voluntarily
participate in the study on attendance to the department
for any outpatient ambulatory imaging. The study recruited
patients from 1 August 2018 to 1 December 2018.
All patients over the age of 18 years were invited and the
written survey was in English. 500 surveys were printed, and
reception staff asked to hand out the survey to any patient
attending for a scan or procedure. Completed surveys
were placed by the patient into an anonymous collection
box and were collated by study investigators. Surveys were
excluded if they were not fully completed, or if the answers
not legible.
STATISTICAL ANALYSIS
Data was pooled using Microsoft Excel (Microsoft, USA) and
analysed using the Real Statistics Resource Pack software
(Release 6.8) [17]. Presentation of the data was
appropriate to the data type using mean (standard
deviation), median (range), or frequency (percentage).
Using student's t-test, a two-sided p-value less than 0.05 was
chosen to indicate statistical significance.
RESULTS
During the time period, 316 surveys were completed (63.2%
response). 33 surveys were excluded including 32 where
the second page of the survey was not completed, and 1
which contained illegible notes and the survey itself was
not filled. 283 surveys were included for the final analysis as
shown in figure 1.
FIGURE 1: FLOW CHART SHOWING RECRUITMENT OF PATIENTS INTO THE STUDY.
As shown in table 1, of the cohort who responded to the
survey, 52.7% were male. The median age range of
participants was 51-60 years old (range 18-30 to 71+ years).
Participants who responded to the survey were in
attendance at our department for a range of different
imaging studies including MRI in 31.4%, ultrasound in 21.9%,
plain radiograph in 21.2%, CT in 6.7%, procedure in 2.8%,
and an other study in 15.9%. Other studies included nuclear
medicine scan, bone densitometry, and mammography.
33.2% of patients reported completing high school, 27.9% a
bachelor degree, 27.6% a master's degree, and 11.3%
other.
48

TABLE 1: PARTICIPANT INFORMATION AND BACKGROUND
Participants 283
Male gender (number, percentage) 149 (52.7%)
Age of participants in range of years (number,
percentage)
18-30: 32 (11.3%)
31-40: 39 (13.8%)
41-50: 42 (14.8%)
51-60: 71 (25.1%)
61-70: 53 (18.7%)
71+: 46 (16.3%)
Reason for attendance at radiology department
(number, percentage)
CT: 19 (6.7%)
MRI: 89 (31.4%)
Plain radiograph: 60 (21.2%)
Ultrasound: 62 (21.9%)
Procedure: 8 (2.8%)
Other: 45 (15.9%)
Background highest level of education (number,
percentage)
High school: 94 (33.2%)
Bachelor's degree: 79 (27.9%)
Master's degree: 78 (27.6%)
Other: 32 (11.3%)
Background use of technology aids including
smart phone, tablet, and computer in range of
number how hours per week (number,
percentage)
0-5: 44 (15.5%)
6-10: 41 (14.5%)
11-20: 65 (23.0%)
21+: 133 (47.0%)
Patient comfort with day-to-day technology use was a
mean of 5.1 (SD 1.8) out of 7. 70% of participants used
technology for over 11 hours a week. Patients were also
familiar with the system of medical image interpretation,
with 97.9% of respondents aware of the role of a radiologist,
and the mean score for familiarity of the steps in
performing, acquiring, and reporting imaging was 5.0 (SD
1.6) out of 7. Only 105 patients (37.1%) were aware clinical
AI technology that could provide image interpretation was
available.
Patients rated their comfort in their imaging being reported
by a radiologist at a mean 6.5 out of 7 (SD 1.1) as shown in
table 2. However, patient comfort in AI providing a report
without radiologist involvement was a mean of 3.5 out of 7
(SD 1.8), p<0.0001. This compared to patient comfort in AI
providing a report in part by AI and part radiologist at a
mean of 5.4 out of 7 (SD 1.6), p<0.0001 (figure 2). Patients
felt that AI would provide a faster time to report (AI 63.3%,
radiologist 15.9%, equal 20.8%), that radiologists would
provide better accuracy (AI 10.6%, radiologist 52.3%, equal
37.1%), whilst AI would provide a less expensive solution (AI
54.8%, radiologist 13.1%, equal 32.2%). Patients reported
that AI should have an accuracy of mean 91.4 +/- 16.6% to
be able to be used in a clinical environment, and 94.4% of
patients wanted AI to be either the same or of higher
accuracy to a radiologist in order to be implemented.
49

FIGURE 2: BAR GRAPH COMPARING THE MEAN SCORE ON A LIKERT SCALE (OUT OF 7) FOR PATIENT COMFORT IN REPORTS
BEING ISSUES BY RADIOLOGIST, AI, OR A HYBRID MODEL. ASTERIX INDICATES P<0.05 USING STUDENT’S T-TEST.
TABLE 2: PATIENT COMFORT WITH ACCURACY OF REPORT
PARAMETER # MEDIAN
(RANGE)
MEAN (SD)
Patient comfort in report being issued by radiologist alone 7 (1-7) 6.1 (1.1)
Patient comfort in report being issued by AI alone 4 (1-7) 3.5 (1.8)*
Patient comfort in report being issued in part by AI 6 (1-7) 5.4 (1.6)*
# reported on Likert scale 1 to 7, with 7 indicating highest comfort
* p<0.0001 compared to radiologist alone
Comparing male (n=150) and female (n=133) participants,
males rated their comfort in radiologist reporting as a mean
of 6.4 (SD 1.2) out of 7 compared with females who
reported a mean of 6.6 (SD 0.9) out of 7, p=0.02. No mean
difference was seen between genders for reports entirely
by AI (males 3.7 (SD 1.8), females 3.3 (SD 1.8), p=0.10) and
for reports in part by AI (males 5.5 (SD 1.6), females 5.3 (SD
1.6), p=0.27).
Comparing the background technology usage with
comfort in reporting, participants were grouped as 10 or
less hours technology use per week (n=85), or 11 or more
hours (n=198). The results on a Likert scale from 1 to 7
showed no difference in the mean comfort for radiologist
reports (10 or less 6.3 (SD 1.3), 11 or more 6.6 (SD 1.0), p=0.11)
and there was no difference in the overall comfort of AI
providing a report entirely on its own (10 or less 3.4 (SD 1.6),
11 or more 3.6 (SD 1.9), p=0.11). However, those who used
10 or less hours technology per week were less comfortable
in AI issuing a report in part compared with those who used
technology for 11 or more hours per week (10 or less hours
mean 4.8 (SD 1.6), 11 or more hours mean 5.6 (SD 1.6),
p=0.0001).
Comparing the influence of background participant
highest education level, participants were grouped as high
school education (n=94) or university education (n=157).
Patients in the "other" category (n=32) were not included in
this sub-analysis. The results on a Likert scale from 1 to 7
showed no difference in the mean comfort for radiologist
reports (high school mean 6.3 (SD 1.3), university mean 6.6
(SD 1.0), p=0.06) and there was no difference in the overall
comfort of AI providing a report entirely on its own (high
school mean 3.9 (SD 1.8), university mean 3.5 (SD 1.8),
p=0.10). However, those with high school education were
less comfortable in AI issuing a report in part compared with
those who had received university education (high school
mean 5.0 (SD 1.7), university mean 5.5 (SD 1.1), p=0.008).
Patients overall rated their comfort with data security in the
50

current radiologist reporting model as a mean of 5.5 out of
7 (SD 1.7) however, when proposed that AI would be
involved in data assessment, patients rated their comfort
with data security as a mean of 4.4 out of 7 (SD 2.0),
p<0.0001. This is shown in table 3.
TABLE 3: PATIENT COMFORT WITH DATA SECURITY
PARAMETER # MEDIAN
(RANGE)
MEAN
(SD)
Patient comfort in data
security with radiologist
6 (1-7) 5.5 (1.7)
Patient comfort in data
security with AI technology
4 (1-7) 4.4 (2.0)*
# reported on Likert scale 1 to 7, with 7 indicating highest comfort
* p<0.0001 compared to radiologist alone
In terms of clinical accuracy and responsibility, patients
rated the following healthcare stakeholders as having
medicolegal responsibility for any potential error in AI
imaging reports using a yes/no answer: hospital or
healthcare network 76.3%, computer program 60.1%,
radiologist 37.5%, referring doctor 10.3%, patient 4.2%, and
other 1.8%. Of the 5 patients who selected "other", 4 out of
5 wrote in free text that they would place responsibility on
the government and 1 patient wrote they were unsure.
DISCUSSION
There is no doubt that the future of medical practice,
including diagnostic imaging, will involve the use of artificial
intelligence in some capacity [1,11]. While literature to
support machine learning and accuracy of AI is growing
[11], there is a relative lack of evidence supporting patients'
perception on the use of this technology as a health care
decision maker, at an individual patient-level. The majority
of patients in this study (62.9%) were not even aware that
AI technology to interpret imaging was in existence, let
alone already in clinical use.
This study showed that patients have an extremely high
level of confidence in reports being issued by radiologists
but are significantly less trustworthy with the use of AI in
health care at this stage. This is more evident in patients
with low technology use compared to those who use
technology more than 11 hours per week, and in those who
do not have university-level education - both these groups
were shown to have less trust in a hybrid radiologist-AI
reporting model compared with radiologist alone. This
information supports the recent study from York et al. who
assessed the perception of 216 patients on the use of AI in
skeletal radiology. The authors concluded that patients
held clinician assessment in the highest regard [18] and this
acknowledges the nuances of the radiologist role in
providing a holistic report taking into consideration the
entire medical history, not just the current imaging. Other
studies have suggested a similar level of distrust in emerging
AI technology both within healthcare and in non-
healthcare settings [19-22]. While there was a similar
degree of comfort in AI technology between males and
females, females showed a significantly higher confidence
in radiologist reports than for males, although the reason for
this is not clear from our study.
Our study also showed that patients’ confidence in data
security with the introduction of AI was significantly lower
than for the current radiologist-model of healthcare
interaction. The 2019 North American and European
position statement expressed the importance of data
security and accountability in the ethics of AI [2]. In
addition, a recent commentary from Peterson describes
the challenges in assessing health information from the
patients’ perspective. The author describes privacy as a
unique factor individual to each patient and which can
take many forms and that we must use our emotional
intelligence to understand and balance the needs of our
patients. Kerasidou describes current day as a point where
there is the potential for AI to cause a fundamental shift in
the empathy, compassion, and trust in healthcare, and
that we must re-evaluate how we can incorporate these
values in the early adoption of AI [23]. However, Feldman
et al. suggested that some patients don’t fully understand
modern medicine anyway, and that there are multiple
facets of their health care treatment which currently
already requires them to place their trust within the care of
their physician [19,24]. In this context, Feldman suggests
that rather than developing trust in AI from the ground up,
we should place more of a focus on shifting their trust from
medicine and their physician to a new model involving AI.
If an AI report were to be inaccurate, it is interesting to see
in our study that patients felt a range of different
stakeholders were to be accountable. Patients felt that the
developer of the technology (60.1%) and the healthcare
facility (76.3%) would be afforded the most responsibility.
Even radiologists who weren't issuing the report were
considered accountable (37.5%). Interestingly a small
percentage of patients even held themselves or their
referring doctor accountable. Until this is tested in a court
of law, we won't know which parties will ultimately be held
51

most liable. However, as supported by major consensus
statements [2,3], the ethics of responsibility should be
decided before the technology fully matures. Considering
patients will apportion blame to their referring doctor, we
must also consider their opinion on the use of AI and this is
an area which has yet to be explored.
The majority of patients reported that they felt AI would be
faster and less expensive than a radiologist, but also less
accurate. Patients expected AI to be a mean of 91.4%
accurate to be used in clinical medicine, and 94.4% of
patients expected this accuracy to either meet or exceed
radiologist accuracy before being used. This supports the
argument from Haan et al. that a degree of scepticism
remains amongst patients regarding AI technology [12],
and they are acknowledging that the technology must be
proven to be accurate as we enter this life-changing era in
radiology. This also acknowledges the high regard patients
currently hold for the integral work that radiologists do in
their healthcare interaction [18].
The results of this study suggest to us all that if we are to
integrate with AI, we must work on a number of factors to
improve patient perception and trust [25]. This should start
with education, with our study showing a higher trust in both
radiologists and AI for those with university-level education
compared to high-school education. This education
concept would be no different to educating patients that
magnetic resonance technology is safe or that ionizing
radiation in diagnostic imaging is also safe when used
appropriately. Education responsibility can be shared
amongst radiologists, hospital networks, major societies,
specialty colleges, and even computer technology
companies. The study also implied that increasing
background technology usage will be positively correlated
with improving patient comfort. Finally, for patients to
adopt the technology as a physician-assistant then there
must be transparency on data use, security, and the role of
consent [20].
While this study has a large sample size in an area without
significant pre-existing literature, we must acknowledge
that this study was single-centre and performed without a
formally validated questionnaire. It is also open to selection
bias due to the specific catchment of our hospital and
reflects social and educations biases within our country. This
includes the relatively high background level of education
reported in our cohort which, based on the results, may
positively influence patient comfort with AI. In addition, the
authors have no documentation of patients who declined
to participate or where patients weren't offered the
opportunity to participate, both are biases inherent with
written surveys. Finally, the authors acknowledge that there
was a wide variability in results with all scaled questions
receiving opinions varying from 1 to 7, resulting in a large
standard deviation. This reflects healthy individual opinions,
but doesn’t affect the ability to interpret the mean in a
dataset which was normalised.
CONCLUSIONS
The authors remain cautious of the longer-term implications
of AI on the profession of diagnostic radiology. Patient
expectations remain that human interaction is essential in
medical care as evidenced by significantly higher
confidence in radiologist involvement in their healthcare
than for AI. If AI technology is to evolve then it must do so
with appropriate involvement of stakeholders, of which
patients are paramount. This will include balancing data
security and medicolegal risk. This must happen before it is
implemented, otherwise the technology is at risk of
advancing too rapidly for the contentment of our patients.
References
1. Pesapane F, Codari M, and Sardanelli F. Artificial
intelligence in medical imaging: threat or opportunity?
Radiologists again at the forefront of innovation in
medicine. Eur Radiol Exp 2. 2018. 35.
https://doi.org/10.1186/s41747-018-0061-6
2. Geis JR, Brady AP, Wu CC, et al. Ethics of Artificial
Intelligence in Radiology: Summary of the Joint
European and North American Multisociety Statement.
Can Assoc Radiol J. 01 Oct 2019, 70(4):329-334. DOI:
10.1016/j.carj.2019.08.010
3. Royal Australian and New Zealand College of
Radiologists. Artificial Intelligence: The State of Play
2019 [internet]. Available from URL:
https://www.ranzcr.com/college/document-
library/artificial-intelligence-the-state-of-play-2019.
Accessed 23 July 2020.
4. Pakdemirli E. Artificial intelligence in radiology: friend or
foe? Where are we now and where are we heading?.
Acta radiologica open. 2019
Feb;8(2):2058460119830222.
5. Waymel Q, Badr S, Demondion X, Cotten A, Jacques T.
Impact of the rise of artificial intelligence in radiology:
what do radiologists think?. Diagnostic and
Interventional Imaging. 2019 Jun 1;100(6):327-36.
52

6. Abuzaid MM, Elshami W, Tekin H, Issa B. Assessment of
the Willingness of Radiologists and Radiographers to
Accept the Integration of Artificial Intelligence Into
Radiology Practice. Academic Radiology. 2022. 29(1)
pp87-94. https://doi.org/10.1016/j.acra.2020.09.014
7. Coppola F, Faggioni L, Regge D, Giovagnoni A, Golfieri
R, Bibbolino C, Miele V, Neri E, Grassi R. Artificial
intelligence: radiologists’ expectations and opinions
gleaned from a nationwide online survey. La radiologia
medica. 2021 Jan;126(1):63-71.
8. Pakdemirli E. Perception of artificial intelligence (AI)
among radiologists. Acta radiologica open. 2019
Sep;8(9):2058460119878662.
9. Collado-Mesa, F, Alvarez, E, Arheart, K. The role of
Artificial Intelligence in diagnostic radiology: a survey
at a single radiology residency training program. J Am
Coll Radiol 2018; 15:1753–1757.
10. Chan S and Siegel EL. Wiill machine learning end the
viability of radiology as a thriving medical specialty? Br
J Radiol. 2019 Feb;92(1094):20180416
11. Honsy A, Parmar C, Quackenbush J, et al. Artificial
intelligence in Radiology. Nat Rev Cancer 2018 Aug;
18; 18(8):500-510. doi: 10.1038/s41568-018-0016-5.
12. Haan M, Ongena YP, Hommes MA, et al. A Qualitative
Study to Understand Patient Perspective on the Use of
Artificial Intelligence in Radiology. J Am Coll Radiol.
2019 October. 16(10) pp1416-1419.
https://doi.org/10.1016/j.jacr.2018.12.043
13. Ongena YP, Haan M, Yakar D. et al. Patients’ views on
the implementation of artificial intelligence in
radiology: development and validation of a
standardized questionnaire. Eur Radiol, 2020. 30, 1033–
1040. https://doi.org/10.1007/s00330-019-06486-0/
14. Yang L, Ene IC, Arabi Belaghi R, Koff D, Stein N,
Santaguida PL. Stakeholders’ perspectives on the
future of artificial intelligence in radiology: a scoping
review. European Radiology. 2021 Sep 21:1-9.
15. Lim SS, Phan TD, Law M, Goh GS, Moriarty HK, Lukies
MW, Joseph T, Clements, W. Non-radiologist
perception of the use of artificial intelligence (AI) in
diagnostic medical imaging reports. J Med Imaging
Radiat Oncol. 2022. https://doi.org/10.1111/1754-
9485.13388
16. Liew C. The future of radiology augmented with
Artificial Intelligence: A strategy for success. Eu J Rad.
2018. 102 pp 152-156.
https://doi.org/10.1016/j.ejrad.2018.03.019
17. Zaiontz C. Real Statistics Using Excel [internet].
Available from URL: www.real-statistics.com
18. York T, Jenney H, Jones G. Clinician and computer: a
study on patient perceptions of artificial intelligence in
skeletal radiography. BMJ Health Care Inform
2020;27:e100233. doi:1
19. Feldman RC, Aldana E, and Stein K. Artificial
intelligence in the health care space: how we can trust
what we cannot know. Stan. L. & Pol'y Rev. 2019. 399.
20. Nundy S, Montgomery T, Wachter RM. Promoting Trust
Between Patients and Physicians in the Era of Artificial
Intelligence. JAMA. 2019;322(6):497–498.
doi:10.1001/jama.2018.20563
21. Fast E, and Horvitz E. Long-Term Trends in the Public
Perception of Artificial Intelligence. Proceedings of the
AAAI Conference on Artificial Intelligence. 2017. 31(1).
22. Kovarik CL. Patient Perspectives on the Use of Artificial
Intelligence. JAMA Dermatol. 2020;156(5):493–494.
doi:10.1001/jamadermatol.2019.5013
23. Kerasidou A. Artificial intelligence and the ongoing
need for empathy, compassion and trust in healthcare.
Bull World Health Organ. 2020;98(4):245-250.
doi:10.2471/BLT.19.237198
24. Peterson C. Through Patients' Eyes: Regulation,
Technology, Privacy, and the Future. Yearb Med Inform
2018; 27(01): 010-015. https://doi.org/ 10.1055/s-0038-
1641193
25. Syed AB and Zoga AC. Artificial Intelligence in
Radiology: Current Technology and Future Directions.
Semin Musculoskelet Radiol 2018; 22(05): 540-545.
https://doi.org/10.1055/s-0038-1673383
53
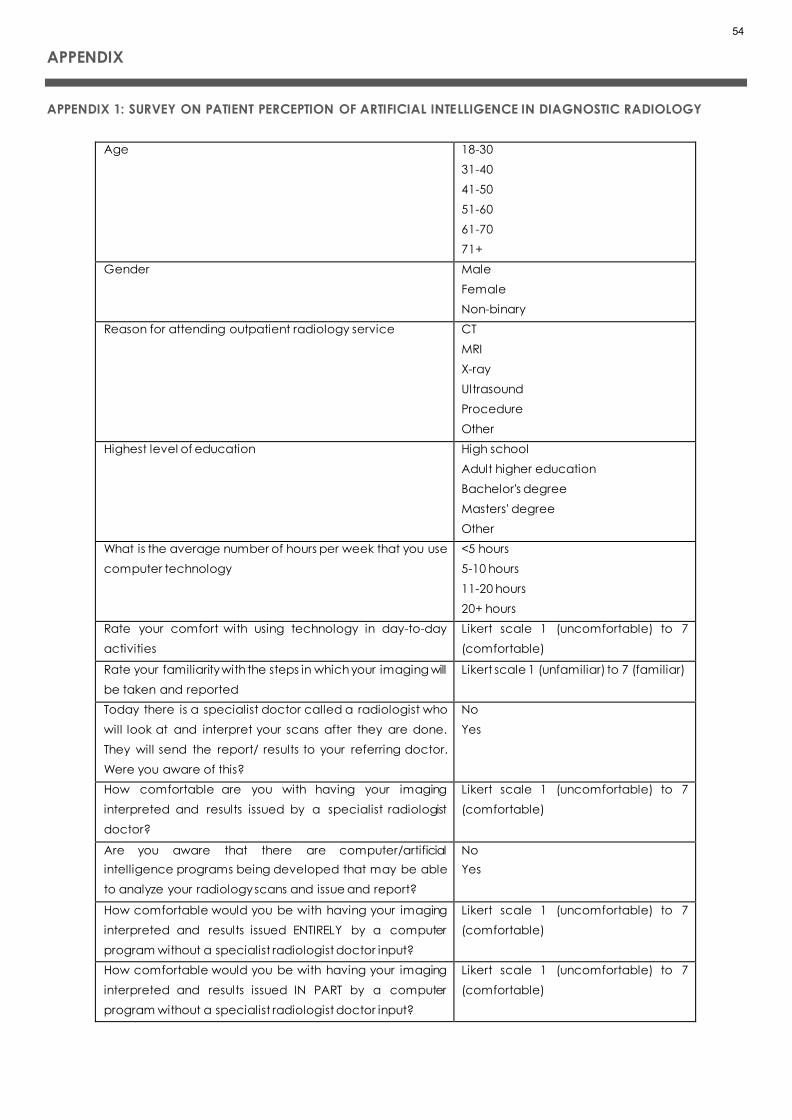
APPENDIX
APPENDIX 1: SURVEY ON PATIENT PERCEPTION OF ARTIFICIAL INTELLIGENCE IN DIAGNOSTIC RADIOLOGY
Age 18-30
31-40
41-50
51-60
61-70
71+
Gender Male
Female
Non-binary
Reason for attending outpatient radiology service CT
MRI
X-ray
Ultrasound
Procedure
Other
Highest level of education High school
Adult higher education
Bachelor's degree
Masters' degree
Other
What is the average number of hours per week that you use
computer technology
<5 hours
5-10 hours
11-20 hours
20+ hours
Rate your comfort with using technology in day-to-day
activities
Likert scale 1 (uncomfortable) to 7
(comfortable)
Rate your familiarity with the steps in which your imaging will
be taken and reported
Likert scale 1 (unfamiliar) to 7 (familiar)
Today there is a specialist doctor called a radiologist who
will look at and interpret your scans after they are done.
They will send the report/ results to your referring doctor.
Were you aware of this?
No
Yes
How comfortable are you with having your imaging
interpreted and results issued by a specialist radiologist
doctor?
Likert scale 1 (uncomfortable) to 7
(comfortable)
Are you aware that there are computer/artificial
intelligence programs being developed that may be able
to analyze your radiology scans and issue and report?
No
Yes
How comfortable would you be with having your imaging
interpreted and results issued ENTIRELY by a computer
program without a specialist radiologist doctor input?
Likert scale 1 (uncomfortable) to 7
(comfortable)
How comfortable would you be with having your imaging
interpreted and results issued IN PART by a computer
program without a specialist radiologist doctor input?
Likert scale 1 (uncomfortable) to 7
(comfortable)
54

In the following categories, which do you believe would
perform better: computer/artificial intel ligence, specialist
radiologist doctor, or equal?
Time to report
Accuracy of the report
Cost of imaging
Currently the specialist radiologist doctor assesses and
reports on your imaging. How comfortable are you about
your PRIVACY and SECURITY of this data
Likert scale 1 (uncomfortable) to 7
(comfortable)
If your imaging was assessed by a computer program/AI,
how comfortable would you be about your PRIVACY and
the SECURITY of your data?
Likert scale 1 (uncomfortable) to 7
(comfortable)
How accurate should a computer/AI program be in making
the right diagnosis before you would feel comfortable with
having your imaging ENTIRELY reported by a computer
without a specialist radiologist doctor reviewing the scan?
Likert scale 0 – 100%
How accurate should a computer/AI program be
compared to a specialist doctor radiologist before you
would trust it to interpret your imaging?
Less accurate
Same accuracy
More accurate
If your report was made entirely by a computer program/AI
without a specialist radiologist doctor reviewing your
imaging, who's responsibility should it be if the computer
program missed an important medical condition on your
scan or made the wrong diagnosis?
Answer yes/no for the following:
Computer program company
Hospital / radiology practice
Referring doctor
You, the patient
The radiologist
Other
55

RESEARCH ARTICLE
EVALUATION OF SERVICE-ORIENTED NURSING SUPERVISOR
STRATEGY BASED ON DATA ENVELOPMENT ANALYSIS (DEA)
Farhad Hamzehzadeh, MD; Fateme Mirzaee, MSc; Alireza Jalali, MD; Bahareh
Ahmadinejad*, MSc; Hoshang Shahmoradi, MSc; Anis Navand, MSc
Health Systems Engineering Research Center, Milad hospital, Tehran, Iran.
Correspondence: [email protected]
ABSTRACT
BACKGROUND:
This study introduced a service-oriented nursing supervisor strategy to increase the performance efficiency of different
hospital wards. The efficiency of this strategy, in 12 wards under the supervision of 12 supervisors, was evaluated using Data
Envelopment Analysis (DEA).
MATERIALS AND METHODS:
The efficiency of the service-oriented nursing supervisor strategy was evaluated using DEA. This study aims to evaluate the
relative efficiency of hospital wards before and after implementing the service-oriented nursing supervisor strategy at
Milad hospital. Data were evaluated using two basic models of data envelopment analysis technique, i.e., CCR and BCC
output-oriented methods. Then, the relative performance efficiencies of 12 wards in 2 periods, including the first half of
2020 (before service-oriented nursing supervisor strategy) and the second half of 2020 (after service-oriented nursing
supervisor strategy) were analyzed. Finally, efficient wards were ranked using the Anderson-Peterson method based on
the results.
RESULTS:
According to the CCR output-oriented method, after implementing service-oriented nursing supervisor strategy, Urology,
Gastroenterology, and Neurosurgery wards, as well as ENT, had the highest and lowest efficiency rates, respectively. Based
on the BCC output-oriented method, Urology, Renal Transplant, Neurosurgery, and Gynecology wards had the highest
efficiency in performance, while ENT had the lowest efficiency.
CONCLUSION:
In conclusion, the findings of this study offer a service-oriented nursing supervisor strategy that improves the efficiency of
different wards of the hospital.
KEYWORDS
Supervisor, DEA, Nurse, Hospital, Efficiency, strategy
56

INTRODUCTION
Hospitals can be understood as institutions that have the
mission to provide health improvements, both at a broader
level, such as the communities in which they are located
and, more specifically, for patients to whom they directly
offer assistance [1]. The quality of health care and the
nursing care management reflect the hospital's image. For
the success of health services, scientific and systematic
activities are needed. Accordingly, the participation of all
staff and understanding the perceptions and expectations
of patients is necessary to increase productivity and
improve and improve healthcare processes. Nursing
services are one of the essential components of hospital
services that play an influential role in meeting the nursing
needs of the community [2]. The clinical supervisor plays a
critical role in guaranteeing the quality of treatment while
improving patient care and efficiency. The nurse
supervisor's duty is still mostly unknown. Depending on the
organization, the nurse supervisor may be referred to as a
shift supervisor, clinical coordinator, administrative
coordinator, shift administrator, or patient care
coordinator[3]. Some nurse supervisor tasks include staffing,
clinical quality, patient safety, executive presence,
emergency response, customer satisfaction, census
management, throughput, and nursing resource [4]. Thus,
establishing a proper process is vital for implementing
hospital management, which leads to the identification
and scope of organizational effectiveness [5]. Accordingly,
in the clinical or medical environment, performance
management can be translated into the systematic
development and constant monitoring of the standards
applied to this specific environment to guarantee
particular outcomes [6]. One of performance
management's crucial challenges in hospital organizations
is to avoid mismatching wards workload. Consequently,
once hospitals investigate extending care quality while
reducing costs [7], it also looks for an optimal balance
between resource planning and the necessary resources,
represented by beds, ward staff, outpatient clinics, etc..
Consequently, hospitals seek to optimize resource planning
and the necessary resources, represented by beds, ward
staff, outpatient clinics, etc. In other words, it is up to the
hospital performance management to ensure the best
allocation to the specialties, according to the available
budget and resources[1]. In recent years, healthcare
providers have attempted to improve the quality of nursing
services; however, instead of facing numerous obstacles,
they have been practically unsuccessful. Based on the
fierce competition rampant in healthcare, attention to the
quality and services provided to patients can be
considered an influential factor in the success of
healthcare institutions. In this study, to increase the
efficiency of Milad Hospital wards, a different strategy was
presented to promote the services of supervisors. The
opinions of health managers and medical staff opinions
were employed to design a service-oriented nursing
supervisor strategy. In general, at Milad Hospital, each floor
was managed by one supervisor. In the new strategic plan,
to improve the efficiency of the hospital wards, the number
of supervisors increased. For each specialty, a trained and
experienced supervisor was assigned in the same specialty.
Then, the DEA method was used to evaluate the efficiency
of the wards before and after implementing the supervisor
strategy.
SERVICE-ORIENTED NURSING SUPERVISOR
STRATEGY
Supervision is staff observation during work and providing
formal guidance. In health care sectors, protecting life,
human health, and nullifying clients' needs are the main
goals; hence, much complexity has been observed in
health sectors that duplicate the importance of
supervision[3]. Supervision has been introduced as clinical
supervision in health care organizations. The Department of
Health's clinical supervision has been defined as "a formal
process for supporting, training, and professional learning."
It provides a safe and confidential environment for the staff
to reflect on and discuss their work, enhancing their
awareness and clinical skills and improving competency.
The supervisee should accept responsibility for their
performance[8]. In nursing, clinical supervision is a process
in which between two or more professionals (novice nurse
and practitioner nurse), the focus is to provide a basis for
monitoring, assessing, examining practice, and receiving
feedback at work, which could lead to the development
of professional skills[3]. Clinical supervision is done in
hospitals by clinical supervisors. A clinical supervisor is a
nurse responsible for supervising nursing services directly
and helps reach the organization's goals by supporting and
expanding knowledge, skills, commitment, and
performance[9]. Supervision is helpful in the identification
of clinical problems, and supervisors may help nurses in the
admission of new roles[10]. Experts and fully trained clinical
supervisor/s can inform nurses what and when to do while
supervising and bringing development to the organization;
57

they support and strengthen the supervised nurse and
maintain and enhance the quality of care[11]. Milad
Hospital is the largest specialized and subspecialized
hospital in Iran. This hospital is a complementary health
service provider in Iran's Social Security organization (SSO)
hospitals. Supervisors at Milad Hospital were based on floor-
oriented, and a supervisor managed each floor. In order
to elevate the efficiency and reduce the number of
accommodations and the rate of bed employment
(increasing the patients' discharge from the hospital), a
service-oriented nursing supervisor strategy is performed
experimentally in the case of 6 floors and 12 specialties at
the hospital.
FIGURE 1. SERVICE-ORIENTED NURSING SUPERVISOR STRATEGY
According to Figure 1, there are two specialties on each
floor which are normally managed by one supervisor, and
a total of 12 wards are managed by 6 supervisors. After the
implementation of the service-oriented nursing supervisor
strategy, 2 supervisors are hired on each floor so that each
specialty is managed by a trained and experienced
supervisor. Overall the number of supervisors is doubled.
58

DATA ENVELOPMENT ANALYSIS (DEA)
Data envelopment analysis (DEA) measures the efficiency
of homogeneous decision-making units (DMUs) with
multiple inputs and outputs. The DMUs may be companies,
schools, hospitals, shops, bank branches, etc. Efficiency is a
management concept with a long management science
history[12]. Efficiency shows that an organization has used
its resources well to produce the best performance at some
point in time. If the DMU has an input and an output, its
efficiency is defined
Output
Input as the same unit. In 1975,
Farrell introduced a method for measuring efficiency
based on economic theories in an article referring to the
problems of measuring the efficiency of units with multiple
inputs and outputs[13]. Farrell considered the measure of
relative efficiency when there are numerous and
incomparable data and outputs and suggested that an
efficient hypothetical department be constructed based
on the weighted average of the efficient unit to be used as
a comparative basis for using an inefficient unit. The
ordinary equation for measuring the relative efficiency of
DMUs despite multiple data and outputs is as follows:
Total output weights
Total input weights:Efficiency
Which function is as follows:
1 1 2 2
1 1 2 2
... (1)
...
j j
j
j j
u y u yEfficiency of unit
v x v x
+ +=
+ +
Where in:
U1 Weight given to output number 1, 1 jYthe output of
number 1 from unit j, 1VWeight given to input number 1,
1 jXis the input value of number 1 to unit j. In the term
relative efficiency, the resulting efficiency is the result of
comparing units. In the term relative efficiency, the resulting
efficiency is the result of comparing units with each other,
which efficiency of each DMU to be numerically
between[14]. Usually, the maximum value can be
considered after calculating efficiency, and all values can
be divided. In this case, the change range is between [0 1].
Relative efficiency for unit k:
k )RE :{ : 1, .
(,
2.. }
k k
j j
y x
Max y x j n=
Due to the limitations of the Farrell method, in terms of
constant efficiency compared to scale, this method did
not find much practical application. Over time, practical
methods for measuring efficiency were provided.[15] later
proposed a practical method for determining the
efficiency of a set of DMUs with multiple data and outputs,
known as data envelopment analysis. Bunker, Charans,
and Cooper (1984) developed the concepts and models
of data envelopment analysis and introduced the BCC
model for determining performance without assuming
constant returns to scale (RTS) [16]. Charnes and Cooper
(1985) introduced the collective model as another model
for data envelopment analysis that simultaneously
considers reducing inputs and the increase of outputs [17].
Suppose the unit under evaluation consists of n DMUs as
( 1, , )j n= and DMUj, which consumes m input
1( ,... ), j mjx xto produce s output 1( ,..., )j mjy x
. In
addition, suppose that the inputs and outputs of each DMU
are all negative and that each DMU has at least one
positive input and one positive output. Also, in most
organizations, managers of the organization must examine
the performance of DMUs consistent with similar inputs and
outputs and compare their performance. One of the
principles of DEA models is the relationship between the
number of inputs, outputs, and DMU. Usually, restrictions
such as ( ) ³ 3 ³ 2 n m s or n m s+ +
are applied in the
DEA, where n, m, and s are the number of units, inputs, and
outputs, respectively. This problem can be solved by
controlling the weights. Managers must follow the principle
of the correct selection of inputs and outputs. In other
words, inputs and outputs must be selected to include all
the factors that affect the efficiency or inefficiency. For
example, comparing two hospitals regardless of where
they are located makes the evaluation results unrealistic.
Determining the efficiency or inefficiency and ranking of
each DMU, is one of the strengths of data envelopment
analysis models compared to the other methods.
MATERIAL AND METHOD
This research is descriptive and analytical in terms of
purpose, quantitative in terms of method, and practical for
results. For this study, the efficiency of 12 different wards
(Data were collected through Milad Hospital Information
System H.I.S) of Milad Hospital was evaluated based on the
data envelopment analysis (DEA) method. The ethical
approval for the publication of this study was obtained by
Milad hospital.
59

The primary data envelopment analysis models are divided
into CCR and BCC. These methods can be examined in
two ways: input-oriented and output-oriented. The
difference between the two models, CCR and BCC, is
assumed to be a constant or variable return on the scale.
The CCR model assumes a constant return and the BCC
model assumes a variable return on the scale. Constant
return on the scale means that outputs change relative to
inputs; for example, if inputs double, outputs double.
However, the meaning of variable returns to scale is that
the outputs do not change in proportion to the inputs. The
constant return to scale assumption is only valid if units
operate at an optimal scale. In evaluating DMUs by data
envelopment analysis, efficiency scores were assigned
between [0 1], and if the efficiency value is 1, this DMU is
efficient. Several methods have been proposed for ranking
efficient DMU in data envelopment analysis. In this
research, for ranking DMUs, Anderson and Peterson's model
have been used. One of the reasons for using this method
is that the computational process of this method is low. The
technology of ranking production does not change
concerning efficiency. The exact ratio as the performance
score obtained is calculated with the same ranking
pattern. The A&P model does not accurately assess the
nature of the input for the DMU with data close to 0, so using
this model with the nature of the output solves this problem.
The indicators essential to evaluating the performance of
hospital wards based on the literature are as follow:
TABLE 1: INPUT / OUTPUT INDICATORS
input Fall Bedsore Medical
Errors
output Bed Occupancy Rate Average
Stay
The service-oriented nursing supervisor was first
implemented in the second half of 2020 by assigning a
supervisor separately for each ward specialty (Table 2).
CCR OUTPUT-ORIENTED
This model has a return to constant scale. Output-based
models seek to increase or maximize outputs as long as
there is no increase (without change or decrease) in the
number of inputs. Suppose there are n DMUs, each of which
uses the input m to generate the output s. ikXis the input
value i( ) 1,2, , i m=
, which is used by
( ) 1,2, .., kk n DMU=and rky
is the output value r
produced by ( ) 1 , 2, .., k n=
DMUk The variables ur
and vi are the weights of output indices and input indices,
respectively. The technical efficiency of DMU j is calculated
according to the multiplicative model as follows:
1
1
1 1
1
0
, 0; 1,
)
2, , ; 1,2, , ; 1,2, ,
(
3
m
j i ij
i
s
r rj
i
s m
r rk i ik
r i
i
minE v x
u y
u y v x
ur v k n r s i m
=
=
= =
=
=
−
= = =
BCC OUTPUT-ORIENTED
In 1984, Bunker, Charans, and Cooper introduced a vital
factor called "return to scale" and added it to the CCR
model. With this change, they created the BCC model,
whose mathematical model was quite similar to the CCR
model, except that the efficiency factor was added to the
W scale to the objective function and the unequal
constraint of the CCR model [16].
( )
1
1
1 1
r iW free , U 0
4
. 1
0
,
V 0
m
j i ij
i
s
r rj
i
s m
r rk i ik
r i
minE v x W
S t u y
u y v x W
=
=
= =
= +
=
− +
RTS means that if we multiply our input by x, our output by
y. Ify x
, the RTS is incremental; ify x=
, the return to
the scale is constant; ify x
, the RTS is declining [18].
ANDERSON-PATTERSON OUTPUT-ORIENTED MODEL
In this method, in the linear programming model related to
performance DMU,( ) 0j
is removed. This constraint
causes the maximum value of the objective function to be
1. The efficiency is 1 after removing this limitation. Thus,
the most efficient unit has higher efficiency.
60

( )
1
1
1
.
5
1
i=1,2,..., ;
r=1,2,.
.
. , ;
k=1,2,..., ;
j
n
r ik s ij
k
r rk s rj
n
k
n
k
k
n k j
s
n k j
n k
M
j
axy
S t y S X
y S y
−
=
+
=
=
=
+
=
+ =
=
SCALE EFFICIENCY
[16] showed that the performance score obtained by the
CCR method indicates total technical efficiency and the
performance score obtained by the BCC method indicates
the pure technical efficiency.
(6)CCR
BCC
SEj
=
In an envelopment analysis model, the output-oriented
( 1)SE =indicates deductive efficiency and
( )1SE
indicates deductive inefficiency. In other words, if the DMU
operates under efficiency conditions relative to the scale
of increase or decrease, it is deductive inefficiency [19].
RESULTS
Selecting the best set of inputs and outputs is one of the
most critical steps in calculating performance using data
envelopment analysis. According to inputs and outputs
(Table 1), envelopment analysis methods were adopted,
and their relative efficiency was determined. After forming
the desired models based on the data associated with
wards, they were evaluated using DEA Solver Pro software.
The performance of each ward and its ranking were
obtained. In the next step, the Anderson-Peterson model
was implemented in Lingo software for the wards with an
efficiency coefficient of 1. The problem-solving results
based on two data envelopment analysis models are
presented in Tables 2 and 3 based on the CCR and BCC
output-oriented methods. Selecting the best set of inputs
and outputs is one of the most critical steps in calculating
performance using data envelopment analysis. The
indicators essential to evaluating the performance of
hospital wards based on the literature were Fall, Bedsore,
and Medical Errors as input factors along with Bed
Occupancy Rate and Average Stay as output factors.
According to inputs and outputs, envelopment analysis
methods were adopted, and their relative efficiency was
determined. After forming the desired models based on the
data associated with wards, they were evaluated using
DEA Solver Pro software, and the performance of each
ward and its ranking were obtained. In the next step, the
Anderson-Peterson model was implemented in Lingo
software for the wards with an efficiency coefficient of 1.
The problem-solving results based on two data
envelopment analysis models are presented in Tables 2
and 3 based on the CCR and BCC output-oriented
methods.
TABLE 2: EFFICIENCY COEFFICIENT AND RANK OF WARDS BASED ON OUTPUT CCR AND AP MODEL
FIRST HALF OF 2020
(BEFORE SERVICE-ORIENTED NURSING
SUPERVISOR STRATEGY)
SECOND HALF OF 2020
(AFTER SERVICE-ORIENTED NURSING
SUPERVISOR STRATEGY)
Wards
Efficiency
in the
CCR
method
Rank
based
on CCR
method
Efficiency
in the AP
method
Rank
based
on AP
method
Efficiency
in the
CCR
method
Rank
based
on CCR
method
Efficiency
in the AP
method
Rank
based
on AP
method
C.C.U 0.853 5 5 0.646 5 5
Cardiovascular 0.891 3 3 0.756 4 4
ENT 0.092 11 11 0.143 11 11
Gynecology 0.432 8 8 0.575 6 6
I.C.U 0.614 6 6 0.515 9 9
61

Internal .0254 10 10 0.133 12 12
Neurosurgery 0.086 12 12 0.212 10 10
Gastroenterology 0.999 2 1.193 2 1 1 1.028 2
Orthopedic 0.394 9 9 0.518 8 8
Pediatric 0.443 7 7 0.521 7 7
Renal Transplant 0.873 4 4 0.936 3 3
Urology 1 1 1.667 1 1 1 1.629 1
Following the implementation of the service-oriented
nursing supervisor strategy based on the CCR method,
Urology and Gastroenterology wards had the highest
efficiency. Cardiovascular, I.C.U, and Internal wards
followed a downward trend for efficiency; however, C.C.U,
ENT, Pediatric wards and Renal Transplant, Neurosurgery,
Orthopedics, and Gynecology wards had a constant and
increasing efficiency rate.
According to the BCC method, Urology, Renal Transplant,
Neurosurgery, and Gynecology wards had the highest
efficiency rate, while ENT had the lowest efficiency. C.C.U,
I.C.U, and Internal wards and Cardiovascular,
Neurosurgery, Orthopedic, and Pediatric wards had lower
and higher efficiency rates, respectively. Based on the total
technical efficiency coefficient and pure technical
efficiency, the scale efficiency coefficient can be
calculated for each period using Equation 3. The scale
efficiency coefficient for the desired period for each ward
is given in Table 4
TABLE 3: EFFICIENCY COEFFICIENT AND RANK OF WARDS BASED ON OUTPUT BCC AND AP MODEL
Wards
FIRST HALF OF 2020
(BEFORE SERVICE-ORIENTED NURSING
SUPERVISOR STRATEGY)
SECOND HALF OF 2020
(AFTER SERVICE-ORIENTED NURSING
SUPERVISOR STRATEGY)
Efficiency
in the BCC
method
Rank
based
on BCC
method
Efficiency
in the AP
method
Returns to
scale
(RTS)
Efficiency
in the BCC
method
Rank
based
on BCC
method
Efficiency
in the AP
method
Returns to
scale
(RTS)
C.C.U 1 1 1.059 Decrease 0.746 7 Decrease
Cardiovascular 0.942 7 Decrease 0.789 6 Decrease
ENT 0.104 12 Increase 0.164 12 Increase
Gynecology 1 1 1.74 Increase 1 1 1.3 Increase
I.C.U 0.776 8 Decrease 0.535 10 Increase
Internal 1 1 1.32 Increase 0.199 11 Increase
Neurosurgery 0.467 10 Increase 1 1 1.105 Increase
Gastroenterology 1 1 1.539 Constant 1 1 1.4 Constant
Orthopedic 0.6 9 Decrease 0.629 8 Decrease
Pediatric 0.453 11 Decrease 0.538 9 Increase
Renal Transplant 1 1 3.043 Decrease 1 1 2.990 Decrease
Urology 1 1 1.816 Constant 1 1 1.728 Constant
62

TABLE 4: AVERAGE EFFICIENCY OF THE WARDS SCALE AND RANKING
WARDS
SCALE EFFICIENCY (SE) RANK BASED
ON
EFFICIENCY
First half of
2020
Second half of
2020 Average
C.C.U 0.583 0.865 0.724 8
Cardiovascular 0.945 0.958 0.951 4
ENT 0.884 0.871 0.877 6
Gynecology 0.432 0.575 0.503 10
I.C.U 0.719 0.962 0.840 7
Internal 0.254 0.668 0.461 11
Neurosurgery 0.184 0.212 0.198 12
Gastroenterology 0.999 1 0.999 2
Orthopedic 0.581 0.823 0.702 9
Pediatric 0.977 0.968 0.972 3
Renal Transplant 0.873 0.936 0.904 5
Urology 1 1 1 1
After implementing the CCR and BCC data envelopment
analysis method of the output-oriented, for 12 wards, in two
periods (before and after implementing the service-
oriented nursing supervisor strategy), It indicates that the
number of efficient, inefficient wards is different before
after the strategy. For example, in the first half of 2020, when
each supervisor was floor-specific and monitored a floor
(regardless of departmental expertise), departmental
performance was much lower than after strategy
execution.
DISCUSSION
There is no doubt that various elements may help
supervisors and advanced nursing roles perform better [20].
Tavrow's study implied that supervisors devoted <5% of their
time to patient care issues [21]. The study's essential
contribution is introducing a new strategy for the work of
the nursing supervisor. In recent years, the DEA Model has
been widely used in the research field of efficiency, but
there have been no studies evaluating the supervisor
model. According to Kilmenster et al., supervision should be
structured and carried out regularly following the program.
Content of supervision should be agreed upon and the
aims specified before beginning supervision[22]. Knudsen
et al. founded that clinical supervision quality is substantially
influenced by autonomy or authority at work [23].
Supervisors must act successfully in their tasks (staffing,
clinical quality, patient safety, executive presence,
emergency response, and customer satisfaction, census
management) to enhance patient care. Several factors
have been identified as influencing effective practice in
novel nurse roles in acute settings, with opposition to self-
directed nursing advances being higher in larger
acute/general hospital trusts than in "small enterprises."
Feedback, performance evaluation, and reflective
practice Feedback from other health care professionals
can promote professional development. Performance
measurement can also aid personal and professional
development[24]. Also, Graduate level education and
leadership courses could influence the innovativeness of
supervisors, hence making acting better in line with hospital
goals [25]. In this study, the service-oriented nursing
supervisor strategy was first presented to increase the
performance efficiency of wards and the management of
each ward by a experienced supervisor. Then, the
efficiency of the ward before and after the strategy was
evaluated using DEA method. The results demonstrated
that based on the CCR output-oriented method after
implementing service-oriented nursing supervisor strategy,
Urology and Gastroenterology wards and Neurosurgery
and ENT had the highest and lowest efficiency rates,
respectively. However, according to the BCC output-
oriented method, Urology, Renal Transplant, Neurosurgery,
and Gynecology wards had the highest efficiency, while
ENT had the lowest efficiency.
63

CONCLUSION
In conclusion, the findings of this study offer a service-
oriented nursing supervisor strategy that improves the
efficiency of different wards of the hospital. Given the
importance of hospitals in providing health services, using
data envelopment analysis (DEA) to compare and model
can be an essential step for the continuous improvement
of different wards efficacy with the new strategy service-
oriented nursing supervisor.
LIMITATIONS
Some of our research limitations should be highlighted at
this time. Because causal inferences might be challenging
to draw from cross-sectional data, relationships between
research variables should be carefully studied before
drawing any conclusions. Furthermore, the primary data's
convenience reduced the generalizability of the findings.
Thus, future research should adopt samples from other
hospital wards in the long run. Future research should focus
on replicating this study in a more extensive and
multicenter representative population of nurse supervisors.
However, more work is required to optimize the hospital
wards' efficiency fully.
ACKNOWLEDGMENT
The researchers are grateful to health systems engineering
research center that collaborated with this research.
FINANCIAL SUPPORT AND SPONSORSHIP
Health Systems Engineering Research Center, Milad
Hospital, Tehran, Iran.
CONFLICTS OF INTEREST
Nothing to declare
References
1. Peixoto MGM, Musetti MA, de Mendonça MCA.
Performance management in hospital organizations
from the perspective of Principal Component Analysis
and Data Envelopment Analysis: the case of Federal
University Hospitals in Brazil. Computers & Industrial
Engineering. 2020;150:106873.
2. Hoseini M. Management principles of nursing services.
Tehran: Boshra-Tohfeh. 2007:65-71.
3. Dehghani K, Nasiriani K, Salimi T. Requirements for nurse
supervisor training: A qualitative content analysis.
Iranian journal of nursing and midwifery research.
2016;21(1):63.
4. Matsumoto A. Effective human resource management
strategy for hospital nursing organizations.
Management Science Letters. 2019;9(2):243-52.
5. Sebashe S, Mtapuri O. Implementation of a
performance management system: A case study of
Ba-Phalaborwa Municipality in Limpopo. Journal of
Public Administration. 2011;46(4):1323-37.
6. Harnett P, Bowles N, Coughlan A. Refocusing acute
psychiatry, performance management, standards and
accountability, a new context for mental health
nursing. Journal of psychiatric and mental health
nursing. 2009;16(5):434-9.
7. Weir TB, Sardesai N, Jauregui JJ, Jazini E, Sokolow MJ,
Usmani MF, et al. Effect of Surgical Setting on Hospital -
Reported Outcomes for Elective Lumbar Spinal
Procedures: Tertiary Versus Community Hospitals.
Global spine journal. 2020;10(4):375-83.
8. Rwelamira DM. The perceptions of clinical
physiotherapists of their role in supervising
undergraduate students in selected tertiary hospitals in
Tanzania. 2019.
9. SIROLA‐KARVINEN P, Hyrkäs K. Clinical supervision for
nurses in administrative and leadership positions: a
systematic literature review of the studies focusing on
administrative clinical supervision. Journal of Nursing
Management. 2006;14(8):601-9.
10. Kelly B, Long A, McKenna H. A survey of community
mental health nurses' perceptions of clinical supervision
in Northern Ireland. Journal of psychiatric and mental
health nursing. 2001;8(1):33-44.
11. Holloway E. Clinical supervision: A systems approach:
Sage; 1995.
12. Witzel M. A short history of efficiency. Business Strategy
Review. 2002;13(4):38-47.
13. Farrell MJ. The measurement of productive efficiency.
Journal of the Royal Statistical Society: Series A
(General). 1957;120(3):253-81.
14. Aggarwal L, Goswami P, Sachdeva S. Multi -criterion
Intelligent Decision Support system for COVID-19.
Applied Soft Computing. 2021;101:107056.
15. Charnes A, Cooper WW, Rhodes E. Measuring the
efficiency of decision making units. European journal of
operational research. 1978;2(6):429-44.
16. Banker RD, Charnes A, Cooper WW. Some models for
estimating technical and scale inefficiencies in data
envelopment analysis. Management science.
1984;30(9):1078-92.
17. Charnes A, Cooper WW. Preface to topics in data
envelopment analysis. Annals of Operations research.
1984;2(1):59-94.
64

18. Färe R, Grosskopf S, Norris M, Zhang Z. Productivity
growth, technical progress, and efficiency change in
industrialized countries. The American economic
review. 1994:66-83.
19. Munisamy S, Jun OB, editors. Efficiency of Latin
American container seaports using DEA. Proceedings
of 3rd Asia-Pacific business research conference; 2013.
20. Glasofer A, Lapinsky AB. Delineation of the Nursing
Supervisor Role: A Pilot Study. JONA: The Journal of
Nursing Administration. 2019;49(7/8):359-65.
21. Tavrow P, Kim Y-M, Malianga L. Measuring the quality
of supervisor–provider interactions in health care
facilities in Zimbabwe. International Journal for Quality
in Health Care. 2002;14(suppl_1):57-066.
22. Kilminster S, Cottrell D, Grant J, Jolly B. AMEE Guide No.
27: Effective educational and clinical supervision.
Medical teacher. 2007;29(1):2-19.
23. Knudsen HK, Ducharme LJ, Roman PM. Clinical
supervision, emotional exhaustion, and turnover
intention: A study of substance abuse treatment
counselors in the Clinical Trials Network of the National
Institute on Drug Abuse. Journal of substance abuse
treatment. 2008;35(4):387-95.
24. Jones ML. Role development and effective practice in
specialist and advanced practice roles in acute
hospital settings: systematic review and meta‐synthesis.
Journal of advanced nursing. 2005;49(2):191-209.
25. CLEMENT‐O’BRIEN K, Polit DF, Fitzpatrick JJ.
Innovativeness of nurse leaders. Journal of Nursing
Management. 2011;19(4):431-8.
65

RESEARCH ARTICLE
THE USE OF INFOGRAPHICS, TABLES AND GRAPHS IN THE
HOSPITALS AND HEALTH SERVICES QUALITY ACCOUNT IN
AUSTRALIA
Abdel K Halabi, Lee Brown
Federation Business School, Federation University Australia
Correspondence: [email protected]
ABSTRACT
OBJECTIVE: This study will investigate whether removing the Quality Accounts purpose and aim led to differences in the
number of Infographics, Tables and Graphs used over four years.
DESIGN:
A content analysis was performed on the Quality Accounts of six Hospitals and Health Services from 2016 to 2019.
Statistical analysis was then performed to examine differences in the use of Infographics, Tables and Graphs in the Quality
Account
SETTING:
The six Hospitals and Health Services were operating in a rural geographical area in the state of Victoria, Australia.
RESULTS:
Even though some significant differences were found, this was largely due to yearly variability in the use of Infographic s,
Tables and Graphs. The six Hospitals were quite different in their Quality Account presentations because these reports are
structured to a particular community.
CONCLUSIONS:
The removal of the purpose and aim has not affected the number of Infographics, Tables and Graphs. While limitations
are noted, a number of future research opportunities stem from this study to enhance the Quality Account and overall
understandability of Hospital reports.
KEYWORDS
Quality Account; Hospitals; Understandability; Infographics; Tables; Graphs; Management
INTRODUCTION
This paper examines how six rural Hospitals and Health
Services (HHS) in Australia use Infographics, Tables and
Graphs within their Quality Account. The Quality Account
(formerly called a Quality of Care report) provides an
annual snapshot of hospital operational performance
information, including how quality and safety of care are
measured and monitored [1]. In the Australian state of
Victoria, all HHS are required to produce a yearly Quality
Account based on government reporting guidelines and
an Annual Report.
66

The release of hospital performance data to the general
public aims to fulfil a healthcare provider's duty to disclose
quality or performance information to the public, thereby
increasing transparency and accountability of the
healthcare system to its citizens [2] and improving the
quality of care [3]. The Victorian Government [1] Quality
Account reporting guidelines for HHS acknowledge the
purpose is to provide accessible information about the
service's quality of care and in doing so demonstrate the
service's transparency and accountability and the aim is to
meet diverse quality and safety health literacy needs by
providing a report that is accessible and easy to
understand.
In terms of health performance reporting, Islam [4] noted
that adhering to high governance standards by
implementing accountability for health service
organisations can enhance the quality of health service
delivery. Reporting systems, however, can often be
complex, and the sector requires support with data
reporting to make it easier to understand [3]. As a result,
the Victorian Government's Quality Account guidelines [5]
suggest the written content needs to be easy to read and
understand for consumers, carers and the community. The
Quality Account guidelines are structured to ask the
community what specific content they would like to see
and note that hospitals should think about how you can use
images, graphs and graphic elements to help the
community comprehend the report. Research has shown
that accountability and transparency can be discharged
by presenting information in a format that community
members can easily understand. To this end, Infographics,
Tables and Graphs can assist understandability because
they convert complex technical data into information that
is useful to stakeholders with little to no professional
knowledge of the subject matter [6]. Healthcare
performance management, visualisations, such as
“emergency care” through charts and graphs, help
administrators interpret performance and take appropriate
actions [7].
The purpose of the Quality Account (to demonstrate
transparency and accountability) and the aim (to provide
information that is easy to understand) were outlined in the
Victorian Government reporting guidelines from 2016 to
2018. In 2019, however, both the purpose and aim were
excluded and not replaced. Given the request to consider
the use of images, graphs and graphic elements, this study
will investigate whether the exclusion of the purpose and
aim led to differences in the number of Infographics, Tables
and Graphs used in the Quality Account over the four years
from 2016 to 2019, and particularly between 2018 and 2019.
Infographics, Tables and Graphs have been widely used to
help users understand financial and non-financial
information. In terms of infographics, Mindu et al. [8]
explain that these are graphic visual representations of
information, data or knowledge and that apart from being
beautiful, engaging and easier to understand, … also
present complex information effectively. Research on the
effects of infographics within publicly available reports has
shown that these increase understandability [6] and uphold
legitimacy [9]. Dunlap & Lowenthal [10] added that
Infographics could deliver the maximum amount of
content in the least amount of space while still being
precise and clear. Hall [11] found that younger people
preferred infographics, while Cox and De Goeij [6] noted
that infographics are most effective for investors who lack
literacy. Finally, Jahan et al. [12] found well-planned
content within an infographic can lead to better
understandability and increased dissemination of the key
message.
In terms of graphs, previous research has examined and
evaluated their use within publicly available reports. Courtis
[13] for example, noted organisations use graphs to focus
a 'reader's interest, attract and hold attention, facilitate
understanding, save time in analysing data, help memory
recall, highlight trends, clarify relationships and generally
break down language barriers. Courtis [13] also stated that
"the basic messages portrayed through a graph should be
visually apparent and understandable to readers
regardless of their educational or experience background".
Frownfelter-Lohrke & Fulkerson [14] and Beattie [15]
confirmed that graphs could assist report understandability,
while Usmani et al. [16], noted that graphs assist readers to
understand detailed information by giving a richer
perspective of data, and this facilitates informed decision-
making. Graphs can summarise data which assists readers
to process information, and this saves time when analysing
data [17,6].
Tables within publicly available reports can also facilitate
understandability and improve disclosure quality [18]. The
more frequent use of tables helps users of financial
statements to understand and compare information
quickly [19]. Tables can improve reader retention by clearly
displaying statistical data [20] and can be used to
emphasise symbolic information (numbers) and make
information more understandable [21].
67
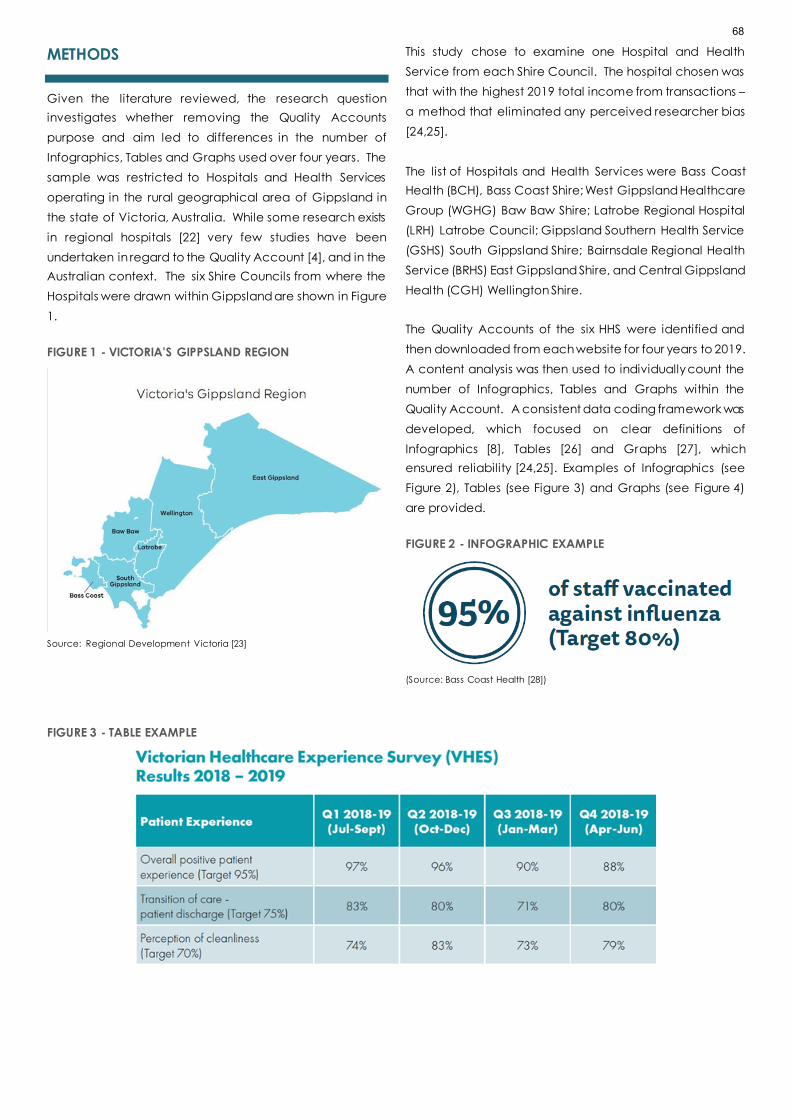
METHODS
Given the literature reviewed, the research question
investigates whether removing the Quality Accounts
purpose and aim led to differences in the number of
Infographics, Tables and Graphs used over four years. The
sample was restricted to Hospitals and Health Services
operating in the rural geographical area of Gippsland in
the state of Victoria, Australia. While some research exists
in regional hospitals [22] very few studies have been
undertaken in regard to the Quality Account [4], and in the
Australian context. The six Shire Councils from where the
Hospitals were drawn within Gippsland are shown in Figure
1.
FIGURE 1 - VICTORIA'S GIPPSLAND REGION
Source: Regional Development Victoria [23]
This study chose to examine one Hospital and Health
Service from each Shire Council. The hospital chosen was
that with the highest 2019 total income from transactions –
a method that eliminated any perceived researcher bias
[24,25].
The list of Hospitals and Health Services were Bass Coast
Health (BCH), Bass Coast Shire; West Gippsland Healthcare
Group (WGHG) Baw Baw Shire; Latrobe Regional Hospital
(LRH) Latrobe Council; Gippsland Southern Health Service
(GSHS) South Gippsland Shire; Bairnsdale Regional Health
Service (BRHS) East Gippsland Shire, and Central Gippsland
Health (CGH) Wellington Shire.
The Quality Accounts of the six HHS were identified and
then downloaded from each website for four years to 2019.
A content analysis was then used to individually count the
number of Infographics, Tables and Graphs within the
Quality Account. A consistent data coding framework was
developed, which focused on clear definitions of
Infographics [8], Tables [26] and Graphs [27], which
ensured reliability [24,25]. Examples of Infographics (see
Figure 2), Tables (see Figure 3) and Graphs (see Figure 4)
are provided.
FIGURE 2 - INFOGRAPHIC EXAMPLE
(Source: Bass Coast Health [28])
FIGURE 3 - TABLE EXAMPLE
68

FIGURE 4 - GRAPH EXAMPLES
RESULTS
Page Length
The Quality Accounts were colourful and contained staff
and client pictures to make them vibrant and attractive.
Because of the uniqueness of these reports to their
communities, the documents varied in page length.
Figure 5 shows that a clear year on year pattern is not
evident. BRHS and CGHS have similar page lengths, while
GSHS had slightly more. BCH and WGHG generally
increased year on year, whereas LRH decreased. The
longest Quality Account was the LRH in 2019 (48 pages),
while the least was BCH in 2016 (20 pages).
FIGURE 5 - QUALITY ACCOUNT – NUMBER OF PAGES (INCLUDING FRONT AND BACK COVERS) FOR SIX GIPPSLAND BASED
HOSPITALS AND HEALTH SERVICES 2016 TO 2019
Quality Account analysis
Table 1 shows the total number of Infographics, Tables and
Graphs used within the Quality Account over four years
and the yearly mean. The results show that the yearly total
number was highest in 2017 (113) and lowest in 2018 (79).
Of the individual organisations, CGHS had the highest (94)
and LRH the least (38).
A chi-square test examined whether the organisations
consistently use Infographics, Tables and Graphs. Table 1
shows the p-value is 0.015, indicating a significant
difference between how each organisation uses
Infographics, Tables and Graphs. In terms of each
organisation BCH, CGHS and 'BRHS's show variabi lity over
the years, while GSHS, WGHG and LRH show a downward
trend in total numbers. The results also show that only BRHS
and CGHS increased the use from 2018 to 2019. Over the
four years, CGHS used the highest number (94).
69

Of importance to the study was whether the removal of the
purpose and aim from the 2019 guidelines impacted the
collective use of Infographics, Tables and Graphs. A chi -
square test was conducted. Table 2 confirms no significant
difference in the usage pattern for three organisations (LRH,
GSHS & BRHS). BCH’s p-value of 0.070 (between 0.05 to
0.10) indicates a weak statistical difference, while both
WGHG & CGHS show a significant difference (p-value
below 0.05). Upon further examination, CGHS's p-value
(0.021) is because there is an unusual number in 2018
(where the total was only 11 - see Table 1) and does not
indicate the usage altered in 2019. WGHG is showing the
most significant statistical difference, yet Table 1 confirms
the total usage is declining every year, and the change in
2019 may be due to this trend rather than the removal of
the purpose and aim.
The communication tool used most in the Quality
Account:
Analysis was undertaken on the separate use of
Infographics, Tables and Graphs and the results in Table 3
shows there are more graphs (252, average 63) used
compared to Infographics (72, average 18) and Tables (52,
average 13). The total mean usage between 2018 and
2019 showed no real difference (13.17 in 2018 compared to
13.67 in 2019), which further substantiates that the removal
of the purpose and aim in the 2019 guidelines did not
impact the use of these communication tools.
TABLE 1 - QUALITY ACCOUNT TOTAL NUMBER OF INFOGRAPHICS, TABLES AND GRAPHS 2016 TO 2019
TABLE 2 - QUALITY ACCOUNT ONE-WAY CHI-SQUARE TEST RESULTS PER ORGANISATION, 2016 TO 2019
ORGANISATION
QUALITY
ACCOUNT CHI-
SQUARE
P-VALUE
Bass Coast Health (BCH) 0.070
West Gippsland Healthcare Group (WGHG) 0.017
Latrobe Regional Hospital (LRH) 0.384
Gippsland Southern Health Service (GSHS) 0.286
Bairnsdale Regional Health Service (BRHS) 0.551
Central Gippsland Health Service (CGHS) 0.021
TOTAL NUMBER OF INFOGRAPHICS, TABLES AND GRAPHS WITHIN THE QUALITY ACCOUNT
ORGANISATION 2016 2017 2018 2019
4
YEAR
TOTAL
MOVEMENT
BETWEEN
2018 AND
2019
YEARLY
MEAN
Bass Coast Health (BCH) 14 28 26 16 84 -10 21.00
West Gippsland Healthcare Group
(WGHG) 18 11 8 4 41 -4 10.25
Latrobe Regional Hospital (LRH) 14 9 8 7 38 -1 9.50
Gippsland Southern Health Service
(GSHS) 13 12 11 5 41 -6 10.25
Bairnsdale Regional Health Service
(BRHS) 19 24 15 20 78 5 19.50
Central Gippsland Health Service
(CGHS) 24 29 11 30 94 19 23.50
Total 102 113 79 82 376 3 94.00
Two way P- value 0.015
70

TABLE 3 - QUALITY ACCOUNT TOTAL HOSPITALS AND HEALTH SERVICES USE OF EACH COMMUNICATION TOOL
QUALITY ACCOUNT - TOTAL HOSPITAL AND HEALTH SERVICE USE OF EACH COMMUNICATION
TOOL
TYPE 2016 2017 2018 2019 TOTAL
YEARLY
MEAN
USAGE
2018 HHS
MEAN
USAGE
2019 HHS
MEAN
USAGE
Infographic 16 16 26 14 72 18.00 4.33 2.33
Table 11 16 12 13 52 13.00 2.00 2.17
Graph 75 81 41 55 252 63.00 6.83 9.17
Total 102 113 79 82 376 94.00 13.17 13.67
Analysis was then undertaken to determine if the usage of
Infographics, Tables and Graphs had changed over the
period. A one-way chi-square test was conducted. The
results reported in Table 4 show that there is no statistical
change in the use of Infographics and Tables. However,
there was a change in the use of graphs (p = 0.001). The
change in Graphs was largely due to yearly variability (refer
to Table 3) because the number declined between 2017
(81) and 2018 (41) then increased in 2019 (55).
TABLE 4 - QUALITY ACCOUNT ONE-WAY CHI-SQUARE TEST
RESULTS PER COMMUNICATION TOOL FROM 2016 TO 2019
COMMUNICATION TOOL P-VALUE
Infographic 0.180
Table 0.783
Graph 0.001
DISCUSSION
The objective of this study was to examine whether the
removal of the purpose and aim from the 2019 Quality
Account guidelines had an impact on how six Gippsland
Hospitals and Health Services used Infographics, Tables and
Graphs. There has been a desire for HHS to consider the
use of Images, Graphs and Graphic elements to engage
readers and demonstrate accountability and
transparency [5].
Results found that the change in 2019 guideline wording
has not influenced the use of Infographics, Tables and
Graphs between 2018 to 2019, and this was confirmed in
Tables 1 and 2. Any movement was attributable to yearly
fluctuations naturally occurring, and this can be seen
clearly in CGSH, which increased the total number of
Infographics, Tables and Graphs in 2019 (from 11 to 30) to
previous levels in 2016 and 2017. The one-way chi-square
test (Table 4) again indicates no statistical change in the
use of Infographics and Tables, and while there is a
significant change in the use of Graphs, this is because of
natural fluctuations.
Infographics, Tables and Graphs can assist
understandability because they convert complex
technical data into information that is useful to stakeholders
with little professional knowledge [6, 31]. Because each HHS
is operating in a different geographical area, and the
Victorian Government [5] Quality Account guidelines
request the HHS ask the community what content they
would like to see, it was anticipated that each Quality
Account would be unique.
The individual count of Infographics, Tables and Graphs
within the Quality Account shows that HHS prefers to use
graphs. Previous literature has recommended that graphs
better show overall trends and patterns [32]. Graphs are
highlighted in the reporting guidelines because they show
operational trends, performance against targets and
outcomes [5]. As the Quality Account is written and
distributed among the community to all stakeholders
regardless of age, gender, education and background,
graphs may be preferred because these groups can better
comprehend the 'HHS' information without engaging
professional advice [13,16].
CONCLUSION
The principal finding of this study is that removing the
Quality Accounts purpose and aim in 2019 did not lead to
differences in the number of Infographics, Tables and
Graphs used over between 2018 to 2019. The research has
also highlighted that HHS use Infographics, Tables or Graphs
in large numbers to explain performance data. An
implication is that in the future, regulators may need to
consider creating a framework and further guidelines
71

around how these communication tools can be used within
the Quality Account to further enhance understandability.
A further implication is that while prior research has found
that Infographics, Tables and Graphs assist understanding
(6,7,10,13], graphs are more widely used in this instance.
The management of HHS may use this research to embed
more graphs in their Quality Accounts. Infographics are a
newer way of presenting data, and these could also
become more utilised in future Quality Accounts.
Why the Victorian Government removed the purpose and
aim from the Quality Account is not evident. Even with the
removal, this research has shown there is little differences in
how Infographics, Tables or Graphs were used over the four
years. Quality Accounts are produced based on content
targeted for a specific community and may help explain
why there were no real differences.
The main limitation of this study is that it looked at six HHS in
a specific regional area of Victoria over four years, so
caution should be taken when making generalisations
about larger populations based on these results [24,25].
However, opportunities exist to expand this study into other
HHS across regional and rural areas and over a longer
period. Of interest here is the announcement that due to
the COVID-19 pandemic, public health services were not
required to submit a Quality Account for 2020-21 [33].
Future academic research could also be undertaken from
other perspectives. Firstly, the effectiveness of the Quality
Account in engaging the community and meeting
stakeholders' information needs could be independently
confirmed. Currently, the HHS is self-regulating how
effective they are at engaging the community and gaining
feedback about how they are at meeting community
needs. Independent research could undertake interviews
or surveys with community members to understand how
effective the Quality Account meets their information
requirements about performance care. It would also be
interesting to determine how much information users can
understand in the Quality Account report and what
benefits the report gives them.
There is also an opportunity to expand this study by
determining what type of data is included in each
communication tool. For example, what actual
performance data is usually conveyed by tables, and what
is data is more suited to graphs? This research was primarily
a content analysis and did not go into the details of the
information portrayed. However, some research has
indicated that emergency care may be best displayed
through graphs [7].
A further question to be considered is whether Infographics,
Tables and Graphs are being used as impression
management tools instead of assisting understandability
and supporting accountability and transparency. Previous
literature in this area confirms that communication tools
can be used for impression management where visuals can
be systematically manipulated to project a favourable
image [34]. Zhang [35] also suggests that positive or neutral
financial performance is presented using vivid graphs, so
nonprofessional investors perceive the results as better than
they are.
Finally, the scope of this study was restricted to the Quality
Account and did not consider the financial statements and
supporting financial notes. Infographics, Tables and Graphs
may be included in these reports, and a similar study could
be targeted to the Annual Reports of HHS to see how these
communication tools are used.
Observations of academic literature suggest the Victorian
HHS publicly available reports are an under-researched
area, and there exist opportunities to undertake additional
research on these entities. This particularly study is useful to
HHS, particularly as they continually try to meet their
accountability and the understandability of their
operational performance.
CONFLICT OF INTEREST
The authors declare that there is no conflict of interest.
References
1. Victorian Government (2016). Victorian quality
account Reporting guidelines for 2015–16. Available at
https://www2.health.vic.gov.au/about/publications/p
oliciesandguidelines/victorian-quality-account-
reporting-guidelines-2015-16 [verified 31 October
2020].
2. Canaway R, Bismark M, Dunt D, et al. What is meant by
public Stakeholder views on strengthening impacts of
public reporting of hospital performance data. Social
Science & Medicine 2018; 202: 143-150.
3. Zaga C, Leggat SG, Hill S. Partnering with consumers in
the public reporting of quality of care: review of the
Victorian quality of care report. Aust Health Rev 2018;
42, 550-556.
72

4. Islam, M. The Influence of Politics on Accountability of
Health Professionals in Bangladesh: An Analysis of the
Quality of Health Service Delivery. Asia Pacific Journal
of Health Management 2017; 12: 1, 75-82.
5. Victorian Government (2019). Victorian quality
account Reporting guidelines for 2018–19. Available at
https://www.bettersafercare.vic.gov.au/our-
work/governance/quality-accounts [verified 31
October 2020].
6. Cox R, de Goeij P. Infographics and Financial Decisions.
Available at
https://www.netspar.nl/assets/uploads/P20200624_Net
spar-Design-Paper-148-WEB.pdf [verified 31 October
2020].
7. Victor S, Farooq, A. Dashboard Visualisation for
Healthcare Performance Management: Balanced
Scorecard Metrics. Asia Pacific Journal of Health
Management 2021; 16(2): i625.
doi:10.24083/apjhm.v16i2.625
8. Mindu T, Kabuyaya M, Chimbari MJ. Edutainment and
infographics for schistosomiasis health education in
Ndumo area, Kwazulu-Natal, South Africa. Cogent
Medicine 2020; 7(1): 1-18.
9. Chwastiak M, Young JJ. Silences in Annual Reports.
Critical Persp on Acc 2003; 14(5): 533-552.
10. Dunlap JC, Lowenthal PR. Getting graphic about
infographics: design lessons learned from popular
infographics. J of Visual Literacy 2016;35(1): 42-59.
11. Hall J. Infographics and Annual Reports for Nonprofit
Organizations. Available at
https://digitalcommons.calpoly.edu/cgi/viewcontent.
cgi?article=1119&context=grcsp [verified 15
November 2020].
12. Jahan S, Al-Saigul AM, Alharbi AM. Assessment of
health education infographics in Saudi Arabia. Health
Ed J 2021; 80(1): 3-15.
13. Courtis, JK. Corporate Annual Report Graphical
Communication in Hong Kong: Effective or Misleading.
J of Bus Comm 1997; 34(3): 269-288.
14. Frownfelter-Lohrke C, Fulkerson CL. The Incidence and
Quality of Graphics in Annual Reports: An International
Comparison. The J of Bus Comm 2001; 38(3): 337-358.
15. Beattie V, Dhanani A, Jones MJ. Investigating
presentational change in UK annual reports: a
longitudinal perspective. J of Bus Comm 2008; 45(2):
181-222.
16. Usmani M, Davison J, Napier, CJ. The production of
stand-alone sustainability reports: visual impression
management, legitimacy and functional stupidity".
Acc Forum 2020; 44(4): 315-343.
17. Varachia Z, Yasseen Y. The use of graphs as an
impression management tool in the annual integrated
reports of South African listed entities. J of Eco and Fin
Sci 2020; 13(1): 1-11.
18. El-Haj M, Alves P, Rayson P, et al. Retrieving, classifying
and analysing narrative commentary in unstructured
(glossy) annual reports published as PDF files. Acc and
Bus Res 2020; 50(1): 6-34.
19. International Accounting Standards Board (2017).
Disclosure Initiative - Principles of Disclosure. Discussion
Paper DP/2017/1. Available at
https://cdn.ifrs.org/content/dam/ifrs/project/disclosur
e-initative/disclosure-initiative-principles-of-
disclosure/discussion-paper/published-
documents/discussion-paper-disclosure-initiative-
principles-of-disclosure.pdf [verified 19 February 2021].
20. Peterson BK. Tables and Graphs Improve Reader
Performance and Reader Reaction. J Of Bus Comm
1983;20(2): 47–55.
21. Vessey I. Cognitive Fit: A Theory-Based Analysis of the
Graphs Versus Tables Literature. Dec Sci 1991; 22(2):
219–240.
22. Nicol J, Wilks J, Wood M. Tourists as inpatients in
Queensland regional hospitals. Aust Health Rev 1996;
19: 55-72.
23. Regional Development Victoria. Victoria's Gippsland
Region. Available at
https://www.rdv.vic.gov.au/victorias-
regions/gippsland [verified 8 August 2020].
24. Selvanathan A, Selvanathan S, Keller G, et al. Australian
Business Statistics (2nd ed.). Melbourne: Cengage
Learning Australia
25. Clark KR, Veale BL. Strategies to Enhance Data
Collection and Analysis in Qualitative Research.
Radiologic Tech 2018; 86(5): 482CT – 485CT.
26. Metrworks. Mathematics. Available at
https://sites.google.com/site/mathclc/graphs#:~:text
=A%20table%20is%20a%20set,organizing%20numerical
%20information%20or%20data [verified 12 September
2020].
27. Collins Dictionary. Definition of ‘graph'. Available at
https://www.collinsdictionary.com/dictionary/english/
graph [verified 12 September 2020].
28. Bass Coast Health. Annual Report 2018-2019. Available
at
https://www.gha2.net.au/site/DefaultSite/filesystem/u
ploads/202009301309534367/BCH%20Annual%20Repor
t%202018-19_FINAL-for-web.pdf [verified 12 August
2020].
73

29. West Gippsland Healthcare Group. Annual Report
2018-19. Available at
https://www.gha2.net.au/site/DefaultSite/filesystem/u
ploads/201611171421523931/WGHG%20Annual%20Re
port%202016_final.pdf [verified 12 August 2020].
30. Central Gippsland Health. Annual Report 2018-19.
Available at http://www.cghs.com.au/wp-
content/uploads/2020/01/cgh-annual-report-2019-
ReducedSize.pdf [verified 12 August 2020].
31. Beattie V, Jones MJ. A Comparative Study of the Use of
Financial Graphs in the Corporate Annual Reports of
Major U.S. and U.K. Companies. J of Int Fin Man and
Acc 1997; 8(1): 35-68.
32. Falschlunger LM, Eisl C, Losbichler H, et al. Impression
management in annual reports of the largest European
companies, A longitudinal study on graphical
representations. J of App Acc 2015; 16(3): 383-399.
33. Victorian Agency for Health Information. available at
https://www.bettersafercare.vic.gov.au/support-and-
training/clinical-governance/quality-accounts
[verified 22 May 2021].
34. Cho CH, Michelon G, Patten DM. Impression
Management in Sustainability Reports: An Empirical
Investigation of the use of Graphs. Acc and the Pub
Interest 2010; 12(1): 16-37.
35. Zhang J. The Impact of Vivid Graphical Presentation of
Financial Information in Digital Annual Reports on
Investors' Impressions of Management and Firm
Performance. J of Inf Sys 2020; 34(3): 233-253.
74
RESEARCH ARTICLE
DETERMINING THE BARRIERS TO ACCESS DENTAL SERVICES
FOR PEOPLE WITH A DISABILITY: A QUALITATIVE STUDY
Nicholas Liu1, Maxine Drake2, Estie Kruger1, Marc Tennant1
1. School of Human Sciences, The University of Western Australia, Perth, Australia
2. Developmental Disability Western Australia, Perth, Australia
Correspondence: [email protected]
ABSTRACT
AIM:
To determine the perceptions of carers of people with a disability in terms of the problems they face in accessing dental
care.
METHOD:
The survey was based on the modified Penchansky’s 5A classification. It focused on members of a local disability suppo rt
agency and was completed as part of their ongoing quality improvement processes.
RESULT:
A total of 169 carers took part, with a quarter indicating that the person they cared for did not have a regular dentist.
Nearly 25% of the participants found it extremely difficult to obtain appropriate oral health care. Amongst the participants
10% had to abandon dental treatment due to difficulties, while 13% have yet to receive any sort of dental care. Amongst
school-aged children, 64.5% were unable to receive dental care from the school dental service.
CONCLUSION:
The study was conducted to obtain an insight and understanding of how people with a disability and their primary
caregivers experience dental care. Several concerns were identified, with most related to the process of providing care
(patient-professional interaction factors) and the structure of the dental health system and its operation (factors related
to access, affordability and information systems.) Targeted strategies aimed at providing affordable and appropriate
services to people with disabilities should be prioritised.
SO WHAT?
The study showed emerging concerns among the participants relating to providing information regarding dental care
options, as well as concerns regarding the availability and accessibility of the services. Further research will be conducted
using the standardized tool the Measure of Processes of Care, and findings will translate to help initiate a program with
the help of Developmental Disability Western Australia to provide information.
KEYWORDS
disability, dental care, access, Australia.
75

INTRODUCTION
The World Health Organisation’s (WHO) global disability
action plan 2014–2021, defines disability as “an umbrella
term for impairments, activity limitations and participation
restrictions, denoting the negative aspects of the
interaction between an individual (with a health condition)
and that individual’s contextual (environmental and
personal) factors” [1]. According to the WHO it is estimated
that more than 1 billion people are living with any sort of
disability, and this accounted for roughly 15% of the global
population, or one in seven people [1]. In 2019 the
Australian Institute of Health and Welfare (AIHW) reported
that about 4.4 million people in Australia, or about 18% of
the population, have a disability [2].
The population distribution of disability status is not even,
with prevalence rates of disability higher in women, older
people and people from lower socio-economic status [1,2].
Numerous studies have been conducted enumerating
various barriers to accessing health care for people living
with a disability [1-5]. These barriers include longer waiting
times, affordability of the services, limited availability of the
services, difficulty accessing facilities and buildings,
discrimination by health professionals, lack of
communication between different health services and
insufficient skills and knowledge of health professionals [6].
Disability is recognized not only as a global public health
issue, but also a basic human rights issue [1,4,5,7]. People
living with a disability have equal rights to have good oral
health and should enjoy equal access to health care and
equal quality of health care [4, 5,7-9].
Previous studies showed that people with a disability have
a higher risk of having dental caries and periodontal
disease, coupled with poorer oral hygiene than people
without disabilities [1,4,5,8,10-12]. A major portion of people
living with a disability also depend on carers for their oral
hygiene and dental visits [3,13]. The dental treatment of
people with a disability is also more time consuming and
requires additional emotional and physical involvement
from health professionals along with their primary care
givers [4, 14]. All these factors play a significant role in
placing a burden on the total quality of life of the affected
individual, his/her immediate family, and the community in
which they live.
The disability sector in Western Australia (WA) consists of a
combination of both government and non-government
services. This can be confusing for families in navigating the
system. Local area co-ordinator (LAC) services are there to
support families however, and their primary function is to
assist with the co-ordination of various services (Disability
Services Commission WA 2003).
Against this background, a survey was carried out amongst
members of a disability support agency in Western
Australia, one of the States in Australia. The aim of this study
was to obtain an insight and understanding of how people
with a disability and their primary caregivers experience
dental care and access to dental services.
MATERIALS AND METHODS
SURVEY DESIGN
The survey was designed by a small community reference
group of local advocates working for Developmental
Disability WA. The membership of the group included
people with any disability and their famil ies residing in
Western Australia.
This survey (anonymous questionnaires) focused on
members of a local disability support agency, and was
completed as part of the agency’s ongoing quality
improvement processes. The opportunistic survey was
completed in the middle of 2016 and was carried out to
identify problems relating to dental service access.
Secondary analysis of these questionnaires was then
carried out.
DATA COLLECTION
The survey was conducted using Survey Monkey online
services, with anonymous open-ended questions. The
answers to the survey questions were in the form of yes and
no options, with an open section for qualitative expression
of their views. The participants were the primary care givers
or family members reporting on behalf of the person living
with a disability.
These anonymous questionnaires were then reviewed and
deductively mapped to their related themes based on the
modified Penchansky’s definition of access [16,17].
According to Penchansky and Thomas, access reflects the
fit between characteristics and expectations of the health
providers and their clients. They grouped these
characteristics into five as of access to care: affordability,
availability, accessibility, accommodation, and
acceptability. A sixth dimension, namely awareness, was
76

later added to a modified version of the framework 16,17].
A total of 8 questions in the survey were related to access.
Ethics approval: Ethics approval was sought (and
exemption provided) from the Human Ethics Committee at
The University of Western Australia (RA/4/20/4088).
RESULTS
QUANTITATIVE STUDY
There were a total of 169 participants who were the primary
carers or family members of a person with a disability, and
among those, 24% did not have any regular dentist (Figure
1). Amongst the participants, 28% found it extremely
difficult or nearly impossible to provide proper daily oral
care for the person with a disability (Figure 2). The majority
of the participants (79%) also reported as having difficulties
in participation when receiving dental examinations or
treatment (Figure 3). Participants who responded that it
was “extremely difficult” to provide proper oral care for the
person living with a disability, were 8 times more likely to
respond that the person living with a disability had
difficulties to participate in dental treatment or
examination (Figure 3).
One in ten (9.7%) of the participants indicated that dental
treatment of the person with a disability had to be
abandoned due to difficulties, while 13% have yet to
receive any sort of dental care (Figure 4). Among the
participants who had school-aged children with any
disability, the vast majority (64.5%) faced the problem of
the school dental service being unable to provide their
treatment (Figure 5).
FIGURE 1. PERSONS WITH A DISABILITY HAVING A REGULAR DENTIST.
FIGURE 2. EASE OF TEETH CLEANING
Our whole
family uses the
same dentist
Our family
member with
disability has
their own
dentist, or more
than one
dentist
Different family
members have
different
dentists
No they do not
have a dentist
Response(%) 17.83 36.94 21.66 23.57
15
20
25
30
35
40
Fairly
straightforw
ard
A bit of a
challenge
but
manageab
le
Extremely
difficult,
sometimes
impossible
Response (%) 19.51 53.05 27.44
15
20
25
30
35
40
45
50
55
77

FIGURE 3. ABILITY AND CAPACITY OF PERSON WITH INTELLECTUAL DISABILITY TO PARTICIPATE IN DENTAL EXAMINATIONS AND
TREATMENT
FIGURE: 4. ACCESS TO DENTAL TREATMENT.
FIGURE 5. EXPERIENCE WITH SCHOOL DENTAL SERVICES
Yes No
Response (%) 78.85 21.15
10
20
30
40
50
60
70
80
90
Special
arrangeme
nts were
needed to
attend the
local
practice
Some
sedation
was
needed at
the
general
dentist
Dental
treatment
needed to
be
performed
at a day
surgery/hos
pital
The
treatment
was
effective
and
completed
The
treatment
had to be
abandone
d due to
difficulties
My family
member
has not
been yet
able to
access the
dental
treatment
required
Response (%) 14.5 8.2 32.5 21.8 9.7 13.1
5
10
15
20
25
30
35
We rely
upon the
School
Dental
Service for
all dental
care
The School
Dental
Service is
not able to
provide
care for my
child
The School
Dental
Service has
been
flexible and
able to
assist my
child
Response (%) 21 64.5 14.5
10
20
30
40
50
60
70
78

QUALITATIVE STUDY
Open-ended questions provided the opportunity for
participants to share their views and experiences in terms
of accessing dental care. Their perceptions were analysed
and themed according to the five dimensions of the term
“accessibility” [16,17] as proposed by Pechancsky:
AVAILABILITY
Availability measures the extent to which the provider has
the requisite resources, such as personnel and technology,
to meet the needs of the client. The participants reported
lack of service, long waiting times, or refusal of dental care
either due to inappropriate dental equipment or no dentist
available to meet the special needs of people with a
disability.
“Still waiting to hear from dental surgery about his
treatment for surgery and braces but it's been 3yrs so I think
it won't happen.”
“My child (now 28) requires an anaesthetic every 3 - 5 years
for dental treatment. If these treatments had been closer
together, she would not have needed to have 9
extractions at the second to last operation. I do not like
having to wait months for a simple check-up at dentist - a
procedure that should be carried out regularly every 12-18
months without me reminding them, and I am very angry
at being told there was a two year waiting list for treatment
in 2013, a wait I managed to get down to one year after
writing to members of parliament and others, although we
still had to travel to Perth because she is supposedly an
anaesthetic risk.”
“The waiting list for my son to see an Orthodontist I have
been told is about 2 years. What if this is too late? Some of
his adult teeth are coming through as a double tooth with
the adult tooth above the baby tooth. More needs to be
done so the wait list isn’t so long.”
“He had tooth pain and was on a waiting list for six weeks
until we could get him seen. During that time, I had to give
him pain relief and because he was so distressed by the
pain he pulled out 3 of his teeth one of them with the roots
intact. Psychologically this was extremely difficult to have
to see my child go through this not to mention the distress
he was in.”
“The negatives was the time it took to access emergency
dental services the first time took six weeks the second time
a month. I think this is way too long for a child to be in pain
and almost caused me to have a nervous breakdown due
to stress.”
ACCESSIBILITY
Accessibility refers to geographic accessibility, which is
determined by how easily the client can physically reach
the provider's location. The participants did not visit a
dentist because the service was too far or the service was
not optimised structurally and functionally for them to
access.
“It’s all too far away school clinics should be for all school
kids disabled or not why should we have to stressfully
travel?”
“We travel a long way for my son to visit the private
practice of the paediatric dentist he had previously as they
have a good relationship, but this is not ideal, and not
affordable.”
“In general, the health system has been accommodating
of the challenging behaviours etc. but a negative is
travelling to city (a long distance for home) to have dental
work done. Not been told clearly what happening on the
day etc.…”
“Attending general practise dentists is expensive and many
of them don't cater for wheelchairs, due to restricted
spaces, many being in older renovated homes.”
AFFORDABILITY
Affordability is determined by how the provider's charges
relate to the client's ability and willingness to pay for
services The participants reported insufficient financial
funds, extra out of pocket payments, and dental services
being too expensive.
“I have 2 children with autism. Both of them need to be
sedated in day hospital for basic treatment e.g. fillings,
baby teeth removal. It was very expensive. Despite having
private health insurance, I was out of pocket $2800.00. I am
dismayed that private practice dentists don’t recognise
the health concession card and charge well above the
rate that health insurers cover, hence why I was so much
out of pocket.”
“Very good service but user pay and expensive will exclude
a lot of people on low income. Anything more detailed
means seeing a specialist in Perth. 4.5 hours away. Careful
79

coordination must happen regarding X-rays need a cons
first then treatment needs to be next day or means another
trip, no subsidy huge addition of costs need
accommodation and transport.”
“Living in the country, on a low income and reliant on the
public dental clinic means that there is little ability to meet
the dental care needs for someone who requires
anaesthetic for treatment unless we take a trip to Perth (at
our own cost - not covered by Patient Assisted Transport) so
it gets put in the too hard basket, with the hope that there
is not a crisis requiring urgent dental treatment.”
“We access the special needs dental centre, though it can
be unreliable. I'm a student so struggle with the costs
associated with dental care for my son to access private,
though have the entry considered doing that instead.”
ACCOMMODATION
Accommodation reflects the extent to which the provider's
operation is organized in ways that meet the constraints
and preferences of the client. Of greatest concern are
hours of operation, how telephone communications are
handled, and the client's ability to receive care without
prior appointments. The participants reported negative
experience with booking appointments and a poor referral
system.
“All previously mentioned - HUGE Stress to go to Perth for
dental work and especially as they will not book him for
surgery over phone and make us go back and forth...
cannot express the impact this has on our family and little
son.”
“And despite URGENT need, it took weeks to get a Princess
Margaret Hospital dental appointment, made to drive
900km round trip for exam and back for surgery again....
HUGE impact for a super stressed little boy. He was in severe
pain and could be again now whilst we wait again just for
a check-up.”
“We have only seen school dental once, we attend the
special needs dental clinic in North Perth. Even then it's
never regular enough and I always have to ring and follow
up even though they say he will get a recall!”
“We were referred by school dental nurse as it was
identified that my child had a need for a filling and my child
would not sit for the work and would need sedation, it took
couple of months before we could then see to the school
dental dentist who then referred us to the special needs
dentist for the same reason, it took a few more months to
get into the special needs dentist who agreed my child
would not sit for the work required and would require
sedation, we were then referred to PMH, it took a few more
months and then when we were seen by the dental nurse
there they agreed again that my child would not sit for the
work and would require sedation and there was a one year
wait list however if the tooth got infected and formed an
abscess I should come in for emergency. I then opted to go
private to the paediatric dentist and had it sorted in 6
weeks, unfortunately it took us so long getting referred from
service to service that my child had to have the tooth
removed completely.”
ACCEPTABILITY
Acceptability captures the extent to which the client is
comfortable with the more immutable characteristics of
the provider, and vice versa. These characteristics include
the age, sex, social class, and ethnicity of the provider (and
of the client), as well as the diagnosis and type of coverage
of the client. The participants reported feelings of insecurity
and discrimination at the dental service. Many also
reported a negative attitude of the dentist or staff and their
knowledge of how to handle people with a disability.
“Dentist experience as a toddler was horrific and extremely
traumatising. Dentist rammed a piece of polypipe in his
mouth and examined his teeth while he screamed (held
him down).”
“When my son initially attended a paediatric dentist,
despite them having a very good reputation, they did not
accommodate for my son at all. Consultations were
rushed, I was encouraged to restrain my son so that
examinations could take place, and my son's anxieties
increased.”
“Some dentists are totally unaware of the needs of children
with autism, and how enormously stressful they find the
experience from a sensory perspective. Extreme patience
and kindness is required!”
“I would never recommend this service, I explained the
situation and asked for the first appointment they told me
they understood ASD and yet they shoved a mirror in his
mouth never explaining what they were going to do (this
was his first dentist appointment) then a polisher my son
became very anxious and they started telling him to be still
80
I tried to intervene but was told they know what they are
doing, I couldn’t get out of there quick enough.”
“I tried using the School Dentist, but they had no
understanding of ASD and refused any of my advice and
made his first dental session extremely scary and had no
idea the damage they had done, nor did they care. I am
furious that the public dentist are so uncaring including
admin staff.”
AWARENESS
Awareness refers to a service that is aware of the local
context and population need (and could then provide
more appropriate and effective care), and patients could
better access and use such services if they were simply
aware of them in the first place. The participants had poor
oral health awareness and little knowledge of the services
available and their options.
“Are there any private dentists/oral surgeons who are
prepared to treat people with high intellectual and
physical needs? At this stage I see there is no advantage
to my sister having private medical as she does not receive
any benefit - cannot choose any practitioner, cannot
receive immediate treatment. Sadly, even money can't
buy her service/treatment.”
“14-year-old son with intellectual disability finished primary
school end of 2014; no more school dentists appointments
have been made (I thought they were to be until end high
school (?)) - So, he will commence seeing our family dentist
in January 2016.”
“We have never known that school has a dental service for
special need kids.”
“The fact is that my child is now out of the age range to
access School Dental Services. Unsure of where to go for
ongoing dental services.”
“Princess Margaret Hospital have been great, but my son is
now at the age he won’t be able to access princess
Margaret so need to know where to go.”
“Regional Hospital does not seem to be geared to dental
work at all-no facility to take x rays while under anaesthetic,
very little time allocated to dentists. Dr Y used to be
available but not last year. Dr X was fantastic. Where do we
go next time?”
DISCUSSION
This study provides insight to the perspectives and
experiences of the members of Developmental Disability
WA in regard to dental care and barriers to access dental
services.
Findings showed that many participants did not have a
regular dentist, some have not received any dental care at
all, and many commented that dentists were not aware of
the needs of people with disabilities and did not have
adequate experience to manage their care. Previous
studies have shown the lack of trained special care dentists
as a barrier to access of dental care for people with a
disability [3-7], which also result in longer waiting times.
School dental services were also not able to provide
appropriate services to children with disabilities. The results
overall is an indication of problems with availability and
accessibility of services, and other specific service-related
issues, such as inadequate knowledge and experience of
staff, and lack of infrastructure. Similar problems have been
identified in a U.S study [20], and many studies have also
shown that access to dental care and dental visits was
generally better for people living in dedicated care
institutions than those living independently or in family
homes [3,5,18]. The participants in this study were mostly
living independently or in family homes, thereby
encompassing people at higher risk for experiencing unmet
dental needs [3, 5, 18].
Similar problems with affordability and accessibility,
including cost, travel distances, waiting times, wheelchair
access, and disability parking have also been highlighted
by previous studies [3-7, 22-23]. Patients in this study also
reported feelings of discrimination, insecurity, anxiety and
fear. A recent study from Canada [8] also reported the
experience of discrimination and insecurity among
wheelchair users, where many participants reported
feeling insecure in a dental chair. It is also seen that some
people with a disability are unwilling to seek dental care
due to feelings of discrimination [8]. In 2019 the AIHW
reported that about 42% of the reports lodged to Australian
Human Rights Commission are about disability
discrimination [2].
The Measure of Processes of Care (MPOC) is the instrument
used to measure the success of a family-centred service
[19], and it is used to measure the range to which the
81

provided services are family centred. It includes the
following five domains: Enabling and partnership; providing
specific information; providing general information;
respectful and supportive care; and co-ordinated and
comprehensive care. A previous survey [19] showed that
the highest rated domain was ‘respectful and supportive
care’ while ‘providing general information’ was rated as
the worst. Many participants in the current survey also
reported issues with the lack of an appropriate information
system, especially around referral pathways. The reported
lack of general information confirms findings of other
studies using the MPOC, which showed that providing
general information was rated the lowest in their study
[19,21].
In Australia’s National Oral Health Plan 2015-2024, “people
with additional and/or special health care needs” is listed
as one of the four priority populations in Australia that
experience the most significant barriers to accessing oral
health care and have the greatest burden of oral disease
[24]. Overall, findings in this study support this, and identified
both structure and process-related problems. In the public
sector the structure-related problems, such as spatial
access, lack of facilities, service availability, unclear
information, affordability, referral pathways, resource
shortages and waiting lists, can be improved at a health
service/system level. Data collection on exactly where
services are most needed, and at what level, is necessary,
with ongoing monitoring. Targeted and sustainable
strategies aimed at providing affordable or subsidised,
appropriate services and interventions to people with
disabilities should be prioritised.
Process-related problems mostly identified issues in terms of
the patient-professional interaction, with comments on
behaviour management skills and experience of dental
health professionals, as well as shortages in special needs
dentistry specialists. This indicates a need for improved
training and competency of dentists in the management
and treatment of patients with special needs, as well as
building a specialist workforce capacity to meet the
identified needs.
CONCLUSION
The study was conducted to obtain an insight and
understanding of how people with a disability and their
primary caregivers experience dental care. Several
concerns were identified, with most related to the process
of providing care (patient-professional interaction factors)
and the structure of the dental health system and its
operation (factors related to access, affordability and
information systems.) Targeted strategies aimed at
providing affordable and appropriate services to people
with disabilities should be prioritised.
CONFLICTS OF INTEREST
None to declare
References
1. World Health Organization. WHO global disability
action plan 2014-2021. Better health for all people with
disability. ISBN 978 92 4 150961 9. Available at:
https://www.who.int/publications/i/item/who-global-
disability-action-plan-2014-2021
2. Australian Institute of Health and Welfare 2020. People
with disability in Australia 2020. Canberra: AIHW.
Available from:
https://www.aihw.gov.au/reports/disability/people-
with-disability-in-australia/contents/people-with-
disability/prevalence-of-disability
3. Pradhan A, Slade GD, Spencer AJ. Access to dental
care among adults with physical and intellectual
disabilities: residence factors. Australian Dental
Journal. 2009 Sep;54(3):204-211.
4. Gerreth K, Borysewicz‐Lewicka M. Access Barriers to
Dental Health Care in Children with Disability. A
Questionnaire Study of Parents. Journal of Applied
Research in Intellectual Disabilities. 2015; 29.
10.1111/jar.12164.
5. Sermsuti-Anuwat N, Pongpanich S. Perspectives and
experiences of Thai adults using wheelchairs regarding
barriers of access to dental services: a mixed methods
study. Patient Prefer Adherence. 2018;12:1461-1469.
6. da Rosa SV, Moysés SJ, Theis LC, Soares RC, Moysés ST,
Werneck RI, Rocha JS. Barriers in Access to Dental
Services Hindering the Treatment of People with
Disabilities: A Systematic Review. International Journal
of Dentistry. 2020; vol. 2020, ID 9074618,
https://doi.org/10.1155/2020/9074618
7. McColl M, Forster D, Shortt S, Hunter D, Dorland J,
Godwin M, et al. Physician Experiences Providing
Primary Care to People with Disabilities. Healthcare
Policy. 2008;4(1):e129-e47.
8. Rashid-Kandvani F, Nicolau B, Bedos C. Access to
Dental Services for People Using a Wheelchair.
82

American Journal of Public Health. 2015;105(11): 2312–
2317.
9. Dougall A, Fiske, J. Access to special care dentistry,
part 1. Access. British Dental Journal. 2008; 204. 605-16.
10.1038/sj.bdj.2008.457.
10. Anders PL, Davis EL. Oral health of patients with
intellectual disabilities: A systematic review. Special
Care Dentistry 2010; 30: 110–117. doi:10.1111/j.1754-
4505.2010.00136.x
11. Kancherla V, Van Naarden Braun K, Yeargin-Allsopp
M. Dental care among young adults with intellectual
disability. Research in Developmental Disabilities. 2013;
34 1630–1641 http://doi.org/10.1016/j.ridd.2013.02.006
12. Owens PL, Kerker BD, Zigler E, Horwitz SM. Vision and
oral health needs of individuals with intel lectual
disability. Mental Retardation and Developmental
Disabilities Research Reviews. 2006;12(1):28-40.
doi:10.1002/mrdd.20096
13. Cumella S, Ransford N, Lyons J, Burnham H. Needs for
oral care among people with intellectual disability not
in contact with community dental services. Journal of
Intellect Disability Research. 2000; 44:45-52. DOI:
10.1046/j.1365-2788.2000.00252.x
14. Burtner AP, Jones JS, McNeal DR, Low DW. A survey of
the availability of dental services to developmentally
disabled persons residing in the community. Special
Care in Dentistry. 1990;10, 182–184.
15. Disability Services Commission WA (2003) Review of
the Local Area Coordination Program, Western
Australia. Disability Services Commission, Perth,
Australia. Available at:
http://www.derby.gov.uk/media/derbycitycouncil/co
ntentassets/documents/adultsocialcare/WesternAustr
aliaGorvernment-Review-of-Local-Area-
Coordination.pdf Accessed January 2017
16. Penchansky R, Thomas JW. The concept of access:
definition and relationship to consumer satisfaction.
Medical Care. 1981 Feb;19(2):127-40.
17. Saurman E. Improving access: modifying Penchansky
and Thomas's Theory of Access. Journal of Health
Services Research Policy. 2016;21(1):36-39.
doi:10.1177/1355819615600001
18. Horner-Johnson W, Dobbertin K, Beilstein-Wedel E.
Disparities in dental care associated with disability and
race and ethnicity. Journal of the American Dental
Association. 2015;146(6):366–374.
19. Dyke, P, Buttigieg P, Blackmore A, Ghose A. Use of the
Measure of Processes of Care for families (MPOC-56)
and service providers (MPOC-SP) to evaluate family-
centred services in a paediatric disability setting. Child
Care Health Development. 2006; 32, 167–176.
doi:10.1111/j.1365-2214.2006.00604.x
20. Mofidi M, Rozier RG, King RS. Problems With Access to
Dental Care for Medicaid-Insured Children: What
Caregivers Think. American Journal of Public
Health. 2002 ;92(1):53-8.
21. Raghavendra P, Murchland S, Bentley M, Wake-Dyster
W, Lyons T. Parents' and service providers' perceptions
of family-centred practice in a community-based,
paediatric disability service in Australia. Child Care
Health Development. 2007; 33: 586–592.
doi:10.1111/j.1365-2214.2007.00763.x
22. Rocha LL, de Lima Saintrain VM, Pimentel Gomes
Fernandes Vieira-Meyer A. Access to dental public
services by disabled persons. BMC Oral Health.
2015;15:35.
23. Rouleau T, Harrington A, Brennan M, et al. Receipt of
dental care and barriers encountered by persons with
disabilities. Special Care Dentistry. 2011; 31(2):63–67.
24. COAG (Council of Australian Governments) Health
Council 2015. Healthy mouths, healthy lives: Australia’s
National Oral Health Plan 2015–2024. Adelaide: South
Australian Dental Service.
83

RESEARCH ARTICLE
THE IMPORTANCE OF ENVIRONMENTAL SUSTAINABILITY FOR
HEALTHY AGEING AND THE INCORPORATION OF SYSTEMS
THINKING IN EDUCATION FOR A SUSTAINABLE ENVIRONMENT
Wang-Kin Chiu*, Ben Y. F. Fong, Wing Yi Ho
Division of Science, Engineering and Health Studies, College of Professional and Continuing Education, The Hong Kong
Polytechnic University, Hong Kong, China
Correspondence: [email protected]
ABSTRACT
Environmental sustainability is important to public health and of particular significance considering the rapidly growing
ageing population. While advancement in chemical science has contributed to enhanced quality of life, increasing levels
of chemical pollutions and the impact of chemicals on human health and the environment have led to serious concern.
The deterioration of environmental quality has been largely due to chemical pollution and the elderly group in the
population are more susceptible to the hazardous effects of industrial chemicals and airborne pollutants. This situation
also presents uphill challenges to the promotion of healthy ageing which requires a sustainable clean environment,
contributed through the advancement of sustainable and green chemistry. However, innovations in green chemistry
require a systems thinking mindset which is also important in realizing the impact of chemicals on human health and the
environment. The adoption of the Sustainable Development Goals (SDGs) by the United Nations has called for immediate
actions in adopting the SDGs as a central concern in the reform of different domains for the invention of a sustainable
future. The practice of chemistry has various impacts on many interconnected systems, re -orientation of chemistry
education has been proposed with the implementation of inter-disciplinary approaches as informed by systems thinking,
with a growing number of reports suggesting its potentials and applications in chemical education. Despite the vast
opinions suggesting the promising prospects of applying systems thinking in education, reports on the development of
relevant tools and educational resources are only of a limited amount, with recent perspectives identifying the design of
educational tools and resources as one of the priority areas. In thi s study, we report the collaborative work across the
disciplines of health and chemical sciences in the pedagogic design of incorporating systems thinking in chemistry
education adopting the theoretical framework. The design of a system -oriented concept map extension (SOCME)
diagram is described, with reference to a case study of chemicals released from the degradation of plastics. The work
presented illustrates the potential of systems thinking in sustainable education and adds to the collections of educat ional
resources for incorporation of systems thinking in teaching and learning.
KEYWORDS
Environmental sustainability, healthy ageing, systems thinking, sustainable education.
84
INTRODUCTION
A green environment has long been regarded as an
important factor contributing to human well -being, with a
continued growth of studies reporting the associated
psychological and physiological health benefits. [1, 2] In
recent years, lower fertility rates and increase in life
expectancy have led to the ageing of the world’s
populations, further intensifying the prominent need for a
sustainable green environment. [3] A green environment is
essential to support healthy ageing and the sustainability of
a healthy environment is considered a top priority of major
global health issues. While advancement of chemical
technologies and various applications of chemicals have
enhanced quality of life with a significantly added level of
convenience to the public, the heavy use of chemicals is
still of alarming concern and poses global challenges to
environmental sustainability. The impact of chemicals on
human health and the environment cannot be overlooked
despite their versatile functions and various benefits
brought to industrial processes and society. Extensive use of
chemicals in daily life has led to chemical pollution posing
a significant threat to human health. This is especially so for
older adults who are more vulnerable to chemical attack,
with the higher susceptibility of this population group
resulting from weakened bodily functions and
degeneration of organs. [4] For example, it has been well
documented that exposure to fine particulate matter
(PM2.5) is a leading risk factor which contributes
substantially to a heavy global disease burden. [5] Long-
term exposure to ambient air pollution is also reported to
have led to decreased life expectancy and increased
incidence of morbidity and mortality from cardiovascular
disease, pulmonary disease and lung cancer. [6] In
addition and not just limited to air pollution, various types of
chemical contaminants released from different sources
also contribute to serious water and food pollution, leading
to further deterioration of environmental quality. Chemical
pollution of water and food has been reported to pose
significant health risks. Consumption of chemically
contaminated food can have serious health implications
ranging from minor gastric problems to fatal diseases. [7] It
is noteworthy that one of the major sources of chemical
pollution originates from daily consumption of a variety of
chemical products. Recently, a comprehensive study has
reported the production of greenhouse gases such as
methane and ethylene from the widely used plastics. [8]
The findings indicate that plastics is a hitherto unrecognized
source of climate-relevant gases, with increasing impact
on climate variation due to increased production and
accumulation of plastics in the environment. In addition,
human exposure to microplastics can lead to serious health
consequences including disruption of immune systems,
inflammatory lesions and neurodegenerative diseases. [9]
Overall, the adverse health effects of chemical pollution
are significantly aggregated due to population ageing, as
well as increasing prevalence of non-communicable
diseases over the recent decades. [5]
Under these circumstances, it is therefore not surprising to
see the recent development of various strategies to reduce
the use of hazardous chemicals, as well as the
implementation of regulatory frameworks and policies for
new chemicals. [10] In recent years, there has also been a
growing amount of research investigating the
advancement and applications of green chemistry and
emerging technologies in the transformation of the
chemical industry. In the interim, there are also emerging
studies that have investigated sustainable chemistry and its
development for achieving the Sustainable Development
Goals (SDGs), as well as moving society towards a
sustainable future. [2, 11, 12] While these research
investigations are valuable contributions, it is noteworthy
that health promotion and education also plays an
important role in the achievement of a sustainable
environment. Recent studies have also reported the
importance of nurturing future global citizens and called for
more educational research in the promotion of
environmental sustainability through education. In the
educational context, increasing studies have identified the
promising prospects of incorporating systems thinking in the
teaching of core science subjects, especially in chemistry
education. [13] Chemistry is a central science and provides
the fundamentals which link up different science
disciplines. It plays an indispensable role in the contribution
of inter-disciplinary efforts from various established and
emerging science disciplines leading to the outstanding
advancement of human health and well-being in the past
decades. [14] While advancement of chemical science
has contributed to the development of functional
materials, pharmaceuticals, industrial processes and drug
production, which leads to substantial enhancement of
quality of life, however, attitudes towards chemical science
and its practitioners by various stakeholders, including the
85
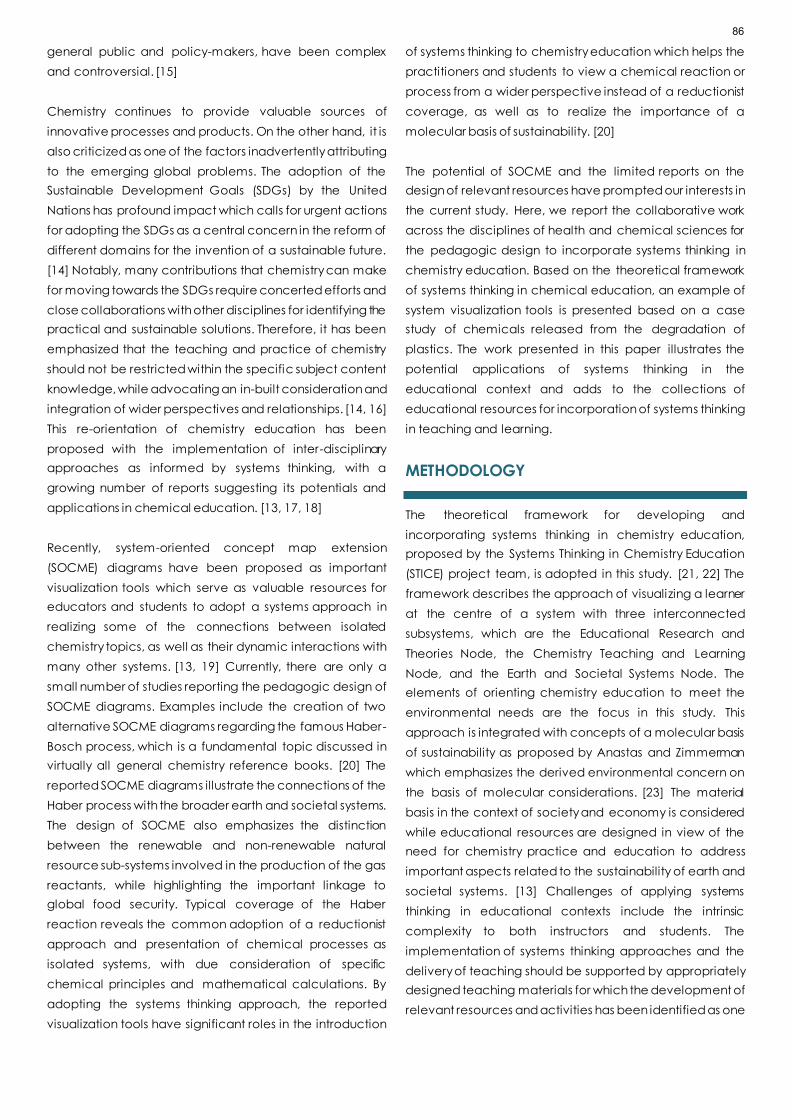
general public and policy-makers, have been complex
and controversial. [15]
Chemistry continues to provide valuable sources of
innovative processes and products. On the other hand, it is
also criticized as one of the factors inadvertently attributing
to the emerging global problems. The adoption of the
Sustainable Development Goals (SDGs) by the United
Nations has profound impact which calls for urgent actions
for adopting the SDGs as a central concern in the reform of
different domains for the invention of a sustainable future.
[14] Notably, many contributions that chemistry can make
for moving towards the SDGs require concerted efforts and
close collaborations with other disciplines for identifying the
practical and sustainable solutions. Therefore, it has been
emphasized that the teaching and practice of chemistry
should not be restricted within the specific subject content
knowledge, while advocating an in-built consideration and
integration of wider perspectives and relationships. [14, 16]
This re-orientation of chemistry education has been
proposed with the implementation of inter-disciplinary
approaches as informed by systems thinking, with a
growing number of reports suggesting its potentials and
applications in chemical education. [13, 17, 18]
Recently, system-oriented concept map extension
(SOCME) diagrams have been proposed as important
visualization tools which serve as valuable resources for
educators and students to adopt a systems approach in
realizing some of the connections between isolated
chemistry topics, as well as their dynamic interactions with
many other systems. [13, 19] Currently, there are only a
small number of studies reporting the pedagogic design of
SOCME diagrams. Examples include the creation of two
alternative SOCME diagrams regarding the famous Haber-
Bosch process, which is a fundamental topic discussed in
virtually all general chemistry reference books. [20] The
reported SOCME diagrams illustrate the connections of the
Haber process with the broader earth and societal systems.
The design of SOCME also emphasizes the distinction
between the renewable and non-renewable natural
resource sub-systems involved in the production of the gas
reactants, while highlighting the important linkage to
global food security. Typical coverage of the Haber
reaction reveals the common adoption of a reductionist
approach and presentation of chemical processes as
isolated systems, with due consideration of specific
chemical principles and mathematical calculations. By
adopting the systems thinking approach, the reported
visualization tools have significant roles in the introduction
of systems thinking to chemistry education which helps the
practitioners and students to view a chemical reaction or
process from a wider perspective instead of a reductionist
coverage, as well as to realize the importance of a
molecular basis of sustainability. [20]
The potential of SOCME and the limited reports on the
design of relevant resources have prompted our interests in
the current study. Here, we report the collaborative work
across the disciplines of health and chemical sciences for
the pedagogic design to incorporate systems thinking in
chemistry education. Based on the theoretical framework
of systems thinking in chemical education, an example of
system visualization tools is presented based on a case
study of chemicals released from the degradation of
plastics. The work presented in this paper illustrates the
potential applications of systems thinking in the
educational context and adds to the collections of
educational resources for incorporation of systems thinking
in teaching and learning.
METHODOLOGY
The theoretical framework for developing and
incorporating systems thinking in chemistry education,
proposed by the Systems Thinking in Chemistry Education
(STICE) project team, is adopted in this study. [21, 22] The
framework describes the approach of visualizing a learner
at the centre of a system with three interconnected
subsystems, which are the Educational Research and
Theories Node, the Chemistry Teaching and Learning
Node, and the Earth and Societal Systems Node. The
elements of orienting chemistry education to meet the
environmental needs are the focus in this study. This
approach is integrated with concepts of a molecular basis
of sustainability as proposed by Anastas and Zimmerman
which emphasizes the derived environmental concern on
the basis of molecular considerations. [23] The material
basis in the context of society and economy is considered
while educational resources are designed in view of the
need for chemistry practice and education to address
important aspects related to the sustainability of earth and
societal systems. [13] Challenges of applying systems
thinking in educational contexts include the intrinsic
complexity to both instructors and students. The
implementation of systems thinking approaches and the
delivery of teaching should be supported by appropriately
designed teaching materials for which the development of
relevant resources and activities has been identified as one
86

of the priority areas. [22] Regarding the delivery of lecture
or learning content, added complexity would lead to
difficulty in the expression and visualization of many
interconnected ideas thereby leading to reduced learning
motivation. Development of tools for visualizing the
complex ideas instead of only word descriptions is an
important step for implementation of systems thinking
approaches in education. Taking reference from relevant
studies reporting the creation of SOCME diagrams, a
SOCME diagram focusing on methane (CH4), an example
of greenhouse gases, is presented in this study. The
interconnections between this chemical compound with
various systems including those of food supply, ecosystem
and human health were identified. Recent findings on the
impact of methane on these systems were reviewed and
relevant effects were included to give an updated SOCME
diagram. The identified components were linked by arrows
to indicate the cause-and-effect relationships. In the
design of the SOCME, the subject content and learning
outcomes of a general-education (GE) chemistry course in
the College were considered. The SOCME diagram would
be delivered to students in the General Education subject
to illustrate the application of systems thinking approach in
the understanding of the various impacts that a simple
molecule, released from daily consumption of chemical
products, can bring to the environment and health systems.
The delivery of the systems diagram in the teaching
materials would be supported by the use of digital
technology adopted in previous reports. [24]
RESULTS AND DISCUSSION
In this study, we have created a SOCME diagram based on
methane, an example of chemical released from daily
consumption of chemical products. The current work also
represents an example of collaborative work across the
disciplines of health and chemistry, contributing to the
limited educational resources for incorporating systems
thinking to view the big picture of chemical impact on the
environment and health systems.
The extensive use of plastic products in daily life has
aroused significant scientific and societal concern over
human health and environmental sustainability due to the
toxicity of plastics. [25] Recently, the study by Royer et al.
reported the production of greenhouse gases from plastics
which added further concern over the human and
environmental health. [8] Methane is one of the
greenhouse gases that may be produced in the
degradation of some commonly used plastics such as
polyethene (PE). PE is a very common polymer with
extensive applications in our daily life. Its degradation can
result in the release of methane, which is a discrete
molecule having a simple structure. However, the release
of this simple gas can lead to profound consequences to
the environment, which are not easily realized if teaching is
confined to restricted discipline with narrow perspectives.
A student cannot just learn the scientific knowledge of
chemicals without looking at the impact of extensive
productions and uses of these chemicals. In addition to the
teaching of specific subject content knowledge, emphasis
should also be put on how the production and use of
chemical products can have adverse effects on human
health and the environment, as informed by systems
thinking and facilitated with specific visualization tools. The
linkage to other systems should be realized and reflected in
the graphical tool to accomplish widened viewpoints in the
process of learning. In addition to human health aspects,
the impacts of methane on the atmosphere and marine
systems are also considered. [26] These form the basis for
the design of a SOCME diagram which considers the
interconnections between this chemical release with
various systems including the food supply, ecosystem and
human health. The developed SOCME diagram is
presented in Figure 1. The interconnections of the chemical
system with specific components in dynamic systems of
human and environmental health are indicated. The extent
of boundaries was decided with reference to the subject
content and learning outcomes of a general-education
chemistry course in the College. The associated topics
include chemicals in daily life and polymer materials.
87

FIGURE 1: SYSTEM-ORIENTED CONCEPT MAP EXTENSION (SOCME) DIAGRAM ILLUSTRATING THE INTERCONNECTIONS OF
METHANE (CH4) WITH OTHER SYSTEMS.
FUTURE WORK
While there is increasing advocacy for applying systems
thinking in education for a sustainable future, reports on the
development of relevant tools and educational resources
for specific topics are only of limited amount. Future work
includes further development of systems thinking resources
for educators and students. [22] Furthermore, the possibility
of supporting the implementation of systems thinking with
emerging technologies in the digital era should be
explored. [27] Teachers, researchers, academic and
educational institutions, and government should work
towards the adoption of systems thinking approach in
school, college and community education for the
promotion of population health and sustainability
development of the world. Global citizens, particularly
younger generations, must learn the significance and
impact of health and the environment on lives on earth.
CONCLUSION
In this paper, we have demonstrated an example of
collaborative efforts from health and science disciplines in
applying systems thinking in the context of sustainable
education. A SOCME approach and diagram, which
signifies the interconnections of a chemical system with
human health and environmental systems, has been
developed and is presented. Further development of
systems thinking visualization tools and resources for
educators and students, as well as evaluation of the
teaching practice, are worth investigating. Understanding
the interconnections of the chemical system with the
environment and health systems is important for sustaining
a clean environment, which is an essential component for
the promotion of healthy ageing. More concerted efforts
across disciplines are imperative for incorporation of
systems thinking in education for a sustainable future.
ACKNOWLEDGEMENT
The work described in this presentation was supported by a
research grant from the College of Professional and
Continuing Education of The Hong Kong Polytechnic
University, Hong Kong, China (project reference no.: SEHS-
TF-2021-005(J)).
References:
1. Haluza D, Schönbauer R, Cervinka R. Green
Perspectives for Public Health: A Narrative Review on
the Physiological Effects of Experiencing Outdoor
Nature. International Journal of Environmental
Research and Public Health. 2014;11(5):5445-61.
88

2. Sofia D, Gioiella F, Lotrecchiano N, Giuliano A.
Mitigation strategies for reducing air pollution.
Environmental Science and Pollution Research.
2020;27(16):19226-35.
3. Fong BYF, Chiu W-K, Chan WFM, Lam TY. A Review
Study of a Green Diet and Healthy Ageing.
International Journal of Environmental Research and
Public Health. 2021;18(15):8024.
4. Simoni M, Baldacci S, Maio S, Cerrai S, Sarno G, Viegi
G. Adverse effects of outdoor pollution in the elderly.
Journal of Thoracic Disease. 2015;7(1):34-45.
5. Liang F, Liu F, Huang K, Yang X, Li J, Xiao Q, et al. Long-
Term Exposure to Fine Particulate Matter and
Cardiovascular Disease in China. Journal of the
American College of Cardiology. 2020;75(7):707-17.
6. Cohen AJ, Brauer M, Burnett R, Anderson HR, Frostad J,
Estep K, et al. Estimates and 25-year trends of the
global burden of disease attributable to ambient air
pollution: an analysis of data from the Global Burden of
Diseases Study 2015. The Lancet. 2017;389(10082):1907-
18.
7. Rather IA, Koh WY, Paek WK, Lim J. The Sources of
Chemical Contaminants in Food and Their Health
Implications. Frontiers in Pharmacology. 2017;8.
8. Royer S-J, Ferrón S, Wilson ST, Karl DM. Production of
methane and ethylene from plastic in the environment.
PLOS ONE. 2018;13(8):e0200574.
9. Prata JC, da Costa JP, Lopes I, Duarte AC, Rocha-
Santos T. Environmental exposure to microplastics: An
overview on possible human health effects. Science of
The Total Environment. 2020;702:134455.
10. Matus K. Factoring in Public Policy and Perception.
How to Commercialize Chemical Technologies for a
Sustainable Future2021. p. 103-18.
11. Barra R, González P. Sustainable chemistry challenges
from a developing country perspective: Education,
plastic pollution, and beyond. Current Opinion in
Green and Sustainable Chemistry. 2018;9:40-4.
12. Matlin SA, Mehta G, Hopf H, Krief A, Keßler L, Kümmerer
K. Material circularity and the role of the chemical
sciences as a key enabler of a sustainable post-trash
age. Sustainable Chemistry and Pharmacy.
2020;17:100312.
13. Mahaffy PG, Matlin SA, Holme TA, MacKellar J. Systems
thinking for education about the molecular basis of
sustainability. Nature Sustainability. 2019;2(5):362-70.
14. Matlin SA, Mehta G, Hopf H, Krief A. The role of
chemistry in inventing a sustainable future. Nature
Chemistry. 2015;7(12):941-3.
15. Matlin SA, Mehta G, Hopf H, Krief A. One-world
chemistry and systems thinking. Nature Chemistry.
2016;8(5):393-8.
16. Talanquer V, Bucat R, Tasker R, Mahaffy PG. Lessons
from a Pandemic: Educating for Complexity, Change,
Uncertainty, Vulnerability, and Resilience. Journal of
Chemical Education. 2020;97(9):2696-700.
17. Hardy JG, Sdepanian S, Stowell AF, Aljohani AD, Allen
MJ, Anwar A, et al. Potential for Chemistry in
Multidisciplinary, Interdisciplinary, and Transdisciplinary
Teaching Activities in Higher Education. Journal of
Chemical Education. 2021;98(4):1124-45.
18. Orgill M, York S, MacKellar J. Introduction to Systems
Thinking for the Chemistry Education Community.
Journal of Chemical Education. 2019;96(12):2720-9.
19. Aubrecht KB, Dori YJ, Holme TA, Lavi R, Matlin SA, Orgill
M, et al. Graphical Tools for Conceptualizing Systems
Thinking in Chemistry Education. Journal of Chemical
Education. 2019;96(12):2888-900.
20. Mahaffy PG, Matlin SA, Whalen JM, Holme TA.
Integrating the Molecular Basis of Sustainability into
General Chemistry through Systems Thinking. Journal of
Chemical Education. 2019;96(12):2730-41.
21. Mahaffy PG, Krief A, Hopf H, Mehta G, Matlin SA.
Reorienting chemistry education through systems
thinking. Nature Reviews Chemistry. 2018;2(4):0126.
22. Flynn AB, Orgill M, Ho FM, York S, Matlin SA, Constable
DJC, et al. Future Directions for Systems Thinking in
Chemistry Education: Putting the Pieces Together.
Journal of Chemical Education. 2019;96(12):3000-5.
23. Anastas Paul T, Zimmerman JB. The Molecular Basis of
Sustainability. Chem. 2016;1(1):10-2.
24. Chiu W-K. Implications for the Use of PowerPoint,
Classroom Response Systems, Teams, and Whiteboard
to Enhance Online Teaching of Chemistry Subjects in
Community College. Journal of Chemical Education.
2020;97(9):3135-9.
25. Rodrigues MO, Abrantes N, Gonçalves FJM, Nogueira
H, Marques JC, Gonçalves AMM. Impacts of plastic
products used in daily life on the environment and
human health: What is known? Environmental
Toxicology and Pharmacology. 2019;72:103239.
26. Di P, Feng D, Chen D. The Distribution of Dissolved
Methane and Its Air-Sea Flux in the Plume of a Seep
Field, Lingtou Promontory, South China Sea. Geofluids.
2019;2019:3240697.
27. Chiu W-K. Pedagogy of Emerging Technologies in
Chemical Education during the Era of Digitalization
and Artificial Intelligence: A Systematic Review.
Education Sciences. 2021;11(11):709
89

RESEARCH ARTICLE
EVALUATING AN AUTOMATED TEMPERATURE-MONITORING
SYSTEM IN MEDICINE AND VACCINE STORAGE FACILITIES OF
A HOSPITAL NETWORK
Mazdak Zamani, Paul Wembridge
Eastern Health Pharmacy Department, Melbourne, Victoria, Australia
Correspondence: [email protected]
ABSTRACT
OBJECTIVE
The aims of this study were to evaluate the effectiveness of a new automated continuous temperature monitoring system
in detecting temperature excursions and describe the challenges of implementing such a system.
DESIGN
This study is an observational before-and-after audit comparing temperature excursions detected in the three months
before and three months after the implementation of the new monitoring system at Eastern Health. Inclusion criteria
consisted of all medicine and vaccine storage facilities monitored by the new automated temperature monitoring system.
Four sites not connected to the new monitoring system were excluded.
SETTING
Eastern Health is a large tertiary metropolitan health service in Melbourne, Australia. It operates from 21 locations including
seven teaching hospitals, with medicines and vaccines stored in 124 refrigerators, 6 freezers and 101 ambient room
temperature storage locations.
MAIN OUTCOME MEASURES
An analysis of post-implementation data identified a potential association between refrigerator brands and temperature
excursion rate.
RESULTS
There was a large increase in the number of temperature excursions detected post-implementation of the new
automated monitoring system. 28,746, 24 and 8,966 temperature excursions were detected post-implementation
compared to 344, 0 and 0 pre-implementation in refrigerators, freezers and ambient locations, respectively. The majority
of temperature excursions detected in medicine and vaccine fridges were below +2°C (98.4%). One brand of refrigerators
was linked to 27,231 (94.7%) excursions (p<0.001).
CONCLUSIONS
The new temperature monitoring system detects higher number of excursions which provides better visibility of
performance, identifies areas of non-compliance, and guides and evaluates solutions. This study recommends that
freezers and ambient storage locations are monitored as robustly as refrigerators, temperature monitoring devices are
placed in close proximity to pharmaceuticals, and that healthcare organisations avoid purchasing unreliable medicine
and vaccine refrigerators. Finally, this study suggests the development of a National Medicine Storage Guideline.
KEYWORDS
Medicine, medication, vaccine, excursion, automated, temperature, monitoring.
90

INTRODUCTION
Correct storage temperature of medicines and vaccines
ensures their effectiveness and safety. Besides clinical risks
to individual patients, inappropriate storage of medicines
and vaccines imposes considerable financial wastage and
creates potential public health risks such as the outbreak of
measles in the Federated States of Micronesia in 2014. [1-3]
The National Safety and Quality Health Service Standards
require Australian hospitals to implement systems that
continuously monitor and preserve the integrity of
temperature-sensitive medicines and vaccines.[4]
In October 2020, Eastern Health implemented a centralised
automated temperature monitoring system in its medicine
storage facilities. Eastern Health is geographically the
largest metropolitan health service in Melbourne, Victoria,
Australia. It operates from 65 sites across 21 locations
including seven teaching hospitals, four nursing homes, and
multiple community health and mental health services.
Eastern Health has over 10,000 staff and volunteers, 1,500
beds and provides over 1.3 million episodes of patient care
per annum.[5] At Eastern Health, medicines and vaccines
are stored in 124 refrigerators, six freezers and 101 ambient
room temperature storage locations including seven
pharmacy departments and 94 medicine rooms and
cabinets. Prior to implementing the new monitoring system,
the temperate monitoring of refrigerators and freezers was
conducted through a combination of manual and
automated monitoring systems. The ambient room
temperature was only monitored in the seven pharmacy
departments. Eastern Health has a clear process for
managing temperature excursions, when they are
identified, to ensure patient safety is not compromised.
The primary aim of this study was to evaluate the
effectiveness of the new centralised automated
temperature monitoring system in detecting temperature
excursions. The secondary aim was to describe the main
challenges of implementing this new system and how they
were addressed.
METHODS
This study is an observational before-and-after audit. It
compares the temperature excursions detected three
months before and three months after the implementation
of a new centralised continuous temperature monitoring
system, Invisible Systems™ (Manchester, England). The pre-
implementation study phase was from 1 July 2020 until 30
September 2020 and the post-implementation from 1
October 2020 until 31 December 2020. Pre-implementation
data was retrospectively collected by reviewing paper
temperature monitoring records and electronic reports
from the previous temperature monitoring systems. Post-
implementation data was extracted from Invisible
Systems™ online portal.
Inclusion criteria consisted of all medicine and vaccine
storage facilities monitored by the calibrated and certified
Invisible Systems™. Information about the temperature
monitoring sensors and their specifications is available from
the manufacturer’s website (www.invisible-systems.com).
Four medicine and vaccine storage facilities not yet
connected to the new system were excluded. The ward
medicine trolleys, resuscitation trolleys, anaesthetic trolleys,
and patient bedside drawers were considered out of
scope.
Age, brand and size of refrigerators were manually audited.
Air temperature control mechanisms in ambient storage
locations were manually audited. Data was compared
and analysed using R (version 3.5.2). Mann-Whitney U test
was used to compare the temperature excursion rates of
different brands of refrigerators. Fisher's exact test was used
to compare different room temperature control
mechanisms in ambient storage locations.
The storage temperature range for refrigerators was
defined as between +2°C and +8°C (5±3°C).[6,7] Ambient
room temperature was defined as below +25°C.[7] The
acceptable temperature range for freezers were defined
as below -15°C or -70°C depending on the type, function
and products stored in that freezer. One temperature
excursion was defined as a single occasion of temperature
deviating outside the recommended range until it returned
within the range, regardless of the length of time it
remained outside the range.
RESULTS
The number of temperature excursions in medicine and
vaccine storage facilities pre- and post-implementation of
the new automated temperature monitoring system are
shown in table 1. There were large increases in the number
of temperature excursions detected by the new monitoring
system compared to the previously recorded data. The
91
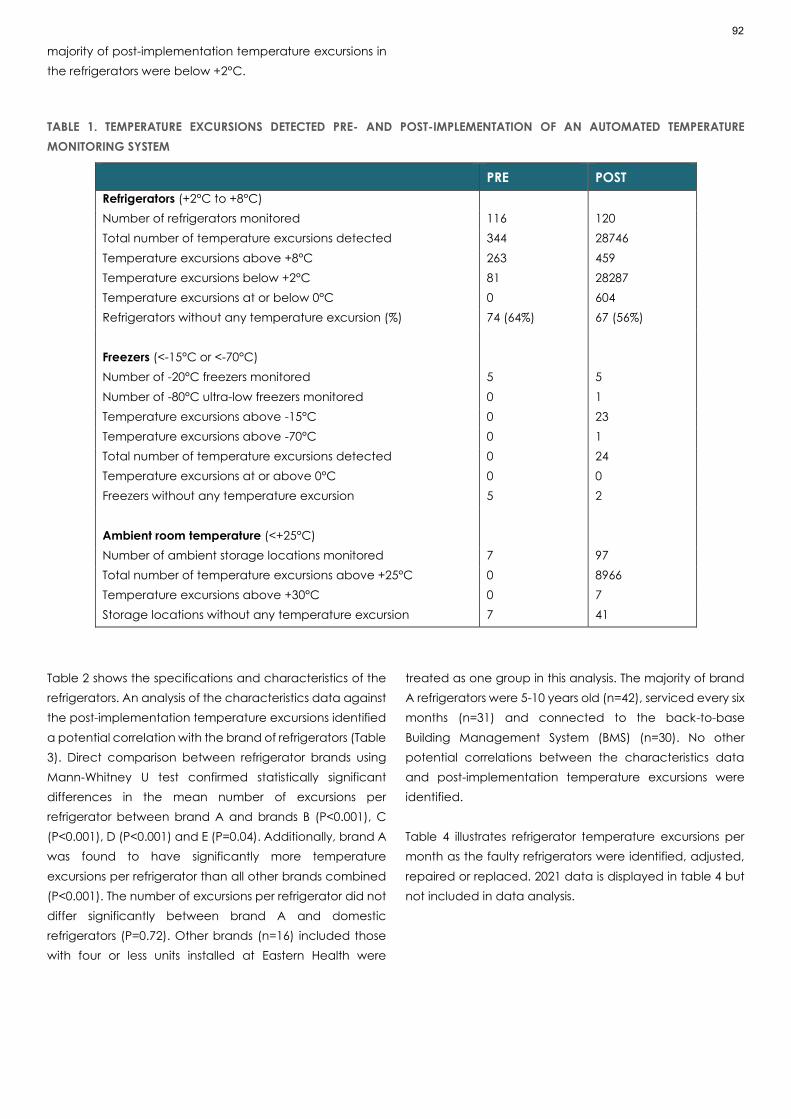
majority of post-implementation temperature excursions in
the refrigerators were below +2°C.
TABLE 1. TEMPERATURE EXCURSIONS DETECTED PRE- AND POST-IMPLEMENTATION OF AN AUTOMATED TEMPERATURE
MONITORING SYSTEM
PRE POST
Refrigerators (+2°C to +8°C)
Number of refrigerators monitored 116 120
Total number of temperature excursions detected 344 28746
Temperature excursions above +8°C 263 459
Temperature excursions below +2°C 81 28287
Temperature excursions at or below 0°C 0 604
Refrigerators without any temperature excursion (%) 74 (64%) 67 (56%)
Freezers (<-15°C or <-70°C)
Number of -20°C freezers monitored 5 5
Number of -80°C ultra-low freezers monitored 0 1
Temperature excursions above -15°C 0 23
Temperature excursions above -70°C 0 1
Total number of temperature excursions detected 0 24
Temperature excursions at or above 0°C 0 0
Freezers without any temperature excursion 5 2
Ambient room temperature (<+25°C)
Number of ambient storage locations monitored 7 97
Total number of temperature excursions above +25°C 0 8966
Temperature excursions above +30°C 0 7
Storage locations without any temperature excursion 7 41
Table 2 shows the specifications and characteristics of the
refrigerators. An analysis of the characteristics data against
the post-implementation temperature excursions identified
a potential correlation with the brand of refrigerators (Table
3). Direct comparison between refrigerator brands using
Mann-Whitney U test confirmed statistically significant
differences in the mean number of excursions per
refrigerator between brand A and brands B (P<0.001), C
(P<0.001), D (P<0.001) and E (P=0.04). Additionally, brand A
was found to have significantly more temperature
excursions per refrigerator than all other brands combined
(P<0.001). The number of excursions per refrigerator did not
differ significantly between brand A and domestic
refrigerators (P=0.72). Other brands (n=16) included those
with four or less units installed at Eastern Health were
treated as one group in this analysis. The majority of brand
A refrigerators were 5-10 years old (n=42), serviced every six
months (n=31) and connected to the back-to-base
Building Management System (BMS) (n=30). No other
potential correlations between the characteristics data
and post-implementation temperature excursions were
identified.
Table 4 illustrates refrigerator temperature excursions per
month as the faulty refrigerators were identified, adjusted,
repaired or replaced. 2021 data is displayed in table 4 but
not included in data analysis.
92

TABLE 2. EASTERN HEALTH MEDICINE AND VACCINE REFRIGERATOR DEMOGRAPHIC DATA
MEDICINE AND VACCINE REFRIGERATORS (N=120) NUMBER OF REFRIGERATORS (%)
Type of refrigerators:
Purpose-built refrigerators
Domestic refrigerators
114 (95%)
6 (5%)
Size of refrigerators:
Small (<200L)
Medium (300-500L)
Large (>900L)
70 (58.3%)
30 (25%)
20 (16.7%)
Estimated age of refrigerators:
<5 years
5-10 years
>10 years
24 (20%)
66 (55%)
30 (25%)
Scheduled maintenance/service of refrigerators:
Every 3 months
Every 6 months
Every 12 months
Unknown or None
8 (6.7%)
34 (28.3%)
2 (1.7%)
76 (63.3%)
Method of temperature monitoring pre-intervention:
Manual paper chart (± data logger)
Building Management System
Comark™ automated monitoring system
Omnicell™ automated dispensing system
Audible alarm and data logger
65 (54.2%)
42 (35%)
9 (7.5%)
2 (1.7%)
2 (1.7%)
TABLE 3. COMPARISON OF POST-IMPLEMENTATION TEMPERATURE EXCURSIONS AGAINST REFRIGERATOR BRANDS
BRANDS OF MEDICINE AND
VACCINE REFRIGERATORS
(N=120)
BR
AN
D A
BR
AN
D B
BR
AN
D C
BR
AN
D D
BR
AN
D E
BR
AN
D –
OTH
ER
DO
MESTI
C
REFR
IGER
ATO
RS
Number of refrigerators
installed
45 20 18 10 5 16 6
Percentage of all refrigerators
installed
37.5% 16.7% 15% 8.3% 4.2% 13.3% 5%
Number of temperature
excursions post-
implementation
27,231 197 13 2 7 572 724
Temperature excursions
above +8°C
85 196 13 2 2 13 148
Temperature excursions
below +2°C
27,146 1 0 0 5 559 576
93

Temperature excursions at or
below 0°C
507 1 0 0 0 0 96
Percentage of all
temperature excursions
(n=28746)
94.73% 0.69% 0.05% 0.01% 0.02% 1.99% 2.52%
Mean temperature excursions
per refrigerator of this brand
605.1 9.8 0.7 0.2 1.4 35.7 120.7
TABLE 4. NUMBER OF TEMPERATURE EXCURSIONS DETECTED EACH MONTH IN THE MEDICINE AND VACCINE REFRIGERATORS
REFRIGERATOR TEMPERATURE
EXCURSIONS
≤0°C <+2°C >+8°C TOTAL
Pre-implementation
July 2020 0 0 95 95
August 2020 0 77 86 163
September 2020 0 4 82 86
Post-implementation
October 2020 508 24100 328 24428
November 2020 89 1936 72 2008
December 2020 7 2251 59 2310
Follow-up data (not analysed)
January 2021 1 69 91 160
February 2021 0 219 55 274
March 2021 2 102 95 197
Out of six medicine and vaccine freezers, one recorded 21
excursions, three had one excursion each and two had no
excursions post-implementation. No further data was
collected or analysed for freezers.
The ambient room temperature storage locations were
audited to determine the possibility of adjusting air
temperature independently from the surrounding areas. An
analysis of room temperature excursions against the audit
results did not identify any possible correlation (table 5).
Further analyses of ambient temperature excursions
against other variables such as the number, size and brand
of medicine and vaccine refrigerators in each location did
not suggest any potential correlations either.
TABLE 5. AUDIT OF ROOM TEMPERATURE CONTROL IN THE MEDICINE AND VACCINE AMBIENT STORAGE FACILITIES
AMBIENT STORAGE AIR TEMPERATURE
CONTROL (N=97)
TOTAL
NUMBER OF
LOCATIONS
LOCATIONS
WITHOUT
EXCURSIONS
COMPARISON
A. Locations with air-conditioned air supply
but without independent temperature
control
66 (68%)
29 (43.9%)
A versus B
(P=0.62)
B. Locations with air-conditioned air supply
and with independent temperature
control
22 (22.7%) 8 (36.4%) B versus C
(P=0.70)
C. Locations without air-conditioned air
supply
9 (9.3%) 4 (44.4%) C versus A+B
(P=1.00)
94

DISCUSSION
Following the installation of an automated continuous
temperature monitoring system at a large hospital network,
the number of temperature excursions detected in
medicine and vaccine refrigerators, freezers and ambient
storage locations increased.
Temperature excursions of refrigerated medicines and
vaccines are common in hospitals and health service
managers are not necessarily aware of them.[8,9] Even
though exposure to extreme temperatures including heat
and freezing does not cause the formation of toxic
substances, it may reduce the potency of medicines and
vaccines.[10,11] Vaccines and some medicines such as
insulins and monoclonal antibodies are complex biological
molecules and denature if frozen.[12-14] Ineffective
medicines can harm patients by failing to deliver
therapeutic effects.[15] Similarly, ineffective vaccines can
harm individuals and pose serious public health risks.[3] The
inconvenience of revaccination, potential lawsuits and
financial wastage are some of the other adverse outcomes
of inappropriate storage.[10] Despite advances in the
vaccine supply chain, temperature excursions are still
common in Australian health system and result in an
estimated $16 million dollars wastage per annum.[2]
Refrigerators
This study has highlighted that a large number of
temperature excursions in medicine and vaccine
refrigerators go undetected when using the conventional
monitoring methods. The main difference between the
new temperature monitoring system and previous methods
used at Eastern Health was the source of temperature
data. Pre-implementation, temperature data was
obtained either manually once or twice daily from the
refrigerator digital thermometers or electronically through
BMS. Both methods rely on the built-in refrigerator
thermostats to provide the temperature data. This created
the biggest challenge of implementing the new
temperature monitoring system as it was reporting different
readings to those measured by the refrigerator thermostats
and staff were questioning its accuracy. This finding was,
however, consistent with published literature. Kartoğlu,
Nelaj and Maire found the temperature data provided by
built-in refrigerator thermometers to be inaccurate and
suggested abandoning their use.[16] After numerous tests
with calibrated thermometers and digital data loggers,
three possible reasons for the temperature discrepancies
were suggested.
Firstly, internal refrigerator thermometers are generally
installed on top of the refrigerator cabinets for
manufacturing convenience. The location of thermometer
probe is critical as temperature can vary considerably in
different parts of a refrigerator cabinet. In Australia,
purpose-built medicine and vaccine refrigerators are
required to maintain a stable, uniform and controlled
temperature between +2°C and +8°C, close to +5°C.[6]
However, local guidelines do not elaborate on the location
of built-in refrigerator thermometers although they
recommend temperature mapping to identify cold
spots.[6,7] Furthermore, the local guidelines provide
conflicting information about the location of external data
loggers. They recommend both placing digital data
loggers in the middle of medicines and vaccines and co-
locating them with inbuilt minimum/maximum
thermometers to “prevent different readings”.[6,7] As a
result, the back-to-base BMS probes in the 42 BMS-
connected refrigerators at Eastern Health were co-located
with the inbuilt thermometers. Conversely, international
guidelines recommend placing digital data loggers in the
centre of refrigerators and in close proximity to medicines
and vaccines. [17,18]
Secondly, observation from this study suggests that some
brands of purpose-built refrigerators are more successful in
achieving a stable and uniform temperature through more
effective air circulation and cooling system design. The
analysis of temperature excursion data against different
brands of refrigerators identified one brand of purpose-built
refrigerators to have the highest rate of temperature
excursions, followed by domestic refrigerators. Thirdly,
inbuilt thermometers are typically exposed to air
temperature. Thus, they record rapid fluctuations in
temperature, for instance, when the refrigerator door is
opened briefly. On the other hand, the new monitoring
system uses validated lagged or buffered temperature
probes which are placed inside solid thermal blocks to
simulate the core temperature of medicines and vaccines,
and avoid rapid fluctuations and false alarms.[6]
The challenges related to medicine and vaccine
refrigerators were the most difficult to address. Initially, a
review of the national and international guidelines was
conducted to verify the new monitoring system probes
were correctly installed. [6,7,17-19] Relevant stakeholders
were consulted and a consensus was reached to place the
Invisible Systems™ temperature probes in the centre of
refrigerators, in the middle of medicines and vaccines.
95

Next, the accuracy of the new monitoring system probes
were confirmed using calibrated thermometers and digital
data loggers. The frequent temperature excursions below
+2°C, including subzero readings, were consistent with the
literature. Hanson et al [20] conducted a review of 21
published research articles and concluded that cold chain
breach of vaccines is an ongoing global issue and
exposing refrigerated vaccines to freezing temperatures
continues to be a major problem. This review highlighted
that many frontline healthcare workers are unaware of the
risks associated with exposure to subzero temperatures and
their focus has been on preventing exposure to heat.
[20,21]
Moreover, the most common brand of refrigerators at
Eastern Health was found to have the highest rate of
excursions. To ensure appropriate medicine and vaccine
refrigerators are purchased at Eastern Health, a group of
representatives from the Pharmacy, Nursing,
Infrastructure/Maintenance and Procurement
Departments convened and recommended a list of criteria
for future purchases such as certified purpose-built
medicine and vaccine refrigerator, frost-free, double-
glazed glass door, self-closing door, audible door ajar
alarm, lockable door, low energy consumption and low
noise level.
Freezers
More temperature excursions were detected in freezers
post-implementation. One freezer recorded 21
temperature excursions which was found to be due to
placing unfrozen ice bricks inside the freezer near the
temperature probe. This issue was addressed by placing a
dedicated container for unfrozen ice bricks inside the
freezer, away from the temperature sensor and frozen
pharmaceuticals.
The main challenge with the freezer temperature
monitoring was that, contrary to refrigerated medicines,
there were no national guidelines regarding the frozen
storage thresholds and how to manage freezer
temperature excursions. [6,7,17-19,22,23]
Ambient room temperature
A large number of temperature excursions were detected
in ambient storage locations post-implementation
compared to zero in the seven monitored locations pre-
implementation. Of the monitored locations pre-
implementation, one recorded temperature excursions
post implementation. This was due to staff changing the
settings of the air conditioning unit for personal comfort. This
finding in addition to the analysis of the temperature
excursion data in ambient locations with independent air
temperature controls has demonstrated that installing local
air conditioning units is not a fail-proof solution as the stand-
alone air conditioners can be adjusted or turned off by
staff. Additionally, it is not practical to remove the air-
conditioner controllers as they may be hardwired on the
wall or must be readily accessible to turn on the units
following interruptions to power supply. We expected to
observe higher rates of temperature excursions in medicine
rooms with more heat generating sources such as those
with more than one refrigerator or with refrigerators that
consume more electricity. However, this was not observed
which we believe is due to the complex nature of room
temperature control and the many variables involved such
as room size, temperature and volume of air entering the
room, heat generation, source of heat, presence of air
vents or exhaust fans and location of temperature sensors.
Similar to freezers, another challenge was the limited
number and variability of guidelines and published articles
regarding ambient room temperature monitoring for
medicines and vaccines.[22,23] For instance, local
guidelines only recommend a high threshold of +25°C for
ambient room temperature.[7] However, it is important to
also have a low threshold as liquid medicines presented in
the forms of solution or suspension may crystalize or
precipitate if exposed to cold temperatures.[24] Besides,
some automated temperature monitoring systems require
both high and low thresholds to be programmed.
Therefore, +8°C was programmed in the Invisible Systems™
as the minimum room temperature. The lowest
temperature recorded post-implementation was +13.7°C.
The World Health Organisation recommends ‘controlled
room temperature’ to be between +15°C and +25°C and
‘cool place temperature’ between +8°C and +15°C.[22]
The United States Pharmacopeia defines ‘controlled room
temperature’ to be between +20°C and +25°C and allows
excursions between +15°C and +30°C as long as Mean
Kinetic Temperature (MKT) remains below +25°C.[23] These
definitions are not currently included in the Australian
guidelines and not used at Eastern Health although Invisible
Systems™ reports MKT values.
The third challenge has been the difficulty in managing
ambient temperature excursions. Unlike refrigerator
temperature excursions where the affected stock can be
quarantined and moved to another refrigerator until the
faulty refrigerator is repaired or replaced, there are larger
96

amounts of medicines stored in ambient storage facilities
and it is not always practical to move them. Moreover,
changing the temperature of air supply to medicine rooms
often impacts the surrounding areas potentially making it
uncomfortably cold for patients and staff.
Strengths and weaknesses
A major strength of this study is the inclusion of three
different temperature storage conditions across an entire
healthcare network. Another strength is including all
temperature excursions detected over three months pre-
and three months post-implementation. It suffices to say
that the new system is programmed to record the
temperature every 5 minutes which means it could record
up to 144 excursions per day for one probe if the
temperature repeatedly goes in and out of the
recommended range. In contrast, the manual monitoring
was undertaken once or twice daily. Furthermore, the new
monitoring system continued to record temperature
excursions while the faulty refrigerators were being
assessed, adjusted, repaired or replaced, and the affected
medicines and vaccines were quarantined. This data was
not excluded as the primary aim of this study was to
evaluate the ability of the new monitoring system in
detecting temperature excursions. To ensure patient
safety, Eastern Health policy requires affected medicines
and vaccines to be immediately quarantined until their
safety for use is determined; and the faulty equipment is not
used for storage of pharmaceuticals until repaired or
replaced.
A limitation of this study was the inability to locate 14 pre-
intervention monthly manual temperature recording
charts. Despite this, a search of Eastern Health incident
management system identified no pre-intervention
reported temperature excursions for these locations.
Another limitation was that we introduced additional four
refrigerators and one freezer at the time of the intervention,
and commenced monitoring of ambient temperature in 90
locations resulting in mismatch in total storage locations
pre- and post-intervention. It is of note that this study was
undertaken during winter and spring in Melbourne. It is
important to reassess the effect of higher outdoor
temperatures over summer on ambient room
temperatures.
Implications for practice
Health service managers should ensure this critical yet
basic aspect of patient safety is adequately addressed at
their organisations.[4] Effective monitoring of medicines
and vaccines temperature is the first step in the quality
management process. It provides better visibility of
performance, highlights areas of risk, and guides and
evaluates mitigation strategies. It is recommended that:
• Inbuilt refrigerator thermometers are not solely
relied upon to monitor the storage temperature of
medicines and vaccines
• Temperature monitoring loggers and sensors are
co-located with medicines and vaccines if
mapping data is unavailable
• Medicine and vaccine freezers and ambient room
temperature storage locations are monitored as
robustly as refrigerators
• Health services avoid using unreliable or domestic
refrigerators for storage of medicines and vaccines
Unanswered questions and future research
This study has identified some areas for future research and
improvement. Firstly, it has been noted there is no National
Medicine Storage Guideline in Australia. Secondly, it is
recommended to explore the use of MKT in managing
temperature excursions with the aim to incorporate in the
relevant local guidelines. Thirdly, it is suggested to
temperature map different medicine and vaccine
refrigerators based on brand, size, type, etc. The findings of
this research will guide correct placement of built-in
thermometers and temperature monitoring devices and
whether more than one sensor is needed for larger
refrigerators.
CONCLUSIONS
An automated continuous temperature monitoring system
was installed in all medicine and vaccine storage locations
at Eastern Health. Comparison of temperature excursions
pre- and post-implementation has shown the new system
can detect higher numbers of excursions compared to
previous temperature monitoring methods. This provides
better visibility of performance, identifies areas of non-
compliance, and guides and evaluates solutions. Analysis
of temperature excursions identified most temperature
excursions were in refrigerators and below +2°C. One brand
of purpose-built medicine and vaccine refrigerators was
flagged to have the highest rate of excursions, followed by
the domestic refrigerators. It has been noted that national
and international guidelines do not elaborate on the
monitoring of freezers and ambient storage to the same
extent as refrigerators. Finally, this study recommends the
development of a National Medicine Storage Guideline.
97

ACKNOWLEDGEMENTS
We like to thank Mrs Saly Rashed, Wantirna Health
Pharmacy Manager, for assisting with the implementation
of the new temperature monitoring system and review of
this article. We also like to thank Mr Bruce Leslie, Director of
Infrastructure at Eastern Health, for arranging the audit of
ambient storage locations and assisting with the
implementation of the new temperature monitoring
system.
CONFLICTS OF INTEREST
The authors declare that there is no conflict of interest
regarding the publication of this article.
ETHICAL APPROVAL
This study did not involve human or animal subjects and
therefore did not require ethics approval. The manuscript
was reviewed by Eastern Health Pharmacy Practice
Research Group.
References
1. Khan MH, Hatanaka K, Sovannarith T, Nivanna N, Casas
LC, Yoshida N, et al. Effects of packaging and storage
conditions on the quality of amoxicillin-clavulanic
acid–an analysis of Cambodian samples. BMC
Pharmacol Toxicol. 2013 Dec;14(1):1-7.
https://doi.org/10.1186/2050-6511-14-33
2. D'Onise K, Almond S, MacDonald B, Watson M,
Scrimgeour S. Have purpose built vaccine refrigerators
reduced the cost of vaccine losses in South Australia?
Aust N Z J Public Health. 2012 Dec;36(6):572-6.
https://doi.org/10.1111/j.1753-6405.2012.00932.x
3. Breakwell L, Moturi E, Helgenberger L, Gopalani SV,
Hales C, Lam E, et al. Measles outbreak associated with
vaccine failure in adults—Federated States of
Micronesia, February–August 2014. Morb Mortal Wkly
Rep. 2015 Oct 2;64(38):1088-92.
https://doi.org/10.15585/mmwr.mm6438a7
4. Australian Commission on Safety and Quality in Health
Care. National Safety and Quality Health Service
(NSQHS) Standards: Medication Safety Standard
[Internet]. Sydney NSW: Australian Commission on
Safety and Quality in Health Care; 2019 [cited 2021 Jan
27]. Available from:
https://www.safetyandquality.gov.au/standards/nsqh
s-standards/medication-safety-standard
5. Eastern Health. About us [Internet]. Melbourne VIC:
Eastern Health; 2020 [cited 2021 Jan 27]. Available
from:
https://www.easternhealth.org.au/images/Eastern_He
alth_Quick_Facts_2020.pdf
6. Australian Government Department of Health.
National Vaccine Storage Guidelines – Strive for 5, 3rd
edition [Internet]. Canberra ACT: Commonwealth of
Australia; 2019 [updated 2020 Apr 16; cited 2021 Jan
27]. Available from:
https://www.health.gov.au/sites/default/files/docume
nts/2020/04/national-vaccine-storage-guidelines-
strive-for-5.pdf
7. Victorian Pharmacy Authority. Victorian Pharmacy
Authority Guidelines [Internet]. Melbourne VIC:
Victorian Pharmacy Authority Guidelines; 2019 [cited
2021 Jan 27]. Available from:
https://www.pharmacy.vic.gov.au/cms_files/VPA%20
Guidelines%20effective%201%20November%202019.p
df
8. Dubrava S, Tait PA, Humphris MA. Identification of
Potential and Actual Breaches in the Cold Chain within
a Tertiary Hospital. J Pharm Pract Res. 2007
Mar;37(1):16-8. https://doi.org/10.1002/j.2055-
2335.2007.tb00650.x
9. Levinson DR, General I. Vaccines for children program:
vulnerabilities in vaccine management. Department of
Health and Human Services: Office of Inspector
General. 2012 Jun. Available from:
https://www.coldchain-
tech.com/images/documents/VaccineForChildrenPro
gram.pdf
10. Hibbs BF, Miller E, Shi J, Smith K, Lewis P, Shimabukuro TT.
Safety of vaccines that have been kept outside of
recommended temperatures: reports to the vaccine
adverse event reporting system (VAERS), 2008–2012.
Vaccine. 2018 Jan 25;36(4):553-8.
https://doi.org/10.1016/j.vaccine.2017.11.083
11. Vimalavathini R, Gitanjali B. Effect of temperature on
the potency & pharmacological action of insulin.
Indian J Med Res. 2009 Aug 1;130(2):166-70. Available
from:
https://medgreen.com.tw/images/productnews/5d11
fd08e6e87558eb51c761d8dc1c67.pdf
12. Carter AW, Heinemann L. Insulin concentration in vials
randomly purchased in pharmacies in the United
States: considerable loss in the cold supply chain. J
Diabetes Sci Technol. 2018 Jul;12(4):839-41.
https://doi.org/10.1177/1932296817747292
13. Matthias DM, Robertson J, Garrison MM, Newland S,
Nelson C. Freezing temperatures in the vaccine cold
chain: a systematic literature review. Vaccine. 2007
98

May 16;25(20):3980-6.
https://doi.org/10.1016/j.vaccine.2007.02.052
14. Lazar KL, Patapoff TW, Sharma VK. Cold denaturation
of monoclonal antibodies. MAbs. 2010 Jan 27;2(1):42-
52. https://doi.org/10.4161/mabs.2.1.10787
15. Bassat Q, Tanner M, Guerin PJ, Stricker K, Hamed K.
Combating poor-quality anti-malarial medicines: a call
to action. Malar J. 2016 Dec;15(1):1-2.
https://doi.org/10.1186/s12936-016-1357-8
16. Kartoğlu Ü, Nelaj E, Maire D. Improving temperature
monitoring in the vaccine cold chain at the periphery:
An intervention study using a 30-day electronic
refrigerator temperature logger (Fridge-tag®).
Vaccine. 2010 May 28;28(24):4065-72.
https://doi.org/10.1016/j.vaccine.2010.03.076
17. Hamborsky J, Kroger A, editors. Centers for Disease
Control and Prevention (CDC). Epidemiology and
prevention of vaccine-preventable diseases, E-Book:
The Pink Book – Chapter 5: Vaccine Storage and
Handling [Internet]. Washington DC: Public Health
Foundation; 2015 Oct 19 [updated 2020 Jul; cited 2021
Jan 27]. Available from:
https://www.cdc.gov/vaccines/pubs/pinkbook/vac-
storage.html
18. Public Health Agency of Canada. Storage and
handling of immunizing agents: Canadian
Immunization Guide [Internet]. Ottawa ON: Public
Health Agency of Canada; 2015 [updated 2017 Mar;
cited 2021 Jan 27]. Available from:
https://www.canada.ca/en/public-
health/services/publications/healthy-living/canadian-
immunization-guide-part-1-key-immunization-
information/page-9-storage-handling-immunizing-
agents.html
19. Ramsay M, editor. Immunisation against infectious
disease (the green book): Chapter 3 - Storage,
distribution and disposal of vaccines [Internet]. London:
Public Health England; 2006 [updated 2013 Jun; cited
2021 Jan 27]. Available from
https://assets.publishing.service.gov.uk/government/u
ploads/system/uploads/attachment_data/file/223753
/Green_Book_Chapter_3_v3_0W.pdf
20. Hanson CM, George AM, Sawadogo A, Schreiber B. Is
freezing in the vaccine cold chain an ongoing issue? A
literature review. Vaccine. 2017 Apr 19;35(17):2127-33.
https://doi.org/10.1016/j.vaccine.2016.09.070
21. Lloyd J, Cheyne J. The origins of the vaccine cold chain
and a glimpse of the future. Vaccine. 2017 Apr
19;35(17):2115-20.
https://doi.org/10.1016/j.vaccine.2016.11.097
22. World Health Organisation. TRS 1025 - Annex 7: Good
storage and distribution practices for medical products
[Internet]. Geneva: World Health Organisation; 2020
Apr 20 [cited 2021 Jan 27]. Available from:
https://www.who.int/publications/m/item/trs-1025-
annex-7-gdp-medical-products
23. United States Pharmacopeia and National Formulary
(USP 43-NF 38). Chapter ⟨659⟩ Packaging and Storage
Requirements [Internet]. Rockville MD: United States
Pharmacopeia; 2017 [updated 2020 Dec; cited 2021
Feb 19]. Available from: https://www.uspnf.com/
24. Allegra JR, Brennan J, Lanier V, Lavery R, MacKenzie B.
Storage Temperatures of Out of Hospital Medications.
Acad Emerg Med. 1999 Nov;6(11):1098-103.
https://doi.org/10.1111/j.1553-2712.1999.tb00110.x.
99

RESEARCH ARTICLE
FACTORS ASSOCIATED WITH THE FOUR-VISIT ANC IN
INDONESIA: A POPULATION-BASED STUDY
Helen Andriani*1, Valencia Natasha2, Salma Dhiya Rachmadani2, Adila Saptari3
1. Department of Health Policy and Administration, Faculty of Public Health, Universitas Indonesia, Depok, Indonesia
2. Public Health Science Undergraduate Study Program, Faculty of Public, Universitas Indonesia, Depok, Indonesia
3. Master of Public Health Program, School of Public Health, Boston University, Boston, USA
Correspondence: [email protected]
ABSTRACT
INTRODUCTION:
The number of maternal, neonatal and child mortality remains high in developing countries, including Indonesia.
Antenatal care (ANC) coverage is an indicator of health-care use and access during pregnancy. Receiving at least four
visits of ANC increases the chances of receiving appropriate maternal health interventions as one of the tracer indicators
for universal health coverage in the Global Strategy for Women's, Children's, and Adolescents' Health Monitoring
Framework (SDG indicator 3.8.1). The study aims to investigate the distribution and the factors associated with the four -
visit ANC across urban and rural areas in Indonesia.
METHODS:
We used data from the 2017 Indonesia Demographic and Health Survey which is a large-scale nationally representative
cross-sectional survey of women aged 15–49 years old (n=15,288). The use of ANC for the MNCH system is the dependent
variable. The determinants are individual characteristics, family factors, and community factors.
RESULTS:
Age, parity, household income, and distance from health facilities are significant factors associated with the four -visit
ANC, as the first step in achieving continuum of care for MNCH. Urban women who had been pregnant 1 –2 times or 3–4
times were 6.475 (95% Confidence Interval (95%CI) = 4.750–9.306) and 3.109 (95% CI = 2.268–4.262) times more likely to
have at least four ANC visits than those who had been pregnant five times or more.
CONCLUSION:
Developing a health system, human resources, health facilities, and infrastructure are crucial for overcoming maternal
and child health problems, especially in rural areas to make ANC universally affordable and accessible.
KEYWORDS
pregnancy; Indonesia; antenatal care; population-based study
100

INTRODUCTION
Over the years, maternal child health has improved ever
since countries worldwide have committed to reducing
Maternal Mortality Ratio (MMR) as a result the Sustainable
Development Goals (SDGs) of the United Nations [1]. SDGs
encourage every country to achieve SDG target 3.1 (i.e.
reduce the global MMR to less than 70 per 100,000 live births
by 2030) and target 3.2 (i.e. end preventable deaths of
newborns and children under 5 years of age by 2030, with
all countries aiming to reduce neonatal mortality to at least
12 per 1,000 live births and under-5 mortality to at least 25
per 1,000 live births) [2]. By 2017, the global MMR is 211 per
100,000 live births with 295,000 cases of maternal death. This
rate has decreased by 38% with a 2.9% reduction annually
since 2000 (342 per 100,000 live births). More than three-
fourth of maternal deaths are related to direct obstetric
causes, such as hemorrhage, sepsis, abortion, ruptured
uterus and hypertensive pregnancy diseases, which are
easily preventable and treatable. Moreover, 77% of death
occur during or shortly after birth (within 24 h) [3]. However,
MMR remains high across the world. Notwithstanding
national and global initiatives, the indices of maternal and
newborn morbidity or mortality have indicated no
improvement or only modest declines over the last five
years.
In parallel with the global trends, Indonesia was unable to
reach the SDG target as the MMR was 305 per 100,000 live
births in 2015 [6]. This notion is demonstrated by the WHO in
2017 at 177 per 100,000 live births with 8,600 deaths. This
number is higher than that for South-east Asia, which is 152
per 100,000 live births [7]. With this progress, Indonesia
became one of the developing countries with high
maternal, neonatal and child mortality. In 2016, the United
Nations Children’s Fund reported that the under-five
mortality rate in Indonesia was 27 per 1,000 live births,
whereas neonatal mortality rate reached 14 per 1,000 live
births [8]. Furthermore, the WHO recommended that all
pregnant women should undergo at least four Antenatal
Care (ANC) visits during pregnancy [7] to maintain and
monitor the health of the mother and fetus, detect
pregnancy complications early and react accordingly,
respond to complaints, prepare for childbirth and promote
a healthy lifestyle [9].
Adequate ANC visits can be used as an indicator for SDGs
to ensure coverage of maternal health services. Previous
research demonstrated a negative correlation between
ANC and maternal mortality (r = −0.5; P < 0.0001). Mothers
who did not receive ANC had 3.9 higher odds of neonatal
death (95% Confidence Interval [CI] = 2.3–6.3) than
mothers with four or more ANC visits. Moreover, neonates
with mothers who had one to three ANC visits had 1.3
higher odds of death (95% CI = 1.0–1.8) than mothers who
had four or more ANC visits [10]. Despite this result, a gap in
the four-visit ANC continues to occur due to demographic,
geographical, cultural and socioeconomic differences in
developing countries, such as Indonesia. Disparities occur
as a result of inability to access services, service
affordability and service quality [11]. The study aims to
investigate the distribution and the factors associated with
the four-visit ANC across urban and rural areas in Indonesia.
METHODS
Data were derived from the Indonesia Demographic and
Health Survey (IDHS), a national survey conducted in 2017
using a cross-sectional method. The sample of the survey
includes 1,970 census blocks with 49,250 households in rural
and urban areas. The IDHS sample design uses two-stage
probability sampling. The first stage selects a number of
blocks using the probability proportional to size system
based on the listing result of Population Census 2010. The
second stage then systematically selects 25 households
from the abovementioned census blocks.
Data from IDHS covered a total of 49,267 women aged 15–
49 years old. The criteria for inclusion in the survey were
ever-married women aged 15–49 years who had given
birth in the last 5 years prior to the survey. After screening,
data from 15,288 women were used for the study. The
reason for selecting women who gave birth in the last 5
years prior to the survey was to avoid memory bias from
mothers.
The use of ANC for the maternal, neonatal and child health
(MNCH) system is designated as the dependent variable.
The determinants of the dependent variable are individual
characteristics, such as respondent’s age, age at first birth,
educational level, employment status, parity, and
autonomy in health care decisions. Apart from individual
factors, the family also plays a role in the use of ANC. Thus,
social demographic characteristics were measured
through the educational level and employment status of
husbands, household income and mass media exposure
(frequency of watching television, listening to the radio or
reading newspapers). Lastly, community factors denote
101

the form of geographical conditions that divide the
respondents into urban or rural areas and distance from
health facilities.
SPSS (version 25) was used for data analysis. Frequency and
percentage from descriptive statistics are used to report
the outcomes of MNCH services during ANC. The
relationships among factors are defined by logistic
regression with simple, bivariate, and multivariate analyses.
The relationship is analyzed at three levels: odds ratio (OR),
adjusted odds ratio (aOR) with 95% CI, and p-value with
significance at p-value < 0.05.
The IDHS program collects data periodically for policy
development and program planning, monitoring and
evaluation. Respondents provided written informed
consent before each interview. The statements include
voluntary participation, refusal to answer question or
termination of participation at any time and confidentiality
of identity and information. Consent prior to a child’s
participation is provided by a parent or guardian. The
Institutional Review Board (IRB) of the Inner-City Fund
International Inc., Fairfax, VA, USA, reviewed and approved
the procedures and survey protocols. After the IDHS
provided authorization to use the dataset, additional
ethical review approval was obtained from the IRB at
Universitas Indonesia, Indonesia.
RESULTS
There were 13,510 (88.4%) women who obtained at least
four ANC visits (ANC4+). Table 1 provides the
socioeconomic and demographic characteristics of the
respondents. Women aged 25–34 years old (51.9%), aged
20–29 years old (66.5%) and above 29 years old (6.5%) at
first birth, who had secondary (57.4%) and higher (18.3%)
levels of education, have husbands with secondary (57.9%)
and higher (15.7%) levels of education, have employed
husbands (99.3%), had 1–2 parity (67.8%), have autonomy
in health care decisions (44.2%), had any two (28.0%) and
all three (27.7%) types of mass media exposure, belonged
to the richest (18.4%), Q4 (19.2%) or Q3 (19.5%) household
income, without issues regarding distance from health
facilities (89.3%) and lived in urban areas (51.4%) tend to
have at least four ANC visits during pregnancy.
TABLE 1. SOCIOECONOMIC AND DEMOGRAPHIC CHARACTERISTICS OF RESPONDENTS WITH ADEQUATE AND INADEQUATE
ANTENATAL CARE
Pregnancy level (ANC4+)
p >4 visits
n (%)
(n = 13,510)
<4 visits
n (%)
(n = 1,778)
Age
15–24
25–34
>34
2,402 (17.8)
7,005 (51.9)
4,103 (30.4)
396 (22.3)
790 (44.4)
592 (33.3)
<0.001
Age at First Birth
<20
20–29
>29
3,652 (27.0)
8,984 (66.5)
874 (6.5)
755 (42.5)
942 (53.0)
81 (4.6)
<0.001
Educational Level
No education
Primary
Secondary
Higher than secondary
116 (0.9)
3,159 (23.4)
7,759 (57.4)
2,476 (18.3)
88 (4.9)
683 (38.4)
832 (46.8)
175 (9.8)
<0.001
Husband’s Educational Level
No education
Primary
Secondary
Higher than secondary
171 (1.3)
3,289 (25.0)
7,613 (57.9)
2,067 (15.7)
84 (5.0)
603 (36.1)
853 (51.0)
131 (7.8)
<0.001
102

Table 2 indicates that women aged 25–34 years (aOR =
1.368; 95% CI = 1.168–1.603) and older than 34 years (aOR
= 1.678; 95% CI = 1.363–2.065) were more likely to have
ANC4+ than women aged 15–25 years. Women who give
first birth at 20–29 years old (aOR = 1.270; 95% CI = 1.123–
1.436) are more likely to have ANC4+ than those who gave
birth before 20 years. Women with secondary education
are 2.327 (95% CI = 1.645–3.292) times more likely to have
ANC4+ than those without education. Women who had
been pregnant for 1–2 times or 3–4 times were 3.617 (95%
CI = 2.916–4.486) and 2.127 (95% CI = 1.761–2.568) times
more likely to have ANC4+ than those who had been
pregnant five times or more. Compared with women
without exposure to any mass media, women with two
mass media exposures are 1.553 (95% CI = 1.230–1.963)
times more likely to have ANC4+. Women with higher
household wealth (Q2 to Q5) were 1.587 (95% CI = 1.369–
1.839), 1.953 (95% CI = 1.648–2.314), 2.767 (95% CI = 2.255–
3.397) and 4.131 (95% CI = 3.187–5.355) times, respectively,
more likely to have ANC4+ than the poorest group. Women
without issues regarding distance from health facilities (aOR
= 1.463; 95% CI = 1.270–1.686) were more likely to have
ANC4+ than those with issues.
TABLE 2. FACTORS ASSOCIATED WITH USE OF ANTENATAL CARE
Employment Status
Employed
Unemployed
6,201 (45.9)
7,299 (54.1)
878 (49.5)
897 (50.5)
0.005
Husband’s Employment Status
Unemployed
Employed
94 (0.7)
12,909 (99.3)
26 (1.6)
1,636 (98.4)
<0.001
Parity
5 or more
3–4
1–2
645 (4.8)
3,699 (27.4)
9,166 (67.8)
275 (15.5)
570 (32.1)
933 (52.5)
<0.001
Autonomy in Health Care Decisions
No
Yes
7,321 (55.8)
5,809 (44.2)
1,022 (61.2)
648 (38.8)
<0.001
Mass Media Exposure
Not at all
Any one
Any two
All three
413 (3.1)
5,572 (41.2)
3,784 (28.0)
3,741 (27.7)
181 (10.2)
805 (45.3)
407 (22.9)
385 (21.7)
<0.001
Household Wealth
Q1 (poorest)
Q2
Q3
Q4
Q5 (richest)
3,144 (23.3)
2,661 (19.7)
2,628 (19.5)
2,588 (19.2)
2,489 (18.4)
893 (50.2)
361 (20.3)
255 (14.3)
166 (9.3)
103 (5.8)
<0.001
Distance from Health Facilities
With issues
Without issues
1441 (10.7)
12,059 (89.3)
362 (20.4)
1,415 (79.6)
<0.001
Residence
Urban
Rural
6,938 (51.4)
6,572 (48.6)
610 (34.3)
1,168 (65.7)
<0.001
Care at pregnancy (ANC4+)
Bivariate
OR p
Multivariate
aOR (95% CI) P
103

Age
15–24
25–34
>34
1
1.462
1.143
<0.001
0.056
1
1.368 (1.168–1.603)
1.678 (1.363–2.065)
<0.001
<0.001
Age at First Birth
<20
20–29
>29
1
1.972
2.231
<0.001
<0.001
1
1.270 (1.123–1.436)
1.083 (0.813–1.444)
<0.001
0.585
Educational Level
No education
Primary
Secondary
Higher than secondary
1
3.509
7.075
10.733
<0.001
<0.001
<0.001
1
1.805 (1.289–2.526)
2.327 (1.645–3.292)
1.821 (1.221–2.174)
0.001
<0.001
0.003
Husband’s Educational Level
No education
Primary
Secondary
Higher than secondary
1
2.679
4.384
7.751
<0.001
<0.001
<0.001
1
1.693 (1.238–2.315)
1.625 (1.182–2.234)
1.896 (1.294–2.777)
0.001
0.003
0.001
Employment Status
Unemployed
Employed
1
1.152
<0.005
1
1.186 (1.061–1.324)
0.003
Husband’s Employment Status
Unemployed
Employed
1
2.183
<0.001
1
1.972 (1.234–3.150)
0.005
Parity
5 or more
3–4
1–2
1
2.767
4.189
<0.001
<0.001
1
2.127 (1.761–2.568)
3.617 (2.917–4.486)
<0.001
<0.001
Autonomy in Health Care Decisions
No
Yes
1
1.251
<0.001
1
1.138 (1.020–1.270)
0.021
Mass Media Exposure
None
Any one
Any two
All three
1
3.033
4.075
4.258
<0.001
<0.001
<0.001
1
1.427 (1.147–1.775)
1.553 (1.230–1.963)
1.396 (1.098–1.774)
0.001
<0.001
0.006
Household Wealth
Q1 (poorest)
Q2
Q3
Q4
Q5 (richest)
1
2.094
2.927
4.428
6.684
<0.001
<0.001
<0.001
<0.001
1
1.587 (1.369–1.839)
1.953 (1.648–2.314)
2.767 (2.255–3.397)
4.131 (3.187–5.335)
<0.001
<0.001
<0.001
<0.001
Distance from Health Facilities
With issues
Without issues
1
2.141
<0.001
1
1.463 (1.270–1.686)
<0.001
Residence
Urban
Rural
1
0.495
<0.001
1
0.919 (0.810–1.043)
0.190
104

TABLE 3 FACTORS ASSOCIATED WITH USE OF ANTENATAL CARE IN URBAN AND RURAL AREAS
Care at pregnancy (ANC4+)
Urban Rural
Bivariate
OR p
Multivariate
aOR (95% CI) p
Bivariate
OR p
Multivariate
aOR (95% CI) p
Age
15– 24
25–34
>34
1
1.394
1.117
0.004
0.363
1
1.341 (1.015–1.772)
1.857 (1.303–2.647)
0.039
0.001
1
1.398
1.043
<0.001
0.630
1
1.366 (1.125–1.659)
1.559 (1.204–2.019)
0.002
0.001
Age at First Birth
<20
20–29
>29
1
2.172
2.535
<0.001
<0.001
1
1.247 (1.007–1.545)
0.874 (0.558–1.371)
0.043
0.558
1
1.686
1.625
<0.001
0.003
1
1.280 (1.102–1.487)
1.227 (0.841–1.789)
0.001
0.288
Educational Level
No education
Primary
Secondary
Higher than secondary
1
2.783
5.644
9.097
0.009
<0.001
<0.001
1
2.440 (1.064–5.596)
3.411 (1.485–7.839)
2.985 (1.231–7.239)
0.035
0.004
0.016
1
3.397
5.939
7.827
<0.001
<0.001
<0.001
1
1.677 (1.162–2.421)
2.126 (1.448–3.121)
1.535 (0.964–2.444)
0.006
<0.001
0.071
Husband’s Educational
Level
No education
Primary
Secondary
Higher than secondary
1
1.102
1.585
3.063
0.815
0.257
0.008
1
0.907 (0.378–2.177)
0.746 (0.312–1.786)
0.903 (0.356–2.294)
0.826
0.511
0.831
1
3.015
4.455
6.276
<0.001
<0.001
<0.001
1
1.890 (1.344–2.658)
1.953 (1.375–2.773)
2.151 (1.374–3.367)
<0.001
<0.001
0.001
Employment Status
Employed
Unemployed
1
1.232
0.013
1
1.147 (0.952–1.382)
0.148
1
1.110
0.100
1
1.208 (1.052–1.387)
0.007
Husband’s Employment
Status
Unemployed
Employed
1
3.496
<0.001
1
2.852 (1.487–5.417)
0.002
1
1.533
0.191
1
1.340 (0.678–2.646)
0.399
105
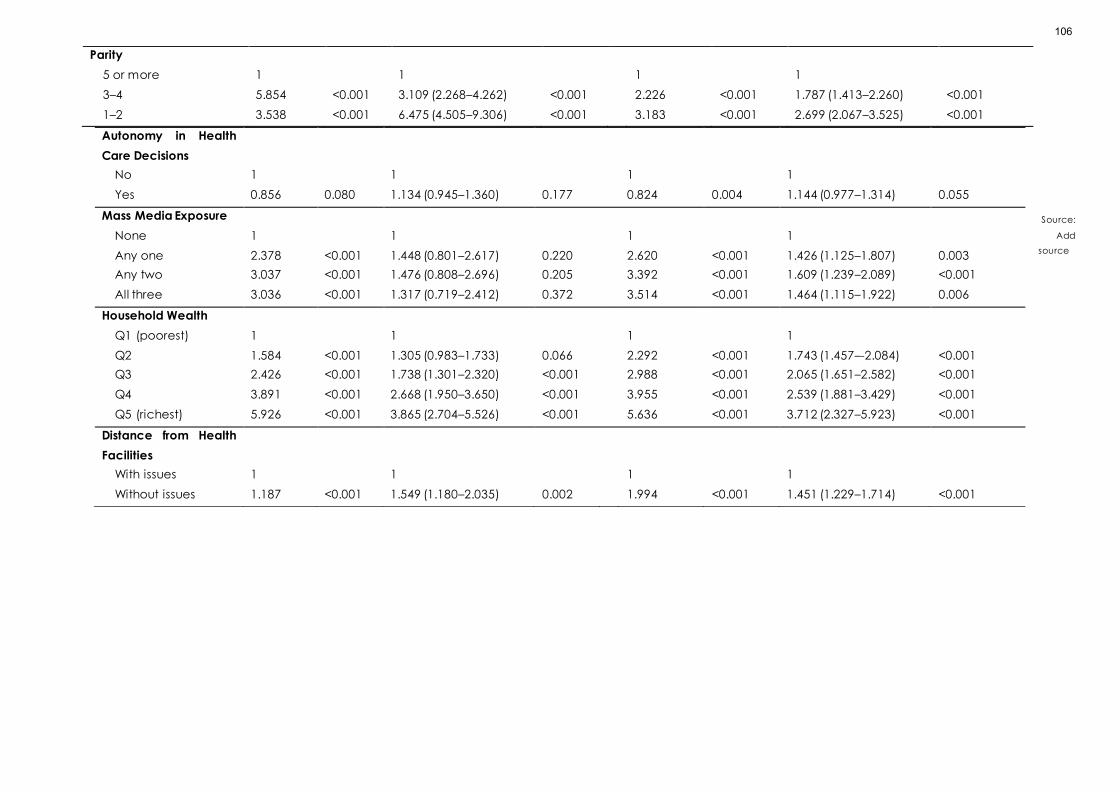
Source:
Add
source
Parity
5 or more
3–4
1–2
1
5.854
3.538
<0.001
<0.001
1
3.109 (2.268–4.262)
6.475 (4.505–9.306)
<0.001
<0.001
1
2.226
3.183
<0.001
<0.001
1
1.787 (1.413–2.260)
2.699 (2.067–3.525)
<0.001
<0.001
Autonomy in Health
Care Decisions
No
Yes
1
0.856
0.080
1
1.134 (0.945–1.360)
0.177
1
0.824
0.004
1
1.144 (0.977–1.314)
0.055
Mass Media Exposure
None
Any one
Any two
All three
1
2.378
3.037
3.036
<0.001
<0.001
<0.001
1
1.448 (0.801–2.617)
1.476 (0.808–2.696)
1.317 (0.719–2.412)
0.220
0.205
0.372
1
2.620
3.392
3.514
<0.001
<0.001
<0.001
1
1.426 (1.125–1.807)
1.609 (1.239–2.089)
1.464 (1.115–1.922)
0.003
<0.001
0.006
Household Wealth
Q1 (poorest)
Q2
Q3
Q4
Q5 (richest)
1
1.584
2.426
3.891
5.926
<0.001
<0.001
<0.001
<0.001
1
1.305 (0.983–1.733)
1.738 (1.301–2.320)
2.668 (1.950–3.650)
3.865 (2.704–5.526)
0.066
<0.001
<0.001
<0.001
1
2.292
2.988
3.955
5.636
<0.001
<0.001
<0.001
<0.001
1
1.743 (1.457–-2.084)
2.065 (1.651–2.582)
2.539 (1.881–3.429)
3.712 (2.327–5.923)
<0.001
<0.001
<0.001
<0.001
Distance from Health
Facilities
With issues
Without issues
1
1.187
<0.001
1
1.549 (1.180–2.035)
0.002
1
1.994
<0.001
1
1.451 (1.229–1.714)
<0.001
106
Table 3 illustrates the differences in the use of ANC between
urban and rural areas. Women from rural areas who gave
first birth at more than 29 years old (aOR = 1.227; 95% CI =
0.841–1.789) were more likely to have ANC4+ than those
who gave birth before 20 years old. In addition, women
with primary, secondary and higher levels of education
were 2.440 (95% CI = 1.064–5.596), 3.411 (95% CI = 1.485–
7.839) and 2.985 (95% CI = 1.231–7.239) times, respectively,
more likely to have ANC4+ than urban women without
education. However, husband’s educational level (i.e.,
primary, secondary and higher levels of education) in rural
areas had higher aOR compared with those in urban areas.
Women with husbands who worked and lived in urban
areas were 2.852 times (95% CI = 1.487–5.471) more likely to
have ANC4+ than unemployed husbands. Urban women
who had been pregnant 1–2 times or 3–4 times were 6.475
(95% CI = 4.750–9.306) and 3.109 (95% CI = 2.268–4.262)
times more likely to have ANC4+ than those who had been
pregnant five times or more.
DISCUSSION
Each component of the Continuum of Care (CoC) is
important for the provision of critical and lifesaving
maternal services. ANC plays a key role in CoC as the first
step in achieving continuity for MNCH services. Medical
professionals educate expectant mothers about the
importance of giving birth in health facilities through ANC,
including exclusive breastfeeding, postnatal and
postpartum care and family planning services. Facilitating
ANC for women who live far from health facilities, are
poorly educated, have financial constraints and other
barriers is crucial for the reduction of the current health and
healthcare access inequities [12]. The study identified
several factors associated with the four-visit ANC in
Indonesia.
Age, age at first birth, educational level, parity, mass media
exposure, household wealth and distance from health
facilities were significantly associated with the four-visit
ANC. Women aged 25 years old were more likely to have
ANC4+ compared with other age groups. This result is similar
to findings from other studies in Nepal [13], Shanghai [14],
and analysis of national survey data from Bangladesh,
Cambodia, Cameroon, Nepal, Peru, Senegal and Uganda
[15]. Younger women have a higher risk of inadequate
ANC than older women [16]. However, a study conducted
on seven regions of Indonesia found that as the age of the
mother increases, they are less likely to use ANC services,
especially mother aged more than 25 years [17].
Our finding was consistent with a study in Canada. Women
who first gave birth at 20–29 years old tend to use ANC [16].
Women who are victims of underage marriages and gave
birth at aged 19 years or less were 26% less likely to use ANC
services [18]. A study in Nepal proposed that child marriage
hinders access to maternal health care due to economic
and social barriers. This condition drives women to gain
limited autonomy in decision-making and access to
maternal services [18]. Policy makers need to review the
negative consequences of child marriage and set a
minimum age for legal marriage to mitigate this issue.
Women with higher educational level were more likely to
receive the four-visit ANC compared with the other group.
A systematic review and meta-analysis in Ethiopia also
revealed that educated women were more likely to use
ANC compared with uneducated women [19]. Literate
mothers paid more attention to health and family
development [13]. Similar study using the IDHS data for
2002/2003 and 2007 in Indonesia demonstrated that the
increased educational level exerted a greater impact on
the four-visit ANC for women from poor households than
those from the richest households [20]. Several factors of
the four-visit ANC can be modified by empowering women
through education and increasing decision-making power
[19]. Health promotion should target women with low levels
of education to increase their consciousness about the
importance of ANC services [20].
Women with 1–2 and 3–4 pregnancies are more likely to use
ANC than women who had been pregnant for five or more.
Women with two or more pregnancies (multipara) were
more likely to use ANC than women giving birth for the first
time (primipara) [21]. Women who had been pregnant four
times or more were likely to receive inadequate prenatal
care [16]. The frequencies of ANC decreased as the
number of births increased from the first to second until the
fifth or more births [15]. Women with higher parity are more
likely to depend on experiences from past pregnancies. As
such, they feel confident about their pregnancy, which
lessens the urgency to seek ANC services. Moreover,
women with higher parity did not expect to become
pregnant again, such that they tend to use less ANC [22].
Our study found that there was a strong connection
between mass media exposure and the four-visit ANC [19].
Women with less exposure to mass media were at higher
risk for the under-utilization of antenatal services [20].
107

Women with exposure to mass media were 1.52 times more
likely to use ANC during pregnancy than those without
exposure [23]. In rural areas, health workers struggle to
reach all mothers. Instead, mass media can be used to
disseminate messages about the importance and
availability of ANC services in their communities. In
addition, advocating ANC in mass media can be a
strategy for increasing the four-visit ANC [19, 24]
Household wealth has a significant association with ANC4+.
A study in Lao PDR showed that women with high income
were 2.6 times more likely to obtain ANC services than
women with low income [25]. Another study in Brussels
emphasized that women with high and moderate incomes
had 14% and 9%, respectively, more antenatal visits
compared with those with low income [21]. The four-visit
ANC was improved with the increase in household wealth
[15, 17] and 20.2% of mothers experience inadequate ANC
because they often lacked money to access ANC [14].
In certain countries, ANC services are free. However, it does
not completely solve the under-utilization of ANC service.
In Ghana, the number of women receiving less than four
ANC visits remains high because these mothers continue to
face barriers related to direct (consultation and
medication) and indirect (transportation and waiting time)
costs [26]. In addition, long waiting hours is another barrier
for expecting mothers who work in informal sectors as hours
spent in health facilities may reduce their daily income.
Thus, increasing the number of service providers and
physicians is vital to reduce waiting time to enable women
to leave early and take care of their families [26].
The opportunities for the four-visit ANC increase among
mothers without distance barriers to health facilities. The
under-utilization of ANC tends to occur among mothers
who reported distance from health services as a major
problem [20]. Pregnant women who live far from health
facilities had lower rates of ANC visits than those who lived
near health facilities. A study in Burkina Faso illustrated that
if distance to the closest health facilities increases by 1 km,
the odds of a woman receiving ANC4+ will decline by 0.05
and 0.113, respectively [27]. The availability of
transportation (bicycle) at the community level was
positively associated with the likelihood of women
receiving any ANC. The prioritization of investment in
transportation infrastructure supports the improvement of
MNCH [25, 27].
The present study also assessed the urban–rural differences
in the four-visit ANC. Previous studies indicated that women
who live in urban areas are more likely to receive ANC
services, as they have better information and access to
health facilities [17, 19, 21]. Mothers from under-developed
areas in Indonesia, such as the rural areas of Sumatera and
Eastern Indonesia region, are more likely to under-utilize
ANC services compared with women from the urban areas
of the Java–Bali region. The government should prioritize
the strategies for improving the distribution of human
resources, health facilities, roads and infrastructure to be
more accessible and available to women who lived in rural
areas [20, 26].
We used the IDHS dataset, which is representative of the
Indonesian population. The survey was conducted using
standard procedures and measurement units to select the
sampling units, respondents and household strata.
Therefore, the generalizability of the study can be
increased. In addition, the possibility of recall bias has been
reduced by restricting the study sample only to women
who had given birth in the last five years prior to the survey.
The study has several limitations. The secondary data can
only analyze and explain the risk factors based on
available variables. The study design restricted the
explanation of the causality of factors associated with the
four-visit ANC. Moreover, the data used are subject to
recall bias as they were based on self-reported data. Future
research, such as a qualitative study, and cultural influence
as a community factor can be considered to further
understand women’s perception as individual factors
regarding the four-visit ANC.
CONCLUSION
A total of 88.4% of women in the study received ANC4+
during pregnancy. Age, age at first birth, educational level,
parity, household wealth and distance from health facilities
were associated with the four-visit ANC. Women living in
urban areas received adequate ANC services compared
with those living in rural areas. Therefore, future policies
should focus on teenage pregnancy and women
empowerment issues to overcome maternal health
problems. Health promotion and advocacy should also be
specifically tailored to reach the underprivileged
population. This problem is multisectoral in nature as the
distribution of human resources, health facilities and
infrastructure should be built to provide rural residents with
access to better healthcare services. Indonesia’s national
health insurance also plays a vital role in making healthcare
affordable.
108
DECLARATIONS
Authors' contributions
Conceptualization: HA Formal analysis: SDR and VN
Methodology: HA and AS Supervision: H.A Writing—original
draft preparation: HA Writing—review and editing: HA, SDR,
VN, and AS. All authors contributed to the drafting, review,
and approval of this manuscript.
Acknowledgments
We are grateful to the Indonesia Demographic and Health
Survey Program for access to data. The project was fully
supported by the Directorate of Research and Community
Engagement of Universitas Indonesia, grant number NKB-
923/UN2.RST/HKP.05.00/2020. The funders had no role in the
design of the study; in the collection, analyses, or
interpretation of data; in the writing of the manuscript, or in
the decision to publish the results.
Conflicts of interest/Competing interests
The authors have no conflicts of interest associated with the
material presented in this paper.
References
1. McArthur JW, Rasmussen K, Yamey G. How many lives
are at stake? Assessing 2030 sustainable development
goal trajectories for maternal and child health. BMJ
(Clinical research ed). 2018;360:k373.
2. Nations U. Goal 3: Ensure healthy lives and promote
well-being for all at all ages 2015.
3. UNFPA. Trends in maternal health in Ethiopia:
challenges in achieving the MDG for maternal
mortality” in In-Depth Analysis of the EDHS 2000–2011.
Addis Ababa, Ethiopia: United Nations Population Fund
(UNFPA); 2012 [cited 2020 August 16]. Available from:
http://apps.who.int/iris/bitstream/handle/10665/19425
4/9789241565141_eng.pdf;jsessionid=41AA9370626219
4653B29C9FE1DA0532?sequence=1.
4. Fund TCsD. Accelerating Reductions in Maternal and
Newborn Mortality: Challenges and Opportunities: The
Children's Defense Fund; 2006 [cited 2020 June 10].
Available from:
http://cdf.childrensdefense.org/site/DocServer/Accel
erating_Reductions_in_MNM.pdf?docID=2148.
5. Choulagai B, Onta S, Subedi N, Mehata S, Bhandari GP,
Poudyal A, et al. Barriers to using skilled birth
attendants' services in mid- and far-western Nepal: a
cross-sectional study. BMC international health and
human rights. 2013;13:49.
6. Laksono A, Paramita A, Dwi Wulandari R.
Socioeconomic Disparities of Facility-Based Childbirth
in Indonesia2019.
7. Organization WH. Maternal mortality : level and trends
2000 to 2017 Geneva: World Health Organization; 2019
[cited 2020 July 14]. Available from:
https://www.who.int/reproductivehealth/publications
/maternal-mortality-2000-2017/en/.
8. UNICEF. Maternal and Newborn Health Disparities in
Indonesia. New York: UNICEF, 2016.
9. Hijazi HH, Alyahya MS, Sindiani AM, Saqan RS, Okour
AM. Determinants of antenatal care attendance
among women residing in highly disadvantaged
communities in northern Jordan: a cross-sectional
study. Reproductive health. 2018;15(1):106.
10. Arunda M, Emmelin A, Asamoah BO. Effectiveness of
antenatal care services in reducing neonatal mortality
in Kenya: analysis of national survey data.
2017;10(1):1328796.
11. Laksono AD, Rukmini R, Wulandari RD. Regional
disparities in antenatal care utilization in Indonesia.
2020;15(2):e0224006.
12. McNellan CR, Dansereau E, Wallace MCG, Colombara
DV, Palmisano EB, Johanns CK, et al. Antenatal care as
a means to increase participation in the continuum of
maternal and child healthcare: an analysis of the
poorest regions of four Mesoamérican countries. BMC
Pregnancy Childbirth. 2019;19(1):66.
13. Awasthi MS, Awasthi KR. Utilization of Antenatal Care
Services in Dalit Communities in Gorkha, Nepal: A
Cross-Sectional Study. 2018;2018:3467308.
14. Zhao Q, Huang ZJ, Yang S, Pan J, Smith B, Xu B. The
utilization of antenatal care among rural-to-urban
migrant women in Shanghai:a hospital-based cross-
sectional study. BMC public health. 2012;12(1):1012.
15. Saad-Haddad G, DeJong J, Terreri N, Restrepo-Méndez
MC, Perin J, Vaz L, et al. Patterns and determinants of
antenatal care utilization: analysis of national survey
data in seven countdown countries. Journal of global
health. 2016;6(1):010404.
16. Heaman MI, Martens PJ, Brownell MD, Chartier MJ,
Thiessen KR, Derksen SA, et al. Inequities in utilization of
prenatal care: a population-based study in the
Canadian province of Manitoba. BMC Pregnancy
Childbirth. 2018;18(1):430.
17. Tripathi V, Singh R. Regional differences in usage of
antenatal care and safe delivery services in Indonesia:
findings from a nationally representative survey. BMJ
open. 2017;7(2):e013408.
109

18. Sekine K, Carter DJ. The effect of child marriage on the
utilization of maternal health care in Nepal: A cross-
sectional analysis of Demographic and Health Survey
2016. PLoS One. 2019;14(9):e0222643.
19. Tekelab T, Chojenta C, Smith R, Loxton D. Factors
affecting utilization of antenatal care in Ethiopia: A
systematic review and meta-analysis. PLoS One.
2019;14(4):e0214848.
20. Titaley CR, Dibley MJ, Roberts CL. Factors associated
with underutilization of antenatal care services in
Indonesia: results of Indonesia Demographic and
Health Survey 2002/2003 and 2007. BMC public health.
2010;10:485.
21. Beeckman K, Louckx F, Putman K. Determinants of the
number of antenatal visits in a metropolitan region.
BMC public health. 2010;10:527.
22. Ali AA, Osman MM, Abbaker AO, Adam I. Use of
antenatal care services in Kassala, eastern Sudan. BMC
Pregnancy Childbirth. 2010;10:67.
23. Singh R, Neogi SB, Hazra A, Irani L, Ruducha J, Ahmad
D, et al. Utilization of maternal health services and its
determinants: a cross-sectional study among women in
rural Uttar Pradesh, India. Journal of health, population,
and nutrition. 2019;38(1):13.
24. Acharya D, Khanal V, Singh JK, Adhikari M, Gautam S.
Impact of mass media on the utilization of antenatal
care services among women of rural community in
Nepal. BMC research notes. 2015;8:345.
25. Ye Y, Yoshida Y, Harun-Or-Rashid M, Sakamoto J.
Factors affecting the utilization of antenatal care
services among women in Kham District,
Xiengkhouang province, Lao PDR. Nagoya journal of
medical science. 2010;72:23-33.
26. Arthur E. Wealth and antenatal care use: implications
for maternal health care utilisation in Ghana. Health
economics review. 2012;2(1):14.
27. Tanou M, Kamiya Y. Assessing the impact of
geographical access to health facilities on maternal
healthcare utilization: evidence from the Burkina Faso
demographic and health survey 2010. BMC public
health. 2019;19(1):838.
110

RESEARCH ARTICLE
EXPLORING THE CHALLENGES OF PREHOSPITAL EMERGENCY
PERSONNEL IN COVID-19 PANDEMIC: A QUALITATIVE STUDY
Zohreh Sarchahi1, Hasan Ghodsi1*, Rasool lakziyan2, Razieh Froutan3, 4
1. Department of Nursing, School of Nursing and Midwifery, Neyshabur University of Medical Sciences, Neyshabur, Iran
2. Department of Nursing, Sabzevar University of Medical Sciences, Sabzevar, Iran.
3. Nursing and Midwifery Care Research Center, Mashhad University of Medical Sciences, Mashhad, Iran
4. Department of Medical-Surgical Nursing, School of Nursing and Midwifery, Mashhad University of Medical Sciences, Mashhad,
Iran
Correspondence: Hasan Ghodsi; [email protected]
ABSTRACT
OBJECTIVES:
To explore the challenges and experiences of Prehospital Emergency Personnel in the context of the COVID-19 pandemic
in Iran.
DESIGN:
Qualitative study
SETTING:
Prehospital Emergency Medical Services (EMS), Iran.
PARTICIPANTS:
15 Prehospital Emergency personnel were invited to participate. Sem i-structured in-depth interviews were conducted
between Januarys to March 2021.
RESULTS:
Themes relating to challenges of Prehospital Emergency Personnel in COVID – 19 were: Lack of preparedness of EMS for
the pandemic, shortage of Personal Protective Equipment (PPE), psychological distress and negative emotions, shortage
of staff and challenges associated with delivering care for patients using PPE.
CONCLUSIONS:
The current study found that Health Care Workers (HCWs) in the prehospital emergency field had multiple challenges in
caring for their patients during COVID-19. Therefore, they are vulnerable in this situation. These challenges must be
addressed in order to protect them in pandemics.
KEYWORDS
Pandemics; COVID-19; Personal Protective Equipment; Emergency Medical Services; Psychological Distress .
111

INTRODUCTION
On 1 December 2019, the global outbreak of the novel
Severe Acute Respiratory Corona Virus-2 (SARS-CoV-2),
known as COVID-19, was reported by the World Health
Organization. This was the first pandemic caused by the
virus. [1] By December 14, 2021, more than 271 million
confirmed cases and 5.3 million deaths of COVID-19
globally were reported. [2] In Iran, the number of confirmed
cases has been recorded at more than 3 million with 82,217
deaths as of June 15, 2021. Due to exposure to patients with
COVID-19, front-line Health Care Workers (HCWs) were at
high risk of this infection which may contribute to death. In
Iran, ithas been registered that over 12,000 HCWs have
been infected and 164 HCWs have died from COVID-19 so
far. [3] The HCWs who are in contact with the pandemic
COVID-19 may develop different psychological and
mental disorders including symptoms of depression,
insomnia, anxiety, posttraumatic stress disorder (PTSD), and
burnout.
In a study conducted in Wuhan, China, it was found during
the COVID-19 pandemic that a significant percentage of
HCWs have been experiencing symptoms of depression
(50.4%), anxiety (44.6%), insomnia (34%) and distress (71%).
[4] Another study conducted on HCWs during COVID-19
showed that 39.1% of front-line HCWs during the fight
against COVID-19 had been challenged with
psychological problems. [5]
Prehospital Emergency Personnel are among the front-line
HCWs who provide urgent care to people, are at a
different risk of infections because they have close contact
with both symptomatic and asymptomatic cases.
Therefore, during the COVID-19 crisis, in providing essential
care to patients, Emergency Medical Services (EMS) may
encounter the factors associated with increased risk of
anxiety, fear of infection, and burnout. [6]
Due to the fact that there is still not enough information
available about this disease, and its form is getting
changed every day, this intensifies the difficult decision-
making for HCWs who have faced in these situations. [7]
However, a number of studies have been conducted on
previous challenges facing pre-hospital emergency care
staff, [3-8] the challenges will be certainly different than
before considering the different nature, spread rate and
mortality of SARS-CoV-2.
The aim of this study was to investigate the
challenges experiences with Prehospital Emergency
Personnel in the context of the COVID-19 pandemic in Iran.
METHODS
DESIGN AND SETTING
This study adopted a conventional approach to qualitative
content analysis. [9] Semi‑structured interviews were
conducted with Prehospital Emergency Personnel from the
different provinces of Iran from 20 January to 30 March
2021. EMS Iran is an affiliate of Iran’s Ministry of Health. There
are 2,190 Emergency bases in 31 provinces of Iran.
PARTICIPANTS
The participants were chosen using a purposive sampling
method with maximum diversity in education, age and
gender. We selected the participants who had at least six-
months experience in caring for patients with COVID-19 in
the field through prehospital emergency medical services
to obtain realistic perspectives from the challenges EMS
faced. Sampling continued until a point of theoretical
saturation was reached, i.e., when no new data were
generated. The research participants were asked to sign a
consent form in which the participants have a right to
withdraw from the study at any time.
DATA COLLECTION
Semi-structured in-depth interviews were conducted with
participants to explore the challenges EMS faced during
the COVID-19 pandemic period. On average, the
interviews lasted between 45 and 60 minutes and were
conducted by the same interviewer H Gh (in Persian). The
time and location of the interviews were arranged by
agreement with the participants. The interview guide and
questions were developed and modified after review of
the related literature using opinions from experts and was
tested in two pilot interviews. One major question and
several minor ones were set.
An interview guide containing a list of general open-ended
questions, such as “How do you describe your work
experiences in EMS during the COVID-19?”, “What
challenges have you been facing during missions with
patients who needed care for COVID-19?” and if needed,
a probe question, “Could you describe in detail what you
mean?” was used. The interviews continued until data
saturation. To ensure data saturation, two additional
participants were interviewed.
112

DATA ANALYSIS
The deployed analytical approach was a qualitative
content analysis (Graneheim and Lundman approaches).
[10] Audio-recorded interviews were transcribed verbatim
and verified by participants. For immersion, the interviews
were read several times and the data analysis was started
line by line and the initial codes were extracted. Data were
compared to find similarities and differences, then labeled
and classified into categories and subcategories. Finally,
the underlying meanings were interpreted as themes. Data
from the interviews were initially coded by H Gh and codes
were cross-checked with R F.
RIGOR
Trustworthiness of research was established through
credibility, dependability, conformability and
transferability. To fulfill this objective, prolonged
engagement with data, constant comparison analysis,
member checks, peer checks and maximum variation of
sampling were accomplished. [11]
ETHICAL CONSIDERATIONS
The Ethical Committee of Neyshabur University of Medical
Sciences, Iran approved this study (IR.NUMS.REC.1400.013).
The principles of informed consent and confidentiality were
observed carefully. All participants were assured about
their anonymity and confidentiality of any information.
Moreover, all of them were assured that they could quit the
study at will.
RESULTS
15 participants consisting of six paramedics, three
dispatchers, one anesthesiology assistant, two physicians
and three nurses were studied. They were within the age
range of 24-48 years, with an average age of 33.8 ± 8.29
years (66.7% male) and a mean working history of 9.67 ±
6.37 years (Table 1).
TABLE 1. PARTICIPANT CHARACTERISTICS
NO AGE(YEARS) POSITION WORKING EXPERIENCE(YEARS)
1 25 Paramedic 3
2 45 Nurse 20
3 36 Dispatcher 5
4 43 Paramedic 15
5 24 Paramedic 5
6 32 Paramedic 8
7 24 Anesthesiology assistant 3
8 35 Nurse 12
9 48 Paramedic 22
10 43 Dispatcher 18
11 38 Physician 10
12 34 Nurse 8
13 25 Paramedic 5
14 25 Dispatcher 3
15 34 Physician 8
Challenges facing Prehospital EMS staff were classified
under five main categories including:
1- lack of preparedness of EMS for pandemic 2- Shortage
of personal protective equipment (PPE) 3- Psychological
distress and negative emotions in staffs 4- Shortage of staff
5-Challenges associated with delivering care for patients
using PPE (Table 2).
113

TABLE 2. THEMES AND SUB-THEMES
N THEME SUB-THEMES
1 lack of preparedness of EMS for pandemic
- Education & training gap
- Inconsistent Guidelines
- Lack of operational plan
2 Shortage of Personal Protective Equipment
-Shortage of mask,
hand rub, PPE
- Barrier in access
- Lack of alternative
3 Psychological distress and negative emotions in staffs
- Risk of disease
- Transition disease to family
members
- Unknown nature of disease
- Fear of death
- Sympathy with family of
patients
4 Shortage of staff
-Self isolation period
- Positive test
- Increased missions
- Leave the job
- Setting up new EMS centers
5 Challenges associated with delivering care for patients using PPE
- Providing care problem
- Communication problem
- Uncomfortable PPE
- Hardness of eating & drinking
with PPE
LACK OF PREPAREDNESS OF EMS FOR PANDEMIC
Most participants agreed that all pre-hospital emergency
care staff were not sufficiently prepared for this pandemic.
They also stated that at the start of the COVID-19 outbreak,
the operational plan to respond to this pandemic was not
clearly delineated.
“We were deeply surprised; it was difficult to believe that
such a thing had happened. First few days, there were no
special procedures and safety instructions for receiving
and transporting a patient, ambulance cleaning and
disinfection and so on. We felt as if we were drowning in the
sea while we were not prepared to deal with that”. P8
“No one, even, had thought that we’ve faced such a
global catastrophe, we were all stunned. We weren’t
adequately trained and qualified to deal with this disease.
Even, in early days, we didn’t know how to put the PPE on
and take it out to avoid being contaminated. It was the first
time I had experienced dealing with an infectious disease”.
P4
“Early on, there weren’t any specific instructions, dispatch
protocols and standard operating procedures for receiving
the patients with COVID-19. We were limited by
inadequate information, and every day we received a
new circular that might be different from the last-day one
and this can make a person confused. Everything seemed
to be going wrong. It can be said that we weren’t well-
prepared to deal with such this unknown infectious
disease”. P14
SHORTAGE OF PERSONAL PROTECTIVE EQUIPMENT
(PPE)
All participants noted the shortage of personal protective
equipment that was required for doing missions early in the
pandemic. The biggest shortage was profound among
personal protective equipment and N95 filtering masks.
114

They were really worried about being infected with COVID-
19 due to the lack of equipment (especially those with
underlying medical conditions or pregnant women).
“Early days, there were shortages of essential PPE for
everyone such as respirators masks. We had to wear the
same clothes for more than one mission without changing
them. We don’t have enough appropriate gloves and
glasses”. P11
Sometimes, there wasn’t an appropriate size of personal
protective clothing for us. You know, most of these clothes
are equal in size and they weren’t well-fit for me because
I’m short. The masks were not correctly fixed and fitted on
my face well. Some filtering respirators didn’t meet the
quality of standards and their filters got detached.
PSYCHOLOGICAL DISTRESS AND NEGATIVE
EMOTIONS IN STAFFS
The participants were sharing their experiences including
the fear of getting infected and seriously ill due to the
coronavirus which would result in death.It being a horrible
disease because of its unknown nature and of being a
carrier and transmitting it to another person. Also, they were
worried about returning home and infecting their family
with the virus.
“Every day, on the way to go to work, I thought it was the
last time that I would see my family. Because our mission
was to give care to COVID-19 patients every day, I was
afraid of becoming infected by the virus. I got nervous
when I heard of the death of patients and my colleagues”.
P5
“There is no(sic) enough information about the disease
including how to transmit, treat and bury the bodies. These
patients were dying alone in hospital rooms. The hospital
neither allows the patients to have visitors and nor delivers
the dead patients’ bodies to their families. Nobody is
permitted to participate in their burial ceremonies. This is
too deep anxiety that I feel like I'm going insane. I don’t
want to die like this (having a lump in his throat)”. P15
SHORTAGE OF STAFF
All participants pointed out the severe shortage of staff,
due to the 14-day self-isolation period when they tested
positive for COVID-19, the increased number of EMS
missions and the need to establish new bases at EMS
centers during the COVID-19 pandemic.
“According to instruction, the staff had to self-isolate when
they developed the early symptoms of the COVID-19. Also,
the test results were given within 2 days. These compulsory
leaves and subsequently 14-day sick leaves for a positive
COVID-19 test result put a great deal of pressure on other
staff who had to take mandatory overtime.” P1
"First days, the people callings to EMS center was
harassment. They called EMS center to ask their questions
about Corona and the number of deaths and
hospitalizations caused by COVID-19. We had to put more
staff in the dispatch to answer the calls, while most of the
staff went on sick leave and the shortage of staff was
suffering.” P3
“In the past one year, 80% of our pre-hospital emergency
staff have tested positive. Therefore, these staff go on 14-
day sick leave and it’s necessary to find the replacement
staff. On the other hand, since the number of missions was
increasing, we had to establish some mobile bases that it
caused the double shortage.” P2
CHALLENGES ASSOCIATED WITH DELIVERING CARE
FOR PATIENTS USING PPE
Most of the participants claimed that providing care for
patients was difficult and tedious when wearing PPE. They
also explain their other problems with PPE including profuse
sweating, shortness of breath, local pain and damage to
their ears and face with prolonged use of a mask.
“You know, working in this coverall is really difficult. It’s hard
to breathe during PPE use. You sweat profusely and they
are cumbersome. Totally, it’s better to say that you get
sweltered when you use PPE and respirator for a long time.
I’m not comfortable with them at all.” P8
“When I have to intubate the patients, either I should be
afraid of being infected intubating or we have to work in
impermeable PPE that makes us feel someone ties our
hands and then asks us to continue working. My face shield
gets foggy and hard to see out. Providing care for patients
is really hard in this clothing.” P 7
“We have to put on the PPE when the dispatch has
announced a COVID-19 mission. This means a twofold
increase in mission time. However, this wasted time is vital in
prehospital care, but there is no choice. As a result, we
have to speed up the ambulance to compensate for this
wasted time.” P12
115

DISCUSSION
This study found the challenges facing prehospital
emergency personnel during COVID-19 pandemic
included inadequate preparedness of EMS for the
pandemic, shortage of personal protective equipment,
psychological distress and negative emotions in staffs,
shortage of staff and challenges associated with delivering
care for patients using PPE. To our knowledge, this study is
the first qualitative study explaining the challenges of
prehospital emergency personnel during the COVID-19
pandemic in Iran.
The results of our study showed that the first category of
challenges was inadequate pandemic preparedness
levels of EMS. This theme was pointed out by other
researchers. [7, 12] The preparedness of EMS is a key factor
to control and manage any disaster such as natural,
manmade or pandemics. If they aren’t prepared for such
a situation, they may be scared, confused, or can’t do their
jobs properly. According to the above, it is necessary that
prehospital emergency medical managers have a
preparedness plan to control and manage the pandemic.
They must have ongoing policies to address the epidemic
or pandemic.
Another category that is identified by this research was the
shortage of personal protectiveeEquipment. PPE is one of
the most important pieces of equipment to deal with a
pandemic like COVID-19. [13, 14] Shortage of PPE has been
reported due to the increasing worldwide demand (15).
Nearly, all the participants reported a severe shortage of
PPE in their workplaces. Shortage of PPE can lead to
infection in the EMTs; hence, perceived shortages were a
major source of stress for participants in this study, which is
reported in different studies. [12, 16-18] The participants
reported several adaptations in delivering care in
prehospital emergency medical services in order to save
PPE. Availability of PPE in the right quality and the right
quantity at the right place and right time to reduce the
stress of the staff is necessary. Adequate stock of PPE must
be prepared by all healthcare organizations especially for
frontline HCWs such as EMS staff.
When people encounter an unknown disease and
pandemic, they become gripped by fear and anxiety. [19]
This phenomenon is not new for COVID-19. [20] Almost all
participants explained that fear and anxiety affected their
work after this pandemic which is reported in different
Studies. [5, 7, 21-23] The reasons for fear and anxiety which
were explained by participants included
suspicion/confirmation for COVID-19, insufficient PPE,
insufficient knowledge about disease, risk of infection
transmission in the family. Health care managers have
inevitably established psychological support systems to
counter fear and anxiety in pandemics such as COVID-19
amongst their staff. Moreover, it is important for EMS staff to
learn coping strategies to deal with fear and anxiety in
various situations.
Another theme drawn from interviews was the shortage of
staff which is explained in other studies. [7, 24, 25] The
reasons for this shortage of staff are increased daily EMS
calls and dispatches, staff absence, extremely vulnerable
absence and 14-day self-isolation after a positive test. The
average number of daily calls and dispatches in the post-
outbreak periods was increased significantly. There was a
substantially higher number of EMS phone calls during the
post-outbreak period compared to the pre-outbreak
period. [25]
Most participants described that using PPE is necessary to
prevent infection, but it makes everything more difficult for
health care workers. Face sgields or glasses fog up whilst
performing procedures on patients such as intubation.
When using several layers of gloves, palpitations were less
effective in physical examination. When you are wearing
PPE communication with hearing-impaired older patients is
difficult; so, some participants reported removing their
masks when speaking about important issues with them.
Also putting on the PPE can reduce the activity of EMTs
while they drive an ambulance. These findings were
reported in previous studies. [12, 26, 27] Comfortable PPE is
an essential issue for health care providers such as EMS
staff. Participants said PPE coverall could reduce their
activity and focus at the scene. They noticed prolonged
use of PPE had led to some complications such as
headache, skin damage, and facial pain, difficulty in
breathing and physical tiredness. Participants said that PPE
use is not comfortable for a long time, it being time-
consuming, hot, tiring and restrictive in delivery of care. Our
findings showed that delay between a 115 call and EMS
arrival, increased about 1.5 minutes.
STRENGTH AND LIMITATIONS
To our knowledge this is the first research study to explore
challenges experiences with prehospital emergency
personnel in the context of the COVID-19 pandemic in Iran.
116

This research has provided a comprehensive account of
challenges associated with delivery cares to patients with
COVID –19 in the prehospital field in Iran.
CONCLUSION
The results of this study regarding the challenges of
prehospital emergency personnel in COVID-19 pandemic
showed that they are not adequately equipped to an
encounter with pandemics. Therefore, in preparation for
further pandemics or public health emergencies, more
efforts and coordination should be made to remove or
reduce challenges for health care workers.
This qualitative study was conducted only utilizing
interviews. In the future, research involving other methods
may be needed to cover all aspects of this issue. Another
limitation was the small number of participants. For this
limitation, we chose our participants with maximum
diversity and all of them were experienced in EMS.
Supplemental employee assistant such as financial,
emotional or other supports can reduce their pressure and
useful for the staff in order to improve their psychological
state.
ACKNOWLEDGEMENTS
The authors would like to thank all the participants for their
contribution to the study.
AUTHOR CONTRIBUTIONS
The conception and design of the work was by HGH, RF
and EM. Interviews conducted by HGH. Data from the
interviews were coded by HGH and codes were cross-
checked with RF. HGH, RF, ZS and MA were involved in the
acquisition, analysis, or interpretation of data. All authors
approved the submitted version and agree to be
accountable for all aspects of the work, ensuring that
questions related to the accuracy or integrity of any part of
the work will be answered.
FUNDING/SUPPORT
This study was funded by Neyshabur University of Medical
Sciences, Grant/Award number: 99-01-218.
CONFLICT OF INTEREST
None declared.
DATA AVAILABILITY STATEMENT
Data are available in a public, open access repository.
Data are available upon reasonable request. The data
used for this study are qualitative, and the original
transcripts can be made available from the first author
upon reasonable request.
ETHICS APPROVAL
The Ethical Committee of Neyshabur University of Medical
Sciences, Iran approved this study (IR.NUMS.REC.1400.013).
References
1. World Health Organization (WHO). Director-General’s
opening remarks at the media briefing on COVID-19-11
March 2020. [Available from:
https://www.who.int/dg/speeches/detail/who-
director-general-s-opening-remarksat-the-media-
briefing-on-COVID-19—11-march-2020. Accessed 12
April 2021.
2. Johns Hopkins University. COVID-19 Dashboard by the
Center for Systems Science and Engineering (CSSE) at
Johns Hopkins University (JHU).
https://coronavirus.jhu.edu/map.html . Accessed 15
June 2021.
3. Erdem H, Lucey DR. Healthcare worker infections and
deaths due to COVID-19: A survey from 37 nations and
a call for WHO to post national data on their website.
Int J Infect Dis. 2021;102:239-41. doi:
10.1016/j.ijid.2020.10.064
4. Lai J, Ma S, Wang Y, Cai Z, Hu J, Wei N, et al. Factors
Associated With Mental Health Outcomes Among
Health Care Workers Exposed to Coronavirus Disease
2019. JAMA Network Open. 2020;3(3):e203976-e. doi:
10.1001/jamanetworkopen.2020.3976.
5. Dai Y, Hu G, Xiong H, Qiu H, Yuan XJM. Psychological
impact of the coronavirus disease 2019 (COVID-19)
outbreak on healthcare workers in China.
2020.03.03.20030874. doi:
https://doi.org/10.1101/2020.03.03.20030874.
6. Anderson C, Pooley JA, Mills B, Anderson E, Smith EC.
Do Paramedics Have a Professional Obligation to Work
During a Pandemic? A Qualitative Exploration of
Community Member Expectations. Disaster medicine
and public health preparedness. 2020;14(3):406-12.
DOI: 10.1017/dmp.2020.212.
117

7. Nyashanu M, Pfende F, Ekpenyong M. Exploring the
challenges faced by frontline workers in health and
social care amid the COVID-19 pandemic:
experiences of frontline workers in the English Midlands
region, UK. Journal of interprofessional care.
2020;34(5):655-61.
https://doi.org/10.1080/13561820.2020.1792425
8. Sorani M, Tourani S, Khankeh HR, Panahi S. Prehospital
Emergency Medical Services Challenges in Disaster; a
Qualitative Study. Emergency (Tehran, Iran).
2018;6(1):e26. PMCID: PMC6036538
9. Strauss a cj. Basics of qualitative research: Grounded
theory procedures and techniques.4 ed. Losangeles:
Sage publications; 2015.
10. Graneheim UH, Lundman B. Qualitative content
analysis in nursing research: concepts, procedures and
measures to achieve trustworthiness. Nurse education
today. 2004;24(2):105-12. DOI:
10.1016/j.nedt.2003.10.001
11. Boswell C CS. Introduction to Nursing Research:
Incorporating Evidence Based Practice. Boston, MA:
Jones & Bartlett Publishers; 2007.
12. Hoernke K, Djellouli N, Andrews L, Lewis-Jackson S,
Manby L, Martin S, et al. Frontline healthcare workers'
experiences with personal protective equipment
during the COVID-19 pandemic in the UK: a rapid
qualitative appraisal. BMJ open. 2021;11(1):e046199.
DOI: 10.1136/bmjopen-2020-046199
13. Cook TM. Personal protective equipment during the
coronavirus disease (COVID) 2019 pandemic – a
narrative review. 2020;75(7):920-7. DOI:
10.1111/anae.15071
14. Sharma N, Hasan Z, Velayudhan A, M. A. E, Mangal DK,
Gupta SD. Personal Protective Equipment: Challenges
and Strategies to Combat COVID-19 in India: A
Narrative Review. 2020;22(2):157-68.
https://doi.org/10.1177/0972063420935540.
15. World Health Organization & United Nations Children's
Fund (UNICEF). (2020). Water, sanitation, hygiene, and
waste management for the COVID-19 virus: interim
guidance, 19 March 2020. World Health Organization.
https://apps.who.int/iris/handle/10665/331499.
License: CC BY-NC-SA 3.0 IGO.
16. Liu Q, Luo D, Haase JE, Guo Q, Wang XQ, Liu S, et al.
The experiences of health-care providers during the
COVID-19 crisis in China: a qualitative study. The Lancet
Global health. 2020;8(6):e790-e8 DOI: 10.1016/S2214-
109X(20)30204-7 .
17. Shanafelt T, Ripp J, Trockel M. Understanding and
Addressing Sources of Anxiety Among Health Care
Professionals During the COVID-19 Pandemic. JAMA.
2020;323(21):2133-4. doi:10.1001/jama.2020.5893
18. Gordon A, Lyons C, Rao S, Finoli L. Health Care Workers'
Challenges in the Care of a COVID-19 Patient. Critical
care nursing quarterly. 2020;43(4):400-6 DOI:
10.1097/CNQ.0000000000000325 .
19. DeJean D, Giacomini M, Vanstone M, Brundisini F.
Patient experiences of depression and anxiety with
chronic disease: a systematic review and qualitative
meta-synthesis. Ontario health technology assessment
series. 2013;13(16):1-33. PMCID: PMC3817854
20. Camara A, Sow MS, Touré A, Sako FB, Camara I,
Soumaoro K, et al. Anxiety and depression among HIV
patients of the infectious disease department of
Conakry University Hospital in 2018. Epidemiology and
infection. 2020;148:e8. doi: 10.1017/S095026881900222X
21. Du J, Dong L, Wang T, Yuan C, Fu R, Zhang L, et al.
psychological symptoms among frontline healthcare
workers during COVID-19 outbreak in Wuhan. Gen
Hosp Psychiatry. 2020; 67:144-5 doi:
10.1016/j.genhosppsych.2020.03.011.
22. Sanghera J, Pattani N, Hashmi Y, Varley KF, Cheruvu
MS, Bradley A, et al. The impact of SARS-CoV-2 on the
mental health of healthcare workers in a hospital
setting-A Systematic Review. Journal of occupational
health. 2020; 62(1):e12175
https://doi.org/10.1002/1348-9585.12175
23. Fathi E, Malekshahi Beiranvand F, Hatami Varzaneh A,
Nobahari A. Health Care Workers Challenges during
Coronavirus Outbreak: The Qualitative Study. mui-jbs.
2020;18(2):237-48. URL: http://rbs.mui.ac.ir/article-1-
745-en.html
24. Xu H, Intrator O, Bowblis JR. Shortages of Staff in Nursing
Homes During the COVID-19 Pandemic: What are the
Driving Factors? Journal of the American Medical
Directors Association. 2020;21(10):1371-7. doi:
10.1016/j.jamda.2020.08.002
25. Saberian P, Conovaloff JL, Vahidi E, Hasani-Sharamin P,
Kolivand P-H. How the COVID-19 Epidemic Affected
Prehospital Emergency Medical Services in Tehran,
Iran. West J Emerg Med. 2020;21(6):110-6. DOI:
10.5811/westjem.2020.8.48679
118

26. Kim Y. Nurses' experiences of care for patients with
Middle East respiratory syndrome-coronavirus in South
Korea. American journal of infection control.
2018;46(7):781-7. DOI: 10.1016/j.ajic.2018.01.012
27. Lam KK, Hung SY. Perceptions of emergency nurses
during the human swine influenza outbreak: a
qualitative study. International emergency nursing.
2013;21(4):240-6. DOI: 10.1016/j.ienj.2012.08.008
119

RESEARCH ARTICLE
IMPACT OF COVID-19 ON MENTAL HEALTH ISSUES IN INDIA:
UNDERSTANDING THE FACTORS OF SUICIDES DUE TO
PANDEMIC
Subhra Rajat Balabantaray, Deepak Bangwal, Upananda Pani
University of Petroleum and Energy Studies, India
Correspondence: [email protected]
ABSTRACT
This study seeks to evaluate how the COVID-19 pandemic is not just impacting tremendously on physical health, rather it
has a serious effect on the psychological health as well as the mental health of individuals. This needs to be addressed on
an urgent basis. The paper looks forward to examing the various kinds of repercussions the current pandemic is having
with regards to the deterioration of mental health conditions among individuals, resulting in suicide. The outbreak of
Coronavirus has brought about massive changes in India. A lot of misinformation is circulating and this has subsequently
led to the creation of anxiety issues among individuals.
KEYWORDS
Covid-19; mental health; suicide; India
INTRODUCTION
The COVID-19 pandemic has infected 178,964,181 in the
world and it claimed lives of 3,875,656 individuals across the
globe (as on 20th June 2021) [38]. India has witnessed
2,98,81,405 cases with 3,86,741 deaths as on20th June 2021)
[38]. The only silver lining that provides a ray of hope is the
discharged/ cured number of cases in India which stands
at 2,87,58,560 as on 20th June 2021[38]. The disease which
started from Wuhan, China [1] is seen o be spreading
across the world [2] like a wildfire and is responsible for
causing high degrees of morbidity and mortality. The World
Health Organisation (WHO) [3] declared COVID-19 as a
pandemic as it led to this global health crisis. The pandemic
has shaken healthcare systems worldwide. [4, 32]
The pandemic is considered as one of the deadliest and
biggest challenge at the global level and can be
designated as a global health crisis. [5, 31] During these
testing times, issues of mental health were reported from
across the globe. [6, 20] Mental health is the combination
of emotional, psychological and social well being. It has an
impact they way individuals, feel, think and display various
behaviours. This also assists in determining as how people
handle stress and also make various choices.
Considering the catastrophe the pandemic is capable of,
it was witnessed that several countries initiated a lockdown
process thereby to ensure maximum social distancing
among individuals to curb the spread. [7–10] The mitigation
strategies adopted by various countries included
cancelling all mass gatherings as well as shutting down
120

educational institutions, places of work, religious places
and places of worship [4,11] which could potentially trigger
the spread of the pandemic. As a result, this led to a spike
in the mental health issues.
In the testing times of the unavailability of vaccine for the
virus and huge amount of population being susceptible to
it, the need of the hour was to ensure mechanisms to avoid
human contact, for which the lockdown was the best
possible policy strategy developed. Lockdowns initiated by
various countries had tremendous effect on the economy
and several research studies raised concerns regarding
enhancement of mental health issues. [12, 33] Scholarly
studies have documented that lockdown and isolation has
resulted in enhancement of psychological issues like,
anxiety, panic attacks, depression, trauma and extreme
levels of stress. [5, 13–17] Mamun and Griffiths [15] have
stated in their studies that psychological issues might have
contributed to around 90% of suicides.
COVID-19 is not only a national concern but has become
a challenge faced at the global level, with almost all
countries affected by it. In most countries, the healthcare
sector is facing tremendous challenges to deal with the
pandemic. In addition to that, no individual can make a
proper forecast as how long the virus is going to stay and
what number of individuals will be casualties. A pertinent
challenge to deal with the pandemic is the asymptomatic
nature of the disease. A major problem the pandemic is
posing is that close to 80% of individuals with COVID-19
show mild or no symptoms of the same, which is termed
“asymptomatic”, and only 14% of affected individuals are
said to be severe and another 6% are believed to be
critically ill. A chain reaction has started, owing to the lock
down initiated by the pandemic, which has resulted in
salary reductions, job loss and rising rates of unemployment
[18]. People are more than worried, as the world had not
experienced anything of this kind before. These
circumstances of job loss and unemployment appear to
have huge psychological effects in terms of anxiety,
depression and stress on people worldwide. [4] Sher in his
article [1] has highlighted the fact that the tendency of
suicidal thoughts among individuals may be a result of both
neurobiological factors and psychological factors.
Social Media is largely responsible for creating unnecessary
panic among individuals thereby spreading false and half-
baked information. [34] Considering the large-scale
uncertainty surrounding the virus and thereby the role of
social media in compounding the misinformation, it is a
perfect breeding ground for posing large scale threats to
the mental health issues of individuals. [34] COVID-19 has
certainly aroused several narratives and discussions about
the state of healthcare systems.
METHODOLOGY
An extensive review of literatures was basically conducted
to carry out the study. The study is a narrative review trying
to focus on the issues of suicides due to pandemic. The
research paper included literature focussing on issues of
suicides due to pandemic. Plenty of research paers are
available on impact of COVID-19, however, only the
research paers focussing on issues of mental helath and
suicide due to the impact of COVID-19 were taken into
consideration.
The present research paper relies on information collected
from secondary sources. Research papers, newspaper
articles, books and reports were analysed for the present
study. The keywords used to search for research articles
were suicide, suicidal tendencies, COVID-19, and mental
health. The central objective of this research paper is to
understand the psychosocial impact of the current
pandemic on individuals and subsequent development of
suicidal thoughts and suicidal tendencies among Indians.
1.CONCEPTUAL FRAMEWORK:
The effect of pandemic is unimaginable and
unpredictable. Such pandemics have brought about in the
past tremendous burden on the economy as well as having
had an impact on the mental health of various segments
of the population. Issues like anxiety, stress, depression
related issues are believed to be able to be addressed by
social interaction. However, the current pandemic and its
contagious nature, has demonstrated, has severely
minimised social interactions. Lockdown, shut down and
social distancing practices has even made things worse.
Subsequently, it had a tremendous toll on the mental
health of people. Suicides or suicidal tendencies are a
byproduct of two extreme situations in society. As has been
pointed by Durkheim, [36] extreme or less social integration
can lead to suicide and extreme or minimal social
regulation can lead to suicidal measures. [36]
2. STATEMENT OF THE PROBLEM
Various disease outbreaks, pandemics and epidemics are
largely responsible for generating widespread fear and
have the potential of inflicting negative thoughts in the
minds of individuals. [4, 30] de Hoog, Stroebe and de Wit
121

[19] have defined fear as an unfavourable state of mind,
which is the result of anticipation of a threat. There have
been instances where persons have committed suicide
only by the thought that they have contracted COVID-19
whereas the later autopsies have exhibited that they are
not affected by the virus. The fear of the virus is looming
larger than the virus itself. [15, 20]
Patients who have survived COVID-19 should be screened
and kept under review as they are the ones who are more
vulnerable and are more prone to commit suicide. [37] The
prime reason or the cause of suicide is the presence of
large amount of depression. It can be inferred here that the
patients who have recovered from COVID-19 face
tremendous amounts of mental stress and agony, which
can result in suicidal tendencies. [1] Sher has pointed out
[1] that the individuals who have recovered from COVID-
19 still need psychological guidance considering the fact
that they have undergone through a lot of mental turmoil.
Moreover, there is a need to examine the various
interventions that could be helpful to reduce suicidal
tendencies and psychiatric morbidity.
Considering the rate at which the COVID-19 is spreading, it
is evident that there will be far reaching effects of the same
and they will be largely responsible for an impact on the
psychology of individuals. [21] Negative consequences of
COVID-19 may extend far beyond its considerable death
toll, having a significant impact on psychological well-
being. The World Health Organization reports [22], suicide
happens to be one among the leading causes of death
worldwide. In this context there is a need to seriously
consider the case of COVID-19 and subsequent
repercussions on the mental health issues of individuals. In
addition to that, when we have instances of people
committing suicide with the apprehension of having
contracted COVID-19, there is a serious need to revisit and
debate these issues.
COVID-19 has become a global health concern that is
impacting both physical and mental health across
populations. Alongside depression, anxiety, distress,
phobia, and many other psychological impacts, [23, 24]
COVID-19 is also found to be associated with suicidal
behavior (1). Several cases of suicide are reported amid
COVID-19, [15, 20, 25] where the affected individual
experienced psychosocial stressors attributable to fears
and misconceptions on COVID-19. COVID-19 may directly
impact mental health and wellbeing among individuals
and populations; however, infection prevention measures
like lockdown may have indirect socioeconomic and
psychological implication. [13, 26] There is a need to
acknowledge the fact that India being a developing
country is not well equipped to deal with mental health
issues and the number of mental professionals is also very
less in number. In addition to that, it may be highlighted
here that the limited mental health professionals will never
be able to address to the needs and demands of the large
scale up surging cases relating to mental health. Hence, a
large number of mental health issues might go unnoticed
which are bound to create and pose large degree of
problems in future. This might further lead to issues in
employment and general lifestyle of various individuals
affected by COVID-19.
In this research paper, we describe suicides committed by
various individuals in India, evaluate the social and
psychological determinants of suicidal behavior in that
context, and discuss potential interventions addressing the
same.
REVIEW OF RELATED LITERATURE
The World Health Organisation [22] sets out that 703,000
people commit suicide every year and there are more than
20 suicide attempts per each suicide. The degree of
seriousness regarding the magnitude of mental health
issues can be gauged from the above information. Hence,
a detailed review of literature will help to understand as
how the global pandemic has made worse the already
problematic situation.
Halford, Lake and Gould in their article [27] “Google
searches for Suicides and suicide risk factors in the early
stages of the COVID-19 pandemic” have documented the
fact that due to COVID-19 there has been paramount
changes in the lifestyle of individuals. Speaking of the
various stressors, which come alongside the pandemic,
poses a serious threat to issues of mental health and
subsequently increases chances of individuals being
vulnerable to suicidal tendencies. This study was
conducted in United States of America to examine the
effect of COVID-19 on suicidal tendencies at the early
stage of this pandemic and it was based on the data
collected by Google trends. It revealed that there was a
drop in Google search regarding suicide and its related
concepts but in long run, there was a chance of increased
suicide ideation and known risk factors of suicide. As after
the crisis of September 11, there was a decrease in suicide
122
rates but in the long-run aftermath of the influenza
pandemic, there was an increase in suicide rates.
The authors Kakunje et al. [28] have highlighted that due to
COVID-19, people are forced to stay indoors and their
regular activities have been disturbed and restricted. Due
to this confinement and reduced social interaction, many
psychological problems started which includes high stress
levels, sleeplessness, and subsequently anxiety and suicide
cases were reported. To face this challenging time mental
health awareness, mindfulness and digital psychiatry has
played major roles.
In Asian countries, the research data is also corroborating
with the western research output in terms of mental health
issues like anxiety, depression and suicide during this
COVID-19 pandemic. Mamun and Ullah reported in their
study [24] have documented that in developing countries
people die not just because of CORONA rather many other
factors were there. Those were fear of infection, economic
recession and distress, fear of COVID-19 and work stress.
The data were collected from the cases reported at
Government level for the first time in their country to monitor
the suicide cases and to plan for intervention programmes
in line with need.
Mamun and Griffiths in their study [15] on Bangladesh have
documented first suicide case from the country as a result
of fear due to COVID-19. A man of Ramchandrapur village
in Bangladesh had returned from Dhaka and subsequently
he exhibited certain symptoms related to COVID-19 like
cold, fever and weight loss. Despite of being empathetic
towards his condition, villagers exhibited severe degree of
social avoidance and discrimination. This compelled him to
commit suicide but from biopsy, it was revealed that he did
not contract COVID-19 virus. The authors have suggested
that bias and prejudice claimed the life of an inncocent
person which could have been otherwise saved.
Rajkumar conducted a pilot study [23] of media reports on
suicides related to COVID-19 outbreak in India. They have
collected the data through media reports in the period of
12th March to 10th April 2020. The author has highlighted
various impact of COVID-19 on the mental health of
individuals.
The findings suggests that few of the suicides are due to a
direct outcome of COVID-19 related stress. The drastic and
sudden change in lifestyle induced by the pandemic has
caused potential threats to mental health and is leading to
suicidal tendencies and suicides. It can also be ascertained
that the state of mental health of majority of people has
comprehensively deteriorated during the COVID-19 phase
as compared to the pre COVID-19 phase. The lockdown,
social distancing and quarantine measures initiated by the
Government has led to sudden confinement and has
reduced as well as restricted social interaction. The
reduction in social interaction has paved the way for
emergence of various psychological issues like anxiety,
sleeplessness and suicide ideation. Moreover, the loss of
jobs, economic recession, work related stress and financial
insecurity is adding to the existing mental health issues. In
addition to that, the discriminatory practices targeted
towards an infected person is worsening the mental
strength of a person to deal with the virus.
FINDINGS AND DISCUSSIONS
The first suicide in India due to COVID-19 was reported from
the state of Andhra Pradesh on 12th February 2020 [35]. The
person belonging to the Chitoor district communicated to
a doctor he consulted that he was having some kind of viral
illness. However, with the extreme level of false news going
on around he believed that he has contracted COVID-19.
It was reported that for quite some time he was obsessed
with several videos where he saw many Chinese people
collapsing in public. Moreover, he was under the impression
that people who have contracted the virus will be forced
to stay in a quarantine facility against their will where the
treatment will be inhuman in nature. The very thought
process that he might contract other people or his friend
sand family, resulted in resistance by him as he was
supposedly throwing stones to family members and his
close friends who tried to come close to him. After a few
days, he was found hanging from a tree apparently having
committed suicide and the fear he had was that he had
contracted the virus.
Several developing and underdeveloped countries
including India are reporting cases of suicides. [20]
According to the reports of the United Nations
Development Programme (UNDP) [29] approximately 55%
of the world’s population do not have access to adequate
mechanisms relating to social protection and the current
pandemic poses serious threat to their level of subsistence.
It can also be highlighted that their basic accessibility to
education is severely compromised and in general it can
be said that their basic human rights are vulnerable as well.
123

The Indian Government initiated lockdown to contain the
virus and effectively manage the spread of the disease.
However, the lockdown initiatives have resulted in serious
and severe psychological distress among individuals
leading them to commit suicide or at least have suicidal
tendencies. Lockdown measures have resulted in
unavailability of alcohol and drugs, which has led to an
extreme situation of psychological distress. [35] This has
further resulted in individuals with serious degree of
addiction succumbing to self-harm activities. Moreover,
lockdown has resulted in economic crisis amounting to
unemployment and subsequent poverty thereby creating
a fertile ground for forcing people into psychological
distress. Excessive amount of psychological distress is largely
responsible for suicidal tendencies.
Media is primarily responsible for creating panic among
vulnerable individuals. Therefore, contemporary need is for
media houses to display a higher degree of integrity in
delivering their responsibilities and to ensure that the
transmission of news happens in such a manner that it
should not scare people.
CONCLUSION
COVID-19 is imposing psychosocial challenges among
individuals and populations, which can be unique and
severe among marginalized population. It is inferred from
our discussion that COVID-19 has brought about massive
changes in the social structure, which is largely responsible
for putting psychology of individuals under severe duress.
This has also resulted in surge in suicides in the country. This
requires adequate and comprehensive support of services
(mental health). Under the circumstances when the face-
to-face meeting with the psychologists is not a viable task,
several other options can be explored like tele-mental
health care. In addition to that, adequate and correct
knowledge of COVID-19 should be available for the public.
This would largely play a role in reducing unnecessary
panic and stress among individuals. Social Media
platforms, news channels, and other media platforms
should shoulder responsibilities to promote positive mental
health in dealing with COVID-19.
POLICY RECOMMENDATIONS:
• Organizing mass media campaigns and infotainment
programs to alleviate the fear of COVID-19 and
promote regular activities with preventive measures
• Reliable and authentic information programmes about
COVID-19 and promotion of tele-medical care
• Arranging community-based mental health promotion
programs engaging community stakeholders and
psychosocial care providers
• Incorporating mental health services in primary care as
well as telemedicine programs with provisions of
referral for qualified cases
• Providing targeted individual and group-based
interventions for individuals who have acute or chronic
psychosocial problems
References
1. Sher L. Are COVID-19 survivors at increased risk for
suicide? Acta Neuropsychiatrica. 2020 Oct;
32(5):270.
2. Ahmed SF, Quadeer AA, McKay MR. Preliminary
Identification of Potential Vaccine Targets for the
COVID-19 Coronavirus (SARS-CoV-2) Based on
SARS-CoV Immunological Studies. Viruses. 2020 Feb
25; 12(3): E254.
3. Lipsitch M, Swerdlow DL, Finelli L. Defining the
Epidemiology of Covid-19 — Studies Needed. N
Engl J Med. 2020 Mar 26; 382(13):1194–6.
4. Pakpour AH, Griffiths MD. The fear of COVID-19 and
its role in preventive behaviors. J Concurr Disord.
2020; 2(1):58–63.
5. Carbone SR. Flattening the curve of mental ill-
health: the importance of primary prevention in
managing the mental health impacts of COVID-19.
Ment Health Prev. 2020 Sep;19:200185.
6. Roy A, Singh AK, Mishra S, Chinnadurai A, Mitra A,
Bakshi O. Mental health implications of COVID-19
pandemic and its response in India. Int J Soc
Psychiatry. 2021 Aug;67 (5):587–600.
7. Iacobucci G. Covid-19: UK lockdown is “crucial” to
saving lives, say doctors and scientists. BMJ. 2020
Mar 24;368:m1204.
8. Pulla P. Covid-19: India imposes lockdown for 21
days and cases rise. BMJ. 2020 Mar 26; 368:m1251.
9. Passavanti M, Argentieri A, Barbieri DM, Lou B,
Wijayaratna K, Foroutan Mirhosseini AS, et al. The
psychological impact of COVID-19 and restrictive
measures in the world. J Affect Disord. 2021 Mar 15;
283:36–51.
10. Rubin GJ, Wessely S. The psychological effects of
quarantining a city. BMJ. 2020 Jan 28; 368:m313.
11. Anderson RM, Heesterbeek H, Klinkenberg D,
Hollingsworth TD. How will country-based
mitigation measures influence the course of the
124

COVID-19 epidemic? The Lancet. 2020 Mar 21;
395(10228):931–4.
12. Shigemura J, Ursano RJ, Morganstein JC, Kurosawa
M, Benedek DM. Public responses to the novel 2019
coronavirus (2019-nCoV) in Japan: Mental health
consequences and target populations. Psychiatry
Clin Neurosci. 2020; 74(4):281–2.
13. Brooks SK, Webster RK, Smith LE, Woodland L,
Wessely S, Greenberg N, et al. The psychological
impact of quarantine and how to reduce it: rapid
review of the evidence. The Lancet. 2020 Mar 14;
395(10227):912–20.
14. Shammi M, Bodrud-Doza Md, Towfiqul Islam ARMd,
Rahman MdM. COVID-19 pandemic,
socioeconomic crisis and human stress in resource-
limited settings: A case from Bangladesh. Heliyon.
2020 May 1; 6(5):e04063.
15. Mamun MA, Griffiths MD. First COVID-19 suicide
case in Bangladesh due to fear of COVID-19 and
xenophobia: Possible suicide prevention strategies.
Asian J Psychiatry. 2020 Jun; 51:102073.
16. Robertson E, Hershenfield K, Grace SL, Stewart DE.
The Psychosocial Effects of Being Quarantined
following Exposure to SARS: A Qualitative Study of
Toronto Health Care Workers. Can J Psychiatry.
2004 Jun 1; 49(6):403–7.
17. Sakib N, Bhuiyan AKMI, Hossain S, Al Mamun F,
Hosen I, Abdullah AH, et al. Psychometric
Validation of the Bangla Fear of COVID-19 Scale:
Confirmatory Factor Analysis and Rasch Analysis.
Int J Ment Health Addict. 2020 May 11;1–12.
18. Shader RI. COVID-19 and Depression. Clin Ther.
2020 Jun;42(6):962–3.
19. de Hoog N, Stroebe W, de Wit JBF. The processing
of fear‐arousing communications: How biased
processing leads to persuasion. Soc Influ. 2008
Jun;3(2):84–113.
20. Goyal K, Chauhan P, Chhikara K, Gupta P, Singh
MP. Fear of COVID 2019: First suicidal case in India !
Asian J Psychiatry. 2020 Mar;49:101989.
21. Sood S. Psychological effects of the Coronavirus
disease-2019 pandemic. Res Humanit Med Educ.
2020 Apr 1; 7:23–6.
22. Suicide worldwide in 2019 [Internet]. [cited 2021
Aug 26]. Available from:
https://www.who.int/publications-detail-
redirect/9789240026643
23. Rajkumar RP. COVID-19 and mental health: A
review of the existing literature. Asian J Psychiatry.
2020 Aug; 52:102066.
24. Mamun MA, Ullah I. COVID-19 suicides in Pakistan,
dying off not COVID-19 fear but poverty? – The
forthcoming economic challenges for a
developing country. Brain Behav Immun. 2020
Jul;87:163–6.
25. Sahoo S, Rani S, Parveen S, Pal Singh A, Mehra A,
Chakrabarti S, et al. Self-harm and COVID-19
Pandemic: An emerging concern – A report of 2
cases from India. Asian J Psychiatry. 2020
Jun;51:102104.
26. Bonaccorsi G, Pierri F, Cinelli M, Flori A, Galeazzi A,
Porcelli F, et al. Economic and social
consequences of human mobility restrictions under
COVID-19. Proc Natl Acad Sci. 2020 Jul 7;
117(27):15530–5.
27. Halford EA, Lake AM, Gould MS. Google searches
for suicide and suicide risk factors in the early
stages of the COVID-19 pandemic. PLOS ONE.
2020 Jul 24; 15(7):e0236777.
28. Kakunje A, Mithur R, Kishor M. Emotional well-being,
mental health awareness, and prevention of
suicide: Covid-19 pandemic and digital psychiatry.
Arch Med Health Sci. 2020 Jan 1; 8(1):147–53.
29. COVID-19: Looming crisis in developing countries
threatens to devastate economies and ramp up
inequality [Internet]. United Nations Development
Programme. [cited 2021 Aug 26]. Available from:
https://www.undp.org/press-releases/covid-19-
looming-crisis-developing-countries-threatens-
devastate-economies-and-ramp
30. Dash DP, Dash AK, Sethi N. Understanding the
Pandenomics: Indian Aviation Industry and Its
Uncertainty Absorption. The Indian Economic
Journal. 2021:00194662211013211.
31. Haldar A, Sethi N. The News Effect of COVID-19 on
Global Financial Market Volatility. Buletin Ekonomi
Moneter dan Perbankan. 2021 Mar 8;24:33-58.
32. Dash DP, Sethi N, Dash AK. Infectious disease,
human capital, and the BRICS economy in the time
of COVID-19. MethodsX. 2021 Jan 1;8:101202.
33. Haldar A, Sethi N. The effect of country-level
factors and government intervention on the
incidence of COVID-19. Asian Economics Letters.
2020 Oct 27; 1(2):17804.
34. Banerjee D, Rao TS. Psychology of misinformation
and the media: Insights from the COVID-19
pandemic. Indian Journal of Social Psychiatry.
2020 Oct 1;36(5):131.
35. Dsouza DD, Quadros S, Hyderabadwala ZJ,
Mamun MA. Aggregated COVID-19 suicide
125

incidences in India: Fear of COVID-19 infection is
the prominent causative factor. Psychiatry
research. 2020 Aug 1; 290:113145.
36. Lester D. A test of Durkheim's theory of suicide using
data from modern nations. International journal of
comparative sociology. 1989 Jan 1; 30(3-4):235-8.
37. Brown E, Gray R, Monaco SL, O'Donoghue B,
Nelson B, Thompson A, Francey S, McGorry P. The
potential impact of COVID-19 on psychosis: a rapid
review of contemporary epidemic and pandemic
research. Schizophrenia research. 2020 Aug
1;222:79-87.
38. Ministry of Health and Family Welfare, Government
of India. COVID-19 INDIA. 2020. Available:
https://www.mohfw.gov.in/ [Accessed 20
June2021]
126

RESEARCH ARTICLE
COVID-19 RELATED FACTORS ASSOCIATED WITH ANTENATAL
CARE IN RURAL BANGLADESH: A QUALITATIVE STUDY
S. M. Mostafa Kamal1*, M Anisur Rahman1, Sonia Singh2
1. Department of Mathematics, Islamic University, Kushtia-7003, Bangladesh
2. Toss Global Management, International City Dubai, UAE.
Correspondence: [email protected]
ABSTRACT
OBJECTIVE
The available literature reveals that usage of Maternal Health Care Services (MHCSs), including antenatal care (ANC),
has decreased significantly in developing countries due to the Corona Virus Disease (COVID-19) pandemic. However, the
COVID-19 related factors on MHCSs utilization in Bangladeshi women are yet to be examined. Therefore, this study
examines the effect of COVID-19 on the use of ANC services among rural communities in Bangladesh.
METHOD
A community-based qualitative study was conducted from May 01, 2021, to July 20, 2021, among selected pregnant
women residing in ten villages of the Kushtia District, Bangladesh. A total of ten focus group discussions (FGDs) were
conducted. Open Code 4.0 software was used to transcribe, translate, and analyze the data thematically.
RESULTS
Findings suggest that the measures taken by the government against the COVID-19 pandemic have significantly
decreased the optimum usage of ANC services. The need to shift the role of the health workforces is a vital factor that
has a negative effect on women's attitude towards seeking MHCSs. Anxiety, dirty and poor environment of the health
facilities, low quality of care, stigma, and risk minimization strategies are among other factors meant that pregnant women
refrained from seeking ANC services.
CONCLUSION
Undoubtedly, COVID-19 related factors have decreased the possible usage of ANC services among rural communities in
Bangladesh. Additional necessary health workforces are needed to be recruited urgently. A special wing for pregnant
women in each health facility may be opened as a one-stop ANC service center for the COVID-19 period. Policymakers
should take necessary actions to reduce anxiety among pregnant women and motivate them to use MHCSs for safe
motherhood.
KEYWORDS
Bangladesh, Covid-19, Antenatal care, Qualitative study, Health facility.
127

INTRODUCTION
The world has fallen under an unprecedented burden in
health care systems due to the Coronavirus Disease 2019
(COVID-19). The progress in maternal health care services
(MHCSs) utilization is now under threat due to this
unexpected pandemic. [1] COVID-19 has stuck both the
supply and demand for MHCS. On one side, usage of MHCS
has decreased with the pandemic; on the other side,
health facilities prepared and reorganized their maternity
care services to handle COVID-19 patients. [2]
Since the detection of COVID-19 first in China in December
2019, the virus has spread out rapidly worldwide. The virus
hastily changed its patterns many times. The Delta pattern
of the COVID-19, found first in India, has been moving swiftly
to other countries. As of July 20, 2021, the Worldometer
recorded more than 191,733,410 confirmed cases, 4113,054
deaths, and 174,585,511 recovered cases. [3] The latest
pattern of COVID-19 called Omicron is now the main
concern of the health professionals around the world.
In Bangladesh, the first three cases of COVID-19 were
detected on March 08, 2020, and the first death on March
18, 2020. [2] As of July 20, 2021, Bangladesh has witnessed
total death numbers of 18,325 people due to COVID-19. By
this time, a total of 1128,889 cases have been confirmed,
and 951,340 people have recovered. [4]
Bangladesh is one of the most vulnerable countries of the
COVID-19 pandemic due to its poverty and flawed health
care system. Lack of medical personnel, technicians,
equipments, medicines, and affordability costs has placed
the country at a higher risk of tackling the pandemic. The
World Health Organization (WHO) Emergency Committee
has announced that the transmission of COVID-19 could be
reduced and discontinued by contract tracing, early
detection, isolation, and prompt treatment. [5]
Irrespective of pregnancy status, women are at the same
risk of transmission of COVID-19, but morbidity outcomes
were found higher among pregnant women compared to
non-pregnant women. [6,7] Although studies are yet to
confirm the transmission of the virus from mother to fetus;
however, pregnant women may be at higher risk of viral
respiratory infections. Earlier, the Ebola outbreak in West
Africa increased maternal mortality by 75%. [8] Therefore,
researchers suspect that COVID-19 may increase maternal
mortality for women’s non-use of MHCSs. [9]
An estimated 295,000 women died in 2017 worldwide due
to pregnancy and child-birth related complications. [10]
The WHO recommends at least four antenatal care (ANC)
visits to improve maternal and newborn health; because
most of these births are avertable by early detection of
complications by ANC. [11] A study on Ethiopian women
added that ANC visits reduced by 39% to 52% due to
COVID-19. [12]
The critical elements of ANC include screening, treatment
of minor ailments, counseling, and immunization services.
[13] ANC visits are essential for both maternal and fetal
health. ANC visits help pregnant mothers providing
information regarding proper nutrition, detect and treat
danger signs, birth preparedness, and care for pregnancy
complications. [9] Pre-eclampsia, eclampsia, anemia,
diabetes, etc., may create severe complications and even
death, which ANC can detect. [9]
Bangladesh is committed to ensure safe motherhood for
each woman and aims to reduce the maternal mortality
ratio to 121 deaths per 100,000 live births by 2022. [14]
According to the latest Bangladesh Demographic and
Health Survey 2017-18, 43% of the rural women visited for
ANC at least four times which was 17% in 2004. [15] Studies
from developing countries, including Bangladesh, reported
that maternal age, parity, women’s education, place of
residence, religion, socioeconomic status, distance to
health care facilities, road difficulties etc. are important
determinants of ANC seeking. [15-17]
Pregnant women and mothers with newborns may
experience various difficulties in using MHCS caused by
lockdown and transportation problems during COVID-19
era. They may also be reluctant to go to health care
facilities due to anxiety and fear of COVID-19. [9] This study
aims to explore the effect of the COVID-19 pandemic on
ANC seeking among the rural pregnant women of the
South-Western part of Bangladesh using field survey data
by adopting a conceptual framework developed by
Hailemariam et al. [12] The conceptual framework has
been shown in Figure I.
128

FIGURE I: CONCEPTUAL FRAMEWORK FOR ANTENATAL CARE DURING CORONAVIRUS.
METHODS
STUDY DESIGN
This study is exploratory, descriptive, and qualitative by
nature. More specifically, the study aims to accumulate
perception, opinion, and experiences of pregnant women
regarding the impact of COVID-19 on seeking skilled ANC
services. Such qualitative research helps the policy makers
to understand social phenomena in a particular setting.
[18]
RESEARCH SETTING
The research area is for rural settings of the Kushtia District,
located in the South-Western part of Bangladesh. It lies
between 23°42' and 24°12' north latitude and between
88°42' and 89°22' east longitudes. The total area of the
district is 1621.15 km2. The district consists of five sub-districts.
The total population of the district is 2,018,000, representing
about 1.4% of the country's total population. More than 75%
of the people live in rural areas. [19]
Target Population and Sampling Technique
A total of ten villages was purposively selected taking two
villages from each of the five sub-districts. Fifty pregnant
women were selected randomly for ten focus group
discussions (FGDs), taking five from each village. Finally,
four women did not take part in the FGDs for different
reasons. Finally, forty-six women participated in the FGDs.
Data were collected during the period May 01, 2021, to July
20, 2021. Each of the FGDs was consisted of 4-5 women and
took times as lowest at 90 minutes and highest at 120
minutes.
Data Collection Method
Data were collected directly by the main author from ten
FGDs. The family planning workers (FPWs) are the main
informants who identified the pregnant women during their
field visits. The study women were selected by the FSWs. The
FPWs randomly selected the pregnant women and fixed a
date and time for FGDs. They also screened to ensure
whether the participants were pregnant at least for the last
three months. Before the scheduled date of the interview,
the researchers supplied personal protection equipment
for all FPWs and participants. Prior to start discussions, the
author described the study objectives in detail, and a
written consent was taken from all participants. The
participants were affirmed that all information they would
provide should be kept confidential and be used only for
research purposes. To gather personal information of the
129
participants, a semi-structured questionnaire was
developed which included respondents’ current age, age
at marriage, number of living children, education,
participant’s occupation, monthly family income, duration
of pregnancy and times they visited health facilities for
ANC services. The descriptive statements of the
participants were recorded by a digital voice recorder. The
language used for interviews was ‘Bangla’ –the national
language of Bangladesh. While recording, a code was
used to identify the respondent.
Data Processing and Analysis
Open Code 4.0 software was used thematically to analyze
the data collected from the ten FGDs. All audio records
and notes were then transcribed and translated from
Bangla to English. Transcripts were checked carefully and
comprehended to obtain a good grasp of the information
provided by the participants.
Ethical Considerations
Ethical clearance for this study was obtained from the
Institutional Review Board (IRB) of Islamic University (IU),
Kushtia-7003, Bangladesh (IU/ACA/SCFRC-0009/2020-
2021).
Methodological Rigor
The rigor of a qualitative study measures the extent to
which privacy of the participants represents, and to what
extent the participants maintain reliability in providing
information. The criteria for ensuring rigor include credibility,
transferability, dependability, and conformability. To ensure
the credibility, we have checked the accuracy of
transcribed data and confirmed whether the participants
shared their experiences honestly. To enhance
transferability, a detailed description of the research setting
and selection criteria of the participants is represented.
Methods used for data collection, analyzing procedure,
and interpretations are also captured for dependability. For
conformability, field notes, audio recordings, and coding
were kept de-identified.
RESULTS
The age of the women ranges from 19 to 41 years. Eleven
women had no formal education, twenty-five had some
primary education, nineteen women had secondary
education, and only one had higher education. Except
one women, others were housewives. None of the
participants visited four times for ANC checkup.
Perception towards COVID-19
Most of the participants had some knowledge about the
danger of COVID-19. They believed that COVID-19 was like
a viral fever at the initial stage of the pandemic. However,
they are now more conscious of the pandemic.
“…we thought it was like a simple fever and can be
relieved taking only simple medicine. However, when a
dead body of our neighbor come to our village from the
town, the government authority did not allow us to see his
face even for the last time. Then we understood that
Corona is a dangerous infectious disease.” (FGD-3,
Participant-3)
“Corona affects only the urban people because of
overcrowding. We, the rural people, are free of Corona.
We did not see any COVID-19 patients in our village till
today. So we do not wear masks. This is the first time I have
used the mask…and feeling uneasy.” (FGD-8, Participant-
4)
A participant reported that,
“Before lockdown, I went to the town for regular checkup
of ANC. I wanted to take shelter in my elder sister's rented
house. My brother-in-law was a COVID-19 patient and he
was in isolation. My sister advised me to go away to village
for safety and to follow previous advice that my doctor
prescribed for me earlier.” (FGD-1, Participant-4)
GOVERNMENT INITIATIVES AGAINST COVID-19
As a precaution, the Bangladesh Government has
announced lockdown several times and also advised
people to maintain social distancing and wearing mask
compulsory while going outside of home for emergency.
“My husband asked an easy bike (a battery-driven small
vehicle) driver to go to the town for me. The driver
demanded fare three times more than the usual, which is
not affordable for us as my husband's income has been
decreased in these days. Now my fortune is up to God.”
(FGD-6, Participant-3)
“I am not accustomed to using a mask. When I use a mask,
I feel uneasy and cannot breathe freely. It seems that my
breath comes off and going to die. It is not possible for me
to wait for a long time wearing a mask in doctor’s
chamber.” (FGD-7, Participant-2)
130
“I do not like to go to town because of overcrowding.
Moreover, free movement has been restricted by the
authority. If I go to town, police may catch me and my
husband. As evidence, I will not show my baby bump to
others to prove that I am a pregnant woman. So all is up to
God.” (FGD-9, Participant-1)
Fear, Anxiety and Stigma
Several participants of the FGDs reported that they are
worried about social distancing and social isolation
following health facility visits.
“I went to a doctor due to influence of my husband. After
coming back home, I noticed that my mother-in-law and
sister-in-law do not come near to me, and even to my
husband. When I asked them why they are doing such
behave, my sister-in-law replied that I might be a carrier of
Coronavirus.” (FGD-10, Participant-4)
“…Hospitals and clinics are now hotspot areas. I heard that
corona means death. Hence I have decided to endure my
physical problem, but I would not go to the doctor to
embrace premature death. My child (fetus) may also be
affected by me.” (FGD-4, Participant-2)
“If I be affected somehow, I would have to go for
quarantine and live in an isolated room for many days. Who
will then take care of my 3-years aged child at that time?”
(FGD-2, Participant-1)
PERCEIVED QUALITY OF CARE DURING COVID-19
The pregnant women expressed their perception towards
the quality of MHCSs, including ANC, during COVID-19.
“At that time of my first visit, doctor asked me about many
issues. But when I went to him for the second time, I
observed hurry in him. He quickly asked me some questions
and prescribed some medicines. They did not checkup my
blood pressure and weight. I know that the measurement
of these two is very important for a pregnant mother. If they
do like this, what would be the ultimate result to go for ANC
checkup?” (FGD-2, Participant-5)
One of the participants shared that,
“My doctor advised me for an ultra-sonogram. Some other
pregnant women were waiting there. I heard that the
authority of the clinic asked a technician from other clinic.
I had to wait there for more than two hours. I observed that
the technician did not use gloves and even nor hand
sanitizer. I also noticed that some facial masks and tissue
papers were scattered away on the floor. …who knows…
there may have Corona or other viruses hidden in those
garbage which may be harmful.” (FGD-1, Participant-3)
“In these days, doctors and nurses are busy with Corona
affected patients. They do not have enough time to
provide adequate services to the pregnant mothers. Thus,
how much will I be benefited going to hospitals for ANC
checkups if doctors do not provide treatment properly and
carefully with adequate information?” (FGD-8, Participant-
4)
Risk minimization
Many of the FGD participants perceived that health care
facilities are now potential sources of COVID-19.
Overcrowding and the unclean environment of the
facilities may be the main reasons behind it.
“I heard that hospitals are not neat and clean. In this
pandemic situation, it is important to clean floors, chairs,
and other materials used for treatment. If I go there, I may
be infected through contacting that materials, and my
baby (fetus) may also be infected with the virus.” (FGD-9,
Participant-2)
“Different types of patients come to doctors. We are not
sure who are and who are not COVID-19 patients. If once I
come into contact with such a Corona patient, I may be
affected. Hence, I have decided to take treatment from a
local Kabiraj (herbal medicine practitioners) rather than
hospitals.” (FGD-1, Participant-3)
“I heard that Corona has changed its pattern. The present
pattern is more dangerous than it was one year ago.
Visitation to a health facility may bring more jeopardy than
benefits to my unborn child and even to my family
members. Thus, it is better to stay at home.”
(FGD-3, Participant-5)
DISCUSSION
The perception towards the COVID-19 is found as
somewhat mixed in the pregnant women of rural
Bangladesh. While some women are quite afraid of the
pandemic, others are a bit relaxed. Possibly, the lower
educated women have little knowledge about the virus
and danger. The fact is that, in Bangladesh, urban people
have been more affected than those of rural areas.
Moreover, rural women have little access to mass media –
resulting in lower awareness among them regarding
131

COVID-19. A previous study reported that rural women of
Bangladesh compared to their urban counterparts had
significantly lower knowledge scores regarding COVID-19.
[20]
Our study findings reveal that COVID-19 has largely
disrupted health facility systems and provisions they
generally offer to pregnant mothers for MHCSs use. This has
been echoed by the voice of a woman who expressed her
dissatisfaction regarding the time she needed for her
adequate checkup. Plausibly, the lack of sufficient medical
personnel, including doctors, nurses, and technicians, is a
significant reason behind it. Moreover, a large number of
medical staff are shifted to manage the COVID-19 patients.
Our findings are consistent with those conducted
elsewhere. [12,21]
Decreased household income, increased living costs, and
transportation unavailability has made it difficult for rural
women to seek skilled MHCSs, including ANC. Our findings
corroborated those of a similar study on Ethiopian women.
[12] Consistent with previous studies conducted in other
developing countries [12,21,22] our study also shows that
the government's restriction measures such as lockdown,
obstruction of traffic, use of facial masks are vital factors to
influencing pregnant women not to receive ANC services.
These measures taken against COVID-19 are causing an
unanticipated consequence on the utilization of skilled
MHCSs. [12]
Anxiety and stigma are other important factors that
prohibits women from using skilled MHCSs. This translates as
that the rural community considers that a pregnant woman
who visited a health facility during the pandemic period
might have already been infected by COVID-19 and she
may spread out the virus in the communities – resulting in
inadequate use of MHCSs. These causes are also reported
elsewhere. [12]
In general, the participants in this study stated that they
would have to be careful to avoid COVID-19 by
maintaining social distancing and following other rules of
health safety. Although some of the participants do not
agree to go to the health facilities for ANC services since
they have no complicacy, some others stated that
pregnancy is an important event and they need to take
proper care for safe motherhood. The risky environment of
the health facility, transportation problems, anxiety, and
affordability costs are the most reported excuses to refrain
from using ANC services.
STRENGTH AND LIMITATION
The study has several limitations and strengths. The study is
entirely qualitative, and it was not possible to examine to
what extent the factors influence the use of ANC services
with a few participants. The strength is that, to our
knowledge, this is the first ever qualitative study that
explored the factors affecting ANC seeking among rural
women in Bangladesh during the COVID-19 era.
CONCLUSION
The COVID-19 pandemic has had significantly negative
effect on MHCSs use by the rural women of Bangladesh.
The measures taken by the government against the
COVID-19 pandemic have significantly decreased the
usage of MHCSs. The need to shift the abruptly changing
role of the health workforces in the health facilities is
another factor that has a negative effect on women's
attitude towards seeking MHCSs. Anxiety, low quality of
care, dirty and poor environment of the health facilities,
stigma, and risk minimization strategy are among other
factors that refrained pregnant women from seeking ANC
services. The negative impact of COVID-19 on women's
attitude towards the usage of MHCSs may be minimized
through providing health education by the FPWs since they
have direct contact with married women in Bangladesh.
Additional necessary health workforces are needed to be
recruited urgently. A special wing for pregnant women in
each health facility may be opened as a one-stop MHCSs
center for the COVID-19 period. The policymakers should
take necessary actions to reduce anxiety among pregnant
women and encourage them to use MHCSs for safe
motherhood.
References
1. Lu H, Stratton CW, Tang YW. Outbreak of pneumonia of
unknown etiology in Wuhan China: the mystery and the
miracle. J Med Virol. 2020;92(4):401-2.
2. Islam MT, Talukder AK, Badruzzaman M, Khan M. Health
service facilities are positively linked with outcome of
COVID-19 patients in majority of the countries: The
global situation. J Adv Biotechnol Exp Ther.
2020;3(4):36-41.
3. Wordometer. Available:
https://www.worldometers.info/coronavirus/
(Accessed 20/07/21)
132

4. Wordometer. Available:
(https://www.worldometers.info/coronavirus/country/
bangladesh/) (Accessed 20/07/21)
5. Sohrabi C, Alsafi Z, O'Neill N, Khan M, Kerwan A, Al-Jabir
A, Iosifidis C, Agha R. World Health Organization
declares global emergency: A review of the 2019 novel
coronavirus (COVID-19). Inter J Surg. 2020;76:71-6.
6. Allotey, J., Stallings, E., Bonet, M., 2020. Clinical
manifestations, risk factors, and maternal and perinatal
outcomes of coronavirus disease 2019 in pregnancy:
living systematic review and meta-analysis. BMJ.
2020;370,m3320. DOI: 0.1136/bmj.m3320.
7. Brandt, J.S., Hill, J., Reddy, A., Sauer, M.V., Boyle, C.,
Anath, C.V., 2020. Epidemiology of coronavirus disease
2019 in pregnancy: risk factors and associations with
adverse maternal and neonatal outcomes. Am J
Obstet Gynecol. 224(4):e389.e1-e389.e9.
DOI: 10.1016/j.ajog.2020.09.043.
8. Ribacke BKJ, Saulnier DD, Eriksson A, von Schreeb J.
(2016) Effects of the West Africa Ebola Virus Disease on
Health-Care Utilization – A Systematic Review. Front
Public Health. 2016;4:222.
DOI: 10.3389/fpubh.2016.00222
9. Tadesse E. Antenatal care service utilization of
pregnant women attending antenatal care in public
hospitals during the COVID-19 pandemic period. Int J
Women’s Health. 2020;12:1181-88. DOI:
10.2147/IJWH.S287534.
10. World Health Organization (WHO). Maternal Mortality.
Geneva: Department of Reproductive Health and
Research, Geneva: WHO, Switzerland; 2019.
11. World Health Organization (WHO). WHO
recommendations on antenatal care for a positive
pregnancy experience. Geneva: WHO, Switzerland;
2016
12. Hailemariam S, Agegnehu W, Derese M. Exploring
COVID-19 related factors influencing antenatal care
services uptake: a qualitative study among women in
a rural community in Southwest Ethiopia. Journal of
Primary Care & Community Health, 2021, 12: 1–8 . DOI:
10.1177/215013272199689
13. Akowuah JA, Agyei-Baffour P, Awunyo-Vitor D.
Determinants of antenatal healthcare utilisation by
pregnant women in third trimester in Peri-Urban Ghana.
J Trop Med. 2018;2018:8. DOI: 10.1155/2018/1673517
14. Ministry of Health and Family Welfare (MOHFW)
[Bangladesh]. 4th Health, Population and Nutrition
Sector Programme (4th HPNSP) (January 2017-June
2022). Programme Implementation Plan (PIP), Dhaka:
MOHFW, Bangladesh; 2017.
15. National Institute of Population Research and Training
(NIPORT), and ICF. Bangladesh Demographic and
Health Survey 2017-18. Dhaka, Bangladesh, and
Rockville, Maryland, USA: NIPORT and ICF; 2020.
16. Tegegne TK, Chojenta C, GetachewT, Smith R, Loxton
D. Antenatal care use in Ethiopia: a spatial and
multilevel analysis BMC Pregnancy and Childbirth.
2019;19:399. DOI: 10.1186/s12884-019-2550-x.
17. Bhowmik KR, Das S, Islam MA. Modelling the number of
antenatal care visits in Bangladesh to determine the
risk factors for reduced antenatal care attendance.
PLoS ONE. 2020;15(1): e0228215. DOI: 10.1371/journal.
pone.0228215.
18. Pope N, Mays C. Reaching the parts other methods
cannot reach: an introduction to qualitative methods
in health and health services research. BMJ.
1995;311(6996):42–5
19. Bangladesh Bureau of Statistics (BBS). District Statistics
2011. Dhaka, BBS; 2013.
20. Anwar S, Araf Y, Newaz Khan A, Ullah MA, Hoque N,
Sarkar B, Reshad RAI, Islam R, Ali N and Hosen MJ.
Women’s knowledge, attitude, and perceptions
toward COVID-19 in lower-middle-income countries: a
representative cross-sectional study in Bangladesh.
Front Public Health. 2020;8:571689. DOI:
10.3389/fpubh.2020.571689.
21. Sarwer A, Javed B, Soto EB, Mashwani Z. Impact of the
COVID-19 pandemic on maternal health services in
Pakistan. Int J Health Plann Manage. 2020;35:1306-
1310. DOI: 10.1002/ hpm.3048.
22. Ombere SO. Access to Maternal Health Services During
the COVID-19 Pandemic: Experiences of indigent
mothers and health care providers in Kilifi County,
Kenya. Front Sociol. 2021;6:613042. DOI:
10.3389/fsoc.2021.613042.
133
RESEARCH ARTICLE
CONVERGENCE OF COMORBIDITY AND COVID-19 INFECTION TO
FATALITY: AN INVESTIGATION BASED ON HEALTH ASSESSMENT
AND VACCINATION AMONG OLDER ADULTS IN KERALA, INDIA
Sindhu Joseph1, Jijo Pulickiyil Ulahannan2, Parvathy A J3
1. Department of Travel and Tourism Management GPM Government College, Kannur University, India
2. Department of Physics, Government College, Kannur University, India
3. Department of Computer Science, Vellore Institute of Technology, India
Correspondence: [email protected]
ABSTRACT
OBJECTIVE
To investigate the impact of age, comorbidity, and vaccination in the fatality of older COVID-19 patients in the state of
Kerala, India.
METHODS
A cross sectional study, adopting a mixed method approach was used and conducted among the older population in
Kerala. To study the health profile of study participants 405 older people were surveyed and 102 people were interviewed
in-depth at their households between June to November 2020. The results of the study were triangulated with elderly
COVID-19 fatality data available from the citizen-science dashboards of the research team and Department of Health,
Kerala. Vaccination data was retrieved from the Co-WIN government website (cowin.gov.in) to study its impact. The data
was analyzed using the IBM SPSS version 22.0.
RESULTS
Age is a predictor of COVID-19 fatality. Diabetes, hypertension, CAD, CKD and COPD are the significant predictors of
elderly COVID-19 fatality in Kerala. The current comorbidity profile of the total older population matches with the
comorbidities of the COVID-19 elderly death cases. CFR and IFR have declined even when the CMR is high in the second
wave of COVID-19 with more deaths. This is attributable to vaccination even though there exists a lesser chance for
breakthrough infection.
CONCLUSIONS
Age and comorbidities can predict potential fatality among older COVID-19 patients. Timely and accurate health data
and better knowledge of high-risk factors such as comorbidity can easily guide the healthcare system and authorities to
efficient prevention and treatment methodologies. Knowledge on prevailing NCDs can drive early preparedness before
it converges with an epidemic like the present zoonotic disease. Vaccination is an effective tool in preventing infection
compared to the unvaccinated even though the chance for breakthrough infection is there, particularly, in people with
comorbidities.
KEYWORDS
Comorbidity, Convergence, COVID-19 Mortality, Fatality, Older population, Vaccination.
134

INTRODUCTION
It is already acknowledged that health conditions
deteriorate when age increases and ageing goes hand in
hand with many behavioral issues and disabilities,
contagious infections, lifestyle, and chronic diseases.
Therefore, the impact of multi-morbidity on various aspects
such as quality of life, functionality and risk of mortality
becomes a matter of present discussions worldwide. In
India, the elderly face NCDs' threats, including cancers,
CVD (cardiovascular disease), respiratory diseases, and
diabetes and one out of every two older people suffers
from at least one chronic disease requiring life-long
medication, particularly in urban areas [1].
Kerala’s older population has increased by one million
people every consecutive year since 1981 [2]. If this trend
continues incessantly, it is expected to surpass the
proportion of young and old people in between 2021 and
2031 [2]. In 2020, 4.8 million people of Kerala were above
60 years of age of which 15 percent of them were above
80 years, the fastest-growing group among the older
population [3]. Kerala has higher hospitalization rates
indicating higher morbidity levels [4]. The reported
common ailments were paralysis, urinary problems, CVD
and cancer in 2010 [5]; hypertension, diabetes mellitus,
cataract and heart disease in 2011 [4]; CVD, diabetes,
musculoskeletal, and respiratory disease in 2016 [6]; and
diabetes, abdominal obesity, and hypertension in 2016-17
[7]. Based on these previous studies, it can be assumed that
the significant prevalent diseases of older people in Kerala
are hypertension, diabetes, CVD, cancer, and respiratory
diseases.
THE COVID-19 FATALITY
Kerala reported the first COVID-19 case in India in January
2020 and was the first state that saw the first wave of the
disease spread in the country. The spread of COVID-19
affected mostly older people. Patients with chronic
comorbidities, including malignancy, CVD, diabetes,
hypertension, kidney and respiratory disease are prone to
the fatal outcome of COVID-19 infection [8–11]. Various
studies [8–10] found that for CVD and hypertension, the use
of renin-angiotensin system inhibitors may accelerate the
susceptibility to SARS-CoV-2 infection.
Despite the long COVID-19 studies describing comorbidities
and the poor clinical outcomes leading to fatality, the
results are inconsistent. Throughout the COVID-19 outbreak,
wide variations in CFR (Case Fatality Rate) and IFR
(Infection Fatality Rate) estimates have been noted. There
is a dearth of studies on COVID-19 and comorbidity while
having timely data on the health profile of a population.
Likewise, the study findings related to the health status,
comorbidity profile, and the NCDs scenario of the older
people over a decade in Kerala are also inconsistent [4–7]
and there is no study on the impact of vaccination among
the older population. In this context, this study is intended
to fill the above knowledge gaps and plans to relate the
comorbidity profile of the older people in Kerala in the
COVID-19 scenario to the elderly mortality rate of COVID-
19, which will help to identify the severity of risks. It is
essential to draw a clear picture of the health status and
morbidity levels of the older people amidst the pandemic
to assess the possible implications of comorbidities and
thereby frame geriatric treatment policies while it
converges with infectious diseases.
This study is unique as it measured the comorbidity level of
the older people, while the pandemic is ongoing with
simultaneous assessment of the older people COVID-19
deaths due to the suspected comorbidity levels. Even
though it is too early to assess the impact of vaccination,
the study attempted to show its impact on COVID-19
mortality in the elderly.
METHODOLOGY
This study is based on a mixed methodology approach. The
study used a concurrent timing strategy where both the
quantitative and qualitative strands occurred during a
single phase, from June 2020 to November 2020.
Quantitative data was collected from 405 older people
from 36 panchayats (village level council) of Kerala,
adopting multi-stage sampling techniques, using a
structured questionnaire. The study area was divided into
three zones, South, Central and North Kerala. From each
zone, three districts were selected at random. Four
panchayats from each district were selected by drawing
lots, making 36 panchayats of Kerala under study. From
each selected panchayath, 11 households with older
people were selected randomly.
The survey questionnaire included questions on socio-
demographic profile and the disease profile of the elderly.
The respondents were asked to mark appropriate
responses against the names of different diseases they
135

have in a 5-point scale ranging from ‘Always to Never’. The
data was analyzed with the IBM SPSS version 22.0. The
percentage of a particular disease is calculated
exempting the ‘never’ and ‘rarely’ responses, therefore
including ‘always’, ‘frequently’ and ‘sometimes.’
Using a panchayat-wise list, received from Anganvadi and
Asha workers (local health workers), older people above 60
years of age were selected randomly for the qualitative
interview. The interviews were conducted at their
households for about 30 - 45 minutes. An average of seven
interviews per district were conducted and therefore 102
in-depth interviews were undertaken from all the fourteen
districts of Kerala. They were asked about the present
ailments. To further enrich the data, 12 interviews were
conducted with Vayomithram (a public project for elderly
care) district coordinators of 12 districts in Kerala.
Directorate Health Services (DHS) website
(http://dhs.kerala.gov.in) gives updates about the COVID-
19 spread. However, access to primary data is not
complete and therefore, a multi-disciplinary team of
experts compiled data through a citizen science initiative,
managed by the researchers of this study [11]. A systematic
analysis of the above mentioned two dashboards on CFR
and comorbidities was done. The data was extracted from
the death cases reported in Kerala with COVID-19 infection
between January 2020 and September 20, 2021 (Fig. 1).
Vaccination data was retrieved from the centralized C0-
WIN portal in India (cowin.gov.in). To check and identify a
consistent pattern in the association between age and
COVID-19 mortality, an extensive review of the literature
was carried out. The quantitative and qualitative strands
were triangulated and integrated at the point of
interpretation and drawn inferences from them.
The study is conducted in line with the guidelines of the
ICSSR (Indian Council of Social Sciences) New Delhi, India
under the ICSSR – IMPRESS scheme (F. No.
IMPRESS/P1132/428/2018-19/ICSSR). The sanctioned study
on geriatric health was carried out while the pandemic is
ongoing, enabling the research team to simultaneously
investigate older people COVID-19 deaths due to the
suspected comorbidity levels. Before the qualitative and
quantitative data collection, the participants were briefed
about the study's purpose, and informed consent was
obtained. COVID-19 protocol was adhered to while
collecting the data.
Effective and safe vaccines are the pharmaceutical
interventions to prevent this pandemic and different types
of vaccines are getting acceptance. Over 90 per cent of
the population in Kerala has been administered the first
dose of the Covid-19 vaccine as of September 20, 2021, a
target achieved within 247 days since beginning on
January 16. The vaccination for the Age-Appropriate
category (persons over 60 years of age, and persons
between 45 and 59 years with comorbid conditions) started
from March 1, 2021, onwards. Hence, we considered
mortality data after April 1 for comparison with that of pre-
vaccination data.
RESULTS
The socio-demographic profile (Table 1 Supplementary
Data) shows that 55.3% were males, and 44.7% were
females. Around 50.1% were in the 60-69 age category,
followed by 31.6% in the 70-79 category(n=405).
Covid-19 Deaths in Kerala-Age wise
Figure 1 shows that age is a predictor of increased mortality
rate. Till May 31, 2021, the number of COVID-19 deaths in
Kerala were 8815, of which 6546 (73.24%) were elderly,
where the majority (28.2%) belongs to the 60-69 age group
(Fig.1). On September 20, 2021, the number of COVID-19
deaths in Kerala rose to 23683 (0.52% of the total infected),
of which 17533 (74.03%) were elderly, where the majority is
in the 70-79 age (27.0%) (Fig. 1).
COMORBIDITY OF ELDERLY PEOPLE IN KERALA
Table 1 shows that older people of Kerala suffer from
Hypertension (59.3%), Diabetes (49.8%), Heart Disease
(20.5%), Lungs Disease (13.4%), Cancer (5.9%), Rheumatic
Disease (31.6%), Urinary Disease (20.7%) and Abdominal
Disease (17.1%). Many of them have two or more diseases
(comorbidities) (Table 2). Interviews with the elderly and
Vayomithram coordinators also showed that most of them
had lifestyle diseases like Hypertension, Diabetes, Heart
Disease, Cancer, and Cholesterol (Table 2 supplementary
data).
ELDERLY PEOPLE COVID-19 DEATHS AND
COMORBIDITY
The study used the comorbidity data of the total death
cases of COVID-19 as separate elderly comorbidity data is
not available. As set out in the Death Audit report, which is
available until March 2021, published by the Department of
136

Health, Kerala, out of the 4,621 people who died, 4,420
(95.65%) of them had comorbidities (Table 2 and Figure 2).
Major comorbidities were diabetes (59.14%), hypertension
(47.95%), CAD (25.84%), CKD (18.81%), COPD (11.32%) and
only 4.35% had no comorbidities (Table 2 and Figure 2).
FIGURE 1. COVID-19 DEATHS IN KERALA-AGE WISE TILL SEPTEMBER 20, 2021
Source: DHS, Government of Kerala, COVID-19 Dashboard
TABLE 1. ELDERLY DISEASE PROFILE IN KERALA
TYPE OF DISEASE ALWAYS FREQUENTLY SOMETIMES RARELY NEVER
Diabetes 156 (38.5%) 37 (9.1%) 9 (2.2%) 6 (1.5%) 197 (48.6%)
Hypertension 145 (35.8%) 66 (16.3) 29 (7.2%) 19 (4.7%) 146 (36%)
Urinary Disease 24 (5.9%) 27 (6.7%) 33 (8.1%) 43 (10.6%) 278 (68.6%)
Lungs Disease 32 (7.9%) 8 (2%) 14 (3.5%) 25 (6.2%) 326 (80.5%)
Heart Disease 46 (11.4%) 18 (4.4%) 19 (4.7%) 9 (2.2%) 313 (77.3%)
Cancer 17 (4.2%) 4 (1%) 3 (0.7%) 3 (0.7%) 378 (93.3%)
Rheumatic
Disease
57 (14.1%) 35 (8.6%) 36 (8.9%) 42 (10.4%) 235 (58%)
Abdominal
Disease
25 (6.2%) 13 (3.2%) 31 (7.7%) 42 (10.4%) 294 (72.6%)
137
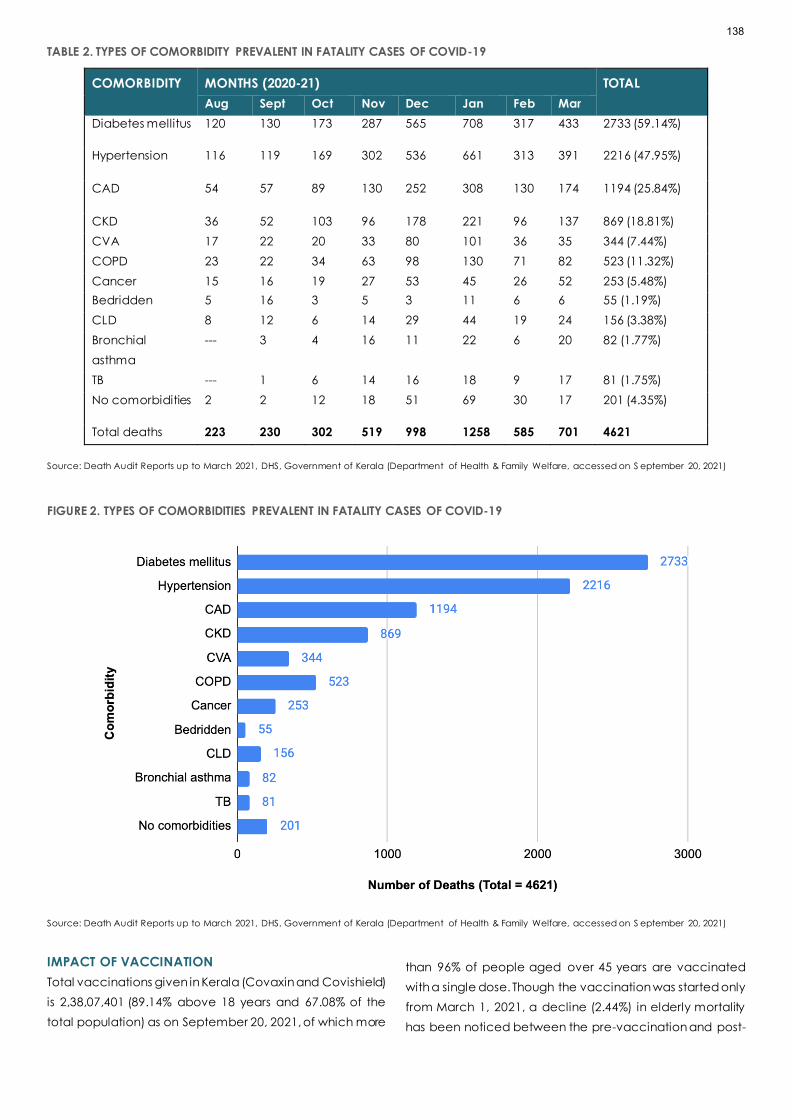
TABLE 2. TYPES OF COMORBIDITY PREVALENT IN FATALITY CASES OF COVID-19
COMORBIDITY MONTHS (2020-21) TOTAL
Aug Sept Oct Nov Dec Jan Feb Mar
Diabetes mellitus 120 130 173 287 565 708 317 433 2733 (59.14%)
Hypertension 116 119 169 302 536 661 313 391 2216 (47.95%)
CAD 54 57 89 130 252 308 130 174 1194 (25.84%)
CKD 36 52 103 96 178 221 96 137 869 (18.81%)
CVA 17 22 20 33 80 101 36 35 344 (7.44%)
COPD 23 22 34 63 98 130 71 82 523 (11.32%)
Cancer 15 16 19 27 53 45 26 52 253 (5.48%)
Bedridden 5 16 3 5 3 11 6 6 55 (1.19%)
CLD 8 12 6 14 29 44 19 24 156 (3.38%)
Bronchial
asthma
--- 3 4 16 11 22 6 20 82 (1.77%)
TB --- 1 6 14 16 18 9 17 81 (1.75%)
No comorbidities 2 2 12 18 51 69 30 17 201 (4.35%)
Total deaths 223 230 302 519 998 1258 585 701 4621
Source: Death Audit Reports up to March 2021, DHS, Government of Kerala (Department of Health & Family Welfare, accessed on S eptember 20, 2021)
FIGURE 2. TYPES OF COMORBIDITIES PREVALENT IN FATALITY CASES OF COVID-19
Source: Death Audit Reports up to March 2021, DHS, Government of Kerala (Department of Health & Family Welfare, accessed on S eptember 20, 2021)
IMPACT OF VACCINATION
Total vaccinations given in Kerala (Covaxin and Covishield)
is 2,38,07,401 (89.14% above 18 years and 67.08% of the
total population) as on September 20, 2021, of which more
than 96% of people aged over 45 years are vaccinated
with a single dose. Though the vaccination was started only
from March 1, 2021, a decline (2.44%) in elderly mortality
has been noticed between the pre-vaccination and post-
138

vaccination period (Table 3 and Fig. 1) even when total
mortality is high after the onset of second wave (from
February onwards) while the average age of death
remains static.
TABLE 3 IMPACT OF VACCINATION ON COVID-19 MORTALITY AMONG OLDER ADULTS
DEATHS PRE-VACCINATION
(JANUARY 30, 2020 -
MARCH 31, 2021)
POST VACCINATION
(APRIL 01, 2021 -
SEPTEMBER 20, 2021)
OVERALL
(JANUARY 30, 2020 -
SEPTEMBER 20, 2021)
All age groups 4621 19062 23683
Older Adults 3512 (76.0%) 14022 (73.57%) 17535 (74.04%)
60-79 group 2531 (56.94%) 10112 (53.01%) 12744 (53.81%)
Source: https://dashboard.cowin.gov.in, accessed on September 19, 2021
The effect of this pandemic can be studied by using CFR,
Crude Mortality Rate (CMR), and IFR [12]. CFR helps to
recognize the disease severity, risks, and healthcare system
quality. CFR and recovery rates are important indicators
during epidemics and pandemics which will help clinicians
in stratifying patients in terms of the extent of care required,
and in turn, increase the possibilities of survival from the
deadly pandemic [13]. The CFR of an ongoing pandemic
is calculated using the formula:
CFR(%)=Total number of deaths
Number of deaths + Number of recoveries×100%
Since the data for the number of infected and recovered
older people is not available, COVID-19 epidemiology
data on total number of infections and recoveries have
been used.
Therefore, CFR=0.54%, IFR=0.52% (IFR (%) =
Number of deaths from disease
Total number of cases×100%), CMR = 66.73% ( IFR (%) =
Number of deaths from the disease
Total population×100%), till September 20, 2021
(Table 4). Here CMR estimates the probability of any
individual in a population dying from the disease [12] and
IFR estimations give the proportion of fatality among all
infected. Table 4 shows that CFR and IFR have declined
even when the CMR is high in the second wave of COVID-
19 with more deaths, which is attributable to vaccination.
TABLE 4. COVID-19 INDICATORS (CFR, CMR, IFR)
TYPE OF DATA
NO. OF
INFECTED
CASES
NO OF
DEATHS
CFR
%
CMR
(X100000)
IFR
%
DHS Dashboard (as on 31
March 2021)
1,124,584 4621 0.42 13.02 0.41
DHS Dashboard (as on 20
September 2021)
4,524,158 23683 0.54 66.73 0.52
Note: The 2021 Projected population of Kerala is 3,54,89,000 as per the report of National Commission on Population of India. The number of the elderly
population is projected as 52,71,660.
DISCUSSION
The emergence of the COVID-19 disease has spread with
surges and resurges. In this context, this paper is intended
to associate older people's health scenario with COVID-19
comorbidity and fatality rates, using a concurrent mixed-
method approach and to analyze the impact of
vaccination.
Comorbidity profile of older population, age-wise COVID-
19 death report, and the type of comorbidities of COVID-
19 death cases in Kerala clearly show that the older
139

population has been adversely affected by the pandemic,
which is consistent with the international studies [8,14–16].
Fatalities have been mostly reported from the 60-79 age
category, which can be explained by using Kerala's socio-
demographic profile (Table 1 supplementary data). It is to
be noted that during the entire period of the pandemic
from the first death to September 18, 2021, the median age
of deaths remains static indicating that even after the
second wave of COVID-19 infection with increased
mortality rates, the association between the age and
fatality remains. Here it is to be noted that the occupational
structure of Kerala elderly (Work Participation Rate) has
considerably increased as they continue as the major
contributor to the household since 1983 by working in
informal, low paying occupations in poor work
environments [17]. This exposure to the outside environment
during the pandemic might have led them to COVID-19
infection.
Despite these demographical factors, many older people
are incapacitated due to attributable age-related
diseases. This is consistent with the previous report [6] that,
in the last two decades, the morbidity burden has grown
faster than the rest of India wherein the Proportion of Ailing
Population (PAP) in Kerala during 1995-96 was 109 against
the national average of 55 which was increased to 251 in
2004, and to 308 in 2014, showing, an increase of 57 points
in the overall morbidity rate against national average
increase of just seven points during the 2004-2014 period.
Existing evidence on the health profile suggests that Kerala
has been going through a demographic transition with an
unprecedented increase in the NCDs burden (Table 1).
Qualitative data also validate this finding (Table 1
supplementary data). This is akin to the previous study
results of Kerala over a decade [4,6,7].
This disease profile (Table 1) validates the comorbidity
status of the older COVID-19 deaths (Table 2) where the
most prevalent comorbidities were hypertension, diabetes,
heart disease, COPD (Chronic Obstructive Pulmonary
Disease) and CKD (Chronic Kidney Disease) where about
95% of the deceased had one or other comorbidities and
the majority of them had multiple comorbidities. Many
previous studies on COVID-19 have obtained the same
results [12,18–21]. To be more specific, the major
comorbidity found in Kerala's COVID-19 death cases is
heart disease, followed by diabetes which are major
predictors of COVID-19 fatality [22,23]. It is found that, for
the total population in Kerala, the incidence of type 2
diabetes (T2DM) is 21.9% [24]. This can be attributable to
risky health behaviors such as lack of exercise and an
unhealthy diet which necessitates urgent implementation
of healthy behavior policy initiative. Previous studies on
Middle East Respiratory Syndrome (MERS-CoV) also found
comorbidity leads to MERS-CoV infection [12,25]. Therefore,
it can be assumed that a high proportion of older people
with NCDs prevalence leading to multi -morbidities can be
attributed to the increased older people fatality of COVID-
19 in Kerala. Nevertheless, this study discards the findings
that there is no significant relationship between COVID-19
infection and diabetes [21,22].
The outcome of convergence of NCDs and COVID-19
infection is serious and it is fatal when there is multi-
morbidity. Multi-morbidity gives rise to multiple interactions
between one condition and the treatment
recommendations for another which necessitates
simultaneous multiple drug use leading to complications.
The susceptibility of the older people to COVID-19 is
explained by immunosenescence where the innate
immune cells’ function is impaired when there is a decrease
in the naïve T as well as B cells production, consequently
leading to a situation where the innate immunity cannot
fight the infection [26]. Another characteristic of ageing
immunity is the CSSI (Chronic Subclinical Systemic
Inflammation), which results in an elevation of inflammatory
cytokines in serum due to the failure to resolve severe
inflammation, which is a critical pathogenic mechanism in
COVID-19, contribute to poor clinical outcome in older
people [27]. This phenomenon called cytokine storm/
hypercytokinemia, associated impairment begins with the
damage of the lungs' epithelial barrier. Subsequently, this
initiates a cascade of tissue damage in other vital human
organs, including the heart, kidneys, brain, and blood
vessels, leading to Multiple Organ Dysfunction Syndrome
(MODS), which may be even more fatal [28].
Studies report that most recovered patients experienced
different manifestations even up to 30 days following
diagnosis. Sequelae of COVID-19 may be manifested in a
patient even if the virus is cleared and test shows negative.
Once a person is tested positive for COVID-19, it is important
to monitor the health status for at least 30 days, especially
for elderly age groups with comorbidities. Here is the
significance of the evaluation of elderly health profiles in
predicting both COVID-19 fatality and post COVID
syndrome as a clear understanding of these risk factors will
help the healthcare system, particularly the clinicians, to
identify and implement protocols to mitigate the fatal
outcomes. Organized preventive and curative care for
140

infectious diseases and NCDs must be ensured for older
people in the line of the Vayomithram project of Kerala,
where free health check-ups and medicines are available
in proximity, particularly when Kerala is undergoing
demographic transition with largest proportion of elderly in
India.
Since epidemiology has a holistic approach on wellness
and maintenance, priority must be given to the complete
vaccination of elderly as it has brought down the elderly
mortality to 73.57 percent in the second wave from 76% in
the first wave in Kerala (Figure1 and Table 4). Moreover,
more than 90.2% of the infected and 78.21% of the
deceased from June to August 2021 (post-vaccination
period) were unvaccinated [29]. However, In August 2021,
the death rate was 78.21% among the non-vaccinated,
12.47% among those with one dose vaccinated and 5.12%
among the fully vaccinated, indicating that vaccinated
people also may get infected, termed as breakthrough
infections, but chances of worsening the symptoms leading
to severe disease is relatively very less when compared to
non-vaccinated individuals.
Ageing is inevitable, and often, the promotional and
preventative aspects of geriatric care are neglected with
a notion that it is 'unavoidable' and ‘genetically
determined’ neglecting the impact of healthier lifestyle to
decrease healthcare expenditure [30]. To ensure geriatric
care, there must be an attitudinal change and subsequent
efforts from the policymakers to ensure 'quality ageing.'
Furthermore, the public healthcare system should ensure
documentation of incidents and causes of death to
estimate 'excess deaths' occurring during outbreaks, when
it becomes difficult to estimate the CFR. Weekly/ monthly
death counts can be collated with trends over the years to
ascertain whether it is significantly higher than the
expected count. This estimation can provide information
about the potential burden of mortality and fatality,
associated with the infection, directly or indirectly [31].
The study findings on older people's comorbidity level and
their subsequent mortality, determine the etiology of
COVID-19 and therefore, prevention strategies can be
implemented to avoid further spread and increased
fatalities. Moreover, the study findings l adds to the existing
knowledge realm on the spectrum of comorbidities among
the older people and its converged impact on the phase
of epidemics spread. Future studies can be undertaken to
assess the impact of vaccination after vaccinating the
total older population in Kerala.
The study has its limitations. First, this study was carried out
among the older people in Kerala, and therefore, the
results may not be suitable in an international context.
Second, getting authentic and correct primary data in
calculating CFR of the elderly was a limitation. Third, there
may be underestimations, hidden cases, and
asymptomatic or mild symptomatic cases affecting the
actual COVID- 19 data. Fourth, there will be vulnerable
segments of the population who keep themselves away
from COVID-19 testing and hesitate to undergo treatment.
Finally, the COVID-19 infection might have influenced the
responses of study participants.
CONCLUSION
It is found that older patients with chronic diseases are more
susceptible to COVID-19 infection. Knowledge of these risk
factors and the present health profile of the older
population in Kerala necessitate a more focused
approach to introduce a spectrum of interventions to
protect the lives of the older people when there is a
convergence of epidemics and NCDs. The study
emphasizes the need for having timely and accurate
health data of a population, which can easily guide the
healthcare system and authorities to more efficient
prevention and treatment methodologies in health care
emergencies.
Reference:
1. Rajan SI. Population Aging, Health and Social Security
in India [Internet]. CREI; 2007. Report No.: 3. Available
from: https://www.econ.osaka-
cu.ac.jp/CREI/discussion/2006/CREI_DP003.pdf
2. Press Trust of India. Kerala population ageing fast:
survey. Business Standard [Internet]. 2014 Sep 18 [cited
2021 May 19]; Available from: https://www.business-
standard.com/article/pti-stories/kerala-population-
ageing-fast-survey-114091800463_1.html
3. Kerala State Planning Board. Economic Review 2017
[Internet]. 2018 Jan [cited 2021 May 19]. Available
from: https://spb.kerala.gov.in/economic-
review/ER2017/web_e/index.php
4. Alam M, James KS, Giridhar G, Sathyanarayana KM,
Kumar S, Raju SS, et al. Building a knowledge base on
population aging in India: Report on the Status of
Elderly in Select States of India [Internet]. United
Nations Population Fund; 2013. Available from:
https://ideas.repec.org/p/ess/wpaper/id5209.html
141

5. Sandhya RS. Sociological analysis of the Problems of
the oldest old (A study conducted in Kerala).
International Research Journal of Social Sciences.
2010;3(1):57–79.
6. Karan A, Srivastava S, Chakraborty A, Matela H. Key
indicators of health and morbidity: Kerala 2014. Delhi:
Public Health Foundation of India; 2016 Apr.
7. Madore A, Rosenberg J, Dreisbach T, Weintraub R.
Positive Outlier: Health Outcomes in Kerala, India over
Time | The Global Health Delivery Project [Internet].
Boston, MA: Harvard Business Publishing; 2018.
Available from:
https://www.globalhealthdelivery.org/files/ghd/files/g
hd-042_kerala_as_a_positive_outlier_2018_09_05.pdf
8. Zhou F, Yu T, Du R, Fan G, Liu Y, Liu Z, et al. Clinical
course and risk factors for mortality of adult inpatients
with COVID-19 in Wuhan, China: a retrospective
cohort study. Lancet. 2020 Mar;395(10229):1054–62.
9. Fang L, Karakiulakis G, Roth M. Are patients with
hypertension and diabetes mellitus at increased risk for
COVID-19 infection? The Lancet Respiratory Medicine.
2020 Apr;8(4):e21.
10. Pal R, Bhansali A. COVID-19, diabetes mellitus and
ACE2: The conundrum. Diabetes Res Clin Pract. 2020
Apr;162:108132.
11. Ulahannan JP, Narayanan N, Thalhath N, Prabhakaran
P, Chaliyeduth S, Suresh SP, et al. A citizen science
initiative for open data and visualization of COVID-19
outbreak in Kerala, India. J Am Med Inform Assoc.
2020 Nov 5;00(0):1–8.
https://doi.org/10.5281/zenodo.3818096
12. Roser M, Ritchie H, Ortiz-Ospina E, Hasell J. Coronavirus
Pandemic (COVID-19). Our World in Data [Internet].
2020; Available from:
https://ourworldindata.org/coronavirus
13. Khafaie MA, Rahim F. Cross-Country Comparison of
Case Fatality Rates of COVID-19/SARS-COV-2. Osong
Public Health Res Perspect. 2020 Apr;11(2):74–80.
14. Yanez ND, Weiss NS, Romand JA, Treggiari MM.
COVID-19 mortality risk for older men and women.
BMC Public Health. 2020 Dec 1;20(1):1742.
15. Wang L, He W, Yu X, Hu D, Bao M, Liu H, et al.
Coronavirus disease 2019 in elderly patients:
Characteristics and prognostic factors based on 4-
week follow-up. J Infect. 2020 Jun 1;80(6):639–45.
16. Kang SJ, Jung SI. Age-related morbidity and mortality
among patients with COVID-19. Infect Chemother.
2020 Jun;52(2):154–64.
17. Tripathi T. Insights into the condition of elderly in India.
Econ Polit Wkly. 2015 Jun 5;55(23):7–8.
18. Guan W-J, Liang W-H, Zhao Y, Liang H-R, Chen Z-S, Li Y-
M, et al. Comorbidity and its impact on 1590 patients
with COVID-19 in China: a nationwide analysis. Eur
Respir J. 2020 May 14;55(5):2000547.
19. Onder G, Rezza G, Brusaferro S. Case-Fatality Rate
and Characteristics of Patients Dying in Relation to
COVID-19 in Italy [Internet]. Vol. 323, JAMA - Journal of
the American Medical Association. American Medical
Association; 2020. p. 1775–6. Available from:
https://www.who.int/docs/default-
20. Sanyaolu A, Okorie C, Marinkovic A, Patidar R, Younis
K, Desai P, et al. Comorbidity and its Impact on
Patients with COVID-19. SN Comprehensive Clinical
Medicine. 2020 Aug;2(8):1069–76.
21. Yang X, Yu Y, Xu J, Shu H, Xia J ’an, Liu H, et al. Clinical
course and outcomes of critically ill patients with SARS-
CoV-2 pneumonia in Wuhan, China: a single-
centered, retrospective, observational study. The
Lancet Respiratory Medicine. 2020 May;8(5):475–81.
22. Li J, Guo T, Dong D, Zhang X, Chen X, Feng Y, et al.
Defining heart disease risk for death in COVID-19
infection. QJM: An International Journal of Medicine
[Internet]. 2020 Aug 13; Available from:
https://academic.oup.com/qjmed/advance-
article/doi/10.1093/qjmed/hcaa246/5892264
23. Guo W, Li M, Dong Y, Zhou H, Zhang Z, Tian C, et al.
Diabetes is a risk factor for the progression and
prognosis of COVID-19. Diabetes Metab Res Rev
[Internet]. 2020 Oct 1;36(7). Available from:
http://dx.doi.org/10.1002/dmrr.3319
24. Vijayakumar G, Manghat S, Vijayakumar R, Simon L,
Scaria LM, Vijayakumar A, et al. Incidence of type 2
diabetes mellitus and prediabetes in Kerala, India:
results from a 10-year prospective cohort. BMC Public
Health. 2019 Jan 31;19(1):140.
25. Badawi A, Ryoo SG. Prevalence of comorbidities in the
Middle East respiratory syndrome coronavirus (MERS-
CoV): a systematic review and meta-analysis. Int J
Infect Dis [Internet]. 2016; Available from:
https://www.sciencedirect.com/science/article/pii/S1
201971216311006
142

26. Castle SC. Clinical relevance of age-related immune
dysfunction. Clin Infect Dis. 2000;31(2):578–85.
27. Bonafè M, Prattichizzo F, Giuliani A, Storci G,
Sabbatinelli J, Olivieri F. Inflamm-aging: Why older men
are the most susceptible to SARS-CoV-2 complicated
outcomes. Cytokine Growth Factor Rev. 2020 Jun
1;53:33–7.
28. Bhaskar S, Sinha A, Banach M, Mittoo S, Weissert R,
Kass JS, et al. Cytokine Storm in COVID-19-
Immunopathological Mechanisms, Clinical
Considerations, and Therapeutic Approaches: The
REPROGRAM Consortium Position Paper. Front
Immunol. 2020 Jul 10;11:1648.
29. Daily Bulletins [Internet]. Directorate of Health Services.
2021 [cited 2021 Sep 20]. Available from:
https://dhs.kerala.gov.in/
30. Prabhu P, Singh FMA. Nutrition the Geriatric
Population. In: Geriatric Care. Cochin: Brookdale
Foundation; 2002. p. 56–65.
31. Centers for Disease Control and Prevention. Excess
deaths associated with COVID-19: Provisional Death
Counts for Coronavirus Disease (COVID-19) [Internet].
National Center for Health Statistics. 2020 [cited 2020
Dec 29]. Available from:
https://www.cdc.gov/nchs/nvss/vsrr/covid19/excess_
deaths.htm
143
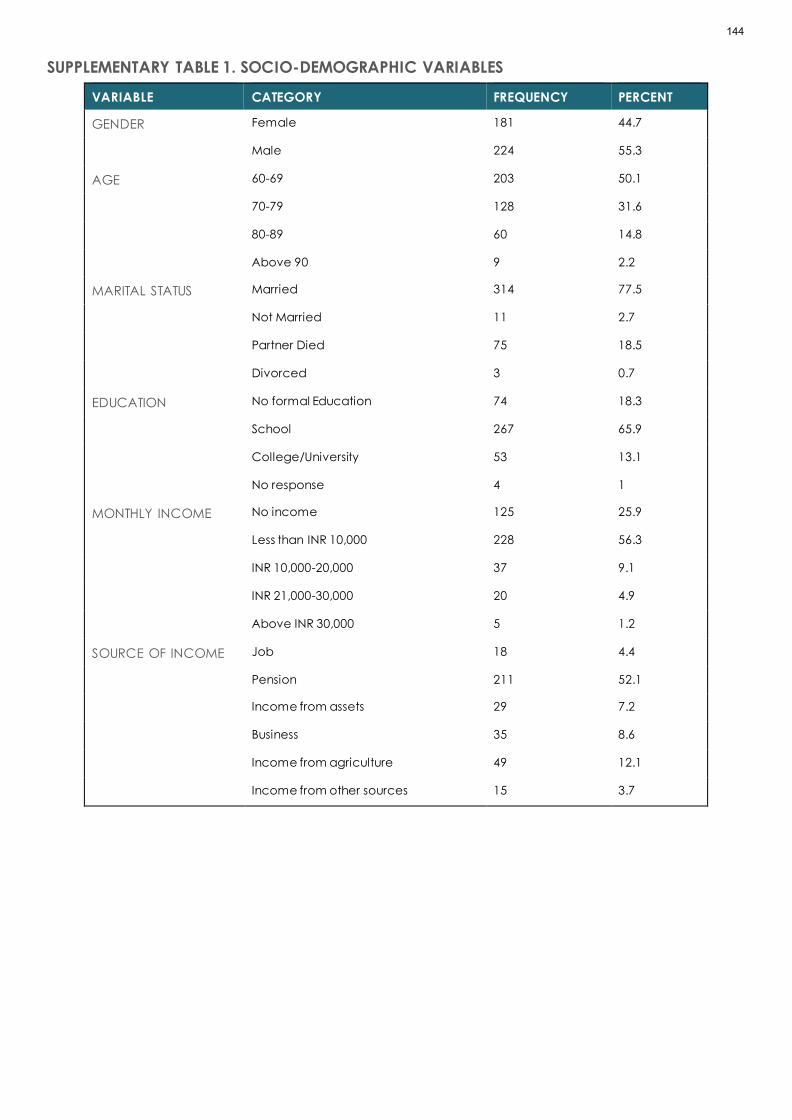
SUPPLEMENTARY TABLE 1. SOCIO-DEMOGRAPHIC VARIABLES
VARIABLE CATEGORY FREQUENCY PERCENT
GENDER Female 181 44.7
Male 224 55.3
AGE 60-69 203 50.1
70-79 128 31.6
80-89 60 14.8
Above 90 9 2.2
MARITAL STATUS Married 314 77.5
Not Married 11 2.7
Partner Died 75 18.5
Divorced 3 0.7
EDUCATION No formal Education 74 18.3
School 267 65.9
College/University 53 13.1
No response 4 1
MONTHLY INCOME No income 125 25.9
Less than INR 10,000 228 56.3
INR 10,000-20,000 37 9.1
INR 21,000-30,000 20 4.9
Above INR 30,000 5 1.2
SOURCE OF INCOME Job 18 4.4
Pension 211 52.1
Income from assets 29 7.2
Business 35 8.6
Income from agriculture 49 12.1
Income from other sources 15 3.7
144

SUPPLEMENTARY TABLE 2. ELDERLY DISEASE PROFILE IN KERALA
ATTRIBUTE RESPONSES (DISTRICT-PARTICIPANT ID, GENDER, AGE)
Disease ..I have Diabetes for the past 35 years, severe joint pain, back pain...
(Palakkad, F, 70-75)
…there are number of diseases in this age…headache, back pain, blood
pressure, disk problem, cholesterol (Pathanamthitta, F, 60-65)
I am taking medicines for blood pressure regularly…. (Pathanamthitta, M, 60-
65)
….I had a block in my heart, for which cardiac surgery was done. Check-up is
done every three months. Then I had prostate cancer… follow up visits once in
six months. I am a diabetic patient too... (Thrissur, M, 65-70)
…angioplasty was done ….taking medicines for blood pressure twice a day.”
(Kozhikode, F, 70-75)
“I am a cardiac patient, using a pacemaker…. (Palakkad, F, 70-75)
“Taking medicines for thyroid, sugar, BP daily… (Thiruvananthapuram, F, 65 -70)
“My current health problems are Asthma, Cholesterol, Sugar, blood pressure,
thyroid, Cardiac diseases…… (Kollam, F, 70-75)
I have cancer, BP, Heart problem, doing chemotherapy (Malappuram, M, 70-
75)
145

RESEARCH ARTICLE
AWARENESS OF JORDANIAN SURGICAL PATIENTS ABOUT
COVID 19 DURING PEAK OF EPIDEMIC AT JUH
Abdelkarim S. Aloweidi*, Sami Abu Halaweh, Mahmoud M. Al-Mustafa, Islam Massad,
Ibraheem Qudaisat, Ahmad El-share, Mohammad Rwaidi, Mohammad Yousef,
Mazin Al-Nouti, Isam Bsisu, Mohammad Aqel
Anesthesia and Intensive Care Department, School of Medicine, the University of Jordan, Amman, Jordan
Correspondence: Abdelkarim S. Aloweidi, [email protected]
ABSTRACT
Around the first COVID-19 epidemic in Jordan, we aimed to explore awareness of COVID-19 (knowledge and attitudes)
disease, treatment options, and preventive measures among patients who were admitted to Jordan University Hospital
(JUH) and planned to undergo elective surgery over a period of 3 months in 2020.
This prospective cross-sectional article uses a questionnaire based survey which was provided to and was answered by
patients themselves, then collected data was migrated to computer software and analyzed. The sample resulted in 292
patients. More than 95% were aware of the disease and and given age, educational levels and gender, we found no
significant differences in knowledge and awareness of COVID-19 and protective and preventive measures. More than
60% of those surveyed were aware of COVID-19 serious complications and risk factors for developing them. Around 28%
of patients who were admitted had significant anxiety from having COVID-19. The media appears to largely influence
and spread some misconceptions about COVID-19 transmission and claimed therapies.
KEYWORDS
COVID-19, awareness, surgical patients.
INTRODUCTION
Since the beginning of 2020 the Corona virus is continuing
in spreading from the Far East reaching the whole world
and causing major impacts in every single country in the
world. [11] Located in the Middle East, Jordan, with a
population reaching 10 million people and 117 working
hospitals, [12,13] the story of the COVID-19 pandemic
began in March 2020 when the diagnosis of the first case of
COVID-19 infection occurred. [1] This caused a strict series
of governmental actions ending in major lockdown and
activation of national defense law which prohibited the
majority of citizens going outside of their homes for most of
the time with the exception for some including patients
going to hospitals to receive healthcare and treatment. [2,
3,7] From August 2020 the wearing of a facemask in public
became mandatory in the law. [6] Those actions delayed
the outbreak and prevented hospitals being crowded with
infected patients. [14, 15] In the beginning, special hospitals
were assigned to treat COVID-19 positive patients, [8] but
by October 2020, when numbers of positive cases started
to increase, many hospitals participated in treating CVOID-
146

19 infected patients. The University of Jordan Hospital (JUH)
is one of the three largest hospitals in the country and it
offered health services for infected and non-infected
patients.
The peak of the pandemic in Jordan began at the
beginning of October 2020, when cases started to rise
above 1,000 daily reaching near 8,000 daily by November.
This large rise in numbers goes hand in hand with increased
numbers of critical cases and deaths. [10, 11]
The Jordanian population is considered to be one with high
literacy rates reaching 98% in 2018, [4] and 67% of the
population has access to internet. [5] An abundance of
information and the continuous official and non-official
health related awareness and information on web-based
platforms announced daily news about the Corona virus,
COVID-19 disease, and emerging updates about risks,
challenges and possible solutions to the global pandemic.
[16, 17]
Daily news set out that it made it a risky journey to the
hospital for patients who needed to undergo elective
surgeries. Considering the situation of home lockdown,
exposure to the high flow of information and misinformation
about the diseases and there spread; the community’s
anxiety increased and their fears grew higher. A recent
study undertaken with over 5,200 participant in Jordan
demonstrated that approximately four out of every ten
participant’s experienced quarantine-related anxiety. [9]
Many papers have been published worldwide exploring
levels of awareness among different groups from different
populations In Saudi Arabia two studies were conducted
where both of them found that people from higher
socioeconomic classes have more knowledge about the
COVID-19 pandemic, but there’s varying results among the
two genders. [19, 20] While in India a study [21] showed that
men have a better knowledge about the pandemic.
We conducted this survey in the peak period between
October and December 2020 to explore awareness of
patients planned to undergo elective surgery under
general and regional anesthesia in JUH. To our knowledge,
no similar studies were conducted in the same period for
the same exact purpose.
Face masks and social distancing remain the best methods
to prevent infection. [18]
METHODS
STUDY DESIGN:
This research was designed to be a prospective cross-
sectional survey by conducting a questionnaire survey tht
was answered directly by our sample of patients. Ethical
clearance was granted by the University of Jordan’s
Hospital IRB (number 10/2020/22589) prior to conducting
the survey. Written and verbal consent was obtained from
the sample patients directly in order for them to participate
in this study. All patients’ identities are hidden and kept
anonymous for the sake of privacy and safety. This study
was conducted in JUH in the period between October and
December 2020.
STUDY POPULATION, SAMPLE, AND DATA
COLLECTION:
Over a period of 3 months in 2020 we collected data from
a sample of 292 randomly selected subjects from the
population of patients undergoing elective surgeries at
JUH. The total invited population of patients was about
1,500 cases during the study period. Data was obtained
through a pre-designed questionnaire. The questionnaire
was designed by the authors in the light of previous similar
articles and was checked and validated by medical
doctor colleagues with any necessary questionaire
adjustment and optimization occuring before conducting
the study. The survey/questionnaire was conducted in the
Arabic language, which is the mother tongue of the
population.
INCLUSION CRITERIA:
Adult patients: males and females, admitted to JUHwith
planned elective surgical treatment under anesthesia -
regardless of diagnosis and type of anesthesia.
EXCLUSION CRITERIA:
Patients aged below 18 years, patients undergoing non-
elective surgeries and patients who are not eligible to
consent.
The questionnaire is comprised of 27 Questions among 3
fields in addition to the patient profile. The first field was
about general knowledge of COVID-19 disease;, the
second about anxiety from this disease; and lastly
knowledge of prevention from COVID-19. Questions
included open ended and multiple choice types of
questions.
147

Participantsin the sample were compared between
among three variables; Gender (Male and Female), Age
(<20 years, 20-40 years, 40-60 years, > 60 years), and
educational level (Primary school, High school, Diploma,
Bachelor, Masters, PhD).
TABLE 1: QUESTIONNAIRE USED IN THE STUDY
NAME: AGE: GENDER: MALE FEMALE OCCUPATION:
Educational degree: below. High school. Diploma. Bachelor. Masters. PhD
1. Are you aware of COVID19?
2. What is the cause of COVID 19? Ø Bacteria. Ø Virus. Ø Other.
3. Can COVID 19 be transmitted? Ø Yes ø No.
4. How many times did you undergo the COVID19 swab?
5. Have you been diagnosed +ve COVID19? 6. If yes what treatment did u had?
ø Paracetamol, ø choloroquine, ø others 7. Have you ever took prophylactic meds to protect u from corona virus?
8. Have you ever contacted a +ve patient?
ø Family, ø friend, ø during travel, ø In hospital, ø never 9. Have you ever been isolated?
ø Hotel, ø home, ø hospital, ø never
10. If yes, why have you been isolated? ø Travel, ø contact isolation. Ø Diagnosed.
11. Dou you feel stressed due to corona? 12. Have you had isolated yourself due to stress/anxiety?
13. Have you had postponed your surgery due to stress/anxiety?
14. Have you had quit your job or took a long leave off due to stress/anxiety? 15. Were you affected medically due to the general lockdown and had medical complications?
16. Are all COVID19 patients symptomatic?
17. What is the most common symptom? ø Fever. Ø Diarrhea. Ø Runny nose. Ø Cough. Ø Arthralgia. ø Fatigue.
18. Is it important to get knowledge about COVID19? 19. Who are most at risk of getting infected?
ø Elderly. Ø Who works with animals. Ø Healthcare workers. Ø Police. Ø Everybody
is at high risk. Ø I don’t know. 20. Who are most at risk from COVID19 morbidity?
ø Healthcare workers. Ø Elderly. Ø Children. Ø Pregnant women. Ø Police.
21. How is it transmitted? ø Bloodborne. Ø Airborne. Ø Respiratory droplets. Ø Touch. Ø Animals. Ø I don’t
know 22. What are the complications?
ø Sepsis, ø respiratory failure. Ø Pneumonia, ø CVA/MI. ø I don’t know
23. Are there any effective treatment? ø Yes. Ø No.
24. Is there any vaccine?
ø Yes. Ø No. 25. Do you think wearing protection is important?
ø Yes. Ø No. ø I don’t know. Ø Doesn’t matter. 26. What is the most important protection mode?
ø Mask. Ø Gloves. Ø Distancing. Ø Avoid raw food.
27. Are you at a higher risk for getting COVID19 due to surgery and anesthesia? ø Yes. Ø No.
148
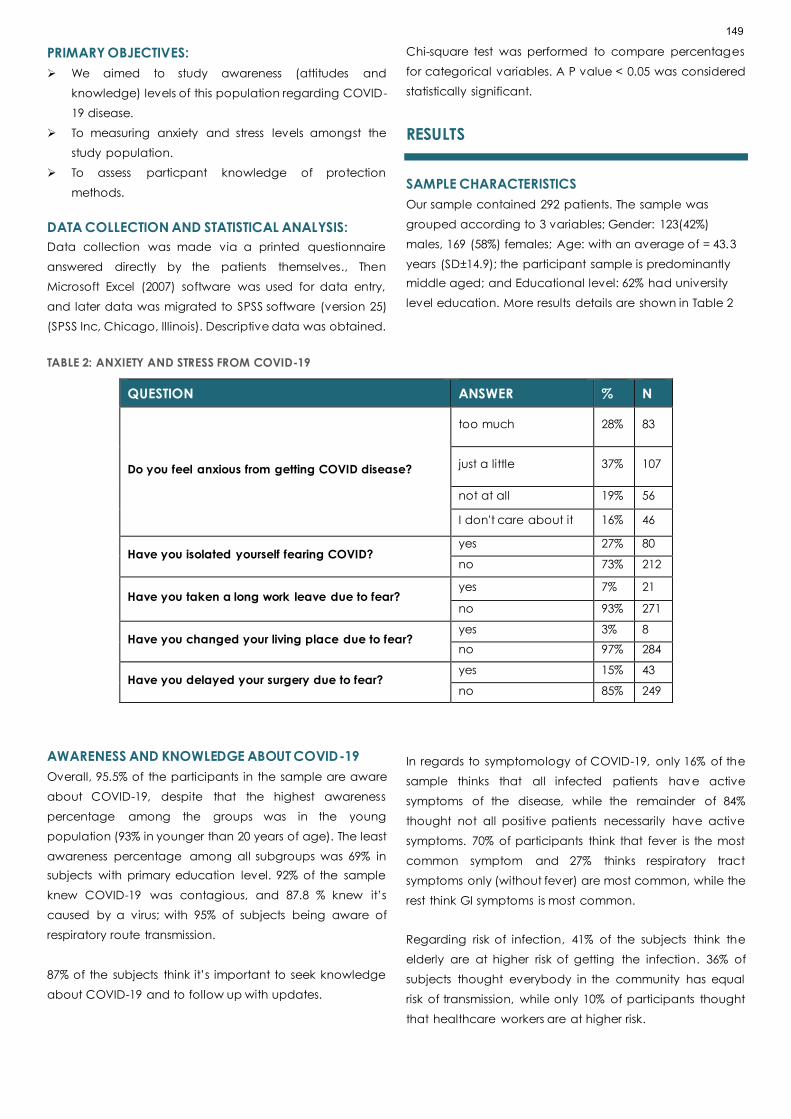
PRIMARY OBJECTIVES:
➢ We aimed to study awareness (attitudes and
knowledge) levels of this population regarding COVID-
19 disease.
➢ To measuring anxiety and stress levels amongst the
study population.
➢ To assess particpant knowledge of protection
methods.
DATA COLLECTION AND STATISTICAL ANALYSIS:
Data collection was made via a printed questionnaire
answered directly by the patients themselves., Then
Microsoft Excel (2007) software was used for data entry,
and later data was migrated to SPSS software (version 25)
(SPSS Inc, Chicago, Illinois). Descriptive data was obtained.
Chi-square test was performed to compare percentages
for categorical variables. A P value < 0.05 was considered
statistically significant.
RESULTS
SAMPLE CHARACTERISTICS
Our sample contained 292 patients. The sample was
grouped according to 3 variables; Gender: 123(42%)
males, 169 (58%) females; Age: with an average of = 43.3
years (SD±14.9); the participant sample is predominantly
middle aged; and Educational level: 62% had university
level education. More results details are shown in Table 2
TABLE 2: ANXIETY AND STRESS FROM COVID-19
QUESTION ANSWER % N
Do you feel anxious from getting COVID disease?
too much 28% 83
just a little 37% 107
not at all 19% 56
I don't care about it 16% 46
Have you isolated yourself fearing COVID? yes 27% 80
no 73% 212
Have you taken a long work leave due to fear? yes 7% 21
no 93% 271
Have you changed your living place due to fear? yes 3% 8
no 97% 284
Have you delayed your surgery due to fear? yes 15% 43
no 85% 249
AWARENESS AND KNOWLEDGE ABOUT COVID-19
Overall, 95.5% of the participants in the sample are aware
about COVID-19, despite that the highest awareness
percentage among the groups was in the young
population (93% in younger than 20 years of age). The least
awareness percentage among all subgroups was 69% in
subjects with primary education level. 92% of the sample
knew COVID-19 was contagious, and 87.8 % knew it’s
caused by a virus; with 95% of subjects being aware of
respiratory route transmission.
87% of the subjects think it’s important to seek knowledge
about COVID-19 and to follow up with updates.
In regards to symptomology of COVID-19, only 16% of the
sample thinks that all infected patients have active
symptoms of the disease, while the remainder of 84%
thought not all positive patients necessarily have active
symptoms. 70% of participants think that fever is the most
common symptom and 27% thinks respiratory tract
symptoms only (without fever) are most common, while the
rest think GI symptoms is most common.
Regarding risk of infection, 41% of the subjects think the
elderly are at higher risk of getting the infection. 36% of
subjects thought everybody in the community has equal
risk of transmission, while only 10% of participants thought
that healthcare workers are at higher risk.
149

Although 61% believed that COVID-19 is self-limiting and
doesn’t need specific treatment, there appeared a good
level of awareness regarding progression of the disease in
some patients. Among a list of COVID-19 complications;
84% of the subjects thought respiratory failure is the most
serious complication and 67% of the subjects think the
elderly are at most risk developing serious complication
from all infected patients. On the other hand, 7% of the
sample believed COVID-19 doesn’t cause any serious
complication of infection. Our participants were aware of
risk factors leading to complications of COVID-19 as 70-83%
thought smoking, malignancy and diabetes are major risk
factors. 60% thought that obesity, and 42% thought that
Hypertension, as a major risk factor. 90% thought that
pregnancy and abnormal lipid profiles are not risk factors
for developing serious complications.
Interestingly, 54% of the participant sample thought that
the Jordanian population has a lower risk of getting COVID-
19 and its complications in comparison compared with
other populations including European nations. This result is
similar (between 40-64%) among different variables
subgroups of age, gender and educational levels.
KNOWLEDGE AND FOLLOWING PROTECTIVE
MEASURES
38% of our participants have had a nasal-swab for RT-PCR
testing, 7% of them have been diagnosed COVID-19
positive (3% of the sample).
Of our participants, 38% believes that antibiotics, and 30%
that nebulizers, are effective for prophylaxis against COVID-
19. Only 2% of the whole sample size have actually took
some form of herbal supplement or pharmacological
agent as a prophylaxis against COVID-19.
Only 6% of particpiants have been quarantined, all of them
were due to travel, and only 2% has been in physical
contact with an infected patient during last 3 months prior
to survey.
Around 81% of our subjects believe there’s no treatment for
COVID-19, with 78% believing there is no vaccine
developed to protect against the disease, and 40%
believed that infection provides immunity against re-
infection.
Despite that, 90% of participants considered PPE important
and vital for protection from COVID-19 transmission, with a
variety of responses in deciding which is the most important
PPE; 37% consider face masks the most important and 32%
went with physical distancing.
ANXIETY AND STRESS DUE TO COVID-19
We asked the surevyed patients 5 questions to assess their
anxiety and fear due to COVID-19 in general; only 21% had
isolated themselves from their friends and families due fear
of getting the infection, 28% described their fear as too
much, while 35% claimed that they aren’t really stressed
about COVID-19. Details of these results are shown in Table
3.
TABLE 3: ANXIETY AND STRESS FROM COVID-19
QUESTION ANSWER % N
Do you feel anxious from getting COVID disease?
too much 28% 83
just a little 37% 107
not at all 19% 56
I don't care about it 16% 46
Have you isolated yourself fearing COVID? yes 27% 80
no 73% 212
Have you taken a long work leave due to fear? yes 7% 21
no 93% 271
Have you changed your living place due to fear? yes 3% 8
no 97% 284
Have you delayed your surgery due to fear? yes 15% 43
no 85% 249
150

3% of the whole sample has changed their residency
location due to anxiety and fear and about 7% of
respondents have taken a long leave from work (more than
one month) to minimize risk of infection.
About 15% of participants have previously rescheduled
their planned surgical operation due to fear of getting the
infection while they were in the hospital.
DISCUSSION
This paper targeted surgical patients admitted to Jordan
university hospital during the major lockdown in Jordan,
and the first peak of COVID-19 cases. Those patients were
planned to undergo different surgical procedures
electively and were admitted one day prior to surgery.
Our sample of randomly selected 292 patients (out of a
1500 population) was predominantly middle aged. All
subjects were literate, with majority having educational
level higher than secondary school. That was reflected by
the high percentage of awareness about basic features of
COVID-19 being viral contagious through respiratory route,
with their agreement on importance of general population
seeking further knowledge about this disease. This
knowledge might be motivated by fear of infection due to
the fact that those patients were free of COVID-19 going to
a hospital (for other reasons) where there’s a risk of
contacting an infected individual.
Majority of subjects’ beliefs about percentage of
asymptomatic population is consistent with different
worldwide reports displaying variable percentage of
asymptomatic COVID-19 infected individuals ranging
between 50-80 % [24, 25]. Adding to that majority of our
sample also is aware of most common symptom caused by
COVID-19 is fever. [26] In same page also; majority
recognized the true at higher risk of complications being
elderly and risk factors of developing life-threatening
disease as obesity, DM, smoking and malignancy. [27]
As in every large event, or this time, a pandemic, lots of
misguiding news and rumors circulate in the media; of them
one claimed that Mediterranean and Middle Eastern
population are genetically more resistant to COVID-19 than
European population, and another claimed that traditional
foods as Mansaf in Jordan and Mulukhiyah in Egypt protect
from COVID-19, that is clearly reflected on our subjects
beliefs where 54% thought Jordanians are less likely to be
infected, and interestingly this result is similar among
different groups of age, and education.
Despite large and wide trials of finding a specific cure for
COVID-19, none till this moment succeeded, and main lines
of treatment are preventive and supportive. [28 – 30] At the
time of implementing this survey there was no vaccine yet
approved, as first vaccine was approved by the FDA in the
US was on December 11, 2020. [31] And that is reflected on
our subjects’ beliefs and knowledge of those facts.
Undergoing PCR testing or being under quarantine doesn’t
seem to affect awareness or beliefs of the patients. Again,
social media and news affect misconception of the
population; as around 40% of the sample belief that
nebulizers and / or antibiotics helps in preventing or treating
COVID-19. [28 -30]
There’s no clear preference of social distancing or wearing
a face mask over one another, but both of them remain
best methods of protection from COVID-19 transmission,
[18] and that’s reflected on our samples’ beliefs where
majority split (around one third each) supporting each of
these two methods of protection.
Relatively a small percentage of subjects have previously
re-scheduled their surgical operation date due to fear of
COVID-19, and that is surely caused by different factors;
most importantly the underlying disease or condition urging
the patient to go to hospital and undergo surgical
treatment, despite 37% claiming mild anxiety and 28%
claiming too much fear from getting infected with COVID-
19.
Changing residency location or taking work-leaves is not
easy, especially in the difficult economical situations in
Jordan, so the small percentage (less than 8%) of patients
changing their residency state or taking a long work leave
is biased and not conclusive.
CONCLUSION
Patients from this study undergoing surgical procedures
seem to be well aware and knowledgeable about the
COVID-19 situation and with general information. They also
are well aware of transmission methods, risk factors and
main lines of protection from transmission. Media, news and
rumors seem to largely affect popular beliefs and cause
basic misconceptions regarding treatment options, and
151

that opens a door for financial exploitation of the
population to target them towards specific
pharmacological or non-pharmacological claimed
“therapies”.
CONFLICT OF INTERESTS:
All authors declare no conflict of interests.
FUNDING:
No funding of any form has been received.
ABBREVIATIONS
JUH: Jordan University Hospital
DM: Diabetes Mellitus
COVID-19: Corona Virus Disease
PPE: Protective Personal Equipments
References:
1. JT. Jordan confirms First case of Coronavirus. The
Jordan Times. Mar 02,2020. Available at
https://www.jordantimes.com/news/local/jordan-
confirms-first-case-coronavirus
2. Maram Kayed. Schools suspended, borders closed,
gatherings banned as gov't responds to continued
coronavirus spread. The Jordan Times. Mar 14,2020.
Available at
https://www.jordantimes.com/news/local/schools-
suspended-borders-closed-gatherings-banned-govt-
responds-continued-coronavirus
3. Suleiman Al-Khalidi. Jordan's monarch announces
state of emergency to combat coronavirus. Reuters.
March 17, 2020. Available at
https://www.reuters.com/article/us-health-
coronavirus-jordan-idUSKBN2141FA
4. Jordan. UNESCO UIS. Available at
http://uis.unesco.org/en/country/jo . Accessed in
March 2021.
5. The World Bank. Available at
https://data.worldbank.org/indicator/IT.NET.USER.ZS?lo
cations=JO . Accessed in March 2021.
6. JT. Circular issued for mandatory face mask use. The
Jordan Times. Aug 13,2020. Available at:
http://www.jordantimes.com/news/local/circular-
issued-mandatory-face-mask-use .
7. COVID-19-related legislation in the Hashemite
Kingdom of Jordan. Dentons. April 21, 2020. Available
at:
https://www.dentons.com/en/insights/articles/2020/a
pril/21/covid-19-related-legislation-in-the-hashemite-
kingdom-of-jordan .
8. Bahaa Al Deen Al Nawas. Five hospitals designated for
quarantine, Covid-19 testing. The Jordan Times. Mar
08,2020. Available at:
https://jordantimes.com/news/local/five-hospitals-
designated-quarantine-covid-19-testing .
9. Massad I; Al-Taher R; et, al. The impact of the COVID-
19 pandemic on mental health: early quar-antine-
related anxiety and its correlates among Jordanians.
East Mediterr Health J. 2020;26(10):1165–1172.
https://doi.org/10.26719/emhj.20.115
10. COVID-19 Data Repository by the Center for Systems
Science and Engineering (CSSE) at Johns Hopkins
University. Available at:
https://github.com/CSSEGISandData/COVID-19 .
Visited at March 2021.
11. Joint Statement by ILO, FAO, IFAD and WHO. Impact
of COVID-19 on people's livelihoods, their health and
our food systems. The World Health Organization. 13
October 2020. Available at:
https://www.who.int/news/item/13-10-2020-impact-of-
covid-19-on-people%27s-livelihoods-their-health-and-
our-food-systems
12. The Official Site of the Jordanian e-Government.
Available at:
https://portal.jordan.gov.jo/wps/portal?lang=en .
Visited at March 2021.
13. The Official Site of Department of Statistics. Jordanian
ministry of planning and international cooperation.
Available at: http://dosweb.dos.gov.jo/ar . Visited at
March 2021.
14. Maram Kayed. Jordan’s extraordinary measures to
contain COVID-19 spread draw int’l accolades. The
Jordan Times. Apr 02,2020. Available at:
http://jordantimes.com/news/local/jordans-
extraordinary-measures-contain-covid-19-spread-
draw-intl-accolades .
15. Ali Younes. How Jordan is flattening its COVID-19
curve. Aljazeera. 22 Apr 2020. Available at:
https://www.aljazeera.com/news/2020/4/22/how-
jordan-is-flattening-its-covid-19-curve .
16. In crisis: Jordan battles COVID-19 and misinformation.
Reliefweb. United Nations office for the coordination
of humanitarian affairs. 20 Apr 2020. Available at:
https://reliefweb.int/report/jordan/crisis-jordan-battles-
covid-19-and-misinformation .
152
17. Ministry of Health, the official website of the Jordanian
Ministry of Health Coronavirus disease. Jordanian
ministry of health. Available at:
https://corona.moh.gov.jo/en . Visited at March 2021.
18. Physical distancing, face masks, and eye protection
to prevent person-to-person transmission of SARS-CoV-
2 and COVID-19: a systematic review and meta-
analysis, Derek K Chu, MD , Prof Elie A Akl, MD,
Stephanie Duda, MSc , Karla Solo, MSc, Sally
Yaacoub, MPH, Prof Holger J Schünemann, MD.
19. Al-Hanawi MK, A. K. (2020). Knowledge, Attitude and
Practice Toward COVID-19 Among the Public in the
Kingdom of Saudi Arabia: A Cross-Sectional Study.
Front. Public Health, 10. doi: 10.3389/fpubh.2020.00217
20. Hadil Alahdal, F. B. (2020). An analytical study on the
awareness, attitude and practice during theCOVID-19
pandemic in Riyadh, Saudi Arabia. Journal of Infection
& Public Health, 7. doi:10.1016/j.jiph.2020.06.015
21. Singh, A. K. (2020). COVID-19: Assessment of
knowledge and awareness in Indian society. Journal
of public affairs, 9. doi:10.1002/pa.2354.
22. Hamilton M. A. Rating Scale For Depression. Journal of
Neurology, Neurosurgery & Psychiatry 1960;23:56-62.
23. American Psychiatric Association Diagnostic and
statistical manual of mental disorders: 5th Edn.
Washington, DC: (2013).
24. Yanes-Lane M, Winters N, Fregonese F, Bastos M,
Perlman-Arrow S, Campbell JR, et al. (2020) Proportion
of asymptomatic infection among COVID-19 positive
persons and their transmission potential: A systematic
review and meta-analysis. PLoS ONE 15(11): e0241536.
https://doi.org/10.1371/journal.pone.0241536 .
25. Petersen I, Phillips A. Three Quarters of People with
SARS-CoV-2 Infection are Asymptomatic: Analysis of
English Household Survey Data. Clin Epidemiol. 2020;
12:1039-1043. https://doi.org/10.2147/CLEP.S276825 .
26. Coronavirus disease (COVID-19) Q&A. The World
Health Organization. Available at:
https://www.who.int/emergencies/diseases/novel-
coronavirus-2019/question-and-answers-hub/q-a-
detail/coronavirus-disease-covid-19#:~:text=symptoms
. Visited at March 2021
27. Coronavirus disease (COVID-19). The World Health
Organization. Available at:
https://www.who.int/health-
topics/coronavirus#tab=tab_1 . Visited at March 2021.
28. Bhimraj A, Morgan RL, Shumaker AH, et al. Infectious
Diseases Society of America Guidelines on the
Treatment and Management of Patients with COVID-
19. Infectious Diseases Society of America 2021;
Version 4.2.0. Available at
https://www.idsociety.org/practice-guideline/covid-
19-guideline-treatment-and-management/ .
29. Interim Clinical Guidance for Management of Patients
with Confirmed Coronavirus Disease (COVID-19).
CDC. Available at
:https://www.cdc.gov/coronavirus/2019-
ncov/hcp/clinical-guidance-management-
patients.html . visited in March 2021.
30. Kim, Arthur. And others. (2021). Coronavirus disease
2019 (COVID-19): Management in hospitalized adults.
UpToDate. Retrieved Feb 26, 2021from:
https://www.uptodate.com/contents/coronavirus-
disease-2019-covid-19-management-in-hospitalized-
adults .
31. Comirnaty and Pfizer-BioNTech COVID-19 Vaccine. US
Food and Drug Administration. Available at:
https://www.fda.gov/emergency-preparedness-and-
response/coronavirus-disease-2019-covid-19/pfizer-
biontech-covid-19-vaccine . Visited at March 2021.
153

RESEARCH ARTICLE
PUBLIC AWARENESS AND PERSONAL HYGIENIC PRACTICES OF
RURAL PEOPLE IN THE COVID-19 SITUATION
Prodip Kumar Baral1, Umme Habiba2, Md. Emdadul Islam2, S. M. Woahid Murad3,4
1. Department of Pharmacy, Noakhali Science and Technology University, Noakhali, Bangladesh
2. Institute of Information Sciences, Noakhali Science and Technology University, Noakhali, Bangladesh
3. Department of Economics, Noakhali Science and Technology University, Noakhali, Bangladesh
4. School of Accounting, Economics and Finance, Curtin University, Perth, Australia
Correspondence: [email protected]
ABSTRACT
BACKGROUND
The study attempted to understand rural Bangladesh's health information, awareness level, and preventive measures in
the Coronavirus disease -19 (COVID-19) pandemic.
METHODS
A cross-sectional survey by face-to-face interview was conducted with rural people from 14 June 2020 to 13 August 2020.
An ordered logistic regression model was employed for data analysis. A total of 3,007 people (Female = 55.97%; Male =
44.03%) participated in the survey who met the inclusion criteria.
RESULTS
The demography of respondents revealed that a significant portion of villagers were within the ages 21-30 (26.80%), had
primary education (23.88%), unemployed (31.73%), and middle class (56.17%). The most common and influential used
media to know about the Coronavirus disease were electronic media and relative/family/friend/neighbors. Change of
demography created a spectacular difference in public awareness level and hygiene practice. Female, illiterate, poor,
and age above 60 were comparatively less aware of seven essential facts about the disease. There was no mentionable
difference in personal hygienic practices due to sex. But particpants who were aged 51-60 years, graduates or
postgraduates, unmarried, government or non-government employees and middle class exhibitedthe best hygiene
practice over other features. Invariably, the education level of rural people had a positive effect on awareness and
preventive measures.
CONCLUSIONS
Overall, the government and policymakers must identify vulnerable groups whose awareness and hygi enic practices are
not at the optimum level. Afterward, the government and related organizations should take necessary measures
immediately to protect these groups from COVID-19 threats until the complete immunization.
KEYWORDS
COVID-19; awareness; health information; ordered logit; rural people
154

INTRODUCTION
Severe Acute Respiratory Syndrome Coronavirus-2 (SARS-
CoV-2), a zoonotic infectious virus, is the causative
organism of the 21st-century pandemic. [1, 2] It was a novel
coronavirus, and the infection pattern was entirely
hypothetical from the beginning of the outbreak in
December 2019. Therefore, better preventive and curative
measures were obscure. [3,4] As the enveloped RNA virus
mainly spreads human-to-human through respiratory
droplets, the World Health Organization and other national
and international health authorities provided guidelines to
enforce standard personal hygiene practice to prevent the
contagious virus from community transmission. [1, 5, 6] They
suggested maintaining public distancing, using face masks,
regular hand sanitization, and a healthy diet. The general
attitudes towards these hygiene measures relied on their
knowledge and awareness development. [7] The people
who live below the margins of literacy, economy, and
adequate information sources were considered vulnerable
to prevent the disease. [8,9]
Bangladesh is the South Asian eighth-most populated
country with 162 million, and 62.60% live in rural areas [10].
Therefore, the virus transmission control at the community
level was challenging for government. When the entire
world was preparing to prevent the virus, Bangladesh
faced difficulties with one of the world's dense populations.
Furthermore, a lower-middle-income economy is a barrier
to maintaining social distancing, sanitization facilities,
temporary quarantine sites and healthcare facilities at a
local level. [11,10]
The country experienced two waves of infection with a
death toll of 13,282 until 16 June 2021, and virologists have
warned of a chance of a third wave by the Indian SARS-
CoV-2 variant. [12,13] During that time, low-income rural
areas suffered from a scarcity of food, treatment, and
medication during the multiphase lockdown and partial
lockdown. [14] In addition, the private sector's jobholder,
day laborers, fishermen, vehicle drivers, small employee
industry and cottage industry employees have lost their
jobs. This led to psychological disturbances such as fear,
anxiety, and depression. [15]
Public knowledge, awareness levels, attitudes, and cultural
norms have been considered as crucial indicators for an
individual’s perspective of disease prevention from the very
beginning of the pandemic. [16] Based on these indicators,
the rural people of Bangladesh are behind the urban
people. [10, 11] Additionally, the knowledge level of rural
men, women, and adolescents about different infectious
diseases and chronic diseases was deficient compared to
the urban community. [17-19] Some recent studies have
found that the Indonesian, Nepalese and Pakistani
communities had an excellent experience and a positive
approach regarding the COVID-19 pandemic. However, it
was reported half of those populations did not understand
the quarantine concept and the distance between
people to be kept up to limit the transmission. [20-22] Like
these communities of the three nations, most of the rural
Bangladeshi people are also not aware about pandemic.
The present study was aimed at demonstrating the health
information sources, people's awareness level, and the
extent of hygienic procedures people maintain to combat
the COVID-19 grim circumstance in rural Bangladesh. To
our knowledge no previous investigations on Bangladesh's
perspectives about the rural people's awareness and
preventive measures are still to be conducted.
METHODS
DATA COLLECTION
This study relies on a database generated from a cross-
sectional survey. It was conducted in the rural areas of all
divisions of Bangladesh from 14 June 2020 to 13 August
2020. The random invited participants needed to meet the
following inclusion criteria: age ≥18 years, psychologically
healthy, not temporally visiting rural areas, excluding the
standard gender ratio of the 2011 Bangladesh census. A
structured questionnaire was developed considering
previous related empirical studies. [23,20,24] Surevys were
in the Bengali language for the convenience of both
interviewers and interviewees. The questionnaire was
finalized after pretesting and checking its reliability using
Cronbach (1951). [25] The Cronbach's αlpha for the sources
of awareness of COVID-19 was 0.7520, while the
Cronbach's αlpha for the awareness level regarding the
COVID-19 diseases and the practices of health guidelines
during the COVID-19 pandemic were 0.9176 and 0.9202,
respectively.
To ease data entry, we created a Google form along with
the questionnaire in a printed format, As most rural dwellers
neither use smartphones or access to the internet, [26,10]
we hired and trained 16 young interviewers who had their
university graduation and had a smartphone. In addition,
155

we verified their performance by a pilot study on this survey
and personal safety measures were ensured before
inaugurating the interviewers' field surveys. The
questionnaires mainly comprised two parts: the first part
involved participants' sociodemographic characteristics.
The second part covered questions regarding awareness
levels and hygiene techniques that combine the variables
for combating COVID-19. [45,46] The first section consisted
of multiple-choice questions and the second section was
based on responses on a 5-point Likert scale. This survey's
actual sample size was 3,007, justified at a 5% significance
level and a 2% margin of error.
ECONOMETRIC TOOLS FOR DATA ANALYSIS
Stata 16 was used for the data analysis. The Ordered Logit
(ologit) model was employed to estimate the likelihood of
awareness and practice of hygiene in daily life in terms of
each sociodemographic category, specifically, sex, age,
level of education, and marital status, occupation, and
socioeconomic status. [27] Since all independent variables
considered in this study were categorical variables, we
estimated the odds ratio for each category of the
independent variables keeping the first category as a
benchmark. The Odds vary from zero to positive infinity. If
odds exceed 1, the likelihood of success is greater than the
possibility of failure.
RESULTS
RESPONDENTS' DEMOGRAPHIC INFORMATION
This study was conducted in rural Bangladesh and tried to
determine the level of awareness and hygienic practices
the surveyed people maintained regarding COVID-19,
which were subsequently evaluated with their
demographic characteristics. The sociodemographic
aspects, including sex, age, education level,
socioeconomic status, marital status, and occupation, are
worthy of mentioning independent variables in the reverse
of awareness and hygiene measures. Table 1 reports the
demographic characteristics of the respondents. Out of
3,007 respondents, males and females were 55.97% and
44.03%, respectively. The most significant number of
respondents were within the age range of 21-30 (26.80%).
Among the respondents, 36.88% of people were
impoverished. In terms of education, about 20% were
illiterate, and 23.88% had only primary education. Finally, it
was found that only 15.6% of people are directly affiliated
with farming, although diversity in occupation was
noteworthy.
TABLE 1: DEMOGRAPHIC CHARACTERISTICS OF RESPONDENTS IN RURAL BANGLADESH (𝒏 = 𝟑𝟎𝟎𝟕)
DEMOGRAPHY CATEGORY PERCENTAGE DEMOGRAPHY CATEGORY PERCENTAGE
Sex Male 55.97
Education
Illiterate/only can sign 19.72
Female 44.03 Primary education 23.88
Age
Less than 21 17.03 SSC level 20.15
21-30 26.8 HSC level 12.87
31-40 20.65 Graduate 15.43
41-50 18.09 Post-graduate 7.95
51-60 10.81
Marital status
Married 61.02
above 60 6.62 Unmarried 33.12
Residence
(Division)
Dhaka 1.76 Widows 4.82
Chittagong 9.78 Divorced 0.73
Barisal 33.89 Others 0.3
Khulna 9.44
Occupation
Unemployed 31.73
Mymensingh 2.06 Farmer 15.6
Rajshahi 1 Housewife 25.17
Rangpur 28.9 Self-employed 5.52
Sylhet 13.17 Local Businessman 8.05
Socio-
economic
status
Poor class 36.88 Non-government worker 5.65
Middle class 56.17 Government worker 5.19
Rich class 6.95 Others 3.09
SSC - Secondary School Certificate; HSC - Higher Secondary School Certificate
156

SOURCES OF AWARENESS OF THE COVID-19 BY
DEMOGRAPHIC CHARACTERISTICS
Table 2 illustrates the percent contribution of information
sources for getting awareness of COVID-19 within five levels
of agreements (Strongly disagree, Disagree, Neutral,
Agree, Strongly agree). Over 40% of participants agreed on
relative/family/friend/neighbors' contribution source; more
than that, nearly one-fourth strongly agreed on that source.
Furthermore, the agree and strongly agree levels on
electronic media information sources were 38.78% and
34.62%, respectively. The contributions of print media, social
media, workplace, and doctors and other healthcare
service providers strongly disagreed with each most
significant percentage. Interestingly, the awareness
development role of social media didn't show any notable
difference among the five levels, where each level was
around 20%.
TABLE 2: CONTRIBUTION OF DIFFERENT SOURCES OF AWARENESS ABOUT COVID-19 IN RURAL BANGLADESH (IN PERCENTAGE)
SOURCES STRONGLY
DISAGREE DISAGREE NEUTRAL AGREE
STRONGLY
AGREE
Electronic media (Television, Radio, Internet) 3.86 8.48 14.27 38.78 34.62
Print media (Magazines, Newspapers, Flyers, Newsletters) 24.84 20.05 17.99 23.74 13.37
Social media (Facebook, YouTube, Twitter, Instagram, Blog) 22.18 18.89 20.98 22.31 15.63
Workplace (Peers, Colleagues) 29.83 20.65 27.97 17.23 4.32
Doctors and other healthcare service providers) 31.56 19.52 24.54 19.69 4.69
Relatives/ family members/ friends/ neighbors 11.27 5.85 12.5 43.23 27.14
AWARENESS LEVEL OF RURAL PEOPLE ABOUT COVID-
19 DISEASE
The study investigated the extent of the eight COVID-19
related information sources that people know vital for
awareness and attitude development. The knowledge
source was used as indicators to determine the awareness.
Table 3 correlates among demographic features on the
five levels of awareness (Nothing, Little, Fair, Good,
Excellent) through an ordered logit model. The chi-square
values of all estimated variables were significant at the
level of 1%, which confirmed the ologit models' fitness in
data analysis.
In all categories, the odds ratio for females was less than 1.
This indicated the female knowledge level about the
pandemic was lower than males in every case,
nevertheless, literacy on respiratory complications was
moderately significant with signs and symptoms and self-
isolation were minimally substantial for women. On the
other hand, depending on information, age showed
diversity in health awareness. Surprisingly, in most cases, the
values of the age range 21-30 and above 60 were relatively
smaller than the others. The age group 21-30 had highly
significant values on the knowledge about the respiratory
complications, the extent of severity, and the transmission
through tiny respiratory droplets. Whereas the age groups
above 60 had a highly compelling value for respiratory
droplet knowledge. Furthermore, age levels, such as for the
41-50 age goup, also found highly significant health literacy
values on self-isolation and preventive measures. As the
level of education increased, this study revealed the
improvement of health literacy in all cases. Most of the
odd’s ratios were highly significant.
Compared to married individuals, unmarried people
showed a little better result except for the extent of severity.
On the contrary, divorced individuals and
widows/widowers were less likely to be aware of the
COVID-19 since the odds ratios were highly significant in
most cases and less than 1. Furthermore, we found a
heterogeneous level of awareness across different
occupations. In contrast with unemployed respondents,
the awareness levels of non-government and government
employees were significant. In the case of self-isolation and
preventive measures, most occupations had considerable
knowledge. Moreover, in terms of socioeconomic status,
the middle class had highly effective health literacy relative
to the poor respondents. Analogously, the middle class's
odds ratios were larger and statistically significant than the
rich class except for the presence of mild symptomatic or
asymptomatic infection and the spread of disease via
asymptomatic patients.
157
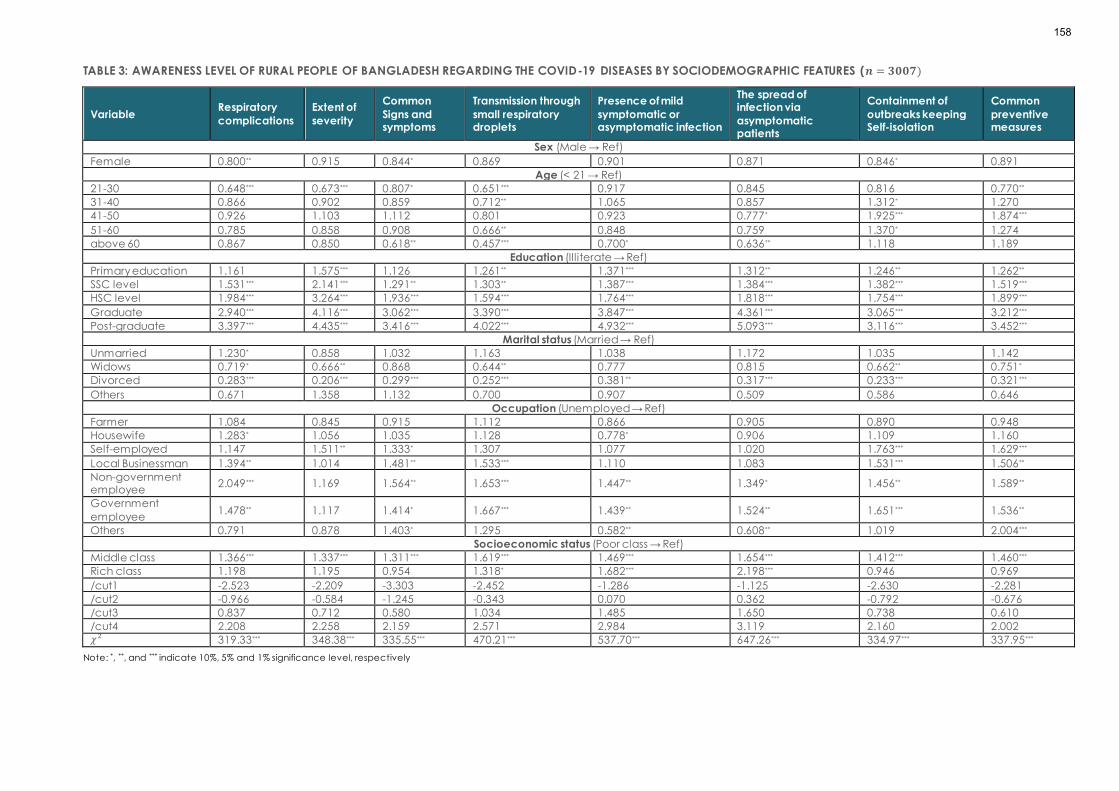
TABLE 3: AWARENESS LEVEL OF RURAL PEOPLE OF BANGLADESH REGARDING THE COVID-19 DISEASES BY SOCIODEMOGRAPHIC FEATURES (𝒏 = 𝟑𝟎𝟎𝟕)
Variable Respiratory
complications
Extent of
severity
Common
Signs and symptoms
Transmission through
small respiratory droplets
Presence of mild
symptomatic or asymptomatic infection
The spread of infection via
asymptomatic patients
Containment of
outbreaks keeping Self-isolation
Common
preventive measures
Sex (Male → Ref)
Female 0.800** 0.915 0.844* 0.869 0.901 0.871 0.846* 0.891
Age (< 21 → Ref)
21-30 0.648*** 0.673*** 0.807* 0.651*** 0.917 0.845 0.816 0.770**
31-40 0.866 0.902 0.859 0.712** 1.065 0.857 1.312* 1.270
41-50 0.926 1.103 1.112 0.801 0.923 0.777* 1.925*** 1.874***
51-60 0.785 0.858 0.908 0.666** 0.848 0.759 1.370* 1.274
above 60 0.867 0.850 0.618** 0.457*** 0.700* 0.636** 1.118 1.189
Education (Illiterate → Ref)
Primary education 1.161 1.575*** 1.126 1.261** 1.371*** 1.312** 1.246** 1.262**
SSC level 1.531*** 2.141*** 1.291** 1.303** 1.387*** 1.384*** 1.382*** 1.519***
HSC level 1.984*** 3.264*** 1.936*** 1.594*** 1.764*** 1.818*** 1.754*** 1.899***
Graduate 2.940*** 4.116*** 3.062*** 3.390*** 3.847*** 4.361*** 3.065*** 3.212***
Post-graduate 3.397*** 4.435*** 3.416*** 4.022*** 4.932*** 5.093*** 3.116*** 3.452***
Marital status (Married → Ref)
Unmarried 1.230* 0.858 1.032 1.163 1.038 1.172 1.035 1.142
Widows 0.719* 0.666** 0.868 0.644** 0.777 0.815 0.662** 0.751*
Divorced 0.283*** 0.206*** 0.299*** 0.252*** 0.381** 0.317*** 0.233*** 0.321***
Others 0.671 1.358 1.132 0.700 0.907 0.509 0.586 0.646
Occupation (Unemployed → Ref)
Farmer 1.084 0.845 0.915 1.112 0.866 0.905 0.890 0.948
Housewife 1.283* 1.056 1.035 1.128 0.778* 0.906 1.109 1.160
Self-employed 1.147 1.511** 1.333* 1.307 1.077 1.020 1.763*** 1.629***
Local Businessman 1.394** 1.014 1.481** 1.533*** 1.110 1.083 1.531*** 1.506**
Non-government employee
2.049*** 1.169 1.564** 1.653*** 1.447** 1.349* 1.456** 1.589**
Government
employee 1.478** 1.117 1.414* 1.667*** 1.439** 1.524** 1.651*** 1.536**
Others 0.791 0.878 1.403* 1.295 0.582** 0.608** 1.019 2.004***
Socioeconomic status (Poor class → Ref)
Middle class 1.366*** 1.337*** 1.311*** 1.619*** 1.469*** 1.654*** 1.412*** 1.460***
Rich class 1.198 1.195 0.954 1.318* 1.682*** 2.198*** 0.946 0.969
/cut1 -2.523 -2.209 -3.303 -2.452 -1.286 -1.125 -2.630 -2.281
/cut2 -0.966 -0.584 -1.245 -0.343 0.070 0.362 -0.792 -0.676
/cut3 0.837 0.712 0.580 1.034 1.485 1.650 0.738 0.610
/cut4 2.208 2.258 2.159 2.571 2.984 3.119 2.160 2.002 𝜒2 319.33*** 348.38*** 335.55*** 470.21*** 537.70*** 647.26*** 334.97*** 337.95***
Note: *, **, and *** indicate 10%, 5% and 1% significance level, respectively
158

TABLE 4: THE PRACTICES OF HEALTH GUIDELINE DURING THE COVID-19 PANDEMIC BY SOCIODEMOGRAPHIC FEATURES IN RURAL BANGLADESH (𝒏 = 𝟑𝟎𝟎𝟕)
Variable
Proper handwashing
while coming back from outside
Use of mask when
going outside
Sanitation in sudden
sneezing at a public place
Proper
handwashing before eating food
Maintenance of
social distance
Abstain from
touching eye, nose, and mouth
Eating more fruits
and vegetables than ever before
Sex (Male → Ref)
Female 1.005 1.018 1.097 1.027 1.131 1.133 1.066
Age (< 21 → Ref)
21-30 0.722** 0.589*** 0.923 0.682*** 0.790* 0.810* 0.715***
31-40 0.780 0.545*** 0.713** 0.728** 0.718** 0.783* 0.684**
41-50 0.814 0.588*** 0.742* 1.054 0.727** 0.790 0.744*
51-60 1.027 0.937 0.907 1.047 0.898 0.957 1.286
above 60 1.152 0.828 0.606*** 0.996 0.722* 0.897 0.984
Education (Illiterate → Ref)
Primary education 1.287** 1.591*** 1.263** 1.415** 1.244** 1.144 0.864
SSC level 1.439*** 1.513*** 1.565*** 1.001 1.161 1.166 0.815*
HSC level 2.281*** 2.302*** 2.312*** 1.327** 1.528*** 1.633*** 1.243
Graduate 4.095*** 5.292*** 4.606*** 3.565*** 3.066*** 3.187*** 2.499***
Post-graduate 4.104*** 4.887*** 5.225*** 3.241*** 3.186*** 3.218*** 2.528***
Marital status (Married → Ref)
Unmarried 1.238* 1.117 1.145 1.223 1.384*** 1.491*** 1.463***
Widows 0.625*** 0.562*** 0.734* 0.704** 0.559*** 0.672** 0.883
Divorced 0.438** 0.397*** 0.541 0.383** 0.409** 0.391** 0.410**
Others 1.751 0.888 0.789 0.844 0.571 0.316** 0.526
Occupation (Unemployed → Ref)
Farmer 0.833 0.849 0.679*** 0.933 1.050 1.088 1.461***
Housewife 0.968 0.927 0.589*** 1.081 0.841 0.871 1.171
Self-employed 0.737* 0.765 0.727* 0.936 0.893 0.842 0.958
Local Businessman 1.266 1.466** 0.986 1.728*** 1.110 1.354** 1.408**
Non-government employee
1.685*** 1.725*** 1.160 2.046*** 1.985*** 1.616*** 1.990***
Government employee 1.876*** 1.968*** 1.158 2.100*** 1.996*** 1.543** 2.111***
Others 0.602** 0.499*** 0.489*** 1.105 0.543*** 0.351*** 0.659
Socioeconomic status (Poor class → Ref)
Middle class 1.317*** 1.438*** 1.651*** 1.210** 1.662*** 1.624*** 1.632***
Rich class 0.856 0.969 1.627*** 0.700** 1.422** 1.441** 1.434**
/cut1 -2.986 -2.479 -1.426 -2.597 -1.933 -1.339 -1.431
/cut2 -1.462 -0.696 -0.120 -1.108 -0.438 0.172 -0.472
/cut3 0.686 0.730 1.300 0.264 1.055 1.362 0.929
/cut4 1.670 1.807 2.533 1.307 2.197 2.647 2.240 𝜒2 439.42*** 586.40*** 764.55*** 335.38*** 533.21*** 512.09*** 406.60***
Note: *, **, and *** indicate 10%, 5% and 1% significance level, respectively
159

PRACTICES OF PERSONAL HYGIENIC PROCEDURES OF
RURAL PEOPLE DUE TO COVID-19
Table 4 illustrates the seven health-related daily practices
and the odds ratio on the five levels of hygiene practice
(Never, Rarely, Sometimes, Often, Always) among the
aforesaid demographic features obtained from ordered
logistic regressions. The first category of each demographic
variable was considered as a reference. The seven
questions covering the essential personal hygiene
practices were (i) proper handwashing while coming back
home, (ii) use of a mask when going outside of the house,
(iii) sanitation in sudden sneezing at a public place, (iv)
proper handwashing before eating food, (v) maintenance
of social distance, (vi) abstain from touching eye, nose,
and mouth, (vii) eating more fruits and vegetables than
ever before.
In all cases, the female odds ratio against the male was not
a statistically significant event at a 1% significance level. It
implies that practices of personal hygiene did not
significantly vary among different sexes. The age groups'
significant odds ratio from 21 and above were less than the
reference age group (odds ratio < 1). It implied that people
aged 21 and above were less likely to practice hygienic
procedures than the younger respondents.
Like awareness level, we found a significant positive effect
of education level on the likelihood of the sanitizing level.
Moreover, people who had tertiary education, were more
likely to practice hygienic procedures. In marital status,
unmarried and married respondents practiced sanitary
measures more frequently than widows/widowers,
divorced respondents.
The government and non-government employees
continued hygiene practice regularly than other
categories of occupation. However, sanitation in sudden
sneezing in public places was statistically significant, and
substantially, the odds values were more prominent for
farmers, homemakers, and self-employed, respectively,
than unemployed people. Moreover, farmers' odds of
eating more fruits and vegetables than ever before were
also 1.461 times larger. In terms of socioeconomic status,
almost all odds value of the middle class and the rich class
was greater than 1. Surprisingly, the middle class practiced
health safety measures more steadily compared to the
affluent class.
DISCUSSION
This study was conducted to determine rural people's
information-seeking behavior, such as sources of
information they used for getting COVID-19 related health
information, awareness levels, and preventive measures
they practiced during the COVID-19 pandemic. The most
reported sources of information for people in rural areas
were electronic media, relatives, and other interpersonal
sources. Most young villagers also stated that they first knew
about this Coronavirus from social media platforms. An
early paper set out that primarily rural people get
information from television and radio followed by public
speaking with neighbors, friends, and relatives [28]. That is
mainly because of insufficient print media supply and have
no information center in the rural area in Bangladesh.
Similarly, another recent study also confirmed that it was
not easy for rural people to access and understand official
website news (e.g., the World Health Organization, Ministry
of Health), official pages of social media, newspapers, and
video broadcasts through electronic sources due to their
poor media knowledge and language gaps. [29-31]
Moreover, the study of Abdelhafiz et al. (2020) found similar
findings where senior citizens of Egypt obtained information
from social media (66.9%) and the internet (58.3%). [23]
Similarly, another investigation found that the north-central
Nigerians had enough knowledge (99.5%) of COVID-19,
and where 55.7% of them achieved information primarily
through the internet and social media, and television [32].
In their study, Karim et al. (2020) also mentioned that using
the internet positively correlates with good knowledge in
demographic characteristics such as gender, higher
education, living in a town/urban area, and good financial
condition. [33]
This study also found that females' knowledge level was
lower than males in every case. The age groups, such as
those above 60 years, had a highly significant value for
respiratory droplet knowledge. Furthermore, age levels,
such as 41-50 years, also found highly significant health
awareness values in self-isolation and preventive measures.
Remarkably, the odds ratio for the awareness level from
SSC to the postgraduate education level was highly
effective. Furthermore, some other investigations similarly
observed that more than half of the participants in
Bangladesh declared "had a good understanding" about
COVID-19, and in the case of their age and education
160

levels, theknowledge and prevention practices of COVID-
19 had a notable impact. [34-37] Previous studies have also
found that the COVID-19 related knowledge was
significantly lower among the people with less education,
which led to a poor attitude and practice to prevent the
disease. [23,38-41] Another paper by Rahman et al. (2021)
showed that urban people comparatively had sufficient
knowledge, attitudes, and practices (KAP) than rural
citizens [34]. The authors further stated that this might be
mainly because of adequate education, have enough
flexibility of internet access, communication procedures,
and health facilities that influenced the respondents' level
of KAP. Similarly, Islam et al. (2021) conducted
investigations on Bangladeshi citizens, and findings showed
that approximately 89.80% of the residents in Bangladeshi
expressed knowing about the COVID-19 and its preventive
measures, which had many differences that of our study
because this study only covered rural dwellers [8]. However,
the difference might be that there are more higher
education facilities in the urban areas than the rural area.
In preventive measures among Bangladesh's rural people,
none of the female odds ratios were statistically significant.
Therefore, sex was not an essential determinant of hygienic
procedures. These findings confirmed that the respondents,
including all demographic levels, usually maintained and
practiced preventive measures to combat COVID-19. For
example, the graduate and postgraduate education
levels saw a higher attitude towards practicing hygienic
processes than the other education groups. Additionally,
the government and non-government employees always
try to keep in maximum practice level, and the odds ratios
for the two occupations are almost highly significant in all
cases. The national and international welfare organizations
have provided guidelines to enhance the daily food list
with fruits, vegetables, and whole-grain foods from the very
beginning. Adjustment of daily protein needs is an essential
preventive action to combat COVID-19. [42] Yet, the
people's knowledge and awareness of food and nutrition
are deficient, and the access to economic resources of
rural Bangladesh is limited. Rahman et al. (2021) found their
respondents had a low level of adequate knowledge of
COVID-19 (i.e., 70.8%, and preventative practices were
73.8%). [34]
Additionally, rural residents had an exceptionally high risk of
COVID-19 than urban people. Ferdous et al. (2020) found
that 48.3% of participants in Bangladesh had
comprehensive knowledge, and 55.1% of residents,
especially females, frequently practice COVID-19
prevention than did males. [36] In contrast, our findings
revealed that male respondents were more conscious of
maintaining hygienic procedures. In these health
difficulties, particularly with a contagious disease outbreak,
such as COVID-19 that causes millions of deaths, public
well-being, and social measures and vaccines are the most
powerful tool to save lives. [43] Therefore, inadequacy of a
proven vaccine or medicine, several precautions, and
preventive measures have been adopted worldwide to
limit the transmission of COVID-19. [8] Unfortunately, in
some areas, with word of mouth, rumors start raising distrust
about vaccines and people fail to believe in the
vaccination. However, these types of findings may be
useful for public health policymakers and health workers to
identify target populations for health-related knowledge
development and disease prevention. [44]
The rural people of Bangladesh are neither entirely
incompetent nor so much fit for this pandemic situation. The
direction in rural pandemic prevention relies on
segregating vulnerable groups of people like old, illiterate,
unwealthy by focusing on the criterion. Though it is an
arduous approach, it should highlight vulnerable groups
whose awareness and hygienic practices are not at the
optimum level. Therefore, the government and
development agencies should immediately take necessary
measures to protect rural people from COVID-19 threats
until complete immunization can be achieved.
DECLARATIONS
Ethics approval and consent to participate
Before the study was initiated, the present research
achieved ethical consideration from the Noakhali Science
and Technology University (reference no# 27/2020).
Consent for publication
Patient consent for publication is not required.
Availability of data and material
Upon request in the future, we confirm that all the pertinent
information will be disclosed for further use.
Competing interests
There are no competing interests.
Funding
We did not receive any financial assistance from any
agency—all the costs associated with preparing the article
bear by authors solely.
161

Authors' contributions
WM, PKB, UH, and MEI conceptualized and designed the
study. Data collections were done by UH, PKB, and MEI.
WM, PKB, and UH analyzed the data, and PKB wrote the first
draft, and WM, UH wrote the final draft. All authors
contributed to the critical reviews. All authors examined the
entire manuscript and approved it for submission.
Acknowledgments
We would like to thank all survey respondents conducted
among Bangladesh's rural dwellers for their cooperation.
References
1. Baral PK, Nuruzzaman M, Uddin MS, Ferdous M,
Chowdhury IH, Smrity SZ. Severe acute respiratory
coronavirus-2 invasion of the central nervous system: a
host-virus deadlock. Acta virologica. 2021;65(2):115-
126.
2. Wertheim JO. A Glimpse Into the Origins of Genetic
Diversity in the Severe Acute Respiratory Syndrome
Coronavirus 2. Clinical Infectious Diseases.
2020;71(15):721–722.
3. Cheng ZJ, Shan J. 2019 Novel coronavirus: where we
are and what we know. Infection. 2020;48(2):155-163.
4. Riou J, Althaus CL. Pattern of early human-to-human
transmission of Wuhan 2019 novel coronavirus (2019 -
nCoV), December 2019 to January 2020.
Eurosurveillance. 2020;25(4):2000058.
5. Sohrabi C, Alsafi Z, O'Neill N, Khan M, Kerwan A, Al-Jabir
A, et al. World Health Organization declares global
emergency: A review of the 2019 novel coronavirus
(COVID-19). International journal of surgery. 2020;76:71-
76.
6. World Health Organization. Responding to community
spread of COVID-19: interim guidance, 7 March 2020.
World Health Organization. (2020, 7 March).
https://apps.who.int/iris/handle/10665/331421
7. Azlan AA, Hamzah MR, Sern TJ, Ayub SH, Mohamad E.
Public knowledge, attitudes and practices towards
COVID-19: A cross-sectional study in Malaysia. Plos one.
2020;15(5):e0233668.
8. slam SDU, Mondal PK, Ojong N, Bodrud-Doza M,
Siddique MAB, Hossain M, et al. Water, sanitation,
hygiene and waste disposal practices as COVID-19
response strategy: insights from Bangladesh.
Environment, development and sustainability. 2021;1 -
22.
9. Salman M, Mustafa ZU, Asif N, Zaidi HA, Hussain K,
Shehzadi N, et al. Knowledge, attitude and preventive
practices related to COVID-19: a cross-sectional study
in two Pakistani university populations. Drugs & Therapy
Perspectives. 2020;36:319-325.
10. South Asian Network on Economic Modeling. SANEM-
Action Aid Bangladesh Webinar on Gender and Youth
Inclusiveness in Technology in Bangladesh. 2020.
https://sanemnet.org/sanem-netizen-forum-on-covid-
19-pandemic-2-june-2020-2/
11. Seven days in medicine: 8-14 Jan 2020. BMJ. 2020.
https://www.bmj.com/content/bmj/368/bmj.m132.full.
12. Ministry of Health and Family Welfare. Coronavirus
COVID-19 Dashboard. Directorate General of Health
Services (DGHS). Government of the People's Republic
of Bangladesh. 2021.
https://dghs.gov.bd/index.php/en/home
13. Experts: Indian variant, gatherings could spark third
wave in June. Dhaka Tribune. (2021, 9 May).
https://www.dhakatribune.com/health/coronavirus/2
021/05/09/experts-indian-variant-gatherings-could-
spark-3rd-wave-in-june
14. Shammi M, Bodrud-Doza M, Islam ARMT, Rahman MM.
Strategic assessment of COVID-19 pandemic in
Bangladesh: comparative lockdown scenario analysis,
public perception, and management for sustainability.
Environment, Development and Sustainability.
2021;23(4):6148-6191.
15. Bodrud-Doza M, Shammi M, Bahlman L, Islam ARM,
Rahman MM. Psychosocial and socioeconomic crisis in
Bangladesh due to COVID-19 pandemic: a
perception-based assessment. Frontiers in Public
Health. 2020;8:341.
16. Larson EL, Ferng YH, McLoughlin JW, Wang S, Morse SS.
Effect of intensive education on knowledge, attitudes,
and practices regarding upper respiratory infections
among urban Latinos. Nursing Research.
2009;58(3):150-157.
17. Gani MS, Chowdhury AMR, Nyström L. Urban–rural and
socioeconomic variations in the knowledge of STIs and
AIDS among Bangladeshi adolescents. Asia Pac J
Public Health. 2014;26(2):182-195.
18. Islam FMA, Chakrabarti R, Dirani M, Islam MT, Ormsby G,
Wahab M, et al. Knowledge, attitudes and practice of
diabetes in rural Bangladesh: the Bangladesh
162

population based diabetes and eye study (BPDES).
PLoS One. 2014;9(10):e110368.
19. Hossain M, Mani KK, Sidik SM, Shahar HK, Islam R.
Knowledge and awareness about STDs among women
in Bangladesh. BMC Public Health. 2014;14(1):1-7.
20. Afzal MS, Khan A, Qureshi UUR, Saleem S, Saqib MAN,
Shabbir RMK, et al. Community-based assessment of
knowledge, attitude, practices and risk factors
regarding COVID-19 among Pakistanis residents during
a recent outbreak: a cross-sectional survey. Journal of
Community Health. 2021;46(3):476-486.
21. Sari DK, Amelia R, Dharmajaya R, Sari LM, Fitri NK.
Positive correlation between general public
knowledge and attitudes regarding COVID-19
outbreak 1 month after first cases reported in Indonesia.
J Community Health. 2021;46(1):182-189.
22. Singh DR, Sunuwar DR, Karki K, Ghimire S, Shrestha N.
Knowledge and perception towards universal safety
precautions during early phase of the COVID-19
outbreak in Nepal. J Community Health. 2020;45:1116-
1122.
23. Abdelhafiz AS, Mohammed Z, Ibrahim ME, Ziady HH,
Alorabi M, Ayyad M, et al. Knowledge, perceptions,
and attitude of Egyptians towards the novel
coronavirus disease (COVID-19). Journal of Community
Health. 2020;45(5):881-890.
24. Alahdal H, Basingab F, Alotaibi R. An analytical study
on the awareness, attitude and practice during the
COVID-19 pandemic in Riyadh, Saudi Arabia. Journal
of Infection and Public Health. 2020;13(10):1446-1452.
25. Cronbach LJ. Coefficient alpha and the internal
structure of tests. Psychometrika. 1951;16(3):297–334.
26. BRAC Institute of Governance and Development.
Digital Literacy in Bangladesh. BRAC 2020.
https://bigd.bracu.ac.bd/news/54-pc-bangladeshi-
rural-families-lack-internet-access-survey/
27. Grilli L, Rampichini C. Ordered logit model.
Encyclopedia of quality of life and well-being research.
2014;4510-4513. Springer.
28. Uddin MJ, Mezbah-ul-Islam M. The flow of, and access
to, information in Bangladesh: A village level case
study. The International Information & Library Review.
2012;44(4):224-232.
29. Islam MN, Zaman A, Sarker S. Beliefs About COVID-19 of
Elderly Residents in Rural Bangladesh. Asia Pacific
Journal of Public Health. 2020;32(8):527-528.
30. Laato S, Islam AN, Islam MN, Whelan E. What drives
unverified information sharing and cyberchondria
during the COVID-19 pandemic?. European Journal of
Information Systems. 2020;29(3):288-305.
31. World Health Organization. Addressing myths and
rumours. World Health Organization (2020, 17 April).
https://www.who.int/bangladesh/emergencies/coron
avirus-disease-(covid-19)-update/addressing-myths-
and-rumours
32. Reuben RC, Danladi MM, Saleh DA, Ejembi PE.
Knowledge, attitudes and practices towards COVID-
19: an epidemiological survey in North-Central Nigeria.
Journal of community health. 2021;46(3):457-470.
33. Karim A, Akter M, Mazid A, Pulock OS, Aziz TT, Hayee S,
et al. Knowledge and attitude towards COVID-19 in
Bangladesh: population-level estimation and a
comparison. Nature. 2020;5(4):536-544.
34. Rahman M, Karamehic-Muratovic A, Amrin M,
Chowdhury AH, Mondol M, Haque U, et al. COVID-19
Epidemic in Bangladesh among Rural and Urban
Residents: An Online Cross-Sectional Survey of
Knowledge, Attitudes, and Practices. Epidemiologia.
2021;2(1):1-13.
35. Hossain I, Mullick AR, Khan MH, Ahmad SA, Rahman MS,
Aktaruzzaman MM. Epidemiology of Coronavirus
Disease: Past, Present, Future Prospects and Its Journey
Towards Bangladesh. Epidemiology. 2020;25(06):2518-
2529
36. Ferdous MZ, Islam MS, Sikder MT, Mosaddek ASM,
Zegarra-Valdivia JA, Gozal D. Knowledge, attitude,
and practice regarding COVID-19 outbreak in
Bangladesh: An online-based cross-sectional study.
PloS one. 2020;15(10):e0239254.
37. Paul A, Sikdar D, Hossain MM, Amin MR, Deeba F,
Mahanta J, et al. Knowledge, attitudes, and practices
toward the novel coronavirus among Bangladeshis:
Implications for mitigation measures. PloS one.
2020;15(9):e0238492.
38. Al-Mohrej OA, Al-Shirian SD, Al-Otaibi SK, Tamim HM,
Masuadi EM, Fakhoury HM. Is the Saudi public aware of
Middle East respiratory syndrome?. Journal of infection
and public health. 2016;9(3):259-266.
39. Gudi SK, Chhabra M, Undela K, Venkataraman R,
Mateti UV, Tiwari KK, et al. Knowledge and beliefs
towards universal safety precautions during the
coronavirus disease (COVID-19) pandemic among the
163

Indian public: a web-based cross-sectional survey.
Drugs & Therapy Perspectives. 2020;36(9):413-420.
40. Wolf MS, Serper M, Opsasnick L, O'Conor RM, Curtis L,
Benavente JY, et al. Awareness, attitudes, and actions
related to COVID-19 among adults with chronic
conditions at the onset of the US outbreak: a cross-
sectional survey. Annals of internal medicine.
2020;173(2):100-109.
41. Zhong BL, Luo W, Li HM, Zhang QQ, Liu XG, Li WT, et al.
Knowledge, attitudes, and practices towards COVID-
19 among Chinese residents during the rapid rise period
of the COVID-19 outbreak: a quick online cross-
sectional survey. International Journal of Biological
Sciences. 2020;16(10):1745.
42. de Faria Coelho-Ravagnani C, Corgosinho FC,
Sanches FLFZ, Prado CMM, Laviano A, Mota JF. Dietary
recommendations during the COVID-19 pandemic.
Nutrition Reviews. 2021;79(4):382-393.
43. World Health Organization (WHO). COVID-19 vaccines,
Coronavirus disease (COVID-19). World Health
Organization 2021.
https://www.who.int/emergencies/diseases/novel-
coronavirus-2019/covid-19-vaccines
44. Alyousefi TA, Abdul-Ghani R, Mahdy MA, Al-Eryani SM,
Al-Mekhlafi AM, Raja YA, et al. A household-based
survey of knowledge, attitudes and practices towards
dengue fever among local urban communities in Taiz
Governorate, Yemen. BMC infectious diseases.
2016;16(1):1-9.
45. Singh, Ashish Kumar, Bharti Agrawal, Anukriti Sharma,
Prayas Sharma, et al. COVID‐19: Assessment of
knowledge and awareness in Indian society. Journal of
Public Affairs. 2020; 20(4): e2354.
46. Siddiqui, A. A., Alshammary, F., Amin, J., Rathore, H. A.,
Hassan, I., Ilyas, M., Alam, M. K., et al. Knowledge and
practice regarding prevention of COVID-19 among the
Saudi Arabian population. Work. 2020; 66(4):767-775.
164

REVIEW ARTICLE
ETHICAL CONFLICTS AMONG THE LEADING MEDICAL AND
HEALTHCARE LEADERS
Dr. Bindu Roy1, Anuj Kumar2, Dr. Arya Kumar3, Dr. Kavitha R Gowda4
1. Department of Commerce, D.A.V Centenary College, Faridabad, Haryana, India
2. Department of Management, Apeejay School of Management, Dwarka, Delhi, India
3. KIIT School of Social, Financial & Human Sciences, Kalinga Institute of Industrial Technology (Deemed to be University), Bhubaneswar, India
4. School of Business and Management, Christ (Deemed to be University), Bangalore, Karnataka, India
Correspondence: Anuj Kumar, [email protected]
ABSTRACT
Today, the whole world is fighting the pandemic of COVID-19. In these circumstances, the medical professionals and
Doctors are being viewed as the frontline warriors who are risking their lives for the sake of helping, caring, and curing
these patients. However, in these difficult times, there are few medical professionals and health care providers who are
taking advantage of this situation and milking distressed and distraught patients at will. A conflict between professional
and personal ethical values makes them depressed and puzzled. It is tough for them to maintain a good image of their
profession and business. The objectives of this study are to review the ethical conflict amid the ongoing Covid pandemic
and post-Covid pandemic (vaccination period) in the context of medical professionals and health care providers. The
paper is designed based on a literature review. Almost fifty-two research papers, articles, survey reports, and newspapers
were studied in the context of ethics in business/profession. After reviewing moral distress is ongoing and post -pandemic
period, the researchers have tried to present the medical professionals and health care providers' critical situation to give
priority to their professional ethics or personal interest.
KEYWORDS
ethical conflicts, medical professionals, healthcare providers, COVID-19, leadership
INTRODUCTION
Ethics is the discipline dealing with what is good and evil
and with moral duty and obligation. It explains guidelines
for checking and administrating while framing the right
decision. It is essential for medical field’s success, just like
safety while flying in an airplane. In both cases, if the
prerequisites are not in place to ensure trust in the product
or services provided, consumers will not utilize the product
or service. In the case of the medical field, the public trusts
the medical profession to regulate its own practices.
Medical professionals are the most respected among the
various professionals across a wide variety of occupations.
This paper focuses on medical professionals and health
care providers. By the term medical professionals, we imply
those professionals who have the qualification of the
medical field such as doctors, nurses, pathologists, etc. and
the term health care providers includes all the stakeholders
who are directly and indirectly involved with the medical
165

profession such as hospital authorities, medicine
companies, medical transportation providers, medical
equipment suppliers, and other supporting staff. Today, the
whole world is fighting with the pandemic, and COVID-19
has claimed many lives to date, more than the world wars
put together, and it is yet to stop. In these circumstances,
the medical professionals are being viewed as the frontline
warriors who are risking their lives for the sake of helping,
caring, and curing these patients.
RATIONALE OF THE STUDY
During COVID-19, medical professionals and health care
workers have been subjected to immense pressure and
conflicts that has not been previously experienced by
them. This has led to immense psychological and
physiological stress which has made health care providers
act differently than they would do so normally. Few
medical practitioners and health care workers took this as
an opportunity to make money and hence, resorted to
unfair practices [1, 2, 3]. [4, 5, 6]. However, the majority of
healthcare providers were affected mentally leading to
deterioration in their mental well-being [7]. In fact, the role
of psychiatrists and counsellors has increased and their
importance felt. It is not just the persons from the medical
fraternity who have shown evidence of mental disorder
and confusion, but the lockdown associated with Covid 19
have also rendered many people, especially elderly and
children, mentally traumatized [8]. Healthcare workers
have to constantly keep themselves updated as to the
situation globally which was very fluid [9]. These situations
were very unique to even the most experienced of the
medical practitioners and hence, study in this field needs
to be undertaken so that appropriate measures,
techniques and guidelines may be formulated for the well-
being of both the medical fraternity and society.
OBJECTIVES
The objective of this study was to review any ethical conflict
amid the ongoing COVID -19 pandemic period and in the
vaccination period in the context of medical professionals
and health care providers.
RESEARCH METHODOLOGY
The present study is a traditional narrative review based
study in which the Scopus database, Google Scholar and
Google are used to get valuable insights in the context of
research objective. The review methodology was to
identify a few studies that can describe the problem of
interest. No predetermined research question or specified
search strategy is applied for this methodology. The Scopus
database, Google Scholar and Google were searched to
retrieve journal articles, review articles, reports and news
releases to review any arising conflicts amongst medical
professionals and health care providers especially during
the period of ongoing COVID-19 pandemic from 2020 to
2021. More than 30 articles are for review to fulfill the
objective of the study. The research methodology is totally
based on previously available literature on this topic. After
review findings that moral distress is ongoing, the
researchers have tried to present the medical professionals
and health care providers' critical situations to give priority
support to their professional ethics or personal interests.
.
ETHICS IN THE MEDICAL PROFESSION AND
BUSINESS
The medical profession is about giving primary preference
to serve patients rather than to earn money, but in actual
practice, few medical practitioners have become
materialistic in their approach. With the increased use of
internet and development of various apps. Many medical
customers are using these apps to obtain medical services
since authenticity of these apps and related
guidelines/prescriptions provided are from unknown
sources they can’t be realistically relied upon. [1] In the
recent years, extreme competition between
pharmaceutical companies have led to extreme pressure
placed on their manpower and also on their sales partners.,
This combined with the greed to earn more have created
grounds for a few to indulge in unethical practices which
can or can’t be harmful to life.[2]
EXISTING CIRCUMSTANCES OF HEALTH CARE
PROVIDERS AND MEDICAL PROFESSIONALS
The deadly coronavirus is spreading all around the globe,
and because of this, general wards and special wards are
being quickly converted into isolation wards for the patients
who are affected by the virus, and the medical
professionals stepped in to serve these patients and thus,
they are considered as an essential resource for every
nation. Good health is necessary for them so that they can
help their country. [3] The doctors, nurses, and other
healthcare providers were under extraordinary stress
related to the high risk of infection, stigmatization,
166

understaffing, and uncertainty. Comprehensive support
was a high priority during the outbreaks and afterward. [4]
[5] The frontline healthcare providers treating patients with
COVID-19 also have more significant risks of mental health
problems, such as anxiety, depression, insomnia, and stress.
[6] [7] In this high-risk emergency situations, the doctor must
compete for various duties like a duty to patients,
commitment to protect himself from undue risk of harm, the
duty to his family, duty to colleagues whose workloads and
risk of injury will increase in his absence and commitment to
society which make a great deal of pressure on him.
Figure 1 presents the various factors that create conflicting
circumstances for medical professionals and health care
providers.
FIGURE 1- VARIOUS FACTORS CREATING CONFLICT CIRCUMSTANCES FOR MEDICAL PROFESSIONALS AND HEALTH CARE
PROVIDERS
TABLE 1 (AUTHORS' OWN) ETHICAL CONFLICTS IDENTIFIED DURING PANDEMIC PERIOD
Author(s) publication
details
Ethical conflict amid a COVID-
19 pandemic
Findings
[8] Communication of attractive
vs. actual information to the
public
The conflicting situation, in this case, is that
sometimes they are unable to deliver essential
information, which is anti to their professional
ethics, but due to problems, they must ignore it
[9] [10]
Conflict of actual availability
of precautionary resources
Front line health care providers are not getting
sufficient resources; this creates conflict among
them either they should blow the whistle in this
regard or should keep quiet
Hospital Authorities
(Rules and Regulations
like incentives etc.)
Personal
Ethics Professional
Ethics
Family
Pressure
Supporting
Staffs’
pressure
Societal
pressure
Political
pressure
167

[9]
To meet the acute need of
medical services with limited
resources and restricted norms
In this circumstance, where resources to check
the virus presence is limited, conflict arises for
methodology with which services must be
provided, treatment of virus-infected and non-
virus-infected patients at the same place, and
questioning regarding mere lockdown is the
solution to this drastic problem
[11] [12] Conflict in delivering health
care services to non-Covid
chronic patients amid a
pandemic
Patients who are not suffering from corona
instead but may have other serious diseases
(such as HIV, TB) are not able to access
treatment as the authorities are majorly
concerned for coronavirus affected people
[9] Conflict of hiding the
professional identity
The medical professionals and health care
providers who are working in hospitals are
criticized as they may create problematic
situations for their landlords and surroundings.
[13] Ethical conflict during the
treatment of COVID-19
patients in isolation:
In the field of medical professionals, physical
touch and personal care provided by the
doctors is essential and non-replaceable
medicine for any patients who help them in
fighting against any significant disease, and in
the case of coronavirus, this vital touch and feel
lacking. This leads to conflict among medical
professionals of not treating their patients
properly because of isolation requirements
[14] [10] Moral distress due to working
with uncertain and unproven
therapies
In such conditions, where exact medication is
not available, and everyone is just trying to
address issues and trying methods. When their
methods become a failure, this leads to mental
stress and loss of confidence among medical
professionals and health care providers; this
situation leads to the creation of mental conflict
of not knowing the exact treatment method
[15] [10]
Duty to care vs. the right of
protection
The conflicting situation is that where hospitals
are unable to provide proper safety kits and
other requirements to their staff, hospitals are not
serving people, whereas hospitals are working as
multiplayer in those cases. The America Medical
Association said that they must ensure patient
safety as well as their own
[10] Ethical stress for dignity in the
death of patients
The conflicting situation is that family members
are not allowed to do post-death rituals
properly. Also, the patient is kept in isolation.
Thus, that patient lives in isolation before death,
and even that dead body is not allowed to see
my family members.
[16] Conflict in priority of testing of
a celebrity or average person
There arises a battle in front of medical
professionals and health care providers who
must be given priority for testing. It should be an
168

ordinary person or a celebrity who might have
infected a significant lot of people.
[17] Conflict at the time of
availability of vaccine
After the arrival of the vaccine, they will have to
allocate those limited vaccines to individuals
based on some pre-fixed benchmarks.
ETHICAL CONFLICT AMID ONGOING PANDEMIC IN MEDICAL PROFESSIONALS
AND IN HEALTH CARE PROVIDERS
Table 1 shows various reviews about ethical conflict among
medical professionals and health care providers during the
pandemic period as found through this literature review.
ETHICAL CONFLICT AND COVID-19 PANDEMIC
Table 1that COVID-19 had presented a big dilemma to the
medical fraternity. The first dilemma is to choose between
individual patient health and public health. The second
dilemma was how to maintain a balance in justifying and
delivering treatment to Covid and non-Covid patients.
There is also a third quandary which needs to be
mentioned and that is patient’s health versus self-health
and health of a person’s families. COVID-19 also has
brought about big shortfalls in logistics, medical equipment
and medicines that medical community has had to cope
with across the globe. Constructive communication was
required during this period. The biggest question that
medical professionals faced during this pandemic was
about who to save and when to take that call for help or
assistance. During COVID-19, even dignity with death was
rare and privileged. COVID-19 has also affected the
importance of personal and public privacy.
ETHICAL CONFLICT AMID VACCINATION
PERIOD IN MEDICAL PROFESSIONALS AND IN
HEALTH CARE PROVIDERS
The WHO draft on the landscape of COVID-19 candidate
vaccines, 2020 by World Health Organization, [27] "As of 17
November 2020, the WHO reports 48 vaccines undergoing
clinical trials and 164 candidates in preclinical evaluation."
Many studies have been conducted on this deadly virus,
and it has been found that overcoming coronavirus
disease is just a start towards an unknown journey from a
health perspective. [18] The significant issue during the
vaccination period is building and retaining trust among
the public by providing them the transparent and correct
information, equal distribution of resources among all
demographical and economic profiles. [19]
Table 2 sets out the conflicts that are arising in the
vaccination period for medical professionals and health
care providers:
TABLE 2 (AUTHORS' OWN) ETHICAL CONFLICT IDENTIFIED IN VACCINATION PERIOD
Ethical conflict amid
vaccination period
Findings Authors' publication
support
(i)Setting framework for
vaccination priority order
for distribution among
population
As the resources are scarce for fighting this deadly virus
and therefore on ethical grounds, these resources may
be allocated by taking into consideration four pillars
namely, maximum derived benefits from these limited
resources, equality, spreading instrumental values, and
prioritizing the neediest ones. Sometimes, due to
situational circumstances, they cannot help themselves
to maintain ethical values of professionalism due to
personals.
[20], [21] [22], [23], [24]
[25]
(ii) Delivering the correct
information or working for
the personal benefits
On the landscape of COVID-19 candidate vaccines,
two dosages are required for the vaccination schedule
for any person. But clear and transparent
communication for vaccination is not being followed.
Few misleading information issues regarding multiple
[26], [27] [28]
169

dosages, the inefficiency of vaccines, and its side effects
promoted through social media are unethically
enhancing costs to people and leading to wastage of
vaccines with no use.
(iii) Equality with limited
supply and storage of
resources
The role of medical professionals and health care
providers is vital to follow ethical norms regarding
equality during the implementation of the vaccination
process. The vaccination process must follow a first cum
first serve basis by avoiding the economic, personal
cultural, etc. backgrounds of individuals.
[29], [16]
[27]
(iv) Recordkeeping and
Privacy of Information
Medical professionals are required to maintain proper
records of people to identify those categories of
populations which are vaccinated once and
groups/classes which are still not vaccinated. Due to
some doubt and lacking trust in healthcare providers,
individuals generally hesitate to share their personal
data regarding the safety of their private information.
[30], [17]
ETHICAL CONFLICT IDENTIFIED IN VACCINATION
PERIODS
This COVID-19 pandemic has shone light on various
managerial and planning tools which need to be used to
fight COVID-19 as the best possible way considering limited
resources (vaccines, manpower, centres and logistics.).
Who, when, where and how are the questions which need
to be answered at each step towards dealing with COVID-
19 patients and towards the process of vaccinating the
public. Data management and privacy regarding
vaccination also needs to be structured in such a way that
along with effective communication, all confusion and fear
that populations and communities may have can be
addressed and settled.
CONCLUSION
The ongoing COVID-19 pandemic has reduced
opportunity for health workers to play a vital role in relieving
sufferings of communities and populations. As stated by Dr
Tedros Adhanom Ghebreyesus, WHO Director-General.
“No country, hospital or clinic can keep its patients safe
unless it keeps its health workers safe.” (WHO News 17
September 2020) The COVID-19 pandemic not only affects
the physical and medical well-being of an individual, but it
also significantly impacts the mental health of healthcare
workers (HCWs) and as well as the public [40]. These issues
are due to an imbalance in effectively handling various
factors such as professional ethics, personal ethics, and
pressure on hospital administration and supporting staff,
hype from social media, political and societal pressure.
These factors thereby create conflicting circumstances for
medical professionals and health care providers who are in
the frontline of this crisis. Healthcare providers, namely
doctors, nurses, technicians and others are not
experienced regarding this new pandemic, and hence
unable to address the major ethical issues immediately. Key
impact factors such as prioritization of patients in view of
limited resources, selection related to individual patient
health needs, self-health, family’s health and public health,
require balance in justifying and delivering treatment to
Covid and non-Covid patients. Issues involved relate to
coping with the big shortfall in logistics, medical equipment
and medicines. A range of responses are required such as
setting frameworks for vaccination, equality among the
public entitled to vaccination as well as dealing with limited
supply and storage of resources and record keeping and
maintenance of privacy. Such ethical issues are a cause
for severe moral distress among healthcare providers.
Urgent attention needs to be taken to monitor community
member’s mood, sleep and other mental health issues to
understand mediating factors.
This study identifies the need to educate society about the
various stress and pressures that healthcare leaders
experience. This ultimately leads to creation of conflict due
to various factors that surround medical professionals and
healthcare providers. This pandemic is new experience to
170

everyone therefore, medical professionals and healthcare
providers should have safe working conditions, should be
trained to handle such situations, and should be provided
special remuneration, rewards and moral support. Proper
counselling also needs to be provided to support health
professional’s mental health. This study aims at opening
doors for other research work based on these dilemma and
constraints so that a proper roadmap can be framed to
benefit both the medical professionals along with
healthcare providers and the public. This study also
identifies the need for future research to study effective
communication needed to ensure the bond between the
public and the health care providers becomes stronger
and is without any prejudice.
References:
1. ANI, "Families allege medical negligence after 5 COVID
patients die at Hisar hospital," 2021.
2. L. Leo, "DCGI pulls up Glenmark for false claims,
overpricing of covid-19 drug FabiFlu," New Delhi, 2020.
3. R. Nagarkoti, "Punjab: Private hospital booked for
cheating Covid patients," TNN, Mohali, 2021.
4. D. Mohanty, "Odisha Police arrest drug company MD
for selling fake, overpriced Covid medicine," The
Hindustan Times, Odisha, 2021.
5. P. Singhal, "Overcharging for Covid treatment:
Panchkula private hospitals to return Rs 20 lakh, most
refunds processed, say authorities," The Indian Express,
Punchkula, 2021.
6. "DCGI asks manufacturers to take steps to prevent
black-marketing, overpricing of COVID-19 drugs," Press
Trust of India, New Delhi, 2020.
7. P. Pujari, P. Pujari and A. Kumar, " Impact of COVID-19
on the Mental Health of Healthcare Workers:
Predisposing factors, prevalence and supportive
strategies," Asia Pacific Journal of Health Management,
vol. 16, no. 4, pp. 260-265, 2021.
8. A. Kumar and N. Ayedee, "Life under COVID-19
lockdown: an experience of old age people in India,"
Working with Older People, Vols. Vol. ahead-of-print,
no. No. ahead-of-print., pp.
https://doi.org/10.1108/WWOP-06-2020-0027, 2022.
9. S. Lloyd, S. M. Walker and A. Goswami, " Health
information: Applications and challenges in the COVID-
19 pandemic.," Asia Pacific Journal of Health
Management, vol. 15, no. 3, p. 23–28, 2020.
10. D. KA, "Ethical Challenges of Medicine and Health on
the Internet: A Review," J. Med Internet Res, vol. 3, no.
2, p. 23, 2001.
11. R. Ganesan and R. Thambusamy, "Ethics in Business: A
Case Study of a Pharmaceutical Company.," The
European Journal of Social & Behavioural Sciences, vol.
28, pp. 3143-3149, 2020.
12. D. Chang, H. Xu, A. Rebaza, L. Sharma and C. Dela
Cruz, "Protecting health-care workers from subclinical
coronavirus infection," Lancet Respir Med., vol. 8, p. 13,
2020.
13. S. Lee, W. Kang, A. Cho, T. Kim and J. Park,
"Psychological impact of the 2015 MERS outbreak on
hospital workers and quarantined hemodialysis
patients," Compr Psychiatry, vol. 87, p. 123–27, 2018.
14. R. Maunder, J. Hunter and L. Vincent, "The immediate
psychological and occupational impact of the 2003
SARS outbreak in a teaching hospital.," CMAJ, vol. 168,
p. 1245–1251, 2003.
15. L. Qian, L. Dan, E. H. Joan, G. Qiaohong, Q. W. Xiao, L.
Shuo, X. Z. Lin, J. Y. Liu and B. X. Yang, "The experiences
of health-care providers during the COVID-19 crisis in
China: a qualitative study," The Lancet Global Health,
vol. 8, no. 6, pp. 790-798, 2020.
16. S. Liu, L. Yang and C. Zhang, "Online mental health
services in China during the COVID-19 outbreak,"
Lancet Psychiatry, vol. 7, p. 17–18, 2020.
17. A. N. M. Yusof, M. Z. Muuti, L. A. Ariffin and M. K. M. Tan,
"Sharing Information on COVID-19: the ethical
challenges in the Malaysian setting," Asian Bioethics
Review, vol. 12, no. 3, pp. 1-13, 2020.
18. Hebbar, P. &. Sudha, A. &. Dsouza, V. &. Chilgod and L.
&. A. Adhip., "Healthcare Delivery in India amid the
COVID-19 Pandemic: Challenges and Opportunities.,"
Indian Journal of Medical Ethics, pp. 01-04, 2020.
19. G. V., "Clinical ethics during the COVID-19 pandemic:
Missing the trees for the forest..," Indian J Med Ethics,
vol. 5, no. 3, pp. 182-187, 2020.
20. H. Lau, V. Khosrawipour, P. Kocbach, A. Mikolajczyk, J.
Schubert and J. Bania, "The positive impact of
lockdown in Wuhan on containing the COVID-19
outbreak in China.," J Travel Med, 2020.
21. Z. Wang and K. Tang, "Combating COVID-19: health
equity matters," Nat Med, p. 1, 2020.
22. G. Yang, B. Nelson, R. Murphy, H. Choset, H. Christensen
and S. Collins, "Combating COVID-19—The role of
robotics in managing public health and infectious
171

diseases.," Science Robotics, vol. 5, no. 40, p. 5589,
2020.
23. S. Hasan, C. Kow and H. Merchant, "Is it worth the wait?
Should Chloroquine or Hydroxychloroquine be allowed
for immediate use in COVID-19?," Br J Pharm, vol. 5, no.
1, p. 745, 2020.
24. H. D. K and M. Goldrich, "Physician obligation in disaster
preparedness and response," Camb Q Healthc Ethics,
vol. 15, no. 4, p. 417–31, 2006.
25. J. E. Ezekiel, P. Govind, R. U. J.D., T. Beatriz, P. Michael,
G. Aaron, Z. Cathy, B. Connor, S. Maxwell and P. P.
James, "Fair Allocation of Scarce Medical Resources in
the Time of COVID-19.," The new England Journal of
Medicine, 2020.
26. World Health Organization, "A Global Framework to
Ensure Equitable and Fair Allocation of COVID-19
Products and Potential implications for COVID-19
Vaccines.," 18 June 2020.
27. WHO, "DRAFT landscape of COVID-19 candidate
vaccines," Dec, 2020.
28. Gemelli Against COVID-19 Post-Acute Care Study
Group, "Post-COVID-19 global health strategies: the
need for an interdisciplinary approach," Aging Clin Exp
Res, pp. 1613-1620, Aug 2020.
29. P. B. Beth, R. R. José and M. L. Grace, "Scientific and
Ethical Principles Underlying Recommendations From
the Advisory Committee on Immunization Practices for
COVID-19 Vaccination Implementation.," JAMA, vol.
324, no. 20, pp. 2025-2026, 2020.
30. G. Persad, A. Wertheimer and E. Emanuel, "Principles for
allocation of scarce medical interventions," The Lancet
Global Health, vol. 373, pp. 423-431, 2009.
31. G. Persad, M. Peek and E. Emanuel, "Fairly Prioritizing
Groups for Access to COVID-19 Vaccines," JAMA, vol.
324, no. 16, p. 1601–1602, 2020.
32. L. Biddison, K. Berkowitz and B. Courtney, "Ethical
considerations: care of the critically ill and injured
during pandemics and disasters," CHEST consensus
statement, pp. 145S-155S., 2014.
33. S. Rosenbaum, R. Bayer and R. Bernheim, "Ethical
considerations for decision making regarding
allocation of mechanical ventilators during a severe
influenza pandemic or other public health
emergency," Atlanta: Centers for Disease Control and
Prevention, 2011.
34. H. Zucker, K. Adler and D. Berens, "Ventilator allocation
guidelines," Albany: New York State Department of
Health Task Force on Life and the Law, Nov. 2015.
35. M. Christian, C. Sprung and M. King, "Triage: care of the
critically ill and injured during pandemics and disasters,"
CHEST consensus statement, pp. 61S-74S., 2014.
36. E. W. Dward, W. Robert, J. Frenck, R. F. Ann, K. Nicholas,
A. Judith, G. Alejandra, L. Stephen, N. Kathleen, J. M.
Mark and B. Ruth, "Safety and immunogenicity of
tworna-based COVID-19 vaccine candidates.," New
England Journal of Medicine, 2020.
37. WHO, "Draft landscape of COVID-19 candidate
vaccines," 2020.
38. T. Burk, "Vaccine misinformation and social media.," The
Lancet Digital Health, vol. 1, no. 6, p. 258–259, 2019.
39. S. Harald, O. G. Lawrence and A. W. Michelle, "Is it
lawful and ethical to prioritize racial minorities for
COVID-19 vaccines?," Jama, vol. 324, no. 20, pp. 2023-
2024, 2020.
40. D. Calina, T. Hartung, A. O. Docea, D. A. Spandidos, A.
M. Egorov, M. I. Shtilman and A. Tsatsakis, "COVID-19
vaccines: ethical framework concerning human
challenge studies," DARU Journal of Pharmaceutical
Sciences, 2020.
41. P. Sofia, i. N. Vasilik, G. Timoleon, G. G. Vassilis, P. Eleni
and i. K. Paraskev, "Prevalence of depression, anxiety,
and insomnia among healthcare workers during the
COVID-19 pandemic: A systematic review and meta-
analysis," Brain, Behavior and Immunity, vol. 92, p. 245,
2021.
172

REVIEW ARTICLE
ROLE OF SOCIAL DISTANCING, HAND HYGIENE AND WEARING
MASK IN CONTROLLING COVID-19 PANDEMIC: A REVIEW
Santosh Kumar Swain1*, MNAMS; Pragnya Paramita Jena, MD 2; Somadatta Das, MA3
1. Department of Otorhinolaryngology, IMS and SUM hospital, Siksha “O” Anusandhan University, K8, Kalinganagar,
Bhubaneswar-751003, Odisha, India.
2. Department of Microbiology, IMS and SUM hospital, Siksha “O” Anusandhan University, K8, Kalinganagar, Bhubaneswar-
751003, Odisha, India.
3. Central Research Laboratory, IMS and SUM hospital, Siksha “O” Anusandhan University, K8, Kalinganagar, Bhubaneswar-
751003, Odisha, India.
Correspondence: Santosh Kumar Swain, [email protected]
ABSTRACT
BACKGROUND:
Coronavirus disease 2019(COVID-19) continues to spread all over world and is outpacing the resources and capacity of
health care systems. This rapidly spreading COVID-19 infection is caused by severe acute respiratory syndrome coronavirus
2 (SARS-CoV-2) and has been challenging the medical community and keeping the whole world in great threat to an
unprecedented degree.
OBJECTIVES:
The objective of this review article is to describe details of social distancing, hand hygiene and wearing face masks
including there role in controlling the current COVID-19 pandemic.
METHOD:
We conducted an electronic search of Google Scholar, Scopus, Medline and PubMed databases for articles between
June to September 2021.
RESULTS:
The novel SARS-CoV-2 virus is transmitted from person to person by respiratory droplets or contact with an infected person.
There are no established medications and vaccine available until now to restrain the transmission of the COVID-19
infection. Currently, social distancing, hand hygiene and wearing a mask are key steps to lower the transmission of the
SARS-CoV-2 virus in COVID-19 pandemic. As this infection is highly contagious via a respiratory pathway through coughing,
sneezing and contact with an infected surface, the spread can be reduced by the proper practice of social distancing,
hand hygiene or frequent hand washing and wearing mask. These universal precautions should be done as COVID-19
patients may be asymptomatic.
CONCLUSION:
Social distancing, hand washing and wearing face masks are cheap and widely acceptable methods for the prevention
of the COVID-19 infection. The goal of this review paper is to discuss social dis tancing, hand hygiene and face mask
information, including its role in managing the current COVID-19 pandemic
KEYWORDS
COVID-19 pandemic; Social distancing; Hand hygiene; Wearing mask.
173

INTRODUCTION
COVID-19 infection refers to an outbreak of the acute
respiratory infection caused by a novel coronavirus, called
severe acute respiratory syndrome coronavirus 2(SARS-
CoV-2). [1] This infection was first started at Wuhan, Hubei
Province of China and it has rapidly spread throughout the
world. [2] COVID-19 infections have a dramatic impact on
the health care systems even in the developed countries of
the world. Vaccines and curative medicines against
COVID-19 infections are not available to date. As there is
no effective vaccine, the only choice to prevent this
infection is to break the transmission link. In this context,
public health actions are vital steps to reduce the
transmission of the virus. Social distancing, hand hygiene
and wearing masks are less expensive and widely
acceptable preventive measures for both individual
protection and pandemic prevention of the COVID-19
infections. [3] However, it is very difficult to maintain these
three norms for effective compliance. In one study, it was
found that most important recommendation of prevention
of the COVID-19 infections by use of the face mask which
protect from the coughing, sneezing from the infected
persons along with hand washing and social distancing. [4]
Maintaining the appropriate distance from people,
avoiding the touching of the eyes, nose and mouth are also
important advisories for presentation of COVID-19
infections. There are not many studies or literature
regarding the role of social distancing, hand washing and
wearing masks in the COVID-19 pandemic. This review
article focuses on the importance of social distancing,
hand washing and use of face masks during current
COVID-19 pandemic.
METHODS
We conducted an electronic search of Google Scholar,
Scopus, Medline and PubMed databases for articles. The
search terms in the data base included social distancing,
hand hygiene, wearing face masks and COVID-19
pandemic. The abstracts of the published articles were
identified manually from these citations. We started by
searching the Scopus, PubMed, Medline, and Google
Scholar databases online. A search strategy using PRISMA
(Preferred Reporting Items for Systematic Reviews and
Meta-Analysis) guidelines was developed. This search
strategy recognized the abstracts of published articles,
while other research articles were discovered manually
from the citations. Observational studies, comparative
studies, case series, and case reports were evaluated for
eligibility. There were a total number of 82 articles (32
original articles, 28 case series, 22 case reports) (Figure 1).
This review examines the importance of social distancing,
hand hygiene and wearing a face mask in controlling the
current COVID-19 pandemic. This review article presents a
baseline from where further studies can be designed
regarding these universal precautions for controlling this
dreaded pandemic as there are not many studies or
reviews in medical literature.
FIGURE 1: FLOW CHART OF METHODS FOR LITERATURE SEARCH
174
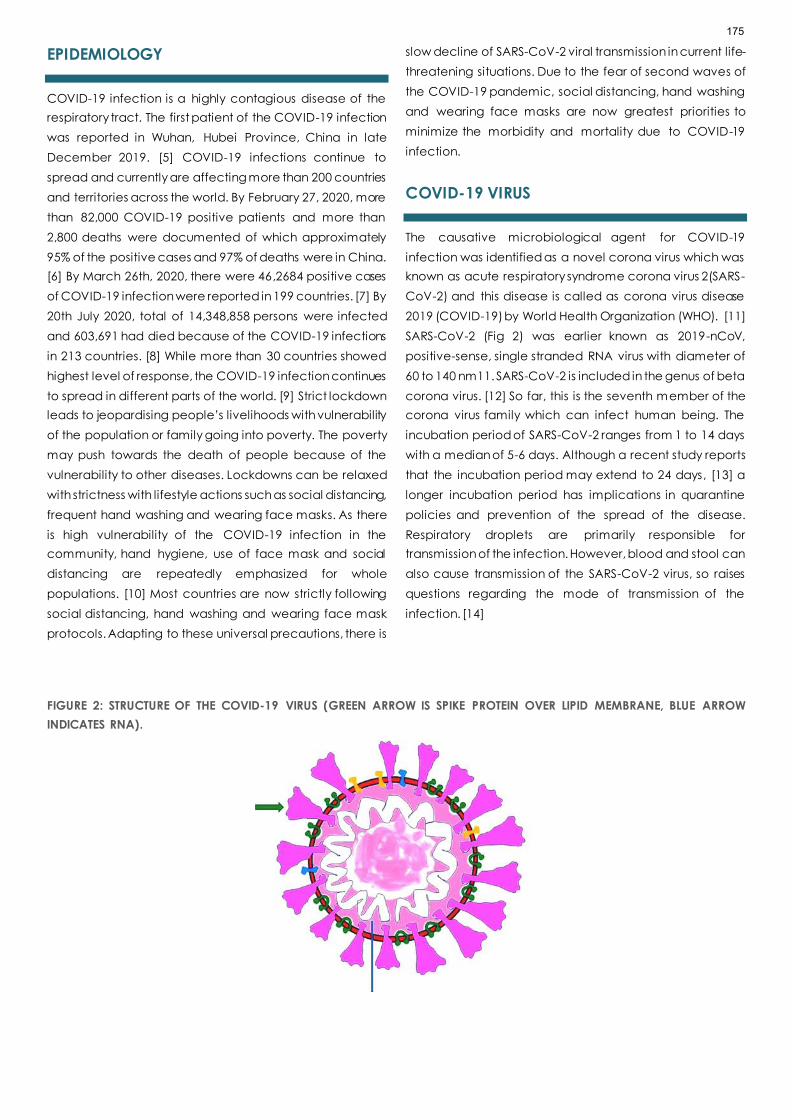
EPIDEMIOLOGY
COVID-19 infection is a highly contagious disease of the
respiratory tract. The first patient of the COVID-19 infection
was reported in Wuhan, Hubei Province, China in late
December 2019. [5] COVID-19 infections continue to
spread and currently are affecting more than 200 countries
and territories across the world. By February 27, 2020, more
than 82,000 COVID-19 positive patients and more than
2,800 deaths were documented of which approximately
95% of the positive cases and 97% of deaths were in China.
[6] By March 26th, 2020, there were 46,2684 positive cases
of COVID-19 infection were reported in 199 countries. [7] By
20th July 2020, total of 14,348,858 persons were infected
and 603,691 had died because of the COVID-19 infections
in 213 countries. [8] While more than 30 countries showed
highest level of response, the COVID-19 infection continues
to spread in different parts of the world. [9] Strict lockdown
leads to jeopardising people’s livelihoods with vulnerability
of the population or family going into poverty. The poverty
may push towards the death of people because of the
vulnerability to other diseases. Lockdowns can be relaxed
with strictness with lifestyle actions such as social distancing,
frequent hand washing and wearing face masks. As there
is high vulnerability of the COVID-19 infection in the
community, hand hygiene, use of face mask and social
distancing are repeatedly emphasized for whole
populations. [10] Most countries are now strictly following
social distancing, hand washing and wearing face mask
protocols. Adapting to these universal precautions, there is
slow decline of SARS-CoV-2 viral transmission in current life-
threatening situations. Due to the fear of second waves of
the COVID-19 pandemic, social distancing, hand washing
and wearing face masks are now greatest priorities to
minimize the morbidity and mortality due to COVID-19
infection.
COVID-19 VIRUS
The causative microbiological agent for COVID-19
infection was identified as a novel corona virus which was
known as acute respiratory syndrome corona virus 2(SARS-
CoV-2) and this disease is called as corona virus disease
2019 (COVID-19) by World Health Organization (WHO). [11]
SARS-CoV-2 (Fig 2) was earlier known as 2019-nCoV,
positive-sense, single stranded RNA virus with diameter of
60 to 140 nm11. SARS-CoV-2 is included in the genus of beta
corona virus. [12] So far, this is the seventh member of the
corona virus family which can infect human being. The
incubation period of SARS-CoV-2 ranges from 1 to 14 days
with a median of 5-6 days. Although a recent study reports
that the incubation period may extend to 24 days, [13] a
longer incubation period has implications in quarantine
policies and prevention of the spread of the disease.
Respiratory droplets are primarily responsible for
transmission of the infection. However, blood and stool can
also cause transmission of the SARS-CoV-2 virus, so raises
questions regarding the mode of transmission of the
infection. [14]
FIGURE 2: STRUCTURE OF THE COVID-19 VIRUS (GREEN ARROW IS SPIKE PROTEIN OVER LIPID MEMBRANE, BLUE ARROW
INDICATES RNA).
175

TRANSMISSION OF THE INFECTION
SARS-CoV-2 spreads by air-borne transmission, respiratory
droplets and contaminated surfaces. [15] There are four
patterns of the transmission of the COVID-19 infections, and
these include community transmission, nosocomial
transmission, household transmission and transmission of the
infection in a closed environment. [16] Prevention of the
viral transmission from human to human is the most
challenging step in current COVID-19 pandemic. The rapid
spread of the COVID-19 infection is mainly due to
asymptomatic cases and travelling of the cases with or
without symptoms. Certain surgical procedure like
tracheostomy which is considered as aerosol generating
procedures and high risk for exposing the aerosols from the
air way to the health care professionals or others. [17,18]
The common clinical symptoms of the COVID-19 patients
are cough, fever, fatigue and dyspnea. There are some
patients those are asymptomatic and considered as si lent
carriers in this pandemic. There are also symptoms like
anosmia and taste alterations are two important features
are associated with this patient. Therefore, health care
workers should be aware about these symptoms and so
can prevent from transmission to them and other patients.
The procedures which deal with nose, nasopharynx, oral
cavity, larynx and trachea which produces respiratory
droplets, leads to transmission of the infections. After
declaration of the COVID-19 infection as a pandemic by
the WHO on 11 March 2020, most countries declared
preparedness against COVID-19 such as lock-down, social
distancing, hand washing and wearing face mask.
Frequent hand washing, wearing masks and social
distancing are the proven approach to slow the
exponential spread of the SARS-CoV-2 in current threat
situation of the COVID-19 pandemic. [19]
SOCIAL DISTANCING
Social distancing is also called as physical distancing which
is about keeping a safe distance between people. Social
distancing is an important public health measure which
reduces social interaction between people based on
touch or physical proximity.[20] The virus mainly spreads
during breathing, coughing, talking or sneezing through
droplet contamination. To stop the spread of COVID-19,
the person should avoid close contact with anyone who
does not live with them. Social distancing is a critical
measure for the slowing the rapidly spreading COVID-19
pandemic. Social distancing should be maintained by at
least six feet from one person to other. Social distancing
should be practiced rigorously for minimizing the spread of
the COVID-19 infection. It is safe to avoid crowded places
and social gathering for maintain proper social distancing
as it is difficult to maintain six feet distance from other
person. However, a high compliance is required for getting
maximum impact which may not be easily achievable.
Even at the time of lockdown, person to person contacts in
supermarkets or medical care, many citizens were not
obeyed properly. As several people are moving constantly,
the SARS-CoV-2 can be easily picked up when social
distancing is not rigorously practiced. This makes the virus
back into the home and workplace and lead to
community spread of the virus easily. Individuals more than
70 years of age should strictly practice social distancing
meaning they must maintain a two-meter distance from
other persons and avoid gatherings or congregations. [21]
This social distancing measure is targeted to decrease the
contacts by 50% at the workplace and reduce other
contacts by 75%. [22] All individuals must practice social
distancing to prevent the transmission of the viral infections
from human to human. Non-essential use of the public
transport should be avoided and the arrangement to work
from the home. Person should use remote technology to
keep in touch with family and friends, so that small and
large gatherings can be avoided. Online services and
telephone should be utilized for contacting health care
professionals and other essential services. [23] The power of
social distancing should be properly understood by the
public and health care professionals. The power of the
social distancing is given in (Table 1). [24]
TABLE 1: POWER OF THE SOCIAL DISTANCING AND RATE OF COVID-19 INFECTION
NOW 5 DAYS 30DAYS
1 person 2.5 persons are infected 406 persons are infected
50% LESS EXPOSURE 5 DAYS 30DAYS
1 person 1.25 persons are infected 15 persons are infected
176

75% LESS EXPOSURE 5 DAYS 30DAYS
1 person 1 person is infected 3 persons are infected
HAND HYGIENE
Hand hygiene is an important element for prevention of the
transmission of the viral infection. The literature showed that
frequent hand washing would minimize the risk of viral
transmission by 55%. [25] Appropriate hand washing can
break the transmission cycle of the virus and reduce the risk
of infection between 6% to 44%. [26] The behaviors of hand
hygiene in COVID-19 pandemic reflect the global issue and
its presentation. There should be feedback for monitoring
hand hygiene and this should be monitored properly.
However, there are still some inadequacies. In line withthe
WHO recommendation, hand washing should be done
thoroughly, including for inter-digital web spaces, wrists and
finger nails for at least 20 seconds with soap and water.
Frequent hand washing causes prolonged exposure to
water and chemical or physical agents which lead to
several pathophysiologic changes with epidermal barrier
disruption of the hand. Hand hygiene products are
available in different types such as bar or liquid soaps,
synthetic detergents, antiseptic hand washes and alcohol-
based hand sanitizers (ABHSs). These work by penetrating
into the viral membrane to denature and coagulate the
proteins, disruption of the cellular metabolism and
enhances the lyses’ of the viral particles. [27] For health
care workers, hands must be washed before and after
encountering patients with the use of ABHS and antiseptics
with antiviral activity. [28] Each formulation is usually
effective against COVID-19 infection but these may alter
the skin barrier integrity and functional aspect, leading to
the chance of the hand dermatitis. The alteration in the skin
of the hand due to excessive hand washing may cause
dryness of the skin and even contact dermatitis. Wet work
and synthetic detergents are often contributors in causing
hand dermatitis because of the inclusion of the
preservative, surfactant and fragrance allergens. A mixture
of the chemical and physical irritants e.g., detergents and
hot water leads to release of pro-inflammatory cytokines
from keratinocytes which instigate the disruption of the skin
barriers of the hands. The documented irritants are
detergents, iodophors, chlorhexidine, triclosan and
alcohol-based products. Methods for avoiding hand
dermatitis include devoid of common allergens and use of
moisturizers. Individuals with recalcitrant hand dermatitis
should be properly evaluated and treated by a
dermatologist. These manifestations of the skin can be
managed by applying moisturizer immediately after hand
washing. The proper technique of rinsing of the hands
should be done gently to prevent physical irritation of the
skin. Regular skin hydration is the key point for preventing
the dermatitis on the hand as a consequence of the
frequent hand washing. These hydrating products should
be applied liberally, several times per day, specifically after
washing hand. In case of person with highly sensitive skin
which easily develop dermatitis, short course of topical
corticosteroids can be used to minimize the signs and
symptoms of the inflammations of the skin. Those are
wearing protective gloves; it is recommended to wash the
hands and use moisturizers whenever gloves are removed.
Awareness about adverse effects for hand washing should
be promoted such as to avoiding excessive hand washing,
prolonged surgical scrubbing and prolonged use of gloves.
[29]
WEARING MASK
Face mask use by the general population for preventing
the spread of the COVID-19 infection is controversial,
though increasingly recommended. Mass uses of face
masks for healthy individuals in the community were not
recommended by the WHO to prevent the SARS-CoV-2
virus in its interim guidance of April 6, 2020. [30] Public
Health England (PHE) had not recommended same as
WHO, but Centers for Disease Control and Presentation
(CDC) advised for wearing cloth masks in public places.
[31] After this, several countries accepted mass mask use in
public spaces. Mass use of the face mask is useful for the
daily workers those cannot stay at home. As daily workers
return to work, mass use of the face mask might be helpful
to reduce the transmission of the SARS-CoV-2 virus. The
exact pathophysiology of the COVID-19 is still unclear, and
the droplet and contact transmission are thought to be
important route. Wearing face mask is a simple method to
prevent the transmission of the virus which reduces the
spread of the disease. [32] Use of face mask prohibits
pathogens from entering into the respiratory airway which
will cut the droplet transmission route directly. Face masks
will purify the air entering into lungs by filtration of inspiratory
177

air. Currently, few western countries oppose mask wearing
by general community members, however, the experience
from China and South Korea showed that use of face
masks are a effective protective measure. There are
several types of the masks available such as medical or
homemade masks for general public and N95 masks for the
health care workers. N95 masks can filter 95% or tinier 0.3µm
particles. Use of N95 masks and surgical masks can
separately block 91% and 68% pathogens respectively. [25]
Cloth masks usually filter viral particles at the time of
coughing with 50 to 100% filtration efficiency of surgical
masks. [33] Properly fitted face masks play an important
role for prevention of the infection in youth persons. One
study showed that approximately 32.47% of the primary
school children used properly fitted masks. [34] Mass mask
wearing is helpful to control the source of the infection and
considered as low-cost adjunct in relation to the social
distancing and hand washing in COVID-19 pandemic. So,
the mass mask wearing is a symbol of social solidarity during
the global response to the COVID-19 pandemic. More than
100 countries, including India, have guidelines for people
to wear face mask when they leave their home as
preventive measures against COVID-19 infection. Several
countries like Japan, Singapore and Hong Kong adopted
the mandatory use of the face mask at initial phases of the
COVID-19 outbreak, resulting in low mortality rates. Thus,
wearing face masks in public space will stop the spread of
the virus. Such preventive measures are helpful to reduce
the spread of the infection in a large population. So, use of
the face mask in the public space is an important health
measure and now wearing face mask is called a new
normal after COVID-19 pandemic.
CONCLUSION
Currently there is a challenge to break the chain of the
human transmission of COVID-19 infection. There should be
continuous monitoring, tracing of the COVID-19 patients
and strict adherance to the universal precautions for
preventing such a dreaded pandemic. Social distancing,
hand washing and wearing face masks are inexpensive
and widely acceptable options for theprevention of the
COVID-19 infection. These should be strict and effective
ways for controlling this current COVID-19 pandemic. Social
distancing, hand hygiene and wearing face masks
contributed not only to preventing current COVID-19
infections but also help to reduce further waves of the
COVID-19 infection and other respiratory infections.
References
1. Swain SK, Agrawal R. Mastoid surgery: a high-risk
aerosol generating surgical procedure in COVID-19
pandemic. International Journal of
Otorhinolaryngological and Head and Neck Surgery
2020;6(10):1941.
2. Remuzzi A, Remuzzi G. COVID-19 and Italy: what next?
Lancet 2020; 395:1225-1228.
3. Swain SK, Behera IC. Managing pediatric
otorhinolaryngology patients in coronavirus disease-19
pandemic-A real challenge to the clinicians. Indian J
Child Health 2020;7(9):357-362.
4. Di Gennaro F, Pizzol D, Marotta C, Antunes M,
Racalbuto V, Veronese N, et al. Coronavirus diseases
(COVID-19) current status and future perspectives: a
narrative review. International journal of
environmental research and public health
2020;17(8):2690.
5. Swain SK, Acharya S, Sahajan N.
Otorhinolaryngological manifestations in COVID-19
infections: An early indicator for isolating the positive
cases. J Sci Soc 2020; 47:63-68.
6. Wu Z, McGoogan JM. Characteristics of and
important lessons from the coronavirus disease
2019(COVID-19) outbreak in China: summary of a
report of 72314 cases from the Chinese Center for
Disease Control and Prevention. JAMA 2020; 323:1239-
1242.
7. Coronavirus disease 2019 (COVID-19) Situation Report
–66. World Health Organization. March 26, 2020
https://www.who.int/docs/defaultsource/
coronaviruse/situation-reports/20200326-sitrep-66-
covid- 19.pdf?sfvrsn=81b94e61_2 March 27,2020.
8. WHO. Situation report – 182.
https://www.who.int/docs/default-
source/coronaviruse/situation-reports/20200720-covid-
19-sitrep-182.pdf?sfvrsn=60aabc5c_2. Accessed 21
July 2020.
9. WHO. Rolling updates on coronavirus disease (COVID-
19) https://www.who.int/emergencies/diseases/novel-
coronavirus-2019/events-as-they-happen. Accessed
15 July 2020.
10. McIntosh K, Hirsch MS, Bloom A. Coronavirus disease
2019 (COVID-19): pidemiology, virology, and
prevention. Lancet Infect Dis 2020; 1:2019-2020.
178

11. Zhu N, Zhang D, Wang W, Li X, Yang B, Song J, et al. A
novel coronavirus from patients with pneumonia in
China, 2019. N Engl J Med 2020; 382(8):727-733.
12. He F, Deng Y, Li W. Coronavirus disease 2019: What we
know? Journal of medical virology 2020; 92(7):719-725.
13. Bai Y, Yao L, Wei T, Tian F, Jin DY, Chen L, Wang M.
Presumed asymptomatic carrier transmission of
COVID-19. JAMA 2020;323(14):1406-1407.
14. Zhang W, Du RH, Li B, Zheng XS, Yang XL, Hu B, et al.
Molecular and serological investigation of 2019-nCoV
infected patients: implication of multiple shedding
routes. Emerging Microbes & Infections 2020;9(1):386-
389.
15. Jones NR, Qureshi ZU, Temple RJ, Larwood JP,
Greenhalgh T, Bourouiba L. Two metres or one: what is
the evidence for physical distancing in covid-19?. BMJ
2020 Aug 25;370.
16. Xie Y, Wang Z, Liao H, Marley G, Wu D, Tang W.
Epidemiologic, clinical, and laboratory findings of the
COVID-19 in the current pandemic: systematic review
and meta-analysis. BMC infectious Diseases
2020;20(1):1-2.
17. Zhejiang University School of Medicine: Handbook of
COVID-19 Pre-vention and Treatment, 18/03/2020.2.
18. Swain SK, Das S, Padhy RN. Performing tracheostomy
in intensive care unit-A challenge during COVID-19
pandemic. Siriraj Medical Journal 2020;72(5):436-442.
19. Ma QX, Shan H, Zhang HL, Li GM, Yang RM, Chen JM.
Potential utilities of mask-wearing and instant hand
hygiene for fighting SARS-CoV-2. J Med Virol 2020;
31:10.1002/jmv.25805. doi: 10.1002/jmv.25805. Epub
ahead of print. PMID: 32232986; PMCID: PMC7228401.
20. Mishra M, Majumdar P. Social Distancing During
COVID-19: Will it Change the Indian Society? Journal
of Health Management 2020;22(2):224-235.
21. Tom Inglesby answers your COVID-19 questions,
[Internet]. [cited 2020 Mar 29]. Available from:
https://html5-
player.libsyn.com/embed/episode/id/13526585/
height/90/theme/custom/thumbnail/yes/direction/for
ward/render-playlist/no/ custom-color/ea5329/.
22. Ferguson NM, Laydon D, Nedjati-Gilani G, Imai N,
Ainslie K, Baguelin M. vol. 20. 2020. (Impact of Non-
pharmaceutical Interventions (NPIs) to Reduce
COVID- 19 Mortality and Healthcare Demand)
23. Guidance on social distancing for everyone in the UK.
https://www.gov.uk/government/publications/covid-
19-guidance-on-social-distancing-and-for-vulnerable-
people/guidance-on-social-distancing-for-everyone-
in-the-uk-and-protecting-older-people-and-
vulnerable-adults [Internet], GOV.UK. [cited 2020 Mar
22].
24. Nicola M, O'Neill N, Sohrabi C, Khan M, Agha M, Agha
R. Evidence based management guideline for the
COVID-19 pandemic - Review article. Int J Surg 2020;
77:206-16.
25. Je_erson T, Del Mar CB, Dooley L, Ferroni E, A Al -Ansary
L, A Bawazeer, et al. Physical interventions to interrupt
or reduce the spread of respiratory viruses: Systematic
review. BMJ 2009; 339: 3675.
26. Rabie T, Curtis V. Handwashing and risk of respiratory
infections: A quantitative systematic review. Trop Med
Int Health 2006;11: 258-267.
27. Kampf G, Todt D, Pfaender S, Steinmann E. Persistence
of coronaviruses on inanimate surfaces and their
inactivation with biocidal agents. J Hosp Infect
2020;104(3):246-251.
28. World Health Organization. WHO Guidelines on Hand
Hygiene in Health Care: First Global Patient Safety
Challenge: Clean Care Is Safer Care. World Health
Organization; 2009.
29. Gasparini G, Carmisciano L, Giberti I,Murgioni F, Parodi
A,Gallo R. ‘‘HEALTHY HANDS’’. A pilot study for the
prevention of chronic hand eczema in healthcare
workers of an Italian University Hospital. [Epub ahead
of print]. G Ital Dermatol Venereol. 2019.
https://doi.org/10.23736/S0392-0488.19.06220-5.
Accessed June 12, 2019.
30. WHO. Advice on the use of masks in the context of
COVID-19: interim guidance, April 6, 2020.
https://www.who.int/publications-detail/ advice-on-
the-use-of-masks-in-the-community-during-home-
care-andin- healthcare-settings-in-the-context-of-the-
novel-coronavirus-(2019-ncov)-outbreak (accessed
April 15, 2020).
31. US Centers for Disease Control and Prevention.
Recommendation regarding the use of cloth face
coverings, especially in areas of significant
community-based transmission. April 3, 2020.
https://www.cdc.gov/coronavirus/2019-
ncov/prevent-getting-sick/cloth-face-cover.html
(accessed April 15, 2020).
179

32. Feng S, Shen C, Xia N, Song W, Fan M, Cowling BJ.
Rational use of face masks in the COVID-19
pandemic. Lancet Respir Med 2020; 8(5):434-436.
33. Dugdale CM, Walensky RP. Filtration Efficiency,
Effectiveness, and Availability of N95 Face Masks for
COVID-19 Prevention. JAMA Intern Med Published
online August 11, 2020.
doi:10.1001/jamainternmed.2020.4218
34. Chen X, Ran L, Liu Q, Hu Q, Du X , Tan X. Hand
Hygiene, Mask-Wearing Behaviors and Its Associated
Factors during the COVID-19 Epidemic: A Cross-
Sectional Study among Primary School Students in
Wuhan, China. Int J Environ Res Public Health 2020;
17(8):2893
180