The Principal Components of Adult Female Insole Shape ...
14
RESEARCH ARTICLE The Principal Components of Adult Female Insole Shape Align Closely with Two of Its Classic Indicators Fred L. Bookstein 1 *, Jacqueline Domjanic 2 1 Department of Anthropology, University of Vienna, Vienna, Austria, 2 Department of Clothing Technology, University of Zagreb, Zagreb, Croatia * [email protected] Abstract The plantar surface of the human foot transmits the weight and dynamic force of the owner’s lower limbs to the ground and the reaction forces back to the musculoskeletal system. Its anatomical variation is intensely studied in such fields as sports medicine and orthopedic dysmorphology. Yet, strangely, the shape of the insole that accommodates this surface and elastically buffers these forces is neither an aspect of the conventional anthropometrics of feet nor an informative label on the packet that markets supplementary insoles. In this paper we pursue an earlier suggestion that insole form in vertical view be quantified in terms of the shape of the foot not at the plane of support (the “footprint”) but some two millimeters above that level. Using such sections extracted from laser scans of 158 feet of adult women from the University of Zagreb, in conjunction with an appropriate modification of today’s standard geometric morphometrics (GMM), we find that the sectioned form can be described by its size together with two meaningful relative warps of shape. The pattern of this shape varia- tion is not novel. It is closely aligned with two of the standard footprint measurements, the Chippaux-Šmiřák arch index and the Clarke arch angle, whose geometrical foci (the former in the ball of the foot, the latter in the arch) it apparently combines. Thus a strong contempo- rary analysis complements but does not supplant the simpler anthropometric analyses of half a century ago, with implications for applied anthropology. Introduction The foot of Homo sapiens must repeatedly absorb reaction forces during locomotion. In the normal foot, shod or unshod, much of this reaction is managed by the mechanics and the struc- tural strength of the longitudinal arch. [1] A century ago, orthopedists, anthropologists and sports scientists began to investigate the configuration of this arch in order to prevent a variety of frequently encountered foot deformations and pathologies, such as the fallen arches that kept many conscripts out of World War I. After that war, interest in physical education rose, and in its role in maintaining standards of general public health and well-being, especially in America. As Stafford [2] remarked, “The PLOS ONE | DOI:10.1371/journal.pone.0133303 August 26, 2015 1 / 14 OPEN ACCESS Citation: Bookstein FL, Domjanic J (2015) The Principal Components of Adult Female Insole Shape Align Closely with Two of Its Classic Indicators. PLoS ONE 10(8): e0133303. doi:10.1371/journal. pone.0133303 Editor: Alistair Robert Evans, Monash University, AUSTRALIA Received: March 9, 2015 Accepted: June 25, 2015 Published: August 26, 2015 Copyright: © 2015 Bookstein, Domjanic. This is an open access article distributed under the terms of the Creative Commons Attribution License, which permits unrestricted use, distribution, and reproduction in any medium, provided the original author and source are credited. Data Availability Statement: All relevant data are within the paper and its Supporting Information files. Funding: The authors have no support or funding to report. Competing Interests: The authors have declared that no competing interests exist.
-
Upload
khangminh22 -
Category
Documents
-
view
0 -
download
0
Transcript of The Principal Components of Adult Female Insole Shape ...
RESEARCH ARTICLE
The Principal Components of Adult FemaleInsole Shape Align Closely with Two of ItsClassic IndicatorsFred L. Bookstein1*, Jacqueline Domjanic2
1Department of Anthropology, University of Vienna, Vienna, Austria, 2 Department of Clothing Technology,University of Zagreb, Zagreb, Croatia
AbstractThe plantar surface of the human foot transmits the weight and dynamic force of the owner’s
lower limbs to the ground and the reaction forces back to the musculoskeletal system. Its
anatomical variation is intensely studied in such fields as sports medicine and orthopedic
dysmorphology. Yet, strangely, the shape of the insole that accommodates this surface and
elastically buffers these forces is neither an aspect of the conventional anthropometrics of
feet nor an informative label on the packet that markets supplementary insoles. In this paper
we pursue an earlier suggestion that insole form in vertical view be quantified in terms of the
shape of the foot not at the plane of support (the “footprint”) but some two millimeters above
that level. Using such sections extracted from laser scans of 158 feet of adult women from
the University of Zagreb, in conjunction with an appropriate modification of today’s standard
geometric morphometrics (GMM), we find that the sectioned form can be described by its
size together with two meaningful relative warps of shape. The pattern of this shape varia-
tion is not novel. It is closely aligned with two of the standard footprint measurements, the
Chippaux-Šmiřák arch index and the Clarke arch angle, whose geometrical foci (the former
in the ball of the foot, the latter in the arch) it apparently combines. Thus a strong contempo-
rary analysis complements but does not supplant the simpler anthropometric analyses of
half a century ago, with implications for applied anthropology.
IntroductionThe foot ofHomo sapiensmust repeatedly absorb reaction forces during locomotion. In thenormal foot, shod or unshod, much of this reaction is managed by the mechanics and the struc-tural strength of the longitudinal arch. [1] A century ago, orthopedists, anthropologists andsports scientists began to investigate the configuration of this arch in order to prevent a varietyof frequently encountered foot deformations and pathologies, such as the fallen arches thatkept many conscripts out of World War I.
After that war, interest in physical education rose, and in its role in maintaining standardsof general public health and well-being, especially in America. As Stafford [2] remarked, “The
PLOSONE | DOI:10.1371/journal.pone.0133303 August 26, 2015 1 / 14
OPEN ACCESS
Citation: Bookstein FL, Domjanic J (2015) ThePrincipal Components of Adult Female Insole ShapeAlign Closely with Two of Its Classic Indicators. PLoSONE 10(8): e0133303. doi:10.1371/journal.pone.0133303
Editor: Alistair Robert Evans, Monash University,AUSTRALIA
Received: March 9, 2015
Accepted: June 25, 2015
Published: August 26, 2015
Copyright: © 2015 Bookstein, Domjanic. This is anopen access article distributed under the terms of theCreative Commons Attribution License, which permitsunrestricted use, distribution, and reproduction in anymedium, provided the original author and source arecredited.
Data Availability Statement: All relevant data arewithin the paper and its Supporting Information files.
Funding: The authors have no support or funding toreport.
Competing Interests: The authors have declaredthat no competing interests exist.

desire to be healthy [now] became fashionable.”Much of this new attention concentrated onthe foot, sometimes to an absurd extent: thus Morton [3] claimed that more than 75% of Amer-ican youth have had some sort of foot disorder. Stafford, basing his argument on the prevalenceof flat feet, went on to emphasize the need for preventive and corrective physical educationamong civilized people. Only a very few reach adulthood with comfortable, efficient feet, hereported, owing to improper shoes, bodily weakness, or injuries to the lower limb. Not onlyevolutionary biology was to blame, but also civilization. Walking on hard floors and pavementforced the populace to use shoes and stockings, but the consequent restriction of normal footaction resulted in deformation and discomfort for millions. Stafford classified feet into threegroups (normal, weak, and deformed), characterized each type, and proposed treatments.
This decade also saw the advent of the pedograph, a device originally intended for the use ofshoe salesmen as an aid in fitting shoes and now used in sports science. [4] Much of the subse-quent course of pedometry over the rest of the twentieth century pursued the problem of infor-mation transfer from this two-dimensional image, which is in reality a controlled footprint, tothe three-dimensional representation at the core of the earlier concern with arch height (seethe premature claim of Clarke [5], for instance, that the footprint, if taken properly, shows theheight of the longitudinal arch). Schwartz [6] seems to have been the first to anticipate the mea-sures persisting into the present paper when he introduced the footprint angle, characterizedpretentiously as the chief mathematical measure of foot conditions available from footprints.His conjecture was that as arches are strengthened, the arch angle increases steadily, and socould be used as a proxy for therapeutic improvement over the course of various treatment reg-imens. Rogers [7] pursued such investigations further, but neither actually managed to providea strict protocol for the placement of the two lines making up the angle that was to be mea-sured. Clarke was honest about this, noting, “the footprint measure would become a more use-ful tool for physical educators if this line of best fit was definitely [sic] defined.”
Clarke tested this then-novel metrology on some students from Syracuse (New York, USA)University and claimed to have proven sufficient reliability and validity of the method for it tobe considered a valuable aid in educational programs, medical treatment, and posture training.He was partially correct, in that a smaller angle is correlated with a lower arch. [8, 9] This plan-tographic method surely was more convenient than radiography and more reliable than palpa-tion, and it supplied numbers, which could be converted into statistics, which generallyimpressed colleagues, clients, and customers. [10–13]
Continuing with this Whig history, we find the next forward step to be Chippaux’s, who,working in the French anthropological tradition, pursued additional characterizations of archshape and its pathologies. [14] The arch angle was augmented by an additional parameter, theratio of minimum to maximum width of the apparent arch outline measured perpendicular tothe anteroposterior tangent of the footprint along its lateral edge. For a particularly good earlyexample of a research application relying on this index, a 1960 study of Czech children andadolescents, see [15]. Later Šmahel [10] applied the same method to a sample of Czech adults.The combination of the Chippaux arch ratio and the Clarke arch angle provided a plausiblebasis for the classification of their sample into categories of arch types along with an ascertain-ment of their population frequencies. Of course the investigator must be concerned to controlthe weight borne by the foot whose footprint is being quantified. Where Šmahel required thatthe full body weight be borne by the foot under inspection, as in active striding, later investiga-tors [11, 16–19, 9] would typically impose a condition of static bipedal loading instead. Wehave done the same.
The main clinical uses of the images that result from arch pedography and pedometry are tofurther a pair of quasimedical diagnoses (“pes planus,” “pes cavus”) and to pursue the implica-tions for the design of appropriate arch inserts where necessary (see, e.g., [11, 20]). This
Human Female Insole Shape
PLOSONE | DOI:10.1371/journal.pone.0133303 August 26, 2015 2 / 14
therapeutic prosthesis, the insole, has a long history, back to the very first types of footwear(which often used layers of wool to cushion the feet). The early 20th-century adoption of fac-tory-made shoes with different left-right lasts was associated with a wider exploration of theorthotic devices that could be inserted in shoes. Orthotics promised to correct various footproblems, improve foot function during locomotion, and relieve pain. Recent studies continueto address the issue of plantar pressure relief on sensitive feet [21–23] that can explain theincreased popularity of insoles worldwide, along with the rapid advances in scanning and engi-neering technology and in materials science pertinent to design and fabrication of customizedor custom-made insoles. [24, 25] However, the time and labor required for production of theseobjects make them more expensive than the mass-produced (prefabricated) insoles that fulfillneeds of odor and moisture control or additional cushioning as well as (however approxi-mately) the originally intended function of added arch support. [26] There is still market com-petition between personalized and prefabricated foot orthotics. A crucial step in rationalizingthis competition would be an improved understanding of the shape variation of the arch out-line supplied by pedography.
We present a retrospective view of this near-century of methodological development, begin-ning with a reanalysis of previously published data [1] demonstrating how the new morpho-metrics (geometric morphometrics, GMM) may be applied to a two-dimensionalrepresentation of a clinically important three-dimensional structure, the plantar surface of thefoot. That earlier publication did not pursue comparisons of its findings with those of earliermethodologies. Our present follow-up computations fill the lacuna in that earlier investigation;but our conclusion is an unexpected one. Our main finding is indeed closely aligned with thegifted guesses of Clarke and Chippaux more than half a century ago, in that the best contempo-rary morphometric techniques of pattern analysis, applied to a good contemporary representa-tion of the pedogram, yield two factors that can be directly interpreted as the sum anddifference of those two early twentieth-century indices. In other words, although our computa-tions closely parallel those of the earlier paper, our conclusion is actually the opposite: the newmethods do not supplant, but rather complement, the insights of the founders of the anthro-pometry of the footprint.
Materials and Methods
DataData for this analysis combine information from sections of three-dimensional surface repre-sentations of 158 feet with additional linear and angular measurements and with responses toquestionnaires.
The study was conducted among a sample of convenience comprising 83 female Universityof Zagreb (Croatia) students between 19 and 36 years of age scanned during January and Feb-ruary 2012 on the Pedus scanner in the Department of Clothing Technology at the Universityof Zagreb. To control for time-of-day effects, scanning was restricted to the hours between11:00 and 16:00. Before scanning, each subject filled out a brief questionnaire informing us ofher body weight and body height, shoe size, and frequency of wearing high heels, and alsoabout any use of orthotics. (The restriction of the sample to females owed to the originalresearch context of the project, an investigation of the consequences of wearing high heels forforefoot pain and long-term functional damage that might require orthotics for itsamelioration.)
Morphometric data were acquired as detailed surface scans of each foot using a device spe-cialized for that purpose (PedusTM, Human Solutions, Germany). Each foot was scanned sepa-rately. During each of the two scanning intervals of about ten seconds, subjects stood upright
Human Female Insole Shape
PLOSONE | DOI:10.1371/journal.pone.0133303 August 26, 2015 3 / 14
with their weight borne symmetrically on both feet. Each scan produced a three-dimensionalpoint cloud of some 60,000 points that was exported for analysis. In the AmiraTM software plat-form that is common to many anthropometry labs nowadays, the point cloud was converted tothe form of a surface triangulation (.stl format), and then left and right footprints were pro-duced as surface cuts two millimeters proximal to the bearing surface of the Pedus device. Thevalue of 2 millimeters was chosen subjectively as a compromise between representation of thesilhouette and sensitivity of the actual lower margin of the footprint to details of the stiffness ofthe skin in that region. (For more discussion of the interplay between two-dimensional andthree-dimensional analyses in pedal surface data, see [27]. In the present context, of course, thecomparison scalars to which we are referring, arch index and arch angle, are themselves onlytwo-dimensional.) Left feet were reflected to the right side for all further analyses. For four ofour 83 participants, at least one of their footprints could be classified by eye as either pes cavusor pes planus; the other 79 pairs made up the 158 feet of the present study.
There resulted six closed outlines per foot, one for each of the five toes and one for theremaining area of the footprint. Discarding the toes, we used Jim Rohlf’s program TPSdig2.0(http://life.bio.sunysb.edu/morph/) to sample each of the 158 outlines of the main footprint at36 approximately equally spaced sampling points, and resampled these 36-gons by sliding pointsalong edge chords to the positions of minimum bending energy according to the algorithm ofBookstein [28]. The resulting locations are known in the GMM literature as semilandmarks orslipped shape coordinates. These 158 polygons were our primary morphometric resource.
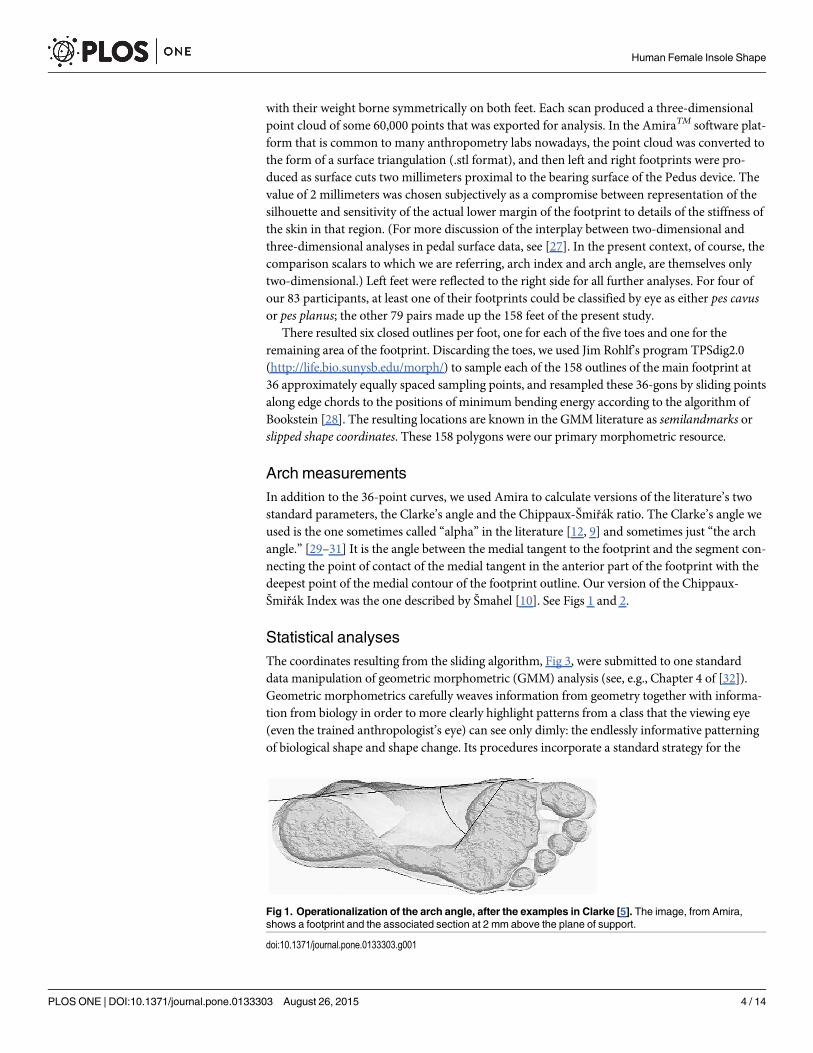
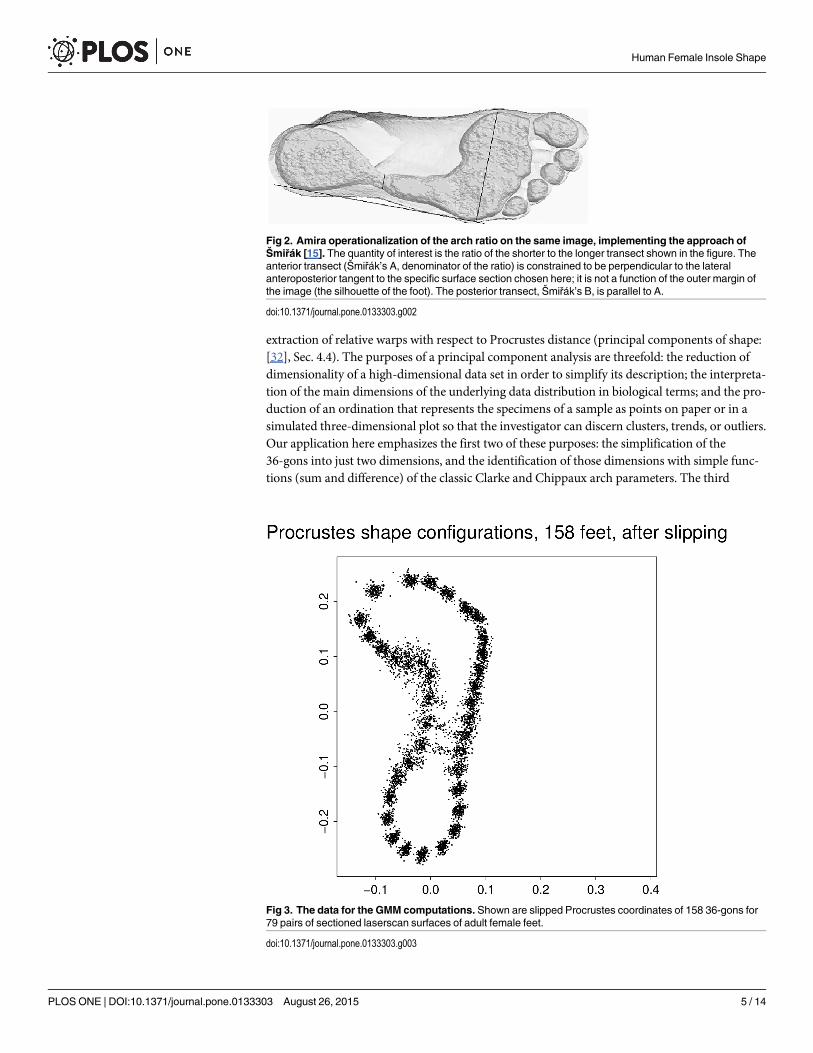
Arch measurementsIn addition to the 36-point curves, we used Amira to calculate versions of the literature’s twostandard parameters, the Clarke’s angle and the Chippaux-Šmiřák ratio. The Clarke’s angle weused is the one sometimes called “alpha” in the literature [12, 9] and sometimes just “the archangle.” [29–31] It is the angle between the medial tangent to the footprint and the segment con-necting the point of contact of the medial tangent in the anterior part of the footprint with thedeepest point of the medial contour of the footprint outline. Our version of the Chippaux-Šmiřák Index was the one described by Šmahel [10]. See Figs 1 and 2.
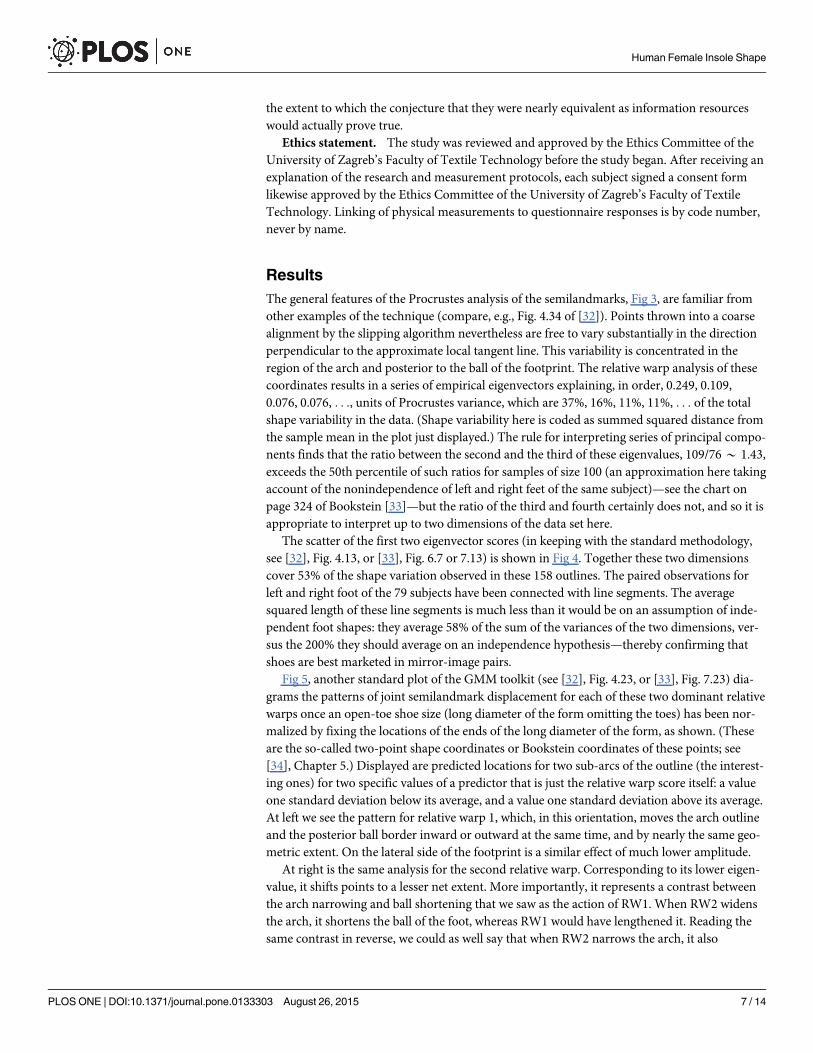
Statistical analysesThe coordinates resulting from the sliding algorithm, Fig 3, were submitted to one standarddata manipulation of geometric morphometric (GMM) analysis (see, e.g., Chapter 4 of [32]).Geometric morphometrics carefully weaves information from geometry together with informa-tion from biology in order to more clearly highlight patterns from a class that the viewing eye(even the trained anthropologist’s eye) can see only dimly: the endlessly informative patterningof biological shape and shape change. Its procedures incorporate a standard strategy for the
Fig 1. Operationalization of the arch angle, after the examples in Clarke [5]. The image, from Amira,shows a footprint and the associated section at 2 mm above the plane of support.
doi:10.1371/journal.pone.0133303.g001
Human Female Insole Shape
PLOSONE | DOI:10.1371/journal.pone.0133303 August 26, 2015 4 / 14
extraction of relative warps with respect to Procrustes distance (principal components of shape:[32], Sec. 4.4). The purposes of a principal component analysis are threefold: the reduction ofdimensionality of a high-dimensional data set in order to simplify its description; the interpreta-tion of the main dimensions of the underlying data distribution in biological terms; and the pro-duction of an ordination that represents the specimens of a sample as points on paper or in asimulated three-dimensional plot so that the investigator can discern clusters, trends, or outliers.Our application here emphasizes the first two of these purposes: the simplification of the36-gons into just two dimensions, and the identification of those dimensions with simple func-tions (sum and difference) of the classic Clarke and Chippaux arch parameters. The third
Fig 2. Amira operationalization of the arch ratio on the same image, implementing the approach ofŠmiřák [15]. The quantity of interest is the ratio of the shorter to the longer transect shown in the figure. Theanterior transect (Šmiřák’s A, denominator of the ratio) is constrained to be perpendicular to the lateralanteroposterior tangent to the specific surface section chosen here; it is not a function of the outer margin ofthe image (the silhouette of the foot). The posterior transect, Šmiřák’s B, is parallel to A.
doi:10.1371/journal.pone.0133303.g002
Fig 3. The data for the GMM computations. Shown are slipped Procrustes coordinates of 158 36-gons for79 pairs of sectioned laserscan surfaces of adult female feet.
doi:10.1371/journal.pone.0133303.g003
Human Female Insole Shape
PLOSONE | DOI:10.1371/journal.pone.0133303 August 26, 2015 5 / 14

purpose is conveyed only in Fig 4, which shows that the left and right foot of a single subjectresemble one another enough that these parameters can be considered pertinent to the person,not the specific foot. The restriction of the count of meaningful components to just two was perthe stepdown rules of Bookstein. ([33], Sec. 5.2.3.4) Although the computation of these relativewarps was itself wholly standard, Figs 5 through 9 here render them with both ends of the longdiameter fixed (the so-called Bookstein coordinate representation). The visual impression ofsize standardization then corresponds to an anatomical length measurement rather than themore technical Centroid Size scaling built into the Procrustes toolkit.
This data resource differs from that of Domjanic [1] in a few details. Most obviously, thepresent paper excludes the outline information from the toes. Their length, in particular, is nota factor in the computation of the Procrustes size measure that is divided out in the course ofstandardizations such as that in Fig 3. The visualization of the relative warps has changed froma juxtaposition of filled outlines to a direct construction as simultaneous displacement of allthe outline’s semilandmarks at the same time. We explicitly measured the two classical insole-relevant quantities mentioned above to see if the principal components of the footprint outlineresembled them to any extent. Because they do, we can quantify that relationship by anotherstandard tool, the technique of shape regression (regression of each element in a vector of scapecoordinates against the same endogenous or exogenous scalar predictor). We did not anticipate
Fig 4. The first two relative warp scores for 79 pairs of insole outlines.Dashes link left and right foot ofeach subject.
doi:10.1371/journal.pone.0133303.g004
Human Female Insole Shape
PLOSONE | DOI:10.1371/journal.pone.0133303 August 26, 2015 6 / 14
the extent to which the conjecture that they were nearly equivalent as information resourceswould actually prove true.
Ethics statement. The study was reviewed and approved by the Ethics Committee of theUniversity of Zagreb’s Faculty of Textile Technology before the study began. After receiving anexplanation of the research and measurement protocols, each subject signed a consent formlikewise approved by the Ethics Committee of the University of Zagreb’s Faculty of TextileTechnology. Linking of physical measurements to questionnaire responses is by code number,never by name.
ResultsThe general features of the Procrustes analysis of the semilandmarks, Fig 3, are familiar fromother examples of the technique (compare, e.g., Fig. 4.34 of [32]). Points thrown into a coarsealignment by the slipping algorithm nevertheless are free to vary substantially in the directionperpendicular to the approximate local tangent line. This variability is concentrated in theregion of the arch and posterior to the ball of the footprint. The relative warp analysis of thesecoordinates results in a series of empirical eigenvectors explaining, in order, 0.249, 0.109,0.076, 0.076, . . ., units of Procrustes variance, which are 37%, 16%, 11%, 11%, . . . of the totalshape variability in the data. (Shape variability here is coded as summed squared distance fromthe sample mean in the plot just displayed.) The rule for interpreting series of principal compo-nents finds that the ratio between the second and the third of these eigenvalues, 109/76* 1.43,exceeds the 50th percentile of such ratios for samples of size 100 (an approximation here takingaccount of the nonindependence of left and right feet of the same subject)—see the chart onpage 324 of Bookstein [33]—but the ratio of the third and fourth certainly does not, and so it isappropriate to interpret up to two dimensions of the data set here.
The scatter of the first two eigenvector scores (in keeping with the standard methodology,see [32], Fig. 4.13, or [33], Fig. 6.7 or 7.13) is shown in Fig 4. Together these two dimensionscover 53% of the shape variation observed in these 158 outlines. The paired observations forleft and right foot of the 79 subjects have been connected with line segments. The averagesquared length of these line segments is much less than it would be on an assumption of inde-pendent foot shapes: they average 58% of the sum of the variances of the two dimensions, ver-sus the 200% they should average on an independence hypothesis—thereby confirming thatshoes are best marketed in mirror-image pairs.
Fig 5, another standard plot of the GMM toolkit (see [32], Fig. 4.23, or [33], Fig. 7.23) dia-grams the patterns of joint semilandmark displacement for each of these two dominant relativewarps once an open-toe shoe size (long diameter of the form omitting the toes) has been nor-malized by fixing the locations of the ends of the long diameter of the form, as shown. (Theseare the so-called two-point shape coordinates or Bookstein coordinates of these points; see[34], Chapter 5.) Displayed are predicted locations for two sub-arcs of the outline (the interest-ing ones) for two specific values of a predictor that is just the relative warp score itself: a valueone standard deviation below its average, and a value one standard deviation above its average.At left we see the pattern for relative warp 1, which, in this orientation, moves the arch outlineand the posterior ball border inward or outward at the same time, and by nearly the same geo-metric extent. On the lateral side of the footprint is a similar effect of much lower amplitude.
At right is the same analysis for the second relative warp. Corresponding to its lower eigen-value, it shifts points to a lesser net extent. More importantly, it represents a contrast betweenthe arch narrowing and ball shortening that we saw as the action of RW1. When RW2 widensthe arch, it shortens the ball of the foot, whereas RW1 would have lengthened it. Reading thesame contrast in reverse, we could as well say that when RW2 narrows the arch, it also
Human Female Insole Shape
PLOSONE | DOI:10.1371/journal.pone.0133303 August 26, 2015 7 / 14
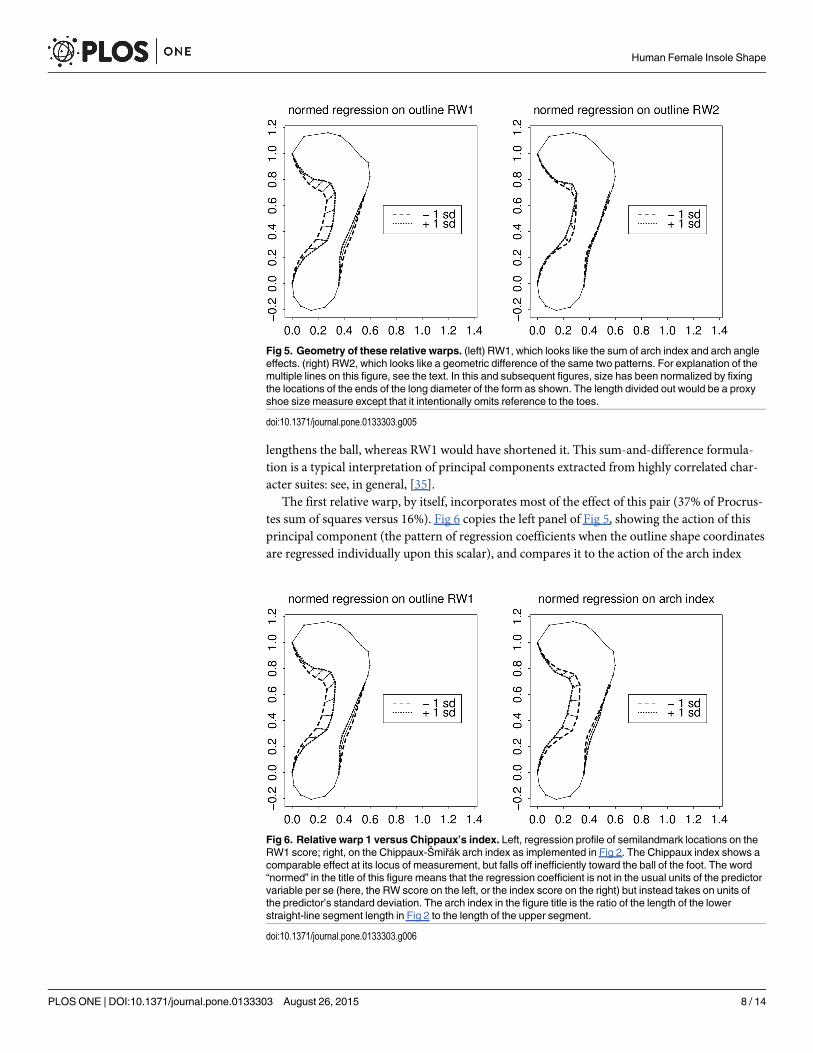
lengthens the ball, whereas RW1 would have shortened it. This sum-and-difference formula-tion is a typical interpretation of principal components extracted from highly correlated char-acter suites: see, in general, [35].
The first relative warp, by itself, incorporates most of the effect of this pair (37% of Procrus-tes sum of squares versus 16%). Fig 6 copies the left panel of Fig 5, showing the action of thisprincipal component (the pattern of regression coefficients when the outline shape coordinatesare regressed individually upon this scalar), and compares it to the action of the arch index
Fig 5. Geometry of these relative warps. (left) RW1, which looks like the sum of arch index and arch angleeffects. (right) RW2, which looks like a geometric difference of the same two patterns. For explanation of themultiple lines on this figure, see the text. In this and subsequent figures, size has been normalized by fixingthe locations of the ends of the long diameter of the form as shown. The length divided out would be a proxyshoe size measure except that it intentionally omits reference to the toes.
doi:10.1371/journal.pone.0133303.g005
Fig 6. Relative warp 1 versus Chippaux’s index. Left, regression profile of semilandmark locations on theRW1 score; right, on the Chippaux-Šmiřák arch index as implemented in Fig 2. The Chippaux index shows acomparable effect at its locus of measurement, but falls off inefficiently toward the ball of the foot. The word“normed” in the title of this figure means that the regression coefficient is not in the usual units of the predictorvariable per se (here, the RW score on the left, or the index score on the right) but instead takes on units ofthe predictor’s standard deviation. The arch index in the figure title is the ratio of the length of the lowerstraight-line segment length in Fig 2 to the length of the upper segment.
doi:10.1371/journal.pone.0133303.g006
Human Female Insole Shape
PLOSONE | DOI:10.1371/journal.pone.0133303 August 26, 2015 8 / 14
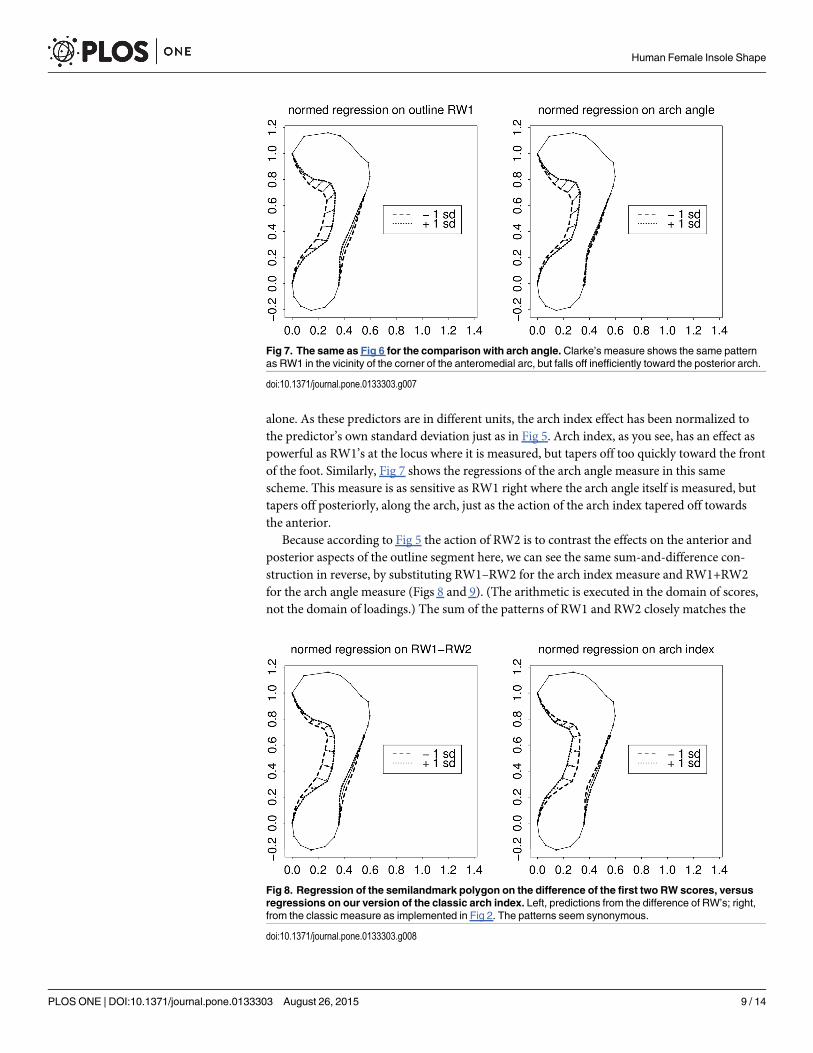
alone. As these predictors are in different units, the arch index effect has been normalized tothe predictor’s own standard deviation just as in Fig 5. Arch index, as you see, has an effect aspowerful as RW1’s at the locus where it is measured, but tapers off too quickly toward the frontof the foot. Similarly, Fig 7 shows the regressions of the arch angle measure in this samescheme. This measure is as sensitive as RW1 right where the arch angle itself is measured, buttapers off posteriorly, along the arch, just as the action of the arch index tapered off towardsthe anterior.
Because according to Fig 5 the action of RW2 is to contrast the effects on the anterior andposterior aspects of the outline segment here, we can see the same sum-and-difference con-struction in reverse, by substituting RW1–RW2 for the arch index measure and RW1+RW2for the arch angle measure (Figs 8 and 9). (The arithmetic is executed in the domain of scores,not the domain of loadings.) The sum of the patterns of RW1 and RW2 closely matches the
Fig 7. The same as Fig 6 for the comparison with arch angle. Clarke’s measure shows the same patternas RW1 in the vicinity of the corner of the anteromedial arc, but falls off inefficiently toward the posterior arch.
doi:10.1371/journal.pone.0133303.g007
Fig 8. Regression of the semilandmark polygon on the difference of the first two RW scores, versusregressions on our version of the classic arch index. Left, predictions from the difference of RW’s; right,from the classic measure as implemented in Fig 2. The patterns seem synonymous.
doi:10.1371/journal.pone.0133303.g008
Human Female Insole Shape
PLOSONE | DOI:10.1371/journal.pone.0133303 August 26, 2015 9 / 14

action of the arch angle measure. Analogously the difference of the same patterns, Fig 9, closelymatches the action of the other main scalar index, the Chippaux-Šmiřák.
The corresponding plots of correlations of these sectional outlines by other measures of thewomen, such as body mass index, need for orthotics, or habitual use of high heels, are effec-tively null. Hence the two relative warps we have identified here should not be considered asconsequences of interventions on these feet.
Discussion
Reassurance about conventional measurementsThe role of geometric morphometrics as we have seen it in this example—to sharpen conven-tional measurement schemes by expansion into a spatial distribution—is typical of its applica-tions all over applied anthropology. Earlier experts in amateur anthropometry foundindividual measurements that supported clinically useful comparisons; the role of the GMMtools is to understand the structure of those candidate indexes themselves. We saw in Fig 5 thatour first two relative warps proved to be the difference and the sum of one particular pair ofstandard scalar indices, the Chippaux-Šmiřák arch ratio and the arch angle. The two measuresare correlated −0.53 with each other, but each correlates about ±0.8 with our first relative warp—as we have seen, the value of that first relative warp, treated as a score for each of our 158footprint outlines, is nearly equivalent in its information content to a linear combination of thetwo indexes taken together (R* 0.94).
While the conventional indexes are not thereby shown to be unreasonable, nevertheless oneparticular formal property of principal component solutions, their role as optimal predictors,recommends them whenever they are computationally feasible. A possible explanation for thispreference within the present data set is set out in Fig 10: the distribution patterns (each oneover all 158 footprints) of the four quantities we are considering here. The top row shows ourtwo relative warp scores; the bottom row, the pair of matching conventional indices (left, Chip-paux-Šmiřák ratio; right, arch angle). While both of the relative warp distributions lookapproximately Gaussian, that for the Chippaux-Šmiřák index is obviously not: it is skewed tothe left and much too sharply peaked. That would correspond to its clinical purpose, which isthe detection of specific anomalies. Relative warp 2 looks particularly Gaussian in this
Fig 9. The same for Clarke arch angle (Fig 1) vis-à-vis the sum of the first two relative warp scores.Panels are as in Fig 8. Again the actions seem synonymous.
doi:10.1371/journal.pone.0133303.g009
Human Female Insole Shape
PLOSONE | DOI:10.1371/journal.pone.0133303 August 26, 2015 10 / 14

representation. (In a context of detection, a bimodal distribution may be preferable to one withjust a single mode. See, for instance, [36] for a contrasting application to the explicit diagnosisof pes planus.)
When GMM was introduced into anthropometry around the turn of the present century, bythe efforts of teams in Vienna and elsewhere, one of the principal arguments accounting for itssuccess was the demonstration that it obviated the need to continually guess at more and moreconventional quantifications (indexes, proportions, angles) as the number of salient anthropo-metric points and curves continued to rise. (See the discussion in [32], Sec. 4.5.3.) The demon-stration in the present manuscript constitutes a first step toward a similar possibility for theapplied anthropology of clothing. To the extent that the two relative warps of these outlinestogether span the same information as a small system of conventional indicators (namely, thearch index and the arch angle), there is no further need for either of those indexes separately.The profession is free thereby to concentrate on the actual clinical matter at hand, which is theordination of clinical subjects along a suitable number of dimensions of continuous variationbearing implications for the appropriate markets or therapies, in this context, prostheses. Thedesign of index formulas was always an art, not a craft; one important consequence of theadvent of GMM is the possibility of circumventing further needs for that high art.
The results here bear substantial implications for the marketing of orthotics. The first tworelative warps, in particular, can serve as a template against which to simultaneously shift all
Fig 10. Dominance of the relative warp analyses over the classic indexes. This may owe tomaldistribution of the standard measurements in comparison to the relative warps of the same outlines.
doi:10.1371/journal.pone.0133303.g010
Human Female Insole Shape
PLOSONE | DOI:10.1371/journal.pone.0133303 August 26, 2015 11 / 14

the points of the margin at which an orthotic is designed to rise (to convey support) at thesame time. The descriptive system here combines the effects of arch width variability and archangle variability, while accommodating their moderate intercorrelation.
But beyond custom-fitted products, these findings bear implications for the broader marketof prefabricated inserts. Within a given product line, typically shoes come in a two-parametersystem, size (length) by width (perhaps AAAA to EEEE, perhaps narrow, medium, wide).Today’s insoles, however, seem not to be width-coded. If they were not custom-fitted by a pro-fessional from the details of the individual footprint, they were purchased from a store or awebsite that codes them by a single integer only, their overall size. Our results strongly suggestthat there may be a rational design compromise midway between these two extremes: a seconddimension of form (our first dimension of shape) that modifies the average insole of a particu-lar size for feet whose arch-ball combinations are thinner than normal, thicker than normal, orwithin the normal range. A second dimension of shape, explaining roughly half as much varia-tion as the first, represents the contrast between the two factors of that arch-ball combinationrather than their sum.
In the same way that the manufacture of shoes turned to a two-dimensional system of pre-fabricated sizes (length by width, in equal increments), the manufacture of insoles could beconverted from the present one-dimensional system (just an integer size, to be modified by thepedestrian’s own scissors) to a three-parameter system that could still be marketed in prefabri-cated packets hanging from a compact display rack, but that would much more closely trackthe actual population variation of geometries by which the insole actually varies—according tothe figures here, that is by a combination of foot size, arch angle, and arch ratio.
Fulfilling the vision of biostereometricsJust as dress design patterns modify the geometry of a fixed template for a range of physicalsizes and extents of obesity, this three-dimensional insole scheme would incorporate the bestcontemporary quantifications of arch form, adapting the earlier insights of Clarke and Chip-paux to the present context of three-dimensional surface-based anthropometry. We willthereby have taken a major step forward toward bridging the concerns of enterprises like Proj-ect CAESAR [37], based as they are on actual population ranges of a fixed roster of a-prioriparameters, with the more flexible approach to human morphological variation appropriatefor data from dense meshes, [38] the data type that characterizes most 21st-century researchinto human clothing manufacturing patterns (e.g., [39]). This was the original goal of bioster-eometrics as it coalesced around the new surface-scanning technologies in the 1970’s (see[40]). The promise of that new information resource proved inseparable from the generationof the corresponding biometric technologies for averaging and correlating the informationthus acquired.
In this paper we demonstrate one contemporary bridge of that sort, the match of relativewarps of outline shape to the best guesses at relevant dimensions of form-variation as imaginedand diagrammed more than half a century ago. We commend this thrust as a fertile domainfor advancing the technological use of information about the variation of human forms in gen-eral. Today’s statistics are quite capable of confirming, rather than replacing, the judgments ofthe founding generation of anthropometricians.
Supporting InformationS1 Text. Semilandmark coordinates and indices. This text file is a listing of of 158 × 36ordered pairs, the Cartesian coordinates of the semilandmarks described in the Methods sec-tion above, along with two decimal values, the classic arch index (Fig 2) and the arch angle (Fig
Human Female Insole Shape
PLOSONE | DOI:10.1371/journal.pone.0133303 August 26, 2015 12 / 14

1), for the same 158 cases. The format of the file is 158 lines of 72 Cartesian coordinates andthen two decimal index values per line. Arch angle is in units of degrees.(TXT)
AcknowledgmentsO.Prof.emer. Dr. Horst Seidler, Dean of Life Sciences at the University of Vienna, supportedthe analyses reported here with enthusiasm and resources. Philipp Mitteroecker aided in thecollection of the original sectioned images. Dean Sandra Bischof of the Faculty of Textile Tech-nology, University of Zagreb, hosted the visit of Prof. Bookstein to the Zagreb Faculty of TextileTechnology during which this paper was envisioned.
Author ContributionsConceived and designed the experiments: JD. Performed the experiments: JD. Analyzed thedata: JD FLB. Contributed reagents/materials/analysis tools: JD FLB. Wrote the paper: JD FLB.
References1. Domjanic J, Fieder M, Seidler H, Mitteroecker PM. Geometric morphometric footprint analysis of young
women. J Foot Ankle Res. 2013; 6: 27–34. doi: 10.1186/1757-1146-6-27 PMID: 23886074
2. Stafford GT. Preventive and corrective physical education. New York: A. S. Barnes and Co.; 1928.
3. Morton DJ. Evolution of the longitudinal arch. J Bone Joint Surg. 1924; 22: 59–90.
4. Waerlop I, Shawn A. Pedographs and gait analysis: Clinical pearls and case studies. Victoria, BC, Can-ada: Trafford Publishing Ltd.; 2006.
5. Clarke HH. An objective method of measuring the height of the longitudinal arch in foot examinations.Research Quarterly of the American Physical Education Association 1933; 4: 99–107.
6. Schwartz L, Britten RH, Thompson LR. Studies in physical development and posture. U.S. PublicHealth Bulletin 179. 1928.
7. Rogers FR. Fundamental administrative measures in physical education. Newton, MA: the PleiadesCo.; 1932.
8. Stavlas P, Grivas TB, Michas C, Vasiliadis E, Polyzois V. The evaluation of foot morphology in childrenbetween 6 and 17 years of age: A cross-sectional study based on footprints in a Mediterranean popula-tion. J Foot Ankle Surg. 2005; 44: 424–428. doi: 10.1053/j.jfas.2005.07.023 PMID: 16257670
9. Sacco ICN, Noguera CG, Bacarin TA, Casarotti R, Tozzi FL. Medial longitudinal arch change in diabeticperipheral neuropathy. Acta Ortop Bras. 2009; 17: 13–16.
10. Šmahel Z. The configuration of the arch of the foot in adults and the influence of body weight. Zeitschriftfür Morphologie und Anthropologie 1977; 68: 201–212. PMID: 930238
11. Shiang TY, Lee SH, Lee SJ, ChuWC. Evaluating different footprint parameters as a predictor of archheight. Engineering in Medicine and Biology Magazine, IEEE. 1998; 17: 62–66. doi: 10.1109/51.731323
12. Chen KC, Yeh CJ, Kuo JF, Hsieh CL, Yang SF, Wang CH. Footprint analysis of flatfoot in preschool-aged children. J Pediatrics. 2010; 169: 1–16.
13. Ozer CM, Barut C. Evaluation of the sole morphology of professional football players. InternationalSportMed Journal. 2012; 13: 8–17.
14. Chippaux C. Elements d’anthropologie. École d’application du service de santè des troupes coloniales,Marseille. 1947.
15. Šmiřák J (1960) Přìspěvek k problematice ploché nohy u školnì a pracujìcì mládeže (Der Plattfußbeider Schuljugend und den Arbeitsreserven). SPN; 1960.
16. Mathieson D, Upton D, Birchenough A. Comparison of footprint parameters calculated from static anddynamic footprints. The Foot. 1999; 9: 145–149. doi: 10.1054/foot.1999.0544
17. Riddiford-Harland DL, Steele JR, Storlien LH. Does obesity influence foot structure in prepubescentchildren? Int J Obes. 2000; 24: 541–544. doi: 10.1038/sj.ijo.0801192
18. Onodera AN, Sacco ICN, Morioka EH, Souza PS, de Sá MR, Amadio AC. What is the best method forchild longitudinal plantar arch assessment and when does arch maturation occur? The Foot. 2008; 18:142–149. doi: 10.1016/j.foot.2008.03.003 PMID: 20307428
Human Female Insole Shape
PLOSONE | DOI:10.1371/journal.pone.0133303 August 26, 2015 13 / 14

19. Mauch M, Grau S, Krauss I, Maiwald C, Horstmann T. Foot morphology of normal, underweight andoverweight children. Int J Obes. 2008; 32: 1068–1075. doi: 10.1038/ijo.2008.52
20. Smirnova LM, Yuldashev ZM, Ioffe RY, Ioffe EA. Computer plantography and podography in screeningexamination of children of preschool age using the SCANM firmware system. Biomedical Engineering.2010; 44: 41–44. doi: 10.1007/s10527-010-9152-2
21. Ibrahim M, El Hilaly R, Taher M, Morsy A. A pilot study to assess the effectiveness of orthotic insoles onthe reduction of plantar soft tissue strain. Clin Biomech. 2013; 28: 68–72. doi: 10.1016/j.clinbiomech.2012.09.003
22. Bousie J, Blanch P, McPoil TG, Vicenzino B. Contoured inshoe foot orthoses increase mid-foot plantarcontact area when compared with a flat insert during cycling. J Sci Med Sport. 2013; 16: 60–4. doi: 10.1016/j.jsams.2012.04.006 PMID: 22658845
23. Peduzzi de Castro M, Abreu S, Pinto V, Santos R, Machado L, Vaz M, et al. Influence of pressure-reliefinsoles developed for loaded gait (backpackers and obese people) on plantar pressure distribution andground reaction forces. Appl Ergon. 2014; 45: 1028–34. doi: 10.1016/j.apergo.2014.01.005 PMID:24468683
24. Yick KL, Tse CY. Textiles and other materials for orthopaedic footwear insoles. In: Luximon A, editor.Handbook of footwear design and manufacture. Cambridge, UK: Woodhead Publ.; 2013.
25. Crabtree P, Dhokia VG, Newman ST, AnsellM. Manufacturing methodology for personalized symptom-specific sport insoles. Robot Comput-Integr Manuf. 2009; 25: 972–979. doi: 10.1016/j.rcim.2009.04.016
26. Owings TM, Botek G. (2013) Design of Insoles. In: The Science of Footwear (Ed. Goonetilleke R.S.)Boca Raton, FL: CRC Press; 2013.
27. Bookstein FL, Domjanic J. Analysis of the human female foot in two different measurement systems:From geometric morphometrics to functional morphology. Coll Antropol. 2014; 38: 855–863.
28. Bookstein FL. Landmark methods for forms without landmarks: morphometrics of group differences inoutline shape. Med Image Anal. 1997; 1: 225–243. doi: 10.1016/S1361-8415(97)85012-8 PMID:9873908
29. Hawes MR, Nachbauer W, SovakW, Nigg BM. Footprint parameters as a peasure of arch height. Footand Ankle. 1992; 13: 22–26. doi: 10.1177/107110079201300104 PMID: 1577337
30. Razeghi M, Batt ME. Foot type classification: a critical review of current methods. Gait and Posture.2002; 15: 282–291. doi: 10.1016/S0966-6362(01)00151-5 PMID: 11983503
31. Mauch M, Grau S, Krauss I, Maiwald C, Horstmann T. A new approach to children’s footwear based onfoot type classification. Ergonomics. 2009; 52: 999–1008. doi: 10.1080/00140130902803549 PMID:19629814
32. Weber GW, Bookstein FL. Virtual anthropology: A guide to a new interdisciplinary field. Springer Publ.Co; 2011.
33. Bookstein FL. Measuring and Reasoning: Numerical inference in the sciences. New York: CambridgeUniversity Press; 2014.
34. Bookstein FL. Morphometric tools for landmark data: Geometry and biology. New York: CambridgeUniversity Press; 1991.
35. Mitteroecker PM, Bookstein FL. The conceptual and statistical relationship between modularity andmorphological integration. Systematic Zoology. 2007; 56: 818–836.
36. Chang C-H, Chen Y-C, YangW-T, Ho P-C, Hwang A-W, et al. Flatfoot diagnosis by a unique bimodaldistribution of footprint index in children. PLoS ONE 2014; 9(12): e115808. doi: 10.1371/journal.pone.0115808 PMID: 25551228
37. Harrison CR, Robinette KM. CAESAR: Summary statistics for the adult population (ages 18–65) of theUnited States of America. United States Air Force Research Laboratory, Wright-Patterson Air ForceBase; 2002.
38. Allen B, Curless B, Popovič Z. The space of human body shapes: reconstruction and parameterizationfrom range scans. ACM Transactions on Graphics. 2003; 22: 587–594. doi: 10.1145/882262.882311
39. Kim S, Park CK. Basic garment pattern generation using geometric modeling method. Int J Cloth SciTech. 2007; 19: 7–17. doi: 10.1108/09556220710717017
40. Coblentz AM, Herron RE, editors. Applications of human biostereometrics (NATO). Proc SPIE 166;1978.
Human Female Insole Shape
PLOSONE | DOI:10.1371/journal.pone.0133303 August 26, 2015 14 / 14