On the Univariate Representation of BEKK Models with Common Factors
Tb
GDa
b
c
a
ARRA
KTFBSIN
1
fm2aetrbattc(
sf
0d
Journal of Neuroscience Methods 191 (2010) 283–289
Contents lists available at ScienceDirect
Journal of Neuroscience Methods
journa l homepage: www.e lsev ier .com/ locate / jneumeth
he issue of multiple univariate comparisons in the context of neuroelectricrain mapping: An application in a neuromarketing experiment
. Vecchiatoa,b, F. De Vico Fallania,b, L. Astolfib,c, J. Toppib,c, F. Cincottib,
. Mattiab, S. Salinari c, F. Babilonia,b,∗
IRCCS “Fondazione Santa Lucia”, Rome, ItalyDepartment of Physiology and Pharmacology, University “Sapienza”, Rome, ItalyDepartment of Computer Science and Systems, University “Sapienza”, Rome, Italy
r t i c l e i n f o
rticle history:eceived 29 April 2010eceived in revised form 12 June 2010ccepted 9 July 2010
eywords:ype I errorsalse discovery rateonferroni adjustment
a b s t r a c t
This paper presents some considerations about the use of adequate statistical techniques in the frame-work of the neuroelectromagnetic brain mapping. With the use of advanced EEG/MEG recording setupinvolving hundred of sensors, the issue of the protection against the type I errors that could occur duringthe execution of hundred of univariate statistical tests, has gained interest. In the present experiment,we investigated the EEG signals from a mannequin acting as an experimental subject. Data have beencollected while performing a neuromarketing experiment and analyzed with state of the art compu-tational tools adopted in specialized literature. Results showed that electric data from the mannequin’shead presents statistical significant differences in power spectra during the visualization of a commercial
tatistical mappingnverse problemeuromarketing
advertising when compared to the power spectra gathered during a documentary, when no adjustmentswere made on the alpha level of the multiple univariate tests performed. The use of the Bonferroni orBonferroni–Holm adjustments returned correctly no differences between the signals gathered from themannequin in the two experimental conditions. An partial sample of recently published literature ondifferent neuroscience journals suggested that at least the 30% of the papers do not use statistical protec-tion for the type I errors. While the occurrence of type I errors could be easily managed with appropriate
use
statistical techniques, the. Introduction
In these last two decades, the comprehension of some basicacts related to the human sensory and cognitive processes has
ade huge steps forward, by collecting the hemodynamic (Friston,009) and the neuroelectromagnetic correlates of the cerebralctivity and connectivity generated during these processes (Astolfit al., 2007, 2008a,b; Babiloni et al., 2000, 2004). In the case ofhe collection of the cerebral activity involving the use of neu-oelectromagnetic modality, the use of hundred of sensors hasecame quite common in literature, both for the electric as wells for the magnetic modalities (Urbano et al., 1997). This was due
o the advancement of the technical capabilities of the acquisi-ion devices; nowadays an entry-level systems for EEG researchommonly use 64 sensors while in the magnetoencephalographyMEG) study the number of magnetic sensors are usually well above∗ Corresponding author at: Department of Physiology and Pharmacology, Univer-ity of Rome “Sapienza”, P.le A. Moro 5, 00185 Rome, Italy. Tel.: +39 3287697914;ax: +39 0623326835.
E-mail address: [email protected] (F. Babiloni).
165-0270/$ – see front matter © 2010 Elsevier B.V. All rights reserved.oi:10.1016/j.jneumeth.2010.07.009
of such techniques is still not so largely adopted in the literature.© 2010 Elsevier B.V. All rights reserved.
100. Electromagnetic activity gathered from these large number ofsensors could be then analyzed during different behavioral tasksperformed by several subjects, and the issue of the statistical com-parisons of the EEG or MEG activity gathered across such sensors inthese analyzed conditions arose. A statistical comparison of the EEGor MEG values collected in two populations or in a same populationduring two experimental tasks is usually performed for each sen-sor by using univariate tests, such the Student’s t-test or the z-score(Zar, 1984). In the case in which the estimation of the cortical cur-rent density is performed from EEG/MEG data (Grave de Peraltaet al., 1997; Grave de Peralta Menendez and Gonzalez Andino,1998) then the statistical comparisons between the two popula-tions are computed directly into the source space instead of in thesensors space. Such source space is usually composed by severalthousands of equivalent current dipoles. In scientific literature, theusual threshold at which the statistical significance of the compar-isons performed is declared to be significant is commonly taken at
p < 0.05. Results of the statistical analysis in the context of EEG/MEGdata were then usually represented in forms of spatial distributionof the detected statistically significant differences over the sensoror the source space, by using the well known statistical mapping.Strictly speaking, a statistical significance (e.g., p < 0.05) means that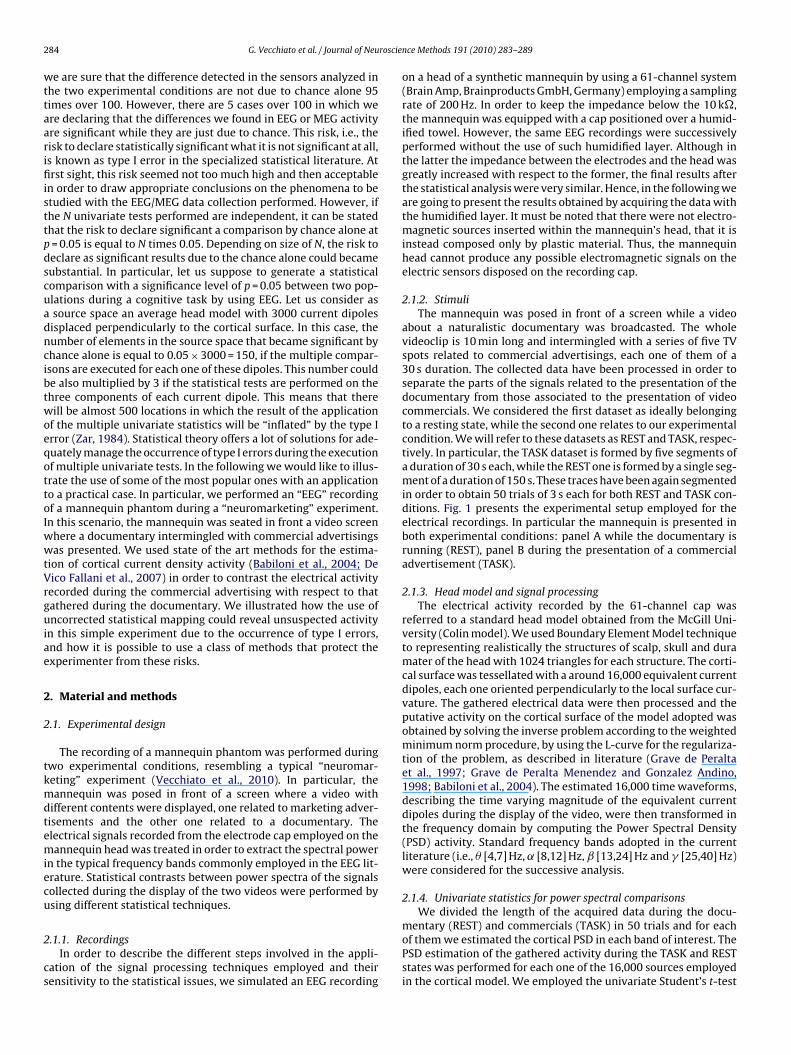
2 roscie
wttaarifiisttpdscuadncibtwoeqottoIwwtVrguiae
2
2
tkmdtemiecu
2
cs
84 G. Vecchiato et al. / Journal of Neu
e are sure that the difference detected in the sensors analyzed inhe two experimental conditions are not due to chance alone 95imes over 100. However, there are 5 cases over 100 in which were declaring that the differences we found in EEG or MEG activityre significant while they are just due to chance. This risk, i.e., theisk to declare statistically significant what it is not significant at all,s known as type I error in the specialized statistical literature. Atrst sight, this risk seemed not too much high and then acceptable
n order to draw appropriate conclusions on the phenomena to betudied with the EEG/MEG data collection performed. However, ifhe N univariate tests performed are independent, it can be statedhat the risk to declare significant a comparison by chance alone at= 0.05 is equal to N times 0.05. Depending on size of N, the risk toeclare as significant results due to the chance alone could becameubstantial. In particular, let us suppose to generate a statisticalomparison with a significance level of p = 0.05 between two pop-lations during a cognitive task by using EEG. Let us consider assource space an average head model with 3000 current dipolesisplaced perpendicularly to the cortical surface. In this case, theumber of elements in the source space that became significant byhance alone is equal to 0.05 × 3000 = 150, if the multiple compar-sons are executed for each one of these dipoles. This number coulde also multiplied by 3 if the statistical tests are performed on thehree components of each current dipole. This means that thereill be almost 500 locations in which the result of the application
f the multiple univariate statistics will be “inflated” by the type Irror (Zar, 1984). Statistical theory offers a lot of solutions for ade-uately manage the occurrence of type I errors during the executionf multiple univariate tests. In the following we would like to illus-rate the use of some of the most popular ones with an applicationo a practical case. In particular, we performed an “EEG” recordingf a mannequin phantom during a “neuromarketing” experiment.n this scenario, the mannequin was seated in front a video screen
here a documentary intermingled with commercial advertisingsas presented. We used state of the art methods for the estima-
ion of cortical current density activity (Babiloni et al., 2004; Deico Fallani et al., 2007) in order to contrast the electrical activityecorded during the commercial advertising with respect to thatathered during the documentary. We illustrated how the use ofncorrected statistical mapping could reveal unsuspected activity
n this simple experiment due to the occurrence of type I errors,nd how it is possible to use a class of methods that protect thexperimenter from these risks.
. Material and methods
.1. Experimental design
The recording of a mannequin phantom was performed duringwo experimental conditions, resembling a typical “neuromar-eting” experiment (Vecchiato et al., 2010). In particular, theannequin was posed in front of a screen where a video with
ifferent contents were displayed, one related to marketing adver-isements and the other one related to a documentary. Thelectrical signals recorded from the electrode cap employed on theannequin head was treated in order to extract the spectral power
n the typical frequency bands commonly employed in the EEG lit-rature. Statistical contrasts between power spectra of the signalsollected during the display of the two videos were performed bysing different statistical techniques.
.1.1. RecordingsIn order to describe the different steps involved in the appli-
ation of the signal processing techniques employed and theirensitivity to the statistical issues, we simulated an EEG recording
nce Methods 191 (2010) 283–289
on a head of a synthetic mannequin by using a 61-channel system(Brain Amp, Brainproducts GmbH, Germany) employing a samplingrate of 200 Hz. In order to keep the impedance below the 10 k�,the mannequin was equipped with a cap positioned over a humid-ified towel. However, the same EEG recordings were successivelyperformed without the use of such humidified layer. Although inthe latter the impedance between the electrodes and the head wasgreatly increased with respect to the former, the final results afterthe statistical analysis were very similar. Hence, in the following weare going to present the results obtained by acquiring the data withthe humidified layer. It must be noted that there were not electro-magnetic sources inserted within the mannequin’s head, that it isinstead composed only by plastic material. Thus, the mannequinhead cannot produce any possible electromagnetic signals on theelectric sensors disposed on the recording cap.
2.1.2. StimuliThe mannequin was posed in front of a screen while a video
about a naturalistic documentary was broadcasted. The wholevideoclip is 10 min long and intermingled with a series of five TVspots related to commercial advertisings, each one of them of a30 s duration. The collected data have been processed in order toseparate the parts of the signals related to the presentation of thedocumentary from those associated to the presentation of videocommercials. We considered the first dataset as ideally belongingto a resting state, while the second one relates to our experimentalcondition. We will refer to these datasets as REST and TASK, respec-tively. In particular, the TASK dataset is formed by five segments ofa duration of 30 s each, while the REST one is formed by a single seg-ment of a duration of 150 s. These traces have been again segmentedin order to obtain 50 trials of 3 s each for both REST and TASK con-ditions. Fig. 1 presents the experimental setup employed for theelectrical recordings. In particular the mannequin is presented inboth experimental conditions: panel A while the documentary isrunning (REST), panel B during the presentation of a commercialadvertisement (TASK).
2.1.3. Head model and signal processingThe electrical activity recorded by the 61-channel cap was
referred to a standard head model obtained from the McGill Uni-versity (Colin model). We used Boundary Element Model techniqueto representing realistically the structures of scalp, skull and duramater of the head with 1024 triangles for each structure. The corti-cal surface was tessellated with a around 16,000 equivalent currentdipoles, each one oriented perpendicularly to the local surface cur-vature. The gathered electrical data were then processed and theputative activity on the cortical surface of the model adopted wasobtained by solving the inverse problem according to the weightedminimum norm procedure, by using the L-curve for the regulariza-tion of the problem, as described in literature (Grave de Peraltaet al., 1997; Grave de Peralta Menendez and Gonzalez Andino,1998; Babiloni et al., 2004). The estimated 16,000 time waveforms,describing the time varying magnitude of the equivalent currentdipoles during the display of the video, were then transformed inthe frequency domain by computing the Power Spectral Density(PSD) activity. Standard frequency bands adopted in the currentliterature (i.e., � [4,7] Hz, ˛ [8,12] Hz, ˇ [13,24] Hz and � [25,40] Hz)were considered for the successive analysis.
2.1.4. Univariate statistics for power spectral comparisonsWe divided the length of the acquired data during the docu-
mentary (REST) and commercials (TASK) in 50 trials and for eachof them we estimated the cortical PSD in each band of interest. ThePSD estimation of the gathered activity during the TASK and RESTstates was performed for each one of the 16,000 sources employedin the cortical model. We employed the univariate Student’s t-test
G. Vecchiato et al. / Journal of Neuroscie
Fwms
(oiai
2m
utobm
2
ecoswi
ig. 1. The experimental setup employed for the electrical recordings. In this picturee may see the mannequin in both experimental conditions. Panel A shows theannequin in front of the screen while the documentary is playing (REST); panel B
hows the mannequin while a commercial advertisement is playing on the screen.
Zar, 1984) in order to compare differences in the power spectrumf the signals recorded during TASK and REST periods, for the activ-ty of each single cortical dipole. Such t-tests were then performedt the 5% of statistical significance, a threshold commonly acceptedn the current scientific literature.
.2. Reducing the occurrence of type I errors in statisticalapping
The statistic theory provides several techniques that could besefully applied in the context of the analysis of the neuroelec-romagnetic statistical mapping in order to avoid the occurrencef the type I errors. Some of these techniques are first describedriefly and then successively applied for the analysis of the gatheredannequin data.
.2.1. Family-wise error rateBy definition, false positives are results of statistical tests that
xceed the statistical threshold of significance employed just by
hance. The family-wise error rate represents the probability ofbserving one or more false positives after carrying out multipleignificance tests. Using a family-wise error rate (FWER) of 0.05ould mean that there is a 5% chance that one or more false pos-tives could occur across the entire set of hypothesis tests. The
nce Methods 191 (2010) 283–289 285
Bonferroni adjustment is probably the most widely known FWERcontrol since it is the adjustment method for the control of theoccurrence of false positives that most investigators are familiarwith. Due to the scope of this paper, although other method-ologies are available for FWER (Brett et al., 2004; Nichols andHayasaka, 2003), in the following sections we limit the discussionof this methodology to the false discovery rate and the Bonfer-roni adjustment, with also its less stringent variant known asBonferroni–Holm procedure. They are also implemented in pop-ular software packages for the estimation of the inverse problem,such as sLORETA (Pascual-Marqui, 2002).
2.2.2. False discovery rateThe FWER methodologies illustrated above are successful in
the removal the type I errors, although this often happens at theexpenses of the statistical power of the test (i.e., there is the needof less variance in the data to detect significant real differences).Another method that it is available in literature to limit the occur-rence of these type I errors, is the technique of false discovery rate(FDR). In this technique it can be decided a superior limit to theoccurrence of the false positives during the execution of multi-ple univariate tests. For instance, using a false discovery rate of0.05 would mean that at most 5% of the detected results are falsepositives (Benjamini and Hochberg, 1995; Benjamini and Yekutieli,2001). The control on the number of false positives performed withthis FDR approach could be not optimal, especially with respectto the control performed by the FWER techniques. However, FDRhas been considered to provide a more ideal balance between sta-tistical power and multiple comparisons control when comparedto FWER techniques because of its less conservative approach, atleast in studies of brain activity that used the hemodynamic signals(Genovese et al., 2002).
2.2.3. Bonferroni adjustmentThe Bonferroni adjustment (Bonferroni, 1936) starts from the
consideration that if we perform N univariate tests, each one ofthem with an unknown significant probability ˇ, the probability pthat at least one of the test is significant is given by:
p < Nˇ (1)
due to the Boole’s inequality (Zar, 1984). In other words this meansthat if N = 20 tests are performed with the usual probability ˇ = 0.05,at least one of them became significant statistically by chance alone.
However, the Bonferroni adjustment required that the proba-bility p for which this event could occur (i.e., one result will bestatistically significant by chance alone) could equal to ˛, with atypical value of 0.05. By using the Eq. (1), the single test will be per-formed at a probability ˇ = ˛/N. In the case of N = 20 and ˛ = 0.05 wehave ˇ* = 0.05/20 = 0.0025. This ˇ* is the actual probability at whichthe statistical tests are performed in order to conclude that all ofthe tests are performed at a 0.05 level of statistical significance,Bonferroni adjusted for multiple comparisons.
The Bonferroni adjustment is quite flexible since it does notrequire the hypothesis of independence of the data to be applied.However, there is some consensus that Bonferroni adjustment maybe too conservative both for EEG and MEG data as well as for theanalysis of hemodynamic data (Logan et al., 2008). In fact, the val-ues obtained at each sensor, as well as in the source space, oftenare not really statistically independent one to each other (Nunez,1981; Grave de Peralta Menendez and Gonzalez Andino, 1998).For instance, in the neuroelectromagnetic modality it has been
demonstrated that the lead field matrix (i.e., the matrix describ-ing all the potential distributions occurring at the scalp level forthe unitary current dipoles employed in the source space) is rank-deficient, meaning that the activity propagated by nearby dipoles atthe cerebral level is equivalent on the scalp sensors. This last effect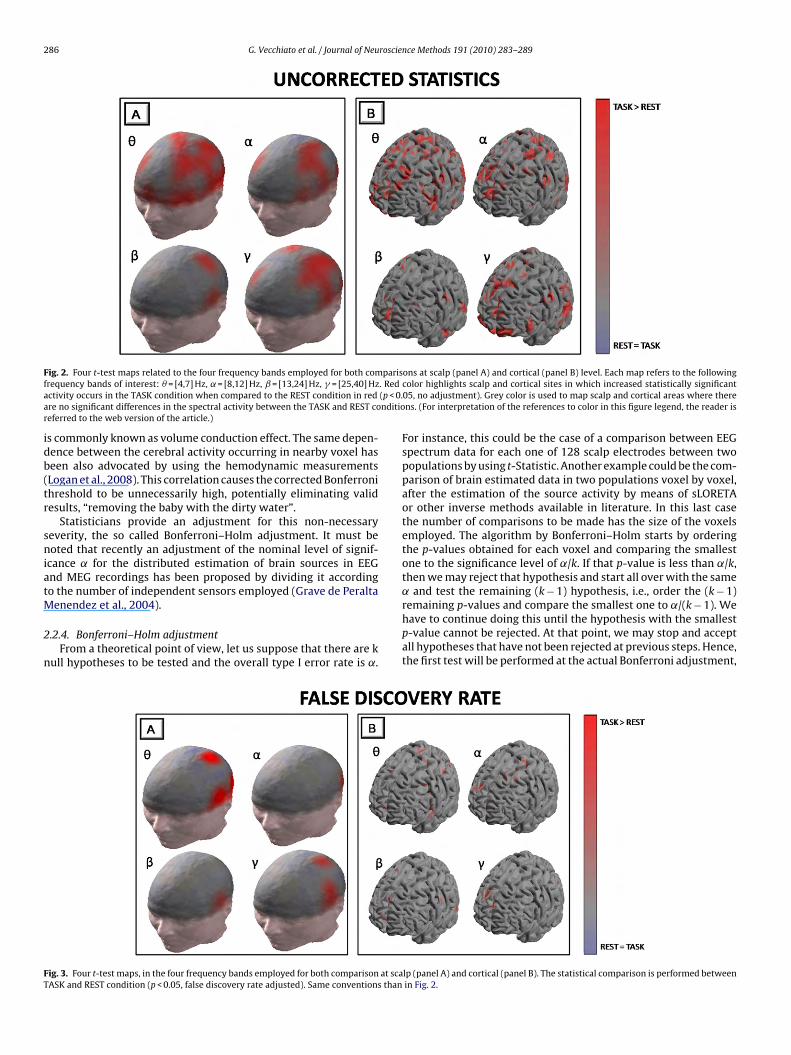
286 G. Vecchiato et al. / Journal of Neuroscience Methods 191 (2010) 283–289
F parisf . Reda (p < 0.a nditior
idb(tr
sniatM
2
n
FT
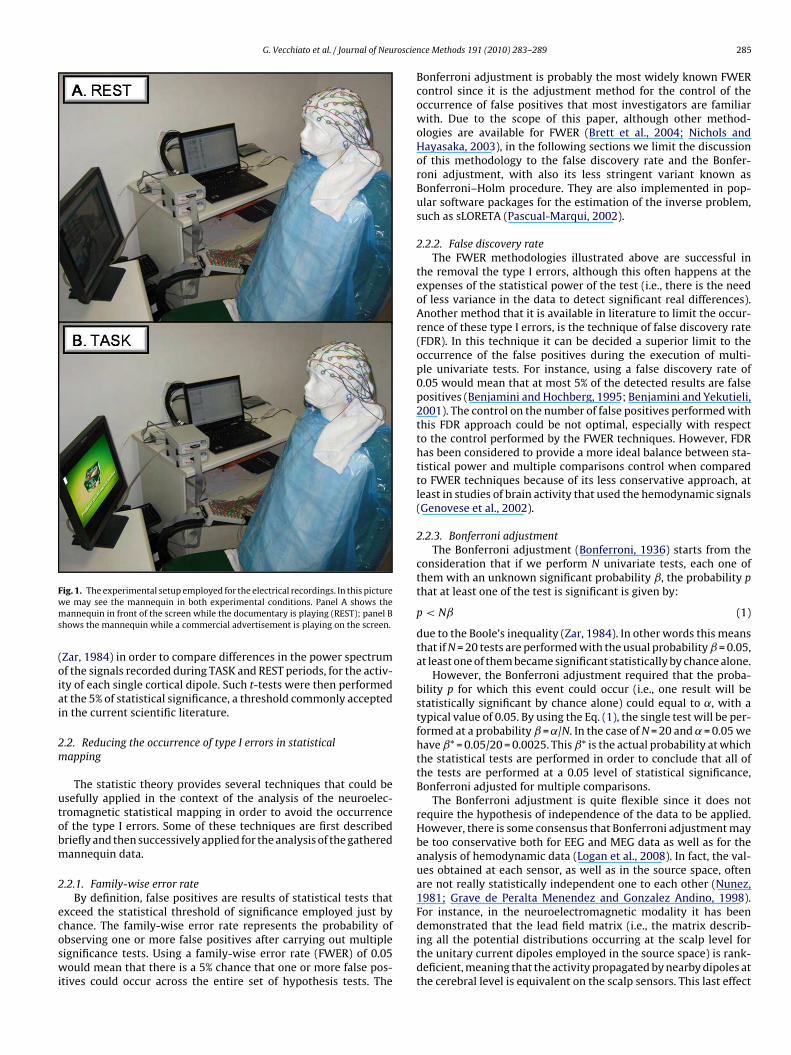
ig. 2. Four t-test maps related to the four frequency bands employed for both comrequency bands of interest: � = [4,7] Hz, ˛ = [8,12] Hz, ˇ = [13,24] Hz, � = [25,40] Hzctivity occurs in the TASK condition when compared to the REST condition in redre no significant differences in the spectral activity between the TASK and REST coeferred to the web version of the article.)
s commonly known as volume conduction effect. The same depen-ence between the cerebral activity occurring in nearby voxel haseen also advocated by using the hemodynamic measurementsLogan et al., 2008). This correlation causes the corrected Bonferronihreshold to be unnecessarily high, potentially eliminating validesults, “removing the baby with the dirty water”.
Statisticians provide an adjustment for this non-necessaryeverity, the so called Bonferroni–Holm adjustment. It must beoted that recently an adjustment of the nominal level of signif-
cance ˛ for the distributed estimation of brain sources in EEGnd MEG recordings has been proposed by dividing it accordingo the number of independent sensors employed (Grave de Peralta
enendez et al., 2004).
.2.4. Bonferroni–Holm adjustmentFrom a theoretical point of view, let us suppose that there are k
ull hypotheses to be tested and the overall type I error rate is ˛.
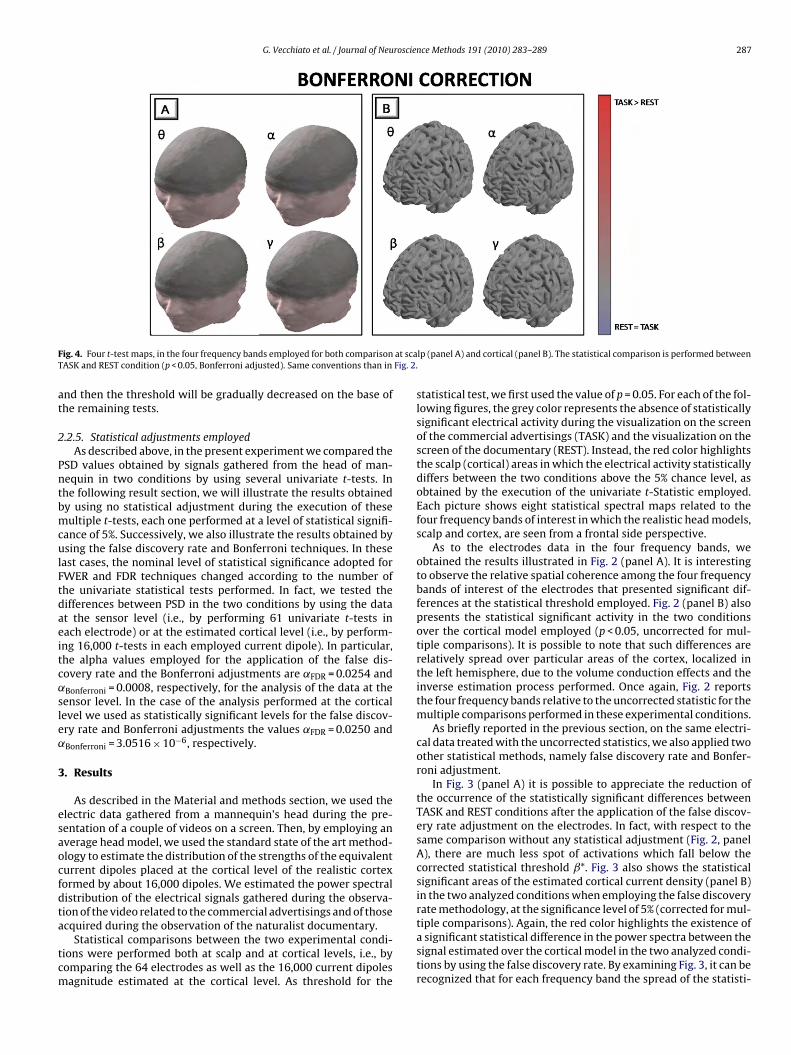
ig. 3. Four t-test maps, in the four frequency bands employed for both comparison at scaASK and REST condition (p < 0.05, false discovery rate adjusted). Same conventions than
ons at scalp (panel A) and cortical (panel B) level. Each map refers to the followingcolor highlights scalp and cortical sites in which increased statistically significant05, no adjustment). Grey color is used to map scalp and cortical areas where therens. (For interpretation of the references to color in this figure legend, the reader is
For instance, this could be the case of a comparison between EEGspectrum data for each one of 128 scalp electrodes between twopopulations by using t-Statistic. Another example could be the com-parison of brain estimated data in two populations voxel by voxel,after the estimation of the source activity by means of sLORETAor other inverse methods available in literature. In this last casethe number of comparisons to be made has the size of the voxelsemployed. The algorithm by Bonferroni–Holm starts by orderingthe p-values obtained for each voxel and comparing the smallestone to the significance level of ˛/k. If that p-value is less than ˛/k,then we may reject that hypothesis and start all over with the same˛ and test the remaining (k − 1) hypothesis, i.e., order the (k − 1)
remaining p-values and compare the smallest one to ˛/(k − 1). Wehave to continue doing this until the hypothesis with the smallestp-value cannot be rejected. At that point, we may stop and acceptall hypotheses that have not been rejected at previous steps. Hence,the first test will be performed at the actual Bonferroni adjustment,lp (panel A) and cortical (panel B). The statistical comparison is performed betweenin Fig. 2.
G. Vecchiato et al. / Journal of Neuroscience Methods 191 (2010) 283–289 287
F at scaT Fig. 2.
at
2
PntbmculFtdaeitc˛sle˛
3
esaocfdta
tcm
ig. 4. Four t-test maps, in the four frequency bands employed for both comparisonASK and REST condition (p < 0.05, Bonferroni adjusted). Same conventions than in
nd then the threshold will be gradually decreased on the base ofhe remaining tests.
.2.5. Statistical adjustments employedAs described above, in the present experiment we compared the
SD values obtained by signals gathered from the head of man-equin in two conditions by using several univariate t-tests. Inhe following result section, we will illustrate the results obtainedy using no statistical adjustment during the execution of theseultiple t-tests, each one performed at a level of statistical signifi-
ance of 5%. Successively, we also illustrate the results obtained bysing the false discovery rate and Bonferroni techniques. In these
ast cases, the nominal level of statistical significance adopted forWER and FDR techniques changed according to the number ofhe univariate statistical tests performed. In fact, we tested theifferences between PSD in the two conditions by using the datat the sensor level (i.e., by performing 61 univariate t-tests inach electrode) or at the estimated cortical level (i.e., by perform-ng 16,000 t-tests in each employed current dipole). In particular,he alpha values employed for the application of the false dis-overy rate and the Bonferroni adjustments are ˛FDR = 0.0254 andBonferroni = 0.0008, respectively, for the analysis of the data at theensor level. In the case of the analysis performed at the corticalevel we used as statistically significant levels for the false discov-ry rate and Bonferroni adjustments the values ˛FDR = 0.0250 andBonferroni = 3.0516 × 10⁻⁶, respectively.
. Results
As described in the Material and methods section, we used thelectric data gathered from a mannequin’s head during the pre-entation of a couple of videos on a screen. Then, by employing anverage head model, we used the standard state of the art method-logy to estimate the distribution of the strengths of the equivalenturrent dipoles placed at the cortical level of the realistic cortexormed by about 16,000 dipoles. We estimated the power spectralistribution of the electrical signals gathered during the observa-ion of the video related to the commercial advertisings and of those
cquired during the observation of the naturalist documentary.Statistical comparisons between the two experimental condi-ions were performed both at scalp and at cortical levels, i.e., byomparing the 64 electrodes as well as the 16,000 current dipolesagnitude estimated at the cortical level. As threshold for the
lp (panel A) and cortical (panel B). The statistical comparison is performed between
statistical test, we first used the value of p = 0.05. For each of the fol-lowing figures, the grey color represents the absence of statisticallysignificant electrical activity during the visualization on the screenof the commercial advertisings (TASK) and the visualization on thescreen of the documentary (REST). Instead, the red color highlightsthe scalp (cortical) areas in which the electrical activity statisticallydiffers between the two conditions above the 5% chance level, asobtained by the execution of the univariate t-Statistic employed.Each picture shows eight statistical spectral maps related to thefour frequency bands of interest in which the realistic head models,scalp and cortex, are seen from a frontal side perspective.
As to the electrodes data in the four frequency bands, weobtained the results illustrated in Fig. 2 (panel A). It is interestingto observe the relative spatial coherence among the four frequencybands of interest of the electrodes that presented significant dif-ferences at the statistical threshold employed. Fig. 2 (panel B) alsopresents the statistical significant activity in the two conditionsover the cortical model employed (p < 0.05, uncorrected for mul-tiple comparisons). It is possible to note that such differences arerelatively spread over particular areas of the cortex, localized inthe left hemisphere, due to the volume conduction effects and theinverse estimation process performed. Once again, Fig. 2 reportsthe four frequency bands relative to the uncorrected statistic for themultiple comparisons performed in these experimental conditions.
As briefly reported in the previous section, on the same electri-cal data treated with the uncorrected statistics, we also applied twoother statistical methods, namely false discovery rate and Bonfer-roni adjustment.
In Fig. 3 (panel A) it is possible to appreciate the reduction ofthe occurrence of the statistically significant differences betweenTASK and REST conditions after the application of the false discov-ery rate adjustment on the electrodes. In fact, with respect to thesame comparison without any statistical adjustment (Fig. 2, panelA), there are much less spot of activations which fall below thecorrected statistical threshold ˇ*. Fig. 3 also shows the statisticalsignificant areas of the estimated cortical current density (panel B)in the two analyzed conditions when employing the false discoveryrate methodology, at the significance level of 5% (corrected for mul-
tiple comparisons). Again, the red color highlights the existence ofa significant statistical difference in the power spectra between thesignal estimated over the cortical model in the two analyzed condi-tions by using the false discovery rate. By examining Fig. 3, it can berecognized that for each frequency band the spread of the statisti-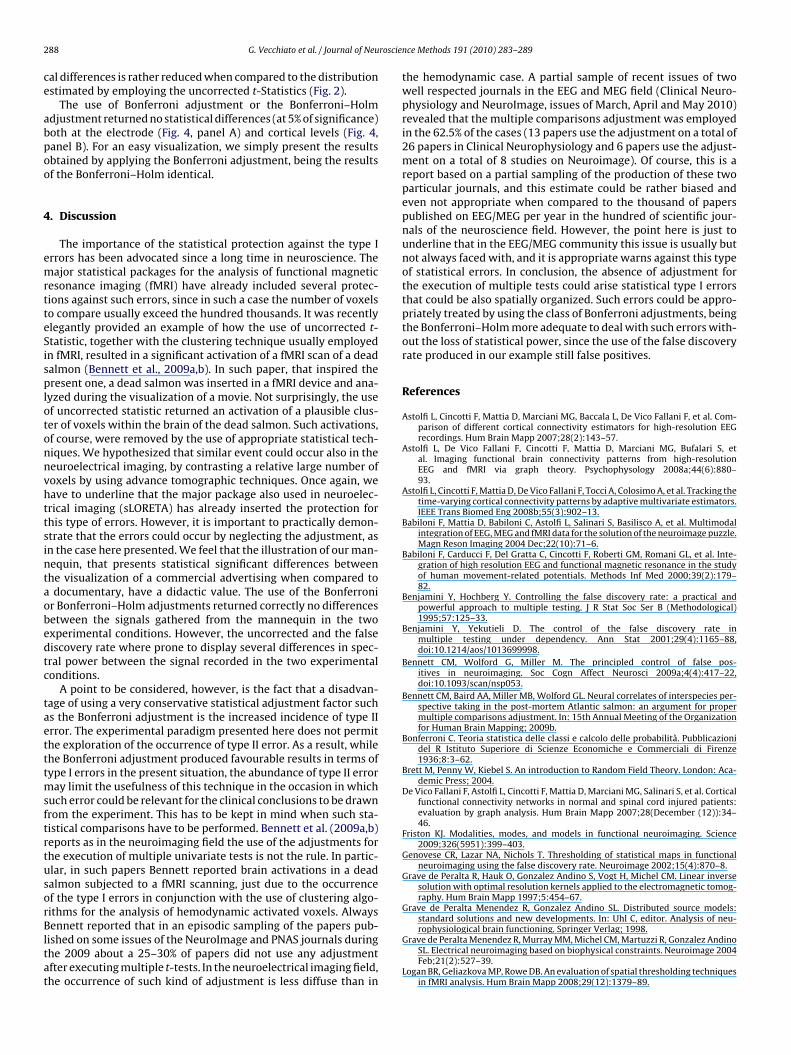
2 roscie
ce
abpoo
4
emrtteSisplotonnvhttsintaobedtc
taetttmsftrtusorBltat
88 G. Vecchiato et al. / Journal of Neu
al differences is rather reduced when compared to the distributionstimated by employing the uncorrected t-Statistics (Fig. 2).
The use of Bonferroni adjustment or the Bonferroni–Holmdjustment returned no statistical differences (at 5% of significance)oth at the electrode (Fig. 4, panel A) and cortical levels (Fig. 4,anel B). For an easy visualization, we simply present the resultsbtained by applying the Bonferroni adjustment, being the resultsf the Bonferroni–Holm identical.
. Discussion
The importance of the statistical protection against the type Irrors has been advocated since a long time in neuroscience. Theajor statistical packages for the analysis of functional magnetic
esonance imaging (fMRI) have already included several protec-ions against such errors, since in such a case the number of voxelso compare usually exceed the hundred thousands. It was recentlylegantly provided an example of how the use of uncorrected t-tatistic, together with the clustering technique usually employedn fMRI, resulted in a significant activation of a fMRI scan of a deadalmon (Bennett et al., 2009a,b). In such paper, that inspired theresent one, a dead salmon was inserted in a fMRI device and ana-
yzed during the visualization of a movie. Not surprisingly, the usef uncorrected statistic returned an activation of a plausible clus-er of voxels within the brain of the dead salmon. Such activations,f course, were removed by the use of appropriate statistical tech-iques. We hypothesized that similar event could occur also in theeuroelectrical imaging, by contrasting a relative large number ofoxels by using advance tomographic techniques. Once again, weave to underline that the major package also used in neuroelec-rical imaging (sLORETA) has already inserted the protection forhis type of errors. However, it is important to practically demon-trate that the errors could occur by neglecting the adjustment, asn the case here presented. We feel that the illustration of our man-equin, that presents statistical significant differences betweenhe visualization of a commercial advertising when compared todocumentary, have a didactic value. The use of the Bonferroni
r Bonferroni–Holm adjustments returned correctly no differencesetween the signals gathered from the mannequin in the twoxperimental conditions. However, the uncorrected and the falseiscovery rate where prone to display several differences in spec-ral power between the signal recorded in the two experimentalonditions.
A point to be considered, however, is the fact that a disadvan-age of using a very conservative statistical adjustment factor suchs the Bonferroni adjustment is the increased incidence of type IIrror. The experimental paradigm presented here does not permithe exploration of the occurrence of type II error. As a result, whilehe Bonferroni adjustment produced favourable results in terms ofype I errors in the present situation, the abundance of type II error
ay limit the usefulness of this technique in the occasion in whichuch error could be relevant for the clinical conclusions to be drawnrom the experiment. This has to be kept in mind when such sta-istical comparisons have to be performed. Bennett et al. (2009a,b)eports as in the neuroimaging field the use of the adjustments forhe execution of multiple univariate tests is not the rule. In partic-lar, in such papers Bennett reported brain activations in a deadalmon subjected to a fMRI scanning, just due to the occurrencef the type I errors in conjunction with the use of clustering algo-ithms for the analysis of hemodynamic activated voxels. Always
ennett reported that in an episodic sampling of the papers pub-ished on some issues of the NeuroImage and PNAS journals duringhe 2009 about a 25–30% of papers did not use any adjustmentfter executing multiple t-tests. In the neuroelectrical imaging field,he occurrence of such kind of adjustment is less diffuse than in
nce Methods 191 (2010) 283–289
the hemodynamic case. A partial sample of recent issues of twowell respected journals in the EEG and MEG field (Clinical Neuro-physiology and NeuroImage, issues of March, April and May 2010)revealed that the multiple comparisons adjustment was employedin the 62.5% of the cases (13 papers use the adjustment on a total of26 papers in Clinical Neurophysiology and 6 papers use the adjust-ment on a total of 8 studies on Neuroimage). Of course, this is areport based on a partial sampling of the production of these twoparticular journals, and this estimate could be rather biased andeven not appropriate when compared to the thousand of paperspublished on EEG/MEG per year in the hundred of scientific jour-nals of the neuroscience field. However, the point here is just tounderline that in the EEG/MEG community this issue is usually butnot always faced with, and it is appropriate warns against this typeof statistical errors. In conclusion, the absence of adjustment forthe execution of multiple tests could arise statistical type I errorsthat could be also spatially organized. Such errors could be appro-priately treated by using the class of Bonferroni adjustments, beingthe Bonferroni–Holm more adequate to deal with such errors with-out the loss of statistical power, since the use of the false discoveryrate produced in our example still false positives.
References
Astolfi L, Cincotti F, Mattia D, Marciani MG, Baccala L, De Vico Fallani F, et al. Com-parison of different cortical connectivity estimators for high-resolution EEGrecordings. Hum Brain Mapp 2007;28(2):143–57.
Astolfi L, De Vico Fallani F, Cincotti F, Mattia D, Marciani MG, Bufalari S, etal. Imaging functional brain connectivity patterns from high-resolutionEEG and fMRI via graph theory. Psychophysology 2008a;44(6):880–93.
Astolfi L, Cincotti F, Mattia D, De Vico Fallani F, Tocci A, Colosimo A, et al. Tracking thetime-varying cortical connectivity patterns by adaptive multivariate estimators.IEEE Trans Biomed Eng 2008b;55(3):902–13.
Babiloni F, Mattia D, Babiloni C, Astolfi L, Salinari S, Basilisco A, et al. Multimodalintegration of EEG, MEG and fMRI data for the solution of the neuroimage puzzle.Magn Reson Imaging 2004 Dec;22(10):71–6.
Babiloni F, Carducci F, Del Gratta C, Cincotti F, Roberti GM, Romani GL, et al. Inte-gration of high resolution EEG and functional magnetic resonance in the studyof human movement-related potentials. Methods Inf Med 2000;39(2):179–82.
Benjamini Y, Hochberg Y. Controlling the false discovery rate: a practical andpowerful approach to multiple testing. J R Stat Soc Ser B (Methodological)1995;57:125–33.
Benjamini Y, Yekutieli D. The control of the false discovery rate inmultiple testing under dependency. Ann Stat 2001;29(4):1165–88,doi:10.1214/aos/1013699998.
Bennett CM, Wolford G, Miller M. The principled control of false pos-itives in neuroimaging. Soc Cogn Affect Neurosci 2009a;4(4):417–22,doi:10.1093/scan/nsp053.
Bennett CM, Baird AA, Miller MB, Wolford GL. Neural correlates of interspecies per-spective taking in the post-mortem Atlantic salmon: an argument for propermultiple comparisons adjustment. In: 15th Annual Meeting of the Organizationfor Human Brain Mapping; 2009b.
Bonferroni C. Teoria statistica delle classi e calcolo delle probabilità. Pubblicazionidel R Istituto Superiore di Scienze Economiche e Commerciali di Firenze1936;8:3–62.
Brett M, Penny W, Kiebel S. An introduction to Random Field Theory. London: Aca-demic Press; 2004.
De Vico Fallani F, Astolfi L, Cincotti F, Mattia D, Marciani MG, Salinari S, et al. Corticalfunctional connectivity networks in normal and spinal cord injured patients:evaluation by graph analysis. Hum Brain Mapp 2007;28(December (12)):34–46.
Friston KJ. Modalities, modes, and models in functional neuroimaging. Science2009;326(5951):399–403.
Genovese CR, Lazar NA, Nichols T. Thresholding of statistical maps in functionalneuroimaging using the false discovery rate. Neuroimage 2002;15(4):870–8.
Grave de Peralta R, Hauk O, Gonzalez Andino S, Vogt H, Michel CM. Linear inversesolution with optimal resolution kernels applied to the electromagnetic tomog-raphy. Hum Brain Mapp 1997;5:454–67.
Grave de Peralta Menendez R, Gonzalez Andino SL. Distributed source models:standard solutions and new developments. In: Uhl C, editor. Analysis of neu-
rophysiological brain functioning. Springer Verlag; 1998.Grave de Peralta Menendez R, Murray MM, Michel CM, Martuzzi R, Gonzalez AndinoSL. Electrical neuroimaging based on biophysical constraints. Neuroimage 2004Feb;21(2):527–39.
Logan BR, Geliazkova MP, Rowe DB. An evaluation of spatial thresholding techniquesin fMRI analysis. Hum Brain Mapp 2008;29(12):1379–89.

roscie
N
NP
G. Vecchiato et al. / Journal of Neu
ichols T, Hayasaka S. Controlling the familywise error rate in functional neu-
roimaging: a comparative review. Stat Methods Med Res 2003;12(5):419–46.unez P. Electric fields of the brain. New York: Oxford University Press; 1981.ascual-Marqui RD. Standardized low-resolution brain electromagnetic tomog-
raphy (sLORETA): technical details. Methods Find Exp Clin Pharmacol2002;24(Suppl. D):5–12.
nce Methods 191 (2010) 283–289 289
Urbano A, Babiloni F, Babiloni C, Ambrosini A, Onorati P, Rossini PM. Human short-
latency cortical responses to somatosensory stimulation. A high resolutionstudy. NeuroReport 1997;8(15):3239–43.Vecchiato G, Astolfi L, De Vico Fallani F, Cincotti F, Mattia D, Salinari S, et al. Changesin brain activity during the observation of TV commercials by using EEG, GSRand HR Measurements. Brain Topogr 2010;23(2):165–79.
Zar J. Biostatistical analysis. NewYork: Prentice Hall; 1984.
Copyright © 2022 FDOKUMEN