The Iranian version of 12-item Short Form Health Survey (SF-12): factor structure, internal...
10
BioMed Central Page 1 of 10 (page number not for citation purposes) BMC Public Health Open Access Research article The Iranian version of 12-item Short Form Health Survey (SF-12): factor structure, internal consistency and construct validity Ali Montazeri* 1 , Mariam Vahdaninia 2 , Sayed Javad Mousavi 3 and Speideh Omidvari 1 Address: 1 Department of Mental Health, Iranian Institute for Health Sciences Research, ACECR, Tehran, Iran, 2 Department of Social Medicine, Iranian Institute for Health Sciences Research, ACECR, Tehran, Iran and 3 Department of Physical Therapy, Faculty of Rehabilitation Sciences, Tehran University of Medical Sciences, Tehran, Iran Email: Ali Montazeri* - [email protected]; Mariam Vahdaninia - [email protected]; Sayed Javad Mousavi - [email protected]; Speideh Omidvari - [email protected] * Corresponding author Abstract Background: The 12-item Short Form Health Survey (SF-12) as a shorter alternative of the SF-36 is largely used in health outcomes surveys. The aim of this study was to validate the SF-12 in Iran. Methods: A random sample of the general population aged 15 years and over living in Tehran, Iran completed the SF-12. Reliability was estimated using internal consistency and validity was assessed using known groups comparison and convergent validity. In addition, the factor structure of the questionnaire was extracted by performing both exploratory factor analysis (EFA) and confirmatory factor analysis (CFA). Results: In all, 5587 individuals were studied (2721 male and 2866 female). The mean age and formal education of the respondents were 35.1 (SD = 15.4) and 10.2 (SD = 4.4) years respectively. The results showed satisfactory internal consistency for both summary measures, that are the Physical Component Summary (PCS) and the Mental Component Summary (MCS); Cronbach's α for PCS- 12 and MCS-12 was 0.73 and 0.72, respectively. Known-groups comparison showed that the SF-12 discriminated well between men and women and those who differed in age and educational status (P < 0.001). In addition, correlations between the SF-12 scales and single items showed that the physical functioning, role physical, bodily pain and general health subscales correlated higher with the PCS-12 score, while the vitality, social functioning, role emotional and mental health subscales more correlated with the MCS-12 score lending support to its good convergent validity. Finally the principal component analysis indicated a two-factor structure (physical and mental health) that jointly accounted for 57.8% of the variance. The confirmatory factory analysis also indicated a good fit to the data for the two-latent structure (physical and mental health). Conclusion: In general the findings suggest that the SF-12 is a reliable and valid measure of health related quality of life among Iranian population. However, further studies are needed to establish stronger psychometric properties for this alternative form of the SF-36 Health Survey in Iran. Published: 16 September 2009 BMC Public Health 2009, 9:341 doi:10.1186/1471-2458-9-341 Received: 11 May 2009 Accepted: 16 September 2009 This article is available from: http://www.biomedcentral.com/1471-2458/9/341 © 2009 Montazeri et al; licensee BioMed Central Ltd. This is an Open Access article distributed under the terms of the Creative Commons Attribution License (http://creativecommons.org/licenses/by/2.0 ), which permits unrestricted use, distribution, and reproduction in any medium, provided the original work is properly cited.
-
Upload
independent -
Category
Documents
-
view
1 -
download
0
Transcript of The Iranian version of 12-item Short Form Health Survey (SF-12): factor structure, internal...
BioMed CentralBMC Public Health
ss
Open AcceResearch articleThe Iranian version of 12-item Short Form Health Survey (SF-12): factor structure, internal consistency and construct validityAli Montazeri*1, Mariam Vahdaninia2, Sayed Javad Mousavi3 and Speideh Omidvari1Address: 1Department of Mental Health, Iranian Institute for Health Sciences Research, ACECR, Tehran, Iran, 2Department of Social Medicine, Iranian Institute for Health Sciences Research, ACECR, Tehran, Iran and 3Department of Physical Therapy, Faculty of Rehabilitation Sciences, Tehran University of Medical Sciences, Tehran, Iran
Email: Ali Montazeri* - [email protected]; Mariam Vahdaninia - [email protected]; Sayed Javad Mousavi - [email protected]; Speideh Omidvari - [email protected]
* Corresponding author
AbstractBackground: The 12-item Short Form Health Survey (SF-12) as a shorter alternative of the SF-36is largely used in health outcomes surveys. The aim of this study was to validate the SF-12 in Iran.
Methods: A random sample of the general population aged 15 years and over living in Tehran, Irancompleted the SF-12. Reliability was estimated using internal consistency and validity was assessedusing known groups comparison and convergent validity. In addition, the factor structure of thequestionnaire was extracted by performing both exploratory factor analysis (EFA) andconfirmatory factor analysis (CFA).
Results:
In all, 5587 individuals were studied (2721 male and 2866 female). The mean age and formaleducation of the respondents were 35.1 (SD = 15.4) and 10.2 (SD = 4.4) years respectively. Theresults showed satisfactory internal consistency for both summary measures, that are the PhysicalComponent Summary (PCS) and the Mental Component Summary (MCS); Cronbach's α for PCS-12 and MCS-12 was 0.73 and 0.72, respectively. Known-groups comparison showed that the SF-12discriminated well between men and women and those who differed in age and educational status(P < 0.001). In addition, correlations between the SF-12 scales and single items showed that thephysical functioning, role physical, bodily pain and general health subscales correlated higher withthe PCS-12 score, while the vitality, social functioning, role emotional and mental health subscalesmore correlated with the MCS-12 score lending support to its good convergent validity. Finally theprincipal component analysis indicated a two-factor structure (physical and mental health) thatjointly accounted for 57.8% of the variance. The confirmatory factory analysis also indicated a goodfit to the data for the two-latent structure (physical and mental health).
Conclusion: In general the findings suggest that the SF-12 is a reliable and valid measure of healthrelated quality of life among Iranian population. However, further studies are needed to establishstronger psychometric properties for this alternative form of the SF-36 Health Survey in Iran.
Published: 16 September 2009
BMC Public Health 2009, 9:341 doi:10.1186/1471-2458-9-341
Received: 11 May 2009Accepted: 16 September 2009
This article is available from: http://www.biomedcentral.com/1471-2458/9/341
© 2009 Montazeri et al; licensee BioMed Central Ltd. This is an Open Access article distributed under the terms of the Creative Commons Attribution License (http://creativecommons.org/licenses/by/2.0), which permits unrestricted use, distribution, and reproduction in any medium, provided the original work is properly cited.
Page 1 of 10(page number not for citation purposes)
BMC Public Health 2009, 9:341 http://www.biomedcentral.com/1471-2458/9/341
BackgroundThe Short Form Health Survey SF-36 is a well-knowngeneric health-related quality of life measure that haswidely been used worldwide [1-6]. The SF-36 was first pre-sented in a 'developmental' form in 1988 and in 'stand-ard' form in 1990. The standard form reflectedimprovements in item wording, format and scoring [7].The SF-36 includes multi-item scales measuring eighthealth concepts: physical functioning (PF), role limita-tions due to physical health (RP), bodily pain, generalhealth perception (GH), social functioning (SF), role lim-itations due to emotional problems (RE), vitality (VT),and mental health (MH). These eight scales are hypothe-sized to form two distinct clusters related to physical andmental health known as Physical Component Summary(PCS) and Mental Component Summary (MCS). As Gan-dek et al. explained development of two summary meas-ures from the SF-36 suggested that it might be possible todevelop a shorter questionnaire that would produce theSF-36 physical and mental health summary with feweritems [8]. Thus the SF-12 Health Survey was developed asa shorter practical form of the questionnaire to permit itsapplication in large health studies with focus on overallphysical and mental health outcomes. Cross-cultural vali-dation studies have shown that there were substantial cor-relation between the summary measures of the SF-36 andthe SF-12 Health Survey [8,9].
Studies using the 12-item Short Form Health Survey (SF-12) have verified the questionnaire as a valid and reliablemeasure for evaluating overall community health status[10,11] as well as minority ethnic groups [12,13]. Theinstrument also showed that would properly distinguish avariety of health status among elderly people [14,15].Similarly well-documented research works have shownthat the SF-12 summary scores are acceptable measures ofhealth-related quality of life in patients with differentdiagnosis such as mental health disorders [16], low backpain [17], retinal diseases [18], osteoarthritis [19] andobesity [20]. However, studies have found that althoughthe instrument showed acceptable validity and reliability,its factor structure in some countries with different cul-tures might not follow the intended structure of theinstrument [15,21].
As a recent publication noted since the ability to accu-rately and efficiently measure physical and mental healthis of great importance in academic and clinical settingsand the SF-12 takes less than two minutes to administerand provide such information; the questionnaire isquickly becoming one of the most popular instrumentsnot only in its original country but also among investiga-tors from other nations [22]. The SF-12 is available inmany languages such as Spanish, French, German, Swed-ish, Japanese [9], Italian, Russian, Greek and Chinese [23-26]. However, since the Iranian version of the SF-12 was
not available, this study aimed to provide evidence for thepsychometric properties of the Iranian version of SF-12among a general Iranian population. It was hoped thismight contribute to the exiting literature and help bothresearchers and health professionals to have an opportu-nity to use the questionnaire in their potential researchand practice in the future.
MethodsThe questionnaire and scoringPermission was asked from the QualityMetric Inc. todevelop the Iranian version of SF-12 (License agreement#F1-072706-27488). Since previously we have developedthe Iranian version of the SF-36 [27], the SF-12 wasextracted from the SF-36 and used in this study. The 12-item Short Form Health Survey (SF-12) is a shorter alter-native of the SF-36 instrument that includes 12 questionsand 8 scales: physical functioning (PF-2 items on limita-tions doing moderate activities and climbing severalflights of stairs), role limitations due to physical problems(RP-2 items on less accomplishment than one would liketo achieve and limitation in kind of work or other activi-ties), bodily pain (BP-1 item on pain interference withone's normal work), general health (GH-1 item on gen-eral health perception), vitality (VT-1 item on havingenergy), social functioning (SF-1 item on interference ofphysical health or emotional problems with one's socialactivities), role limitations due to emotional problems(RE-2 items on less accomplishment than one would liketo achieve and not being careful in doing activities asusual) and perceived mental health (MH-2 items on feel-ing calm or peaceful and feeling sad or blue). Responsecategories for items vary from 2- to 6-point scales and rawscores for items are ranging from 1 to 6. After recoding rawscores for some items (that are BP, GH, VT, and one itemfrom MH); then the raw scores could be transformed inorder to provide eight scale scores each ranging from 0(the worst) to 100 (the best). This method of scoring(summated ratings) assumes that item or items belongingto each scale can be transformed or summed withoutstandardization of scores or item weighting [6,9,28]. Weused this method to calculate scale scores. However to cal-culate the PCS-12 and the MCS-12 scores we used theQualityMetric Health Outcomes Scoring Software 2. Thesoftware uses all the 12 items to produce scores for thePCS-12 and the MCS-12 and applies a norm-based scor-ing algorithm empirically derived from the data of a USgeneral population survey [29]. It has been recommendedthat the US-derived summary scores, that assume a meanof 50 and a standard deviation (SD) of 10, be used inorder to facilitate cross-cultural comparison of results[8,25].
Data collectionA cross-sectional population-based study was conductedin Tehran, Iran in 2007. The ethics committee of the Ira-
Page 2 of 10(page number not for citation purposes)

BMC Public Health 2009, 9:341 http://www.biomedcentral.com/1471-2458/9/341
nian Center for Education, Culture and Research (ACECR)approved the study. The Iranian version of SF-12 ques-tionnaire was administered to a random sample of indi-viduals aged 15 years and over. To select a representativesample of the general population a stratified multi-stagearea sampling procedure was applied. Every householdwithin 22 municipal districts in Tehran had the sameprobability to be sampled. A team of trained interviewerscollected data and all participants were interviewed intheir home. The interviews were carried out with individ-uals' informed consent.
Statistical analysisIn addition to descriptive statistics (including floor andceiling effects), according to International Quality of LifeAssessment (IQOLA) Project to assess the psychometricproperties of the Iranian version of SF-12 several testswere performed. To test reliability, the internal consist-ency for summary measures was estimated using Cron-bachs' alpha coefficient and alpha equal to or greater than0.70 was considered satisfactory [30]. Validity wasassessed using known groups comparison to test how wellthe questionnaire discriminates between subgroups of thestudy sample that differed in gender, age, and educationalstatus. It was expected that women, old people, and thosewith lower educational levels would have lower scoresthan men, young people and better educated respondentsin all measures. Test for trends was used for comparisons.Furthermore convergent validity was assessed performingitem-scale correlations corrected for overlaps. Correla-tions were calculated using Spearman's correlation coeffi-cient (rho). It was expected that item scores wouldcorrelate higher with own hypothesized scale than otherscales and PF, RP, BP and GH scores would correlatehigher with the PCS-12 whereas the VT, SF, RE and MHscores would correlate higher with the MCS-12. Correla-tion values of 0.40 or above were considered satisfactory(r ≥ 0.81-1.0 as excellent, 0.61-0.80 very good, 0.41-0.60good, 0.21-0.40 fair, and 0-0.20 poor) [30].
The factor structure of the questionnaire was extracted byperforming both exploratory factor analysis (EFA) andconfirmatory factor analysis (CFA). Exploratory factoranalysis was performed using the principal componentanalysis with varimax rotation. It was hypothesized that atwo-factor solution would be obtained with eigenvaluesgreater than 1. Finally, confirmatory factor analysis wasperformed while a two-factor model (physical componentsummary and mental component summary) was speci-fied for the analysis. There are varying suggestions in theliterature about the number, type and cut-off values forgoodness-of-fit required to be reported for confirmatoryfactor analysis. Accordingly, we report several goodness-of-fit indicators including: goodness of fit index (GFI),adjusted goodness of fit index (AGFI), the root mean
square error of approximation (RMSEA), normed fit index(NFI), and comparative fit index (CFI). The GFI and AGFIare chi-square based calculations independent of degreesof freedom. The recommended cut-off values for accepta-ble values are ≥ 0.90. The RMSEA tests the fit of the modelto the covariance matrix. As a guideline, values of < 0.05indicate a close fit and values below 0.11 are an acceptablefit. The NFI and CFI values range from 0 to 1 with a valueof greater than 0.90 being acceptable fit to the data.[31,32].
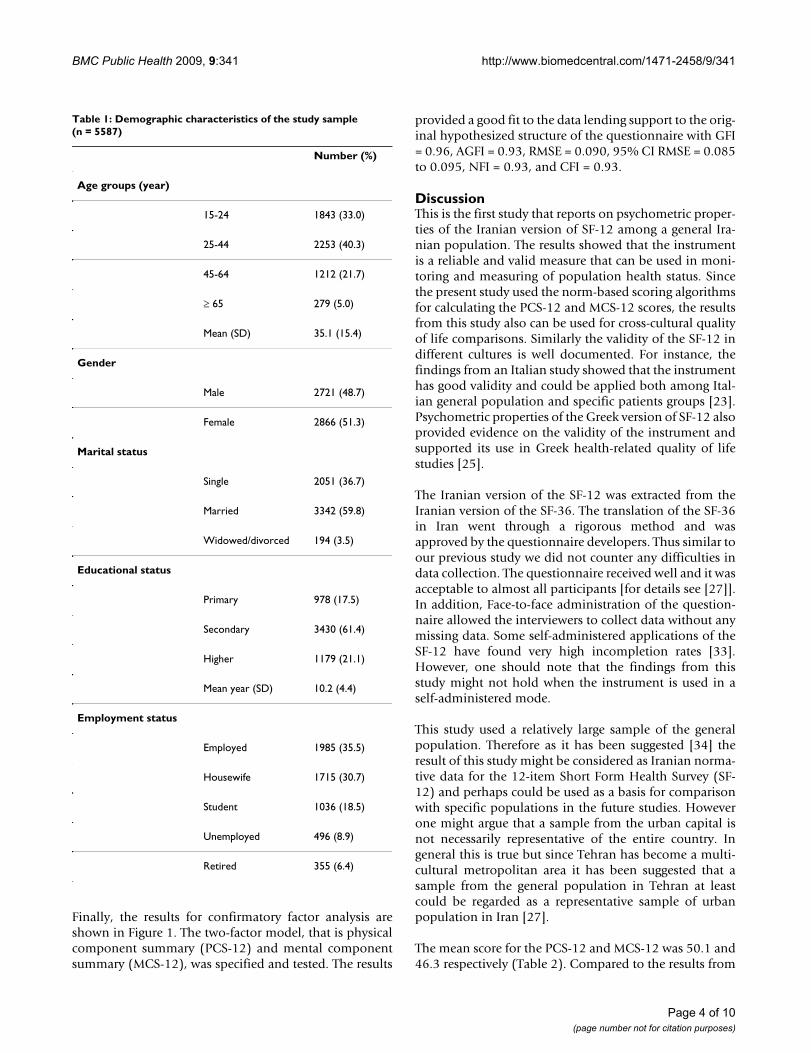
ResultsIn all, 6228 individuals were approached. Of these, 5587individuals (2721 male and 2866 female) were agreed totake part in the study, giving a response rate of 89.7%. Themean age and formal education of the respondents was35.1 (SD = 15.4) and 10.2 (SD = 4.4) years respectively.The demographic characteristics of the study sample areshown in Table 1.
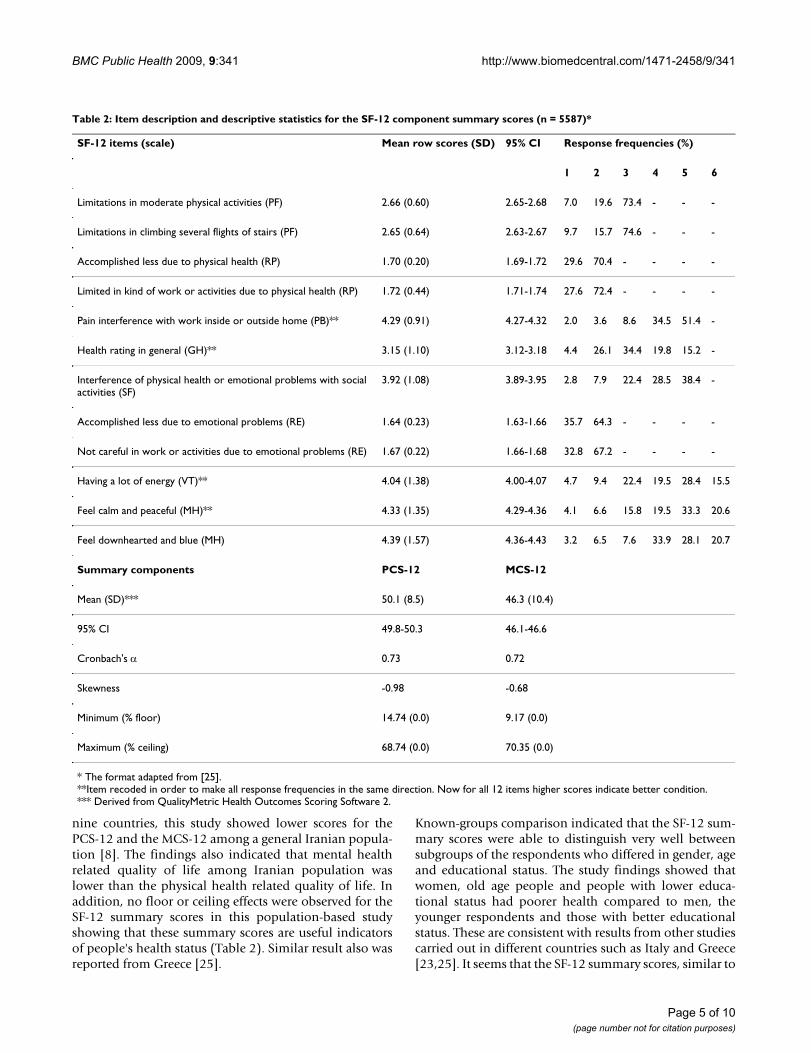
Table 2 shows the descriptive statistics for the SF-12 scales.Both summary measures exceeded the 0.70 level indicat-ing satisfactory results (Cronbach's α for PCS-12 andMCS-12 was 0.73 and 0.72, respectively). The mean scorefor the PCS-12 was 50.1 (SD = 8.5) and for the MCS-12 itwas 46.3 (SD = 10.4). For both the PCS-12 and the MCS-12 the percentage of respondents scoring at the lowestlevel (i.e. floor effect) and at highest level (i.e. ceilingeffect) was almost nothing (frequency was 1 for each).
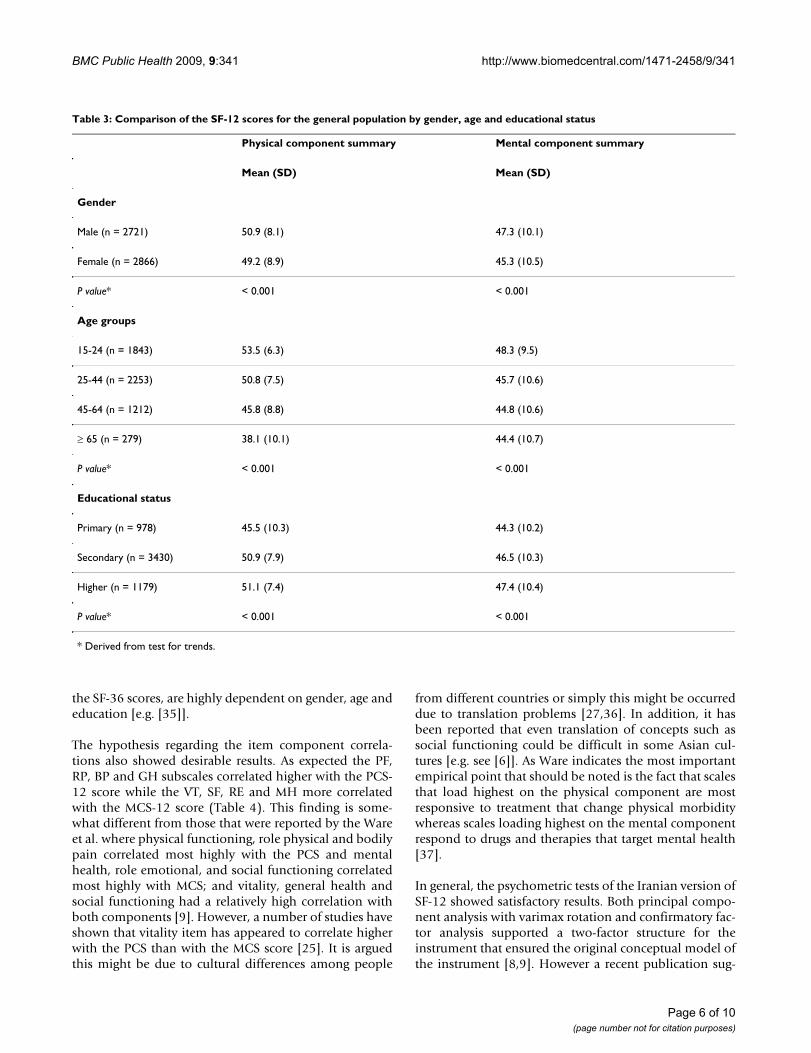
Known groups comparison showed that the SF-12 dis-criminated well between subgroups of people who werediffered in gender, age and educational status. As hypoth-esized women, older people and respondents with lowereducation reported poorer health status than men,younger participants and those with a better educationalstatus in all measures (Tables 3).
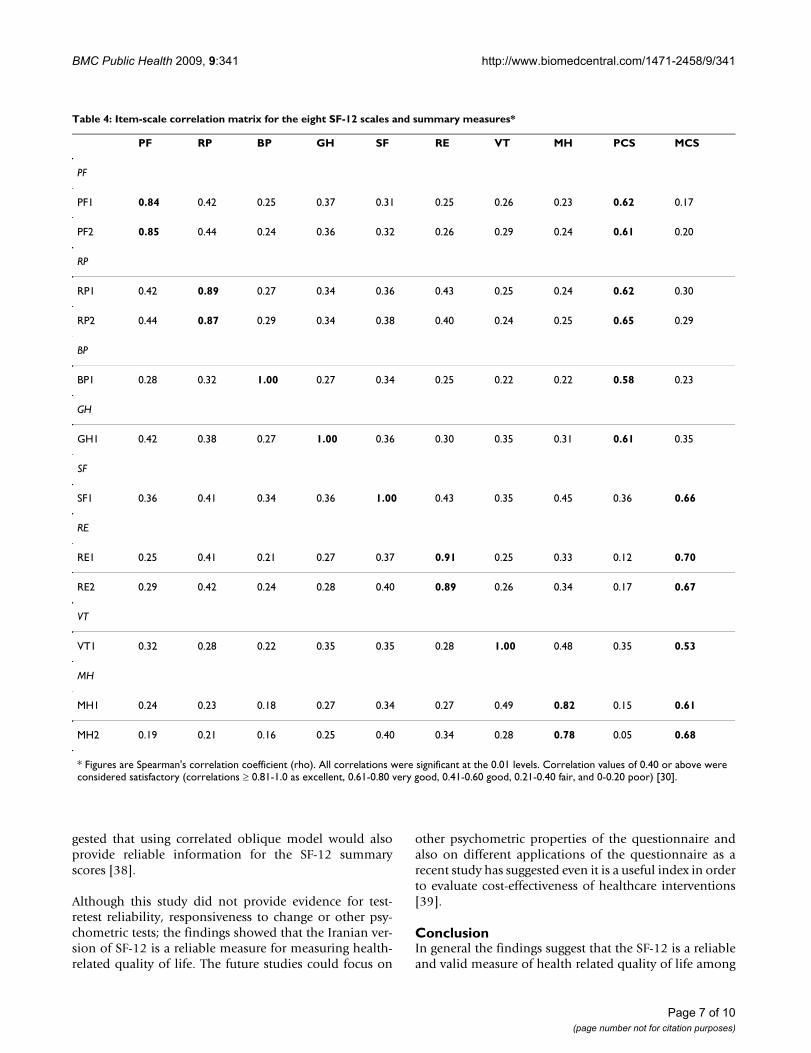
In addition the results from correlation analysis showedthat item scores correlated higher with own hypothesizedscale than other scales and that the PF, RP, BP and GHsubscales correlated higher with the PCS-12 score, whilethe VT, SF, RE and MH subscales more correlated with theMCS-12 score lending support to its good convergentvalidity. (Table 4).
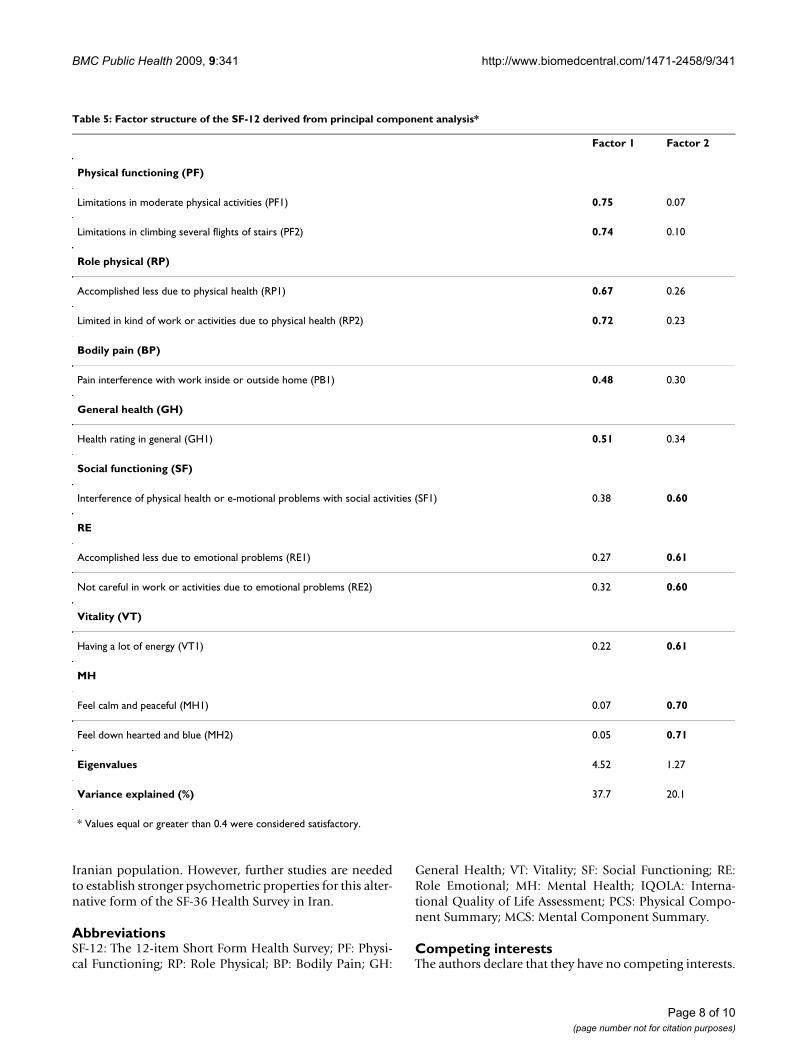
Principal component analysis with varimax rotationloaded two factors. The results are shown in Table 5.Eigenvalues for the two factors that explained most of thevariance observed was 4.52 and 1.27 respectively. Thetwo-factor structure (physical and mental health) jointlyaccounted for 57.8% of the variance. The results showedthat PF, RP, BP and GH items loaded higher on the phys-ical component and VT, SF, RE and MH loaded higher onthe mental component.
Page 3 of 10(page number not for citation purposes)
BMC Public Health 2009, 9:341 http://www.biomedcentral.com/1471-2458/9/341
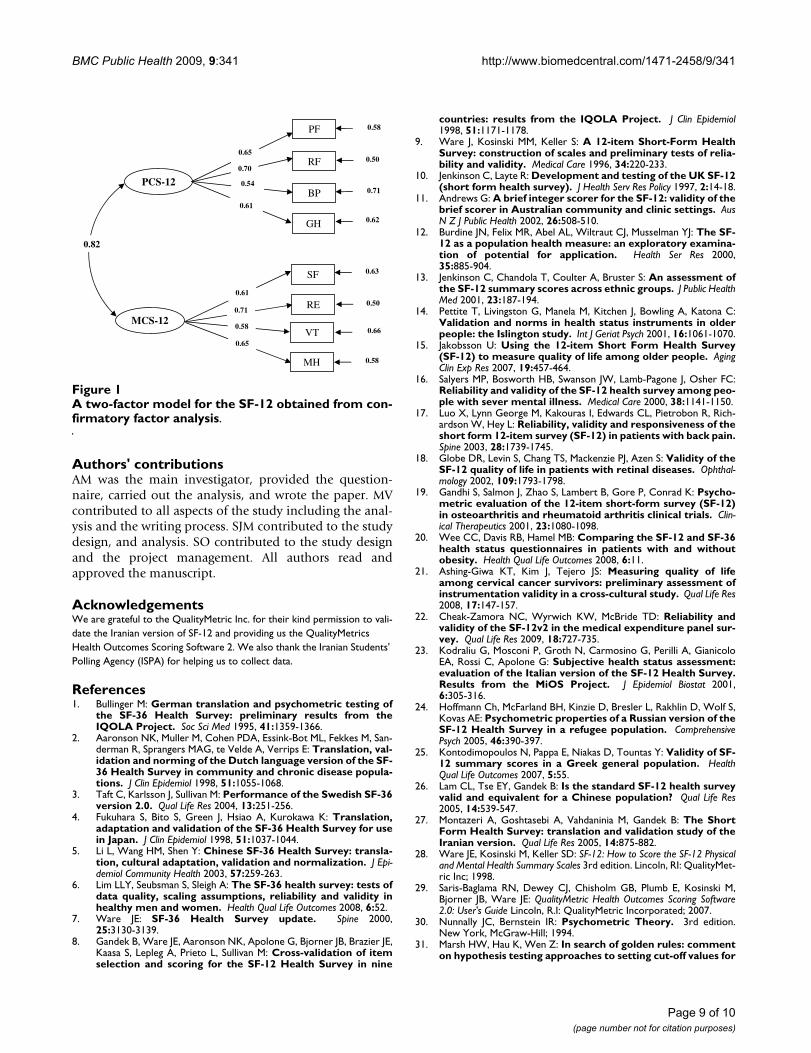
Finally, the results for confirmatory factor analysis areshown in Figure 1. The two-factor model, that is physicalcomponent summary (PCS-12) and mental componentsummary (MCS-12), was specified and tested. The results
provided a good fit to the data lending support to the orig-inal hypothesized structure of the questionnaire with GFI= 0.96, AGFI = 0.93, RMSE = 0.090, 95% CI RMSE = 0.085to 0.095, NFI = 0.93, and CFI = 0.93.
DiscussionThis is the first study that reports on psychometric proper-ties of the Iranian version of SF-12 among a general Ira-nian population. The results showed that the instrumentis a reliable and valid measure that can be used in moni-toring and measuring of population health status. Sincethe present study used the norm-based scoring algorithmsfor calculating the PCS-12 and MCS-12 scores, the resultsfrom this study also can be used for cross-cultural qualityof life comparisons. Similarly the validity of the SF-12 indifferent cultures is well documented. For instance, thefindings from an Italian study showed that the instrumenthas good validity and could be applied both among Ital-ian general population and specific patients groups [23].Psychometric properties of the Greek version of SF-12 alsoprovided evidence on the validity of the instrument andsupported its use in Greek health-related quality of lifestudies [25].
The Iranian version of the SF-12 was extracted from theIranian version of the SF-36. The translation of the SF-36in Iran went through a rigorous method and wasapproved by the questionnaire developers. Thus similar toour previous study we did not counter any difficulties indata collection. The questionnaire received well and it wasacceptable to almost all participants [for details see [27]].In addition, Face-to-face administration of the question-naire allowed the interviewers to collect data without anymissing data. Some self-administered applications of theSF-12 have found very high incompletion rates [33].However, one should note that the findings from thisstudy might not hold when the instrument is used in aself-administered mode.
This study used a relatively large sample of the generalpopulation. Therefore as it has been suggested [34] theresult of this study might be considered as Iranian norma-tive data for the 12-item Short Form Health Survey (SF-12) and perhaps could be used as a basis for comparisonwith specific populations in the future studies. Howeverone might argue that a sample from the urban capital isnot necessarily representative of the entire country. Ingeneral this is true but since Tehran has become a multi-cultural metropolitan area it has been suggested that asample from the general population in Tehran at leastcould be regarded as a representative sample of urbanpopulation in Iran [27].
The mean score for the PCS-12 and MCS-12 was 50.1 and46.3 respectively (Table 2). Compared to the results from
Table 1: Demographic characteristics of the study sample (n = 5587)
Number (%)
Age groups (year)
15-24 1843 (33.0)
25-44 2253 (40.3)
45-64 1212 (21.7)
≥ 65 279 (5.0)
Mean (SD) 35.1 (15.4)
Gender
Male 2721 (48.7)
Female 2866 (51.3)
Marital status
Single 2051 (36.7)
Married 3342 (59.8)
Widowed/divorced 194 (3.5)
Educational status
Primary 978 (17.5)
Secondary 3430 (61.4)
Higher 1179 (21.1)
Mean year (SD) 10.2 (4.4)
Employment status
Employed 1985 (35.5)
Housewife 1715 (30.7)
Student 1036 (18.5)
Unemployed 496 (8.9)
Retired 355 (6.4)
Page 4 of 10(page number not for citation purposes)
BMC Public Health 2009, 9:341 http://www.biomedcentral.com/1471-2458/9/341
nine countries, this study showed lower scores for thePCS-12 and the MCS-12 among a general Iranian popula-tion [8]. The findings also indicated that mental healthrelated quality of life among Iranian population waslower than the physical health related quality of life. Inaddition, no floor or ceiling effects were observed for theSF-12 summary scores in this population-based studyshowing that these summary scores are useful indicatorsof people's health status (Table 2). Similar result also wasreported from Greece [25].
Known-groups comparison indicated that the SF-12 sum-mary scores were able to distinguish very well betweensubgroups of the respondents who differed in gender, ageand educational status. The study findings showed thatwomen, old age people and people with lower educa-tional status had poorer health compared to men, theyounger respondents and those with better educationalstatus. These are consistent with results from other studiescarried out in different countries such as Italy and Greece[23,25]. It seems that the SF-12 summary scores, similar to
Table 2: Item description and descriptive statistics for the SF-12 component summary scores (n = 5587)*
SF-12 items (scale) Mean row scores (SD) 95% CI Response frequencies (%)
1 2 3 4 5 6
Limitations in moderate physical activities (PF) 2.66 (0.60) 2.65-2.68 7.0 19.6 73.4 - - -
Limitations in climbing several flights of stairs (PF) 2.65 (0.64) 2.63-2.67 9.7 15.7 74.6 - - -
Accomplished less due to physical health (RP) 1.70 (0.20) 1.69-1.72 29.6 70.4 - - - -
Limited in kind of work or activities due to physical health (RP) 1.72 (0.44) 1.71-1.74 27.6 72.4 - - - -
Pain interference with work inside or outside home (PB)** 4.29 (0.91) 4.27-4.32 2.0 3.6 8.6 34.5 51.4 -
Health rating in general (GH)** 3.15 (1.10) 3.12-3.18 4.4 26.1 34.4 19.8 15.2 -
Interference of physical health or emotional problems with social activities (SF)
3.92 (1.08) 3.89-3.95 2.8 7.9 22.4 28.5 38.4 -
Accomplished less due to emotional problems (RE) 1.64 (0.23) 1.63-1.66 35.7 64.3 - - - -
Not careful in work or activities due to emotional problems (RE) 1.67 (0.22) 1.66-1.68 32.8 67.2 - - - -
Having a lot of energy (VT)** 4.04 (1.38) 4.00-4.07 4.7 9.4 22.4 19.5 28.4 15.5
Feel calm and peaceful (MH)** 4.33 (1.35) 4.29-4.36 4.1 6.6 15.8 19.5 33.3 20.6
Feel downhearted and blue (MH) 4.39 (1.57) 4.36-4.43 3.2 6.5 7.6 33.9 28.1 20.7
Summary components PCS-12 MCS-12
Mean (SD)*** 50.1 (8.5) 46.3 (10.4)
95% CI 49.8-50.3 46.1-46.6
Cronbach's α 0.73 0.72
Skewness -0.98 -0.68
Minimum (% floor) 14.74 (0.0) 9.17 (0.0)
Maximum (% ceiling) 68.74 (0.0) 70.35 (0.0)
* The format adapted from [25].**Item recoded in order to make all response frequencies in the same direction. Now for all 12 items higher scores indicate better condition.*** Derived from QualityMetric Health Outcomes Scoring Software 2.
Page 5 of 10(page number not for citation purposes)
BMC Public Health 2009, 9:341 http://www.biomedcentral.com/1471-2458/9/341
the SF-36 scores, are highly dependent on gender, age andeducation [e.g. [35]].
The hypothesis regarding the item component correla-tions also showed desirable results. As expected the PF,RP, BP and GH subscales correlated higher with the PCS-12 score while the VT, SF, RE and MH more correlatedwith the MCS-12 score (Table 4). This finding is some-what different from those that were reported by the Wareet al. where physical functioning, role physical and bodilypain correlated most highly with the PCS and mentalhealth, role emotional, and social functioning correlatedmost highly with MCS; and vitality, general health andsocial functioning had a relatively high correlation withboth components [9]. However, a number of studies haveshown that vitality item has appeared to correlate higherwith the PCS than with the MCS score [25]. It is arguedthis might be due to cultural differences among people
from different countries or simply this might be occurreddue to translation problems [27,36]. In addition, it hasbeen reported that even translation of concepts such associal functioning could be difficult in some Asian cul-tures [e.g. see [6]]. As Ware indicates the most importantempirical point that should be noted is the fact that scalesthat load highest on the physical component are mostresponsive to treatment that change physical morbiditywhereas scales loading highest on the mental componentrespond to drugs and therapies that target mental health[37].
In general, the psychometric tests of the Iranian version ofSF-12 showed satisfactory results. Both principal compo-nent analysis with varimax rotation and confirmatory fac-tor analysis supported a two-factor structure for theinstrument that ensured the original conceptual model ofthe instrument [8,9]. However a recent publication sug-
Table 3: Comparison of the SF-12 scores for the general population by gender, age and educational status
Physical component summary Mental component summary
Mean (SD) Mean (SD)
Gender
Male (n = 2721) 50.9 (8.1) 47.3 (10.1)
Female (n = 2866) 49.2 (8.9) 45.3 (10.5)
P value* < 0.001 < 0.001
Age groups
15-24 (n = 1843) 53.5 (6.3) 48.3 (9.5)
25-44 (n = 2253) 50.8 (7.5) 45.7 (10.6)
45-64 (n = 1212) 45.8 (8.8) 44.8 (10.6)
≥ 65 (n = 279) 38.1 (10.1) 44.4 (10.7)
P value* < 0.001 < 0.001
Educational status
Primary (n = 978) 45.5 (10.3) 44.3 (10.2)
Secondary (n = 3430) 50.9 (7.9) 46.5 (10.3)
Higher (n = 1179) 51.1 (7.4) 47.4 (10.4)
P value* < 0.001 < 0.001
* Derived from test for trends.
Page 6 of 10(page number not for citation purposes)
BMC Public Health 2009, 9:341 http://www.biomedcentral.com/1471-2458/9/341
gested that using correlated oblique model would alsoprovide reliable information for the SF-12 summaryscores [38].
Although this study did not provide evidence for test-retest reliability, responsiveness to change or other psy-chometric tests; the findings showed that the Iranian ver-sion of SF-12 is a reliable measure for measuring health-related quality of life. The future studies could focus on
other psychometric properties of the questionnaire andalso on different applications of the questionnaire as arecent study has suggested even it is a useful index in orderto evaluate cost-effectiveness of healthcare interventions[39].
ConclusionIn general the findings suggest that the SF-12 is a reliableand valid measure of health related quality of life among
Table 4: Item-scale correlation matrix for the eight SF-12 scales and summary measures*
PF RP BP GH SF RE VT MH PCS MCS
PF
PF1 0.84 0.42 0.25 0.37 0.31 0.25 0.26 0.23 0.62 0.17
PF2 0.85 0.44 0.24 0.36 0.32 0.26 0.29 0.24 0.61 0.20
RP
RP1 0.42 0.89 0.27 0.34 0.36 0.43 0.25 0.24 0.62 0.30
RP2 0.44 0.87 0.29 0.34 0.38 0.40 0.24 0.25 0.65 0.29
BP
BP1 0.28 0.32 1.00 0.27 0.34 0.25 0.22 0.22 0.58 0.23
GH
GH1 0.42 0.38 0.27 1.00 0.36 0.30 0.35 0.31 0.61 0.35
SF
SF1 0.36 0.41 0.34 0.36 1.00 0.43 0.35 0.45 0.36 0.66
RE
RE1 0.25 0.41 0.21 0.27 0.37 0.91 0.25 0.33 0.12 0.70
RE2 0.29 0.42 0.24 0.28 0.40 0.89 0.26 0.34 0.17 0.67
VT
VT1 0.32 0.28 0.22 0.35 0.35 0.28 1.00 0.48 0.35 0.53
MH
MH1 0.24 0.23 0.18 0.27 0.34 0.27 0.49 0.82 0.15 0.61
MH2 0.19 0.21 0.16 0.25 0.40 0.34 0.28 0.78 0.05 0.68
* Figures are Spearman's correlation coefficient (rho). All correlations were significant at the 0.01 levels. Correlation values of 0.40 or above were considered satisfactory (correlations ≥ 0.81-1.0 as excellent, 0.61-0.80 very good, 0.41-0.60 good, 0.21-0.40 fair, and 0-0.20 poor) [30].
Page 7 of 10(page number not for citation purposes)
BMC Public Health 2009, 9:341 http://www.biomedcentral.com/1471-2458/9/341
Iranian population. However, further studies are neededto establish stronger psychometric properties for this alter-native form of the SF-36 Health Survey in Iran.
AbbreviationsSF-12: The 12-item Short Form Health Survey; PF: Physi-cal Functioning; RP: Role Physical; BP: Bodily Pain; GH:
General Health; VT: Vitality; SF: Social Functioning; RE:Role Emotional; MH: Mental Health; IQOLA: Interna-tional Quality of Life Assessment; PCS: Physical Compo-nent Summary; MCS: Mental Component Summary.
Competing interestsThe authors declare that they have no competing interests.
Table 5: Factor structure of the SF-12 derived from principal component analysis*
Factor 1 Factor 2
Physical functioning (PF)
Limitations in moderate physical activities (PF1) 0.75 0.07
Limitations in climbing several flights of stairs (PF2) 0.74 0.10
Role physical (RP)
Accomplished less due to physical health (RP1) 0.67 0.26
Limited in kind of work or activities due to physical health (RP2) 0.72 0.23
Bodily pain (BP)
Pain interference with work inside or outside home (PB1) 0.48 0.30
General health (GH)
Health rating in general (GH1) 0.51 0.34
Social functioning (SF)
Interference of physical health or e-motional problems with social activities (SF1) 0.38 0.60
RE
Accomplished less due to emotional problems (RE1) 0.27 0.61
Not careful in work or activities due to emotional problems (RE2) 0.32 0.60
Vitality (VT)
Having a lot of energy (VT1) 0.22 0.61
MH
Feel calm and peaceful (MH1) 0.07 0.70
Feel down hearted and blue (MH2) 0.05 0.71
Eigenvalues 4.52 1.27
Variance explained (%) 37.7 20.1
* Values equal or greater than 0.4 were considered satisfactory.
Page 8 of 10(page number not for citation purposes)
BMC Public Health 2009, 9:341 http://www.biomedcentral.com/1471-2458/9/341
Authors' contributionsAM was the main investigator, provided the question-naire, carried out the analysis, and wrote the paper. MVcontributed to all aspects of the study including the anal-ysis and the writing process. SJM contributed to the studydesign, and analysis. SO contributed to the study designand the project management. All authors read andapproved the manuscript.
AcknowledgementsWe are grateful to the QualityMetric Inc. for their kind permission to vali-date the Iranian version of SF-12 and providing us the QualityMetrics Health Outcomes Scoring Software 2. We also thank the Iranian Students' Polling Agency (ISPA) for helping us to collect data.
References1. Bullinger M: German translation and psychometric testing of
the SF-36 Health Survey: preliminary results from theIQOLA Project. Soc Sci Med 1995, 41:1359-1366.
2. Aaronson NK, Muller M, Cohen PDA, Essink-Bot ML, Fekkes M, San-derman R, Sprangers MAG, te Velde A, Verrips E: Translation, val-idation and norming of the Dutch language version of the SF-36 Health Survey in community and chronic disease popula-tions. J Clin Epidemiol 1998, 51:1055-1068.
3. Taft C, Karlsson J, Sullivan M: Performance of the Swedish SF-36version 2.0. Qual Life Res 2004, 13:251-256.
4. Fukuhara S, Bito S, Green J, Hsiao A, Kurokawa K: Translation,adaptation and validation of the SF-36 Health Survey for usein Japan. J Clin Epidemiol 1998, 51:1037-1044.
5. Li L, Wang HM, Shen Y: Chinese SF-36 Health Survey: transla-tion, cultural adaptation, validation and normalization. J Epi-demiol Community Health 2003, 57:259-263.
6. Lim LLY, Seubsman S, Sleigh A: The SF-36 health survey: tests ofdata quality, scaling assumptions, reliability and validity inhealthy men and women. Health Qual Life Outcomes 2008, 6:52.
7. Ware JE: SF-36 Health Survey update. Spine 2000,25:3130-3139.
8. Gandek B, Ware JE, Aaronson NK, Apolone G, Bjorner JB, Brazier JE,Kaasa S, Lepleg A, Prieto L, Sullivan M: Cross-validation of itemselection and scoring for the SF-12 Health Survey in nine
countries: results from the IQOLA Project. J Clin Epidemiol1998, 51:1171-1178.
9. Ware J, Kosinski MM, Keller S: A 12-item Short-Form HealthSurvey: construction of scales and preliminary tests of relia-bility and validity. Medical Care 1996, 34:220-233.
10. Jenkinson C, Layte R: Development and testing of the UK SF-12(short form health survey). J Health Serv Res Policy 1997, 2:14-18.
11. Andrews G: A brief integer scorer for the SF-12: validity of thebrief scorer in Australian community and clinic settings. AusN Z J Public Health 2002, 26:508-510.
12. Burdine JN, Felix MR, Abel AL, Wiltraut CJ, Musselman YJ: The SF-12 as a population health measure: an exploratory examina-tion of potential for application. Health Ser Res 2000,35:885-904.
13. Jenkinson C, Chandola T, Coulter A, Bruster S: An assessment ofthe SF-12 summary scores across ethnic groups. J Public HealthMed 2001, 23:187-194.
14. Pettite T, Livingston G, Manela M, Kitchen J, Bowling A, Katona C:Validation and norms in health status instruments in olderpeople: the Islington study. Int J Geriat Psych 2001, 16:1061-1070.
15. Jakobsson U: Using the 12-item Short Form Health Survey(SF-12) to measure quality of life among older people. AgingClin Exp Res 2007, 19:457-464.
16. Salyers MP, Bosworth HB, Swanson JW, Lamb-Pagone J, Osher FC:Reliability and validity of the SF-12 health survey among peo-ple with sever mental illness. Medical Care 2000, 38:1141-1150.
17. Luo X, Lynn George M, Kakouras I, Edwards CL, Pietrobon R, Rich-ardson W, Hey L: Reliability, validity and responsiveness of theshort form 12-item survey (SF-12) in patients with back pain.Spine 2003, 28:1739-1745.
18. Globe DR, Levin S, Chang TS, Mackenzie PJ, Azen S: Validity of theSF-12 quality of life in patients with retinal diseases. Ophthal-mology 2002, 109:1793-1798.
19. Gandhi S, Salmon J, Zhao S, Lambert B, Gore P, Conrad K: Psycho-metric evaluation of the 12-item short-form survey (SF-12)in osteoarthritis and rheumatoid arthritis clinical trials. Clin-ical Therapeutics 2001, 23:1080-1098.
20. Wee CC, Davis RB, Hamel MB: Comparing the SF-12 and SF-36health status questionnaires in patients with and withoutobesity. Health Qual Life Outcomes 2008, 6:11.
21. Ashing-Giwa KT, Kim J, Tejero JS: Measuring quality of lifeamong cervical cancer survivors: preliminary assessment ofinstrumentation validity in a cross-cultural study. Qual Life Res2008, 17:147-157.
22. Cheak-Zamora NC, Wyrwich KW, McBride TD: Reliability andvalidity of the SF-12v2 in the medical expenditure panel sur-vey. Qual Life Res 2009, 18:727-735.
23. Kodraliu G, Mosconi P, Groth N, Carmosino G, Perilli A, GianicoloEA, Rossi C, Apolone G: Subjective health status assessment:evaluation of the Italian version of the SF-12 Health Survey.Results from the MiOS Project. J Epidemiol Biostat 2001,6:305-316.
24. Hoffmann Ch, McFarland BH, Kinzie D, Bresler L, Rakhlin D, Wolf S,Kovas AE: Psychometric properties of a Russian version of theSF-12 Health Survey in a refugee population. ComprehensivePsych 2005, 46:390-397.
25. Kontodimopoulos N, Pappa E, Niakas D, Tountas Y: Validity of SF-12 summary scores in a Greek general population. HealthQual Life Outcomes 2007, 5:55.
26. Lam CL, Tse EY, Gandek B: Is the standard SF-12 health surveyvalid and equivalent for a Chinese population? Qual Life Res2005, 14:539-547.
27. Montazeri A, Goshtasebi A, Vahdaninia M, Gandek B: The ShortForm Health Survey: translation and validation study of theIranian version. Qual Life Res 2005, 14:875-882.
28. Ware JE, Kosinski M, Keller SD: SF-12: How to Score the SF-12 Physicaland Mental Health Summary Scales 3rd edition. Lincoln, RI: QualityMet-ric Inc; 1998.
29. Saris-Baglama RN, Dewey CJ, Chisholm GB, Plumb E, Kosinski M,Bjorner JB, Ware JE: QualityMetric Health Outcomes Scoring Software2.0: User's Guide Lincoln, R.I: QualityMetric Incorporated; 2007.
30. Nunnally JC, Bernstein IR: Psychometric Theory. 3rd edition.New York, McGraw-Hill; 1994.
31. Marsh HW, Hau K, Wen Z: In search of golden rules: commenton hypothesis testing approaches to setting cut-off values for
A two-factor model for the SF-12 obtained from confirma-tory factor analysisFigure 1A two-factor model for the SF-12 obtained from con-firmatory factor analysis.
PCS-12
0.82
PF
RF
BP
GH
SF
RE
VT
MH
0.65
0.70
0.54
0.61
0.58
0.50
0.71
0.62
0.61
0.71
0.58
0.65
0.63
0.50
0.66
0.58
MCS-12
Page 9 of 10(page number not for citation purposes)
http://www.ncbi.nlm.nih.gov/entrez/query.fcgi?cmd=Retrieve&db=PubMed&dopt=Abstract&list_uids=8560303
http://www.ncbi.nlm.nih.gov/entrez/query.fcgi?cmd=Retrieve&db=PubMed&dopt=Abstract&list_uids=8560303
http://www.ncbi.nlm.nih.gov/entrez/query.fcgi?cmd=Retrieve&db=PubMed&dopt=Abstract&list_uids=8560303
http://www.ncbi.nlm.nih.gov/entrez/query.fcgi?cmd=Retrieve&db=PubMed&dopt=Abstract&list_uids=9817123
http://www.ncbi.nlm.nih.gov/entrez/query.fcgi?cmd=Retrieve&db=PubMed&dopt=Abstract&list_uids=9817123
http://www.ncbi.nlm.nih.gov/entrez/query.fcgi?cmd=Retrieve&db=PubMed&dopt=Abstract&list_uids=9817123
http://www.ncbi.nlm.nih.gov/entrez/query.fcgi?cmd=Retrieve&db=PubMed&dopt=Abstract&list_uids=9817121
http://www.ncbi.nlm.nih.gov/entrez/query.fcgi?cmd=Retrieve&db=PubMed&dopt=Abstract&list_uids=9817121
http://www.ncbi.nlm.nih.gov/entrez/query.fcgi?cmd=Retrieve&db=PubMed&dopt=Abstract&list_uids=9817121
http://www.ncbi.nlm.nih.gov/entrez/query.fcgi?cmd=Retrieve&db=PubMed&dopt=Abstract&list_uids=9817135
http://www.ncbi.nlm.nih.gov/entrez/query.fcgi?cmd=Retrieve&db=PubMed&dopt=Abstract&list_uids=9817135
http://www.ncbi.nlm.nih.gov/entrez/query.fcgi?cmd=Retrieve&db=PubMed&dopt=Abstract&list_uids=9817135
http://www.ncbi.nlm.nih.gov/entrez/query.fcgi?cmd=Retrieve&db=PubMed&dopt=Abstract&list_uids=8628042
http://www.ncbi.nlm.nih.gov/entrez/query.fcgi?cmd=Retrieve&db=PubMed&dopt=Abstract&list_uids=8628042
BMC Public Health 2009, 9:341 http://www.biomedcentral.com/1471-2458/9/341
Publish with BioMed Central and every scientist can read your work free of charge
"BioMed Central will be the most significant development for disseminating the results of biomedical research in our lifetime."
Sir Paul Nurse, Cancer Research UK
Your research papers will be:
available free of charge to the entire biomedical community
peer reviewed and published immediately upon acceptance
cited in PubMed and archived on PubMed Central
yours — you keep the copyright
Submit your manuscript here:http://www.biomedcentral.com/info/publishing_adv.asp
BioMedcentral
fit indexes and dangers in over generalizing Hu and Bentler'sfindings. Structural Equation Modelling 2004, 11:320-341.
32. Byrne BM: Structural Equation Modelling Mahwah, NJ: Lawrence Erl-baum Associates Publishers; 1998.
33. Lim LL, Fisher JD: Use of the 12-item Short-Form (SF-12)Health Survey in an Australian heart and stroke population.Qual Life Res 1999, 8:1-8.
34. Gandek B, Ware JE: Methods for validating and norming trans-lations of health status questionnaires: The IQOLA Projectapproach. J Clin Epidemiol 1998, 51:953-959.
35. Hung DY, Lubetkin EI, Fahs M, Shelley DR: Assessing the impactof behavioral risk factors and known-groups validity of the Sf-12 in a US Chinese immigrant population. Medical Care 2009,47:262-267.
36. Bullinger M, Alonso J, Apolone G, Leplege A, Sullivan M, Wood-Dau-phinee S, Gandek B, Wagner A, Aaronson N, Bech P, Fukuhara S,Kaasa S, Ware JE: Translating health status questionnaires andevaluating their quality: The IQOLA Project approach.International Quality of Life Assessment. J Clin Epidemiol 1998,51:913-923.
37. Ware JE, Kosinski M, Keller SK: SF-36 Physical and Mental Health Sum-mary Scales: A User's Manual Boston, MA: The Health Institute; 1994.
38. Farivar S, Cunningham WE, Hays RD: Correlated physical andmental summary scores for the SF-36 and SF-12 Health Sur-vey, V.1. Health Qual Life Outcomes 2007, 5:54.
39. Brazier JE, Roberts J: The estimation of a preference-basedmeasure of health from the SF-12. Med Care 2004, 42:851-859.
Pre-publication historyThe pre-publication history for this paper can be accessedhere:
http://www.biomedcentral.com/1471-2458/9/341/prepub
Page 10 of 10(page number not for citation purposes)
http://www.ncbi.nlm.nih.gov/entrez/query.fcgi?cmd=Retrieve&db=PubMed&dopt=Abstract&list_uids=9817112
http://www.ncbi.nlm.nih.gov/entrez/query.fcgi?cmd=Retrieve&db=PubMed&dopt=Abstract&list_uids=9817112
http://www.ncbi.nlm.nih.gov/entrez/query.fcgi?cmd=Retrieve&db=PubMed&dopt=Abstract&list_uids=9817112
http://www.ncbi.nlm.nih.gov/entrez/query.fcgi?cmd=Retrieve&db=PubMed&dopt=Abstract&list_uids=9817108
http://www.ncbi.nlm.nih.gov/entrez/query.fcgi?cmd=Retrieve&db=PubMed&dopt=Abstract&list_uids=9817108