The InvIsIble economy and Gender InequalITIes - IRIS PAHO ...
284
-
Upload
khangminh22 -
Category
Documents
-
view
1 -
download
0
Transcript of The InvIsIble economy and Gender InequalITIes - IRIS PAHO ...

aThe InvIsIble
economy and GenderInequalITIes
The importance of measuring and valuing
unpaid work
PAHO Headquarters Library – Cataloging at the source
Pan American Health Organization The Invisible Economy and Gender Inequalities. The Importance of Measuring and Valuing Unpaid Work.
Washington, D.C.: PAHO, 2010
ISBN 978-92-75-13224-1
I. Title
1. GENDER IDENTITY2. EQUITY 3. FAMILY HEALTH4. CAREGIVERS5. HOMEMAKER SERVICES6. UNCOMPENSATED CARE– economics7. PUBLIC POLICIES 8. SOCIOECONOMIC FACTORS9. SOCIAL VALUES
(NLM- HQ1075)
Copyright Pan American Health Organization, 2010
The Pan American Health Organization welcomes requests for permission to reproduce, in part or in full. Applications and inquiries should be addressed to the Gender, Ethnicity, and Health Office, Pan American Health, Washington, D.C., United States of America.
Publication of the Pan American Health Organization
Pan American Sanitary Bureau, Regional Office of theWorld Health Organization
525 Twenty –third Street, N.W.Washington, D.C. 20037
Design and composition: ULTRAdesigns

iii
Acknowledgments . . . . . . . . . . . . . . . . . . . . . . . . . . . . . . . . . . . . . . . . . . . . . . . . . . . . . . . . . . . . . . . . v
Prologue . . . . . . . . . . . . . . . . . . . . . . . . . . . . . . . . . . . . . . . . . . . . . . . . . . . . . . . . . . . . . . . . . . . . . . . . vii
Introduction . . . . . . . . . . . . . . . . . . . . . . . . . . . . . . . . . . . . . . . . . . . . . . . . . . . . . . . . . . . . . . . . . . . . . ix
PArt I: Household Satellite Accounts and the Measurment and Valuation of Unpaid Work: results and Policy Implications for the reduction of Gender Inequalities . . . . . . . . . . . . . . . . 1
Chapter 1the Valuation of Unpaid Work: A Key Strategy for Gender Equality Policy . . . . . . . . 3Elsa Gómez Gómez
Chapter 2Household Production Accounts for Canada, Mexico, and the United States: Methodological Issues, results, and recommendations . . . . . . . . . . . . . . . . . . . . . . . 19Barbara M. Fraumeni
Chapter 3Satellite Account for Unpaid Household Services: An Approximation for Mexico . . 31María Eugenia Gómez Luna*
Chapter 4Calculating the Value of Unpaid Labor . . . . . . . . . . . . . . . . . . . . . . . . . . . . . . . . . . . . . . 53Debbie Budlender and Ann Lisbet Brathaug
Chapter 5Conceptual Framework and Methodological Guidelines for the Household Satellite Account to Measure Unpaid Work in Health . . . . . . . . . . . . . . . 77Lourdes Ferrán
Chapter 6the Inclusion of Unpaid Work in the Analyses of the Health and Social Welfare Sectors . . . . . . . . . . . . . . . . . . . . . . . . . . . . . . . . . . . . . . . . . . . . . . . . . . . . 89 ten Good reasons for Measuring Unremunerated Work in Health Care . . . . . . . . 135María-Ángeles Durán
Contents
a
iv
Contents
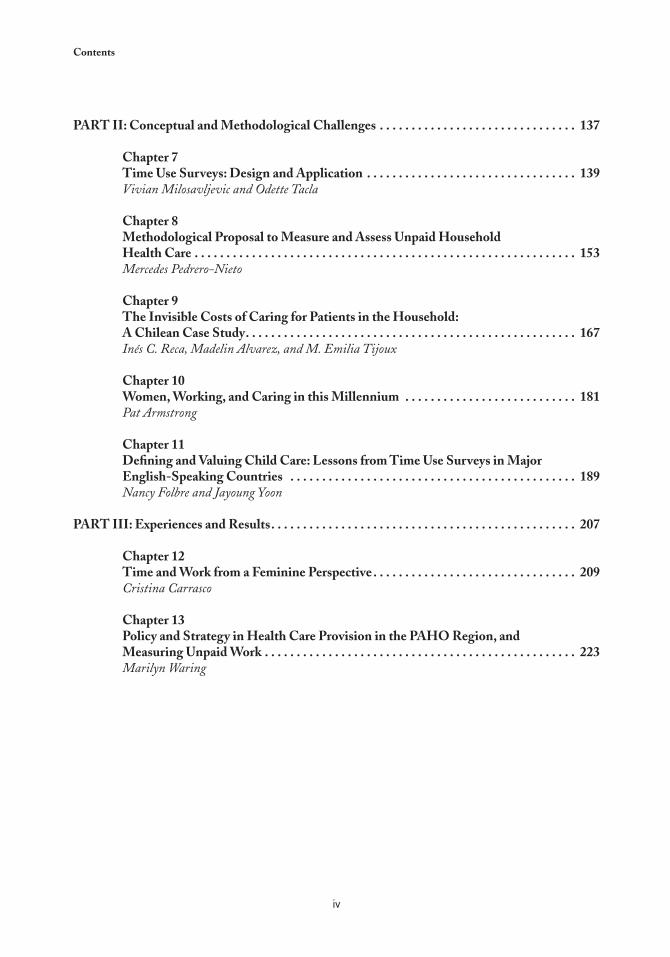
PArt II: Conceptual and Methodological Challenges . . . . . . . . . . . . . . . . . . . . . . . . . . . . . . . 137
Chapter 7time Use Surveys: Design and Application . . . . . . . . . . . . . . . . . . . . . . . . . . . . . . . . . 139Vivian Milosavljevic and Odette Tacla
Chapter 8Methodological Proposal to Measure and Assess Unpaid Household Health Care . . . . . . . . . . . . . . . . . . . . . . . . . . . . . . . . . . . . . . . . . . . . . . . . . . . . . . . . . . . . 153Mercedes Pedrero-Nieto
Chapter 9the Invisible Costs of Caring for Patients in the Household: A Chilean Case Study . . . . . . . . . . . . . . . . . . . . . . . . . . . . . . . . . . . . . . . . . . . . . . . . . . . . 167Inés C. Reca, Madelin Alvarez, and M. Emilia Tijoux
Chapter 10Women, Working, and Caring in this Millennium . . . . . . . . . . . . . . . . . . . . . . . . . . . 181Pat Armstrong
Chapter 11Defining and Valuing Child Care: Lessons from time Use Surveys in Major English-Speaking Countries . . . . . . . . . . . . . . . . . . . . . . . . . . . . . . . . . . . . . . . . . . . . . 189Nancy Folbre and Jayoung Yoon
PArt III: Experiences and results . . . . . . . . . . . . . . . . . . . . . . . . . . . . . . . . . . . . . . . . . . . . . . . . 207
Chapter 12time and Work from a Feminine Perspective . . . . . . . . . . . . . . . . . . . . . . . . . . . . . . . . 209Cristina Carrasco
Chapter 13Policy and Strategy in Health Care Provision in the PAHO region, and Measuring Unpaid Work . . . . . . . . . . . . . . . . . . . . . . . . . . . . . . . . . . . . . . . . . . . . . . . . . 223Marilyn Waring
v
The volume was made possible thanks to the diligent coordination efforts of Rubén Suárez, Regional Advisor on Health Economics and Financing at the Pan American Health Organization (PAHO) and Lilia Jara, Advisor on Gender and
Health at PAHO. The chapters herein are the result of several activities oriented towards the development of statistical instruments and social and economical indicators that will enhance the visibility of gender inequalities, particularly macroeconomic indicators commonly used in the formulation of public policies. Many individuals participated in this volume, including professionals from national and international institutions, and experts in gender-related issues, statistics, and in the UN System of National Accounts (SCN, 1993).
We especially acknowledge the work of Elsa Gómez Gómez, who, in her position of Regional Advisor on Gender and Health at PAHO, has been a pioneer in the subject discussed in this publication, promoting within PAHO and among state members the importance of measuring and valuing unpaid work in health care as a central topic in facing the challenges of gender inequalities and inequities. Elsa originally conceived this publication and it came together in great part due to her valuable contributions from the very early stages.
We appreciate the support of the governments of Canada, Cuba, Dominica, the United States, Honduras, and Paraguay, who —as members of the Subcommittee of Women, Health, and Development at PAHO— requested the inclusion of indicators concerning the value of time dedicated to health care in the national health accounts. We are also grateful for the support of the following organizations, which were invited to participate in the above-mentioned subcommittee: United Nations International Research and Training Institute for the Advancement of Women (UN-INSTRAW); the Economic Commission for Latin America and the Caribbean (ECLAC); the United Nations Population Fund (UNFPA); the Department of Gender, Women, and Health of the World Health Organization (WHO/GWH); the Inter-American Commission of Women of the Organization of American States (CIM/OEA); the Inter-American Development Bank (IDB); and the International Planned Parenthood Federation (IPPF).
We are grateful for the collaboration of the United Nations Development Fund for Women (UNIFEM); the Spanish National Research Council, in particular, of María Ángeles Durán; National Institute of Statistics and Geography (INEGI) in Mexico; the Central Bank in Venezuela; the Office of Statistics of Sweden; and the Development Research Institute at Tilburg University (IVO) in Holland.
Acknowledgments
a
vi
Acknowledgments
We would also like to thank Sonia Montaño, Salvador Marconi, Juan Carlos Feres, María Isabel Matamala, Thelma Gálvez, María Luisa Clark, and Souad Lakhdim for their essential contributions.
The funding of this volume has been made possible due to the financial support of the Ford Foundation, within the framework of the Integration of Gender Equity in the Policies to Reform the Health Sector program of the Swedish International Development Cooperation Agency (SIDA) and the Norwegian Agency for Development Cooperation (NORAD); through the Towards Gender Equality in Health project; and through the National Health Accounts project supported by the Norwegian Agency for Development Cooperation (NORAD).
vii
Prologue
a
Unpaid health and child care provided in the household, along with other activities that contribute to the physical, cognitive, and emotional development of members of a household, have a major impact on individual and public well-being, as well
as on the human development potential of the countries. These economic activities, performed largely by women, take place outside the market and are therefore invisible in the economic statistics and national accounts systems of most countries.
Actually, the invisibility of the unpaid work of women in delivering health services to other members of the household and the community, and in developing the human capital of new generations, prevents a proper analysis of the impact of public policies on them and hinders a definition of broader economic and social development strategies. Few countries have fiscal adjustment or sectoral financing policies that explicitly consider the impact of changes in the quantity and quality of in-home health service delivery as a result of such policies, nor do many countries have social and economic development strategies and policies in place that acknowledge the importance of unpaid work in the household.
The chapters in this volume present conceptual, methodological, and empirical aspects related to the measurement and valuation of the time spent by members of the household on nonmarket productive activities, which are invisible in national accounts systems governed by the System of National Accounts of 1993 (SNA, 1993). Most of the chapters were prepared by the Pan American Health Organization in collaboration with the Economic Commission for Latin America and the Caribbean and the Spanish National Research Council between 2001 and 2006. Some of the material herein focuses on activities included in the Platform for Action that grew out the recommendations of the Fourth World Conference on Women —held in Beijing in 1995— to develop economic and social indicators that will lend visibility to the contribution of women’s unpaid work to the countries’ development. More recently, at the 10th Regional Conference on Women in Latin America and the Caribbean —held in Quito in August 2007— the governments of the Region reaffirmed the need to make unpaid health care activities visible and assign a value to them.
viii
Along with its goal to bring visibility to the contribution of women’s unpaid work in the household and community, we hope that this volume will shed light on the economic relations that underlie gender-based inequalities and promote analytical research aimed at reducing such inequalities in the countries of our Region.
Mirta roses José Luis MachineaDirector Executive SecretaryPan American Health Organization Economic Commission for Latin America and the Caribbean
Prologue
ix
The unequal division of labor by sex is the factor behind much of the discrimination against women. Facilitating public policymaking will require the development of methodologies to quantify and assign a monetary value to the economic contribution
of women’s unpaid work in the household; in areas of agriculture, food production, and reproduction; within the community; and in the design of gender indicators to determine the magnitude of these contributions in relation to the gross domestic product (GDP) of the countries of the Region. At the same time, people who work without pay should be considered in country statistics, as indicated in some of the strategic actions proposed during the 1994 Regional Conference on the Integration of Women into the Economic and Social Development of Latin America and the Caribbean and the Platform for Action of the Fourth World Conference on Women in Beijing, 1995: Action for Equality, Development, and Peace. Most of the unpaid economic activities are performed by women, and thus the lack of indicators for measuring and valuing this work renders women’s true contributions to the well-being and economic and social development of the countries invisible.
The invisibility of the economic importance of such activities is one of the factors that perpetuate the economic and power relations that underlie gender inequalities, which is stated by the Consensus of Quito. This consensus, endorsed by every country in the Region, notes that the social and economic value of women’s unpaid domestic work is a public matter of interest to states, local governments, organizations, businesses, and families. It also underscores the significant value of the unpaid agricultural and subsistence work of rural women and the need to make visible and assign a monetary value to women’s contributions to the national economies and the cohesiveness of our societies. Within that framework, the countries in the Region have committed to formulate and implement state policies that promote the equitable sharing of household responsibilities between women and men, moving beyond gender stereotypes and recognizing the importance of caregiving and domestic work to economic reproduction and the well-being of society. The governments, moreover, have agreed to develop instruments, especially time use surveys, to periodically measure the unpaid work of both women and men and to integrate their results into the national accounts systems. This volume is a major contribution to these efforts.
The chapters herein present and discuss the concepts, methodologies, and results of the two most common instruments, or extensions, of the System of National Accounts of the United Nations (SNA, 1993) for measuring and assigning a value to economic activities that are invisible in the countries’ national accounts systems. They also provide analyses of
Introduction
a
x
Introduction
Household Satellite Accounts (HHSA) and time use surveys (TUS) as instruments to lend visibility to this work. Certain chapters focus on the gender constraints and biases implicit in the economic concepts and measurement and valuation methodologies of approaches based on the SCN 1993 and propose alternative concepts and methodologies for measuring the importance of women’s paid and unpaid work to the well-being and economic and social development of the countries.
The chapters on Household Satellite Accounts (Part I) include empirical results that show the value of production accomplished with unpaid work in terms of the countries’ GDP, using different approaches and criteria for measurement and valuation. They provide estimates for Canada, Spain, the United States, Mexico, and South Africa and include methodological proposals for using HHSA to measure and value unpaid health care and other caregiving activities that have been invisible in the design and evaluation of policies to promote public health and well-being. In the case of Spain, empirical results are presented and the implications of gender inequalities are analyzed through estimates of the magnitude and distribution of the burden of health care and other caregiving activities between men and women.
The chapters on time use surveys (Part II) summarize the approaches and results of these instruments in five countries of the Region: Bolivia, Ecuador, Guatemala, Mexico, and Nicaragua. They show the value of using TUS in evaluating gender inequalities that stem from the distribution of the time burden produced by unpaid labor in domestic activities. The country case studies include the results of an exercise to assign a value to the time spent on unpaid domestic activities in Mexico, as well as the invisible cost of caring for the sick at home in Chile. These studies reveal gender inequalities in the distribution of the work time devoted to unpaid domestic activities, including care for the sick, which are invisible to society and public policymakers because no monetary costs are involved. This section is complemented with two chapters that summarize the lessons learned and conceptual and methodological challenges involved in applying the concepts of other caregiving in Canada and of care for children to TUS in some English-speaking countries.
Part III examines the androcentric gender biases in the economic concepts of the countries’ national accounts and economic statistics. This section presents and questions the gender biases implicit in the concepts of economic transactions, institutional units, employment and occupation, income and well-being, and economic activity that underlie the measurement and valuation principles of approaches based on the SNA 1993. The chapters that make up this section suggest alternative concepts and methodologies for lending visibility to the contribution of unpaid work by men and women outside the market to well-being and economic and social development, explicitly describing the economic relations underlying gender inequalities derived from the restrictive use of market transactions in assigning value to unpaid work. The authors propose an expansion of the concept of “economically active population” to include unpaid work outside the market and also criticize the use of the GDP as an indicator for measuring the level of economic activity
xi
Introduction
and well-being and the overemphasis on conceptual and methodological considerations related to harmonization to achieve international comparability of the indicators derived from the SNA. In this section, there is also a suggestion to develop a Genuine Progress Indicator (GPI) as an alternative to the expanded GDP obtained through household satellite accounts.
The material presented in this volume indicates the need to develop indicators for measuring and assigning value to economic progress accomplished through the unpaid work of members of the household, particularly women. These indicators can be conceptually rigorous and methodologically coherent, making a valuable contribution to conventional economic statistics. Regular production of these indicators will aid in the formulation of policies to reduce gender inequalities and complement the contributions of conventional economic statistics, helping to change social and political perceptions that regard market activities as the only economic contributions.
We hope that the conceptual and methodological challenges outlined in this volume will contribute to the development of new databases and indicators that will make visible the real contribution of women’s unpaid work to the well-being and economic development of the countries.
Marijke Velzeboer-Salcedo, PAHOrubén Suárez, PAHOSonia Montaño, ECLACJuan Carlos Feres, ECLAC

1
ParT I
Cc
Household Satellite Accounts and the Measurment and Valuation of Unpaid Work: Results and Policy Implications for the Reduction of
Gender Inequalities

3
chapter 1
The Valuation of Unpaid Work:A Key Strategy for
Gender Equality Policy
Cc
Elsa Gómez Gómez*
“...in addition to examining the respective advantages or disadvantages of women and men, it is essential to analyze the contrast between effort and compensation for each sex. This contrast is essential in order to better understand gender injustice in the contemporary world.
The highly demanding nature of the effort and contributions of women, without proportional rewards, is a particularly important issue to identify and explore.”
—Sudhir Anand and Amartya Sen, 1995
INTRODUCTION
Promoting gender equality and the empowerment of women was one of the eight fundamental goals of the United Nations Millennium Declaration. This declaration reaffirmed the international community’s commitment to support
women’s empowerment, not only as ends that are desirable in themselves but as vehicles for achieving the other seven development goals. This support was explicitly pledged in
* Regional Consultant for the Pan American Health Organization ( June 1993–March 2007).
4
the Valuation of Unpaid Work: A Key Strategy for Gender Equality Policy
several international instruments, such as the Platform for Action of the Fourth World Conference on Women in Beijing (1995) and the Convention on the Elimination of All Forms of Discrimination against Women (CEDAW) (1972).
In accordance with these agreements, as well as the gender policy of the World Health Organization (2002), the Member States of the Pan American Health Organization (PAHO) officially adopted their own gender equality policy in 2005 (1), through which the countries and the Secretariat have committed to integrating gender equality initiatives and the empowerment of women into all aspects of their work in health. The consensus on this issue has been developed through three decades of PAHO technical cooperation with governments, civil society, and other agencies of the Inter-American and United Nations systems. Therefore, the PAHO Gender Equality Policy encompasses the experiences, political will, and historical commitment of PAHO/WHO to fairness under the principles of social justice, human rights, and sound public health practices.
The concepts of equality, equity, and empowerment that guide the PAHO Gender Equality Policy are linked to the vision of health as a human right. Gender equality in health means that women and men enjoy similar conditions and opportunities to fully exercise their potential to be healthy, to contribute to health development, and benefit from the results of such development. Gender equity refers to justice in the distribution of responsibilities, resources, and power between women and men, and is based on recognizing and correcting the unjust disparities between the sexes in these areas. As such, equity is seen as a means, and equality, as an end. Nevertheless, the policy emphasizes that equitable interventions are not enough to achieve equality. Empowerment, particularly of women, is crucial in order to achieve gender equality.
Modifying the traditional division of labor by sex is a key objective in gender equality strategies, a division that has been widely recognized as the source of economic and social subordination of women. In most societies, men have the primary responsibility for paid work (“productive work”), while the responsibility for unpaid work in the household and community (“reproductive work”) rests with women. Even though it provides essential support for “productive” work, unpaid work has remained invisible in terms of its contribution to production and well-being, making it more difficult to access economic resources and social protection for those responsible for this work—mainly women.
The importance of fully recognizing the economic contributions of all forms of work—paid and unpaid—as a precondition for achieving gender equality was spelled out in several United Nations (UN) treaties during the Decade for Women 1975–1985.1 Later, the Beijing Declaration and Platform for Action adopted at the Fourth United Nations World Conference on Women (Beijing, 1995) represented a political milestone in this regard.
The first mention of the productive and reproductive roles of women in a UN document occurred in 1980 at the Decade for Women 1
conference in Copenhagen. In Nairobi in 1985, the World Conference to Review and Appraise the Achievements of the United Nations Decade for Women: Equality, Development and Peace made explicit recommendations to advance towards equality between women and men through such recognition (Chap.1, Sec. A, par. 120).
5
Elsa Gómez Gómez
These instruments reaffirmed the commitment of the Member States and United Nations Systems of Organizations to develop appropriate methods to (2):
Measure and assign values to contributions of unpaid work to the economy;■■
Accurately reflect such values in satellite accounts or other official accounts consis-■■
tent with the central national accounts;Increase the visibility of the inequitable distribution of paid and unpaid work be-■■
tween women and men;Examine the relationship between unpaid work and women’s vulnerability to pov-■■
erty, with particular emphasis on calculating the value of unpaid work that is not included in the national accounts, such as caring for family members.
In line with these agreements, the Gender Equality Policy (2005) resolution adopted by the PAHO Member States highlighted the valuation of unpaid work performed by women as a key strategy for promoting gender equality (3). This resolution urges governments to include indicators of the value of unpaid time spent by both sexes in-home health care in the national health accounts and relate these indicators to total expenditures in the health care system. This emphasis on the valuation of unpaid work is based on the work conducted in the region since 2001 with the coordinated support of the “Gender, Ethnicity, and Health” and “Health Policies and Systems” units at PAHO (4). This work stresses that the debate on health gender equality should include capacities and opportunities, as well as compensation, and that a major step toward equality is to make unpaid work visible and counted in the design and evaluation of economic and social development policies. “Counted,” in the words of Diane Elson, means that it is counted in the statistics, entered into the accounts in the economic models, and taken into account in decision making at macro- and micropolicy levels (5).
PAHO had made efforts to enter unpaid work into the accounts within a broad initiative to integrate gender equality criteria in health policy development that began in 2000 (6). The purpose of this far-reaching initiative was to shift gender considerations from the margin of the debates on equity in social and economic policymaking to the center of such debates, supporting the coordinated work of governments and civil society. This initiative was an example of the response to the specific institutional and global mandate (7) to mainstream the gender equality approach in technical cooperation and national policy frameworks.
The basic components of this PAHO strategy, many of which led to this publication, have been as follows: a) generating relevant evidence; b) developing conceptual and methodological tools to make the transition from knowledge to action; c) strengthening the technical and advocacy capacity of key actors in government and civil society; d) creating intersectoral and interagency partnerships with the participation of civil society in order to put the issue on the political agenda; and e) institutionalization of measures and mechanisms that ensure the continuity of the changes promoted. A key premise of this
6
the Valuation of Unpaid Work: A Key Strategy for Gender Equality Policy
strategy has been the practical recognition that, along with equitable “top-down” policy measures, gender equality requires the “empowerment” of women so that they can bring these issues to the political debate and monitor their crystallization into practice.
This chapter outlines the regulatory, conceptual, and political frameworks that, from the standpoint of promoting gender equality, lead to and guide the initiative to assign a value to the contribution of unpaid work to health and human development. As mentioned in the introduction, this initiative is being promoted by PAHO/WHO in association with the United Nations Economic Commission for Latin America and the Caribbean (ECLAC) and the collaboration of the Spanish National Research Council (CSIC).
With particular emphasis on health, the sections herein describe the conceptual, empirical, and strategic elements on which the PAHO initiative to assign a value to unpaid work is based, as well as address the challenges associated with such consideration2 in terms of technical cooperation and policy development. They also outline PAHO’s technical cooperation activities to achieve real recognition of the value of unpaid work.
THE IMPORTANCE OF UNPAID WORK FOR GENDER EQUALITY AND WOMEN’S EMPOWERMENT
Achieving gender equality and the empowerment of women is a multifaceted objective. The Task Force on Education and Gender Equality, part of the United Nations Millennium Project, distinguishes three main dimensions in this objective: a) human capacities, such as education and health; b) opportunities to use or apply capacities through access to economic and political resources, and c) security, in the sense of reducing vulnerability to violence and conflict. Although these three dimensions are related, a change in one dimension does not guarantee a change in the others. Gender equality requires coordinated action of these dimensions and the “empowerment” or self-determination of women comes from changes in all three. In other words, empowerment for women requires them to reach equality with men, not merely with regard to capacities and opportunities, but also in terms of their agency to use such tools and exercise their rights (8).
As mentioned earlier, at the heart of gender inequality and the subordination of women is the division of labor by sex. Historically, paid work has been a responsibility assigned to men, while women have been relegated to performing unpaid work that provides support for paid work activities. Unpaid work predominates in subsistence production, household work that includes direct care for others, services that support this care, and community volunteering. Women are increasingly taking on paid work, although this has not led to a significant redistribution of the unpaid work. Universally, women continue to take most unpaid work responsibilities and therefore, their contribution to the economy goes mostly unrecognized.
These sections include elements in common with the article about unpaid work and gender equality prepared by PAHO for the ECLAC 2
Regional Report on the third Millennium Development Goal.
7
Elsa Gómez Gómez
These asymmetries in the distribution and valuation of work have adverse effects on gender equality and the empowerment of women and, at the same time, on the visibility of their interests in policymaking. The intersection between gender, social class, and ethnicity gives poor women a particular disadvantage in terms of the burden of unpaid work, options for paid work, and the representation of their interests in the political process.
The Division of Labor and Poverty
There is a clear relationship between the division of labor by sex and the overrepresentation of women in poor sectors. First, since women have the primary responsibility for child care and housekeeping, they have fewer opportunities to participate in the paid labor market, and thus they have less access to the economic benefits and social protection linked to that participation.
Second, since “women’s work” is socially and economically undervalued when performed in the household, it is not recognized as work. Moreover, the primarily female jobs and sectors of the labor market enjoy less prestige and remuneration. In fact, the domestic role tends to be considered the “natural” role of women and “feminized” jobs are considered an extension of this role, requiring no special qualifications since women can perform them “naturally” for free (9).
The information provided by ECLAC indicates the following:
Despite the growing participation of women in the labor market, their rate of par-■■
ticipation (58 percent) continues to be greatly lower than men’s (83 percent) (10); Unemployment rates are higher for women (12 percent) than men (8 percent) (■■ 10); Income levels of women in urban areas are 65 percent of men’s (■■ 10); Women (56 percent) enter the informal labor market more frequently than men ■■
(48 percent) (11), in lower-paid jobs that require fewer skills and provide less job security;Women interrupt their work history more often than men to attend to family ob-■■
ligations, such as raising children and caring for older adults; As women face greater difficulties in entering the job market than men, a smaller ■■
percentage of women (19 percent) contribute to the Social Security system than men (32 percent), thus women receive lesser retirement benefits. In addition, most women have lower pensions; in the over-65 population, they are equivalent to 77 percent of the value of men’s pensions (11).
Unpaid Work and Women’s Empowerment
As women assume the greatest burden of unpaid work, their empowerment is harder to achieve. As their opportunities to take on paid jobs due to household responsibilities are
8
the Valuation of Unpaid Work: A Key Strategy for Gender Equality Policy
limited, they have less chance of obtaining economic independence (i.e., availability of their own income and social protection resources to meet their needs on their own). This is true not only in the short term, but during old age as well, since the financial and health care benefits associated with retirement usually depend on the time spent in paid employment, particularly in the formal sector of the economy. Therefore, there is a perverse logic in this cycle in which those who make up for the deficit in public services, with little or no financial compensation, face the greatest barriers in obtaining such services.
For the high percentage of women who spend most of their lives outside the formal job market, and even for those who work informally or irregularly, Social Security benefits are often only available through their employed spouse. For these women, social protection becomes a derived rather than a civil right, apparent in both the private and the public sphere. Accordingly, it should be emphasized that poverty measurements that consider the household as the basic unit of analysis conceal the fact that, even in households that are not “poor,” some members lack sufficient income to meet their individual needs and access to Social Security benefits in their own rights (12).
In a broad sense, the concept of empowerment refers to expansion of the freedom to choose and act. The freedom to opt for paid work is limited by the balance that women and men are able to establish between formal work and the unpaid work of maintaining the household. This balance depends on internal agreements between household members regarding the distribution of responsibilities, the availability of and access to public services for the care of dependent family members, the ability to pay for private services, the amount of flexibility offered by paid work, labor policies that allow for harmonization of both sexes in the public and private spheres, and, finally, lack of domestic violence, particularly against women, which is used as a means of limiting their options.
In addition to economic considerations, it is important to underscore that assigning women the main responsibility for unpaid care work often confines their action sphere to the domestic arena. This limits their access to resources acquired through the social relations that enable people to develop effectively in their environment and participate in policy decisions that affect the well-being of their community (12). In addition, women’s economic subordination increases their vulnerability to spousal violence and often leads to hostile environments in which women are refrained from exercising their rights.
Recognizing the Contributions of Unpaid Work
Macroeconomic Level The “care economy” refers to unpaid work in the domestic sphere that sustains the current workforce, raises the future workforce, and cares for the elderly. This invisible area of production, which includes caring for children, the elderly, and the sick; daily maintenance of the household’s well-being; volunteer community work; and subsistence, is of fundamental economic importance. Indeed, as pointed out in other chapters in this
9
Elsa Gómez Gómez
book, the statistics on time use in different countries suggest that unpaid work contributes to well-being, human capacity building, and long-term economic growth, while accounting for the highest number of working hours, which may represent over 50 percent of the gross domestic product (GDP). These statistics also show that women perform most of this work and have longer workweeks than men, when paid work and unpaid work are considered.
“If the value of women’s unpaid work were properly considered, it is very likely that women would emerge in most societies as the main ––or at least equal–– providers (13).”
The underestimation of unpaid work in economic terms is partly due to the limited definition of economic activity, which considers economic value synonymous with market value. As such, for example, domestic work is considered a contribution to production when it is performed in other households for pay, but not in one’s own household. Consequently, approximately 66 percent of women’s working time, versus 24 percent of men’s, receives no economic recognition in the System of National Accounts (SNA) (14).
The lack of recognition of unpaid work in the national accounts has a negative impact on gender equality at the macroeconomic level due to the importance of these accounts as instruments for policymaking. In fact, the national accounts quantify all areas defined as part of the domestic economy. Accordingly, the current economic situation and trends are analyzed, the economic dynamics are interpreted, forecasts are made on the potential effects of economic or policy changes, and decisions are taken on the allocation of resources. The failure to recognize the economic value of unpaid work leads to the belief that people who spend their time caring for others without compensation are “unproductive,” “inactive,” “unemployed,” and outside the business cycle. In addition to considering justice in the recognition of production contributions, it must be emphasized that the invisibility of such contributions adversely impacts the just distribution of resources, benefits, and compensation deriving from that production.
Changes in the 1993 NAS broadened the concept of economic activity to include some activities typical of subsistence agriculture economies. However, the economic value of most of the household and community work is still disregarded, which leads to an underestimation of the total product of society; failure to recognize and compensate many individual contributions, particularly from women; and the distortion of the forecasts of future needs.
Human Capacity Development The value of unpaid care work in the household transcends the economic sphere. For both children and adults, this value is related to the development of capacities, the broadening of options, and key issues of creating and nurturing human relationships. Unpaid care work is an essential component of human development (15).
The meaning of “unpaid care work” is similar to the definition adopted by Diane Elson in the biennial UNIFEM Report, Progress of the World’s Women 2000. “Work” emphasizes
10
the Valuation of Unpaid Work: A Key Strategy for Gender Equality Policy
that activity has a cost in terms of time and energy. It arises out of a social (usually family) relationship that is accepted as an obligation. “Care” denotes that the activity is focused on providing services for the well-being of others, while “unpaid” stresses that the activity is performed without any financial compensation (5).
The UNDP highlighted this issue in the Human Development Report 1999 (15). This report brought attention to the fact that in analyzing the effects of globalization, there had been a failure to consider the impact of such processes on the work of caring for children, the sick, the elderly, and healthy people who need to maintain and renew their health to remain in the formal workforce. It was emphasized in the report that the gender perspective is essential for this analysis, as women take on the majority of the workload for providing care and receive the least compensation for it.
A major portion of care cannot be delegated to third parties and must be performed in the household, which has implications for women’s job opportunities and economic independence, as well as the need to determine what types of action are needed to gain recognition for care work. This implies recognition of its practical value in public policy.
Health Care DeliveryThe promotion of unpaid health care work, especially when performed in the household,
is the foundation for health development. Evidence from studies in industrialized and developing countries shows that over 80 percent of health care services are provided in the household (16). Since women have the primary responsibility for such care, they are more affected than men by changes in the provision of public health services.
Historically, this unpaid contribution has been guaranteed through the traditional division of labor by sex that gives women responsibility for providing health care for children, the sick, the elderly, and the disabled, as well as the daily hygiene and well-being of the family. This division of labor, along with the economic invisibility of unpaid work and the assumption that the elasticity of women’s time is unlimited, has delayed the consideration of the limitations and costs of the time that women spend on such tasks and, even more, on caring for themselves. On the contrary, from the outset, health care programs, such as those that promote children’s health (through healthy child monitoring, oral rehydration, breast-feeding, and immunization programs) (17) have been geared primarily to mothers, and thus mothers are expected to sustain them.
The assignment of these obligations to women has not been consistently accompanied by a concern for creating the conditions that will prepare them to play such roles (17). Cutbacks have been made in public services ––such as reduction of the length of hospital stays and de-institutionalization of the mentally ill and elderly–– without considering the feasibility of women being able to provide such services effectively in their available time. These policies have also failed to take into consideration the effects of the excessive workload of women on their health and economic security.
11
Elsa Gómez Gómez
The trend towards transferring health services to the household increases the time and workload that must be accepted by those who provide the care. These health care providers, mostly women, must coordinate fragmented services and learn how to perform them with little or no training, a situation that increases their anxiety level and potential for error (18). Current information indicates that the distribution patterns for women’s time, particularly poor women, include little or no discretional time. This lack of time is associated with the “double shift” (paid and unpaid) for women who participate in the formal labor market. Studies in Canada indicated that one-third of women who cared for an elderly dependent family member were employed; this portion increased to 50 percent when considering women who cared for their parents (18). For example, research in Chile and Canada shows that 14 percent of employed women in Santiago (19) and 6 percent in Quebec had to leave their jobs to care for a family member (20). Accordingly, the “savings” in public expenditures are simply costs transferred from the State to the community and families.
As a result of the economic invisibility of unpaid work, no realistic analysis is available on the sustainability of a health care system based primarily on gender roles and the unpaid work of women. However, such analysis must be considered given factors of aging and changes in the epidemiological profile, which are steadily increasing the demand for health services. The higher demand is concurrent with the increase in female participation in the labor market, which in turn implies a reduction of the supply of care. Accordingly, it is imperative to consider the actual cost of providing care as well as its just distribution, not only between men and women in the household but also between families, the community, and the state.
CHALLENGES FOR POLICYMAKING
If the unpaid contributions of women and men were properly recognized, social and economic policy and the regulations and institutions that structure society would undergo significant changes (13). The fruits of labor would be distributed more equitably between women and men, leading to a radical change in income potential and the direct right to social security benefits, including health care.
Recognizing the importance of promoting gender equality in terms of capacities and opportunities as well as compensation, PAHO is committed to working with other international and national organizations to facilitate greater visibility of unpaid work, promoting its consideration in the design and evaluation of health-related policies. This is not simply a matter of providing salaries for housewives; rather the objectives include keeping the economic invisibility of unpaid care work from increasing the social fragility of care providers and from becoming a factor in social exclusion. The objective of these efforts is to create conditions to ensure that the burden and rewards associated with care work are fairly and optimally distributed between sexes, families, the market, and the state.
12
the Valuation of Unpaid Work: A Key Strategy for Gender Equality Policy
In the next section, the discussion includes some of the implications and potential applications of measuring unpaid work and evaluating its impact on social and economic policymaking.
The Importance of Measuring Unpaid Work
The production and analysis of information on time spent in unpaid work activities by household members is clearly a prerequisite for the consideration of the value of this work in national accounts and policies. Measurement options primarily include determining how many people and how much time is involved in unpaid work activities. For these measurements, time use surveys (TUS) are the preferred tools, whether the research is for this subject alone or time use modules are included in data collection instruments with broader objectives, such as household surveys and censuses.
The information furnished by TUS can be used to measure unpaid work within the framework of current national account measurements ––such as the GDP–– by assigning economic value to time indicators, a topic discussed in greater detail in other chapters of this volume. Assigning value to unpaid work makes it visible and affects the criteria used in public policymaking.
In addition to encouraging the economic valuation of unpaid work through the national accounts, TUS offer critical evidence for ensuring that the care and needs of caregivers count in policymaking. In fact, these surveys provide measurements of the interdependence between the activities of household members —that is, the relationship between paid work, unpaid work in the household, community work, study, rest, and personal care (21)—, information that is essential to advance the knowledge of:
The impact of transferring services to the community ––or expanding the cover-■■
age of public services–– in terms of changes in the unpaid workload of women and men in the household and, at the same time, the types of adjustments that both sexes must make to cover the service deficit (i.e., reduction of time spent on paid work, study, domestic activities, care for others, and rest); The nature and magnitude of the demand for direct and indirect care services that ■■
can be covered by third parties, as well as those that cannot be delegated outside the household and are related to the development of human capacity;The additional work created by children in the household;■■
The amount and use of discretional time by people in or outside the labor mar-■■
ket;The magnitude of the double workload of women who participate in the labor ■■
market and maintain the household;The effects of changes in paid and unpaid workloads on the health and nutrition ■■
indicators of the household members;
13
Elsa Gómez Gómez
Socioeconomic diversity in time use patterns, as well as the dynamics of such pat-■■
terns in response to demographic, economic, and public policy changes;The nature of the division of labor in the household by sex and the degree of gen-■■
der equality achieved in the distribution of work in and outside the household.
This information has clear implications for public policymaking and immediate rele-vance to the health sector. The evidence drawn from the TUS challenges the implicit assumptions that the transfer of government responsibilities to the “community” is based on a strategy for cost containment and incentives for social participation. One assumption is that there are ample “inactive” human resources with time available to accept such responsibilities and another is that these resources consist of all the women outside of the workforce (21).
As pointed out by María Ángeles Durán (22) in this publication, measuring unpaid work in the household creates opinions, informs decisionmakers, and “empowers” interest groups that advocate gender equity in social and economic development policy. The evidence from these measurements helps promote policies that reconcile the responsibilities of the two sexes in the public and private spheres, guarantees the civil right to social protection, and ensures adequate availability of care services.
In this context of measurement, it must be stressed that households are not internally uniform units in terms of the work distribution, resources, and power among their members, and thus data must be disaggregated by age and sex. It is worth repeating that the measurements of poverty and workload that account for the entire household as the basic unit of information conceal critical inequalities in such dimensions. Figures for compensation and contribution to production by women and men, and girls and boys can be obtained only if this basic unit is the individual. The emphasis on disaggregated does not take away from the analytical importance of evaluating individuals in the relational context of the household and family, units that do not always overlap. From a gender perspective, the analytical reference to the household/family is essential, considering that family power relationships and roles are the central locus of the subordination of women. Accordingly, efforts to facilitate gender equality and the empowerment of women in broad social and economic areas should especially consider their implications at the household level.
Valuation of Unpaid Work in Economic and Social Policymaking
Although explicit objectives refer to equity, social protection, and poverty alleviation, current social and economic policymakers tend to ignore the contribution of unpaid care providers, unaware of the requirements and consequences associated with such work. Addressing this problem implies a reconsideration of policies so that redistribution and solidarity are considered key issues in their design.
The first step in such reconsideration is to question the justice and efficiency of current policies related to the social distribution of care responsibilities. Some policies not only
14
the Valuation of Unpaid Work: A Key Strategy for Gender Equality Policy
increase the social vulnerability of women, but also fail to create conditions for the adequate delivery of care to society members in need. Adequate health care delivery is not possible without recognizing care work as an essential ingredient of development that society has the obligation to guarantee. As mentioned earlier, such acknowledgment entails the valuation of unpaid care work, not only in terms of its contribution to economic production, but also its key importance in the development of human capacities.
Unpaid work performed in the household without Social Security benefits has traditionally been and still remains to be the backbone of care and of the subsidy for social protection. The latter is true because, in their role as caregivers, women absorb the main impact of structural adjustments that decrease public health care delivery. In the health sphere, the current trend toward public expenditure cutbacks, fees for services, the privatization of services, and insurance linked to employment have exacerbated gender inequities in the distribution of the unpaid workload and access to direct social protection benefits. These policies, which appear to be neutral, conceal profound gender biases because they lead to the transfer of costs from a paid health economy to one based on the unpaid work of women. These policies lack a consideration of both time and resource constraints to effectively provide care and of the impact that the additional workload can have on the employment situation, economic independence, and physical and emotional health of caregivers. In most cases, they also fail to consider the sustainability of a free health care system, the quality of care provided in the household, and the availability of support structures for that care (23). Such policies are inconsistent with the criterion of both equity and efficiency, especially when acknowledging that the best health investments are those connected with prevention, early detection, and treatment, which take place in the household in over 80 percent of cases (24). In addition, as noted earlier, assumptions that health care systems are sustainable based on the unpaid work of women require an empirical consideration of current demographic and epidemiological trends. Given the steady entry of women into the labor market, the expected increases in the demand for services linked to the aging population and rise in chronic diseases cannot be covered effectively and indefinitely in the household.
When policies consider gender equality in work as a desirable goal, this equality tends to be defined only partially in terms of participation in the job market, not in terms of unpaid care work. As mentioned earlier, although the availability of one’s own income certainly plays a key role in a person’s empowerment, women’s freedom to opt for paid work is limited by the need to find a balance between their paid work and household responsibilities. Consequently, the nature of the options faced by women and men in the search for gender equality depends significantly on the degree to which policies give integral consideration to the labor market and the care required by household members (e.g., children, the elderly, and the sick).
At policy levels that have shown explicit interest in reconciling the private and public spheres of work, interest has been mainly expressed by women, reinforcing the overall view that household maintenance is a feminine task that should be combined with women’s paid
15
Elsa Gómez Gómez
work, not with the work of men or the couple. The emphasis of this reconciliation has been primarily on the provision of child care (particularly maternity leave and daycare centers) as an instrument to facilitate mothers’ participation in paid work. There are very few parallel labor laws for fathers and, when they do exist, they are more limited than those for mothers. It is also important to point out that care for the sick, disabled, and elderly, a responsible that mainly lies with women, is rarely considered in this context.
If it is acknowledged, first of all, that in-home care work is essential for developing capacities and human relationships and, secondly, that a significant percentage of this work cannot be delegated to third parties, the corollary would be for the work to become a viable option, that is, to be socially and economically valued.
“The key challenge for human development is to find incentives and compensations that ensure that care services are offered ––by the family, the community, the state, and the market–– while recognizing gender equality and fairly distributing the workload and cost of care” (15).
Hence, the idea is that to respond to the challenge of reconciling the public and private spheres of work, a) to protect and promote gender equality in terms of capacities, opportunities, compensation, and freedoms, and b) to guarantee the care required by dependent individuals, a wide range of investments and legislative measures are required that aim to:
Facilitate personal choice by women and men concerning how to reconcile respon-■■
sibilities in employment and the household (i.e., time and money for care, care for children and the elderly, flexible schedules). Promote and encourage shared responsibility between women and men in unpaid ■■
care work, with an emphasis on incentives for men (i.e., paternity leave).Strengthen the service delivery in the public sphere or facilitate the purchase of ■■
services by households through money transfers or tax exemptions.Provide universal access to social protection, separating it from participation in ■■
paid work. It must be emphasized that, to the extent that insurance programs are linked to employment, taking on the responsibility for unpaid care work in the household will result in less access to health care and the categorical exclusion of unpaid health care providers.
ACTIONS IN PROGRESS
Based on its experience and leadership in promoting gender equality and in the preparation of national health accounts in the countries of the Region, PAHO has promoted a series of seminars, workshops, and intersectoral working groups to emphasize the importance
16
the Valuation of Unpaid Work: A Key Strategy for Gender Equality Policy
of unpaid household work for the production of health. Focuses include the preparation of conceptual frameworks and methodological instruments for quantifying time spent on unpaid work, assignment of an economic value to time indicators, and representation of the contribution of unpaid work in the estimation of national accounts, with special reference to satellite accounts.
Although the economic valuation of unpaid work is a necessary component in promoting gender equality, more actions are needed to move toward a fairer redistribution of work, resources, and compensation derived from work. For that reason, PAHO is promoting actions designed to generate evidence and strengthen intersectoral networks that advocate the development of policies that recognize and support care work as an essential component of human development, while pursuing redistributive objectives.
In private health, PAHO has proposed a series of coordinated activities to promote the development of financial, economic, and social indicators to increase the visibility of unpaid contributions of women to health and development. These actions, designed to help the countries in the Region fulfill the commitments in this area that were agreed upon at the conference in Beijing, include (24):
Develop a proposal for the standardized classification of activities that is consistent ■■
with the realities of the Region and compatible with the International Classifica-tion of Activities for Time Use Statistics (ICATUS) prepared by the UN Statistics Division. This classification would have a flexible structure, be adaptable to differ-ent national and subnational situations, and facilitate selection and estimation of indicators to respond to each country’s political needs and priorities.Promote and support the preparation of household sector accounts that comple-■■
ment the national health accounts, within the framework of the NAS, in order to develop indicators that assign a monetary value to women’s unpaid contributions to health and development.Promote and support the collection, analysis, and implementation of time use sta-■■
tistics that specifically target the subject of health.Promote studies to determine the magnitude and distribution of the workload ■■
imposed by the underfunding of public health systems on household members ––particularly women–– considering the socioeconomic diversity of the impact.In sectoral reform policies, promote the inclusion of the “transfer” —from the State ■■
to the household— of invisible costs of structural adjustment and cost containment measures.In policies that extend social protection, promote the consideration for the benefit ■■
exclusion experienced by women who work primarily or exclusively in providing in-home care without financial compensation.
17
Elsa Gómez Gómez
Endorse studies and forecasts on increases in the unpaid care workload resulting ■■
from demographic and epidemiological changes underway (aging, chronic diseases, mental illness, HIV infection, reemerging infectious diseases, etc.).Support the accumulation of evidence on the impact that the unpaid workload of ■■
poor women has on achieving the Millennium Goals in nutrition, poverty reduc-tion, and the reduction of maternal mortality, infant mortality, HIV, malaria, and other diseases.
These actions are based on the premise that for women to achieve gender equality and empowerment, the private sphere of unpaid health care work in the household must become a public issue. That achievement implies not only the need to give value to the economic contribution of this work on the well-being of the population, but also to elevate to the political agenda and treat as civil rights those issues that are concentrated mainly in the private sphere, such as social protection for care providers, care for dependent members of the household, and domestic violence.

19
chapter 2
Household Production Accounts for Canada, Mexico, and the United
States: Methodological Issues, Results, and Recommendations
Cc
Barbara M. Fraumeni*
INTRODUCTION
Men and women spend a majority of their time in nonmarket activities, yet the importance of these activities goes unrecognized in the official measure of economic activity: gross domestic product (GDP). Failure to do so implicitly devalues
the worth of nonmarket activities, yet no society can function without them. Household production accounts are available for a number of countries and are sometimes constructed by government agency personnel. Such accounts cover a subset of nonmarket activities, therefore neglecting or failing to properly identify future benefits of some activities, such as those leading to human capital creation. In addition, often neither nonmarket nor household production accounts can be easily compared to macroeconomic measures in official national income (GDP) accounts. Commonly this is because they are in nominal dollars and lack measures of inputs and outputs, although other problems also exist. These limitations hinder attempts to design public policies that impact economic growth and social well-being.
* Muskie School of Public Service, University of Southern Maine, and National Bureau of Economic Research of USA. The research assistance of Marc Hitchcock is gratefully acknowledged.
20
Household Production Accounts for Canada, Mexico, and the United States
The focus of this chapter is on household production accounts for Canada, Mexico, and the United States, specifically accounts constructed by Hamdad (Canada), Harvey and Mukhopadhyay (Canada), Gómez Luna [undated] (Mexico), and Landefeld, Fraumeni, and Vojtech (United States)1 (25–28). Construction of these accounts depends on time use surveys. Major conceptual and methodological issues surround these surveys and both nonmarket and household production accounts. Each of the accounts and surveys utilize unique implementation tools, including what activities and populations to cover. This chapter will discuss these differences, present the major results of the accounts, and propose ways to improve the accounts and increase international comparability with an eye to facilitating public policy formulation.
Household production accounts use Reid’s third-party criterion to determine what activities are to be covered (29); nonmarket accounts can include all activities that occur outside the market sector2 (30–31). The third-party criterion calls for household production accounts to include all activities that another party could be paid to perform.3 Nonmarket accounts include all the activities of household production accounts, as well as excluded activities, such as attending school and receiving health care, and they may or may not include certain activities such as leisure or sleep.
TIME USE SURVEYS
Time use surveys provide the foundation upon which almost all nonmarket or household production accounts are built4 (30–31). The multinational time budget study of Szalai and his collaborators (32) is frequently cited and has been used as a model for other surveys. Ideally, through the use of sampling techniques, the activities of the entire population of a country at different times of the day, different days of the week, and different times of the year should be covered.5 Ideally, samples should identify the diverse time use patterns used by subgroups of the population and people living in different areas of the country; however, primarily for budgetary reasons, the ideal is rarely achievable.
One of the major difficulties in time use surveys is dealing with secondary activities.6 Assuming that one can obtain accurate information on secondary activities from survey
Two household production accounts are included for Canada, as Harvey and Mukhopadhyay use a distinct methodology from the others.1
Nonmarket accounts are rare; one example is that constructed by Jorgenson and Fraumeni.2
Some activities that could pass the criterion are still excluded from household production accounts, most notably childbearing by surrogate 3
mothers.
The set of nonmarket accounts that underlie the research by Jorgenson and Fraumeni do not rely on time use accounts to determine the 4
amount of time spent in different nonmarket activities, rather they divide such time into three broad categories: time spent in formal schooling, time spent in personal maintenance and sleep, and time allotted to other activities.
A great deal has been written on time use surveys. For a brief summary, see Jackson and Chandler (5 33), a chapter by Harvey and other chapters in the book edited by Pentland et al. (34), and an article by Juster and Stafford (35).
See Pollak for a detailed discussion of secondary and passive (standby) activities, and other articles on time use in the same 6 Monthly Labor Review (36).
21
Barbara M. Fraumeni
respondents, what does one then do with this information? Should a day be allowed to include more than 24 hours, or should a 24-hour day be split somehow among primary and secondary activities? How should passive secondary activities be treated, such as sleeping in the same house as your children in case they have emergency needs? Frequently, surveyors only collect information on certain secondary activities, such as child care, and even then, sometimes with special supplements to regular time use surveys.
Collection methodology is also a controversial issue in time use surveys. Some studies are conducted using time diaries, while others have a more direct approach. For a time diary, how long should the intervals be: five minutes, 10 minutes, or left up to the respondent? What is the best way to take on a direct approach, through telephone interviews, mailings, personal interviews, or a combination of all approaches with follow-up? Should computer-assisted systems be used? Should household members be able to report data only for themselves, or also for other members? What is the most effective method to collect information on children? What is the most effective recall period: one day (yesterday), various days (the previous week), or another method? If time use data is collected as part of another survey, will the respondents’ fatigue affect the responses?7 Collection methodologies can impact time use survey results, so such procedures must be researched and designed carefully.
VALUATION METHODS IN HOUSEHOLD PRODUCTION ACCOUNTS
Labor input is clearly the largest input to household production,8 and can be valued either with a replacement or opportunity cost approach. The term “replacement” refers to the cost of replacing an unpaid household worker with a paid worker. In this approach, the cost used is typically that of a generalist, (e.g., someone who performs all of the household tasks) or a specialist (e.g., a cook, a plumber, someone with a specific aptitude to perform a certain task9). The U.S. Committee on National Statistics’ Panel to Study the Design of Nonmarket Accounts recommended a unique variant in the replacement approach: a productivity-adjusted replacement cost, which takes into consideration the relative productivity of the unpaid household when establishing the specialist wage.10 On the other hand, with an opportunity cost approach, the market wage of the individual who performs the unpaid
Households that have completed their last (eighth) month of the Current Population Survey are eligible for inclusion in the American Time 7
Use Survey (ATUS), the recently instituted U.S. time use survey. Respondent fatigue may be one reason why the response rate for ATUS is less than originally expected.
Table 3 of Landefeld et al. gives a sense of the relative magnitudes of inputs to household production. In 2004, housing services (housing 8
capital input) were US$1,221 million, consumer durables services (consumer durable capital input) were US$865 million, and nonmarket household services (labor input) were US$2,219 million.
The generalist approach is frequently called the “housekeeper approach,” as if only one person (a housekeeper) is hired to perform all 9
tasks.
See equation 1.2, p. 31 of Abraham and Mackie (10 37).
22
Household Production Accounts for Canada, Mexico, and the United States
household task is used to value that time.11 As will be demonstrated later, the value of household labor input fluctuates significantly when using different methodologies.
Most household production accounts use an “input” approach to assess output; these accounts, which frequently only appraise labor —rather than capital input— set an equal value for output and input in nominal dollars.
Another option is the output approach, which gives nonmarket goods and services in the household production account the same values as similar goods or services available in the market. Harvey and Mukhopadhyay’s example (26) for Canada is included in this chapter primarily to illustrate this technique.
ACCOUNTS bY COUNTRY
Coverage
There are significant differences in the year(s) and populations covered by the household production account, except in the case of the two Canadian accounts. Harvey and Mukhopadhyay (26) and Hamdad (25) use the same data set, except that Hamdad compares results over two years, 1992 and 1998, while Harvey and Mukhopadhyay and construct a household production account for only one year, 1992. Gómez Luna elaborates a household production account for one year, 1996 (27), while Landefeld, Fraumeni, and Vojtech construct an account for several years, 1946–2004 (28).
The youngest persons included in the household production accounts range from eight in Mexico, 15 for Canada, and 18 for the United States. Most time use surveys underlying household production accounts randomly select one individual from each chosen household to interview, aside from in Mexico, where data is collected from every household member.
The time use surveys in use are the General Social Survey (GSS) in Canada; the National Survey of Work, Contributions, and Time Use (ENTAUT) in Mexico (38); and the Multinational Time Use Study (MTUS) in 1965, 1975, and 1985 (39) and American Time Use Survey (ATUS) for 2003–2004 in the United States12 (40). Samples taken in each case represent the population as a whole but not necessarily particular subsamples.13 The size of the Mexican sample is unknown; the Canadian sample is about 10,000 people; and the sample in the United States for 2004 is just over 13,000 people. The GSS and ATUS base their time use questions on a 24-hour period using a Computer-Assisted Telephone System (CATI), while the ENTAUT asks for information on time use for the previous
The unpaid household worker may not perform market work. This is not problematic, as the opportunity-cost wage is typically set equal to 11
the average wage of market workers who are demographically similar.
Time use estimates for earlier years come from Eisner (12 41).
The term population is used as a general term; often the represented population is the civilian noninstitutional population.13
23
Barbara M. Fraumeni
week. GSS interviews take place within 48 hours of the designated time use day, and ATUS covers time use from 4 a.m. on the previous day to 4 a.m. on the contact day.
Hamdad and Gómez Luna include only labor as an input to household production, while Harvey and Mukhopadhyay may implicitly include consumer durable inputs as well. They subtract intermediate inputs and the cost of the Use Of Dwelling (UOD) (or a portion of the cost) per unit of household output from the basic price of a similar good or service, but do not subtract consumer durables services. Consumer durables include motor vehicles, stoves, refrigerators, washing machines, and others. Landefeld et al. include labor, consumer durables, capital from government roads related to household production, and residential housing services as inputs.14 Landefeld and McCulla include intermediate inputs to illustrate an extended input-output account for household production (42).
Valuation
With the exception of the Harvey and Mukhopadhyay household production account, which values household production through the basic price of goods or services of like quality, all other household production accounts examined in this chapter value labor input through at least two different approaches. Hamdad values labor using three approaches: opportunity cost, specialist cost, and generalist cost; the latter is cited as the preferred approach and is the only one reported.15 Gómez Luna practices two variations of a specialist approach: in the first, the average specialist wages are taken from the System of National Accounts of Mexico (SNAM) and in the second, average specialist wages are taken from ENTAUT. As individuals are typically unaware of the dollar value of contributions and employer-paid benefits, the estimates based on the ENTAUT household survey are lower, as expected, than those reported in SNAM, which relies on an employer survey. Landefeld et al. use all four approaches —opportunity cost, specialist cost, generalist cost, and productivity adjusted specialist cost—, as well as a minimum wage variation on the generalist approach. The generalist approach, using a housekeeper’s wage, is the basis for all but one table.
As noted earlier, Landefeld et al. include both capital and labor input to household production. Residential housing capital input is recorded as part of the U.S. National Income and Product Accounts (NIPAs). Consumer durable capital input is calculated by multiplying consumer durable stocks by a gross rate of return, which is the sum of net return to capital plus the depreciation rate. As the NIPAs estimate the return to government capital input as depreciation, the Landefeld et al. NIPA value for government capital input is increased by the net return, which is a net rate of return times the government road capital stock.
Some consumer durables related to maintenance are excluded.14
Jackson and Chandler value labor using an opportunity cost approach, before and after tax; a generalist approach; and a specialist approach, 15
and then show their results for all four approaches (33). However, 1992 is the last year of their Canadian household production account.
24
Household Production Accounts for Canada, Mexico, and the United States
Because national accounts are a double-entry system, any income-side imputation, whether labor or capital input, must be added to the product side. Accordingly, in Landefeld et al.’s household production account adjusted GDP, housing, consumer durables, and nonmarket services (the labor component) are added to personal consumption expenditures and the net return of government services capital (roads and others) is added to government consumption and investment.16
For nonmarket goods and services, Harvey and Mukhopadhyay’s main challenge is to estimate the basic prices for similar market goods or services; a basic price is equal to market price, plus subsidy and less tax. Intermediate inputs per unit of production are subtracted in order to emulate GDP market production; they rationalize subtracting UOD from household production by noting that UOD is already included in Canada’s GDP. Accordingly, to be more comparable with the Landefeld et al. household production account with both capital and labor input, the adjusted version in Table 1 with UOD included should be used as a basis to compare the United States and Canada.
Results Comparison
Although the four household production accounts examined are in nominal dollars (not adjusted for inflation or quality change), the years covered vary and thus results are presented in terms of percentages of GDP as currently measured in the country’s national accounts.
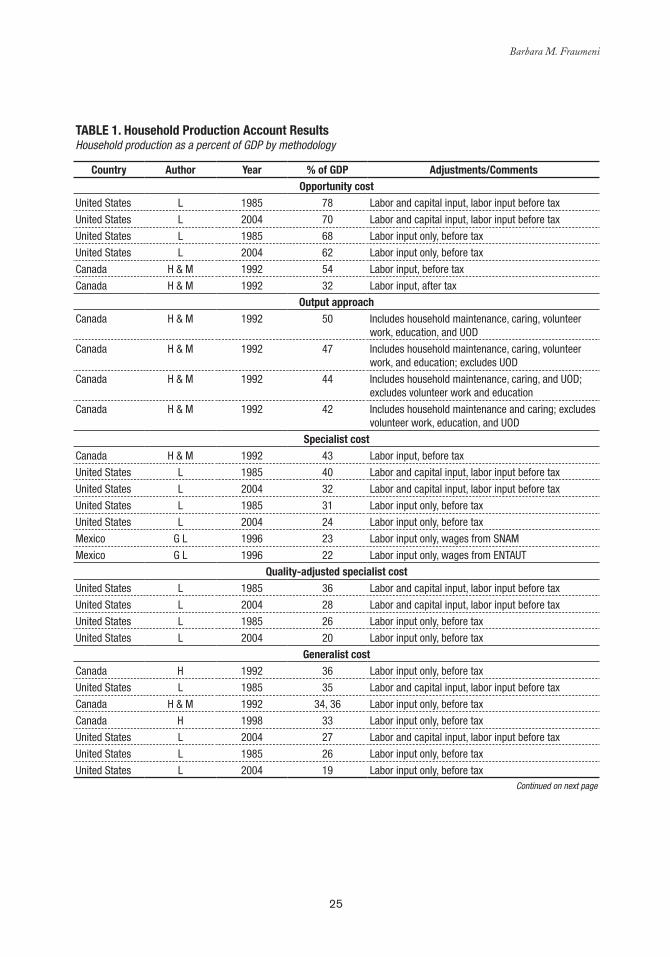
Three types of comparisons are presented: 1) comparisons for various years with adjustments made to increase comparability, 2) comparisons that include all components, and 3) comparisons by gender. Table 1 includes all adjusted and unadjusted results. The results are listed by approach in descending order determined by the maximum estimate relative to GDP, and then, in each approach by size of estimate relative to GDP from largest to smallest. Table 1 also includes results from Harvey and Mukhopadhyay [1996] (26), which use an input approach.
To be consistent, when a net return is imputed to government road capital, a net return must be imputed to all types of government capital. 16
Expenditures on consumer durables are reallocated from consumption to investment, but this has no impact on GDP.
25
Barbara M. Fraumeni
Table 1. Household Production account Results Household production as a percent of GDP by methodology
Country author Year % of GDP adjustments/CommentsOpportunity cost
United States L 1985 78 Labor and capital input, labor input before tax
United States L 2004 70 Labor and capital input, labor input before tax
United States L 1985 68 Labor input only, before tax
United States L 2004 62 Labor input only, before tax
Canada H & M 1992 54 Labor input, before tax
Canada H & M 1992 32 Labor input, after tax
Output approachCanada H & M 1992 50 Includes household maintenance, caring, volunteer
work, education, and UOD
Canada H & M 1992 47 Includes household maintenance, caring, volunteer work, and education; excludes UOD
Canada H & M 1992 44 Includes household maintenance, caring, and UOD; excludes volunteer work and education
Canada H & M 1992 42 Includes household maintenance and caring; excludes volunteer work, education, and UOD
Specialist costCanada H & M 1992 43 Labor input, before tax
United States L 1985 40 Labor and capital input, labor input before tax
United States L 2004 32 Labor and capital input, labor input before tax
United States L 1985 31 Labor input only, before tax
United States L 2004 24 Labor input only, before tax
Mexico G L 1996 23 Labor input only, wages from SNAM
Mexico G L 1996 22 Labor input only, wages from ENTAUT
Quality-adjusted specialist costUnited States L 1985 36 Labor and capital input, labor input before tax
United States L 2004 28 Labor and capital input, labor input before tax
United States L 1985 26 Labor input only, before tax
United States L 2004 20 Labor input only, before tax
Generalist costCanada H 1992 36 Labor input only, before tax
United States L 1985 35 Labor and capital input, labor input before tax
Canada H & M 1992 34, 36 Labor input only, before tax
Canada H 1998 33 Labor input only, before tax
United States L 2004 27 Labor and capital input, labor input before tax
United States L 1985 26 Labor input only, before tax
United States L 2004 19 Labor input only, before taxContinued on next page
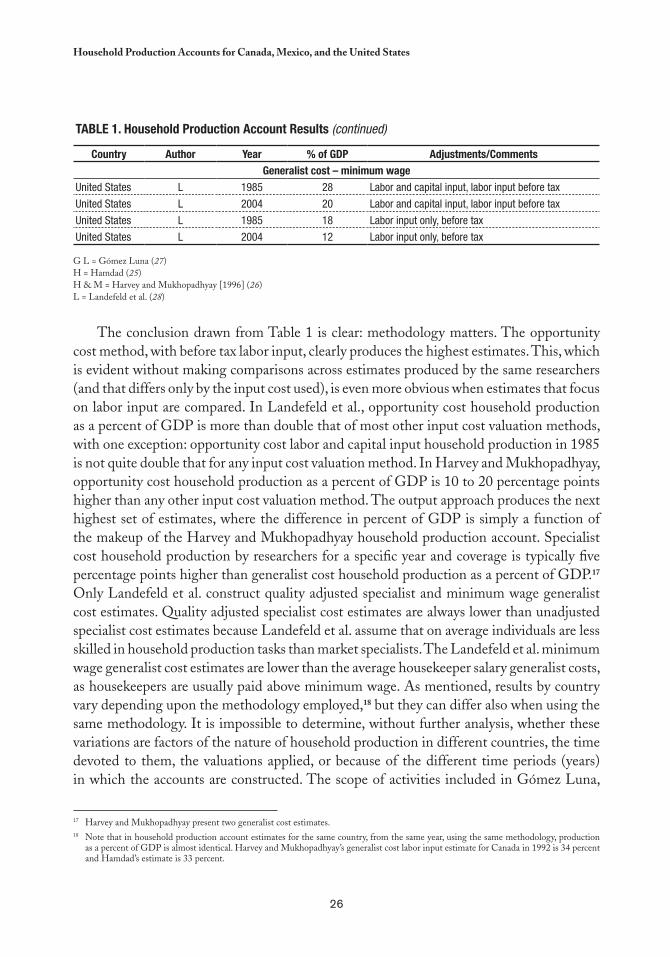
26
Household Production Accounts for Canada, Mexico, and the United States
Table 1. Household Production account Results (continued)
Country author Year % of GDP adjustments/CommentsGeneralist cost – minimum wage
United States L 1985 28 Labor and capital input, labor input before tax
United States L 2004 20 Labor and capital input, labor input before tax
United States L 1985 18 Labor input only, before tax
United States L 2004 12 Labor input only, before tax
G L = Gómez Luna (27)H = Hamdad (25)H & M = Harvey and Mukhopadhyay [1996] (26)L = Landefeld et al. (28)
The conclusion drawn from Table 1 is clear: methodology matters. The opportunity cost method, with before tax labor input, clearly produces the highest estimates. This, which is evident without making comparisons across estimates produced by the same researchers (and that differs only by the input cost used), is even more obvious when estimates that focus on labor input are compared. In Landefeld et al., opportunity cost household production as a percent of GDP is more than double that of most other input cost valuation methods, with one exception: opportunity cost labor and capital input household production in 1985 is not quite double that for any input cost valuation method. In Harvey and Mukhopadhyay, opportunity cost household production as a percent of GDP is 10 to 20 percentage points higher than any other input cost valuation method. The output approach produces the next highest set of estimates, where the difference in percent of GDP is simply a function of the makeup of the Harvey and Mukhopadhyay household production account. Specialist cost household production by researchers for a specific year and coverage is typically five percentage points higher than generalist cost household production as a percent of GDP.17 Only Landefeld et al. construct quality adjusted specialist and minimum wage generalist cost estimates. Quality adjusted specialist cost estimates are always lower than unadjusted specialist cost estimates because Landefeld et al. assume that on average individuals are less skilled in household production tasks than market specialists. The Landefeld et al. minimum wage generalist cost estimates are lower than the average housekeeper salary generalist costs, as housekeepers are usually paid above minimum wage. As mentioned, results by country vary depending upon the methodology employed,18 but they can differ also when using the same methodology. It is impossible to determine, without further analysis, whether these variations are factors of the nature of household production in different countries, the time devoted to them, the valuations applied, or because of the different time periods (years) in which the accounts are constructed. The scope of activities included in Gómez Luna,
Harvey and Mukhopadhyay present two generalist cost estimates.17
Note that in household production account estimates for the same country, from the same year, using the same methodology, production 18
as a percent of GDP is almost identical. Harvey and Mukhopadhyay’s generalist cost labor input estimate for Canada in 1992 is 34 percent and Hamdad’s estimate is 33 percent.
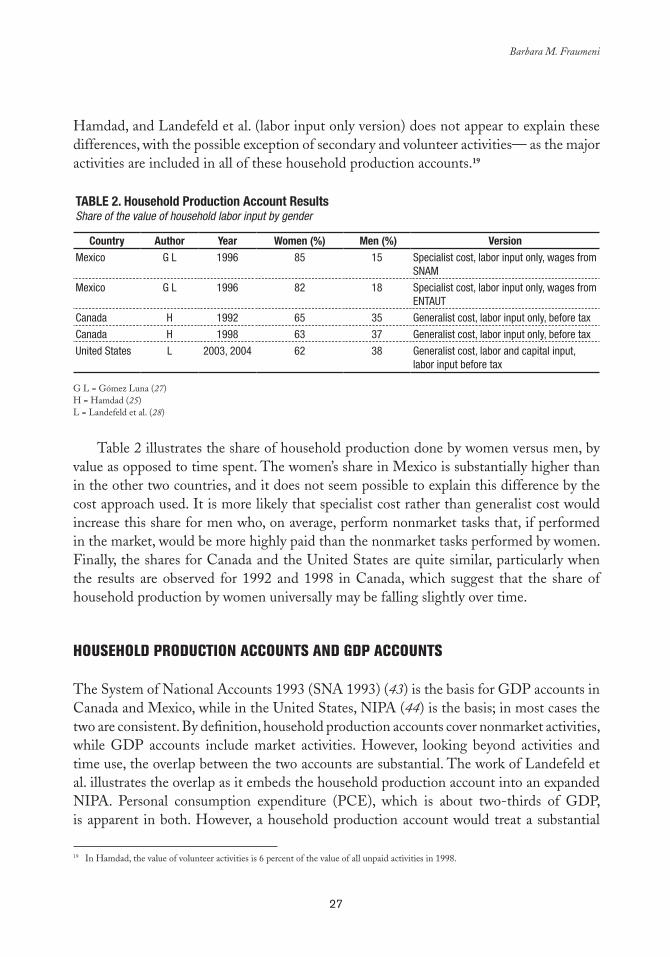
27
Barbara M. Fraumeni
Hamdad, and Landefeld et al. (labor input only version) does not appear to explain these differences, with the possible exception of secondary and volunteer activities— as the major activities are included in all of these household production accounts.19
Table 2. Household Production account Results Share of the value of household labor input by gender
Country author Year Women (%) Men (%) VersionMexico G L 1996 85 15 Specialist cost, labor input only, wages from
SNAM
Mexico G L 1996 82 18 Specialist cost, labor input only, wages from ENTAUT
Canada H 1992 65 35 Generalist cost, labor input only, before tax
Canada H 1998 63 37 Generalist cost, labor input only, before tax
United States L 2003, 2004 62 38 Generalist cost, labor and capital input, labor input before tax
G L = Gómez Luna (27)H = Hamdad (25)L = Landefeld et al. (28)
Table 2 illustrates the share of household production done by women versus men, by value as opposed to time spent. The women’s share in Mexico is substantially higher than in the other two countries, and it does not seem possible to explain this difference by the cost approach used. It is more likely that specialist cost rather than generalist cost would increase this share for men who, on average, perform nonmarket tasks that, if performed in the market, would be more highly paid than the nonmarket tasks performed by women. Finally, the shares for Canada and the United States are quite similar, particularly when the results are observed for 1992 and 1998 in Canada, which suggest that the share of household production by women universally may be falling slightly over time.
HOUSEHOLD PRODUCTION ACCOUNTS AND GDP ACCOUNTS
The System of National Accounts 1993 (SNA 1993) (43) is the basis for GDP accounts in Canada and Mexico, while in the United States, NIPA (44) is the basis; in most cases the two are consistent. By definition, household production accounts cover nonmarket activities, while GDP accounts include market activities. However, looking beyond activities and time use, the overlap between the two accounts are substantial. The work of Landefeld et al. illustrates the overlap as it embeds the household production account into an expanded NIPA. Personal consumption expenditure (PCE), which is about two-thirds of GDP, is apparent in both. However, a household production account would treat a substantial
In Hamdad, the value of volunteer activities is 6 percent of the value of all unpaid activities in 1998.19
28
Household Production Accounts for Canada, Mexico, and the United States
portion of PCE as intermediate input to household production; for example, food used in cooking at home. Consumer durables are not capitalized in GDP accounts, where they are considered as consumables, yet they are in a household production account. Housing services are already capitalized in the GDP accounts. To maximize the comparability of the magnitudes from a household production account to those in current GDP accounts, both labor and capital input should be included. Landefeld et al.’s augmented GDP, with labor and capital input as a percentage of GDP, is eight to 10 points higher than a version with labor input only.
RECOMMENDATIONS
Household production accounts are an important complement to GDP accounts, and therefore public policy decisions that consider only market activities could be short sighted and inappropriate. For women, the use of household productions accounts could be particularly important. Both men and women spend a substantial amount of time in nonmarket activities, but on average women spend substantially more hours in household production than men.20 Essential goods and services that contribute to the well-being of all individuals are being provided in household production, thus all countries should strive to construct adequate household production accounts and incorporate them into public policy decisions.
What should such accounts look like? Having demonstrated that methodology matters, for purposes of international comparability all household accounts should use the same methodology. And the most common valuation approach is a generalist cost labor input only approach, which should be used by all household production accounts. Moreover, the scope of any household production account should include child care. Substantial research is needed to determine how to adjust accounts for secondary activities, including child care. At this point, there is no general consensus on the best approach to secondary activities, but it is clear that a core approach should exclude volunteer activities, as information on time spent on these activities may be limited in many countries. Nonetheless, results using alternative methodology should be presented to increase the “how-to-do” knowledge in the field. The inclusion of capital and labor input and output measures in these alternative presentations is important to facilitate direct comparisons with GDP accounts. Similarly, to give a more complete picture of economic activity, household accounts should be embedded in GDP accounts to give a more complete picture of all types of economic activity. This objective suggests that the household production accounts should be presented in nominal and real terms, the latter adjusting to inflation and quality change. Even if household production accounts are not embedded in GDP accounts, it is desirable to
In 2004, women in the United States spent 31 hours per week in household production, while men spent 19 hours per week (20 28). In Canada, the corresponding figures for unpaid work in 1992 are 29 (women) and 16 (men) hours per week (33).
29
Barbara M. Fraumeni
construct household production accounts to facilitate historical comparisons and estimate productivity in both market and nonmarket sectors. How market and household production activities are performed has changed substantially over time, mostly due to technological innovations. Productivity change can impact substitution between market and nonmarket activities and goods and services, as can changes in the value of time caused by an increased participation of women in the labor force.21 Time devoted to activities for major categories of time use and demographic groups, at least by gender, should be presented along with household production account values. This information on time use would allow researchers to evaluate the differences between countries and changes over time, for example, to what extent do they relate to time use or to valuation wages? Finally, researchers should attempt to reconstruct nonmarket accounts, as some activities are only included in these accounts because of the “third party” rule, notably education and self health care.
To be useful to policymakers, household production accounts need to be published regularly with reasonably short time lag. Likewise, this is only possible if the time use surveys are conducted systematically. In most cases, government agencies need to construct household production accounts and conduct time use surveys of their own, when the production accounts attain a certain level of systemization (more frequency, less time lag), as relying on private researchers can be risky. The following is a brief listing of household production accounts, published by authors of the reviewed studies or employees of their agencies since 1990, and the associated time use surveys.22 The Canadian General Social Survey has collected time use data every six years since 1986. Statistics Canada published articles on the valuation of unpaid work in 1995 and 2003. The 1995 Jackson and Chandler article gives results for selected years beginning in 1961 and Hamad gives results for 1992 and 1998. A 2004 household production/unpaid work account has yet to be released.23 Harvey and Mukhopadhyay have not released a household production for Canada for a year past 1992. The fact that the ATUS is conducted on an annual basis allows for the yearly construction of a U.S. household production account. However, the Landefeld household production accounts, which cover 1946–2004 (28,42), are not official satellite accounts of the Bureau of Economic Analysis; accordingly the frequency of their publications is uncertain.24 25 Similarly, the publication regularity of the Mexican household production accounts is unknown, but a time use survey exists for 2002 (38).
Landefeld et al. give an example of the cost increase of restaurant meals versus home-cooked meals. As the valuation of home-cooked meal 21
preparation has increased, based on a rise in generalist wages, the increase in the cost of restaurant meals between 1985 and 2004 is less than the increase in the price (opportunity cost) of home-cooked meals.
For a listing of household production or unpaid work accounts prior to 1990 by country, see Table 5.1 of Jackson and Chandler (22 33).
Hamdad, the author of the most recent Statistics Canada household production account, has indicated to the author of this chapter her 23
involvement in working on volunteer accounts, instead of a 2004 household production account.
Landefeld and his co-authors were all employees of the Bureau of Economic Analysis when all —or almost all— of the work on these 24
accounts was done. It is more likely that official satellite accounts, rather than research accounts, will be funded, such as the Landefeld household production accounts.
The last year available for a Jorgenson and Fraumeni nonmarket account is 1986. Although Jorgenson, Fraumeni, and Christian have begun 25
to revive the nonmarket account project, it is uncertain when results will be available. For further analysis, see Fraumeni (45).
30
Household Production Accounts for Canada, Mexico, and the United States
As demonstrated, if household production accounts are to be an important source of information for policymakers, their frequency must be increased. Household production accounts time series would also facilitate policy formulation and analysis. Researchers need to determine why time use and its value have changed to determine the impact of policy actions and learn how to best support nonmarket work, particularly as the participation of women in the labor force has substantially increased over time. The Landefeld et al. household production account for the United States, and the older Jackson and Chandler account for Canada (33) have provided such time series. As new results are published for Canada, care should be taken to maintain consistency of these new values with the earlier results, or to indicate any significant differences. The U.S. efforts have benefited from the development and improvement of the MTUS and American Heritage Time Use Study (AHTUS)26 and it would be useful to expand these time series activities to other countries.
It is not possible to implement any of the recommendations in this work without a substantial commitment of resources, and, as previously noted, this would require a government commitment to annual publication of household production accounts with a reasonably short time lag. Nonetheless, since not even one of the major industrialized countries has such a program, much would have to changes before the recommendations herein could be implemented.
There has been substantial progress around the world in accounting for nonmarket activities through household production accounts, yet there is still much to be done, particularly to bring these accounts to the attention of policymakers. It is crucial to enhance the profile of the household production accounts through interaction with government officials and other actors, first, to obtain sufficient funding for the development of such accounts and the underlying time use surveys, and then (or perhaps simultaneously) to present this information to the policymakers. As such, both GDP accounts and household production accounts can form the basis for public policy.
For information on AHTUS, see Center for Time Use Research, American Heritage Time Use Study (26 46).
31
chapter 3
Satellite Account for Unpaid Household Services: An
Approximation for Mexico
Cc
María Eugenia Gómez Luna*
INTRODUCTION
Unpaid production activities carried out in the household, mainly by women, generate abundant services, which suggests that more goods and services are available in most countries than recorded in national accounts. When the production from
unpaid work is included in national accounts, a fundamental contribution to the lifestyle of the society can be seen and quantified. At the same time, appropriate measurements can be taken and linked to macroeconomic aggregates that governments, national society, and the international community will thoroughly examine.
This study —although referring to Mexico and falling within the framework of the System of National Accounts (SNA) of 1993 (43)— presents a method to measure production, via a satellite account, of unpaid services provided by men and women to household members, as well as their impact on macroeconomic aggregates. In addition to the total data, there are detailed estimates of domestic activities, community services, and care services, particularly health care. This information on what men and women do and how they contribute to household production will be analyzed and discussed, while at the
* Coordinator of Advisers to the Presidency of the National Statistics, Geography, and Informatics Institute (INEGI), Mexico.
32
Satellite Account for Unpaid Household Services: An Approximation for Mexico
same time the importance of unpaid work, which results in own consumption services, and its relation to overall economic activity will be revealed.
CONTEXT AND APPROACH
Globalization and economic structural adjustment have had major economic and social impacts on individual countries and the international community as a whole. It is necessary to implement new analysis that examines this impact with greater width and depth. Such analysis must incorporate the gender approach, transcending the current method of program and public policy evaluation and offering a comprehensive view of how these changes affect the social, economic, and physical livelihood of populations.
In the context of structural adjustment, certain policies reshape or reduce the size and characteristics of the public sector in the economy. Such policies are based on the premise that the marketplace opens “opportunities for all” and guides decisions “adequately.” Civil service has adopted criteria in which financial prudence and the maintenance of a balanced budget is crucial, and, therefore, many of its strategic development actions have left gaps that should be filled by other economic agents. In particular, public health services have experienced a lack of economic resources, which translate to household problems that, in another scheme, have been addressed by government support under the Social Security system.
In addition, demographic trends towards an aging population and changes in epidemiological profiles (such as the increase in chronic diseases) have increased the visibility and importance of in-home caregivers. Here it is worth adding that women, for the most part, provide health care in the household. Such activities have become an important supplement to health care services provided by public institutions (with increasingly limited financial resources), and also those provided by the private sector (at increasingly high prices). As a result, the mixed modality of public and private paid services, and unpaid household services has become more evident in health services delivery. For example hospital stays for postoperative convalescent care have been limited, while most of the care required for recovery is transferred to the household.
The social and economic impacts of these adjustments have resulted in the deterioration of individual and collective well-being within countries, and specifically within the households. Private life activities carried on outside the marketplace have entered the public sphere, while at the same time marketplace activities have been transferred to the private sphere of the household. An example is the increased participation of women in market activities, while they continue to attend to activities outside the marketplace. These unpaid activities are time consuming and receive no social or economic recognition. The participation of women in such activities has important implications that should be identified to steer government actions toward the harmonization of public life in the marketplace and private life outside the marketplace.
33
María Eugenia Gómez Luna
In that context, this study aims at estimating the value of unpaid household services outside the marketplace, with the same conceptual and methodological framework that is used to measure the production of all goods and services included within the framework of the SNA (marketplace activities). This means a macroeconomic approach that extends the boundary of production through a satellite account that expresses (in money) the value of the services provided in the household by men and women, and their impact on the overall values related to that production.
THE SYSTEM OF NATIONAL ACCOUNTS AND SATELLITE ACCOUNTS: CONCEPTUAL ASPECTS
The SNA and Production boundary
The SNA 19931 contains the conceptual framework for preparing the national accounts. “It is made up of a coherent, systematic, and integrated set of accounts and tables based on a set of internationally accepted concepts, definitions, classifications, and accounting rules that present economic actions carried out during the productive process in a given period” (43).
National accounts provide the information about a country’s economic performance —through the systematic recording of production, distribution, savings, and financing operations— to contribute to the knowledge, analysis, planning, and design of public policies. Accordingly, they contribute to the evaluation and communication of the results of a country’s economic activities,2 as a central focus of governments, investors, and society in general.
In order for the concepts and variables of the accounts to maintain their systemic approach, they must remain within limits established by the SNA, which are defined by production boundary that include:
Market production(a) is production mainly delivered on the market at economically significant prices, which influence the amount producers are willing to offer or consumers are willing to pay. This production is obtained in financial and nonfinancial companies and is the largest within the group.
The 1 System of National Accounts 1993 presents the conceptual and methodological framework for preparing national accounts for countries and is the basic reference for this work. It is endorsed by the World Bank, the International Monetary Fund, the Organization for Economic Cooperation and Development, the Statistical Office of the European Communities (EUROSTAT), and the United Nations Organization.
National accounting records economic facts in two different ways: by activities related to industries —production, GDP, consumption, 2
reserves, and financing—, which is the most common way, and by institutional sectors. In the latter case, economic units and households are divided into five groups according to their economic objectives, functions, and behavior: nonfinancial and financial companies, general government, households, and nonprofit institutions that serve households. The household sector includes all individuals and, accordingly, all residential households. Households, defined as institutional units, include unincorporated home businesses, whether they produce for the market or their own use. Such businesses (quasi companies) are the only ones treated as separate institutional units.
34
Satellite Account for Unpaid Household Services: An Approximation for Mexico
Production for own use(b) takes place in households and includes production for personal consumption of agricultural and nonagricultural goods, homeowner rental services, paid domestic services, and construction for personal use. The principal goal of such production is personal consumption, which means that the market does not govern it. Other production(c) , that is nonmarket and offered free or at nominal prices, which may or may not cover production costs. Markets have no influence on how much is produced or consumed; it comes from the general government and nonprofit institutions.
As observed in paragraph “b,” some “personal consumption” services produced in households with unpaid work are not included in the national accounts. However, foundations have been laid in the SNA to assign a value to such production in a satellite account, because it is recognized that “activities like doing the laundry, preparing food, and caring for children, the sick, or the elderly are activities that can be performed by other units and that therefore remain within the general boundary of production” (43). On the other hand, “…among the activities that are not productive in an economic sense are basic human activities like eating, drinking, sleeping, exercising, etcetera, which cannot be performed by one person instead of another…” Accordingly, the SNA document mentions, “…they are non-productive personal activities from an economic standpoint” (43).
In light of the above, in-home activities that result in personal consumption services for household members, herein referred to as Unpaid Household Services (UHS), are recognized as productive activities. Such identification criterion is known as “third party,” which means it can be performed by people or economic units in the marketplace.
Satellite Accounts
Today, there is an urgent need for more diverse information, and the SNA does not provide all the answers in its field of coverage, defined by the boundary of production. For example, it does not include measurements of the impact of economic activity on natural resources and the environment, nor on what occurs in the tourism sector, or the economic results of unpaid work. To address such needs, the SNA proposes the development of satellite accounts3 that, without changing its core, permit measurements that can be linked with other accounts and aggregates.
Satellite accounts or satellite systems are an expression of the need to extend the analytical capacity of the SNA to better understand specific 3
aspects of economic and social life; accordingly it is necessary to develop —and expand— complementary or alternative categories and concepts. They can be identified as satellite systems because, depending on the source of the analytical needs they originate from, these tasks require the establishment of all required relationships with the central framework. Household services accounts presented herein help convey the economic situation, thus expanding the boundary of production, GDP, and consumption in macroeconomic aggregates, and also allowing data to be segmented by activity and gender.
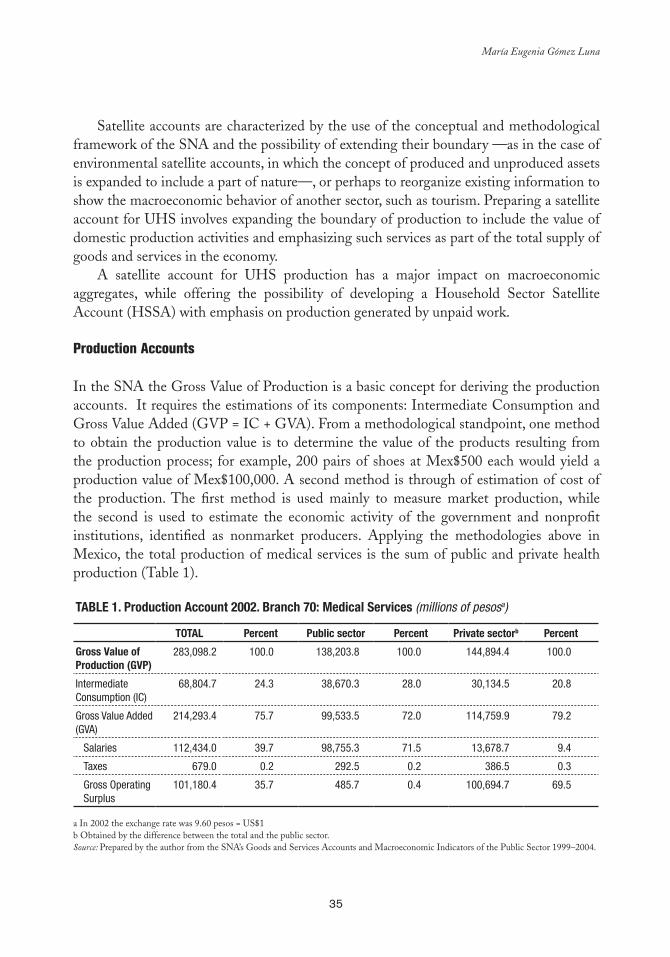
35
María Eugenia Gómez Luna
Satellite accounts are characterized by the use of the conceptual and methodological framework of the SNA and the possibility of extending their boundary —as in the case of environmental satellite accounts, in which the concept of produced and unproduced assets is expanded to include a part of nature—, or perhaps to reorganize existing information to show the macroeconomic behavior of another sector, such as tourism. Preparing a satellite account for UHS involves expanding the boundary of production to include the value of domestic production activities and emphasizing such services as part of the total supply of goods and services in the economy.
A satellite account for UHS production has a major impact on macroeconomic aggregates, while offering the possibility of developing a Household Sector Satellite Account (HSSA) with emphasis on production generated by unpaid work.
Production Accounts
In the SNA the Gross Value of Production is a basic concept for deriving the production accounts. It requires the estimations of its components: Intermediate Consumption and Gross Value Added (GVP = IC + GVA). From a methodological standpoint, one method to obtain the production value is to determine the value of the products resulting from the production process; for example, 200 pairs of shoes at Mex$500 each would yield a production value of Mex$100,000. A second method is through of estimation of cost of the production. The first method is used mainly to measure market production, while the second is used to estimate the economic activity of the government and nonprofit institutions, identified as nonmarket producers. Applying the methodologies above in Mexico, the total production of medical services is the sum of public and private health production (Table 1).
Table 1. Production account 2002. branch 70: Medical Services (millions of pesosa)
TOTal Percent Public sector Percent Private sectorb Percent
Gross Value of Production (GVP)
283,098.2 100.0 138,203.8 100.0 144,894.4 100.0
Intermediate Consumption (IC)
68,804.7 24.3 38,670.3 28.0 30,134.5 20.8
Gross Value Added (GVA)
214,293.4 75.7 99,533.5 72.0 114,759.9 79.2
Salaries 112,434.0 39.7 98,755.3 71.5 13,678.7 9.4
Taxes 679.0 0.2 292.5 0.2 386.5 0.3
Gross Operating Surplus
101,180.4 35.7 485.7 0.4 100,694.7 69.5
a In 2002 the exchange rate was 9.60 pesos = US$1b Obtained by the difference between the total and the public sector.Source: Prepared by the author from the SNA’s Goods and Services Accounts and Macroeconomic Indicators of the Public Sector 1999–2004.
36
Satellite Account for Unpaid Household Services: An Approximation for Mexico
The account for the production of medical services in the private sector shows a large operating surplus, which includes profits and mixed income of independent professionals, while the relevant component in the public services account is the payment of salaries, and the surplus is irrelevant. This is due to the way activities are organized and how each sector provides services.
The challenge in measuring household production for own consumption is separating goods and services that could be considered inputs, from those that constitute final consumption, for which the production account often does not record intermediate consumption. The only one component in the gross value added —and if that valuation is difficult in the case of production of goods, it is more so in the case of services. Accordingly, measuring household production for own consumption has special features. In the case of domestic services, for example, the SNA says that “by convention, intermediate costs and the consumption of fixed capital incurred in the production of those domestic services are unknown and the value of the production obtained is considered to be equal to the remuneration of salaried workers, which includes remuneration in kind, such as food and lodging. Consequently, this value is recorded in final consumption expenditures for households” (43). In the case of homeowner rental services, the only component of the production account is the operating surplus.
Considering the concepts and reasoning previously outlined, in this chapter it is assumed that the production value obtained is equal to the value of unpaid work and, consequently, the production account will only record that component as pay, based on time spent on the activity (preparing food, doing the laundry, ironing, care for family members) multiplied by the hourly price of each activity, as shown in the following section. Moreover, it is assumed that the production value is equivalent to the value added or GDP, and to value of the final consumption, since by definition, the services are provided and consumed simultaneously.
METHODOLOGY FOR ASSIGNING VALUE TO UHS PRODUCTION AND ITS RESULTS
To determine the gross value of UHS production, the following steps have been taken: analysis of information sources, deciding which activities to consider, selecting market occupations equivalent to activities carried out in the household, and establishing their “prices per hour,” and making the pertinent calculations.
Information Sources
The frame of reference and quantitative information on national accounting in Mexico, as well as time spent on domestic production activities and hourly wages of equivalent paid activities, was obtained from the following sources: the System of National Accounts of Mexico (SNAM) 1999–2004, Goods and Services Accounts, Volume 1 (47); the National
37
María Eugenia Gómez Luna
Time Use Survey (NTUS) 2002 (48); and the National Survey of Household Income and Expenditures (NSHIE) 2002 (49).
Delimitation of Household Production Activities
The NTUS 2002 was designed considering the experience of the National Survey on Work, Contributions, and Time Use (1996), as well as international experiences and recommendations. The survey was conducted to provide statistical information on the time that the household members —men and women over the age of 12— devote to daily activities. Its main purpose was to highlight the work of both men and women, identify gender differences and inequalities, and contribute inputs to the unpaid domestic work valuation.
Once the NSHIE was completed, a questionnaire on predetermined activities was completed through a direct interview of household members from November 18 to December 13, 2002. The questionnaire was divided into major categories that reported the time involved in approximately 90 activities, including personal activities. The categories were in alphabetical order and their components identified by number.
In order to categorize the activities for calculations, the questions were analyzed together with the type of activities that they triggered in order to classify them based on the Trial International Classification of Activities for Time Use Statistics (ICATUS) included in the Guide to Producing Statistics on Time Use for Measuring Paid and Unpaid Work (50).
This classification considers SNA production boundary as their starting points, identifying three types of activities: a) production activities within SNA boundary; b) activities included in general production boundary, but outside the SNA, and c) personal activities, considered nonproductive from an economic perspective (Table 2).
Herein, the focus was on the major activities in categories 6, 7, and 8, in which unpaid work generates the UHS. Category 6 (unpaid domestic services) includes daily tasks such as food preparation, house cleaning, and laundry. In category 7 (caregiving services to household members), the classification was reordered to emphasize child care, health care, and care for other household members. This means that child health care was included under “health” and transfers to school, the hospital, and other places remained associated with care for each group of people. Furthermore, it was considered advisable to eliminate simultaneous activities. Category 8 includes domestic services in other households, activities that benefit the community, and volunteer work, all activities through which services are provided to people outside of the household. These activities have also been included in the calculations because their production value is not recorded in the national accounts. Moreover, within this category it is noteworthy that “participating in some social activity, civil, professional, or political action” (48) —according to the NTUS— implies volunteer activity that is always accomplished indirectly through nonprofit institutions such as dispensaries, shelters, or orphanages, although its ultimate purpose is to assist people.
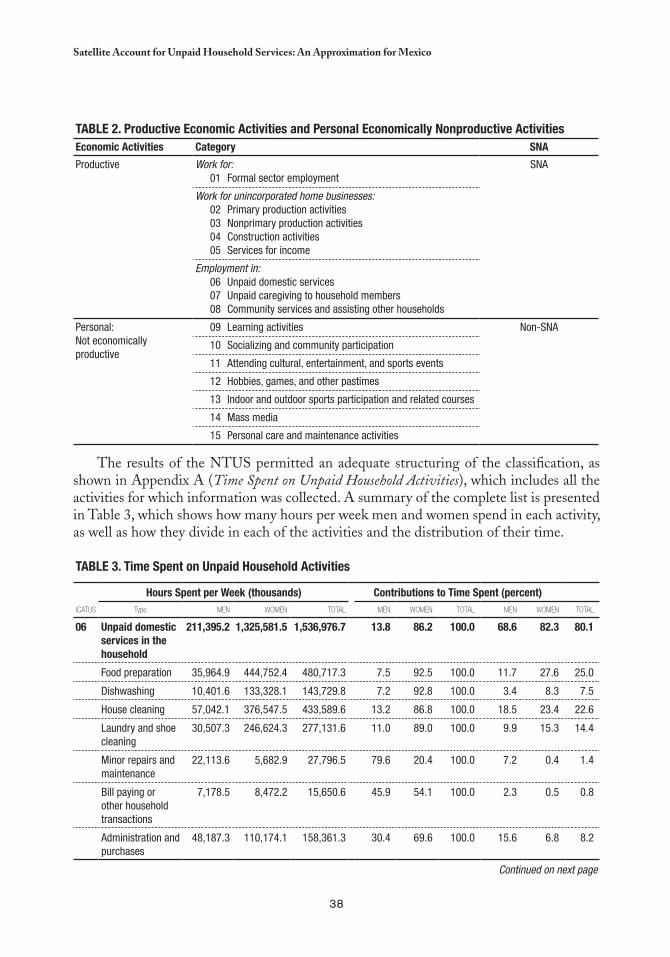
38
Satellite Account for Unpaid Household Services: An Approximation for Mexico
The results of the NTUS permitted an adequate structuring of the classification, as shown in Appendix A (Time Spent on Unpaid Household Activities), which includes all the activities for which information was collected. A summary of the complete list is presented in Table 3, which shows how many hours per week men and women spend in each activity, as well as how they divide in each of the activities and the distribution of their time.
Table 3. Time Spent on Unpaid Household activities
Hours Spent per Week (thousands) Contributions to Time Spent (percent)ICATUS Type MEN WOMEN TOTAL MEN WOMEN TOTAL MEN WOMEN TOTAL
06 Unpaid domestic services in the household
211,395.2 1,325,581.5 1,536,976.7 13.8 86.2 100.0 68.6 82.3 80.1
Food preparation 35,964.9 444,752.4 480,717.3 7.5 92.5 100.0 11.7 27.6 25.0
Dishwashing 10,401.6 133,328.1 143,729.8 7.2 92.8 100.0 3.4 8.3 7.5
House cleaning 57,042.1 376,547.5 433,589.6 13.2 86.8 100.0 18.5 23.4 22.6
Laundry and shoe cleaning
30,507.3 246,624.3 277,131.6 11.0 89.0 100.0 9.9 15.3 14.4
Minor repairs and maintenance
22,113.6 5,682.9 27,796.5 79.6 20.4 100.0 7.2 0.4 1.4
Bill paying or other household transactions
7,178.5 8,472.2 15,650.6 45.9 54.1 100.0 2.3 0.5 0.8
Administration and purchases
48,187.3 110,174.1 158,361.3 30.4 69.6 100.0 15.6 6.8 8.2
Continued on next page
Table 2. Productive economic activities and Personal economically Nonproductive activitieseconomic activities Category SNa
Productive Work for:01 Formal sector employment
SNA
Work for unincorporated home businesses:02 Primary production activities03 Nonprimary production activities04 Construction activities05 Services for income
Employment in:06 Unpaid domestic services 07 Unpaid caregiving to household members08 Community services and assisting other households
Personal:Not economically productive
09 Learning activities Non-SNA
10 Socializing and community participation
11 Attending cultural, entertainment, and sports events
12 Hobbies, games, and other pastimes
13 Indoor and outdoor sports participation and related courses
14 Mass media
15 Personal care and maintenance activities
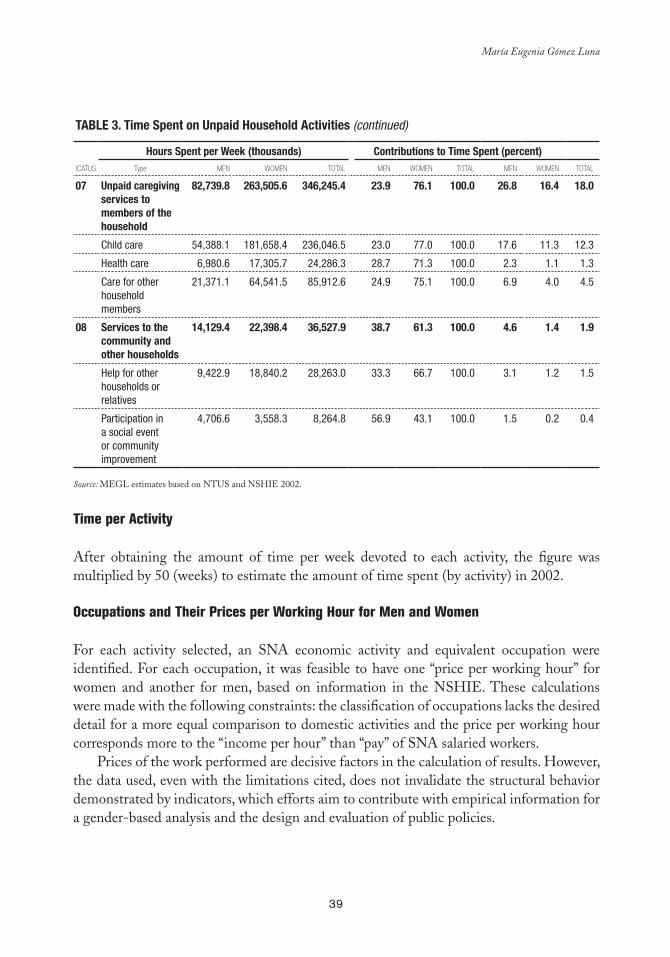
39
María Eugenia Gómez Luna
Table 3. Time Spent on Unpaid Household activities (continued)
Hours Spent per Week (thousands) Contributions to Time Spent (percent)ICATUS Type MEN WOMEN TOTAL MEN WOMEN TOTAL MEN WOMEN TOTAL
07 Unpaid caregiving services to members of the household
82,739.8 263,505.6 346,245.4 23.9 76.1 100.0 26.8 16.4 18.0
Child care 54,388.1 181,658.4 236,046.5 23.0 77.0 100.0 17.6 11.3 12.3
Health care 6,980.6 17,305.7 24,286.3 28.7 71.3 100.0 2.3 1.1 1.3
Care for other household members
21,371.1 64,541.5 85,912.6 24.9 75.1 100.0 6.9 4.0 4.5
08 Services to the community and other households
14,129.4 22,398.4 36,527.9 38.7 61.3 100.0 4.6 1.4 1.9
Help for other households or relatives
9,422.9 18,840.2 28,263.0 33.3 66.7 100.0 3.1 1.2 1.5
Participation in a social event or community improvement
4,706.6 3,558.3 8,264.8 56.9 43.1 100.0 1.5 0.2 0.4
Source: MEGL estimates based on NTUS and NSHIE 2002.
Time per Activity
After obtaining the amount of time per week devoted to each activity, the figure was multiplied by 50 (weeks) to estimate the amount of time spent (by activity) in 2002.
Occupations and Their Prices per Working Hour for Men and Women
For each activity selected, an SNA economic activity and equivalent occupation were identified. For each occupation, it was feasible to have one “price per working hour” for women and another for men, based on information in the NSHIE. These calculations were made with the following constraints: the classification of occupations lacks the desired detail for a more equal comparison to domestic activities and the price per working hour corresponds more to the “income per hour” than “pay” of SNA salaried workers.
Prices of the work performed are decisive factors in the calculation of results. However, the data used, even with the limitations cited, does not invalidate the structural behavior demonstrated by indicators, which efforts aim to contribute with empirical information for a gender-based analysis and the design and evaluation of public policies.
40
Satellite Account for Unpaid Household Services: An Approximation for Mexico
The Value of Unpaid Work and Determination of Production
Considering that unpaid work is the only input for UHS production, assigning it a value is an essential task. As such, it is important to define the objective of the measurement. For example, if the valuation could serve as a reference to determine an “indemnization” in divorce cases, it might suffice to consider an “opportunity cost” in terms of the characteristics of the person in question. However, in this exercise focused on macroeconomic estimates, a valuation similar to that of SNA activities is recommended, and, particularly in this case, the designation of a price per hour for paid work in the activities specified would be ideal.
It should also be noted that there was no disaggregated information that clearly distinguished between the work of a cook, a dishwasher, or a waiter, or even of a nurse or caregiver, which is why it was necessary to use the prices of the group that included such occupations. Regardless of these constraints, the price obtained per hour of work is considered valid for this exercise, since its purpose is not only to produce a traditional economic analysis, but instead to contribute to a broader, more complete view of the economy. Observations made in several studies concerning assigning monetary value to unpaid household work, as well as productivity, may also apply to the measurement of goods produced for personal consumption and other SNA outputs. The objective of national accounting is to report total goods and services produced and consumed, including those obtained at market and nonmarket prices, with high or low productivity.
UHS Satellite Production Accounts
Multiplying the amount of time devoted to each specified activity by a price per working hour for an equivalent occupation yields the value of the input labeled “work,” which is identical to the value of UHS production, as established in earlier paragraphs. Accordingly, the production value for each unpaid household activity results in a satellite production account; for example, the satellite account for the care of sick people, or for food preparation. The sum of these values yields the UHS satellite production account, which is equivalent to production and value added, or GDP, as shown in Table 4.
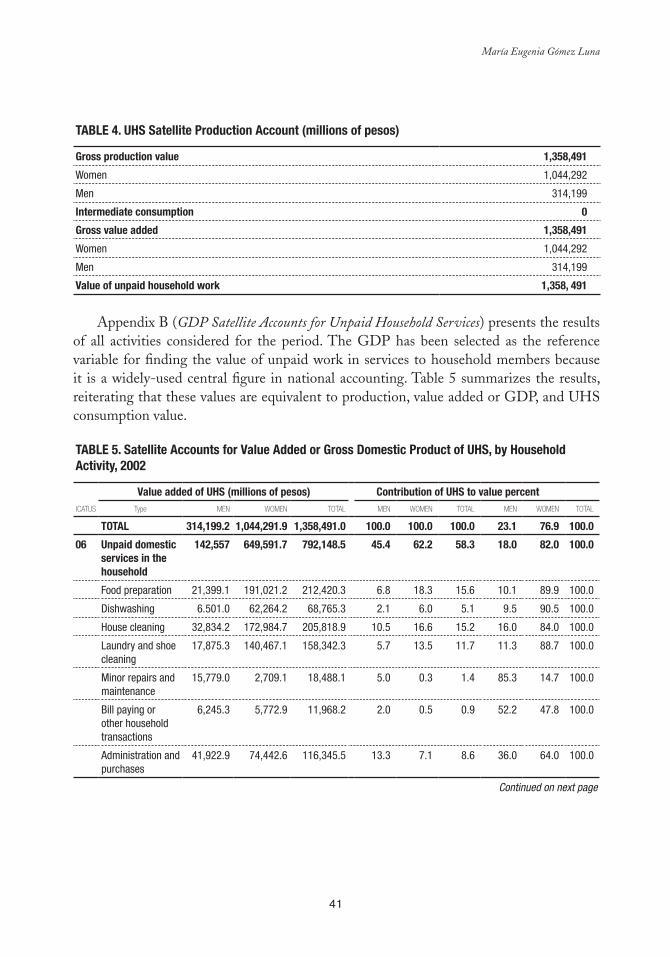
41
María Eugenia Gómez Luna
Table 4. UHS Satellite Production account (millions of pesos)
Gross production value 1,358,491
Women 1,044,292
Men 314,199
Intermediate consumption 0
Gross value added 1,358,491
Women 1,044,292
Men 314,199
Value of unpaid household work 1,358, 491
Appendix B (GDP Satellite Accounts for Unpaid Household Services) presents the results of all activities considered for the period. The GDP has been selected as the reference variable for finding the value of unpaid work in services to household members because it is a widely-used central figure in national accounting. Table 5 summarizes the results, reiterating that these values are equivalent to production, value added or GDP, and UHS consumption value.
Table 5. Satellite accounts for Value added or Gross Domestic Product of UHS, by Household activity, 2002
Value added of UHS (millions of pesos) Contribution of UHS to value percentICATUS Type MEN WOMEN TOTAL MEN WOMEN TOTAL MEN WOMEN TOTAL
TOTal 314,199.2 1,044,291.9 1,358,491.0 100.0 100.0 100.0 23.1 76.9 100.0
06 Unpaid domestic services in the household
142,557 649,591.7 792,148.5 45.4 62.2 58.3 18.0 82.0 100.0
Food preparation 21,399.1 191,021.2 212,420.3 6.8 18.3 15.6 10.1 89.9 100.0
Dishwashing 6.501.0 62,264.2 68,765.3 2.1 6.0 5.1 9.5 90.5 100.0
House cleaning 32,834.2 172,984.7 205,818.9 10.5 16.6 15.2 16.0 84.0 100.0
Laundry and shoe cleaning
17,875.3 140,467.1 158,342.3 5.7 13.5 11.7 11.3 88.7 100.0
Minor repairs and maintenance
15,779.0 2,709.1 18,488.1 5.0 0.3 1.4 85.3 14.7 100.0
Bill paying or other household transactions
6,245.3 5,772.9 11,968.2 2.0 0.5 0.9 52.2 47.8 100.0
Administration and purchases
41,922.9 74,442.6 116,345.5 13.3 7.1 8.6 36.0 64.0 100.0
Continued on next page

42
Satellite Account for Unpaid Household Services: An Approximation for Mexico
Table 5. Satellite accounts for Value added or Gross Domestic Product of UHS, by Household activity, 2002 (continued)
Value added of UHS (millions of pesos) Contribution of UHS to value percentICATUS Type MEN WOMEN TOTAL MEN WOMEN TOTAL MEN WOMEN TOTAL
07 Unpaid caregiving services to members of the household
162,083 383,704.0 545,786.9 51.6 36.7 40.2 29.7 70.3 100.0
Child care 119,929.8 270,719.4 390,649.2 38.2 25.9 28.8 30.7 69.3 100.0
Health care 6,980.8 21,331.1 28,311.9 2.2 2.0 2.1 24.7 75.3 100.0
Care for other household members
35,172.3 91,653.5 126,825.8 11.2 8.8 9.3 27.7 72.3 100.0
08 Services to the community and other households
9,559.5 10,966.1 20,555.6 3.0 1.1 1.5 46.5 53.5 100.0
Help for other households or relatives
5,889.3 8,798.4 14,687.6 1.9 0.8 1.1 40.1 59.9 100.0
Participation in a social event or community improvement
3,670.2 2,197.8 5,868.0 1.2 0.2 0.4 62.5 37.5 100.0
Source: MEGL estimates based on NTUS and NSHIE 2002.
SHARE OF GDP OF UNPAID HOUSEHOLD SERVICES4
Gross Domestic Product of UHS Provided by Men and Women
In 2002, when the Mexican economy grew by only 0.8 percent, unpaid work in households showed major activity, generating a value added or GDP of Mex$1,358,491 million pesos. The monetary value of the UHS represented 23.7 percent of the country’s GDP, expressed in basic values, and 21.7 percent when related to the GDP at market prices. This figure (23.7 percent) is significant, since it is higher than the percentage corresponding to the value added for the major SNA trade, restaurants, and hotels division (20 percent) and to that of the manufacturing industries (18.6 percent), and is surpassed only by community services, volunteering, and personal services (27 percent) (see Figure 1).
4 The GDP is a key figure and summary indicator in economic analysis; the GDP at market prices is the end result of the production of all resident production units. The GDP is a value added concept equivalent to the total value of goods and services produced in an economy during a given period, free of duplications, and obtained from the sum of the value added of all resident production units; it is usually broken down by economic activity: agriculture, industry, trade, and services sectors. It also represents the following equivalents: GDP = private consumption + government consumption + reserves + exports – imports; GDP = salaried workers’ pay + taxes net of production subsidies + gross operating surplus. Due to the analysis potential of this indicator, it was used to measure the UHS. Moreover, it should be noted that “value added” is a more apt description; however, to facilitate descriptions, the term GDP is used here as an equivalent.
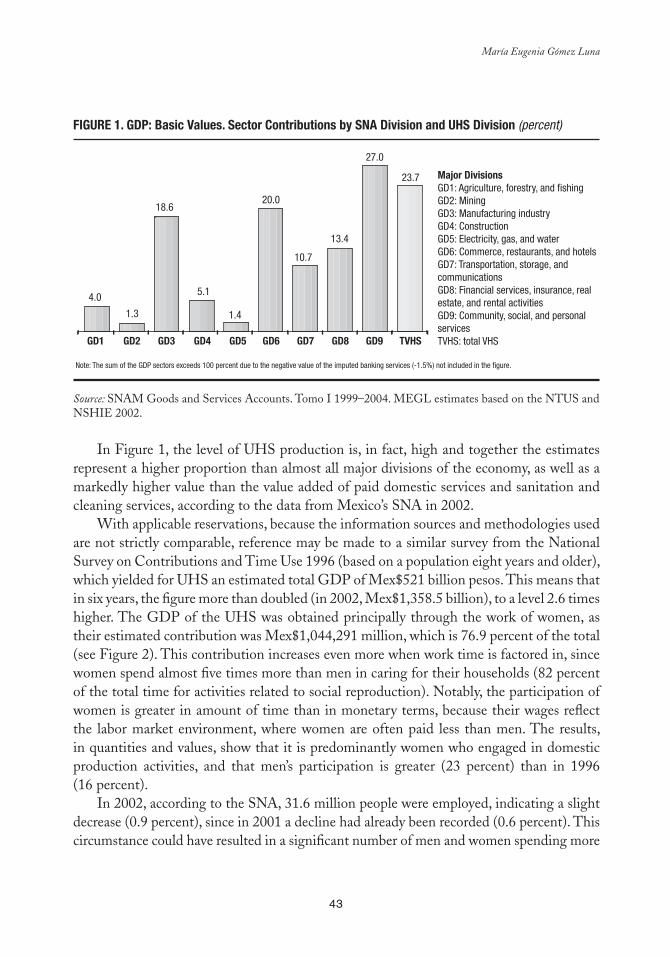
43
María Eugenia Gómez Luna
FIGURe 1. GDP: basic Values. Sector Contributions by SNa Division and UHS Division (percent)
Source: SNAM Goods and Services Accounts. Tomo I 1999–2004. MEGL estimates based on the NTUS and NSHIE 2002.
In Figure 1, the level of UHS production is, in fact, high and together the estimates represent a higher proportion than almost all major divisions of the economy, as well as a markedly higher value than the value added of paid domestic services and sanitation and cleaning services, according to the data from Mexico’s SNA in 2002.
With applicable reservations, because the information sources and methodologies used are not strictly comparable, reference may be made to a similar survey from the National Survey on Contributions and Time Use 1996 (based on a population eight years and older), which yielded for UHS an estimated total GDP of Mex$521 billion pesos. This means that in six years, the figure more than doubled (in 2002, Mex$1,358.5 billion), to a level 2.6 times higher. The GDP of the UHS was obtained principally through the work of women, as their estimated contribution was Mex$1,044,291 million, which is 76.9 percent of the total (see Figure 2). This contribution increases even more when work time is factored in, since women spend almost five times more than men in caring for their households (82 percent of the total time for activities related to social reproduction). Notably, the participation of women is greater in amount of time than in monetary terms, because their wages reflect the labor market environment, where women are often paid less than men. The results, in quantities and values, show that it is predominantly women who engaged in domestic production activities, and that men’s participation is greater (23 percent) than in 1996 (16 percent).
In 2002, according to the SNA, 31.6 million people were employed, indicating a slight decrease (0.9 percent), since in 2001 a decline had already been recorded (0.6 percent). This circumstance could have resulted in a significant number of men and women spending more
Major DivisionsGD1: Agriculture, forestry, and fishingGD2: MiningGD3: Manufacturing industryGD4: ConstructionGD5: Electricity, gas, and waterGD6: Commerce, restaurants, and hotelsGD7: Transportation, storage, and communicationsGD8: Financial services, insurance, real estate, and rental activitiesGD9: Community, social, and personal servicesTVHS: total VHS
4.0
1.3
18.6
5.1
1.4
20.0
10.7
13.4
27.0
23.7
Note: The sum of the GDP sectors exceeds 100 percent due to the negative value of the imputed banking services (-1.5%) not included in the figure.
GD1 GD2 GD3 GD4 GD5 GD6 GD7 GD8 GD9 TVHS
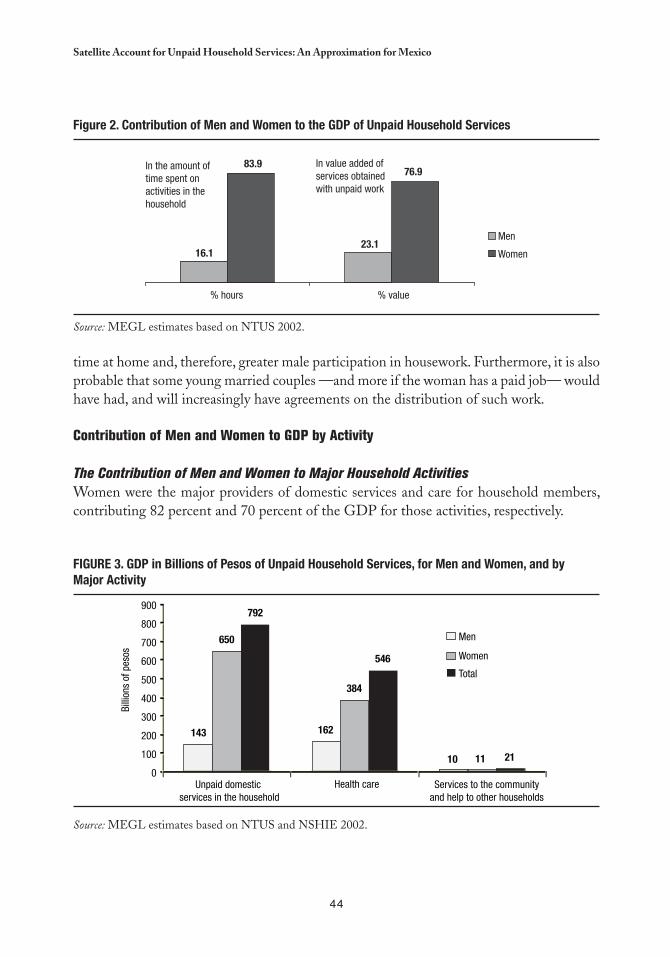
44
Satellite Account for Unpaid Household Services: An Approximation for Mexico
time at home and, therefore, greater male participation in housework. Furthermore, it is also probable that some young married couples —and more if the woman has a paid job— would have had, and will increasingly have agreements on the distribution of such work.
Contribution of Men and Women to GDP by Activity
The Contribution of Men and Women to Major Household ActivitiesWomen were the major providers of domestic services and care for household members, contributing 82 percent and 70 percent of the GDP for those activities, respectively.
FIGURe 3. GDP in billions of Pesos of Unpaid Household Services, for Men and Women, and by Major activity
Source: MEGL estimates based on NTUS and NSHIE 2002.
Men
Women
In the amount of time spent on activities in the household
In value added of services obtained with unpaid work
83.9
16.123.1
76.9
% hours % value
143 162
650
384
792
546
900
800
700
600
500
400
300
200
100
0
Men
Women
Total
Billi
ons
of p
esos
10 11 21
Unpaid domestic services in the household
Health care Services to the communityand help to other households
Figure 2. Contribution of Men and Women to the GDP of Unpaid Household Services
Source: MEGL estimates based on NTUS 2002.
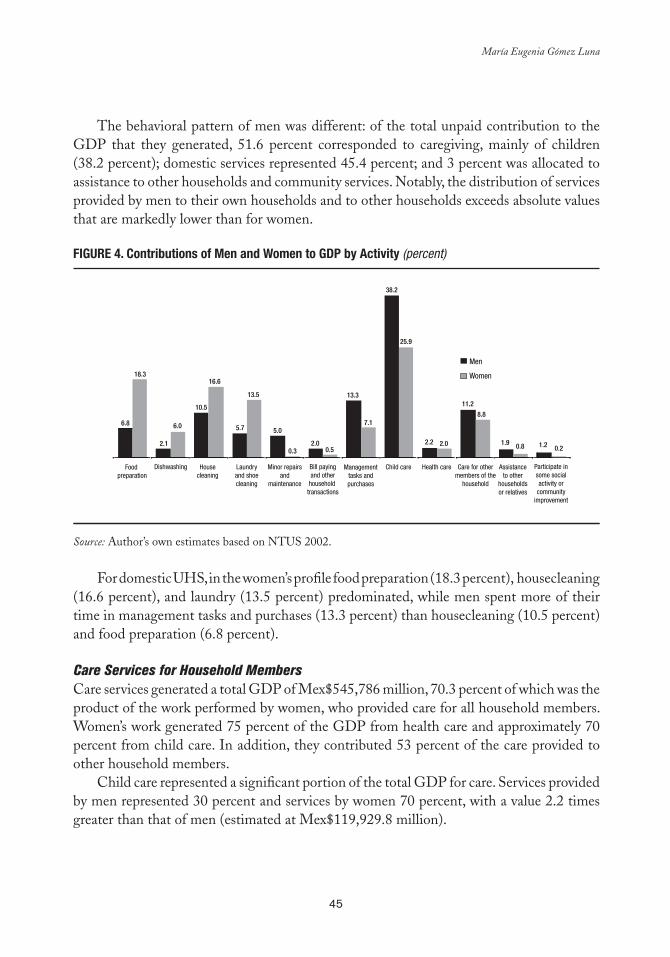
45
María Eugenia Gómez Luna
The behavioral pattern of men was different: of the total unpaid contribution to the GDP that they generated, 51.6 percent corresponded to caregiving, mainly of children (38.2 percent); domestic services represented 45.4 percent; and 3 percent was allocated to assistance to other households and community services. Notably, the distribution of services provided by men to their own households and to other households exceeds absolute values that are markedly lower than for women.
FIGURe 4. Contributions of Men and Women to GDP by activity (percent)
Source: Author’s own estimates based on NTUS 2002.
For domestic UHS, in the women’s profile food preparation (18.3 percent), housecleaning
(16.6 percent), and laundry (13.5 percent) predominated, while men spent more of their time in management tasks and purchases (13.3 percent) than housecleaning (10.5 percent) and food preparation (6.8 percent).
Care Services for Household Members Care services generated a total GDP of Mex$545,786 million, 70.3 percent of which was the product of the work performed by women, who provided care for all household members. Women’s work generated 75 percent of the GDP from health care and approximately 70 percent from child care. In addition, they contributed 53 percent of the care provided to other household members.
Child care represented a significant portion of the total GDP for care. Services provided by men represented 30 percent and services by women 70 percent, with a value 2.2 times greater than that of men (estimated at Mex$119,929.8 million).
Food preparation
Dishwashing Housecleaning
Laundryand shoecleaning
Minor repairsand
maintenance
Bill payingand other
household transactions
Managementtasks andpurchases
Child care Health care Care for othermembers of the
household
Assistanceto other
householdsor relatives
Participate insome socialactivity or
communityimprovement
6.8
143 162
650
384
792
546
900
800
700
600
500
400
300
200
100
0
Men
Women
Total
Billi
ons
of p
esos
10 11 21
Unpaid domestic services in the home
Health care Services to the communityand help to other households
18.3
2.1
6.0
10.5
16.6
5.7
13.5
5.0
0.32.0
0.5
13.3
7.1
38.2
25.9
2.2 2.0
11.2
8.8
1.9 0.8 1.2 0.2
Men
Women
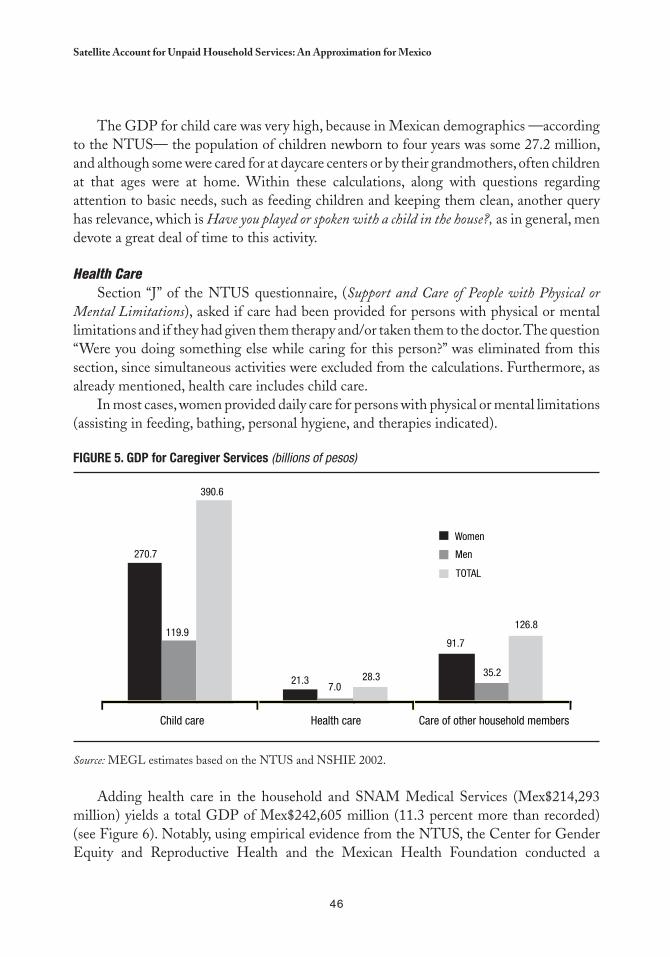
46
Satellite Account for Unpaid Household Services: An Approximation for Mexico
The GDP for child care was very high, because in Mexican demographics —according to the NTUS— the population of children newborn to four years was some 27.2 million, and although some were cared for at daycare centers or by their grandmothers, often children at that ages were at home. Within these calculations, along with questions regarding attention to basic needs, such as feeding children and keeping them clean, another query has relevance, which is Have you played or spoken with a child in the house?, as in general, men devote a great deal of time to this activity.
Health CareSection “J” of the NTUS questionnaire, (Support and Care of People with Physical or
Mental Limitations), asked if care had been provided for persons with physical or mental limitations and if they had given them therapy and/or taken them to the doctor. The question “Were you doing something else while caring for this person?” was eliminated from this section, since simultaneous activities were excluded from the calculations. Furthermore, as already mentioned, health care includes child care.
In most cases, women provided daily care for persons with physical or mental limitations (assisting in feeding, bathing, personal hygiene, and therapies indicated).
FIGURe 5. GDP for Caregiver Services (billions of pesos)
Source: MEGL estimates based on the NTUS and NSHIE 2002.
Adding health care in the household and SNAM Medical Services (Mex$214,293 million) yields a total GDP of Mex$242,605 million (11.3 percent more than recorded) (see Figure 6). Notably, using empirical evidence from the NTUS, the Center for Gender Equity and Reproductive Health and the Mexican Health Foundation conducted a
270.7
119.9
390.6
21.37.0
28.3
91.7
35.2
126.8
Child care Health care Care of other household members
Women
Men
TOTAL
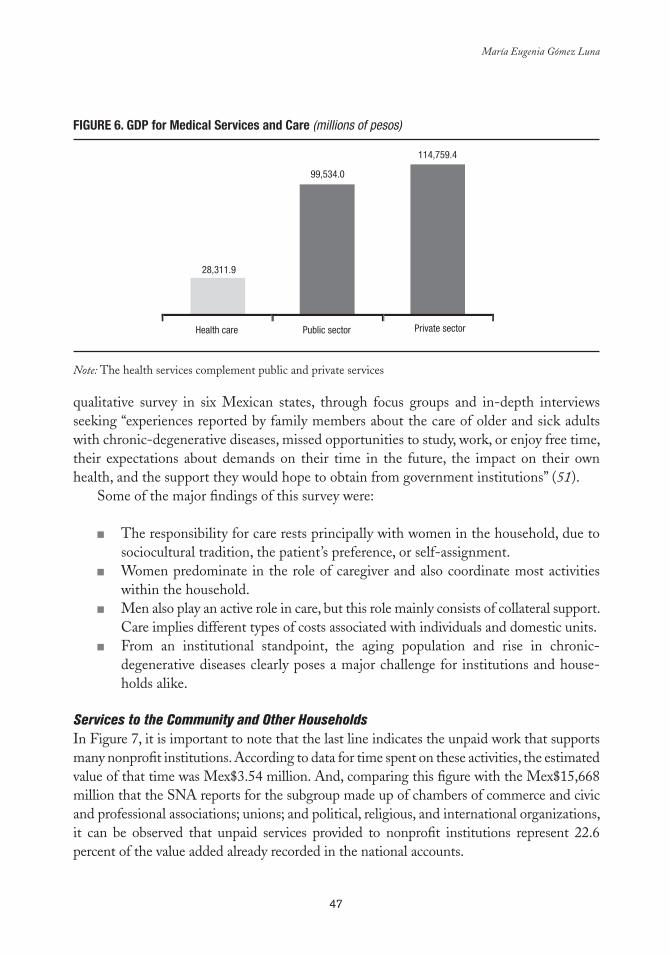
47
María Eugenia Gómez Luna
qualitative survey in six Mexican states, through focus groups and in-depth interviews seeking “experiences reported by family members about the care of older and sick adults with chronic-degenerative diseases, missed opportunities to study, work, or enjoy free time, their expectations about demands on their time in the future, the impact on their own health, and the support they would hope to obtain from government institutions” (51).
Some of the major findings of this survey were:
The responsibility for care rests principally with women in the household, due to ■■
sociocultural tradition, the patient’s preference, or self-assignment.Women predominate in the role of caregiver and also coordinate most activities ■■
within the household.Men also play an active role in care, but this role mainly consists of collateral support. ■■
Care implies different types of costs associated with individuals and domestic units. From an institutional standpoint, the aging population and rise in chronic- ■■
degenerative diseases clearly poses a major challenge for institutions and house-holds alike.
Services to the Community and Other Households In Figure 7, it is important to note that the last line indicates the unpaid work that supports many nonprofit institutions. According to data for time spent on these activities, the estimated value of that time was Mex$3.54 million. And, comparing this figure with the Mex$15,668 million that the SNA reports for the subgroup made up of chambers of commerce and civic and professional associations; unions; and political, religious, and international organizations, it can be observed that unpaid services provided to nonprofit institutions represent 22.6 percent of the value added already recorded in the national accounts.
FIGURe 6. GDP for Medical Services and Care (millions of pesos)
Note: The health services complement public and private services.
99,534.0
114,759.4
28,311.9
Health care Public sector Private sector
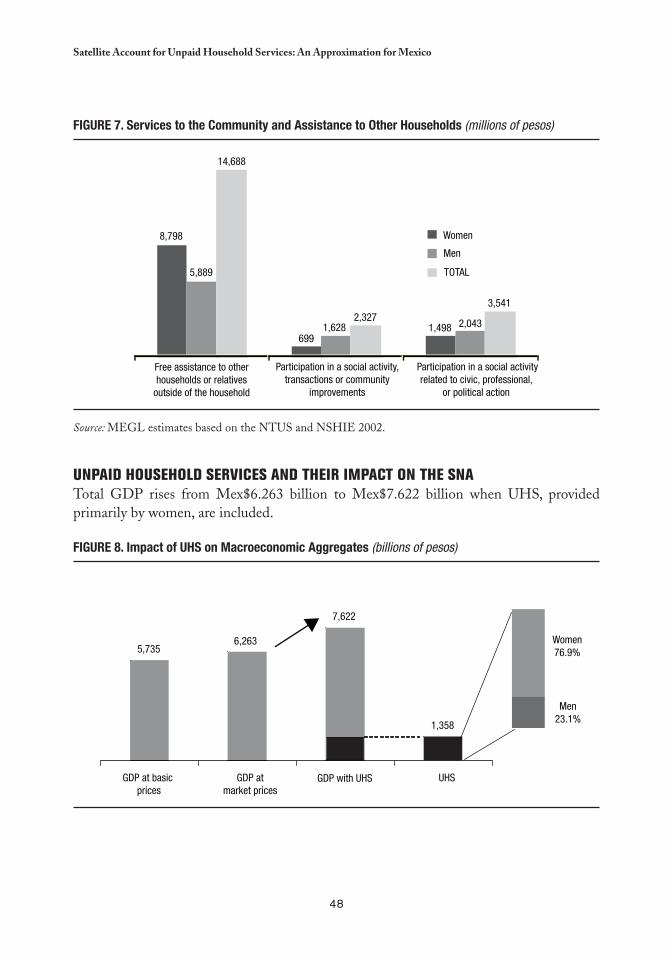
48
Satellite Account for Unpaid Household Services: An Approximation for Mexico
UNPAID HOUSEHOLD SERVICES AND THEIR IMPACT ON THE SNATotal GDP rises from Mex$6.263 billion to Mex$7.622 billion when UHS, provided primarily by women, are included.
FIGURe 8. Impact of UHS on Macroeconomic aggregates (billions of pesos)
FIGURe 7. Services to the Community and assistance to Other Households (millions of pesos)
Source: MEGL estimates based on the NTUS and NSHIE 2002.
8,798
5,889
14,688
6991,628
2,3271,498 2,043
3,541
Free assistance to otherhouseholds or relatives
outside of the household
Participation in a social activity,transactions or community
improvements
Participation in a social activityrelated to civic, professional,
or political action
Women
Men
TOTAL
5,7356,263
7,622
1,358
Women76.9%
Men23.1%
GDP at basic prices
GDP atmarket prices
GDP with UHS UHS
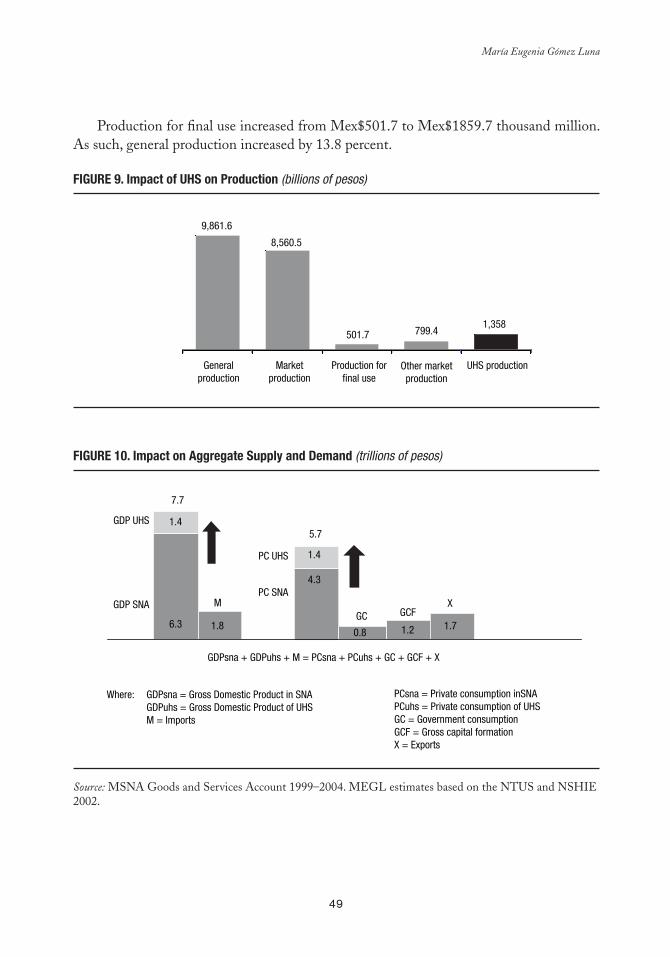
49
María Eugenia Gómez Luna
Production for final use increased from Mex$501.7 to Mex$1859.7 thousand million. As such, general production increased by 13.8 percent.
FIGURe 9. Impact of UHS on Production (billions of pesos)
FIGURe 10. Impact on aggregate Supply and Demand (trillions of pesos)
Source: MSNA Goods and Services Account 1999–2004. MEGL estimates based on the NTUS and NSHIE 2002.
9,861.6
8,560.5
501.7 799.41,358
Generalproduction
Marketproduction
Production forfinal use
Other marketproduction
UHS production
MGC
GDP UHS
GDP SNA
1.4
7.7
6.3 1.8
5.7
1.4
4.3
0.8 1.2
X
1.7
PC UHS
PC SNA
GDPsna + GDPuhs + M = PCsna + PCuhs + GC + GCF + X
Where: GDPsna = Gross Domestic Product in SNA GDPuhs = Gross Domestic Product of UHSM = Imports
PCsna = Private consumption inSNAPCuhs = Private consumption of UHSGC = Government consumptionGCF = Gross capital formationX = Exports
GCF
50
Satellite Account for Unpaid Household Services: An Approximation for Mexico
FINAL COMMENTS
This study on the satellite accounts for production from unpaid household activities —the results of which are UHS— has been developed from the 1993 SNA, the international recommendations published subsequently, and the experiences of diverse international agencies and countries in this area. The aim is an approach consistent with the conceptual and methodological considerations in regard to households as production units, and with the recommendations on production for final use. This not only lends visibility to unpaid work —performed basically by women—, but also yields new aggregates (production, GDP, private consumption), expanded with the UHS, that can be linked to the SNA aggregates.
The UHS satellite accounts extend the boundary of SNA production and consumption. This provides a broad and complete picture of the total goods and services that society requires to meet its needs, within the activities in the spheres of production and social reproduction. Satellite accounts permit quantification of the important contributions of women to the value added of UHS, since information is disaggregated by sex for all household production activities that were captured in the 2002 NTUS (48) and grouped into three major categories: unpaid domestic services, care for people, and services to other households and the community.
A satellite account system is also an “analytical” scheme. Therefore, the results obtained here can serve as the foundation for the development of a satellite account for the household sector that more broadly describes the context of the work —paid and unpaid— and especially work performed in the household for its own members. Using the SNA as a frame of reference contributes empirical elements that are very useful for the analysis, planning, design, and evaluation of public policies, mainly those that contribute to the harmonization of home life with economic activities, recognizing that they are complementary.
It is very important to promote research and development of the statistics necessary for a gender-sensitive economic analysis. In particular, it is recommended that the conceptual framework of time use surveys be strengthened and that a classifier of time use activities be available. This will help to improve the quality of the basic statistics on time use, offer better input for assigning a value to unpaid work, and result in comparability in time and space (in every country and among countries).
Progress has certainly been made since the Beijing conference. However, there is still a long way to go in terms of economic and gender analysis and analysis of the paid and unpaid work of men and women. The SNA has been enriched by recognizing household production activities and by proposing the development of satellite accounts for particular sectors, which is an excellent incentive —and even a “new” starting point— for the conceptual and methodological development of standards that will provide a sounder empirical framework for economic analyses, economic policies, and policies with a gender perspective.
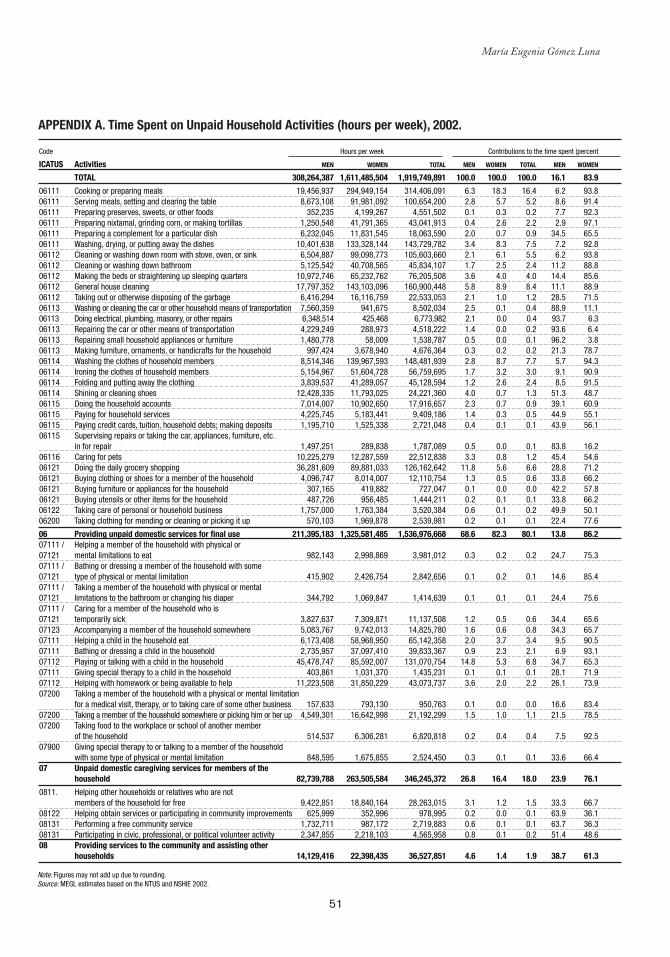
51
María Eugenia Gómez Luna
aPPeNDIx a. Time Spent on Unpaid Household activities (hours per week), 2002.
Code Hours per week Contributions to the time spent (percent
ICATUS Activities MEN WOMEN TOTAL MEN WOMEN TOTAL MEN WOMEN
TOTAL 308,264,387 1,611,485,504 1,919,749,891 100.0 100.0 100.0 16.1 83.9
06111 Cooking or preparing meals 19,456,937 294,949,154 314,406,091 6.3 18.3 16.4 6.2 93.806111 Serving meals, setting and clearing the table 8,673,108 91,981,092 100,654,200 2.8 5.7 5.2 8.6 91.406111 Preparing preserves, sweets, or other foods 352,235 4,199,267 4,551,502 0.1 0.3 0.2 7.7 92.306111 Preparing nixtamal, grinding corn, or making tortillas 1,250,548 41,791,365 43,041,913 0.4 2.6 2.2 2.9 97.106111 Preparing a complement for a particular dish 6,232,045 11,831,545 18,063,590 2.0 0.7 0.9 34.5 65.506111 Washing, drying, or putting away the dishes 10,401,638 133,328,144 143,729,782 3.4 8.3 7.5 7.2 92.806112 Cleaning or washing down room with stove, oven, or sink 6,504,887 99,098,773 105,603,660 2.1 6.1 5.5 6.2 93.806112 Cleaning or washing down bathroom 5,125,542 40,708,565 45,834,107 1.7 2.5 2.4 11.2 88.806112 Making the beds or straightening up sleeping quarters 10,972,746 65,232,762 76,205,508 3.6 4.0 4.0 14.4 85.606112 General house cleaning 17,797,352 143,103,096 160,900,448 5.8 8.9 8.4 11.1 88.906112 Taking out or otherwise disposing of the garbage 6,416,294 16,116,759 22,533,053 2.1 1.0 1.2 28.5 71.506113 Washing or cleaning the car or other household means of transportation 7,560,359 941,675 8,502,034 2.5 0.1 0.4 88.9 11.106113 Doing electrical, plumbing, masonry, or other repairs 6,348,514 425,468 6,773,982 2.1 0.0 0.4 93.7 6.306113 Repairing the car or other means of transportation 4,229,249 288,973 4,518,222 1.4 0.0 0.2 93.6 6.406113 Repairing small household appliances or furniture 1,480,778 58,009 1,538,787 0.5 0.0 0.1 96.2 3.806113 Making furniture, ornaments, or handicrafts for the household 997,424 3,678,940 4,676,364 0.3 0.2 0.2 21.3 78.706114 Washing the clothes of household members 8,514,346 139,967,593 148,481,939 2.8 8.7 7.7 5.7 94.306114 Ironing the clothes of household members 5,154,967 51,604,728 56,759,695 1.7 3.2 3.0 9.1 90.906114 Folding and putting away the clothing 3,839,537 41,289,057 45,128,594 1.2 2.6 2.4 8.5 91.506114 Shining or cleaning shoes 12,428,335 11,793,025 24,221,360 4.0 0.7 1.3 51.3 48.706115 Doing the household accounts 7,014,007 10,902,650 17,916,657 2.3 0.7 0.9 39.1 60.906115 Paying for household services 4,225,745 5,183,441 9,409,186 1.4 0.3 0.5 44.9 55.106115 Paying credit cards, tuition, household debts; making deposits 1,195,710 1,525,338 2,721,048 0.4 0.1 0.1 43.9 56.106115 Supervising repairs or taking the car, appliances, furniture, etc. in for repair 1,497,251 289,838 1,787,089 0.5 0.0 0.1 83.8 16.206116 Caring for pets 10,225,279 12,287,559 22,512,838 3.3 0.8 1.2 45.4 54.606121 Doing the daily grocery shopping 36,281,609 89,881,033 126,162,642 11.8 5.6 6.6 28.8 71.206121 Buying clothing or shoes for a member of the household 4,096,747 8,014,007 12,110,754 1.3 0.5 0.6 33.8 66.206121 Buying furniture or appliances for the household 307,165 419,882 727,047 0.1 0.0 0.0 42.2 57.806121 Buying utensils or other items for the household 487,726 956,485 1,444,211 0.2 0.1 0.1 33.8 66.206122 Taking care of personal or household business 1,757,000 1,763,384 3,520,384 0.6 0.1 0.2 49.9 50.106200 Taking clothing for mending or cleaning or picking it up 570,103 1,969,878 2,539,981 0.2 0.1 0.1 22.4 77.6
06 Providing unpaid domestic services for final use 211,395,183 1,325,581,485 1,536,976,668 68.6 82.3 80.1 13.8 86.207111 / Helping a member of the household with physical or 07121 mental limitations to eat 982,143 2,998,869 3,981,012 0.3 0.2 0.2 24.7 75.307111 / Bathing or dressing a member of the household with some 07121 type of physical or mental limitation 415,902 2,426,754 2,842,656 0.1 0.2 0.1 14.6 85.407111 / Taking a member of the household with physical or mental 07121 limitations to the bathroom or changing his diaper 344,792 1,069,847 1,414,639 0.1 0.1 0.1 24.4 75.607111 / Caring for a member of the household who is 07121 temporarily sick 3,827,637 7,309,871 11,137,508 1.2 0.5 0.6 34.4 65.607123 Accompanying a member of the household somewhere 5,083,767 9,742,013 14,825,780 1.6 0.6 0.8 34.3 65.707111 Helping a child in the household eat 6,173,408 58,968,950 65,142,358 2.0 3.7 3.4 9.5 90.507111 Bathing or dressing a child in the household 2,735,957 37,097,410 39,833,367 0.9 2.3 2.1 6.9 93.107112 Playing or talking with a child in the household 45,478,747 85,592,007 131,070,754 14.8 5.3 6.8 34.7 65.307111 Giving special therapy to a child in the household 403,861 1,031,370 1,435,231 0.1 0.1 0.1 28.1 71.907112 Helping with homework or being available to help 11,223,508 31,850,229 43,073,737 3.6 2.0 2.2 26.1 73.907200 Taking a member of the household with a physical or mental limitation for a medical visit, therapy, or to taking care of some other business 157,633 793,130 950,763 0.1 0.0 0.0 16.6 83.407200 Taking a member of the household somewhere or picking him or her up 4,549,301 16,642,998 21,192,299 1.5 1.0 1.1 21.5 78.507200 Taking food to the workplace or school of another member of the household 514,537 6,306,281 6,820,818 0.2 0.4 0.4 7.5 92.507900 Giving special therapy to or talking to a member of the household with some type of physical or mental limitation 848,595 1,675,855 2,524,450 0.3 0.1 0.1 33.6 66.407 Unpaid domestic caregiving services for members of the household 82,739,788 263,505,584 346,245,372 26.8 16.4 18.0 23.9 76.1
0811. Helping other households or relatives who are not members of the household for free 9,422,851 18,840,164 28,263,015 3.1 1.2 1.5 33.3 66.708122 Helping obtain services or participating in community improvements 625,999 352,996 978,995 0.2 0.0 0.1 63.9 36.108131 Performing a free community service 1,732,711 987,172 2,719,883 0.6 0.1 0.1 63.7 36.308131 Participating in civic, professional, or political volunteer activity 2,347,855 2,218,103 4,565,958 0.8 0.1 0.2 51.4 48.608 Providing services to the community and assisting other households 14,129,416 22,398,435 36,527,851 4.6 1.4 1.9 38.7 61.3
Note: Figures may not add up due to rounding.Source: MEGL estimates based on the NTUS and NSHIE 2002.
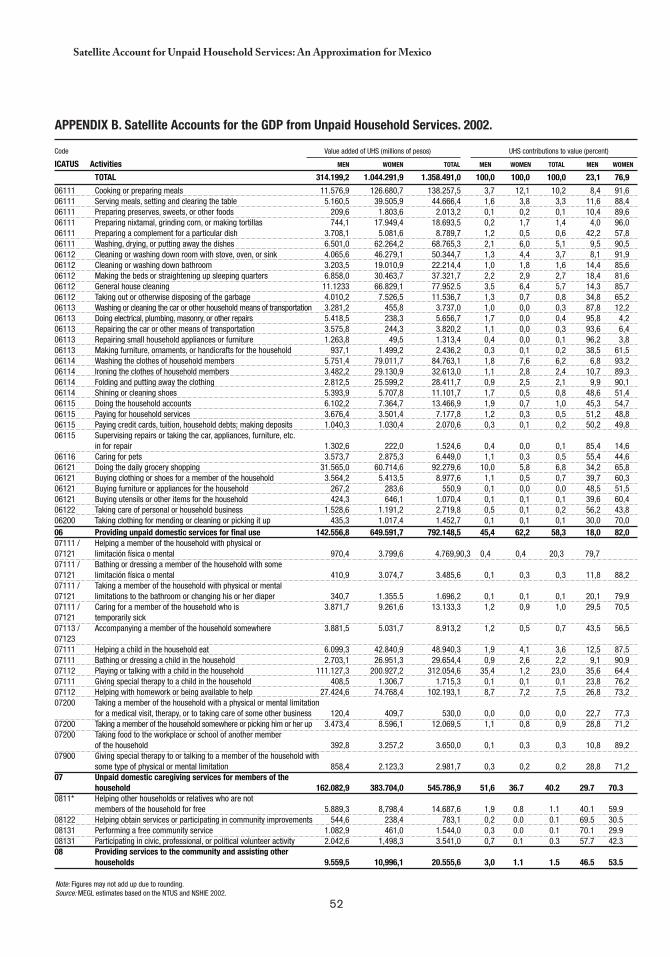
52
Satellite Account for Unpaid Household Services: An Approximation for Mexico
aPPeNDIx b. Satellite accounts for the GDP from Unpaid Household Services. 2002.
Note: Figures may not add up due to rounding.Source: MEGL estimates based on the NTUS and NSHIE 2002.
Code Value added of UHS (millions of pesos) UHS contributions to value (percent)
ICATUS Activities MEN WOMEN TOTAL MEN WOMEN TOTAL MEN WOMEN
TOTAL 314.199,2 1.044.291,9 1.358.491,0 100,0 100,0 100,0 23,1 76,9
06111 Cooking or preparing meals 11.576,9 126.680,7 138.257,5 3,7 12,1 10,2 8,4 91,606111 Serving meals, setting and clearing the table 5.160,5 39.505,9 44.666,4 1,6 3,8 3,3 11,6 88,406111 Preparing preserves, sweets, or other foods 209,6 1.803,6 2.013,2 0,1 0,2 0,1 10,4 89,606111 Preparing nixtamal, grinding corn, or making tortillas 744,1 17.949,4 18.693,5 0,2 1,7 1,4 4,0 96,006111 Preparing a complement for a particular dish 3.708,1 5.081,6 8.789,7 1,2 0,5 0,6 42,2 57,806111 Washing, drying, or putting away the dishes 6.501,0 62.264,2 68.765,3 2,1 6,0 5,1 9,5 90,506112 Cleaning or washing down room with stove, oven, or sink 4.065,6 46.279,1 50.344,7 1,3 4,4 3,7 8,1 91,906112 Cleaning or washing down bathroom 3.203,5 19.010,9 22.214,4 1,0 1,8 1,6 14,4 85,606112 Making the beds or straightening up sleeping quarters 6.858,0 30.463,7 37.321,7 2,2 2,9 2,7 18,4 81,606112 General house cleaning 11.1233 66.829,1 77.952.5 3,5 6,4 5,7 14,3 85,706112 Taking out or otherwise disposing of the garbage 4.010,2 7.526,5 11.536,7 1,3 0,7 0,8 34,8 65,206113 Washing or cleaning the car or other household means of transportation 3.281,2 455,8 3.737,0 1,0 0,0 0,3 87,8 12,206113 Doing electrical, plumbing, masonry, or other repairs 5.418,5 238,3 5.656,7 1,7 0,0 0,4 95,8 4,206113 Repairing the car or other means of transportation 3.575,8 244,3 3.820,2 1,1 0,0 0,3 93,6 6,406113 Repairing small household appliances or furniture 1.263,8 49,5 1.313,4 0,4 0,0 0,1 96,2 3,806113 Making furniture, ornaments, or handicrafts for the household 937,1 1.499,2 2.436,2 0,3 0,1 0,2 38,5 61,506114 Washing the clothes of household members 5.751,4 79.011,7 84.763,1 1,8 7,6 6,2 6,8 93,206114 Ironing the clothes of household members 3.482,2 29.130,9 32.613,0 1,1 2,8 2,4 10,7 89,306114 Folding and putting away the clothing 2.812,5 25.599,2 28.411,7 0,9 2,5 2,1 9,9 90,106114 Shining or cleaning shoes 5.393,9 5.707,8 11.101,7 1,7 0,5 0,8 48,6 51,406115 Doing the household accounts 6.102,2 7.364,7 13.466,9 1,9 0,7 1,0 45,3 54,706115 Paying for household services 3.676,4 3.501,4 7.177,8 1,2 0,3 0,5 51,2 48,806115 Paying credit cards, tuition, household debts; making deposits 1.040,3 1.030,4 2.070,6 0,3 0,1 0,2 50,2 49,806115 Supervising repairs or taking the car, appliances, furniture, etc. in for repair 1.302,6 222,0 1.524,6 0,4 0,0 0,1 85,4 14,606116 Caring for pets 3.573,7 2.875,3 6.449,0 1,1 0,3 0,5 55,4 44,606121 Doing the daily grocery shopping 31.565,0 60.714,6 92.279,6 10,0 5,8 6,8 34,2 65,806121 Buying clothing or shoes for a member of the household 3.564,2 5.413,5 8.977,6 1,1 0,5 0,7 39,7 60,306121 Buying furniture or appliances for the household 267,2 283,6 550,9 0,1 0,0 0,0 48,5 51,506121 Buying utensils or other items for the household 424,3 646,1 1.070,4 0,1 0,1 0,1 39,6 60,406122 Taking care of personal or household business 1.528,6 1.191,2 2.719,8 0,5 0,1 0,2 56,2 43,806200 Taking clothing for mending or cleaning or picking it up 435,3 1.017,4 1.452,7 0,1 0,1 0,1 30,0 70,006 Providing unpaid domestic services for final use 142.556,8 649.591,7 792.148,5 45,4 62,2 58,3 18,0 82,007111 / Helping a member of the household with physical or 07121 limitación física o mental 970,4 3.799,6 4.769,9 0,3 0,4 0,4 20,3 79,707111 / Bathing or dressing a member of the household with some 07121 limitación física o mental 410,9 3.074,7 3.485,6 0,1 0,3 0,3 11,8 88,207111 / Taking a member of the household with physical or mental 07121 limitations to the bathroom or changing his or her diaper 340,7 1.355.5 1.696,2 0,1 0,1 0,1 20,1 79,907111 / Caring for a member of the household who is 3.871,7 9.261,6 13.133,3 1,2 0,9 1,0 29,5 70,5 07121 temporarily sick 07113 / Accompanying a member of the household somewhere 3.881,5 5.031,7 8.913,2 1,2 0,5 0,7 43,5 56,5 0712307111 Helping a child in the household eat 6.099,3 42.840,9 48.940,3 1,9 4,1 3,6 12,5 87,507111 Bathing or dressing a child in the household 2.703,1 26.951,3 29.654,4 0,9 2,6 2,2 9,1 90,907112 Playing or talking with a child in the household 111.127,3 200.927,2 312.054,6 35,4 1,2 23,0 35,6 64,407111 Giving special therapy to a child in the household 408,5 1.306,7 1.715,3 0,1 0,1 0,1 23,8 76,207112 Helping with homework or being available to help 27.424,6 74.768,4 102.193,1 8,7 7,2 7,5 26,8 73,207200 Taking a member of the household with a physical or mental limitation for a medical visit, therapy, or to taking care of some other business 120,4 409,7 530,0 0,0 0,0 0,0 22,7 77,307200 Taking a member of the household somewhere or picking him or her up 3.473,4 8.596,1 12.069,5 1,1 0,8 0,9 28,8 71,207200 Taking food to the workplace or school of another member of the household 392,8 3.257,2 3.650,0 0,1 0,3 0,3 10,8 89,207900 Giving special therapy to or talking to a member of the household with some type of physical or mental limitation 858,4 2.123,3 2.981,7 0,3 0,2 0,2 28,8 71,207 Unpaid domestic caregiving services for members of the household 162.082,9 383.704,0 545.786,9 51,6 36.7 40.2 29.7 70.30811* Helping other households or relatives who are not members of the household for free 5.889,3 8,798,4 14.687,6 1,9 0.8 1.1 40.1 59.908122 Helping obtain services or participating in community improvements 544,6 238,4 783,1 0,2 0.0 0.1 69.5 30.508131 Performing a free community service 1.082,9 461,0 1.544,0 0,3 0.0 0.1 70.1 29.908131 Participating in civic, professional, or political volunteer activity 2.042,6 1,498,3 3.541,0 0,7 0.1 0.3 57.7 42.308 Providing services to the community and assisting other households 9.559,5 10,996,1 20.555,6 3,0 1.1 1.5 46.5 53.5
53
chapter 4
Calculating the Value of Unpaid Labor
Cc
Debbie Budlender* and Ann Lisbet Brathaug**
INTRODUCTION
The Beijing Platform for Action, which emerged from the 1995 Fourth United Nations World Conference on Women, called for the development of “suitable statistical means to recognize the full impact of the work of women and their
contributions to the national economy, including those to the unpaid and domestic sectors.” In other words, it called for valuation of unpaid labor.
During 2000, Statistic South Africa (Stats SA) conducted the fieldwork for the country’s first national time use study, with the financial and technical assistance from the Norwegian Agency for Development Cooperation and Stats Norway. The survey provided data that helped generate the first calculations of the value of unpaid labor in South Africa.
This chapter, which represents the efforts to realize this valuation, begins by describing the current content of national accounts, and how it relates to the valuation of unpaid labor. This is followed by an examination of the different methods used to valuate unpaid labor and then a section dedicated to explaining how such methods were applied in South Africa
* Specialized Researcher with the Community Agency for Social Enquiry, El Cabo, South Africa. Email [email protected]. ** Head of Division of National Accounts, Oslo, Norway. Email: [email protected].
54
Calculating the Value of Unpaid Labor
and what data sources were used. The chapter closes with a presentation of the results of this valuation exercise.
GDP, NATIONAL ACCOUNTS, AND SATELLITE ACCOUNTS
Standard GDP Measurements
The 1993 System of National Accounts (SNA93) is the basis of national accounts, which, in turn, are the basis for calculations of gross domestic product (GDP). Growth in GDP is generally seen as the main indicator of the strength or weakness of an economy’s performance.
Given that the GDP level and rate of change are often used to compare economic performances of different countries, it is important for all countries to calculate their GDP in the same way. The System of National Accounts provides an internationally agreed set of standards to designate how countries should calculate GDP, in particular clarifying what should and should not be included in the calculations as well as how different components should be measured. The SNA3, the latest version, was developed by international agencies such as the United Nations, Organization for Economic Cooperation and Development (OECD), and International Monetary Fund.
In the 1999 South African Budget Review, GDP is defined as “a measure of total national output, income, and expenditure in the economy,” noting, however, that “GDP per head […] does not take account of the distribution of income, nor of goods and services that are produced outside the economy, such as work within the household.”
The SNA93 makes a distinction between three production types that form part of the calculation of output, and therefore of GDP: a) market production, b) own final use, and c) nonmarket production. GDP measures all transactions that occur in the market. In regards to nonmarket production, GDP calculations exclude the production of (unpaid) household services for own consumption, but include the production of goods by households for their own final use (for example subsistence production), an imputed value for owner-occupied dwellings, and paid household services, such as domestic worker wages.
The way in which production is covered by national accounts can result in misinterpretation of GDP trends, in particular with respect to the way people provide for their changes in needs. For example, most people believe an increase in the GDP implies an improvement in living standards, yet this may not be realistic, as GDP also increases when goods and services previously produced and consumed within the household are instead obtained through the market. Thus, the household still enjoys the same level of goods and services, but GDP increases due to a market shift. In addition to this undercount, Acharya (52) observes that, “marketization involves costs also in terms of transportation, increased requirements for nutrition, etc.”
55
Debbie Budlender and Ann Lisbet Brathaug
Exclusion of Household Services
The basic SNA93 rule for household production is that production of goods is included, while production of services is not. SNA documents explain the exclusion of services produced in the household as follows:
A large volume of household services, including the imputed values derived from production, would distort the usefulness of the accounts for policy purposes and for the analysis of markets and market disequilibria: the analysis of inflation, unemployment, etcetera. (See reference 3 and paragraph 6.21 of SNA93.)
The documents also argue that household production “is relatively isolated from and independent of market activities” (53). Other arguments against the inclusion of such services include lack of data, difficulty of measurement, and inability to make historical comparisons because services were previously excluded.
Kulshreshtha and Singh (54) point to another reason, noting that, “if personal and domestic services by members of households for own final consumption are included, all persons engaged in such activities would become self-employed, making unemployment virtually impossible by definition.” These authors imply that people who engage in activities that produce the goods and services included in GDP are statistically regarded as employed, yet they fail to point out the existing anomalies. For example, according to SNA93, fetching water and fuel for household use should be included in GDP calculations, yet few would regard a person who spends an hour per day collecting water as employed if her or she engages in no other economic activity.
More generally, Chadeau (55) notes that the “arguments for excluding domestic and personal services from the production boundary in the System are not all equally convincing.”
Interaction of Household and Market Production
Duncan Ironmonger has illustrated different methods of combining household production with capital and labor from the market, for example using laundry service (60). The following matrix illustrates the four possibilities in this case:
Cell 1: Sending clothing to a laundry service.Cell 2: Paying a domestic worker to do the laundry at home using the household
washing machine.Cell 3: Going to the self-service laundry and using their washing machine and own
labor.Cell 4: Washing laundry at home using own labor and washing machine.
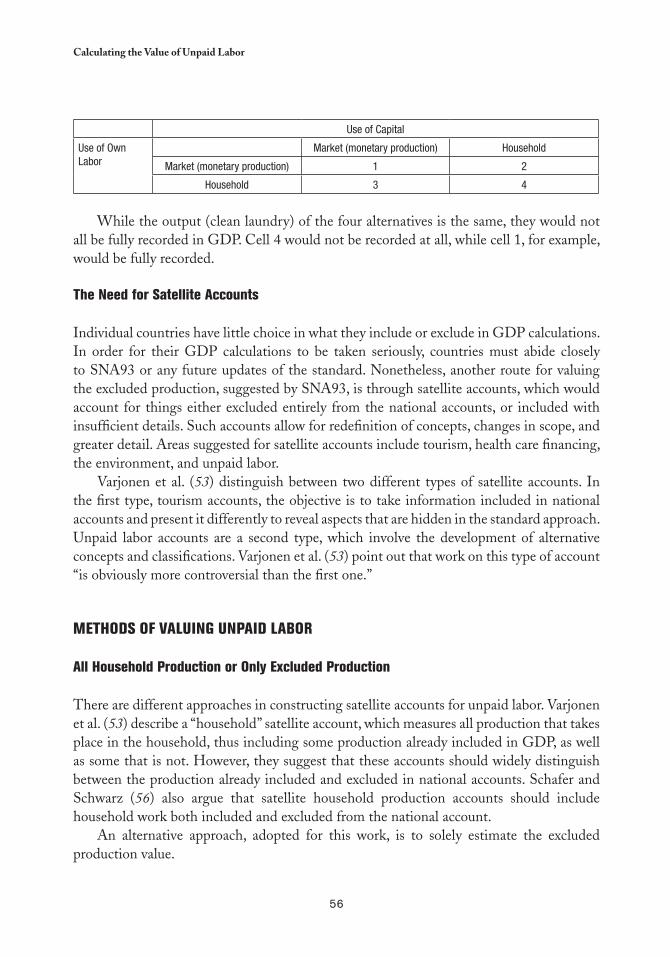
56
Calculating the Value of Unpaid Labor
Use of Capital
Use of Own Labor
Market (monetary production) Household
Market (monetary production) 1 2
Household 3 4
While the output (clean laundry) of the four alternatives is the same, they would not all be fully recorded in GDP. Cell 4 would not be recorded at all, while cell 1, for example, would be fully recorded.
The Need for Satellite Accounts
Individual countries have little choice in what they include or exclude in GDP calculations. In order for their GDP calculations to be taken seriously, countries must abide closely to SNA93 or any future updates of the standard. Nonetheless, another route for valuing the excluded production, suggested by SNA93, is through satellite accounts, which would account for things either excluded entirely from the national accounts, or included with insufficient details. Such accounts allow for redefinition of concepts, changes in scope, and greater detail. Areas suggested for satellite accounts include tourism, health care financing, the environment, and unpaid labor.
Varjonen et al. (53) distinguish between two different types of satellite accounts. In the first type, tourism accounts, the objective is to take information included in national accounts and present it differently to reveal aspects that are hidden in the standard approach. Unpaid labor accounts are a second type, which involve the development of alternative concepts and classifications. Varjonen et al. (53) point out that work on this type of account “is obviously more controversial than the first one.”
METHODS OF VALUING UNPAID LAbOR
All Household Production or Only Excluded Production
There are different approaches in constructing satellite accounts for unpaid labor. Varjonen et al. (53) describe a “household” satellite account, which measures all production that takes place in the household, thus including some production already included in GDP, as well as some that is not. However, they suggest that these accounts should widely distinguish between the production already included and excluded in national accounts. Schafer and Schwarz (56) also argue that satellite household production accounts should include household work both included and excluded from the national account.
An alternative approach, adopted for this work, is to solely estimate the excluded production value.
57
Debbie Budlender and Ann Lisbet Brathaug
Input versus Output
Most studies use the costs of the production inputs to valuate household production. This method is common in standard national accounts and is the approach adopted in relation to valuing production by government and nonprofit institutions. The alternative method is to value output, which is the preferred method in both GDP and satellite calculations. However, it is difficult when the goods and services produced are not sold on the market.
For output-based valuation one needs a) household output, measured in physical units, b) intermediate consumption, measured in either physical or monetary terms, and c) market prices for the physically-measured items in (a) and (b) in order to convert them into a monetary measure.
Acharya’s (52) output-based calculations for Nepal yield a value added equal to the official GDP, if all goods and services produced for household consumption and maintenance activities are counted. She points out the significant increase over that of 40 percent of GDP recorded in a Norwegian study, which could be the result of data used. For meal preparation, Acharya relied on a special, but small survey of 276 households that calculated the frequency of which each product was generated or activity was performed, the average quantity produced in the given time, the per unit cost of in-home preparation, and the total persons involved in production, which allowed for the use of output values for these products.
However, Acharya used wages for other activities and products, and was forced to use aggregated earnings figures for a “polyvalent” worker —a hypothetical worker performing a range of jobs rather than performing the specific activity concerned in one— due to the lack of detailed statistics. A further reason for the fluctuation is that the Norwegian calculations assumed operating surplus and consumption of fixed capital to be zero. Nonetheless, this explains only a small part of the difference between the Norwegian and Nepalese results. A more important reason is the different nature of the Norwegian and Nepalese economies. In Nepal, far more productive activities are likely to be nonmarketized than in Norway.
Output-based valuation corrects for different productivity levels. For example, two households could spend an equal number of hours cooking meals of similar nutritional value; however if one household has an electric stove or microwave while the other relies on wood fuel, the first household would expend far less time in preparing the meal. Through the input-based approach, the meal of the second household would be assigned a higher value since the estimate is based primarily on time, while through the output-based approach, both meals would be assigned the same value.
However, primitive equipment is not the only factor in lower productivity. When unpaid work activities are carried out partly for leisure —for example, when someone gardens or cooks partly because they enjoy this— more time may be spent than necessary on the task (57). In calculating the value of unpaid labor, the focus is on the nature of the activity, rather than the purpose or enjoyment level. Therefore, herein there is no distinction between unpaid work done for leisure and that done for other reasons.
58
Calculating the Value of Unpaid Labor
Furthermore, Schafer and Schwarz (56) point out that productivity differences sometimes favor households. They observe, for example, that with person-related services households may be better informed about needs, more willing to provide ongoing services, more flexible, and able to adjust more rapidly to unforeseen circumstances. Moreover, they will not have to factor in travel, idle time, and breaks, which is necessary when services are produced commercially.
The Approach
Due to the lack of necessary data for South Africa, an input-based approach is adopted in this chapter. In household production, input production costs include labor, taxes minus subsidies on production, consumption of household durables, and the goods and services used in production, which is referred to as intermediate consumption. Taxes that should be included in the calculation correspond to real estate and vehicle ownership. Subsidies on production should include in-home care and housing allowances. The input approach does not take net operating surplus into account, or gives it a value of zero.
To perform the full input-based calculations described above, it is necessary to clarify whether the goods purchased for the household are used for final or intermediate consumption, or considered as fixed assets. Some European countries call upon the Classification of Individual Consumption by Purpose (COICOP) to help with this decision. Varjonen et al. (53) provide a table suggesting how different categories of goods could be allocated. Schafer and Schwarz also include a chart of “Goods and Services for Intermediate Consumption and Consumer Durables used in Household Production” in which they allocate goods either completely or partially to various types of household production (56).
Unfortunately this approach is not possible in South Africa, which has not yet developed the COICOP system in sufficient detail. Still, even with the system in place, it would be necessary to review the allocation of categories of Varjonen et al. to see whether they fit the situation in South Africa.
In the absence of the necessary data, many analysts have used the estimated labor value as a rough indication of value added by household production. This approach is adopted herein, as in other countries, by which the time-based values obtained from the time use study are converted into a monetary equivalent. Labor-only estimates are a good start, considering that household production is more labor intensive than production in most other economic sectors. However, it is important to note the warning of Brathaug (58) that the resulting calculations produce an underestimate of the full value added in household production.
Wages
Time use surveys provide an estimate of the number of hours spent on unpaid labor. These hours and minutes then need to be converted into a monetary value, which is done by
59
Debbie Budlender and Ann Lisbet Brathaug
assigning an hourly wage to time spent. Kulshreshtha and Singh (54) report that in 1996, Jackson was able to identify at least 12 different approaches to wage imputation, clustered into the following four broad categories: mean wage approach, opportunity cost approach, generalist approach, and the specialist approach.
The mean wage approach assigns the mean wages in the economy as a whole to each hour. Usually, the mean is calculated separately for men and women and the appropriate wage is assigned according to who performed the unpaid labor. When sex-disaggregated wages are used, the value of unpaid work decreases because a) women generally perform far more unpaid work than men, and b) the average female wage is usually lower than the average male wage.
The disadvantage of the mean wage approach is that it is based only on employed people, who are not representative of the total population. It assigns values to unemployed and economically inactive people that are appropriate for employed individuals, but perhaps not for all people. This disadvantage is accentuated where a country has large wage discrepancies between the highest and lowest paid.
The opportunity cost approach uses the economic concept that refers to the benefit foregone by making one choice over another. In this case, it relates to the earnings that the person could have earned in paid work if they had not been occupied with unpaid labor instead. Theoretically, this creates problems, as it applies different rates for the same task —although the outputs are similar— when different people perform the work. This implies, for example, that time spent cooking a meal by a university graduate has more value than time spent by someone without formal schooling, even if they use the same ingredients.
In addition, it is difficult to find the opportunity cost for many respondents in a situation of high unemployment. In the time use survey, respondents 10 years and older were targeted and less than half of the respondents were employed, 44 percent were economically inactive, and 8 percent were unemployed. Many of the unemployed and economically inactive people were basically unemployable, thus making it difficult to assign an occupation and associated opportunity cost wage.
A third weakness of the opportunity cost method is the assumption that people can always choose whether or not to spend an extra hour on paid work or other activity. In practice, especially in the formal job market, such flexibility does not exist. For these and other reasons, Varjonen et al. (53) report that the opportunity cost method is widely rejected by researchers.
In the generalist approach, the mean wages of workers that perform similar work are assigned to the unpaid work. In the case of the household, paid domestic workers would be included, while child care work would include preschool employees. While the generalist approach uses domestic worker wages, it underestimates the true value of housework to the extent that it disregards the more highly valued management-type tasks associated with household maintenance.
Schafer and Schwarz (56) argue that the housekeeper wage is more appropriate than that for ordinary domestic workers, as it better reflects the range of tasks performed
60
Calculating the Value of Unpaid Labor
by household members. Unfortunately, South African data do not include sufficient observations of housekeepers to provide a reliable estimate based on this category alone.
The specialist approach assigns different wages to different activities, regardless of who performs them. In each case, the paid worker whose functions and circumstances most closely match the unpaid work concerned is chosen. For example, cooking activities would be assigned the wages of a paid chef, cleaning activities would be assigned the salary of a paid housecleaner, and so on. This approach requires a significant amount of detailed data on both time use and wages and is sometimes broadly applied. For example, it is possible to assign one wage to household maintenance work, another to care work, and a third to community services work. The difference in total value that results from specialist and generalist approaches varies according to the mix of occupations and income levels.
Chadeau (55) notes that across all countries that have done the calculations, by and large the opportunity cost approach gives the highest value, while the generalist approach gives the lowest. The only exception is Norway, where generalist approach gave a higher value than its specialist substitute. Some studies have found that the opportunity cost value is double that of the generalist wage.
The above discussion assumes that the relevant mean wage was used for all but the opportunity cost method. Some analysts have suggested using union and statutory minimum wage rates, but Schafer and Schwarz (56) argue that the wage rates should be the actual wages prevalent on the market, which would usually be higher than the minimum, unless enforcement and coverage are poor.
What to Include in the Wage
There is general agreement that the gross wage should be used in the calculations (see reference 3 for a discussion of the reasons). This calculation should also include amounts paid by the employer with respect to the job, but not directly received by the worker, because if the household had to buy the product on the market, the price would include all employer expenses. This all-inclusive approach is in line with the overall SNA approach.
Accordingly, in South Africa, the wage amount should include payments such as employer contributions to the Unemployment Insurance Fund (UIF), the skills levy, and any employer contributions to medical aid and pension funds.
Estimating the Hours
With regards to hours, the main decision to be made is whether or not to allow for the performance of more than one activity at a time. Some time use studies allow for only one activity to be reported in a given period, while other studies allow for more than one to be performed at a time. In this case, usually the measuring instrument distinguishes between the main or primary activities, and secondary or tertiary activities.
61
Debbie Budlender and Ann Lisbet Brathaug
Research in other countries has found a systematic bias in the designation of activities as primary, secondary, or tertiary. In particular, child care is typically reported as a secondary activity when performed simultaneously with another activity. In this regards, Brathaug notes that the time use data used in her report focused on main activities, thus as many care tasks were conducted simultaneously with others, the value for such tasks was low (58).
Varjonen et al. (53) suggest that European countries ignore simultaneous activities when making calculations for satellite accounts, providing two reasons. The first is that such activities are infrequently reported, while the second is that activities such as child care lack reliable data. In essence, by advocating the disregard for the underreported activity, Varjonen et al. increase the undervaluation.
Schafer and Schwartz (56) provide an estimate of the difference between when only primary activities are included and when they are combined with secondary activities. In the German case, they note that an average of 20 minutes per day is used for primary child care while about 90 minutes per day is spent with children when secondary activities are included. Still, this longer estimate excludes “standby” time, during which the person is available for children.
Households versus Institutions
Varjonen et al. (53) note that, theoretically, one should include institutional households in household production calculations, yet it is rarely done. They suggest that the exclusion is not serious as the amount of unpaid labor performed in institutions is probably insignificant, a contention which could be disputed. Nonetheless, for the South African estimates institutions were excluded, as they were not covered in the time use survey.
APPLYING THE METHOD IN SOUTH AFRICA
Using the Time Use Survey
As noted above, input-based unpaid labor valuations rely on time use studies to provide estimates of time spent on non-SNA production. The fieldwork for South Africa’s first national time use study was conducted in three tranches —February, June, and October 2000— in order to capture possible seasonal variations in time use. The sample covered all nine provinces and, within each province, four different settlement types: formal urban, informal urban, commercial farms, and other rural settlements.
Within each household, two people aged ten years or older were selected systematically and asked what activities they had performed on the previous day. To record the activities, the study used a 24-hour diary, divided into half-hour slots, with a maximum of three activities per slot. The diary was administered in person through an interview.

62
Calculating the Value of Unpaid Labor
For coding the activities recorded in the half-hour slots, the survey used a trial classification developed by the United Nations Statistics Division (UNSD), which is organized according to 10 broad categories:
Work in establishments, for example working in a factory or mine.1) Primary production, for example growing maize or other vegetables on a household 2) plot or collecting fuel and water.Work in nonestablishments, for example selling fruit and vegetables at the side of a 3) road, or doing hairdressing at home.Household maintenance, for example cooking and cleaning.4) Care provision, for example caring for children, the sick, or elderly in the household.5) Community service, for example attending a political meeting or helping other 6) households.Learning, for example attending school or doing homework.7) Social and cultural activities, for example socializing with family or friends.8) Mass media activities, for example watching television or listening to the radio.9) Personal care, for example sleeping, eating and drinking, dressing, and washing.10)
Notably, these 10 categories can be grouped according to how they are treated in the SNA, and thus in the calculation of GDP.
The activities in categories 1–3 fall in the SNA production boundary, and thus would be 1) included in national accounts and GDP calculation. Stats SA reports refer to activities in these categories as “SNA production.” The activities in categories 4–6 fall outside the SNA production boundary, however 2) they are universally recognized as “productive” activities and largely correspond to unpaid work. Stats SA reports refer to such activities as “non-SNA production.” The remaining four categories are not covered at all by the SNA, failing what is 3) referred to as the “third person test,” meaning they cannot be performed for a person by someone else. People cannot hire someone else to sleep, learn, or eat for them, thus such activities cannot become part of the market economy. Stats SA reports refer to such activities as “nonproductive.”
Assumptions for Valuation
In calculating the value of unpaid labor, it was assumed that most production resulting from categories 1, 2, and 3 of the coding scheme would be included in the gross domestic product (GDP) calculations, with the exceptions of collecting fuel and water. Although SNA93 specifies that such activities should be included in the GDP computations, to date this has not been done by Stats SA or other statistical agencies.
63
Debbie Budlender and Ann Lisbet Brathaug
Here, calculations in respect to productive activities that are not currently included in GDP calculations concentrate on categories 4 (household maintenance), 5 (care for household members) and 6 (community work), plus fuel and water collection. Schafer and Schwarz describe all three of these chosen categories as “household production” (56).
Ironmonger (personal communication) and others (60) argue that education should be considered as a type of production, in that it produces improved human capacity. In general, learning activities are considered nonproductive, as they do not pass the third-person test. In other words, a person cannot pay someone else to learn for them. This report follows the standard approach.
There is also some debate as to how to treat travel. Chadeau (55) argues that the third-party criterion dictates that, “transporting oneself should be considered as a productive activity provided it is not performed as a nonproductive leisure activity.” In the classification system used by Stats SA, all travel activities associated with a particular type of work are included in this category. In order to be consistent with calculations of GDP, which usually exclude travel related to paid work, all travel related to non-SNA production is excluded from the calculations herein.
Calculating the Hours
The Stats SA survey allowed for up to three activities to be reported for every half-hour timeslot. For each activity, the respondent was asked to state whether it was performed simultaneously with other activities or alone. The Stats SA survey did not distinguish between primary, secondary, and tertiary activities within a given period, rather they were all given equal weight.
In order to obtain a broadened understanding of simultaneous activities, Stats SA used two different methods of assigning minutes to activities. When only one activity took place in 30 minutes, the time slot was assigned accordingly. When two or three activities were carried out in a half hour sequentially, each activity was assigned 10 or 15 minutes. However, when two or more activities were performed simultaneously, it was more complicated. In this case, should they each be assigned 30 minutes or 15?
The advantage of assigning 15 minute time slots is that the total minutes per person adds up to 24 hours in one day, making the results more easily comparable with those of other countries. Yet, a disadvantage of this approach is the impression that less time is being spent on an activity than in actuality. For example, if a person spends eight hours at work, during which the person also listens to the radio, the results will account for four hours of work and four hours of listening to the radio. Intuitively, most people would not understand such findings.
The advantage of assigning 30 minutes to each activity is that it shows a more valid duration of a particular activity, that is, the full time span. This report mainly follows the 24-hour minute approach. However, some comparisons are made with the results that would have been obtained through the “full-minute” approach.
64
Calculating the Value of Unpaid Labor
Calculating the Wages
Mean wages were calculated on an hourly scale based on data from the Labor Force Survey (LFS) conducted in September 2000. As with most household surveys, the LFS probably provides an underestimate of actual earnings. However, it is the best source available in terms of coverage of the formal and informal sectors.
Employees were selected by means of question 4.3 of the survey, which inquired about the respondent’s situation related to their main job. Respondents were selected if they answered that they were either a) working for someone else for pay, or b) working for one or more private households as a domestic employee, gardener, or security guard. In both cases, the questionnaire specified that payment could be in cash, kind, or accommodation, implying that that the cash wages reported could understate the actual compensation.
Mean hourly wages were calculated based on responses to questions 4.15a to 4.15c and 4.20a. Question 4.15a asked for the respondent’s total pay at his or her main job, including overtime, allowances, and bonus, before any tax or deductions (i.e., gross pay). Question 4.15b asked wether the frequency of pay was weekly, monthly, or annually. These final two variables permitted the calculation of a weekly equivalent.
For those who would or could not specify an exact amount, question 4.15c requested the wage range, specified in terms of 14 income brackets. The logarithmic mean of the bracket was used for all but the bottom non-zero and top brackets. For the bottom bracket, an amount equal to two-thirds of the top cut-off was used, while for the top bracket, an amount equal to double that of the second from top was used.
The LFS provides estimates of the gross wage received by the worker, without including additional payments, thus the estimations in South Africa are undervalued. However, the discrepancy is probably less serious than in other countries, as many South African workers do not receive —or receive very small— contributions from their employers. The employer UIF contribution is equal to 1 percent of the wage and is not paid by informal sector employers or by employers of domestic workers. The skills levy was equal to 0.5 percent of the payroll for most of 2000, when the time use survey was conducted, and was payable only by formal sector employers with payrolls of R250,000 (approximately US$34,570) or more per month. The gross wage should also include extra irregular wages such as a 13th paycheck and other bonuses. The data herein likely excludes such payments.
Of the 21,875 total selected employee respondents, valid nonzero responses were obtained from questions 4.15a and 4.15b for 19,045 (87 percent), and nonzero income bracket responses for a further 2,023 (9 percent). The remaining records were ignored in the calculations.
As time use surveys produce information in terms of hours and minutes, it was necessary to obtain an hourly rather than a weekly wage. Question 4.21a of the Labor Force Survey asks how many hours per week, including overtime, the respondent usually works in his or her main job or activity. For the purpose of this report, the weekly wage and number
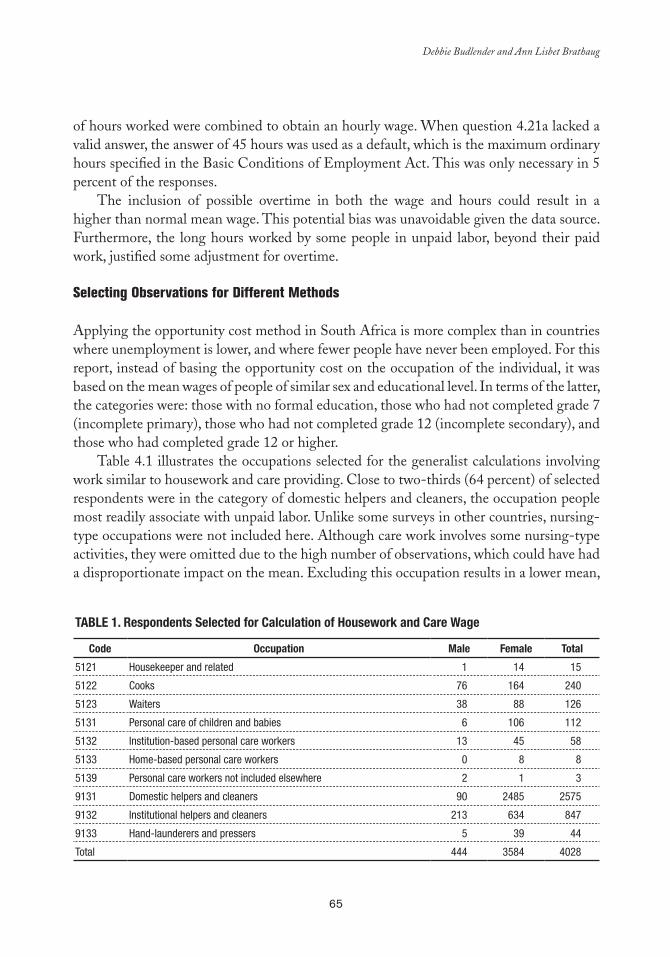
65
Debbie Budlender and Ann Lisbet Brathaug
of hours worked were combined to obtain an hourly wage. When question 4.21a lacked a valid answer, the answer of 45 hours was used as a default, which is the maximum ordinary hours specified in the Basic Conditions of Employment Act. This was only necessary in 5 percent of the responses.
The inclusion of possible overtime in both the wage and hours could result in a higher than normal mean wage. This potential bias was unavoidable given the data source. Furthermore, the long hours worked by some people in unpaid labor, beyond their paid work, justified some adjustment for overtime.
Selecting Observations for Different Methods
Applying the opportunity cost method in South Africa is more complex than in countries where unemployment is lower, and where fewer people have never been employed. For this report, instead of basing the opportunity cost on the occupation of the individual, it was based on the mean wages of people of similar sex and educational level. In terms of the latter, the categories were: those with no formal education, those who had not completed grade 7 (incomplete primary), those who had not completed grade 12 (incomplete secondary), and those who had completed grade 12 or higher.
Table 4.1 illustrates the occupations selected for the generalist calculations involving work similar to housework and care providing. Close to two-thirds (64 percent) of selected respondents were in the category of domestic helpers and cleaners, the occupation people most readily associate with unpaid labor. Unlike some surveys in other countries, nursing-type occupations were not included here. Although care work involves some nursing-type activities, they were omitted due to the high number of observations, which could have had a disproportionate impact on the mean. Excluding this occupation results in a lower mean,
Table 1. Respondents Selected for Calculation of Housework and Care Wage
Code Occupation Male Female Total
5121 Housekeeper and related 1 14 15
5122 Cooks 76 164 240
5123 Waiters 38 88 126
5131 Personal care of children and babies 6 106 112
5132 Institution-based personal care workers 13 45 58
5133 Home-based personal care workers 0 8 8
5139 Personal care workers not included elsewhere 2 1 3
9131 Domestic helpers and cleaners 90 2485 2575
9132 Institutional helpers and cleaners 213 634 847
9133 Hand-launderers and pressers 5 39 44
Total 444 3584 4028

66
Calculating the Value of Unpaid Labor
as nurses generally earn more than those in the selected occupations. The inclusion of the 284 nursing professionals (code 3231) would have resulted in a mean hourly wage of R6.23 (US$0.86) rather than the R5.08 (US$0.70) obtained without them.
In addition to the occupation codes, Table 1 shows the number of male and female respondents for each. Overall, there were relatively few observations and male respondents accounted for only 11 percent of the total, thus the wage computations were not sex-disaggregated for this calculation.
For the specialist approach, we considered each of the different activities included in non-SNA production, and chose paid occupations that most resembled them, as reflected in the following:
Activity codes 410 (cooking-related) and 620 (organized community work) were ■■
equated with the work of cooks and wait staff.Activity codes 420 (cleaning), 440 (shopping), 450 (household management), 490 ■■
(miscellaneous housework), 615 (cleaning of classrooms), 250 (collection of water), and 236 (collection of firewood) were equated with the work of paid domestic workers, housekeepers, and janitors.Activity code 430 (care of clothing, etc.) was equated with the work of hand launderers■■ .Activity code 460 (do-it-yourself home improvements) was equated with the work ■■
of craftspeople.Activity codes 470 (pet care), 511/2 (physical care of household children), 531/2 ■■
(accompanying household children), 550 (accompanying household adults), 561/2 (supervising household children), 590 (miscellaneous care of household persons), and 671/2/3/4 (care of nonhousehold persons) were equated with the work of child providers, institution and home-based personal care administrators, and general personal care workers.Activity code 540 (physical care of sick and elderly household members) was ■■
equated with the work of nursing associate professionals.Activity code 521/2 (teaching household children) was equated with the work of ■■
primary and secondary teachers.Activity code 610 (community organized construction) was equated with the work ■■
of construction laborers.Activity codes 630 (volunteering), 650 (participation in meetings), 660 (involve-■■
ment in civic activities), and 690 (miscellaneous community services) were equated with unskilled (elementary) labor.
The Population Census as an Alternative Data Source
The census provides an alternative source of income data and its strength lies in its more extensive coverage compared to the LFS. Weaknesses include a) less specific questions
67
Debbie Budlender and Ann Lisbet Brathaug
about employee incomes, b) census data are less current (1996) than time use data (2000), and c) income appears to be underestimated when compared with other sources (59).
In terms of the first weakness, there are several aspects:
The census enquired about every individual’s personal income, whether that per-■■
son was employed or not. As such, responses could include nonearned property income. To approximate earned income, calculations were restricted to people who were classified as employed. This category included self-employed and employers, as well as employees, but the latter predominated. The census requested income information only in terms of income brackets, which ■■
is less accurate than the exact figures obtained for employees in the LFS. To over-come this weakness, we adopted the same logarithmic mean approach as for the income bracket data from the LFS. The census data did not include a question regarding the amount of hours the ■■
person worked. To overcome this obstacle, the working week was set at 46 hours, which was the maximum ordinary hours specified in the Basic Conditions of Em-ployment Act in 1996.The census only recorded employment status for people aged 15 and older, whereas ■■
the time use information is available for people aged 10 and older.In terms of the second weakness, in the absence of a more reliable basis of adjustment, ■■
the 1996 figures were adjusted by the consumer price index. In terms of the third weakness, no adjustments were made. Accordingly, it is expected that census-based calculations will yield lower estimates of value added in household production.
In the case of the calculation realized with the generalist approach and based on the census, two categories were considered: domestic and related helpers, accounting for 1.3 million people, and personal care workers, accounting for 17,875 people.
Results of Valuation of Unpaid Labor
Table 2 provides basic statistics of how male and female South Africans spend a 24-hour day, distinguishing between activities included in GDP calculations as specified by SNA93, production activities that were excluded, and nonproductive activities. In these calculations, some adjustments were made to the division suggested by the activity classification; in particular, all travel and employment seeking activities were reclassified as nonproductive, and water and fuel collection were reclassified from SNA production to non-SNA production. Ironmonger (60) estimates that in 1987, Australian market industries used 252 million hours while “household industries” used 282 million hours; thus unpaid work was 12 percent greater than paid work in terms of time. Table 2 suggests that in South Africa unpaid work is 33 percent greater than paid work in terms of time.
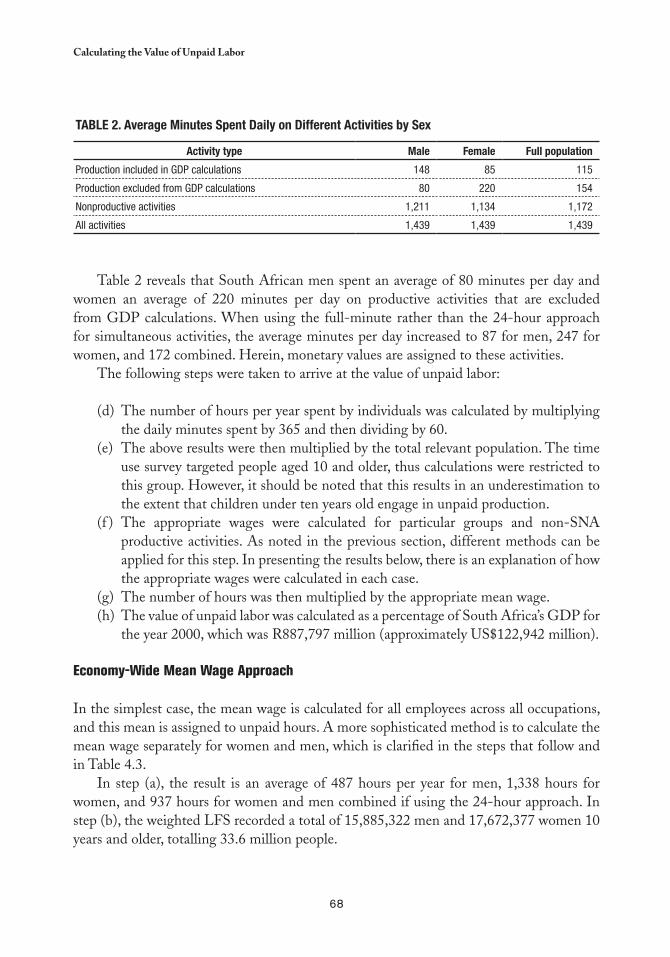
68
Calculating the Value of Unpaid Labor
Table 2. average Minutes Spent Daily on Different activities by Sex
activity type Male Female Full population
Production included in GDP calculations 148 85 115
Production excluded from GDP calculations 80 220 154
Nonproductive activities 1,211 1,134 1,172
All activities 1,439 1,439 1,439
Table 2 reveals that South African men spent an average of 80 minutes per day and women an average of 220 minutes per day on productive activities that are excluded from GDP calculations. When using the full-minute rather than the 24-hour approach for simultaneous activities, the average minutes per day increased to 87 for men, 247 for women, and 172 combined. Herein, monetary values are assigned to these activities.
The following steps were taken to arrive at the value of unpaid labor:
The number of hours per year spent by individuals was calculated by multiplying (d) the daily minutes spent by 365 and then dividing by 60.The above results were then multiplied by the total relevant population. The time (e) use survey targeted people aged 10 and older, thus calculations were restricted to this group. However, it should be noted that this results in an underestimation to the extent that children under ten years old engage in unpaid production.The appropriate wages were calculated for particular groups and non-SNA (f ) productive activities. As noted in the previous section, different methods can be applied for this step. In presenting the results below, there is an explanation of how the appropriate wages were calculated in each case.The number of hours was then multiplied by the appropriate mean wage.(g) The value of unpaid labor was calculated as a percentage of South Africa’s GDP for (h) the year 2000, which was R887,797 million (approximately US$122,942 million).
Economy-Wide Mean Wage Approach
In the simplest case, the mean wage is calculated for all employees across all occupations, and this mean is assigned to unpaid hours. A more sophisticated method is to calculate the mean wage separately for women and men, which is clarified in the steps that follow and in Table 4.3.
In step (a), the result is an average of 487 hours per year for men, 1,338 hours for women, and 937 hours for women and men combined if using the 24-hour approach. In step (b), the weighted LFS recorded a total of 15,885,322 men and 17,672,377 women 10 years and older, totalling 33.6 million people.
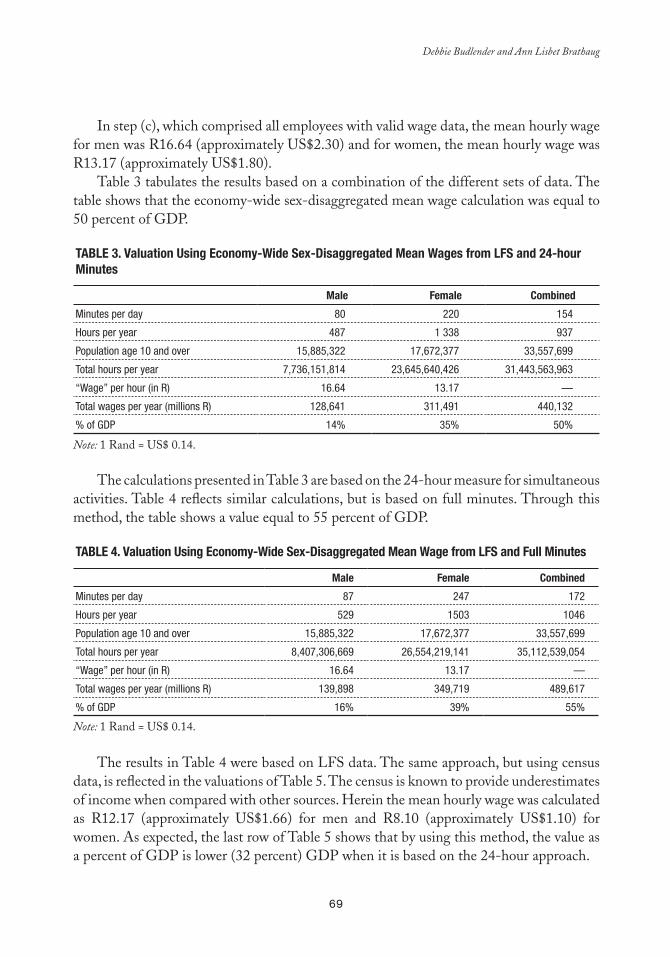
69
Debbie Budlender and Ann Lisbet Brathaug
In step (c), which comprised all employees with valid wage data, the mean hourly wage for men was R16.64 (approximately US$2.30) and for women, the mean hourly wage was R13.17 (approximately US$1.80).
Table 3 tabulates the results based on a combination of the different sets of data. The table shows that the economy-wide sex-disaggregated mean wage calculation was equal to 50 percent of GDP.
Table 3. Valuation Using economy-Wide Sex-Disaggregated Mean Wages from lFS and 24-hour Minutes
Male Female Combined
Minutes per day 80 220 154
Hours per year 487 1 338 937
Population age 10 and over 15,885,322 17,672,377 33,557,699
Total hours per year 7,736,151,814 23,645,640,426 31,443,563,963
“Wage” per hour (in R) 16.64 13.17 —
Total wages per year (millions R) 128,641 311,491 440,132
% of GDP 14% 35% 50%
The calculations presented in Table 3 are based on the 24-hour measure for simultaneous activities. Table 4 reflects similar calculations, but is based on full minutes. Through this method, the table shows a value equal to 55 percent of GDP.
Table 4. Valuation Using economy-Wide Sex-Disaggregated Mean Wage from lFS and Full Minutes
Male Female Combined
Minutes per day 87 247 172
Hours per year 529 1503 1046
Population age 10 and over 15,885,322 17,672,377 33,557,699
Total hours per year 8,407,306,669 26,554,219,141 35,112,539,054
“Wage” per hour (in R) 16.64 13.17 —
Total wages per year (millions R) 139,898 349,719 489,617
% of GDP 16% 39% 55%
The results in Table 4 were based on LFS data. The same approach, but using census data, is reflected in the valuations of Table 5. The census is known to provide underestimates of income when compared with other sources. Herein the mean hourly wage was calculated as R12.17 (approximately US$1.66) for men and R8.10 (approximately US$1.10) for women. As expected, the last row of Table 5 shows that by using this method, the value as a percent of GDP is lower (32 percent) GDP when it is based on the 24-hour approach.
Note: 1 Rand = US$ 0.14.
Note: 1 Rand = US$ 0.14.

70
Calculating the Value of Unpaid Labor
Table 5. Valuations Using economy-Wide Sex-Disaggregated Mean Wage from Census and 24-hour Minutes
Male Female Combined
Minutes per day 80 220 154
Hours per year 487 1 338 937
Population age 10 and over 15,885,322 17,672,377 33,557,699
Total hours per year 7,736,151,814 23,645,640,426 31,443,563,963
“Wage” per hour (in R) 12.17 8.10 -
Total wages per year (in millions R)) 94,149 191,530 285,679
% of GDP 11% 22% 32%
Opportunity Cost Approach
Table 6 shows the mean wages for each of the chosen educational levels discussed earlier, as well as the estimated percentage of men and women age 10 and over at each level. The final row of the table shows the average wages of all levels, which are R13.67 (approximately US$1.87) for men and R9.74 (approximately US$1.30) for women.
Table 6. Mean Wage (R) and average Minutes by education
Male Female
% Population Wage (R) Minutes % Population Wage (R) Minutes
No schooling 8 5.51 88 10 2.10 242
Incomplete primary 40 6.61 75 34 4.56 187
Incomplete secondary 29 11.34 83 35 8.90 238
Completed secondary education or more
24 30.90 80 21 22.94 216
Average 13.65 80 9.74 216
Table 7 depicts the value of non-SNA production. The total calculated wages in the row second from the bottom are based on more accurate figures than those in higher rows, which are rounded off. Thus, multiplying the total hours from the table by the hourly wage will give slightly different results. As shown in the final row, through this approach the combined wages were 38 percent of GDP.
Note: 1 Rand = US$ 0.14.
Note: 1 Rand = US$ 0.14.
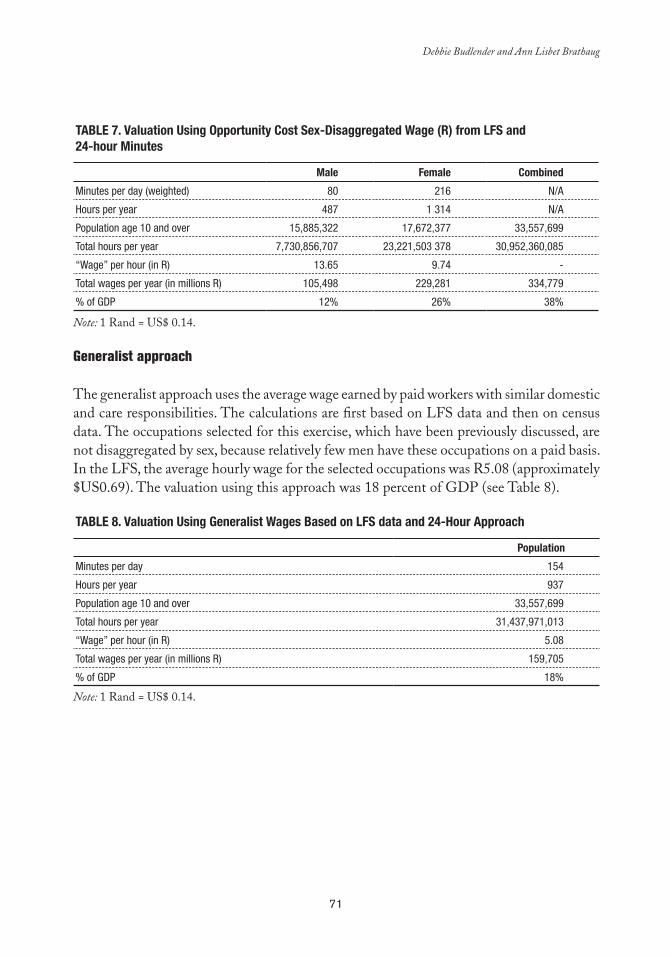
71
Debbie Budlender and Ann Lisbet Brathaug
Table 7. Valuation Using Opportunity Cost Sex-Disaggregated Wage (R) from lFS and 24-hour Minutes
Male Female Combined
Minutes per day (weighted) 80 216 N/A
Hours per year 487 1 314 N/A
Population age 10 and over 15,885,322 17,672,377 33,557,699
Total hours per year 7,730,856,707 23,221,503 378 30,952,360,085
“Wage” per hour (in R) 13.65 9.74 -
Total wages per year (in millions R) 105,498 229,281 334,779
% of GDP 12% 26% 38%
Generalist approach
The generalist approach uses the average wage earned by paid workers with similar domestic and care responsibilities. The calculations are first based on LFS data and then on census data. The occupations selected for this exercise, which have been previously discussed, are not disaggregated by sex, because relatively few men have these occupations on a paid basis. In the LFS, the average hourly wage for the selected occupations was R5.08 (approximately $US0.69). The valuation using this approach was 18 percent of GDP (see Table 8).
Table 8. Valuation Using Generalist Wages based on lFS data and 24-Hour approach
Population
Minutes per day 154
Hours per year 937
Population age 10 and over 33,557,699
Total hours per year 31,437,971,013
“Wage” per hour (in R) 5.08
Total wages per year (in millions R) 159,705
% of GDP 18%
Note: 1 Rand = US$ 0.14.
Note: 1 Rand = US$ 0.14.
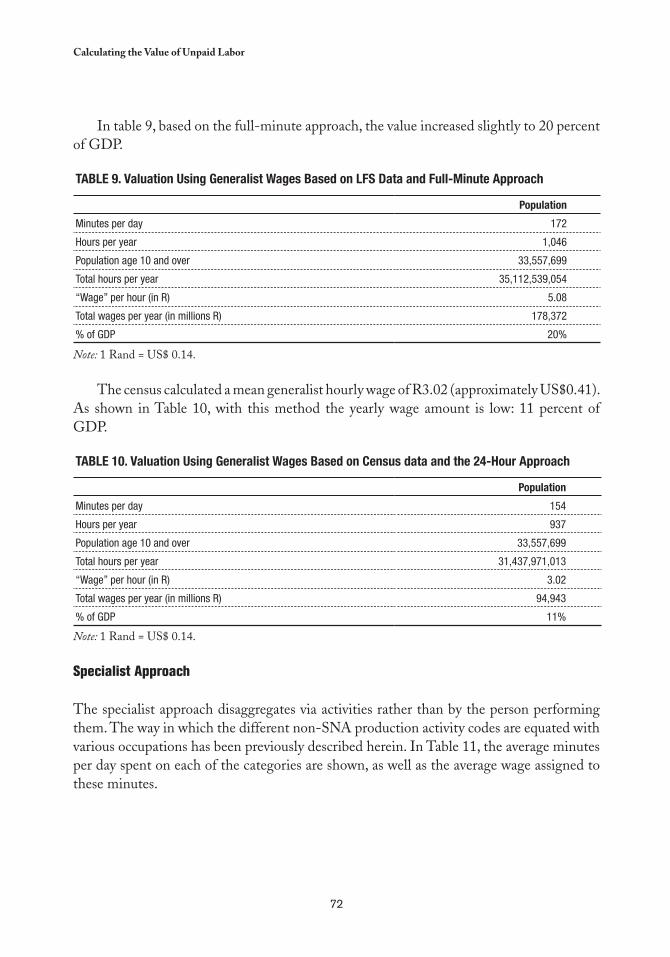
72
Calculating the Value of Unpaid Labor
In table 9, based on the full-minute approach, the value increased slightly to 20 percent of GDP.
Table 9. Valuation Using Generalist Wages based on lFS Data and Full-Minute approach
Population
Minutes per day 172
Hours per year 1,046
Population age 10 and over 33,557,699
Total hours per year 35,112,539,054
“Wage” per hour (in R) 5.08
Total wages per year (in millions R) 178,372
% of GDP 20%
The census calculated a mean generalist hourly wage of R3.02 (approximately US$0.41). As shown in Table 10, with this method the yearly wage amount is low: 11 percent of GDP.
Table 10. Valuation Using Generalist Wages based on Census data and the 24-Hour approach
Population
Minutes per day 154
Hours per year 937
Population age 10 and over 33,557,699
Total hours per year 31,437,971,013
“Wage” per hour (in R) 3.02
Total wages per year (in millions R) 94,943
% of GDP 11%
Specialist Approach
The specialist approach disaggregates via activities rather than by the person performing them. The way in which the different non-SNA production activity codes are equated with various occupations has been previously described herein. In Table 11, the average minutes per day spent on each of the categories are shown, as well as the average wage assigned to these minutes.
Note: 1 Rand = US$ 0.14.
Note: 1 Rand = US$ 0.14.
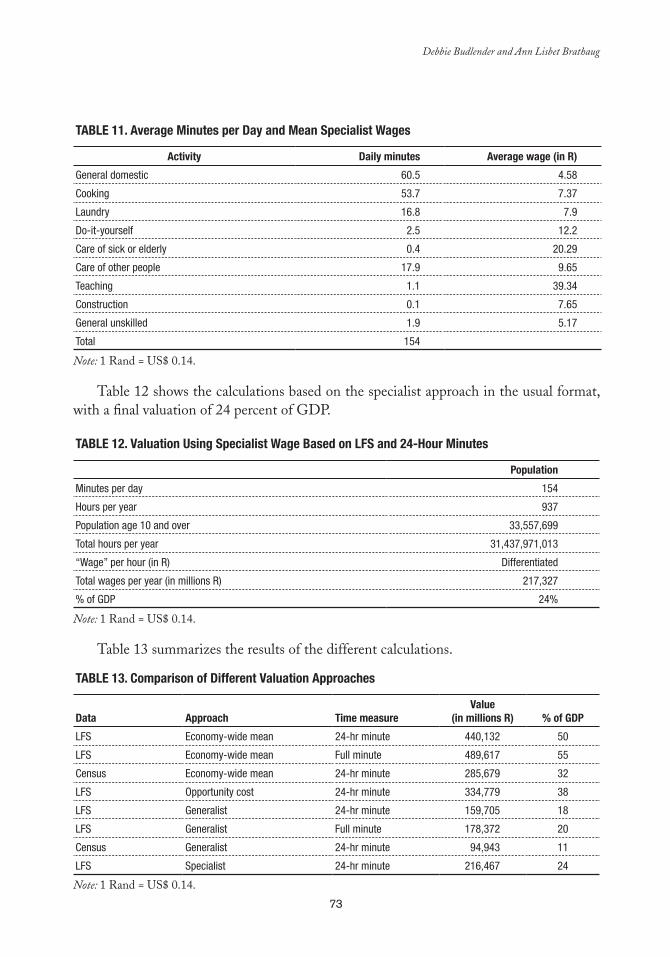
73
Debbie Budlender and Ann Lisbet Brathaug
Table 11. average Minutes per Day and Mean Specialist Wages
activity Daily minutes average wage (in R)
General domestic 60.5 4.58
Cooking 53.7 7.37
Laundry 16.8 7.9
Do-it-yourself 2.5 12.2
Care of sick or elderly 0.4 20.29
Care of other people 17.9 9.65
Teaching 1.1 39.34
Construction 0.1 7.65
General unskilled 1.9 5.17
Total 154
Table 12 shows the calculations based on the specialist approach in the usual format, with a final valuation of 24 percent of GDP.
Table 12. Valuation Using Specialist Wage based on lFS and 24-Hour Minutes
Population
Minutes per day 154
Hours per year 937
Population age 10 and over 33,557,699
Total hours per year 31,437,971,013
“Wage” per hour (in R) Differentiated
Total wages per year (in millions R) 217,327
% of GDP 24%
Table 13 summarizes the results of the different calculations.
Table 13. Comparison of Different Valuation approaches
Data approach Time measureValue
(in millions R) % of GDP
LFS Economy-wide mean 24-hr minute 440,132 50
LFS Economy-wide mean Full minute 489,617 55
Census Economy-wide mean 24-hr minute 285,679 32
LFS Opportunity cost 24-hr minute 334,779 38
LFS Generalist 24-hr minute 159,705 18
LFS Generalist Full minute 178,372 20
Census Generalist 24-hr minute 94,943 11
LFS Specialist 24-hr minute 216,467 24
Note: 1 Rand = US$ 0.14.
Note: 1 Rand = US$ 0.14.
Note: 1 Rand = US$ 0.14.
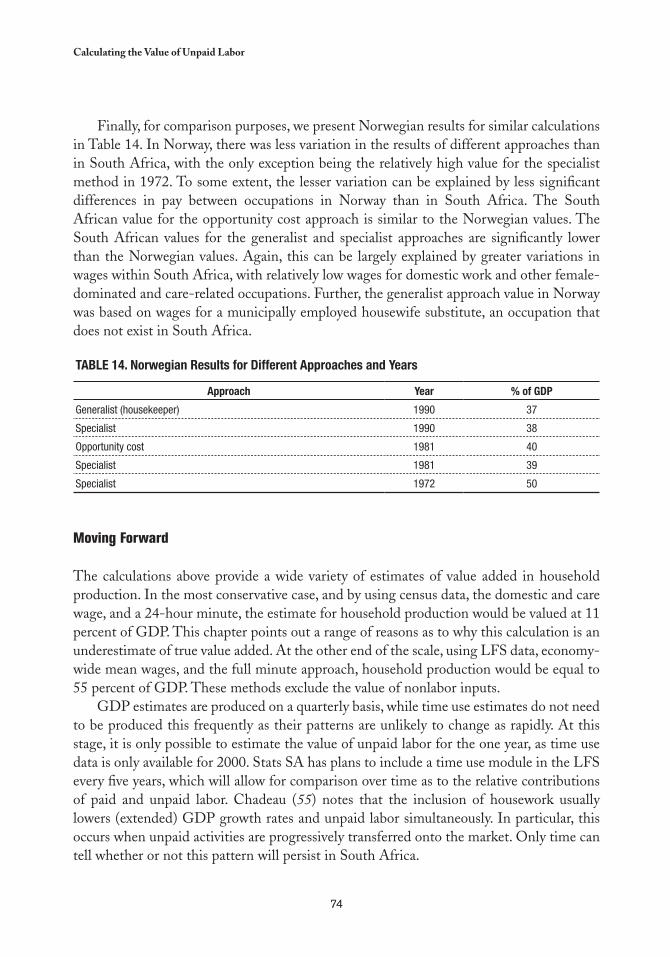
74
Calculating the Value of Unpaid Labor
Finally, for comparison purposes, we present Norwegian results for similar calculations in Table 14. In Norway, there was less variation in the results of different approaches than in South Africa, with the only exception being the relatively high value for the specialist method in 1972. To some extent, the lesser variation can be explained by less significant differences in pay between occupations in Norway than in South Africa. The South African value for the opportunity cost approach is similar to the Norwegian values. The South African values for the generalist and specialist approaches are significantly lower than the Norwegian values. Again, this can be largely explained by greater variations in wages within South Africa, with relatively low wages for domestic work and other female-dominated and care-related occupations. Further, the generalist approach value in Norway was based on wages for a municipally employed housewife substitute, an occupation that does not exist in South Africa.
Table 14. Norwegian Results for Different approaches and Years
approach Year % of GDP
Generalist (housekeeper) 1990 37
Specialist 1990 38
Opportunity cost 1981 40
Specialist 1981 39
Specialist 1972 50
Moving Forward
The calculations above provide a wide variety of estimates of value added in household production. In the most conservative case, and by using census data, the domestic and care wage, and a 24-hour minute, the estimate for household production would be valued at 11 percent of GDP. This chapter points out a range of reasons as to why this calculation is an underestimate of true value added. At the other end of the scale, using LFS data, economy-wide mean wages, and the full minute approach, household production would be equal to 55 percent of GDP. These methods exclude the value of nonlabor inputs.
GDP estimates are produced on a quarterly basis, while time use estimates do not need to be produced this frequently as their patterns are unlikely to change as rapidly. At this stage, it is only possible to estimate the value of unpaid labor for the one year, as time use data is only available for 2000. Stats SA has plans to include a time use module in the LFS every five years, which will allow for comparison over time as to the relative contributions of paid and unpaid labor. Chadeau (55) notes that the inclusion of housework usually lowers (extended) GDP growth rates and unpaid labor simultaneously. In particular, this occurs when unpaid activities are progressively transferred onto the market. Only time can tell whether or not this pattern will persist in South Africa.
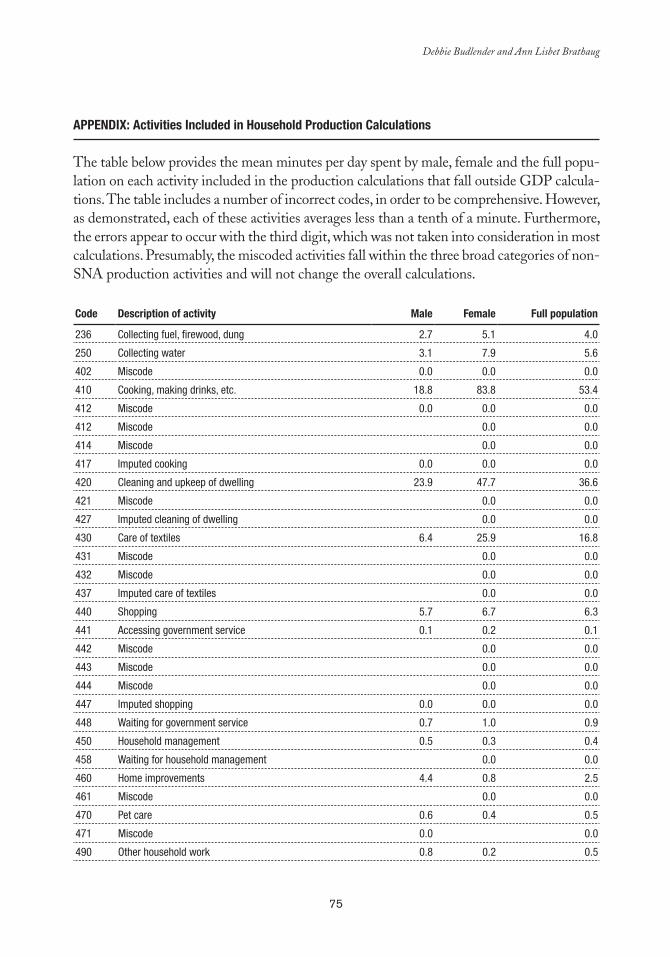
75
Debbie Budlender and Ann Lisbet Brathaug
aPPeNDIx: activities Included in Household Production Calculations
The table below provides the mean minutes per day spent by male, female and the full popu-lation on each activity included in the production calculations that fall outside GDP calcula-tions. The table includes a number of incorrect codes, in order to be comprehensive. However, as demonstrated, each of these activities averages less than a tenth of a minute. Furthermore, the errors appear to occur with the third digit, which was not taken into consideration in most calculations. Presumably, the miscoded activities fall within the three broad categories of non-SNA production activities and will not change the overall calculations.
Code Description of activity Male Female Full population
236 Collecting fuel, firewood, dung 2.7 5.1 4.0
250 Collecting water 3.1 7.9 5.6
402 Miscode 0.0 0.0 0.0
410 Cooking, making drinks, etc. 18.8 83.8 53.4
412 Miscode 0.0 0.0 0.0
412 Miscode 0.0 0.0
414 Miscode 0.0 0.0
417 Imputed cooking 0.0 0.0 0.0
420 Cleaning and upkeep of dwelling 23.9 47.7 36.6
421 Miscode 0.0 0.0
427 Imputed cleaning of dwelling 0.0 0.0
430 Care of textiles 6.4 25.9 16.8
431 Miscode 0.0 0.0
432 Miscode 0.0 0.0
437 Imputed care of textiles 0.0 0.0
440 Shopping 5.7 6.7 6.3
441 Accessing government service 0.1 0.2 0.1
442 Miscode 0.0 0.0
443 Miscode 0.0 0.0
444 Miscode 0.0 0.0
447 Imputed shopping 0.0 0.0 0.0
448 Waiting for government service 0.7 1.0 0.9
450 Household management 0.5 0.3 0.4
458 Waiting for household management 0.0 0.0
460 Home improvements 4.4 0.8 2.5
461 Miscode 0.0 0.0
470 Pet care 0.6 0.4 0.5
471 Miscode 0.0 0.0
490 Other household work 0.8 0.2 0.5
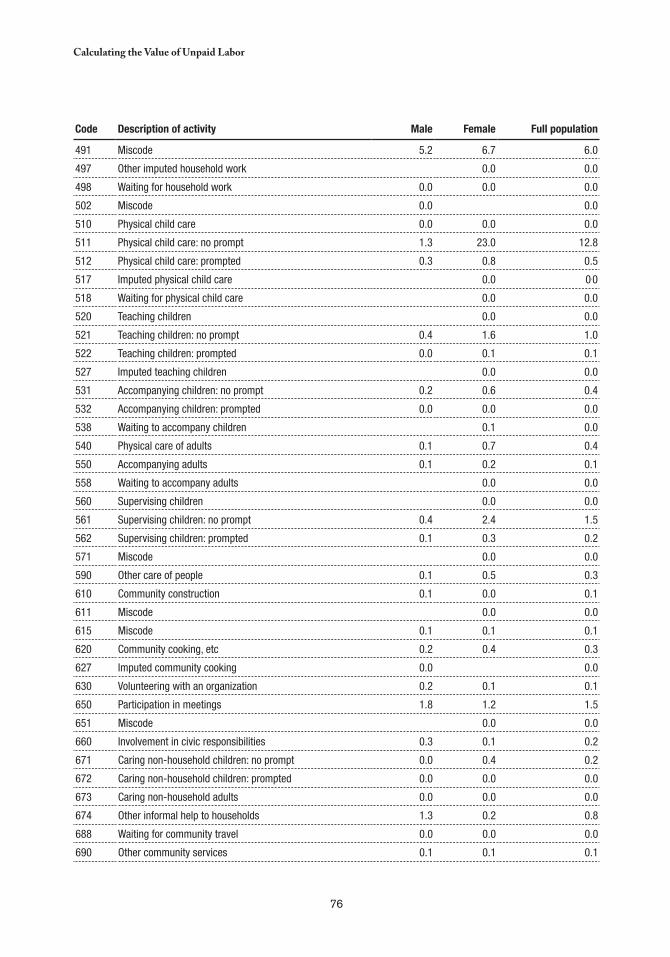
76
Calculating the Value of Unpaid Labor
Code Description of activity Male Female Full population
491 Miscode 5.2 6.7 6.0
497 Other imputed household work 0.0 0.0
498 Waiting for household work 0.0 0.0 0.0
502 Miscode 0.0 0.0
510 Physical child care 0.0 0.0 0.0
511 Physical child care: no prompt 1.3 23.0 12.8
512 Physical child care: prompted 0.3 0.8 0.5
517 Imputed physical child care 0.0 0.0
518 Waiting for physical child care 0.0 0.0
520 Teaching children 0.0 0.0
521 Teaching children: no prompt 0.4 1.6 1.0
522 Teaching children: prompted 0.0 0.1 0.1
527 Imputed teaching children 0.0 0.0
531 Accompanying children: no prompt 0.2 0.6 0.4
532 Accompanying children: prompted 0.0 0.0 0.0
538 Waiting to accompany children 0.1 0.0
540 Physical care of adults 0.1 0.7 0.4
550 Accompanying adults 0.1 0.2 0.1
558 Waiting to accompany adults 0.0 0.0
560 Supervising children 0.0 0.0
561 Supervising children: no prompt 0.4 2.4 1.5
562 Supervising children: prompted 0.1 0.3 0.2
571 Miscode 0.0 0.0
590 Other care of people 0.1 0.5 0.3
610 Community construction 0.1 0.0 0.1
611 Miscode 0.0 0.0
615 Miscode 0.1 0.1 0.1
620 Community cooking, etc 0.2 0.4 0.3
627 Imputed community cooking 0.0 0.0
630 Volunteering with an organization 0.2 0.1 0.1
650 Participation in meetings 1.8 1.2 1.5
651 Miscode 0.0 0.0
660 Involvement in civic responsibilities 0.3 0.1 0.2
671 Caring non-household children: no prompt 0.0 0.4 0.2
672 Caring non-household children: prompted 0.0 0.0 0.0
673 Caring non-household adults 0.0 0.0 0.0
674 Other informal help to households 1.3 0.2 0.8
688 Waiting for community travel 0.0 0.0 0.0
690 Other community services 0.1 0.1 0.1
77
chapter 5
Conceptual Framework and Methodological Guidelines for the
Household Satellite Account to Measure Unpaid Work in Health
Cc
Lourdes Ferrán*
INTRODUCTION
Despite the fact that productive domestic activities are for the most part unpaid, they play a significant role in the economic and social life in Latin America and the Caribbean. However, precisely because they are treated as unpaid services and
are thus difficult to quantify, productive domestic activities have not been incorporated to date into the system of national accounts.
An effort to expand the traditional indicators of these accounts, that consider such key social development factors as income distribution and gender equity opens the possibility to develop a household satellite account (HSA) that allows for assessing the production of domestic services generated and consumed in the household (27).
Health care, the subject of this report, constitutes one of the domestic activities with the greatest potential market value. Given the financial constraints generally faced by public services, particularly in Latin America and the Caribbean, it often falls on the household to
* Full professor at the Central University of Venezuela. E-mail: [email protected].
78
Conceptual Framework and Methodological Guidelines to Measure Unpaid Work in Health
complement or, at times, completely take charge of health care, either by purchasing drugs, using private services, or directly caring for the patient (27).
Given the historical role of women in running the household, it is likely that measuring health services provided in households will make it possible to develop indicators that can be integrated with other economic and social measures, thus facilitating policymaking and the application of measures directed toward achieving greater gender equity.
TIME USE SURVEYS
Running a household has always been unrecognized work, both socially and economically. Nevertheless, the evolution of gender studies in recent decades has made it possible to present this problem in the public sphere. Valuable and effective efforts are already underway to address the utter lack of attention to the unequal distribution of unpaid domestic work, at the expense of women (61).
To attain gender equity, data on time allotted to certain activities is fundamental, with particular attention that women often take on double, and as much as triple, amounts of daily work. With the objective of generating better statistics on paid and unpaid work, time use surveys are valuable in terms of the gender approach, since they become a basic tool for developing more comprehensive knowledge about all forms of work and employment (61). Moreover, the scarcity of quantitative information on the time devoted to health care in the household impedes an understanding of how significantly it complements public and private care.
HEALTH CARE IN THE HOUSEHOLD
The scarcity of information concerning the role of patient care provided in the household has a negative impact both on effective health policymaking and on the countries’ economic and social growth. In fact, the omission of indicators on household health services from the macroeconomic aggregates of national accounts prevents public policies from duly recognizing the economic value of such services within the framework of both public and private health care.
Budgetary and organizational issues have hindered people’s access to public sector medical care, thus there has been a tendency to replace those services with care provided by members of the family, particularly in low-income households that cannot opt for private medicine. This transfer of services from the public sector to the domestic sphere is ignored both socially and economically, because after the transfer, such services are considered activities generated and consumed within the household and outside the market.
79
Lourdes Ferrán
As happens with all unpaid domestic work, these services are not recorded, even though similar services are indeed recorded when provided by a public institution or a private company. In passing one of these activities from the market or public sector to the household, it migrates out of the national accounts, introducing a bias by reducing national production figures. In fact, no such real reduction has occurred; rather there has been a transfer of production to a sector considered outside of the market. The opposite happens when the market absorbs an activity previously carried out in the household.
CONCEPTUAL FRAMEWORK AND METHODOLOGICAL GUIDELINES
The Market Economy and Unpaid Work
Every economy is made up of sets of commercial and noncommercial activities whose relative importance vary according to the country’s situation and degree of development. Although commercial and monetized activity is more visible, noncommercial activity should not fall from sight, because of both its important economic value as well as the social implications —mainly related to gender— brought about by failing to give it recognition.
As the focus of the analysis, it is fundamental from the gender equity perspective to divide paid and unpaid labor by sex and allocate resources and power accordingly. At the macro level, the importance lies in the articulation of the two dimensions of the economy: productive or paid work and reproductive or unpaid domestic work.
The degree and intensity of substitution between the paid and unpaid sectors was not well marked in the past when, due to the division of labor by sex, women devoted their time mainly to unpaid household activities. The incorporation of a sizable number of women into the labor market represented an excessive workload for most women, while prompting the need to use market services for others.
In the latter instance, women try to purchase free time by outsourcing certain activities that used to be done in the household. A company outsources to improve its employment and cost structure in order to increase profits. Similarly, the household outsources activities to maximize time use, replacing unpaid activities with market services. In all cases, the substitution generated from outsourcing a domestic service is subject to certain elasticity that depends, in particular, on factors such as the availability of time, income level, market prices, and the development level of industrial and commercial activity.
Substitution and the Pareto Optimum
There is an important relationship between household work and public policies. Every policy aims to optimize the results that it pursues. When redistributing the burdens among the market, the state, and the unpaid work carried out in the household, it is necessary to
80
Conceptual Framework and Methodological Guidelines to Measure Unpaid Work in Health
balance the different criteria, such as gains and losses in income, expenditures, taxes, and working hours that correspond to each institutional sector involved.
In turn, such a comparison can only be definitive if the activities and their effects in compared sectors can be measured in a single accounting unit. What common unit can be used? Optimization should encompass all affected sectors, thus the monetary unit is the most common and attainable solution. Hence the practice of estimating unpaid household activities in terms of their monetary value comes into play.
Household Work and its Macroeconomic Accounting
Once the common unit of measurement for unpaid work is determined, the macroeconomic accounting of that work can be configured. As stated earlier, the exclusion of such measurements in the national accounts, used as a basis for adopting procedures and policies, shortchanges those who prepare the accounts and presents an imprecise picture of the country’s economy. For example, when an activity is transferred from the household to the marketplace, it registers as economic growth, although no growth has occurred, simply because the activity has moved from an unrecorded to a recorded sector. In turn, this bias tends to distort the image of the cyclic movement of the economy, because in the cycle’s upswing, with the increase in income and employment, household activities migrate to the market sphere and recorded figures indeed differ from real growth. On the other hand, during the downswing, a contrary distortion occurs as the reduction in paid employment and consequent decrease in purchasing power prompts many households to provide certain services themselves, instead of purchasing them in the marketplace. It is now worth focusing on the reasons why the System of National Accounts (SNA) opts not to include unpaid household work in the central section of its books. According to its manual, the system excludes these activities because “the relative importance of the noncash transactions varies with the type of economy and the objectives pursued by the accounting system; generally, it is greater for less developed economies than developed ones, in which, however, it is not negligible.” (43)
According to paragraphs 1.68 and 1.69 of the SNA, in principle the unpaid activities form an integral part of the accounting body of the SNA, both because they are carried out in tandem with the economy and because they are an indicator of well-being. Moreover, activities that involve unpaid transactions should not be excluded, according to what is indicated in paragraphs 1.72 to 1.75.
This topic is revisited in another passage of the manual, which states the reasons for adopting such procedures. In Chapter VI, entitled “Domestic and Personal Services Produced for Final Personal Consumption within Households,” it is noted that although such services are significant, they are excluded from the domestic product due to their limited impact on the rest of the economy.
It is worth pointing out that more and more commercial services are being replaced by activities within the household. Contrary to what is stated in the manual, today these
81
Lourdes Ferrán
activities could have a significant impact on the rest of the economy and a greater influence than certain transactions currently accounted for in the system. In any case, to be certain, it is necessary to carry out the corresponding estimates by adopting the so-called “household satellite accounts,” as proposed in the manual itself.
Analysis and Satellite Accounts
The proposal to account for unpaid household activities as functions of health services coincides with all points discussed in the SNA manual. The idea is to collect additional information on a fundamental social topic, use a concept that introduces a new dimension into the national accounts, expand the coverage of expenditures and benefits, and extend the analysis and crucial connection between physical and monetary measurements.
The principal impact of the current proposal with regards to other aggregates of the system is precisely to use a complementary conceptual framework related to production limits. As stated in the SNA, the objective of recording and analyzing the many factors involved in unpaid domestic activities cannot be accomplished with a single account. Rather, there is a need for a system of supplementary accounts.
As a first step, it is recommended that an account be created that represents a rearrangement of the data contained in the central accounts, without adding other data. Subsequently, a more complete institutional account will introduce activities excluded from the central body.
Conceptual boundary
To start, it is necessary to point out that the word “household” includes many activities carried out in that physical space, as well as outside activities, such as accompanying a household member to a physician’s office.
With regards to the concept of “economic activities,” as well as its broader meaning, it is necessary to account for certain boundaries that can be categorized in three criteria: “third party,” “pay,” and “separability.” An activity falls within the boundaries of the first criterion if it can be delegated to another person. As a condition, the second criterion designates that the activity is not paid. The third criterion, which refers to personal services, requires that the activity is separable as well as delegable.
In the case of activities involving the production of health services, it is necessary to establish specific limits. What do activities geared toward health encompass? There is no easy answer. In reference to factors that affect health, the International Labor Organization (ILO) states, “housing and improper diet, nonpotable water, insufficient hygienic facilities, dangerous working conditions, and minimal access to medical care contribute to health…” (62). If all of these factors were taken into account, the concept of health maintenance would be broad, and it would be necessary to include numerous activities, such as the
82
Conceptual Framework and Methodological Guidelines to Measure Unpaid Work in Health
construction of dwellings or water transport. Thus, activities geared toward health would be confused with activities with different purposes.
For accuracy in measuring, it is necessary to specify the activity of focus. There are cases where the dividing line is tenuous and decisions relating to separating out activities seem doubtful and arbitrary. This occurs especially when trying to distinguish between activities associated with health or assisting disabled people and those relating to people’s general well-being.
Indeed, beyond those activities of interest mentioned herein, an array of activities provides people with satisfaction and better physical and mental well-being, sensations which indirectly influence health. In such cases, the major difference is that the impact on health is only indirect. Thus it is necessary to distinguish between activities with direct and indirect benefits, including the former and excluding the latter in the measurements.
At this point, it is worthwhile to clarify that the analysis of one or more person’s health is not the focus; rather the focus is the extension and importance of actions to recover health and mitigate physical afflictions and disabilities (therapeutic activities, providing assistance to people who are incapacitated). In other words, the concentration is in the measurement of flows, rather than supplies.
Finally, as previously mentioned, the production of unpaid services in households is related to the same type of production in other sectors of the economy. In turn, this requires global information on all such activities. To statistically integrate activities in the household with those in other sectors, international classifications are required, keeping in mind the United Nations’ Classification of Activities for Time Use (63).
MEASURING HEALTH SERVICES IN THE HOUSEHOLD
Health services provided in the household must be measured in monetary and physical terms. Monetary measurements make it possible to add such services to market production and calculate their relative value, since quantitative indicators are more heterogeneous for services than for goods.1
The monetary value of these services can be estimated by considering that the value added by the unpaid work is equal to the production value (work channel), or by assuming that these services represent production similar to that of the market and include certain material inputs in the form of work (product channel). When using the work channel, it is necessary to measure the time devoted to producing each type of service and assigning compensation. Using the product channel requires the assessment of quantities produced by the household by service type and, subsequently, their market prices.
For their part, physical indicators are complementary and should be reflected in the measurement because they shed light on important 1
aspects that are not clarified in monetary terms, such as the physical effort made by the people who provide these services and who frequently sacrifice what would otherwise be their time of rest.
83
Lourdes Ferrán
In the first case, household work is considered the only input and, accordingly, material inputs are included separately in household consumption. This presumption resembles the SNA’s case of nonmarket production, which is measured using the explicit production cost, excluding benefits. In the second case, in which household work is equated with market production, it is presumed that, in addition to material inputs and household work, there is depreciation and a production surplus consumed by the household.
However, activities geared toward health do not end with services, but rather include the production of such goods as household remedies, which are of particular importance in developing countries. In these cases, the calculation of the production value might need to add ––to the work value–– the value of material inputs. In fact, the SNA endorses both procedures (43).
Continuing with the development of these concepts, the measurement of health production in the household should reflect the two stated criteria. In the sections that follow, the approaches that consider production equal to household work are referred to as the “input channel” and the “product channel.”
Input Channel
When using the input channel assessment —the time invested in the activity— some household activities can be carried out simultaneously, such as preparing food while caring for a baby, or washing clothes while attending to an ill household member.
However, this simultaneity is relative; when it involves administering medication or giving an injection, the activity becomes exclusive, even though it may only involve a small amount of time. Along these same lines, it is important to consider that when a caretaker is hired, this person provides care the entire time that he or she is with the patient. In contrast, in the household, although there are cases where exclusive dedication to the patient is needed, the more typical situation is that the person who cares for the patient also has other domestic duties. Thus, should this be considered as total care time when a hired person is providing the service, but only specific care time when it is provided amidst other household activities?
Alternative Cost Versus Additional burden
Choosing between alternative cost and additional burden is one of the difficulties in comparing market and household activities. This important decision affects the estimate of the total value of production and should be examined in accordance with the reasons for the measurement. The choice will vary, depending on whether one wants to compare the alternative costs of caring for a patient in the household to the costs in a private facility or with hired personnel, or if one only wants to measure the additional burden taken on by the family members in caring for the patient.
84
Conceptual Framework and Methodological Guidelines to Measure Unpaid Work in Health
This decision will determine whether to include all the time devoted, such as, for example, the preparation of food for patients as well as the lodging value. On one hand, it can be argued that food preparation is still required for a healthy person, thus this time would correspond to another type of domestic service, but it also can be argued that in a private facility food preparation is considered part of the production of health services included in lodging and consumption fees. Such differences should be analyzed to determine what the objective of measurement is —alternative cost or additional burden— and what will be encompassed by the concept of health services in the household.
Nonmarket Production Activities
In the case of health care in the household, nonmarket productive activities include all specific health services and the preparation of household remedies, as well as incidental services for the patient such as transportation, food preparation, hygiene, and washing his or her clothes.
With regards to specific health services, it is important to remember that home care is often broader in principle than it appears. This is often the case when, in taking a child to the doctor, parents receive instructions to administer medicines and watch over the child for one or two days. This constitutes an additional household task and may imply the need to be absent from paid work.
There are other more clear cases, such as when a diagnosis is given and the prescribed treatment requires personalized rather than specialized care. Such care can be provided by a paid assistant from outside the household, specialized or otherwise, or handled by a responsible adult free of charge. In most cases, the care will be provided free of charge by a member of the household or by someone else. Although the SNA does not consider this activity within the production sphere, it would indeed fall under the satellite account limits proposed in this chapter.
Below, all the activities related to health care in the household are listed, without distinctions as to whether they are comparable with market activities. For example, administrative tasks, which tend to consume large amounts of time and effort, are usually carried out even if the sick person is in a health facility. The activities are a) caregiving, b) daytime monitoring, c) nighttime monitoring, d) transportation to health centers, e) purchase of medicines, f ) hygiene, g) feeding, h) food preparation, i) preparation of household remedies, j) laundry, k) cleaning of room, and l) paperwork. These activities can be divided into two major groups: those that represent an additional burden and those taken into account only if an alternative cost is estimated.
Valuation
In general terms, methods for estimating costs make use of quantities and values that can be of a macro- or microtype. A macroestimate of the value of unpaid work (VUW) can be carried out with this formula:
VUW = Σg Σa [Pg x AUWHag x Cag]
85
Lourdes Ferrán
Here, Pg is the number of people in each group (g) of the population. AUWHag is the annual average of unpaid working hours in the activity a by people in the group g. Cag is the input value per hour in activity a carried out by people in the group g.
Data for these assessments were taken from wage records, as well as average wages and income from employment surveys in occupations related to the respective benefits.
For their part, estimates supported by micro procedures utilize time use surveys, measuring quantities as follows: by total number of people surveyed, replacing the number of people in each group with the corresponding calculation and annualizing the corresponding time to each activity. The number of groups will be a function of the disaggregation level of the survey and the classification criteria. Nevertheless, the value per hour in each activity cannot be extracted from the time use surveys, but rather, as demonstrated, should be sought in data from administrative records and employment surveys.
In the cases of estimate by inputs, a value is assigned to the hours invested in household health activities through the use of two possible variables: the opportunity cost and the equivalent function in the marketplace —which is the most used.
The opportunity cost is the income that the person who carries out the health activities would earn if he or she were to use that time for other activities in his or her area of competence in the marketplace. Or, in other words, time devoted to household work reduces time available for market activities.
With regard to the assessment by equivalent function in the market, one can proceed by using the wage paid for a household service (with a focus on specialists), or by researching market wages paid by facilities that provide similar goods and services to those involved in home care. As the latter values reflect a given amount of productivity, the assigning of compensation by referencing the average value per hour in the marketplace should be carried out with caution, taking into account the differences in terms of the productivity of activities carried out in the household.
In the event that the average has been calculated without considering common differences between the compensation of men and women in the same occupation, the obtained value will reflect the existing discrimination. Accordingly, a correction has been introduced in some studies assigning half the average compensation to women for the same hours worked by men —salary without discrimination.
Product Channel
The product channel consists of equating household production with market production according to the product type. In this case, the time devoted is not measured and subsequently hourly compensation is used. The first step is to establish which products —goods and services— will be taken into account in order to then determine the production value and the value added by the household production.

86
Conceptual Framework and Methodological Guidelines to Measure Unpaid Work in Health
ProductsAs already stated, although most household health production refers to services, there
are certain goods created (for example, home remedies). The product channel should take into account both goods and services.
Production Value and its Value-Added
Estimating the value of household health services requires opening a production account, since the end product implies costs similar to those considered in standard accounts (6). Measurements include: intermediate consumption (IC), consumption of fixed capital, or depreciation (D), and mixed income (Ymx).
IC . This is the value of material inputs acquired to carry out production. In pertinent cases, the value of the input purchased must be distributed when part of that input is used for other household services.
D . This is the depreciation of fixed capital and durable consumer goods used for production. This implies first determining the value and then distributing what remains between health service use and the remaining household services.
Ymx . This last item creates a difficult situation for the analysis because it includes employee compensation, as well as the capital benefit. In other words, taking care of the patient creates a benefit.
The production value also requires knowing the physical value of a quantifiable unit. This reintroduces the issue of hours devoted to caring for the sick and disabled, since frequently the market products have different values according to the time used.
Although the difficulties noted above may appear minor if the health services contrast the household services, when the comparison is made with services sold by business units, the price indeed takes into account all of those cost elements. On the other hand, if the comparison is made with services produced by specialized workers, part of the cost elements go unnoticed, as is the case of capital goods. In terms of patient care in the household, assets directed toward providing care are confused with the household’s own assets. Hence it is important to determine whether what is to be measured is the alternative cost or the additional burden.
Disaggregation by Sex
Information should be disaggregated according to the sex of the care provider. This is based on the hypothesis, confirmed by the time use survey, that a very high proportion of the health care burden in the household falls on women. Although it is easy to collect such information from the time use survey, processing it is more complicated in cases where the
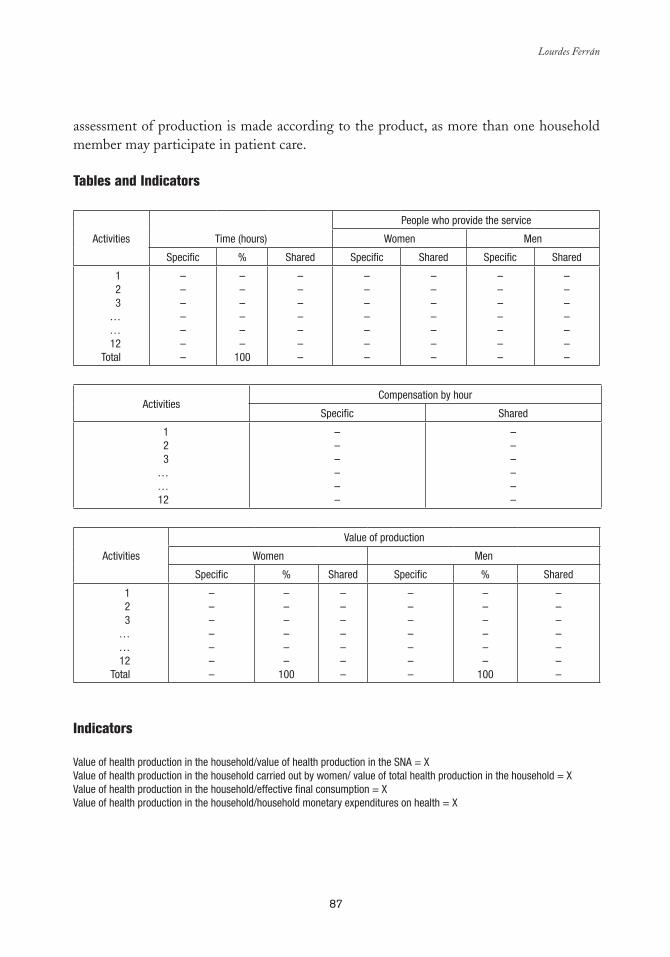
87
Lourdes Ferrán
assessment of production is made according to the product, as more than one household member may participate in patient care.
Tables and Indicators
Activities Time (hours)
People who provide the service
Women Men
Specific % Shared Specific Shared Specific Shared
123
……12
Total
–––––––
––––––
100
–––––––
–––––––
–––––––
–––––––
–––––––
Activities Compensation by hour
Specific Shared
123
……12
––––––
––––––
Activities
Value of production
Women Men
Specific % Shared Specific % Shared
123
……12
Total
–––––––
––––––
100
–––––––
–––––––
––––––
100
–––––––
Indicators
Value of health production in the household/value of health production in the SNA = XValue of health production in the household carried out by women/ value of total health production in the household = XValue of health production in the household/effective final consumption = XValue of health production in the household/household monetary expenditures on health = X

89
chapter 6
The Inclusion of Unpaid Work in the Analyses of the Health and Social
Welfare Sectors
Cc
María-Ángeles Durán*
INTRODUCTION
The objective of the pages ahead is to contribute to the international comparative analysis of health care systems, in order to improve the forecasting of people’s future health needs and the possible ways to meet them. To achieve this, the chapter begins
with a presentation of the available indicators for current and future health status and those for assessing the need for and delivery of institutional and family care. This is followed by an analysis of common illnesses, accidents, and dependence, with particular attention to age and sex variations. The next section reviews the systems for financing assistance and the particular characteristics that distinguish care provided by the family from that of the government and private entities. Within this framework, emphasis is placed on measuring the cost of converting unpaid health care into paid work and to the need for prioritizing certain health policy objectives. The data for the analysis is drawn from surveys and research conducted in Spain.
* María-Ángeles Durán, Sociologist, has a PhD in political science and is a research professor at the Spanish National Research Council (CSIC), Department of Economy, Institute of Economics and Geography (IEG), Madrid, Spain. E-mail: [email protected]. The author expresses her gratitude for the permission granted to use data from the research project El uso del tiempo: integración en el análisis de la estructura social y económica (CICYT SEC-/2002/00504), as well as for the input and suggestions of Jesús Rogero, Antonio Abellán, and Marga Suazo.
90
the Inclusion of Unpaid Work in Analyses of the Health and Social Welfare Sectors
HEALTH INDICATORS
Population health indicators tend to be grouped into the following categories: subjective or self-perceived indicators, morbidity and mortality indicators, and health care reception indicators. A new group, which has received scant attention until now, should be added: indicators of the supply and demand of unpaid time devoted to health care.
The subjective or self-perceived indicators have the advantage of being based on general population samples and can be effective in forecasting future health care consumption. In turn, morbidity and mortality indicators stand out as having the longest history and being the best developed. Finally, indicators for health care reception, although frequently called “objective indicators,” in fact only reflect care that is actually provided and not particularly what the population needs. As a result, these are more indicators of health expenditure or cost than of benefits or production of health.
Subjective Indicators
To illustrate the way self-perceived health status works (Table 1) results by sex and age are drawn from the latest National Health Survey (Instituto Nacional de Estadística, INE, 2003) in Spain, where comprehensive health surveys are conducted every three years.
According to the scale used with this survey, a 5 indicates very good health and a 1 indicates very poor health. While more precise indicators of time consumption are not available, this scale is an excellent indirect indicator of the time needed to assist people in need of care. However, it is not very useful in measuring the need for preventions and treatments.
As illustrated in the Table 1, the average for self-perceived health in the total population is 3.75 points, and is slightly better for men than women (3.83 compared to 3.67). Girls have better health (as perceived by their parents) in their first five years, alleged as their best period in life, but from then on, men have better health, and their best period is between ages five and 15. At age 16, for both sexes, the categories fair, poor, and very poor begin to increase steadily. In the older age groups, self-perceived health is worse for women than men.
By age 65, more than 50 percent of men and women claim fair or poor health, although women to a higher degree. There are three possible explanations for the differences between self-perceived health in men and women: biological (men are born weaker but nature makes them progressively stronger, while women are born more resistant to serious disease), social (men’s private and public activities pose greater health risks), and psychological (men do not recognize their health problems, while women do).
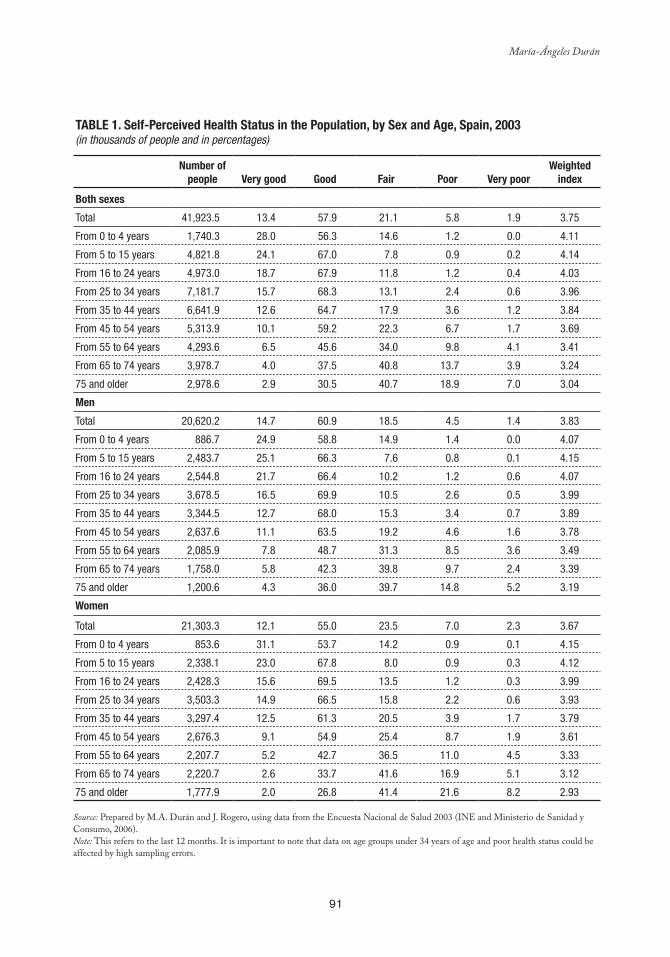
91
María-Ángeles Durán
Table 1. Self-Perceived Health Status in the Population, by Sex and age, Spain, 2003 (in thousands of people and in percentages)
Number of people Very good Good Fair Poor Very poor
Weighted index
both sexes
Total 41,923.5 13.4 57.9 21.1 5.8 1.9 3.75
From 0 to 4 years 1,740.3 28.0 56.3 14.6 1.2 0.0 4.11
From 5 to 15 years 4,821.8 24.1 67.0 7.8 0.9 0.2 4.14
From 16 to 24 years 4,973.0 18.7 67.9 11.8 1.2 0.4 4.03
From 25 to 34 years 7,181.7 15.7 68.3 13.1 2.4 0.6 3.96
From 35 to 44 years 6,641.9 12.6 64.7 17.9 3.6 1.2 3.84
From 45 to 54 years 5,313.9 10.1 59.2 22.3 6.7 1.7 3.69
From 55 to 64 years 4,293.6 6.5 45.6 34.0 9.8 4.1 3.41
From 65 to 74 years 3,978.7 4.0 37.5 40.8 13.7 3.9 3.24
75 and older 2,978.6 2.9 30.5 40.7 18.9 7.0 3.04
Men
Total 20,620.2 14.7 60.9 18.5 4.5 1.4 3.83
From 0 to 4 years 886.7 24.9 58.8 14.9 1.4 0.0 4.07
From 5 to 15 years 2,483.7 25.1 66.3 7.6 0.8 0.1 4.15
From 16 to 24 years 2,544.8 21.7 66.4 10.2 1.2 0.6 4.07
From 25 to 34 years 3,678.5 16.5 69.9 10.5 2.6 0.5 3.99
From 35 to 44 years 3,344.5 12.7 68.0 15.3 3.4 0.7 3.89
From 45 to 54 years 2,637.6 11.1 63.5 19.2 4.6 1.6 3.78
From 55 to 64 years 2,085.9 7.8 48.7 31.3 8.5 3.6 3.49
From 65 to 74 years 1,758.0 5.8 42.3 39.8 9.7 2.4 3.39
75 and older 1,200.6 4.3 36.0 39.7 14.8 5.2 3.19
Women
Total 21,303.3 12.1 55.0 23.5 7.0 2.3 3.67
From 0 to 4 years 853.6 31.1 53.7 14.2 0.9 0.1 4.15
From 5 to 15 years 2,338.1 23.0 67.8 8.0 0.9 0.3 4.12
From 16 to 24 years 2,428.3 15.6 69.5 13.5 1.2 0.3 3.99
From 25 to 34 years 3,503.3 14.9 66.5 15.8 2.2 0.6 3.93
From 35 to 44 years 3,297.4 12.5 61.3 20.5 3.9 1.7 3.79
From 45 to 54 years 2,676.3 9.1 54.9 25.4 8.7 1.9 3.61
From 55 to 64 years 2,207.7 5.2 42.7 36.5 11.0 4.5 3.33
From 65 to 74 years 2,220.7 2.6 33.7 41.6 16.9 5.1 3.12
75 and older 1,777.9 2.0 26.8 41.4 21.6 8.2 2.93
Source: Prepared by M.A. Durán and J. Rogero, using data from the Encuesta Nacional de Salud 2003 (INE and Ministerio de Sanidad y Consumo, 2006). Note: This refers to the last 12 months. It is important to note that data on age groups under 34 years of age and poor health status could be affected by high sampling errors.
92
the Inclusion of Unpaid Work in Analyses of the Health and Social Welfare Sectors
Morbidity, Mortality, and Health Care Indicators
In order to integrate the unpaid work of caring for people with health needs, morbidity and mortality indicators can be used, since they act as indirect indicators of unpaid time demand and use. Currently, there are no correspondence tables between different indicators, although various studies are making progress, for example, toward measuring the average time in unpaid care used in each incidence of illness (such as a case of the flu, a hip fracture, or a case of Alzheimer’s) or each preventive activity (such as a Pap smear or vaccination).
The principal indicators for morbidity and health service use are explained below, adding a discussion of the implications of paid and unpaid use of time, with variations depending on gender, age, and social class.
Activity RestrictionAccording to the cited National Health Survey, 10.69 percent of people over 16 years of age who are in school, work, or are homemakers had to restrict their activities in the two weeks prior to the survey due to a disease symptom. The average for women, 12.60 percent, is 50 percent higher than for men, 8.63 percent. The survey only offers figures for those engaged in some activity (study, employment, or homemaking), which means it does not include those who, precisely because of their status as chronic patients, are inactive. In all age groups, women have had more frequent symptoms, but the difference is greatest in central age groups, especially from 45 to 54 years of age, during which the figure for women is double that of men (13.71 percent compared to 6.62 percent).
Activity restriction is an indirect indicator of time needed for self care and caring for others, although the survey does not specify if the patient received assistance from third parties. Assuming that the distribution was uniform throughout the year, and that the figures concerned single episodes of illness, the annual rate of episodes would be 2.79, while the average number of days per episode when the principal activity was restricted was 7.31 (6.97 for men and 7.52 for women). In the population over 75 years of age, the average number of days with limited activity was more than double the number for people from 16 to 24 years old (9.29 compared to 4.56 days). The total time that activity was restricted was 20.39 days per year per person.
Prolonged Activity RestrictionProlonged limitation of activity (more than 10 continuous days in the last year) affects 22.21 percent of the population, one-fifth of the men and almost one-fourth of the women (20.44 and 23.92 percent respectively). This indicator refers to the total population and includes those less than 15 years old, of which 17.88 percent experience prolonged activity limitation during the year. Until age 25, prolonged limitation is more frequent among men. Among the population over 75 years old, such limitation affects 43 percent, or 37.12 percent of men and 47.41 percent of women.
93
María-Ángeles Durán
Disease not only affects principal activities, but also free time, which is curtailed at a higher rate than principal activities. This is an indication that free time is more sensitive or elastic and usually limited before main activities. According to the data, 14.04 percent of people had cut back their free-time activities at some point two weeks prior to the survey due to their own indisposition or disease symptoms. Women cut back their free-time activities due to disease more than men (15.83 percent compared to 12.19 percent), which is due to their real health conditions as well as how free time ranks in their priority list for time use.
Women not only restrict their free time more frequently than men, but also for more prolonged periods (7.89 days in comparison with 7.31 days respectively). They also experience longer episodes of restriction and claim more symptoms than men. The estimated annual amount of time that free time is restricted can be estimated at 24.61 days for men and 32.59 days for women.1
Bed RestAlthough limitations on activity do not always require bed rest, 5.28 percent of the population (4.29 percent of men and 6.25 percent of women) had been bedridden two weeks prior to the survey. The equivalent annual rate is 137 percent, which indicates that bed rest affects the population on average 1.37 times a year. Based on the survey, the average time of those affected by bed rest was 4.47 days (4.29 days for men and 4.59 days for women), which, if distributed heterogeneously, can lead to the calculation that in the previous year, each person would have been in bed for 6.12 days. Although, clearly, distribution is quite heterogeneous, depending on age and normal health level. When considering gender, more men were in bed for one or two days than women (49.20 percent versus 45.23 percent).
Drug Use and Self-Medication According to the 2003 National Health Survey, 54.64 percent of the population had taken medication in the two weeks prior to the survey, a figure that steadily increased with age, except for the first five years of life (48 percent of boys, 44 percent of girls). For those from five to 15 years of age, drug use declined to 30 percent, both for males and females. For those over 75 years old, 90 percent of men and 93 percent of women were taking medication.
The results, by type of economic activity, reveal that medication use was lower in higher socioeconomic groups. It is lowest among executives (50.91 percent) and increases steadily until reaching a high point in unskilled workers (58.64 percent). Nevertheless, the average age of unskilled workers is higher, which means that factors of age and social class overlap.
Self-medication also follows a pattern influenced by social status, which is the inverse of the pattern seen according to economic activity type; as such the average for self-medication
The figure is obtained by multiplying the annual number of two-week periods (26.1) by the percentage of people who restricted their free 1
time (12.9 percent) and the average number of days of restriction (7.31). The same procedure is used for the rest of the indicators.
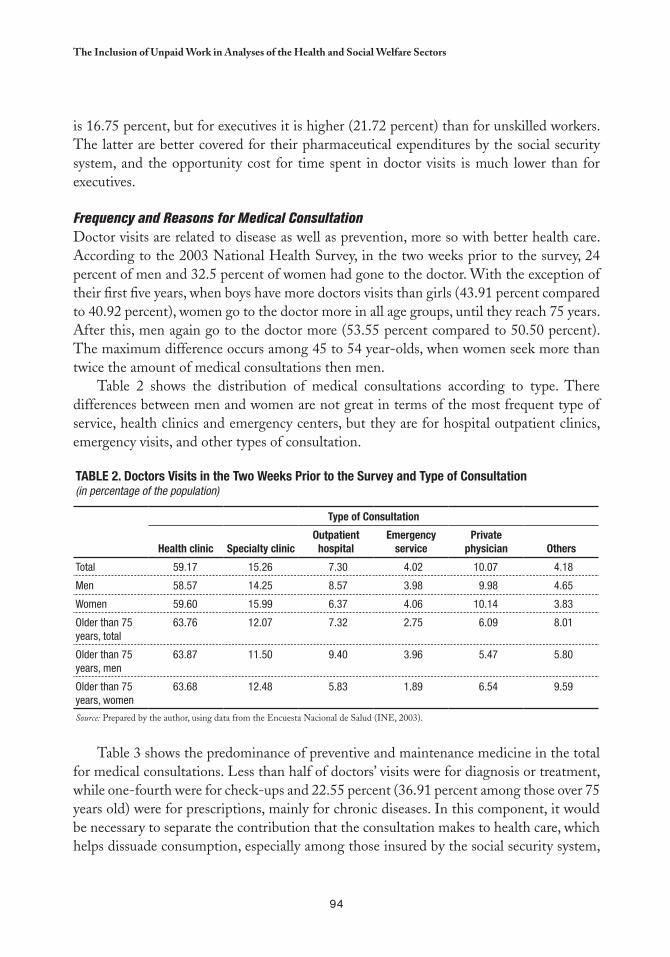
94
the Inclusion of Unpaid Work in Analyses of the Health and Social Welfare Sectors
is 16.75 percent, but for executives it is higher (21.72 percent) than for unskilled workers. The latter are better covered for their pharmaceutical expenditures by the social security system, and the opportunity cost for time spent in doctor visits is much lower than for executives.
Frequency and Reasons for Medical ConsultationDoctor visits are related to disease as well as prevention, more so with better health care. According to the 2003 National Health Survey, in the two weeks prior to the survey, 24 percent of men and 32.5 percent of women had gone to the doctor. With the exception of their first five years, when boys have more doctors visits than girls (43.91 percent compared to 40.92 percent), women go to the doctor more in all age groups, until they reach 75 years. After this, men again go to the doctor more (53.55 percent compared to 50.50 percent). The maximum difference occurs among 45 to 54 year-olds, when women seek more than twice the amount of medical consultations then men.
Table 2 shows the distribution of medical consultations according to type. There differences between men and women are not great in terms of the most frequent type of service, health clinics and emergency centers, but they are for hospital outpatient clinics, emergency visits, and other types of consultation.
Table 2. Doctors Visits in the Two Weeks Prior to the Survey and Type of Consultation(in percentage of the population)
Type of Consultation
Health clinic Specialty clinicOutpatient hospital
emergency service
Private physician Others
Total 59.17 15.26 7.30 4.02 10.07 4.18
Men 58.57 14.25 8.57 3.98 9.98 4.65
Women 59.60 15.99 6.37 4.06 10.14 3.83
Older than 75 years, total
63.76 12.07 7.32 2.75 6.09 8.01
Older than 75 years, men
63.87 11.50 9.40 3.96 5.47 5.80
Older than 75 years, women
63.68 12.48 5.83 1.89 6.54 9.59
Source: Prepared by the author, using data from the Encuesta Nacional de Salud (INE, 2003).
Table 3 shows the predominance of preventive and maintenance medicine in the total for medical consultations. Less than half of doctors’ visits were for diagnosis or treatment, while one-fourth were for check-ups and 22.55 percent (36.91 percent among those over 75 years old) were for prescriptions, mainly for chronic diseases. In this component, it would be necessary to separate the contribution that the consultation makes to health care, which helps dissuade consumption, especially among those insured by the social security system,
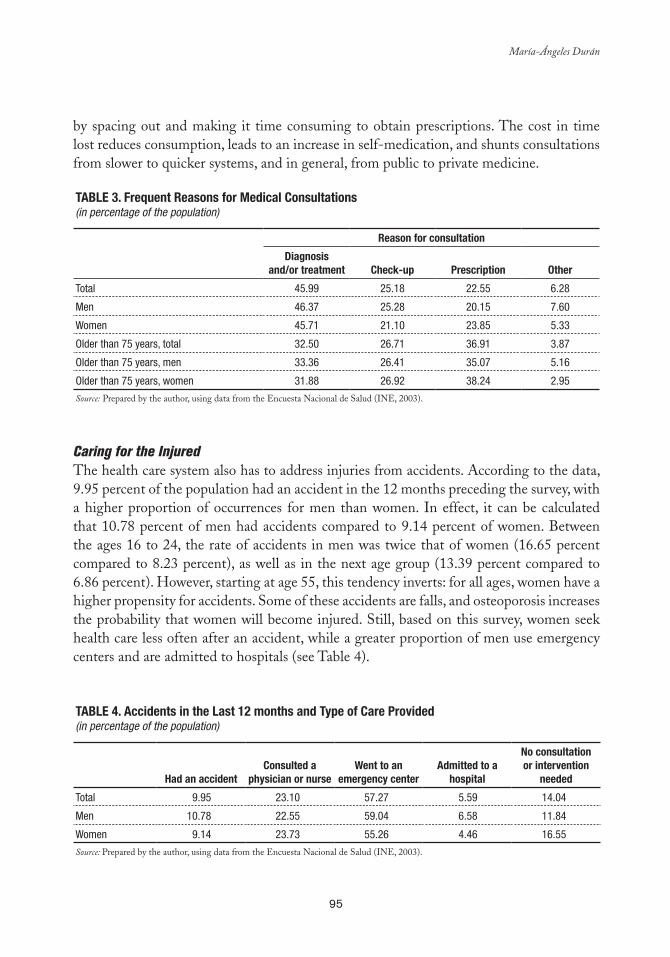
95
María-Ángeles Durán
by spacing out and making it time consuming to obtain prescriptions. The cost in time lost reduces consumption, leads to an increase in self-medication, and shunts consultations from slower to quicker systems, and in general, from public to private medicine.
Table 3. Frequent Reasons for Medical Consultations(in percentage of the population)
Reason for consultation
Diagnosisand/or treatment Check-up Prescription Other
Total 45.99 25.18 22.55 6.28
Men 46.37 25.28 20.15 7.60
Women 45.71 21.10 23.85 5.33
Older than 75 years, total 32.50 26.71 36.91 3.87
Older than 75 years, men 33.36 26.41 35.07 5.16
Older than 75 years, women 31.88 26.92 38.24 2.95
Source: Prepared by the author, using data from the Encuesta Nacional de Salud (INE, 2003).
Caring for the InjuredThe health care system also has to address injuries from accidents. According to the data, 9.95 percent of the population had an accident in the 12 months preceding the survey, with a higher proportion of occurrences for men than women. In effect, it can be calculated that 10.78 percent of men had accidents compared to 9.14 percent of women. Between the ages 16 to 24, the rate of accidents in men was twice that of women (16.65 percent compared to 8.23 percent), as well as in the next age group (13.39 percent compared to 6.86 percent). However, starting at age 55, this tendency inverts: for all ages, women have a higher propensity for accidents. Some of these accidents are falls, and osteoporosis increases the probability that women will become injured. Still, based on this survey, women seek health care less often after an accident, while a greater proportion of men use emergency centers and are admitted to hospitals (see Table 4).
Table 4. accidents in the last 12 months and Type of Care Provided (in percentage of the population)
Had an accidentConsulted a
physician or nurse Went to an
emergency centeradmitted to a
hospital
No consultation or intervention
needed
Total 9.95 23.10 57.27 5.59 14.04
Men 10.78 22.55 59.04 6.58 11.84
Women 9.14 23.73 55.26 4.46 16.55
Source: Prepared by the author, using data from the Encuesta Nacional de Salud (INE, 2003).
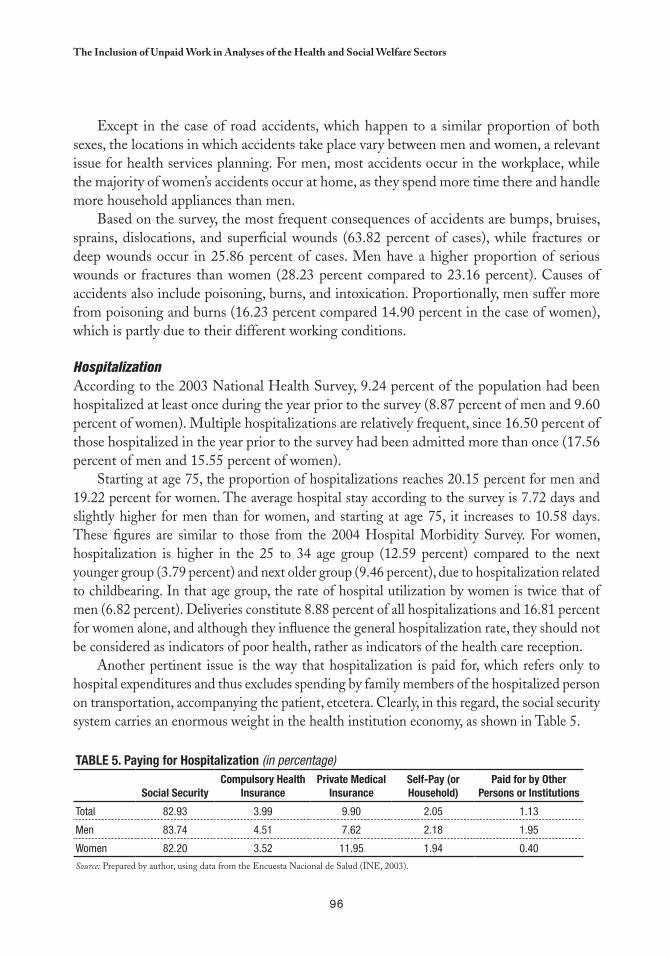
96
the Inclusion of Unpaid Work in Analyses of the Health and Social Welfare Sectors
Except in the case of road accidents, which happen to a similar proportion of both sexes, the locations in which accidents take place vary between men and women, a relevant issue for health services planning. For men, most accidents occur in the workplace, while the majority of women’s accidents occur at home, as they spend more time there and handle more household appliances than men.
Based on the survey, the most frequent consequences of accidents are bumps, bruises, sprains, dislocations, and superficial wounds (63.82 percent of cases), while fractures or deep wounds occur in 25.86 percent of cases. Men have a higher proportion of serious wounds or fractures than women (28.23 percent compared to 23.16 percent). Causes of accidents also include poisoning, burns, and intoxication. Proportionally, men suffer more from poisoning and burns (16.23 percent compared 14.90 percent in the case of women), which is partly due to their different working conditions.
HospitalizationAccording to the 2003 National Health Survey, 9.24 percent of the population had been hospitalized at least once during the year prior to the survey (8.87 percent of men and 9.60 percent of women). Multiple hospitalizations are relatively frequent, since 16.50 percent of those hospitalized in the year prior to the survey had been admitted more than once (17.56 percent of men and 15.55 percent of women).
Starting at age 75, the proportion of hospitalizations reaches 20.15 percent for men and 19.22 percent for women. The average hospital stay according to the survey is 7.72 days and slightly higher for men than for women, and starting at age 75, it increases to 10.58 days. These figures are similar to those from the 2004 Hospital Morbidity Survey. For women, hospitalization is higher in the 25 to 34 age group (12.59 percent) compared to the next younger group (3.79 percent) and next older group (9.46 percent), due to hospitalization related to childbearing. In that age group, the rate of hospital utilization by women is twice that of men (6.82 percent). Deliveries constitute 8.88 percent of all hospitalizations and 16.81 percent for women alone, and although they influence the general hospitalization rate, they should not be considered as indicators of poor health, rather as indicators of the health care reception.
Another pertinent issue is the way that hospitalization is paid for, which refers only to hospital expenditures and thus excludes spending by family members of the hospitalized person on transportation, accompanying the patient, etcetera. Clearly, in this regard, the social security system carries an enormous weight in the health institution economy, as shown in Table 5.
Table 5. Paying for Hospitalization (in percentage)
Social Security Compulsory Health
InsurancePrivate Medical
InsuranceSelf-Pay (or Household)
Paid for by Other Persons or Institutions
Total 82.93 3.99 9.90 2.05 1.13
Men 83.74 4.51 7.62 2.18 1.95
Women 82.20 3.52 11.95 1.94 0.40
Source: Prepared by author, using data from the Encuesta Nacional de Salud (INE, 2003).
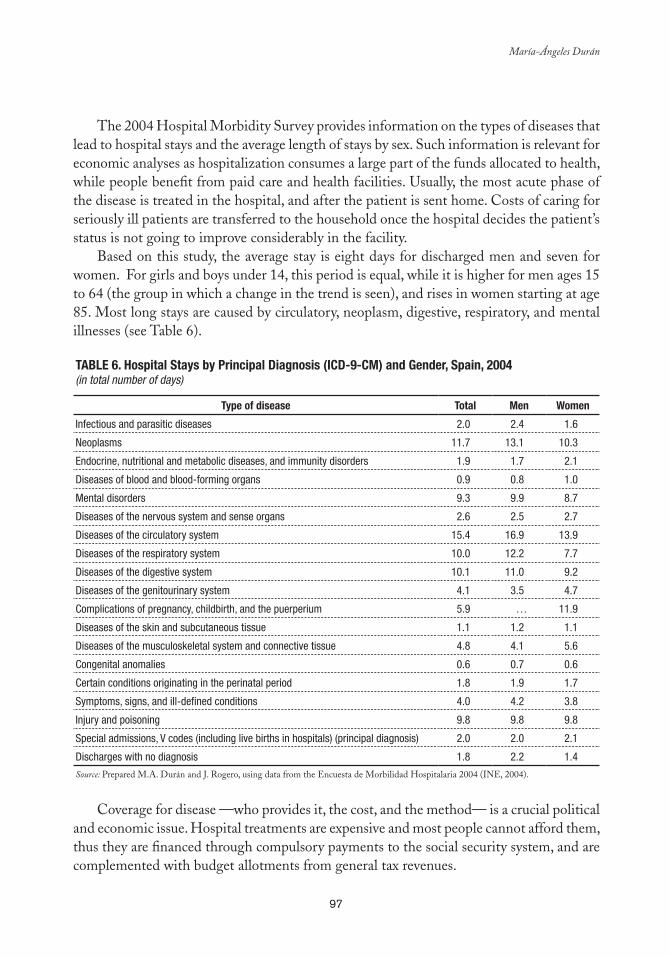
97
María-Ángeles Durán
The 2004 Hospital Morbidity Survey provides information on the types of diseases that lead to hospital stays and the average length of stays by sex. Such information is relevant for economic analyses as hospitalization consumes a large part of the funds allocated to health, while people benefit from paid care and health facilities. Usually, the most acute phase of the disease is treated in the hospital, and after the patient is sent home. Costs of caring for seriously ill patients are transferred to the household once the hospital decides the patient’s status is not going to improve considerably in the facility.
Based on this study, the average stay is eight days for discharged men and seven for women. For girls and boys under 14, this period is equal, while it is higher for men ages 15 to 64 (the group in which a change in the trend is seen), and rises in women starting at age 85. Most long stays are caused by circulatory, neoplasm, digestive, respiratory, and mental illnesses (see Table 6).
Table 6. Hospital Stays by Principal Diagnosis (ICD-9-CM) and Gender, Spain, 2004 (in total number of days)
Type of disease Total Men Women
Infectious and parasitic diseases 2.0 2.4 1.6
Neoplasms 11.7 13.1 10.3
Endocrine, nutritional and metabolic diseases, and immunity disorders 1.9 1.7 2.1
Diseases of blood and blood-forming organs 0.9 0.8 1.0
Mental disorders 9.3 9.9 8.7
Diseases of the nervous system and sense organs 2.6 2.5 2.7
Diseases of the circulatory system 15.4 16.9 13.9
Diseases of the respiratory system 10.0 12.2 7.7
Diseases of the digestive system 10.1 11.0 9.2
Diseases of the genitourinary system 4.1 3.5 4.7
Complications of pregnancy, childbirth, and the puerperium 5.9 … 11.9
Diseases of the skin and subcutaneous tissue 1.1 1.2 1.1
Diseases of the musculoskeletal system and connective tissue 4.8 4.1 5.6
Congenital anomalies 0.6 0.7 0.6
Certain conditions originating in the perinatal period 1.8 1.9 1.7
Symptoms, signs, and ill-defined conditions 4.0 4.2 3.8
Injury and poisoning 9.8 9.8 9.8
Special admissions, V codes (including live births in hospitals) (principal diagnosis) 2.0 2.0 2.1
Discharges with no diagnosis 1.8 2.2 1.4
Source: Prepared M.A. Durán and J. Rogero, using data from the Encuesta de Morbilidad Hospitalaria 2004 (INE, 2004).
Coverage for disease —who provides it, the cost, and the method— is a crucial political
and economic issue. Hospital treatments are expensive and most people cannot afford them, thus they are financed through compulsory payments to the social security system, and are complemented with budget allotments from general tax revenues.
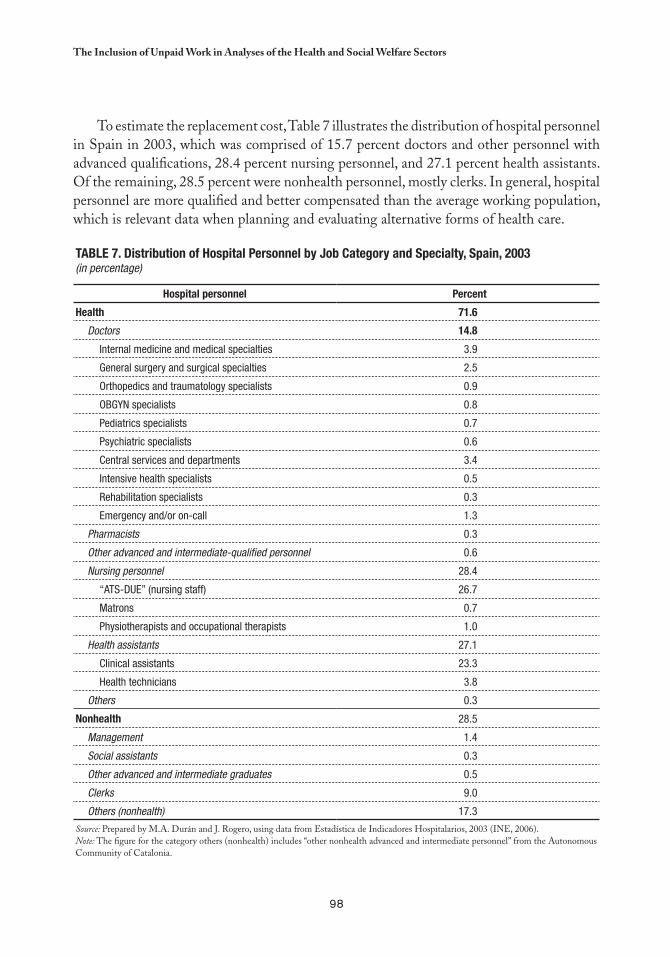
98
the Inclusion of Unpaid Work in Analyses of the Health and Social Welfare Sectors
To estimate the replacement cost, Table 7 illustrates the distribution of hospital personnel in Spain in 2003, which was comprised of 15.7 percent doctors and other personnel with advanced qualifications, 28.4 percent nursing personnel, and 27.1 percent health assistants. Of the remaining, 28.5 percent were nonhealth personnel, mostly clerks. In general, hospital personnel are more qualified and better compensated than the average working population, which is relevant data when planning and evaluating alternative forms of health care.
Table 7. Distribution of Hospital Personnel by Job Category and Specialty, Spain, 2003 (in percentage)
Hospital personnel Percent
Health 71.6
Doctors 14.8
Internal medicine and medical specialties 3.9
General surgery and surgical specialties 2.5
Orthopedics and traumatology specialists 0.9
OBGYN specialists 0.8
Pediatrics specialists 0.7
Psychiatric specialists 0.6
Central services and departments 3.4
Intensive health specialists 0.5
Rehabilitation specialists 0.3
Emergency and/or on-call 1.3
Pharmacists 0.3
Other advanced and intermediate-qualified personnel 0.6
Nursing personnel 28.4
“ATS-DUE” (nursing staff) 26.7
Matrons 0.7
Physiotherapists and occupational therapists 1.0
Health assistants 27.1
Clinical assistants 23.3
Health technicians 3.8
Others 0.3
Nonhealth 28.5
Management 1.4
Social assistants 0.3
Other advanced and intermediate graduates 0.5
Clerks 9.0
Others (nonhealth) 17.3
Source: Prepared by M.A. Durán and J. Rogero, using data from Estadística de Indicadores Hospitalarios, 2003 (INE, 2006). Note: The figure for the category others (nonhealth) includes “other nonhealth advanced and intermediate personnel” from the Autonomous Community of Catalonia.
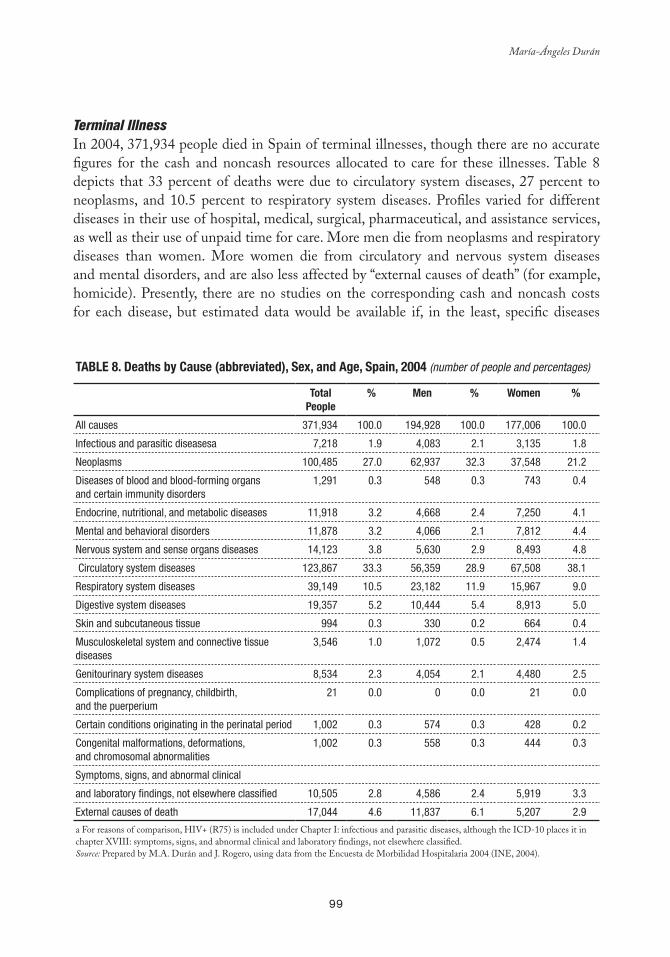
99
María-Ángeles Durán
Terminal IllnessIn 2004, 371,934 people died in Spain of terminal illnesses, though there are no accurate figures for the cash and noncash resources allocated to care for these illnesses. Table 8 depicts that 33 percent of deaths were due to circulatory system diseases, 27 percent to neoplasms, and 10.5 percent to respiratory system diseases. Profiles varied for different diseases in their use of hospital, medical, surgical, pharmaceutical, and assistance services, as well as their use of unpaid time for care. More men die from neoplasms and respiratory diseases than women. More women die from circulatory and nervous system diseases and mental disorders, and are also less affected by “external causes of death” (for example, homicide). Presently, there are no studies on the corresponding cash and noncash costs for each disease, but estimated data would be available if, in the least, specific diseases
Table 8. Deaths by Cause (abbreviated), Sex, and age, Spain, 2004 (number of people and percentages)
TotalPeople
% Men % Women %
All causes 371,934 100.0 194,928 100.0 177,006 100.0
Infectious and parasitic diseasesa 7,218 1.9 4,083 2.1 3,135 1.8
Neoplasms 100,485 27.0 62,937 32.3 37,548 21.2
Diseases of blood and blood-forming organs and certain immunity disorders
1,291 0.3 548 0.3 743 0.4
Endocrine, nutritional, and metabolic diseases 11,918 3.2 4,668 2.4 7,250 4.1
Mental and behavioral disorders 11,878 3.2 4,066 2.1 7,812 4.4
Nervous system and sense organs diseases 14,123 3.8 5,630 2.9 8,493 4.8
Circulatory system diseases 123,867 33.3 56,359 28.9 67,508 38.1
Respiratory system diseases 39,149 10.5 23,182 11.9 15,967 9.0
Digestive system diseases 19,357 5.2 10,444 5.4 8,913 5.0
Skin and subcutaneous tissue 994 0.3 330 0.2 664 0.4
Musculoskeletal system and connective tissue diseases
3,546 1.0 1,072 0.5 2,474 1.4
Genitourinary system diseases 8,534 2.3 4,054 2.1 4,480 2.5
Complications of pregnancy, childbirth, and the puerperium
21 0.0 0 0.0 21 0.0
Certain conditions originating in the perinatal period 1,002 0.3 574 0.3 428 0.2
Congenital malformations, deformations,and chromosomal abnormalities
1,002 0.3 558 0.3 444 0.3
Symptoms, signs, and abnormal clinical
and laboratory findings, not elsewhere classified 10,505 2.8 4,586 2.4 5,919 3.3
External causes of death 17,044 4.6 11,837 6.1 5,207 2.9
a For reasons of comparison, HIV+ (R75) is included under Chapter I: infectious and parasitic diseases, although the ICD-10 places it in chapter XVIII: symptoms, signs, and abnormal clinical and laboratory findings, not elsewhere classified. Source: Prepared by M.A. Durán and J. Rogero, using data from the Encuesta de Morbilidad Hospitalaria 2004 (INE, 2004).
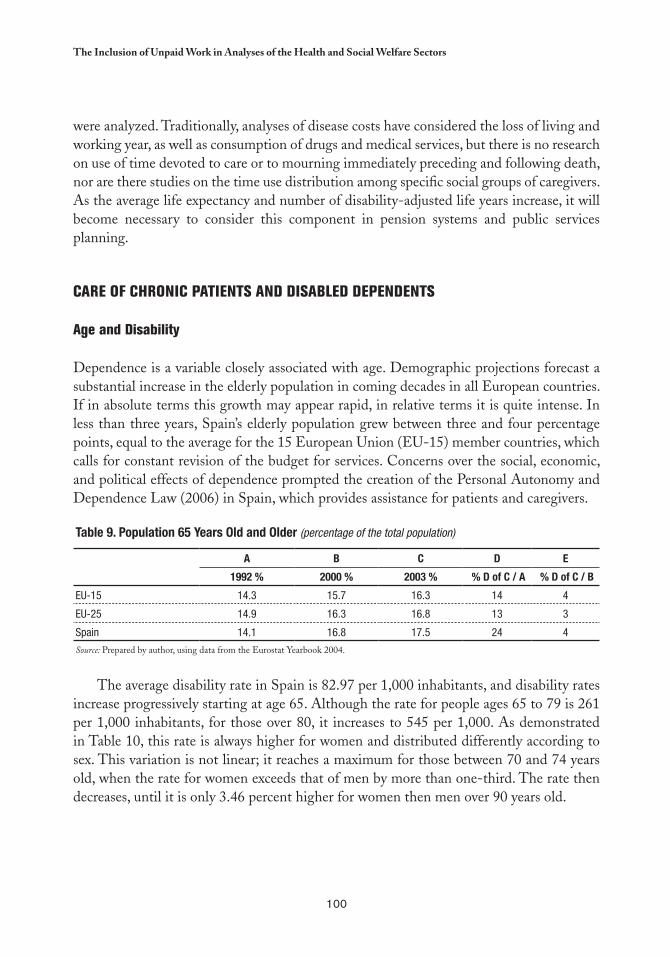
100
the Inclusion of Unpaid Work in Analyses of the Health and Social Welfare Sectors
were analyzed. Traditionally, analyses of disease costs have considered the loss of living and working year, as well as consumption of drugs and medical services, but there is no research on use of time devoted to care or to mourning immediately preceding and following death, nor are there studies on the time use distribution among specific social groups of caregivers. As the average life expectancy and number of disability-adjusted life years increase, it will become necessary to consider this component in pension systems and public services planning.
CARE OF CHRONIC PATIENTS AND DISAbLED DEPENDENTS
Age and Disability
Dependence is a variable closely associated with age. Demographic projections forecast a substantial increase in the elderly population in coming decades in all European countries. If in absolute terms this growth may appear rapid, in relative terms it is quite intense. In less than three years, Spain’s elderly population grew between three and four percentage points, equal to the average for the 15 European Union (EU-15) member countries, which calls for constant revision of the budget for services. Concerns over the social, economic, and political effects of dependence prompted the creation of the Personal Autonomy and Dependence Law (2006) in Spain, which provides assistance for patients and caregivers.
Table 9. Population 65 Years Old and Older (percentage of the total population)
a b C D e
1992 % 2000 % 2003 % % D of C / a % D of C / b
EU-15 14.3 15.7 16.3 14 4
EU-25 14.9 16.3 16.8 13 3
Spain 14.1 16.8 17.5 24 4
Source: Prepared by author, using data from the Eurostat Yearbook 2004.
The average disability rate in Spain is 82.97 per 1,000 inhabitants, and disability rates increase progressively starting at age 65. Although the rate for people ages 65 to 79 is 261 per 1,000 inhabitants, for those over 80, it increases to 545 per 1,000. As demonstrated in Table 10, this rate is always higher for women and distributed differently according to sex. This variation is not linear; it reaches a maximum for those between 70 and 74 years old, when the rate for women exceeds that of men by more than one-third. The rate then decreases, until it is only 3.46 percent higher for women then men over 90 years old.
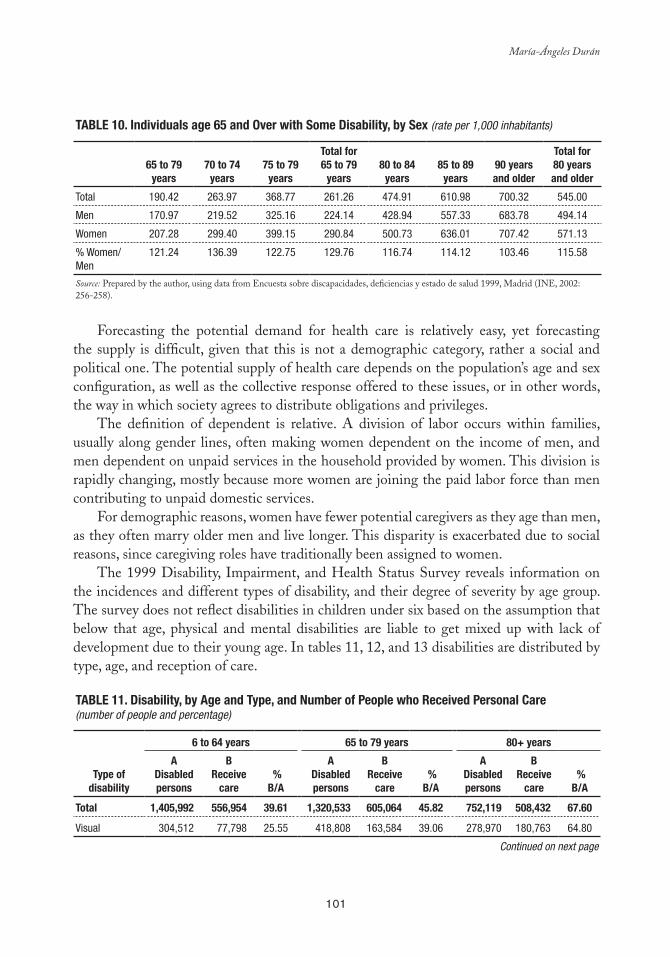
101
María-Ángeles Durán
Table 10. Individuals age 65 and Over with Some Disability, by Sex (rate per 1,000 inhabitants)
65 to 79 years
70 to 74 years
75 to 79 years
Total for65 to 79
years 80 to 84
years 85 to 89
years 90 years and older
Total for 80 years and older
Total 190.42 263.97 368.77 261.26 474.91 610.98 700.32 545.00
Men 170.97 219.52 325.16 224.14 428.94 557.33 683.78 494.14
Women 207.28 299.40 399.15 290.84 500.73 636.01 707.42 571.13
% Women/Men
121.24 136.39 122.75 129.76 116.74 114.12 103.46 115.58
Source: Prepared by the author, using data from Encuesta sobre discapacidades, deficiencias y estado de salud 1999, Madrid (INE, 2002: 256-258).
Forecasting the potential demand for health care is relatively easy, yet forecasting the supply is difficult, given that this is not a demographic category, rather a social and political one. The potential supply of health care depends on the population’s age and sex configuration, as well as the collective response offered to these issues, or in other words, the way in which society agrees to distribute obligations and privileges.
The definition of dependent is relative. A division of labor occurs within families, usually along gender lines, often making women dependent on the income of men, and men dependent on unpaid services in the household provided by women. This division is rapidly changing, mostly because more women are joining the paid labor force than men contributing to unpaid domestic services.
For demographic reasons, women have fewer potential caregivers as they age than men, as they often marry older men and live longer. This disparity is exacerbated due to social reasons, since caregiving roles have traditionally been assigned to women.
The 1999 Disability, Impairment, and Health Status Survey reveals information on the incidences and different types of disability, and their degree of severity by age group. The survey does not reflect disabilities in children under six based on the assumption that below that age, physical and mental disabilities are liable to get mixed up with lack of development due to their young age. In tables 11, 12, and 13 disabilities are distributed by type, age, and reception of care.
Table 11. Disability, by age and Type, and Number of People who Received Personal Care (number of people and percentage)
Type of disability
6 to 64 years 65 to 79 years 80+ years
a Disabled persons
b Receive
care %b/a
a Disabled persons
b Receive
care %b/a
a Disabled persons
b Receive
care %b/a
Total 1,405,992 556,954 39.61 1,320,533 605,064 45.82 752,119 508,432 67.60
Visual 304,512 77,798 25.55 418,808 163,584 39.06 278,970 180,763 64.80
Continued on next page
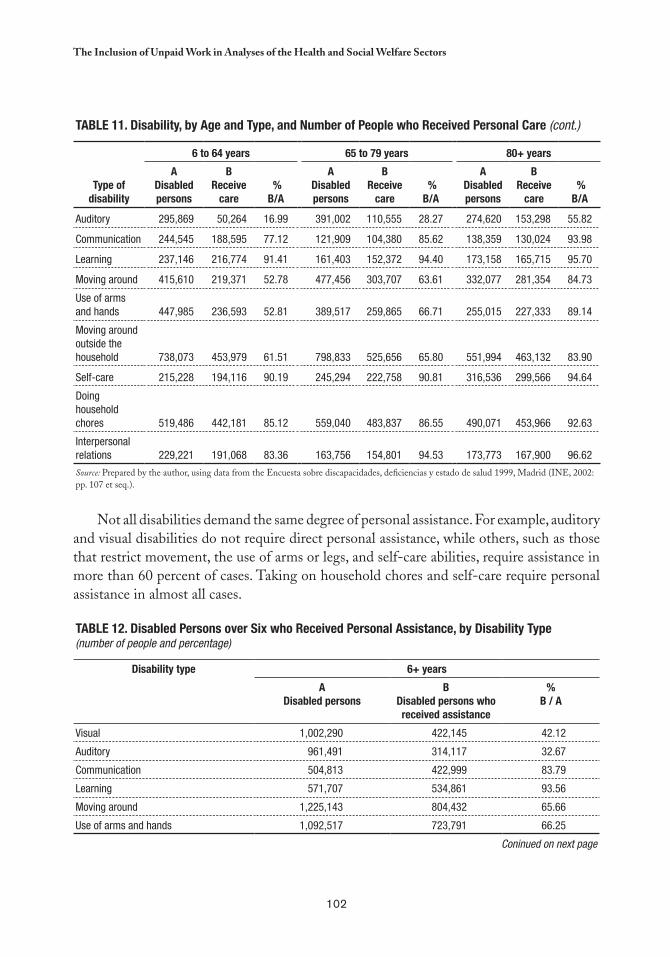
102
the Inclusion of Unpaid Work in Analyses of the Health and Social Welfare Sectors
Table 11. Disability, by age and Type, and Number of People who Received Personal Care (cont.)
Type of disability
6 to 64 years 65 to 79 years 80+ years
a Disabled persons
b Receive
care %b/a
a Disabled persons
b Receive
care %b/a
a Disabled persons
b Receive
care %b/a
Auditory 295,869 50,264 16.99 391,002 110,555 28.27 274,620 153,298 55.82
Communication 244,545 188,595 77.12 121,909 104,380 85.62 138,359 130,024 93.98
Learning 237,146 216,774 91.41 161,403 152,372 94.40 173,158 165,715 95.70
Moving around 415,610 219,371 52.78 477,456 303,707 63.61 332,077 281,354 84.73
Use of arms and hands 447,985 236,593 52.81 389,517 259,865 66.71 255,015 227,333 89.14
Moving around outside the household 738,073 453,979 61.51 798,833 525,656 65.80 551,994 463,132 83.90
Self-care 215,228 194,116 90.19 245,294 222,758 90.81 316,536 299,566 94.64
Doing household chores 519,486 442,181 85.12 559,040 483,837 86.55 490,071 453,966 92.63
Interpersonal relations 229,221 191,068 83.36 163,756 154,801 94.53 173,773 167,900 96.62
Source: Prepared by the author, using data from the Encuesta sobre discapacidades, deficiencias y estado de salud 1999, Madrid (INE, 2002: pp. 107 et seq.).
Not all disabilities demand the same degree of personal assistance. For example, auditory and visual disabilities do not require direct personal assistance, while others, such as those that restrict movement, the use of arms or legs, and self-care abilities, require assistance in more than 60 percent of cases. Taking on household chores and self-care require personal assistance in almost all cases.
Table 12. Disabled Persons over Six who Received Personal assistance, by Disability Type(number of people and percentage)
Disability type 6+ years
aDisabled persons
bDisabled persons who received assistance
% b / a
Visual 1,002,290 422,145 42.12
Auditory 961,491 314,117 32.67
Communication 504,813 422,999 83.79
Learning 571,707 534,861 93.56
Moving around 1,225,143 804,432 65.66
Use of arms and hands 1,092,517 723,791 66.25
Coninued on next page
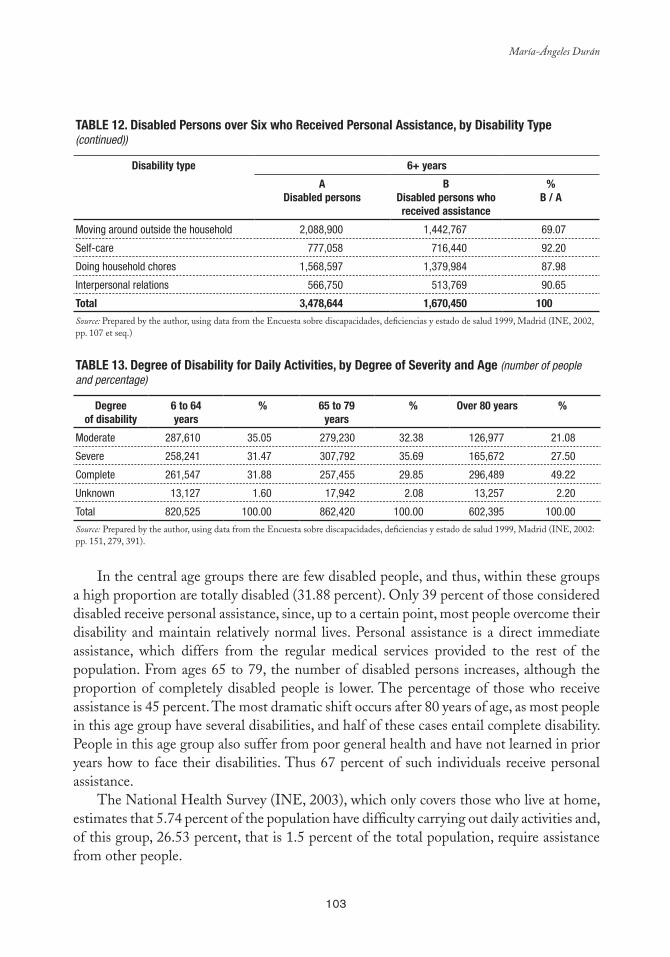
103
María-Ángeles Durán
Table 12. Disabled Persons over Six who Received Personal assistance, by Disability Type(continued))
Disability type 6+ years
aDisabled persons
bDisabled persons who received assistance
% b / a
Moving around outside the household 2,088,900 1,442,767 69.07
Self-care 777,058 716,440 92.20
Doing household chores 1,568,597 1,379,984 87.98
Interpersonal relations 566,750 513,769 90.65
Total 3,478,644 1,670,450 100
Source: Prepared by the author, using data from the Encuesta sobre discapacidades, deficiencias y estado de salud 1999, Madrid (INE, 2002, pp. 107 et seq.)
Table 13. Degree of Disability for Daily activities, by Degree of Severity and age (number of people and percentage)
Degreeof disability
6 to 64years
% 65 to 79years
% Over 80 years %
Moderate 287,610 35.05 279,230 32.38 126,977 21.08
Severe 258,241 31.47 307,792 35.69 165,672 27.50
Complete 261,547 31.88 257,455 29.85 296,489 49.22
Unknown 13,127 1.60 17,942 2.08 13,257 2.20
Total 820,525 100.00 862,420 100.00 602,395 100.00
Source: Prepared by the author, using data from the Encuesta sobre discapacidades, deficiencias y estado de salud 1999, Madrid (INE, 2002: pp. 151, 279, 391).
In the central age groups there are few disabled people, and thus, within these groups a high proportion are totally disabled (31.88 percent). Only 39 percent of those considered disabled receive personal assistance, since, up to a certain point, most people overcome their disability and maintain relatively normal lives. Personal assistance is a direct immediate assistance, which differs from the regular medical services provided to the rest of the population. From ages 65 to 79, the number of disabled persons increases, although the proportion of completely disabled people is lower. The percentage of those who receive assistance is 45 percent. The most dramatic shift occurs after 80 years of age, as most people in this age group have several disabilities, and half of these cases entail complete disability. People in this age group also suffer from poor general health and have not learned in prior years how to face their disabilities. Thus 67 percent of such individuals receive personal assistance.
The National Health Survey (INE, 2003), which only covers those who live at home, estimates that 5.74 percent of the population have difficulty carrying out daily activities and, of this group, 26.53 percent, that is 1.5 percent of the total population, require assistance from other people.
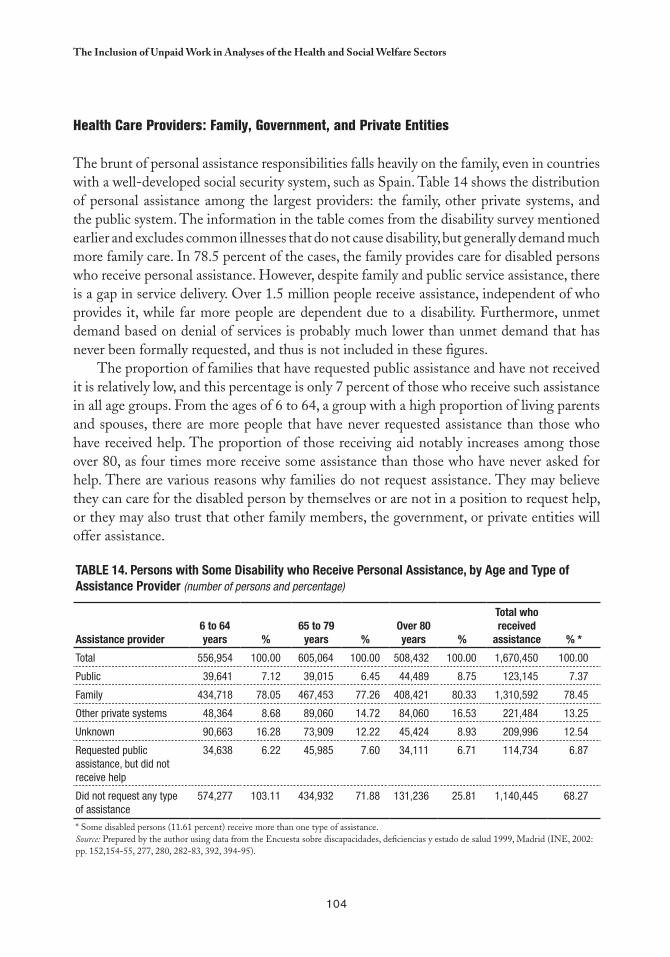
104
the Inclusion of Unpaid Work in Analyses of the Health and Social Welfare Sectors
Health Care Providers: Family, Government, and Private Entities
The brunt of personal assistance responsibilities falls heavily on the family, even in countries with a well-developed social security system, such as Spain. Table 14 shows the distribution of personal assistance among the largest providers: the family, other private systems, and the public system. The information in the table comes from the disability survey mentioned earlier and excludes common illnesses that do not cause disability, but generally demand much more family care. In 78.5 percent of the cases, the family provides care for disabled persons who receive personal assistance. However, despite family and public service assistance, there is a gap in service delivery. Over 1.5 million people receive assistance, independent of who provides it, while far more people are dependent due to a disability. Furthermore, unmet demand based on denial of services is probably much lower than unmet demand that has never been formally requested, and thus is not included in these figures.
The proportion of families that have requested public assistance and have not received it is relatively low, and this percentage is only 7 percent of those who receive such assistance in all age groups. From the ages of 6 to 64, a group with a high proportion of living parents and spouses, there are more people that have never requested assistance than those who have received help. The proportion of those receiving aid notably increases among those over 80, as four times more receive some assistance than those who have never asked for help. There are various reasons why families do not request assistance. They may believe they can care for the disabled person by themselves or are not in a position to request help, or they may also trust that other family members, the government, or private entities will offer assistance.
Table 14. Persons with Some Disability who Receive Personal assistance, by age and Type of assistance Provider (number of persons and percentage)
assistance provider 6 to 64 years %
65 to 79 years %
Over 80 years %
Total who received
assistance % *
Total 556,954 100.00 605,064 100.00 508,432 100.00 1,670,450 100.00
Public 39,641 7.12 39,015 6.45 44,489 8.75 123,145 7.37
Family 434,718 78.05 467,453 77.26 408,421 80.33 1,310,592 78.45
Other private systems 48,364 8.68 89,060 14.72 84,060 16.53 221,484 13.25
Unknown 90,663 16.28 73,909 12.22 45,424 8.93 209,996 12.54
Requested public assistance, but did not receive help
34,638 6.22 45,985 7.60 34,111 6.71 114,734 6.87
Did not request any type of assistance
574,277 103.11 434,932 71.88 131,236 25.81 1,140,445 68.27
* Some disabled persons (11.61 percent) receive more than one type of assistance. Source: Prepared by the author using data from the Encuesta sobre discapacidades, deficiencias y estado de salud 1999, Madrid (INE, 2002: pp. 152,154-55, 277, 280, 282-83, 392, 394-95).
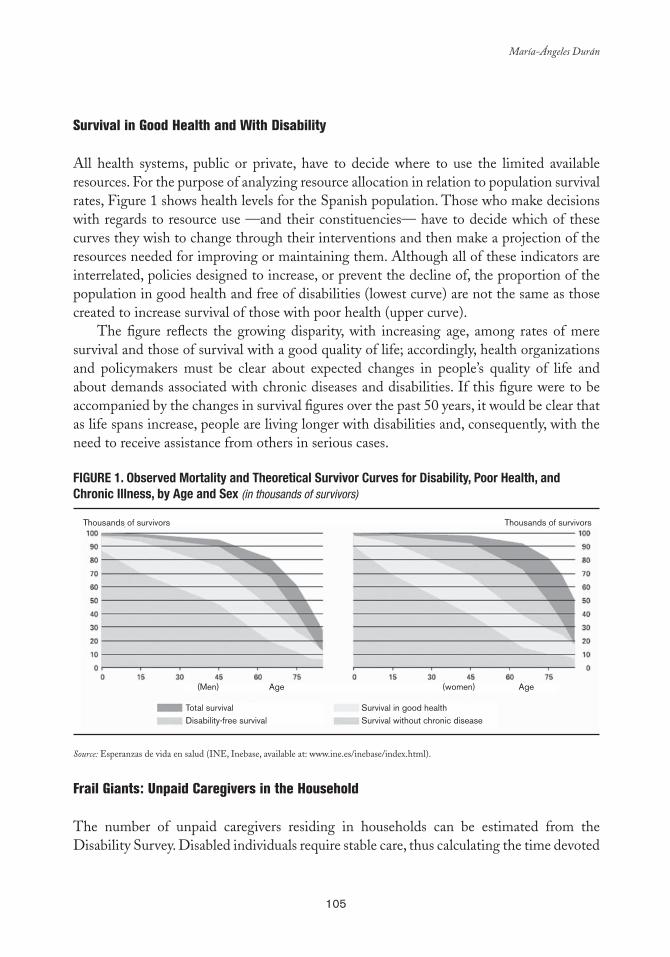
105
María-Ángeles Durán
Survival in Good Health and With Disability
All health systems, public or private, have to decide where to use the limited available resources. For the purpose of analyzing resource allocation in relation to population survival rates, Figure 1 shows health levels for the Spanish population. Those who make decisions with regards to resource use —and their constituencies— have to decide which of these curves they wish to change through their interventions and then make a projection of the resources needed for improving or maintaining them. Although all of these indicators are interrelated, policies designed to increase, or prevent the decline of, the proportion of the population in good health and free of disabilities (lowest curve) are not the same as those created to increase survival of those with poor health (upper curve).
The figure reflects the growing disparity, with increasing age, among rates of mere survival and those of survival with a good quality of life; accordingly, health organizations and policymakers must be clear about expected changes in people’s quality of life and about demands associated with chronic diseases and disabilities. If this figure were to be accompanied by the changes in survival figures over the past 50 years, it would be clear that as life spans increase, people are living longer with disabilities and, consequently, with the need to receive assistance from others in serious cases.
FIGURe 1. Observed Mortality and Theoretical Survivor Curves for Disability, Poor Health, and Chronic Illness, by age and Sex (in thousands of survivors)
Source: Esperanzas de vida en salud (INE, Inebase, available at: www.ine.es/inebase/index.html).
Frail Giants: Unpaid Caregivers in the Household
The number of unpaid caregivers residing in households can be estimated from the Disability Survey. Disabled individuals require stable care, thus calculating the time devoted
(Hombres) (Mujeres)
Thousands of survivors
(Men) Age (women) Age
Thousands of survivors
Total survivalDisability-free survival
Survival in good healthSurvival without chronic disease
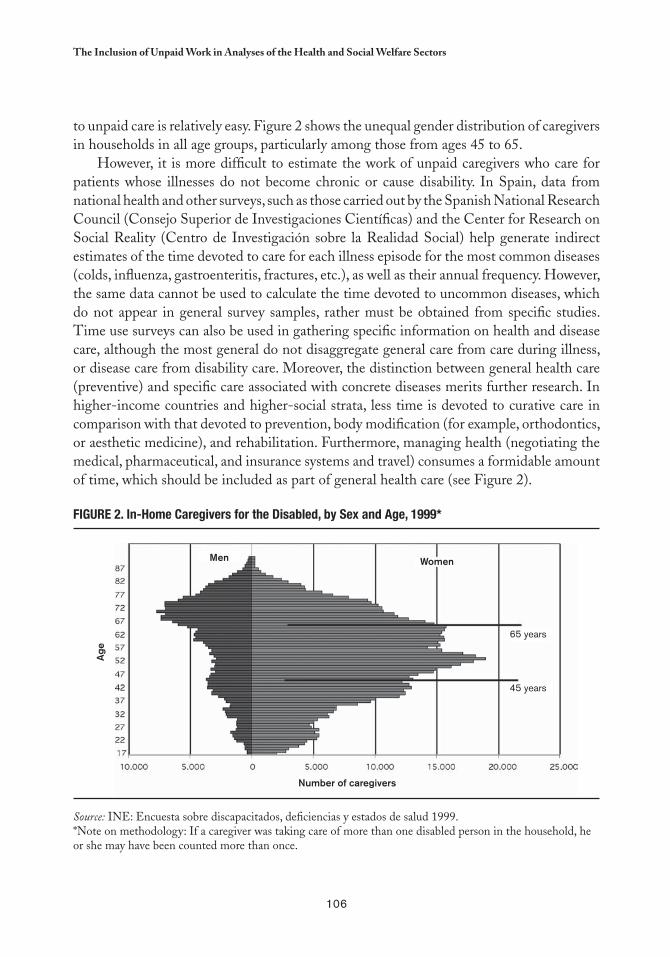
106
the Inclusion of Unpaid Work in Analyses of the Health and Social Welfare Sectors
to unpaid care is relatively easy. Figure 2 shows the unequal gender distribution of caregivers in households in all age groups, particularly among those from ages 45 to 65.
However, it is more difficult to estimate the work of unpaid caregivers who care for patients whose illnesses do not become chronic or cause disability. In Spain, data from national health and other surveys, such as those carried out by the Spanish National Research Council (Consejo Superior de Investigaciones Científicas) and the Center for Research on Social Reality (Centro de Investigación sobre la Realidad Social) help generate indirect estimates of the time devoted to care for each illness episode for the most common diseases (colds, influenza, gastroenteritis, fractures, etc.), as well as their annual frequency. However, the same data cannot be used to calculate the time devoted to uncommon diseases, which do not appear in general survey samples, rather must be obtained from specific studies. Time use surveys can also be used in gathering specific information on health and disease care, although the most general do not disaggregate general care from care during illness, or disease care from disability care. Moreover, the distinction between general health care (preventive) and specific care associated with concrete diseases merits further research. In higher-income countries and higher-social strata, less time is devoted to curative care in comparison with that devoted to prevention, body modification (for example, orthodontics, or aesthetic medicine), and rehabilitation. Furthermore, managing health (negotiating the medical, pharmaceutical, and insurance systems and travel) consumes a formidable amount of time, which should be included as part of general health care (see Figure 2).
FIGURe 2. In-Home Caregivers for the Disabled, by Sex and age, 1999*
Source: INE: Encuesta sobre discapacitados, deficiencias y estados de salud 1999.*Note on methodology: If a caregiver was taking care of more than one disabled person in the household, he or she may have been counted more than once.
Men Women
65 years
45 years
Age
Number of caregivers
107
María-Ángeles Durán
The Large Contribution of Small, Monographic Studies
Sociology and health economics research requires small, monographic studies that contribute information regarding little known aspects of illness care, for example, based on an assessment of the time devoted to caring for chronic patients. Several recent studies have asked interviewees to monetarily evaluate the time they invest in caring for patients in their household. Many interviewees would not put a price on their work (“I wouldn’t do it for all the gold in the world if it were for other people outside my family”) or they insisted that they were unaware of the replacement costs. Some compared themselves with possible replacement personnel and frequently agreed that four or five workers would be needed in shifts to take on all of the responsibilities. Wealthier families frequently hired more than one employee to care for the patient, which often work holidays and vacations. The financial status of the families is the only issue that limits hired help, and more affluent families can afford more qualified caregivers, including physicians, physical therapists, or nurses, as well as chauffeurs and cleaning and kitchen staff.
A study of dependent stroke patients published in Spain in 2004 gave an indication of the costs of caring for dependent patients, many of which were elderly.2 In the opinion of the caregivers interviewed, patients need constant supervision (40.3 percent of the cases), or patients could be left alone for one or two hours per day (41 percent), an indication of most caregivers’ dedication. Care providers perform various tasks, yet a general set of tasks are taken on in all households. Patients mainly depend on their caregivers to relate to the outside world (maintaining contact with the health system, doctor or medical center visits, shopping for food and other necessities).
Patients also need assistance with their personal needs (cleanliness, eating) and with housecleaning, taking medications, and general care. Caregivers are usually the ones that carry out these tasks, which range from emotional support to connecting with social networks to keep patients active and organized. Many tasks that involve little effort by a healthy adult become problematic for some patients, such as the administration of medicines or food, tasks that caregivers can rarely ignore. Taking medications present various complications for patients. In cases of major brain damage, patients are mostly unconscious, but when they are conscious their reactions vary. It is common for patients to violently reject their medication at times, or spit it out as if it were a game. Moreover, although they appear normal, patients with an unreliable memory may believe they have taken their medication correctly when in fact they have forgotten or doubled the dose. Hence, when patients have paid assistance, the supply and control of medicines are often the responsibilities of this primary care provider.
Durán, M.A. (Dir.), Informe sobre el impacto social de los enfermos dependientes por ictus. (Informe ISEDIC, 2004), Madrid, Editorial 2
Luzón, 2004. This report can be consulted online at www.msd.es, requesting the access code from MSD.
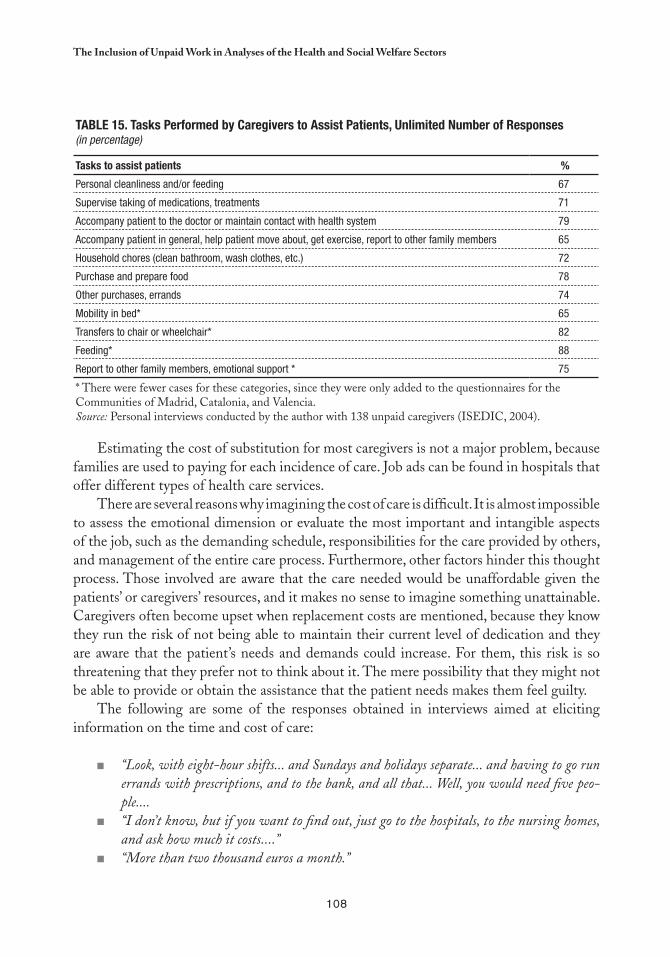
108
the Inclusion of Unpaid Work in Analyses of the Health and Social Welfare Sectors
Table 15. Tasks Performed by Caregivers to assist Patients, Unlimited Number of Responses (in percentage)
Tasks to assist patients %
Personal cleanliness and/or feeding 67
Supervise taking of medications, treatments 71
Accompany patient to the doctor or maintain contact with health system 79
Accompany patient in general, help patient move about, get exercise, report to other family members 65
Household chores (clean bathroom, wash clothes, etc.) 72
Purchase and prepare food 78
Other purchases, errands 74
Mobility in bed* 65
Transfers to chair or wheelchair* 82
Feeding* 88
Report to other family members, emotional support * 75
* There were fewer cases for these categories, since they were only added to the questionnaires for the Communities of Madrid, Catalonia, and Valencia. Source: Personal interviews conducted by the author with 138 unpaid caregivers (ISEDIC, 2004).
Estimating the cost of substitution for most caregivers is not a major problem, because families are used to paying for each incidence of care. Job ads can be found in hospitals that offer different types of health care services.
There are several reasons why imagining the cost of care is difficult. It is almost impossible to assess the emotional dimension or evaluate the most important and intangible aspects of the job, such as the demanding schedule, responsibilities for the care provided by others, and management of the entire care process. Furthermore, other factors hinder this thought process. Those involved are aware that the care needed would be unaffordable given the patients’ or caregivers’ resources, and it makes no sense to imagine something unattainable. Caregivers often become upset when replacement costs are mentioned, because they know they run the risk of not being able to maintain their current level of dedication and they are aware that the patient’s needs and demands could increase. For them, this risk is so threatening that they prefer not to think about it. The mere possibility that they might not be able to provide or obtain the assistance that the patient needs makes them feel guilty.
The following are some of the responses obtained in interviews aimed at eliciting information on the time and cost of care:
“Look, with eight-hour shifts... and Sundays and holidays separate... and having to go run ■■
errands with prescriptions, and to the bank, and all that... Well, you would need five peo-ple....“I don’t know, but if you want to find out, just go to the hospitals, to the nursing homes, ■■
and ask how much it costs....”“More than two thousand euros a month.”■■
109
María-Ángeles Durán
“Two hundred fifty thousand pesetas.”■■
“The woman who comes to stay with her charges ten euros an hour.”■■
“Just in salaries, it would cost six thousand euros a month.” ■■
“An Ecuadorian lady comes during the week. On the weekends, a different one comes. Of ■■
course, that’s just for daily care and so that she’s not alone....”“Ten thousand a night.”■■
“The woman who comes makes seven thousand pesetas a day.”■■
“One person alone can’t do it. City Hall sends two girls, one for half an hour in the morn-■■
ing and the other for half an hour in the evening. Aside from that, my son comes for a while every day, to help me get him up and put him to bed.... It’s worse on the weekends, when the girls from the City Hall don’t come....”
The interviewees, especially the younger ones, assessed both the replacement cost and the negative impact the opportunity cost had on them, since they had to leave their training and studies or employment, or spend less time on them, and therefore, saw their chances for advancement affected. Costs that were more difficult to estimate were those for traveling to take care of the patient or for moving, or for alterations to the house to make it accessible to the patient, as well as the cost to family members from the loss of use of some part of their property, in particular, the loss of space in the house.
Estimating the work that goes into care and treatment still requires the solution of numerous theoretical and methodological problems, both through research and agreement on how to move forward with options and alternatives.
ESTIMATING THE REPLACEMENT COST FOR UNPAID WORK IN THE HOUSEHOLD
Only goods that circulate on the market have a clear price, contrary to what occurs with most goods produced and consumed at home. The research should be aimed at assigning market prices to household production that is produced outside the market.
Presently, time use surveys, such as one circulated in numerous European countries through Eurostat, do not provide separate data for sick patients and the care of adults or children, and even less for care of occasional and chronic patients, diseases that are acquired or congenital, or accidents. This section will address the general method for using a satellite account for unpaid work, with the full understanding that the empirical and statistical foundation is quite deficient, but being added to rapidly. It is presumed that the principal theoretical and methodological complications with the satellite account will be similar in the health care account; hence there is an interest in hastening its dissemination for information and debate.
A 1998 study on unpaid work by the Spanish National Research Council (CSIC) surveyed those in charge of households in the Community of Madrid. The sample included
110
the Inclusion of Unpaid Work in Analyses of the Health and Social Welfare Sectors
1,205 interviews conducted via a random selection of census tracts and households. In each case, the person who claimed to be responsible for the domestic management of the household was interviewed: 95 percent were women, of which 24 percent had paid employment. It should be noted that from a technical standpoint the status of housewife and being in charge of the household are not same, because some individuals who are in charge of the household identify themselves by other occupations, as do other statistical sources, such as the Census or the Working Population Survey.
According to the 1998 survey, women “in charge of the household” spent an average of 8 hours and 49 minutes daily on household chores, while the rest of the household members contributed an estimated 14 percent of the housework, complementary to their own jobs. Paid assistance was used in 9.9 percent of households.
In 2000, CSIC conducted a survey in the Community of Madrid aimed at learning about how nonmarket production was organized in households. It targeted those who could report in detail on the socioeconomic structure of the household, excluding adult children, unless they were in fact responsible for the family. The objective of this survey was to acquire information that would not have been obtained from random sampling procedures on all household categories (one parent, divorced or separated parents, both spouses employed, etc.). To that end, quotas were established for each household type and interviews were conducted directly by the fieldwork team. The sample was 44.7 percent male and 55.3 percent female. Of the women, 58.5 percent had paid employment, while the Working Population Survey (WPS) estimated only 35.6 percent of women in Madrid as working. The unemployment rate among interviewees was 6.6 percent in the CSIC study compared to 16.3 percent in the WPS. In both surveys, the rate declined slightly in women over 25, the age when young women begin to assume responsibility for their own households. Notably, in the CSIC sample, young families with more modern attitudes were more common than in the Community of Madrid as a whole.
At the same time, CSIC participated in a survey at the national level conducted by the consulting firm Análisis Sociales, Económicos y Políticos (ASEP) and directed at the entire population over age 18. It included 1,218 interviews, selected randomly. According to this survey, the average time spent on domestic activities on workdays is 5.42 hours per person, 2.68 for males and 8 for females.
There are clear differences in the objectives and samples used in the three studies, as well as in their results. Comparative analysis is more useful among subgroups than with full samples.
In the households interviewed for the CSIC Household Survey 2000, the average monthly income generated from all activity areas was 260,000 pesetas (1,562 euros).3 In addition to cash income, 8 percent of the interviewees added an extra good or service
Spain currently uses the euro, but the figures from studies prior to its adoption in January 2002 are given in pesetas. The exchange rate used 3
is €1 = €166.386. In 2005, the euro-dollar exchange rate was, with slight variations, €1 = $1.27.
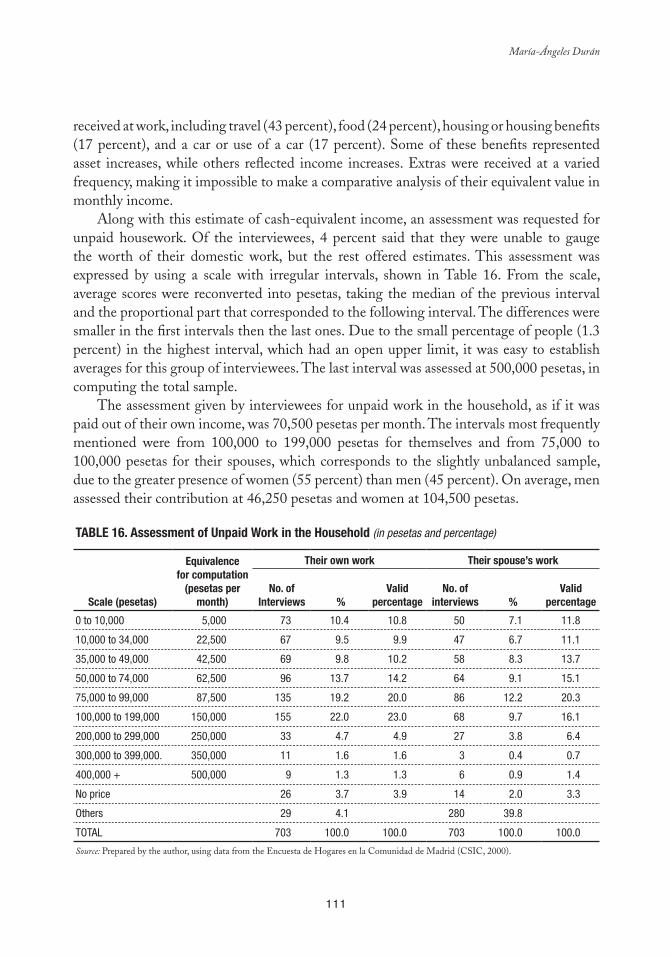
111
María-Ángeles Durán
received at work, including travel (43 percent), food (24 percent), housing or housing benefits (17 percent), and a car or use of a car (17 percent). Some of these benefits represented asset increases, while others reflected income increases. Extras were received at a varied frequency, making it impossible to make a comparative analysis of their equivalent value in monthly income.
Along with this estimate of cash-equivalent income, an assessment was requested for unpaid housework. Of the interviewees, 4 percent said that they were unable to gauge the worth of their domestic work, but the rest offered estimates. This assessment was expressed by using a scale with irregular intervals, shown in Table 16. From the scale, average scores were reconverted into pesetas, taking the median of the previous interval and the proportional part that corresponded to the following interval. The differences were smaller in the first intervals then the last ones. Due to the small percentage of people (1.3 percent) in the highest interval, which had an open upper limit, it was easy to establish averages for this group of interviewees. The last interval was assessed at 500,000 pesetas, in computing the total sample.
The assessment given by interviewees for unpaid work in the household, as if it was paid out of their own income, was 70,500 pesetas per month. The intervals most frequently mentioned were from 100,000 to 199,000 pesetas for themselves and from 75,000 to 100,000 pesetas for their spouses, which corresponds to the slightly unbalanced sample, due to the greater presence of women (55 percent) than men (45 percent). On average, men assessed their contribution at 46,250 pesetas and women at 104,500 pesetas.
Table 16. assessment of Unpaid Work in the Household (in pesetas and percentage)
Scale (pesetas)
equivalence for computation
(pesetas per month)
Their own work Their spouse’s work
No. of Interviews %
Valid percentage
No. of interviews %
Valid percentage
0 to 10,000 5,000 73 10.4 10.8 50 7.1 11.8
10,000 to 34,000 22,500 67 9.5 9.9 47 6.7 11.1
35,000 to 49,000 42,500 69 9.8 10.2 58 8.3 13.7
50,000 to 74,000 62,500 96 13.7 14.2 64 9.1 15.1
75,000 to 99,000 87,500 135 19.2 20.0 86 12.2 20.3
100,000 to 199,000 150,000 155 22.0 23.0 68 9.7 16.1
200,000 to 299,000 250,000 33 4.7 4.9 27 3.8 6.4
300,000 to 399,000. 350,000 11 1.6 1.6 3 0.4 0.7
400,000 + 500,000 9 1.3 1.3 6 0.9 1.4
No price 26 3.7 3.9 14 2.0 3.3
Others 29 4.1 280 39.8
TOTAL 703 100.0 100.0 703 100.0 100.0
Source: Prepared by the author, using data from the Encuesta de Hogares en la Comunidad de Madrid (CSIC, 2000).
112
the Inclusion of Unpaid Work in Analyses of the Health and Social Welfare Sectors
The results obtained were lower than those proposed in the initial research hypothesis, but it is necessary to recognize that the proportionality between amounts is just as important as the absolute figures offered by the interviewees. Men assessed their partners’ work (85,750 pesetas) at an amount lower than the women’s estimate of their own contributions, while women assessed the contribution of their partners equally (46,250 pesetas) to their self-assessment.
Household income information was obtained as an aggregate for the household group and included income from work, property, pensions, and social subsidies. Conversely, the data on unpaid domestic work was obtained in a disaggregated form and only encompassed the interviewees and their partners, leaving out possible contributions of other household members. In all households, at least one member is responsible for taking care of the household; in the majority of cases there are two and often three or more people who do some domestic work. The sample from the 2000 CSIC Household Survey includes more employed women and more households with one person, one parent, or divorced or separated members than the national total. Thus, it can be estimated that domestic work is greater for women and lesser for men in the national total than in this sample.
In addition to considering household composition, to estimate the resources from unpaid work, it is necessary to decide between the use of the two variants, those obtained from their own estimate or those obtained from their partner. As noted, men’s assessment of their own work is consistent with the assessment of their partners; yet, women’s estimate of their work is 22 percent greater than their partners’ estimate. This means that men estimate their spouses’ unpaid work at 16 percent lower than their self-assessment. This was not a double assessment of the same people, rather of different people, but in any case this difference should be taken into account.
Considering family cash income as the base for an index equal to 100, and assuming each household consists of a man and a woman responsible for the household (which introduces a slight tendency to raise the assessment of unpaid work, since this condition is not common in all households), an assessment for domestic work and its proportional relationship to cash-equivalent income is illustrated in Table 16. In this survey, the proportionality is slightly skewed toward an increase in paid work, because the percentage of women with paid employment is higher than in the national total, which partly offsets the upward bias for the aforementioned unpaid work.
The quantity of domestic work is also associated with the household members’ ages. Accordingly, the age of the eldest child was requested in this survey. In households with children under four, both men’s assessment of their own work (52,100 pesetas) and women’s (157,000 pesetas) were at their highest. Yet beyond that age, no clear trend was drawn from the assessments. The zigzagging figures suggest that the intense dedication to small children is compensated for by larger family sizes in intermediate age groups and with frequency of elderly members in households with elderly heads of household.
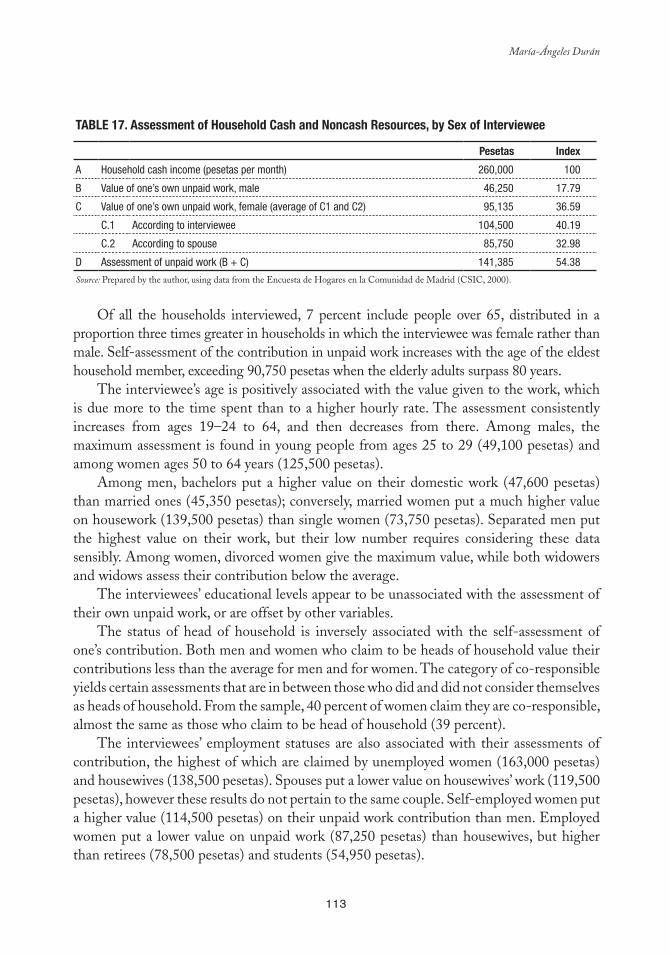
113
María-Ángeles Durán
Table 17. assessment of Household Cash and Noncash Resources, by Sex of Interviewee
Pesetas Index
A Household cash income (pesetas per month) 260,000 100
B Value of one’s own unpaid work, male 46,250 17.79
C Value of one’s own unpaid work, female (average of C1 and C2) 95,135 36.59
C.1 According to interviewee 104,500 40.19
C.2 According to spouse 85,750 32.98
D Assessment of unpaid work (B + C) 141,385 54.38
Source: Prepared by the author, using data from the Encuesta de Hogares en la Comunidad de Madrid (CSIC, 2000).
Of all the households interviewed, 7 percent include people over 65, distributed in a proportion three times greater in households in which the interviewee was female rather than male. Self-assessment of the contribution in unpaid work increases with the age of the eldest household member, exceeding 90,750 pesetas when the elderly adults surpass 80 years.
The interviewee’s age is positively associated with the value given to the work, which is due more to the time spent than to a higher hourly rate. The assessment consistently increases from ages 19–24 to 64, and then decreases from there. Among males, the maximum assessment is found in young people from ages 25 to 29 (49,100 pesetas) and among women ages 50 to 64 years (125,500 pesetas).
Among men, bachelors put a higher value on their domestic work (47,600 pesetas) than married ones (45,350 pesetas); conversely, married women put a much higher value on housework (139,500 pesetas) than single women (73,750 pesetas). Separated men put the highest value on their work, but their low number requires considering these data sensibly. Among women, divorced women give the maximum value, while both widowers and widows assess their contribution below the average.
The interviewees’ educational levels appear to be unassociated with the assessment of their own unpaid work, or are offset by other variables.
The status of head of household is inversely associated with the self-assessment of one’s contribution. Both men and women who claim to be heads of household value their contributions less than the average for men and for women. The category of co-responsible yields certain assessments that are in between those who did and did not consider themselves as heads of household. From the sample, 40 percent of women claim they are co-responsible, almost the same as those who claim to be head of household (39 percent).
The interviewees’ employment statuses are also associated with their assessments of contribution, the highest of which are claimed by unemployed women (163,000 pesetas) and housewives (138,500 pesetas). Spouses put a lower value on housewives’ work (119,500 pesetas), however these results do not pertain to the same couple. Self-employed women put a higher value (114,500 pesetas) on their unpaid work contribution than men. Employed women put a lower value on unpaid work (87,250 pesetas) than housewives, but higher than retirees (78,500 pesetas) and students (54,950 pesetas).
114
the Inclusion of Unpaid Work in Analyses of the Health and Social Welfare Sectors
Wives or partners mainly assess men’s contribution in unpaid work according to their employment statuses: 50,000 pesetas per month for employed men (the majority), 45,750 pesetas for self-employed men, and 33,900 pesetas for retirees. The assessments that men make of their own contributions are higher than their wives or partners when the occupational variable is introduced, although it should be remembered that these results are not based on the same couple from two different perspectives, rather on different couples. In some groups, such as retirees, the reference group can vary considerably, depending on whether they are referring to themselves or their spouses. The average assessment that men give for their own domestic work is 48,250 pesetas for employees, 32,850 pesetas for self-employed, and 55,000 pesetas for retirees.
According to the principal source of household income, the assessment of unpaid work is higher in households that depended on social subsidies (175,000 pesetas) (although there were only four cases) or on sporadic work than in more frequent categories, such as those that depended on pensions (74,000 pesetas), temporary jobs (65,750 pesetas), or stable jobs (65,000 pesetas).
There is no association found between net monthly family income and assessment of unpaid work for either gender. The effect of lost wages probably offset the effect of the degree of dedication.
In households with paid domestic service, self-assessment of one’s unpaid work contribution is lower (68,250 pesetas) than in households that lacked this service (71,500 pesetas), but as the difference is small, it produces a leveling effect on the higher assessment per unpaid hour worked (a result of higher qualifications and comparative lost wages). In other words, households without domestic service save an average of 3,250 pesetas compared to the higher assessment, which is less than the average paid for domestic service. However, factors that offset the assessment disappear when introducing basic variables; thus, men who do not have domestic service assess their own contribution at 16,000 pesetas more than those who do have this service, and women assess it at 15,000 pesetas more.
As pointed out earlier, the general tendency is to state a lower income than the true amount, both because people do not include irregular income and they often refer to net income rather than gross income. Therefore, it should be recalled that according to the Spanish National Accounts (INE, 1998, report for 1997), the true amount is almost 13 times the monthly family income declared in the CSIC Household Survey 2000 for all household members in each category and 19 times the average regular monthly income according to the Family Budget Survey.
In summary, the interviewees have assessed the total amount of unpaid work at 54.38 percent of the value of the remaining monthly household cash income, which could be a key figure in translating the domestic production value into monetary terms. The unit of account is not the individual but the household, which poses a methodological and political problem when comparing it with the amount of time devoted to producing goods and services in the household that do not become merchandise.
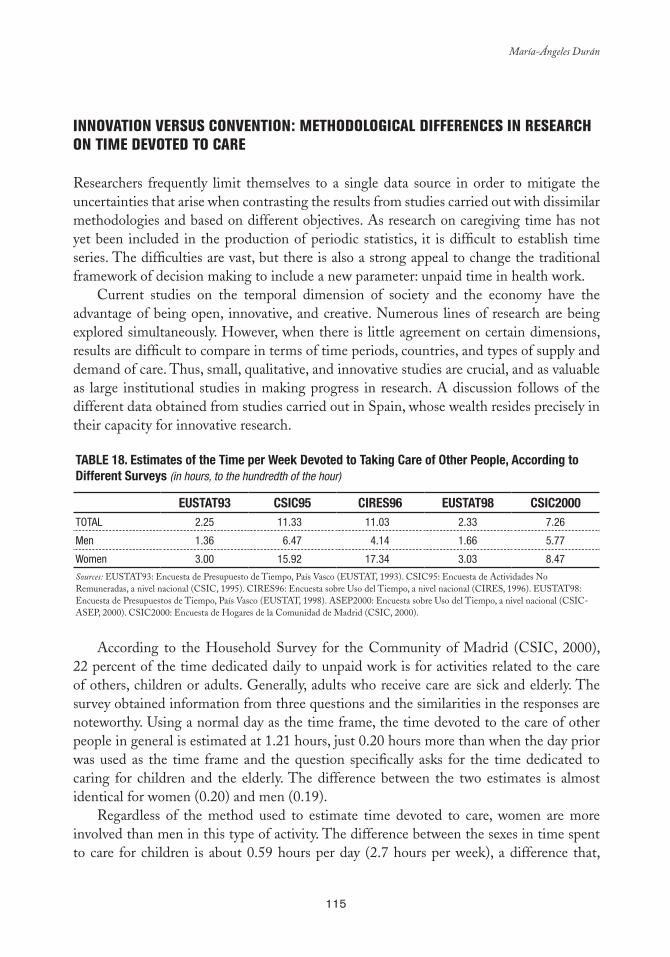
115
María-Ángeles Durán
INNOVATION VERSUS CONVENTION: METHODOLOGICAL DIFFERENCES IN RESEARCH ON TIME DEVOTED TO CARE
Researchers frequently limit themselves to a single data source in order to mitigate the uncertainties that arise when contrasting the results from studies carried out with dissimilar methodologies and based on different objectives. As research on caregiving time has not yet been included in the production of periodic statistics, it is difficult to establish time series. The difficulties are vast, but there is also a strong appeal to change the traditional framework of decision making to include a new parameter: unpaid time in health work.
Current studies on the temporal dimension of society and the economy have the advantage of being open, innovative, and creative. Numerous lines of research are being explored simultaneously. However, when there is little agreement on certain dimensions, results are difficult to compare in terms of time periods, countries, and types of supply and demand of care. Thus, small, qualitative, and innovative studies are crucial, and as valuable as large institutional studies in making progress in research. A discussion follows of the different data obtained from studies carried out in Spain, whose wealth resides precisely in their capacity for innovative research.
Table 18. estimates of the Time per Week Devoted to Taking Care of Other People, according to Different Surveys (in hours, to the hundredth of the hour)
eUSTaT93 CSIC95 CIReS96 eUSTaT98 CSIC2000TOTAL 2.25 11.33 11.03 2.33 7.26
Men 1.36 6.47 4.14 1.66 5.77
Women 3.00 15.92 17.34 3.03 8.47
Sources: EUSTAT93: Encuesta de Presupuesto de Tiempo, País Vasco (EUSTAT, 1993). CSIC95: Encuesta de Actividades No Remuneradas, a nivel nacional (CSIC, 1995). CIRES96: Encuesta sobre Uso del Tiempo, a nivel nacional (CIRES, 1996). EUSTAT98: Encuesta de Presupuestos de Tiempo, País Vasco (EUSTAT, 1998). ASEP2000: Encuesta sobre Uso del Tiempo, a nivel nacional (CSIC-ASEP, 2000). CSIC2000: Encuesta de Hogares de la Comunidad de Madrid (CSIC, 2000).
According to the Household Survey for the Community of Madrid (CSIC, 2000), 22 percent of the time dedicated daily to unpaid work is for activities related to the care of others, children or adults. Generally, adults who receive care are sick and elderly. The survey obtained information from three questions and the similarities in the responses are noteworthy. Using a normal day as the time frame, the time devoted to the care of other people in general is estimated at 1.21 hours, just 0.20 hours more than when the day prior was used as the time frame and the question specifically asks for the time dedicated to caring for children and the elderly. The difference between the two estimates is almost identical for women (0.20) and men (0.19).
Regardless of the method used to estimate time devoted to care, women are more involved than men in this type of activity. The difference between the sexes in time spent to care for children is about 0.59 hours per day (2.7 hours per week), a difference that,
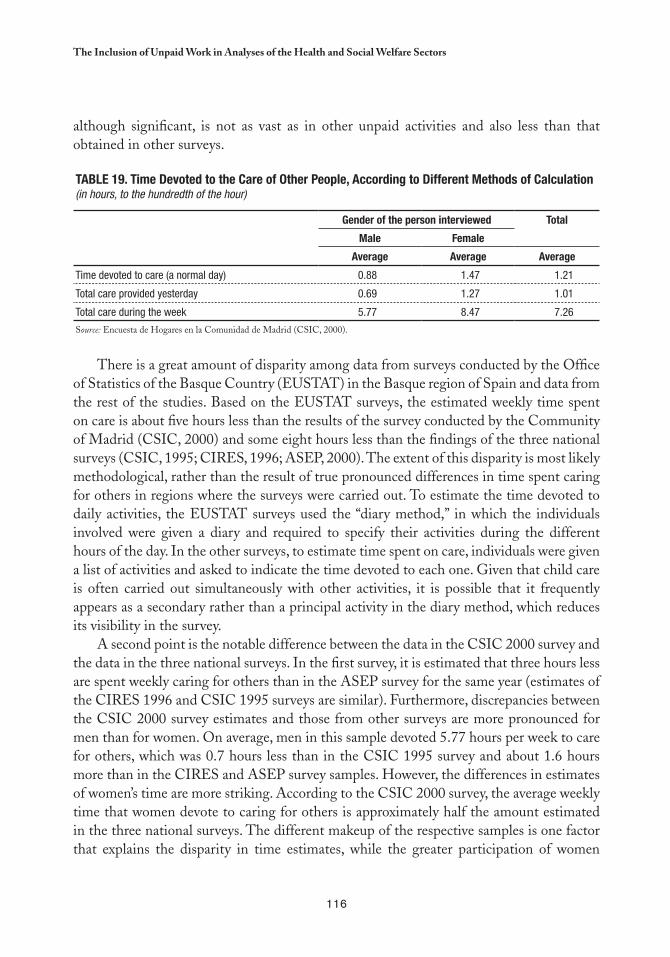
116
the Inclusion of Unpaid Work in Analyses of the Health and Social Welfare Sectors
although significant, is not as vast as in other unpaid activities and also less than that obtained in other surveys.
Table 19. Time Devoted to the Care of Other People, according to Different Methods of Calculation(in hours, to the hundredth of the hour)
Gender of the person interviewed Total
Male Female
average average average
Time devoted to care (a normal day) 0.88 1.47 1.21
Total care provided yesterday 0.69 1.27 1.01
Total care during the week 5.77 8.47 7.26
Source: Encuesta de Hogares en la Comunidad de Madrid (CSIC, 2000).
There is a great amount of disparity among data from surveys conducted by the Office of Statistics of the Basque Country (EUSTAT) in the Basque region of Spain and data from the rest of the studies. Based on the EUSTAT surveys, the estimated weekly time spent on care is about five hours less than the results of the survey conducted by the Community of Madrid (CSIC, 2000) and some eight hours less than the findings of the three national surveys (CSIC, 1995; CIRES, 1996; ASEP, 2000). The extent of this disparity is most likely methodological, rather than the result of true pronounced differences in time spent caring for others in regions where the surveys were carried out. To estimate the time devoted to daily activities, the EUSTAT surveys used the “diary method,” in which the individuals involved were given a diary and required to specify their activities during the different hours of the day. In the other surveys, to estimate time spent on care, individuals were given a list of activities and asked to indicate the time devoted to each one. Given that child care is often carried out simultaneously with other activities, it is possible that it frequently appears as a secondary rather than a principal activity in the diary method, which reduces its visibility in the survey.
A second point is the notable difference between the data in the CSIC 2000 survey and the data in the three national surveys. In the first survey, it is estimated that three hours less are spent weekly caring for others than in the ASEP survey for the same year (estimates of the CIRES 1996 and CSIC 1995 surveys are similar). Furthermore, discrepancies between the CSIC 2000 survey estimates and those from other surveys are more pronounced for men than for women. On average, men in this sample devoted 5.77 hours per week to care for others, which was 0.7 hours less than in the CSIC 1995 survey and about 1.6 hours more than in the CIRES and ASEP survey samples. However, the differences in estimates of women’s time are more striking. According to the CSIC 2000 survey, the average weekly time that women devote to caring for others is approximately half the amount estimated in the three national surveys. The different makeup of the respective samples is one factor that explains the disparity in time estimates, while the greater participation of women
117
María-Ángeles Durán
with paid jobs, who devote less time to caregiving, or the limited percentage of households with elderly members, are other characteristics of the CSIC 2000 survey sample that have influenced these estimates.
The discrepancies in the results highlight the influence of the research methods used. The similarities in the two EUSTAT and the CIRES (1996) and ASEP (2000) surveys and the differences in their estimates compared to other studies strengthens the conclusion that the way time devoted to care is measured greatly affects the final estimates, something to be considered in research design and study comparisons.
Another methodological and political concern is the clarification of the relationship among those who receive and provide care. Usually the unit of analysis is the household, and it is understood that household production consists exclusively of family members residing in the household. However, more specialized studies demonstrate that cash and noncash exchanges occur between an extended network of family and friends: recourses are also shared among households. For example, a person from one household sometimes goes to another —or several others— to provide unpaid assistance services. Women frequently do this, in both caring for younger family members in their household, especially grandchildren, and going to their elderly parents’ households to help them move around and make various arrangements, take them shopping and to the doctors, and attend to their illnesses. Based on the survey, in the Community of Madrid 14.4 percent of women over age 18 devote part of their time to providing unpaid assistance to other households, 5 percent provide assistance from their own household, and 10.6 percent go to other households (adding up to 15.9 percent because some women assume both functions simultaneously).
SYNCHRONY VERSUS PROSPECTIVE: CAREGIVERS’ TIME
The INE-Eurostat Time Use Survey (2002–2003) and the CSIC Time Use Survey (2003)
It is not easy to assess how much time is spent on different activities. Small variations in objectives and methods lead to measuring different aspects and obtaining diverse results. Moreover, in general surveys that focus on more than patient care, the subsamples of those who engage in this activity are small and any variation in case numbers causes significant rate changes. A person’s availability to care for a patient or dependent could imply the lack of personal time, but given the capacity to multitask, caregivers can use their time more intensively, multiplying their tiredness and stress accordingly, which depends both on spatial conditioning factors and working and caregiving styles.
Based on these issues, which call for prudence, it is worth analyzing the unpublished data from time use surveys conducted in Spain in 2002 and 2003, both general in nature, that contribute some information on the proportion of caregivers in the population over age 18: the Time Use Survey by the National Statistics Institute (INE), which used a
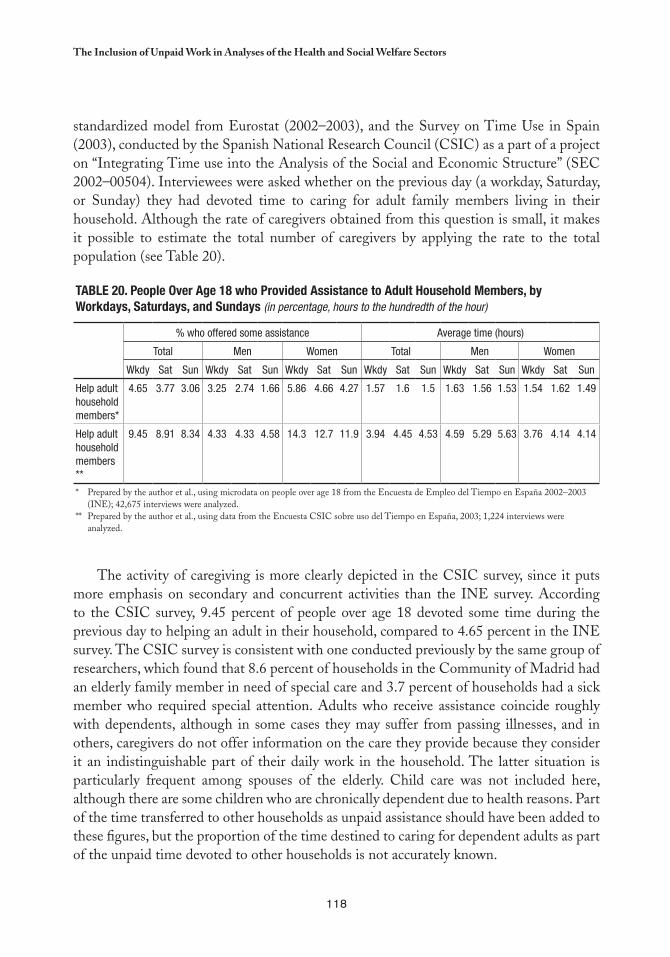
118
the Inclusion of Unpaid Work in Analyses of the Health and Social Welfare Sectors
standardized model from Eurostat (2002–2003), and the Survey on Time Use in Spain (2003), conducted by the Spanish National Research Council (CSIC) as a part of a project on “Integrating Time use into the Analysis of the Social and Economic Structure” (SEC 2002–00504). Interviewees were asked whether on the previous day (a workday, Saturday, or Sunday) they had devoted time to caring for adult family members living in their household. Although the rate of caregivers obtained from this question is small, it makes it possible to estimate the total number of caregivers by applying the rate to the total population (see Table 20).
Table 20. People Over age 18 who Provided assistance to adult Household Members, by Workdays, Saturdays, and Sundays (in percentage, hours to the hundredth of the hour)
% who offered some assistance Average time (hours)
Total Men Women Total Men Women
Wkdy Sat Sun Wkdy Sat Sun Wkdy Sat Sun Wkdy Sat Sun Wkdy Sat Sun Wkdy Sat Sun
Help adult household members*
4.65 3.77 3.06 3.25 2.74 1.66 5.86 4.66 4.27 1.57 1.6 1.5 1.63 1.56 1.53 1.54 1.62 1.49
Help adult household members **
9.45 8.91 8.34 4.33 4.33 4.58 14.3 12.7 11.9 3.94 4.45 4.53 4.59 5.29 5.63 3.76 4.14 4.14
* Prepared by the author et al., using microdata on people over age 18 from the Encuesta de Empleo del Tiempo en España 2002–2003 (INE); 42,675 interviews were analyzed.
** Prepared by the author et al., using data from the Encuesta CSIC sobre uso del Tiempo en España, 2003; 1,224 interviews were analyzed.
The activity of caregiving is more clearly depicted in the CSIC survey, since it puts more emphasis on secondary and concurrent activities than the INE survey. According to the CSIC survey, 9.45 percent of people over age 18 devoted some time during the previous day to helping an adult in their household, compared to 4.65 percent in the INE survey. The CSIC survey is consistent with one conducted previously by the same group of researchers, which found that 8.6 percent of households in the Community of Madrid had an elderly family member in need of special care and 3.7 percent of households had a sick member who required special attention. Adults who receive assistance coincide roughly with dependents, although in some cases they may suffer from passing illnesses, and in others, caregivers do not offer information on the care they provide because they consider it an indistinguishable part of their daily work in the household. The latter situation is particularly frequent among spouses of the elderly. Child care was not included here, although there are some children who are chronically dependent due to health reasons. Part of the time transferred to other households as unpaid assistance should have been added to these figures, but the proportion of the time destined to caring for dependent adults as part of the unpaid time devoted to other households is not accurately known.
119
María-Ángeles Durán
From a methodological standpoint, it is interesting to note that men and women have different perceptions of the time they devote to caregiving. Being available to the patient is one of the possible defining criteria for care, although it is often overlapped with other commitments. Thus, caregiver responses can vary significantly for similar activities.
Women engage in caregiving tasks more frequently than men, but they do so overlapping these tasks with other domestic activities that are also covered in the survey. In other words, they “densify” their unpaid work. Men perform this activity less frequently and tend to multitask less, because, among other reasons, it is incompatible with their paid jobs in the market, to which they tend to be most committed when they are older. They are also more apt to offer responses such as “all day long,” which increase the statistical averages for the amount of time spent. Thus, averages result from heterogeneous commitments, which entail a few minutes per day to uninterrupted dedication over days and weeks.
In short, the number of people over age 18 who devote some time on workdays to assisting an adult family member of the same household is estimated at 3,177,401 according to the most extensive source and about 1,561,830 according to the most restrictive source.
The average time devoted to caregiving on workdays is 1.57 hours according to the most restrictive source, and 3.94 hours according to the most extensive one, which makes it possible to estimate the total daily time devoted to these patients as between 2,452,073 and 12,518,960 hours, giving a range of variation of 5.10 times. If this time were valued at a modest six euros per hour, corresponding to the lowest end of the labor market scale, the replacement cost for unpaid time providing assistance to adults in one’s own household would be between 14,712,438 and 75,113,760 euros per day. This calculation excludes changes in the productivity of care and does not consider other economic criteria, such as job creation and capital circulation, which the outsourcing of care would promote.
Temporary burden of Care: Scenarios for Future Distribution among Several Population Groups
This section presents an estimate of how the need for units of care will change over time in order to maintain the well-being of Spain’s population over the next 50 years (Table 22). The estimate of the units of account have been made according to the Madrid scale (Table 21), a relational scale that allows for aggregate forecasts of the demand for care, applying a coef-ficient to each age group according to the needs at different stages.4 Thus, the population of people from 18 to 64 years of age consumes one unit of care per person and from there, the growing consumption of care units is related to their age group. This scale has been used in several studies to forecast the future demand for general care and it can be adjusted to the idiosyncrasies of each country or social environment, or to specific health demands.
For more details, see Durán, M.A. (2006), “El futuro del trabajo en Europa: el cuidado de las personas dependientes,” in Luís Mora (Coord.) 4
Cohesión Social, Políticas Conciliatorias y Presupuesto Público: Una Mirada de Género, UNFPA/GTZ, pp. 39-74, which presents the results of the International Meeting of Experts on the issue, which took place in Mexico from 24 to 26 October 2005.
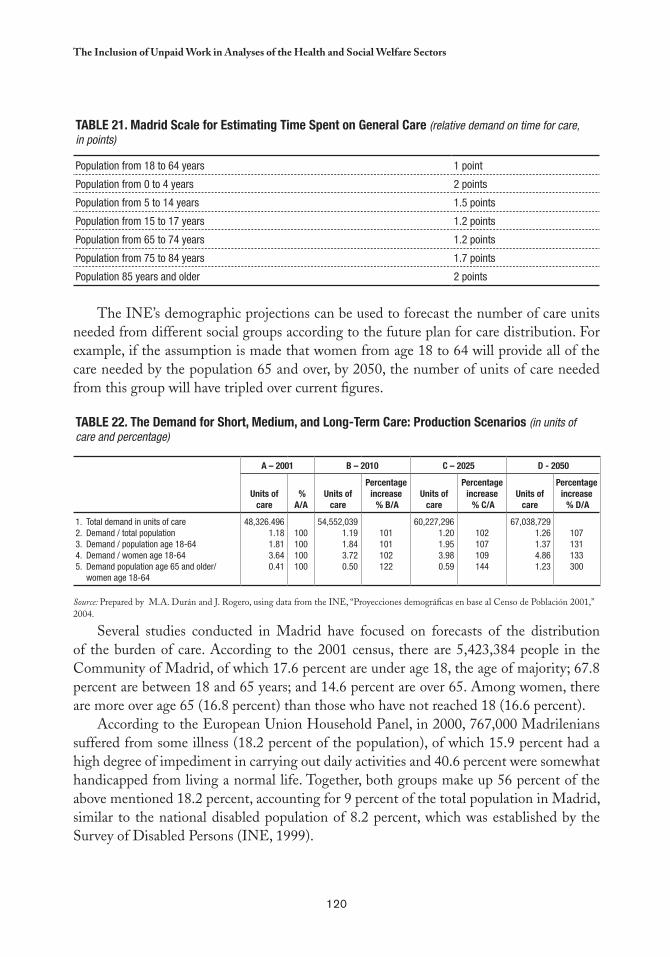
120
the Inclusion of Unpaid Work in Analyses of the Health and Social Welfare Sectors
Table 21. Madrid Scale for estimating Time Spent on General Care (relative demand on time for care, in points)
Population from 18 to 64 years 1 point
Population from 0 to 4 years 2 points
Population from 5 to 14 years 1.5 points
Population from 15 to 17 years 1.2 points
Population from 65 to 74 years 1.2 points
Population from 75 to 84 years 1.7 points
Population 85 years and older 2 points
The INE’s demographic projections can be used to forecast the number of care units needed from different social groups according to the future plan for care distribution. For example, if the assumption is made that women from age 18 to 64 will provide all of the care needed by the population 65 and over, by 2050, the number of units of care needed from this group will have tripled over current figures.
Table 22. The Demand for Short, Medium, and long-Term Care: Production Scenarios (in units of care and percentage)
a – 2001 b – 2010 C – 2025 D - 2050
Units of care
% a/a
Units of care
Percentage increase % b/a
Units of care
Percentage increase % C/a
Units of care
Percentage increase % D/a
1. Total demand in units of care2. Demand / total population3. Demand / population age 18-644. Demand / women age 18-645. Demand population age 65 and older/
women age 18-64
48,326.4961.181.813.640.41
100100100100
54,552,0391.191.843.720.50
101101102122
60,227,2961.201.953.980.59
102107109144
67,038,7291.261.374.861.23
107131133300
Source: Prepared by M.A. Durán and J. Rogero, using data from the INE, “Proyecciones demográficas en base al Censo de Población 2001,” 2004.
Several studies conducted in Madrid have focused on forecasts of the distribution of the burden of care. According to the 2001 census, there are 5,423,384 people in the Community of Madrid, of which 17.6 percent are under age 18, the age of majority; 67.8 percent are between 18 and 65 years; and 14.6 percent are over 65. Among women, there are more over age 65 (16.8 percent) than those who have not reached 18 (16.6 percent).
According to the European Union Household Panel, in 2000, 767,000 Madrilenians suffered from some illness (18.2 percent of the population), of which 15.9 percent had a high degree of impediment in carrying out daily activities and 40.6 percent were somewhat handicapped from living a normal life. Together, both groups make up 56 percent of the above mentioned 18.2 percent, accounting for 9 percent of the total population in Madrid, similar to the national disabled population of 8.2 percent, which was established by the Survey of Disabled Persons (INE, 1999).
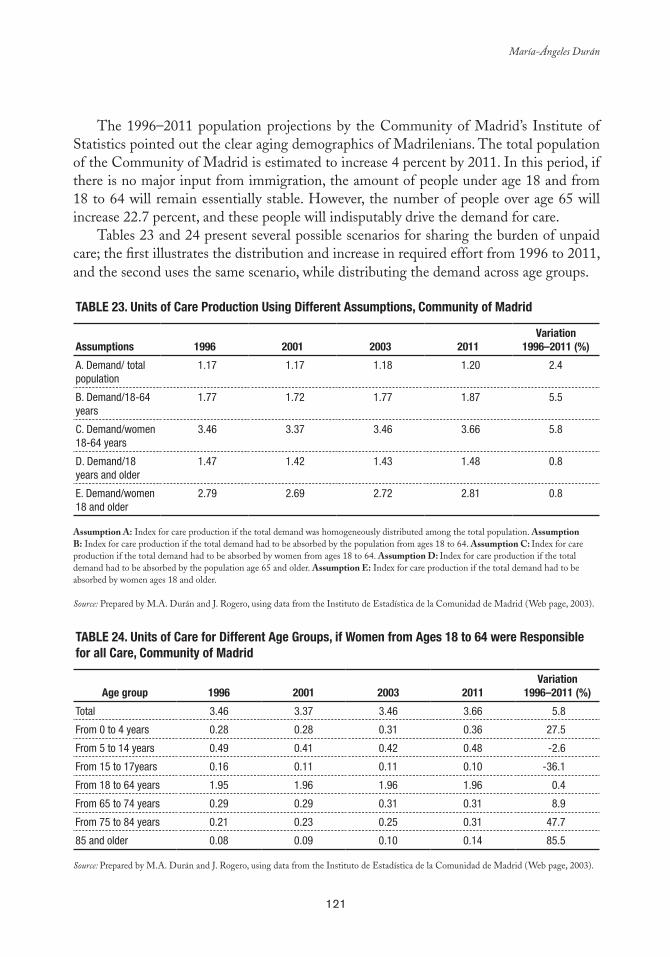
121
María-Ángeles Durán
The 1996–2011 population projections by the Community of Madrid’s Institute of Statistics pointed out the clear aging demographics of Madrilenians. The total population of the Community of Madrid is estimated to increase 4 percent by 2011. In this period, if there is no major input from immigration, the amount of people under age 18 and from 18 to 64 will remain essentially stable. However, the number of people over age 65 will increase 22.7 percent, and these people will indisputably drive the demand for care.
Tables 23 and 24 present several possible scenarios for sharing the burden of unpaid care; the first illustrates the distribution and increase in required effort from 1996 to 2011, and the second uses the same scenario, while distributing the demand across age groups.
Table 23. Units of Care Production Using Different assumptions, Community of Madrid
assumptions 1996 2001 2003 2011Variation
1996–2011 (%)
A. Demand/ total population
1.17 1.17 1.18 1.20 2.4
B. Demand/18-64 years
1.77 1.72 1.77 1.87 5.5
C. Demand/women 18-64 years
3.46 3.37 3.46 3.66 5.8
D. Demand/18 years and older
1.47 1.42 1.43 1.48 0.8
E. Demand/women 18 and older
2.79 2.69 2.72 2.81 0.8
Assumption A: Index for care production if the total demand was homogeneously distributed among the total population. Assumption B: Index for care production if the total demand had to be absorbed by the population from ages 18 to 64. Assumption C: Index for care production if the total demand had to be absorbed by women from ages 18 to 64. Assumption D: Index for care production if the total demand had to be absorbed by the population age 65 and older. Assumption E: Index for care production if the total demand had to be absorbed by women ages 18 and older.
Source: Prepared by M.A. Durán and J. Rogero, using data from the Instituto de Estadística de la Comunidad de Madrid (Web page, 2003).
Table 24. Units of Care for Different age Groups, if Women from ages 18 to 64 were Responsible for all Care, Community of Madrid
age group 1996 2001 2003 2011Variation
1996–2011 (%)
Total 3.46 3.37 3.46 3.66 5.8
From 0 to 4 years 0.28 0.28 0.31 0.36 27.5
From 5 to 14 years 0.49 0.41 0.42 0.48 -2.6
From 15 to 17years 0.16 0.11 0.11 0.10 -36.1
From 18 to 64 years 1.95 1.96 1.96 1.96 0.4
From 65 to 74 years 0.29 0.29 0.31 0.31 8.9
From 75 to 84 years 0.21 0.23 0.25 0.31 47.7
85 and older 0.08 0.09 0.10 0.14 85.5
Source: Prepared by M.A. Durán and J. Rogero, using data from the Instituto de Estadística de la Comunidad de Madrid (Web page, 2003).
122
the Inclusion of Unpaid Work in Analyses of the Health and Social Welfare Sectors
MACROECONOMIC INDICATORS OF HEALTH ECONOMICS
Households, Work, and Health in the National Accounts System
The Spanish National Accounts System makes it possible to examine the household sector in detail, but only to the extent that this sector is part of the conventional economy. Table 25 presents the most recent framework of analysis of the Spanish economy and the role of households therein for 2002, (the data were published in 2005). The total economy is the sum of the nonfinancial corporations (S.11), financial corporations (S.12), general government (S.13), households (S.14), and nonprofit institutions serving households (S.15), to which was added the use of financial intermediation services, sector no explicitly included, but indirectly measured (FISIM) as intermediate consumption, the sector that is not explicitly included. With sustained economic and social globalization, external flows explain a greater proportion of resources and the utilization of domestic economies. Table 25 attempts to interrelate the main figures for the above categories, with resources on the right and their destination or use on the left.
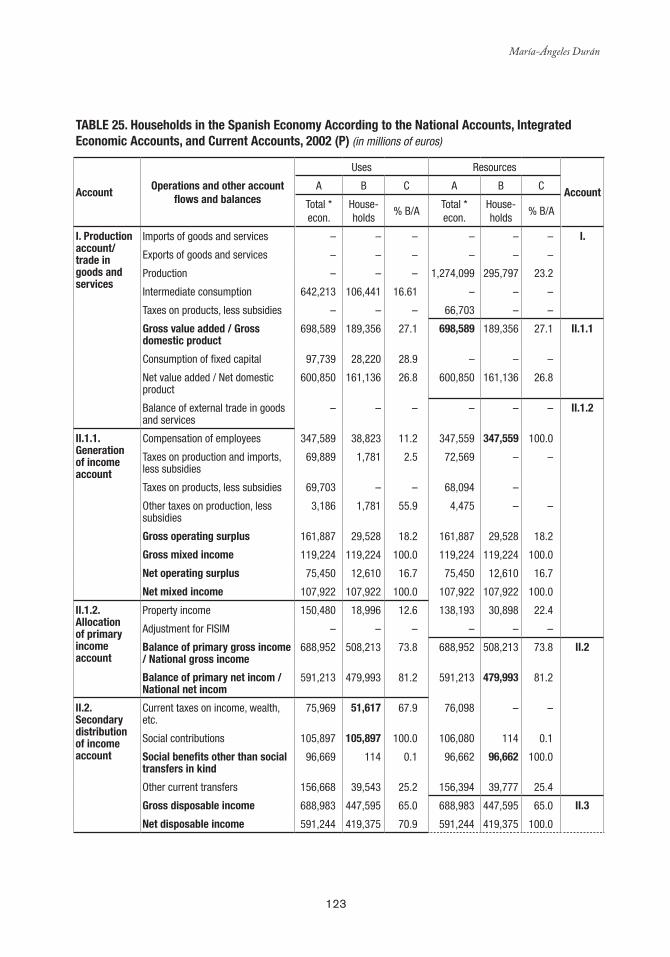
123
María-Ángeles Durán
Table 25. Households in the Spanish economy according to the National accounts, Integrated economic accounts, and Current accounts, 2002 (P) (in millions of euros)
accountOperations and other account
flows and balances
Uses Resources
accountA B C A B C
Total * econ.
House-holds
% B/ATotal * econ.
House-holds
% B/A
I. Production account/ trade in goods and services
Imports of goods and services – – – – – – I.
Exports of goods and services – – – – – –
Production – – – 1,274,099 295,797 23.2
Intermediate consumption 642,213 106,441 16.61 – – –
Taxes on products, less subsidies – – – 66,703 – –
Gross value added / Gross domestic product
698,589 189,356 27.1 698,589 189,356 27.1 II.1.1
Consumption of fixed capital 97,739 28,220 28.9 – – –
Net value added / Net domestic product
600,850 161,136 26.8 600,850 161,136 26.8
Balance of external trade in goods and services
– – – – – – II.1.2
II.1.1. Generation of income account
Compensation of employees 347,589 38,823 11.2 347,559 347,559 100.0
Taxes on production and imports, less subsidies
69,889 1,781 2.5 72,569 – –
Taxes on products, less subsidies 69,703 – – 68,094 –
Other taxes on production, less subsidies
3,186 1,781 55.9 4,475 – –
Gross operating surplus 161,887 29,528 18.2 161,887 29,528 18.2
Gross mixed income 119,224 119,224 100.0 119,224 119,224 100.0
Net operating surplus 75,450 12,610 16.7 75,450 12,610 16.7
Net mixed income 107,922 107,922 100.0 107,922 107,922 100.0
II.1.2. allocation of primary income account
Property income 150,480 18,996 12.6 138,193 30,898 22.4
Adjustment for FISIM – – – – – –
balance of primary gross income / National gross income
688,952 508,213 73.8 688,952 508,213 73.8 II.2
balance of primary net incom / National net incom
591,213 479,993 81.2 591,213 479,993 81.2
II.2. Secondary distribution of income account
Current taxes on income, wealth, etc.
75,969 51,617 67.9 76,098 – –
Social contributions 105,897 105,897 100.0 106,080 114 0.1
Social benefits other than social transfers in kind
96,669 114 0.1 96,662 96,662 100.0
Other current transfers 156,668 39,543 25.2 156,394 39,777 25.4
Gross disposable income 688,983 447,595 65.0 688,983 447,595 65.0 II.3
Net disposable income 591,244 419,375 70.9 591,244 419,375 100.0
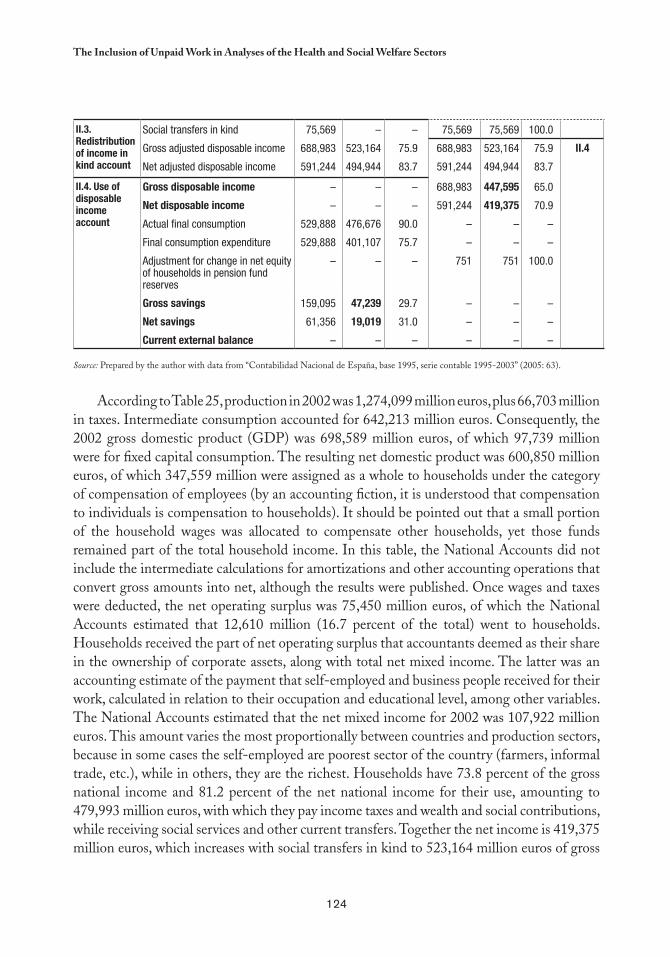
124
the Inclusion of Unpaid Work in Analyses of the Health and Social Welfare Sectors
II.3. Redistribution of income in kind account
Social transfers in kind 75,569 – – 75,569 75,569 100.0
Gross adjusted disposable income 688,983 523,164 75.9 688,983 523,164 75.9 II.4
Net adjusted disposable income 591,244 494,944 83.7 591,244 494,944 83.7
II.4. Use of disposable income account
Gross disposable income – – – 688,983 447,595 65.0
Net disposable income – – – 591,244 419,375 70.9
Actual final consumption 529,888 476,676 90.0 – – –
Final consumption expenditure 529,888 401,107 75.7 – – –
Adjustment for change in net equity of households in pension fund reserves
– – – 751 751 100.0
Gross savings 159,095 47,239 29.7 – – –
Net savings 61,356 19,019 31.0 – – –
Current external balance – – – – – –
Source: Prepared by the author with data from “Contabilidad Nacional de España, base 1995, serie contable 1995-2003” (2005: 63).
According to Table 25, production in 2002 was 1,274,099 million euros, plus 66,703 million in taxes. Intermediate consumption accounted for 642,213 million euros. Consequently, the 2002 gross domestic product (GDP) was 698,589 million euros, of which 97,739 million were for fixed capital consumption. The resulting net domestic product was 600,850 million euros, of which 347,559 million were assigned as a whole to households under the category of compensation of employees (by an accounting fiction, it is understood that compensation to individuals is compensation to households). It should be pointed out that a small portion of the household wages was allocated to compensate other households, yet those funds remained part of the total household income. In this table, the National Accounts did not include the intermediate calculations for amortizations and other accounting operations that convert gross amounts into net, although the results were published. Once wages and taxes were deducted, the net operating surplus was 75,450 million euros, of which the National Accounts estimated that 12,610 million (16.7 percent of the total) went to households. Households received the part of net operating surplus that accountants deemed as their share in the ownership of corporate assets, along with total net mixed income. The latter was an accounting estimate of the payment that self-employed and business people received for their work, calculated in relation to their occupation and educational level, among other variables. The National Accounts estimated that the net mixed income for 2002 was 107,922 million euros. This amount varies the most proportionally between countries and production sectors, because in some cases the self-employed are poorest sector of the country (farmers, informal trade, etc.), while in others, they are the richest. Households have 73.8 percent of the gross national income and 81.2 percent of the net national income for their use, amounting to 479,993 million euros, with which they pay income taxes and wealth and social contributions, while receiving social services and other current transfers. Together the net income is 419,375 million euros, which increases with social transfers in kind to 523,164 million euros of gross
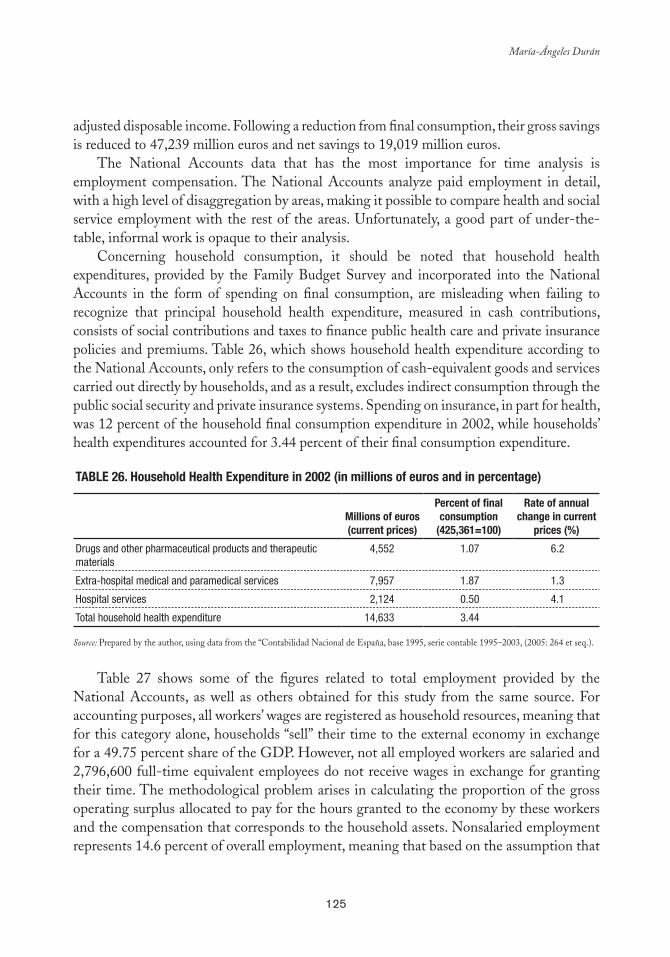
125
María-Ángeles Durán
adjusted disposable income. Following a reduction from final consumption, their gross savings is reduced to 47,239 million euros and net savings to 19,019 million euros.
The National Accounts data that has the most importance for time analysis is employment compensation. The National Accounts analyze paid employment in detail, with a high level of disaggregation by areas, making it possible to compare health and social service employment with the rest of the areas. Unfortunately, a good part of under-the-table, informal work is opaque to their analysis.
Concerning household consumption, it should be noted that household health expenditures, provided by the Family Budget Survey and incorporated into the National Accounts in the form of spending on final consumption, are misleading when failing to recognize that principal household health expenditure, measured in cash contributions, consists of social contributions and taxes to finance public health care and private insurance policies and premiums. Table 26, which shows household health expenditure according to the National Accounts, only refers to the consumption of cash-equivalent goods and services carried out directly by households, and as a result, excludes indirect consumption through the public social security and private insurance systems. Spending on insurance, in part for health, was 12 percent of the household final consumption expenditure in 2002, while households’ health expenditures accounted for 3.44 percent of their final consumption expenditure.
Table 26. Household Health expenditure in 2002 (in millions of euros and in percentage)
Millions of euros (current prices)
Percent of final consumption
(425,361=100)
Rate of annual change in current
prices (%)
Drugs and other pharmaceutical products and therapeutic materials
4,552 1.07 6.2
Extra-hospital medical and paramedical services 7,957 1.87 1.3
Hospital services 2,124 0.50 4.1
Total household health expenditure 14,633 3.44
Source: Prepared by the author, using data from the “Contabilidad Nacional de España, base 1995, serie contable 1995–2003, (2005: 264 et seq.).
Table 27 shows some of the figures related to total employment provided by the
National Accounts, as well as others obtained for this study from the same source. For accounting purposes, all workers’ wages are registered as household resources, meaning that for this category alone, households “sell” their time to the external economy in exchange for a 49.75 percent share of the GDP. However, not all employed workers are salaried and 2,796,600 full-time equivalent employees do not receive wages in exchange for granting their time. The methodological problem arises in calculating the proportion of the gross operating surplus allocated to pay for the hours granted to the economy by these workers and the compensation that corresponds to the household assets. Nonsalaried employment represents 14.6 percent of overall employment, meaning that based on the assumption that
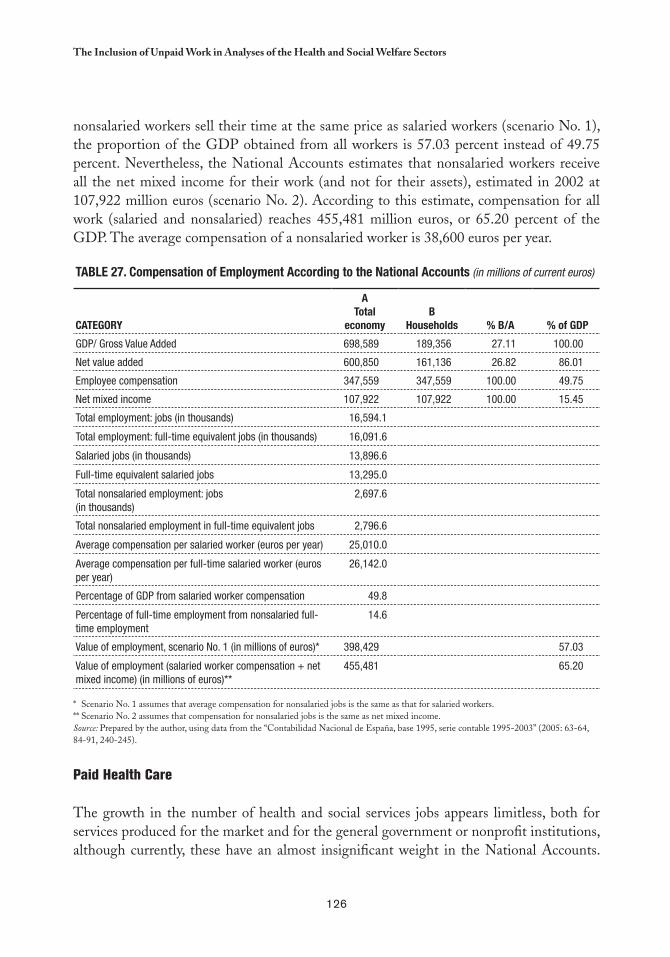
126
the Inclusion of Unpaid Work in Analyses of the Health and Social Welfare Sectors
nonsalaried workers sell their time at the same price as salaried workers (scenario No. 1), the proportion of the GDP obtained from all workers is 57.03 percent instead of 49.75 percent. Nevertheless, the National Accounts estimates that nonsalaried workers receive all the net mixed income for their work (and not for their assets), estimated in 2002 at 107,922 million euros (scenario No. 2). According to this estimate, compensation for all work (salaried and nonsalaried) reaches 455,481 million euros, or 65.20 percent of the GDP. The average compensation of a nonsalaried worker is 38,600 euros per year.
Table 27. Compensation of employment according to the National accounts (in millions of current euros)
CaTeGORY
aTotal
economy b
Households % b/a % of GDP
GDP/ Gross Value Added 698,589 189,356 27.11 100.00
Net value added 600,850 161,136 26.82 86.01
Employee compensation 347,559 347,559 100.00 49.75
Net mixed income 107,922 107,922 100.00 15.45
Total employment: jobs (in thousands) 16,594.1
Total employment: full-time equivalent jobs (in thousands) 16,091.6
Salaried jobs (in thousands) 13,896.6
Full-time equivalent salaried jobs 13,295.0
Total nonsalaried employment: jobs (in thousands)
2,697.6
Total nonsalaried employment in full-time equivalent jobs 2,796.6
Average compensation per salaried worker (euros per year) 25,010.0
Average compensation per full-time salaried worker (euros per year)
26,142.0
Percentage of GDP from salaried worker compensation 49.8
Percentage of full-time employment from nonsalaried full-time employment
14.6
Value of employment, scenario No. 1 (in millions of euros)* 398,429 57.03
Value of employment (salaried worker compensation + net mixed income) (in millions of euros)**
455,481 65.20
* Scenario No. 1 assumes that average compensation for nonsalaried jobs is the same as that for salaried workers. ** Scenario No. 2 assumes that compensation for nonsalaried jobs is the same as net mixed income. Source: Prepared by the author, using data from the “Contabilidad Nacional de España, base 1995, serie contable 1995-2003” (2005: 63-64, 84-91, 240-245).
Paid Health Care
The growth in the number of health and social services jobs appears limitless, both for services produced for the market and for the general government or nonprofit institutions, although currently, these have an almost insignificant weight in the National Accounts.
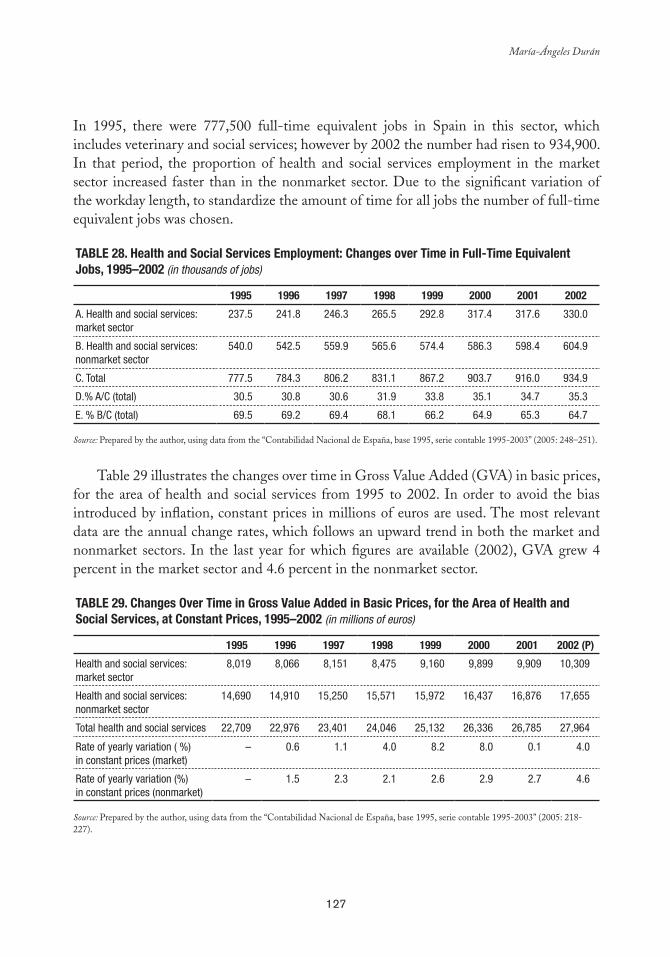
127
María-Ángeles Durán
In 1995, there were 777,500 full-time equivalent jobs in Spain in this sector, which includes veterinary and social services; however by 2002 the number had risen to 934,900. In that period, the proportion of health and social services employment in the market sector increased faster than in the nonmarket sector. Due to the significant variation of the workday length, to standardize the amount of time for all jobs the number of full-time equivalent jobs was chosen.
Table 28. Health and Social Services employment: Changes over Time in Full-Time equivalent Jobs, 1995–2002 (in thousands of jobs)
1995 1996 1997 1998 1999 2000 2001 2002
A. Health and social services: market sector
237.5 241.8 246.3 265.5 292.8 317.4 317.6 330.0
B. Health and social services: nonmarket sector
540.0 542.5 559.9 565.6 574.4 586.3 598.4 604.9
C. Total 777.5 784.3 806.2 831.1 867.2 903.7 916.0 934.9
D.% A/C (total) 30.5 30.8 30.6 31.9 33.8 35.1 34.7 35.3
E. % B/C (total) 69.5 69.2 69.4 68.1 66.2 64.9 65.3 64.7
Source: Prepared by the author, using data from the “Contabilidad Nacional de España, base 1995, serie contable 1995-2003” (2005: 248–251).
Table 29 illustrates the changes over time in Gross Value Added (GVA) in basic prices,
for the area of health and social services from 1995 to 2002. In order to avoid the bias introduced by inflation, constant prices in millions of euros are used. The most relevant data are the annual change rates, which follows an upward trend in both the market and nonmarket sectors. In the last year for which figures are available (2002), GVA grew 4 percent in the market sector and 4.6 percent in the nonmarket sector.
Table 29. Changes Over Time in Gross Value added in basic Prices, for the area of Health and Social Services, at Constant Prices, 1995–2002 (in millions of euros)
1995 1996 1997 1998 1999 2000 2001 2002 (P)
Health and social services: market sector
8,019 8,066 8,151 8,475 9,160 9,899 9,909 10,309
Health and social services: nonmarket sector
14,690 14,910 15,250 15,571 15,972 16,437 16,876 17,655
Total health and social services 22,709 22,976 23,401 24,046 25,132 26,336 26,785 27,964
Rate of yearly variation ( %) in constant prices (market)
– 0.6 1.1 4.0 8.2 8.0 0.1 4.0
Rate of yearly variation (%) in constant prices (nonmarket)
– 1.5 2.3 2.1 2.6 2.9 2.7 4.6
Source: Prepared by the author, using data from the “Contabilidad Nacional de España, base 1995, serie contable 1995-2003” (2005: 218-227).
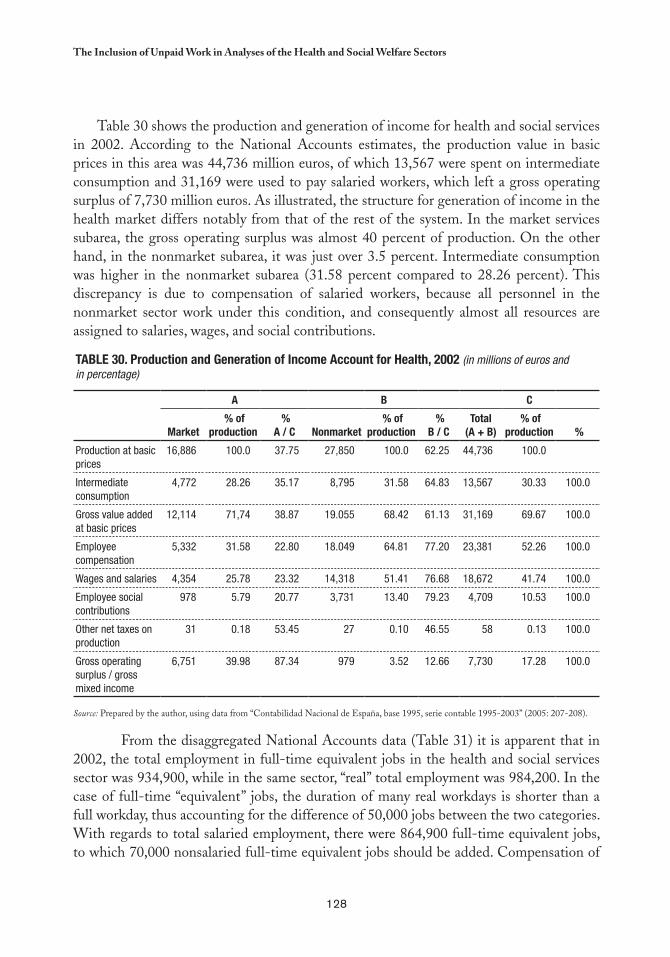
128
the Inclusion of Unpaid Work in Analyses of the Health and Social Welfare Sectors
Table 30 shows the production and generation of income for health and social services in 2002. According to the National Accounts estimates, the production value in basic prices in this area was 44,736 million euros, of which 13,567 were spent on intermediate consumption and 31,169 were used to pay salaried workers, which left a gross operating surplus of 7,730 million euros. As illustrated, the structure for generation of income in the health market differs notably from that of the rest of the system. In the market services subarea, the gross operating surplus was almost 40 percent of production. On the other hand, in the nonmarket subarea, it was just over 3.5 percent. Intermediate consumption was higher in the nonmarket subarea (31.58 percent compared to 28.26 percent). This discrepancy is due to compensation of salaried workers, because all personnel in the nonmarket sector work under this condition, and consequently almost all resources are assigned to salaries, wages, and social contributions.
From the disaggregated National Accounts data (Table 31) it is apparent that in 2002, the total employment in full-time equivalent jobs in the health and social services sector was 934,900, while in the same sector, “real” total employment was 984,200. In the case of full-time “equivalent” jobs, the duration of many real workdays is shorter than a full workday, thus accounting for the difference of 50,000 jobs between the two categories. With regards to total salaried employment, there were 864,900 full-time equivalent jobs, to which 70,000 nonsalaried full-time equivalent jobs should be added. Compensation of
Table 30. Production and Generation of Income account for Health, 2002 (in millions of euros and in percentage)
a b C
Market % of
production %
a / C Nonmarket % of
production %
b / CTotal
(a + b) % of
production %
Production at basic prices
16,886 100.0 37.75 27,850 100.0 62.25 44,736 100.0
Intermediate consumption
4,772 28.26 35.17 8,795 31.58 64.83 13,567 30.33 100.0
Gross value added at basic prices
12,114 71,74 38.87 19.055 68.42 61.13 31,169 69.67 100.0
Employee compensation
5,332 31.58 22.80 18.049 64.81 77.20 23,381 52.26 100.0
Wages and salaries 4,354 25.78 23.32 14,318 51.41 76.68 18,672 41.74 100.0
Employee social contributions
978 5.79 20.77 3,731 13.40 79.23 4,709 10.53 100.0
Other net taxes on production
31 0.18 53.45 27 0.10 46.55 58 0.13 100.0
Gross operating surplus / gross mixed income
6,751 39.98 87.34 979 3.52 12.66 7,730 17.28 100.0
Source: Prepared by the author, using data from “Contabilidad Nacional de España, base 1995, serie contable 1995-2003” (2005: 207-208).
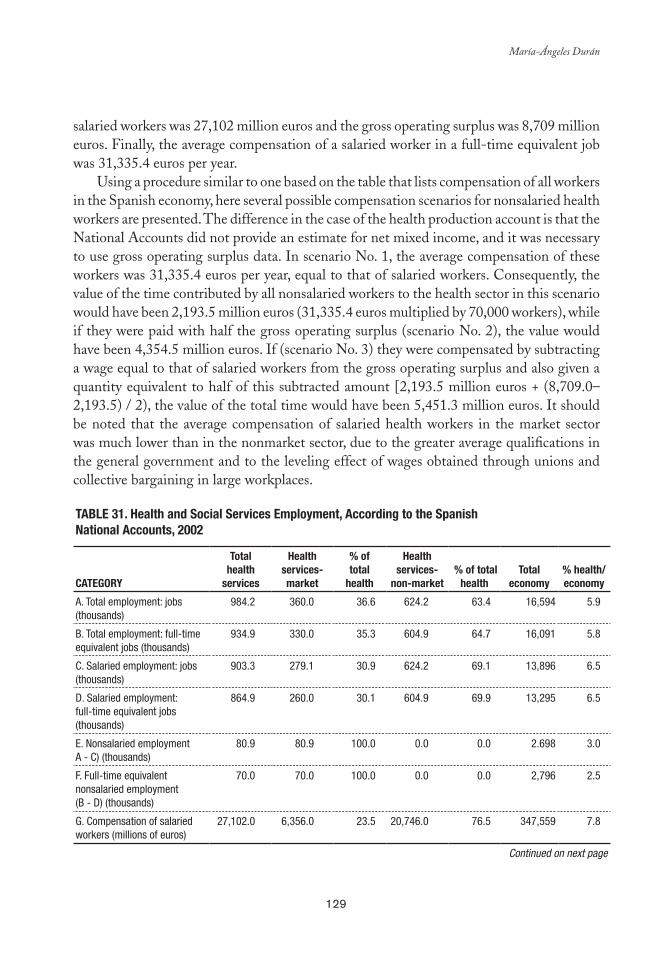
129
María-Ángeles Durán
salaried workers was 27,102 million euros and the gross operating surplus was 8,709 million euros. Finally, the average compensation of a salaried worker in a full-time equivalent job was 31,335.4 euros per year.
Using a procedure similar to one based on the table that lists compensation of all workers in the Spanish economy, here several possible compensation scenarios for nonsalaried health workers are presented. The difference in the case of the health production account is that the National Accounts did not provide an estimate for net mixed income, and it was necessary to use gross operating surplus data. In scenario No. 1, the average compensation of these workers was 31,335.4 euros per year, equal to that of salaried workers. Consequently, the value of the time contributed by all nonsalaried workers to the health sector in this scenario would have been 2,193.5 million euros (31,335.4 euros multiplied by 70,000 workers), while if they were paid with half the gross operating surplus (scenario No. 2), the value would have been 4,354.5 million euros. If (scenario No. 3) they were compensated by subtracting a wage equal to that of salaried workers from the gross operating surplus and also given a quantity equivalent to half of this subtracted amount [2,193.5 million euros + (8,709.0–2,193.5) / 2), the value of the total time would have been 5,451.3 million euros. It should be noted that the average compensation of salaried health workers in the market sector was much lower than in the nonmarket sector, due to the greater average qualifications in the general government and to the leveling effect of wages obtained through unions and collective bargaining in large workplaces.
Table 31. Health and Social Services employment, according to the Spanish National accounts, 2002
CaTeGORY
Total health
services
Healthservices-market
% oftotal
health
Health services-
non-market % of total
health Total
economy% health/economy
A. Total employment: jobs (thousands)
984.2 360.0 36.6 624.2 63.4 16,594 5.9
B. Total employment: full-time equivalent jobs (thousands)
934.9 330.0 35.3 604.9 64.7 16,091 5.8
C. Salaried employment: jobs (thousands)
903.3 279.1 30.9 624.2 69.1 13,896 6.5
D. Salaried employment: full-time equivalent jobs (thousands)
864.9 260.0 30.1 604.9 69.9 13,295 6.5
E. Nonsalaried employment A - C) (thousands)
80.9 80.9 100.0 0.0 0.0 2.698 3.0
F. Full-time equivalent nonsalaried employment (B - D) (thousands)
70.0 70.0 100.0 0.0 0.0 2,796 2.5
G. Compensation of salaried workers (millions of euros)
27,102.0 6,356.0 23.5 20,746.0 76.5 347,559 7.8
Continued on next page
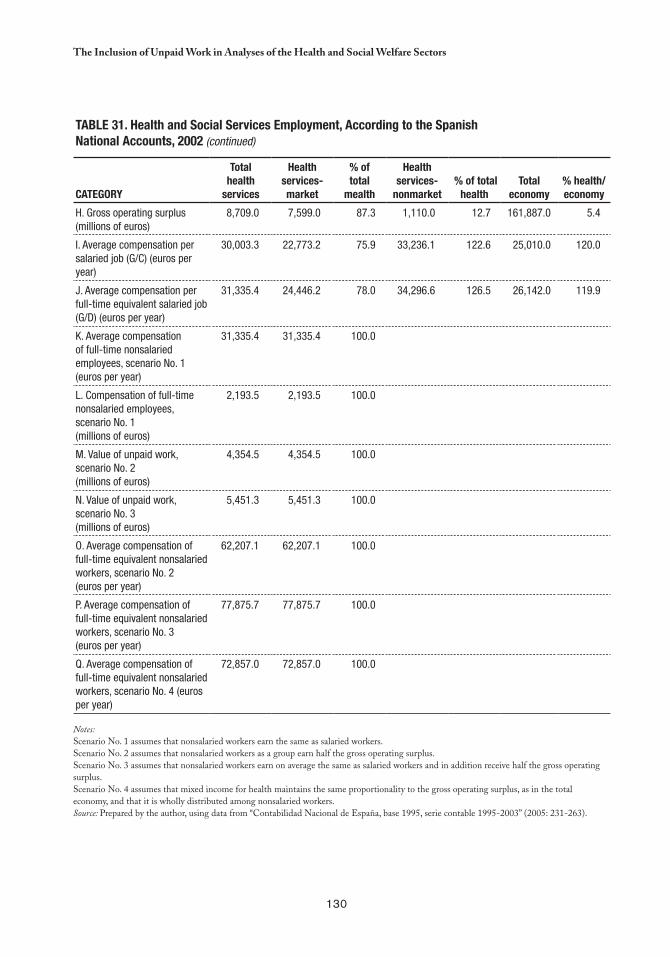
130
the Inclusion of Unpaid Work in Analyses of the Health and Social Welfare Sectors
Table 31. Health and Social Services employment, according to the Spanish National accounts, 2002 (continued)
CaTeGORY
Total health
services
Healthservices-market
% oftotal
mealth
Health services-
nonmarket % of total
health Total
economy% health/economy
H. Gross operating surplus (millions of euros)
8,709.0 7,599.0 87.3 1,110.0 12.7 161,887.0 5.4
I. Average compensation per salaried job (G/C) (euros per year)
30,003.3 22,773.2 75.9 33,236.1 122.6 25,010.0 120.0
J. Average compensation per full-time equivalent salaried job (G/D) (euros per year)
31,335.4 24,446.2 78.0 34,296.6 126.5 26,142.0 119.9
K. Average compensation of full-time nonsalaried employees, scenario No. 1 (euros per year)
31,335.4 31,335.4 100.0
L. Compensation of full-time nonsalaried employees, scenario No. 1 (millions of euros)
2,193.5 2,193.5 100.0
M. Value of unpaid work, scenario No. 2 (millions of euros)
4,354.5 4,354.5 100.0
N. Value of unpaid work, scenario No. 3 (millions of euros)
5,451.3 5,451.3 100.0
O. Average compensation of full-time equivalent nonsalaried workers, scenario No. 2 (euros per year)
62,207.1 62,207.1 100.0
P. Average compensation of full-time equivalent nonsalaried workers, scenario No. 3 (euros per year)
77,875.7 77,875.7 100.0
Q. Average compensation of full-time equivalent nonsalaried workers, scenario No. 4 (euros per year)
72,857.0 72,857.0 100.0
Notes: Scenario No. 1 assumes that nonsalaried workers earn the same as salaried workers. Scenario No. 2 assumes that nonsalaried workers as a group earn half the gross operating surplus. Scenario No. 3 assumes that nonsalaried workers earn on average the same as salaried workers and in addition receive half the gross operating surplus. Scenario No. 4 assumes that mixed income for health maintains the same proportionality to the gross operating surplus, as in the total economy, and that it is wholly distributed among nonsalaried workers. Source: Prepared by the author, using data from “Contabilidad Nacional de España, base 1995, serie contable 1995-2003” (2005: 231-263).
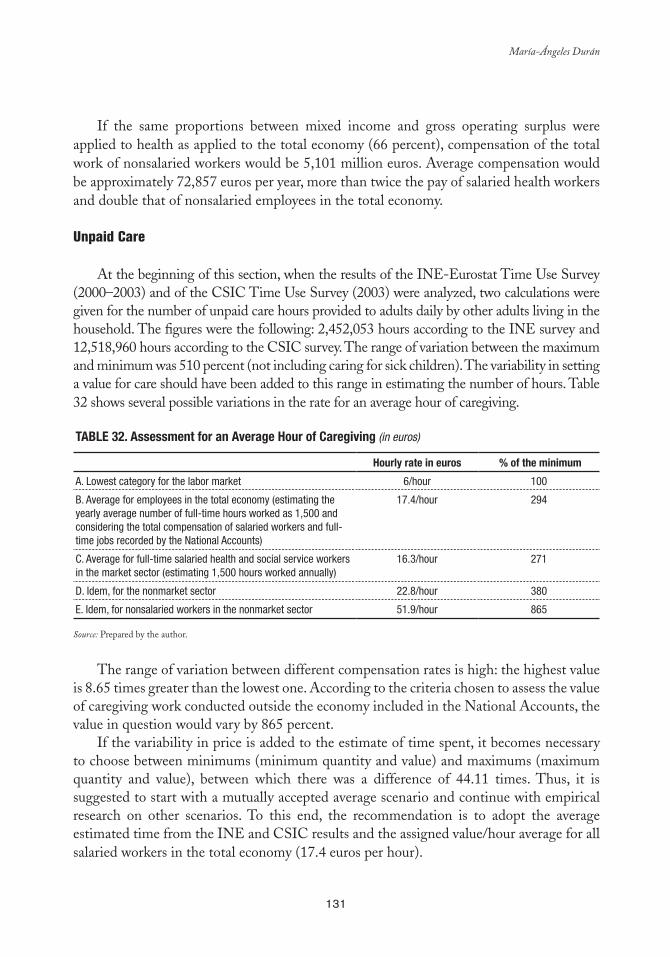
131
María-Ángeles Durán
If the same proportions between mixed income and gross operating surplus were applied to health as applied to the total economy (66 percent), compensation of the total work of nonsalaried workers would be 5,101 million euros. Average compensation would be approximately 72,857 euros per year, more than twice the pay of salaried health workers and double that of nonsalaried employees in the total economy.
Unpaid Care
At the beginning of this section, when the results of the INE-Eurostat Time Use Survey (2000–2003) and of the CSIC Time Use Survey (2003) were analyzed, two calculations were given for the number of unpaid care hours provided to adults daily by other adults living in the household. The figures were the following: 2,452,053 hours according to the INE survey and 12,518,960 hours according to the CSIC survey. The range of variation between the maximum and minimum was 510 percent (not including caring for sick children). The variability in setting a value for care should have been added to this range in estimating the number of hours. Table 32 shows several possible variations in the rate for an average hour of caregiving.
Table 32. assessment for an average Hour of Caregiving (in euros)
Hourly rate in euros % of the minimum
A. Lowest category for the labor market 6/hour 100
B. Average for employees in the total economy (estimating the yearly average number of full-time hours worked as 1,500 and considering the total compensation of salaried workers and full-time jobs recorded by the National Accounts)
17.4/hour 294
C. Average for full-time salaried health and social service workers in the market sector (estimating 1,500 hours worked annually)
16.3/hour 271
D. Idem, for the nonmarket sector 22.8/hour 380
E. Idem, for nonsalaried workers in the nonmarket sector 51.9/hour 865
Source: Prepared by the author.
The range of variation between different compensation rates is high: the highest value is 8.65 times greater than the lowest one. According to the criteria chosen to assess the value of caregiving work conducted outside the economy included in the National Accounts, the value in question would vary by 865 percent.
If the variability in price is added to the estimate of time spent, it becomes necessary to choose between minimums (minimum quantity and value) and maximums (maximum quantity and value), between which there was a difference of 44.11 times. Thus, it is suggested to start with a mutually accepted average scenario and continue with empirical research on other scenarios. To this end, the recommendation is to adopt the average estimated time from the INE and CSIC results and the assigned value/hour average for all salaried workers in the total economy (17.4 euros per hour).
132
the Inclusion of Unpaid Work in Analyses of the Health and Social Welfare Sectors
CONCLUSIONS AND PROPOSALS
The preceding pages have provided a thorough presentation of available indicators on the current and future state of the population’s health and on forecasting institutional and family care. To this end, there have been indicators used for self-perceived morbidity, limitation of activity, use of various health services and facilities, and causes of death. Analyses have been contributed on common illnesses, accidents, and dependence, with particular attention given to age and gender variations.
The most innovative contribution is the analysis of the systems for financing care and the distinction between the provision of care by the family, the government, and private entities. Accordingly, it is evident that family care continues to be the foundation of all health care and that it expands in cases of diseases associated with aging.
The study clearly proposes the need to prioritize health policy objectives, which should go hand in hand with concentration or redistribution of the burdens created by those health policies that impact the population mostly affected by the demands of caregiving.
The exploratory methodology used to measure costs involved in the replacement of unpaid health care work by paid work, both for analytical and substantive purposes, is of particular interest.
The contribution related to health work in the conventional National Accounts systems is also pioneering. This is particularly true of the integration of unpaid health care work into the future Satellite Accounts for Unpaid Work, in response to the proposal made by the United Nations at the Beijing Conference in 1995.
However, beyond the analytical and empirical contributions, the principal objective of this work has been to contribute to the international comparative analysis of health care systems in order to improve the forecasting of future needs and possible ways to meet them.
In this regard, major progress is expected in the next decade. Consequently, it will be necessary to develop organizational tools of proven utility, which include the creation of networks of experts who share their experiences and institutional relationships, permitting not only debates and result comparisons but also the adoption of common agreements and frameworks of analysis.
133
María-Ángeles Durán
REFERENCES
a) Statistical References
National Statistics Institute (INE) 2000: Work Time Survey. 2001: Population Census. 2002: Continuous Family Budget Survey. 2002: Survey on Disability, Impairment, and Health Status 1999: Detailed National Results. 2002: Wage Structure Survey. 2002: Spanish National Accounts. 2003: Time Use Survey 2002–2003. 2005: Spanish National Accounts. Base 1995. Accounting Series 1995–2003. 2005: Working Population Survey. Quarterly Results. 2006: Working Population Survey. Quarterly Results. 2007: Working Population Survey. First Quarter Results. 2005: Spanish Regional Accounts. Base 1995. CRE-95. Series 1997–2003.
Basque Institute of Statistics (EUStAt)1993: Basque Country Time Budget Survey. 1998: Basque Country Time Budget Survey. 2003: Basque Country Time Budget Survey.
Ministry of Health and Consumption and National Statistics Institute2001: National Health Survey 2001.2003: National Health Survey 2003. 2006: National Health Survey 2006.
CIrES1991: Time Use Survey. 1996: Time Use Survey.
CSIC1990: Survey of New Social Demands and Needs. 1995: Unpaid Activity Survey. 1998: Survey of People in Charge of the Household in the Community of Madrid. 2003: Survey on Women and Unpaid Work in the Community of Madrid. 2003: CSIC Survey on Time Use in Spain. 2005: Survey on Unpaid Work in the Community of Madrid.
134
the Inclusion of Unpaid Work in Analyses of the Health and Social Welfare Sectors
Institute of Women1993: Time Use Survey.1996: Time Use Survey.2001: Time Use Survey.
b) Institutional References
EUROSTAT. 2004. How Europeans Spend their Time. European Commission, Luxembourg. IMSERSO. 2005. Libro blanco de atención a las personas en situación de dependencia en España.
Madrid: Ministerio de Trabajo y Asuntos Sociales. PAHO (Pan American Health Organization). 2006. “Actas del Taller internacional sobre
cuentas satélites de los hogares: género y equidad,” PAHO/WHO, Santiago, Chile, June 5–6. Available at (www.paho.org/Spanish/AD/GE/unpaidworkJune06.htm).
SESPAS. 2004. Informe SESPAS 2004: La salud pública desde la perspectiva de género y clase social. Gaceta Sanitaria, May; 18(1).
c) Publications by the Author**
Durán, M.A. 2007. El valor del tiempo. Madrid: España. ––——. 2007, Dir. The Satellite Account for Unpaid Work in the Community of Madrid, 2005.
Madrid: Consejería de Economía y Empleo, Dirección General de la Mujer. ––––––. 2006, Dir. La cuenta satélite del trabajo no remunerado en la Comunidad de Madrid. 2ª
versión (incluye anticipo de resultados para España). Madrid: Consejería de Economía y Empleo, Dirección General de la Mujer.
––––––. 2006. “La población dependiente: los límites del Estado de Bienestar. ” In VVAA El cambio social en España. Visiones y retos de futuro. Sevilla: Centro de Estudios Andaluces.
–––––– and S. García Díez. 2005. Presente y futuro del cuidado de dependientes en España y Alemania. IMSERSO, Boletín sobre Envejecimiento. Perfiles y Tendencias 16. Ma-drid.
––––––. 2004. Dir. Informe sobre el impacto social de los enfermos dependientes por ictus. Informe ISEDIC, 2004. 2ª ed. Madrid: Editorial Luzón.
––––––. 2004. “El desafío contable del tercer sector.” In J.L.Gª Delgado et al. Economía So-cial en España. Vol. 3: Criterios y propuestas. Fundación ONCE, pp. 147–158.
––––––. 2004. Propuesta para la construcción de una cuenta satélite de producción de servi-cios de salud en el sector hogares, en el marco del SCN. Talk given at the Meeting of Experts for a Technical Consultation on calculating the unpaid production of health services in the household, Pan American Health Organization, Gender and Health Unit–Health Policies and Systems Unit, Washington, D.C., December 4–5, 2003. Available at (http://www.paho.org/Spanish/AD/GE/Duran-mar06.pdf ).
––––––. 2003. Los costes invisibles de la enfermedad. 2nd ed. Madrid: Fundación BBVA.
** As this paper is a synthesis, references to other authors who have already been used and cited by the author in her previous publications are not cited here.
135
María-Ángeles Durán
Ten Good Reasons for Measuring Unremunerated Work in Health Care
1. Measurement is an essential part of knowledge. Although not all knowledge is quantifiable, the search for quantification requires prior analysis that sheds light on strengths and weaknesses in the theory and bolsters researchers’ capacities to perform analysis and synthesis.
2. Measurement facilitates the ability to make comparisons over time, at the geographical level and among social groups. Such progress requires scientific discussion and agreements.
3. Measurement is an essential tool in concealing and evaluating the “invisible” limited resources and setting priorities, which helps prevent the shift of costs to the most vulnerable social sectors. The health of the population and the health care system affects production and development sustainability and distributive equity. It is important to promote and maintain good health standards, with a particular focus on fighting diseases and disabilities, responsibilities which demand significant efforts from individuals, the state, and numerous social and political entities.
4. Unremunerated work in health care, assumed mainly by women and low-income sectors, affects the entire population directly or indirectly, regardless of gender, social class, ethnicity, rural or urban status, and geographic location. Its effects are unequal and segmented, rather than uniform, and it undermines the social protection of patients and caregivers alike (induced poverty, lost employment, social precariousness, lack of access to contributory pension systems, etc.).
5. Unremunerated work in health care is mainly an concern within the health sector, however its impact cuts across all sectors, affecting the education, labor, culture, transportation, food, housing, safety, development, and other sectors and influenced, in turn, by their activities. Therefore, health policy must be coordinated with the rest of public policy and with private health systems.
6. Significant changes are occurring in the demand and supply for care in the area of unremunerated work in health worldwide, particularly in Latin America. Changes in the demand are provoked mainly from changes in demographics (more elderly people) and household composition (more single-person households, single-parent families, divorce, and blended families). At the same time, changes in supply stem from the shrinking proportion of potential and actual caregivers per care recipient, women’s increased entry into the workforce, and other social changes.
7. Health is a good safeguarded by a state that is governed by the rule of law; how it is addressed is not an individual, rather an institutional, social, and political matter.
136
the Inclusion of Unpaid Work in Analyses of the Health and Social Welfare Sectors
Measurement and opinion making are key tools for transforming theoretical policy principles into applied, recognized, and enforceable rights.
8. Unremunerated health care has repercussions at local and international levels. When potential caregivers emigrate, it affects caregiver availability and leads to the displacement of specific populations (to provide remunerated care for patients and dependent people in other countries), with the consequent financial transfers (remittances) and changes in formal and informal social protection systems.
9. Several monographs published in Spain estimate that the time spent on unremunerated care represents 88 percent of the total time devoted to health care, an impressive proportion. In cases of the advanced degenerative diseases common in the aging populations (Alzheimer’s disease, for example), unremunerated care is estimated to represent 99 percent of the overall time spent on patient care.
10. Finally, measuring unremunerated work in health is a political commitment made by the vast majority of the governments, which, at the Fourth World Conference on Women held in Beijing in 1995, accepted the United Nations proposal to reform National Accounts Systems in order to rescue unremunerated work from a state of invisibility and take all sector policies into account, including health policies.
137
ParT II
Cc
Conceptual and Methodological Challenges


139
chapter 7*
Time Use Surveys: Design and Application
Cc
Vivian Milosavljevic** and Odette Tacla***
INTRODUCTION
For centuries, the responsibility for household activities has fallen disproportionately on the shoulders of women. Today, even under circumstances that enable women to take a larger part in the economically active population en masse, domestic
responsibilities continue to place an excessive burden on their workday, which is detrimental to their general well-being. Worse yet, there is a lack of visibility and recognition, as well as increased social vulnerability, for women who devote themselves exclusively to household activities, precisely because they lack the time to devote themselves to activities that promote personal development and economic independence.
In light of this situation, time use surveys (TUS), which make it possible to understand and quantify the distribution of household activities and the respective time that they absorb, contribute to the recognition of an important factor in the complications faced by homemakers when they need or wish to join the paid workforce or get involved in other outside activities. The data available in this type of survey measures and evaluates people’s
* The opinions expressed in this chapter are the sole responsibility of the authors and may not coincide with those of ECLAC.
** Statistician, Economic Comission for Latin America and the Caribbean (ECLAC), Women and Development Unit, Santiago, Chile. E-mail: [email protected].
*** Coordinator of the Department of Demography, Geography and Census, National Statistical Institute (INE), Chile. E-mail: [email protected].
140
time Use Surveys: Design and Application
time and involvement in daily activities, while also moving toward a methodology that permits quantification of the productive value of unpaid domestic services and integrates their contribution to the national accounts.
Recognizing the importance of such instruments, the Economic Commission for Latin America and the Caribbean (ECLAC) has been developing methodological materials containing guidelines and recommendations that will aid in the design of a basic TUS prototype, which can be used as a module in the household surveys conducted regularly by the countries of the Latin American region.
This work, based on a document by the same authors published by ECLAC, summarizes the findings and analysis derived from the data taken from TUS in five Latin American countries. Using a comparative approach, the main objective is to identify similarities in the countries studied in behavioral patterns connected with certain relevant characteristics rather than in terms of quantitative components. The analysis particularly focuses on sociodemographic aspects as well as the behavior of women and men in the household, primarily in terms of their time distribution and degree of involvement in activities. The idea is to develop an analytical approach for future surveys or modules similar to the ones proposed herein that serve as the basis for the design of indicators, decision making, and policy implementation.
EXPERIENCES IN FIVE COUNTRIES
Although nine Latin America countries have conducted research on time use, this study examines only those with available databases: Bolivia, Ecuador, Guatemala, Nicaragua, and Mexico. While the objectives and technical and methodological characteristics of each survey differ, the surveys are similar in that they gather information on the time invested in household activities. In some cases, there are similarities in the way the question is formulated, although not in the degree of disaggregation.
It should be noted that the results obtained might not coincide with those published by the respective countries, due to the use of different programming algorithm and specific validation and consistency procedures in processing the data.
For analytical purposes, comparable variables have been used, such as sex —basic for gender analysis—, age, marital status, relationship to the head of household, household status of interviewee, type of household, number of household members that devote themselves primarily to household activities, length of the work week, presence or absence of young children, details of household activities, working children, and number of adults. From this exercise, one of the main conclusions is that the household surveys conducted by the regional countries need to be modified. For example, it is important to know if households have domestic service and what preschool schedules are in order to determine whether or not mothers could opt to work outside the household. In the absence of direct
141
Vivian Milosavljevic and Odette Tacla
information, it is necessary to resort to proxy variables to determine which households include sick or disabled elderly members, which is valuable information associated with care. Finally, the work module should include questions that enable women to state reasons why they are out of the workforce. Notwithstanding these constraints, and as demonstrated herein, there are significant similarities among the five countries in many of the behavioral variables analyzed.
Results of the Time Use Modules
In the following sections, an analysis for each of the five countries examined measures women’s and men’s involvement in unpaid domestic work and —when appropriate— the time spent daily or weekly on these activities.
BoliviaIn the 2001 Continuing Household Survey, Bolivia included a module for measuring
unpaid domestic work, targeting people seven years old and older. The questionnaire contains only two questions on time use, referring to the number of days per week and amount of hours dedicated to household activities. However, seven questions focus on the individual’s involvement in specific activities: caring for children or the elderly, cooking and cleaning, shopping for food, washing or ironing, tending to livestock, carrying firewood or water, and repairing and maintaining the dwelling.
Approximately 56 percent of women and 36 percent of men participate in the care of children or the elderly.
Men’s participation exceeds women’s in only two areas, considered primarily male occupations: carrying firewood or water and repairing and maintaining the dwelling. Women’s involvement in cooking, cleaning the house, washing, and ironing is especially high (88 percent), while in general household activities, women devote an average of two hours more per day than men.
EcuadorIn August 2004, Ecuador added the module “Occupational Status and Household Activities” to its Employment, Unemployment, and Underemployment survey, which targets the population age five and older. This module has a filter question that inquires into the actual participation of the interviewee in household activities. When people answer affirmatively, the interviewer proceeds to the time use questions, which focuses on the hours invested during the week prior to the survey. The activities considered are straightening up the house; grocery shopping; preparing food; caring for children, the elderly, and the sick; and helping with homework.
142
time Use Surveys: Design and Application
Women invest 4.3 more hours per week than men in caring for children, the elderly, and the sick
The results indicate that women participate more (88 to 91 percent) then men in all activities considered. Men’s involvement hovers around 60 percent, with very few exceptions. Women invest nearly 12 hours per week in food preparation and six hours in straightening up the house, and except for “grocery shopping” —where participation for both sexes was equal— women invest more time in all other activities considered.
GuatemalaIn 2000, Guatemala added a time use module to its National Survey on Living Conditions
(ENCOVI), targeting people seven years and older; although direct interviewees have to be at least 12 years old. This module includes questions on the time spent during the day prior to the survey in paid and unpaid work (eight questions), studying (one), housekeeping (nine), shopping and bill paying (two), other activities (five), and parallel activities (six).
Both men and women spend the most time in caring for children, although women devote 2.5 hours more per day than men in this activity. Furthermore, 16 percent of men participate in
this activity, compared to 48 percent of women.
With regard to housekeeping, both the participation rate and time invested by men are limited. The highest rate of male participation is found in cleaning activities, at 19.7 percent, followed by caring for children and carrying firewood, at approximately 16 percent. Men have virtually no participation in activities such as washing clothes, carrying water, and cooking, activities in which women primarily participate. Thus, there is an inverse ratio in the participation of the two sexes in the different activities.
Concerning the time devoted daily to the eight activities studied, men spend considerably less than an hour on six of them, except for carrying firewood and caring for children, in which they spend slightly more than an hour and a half per day. On the other hand, women invest a significant amount of time in cleaning, washing clothes, cooking, and caring for children (nearly five hours per day in this latter activity).
MexicoIn 2003, Mexico added a module comprised of 57 household activities to the National
Survey on Household Income and Expenditure, broken down into the following groups: food preparation (seven activities), housekeeping (10), washing clothes and cleaning shoes (six), daily shopping (five), assisting people with limitations (six), caring for children (10), large purchases (three), bill paying and other transactions (three), and home maintenance (seven).
143
Vivian Milosavljevic and Odette Tacla
This survey targets people 12 years old and older, with a focus on the time devoted to activities the week prior to the interview. Of the five surveys, Mexico’s has the broadest questionnaire, detailing many of the subactivities that make up a specific activity. For example, under food preparation, there are questions about the time spent on cooking; serving the food; preparing canned goods, sweets, and cheeses; preparing nixtamal; grinding corn; lighting the hearth; degraining; toasting; and taking food to a household member.
Assisting persons with limitations and caring for children are the activities in which women and men invest the most time, although women devote twice the time that men do.
The only activity is which men have greater involvement than women is home maintenance and housing construction, in which 15 percent of men compared to 5 percent of women participate. Both are equally involved in activities such as assisting persons with limitations and managing household affairs and services. In the remaining activities, women participate more than men, especially in food preparation, housekeeping, washing clothes, and cleaning shoes.
Furthermore, while both men and women invest the most time in caring for children and people with limitations, women spend about 12 more hours per week in these activities than men.
NicaraguaIn 1998, Nicaragua’s National Statistics and Census Institute (INEC) added a time use
module to the National Household Survey on Standards of Living Measurement, targeting people age six and older. The reference period was the day prior to the interview and the module was administered to 50 percent of the population interviewed (2,104 households).
The time use module includes questions on: occupations —questions related to work and employment— (five), studies (two), household activities (eight), personal activities (five), and social or community activities (two), as well as an open-ended question asking the interviewee about time devoted to activities other than those mentioned, indicating what they were if applicable. The activities are revealed through two questions: “Did you spend time yesterday taking care of children while engaging in other activities?” and “Did you devote time yesterday to other simultaneous activities?”
Caring for children and sick people is the activity in which both sexes invest the most time, three hours per day on average for women and 2.5 hours for men.
Men’s involvement in the household activities considered is rather limited, ranging from 1.3 percent (caring for sick people) to 16.4 percent (home repairs). Men’s participation exceeds women’s in only two activities: carrying firewood and home repairs. These results reinforce the male stereotype with regards to their physical capacities and tendency to work
144
time Use Surveys: Design and Application
in construction activities, historically considered a male domain. Women’s participation is especially high in housekeeping, caring for children, and feeding the family.
Although men participate little in household activities, those who do participate devote a great deal of time to these activities. Similar to other cases mentioned, women devote more time to household activities then men, although the differences are not substantial.
Comparative Analysis of the Results of the Time Use Modules
Through a common parameter, obtained by adding up all the subactivities in the category “household activities,” a comparative analysis was drawn from the modules of the five countries. Nevertheless, it should be pointed out that the modules are not entirely comparable with regards to the activities and reference periods for each questionnaire, the geographical coverage, the interviewees’ ages, and the methodologies employed.
The algorithm used in the calculations was based on countries’ criterion for the specific activities included under the category “household activities.” Thus, in Bolivia the only existing variable, “total time spent the previous day,” was used. In Ecuador, the variable used was “hours spent on household activities;” while in Guatemala and Nicaragua, the variables in the submodule “housekeeping” were added up. Finally, in Mexico, INEGI’s criterion was used, adding up the “the weekly time spent on the subactivities comprising household activities.” In all cases, the respondents were 12 years old and older.
Regarding women’s involvement in household activities, the results in the five countries are similar. In Bolivia, Guatemala, Ecuador, and Mexico, the percentage of women who participate in these activities ranges from 91 percent to 97 percent, while in Nicaragua, the figure is lower at 84 percent. On the other hand, men’s involvement in household activities varies substantially. In Guatemala and Nicaragua, participation is about 45 percent; in Mexico and Bolivia, from 83 percent to 87 percent; and in Ecuador, 62 percent (Table 1).
The three countries that used the day prior to the survey as the reference period exhibit rather similar results. For example, the average time spent daily on household activities by both sexes in Bolivia is 8.8 hours, in Guatemala, 8.2 hours, and in Nicaragua, 8.6 hours. When the participation of the sexes is compared, the greatest similarity is between Nicaragua and Bolivia, while in Guatemala women spend considerably more time to make up for the little time spent by men. On the other hand, although the content of Ecuador’s survey differs significantly from Mexico’s —which includes a large number of activities— men in both countries spend 12 hours per week on these activities (Table 1).
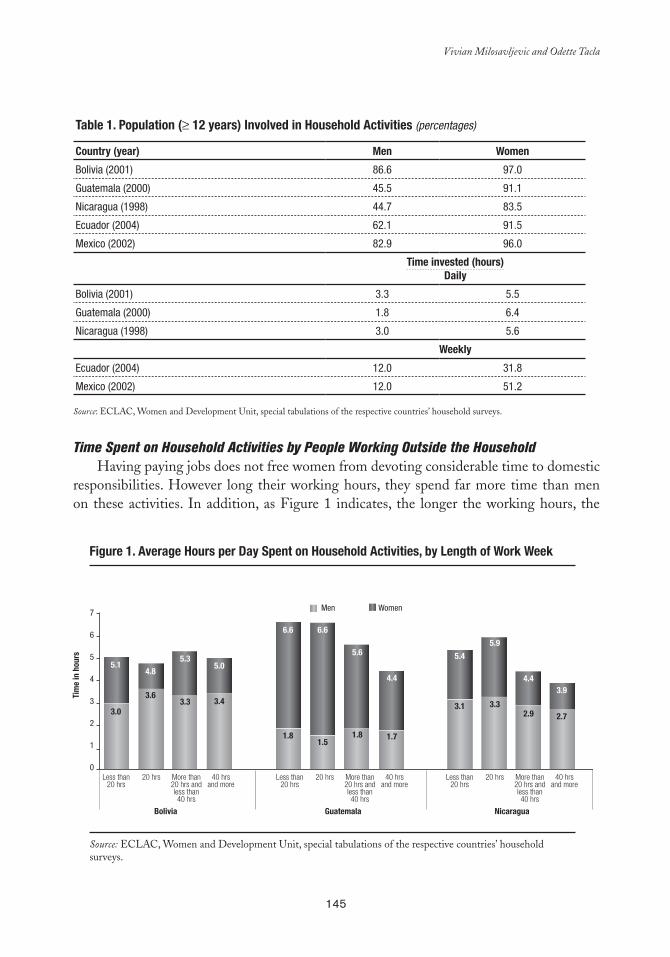
145
Vivian Milosavljevic and Odette Tacla
Time Spent on Household Activities by People Working Outside the HouseholdHaving paying jobs does not free women from devoting considerable time to domestic
responsibilities. However long their working hours, they spend far more time than men on these activities. In addition, as Figure 1 indicates, the longer the working hours, the
Table 1. Population (≥ 12 years) Involved in Household activities (percentages)
Country (year) Men Women
Bolivia (2001) 86.6 97.0
Guatemala (2000) 45.5 91.1
Nicaragua (1998) 44.7 83.5
Ecuador (2004) 62.1 91.5
Mexico (2002) 82.9 96.0
Time invested (hours)Daily
Bolivia (2001) 3.3 5.5
Guatemala (2000) 1.8 6.4
Nicaragua (1998) 3.0 5.6
Weekly
Ecuador (2004) 12.0 31.8
Mexico (2002) 12.0 51.2
Source: ECLAC, Women and Development Unit, special tabulations of the respective countries’ household surveys.
Figure 1. average Hours per Day Spent on Household activities, by length of Work Week
Tim
e in
hou
rs
7
6
5
4
3
2
1
0
Bolivia
Less than20 hrs
20 hrs More than20 hrs andless than40 hrs
40 hrsand more
Less than20 hrs
20 hrs More than20 hrs andless than40 hrs
40 hrsand more
Less than20 hrs
20 hrs More than20 hrs andless than40 hrs
40 hrsand more
Guatemala Nicaragua
5.1
3.0
4.8
3.6
5.3
3.3
5.0
3.4
6.6
1.8
6.6
1.5
5.6
1.8
4.4
1.7
5.4
3.1
5.9
3.3
4.4
2.9
3.9
2.7
Men Women
Source: ECLAC, Women and Development Unit, special tabulations of the respective countries’ household surveys.
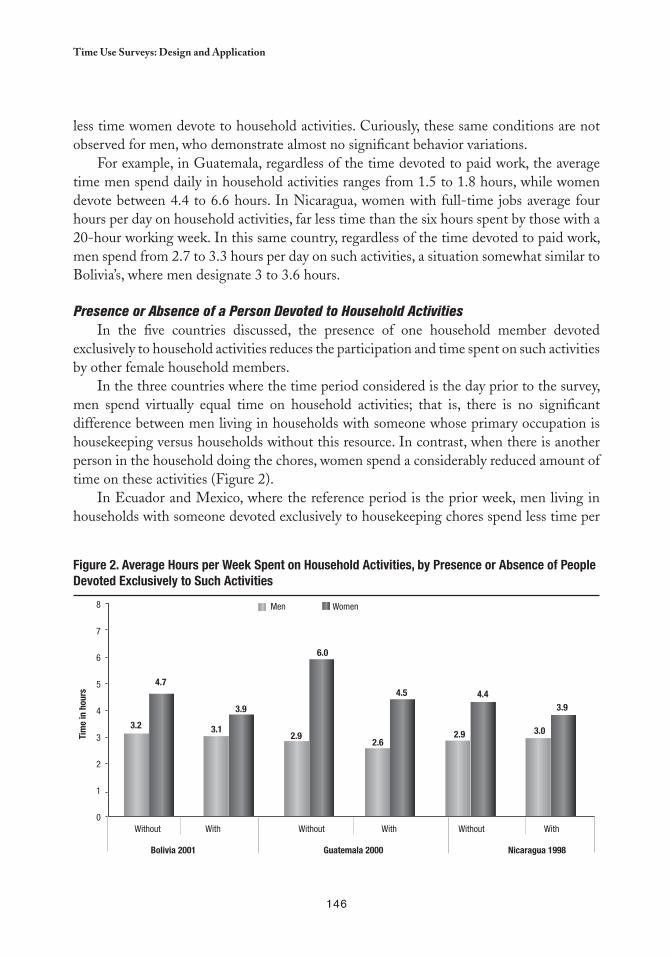
146
time Use Surveys: Design and Application
less time women devote to household activities. Curiously, these same conditions are not observed for men, who demonstrate almost no significant behavior variations.
For example, in Guatemala, regardless of the time devoted to paid work, the average time men spend daily in household activities ranges from 1.5 to 1.8 hours, while women devote between 4.4 to 6.6 hours. In Nicaragua, women with full-time jobs average four hours per day on household activities, far less time than the six hours spent by those with a 20-hour working week. In this same country, regardless of the time devoted to paid work, men spend from 2.7 to 3.3 hours per day on such activities, a situation somewhat similar to Bolivia’s, where men designate 3 to 3.6 hours.
Presence or Absence of a Person Devoted to Household ActivitiesIn the five countries discussed, the presence of one household member devoted
exclusively to household activities reduces the participation and time spent on such activities by other female household members.
In the three countries where the time period considered is the day prior to the survey, men spend virtually equal time on household activities; that is, there is no significant difference between men living in households with someone whose primary occupation is housekeeping versus households without this resource. In contrast, when there is another person in the household doing the chores, women spend a considerably reduced amount of time on these activities (Figure 2).
In Ecuador and Mexico, where the reference period is the prior week, men living in households with someone devoted exclusively to housekeeping chores spend less time per
Figure 2. average Hours per Week Spent on Household activities, by Presence or absence of People Devoted exclusively to Such activities
Men Women
Tim
e in
hou
rs
8
7
6
5
4
3
2
1
0 Without
Bolivia 2001 Guatemala 2000 Nicaragua 1998
With
3.2 3.1 2.9
6.0
2.6 2.9 3.0
4.7
3.9
4.5 4.4 3.9
Without With Without With
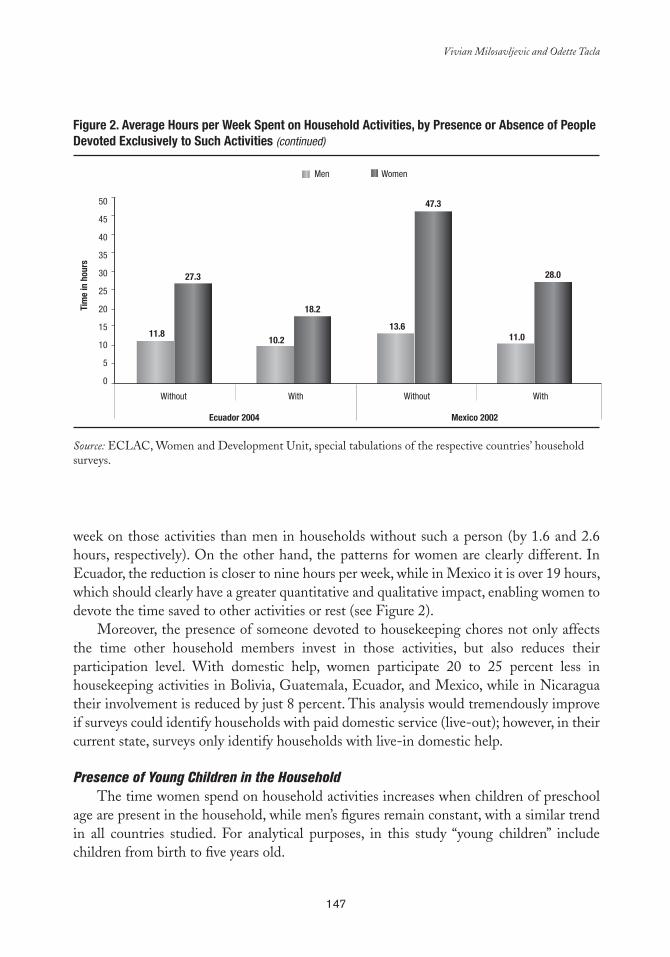
147
Vivian Milosavljevic and Odette Tacla
week on those activities than men in households without such a person (by 1.6 and 2.6 hours, respectively). On the other hand, the patterns for women are clearly different. In Ecuador, the reduction is closer to nine hours per week, while in Mexico it is over 19 hours, which should clearly have a greater quantitative and qualitative impact, enabling women to devote the time saved to other activities or rest (see Figure 2).
Moreover, the presence of someone devoted to housekeeping chores not only affects the time other household members invest in those activities, but also reduces their participation level. With domestic help, women participate 20 to 25 percent less in housekeeping activities in Bolivia, Guatemala, Ecuador, and Mexico, while in Nicaragua their involvement is reduced by just 8 percent. This analysis would tremendously improve if surveys could identify households with paid domestic service (live-out); however, in their current state, surveys only identify households with live-in domestic help.
Presence of Young Children in the HouseholdThe time women spend on household activities increases when children of preschool
age are present in the household, while men’s figures remain constant, with a similar trend in all countries studied. For analytical purposes, in this study “young children” include children from birth to five years old.
Men Women
Tim
e in
hou
rs
50
45
40
35
30
25
20
15
10
5
0
Without
Ecuador 2004 Mexico 2002
With
11.8
27.3
10.2
18.2
13.6
47.3
11.0
28.0
Without With
Source: ECLAC, Women and Development Unit, special tabulations of the respective countries’ household surveys.
Figure 2. average Hours per Week Spent on Household activities, by Presence or absence of People Devoted exclusively to Such activities (continued)
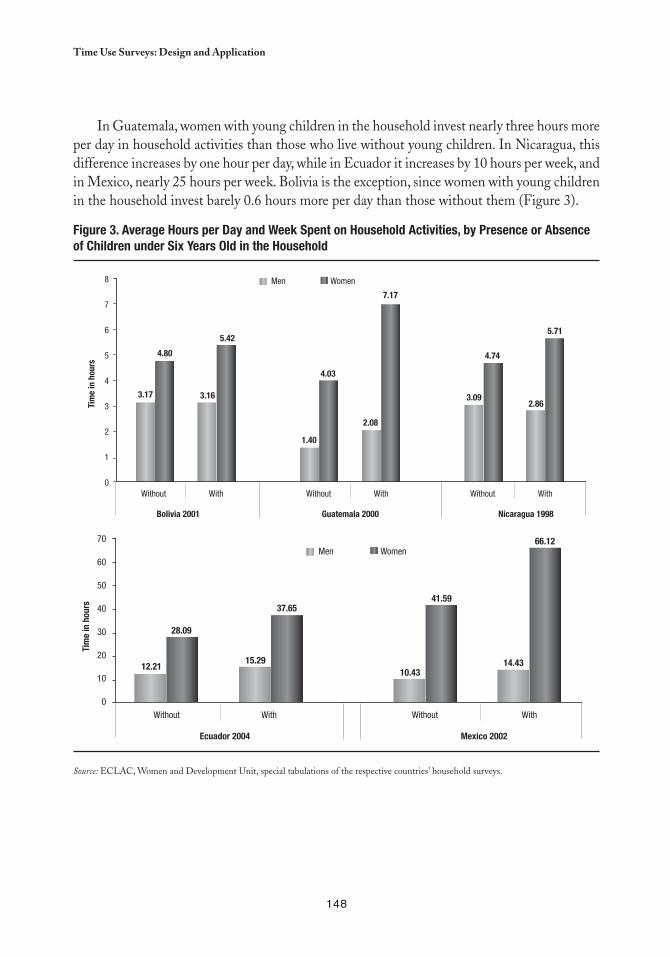
148
time Use Surveys: Design and Application
In Guatemala, women with young children in the household invest nearly three hours more per day in household activities than those who live without young children. In Nicaragua, this difference increases by one hour per day, while in Ecuador it increases by 10 hours per week, and in Mexico, nearly 25 hours per week. Bolivia is the exception, since women with young children in the household invest barely 0.6 hours more per day than those without them (Figure 3).
Figure 3. average Hours per Day and Week Spent on Household activities, by Presence or absence of Children under Six Years Old in the Household
Men Women
Tim
e in
hou
rs
8
7
6
5
4
3
2
1
0 Without
Bolivia 2001 Guatemala 2000 Nicaragua 1998
With
3.17
4.80
3.16
5.42
1.40
4.03
2.08
7.17
3.09
4.74
2.86
5.71
Without With Without With
Men Women
Tim
e in
hou
rs
70
60
50
40
30
20
10
0 Without
Ecuador 2004 Mexico 2002
With
12.21
28.09
15.29
37.65
10.43
41.59
14.43
66.12
Without With
Source: ECLAC, Women and Development Unit, special tabulations of the respective countries’ household surveys.

149
Vivian Milosavljevic and Odette Tacla
Presence of Disabled People in the HouseholdNeither of the sexes exhibit significant differences in the time spent on household
activities in relation to the presence of disabled or sick people in the household, a conclusion that should not be considered definitive as the surveys do not adequately identify these people (Table 2).
In classifying the activities in which people engage, the surveys use the occupational status question, making it possible to distinguish between the economically active population (employed or unemployed) and the economically inactive population, which includes students, people devoted to household activities, retirees, those who lived through independent means, and other people who are inactive or unable to work due to disability. In the disabled group, there are significant differences among the five countries in how this information is recorded in the surveys. Notwithstanding the significance of this population group, some surveys disregard it, while others record it as the occupational disability, or combine it with the very elderly group. In time use surveys, it is important to properly formulate the question about “disabled people” to determine the degree of disability —and hence, the degree of functionality— of such people in their daily lives. This will make it possible to distinguish between the chronically ill and those who require continuing care, either complete or partial, thus contributing to knowledge about the living conditions of both the disabled and their caregivers. Likewise, this question would make a valuable
Table 2. Time and Participation in Household activities in Relation to the Presence or absence of Disabled People in the Household (Population ≥ 12 years)
Country (year) Disabled people Participation (%) Hours per day Participation (%) Hours per Day
Men Men Women Women
Guatemala (2000) Yes 23.9 2.7 62.0 6.6
No 25.0 3.1 62.1 6.3
Total 24.0 2.7 62.0 6.6
Nicaragua (1998) Yes 42.5 2.9 75.6 5.3
No 42.9 3.1 78.5 5.6
Total 42.6 3.0 75.8 5.3
Participation (%) Hours per
week Participation (%) Hours per Week
Ecuador (2004) Yes 52.5 11.2 76.3 29.7
No 46.2 11.9 69.7 28.2
Total 52.0 11.2 75.7 29.5
Mexico (2002) Yes 58.5 11.9 71.7 51.4
No 64.1 12.7 79.5 47.8
Total 58.7 12.0 72.1 51.2
Source: ECLAC, Women and Development Unit, special tabulations of the respective countries’ household surveys. a Bolivia does not include this category.
150
time Use Surveys: Design and Application
contribution to knowledge about the health status of the elderly and the different types of care provided.
Occupational Status of the IntervieweesThe five countries have similar patterns regarding time invested by women in household
activities, classified by the type of activity that they frequently engaged in. Students devote less time to household activities. Only Guatemala exhibits a differentiated distribution of time, where students spend nearly seven hours per day on household activities, and 93 percent of them participate in one or more of these activities. Importantly, Guatemalan girls and adolescents had lower school enrollment rates than their male counterparts.
As expected, women who put themselves in the “household activities” category invest more time in these tasks. Unemployed women are also in the group that devotes more time to housekeeping. In Bolivia and Nicaragua, the amount of time that unemployed women spend on household activities is similar (6.5 and 6.7 hours, respectively), while in Guatemala the figure increases to 8.5 hours, virtually the same amount of time as women who devote themselves exclusively to household activities. This situation undoubtedly decreases their ability to actively look for work, in addition to being one of the main obstacles in being able to maintain a paying job. This could be considered one explanatory factor in the different rates of unemployment, which is higher in women compared to men, who devote much less time each day to household chores.
Working women’s participation in some household activities ranges from 75 to 98 percent in the five countries, reinforcing the idea that paid work does not exempt them from household responsibilities. This excessive workload can be observed in Figure 4, which shows that the time devoted to household activities ranges from 4.3 to 5 hours per day in Bolivia, Guatemala, and Nicaragua, and from 30 to 48 hours per week in Ecuador and Mexico. It should be noted that in Mexico, the situation is linked to the low rate of female participation in the workforce compared to other Latin American countries. Furthermore, for the countries as a whole, this indicator helps explain why women’s working week in paying jobs is shorter than men’s, information that can be obtained and verified through the work modules of the respective household surveys.
In regards to the older population, especially retirees, high participation in the household activities considered herein has been corroborated, as well as the extensive time spent in carrying them out. In the five countries analyzed, women participate in percentages ranging from 83 to 95 percent —in Guatemala, where the rate is much lower, the figure is just over 50 percent, while in Bolivia and Nicaragua, retired women spend 6.3 and 6.7 hours respectively on these activities. In Ecuador, retired women spend 28 hours per week in household activities, while in Mexico they spend 42 hours per week. Consistent with their low levels of participation, retired women in Guatemala spend an average of 3.6 hours per day on household activities.
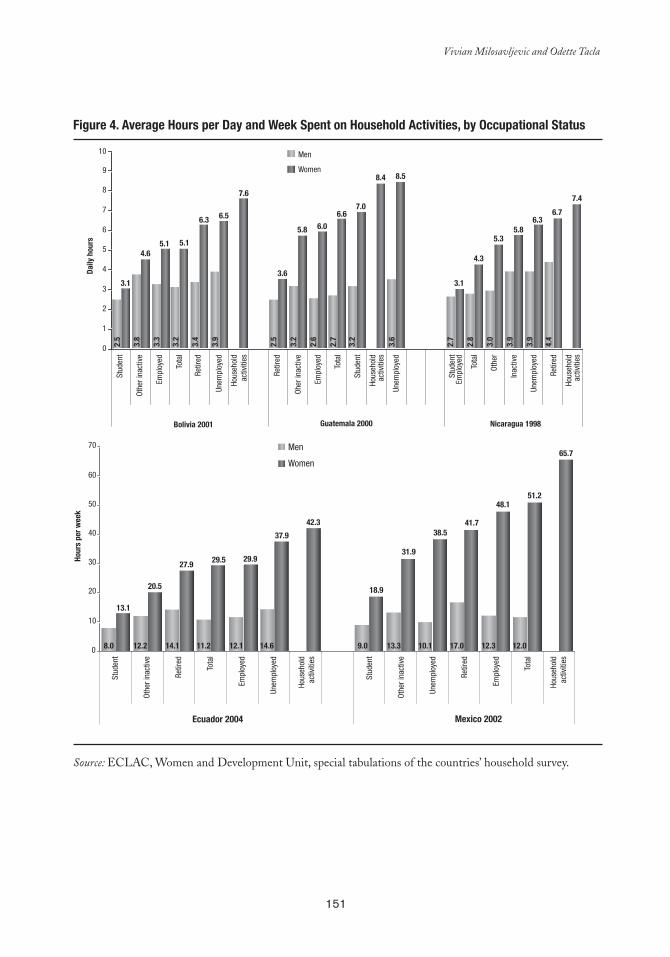
151
Vivian Milosavljevic and Odette Tacla
Figure 4. average Hours per Day and Week Spent on Household activities, by Occupational Status
3.1
4.65.1 5.1
6.3 6.5
7.6
3.6
5.8 6.0
6.67.0
8.4 8.5
3.1
4.3
5.35.8
6.36.7
7.4
0
1
2
3
4
5
6
7
8
9
10 Men
Women
Stud
ent
Othe
r ina
ctiv
e
Empl
oyed
Tot
al
Retir
ed
Unem
ploy
ed
Hous
ehol
dac
tiviti
es
Retir
ed
Oher
inac
tive
Empl
oyed
Tot
al
Stud
ent
Hous
ehol
dac
tiviti
es
Unem
ploy
ed
Stud
ent
Empl
oyed
Tota
l
Othe
r
Inac
tive
Unem
ploy
ed
Retir
ed
Hous
ehol
dac
tiviti
es
Bolivia 2001 Guatemala 2000 Nicaragua 1998
Daily
hou
rs
2.5
3.8
3.3
3.2
3.4
3.9
2.5
3.2
2.6
2.7
3.2
3.6
2.7
2.8
3.0
3.9
3.9
4.4
13.1
20.5
27.9 29.5 29.9
37.9
42.3
18.9
31.9
38.541.7
48.151.2
65.7
0
10
20
30
40
50
60
70 Men
Stud
ent
Othe
r ina
ctiv
e
Retir
ed
Tota
l
Empl
oyed
Unem
ploy
ed
Hous
ehol
dac
tiviti
es
Stud
ent
Othe
r ina
ctiv
e
Unem
ploy
ed
Retir
ed
Empl
oyed
Tota
l
Hous
ehol
dac
tiviti
es
Ecuador 2004 Mexico 2002
Hour
s pe
r wee
k
8.0 12.2 14.1 11.2 12.1 14.6 9.0 13.3 10.1 17.0 12.3 12.0
Women
Source: ECLAC, Women and Development Unit, special tabulations of the countries’ household survey.


153
chapter 8
Methodological Proposal to Measure and Assess Unpaid
Household Health Care
Cc
Mercedes Pedrero-Nieto1♦
INTRODUCTION
In Mexican society, caring for older and sick adults with chronic degenerative illnesses traditionally has taken place in the household, and the responsibility has commonly fallen on women. However, this situation has only recently sparked interest among
those who study health topics. They are concerned because social institutions, in need of infrastructure and resources, increasingly delegate such health services to families and society overall. Furthermore, the demand for such services is likely to increase hand-in-hand with life expectancy at birth, which rose from 30.5 to 49.5 years between 1930 and 1950 (65), and has continued to increase at a less rapid yet steady rate up to the current 74.5 years (66).
This increase in longevity is not necessarily accompanied by good health. Nigenda et al. point to the recent increase in chronic degenerative diseases, adding that “[although] this is a process that accompanies aging…it is not limited to it … Also, this phenomenon has advanced with considerable celerity, since in the period of 50 years the epidemiological profile of the country went from one dominated by infectious diseases to one strongly
Researcher with the Regional Center for Multidisciplinary Research of the National Autonomous University of Mexico.1
154
Methodological Proposal to Measure and Assess Unpaid Household Health Care
characterized by chronic degenerative diseases. The most frequent diseases that result in incapacitated and chronic patients in the household are diabetes, hypertension, cancer, cerebrovascular disorders, and diseases related to mental health such as Alzheimer’s and depression” (51).
Greater longevity results in an increase in the elderly population, which coincides with another demographic change —the decline of the fertility rate, which decreased from 6.1 children per woman in 1970 to 2.2 in 2005 (66). As families are having fewer children, there are less people to take care of the growing elderly population. The number of people over 65 years of age has increased from 3.7 percent of the population in 1970 to 7.3 percent today. This trend is expected to continue, not only because there will be significant increases in life expectancy, but mostly due to gradual changes in the age structure, resulting from lower fertility rates during the last decades. Still, this has not be fully realized in the older population, as generations that were products of higher fertility indices are still of childbearing age.
The Growing Roles of Women
Another important trend in Mexico today is the increased participation of women in economic activities, which has grown steadily from 19 percent in 1970 to 39 percent in 2004 among women over 12 years old —although this rate is still low compared to the rate for men, which rose to 71 percent in 2004. The growing roles of women in the market economy have been general in nature, but most intense in informal sector jobs with flexible schedules, which make it possible for women to continue to work while also taking care of their household and family.
Even so, new labor obligations have reduced the time that women have typically devoted to the household. This also effects family composition, which has shifted from its traditional expanded structure to a nuclear household, made up only of parents and children. Nevertheless, family solidarity continues, exemplified by adult children who help their elderly parents with all aspects of daily life, such as pension transactions, food purchases, laundry, and house cleaning. However, the extended family that once surrounded the nucleus, including relatives and usually more than one adult woman to help care for the household, has become obsolete.
The greatest demand for caregiving within households also relates to the health system, whose coverage, far from having reached the desired universality, has seen a continual decline in both the efficiency and quality of services. In 2004, only 31.2 percent of the working population had social security benefits, an insufficient level of coverage, as most people do not earn enough to turn to private medicine. Even worse, the quality of services for the insured population has deteriorated and recently public hospitals have shortened
155
Mercedes Pedrero-Nieto
hospitalization periods, discharging patients who still require specialized care and training a family member to continue such care in the household.
This work analyzes data generated by Mexico’s 2002 Time Use Survey (67) in relation only to caring for the elderly and other family members who need constant assistance. The sample was not designed to obtain detailed and statistically significant information about caregiving, thus it is difficult to interpret the results as leading to definitive quantitative assessments. However, the methodological proposal herein highlights the potential of time use surveys, which forms the basis for expanding the Mexican survey, as proposed by Ferrán (68), as well as the 2005 Ecuadorian survey. The chapter concludes by proposing a series of questions that would make it possible to more precisely measure the contribution of households to health care, facilitating an economic assessment accurate enough to be incorporated into the satellite health account.
Limitations of the Survey
Although the Mexico survey offers an initial approximation of the economic value of household work as a whole, its results do not yield statistically significant figures for categories linked to health care. Survey data infers that the contribution of household work in monetary terms is 23 percent of GDP (69) and includes the following functions and categories:
Maintenance: clean, repair, and maintain the household.■■
Dress: wash, iron, mend, repair, or make clothing.■■
Nutrition: plan, prepare, and serve meals, and wash the dishes.■■
Care: tend to children, dependent elderly individuals, and other family members ■■
who require constant attention.
Since the Mexico survey only facilitates an aggregate assessment of unpaid general household work, any attempt to calculate the specific economic contribution of health services must follow a design that distinguishes, under the category of “caregiving,” between activities devoted to caring for temporary and chronic dependent patients. In order to obtain statistically significant information, attention must also be paid to the sampling design.
The methodologies to carry out an economic assessment of unpaid health services should be refined, and clearly a good approximation should begin by examining how time is spent in providing those services. There are other difficulties in assessing home health care, such as how to measure a task that involves various functions and requires different qualifications, which thus cannot receive the same economic assessment. These measurements should be based on data that do not exist in administrative records and appear only partially in hospital statistics, since these do not record all patients who do not go to hospitals.
156
Methodological Proposal to Measure and Assess Unpaid Household Health Care
Household surveys could therefore be the way to collect those data, but in this case there are also limitations, because the size of the sample in general does not allow for such measurements and expanding it implies very high costs. Perhaps the safest road would be to refine information on illnesses or disabilities by type in population censuses or household surveys with broad coverage. To detect groups of persons with specific illnesses or disabilities, in-depth and specific studies would have to be conducted that provide good measures of the time implied by the detailed tasks required to care for the illness or disability in question, thus making it possible to do imputations for each population group. The methodology to achieve this still needs to be developed and should constitute part of the agenda for the near future .
Usefulness of the Survey
Although the data from the Mexico survey are not sufficient for economic estimates, they are sufficient to point out the relevant aspects of household health care, among them the broad gender gap that overloads women and that, at the very least, should bring attention to their enormous contribution to health and to economic development through unpaid work. Such recognition could turn into public policies that benefit women who work in health care in their own households by providing economic assistance in the form of tax exemptions or discount cards.
The Time Use Mexican Survey Results
According to the Mexico survey, about 2 percent of the population older than 12 reported that they care for persons with chronic problems that involve physical or mental limitations. In absolute numbers, this percentage means that during the reference week of the survey nearly 1.5 million people, taken together, spent more than 12 million hours caring for people who need assistance in everyday life; that is, an average of about 10 minutes per person if those hours were to be distributed among the entire population. However, when those hours are distributed only among the people who provided care, the average time increases to eight hours and 11 minutes per person. The differences between male and female caregivers are significant, as the contribution of the former is of 2,560,037 hours per week, equivalent to 21 percent of the total time devoted to caregiving. The average among male caregivers is four hours and 50 minutes weekly. Female caregivers provide 9,681,463 hours, which represents 79 percent of the total amount of time devoted to caregiving and corresponds to an average among female caregivers of 10 hours weekly. These figures are revealing, despite the limitations of the size of the sample in terms of working freely with the breakdowns, and indeed they show the potential of this type of data, even though in this case it is necessary to consider the results with caution.
157
Mercedes Pedrero-Nieto
Among the total population, the average time that men devote to household work is nine hours and 37 minutes, while women devote 42 hours and 36 minutes. The average time male caregivers spend doing household work is 14 hours and 42 minutes, while female caregivers devote 56 hours and 46 minutes. However, if the time devoted to caregiving is excluded from the household work of caregivers, the figures are reduced to nine hours and 52 minutes for men and 46 hours and 45 minutes for women. The specific time devoted to caregiving comes to averages of four hours and 50 minutes for men and 10 hours and one minute for women; that is, of the total of time devoted to household work by men, 33 percent corresponds to caregiving, while among women that figure is 18 percent. It is very likely that the greater role in relative terms of men in caregiving is accounted for by instances where the demand for caring for dependent persons is so high that it cannot be added to the already-long domestic workdays of women.
It is worth clarifying that not all of what is captured as caregiving time can or should be recorded when several activities are carried out simultaneously, because this would cause an overestimation of the amount of time worked. Time devoted in this manner is categorized as “vigilant,” meaning that during this period the caregiver does not have the freedom to carry out other activities elsewhere or to relax or fully rest. Taking into account “vigilant” time along with fully-devoted time provided by caregivers, the distribution of responsibility between men and women changes little: 19 percent for men and 81 percent for women. Furthermore, taking into account “vigilant” time, the amount of time per week during which men provide care increases from an average of four hours and 50 minutes to 10 hours and 28 minutes, while for women it increases from 10 hours to 23 hours and 57 minutes, or one-seventh of the total time lived in a week.
In a household where it is necessary to take care of a chronic patient or a dependent person, it is not expected that the entire family participates in the workload or that the workload is uniform. When differences in age are considered along with the previously mentioned differences between men and women, participation is seen to be more intense as age increases. Rates of both participation and caregiving are higher starting at age 40 among caregivers (see Tables 1 and 2).
Within households, it can be seen that those who provide care to the incapacitated are, for the most part, older adults or those nearing that age. This increases the risk that the caregivers themselves will become incapacitated, principally as a result of exhaustion and extreme stress. The median age of the caregiver —42 years for men and 46 for women— is higher by more than 10 years than that of the total population, for which the median age for both sexes is 32 years. Starting with those 40 years of age, the time among men devoted to caregiving exceeds five hours and 30 minutes and among women, 11 hours. In households with a dependent person, the distribution of caregiving is not uniformly distributed among all household members, as when considering the family as a whole, among men caregiving accounts for one hour and 51 minutes, and among women it accounts for six hours and 30 minutes. This is explained by the fact that household members have different positions
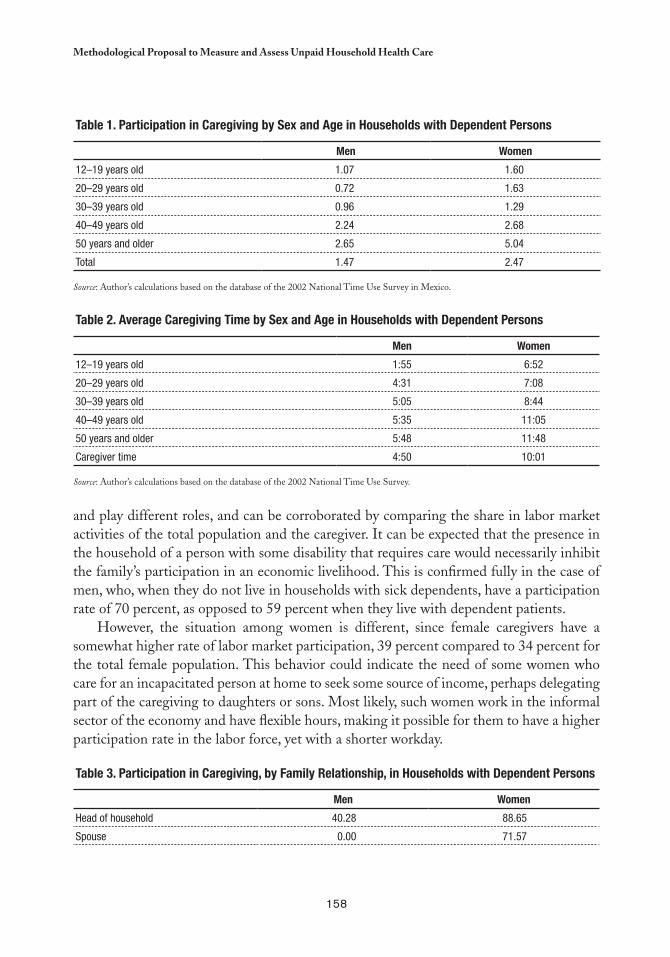
158
Methodological Proposal to Measure and Assess Unpaid Household Health Care
and play different roles, and can be corroborated by comparing the share in labor market activities of the total population and the caregiver. It can be expected that the presence in the household of a person with some disability that requires care would necessarily inhibit the family’s participation in an economic livelihood. This is confirmed fully in the case of men, who, when they do not live in households with sick dependents, have a participation rate of 70 percent, as opposed to 59 percent when they live with dependent patients.
However, the situation among women is different, since female caregivers have a somewhat higher rate of labor market participation, 39 percent compared to 34 percent for the total female population. This behavior could indicate the need of some women who care for an incapacitated person at home to seek some source of income, perhaps delegating part of the caregiving to daughters or sons. Most likely, such women work in the informal sector of the economy and have flexible hours, making it possible for them to have a higher participation rate in the labor force, yet with a shorter workday.
Table 3. Participation in Caregiving, by Family Relationship, in Households with Dependent Persons
Men Women
Head of household 40.28 88.65
Spouse 0.00 71.57
Table 1. Participation in Caregiving by Sex and age in Households with Dependent Persons
Men Women
12–19 years old 1.07 1.60
20–29 years old 0.72 1.63
30–39 years old 0.96 1.29
40–49 years old 2.24 2.68
50 years and older 2.65 5.04
Total 1.47 2.47
Source: Author’s calculations based on the database of the 2002 National Time Use Survey in Mexico.
Table 2. average Caregiving Time by Sex and age in Households with Dependent Persons
Men Women
12–19 years old 1:55 6:52
20–29 years old 4:31 7:08
30–39 years old 5:05 8:44
40–49 years old 5:35 11:05
50 years and older 5:48 11:48
Caregiver time 4:50 10:01
Source: Author’s calculations based on the database of the 2002 National Time Use Survey.
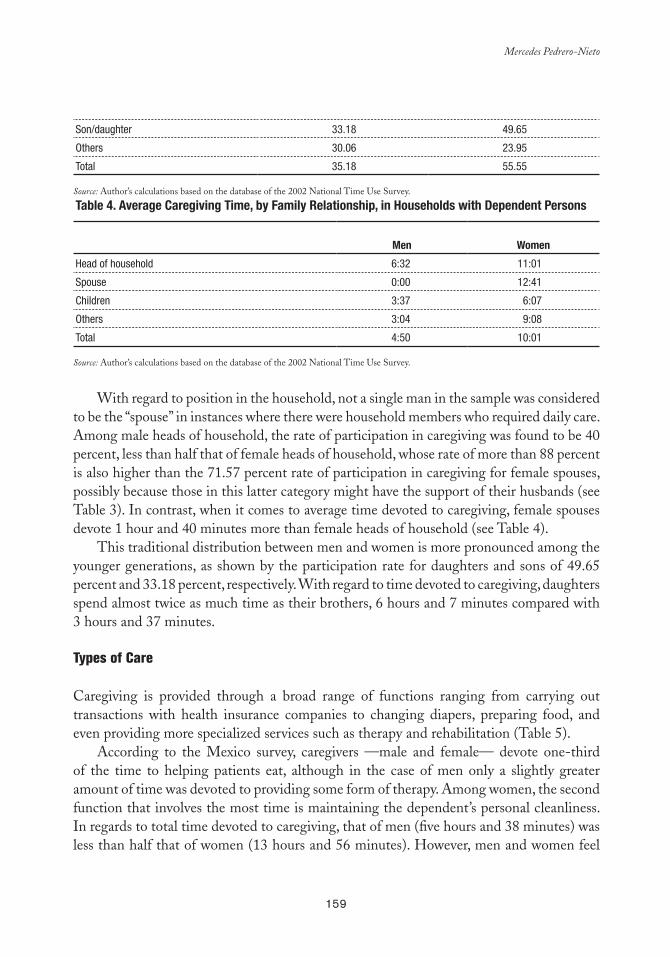
159
Mercedes Pedrero-Nieto
Son/daughter 33.18 49.65
Others 30.06 23.95
Total 35.18 55.55
Source: Author’s calculations based on the database of the 2002 National Time Use Survey.
Table 4. average Caregiving Time, by Family Relationship, in Households with Dependent Persons
Men Women
Head of household 6:32 11:01
Spouse 0:00 12:41
Children 3:37 6:07
Others 3:04 9:08
Total 4:50 10:01
Source: Author’s calculations based on the database of the 2002 National Time Use Survey.
With regard to position in the household, not a single man in the sample was considered to be the “spouse” in instances where there were household members who required daily care. Among male heads of household, the rate of participation in caregiving was found to be 40 percent, less than half that of female heads of household, whose rate of more than 88 percent is also higher than the 71.57 percent rate of participation in caregiving for female spouses, possibly because those in this latter category might have the support of their husbands (see Table 3). In contrast, when it comes to average time devoted to caregiving, female spouses devote 1 hour and 40 minutes more than female heads of household (see Table 4).
This traditional distribution between men and women is more pronounced among the younger generations, as shown by the participation rate for daughters and sons of 49.65 percent and 33.18 percent, respectively. With regard to time devoted to caregiving, daughters spend almost twice as much time as their brothers, 6 hours and 7 minutes compared with 3 hours and 37 minutes.
Types of Care
Caregiving is provided through a broad range of functions ranging from carrying out transactions with health insurance companies to changing diapers, preparing food, and even providing more specialized services such as therapy and rehabilitation (Table 5).
According to the Mexico survey, caregivers —male and female— devote one-third of the time to helping patients eat, although in the case of men only a slightly greater amount of time was devoted to providing some form of therapy. Among women, the second function that involves the most time is maintaining the dependent’s personal cleanliness. In regards to total time devoted to caregiving, that of men (five hours and 38 minutes) was less than half that of women (13 hours and 56 minutes). However, men and women feel
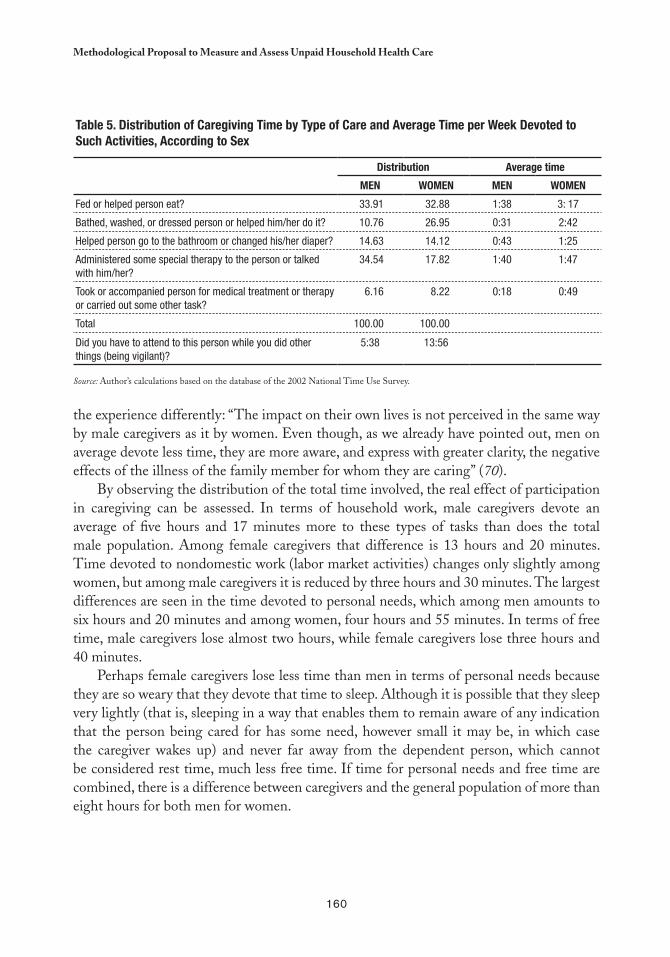
160
Methodological Proposal to Measure and Assess Unpaid Household Health Care
the experience differently: “The impact on their own lives is not perceived in the same way by male caregivers as it by women. Even though, as we already have pointed out, men on average devote less time, they are more aware, and express with greater clarity, the negative effects of the illness of the family member for whom they are caring” (70).
By observing the distribution of the total time involved, the real effect of participation in caregiving can be assessed. In terms of household work, male caregivers devote an average of five hours and 17 minutes more to these types of tasks than does the total male population. Among female caregivers that difference is 13 hours and 20 minutes. Time devoted to nondomestic work (labor market activities) changes only slightly among women, but among male caregivers it is reduced by three hours and 30 minutes. The largest differences are seen in the time devoted to personal needs, which among men amounts to six hours and 20 minutes and among women, four hours and 55 minutes. In terms of free time, male caregivers lose almost two hours, while female caregivers lose three hours and 40 minutes.
Perhaps female caregivers lose less time than men in terms of personal needs because they are so weary that they devote that time to sleep. Although it is possible that they sleep very lightly (that is, sleeping in a way that enables them to remain aware of any indication that the person being cared for has some need, however small it may be, in which case the caregiver wakes up) and never far away from the dependent person, which cannot be considered rest time, much less free time. If time for personal needs and free time are combined, there is a difference between caregivers and the general population of more than eight hours for both men for women.
Table 5. Distribution of Caregiving Time by Type of Care and average Time per Week Devoted to Such activities, according to Sex
Distribution average time
MeN WOMeN MeN WOMeN
Fed or helped person eat? 33.91 32.88 1:38 3: 17
Bathed, washed, or dressed person or helped him/her do it? 10.76 26.95 0:31 2:42
Helped person go to the bathroom or changed his/her diaper? 14.63 14.12 0:43 1:25
Administered some special therapy to the person or talked with him/her?
34.54 17.82 1:40 1:47
Took or accompanied person for medical treatment or therapy or carried out some other task?
6.16 8.22 0:18 0:49
Total 100.00 100.00
Did you have to attend to this person while you did other things (being vigilant)?
5:38 13:56
Source: Author’s calculations based on the database of the 2002 National Time Use Survey.
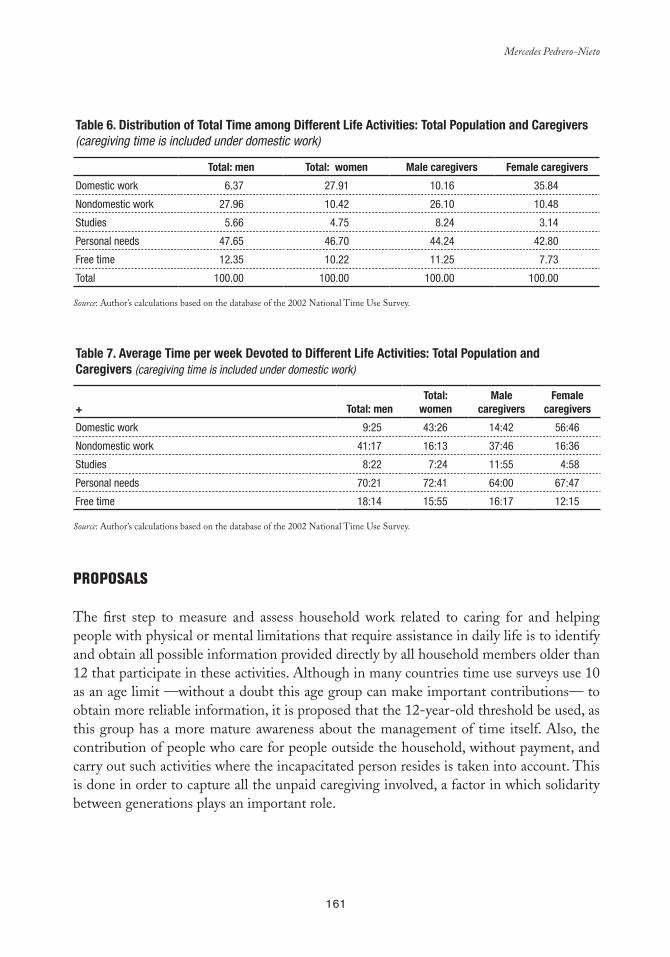
161
Mercedes Pedrero-Nieto
Table 6. Distribution of Total Time among Different life activities: Total Population and Caregivers (caregiving time is included under domestic work)
Total: men Total: women Male caregivers Female caregivers
Domestic work 6.37 27.91 10.16 35.84
Nondomestic work 27.96 10.42 26.10 10.48
Studies 5.66 4.75 8.24 3.14
Personal needs 47.65 46.70 44.24 42.80
Free time 12.35 10.22 11.25 7.73
Total 100.00 100.00 100.00 100.00
Source: Author’s calculations based on the database of the 2002 National Time Use Survey.
Table 7. average Time per week Devoted to Different life activities: Total Population and Caregivers (caregiving time is included under domestic work)
+ Total: men
Total: women
Male caregivers
Female caregivers
Domestic work 9:25 43:26 14:42 56:46
Nondomestic work 41:17 16:13 37:46 16:36
Studies 8:22 7:24 11:55 4:58
Personal needs 70:21 72:41 64:00 67:47
Free time 18:14 15:55 16:17 12:15
Source: Author’s calculations based on the database of the 2002 National Time Use Survey.
PROPOSALS
The first step to measure and assess household work related to caring for and helping people with physical or mental limitations that require assistance in daily life is to identify and obtain all possible information provided directly by all household members older than 12 that participate in these activities. Although in many countries time use surveys use 10 as an age limit —without a doubt this age group can make important contributions— to obtain more reliable information, it is proposed that the 12-year-old threshold be used, as this group has a more mature awareness about the management of time itself. Also, the contribution of people who care for people outside the household, without payment, and carry out such activities where the incapacitated person resides is taken into account. This is done in order to capture all the unpaid caregiving involved, a factor in which solidarity between generations plays an important role.
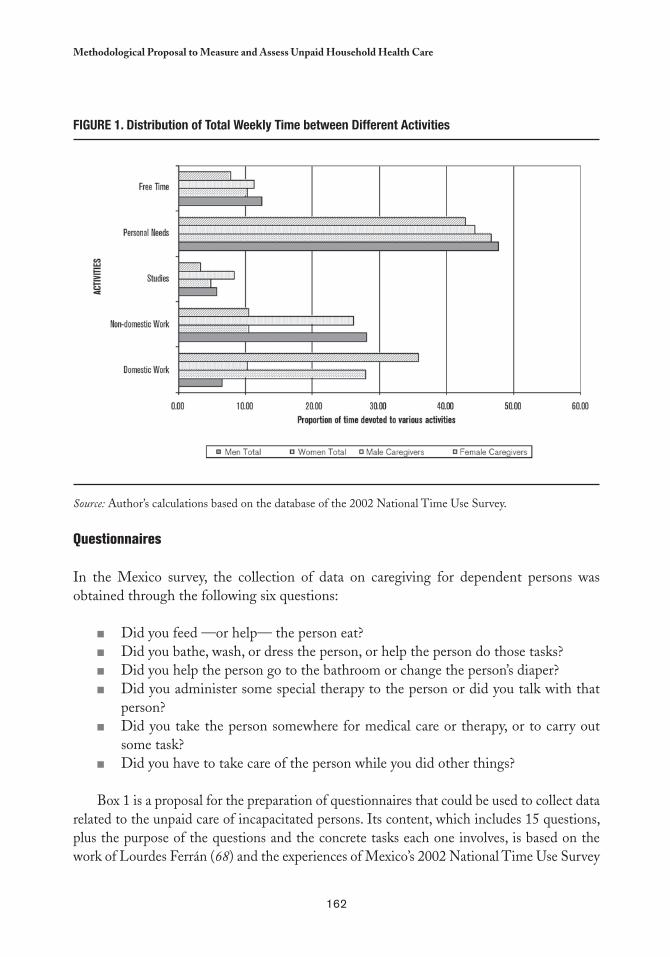
162
Methodological Proposal to Measure and Assess Unpaid Household Health Care
FIGURe 1. Distribution of Total Weekly Time between Different activities
Source: Author’s calculations based on the database of the 2002 National Time Use Survey.
Questionnaires
In the Mexico survey, the collection of data on caregiving for dependent persons was obtained through the following six questions:
Did you feed —or help— the person eat? ■■
Did you bathe, wash, or dress the person, or help the person do those tasks? ■■
Did you help the person go to the bathroom or change the person’s diaper? ■■
Did you administer some special therapy to the person or did you talk with that ■■
person? Did you take the person somewhere for medical care or therapy, or to carry out ■■
some task? Did you have to take care of the person while you did other things? ■■
Box 1 is a proposal for the preparation of questionnaires that could be used to collect data related to the unpaid care of incapacitated persons. Its content, which includes 15 questions, plus the purpose of the questions and the concrete tasks each one involves, is based on the work of Lourdes Ferrán (68) and the experiences of Mexico’s 2002 National Time Use Survey
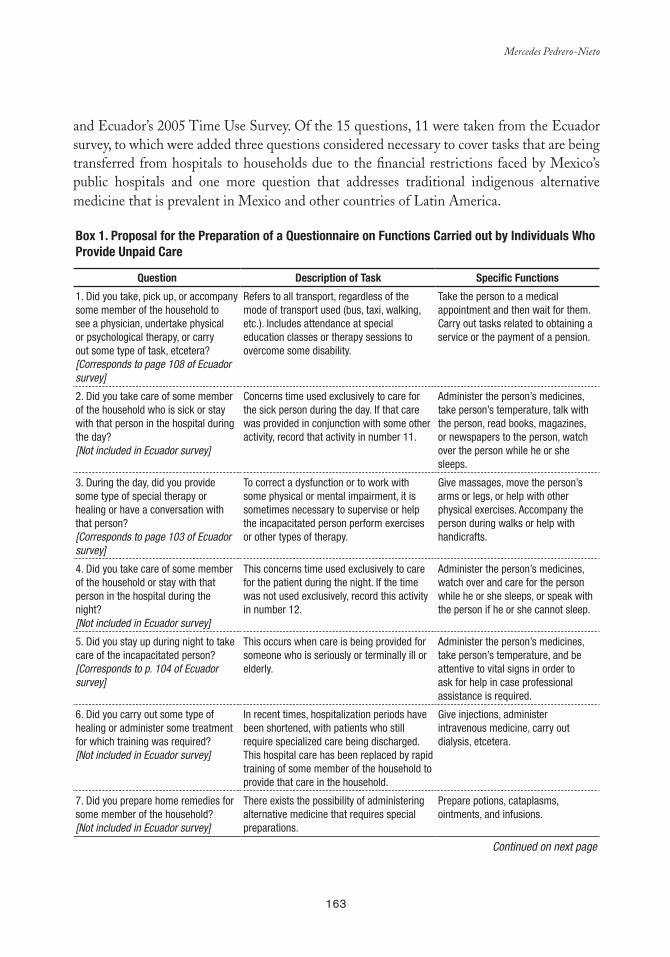
163
Mercedes Pedrero-Nieto
and Ecuador’s 2005 Time Use Survey. Of the 15 questions, 11 were taken from the Ecuador survey, to which were added three questions considered necessary to cover tasks that are being transferred from hospitals to households due to the financial restrictions faced by Mexico’s public hospitals and one more question that addresses traditional indigenous alternative medicine that is prevalent in Mexico and other countries of Latin America.
box 1. Proposal for the Preparation of a Questionnaire on Functions Carried out by Individuals Who Provide Unpaid Care
Question Description of Task Specific Functions
1. Did you take, pick up, or accompany some member of the household to see a physician, undertake physical or psychological therapy, or carry out some type of task, etcetera? [Corresponds to page 108 of Ecuador survey]
Refers to all transport, regardless of the mode of transport used (bus, taxi, walking, etc.). Includes attendance at special education classes or therapy sessions to overcome some disability.
Take the person to a medical appointment and then wait for them. Carry out tasks related to obtaining a service or the payment of a pension.
2. Did you take care of some member of the household who is sick or stay with that person in the hospital during the day? [Not included in Ecuador survey]
Concerns time used exclusively to care for the sick person during the day. If that care was provided in conjunction with some other activity, record that activity in number 11.
Administer the person’s medicines, take person’s temperature, talk with the person, read books, magazines, or newspapers to the person, watch over the person while he or she sleeps.
3. During the day, did you provide some type of special therapy or healing or have a conversation with that person? [Corresponds to page 103 of Ecuador survey]
To correct a dysfunction or to work with some physical or mental impairment, it is sometimes necessary to supervise or help the incapacitated person perform exercises or other types of therapy.
Give massages, move the person’s arms or legs, or help with other physical exercises. Accompany the person during walks or help with handicrafts.
4. Did you take care of some member of the household or stay with that person in the hospital during the night? [Not included in Ecuador survey]
This concerns time used exclusively to care for the patient during the night. If the time was not used exclusively, record this activity in number 12.
Administer the person’s medicines, watch over and care for the person while he or she sleeps, or speak with the person if he or she cannot sleep.
5. Did you stay up during night to take care of the incapacitated person? [Corresponds to p. 104 of Ecuador survey]
This occurs when care is being provided for someone who is seriously or terminally ill or elderly.
Administer the person’s medicines, take person’s temperature, and be attentive to vital signs in order to ask for help in case professional assistance is required.
6. Did you carry out some type of healing or administer some treatment for which training was required? [Not included in Ecuador survey]
In recent times, hospitalization periods have been shortened, with patients who still require specialized care being discharged. This hospital care has been replaced by rapid training of some member of the household to provide that care in the household.
Give injections, administer intravenous medicine, carry out dialysis, etcetera.
7. Did you prepare home remedies for some member of the household? [Not included in Ecuador survey]
There exists the possibility of administering alternative medicine that requires special preparations.
Prepare potions, cataplasms, ointments, and infusions.
Continued on next page
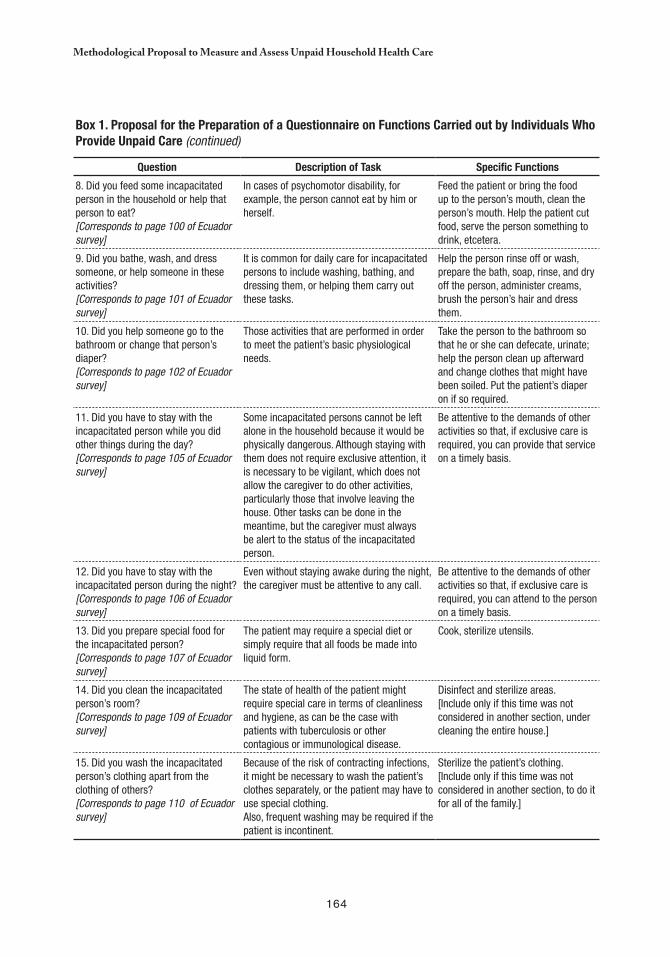
164
Methodological Proposal to Measure and Assess Unpaid Household Health Care
box 1. Proposal for the Preparation of a Questionnaire on Functions Carried out by Individuals Who Provide Unpaid Care (continued)
Question Description of Task Specific Functions
8. Did you feed some incapacitated person in the household or help that person to eat? [Corresponds to page 100 of Ecuador survey]
In cases of psychomotor disability, for example, the person cannot eat by him or herself.
Feed the patient or bring the food up to the person’s mouth, clean the person’s mouth. Help the patient cut food, serve the person something to drink, etcetera.
9. Did you bathe, wash, and dress someone, or help someone in these activities? [Corresponds to page 101 of Ecuador survey]
It is common for daily care for incapacitated persons to include washing, bathing, and dressing them, or helping them carry out these tasks.
Help the person rinse off or wash, prepare the bath, soap, rinse, and dry off the person, administer creams, brush the person’s hair and dress them.
10. Did you help someone go to the bathroom or change that person’s diaper? [Corresponds to page 102 of Ecuador survey]
Those activities that are performed in order to meet the patient’s basic physiological needs.
Take the person to the bathroom so that he or she can defecate, urinate; help the person clean up afterward and change clothes that might have been soiled. Put the patient’s diaper on if so required.
11. Did you have to stay with the incapacitated person while you did other things during the day? [Corresponds to page 105 of Ecuador survey]
Some incapacitated persons cannot be left alone in the household because it would be physically dangerous. Although staying with them does not require exclusive attention, it is necessary to be vigilant, which does not allow the caregiver to do other activities, particularly those that involve leaving the house. Other tasks can be done in the meantime, but the caregiver must always be alert to the status of the incapacitated person.
Be attentive to the demands of other activities so that, if exclusive care is required, you can provide that service on a timely basis.
12. Did you have to stay with the incapacitated person during the night? [Corresponds to page 106 of Ecuador survey]
Even without staying awake during the night, the caregiver must be attentive to any call.
Be attentive to the demands of other activities so that, if exclusive care is required, you can attend to the person on a timely basis.
13. Did you prepare special food for the incapacitated person? [Corresponds to page 107 of Ecuador survey]
The patient may require a special diet or simply require that all foods be made into liquid form.
Cook, sterilize utensils.
14. Did you clean the incapacitated person’s room? [Corresponds to page 109 of Ecuador survey]
The state of health of the patient might require special care in terms of cleanliness and hygiene, as can be the case with patients with tuberculosis or other contagious or immunological disease.
Disinfect and sterilize areas. [Include only if this time was not considered in another section, under cleaning the entire house.]
15. Did you wash the incapacitated person’s clothing apart from the clothing of others? [Corresponds to page 110 of Ecuador survey]
Because of the risk of contracting infections, it might be necessary to wash the patient’s clothes separately, or the patient may have to use special clothing. Also, frequent washing may be required if the patient is incontinent.
Sterilize the patient’s clothing.[Include only if this time was not considered in another section, to do it for all of the family.]
165
Mercedes Pedrero-Nieto
An important lesson of the Ecuador survey was the need to ask questions about caregiving during the final portion of the interview. During the pilot test of the survey, the fieldwork team of the National Statistics and Census Institute (INEC, Instituto Nacional de Estadística y Censos) observed that after the section on caregiving, the state of mind of the interviewees made it virtually impossible to continue the survey. In fact, several case studies on caregivers for incapacitated persons detected serious emotional problems among those doing the caregiving, including depression, which according to these studies affected 36 percent of these household workers. The experience of the INEC pilot survey was that the interview causes caregivers to confront the painful reality of their daily routine and from that point on it is very difficult to continue to obtain reliable information (70).
FINAL COMMENTS
There is growing social awareness across all sectors about the recent increase in chronic degenerative diseases among a growing number of dependent persons that affect their basic vital activities. Certainly it is not unusual to hear public officials refer to the need to promote policymaking directed toward older adults. The problem is that unless accompanied by concrete measures —particularly the allocation of sufficient budgetary funds— these declarations are just empty words, since “ … neither health nor social services personnel would tolerate an increase in the amount of care they provide if it were not accompanied by a proportionate increase in resources allotted for professional care” (70).
Within households that provide care for an incapacitated person, there is often an older adult, increasing the risk of that person becoming yet another incapacitated person, more by way of exhaustion, exertion that exceeds their capacities, and stress. Thus the lack of public care could be exacerbated as a result of the domino effect: one dependent person drags down the next one —that is, the initial dependent person’s caregiver— and so on.
In addition to much-needed institutional support, even if it is only partial, other policy measures could be implemented that would benefit family caregivers, such as tax exemptions and discount cards, as well as provide greater flexibility without a reduction in benefits to caregivers who are also salaried workers. Just as importantly, there would have to be recognition of family caregivers as relevant actors in economic and social life. As Durán points out, “ … there are still no symbolic mechanisms in terms of reinforcement and compensation that officially authorize social and legal recognition of the function of caregivers … There is a need for a social, legal, and economic title and statute that provides special protection to those who, for whatever reasons, take charge of the ongoing care of dependent persons despite the high cost to their own lives that this prolonged devotion causes” (70).
This recognition, however, cannot come from the caregivers themselves, as the aforementioned report states: “ … the political forces and the social actors do not fear the
166
Methodological Proposal to Measure and Assess Unpaid Household Health Care
reactions or claims of this group of people to whom have been transferred the burdens that others have been able to avoid, and who cannot throw off those burdens because of their social weakness, their isolation, and the psychological coercion they face as a result of their own traditional process of education” (70).
What is indeed clear is that there cannot be indifference in the face of a future that is unavoidable for everyone. This topic involves a problem that affects society as a whole, given that the adult of today is the old person of the future and the young people will be the adults. Adults are the people who build lives and wealth from day to day with their labor and from the way in which they operate financial systems based on usury. There is no system of saving (given the current rules) that can resist surges of inflation and the financial risks of a globalized economy where money has neither national nor social responsibility. Only an organized society aware of this future can create alternatives for a more just society in which people who have attained longevity can enjoy the decent lives they deserve.

167
chapter 9
The Invisible Costs of Caring for Patients in the Household:
A Chilean Case Study
Cc
Inés C. Reca, Madelin Alvarez, and M. Emilia Tijoux
INTRODUCTION
The true measure of a society is how it treats it weakest members.
In recent decades, several Chilean studies on the care of patients in the household have focused on two main areas of interest. The first relates to new problems in the health field associated with the gender approach (see, among others, Díaz and Schlaen (71)
and Díaz (72) to cite Chilean research only), and the second reveals an interest, widely shared with divers studies realized in the country, in uncovering “invisible” work of women in the household (73–79).
The work of these women, which is largely unpaid, comes to light only in describing the tasks involved in caring for chronically ill or disabled patients.1 Chilean case studies also introduce the profile of caregivers of ill family members —in most cases women— who not
Chronically ill patients are persons afflicted with a disease that endures over time, including periods of stability and others where their health 1
takes a turn for the worse, commonly referred to as “health crises.” People with disabilities experience limitations that prevent them from fully participating in society, whether due to a physical, psychological, or sensory impairment.

168
the Invisible Costs of Caring for Patients in the Household
only provide care but must also balance those responsibilities with other domestic chores —still considered the duties of “housewives”— and oftentimes with other paid activities.
On one hand, the care of chronically ill or disabled persons in the household necessitates open access to hospital resources. On the other —particularly among lower income households— it requires a shift of the burden of care and other responsibilities onto family members who, in practical terms, must assume all responsibility for caring for these patients and ensure that they get to health care centers if their conditions worsen.
ObJECTIVES AND METHODOLOGY
The objectives of this study are: i) to describe and analyze the work carried out by the caregivers of chronically ill or disabled family members in the household, and ii) to determine the time they spend caring for such patients in terms of paid and unpaid care.
The study methodology included the following components:
Collection of the data via questionnaire combining open and closed-ended questions, 1) as well as interviewer training on data collection techniques and issues.Open-ended questions to collect specific information on each case, perceptions on the 2) types of care different caregivers combine or support, and the emotional and psycho-logical costs involved in the care of chronically ill or disabled patients for caregivers and other members of the household.Preparation of case files with observations that interviewers considered relevant in 3) terms of the caregiver’s understanding of the required care, the problems faced by care-givers, and the background information of the chronically ill or disabled person.Closed questions to evaluate the time spent on different aspects of care by the primary 4) caregiver or by other household members, using a registry to reconstruct the caregiv-er’s activities (primary and secondary) on any given weekday for a period of 24 hours (1,440 minutes).2 Also examined were the types of care provided to the chronically ill or disabled patient and the sociodemographic characteristics of the caregiver as well as those of the patient, including his or her health condition.
Patients in the case study were selected on the basis of two criteria: type of disease and household socioeconomic level. The sample included 21 patients: three at each socioeconomic level considered for each of the disabling chronic diseases, as well as other disabling diseases with a favorable short-term prognosis. The socioeconomic level was classified as high, average, or low, pursuant to the indicators of family income, head-of-household occupation and education level, and household type. Due to the limited size of the sample, the data and conclusions of this study are not generally applicable. Additionally,
Specialized literature indicates differences in the routines followed on weekends and holidays, which would need to be taken into account 2
in a more expanded study.
169
Inés C. Reca, Madelin Alvarez, and M. Emilia Tijoux
A larger sample would be necessary to ensure statistical significance, as the present sample only includes 21 cases.3
The Katz index of Activities of Daily Living (ADL) was used to measure the patients’ level of independence; however, the Katz index does 4
not measure patient psychological dependency.
Existing networks or those established by the family with larger groups, such as neighbors, patient groups, and philanthropic organizations, 5
may also have play a significant role in patient care.
some conclusions from the cases studied may be regarded as hypotheses for the problems posed.
Due to the multiple illnesses that entail disabilities or lead to a terminal stage of patient 5) care, designing a representative sample for the case studies was complex.3 Accordingly, the following were considered:
The epidemiological importance of different diseases, based on the country’s epi-■■
demiological profile;The percentage of the elderly population, as well as children and young people;■■
The inclusion of temporary disabilities with a favorable prognosis for recovery; ■■
and Consideration of diseases, which, although different in terms of their causes and ■■
symptoms, require similar care when the patient is most dependent.
Types of diseases and disabilities selected for this study included AIDS patients (diagnosed but not in a terminal phase), patients suffering the effects of vascular accidents, diabetic patients with lower limb amputations, newborns with hypoxia, Alzheimer’s patients, adolescents suffering temporary depression, and multiple trauma victims. The research strategy sought to:
Identify the common types of care provided to the chronically ill or disabled, associated 1) with the types of disease or disability and the patients’ level of dependency.4
Determine if family members (one or more) provide care on an unpaid basis and if the 2) patient receives ongoing or occasional care, or care in specific situations by profession-als or paid nonprofessionals.
In order to address these two issues, data were compiled on numerous aspects of the care received by chronically ill or disabled patients in the household, including who provides such care and for how long; the capacity of caregivers to take on additional activities or hold a job; household type, including family composition; and the degree to which family members outside the household interact with the patient or contribute to his or her care.5
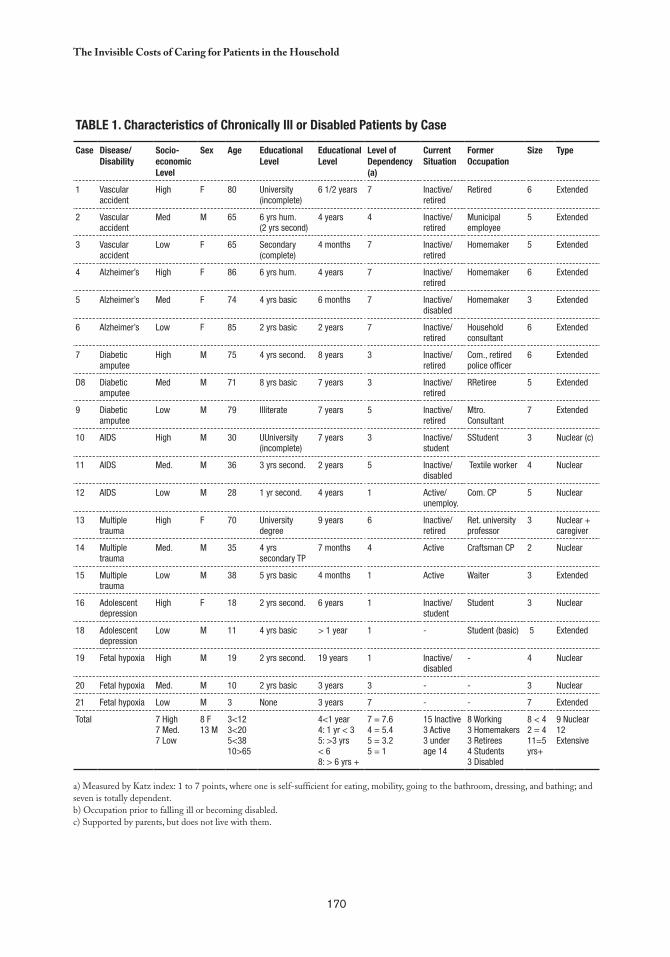
170
the Invisible Costs of Caring for Patients in the Household
Table 1. Characteristics of Chronically Ill or Disabled Patients by Case
Case Disease/Disability
Socio-economic level
Sex age educational level
educational level
level of Dependency (a)
Current Situation
Former Occupation
Size Type
1 Vascular accident
High F 80 University (incomplete)
6 1/2 years 7 Inactive/retired
Retired 6 Extended
2 Vascular accident
Med M 65 6 yrs hum.(2 yrs second)
4 years 4 Inactive/retired
Municipal employee
5 Extended
3 Vascular accident
Low F 65 Secondary (complete)
4 months 7 Inactive/retired
Homemaker 5 Extended
4 Alzheimer’s High F 86 6 yrs hum. 4 years 7 Inactive/retired
Homemaker 6 Extended
5 Alzheimer’s Med F 74 4 yrs basic 6 months 7 Inactive/disabled
Homemaker 3 Extended
6 Alzheimer’s Low F 85 2 yrs basic 2 years 7 Inactive/retired
Household consultant
6 Extended
7 Diabetic amputee
High M 75 4 yrs second. 8 years 3 Inactive/retired
Com., retired police officer
6 Extended
D8 Diabetic amputee
Med M 71 8 yrs basic 7 years 3 Inactive/retired
RRetiree 5 Extended
9 Diabetic amputee
Low M 79 Illiterate 7 years 5 Inactive/retired
Mtro. Consultant
7 Extended
10 AIDS High M 30 UUniversity (incomplete)
7 years 3 Inactive/student
SStudent 3 Nuclear (c)
11 AIDS Med. M 36 3 yrs second. 2 years 5 Inactive/disabled
Textile worker 4 Nuclear
12 AIDS Low M 28 1 yr second. 4 years 1 Active/unemploy.
Com. CP 5 Nuclear
13 Multiple trauma
High F 70 University degree
9 years 6 Inactive/retired
Ret. university professor
3 Nuclear +caregiver
14 Multiple trauma
Med. M 35 4 yrs secondary TP
7 months 4 Active Craftsman CP 2 Nuclear
15 Multiple trauma
Low M 38 5 yrs basic 4 months 1 Active Waiter 3 Extended
16 Adolescent depression
High F 18 2 yrs second. 6 years 1 Inactive/student
Student 3 Nuclear
18 Adolescent depression
Low M 11 4 yrs basic > 1 year 1 - Student (basic) 5 Extended
19 Fetal hypoxia High M 19 2 yrs second. 19 years 1 Inactive/disabled
- 4 Nuclear
20 Fetal hypoxia Med. M 10 2 yrs basic 3 years 3 - - 3 Nuclear
21 Fetal hypoxia Low M 3 None 3 years 7 - - 7 Extended
Total 7 High7 Med.7 Low
8 F13 M
3<123<205<3810>65
4<1 year4: 1 yr < 35: >3 yrs < 68: > 6 yrs +
7 = 7.64 = 5.45 = 3.25 = 1
15 Inactive3 Active3 under age 14
8 Working3 Homemakers3 Retirees4 Students3 Disabled
8 < 42 = 411=5 yrs+
9 Nuclear12 Extensive
a) Measured by Katz index: 1 to 7 points, where one is self-sufficient for eating, mobility, going to the bathroom, dressing, and bathing; and seven is totally dependent.b) Occupation prior to falling ill or becoming disabled.c) Supported by parents, but does not live with them.
171
Inés C. Reca, Madelin Alvarez, and M. Emilia Tijoux
The female caregivers in this study were subjected to emotional stress, including feelings of fear, helplessness, and a heightened sense of 6
responsibility, insecurity, and anxiety, which are known to cause digestive disorders, insomnia, depression, and irritability.
PRIMARY FINDINGS
A main focus of the study was the characteristics of the family members and nonfamily members who served as caregivers of the chronically ill or disabled in the household. Accordingly, during the first household visit, interviewees were asked to disclose all those persons involved in the patient’s care in order to identify the primary caregiver, defined as the person who cares for the patient most of the time. All others involved were identified as “secondary caregivers.”
The care received by chronically ill or disabled patients included various characteristics: i) type of disease or disability affecting the patient ii) age of the patient, particularly in the case of elderly patients suffering from chronic diseases or conditions such as Alzheimer’s or vascular accidents iii) prospects for the patient’s recovery (for example, multiple trauma patients) and iv) household socioeconomic level, composition, and size.
The vast majority of those who care for chronically ill or disabled patients in the household, “the caregivers,” are women. In the 21 cases studied, there were two male primary caregivers. As observed, the characteristics of caring for the chronically ill and disabled in the household has profound implications in terms of gender, including unpaid care, a strong emotional commitment and psychological burden, and extensive sacrifice of the caregiver’s personal time.6
The prolonged working days involved in caring for chronically ill or disabled patient leads to fatigue and caregivers must also contend with serious limitations in meeting their own needs and pursuing personal interests. Although there are patient care organizations and networks in Chile, including volunteer and religious associations, none were referenced in the cases studied.
In most of the cases observed herein, care was provided exclusively by family members (one or more) or, less frequently, by women who were paid for their services, who were neither strictly professional nor exclusively concerned with patient care in all cases. The presence of paid caregivers increases appreciably with the costs of patient care. The few cases of paid care work examined herein involved medium- and high-income households, especially the latter, and households with patients who required rigorous care (cases of Alzheimer’s disease and fetal hypoxia).
PRIMARY CAREGIVERS
It was observed that primary caregivers were predominantly women (19), as well as close family members: mothers (six), wives (four), daughters (four), and one aunt. Only two
172
the Invisible Costs of Caring for Patients in the Household
primary caregivers were men: a father caring for a son injured in an accident and, notably, a patient who cared for himself (suffering from AIDS). In several cases, primary caregivers alternated care work during the day and at night with secondary caregivers. Of the 12 secondary caregivers, eight were family members —daughters, mothers, and an adolescent sister— and four were paid caregivers. In five cases there was a third caregiver: two paid weekend care workers and two family members (sister and son-in-law).
Generally, care providers ages ranged from 39 to 58, with the exception of six ranging from 65 and 72 years —one of which was paid. Very few young people served as caregivers. As a rule, the care providers had no training and they mainly provided support, keeping the patient company and performing domestic chores. Only four of the 21 primary caregivers, and two of the 12 secondary care providers, had participated in patient care courses offered by the Red Cross, the Hospital Sótero del Río, or Hospital Barros Luco.
With respect to employment status, four of the 16 primary caregivers had stopped working (two to care for an AIDS patient, one for a diabetic amputee, and another for a fetal hypoxia patient). In addition to caring for a chronically ill or disabled patient, half of the 16 family caregivers participated in paid activities such as selling clothes or handicrafts, sewing, laundry and housekeeping activities, raising livestock, or toy making. Among low-socioeconomic (SES) households, such activities supplement the family income, while among higher SES households they seem to be forms of distraction.
The profile of the caregiver followed the tradition of the “self-sacrificing” women and their silent sufferings were uncovered only toward the end of the interviews through comments such as: “[this opportunity] allowed me to pour my heart out” or “it’s good to know that someone cares about me.” Consequently, their state of mind and health in some cases had suffered, with common complaints such as insomnia, stress, and irritable bowl syndrome, as well as heightened irritability, feelings of grief, anger, depression, loneliness, anxiety, and worry. Only six caregivers reported a steady state of mind. Some caregivers —especially those working in medium and high SES households— expressed interest in support services, such as receiving training and the possibility of home consultations.
FAMILY AND PAID CAREGIVER
In 16 of the 21 cases studied, the primary caregiver was a family member, and only in four cases did the caregiver have no relation to the patient. Of these four cases, three were paid and attended to patients in medium and high SES families. Distribution of family and nonfamily caregivers by family socioeconomic level in this study reveals that even among high SES families, the primary caregiver is a family member in four out of seven cases, negating the assumption that paid caregivers are the norm for medium and high SES families.
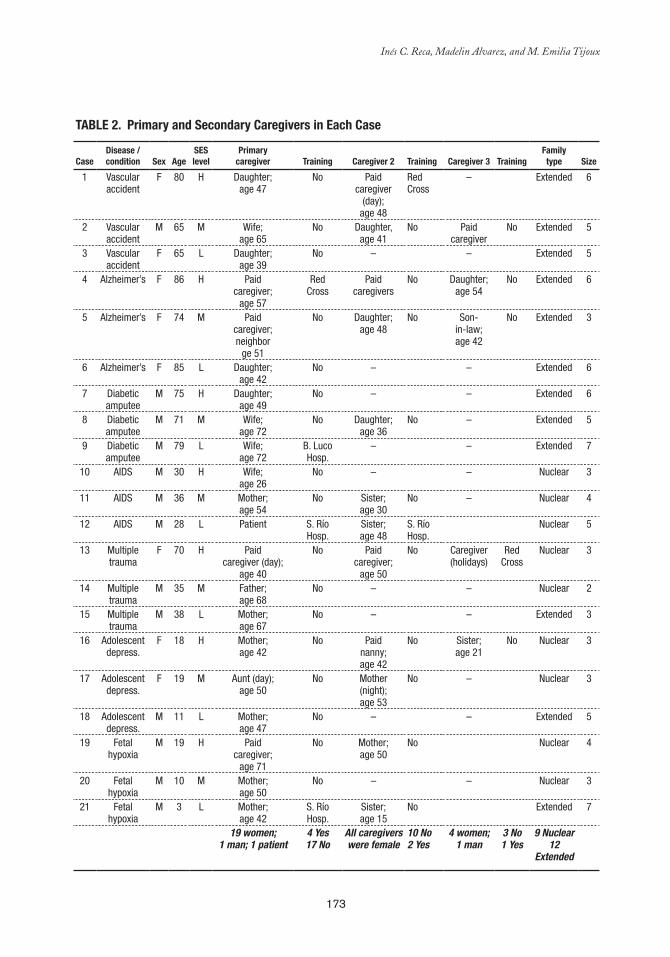
173
Inés C. Reca, Madelin Alvarez, and M. Emilia Tijoux
Table 2. Primary and Secondary Caregivers in each Case
CaseDisease / condition Sex age
SeS level
Primarycaregiver Training Caregiver 2 Training Caregiver 3 Training
Familytype Size
1 Vascular accident
F 80 H Daughter;age 47
No Paidcaregiver
(day);age 48
Red Cross
– Extended 6
2 Vascular accident
M 65 M Wife;age 65
No Daughter, age 41
No Paid caregiver
No Extended 5
3 Vascular accident
F 65 L Daughter;age 39
No – – Extended 5
4 Alzheimer’s F 86 H Paidcaregiver;
age 57
RedCross
Paid caregivers
No Daughter; age 54
No Extended 6
5 Alzheimer’s F 74 M Paidcaregiver;neighbor
ge 51
No Daughter; age 48
No Son- in-law;age 42
No Extended 3
6 Alzheimer’s F 85 L Daughter;age 42
No – – Extended 6
7 Diabetic amputee
M 75 H Daughter;age 49
No – – Extended 6
8 Diabetic amputee
M 71 M Wife;age 72
No Daughter; age 36
No – Extended 5
9 Diabetic amputee
M 79 L Wife;age 72
B. Luco Hosp.
– – Extended 7
10 AIDS M 30 H Wife;age 26
No – – Nuclear 3
11 AIDS M 36 M Mother;age 54
No Sister;age 30
No – Nuclear 4
12 AIDS M 28 L Patient S. Río Hosp.
Sister;age 48
S. Río Hosp.
Nuclear 5
13 Multiple trauma
F 70 H Paidcaregiver (day);
age 40
No Paidcaregiver;
age 50
No Caregiver(holidays)
Red Cross
Nuclear 3
14 Multiple trauma
M 35 M Father;age 68
No – – Nuclear 2
15 Multiple trauma
M 38 L Mother;age 67
No – – Extended 3
16 Adolescent depress.
F 18 H Mother;age 42
No Paid nanny; age 42
No Sister;age 21
No Nuclear 3
17 Adolescent depress.
F 19 M Aunt (day);age 50
No Mother(night);age 53
No – Nuclear 3
18 Adolescent depress.
M 11 L Mother;age 47
No – – Extended 5
19 Fetal hypoxia
M 19 H Paidcaregiver;
age 71
No Mother;age 50
No Nuclear 4
20 Fetal hypoxia
M 10 M Mother;age 50
No – – Nuclear 3
21 Fetal hypoxia
M 3 L Mother;age 42
S. Río Hosp.
Sister;age 15
No Extended 7
19 women; 1 man; 1 patient
4 Yes17 No
All caregivers were female
10 No2 Yes
4 women; 1 man
3 No1 Yes
9 Nuclear12
Extended
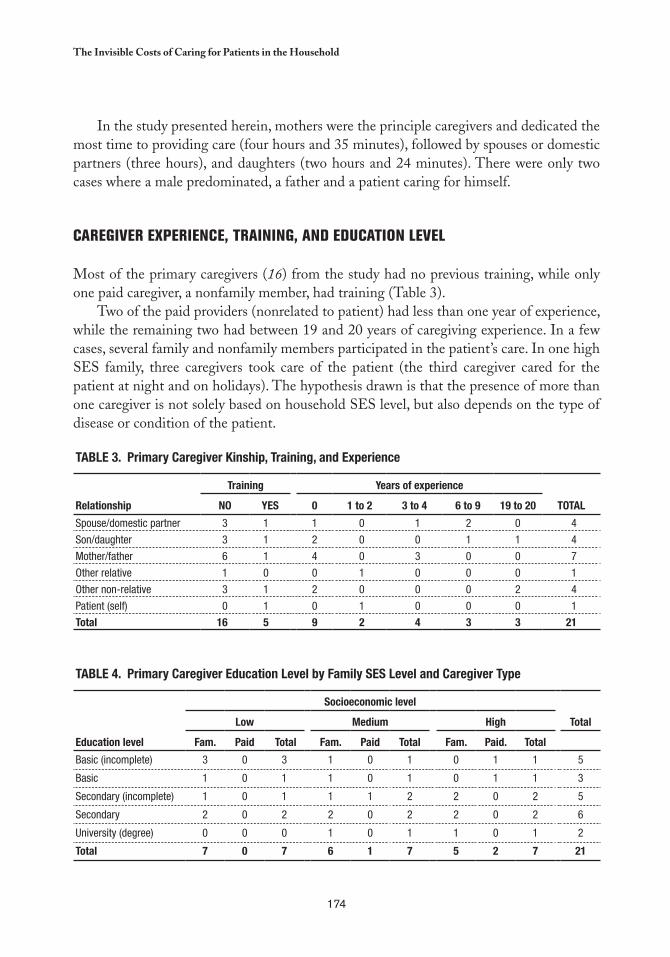
174
the Invisible Costs of Caring for Patients in the Household
In the study presented herein, mothers were the principle caregivers and dedicated the most time to providing care (four hours and 35 minutes), followed by spouses or domestic partners (three hours), and daughters (two hours and 24 minutes). There were only two cases where a male predominated, a father and a patient caring for himself.
CAREGIVER EXPERIENCE, TRAINING, AND EDUCATION LEVEL
Most of the primary caregivers (16) from the study had no previous training, while only one paid caregiver, a nonfamily member, had training (Table 3).
Two of the paid providers (nonrelated to patient) had less than one year of experience, while the remaining two had between 19 and 20 years of caregiving experience. In a few cases, several family and nonfamily members participated in the patient’s care. In one high SES family, three caregivers took care of the patient (the third caregiver cared for the patient at night and on holidays). The hypothesis drawn is that the presence of more than one caregiver is not solely based on household SES level, but also depends on the type of disease or condition of the patient.
Table 3. Primary Caregiver Kinship, Training, and experience
Relationship
Training Years of experience
TOTalNO YeS 0 1 to 2 3 to 4 6 to 9 19 to 20
Spouse/domestic partner 3 1 1 0 1 2 0 4
Son/daughter 3 1 2 0 0 1 1 4
Mother/father 6 1 4 0 3 0 0 7
Other relative 1 0 0 1 0 0 0 1
Other non-relative 3 1 2 0 0 0 2 4
Patient (self) 0 1 0 1 0 0 0 1
Total 16 5 9 2 4 3 3 21
Table 4. Primary Caregiver education level by Family SeS level and Caregiver Type
education level
Socioeconomic level
Totallow Medium High
Fam. Paid Total Fam. Paid Total Fam. Paid. Total
Basic (incomplete) 3 0 3 1 0 1 0 1 1 5
Basic 1 0 1 1 0 1 0 1 1 3
Secondary (incomplete) 1 0 1 1 1 2 2 0 2 5
Secondary 2 0 2 2 0 2 2 0 2 6
University (degree) 0 0 0 1 0 1 1 0 1 2
Total 7 0 7 6 1 7 5 2 7 21
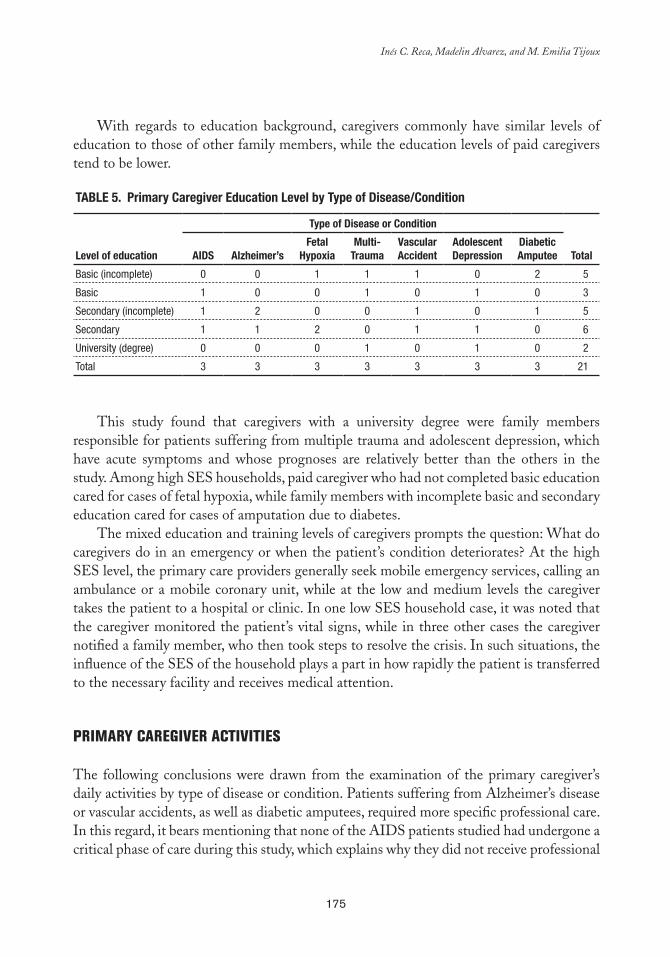
175
Inés C. Reca, Madelin Alvarez, and M. Emilia Tijoux
With regards to education background, caregivers commonly have similar levels of education to those of other family members, while the education levels of paid caregivers tend to be lower.
Table 5. Primary Caregiver education level by Type of Disease/Condition
level of education
Type of Disease or Condition
Total aIDS alzheimer’sFetal
HypoxiaMulti-
TraumaVascular accident
adolescent Depression
Diabetic amputee
Basic (incomplete) 0 0 1 1 1 0 2 5
Basic 1 0 0 1 0 1 0 3
Secondary (incomplete) 1 2 0 0 1 0 1 5
Secondary 1 1 2 0 1 1 0 6
University (degree) 0 0 0 1 0 1 0 2
Total 3 3 3 3 3 3 3 21
This study found that caregivers with a university degree were family members responsible for patients suffering from multiple trauma and adolescent depression, which have acute symptoms and whose prognoses are relatively better than the others in the study. Among high SES households, paid caregiver who had not completed basic education cared for cases of fetal hypoxia, while family members with incomplete basic and secondary education cared for cases of amputation due to diabetes.
The mixed education and training levels of caregivers prompts the question: What do caregivers do in an emergency or when the patient’s condition deteriorates? At the high SES level, the primary care providers generally seek mobile emergency services, calling an ambulance or a mobile coronary unit, while at the low and medium levels the caregiver takes the patient to a hospital or clinic. In one low SES household case, it was noted that the caregiver monitored the patient’s vital signs, while in three other cases the caregiver notified a family member, who then took steps to resolve the crisis. In such situations, the influence of the SES of the household plays a part in how rapidly the patient is transferred to the necessary facility and receives medical attention.
PRIMARY CAREGIVER ACTIVITIES
The following conclusions were drawn from the examination of the primary caregiver’s daily activities by type of disease or condition. Patients suffering from Alzheimer’s disease or vascular accidents, as well as diabetic amputees, required more specific professional care. In this regard, it bears mentioning that none of the AIDS patients studied had undergone a critical phase of care during this study, which explains why they did not receive professional
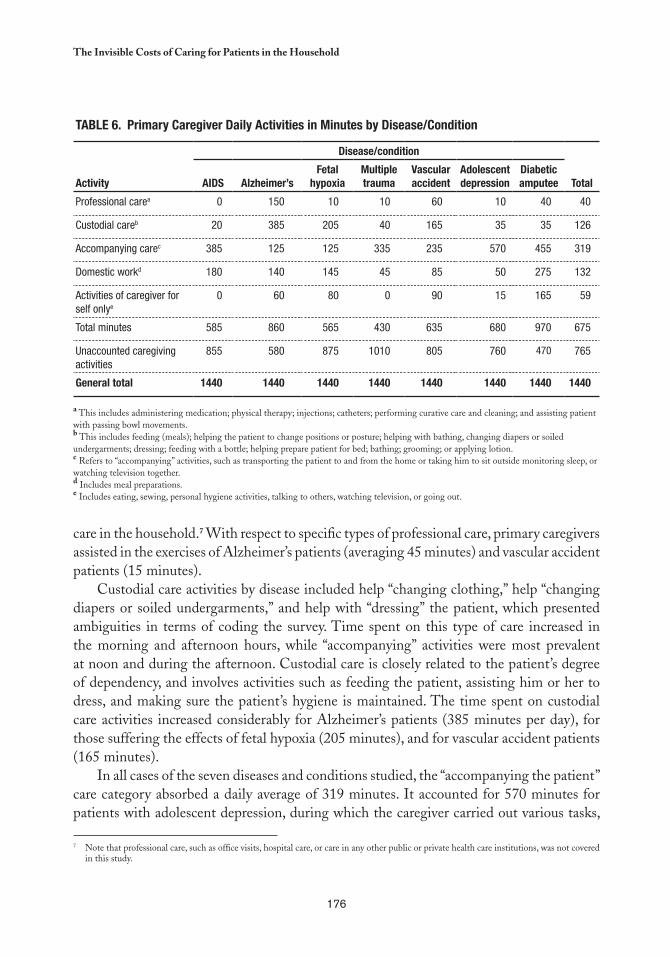
176
the Invisible Costs of Caring for Patients in the Household
care in the household.7 With respect to specific types of professional care, primary caregivers assisted in the exercises of Alzheimer’s patients (averaging 45 minutes) and vascular accident patients (15 minutes).
Custodial care activities by disease included help “changing clothing,” help “changing diapers or soiled undergarments,” and help with “dressing” the patient, which presented ambiguities in terms of coding the survey. Time spent on this type of care increased in the morning and afternoon hours, while “accompanying” activities were most prevalent at noon and during the afternoon. Custodial care is closely related to the patient’s degree of dependency, and involves activities such as feeding the patient, assisting him or her to dress, and making sure the patient’s hygiene is maintained. The time spent on custodial care activities increased considerably for Alzheimer’s patients (385 minutes per day), for those suffering the effects of fetal hypoxia (205 minutes), and for vascular accident patients (165 minutes).
In all cases of the seven diseases and conditions studied, the “accompanying the patient” care category absorbed a daily average of 319 minutes. It accounted for 570 minutes for patients with adolescent depression, during which the caregiver carried out various tasks,
Table 6. Primary Caregiver Daily activities in Minutes by Disease/Condition
activity
Disease/condition
TotalaIDS alzheimer’sFetal
hypoxiaMultiple trauma
Vascular accident
adolescent depression
Diabetic amputee
Professional carea 0 150 10 10 60 10 40 40
Custodial careb 20 385 205 40 165 35 35 126
Accompanying carec 385 125 125 335 235 570 455 319
Domestic workd 180 140 145 45 85 50 275 132
Activities of caregiver for self onlye
0 60 80 0 90 15 165 59
Total minutes 585 860 565 430 635 680 970 675
Unaccounted caregiving activities
855 580 875 1010 805 760 470 765
General total 1440 1440 1440 1440 1440 1440 1440 1440
a This includes administering medication; physical therapy; injections; catheters; performing curative care and cleaning; and assisting patient with passing bowl movements.b This includes feeding (meals); helping the patient to change positions or posture; helping with bathing, changing diapers or soiled undergarments; dressing; feeding with a bottle; helping prepare patient for bed; bathing; grooming; or applying lotion.c Refers to “accompanying” activities, such as transporting the patient to and from the home or taking him to sit outside monitoring sleep, or watching television together.d Includes meal preparations.e Includes eating, sewing, personal hygiene activities, talking to others, watching television, or going out.
Note that professional care, such as office visits, hospital care, or care in any other public or private health care institutions, was not covered 7
in this study.
177
Inés C. Reca, Madelin Alvarez, and M. Emilia Tijoux
such as taking them to and from the home (55 minutes), monitoring them while they slept (180 minutes), and watching television with them (185 minutes).
Although primary caregivers reported having responsibilities for meal preparation, none reported washing clothes or bed dressings, which may indicate that these tasks were perceived as general household chores. Time spent on “exclusive caregiver activities” increased in caring for Alzheimer’s patients, while watching television was observed in practically all cases selected, whether the primary caregiver watched alone or with the patient.
PRIMARY CAREGIVER ACTIVITIES bY FAMILY SOCIOECONOMIC LEVEL
Average time spent on professional care increased considerably for patients of medium and high SES households. High SES families spent threefold more time in such care activities than low SES families. Additionally, time spent by primary caregivers accompanying the patient as needed and performing household chores also increased significantly among medium and high SES families, although this was not the case with regard to time spent in patient custodial care, which was less among medium SES families.
With respect to the “professional care” category, such care among low SES families included the administration of drugs and injections, while in the case of medium and high SES families it included exercising the patient, encouraging intestinal evacuation, changing catheters, and performing curative treatment activities. Moreover, there was a notable increase in caregiver time spent administering drugs to patients of medium and high SES families.
With regard to custodial care, the activity of “changing diapers or soiled undergarments” was reported among caregivers of medium and high SES families, while caregivers of low SES families reported the activity of “changing.” This may reflect economic differences and availability of family resources —which are very important— to acquire certain supplies, in this case disposable diapers and undergarments, but it may also be due to different terminology usage. A similar observation was noted regarding the categories “put to bed” and “get ready for sleep,” which clearly indicates that the list can and should be improved for future studies.
The average time spent each day accompanying the patient increased with socioeconomic level, ranging from 276 minutes at the low SES level, 306 minutes at the medium level, and up to 374 minutes at the high level. “Monitoring sleep” was among the activities where a significant difference was noted, observed only in high SES cases.
Primary caregivers spent the most time (three hours and 10 minutes) on domestic chores in medium SES households, and less in high SES households (two hours and 12 minutes). Paid caregivers were responsible for keeping the patient’s bedrooms and bathrooms clean and for preparing the patient’s medication. However, caregivers for patients of low SES
178
the Invisible Costs of Caring for Patients in the Household
households spent an average of 48 minutes on domestic chores (seven cases), a variable which may be linked to family size or the possibility that somebody else is responsible for household chores.
PRIMARY CAREGIVER ACTIVITIES bY TYPE OF DISEASE/CONDITION
Specific care activities were most prominent among patients with Alzheimer’s disease, vascular accidents, and diabetic amputees, while caregivers spent the most time on custodial care for patients with Alzheimer’s, vascular accidents, and fetal hypoxia. Diabetic amputees required the most custodial care assistance in getting to the bathroom, bathing, and, to a lesser extent, feeding. No significant differences in routine daily activities were noted between weekdays and weekends. At all three socioeconomic levels, families normally gathered on the weekends at the home of the patient, who rarely left the household or received visits from friends.
Consequently, life for such families tends to have established routines that are repeated and reproduced without many interruptions. Such routines, largely organized around the chronically ill or disabled patients, greatly affect female family members who act as caregivers, causing fatigue, boredom and, in several cases, depression. In addition, the constant pace of this routine threatens to unseal the emotional cement of the relationship, which over time can transform into a bond of simple care and concern. As such, this situation can have negative consequences for both patients and family caregivers, especially in lower SES families who lack the means to pay for private caregivers. This situation intensifies their isolated feelings as, unlike their counterparts in medium and high SES families, such caregivers often lack contact with other members of the family and have few visitors, and thus their social interaction is limited.
CONCLUSIONS
The cases studied demonstrate significant differences, owing to a variety of factors. One factor is that in-home caregivers are largely women, who not only care for the patient, but must often “reconcile” this responsibility with socially defined tasks of “housewife,” and perhaps remunerated work. In the 21 cases studied, only three caregivers were men, two primary caregivers and one secondary. The daily workload of the caregivers varies depending on the requirements of the patient’s care and on whether or not their work is supported by others, such as family members or neighbors.
Due to the limited size of the sample, its nonrandom character, and the variability of pathologies that can affect the chronically ill or disabled, the data and assertions introduced
179
Inés C. Reca, Madelin Alvarez, and M. Emilia Tijoux
in this study are not generally applicable; rather they are hypothesis that can be used as a basis for subsequent studies and questions for society to address.
The methodological contributions to the research were important. It was particularly useful to test a suitable methodology to measure the work involved in caring for in-home patients, which can certainly be refined and specified in later studies. The study developed an instrument to gather data and record activities carried out on a given weekday (24-hour period), and thus it can be used as a tool for broader quantitative studies, as well as for coding and procedures for processing the data.
Most of the cases studied reveal that such care is provided exclusively by family members, because costs increase considerably when hiring paid caregivers; in this regard, the few noted cases of paid caregivers were from medium and high SES families for patients requiring exhaustive care, such as Alzheimer’s and fetal hypoxia patients.
Most of the patients studied (18 of 21) received assistance through the National Health Fund (FONASA), which to date does not include a program tailored specifically to the needs of chronically ill or disabled patients cared for in the household. Approximately one-third (nine cases) of the cases involved financially dependent patients, meaning that, in addition to providing care for their chronic illness or disability, other family members were financially responsible for their survival.
In evaluating patient physical or functional autonomy using the Katz index, six patients were totally dependent, five were currently able to care for themselves, and the rest had varying degrees of dependency. Chronically ill or disabled patients who were aware of their situation suffered from the dependency caused by their condition. The dependency significantly impacted their daily routines, as well as the tasks performed by their caregivers and other family members. Consequently, according to the Katz index, in cases of adolescent depression, even when patients were physically able to care for themselves, they still required the companionship and ongoing incentive of their caregivers, as their dependency was primarily psychological. A similar situation was observed in one of the fetal hypoxia patients (high SES family), who could care for himself, but needed permanent company.
A number of questions arise based on these situations, such as: How does a patient who is aware that his caregiver is constantly available take over most of his or her daily tasks? What happens to the dynamic of the caregiver-patient relationship when the care routine suffers due to caregiver fatigue, or lack of training, motivation, or ability to care for him or herself? It is important to note that the chronically ill and disabled patients observed in this study received little professional care, and the care they did receive was unsupervised.
In addition, during the exercise of recording the primary caregiver’s daily activities over a 24-hour period (weekday), the need for using a “list of care activities” became apparent, with the goal of obtaining more precise measurements and minimizing underreporting. Secondary caregiver activities revealed that they spent the most time in caring for patients during afternoon hours, particularly in “supporting” or custodial activities —administering medication, feeding, and patient hygiene— although they also spent time early in the
180
the Invisible Costs of Caring for Patients in the Household
morning before work and at night, helping the patient in bedtime preparation activities. Their second most common task was spending time with the patients, once again demonstrating the importance of not leaving the patient alone.
Moving into the future, and with a view to bringing greater visibility and recognition to this type of work, emphasizing its social and economic contribution to maintaining health, there is an overriding need to design and implement programs that support the care of the chronically ill and disabled in the household. Accordingly, new studies on in-home care of the chronically ill and disabled should help define a system for classifying patient care activities and, in the medium term, establish the equivalent economic cost of such care in the system of national accounts for unpaid care. More importantly, in the short term there is a need to aggressively promote the development of public services and assistance for the care of disabilities and disabling diseases.
181
chapter 10
Women, Working, and Caring in this Millennium
Cc
Pat Armstrong*
Women hold an overwhelming majority of caregiver positions, in the household, through voluntary organizations, and in the labor force. Their work is often unseen and undervalued, and rarely recognized as skilled. When providing
care, a woman’s health is often a risk, as is her present and future economic position if the work is unpaid. Unpaid care constitutes a huge underground economy. In 1998, Canadian estimates, based on the low domestic employee wages, calculated the value of unpaid, informal caretaking as nearly CAN$51 billion, significantly higher than the CAN$42 billion total labor income of paid workers in health and social service sectors (80). Estimates have also indicated that 80 to 90 percent of care work is unpaid, with poorer women providing a disproportionate share (81). There is little reason to believe that such patterns are unique to Canada, rather they exist throughout the world (82).
Given that other chapters in this collection discuss both the unseen nature of caretaking and the economic consequences of unpaid care, in this chapter guidelines are developed that link care work to policy and practices, which can serve as a basis for discussion and further development. Such guidelines should be simultaneously concerned with similarities and differences. There are many common patterns in women’s work, thus it is useful to associate them as a group and examine general patterns in their work, economic conditions, and relationships. This also opens a window into what women share within and across national lines, while exposing both the forces that maintain these patterns and those that
* Professor, Department of Sociology and Women’s Studies, York University, Toronto, Ontario, Canada. Email: [email protected].
182
Women, Working, and Caring in this Millennium
change them. This approach has helped expose the nature and conditions of unpaid work taken on by women and to compare such characteristics to the unpaid work of men.
Assuming similarities in different areas, research indicates that unpaid care work has increased significantly in recent years. In many countries, better nourishment, shelter, and health care means people live longer, often with chronic conditions. With new technology, more people survive with disabilities and more comprehensive care can be provided in the household.
When comparing women as a group, it is apparent that women take on more continuous and demanding care work than men, working longer hours with more responsibilities in both caretaking of others and their own personal care. Such intense and time-consuming labor means that women’s lives are more disrupted by unpaid care, thus they are more likely to face low wages and worse paid working conditions (83, 84). In addition, research shows that women are often subject to violence and other risks when they provide care. Thus, it is not surprising that women provide unpaid care for others often end up in poor health. Yet, in spite of the heavy toll of caretaking, research also indicates that it can be rewarding for women, whether it is paid or unpaid. Grouping women has allowed for the examination of the varied patterns throughout the world.
At the same time, fundamental differences among women are linked to their time; their economic, social, political, racial, cultural, and physical positioning; and to their health and personal skills. These differences affect their overall care responsibilities and their access to resources. Poor women in the most affluent countries do more of the unpaid and low paid care work, while women from poor countries take on substantially more unpaid care work than those in the wealthy countries. Indeed, migrant women caretakers from poorer countries are often paid for only a portion of the hours actually worked (85). Where a woman lives, whether she has children, the health of her children, and the quality of her partnerships all have an impact on the nature of her caregiving activities. The care required for someone recovering from surgery at home is different than the care required for a child with severe disabilities. There are also different demands involved in providing personal care, financial support, or help with shopping.
A range of approaches or slices are required to understanding these differences. Slicing not only highlights the differences between the women and those they care for, but also allows for unique viewpoints of similar issues, circumstances, and evidence. For example, the interests and needs of the care providers, the care recipients, and other household members may all be different, creating tension and stress. Similarly, the work involved in caring for an elderly woman may change significantly if she develops Alzheimer’s.
Slicing also allows us to see how little is “natural” about women’s work, in general, or in caretaking in particular. The wide variety of tasks, skills, and time needed in unpaid care work indicates that it is a socially constructed responsibility, rather than innate. Moreover, there is a substantial difference in the caretaking responsibilities of women and men, reinforcing this claim. When viewed within unequal relationships, it is easier to understand the structures and processes that help women develop caretaking skills.
183
Pat Armstrong
This leads to a second guideline: analyses of women’s work should focus on women within both their general and specific environments, separately and in their intersections. The context of women’s work is influenced by globalization, changes in nation states, new technology, the increasing emphasis on markets, communities, and families. These influences, along with ideas about gender, race, culture, sexuality, equity, and age affect the distribution of income, power, symbols, social supports, and services, which all help shape women’s caregiving roles. It is equally important to recognize that these individual and collective roles are frequently contradictory, leading to tension and conflicts. Such functions cannot be simply classified as good or bad for all women, as some can be positive for one woman, while undermining another, or simultaneously support and harm the same woman. Moreover, some functions have supported women in the past, but no longer do so. Such contradictions need to be addressed as they are, rather than obscured or dismissed. It is important to recognize that human hands shape these factors and the alternatives. Women can be, and are, enabling agents of change. There are numerous possibilities and women have the capacity to mold them.
In spite of notions about inevitability, globalization is about processes that result from actual decisions and practices, rather than forces beyond human control. Nations still establish the processes for deciding how, when, and where care is provided. In offering —or negating— support, benefits, services, and regulations, state practices establish the conditions for care in and outside the formal economy. The state plays a fundamental role in determining how political, material, and symbolic resources are distributed among markets, communities, households, and individuals. Indeed, states are central in determining what is public and what is private in the formal economy, as well as outside the formal economy, such as what is an individual or family responsibility (86).
Governments, for example, set the conditions for health care in the formal economy and for in-home care through their support, or lack of support, of a wide range of programs and services, as well as through messages they transmit regarding responsibility, particular to women and families. The benefits and negative consequences of these state actions —or lack of actions— are unevenly distributed. Thus, in order to create good conditions for both paid and unpaid care, it is necessary to recognize the active and inactive state and global forces, as well as determine who they benefit and how.
While powerful forces limit the options, still there are choices to be made. These choices can have important consequences for women and their work and should be considered in developing overall strategies for care, a crucial step in creating policies that recognize unpaid care.
Some market mechanisms that have become popular with governments have a negative impact on the nature and distribution of both care and care work. Thus it is important to ask where, when, and under what conditions are such mechanisms appropriate. In spite of their popularity, there is reason to believe that these mechanisms will negatively affect the provision of paid care, as well as the conditions under which providers work. At the
184
Women, Working, and Caring in this Millennium
same time, they increase inequality, providing additional caretaking to communities and households where the time, skills, and stress involved become seriously undervalued. In order to determine how markets work best, along with studying existing evidence, more evidence is needed to test those hypotheses central to current market promotions.
Like globalization, communities have a variety of meanings. Giving them definitions is important as governments throughout the western world consider moving care into the communities, which include not-for-profit and for-profit organizations, providing care with or without payment. Religious organizations, usually considered part of the community, often define care as a woman’s duty and promote such responsibility. Friends and neighbors also make up the community, however policymakers mainly refer to families when they talk about sending care to communities, and within families they usually mean women. Such families are usually assumed to be heterosexual unions based on loving relations, mutual support, and a male breadwinner. Yet, a great deal of research confirms that today fewer families fit this mold. In fact, in many families the father is unemployed or not even a part of the household. Many families do not have children that can afford to stay near home to care for them. And there are too many families characterized by violence (87).
Sending care to the community does not necessarily mean more local participation or control, nor does it mean more family togetherness . Indeed, the increased burden of care may undermine families and communities centered on reciprocal relationships, which often suffer when the stress and tensions increase. As Stacey Oliker (88) says based on her research on welfare,
“[W]e might find damage to personal networks and personal relationships, which could threaten families’ capacities to care. The damage might take the form of constriction and greater fragility in networks, the replacement of caregiving support with support for subsistence, and a decline in communal commitments to care.”
In the end, sending care to communities may mean little care, as without time, space, economic resources, and other support, innovation and participation might be stifled. Families often fall apart under stress and frequently leave women alone to provide the unpaid care.
One final point needs to be made here, with regards to care being “sent back home.” Such in-home care, which increasingly involves filling IV tubes or inserting catheters in high income countries, and looking after children with HIV or severe disabilities everywhere, was not common in the past. Rather it is a new, demanding kind of care that often requires special skills and considerable time, as well as intense physical and mental efforts.
This leads to the third guideline: namely, it is necessary to examine the ways globalization, states, markets, communities, and households intersect and influence each other. Especially in high income countries, the period following World War II was marked by increasingly clear distinctions between public and private sectors in the formal economy,
185
Pat Armstrong
between paid and unpaid work, families and labor market employment, and states and households. However, as we move into the new millennium, these distinctions have become increasingly unclear, making it more difficult to distinguish the links and more difficult for women to draw boundaries among them.
Public/private partnerships are one example of the blurring in the formal economy, while more complex medical homecare exemplifies the blurring in the household and community. In the first example, the public sector mimics the private one, eliminating differences once attributed to public sector jobs and services. In the second example, households are less private as more outsiders enter to assess needs and offer services. Concurrently, some boundaries are blurred, as rigid lines are drawn in some areas to reduce public support. For example, care for new mothers no longer qualifies for public support. Also, health care becomes an individual or family responsibility as more people in hospitals are sent home for care.
In examining these various contexts and developments, it is important to understand how they influence each other, as well as how such influences change with time and location.
The fourth guideline worth mentioning is the need to address critical questions regarding who pays for care and at what cost, even when the focus is unpaid care. Funding and payment are complex issues, going beyond a simple question of money. The method of payment, criteria, and use of payments are issues with significant consequences, both in accessing formal care and in terms of caregiver costs, both paid and unpaid. For example, paying women who provide in-home care for relatives, as proposed in some countries, may reinforce their sense of responsibility yet fail to provide them with adequate support. Paying for in-home formal nursing care, while offering no compensation for services such as cooking and cleaning, which is common in Canada, can undermine the health of those with complex needs, as well as the value of such work. It is important to examine all factors that influence care, not only unpaid care.
It is important to understand the paid and unpaid care work of women as integrally linked, which brings up the fifth guideline. As governments have expanded public services and care has moved into the public sphere, more paid jobs have become available to women, reducing their unpaid care work. As such, the workload and skills involved in care has become more visible and valued. However, as cutbacks in public funding, combined with new technology and innovative ideas about care provision, has moved care into the households, the skills and labor time involved in caretaking have become unclear. As such, the paid work sector loses value, as care work seems manageable by any woman, simply by virtue of being a woman (89).
The sixth guideline relates to the context and importance of questions about timing and location of care: where, when, and for how long must care be provided? Social, cultural, racial, physical, age, sexual and psychological factors all have an impact on the nature of the work needed and provided. Physical location must be considered as rural and urban areas are different, and households within each vary depending on income. Too often,
186
Women, Working, and Caring in this Millennium
the emphasis on evidence-based decision making leads to a standardized, single formula for care, which may explain the emphasis on “efficiency,” defined in monetary terms and “accountability,” defined in micromanagement terms. “If you can’t measure it, you can’t manage it,” is a common phrase in public management circles, as is “doing the right thing at the right time.” Both phrases contribute to a “one-size-fits-all” approach, which limits the capacity to respond to individual needs, thus limiting the options and autonomy of the caretakers and those in need of care. Such evidence-based care is often part of the global influence of the high-income countries, and reflects an assumption that such technologies and approaches are relevant throughout the world.
Time interacts with space, and like space, it is about social relations; yet when time is money, care as a relationship may be sacrificed and there may be no time to care. With an increasing number of women in paid jobs, fewer have time to provide unpaid care. While women with economic resources may be able to buy the time of others, most have to speed up their work and sacrifice personal time to provide care. Thus, time should be considered to understand the demands on providers, the little control they have over their work, and the alternatives available to them. Time deficits for providers should be calculated into the care work equation, as women have been complaining long before recent shifts increased the care workload (90).
In turn, time issues are linked to assessing how much unpaid care is provided. In order to determine the workload and address the burdens and inequities of such care, measurements are needed. Yet, as the load is often invisible to the women taking it on and it overlaps with other domestic work, time required for care is difficult to measure. For example, when implementing a scheme for measuring primary tasks, results may give the impression that women at home rarely look after their children, largely because such care is a part of all their daily tasks. Similarly, when laundry and shopping duties increase because someone is sick, a woman is unlikely to add this to her care work time budget. Moreover, a man doing unfamiliar care work is more likely to valuate this time accurately, precisely because it is uncommon work for him and he is more likely to consider such care work as a primary task. In short, it is important to understand the location of care work to assess and accommodate different demands, while also calculating the time taken to provide such care.
The seventh guideline once again shifts to new terrain, drawing attention to the nature of power and the means women have of enhancing their control in providing and receiving care. Power is primarily about access to resources. Some resources are material, such as income and services, and medication and diapers, while others are political, such as the right to participate fully in key decision making, the right to equal pay and other employment protections, and the right to education and information. Some resources are social, such as having time and space to entertain and relax, while others are symbolic, such as recognizing care as time-consuming work that requires space, money, physical capacity, emotional involvement, skills, and social support. As more resources are distributed by market mechanisms, there are greater disparities in resources and thus in power. Research
187
Pat Armstrong
has demonstrated that those with the least choice in providing unpaid care experience the most negative health consequences from such work.
This leads to the final guideline and conclusion of this document. While there is still research work to be done, a great deal is already known about women’s unpaid work. One lingering question is how to make care visible and valued, while creating the conditions that allow women and men to care. The answer is based on this final guideline: namely, care should be understood as the objective, not the problem, and a relationship rather than simply as a task. All societies need to provide care and all people need care in different periods of their lives. The crucial aspects of care must be identified and maintained in the systems. Also, it is important to recognize the conflicting demands put on care providers, and then to determine the best way of handling them so women are left with the right to provide and receive care.
Deborah Stone (91) argues that we need “to make the essence of caring visible, not so much in order to make it countable and rewardable, but rather to render clear what it is that we want to provide in the public sphere.” In other words, it is crucial to recognize the rewarding aspects of care, keeping the values of care, however this is accomplished. Adding to Stone’s argument, it is necessary to do the same in the private sphere.
It is important to recognize the stress involved in relationships between caretakers and those they care for. Such stress often causes paid workers to contribute more hours to their jobs than they are paid for, and pushes unpaid workers beyond the point of exhaustion. In the case of both paid and unpaid care, defining care as women’s work alone is detrimental to their health and problematic in terms of measuring their contribution to health care.
Without both supports and alternatives, paid and unpaid care workers can become overly burdened by their work. Without collective responsibility for care, those with the least resources, with all probability, will take on the most burden and will find it the most difficult to provide care. By making care a visible objective, communities can offer solutions that give all their citizens the right to care.
Such solutions include developing a public health care system that offers services in various locations, while providing decent employment conditions. They also include basing strategies on notions of rights and responsibilities, as well as addressing inequalities, not only between women and men but also among women. Moreover, it is important to understand and accommodate differences in needs and capacities, while locating care in its global, economic, physical, and social contexts, taking into account relations among both people and services. In short, care must be the objective, not the problem.

189
chapter 11
Defining and Valuing Child Care:Lessons from Time Use Surveys in Major English-Speaking Countries
Cc
Nancy Folbre* and Jayoung Yoon**
How much time do parents devote to caring for their children, and how is this affected by factors such as family income, education, and paid employment? What is the appropriate way to assign this time an economic value? The advent of new large-
scale time diary surveys administered to representative samples of national populations makes it possible to answer such questions with some accuracy, although quantitative precision can conceal conceptual ambiguity. This chapter explores the difficulties of defining child care and its relevance to the valuation of parental child care activities.
Problems with measurement in this area are illustrated by comparisons of coding categories in recent time-diary surveys of four major English-speaking countries: Canada (1998), Australia (1997), the United Kingdom (2000), and the United States (2003). Lack of consensus over the boundaries between child care as a primary activity (based on the question “what were you doing?”) and a secondary activity (based on the question “were you doing anything else at the same time?”) has caused inconsistencies in the measurement of child care as a primary activity.
Such inconsistencies are even greater in broader measurements, whether based on secondary activity reports or particular questions regarding time spent “looking after children” or time in which the respondent had children “in his or her care.” The comparison
* Professor, Department of Economics, University of Massachusetts, Amherst. Email: [email protected]
** Graduate of the University of Massachusetts.
190
Defining and Valuing Child Care: Lessons from time Use Surveys in Major English-Speaking Countries
of Canadian and U.S. surveys, which used stylized inquiries to define supervisory responsibilities, illustrate that minor differences in wording can lead to significant variation in the reported results.
These measurement issues have important implications for the valuation of time devoted to child care. Most studies of care valuation rely on time explicitly devoted to a reported activity of care, ignoring the value of supervisory responsibilities for children that represent a constraint on other uses of time. This results in a large underestimate of the actual temporal demands that children impose. The 2003 American Time Use Survey can be used to illustrate the magnitude of this underestimate and to demonstrate an alternative approach to measure time dedicated to different types of child care.
DEFINING CHILD CARE
Most time-use surveys are categorized in terms of activities. People list primary activities in response to questions such as, “What were you doing during this time period?” The recent Australian and UK surveys designated responses as secondary activities when answering questions such as “Were you doing anything else at the time?” This list often includes leisure activities such as “listening to the radio” or “talking with friends,” while caring for children is often considered a secondary activity, as other time use researchers have pointed out (92).
Taking care of children is considered a responsibility as well as an activity, as some adults often feel constrained by the need to supervise young children, even when they are not engaged in an explicit activity with them (93,94). Supervision is often considered a background activity, or not considered as an “activity” at all. Despite efforts to harmonize different time use surveys, there are still ambiguities in the specification of primary and secondary child care time. Further, the scope of many definitions of secondary child care time remains unclear. To what extent do they capture “passive” or “supervisory” care?
Neither the Canadian nor U.S. national surveys include explicit questions regarding secondary activities. However, both acknowledge the diffuse nature of child care by including a special module to ascertain if individuals were “looking after children” (Canadian wording) or if “children were in their care” (U.S. wording). Activities listed in response to these questions were typically reported as secondary (95), yet in the U.S. survey, the wording “in their care” was designed to capture supervisory responsibilities as well (96).
All four surveys considered here questioned whom respondents were with, or “who else was there” while they were engaged in activity. The U.S. time use survey specifically asked if there was another person “in the same room” if the activity took place at home, or if there was another person “accompanying them,” if the activity took place elsewhere. Multiple individuals could be listed. Some inconsistencies exist in international comparisons with regards to spatial specification, as, unless restricted to “in the same room,” respondents may interpret the question as “in the same house” or “within shouting distance” (97). The “with whom” question provides
191
Nancy Folbre and Jayoung Yoon
another vantage point for assessing care responsibilities, one that has often been described as similar to the “in your care” designation because it, too, reaches beyond activity.
Nevertheless, it is important to emphasize that the mere presence of a child is conceptually distinct from having a child “in your care.” A child can be “in the care” of an adult even if napping in another room or playing in the backyard. Indeed, such spatial separation is a typical feature of passive or supervisory care. Conversely, the “with whom” variable could overstate child care responsibilities, including social activities in their definition, during which more than one adult shares the responsibility for a small child. Many leisure activities fall into this category (98,99).
Few time use surveys ask “for whom” an activity is conducted, although this contextual variable could add important information (97,100). Children increase the domestic labor burden in their households, adding tasks such as preparing their food, washing their clothes, purchasing new shoes, and cleaning up toys. Yet, many domestic activities benefit all household members at once: food is prepared for the entire family, all laundry is washed together, and others. Multivariate analysis of the impact of number and age of children on the level and distribution of domestic work could be a way of quantifying this effect (100).
A closer look at coding categories used by recent time use surveys of major English-speaking countries illustrates some specific problems that arise from inconsistencies in defining child care.
PRIMARY ACTIVITY TIME
Most cross-national comparisons of time devoted to child care utilize the Multinational Time Use Survey (MTUS) (101–103). The MTUS harmonizes small differences in coding of primary activities precisely in order to encourage such comparisons. The difficulty of harmonizing measures of secondary child care explains why so much attention has focused on primary child care activities. But while primary child care activities deserve special attention, they represent a distinct subset of all time devoted to child care. They should not be conflated with “time devoted to children” or “time that parents spend with children,” since some part of primary child care occurs in the absence of children. While aware of these distinctions, researchers sometimes use these terms synonymously (103).
To date, harmonization of such activities has mainly been limited to adjustments for disparate age categories and other demographic inconsistencies rather than for survey design or coding details, which require more serious consideration. Both U.S. and Australian surveys, unlike those conducted in Canada and the UK, include a coding category that confounds the distinctions between primary and nonprimary child care time by including child supervision —so called “passive care”— as a separate subcategory of primary care. The American Time Use Survey (ATUS) uses the phrase “looking after children,” while the Australian survey uses “minding children.”
192
Defining and Valuing Child Care: Lessons from time Use Surveys in Major English-Speaking Countries
None of the activity codes used in the four major English-speaking countries and in the Multinational Time Use Survey (MTUS) are precisely equivalent to ATUS code 03-01-09 or the Australian code 54, although the UK survey adds “supervision of a child” to the residual category (3819, other specified physical care and supervision of a child). The MTUS includes “all activities involving/in relation to child care, time spent with children or activities for the purpose of caring for children,” as well as a separate code (1109) for supervising children. Still, the U.S. and Australian primary activity codes are more detailed, reflecting a concerted effort to capture more passive forms of care. According to the published ATUS tables, in households where the youngest child was under six, about 5 percent of women’s and about 7 percent of men’s time devoted to child care activities was spent “looking after children.”1
Another distinction of Australian and U.S. surveys is the attention to time devoted to communication with others on behalf of children, which could be termed the “transaction” dimension of primary child care. The reason for this emphasis in U.S. surveys has been explained at length:
The Bureau of Labor Statistics (BLS) coding team conceptually defined primary child care as any activity done with a child that is interactive in nature—such as reading, playing, and talking—and correctly coding such activities posed few difficulties. However, other activities were considered primary child care as well, but were not limited to this restrictive definition requiring interaction with a child. For example, an activity could be coded as child care if a child was not present but the activity (such as “talking to my child’s teacher”) was clearly done in the child’s interest or on the child’s behalf” (104).
In other words, the ATUS used a “for whom” rather than an “activity with” definition of child care when health care and educational needs were concerned. Similarly, Australian codes 55 and 57 called attention to communication with others on behalf of children. Neither the Canadian nor UK time use surveys make explicit mention of such activities. (All the surveys include a separate category for travel time involved in child care.) Information is limited on how MTUS confronted such inconsistencies in their harmonization process and how such coding variation affected the process of eliciting these survey responses.
Australian and U.S. efforts to capture time devoted to managing the provision of health care and education services are admirable, as management is an important component of parental responsibilities. However, the inclusion of such activities conducted on behalf of children —whether or not they are physically present— is inconsistent with the exclusion of other activities resulting from the presence of children, such as additional housework. This discrepancy could be interpreted as class bias: highly educated and high-income households may spend more time negotiating with doctors, teachers, coaches, and nannies (considered
See American Time Use Survey 2003, Table 7: Average Hours per day Spent by Persons 18 Years and Over Caring for Household Children 1
Under 18 Years.
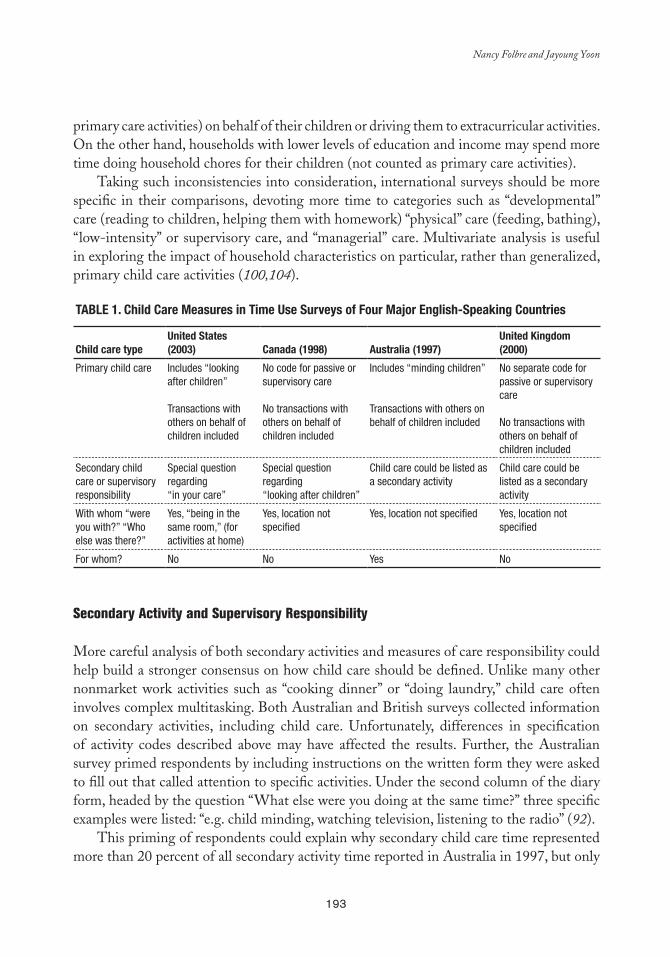
193
Nancy Folbre and Jayoung Yoon
primary care activities) on behalf of their children or driving them to extracurricular activities. On the other hand, households with lower levels of education and income may spend more time doing household chores for their children (not counted as primary care activities).
Taking such inconsistencies into consideration, international surveys should be more specific in their comparisons, devoting more time to categories such as “developmental” care (reading to children, helping them with homework) “physical” care (feeding, bathing), “low-intensity” or supervisory care, and “managerial” care. Multivariate analysis is useful in exploring the impact of household characteristics on particular, rather than generalized, primary child care activities (100,104).
Table 1. Child Care Measures in Time Use Surveys of Four Major english-Speaking Countries
Child care typeUnited States (2003) Canada (1998) australia (1997)
United Kingdom (2000)
Primary child care Includes “looking after children”
Transactions with others on behalf of children included
No code for passive or supervisory care
No transactions with others on behalf of children included
Includes “minding children”
Transactions with others on behalf of children included
No separate code for passive or supervisory care
No transactions with others on behalf of children included
Secondary child care or supervisory responsibility
Special question regarding “in your care”
Special question regarding “looking after children”
Child care could be listed as a secondary activity
Child care could be listed as a secondary activity
With whom “were you with?” “Who else was there?”
Yes, “being in the same room,” (for activities at home)
Yes, location not specified
Yes, location not specified Yes, location not specified
For whom? No No Yes No
Secondary Activity and Supervisory Responsibility
More careful analysis of both secondary activities and measures of care responsibility could help build a stronger consensus on how child care should be defined. Unlike many other nonmarket work activities such as “cooking dinner” or “doing laundry,” child care often involves complex multitasking. Both Australian and British surveys collected information on secondary activities, including child care. Unfortunately, differences in specification of activity codes described above may have affected the results. Further, the Australian survey primed respondents by including instructions on the written form they were asked to fill out that called attention to specific activities. Under the second column of the diary form, headed by the question “What else were you doing at the same time?” three specific examples were listed: “e.g. child minding, watching television, listening to the radio” (92).
This priming of respondents could explain why secondary child care time represented more than 20 percent of all secondary activity time reported in Australia in 1997, but only
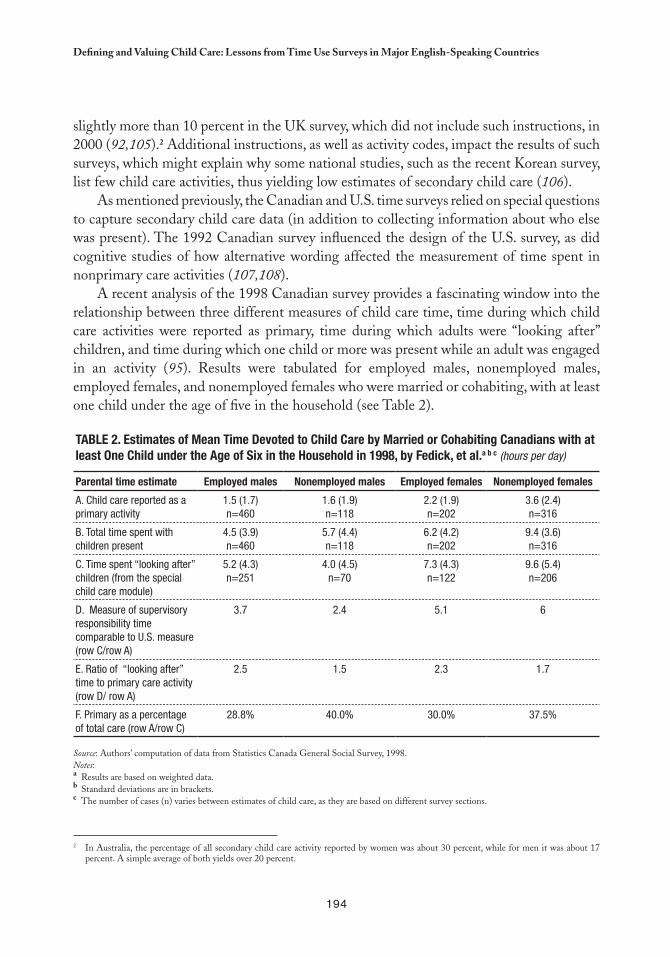
194
Defining and Valuing Child Care: Lessons from time Use Surveys in Major English-Speaking Countries
slightly more than 10 percent in the UK survey, which did not include such instructions, in 2000 (92,105).2 Additional instructions, as well as activity codes, impact the results of such surveys, which might explain why some national studies, such as the recent Korean survey, list few child care activities, thus yielding low estimates of secondary child care (106).
As mentioned previously, the Canadian and U.S. time surveys relied on special questions to capture secondary child care data (in addition to collecting information about who else was present). The 1992 Canadian survey influenced the design of the U.S. survey, as did cognitive studies of how alternative wording affected the measurement of time spent in nonprimary care activities (107,108).
A recent analysis of the 1998 Canadian survey provides a fascinating window into the relationship between three different measures of child care time, time during which child care activities were reported as primary, time during which adults were “looking after” children, and time during which one child or more was present while an adult was engaged in an activity (95). Results were tabulated for employed males, nonemployed males, employed females, and nonemployed females who were married or cohabiting, with at least one child under the age of five in the household (see Table 2).
Table 2. estimates of Mean Time Devoted to Child Care by Married or Cohabiting Canadians with at least One Child under the age of Six in the Household in 1998, by Fedick, et al.a b c (hours per day)
Parental time estimate employed males Nonemployed males employed females Nonemployed females
A. Child care reported as a primary activity
1.5 (1.7)n=460
1.6 (1.9)n=118
2.2 (1.9)n=202
3.6 (2.4)n=316
B. Total time spent with children present
4.5 (3.9)n=460
5.7 (4.4)n=118
6.2 (4.2)n=202
9.4 (3.6)n=316
C. Time spent “looking after” children (from the special child care module)
5.2 (4.3)n=251
4.0 (4.5)n=70
7.3 (4.3)n=122
9.6 (5.4)n=206
D. Measure of supervisory responsibility time comparable to U.S. measure (row C/row A)
3.7 2.4 5.1 6
E. Ratio of “looking after” time to primary care activity (row D/ row A)
2.5 1.5 2.3 1.7
F. Primary as a percentage of total care (row A/row C)
28.8% 40.0% 30.0% 37.5%
Source: Authors’ computation of data from Statistics Canada General Social Survey, 1998.Notes:a Results are based on weighted data.b Standard deviations are in brackets.c The number of cases (n) varies between estimates of child care, as they are based on different survey sections.
In Australia, the percentage of all secondary child care activity reported by women was about 30 percent, while for men it was about 17 2
percent. A simple average of both yields over 20 percent.
195
Nancy Folbre and Jayoung Yoon
For all groups except nonemployed males, the time spent “looking after children” in the special module was highest, followed by time spent in presence of children, and then time spent in child care as a primary activity. Fedick et al. emphasize that these two categories, with broader measures and higher results, are relatively similar (95). However the results in each differed by one hour a day (which amounts to about seven hours per week) for employed females (a difference of about 18 percent). While the two measures are clearly related, they are measuring different things: physical proximity and “looking after” children are not the same.
Comparisons between Canadian and U.S. Measures of Child Care
In order to explore the impact of diverse definitions of child care, the comparisons provided by Fedick et al. for the 1998 Canadian Social Survey are analyzed here with results from the 2003 American Time Use Survey, which established the same universal restrictions —married or cohabiting adults in households with at least one child under five. In both cases, observations for weekdays, Saturdays, and Sundays were weighted to derive estimates for an average day.
While the 2003 ATUS took a similar approach to the 1998 Canadian survey, it captured child care responsibilities more effectively by using the term “in your care” rather than the Canadian phrase “looking after” children, a difference that the cognitive studies conducted by the U.S. Bureau of Labor Statistics showed would likely be significant (108). The ATUS restricted the time that children could be in an adult’s care to time between when the first child woke up and the last child went to bed.3 Excluded from this category was all time that an adult was engaged in child care as a primary activity. The comparable measure for the Canadian survey is all time spent with children minus time devoted to primary care with children (see Row D of Table 2).
Sample sizes were larger for the U.S. survey, and the alternative measures apply to exactly the same group of people, which was not the case for the Canadian survey. As a result of these minor differences, and due to the more recent date of the U.S. survey, the two surveys are not perfectly comparable. But, cross-national differences in the amount of time devoted to primary child care activities are relatively small (less than 15 percent for every demographic category), and display a relatively consistent pattern (the U.S. estimates are lower for three out of the four categories). Similarly, comparisons of “time with” children are synonymous across the two countries. The U.S. averages are never more than 15 percent higher than Canada’s.
In contrast, differences in stylized measures of child care time spent outside of primary activities are quite large: employed women in the United States reported spending 30 percent more time with “children in their care” than their Canadian counterparts reported
Based on an analysis of the Canadian time use survey questionnaire on line, this restriction was also imposed on the Canadian measure.3
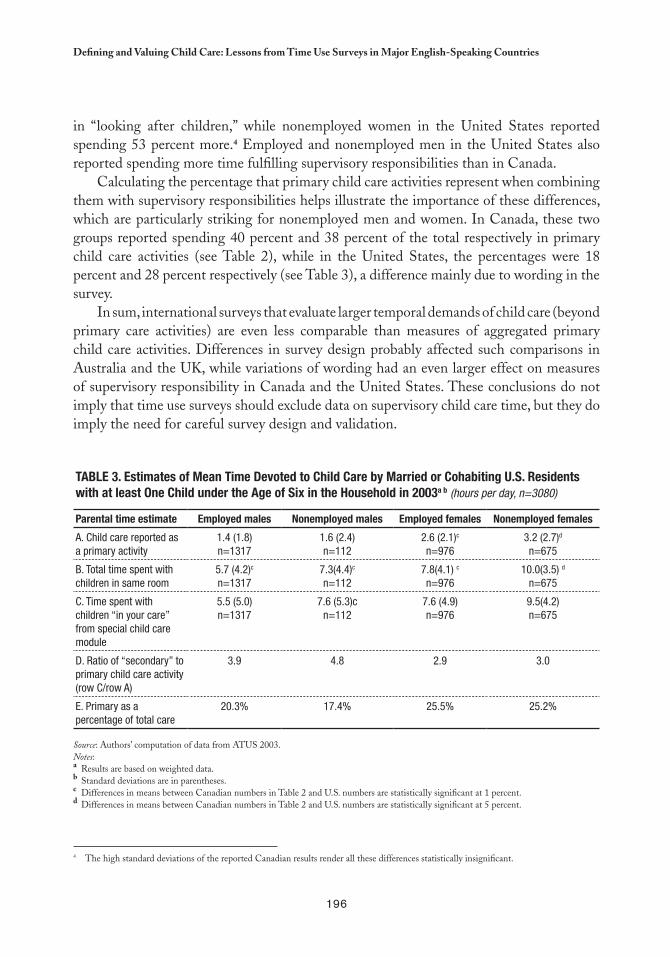
196
Defining and Valuing Child Care: Lessons from time Use Surveys in Major English-Speaking Countries
The high standard deviations of the reported Canadian results render all these differences statistically insignificant.4
in “looking after children,” while nonemployed women in the United States reported spending 53 percent more.4 Employed and nonemployed men in the United States also reported spending more time fulfilling supervisory responsibilities than in Canada.
Calculating the percentage that primary child care activities represent when combining them with supervisory responsibilities helps illustrate the importance of these differences, which are particularly striking for nonemployed men and women. In Canada, these two groups reported spending 40 percent and 38 percent of the total respectively in primary child care activities (see Table 2), while in the United States, the percentages were 18 percent and 28 percent respectively (see Table 3), a difference mainly due to wording in the survey.
In sum, international surveys that evaluate larger temporal demands of child care (beyond primary care activities) are even less comparable than measures of aggregated primary child care activities. Differences in survey design probably affected such comparisons in Australia and the UK, while variations of wording had an even larger effect on measures of supervisory responsibility in Canada and the United States. These conclusions do not imply that time use surveys should exclude data on supervisory child care time, but they do imply the need for careful survey design and validation.
Table 3. estimates of Mean Time Devoted to Child Care by Married or Cohabiting U.S. Residents with at least One Child under the age of Six in the Household in 2003a b (hours per day, n=3080)
Parental time estimate employed males Nonemployed males employed females Nonemployed females
A. Child care reported as a primary activity
1.4 (1.8)n=1317
1.6 (2.4)n=112
2.6 (2.1)c n=976
3.2 (2.7)d
n=675
B. Total time spent with children in same room
5.7 (4.2)c
n=13177.3(4.4)c
n=1127.8(4.1) c
n=97610.0(3.5) d
n=675
C. Time spent withchildren “in your care” from special child care module
5.5 (5.0)n=1317
7.6 (5.3)cn=112
7.6 (4.9) n=976
9.5(4.2) n=675
D. Ratio of “secondary” to primary child care activity (row C/row A)
3.9 4.8 2.9 3.0
E. Primary as a percentage of total care
20.3% 17.4% 25.5% 25.2%
Source: Authors’ computation of data from ATUS 2003.Notes: a Results are based on weighted data.b Standard deviations are in parentheses.c Differences in means between Canadian numbers in Table 2 and U.S. numbers are statistically significant at 1 percent.d Differences in means between Canadian numbers in Table 2 and U.S. numbers are statistically significant at 5 percent.
197
Nancy Folbre and Jayoung Yoon
SUPERVISORY AND SECONDARY CHILD CARE VALUATION
Economists have long recognized that nonmarket work, including raising children, has economic value. Difficulties in measuring and assigning monetary values to child care have discouraged its inclusion in economic accounting frameworks. Nonetheless, now that many national statistical agencies collect regular time use diaries from representative samples of their population, valuation efforts are moving forward. However, most assessments of time devoted to child care ignore the value of supervisory time, as well as variations in the quality and intensity of active care.
How Should “In Your Care” Time be Counted?
There is a large difference between time devoted to primary child care and supervisory activities. Even people expected to spend a great deal of time in primary child care activities —such as unemployed married or cohabiting women with a child under six— only spend an average of 3.2 hours per day in such activities. However, time spent in which a child was “in your care” is three times higher, averaging an additional 9.5 hours per day for this group. In other words, the average amount of “in your care” time is about three times higher than the average amount of primary care activity time.
The ratio of care activity time to “in your care” is about the same for the broader category of all women 18 or older living in a household with at least one child 12 or under, but no child over 12.5 They spend an average of 2.4 hours per day in child care activities compared to seven hours per day with children in their care. In the case of men in this category, however, “in your care” time is almost five times greater. Their care activities average only .92 hours per day compared to 4.4 hours with children “in their care.”
A significant portion of “in your care” time overlaps with other nonmarket work activities, such as housework; women 18 or older —in a household with at least one child 12 or under, but no child over 12— average about 2.1 hours per day carrying out both activities. Similarly, the rest of the “in your care” time overlaps with nonmarket activities, such as socializing with friends or leisure activities. Yet the use of this time is constrained by child care responsibilities. For precisely this reason, as several studies show, women’s leisure time is structured differently than men’s (98,99).
The conceptual dilemma has consequences; leaving “in your care” time out is misleading, while adding it can lead to counting unpaid work twice, since considerable housework is performed at the same time. In a recent estimate of the total value of nonmarket work based on the 2003 ATUS, Frazis and Stewart (109) offer a reasonable compromise. They tally only the hours of “in your care” time that did not overlap with nonmarket work activities.
Adults living in households with children over the age of 12 are excluded, because primary activities of child care could be devoted to these 5
children but the question regarding time “in your care” was only asked of children under 13.
198
Defining and Valuing Child Care: Lessons from time Use Surveys in Major English-Speaking Countries
Regardless of these restrictions, “in your care” time still amounts to about one quarter of all nonmarket work.
Herein, the approach of Frazis and Stewart is somewhat modified using information available in the ATUS on the range of different care activities and the presence of other adults or children. “In your care” time is classified as simple supervisory time only when no other nonmarket work activities took place simultaneously. However, there is a distinction between housework and household management activities performed with children “in your care” and those that were not, assigning a higher value to the former. It is also argued that some of these domestic activities represent an indirect form of child care. For example, children’s clothes need to be washed, their toys need to be picked up, and their meals need to be prepared. Estimates of overall money spent on children do not merely account for child-specific expenditures; they also account for the impact children have on bills such as rent, utilities, and grocery bills. Similarly, estimates of time spent on children should estimate their impact on domestic activities.
Indeed, the ATUS codes seem inconsistent in their effort to measure time spent organizing, planning, and traveling on children’s behalf while ignoring time spent cooking or cleaning on their behalf. This inconsistency could even introduce a class bias, since educated affluent parents are likely to devote more time to such managerial care —and less time to domestic work— than less-educated low-income parents. Even a rough estimate of the proportion of housework and household management attributable to children is preferable to completely ignoring such indirect care.
It is also important to note those limitations of the ATUS that cannot be corrected by additional data analysis. Conventional analysis of the “in your care” measure excludes time when children are asleep during the night, a substantial portion of supervisory time. Children under the age of three spend about 50 percent of their time asleep; the percentage of time they spend awake increases steadily with age (94). Excluding this lengthy sleep time gives the misleading impression that young children require less care than older ones. This is not true, because young children’s sleep is often fitful and periodic. Young children tend to wake periodically and demand brief, but highly inconvenient attention.
The teenagers that are omitted when reporting “in your care” time impose different demands, as they require less direct supervision than children 12 and under. Yet, precisely because parents spend less time in care activities with teenagers, the amount of time that parents are “on call” or “available” may have an important impact on their teenager’s well-being and education. Certainly, many parents feel constrained by the need to monitor their teenagers.
The Care Continuum
As a first step toward exploiting the full potential of the ATUS, it is necessary to move beyond the simple dichotomy between child care activities and “in your care” by describing
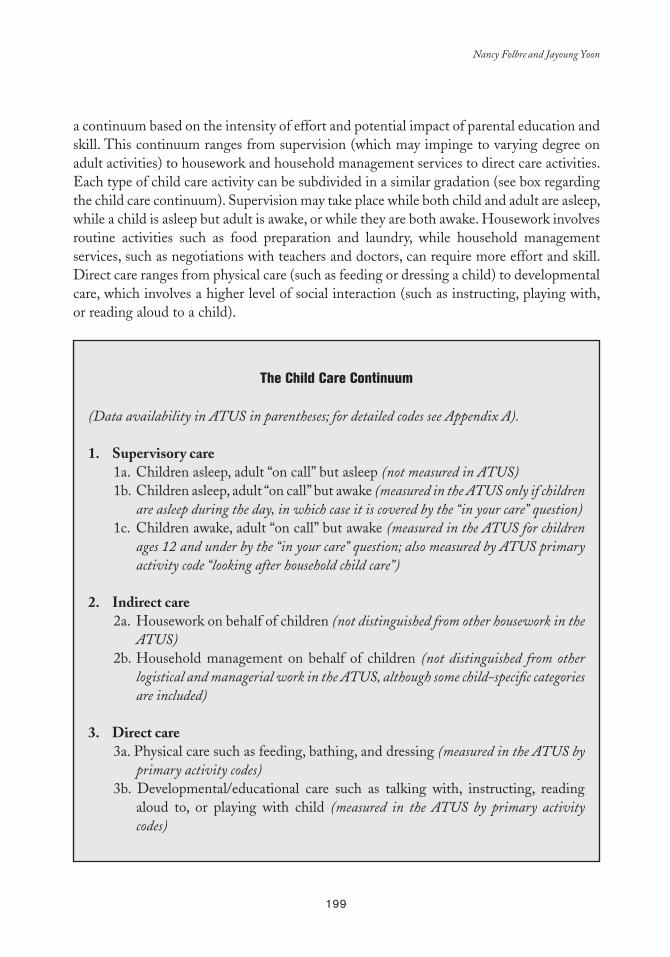
199
Nancy Folbre and Jayoung Yoon
a continuum based on the intensity of effort and potential impact of parental education and skill. This continuum ranges from supervision (which may impinge to varying degree on adult activities) to housework and household management services to direct care activities. Each type of child care activity can be subdivided in a similar gradation (see box regarding the child care continuum). Supervision may take place while both child and adult are asleep, while a child is asleep but adult is awake, or while they are both awake. Housework involves routine activities such as food preparation and laundry, while household management services, such as negotiations with teachers and doctors, can require more effort and skill. Direct care ranges from physical care (such as feeding or dressing a child) to developmental care, which involves a higher level of social interaction (such as instructing, playing with, or reading aloud to a child).
The Child Care Continuum
(Data availability in ATUS in parentheses; for detailed codes see Appendix A).
1 . Supervisory care1a. Children asleep, adult “on call” but asleep (not measured in ATUS)1b. Children asleep, adult “on call” but awake (measured in the ATUS only if children
are asleep during the day, in which case it is covered by the “in your care” question)1c. Children awake, adult “on call” but awake (measured in the ATUS for children
ages 12 and under by the “in your care” question; also measured by ATUS primary activity code “looking after household child care”)
2 . Indirect care 2a. Housework on behalf of children (not distinguished from other housework in the
ATUS) 2b. Household management on behalf of children (not distinguished from other
logistical and managerial work in the ATUS, although some child-specific categories are included)
3 . Direct care3a. Physical care such as feeding, bathing, and dressing (measured in the ATUS by
primary activity codes)3b. Developmental/educational care such as talking with, instructing, reading
aloud to, or playing with child (measured in the ATUS by primary activity codes)
200
Defining and Valuing Child Care: Lessons from time Use Surveys in Major English-Speaking Countries
ATUS activity codes, information regarding presence of children, and estimates of the housework demands of children are used herein to provide an empirical picture of this care continuum. The majority of the primary activities coded by the ATUS fall into the third category of Table 4, although some seem misplaced. For instance, both ATUS activity codes “looking after children” and “caring for or helping children not elsewhere classified” seem to capture mainly passive supervisory care. Such activities consume relatively little time (an average of under six minutes per day, even among married or cohabiting individuals living with at least one child under six but none over 12), but for the sake of consistency, here they are allocated to category 1c in the box, “supervisory” time combined with “in your care” measures.
Other reallocation concerns ATUS primary activity codes are “organization and planning for children,” activities related to children’s health, activities relating to children’s education, and travel. These activities add up to an average of 20 minutes per day. According to the criteria used here, if no children are present these activities should not be considered direct care activities; as such, these time segments (about 20 percent of the total) have been reallocated to child-related household management under indirect care.
The process of estimating time devoted to housework and household management on behalf of children is less straightforward. To some extent, these activities provide a household public good. All household members presumably benefit from vacuuming the floors, cleaning the bathroom, or preparing common meals. Other activities, such as doing children’s laundry or picking up toys, are child-specific, but the survey does not record “for whom” the activities are performed. Multivariate analysis could be used to estimate the impact children have on the overall time devoted to housework.
However parents may reallocate their housework and household management time to meet the needs of children rather than adults. Even if they spend the same amount of time as nonparents in these activities, their individual standards of living may suffer as a result. For instance, parents may prepare meals based on the children’s choices rather than their own, or pick up toys rather than vacuuming their own bedroom.
Mimicking the approach the Department of Agriculture takes with money expenditures (110), one simple approach is to allocate housework and household management time on a per capita basis. The total time devoted to these activities, divided by number of household members, multiplied by the number of children, could be construed as amount of indirect care time devoted to children. Since children represent about half of all members —in households in which adults are living with at least one child under the age of 12— this study assigns 50 percent of housework and household management activities as devoted to children. About 30 percent of this time is combined with children “in your care,” which is tabulated separately.
Table 4 shows time allotted to different categories in the care continuum for adults (individuals over 18) in three types of U.S. households: those with at least one child 12 or younger, those with children ages 13 to 18, and those with no children. Not surprisingly,
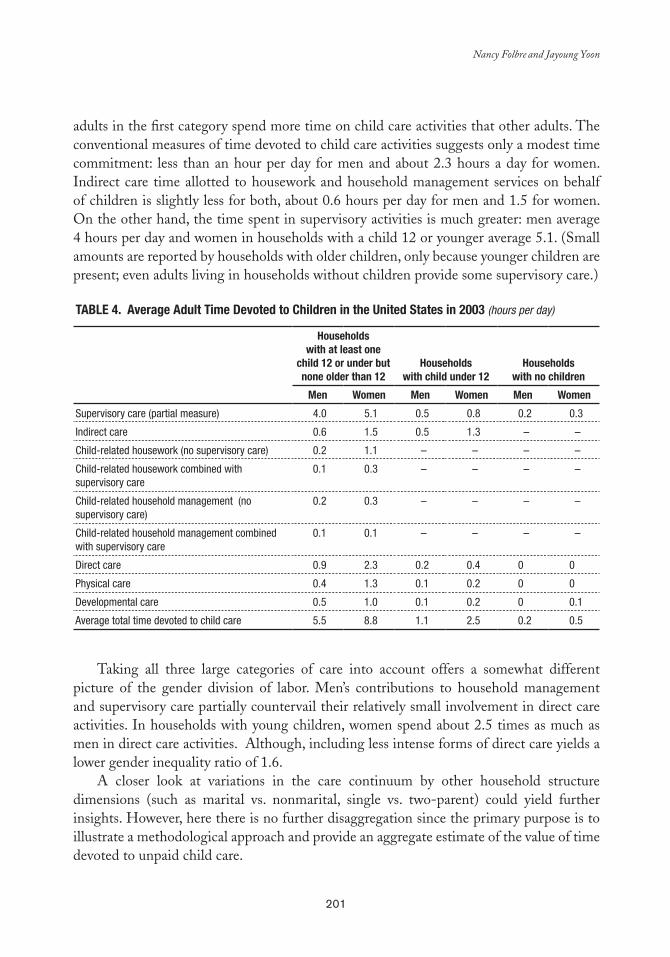
201
Nancy Folbre and Jayoung Yoon
adults in the first category spend more time on child care activities that other adults. The conventional measures of time devoted to child care activities suggests only a modest time commitment: less than an hour per day for men and about 2.3 hours a day for women. Indirect care time allotted to housework and household management services on behalf of children is slightly less for both, about 0.6 hours per day for men and 1.5 for women. On the other hand, the time spent in supervisory activities is much greater: men average 4 hours per day and women in households with a child 12 or younger average 5.1. (Small amounts are reported by households with older children, only because younger children are present; even adults living in households without children provide some supervisory care.)
Table 4. average adult Time Devoted to Children in the United States in 2003 (hours per day)
Householdswith at least one
child 12 or under but none older than 12
Householdswith child under 12
Householdswith no children
Men Women Men Women Men Women
Supervisory care (partial measure) 4.0 5.1 0.5 0.8 0.2 0.3
Indirect care 0.6 1.5 0.5 1.3 – –
Child-related housework (no supervisory care) 0.2 1.1 – – – –
Child-related housework combined with supervisory care
0.1 0.3 – – – –
Child-related household management (no supervisory care)
0.2 0.3 – – – –
Child-related household management combined with supervisory care
0.1 0.1 – – – –
Direct care 0.9 2.3 0.2 0.4 0 0
Physical care 0.4 1.3 0.1 0.2 0 0
Developmental care 0.5 1.0 0.1 0.2 0 0.1
Average total time devoted to child care 5.5 8.8 1.1 2.5 0.2 0.5
Taking all three large categories of care into account offers a somewhat different picture of the gender division of labor. Men’s contributions to household management and supervisory care partially countervail their relatively small involvement in direct care activities. In households with young children, women spend about 2.5 times as much as men in direct care activities. Although, including less intense forms of direct care yields a lower gender inequality ratio of 1.6.
A closer look at variations in the care continuum by other household structure dimensions (such as marital vs. nonmarital, single vs. two-parent) could yield further insights. However, here there is no further disaggregation since the primary purpose is to illustrate a methodological approach and provide an aggregate estimate of the value of time devoted to unpaid child care.
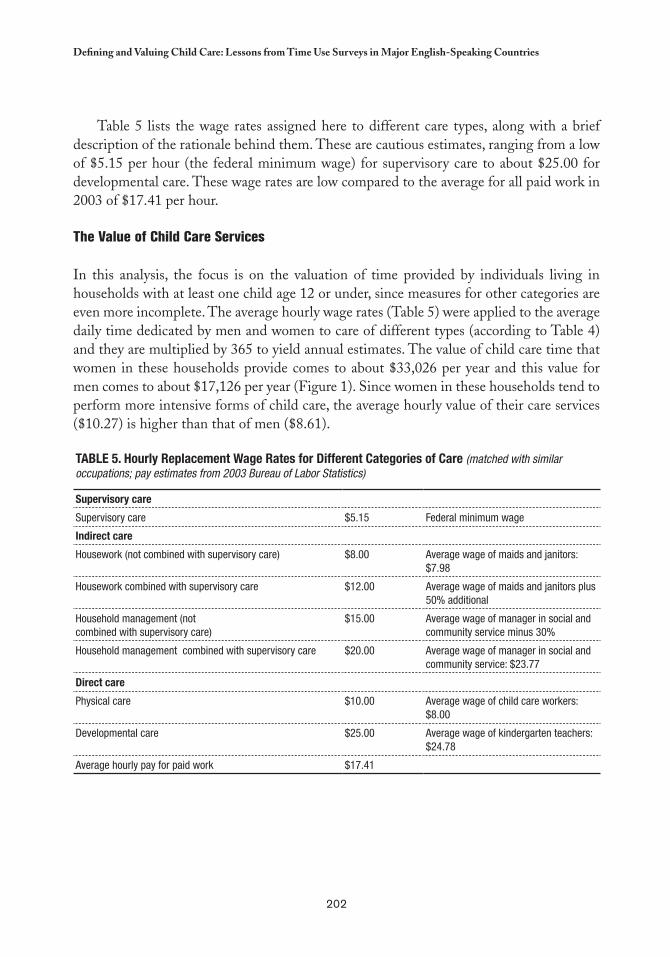
202
Defining and Valuing Child Care: Lessons from time Use Surveys in Major English-Speaking Countries
Table 5 lists the wage rates assigned here to different care types, along with a brief description of the rationale behind them. These are cautious estimates, ranging from a low of $5.15 per hour (the federal minimum wage) for supervisory care to about $25.00 for developmental care. These wage rates are low compared to the average for all paid work in 2003 of $17.41 per hour.
The Value of Child Care Services
In this analysis, the focus is on the valuation of time provided by individuals living in households with at least one child age 12 or under, since measures for other categories are even more incomplete. The average hourly wage rates (Table 5) were applied to the average daily time dedicated by men and women to care of different types (according to Table 4) and they are multiplied by 365 to yield annual estimates. The value of child care time that women in these households provide comes to about $33,026 per year and this value for men comes to about $17,126 per year (Figure 1). Since women in these households tend to perform more intensive forms of child care, the average hourly value of their care services ($10.27) is higher than that of men ($8.61).
Table 5. Hourly Replacement Wage Rates for Different Categories of Care (matched with similar occupations; pay estimates from 2003 Bureau of Labor Statistics)
Supervisory care
Supervisory care $5.15 Federal minimum wage
Indirect care
Housework (not combined with supervisory care) $8.00 Average wage of maids and janitors: $7.98
Housework combined with supervisory care $12.00 Average wage of maids and janitors plus 50% additional
Household management (notcombined with supervisory care)
$15.00 Average wage of manager in social and community service minus 30%
Household management combined with supervisory care $20.00 Average wage of manager in social and community service: $23.77
Direct care
Physical care $10.00 Average wage of child care workers: $8.00
Developmental care $25.00 Average wage of kindergarten teachers: $24.78
Average hourly pay for paid work $17.41
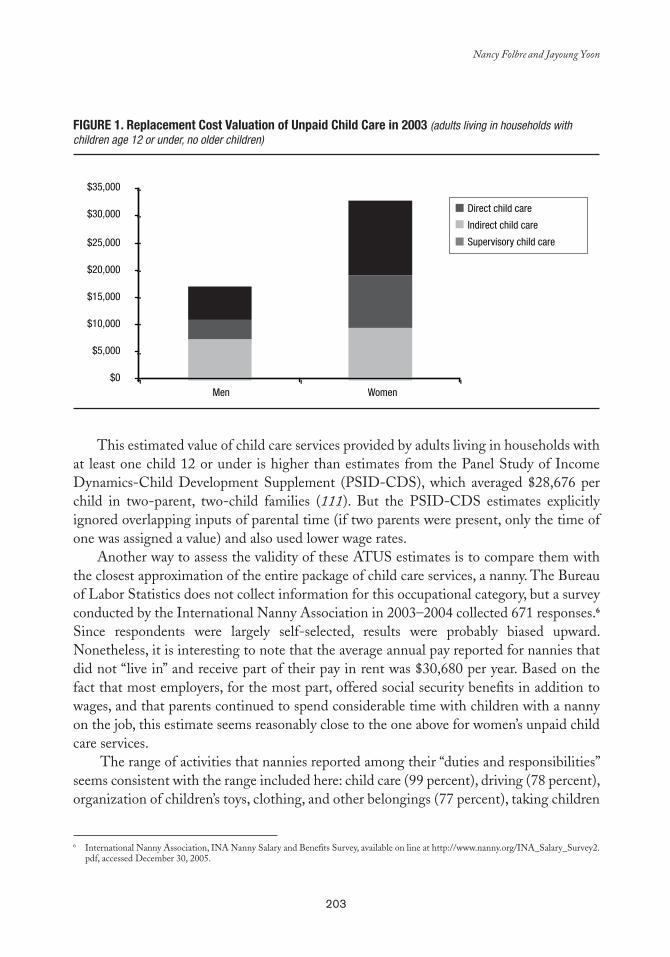
203
Nancy Folbre and Jayoung Yoon
International Nanny Association, INA Nanny Salary and Benefits Survey, available on line at http://www.nanny.org/INA_Salary_Survey2.6
pdf, accessed December 30, 2005.
FIGURe 1. Replacement Cost Valuation of Unpaid Child Care in 2003 (adults living in households with children age 12 or under, no older children)
This estimated value of child care services provided by adults living in households with at least one child 12 or under is higher than estimates from the Panel Study of Income Dynamics-Child Development Supplement (PSID-CDS), which averaged $28,676 per child in two-parent, two-child families (111). But the PSID-CDS estimates explicitly ignored overlapping inputs of parental time (if two parents were present, only the time of one was assigned a value) and also used lower wage rates.
Another way to assess the validity of these ATUS estimates is to compare them with the closest approximation of the entire package of child care services, a nanny. The Bureau of Labor Statistics does not collect information for this occupational category, but a survey conducted by the International Nanny Association in 2003–2004 collected 671 responses.6 Since respondents were largely self-selected, results were probably biased upward. Nonetheless, it is interesting to note that the average annual pay reported for nannies that did not “live in” and receive part of their pay in rent was $30,680 per year. Based on the fact that most employers, for the most part, offered social security benefits in addition to wages, and that parents continued to spend considerable time with children with a nanny on the job, this estimate seems reasonably close to the one above for women’s unpaid child care services.
The range of activities that nannies reported among their “duties and responsibilities” seems consistent with the range included here: child care (99 percent), driving (78 percent), organization of children’s toys, clothing, and other belongings (77 percent), taking children
$0
$5,000
$10,000
$15,000
$20,000
$25,000
$30,000
$35,000
Men Women
Direct child care
Indirect child care
Supervisory child care
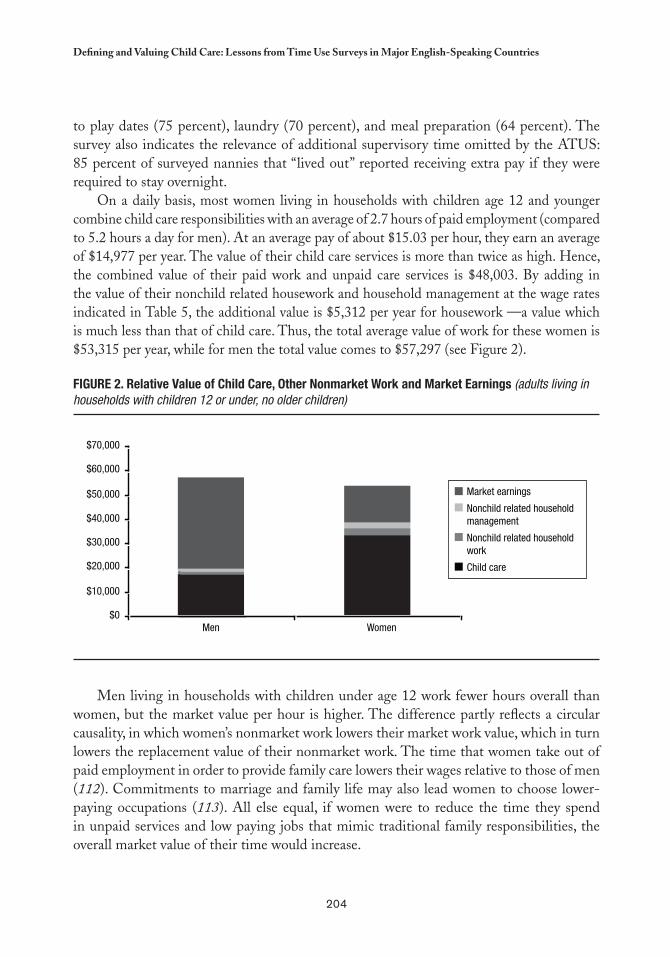
204
Defining and Valuing Child Care: Lessons from time Use Surveys in Major English-Speaking Countries
to play dates (75 percent), laundry (70 percent), and meal preparation (64 percent). The survey also indicates the relevance of additional supervisory time omitted by the ATUS: 85 percent of surveyed nannies that “lived out” reported receiving extra pay if they were required to stay overnight.
On a daily basis, most women living in households with children age 12 and younger combine child care responsibilities with an average of 2.7 hours of paid employment (compared to 5.2 hours a day for men). At an average pay of about $15.03 per hour, they earn an average of $14,977 per year. The value of their child care services is more than twice as high. Hence, the combined value of their paid work and unpaid care services is $48,003. By adding in the value of their nonchild related housework and household management at the wage rates indicated in Table 5, the additional value is $5,312 per year for housework —a value which is much less than that of child care. Thus, the total average value of work for these women is $53,315 per year, while for men the total value comes to $57,297 (see Figure 2).
FIGURe 2. Relative Value of Child Care, Other Nonmarket Work and Market earnings (adults living in households with children 12 or under, no older children)
$0
$10,000
$20,000
$30,000
$40,000
$50,000
$60,000
$70,000
Men Women
Market earnings
Nonchild related household management
Nonchild related household work
Child care
Men living in households with children under age 12 work fewer hours overall than women, but the market value per hour is higher. The difference partly reflects a circular causality, in which women’s nonmarket work lowers their market work value, which in turn lowers the replacement value of their nonmarket work. The time that women take out of paid employment in order to provide family care lowers their wages relative to those of men (112). Commitments to marriage and family life may also lead women to choose lower-paying occupations (113). All else equal, if women were to reduce the time they spend in unpaid services and low paying jobs that mimic traditional family responsibilities, the overall market value of their time would increase.
205
Nancy Folbre and Jayoung Yoon
The measurement strategy used in this chapter understates the relative value of unpaid child care by ignoring the distinctive child-specific skills that it often entails. It also ignores some aspects of supervisory care. On the other hand, supervisory time is valued at a relatively high wage rate compared to physical care, which may overstate total value as well as the value of men’s relative contribution. Analysis based on the CD-PSID show that fathers tend to spend time with children when mothers are also present; they are far less likely than mothers to spend time alone with children (94). If the value of men’s supervisory time were adjusted to account for density variations, the relative value of men’s supervisory child care would likely fall.
CONCLUSION
Efforts to measure and assign a market value to child care should not rely on assessment of direct child care activities alone. Supervisory or indirect child care is quantitatively and qualitatively significant, and the constraints it imposes should be reflected in the valuation of nonmarket work. Similar reasoning applies to the measurement and valuation of time spent caring for other dependents where both supervision and “on-call” responsibilities come into play. Specification of a continuum of temporal demands provides a more realistic —and more accurate— economic value than a simple distinction between active (or primary) and supervisory (or secondary) care.


207
ParT III
Cc
Experiences and Results

209
chapter 12
Time and Work from a Feminine Perspective
Cc
Cristina Carrasco*
INTRODUCTION
This analysis forms part of the research line that, from a feminine perspective, is concerned with recovering the social reality of activities —performed primarily by women— that have become “invisible” under the rationale of the market economy.
This does not merely suggest, as Sandra Harding has affirmed with the simplified catch phrase, to “add women and stir,” rather it implies the need for something more profound: a radical change in the perspective of analysis that deconstructs the models and paradigms traditionally used in social disciplines for the purpose of developing new categories and theoretical frameworks geared toward alternative models.1
As we know, methodology is not without theory and, consequently, mechanisms and statistical methods are needed to facilitate analysis of the above-mentioned line of research. This work offers two proposals: one more generic to study the time and work inputs involved and the other more specific, focusing on the unpaid health care field.
* Professor of Economic Theory, Universidad de Barcelona, Spain. Email: [email protected]
The phrase mentioned here is a reference to two authors: Sandra Harding (1 114) who said to “add women,” in reference to the incorporation of gender issues into the sciences, and Hewitson (115) who built on Harding’s phrase with the inclusion of “and stir.” Harding is ordinarily the only author credited with the phrase, but Pérez (116) notes that it was actually coined by both.
210
time and Work from a Feminine Perspective
The first concerns the “Non-androcentric Labor Force Survey” (EPA-NA), a new instrument of measurement designed on the basis of the Labor Force Survey (EPA) of Spain’s National Statistics Institute (INE). The EPA-NA is not simply a questionnaire protocol designed to expand on the EPA, but provides for a refocus on its conceptual and methodological bases, starting with the concept of “work” itself through the global approach to the interpretation of results. The EPA-NA helps capture periodic data on diverse types of activities —paid work, domestic work, study, and volunteer work— and the differences between sexes in terms of time spent on specific activities, labor division, and employment.
The second alternative addresses a more tangible field: the social and economic analysis of health care work performed by unpaid caregivers. Public health budgets have failed to take such unpaid care into account, strictly treating it as an unlimited free good. Indeed, the enormous contribution of in-home care has never been formally recognized or incorporated into the analysis of the population’s health care needs. In fact, the public health design sector relies on this type of unpaid in-home work, which is primarily performed by women and acts as buffer, absorbing social needs for care, despite the lack of sector data. Specifically, the proposal is a survey —based on fieldwork conducted at a Barcelona public hospital— that provides information on these caregivers, the equivalent monetary value of unpaid care, its relationship to the public health budget, and inequalities between the sexes concerning the time and work inputs involved in such care.
In order to fully understand these surveys and the subsequent interpretation of their findings, first it is important to develop theoretical bases for their analysis.
THE ANALYSIS PERSPECTIVE
The ideas underlying these new proposals relate to criticisms of existing approaches and definitions of new objectives. First, it is important to point out that when the market-based model of production is chosen over other types, many activities designed to ensure the well-being of the population are set aside, especially care and domestic work. Certainly, from a positive sciences perspective, the observation and analysis of such tasks mask significant hurdles. However, while recognizing that tasks performed in the household by household members prove difficult to measure, still these activities are essential to support daily life, and their roles should not be underestimated. Regardless, today “production” is still confused with “market-based production” and “work” with “market-based work.” Secondly, the division of labor by sex has contributed to the way things are done because it associates —more in collective imagination than in reality— men’s work with the market sphere and women’s work with the domestic sphere. Finally, as current studies in different areas suggest, it is important to consider that from a philosophic, sociological, and political standpoint, the ultimate goals will always be well-being and the satisfaction of human
211
Cristina Carrasco
needs, both material and immaterial, and that market production is a means rather than an end in itself. 2
Numerous authors have pointed out the severe limitations of traditional theoretical frameworks, specifically their inability to account for a large portion of women’s work and identify coordination mechanisms between family, market, and public spheres, as well as the role played by institutions in the structuring of labor (117–123). In other words, these frameworks have been criticized for concealing most of the human reproduction processes, without which the market could not exist3 (125,126).
Conversely, new proposals outlined attempt to shift the focus of analysis from the market to people, and from production needs (an end in itself ) to human needs (118,119,127–129). Accordingly, the family sphere gains prominence as the unit from which life is organized —the basis and sustenance for other activities, including market-based activities— and without which the population’s welfare would be an empty, meaningless phrase.
However, despite these criticisms, as well as others aimed at new models, most contemporary economic and statistical studies of work are still centered on market-based work, and, when considering domestic activities, they separate the analysis of unpaid from paid work, as if the two were altogether different. In fact, this is standard practice and is only deviated from when the object of study is feminine employment: in such cases, studies tend to point to the family as an obstacle to women participating in the labor market, without substantially altering the model of analysis. This harbors serious consequences, because such research is no longer exclusively analytical or symbolic from the time it is applied to design and implement social and economic programs and policies —programs and policies that are ineffective in correcting existing gender-based inequality.
In this sense, the main obstacles labor statistics need to address are theoretical in nature, since examining employment and domestic work separately prevents the observation of their strong interrelatedness, while also creating the fallacy of a similar job market for women and men, and banishing what are considered “family restrictions” to the noneconomic realm and the division of labor by sex.4 5 This perception of reality, which can be valid for some purposes, is insufficient for analyzing gender differences in terms of work or employment and for understanding mechanisms that regulate economic and social reproduction. Consequently, current statistics are of little use for analyzing feminine time and work, and are also complicit in legitimizing the market-based model/male employment.
Obviously, the relationship between human needs and production is not so simplistic. Production generates endless new needs, through a 2
dialectic process, which are indefinable except as a function of the social and historical conditions in which they are introduced.
It is important to keep in mind that “generational reproduction and the personal reproduction of individuals are the primary conditions 3
for the production of goods and the market in which such goods are exchanged. However, this reproductive task is rarely linked with the accumulation of essential goods” (124).
Domestic work refers to unpaid labor by household members to produce goods and services for consumption. It includes activities 4
traditionally seen as domestic chores (such as cleaning, ironing, sewing, and cooking), activities pursued outside the household (such as shopping and managements), and direct care activities.
The term “family restrictions” is used in contemporary economics to refer to minor children and elderly household members. Similarly, it 5
could be argued that the organization of the market acts as a “restriction” to the care of these persons.
212
time and Work from a Feminine Perspective
Nevertheless, in recent years new tools have been developed to provide data on unpaid work and, in particular, on domestic work. For example, “time use” surveys (TUS), have encouraged the development of valuable databases that highlight the diverse tasks carried out within the household (such as house cleaning, taking children to school, and caring for an elderly person), the time spent on each, and their unequal distribution according to sex. Although such surveys represent significant progress in terms of labor statistics, their capacity for analysis is limited, because they are not true surveys of work in the concept of “work” herein.
In short, there is a need to gather data on paid and domestic work within an integrated framework in order to observe their interrelationships and analyze, from a global and realistic perspective, the operation of market-based labor, people’s living and reproduction practices, and the division of labor by sex.
NON-ANDROCENTRIC LAbOR FORCE SURVEY6 (EPA-NA)
Theory and Methodology
The methodological proposal presented here refers both to a questioning of the Labor Force Survey (EPA) foundations and to the design of a new analysis tool (EPA-NA). When it comes to preparing economic and labor policy, the EPA is widely recognized as one of Spain’s most important and consulted statistical instruments —in the field of paid work— and any criticism or reformulation of this instrument transcends the national territory, based on the fact that its definitions and categories are based on the International Labor Organization (ILO) guidelines. Consequently, questioning the EPA structure by introducing a new concept like “global work,” leads to the criticism of many of the underlying assumptions of the international system used to calculate employment statistics.7
The EPA-NA survey differs in that it assumes the household —the unit from which life is organized— is the appropriate framework for capturing the depth of the population’s activities. This concept is reflected in the structure, presented below, of EPA-NA, which consists of a household and an individual questionnaire as well as a diary of activities.
EPA-NA Structure1) Household questionnaire2) Individual questionnaire
A. General dataB. Teaching and training
The author, along with other researchers, developed this proposal: “Trabajo con mirada de mujer. Propuesta de una encuesta de población 6
activa no androcéntrica” (130).
“Global work” is understood as the sum of market labor and domestic work. Although volunteer work and civic participation are considered 7
fundamental activities, the topic is complex and merits separate consideration in another type of study.
213
Cristina Carrasco
C. Activity C1. Paid work
C1.1 Workplace characteristics C1.2 Workplace search C1.3 Professional experience
C2. Domestic work3) Diary of activities
Household Questionnaire, Individual Questionnaire, and Diary of ActivitiesThe household questionnaire collects data on specific family variables (household structure,
total income) and activity indicators of the entire family unit. This perspective facilitates an individualized study of activities in terms of needs generated in different family types by life cycle stage, strategies for distribution of work, and gender inequalities.
The individual questionnaire focuses primarily on specific activities of each member of the household and introduces an essential fundamental concept: the “domestic-active person.” The first question asks the interviewee to list the time spent in four categories during the week prior to the interview: paid work, domestic work, study, and volunteer work. With this information, it is possible to stratify the population by each activity, thereby overcoming the limited concept of work as a purely paid activity and expanding it to include the activities that together account for global labor.8 Hence, the data more accurately reflect reality, since people do not fit squarely into one category (economically active or inactive), rather into diverse categories (economically active or inactive, domestically active or inactive), or a combination. This questionnaire is comprised of basic data blocks, one for paid work and another for domestic work. In turn, the questionnaire on paid work closely follows the EPA format, both in using the same indicators and definitions to ensure the result comparability and facilitating integration between the two surveys. Despite their similarities, the questionnaire on work incorporates substantial changes to override the EPA’s androcentric bias toward the paid work sphere.9
Finally, data was logged in a diary of activities for all household members over 16, noting the tasks carried out during the 24-hour period prior to the interview by half-hour intervals.10 This information was then grouped into the five major categories.11
Following the methodology used in the EPA, two different questionnaires were developed for household members under and over age 16. 8
The latter is more concise and the first question also concerns time spent on different activities.
Certain sexist connotations were also adjusted in the EPA language.9
Where budgetary considerations permit time use, surveys are broken down into shorter intervals (five or 10 minutes). According to literature 10
consulted in the bibliography of this study, the maximum interval should not exceed 30 minutes. For this reason and budgetary constraints, this was the interval selected herein. However, selecting an interval of this length has some pitfalls, for example, overestimation of time spent on short-duration activities.
These categories are: a) 11 time spent on personal care (sleeping, eating, hygiene, and health care); b) time spent on paid labor and study (training/study); c) time spent on domestic work, broken down into three basic sections: i) meal preparation, house cleaning, and laundry and vehicle maintenance; ii) shopping, services, and household errands; and iii) caring for dependent persons; d) time spent on leisure activities (participation in different associations/groups, social and cultural activities, and watching TV; and e) time spent on transport (for work, study, shopping, attending services, or leisure).
214
time and Work from a Feminine Perspective
Domestic Work: A Statistical “Oversight”With regard to domestic activities, EPA is limited to requesting information about
household tasks carried out during the previous week, and, despite multiple references to “family/personal obligations,” it does not distinguish among them, as if all interviewees were concerned with similar responsibilities or activities. Given the classification proposed by the EPA for persons working full-time in domestic activities, clearly domestic work has no economic value for the survey: those working in “tasks associated with the household” are considered economically inactive. Moreover, all references made to family responsibilities begin and end in the paid work sphere, with the sole objective of annotating causes of “economic inactivity” or “atypical” workdays.
This situation is unrealistic for women and, accordingly, the EPA’s bias toward paid work is palpable given its association of “activity” and “work” with “male employment.” Indeed, such a limited viewpoint is less satisfactory for women because it renders most of their activities as “invisible;” if domestic work is considered economically insignificant, the interpretation is that time devoted to such tasks is time spent “not working.” To correct these errors, EPA-NA includes, as measurement tools, domestic work and family responsibilities —distinguishable from “personal reasons” category— as vital elements of personal and family well-being. This makes it possible to delve beyond the closed circle of employment to establish interrelationships between domestic work and paid work and observe how family reproduction strategies are reflected in the division of labor by sex.
The EPA’s approach, which centers on employment, discounts a basic fact: time (individual and social) spent working must be divided between employment and domestic activities, a division which has historically been gender-based and has partly contributed to shaping strategies and opportunities for participation in the labor market and domestic sphere, for both women and men.12 Consequently, for the EPA-NA, the treatment of schedule and workdays, inevitably linked to family time, is considered a key aspect of work analysis, which makes it possible to capture data on existing differences by sex.
With respect to domestic work, the EPA-NA applies the same criteria used by the EPA for paid work: people are considered domestically active if they claim to have spent at least one hour per week on such activities.13 The questionnaire also requests information on who organizes domestic work, the reasons by sex in this regard, types of experience and expertise in these tasks, and difficulties inherent in balancing domestic and paid activities. Moreover, for domestic work, concepts are proposed analogous to those used to describe paid work: on one hand, the qualification in family/domestic work based on a series of self-evaluated training exercises in specific areas (such as cooking, sewing, ironing, shopping, laundry, and caring for children and the sick), and on the other, the experience in this
Accordingly, the EPA’s approach does not facilitate analysis of the mechanisms on which market work ultimately depends with respect to 12
domestic activities (125,126).
One would need to reflect on and debate whether or not this measure (one hour per week) is useful as a criterion for defining activity, either 13
in terms of paid or domestic work. For this reason, rates proposed for this study include domestic overemployment and underemployment rates.
215
Cristina Carrasco
type of work (such as, identifying since when an activity was performed and determining whether it is then carried out on a sporadic or continuous basis). The last group compiles data on the personal and labor trajectories followed at different life cycle stages (ages 25, 35 and 45), which is valuable in terms of recognizing social dynamics and establishing logical relationships between different types of work.
A Change of Perspective: Global WorkIt is worth noting that the EPA-NA not only adds a new set of questions to the EPA to
incorporate domestic work, but also includes an essential change of perspective in the way data is understood, collected, and analyzed, which can be summed up as such: (a) the sphere of reproduction is where life is organized; (b) the market and family spheres are inseparable, and thus they must be considered jointly to analyze the global needs of work for family reproduction, the interrelationships among the activities carried out, and the needs for jobs in the care field; and (c) both paid or marked work and domestic work are structured through hierarchical gender relations. Accordingly, the new object of measurement is global labor rather than employment.
Research Possibilities
The proposed methodology, which includes a diary of activities, facilitates the same types of studies offered by TUS. Moreover, it offers research opportunities on the topic of work and clears a path for new study fields, which are difficult to address with current statistics.
Common Areas of AnalysisThrough the diary of activities, the EPA-NA makes it possible to carry out analysis
like those of time use surveys. First, it studies differences in the ways people use their time considering a mix of important variables, such as age, household type, and socioeconomic level.
Secondly, the EPA-NA analyzes simultaneously executed tasks, or intensive use of time in activities performed during the same time period, establishing which activities are most commonly performed and by whom. According to several studies (131,132), women are generally expected to multitask (with or without pay), which is an important research topic, inasmuch as it harbors a potential source of data on women’s capacity to organize and execute tasks, and also highlights the lack of social recognition for such work and its consequences on women’s health and quality of life. Other potential tools in this line of research are studies on time organization —lifestyles— of the most representative population groups, in which the activities of each hour band are analyzed in order to reconstruct the way time was spent during an entire day (133).
A third common analysis regards identifying the monetary value of domestic work, an idea that has sparked the interest of the academic community and international agencies
216
time and Work from a Feminine Perspective
alike in recent years, partly due to the influence of feminist movements, women’s groups, and gender studies. However, such measurement presents certain difficulties that require examination. First and foremost, there is a distinction between the nature of domestic and market activities, and thus they cannot be measured using the same methods (in monetary terms). In addition, the objective of domestic work is to satisfy family members’ needs, many of which are nonmaterial —psychological, emotional— and involve human relations, which makes it difficult to measure such work. Indeed, this is a subjective dimension of domestic work with no substitute in the market due to the different vital needs of household members for physical and emotional stability. Household tasks of managing and organizing are also difficult to measure and compare to market activities, as they require a great deal of time and effort.
In light of these difficulties, it is licit to call on “third party criteria” (29) to define and value domestic production based on its interchangeable character, with the understanding that this assessment only includes a portion of a household’s output, while the remainder —and perhaps the most important part— is not measured. Consequently, it is not sensible to use a universal measurement of domestic production rooted in market criteria for all household tasks.
In any case, by measuring domestic work, it is possible to obtain an additional indicator to capture real conditions and establish who participates in social reproduction and how and when it takes place, thus contributing to the quality of life and well-being of household members. Finally, another interesting strategy is to measure this type of work not only in monetary units, but also in time inputs, which affords two advantages: it is less abstract and does not require the allocation of a market wage.
Specific AnalysesThe EPA-NA is unique from other studies in that it facilitates the global analysis
of work, paid or unpaid, while observing key aspects such as the activities carried out by people and their relationships, the reciprocal influence between domestic and paid work, the groups involved in both (by age, sex, and family situation), the conditions and characteristics of an “unemployed” person, the family and social situations that could change a person’s work status, and many others. From this perspective, an analysis of work would facilitate the formulation and implementation of policies that respond to real social conditions. Currently, people are treated more like “Hobbes’ mushrooms,” which spring up spontaneously and participate freely in the market, disregarding the fact that this creates a demand for further work.14
In accounting for a combination of both types of work, another advantage concerns work needed for social reproduction, understood as the amount of work performed by
This is a situation that is comparable to the reality of many men. 14
217
Cristina Carrasco
society to maintain its current living standards, or rather as family strategies of subsistence and reproduction.15 With respect to the latter, the EPA-NA makes it possible to analyze, by family type, the global work performed by household members to maintain subsistence, and paid or unpaid work that satisfy the direct needs of individuals. These analyses can be conducted based on different variables. Herein, the most relevant are household type and income level.
Logically, the study of these different types of work together requires definitions of a series of elements —indexes, indicators, rates, and categories— which adequately respond to the reality reflected in the new statistical data. Accordingly, it is important to reexamine some of the categories habitually used to understand employment, outside of the scope of the definition of work herein. As such, new populations are identified and grouped into three groups: those associated with all activities, those associated with the labor market, and those associated with domestic work. The first group includes the overall active population, the inactive population, those who are active in a strict sense (employed) and those who are inactive in a wide sense (unemployed). Populations within the second group are defined analogously to those of the EPA. Finally, with regard to domestic work, populations are defined similarly to those with market jobs, the difference being that their work is unpaid. So we have the “employed” domestic population (divided into four groups according to degree of activity), the domestic inactive, and the partially inactive domestic populations.16
Secondly, the EPA-NA proposes a set of rates, indexes, and indicators to design a system of statistical data that facilitates the analysis of: a) work requirements for well-being and reproduction, b) time conflicts —particularly among women— associated with the rigidity of the production and reproduction processes, and c) gender inequalities in the distribution of different types of works and income levels. Clearly, these indexes and indicators paint an atypical picture.
Finally, the EPA-NA offers possibilities to analyze the management of time spent working and living. With regards to the organization of production, significant changes have been under way for some years now, which respond to employers’ needs for flexibility: temporary or part-time hours, weekend jobs, different types of schedules, degrees of elasticity, and others. Moreover, household needs require specific organization, which often causes conflicts in “reconciling” time and activities. Traditionally —and contrary to how it should be— the social organization of how time is spent is built around market production; this situation deteriorates the quality of life, a problem which has worsened today. In addition, it can be argued, from a perspective considered central to human life, that female participation in work can be used as a model for imitation, or at least as a learning opportunity: the responsibility of covering family care needs does not follow a
This does not refer to the “time inputs in terms of work necessary for reproduction,” which is a very complex issue. Notably, numerous 15
factors come into play in the processes of social reproduction, some of which are hard to define due to the social connotations involved such as, for example, levels of consumption.
The active and the employed population coincide because there is no “domestic unemployment;” there is always domestic work to be 16
done.
218
time and Work from a Feminine Perspective
linear path throughout life, but basically depends on one’s life cycle stage. Consequently, participation in the labor market would not follow a linear path either.
Ultimately, the EPA-NA offers a set of data that allows us to deal with current problems —market and household demands, time and schedule conflicts, the consequences of different life cycle stages, and others— in all their depth.
UNPAID HEALTH CARE
The second proposal concerns the socioeconomic analysis of health care provided by unpaid caregivers, or what is now called “informal care.” Specifically, this involves studying care required by a patient admitted to a hospital that is not provided by the public health sector, which is divided into two types: in-patient hospital care and care provided in the household after discharge.
These services, which often go unnoticed by society, significantly contribute to the public health sector, but also considerably increase the workload of women, and, consequently, negatively impact their leisure time, health, careers, and income. This reinforces traditional roles of men and women, further increasing gender inequalities.
However, it is not the suggestion herein for the public sector to provide these health services, rather the proposals are the following: i) to establish the welfare and quality of life of all people as priority objectives, particularly the population with health problems and their caregivers; ii) to recognize that such unpaid care represents an essential contribution to the well-being of the population; iii) to evidence the significant amount of time and effort involved in such care and how this responsibility usually falls on women; iv) to create public health policies that account for the social role played by these women caregivers; and v) to recognize that these care services, and the needs they cover, represent social and political problems that affect all of us —not only women— as the only means of starting citizen debates among different sectors and social actors.
The study presented below was conducted in a Catalonian public hospital, the Corporación Sanitaria Parc Taulí (CSPT), located in the city of Sabadell (134). The hospital was selected based on three criteria: hospital size (medium–large with 800 beds), the availability of an ambulatory surgical center (ASC, mayor surgical operations in outpatient surgeries), and, finally, because the population of reference reflected average sociodemographic characteristics of Catalonian society (serving 400,000 people).
The study focused on care associated with surgical procedures and diseases of “occasional” natures, both at the surgical center and conventional hospital.17 The objective was to identify the gap between the needs of the population of reference and the services
The decision to study “occasional” illnesses rather than those associated with the elderly was made precisely in order to circumvent those 17
illnesses involving long evolution periods and requiring significant time and care. The objective here was to study the most “commonplace” situations observed in the active life of the population.
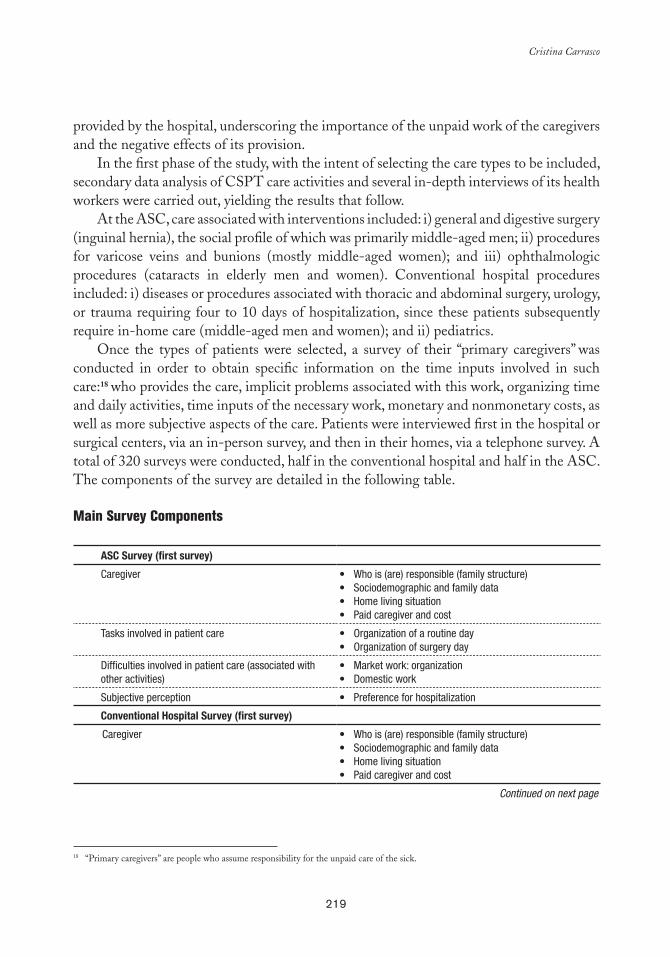
219
Cristina Carrasco
“Primary caregivers” are people who assume responsibility for the unpaid care of the sick.18
provided by the hospital, underscoring the importance of the unpaid work of the caregivers and the negative effects of its provision.
In the first phase of the study, with the intent of selecting the care types to be included, secondary data analysis of CSPT care activities and several in-depth interviews of its health workers were carried out, yielding the results that follow.
At the ASC, care associated with interventions included: i) general and digestive surgery (inguinal hernia), the social profile of which was primarily middle-aged men; ii) procedures for varicose veins and bunions (mostly middle-aged women); and iii) ophthalmologic procedures (cataracts in elderly men and women). Conventional hospital procedures included: i) diseases or procedures associated with thoracic and abdominal surgery, urology, or trauma requiring four to 10 days of hospitalization, since these patients subsequently require in-home care (middle-aged men and women); and ii) pediatrics.
Once the types of patients were selected, a survey of their “primary caregivers” was conducted in order to obtain specific information on the time inputs involved in such care:18 who provides the care, implicit problems associated with this work, organizing time and daily activities, time inputs of the necessary work, monetary and nonmonetary costs, as well as more subjective aspects of the care. Patients were interviewed first in the hospital or surgical centers, via an in-person survey, and then in their homes, via a telephone survey. A total of 320 surveys were conducted, half in the conventional hospital and half in the ASC. The components of the survey are detailed in the following table.
Main Survey Components
aSC Survey (first survey)
Caregiver Who is (are) responsible (family structure)•Sociodemographic and family data•Home living situation•Paid caregiver and cost•
Tasks involved in patient care Organization of a routine day•Organization of surgery day•
Difficulties involved in patient care (associated with other activities)
Market work: organization•Domestic work•
Subjective perception Preference for hospitalization•
Conventional Hospital Survey (first survey)
Caregiver Who is (are) responsible (family structure)•Sociodemographic and family data•Home living situation•Paid caregiver and cost•
Continued on next page
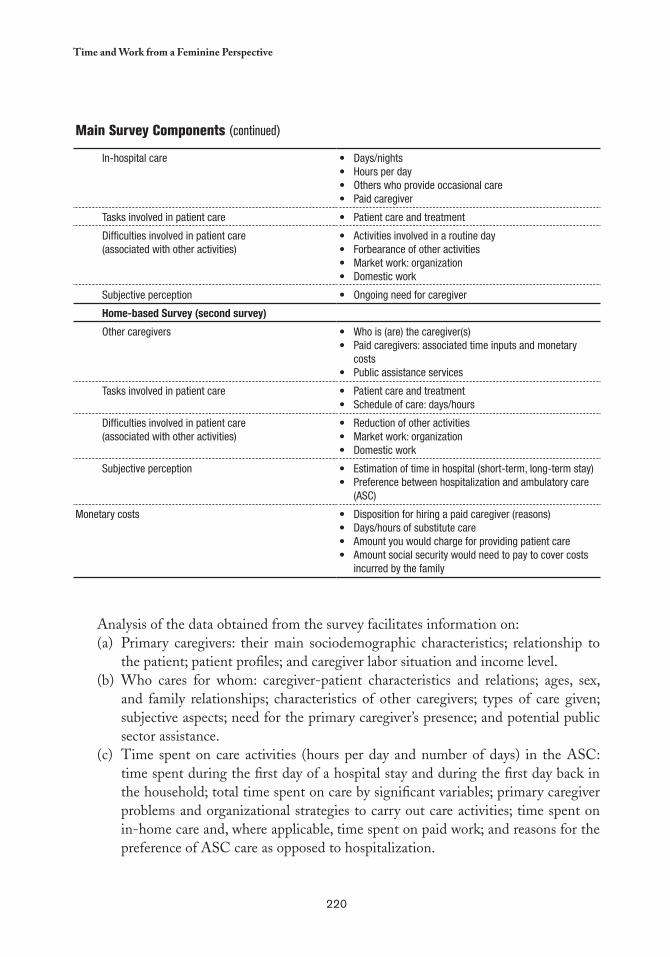
220
time and Work from a Feminine Perspective
Main Survey Components (continued)
In-hospital care Days/nights•Hours per day•Others who provide occasional care•Paid caregiver•
Tasks involved in patient care Patient care and treatment•
Difficulties involved in patient care(associated with other activities)
Activities involved in a routine day•Forbearance of other activities•Market work: organization•Domestic work•
Subjective perception Ongoing need for caregiver•
Home-based Survey (second survey)
Other caregivers Who is (are) the caregiver(s)•Paid caregivers: associated time inputs and monetary •costsPublic assistance services•
Tasks involved in patient care Patient care and treatment•Schedule of care: days/hours•
Difficulties involved in patient care(associated with other activities)
Reduction of other activities•Market work: organization•Domestic work•
Subjective perception Estimation of time in hospital (short-term, long-term stay)•Preference between hospitalization and ambulatory care •(ASC)
Monetary costs Disposition for hiring a paid caregiver (reasons)•Days/hours of substitute care•Amount you would charge for providing patient care•Amount social security would need to pay to cover costs •incurred by the family
Analysis of the data obtained from the survey facilitates information on:Primary caregivers: their main sociodemographic characteristics; relationship to (a) the patient; patient profiles; and caregiver labor situation and income level.Who cares for whom: caregiver-patient characteristics and relations; ages, sex, (b) and family relationships; characteristics of other caregivers; types of care given; subjective aspects; need for the primary caregiver’s presence; and potential public sector assistance.Time spent on care activities (hours per day and number of days) in the ASC: (c) time spent during the first day of a hospital stay and during the first day back in the household; total time spent on care by significant variables; primary caregiver problems and organizational strategies to carry out care activities; time spent on in-home care and, where applicable, time spent on paid work; and reasons for the preference of ASC care as opposed to hospitalization.
221
Cristina Carrasco
Some studies in this discipline analyze and calculate part of the costs of “informal care” on the basis of different methods and objectives 19
then those considered herein. Generally, health economics deals with determining the real costs associated with a specific disease in order to establish the monetary compensation (135–137).
Time spent on care activities (hours per day and number of days) in conventional (d) hospital: in-hospital and in-home care; total time spent on care activities by significant variables; care activities during the night by labor situation and other relevant variables; primary caregiver issues and organizational strategies, both in the household and, where applicable, in paid work.Monetary evaluation of time devoted to care: this issue is of special importance (e) since from a social and economic perspective —specifically, for public policies and budgetary considerations— in-home care of dependent patients is considered a free good, a position widely represented in much of the literature in the health economics field.19 Accordingly, this perspective introduces substantial bias into economic evaluations of health, inasmuch as a decrease in unpaid care would lead to a significant increase in paid care.
This survey facilitates two different types of valuations. The first consists of associating time spent (hours) on care with the corresponding market value or wage for such services (substitution method), while the second is a direct valuation of the caregiver based on his or her response to the following three questions: how much would you be willing to pay someone to perform the care you provide?, how much could you have earned in the market had you provided the same care to another patient in his or her household?, and how much should social security pay for the care you provide? Although the second and third questions are in some way similar, as both refer to how caregivers evaluate their work, there is an important distinction. In the first case, the valuation is based on the market and does not provide for the possibility of a substitute caregiver, because it relates to caring for other people; caregivers are not asked to substitute the care they provide their patient, rather to care for an unrelated third party. In the second case, the valuation is somewhat more ambiguous, as caregivers are asked for two opinions: on one hand, whether the public sector is obligated to provide for the patient’s care and, on the other, their potential valuation —and accordingly, substitution of the care they perform— which includes subjective aspects and the relationship caretakers have with the patient. The previous valuations help estimate the unpaid care, and consequently, how much the public health sector saves in terms of personnel and other global expenses.
CONCLUSIONS
This work presents two methodological proposals that seek to transcend conventional guidelines, both at the theoretical and empiric levels, with the goal of developing new
222
time and Work from a Feminine Perspective
instruments to better understand the social needs involved in caregiving, which is primarily performed by women and ordinarily considered “nonwork.”
There is a clear need for the relevant institutions and organizations to develop new statistics that will facilitate systematic and periodic data on unpaid work, as well as market work. That information is critical for the appropriate planning, formulation, and implementation of public policies, as well as for an appropriate analysis of its results. In this regard, the EPA-NA survey presented herein constitutes an important starting point —theoretical and practical— with a view to beginning a fundamental shift in thinking, a migration from the market-based employment model to one with broader criteria that encompass the idea of “global work.” As with other studies conducted in this line of research, this analysis involves a more comprehensive vision of reality than the one painted by current statistics. Issues such as gender hierarchies and inequalities, responsibility for the reproductive sphere, the organization of domestic work and market labor schedules, as well as their interrelationships, are impossible to solve given the current issues (insufficient statistical data, lack of citizen debate, indifference of the market logic to anything without monetary value).
The second proposal herein, although conceived to investigate a specific situation —nonmarginal— is also relevant in that it proposes a way to visualize caregiving work that is ordinarily “invisible,” and also questions the way public health policy is developed and implemented. The findings of surveys with these characteristics help condemn both the lack of social recognition for this type of services and significant gender inequalities inherent in them. Also of importance is the fundamental change of perspective that supports the concept that society as a whole is responsible for unpaid caregiving services, and not just women; for it is impossible to solve these problems without the joint efforts of public and private sectors, involving both men and women. Concepts of reducing market-economy-based penalties on labor, fostering paid caregiving support from the public sector, and recognizing —and supporting— the household as the organizing unit of life are not impossible to realize; on the contrary, reality is preventing these steps from being taken.
In short, the methodological proposals presented herein underscore the urgent need to develop more appropriate statistics that (also) account for the various unpaid activities carried out to satisfy essential human needs. Without this kind of information, it is indeed difficult to be optimistic about the future effectiveness of public policies on these matters of such great social significance.
223
chapter 13
Policy and Strategy in Health Care Provision in the PAHO Region, and
Measuring Unpaid Work
Cc
Marilyn Waring
INTRODUCTION
This chapter expands upon some of the topics discussed at the International Seminar on Household Sector Satellite Accounts held in Santiago, Chile in June 2006. The measurement of women’s unpaid work in national economies was of key concern
at this seminar, with a particular emphasis on health care. Much of the discussion centered on a review of time use studies that had been undertaken in the region, best practices that emerged in methodologies, and technical and logistical challenges surrounding the conduct of Household Sector Accounts, time use surveys, and other statistical data gathering options that might be available for effective strategic policy design, particularly in the health sector. Herein this discussion is expanded with a focus on the following issues:1. The potential end use of household sector accounts from the strategic policymaker
standpoint;2. The trade off between harmonization and international comparability;3. The use of households or individuals as the reference population;4. The importance of defining the strategic objectives of a survey;5. The methodological issues;
224
Policy and Strategy in Health Care Provision in the PAHO region, and Measuring Unpaid Work
6. The policy implications of measuring “primary” and/or secondary activities, and the prioritization of these;
7. The development of quality of life or well-being indicators; and8. The usefulness of systems of well-being accounts for strategic policy analysis.
DELIMITATION OF THE POLICY CONTEXT
The Millennium Development Goals: A Latin American and Caribbean Perspective, published in 2005, highlighted the policy context and environment relevant for this chapter (138). The pivotal theme of the report was inequality, reflected in the vast disparity in income distribution and endemic poverty. Poverty was apparent in the lack of access to health and education for children, an inadequate food supply, a large informal sector, and a shortage of quality jobs. In different countries in the region evidence included a lack of access to safe water supplies, degradation of the natural and built environment, a high child mortality rate, and high levels of hunger. Forty three percent of the population was classified as poor, including 19 percent which lived in extreme poverty. The report pointed out the major policy challenges; among these was the observation that “economic growth [was] not a sufficient condition for the region to reach the Millennium Development Goals (MDGs)....achieving growth with equity [would] entail institutional changes that [would] allow social policy to be placed at the center of the development strategy” (138). Notably, three of the eight goals, and seven of the 18 targets of the MDGs make specific reference to health issues. The report also discussed inequalities associated with gender, ethnic background, and place of residence.
Strategic Policymaking and the Problems of Invisibility
Throughout the world, economic growth and its measurement is the focus of ministries of finance and annual budgets. The various indices, which contribute to the measurement of growth and its analysis, contain those characteristics which appear inside a “boundary of production” established by the United Nations System of National Accounts (UNSNA) for such measurement (139).
The System of National Accounts has one set of internationally accepted rules that obligate every country to measure growth in the same way, although such methods will vary significantly based on statistical and technical skills. There is a simple equation operating in these accounts in terms of their use in policymaking: if you are invisible as a producer in the nation’s economy, you will be invisible in the distribution of benefits that flow from investment and redistributive policy decisions made by government.
Accordingly, there are two key features of invisibility for policymaking purposes. One is the treatment of the productive, reproductive, and service work of the ecosystem as a
225
Marilyn Waring
“free gift of nature.” Generally, unless conservation features play a major role in tourism, the “value” of nature for an economy lies only in its extraction, depletion, or exploitation, wherein lie the economic transactions. For example, no account is ever taken of the free “work” in pollution dispersal from the wind, sea, or rivers; rather their impact is generally treated in discussion of externalities in relation to a production process.
The other key omission from the accounts is that of unpaid work. The definition of the “economically active population” is “all persons of either sex who furnish the supply of labor for the production of economic goods and services” (140). In real life, it is obvious that unpaid work furnishes the supply of labor for the production of economic goods and service, but for those who actually establish the definitions, there is only economic activity if there is a market transaction.
Unpaid work is the predominant form of labor in four sectors: subsistence production; the household economy, which includes unpaid productive, reproductive, and service work; the informal sector; and voluntary and community work.
Experts in the PAHO region have recognized this for some time. The meeting of time use survey experts held in Chile in 2003 recorded that a key reason to account for domestic labor was “connected with the allocation of fiscal budget resources, as not all policies, plans, and programs incorporated gender issues. Obtaining a global panorama of how work was distributed within the household in relation to the income level and other variables was a way to gain knowledge about the social reality within the household, and on that basis, to stimulate the proposal of family policies that aim at a more equitable distribution of activities” (141).
One of the immediate challenges to the inclusion of unpaid work in the mainstream national economic debate has been one of nomenclature, as frequently this work is described as “soft” or “social,” when it is certainly of major economic benefit. In any policy response to health care challenges, either to meet the MDG targets or address a myriad of other serious health care needs, this work is of major importance.
The public health sector is usually a major expenditure item for any government, whether it is being met from redistributing national revenues or from development assistance programs. In more advanced economies, the economic imperative of the last decade has been for health institutions to develop more “efficiencies” and “effectiveness.” Operationally, these policy approaches have had more focus on outputs than outcomes, an interesting juxtaposition with the nature of health care, which in best practice is focused on outcomes. One of the chief manifestations of this approach has been to discharge patients earlier from public care facilities; consequently, when such policy decisions are made, it is often presumed that a reserve army of unpaid labor is available in the family or community to resume immediate responsibility for the discharged patient. Yet in reality, who do policymakers presume will take on this caretaking role?
Past PAHO agendas have addressed this question, for example, in 2005: “The burden of unpaid health work on women is also increasing as a result of health sector reform
226
Policy and Strategy in Health Care Provision in the PAHO region, and Measuring Unpaid Work
processes. Most health sector reform focuses primarily on reducing the number of hospitals, the number of beds in hospitals, and the amount of time beds are occupied, with little thought as to where people go once they leave the hospital. There has been some increase in state spending on community and home care services, but in very few cases has the increase been large enough to offset the cuts to formal health services. The shift to ambulatory care and an increasing reliance on outpatient services is predicated on the fact that there will be someone at home to care for the recovering patient” (142).
In other growing economies, governments are receiving increasing pressure to provide more sophisticated and expensive secondary and tertiary care facilities, at a time when studies in health economics demonstrate that the best investments in health are those associated with prevention and early detection and treatment. Many activities that promote or hinder this initial investment take place in the household, where an estimated 80 percent of health care is provided, principally by women (142).
Both cases involve economic costs with regards to the invisibility of unpaid household and community work, which is apparent from the growing number of national and other time use data sets, as well as from surveys or pilot studies on unpaid work and health care, decades of narrative captured in a wide range of social science literature, and our own observations and experience. Insufficient or inadequate care at the onset of illness can exacerbate its severity and increase costs across sectors. Such costs are incurred from the loss of labor in the market sector and the loss or diminution of productive and reproductive activities and unpaid services, either when the main female caretaker is ill or has to forego other daily household tasks to carry out the caring work, or when a child is removed from school to assist in caring roles; the result is longer term illnesses that increase the possibilities of poverty, poor nutrition or hunger, and a range of other vulnerabilities.
It is also important to remember that household work includes the daily attention to the well-being of its members, which tends to be more invisible than caring for the sick. Access to water, hygienic practices, and a clean environment are daily household needs that enable the productivity of a healthy paid, informal, or subsistence labor force, which is of significant economic importance. Time use work in New Zealand, Australia, and Canada has suggested that unpaid work is the single largest sector of the nation’s economy and certainly the one in which the most hours are worked.
Most of the calls to measure time use, and indeed in my own early work, confirmed the strategic need for and importance of this work for better policymaking. However, “measuring” the economic contribution size became tied to imputing a market value for the work completed. Regardless of the ongoing academic disputes about the best practices for measuring this (for example, via the replacement or opportunity cost methods), figures of this nature have continually been produced. Within most international documents concerned with women’s unpaid work is a call for market valuations of such work. PAHO documents have contained such calls, for example to “devise suitable statistical means to recognize and make visible ... [women’s] contributions ... and to develop methods, in the
227
Marilyn Waring
appropriate forums, for assessing the value in quantitative terms of unremunerated work that is outside national accounts, such as caring for dependants and preparing food” (142). The document further suggests that “development of indicators assigning a monetary value to the contribution of women’s unremunerated work to the formation of the human capital of the next generation, and to the overall family and societal well-being, may provide the basis for increasing the visibility of women’s contribution to health and development” (142).
As a political strategist, I have never been afraid to use the language and political opportunities of declarations in conferences held in places such as Beijing, Rio, or Copenhagen in order to pursue a policy instrument that could prompt the collection of the data I wanted and needed, even though the need was framed in a different end use. As a strategist and activist, I moved the amendment at the 1980 UN Mid Decade Conference on Women to measure women’s unpaid productive, reproductive, and service work. I have supported satellite accounts and various other manifestations of such activity, because strategically targeted public policy interventions, for example in public health, would be radically enhanced by access to data generated by such recommendations.
The Guide to Producing Statistics on Time Use (143) claims that the production of time use data is “now generally motivated by two general objectives: a) to provide indicators of the quality of life or well-being of the nation in terms of time use patterns of people; and b) to improve estimates of the value of goods and services, with particular emphasis on increasing visibility of women’s work through better statistics on their contributions to the economy.” Such language reveals why parliaments are prepared to provide budgetary support for time use surveys: mainly because of the assistance they offer for strategic policy interventions in particular regions or particular populations nationally, and not because they want to undertake an internationally replicable and comparative survey with the same classifications.
I am now categorically convinced that imputation is an unnecessary step in the most effective use of the time use data. Imputation diminishes the value of the raw data and converts it to an abstract through which the most important details for strategic policy interventions have been lost. Certainly, I recognize the activists’ desires to use imputation to support their submitted arguments in order to gain the attention of finance ministries and other multilateral agencies, but there is no need to assign or impute a monetary value for this work for strategic policy purposes. Consider, for example, PAHO’s interest in the need to assess “the magnitude and distribution of the burden on household members, particularly women, of underfunded public health care systems, and on the consequences of the additional burden on women’s unremunerated work on the ongoing demographic and epidemiologic changes” (142). The paper records “the ‘cost shifting’ to households of the invisible costs of cost containment policies, [and the need to gather] empirical evidence on the contribution of women to human development potential, poverty reduction, and the alleviation of health-based poverty traps” (142).
228
Policy and Strategy in Health Care Provision in the PAHO region, and Measuring Unpaid Work
This position is reiterated in the document, with subtle differences in emphasis: “The full visibility of the type, extent, and distribution of this unremunerated work will contribute to a better assessment of the contribution of women to health and economic development and to the reduction of poverty. Making the contribution of women to health and economic development visible is a mechanism for the empowerment of women and for reducing gender inequalities” (142).
In this same PAHO document, the importance of emphasizing women’s unpaid work in public policy is also recognized: “In general, the impact of public policies is assessed without consideration of the impact on unremunerated activities ... Making women’s unremunerated work visible and an integral part of public policy analysis will provide a different perspective on the overall welfare impact of those policies. It will allow a more comprehensive assessment of the full impact of health sector reform policies, including the total burden and the distribution of unremunerated work” (142).
Nevertheless, abstract imputations for this unpaid work do not help determine what the policy response should be. It may help convince a public minister of the need for a response, because the cost benefit analysis shows, even with trade-offs, that an intervention makes sense. Yet, the cross tabulations of the time use data, supplemented with other material, provide the comprehensive foundation for a strategic policy response and for the monitoring and evaluation of any implementation.
HOUSEHOLD SURVEYS & HOUSEHOLD SECTOR ACCOUNTS
The majority of discussions concerning quantification and valuation of unremunerated work have referenced the use of household sector accounts as a basis for strategic decision making. I promote the use of such accounts in my position as Board Member of the Reserve Bank of New Zealand. The board examines total household income —wages, salaries, pensions, rental income, etcetera— less taxes, socials contributions, benefit investment, etcetera. This data assists our modeling and analysis and interpretation of the “market” behavior of the household sector. For the purposes of this discussion, it is important to distinguish household survey data from household sector accounts. The household survey data, particularly where time use is one of a two or three phase sampling approach, is the vital new ingredient for strategic policy formation.
The publication Designing Household Survey Samples (144) makes a clear case for the use of this instrument as a key tool for the collection of data on unpaid work, especially as this work relates to health sector policy planning. In effect, household surveys provide a cheaper alternative to censuses for timely data, and depending on the strategic purposes of a survey, they may also provide a more relevant and convenient alternative to administrative record systems (144). The household survey relies on representative samples of the entire population to gather data, which means there are smaller workloads for interviewers and

229
Marilyn Waring
longer time periods for data collection. As such, more detailed data is collected in different phases of the survey. Also, fewer field staff is needed for data collection and such staff can receive more intensive training.
Specialized household surveys, or certain phases of surveys, can cover one subject alone, such as time use or nutritional status. Experience in collecting data on disability offers one method in the requirements of a phased approach to time use surveys in the health sector. To determine which households include disabled people as permanent residents an initial phase “usually constitutes a larger sample than subsequent phases. It is used to screen sample units based on certain characteristics to ascertain the eligibility of such units to be used in the subsequent phases. These surveys are a cost-effective way of reaching the target population in the latter phases to collect detailed information on a subject of interest” (144.) This approach will be discussed further in the section on methodological issues.
National Characteristics and Harmonization and International Comparability
As a policymaker and strategist, I have observed that one of the major purposes of gathering national data is to facilitate harmonization of methods and practices in collecting and processing data, as well as in disseminating the data, and ultimately to have an international classification of activities that establishes an international standard.
The need to attain international comparability and the use of the UNSNA indicators as standard indicators of “well-being” is a problem. The UNSNA cannot determine the level of welfare, nor be used to make international comparisons of that level. The recent intent to establish international standards around methods and practice and the call for international comparators —which are designed in the developed countries —constitute an outdated colonizing approach and an impediment to progress for strategic policy purposes, which I believe is intolerable. Any closed database of architecture, whose classification was determined by people in the head offices who never go to the “front line” to collect data, should be ruled out. Accordingly, a classification system established in the North (or the West, or in developed countries) imposed with overly simplistic and questionable classifications, and without consideration for domestic policies, does not deserve analysis. In determining practical politics, it is important to understand that there is a need to use different methods in each country study, as they concern distinct societies, times, and populations.
Conducting social surveys in the PAHO region will offer very different challenges from those carried out in the European Union (EU). “The main difficulties to be taken into account in the Latin American situation are the high percentages of illiteracy in the population, the difficulty of access to rural areas, which increases implementation costs, and the diffuse assimilation of time in hours in rural areas, which require[s] consideration of industrial time, country time and domestic time, in a new configuration of times and spaces. Another difficulty is the limited access to up-to-date technology and limited resources” (141).
230
Policy and Strategy in Health Care Provision in the PAHO region, and Measuring Unpaid Work
In 2003, in a meeting of regional experts regarding time use surveys, representatives from the Social Statistics Unit in the Statistics and Economic Projections Division of ECLAC stressed the need for progress in constructing a system of surveys that would suit the internal diversity of the countries in the region. This highlighted the need to develop a classification of activities in accordance with international criteria in order to define the time period for conducting time use surveys and ensure that the results were comparable (141). The report from this meeting clearly pointed out that the diversity between countries, specifically with respect to the surveys and their strategic objectives, demands an agreement between what works domestically for policy purposes and what could be expected in terms of harmonization and international comparability. Additionally, the report noted that, in view of the new organization of spaces and times, there was an urgent need to develop conceptual tools and to recognize the specific features of each country in the region (141). At another point in the debate, they reasoned that it was not a question of homogenizing or changing cultural aspects that determined kinds of behavior; the standardization should not result in a loss of information with regard to the diversity of each country, rather the process of harmonization between different information collection tools should facilitate comparisons between countries (141).
EUROSTAT TIME USE PROJECT
Who is calling for intercountry comparisons and why are these comparisons important? In an advanced context, it is worthwhile to examine what is happening in Europe. At a meeting in Santiago (Chile) in May 2006, Klas Rydenstam, from Statistics Sweden, outlined the Eurostat pilot project on harmonizing time use statistics to increase the comparability of time use statistics in the EU. The pilot attempted to outline what needed to be defined and specified to conduct surveys with a harmonized design and to calculate the same set of comparable statistical reference tables (145).
The survey samples represented the population (10 years and older, or as a minimum, 15 years or older) of the countries. The sample days covered one year. The variables were primary activity, secondary activity, and information on where and with whom activities were carried out. The duration, frequency, and sequence of episodes also formed possible analysis variables. The domains included sex, age, household type, number of children, education level, labor market position, working hours, total workload in households, and socioeconomic group. Each of these domains was disaggregated by sex.
The pilot project permitted the examination and comparison of most time use survey components, which include designing the survey, organizing the fieldwork, training of interviewers and coding personnel, collecting data, coding, data entry, cleaning the data, and calculating estimates for the reference and other tables.
231
Marilyn Waring
The participating countries carried out the survey without any major or unexpected problems. Overall, the data met high demands, but during the evaluation it was noted that collection of time use data by means of self-administered time diaries caused difficulties, particularly respondent burden. The risks for nonresponse were high, particularly when the participant was assigned the days in which they were to fill in their diary, as opposed to doing this when it suited them. The evaluation suggested that survey agencies should modify the design and procedures to “adapt these to their specific national conditions, particularly in such respects that have less impact on the results and hence affect the international comparability. Consequently, the general recommendation is to shift towards output harmonization, but still applying the same survey attributes that particularly influences the results” (146). Furthermore, “it might be sufficient to define and agree on a set of estimates with certain, precise properties and in a priority order … It is probably even more important to be precise and prescriptive when it comes to coding, code lists, handling of specific situations, code index, etc” (146).
However, it is important to keep the EU’s need for international comparability in context. Due to the shared EU statutes and national and international obligations, especially in the human rights field, and their comparatively similar social programs and common practices as members of the EU, it makes sense to make the comparisons of analyzed time use data a priority. In such circumstances, some value is evident in terms of strategic policy formation, monitoring, and evaluation in making international comparisons a modest priority in time use studies. Still, serious reservations exist concerning its usefulness in other contexts, such as country rankings.
There is a need to be constantly vigilant in respect of the language and practice in calls for harmonization and international comparability of time use surveys. This is at times reflected in the guidelines from the UN Statistics Division, such as in the following paragraph: “Recognizing that each TUS had its own special features in accordance with the objectives established, the place of application, the characteristics of the population and the resources for its financing ... It was essential to continue to reflect on the different methodological designs, the definition of the type of questions (closed or open), the choice of questionnaires (use of one or more diaries for data collection, which could be filled in by the interviewer or self-completed, and in which more than one member of each family could participate), sample size, activities coding, the time period allowed for conducting the survey and processing of the results” (141).
The nature of the strategic objectives of a survey and the policy environment into which those results will be used should be primary considerations for many issues, and obviously play a major part in determining the youngest age for participation. In most cases, time use surveys should not be aligned with any labor force survey, which exclude the participation of younger workers in the time use responses. As of 2007, it would appear that the diary approach for the collection of data has more nonresponse participant resistance in Norway and other European countries than it does in New Zealand, and a substantially
232
Policy and Strategy in Health Care Provision in the PAHO region, and Measuring Unpaid Work
lower response rate and more participant resistance than the recall and interview approach used in time use surveys in Central and South America. (The idea that any one family or household member can speak for all others has been well-debunked in social science literature and is the subject of the next section.)
Harmonized classifications may prove useful provided its architecture is open, as the most important form of classification is one that makes sense and functions adequately inside the relevant nation state. At a later point, if the budget is available, the data should be reconfigured to make international comparisons harmonious and available. Yet, this is absolutely one of the least important strategies in budgeting for a time use survey. Besides, it may well be that based on the nature of the strategic objectives it is not possible to conduct a “national” time use survey.
CONCEPTUAL CHALLENGES AND INTERNATIONAL COMPARAbILITY - A CASE STUDY
At times, the subjects of harmonization and international comparability are debated inside an academic parameter with significant time for deeper investigation of contentious concepts and apparently comparative data. For example, Nancy Folbre and Jayoung Yoon (147) have been conducting interesting research on the value of unpaid child care in the United States. Their question was about the value of the work and they came to the conclusion that in 2003, the replacement value of the time that the average woman devoted to child care was twice as high as the value of her market work. Regardless, based on the nature of their question, there were difficulties determining how much time was devoted to child care, and whether supervision and “on call” time, where there was no direct interaction with a child, would count. (There is an excellent lesson here for the treatment of data on those who care for people who are sick, elderly, or in poor health, which will be discussed later herein.) As economists, Folbre and Yoon are also concerned that there was no real market replacement or substitute for this work, which raises some challenges for imputation. They state: “The choice of specific wage rates to value inputs of care time is, at best, a rather crude exercise” (147). They also note that the nature of many of the caring tasks, particularly person specific, mean that any market replacement value is quite abstract.
In this paper, Folbre and Yoon also debate the conceptual dilemma about how to count the “in your care” time, as including this interim period “can lead to double counting of unpaid work, since considerable housework is performed simultaneously with it” (147). They support a compromise offered by Frazis and Stewart, who suggested tallying only the time that does not overlap with other nonmarket work activities (109). Now the differences between the needs of the policymaker and the needs of the academic economist are clear. Does the policymaker need to see all the work —that is, all the work in terms of time— and where that work is, and who with, and why? Not really. A policy planner does not see the usefulness of preparing figures to assist imputation to a market figure, or to ensure the
233
Marilyn Waring
minutes fit into a tidy 24-hour day or are confined to a primary activity measurement, if that simply is not how women live their days. The policymaker needs the unadulterated time data that clearly reflects the simultaneity.
In another paper based on this research, Folbre and Yoon (148) compare the child care data from the U.S., Canadian, and Australian surveys. The Canadian and U.S. surveys use questions with a slightly different style to capture supervision responsibilities relating to children, and Folbre and Yoon are able to demonstrate that small dissimilarities in wording lead to significant differences in reported results.
Nonetheless, as Folbre has pointed out on many occasions, even when adults are not engaged in an explicit activity with children, they have many limitations regarding what else they can do while supervising them. The Australian time use survey restricts the time that children can be considered in an adult’s care to the hours between when the first child woke up and the last child went to bed, excluding the time when an adult is engaged in child care as a primary activity. The Canadian survey includes all time spent with children, minus time devoted to their primary care.
It seems that the private sector insurance industry would be very interested in this work, in the case of policies which contain replacement of the housework/caring work in the household of a “key man,” if that partner is ill or injured and has to have their work replaced. As an academic, it is useful to understand the different uses of time in secondary activities that can be observed when comparing similarly developed countries. However, as a policymaker I find little usefulness in omitting hours in which people have to be available —for example when children are asleep— nor am I interested in adjustments made to time use data to serve the needs of comparison and imputation, when my need is to have unadulterated time data.
Finally, it has always been difficult for me to understand the apparent need to undercount the time spent in caring. Is it because in most cases only one person is doing this work, mainly a woman, and since she is not working on shift, we just cannot face the fact that her workload supersedes that of everyone else? I am always reminded of friends of mine who are members of the fire service: if they are volunteers, they are always on call, but would surely forget to mention this in a time use diary unless they went out on a call that day. I also have friends who are permanent paid members of the New Zealand Fire Service that spend many hours on duty, but not on call. Even while they are in the gym or reading for pleasure during the on-duty time, no one can say these are their primary activities, and in their daily diaries, they would fill this time in as being on duty; yet, because they are not on duty 24 hours a day, it is not an issue for analysts.
In most of the development of the international classifications and the moves for harmonization, there is a real danger that one of the key motives for the collection of time use data, which is to make women’s lives visible, will be compromised because those who seek to institutionalize the rules are unable to cope with the fact that it demonstrates the vast workload taken on by women in excess of that taken on by men. As such, the invisibility
234
Policy and Strategy in Health Care Provision in the PAHO region, and Measuring Unpaid Work
will be perpetuated because women’s lives do not fit the model, the classification system, or the imputation figures. Likewise, one of the simplest ways to achieve ongoing, textured invisibility of women’s lives would be to insist on an unreasonable degree of international harmonization.
The Reference Population: Households or Individuals?
Today, there is significant experience in the PAHO region in the conduct of time use surveys. In most cases, the need to carry out surveys for the development of strategic policies has meant that all individuals living within a household should be interviewed, rather than having one person speak for all household members. In general, the use of one spokesperson for the entire household has not been accepted for several decades; nonetheless, UN guidelines do suggest that the effectiveness of interviewing each household member, or of selecting one member at random, be evaluated, as the latter approach would help to shorten the interview time and increase the number of households (144).
This approach may be usefully retained where surveys involve progressive phases of sampling so that information about household members —ages, occupations, travel distance to schools, clinics, water, and so on— might be collected in the first phase from one person. However, there is risk here in data collection, for example, if the person asked is not the one who accompanies an ill child to the clinic. To have confidence about data collected in this way, there must be a regular check in respect of the answers to the following questions: “Do you accompany members of your family on visits to the health center?” Only when the answer is in the affirmative should the other questions follow, for example: How far is it? How do you get there? How long does it take? If this person cannot answer these questions, and other household members are not present, any possible budget and other savings resources by choosing this route will soon be undermined.
My preference is that the reference population should be individuals, not households, because there is no way in which one person can speak for an entire household in respect to overall activities. Policymakers need as much reliable data as possible and there are always differences between an individual’s report of the household activities and those that were actually observed as being undertaken. Moreover, simultaneity of activities is rarely captured in such cases. For decades, social science research has proven that men overreport their activities and underreport those of women. Even women tend to underreport their own activities, as well as the number and simultaneity of them, when time use is recalled as opposed to recorded in real time, and the greater the time gap between the activities and the recall, the larger this discrepancy.
Researchers recognize the problems of the household response. For example, in her paper on Gender and Poverty, Sonia Montano (149) pointed out that her income poverty methodology was biased, particularly as it was based on the household, and did not capture individual poverty. Similarly, as the methodology was based on the household, it did not
235
Marilyn Waring
capture gender-based violence, which has a high prevalence in the Central and South American region and is a significant public health issue and well-being indicator. Frequently, a manifestation of that violence towards women is economic, such as the prohibition to hold a market job. Ms. Montano also demonstrated that her research did not capture income vulnerability; across the region women had smaller access to income, there were a very high percentage of female-headed households under the extreme poverty line, and the severity of poverty was higher in female-headed households. In the population between 20 and 59 years of age, there were more women than men living in poverty, particularly among women who were separated or widowed.
In making any decision about whether the reference population should be households or individuals, it is helpful to consider the practices adopted to date in the region. In Mexico, time use surveys were conducted in 1996 and 1998 as modules of the national income expenditure survey, called the National Survey of Household Expenses. The objectives were to recognize the different activities that people performed during the day and know the period of time that household members dedicated to such activities.
For 1996, an interagency group prepared a questionnaire with a list of 27 possible options for activities, without including questions about secondary activities. For 1998, an open questionnaire was used in which the informant was requested to describe the activities carried out in order to include more activities in addition to those specified in 1996. The two surveys used different methodologies, but both were conducted as modules of the National Survey of Household Expenses. This meant data was also recorded on demographic characteristics, the occupation of household members, income, expenditures, and household characteristics. The survey also collected information regarding income distribution and time use within the household by sex, age, family structure, and income and expenditure levels.
The method of data collection was recall and the survey instrument was an open diary where the total time spent on each activity was reported. Parallel activities and the total time spent on these were recorded, as were the location of the activity and with whom it was being performed. The reference population was national and included household members aged eight years and over. The nonresponse index was very low (141).
The following is an example of the use of different phases of a data collection instrument to move from households to individuals as the reference population.
The Dominican Republic conducted an independent time use survey in 1995 to evaluate the magnitude of unpaid work, analyze the participation of women and men in unpaid work, and identify the variables that were related to unpaid work. The data collection method used a recall interview and observation. The main survey instrument was a 24-hour time diary (from 5 a.m. to 5 a.m.) with activities recorded at 15-minute intervals and post-coded. In addition to the individual diaries, there was a household questionnaire which listed household members, obtained information on the activities of the children, whether they worked or not, and questioned who the principal decision maker was. Secondary
236
Policy and Strategy in Health Care Provision in the PAHO region, and Measuring Unpaid Work
activities were recorded and context variables were included to determine where the activity was carried out and for what purpose. It was also recorded whether the activities were paid or unpaid for both principal and secondary activities. Additionally, crops were used as stratification varieties to capture seasonal variation in agriculture. First, households were selected and then interviews were spaced over seven months; each respondent was expected to maintain a diary of data for an entire day, distributing the days among themselves so that each day of the week was represented in this survey. The reference population was national, urban, and rural, and included persons aged 10 years and over. The overall response rate was 84.4 percent, with 79.7 percent in urban areas and 88.6 percent in rural areas. In this case, the time use survey for individual responses also had a separate household questionnaire.
In 2000, Guatemala undertook a survey to measure living standards, which was designed to provide policy relevant data on living conditions to be used by the government in designing a poverty alleviation strategy. A module on time use was included to explore more fully the issues of labor behavior and how households made decisions regarding trade-offs, for example between time use and income earning opportunities. It was envisaged that this information would assist in the adoption of a range of government policies, from the development of employment programs to infrastructure needs. The method of data collection was an interview with all household members aged seven and older.
The Nicaraguan household questionnaire was a multi-topic questionnaire, which included questions on housing, social capital, languages spoken, health, education, fertility, time use, household enterprises, household expenditures, agricultural activities, credit savings, etcetera. The time use module included 22 specific activities, as well as information on how long it took to travel to services, such as schools and health facilities, and how long people had to wait for such services. It allowed for recording of simultaneous activities, and information was collected about the day prior to the interview. The survey sample represented the entire country, at both the urban and rural level, as well as the five main ethnic groups in the country. The time use module was administered to a quarter of the interviewed households, including members aged seven and older.
These surveys, along with other time use work, for example in Cuba, Bolivia, and Ecuador, have given experts in the region excellent examples of the trade-offs between households or individuals as the reference population. At the 2003 meeting of experts in Santiago (Chile), the following characteristics for times use data collection were proposed to assist in its analysis: “(a) place of residence, (b) socioeconomic strata, (c) the gender variable, and (d) stages of the life cycle. These would make it possible to go beyond a comparison of the time allocated by men and women in performing various types of activities and obtain more substantive and relevant information on inequalities in the composition of domestic labor. The information obtained would thus be of higher quality and comparable between countries, providing a basis for more effective public policies” (141).
Finally, it is important to understand the needs of health sector interventions and programs. The document regarding the Millennium Development Goals (138) makes it
237
Marilyn Waring
quite clear that, because of their domestic duties, women are far more likely than men to be excluded from access to health systems. While over 30 percent of the region’s households are headed by women, and even though these households are likely to be more vulnerable than the other 70 percent, it is not possible to generalize women’s experiences in the health sector from data collected from female-headed households. As previously pointed out, the reference population must be individuals for health data.
Defining the Strategic Objectives of a Survey
The strategic objectives of a survey must be to add significantly to the database of policy planning. The health sector is vast, with many different competing claims on public revenue for inputs; in such cases, when a time use survey is being planned, it is vital that the survey, in all phases, does not try to accomplish too much. Frequently, many advocates and officials see such a survey as a “grab bag” of opportunities to load the census instrument with too much that may possibly provide new data. On the other hand, it is essential that the survey designers do not make assumptions about what they will find. In doing so, these presumptions can be built into the survey itself, contaminating the results.
The UN handbook makes reference to such circumstances, proposing that: “For a survey to yield desired results, there is need to pay particular attention to the preparations that precede the fieldwork. In this regard, all surveys require careful and judicious preparations to be successful. However, the amount of planning will vary depending on the type of survey, materials, and information required. The development of an adequate survey plan requires sufficient time and resources, and a planning cycle of two years is not uncommon for a complex survey” (144). It follows with “it is imperative that the objectives of a survey be clearly spelled out from the start of the project. There should be a clear statistical statement on the desired information, giving a clear description of the population and geographical coverage” (144).
There are some agendas that are more important or urgent than others, and the realization of the MDGs and need to have policy responses to these targets are undoubtedly on the top of the agenda. Previous PAHO documents have outlined other key features of challenges to health care in the region, for example:
“The contribution of women to health ... also includes the unremunerated time ■■
dedicated to providing care to a sick, disabled, or elderly family member, friend, or community member” (142).“Over recent years, a number of factors are contributing to increase the burden of ■■
women regarding unpaid health work: the aging population, the increase in the incidence of diseases that require long-term care, and the increasing reliance of the health sector on ambulatory care and out-patient services. ... Inadequate sharing of family responsibilities ... lack of adequate social protection systems” (142).While the “share of women in the labor force has been rising continuously... there ■■
has been little change in the overall burden and distribution of the burden of un-

238
Policy and Strategy in Health Care Provision in the PAHO region, and Measuring Unpaid Work
remunerated household activities” (142). For example, upon entering the labor market, Nicaraguan women, instead of being freed from reproductive work, were confronted with a double working day.“An estimated 80 percent of health care is provided in the household, principally ■■
by women.... Assuming that providing family health care does not have personal, family, and social consequences is unfair, unrealistic, and dangerous for health pol-icy” (142). With the “rapid process of aging of the population, the national health care sys-■■
tems of the countries of the region are about to face an unprecedented demand for long-term care services, which the majority of them are unprepared for… most of the care for the chronically ill and elderly relies, to a large extent, on women’s unpaid labor, particularly in rural areas” (142).“In the next 25 years, from 2000 to 2025, while the population older than 60 will ■■
almost double —from 41.4 million in 2000 to 96.3 million in 2025— the number of women in the working-age population will increase less than proportionally. The number of women of working-age per population older than 60 years will decline to around two to one” (142).
In this context, the strategic objectives of a survey of households would be focused on the key problems for the region in the MDGs. As previously mentioned, a survey is not an opportunity to go on an exploratory journey of how much information might be gathered. In developing any survey instrument, a key phase is also to determine what other reliable and timely data might be available, for example administrative data on HIV AIDS.
The strategic objectives also have to be designed in a policy environment that is highly aware of the resilience of the public sector health delivery mechanisms in the different countries. It is necessary to ask difficult questions about the strategic purpose of TUS, such as whether or not resources should be expended in certain areas, or if the policy interventions designed on the basis of TUS data would be delivered under all circumstances. Fragmentation is a major problem in the region, which has been summed up as follows: “Numerous agents operating without coordination makes it difficult to standardize the quality, content, cost and application of health measures, raises their cost and encourages inefficient use of resources within the system … In respect of the way initiatives are organized and funding is assigned to them, the greatest shortcomings of the region’s health systems lie in the allocation, distribution, and training of human resources; in the amount and distribution of public spending; and in the territorial distribution of the service network and health infrastructure” (138). Research in health systems in the countries of the region has demonstrated that health teams are unlikely to remain in areas far from urban centers or where conditions are the most difficult (138).
It is very important that stakeholders, as well as various users and producers of statistics, be involved in defining the strategic policy objectives of the survey. Andrew Sharpe (150) has noted that a key issue for developers of an index to consider is whether the design will
239
Marilyn Waring
be done in a bottom-up manner, when the input on design —understanding which variables must be included— is directly gathered from a wide variety of individuals and groups, or where the developers decide themselves —based on their knowledge, experience and world view— what the index will include. Advantages of the bottom-up approach include the sense of ownership the community members may take in the index if they are directly involved in the design, and of course, the grassroots understanding of the community’s needs that can be reflected in the index. This is a vital approach for some of the most vulnerable communities, particularly the indigenous, which will be discussed later herein.
In the development and preparation periods of a survey —which has proven in certain complex cases to last for two years— there will always be competing claims and questions about the subject matters for the second or third phase of a survey and the trade-offs in respect of validity and reliability, as well as the need for textured data or the over-sampling of more vulnerable groups as opposed to leaving them out. In general, surveys produce significant data expressed as frequencies (regarding orphans, the disabled, single woman-headed households), but often these figures are not collected inside a strategic policy framework that supplies answers related to implementation costs of a new policy approach. For example, if the strategic questions are “which women?” and “where, how, and why are they caring for an ill person 24 hours per day, seven days per week?” and “how can that be better resourced?” then the survey framework must focus on delivering data to contribute to a baseline for planning possible policy responses. However, there could be another focus within this question that would reflect the different priorities of countries in the Latin American and Caribbean region; as such, those countries with significant HIV/AIDS cases could make this the focus and gather information accordingly. In the Sub-Saharan Africa region, time use studies have revealed some of the hidden costs for HIV/AIDS. UNIFEM, in collaboration with the Tropical Institute of Community Health and Development (TICH) in Kenya, have been the partners in a multi-country participatory research project on the gender dimensions of HIV/AIDS care policies and practices on Djibouti, Ethiopia, Kenya and Somalia (151).
A final note of concern here relates to the earlier question about harmonization and classification. Great care must be taken to ensure that strategic policy interests of individual nation states and the differences between the nature of their health crises and challenges are not compromised by the search for harmonization and comparability.
Methodological Issues
The methodological issues involved in the design of any instrument to capture data for policy decisions must be closely related to the strategic objectives —in this case, of a survey— to avoid the “grab bag” approach mentioned in the previous section. The problems that this approach can create have already been discussed. The regional meeting of experts in 2003 mentioned a number of methodological issues that surfaced in the application of
240
Policy and Strategy in Health Care Provision in the PAHO region, and Measuring Unpaid Work
TUS. The first was the length of the questionnaires, which often meant that information obtained was not very useful for the study, while at the same time the cost of the survey was increased. Another issue was the coding of activities, which was a complex task; when open questionnaires were used, each action mentioned by the interviewee had to be coded, sometimes with unnecessary repetition of information. Lastly, problems arose with respect to the time measurement units (141).
In this meeting of experts, the debate focused on the construction of a system whereby the survey would be included as modules within general surveys on household characteristics —distribution of income and expenditures— and applied to a subsample of families selected for a more extensive household survey. Thus, data on socioeconomic level, stage of the life cycle, and place of residence would be collected only once; similarly, the TUS would collect only data and information referring to time allocated to different types of activities, with the advantages of a more brief, simple to apply, and less costly structure (141).
TUS AS MODULES OF A HOUSEHOLD SURVEY
Using the UN publication Designing Household Survey Samples as a reference, it is worth reflecting on where there might be methodological issues of importance in adopting a TUS as a second phase of a household survey. As indicated by the above-mentioned publication, the following three basic aspects should be determined:
It is necessary to define the geographical areas to be covered and the target popula-■■
tion. The target population is somewhat smaller than the population forming the uni-■■
verse. Comprehensive and mutually exclusive frames should be constructed for every ■■
stage of selection.For the purposes of a survey concerning the health sector, it is important that the
sample size also address the urgent needs of users seeking data for subpopulations or subareas (144).
Sometimes, conditions for probability sampling are violated because of vague criteria in defining the target population for the survey. For example, the desired target population may be all households nationwide, yet when the survey is designed and/or implemented, certain population subgroups are intentionally excluded. (144). This could occur for different reasons, such as in the cases of indigenous populations, people of different language groups, people who live in very remote areas, people left out because they live in areas of civil unrest or criminal activity which might endanger the individuals collecting data, and a myriad of other such examples.
Thus, it is important to define the target population carefully to cover only those members that will actually be given a chance of selection in the survey. Yet, at this stage
241
Marilyn Waring
it is also vital to ask the question about the strategic objectives of the survey such as: At this point in the decision-making process, to what extent are health sector data needs to be compromised to the logistical and technical guidelines of the statisticians? What are the losses or gains in terms of forecasting costs and benefits to national health programs by having to guess the circumstances of the eliminated subgroups? What would be the additional costs of using a nonprobability sample in some of these settings? To what extent are the MDG targets a greater systemic problem in these groups, which are often among the most disadvantaged?
Indeed, segmentation and fragmentation are seen as the greatest systemic constraints in making progress towards the achievement of the MDG goals (138). Inequities are entrenched when groups that are best placed in social, occupational, and financial terms are the only ones that have access to the health system. Similarly, among the poor population, those who live in rural areas, those who work in the informal economy, indigenous peoples, monolingual minorities, and every group with similar characteristics, women are more likely to lack access to the health sector than men. Typically, these are also the subgroups omitted from the “target population” of the surveys.
Another major methodological issue concerns the size of the estimate, that is, its expected proportion of the total population. For example, to reliably estimate the proportion of households with access to potable water requires a different sample size than approximating the number of women caring for a dependent household member full-time, and this calculation will be different from that needed to calculate the number of women of childbearing age who lack access to health care (144). When many key indicators are involved, the necessary sample size is frequently calculated for each and then the one that yields the largest sample is used (144). However, this is less complicated if the household survey collects some data or if other administrative records provide some indication of such data. In the TUS module, it is vital that there is no expectation to collect data available from another reliable source.
When collecting only national-level data, there is a single domain and sample size; however, to obtain equally reliable results from urban and rural areas separately, then the calculated sample size must apply to each domain, which, in this case, would require doubling it. Moreover, if domains were defined, for example as the five major regions of a country, then five times the calculated sample size would be necessary —if, as mentioned, equally reliable data for each region takes precedence over the national estimate (144).
On the other hand, in choosing domains, a plausible strategy is to decide which estimation groups, despite their importance, would not require equal reliability in the survey measurement. Instead, such groups would be treated in the analysis as major tabulation categories as opposed to domains. As such, the sample sizes for each one would be considerably less than if they were treated as domains, and, consequently, their reliability would be less as well (144). In terms of the priorities for health policy, a number of considerations could determine such groups; for example, is it important to have equal

242
Policy and Strategy in Health Care Provision in the PAHO region, and Measuring Unpaid Work
reliability for upper and upper-middle class groups for health sector purposes and MDG priorities? In effect, it is possible to save resources by removing high and upper-middle class cells from those interviewed and use such resources to expand the sample on those cohorts that traditionally have high deficiencies. In relation to different problems in health care, in particular those centered on how to assist with the unpaid care burden, it is simply not necessary to collect equal sample sizes from male and female respondents. Pretest and pilot studies will show the amount of data needed, and from what size of male cohort, to produce reliable data for strategic policy interests. Ultimately, such an approach also complies with the Guide, in the sense that the norm should be “the minimum number of representations of a particular day of the week that will produce tolerable standard errors given specific analytical objectives” (144), as a smaller target population can lead to more valid temporal coverage.
TWO PHASE SAMPLING
A special type of sample design is needed in household surveys that lack adequate information to efficiently select a sample of the target population of interest. Generally, this need arises when the target group is a subpopulation whose members are present in a smaller percentage of households (members of a particular ethnic group, disabled persons, and other previously mentioned examples). When such groups are dispersed randomly throughout the population or when the target group is rare, then stratification is an insufficient strategy and other techniques must be used (144).
Sample weights are now considered an integral part of the analysis of household survey, in developing countries as well as the rest of the world, and today most survey programs advocate the use of weights (144). The use of weights reduces biases due to imperfections in the sample related to “noncoverage” and “nonresponse,” two different types of errors due to the failure of a designed survey to obtain information from some units in the target population. In developing countries, noncoverage is a more serious problem than nonresponse (144).
In general, sample surveys produce statistical information of better quality because, as stated earlier, it is more feasible to engage well-trained, more capable interviewers. Moreover, supervisors are usually well-trained and the supervisor/interviewer ratio can be as high as 1:4.
COLLECTING TUS DATA
Direct observation and measurement is the most ideal method for collecting TUS data, as it is usually more objective. It is also free from memory lapse and subjectivity of both respondents and interviewers (144). However, this method is often more expensive in terms
243
Marilyn Waring
of both resources and time. Experience has shown that the method of direct observation and measurement tends to be useful and practical when the sample sizes or populations are relatively small.
The Personal Interview Method is the most common in collecting data through large-scale sample surveys in developing countries. Apart from the usually high response rate resulting from personal interviews, the method is also effective when there are high levels of illiteracy. The method entails sending interviewers to selected respondents to collect information through a series of questions. The main advantage here is that the interviewers can persuade (through motivation) respondents to answer questions, while explaining the objectives of the survey. Moreover, it is possible to ask respondents to clarify their answers when necessary (144).
The following are some limitations in using the personal interview method:a) Different interviewers may give distinct interpretations to questions, thereby
introducing bias in the survey results, as few interviewers consistently refer to the instructions manual.
b) In the process of probing, some interviewers may suggest answers to respondents.c) Personal characteristics of interviewers may influence attitudes of respondents, for
example age, sex, and at times, even race.d) Interviewers may read questions incorrectly, as they must divide their attention
between interviewing and recording answers.With regards to the information collected, whether through or connected with a TUS,
it is important to know where the activities are taking place, with whom, and for whom. Also, temporal data must include all pertinent details, that is the time, the day, the month, and the year in which the activity is undertaken.
It was previously mentioned herein that in seeking to maximize the policy potential of a TUS, a national time use survey might not be necessary. What do I mean by this? The Guide (144) points out the importance of answering the question: “What are the strategic aims and objectives for the survey?” This will tell us what to consider regarding survey content, population coverage, and time coverage. I do not hesitate to emphasize the need for the strategic focus of surveys to ensure savings.
Identifying the “experts” is also important at every step of a time use survey. Aside from the technical and logistical requirements of this type of survey, the “experts” are actually those filling in the time diaries on their own lives, yet they are often misperceived. Commonly, these people —who are neither academics nor bureaucrats— are the best analysts of the socioenvironmental area in which they live and the way they work, particularly in the work done before administering the survey. The Guide also suggests that this information can be collected “without asking the respondents themselves, rather by collecting information from maps and local authorities” (144). This process is absolutely valid, but it is important to understand that a significant portion of the information collected is unreliable for various reasons (political, financial, incompetence, corruption), thus it is advisable to validate it with
244
Policy and Strategy in Health Care Provision in the PAHO region, and Measuring Unpaid Work
the local people. Sometimes, all that is required are life history interviews and a community meeting.
The Guide leaves out the option of the leave-behind diary being completed where there are household respondents who are unable to read and write. This approach presumes that using the diary is not a viable observation method, which occurs only when the outside adults, who are paid observers, collect the data. In the pilot work conducted in Asia in an FAO project, it was found that in most communities identified as “preliterate,” there were children aged 12 and older who were not only literate, but also capable of being trained as observant enumerators for members of their immediate family and extended family households. These children were also extremely accurate at recording simultaneous activities every five minutes in 48-hour time diaries. The boys followed men and the girls followed women; the major impediment to overcome was the family’s disapproval that the child was unavailable for family work activities during these 48 hours. The activity was treated as an important educational experience for the children, who filled in their own diaries in the preceding week as part of their training, as well as assisted in the construction of the village profile. Compensation was allotted in the form of school lunches and equipment for all children at the school they attended. (Summarizing this experience, it can be said that not only were these 12-year-old participants fabulous observers, but in the New Zealand survey, the young people were generally more reliable than adults in filling in their diaries. They took this activity seriously and felt responsible and honored to participate.) To argue that a lack of literacy implies the responses are only remembrances leaves out a number of options.
It is of vital importance to be realistic about the type of data collected when the “official” collector calls at the door. It is obvious that some significant populations are not counted in the most sophisticated statistical offices: no one has any idea of how many illegal migrants are not counted in North America. Moreover, in countries which are or have been under oppressive regimes, there is a considerable reluctance to participate in surveys, and even where there is participation, the data is unreliable. Almost all UN and other agency publications disregard the importance of these issues.
With respect to coding and the diary approach, the pilot can assist in saving resources as it provides particular options for the most time-consuming activities —travel, sleeping, eating—, by asking respondents to enter those activities via a code.
I believe that fixed intervals in a 24-hour diary also help capture specificity and simultaneity, with the condition that it will often have to be presented distinctly for those whose sense of the time of day is not driven by Greenwich Mean Time.
The Guide also deals with the problem of separating market or commercial work from nonmarket work for the purposes of defining the SNA production boundary, as well as includes commentary about people who are not working. As previously explained, the use of satellite accounts is justifiable in the collection of time use data, but I believe that once the data is collected, the end use is a low strategic policy priority. I also think the UN
245
Marilyn Waring
publications on the boundary of production offer certain opportunities to have a “little fun.” For example, the Guide says: “reporting paid work activities may help to distinguish unremunerated activities that are performed for work. For example, self-employed persons may carry out various activities that are important for their business, but are not formally remunerated, such as socializing” (144). What irony! It is acceptable to count socializing as work in a paid job, but when a woman is cooking or preparing meals and cleaning up afterwards, this is considered an unpaid activity that is not counted as work. Of course, time spent on household and care work during paid work continues to be measured as paid work: sending a text message to the children, online shopping, or reading a newspaper. Such activities can generally be justified as “work,” but there are perverse notions about the limit or “boundary” of production. For example, people who use a Blackberry-type telephone are constantly shifting from one side to the other of the production limit. Yet, I also find the question purely academic. Rigorous time use data means we can see the real picture for strategic policymaking, which makes the SNA boundary irrelevant.
There are country-specific needs and situations with respect to the limitations and politics of time use surveys. Decisions regarding the nature and type of time use diary are a question of trade-offs, where piloting exercises play a vital role. Moreover, pretesting in the field is crucial and those who design the survey, enter the data, lead analysis and interpretation of the data, and take charge of the dissemination plans should all go to the fieldwork sites for a minimum of a week. They should personally visit parts of the countryside or poor areas of the region (which surely are not in the cell blocks for the forthcoming survey) to observe and participate in assembling the geo/eco/political and other data, and then conduct time use surveys via modern, rigorous, and participatory methods before they begin the planning process.
Assigning Priorities to Primary and Secondary Activities
Experts of the Latin American and Caribbean region have recognized the major deficiencies of measuring only primary activities. In reviewing the region’s TUS material, they were concerned that “some activities took place simultaneously and remained hidden, as they were not registered as main activities. As such, other characteristics of work in the family household emerged: its intense nature, that is, the intensity of the work in the sense of having to perform one task rapidly after another, or both simultaneously, including multiple and diverse activities” (141).
The idea that people can do only one thing at a time reflects an old census question: “what is your primary activity?” This is an easy question for a certain class of people, predominantly male, who often follow this pattern. Yet it is nonsense for those who spend most of their time in simultaneous activities, most of which cannot be postponed. It is not possible to prepare a meal, care for the sick or elderly, offer counsel to a child, and attend to household visitors in a sequence of individual activities, nor can it be determined that any one of these
246
Policy and Strategy in Health Care Provision in the PAHO region, and Measuring Unpaid Work
activities is more important than the others. In reality, this is an absurd approach and it is impossible to target efficient policy interventions around the abstract and unreal data drawn from a method that establishes priorities accordingly. The capturing of secondary activities is a fundamental step in the design of effective policy strategies for investments targeted towards the health sector in the Latin American and Caribbean region.
It is also important to record the simultaneity of activities because, of course, it demonstrates an enrichment of activities. This comes into play during the debate over imputation of unpaid work, where it is the practice to replace the work with one imputed wage or salary, normally that of a housekeeper or other domestic employee, as opposed to somebody in the formal labor market who combines strategic management and logistical analysis with consistent outputs seven days a week, is constantly on call, and would be remunerated at a far more significant level if replaced in the formal market. (Insurance policies are enlightening in this particular: in the United States, Canada, and the EU, major corporations purchase “key man” insurance —for up to six-figure USD sums— to cover the loss of the spouse in the household. A number of well-trained, skilled people would be needed to take on the household tasks in every 24 hour period, and compensated accordingly, so the “key man” would still be available for his corporate job.)
The Guide (143) raises the question as to whether or not the respondent or analyst should prioritize simultaneous activities. When reading this in 2005, I was truly shocked! I thought that in social sciences we had moved far beyond regarding the analyst as an interpreter and expert in the experiences of the person from which the data was being collected! As an international examiner of doctoral theses, the approach suggested in the guide would be highly contested, unless, for example, the candidate also belonged to the population cohort being researched, which is highly unlikely in this context. There is no doubt that such prioritization, if indeed it is necessary, should be done by the respondent and not the analyst.
Quality of Life or Well-being Indicators
In the health sector, Health Related QOL (HRQOL), or well-being research, has resulted in the development of numerous individual instruments, each intended to measure specific subsets of populations based, for example, on age, disease status, and condition. While such measurements may provide a snapshot of how well some physical and social needs are met, they have tended to be narrow, opportunity-based, and cannot incorporate many issues that contribute to defining QOL, such as identity and psychological security. Individual disciplines have emphasized various aspects of QOL that are most pertinent to their respective disciplines, with no single QOL instrument flexible enough to be used across disciplines, cultures, and time (152).
While the health sector was decades ahead of other disciplines in researching the topic of well-being, significant pressure for the development of alternate indicators has
247
Marilyn Waring
come from the political economy sector; their concern is the nature of “value” and what was recorded and left out of GDP statistics, which has a significant influence in policy planning. Herman Daly and John Cobb (153) were concerned in realizing that the “costs” were in fact registered as deficits or depletions, not as “goods” or “benefits” in production and consumption, and inturn they proposed the Index of Sustainable Economic Welfare (ISEW) (153).
The next alternate model included the Genuine Progress Index (GPI). Prepared by Dr. Ronald Colman (154), the Nova Scotia GPI project was designated as a pilot for Statistics Canada, which provided staff support and ongoing assistance in data collection and analysis. In addition to the census, the GPI used data from the Canadian System of Environmental and Resource Accounts. The index consisted of 20 components with a sectoral approach and an emphasis on policy relevance. The GPI indices distinguish direct contributions to economic welfare from defensive and intermediate expenditures, as well as from activities that produce an actual decline in well-being. Natural resource accounts include fisheries, soil and agriculture, forestry, wildlife, and greenhouse gas emissions. There is data on costs of crime and income distribution, and a transportation cost analysis; monetary values are imputed where possible, but in the GPI it is not necessary to impute all components.
Since the launch of the Nova Scotia Genuine Progress Index in 1997, the strongest interest in the project has been expressed by local communities, which are urgently looking for ways to accurately assess their well-being and measure their progress.
Between 1999 and 2002, GPI Atlantic worked closely with the communities of Glace Bay in Cape Breton and Kings County in the Annapolis Valley to develop and implement the Community GPI project. A survey was developed to gather local community data on a wide range of subjects, including employment and income, voluntary work and care giving, population health, peace and security, and environmental values and impacts. GPI Atlantic (155) is now working on the completion of a final summary report that will give a basic analysis of the data in both communities.
It should be recognized that well-being indicators can be selected from a range of existing databases, and a full sweep of rigorous surveys should be examined for what they might reveal about well-being priorities of the target population. For example, administrative records, which are health statistics compiled from hospital records, are in this category. The reliability of these statistics depends on the completeness of the administrative records and the consistency of definitions and concepts; while such records can be cost-effective sources, they are not well-established in most developing countries.
The Human Development Index (HDI), developed by the United Nations Development Programme (156), is a global index of human well-being using three primary, equally weighted measures, which include standard of living (measured by GDP per capita and income above the poverty line), educational attainment (measured by adult literacy levels and years of schooling), and longevity (life expectancy). Methods for indexing and aggregating variables with different reporting standards were used, in part, as the basis
248
Policy and Strategy in Health Care Provision in the PAHO region, and Measuring Unpaid Work
for indexing Alberta’s GPI Account variables for the construction of longitudinal trend indicators and in creating collective GPI Sustainability Circles and composite indices (to be discussed shortly). The HDI is an important benchmark for measuring quality of life, since it provides a method for combining otherwise incomparable variables of physical and economic well-being. Its key limitation is that it comprises only three variables in defining human well-being. The Alberta GPI expanded the UN HDI accounting system to about 51 variables of human, social, and environmental well-being.
The Calvert-Henderson Quality of Life Indicators (157) were developed for the United States by economist Hazel Henderson and the Calvert Group (a U.S. asset management firm specializing in social responsibility investments). This represented the first comprehensive national assessment of the quality of life indicators in the United States, taking a systems approach. The Calvert-Henderson model, which uses a “pie” analogy to show the composite of quality of life indicators, inspired the construction of the Alberta GPI Sustainability Circles.
The Index of Social Health (ISH), developed by Marc Miringoff of Fordham University, is a composite index of 17 socioeconomic indicators (158). Similar to the UN HDI, it indexes raw data and then aggregates indicators to create a composite index. The indexing involves establishing benchmarks of performance, deemed as optimal or ideal conditions of human and social well-being, and then converting the raw data set to an index using a scoring system from 1 to 10.
The focus of the Demographic and Health Survey (DHS) (159) are women of childbearing age, but often this instrument is used in different countries to capture more general purpose data, when available and reliable enough to include in a well-being indicator set. The Expanded Program on Immunization Cluster Survey (160) was developed by the Centers for Disease Control and World Health Organization to estimate immunization coverage of children, and it has been widely used in scores of developing nations for more than two decades. While there is criticism of the cluster sampling methodology, I recall the words of Herman Daly, who said, “even the poorest approximation to the correct concept is better than an accurate approximation to an irrelevant or erroneous concept” (161).
However, all too frequently, rather than asking first “what might these people, cohort group, or community consider as the most relevant indicators of their well-being?” the process is instead, “we have already collected all of this data, so let us make these the characteristics of well-being.” In the political economy’s transition toward well-being, the characteristics were initially lifted from the sector accounts of the GDP, and as such remain inside an accounting framework.
In this sense, the work of Mark Anielski (162) in the establishment of the GPI in Alberta was a breakthrough. As a member of the advisory board for this work, I was concerned with three major challenges. The first was that the well-being indicators were designated by the population of Alberta themselves rather than determined by and imposed by a central committee. The second was to find the means to present the collected data not
249
Marilyn Waring
only as an abstraction to dollar values, rather so strategic policy designers and policymakers could deal with more “real” data. The third was to ensure that the data would be relayed to the population who would participate in its interpretation and in determining the priorities and trade-offs.
The Alberta GPI accounts contain 51 ledgers, or subaccounts, for economic, social, and environmental well-being, drawing from existing data sources over four decades (1961–1999). These accounts allow citizens and decision makers to examine and compare long-term trends and view a “landscape” portrait of how society has changed in terms of the state of the environment, people, households, communities, businesses, and government.
In determining what the indicators should be, Anielski wrote, “Values are at the heart of the quality-of-life measurement issue. Ideally, the values of the individual, households, and society should determine the choice of indicators used to measure and manage for the well-being of current and future generations. If what gets measured gets our attention, what we value must ultimately drive what we choose to measure and manage. An assessment of the values of citizens in a community should precede the development and choice of indicators” (162).
The GPI Alberta research team were not financed to conduct polling (or other methods for eliciting responses) on well-being indicators. Instead, they consulted material from the 1997 Alberta Growth Summit, which had begun with an assessment of the values and opinions of the citizens of Alberta, providing one of the best and most current benchmarks about what they considered important to their quality of life. The research team also used the Canadian Policy Research Networks’ Quality of Life Indicators Initiative (162), an impressive initiative that engaged Canadians in evaluating those aspects that, in their opinions, were the most relevant in terms of their quality of life. Such early research assisted the establishment and weighting of the Alberta GPI indicators; however, Anielski notes, “performance measures chosen by governments or derived by experts fail to capture the attention of citizens because they do not necessarily resonate with what people think matters” (162). At times, it is often difficult to find a measure that embraces something of interest, for example, if a decrease in violence is an indicator, how can this be measured? Without being in touch with the local community, it is difficult to distinguish if anxiety is related to feeling unsafe at home (domestic violence) or in a public place. Moreover, in this context, men and women will generally have different ideas about what precisely should be measured.
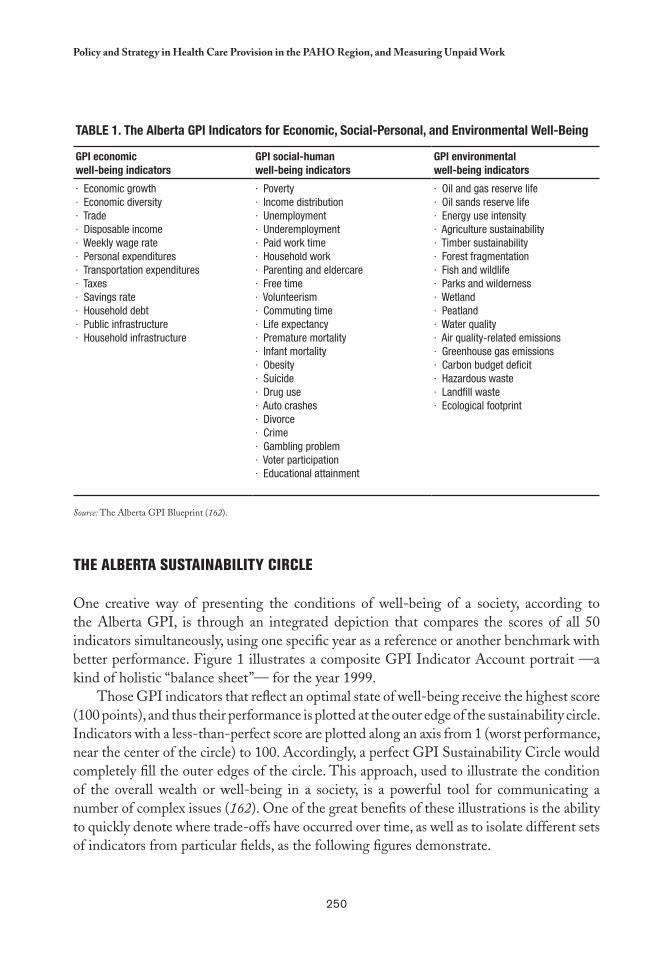
250
Policy and Strategy in Health Care Provision in the PAHO region, and Measuring Unpaid Work
Table 1. The alberta GPI Indicators for economic, Social-Personal, and environmental Well-being
GPI economicwell-being indicators
GPI social-humanwell-being indicators
GPI environmentalwell-being indicators
· Economic growth· Economic diversity· Trade· Disposable income· Weekly wage rate· Personal expenditures· Transportation expenditures· Taxes· Savings rate· Household debt· Public infrastructure· Household infrastructure
· Poverty· Income distribution· Unemployment· Underemployment· Paid work time· Household work· Parenting and eldercare· Free time· Volunteerism· Commuting time· Life expectancy· Premature mortality· Infant mortality· Obesity· Suicide· Drug use· Auto crashes· Divorce· Crime· Gambling problem· Voter participation· Educational attainment
· Oil and gas reserve life· Oil sands reserve life· Energy use intensity· Agriculture sustainability· Timber sustainability· Forest fragmentation· Fish and wildlife· Parks and wilderness· Wetland· Peatland· Water quality· Air quality-related emissions· Greenhouse gas emissions· Carbon budget deficit· Hazardous waste· Landfill waste· Ecological footprint
Source: The Alberta GPI Blueprint (162).
THE ALbERTA SUSTAINAbILITY CIRCLE
One creative way of presenting the conditions of well-being of a society, according to the Alberta GPI, is through an integrated depiction that compares the scores of all 50 indicators simultaneously, using one specific year as a reference or another benchmark with better performance. Figure 1 illustrates a composite GPI Indicator Account portrait —a kind of holistic “balance sheet”— for the year 1999.
Those GPI indicators that reflect an optimal state of well-being receive the highest score (100 points), and thus their performance is plotted at the outer edge of the sustainability circle. Indicators with a less-than-perfect score are plotted along an axis from 1 (worst performance, near the center of the circle) to 100. Accordingly, a perfect GPI Sustainability Circle would completely fill the outer edges of the circle. This approach, used to illustrate the condition of the overall wealth or well-being in a society, is a powerful tool for communicating a number of complex issues (162). One of the great benefits of these illustrations is the ability to quickly denote where trade-offs have occurred over time, as well as to isolate different sets of indicators from particular fields, as the following figures demonstrate.
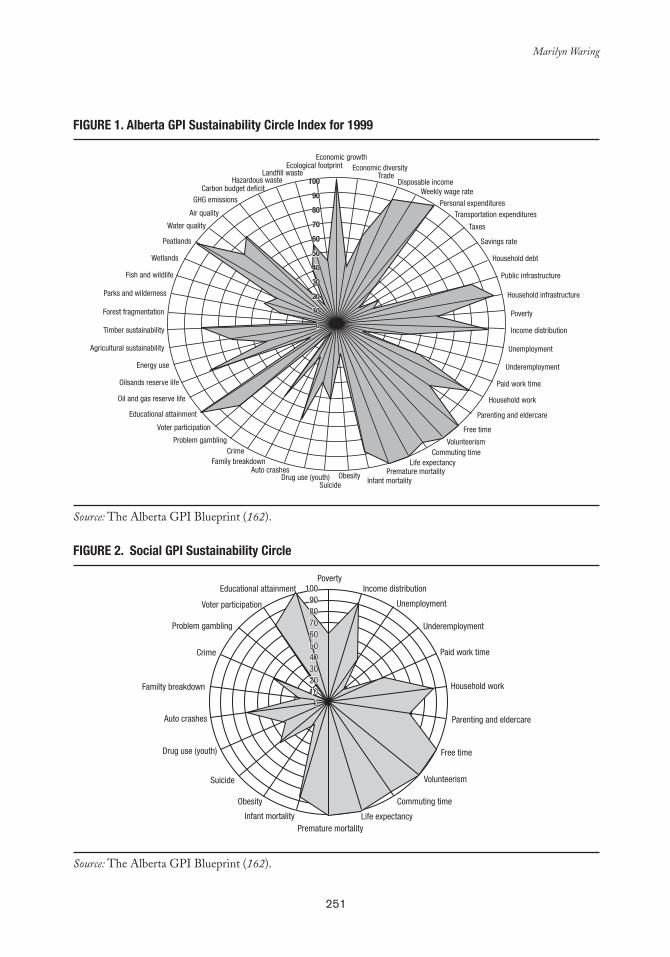
251
Marilyn Waring
FIGURe 1. alberta GPI Sustainability Circle Index for 1999
Source: The Alberta GPI Blueprint (162).
FIGURe 2. Social GPI Sustainability Circle
Source: The Alberta GPI Blueprint (162).
100
90
80
70
60
50
40
30
20
10
0
100
90
80
70
60
50
40
30
20
10
0
Economic growthEconomic diversity
TradeDisposable income
Weekly wage rate
Personal expendituresTransportation expenditures
Taxes
Savings rate
Household debt
Public infrastructure
Household infrastructure
Poverty
Income distribution
Unemployment
Underemployment
Paid work time
Household work
Parenting and eldercare
Free time
VolunteerismCommuting time
Life expectancyPremature mortality
Infant mortalityObesity
SuicideDrug use (youth)
Auto crashes
CrimeProblem gambling
Voter participation
Educational attainment
Oil and gas reserve life
Oilsands reserve life
Energy use
Agricultural sustainability
Timber sustainability
Forest fragmentation
Parks and wilderness
Fish and wildlife
Wetlands
Peatlands
Water quality
Air quality
GHG emissionsCarbon budget deficit
Hazardous wasteLandfill waste
Ecological footprint
Family breakdown
1009080706050403020100
1009080706050403020100
PovertyIncome distribution
Unemployment
Underemployment
Paid work time
Household work
Parenting and eldercare
Free time
Volunteerism
Commuting time
Life expectancyPremature mortality
Infant mortality
Obesity
Suicide
Drug use (youth)
Familty breakdown
Auto crashes
Crime
Problem gambling
Voter participation
Educational attainment
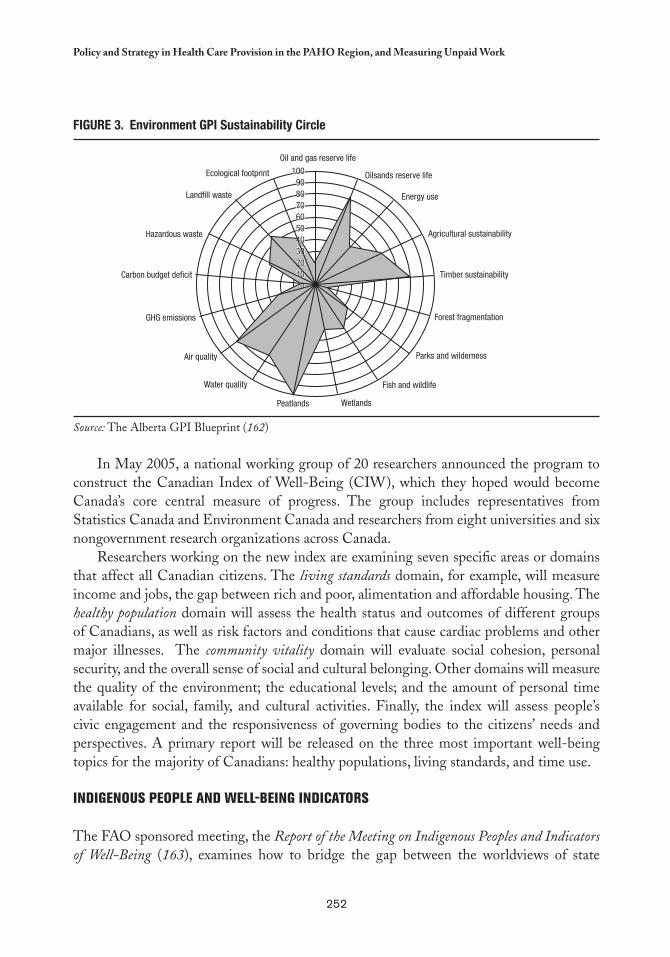
252
Policy and Strategy in Health Care Provision in the PAHO region, and Measuring Unpaid Work
FIGURe 3. environment GPI Sustainability Circle
Source: The Alberta GPI Blueprint (162)
In May 2005, a national working group of 20 researchers announced the program to construct the Canadian Index of Well-Being (CIW), which they hoped would become Canada’s core central measure of progress. The group includes representatives from Statistics Canada and Environment Canada and researchers from eight universities and six nongovernment research organizations across Canada.
Researchers working on the new index are examining seven specific areas or domains that affect all Canadian citizens. The living standards domain, for example, will measure income and jobs, the gap between rich and poor, alimentation and affordable housing. The healthy population domain will assess the health status and outcomes of different groups of Canadians, as well as risk factors and conditions that cause cardiac problems and other major illnesses. The community vitality domain will evaluate social cohesion, personal security, and the overall sense of social and cultural belonging. Other domains will measure the quality of the environment; the educational levels; and the amount of personal time available for social, family, and cultural activities. Finally, the index will assess people’s civic engagement and the responsiveness of governing bodies to the citizens’ needs and perspectives. A primary report will be released on the three most important well-being topics for the majority of Canadians: healthy populations, living standards, and time use.
INDIGENOUS PEOPLE AND WELL-bEING INDICATORS
The FAO sponsored meeting, the Report of the Meeting on Indigenous Peoples and Indicators of Well-Being (163), examines how to bridge the gap between the worldviews of state
1009080706050403020100
100908070605040302010
0
Oil and gas reserve life
Energy use
Oilsands reserve life
Agricultural sustainability
Timber sustainability
Forest fragmentation
Parks and wilderness
Fish and wildlife
WetlandsPeatlands
Water quality
Air quality
Carbon budget deficit
GHG emissions
Hazardous waste
Landfill waste
Ecological footprint
253
Marilyn Waring
governments and indigenous peoples concerning indicators development —referred to by one expert as “jagged worldviews colliding” (163). The workshop sought “a space between statistical reporting requirements of governments and representation of indigenous peoples’ perceptions and understanding of well-being” (163); in this respect, in the workshop they addressed the question of what are the indicators that interconnect these two interests.
An early issue addressed the need for indigenous peoples’ political participation to go beyond measuring token processes of consultation. The full integrity of the meaning of partnership was suggested as a more meaningful standard for measuring indigenous peoples’ political involvement. It was understood that the indicator movement required reciprocal, shared, and mutual accountability —between states and indigenous peoples—, and that expertise was held in both camps. Nonetheless, extensive dialogue was required between both parties, in particular because it might be anticipated that the current gap between state governments and indigenous community capacity in technology and research methodologies would widen with more sophistication and specialization in data skills (163).
Participants echoed best practice policy evaluation by calling for results that would benefit indigenous peoples through consolidating the links between program outputs to outcomes. “Experts agreed that indicators must place significant emphasis on indigenous peoples’ inherent values, traditions, languages, and traditional orders/systems, including laws, governance, lands, economies etc” (163). They also focused on the unpaid work issue, calling for the recognition of indigenous work value (for example, “making a living” versus “having a job”). The report also noted that the term “social capital” was not culturally appropriate and “social capacity” was preferred (163). Examples of good practice from both Canada and New Zealand, discussed in more detail shortly, were recognized as good practice. Experts expressed a desire for a balance of comparative indicators to assess well-being among nonindigenous and indigenous peoples, and indigenous-specific indicators based on their own visions and understandings of well-being.
Many of the problems associated with this subject occur where information gathering and interpretation is done for indigenous communities by nonindigenous outsiders. The Australian experience suggests that greater emphasis should be given to appropriate resourcing, training, and skills development for local personnel as essential components in building internal capacity for measurement and in community development. The key message from this work is the need to create processes that guarantee the inclusion of indigenous peoples in the development of statistics that purport to represent them.2
There has also been interesting academic research that has questioned the use of health indicators framed from a nonindigenous perspective, without the necessary holistic approach adopted in communities. With this in mind, a analysis of indicators that measure structural and contextual aspects of physical and social environments was undertaken to “(1)
2 This work on constructing meaningful statistics for indigenous peoples should not be confused with the debates around cultural indicators for human well-being taken on by UNESCO (164).
254
Policy and Strategy in Health Care Provision in the PAHO region, and Measuring Unpaid Work
2 Statistical data has seldom been gathered for the Mäori people, specifically to identify their needs. Statistics regarding this indigenous group tend to represent an analytical approach and philosophical framework that are not Mäori, and thus does not capture or reflect their circumstances.
assess the state of social and environmental indicators being used in indigenous community research program planning and evaluation and policy decisions, (2) identify remaining gaps in coverage of relevant aspects of physical and social environments and (3) organize the indicators so they could be easily scanned for selection for use in future program” (165). The study concluded that while many projects develop frameworks (of indicators) to guide their work, they generally categorize the indicators according to the specific objectives of the project and, often, include only the areas pertinent to their activities. In such circumstances, frameworks are often limited in scope and cannot integrate indicators outside of their original research domains, which significantly restricts their use in classifying indicators relevant to indigenous communities.
Likewise, these researchers observed that “the inadequacy of existing indicators for characterizing and addressing health issues in indigenous communities highlight[ed] frequent perceptions of irrelevance to community concerns and community goals. A large number of critiques had espoused the development and application of new indicators reflecting more culturally appropriate holistic views of health and well-being for indigenous populations” (165).
For some time, Statistics New Zealand had been aware of and concerned by the limited relevance of much of the official data on Mäori issues and concerns (166), until finally sufficient resources were made available for the development of a statistical framework of well-being for this community.3 The attributes and objectives clearly indicated that the framework had to be “centered on Mäori people and their collective aspirations” and further, that it should be “linked to Mäori development” (166). The Mäori people themselves worked on this statistical framework over several years, while the concept of well-being was fostered by the “capability approach” of Amartya Sen (167), as well as by Mäori traditions and culture. Table 2 provides some examples of the goal and measurement dimensions of their work.
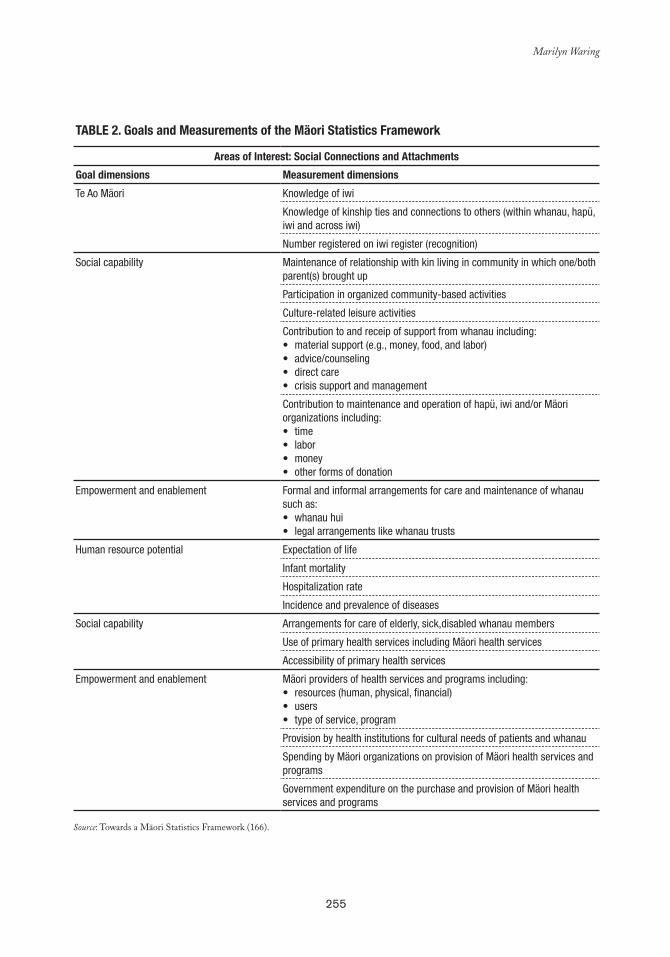
255
Marilyn Waring
Table 2. Goals and Measurements of the Mäori Statistics Framework
areas of Interest: Social Connections and attachments
Goal dimensions Measurement dimensions
Te Ao Mäori Knowledge of iwi
Knowledge of kinship ties and connections to others (within whanau, hapü, iwi and across iwi)
Number registered on iwi register (recognition)
Social capability Maintenance of relationship with kin living in community in which one/both parent(s) brought up
Participation in organized community-based activities
Culture-related leisure activities
Contribution to and receip of support from whanau including:material support (e.g., money, food, and labor)•advice/counseling•direct care•crisis support and management•
Contribution to maintenance and operation of hapü, iwi and/or Mäori organizations including:
time•labor•money•other forms of donation•
Empowerment and enablement Formal and informal arrangements for care and maintenance of whanau such as:
whanau hui•legal arrangements like whanau trusts•
Human resource potential Expectation of life
Infant mortality
Hospitalization rate
Incidence and prevalence of diseases
Social capability Arrangements for care of elderly, sick,disabled whanau members
Use of primary health services including Mäori health services
Accessibility of primary health services
Empowerment and enablement Mäori providers of health services and programs including:resources (human, physical, financial)•users•type of service, program•
Provision by health institutions for cultural needs of patients and whanau
Spending by Mäori organizations on provision of Mäori health services and programs
Government expenditure on the purchase and provision of Mäori health services and programs
Source: Towards a Mäori Statistics Framework (166).
256
Policy and Strategy in Health Care Provision in the PAHO region, and Measuring Unpaid Work
THE STATE OF WELL-bEING IN NUNAVUT, CANADA
The State of Inuit Well-Being in Nunavut (168) report points out key issues that define quality of life for Inuit people, in accordance with their values, life skills, and social competencies. Measurement is complicated, since Nunavut and the Inuit are in transformation from a culture of a subsistence economy, which lives off the land and maintains close-knit family interrelationships, to one that combines the land-based life with a wage-economy, private property rights, and institutionalization of family functions. Clearly, many of these living conditions have never been measured, quantified, or documented in written language. Another measurement challenge is combining indicators that draw on quantitative data from surveys (e.g., the Nunavut Household Survey) and qualitative data that comes from quality of life questions posed to individuals, elder councils, and communities, or derived through dialogue and storytelling. A meaningful portrait of well-being requires combining both quantitative and qualitative information. Nevertheless, anyone familiar with the construction of well-being indicators based on western values can immediately identify the different approaches of the Nunavut people, which can be appreciated, for example, in the following values that determine the well-being indicators on Community Capacity and Self Reliance within the community:
1. Inuit Qaujimanituqangit and Governance.2. Illinniarniq Avatimik “University of the Land:” quality (and quality) of knowledge
transferred by IQ (versus reliance on academic credentials).3. Incidence of sharing (cooperative usage of assets/equipment, for example commu-
nity freezers); incidence of food sharing in Nunavut compared to Greenland.4. Local abundance: high levels of reliance on local food sources, in particular veg-
etables harvested collectively (without government intervention or interference).5. Multigenerational proximity.6. Noncommoditized entertainment (hobbies, dancing, singing, etc.), as opposed to
Canadians’ high dependence on purchased entertainment. 7. A greater tendency and availability to spend time outdoors (they feel more com-
fortable and have more time). 8. Diversity of skill sets: high numbers of Inuit have a broader range of skills (me-
chanical, navigation, safety, hunting, midwifery) than average Canadians who are dependent on specialists.
As clarified, in future work in the Latin American and Caribbean region, more attention must be given to the establishment and interpretation of well-being indicators in the health sector with regards to the indigenous communities.
The Usefulness of Systems of Well-being Accounts
TUS are instrumental in the construction of well-being accounts, and for their use in strategic policy planning, as time is the only ever-present common denominator. Not everyone takes
257
Marilyn Waring
part in formal labor market activities or has disposable cash; rather, on the contrary, most people trade “time” instead of money. Common economics concerns the way individuals use time, and even though frequently there is no choice to use it, time is the common denominator of exchange. Likewise, it is the one unit of exchange that everyone has in equal amounts, the first investment to be made, and the one resource that cannot be reproduced.
Still, on a national level, what can time use data reveal? Among other things, it is an indicator of the goods and services that a households can produce, what the unemployed do with their time, how much additional work children create in a household, and whether or not there is equality in the distribution of household tasks. Through this data, it is possible to analyze the use of discretionary time by those in and out of the paid labor force. Data may point out inefficiencies in the use of human resources by unnecessary fragmentation of time, as well as reveal which sex gets the menial, boring, low status, and unpaid invisible work, which in turn cause oppression and subordination.
In rural areas, such surveys show seasonal variations, allowing identification of suitable time slots for education and other programs. Time use data also provides a measure of the interdependence of the activities of household members, and of how paid work, care work, domestic work, community work, leisure, and time spent on personal care are interrelated. This is vital for understanding how the impact of paid labor force participation of women leads to market activity growth to replace formerly unpaid activity in the household, or alternatively, how the devolution of government services of community care produces an increase in unpaid activity by “invisible” workers.
Such data also reveals the exact moment in which activities are carried out, assisting in the planning of post-compulsory educational facilities and targeting hours and topics to match current and potential students benefits, libraries, schools, community learning, and private educational institutions. Knowing precisely the hours in which various activities are carried out and for how long provides invaluable tools for health service planners, as well as data on electricity demand, retail store hours, and programming information campaigns. Information on where people will be and with whom, at different hours and days of the week, allows for better planning of civil defense activities in case of major disasters (e.g., a major earthquake).
Transport planners should understand the changing patterns of peoples’ activities, such as work and training schedules, travel times, who is working from home, and the use of child care services outside of school hours. Community and voluntary organization would benefit from knowing how many hours are spent, and by whom, in different types of volunteer groups —and how this work is combined with other activities. Commercial suppliers could also benefit by such useful information, particularly related to time spent using their types of products or services. In addition, it would reveal how much or little leisure time young people have, and how they balance employment, unpaid work, and studying. Finally, time use data could show how much productive work the retired population is taking on within the community.
258
Policy and Strategy in Health Care Provision in the PAHO region, and Measuring Unpaid Work
In these examples it is not necessary to impute monetary values to time use to make policies or plan, or to monitor and evaluate programs. Of course, such data can also demonstrate the nature of economic change; the growth of the services economy would be better understood if the shift into the market from work previously done in the unpaid economy could be measured. On the other hand, such data would make it possible to measure unpaid productive work using current national account measures, such as GDP, through the mechanism of monetary imputation.
This occasional need to use imputation is not a reason to abstract all time use data from the economic model, rather more rigorous planning can be achieved by conserving the time use framework, which makes more sense.
Canadian Economist John Helliwell (169) has been looking at empirical research on the determinants of subjective well-being and has sketched possible implications for public policy. In his work, results from national and international samples suggest that measures of social capital —especially including additional measures of specific and general trust— have substantial effects on well-being beyond those flowing through economic channels, as measured by incomes and employment status.
Additionally, the international samples of well-being data show the importance of several measures of government quality. More recently, use of such data to estimate the income equivalent value of a variety of nonfinancial aspects of the workplace produced numbers so large as to suggest the existence of unexploited opportunities to improve both employee satisfaction and enterprise efficiency. In short, recent well-being results suggest renewed policy emphasis, in both the public and private sectors, on the social and institutional contexts within which firms and governments operate.
Beyond this potentially vast but largely unstudied set of process improvements, there is an additional range of policy issues which relate to collection of data and the elaboration of research and policy agendas. Since subjective well-being measures are plausibly linked to the underlying utility experienced by individuals, and because such measures are not costly to collect in the context of established surveys and pilot projects, there are viable arguments for significantly increasing the quantity of well-being data available to aid future analysis.
In particular, Helliwell says, policy interventions should be routinely accompanied by prior and subsequent measures of well-being (169). On a more ambitious scale, large geocoded surveys of social capital and well-being, originally designed to collect ancillary data on existing surveys, offer the potential for developing community-level measures of social capital and well-being that can supplement the existing set of census-based data.

259
references
1. Pan American Health Organization (PAHO). Política de igualdad de género. Washington DC: PAHO; 2005.
2. Fourth World Conference on Women. Platform for Action, Strategic Objective A. 4, par.5; Strategic Objective H.3, Sec. a, par. iii; Sec. b, pars. i, ii. Beijing; 1995.
3. Pan American Health Organization (PAHO). Resolution CD46. R16. Washington DC; September 2005.
4. Pan American Health Organization (PAHO). Advances in Gender Mainstreaming in a PAHO Technical Cooperation Area: National Health Accounts. 21st Session of the Subcommittee on Women, Health, and Development of the Executive Committee, Washington DC; March 2005.
5. United Nations Development Fund for Women (UNIFEM). Progress of the World’s Women. New York: UNIFEM; 2000.
6. Gómez Gómez, E. Género, equidad y políticas de reforma en salud. Pan American Journal of Public Health. Washington DC: Pan American Health Organization; June 2002.
7. The Economic and Social Council (ECOSOC). E/1997/L.30; 1997.8. United Nations Millennium Project. Task Force on Education and Gender Equality.
Taking Action: Achieving Gender Equality and Empowering Women. UNDP, New York; 2005. Available at: http://www.unmillenniumproject.org/documents/Gender-complete.pdf.
9. Budlender, D. Why Should We Care about Unpaid Care Work? A guidebook prepared for the UNIFEM Southern African Region Office, Harare, Zimbawe, by the Community Agency for Social Enquiry, Cape Town; 2002.
10. Economic Commission for Latin America and the Caribbean (ECLAC). Social Panorama of Latin America 2006. Santiago, Chile: ECLAC; 2006.
11. Economic Commission for Latin America and the Caribbean (ECLAC). La protección social de cara al futuro: acceso, financiamiento y solidaridad. Santiago, Chile: ECLAC; 2006.
12. Economic Commission for Latin America and the Caribbean (ECLAC). The Millennium Development Goals: A Latin American and Caribbean Perspective. Santiago, Chile: ECLAC; 2005.
13. United Nations Development Programme. Human Development Report 1995. New York: Oxford University Press; 1995.
260
references
14. Consejo Nacional de las Mujeres, Encuesta del Uso del Tiempo en Ecuador 2005, Quito; 2006. Pedrero Nieto M, Trabajo doméstico no remunerado en México. Una estimación de su valor económico a través de la ENUT 2002, Mexico DF: National Women’s Institute (INAMUJERES); 2002. Aguirre R, Bithyány K, Uso del tiempo y trabajo no remunerado, Encuesta en Montevideo y área metropolitana 2003; 2003. Cuba, Encuesta sobre el uso del tiempo; 2002.
15. United Nations Development Programme. Human Development Report 1999. New York, Oxford: Oxford University Press; 1999.
16. Durán, MA. Los costes invisibles de la enfermedad. Madrid: Fundación BBVA; 2003.17. Leslie, J. Women’s Time: A Factor in the Use of Child Survival Technologies? Health
Policy and Planning: 4(1): 1–16; 1989.18. Maritime Centre of Excellence for Women’s Health. Equity and Diversity Approaches
for Women Caregivers: The Impact of Health Reform. Halifax, Canada: Dalhousie University; 1999.
19. Medel J, Díaz X, Mauro A. Visibilización de los costos de la producción de salud en el hogar. Impacto sobre el trabajo total de las mujeres. Santiago, Chile: Center of Women’s Studies; 2006.
20. Moisan, M. Ambulatory Care: The Hidden Price for Women. Quebec, Gourvement du Quebec: Conseil du statut de la femme; 1999. Available at: http://www.csf.gouv.qc.ca.
21. Waring, M. Counting for Nothing: What Men Value and What Women are Worth. Toronto: University of Toronto Press; 2004.
22. Durán, MA. Diez buenas razones para medir el trabajo no remunerado en el cuidado de la salud (in this publication).
23. Gómez Gómez, E. Equidad, género y reforma de las políticas de salud en América Latina. Contribution from PAHO to the 8th Session of the Regional Conference on Women in Latin America and the Caribbean, called by the Economic Commission for Latin America and the Caribbean (ECLAC). Lima, Peru; 2000.
24. Pan American Health Organization (PAHO). Advances in Gender Mainstreaming in a PAHO Technical Cooperation Area: National Health Accounts. 21st Session of the Subcommittee on Women, Health, and Development of the Executive Committee, Washington DC; March 2005.
25. Hamdad, M. Valuing Households Unpaid Work in Canada, 1992 and 1998: Trends and Sources of Change. Statistics Canada Economic Conference; May 2003.
26. Harvey AS, Mukhopadhyay AK. Household Production in Canada: Measuring and Valuing Outputs. In Advances in Household Economics, Consumer Behaviour and Economic Policy, Hoa, T.V. ed. Hants. England: Ashgate; August 2005 (6): 70–84.
27. Gómez Luna, ME. Cuenta satélite de los hogares: valoración del trabajo doméstico no pagado. El caso de México. Mexico: INEGI; 2001.
261
references
28. Landefeld JS, Fraumeni BM, Vojtech CM. Accounting for Nonmarket Production: A Prototype Satellite Account Using the American Time Use Survey. Fotocopied document; May 2006.
29. Reid, M. The Economics of Household Production. New York: Wiley; 1934.30. Jorgenson DW, Fraumeni BM. The Accumulation of Human and Non-Human
Capital, 1948–1984. En The Measurement of Saving, Investment, and Wealth, R.E. Lipsey y H. Tice, eds. Chicago: University of Chicago Press; 1987. p. 227–82.
31. Jorgenson DW, Fraumeni BM. The Output of the Education Sector. In Output Measurement in the Service Sectors, Z. Griliches, eds. Chicago: University of Chicago Press; 1992. p. 303–38.
32. Szalai, A. The Use of Time. The Hauge, The Netherlands: Mouton; 1973.33. Jackson C, Chandler, W. Households Unpaid Work: Measurement and Valuation.
System of National Accounts, Studies in National Accounting, Statistics Canada, Catalogue 13-603E, No. 3 – Occasional; December 1995.
34. Harvey, AS. Guidelines for Time Use Data Collection and Analysis. Time Use Research in the Social Sciences, W. E. Pentland, A.S. Harvey, M. Powell Lawton y M.A. McColl eds. New York: Kluwer Academic/Plenum Publishers; 2002. p. 19–46.
35. Juster FT, Stafford FP. The Allocation of Time: Empirical Findings, Behavioral Models, and Problems of Measurement. Journal of Economic Literature. June 1991; Vol. XXIX (2): 471–522.
36. Pollak, R. Notes on Time Use. Monthly Labor Review. August 1999; Vol 122 (8).37. Abraham, KG, Mackie, C, eds. Beyond the Market: Designing Nonmarket Accounts for
the United States. Washington, DC: The National Academies Press; 2005.38. Instituto Nacional de Estadística, Geografía e Informática de México (INEGI). No
date. Encuesta Nacional sobre Uso del Tiempo. Available at: http://www.inegi.gob.mx/inegi/default.aspx.
39. Center for Time Use Research. (N.d.) Multinational Time Use Study, St. Hugh’s College, Oxford, UK. Available at: http://www.timeuse.org/mtus/.
40. US Bureau of Labor Statistics. No date. American Time Use Survey. Available at: http://www.bls.gov/tus/home.htm.
41. Eisner, R. The Total Incomes System of Accounts. Chicago: The University of Chicago Press; 1989.
42. Landefeld JS, McCulla SH. Accounting for Nonmarket Household Production within a National Accounts Framework. Review of Income and Wealth. September 2000, Series 46, No. 3, p. 289–307.
43. United Nations (UN), Organisation for Economic Co-operation and Development (OECD), International Monetary Fund (IMF), European Commission. Eurostat. System of National Accounts 1993.
262
references
44. U.S. Bureau of Economic Analysis. (N.d.) A Guide to the NIPA’s. Available at: http://www.bea.gov/bea/an/nipaguid.pdf.
45. Fraumeni, BM. Measuring the Education Output of Government Using a Human Capital Approach: What Might Estimates Show? Statistical Commission and Economic Commission for Europe, Conference of European Statisticians, Fourth Meeting of the 2006/2007 Bureau, CES Plenary Session, Ginebra; 2007 June 11–15.
46. Center for Time Use Research. (N.d.) American Heritage Time Use Study. St. Hugh’s College, Oxford, England. Available at: http://www.timeuse.org/ahtus/.
47. Instituto Nacional de Estadística, Geografía e Informática (INEGI). Sistema de Cuentas Nacionales de México, Cuentas de Bienes y Servicios, 1999–2004. Mexico; 2005.
48. Instituto Nacional de Estadística, Geografía e Informática (INEGI). Encuesta Nacional sobre Uso de Tiempo 2002. Mexico.
49. Instituto Nacional de Estadística, Geografía e Informática (INEGI). Encuesta Nacional de Ingresos y Gastos de los Hogares 2002. Mexico.
50. United Nations. Guide to Producing Statistics on Time Use: Measuring Paid and Unpaid Work. Department of Economic and Social Affairs, Statistics Division; 2006.
51. Nigenda G, Matarazzo C, and López Ortega M. Los cuidados de salud en el hogar: tendencias e inequidades. Análisis desde una perspectiva de género. Mexico: Mexican Foundation for Health, Secretariat of Health; 2005.
52. Acharya, M. Measurement of Contributions of Women and Men to the National Accounts. Submitted to INSTRAW for Beijing Conference on Women. Institute for Integrated Development Studies, Kathmandu, Nepal; 1995.
53. Varjonen J, Hamunen E, Sandstrom T, Nieme I, Paakkonen H. Proposal for a Satellite Account of Household Production. Eurostat Working Paper 9/1999/A4/11; 1999.
54. Kulshreshtha AC, Singh G. (N.d.) Valuation of Non-Market Household Production. Central Statistical Organisation, New Delhi, India.
55. Chadeau, A. What is Household’s Non-Market Production Worth? In OECD Economic Studies, No 18:85-103; 1992.
56. Schafer D, Schwarz N. (N.d.) The Value of Household Production in the Federal Republic of Germany, 1992. Federal Statistical Office, Wiesbaden.
57. Australian Bureau of Statistics. Measuring Unpaid Household Work: Issues and Experimental Estimates. Catalogue No. 5236.0; 1990.
58. Brathaug, AL. Value Added in Households. In Oekonomiske Analyse 3-1990. Statistics Norway; 1990.
59. Alderman H, Babita M, Lanjouw J, Lanjouw P, Makhatha N, Mohamed A, Özler B, Qaba O. Combining Census and Survey Data to Construct a Poverty Map of South Africa. In Statistics South Africa, Measuring Poverty in South Africa. Pretoria, South Africa; 2000. p. 11–52.
263
references
60. Ironmonger, D. Why Measure and Value Unpaid Work? Revised version of document presented at the International Conference of the Measurement and Valuation Unpaid Work. Ottawa, Canada; 1993.
61. Aray, MJ. Un acercamiento a las encuestas sobre el uso de tiempo con orientación de género. Unidad Mujer y Desarrollo, Serie Mujer y Desarrollo 50. Santiago, Chile; 2003.
62. International Labour Organization (ILO). Working Out of Poverty. Geneva, Switzerland; 2003.
63. United Nations. Draft International Classification of Activities for Time Use Statistics. United Nations Secretariat esa/stat/ac.79/22, Statistics Division Expert Group Meeting on Methods for Conducting Time Use Surveys. New York; 2000.
64. Ferrán, L. Aspectos conceptuales de una cuenta satélite de hogares con consideraciones de género. Gender, Equity and Health Reform in Chile. Santiago, Chile: PAHO/WHO; 2002.
65. Camposortega, S. Análisis demográfico de la mortalidad en México 1940–1980. Mexico: El Colegio de México; 1992.
66. National Council of Population (CONAPO). Situación demográfica de México. Mexico; 2003.
67. National Women’s Institute (INMUJERES). National Time Use Survey 2002. México; 2004.
68. Ferrán, L. Marco conceptual y lineamientos metodológicos de la cuenta satélite del sector hogares para medición del trabajo no remunerado en salud dentro del Sistema de Cuentas Nacionales. Regional Meeting: Las Encuestas de Uso del tiempo Su Diseño y Aplicación; November 21–23, 2005; Santiago, Chile. PAHO/UNIFEM/ECLAC.
69. Pedrero Nieto, M. Trabajo doméstico no remunerado en México. Una estimación de su valor económico a través de la Encuesta Nacional sobre Uso del Tiempo 2002. National Women’s Institute (INMUJERES), ISBN: 968-5552-48-7. Mexico; 2005.
70. Durán, MA (Research Coordinator). Informe sobre el impacto social de los enfermos dependientes por ictus (ISEDIC). Merck Sharp & Ohme, Spain. ISBN: 84-7989-296-X. 2005; Madrid; 2004.
71. Díaz X, Schalen N. La salud ignorada. Trabajadoras de la confección. Santiago, Chile: Centro de Estudios de la Mujer (CEM); 1992.
72. Díaz, X. La dimensión de género en la salud ocupacional en Chile. Recomendaciones para la salud de la Mujer. Santiago, Chile: Health and Social Policy Corporation (CORSAPS); 1994.
73. Díaz X, Medel J, Schlaen N. Mujer, trabajo y familia en Chile. El trabajo a domicilio en Chile. (Proyecto Fondecyt No 1950139). Working paper, Santiago, Chile: Centro de Estudios de la Mujer (CEM); 1996.
264
references
74. Reca, I. Familia y trabajo: una tensión no resuelta. In Valenzuela ME, coordinator. Igualdad de oportunidades para la mujer en el trabajo. Santiago, Chile: Servicio Nacional de la Mujer (SERNAM); 1996. p. 141–76.
75. Arriagada, I. Políticas sociales, familia y trabajo en América Latina de fin de siglo. Serie Políticas Sociales No 21. Santiago, Chile: ECLAC/ United Nations; 1997.
76. Díaz X, Medel J. Familia y trabajo: distribución del tiempo y relaciones de género. In Olavarría y Céspedes, eds. Trabajo y familia: ¿Conciliación? Perspectivas de género. Santiago, Chile: SERNAM / FLASCO / CEM; 2002.
77. Valdés X, Araujo K. Vida privada. Modernización agraria y modernidad. Santiago, Chile: CEDEM; 1999.
78. Servicio Nacional de la Mujer. Responsabilidades familiares compartidas. Sistematización y análisis. Working Paper No 41, elaborated by Sharim D and Espinoza E. Santiago, Chile: SERNAM; 1995.
79. Servicio Nacional de la Mujer. Familia y reparto de responsabilidades. Working paper No 58 elaborated by Daniela Sharim and Uca Silva. Santiago, Chile: SUR Profesionales Consultores; 1998.
80. Zukewich, N. Unpaid Informal Caregiving. Canadian Social Trends. 2003 Autumn: 14–18.
81. Armstrong P, Kitts O. One Hundred Years of Caregiving. In Grant K, Amaratunga C, Armstrong P, Boscoe M, Pederson A, Willson K, eds. Caring For/Caring About. Women, Home Care and Unpaid Caregiving. Aurora, ON: Garamond; 2004: 5–44.
82. Zimmerman M, Litt, J, Bose, C, eds. Global Dimensions of Gender and Carework. Stanford, California: Stanford Social Science; 2006.
83. Morris, M. What Research Reveals about Gender, Home Care and Caregiving; Overview and Policy Implications. In Grant K, Amaratunga C, Armstrong P, Boscoe M, Pederson A, Willson K, eds. Caring For/Caring About. Women, Home Care and Unpaid Caregiving. Aurora: Garamond; 2004: 91–114.
84. Harrington, M. Care and Equality. New York: Routledge; 2000.85. Ehrenreich B, Hochschild A, eds. Global Woman. New York: Henry Holt; 2002.86. Armstrong P, Armstrong H. Public and Private: Implications for Care Work.
Sociological Review; 2006, 53(s2): 167–87.87. Baker, M. Restructuring Family Policies: Convergences and Divergences. Toronto:
University of Toronto Press; 2006.88. Oliker, S. Examining Care at Welfare’s End. En: Meyer M, ed. Care Work. Gender,
Labor and the Welfare State. New York: Routledge; 2000. p. 178.89. Armstrong P, Armstrong H, Scott-Dixon K. Critical to Care. Women’s Ancillary
Work in Health Care. Available at: www.cwhn.ca/healthreform.90. Hochschild A, Machung A. The Second Shift. New York: Viking; 1989.91. Stone, D. Caring by the Book. In Meyer M, ed. Care Work Gender, Labor and the
Welfare State. New York: Routledge Press; 2000.
265
references
92. Ironmonger, D. Bringing Up Betty and Bobby: The Inputs and Outputs of Childcare Time. In Folbre, N. and Bittman M., eds. Family Time: The Social Organization of Care. New York: Routledge; 2004. p. 93–109.
93. Budig M, Folbre N. Activity, Proximity or Responsibility? Measuring Parental Childcare Time. In Folbre, N and Bittman, M, eds. Family Time: The Social Organization of Care. New York: Routledge; 2004. p. 51–68.
94. Folbre N, Yoon J, Finnoff K, Fuligni A. By What Measure? Family Time Devoted to Children in the U.S. Demography; May 2005, 42(2): 373–90.
95. Fedick CB, Pacholok S, Gauthier AH. Methodological Issues in the Estimation of Parental Time: Analysis of Measures in a Canadian Time-Use Survey. Electronic International Journal of Time Use Research; 2005 2(1): 14–36.
96. Horrigan M, Herz D. Planning, Designing and Executing the BLS American Time-Use Survey. Monthly Labor Review; 2004 Oct: 3–19.
97. Harvey A, Royal M. Use of Context in Time-Use Research. Document presented in the Expert Group Meeting on Methods for Conducting Time Use Surveys. October 23–27, 2000; New York.
98. Mattingly MJ, Bianchi S. Gender Differences in the Quantity and Quality of Free Time: The U.S. Experience. Social Forces; March 2003 81(3): 999–1030.
99. Bittman M, Wajcman J. The Rush Hour: The Quality of Leisure Time and Gender Equity. In Folbre, N and Bittman, M, eds. Family Time: The Social Organization of Care. New York: Routledge; 2004. p. 171–94.
100. Craig, L. The Effect of Children on Adult’s Time-Use: An Analysis of the Incremental Time Costs of Children in Australia. Discussion Paper No. 143. Social Policy Research Centre, University of New South Wales, Sydney, Australia.
101. Bittman, M. Parenthood Without Penalty: Time Use and Public Policy in Australia and Finland. Feminist Economics; 1999 5(3): 27–42.
102. Gershuny J. Changing Times: Work and Leisure in Postindustrial Society. New York: Oxford University Press; 2000.
103. Gauthier A, Furstenberg F Jr., Smeeding T. Are Parents Investing Less Time in Children? Trends in Selected Industrialized Countries. Population and Development Review; 2004 30 (4): 647–71.
104. Bittman M, Craig L, Folbre N. Packaging Care: What Happens When Children Receive Non-Parental Care? In Folbre N, Bittman, M, eds. Family Time: The Social Organization of Care. New York: Routledge; 2004. p. 133–51.
105. United Kingdom. The United Kingdom 2000 Time Use Survey. Technical Report. London: National Statistics; 2003.
106. Yoon, J. Measuring Unpaid Caring Work Using the Korean Time Use Survey: Methodological Issues. Unpublished. Department of Economics, University of Massachusetts, Amherst; December 2005.
266
references
107. Frederick, J. Measuring Child Care and Sleep: Some Results from the 1992 General Social Survey. Document presented in the meetings of the International Association for Time Use Research, University of Amsterdam, The Netherlands; 1993.
108. Schwartz, L. Minding the Children: Understanding How Recall and Conceptual Interpretations Influence Responses to a Time-Use Summary Question. Unpublished. US Bureau of Labor Statistics; 2001. Available at: http://www.bls.gov/ore/pdf/st010180.pdf.
109. Frazis H, Stewart J. Where Does the Time Go? Concepts and Measurement in the American Time Use Survey. In Berndt, E and Hulten, C, eds. Hard to Measure Goods and Services: Essays in Memory of Zvi Griliches. National Bureau of Economic Research Studies in Income and Wealth. Chicago: University of Chicago Press; 2004.
110. Lino, M. Expenditures on Children by Families, 2000. Annual Report. US Department of Agriculture, Center for Nutrition Policy and Promotion. Miscellaneous Publication No. 1528-2000; 2001.
111. Folbre, N. Valuing Children. Rethinking the Economics of the Family. Cambridge, MA: Harvard University Press; 2007.
112. Waldfogel, J. The Effect of Children on Women’s Wages. American Sociological Review; 1997 62(2): 209–17.
113. Badgett L, Folbre N. Job Gendering: Occupational Choice and the Labor Market. Industrial Relations; April 2003 42 (2): 270–98.
114. Harding, S. Ciencia y feminismo. Madrid: Morata; 1996 (e.o.1986).115. Hewitson, G. Feminist Economics. Interrogating the Masculinity of Rational Economic
Man. England: Edward Elgar; 1999.116. Pérez, A. Perspectivas feministas en torno a la economía: el caso de los cuidados. Spanish
Economic Council; 2005.117. Carrasco, C. El trabajo doméstico. Un análisis económico. Madrid, Spain: Ministry of
Labor and Social Security, Doctoral Thesis Collection; 1991.118. Picchio, A. Social Reproduction: The Political Economy of the Labour Market. Cambridge
University Press; 1992. 119. Picchio, A. Visibilidad analítica y política del trabajo de reproducción social. In
Cristina Carrasco, ed. Mujeres y economía. Nuevas perspectivas para nuevos y viejos problemas. Icaria; 1999: 201–42.
120. Picchio, A. Un enfoque macroeconómico “ampliado” de las condiciones de vida. In Cristina Carrasco, ed. Tiempos, trabajos y género. University of Barcelona Publications; 2001: 15–37.
121. Elson, D. Gender-Neutral, Gender-Blind or Gender-Sensitive Budget?: Changing The Conceptual Framework to Include Women’s Empowerment and The Economy of Care. Preparatory Country Mission to Integrate Gender into National Budgetary Policies and Procedure. Commonwealth Secretariat; 1997.
267
references
122. Budlender D, Sharp R, Allen K. How to Do a Gender-Sensitive Budget Analysis: Contemporary Research and Practice. London: Commonwealth Secretariat; 1998.
123. Himmelweit, S. The Need for Gender Impact Analysis. In Sarah Robinson, ed. The Purse or the Wallet? Proceedings of the Women’s Budget Group Seminar, held at Church House Conference Centre, Westminster, London: Fawcett Society; 1998.
124. Del Re, A. Tiempo del trabajo asalariado y tiempo del trabajo de reproducción. Política y sociedad; 1995:19: 75–81.
125. Carrasco C, Mayordomo M. Tiempos, trabajos y organización social: reflexiones en torno al mercado laboral femenino. In Cristina Carrasco, ed. Mujeres y economía. Nuevas perspectivas para nuevos y viejos problemas. Icaria; 1999: 125–71.
126. Carrasco C, Mayordomo M. Los modelos y estadísticas de empleo como construcción social: la encuesta de población activa y el sesgo de género. Política y Sociedad; 2000 (34): 101–12.
127. Picchio, A. La economía política y la investigación sobre las condiciones de vida. In Cairó, G and Mayordomo, M compiladoras. Por una economía sobre la vida. Icaria; 2005: 17–34.
128. Nelson, J. Feminism, Objectivity, and Economics. London: Routledge; 1996.129. Carrasco C, Domínguez M, Mayordomo M. El trabajo de las mujeres en Cataluña
¿hacia una creciente igualación? Labor, Economic, and Social Council of Catalonia; 2005.
130. Carrasco C, Mayordomo M, Domínguez M, Alabart A. Trabajo con mirada de mujer. Propuesta de una encuesta de población activa no androcéntrica. Madrid: Economic and Social Council; 2004.
131. Folbre N, Bittman M. Family Time. Routledge; 2004.132. Carrasco, C. La paradoja del cuidado: invisible pero necesario. Revista de Economía
Crítica; 2006. Vol. 5: 39–64.133. Carrasco C, Domínguez M. Género y usos del tiempo: nuevos enfoques metodológicos.
Revista de Economía Crítica; 2003. Vol. 1: 129–52.134. Carrasco C, Domínguez M, Simó M. La integración del trabajo familiar doméstico
en los procesos económicos. El análisis de la transferencia de costes monetarios a cuidados no remunerados en el sector público sanitario. Unpublished. Madrid: National Women’s Institute; 2005.
135. Van den Berg B, Brouwer W, van Exel J, Koopmanschap M. Economic Valuation of Informal Care: The Contingent Valuation Method Applied to Informal Caregiving. Health Economics. February 2005 Vol. 14/2: 169–83.
136. Van den Berg B, Bleichrodt H, Eeckhoudt L. The Economic Value of Informal Care: A Study of Informal Caregivers and Patients Willingness to Pay and Willingness to Accept for Informal Care. Health Economics. April 2005 Vol 14/4: 363–76.
268
references
137. van den Berg B, Ferrer-i-Carbonell A. The Well-Being of Informal Caregivers: A Monetary Valuation of Informal Care. Document presented at the Congreso de Economía de la Salud, Barcelona; July 13–15, 2005.
138. United Nations. The Millennium Development Goals: A Latin American and Caribbean Perspective. Santiago, Chile; 2005.
139. Waring, M. Si las mujeres contaran: Una nueva economía feminista. Madrid: Vindicación Feminista; 1994.
140. Organisation for Economic Co-operation and Development. (2004). OECD Glossary of Statistical Terms. Retrieved July 2, 2007 from http://stats.oecd.org/glossary/glossary.pdf.
141. United Nations, Economic Commission for Latin America and the Caribbean. (2004). Report of the Meeting of Experts on Time-Use Surveys, December 11–12 2003. Retrieved July 2, 2007, from http://www.eclac.cl/mujer/reuniones/conferencia_regional/time.pdf.
142. Pan American Health Organization. (2005). Advances in Gender Mainstreaming in a PAHO Technical Cooperation Area: National Health Accounts. Retrieved July 2, 2007 from http://www.paho.org/English/GOV/CE/MSD/msd21-04-e.pdf.
143. United Nations. Guide to Producing Statistics on Time Use: Measuring Paid and Unpaid Work. (2005). New York: United Nations, Department of Economic and Social Affairs, Statistics Division. Retrieved July 2, 2007 from http://unstats.un.org/unsd/publication/SeriesF/SeriesF_93E.pdf.
144. United Nations. Designing Household Survey Samples: Practical Guidelines. (2005). New York: United Nations, Department of Economic and Social Affairs, Statistics Division. Retrieved July 2, 2007 from http://unstats.un.org/unsd/demographic/sources/surveys/Handbook23June05.pdf.
145. Rydenstam, K. (1999a). The Eurostat Project on Harmonising Time Use Statistics: Harmonisation by Definition of Statistics and Estimators. Draft paper on the Eurostat Time Use Project. Retrieved July 2, 2007 from http://www.iser.essex.ac.uk/conferences/iatur/1999/pdf/paper33.pdf.
146. Rydenstam, K. (1999b). Eurostat Project on Harmonisation of Time Use Statistics: Pilot Survey Design and Evaluation, Some Conclusions and Recommendations. Paper presented at the 52nd Session of the Bulletin of the International Statistical Institute, Finland. Retrieved July 2, 2007 from http://www.stat.fi/isi99/proceedings/arkisto/varasto/ryde0488.pdf.
147. Folbre N, Yoon J. (2005). The Value of Unpaid Child Care in the US in 2003. Document presented at the meetings of the Allied Social Science Association, Boston, MA. Retrieved July 2, 2007 from http://www.irs.princeton.edu/seminars/folbre2.pdf.
148. Folbre N, Yoon J. (2006). What is Child Care? Lessons from the 2003 American Time Use Survey. Paper presented at the International Association for Time Use
269
references
Research (IATUR), Halifax, Nova Scotia. Retrieved July 2, 2007 from http://web.uvic.ca/econ/fem1.pdf.
149. Montano, S. (2006). Gender and Poverty: Conceptual Overview. Paper presented at the Inter-Agency and Expert Group Meeting on the Development of Gender Statistics. Retrieved July 2, 2007 from http://unstats.un.org/unsd/demographic/meetings/egm/genderstats06/DOC%2012A%20Gender_Poverty%20-ECLAC.ppt.
150. Sharpe, A. (1999). A Survey of Indicators of Economic and Social Well-Being. Paper prepared for Canadian Policy Research Networks. Retrieved July 2, 2007 from http://www.csls.ca/reports/paper3a.pdf.
151. United Nations. Progress of the World’s Women: Gender Equality and the Millennium Development Goals. New York: United Nations Development Fund for Women; 2002.
152. Costanza R, Fisher B, Ali S, Beer C, Bond L, y cols. (2007). Quality of Life: An Approach Integrating Opportunities, Human Needs, and Subjective Well-Being. Ecological Economics, 61(2–3): 267–276. Retrieved July 2, 2007 from http://www.sciencedirect.com/science/article/B6VDY-4JDN6F9-6/2/79e011309e81356e5c38c5f2863df485.
153. Daly H, Cobb J. For the Common Good: Redirecting the Economy Toward Community, the Environment, and a Sustainable Future. Boston: Beacon Press; 1994.
154. Colman, R. (1998). Measuring Sustainable Development: The Nova Scotia Genuine Progress Index: Framework, Indicators and Methodologies. Retrieved July 2, 2007 from http://www.gpiatlantic.org/pdf/general/framework.pdf.
155. Genuine Progress Index for Atlantic Canada (GPI Atlantic). Retrieved July 2, 2007 from http://www.gpiatlantic.org.
156. United Nations. United Nations Development Programme. Retrieved July 2, 2007 from http://www.undp.org/.
157. Calvert-Henderson Quality of Life Indicators. Retrieved July 2, 2007 from http://www.calvert-henderson.com/.
158. Institute for Innovation in Social Health. The Index of Social Health. Retrieved July 2, 2007 from http://iisp.vassar.edu/ish.html.
159. Demographics and Health Surveys. Retrieved July 2, 2007 from http://www.measuredhs.com/.
160. World Health Organisation (WHO). Expanded Programme on Immunization. Retrieved July 2, 2007 from http://www.wpro.who.int/sites/epi/overview.htm.
161. Daly, H. Beyond Growth. Boston: Beacon Press; 1996.162. Anielski, M. (2001). The Alberta GPI Blueprint: The Genuine Progress Indicator
(GPI) Sustainable Well-Being Accounting System. Retrieved July 2, 2007 from http://www.anielski.com/Documents/Alberta%20GPI%20Blueprint.pdf.
270
references
163. Report of the Meeting on Indigenous Peoples and Indicators of Well-Being. Permanent Forum on Indigenous Issues, Fifth Session. New York; May 15–26, 2006. Retrieved July 2, 2007 from ftp://ftp.fao.org/docrep/fao/009/ag253e/ag253e00.pdf.
164. Taylor, J. (2006). Indigenous Peoples and Indicators of Well-Being: An Australian Perspective on UNPFII Global Frameworks. Canberra, Australia: Centre for Aboriginal Economic Policy Research. Retrieved July 2, 2007 from http://www.anu.edu.au/caepr/data/pdf.gif.
165. Marks E, Cargo M, Daniel M. Constructing a Health and Social Indicator Framework for Indigenous Community Health Research. Social Indicators Research; 2007 (82): 93–110.
166. Towards a Mäori Statistics Framework: A Discussion Document. (2002). Wellington, New Zealand: Statistics New Zealand. Retrieved July 2, 2007 from http://www.stats.govt.nz/NR/rdonlyres/2E5A295F-65F8-4314-96AF-82F7928A33DA/0/Maori.pdf.
167. Sen, A. Commodities and Capabilities. New York: Elsevier; 1985.168. Anielski M, Pollock D. The State of Inuit Well Being in Nunavut. Nunavut, Canada:
Nunavut Social Development Council; 2003.169. Helliwell, J. Well-Being, Social Capital and Public Policy: What’s New?. Economic
Journal; 2006 116(510): 34–45.